

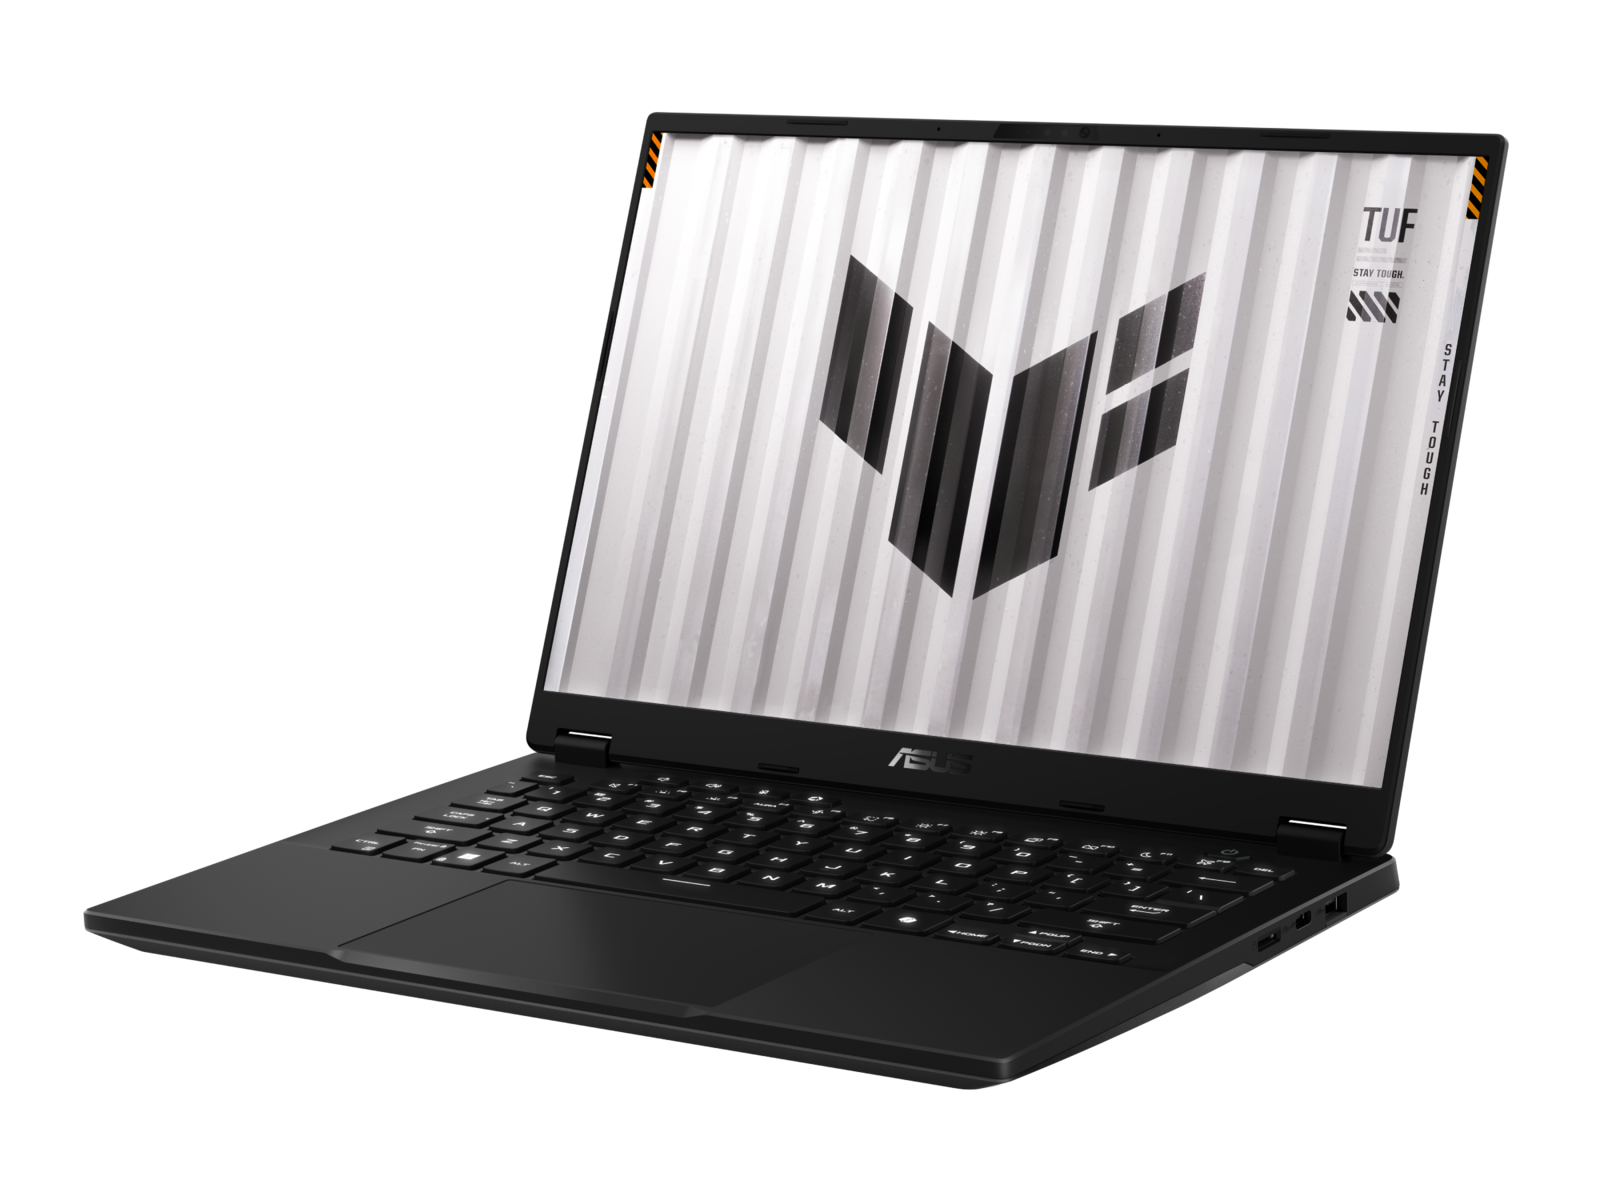
Test de l'Asus TUF Gaming A14 FA401WV : le Zen 5 Ryzen 9 continue d'impressionner

les ordinateurs portables de jeu de 14 pouces étaient relativement rares il y a quelques années, mais il y a maintenant une poignée d'options à choisir, la plupart d'entre elles provenant d'Asus. Le dernier en date est le TUF Gaming A14 FA401 qui est livré avec des options de CPU AMD Zen 5. Comparé au modèle phare de la série ROG Zephyrus G14la série TUF Gaming A14 de milieu de gamme n'inclut pas de GPU ou d'options d'affichage de niveau enthousiaste afin de maintenir les prix à un niveau raisonnable pour les joueurs soucieux de leur budget.
Le TUF Gaming A14 est également le premier modèle de 14 pouces de la famille TUF Gaming, en complément du plus grand modèle de 15,6 pouces, le TUF Gaming A15de 15,6 pouces, le TUF Gaming A16 de 16 pouces et le TUF Gaming A16et 17,3 pouces TUF Gaming A17.
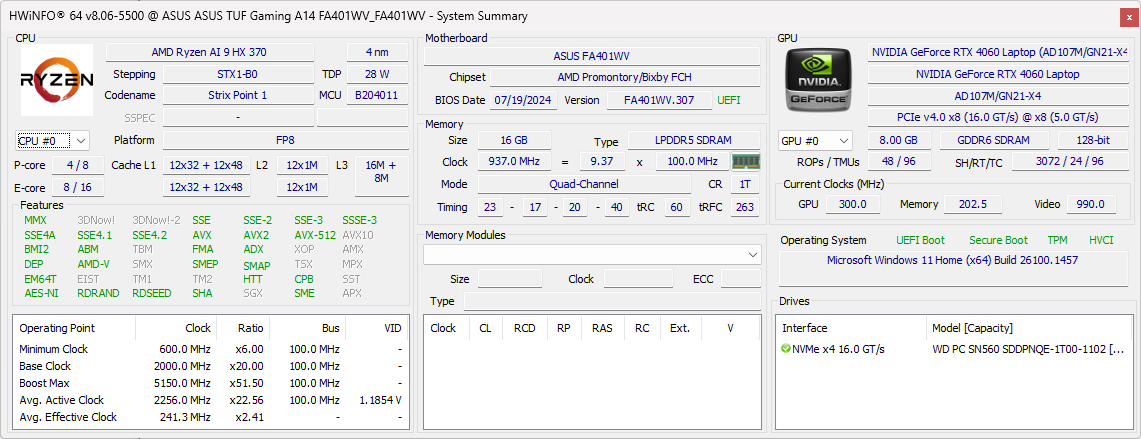
Notre unité de test est équipée du processeur Ryzen AI 9 HX 370, d'un GPU RTX 4060 de 100 W GeForce et d'un écran IPS 2560 x 1600 165 Hz pour environ 1500 $. Bien qu'une configuration Zen 4 Ryzen 7 8845HS soit disponible, le GPU, l'écran et les 16 Go de RAM sont fixes dans toutes les options.
Les alternatives incluent d'autres ordinateurs portables de jeu de 14 pouces, le Razer Blade 14, HP Omen Transcend 14, Acer Predator Helios Neo 14ou Lenovo Legion Slim 5 14.
Plus de commentaires sur Asus :
Comparaison avec les concurrents potentiels
Note | Version | Date | Modèle | Poids | Épaisseur | Taille | Résolution | Meilleur prix |
|---|---|---|---|---|---|---|---|---|
| 80.3 % | v8 | 08/24 | Asus TUF Gaming A14 FA401WV-WB94 Ryzen AI 9 HX 370, NVIDIA GeForce RTX 4060 Laptop GPU | 1.5 kg | 19.9 mm | 14.00" | 2560x1600 | |
| 93 % v7 (old) | v7 (old) | 02/24 | Asus ROG Zephyrus G14 2024 GA403U R9 8945HS, NVIDIA GeForce RTX 4070 Laptop GPU | 1.5 kg | 16.3 mm | 14.00" | 2880x1800 | |
| 80.5 % | v8 | 08/24 | Acer Predator Helios Neo 14 (2024) Ultra 9 185H, NVIDIA GeForce RTX 4070 Laptop GPU | 1.9 kg | 20.9 mm | 14.50" | 3072x1920 | |
| 88.5 % v7 (old) | v7 (old) | 03/24 | HP Omen Transcend 14-fb0014 Ultra 7 155H, NVIDIA GeForce RTX 4060 Laptop GPU | 1.6 kg | 18 mm | 14.00" | 2880x1800 | |
| 89.7 % v7 (old) | v7 (old) | 02/24 | Razer Blade 14 RZ09-0508 R9 8945HS, NVIDIA GeForce RTX 4070 Laptop GPU | 1.9 kg | 17.99 mm | 14.00" | 2560x1600 | |
| 87.7 % v7 (old) | v7 (old) | 09/23 | Lenovo Legion Slim 5 14APH8 R7 7840HS, NVIDIA GeForce RTX 4060 Laptop GPU | 1.7 kg | 20.79 mm | 14.50" | 2880x1600 |
Conseils : Notre système d'évaluation a été mis à jour récemment et les résultats de la version 8 ne sont pas comparables à ceux de la version 7. Vous trouverez d'autres informations à ce sujet ici sont disponibles ici.
Note : Nous avons récemment mis à jour notre système d'évaluation et les résultats de la version 8 ne sont pas comparables à ceux de la version 7. De plus amples informations sont disponibles ici .
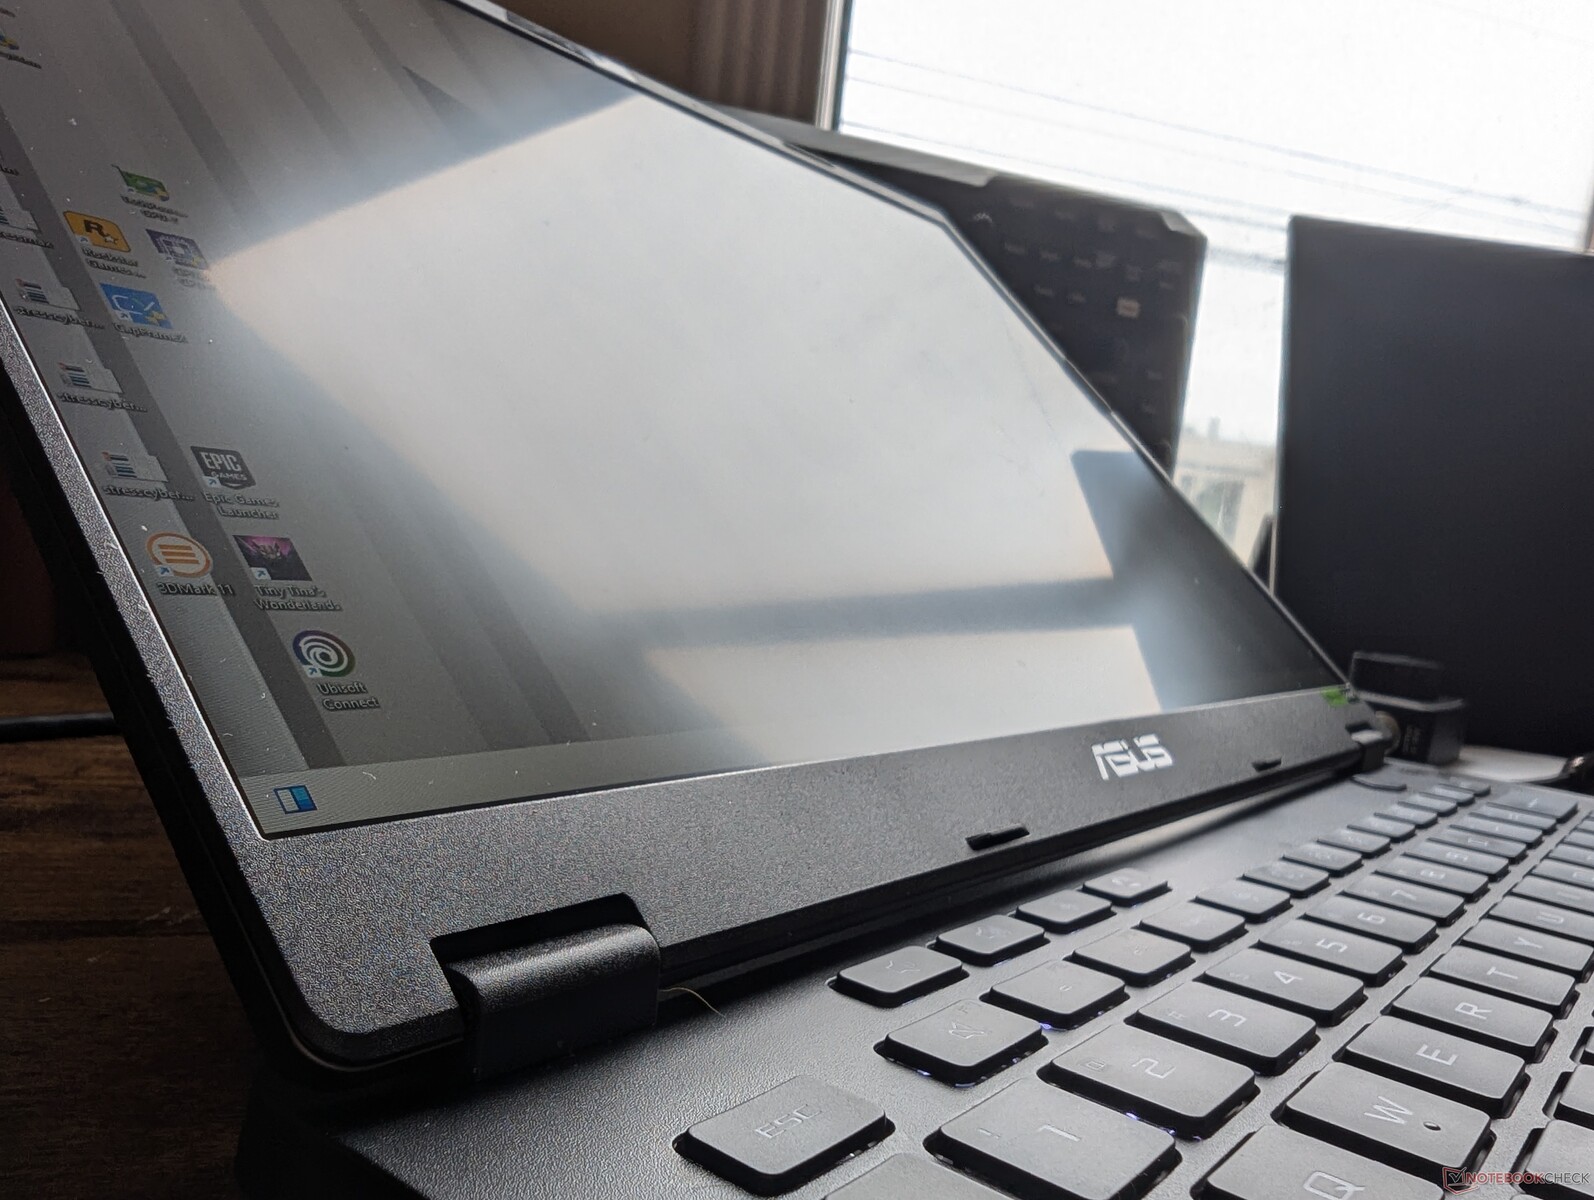
Cas - Construit Ford TUF
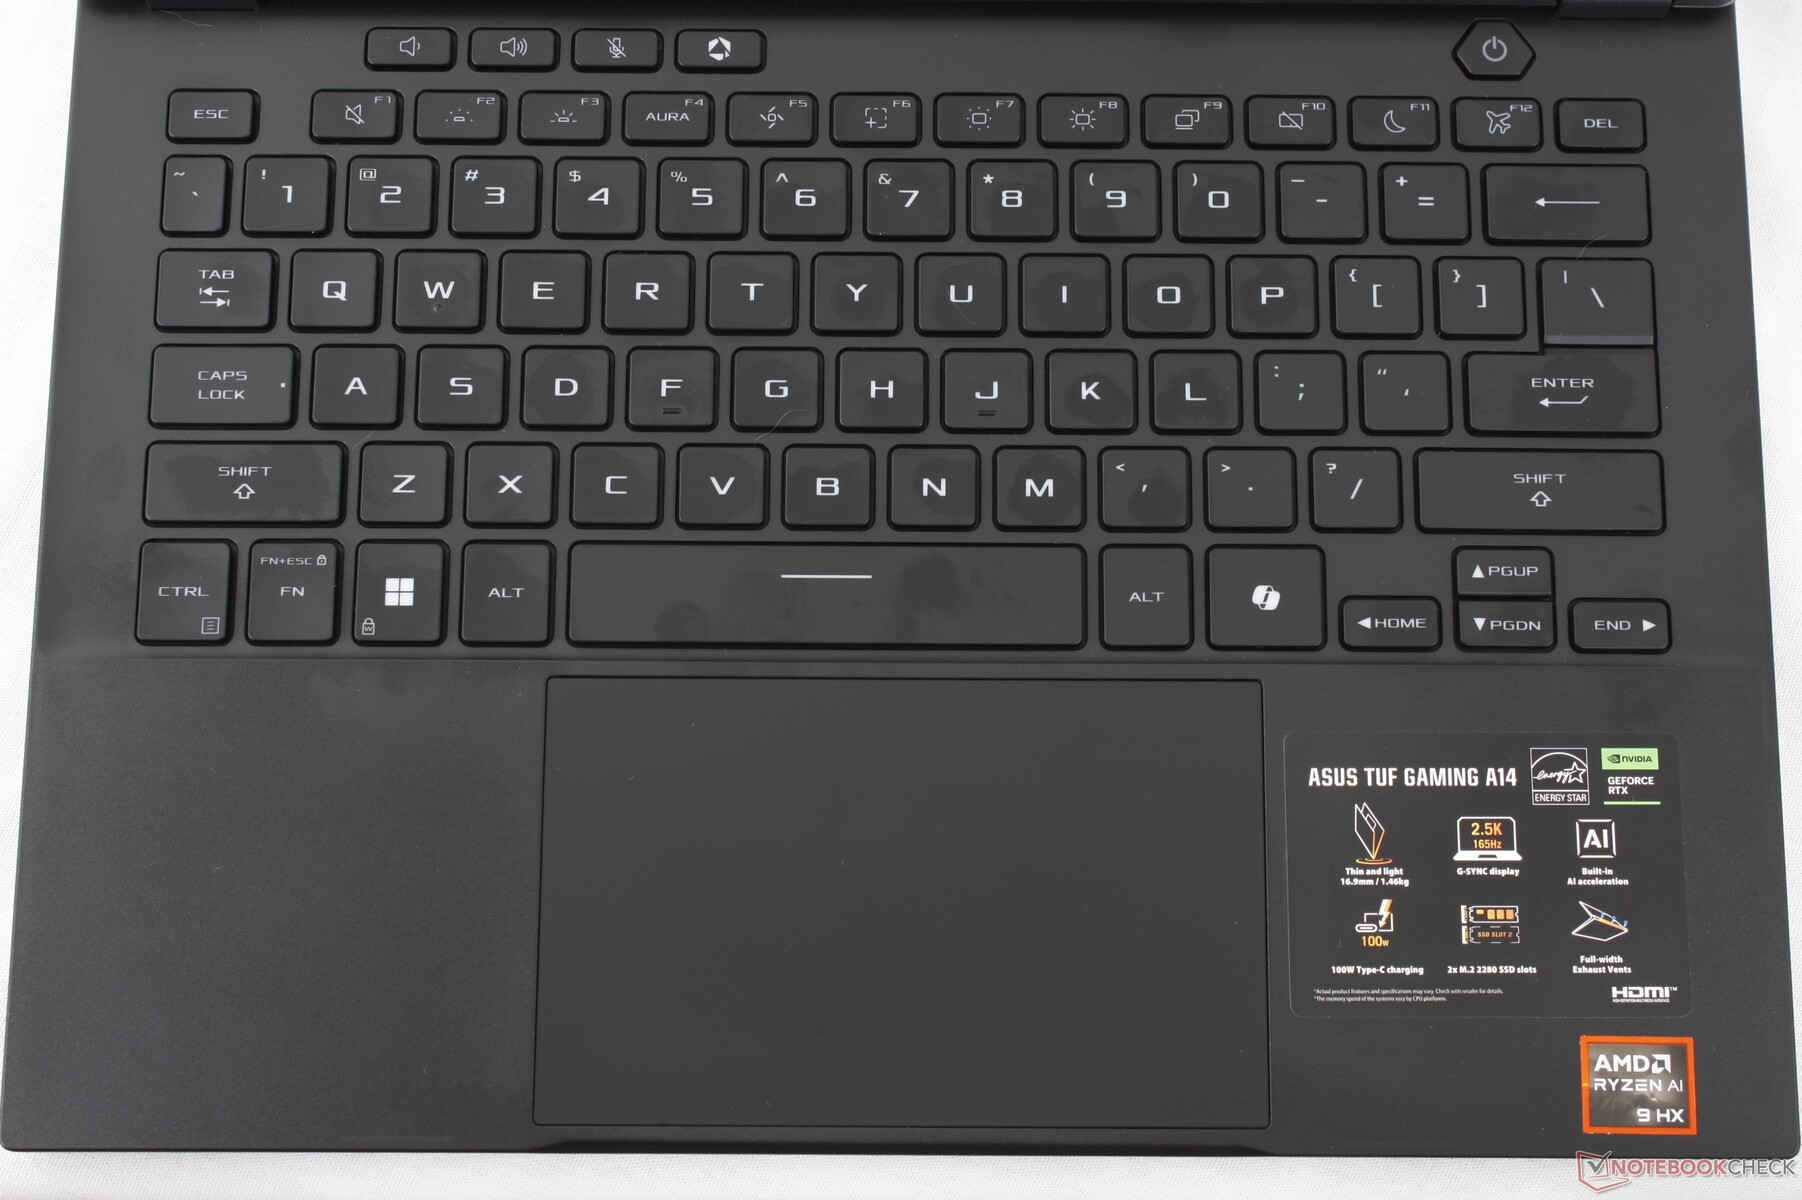
Le châssis utilise du plastique pour le clavier et les repose-poignets, tandis que la plaque inférieure et le couvercle extérieur sont en aluminium. Cela contraste avec les modèles plus coûteux que sont le Blade 14 ou le Zephyrus G14 plus onéreux, qui sont principalement en métal. Le clavier en plastique n'est pas aussi luxueux, mais la qualité de construction est excellente, sans craquement notable et avec une légère torsion de la base.
Les charnières pourraient être améliorées car elles ne semblent pas aussi solides que sur le Blade 14. Nous pouvons remarquer un peu de grincement et de vacillement lors de l'ajustement des angles, tandis que la rigidité moyenne pourrait ne pas être bonne à long terme.
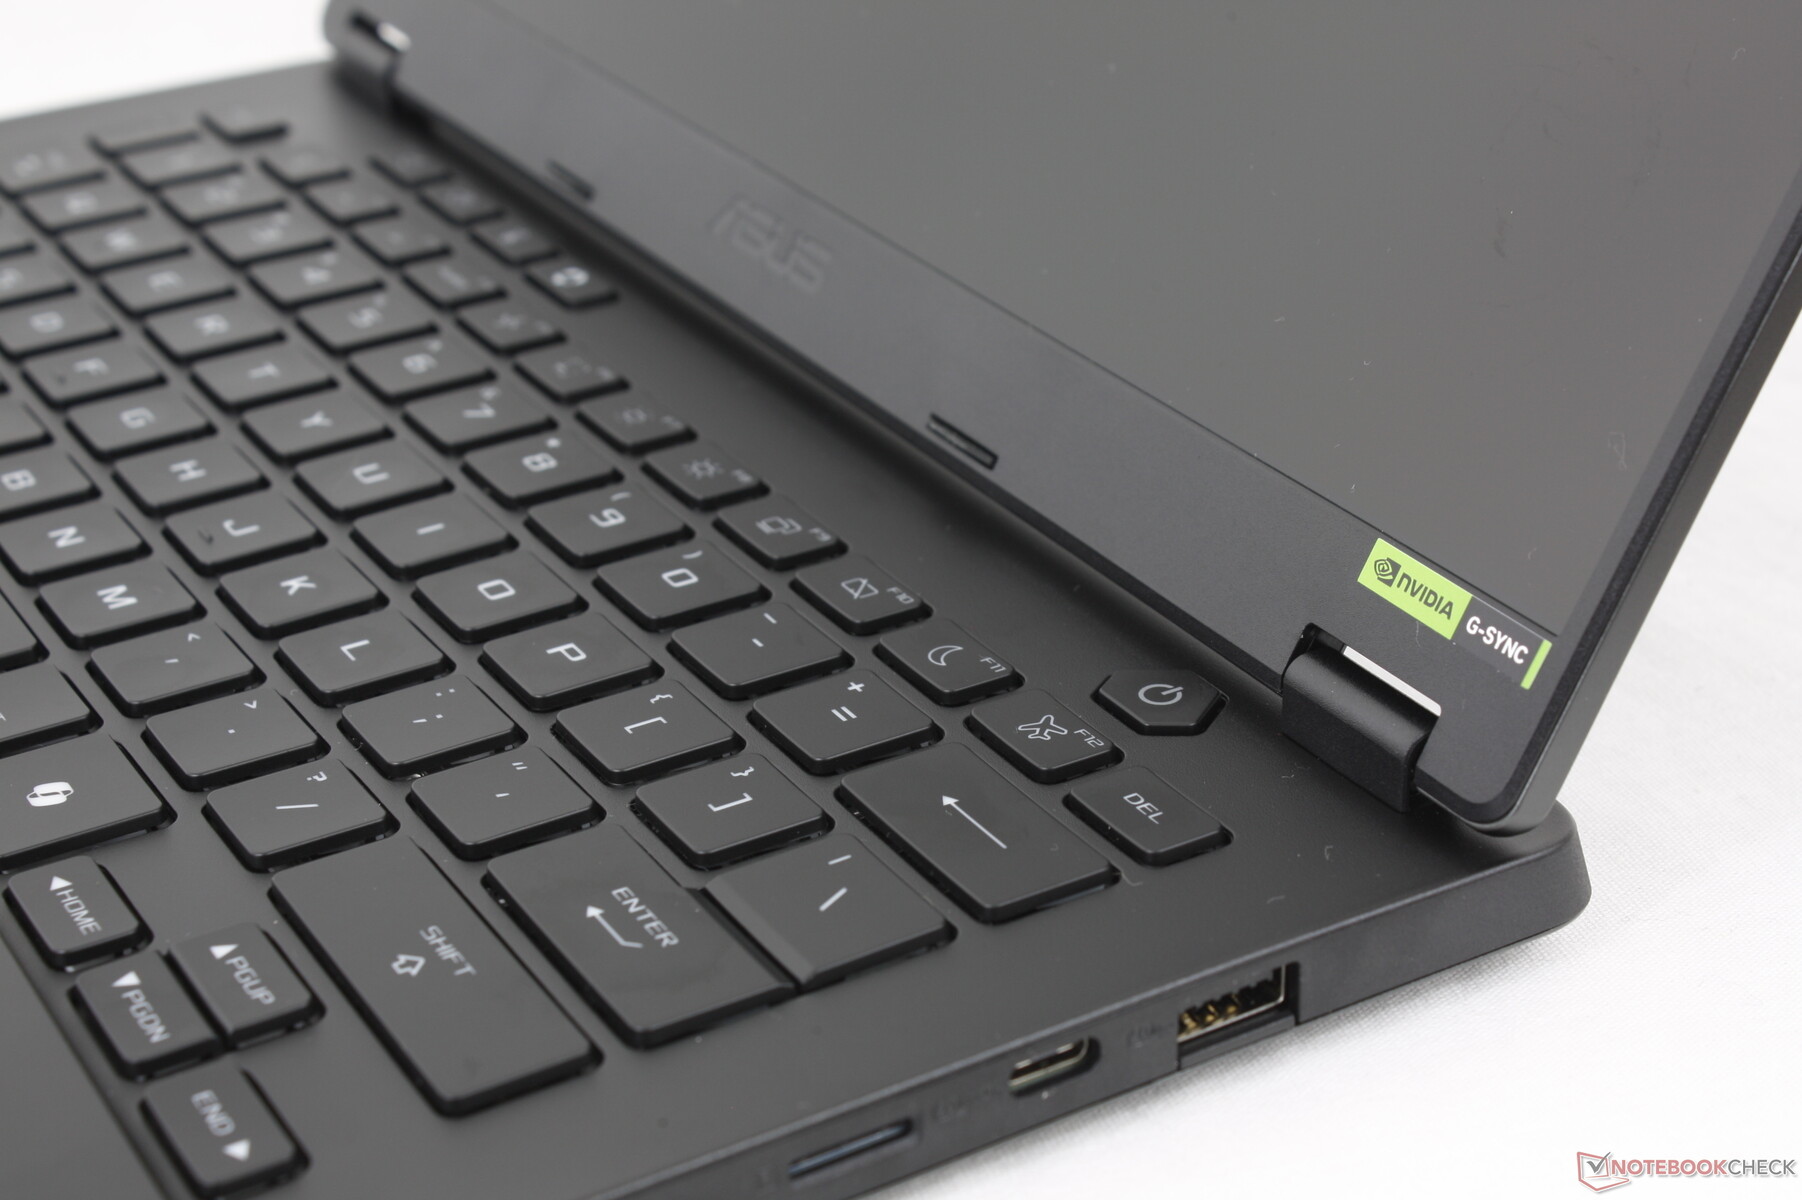
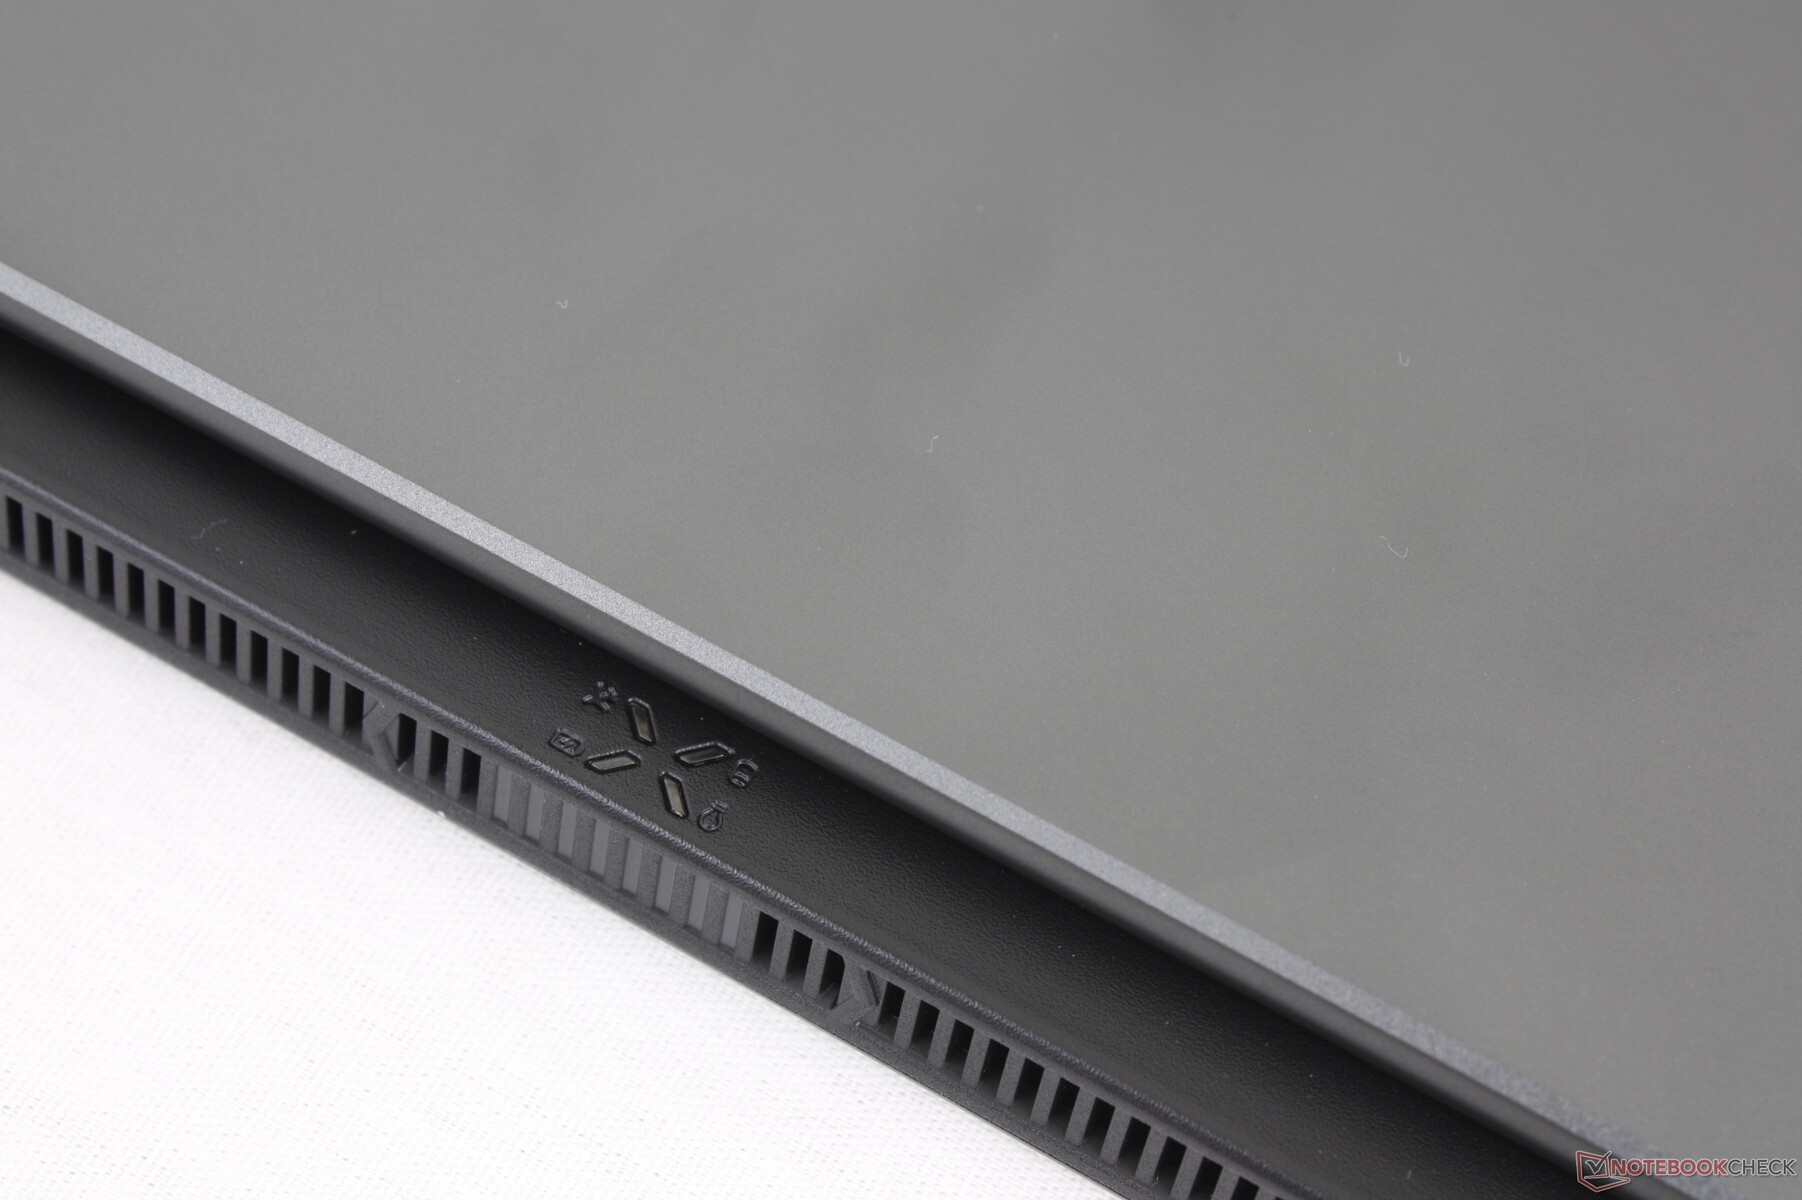
Asus a déplacé les quatre indicateurs LED à l'arrière du système alors qu'ils sont toujours à côté du bouton d'alimentation sur la plupart des autres ordinateurs portables. Cela signifie que les indicateurs ne sont visibles que de l'arrière, ce qui n'est pas très utile lorsque vous êtes devant l'écran.
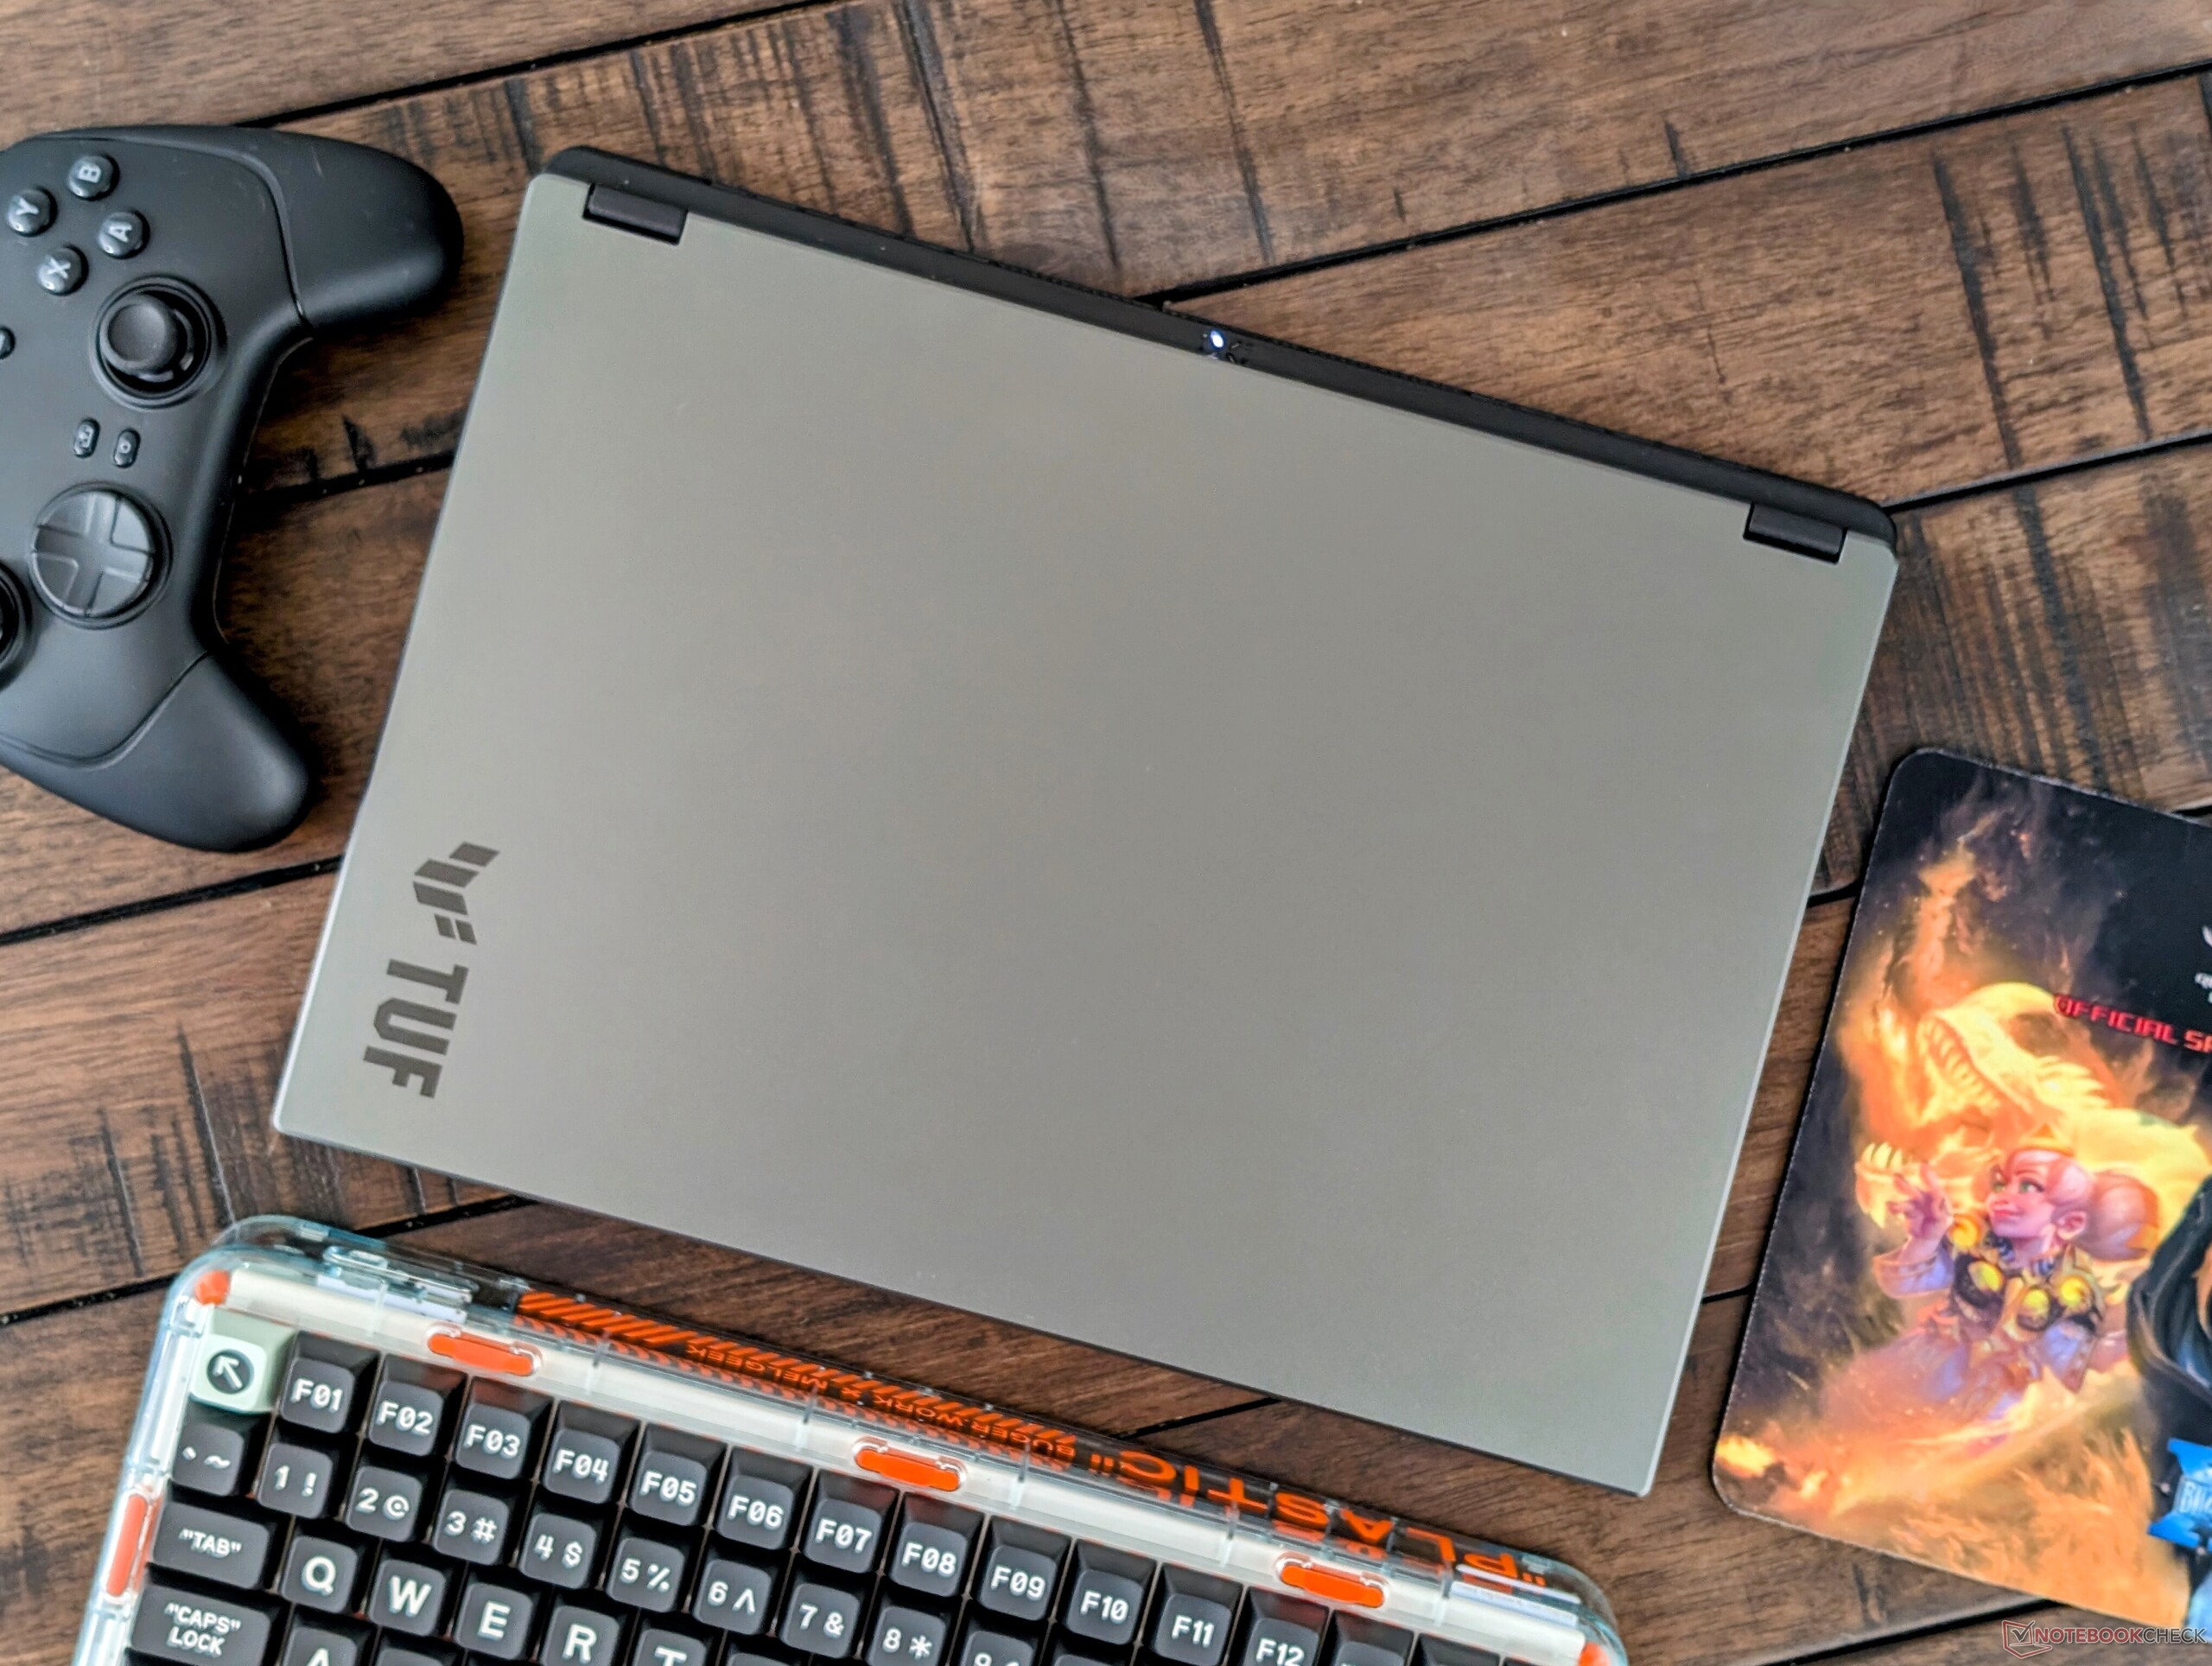
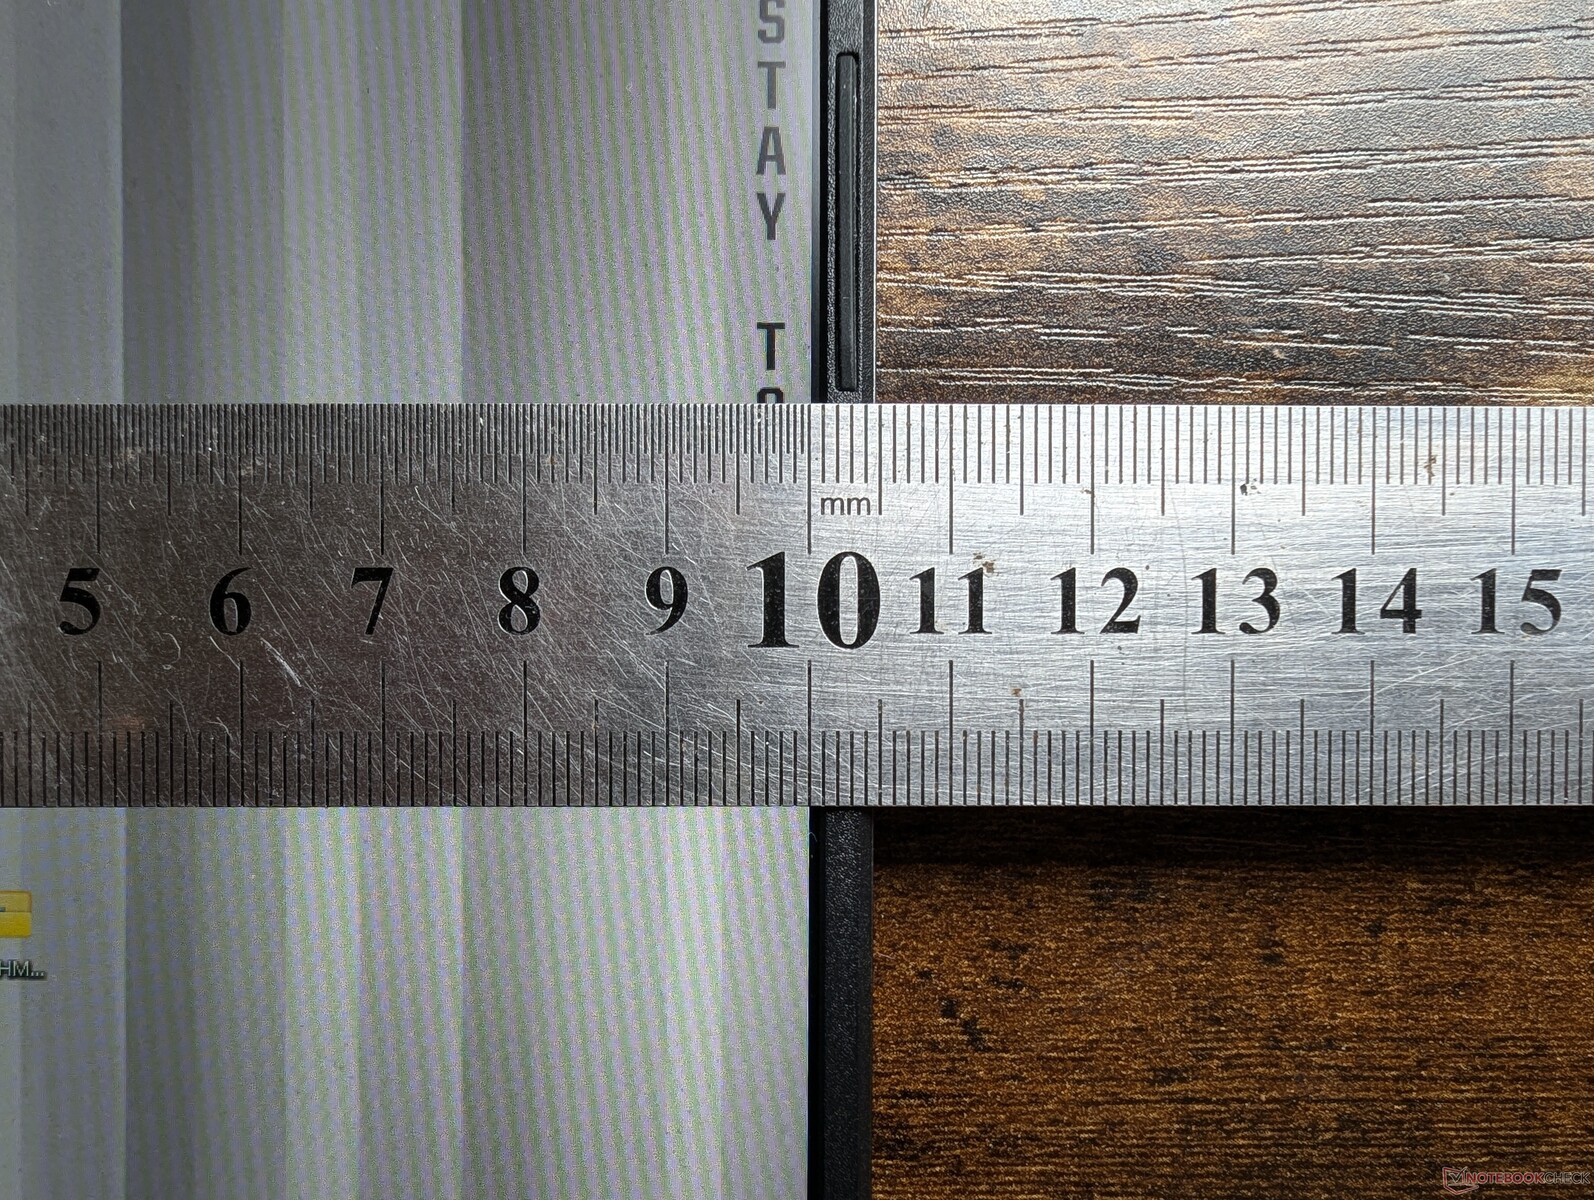
Le modèle est légèrement plus épais et plus grand que son frère plus cher, le ROG Zephyrus G14. Malgré cela, ils pèsent à peu près le même poids, ce qui fait du TUF Gaming A14 l'un des ordinateurs portables de jeu de 14 pouces les plus légers du marché, quel que soit le niveau de prix. Des alternatives comme le 14.5 pouces Lenovo Legion Slim 5 ou le HP Omen Transcend 14 sont plus grands et plus lourds.
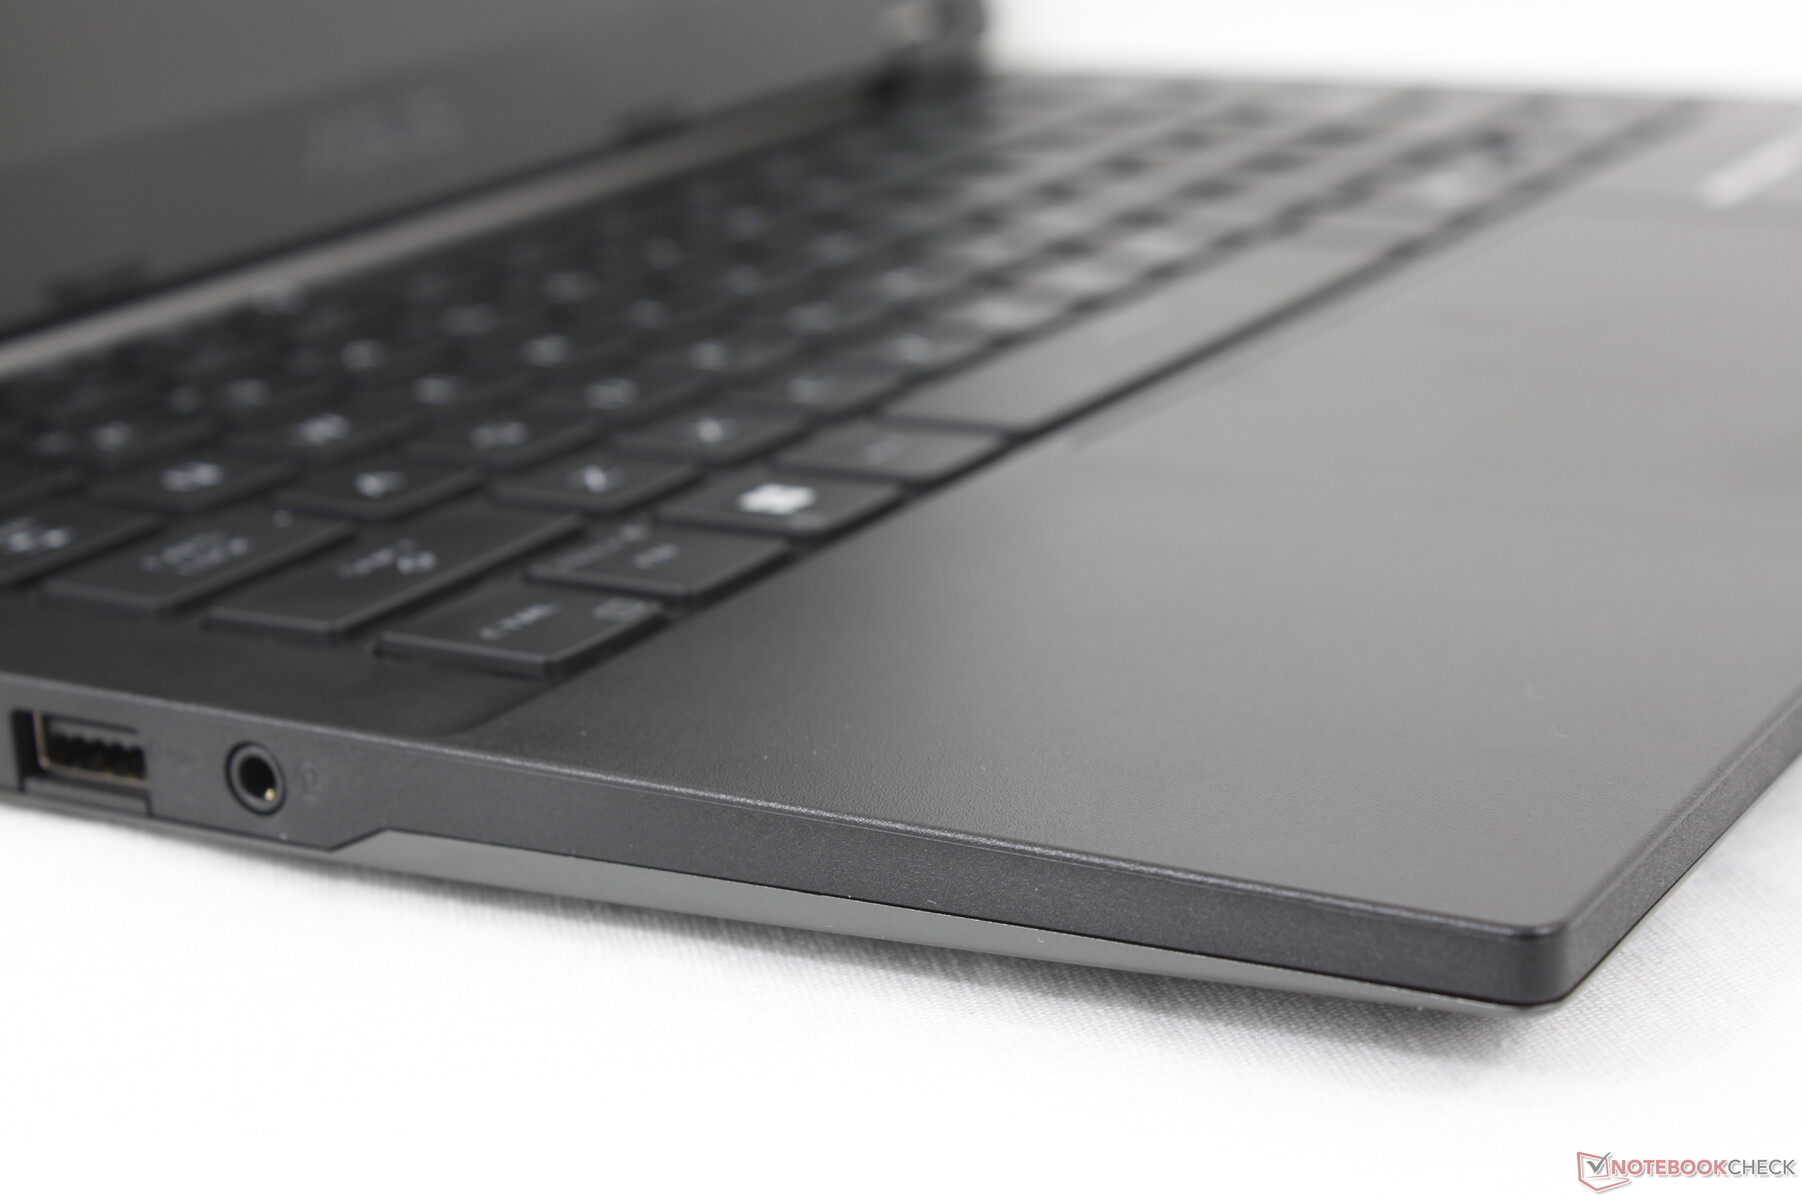
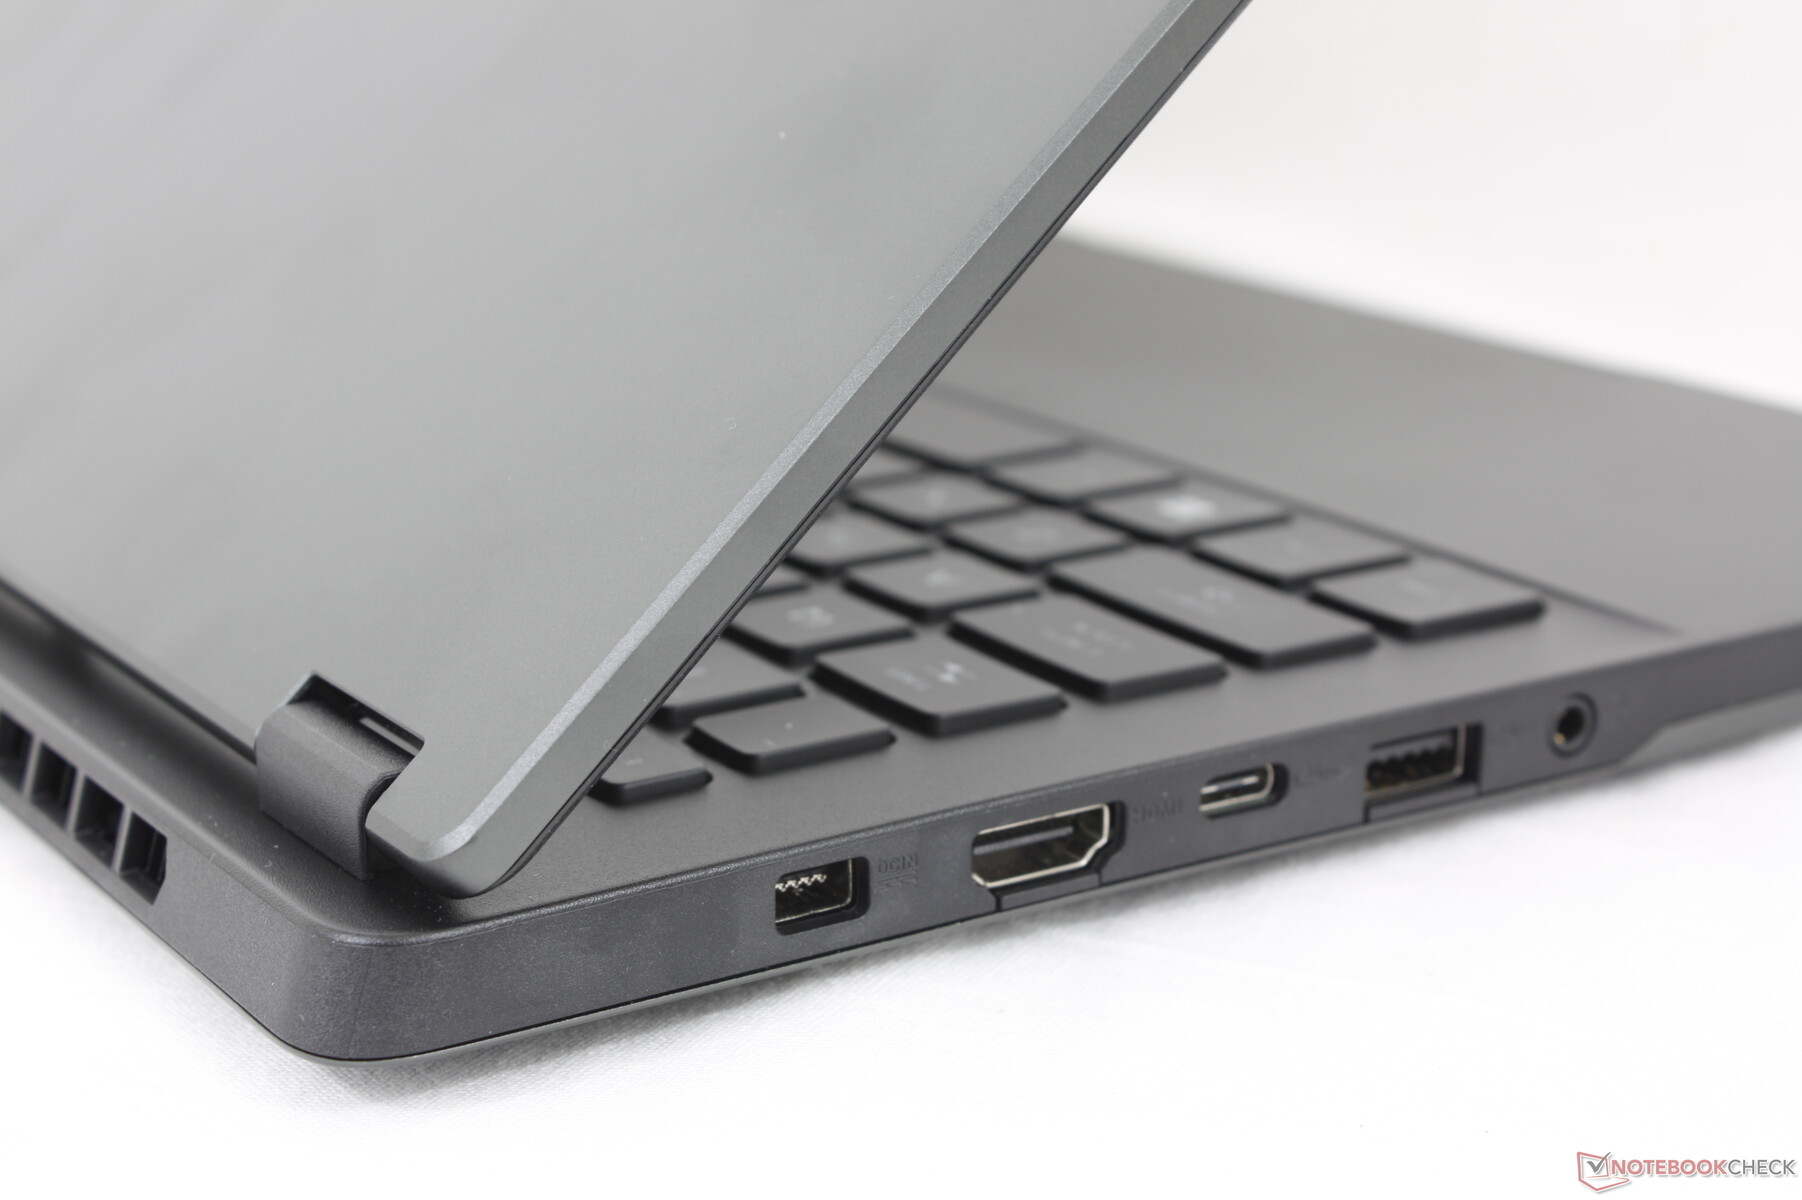
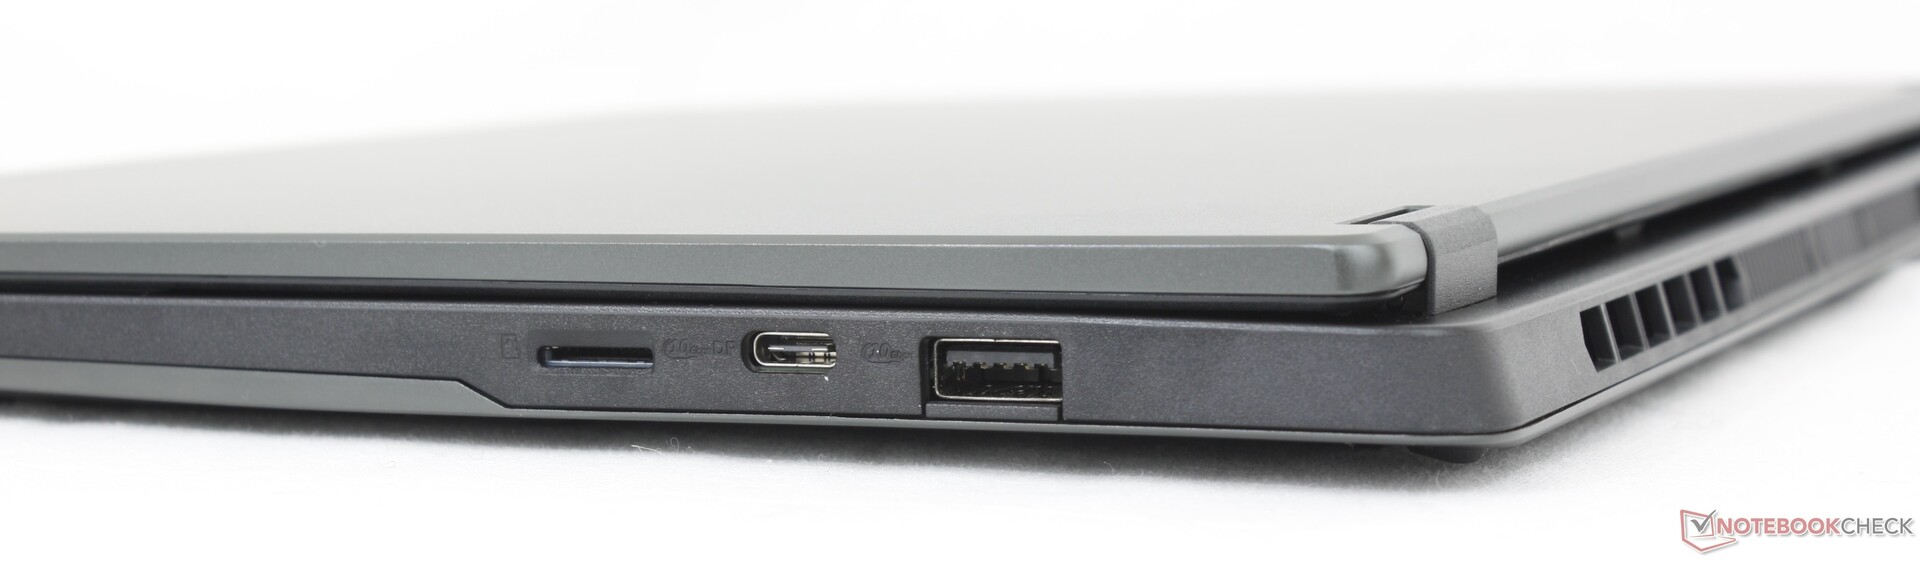
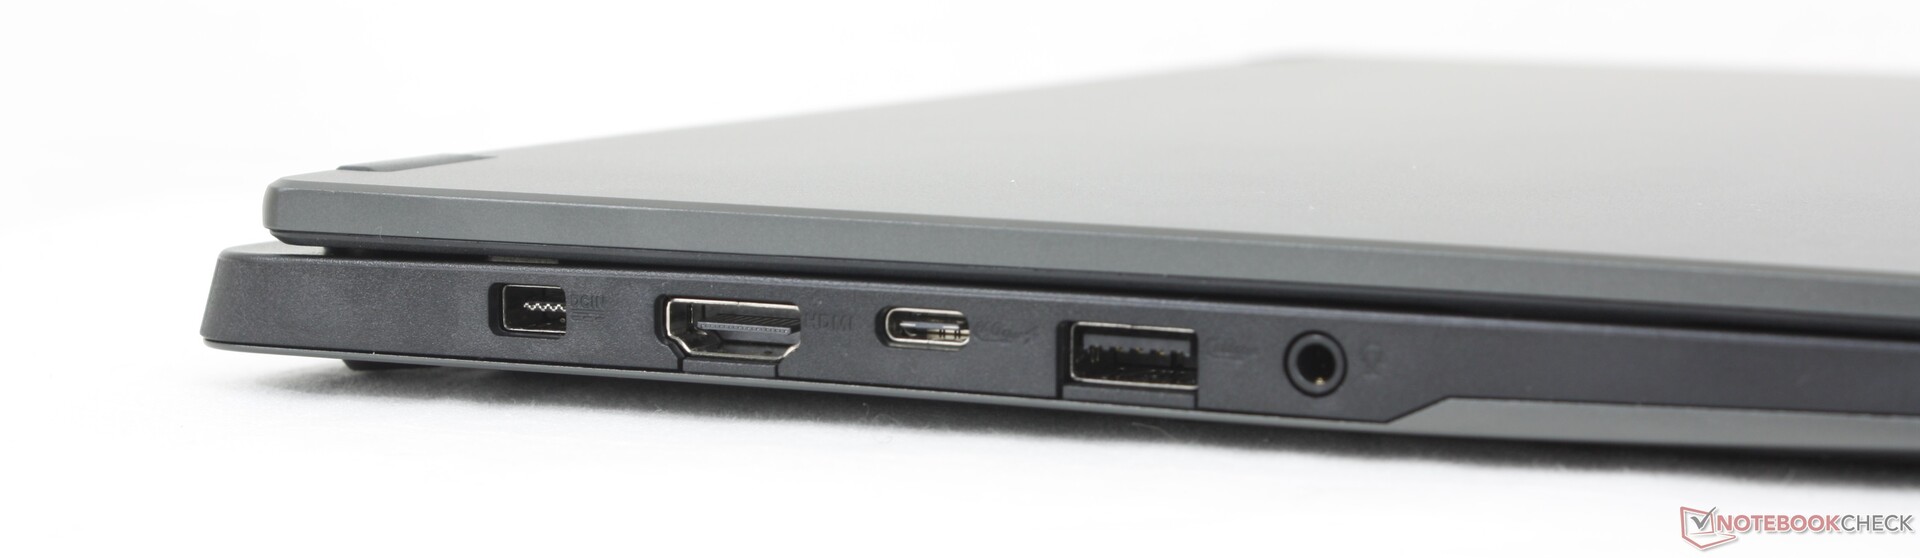
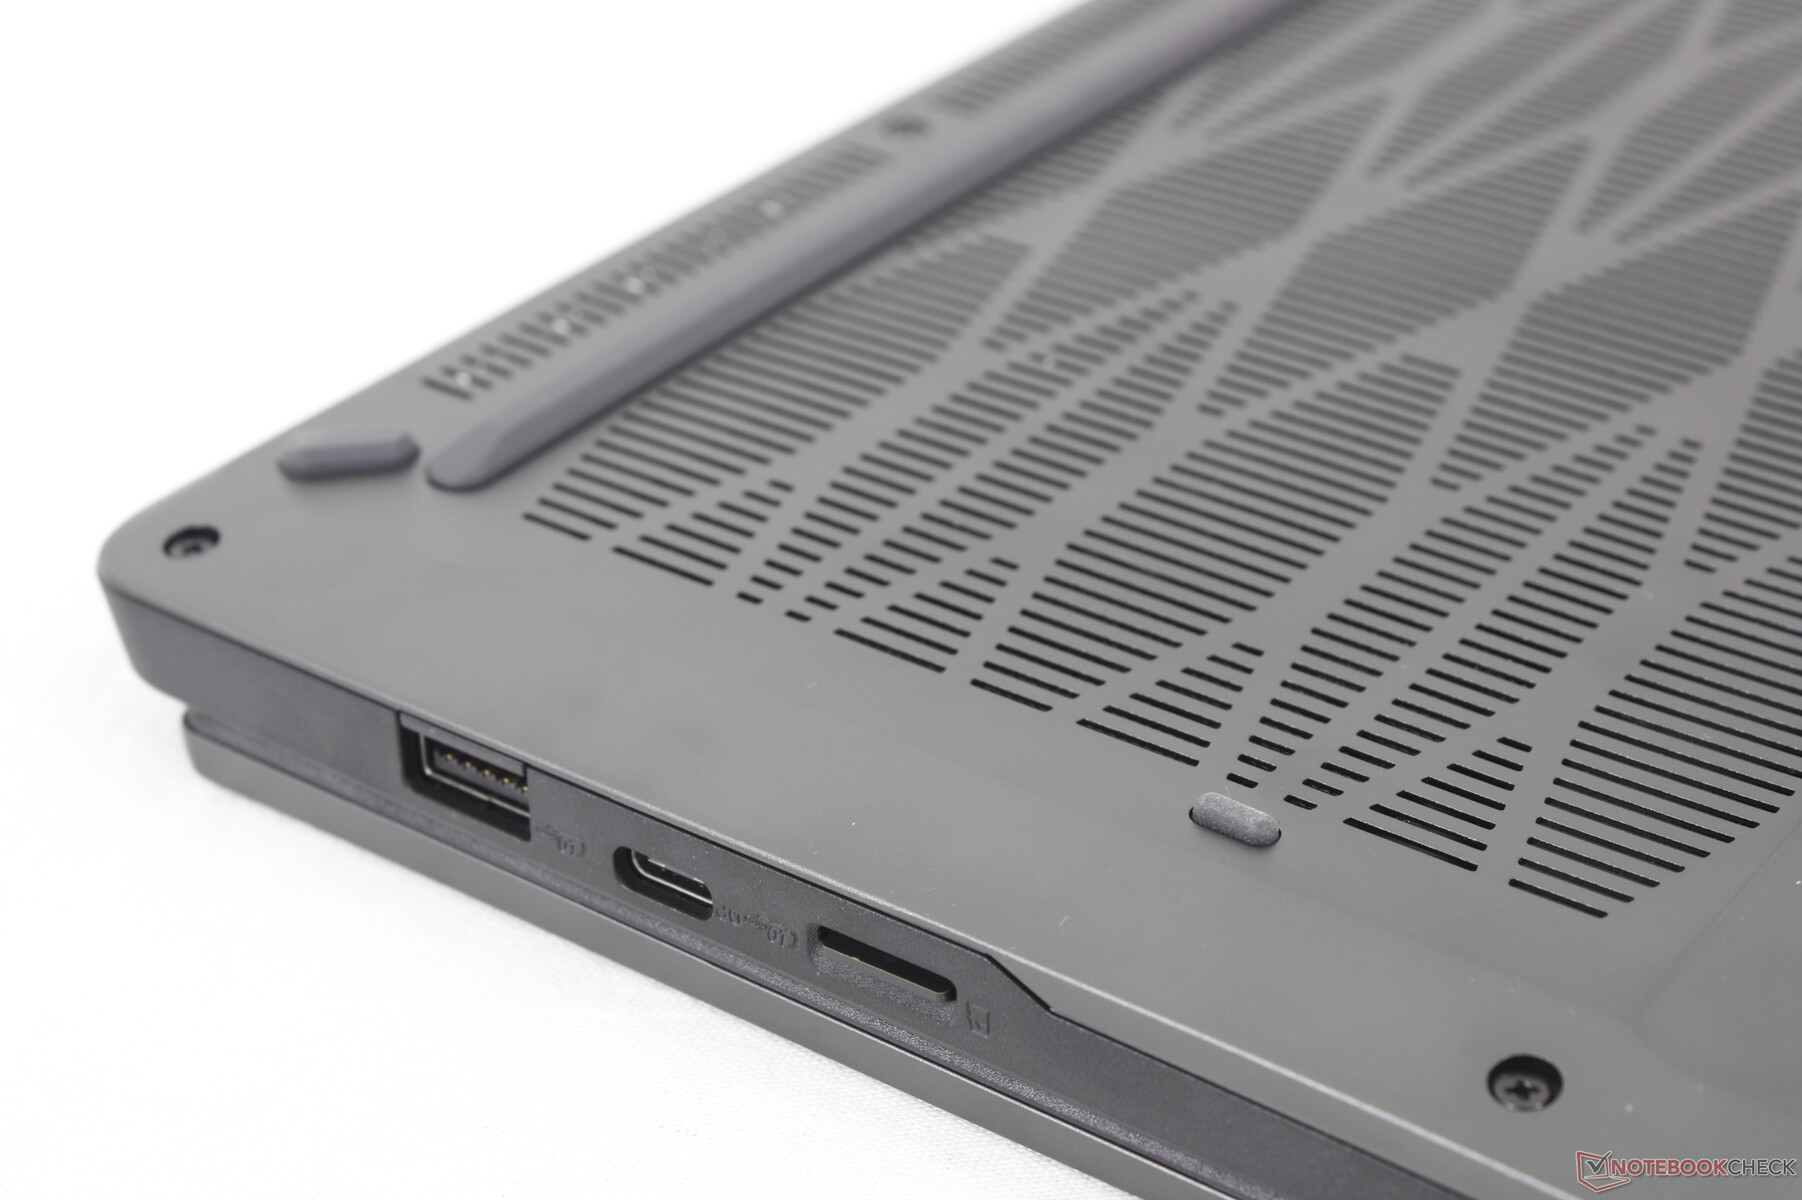
Connectivité
Les options et le positionnement des ports sont identiques à ceux du 2024 Zephyrus G14. Nous apprécions particulièrement le lecteur MicroSD pour répondre aux besoins des créateurs de contenu, comme beaucoup d'autres ordinateurs portables de jeu de 14 pouces tels que le Blade 14 ou l'Omen Transcend 14.
Notez que seul le port USB-C de gauche supporte le Power Delivery tandis que le port USB-C de droite est la version 10 Gbps plus lente avec seulement le DisplayPort.


Lecteur de carte SD
Le lecteur MicroSD intégré prend en charge des taux de transfert très rapides de plus de 200 Mo/s, mais les performances réelles sont beaucoup plus lentes, de près d'un quart, lors du transfert de 1 Go de photos à partir de notre carte MicroSD UHS-II. Les résultats ne se sont pas améliorés, même après plusieurs essais.
| SD Card Reader | |
| average JPG Copy Test (av. of 3 runs) | |
| Alienware x14 i7 RTX 3060 (Angelbird AV Pro V60) | |
| Asus ROG Zephyrus G14 2024 GA403U (Angelbird AV Pro V60) | |
| Lenovo Legion Slim 5 14APH8 (Toshiba Exceria Pro SDXC 64 GB UHS-II) | |
| Asus TUF Gaming A14 FA401WV-WB94 (Angelbird AV Pro V60) | |
| Acer Predator Helios Neo 14 (2024) (AV PRO microSD 128 GB V60) | |
| maximum AS SSD Seq Read Test (1GB) | |
| Asus TUF Gaming A14 FA401WV-WB94 (Angelbird AV Pro V60) | |
| Alienware x14 i7 RTX 3060 (Angelbird AV Pro V60) | |
| Asus ROG Zephyrus G14 2024 GA403U (Angelbird AV Pro V60) | |
| Lenovo Legion Slim 5 14APH8 (Toshiba Exceria Pro SDXC 64 GB UHS-II) | |
| Acer Predator Helios Neo 14 (2024) (AV PRO microSD 128 GB V60) | |
Communication
Le MediaTek MT7922 est livré en standard avec une connectivité Wi-Fi 6E et Bluetooth 5.3. Les taux de transfert sont stables et fiables lorsque vous testez les réseaux Wi-Fi 6 et 6E, mais les vitesses avec ce dernier sont nettement plus élevées.
Webcam
Une webcam de 2 mégapixels et un capteur infrarouge sont fournis en standard. Contrairement à la plupart des autres ordinateurs portables, il n'y a pas d'obturateur pour la caméra.


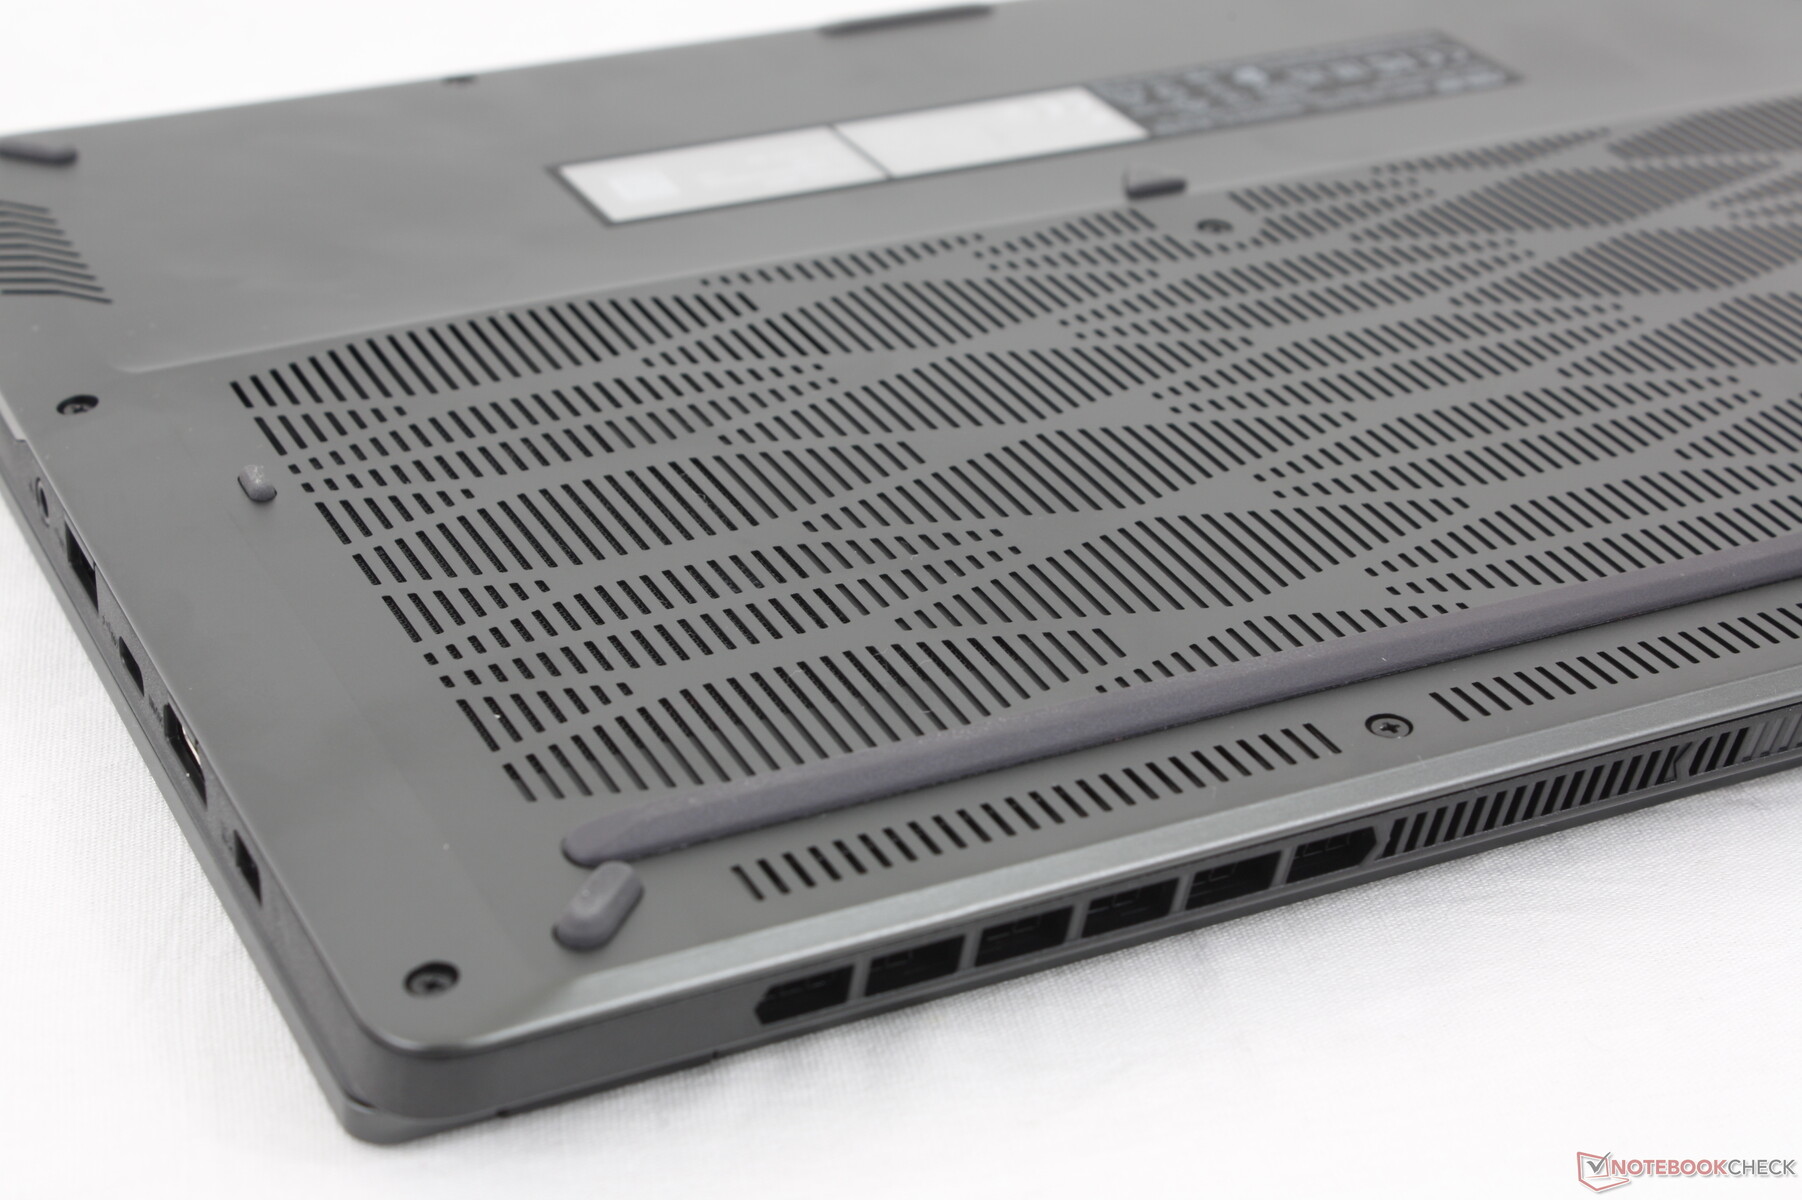
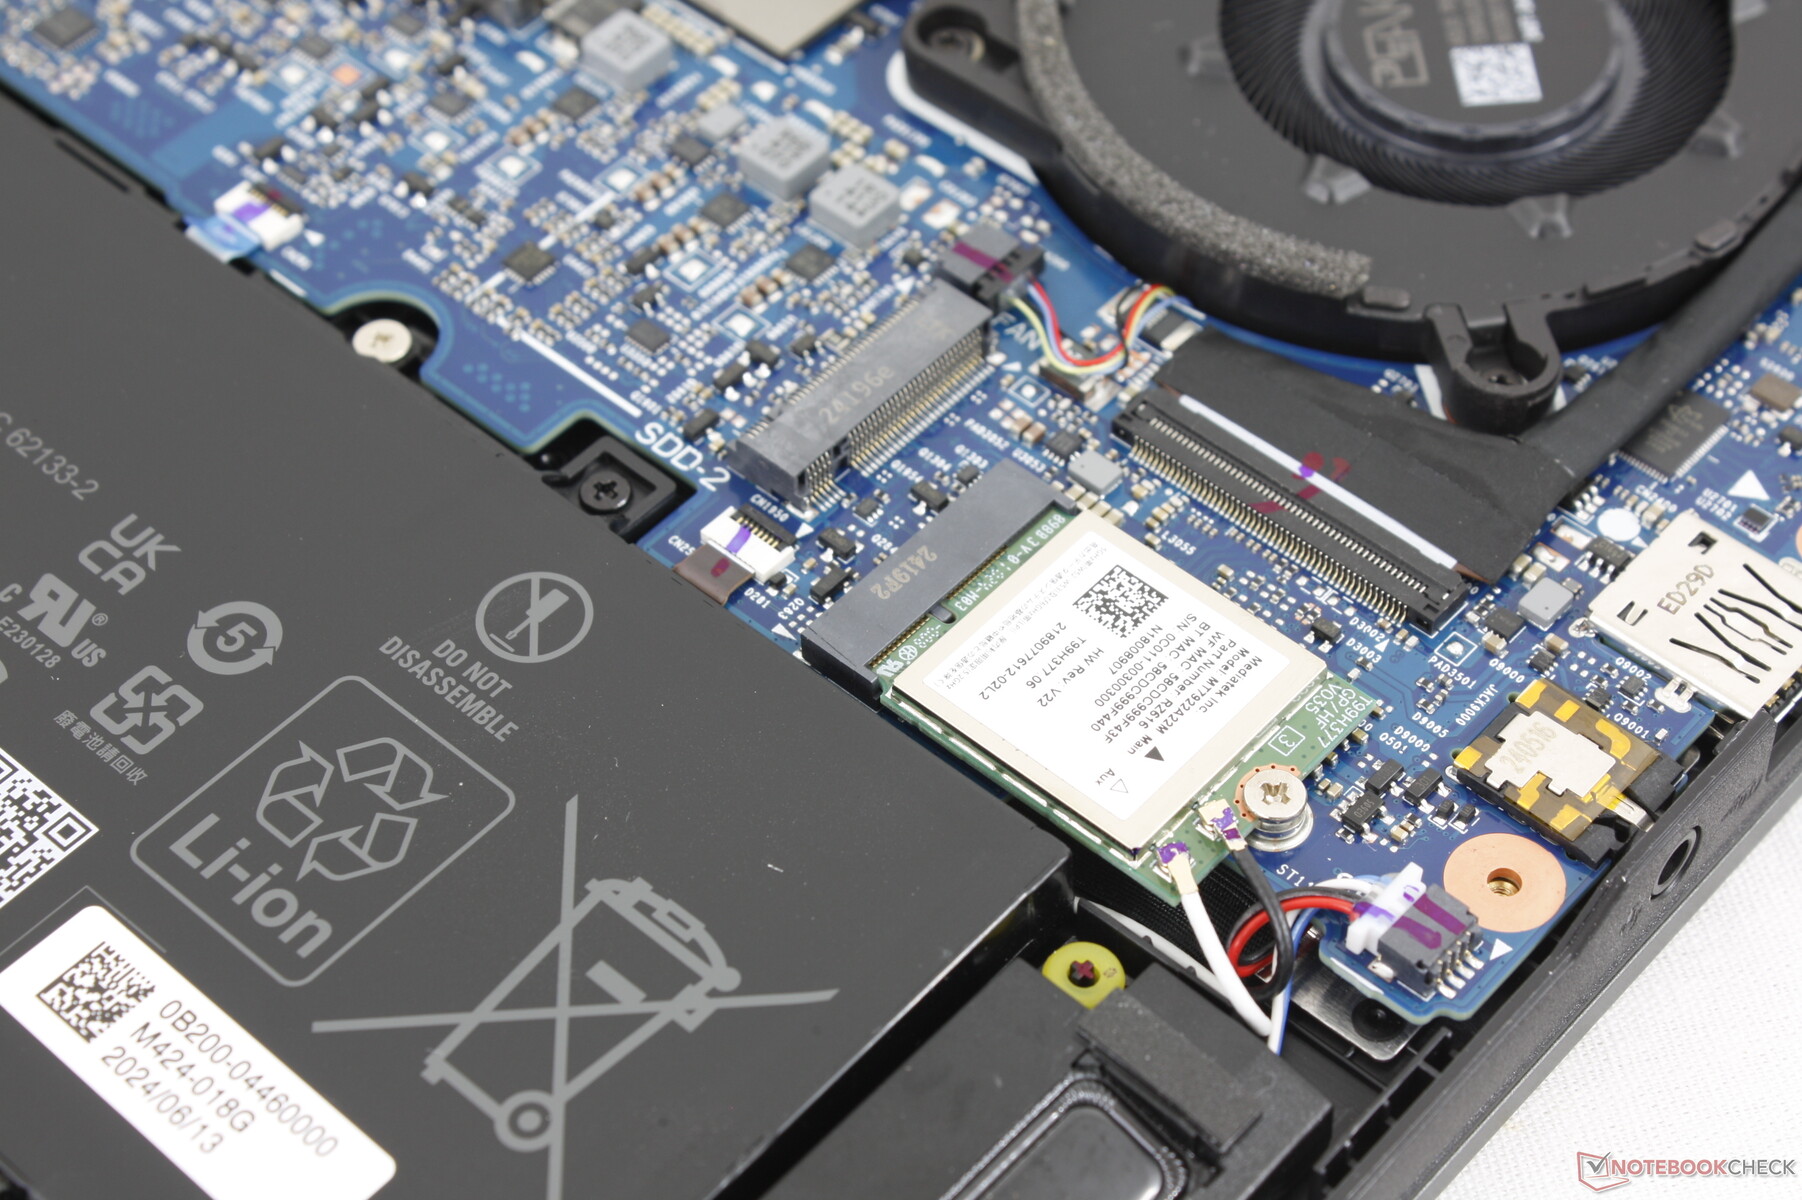
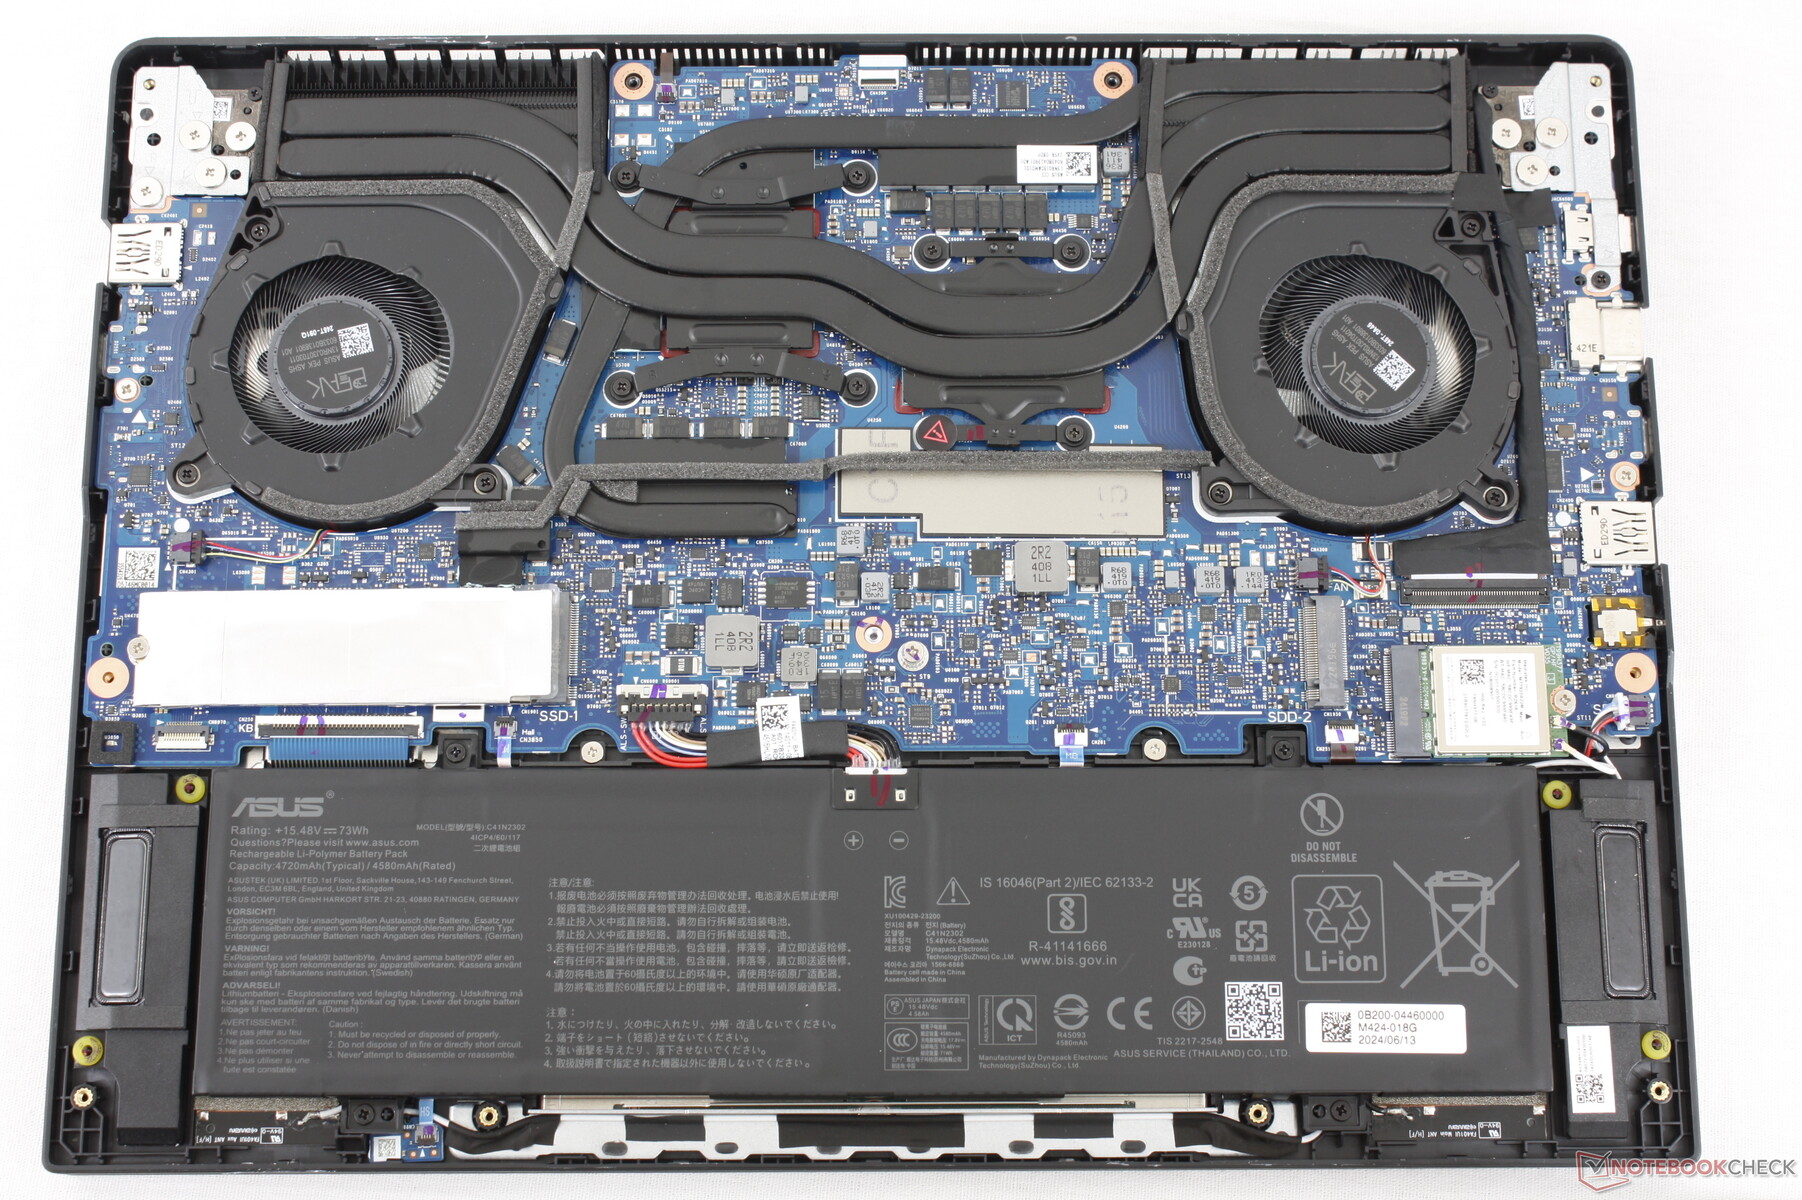
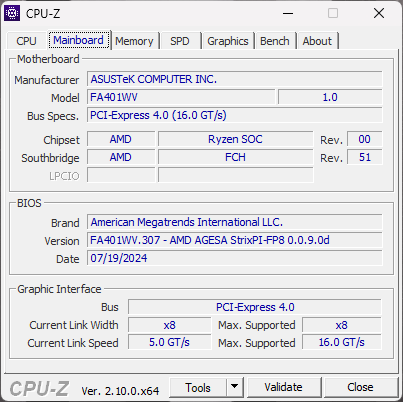
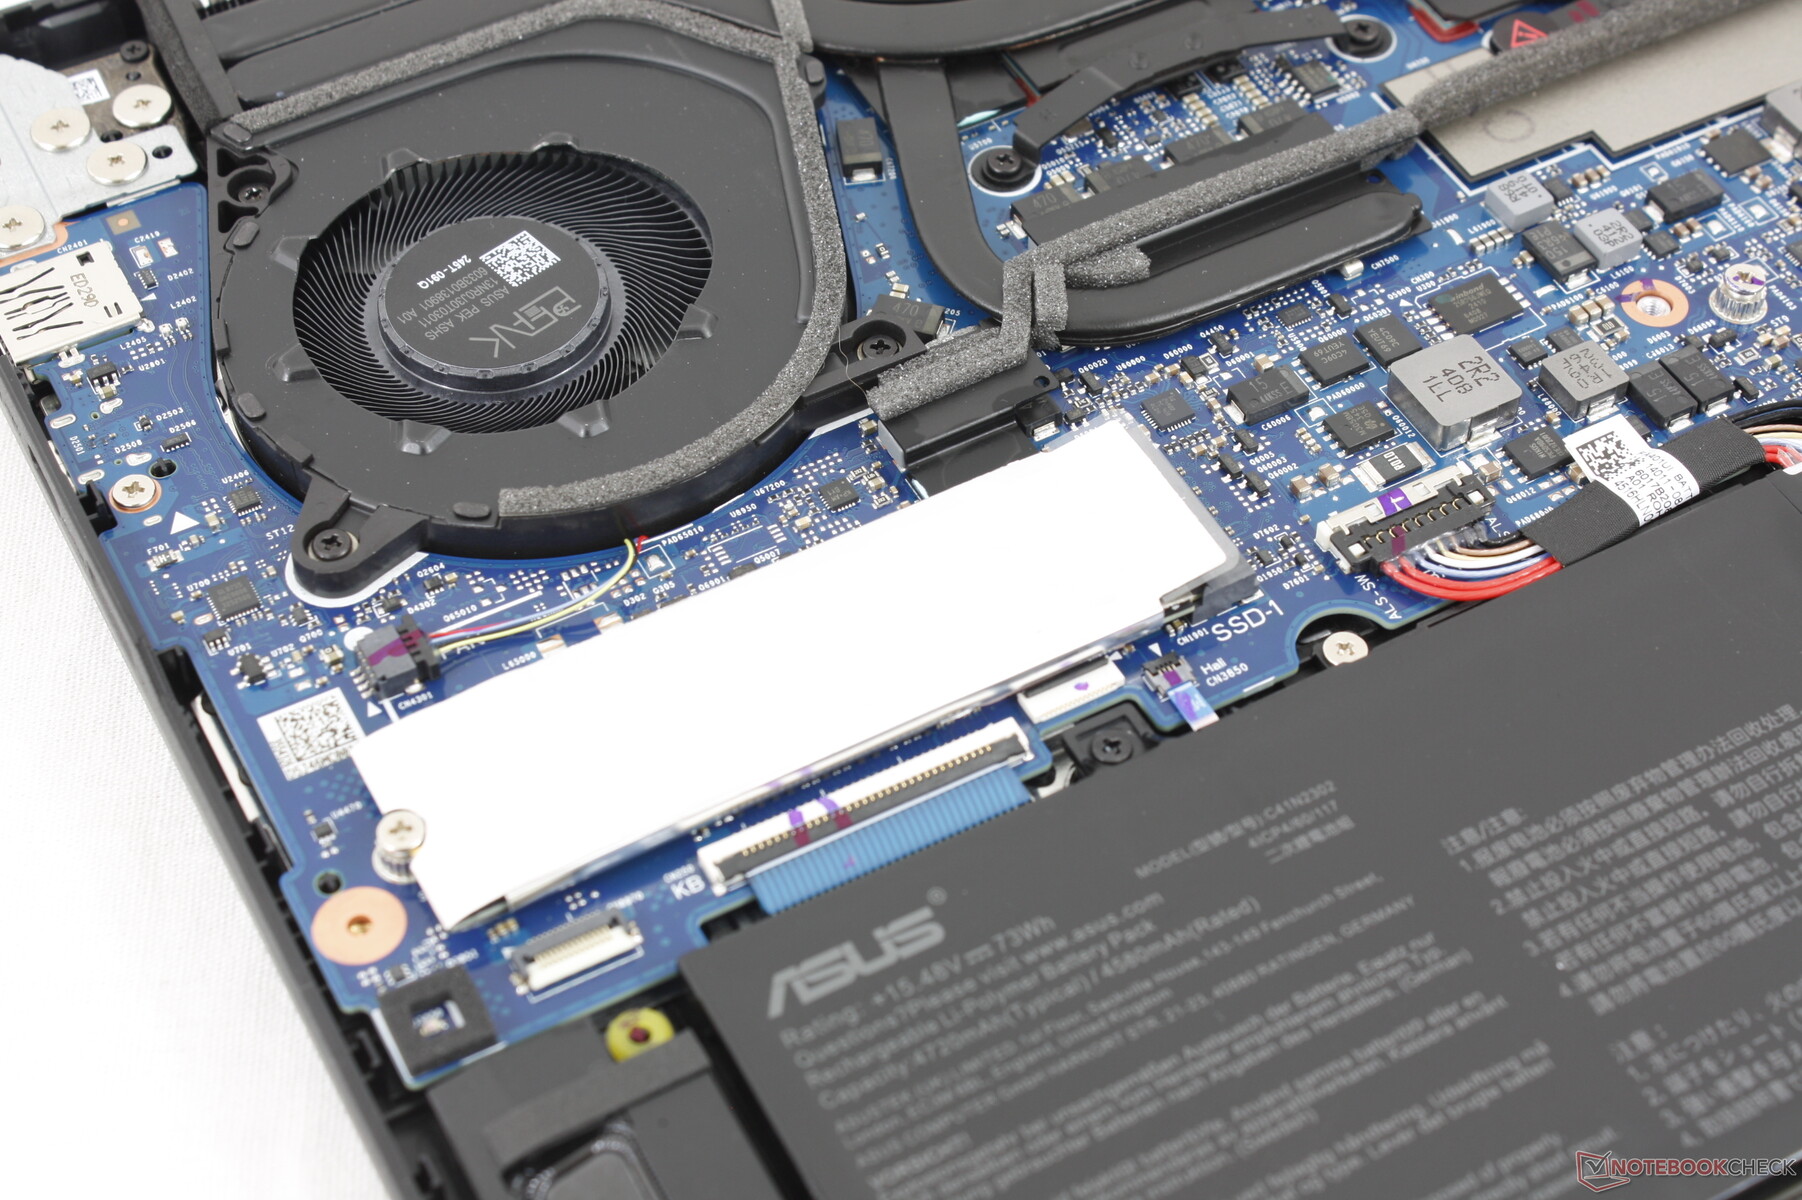
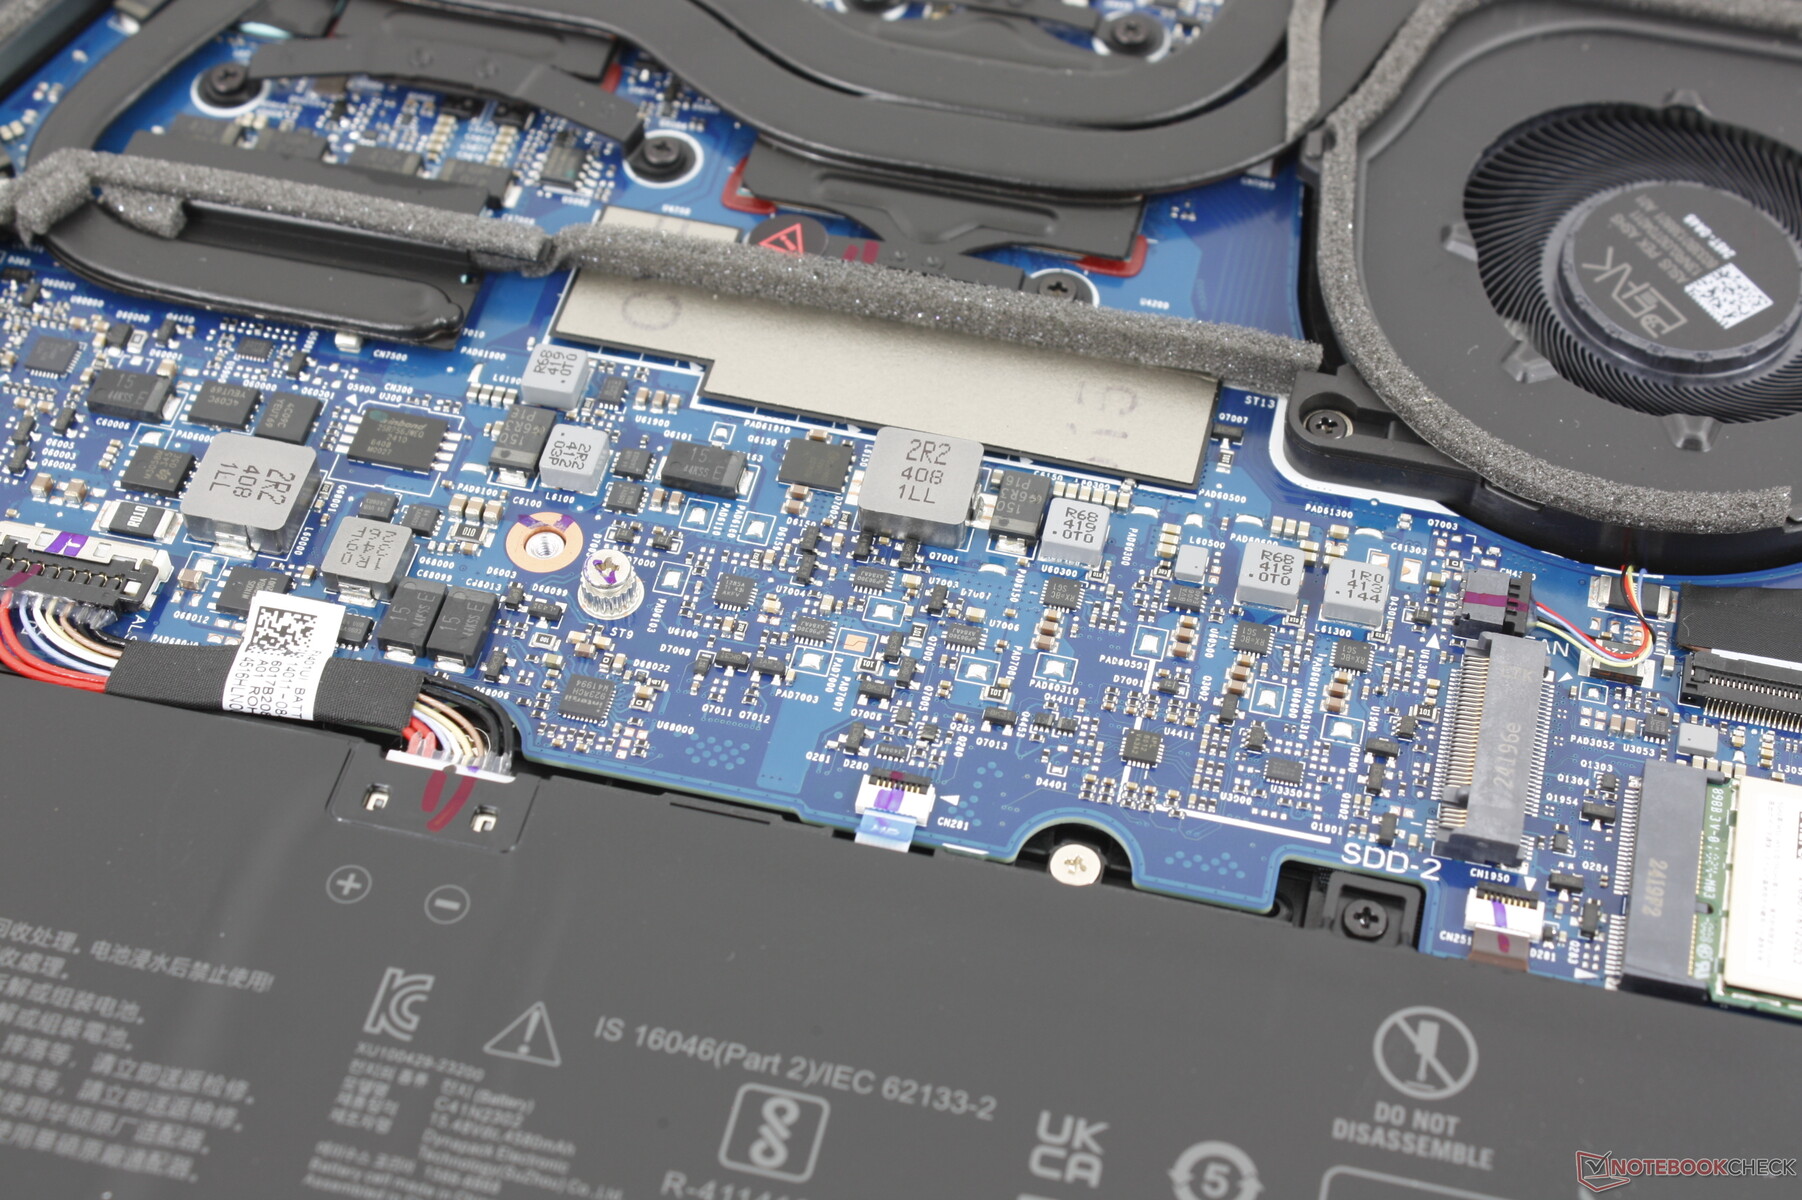
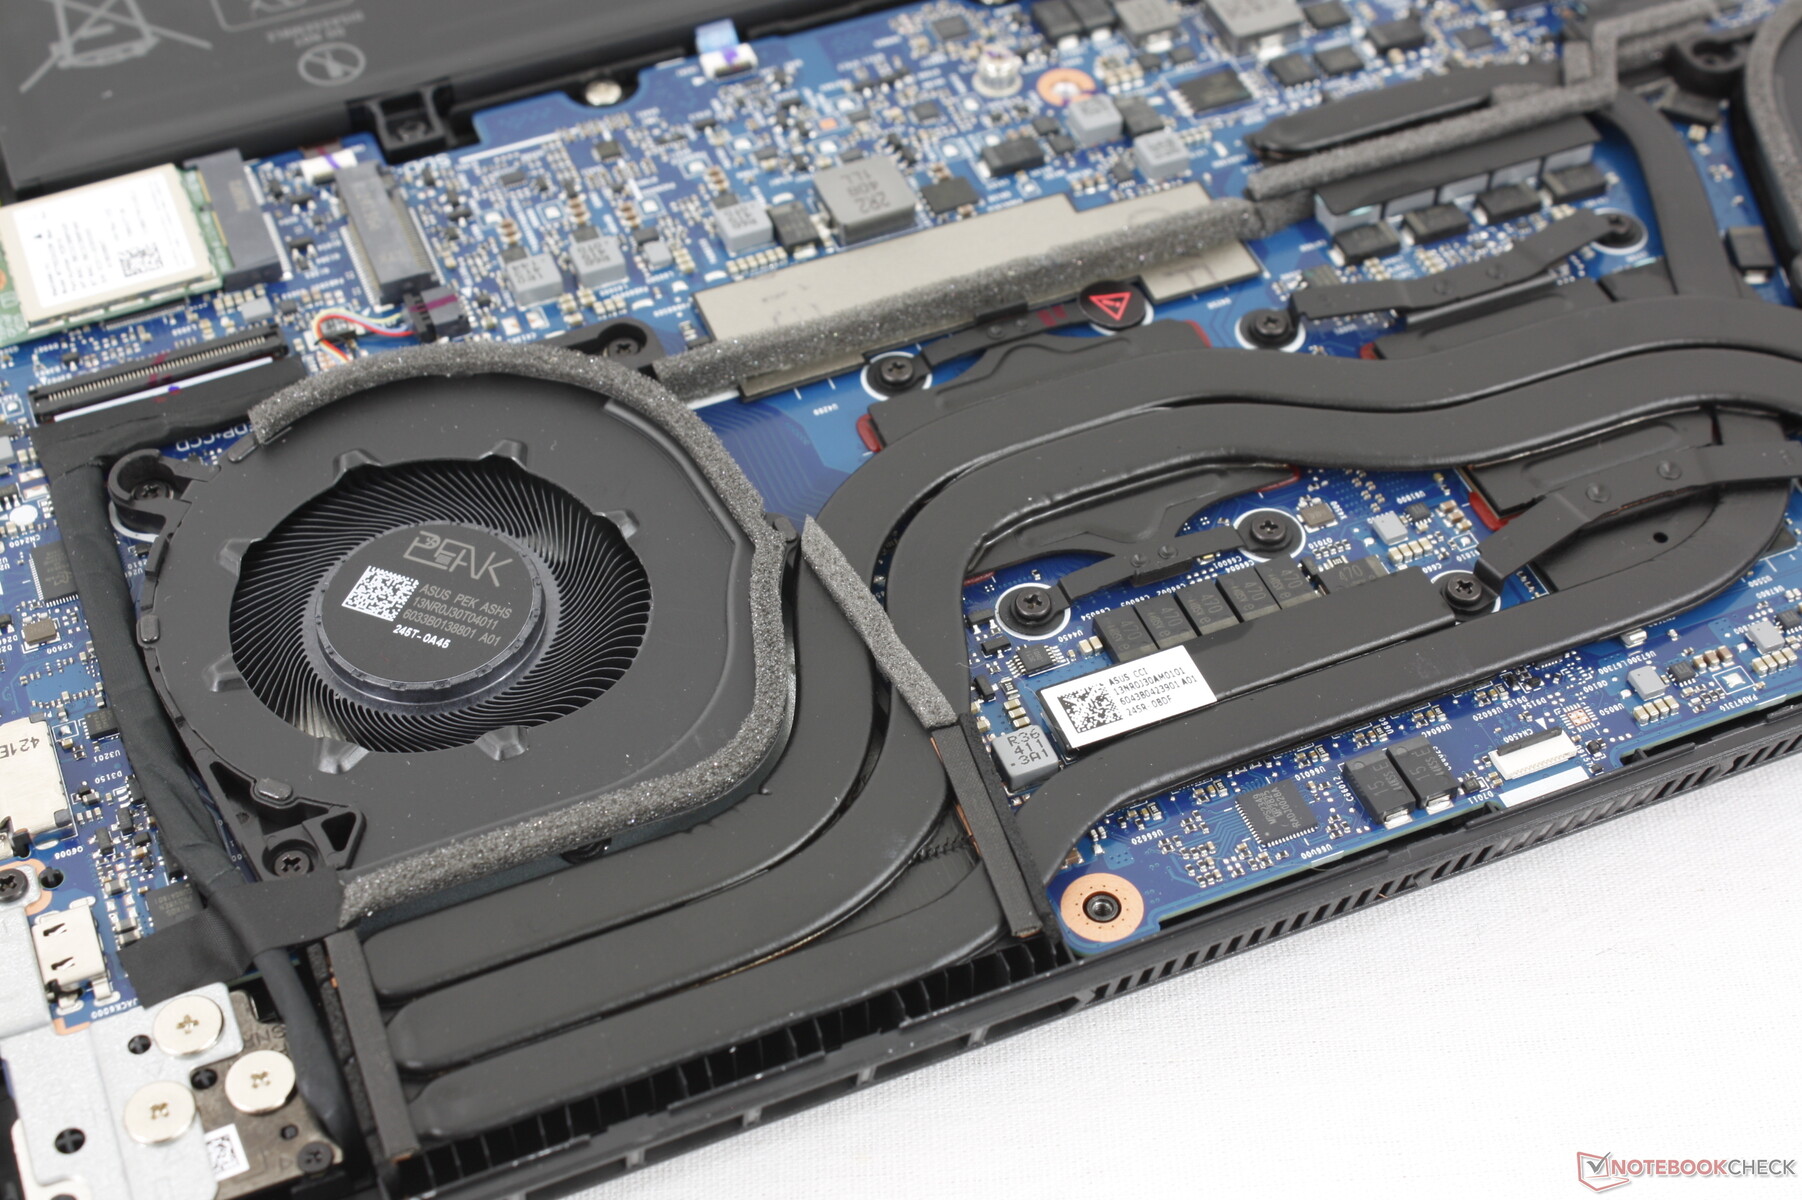
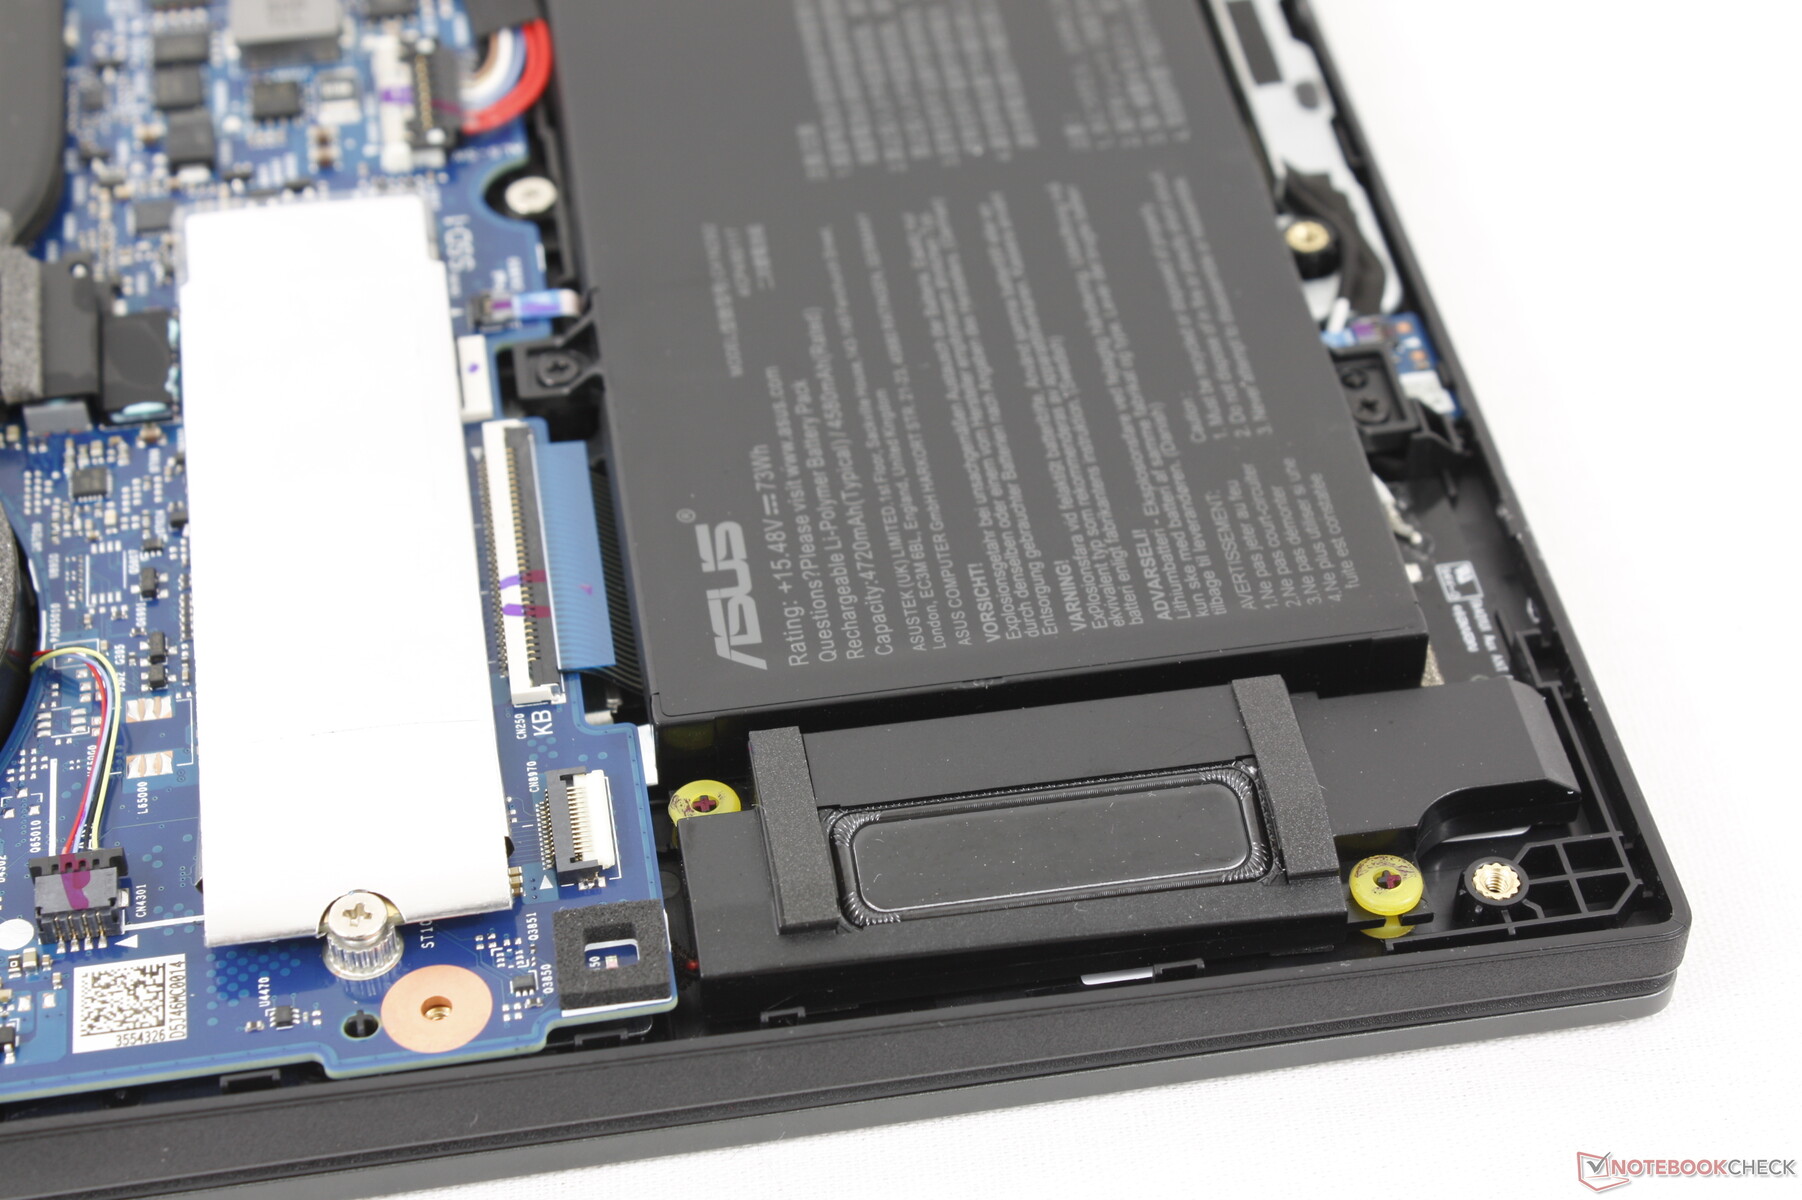
Maintenance
Le panneau inférieur est fixé par 11 vis Phillips pour faciliter l'entretien. L'agencement de la carte mère a beaucoup de points communs avec les récents modèles 2024 Zephyrus G14 comme le montrent les photos comparatives ci-dessous, mais le modèle TUF omet le troisième ventilateur en faveur d'un second emplacement d'extension SSD M.2 2280 PCIe4 x4 pour être l'un des rares ordinateurs portables de jeu de 14 pouces à supporter deux SSD M.2 de pleine longueur. Cependant, d'après nos observations de température, le système aurait pu bénéficier d'un refroidissement supplémentaire.


Durabilité
L'emballage est entièrement recyclable et se compose essentiellement de carton, avec un peu de plastique pour l'adaptateur secteur. Nous n'avons trouvé aucune information sur les émissions de CO2 ou l'utilisation de matériaux recyclés pour la fabrication.
Accessoires et garantie
La boîte ne contient pas d'autres éléments que l'adaptateur secteur et la documentation. La garantie limitée habituelle d'un an s'applique si l'appareil est acheté aux États-Unis.
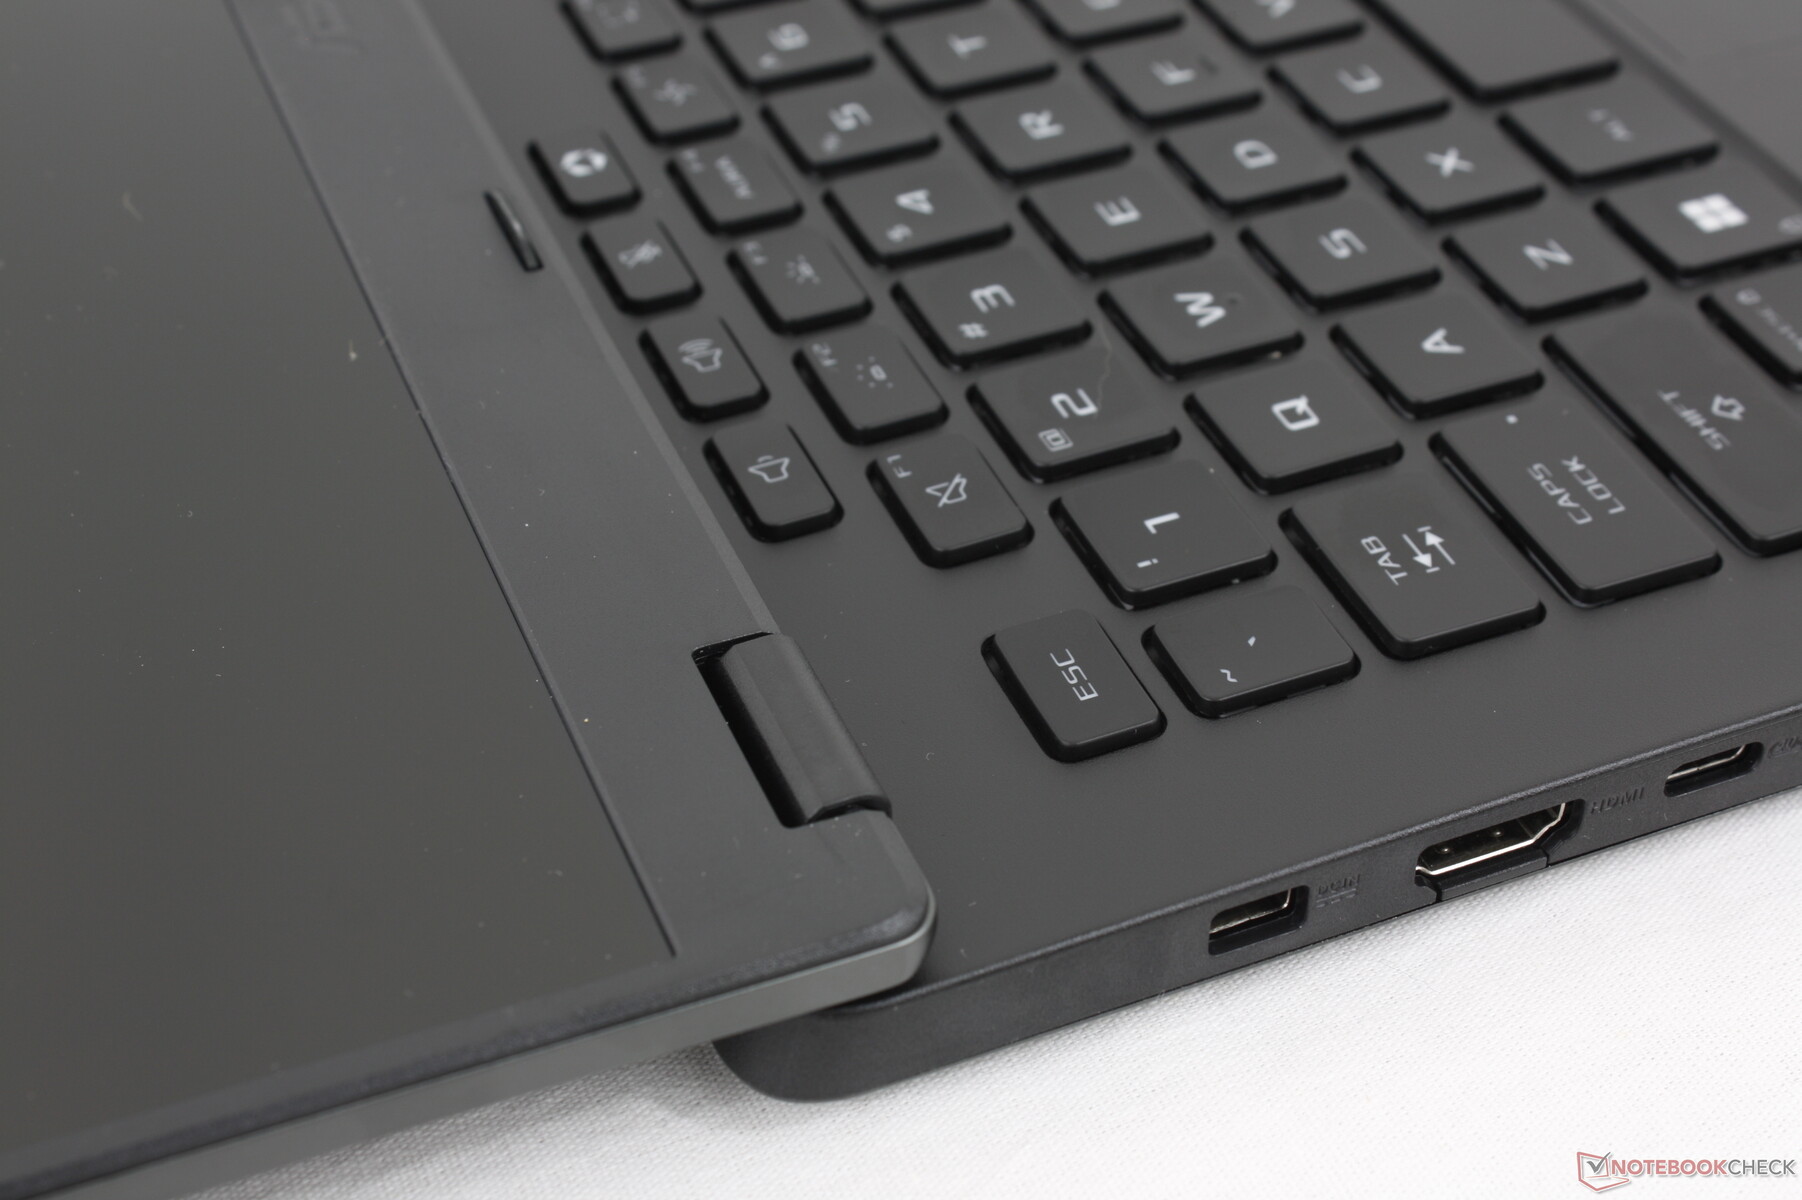
Périphériques d'entrée - Plus confortables que prévu
Clavier
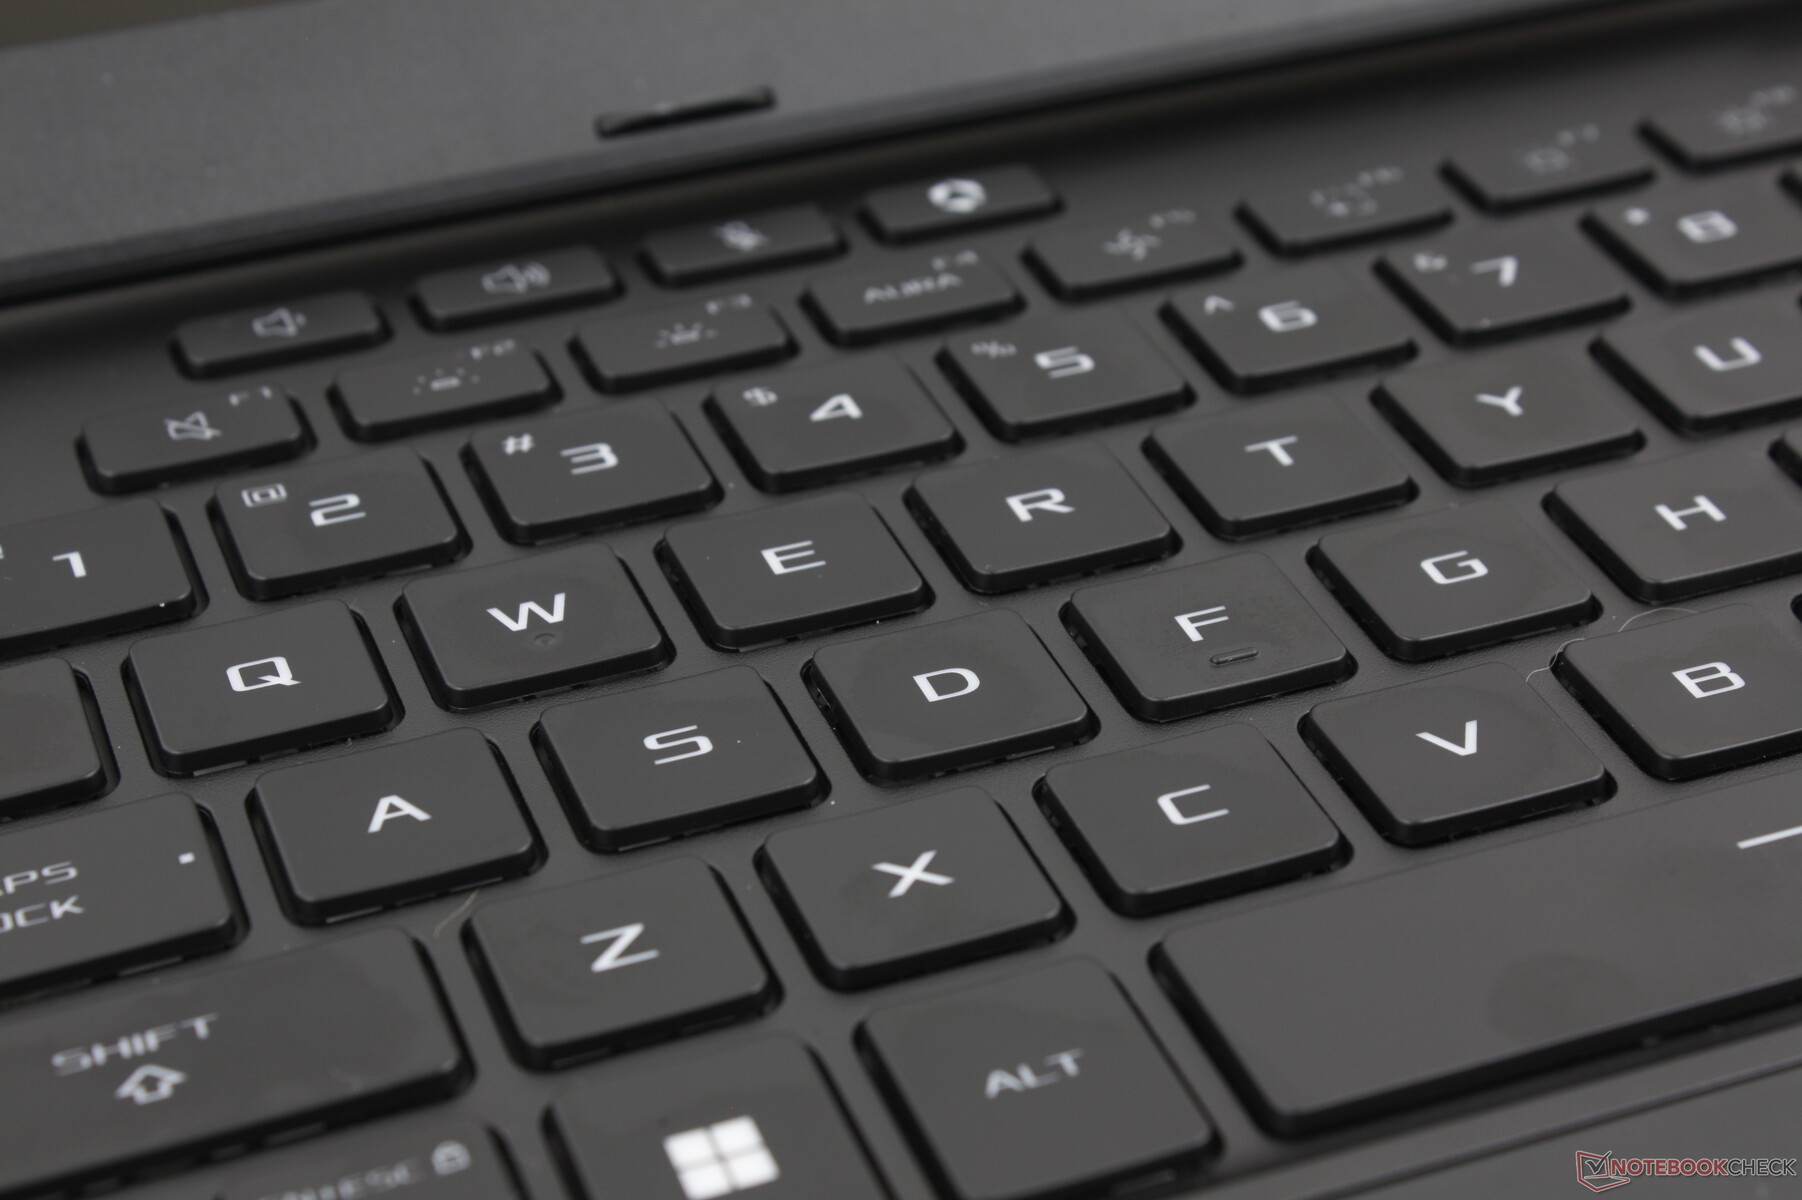
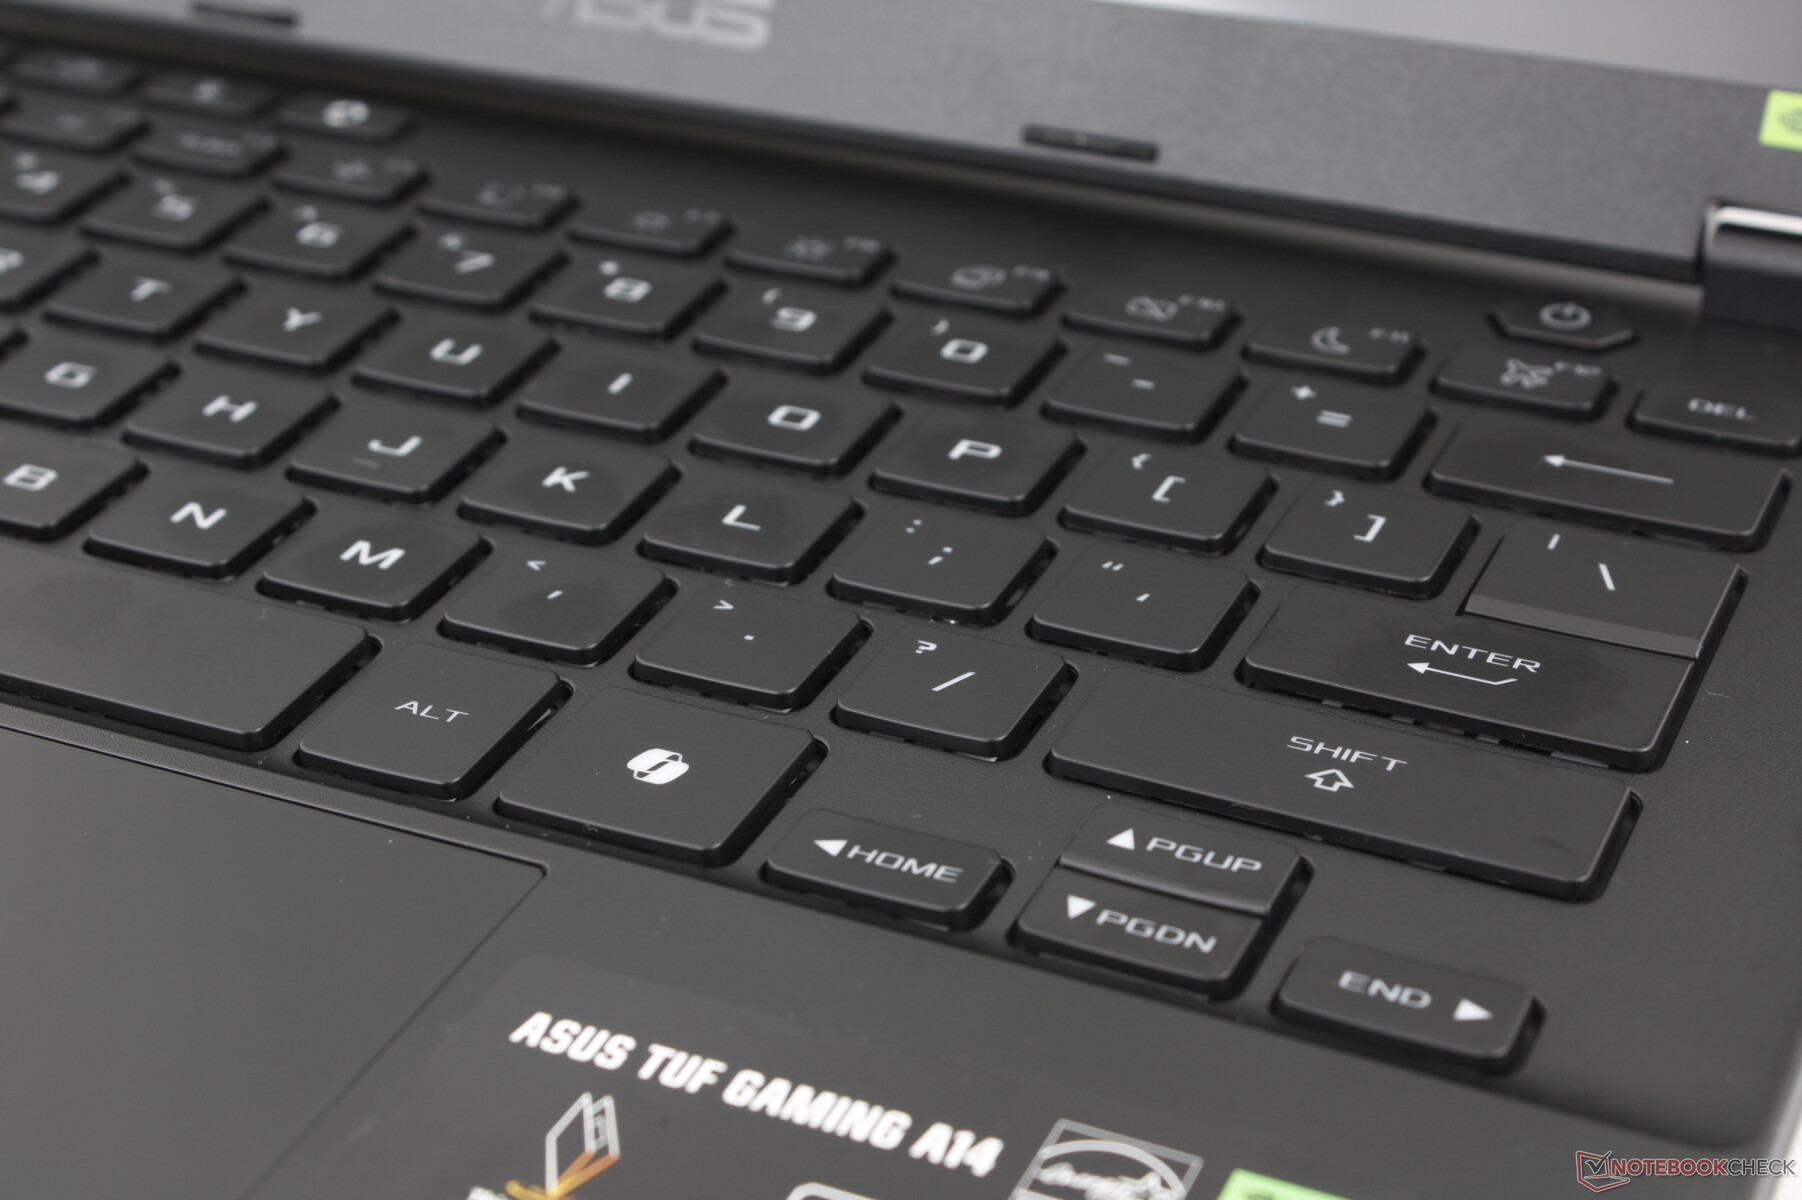
Le clavier est étonnamment plus confortable que celui de la plupart des ordinateurs portables multimédias traditionnels tels que le Lenovo IdeaPad Slim 5 ou le Dell XPS 14. Cela peut être attribué à la course relativement profonde des touches (1,7 mm) et à la netteté du retour d'information, en particulier pour les touches Espace et Entrée. La police de caractères contraste mal avec les capuchons de touches noirs, mais cela peut heureusement être annulé en activant le rétroéclairage.
Le rétroéclairage blanc à zone unique est fourni en standard, sans options RVB par touche ou même RVB, contrairement à la plupart des autres ordinateurs portables de jeu.
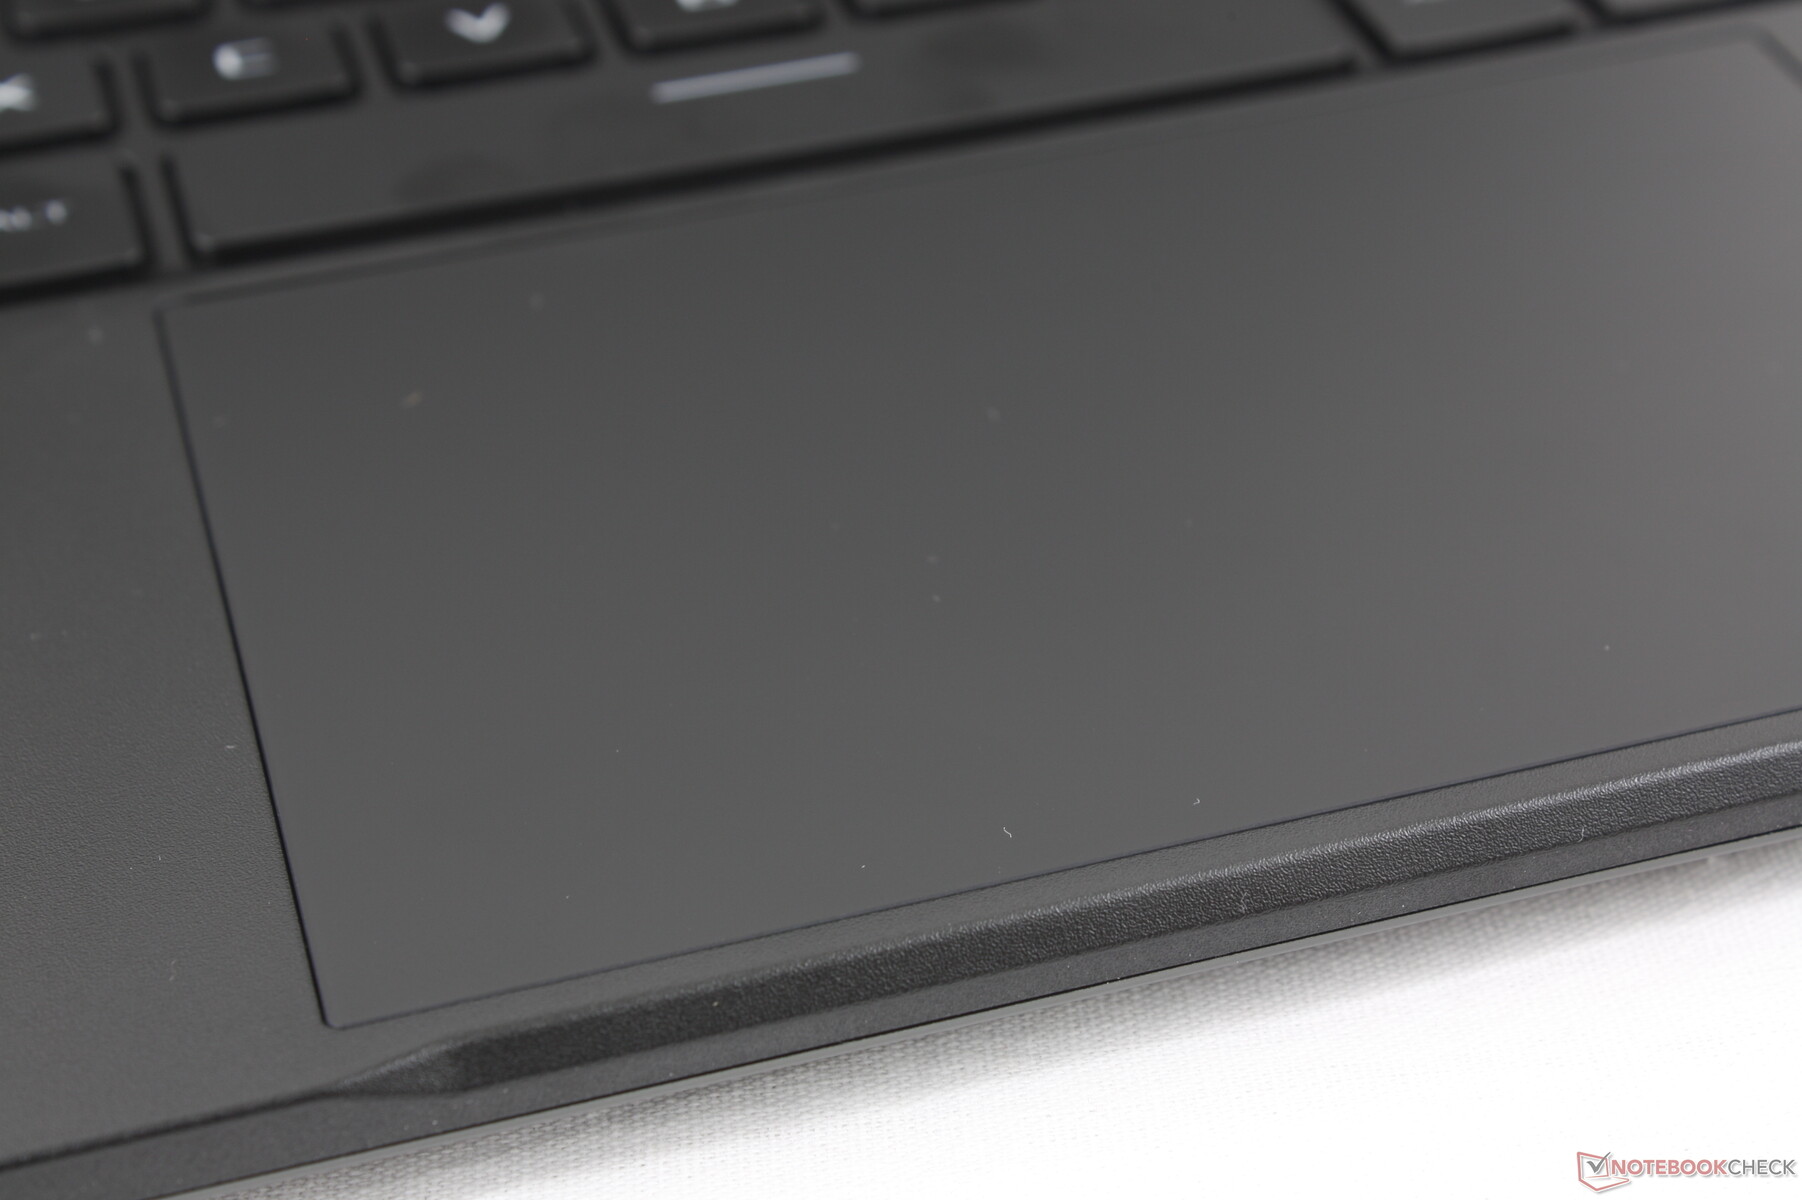
Pavé tactile
Le pavé tactile en verre est légèrement plus petit que celui du ROG Zephyrus G14 (12,7 x 7,8 cm contre 12,7 x 8 cm), mais il reste spacieux pour un format de 14 pouces. La traction est fluide avec seulement un peu d'adhérence à des vitesses plus lentes pour des clics et des glissements plus précis. Le retour d'information lors du clic est plus net et plus ferme que prévu, ce qui le rend plus satisfaisant à utiliser que le pavé tactile plus souple mais encore plus grand du Blade 14.
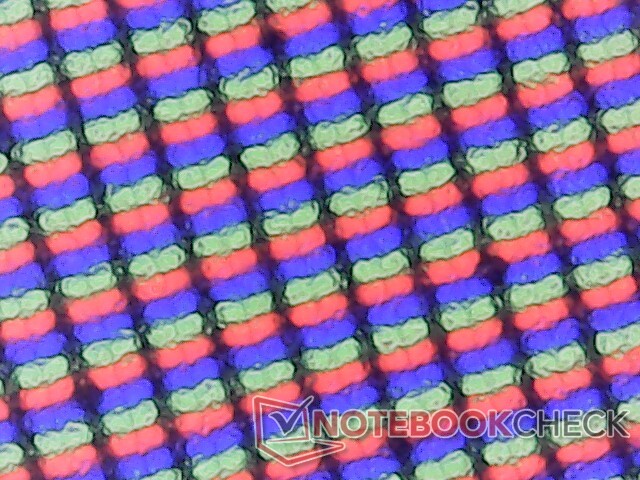
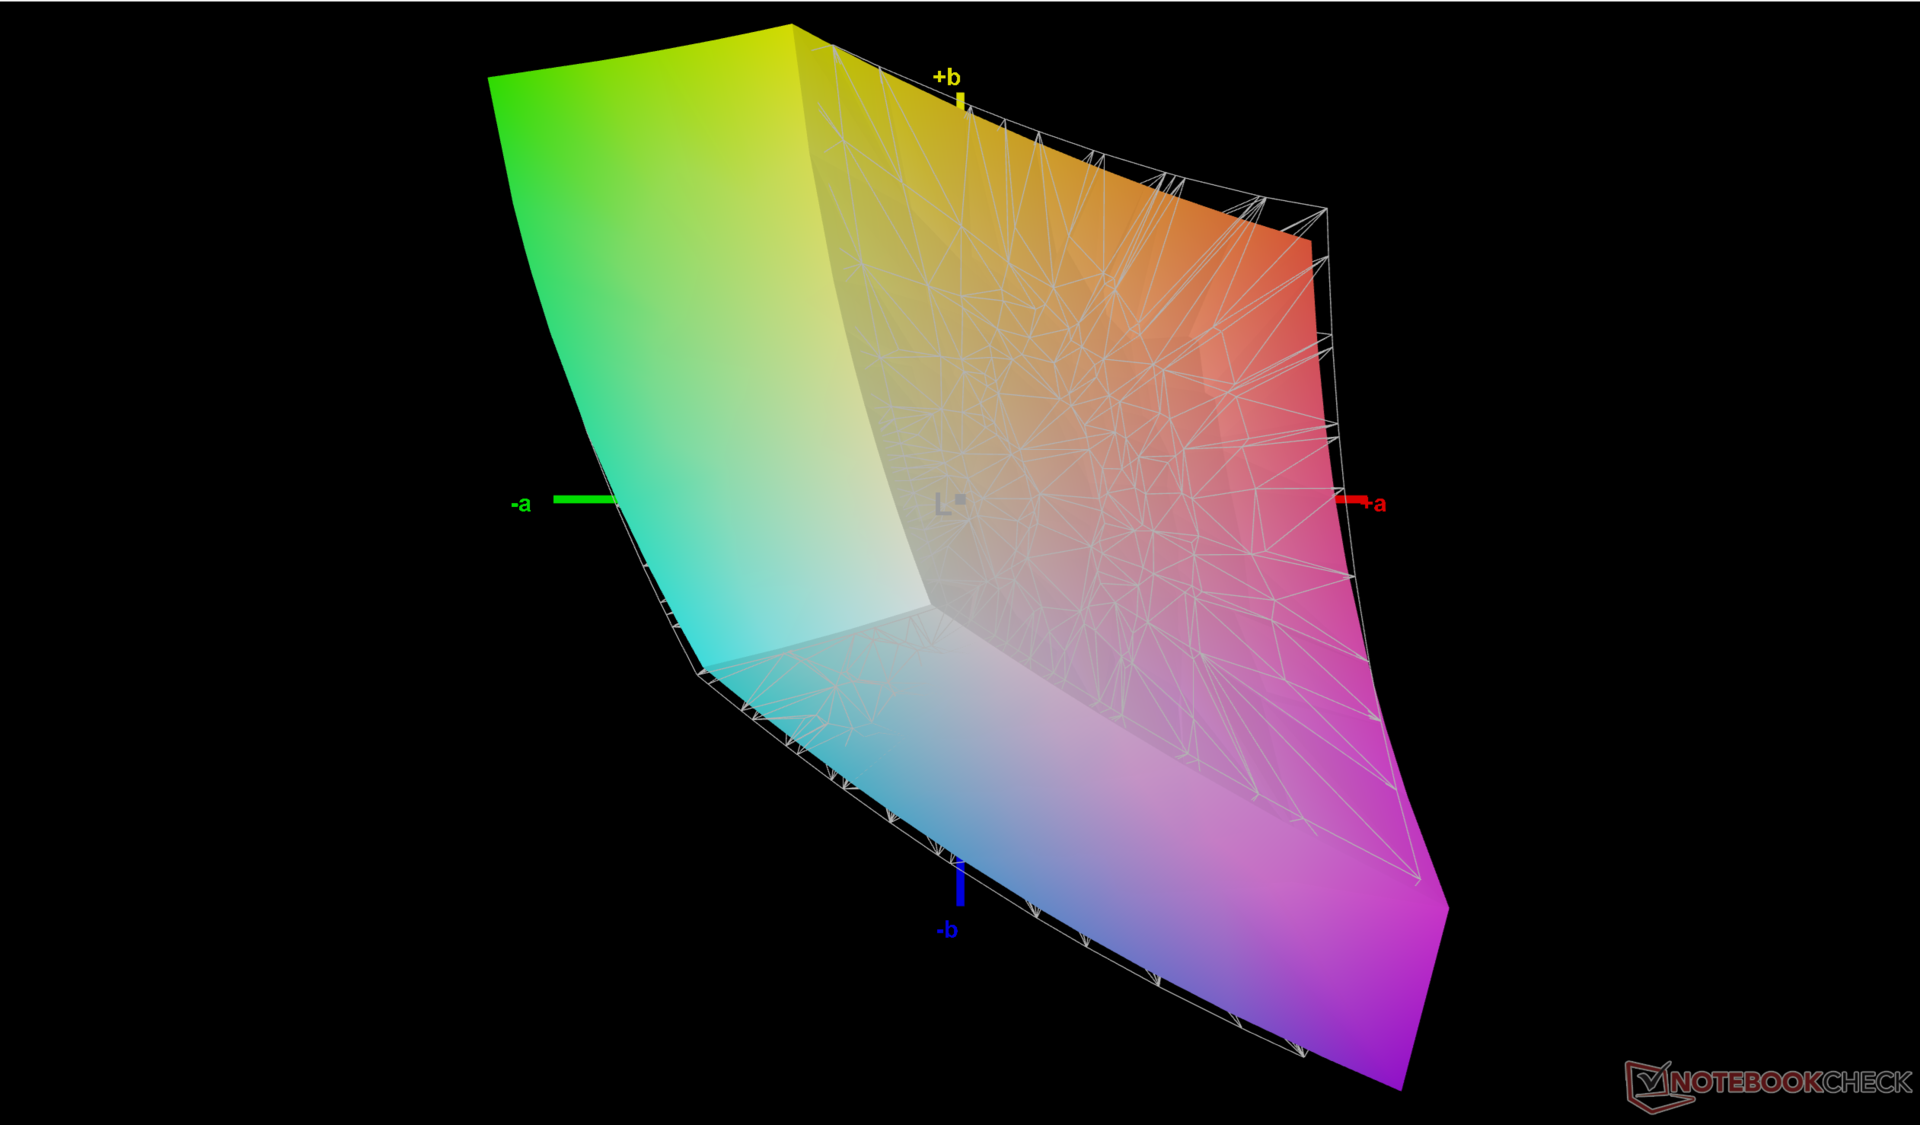
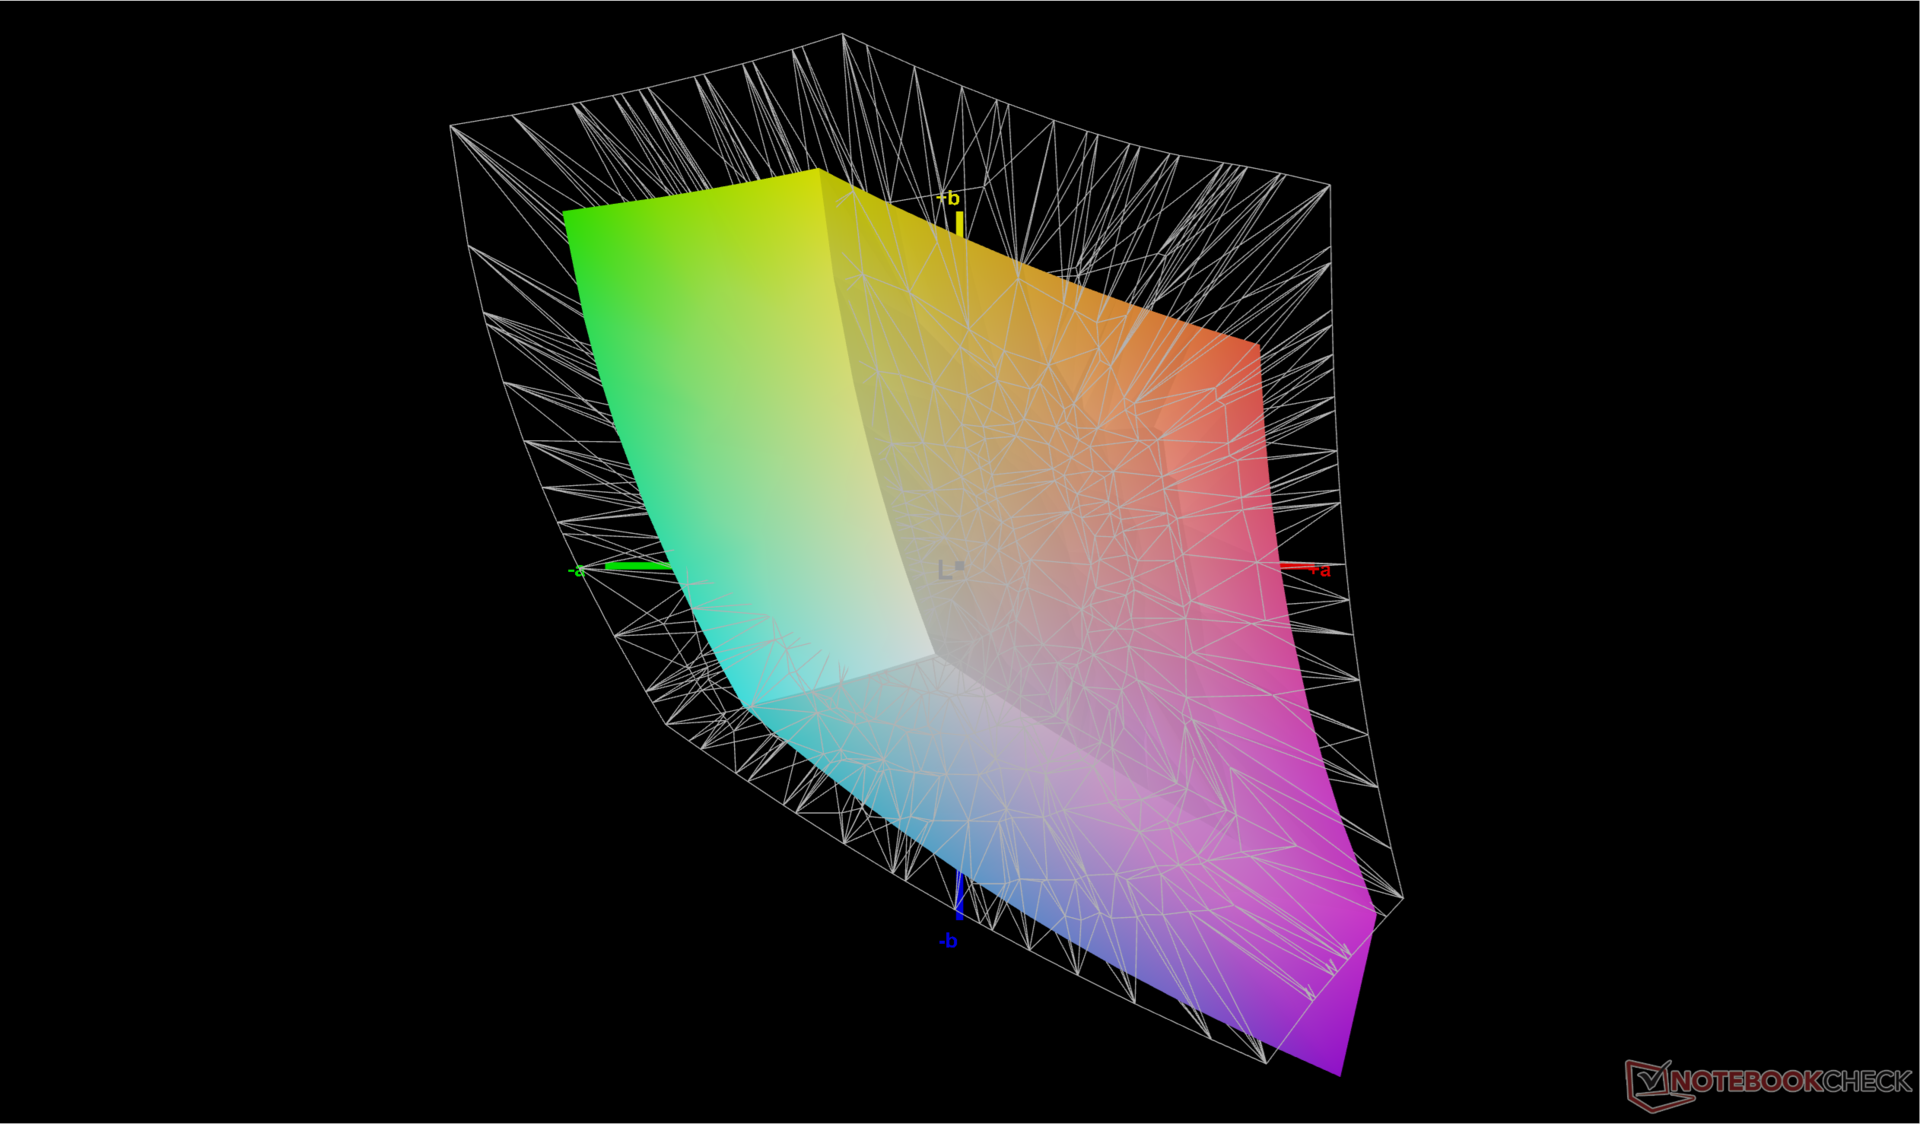
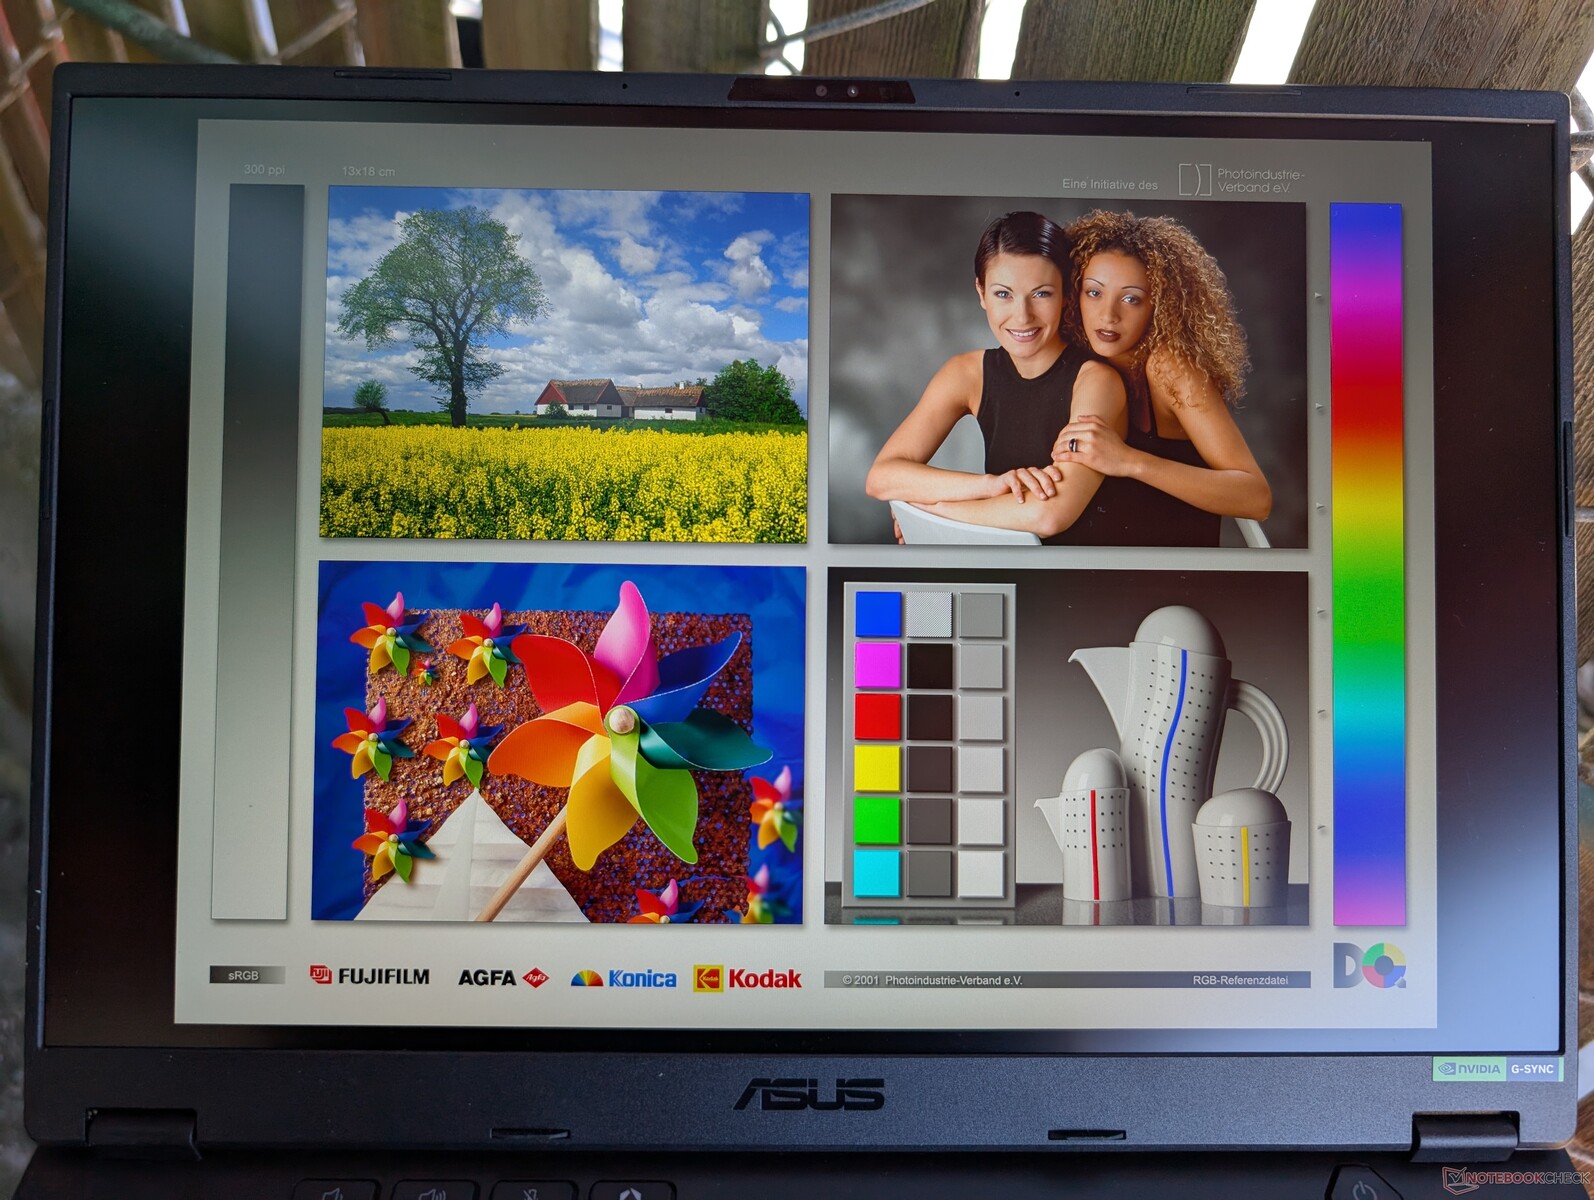
Affichage - Pour un jeu équilibré
La dalle IPS BOE NE140QDM-NX7 est similaire à celle disponible sur le Acer Predator Triton 14. Vous pouvez dire que ce panneau a été spécialement conçu pour le jeu en raison de son taux de rafraîchissement élevé de 165 Hz et de ses temps de réponse rapides pour réduire les images fantômes. Il cible les couleurs sRGB au lieu d'AdobeRGB ou P3 pour réduire les coûts, mais cela n'aura pas d'impact sur l'expérience de jeu pour la plupart des utilisateurs. Le plus gros inconvénient est peut-être l'absence de prise en charge du HDR, mais Asus souhaite que vous passiez au ROG Zephyrus G14 pour bénéficier de ces fonctionnalités avancées.
Si G-Sync est pris en charge, le taux de rafraîchissement variable (VRR) de Windows ne l'est pas. Les paramètres de taux de rafraîchissement de 165 Hz et 60 Hz sont donc fixes, sans option variable pour économiser de l'énergie.
| |||||||||||||||||||||||||
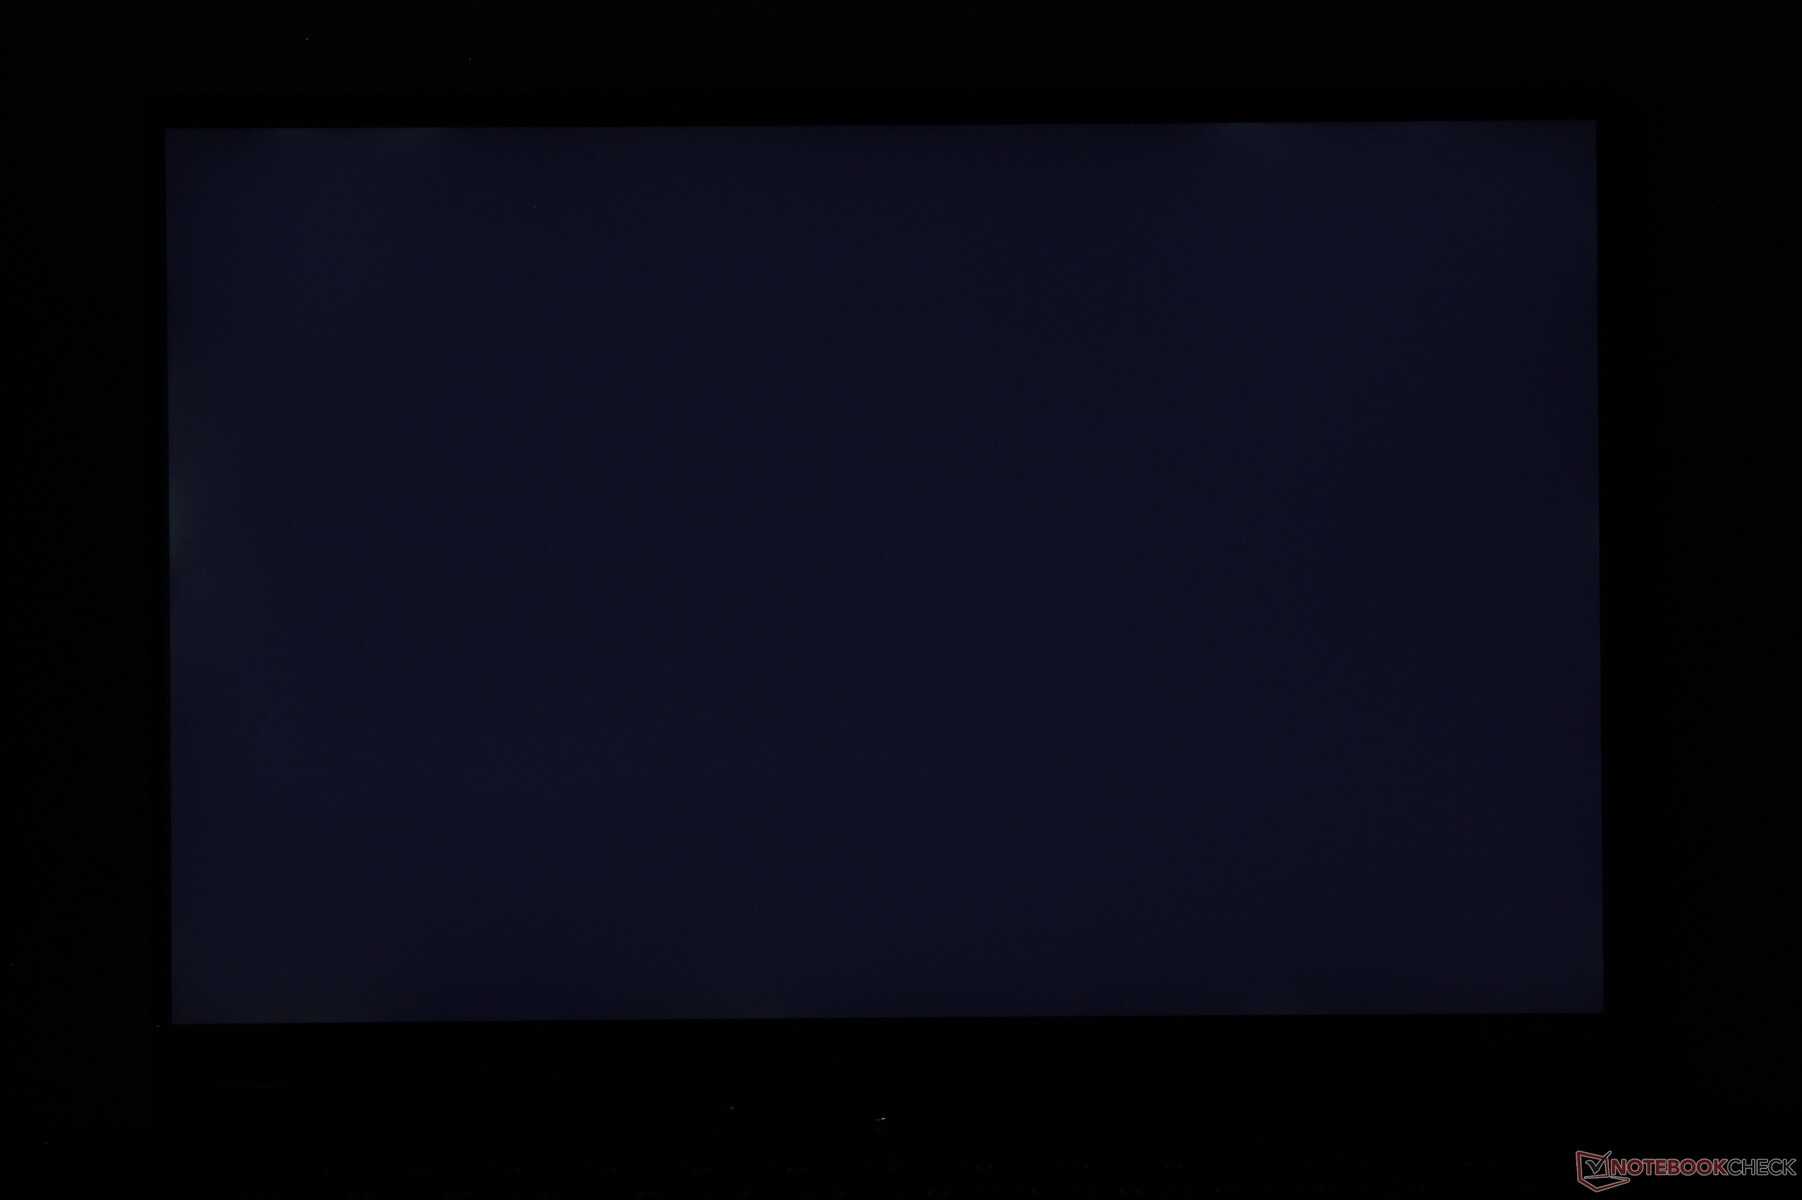
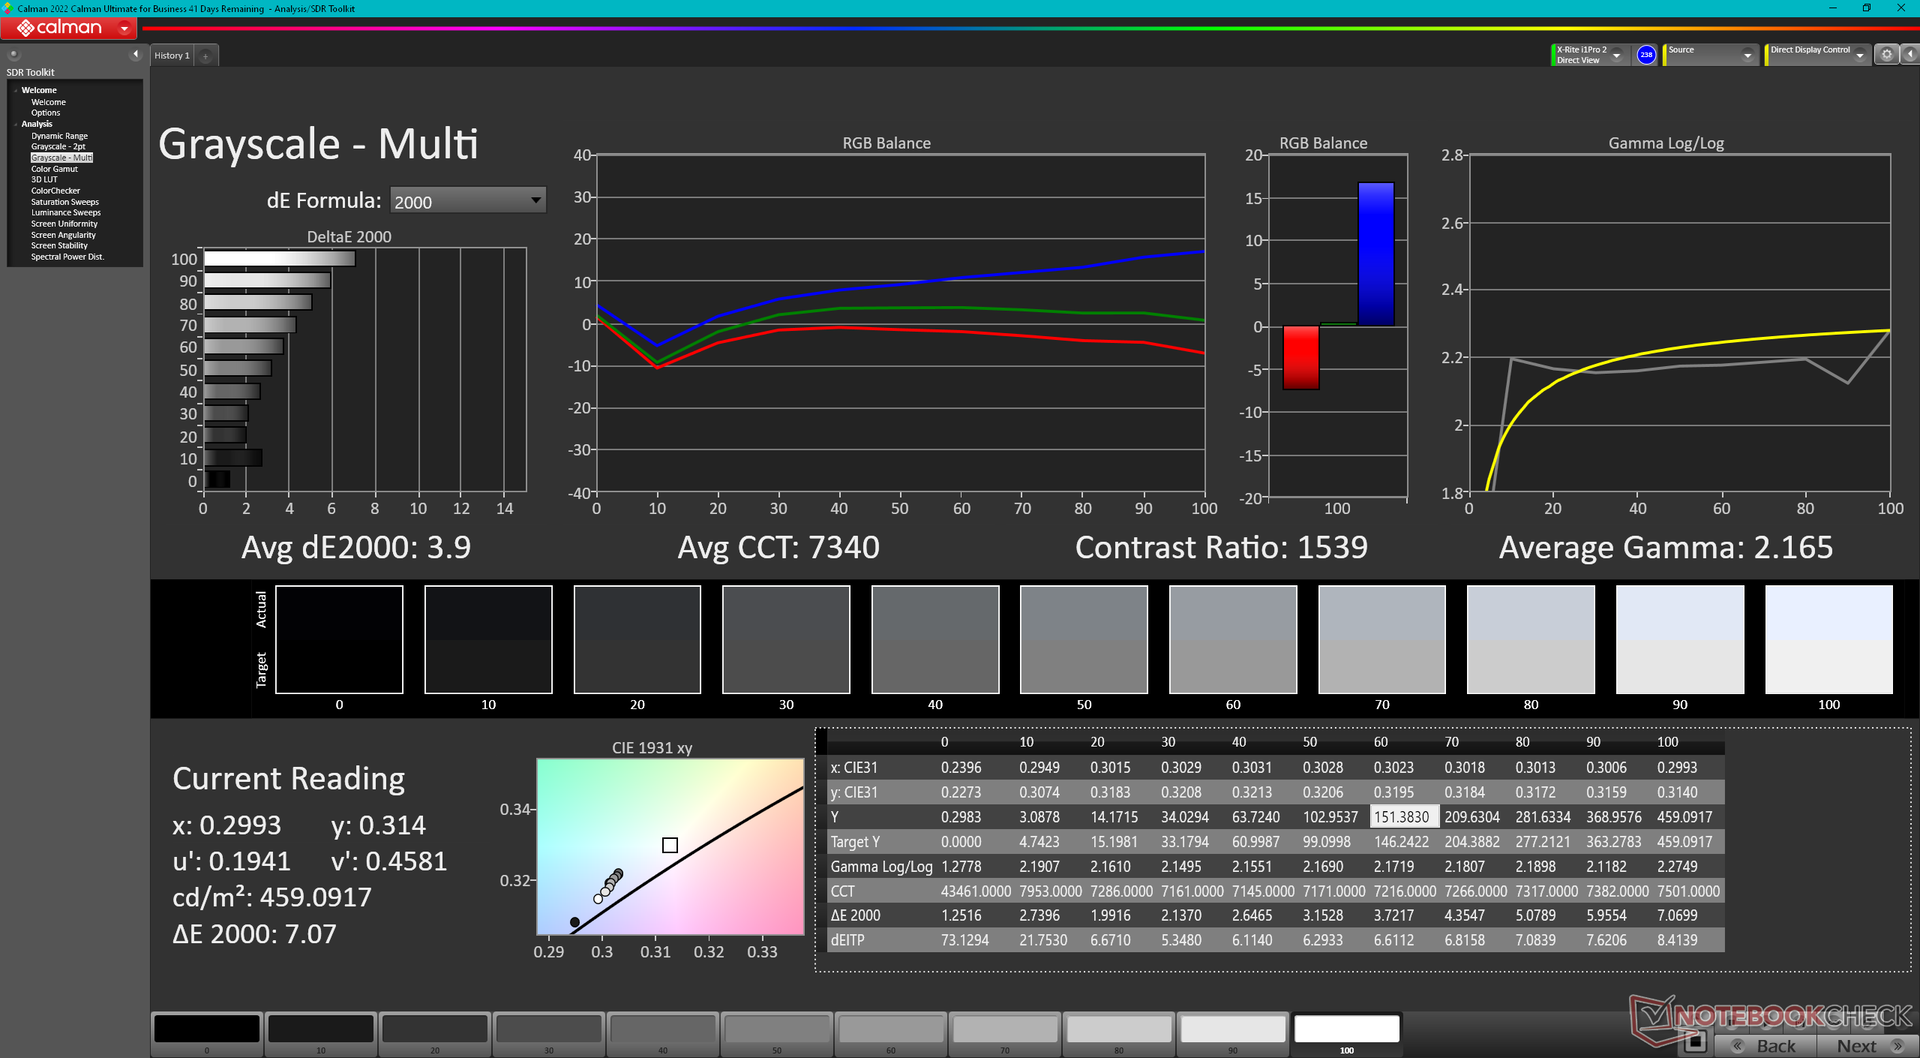
Homogénéité de la luminosité: 93 %
Valeur mesurée au centre, sur batterie: 455.8 cd/m²
Contraste: 1199:1 (Valeurs des noirs: 0.38 cd/m²)
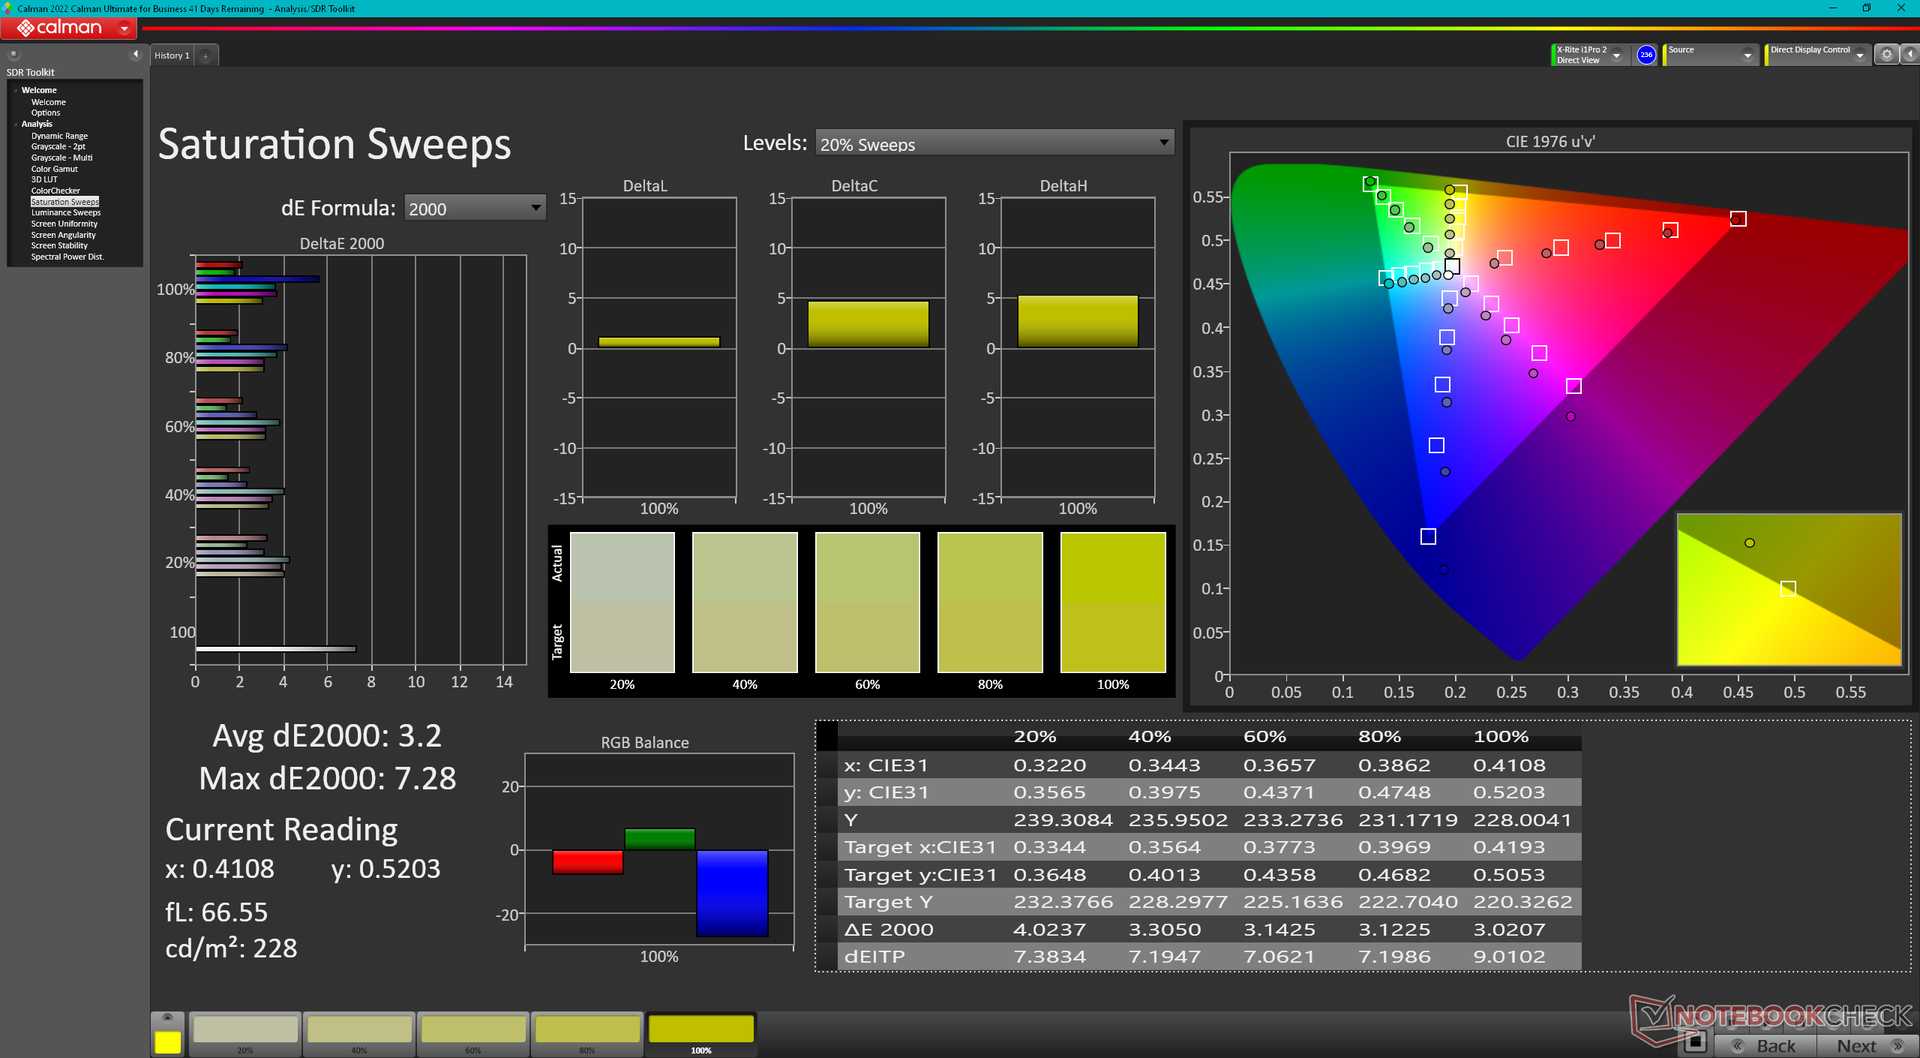
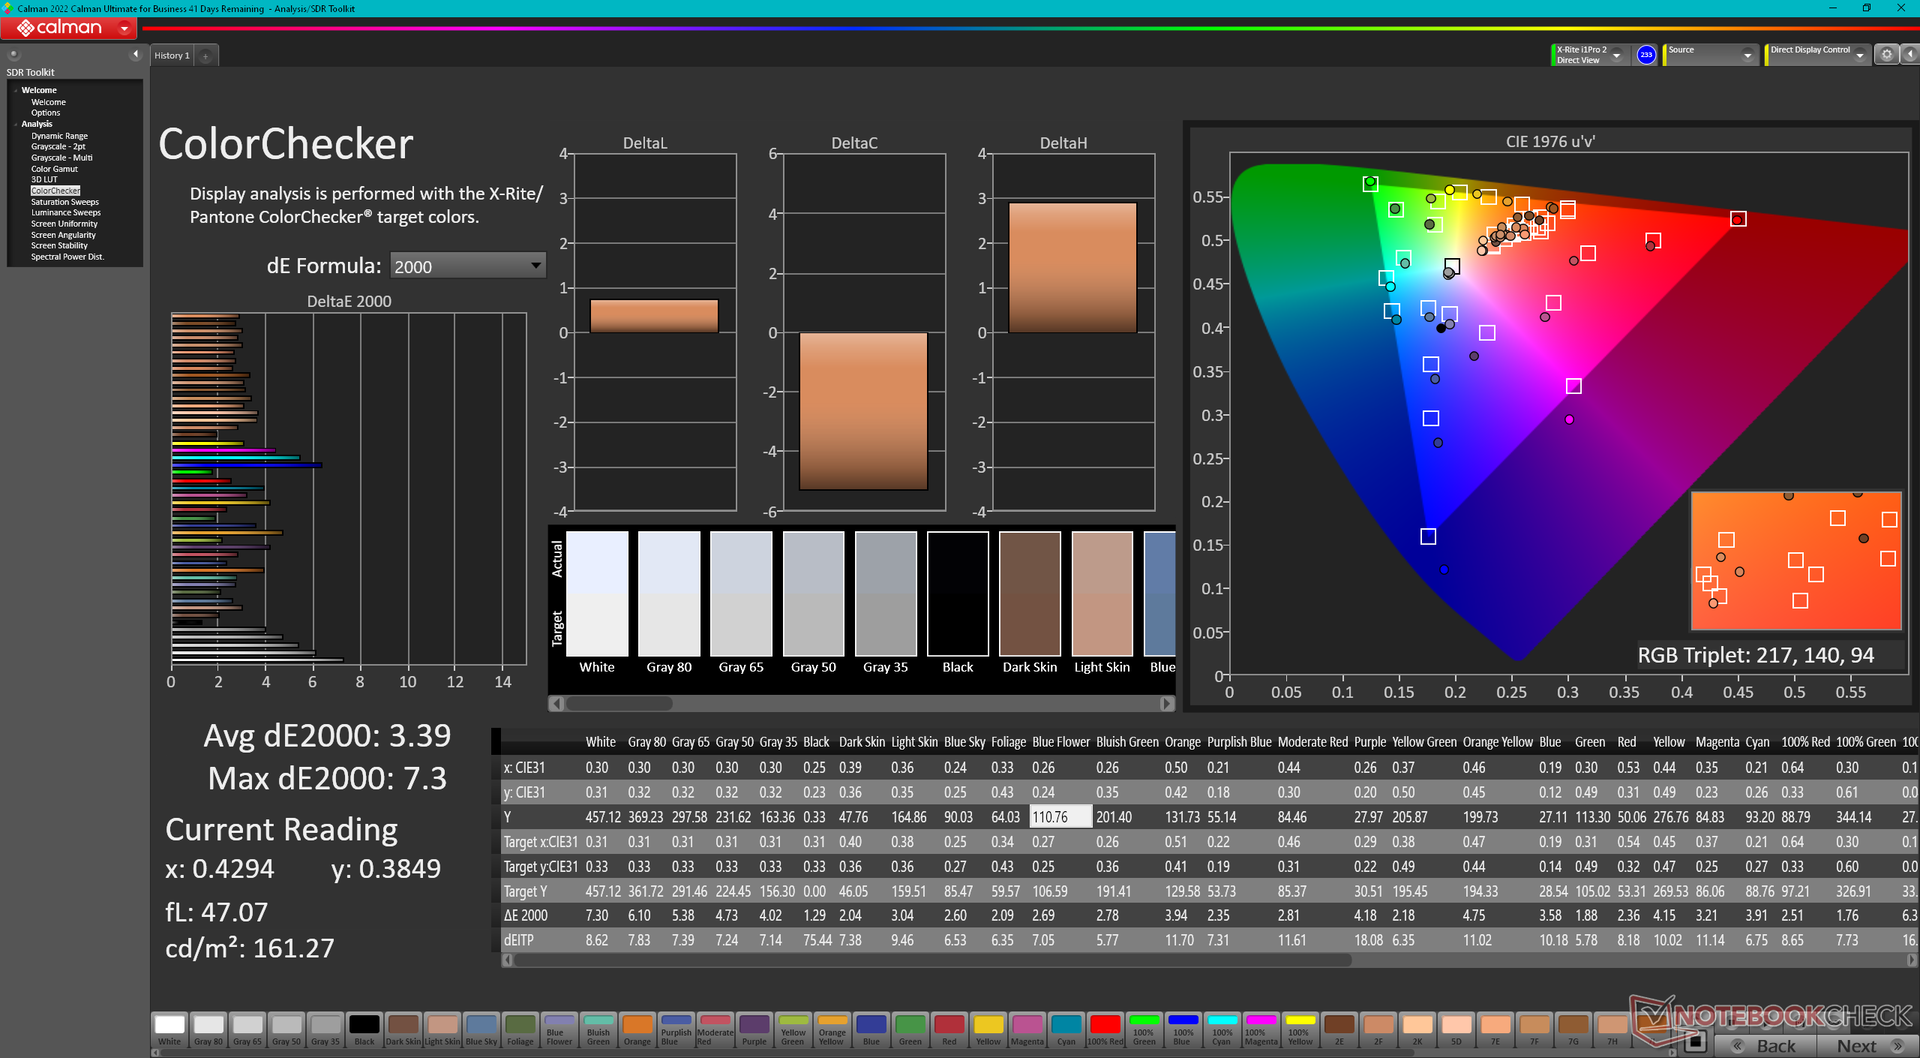
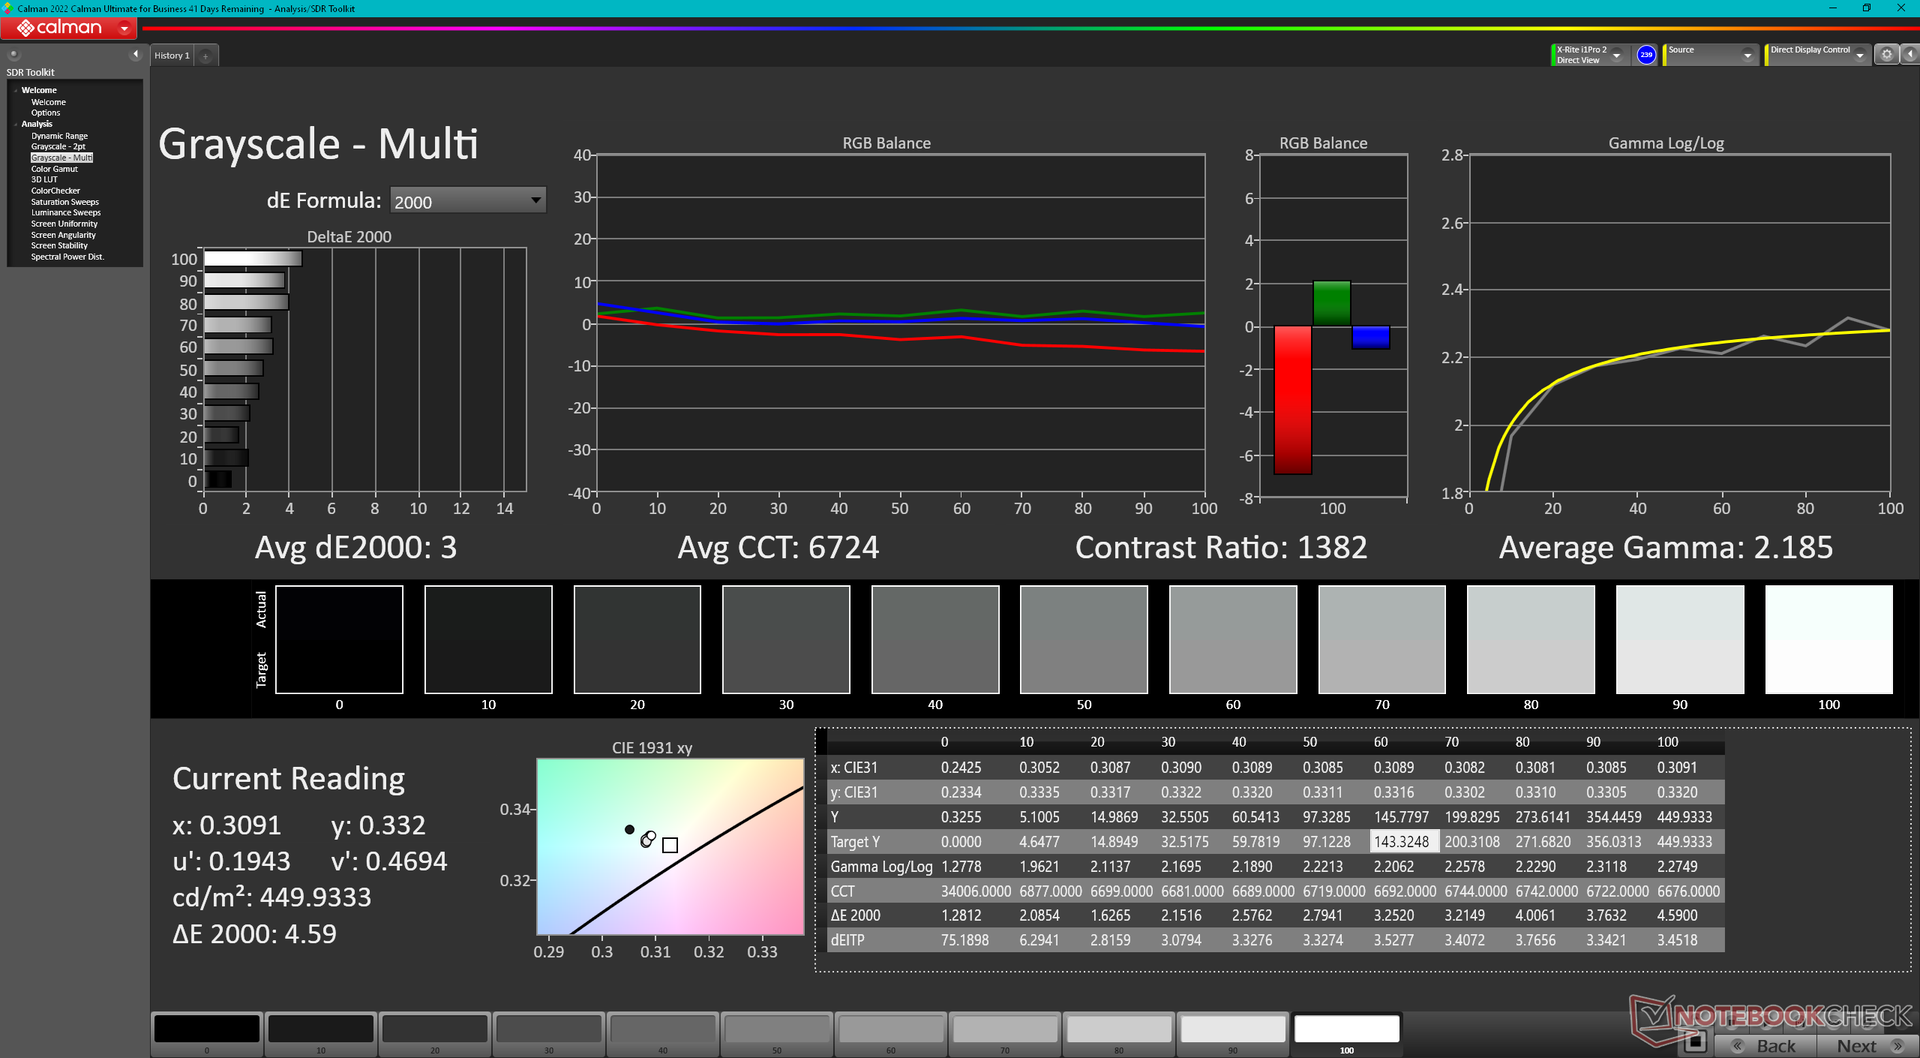
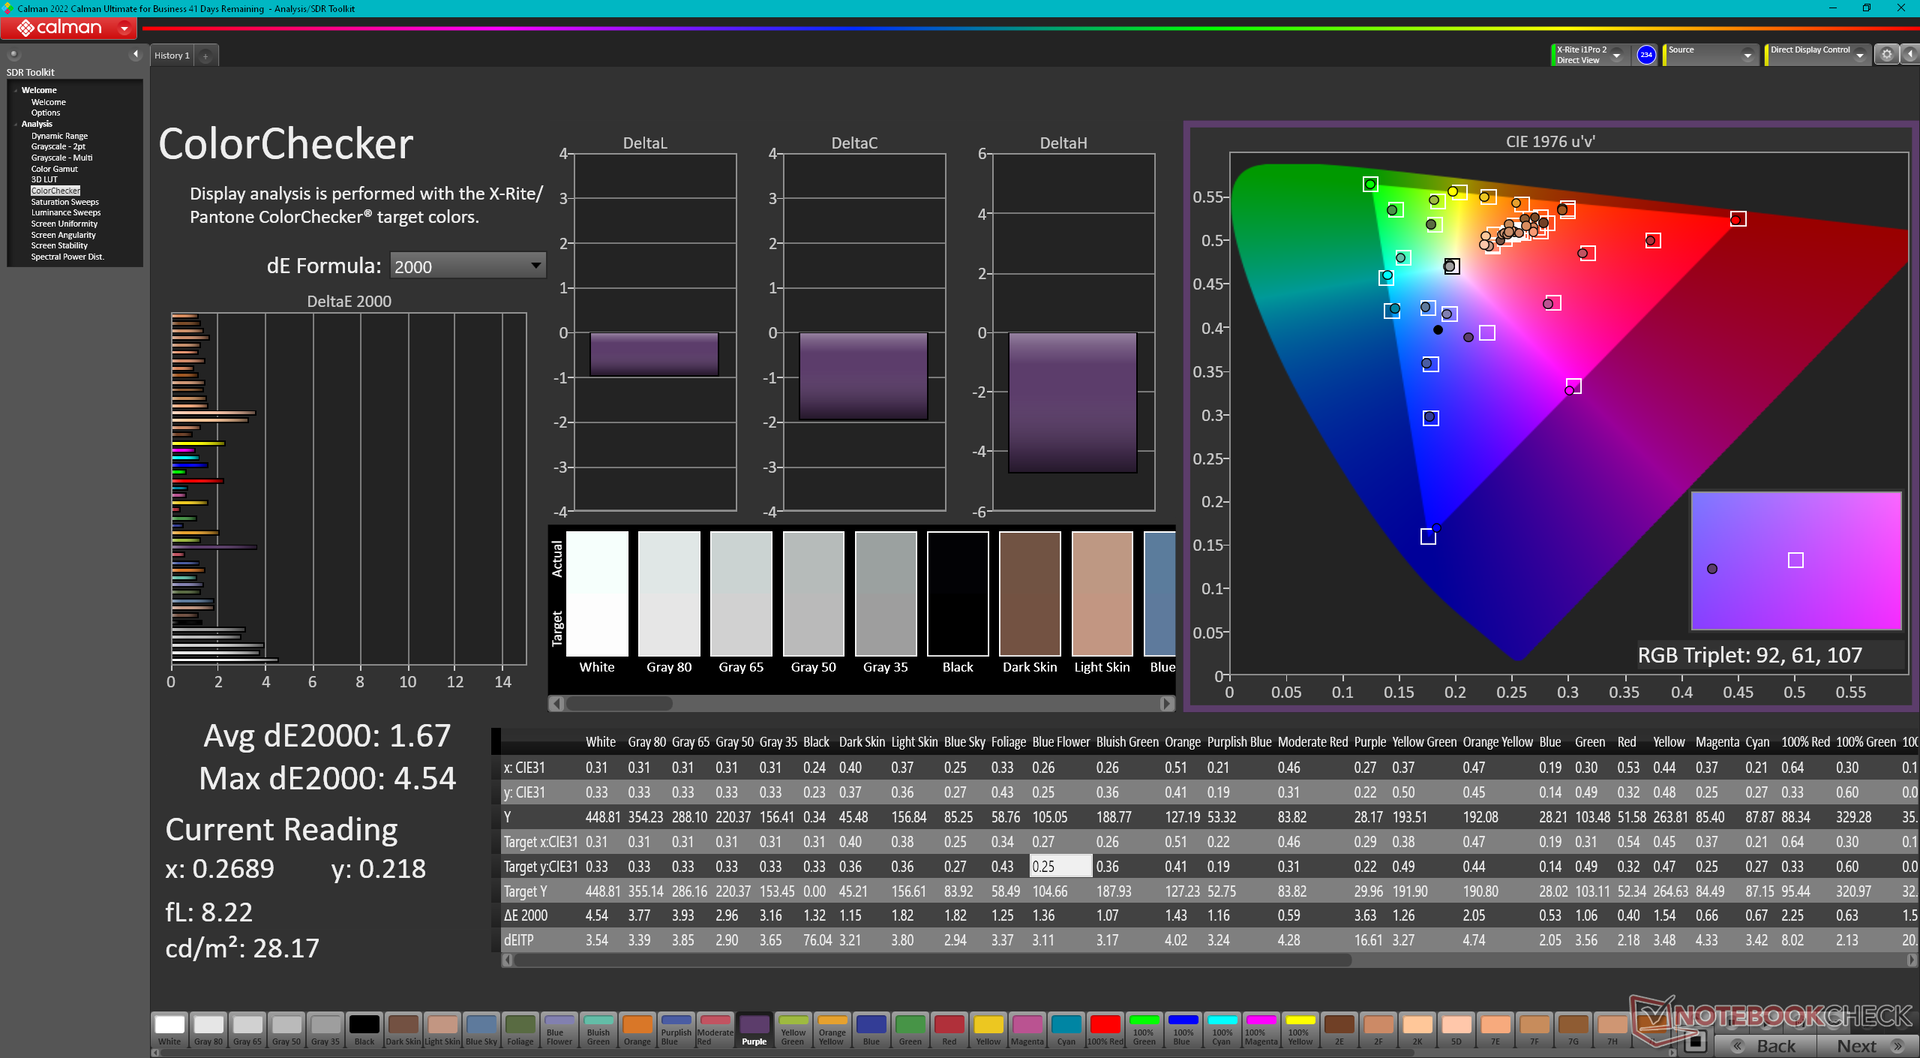
ΔE Color 3.39 | 0.5-29.43 Ø4.9, calibrated: 1.67
ΔE Greyscale 3.9 | 0.5-98 Ø5.2
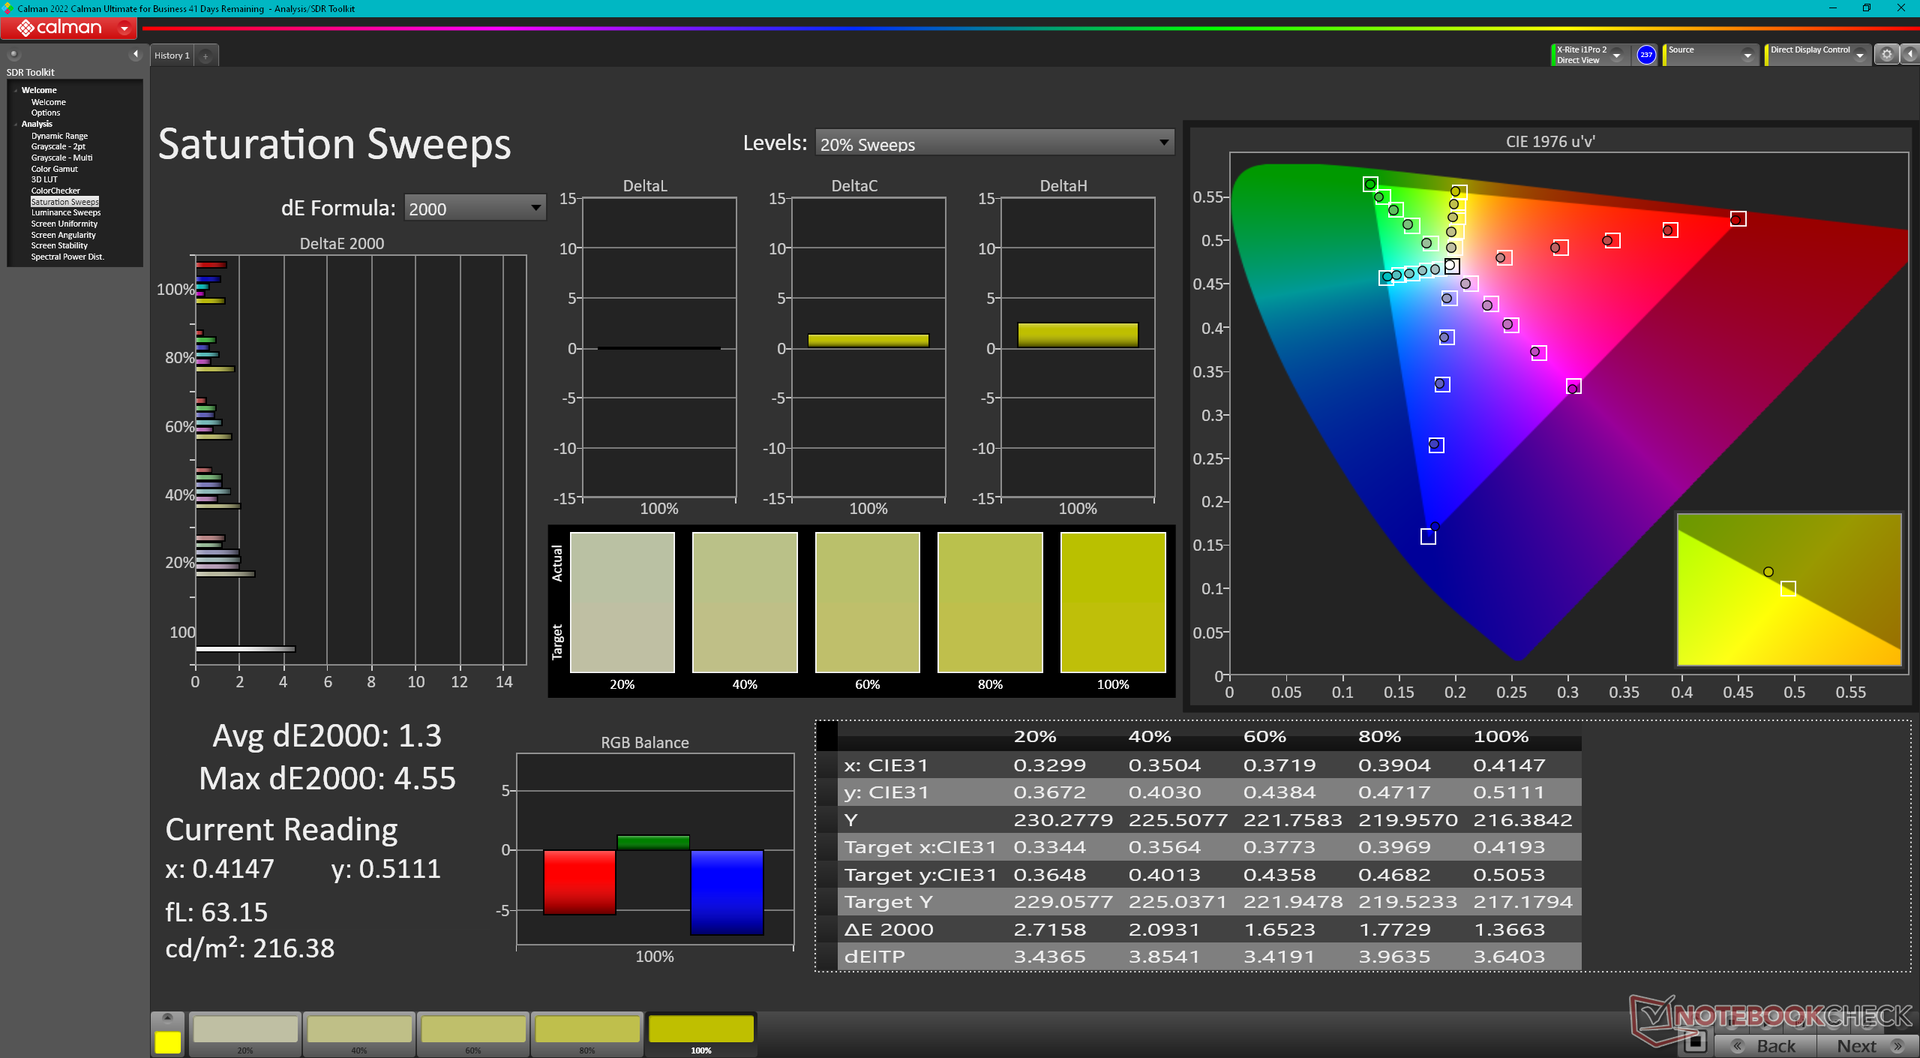
65.6% AdobeRGB 1998 (Argyll 2.2.0 3D)
94% sRGB (Argyll 2.2.0 3D)
65.1% Display P3 (Argyll 2.2.0 3D)
Gamma: 2.17
| Asus TUF Gaming A14 FA401WV-WB94 BOE NE140QDM-NX7, IPS, 2560x1600, 14", 165 Hz | Asus ROG Zephyrus G14 2024 GA403U ATNA40CU05-0, OLED, 2880x1800, 14", 120 Hz | HP Omen Transcend 14-fb0014 Samsung SDC4197, OLED, 2880x1800, 14", 120 Hz | Razer Blade 14 RZ09-0508 TL140ADXP04-0, IPS, 2560x1600, 14", 240 Hz | Lenovo Legion Slim 5 14APH8 Samsung SDC ATNA45AF02-2, OLED, 2880x1600, 14.5", 120 Hz | Alienware x14 i7 RTX 3060 SHP154D, IPS, 1920x1080, 14", 144 Hz | |
|---|---|---|---|---|---|---|
| Display | 32% | 35% | 28% | 35% | 31% | |
| Display P3 Coverage | 65.1 | 99.6 53% | 99.6 53% | 96.9 49% | 99.9 53% | 99.6 53% |
| sRGB Coverage | 94 | 100 6% | 100 6% | 99.8 6% | 100 6% | 100 6% |
| AdobeRGB 1998 Coverage | 65.6 | 89.9 37% | 96.1 46% | 85 30% | 96.5 47% | 87.6 34% |
| Response Times | 92% | 89% | 14% | 90% | 2% | |
| Response Time Grey 50% / Grey 80% * | 10.7 ? | 0.62 ? 94% | 0.86 ? 92% | 6 ? 44% | 0.79 ? 93% | 9.6 ? 10% |
| Response Time Black / White * | 7.1 ? | 0.68 ? 90% | 0.99 ? 86% | 8.3 ? -17% | 1.01 ? 86% | 7.6 ? -7% |
| PWM Frequency | 960 ? | 479 ? | 240.5 ? | |||
| Screen | 469% | 10% | 22% | 11% | 12% | |
| Brightness middle | 455.8 | 423 -7% | 386.3 -15% | 484.1 6% | 377.5 -17% | 434 -5% |
| Brightness | 436 | 424 -3% | 389 -11% | 466 7% | 381 -13% | 411 -6% |
| Brightness Distribution | 93 | 98 5% | 98 5% | 89 -4% | 97 4% | 89 -4% |
| Black Level * | 0.38 | 0.01 97% | 0.38 -0% | 0.25 34% | ||
| Contrast | 1199 | 42300 3428% | 1274 6% | 1736 45% | ||
| Colorchecker dE 2000 * | 3.39 | 0.7 79% | 4.03 -19% | 2.23 34% | 4.19 -24% | 3 12% |
| Colorchecker dE 2000 max. * | 7.3 | 1.8 75% | 6.69 8% | 4.57 37% | 7.02 4% | 7.1 3% |
| Colorchecker dE 2000 calibrated * | 1.67 | 1.07 36% | 0.74 56% | 0.81 51% | 0.7 58% | |
| Greyscale dE 2000 * | 3.9 | 0.8 79% | 1.2 69% | 1.6 59% | 1.2 69% | 5.1 -31% |
| Gamma | 2.17 101% | 2.18 101% | 2.25 98% | 2.24 98% | 2.22 99% | 2.19 100% |
| CCT | 7340 89% | 6505 100% | 6280 104% | 6816 95% | 6296 103% | 6204 105% |
| Moyenne finale (programmes/paramètres) | 198% /
310% | 45% /
30% | 21% /
22% | 45% /
30% | 15% /
14% |
* ... Moindre est la valeur, meilleures sont les performances
L'écran n'est pas pré-calibré et la température de couleur est donc légèrement trop froide. L'étalonnage à l'aide de notre colorimètre X-Rite permet de remédier à cette lacune en réduisant les valeurs deltaE des niveaux de gris et des couleurs de 3,9 et 3,39 à 3,0 et 1,67, respectivement. Les améliorations ne sont pas particulièrement significatives et l'écran devrait donc convenir en l'état à la plupart des jeux et à l'édition amateur.
Temps de réponse de l'écran
| ↔ Temps de réponse noir à blanc | ||
|---|---|---|
| 7.1 ms ... hausse ↗ et chute ↘ combinées | ↗ 3.9 ms hausse | 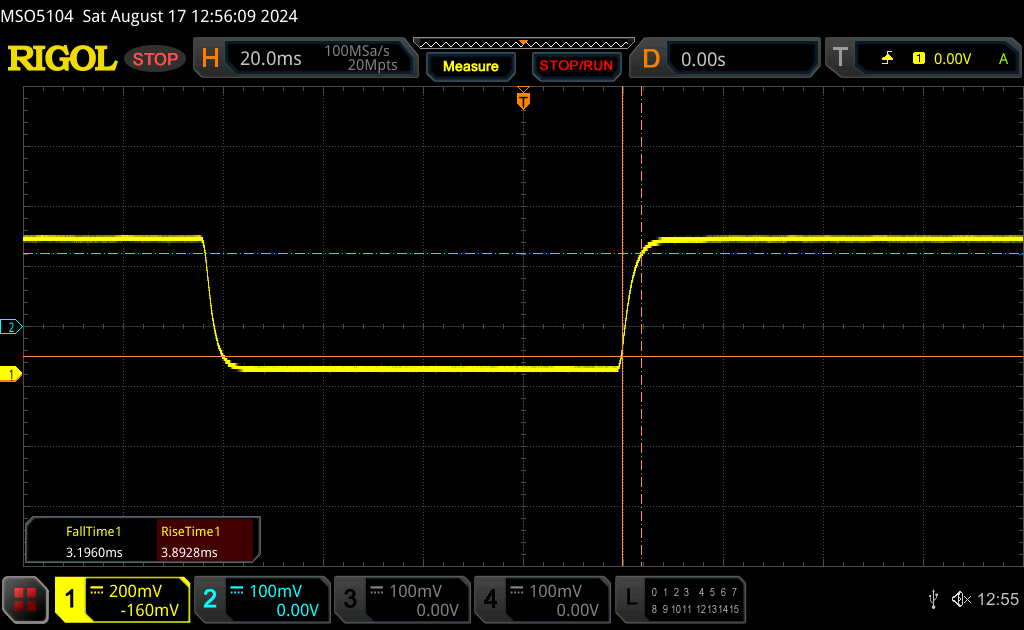 |
| ↘ 3.2 ms chute | ||
| L'écran montre de très faibles temps de réponse, parfait pour le jeu. En comparaison, tous les appareils testés affichent entre 0.1 (minimum) et 240 (maximum) ms. » 18 % des appareils testés affichent de meilleures performances. Cela signifie que les latences relevées sont meilleures que la moyenne (20.9 ms) de tous les appareils testés. | ||
| ↔ Temps de réponse gris 50% à gris 80% | ||
| 10.7 ms ... hausse ↗ et chute ↘ combinées | ↗ 5 ms hausse | 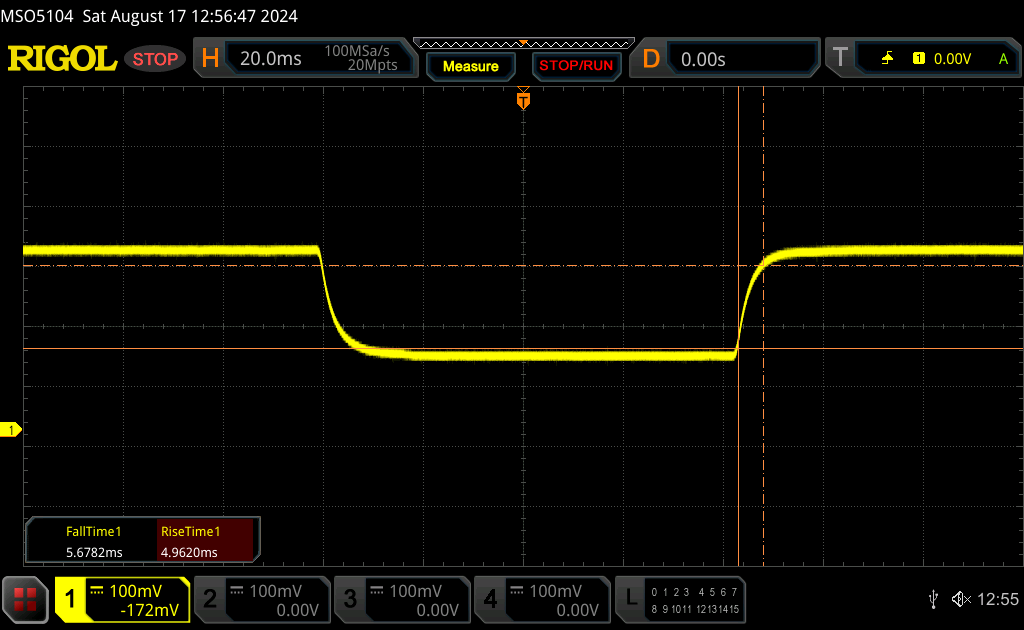 |
| ↘ 5.7 ms chute | ||
| L'écran montre de bons temps de réponse, mais insuffisant pour du jeu compétitif. En comparaison, tous les appareils testés affichent entre 0.165 (minimum) et 636 (maximum) ms. » 21 % des appareils testés affichent de meilleures performances. Cela signifie que les latences relevées sont meilleures que la moyenne (32.8 ms) de tous les appareils testés. | ||
Scintillement / MLI (Modulation de largeur d'impulsion)
| Scintillement / MLI (Modulation de largeur d'impulsion) non décelé | 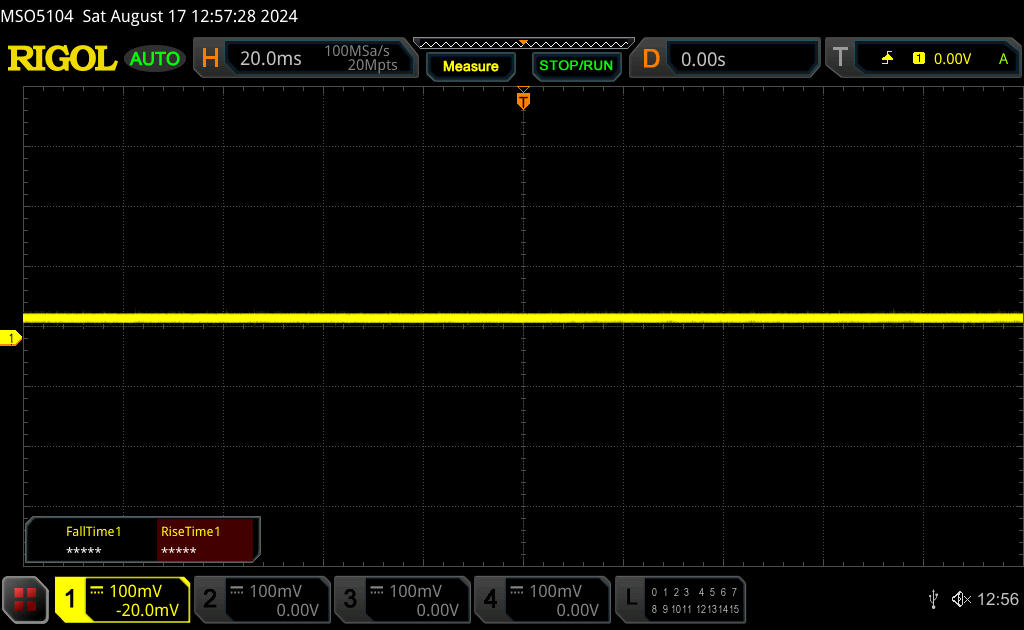 | ||
En comparaison, 53 % des appareils testés n'emploient pas MDI pour assombrir leur écran. Nous avons relevé une moyenne à 8687 (minimum : 5 - maximum : 343500) Hz dans le cas où une MDI était active. | |||
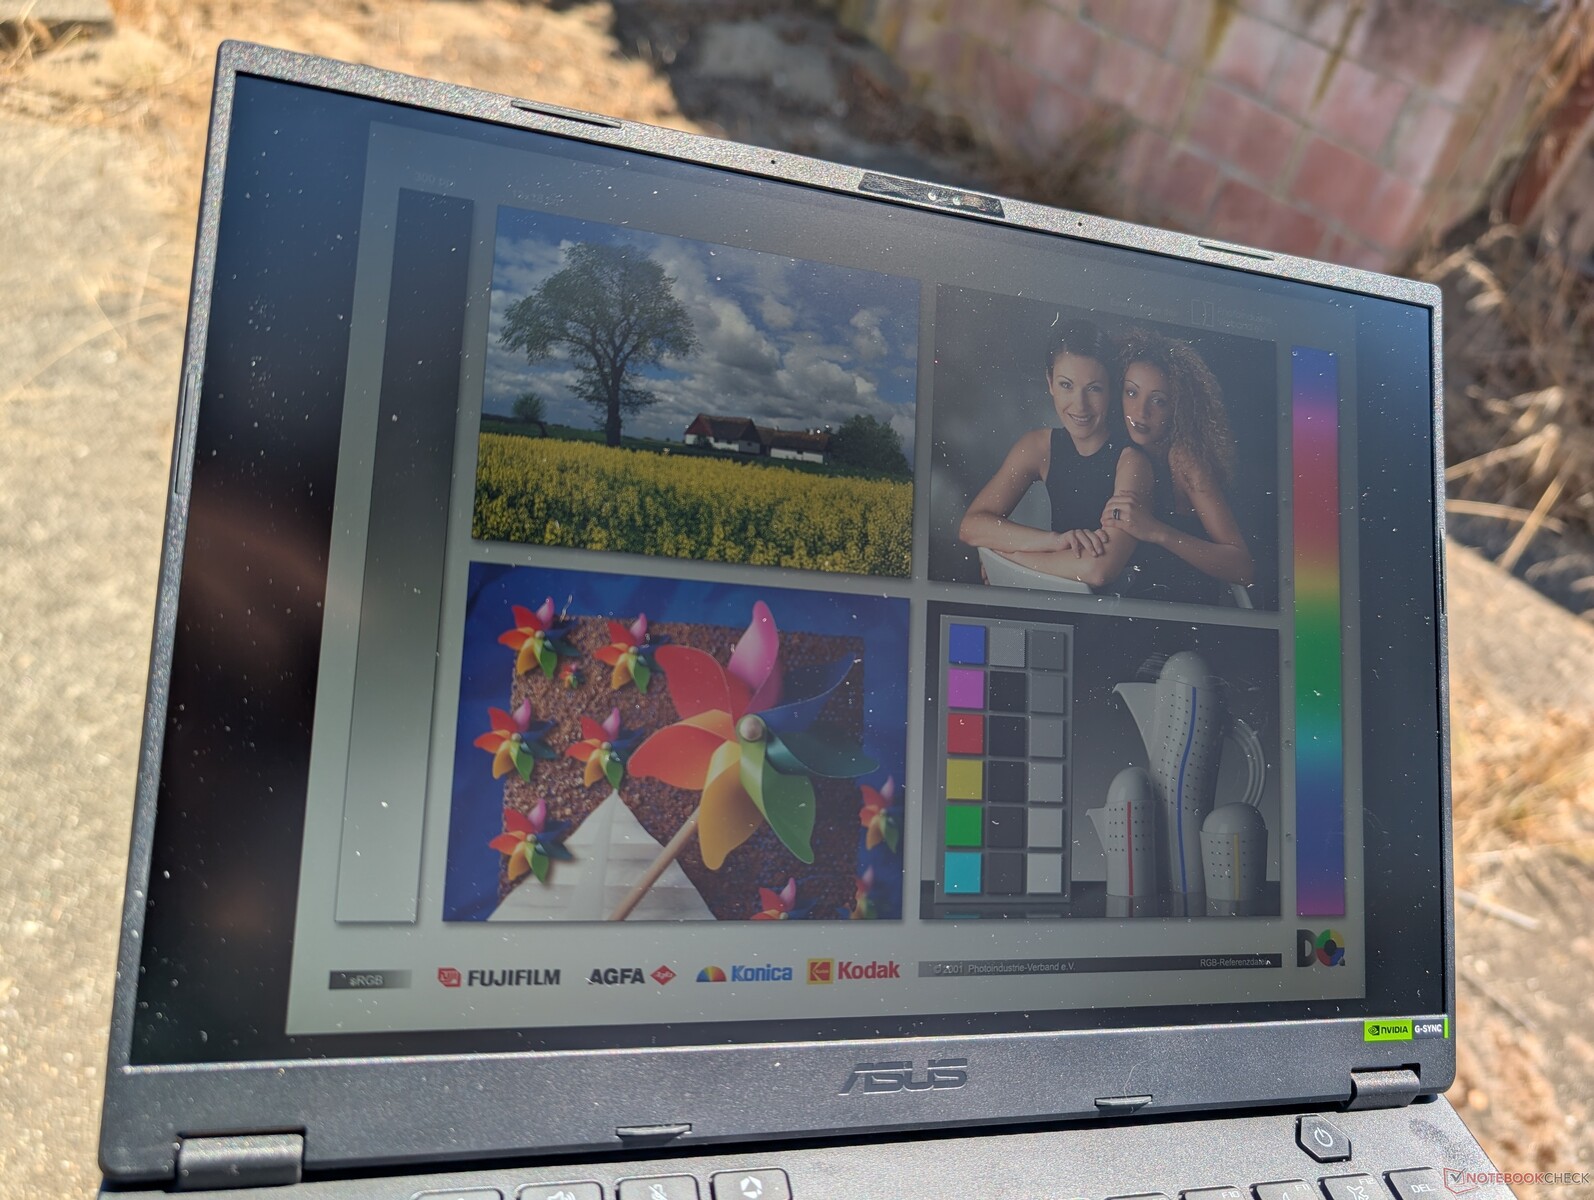
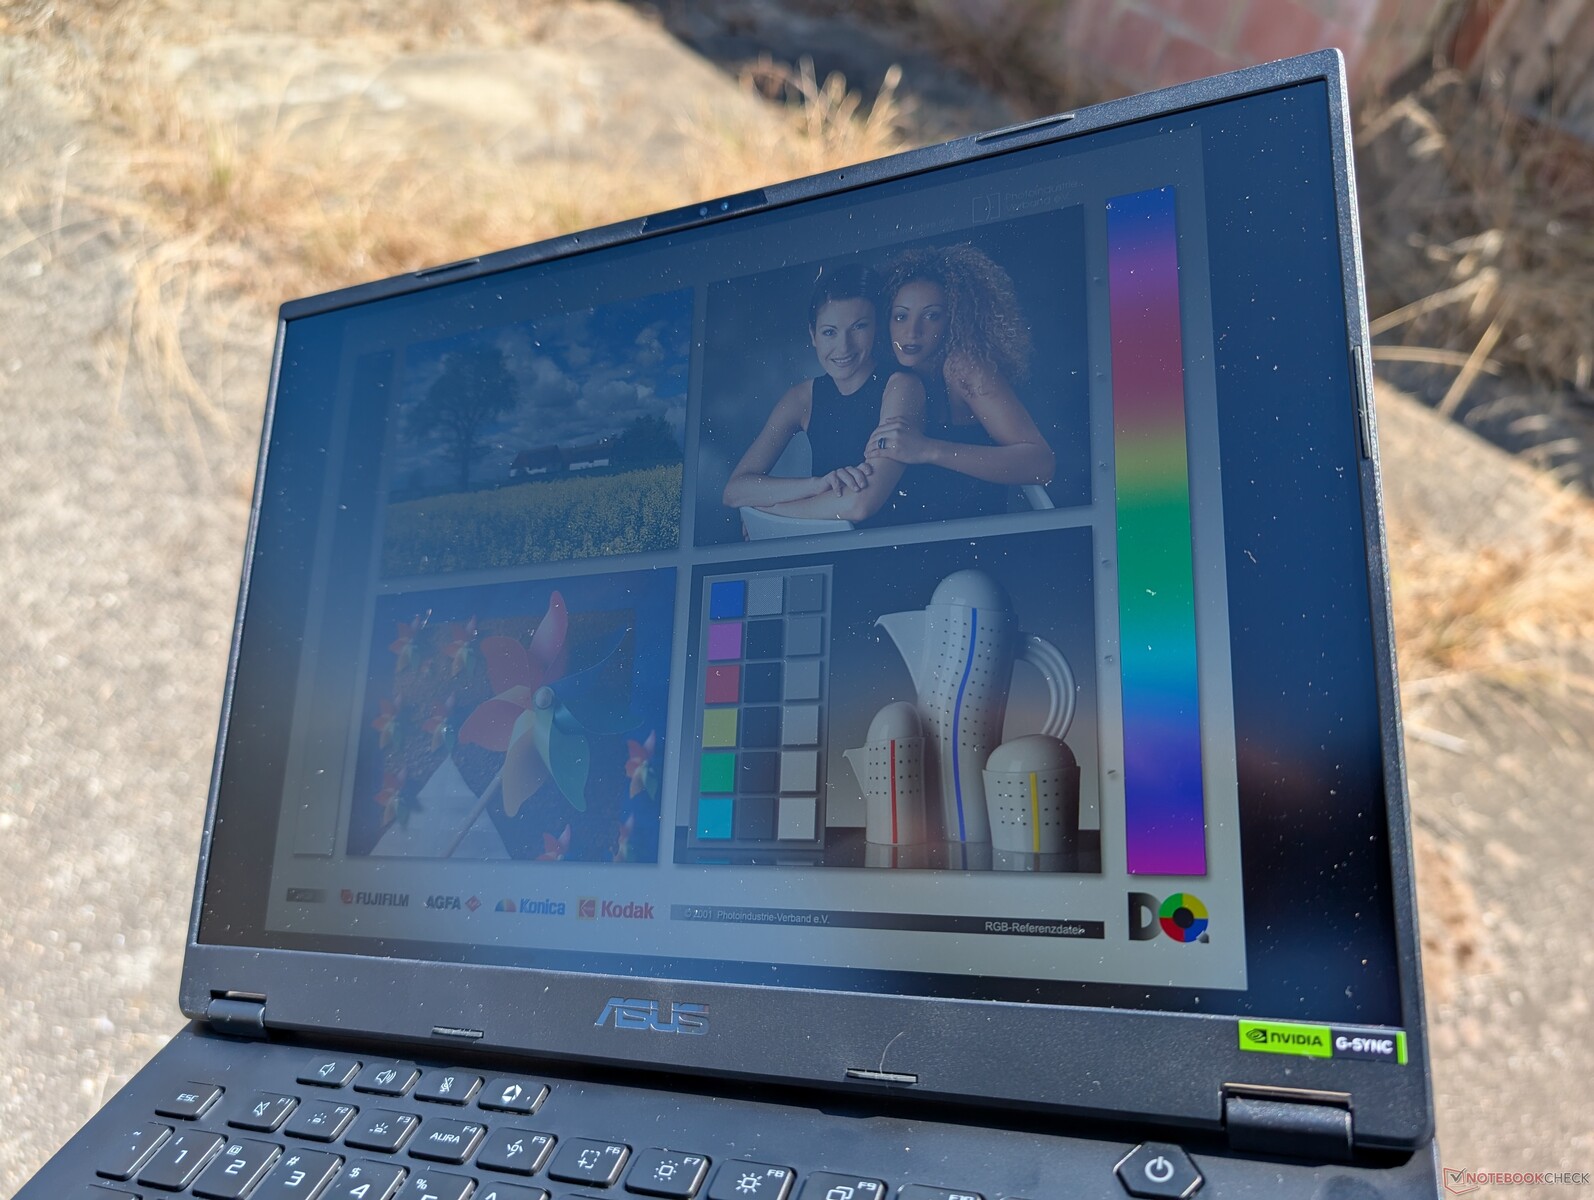
La visibilité en extérieur est correcte et très similaire à celle du Blade 14 ou de l'Alienware x14, tous deux équipés de panneaux IPS avec des niveaux de luminosité maximum similaires. En cas de ciel couvert ou de forte luminosité, les couleurs seront délavées même si les reflets sont minimes.

Performance - Plus rapide qu'il n'y paraît
Conditions d'essai
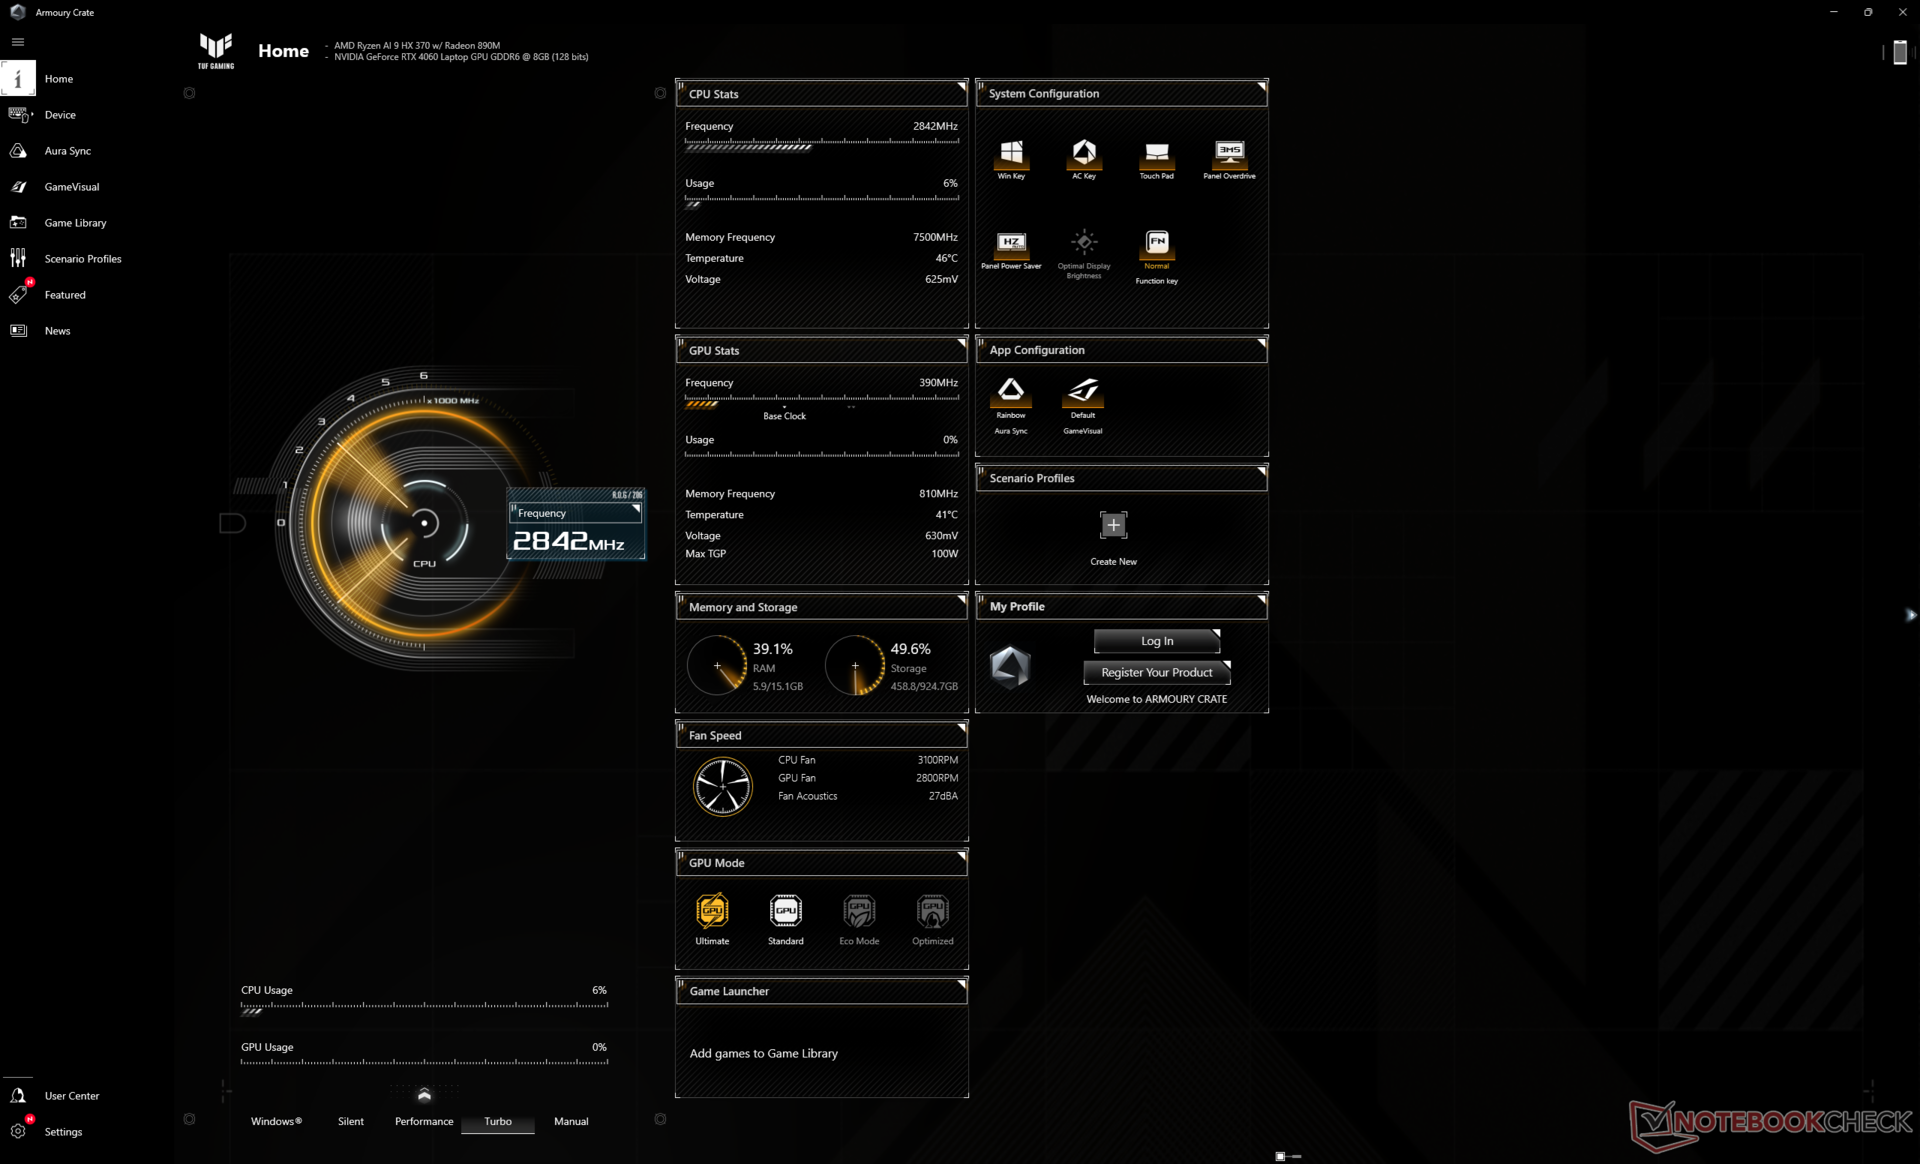
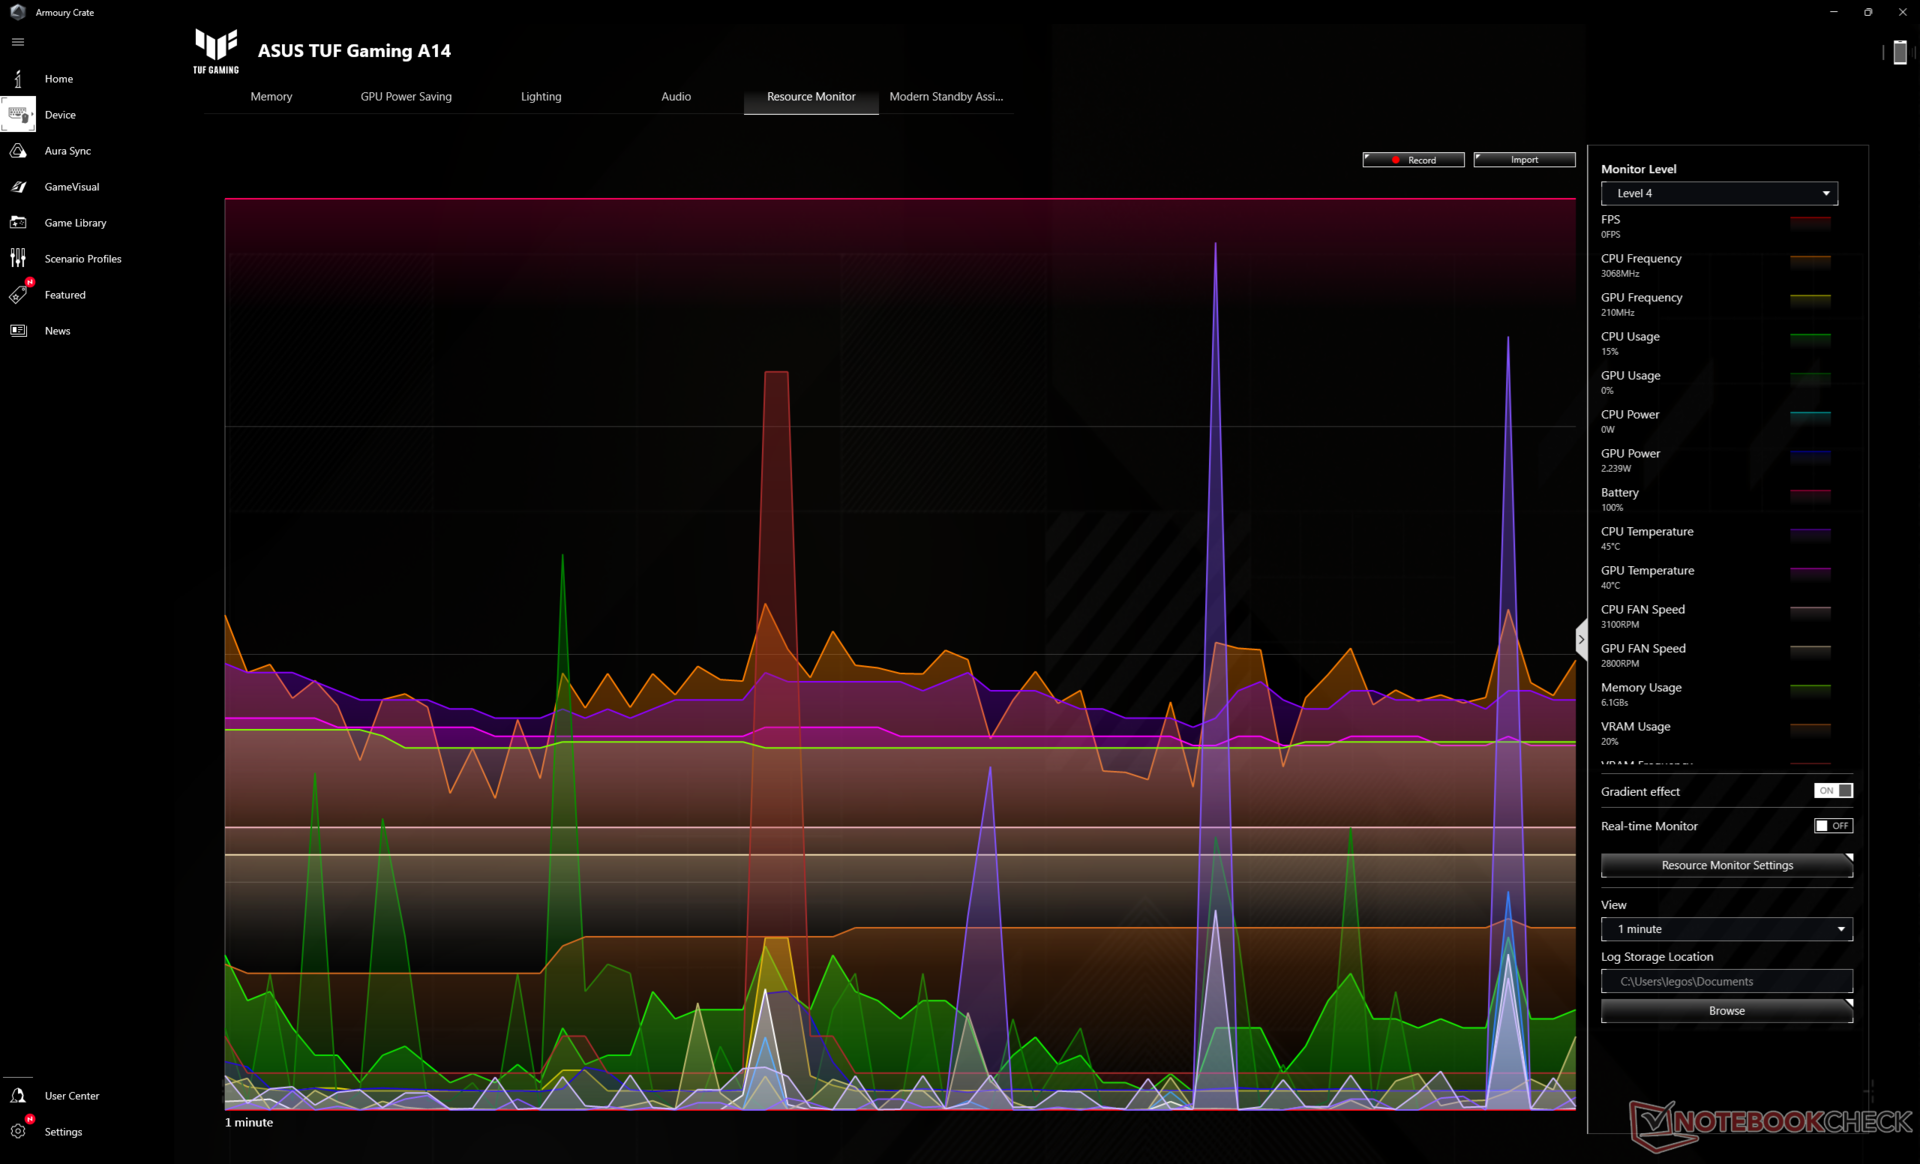
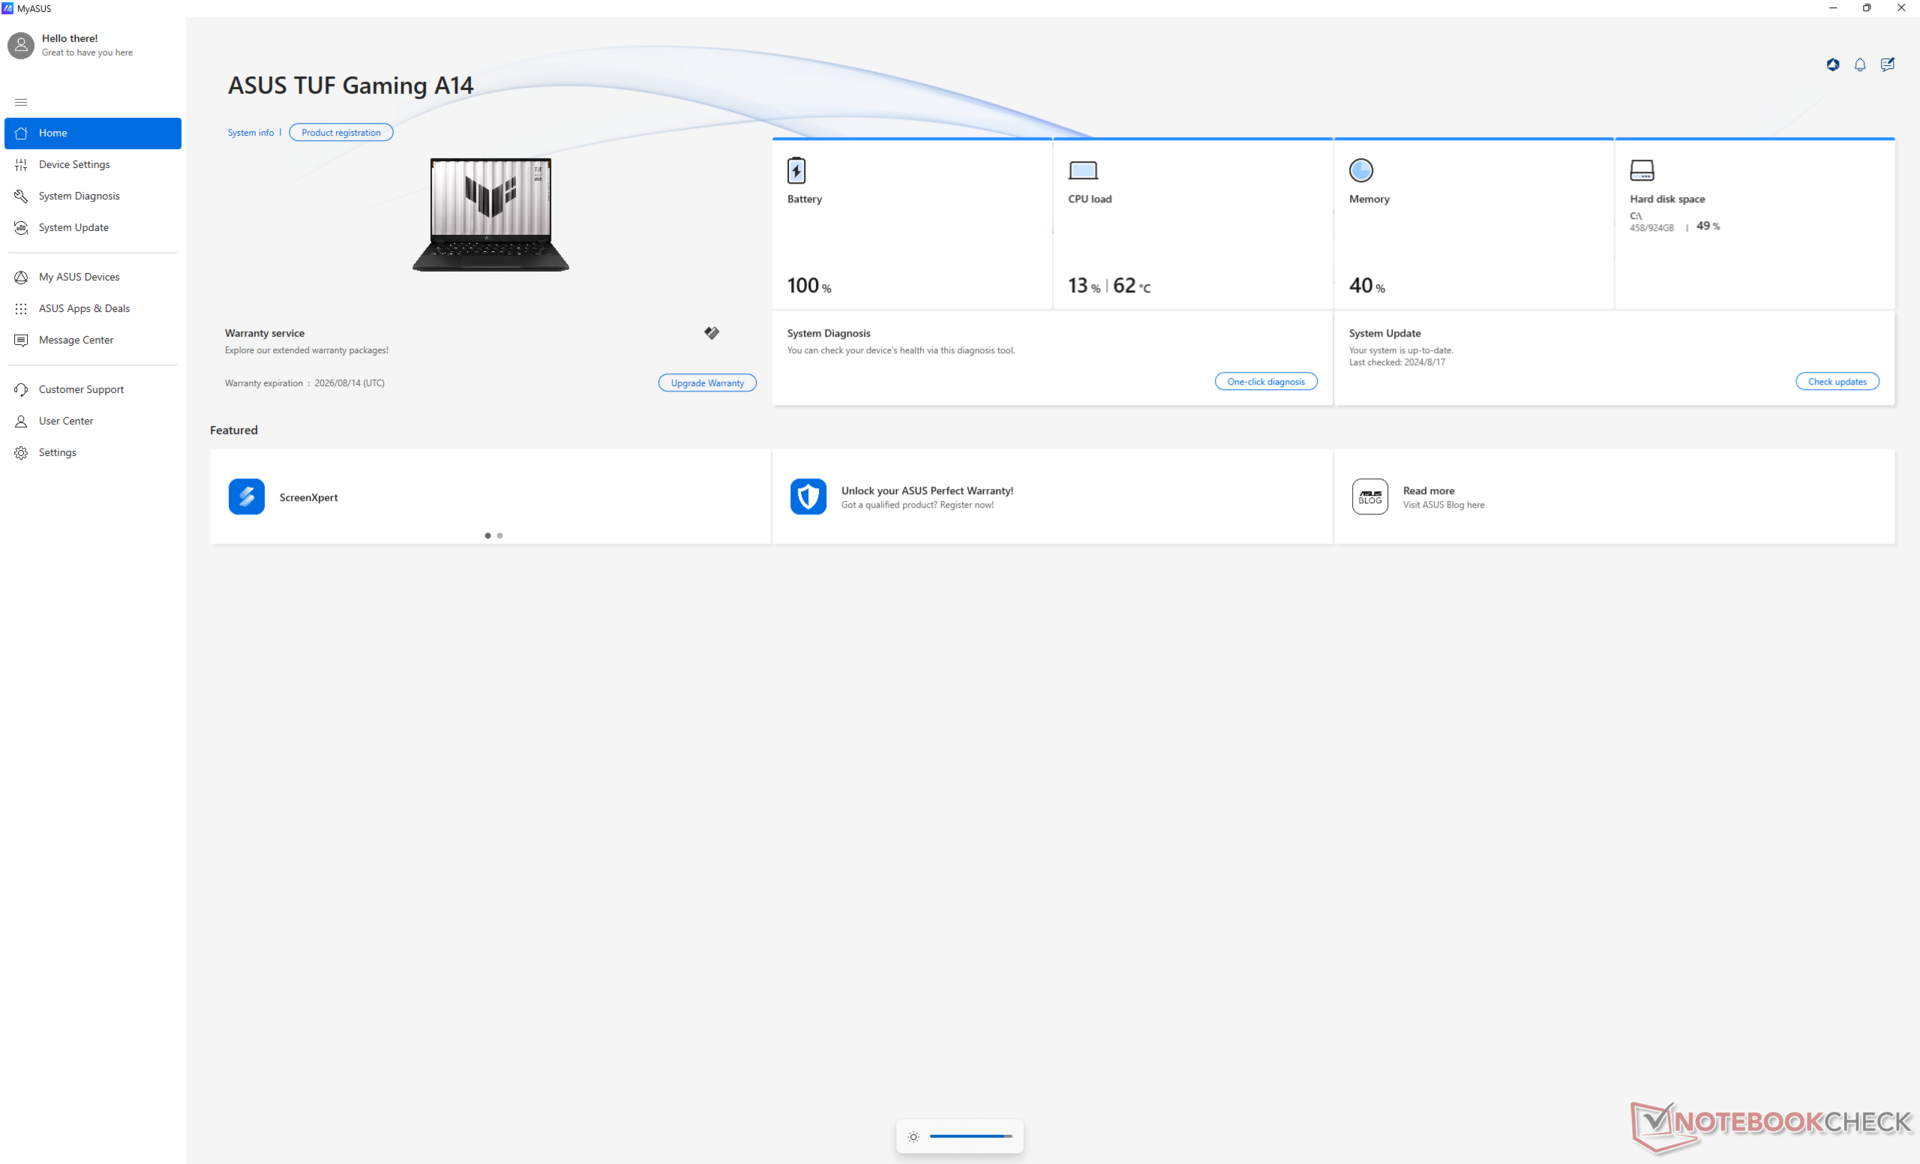
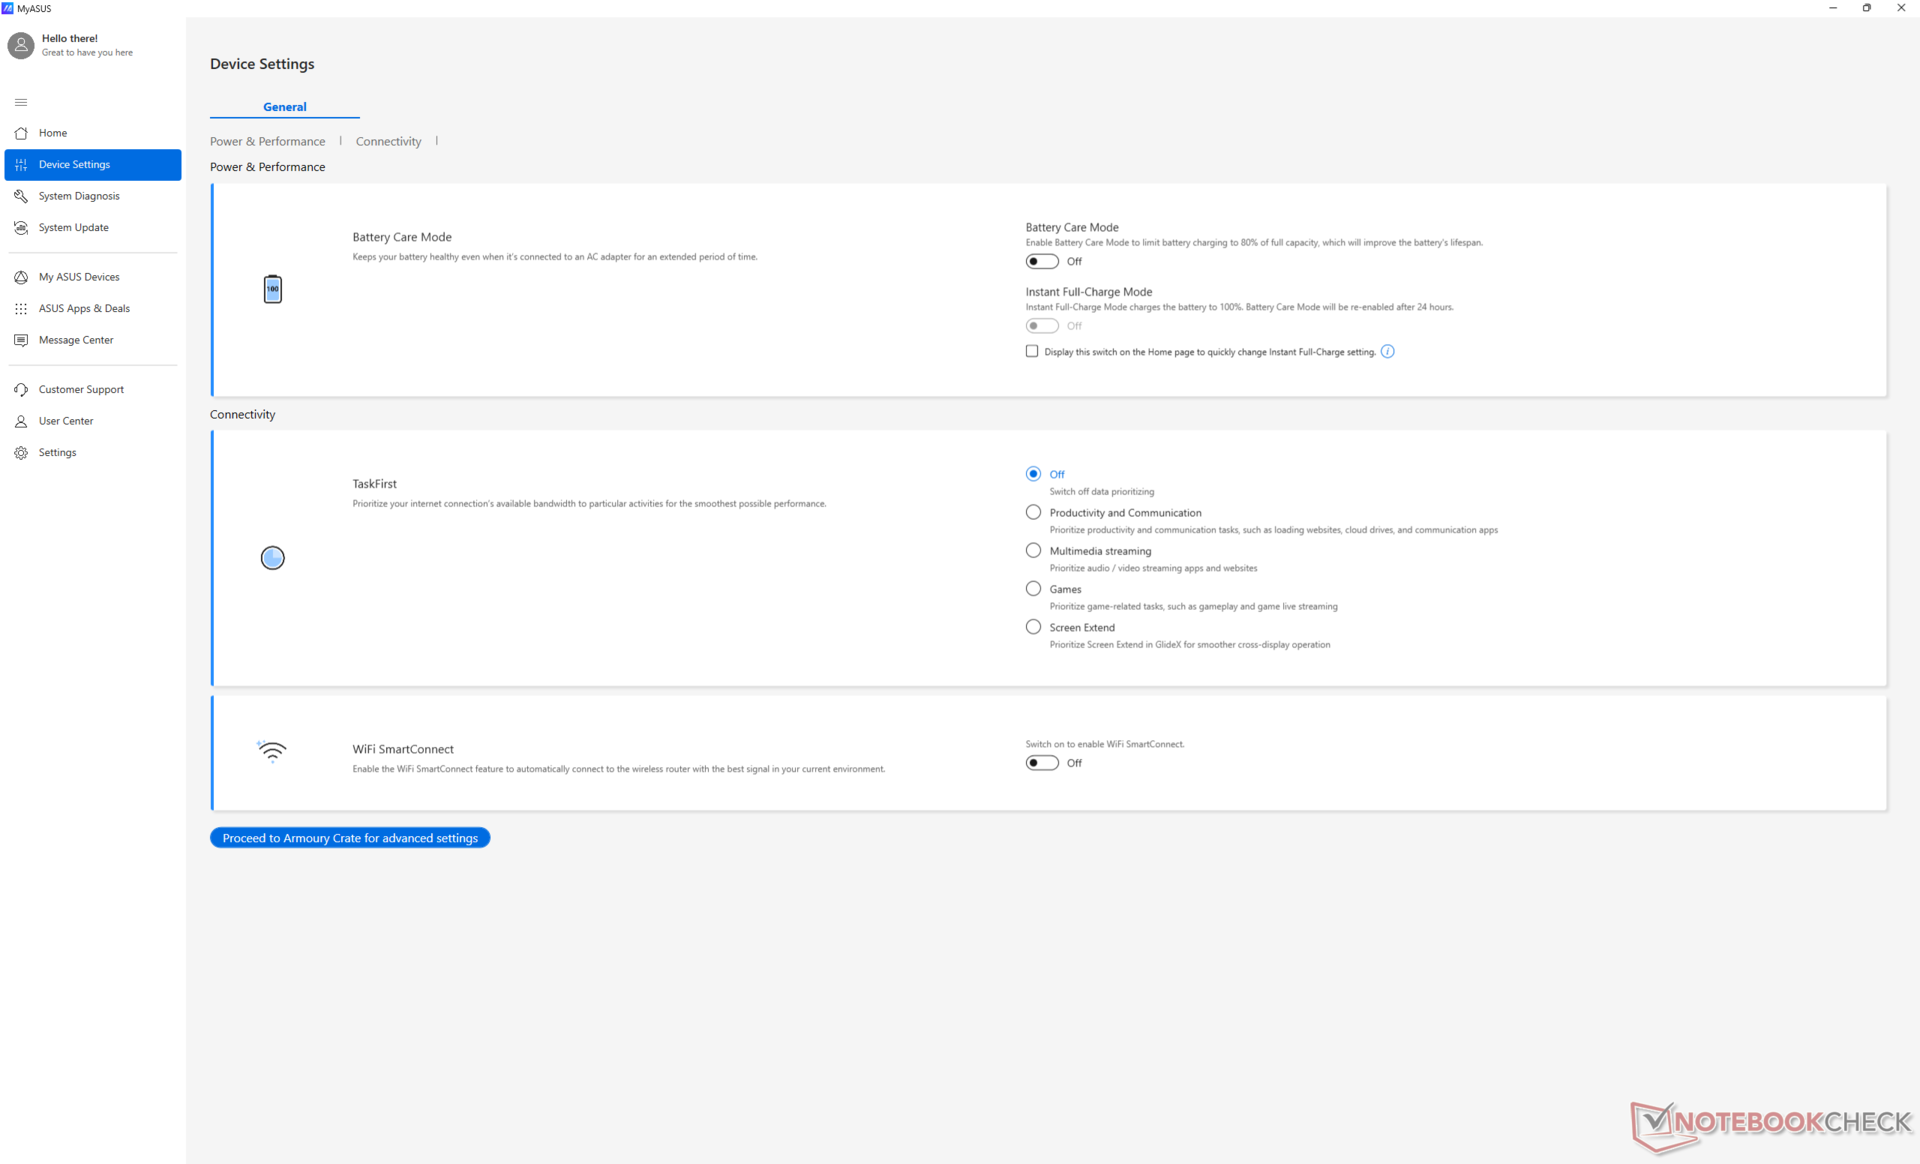
Nous avons réglé Armoury Crate en mode Turbo et les graphiques en mode dGPU avant d'exécuter les tests de référence ci-dessous. Le mode Turbo est nécessaire pour obtenir toutes les performances du système, comme le montrent nos tests. Nous encourageons les propriétaires à se familiariser avec Armoury Crate, car c'est le centre d'ajustement des profils de puissance, des modes GPU, des profils d'éclairage, etc. Des paramètres plus généraux liés à la batterie, aux diagnostics ou à la garantie peuvent être trouvés via l'application distincte MyAsus.
Les modes MUX et Advanced Optimus sont tous deux pris en charge. Néanmoins, le passage du mode dGPU au mode MSHybrid nécessite toujours un redémarrage.
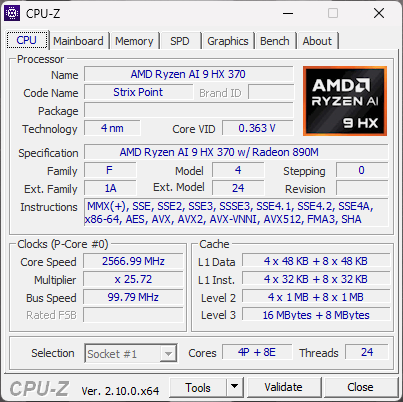
Processeur
Les Ryzen AI 9 HX 370 fait du TUF Gaming A14 l'un des ordinateurs portables de jeu de 14 pouces les plus rapides actuellement disponibles, surpassant même le Core Ultra 9 185H avec une marge confortable de 30 %. C'est un vrai soulagement après la déception de la série Ryzen 8000 H qui n'a pratiquement rien apporté par rapport à la série Ryzen 7000 H en termes de performances brutes du processeur. Plus impressionnante encore est la capacité du processeur à maintenir une fréquence d'horloge Turbo Core élevée pendant des périodes prolongées, ce qui se traduit par une absence quasi-totale de baisse de performances au fil du temps, comme le montre notre test en boucle CineBench R15 xT ci-dessous.
L'utilisation du mode Performance au lieu du mode Turbo n'a qu'un impact marginal sur les performances du CPU, de l'ordre de quelques points de pourcentage, comme le montre notre section sur les performances du GPU.
Les performances du NPU intégré ont été portées à 50 TOPS contre 16 TOPS seulement sur le modèle sortant Ryzen 9 8945HS. Malgré cela, l'intégration Co-Pilot+ reste exclusive aux ordinateurs portables Snapdragon à l'heure où nous écrivons ces lignes et les cas d'utilisation du nouveau NPU intégré d'AMD restent donc limités.
Cinebench R15 Multi Loop
Cinebench R23: Multi Core | Single Core
Cinebench R20: CPU (Multi Core) | CPU (Single Core)
Cinebench R15: CPU Multi 64Bit | CPU Single 64Bit
Blender: v2.79 BMW27 CPU
7-Zip 18.03: 7z b 4 | 7z b 4 -mmt1
Geekbench 6.3: Multi-Core | Single-Core
Geekbench 5.5: Multi-Core | Single-Core
HWBOT x265 Benchmark v2.2: 4k Preset
LibreOffice : 20 Documents To PDF
R Benchmark 2.5: Overall mean
* ... Moindre est la valeur, meilleures sont les performances
AIDA64: FP32 Ray-Trace | FPU Julia | CPU SHA3 | CPU Queen | FPU SinJulia | FPU Mandel | CPU AES | CPU ZLib | FP64 Ray-Trace | CPU PhotoWorxx
| AIDA64 / FP32 Ray-Trace | |
| Asus TUF Gaming A14 FA401WV-WB94 | |
| Moyenne AMD Ryzen AI 9 HX 370 (24673 - 37654, n=7) | |
| Lenovo Legion Slim 5 14APH8 | |
| Razer Blade 14 RZ09-0508 | |
| Asus ROG Zephyrus G14 2024 GA403U | |
| Acer Predator Helios Neo 14 (2024) | |
| HP Omen Transcend 14-fb0014 | |
| Alienware x14 i7 RTX 3060 | |
| AIDA64 / FP64 Ray-Trace | |
| Asus TUF Gaming A14 FA401WV-WB94 | |
| Moyenne AMD Ryzen AI 9 HX 370 (13959 - 20608, n=8) | |
| Razer Blade 14 RZ09-0508 | |
| Lenovo Legion Slim 5 14APH8 | |
| Asus ROG Zephyrus G14 2024 GA403U | |
| Acer Predator Helios Neo 14 (2024) | |
| HP Omen Transcend 14-fb0014 | |
| Alienware x14 i7 RTX 3060 | |
| AIDA64 / CPU PhotoWorxx | |
| HP Omen Transcend 14-fb0014 | |
| Moyenne AMD Ryzen AI 9 HX 370 (37747 - 50118, n=8) | |
| Alienware x14 i7 RTX 3060 | |
| Acer Predator Helios Neo 14 (2024) | |
| Razer Blade 14 RZ09-0508 | |
| Asus ROG Zephyrus G14 2024 GA403U | |
| Asus TUF Gaming A14 FA401WV-WB94 | |
| Lenovo Legion Slim 5 14APH8 | |
Test de stress
Le processeur fait un excellent travail en maintenant des fréquences d'horloge Turbo Core élevées, même lorsqu'il est sollicité. Lors de l'exécution de Prime95, par exemple, le CPU passe à 3,8 GHz et 80 W et maintient ces objectifs indéfiniment. Le principal inconvénient est la température très élevée du cœur de 92°C, qui est encore plus chaude que celle du CPU Ryzen 9 dans le Blade 14 de plusieurs degrés.
En exécutant Cyberpunk 2077 pour représenter les charges de jeu typiques, le GPU se stabilise à 2550 MHz pour le cœur, 2025 MHz pour l'horloge, 82 C, et 92 W pour la consommation d'énergie lorsqu'il est réglé sur le mode Turbo. Le passage en mode Performance réduit toutes ces valeurs, comme le montrent les captures d'écran suivantes, pour des performances plus lentes, ce qui correspond à nos observations dans la section Performances du GPU ci-dessous. Par conséquent, assurez-vous d'activer le mode Turbo lorsque vous jouez si vous souhaitez tirer le maximum de puissance du système, même si cela implique de maximiser le bruit du ventilateur. Sinon, les températures moyennes du cœur de l'ordinateur sont similaires à celles que nous avons enregistrées sur le Blade 14 et à peine plus élevées que sur le Lenovo Slim 5 14 Lenovo Legion Slim 5 14.
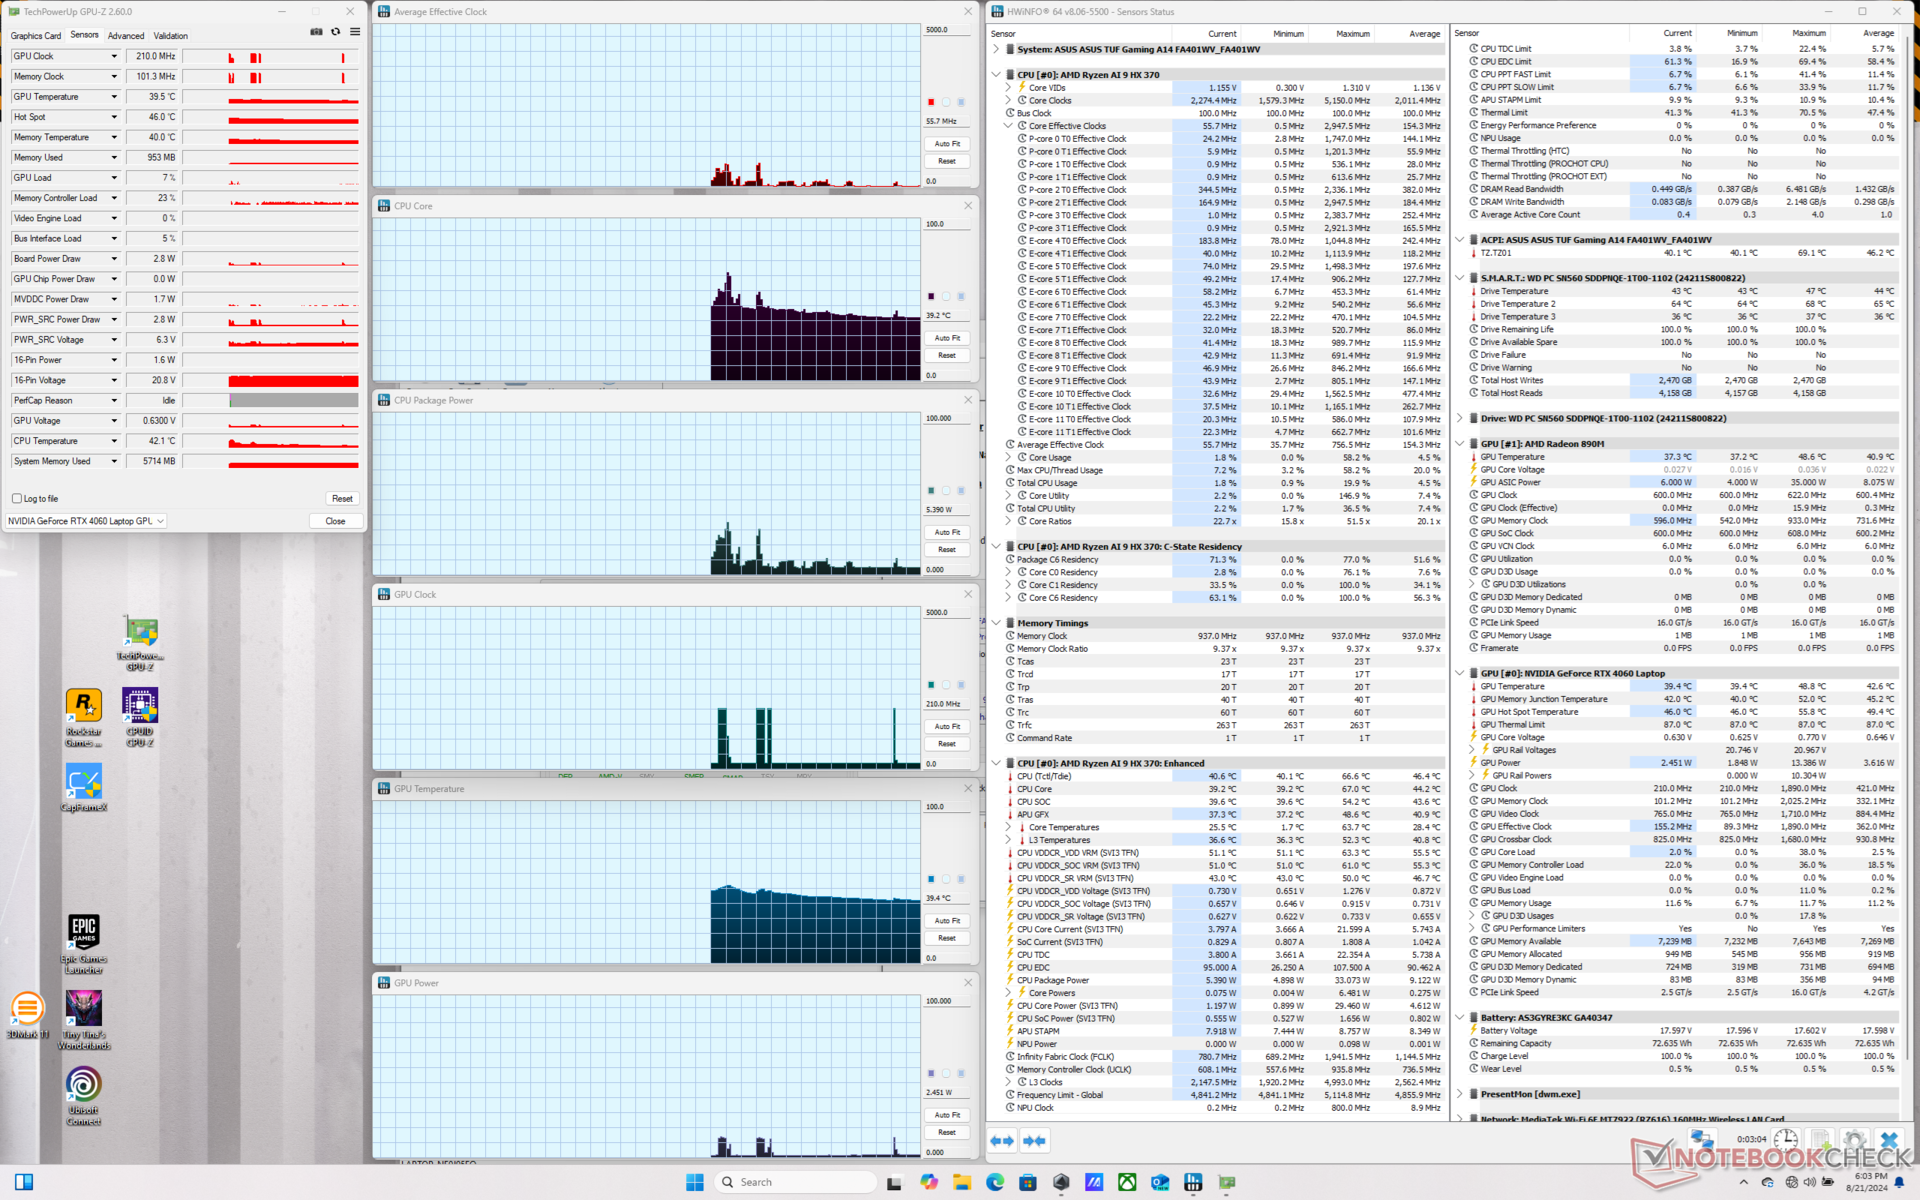

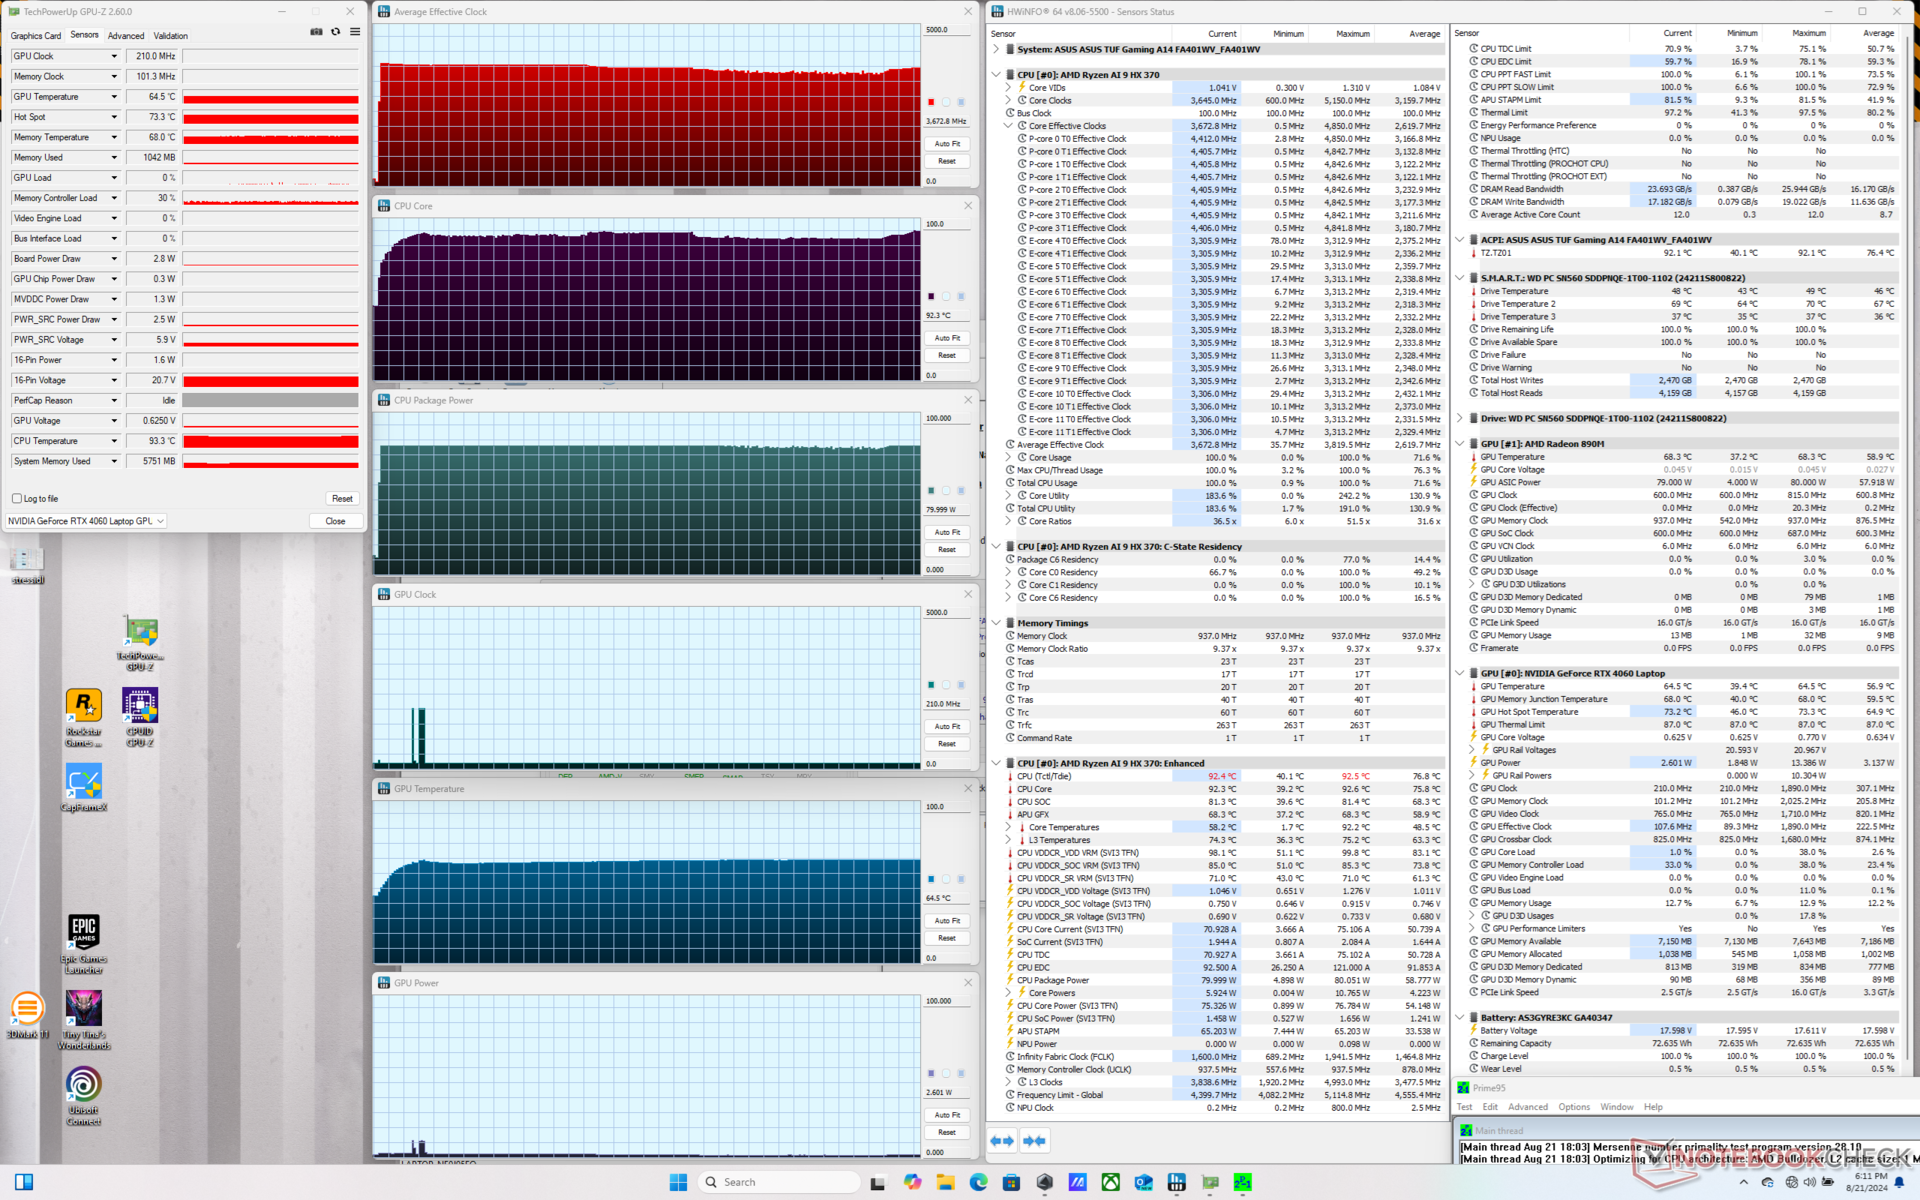
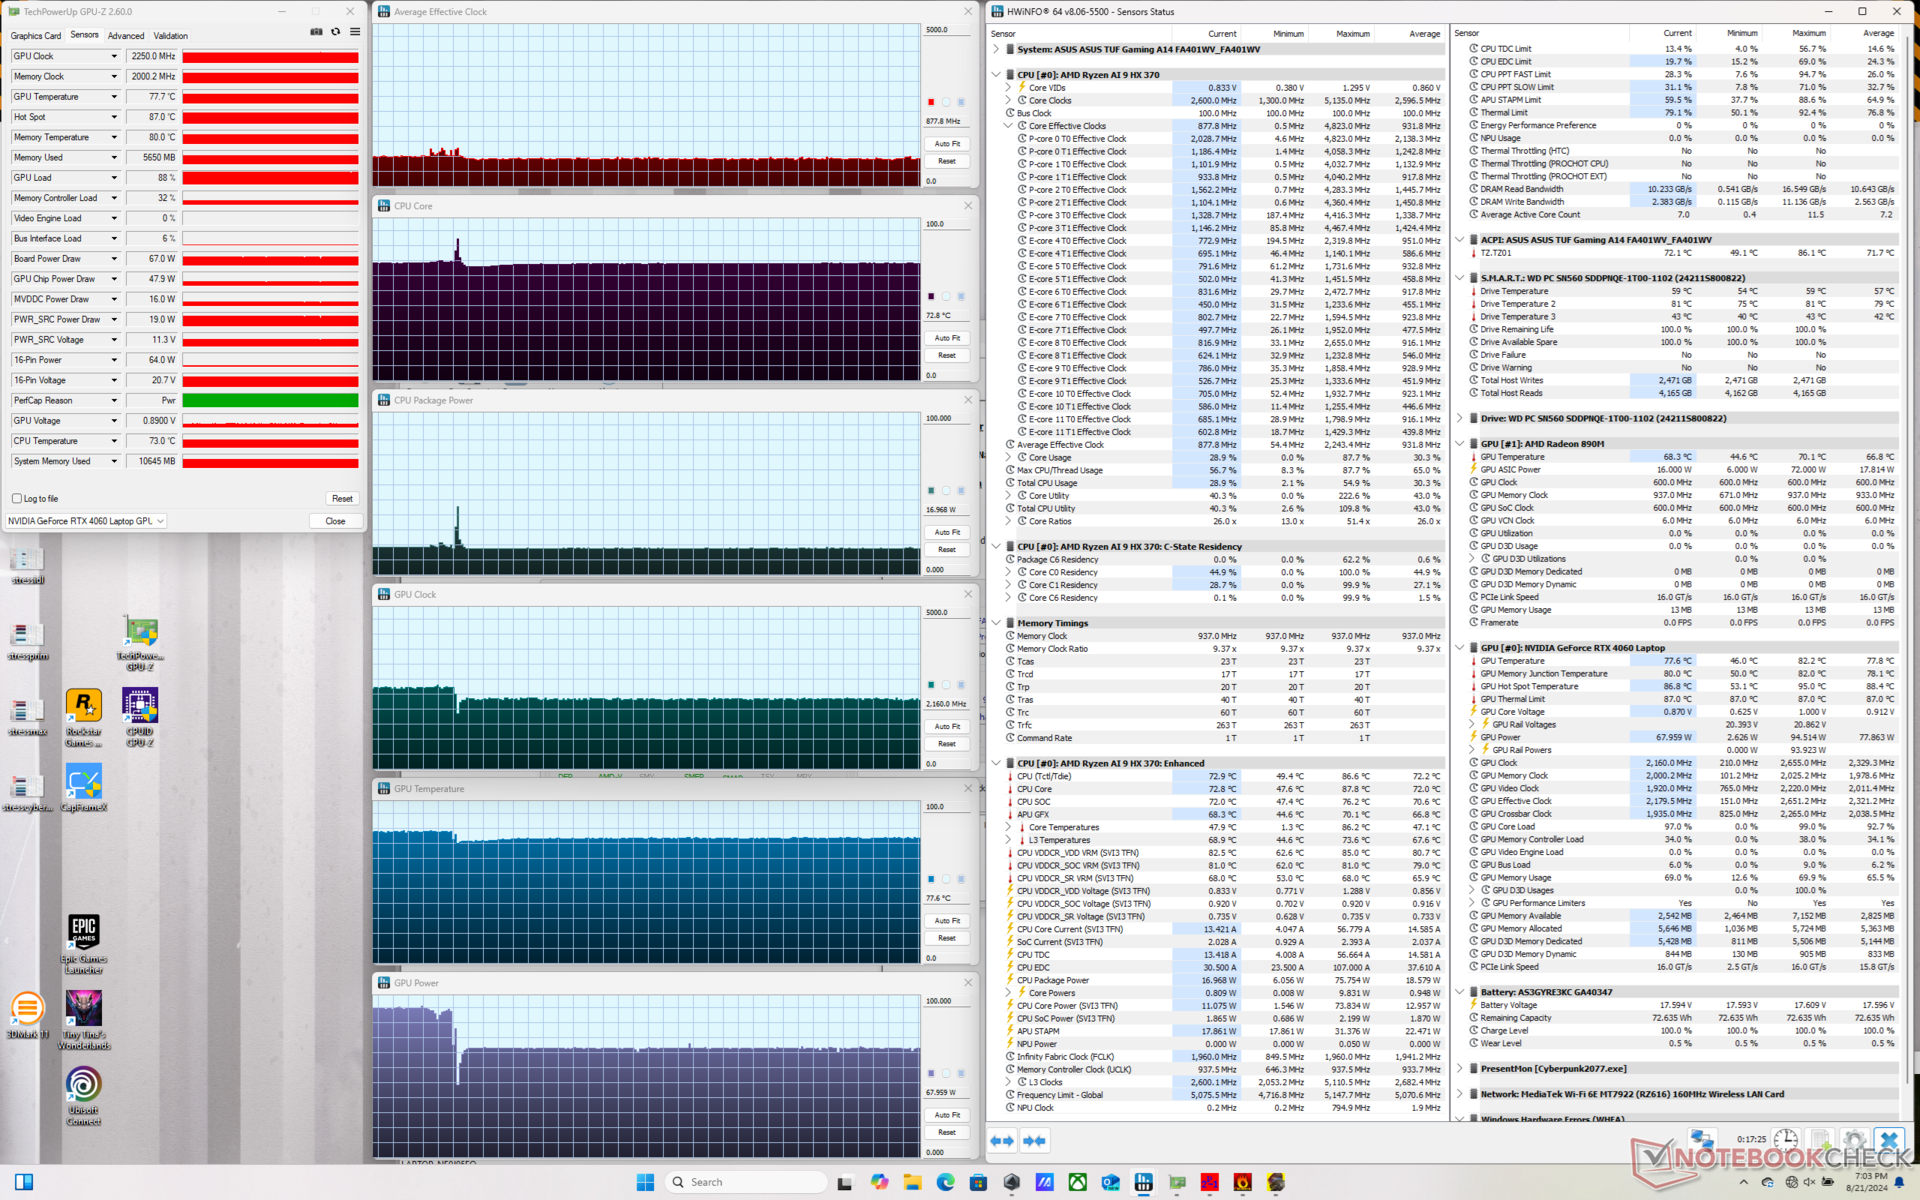
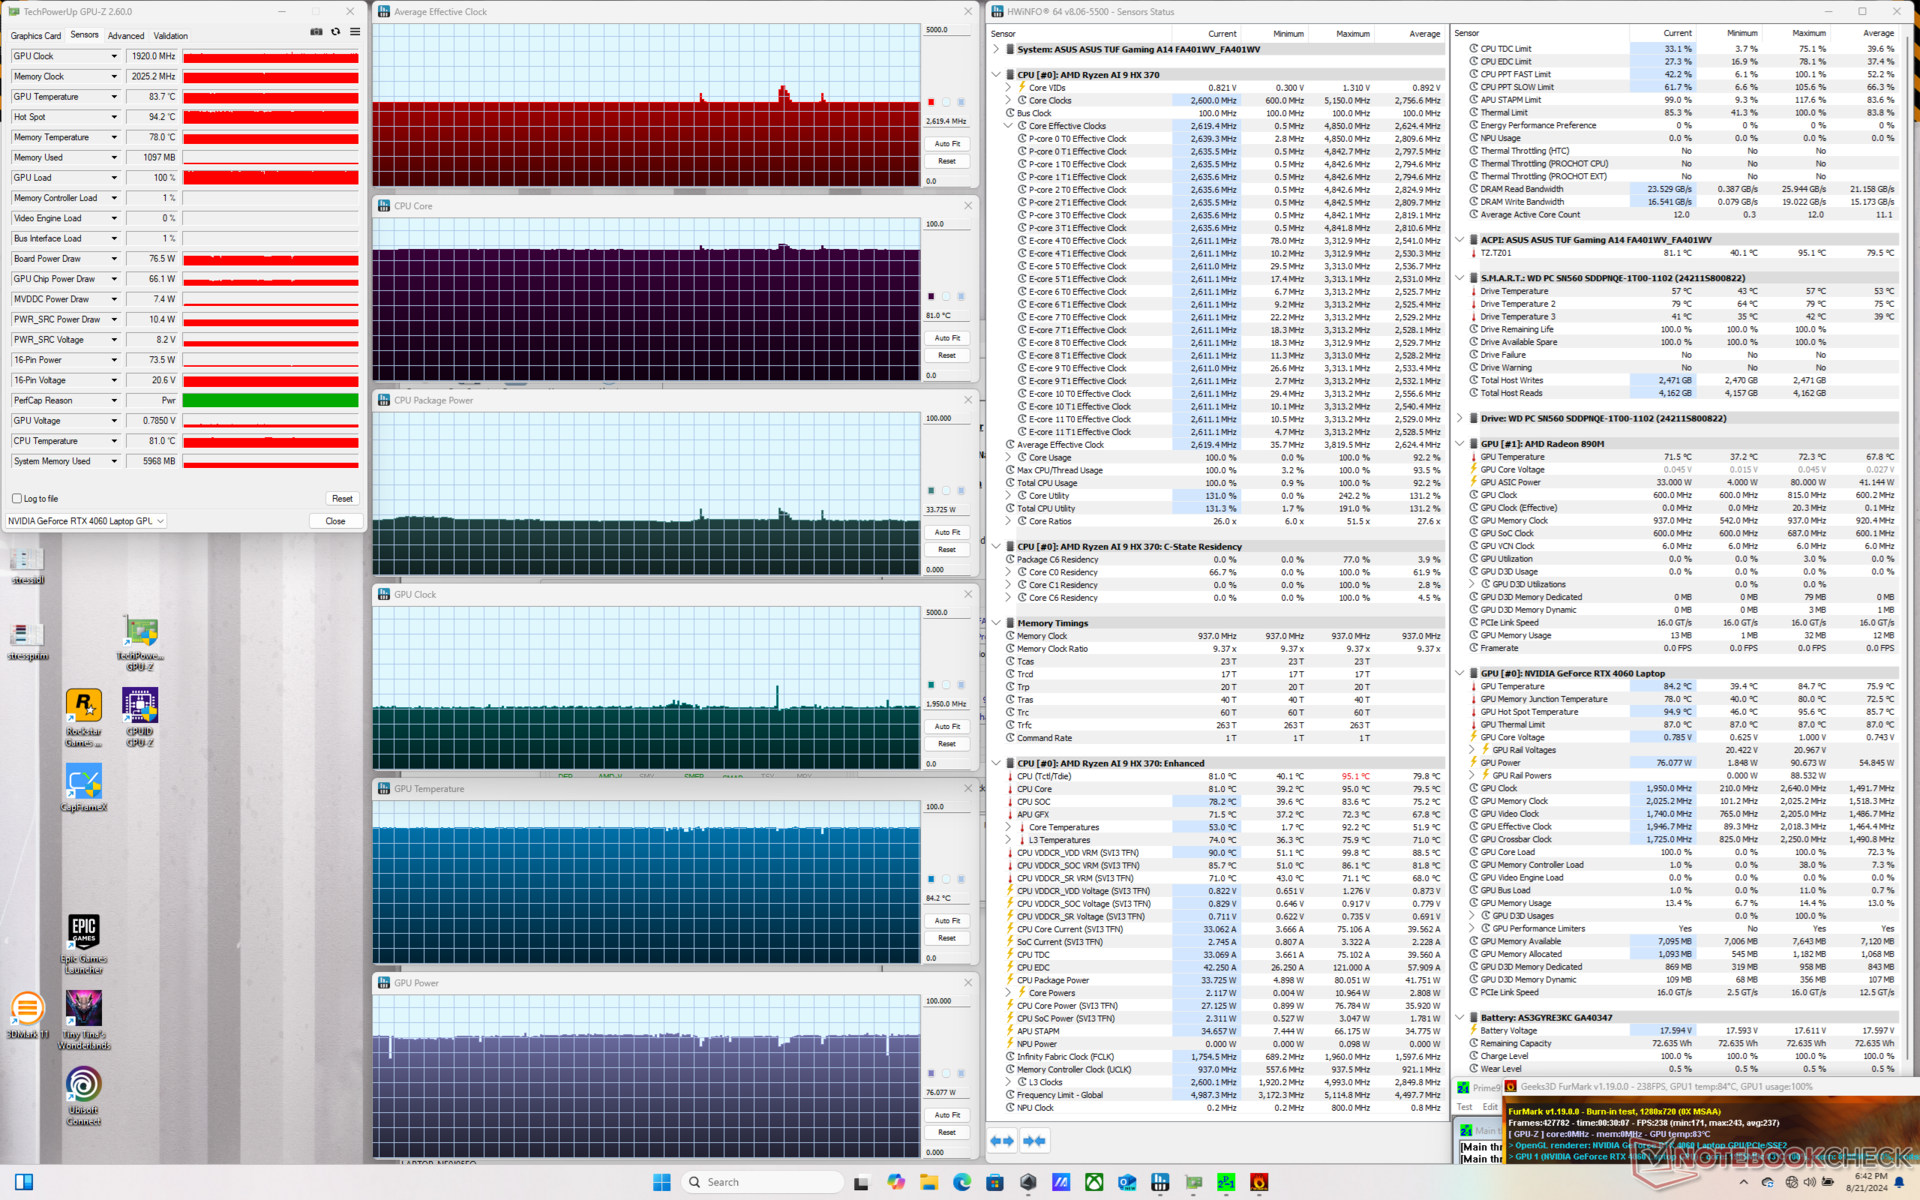
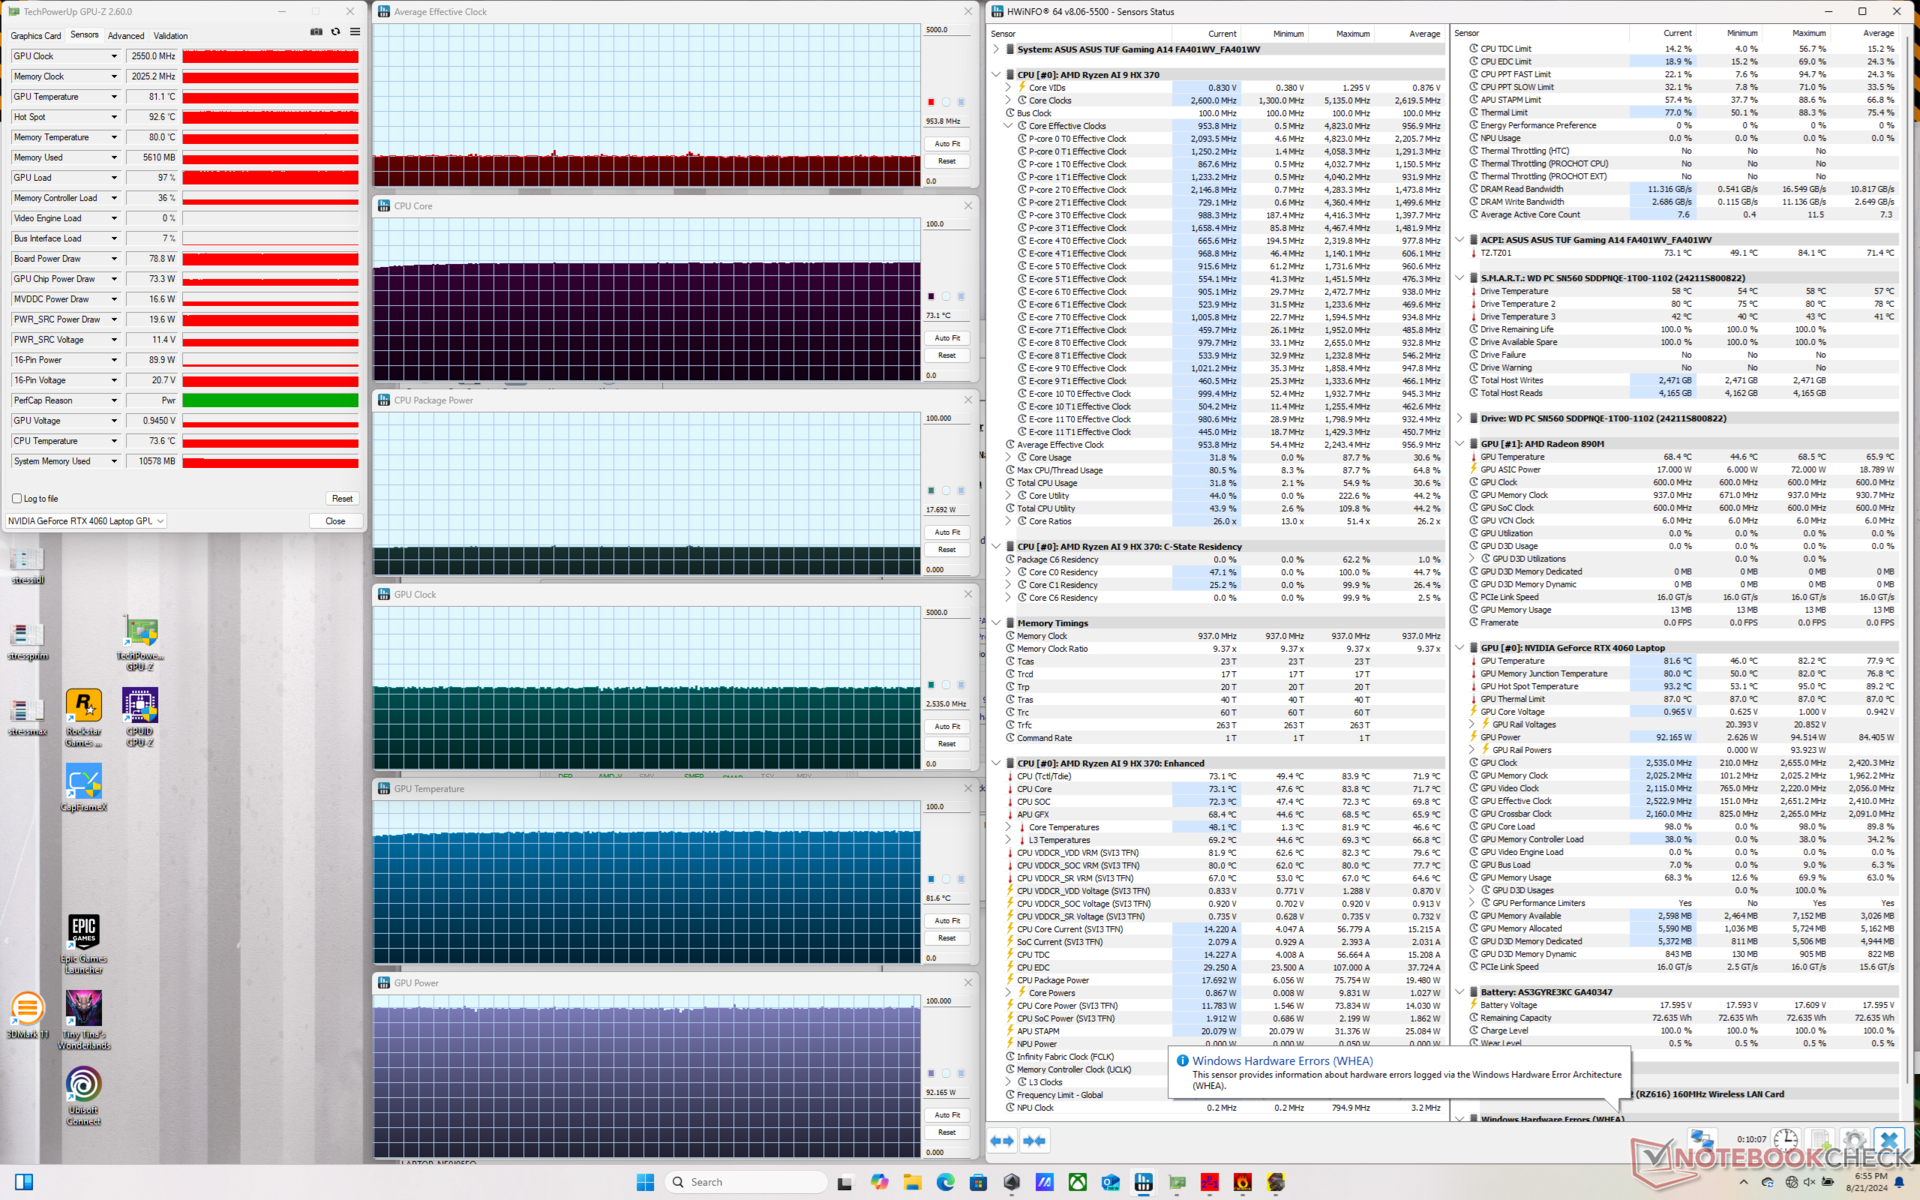
| Horloge moyenne du CPU (GHz) | Horloge du GPU (MHz) | Température moyenne du CPU (°C) | Température moyenne du GPU (°C) | |
| Système au repos | -- | -- | 39 | 39 |
| Prime95 Stress | 3.6 | -- | 92 | 65 |
| Prime95 + FurMark Stress | 2.6 | 1950 | 81 | 84 |
| Cyberpunk 2077 Stress (mode équilibré Windows) | 0.9 | 2235 | 73 | 77 |
| Cyberpunk 2077 Stress (mode Performance) | 0.9 | 2250 | 73 | 78 |
| Cyberpunk 2077 Stress (mode Turbo) | 1.0 | 2550 | 73 | 82 |
Performance du système
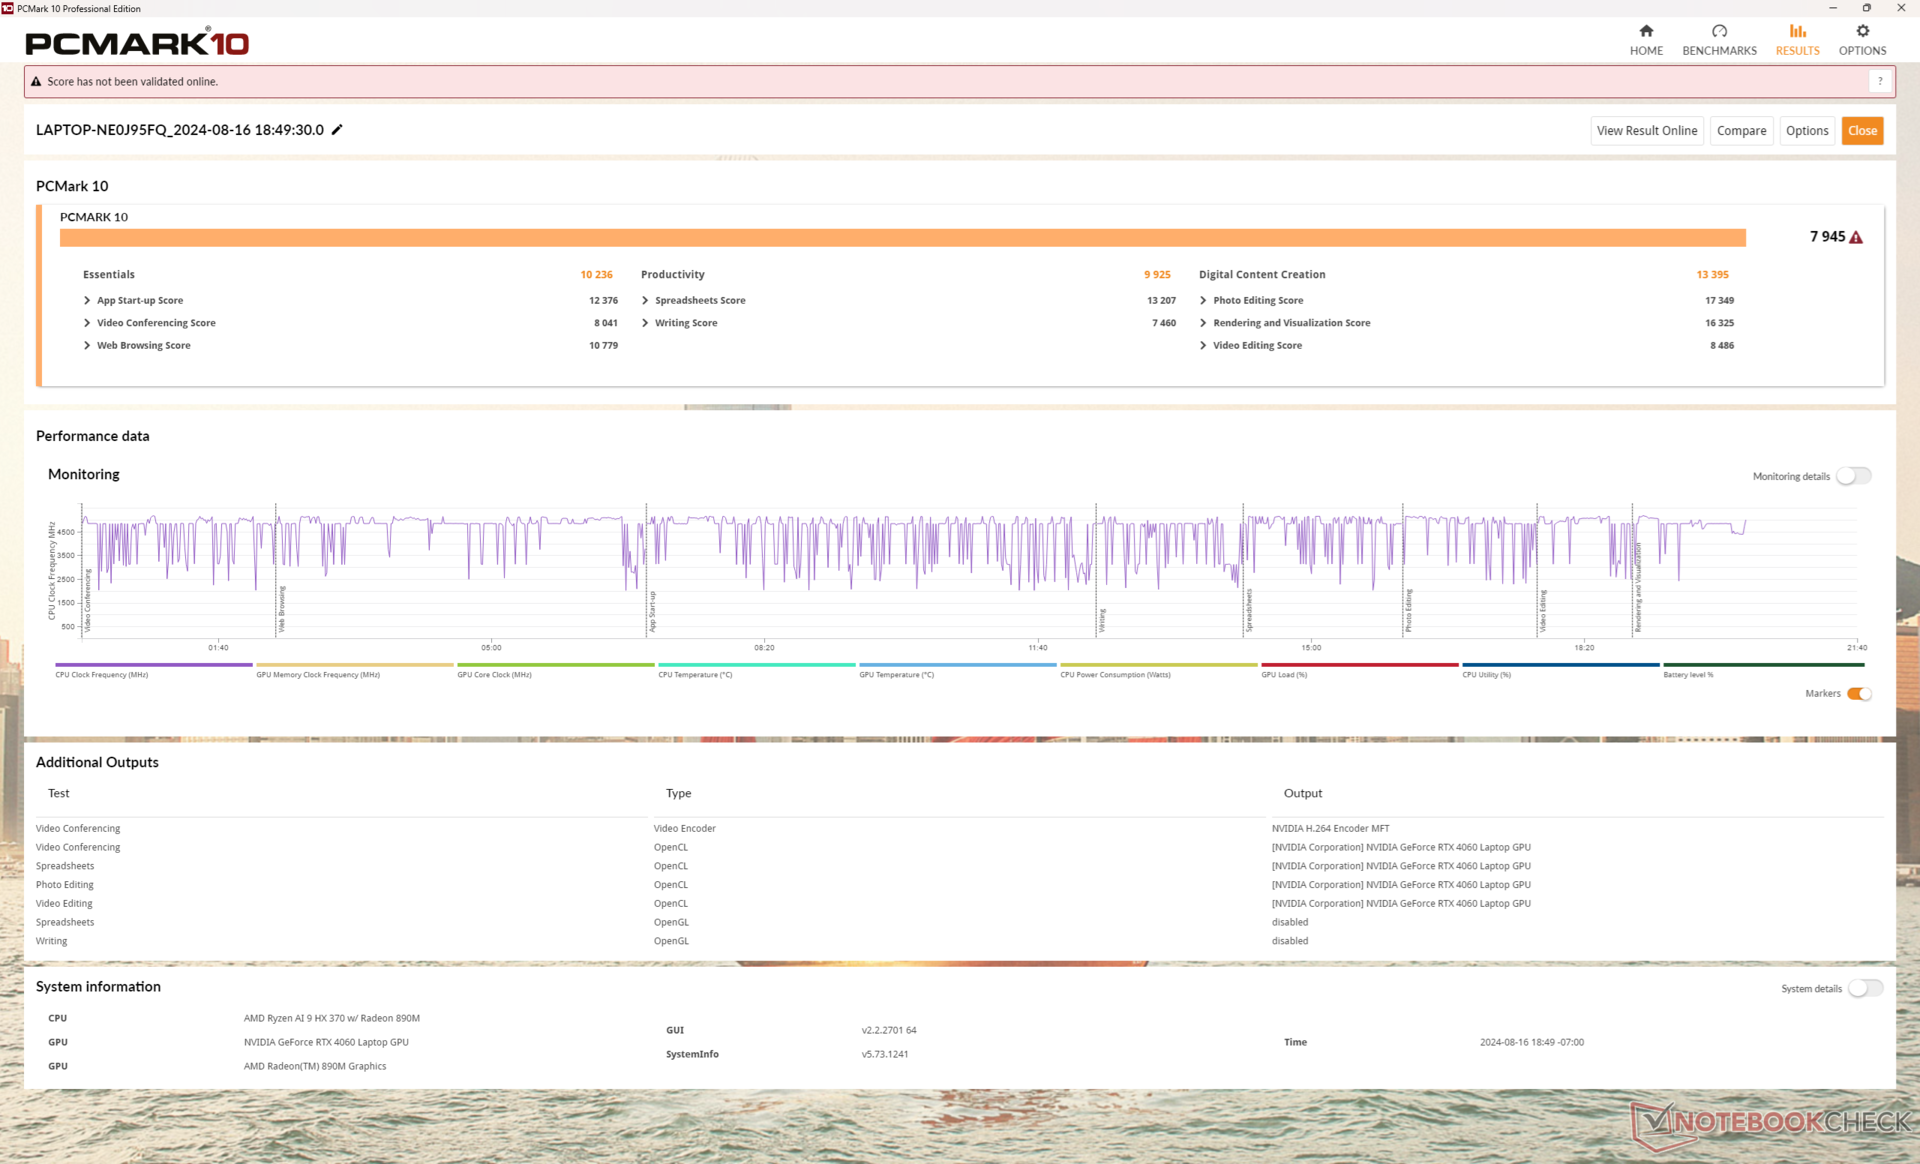
Les résultats de PCMark sont excellents, mais également similaires à ceux d'autres ordinateurs portables de jeu de 14 pouces fonctionnant avec des CPU plus anciens sans accélération AI. Ainsi, le TUF Gaming A14 n'est pas nécessairement plus rapide lorsqu'il s'agit de tâches PC traditionnelles comme la navigation web, le streaming ou l'édition légère.
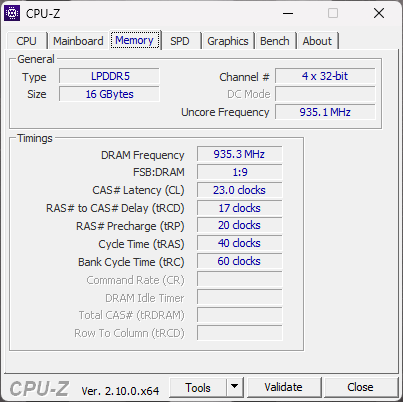
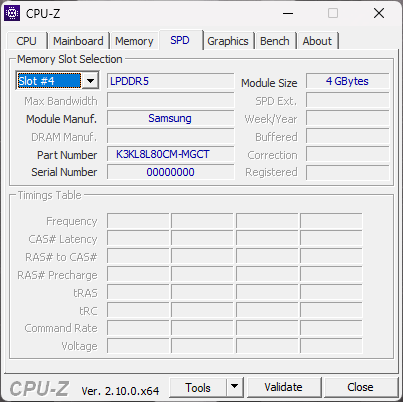
Les performances de la mémoire sont néanmoins très rapides grâce à la RAM à 7500 MHz, contre 6400 MHz ou 5600 MHz sur le TUF Gaming A14 Legion Slim 5 14 ou Blade 14, respectivement.
CrossMark: Overall | Productivity | Creativity | Responsiveness
WebXPRT 3: Overall
WebXPRT 4: Overall
Mozilla Kraken 1.1: Total
| PCMark 10 / Score | |
| Razer Blade 14 RZ09-0508 | |
| Lenovo Legion Slim 5 14APH8 | |
| Moyenne AMD Ryzen AI 9 HX 370, NVIDIA GeForce RTX 4060 Laptop GPU (7645 - 7915, n=2) | |
| Asus TUF Gaming A14 FA401WV-WB94 | |
| Asus ROG Zephyrus G14 2024 GA403U | |
| Alienware x14 i7 RTX 3060 | |
| HP Omen Transcend 14-fb0014 | |
| PCMark 10 / Essentials | |
| Razer Blade 14 RZ09-0508 | |
| Lenovo Legion Slim 5 14APH8 | |
| Alienware x14 i7 RTX 3060 | |
| Asus TUF Gaming A14 FA401WV-WB94 | |
| Moyenne AMD Ryzen AI 9 HX 370, NVIDIA GeForce RTX 4060 Laptop GPU (10140 - 10236, n=2) | |
| Asus ROG Zephyrus G14 2024 GA403U | |
| HP Omen Transcend 14-fb0014 | |
| PCMark 10 / Productivity | |
| Razer Blade 14 RZ09-0508 | |
| Moyenne AMD Ryzen AI 9 HX 370, NVIDIA GeForce RTX 4060 Laptop GPU (9925 - 9971, n=2) | |
| Asus TUF Gaming A14 FA401WV-WB94 | |
| Lenovo Legion Slim 5 14APH8 | |
| Alienware x14 i7 RTX 3060 | |
| Asus ROG Zephyrus G14 2024 GA403U | |
| HP Omen Transcend 14-fb0014 | |
| PCMark 10 / Digital Content Creation | |
| Asus TUF Gaming A14 FA401WV-WB94 | |
| Razer Blade 14 RZ09-0508 | |
| Moyenne AMD Ryzen AI 9 HX 370, NVIDIA GeForce RTX 4060 Laptop GPU (13309 - 13395, n=2) | |
| Lenovo Legion Slim 5 14APH8 | |
| Asus ROG Zephyrus G14 2024 GA403U | |
| Alienware x14 i7 RTX 3060 | |
| HP Omen Transcend 14-fb0014 | |
| CrossMark / Overall | |
| Alienware x14 i7 RTX 3060 | |
| Lenovo Legion Slim 5 14APH8 | |
| Razer Blade 14 RZ09-0508 | |
| Asus ROG Zephyrus G14 2024 GA403U | |
| Moyenne AMD Ryzen AI 9 HX 370, NVIDIA GeForce RTX 4060 Laptop GPU (1710 - 1819, n=2) | |
| Asus TUF Gaming A14 FA401WV-WB94 | |
| HP Omen Transcend 14-fb0014 | |
| CrossMark / Productivity | |
| Lenovo Legion Slim 5 14APH8 | |
| Alienware x14 i7 RTX 3060 | |
| Razer Blade 14 RZ09-0508 | |
| Asus ROG Zephyrus G14 2024 GA403U | |
| Moyenne AMD Ryzen AI 9 HX 370, NVIDIA GeForce RTX 4060 Laptop GPU (1574 - 1637, n=2) | |
| Asus TUF Gaming A14 FA401WV-WB94 | |
| HP Omen Transcend 14-fb0014 | |
| CrossMark / Creativity | |
| Moyenne AMD Ryzen AI 9 HX 370, NVIDIA GeForce RTX 4060 Laptop GPU (2077 - 2264, n=2) | |
| Asus TUF Gaming A14 FA401WV-WB94 | |
| Alienware x14 i7 RTX 3060 | |
| Asus ROG Zephyrus G14 2024 GA403U | |
| Lenovo Legion Slim 5 14APH8 | |
| Razer Blade 14 RZ09-0508 | |
| HP Omen Transcend 14-fb0014 | |
| CrossMark / Responsiveness | |
| Alienware x14 i7 RTX 3060 | |
| Lenovo Legion Slim 5 14APH8 | |
| Razer Blade 14 RZ09-0508 | |
| Asus ROG Zephyrus G14 2024 GA403U | |
| Moyenne AMD Ryzen AI 9 HX 370, NVIDIA GeForce RTX 4060 Laptop GPU (1226 - 1293, n=2) | |
| Asus TUF Gaming A14 FA401WV-WB94 | |
| HP Omen Transcend 14-fb0014 | |
| WebXPRT 3 / Overall | |
| Razer Blade 14 RZ09-0508 | |
| Lenovo Legion Slim 5 14APH8 | |
| Alienware x14 i7 RTX 3060 | |
| Asus ROG Zephyrus G14 2024 GA403U | |
| Asus TUF Gaming A14 FA401WV-WB94 | |
| Moyenne AMD Ryzen AI 9 HX 370, NVIDIA GeForce RTX 4060 Laptop GPU () | |
| HP Omen Transcend 14-fb0014 | |
| WebXPRT 4 / Overall | |
| Razer Blade 14 RZ09-0508 | |
| Lenovo Legion Slim 5 14APH8 | |
| Moyenne AMD Ryzen AI 9 HX 370, NVIDIA GeForce RTX 4060 Laptop GPU (252 - 259, n=2) | |
| Asus TUF Gaming A14 FA401WV-WB94 | |
| Asus ROG Zephyrus G14 2024 GA403U | |
| HP Omen Transcend 14-fb0014 | |
| Mozilla Kraken 1.1 / Total | |
| HP Omen Transcend 14-fb0014 | |
| Alienware x14 i7 RTX 3060 | |
| Asus ROG Zephyrus G14 2024 GA403U | |
| Lenovo Legion Slim 5 14APH8 | |
| Razer Blade 14 RZ09-0508 | |
| Asus TUF Gaming A14 FA401WV-WB94 | |
| Moyenne AMD Ryzen AI 9 HX 370, NVIDIA GeForce RTX 4060 Laptop GPU (434 - 450, n=2) | |
* ... Moindre est la valeur, meilleures sont les performances
| PCMark 10 Score | 7645 points | |
Aide | ||
| AIDA64 / Memory Copy | |
| HP Omen Transcend 14-fb0014 | |
| Asus TUF Gaming A14 FA401WV-WB94 | |
| Moyenne AMD Ryzen AI 9 HX 370 (88377 - 92030, n=8) | |
| Alienware x14 i7 RTX 3060 | |
| Lenovo Legion Slim 5 14APH8 | |
| Asus ROG Zephyrus G14 2024 GA403U | |
| Razer Blade 14 RZ09-0508 | |
| AIDA64 / Memory Read | |
| Moyenne AMD Ryzen AI 9 HX 370 (98398 - 100903, n=8) | |
| Asus TUF Gaming A14 FA401WV-WB94 | |
| HP Omen Transcend 14-fb0014 | |
| Alienware x14 i7 RTX 3060 | |
| Razer Blade 14 RZ09-0508 | |
| Lenovo Legion Slim 5 14APH8 | |
| Asus ROG Zephyrus G14 2024 GA403U | |
| AIDA64 / Memory Write | |
| Asus TUF Gaming A14 FA401WV-WB94 | |
| Moyenne AMD Ryzen AI 9 HX 370 (98429 - 108954, n=8) | |
| Asus ROG Zephyrus G14 2024 GA403U | |
| Lenovo Legion Slim 5 14APH8 | |
| Razer Blade 14 RZ09-0508 | |
| HP Omen Transcend 14-fb0014 | |
| Alienware x14 i7 RTX 3060 | |
| AIDA64 / Memory Latency | |
| HP Omen Transcend 14-fb0014 | |
| Asus TUF Gaming A14 FA401WV-WB94 | |
| Moyenne AMD Ryzen AI 9 HX 370 (108.5 - 119.4, n=8) | |
| Lenovo Legion Slim 5 14APH8 | |
| Alienware x14 i7 RTX 3060 | |
| Asus ROG Zephyrus G14 2024 GA403U | |
| Razer Blade 14 RZ09-0508 | |
* ... Moindre est la valeur, meilleures sont les performances
Latence DPC
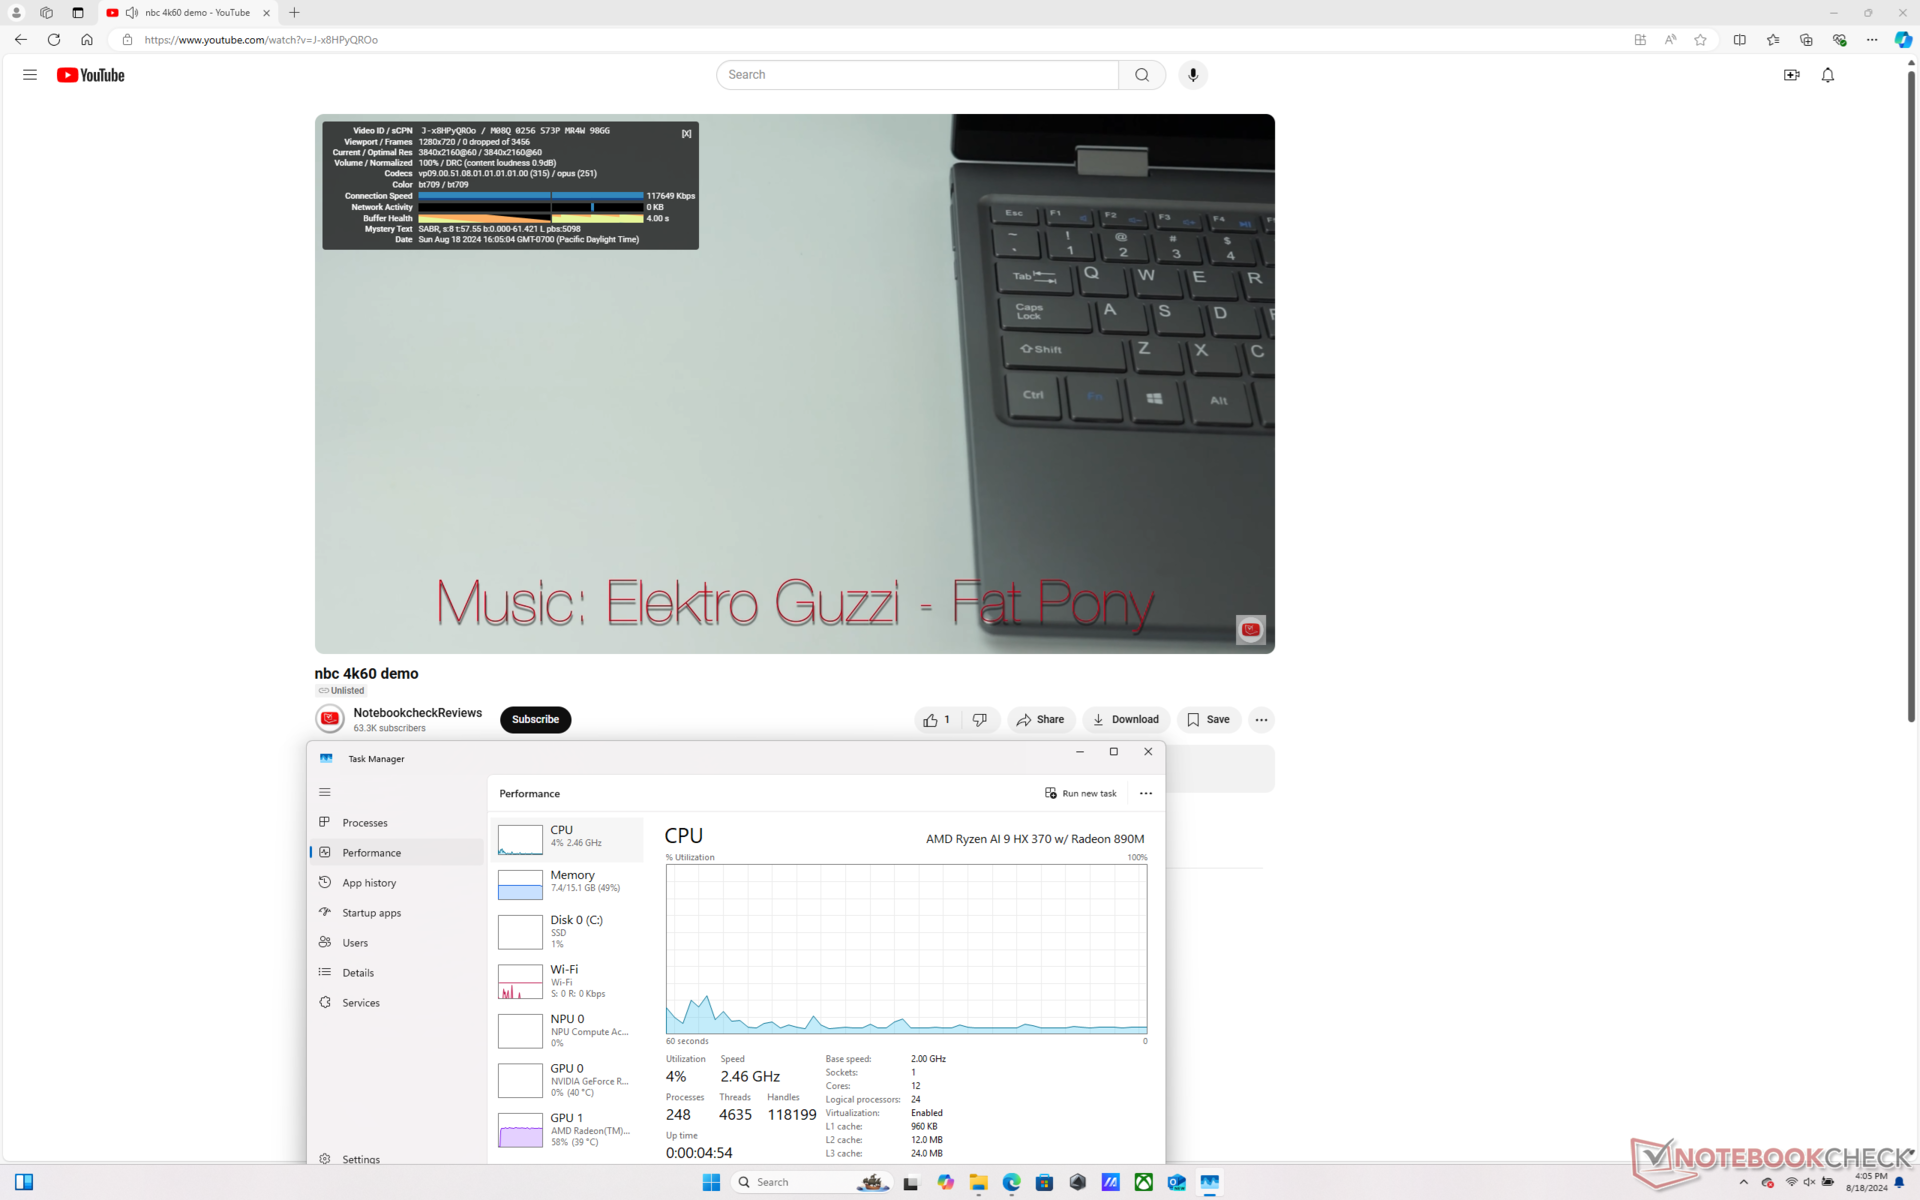
la lecture de vidéos 4K à 60 FPS est parfaite avec une très faible utilisation du CPU et aucune image perdue n'a été enregistrée.
LatencyMon ne se lance pas, probablement en raison de problèmes de compatibilité avec le nouveau processeur Zen 5.
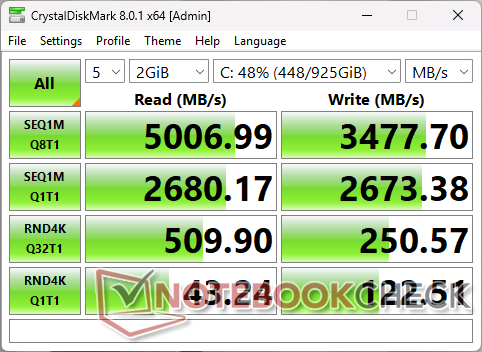
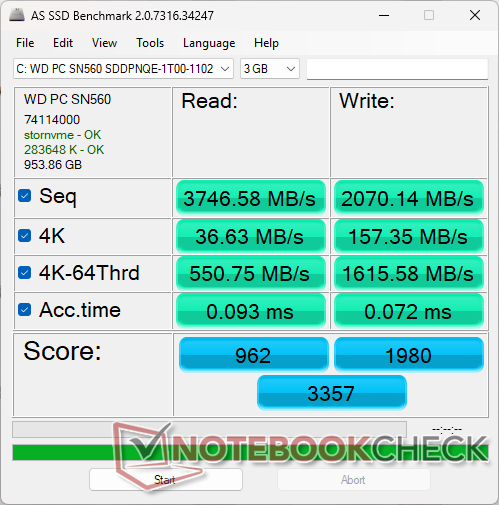
Dispositifs de stockage
Asus livre le même WD PC SN560 PCIe4 x4 NVMe pour son TUF Gaming A14 et son ROG Zephyrus G14 modèles. Étrangement, le disque de notre unité affiche des taux de lecture et d'écriture de fichiers de petite taille beaucoup plus lents que le même disque du Zephyrus G14 selon DiskSpd, même si notre espace disque est plus qu'à moitié vide. Les taux de transfert plus lents que prévu lors de notre test de carte SD ci-dessus peuvent être liés à cette anomalie.

* ... Moindre est la valeur, meilleures sont les performances
Disk Throttling: DiskSpd Read Loop, Queue Depth 8
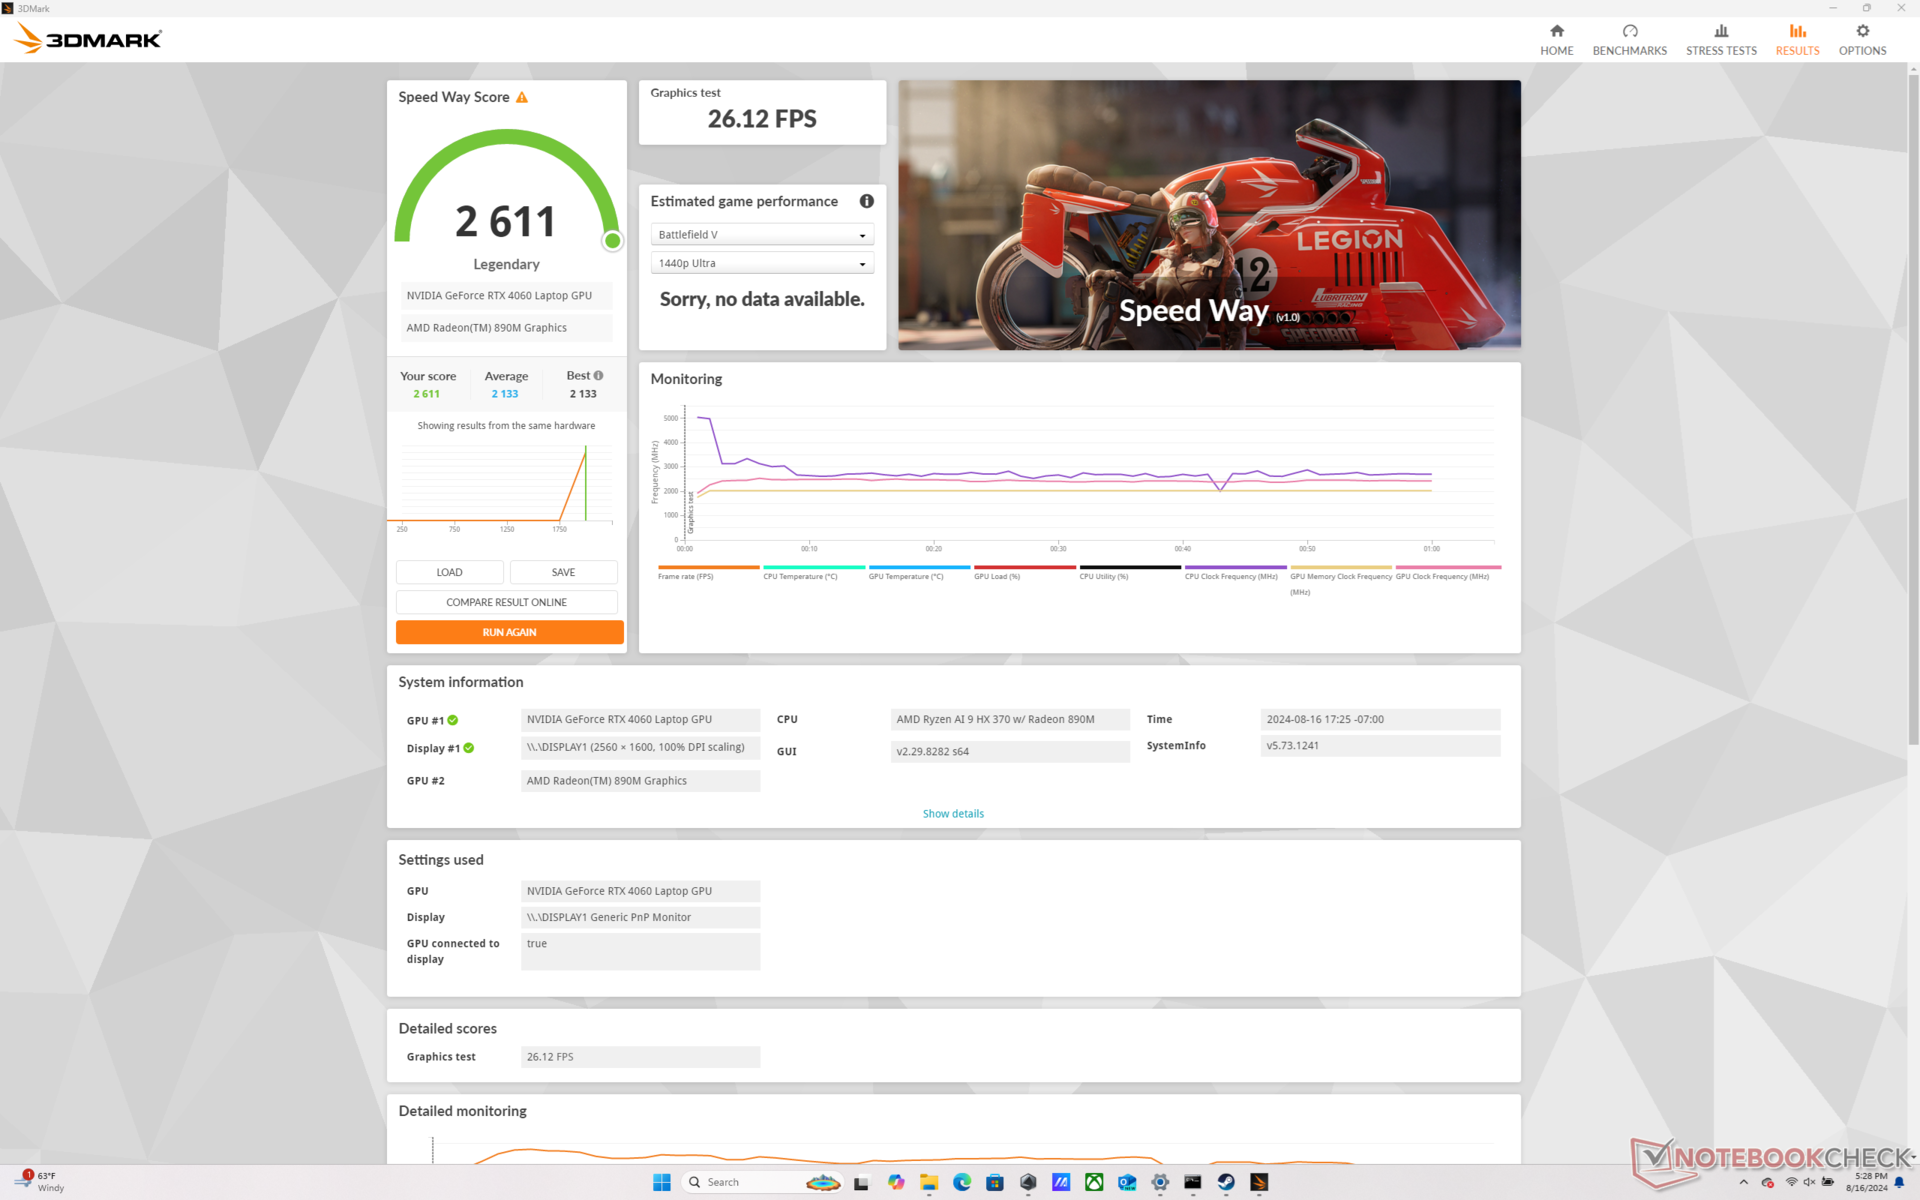
Performances du GPU - 100 W TGP pour un facteur de forme de 14 pouces
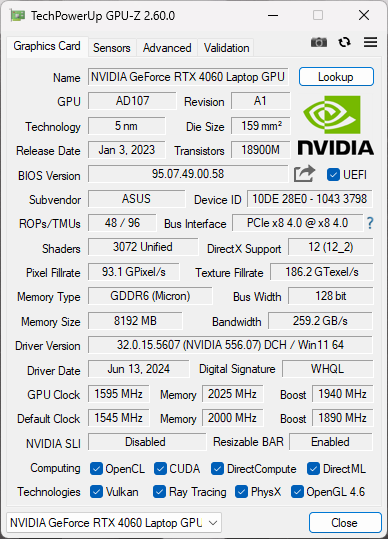
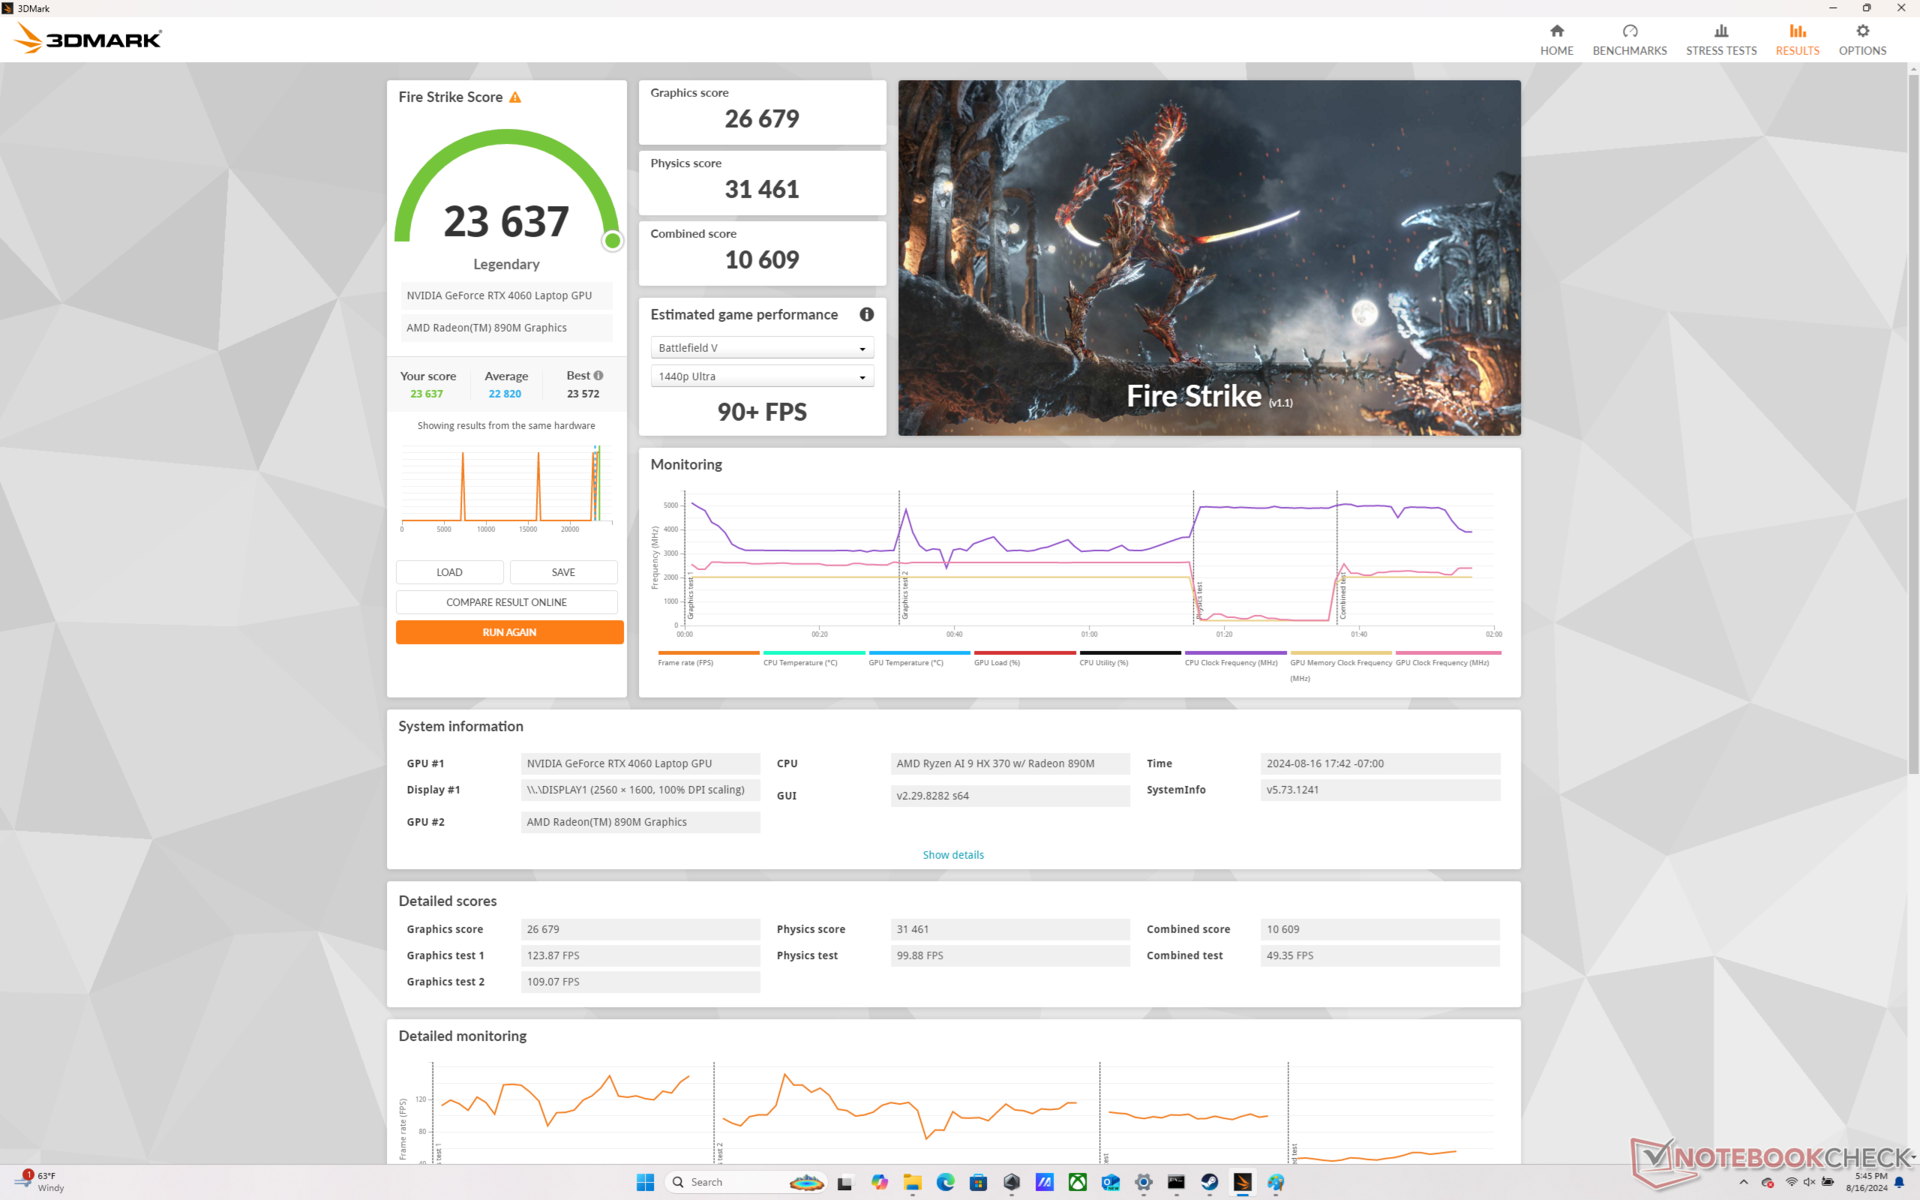
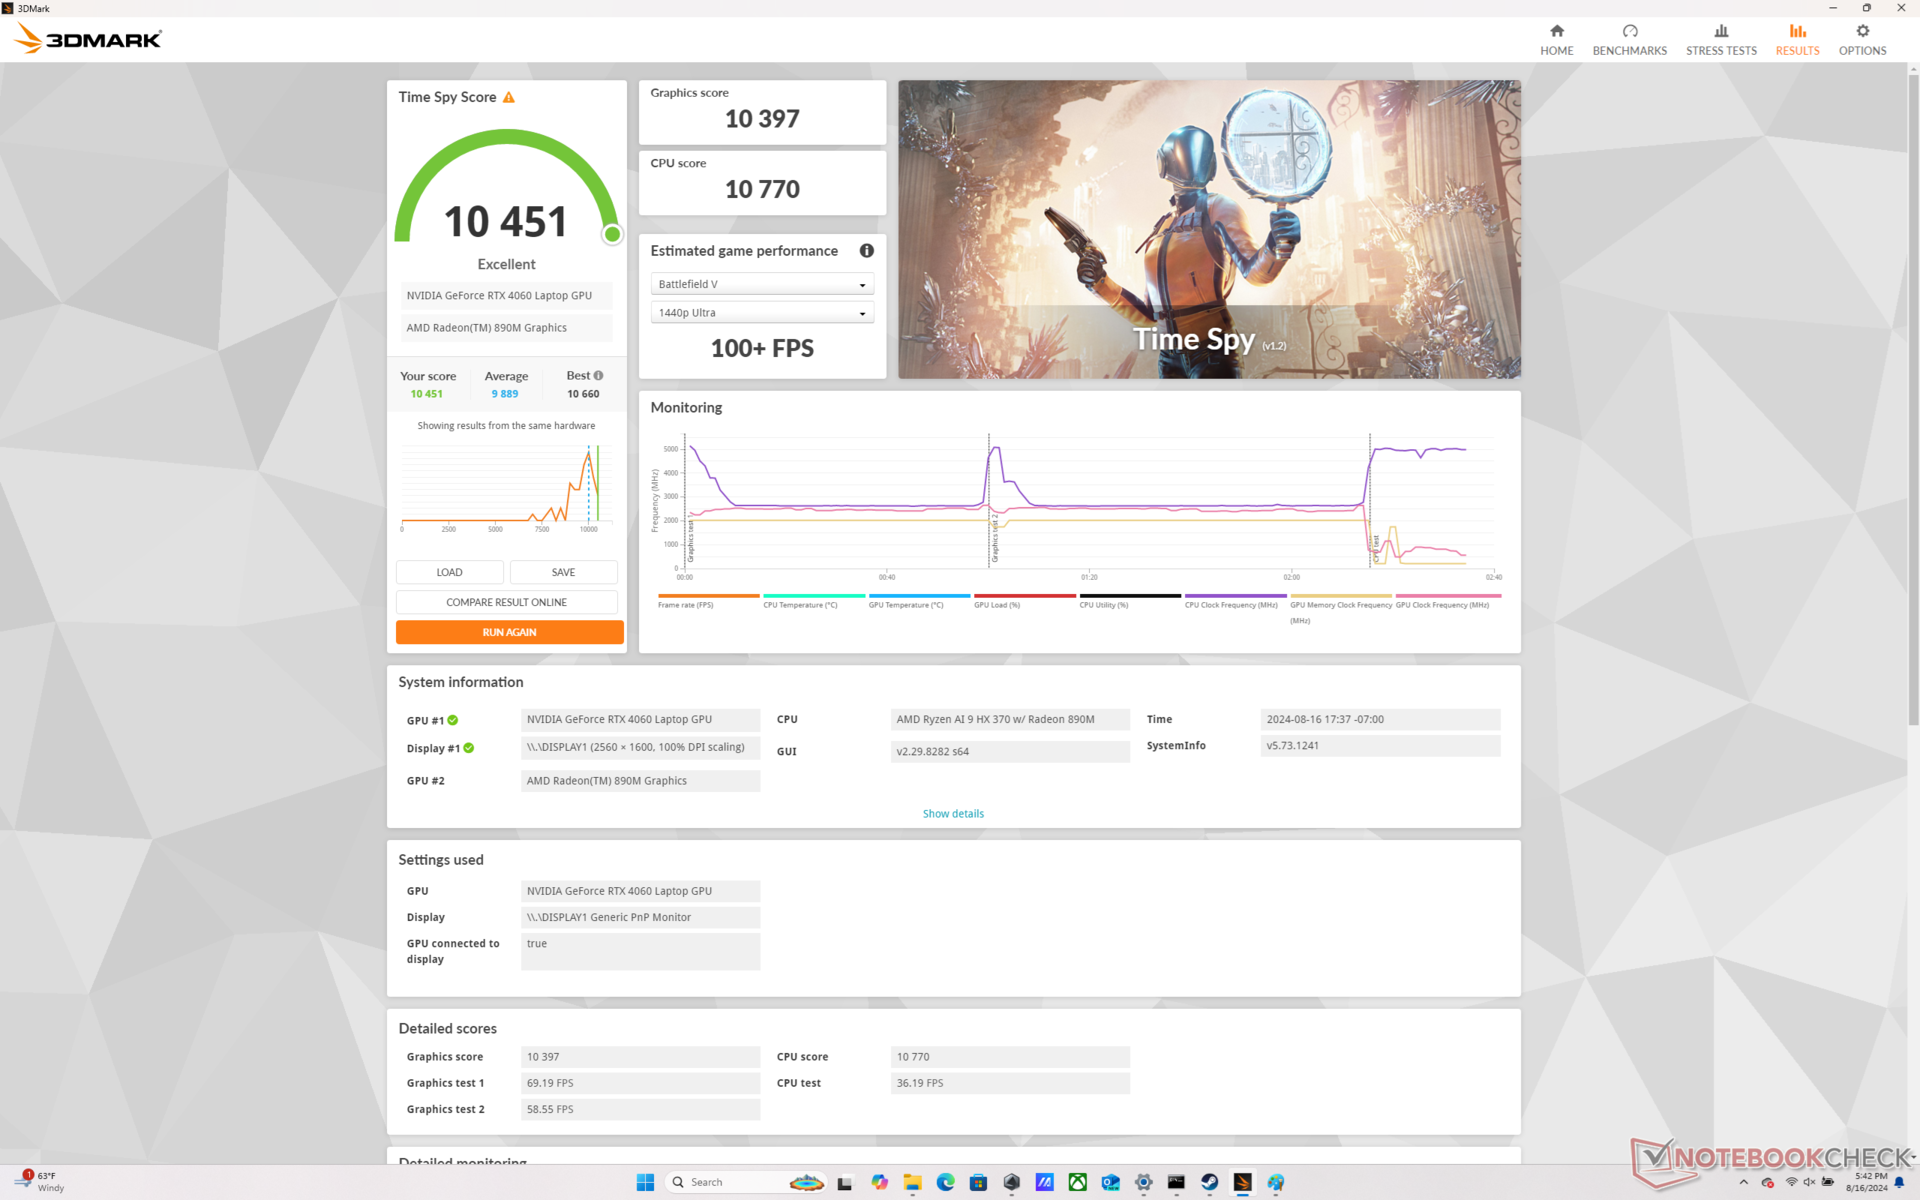
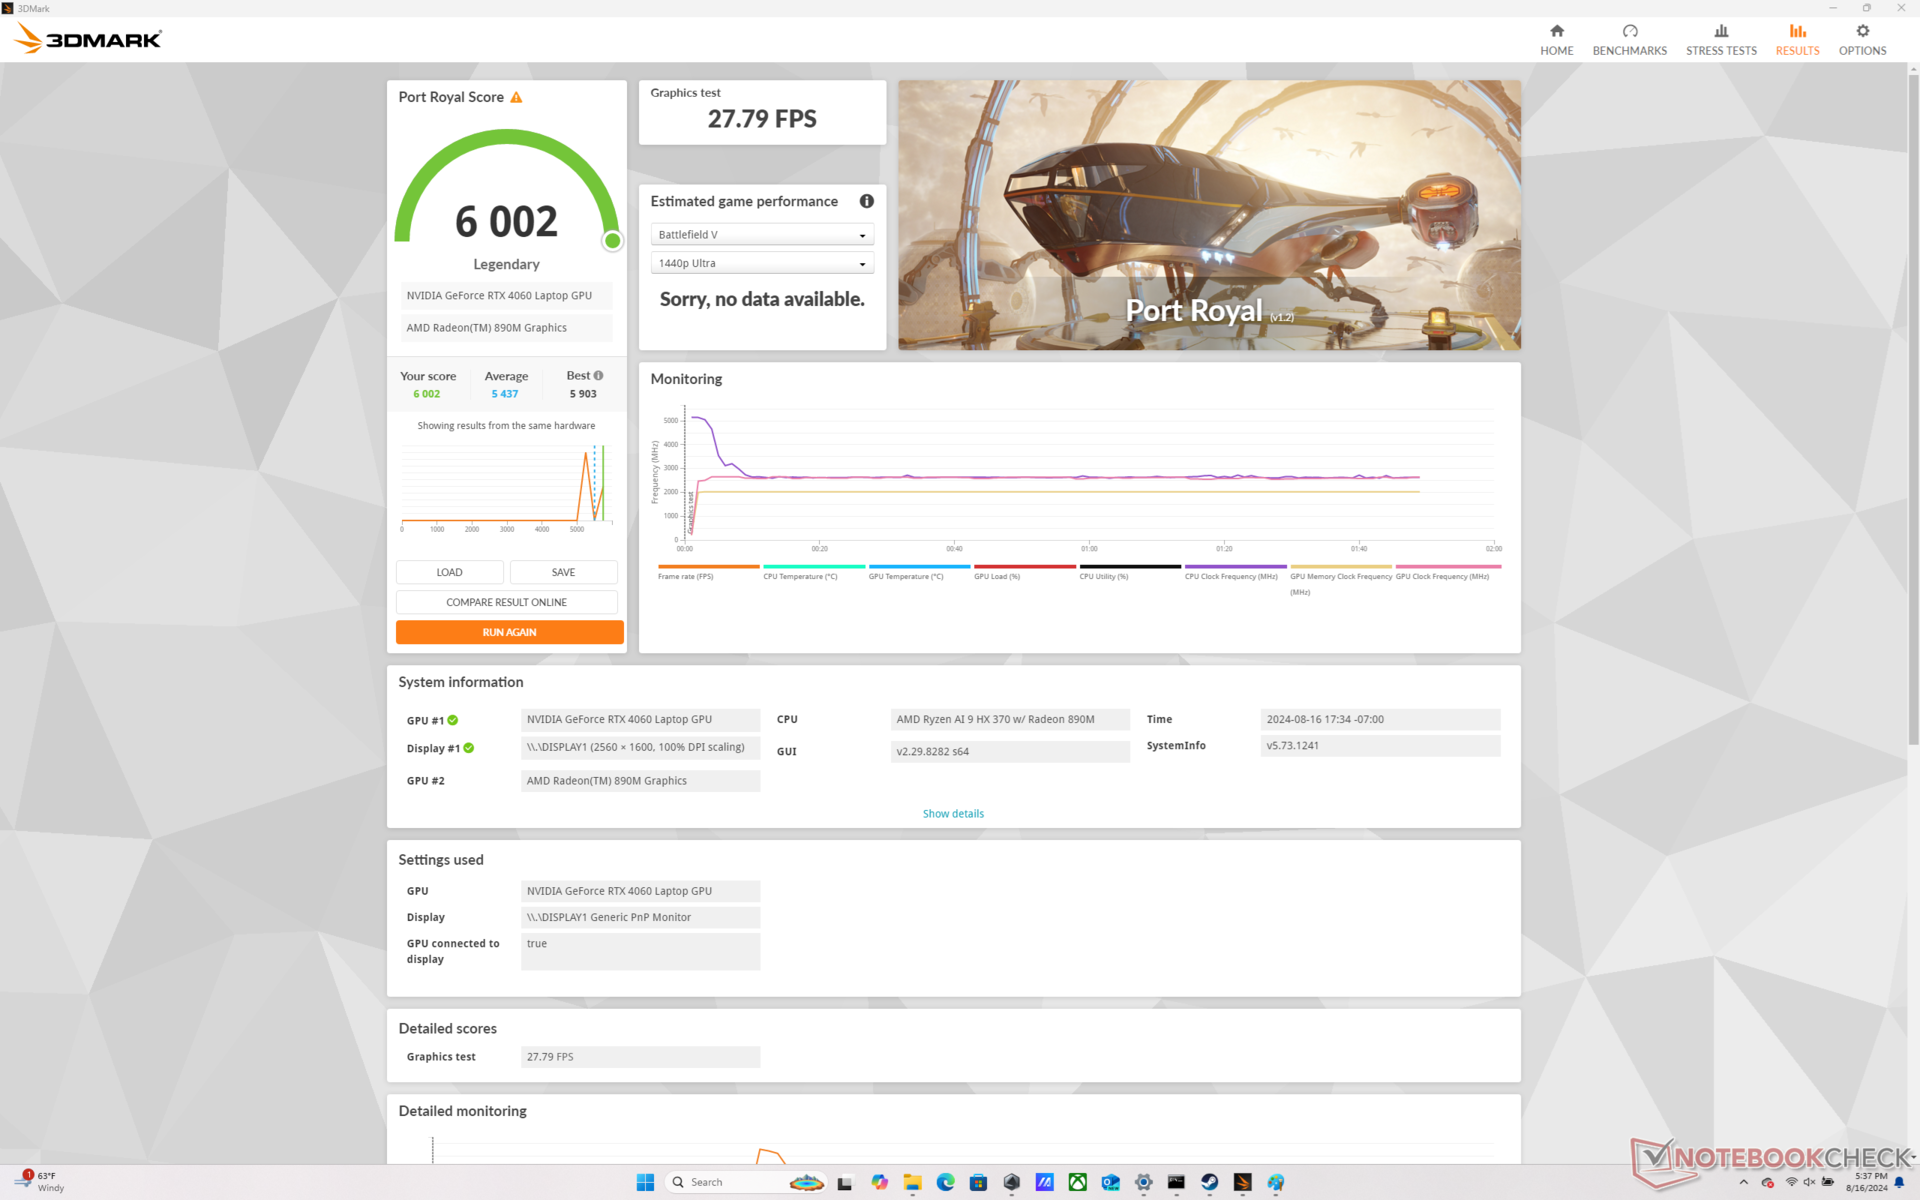
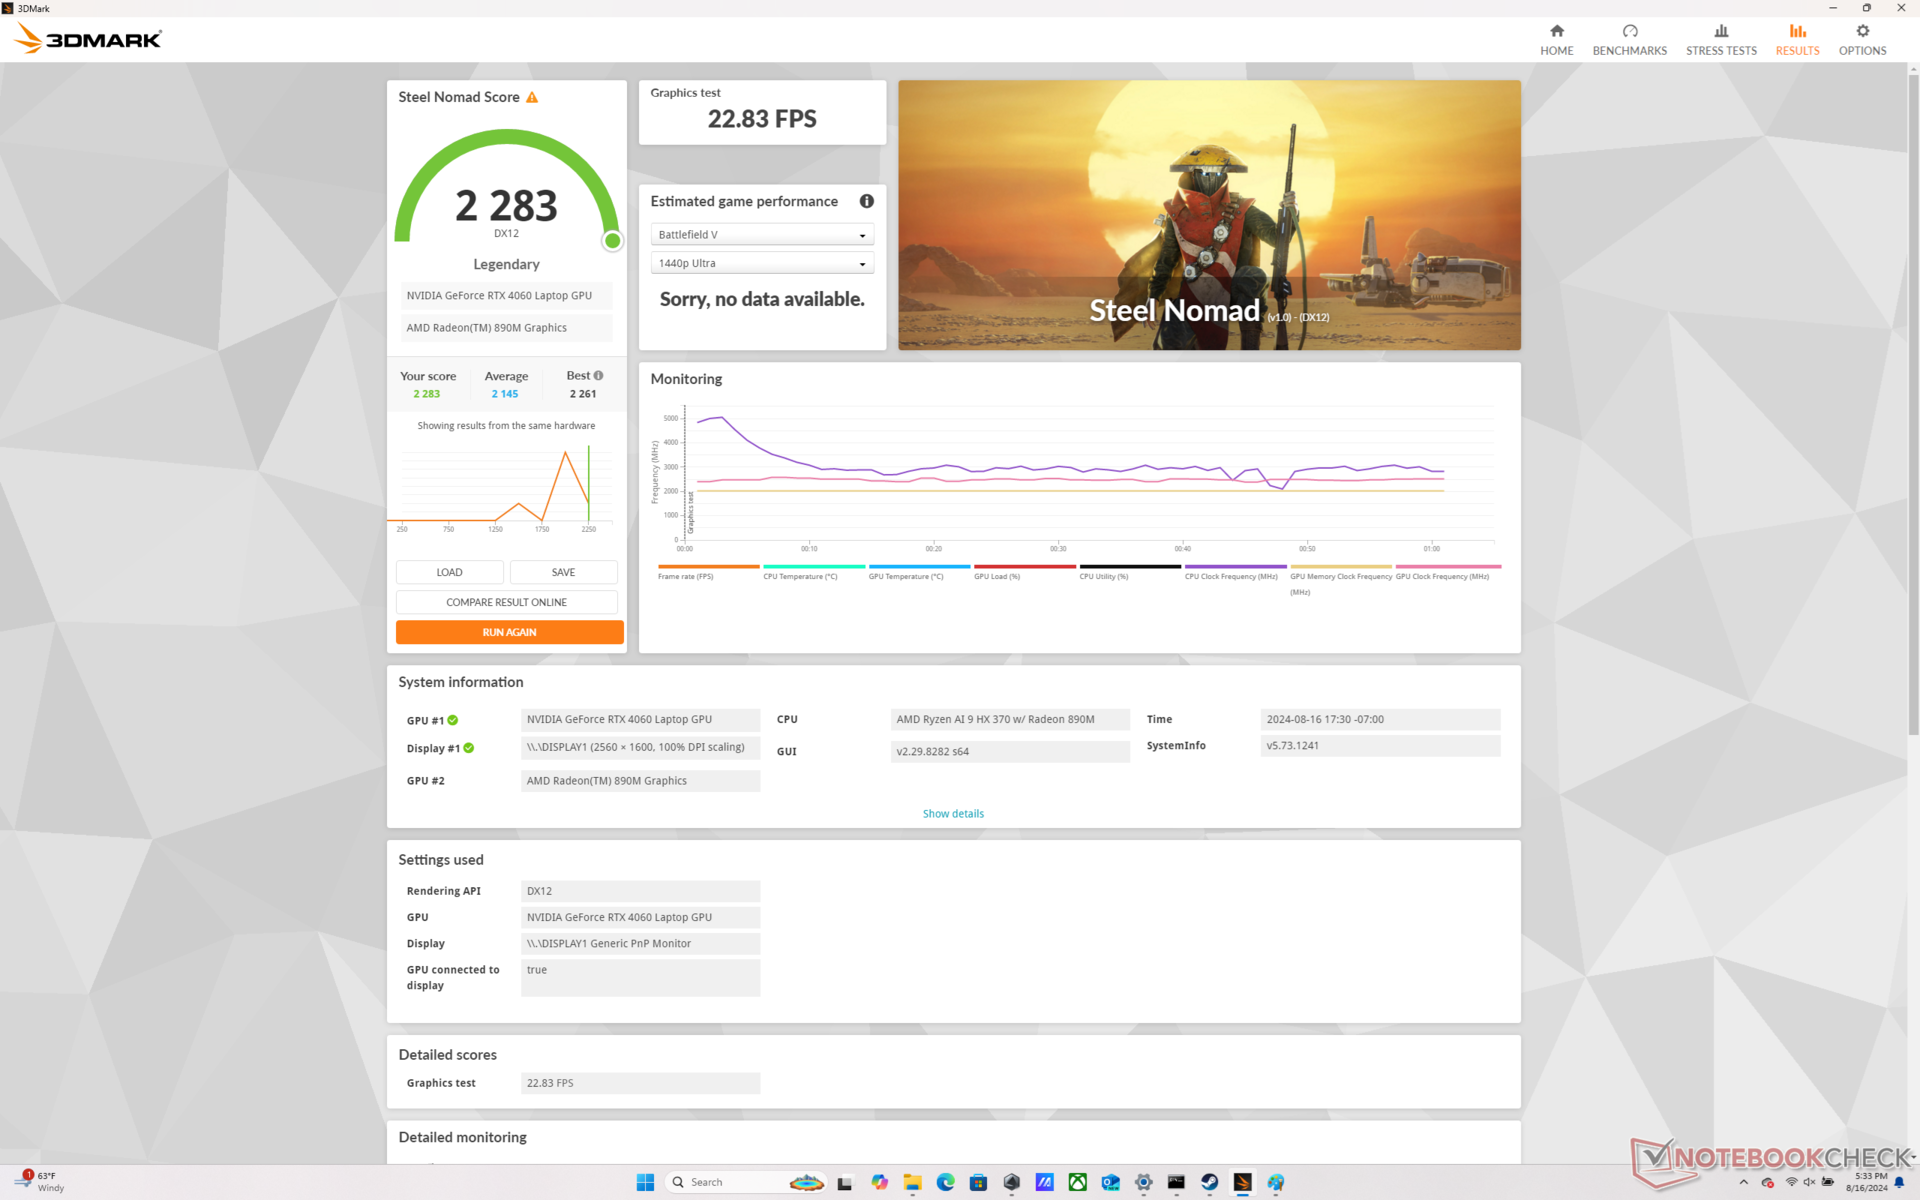
Les performances graphiques du 100 W GeForce RTX 4060 sont conformes à nos attentes par rapport à la moyenne des ordinateurs portables de notre base de données équipés du même GPU. Notamment, ses performances ne sont inférieures que de 5 % à celles de notre ordinateur de bureau KFA2 RTX 4060 carte de référence KFA2 GeForce RTX 4060 ce qui est impressionnant compte tenu du facteur de forme de 14 pouces. Notre GPU de 100 W se compare favorablement à la RTX 4060 de 65 W de la carte concurrente Omen Transcend 14.
Les utilisateurs exigeant des performances encore plus rapides devront plutôt considérer la série ROG Zephyrus G14. Asus a délibérément exclu les RTX 4070, RTX 4080 et RTX 4090 de la gamme TUF Gaming A14 afin de mieux séparer ses deux modèles gaming de 14 pouces.
| Profil de puissance | Score graphique | Score physique | Score combiné |
| Mode Turbo | 26679 | 31461 | 10609 |
| Mode Performance | 24526 (-8%) | 30803 (-2%) | 9899 (-7%) |
| Mode équilibré | 24393 (-9%) | 30687 (-3%) | 9830 (-7%) |
| Alimentation par batterie | 19047 (-29%) | 24466 (-22%) | 8615 (-19%) |
Le passage du mode Turbo au mode Performance diminue les performances graphiques de près de 10 %. Il est intéressant de noter que le fait de passer à nouveau du mode Performance au mode Windows Balanced n'a pas d'incidence sur les performances. Ces observations concordent avec les résultats de la section "Test de stress" ci-dessus. Comme on pouvait s'y attendre, c'est l'utilisation de la batterie qui diminue le plus les performances.
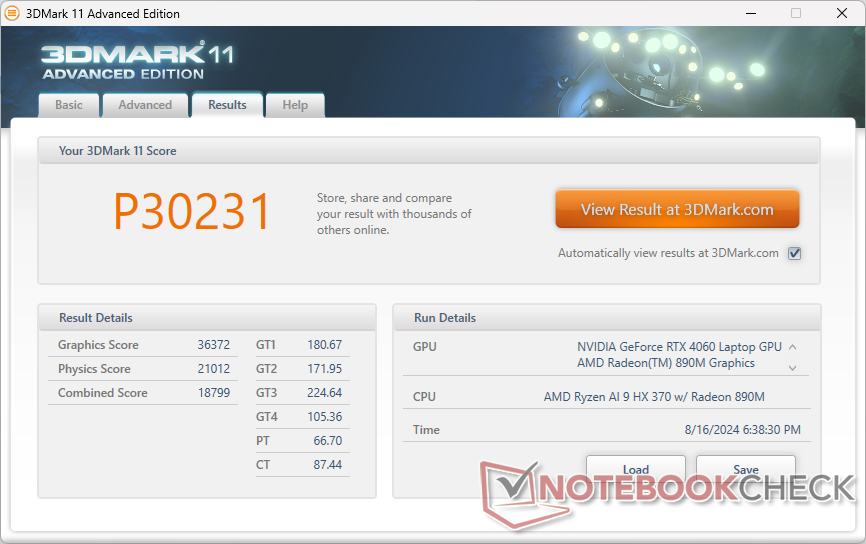
| 3DMark 11 Performance | 30231 points | |
| 3DMark Cloud Gate Standard Score | 61850 points | |
| 3DMark Fire Strike Score | 23637 points | |
| 3DMark Time Spy Score | 10451 points | |
| 3DMark Steel Nomad Score | 2283 points | |
Aide | ||
* ... Moindre est la valeur, meilleures sont les performances
Performances des jeux
La RTX 4060 ( GeForce ) s'associe bien à la résolution native de 1440 Hz. Malheureusement, il sera difficile de viser des taux de rafraîchissement stables de 165 ou plus pour correspondre au taux de rafraîchissement natif sur la plupart des titres et 60 FPS reste l'objectif le plus réaliste.
En raison du bruit très fort du ventilateur en mode Turbo, les utilisateurs peuvent envisager de jouer en mode Performance, même si cela implique un ralentissement des taux de rafraîchissement. Par exemple, Cyberpunk 2077 à 1440p avec DLSS Super Resolution activé et avec les paramètres Ultra donnerait un taux de rafraîchissement moyen de 74,1 en mode Turbo contre 64,5 en mode Performance, plus silencieux.
| Performance Rating - Percent | |
| Razer Blade 14 RZ09-0508 -1! | |
| Lenovo Legion Slim 5 14APH8 -1! | |
| Asus TUF Gaming A14 FA401WV-WB94 | |
| Asus ROG Zephyrus G14 2024 GA403U | |
| HP Omen Transcend 14-fb0014 | |
| Alienware x14 i7 RTX 3060 -1! | |
| GTA V - 1920x1080 Highest Settings possible AA:4xMSAA + FX AF:16x | |
| Asus TUF Gaming A14 FA401WV-WB94 | |
| Razer Blade 14 RZ09-0508 | |
| Lenovo Legion Slim 5 14APH8 | |
| HP Omen Transcend 14-fb0014 | |
| Asus ROG Zephyrus G14 2024 GA403U | |
| Alienware x14 i7 RTX 3060 | |
| Final Fantasy XV Benchmark - 1920x1080 High Quality | |
| Razer Blade 14 RZ09-0508 | |
| Lenovo Legion Slim 5 14APH8 | |
| Asus ROG Zephyrus G14 2024 GA403U | |
| Asus TUF Gaming A14 FA401WV-WB94 | |
| HP Omen Transcend 14-fb0014 | |
| Alienware x14 i7 RTX 3060 | |
| Strange Brigade - 1920x1080 ultra AA:ultra AF:16 | |
| Lenovo Legion Slim 5 14APH8 | |
| Asus TUF Gaming A14 FA401WV-WB94 | |
| Asus ROG Zephyrus G14 2024 GA403U | |
| HP Omen Transcend 14-fb0014 | |
| Alienware x14 i7 RTX 3060 | |
| Dota 2 Reborn - 1920x1080 ultra (3/3) best looking | |
| Alienware x14 i7 RTX 3060 | |
| Razer Blade 14 RZ09-0508 | |
| Asus TUF Gaming A14 FA401WV-WB94 | |
| Lenovo Legion Slim 5 14APH8 | |
| HP Omen Transcend 14-fb0014 | |
| Asus ROG Zephyrus G14 2024 GA403U | |
| X-Plane 11.11 - 1920x1080 high (fps_test=3) | |
| Lenovo Legion Slim 5 14APH8 | |
| Asus ROG Zephyrus G14 2024 GA403U | |
| HP Omen Transcend 14-fb0014 | |
| Razer Blade 14 RZ09-0508 | |
| Asus TUF Gaming A14 FA401WV-WB94 | |
| Cyberpunk 2077 2.1 Phantom Liberty | |
| 1920x1080 High Preset (FSR off) | |
| Asus ROG Strix Scar 16 G634JZR | |
| Razer Blade 14 RZ09-0508 | |
| Asus TUF Gaming A14 FA401WV-WB94 | |
| Moyenne NVIDIA GeForce RTX 4060 Laptop GPU (65.2 - 102, n=25) | |
| HP Omen Transcend 14-fb0014 | |
| 1920x1080 Ultra Preset (FSR off) | |
| Asus ROG Strix Scar 16 G634JZR | |
| Razer Blade 14 RZ09-0508 | |
| Asus TUF Gaming A14 FA401WV-WB94 | |
| Moyenne NVIDIA GeForce RTX 4060 Laptop GPU (56.4 - 93.1, n=30) | |
| HP Omen Transcend 14-fb0014 | |
| 2560x1440 Ultra Preset (FSR off) | |
| Asus ROG Strix Scar 16 G634JZR | |
| Razer Blade 14 RZ09-0508 | |
| Moyenne NVIDIA GeForce RTX 4060 Laptop GPU (32.9 - 51.8, n=19) | |
| Asus TUF Gaming A14 FA401WV-WB94 | |
| HP Omen Transcend 14-fb0014 | |
Cyberpunk 2077 ultra FPS Chart
| Bas | Moyen | Élevé | Ultra | QHD | |
|---|---|---|---|---|---|
| GTA V (2015) | 181.7 | 175.9 | 168.6 | 110.8 | 85.4 |
| Dota 2 Reborn (2015) | 168.1 | 150.3 | 150.8 | 135 | |
| Final Fantasy XV Benchmark (2018) | 174.3 | 139.6 | 100.6 | 74.5 | |
| X-Plane 11.11 (2018) | 89.1 | 81.8 | 67.3 | ||
| Far Cry 5 (2018) | 143 | 129 | 121 | 114 | 93 |
| Strange Brigade (2018) | 388 | 277 | 222 | 193.5 | 130.3 |
| Tiny Tina's Wonderlands (2022) | 204.6 | 167.1 | 110.6 | 86.1 | 58.9 |
| F1 22 (2022) | 194.8 | 190.3 | 172.8 | 64.6 | 42 |
| Baldur's Gate 3 (2023) | 122.1 | 101.7 | 91 | 90.1 | 61.1 |
| Cyberpunk 2077 2.1 Phantom Liberty (2023) | 115.5 | 98.1 | 85.6 | 73.3 | 43.6 |
Émissions
Bruit du système - chaud et bruyant lors des jeux
Le bruit et le comportement des ventilateurs dépendent fortement du profil de puissance sélectionné via Armoury Crate. En mode silencieux, les ventilateurs ont tendance à tourner au ralenti lors de la navigation ou de la lecture en continu, avec seulement une pulsation occasionnelle de 29 dB(A). En revanche, si vous choisissez un autre mode, les ventilateurs se mettent à tourner beaucoup plus fréquemment et à des régimes plus élevés, même lorsque vous effectuez des tâches simples comme le courrier électronique. Vous pouvez envisager d'utiliser le mode silencieux si vous travaillez dans des environnements sensibles au bruit, tels que des salles de classe ou de conférence.
Le bruit du ventilateur se stabilise à 43 dB(A) et 50,6 dB(A) lorsque vous utilisez Cyberpunk 2077 en mode Performance et en mode Turbo, respectivement. La différence est tellement importante que les propriétaires peuvent envisager de jouer en mode Performance et d'accepter la baisse de 10 % des performances graphiques pour des ventilateurs plus silencieux. Pour être honnête, la plage de 50+ dB(A) est partagée par la plupart des ordinateurs portables de jeu de 14 pouces comme le Blade 14, Legion Slim 5 14, ou le Alienware x14 et il ne s'agit donc pas d'un problème propre au TUF Gaming A14.

Degré de la nuisance sonore
| Au repos |
| 22.9 / 28.3 / 28.8 dB(A) |
| Fortement sollicité |
| 37.3 / 50.6 dB(A) |
 | ||
30 dB silencieux 40 dB(A) audible 50 dB(A) bruyant |
||
min: | ||
| Asus TUF Gaming A14 FA401WV-WB94 NVIDIA GeForce RTX 4060 Laptop GPU, Ryzen AI 9 HX 370, WD PC SN560 SDDPNQE-1T00 | Asus ROG Zephyrus G14 2024 GA403U NVIDIA GeForce RTX 4070 Laptop GPU, R9 8945HS, WD PC SN560 SDDPNQE-1T00 | HP Omen Transcend 14-fb0014 NVIDIA GeForce RTX 4060 Laptop GPU, Ultra 7 155H, WDC PC SN810 1TB | Razer Blade 14 RZ09-0508 NVIDIA GeForce RTX 4070 Laptop GPU, R9 8945HS, Samsung PM9A1 MZVL21T0HCLR | Lenovo Legion Slim 5 14APH8 NVIDIA GeForce RTX 4060 Laptop GPU, R7 7840HS, SK Hynix HFS001TEJ9X115N | Alienware x14 i7 RTX 3060 GeForce RTX 3060 Laptop GPU, i7-12700H, WDC PC SN810 1TB | |
|---|---|---|---|---|---|---|
| Noise | 2% | 7% | 3% | -3% | -3% | |
| off / environment * | 22.9 | 23.9 -4% | 24.5 -7% | 24.3 -6% | 22.8 -0% | 24.7 -8% |
| Idle Minimum * | 22.9 | 23.9 -4% | 24.7 -8% | 25 -9% | 22.8 -0% | 24.7 -8% |
| Idle Average * | 28.3 | 23.9 16% | 24.7 13% | 25 12% | 27.3 4% | 24.7 13% |
| Idle Maximum * | 28.8 | 23.9 17% | 24.7 14% | 25 13% | 30.7 -7% | 30.9 -7% |
| Load Average * | 37.3 | 46.2 -24% | 25.2 32% | 33 12% | 41.6 -12% | 40 -7% |
| Cyberpunk 2077 ultra * | 50.6 | |||||
| Load Maximum * | 50.6 | 46.2 9% | 52 -3% | 51.9 -3% | 52.6 -4% | 51.5 -2% |
| Witcher 3 ultra * | 46.2 | 47 | 49.5 | 52.8 | 51.5 |
* ... Moindre est la valeur, meilleures sont les performances
Température
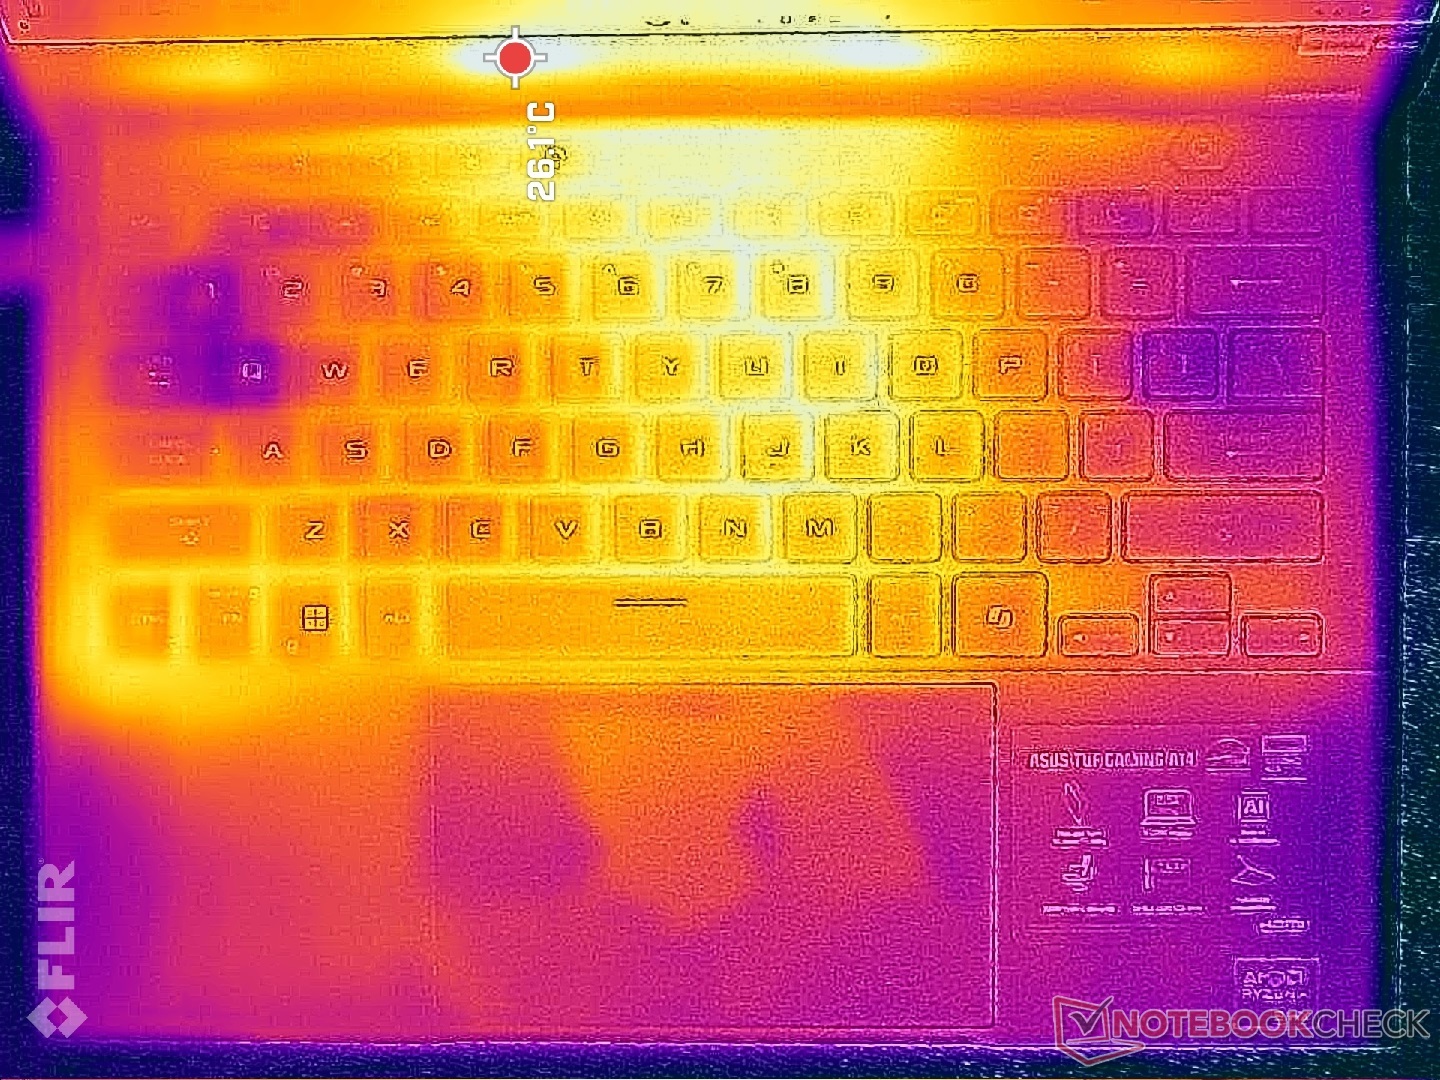
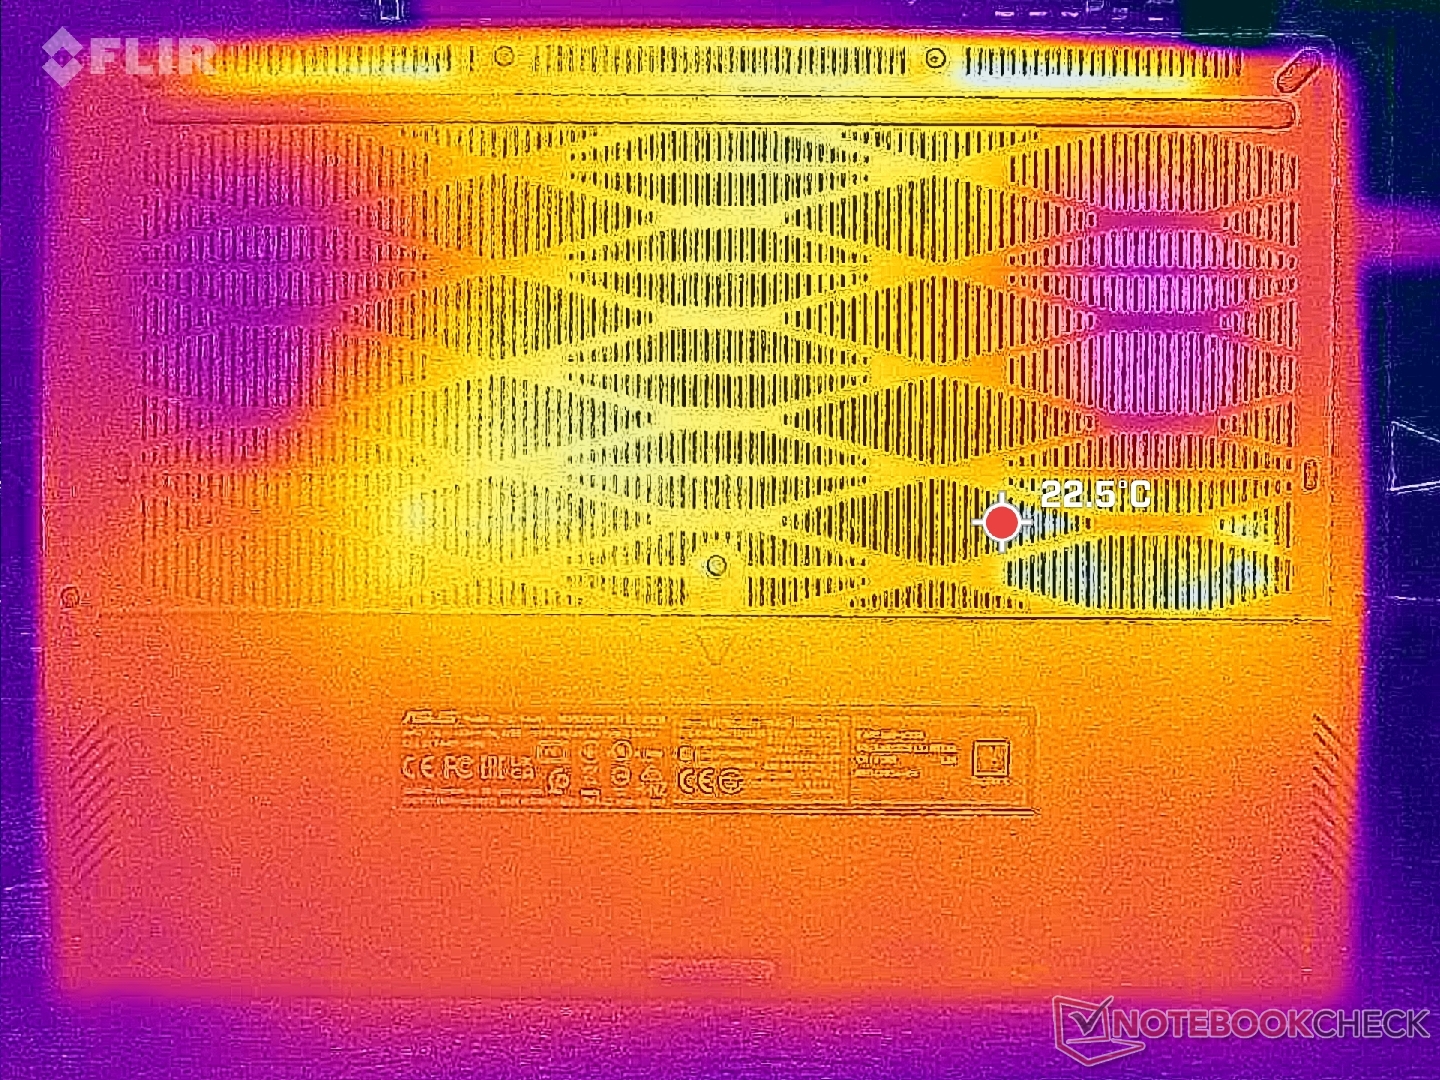
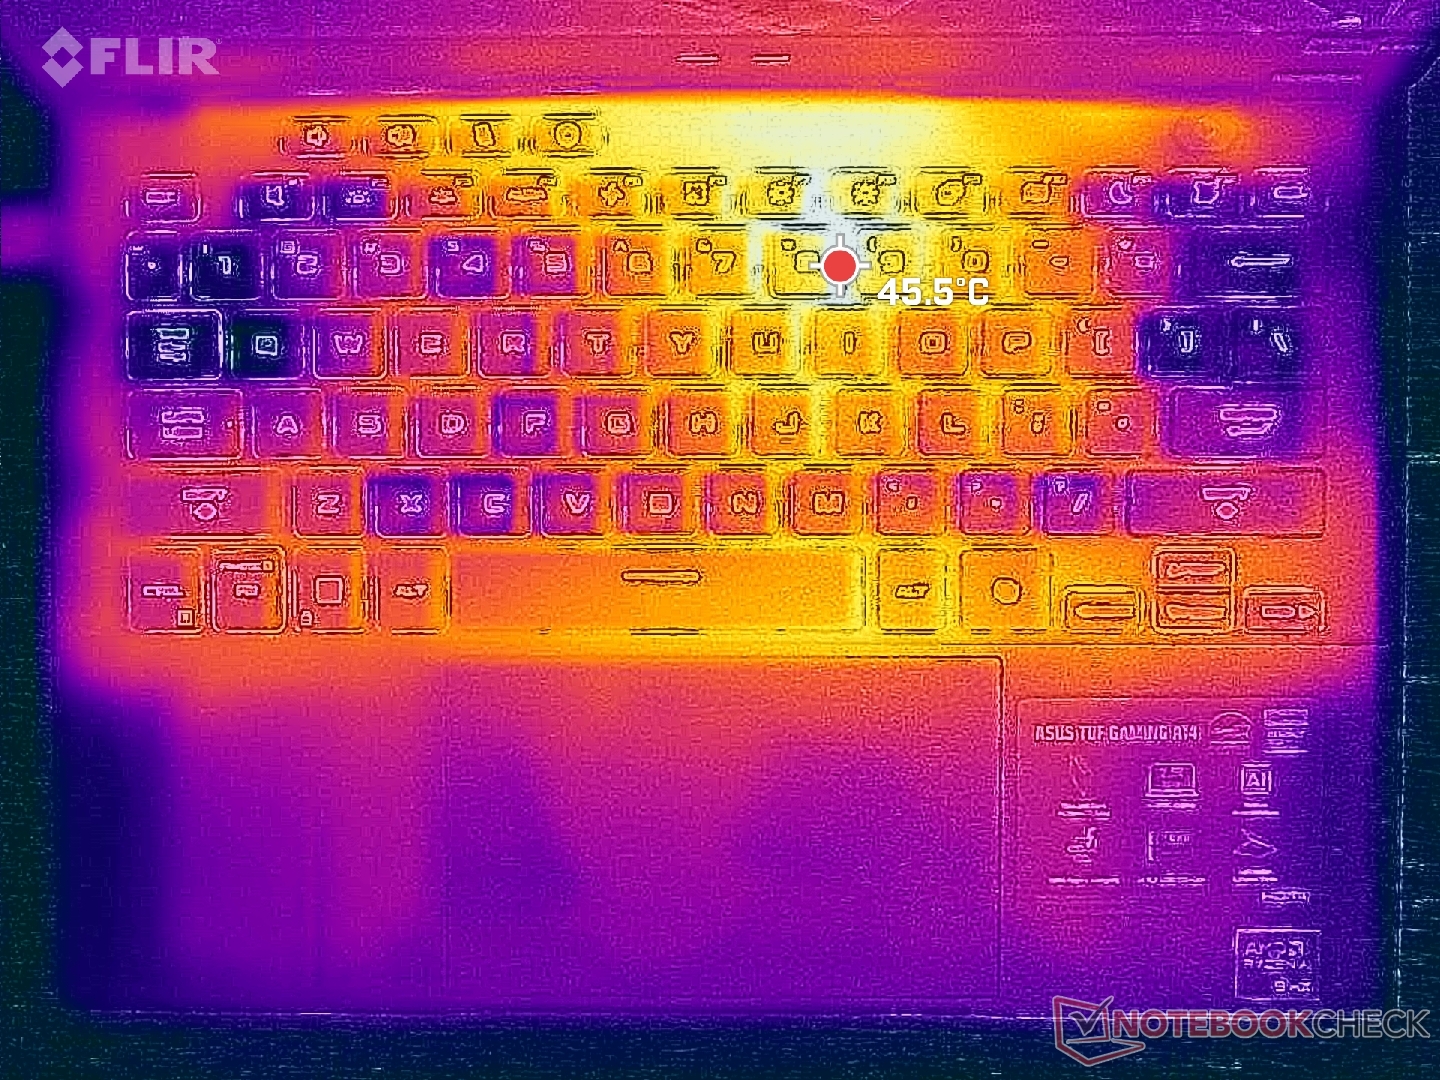
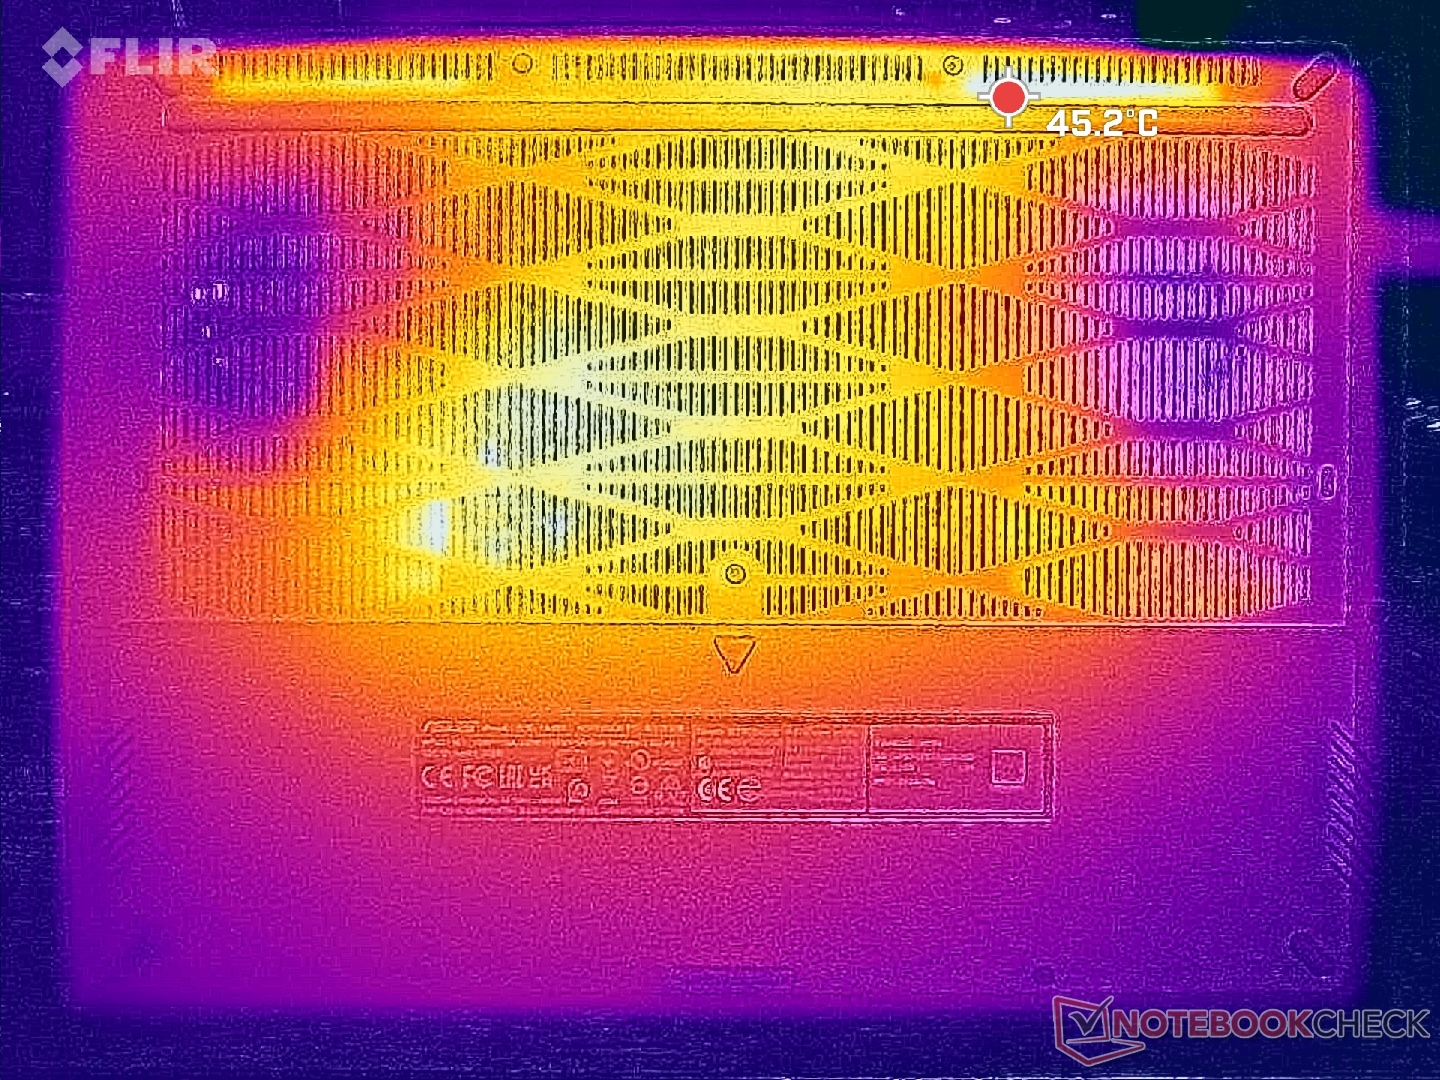
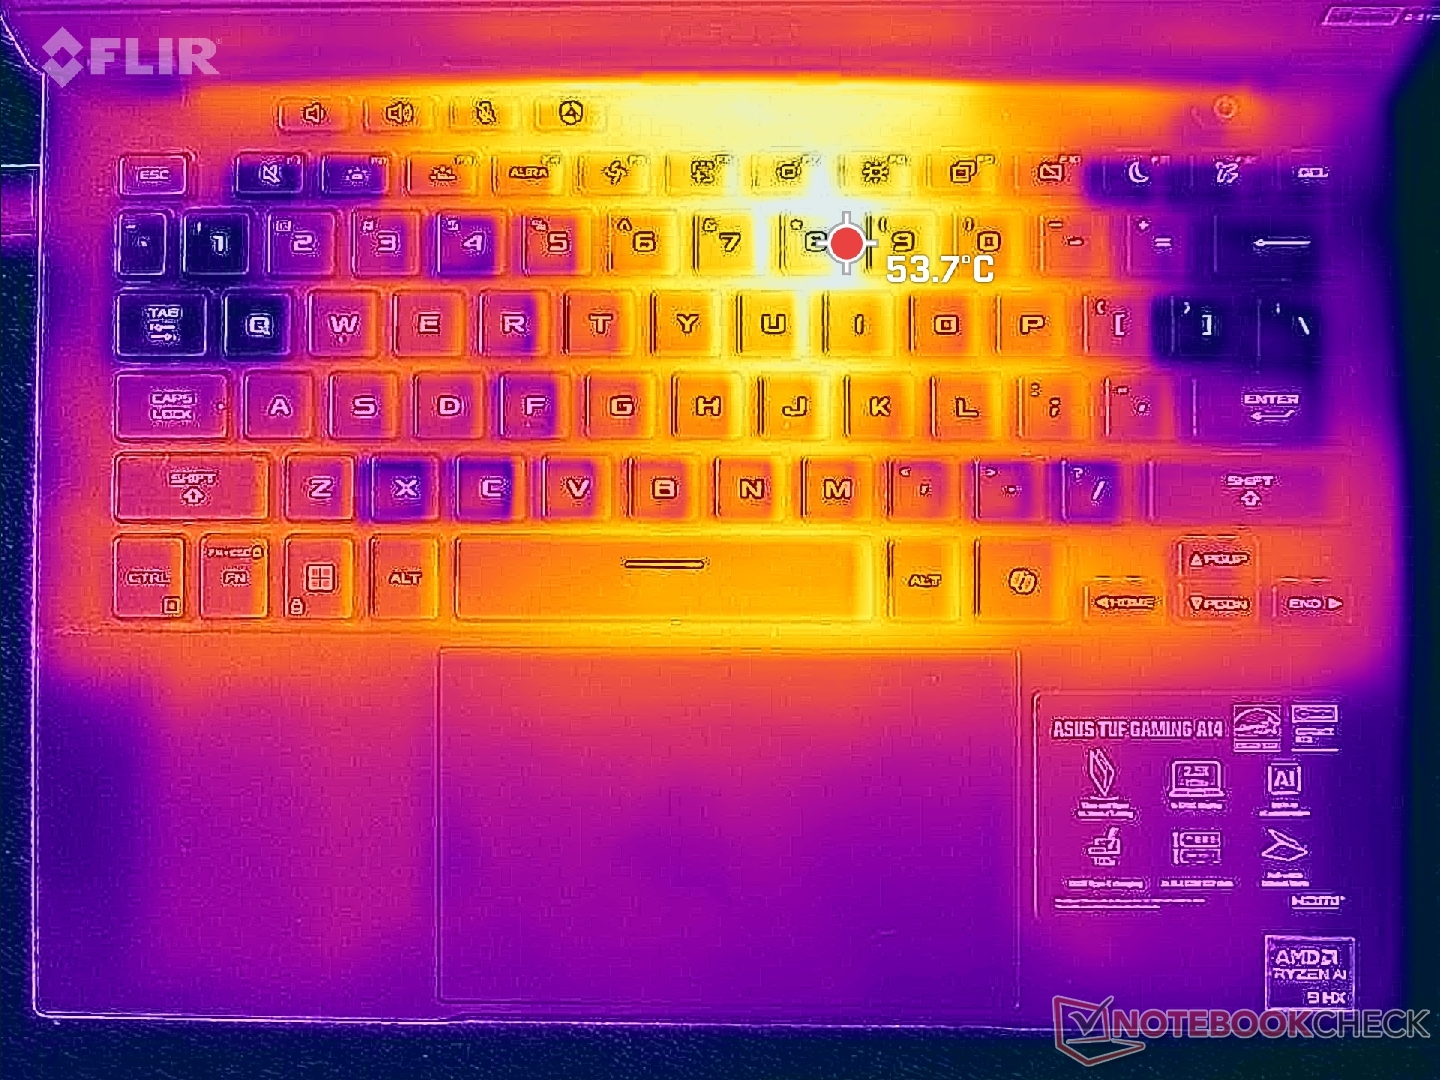
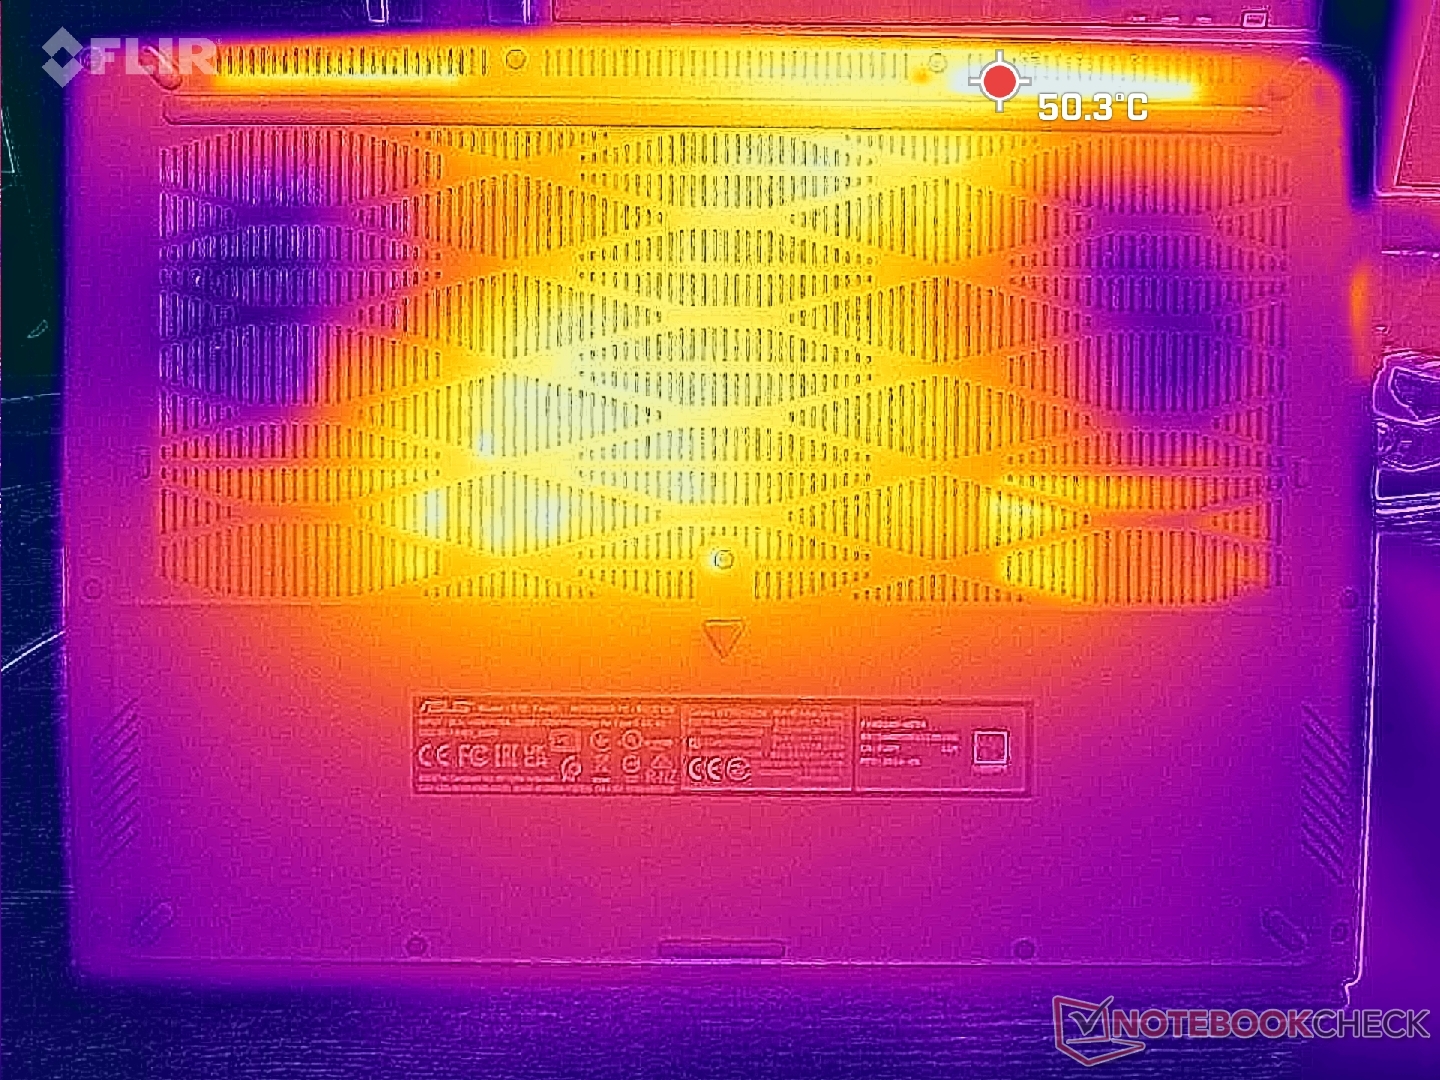
Les températures de surface sont, comme on peut s'y attendre, très chaudes en raison des performances élevées par volume. Les points chauds sur le clavier et le panneau inférieur peuvent atteindre respectivement 50 et 47 °C, tandis que les repose-poignets peuvent atteindre 35 °C. Les Lenovo Legion Slim 5 14 et Omen Transcend 14 sont tous deux très chauds Omen Transcend 14 sont plus froids que notre Asus, tandis que le Predator Helios Neo 14 est encore plus chaud. En pratique, les températures de surface élevées sont perceptibles mais ne gênent pas les joueurs car les points les plus chauds se trouvent près du centre et loin des touches WASD.
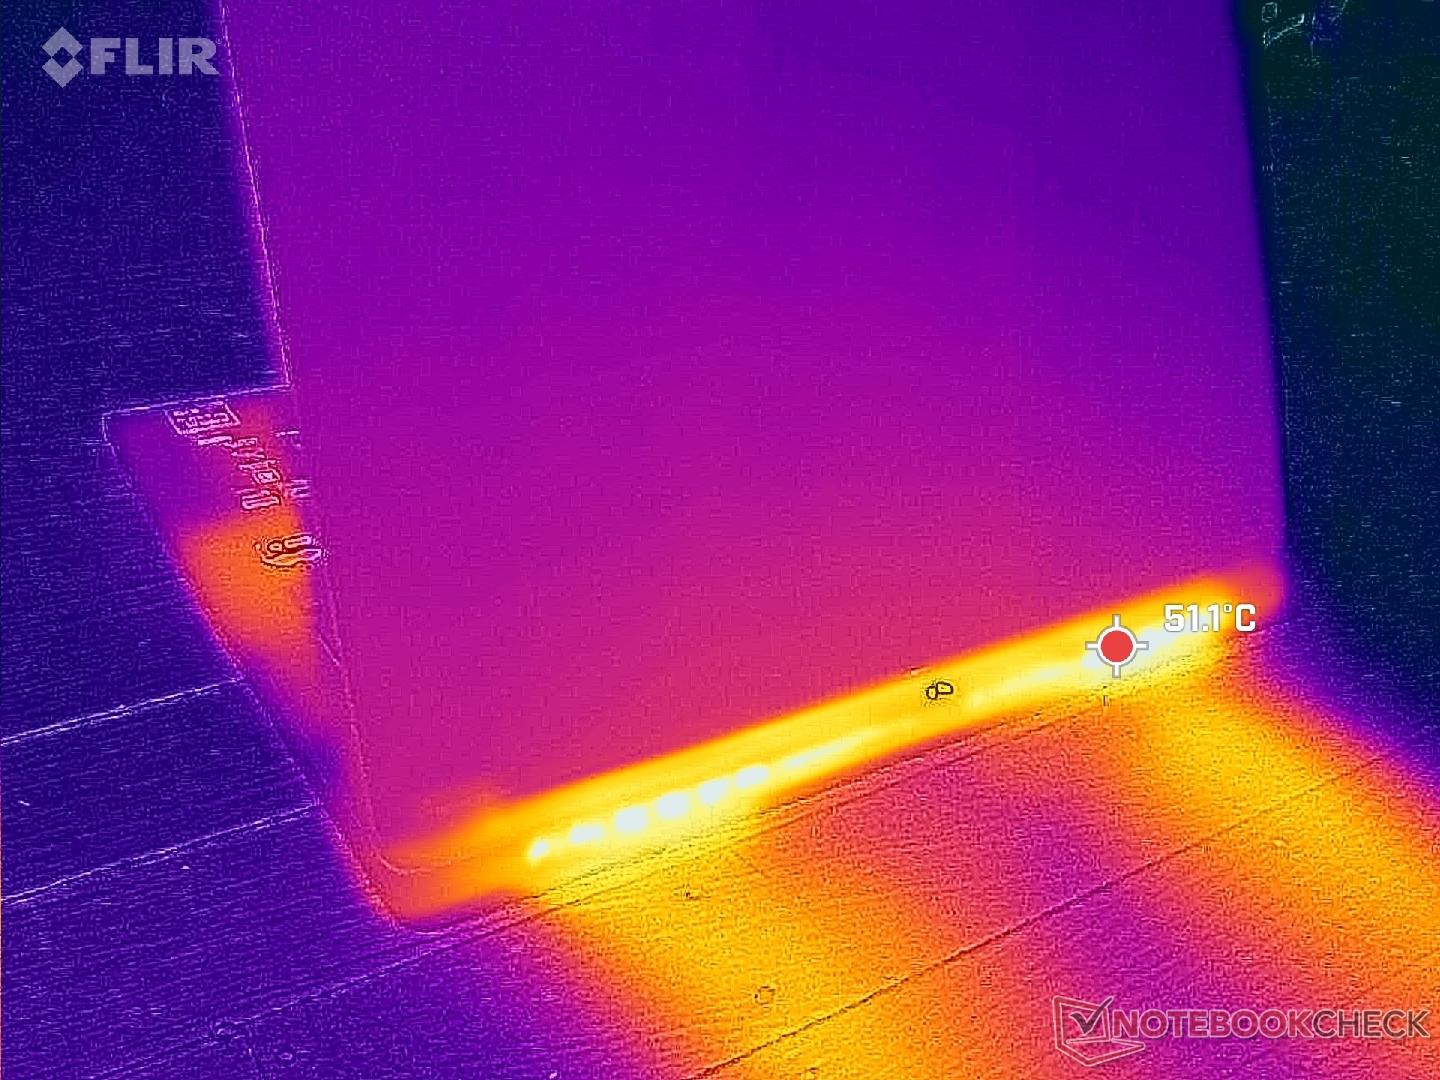
(-) La température maximale du côté supérieur est de 49.8 °C / 122 F, par rapport à la moyenne de 40.5 °C / 105 F, allant de 21.2 à 68.8 °C pour la classe Gaming.
(-) Le fond chauffe jusqu'à un maximum de 46 °C / 115 F, contre une moyenne de 43.2 °C / 110 F
(+) En utilisation inactive, la température moyenne du côté supérieur est de 27.6 °C / 82 F, par rapport à la moyenne du dispositif de 33.9 °C / 93 F.
(±) 3: The average temperature for the upper side is 33.4 °C / 92 F, compared to the average of 33.9 °C / 93 F for the class Gaming.
(±) Les repose-poignets et le pavé tactile peuvent devenir très chauds au toucher, avec un maximum de 36.2 °C / 97.2# F.
(-) La température moyenne de la zone de l'appui-paume de dispositifs similaires était de 28.9 °C / 84 F (-7.3 °C / #-13.2 F).
| Asus TUF Gaming A14 FA401WV-WB94 AMD Ryzen AI 9 HX 370, NVIDIA GeForce RTX 4060 Laptop GPU | Asus ROG Zephyrus G14 2024 GA403U AMD Ryzen 9 8945HS, NVIDIA GeForce RTX 4070 Laptop GPU | Acer Predator Helios Neo 14 (2024) Intel Core Ultra 9 185H, NVIDIA GeForce RTX 4070 Laptop GPU | HP Omen Transcend 14-fb0014 Intel Core Ultra 7 155H, NVIDIA GeForce RTX 4060 Laptop GPU | Razer Blade 14 RZ09-0508 AMD Ryzen 9 8945HS, NVIDIA GeForce RTX 4070 Laptop GPU | Lenovo Legion Slim 5 14APH8 AMD Ryzen 7 7840HS, NVIDIA GeForce RTX 4060 Laptop GPU | |
|---|---|---|---|---|---|---|
| Heat | 5% | -13% | 15% | -4% | 5% | |
| Maximum Upper Side * | 49.8 | 46.6 6% | 57 -14% | 41.2 17% | 41.8 16% | 40.4 19% |
| Maximum Bottom * | 46 | 47.8 -4% | 55 -20% | 39 15% | 42.2 8% | 49.4 -7% |
| Idle Upper Side * | 30.2 | 26.7 12% | 32 -6% | 26.2 13% | 34.8 -15% | 28.2 7% |
| Idle Bottom * | 29.8 | 27.8 7% | 33 -11% | 25.4 15% | 37.4 -26% | 29.8 -0% |
* ... Moindre est la valeur, meilleures sont les performances
Intervenants
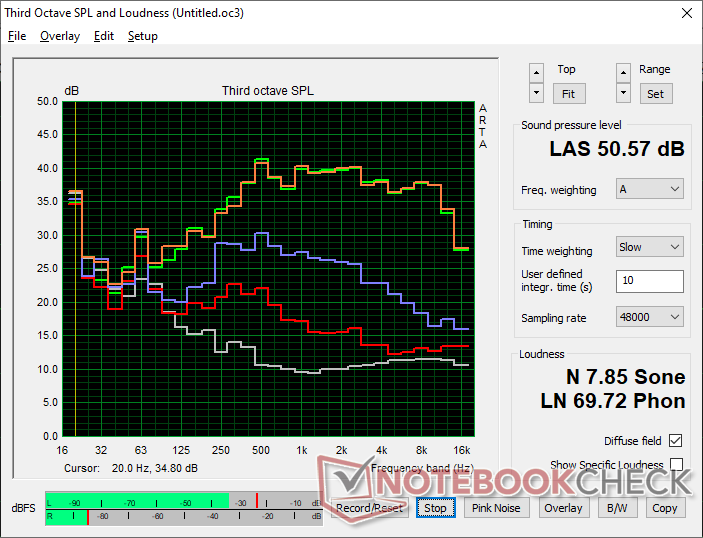
Les haut-parleurs internes sont très faibles, ce qui est sans doute plus problématique sur un ordinateur portable de jeu que sur un ordinateur portable multimédia normal, car ils doivent être plus forts pour compenser le bruit plus élevé du ventilateur. Jouer en mode Turbo sans une bonne paire d'écouteurs pour étouffer le bruit du ventilateur et compenser la faiblesse des haut-parleurs n'est pas une bonne expérience sur cette machine Asus.
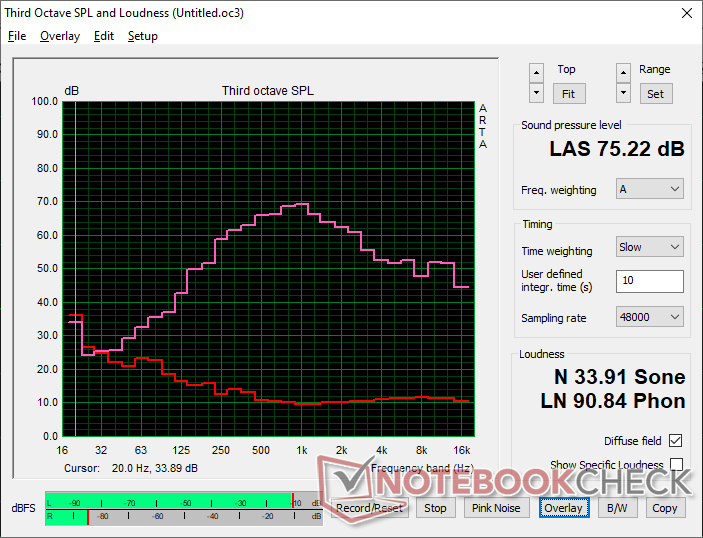
Asus TUF Gaming A14 FA401WV-WB94 analyse audio
(±) | le niveau sonore du haut-parleur est moyen mais bon (75.2# dB)
Bass 100 - 315 Hz
(±) | basse réduite - en moyenne 8.4% inférieure à la médiane
(±) | la linéarité des basses est moyenne (9.7% delta à la fréquence précédente)
Mids 400 - 2000 Hz
(±) | médiane supérieure - en moyenne 10% supérieure à la médiane
(+) | les médiums sont linéaires (4.2% delta à la fréquence précédente)
Aiguës 2 - 16 kHz
(+) | des sommets équilibrés - à seulement 3.8% de la médiane
(+) | les aigus sont linéaires (6.7% delta à la fréquence précédente)
Overall 100 - 16.000 Hz
(±) | la linéarité du son global est moyenne (19.2% de différence avec la médiane)
Par rapport à la même classe
» 63% de tous les appareils testés de cette catégorie étaient meilleurs, 7% similaires, 30% pires
» Le meilleur avait un delta de 6%, la moyenne était de 18%, le pire était de 132%.
Par rapport à tous les appareils testés
» 43% de tous les appareils testés étaient meilleurs, 7% similaires, 50% pires
» Le meilleur avait un delta de 4%, la moyenne était de 25%, le pire était de 134%.
Apple MacBook Pro 16 2021 M1 Pro analyse audio
(+) | les haut-parleurs peuvent jouer relativement fort (84.7# dB)
Bass 100 - 315 Hz
(+) | bonne basse - seulement 3.8% loin de la médiane
(+) | les basses sont linéaires (5.2% delta à la fréquence précédente)
Mids 400 - 2000 Hz
(+) | médiane équilibrée - seulement 1.3% de la médiane
(+) | les médiums sont linéaires (2.1% delta à la fréquence précédente)
Aiguës 2 - 16 kHz
(+) | des sommets équilibrés - à seulement 1.9% de la médiane
(+) | les aigus sont linéaires (2.7% delta à la fréquence précédente)
Overall 100 - 16.000 Hz
(+) | le son global est linéaire (4.6% différence à la médiane)
Par rapport à la même classe
» 0% de tous les appareils testés de cette catégorie étaient meilleurs, 0% similaires, 100% pires
» Le meilleur avait un delta de 5%, la moyenne était de 18%, le pire était de 45%.
Par rapport à tous les appareils testés
» 0% de tous les appareils testés étaient meilleurs, 0% similaires, 100% pires
» Le meilleur avait un delta de 4%, la moyenne était de 25%, le pire était de 134%.
Gestion de l'énergie
Consommation électrique
La consommation globale est relativement élevée, même en mode ralenti sur le bureau, en fonction de vos paramètres. Si vous utilisez les modes Battery Saver et MSHybrid, par exemple, la consommation peut descendre à 9 W. L'activation des modes dGPU et Turbo fait grimper la consommation à 23 W.
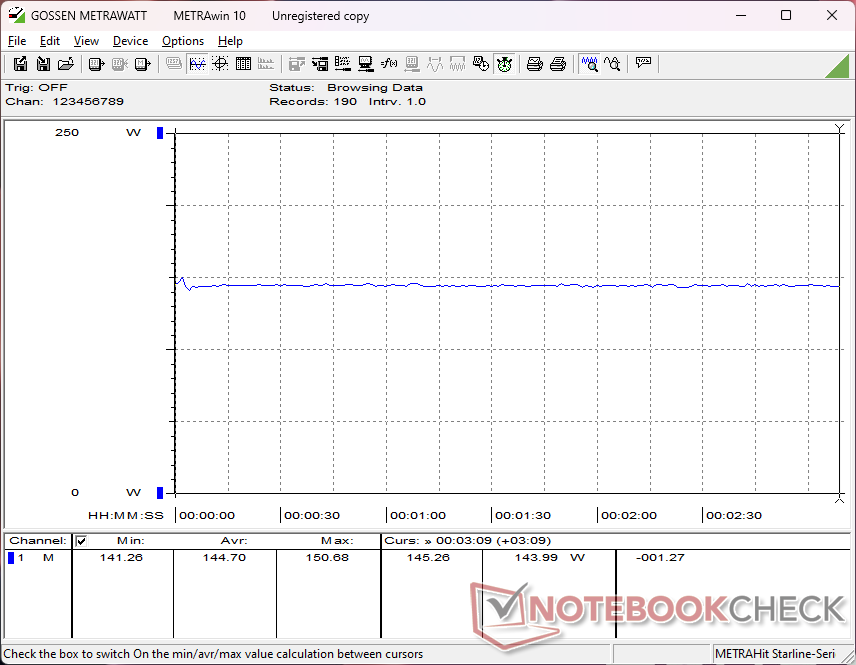
La consommation dans les jeux est proche de celle que nous avons enregistrée sur l'ordinateur de bureau Lenovo Legion Slim 5 14 tout en étant sensiblement plus élevée que sur l'Omen Transcend 14 Omen Transcend 14 tous équipés du même GPU RTX 4060. Ceci est normal car le GPU du modèle HP vise un TGP inférieur de 65 W et sa consommation est donc inférieure d'environ 35 W à celle de notre Asus.
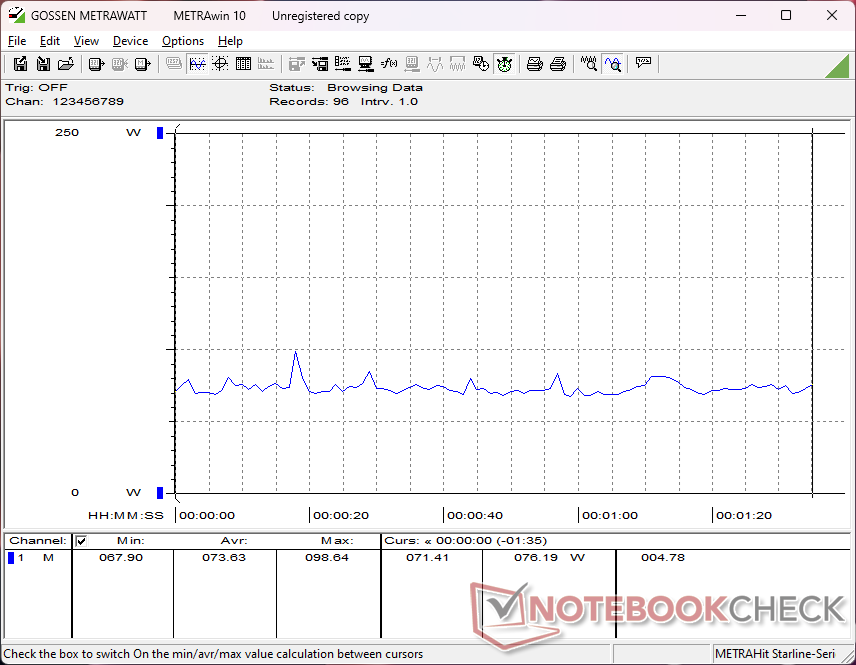
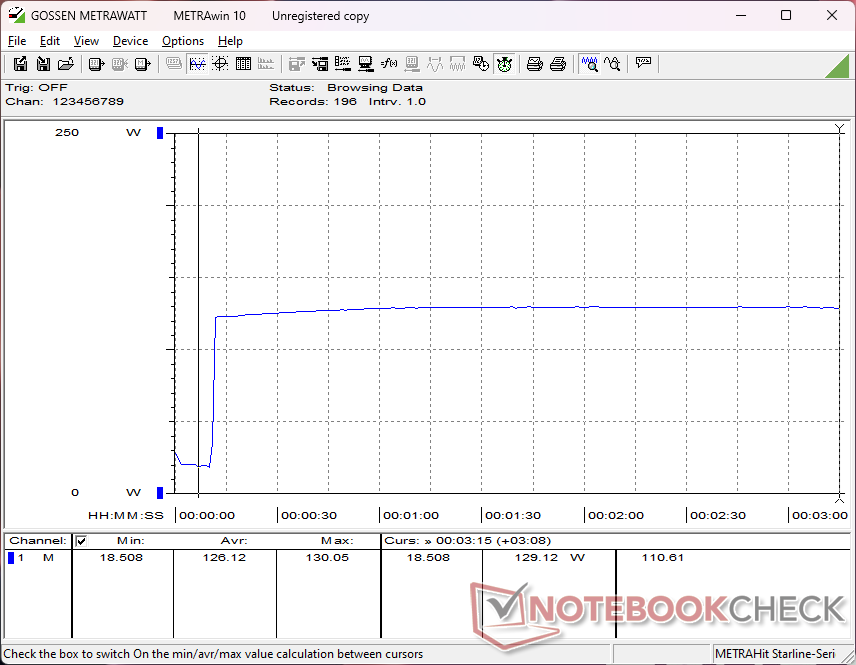
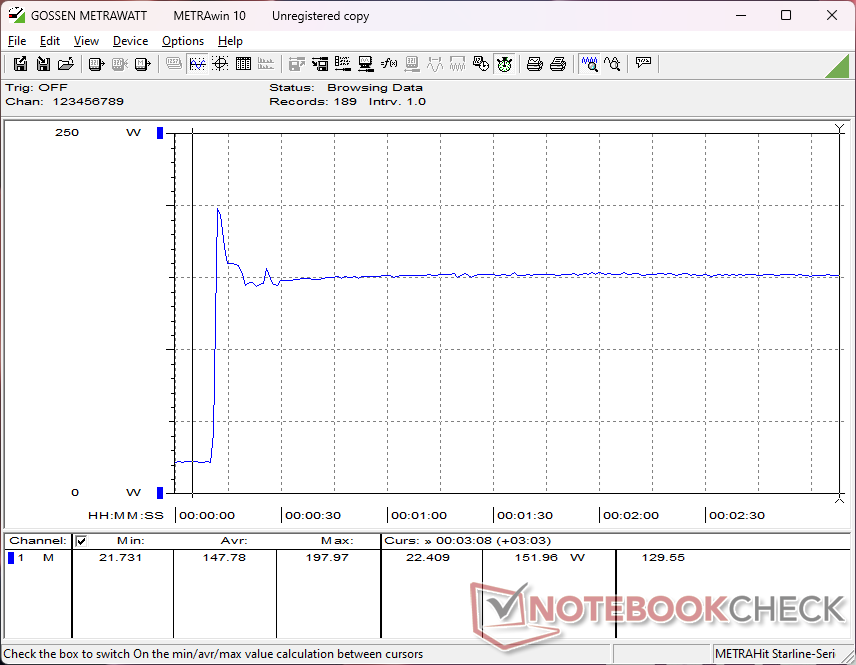
Il est intéressant de noter que le Ryzen AI 9 demande beaucoup plus d'énergie que le Ryzen 9 8945HS de la génération précédente lorsqu'il est en pleine charge. En exécutant Prime95, par exemple, la consommation du système est de 129 W en moyenne, contre 95 W sur le récent ROG Zephyrus G14. La performance par watt d'une année sur l'autre ne s'est donc pas améliorée autant que la performance brute.
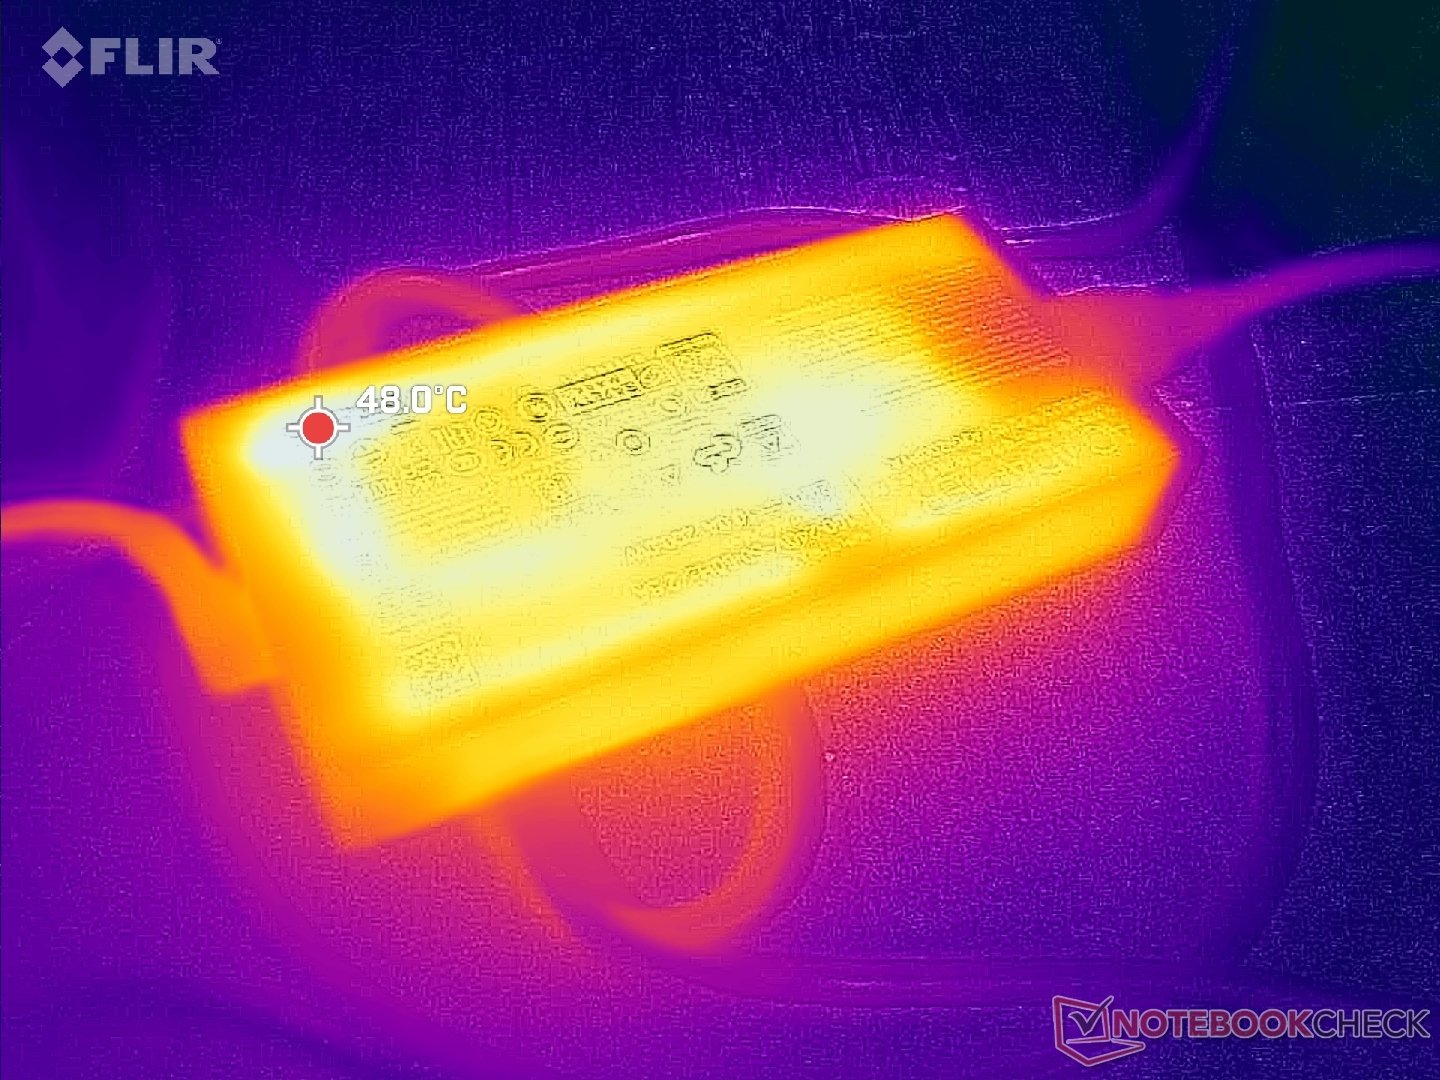
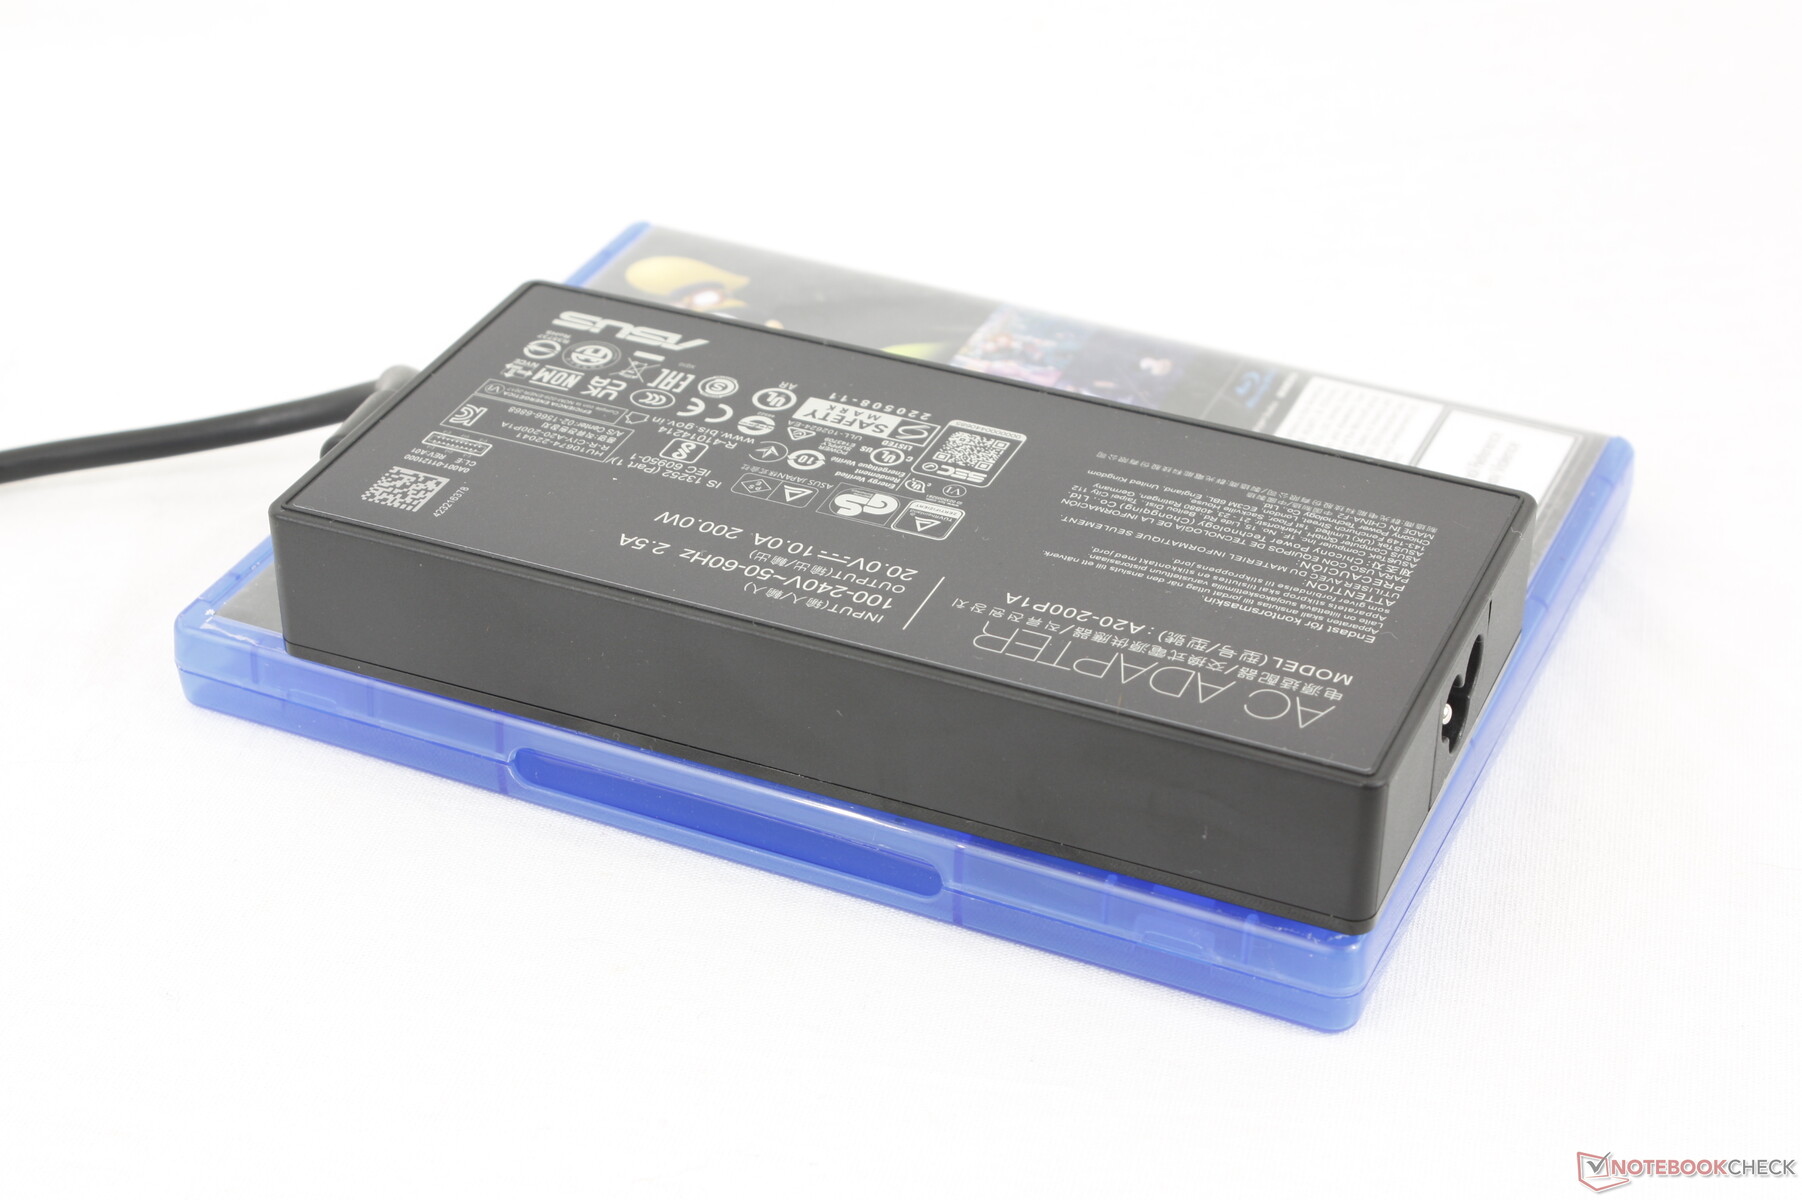
Nous avons pu enregistrer une consommation maximale temporaire de 198 W sur l'adaptateur secteur de taille moyenne (15,2 x 7,2 x 2,3 cm) de 200 W lorsque le CPU et le GPU sont utilisés à 100 %.
| Éteint/en veille | |
| Au repos | |
| Fortement sollicité |
|
Légende:
min: | |
| Asus TUF Gaming A14 FA401WV-WB94 Ryzen AI 9 HX 370, NVIDIA GeForce RTX 4060 Laptop GPU, WD PC SN560 SDDPNQE-1T00, IPS, 2560x1600, 14" | Asus ROG Zephyrus G14 2024 GA403U R9 8945HS, NVIDIA GeForce RTX 4070 Laptop GPU, WD PC SN560 SDDPNQE-1T00, OLED, 2880x1800, 14" | HP Omen Transcend 14-fb0014 Ultra 7 155H, NVIDIA GeForce RTX 4060 Laptop GPU, WDC PC SN810 1TB, OLED, 2880x1800, 14" | Razer Blade 14 RZ09-0508 R9 8945HS, NVIDIA GeForce RTX 4070 Laptop GPU, Samsung PM9A1 MZVL21T0HCLR, IPS, 2560x1600, 14" | Lenovo Legion Slim 5 14APH8 R7 7840HS, NVIDIA GeForce RTX 4060 Laptop GPU, SK Hynix HFS001TEJ9X115N, OLED, 2880x1600, 14.5" | Alienware x14 i7 RTX 3060 i7-12700H, GeForce RTX 3060 Laptop GPU, WDC PC SN810 1TB, IPS, 1920x1080, 14" | |
|---|---|---|---|---|---|---|
| Power Consumption | 28% | 8% | -51% | 19% | 14% | |
| Idle Minimum * | 9.1 | 6.9 24% | 9.1 -0% | 20.9 -130% | 7.3 20% | 7.9 13% |
| Idle Average * | 15.3 | 8.6 44% | 12.6 18% | 25.6 -67% | 9.6 37% | 11.1 27% |
| Idle Maximum * | 22.6 | 9 60% | 27.4 -21% | 32.1 -42% | 17.3 23% | 11.8 48% |
| Load Average * | 72.1 | 75.2 -4% | 63.5 12% | 72.7 -1% | 76.6 -6% | 107.4 -49% |
| Cyberpunk 2077 ultra external monitor * | 141.7 | |||||
| Cyberpunk 2077 ultra * | 144.7 | |||||
| Load Maximum * | 198 | 161.6 18% | 135.3 32% | 228.4 -15% | 160.9 19% | 140.4 29% |
| Witcher 3 ultra * | 109.7 | 118.9 | 182.1 | 152 | 111 |
* ... Moindre est la valeur, meilleures sont les performances
Power Consumption Cyberpunk / Stress Test
Power Consumption external Monitor
Autonomie de la batterie
La capacité de la batterie est identique à celle du Zephyrus G14 avec 73 Wh. L'autonomie est cependant plus courte d'environ deux heures lors de notre test WLAN, même en mode MSHybrid et avec le profil d'alimentation Windows Balanced. Les 7 heures et plus d'utilisation du navigateur sont tout de même assez bonnes pour un ordinateur portable de jeu de 14 pouces.
Le chargement de la batterie vide à la pleine capacité est rapide avec un peu plus de 60 minutes, comparé à 90 minutes sur la plupart des autres ordinateurs portables. Le chargement via un adaptateur secteur USB-C tiers est pris en charge, bien qu'à des taux plus lents.
| Asus TUF Gaming A14 FA401WV-WB94 Ryzen AI 9 HX 370, NVIDIA GeForce RTX 4060 Laptop GPU, 73 Wh | Asus ROG Zephyrus G14 2024 GA403U R9 8945HS, NVIDIA GeForce RTX 4070 Laptop GPU, 73 Wh | Acer Predator Helios Neo 14 (2024) Ultra 9 185H, NVIDIA GeForce RTX 4070 Laptop GPU, 76 Wh | HP Omen Transcend 14-fb0014 Ultra 7 155H, NVIDIA GeForce RTX 4060 Laptop GPU, 71 Wh | Razer Blade 14 RZ09-0508 R9 8945HS, NVIDIA GeForce RTX 4070 Laptop GPU, 68 Wh | Lenovo Legion Slim 5 14APH8 R7 7840HS, NVIDIA GeForce RTX 4060 Laptop GPU, 73.6 Wh | |
|---|---|---|---|---|---|---|
| Autonomie de la batterie | -6% | 11% | -8% | -20% | -9% | |
| Reader / Idle | 662 | 808 22% | 622 -6% | 480 -27% | 629 -5% | |
| WiFi v1.3 | 421 | 555 32% | 519 23% | 517 23% | 428 2% | 448 6% |
| Load | 112 | 64 -43% | 100 -11% | 66 -41% | 72 -36% | 80 -29% |
| H.264 | 725 | 555 |
Points positifs
Points négatifs
Verdict - Une excellente alternative au Zephyrus G14, qui est très cher
Le TUF Gaming A14 est une alternative intéressante au modèle haut de gamme ROG Zephyrus G14 plus haut de gamme. Bien qu'il soit dépourvu de certaines caractéristiques luxueuses telles qu'un clavier en métal, un éclairage RGB du clavier et des options OLED, il les compense par une bonne variété de ports, un clavier étonnamment confortable et un poids très léger. Ce modèle convient donc parfaitement à ceux qui recherchent une machine de jeu sous-compacte pouvant servir de machine de travail en classe.
Le TUF Gaming A14 offre presque autant que le ROG Zephyrus G14, mais pour plusieurs centaines de dollars de moins. Il équilibre très bien la productivité et le jeu pour sa taille, mais préparez-vous à des ventilateurs bruyants et à des températures élevées si vous poussez le système à ses limites.
La plus grande limitation de ce modèle est peut-être son manque d'options de GPU supérieures à la RTX 4060 de GeForce. 1500$ pour un PC GeForce RTX 4060 est une demande difficile, surtout maintenant que le GPU a presque deux ans. Les utilisateurs qui veulent maximiser les performances de jeu et qui n'ont pas peur de renoncer aux performances du NPU peuvent probablement trouver un ROG Zephyrus G14 2023 plus ancien avec des graphiques RTX 4070 plus rapides à peu près au même prix que notre TUF Gaming A14. Les performances supplémentaires du processeur Ryzen AI 9 sont agréables à avoir, mais elles peuvent être excessives pour les jeux lorsqu'elles sont associées à la RTX 4060 de milieu de gamme.
Prix et disponibilité
Walmart livre actuellement l'Asus TUF Gaming A14 FA401WV l'Asus TUF Gaming A14 FA401WV que nous avons testé pour $1500.
Note : Nous avons récemment mis à jour notre système d'évaluation et les résultats de la version 8 ne sont pas comparables à ceux de la version 7. De plus amples informations sont disponibles ici .
Asus TUF Gaming A14 FA401WV-WB94
- 08/27/2024 v8
Allen Ngo
 Total Sustainability Score:
 Transparency
The selection of devices to be reviewed is made by our editorial team. The test sample was provided to the author as a loan by the manufacturer or retailer for the purpose of this review. The lender had no influence on this review, nor did the manufacturer receive a copy of this review before publication. There was no obligation to publish this review. We never accept compensation or payment in return for our reviews. As an independent media company, Notebookcheck is not subjected to the authority of manufacturers, retailers or publishers.
This is how Notebookcheck is testing
Every year, Notebookcheck independently reviews hundreds of laptops and smartphones using standardized procedures to ensure that all results are comparable. We have continuously developed our test methods for around 20 years and set industry standards in the process. In our test labs, high-quality measuring equipment is utilized by experienced technicians and editors. These tests involve a multi-stage validation process. Our complex rating system is based on hundreds of well-founded measurements and benchmarks, which maintains objectivity. Further information on our test methods can be found here.
Price comparison

