

Test du Lenovo IdeaPad Pro 5 16IMH G9 : GeForce RTX 4050 90 W proche de la RTX 4060

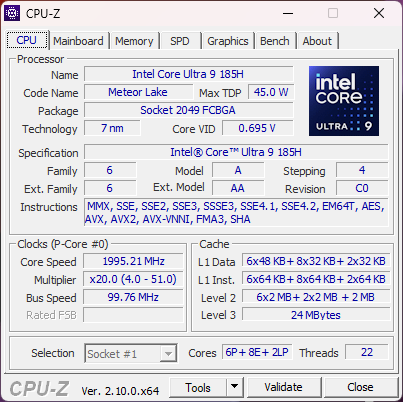
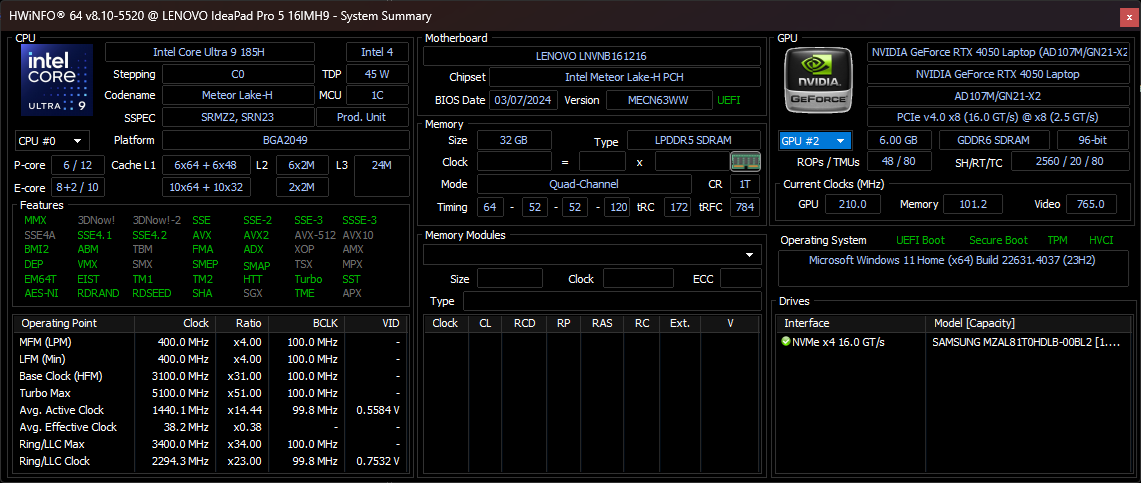
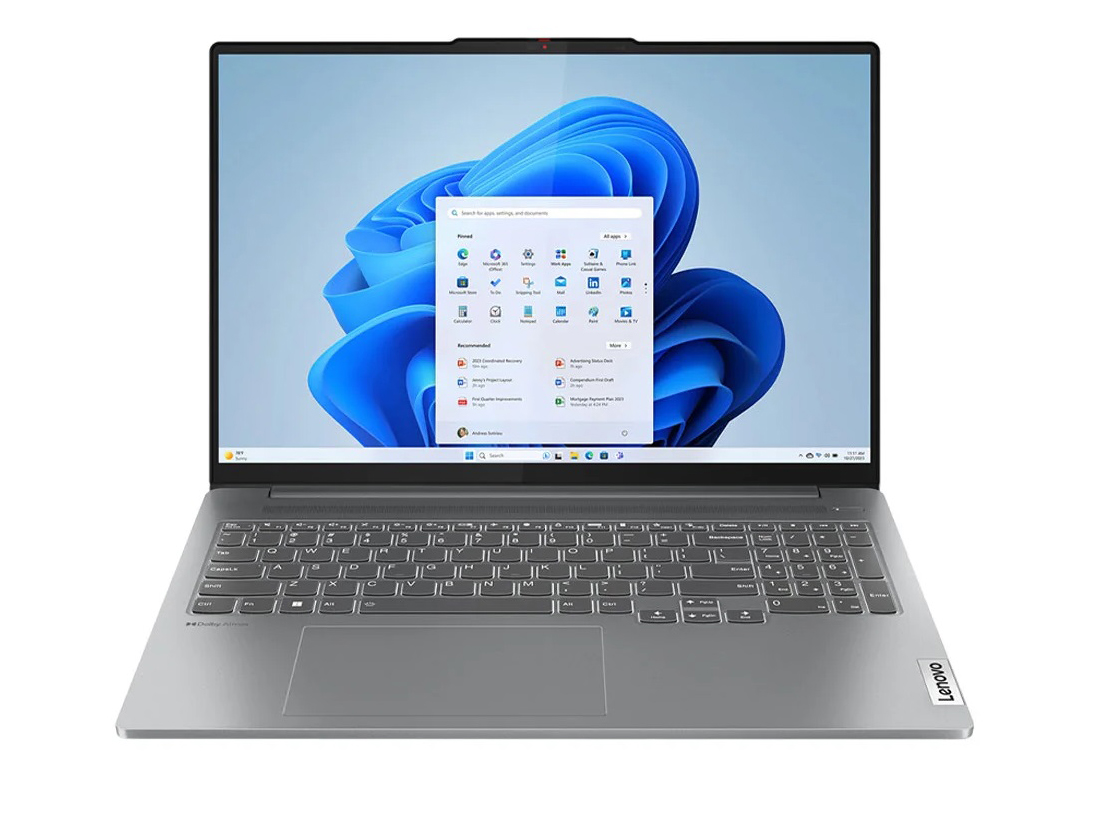
Après avoir récemment testé l'IdeaPad Pro 5 16IMH moins cher IdeaPad Pro 5 16IMH iGPU et IPS, nous sommes maintenant prêts à examiner la configuration dGPU et OLED, plus coûteuse. Notre unité de test spécifique est équipée d'options haut de gamme, y compris le Core Ultra 9 185H de Meteor Lake pour 1500 $ au détail. Il s'agit également de l'un des rares ordinateurs portables multimédias ultrafins dotés d'une RTX 4050 de 90 W ( GeForce ), alors que la plupart des autres ordinateurs de cette catégorie visent généralement des plafonds de TGP plus bas.
L'IdeaPad Pro 5 16 G9 se distingue de l'ordinateur vedette Yoga Pro 9i 16 G9. Ce dernier, par exemple, offre des options mini-LED et RTX 4070 qui ne sont pas disponibles sur l'IdeaPad.
Les alternatives à l'IdeaPad Pro 5 16IMH comprennent d'autres ordinateurs portables multimédias de 16 pouces de milieu de gamme à haut de gamme, comme le Dell Inspiron 16 7640 2-en-1, L'Asus Zenbook S16, Samsung Galaxy Book4 Ultraou la série Série HP Envy. Nous vous recommandons de consulter notre avis sur l'iGPU IdeaPad Pro 5 16IMH G9 pour en savoir plus sur les caractéristiques physiques du modèle. Une version plus petite de 14 pouces de ce modèle est également disponible sous le nom de IdeaPad Pro 5 14 G9.
Plus d'avis Lenovo :
Comparaison avec les concurrents potentiels
Note | Version | Date | Modèle | Poids | Épaisseur | Taille | Résolution | Meilleur prix |
|---|---|---|---|---|---|---|---|---|
| 84.7 % | v8 | 09/24 | Lenovo IdeaPad Pro 5 16IMH G9 RTX 4050 Ultra 9 185H, NVIDIA GeForce RTX 4050 Laptop GPU | 2 kg | 18.95 mm | 16.00" | 2048x1280 | |
| 87.9 % v7 (old) | v7 (old) | 05/24 | Lenovo IdeaPad Pro 5 16IMH G9 Ultra 7 155H, Arc 8-Core | 1.9 kg | 17.5 mm | 16.00" | 2560x1600 | |
| 82.1 % | v8 | 07/24 | Dell Inspiron 16 7640 2-in-1 Ultra 7 155H, Arc 8-Core | 2.1 kg | 18.99 mm | 16.00" | 2560x1600 | |
| 84.7 % | v8 | 07/24 | Asus Zenbook S 16 UM5606-RK333W Ryzen AI 9 HX 370, Radeon 890M | 1.5 kg | 12.9 mm | 16.00" | 2880x1800 | |
| 87.2 % v7 (old) | v7 (old) | 05/24 | HP Envy x360 2-in-1 16-ad0097nr R7 8840HS, Radeon 780M | 1.8 kg | 18.3 mm | 16.00" | 2880x1800 | |
| 90.4 % v7 (old) | v7 (old) | 03/24 | Samsung Galaxy Book4 Ultra Ultra 7 155H, NVIDIA GeForce RTX 4050 Laptop GPU | 1.8 kg | 17 mm | 16.00" | 2880x1800 |
Note : Nous avons récemment mis à jour notre système d'évaluation et les résultats de la version 8 ne sont pas comparables à ceux de la version 7. De plus amples informations sont disponibles ici .
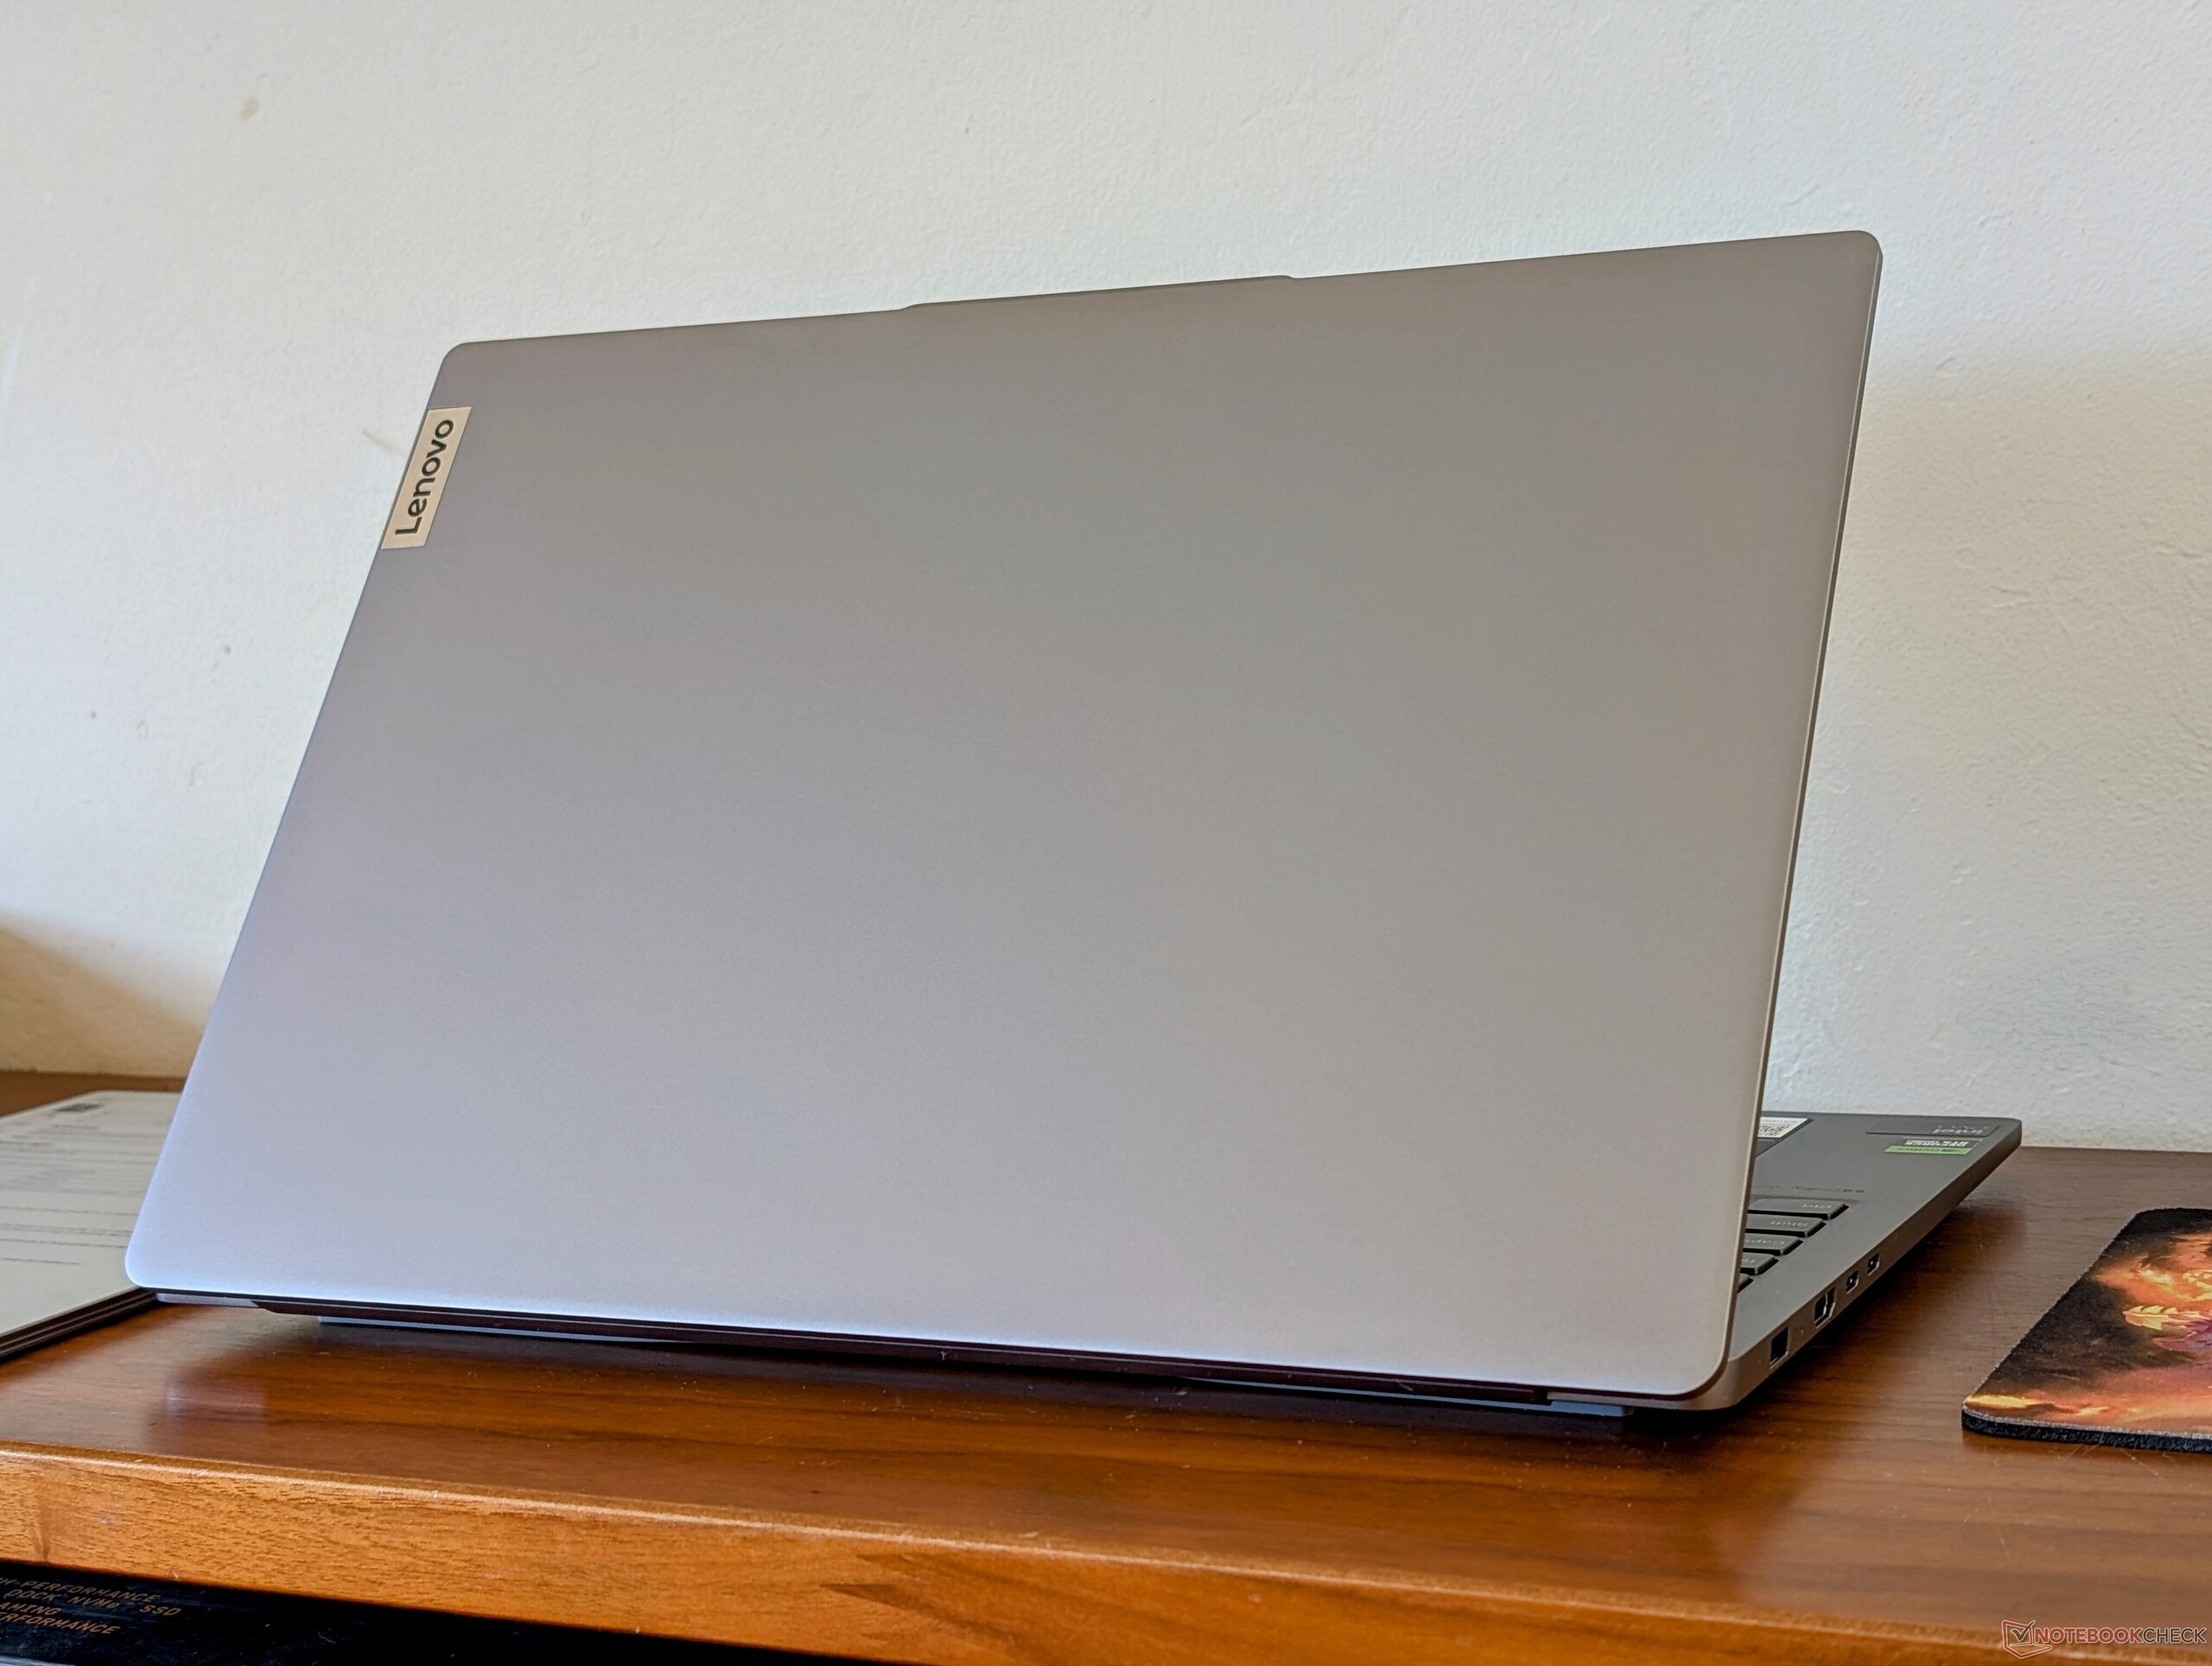
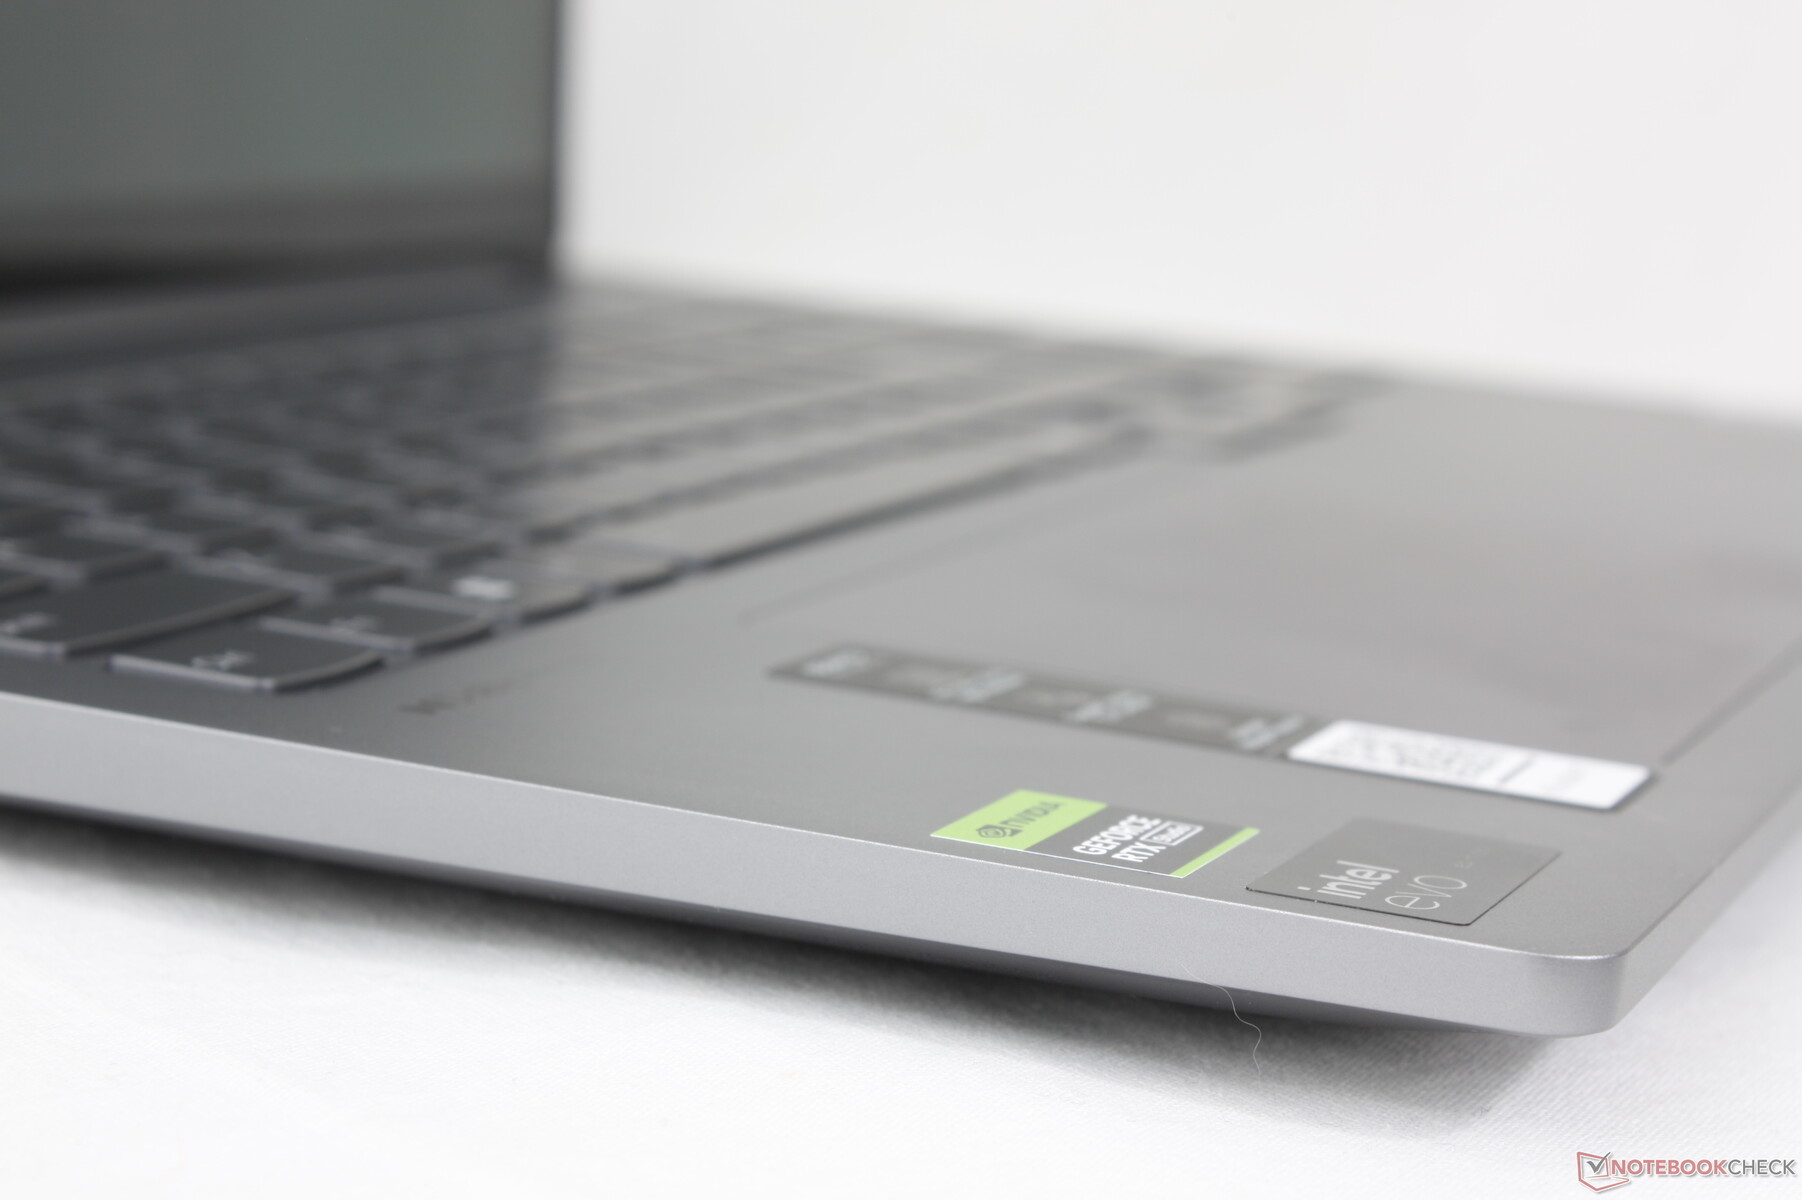
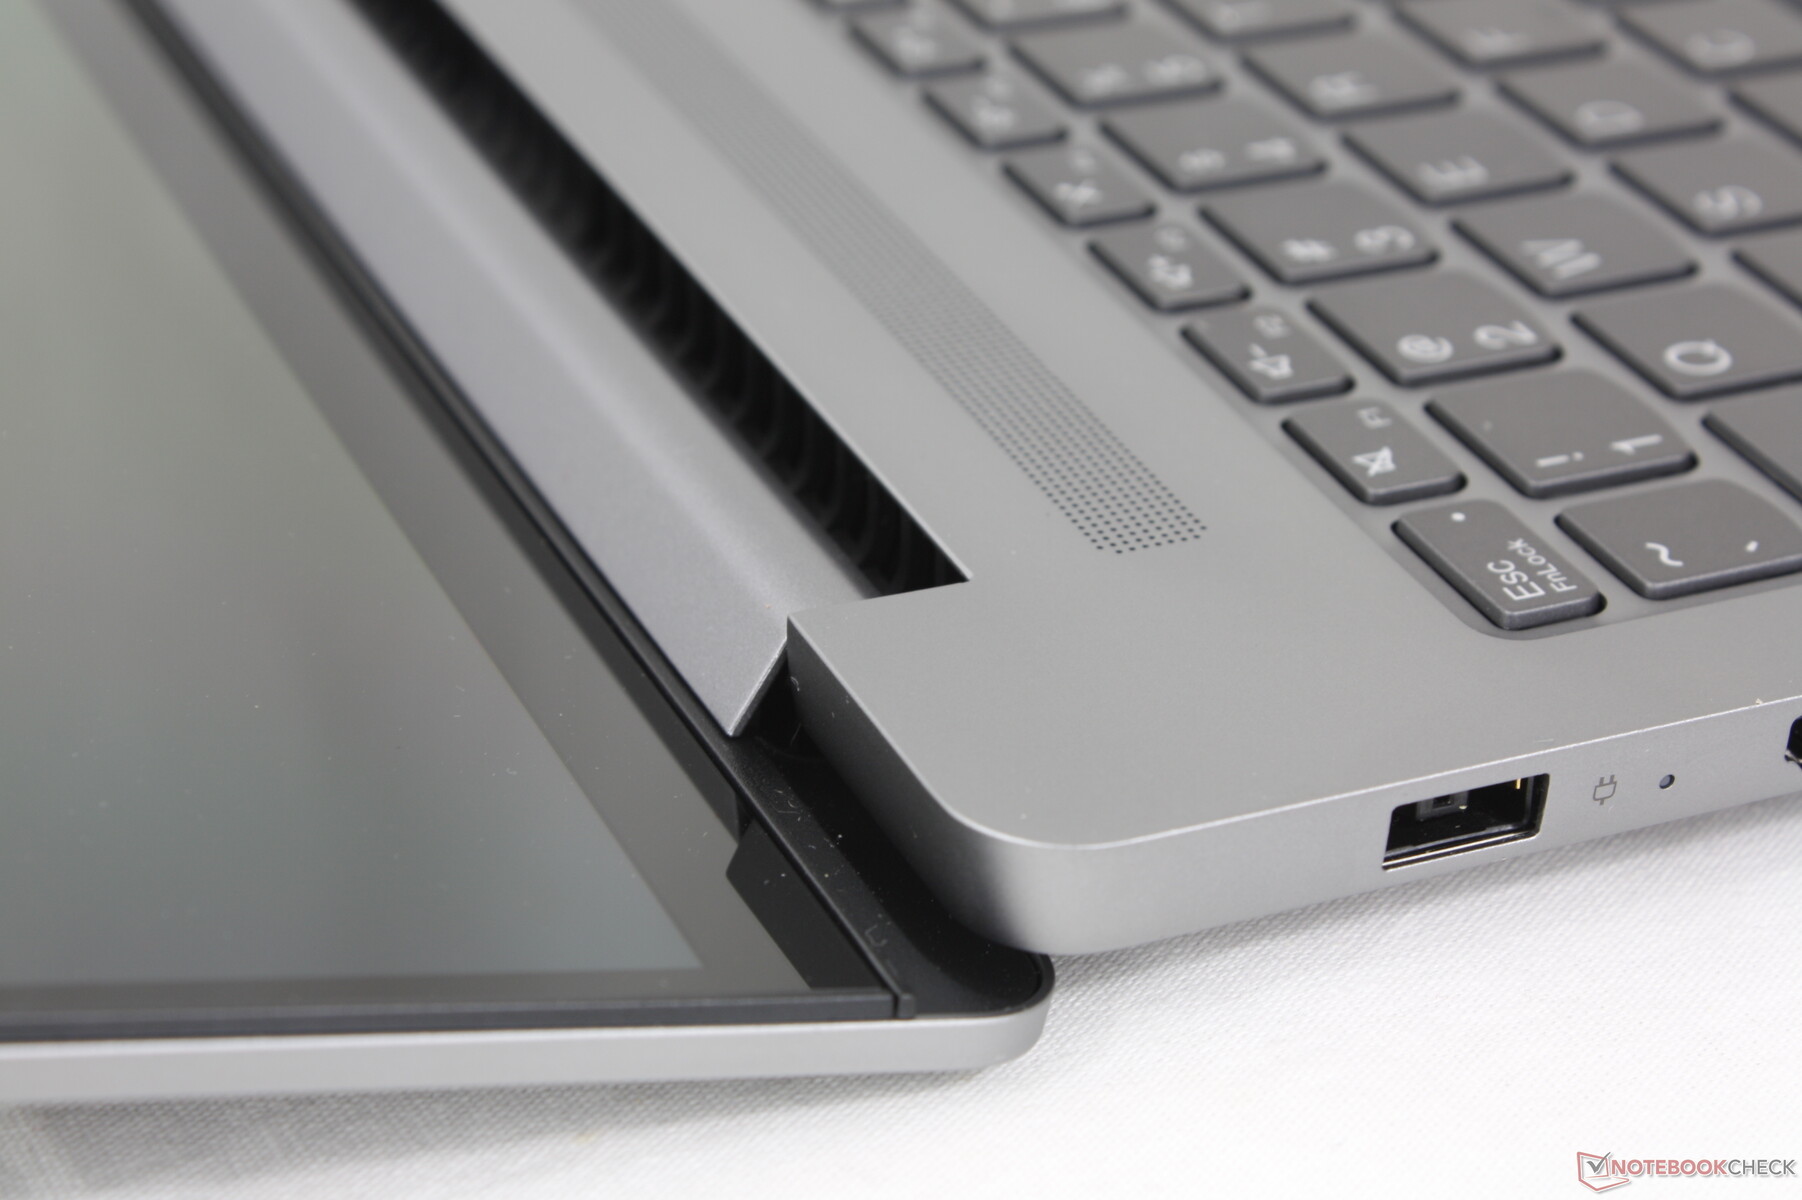
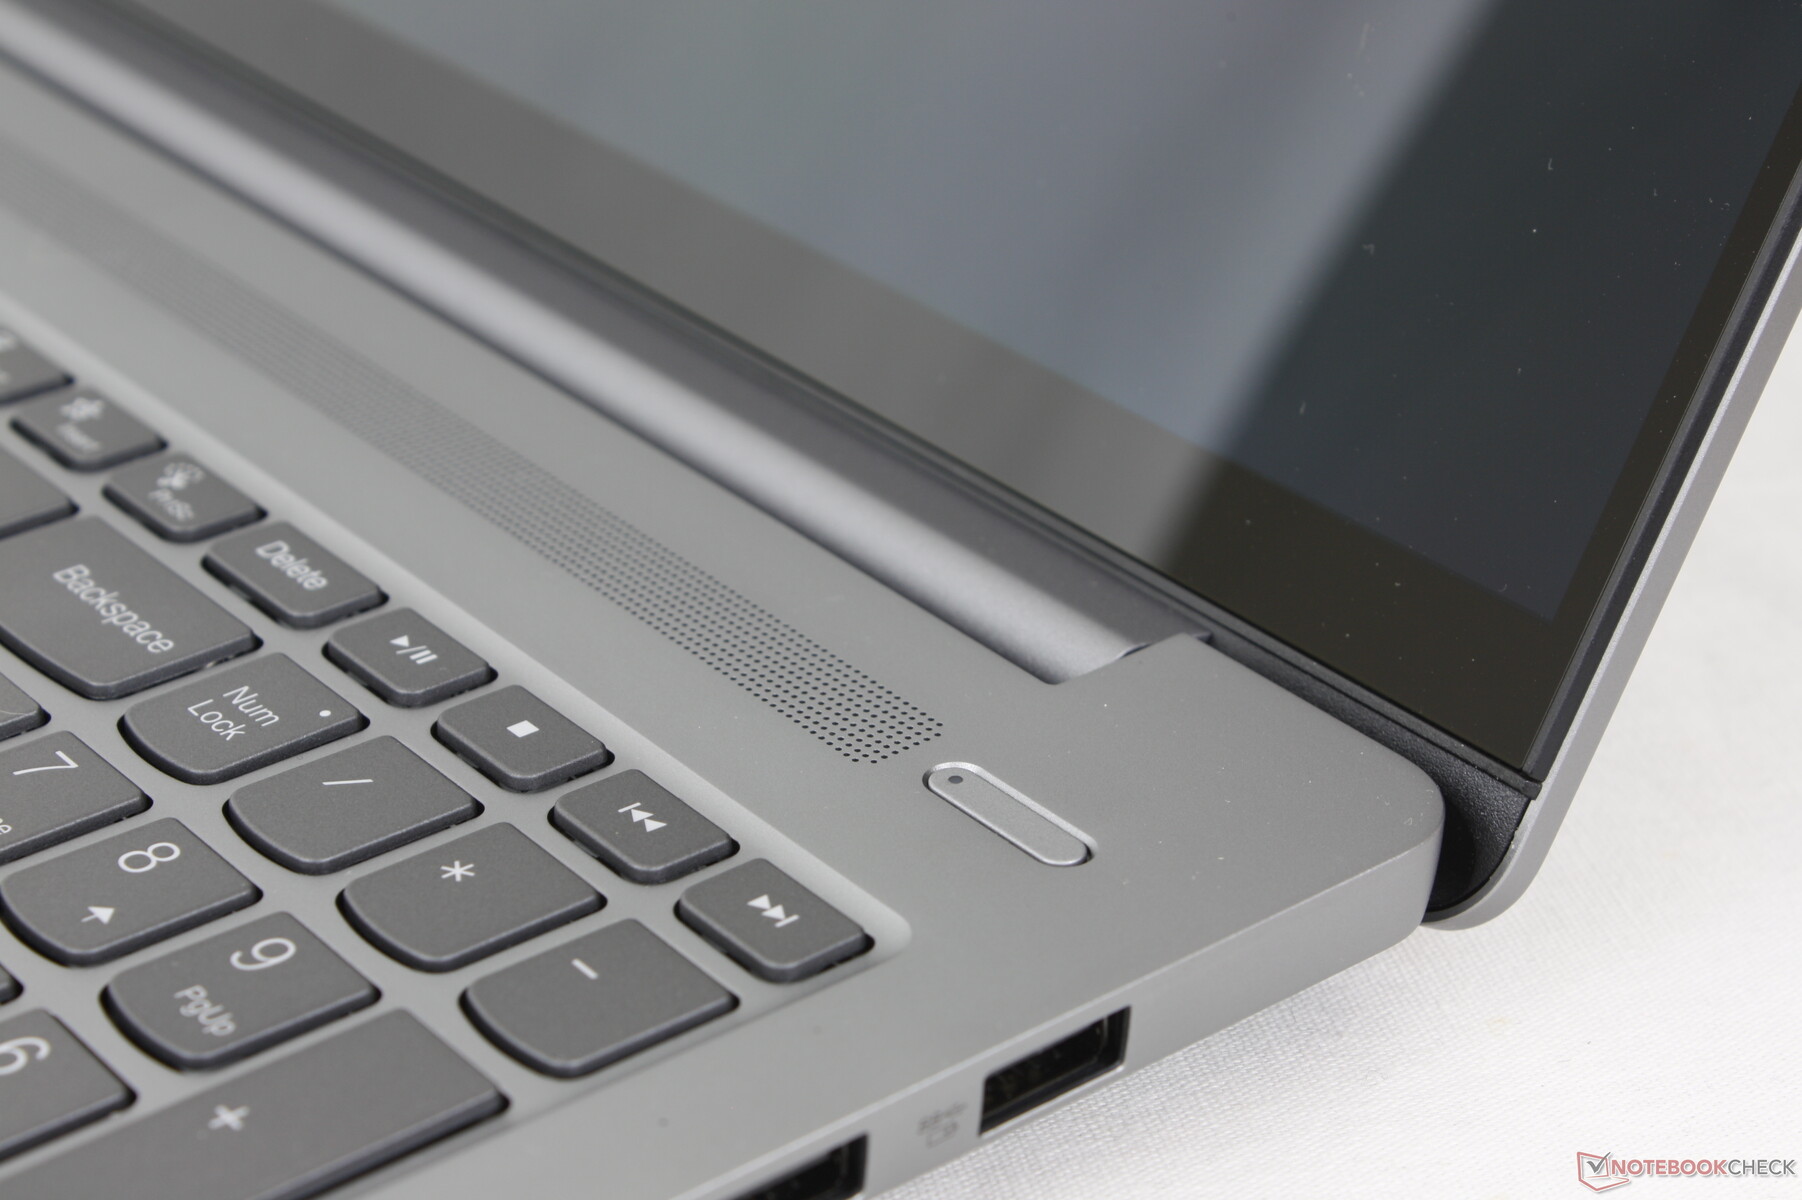
Cas
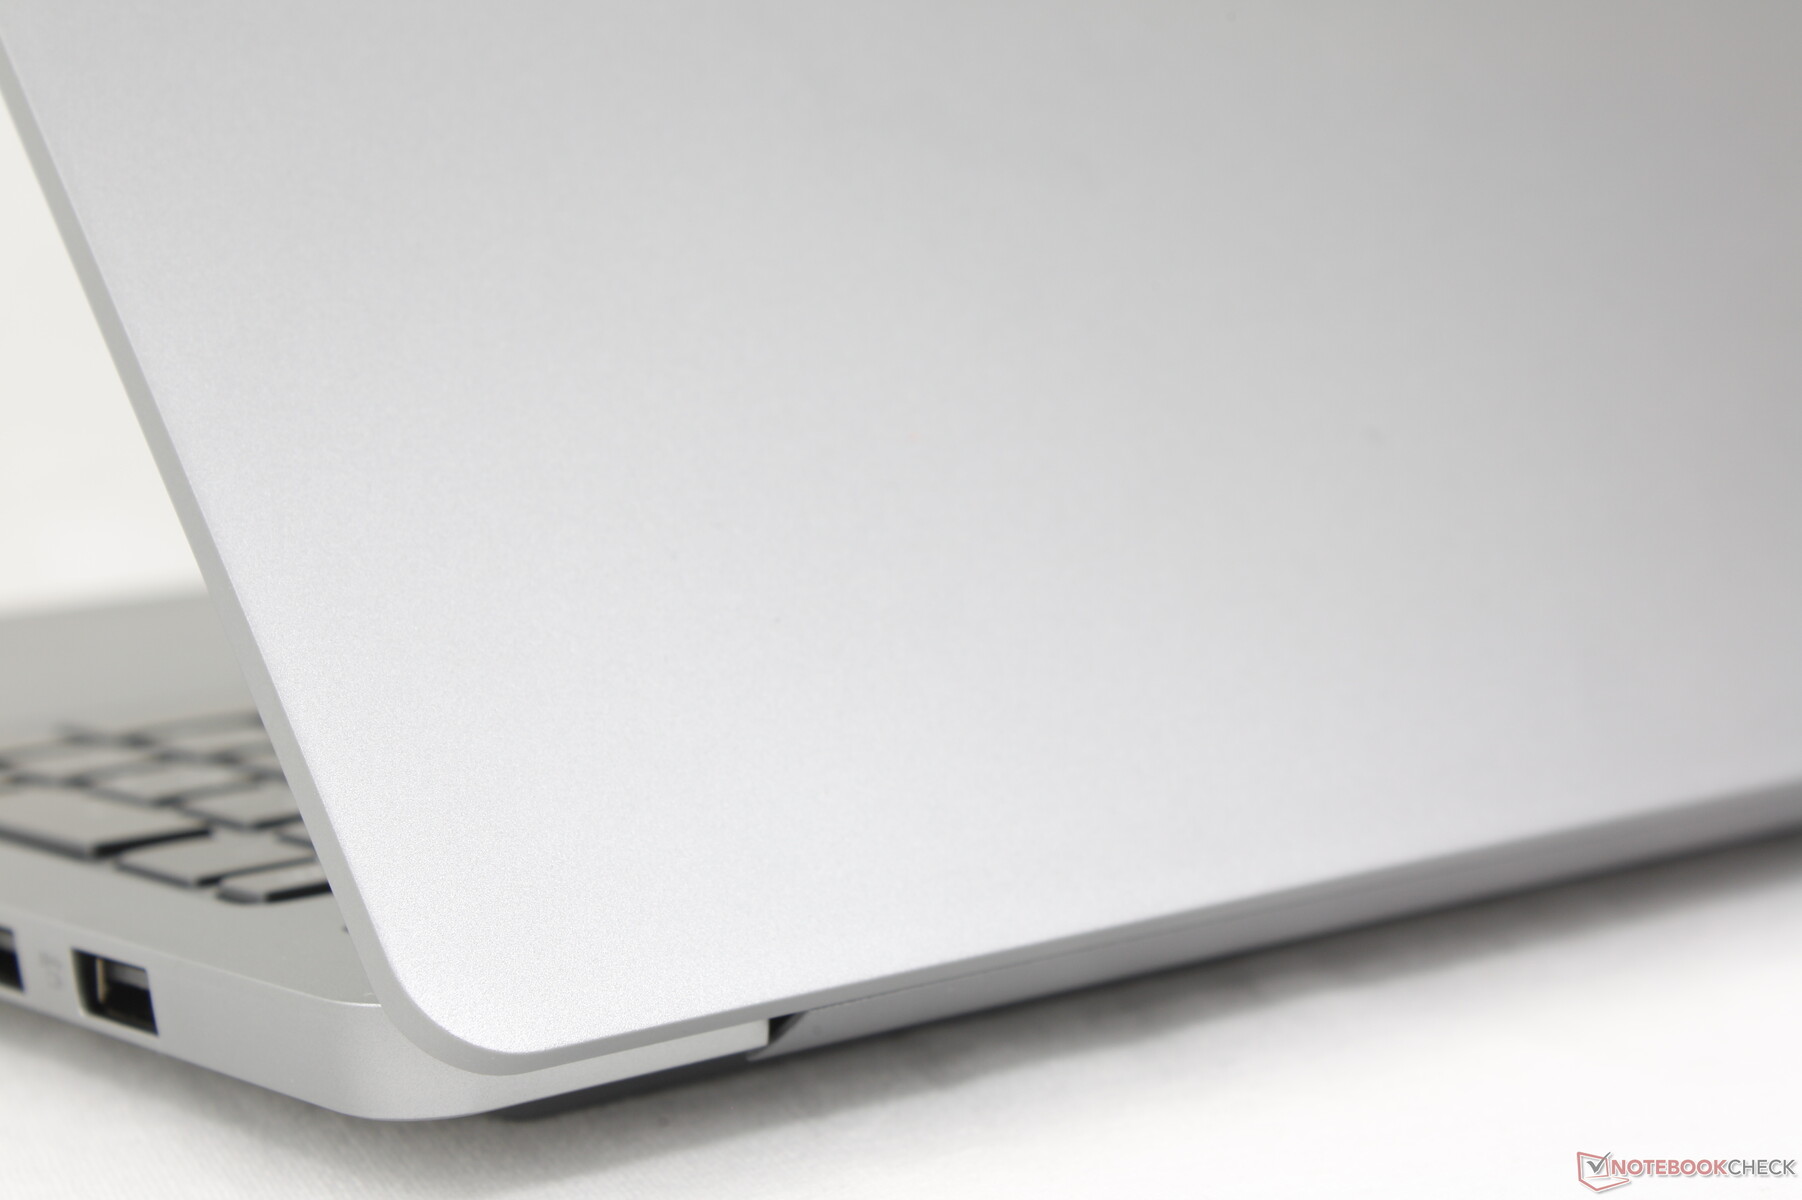
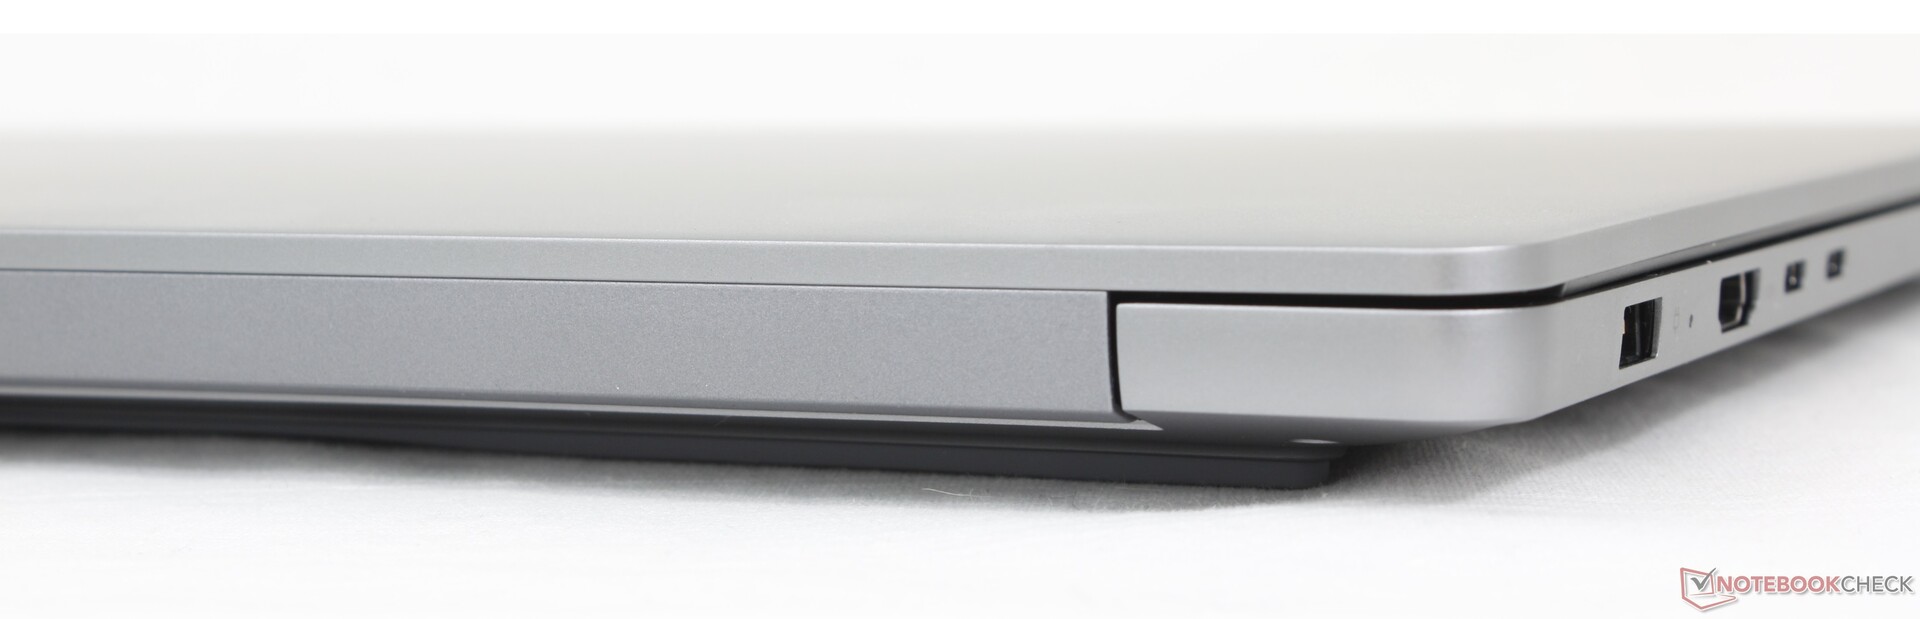
Le châssis intègre un port dédié à l'adaptateur secteur sur le bord gauche, ce qui permet de distinguer visuellement les configurations iGPU et dGPU. Le GPU et le panneau OLED ajoutent environ 100 g au poids total et notre appareil n'est donc pas beaucoup plus lourd que l'option iGPU de base. Les dimensions, le design et les matériaux restent inchangés.

Connectivité
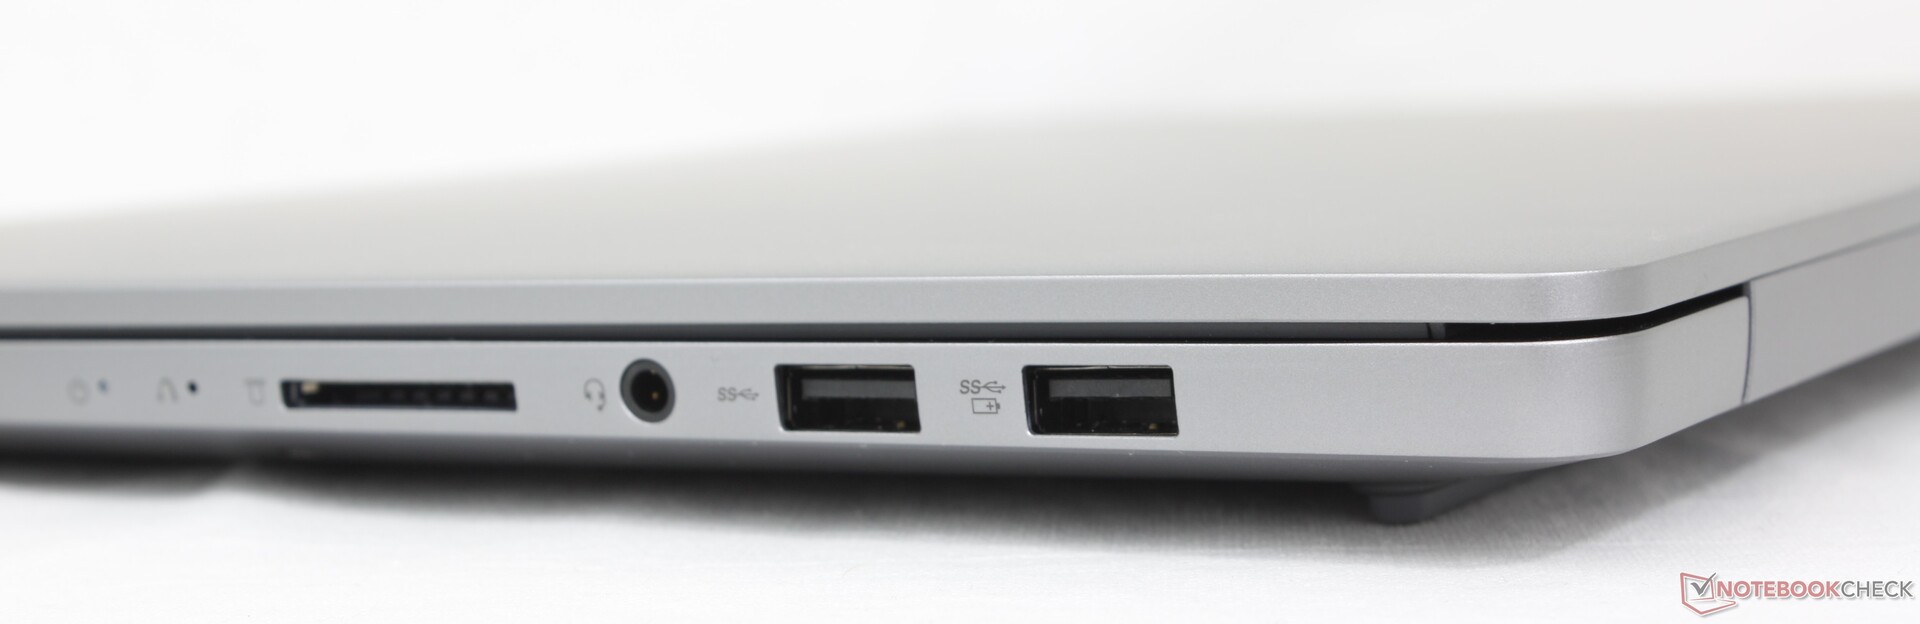
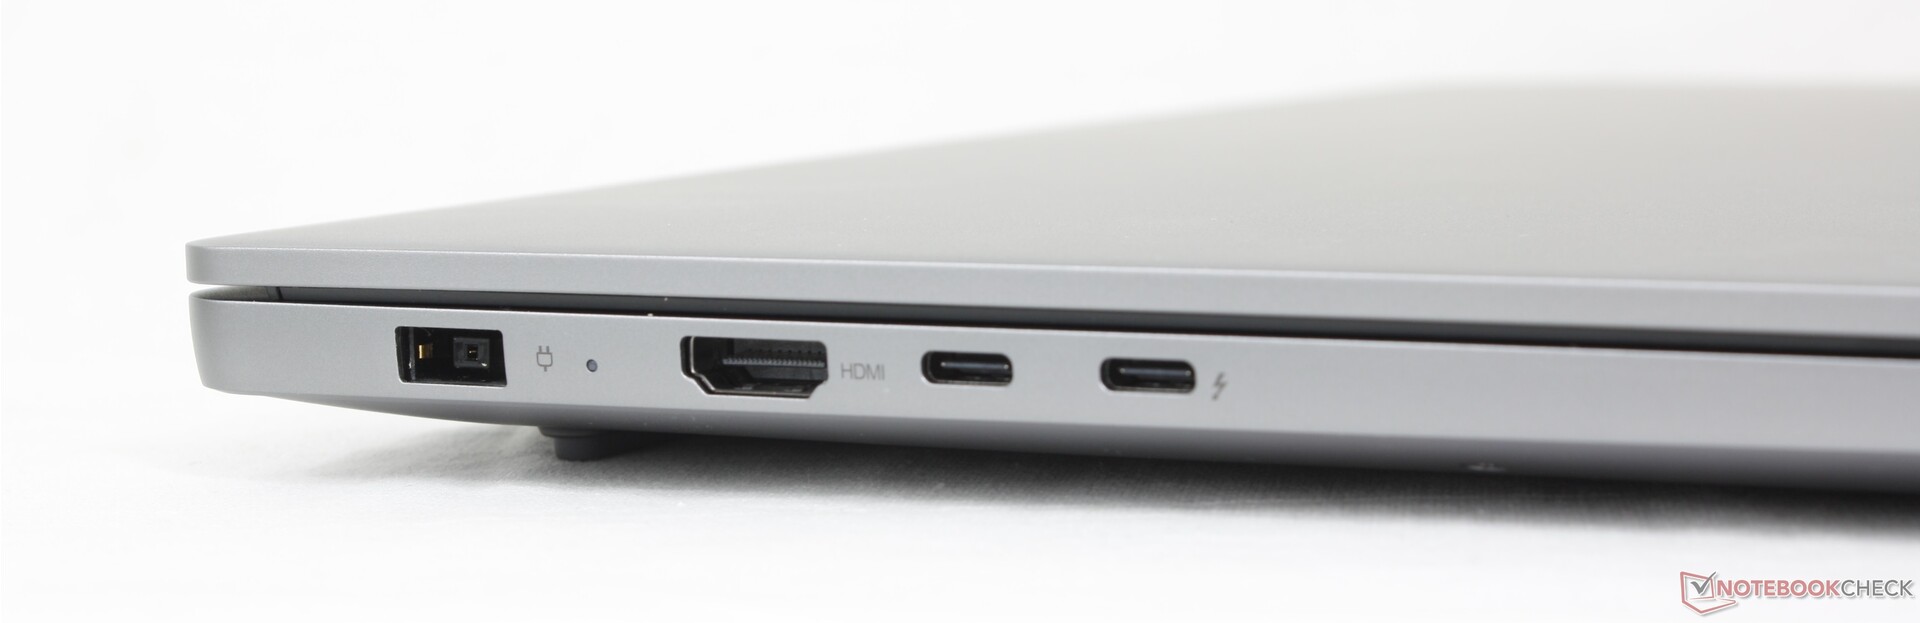
Notre configuration dGPU prend en charge à la fois la charge USB-C universelle et la charge par adaptateur secteur propriétaire, contrairement à la configuration iGPU qui ne prend en charge que la première. L'adaptateur secteur en barillet est nécessaire pour alimenter le CPU Core Ultra H et les graphiques Nvidia discrets de 90 W sans avoir recours à un plafond TGP inférieur de 50 W, ce qui est l'approche adoptée par Samsung avec son Galaxy Book4 Ultra.
Les options de port sont par ailleurs identiques à celles de l Inspiron 16 7640 2-en-1 tout en offrant plus que le Samsung.
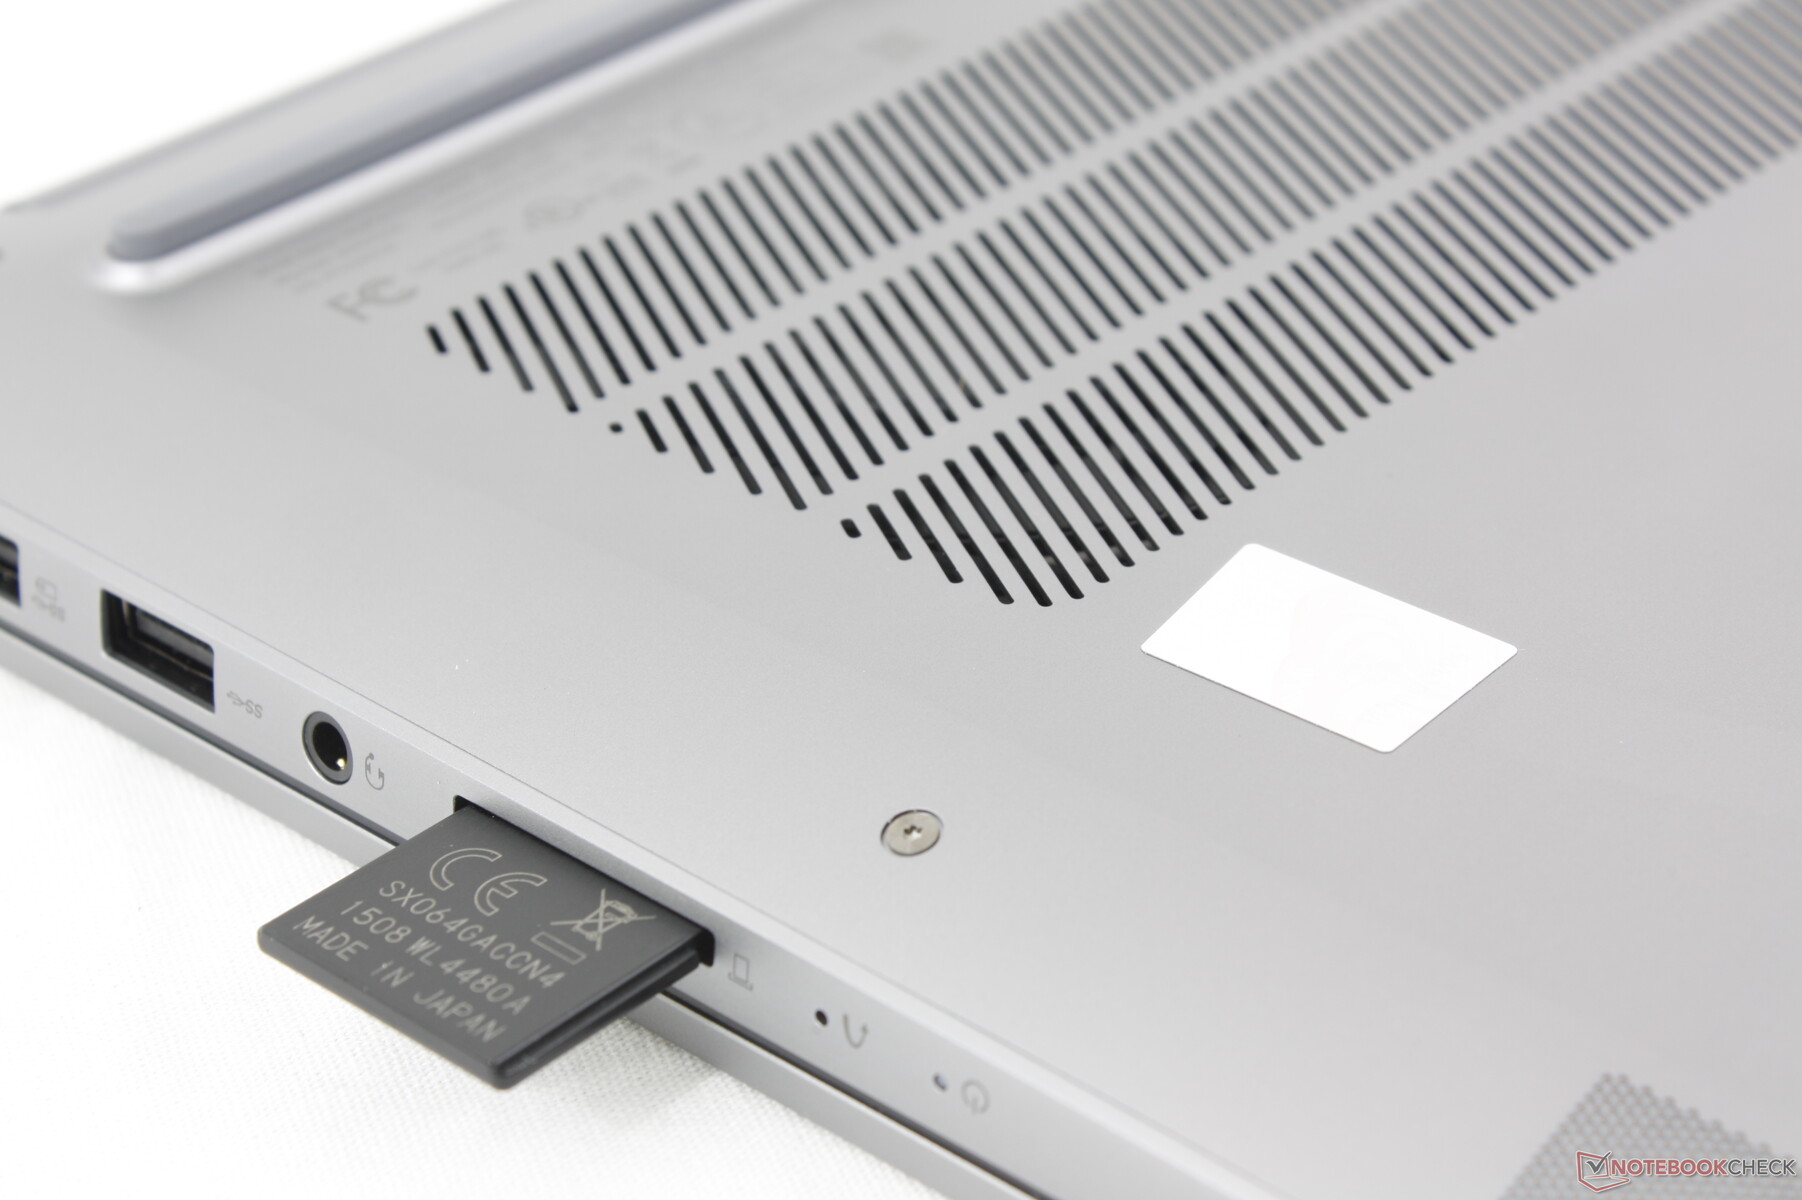
Lecteur de carte SD
| SD Card Reader | |
| average JPG Copy Test (av. of 3 runs) | |
| Asus Zenbook S 16 UM5606-RK333W (Angelbird AV Pro V60) | |
| Samsung Galaxy Book4 Ultra (Angelbird AV Pro V60) | |
| Lenovo IdeaPad Pro 5 16IMH G9 RTX 4050 (Toshiba Exceria Pro SDXC 64 GB UHS-II) | |
| Lenovo IdeaPad Pro 5 16IMH G9 (Angelbird AV Pro V60) | |
| Dell Inspiron 16 7640 2-in-1 (Toshiba Exceria Pro SDXC 64 GB UHS-II) | |
| maximum AS SSD Seq Read Test (1GB) | |
| Asus Zenbook S 16 UM5606-RK333W (Angelbird AV Pro V60) | |
| Lenovo IdeaPad Pro 5 16IMH G9 (Angelbird AV Pro V60) | |
| Samsung Galaxy Book4 Ultra (Angelbird AV Pro V60) | |
| Lenovo IdeaPad Pro 5 16IMH G9 RTX 4050 (Toshiba Exceria Pro SDXC 64 GB UHS-II) | |
| Dell Inspiron 16 7640 2-in-1 (Toshiba Exceria Pro SDXC 64 GB UHS-II) | |
Communication
L'Intel AX211 est équipé en standard du Wi-Fi 6E et du Bluetooth 5.3. Les taux de transfert sont stables à plus de 1 Gbps lorsqu'il est couplé à notre routeur de test AXE11000.
Webcam
La webcam de 2 mégapixels est équipée en standard d'un système infrarouge et d'un obturateur physique pour garantir la confidentialité.


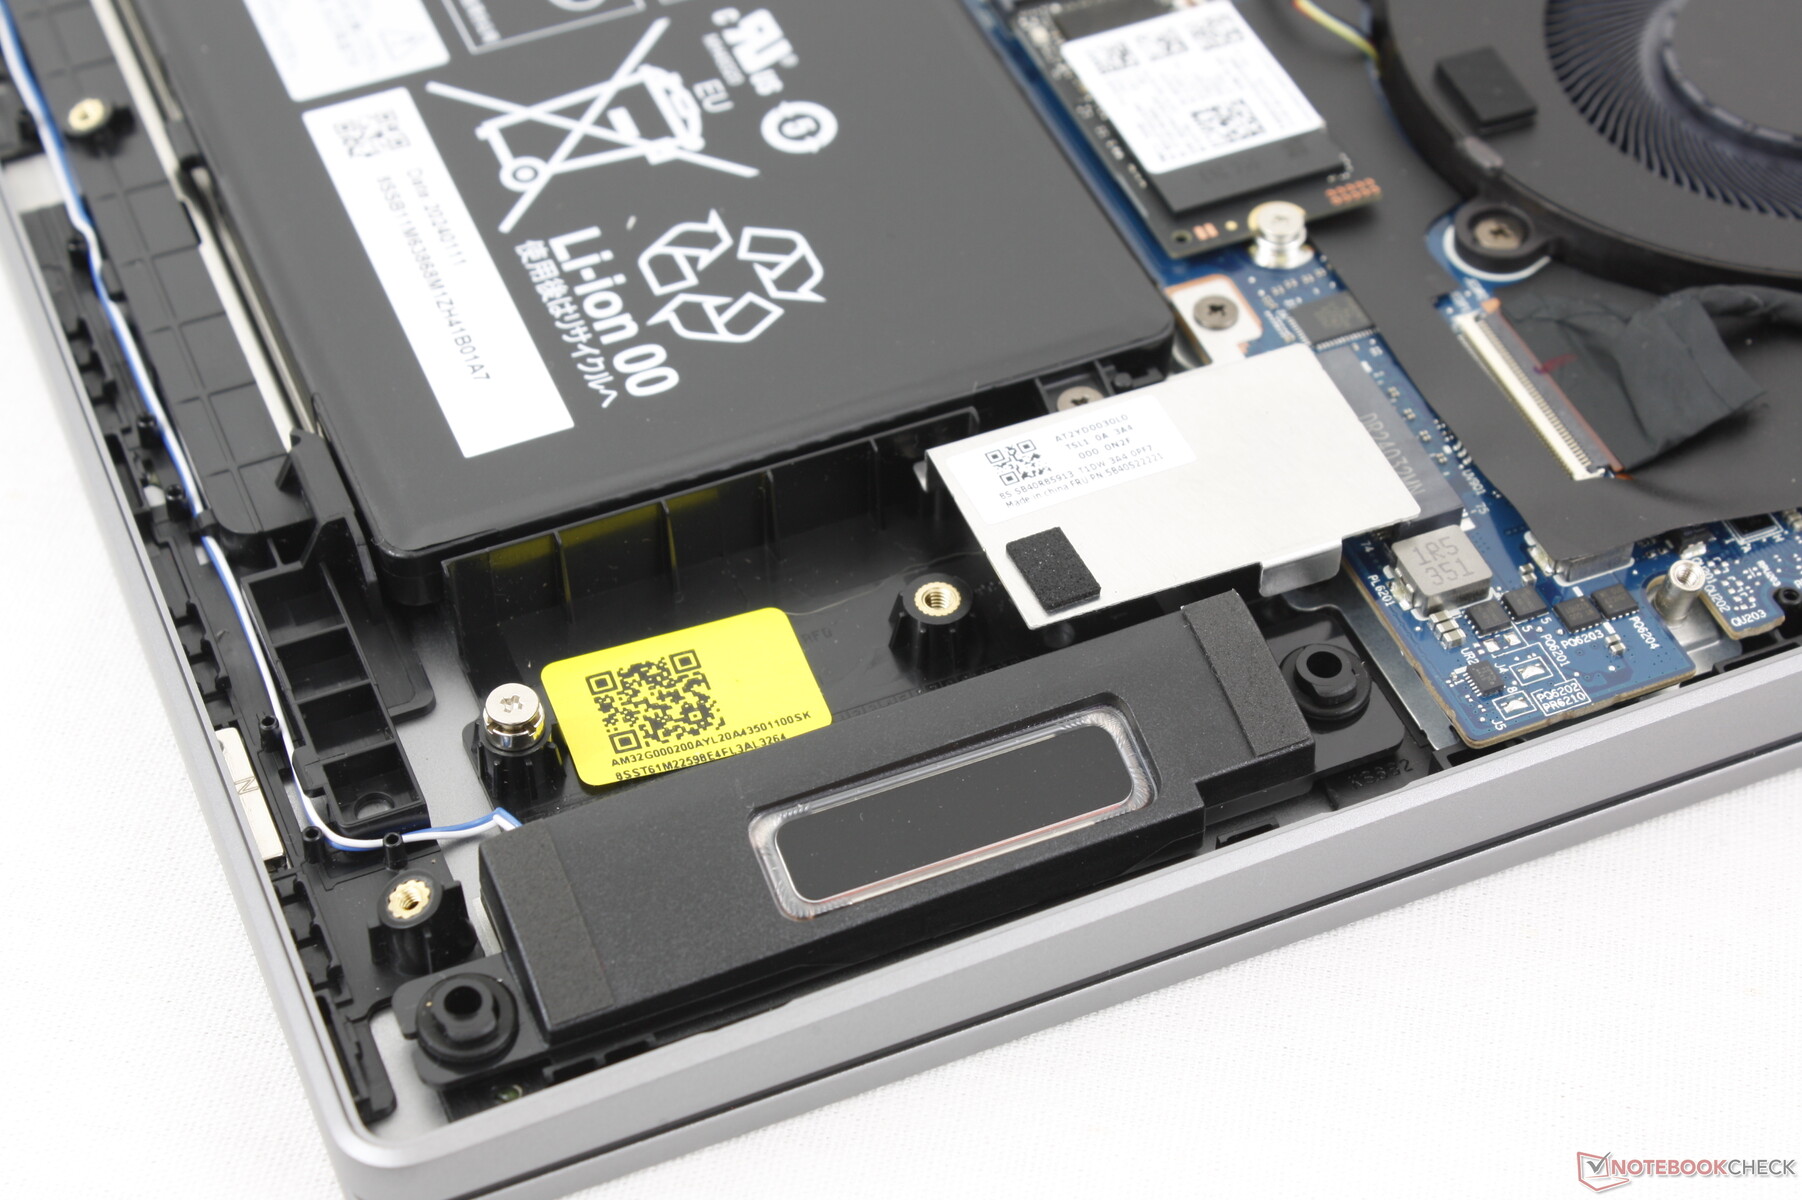
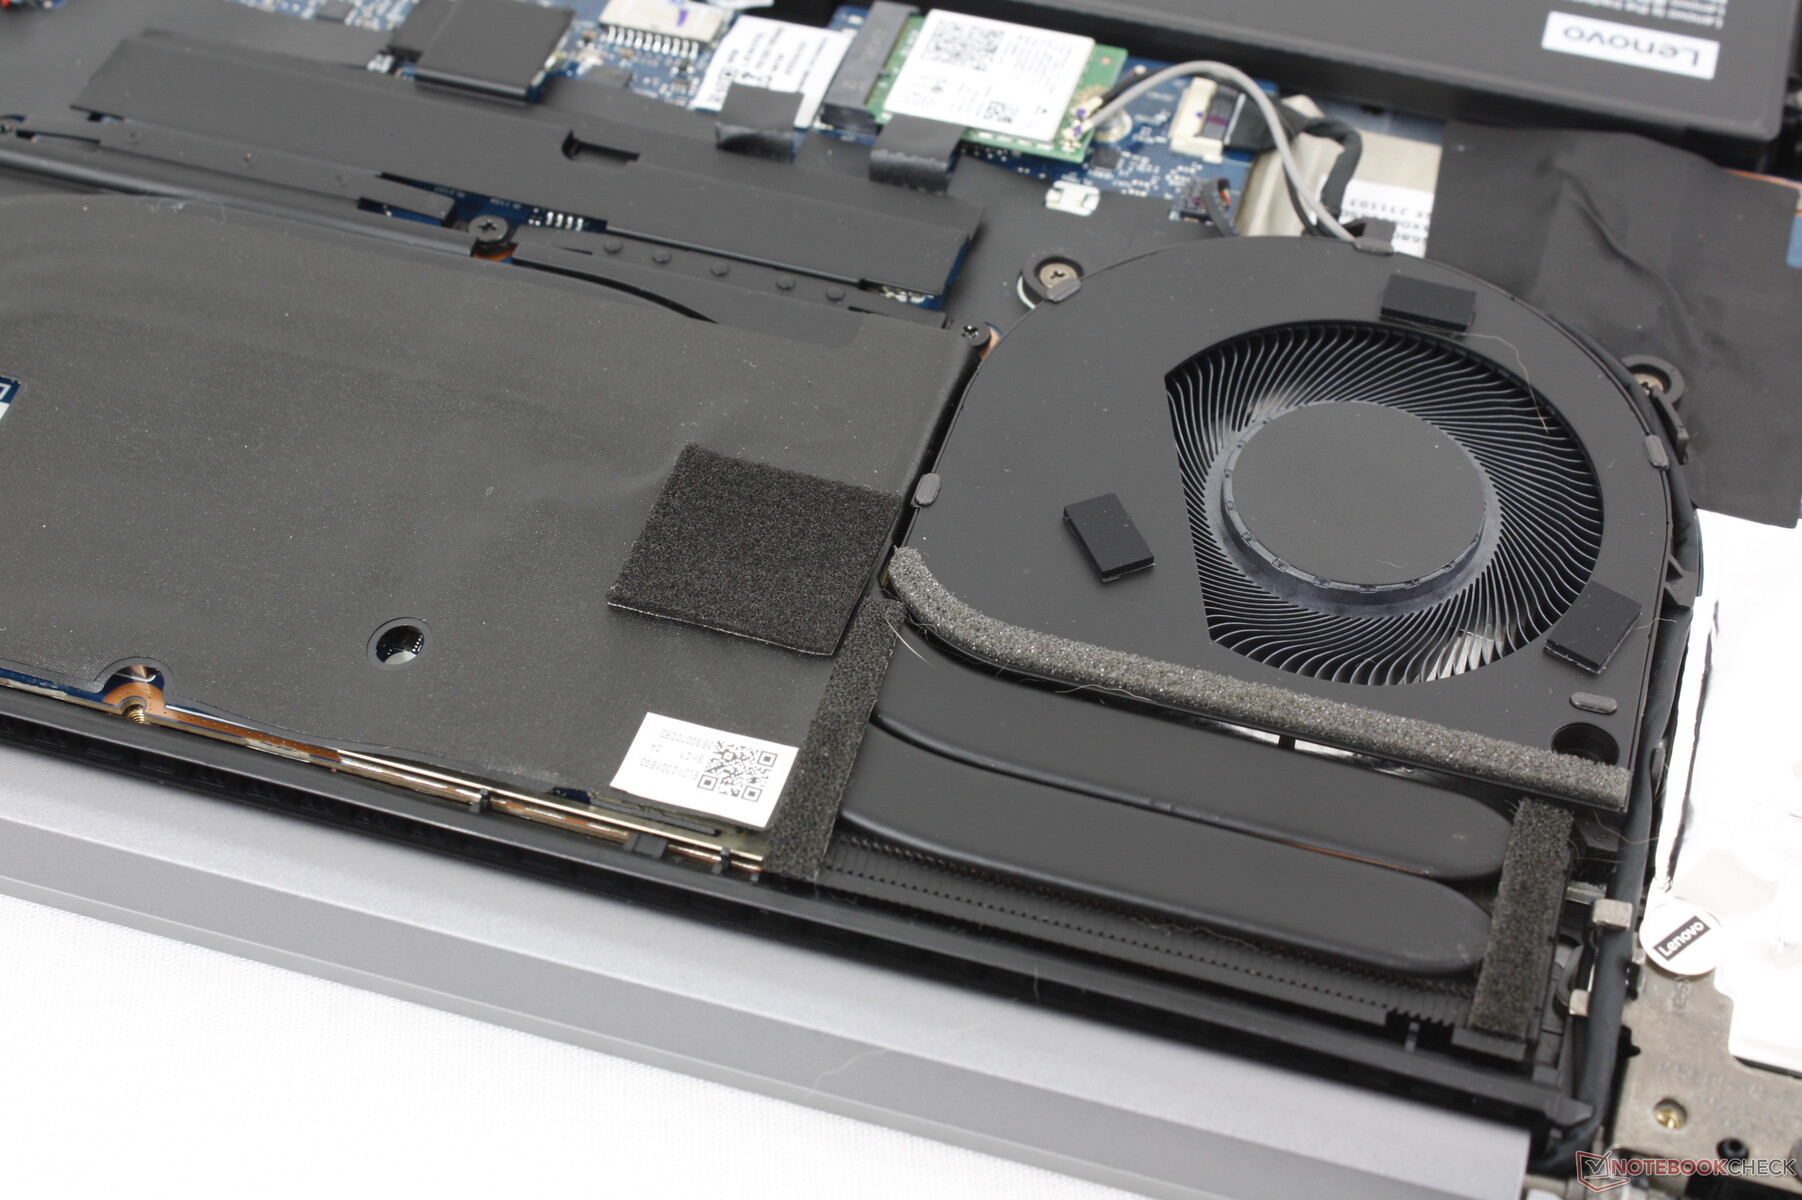
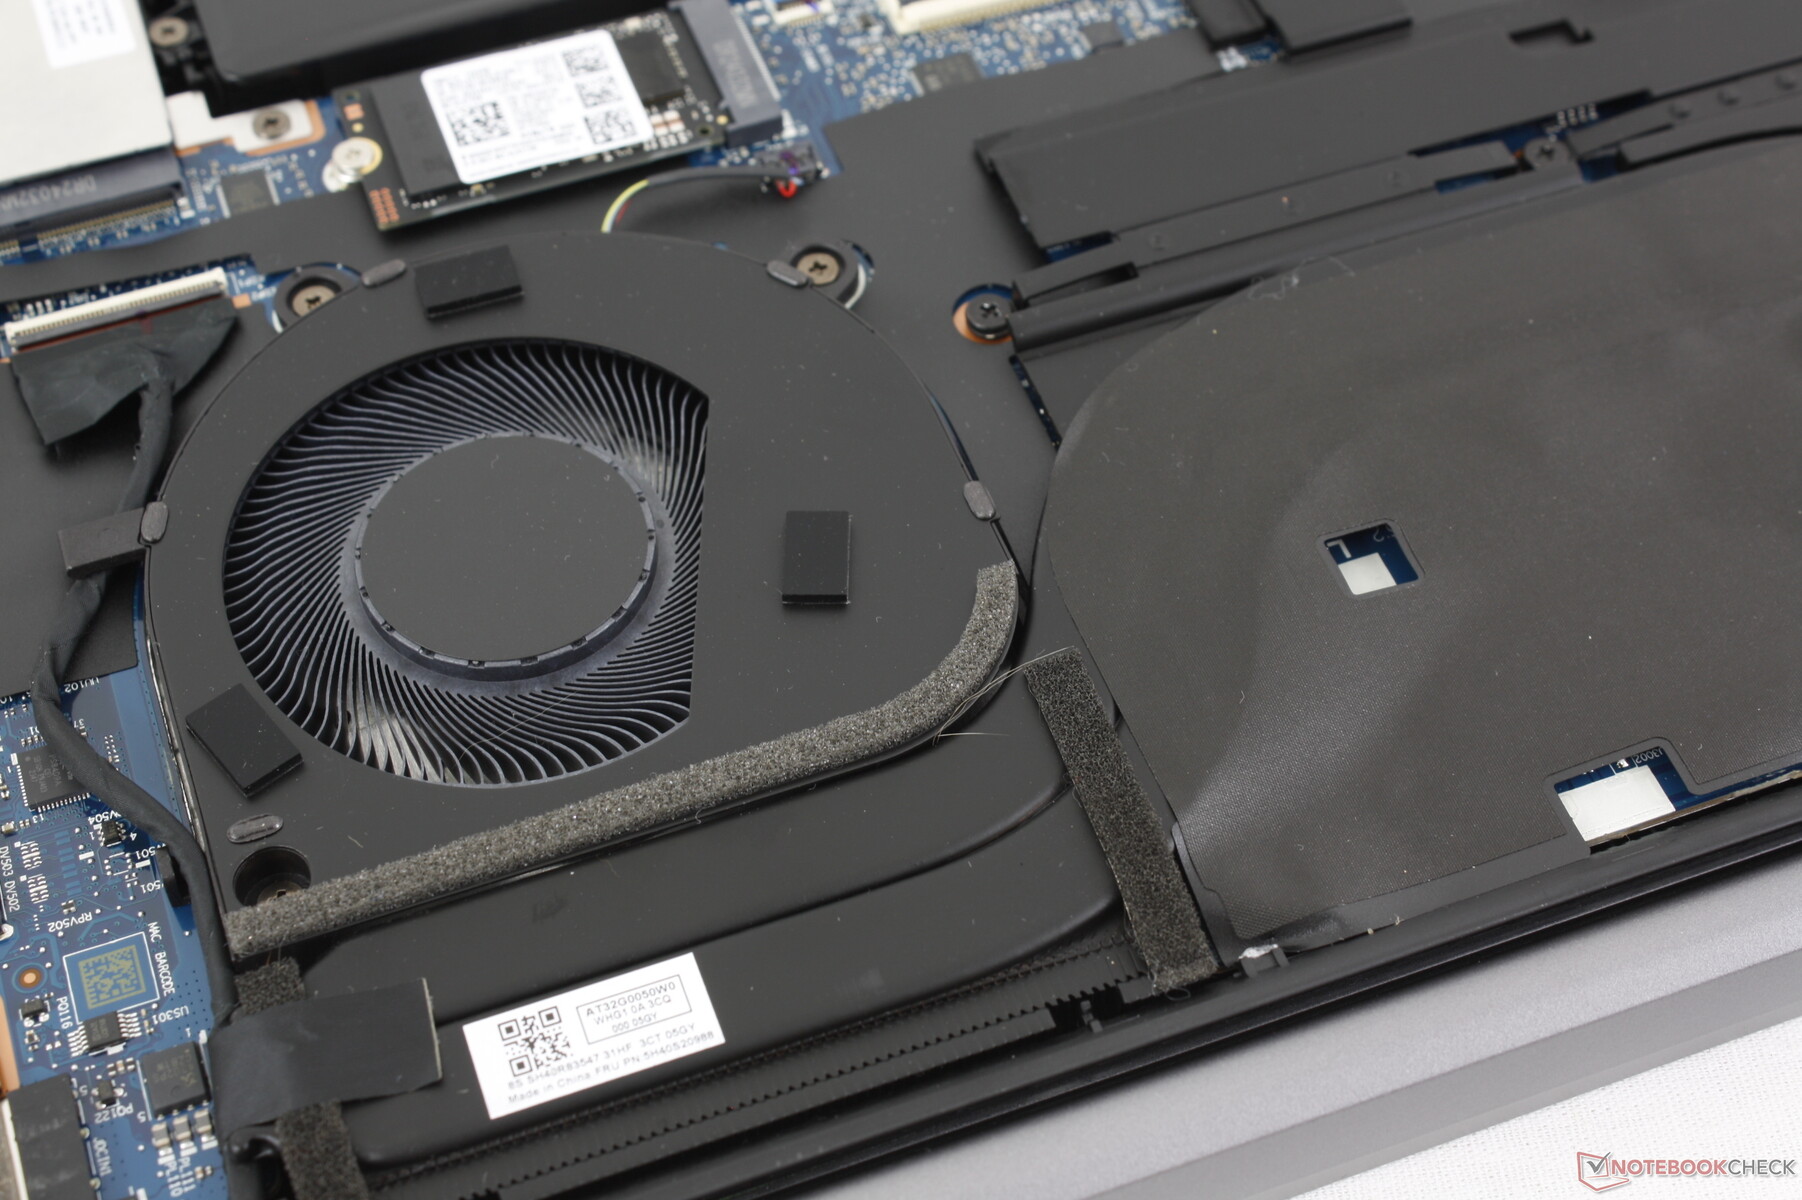
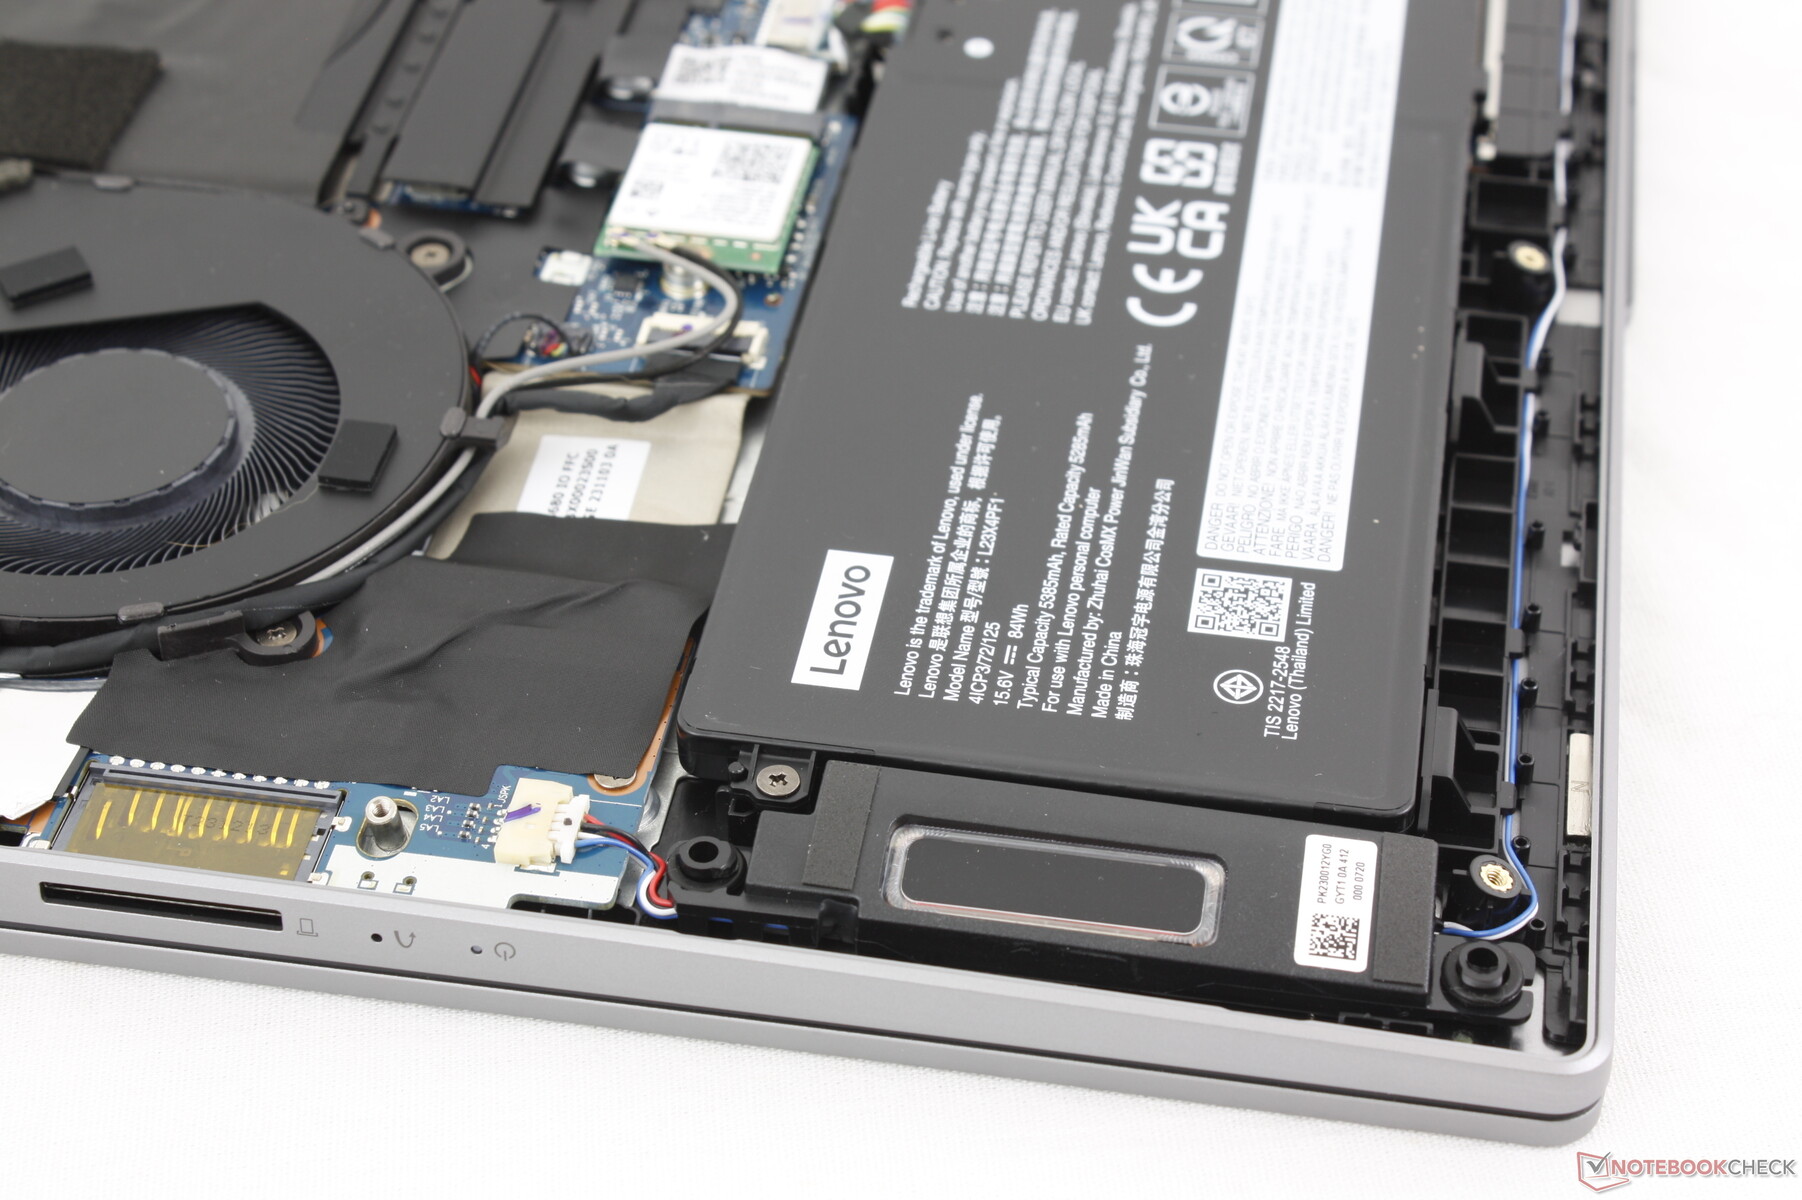
Maintenance
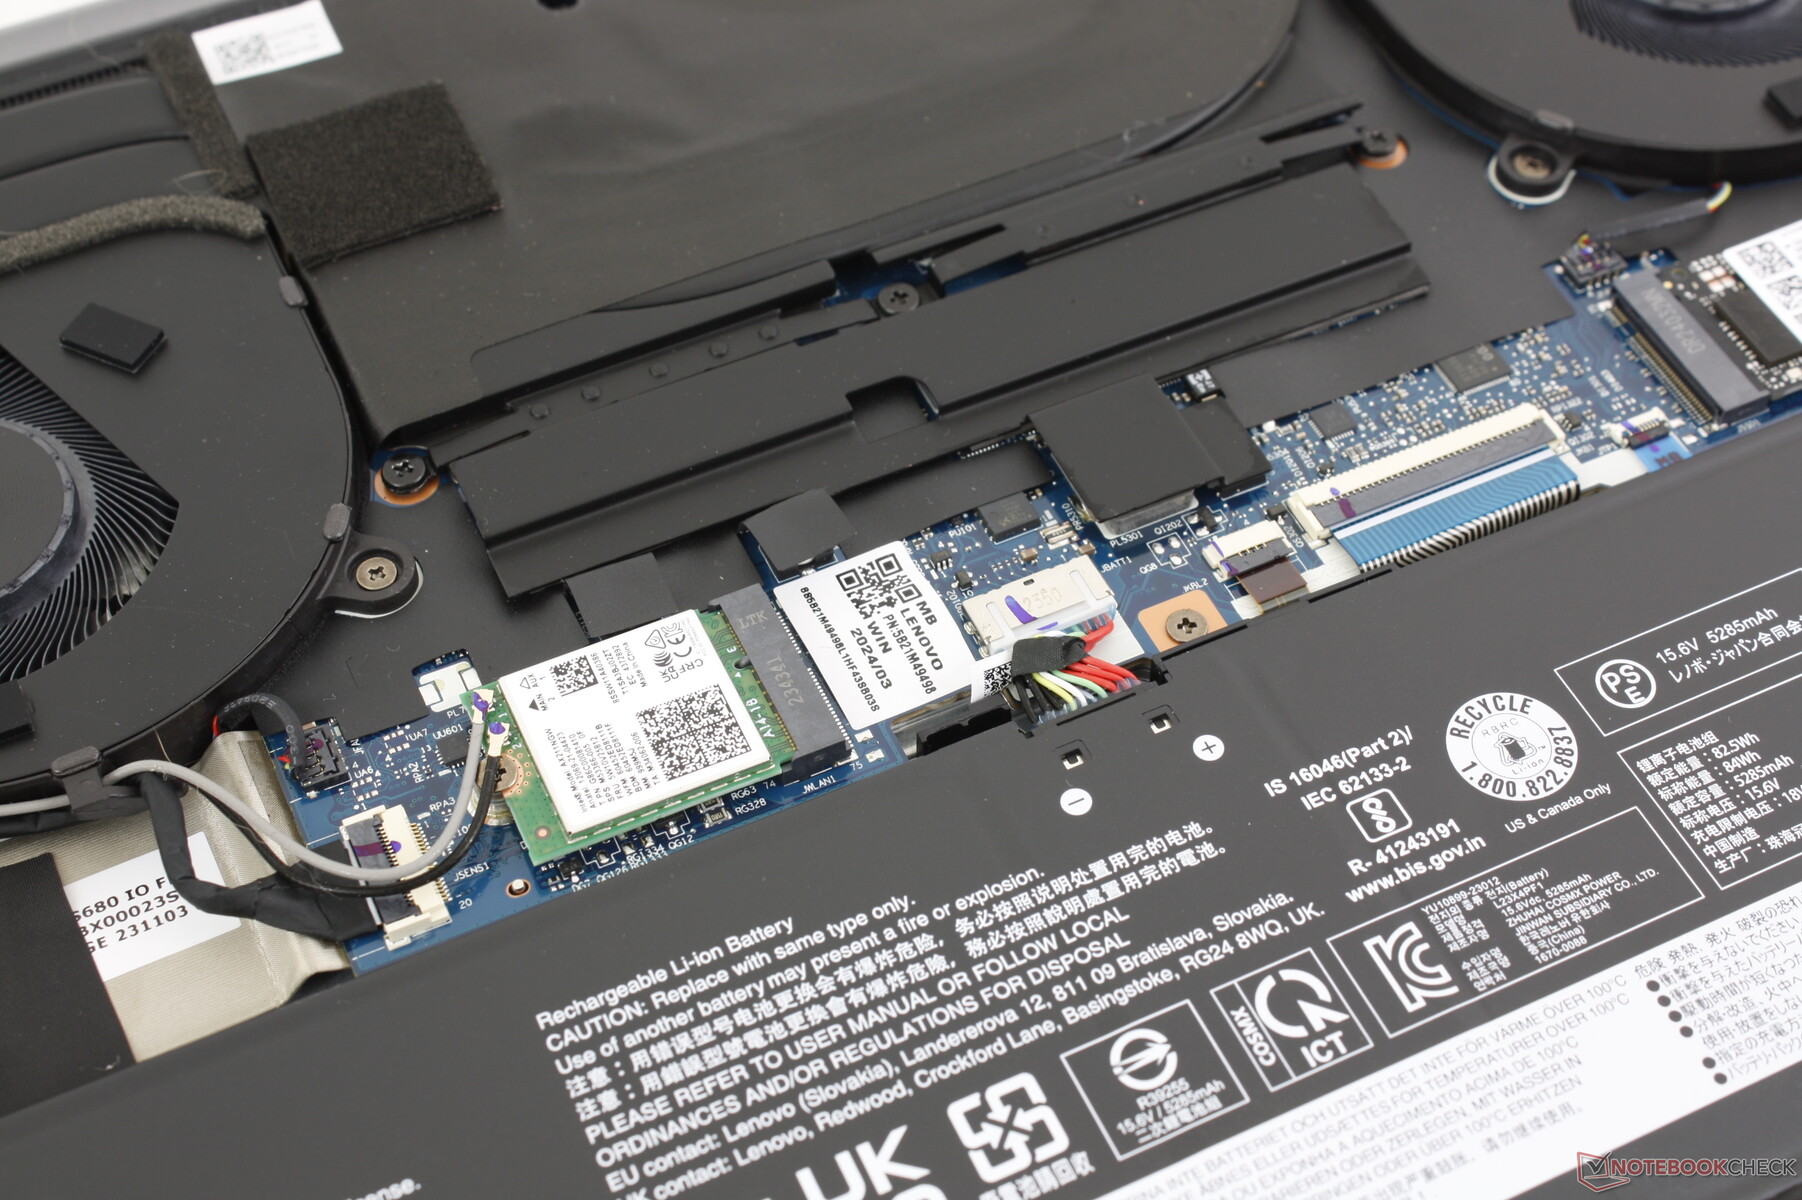
Le panneau inférieur est fixé par neuf vis Torx pour faciliter l'entretien. La solution de refroidissement reste inchangée par rapport à la version iGPU malgré un matériel plus exigeant, ce qui signifie que nous pouvons nous attendre à un bruit plus fort et à des températures plus élevées en moyenne.
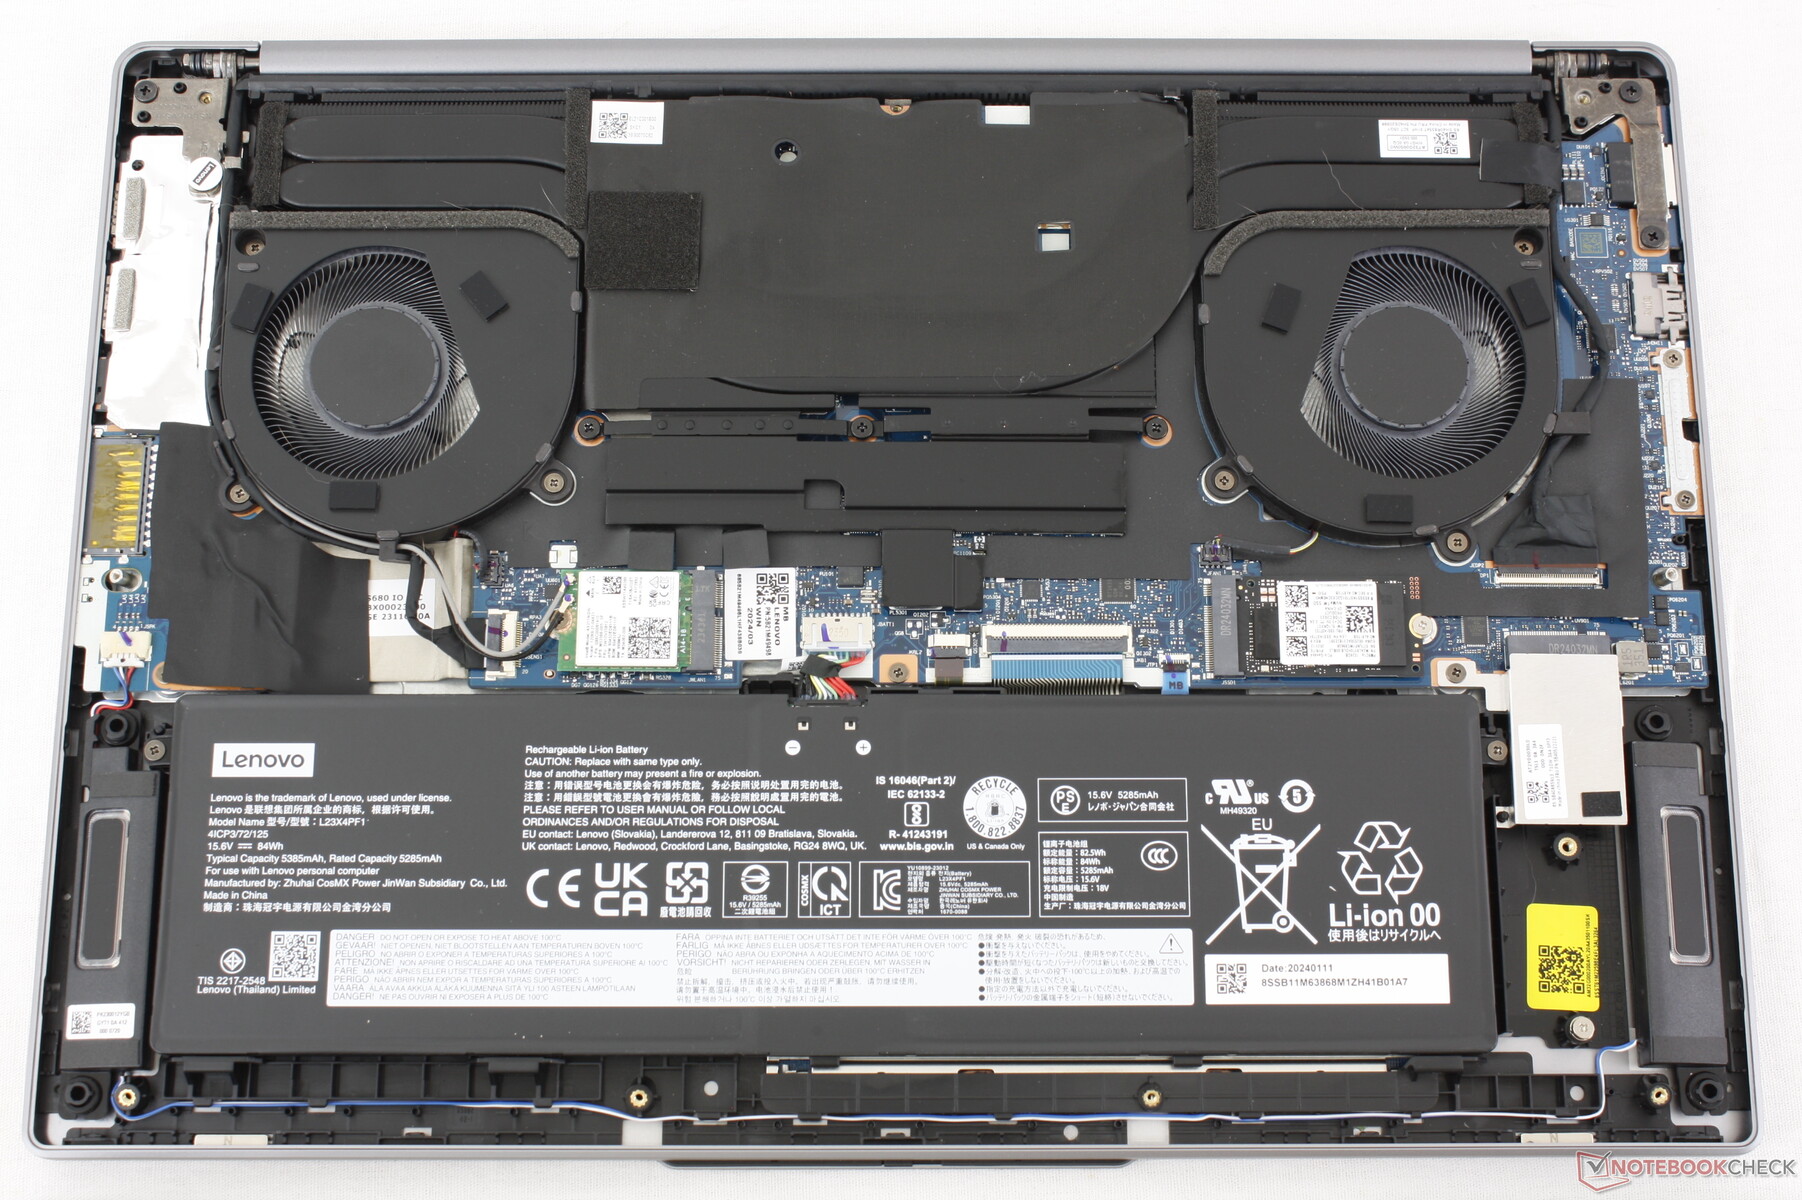

Durabilité
Le couvercle inférieur est composé à 50 % d'aluminium recyclé, tandis que les plastiques de l'emballage proviennent à 90 % de sources océaniques. Nous apprécions également que les guides de réparation officiels https://pcsupport.lenovo.com/us/en/products/laptops-and-netbooks/5-series/ideapad-pro-5-16imh9/83d4/83d4001hus/document-userguide pour le modèle sont disponibles directement auprès de Lenovo sous forme de téléchargements gratuits.
Accessoires et garantie
L'emballage ne contient rien d'autre que l'adaptateur secteur et la documentation. La garantie limitée habituelle d'un an s'applique si l'appareil est acheté aux États-Unis.
Périphériques d'entrée
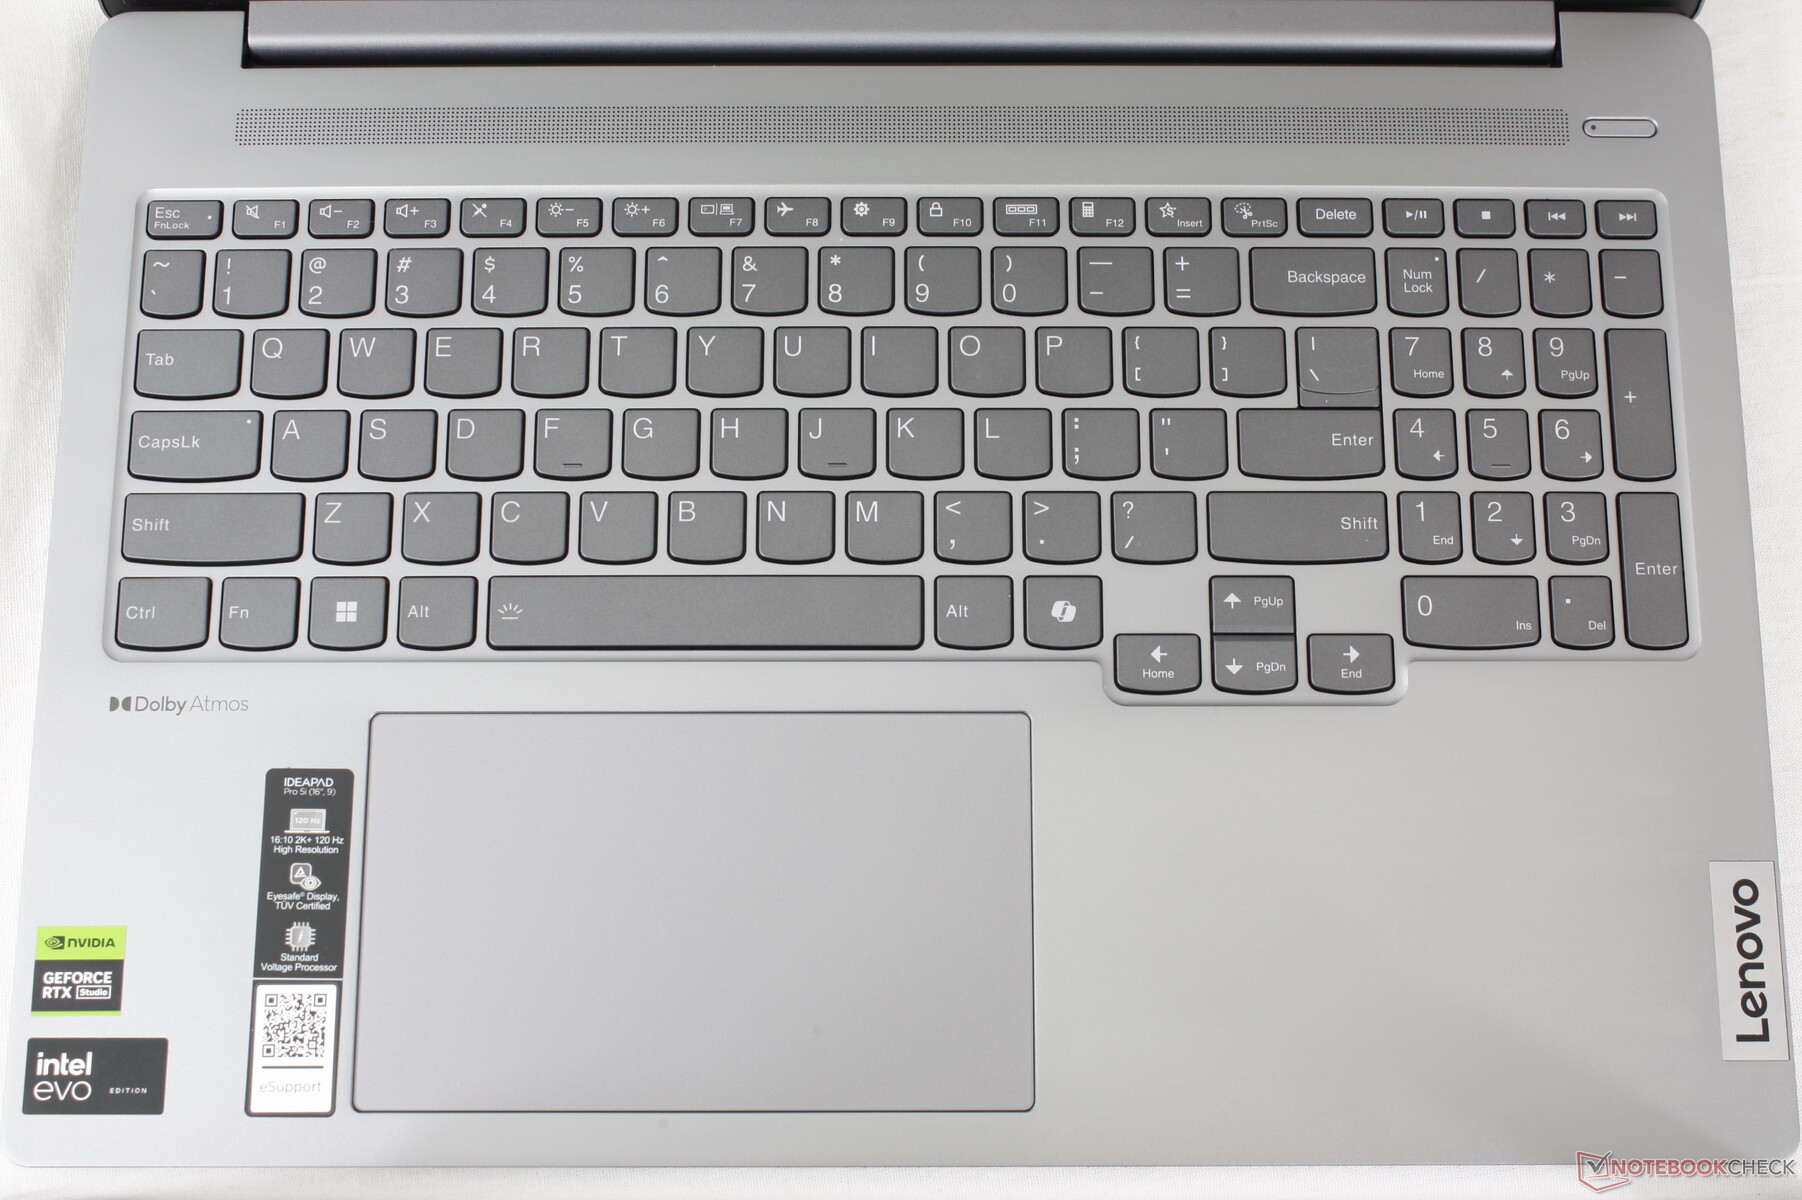
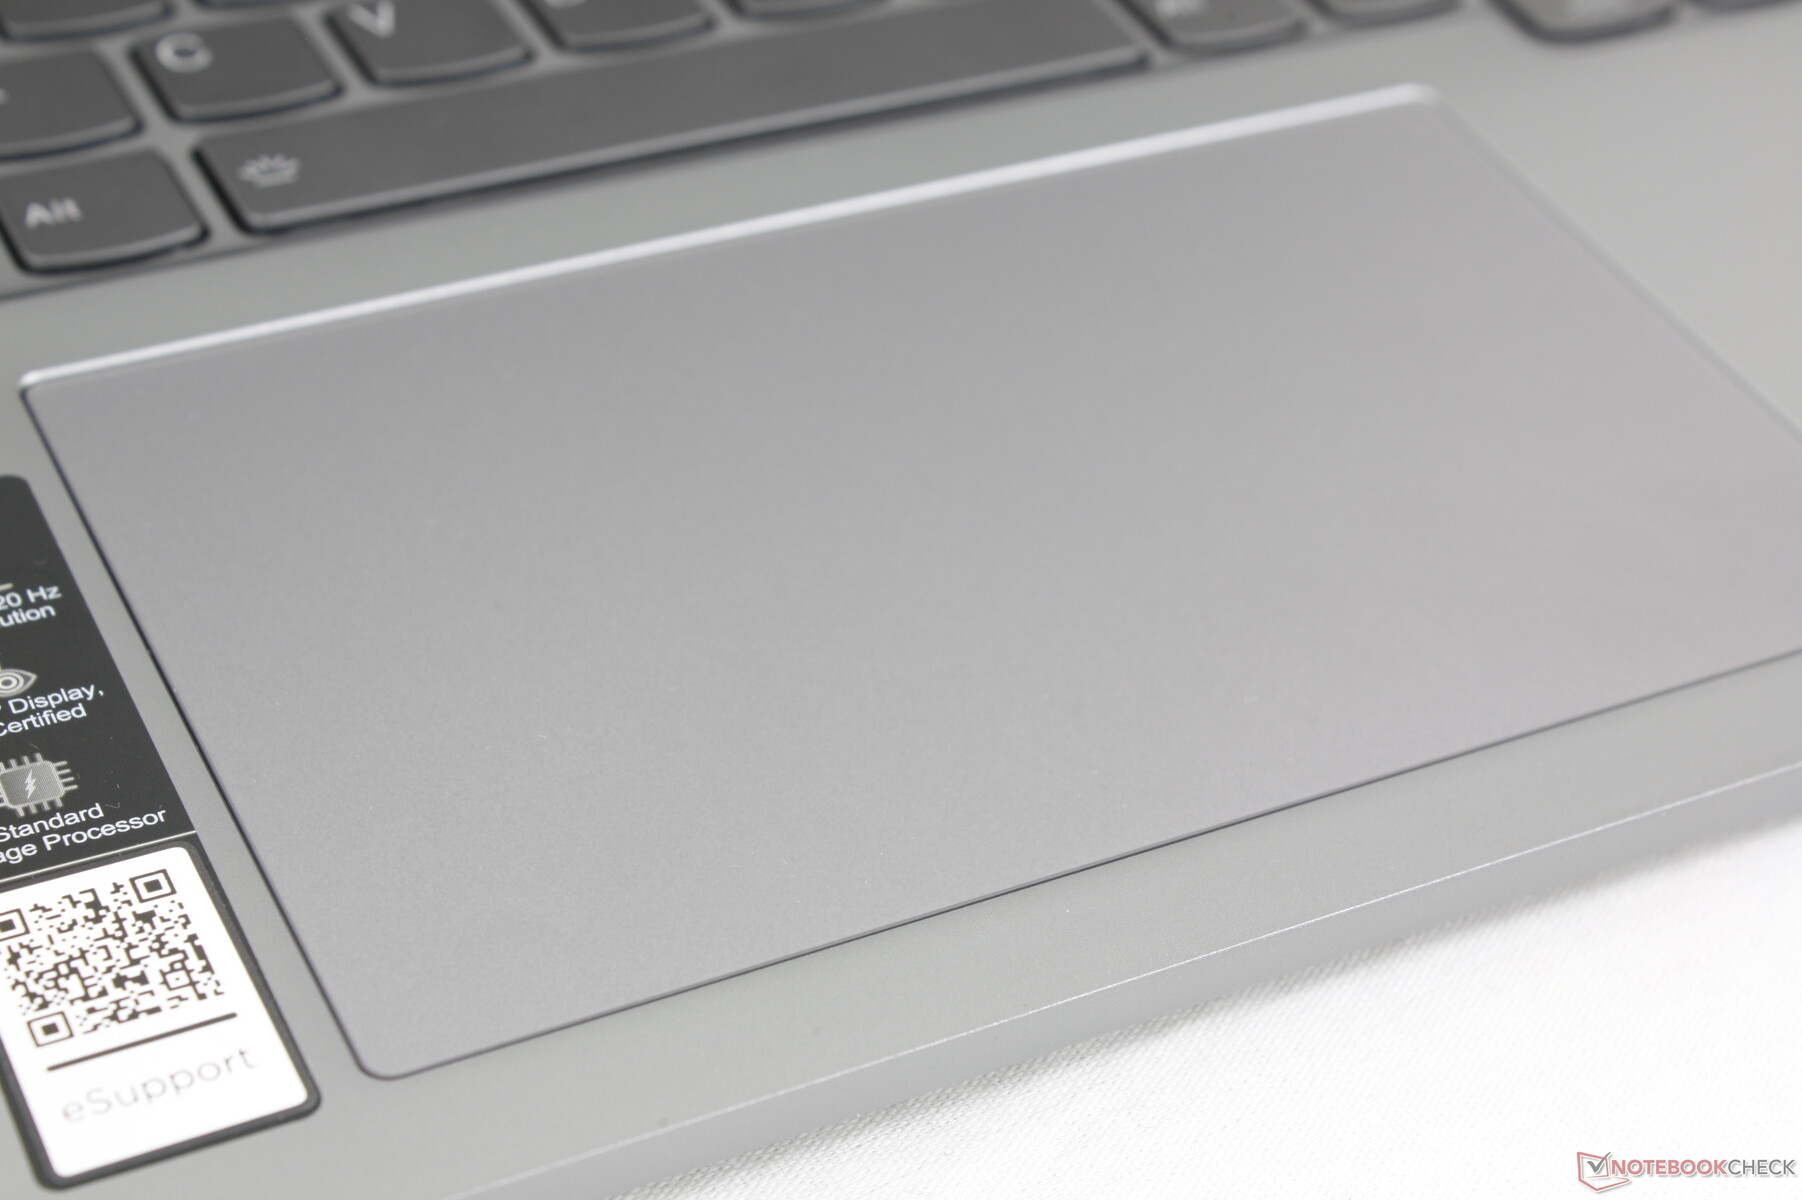
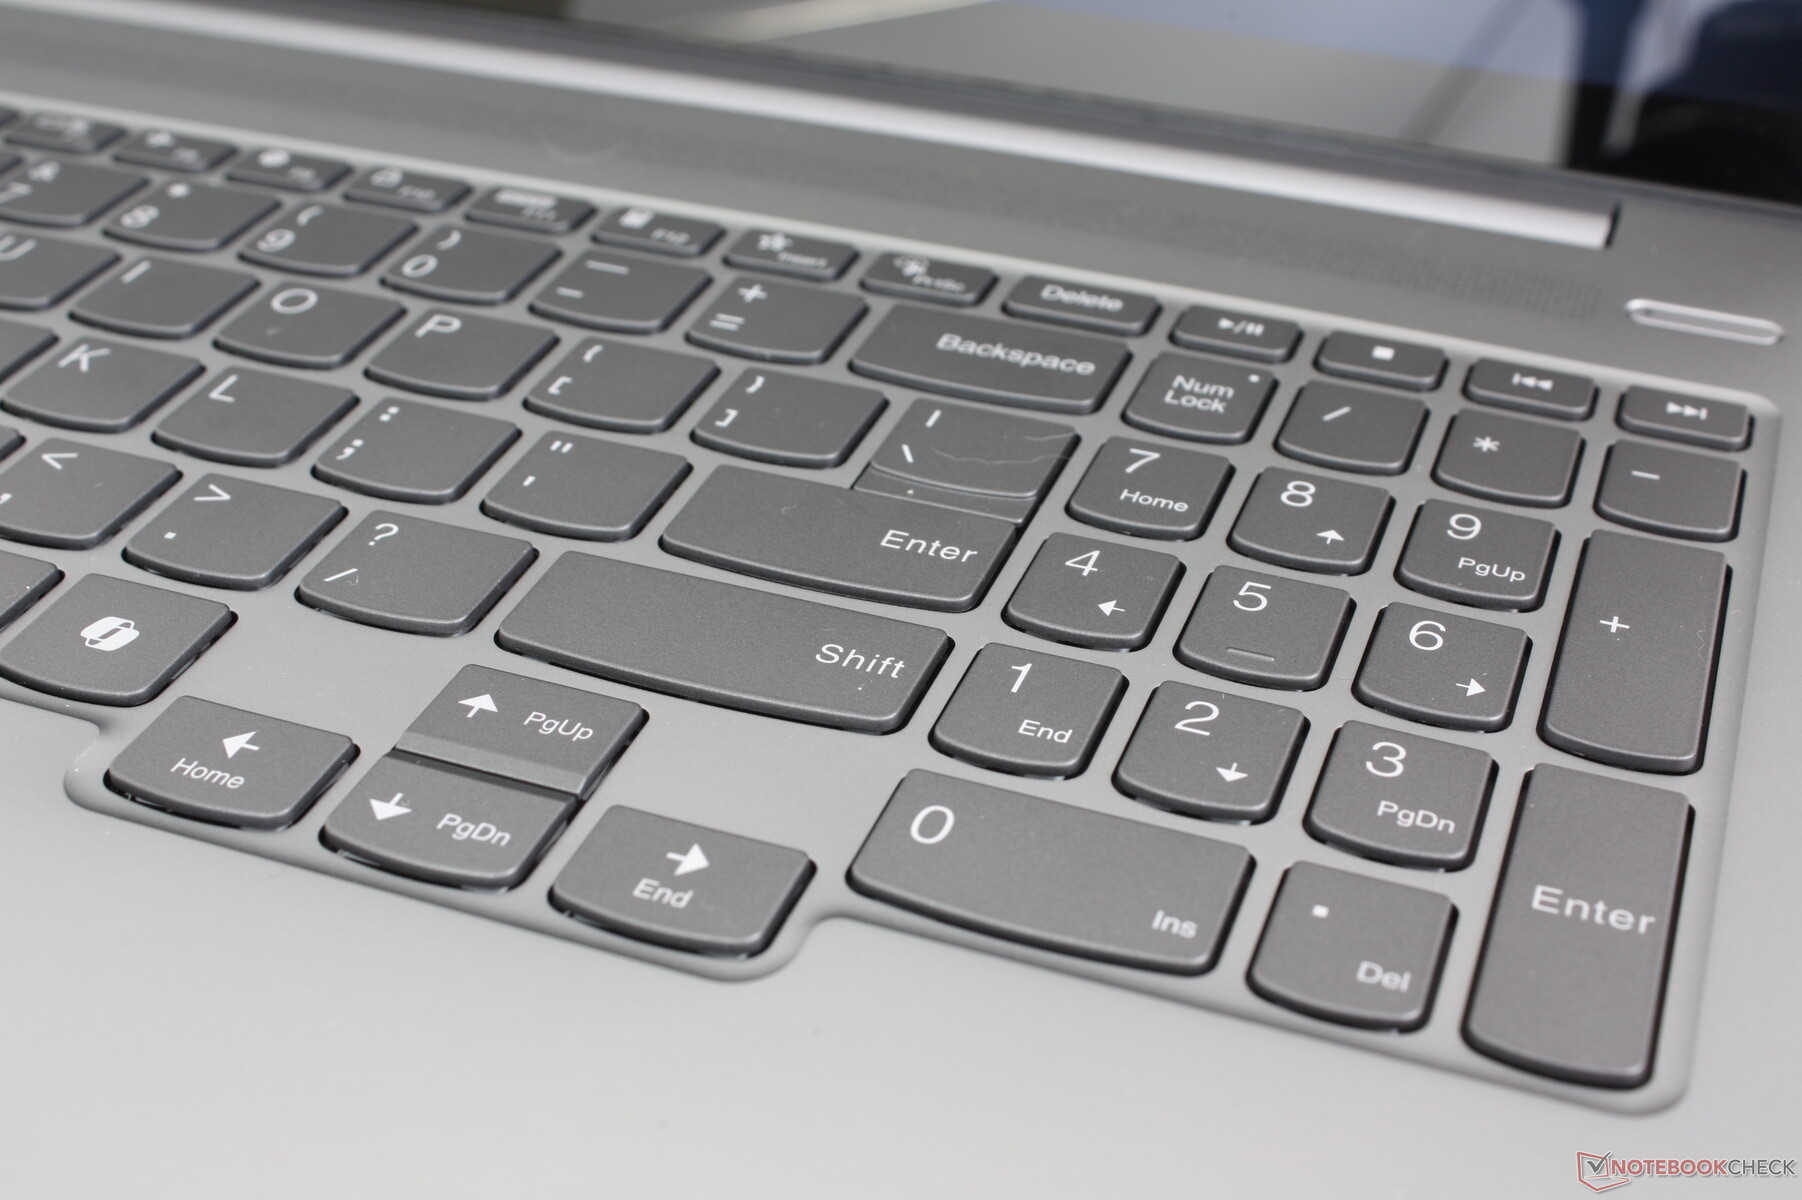
Clavier et pavé tactile
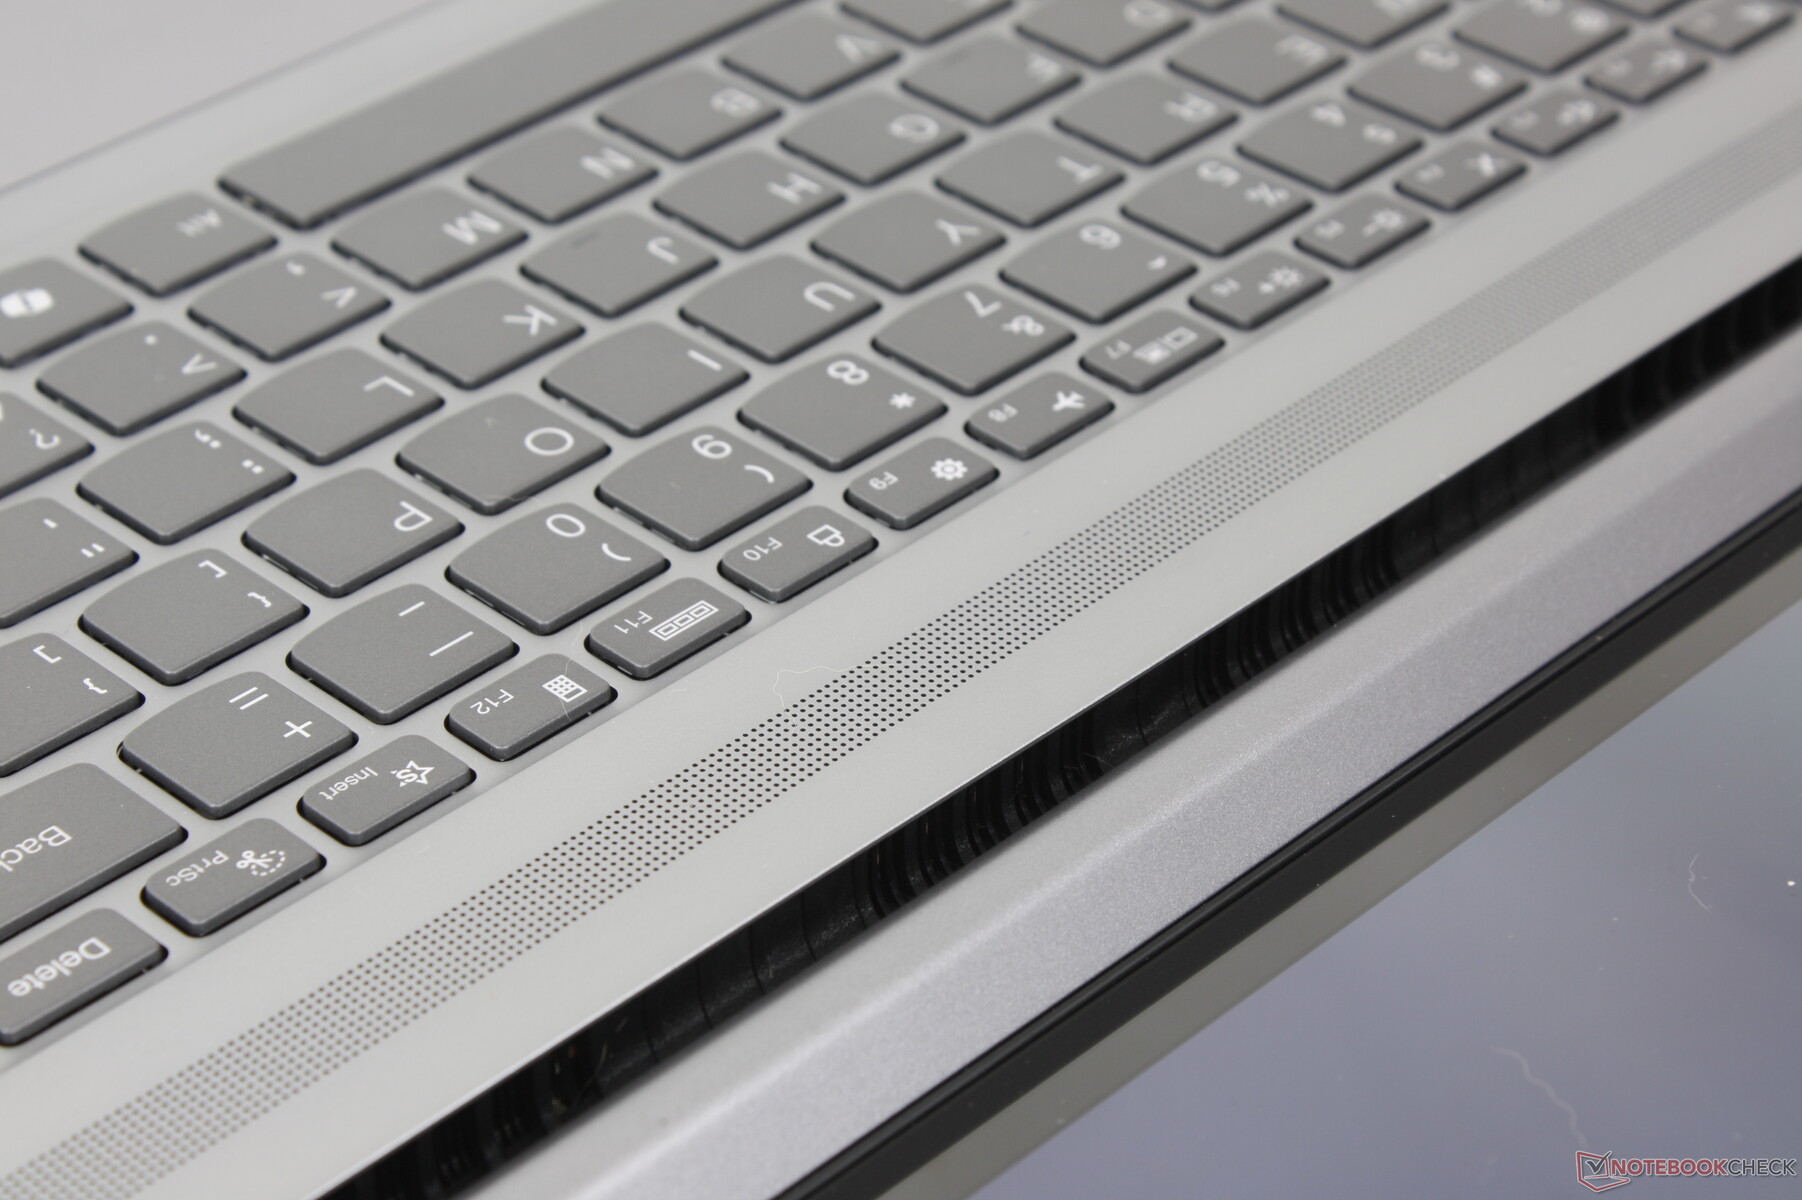
Les claviers des IdeaPad sont moins profonds et offrent un retour d'information plus faible que les claviers des ThinkPad. Bien qu'utilisable, l'expérience de frappe est certainement en retrait par rapport aux meilleurs systèmes de Lenovo, qui se rapprochent des systèmes moins chers, même dans la configuration haut de gamme à 1500 $.

Écran - De l'IPS à l'OLED
Deux options d'affichage sont disponibles :
- 2560 x 1600, IPS, 120 Hz, non tactile
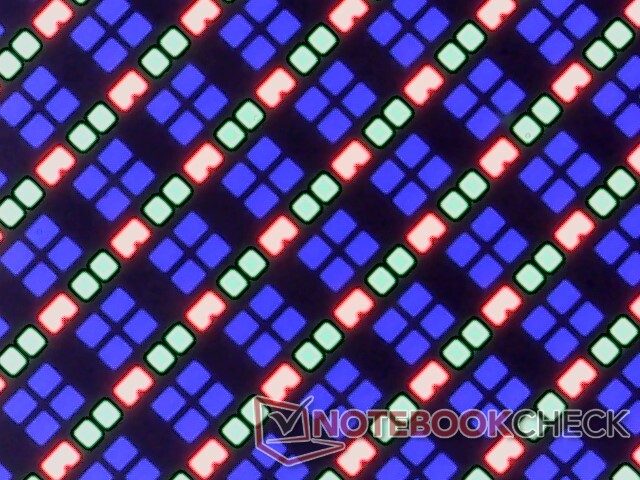
- 2048 x 1280, OLED, 120 Hz, tactile
Contrairement à la plupart des autres ordinateurs portables, l'option OLED n'est pas nécessairement meilleure que l'option IPS, car elle échange une résolution native plus élevée contre des couleurs plus profondes et une meilleure prise en charge du HDR. Si votre charge de travail consiste principalement en des feuilles de calcul ou des fenêtres multitâches, le panneau IPS à plus haute résolution peut s'avérer plus productif. Pour les tâches telles que la lecture ou l'édition de vidéos, les couleurs plus profondes et le contraste plus sombre de l'OLED peuvent améliorer l'expérience.
La résolution de 1280p est néanmoins inférieure à celle d'autres ordinateurs portables de 16 pouces tels que le Asus Zenbook S 16envy x360 2-in-1 16, ou Galaxy Book4 Ultra, qui sont tous équipés de panneaux OLED 1800p. Ceci est probablement intentionnel afin d'encourager les acheteurs à considérer les modèles plus haut de gamme de la série Yoga Pro 9 16 G9 Série Yoga Pro 9 16 G9 mais cela rend l'IdeaPad Pro 5 16 G9 un peu moins attractif par rapport à ses concurrents immédiats.

| |||||||||||||||||||||||||
Homogénéité de la luminosité: 98 %
Valeur mesurée au centre, sur batterie: 367.6 cd/m²
Contraste: ∞:1 (Valeurs des noirs: 0 cd/m²)
ΔE Color 4.31 | 0.5-29.43 Ø4.9, calibrated: 1.11
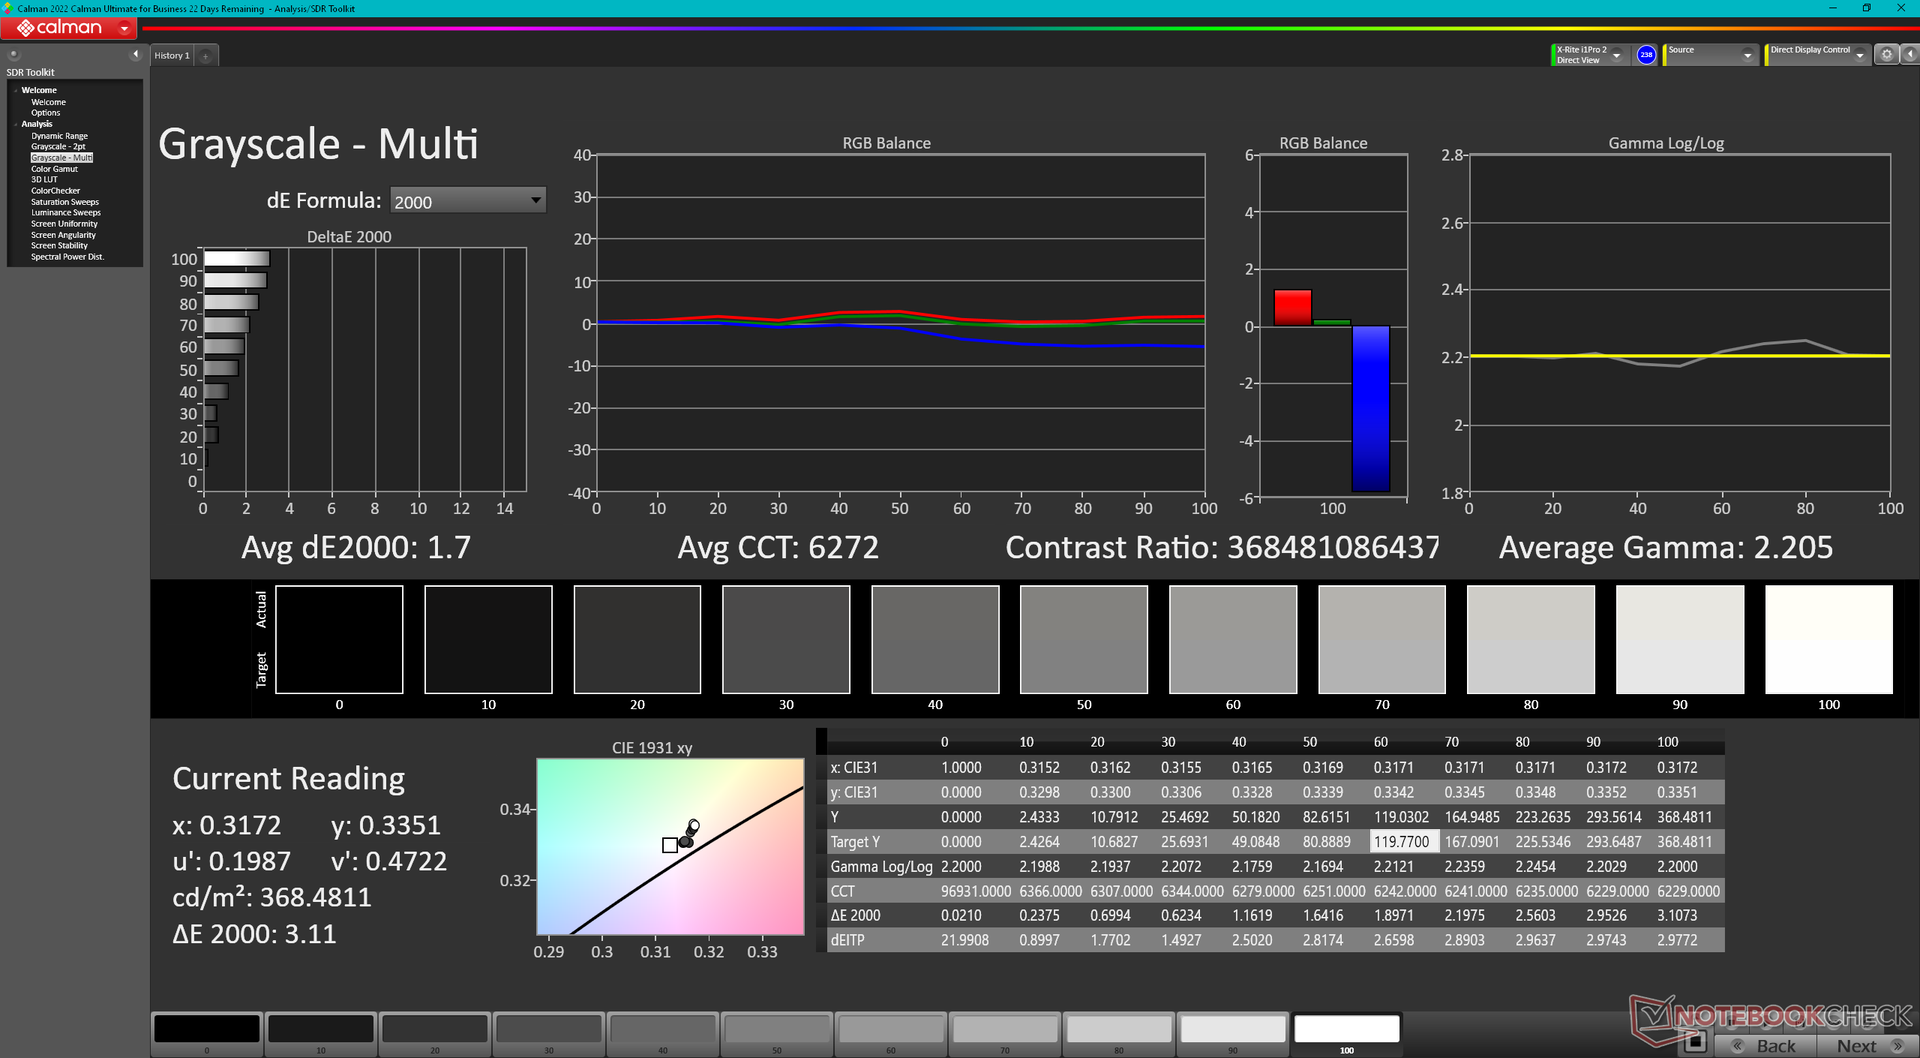
ΔE Greyscale 1.7 | 0.5-98 Ø5.2
97.8% AdobeRGB 1998 (Argyll 2.2.0 3D)
100% sRGB (Argyll 2.2.0 3D)
99.7% Display P3 (Argyll 2.2.0 3D)
Gamma: 2.2
| Lenovo IdeaPad Pro 5 16IMH G9 RTX 4050 LEN1602K, OLED, 2048x1280, 16", 120 Hz | Lenovo IdeaPad Pro 5 16IMH G9 NE160QDM-NY2, IPS, 2560x1600, 16", 120 Hz | Dell Inspiron 16 7640 2-in-1 AU Optronics B160QAT, Mini-LED, 2560x1600, 16", 90 Hz | Asus Zenbook S 16 UM5606-RK333W ATNA60CL10-0, OLED, 2880x1800, 16", 120 Hz | HP Envy x360 2-in-1 16-ad0097nr Samsung SDC41A6, OLED, 2880x1800, 16", 120 Hz | Samsung Galaxy Book4 Ultra ATNA60CL07-0, OLED, 2880x1800, 16", 120 Hz | |
|---|---|---|---|---|---|---|
| Display | -25% | -2% | -1% | -0% | -4% | |
| Display P3 Coverage | 99.7 | 63.3 -37% | 99.4 0% | 99.9 0% | 99.6 0% | 98.6 -1% |
| sRGB Coverage | 100 | 95.2 -5% | 100 0% | 100 0% | 100 0% | 99.9 0% |
| AdobeRGB 1998 Coverage | 97.8 | 65.3 -33% | 92.5 -5% | 95.6 -2% | 96.5 -1% | 88.5 -10% |
| Response Times | -1708% | -2489% | 46% | 26% | 13% | |
| Response Time Grey 50% / Grey 80% * | 0.58 ? | 15 ? -2486% | 15.4 ? -2555% | 0.56 ? 3% | 0.8 ? -38% | 0.54 ? 7% |
| Response Time Black / White * | 1 ? | 10.3 ? -930% | 60.6 ? -5960% | 0.65 ? 35% | 0.89 ? 11% | 0.69 ? 31% |
| PWM Frequency | 240 ? | 2753.7 ? 1047% | 480 100% | 491.8 ? 105% | 240 ? 0% | |
| Screen | -14% | -21% | 43% | 10% | 20% | |
| Brightness middle | 367.6 | 368 0% | 413 12% | 407 11% | 399.4 9% | 390 6% |
| Brightness | 371 | 368 -1% | 409 10% | 405 9% | 405 9% | 393 6% |
| Brightness Distribution | 98 | 91 -7% | 97 -1% | 97 -1% | 98 0% | 98 0% |
| Black Level * | 0.31 | 0.14 | 0.02 | |||
| Colorchecker dE 2000 * | 4.31 | 2.4 44% | 3.48 19% | 0.6 86% | 4.05 6% | 1.4 68% |
| Colorchecker dE 2000 max. * | 6.85 | 6.5 5% | 6.97 -2% | 1.2 82% | 6.69 2% | 2.7 61% |
| Colorchecker dE 2000 calibrated * | 1.11 | 0.8 28% | 1.02 8% | |||
| Greyscale dE 2000 * | 1.7 | 4.5 -165% | 4.5 -165% | 0.5 71% | 1.1 35% | 2.1 -24% |
| Gamma | 2.2 100% | 2.21 100% | 2.15 102% | 2.2 100% | 2.27 97% | 2.27 97% |
| CCT | 6272 104% | 6324 103% | 6446 101% | 6453 101% | 6419 101% | 6431 101% |
| Contrast | 1187 | 2950 | 20350 | |||
| Moyenne finale (programmes/paramètres) | -582% /
-299% | -837% /
-633% | 29% /
33% | 12% /
11% | 10% /
12% |
* ... Moindre est la valeur, meilleures sont les performances
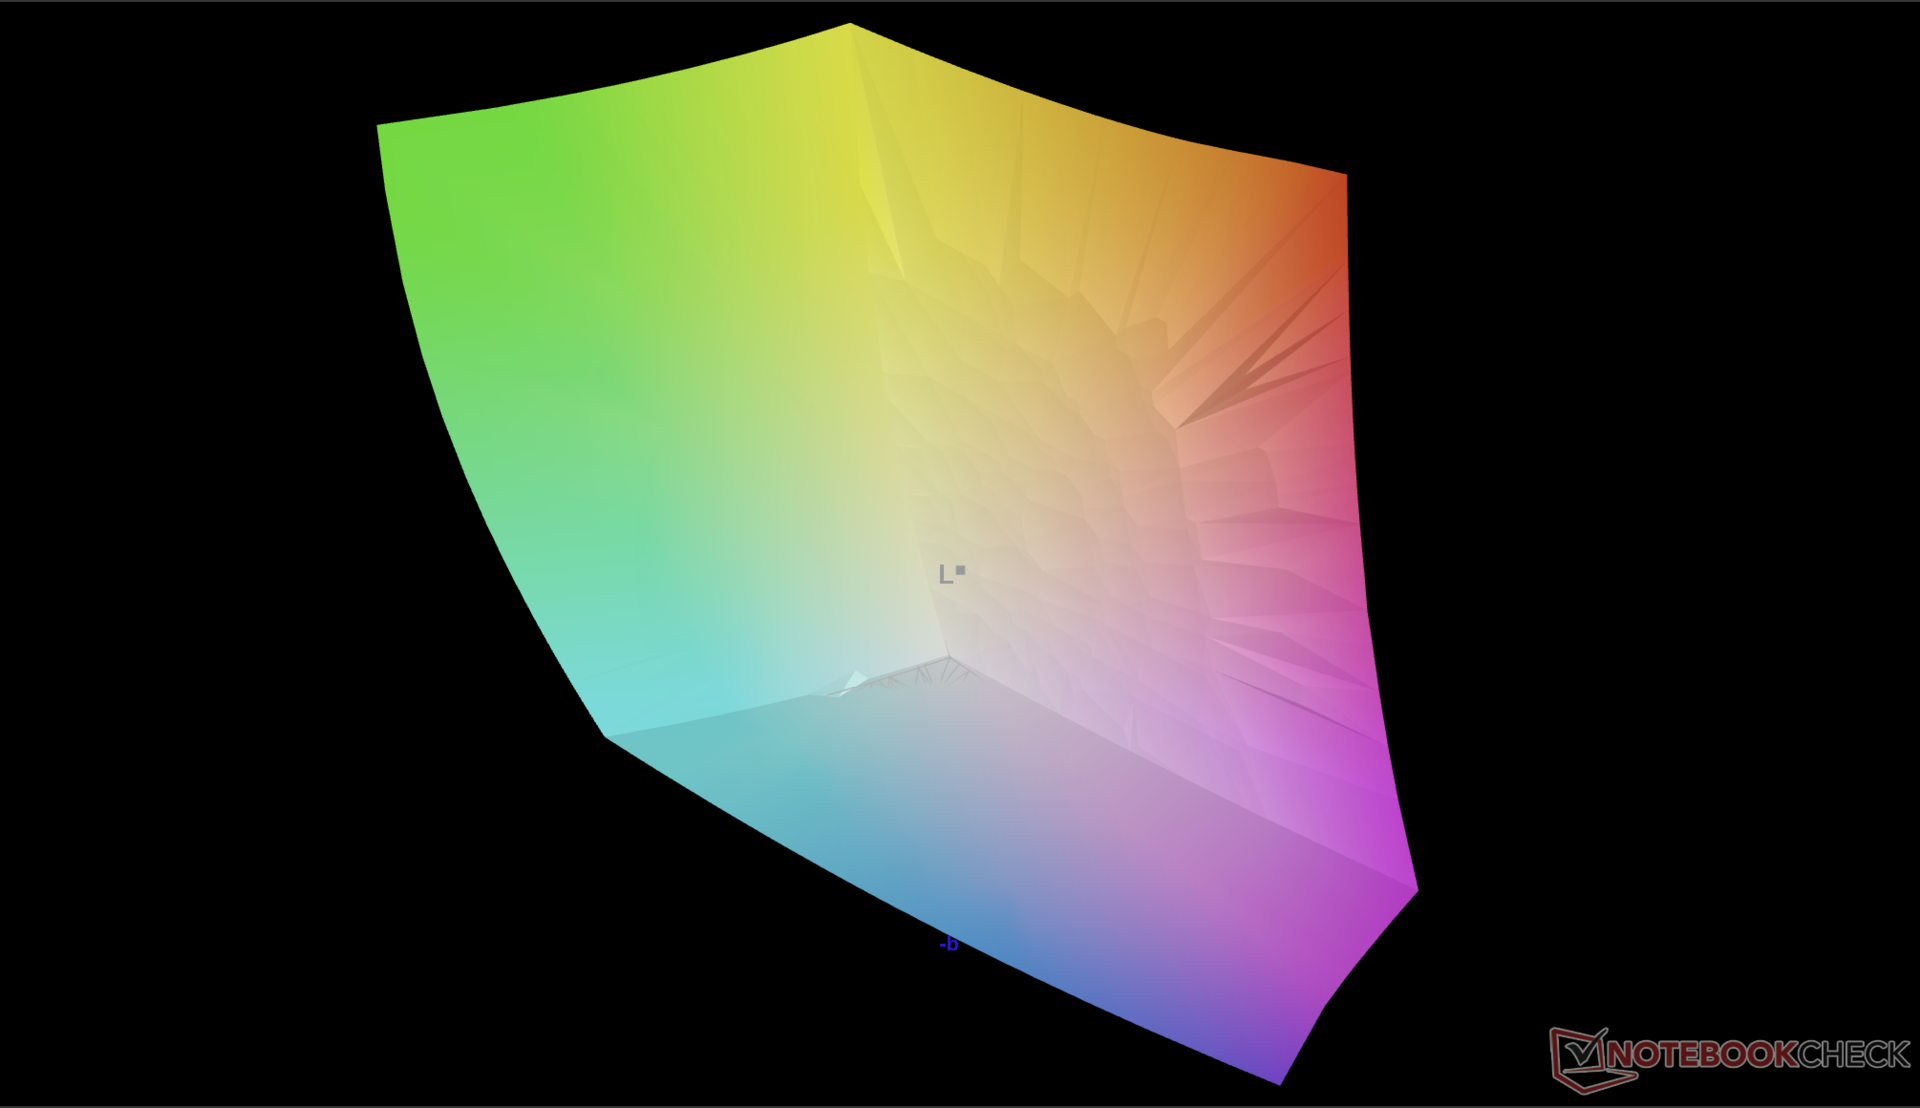

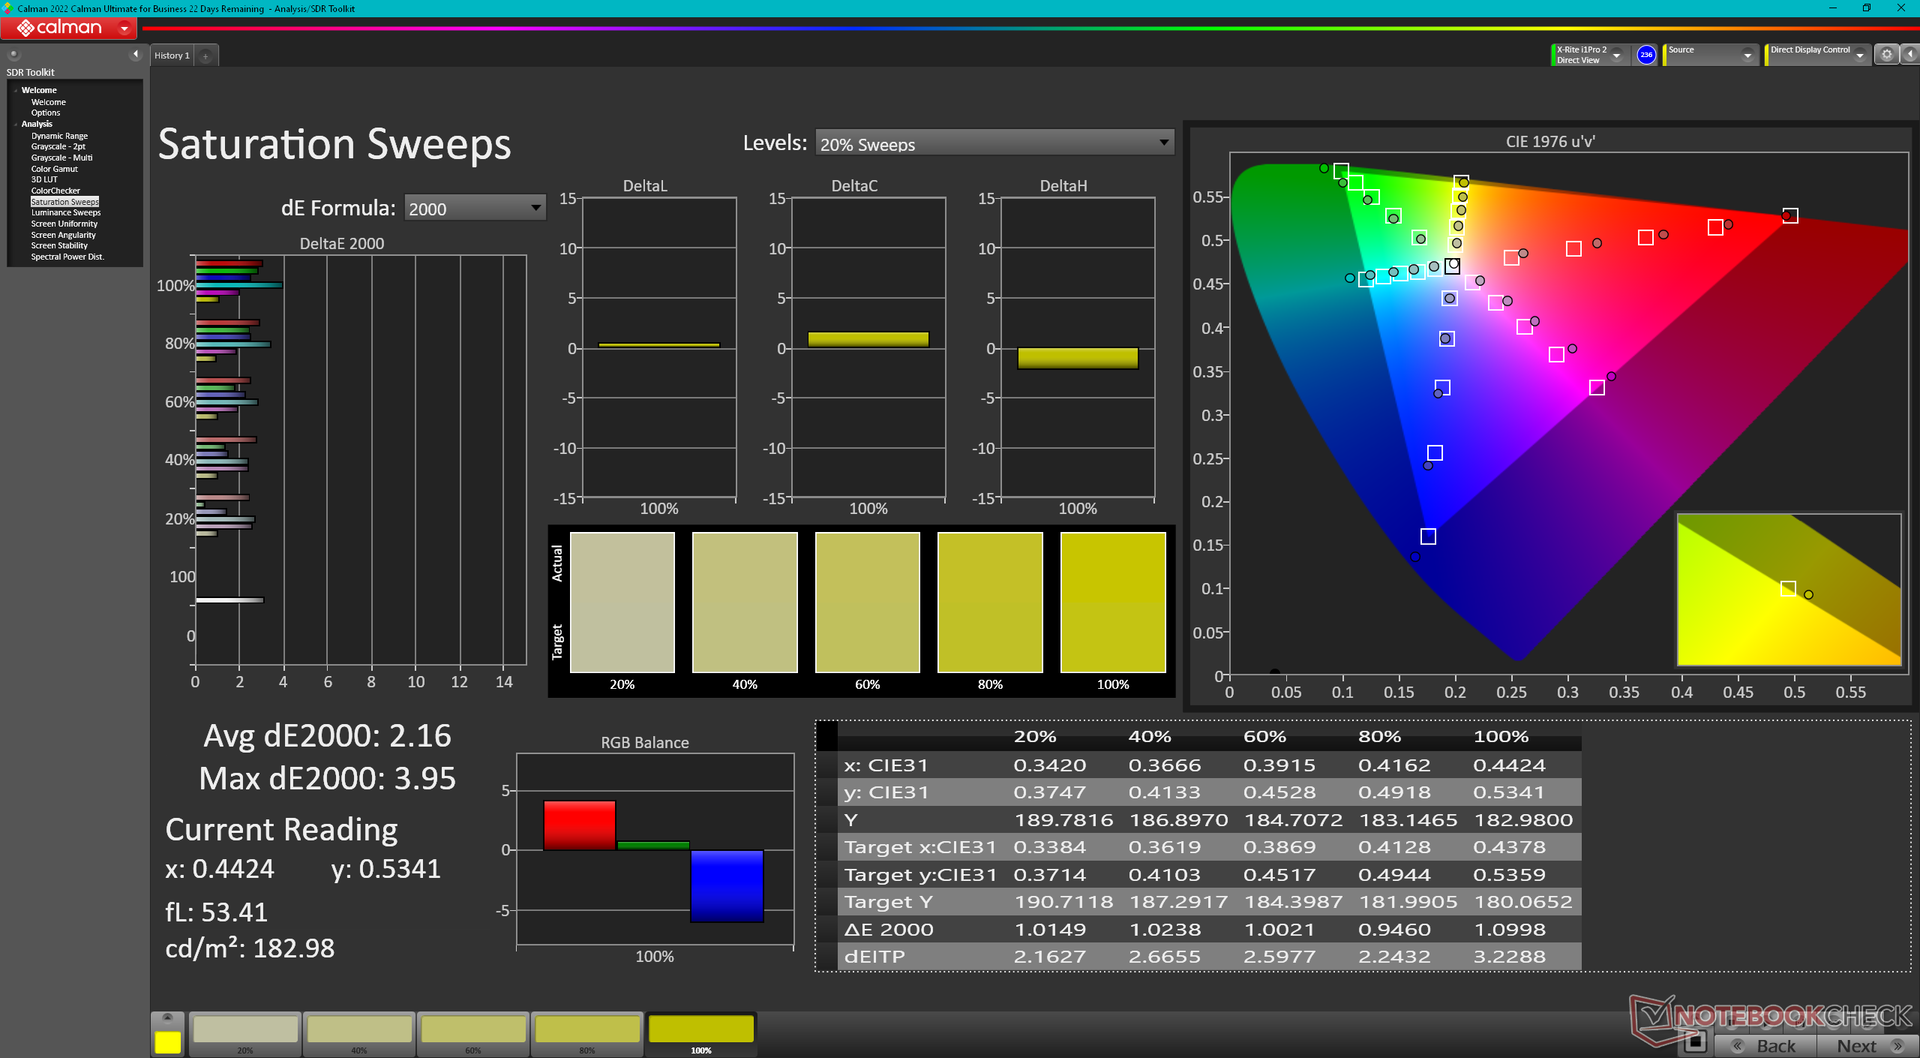
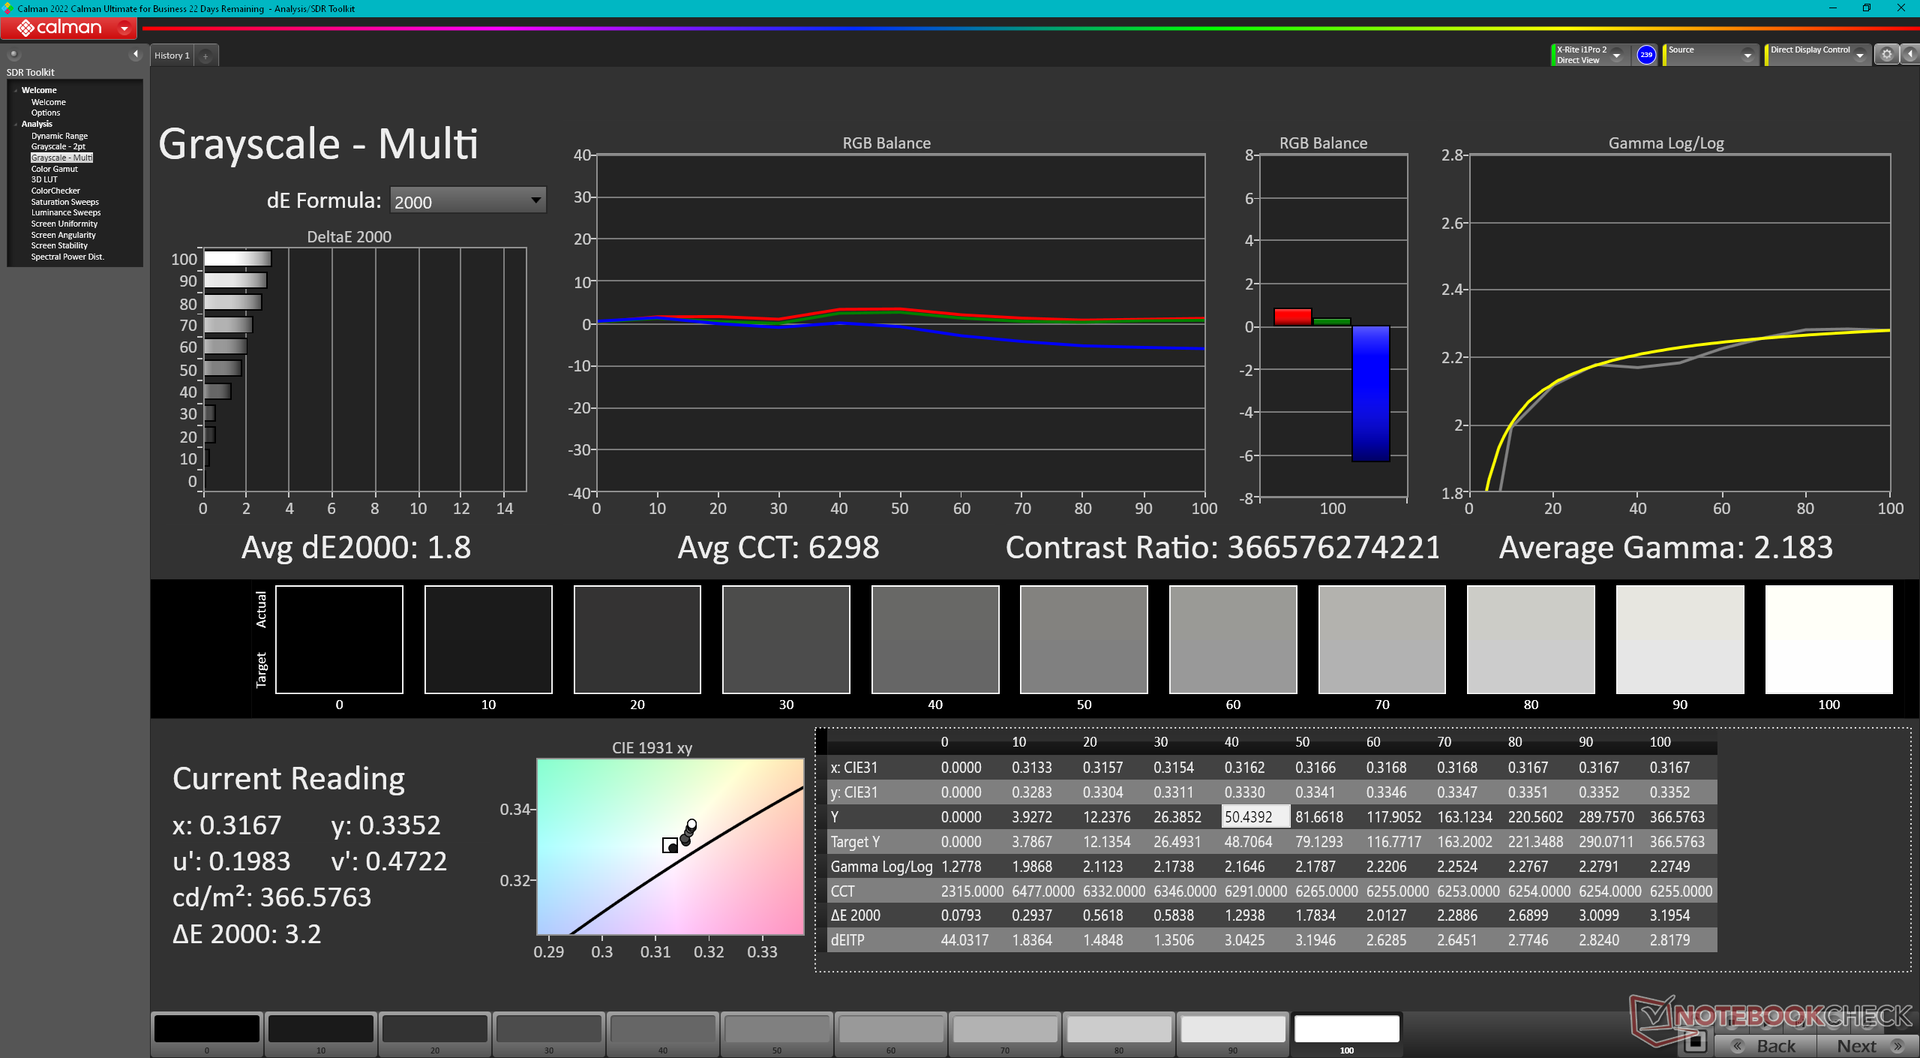
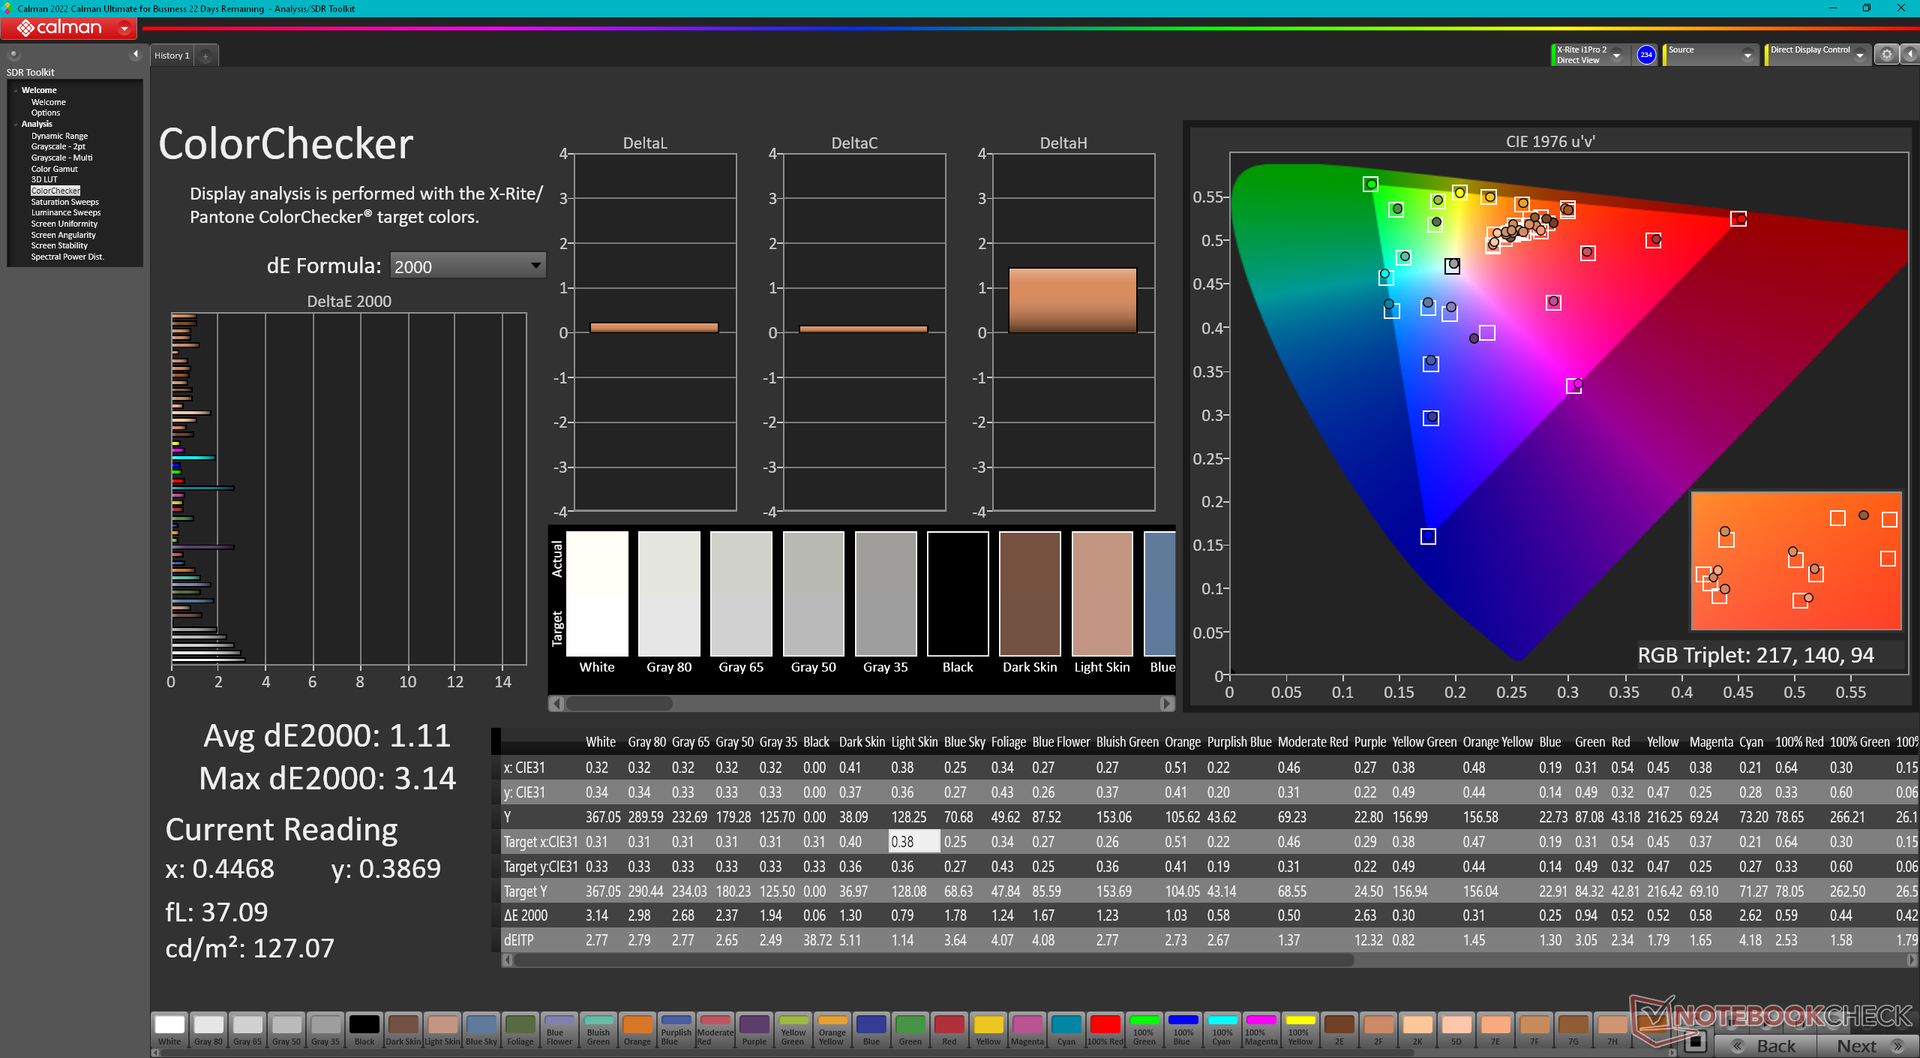
Bien qu'il n'ait pas été étalonné en usine, l'écran est relativement précis par rapport à la norme P3, avec des valeurs moyennes de deltaE en niveaux de gris et en couleurs de 1,7 et 4,31, respectivement.


Temps de réponse de l'écran
| ↔ Temps de réponse noir à blanc | ||
|---|---|---|
| 1 ms ... hausse ↗ et chute ↘ combinées | ↗ 0.56 ms hausse | 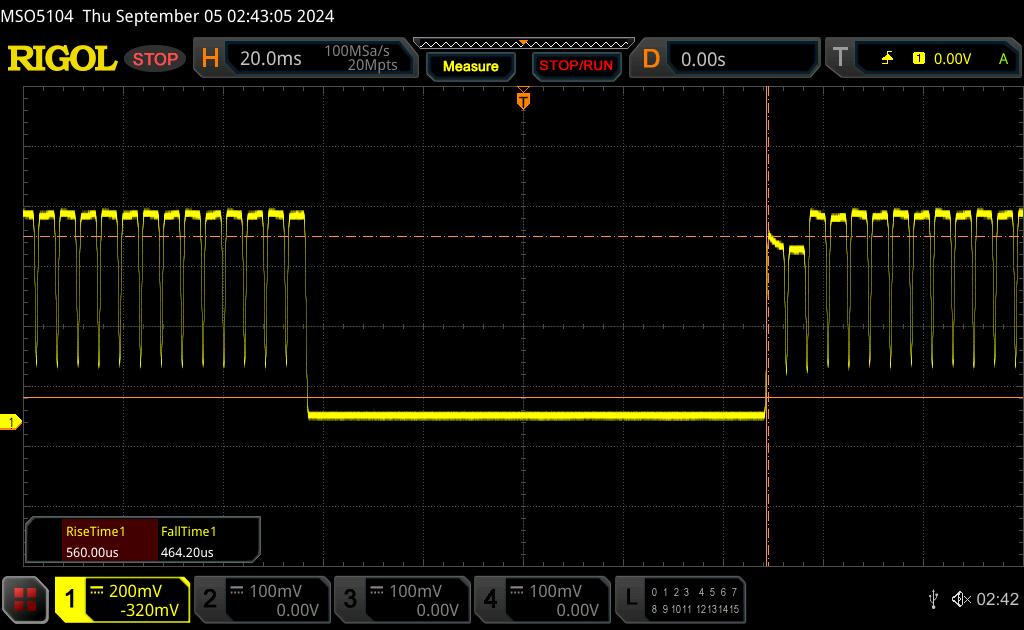 |
| ↘ 0.44 ms chute | ||
| L'écran montre de très faibles temps de réponse, parfait pour le jeu. En comparaison, tous les appareils testés affichent entre 0.1 (minimum) et 240 (maximum) ms. » 2 % des appareils testés affichent de meilleures performances. Cela signifie que les latences relevées sont meilleures que la moyenne (20.9 ms) de tous les appareils testés. | ||
| ↔ Temps de réponse gris 50% à gris 80% | ||
| 0.58 ms ... hausse ↗ et chute ↘ combinées | ↗ 0.28 ms hausse | 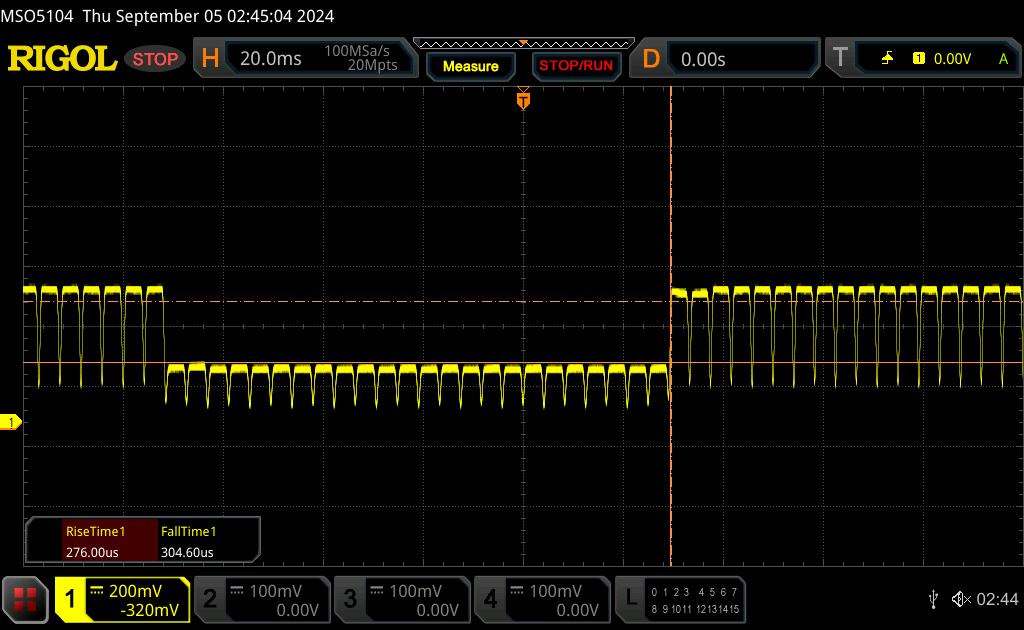 |
| ↘ 0.3 ms chute | ||
| L'écran montre de très faibles temps de réponse, parfait pour le jeu. En comparaison, tous les appareils testés affichent entre 0.165 (minimum) et 636 (maximum) ms. » 1 % des appareils testés affichent de meilleures performances. Cela signifie que les latences relevées sont meilleures que la moyenne (32.8 ms) de tous les appareils testés. | ||
Scintillement / MLI (Modulation de largeur d'impulsion)
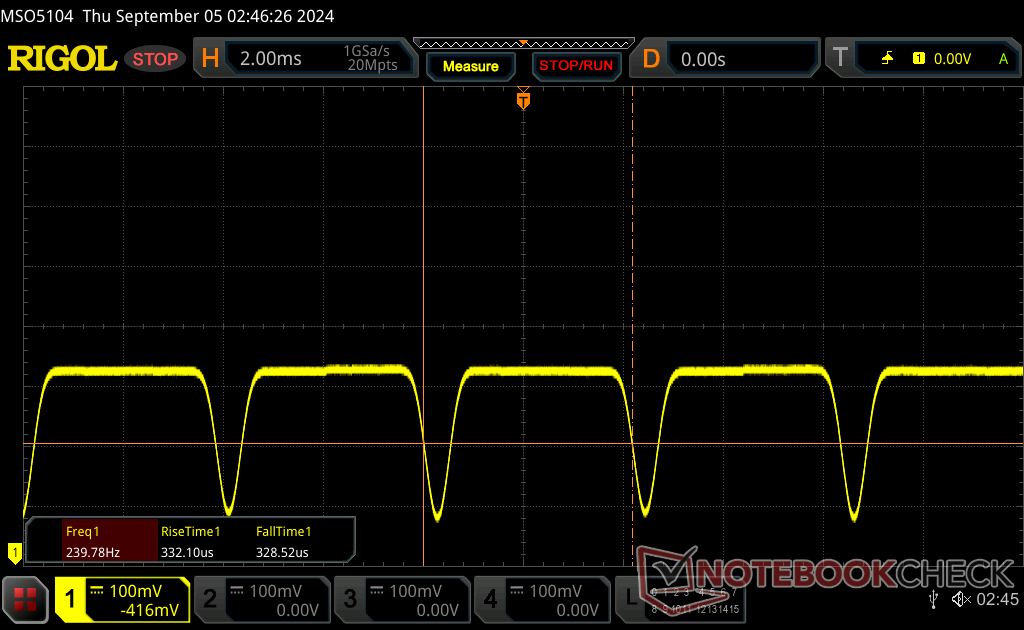
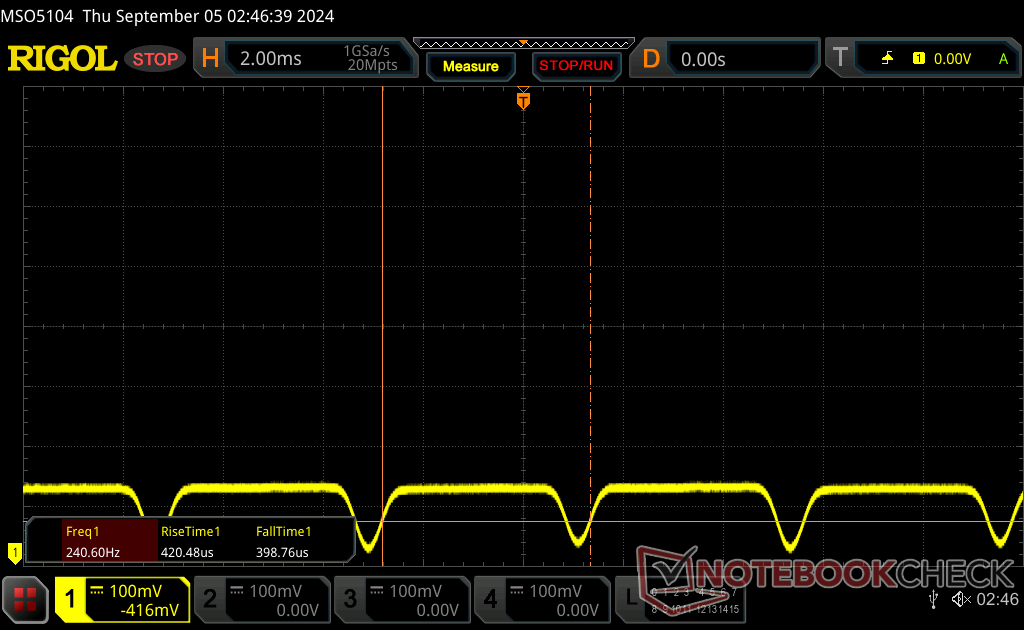
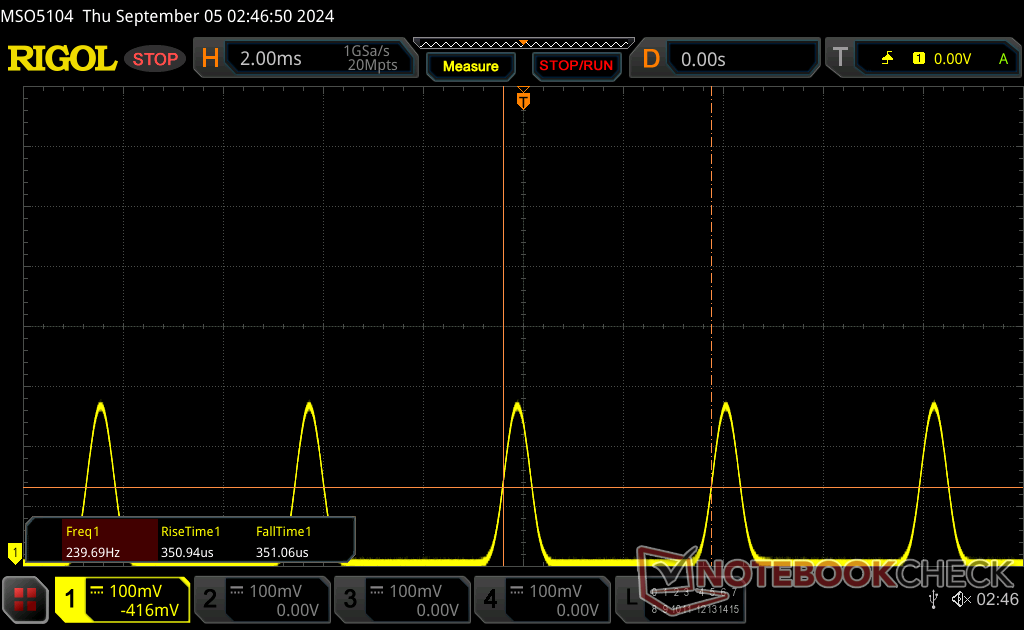
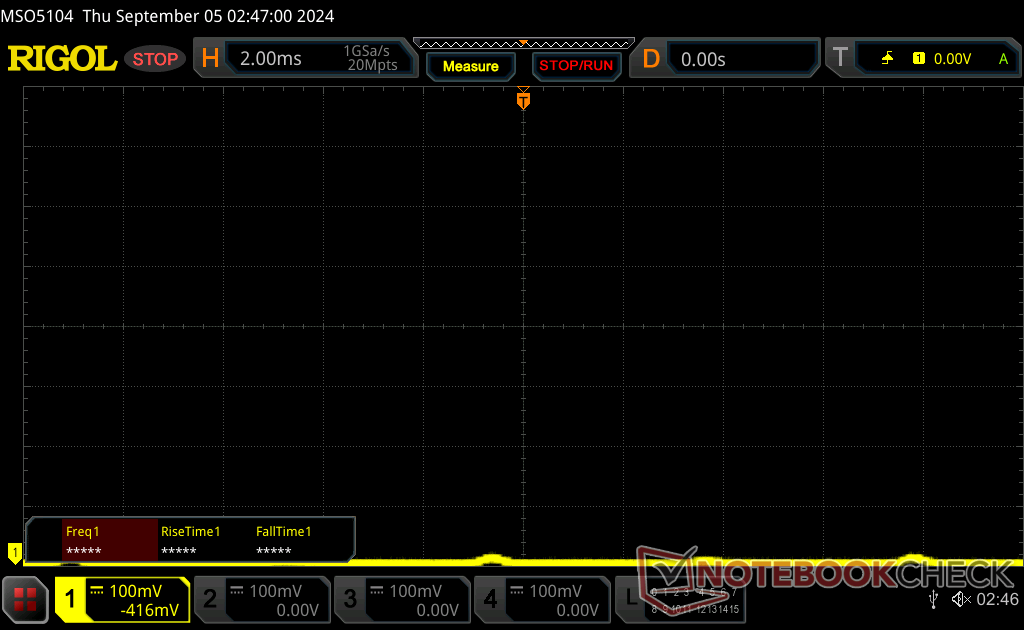
| Scintillement / MLI (Modulation de largeur d'impulsion) décelé | 240 Hz Amplitude: 38 % | ≤ 100 Niveau de luminosité | 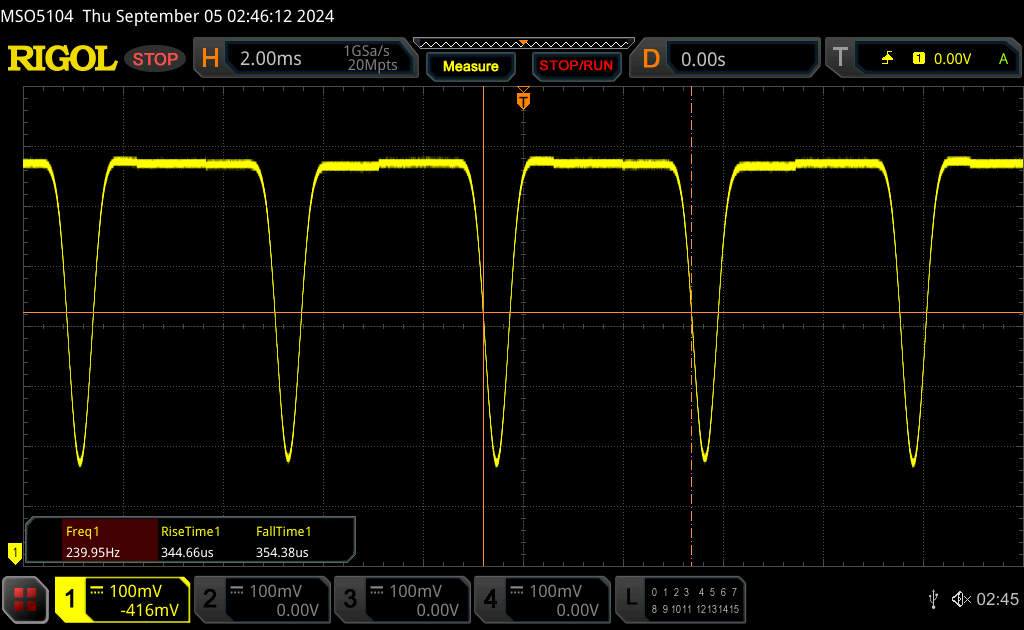 |
Le rétroéclairage de l'écran scintille à la fréquence de 240 Hz (certainement du fait de l'utilisation d'une MDI - Modulation de largeur d'impulsion) à un niveau de luminosité inférieur ou égal à 100 % . Aucun scintillement ne devrait être perceptible au-dessus de cette valeur. La fréquence de rafraîchissement de 240 Hz est relativement faible, les personnes les plus sensibles devraient percevoir un scintillement et être sujettes à une fatigue oculaire accrue (avec le niveau de luminosité indiqué) En comparaison, 53 % des appareils testés n'emploient pas MDI pour assombrir leur écran. Nous avons relevé une moyenne à 8687 (minimum : 5 - maximum : 343500) Hz dans le cas où une MDI était active. | |||
Une fréquence de modulation de largeur d'impulsion de 240 Hz est détectable et cohérente à tous les niveaux de luminosité.
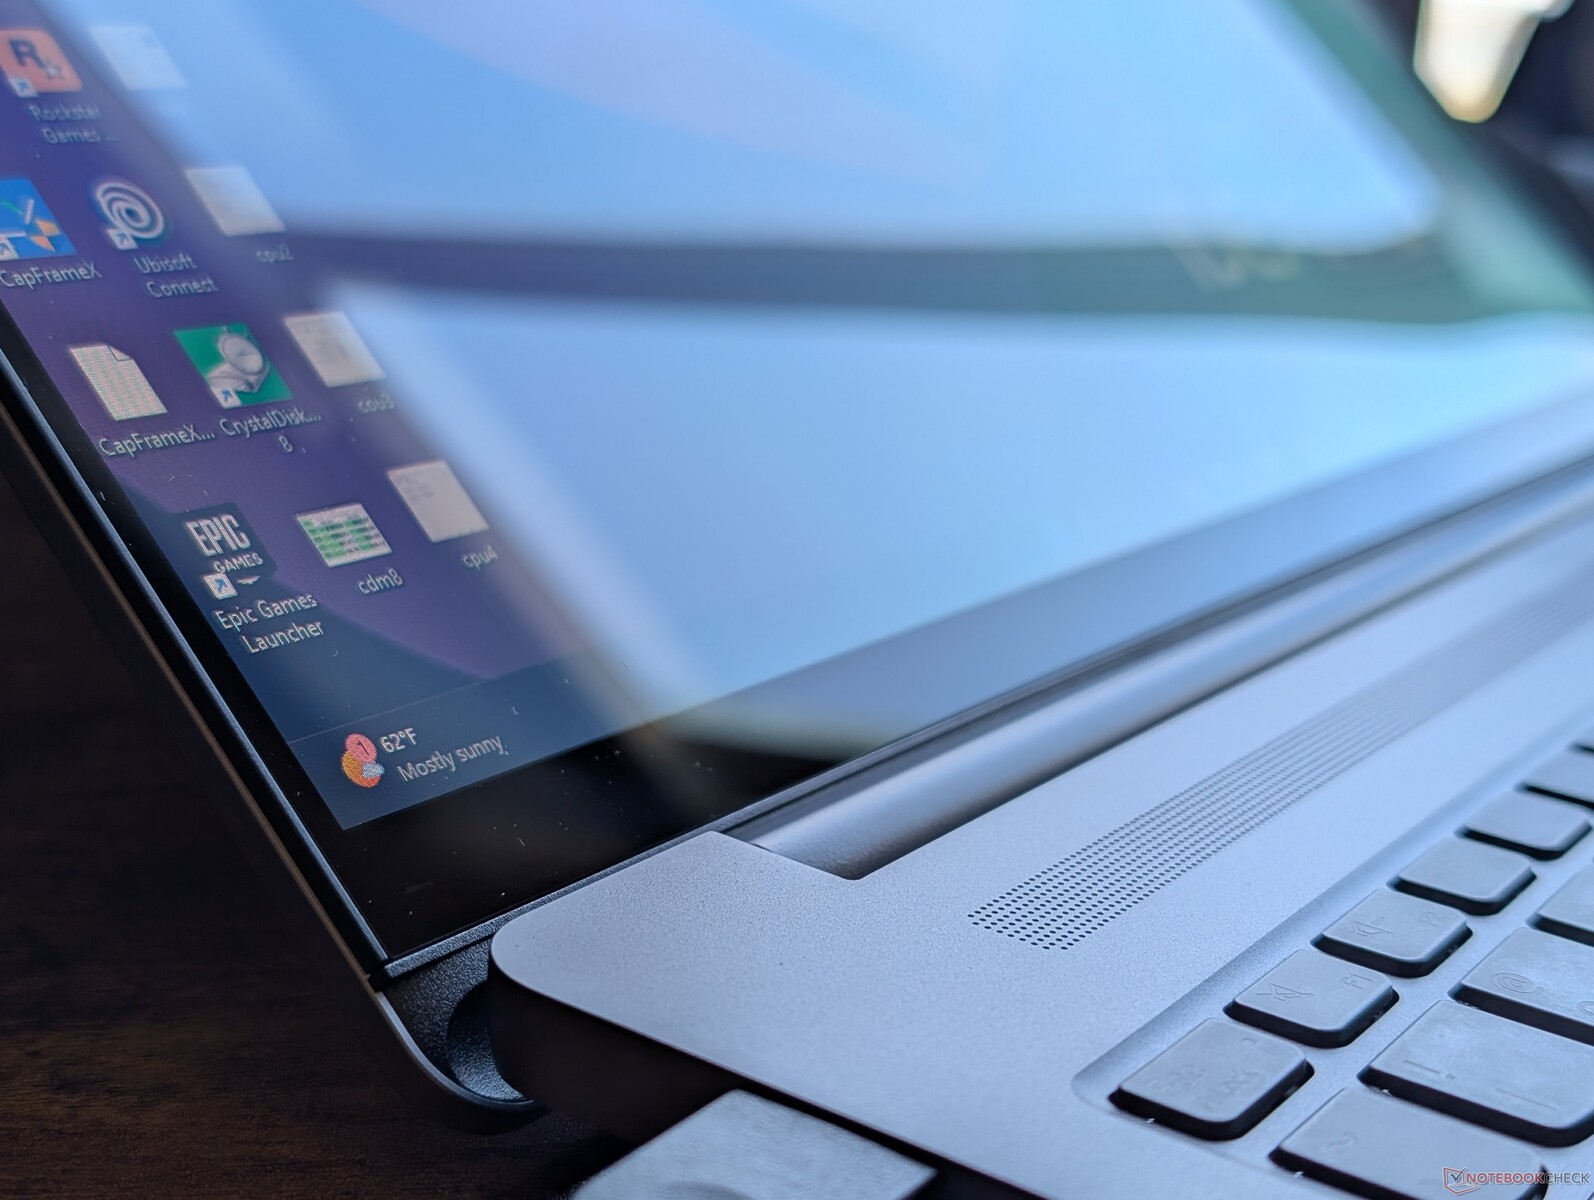
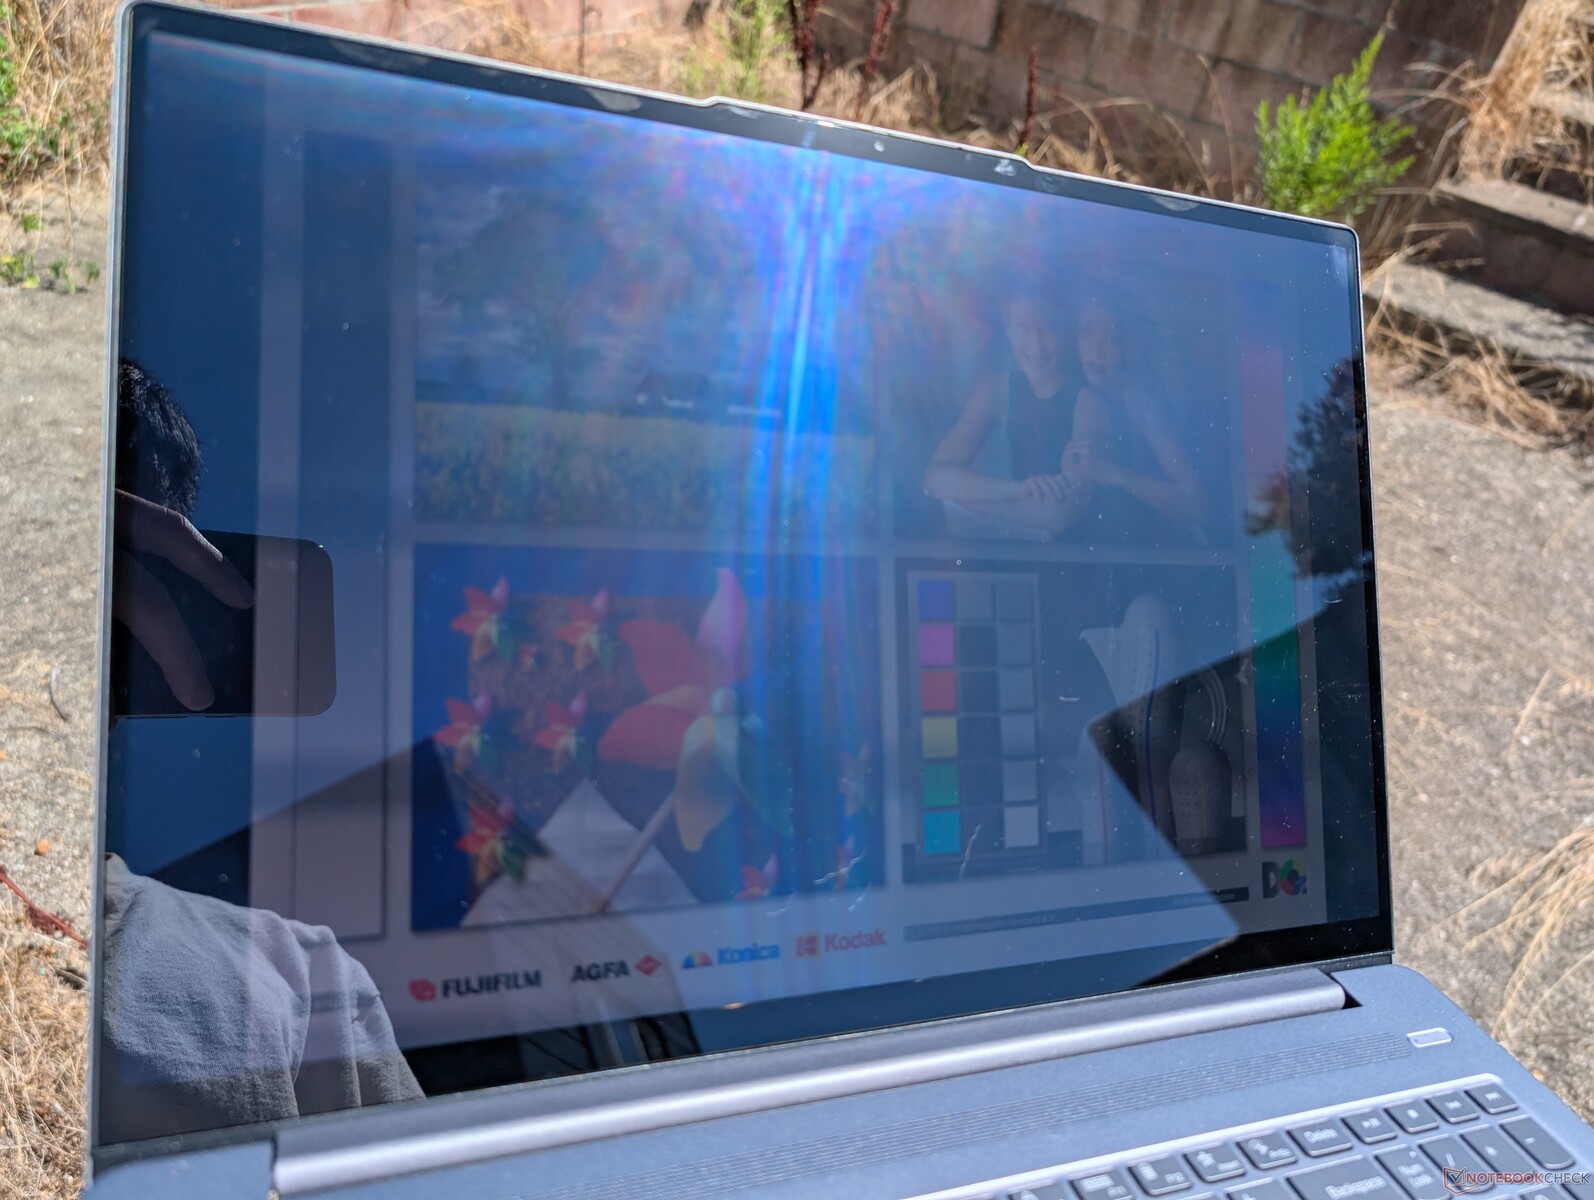
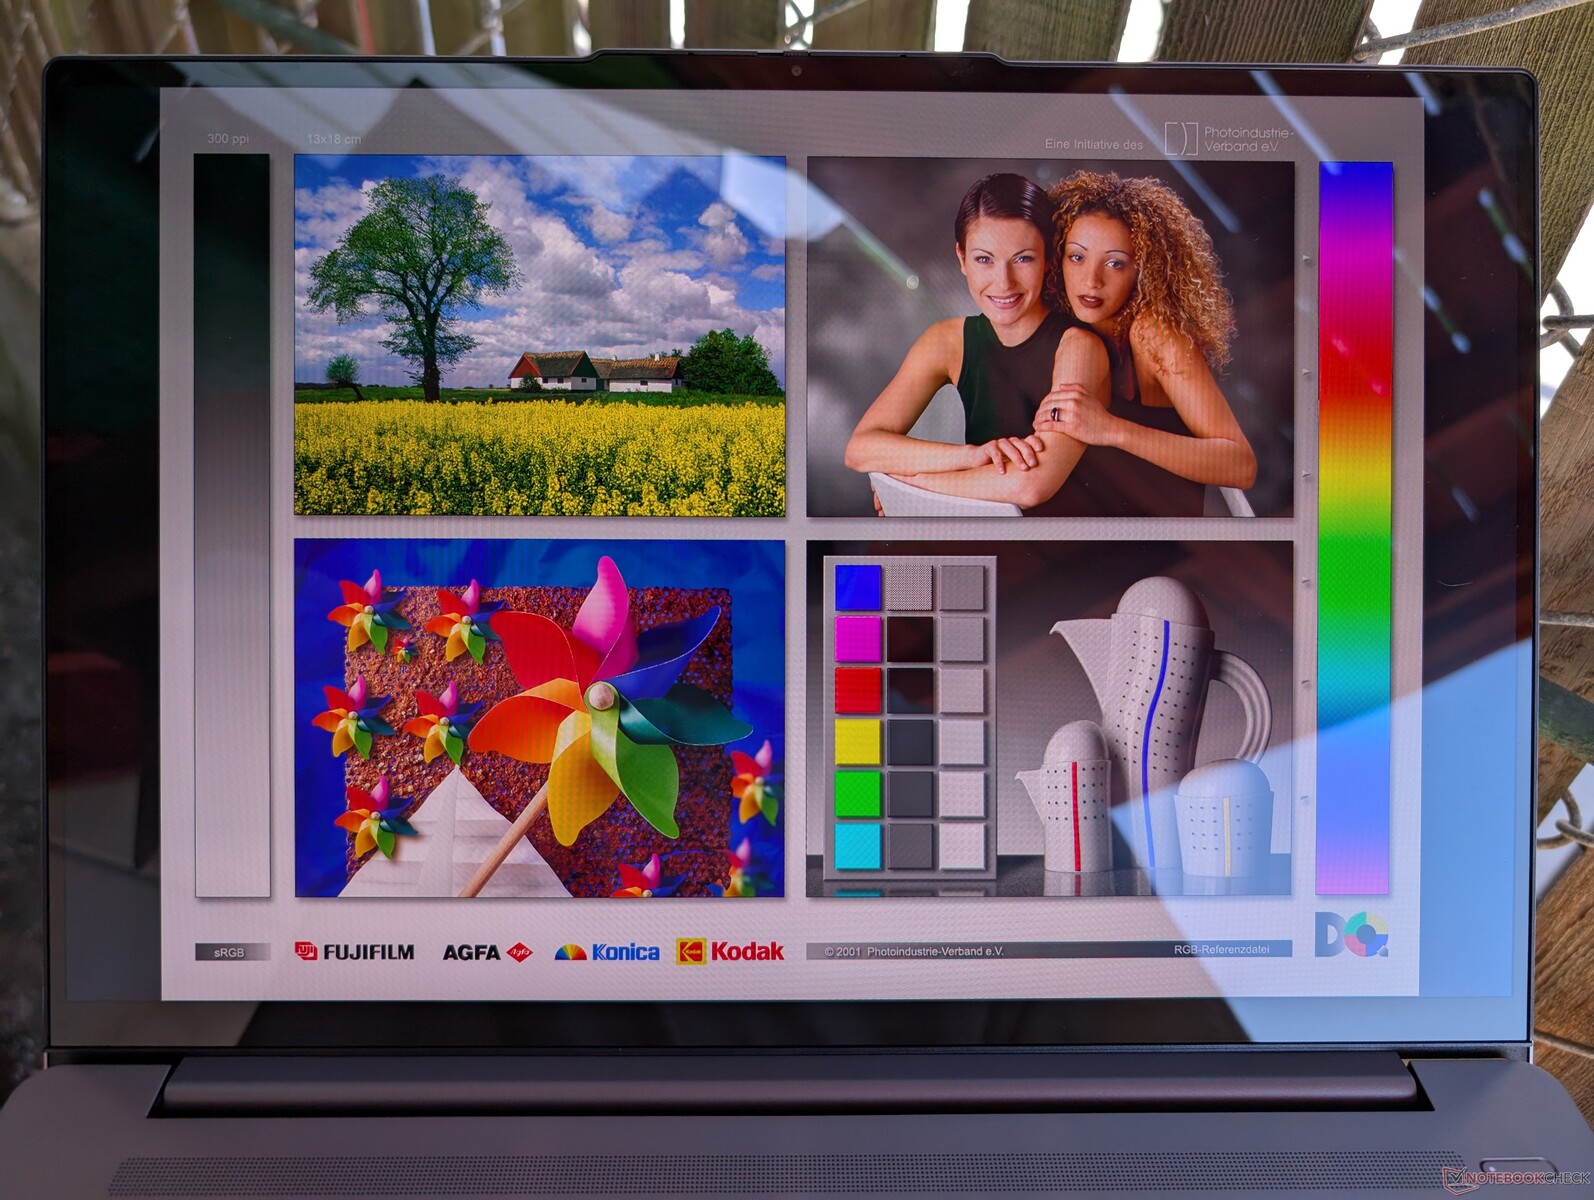
L'option OLED n'est pas nécessairement meilleure que l'option IPS pour le visionnage en extérieur, car leurs niveaux de luminosité maximale sont à peu près les mêmes. En fait, la configuration OLED est moins bonne en raison de sa couche brillante, alors que la configuration IPS est mate pour réduire les reflets.


Performance - Le Core Ultra 9 est un concentré de puissance

Conditions d'essai
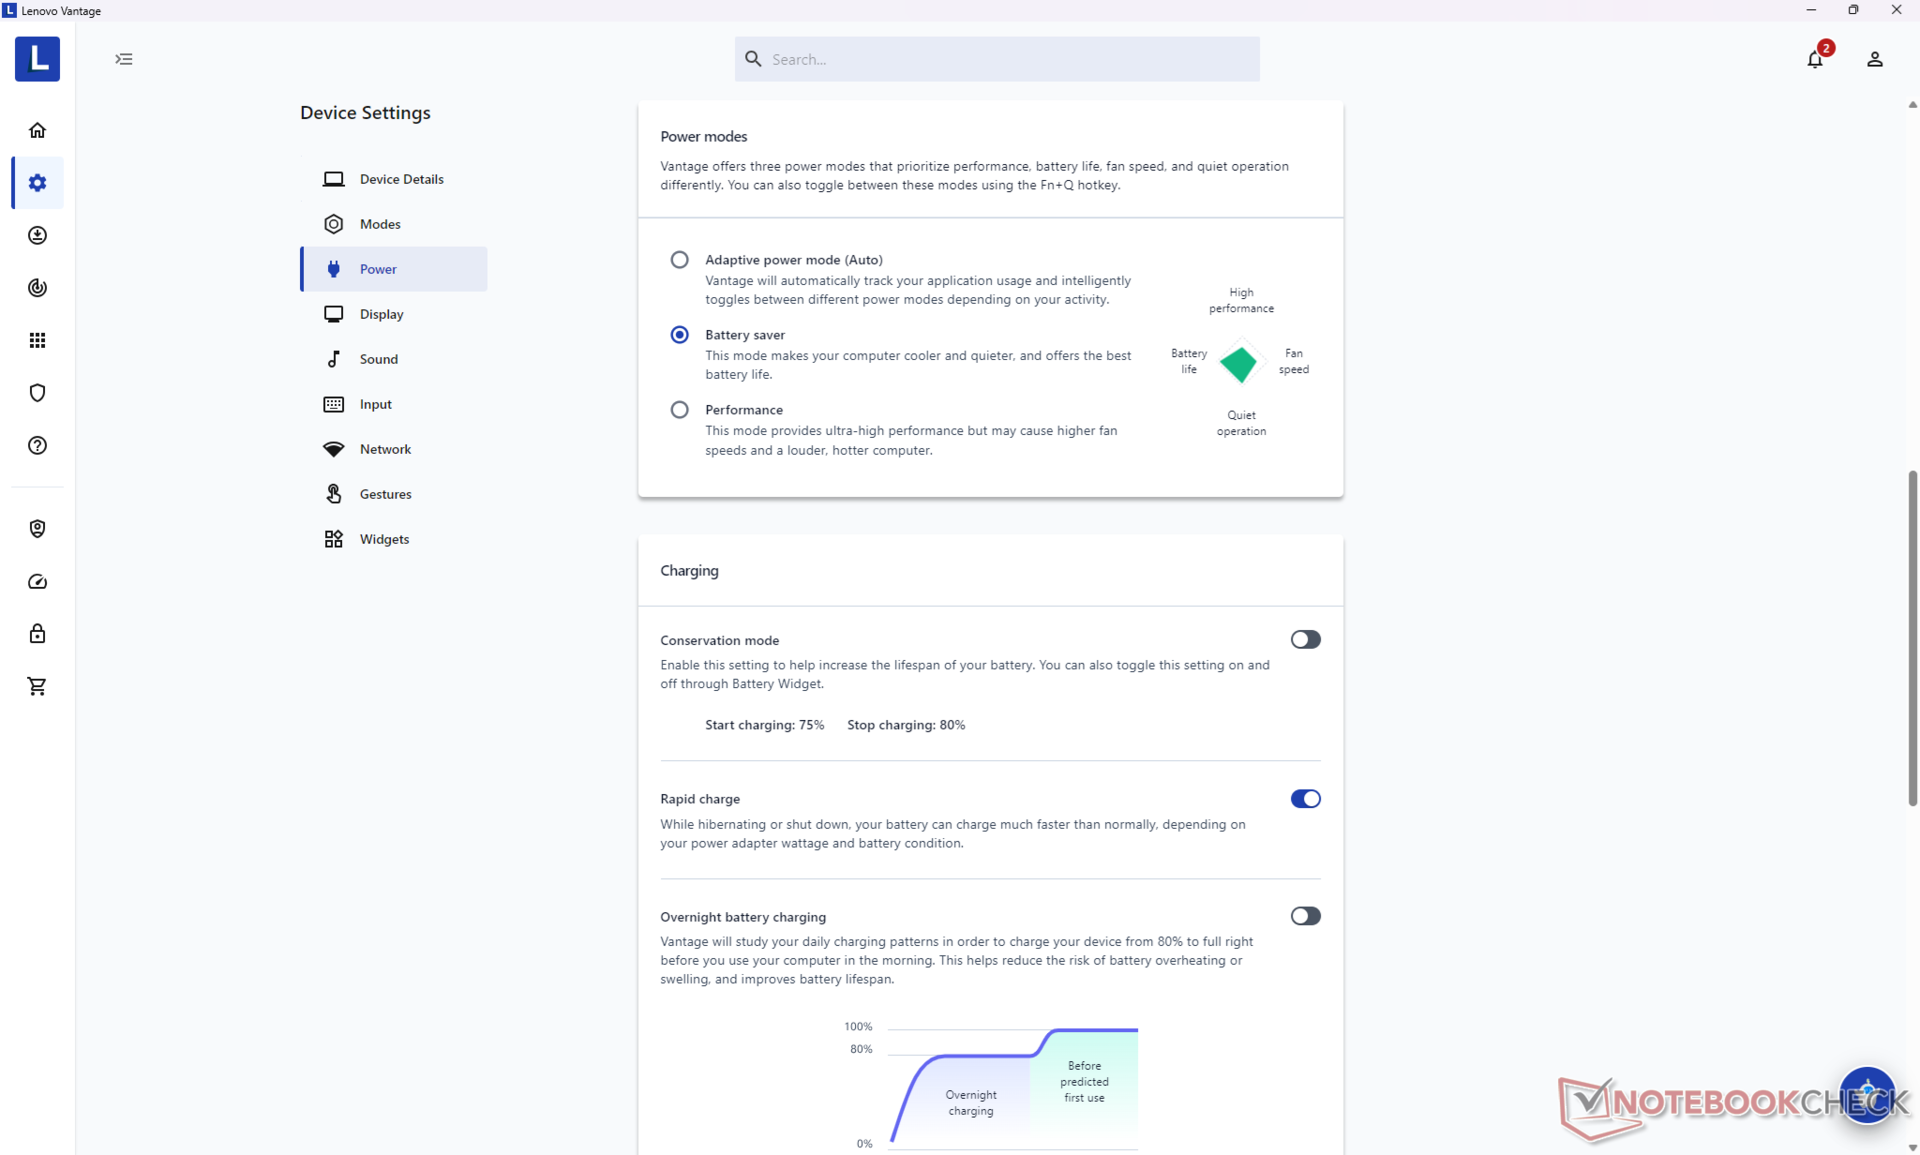
Nous avons réglé Windows et Lenovo Vantage sur le mode Performance avant d'effectuer les tests ci-dessous. Seul Optimus 1.0 est pris en charge, sans les options G-Sync, MUX ou Windows VRR.

Processeur
Trois options de CPU Meteor Lake sont disponibles : Core Ultra 5 125H, Core Ultra 7 155Het Core Ultra 9 185H. Le passage du Core Ultra 5 au Core Ultra 7 apporte une amélioration significative de 80 % des performances, tandis que le passage du Core Ultra 7 au Core Ultra 9 n'ajoute que 5 à 10 % supplémentaires, ce qui est pratiquement imperceptible dans la plupart des scénarios d'utilisation. Ainsi, à moins que vous ne vouliez à tout prix le meilleur du meilleur, l'option Core Ultra 7 suffira à la grande majorité des utilisateurs, d'autant plus qu'elle est toujours plus rapide que la plupart des autres options dans cette catégorie de taille.
Les performances brutes sont supérieures à celles des processeurs AMD concurrents, notamment le Ryzen 7 8840HS et le dernier Ryzen AI 9 HX 370. La série Raptor Lake Core i7 HX peut être encore plus rapide, mais ces CPU ne disposent pas d'un NPU intégré pour accélérer les tâches d'IA compatibles. Notez que Co-Pilot Plus n'est malheureusement pas compatible avec les processeurs Meteor Lake.
Cinebench R15 Multi Loop
Cinebench R23: Multi Core | Single Core
Cinebench R20: CPU (Multi Core) | CPU (Single Core)
Cinebench R15: CPU Multi 64Bit | CPU Single 64Bit
Blender: v2.79 BMW27 CPU
7-Zip 18.03: 7z b 4 | 7z b 4 -mmt1
Geekbench 6.3: Multi-Core | Single-Core
Geekbench 5.5: Multi-Core | Single-Core
HWBOT x265 Benchmark v2.2: 4k Preset
LibreOffice : 20 Documents To PDF
R Benchmark 2.5: Overall mean
* ... Moindre est la valeur, meilleures sont les performances
AIDA64: FP32 Ray-Trace | FPU Julia | CPU SHA3 | CPU Queen | FPU SinJulia | FPU Mandel | CPU AES | CPU ZLib | FP64 Ray-Trace | CPU PhotoWorxx
| Performance Rating | |
| Asus Zenbook S 16 UM5606-RK333W | |
| Lenovo IdeaPad Pro 5 16IMH G9 RTX 4050 | |
| Lenovo IdeaPad Pro 5 16IMH G9 | |
| Moyenne Intel Core Ultra 9 185H | |
| HP Envy x360 2-in-1 16-ad0097nr | |
| Dell Inspiron 16 7640 2-in-1 | |
| Samsung Galaxy Book4 Ultra | |
| AIDA64 / FP32 Ray-Trace | |
| Asus Zenbook S 16 UM5606-RK333W | |
| HP Envy x360 2-in-1 16-ad0097nr | |
| Lenovo IdeaPad Pro 5 16IMH G9 RTX 4050 | |
| Lenovo IdeaPad Pro 5 16IMH G9 | |
| Moyenne Intel Core Ultra 9 185H (9220 - 18676, n=19) | |
| Dell Inspiron 16 7640 2-in-1 | |
| Samsung Galaxy Book4 Ultra | |
| AIDA64 / FPU Julia | |
| Asus Zenbook S 16 UM5606-RK333W | |
| Lenovo IdeaPad Pro 5 16IMH G9 RTX 4050 | |
| Lenovo IdeaPad Pro 5 16IMH G9 | |
| Moyenne Intel Core Ultra 9 185H (48865 - 96463, n=19) | |
| HP Envy x360 2-in-1 16-ad0097nr | |
| Dell Inspiron 16 7640 2-in-1 | |
| Samsung Galaxy Book4 Ultra | |
| AIDA64 / CPU SHA3 | |
| Asus Zenbook S 16 UM5606-RK333W | |
| Lenovo IdeaPad Pro 5 16IMH G9 RTX 4050 | |
| Moyenne Intel Core Ultra 9 185H (2394 - 4534, n=19) | |
| Lenovo IdeaPad Pro 5 16IMH G9 | |
| HP Envy x360 2-in-1 16-ad0097nr | |
| Dell Inspiron 16 7640 2-in-1 | |
| Samsung Galaxy Book4 Ultra | |
| AIDA64 / CPU Queen | |
| HP Envy x360 2-in-1 16-ad0097nr | |
| Lenovo IdeaPad Pro 5 16IMH G9 RTX 4050 | |
| Moyenne Intel Core Ultra 9 185H (66785 - 95241, n=19) | |
| Dell Inspiron 16 7640 2-in-1 | |
| Lenovo IdeaPad Pro 5 16IMH G9 | |
| Asus Zenbook S 16 UM5606-RK333W | |
| Samsung Galaxy Book4 Ultra | |
| AIDA64 / FPU SinJulia | |
| Asus Zenbook S 16 UM5606-RK333W | |
| HP Envy x360 2-in-1 16-ad0097nr | |
| Lenovo IdeaPad Pro 5 16IMH G9 RTX 4050 | |
| Lenovo IdeaPad Pro 5 16IMH G9 | |
| Moyenne Intel Core Ultra 9 185H (7255 - 11392, n=19) | |
| Dell Inspiron 16 7640 2-in-1 | |
| Samsung Galaxy Book4 Ultra | |
| AIDA64 / FPU Mandel | |
| Asus Zenbook S 16 UM5606-RK333W | |
| Lenovo IdeaPad Pro 5 16IMH G9 RTX 4050 | |
| HP Envy x360 2-in-1 16-ad0097nr | |
| Lenovo IdeaPad Pro 5 16IMH G9 | |
| Moyenne Intel Core Ultra 9 185H (24004 - 48020, n=19) | |
| Dell Inspiron 16 7640 2-in-1 | |
| Samsung Galaxy Book4 Ultra | |
| AIDA64 / CPU AES | |
| Moyenne Intel Core Ultra 9 185H (53116 - 154066, n=19) | |
| Lenovo IdeaPad Pro 5 16IMH G9 RTX 4050 | |
| Lenovo IdeaPad Pro 5 16IMH G9 | |
| Dell Inspiron 16 7640 2-in-1 | |
| HP Envy x360 2-in-1 16-ad0097nr | |
| Samsung Galaxy Book4 Ultra | |
| Asus Zenbook S 16 UM5606-RK333W | |
| AIDA64 / CPU ZLib | |
| Lenovo IdeaPad Pro 5 16IMH G9 RTX 4050 | |
| Moyenne Intel Core Ultra 9 185H (678 - 1341, n=19) | |
| Lenovo IdeaPad Pro 5 16IMH G9 | |
| Asus Zenbook S 16 UM5606-RK333W | |
| Dell Inspiron 16 7640 2-in-1 | |
| Samsung Galaxy Book4 Ultra | |
| HP Envy x360 2-in-1 16-ad0097nr | |
| AIDA64 / FP64 Ray-Trace | |
| Asus Zenbook S 16 UM5606-RK333W | |
| HP Envy x360 2-in-1 16-ad0097nr | |
| Lenovo IdeaPad Pro 5 16IMH G9 RTX 4050 | |
| Lenovo IdeaPad Pro 5 16IMH G9 | |
| Moyenne Intel Core Ultra 9 185H (4428 - 10078, n=19) | |
| Dell Inspiron 16 7640 2-in-1 | |
| Samsung Galaxy Book4 Ultra | |
| AIDA64 / CPU PhotoWorxx | |
| Lenovo IdeaPad Pro 5 16IMH G9 | |
| Lenovo IdeaPad Pro 5 16IMH G9 RTX 4050 | |
| Samsung Galaxy Book4 Ultra | |
| Asus Zenbook S 16 UM5606-RK333W | |
| Moyenne Intel Core Ultra 9 185H (44547 - 53918, n=19) | |
| Dell Inspiron 16 7640 2-in-1 | |
| HP Envy x360 2-in-1 16-ad0097nr | |
Test de stress
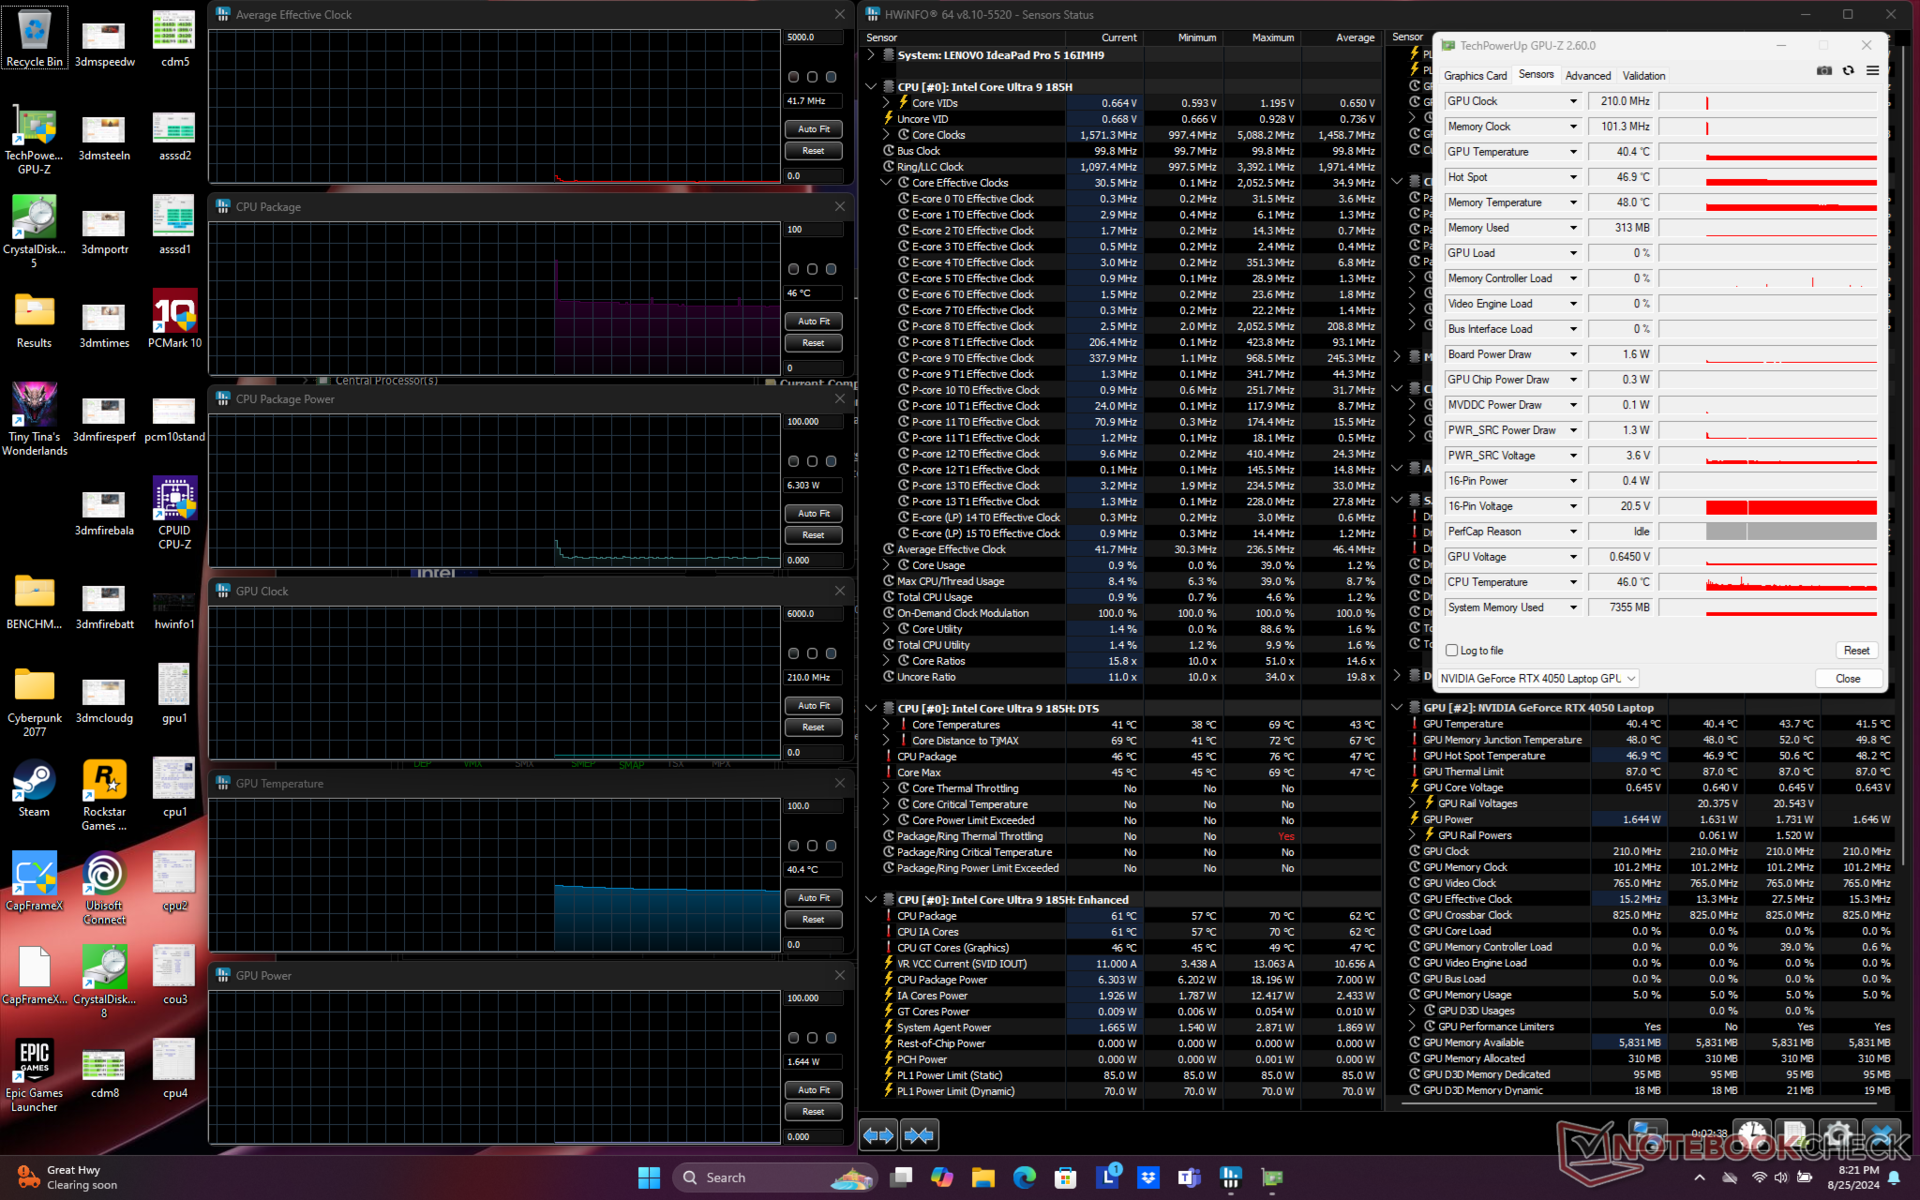
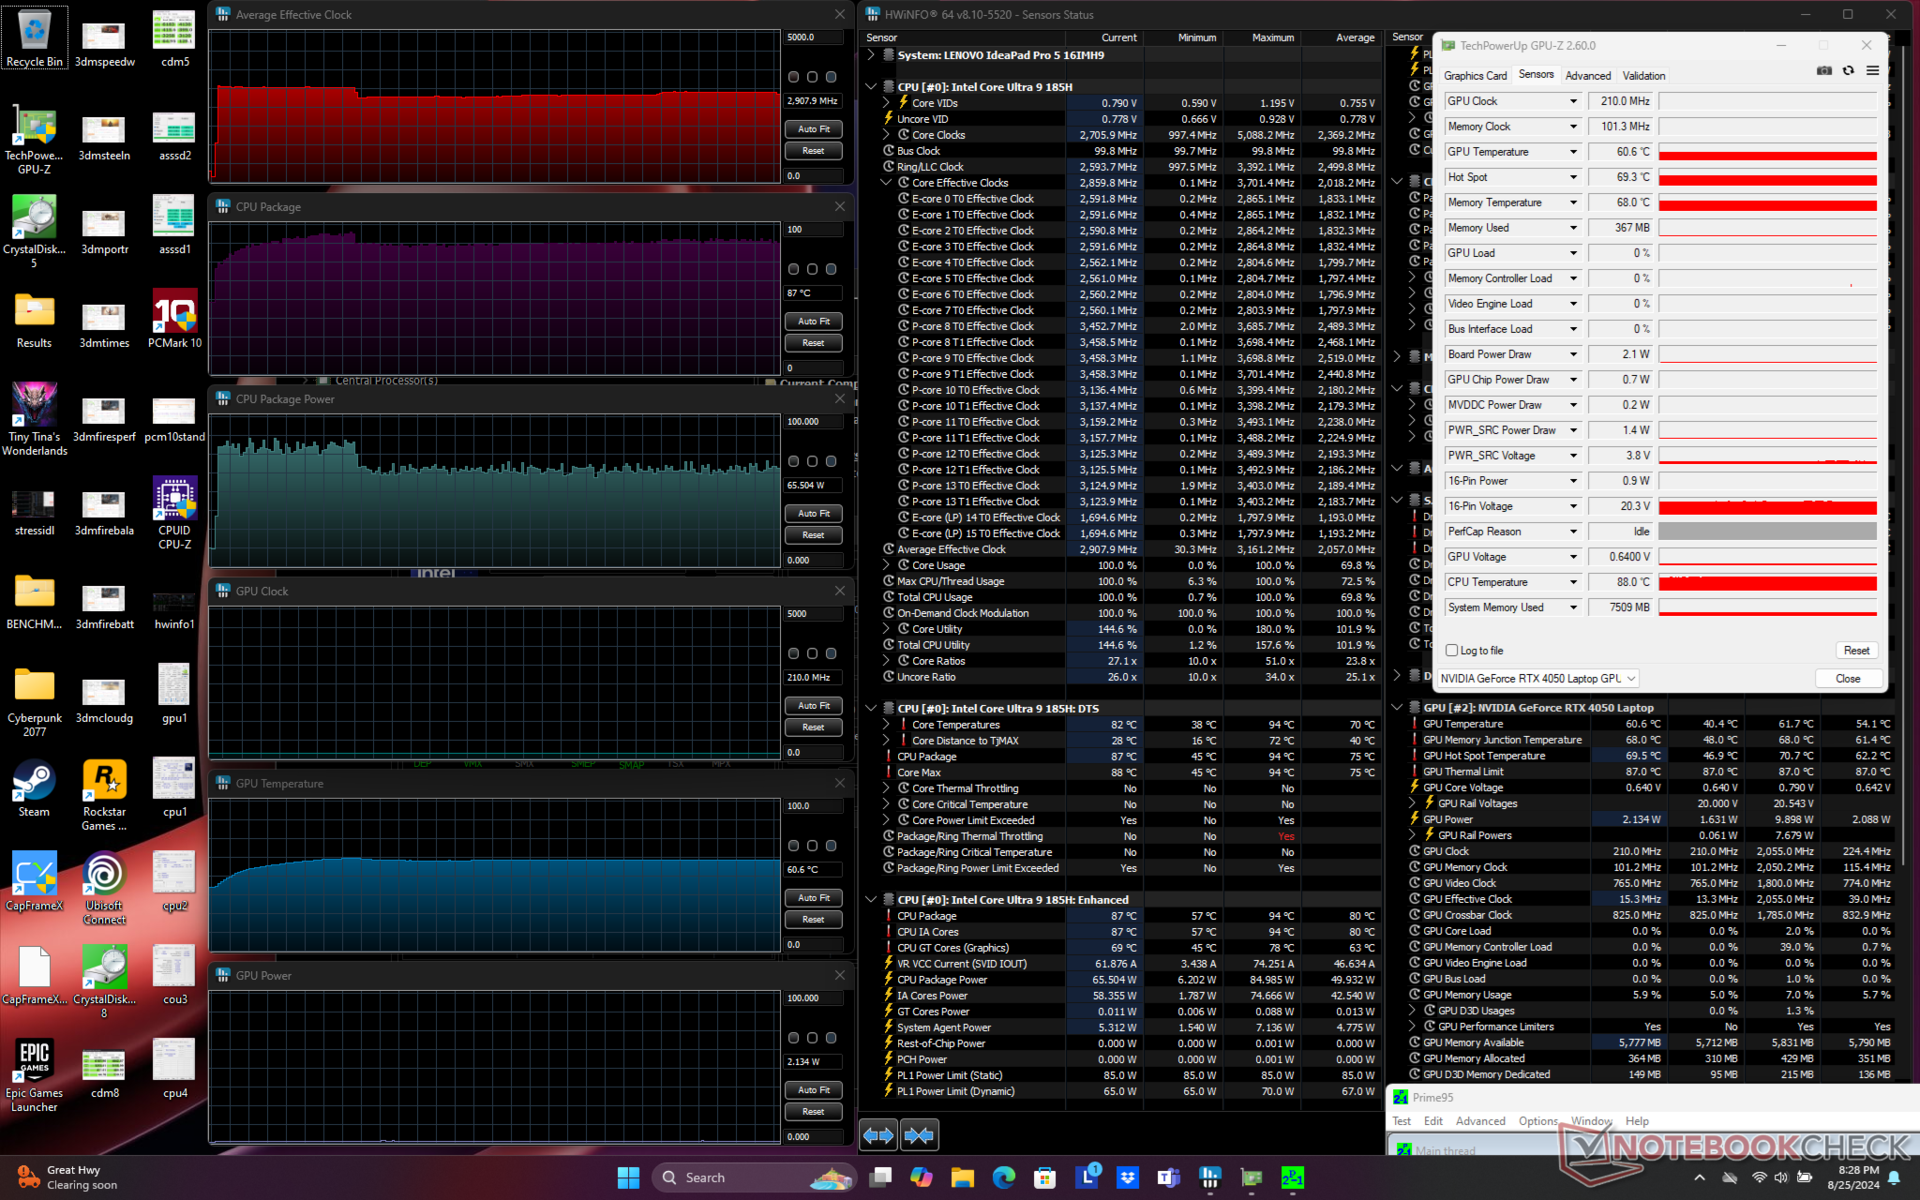
Le processeur atteignait 3,2 GHz, 81 W et 94 C lors de l'initialisation du stress Prime95. Au bout d'une minute environ, il redescend à 2,8 GHz et 65 W afin de maintenir une température légèrement plus basse de 87 C. La plage de 80 C est encore très chaude, ce qui suggère que les performances du CPU auraient probablement été plus rapides si le châssis avait été légèrement plus grand et si la solution de refroidissement avait été plus performante.
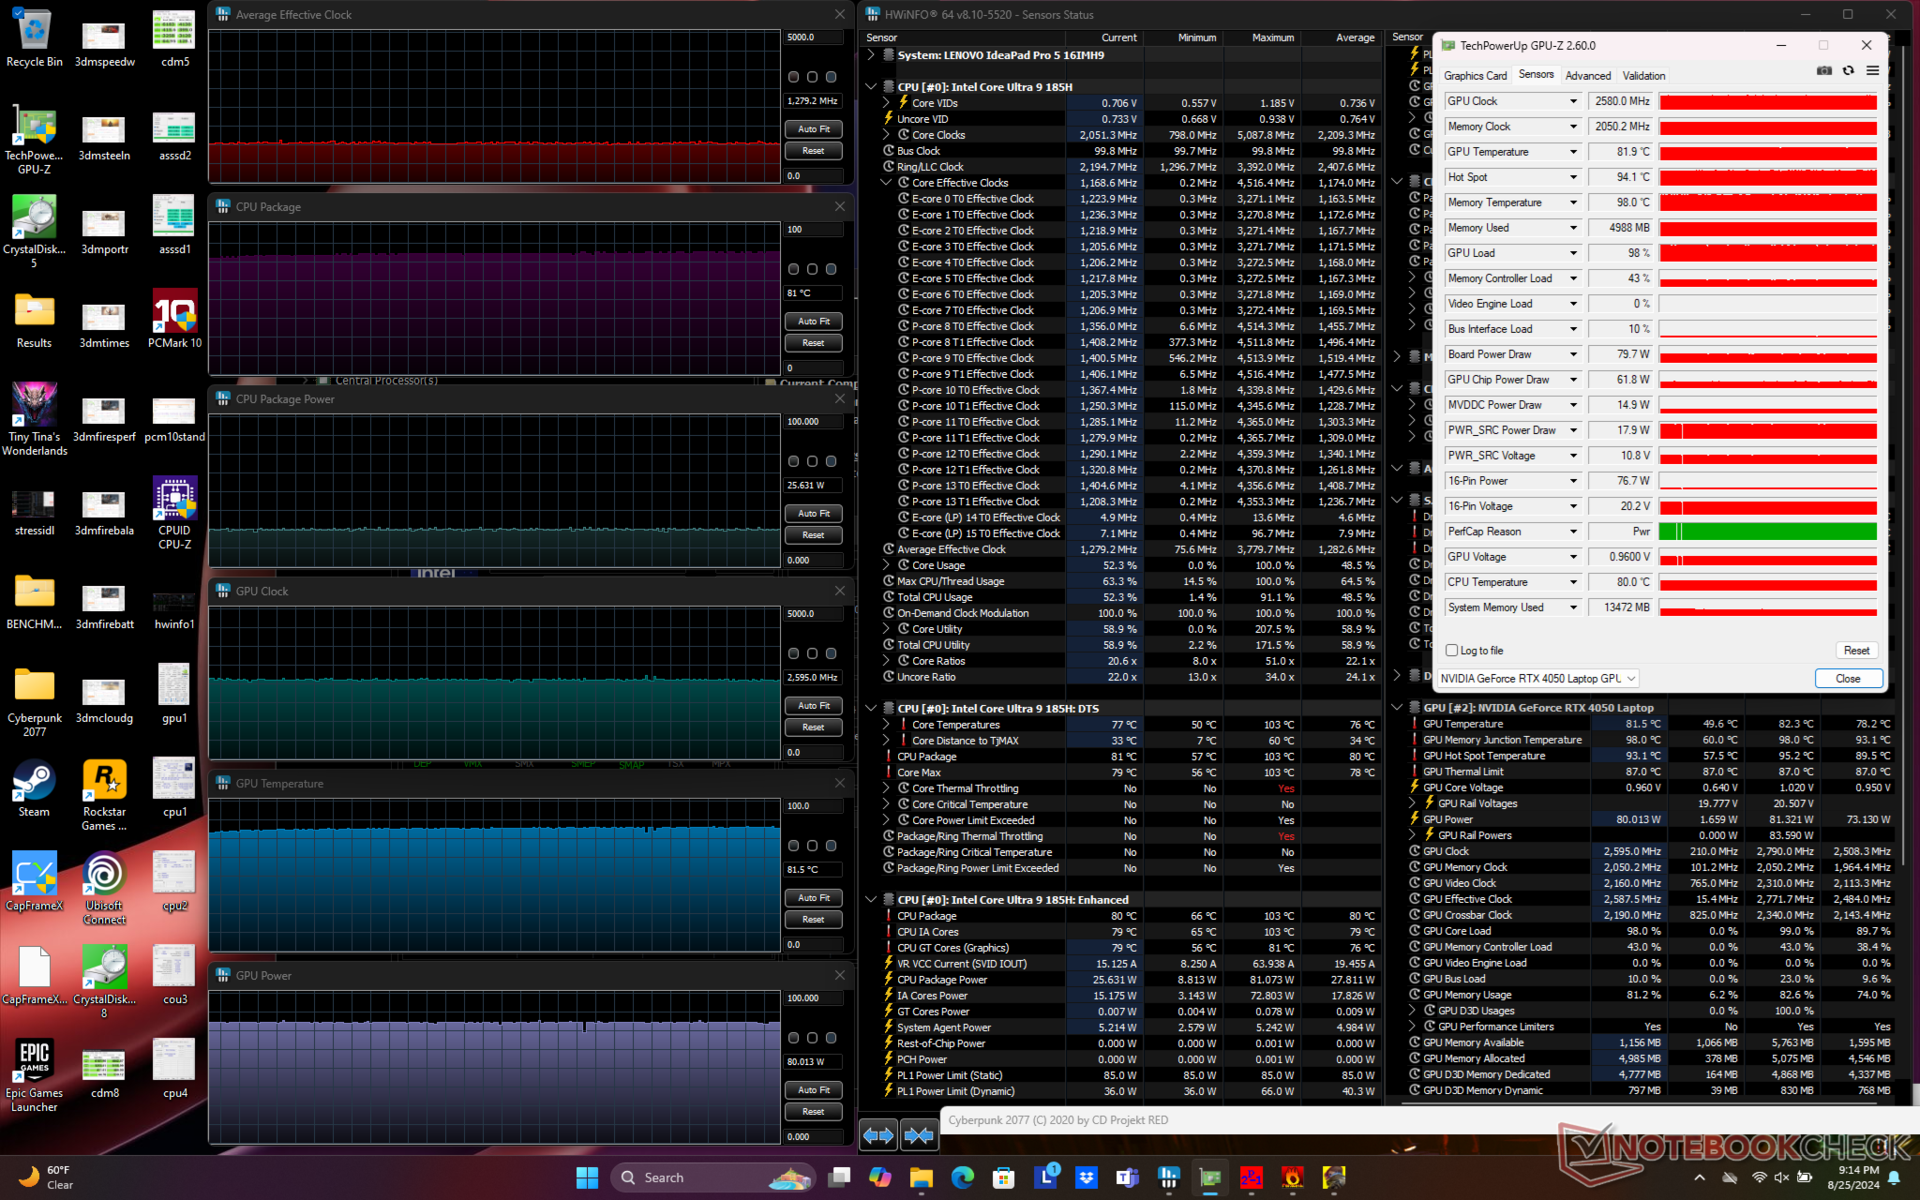
Le GPU se stabilise à 2595 MHz, 82 C et 80 W en exécutant Cyberpunk 2077 pour représenter les charges de jeu typiques, contre 71 C et 75 C sur le Spectre x360 16 ou le Lenovo LOQ 15respectivement, chacun avec le même GPU RTX 4050. Les températures de fonctionnement généralement plus élevées ne sont pas surprenantes compte tenu de la finesse du châssis, du processeur Core Ultra H et de l'objectif TGP de 90 W relativement élevé.
| Horloge moyenne du CPU (GHz) | Horloge du GPU (MHz) | Température moyenne du CPU (°C) | Température moyenne du GPU (°C) | |
| Système en veille | -- | -- | 46 | 40 |
| Prime95 Stress | 2.9 | -- | 87 | 61 |
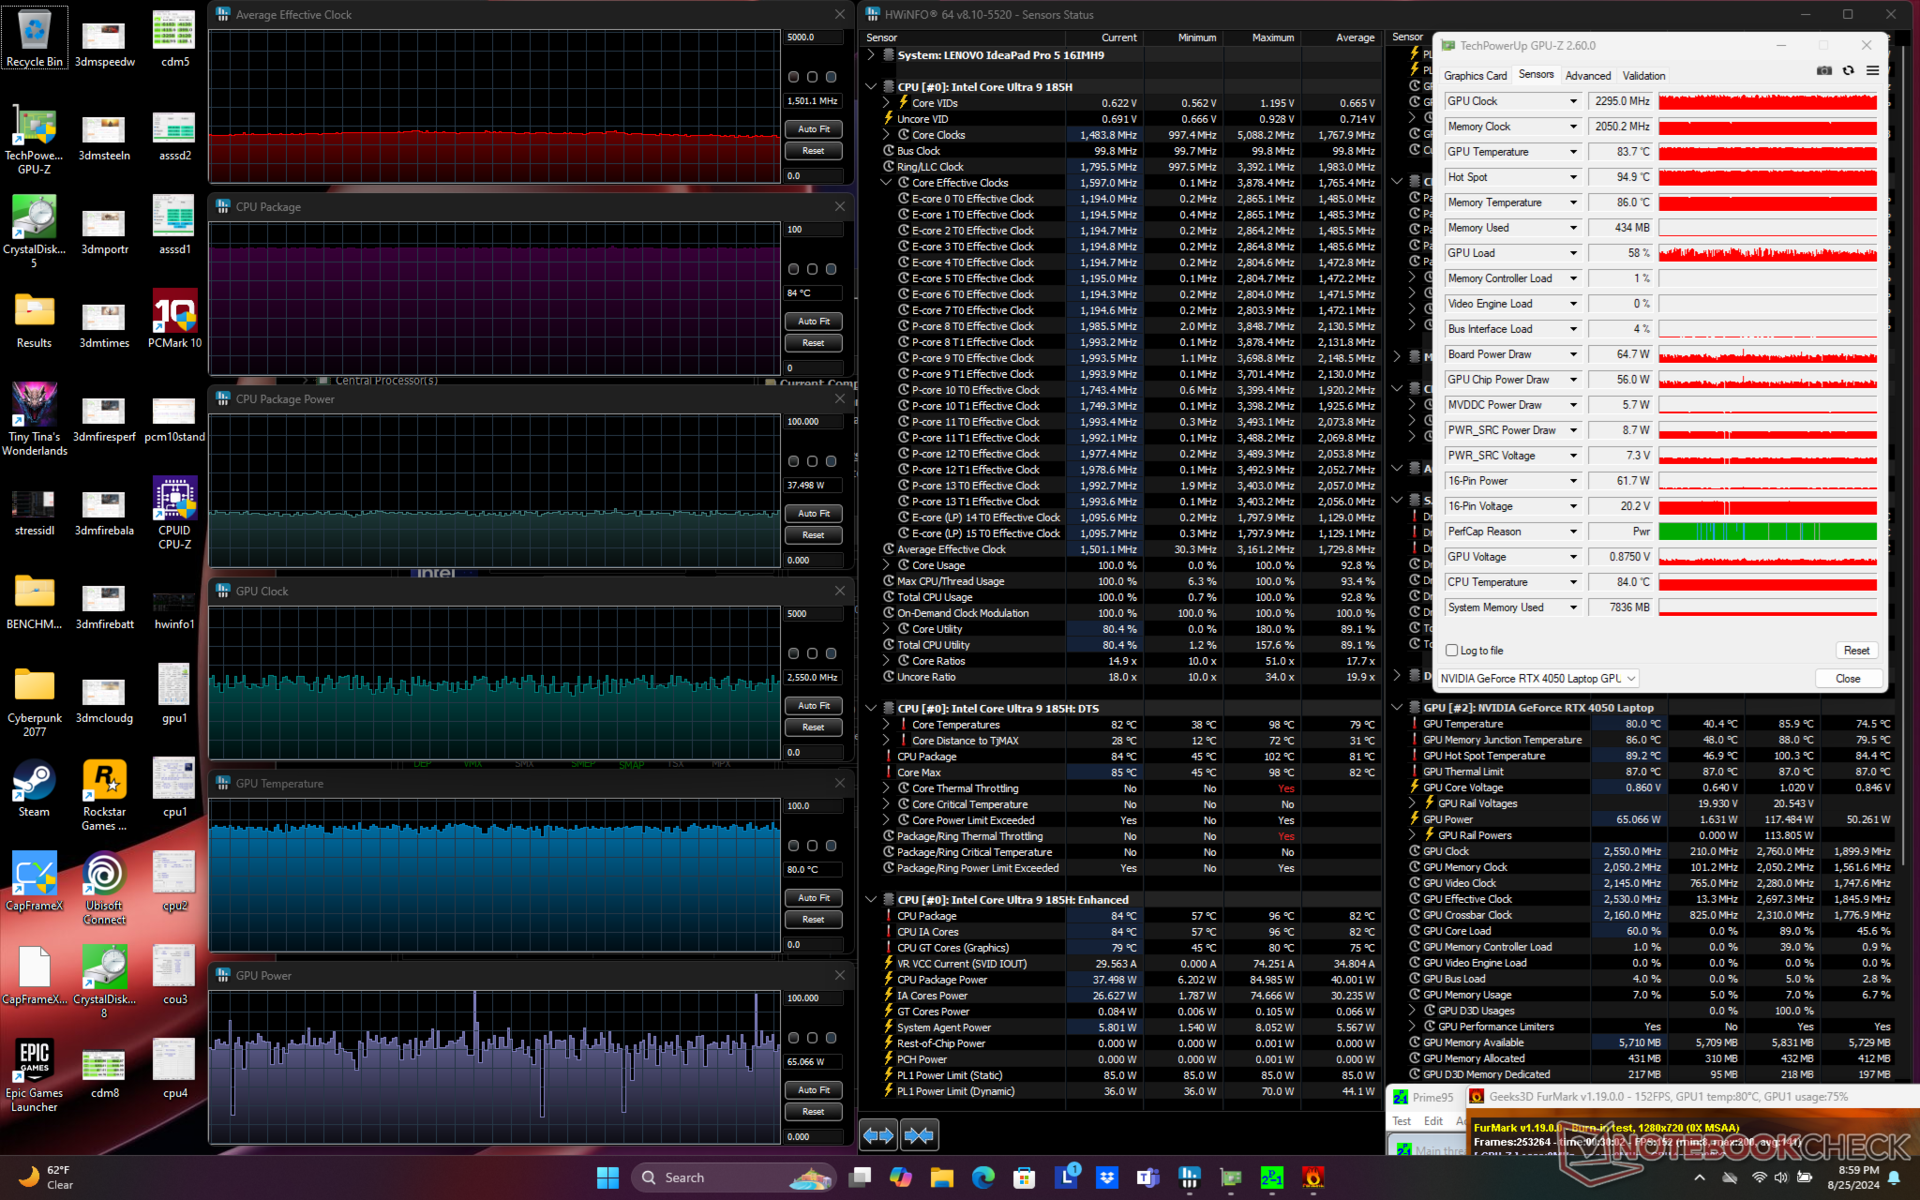
| Prime95 + FurMark Stress | 1.5 | 2295 - 2550 | 84 | 80 |
| Cyberpunk 2077 Stress | 1.3 | 2580 | 81 | 82 |
Performance du système
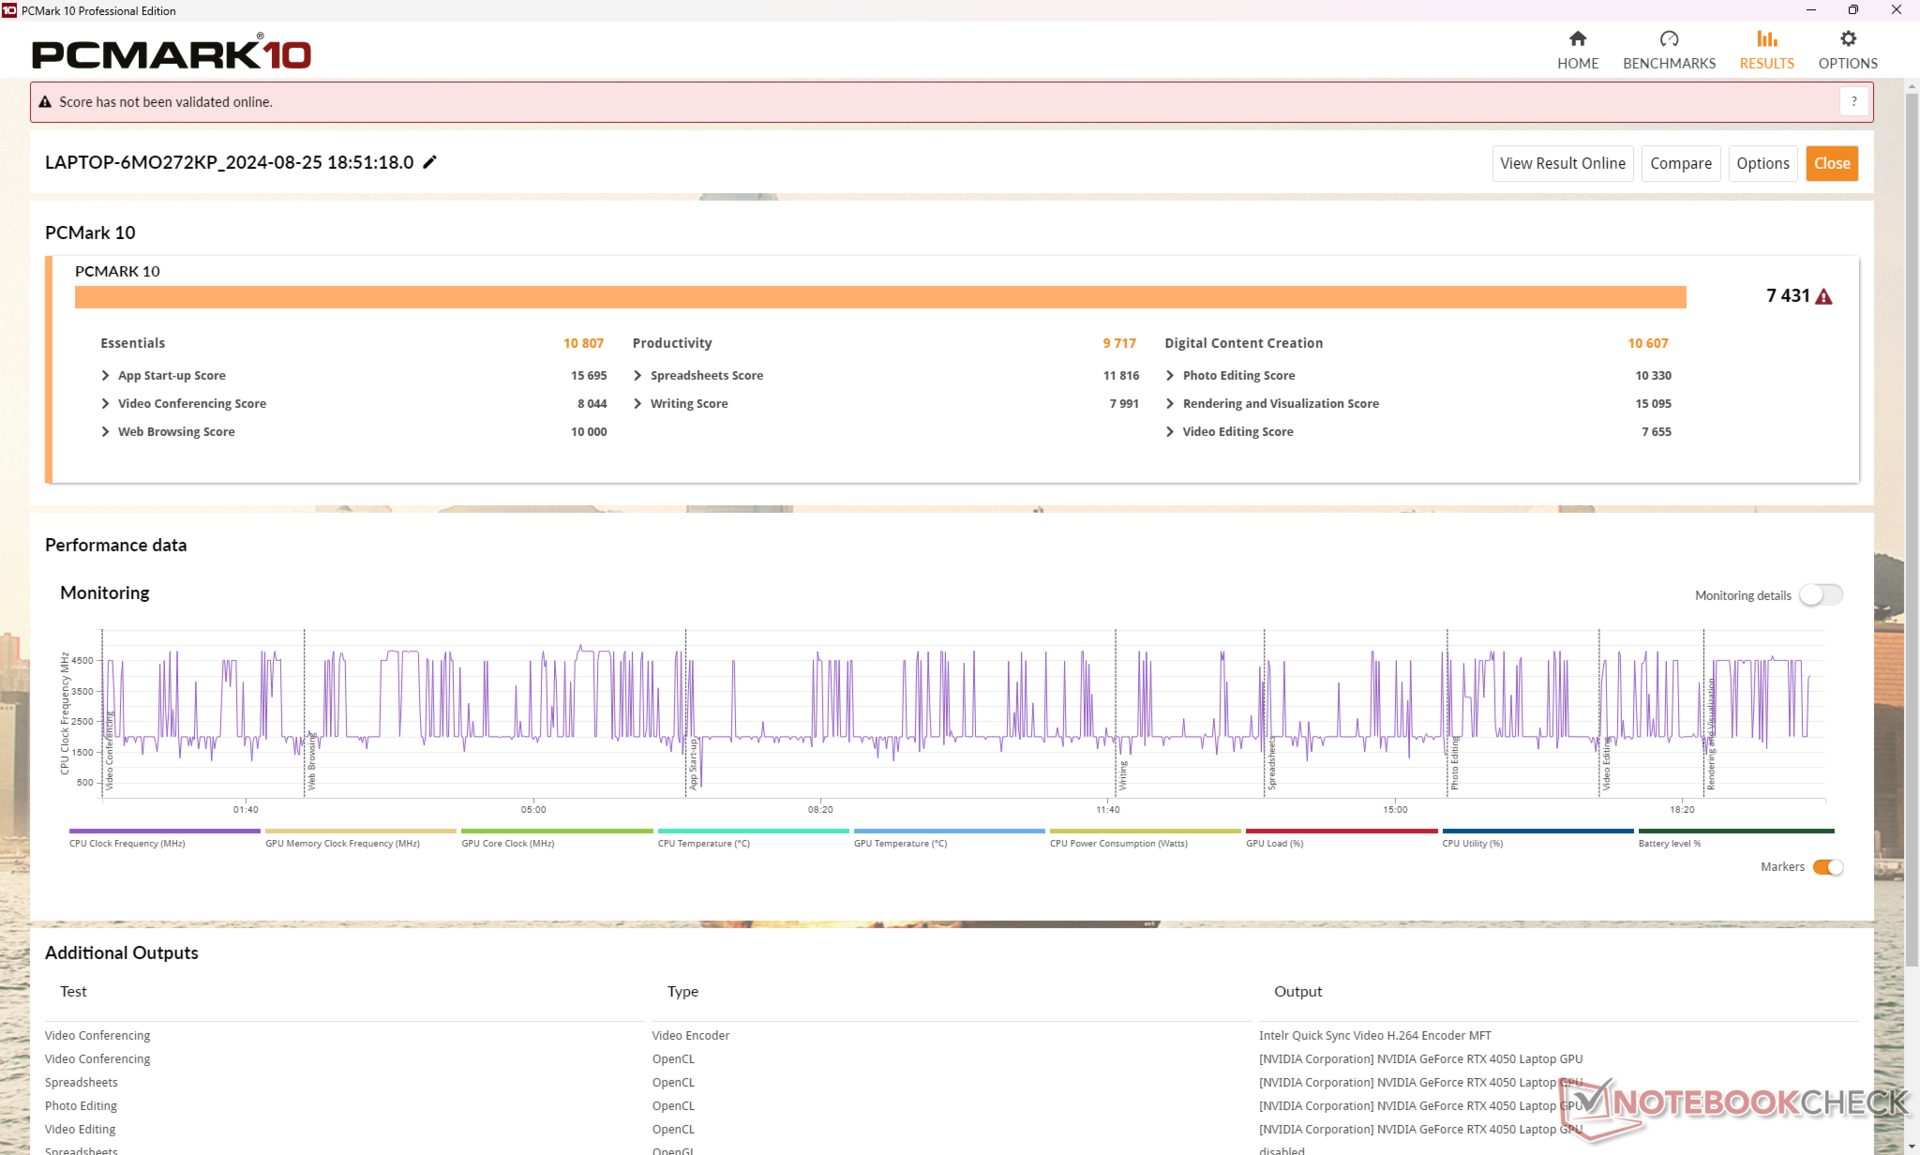
Les résultats de PCMark sont conformes à ceux d'autres ordinateurs portables multimédias de 16 pouces dotés d'une carte graphique intégrée plus lente. Le test PCMark 10 ne permet généralement pas de faire la distinction entre les ordinateurs portables dotés d'un dGPU et ceux dotés d'un iGPU, en particulier si le MUX n'est pas pris en charge.
CrossMark: Overall | Productivity | Creativity | Responsiveness
WebXPRT 3: Overall
WebXPRT 4: Overall
Mozilla Kraken 1.1: Total
| PCMark 10 / Score | |
| Moyenne Intel Core Ultra 9 185H, NVIDIA GeForce RTX 4050 Laptop GPU (7431 - 7846, n=2) | |
| Asus Zenbook S 16 UM5606-RK333W | |
| Lenovo IdeaPad Pro 5 16IMH G9 RTX 4050 | |
| Lenovo IdeaPad Pro 5 16IMH G9 | |
| Dell Inspiron 16 7640 2-in-1 | |
| Samsung Galaxy Book4 Ultra | |
| HP Envy x360 2-in-1 16-ad0097nr | |
| PCMark 10 / Essentials | |
| Lenovo IdeaPad Pro 5 16IMH G9 | |
| Dell Inspiron 16 7640 2-in-1 | |
| Asus Zenbook S 16 UM5606-RK333W | |
| Lenovo IdeaPad Pro 5 16IMH G9 RTX 4050 | |
| Moyenne Intel Core Ultra 9 185H, NVIDIA GeForce RTX 4050 Laptop GPU (10672 - 10807, n=2) | |
| HP Envy x360 2-in-1 16-ad0097nr | |
| Samsung Galaxy Book4 Ultra | |
| PCMark 10 / Productivity | |
| Asus Zenbook S 16 UM5606-RK333W | |
| HP Envy x360 2-in-1 16-ad0097nr | |
| Moyenne Intel Core Ultra 9 185H, NVIDIA GeForce RTX 4050 Laptop GPU (9717 - 9986, n=2) | |
| Lenovo IdeaPad Pro 5 16IMH G9 RTX 4050 | |
| Samsung Galaxy Book4 Ultra | |
| Lenovo IdeaPad Pro 5 16IMH G9 | |
| Dell Inspiron 16 7640 2-in-1 | |
| PCMark 10 / Digital Content Creation | |
| Moyenne Intel Core Ultra 9 185H, NVIDIA GeForce RTX 4050 Laptop GPU (10607 - 12301, n=2) | |
| Lenovo IdeaPad Pro 5 16IMH G9 RTX 4050 | |
| Lenovo IdeaPad Pro 5 16IMH G9 | |
| Asus Zenbook S 16 UM5606-RK333W | |
| Dell Inspiron 16 7640 2-in-1 | |
| Samsung Galaxy Book4 Ultra | |
| HP Envy x360 2-in-1 16-ad0097nr | |
| CrossMark / Overall | |
| Moyenne Intel Core Ultra 9 185H, NVIDIA GeForce RTX 4050 Laptop GPU (1790 - 1811, n=2) | |
| Lenovo IdeaPad Pro 5 16IMH G9 RTX 4050 | |
| Asus Zenbook S 16 UM5606-RK333W | |
| Samsung Galaxy Book4 Ultra | |
| Dell Inspiron 16 7640 2-in-1 | |
| HP Envy x360 2-in-1 16-ad0097nr | |
| Lenovo IdeaPad Pro 5 16IMH G9 | |
| CrossMark / Productivity | |
| Moyenne Intel Core Ultra 9 185H, NVIDIA GeForce RTX 4050 Laptop GPU (1700 - 1717, n=2) | |
| Lenovo IdeaPad Pro 5 16IMH G9 RTX 4050 | |
| Samsung Galaxy Book4 Ultra | |
| Dell Inspiron 16 7640 2-in-1 | |
| Asus Zenbook S 16 UM5606-RK333W | |
| HP Envy x360 2-in-1 16-ad0097nr | |
| Lenovo IdeaPad Pro 5 16IMH G9 | |
| CrossMark / Creativity | |
| Lenovo IdeaPad Pro 5 16IMH G9 RTX 4050 | |
| Moyenne Intel Core Ultra 9 185H, NVIDIA GeForce RTX 4050 Laptop GPU (2037 - 2038, n=2) | |
| Asus Zenbook S 16 UM5606-RK333W | |
| Samsung Galaxy Book4 Ultra | |
| Dell Inspiron 16 7640 2-in-1 | |
| Lenovo IdeaPad Pro 5 16IMH G9 | |
| HP Envy x360 2-in-1 16-ad0097nr | |
| CrossMark / Responsiveness | |
| Samsung Galaxy Book4 Ultra | |
| Moyenne Intel Core Ultra 9 185H, NVIDIA GeForce RTX 4050 Laptop GPU (1419 - 1493, n=2) | |
| Lenovo IdeaPad Pro 5 16IMH G9 RTX 4050 | |
| Asus Zenbook S 16 UM5606-RK333W | |
| Dell Inspiron 16 7640 2-in-1 | |
| HP Envy x360 2-in-1 16-ad0097nr | |
| Lenovo IdeaPad Pro 5 16IMH G9 | |
| WebXPRT 3 / Overall | |
| Asus Zenbook S 16 UM5606-RK333W | |
| Lenovo IdeaPad Pro 5 16IMH G9 RTX 4050 | |
| HP Envy x360 2-in-1 16-ad0097nr | |
| Moyenne Intel Core Ultra 9 185H, NVIDIA GeForce RTX 4050 Laptop GPU (293 - 301, n=2) | |
| Lenovo IdeaPad Pro 5 16IMH G9 | |
| Dell Inspiron 16 7640 2-in-1 | |
| Samsung Galaxy Book4 Ultra | |
| WebXPRT 4 / Overall | |
| Lenovo IdeaPad Pro 5 16IMH G9 RTX 4050 | |
| Moyenne Intel Core Ultra 9 185H, NVIDIA GeForce RTX 4050 Laptop GPU (268 - 271, n=2) | |
| Asus Zenbook S 16 UM5606-RK333W | |
| Lenovo IdeaPad Pro 5 16IMH G9 | |
| Samsung Galaxy Book4 Ultra | |
| Dell Inspiron 16 7640 2-in-1 | |
| HP Envy x360 2-in-1 16-ad0097nr | |
| Mozilla Kraken 1.1 / Total | |
| HP Envy x360 2-in-1 16-ad0097nr | |
| Dell Inspiron 16 7640 2-in-1 | |
| Lenovo IdeaPad Pro 5 16IMH G9 | |
| Moyenne Intel Core Ultra 9 185H, NVIDIA GeForce RTX 4050 Laptop GPU (498 - 512, n=2) | |
| Lenovo IdeaPad Pro 5 16IMH G9 RTX 4050 | |
| Asus Zenbook S 16 UM5606-RK333W | |
| Samsung Galaxy Book4 Ultra | |
* ... Moindre est la valeur, meilleures sont les performances
| PCMark 10 Score | 7431 points | |
Aide | ||
| AIDA64 / Memory Copy | |
| Lenovo IdeaPad Pro 5 16IMH G9 RTX 4050 | |
| Lenovo IdeaPad Pro 5 16IMH G9 | |
| Samsung Galaxy Book4 Ultra | |
| Asus Zenbook S 16 UM5606-RK333W | |
| Moyenne Intel Core Ultra 9 185H (69929 - 95718, n=19) | |
| Dell Inspiron 16 7640 2-in-1 | |
| HP Envy x360 2-in-1 16-ad0097nr | |
| AIDA64 / Memory Read | |
| Asus Zenbook S 16 UM5606-RK333W | |
| Samsung Galaxy Book4 Ultra | |
| Lenovo IdeaPad Pro 5 16IMH G9 RTX 4050 | |
| Lenovo IdeaPad Pro 5 16IMH G9 | |
| Moyenne Intel Core Ultra 9 185H (64619 - 87768, n=19) | |
| Dell Inspiron 16 7640 2-in-1 | |
| HP Envy x360 2-in-1 16-ad0097nr | |
| AIDA64 / Memory Write | |
| Asus Zenbook S 16 UM5606-RK333W | |
| HP Envy x360 2-in-1 16-ad0097nr | |
| Dell Inspiron 16 7640 2-in-1 | |
| Lenovo IdeaPad Pro 5 16IMH G9 | |
| Samsung Galaxy Book4 Ultra | |
| Lenovo IdeaPad Pro 5 16IMH G9 RTX 4050 | |
| Moyenne Intel Core Ultra 9 185H (51114 - 93871, n=19) | |
| AIDA64 / Memory Latency | |
| Moyenne Intel Core Ultra 9 185H (121.4 - 259, n=19) | |
| Dell Inspiron 16 7640 2-in-1 | |
| Samsung Galaxy Book4 Ultra | |
| Lenovo IdeaPad Pro 5 16IMH G9 | |
| Lenovo IdeaPad Pro 5 16IMH G9 RTX 4050 | |
| HP Envy x360 2-in-1 16-ad0097nr | |
| Asus Zenbook S 16 UM5606-RK333W | |
* ... Moindre est la valeur, meilleures sont les performances
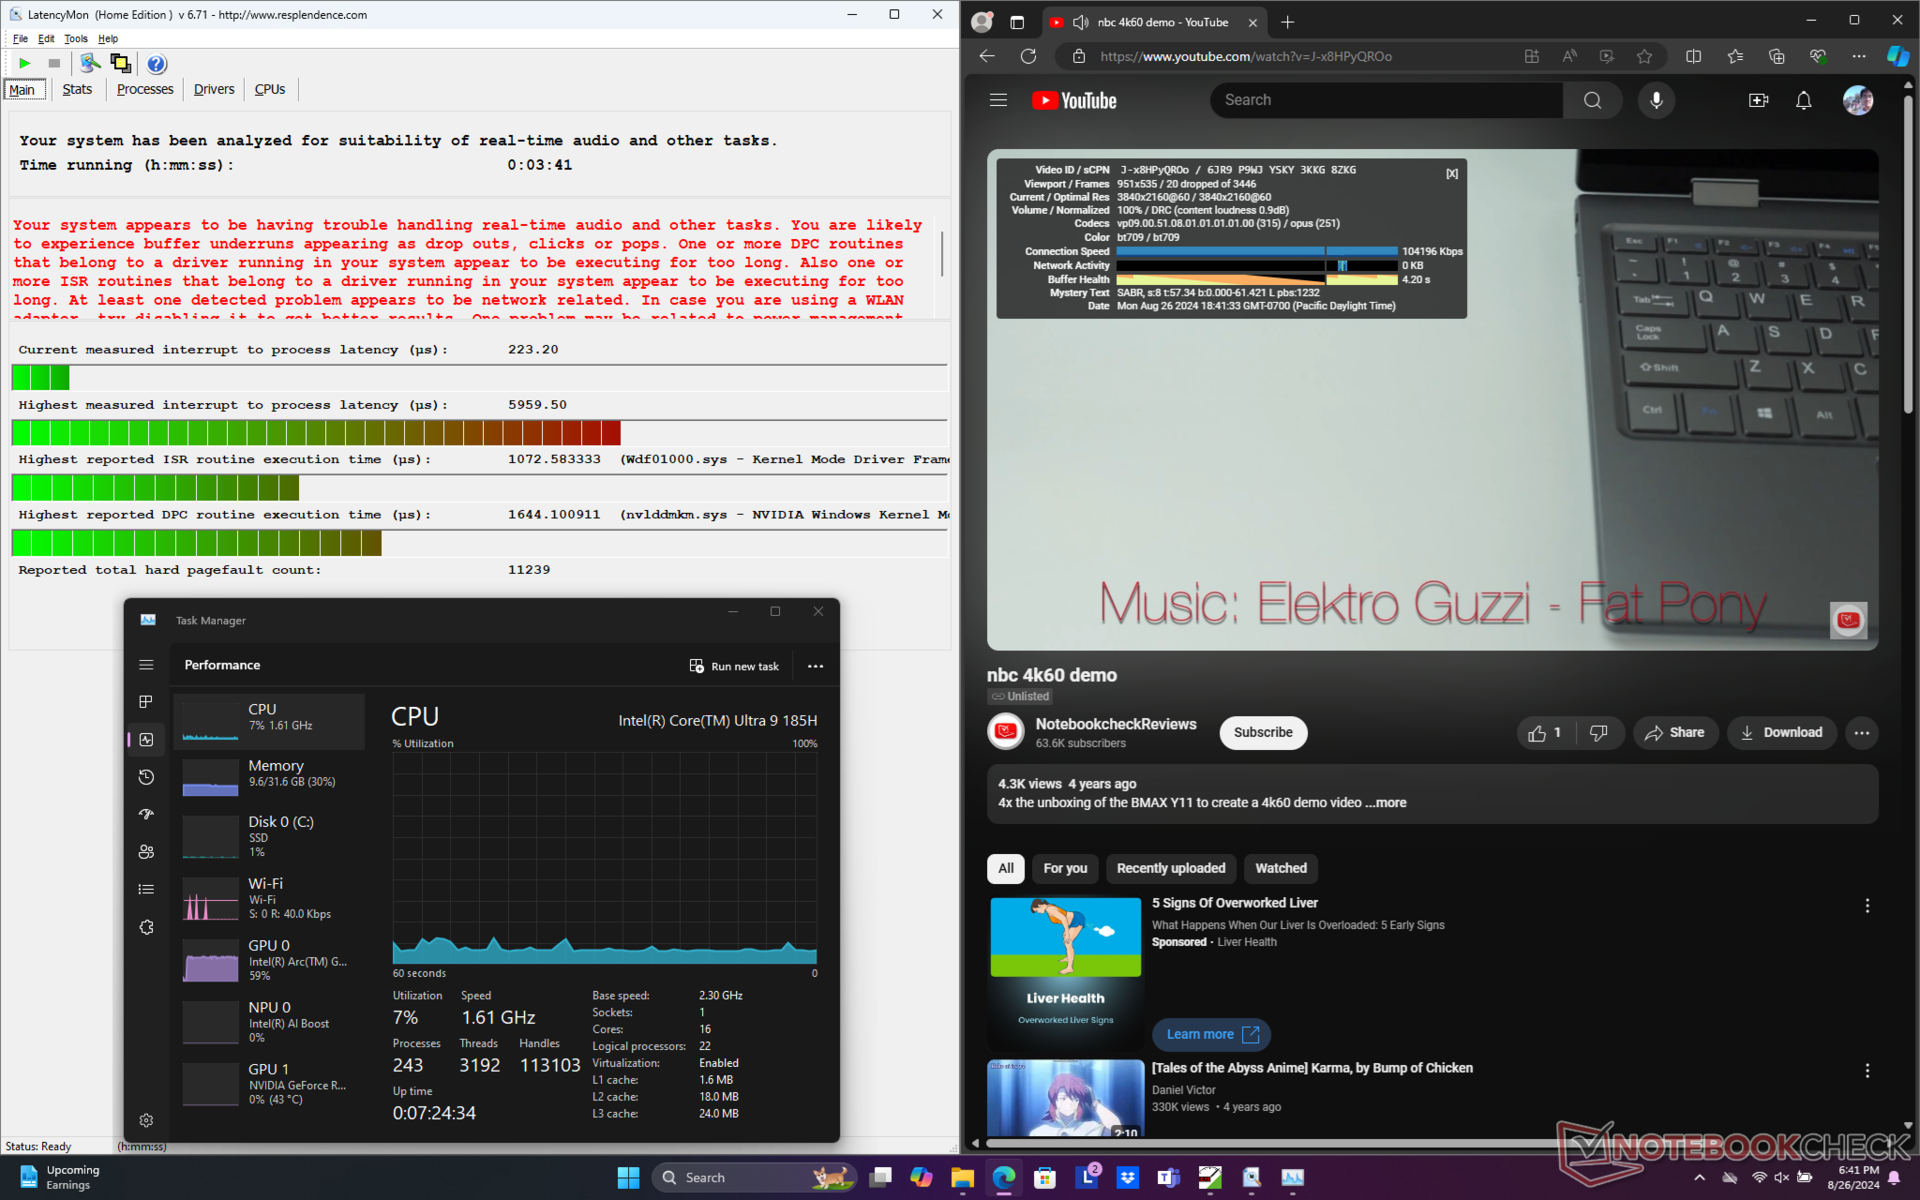
Latence DPC
LatencyMon révèle à la fois des problèmes de DPC et une lecture vidéo 4K imparfaite à 60 FPS. Nous avons pu enregistrer 20 images perdues dans un laps de temps d'une minute, qui se manifestent par des images perdues lors du streaming vidéo. C'est décevant, car notre configuration iGPU ne présente aucune perte d'images en comparaison.

| DPC Latencies / LatencyMon - interrupt to process latency (max), Web, Youtube, Prime95 | |
| Lenovo IdeaPad Pro 5 16IMH G9 RTX 4050 | |
| HP Envy x360 2-in-1 16-ad0097nr | |
| Dell Inspiron 16 7640 2-in-1 | |
| Lenovo IdeaPad Pro 5 16IMH G9 | |
| Samsung Galaxy Book4 Ultra | |
* ... Moindre est la valeur, meilleures sont les performances
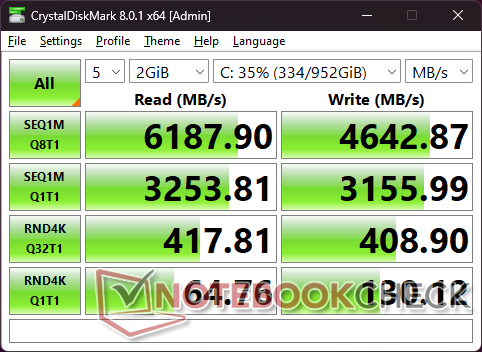
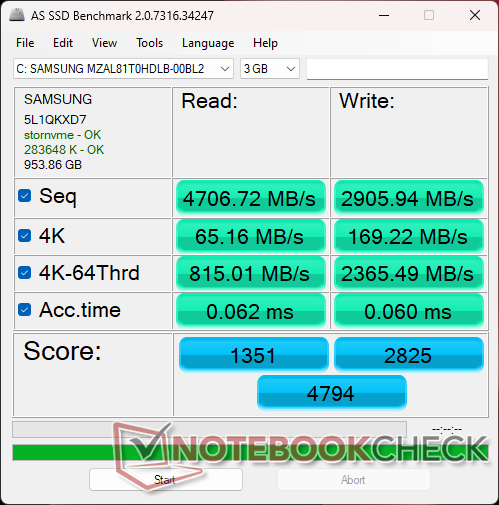
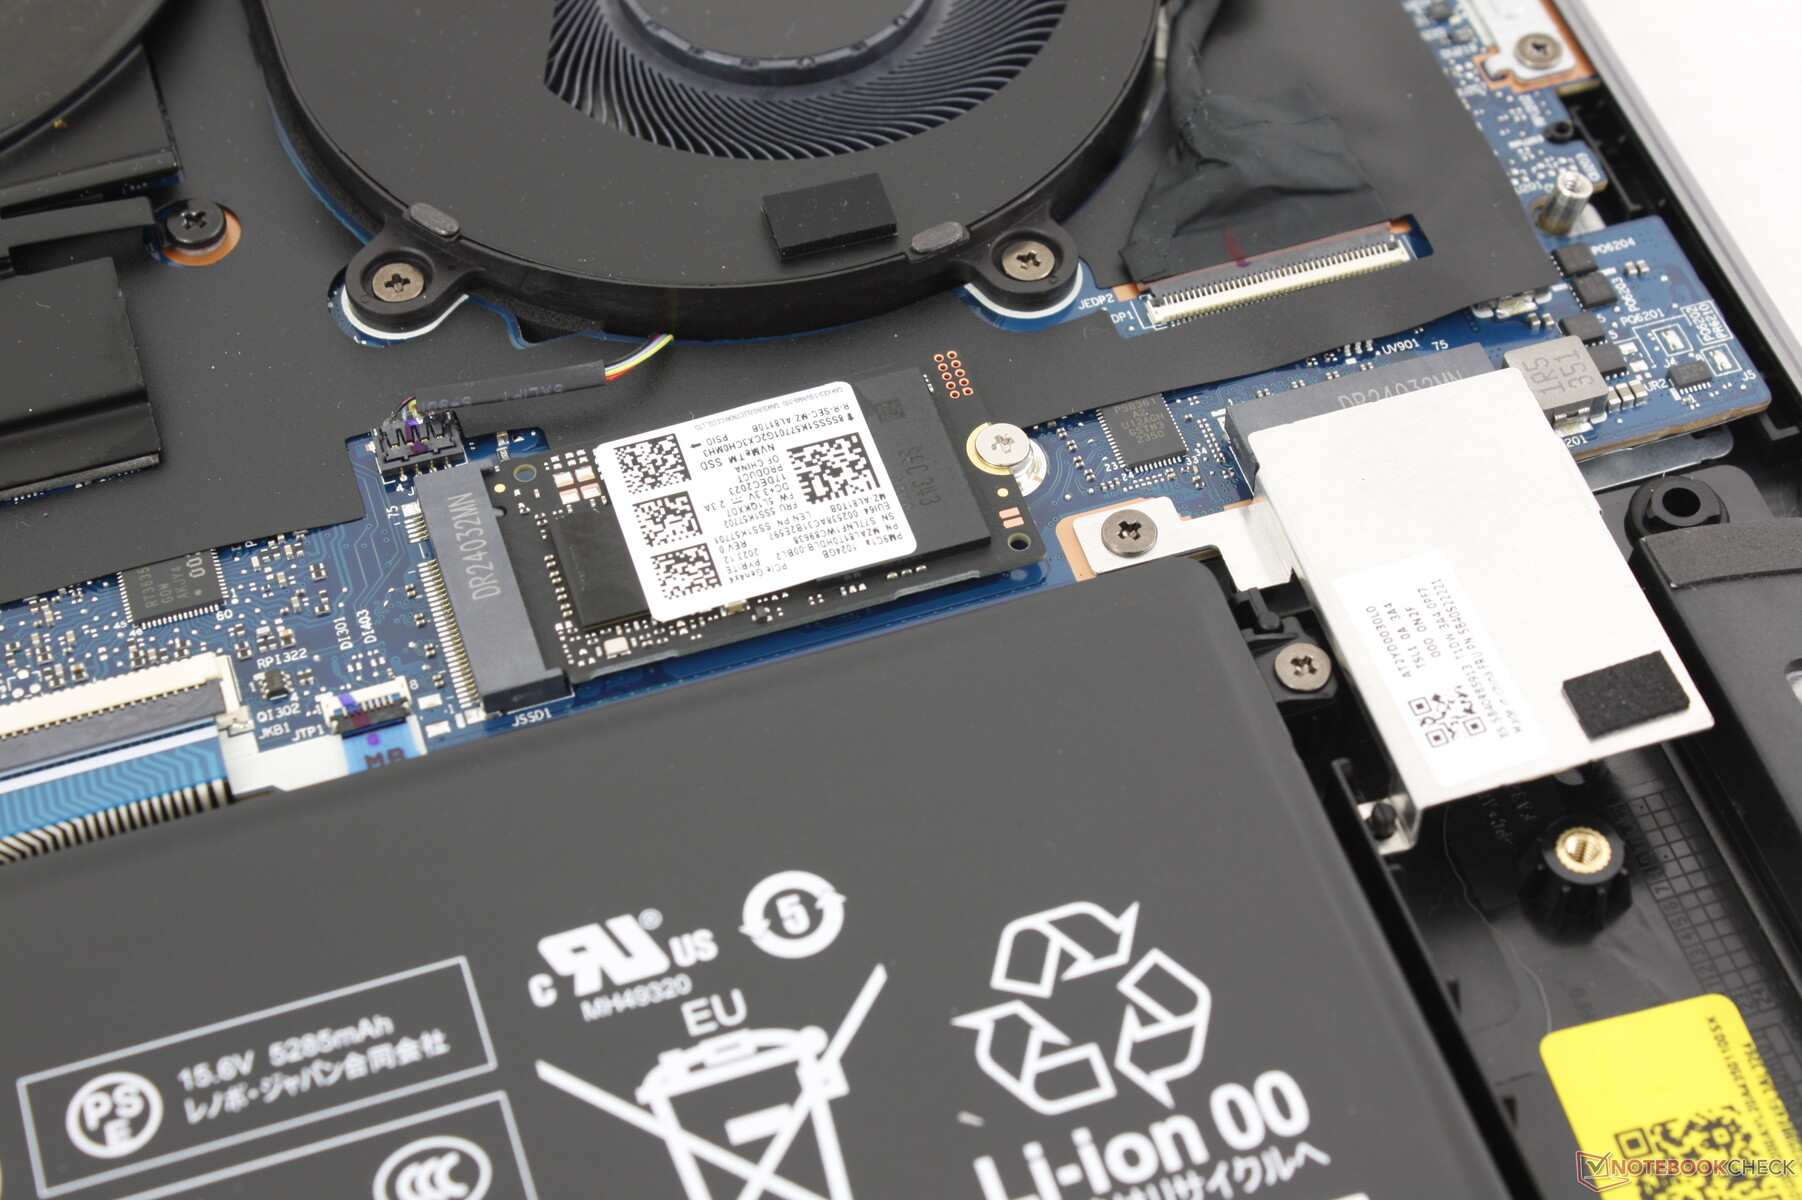
Dispositifs de stockage
Le système est livré avec le même Samsung PM9C1a MZAL81T0HDLB que sur la version iGPU. Il est intéressant de noter qu'il présente les mêmes particularités en matière de taux de transfert, les performances passant de 5100 Mo/s à 6100 Mo/s après quelques minutes de notre test en boucle DiskSpd. La plupart des autres disques, comme le Samsung PM9A1 du Galaxy Book4 Ultrasont restés stables du début à la fin.
Un coussin thermique est inclus pour le SSD primaire afin d'aider à dissiper la chaleur sur le couvercle métallique situé en dessous.

* ... Moindre est la valeur, meilleures sont les performances
Disk Throttling: DiskSpd Read Loop, Queue Depth 8
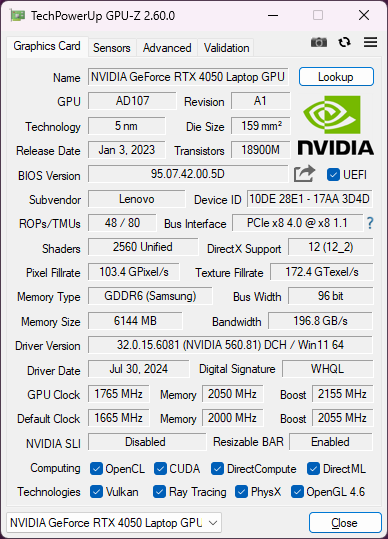
Performances des GPU - La différence de 90 W
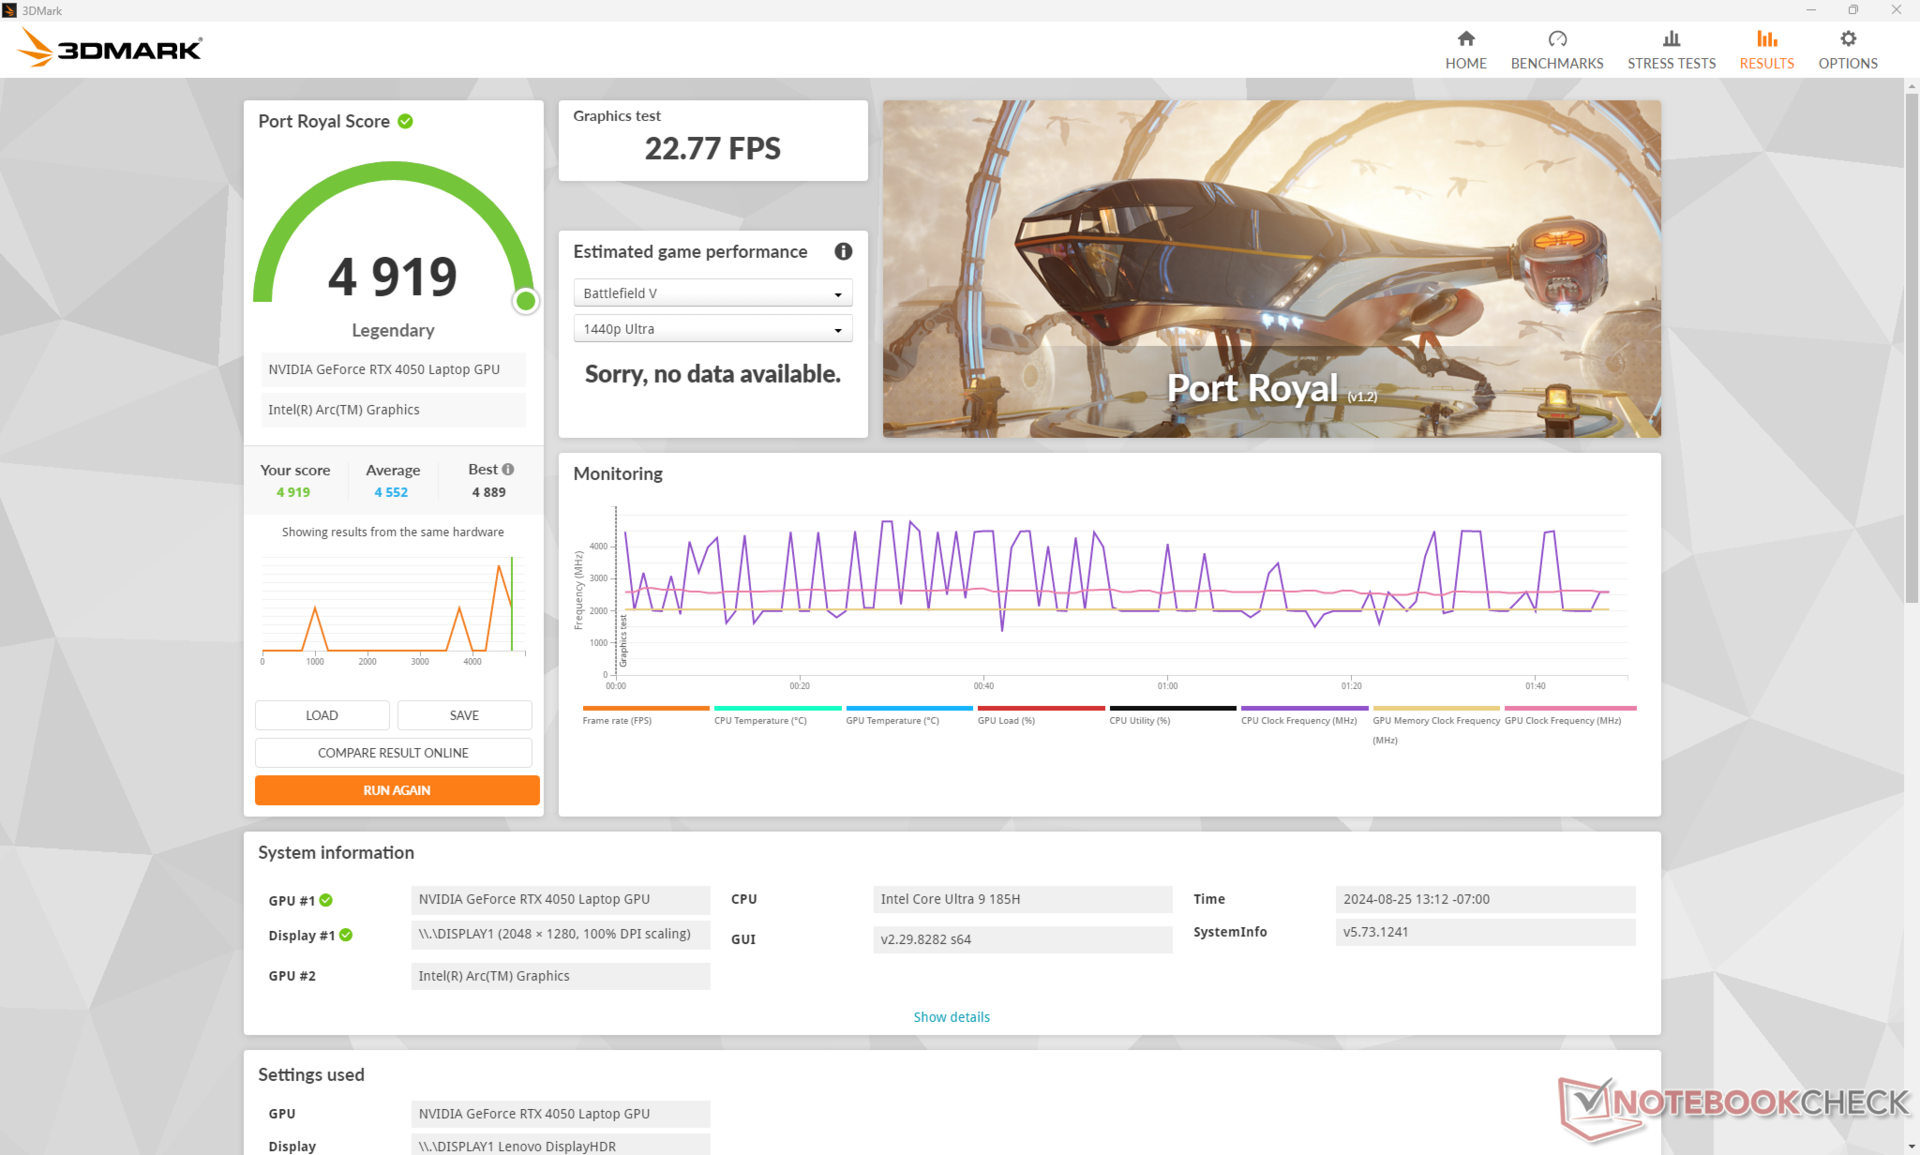
Les 90 W GeForce RTX 4050 Vise un plafond TGP plus élevé que sur de nombreux autres ordinateurs portables non destinés au jeu avec la même option GPU. La RTX 4050 du Spectre x360 16 et du Samsung Galaxy Book3 Ultra 16par exemple, ont des valeurs TGP inférieures de seulement 55 W et 60 W, respectivement. Le GPU de notre IdeaPad Pro 5 16 G9 peut être jusqu'à 10 % plus rapide que l'ordinateur portable moyen de notre base de données avec le même GPU RTX 4050. Cette différence est suffisante pour surpasser même la RTX 4060 de 70 W de l'ordinateur concurrent Inspiron 16 Plus 7640 selon les benchmarks 3DMark.
Les utilisateurs qui passent de l'ancienne GeForce RTX 3050qui équipait la dernière génération d'IdeaPad Pro 5 16 G7 ou G8, peuvent s'attendre à une augmentation significative de 70 à 80 % des performances avec la RTX 4050. Les avantages sont encore plus importants, de 2 à 2,5 fois, lorsque l'on passe de la carte graphique arc 8 intégré intégrée.
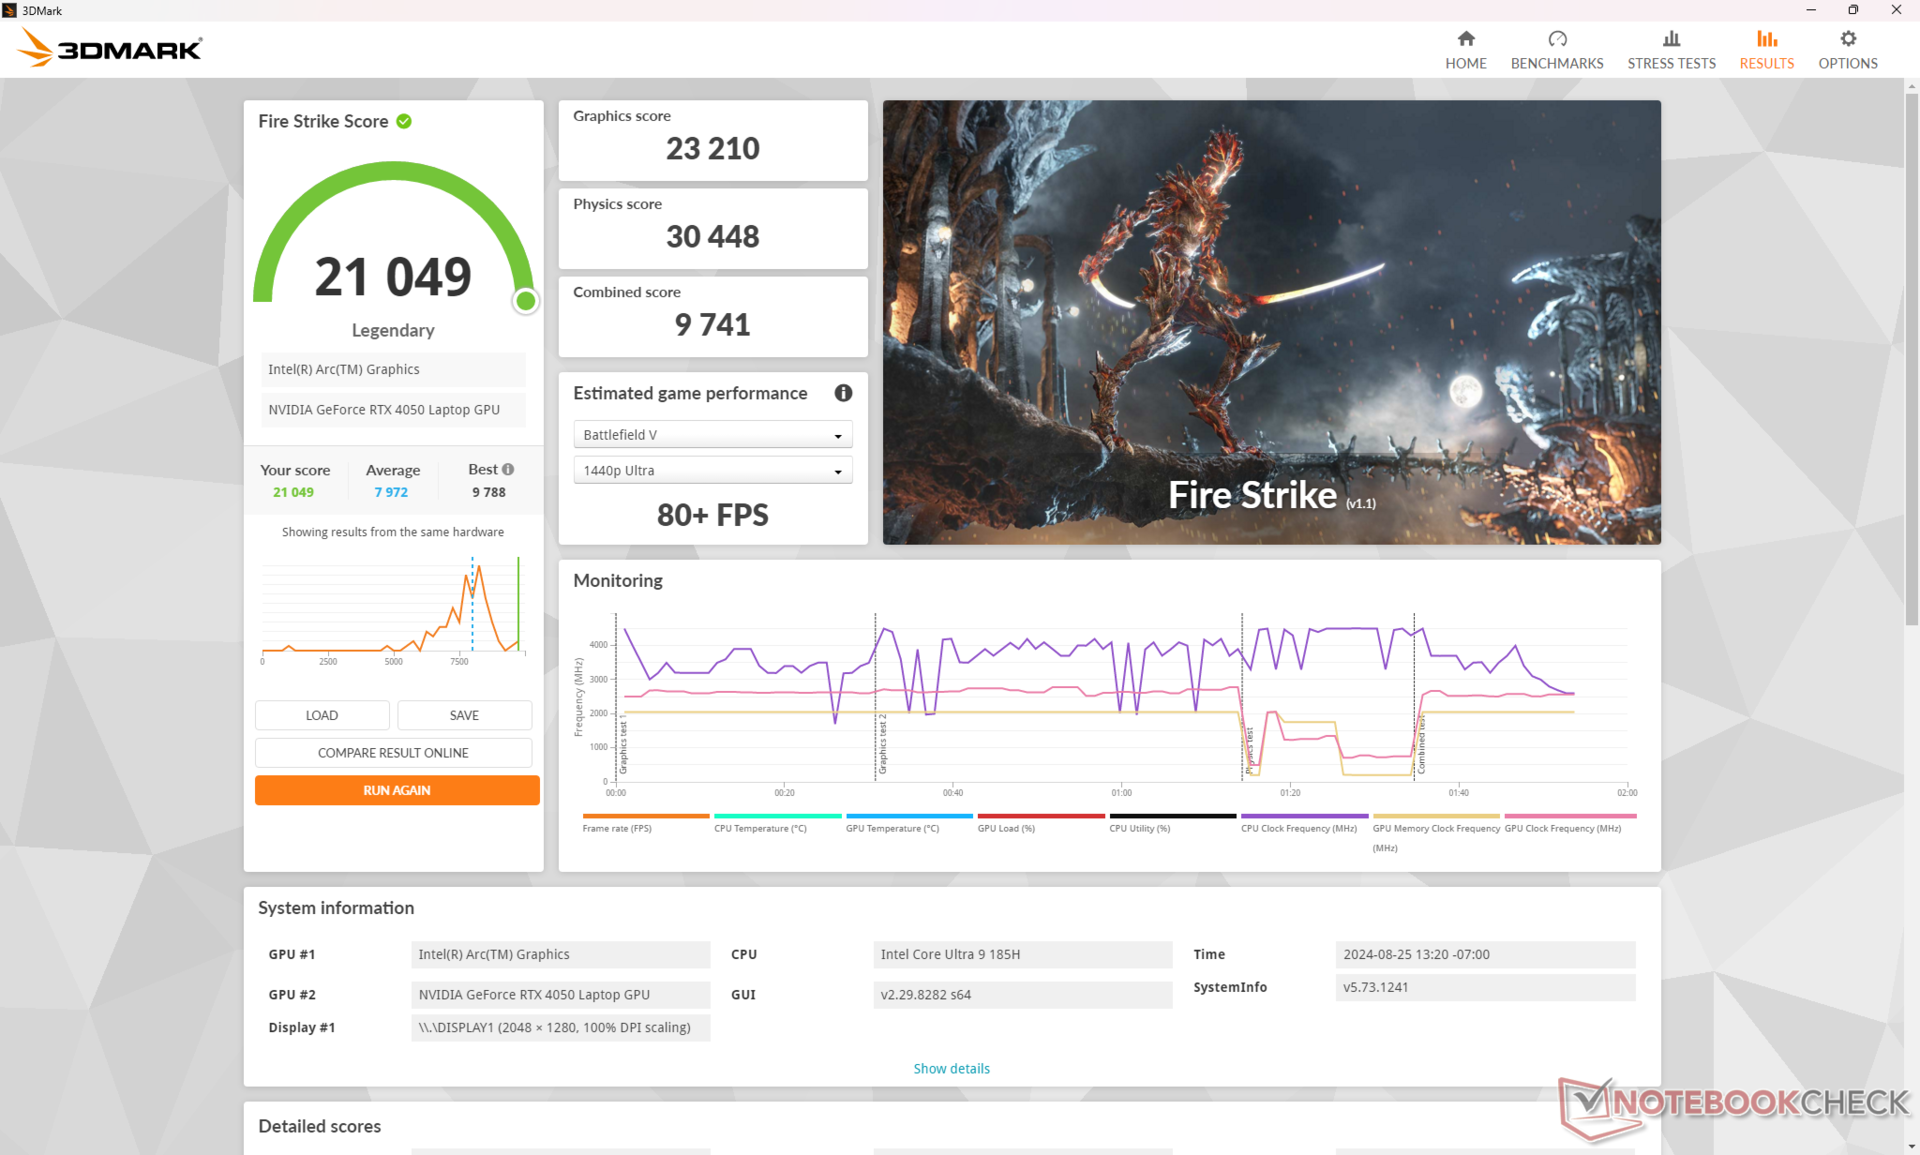
| Profil de puissance | Score graphique | Score physique | Score combiné |
| Mode performance | 23210 | 30448 | 9741 |
| Mode équilibré | 21032 (-9%) | 30008 (-1%) | 8158 (-16%) |
| Alimentation par batterie | 19718 (-15%) | 30484 (-0%) | 8216 (-16%) |
L'exécution en mode équilibré au lieu du mode performance a un impact sur les performances graphiques jusqu'à 10 %, tandis que les performances du processeur restent relativement inchangées selon notre tableau de résultats Fire Strike ci-dessus. L'utilisation de la batterie n'a pas autant d'impact sur les performances du processeur que ce à quoi nous nous attendions initialement.
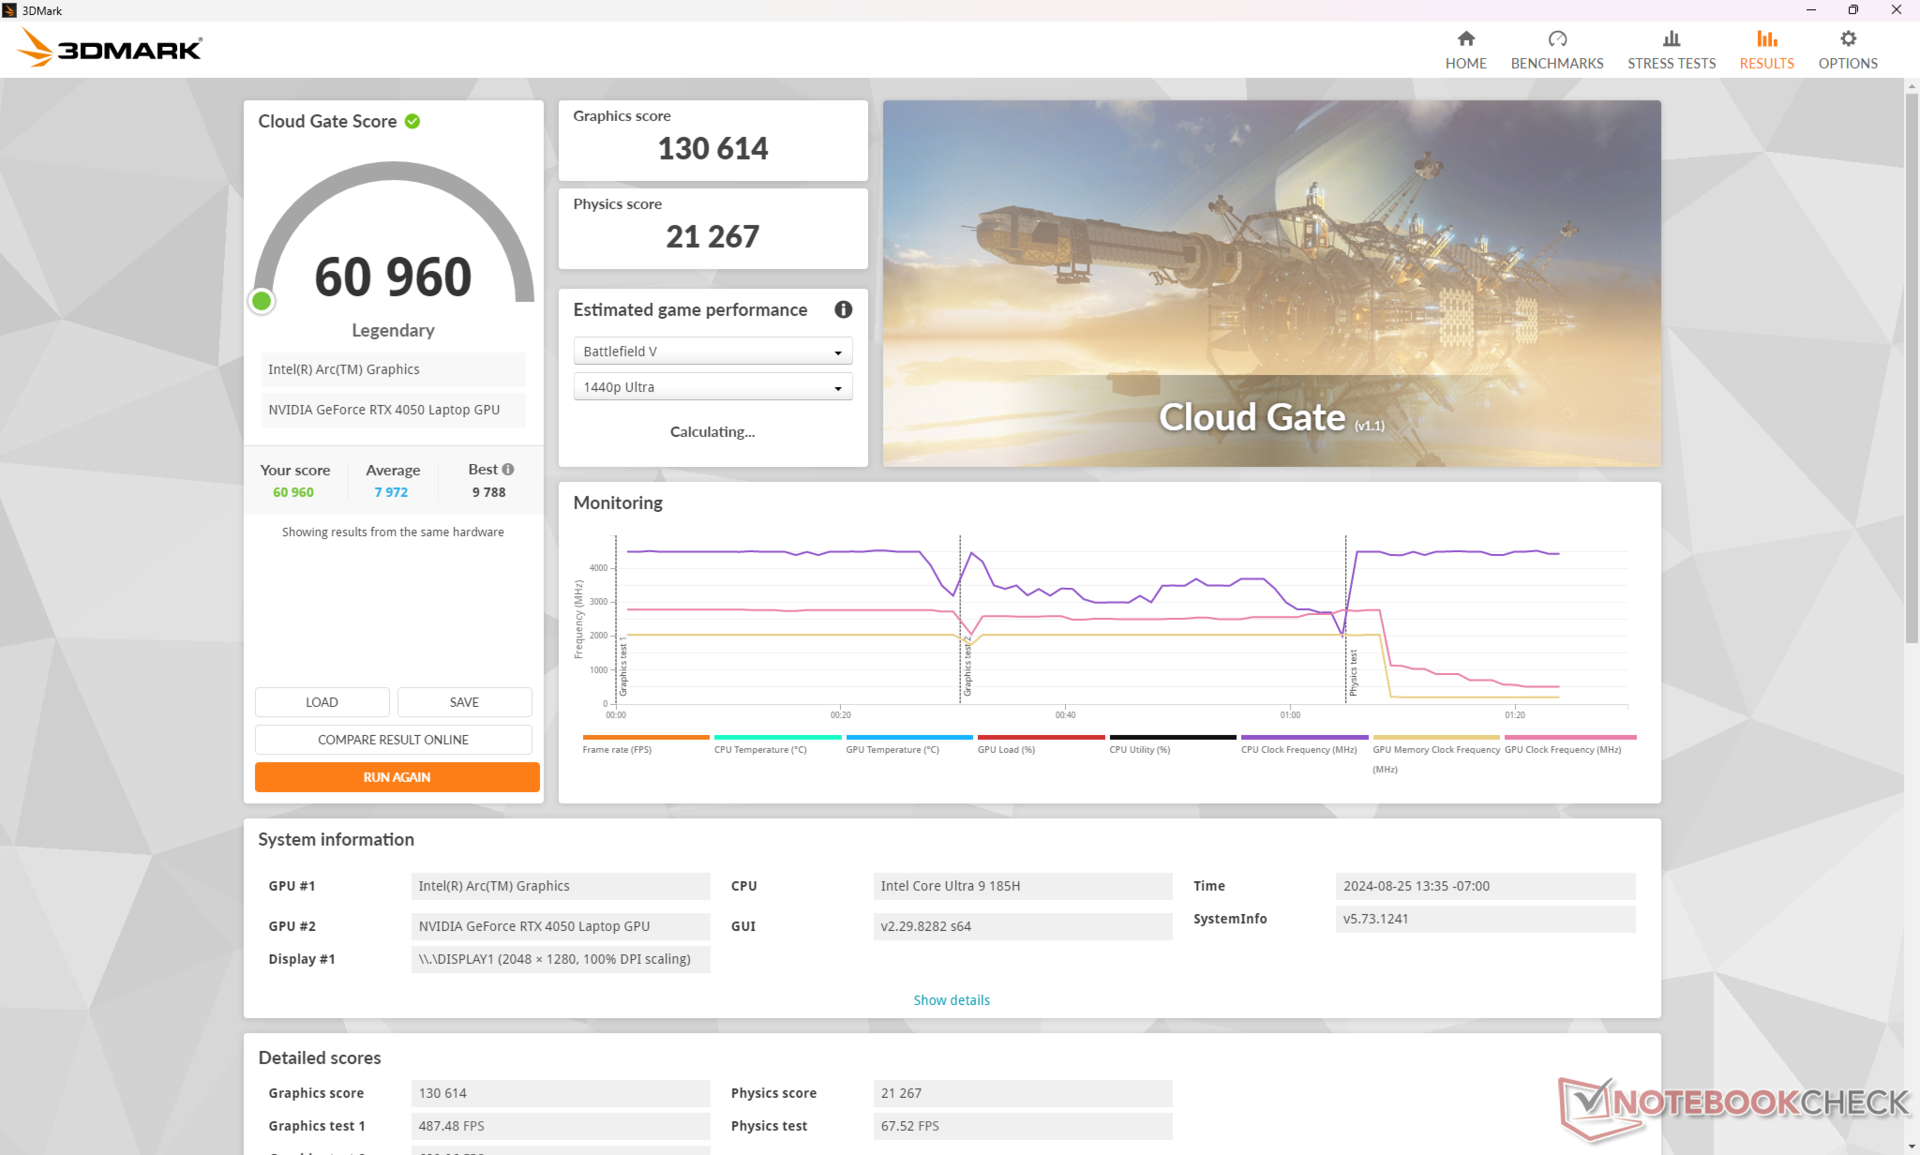

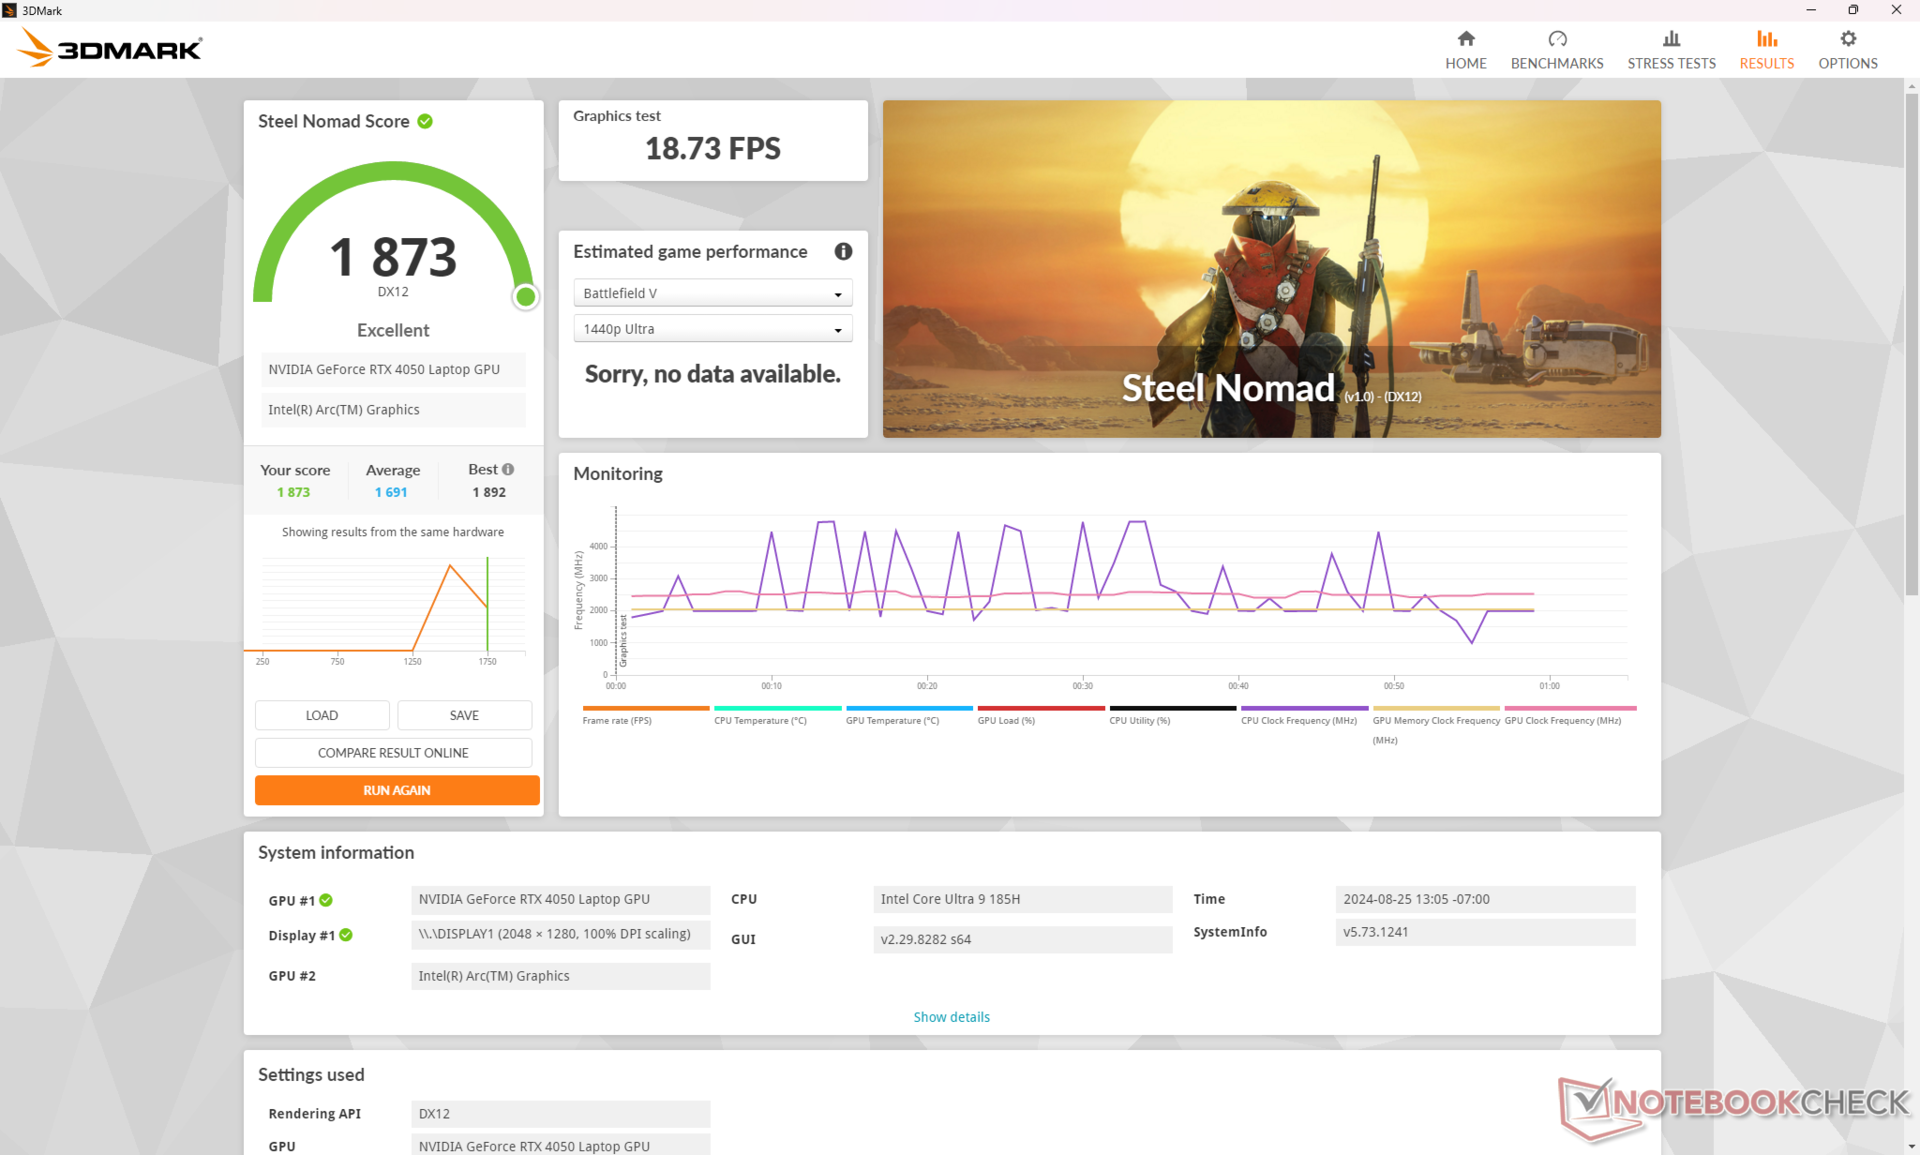
| 3DMark 11 Performance | 27986 points | |
| 3DMark Cloud Gate Standard Score | 60960 points | |
| 3DMark Fire Strike Score | 21049 points | |
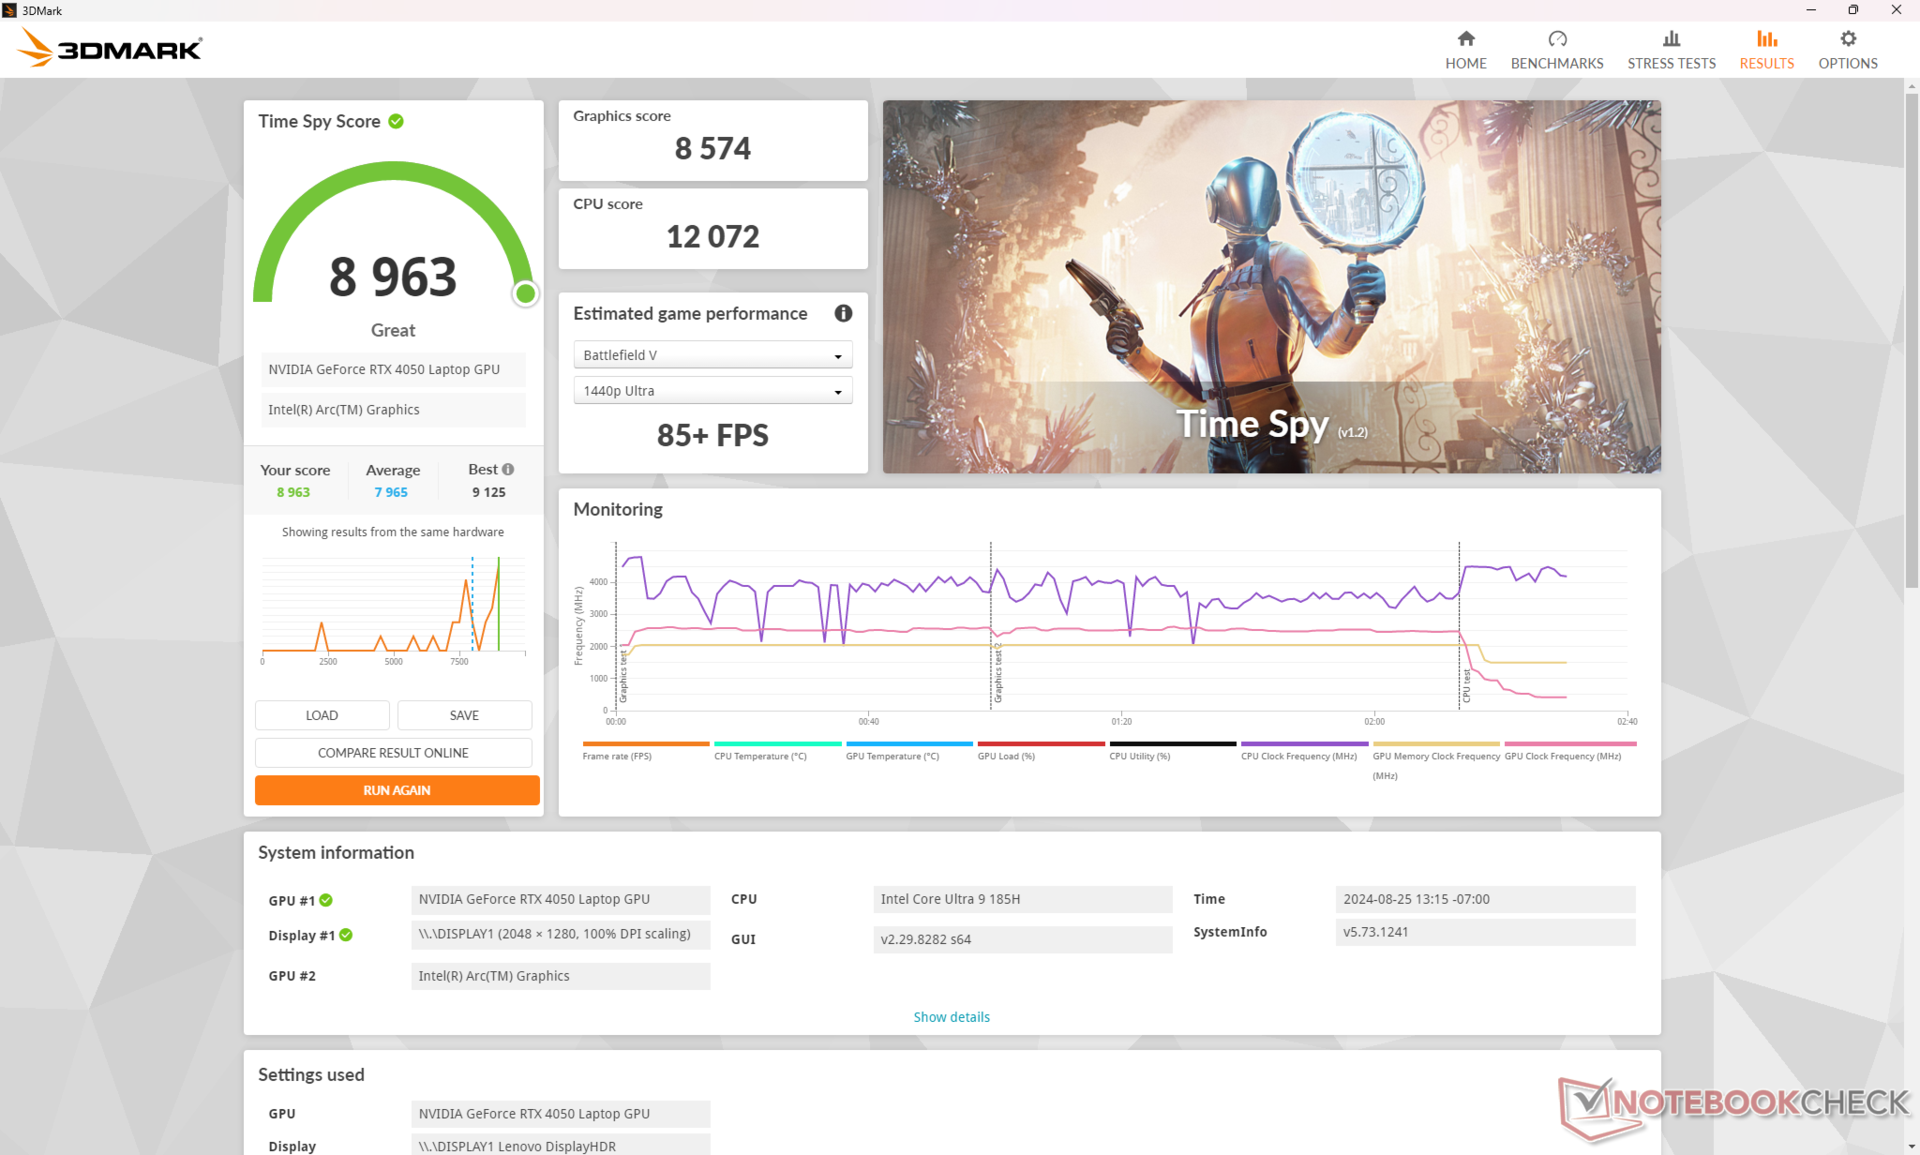
| 3DMark Time Spy Score | 8963 points | |
| 3DMark Steel Nomad Score | 1873 points | |
Aide | ||
* ... Moindre est la valeur, meilleures sont les performances
Performances des jeux
Bien qu'il ne s'agisse pas explicitement d'un ordinateur portable de jeu, la RTX 4050 de 90 W permet au Lenovo de faire tourner les jeux mieux que prévu. En fait, des titres comme Final Fantasy XV, Cyberpunk 2077, Tiny Tina's Wonderlands et bien d'autres tournent 25 à 30 % plus vite que sur le HP Spectre x360 16 avec le même GPU RTX 4050. Notre système surpasse également l Inspiron 16 Plus 7640 et son GPU RTX 4060 de 70 W, comme l'indiquent les scores 3DMark ci-dessus. Dans ce scénario, la résolution native plus faible du panneau OLED est bénéfique pour une expérience de jeu plus fluide que le panneau IPS 1600p.
| GTA V - 1920x1080 Highest Settings possible AA:4xMSAA + FX AF:16x | |
| Lenovo IdeaPad Pro 5 16IMH G9 RTX 4050 | |
| Samsung Galaxy Book4 Ultra | |
| Asus Zenbook S 16 UM5606-RK333W | |
| Lenovo IdeaPad Pro 5 16IMH G9 | |
| Final Fantasy XV Benchmark - 1920x1080 High Quality | |
| Lenovo IdeaPad Pro 5 16IMH G9 RTX 4050 | |
| Samsung Galaxy Book4 Ultra | |
| Lenovo IdeaPad Pro 5 16IMH G9 | |
| Asus Zenbook S 16 UM5606-RK333W | |
| Dell Inspiron 16 7640 2-in-1 | |
| HP Envy x360 2-in-1 16-ad0097nr | |
| Strange Brigade - 1920x1080 ultra AA:ultra AF:16 | |
| Lenovo IdeaPad Pro 5 16IMH G9 RTX 4050 | |
| Samsung Galaxy Book4 Ultra | |
| Lenovo IdeaPad Pro 5 16IMH G9 | |
| Asus Zenbook S 16 UM5606-RK333W | |
| Dell Inspiron 16 7640 2-in-1 | |
| HP Envy x360 2-in-1 16-ad0097nr | |
| Dota 2 Reborn - 1920x1080 ultra (3/3) best looking | |
| Lenovo IdeaPad Pro 5 16IMH G9 RTX 4050 | |
| Samsung Galaxy Book4 Ultra | |
| Lenovo IdeaPad Pro 5 16IMH G9 | |
| Dell Inspiron 16 7640 2-in-1 | |
| HP Envy x360 2-in-1 16-ad0097nr | |
| Asus Zenbook S 16 UM5606-RK333W | |
Cyberpunk 2077 ultra FPS Chart
| Bas | Moyen | Élevé | Ultra | |
|---|---|---|---|---|
| GTA V (2015) | 183 | 178.4 | 166.9 | 98.7 |
| Dota 2 Reborn (2015) | 167.2 | 151.9 | 145.9 | 137.4 |
| Final Fantasy XV Benchmark (2018) | 171.3 | 123.3 | 87.8 | |
| X-Plane 11.11 (2018) | 127.7 | 114.1 | 89 | |
| Far Cry 5 (2018) | 155 | 129 | 120 | 113 |
| Strange Brigade (2018) | 411 | 204 | 172.9 | 149.4 |
| Tiny Tina's Wonderlands (2022) | 181.6 | 149.2 | 96 | 74 |
| F1 22 (2022) | 211 | 204 | 156.6 | 54.1 |
| Baldur's Gate 3 (2023) | 110.1 | 91.4 | 81.3 | 78.6 |
| Cyberpunk 2077 2.1 Phantom Liberty (2023) | 103.1 | 82.2 | 69.4 | 59.8 |
Émissions - bruyantes et chaudes sous charge
Bruit du système
Le bruit du ventilateur reste silencieux lors de l'exécution de charges peu exigeantes telles que les navigateurs ou Word, sans pulsations ou pics gênants. Lors de l'exécution de charges plus lourdes comme 3DMark 06, le bruit du ventilateur reste stable à environ 26 dB(A) pendant la majeure partie de la première scène de benchmark avant de monter à près de 46 dB(A), ce qui est proche de ce que nous avons enregistré sur la configuration iGPU.
Lors des jeux, le bruit du ventilateur atteint un peu plus de 48 dB(A), soit quelques décibels de plus que sur la configuration iGPU. C'est également plus bruyant que les ordinateurs portables 16 pouces concurrents par des marges décentes, y compris l'Inspiron 16 7640 2-en-1 ou Samsung Galaxy Book4 Ultra. Ainsi, l'option dGPU n'est pas nécessairement plus bruyante que l'option iGPU jusqu'à ce que vous commenciez à introduire des charges beaucoup plus exigeantes.
Degré de la nuisance sonore
| Au repos |
| 23 / 23.3 / 23.3 dB(A) |
| Fortement sollicité |
| 45.7 / 48.4 dB(A) |
 | ||
30 dB silencieux 40 dB(A) audible 50 dB(A) bruyant |
||
min: | ||
| Lenovo IdeaPad Pro 5 16IMH G9 RTX 4050 NVIDIA GeForce RTX 4050 Laptop GPU, Ultra 9 185H, Samsung PM9C1a MZAL81T0HDLB | Lenovo IdeaPad Pro 5 16IMH G9 Arc 8-Core, Ultra 7 155H, Samsung PM9C1a MZAL81T0HDLB | Dell Inspiron 16 7640 2-in-1 Arc 8-Core, Ultra 7 155H, Micron 2550 1TB | Asus Zenbook S 16 UM5606-RK333W Radeon 890M, Ryzen AI 9 HX 370, Micron 2400 MTFDKBA1T0QFM | HP Envy x360 2-in-1 16-ad0097nr Radeon 780M, R7 8840HS, KIOXIA BG5 KBG50ZNV1T02 | Samsung Galaxy Book4 Ultra NVIDIA GeForce RTX 4050 Laptop GPU, Ultra 7 155H, Samsung PM9A1 MZVL2512HCJQ | |
|---|---|---|---|---|---|---|
| Noise | -4% | 1% | 5% | 10% | 2% | |
| off / environment * | 23 | 24.1 -5% | 22.9 -0% | 24.7 -7% | 22.9 -0% | 24.2 -5% |
| Idle Minimum * | 23 | 24.1 -5% | 22.9 -0% | 24.7 -7% | 23 -0% | 24.2 -5% |
| Idle Average * | 23.3 | 24.1 -3% | 22.9 2% | 24.7 -6% | 23 1% | 24.2 -4% |
| Idle Maximum * | 23.3 | 28.2 -21% | 25 -7% | 26.4 -13% | 23 1% | 24.2 -4% |
| Load Average * | 45.7 | 44.4 3% | 45.1 1% | 35.7 22% | 23.8 48% | 37.9 17% |
| Cyberpunk 2077 ultra * | 48.4 | 44.9 7% | 36.8 24% | |||
| Load Maximum * | 48.4 | 44.4 8% | 44.9 7% | 36.8 24% | 43.8 10% | 41.7 14% |
| Witcher 3 ultra * | 36.5 | 43.8 | 41.7 |
* ... Moindre est la valeur, meilleures sont les performances
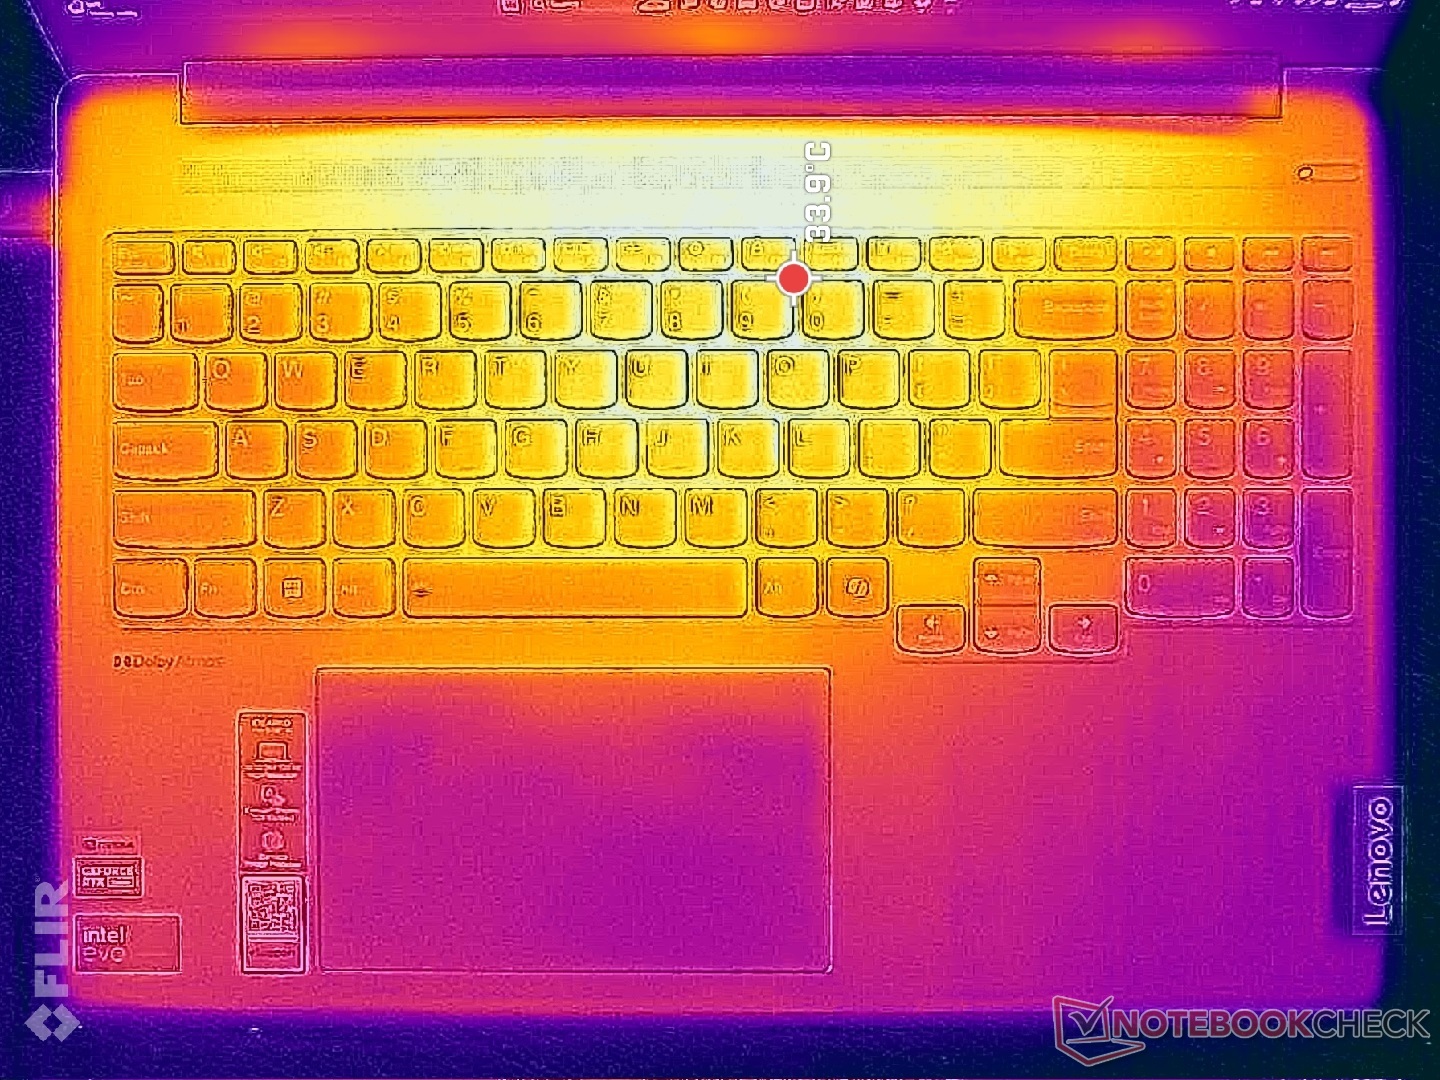
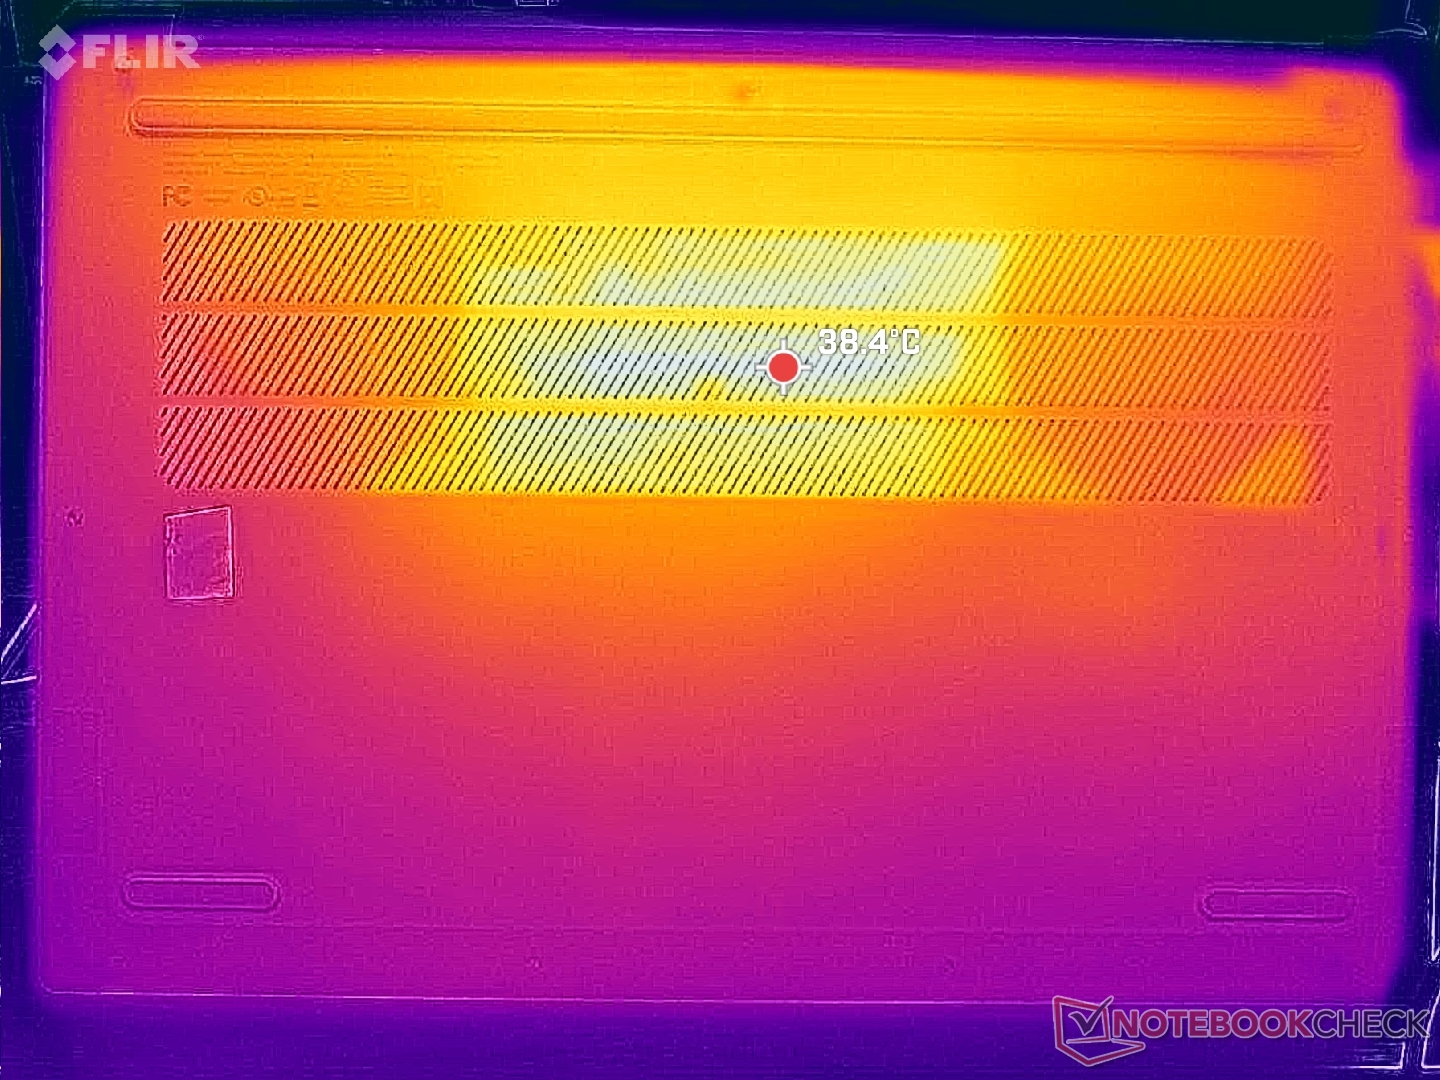
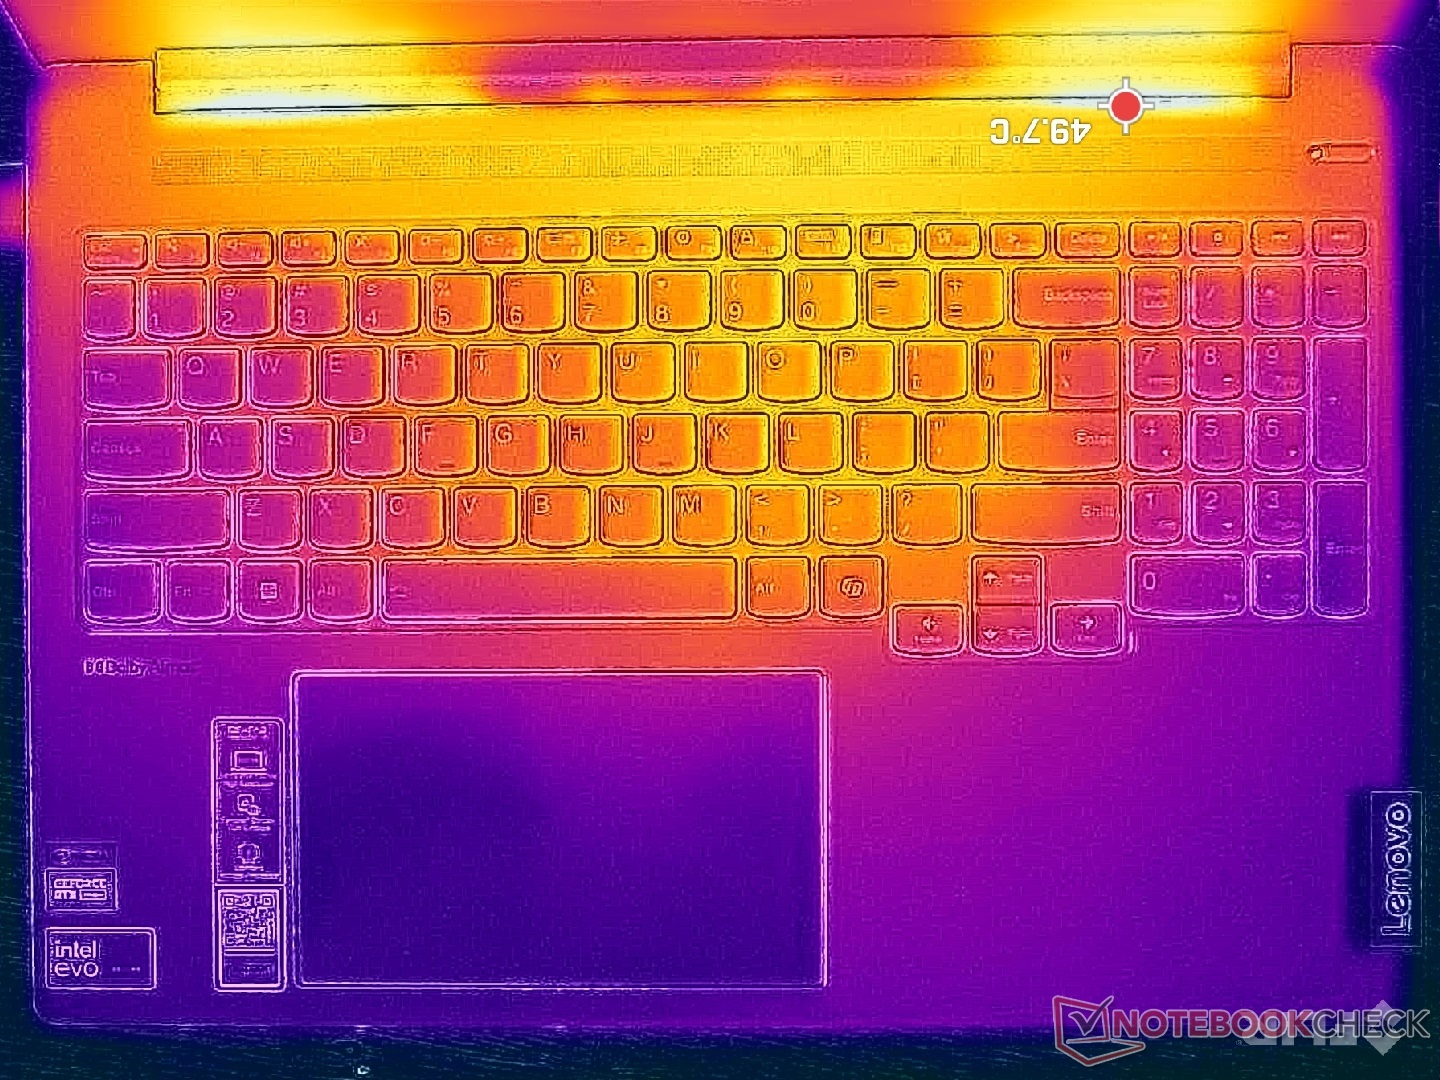
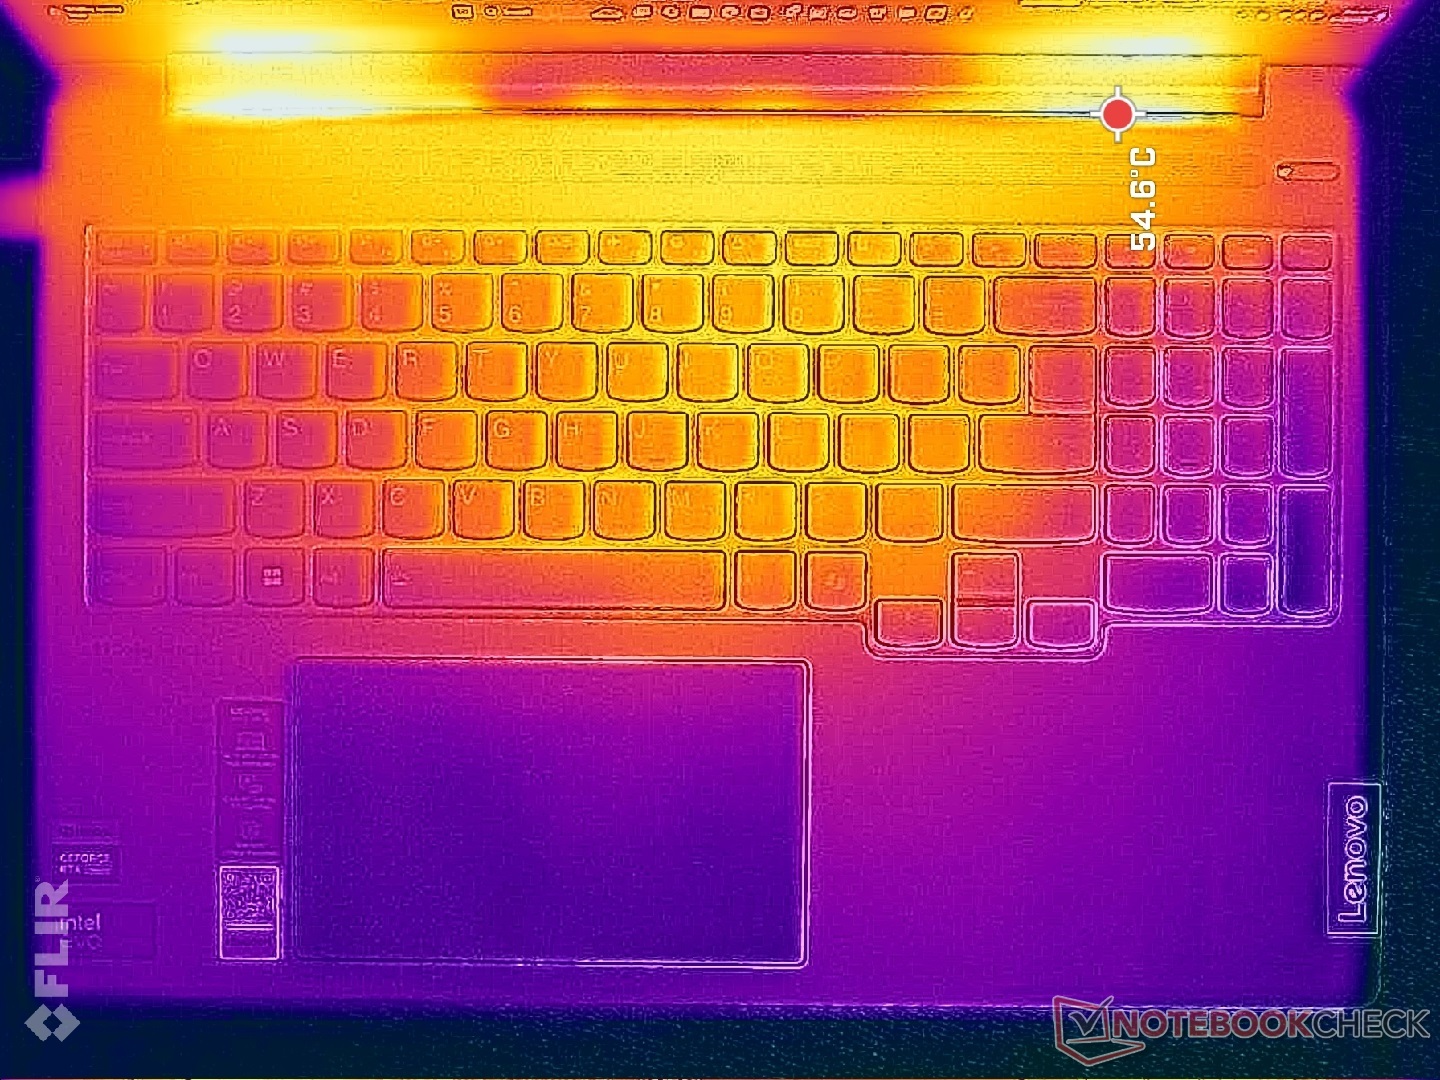
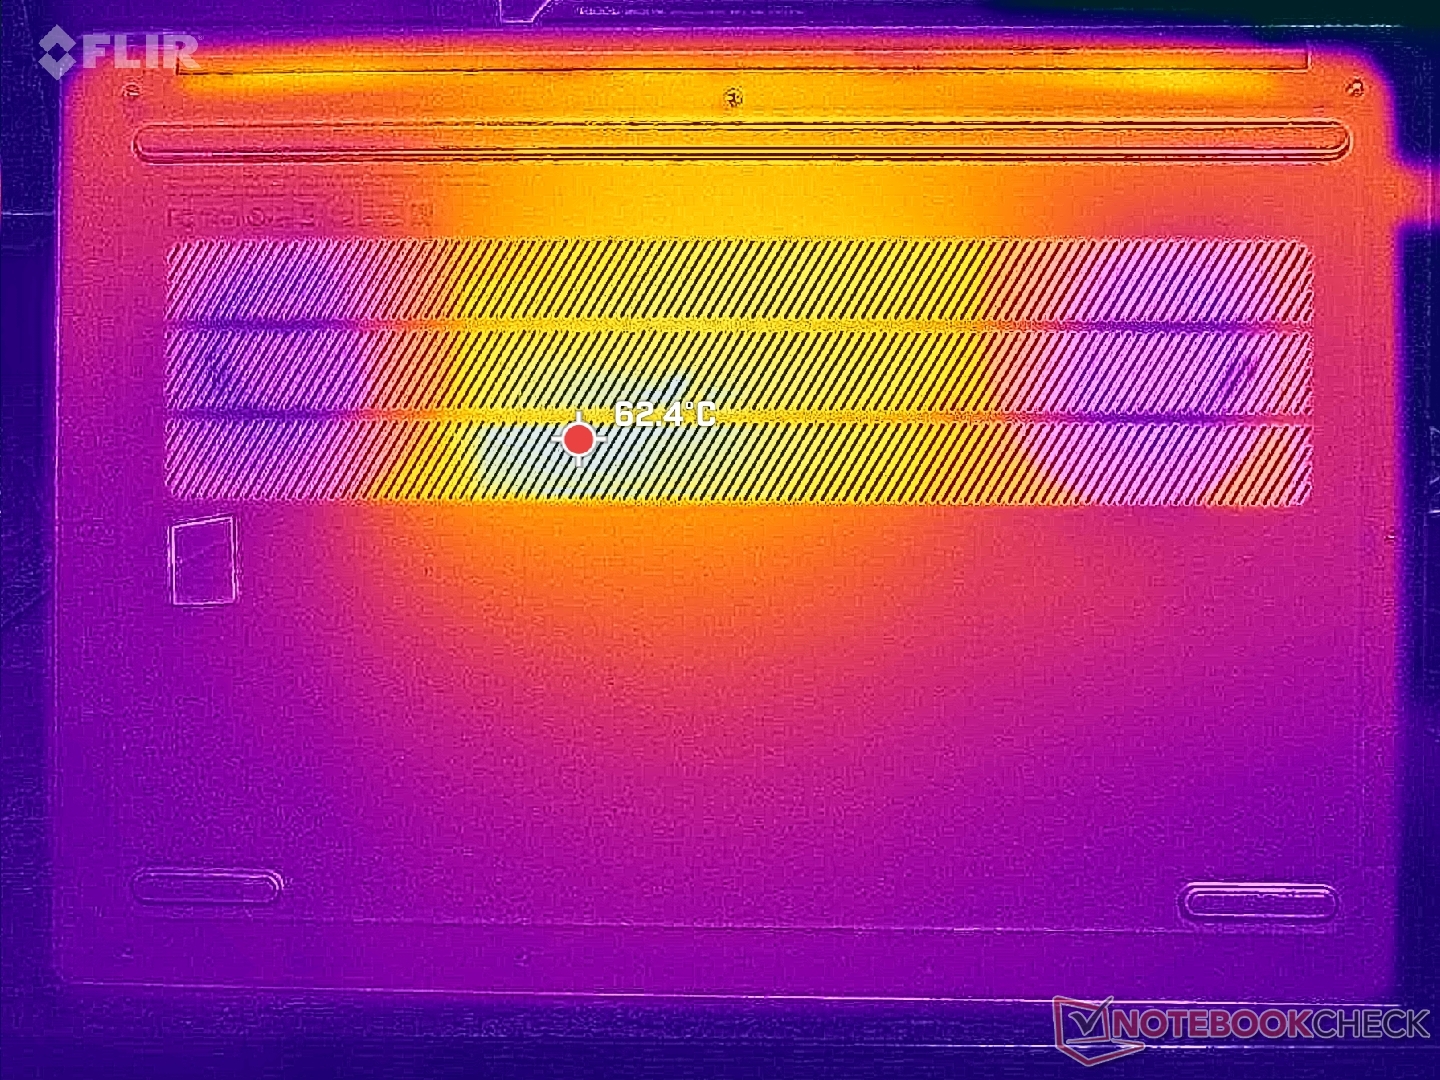
Température
Les températures de surface sont nettement plus élevées que celles de la configuration iGPU, de plusieurs degrés, même au ralenti. Les points chauds en jeu peuvent atteindre 42°C et 52°C sur le clavier et la surface inférieure, respectivement, contre 32°C et 38°C sur la version iGPU. Les points chauds sont heureusement situés vers le centre du clavier, mais vous voudrez certainement exécuter des charges exigeantes sur un bureau plat autant que possible pour une circulation d'air optimale.
Le système fonctionne plus chaudement que le Galaxy Book4 Ultra même si les deux modèles sont livrés avec des CPU Core Ultra H similaires et des options RTX GeForce.
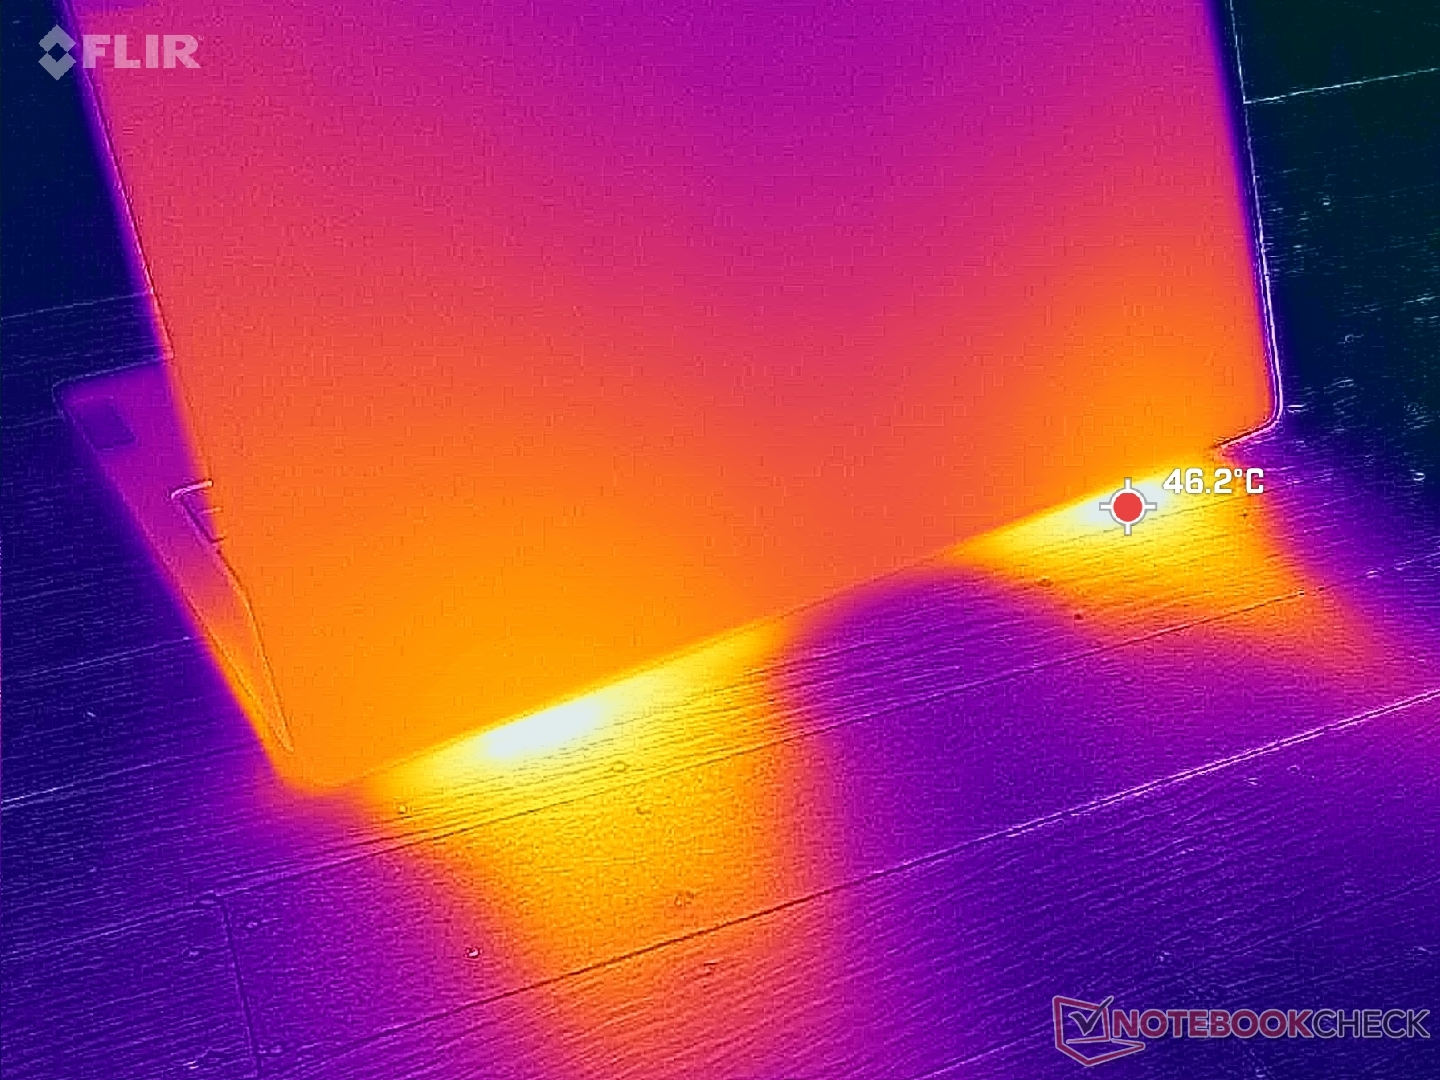
(-) La température maximale du côté supérieur est de 48.2 °C / 119 F, par rapport à la moyenne de 36.9 °C / 98 F, allant de 21.1 à 71 °C pour la classe Multimedia.
(-) Le fond chauffe jusqu'à un maximum de 59.4 °C / 139 F, contre une moyenne de 39.2 °C / 103 F
(+) En utilisation inactive, la température moyenne du côté supérieur est de 31.2 °C / 88 F, par rapport à la moyenne du dispositif de 31.3 °C / 88 F.
(±) 3: The average temperature for the upper side is 35.7 °C / 96 F, compared to the average of 31.3 °C / 88 F for the class Multimedia.
(+) Les repose-poignets et le pavé tactile atteignent la température maximale de la peau (34.4 °C / 93.9 F) et ne sont donc pas chauds.
(-) La température moyenne de la zone de l'appui-paume de dispositifs similaires était de 28.8 °C / 83.8 F (-5.6 °C / #-10.1 F).

| Lenovo IdeaPad Pro 5 16IMH G9 RTX 4050 Intel Core Ultra 9 185H, NVIDIA GeForce RTX 4050 Laptop GPU | Lenovo IdeaPad Pro 5 16IMH G9 Intel Core Ultra 7 155H, Intel Arc 8-Core iGPU | Dell Inspiron 16 7640 2-in-1 Intel Core Ultra 7 155H, Intel Arc 8-Core iGPU | Asus Zenbook S 16 UM5606-RK333W AMD Ryzen AI 9 HX 370, AMD Radeon 890M | HP Envy x360 2-in-1 16-ad0097nr AMD Ryzen 7 8840HS, AMD Radeon 780M | Samsung Galaxy Book4 Ultra Intel Core Ultra 7 155H, NVIDIA GeForce RTX 4050 Laptop GPU | |
|---|---|---|---|---|---|---|
| Heat | 28% | 11% | 10% | 18% | 28% | |
| Maximum Upper Side * | 48.2 | 36.3 25% | 46.8 3% | 46.9 3% | 42.6 12% | 38.5 20% |
| Maximum Bottom * | 59.4 | 39.1 34% | 45.6 23% | 53.5 10% | 47.8 20% | 41.2 31% |
| Idle Upper Side * | 34.2 | 24.9 27% | 32.2 6% | 29.5 14% | 27.4 20% | 23.5 31% |
| Idle Bottom * | 34.8 | 26.1 25% | 31.4 10% | 30.2 13% | 27.8 20% | 24.1 31% |
* ... Moindre est la valeur, meilleures sont les performances
Intervenants
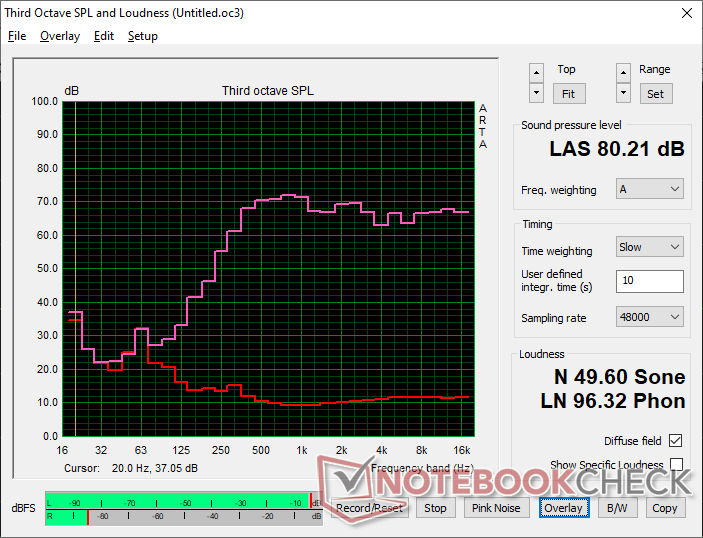
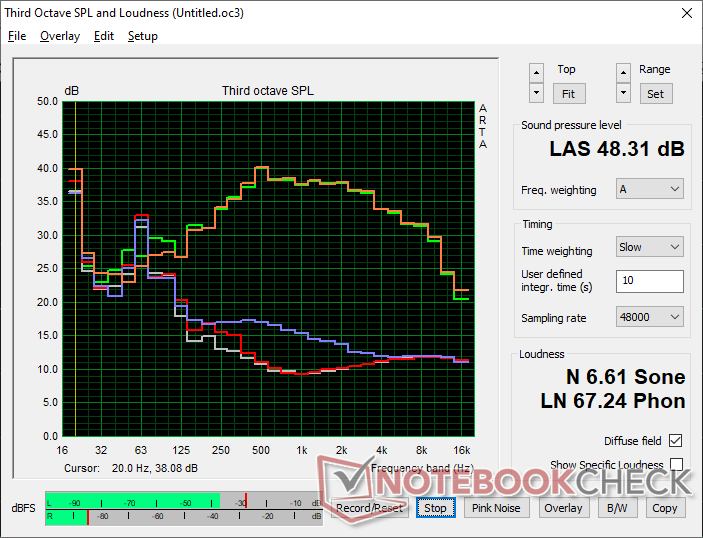
Lenovo IdeaPad Pro 5 16IMH G9 RTX 4050 analyse audio
(±) | le niveau sonore du haut-parleur est moyen mais bon (80.2# dB)
Bass 100 - 315 Hz
(-) | presque aucune basse - en moyenne 22.4% plus bas que la médiane
(±) | la linéarité des basses est moyenne (10.3% delta à la fréquence précédente)
Mids 400 - 2000 Hz
(+) | médiane équilibrée - seulement 2.7% de la médiane
(+) | les médiums sont linéaires (4% delta à la fréquence précédente)
Aiguës 2 - 16 kHz
(+) | des sommets équilibrés - à seulement 1.5% de la médiane
(+) | les aigus sont linéaires (4.1% delta à la fréquence précédente)
Overall 100 - 16.000 Hz
(+) | le son global est linéaire (14.3% différence à la médiane)
Par rapport à la même classe
» 28% de tous les appareils testés de cette catégorie étaient meilleurs, 5% similaires, 67% pires
» Le meilleur avait un delta de 5%, la moyenne était de 18%, le pire était de 45%.
Par rapport à tous les appareils testés
» 15% de tous les appareils testés étaient meilleurs, 4% similaires, 81% pires
» Le meilleur avait un delta de 4%, la moyenne était de 25%, le pire était de 134%.
Apple MacBook Pro 16 2021 M1 Pro analyse audio
(+) | les haut-parleurs peuvent jouer relativement fort (84.7# dB)
Bass 100 - 315 Hz
(+) | bonne basse - seulement 3.8% loin de la médiane
(+) | les basses sont linéaires (5.2% delta à la fréquence précédente)
Mids 400 - 2000 Hz
(+) | médiane équilibrée - seulement 1.3% de la médiane
(+) | les médiums sont linéaires (2.1% delta à la fréquence précédente)
Aiguës 2 - 16 kHz
(+) | des sommets équilibrés - à seulement 1.9% de la médiane
(+) | les aigus sont linéaires (2.7% delta à la fréquence précédente)
Overall 100 - 16.000 Hz
(+) | le son global est linéaire (4.6% différence à la médiane)
Par rapport à la même classe
» 0% de tous les appareils testés de cette catégorie étaient meilleurs, 0% similaires, 100% pires
» Le meilleur avait un delta de 5%, la moyenne était de 18%, le pire était de 45%.
Par rapport à tous les appareils testés
» 0% de tous les appareils testés étaient meilleurs, 0% similaires, 100% pires
» Le meilleur avait un delta de 4%, la moyenne était de 25%, le pire était de 134%.
Gestion de l'énergie
Consommation électrique
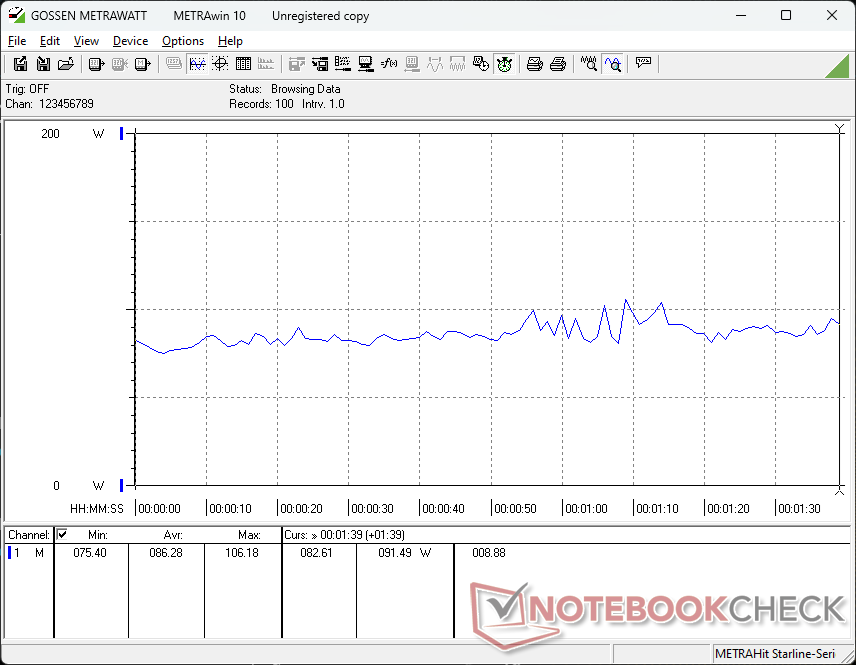
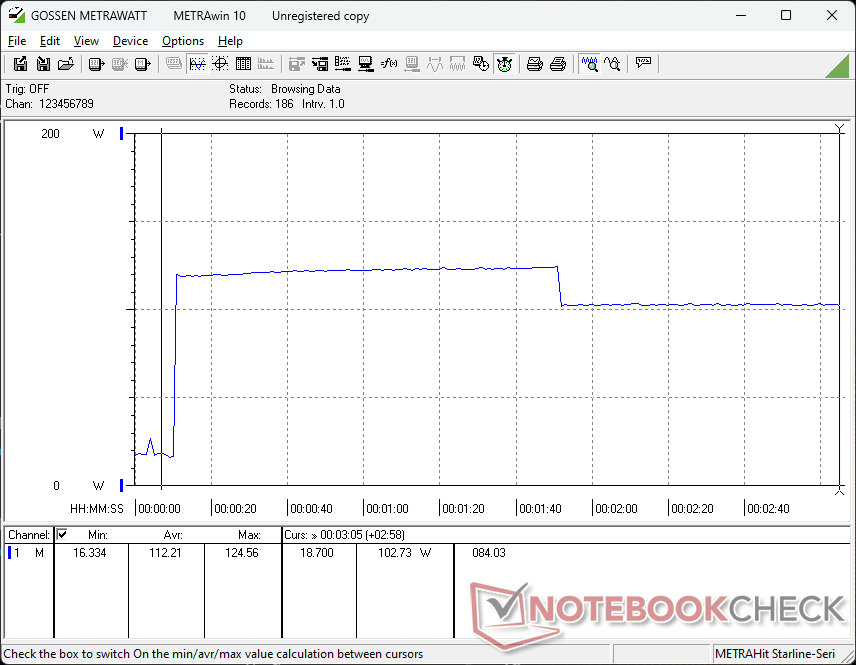
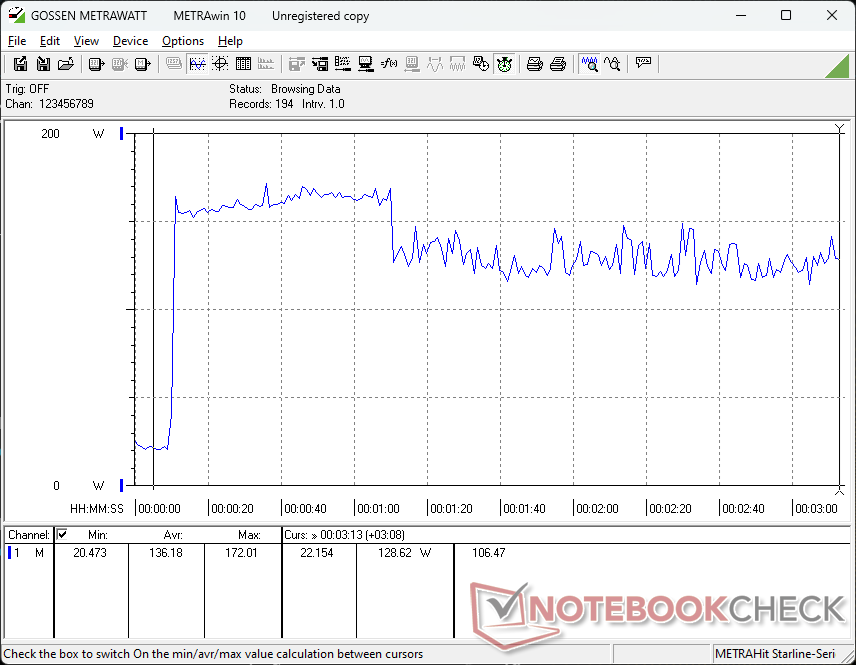
La marche au ralenti sur l'ordinateur de bureau demande jusqu'à 15 W contre seulement 10 W sur la configuration iGPU, en grande partie à cause de l'écran OLED. Le delta s'élargit de 70 à 80 W lorsque l'on exécute des charges exigeantes comme des jeux. Il est intéressant de noter que notre GPU RTX 4050 atteint un peu plus de 80 W dans les jeux contre seulement ~50 W sur le Galaxy Book4 Ultra et donc la consommation d'énergie globale est sensiblement plus élevée sur notre Lenovo pour être presque comme un ordinateur portable de jeu d'entrée de gamme.
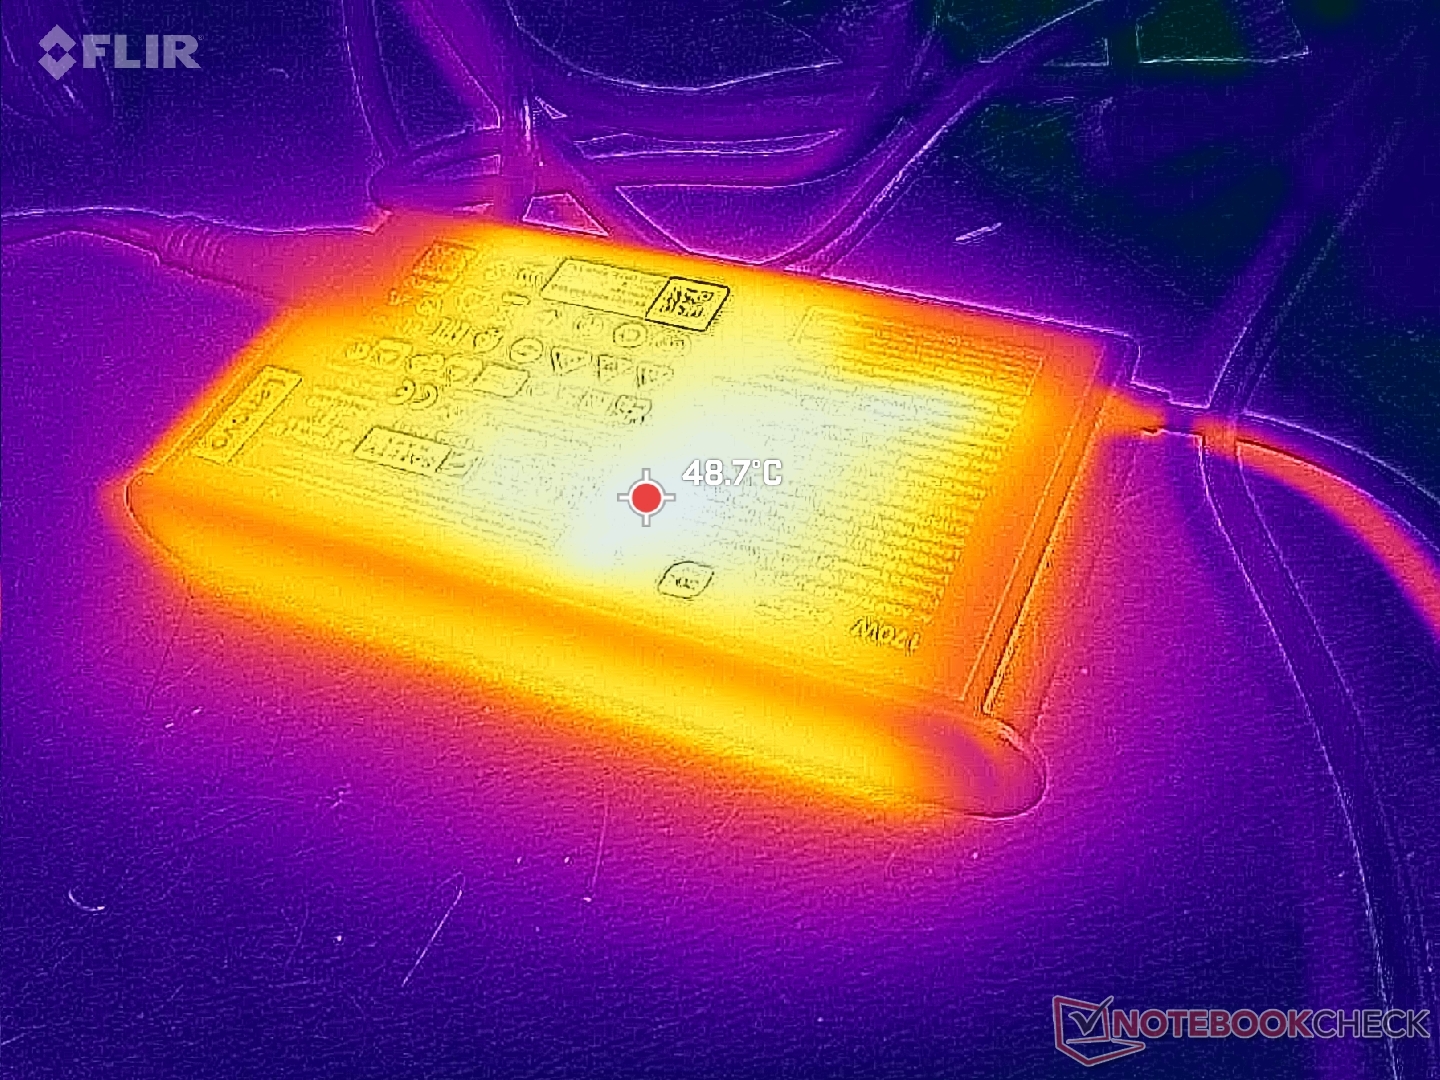
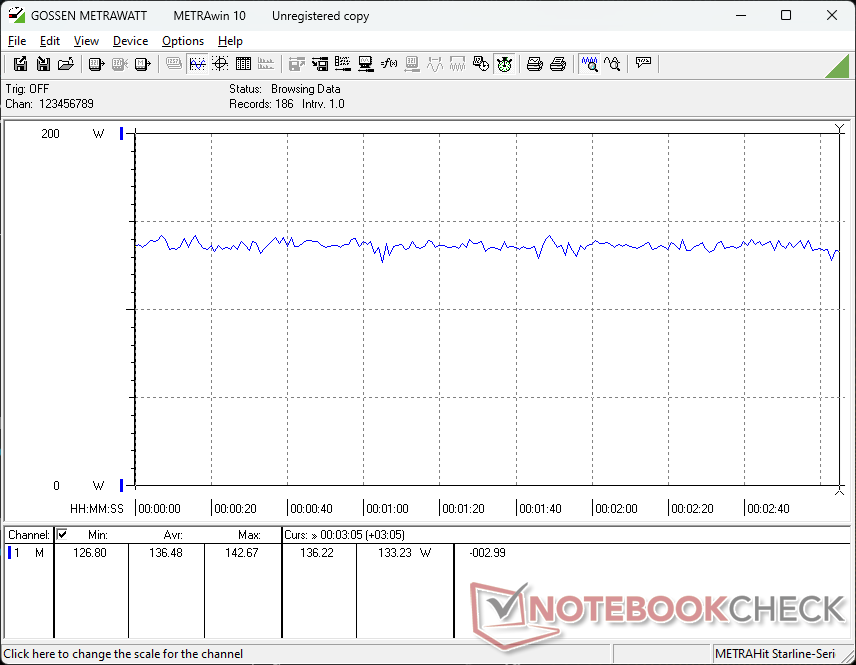
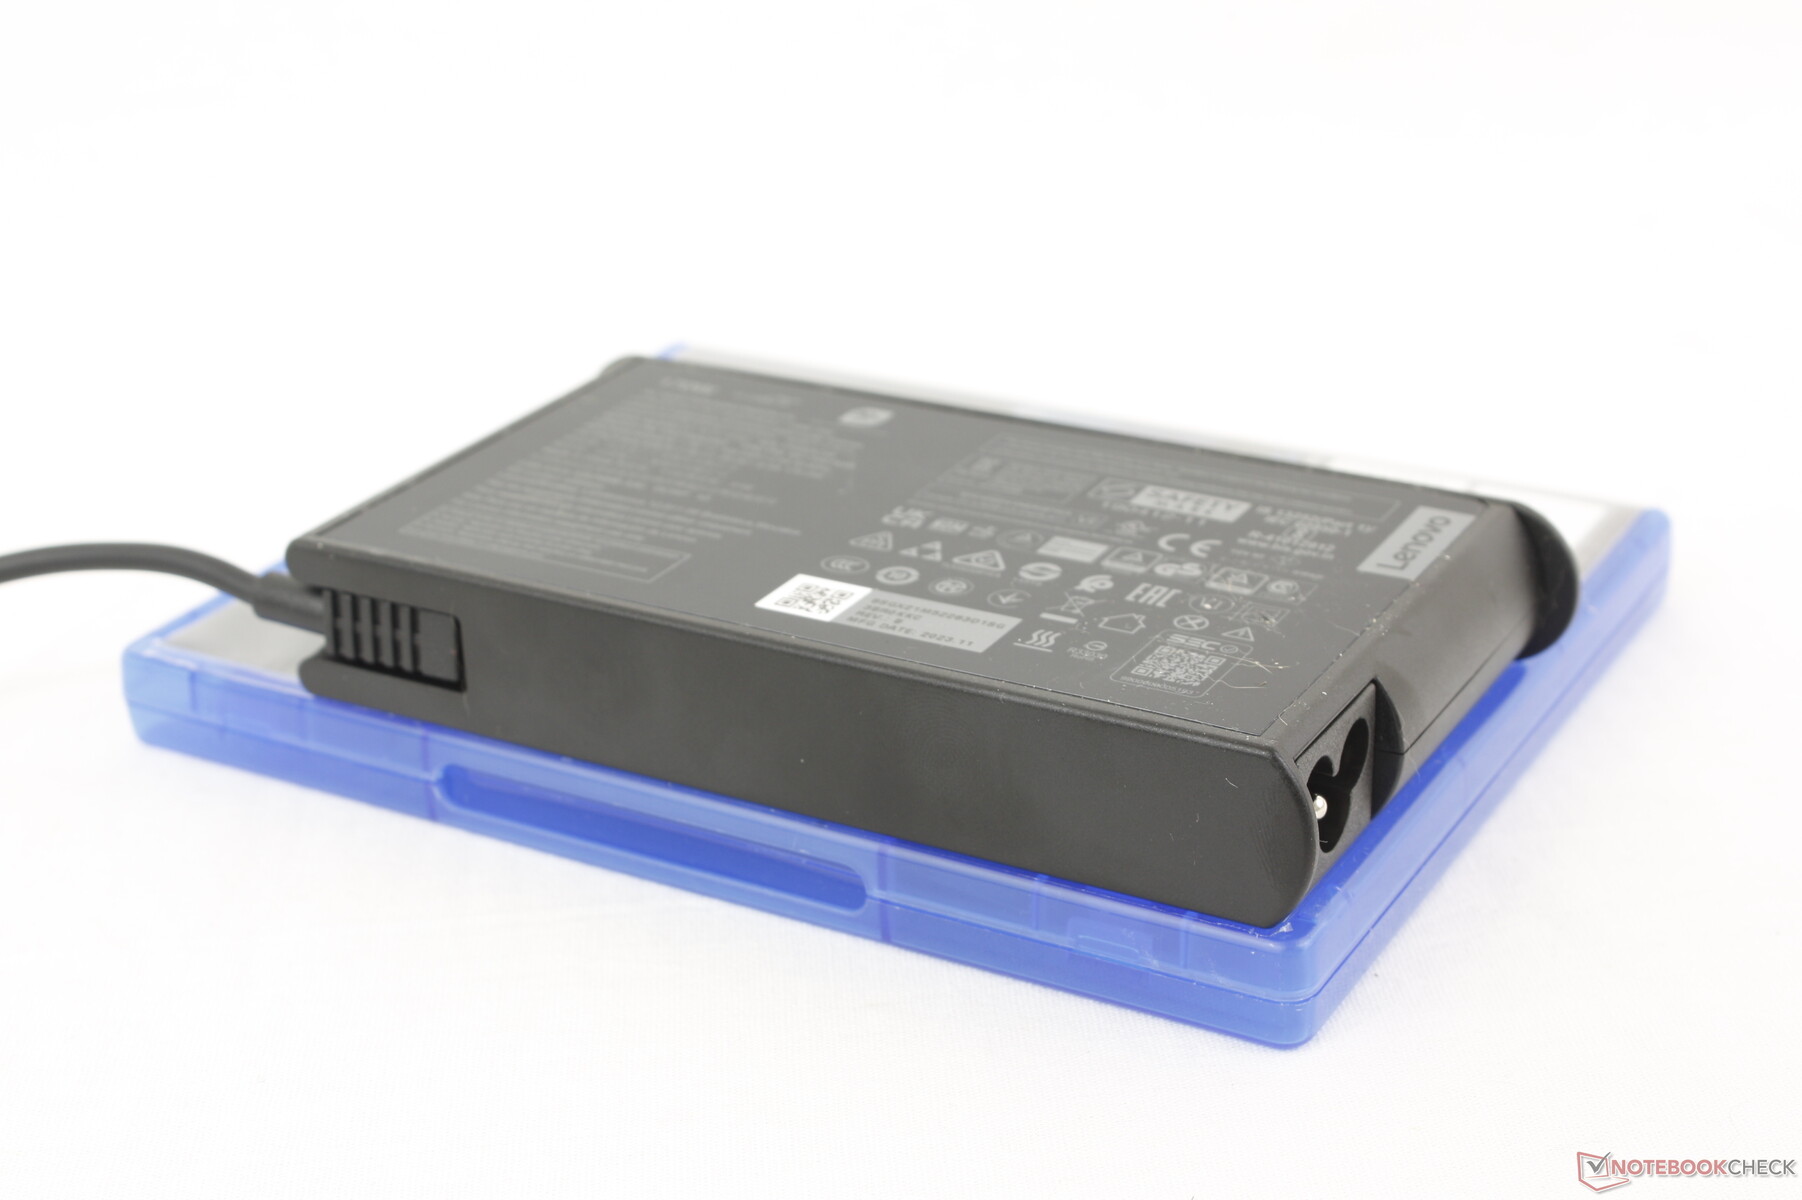
Nous avons pu enregistrer une consommation maximale temporaire de 172 W à partir de l'adaptateur secteur de taille moyenne (~15 x 7,8 x 2,2 cm) de 170 W lorsque le CPU et le GPU sont utilisés à 100 %. La consommation se situe juste en dessous de 140 W lorsque vous jouez et le système peut donc toujours se charger simultanément à un taux décent si nécessaire. Nous sommes heureux de constater que le système Lenovo prend en charge la charge CA de type tonneau au lieu de la seule charge USB-C, car la puissance inférieure de cette dernière aurait gravement affecté les performances. Le Galaxy Book4 Ultra, par exemple, ne prend en charge que la charge USB-C et pourtant notre Lenovo a toujours été plus performant que le Samsung en raison de nos plafonds de puissance plus élevés.
| Éteint/en veille | |
| Au repos | |
| Fortement sollicité |
|
Légende:
min: | |
| Lenovo IdeaPad Pro 5 16IMH G9 RTX 4050 Ultra 9 185H, NVIDIA GeForce RTX 4050 Laptop GPU, Samsung PM9C1a MZAL81T0HDLB, OLED, 2048x1280, 16" | Lenovo IdeaPad Pro 5 16IMH G9 Ultra 7 155H, Arc 8-Core, Samsung PM9C1a MZAL81T0HDLB, IPS, 2560x1600, 16" | Dell Inspiron 16 7640 2-in-1 Ultra 7 155H, Arc 8-Core, Micron 2550 1TB, Mini-LED, 2560x1600, 16" | Asus Zenbook S 16 UM5606-RK333W Ryzen AI 9 HX 370, Radeon 890M, Micron 2400 MTFDKBA1T0QFM, OLED, 2880x1800, 16" | HP Envy x360 2-in-1 16-ad0097nr R7 8840HS, Radeon 780M, KIOXIA BG5 KBG50ZNV1T02, OLED, 2880x1800, 16" | Samsung Galaxy Book4 Ultra Ultra 7 155H, NVIDIA GeForce RTX 4050 Laptop GPU, Samsung PM9A1 MZVL2512HCJQ, OLED, 2880x1800, 16" | |
|---|---|---|---|---|---|---|
| Power Consumption | 21% | 11% | 32% | 26% | 18% | |
| Idle Minimum * | 5.6 | 3.5 37% | 6.1 -9% | 5.4 4% | 5 11% | 4.8 14% |
| Idle Average * | 7.3 | 9.6 -32% | 13.5 -85% | 10.5 -44% | 6.2 15% | 7.5 -3% |
| Idle Maximum * | 14.6 | 9.9 32% | 13.8 5% | 10.9 25% | 14.7 -1% | 7.9 46% |
| Load Average * | 86.3 | 62.7 27% | 63.6 26% | 47.8 45% | 49.9 42% | 79.3 8% |
| Cyberpunk 2077 ultra external monitor * | 135.8 | 64.6 52% | 46.7 66% | |||
| Cyberpunk 2077 ultra * | 136.4 | 67 51% | 49.2 64% | |||
| Load Maximum * | 172 | 101.2 41% | 109.7 36% | 58.6 66% | 65 62% | 125 27% |
| Witcher 3 ultra * | 55.8 | 54.5 | 79.2 |
* ... Moindre est la valeur, meilleures sont les performances
Power Consumption Cyberpunk / Stress Test
Power Consumption external Monitor
Autonomie de la batterie
Les durées d'exécution sont plus courtes que dans la configuration IPS iGPU pour les raisons mentionnées dans la section ci-dessus. Malgré cela, 10,5 heures de navigation WLAN dans le monde réel est encore assez longue et comparable à l'Inspiron 16 7640 2-en-1 ou au Zenbook S 16.
Le chargement de la batterie vide à la pleine capacité est très rapide : environ 60 minutes, contre 90 minutes pour la plupart des autres ultrabooks. La charge avec des adaptateurs secteur USB-C sera plus lente.
| Lenovo IdeaPad Pro 5 16IMH G9 RTX 4050 Ultra 9 185H, NVIDIA GeForce RTX 4050 Laptop GPU, 84 Wh | Lenovo IdeaPad Pro 5 16IMH G9 Ultra 7 155H, Arc 8-Core, 84 Wh | Dell Inspiron 16 7640 2-in-1 Ultra 7 155H, Arc 8-Core, 90 Wh | Asus Zenbook S 16 UM5606-RK333W Ryzen AI 9 HX 370, Radeon 890M, 78 Wh | HP Envy x360 2-in-1 16-ad0097nr R7 8840HS, Radeon 780M, 68 Wh | Samsung Galaxy Book4 Ultra Ultra 7 155H, NVIDIA GeForce RTX 4050 Laptop GPU, 76 Wh | |
|---|---|---|---|---|---|---|
| Autonomie de la batterie | 27% | 30% | 57% | 25% | 30% | |
| Reader / Idle | 1338 | 1310 -2% | 935 -30% | |||
| WiFi v1.3 | 639 | 756 18% | 686 7% | 640 0% | 459 -28% | 656 3% |
| Load | 50 | 68 36% | 93 86% | 107 114% | 116 132% | 78 56% |
| H.264 | 957 | 1204 | 1076 |
Points positifs
Points négatifs
Verdict - Bien équilibré pour 1500 dollars
Alors que la configuration iGPU bas de gamme est une machine multimédia respectable, la configuration dGPU haut de gamme est une machine à la limite du jeu. Sa puissance de 90 W GeForce RTX 4050 est plus rapide que celle de la plupart des autres ordinateurs portables multimédias tels que le Samsung Galaxy Book4 Ultra et il rivalise même avec de nombreux ordinateurs portables de jeu d'entrée de gamme dotés d'une carte graphique RTX 4060, comme le Legion LOQ. Le système est assez puissant si l'on tient compte de son profil fin et de son design terne de type bureautique.
L'IdeaPad Pro 5 16 G9 est plus rapide qu'il n'y paraît lorsqu'il est entièrement configuré grâce à son GPU RTX 4050 de 90 W GeForce.
Toutes ces performances dans un boîtier aussi fin se font au prix d'une autonomie plus courte, de ventilateurs plus bruyants et de températures plus élevées que l'option iGPU d'entrée de gamme et que la plupart des concurrents dans l'espace 16 pouces. Lenovo aurait pu atténuer ces inconvénients en optant pour un GPU plus lent de 50 W, mais nous apprécions le fait qu'ils aient opté pour un plafond plus élevé de 90 W afin de mieux distinguer l'IdeaPad Pro 5 16 G9 de la concurrence. L'IdeaPad Pro 5 16 G9 n'excelle pas dans le travail de bureau comme le ferait un ThinkPad T16 ou dans les jeux vidéo comme le Legion Pro 5 16mais il est plus performant que la moyenne dans les deux cas, ce qui en fait une bonne solution polyvalente.
Prix et disponibilité
Costco livre maintenant le Lenovo IdeaPad Pro 5i 16 avec le Core Ultra 9 185H et RTX 4050 tel que configuré pour $1500 ou $1350 pendant une vente limitée dans le temps.
Note : Nous avons récemment mis à jour notre système d'évaluation et les résultats de la version 8 ne sont pas comparables à ceux de la version 7. De plus amples informations sont disponibles ici .
Lenovo IdeaPad Pro 5 16IMH G9 RTX 4050
- 09/08/2024 v8
Allen Ngo
 Total Sustainability Score:
 Transparency
The selection of devices to be reviewed is made by our editorial team. The test sample was provided to the author as a loan by the manufacturer or retailer for the purpose of this review. The lender had no influence on this review, nor did the manufacturer receive a copy of this review before publication. There was no obligation to publish this review. We never accept compensation or payment in return for our reviews. As an independent media company, Notebookcheck is not subjected to the authority of manufacturers, retailers or publishers.
This is how Notebookcheck is testing
Every year, Notebookcheck independently reviews hundreds of laptops and smartphones using standardized procedures to ensure that all results are comparable. We have continuously developed our test methods for around 20 years and set industry standards in the process. In our test labs, high-quality measuring equipment is utilized by experienced technicians and editors. These tests involve a multi-stage validation process. Our complex rating system is based on hundreds of well-founded measurements and benchmarks, which maintains objectivity. Further information on our test methods can be found here.
Price comparison

