

Test du Lenovo LOQ 15 : le PC portable de jeu FHD avec RTX 4060 à environ 1 000 $ US
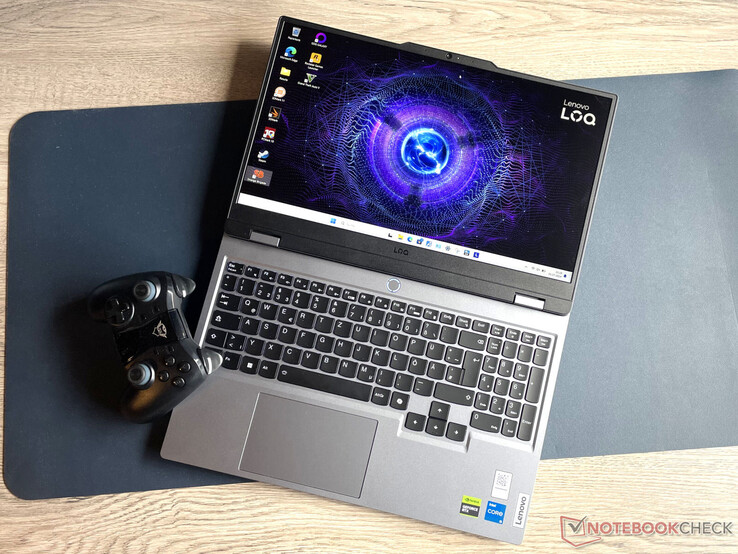
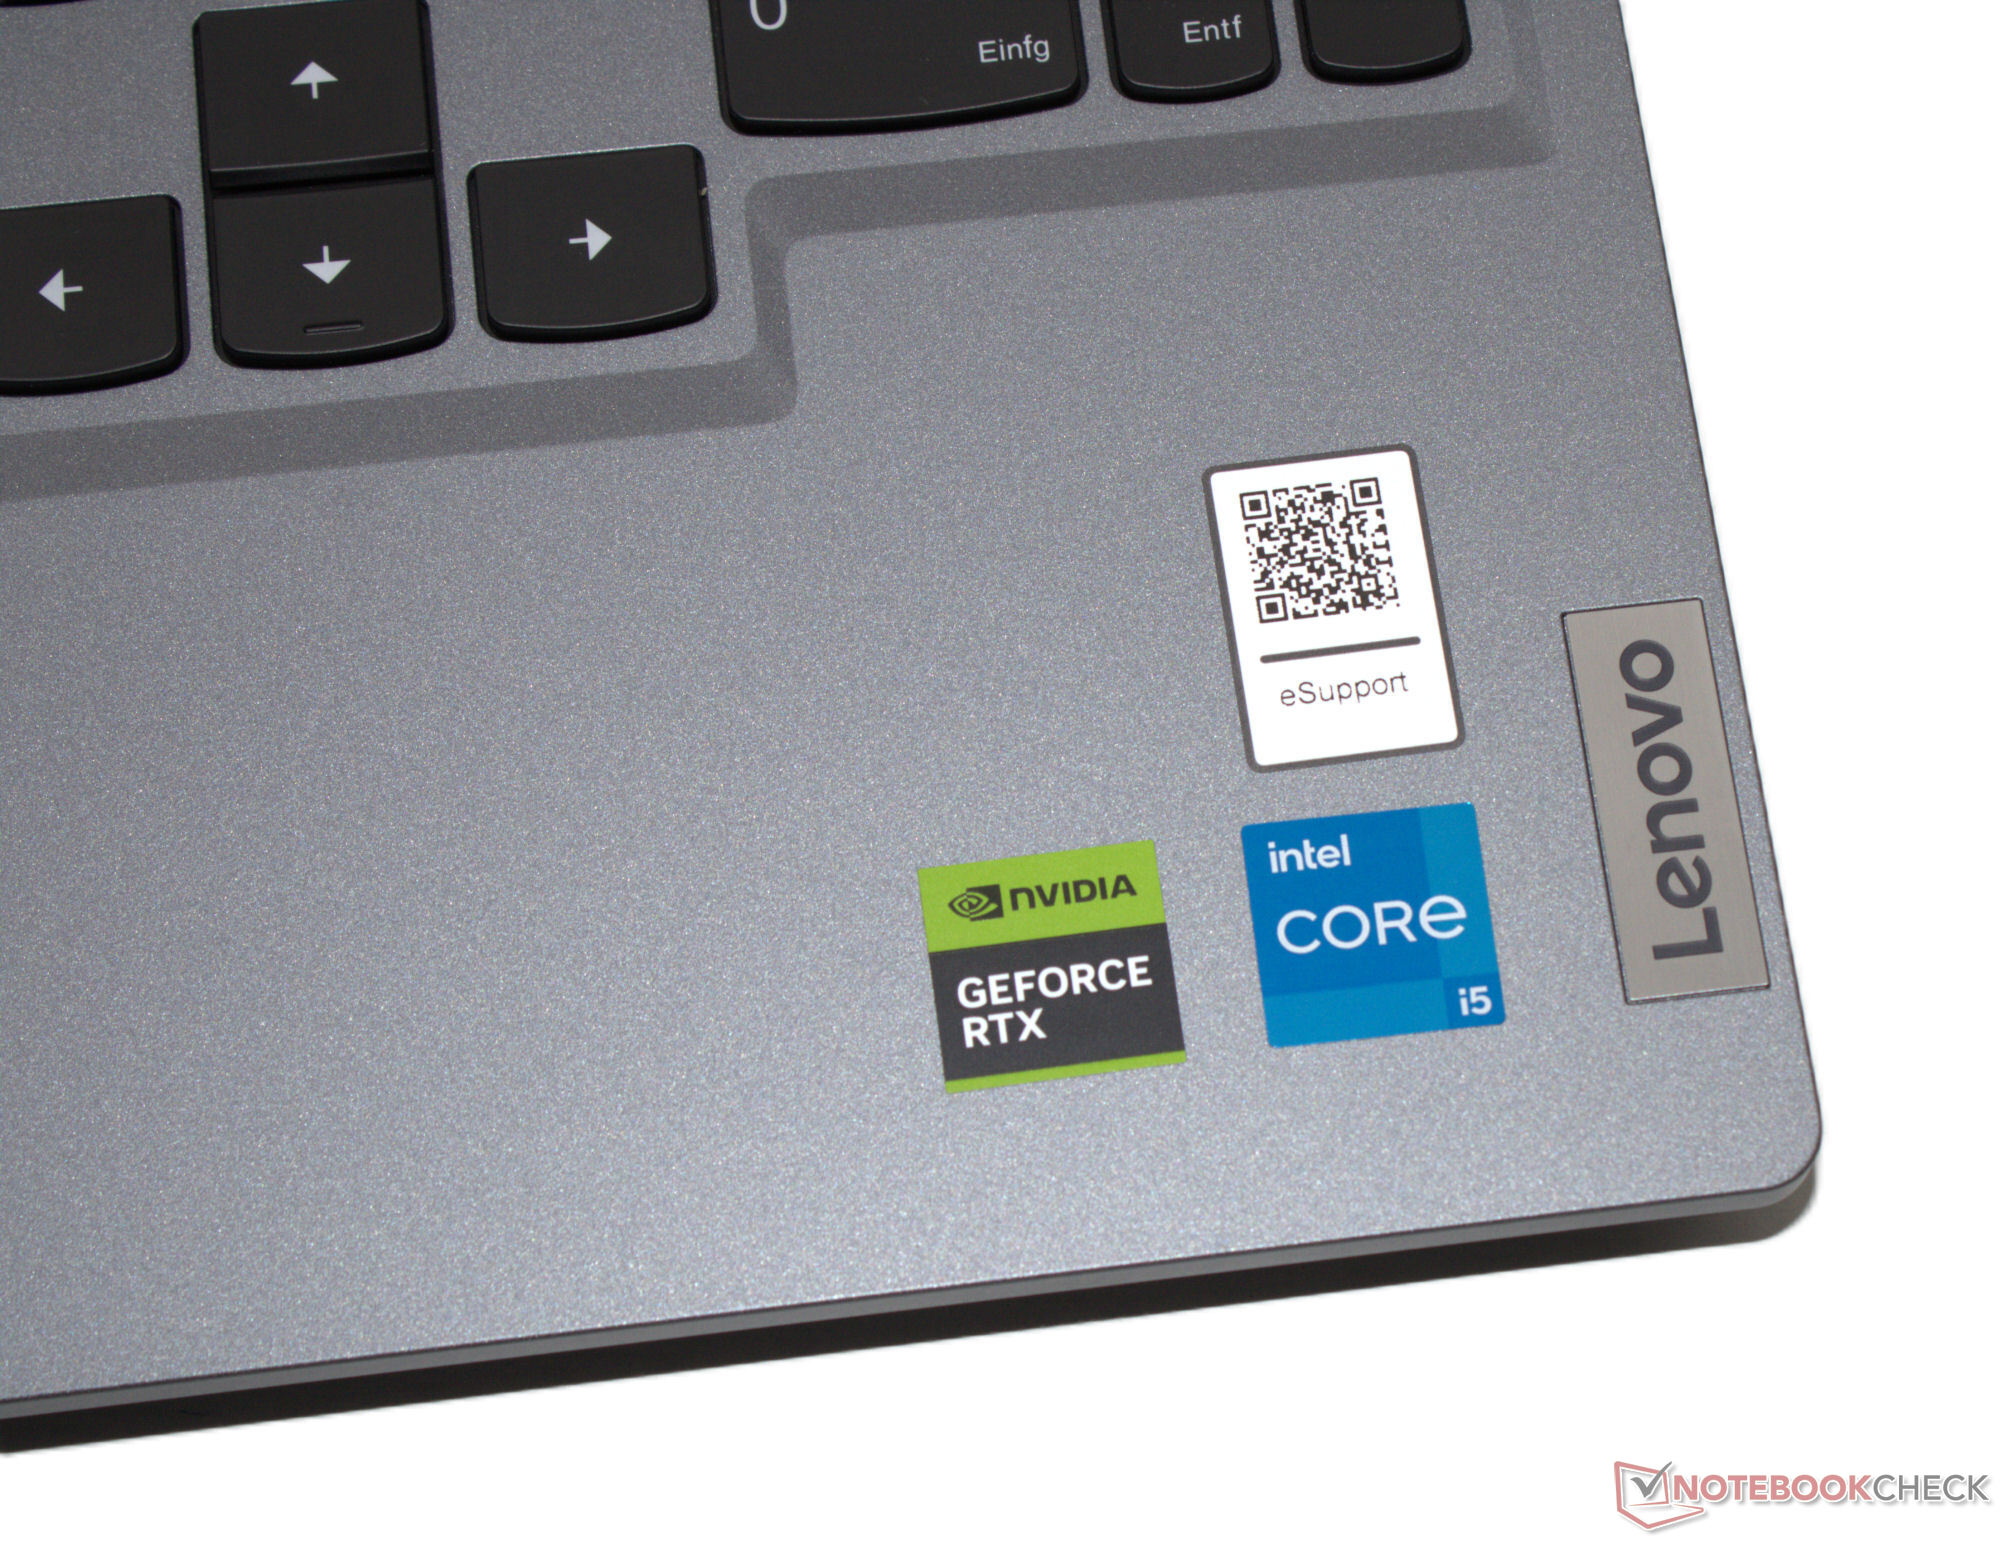
Dans le catalogue de Lenovo, la série LOQ se compose d'ordinateurs portables de jeu économiques. Le présent appareil de test s'inscrit parfaitement dans cette catégorie : Le fabricant demande un peu plus de 1 000 dollars (sans Windows) ou 1 300 dollars (avec Windows 11) pour cet ensemble composé d'un processeur Core i5, de GeForce RTX 4060, de 16 Go de RAM et d'un disque dur SSD de 1 To. Le prix de l'ordinateur portable n'est pas anodin : il est doté d'un boîtier en plastique, d'une batterie de capacité relativement faible et n'est pas équipé de Thunderbolt 4 ou d'USB 4. Parmi les concurrents, on trouve des appareils comme le Gigabyte G6X 9KG (2024), Dell G16, XMG Core 15 (M24) ou le HP Victus 16 (2024).
Le boîtier du Lenovo LOQ 15IRX9 n'est pas construit de manière identique à ceux de ses modèles frères que nous avons déjà testés (Ryzen 7/RTX 4050, Core i7/RTX 4050).
Comparaison avec les concurrents potentiels
Note | Version | Date | Modèle | Poids | Épaisseur | Taille | Résolution | Prix |
|---|---|---|---|---|---|---|---|---|
| 79 % | v8 | 07/24 | Lenovo LOQ 15IRX9 i5-13450HX, NVIDIA GeForce RTX 4060 Laptop GPU | 2.4 kg | 23.9 mm | 15.60" | 1920x1080 | |
| 83.7 % | v8 | 06/24 | SCHENKER XMG Core 15 (M24) R7 8845HS, NVIDIA GeForce RTX 4060 Laptop GPU | 2.1 kg | 21.9 mm | 15.30" | 2560x1600 | |
| 83.2 % v7 (old) | v7 (old) | 03/24 | Gigabyte G6X 9KG (2024) i7-13650HX, NVIDIA GeForce RTX 4060 Laptop GPU | 2.6 kg | 25.1 mm | 16.00" | 1920x1200 | |
| 84.3 % v7 (old) | v7 (old) | 05/24 | HP Victus 16 (2024) i7-14700HX, NVIDIA GeForce RTX 4060 Laptop GPU | 2.4 kg | 23.9 mm | 16.10" | 1920x1080 | |
| 85.5 % v7 (old) | v7 (old) | 02/24 | Dell G16, i7-13650HX, RTX 4060 i7-13650HX, NVIDIA GeForce RTX 4060 Laptop GPU | 2.8 kg | 25.65 mm | 16.00" | 2560x1600 |
Veuillez noter que nous avons récemment mis à jour notre système d'évaluation et que les résultats de la version 8 ne sont pas comparables à ceux de la version 7. Vous trouverez de plus amples informations ici .
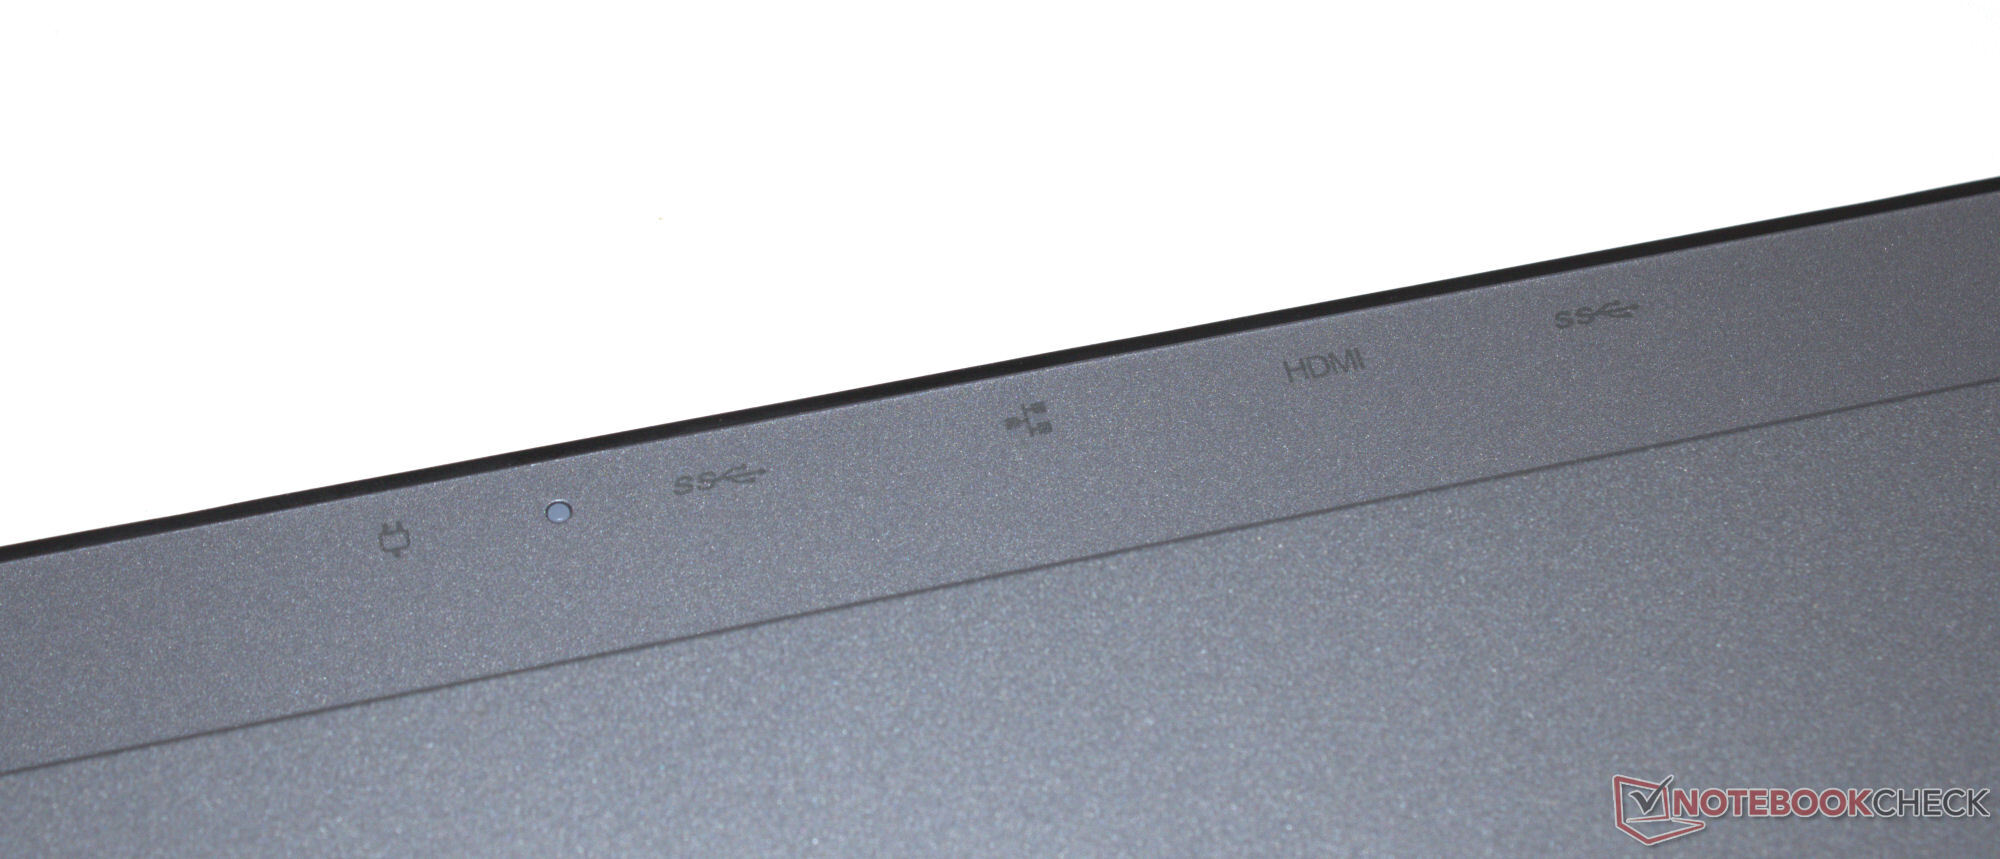
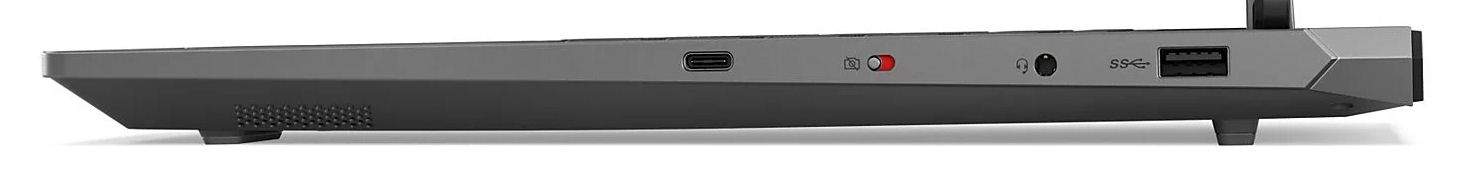
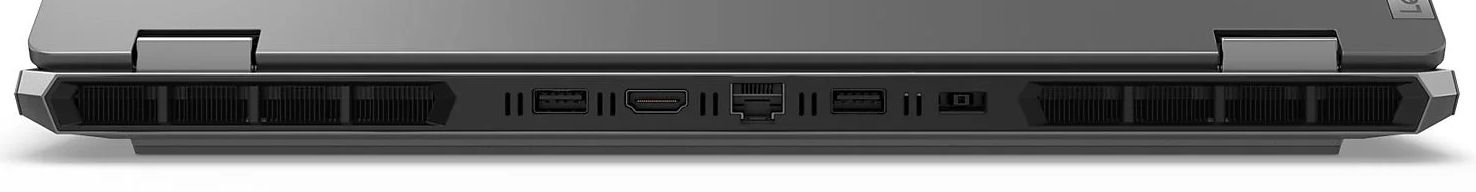
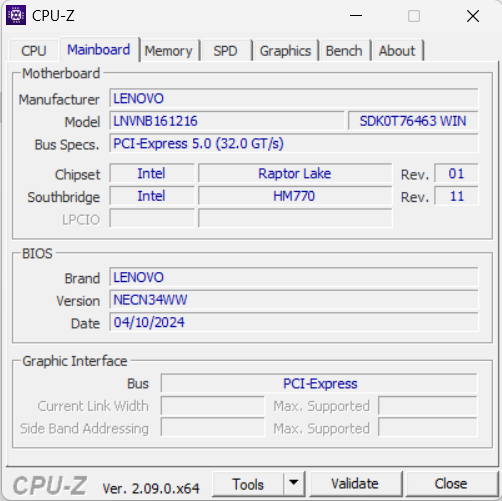
Boîtier et connectivité - Le LOQ sans USB 4 mais avec Power Delivery
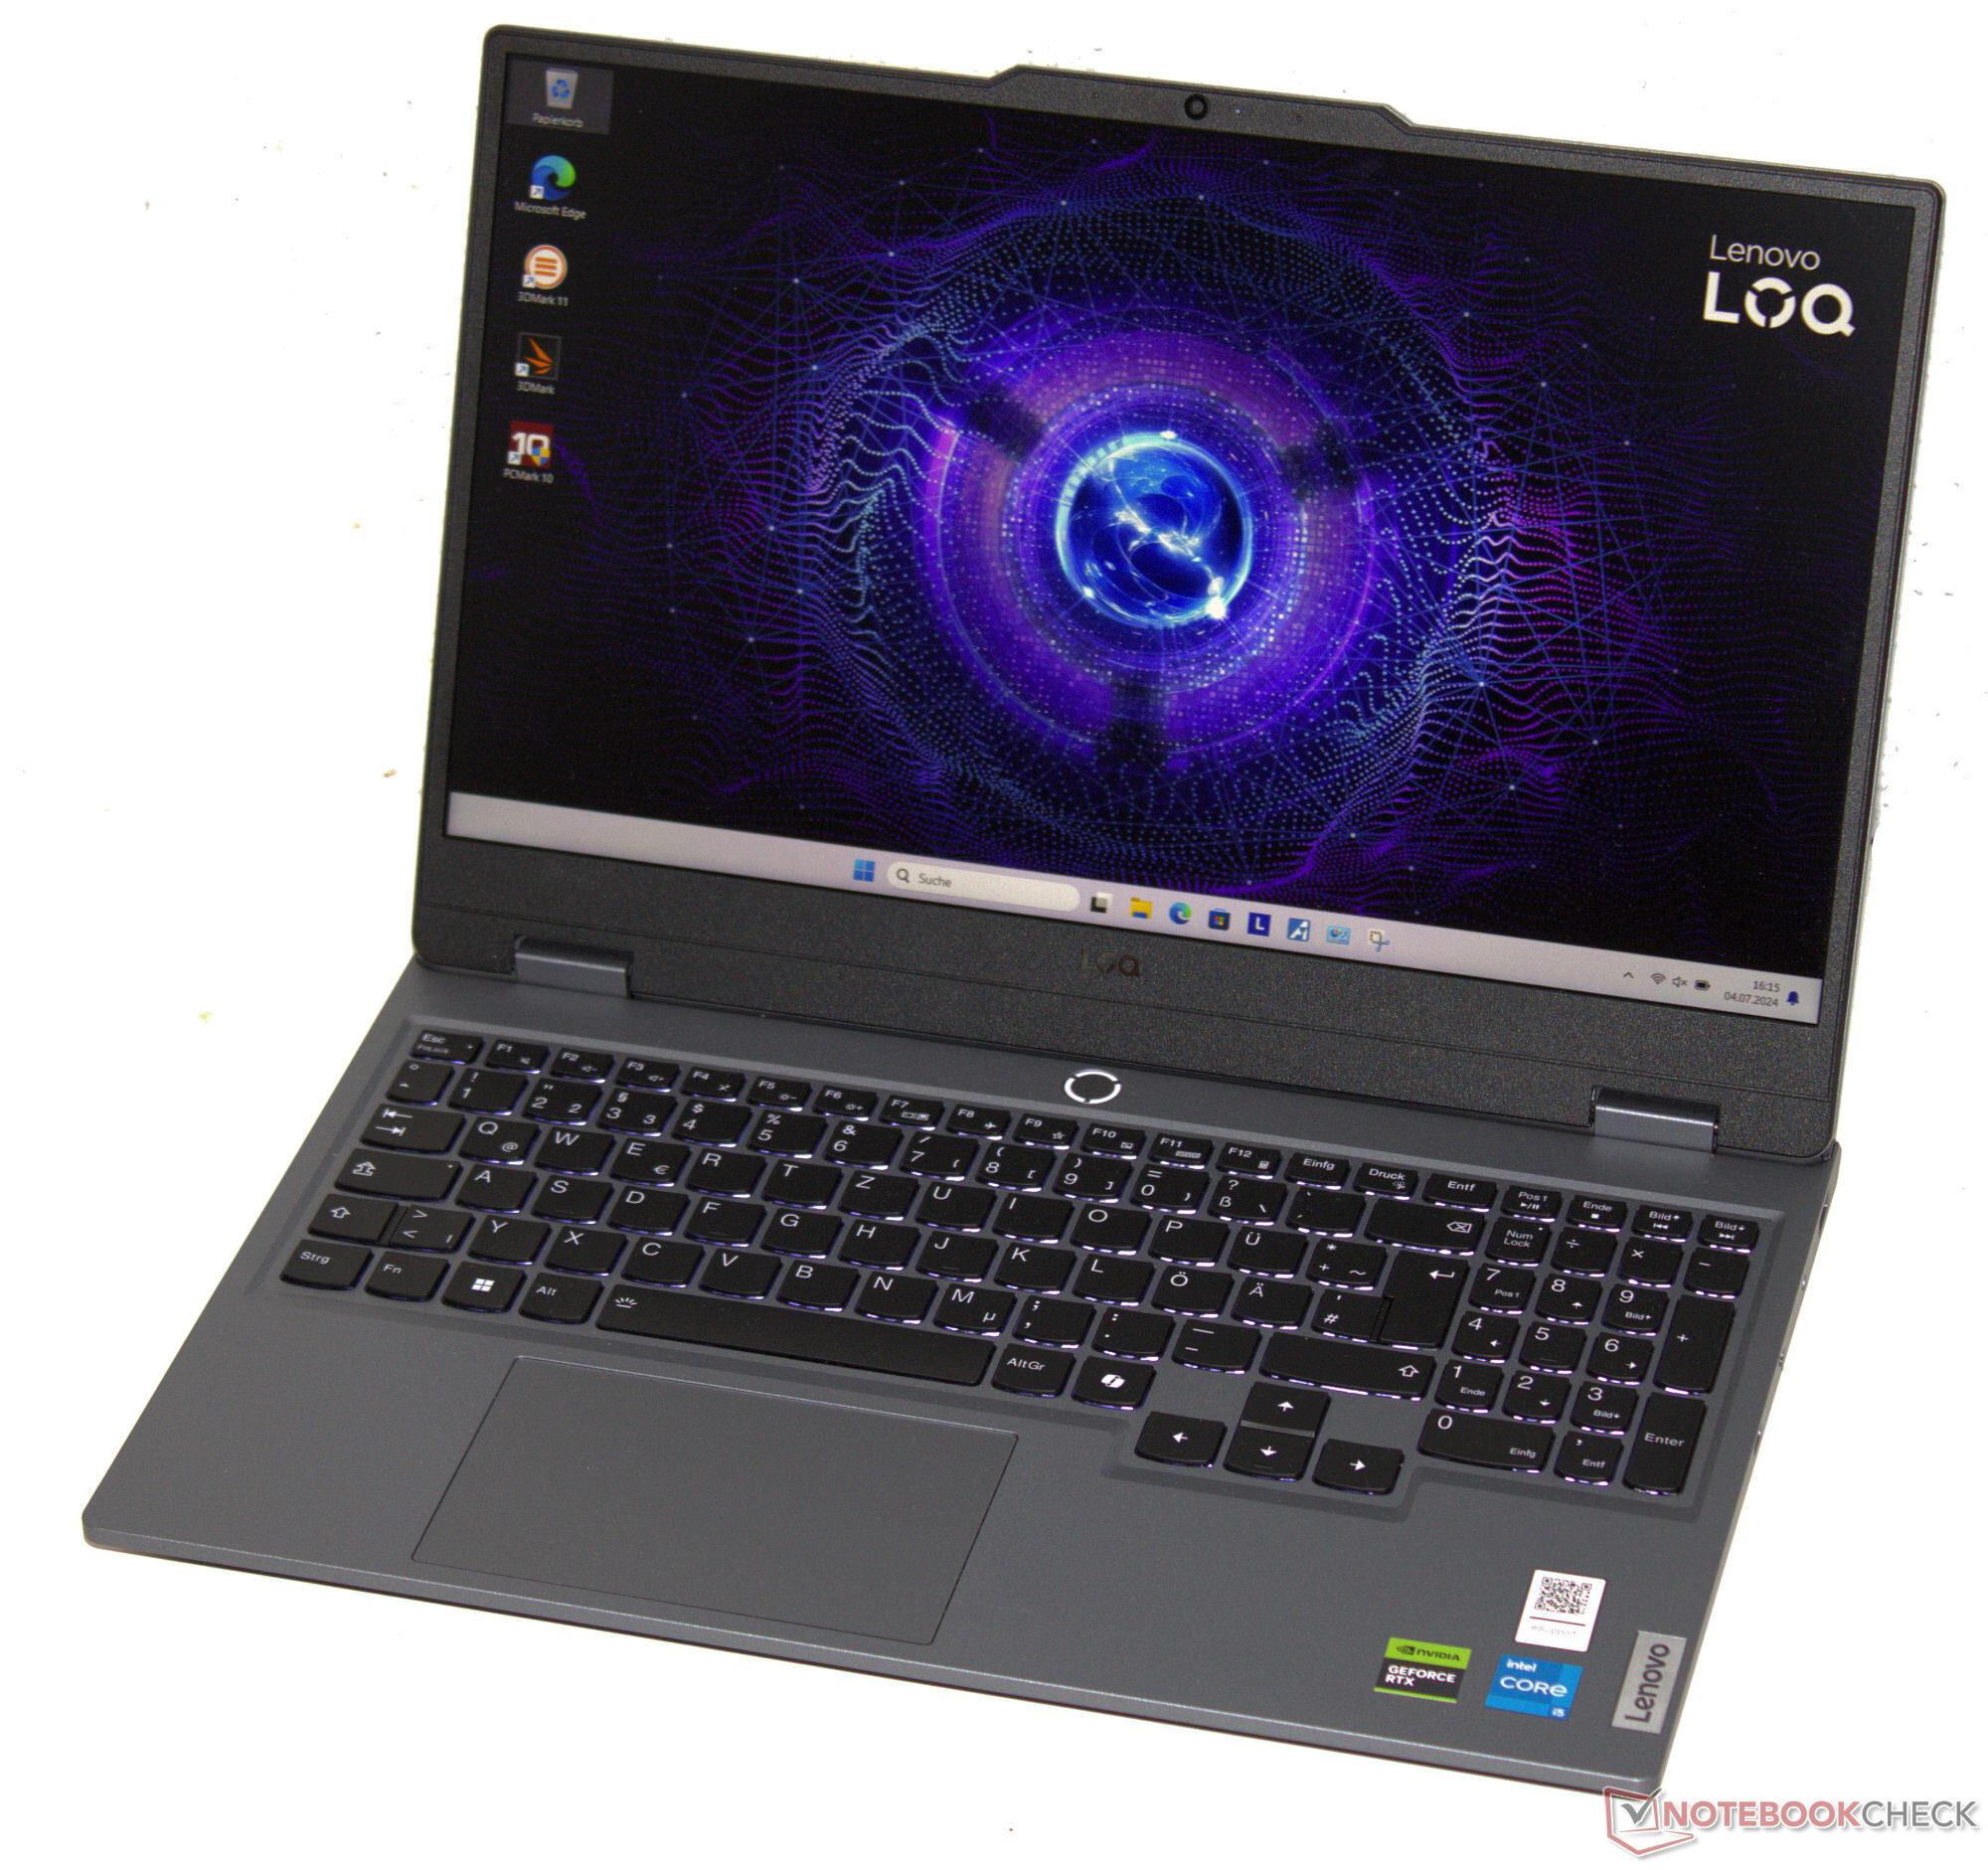
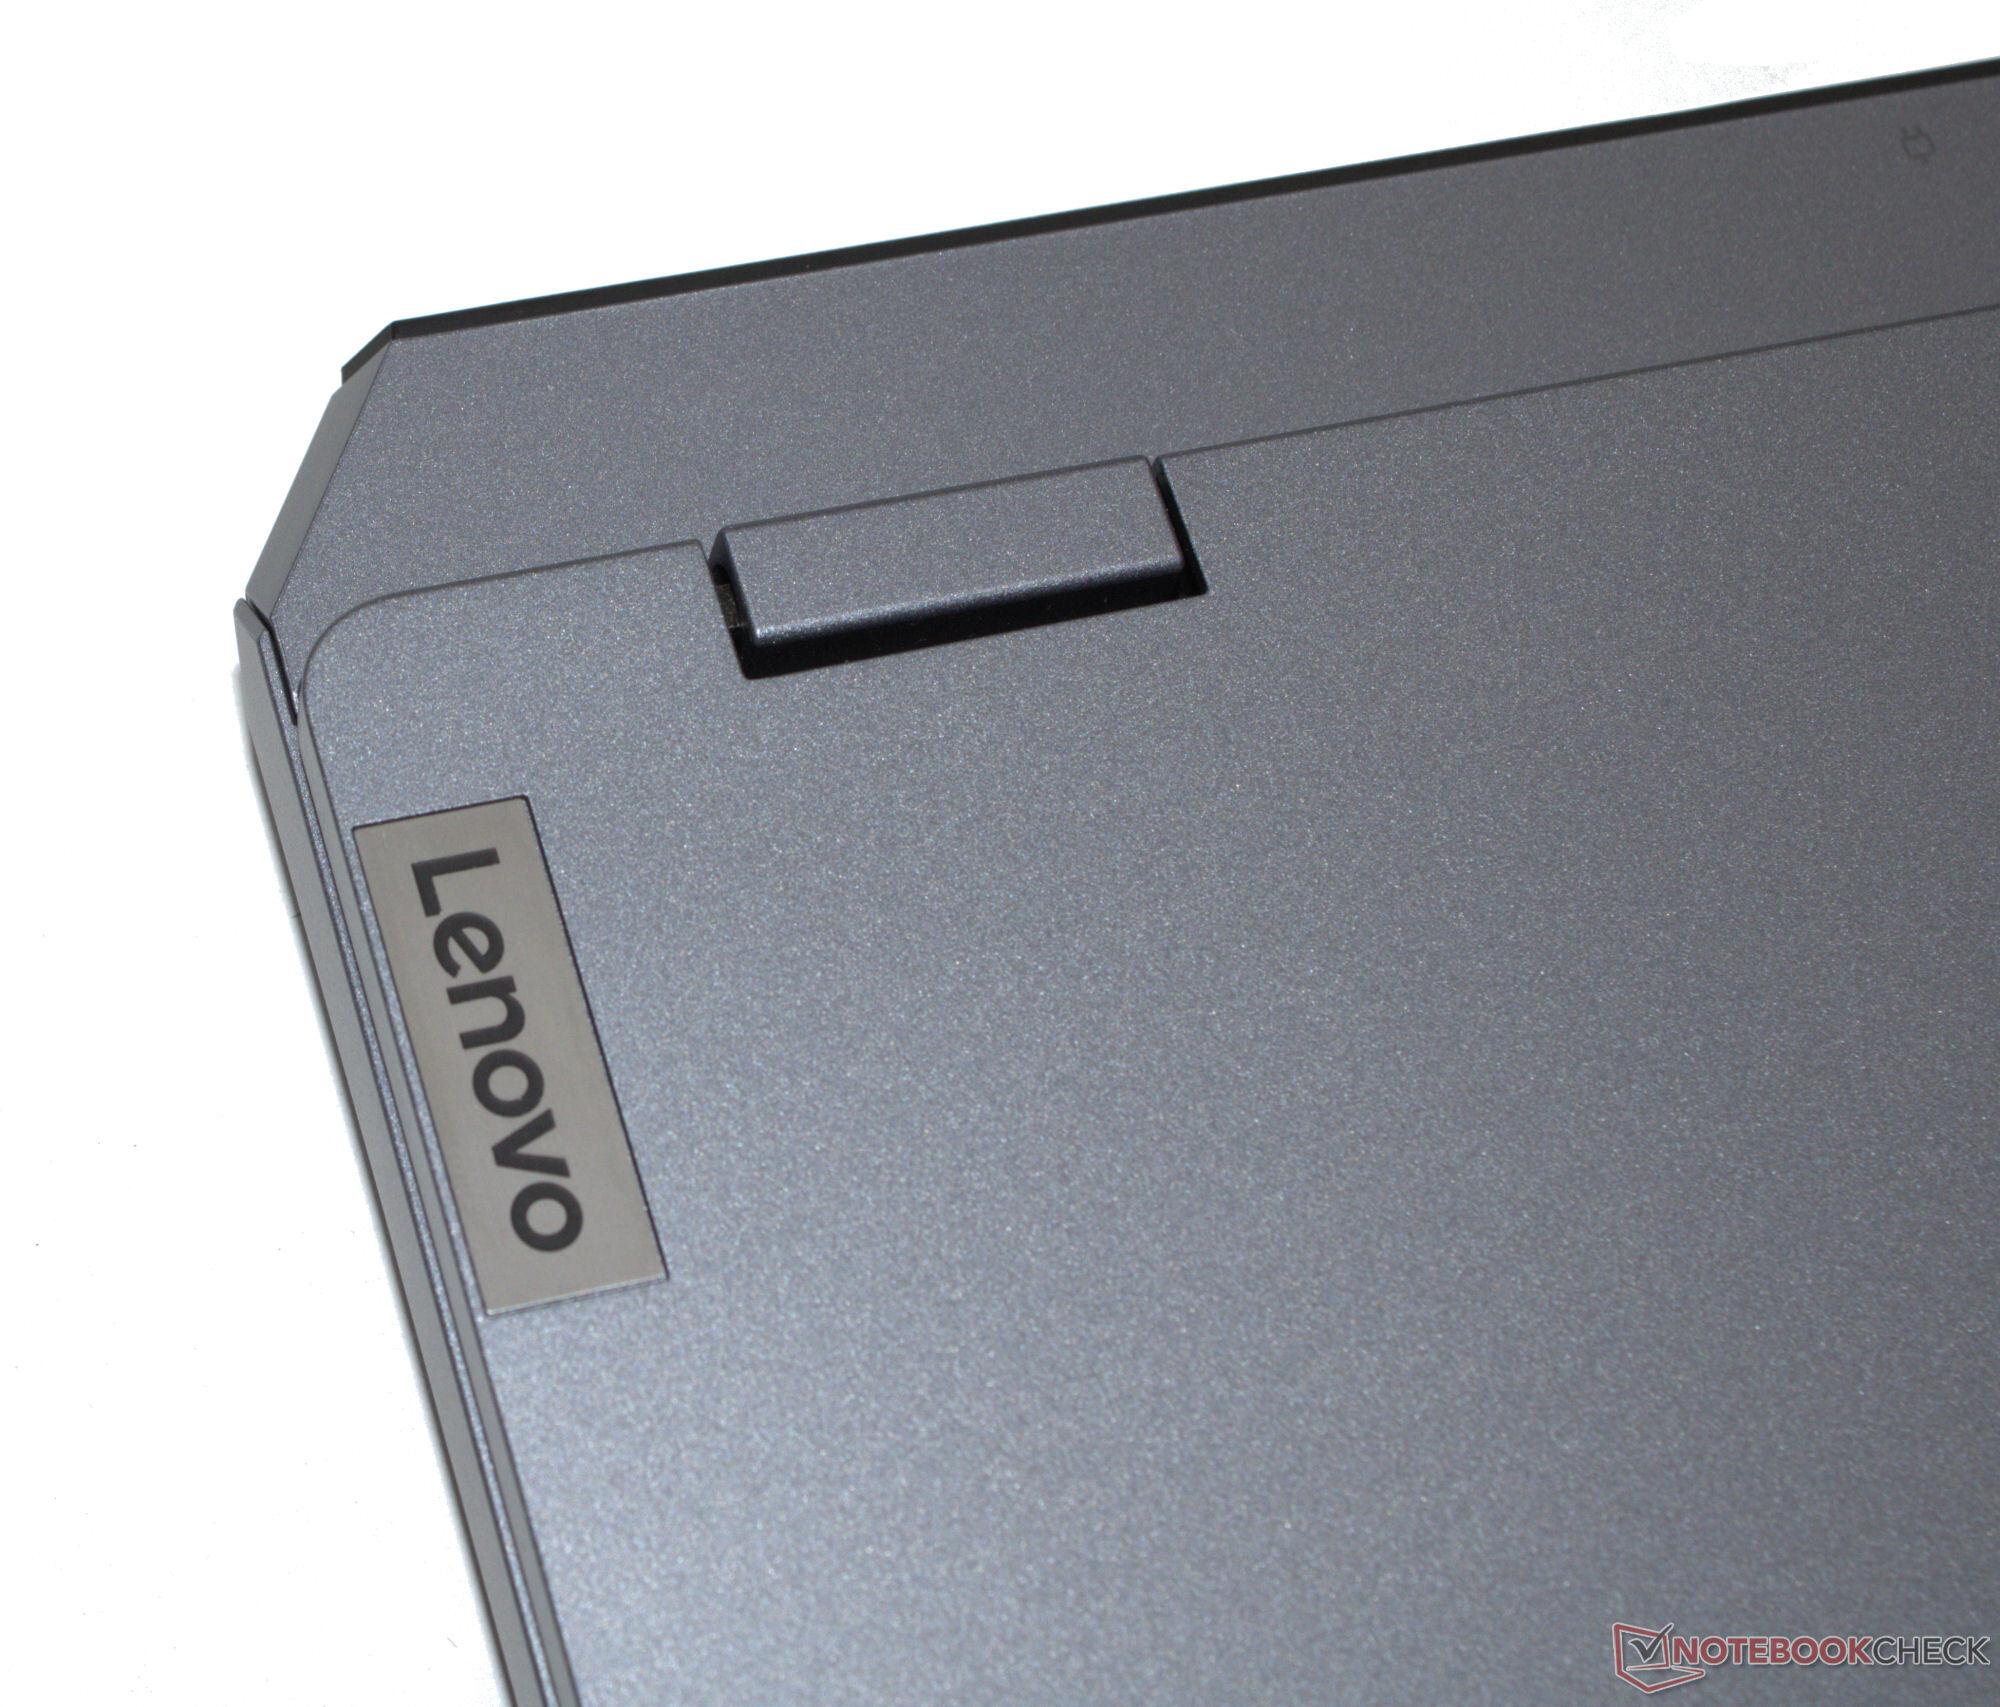
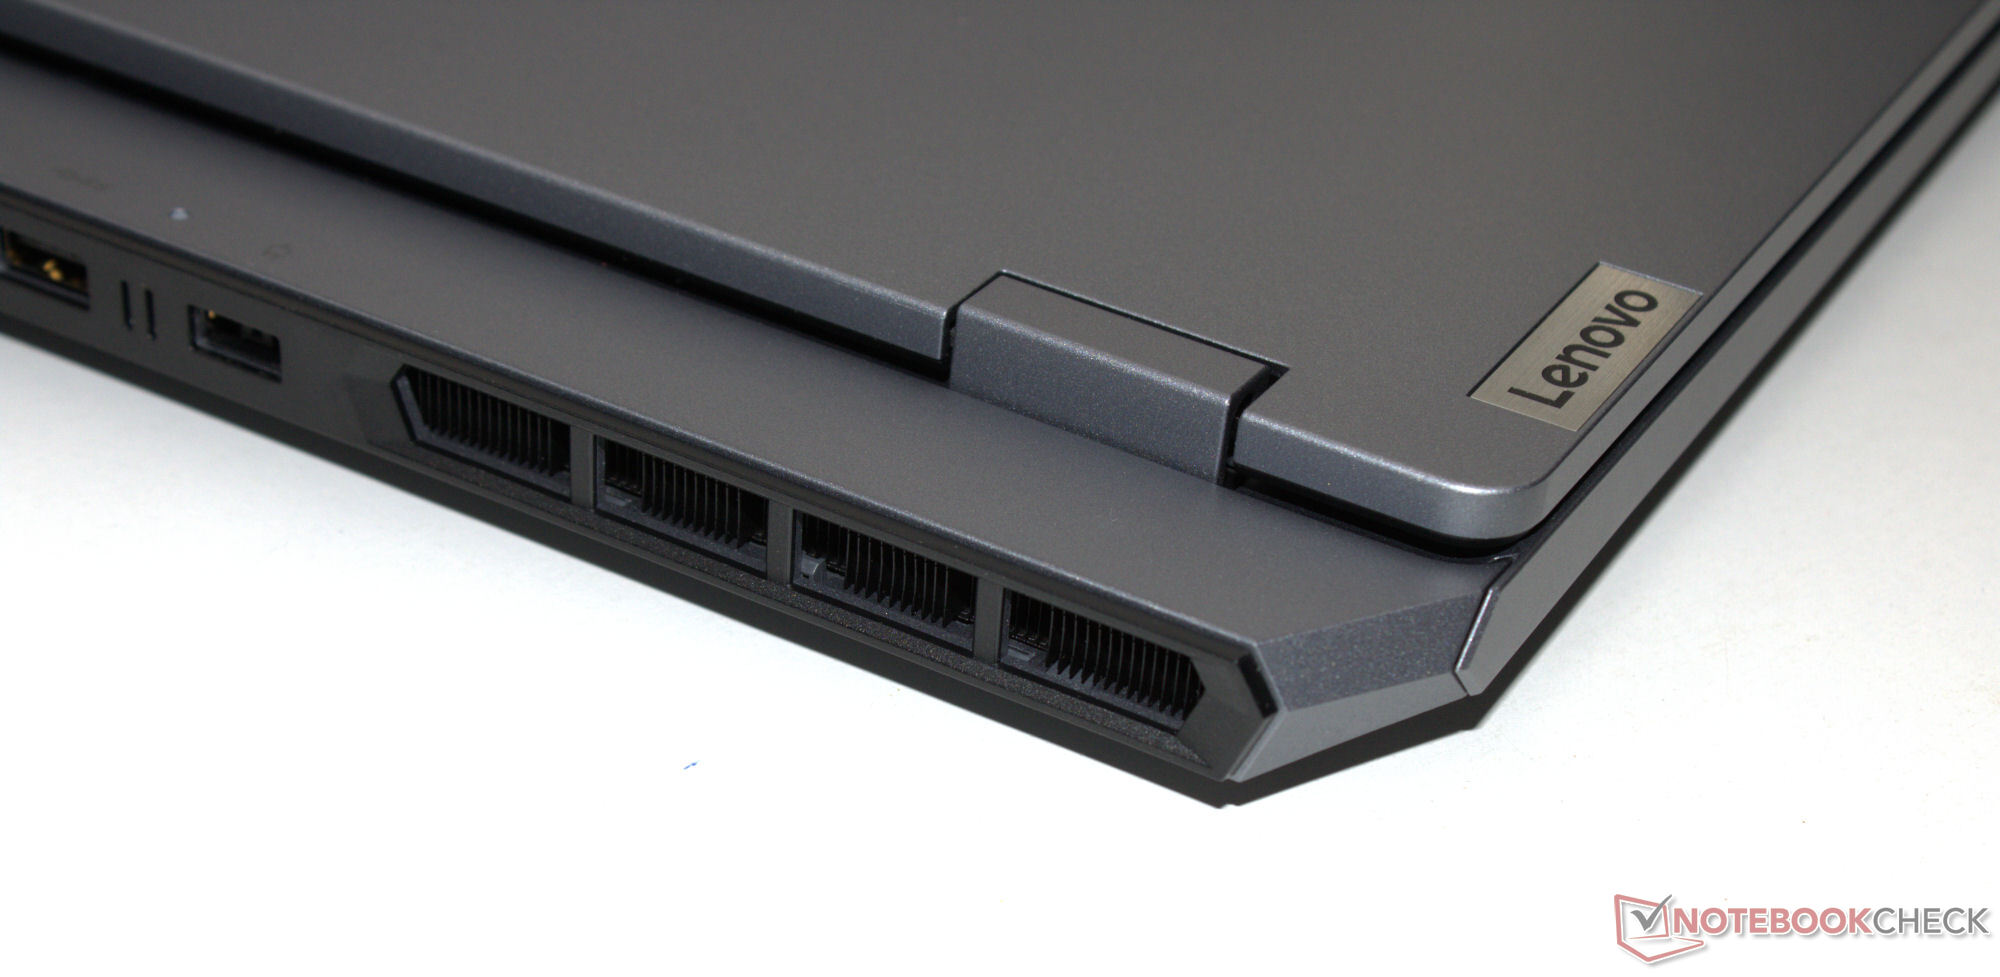
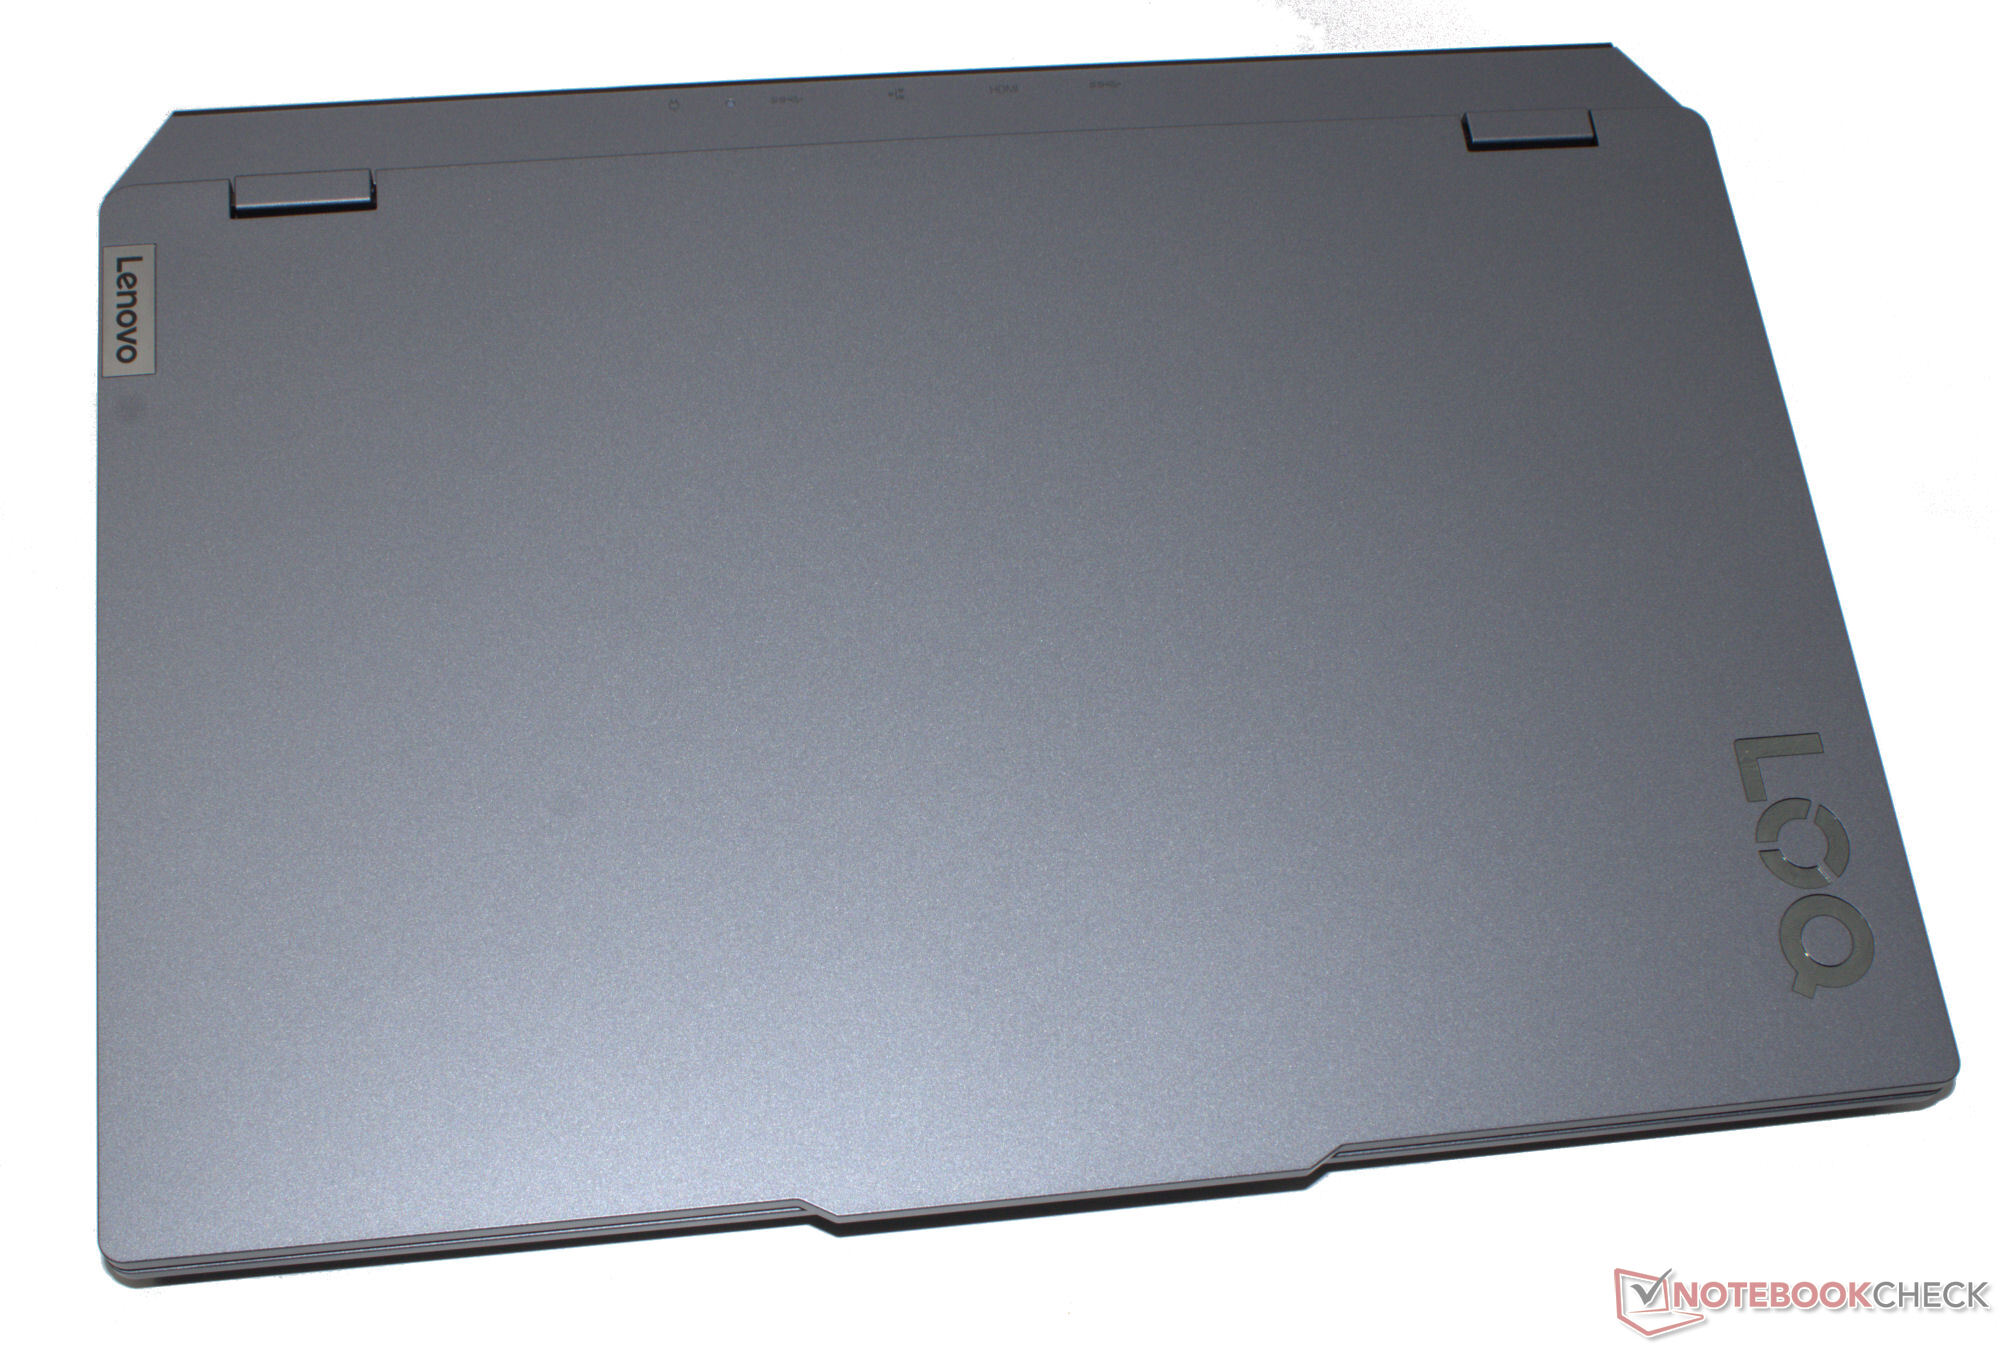
Le matériel de l'ordinateur portable est logé dans un boîtier en plastique gris mat (Luna Gray) qui semble généralement assez élégant. Le couvercle et l'unité de base peuvent être légèrement tordus, mais cela reste acceptable. La stabilité est bonne. Le couvercle permet un angle d'ouverture maximal de 180 degrés. Les bandes LED typiques des ordinateurs portables de jeu ne sont pas présentes sur ce modèle.
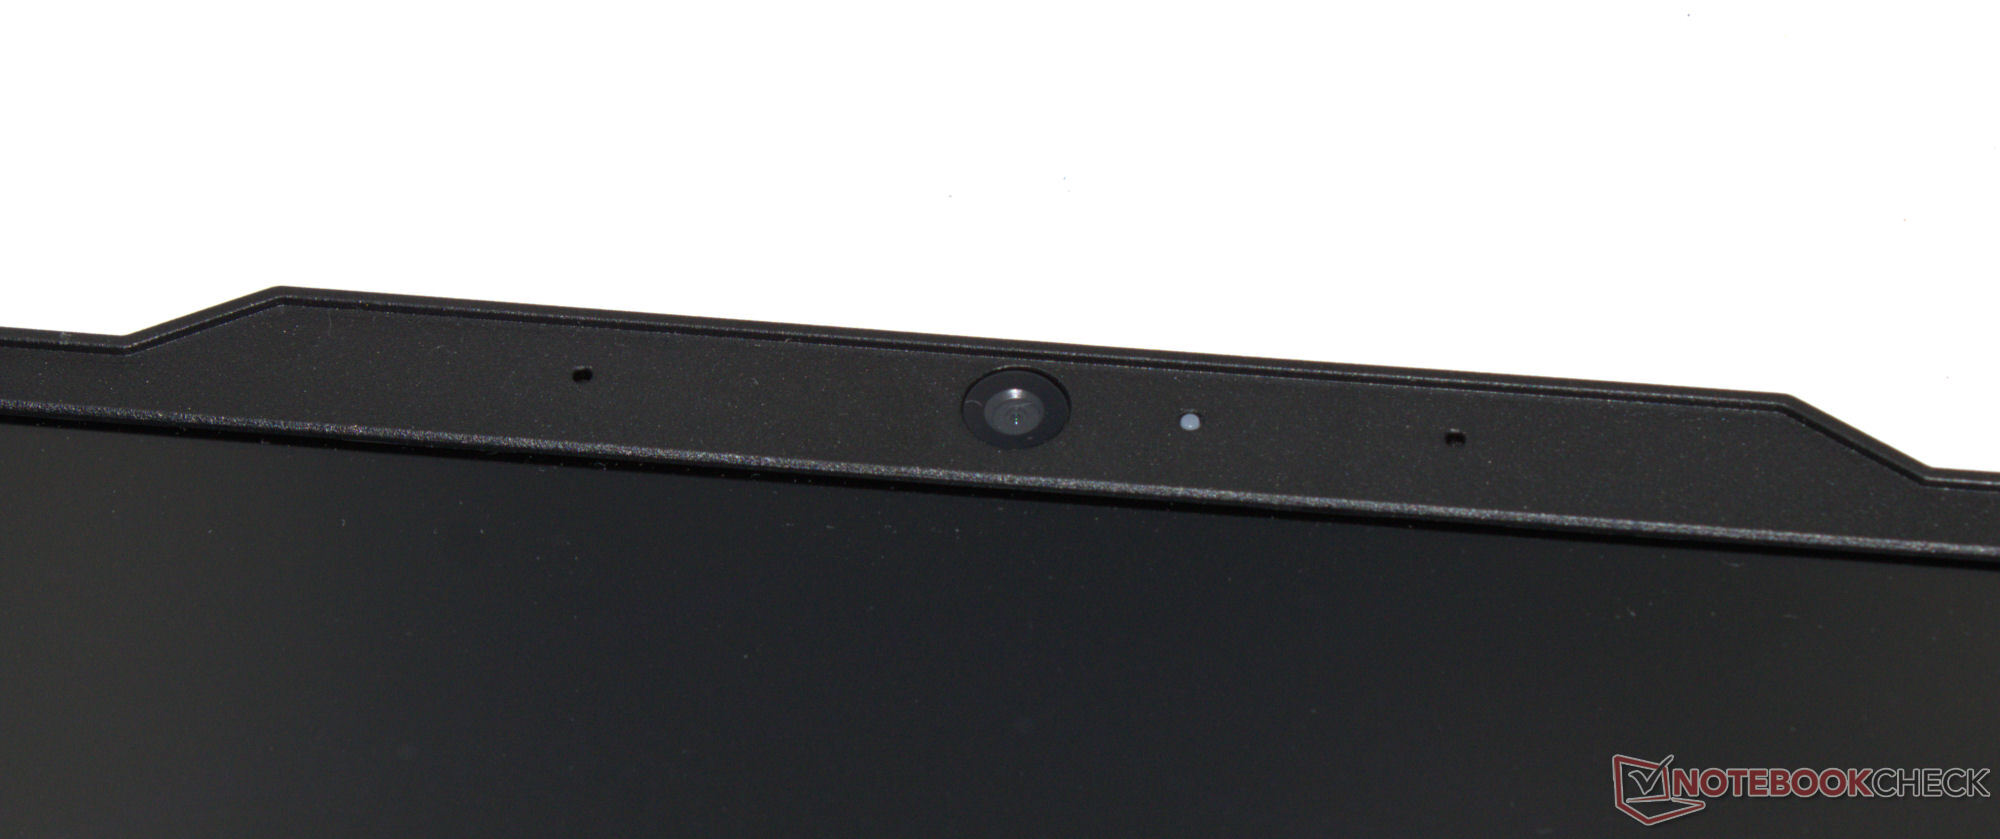
Trois connexions USB-A (USB 3.2 Gen 1) ainsi qu'un port USB-C (USB 3.2 Gen 2) devraient suffire à la plupart des utilisateurs. Ce dernier prend en charge Power Delivery et le mode Display ALT. Au total, l'ordinateur portable dispose de deux sorties vidéo (1x HDMI, 1x DP). La webcam (2,1 MP, avec interrupteur marche/arrêt) donne des résultats moyens. Lenovo n'a pas jugé nécessaire d'ajouter un lecteur de carte SD.
Les débits WiFi que nous avons mesurés sont solides, mais ils sont en deçà de ce qui est possible aujourd'hui. La puce Realtek WiFi 6 (RTL8852BE) du portable Lenovo n'atteint pas les mêmes vitesses que les puces Intel installées dans beaucoup de ses concurrents.


Durabilité
L'ordinateur portable et le bloc d'alimentation sont emballés chacun dans un sac en plastique, tandis que le LOQ est protégé pendant le transport par des inserts en mousse. Les types de plastique utilisés sont indiqués par le fabricant. Une couverture en papier protège le bloc d'alimentation contre les rayures. Le tout est logé dans une boîte en carton - selon l'étiquetage, le bois utilisé provient d'une exploitation forestière durable.
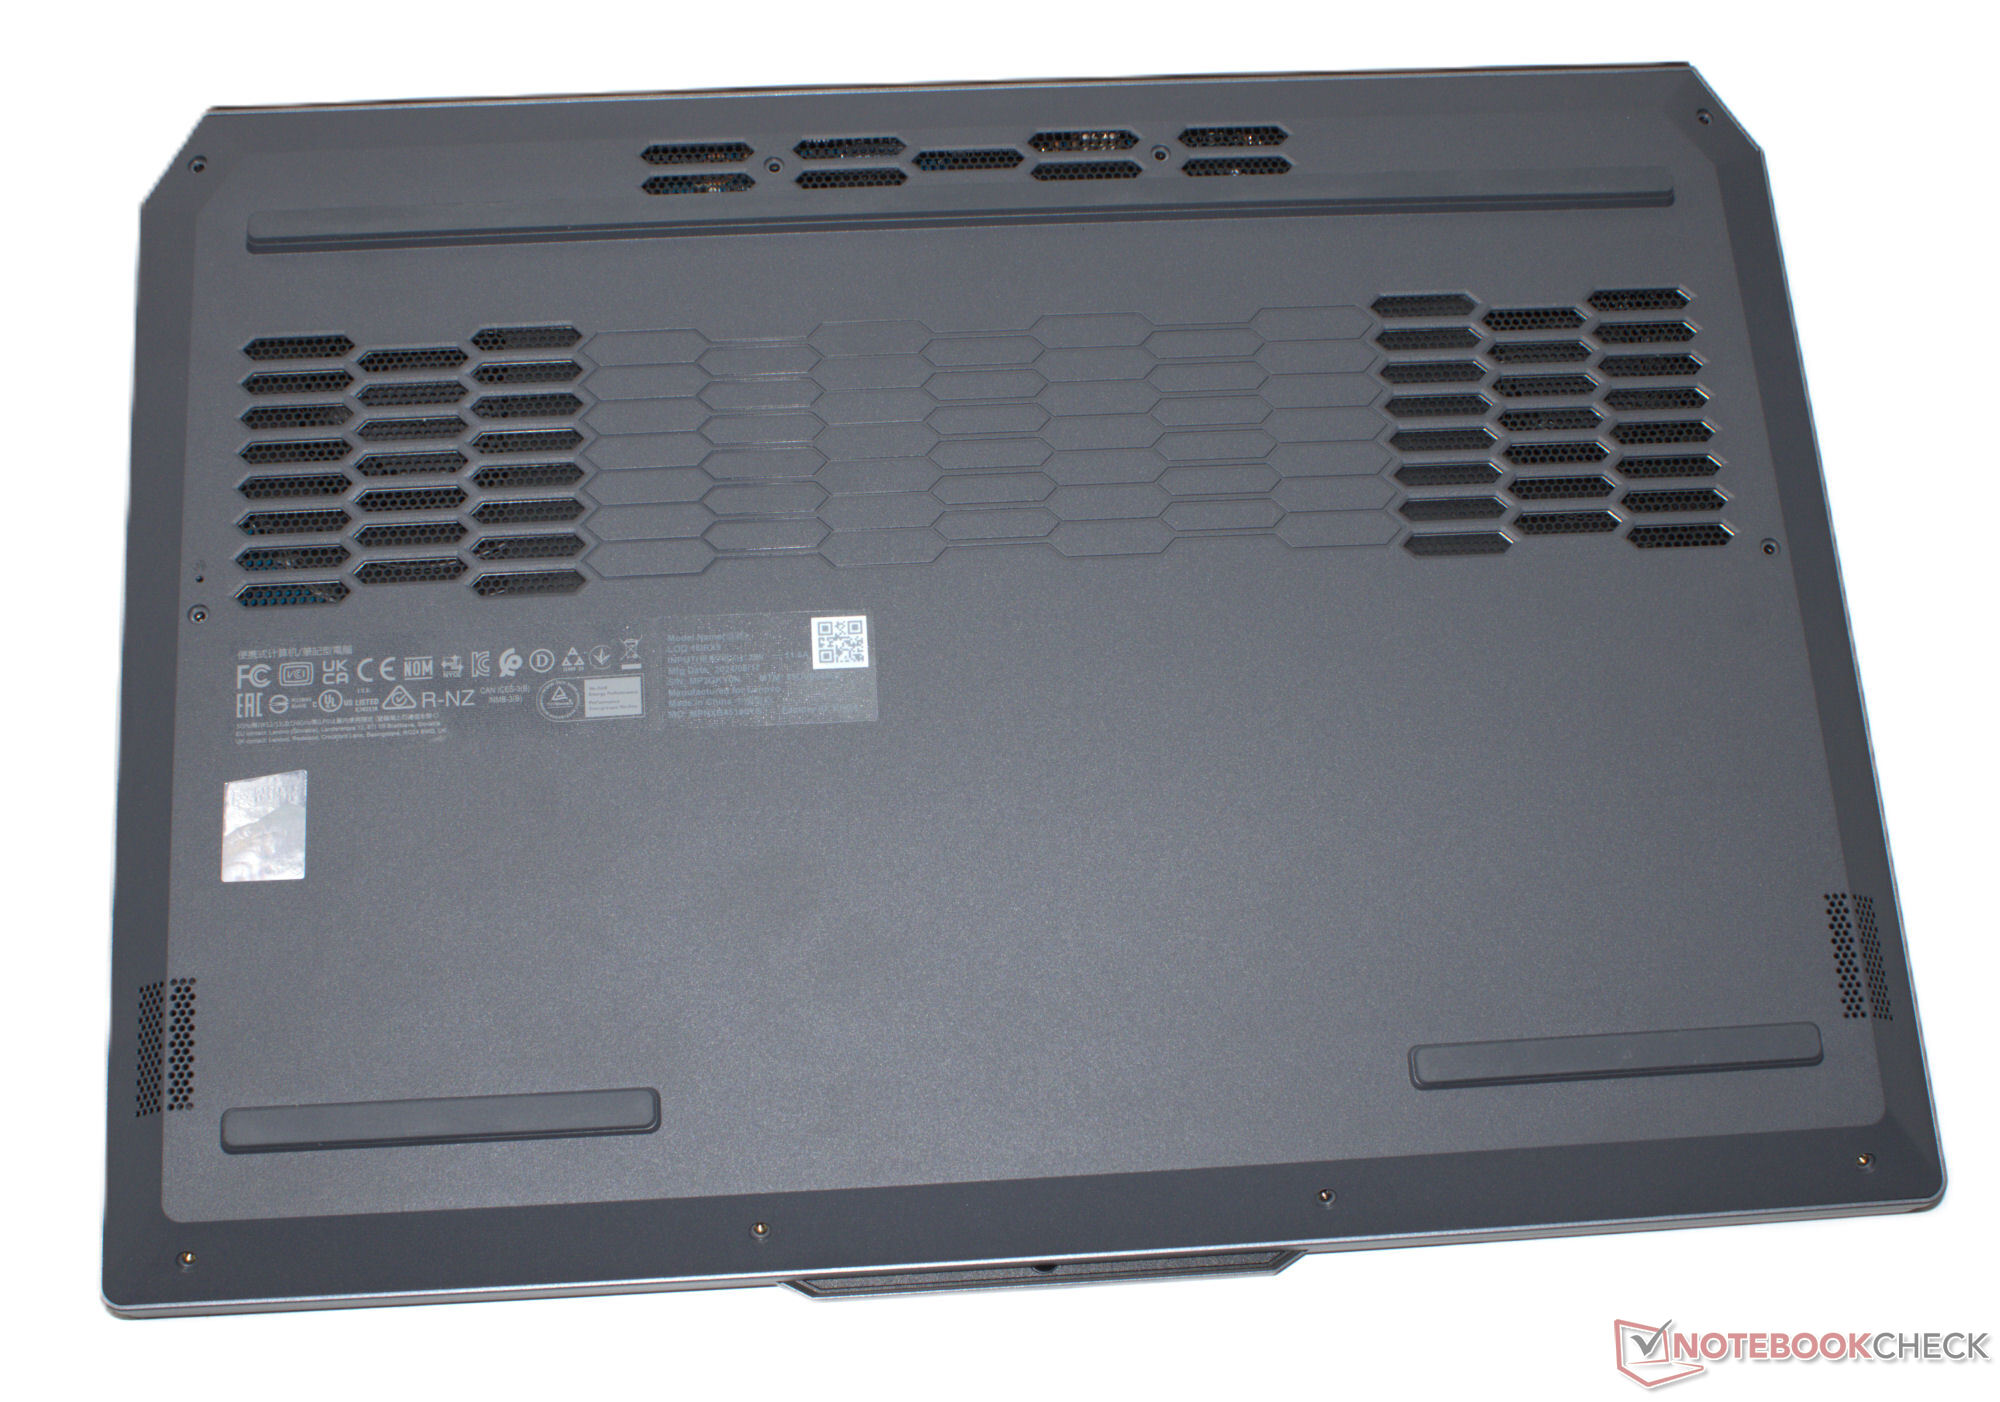
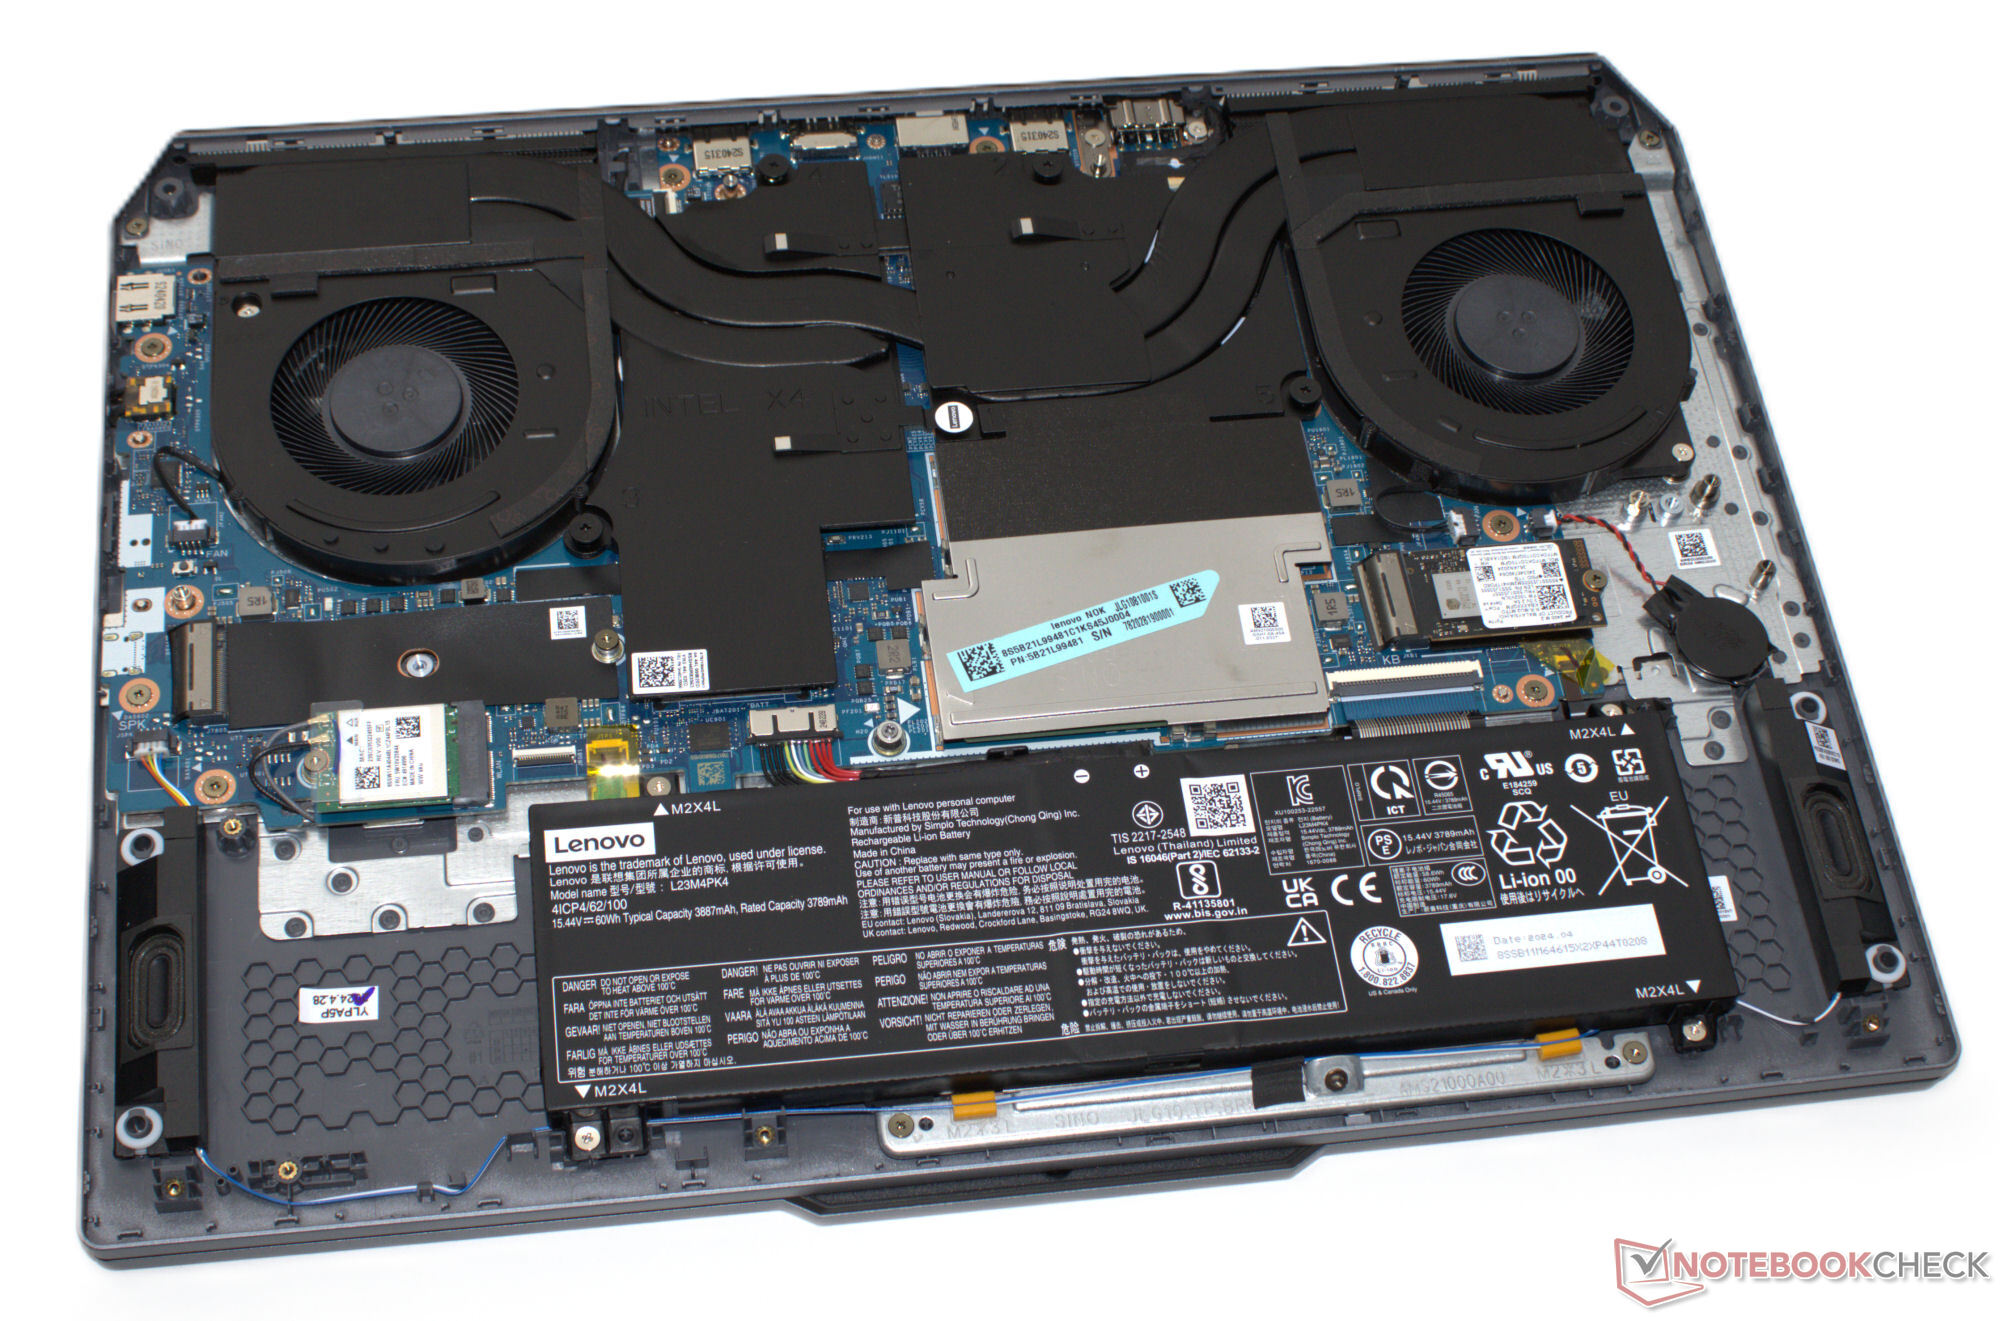
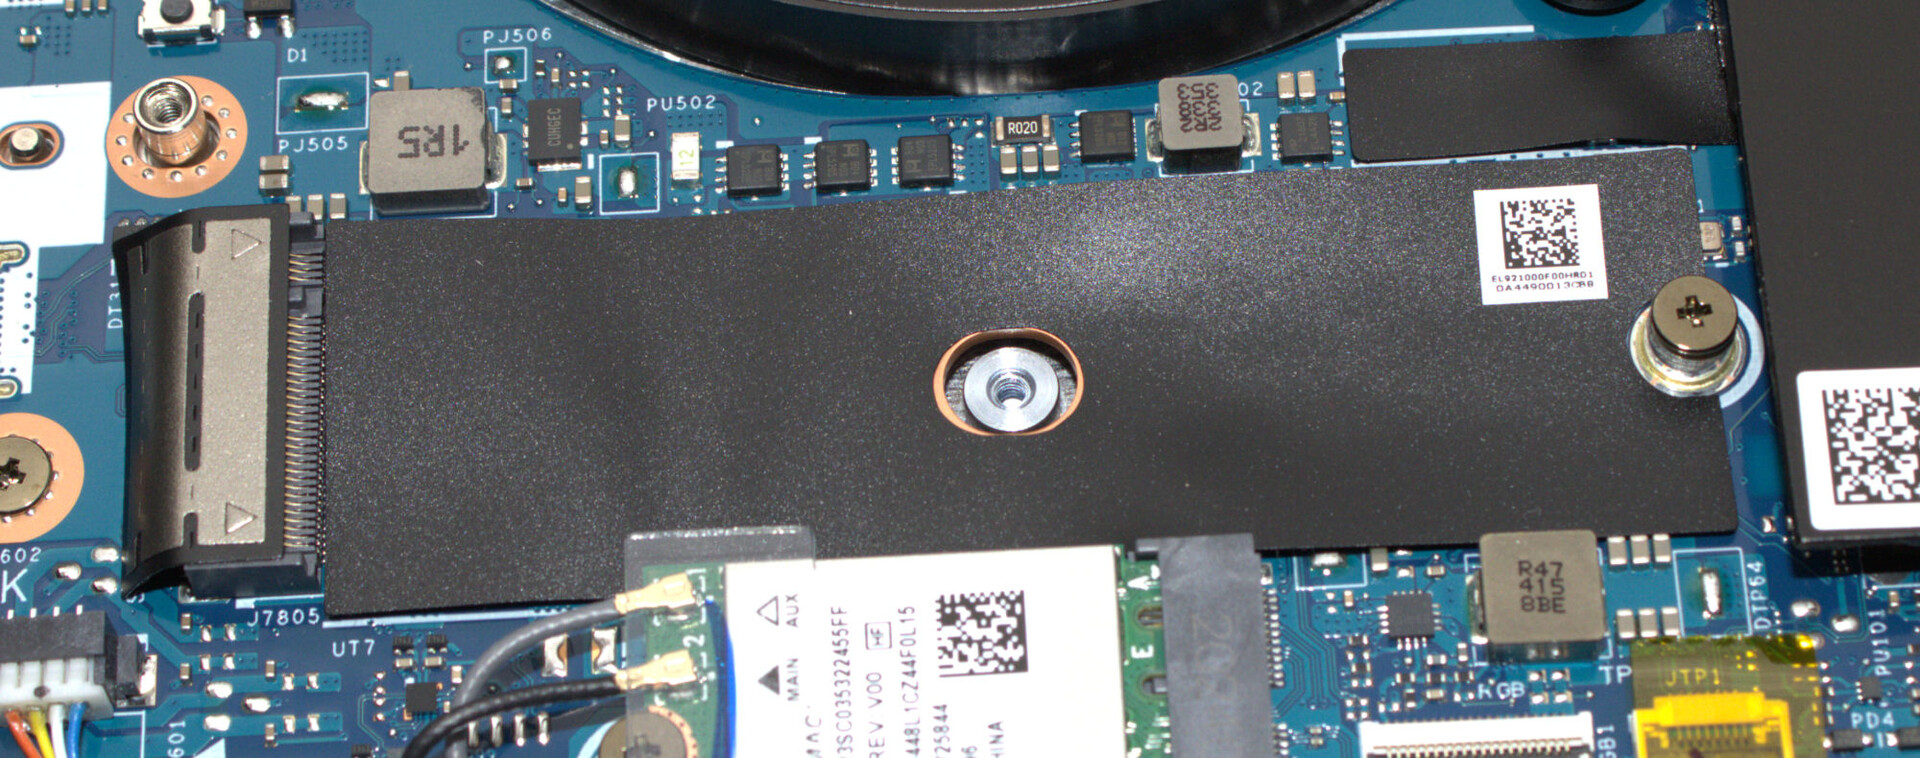
L'appareil devrait être assez facile à réparer : La plaque inférieure peut être retirée sans problème, ce qui vous permet d'accéder à tout le matériel. Nous n'avons trouvé aucune pièce collée à l'intérieur du boîtier. Windows 11 étant utilisé comme système d'exploitation, les mises à jour logicielles devraient être garanties pour les années à venir. Le support de Lenovo se termine le 31 décembre 2029.
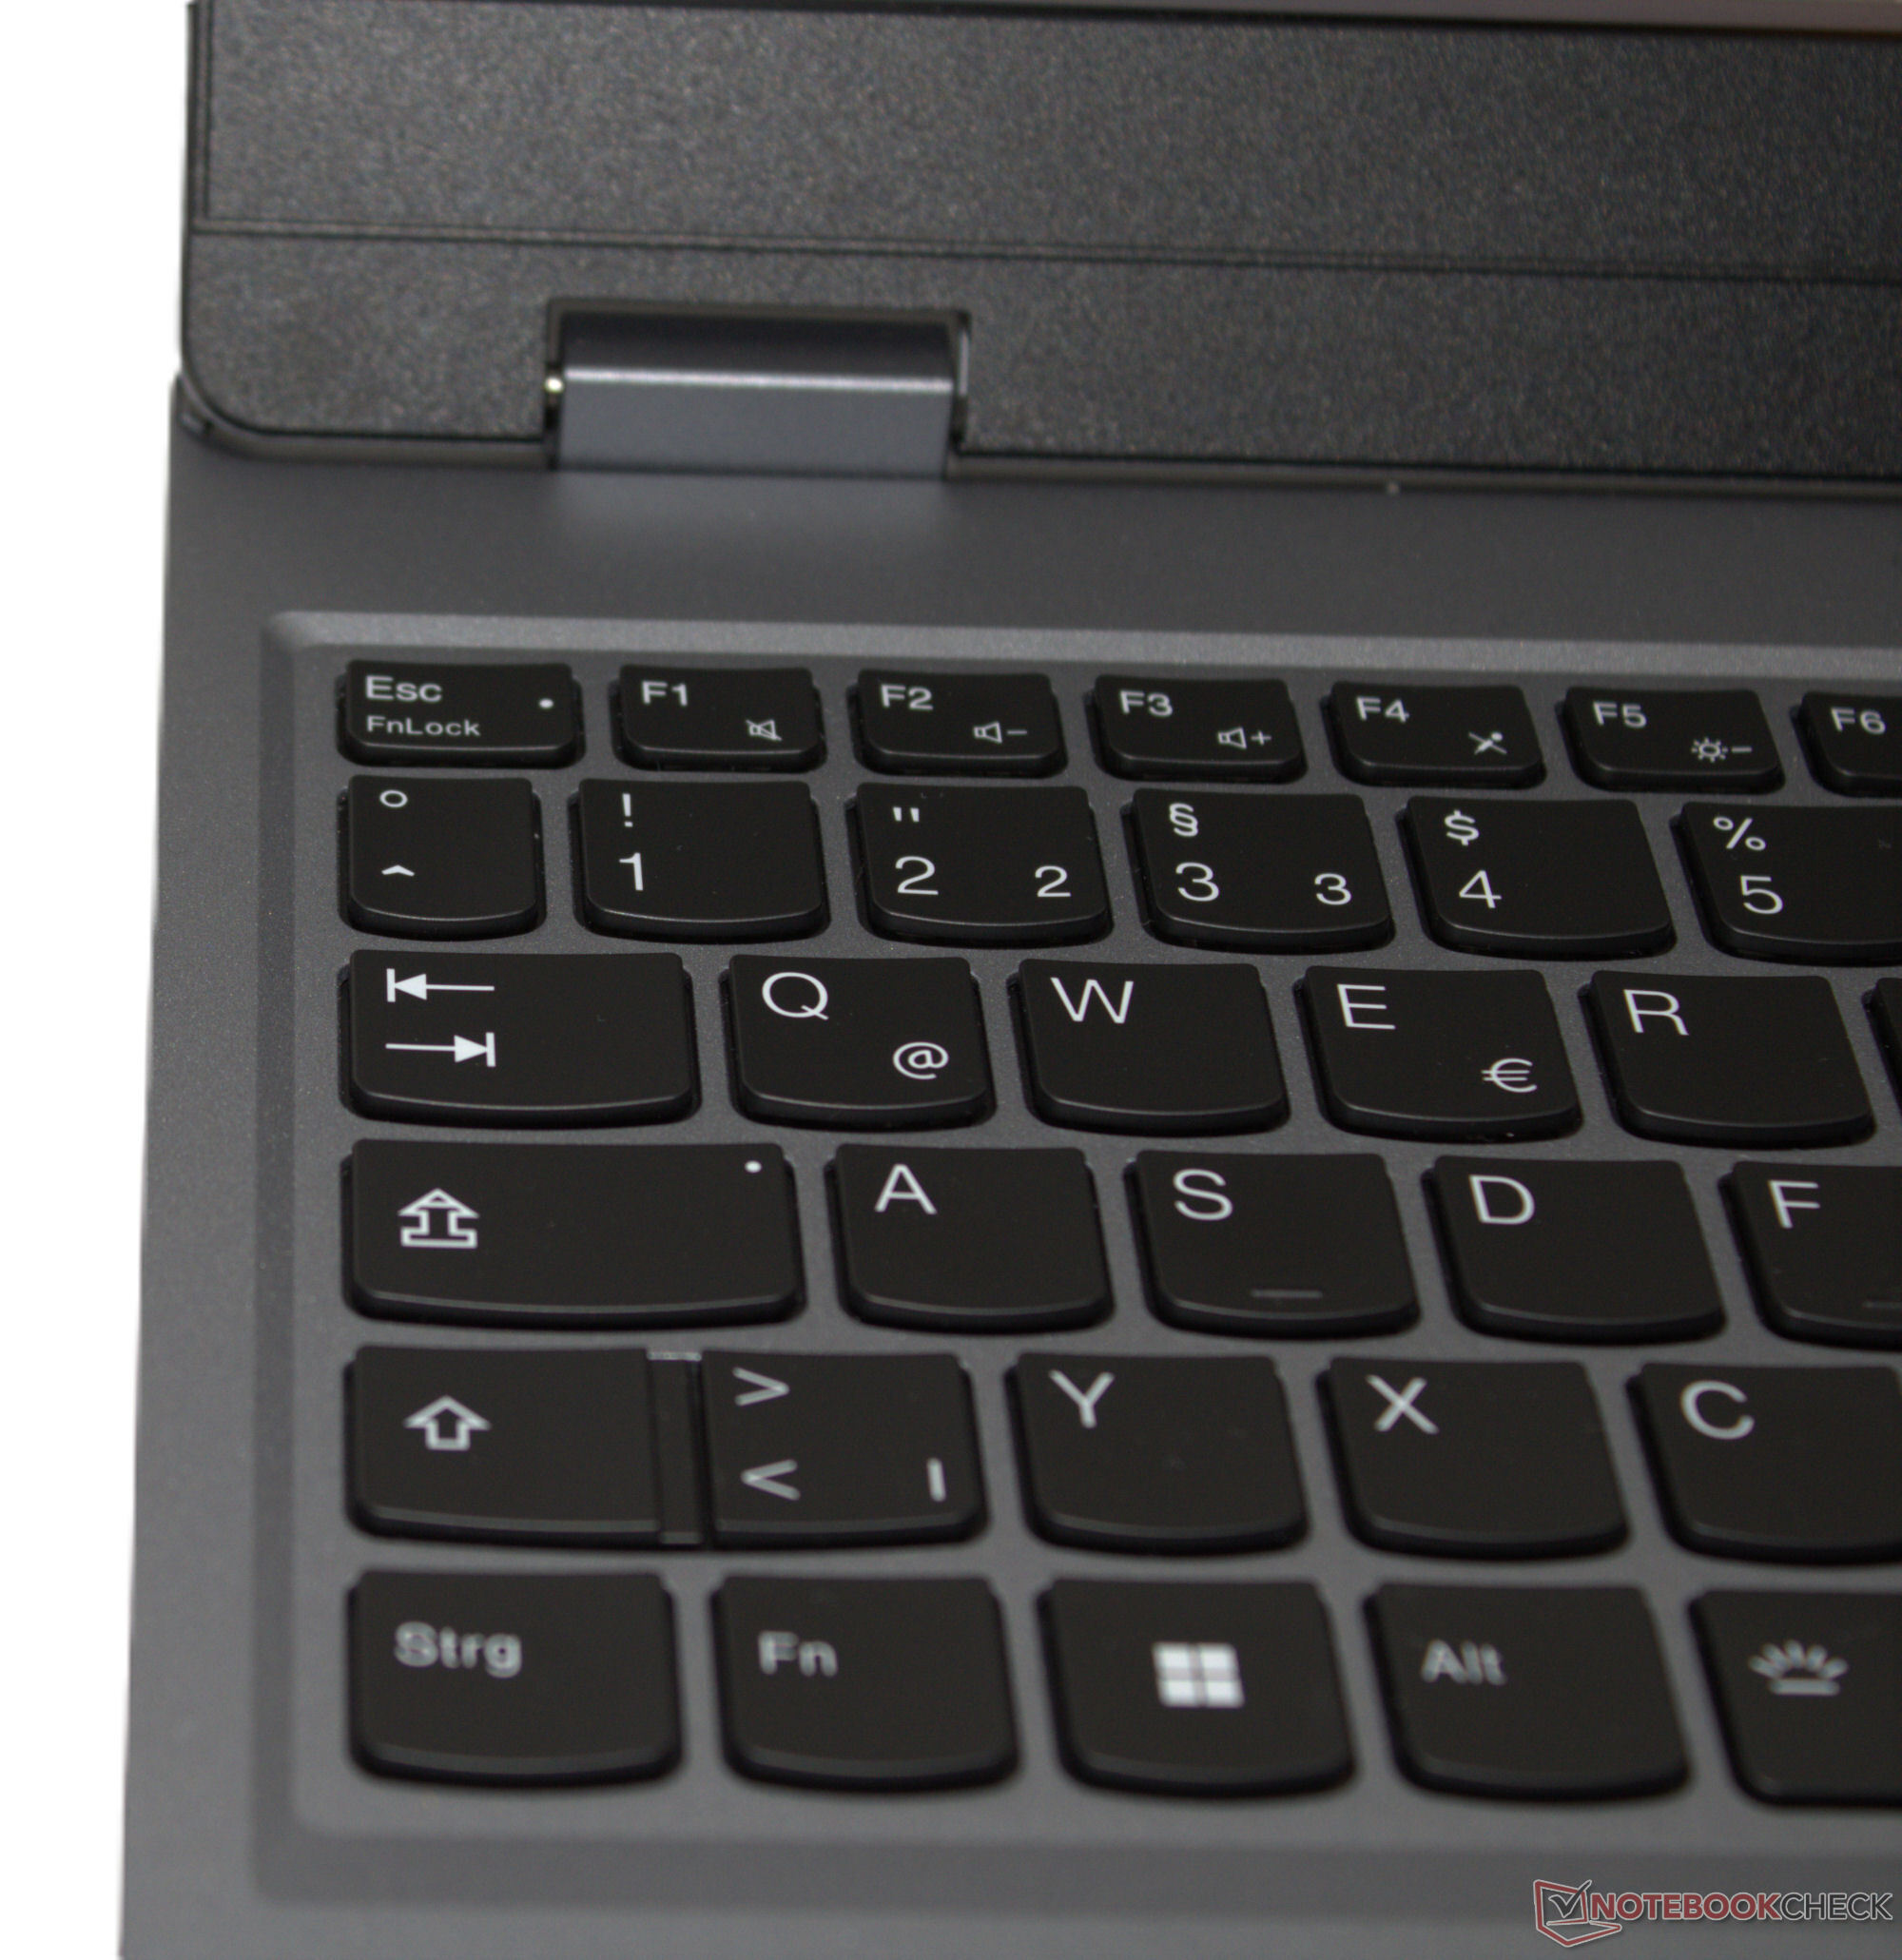
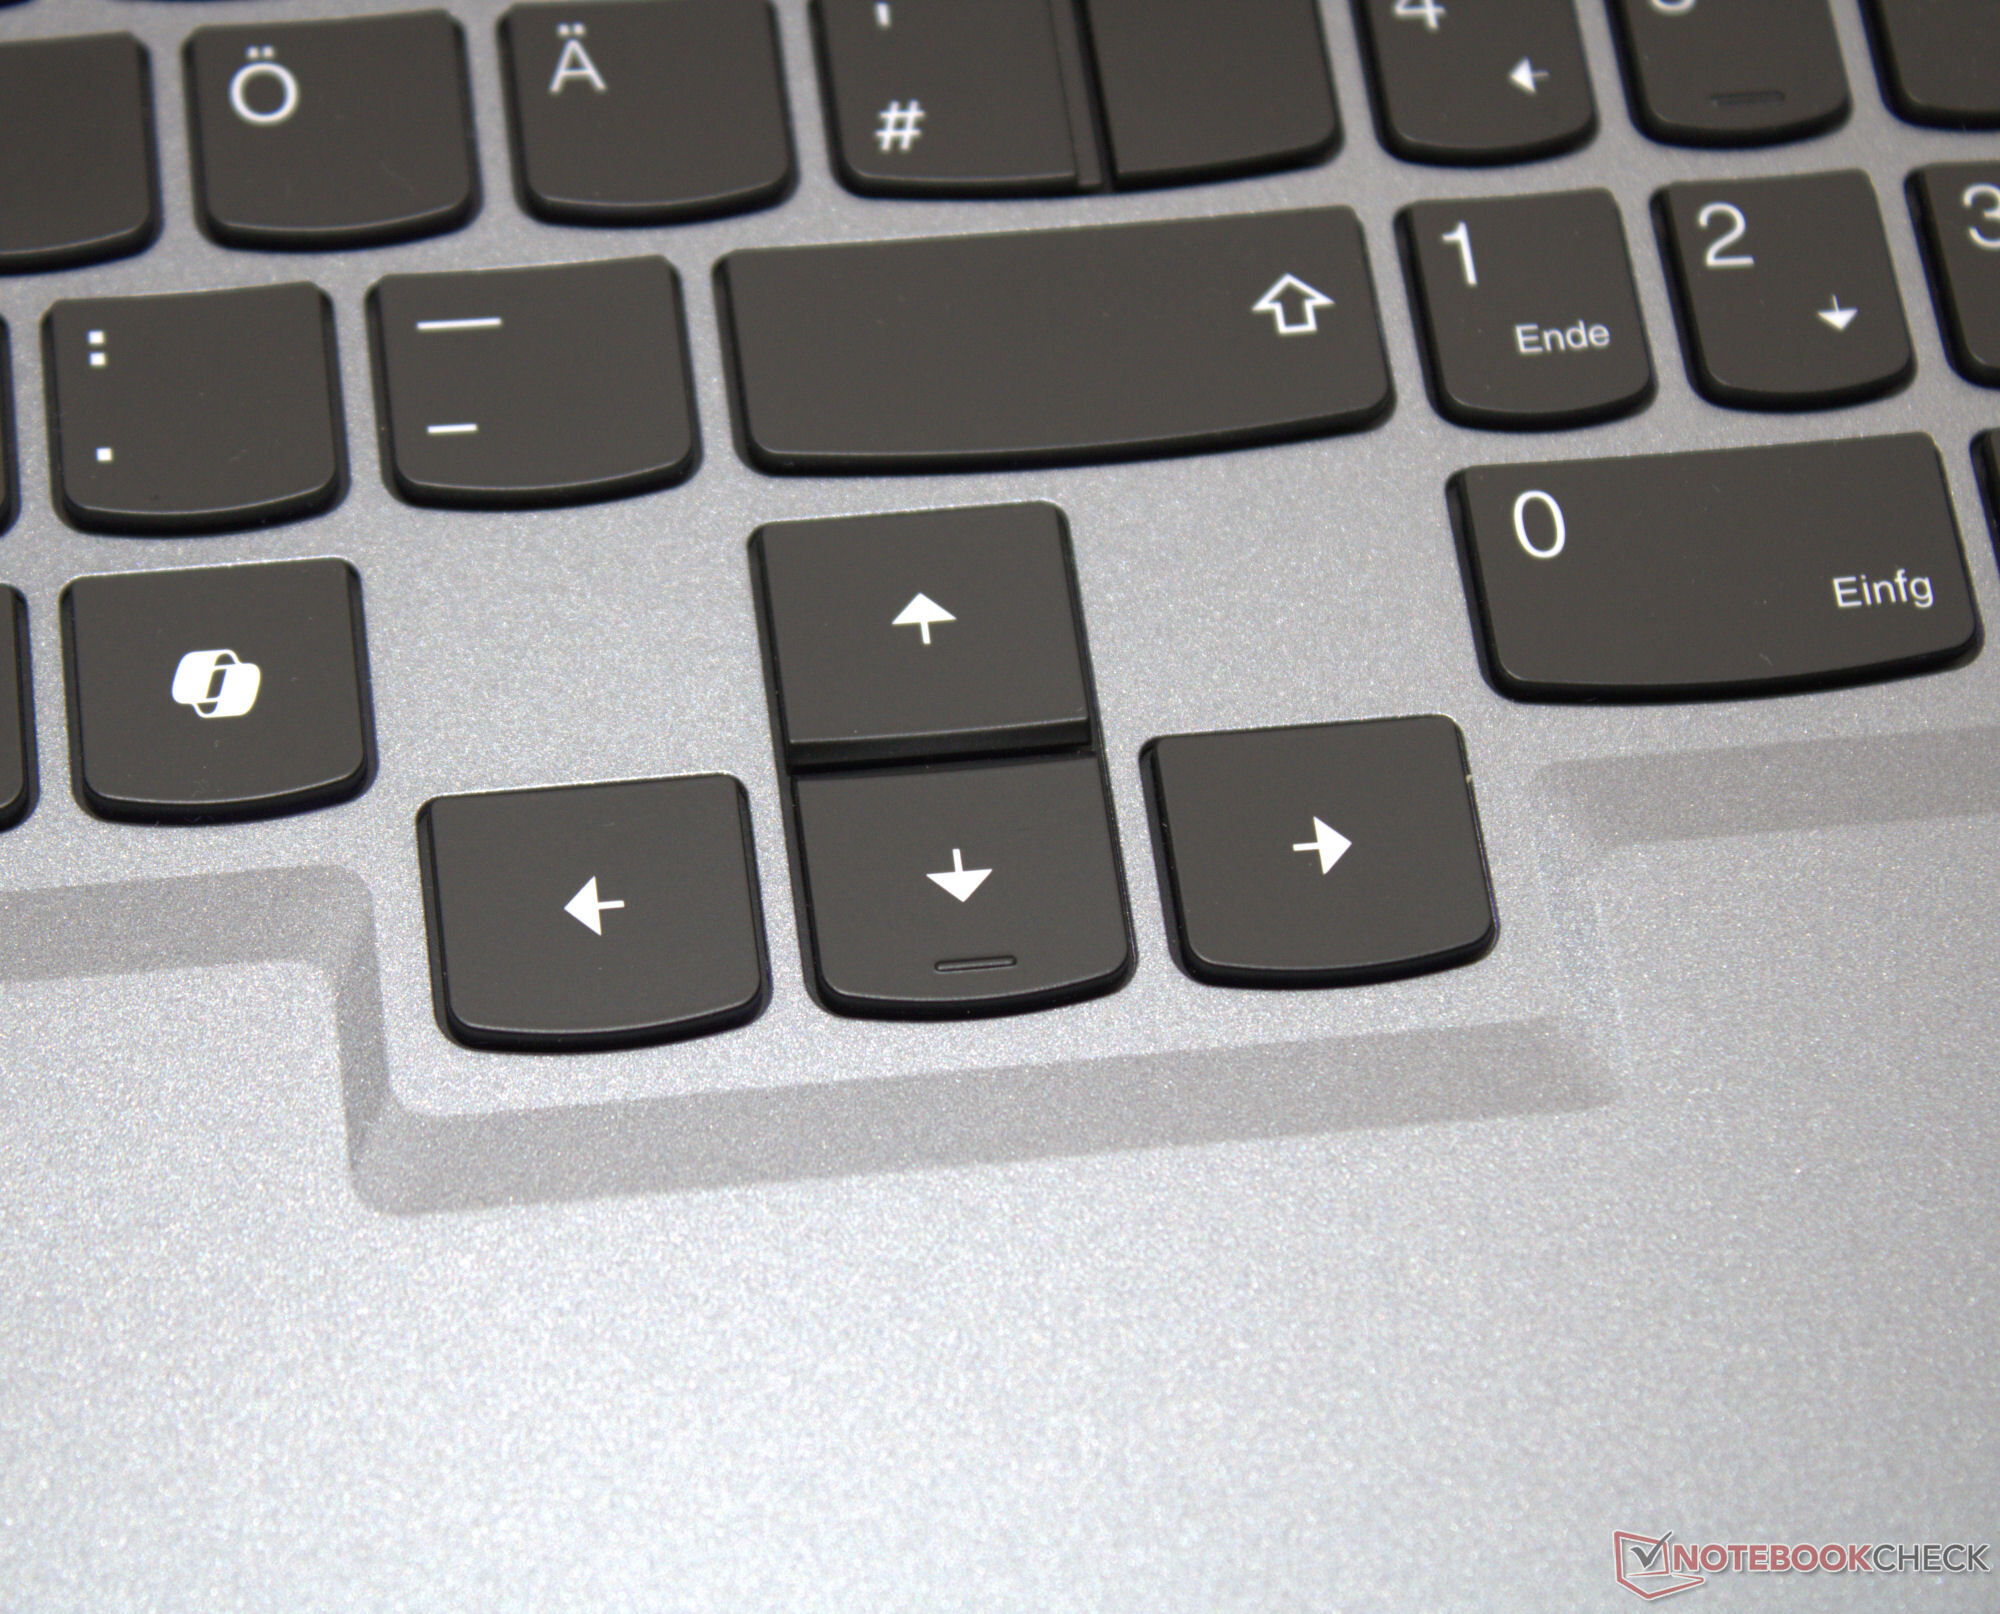
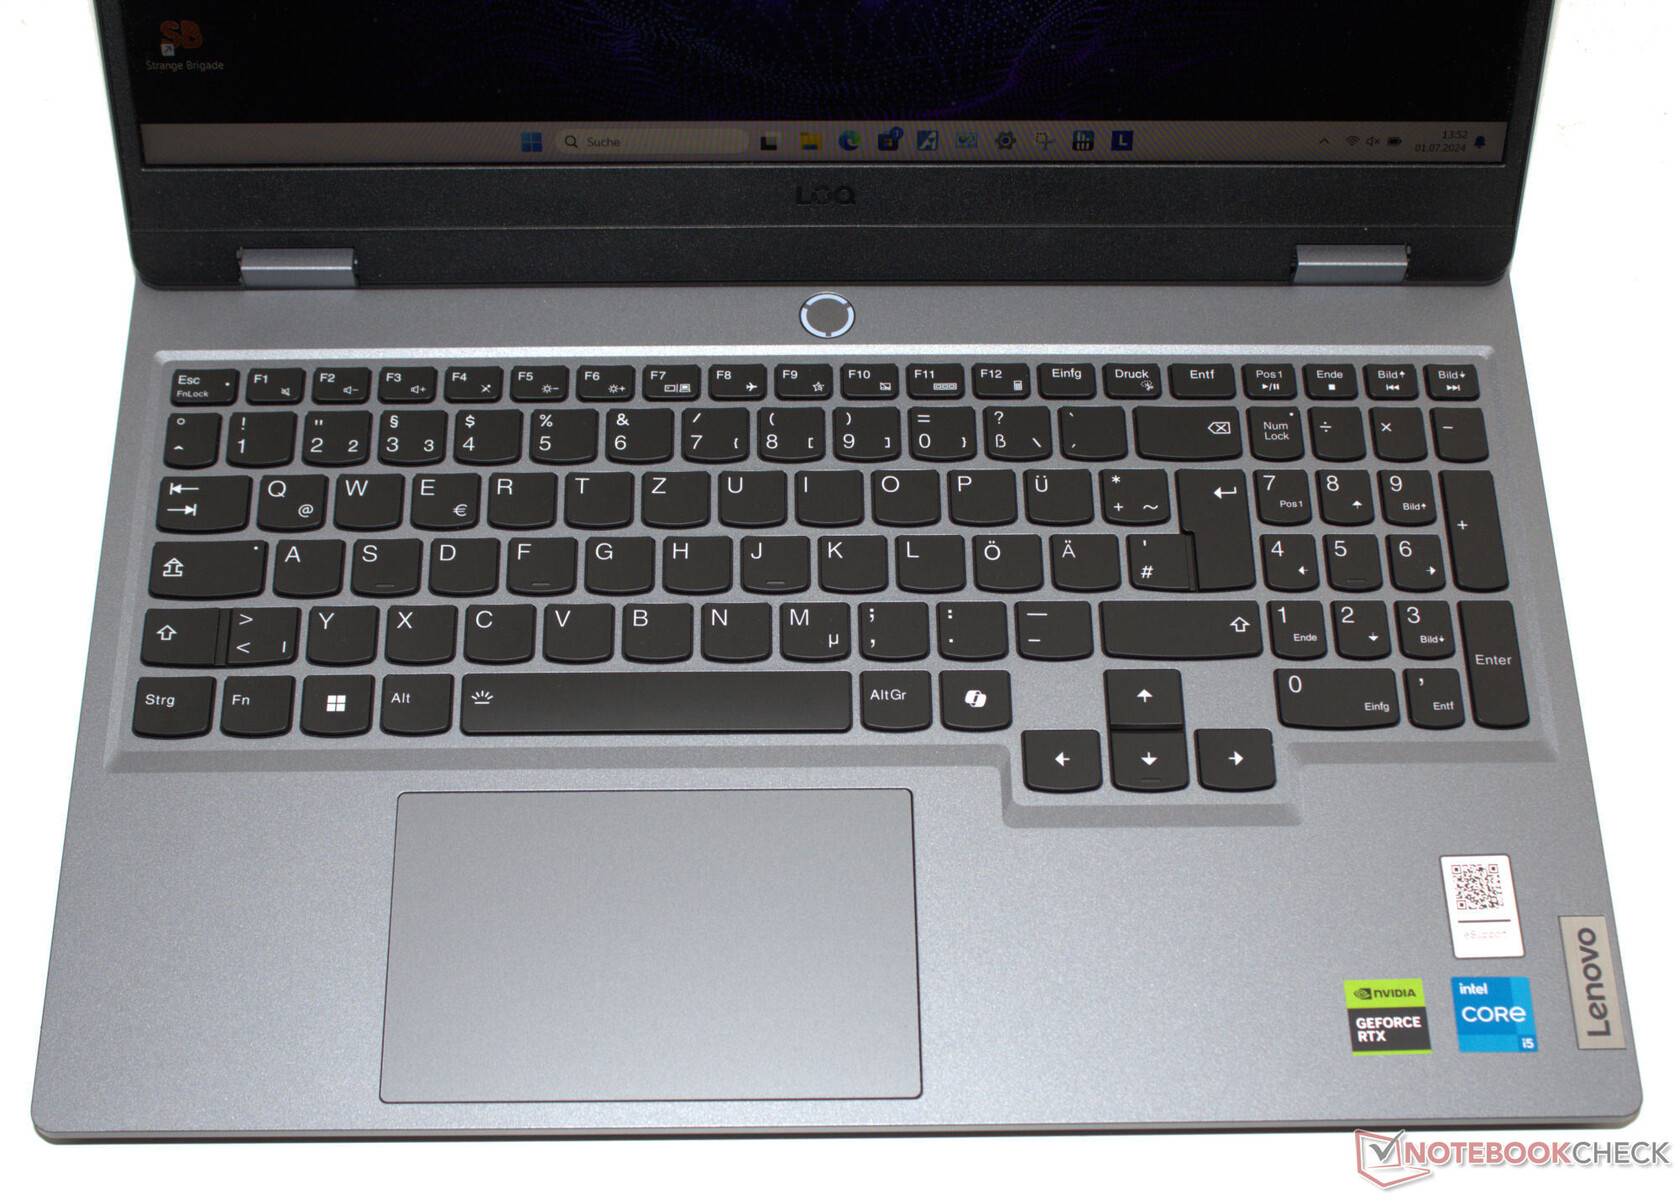
Périphériques d'entrée - L'ordinateur portable Lenovo est doté de grandes touches fléchées
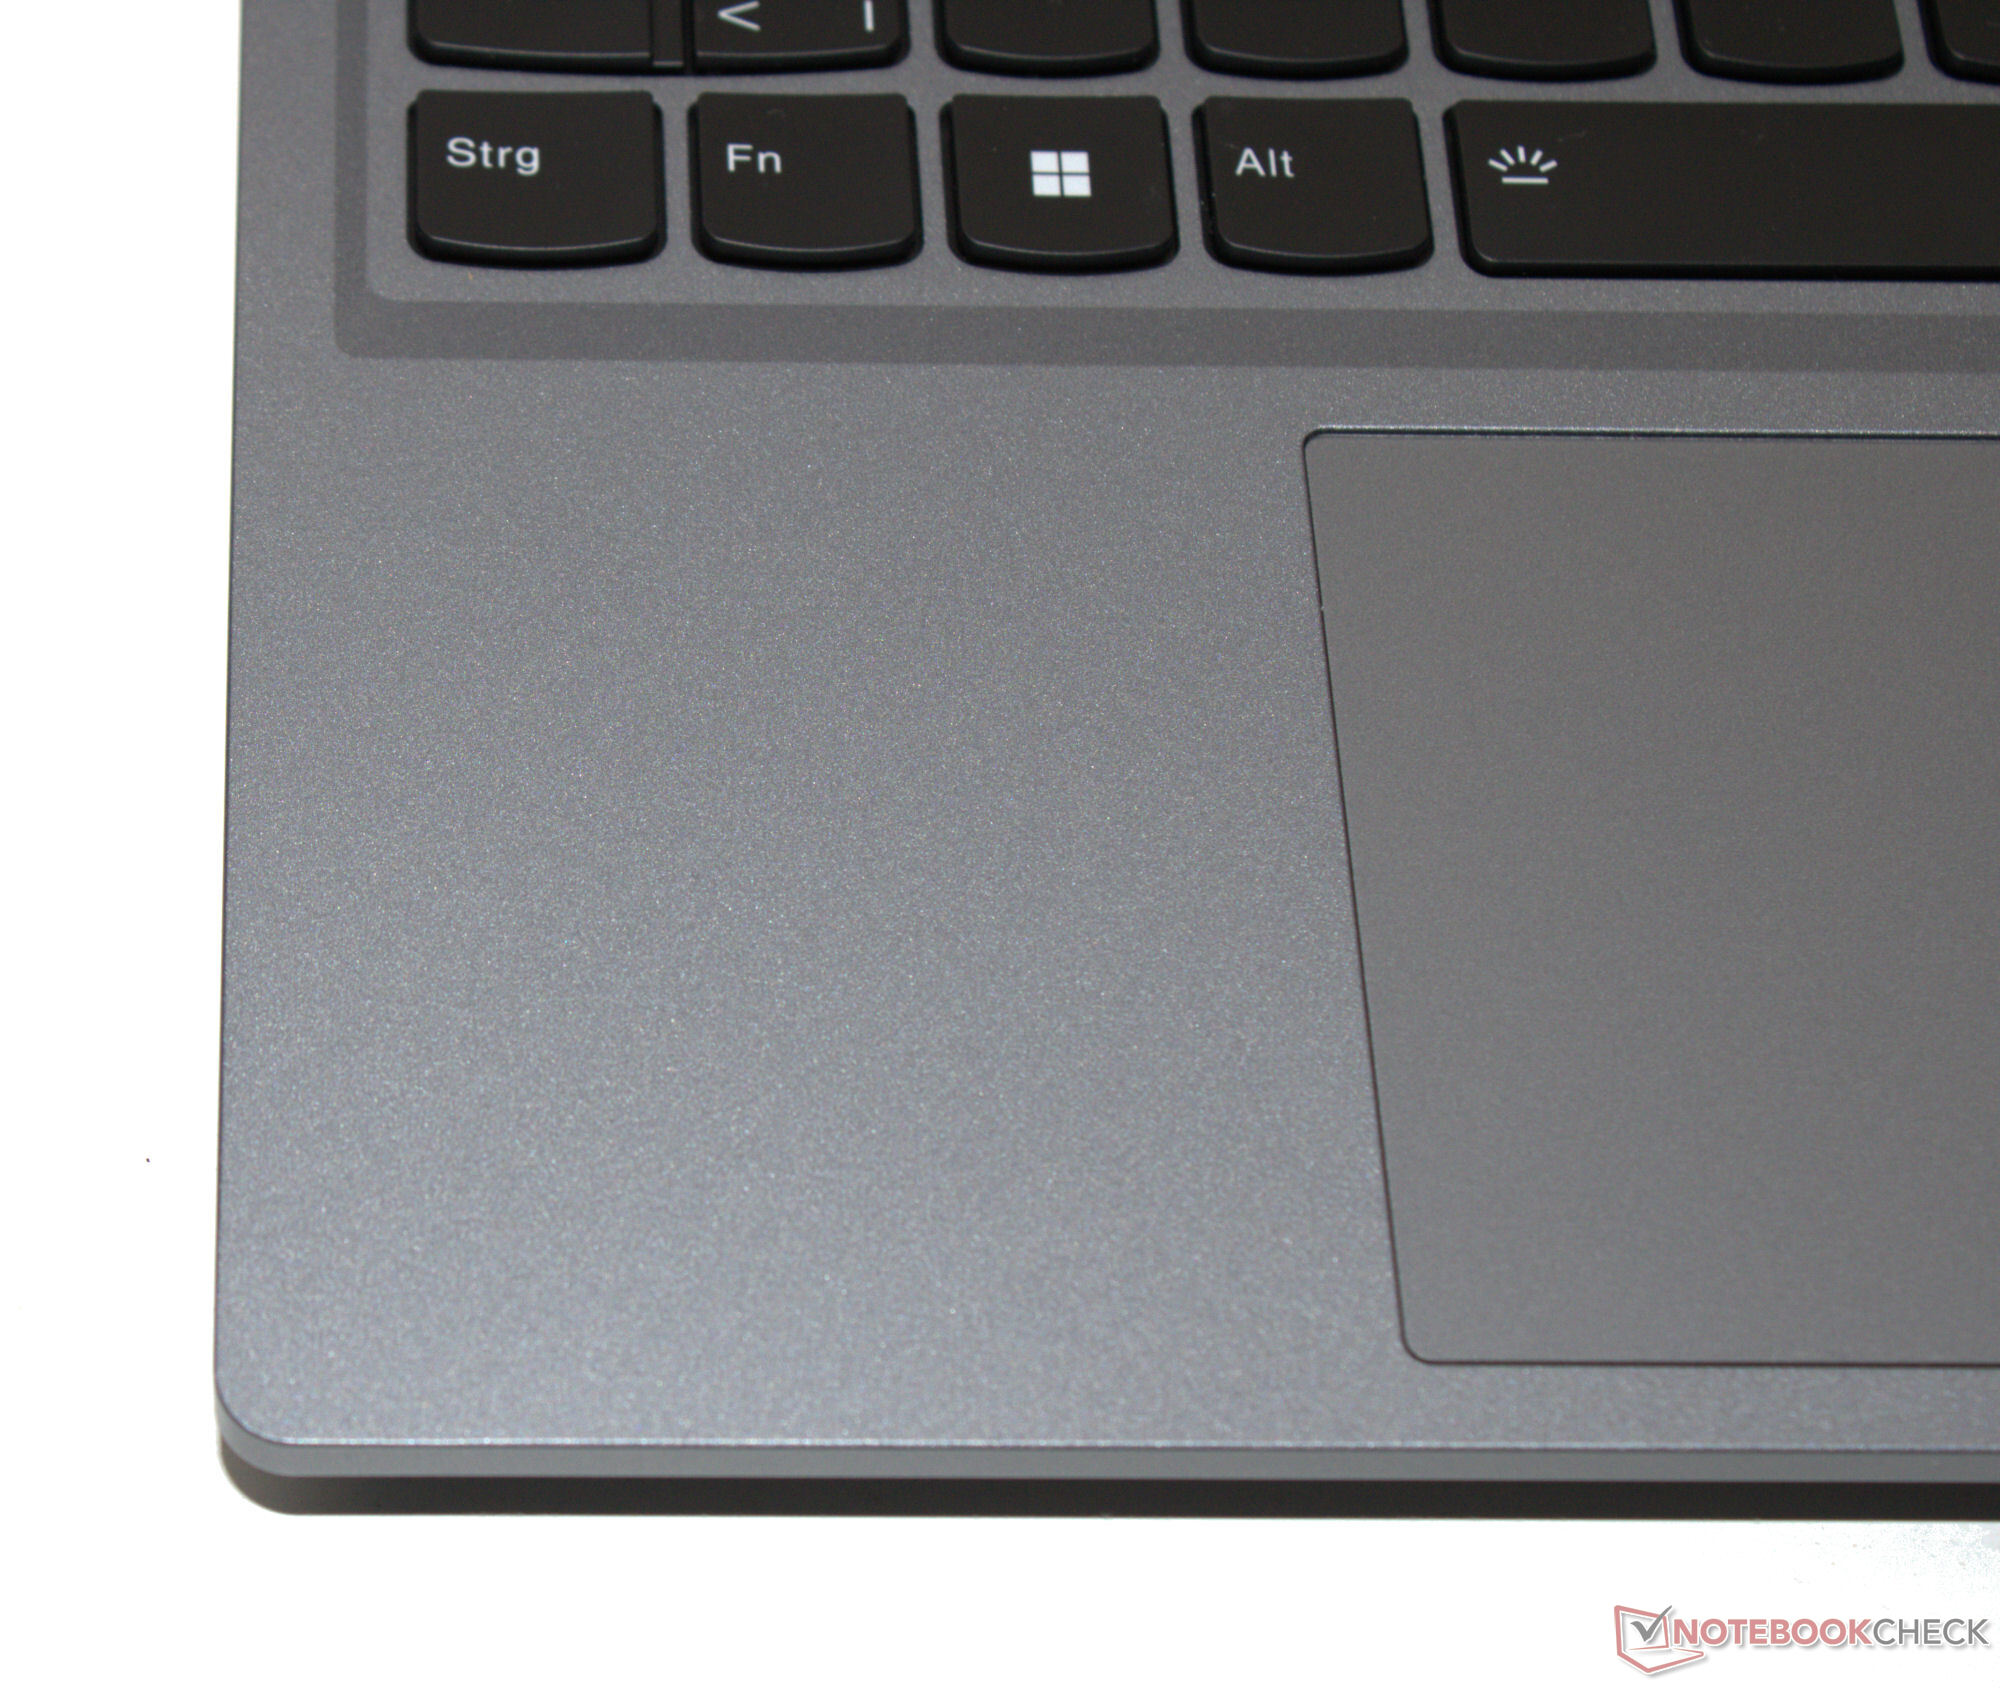
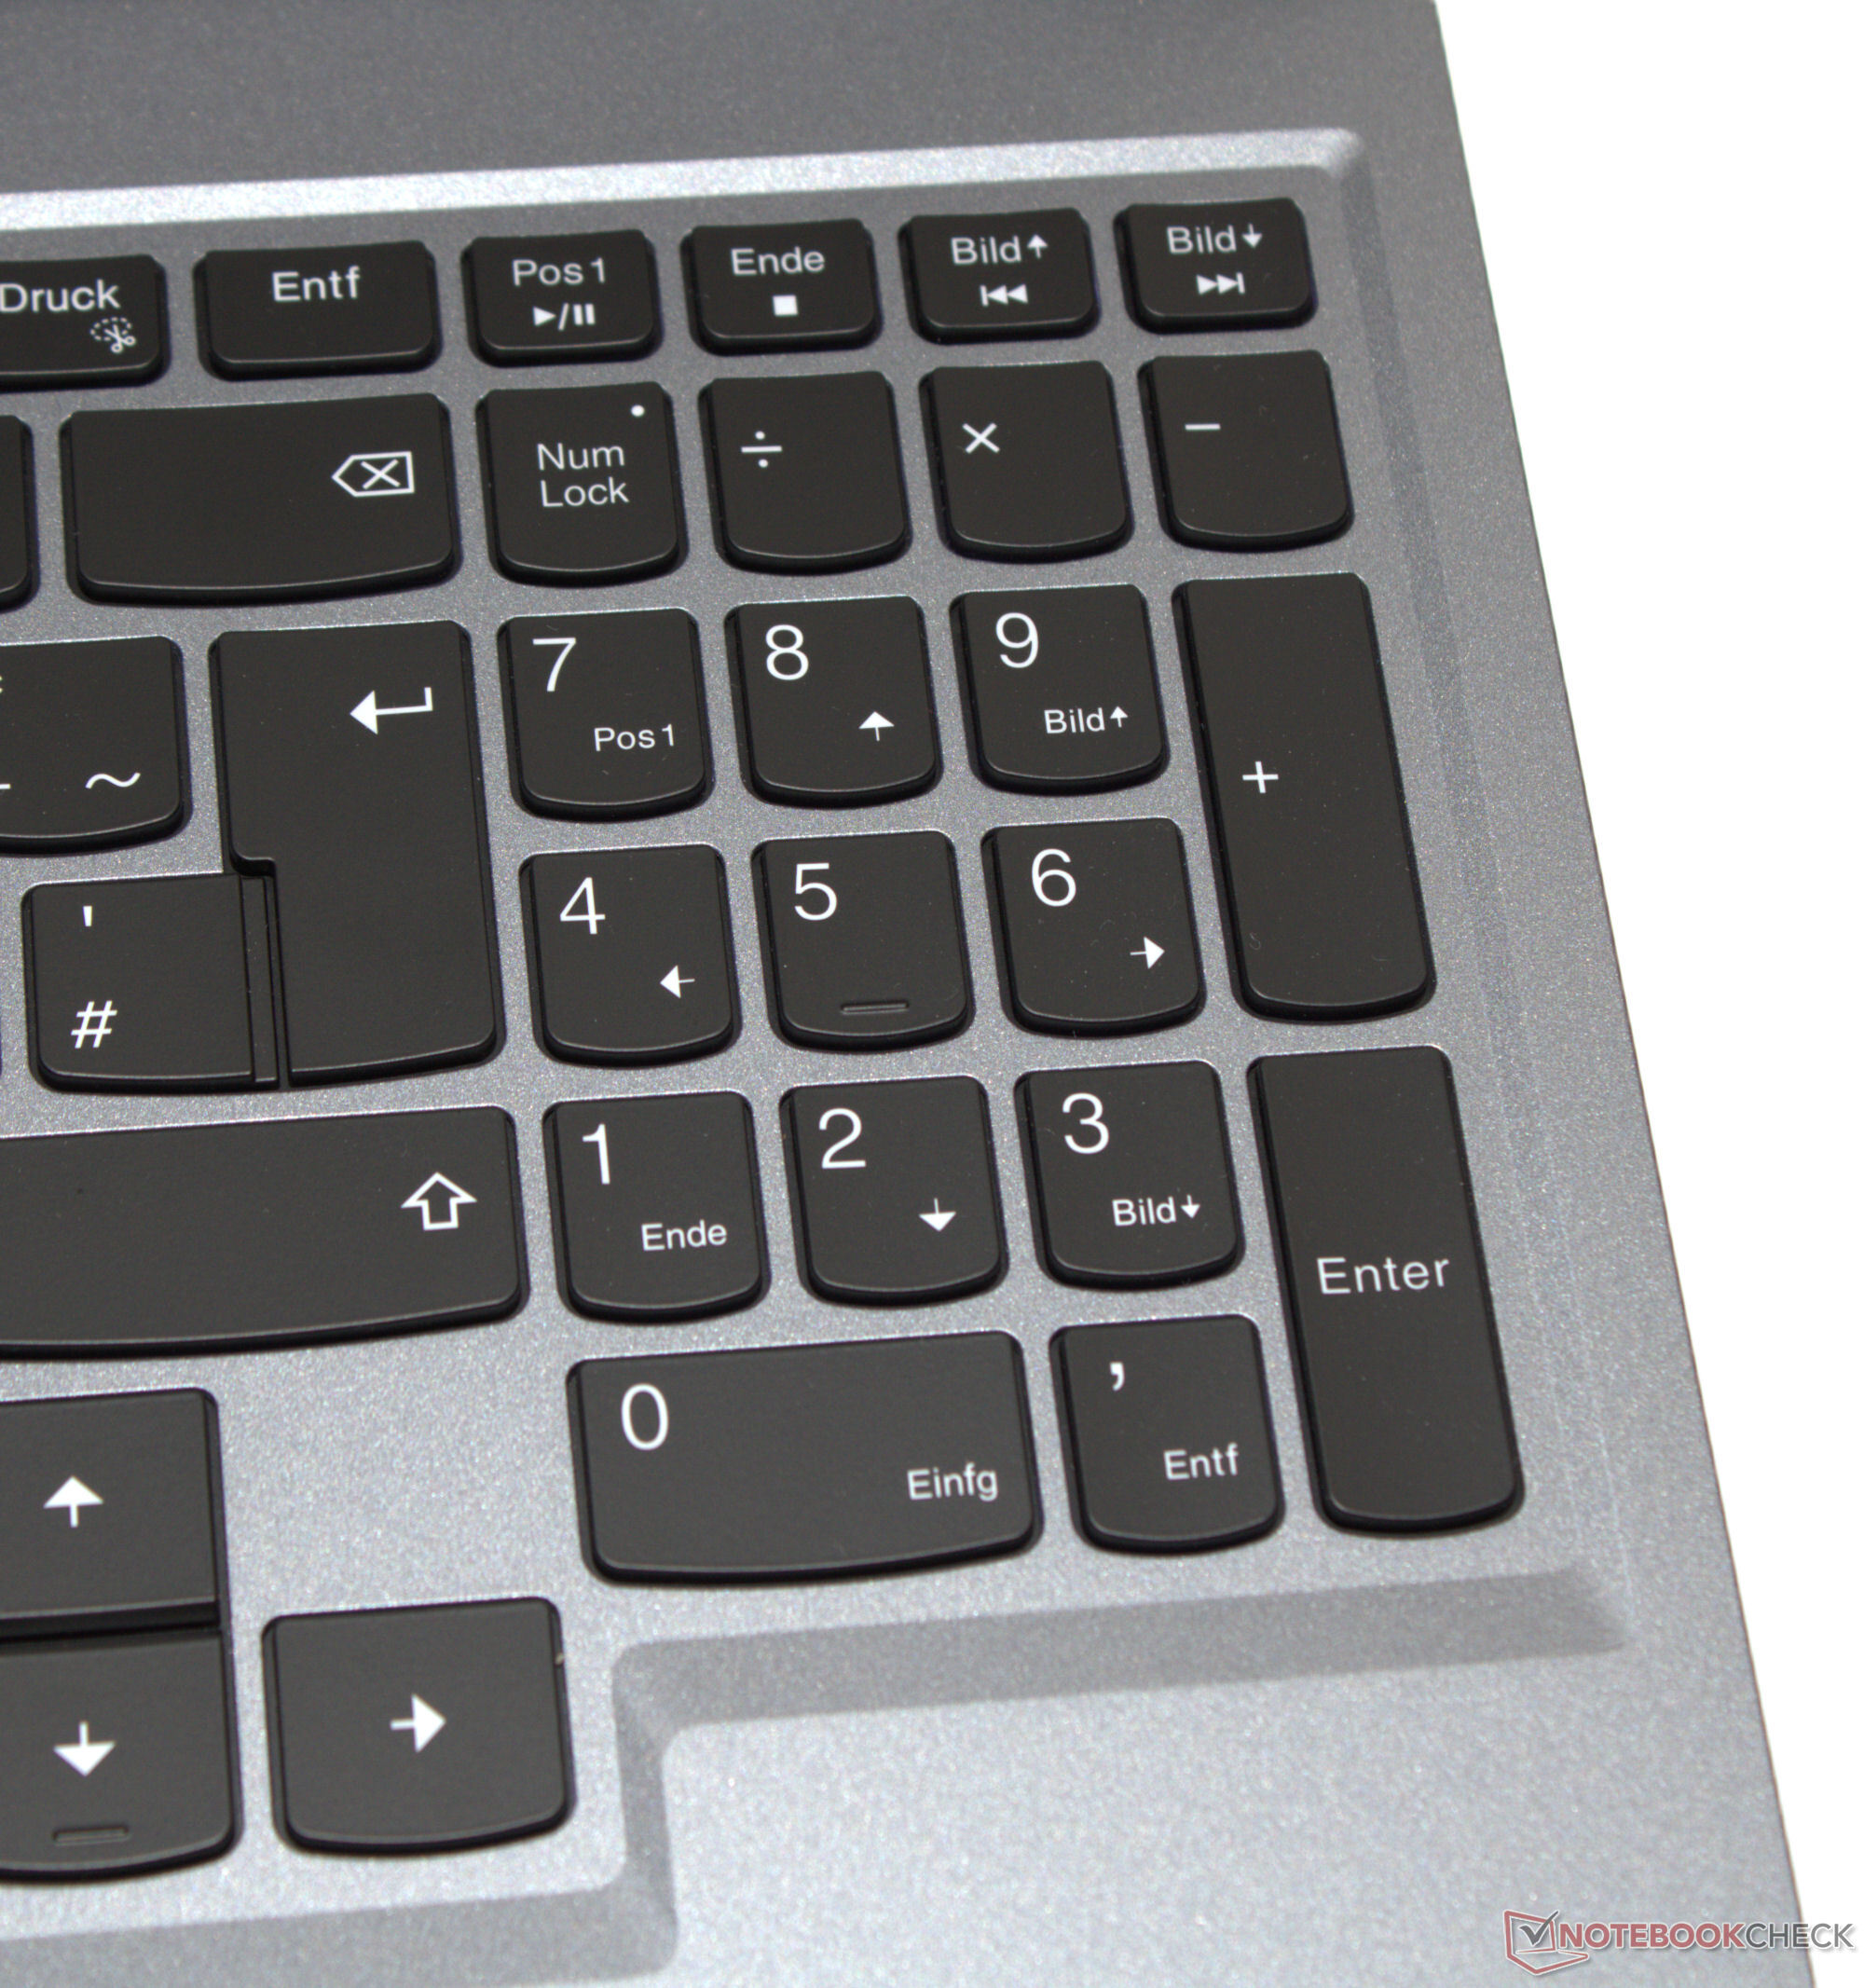
Le clavier chiclet rétroéclairé en blanc s'étend sur toute la largeur de l'ordinateur portable et comporte un pavé numérique. La forme et la disposition des touches correspondent à l'agencement familier de Lenovo. Les touches concaves offrent une bonne résistance et un point de pression bien défini. Le clavier cède légèrement lors de la frappe, mais ce n'est pas un problème. Un point positif : Les touches fléchées décalées et de taille normale sont agréables à utiliser. Un pavé tactile multi-touch (environ 12 x 7,5 cm), avec une levée courte et un point de pression clair, remplace la souris.
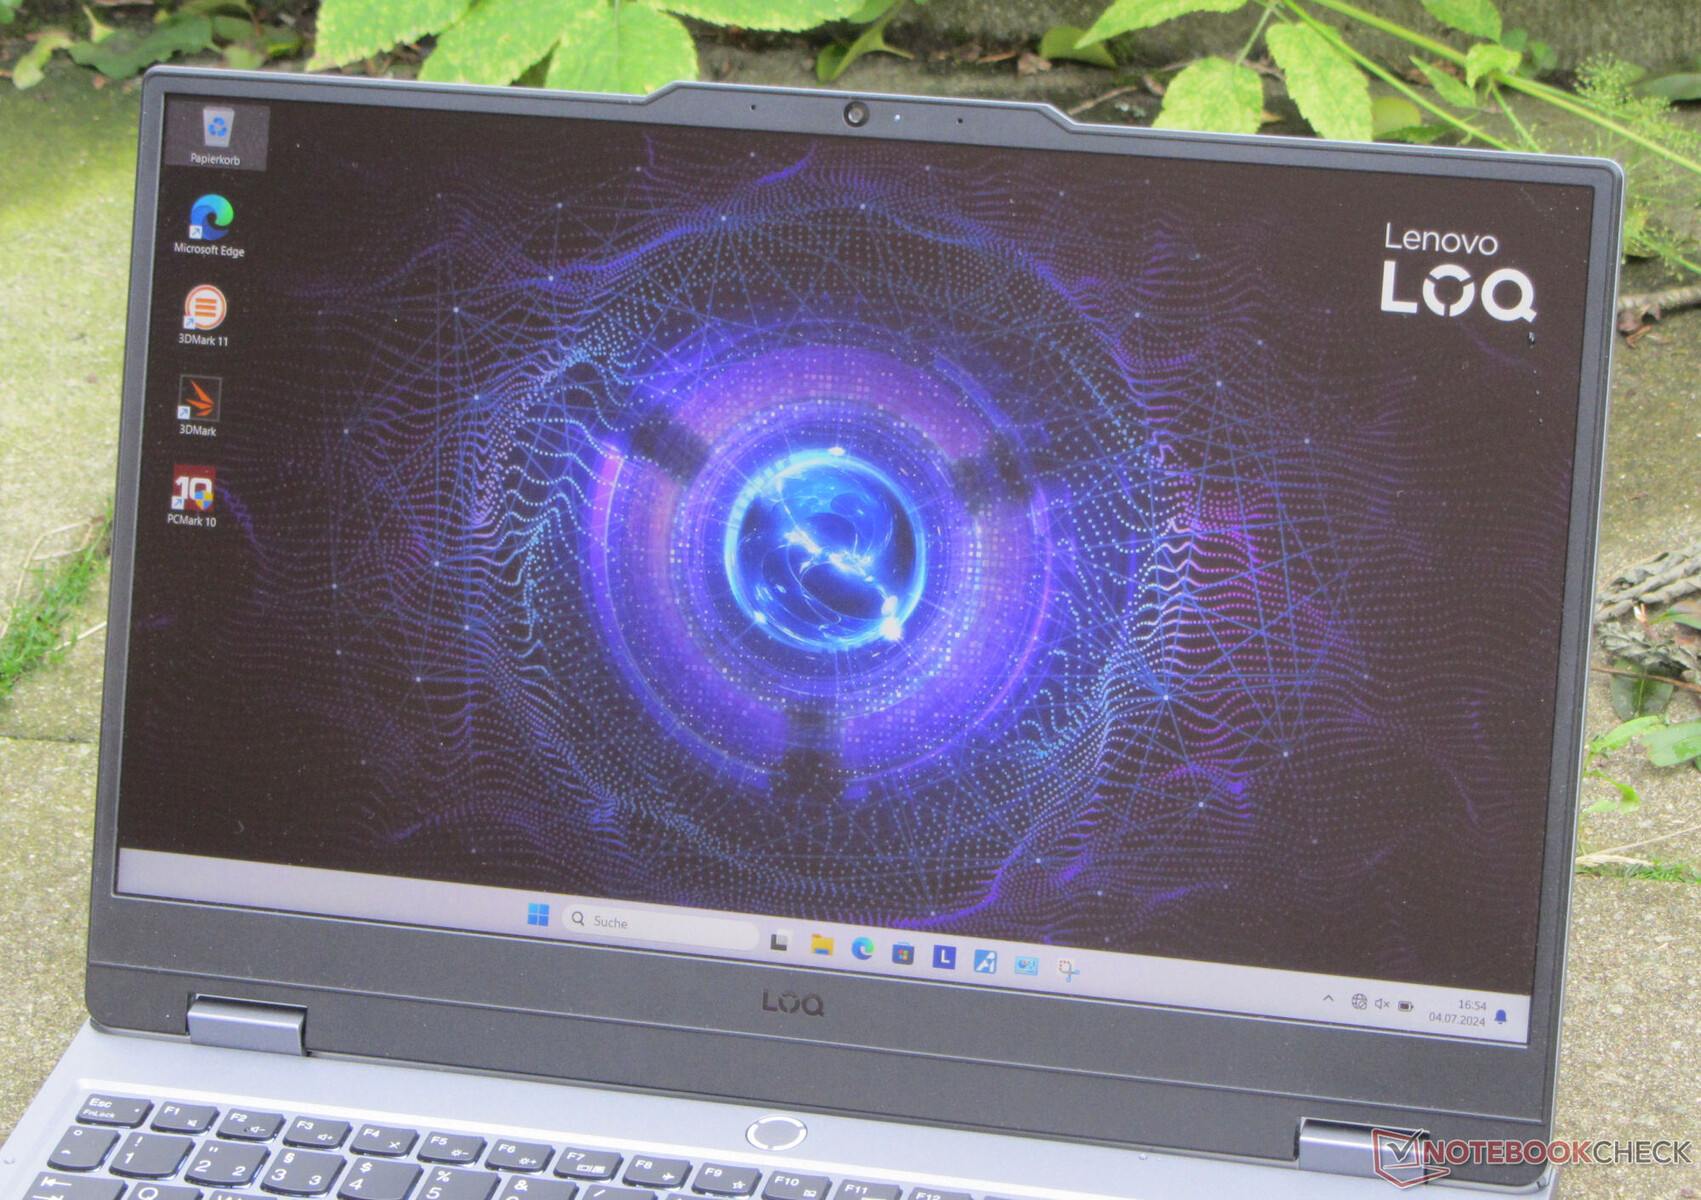
Écran - IPS embarqué
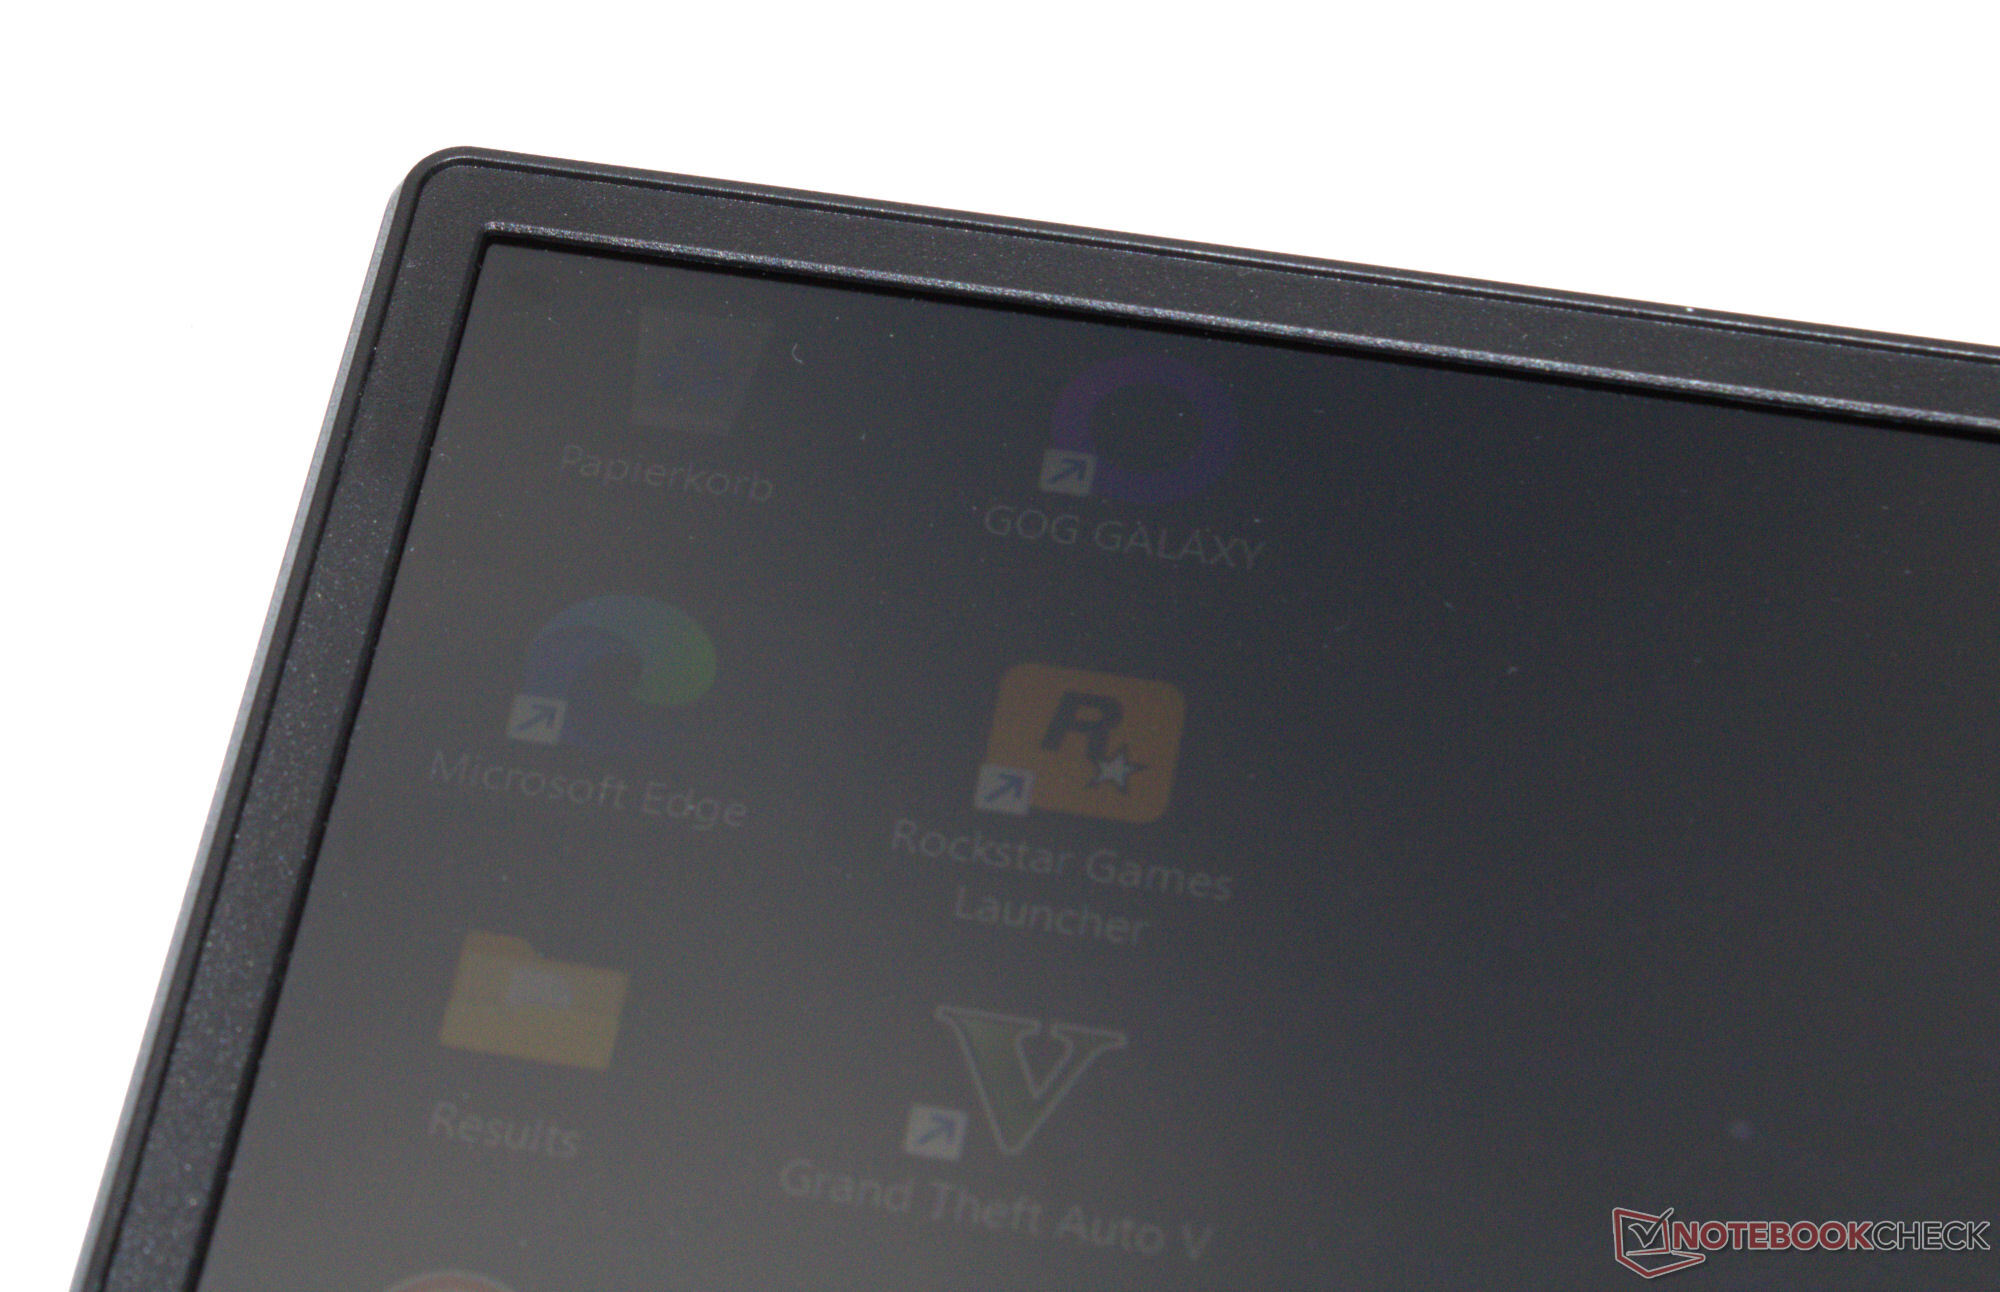
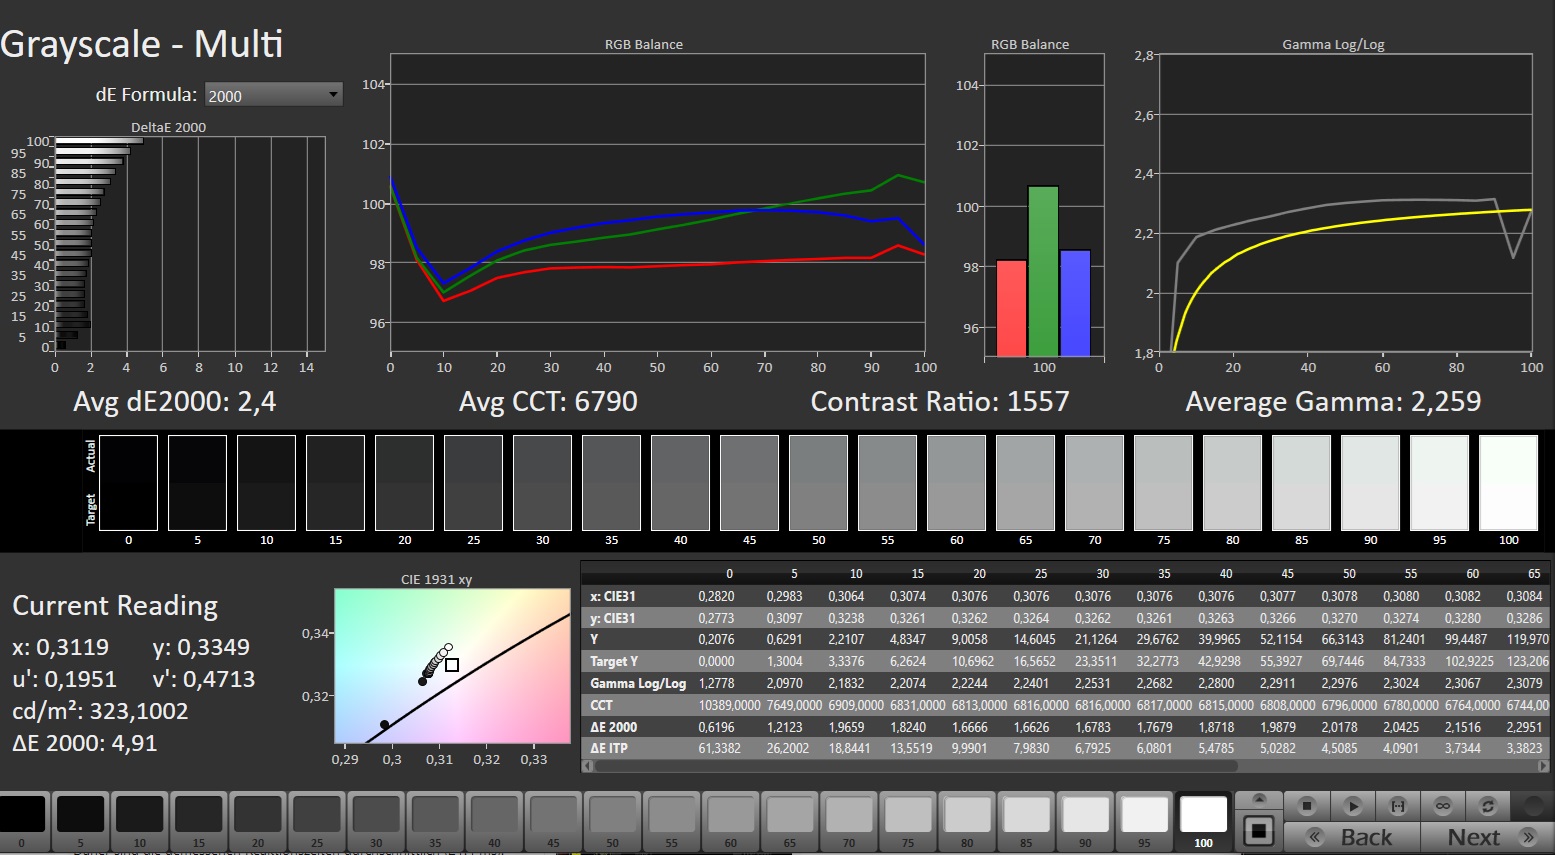
Lenovo a équipé le LOQ d'un écran 144 Hz (FHD, IPS) au format 16:9, stable dans l'angle de vision et compatible avec la technologie G-Sync. Les bons contrastes sont contrebalancés par une luminosité maximale un peu trop faible. D'une manière générale, l'écran est conçu pour une utilisation en intérieur, mais il peut également être lu à l'extérieur dans des conditions météorologiques appropriées. Aucun scintillement PWM n'a été détecté lors de notre test.

| |||||||||||||||||||||||||
Homogénéité de la luminosité: 88 %
Valeur mesurée au centre, sur batterie: 306 cd/m²
Contraste: 1457:1 (Valeurs des noirs: 0.21 cd/m²)
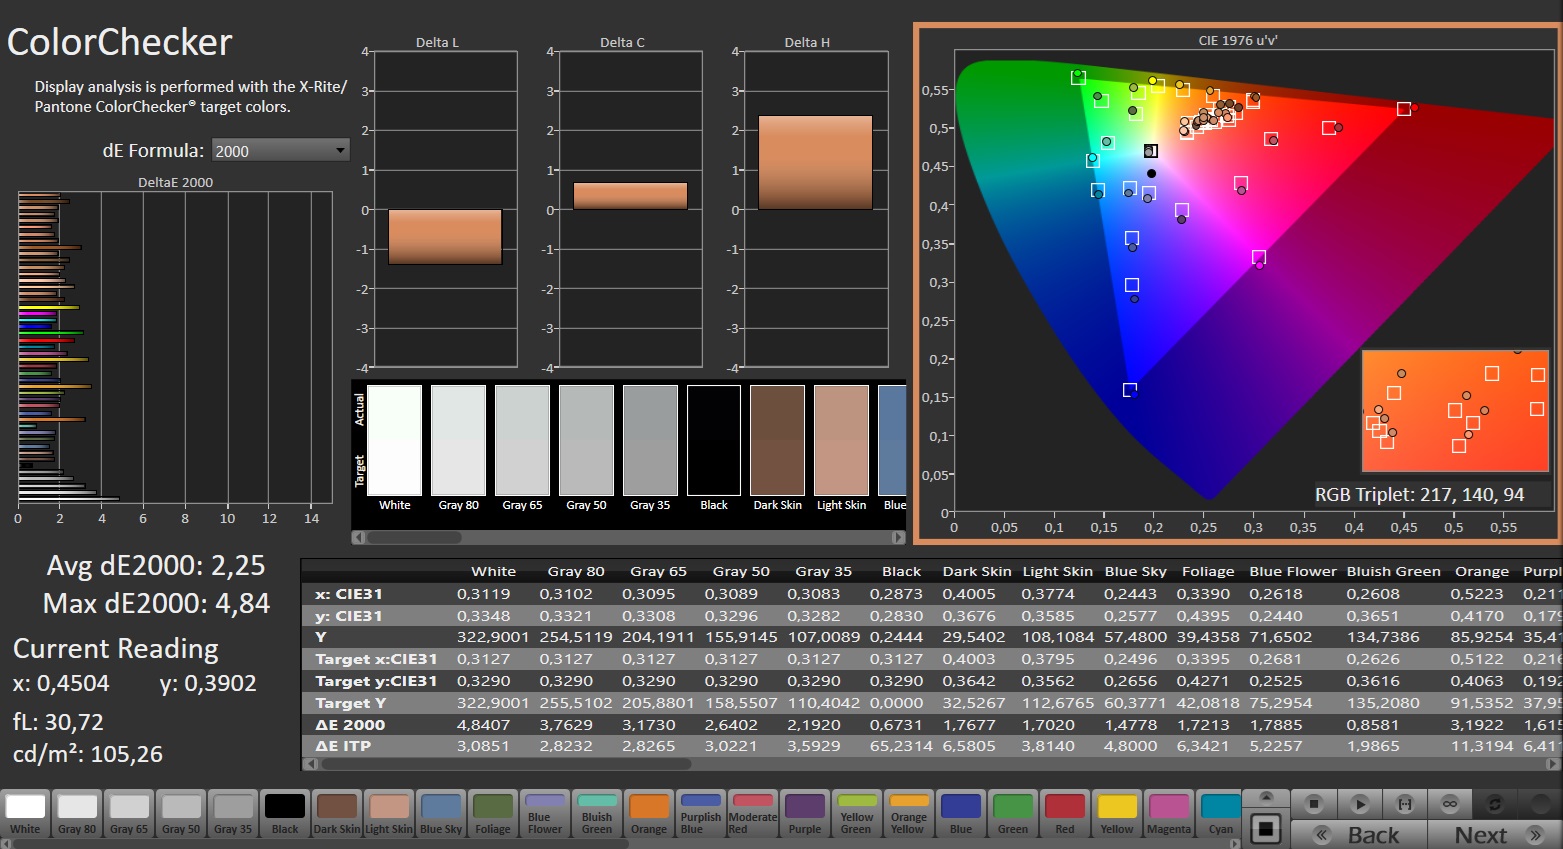
ΔE Color 2.25 | 0.5-29.43 Ø4.87, calibrated: 1.45
ΔE Greyscale 2.4 | 0.5-98 Ø5.1
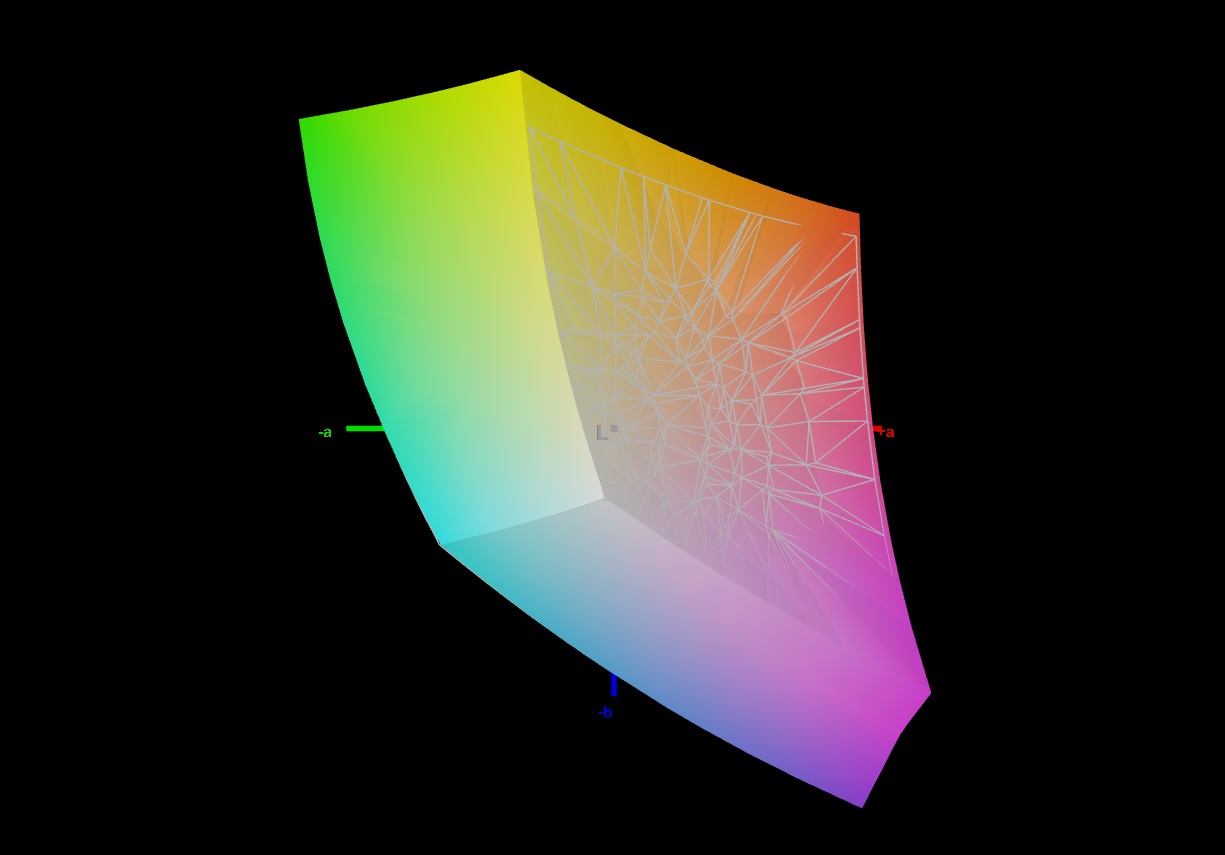
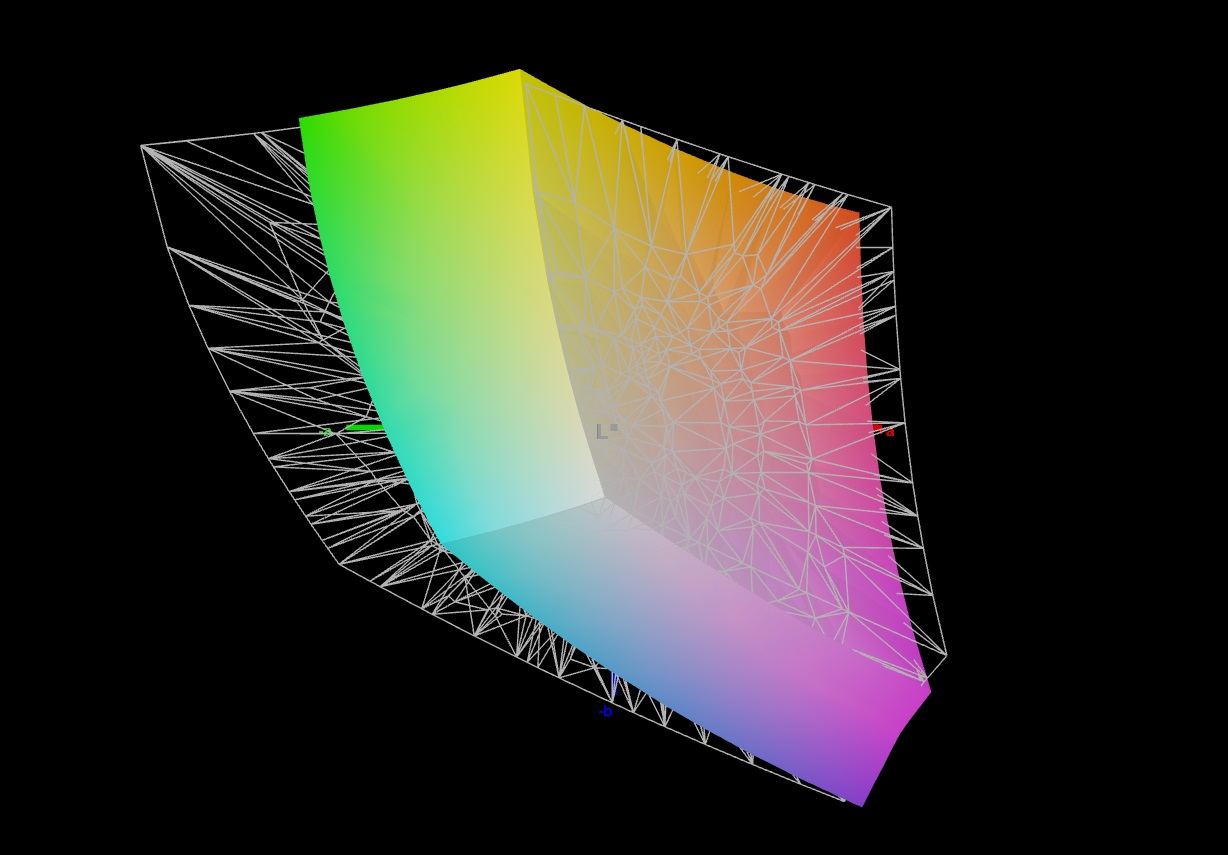
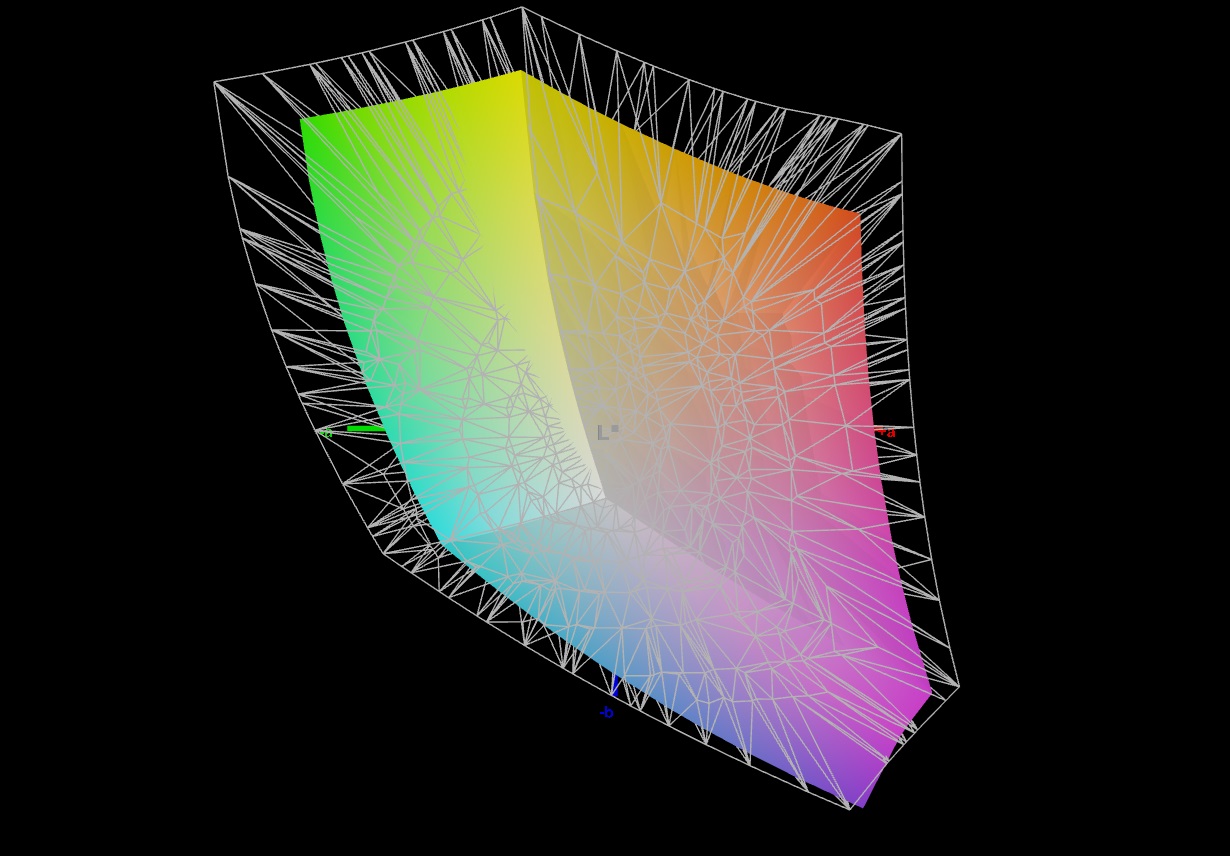
72.6% AdobeRGB 1998 (Argyll 2.2.0 3D)
99.1% sRGB (Argyll 2.2.0 3D)
73.7% Display P3 (Argyll 2.2.0 3D)
Gamma: 2.259
| Lenovo LOQ 15IRX9 BOE NJ NE156FHM-NX9, IPS, 1920x1080, 15.6" | SCHENKER XMG Core 15 (M24) BOE NJ NE153QDM-NZ1 (BOE0C8E), IPS, 2560x1600, 15.3" | Gigabyte G6X 9KG (2024) BOE NE160WUM-NX6, IPS, 1920x1200, 16" | HP Victus 16 (2024) Chi Mei CMN163E, IPS, 1920x1080, 16.1" | Dell G16, i7-13650HX, RTX 4060 Chi Mei CMN161D (160GME), IPS, 2560x1600, 16" | |
|---|---|---|---|---|---|
| Display | 1% | -40% | -41% | -5% | |
| Display P3 Coverage | 73.7 | 73.2 -1% | 41.8 -43% | 41.3 -44% | 67.5 -8% |
| sRGB Coverage | 99.1 | 100 1% | 62.4 -37% | 61.7 -38% | 98.5 -1% |
| AdobeRGB 1998 Coverage | 72.6 | 74.6 3% | 43.3 -40% | 42.7 -41% | 69.3 -5% |
| Response Times | 68% | 4% | 25% | 68% | |
| Response Time Grey 50% / Grey 80% * | 42.2 ? | 9.6 ? 77% | 40.5 ? 4% | 28.6 ? 32% | 7.6 ? 82% |
| Response Time Black / White * | 22.6 ? | 9.2 ? 59% | 21.6 ? 4% | 18.7 ? 17% | 10.4 ? 54% |
| PWM Frequency | |||||
| Screen | 6% | -68% | -78% | -15% | |
| Brightness middle | 306 | 635 108% | 353 15% | 287 -6% | 369 21% |
| Brightness | 287 | 604 110% | 318 11% | 288 0% | 344 20% |
| Brightness Distribution | 88 | 91 3% | 81 -8% | 86 -2% | 89 1% |
| Black Level * | 0.21 | 0.64 -205% | 0.21 -0% | 0.19 10% | 0.26 -24% |
| Contrast | 1457 | 992 -32% | 1681 15% | 1511 4% | 1419 -3% |
| Colorchecker dE 2000 * | 2.25 | 1.89 16% | 5.21 -132% | 5.46 -143% | 3.04 -35% |
| Colorchecker dE 2000 max. * | 4.84 | 3.14 35% | 19.95 -312% | 20.36 -321% | 5.56 -15% |
| Colorchecker dE 2000 calibrated * | 1.45 | 1.14 21% | 3.61 -149% | 3.52 -143% | 2.35 -62% |
| Greyscale dE 2000 * | 2.4 | 2.53 -5% | 3.6 -50% | 4.8 -100% | 3.38 -41% |
| Gamma | 2.259 97% | 2.36 93% | 2.367 93% | 2.108 104% | 2.47 89% |
| CCT | 6790 96% | 6434 101% | 7138 91% | 6442 101% | 6040 108% |
| Moyenne finale (programmes/paramètres) | 25% /
14% | -35% /
-52% | -31% /
-55% | 16% /
-1% |
* ... Moindre est la valeur, meilleures sont les performances
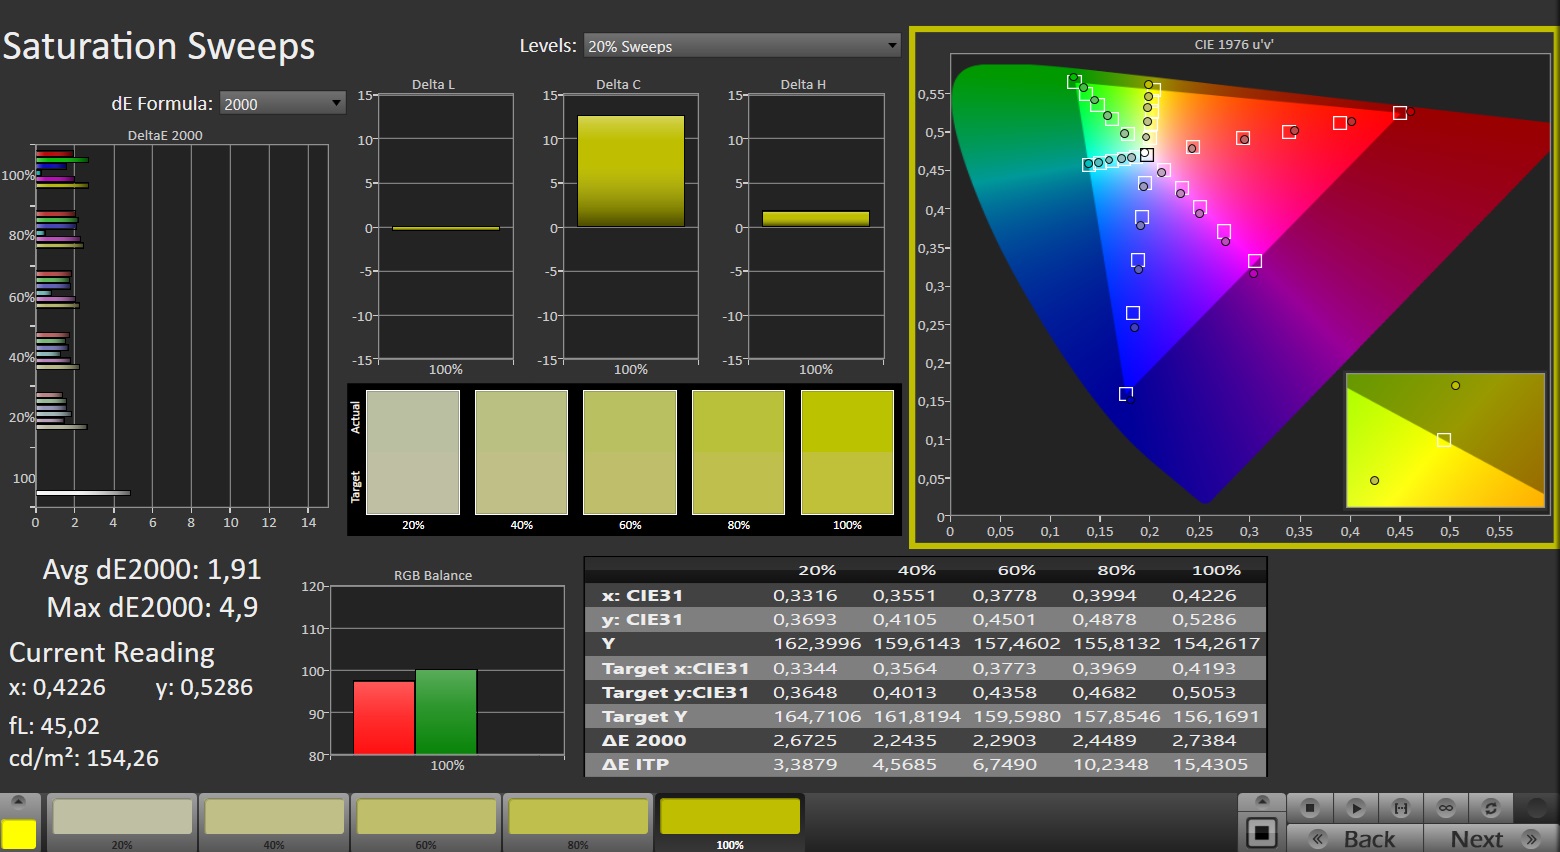
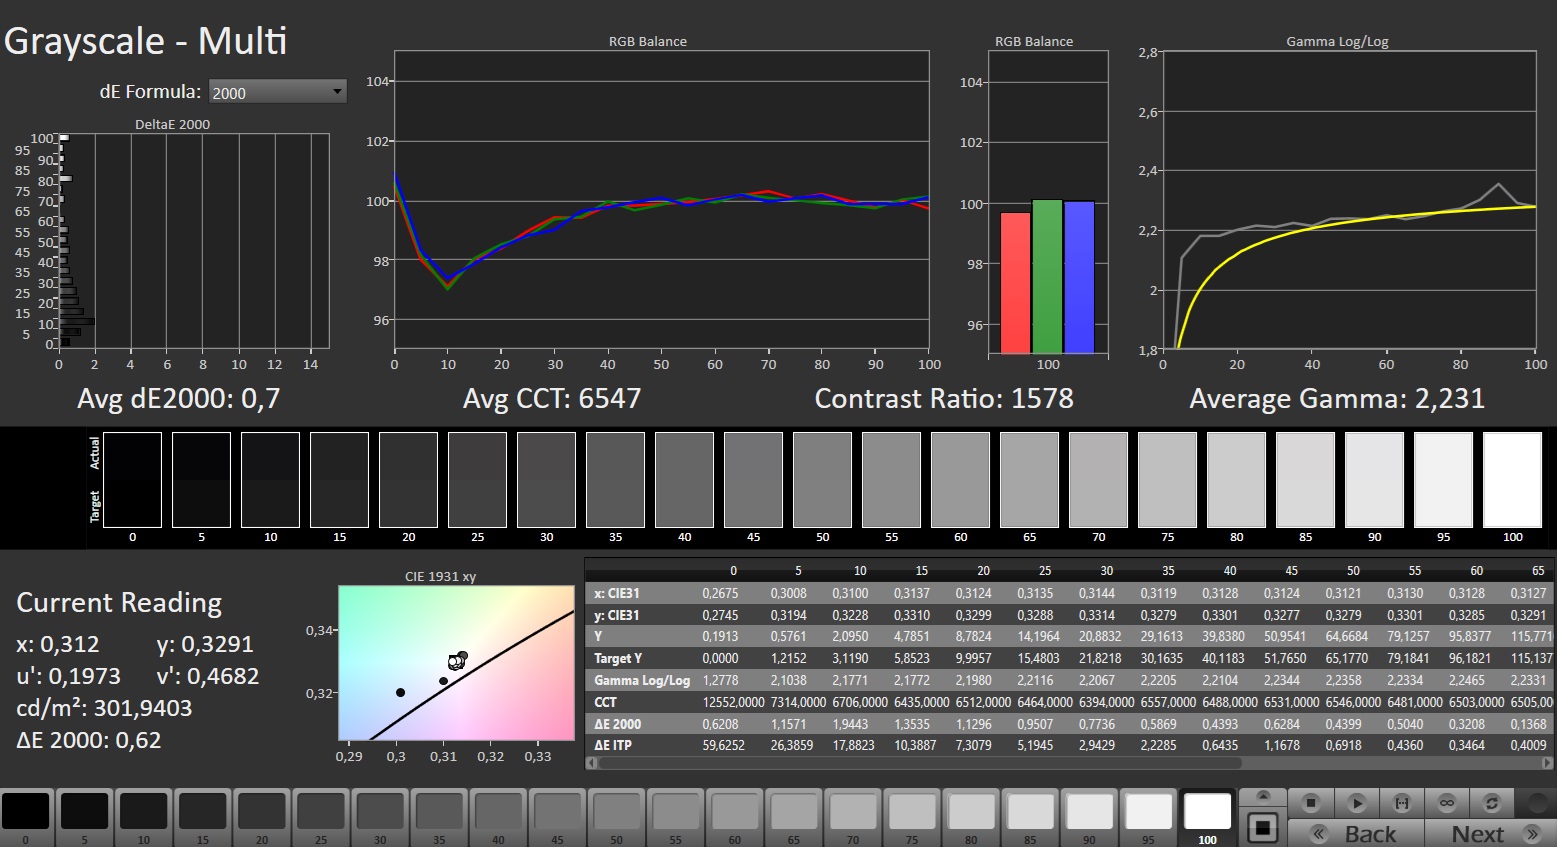
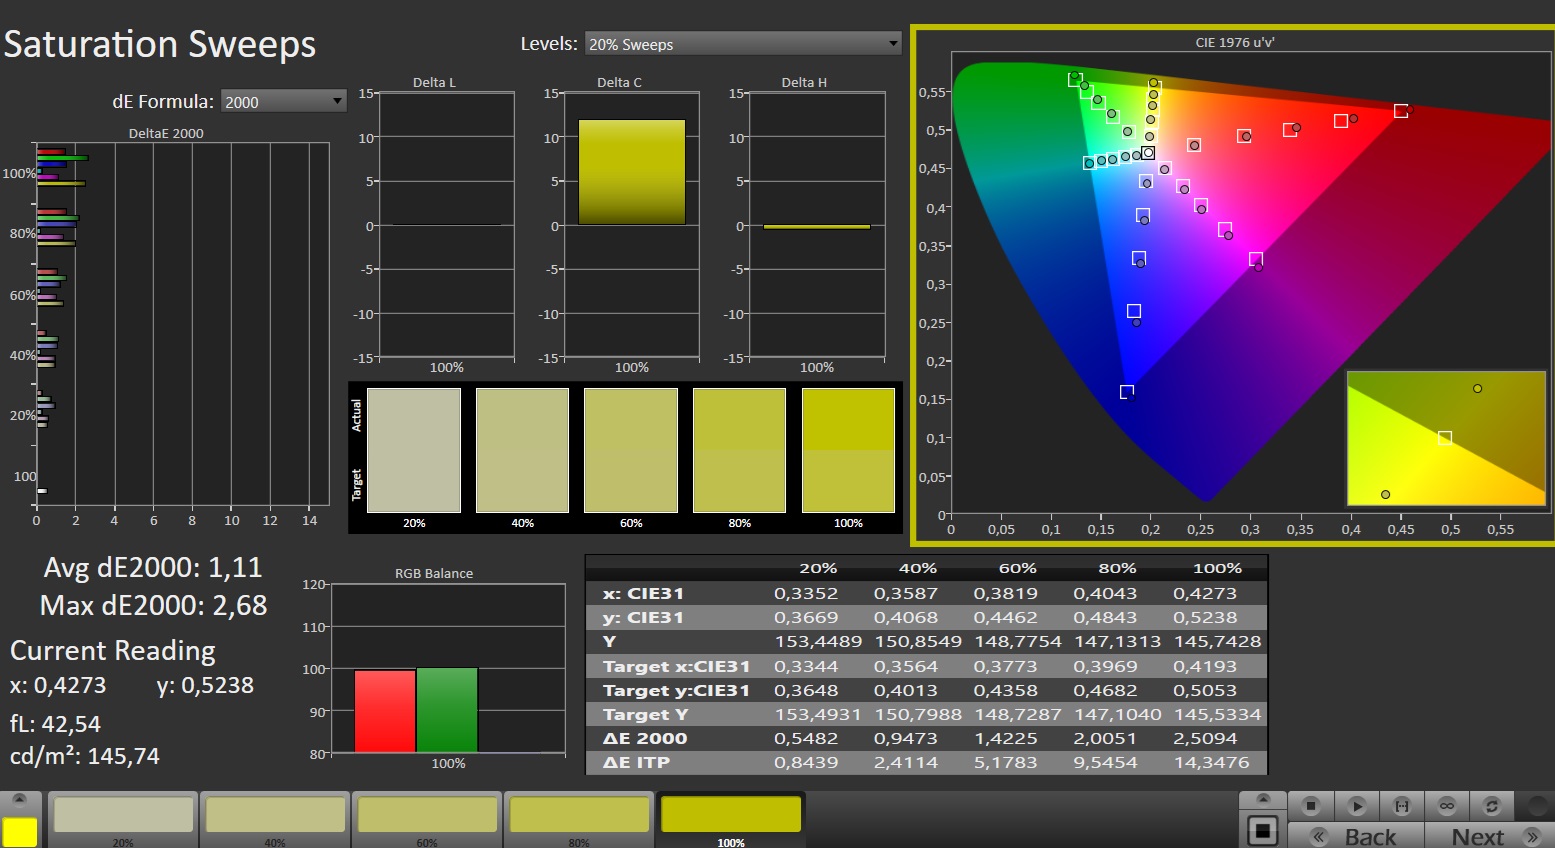
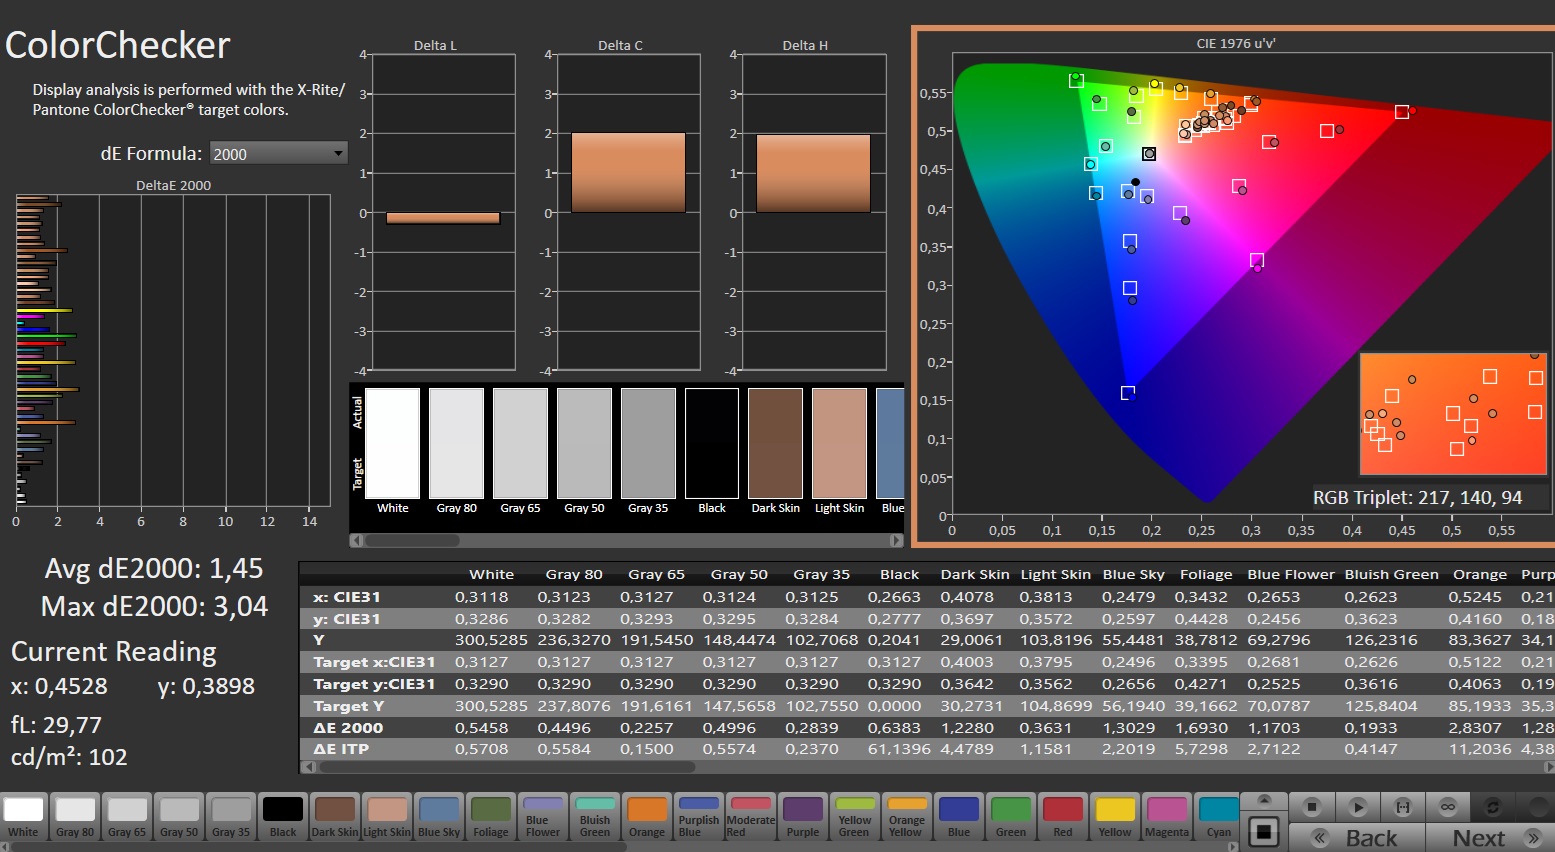
Dès sa sortie de la boîte, l'écran est bien calibré : Avec un écart d'environ 2,25, la valeur cible (DeltaE < 3) a été atteinte. Le calibrage de l'écran ramène les écarts à 1,45 et garantit des tons gris plus équilibrés. L'écran peut représenter l'espace sRGB dans sa quasi-totalité, mais pas les espaces AdobeRGB et DCI P3.
Temps de réponse de l'écran
| ↔ Temps de réponse noir à blanc | ||
|---|---|---|
| 22.6 ms ... hausse ↗ et chute ↘ combinées | ↗ 11.2 ms hausse | 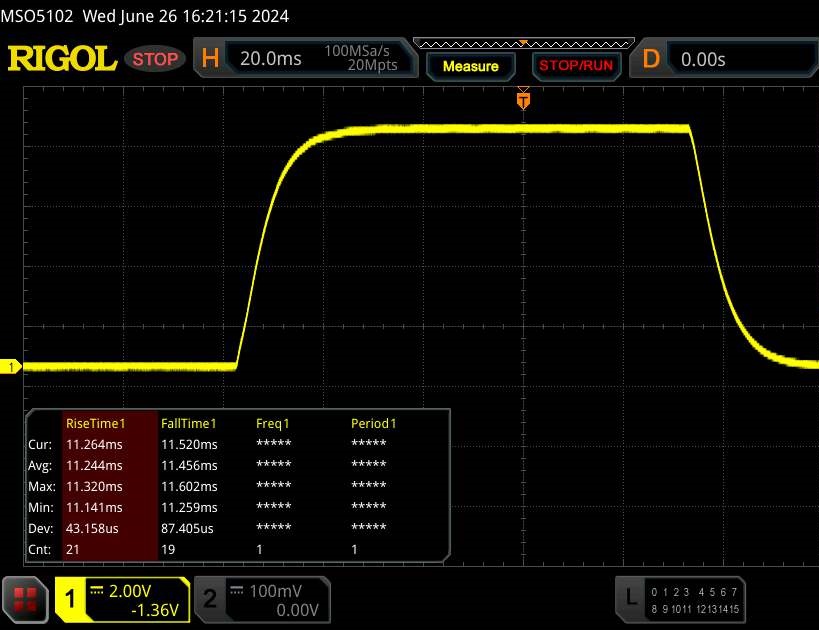 |
| ↘ 11.4 ms chute | ||
| L'écran montre de bons temps de réponse, mais insuffisant pour du jeu compétitif. En comparaison, tous les appareils testés affichent entre 0.1 (minimum) et 240 (maximum) ms. » 48 % des appareils testés affichent de meilleures performances. Cela signifie que les latences relevées sont similaires à la moyenne (20.8 ms) de tous les appareils testés. | ||
| ↔ Temps de réponse gris 50% à gris 80% | ||
| 42.2 ms ... hausse ↗ et chute ↘ combinées | ↗ 19.1 ms hausse | 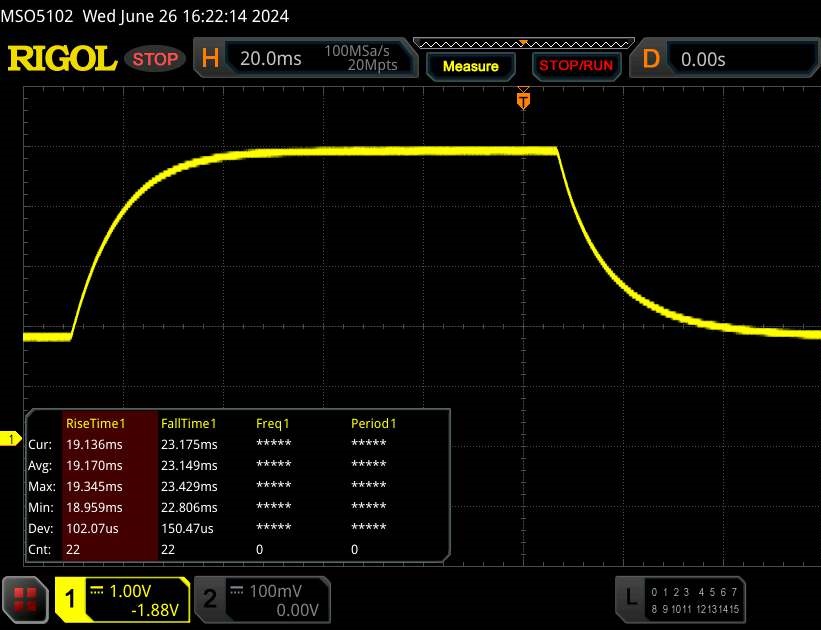 |
| ↘ 23.1 ms chute | ||
| L'écran souffre de latences très élevées, à éviter pour le jeu. En comparaison, tous les appareils testés affichent entre 0.165 (minimum) et 636 (maximum) ms. » 68 % des appareils testés affichent de meilleures performances. Cela signifie que les latences relevées sont moins bonnes que la moyenne (32.5 ms) de tous les appareils testés. | ||
Scintillement / MLI (Modulation de largeur d'impulsion)
| Scintillement / MLI (Modulation de largeur d'impulsion) non décelé | 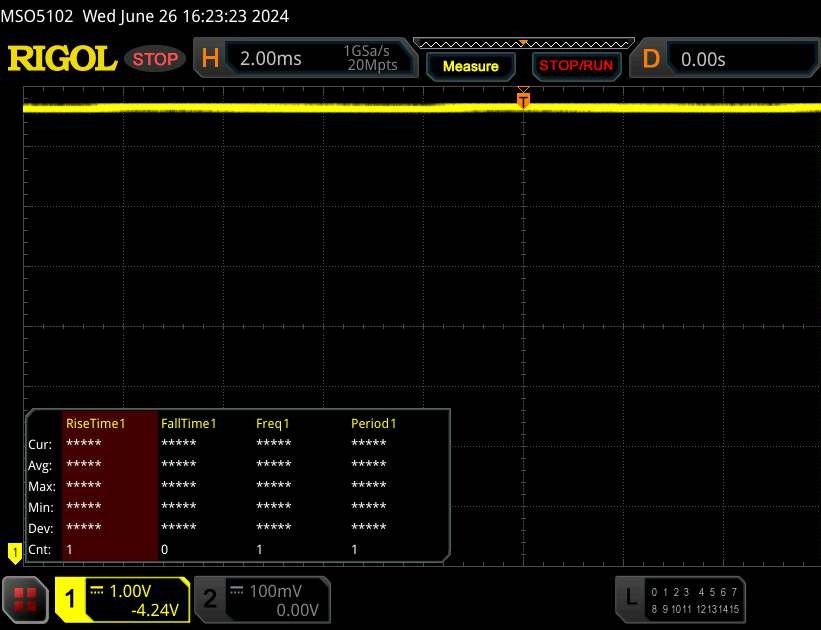 | ||
En comparaison, 53 % des appareils testés n'emploient pas MDI pour assombrir leur écran. Nous avons relevé une moyenne à 8516 (minimum : 5 - maximum : 343500) Hz dans le cas où une MDI était active. | |||
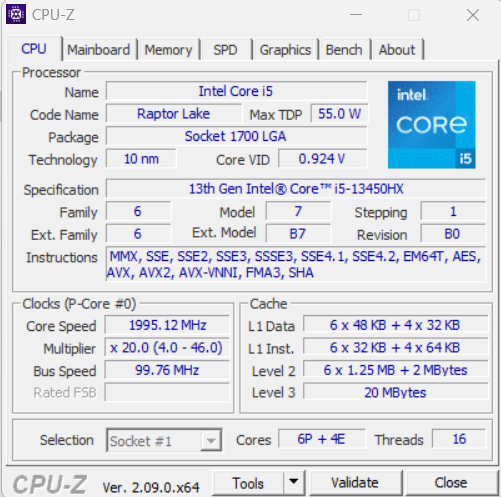
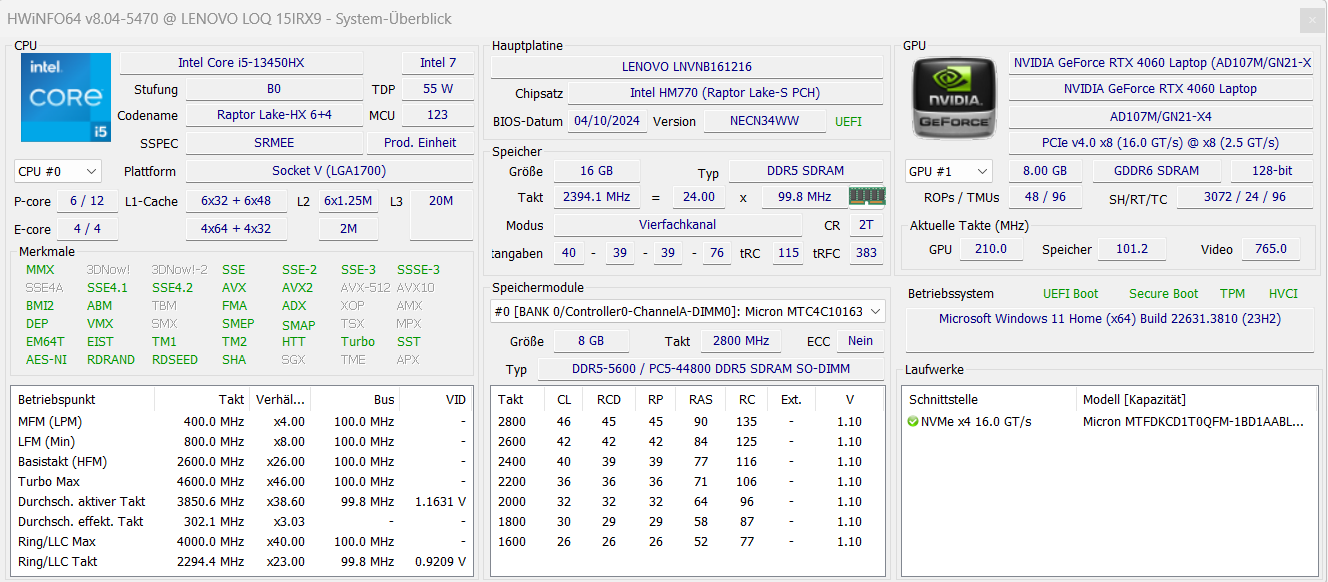
Performance - Raptor Lake et Ada Lovelace alimentent l'ordinateur portable
Les modèles LOQ sont des ordinateurs portables de jeu d'entrée de gamme. Lenovo propose différentes configurations, avec des APU AMD et des CPU Intel. Raptor Lake et Ada Lovelace sous la forme du Core i5-13450HX et de la GeForce RTX 4060 équipent l'appareil de test actuel. Il est disponible pour environ 1 300 dollars (avec Windows 11) ou un peu plus de 1 000 dollars (sans Windows).
Conditions d'essai
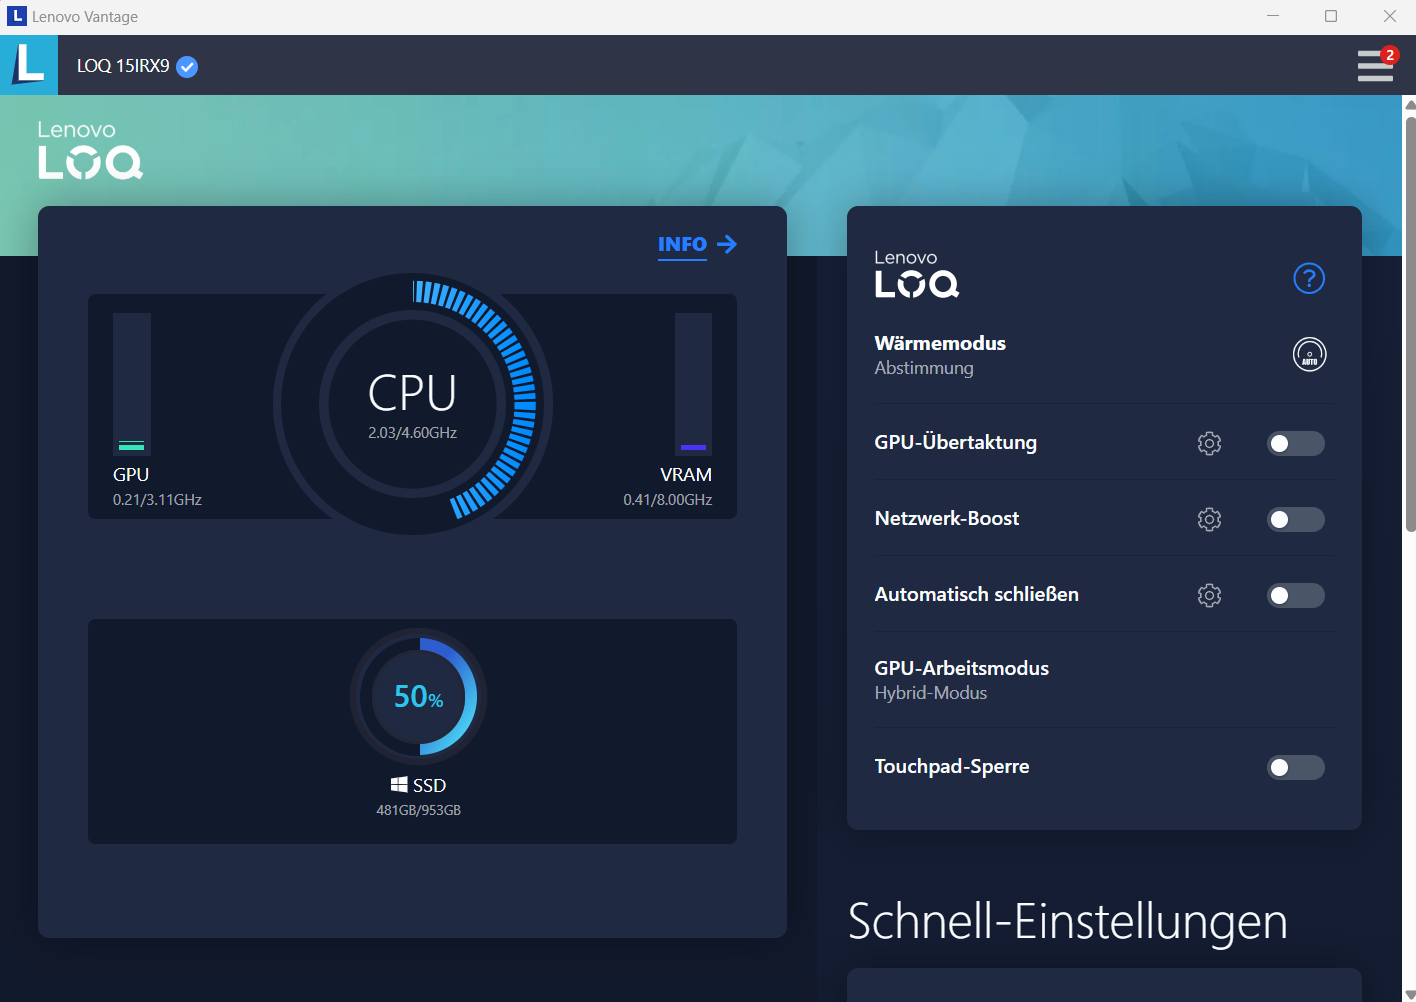
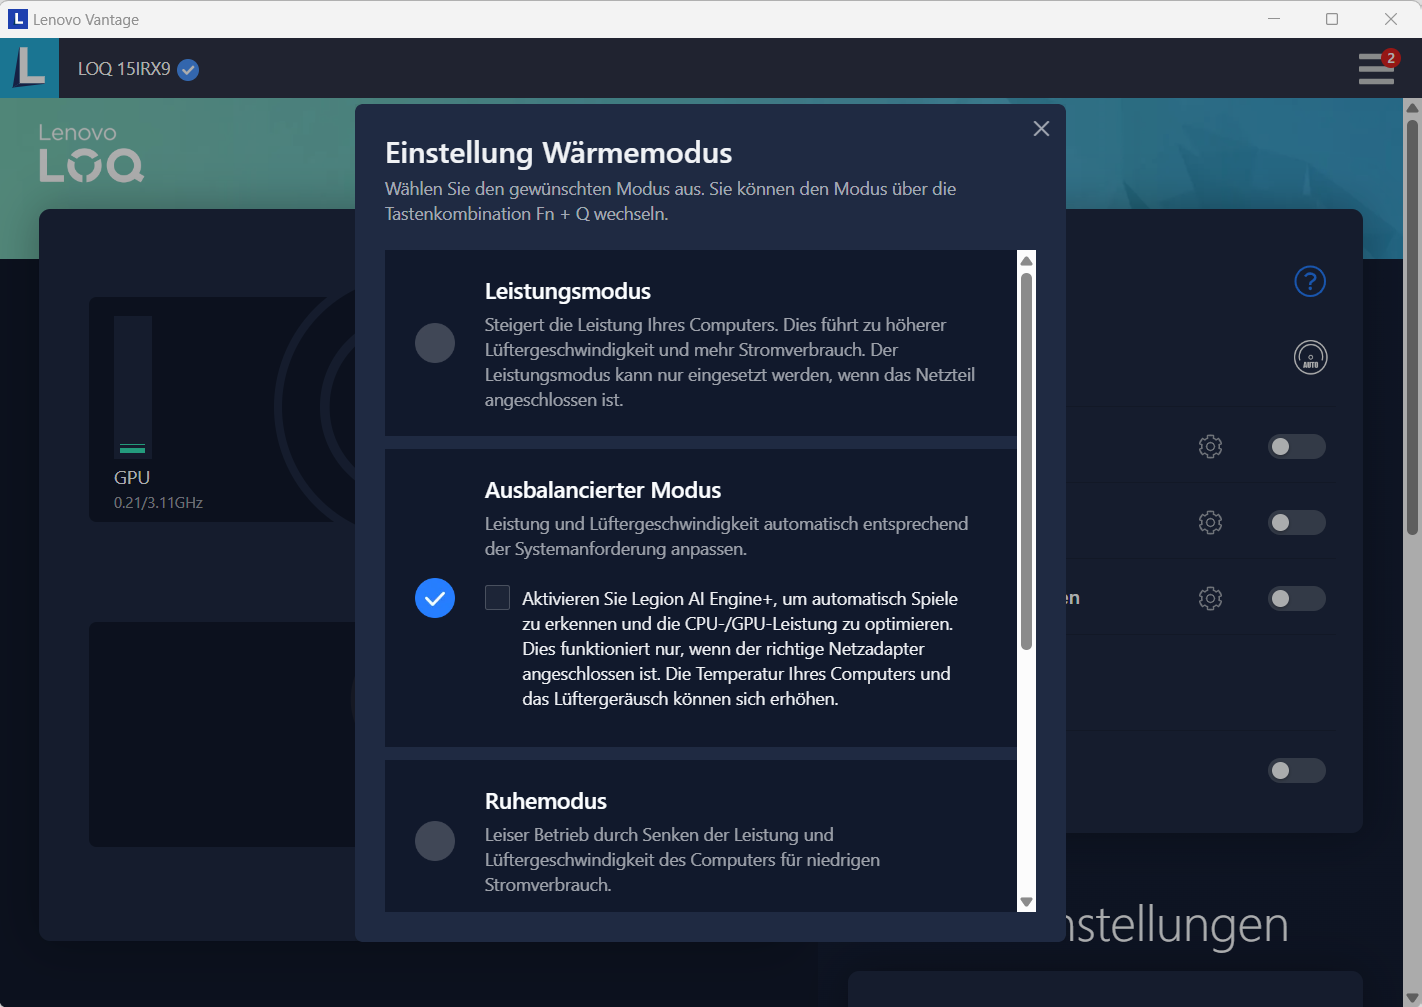
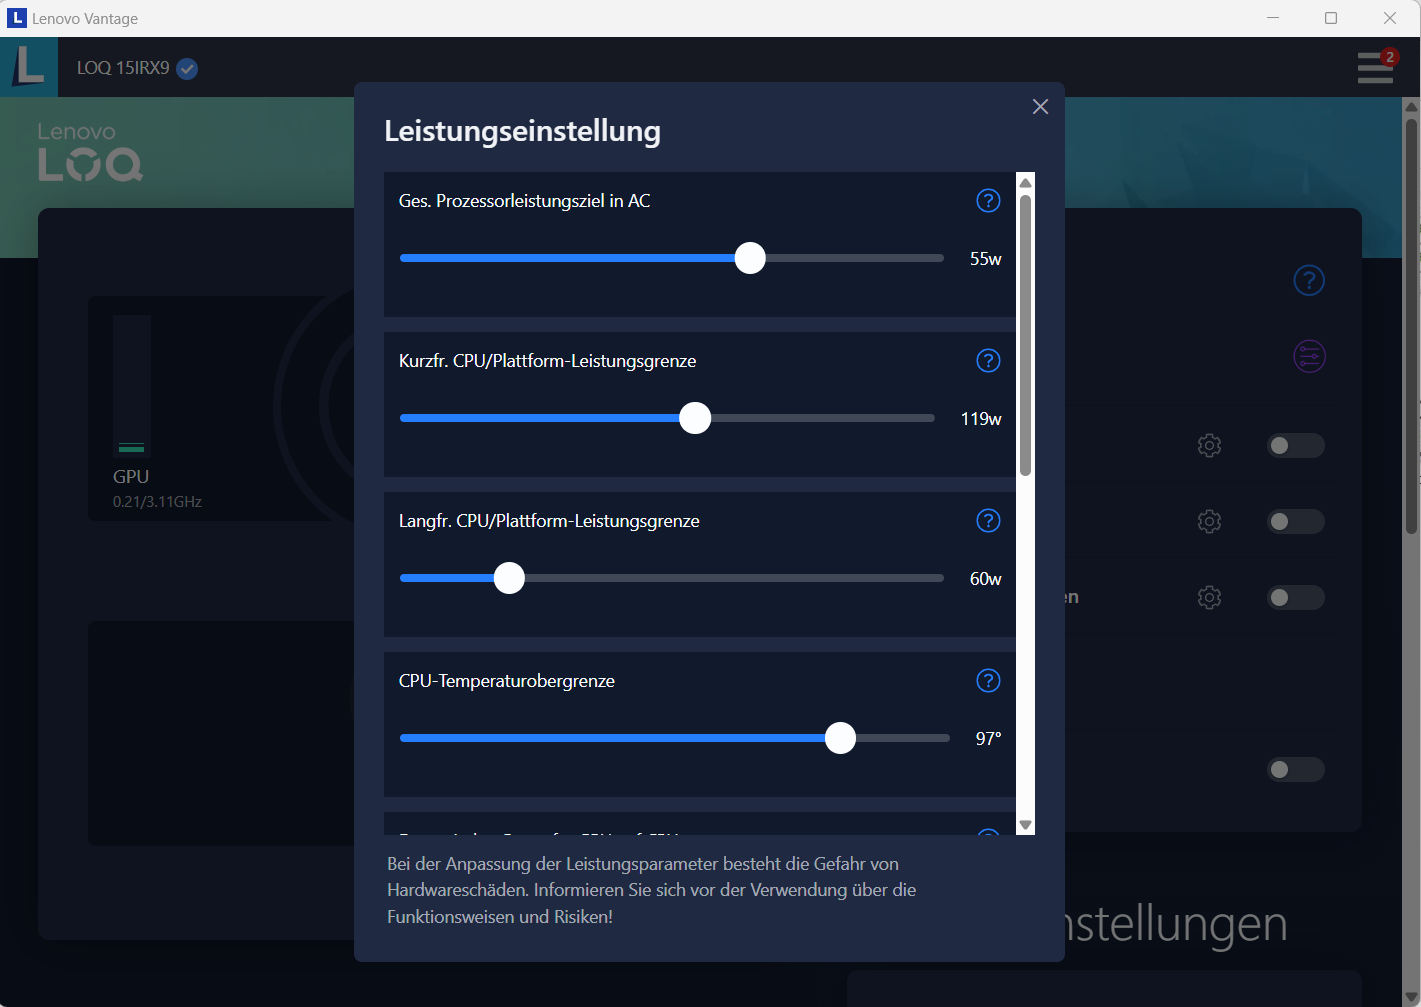
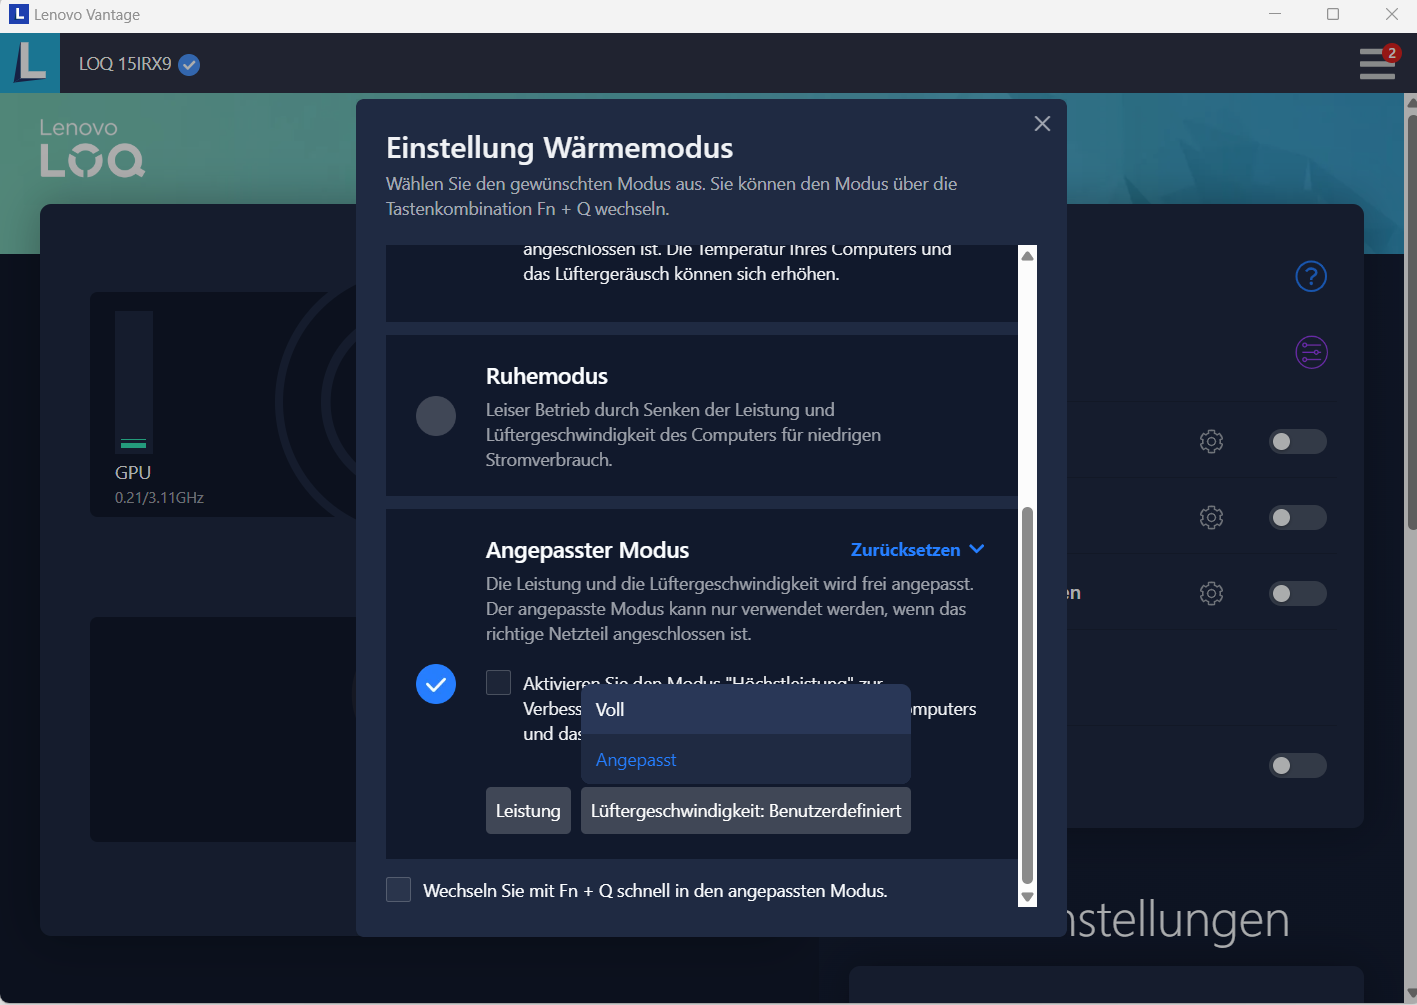
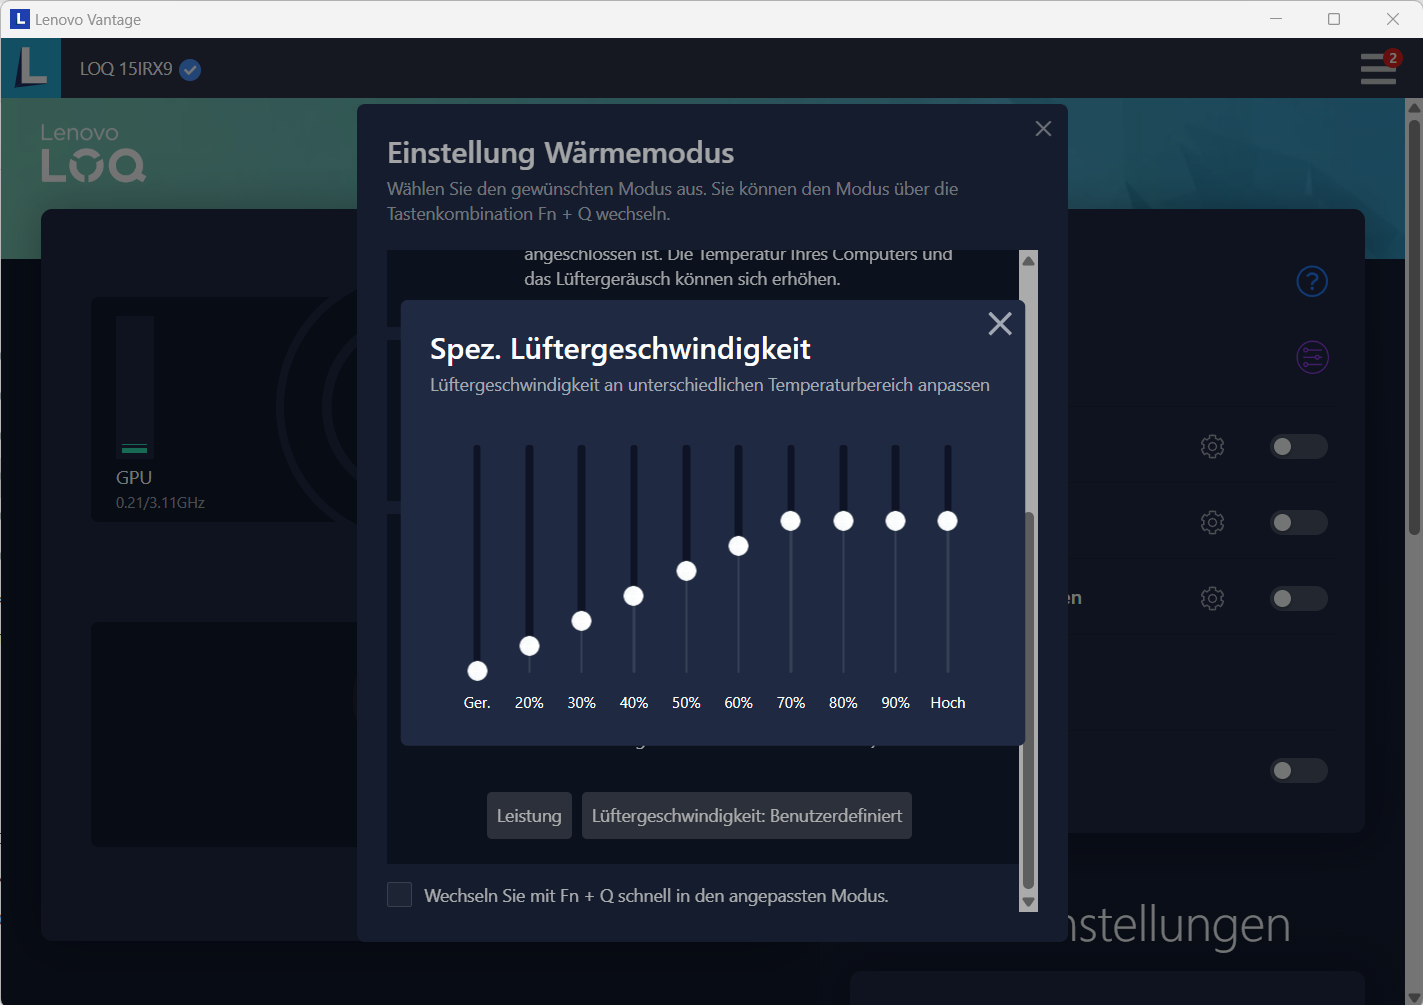
L'ordinateur portable offre trois modes de performance spécifiques au fabricant (voir tableau), entre lesquels vous pouvez basculer à l'aide de la combinaison de touches "Fn" + "Q". Nous avons utilisé les modes équilibré (benchmarks) et silencieux (test de batterie).
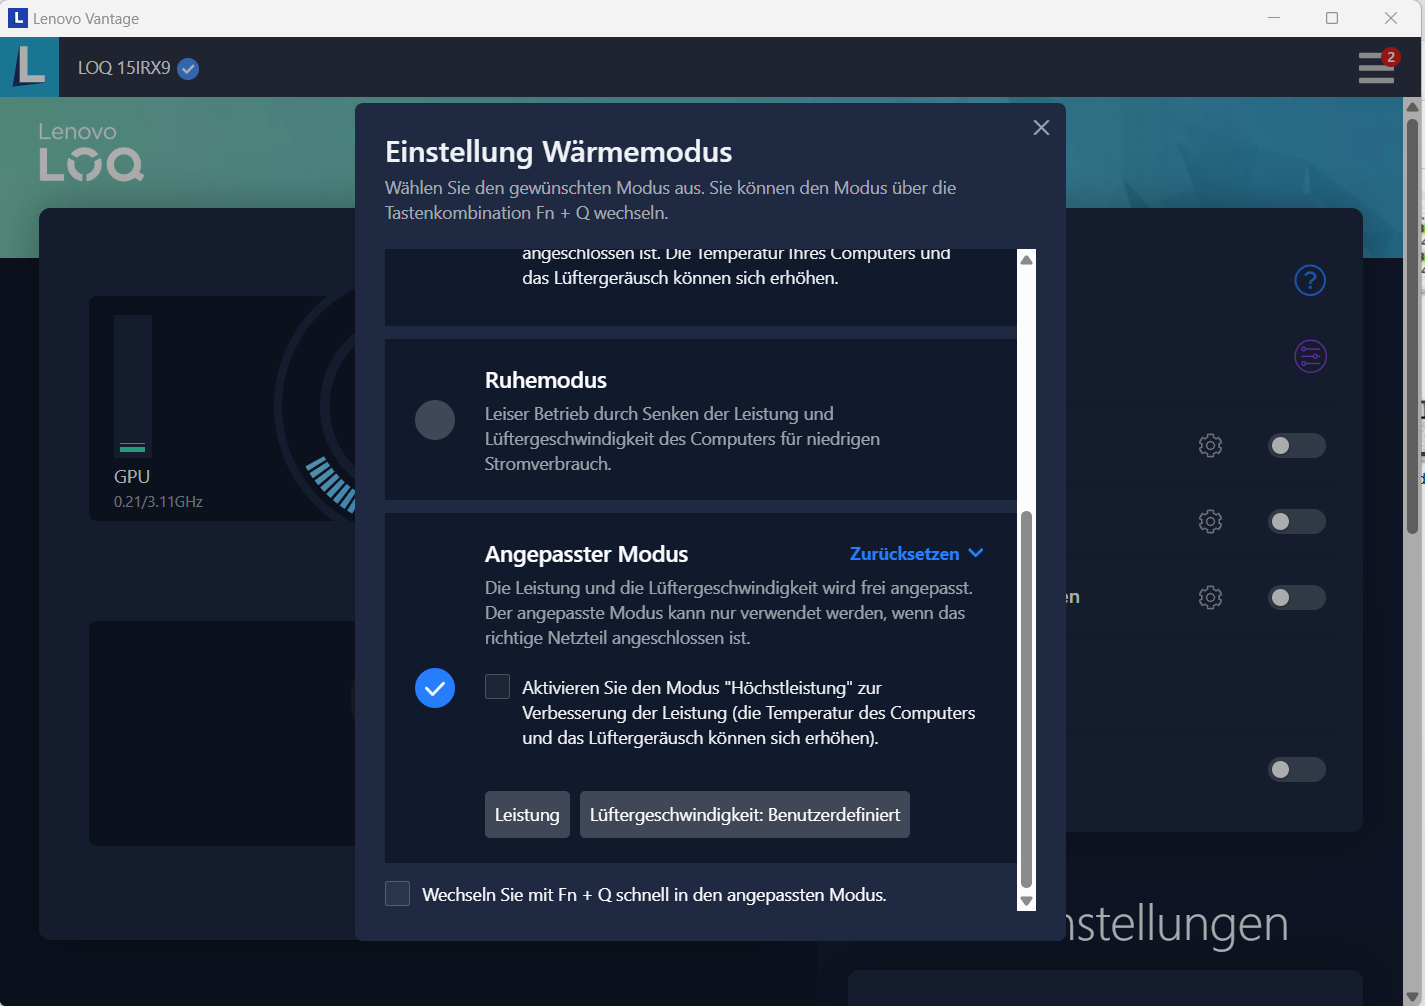
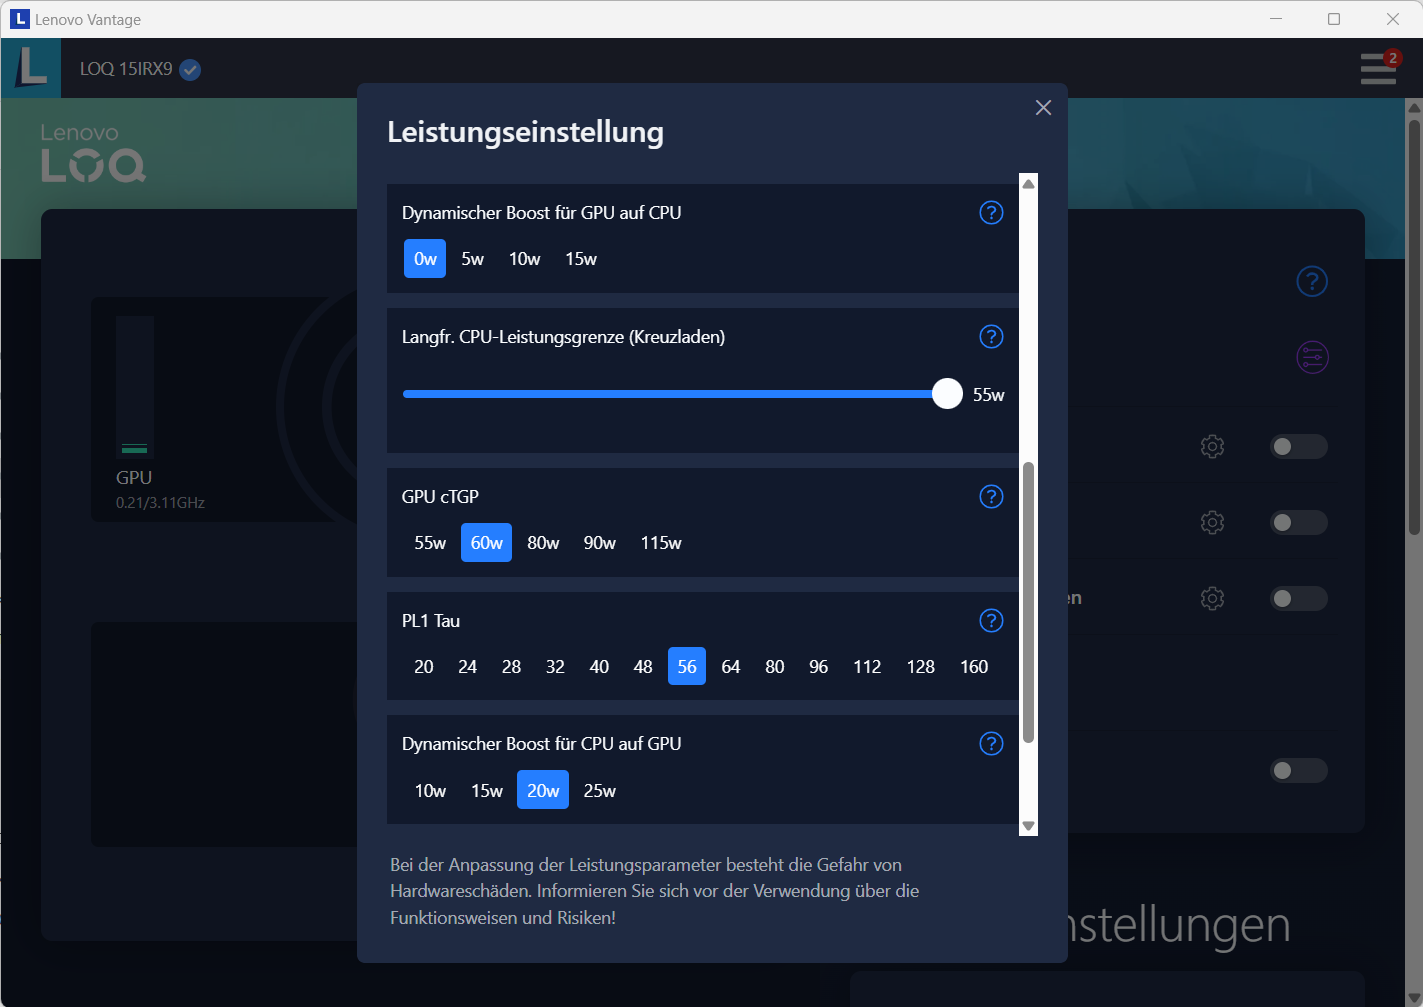
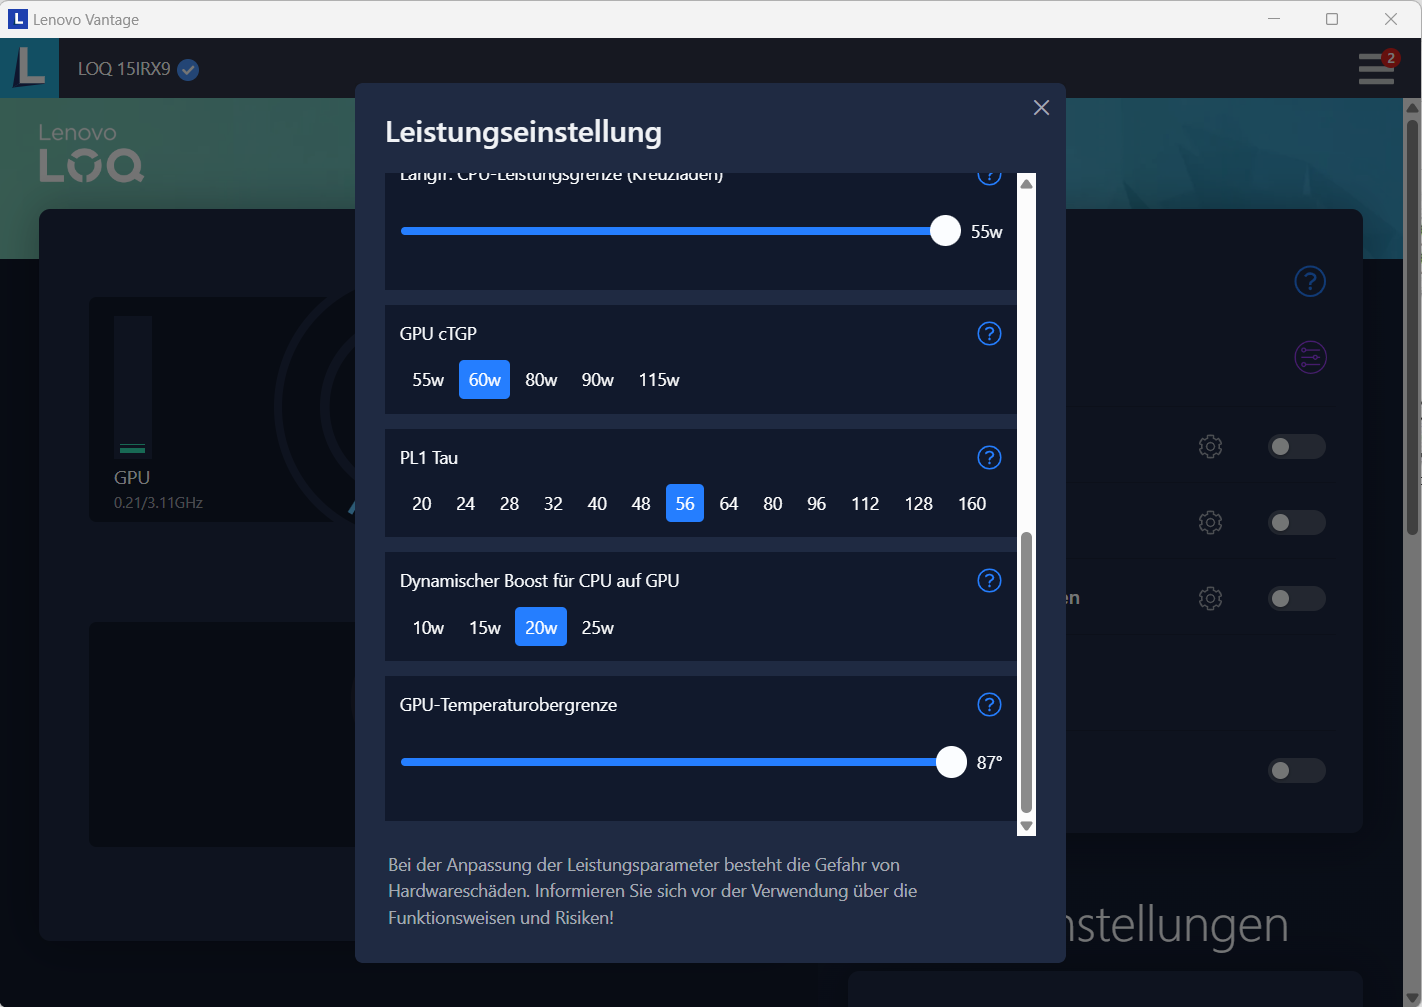
Un quatrième mode(personnalisé) peut être sélectionné via Lenovo Vantage (centre de contrôle de l'ordinateur portable). Il permet de régler individuellement les paramètres de performance du processeur (Power Limit) ou du GPU (TGP, Dynamic Boost, limite de température) ainsi que la vitesse du ventilateur. Il est également possible d'overclocker le GPU et la mémoire graphique indépendamment du profil.
| Mode performance | Mode équilibré | Mode silencieux | |
|---|---|---|---|
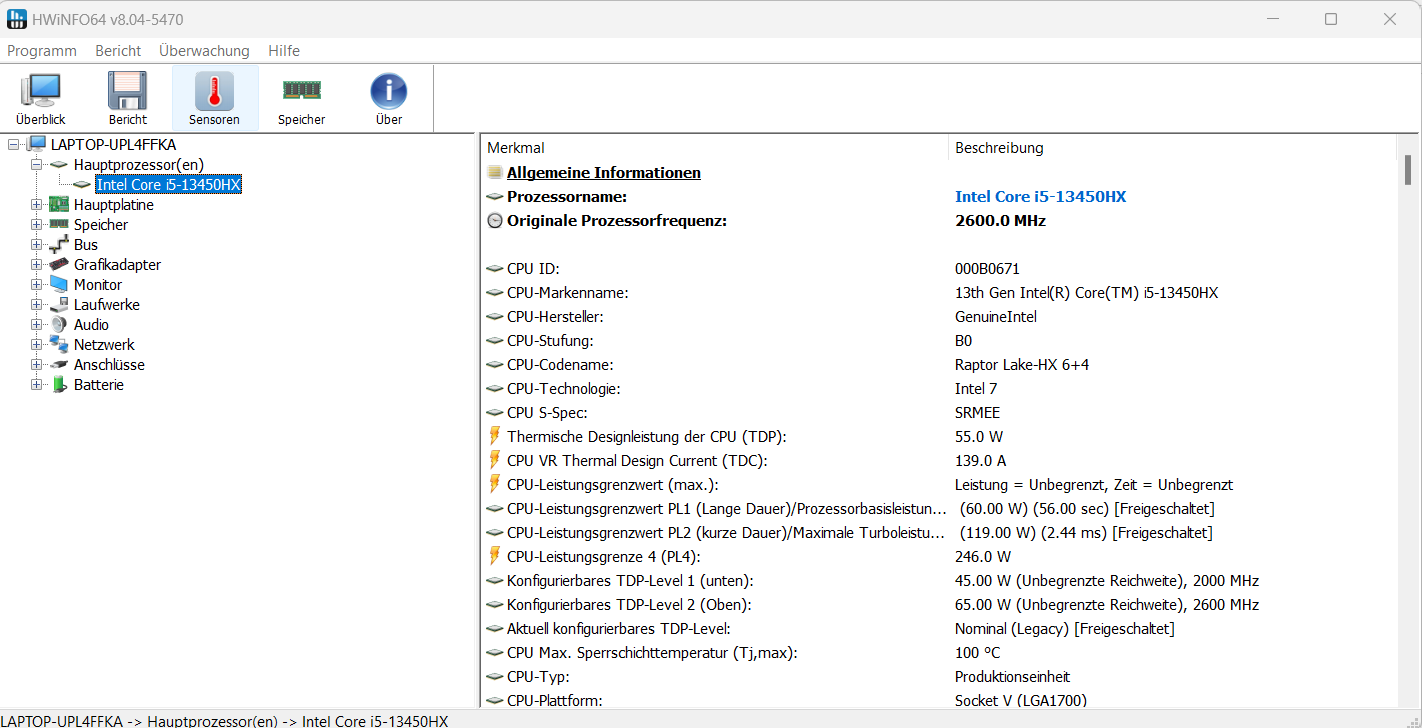
| Limite de puissance 1 (HWInfo) | 90 watts | 60 watts | 55 watts |
| Limite de puissance 2 (HWInfo) | 162 watts | 119 watts | 65 watts |
| Bruit (CP 2077 Phantom Liberty) | 54 dB(A) | 48 dB(A) | 39 dB(A) |
| Performance (CP 2077 Phantom Liberty) | 70 fps | 66 fps | 52 fps |
Processeur
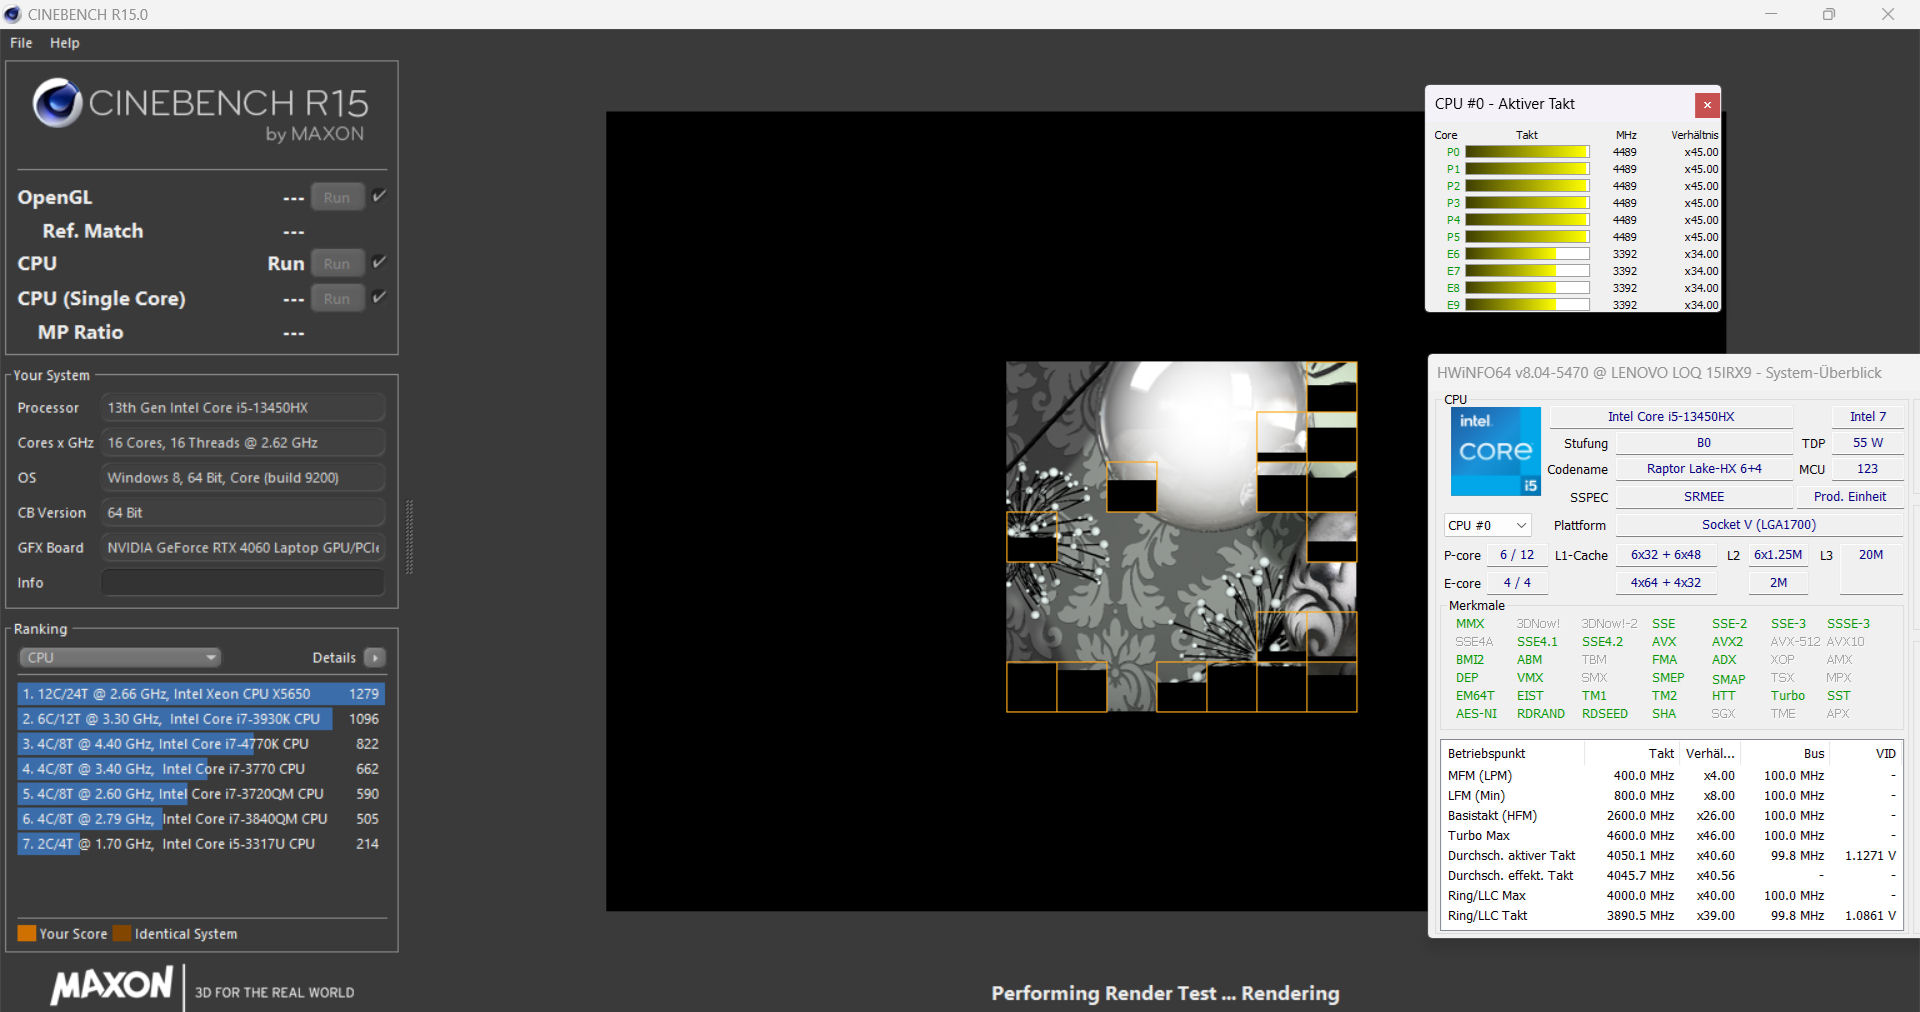
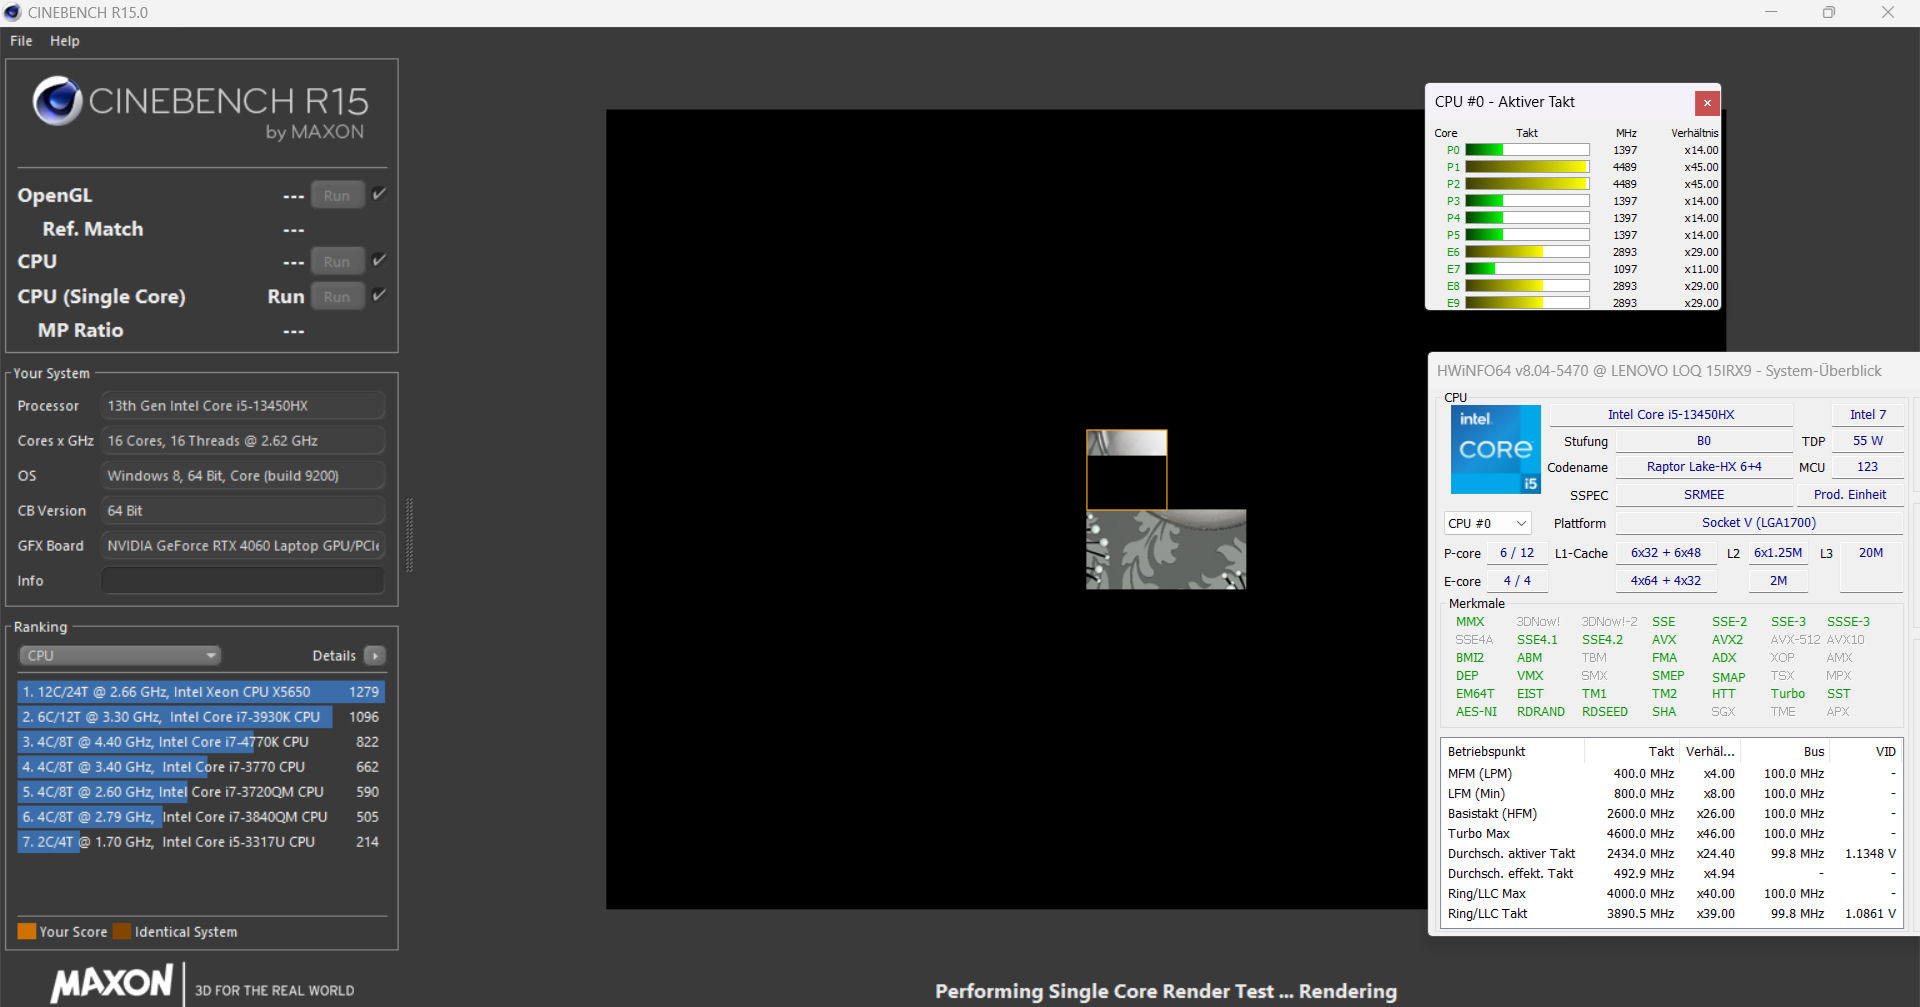
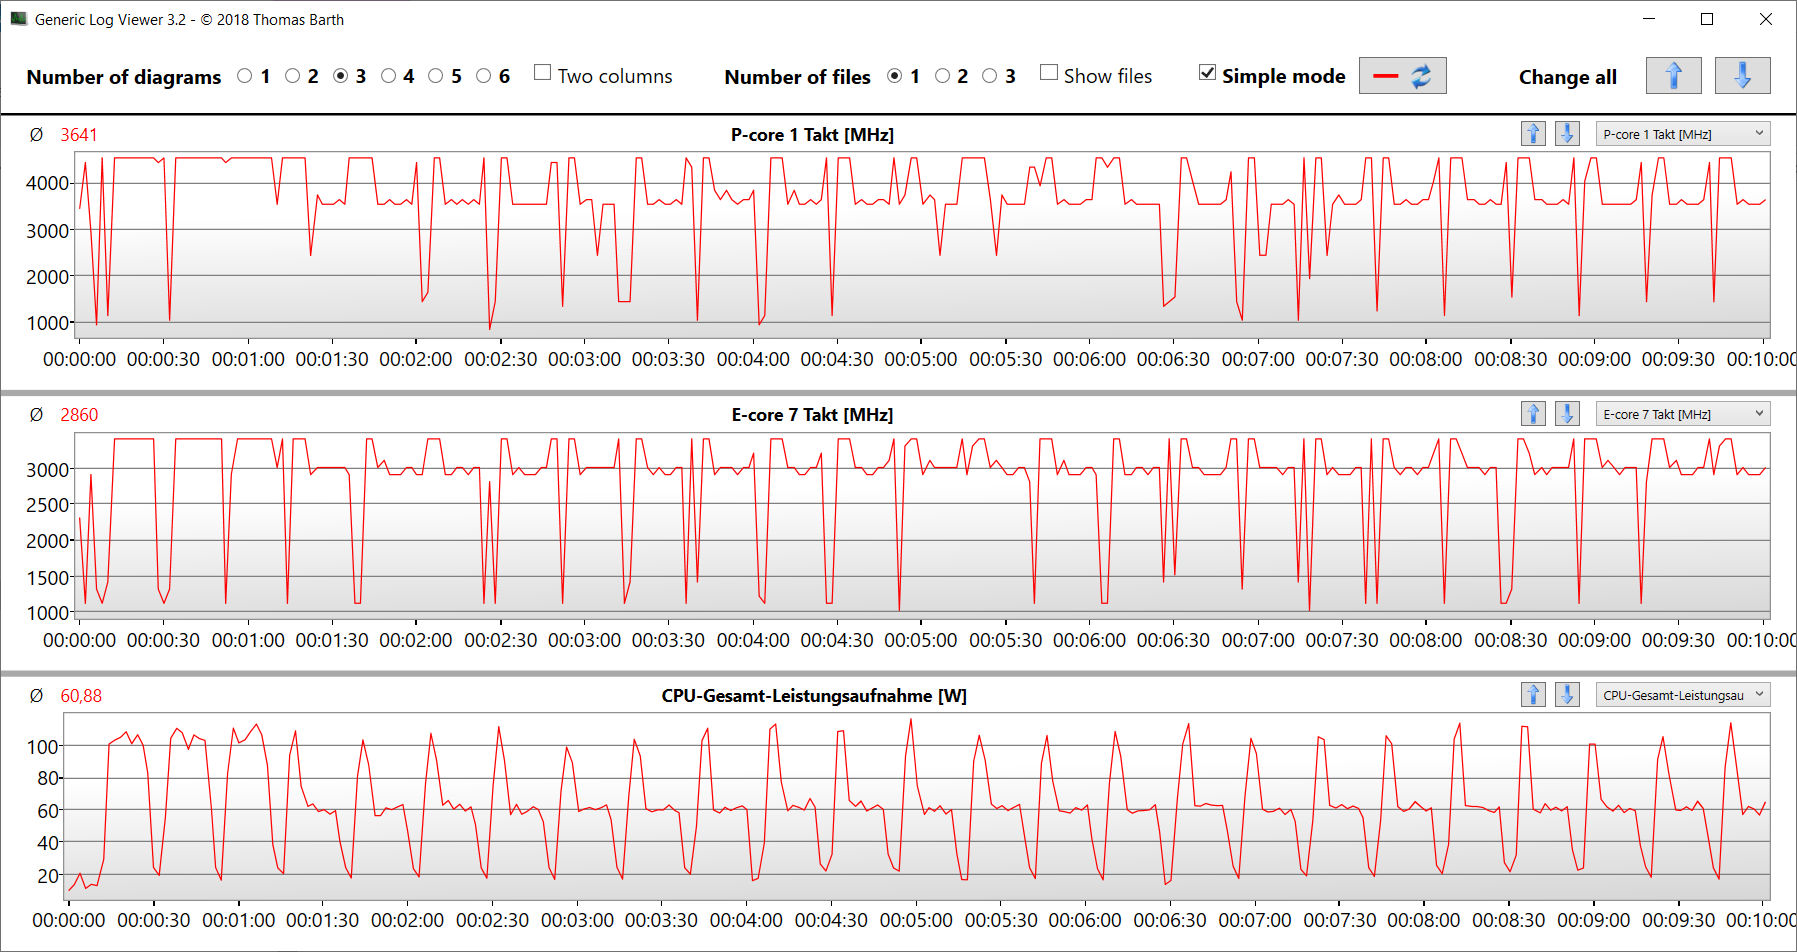
Le Core i5-13450HX(Raptor Lake) (6P + 4E = 16 threads) atteignent des fréquences maximales de 4,6 GHz (P) et 3,4 GHz (E). Une charge multithread continue (boucle CB15) a entraîné une baisse de la fréquence d'horloge du premier au quatrième essai( modeéquilibré ). Ensuite, elle est restée stable. Le mode Performance maintient la fréquence d'horloge à un niveau élevé en permanence.
Les résultats du benchmark sont conformes à nos attentes (modeéquilibré ), et le mode performance se traduit par un avantage (très faible). Dans le champ de comparaison, le Core i5 est le moins performant, car il possède le plus petit nombre de cœurs de calcul. Ce processeur est un choix judicieux pour un joueur à petit budget.
Cinebench R15 Multi continuous test
| CPU Performance Rating - Percent | |
| Moyenne de la classe Gaming | |
| HP Victus 16 (2024) | |
| SCHENKER XMG Core 15 (M24) | |
| Dell G16, i7-13650HX, RTX 4060 | |
| Gigabyte G6X 9KG (2024) | |
| Lenovo LOQ 15IRX9 | |
| Moyenne Intel Core i5-13450HX | |
| Lenovo LOQ 15IRX9 | |
| Cinebench R23 | |
| Multi Core | |
| HP Victus 16 (2024) | |
| Moyenne de la classe Gaming (5668 - 39652, n=151, 2 dernières années) | |
| Dell G16, i7-13650HX, RTX 4060 | |
| Gigabyte G6X 9KG (2024) | |
| SCHENKER XMG Core 15 (M24) | |
| Lenovo LOQ 15IRX9 (Leistungsmodus) | |
| Moyenne Intel Core i5-13450HX (16575 - 17234, n=3) | |
| Lenovo LOQ 15IRX9 | |
| Single Core | |
| Dell G16, i7-13650HX, RTX 4060 | |
| Moyenne de la classe Gaming (1136 - 2252, n=151, 2 dernières années) | |
| Gigabyte G6X 9KG (2024) | |
| SCHENKER XMG Core 15 (M24) | |
| Lenovo LOQ 15IRX9 (Leistungsmodus) | |
| Moyenne Intel Core i5-13450HX (1710 - 1766, n=3) | |
| Lenovo LOQ 15IRX9 | |
| HP Victus 16 (2024) | |
| Cinebench R20 | |
| CPU (Multi Core) | |
| HP Victus 16 (2024) | |
| Moyenne de la classe Gaming (2179 - 15517, n=151, 2 dernières années) | |
| Dell G16, i7-13650HX, RTX 4060 | |
| Gigabyte G6X 9KG (2024) | |
| SCHENKER XMG Core 15 (M24) | |
| Lenovo LOQ 15IRX9 (Leistungsmodus) | |
| Moyenne Intel Core i5-13450HX (6489 - 6595, n=3) | |
| Lenovo LOQ 15IRX9 | |
| CPU (Single Core) | |
| Moyenne de la classe Gaming (439 - 866, n=151, 2 dernières années) | |
| Dell G16, i7-13650HX, RTX 4060 | |
| Gigabyte G6X 9KG (2024) | |
| SCHENKER XMG Core 15 (M24) | |
| Lenovo LOQ 15IRX9 (Leistungsmodus) | |
| Moyenne Intel Core i5-13450HX (652 - 680, n=3) | |
| Lenovo LOQ 15IRX9 | |
| HP Victus 16 (2024) | |
| Cinebench R15 | |
| CPU Multi 64Bit | |
| HP Victus 16 (2024) | |
| Moyenne de la classe Gaming (905 - 6074, n=154, 2 dernières années) | |
| Dell G16, i7-13650HX, RTX 4060 | |
| SCHENKER XMG Core 15 (M24) | |
| Gigabyte G6X 9KG (2024) | |
| Lenovo LOQ 15IRX9 (Leistungsmodus) | |
| Lenovo LOQ 15IRX9 | |
| Moyenne Intel Core i5-13450HX (2427 - 2505, n=3) | |
| CPU Single 64Bit | |
| SCHENKER XMG Core 15 (M24) | |
| Moyenne de la classe Gaming (191.9 - 343, n=151, 2 dernières années) | |
| Dell G16, i7-13650HX, RTX 4060 | |
| Gigabyte G6X 9KG (2024) | |
| Lenovo LOQ 15IRX9 (Leistungsmodus) | |
| Moyenne Intel Core i5-13450HX (239 - 251, n=3) | |
| Lenovo LOQ 15IRX9 | |
| HP Victus 16 (2024) | |
| Blender - v2.79 BMW27 CPU | |
| Lenovo LOQ 15IRX9 | |
| Gigabyte G6X 9KG (2024) | |
| Moyenne Intel Core i5-13450HX (196 - 229, n=3) | |
| Lenovo LOQ 15IRX9 (Leistungsmodus) | |
| SCHENKER XMG Core 15 (M24) | |
| Moyenne de la classe Gaming (81 - 555, n=144, 2 dernières années) | |
| HP Victus 16 (2024) | |
| Dell G16, i7-13650HX, RTX 4060 | |
| Geekbench 6.4 | |
| Multi-Core | |
| HP Victus 16 (2024) (6.2.1) | |
| Moyenne de la classe Gaming (5340 - 21668, n=119, 2 dernières années) | |
| SCHENKER XMG Core 15 (M24) (6.2.1) | |
| Dell G16, i7-13650HX, RTX 4060 (6.2.1) | |
| Gigabyte G6X 9KG (2024) (6.2.1) | |
| Lenovo LOQ 15IRX9 (6.2.1, Leistungsmodus) | |
| Moyenne Intel Core i5-13450HX (12619 - 12799, n=3) | |
| Lenovo LOQ 15IRX9 (6.2.1) | |
| Single-Core | |
| SCHENKER XMG Core 15 (M24) (6.2.1) | |
| Moyenne de la classe Gaming (1490 - 3219, n=119, 2 dernières années) | |
| Dell G16, i7-13650HX, RTX 4060 (6.2.1) | |
| Gigabyte G6X 9KG (2024) (6.2.1) | |
| Lenovo LOQ 15IRX9 (6.2.1, Leistungsmodus) | |
| Moyenne Intel Core i5-13450HX (2381 - 2448, n=3) | |
| Lenovo LOQ 15IRX9 (6.2.1) | |
| HP Victus 16 (2024) (6.2.1) | |
| Geekbench 5.5 | |
| Multi-Core | |
| HP Victus 16 (2024) | |
| Moyenne de la classe Gaming (4557 - 25855, n=148, 2 dernières années) | |
| Gigabyte G6X 9KG (2024) | |
| SCHENKER XMG Core 15 (M24) | |
| Dell G16, i7-13650HX, RTX 4060 | |
| Lenovo LOQ 15IRX9 | |
| Moyenne Intel Core i5-13450HX (11973 - 12022, n=3) | |
| Lenovo LOQ 15IRX9 (Leistungsmodus) | |
| Single-Core | |
| SCHENKER XMG Core 15 (M24) | |
| Moyenne de la classe Gaming (986 - 2423, n=148, 2 dernières années) | |
| Dell G16, i7-13650HX, RTX 4060 | |
| Gigabyte G6X 9KG (2024) | |
| Lenovo LOQ 15IRX9 (Leistungsmodus) | |
| Moyenne Intel Core i5-13450HX (1696 - 1763, n=3) | |
| HP Victus 16 (2024) | |
| Lenovo LOQ 15IRX9 | |
| HWBOT x265 Benchmark v2.2 - 4k Preset | |
| Moyenne de la classe Gaming (6.72 - 42.9, n=148, 2 dernières années) | |
| SCHENKER XMG Core 15 (M24) | |
| HP Victus 16 (2024) | |
| Lenovo LOQ 15IRX9 (Leistungsmodus) | |
| Dell G16, i7-13650HX, RTX 4060 | |
| Gigabyte G6X 9KG (2024) | |
| Moyenne Intel Core i5-13450HX (16.9 - 20.5, n=3) | |
| Lenovo LOQ 15IRX9 | |
| LibreOffice - 20 Documents To PDF | |
| Moyenne Intel Core i5-13450HX (49.5 - 96.6, n=3) | |
| Lenovo LOQ 15IRX9 (6.3.4.2) | |
| HP Victus 16 (2024) (6.3.4.2) | |
| Dell G16, i7-13650HX, RTX 4060 (6.3.4.2) | |
| Lenovo LOQ 15IRX9 (6.3.4.2, Leistungsmodus) | |
| SCHENKER XMG Core 15 (M24) (6.3.4.2) | |
| Moyenne de la classe Gaming (19 - 96.6, n=147, 2 dernières années) | |
| Gigabyte G6X 9KG (2024) (6.3.4.2) | |
| R Benchmark 2.5 - Overall mean | |
| HP Victus 16 (2024) | |
| Lenovo LOQ 15IRX9 | |
| Moyenne Intel Core i5-13450HX (0.4582 - 0.4838, n=3) | |
| Lenovo LOQ 15IRX9 (Leistungsmodus) | |
| Moyenne de la classe Gaming (0.3609 - 0.759, n=150, 2 dernières années) | |
| Gigabyte G6X 9KG (2024) | |
| SCHENKER XMG Core 15 (M24) | |
| Dell G16, i7-13650HX, RTX 4060 | |
| Dell G16, i7-13650HX, RTX 4060 | |
* ... Moindre est la valeur, meilleures sont les performances
AIDA64: FP32 Ray-Trace | FPU Julia | CPU SHA3 | CPU Queen | FPU SinJulia | FPU Mandel | CPU AES | CPU ZLib | FP64 Ray-Trace | CPU PhotoWorxx
| Performance Rating | |
| SCHENKER XMG Core 15 (M24) | |
| Moyenne de la classe Gaming | |
| Dell G16, i7-13650HX, RTX 4060 | |
| HP Victus 16 (2024) | |
| Lenovo LOQ 15IRX9 | |
| Moyenne Intel Core i5-13450HX | |
| Gigabyte G6X 9KG (2024) | |
| Lenovo LOQ 15IRX9 | |
| AIDA64 / FP32 Ray-Trace | |
| SCHENKER XMG Core 15 (M24) (v6.92.6600) | |
| Moyenne de la classe Gaming (4986 - 81639, n=147, 2 dernières années) | |
| Dell G16, i7-13650HX, RTX 4060 (v6.92.6600) | |
| Lenovo LOQ 15IRX9 (v6.92.6600, Leistungsmodus) | |
| HP Victus 16 (2024) (v6.92.6600) | |
| Moyenne Intel Core i5-13450HX (13747 - 17767, n=3) | |
| Lenovo LOQ 15IRX9 (v6.92.6600) | |
| Gigabyte G6X 9KG (2024) (v6.92.6600) | |
| AIDA64 / FPU Julia | |
| SCHENKER XMG Core 15 (M24) (v6.92.6600) | |
| Moyenne de la classe Gaming (25360 - 252486, n=147, 2 dernières années) | |
| Dell G16, i7-13650HX, RTX 4060 (v6.92.6600) | |
| HP Victus 16 (2024) (v6.92.6600) | |
| Lenovo LOQ 15IRX9 (v6.92.6600, Leistungsmodus) | |
| Moyenne Intel Core i5-13450HX (71834 - 83862, n=3) | |
| Lenovo LOQ 15IRX9 (v6.92.6600) | |
| Gigabyte G6X 9KG (2024) (v6.92.6600) | |
| AIDA64 / CPU SHA3 | |
| SCHENKER XMG Core 15 (M24) (v6.92.6600) | |
| Moyenne de la classe Gaming (1339 - 10389, n=147, 2 dernières années) | |
| Dell G16, i7-13650HX, RTX 4060 (v6.92.6600) | |
| HP Victus 16 (2024) (v6.92.6600) | |
| Lenovo LOQ 15IRX9 (v6.92.6600) | |
| Lenovo LOQ 15IRX9 (v6.92.6600, Leistungsmodus) | |
| Moyenne Intel Core i5-13450HX (3519 - 3530, n=3) | |
| Gigabyte G6X 9KG (2024) (v6.92.6600) | |
| AIDA64 / CPU Queen | |
| HP Victus 16 (2024) (v6.92.6600) | |
| SCHENKER XMG Core 15 (M24) (v6.92.6600) | |
| Moyenne de la classe Gaming (50699 - 200651, n=147, 2 dernières années) | |
| Gigabyte G6X 9KG (2024) (v6.92.6600) | |
| Dell G16, i7-13650HX, RTX 4060 (v6.92.6600) | |
| Lenovo LOQ 15IRX9 (v6.92.6600) | |
| Moyenne Intel Core i5-13450HX (85888 - 86148, n=3) | |
| Lenovo LOQ 15IRX9 (v6.92.6600, Leistungsmodus) | |
| AIDA64 / FPU SinJulia | |
| SCHENKER XMG Core 15 (M24) (v6.92.6600) | |
| Moyenne de la classe Gaming (4800 - 32988, n=147, 2 dernières années) | |
| HP Victus 16 (2024) (v6.92.6600) | |
| Dell G16, i7-13650HX, RTX 4060 (v6.92.6600) | |
| Lenovo LOQ 15IRX9 (v6.92.6600, Leistungsmodus) | |
| Lenovo LOQ 15IRX9 (v6.92.6600) | |
| Moyenne Intel Core i5-13450HX (9325 - 9354, n=3) | |
| Gigabyte G6X 9KG (2024) (v6.92.6600) | |
| AIDA64 / FPU Mandel | |
| SCHENKER XMG Core 15 (M24) (v6.92.6600) | |
| Moyenne de la classe Gaming (12321 - 134044, n=147, 2 dernières années) | |
| Dell G16, i7-13650HX, RTX 4060 (v6.92.6600) | |
| Lenovo LOQ 15IRX9 (v6.92.6600, Leistungsmodus) | |
| HP Victus 16 (2024) (v6.92.6600) | |
| Moyenne Intel Core i5-13450HX (34956 - 42825, n=3) | |
| Lenovo LOQ 15IRX9 (v6.92.6600) | |
| Gigabyte G6X 9KG (2024) (v6.92.6600) | |
| AIDA64 / CPU AES | |
| Moyenne de la classe Gaming (19065 - 328679, n=147, 2 dernières années) | |
| SCHENKER XMG Core 15 (M24) (v6.92.6600) | |
| Dell G16, i7-13650HX, RTX 4060 (v6.92.6600) | |
| HP Victus 16 (2024) (v6.92.6600) | |
| Moyenne Intel Core i5-13450HX (70296 - 70680, n=3) | |
| Lenovo LOQ 15IRX9 (v6.92.6600) | |
| Lenovo LOQ 15IRX9 (v6.92.6600, Leistungsmodus) | |
| Gigabyte G6X 9KG (2024) (v6.92.6600) | |
| AIDA64 / CPU ZLib | |
| Moyenne de la classe Gaming (373 - 2531, n=147, 2 dernières années) | |
| Dell G16, i7-13650HX, RTX 4060 (v6.92.6600) | |
| HP Victus 16 (2024) (v6.92.6600) | |
| Gigabyte G6X 9KG (2024) (v6.92.6600) | |
| Lenovo LOQ 15IRX9 (v6.92.6600) | |
| Moyenne Intel Core i5-13450HX (977 - 1002, n=3) | |
| Lenovo LOQ 15IRX9 (v6.92.6600, Leistungsmodus) | |
| SCHENKER XMG Core 15 (M24) (v6.92.6600) | |
| AIDA64 / FP64 Ray-Trace | |
| SCHENKER XMG Core 15 (M24) (v6.92.6600) | |
| Moyenne de la classe Gaming (2540 - 43430, n=147, 2 dernières années) | |
| Dell G16, i7-13650HX, RTX 4060 (v6.92.6600) | |
| Lenovo LOQ 15IRX9 (v6.92.6600, Leistungsmodus) | |
| HP Victus 16 (2024) (v6.92.6600) | |
| Moyenne Intel Core i5-13450HX (7428 - 9561, n=3) | |
| Lenovo LOQ 15IRX9 (v6.92.6600) | |
| Gigabyte G6X 9KG (2024) (v6.92.6600) | |
| AIDA64 / CPU PhotoWorxx | |
| SCHENKER XMG Core 15 (M24) (v6.92.6600) | |
| Moyenne de la classe Gaming (10805 - 60161, n=147, 2 dernières années) | |
| HP Victus 16 (2024) (v6.92.6600) | |
| Gigabyte G6X 9KG (2024) (v6.92.6600) | |
| Lenovo LOQ 15IRX9 (v6.92.6600) | |
| Lenovo LOQ 15IRX9 (v6.92.6600, Leistungsmodus) | |
| Moyenne Intel Core i5-13450HX (36014 - 36764, n=3) | |
| Dell G16, i7-13650HX, RTX 4060 (v6.92.6600) | |
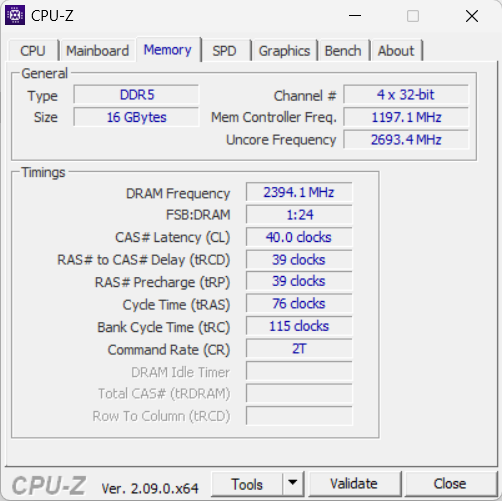
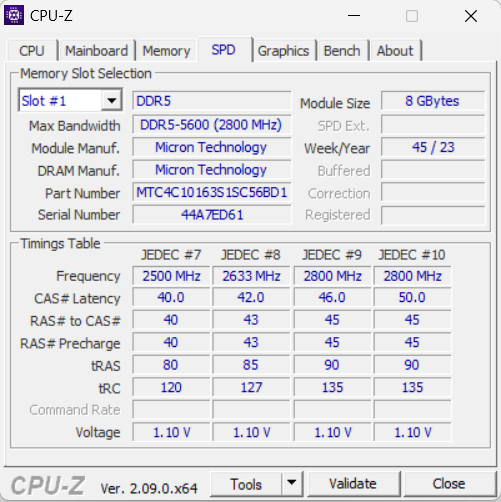
Performance du système
Ce système fluide ne manque pas de performances : l'ordinateur prend en charge les jeux, le rendu et la diffusion en continu sans aucun problème. Les taux de transfert de la RAM sont conformes à ce que l'on attend d'une RAM DDR5-5600.

CrossMark: Overall | Productivity | Creativity | Responsiveness
WebXPRT 3: Overall
WebXPRT 4: Overall
Mozilla Kraken 1.1: Total
| PCMark 10 / Score | |
| SCHENKER XMG Core 15 (M24) | |
| Moyenne de la classe Gaming (5776 - 9852, n=133, 2 dernières années) | |
| Gigabyte G6X 9KG (2024) | |
| HP Victus 16 (2024) | |
| Dell G16, i7-13650HX, RTX 4060 | |
| Lenovo LOQ 15IRX9 | |
| Moyenne Intel Core i5-13450HX, NVIDIA GeForce RTX 4060 Laptop GPU (n=1) | |
| PCMark 10 / Essentials | |
| HP Victus 16 (2024) | |
| Moyenne de la classe Gaming (9057 - 12600, n=133, 2 dernières années) | |
| Gigabyte G6X 9KG (2024) | |
| SCHENKER XMG Core 15 (M24) | |
| Dell G16, i7-13650HX, RTX 4060 | |
| Lenovo LOQ 15IRX9 | |
| Moyenne Intel Core i5-13450HX, NVIDIA GeForce RTX 4060 Laptop GPU (n=1) | |
| PCMark 10 / Productivity | |
| SCHENKER XMG Core 15 (M24) | |
| Gigabyte G6X 9KG (2024) | |
| Dell G16, i7-13650HX, RTX 4060 | |
| HP Victus 16 (2024) | |
| Moyenne de la classe Gaming (6662 - 14612, n=133, 2 dernières années) | |
| Lenovo LOQ 15IRX9 | |
| Moyenne Intel Core i5-13450HX, NVIDIA GeForce RTX 4060 Laptop GPU (n=1) | |
| PCMark 10 / Digital Content Creation | |
| SCHENKER XMG Core 15 (M24) | |
| Moyenne de la classe Gaming (6807 - 18475, n=133, 2 dernières années) | |
| Dell G16, i7-13650HX, RTX 4060 | |
| Gigabyte G6X 9KG (2024) | |
| Lenovo LOQ 15IRX9 | |
| Moyenne Intel Core i5-13450HX, NVIDIA GeForce RTX 4060 Laptop GPU (n=1) | |
| HP Victus 16 (2024) | |
| CrossMark / Overall | |
| Gigabyte G6X 9KG (2024) | |
| HP Victus 16 (2024) | |
| Moyenne de la classe Gaming (1247 - 2344, n=114, 2 dernières années) | |
| SCHENKER XMG Core 15 (M24) | |
| Dell G16, i7-13650HX, RTX 4060 | |
| Lenovo LOQ 15IRX9 | |
| Moyenne Intel Core i5-13450HX, NVIDIA GeForce RTX 4060 Laptop GPU (n=1) | |
| CrossMark / Productivity | |
| Gigabyte G6X 9KG (2024) | |
| Moyenne de la classe Gaming (1299 - 2204, n=114, 2 dernières années) | |
| SCHENKER XMG Core 15 (M24) | |
| HP Victus 16 (2024) | |
| Dell G16, i7-13650HX, RTX 4060 | |
| Lenovo LOQ 15IRX9 | |
| Moyenne Intel Core i5-13450HX, NVIDIA GeForce RTX 4060 Laptop GPU (n=1) | |
| CrossMark / Creativity | |
| HP Victus 16 (2024) | |
| SCHENKER XMG Core 15 (M24) | |
| Moyenne de la classe Gaming (1275 - 2660, n=114, 2 dernières années) | |
| Gigabyte G6X 9KG (2024) | |
| Dell G16, i7-13650HX, RTX 4060 | |
| Lenovo LOQ 15IRX9 | |
| Moyenne Intel Core i5-13450HX, NVIDIA GeForce RTX 4060 Laptop GPU (n=1) | |
| CrossMark / Responsiveness | |
| Gigabyte G6X 9KG (2024) | |
| HP Victus 16 (2024) | |
| Lenovo LOQ 15IRX9 | |
| Moyenne Intel Core i5-13450HX, NVIDIA GeForce RTX 4060 Laptop GPU (n=1) | |
| Moyenne de la classe Gaming (1030 - 2330, n=114, 2 dernières années) | |
| Dell G16, i7-13650HX, RTX 4060 | |
| SCHENKER XMG Core 15 (M24) | |
| WebXPRT 3 / Overall | |
| SCHENKER XMG Core 15 (M24) (Chrome 82) | |
| Gigabyte G6X 9KG (2024) (Chrome 82) | |
| Moyenne de la classe Gaming (215 - 480, n=127, 2 dernières années) | |
| HP Victus 16 (2024) (Chrome 82) | |
| Dell G16, i7-13650HX, RTX 4060 (Chrome 82) | |
| Lenovo LOQ 15IRX9 (Chrome 82) | |
| Moyenne Intel Core i5-13450HX, NVIDIA GeForce RTX 4060 Laptop GPU (n=1) | |
| WebXPRT 4 / Overall | |
| Moyenne de la classe Gaming (176.4 - 335, n=115, 2 dernières années) | |
| SCHENKER XMG Core 15 (M24) (Chrome 105.0.0.0) | |
| Gigabyte G6X 9KG (2024) (Chrome 105.0.0.0) | |
| HP Victus 16 (2024) (Chrome 105.0.0.0) | |
| Lenovo LOQ 15IRX9 (Chrome 105.0.0.0) | |
| Moyenne Intel Core i5-13450HX, NVIDIA GeForce RTX 4060 Laptop GPU (n=1) | |
| Mozilla Kraken 1.1 / Total | |
| Lenovo LOQ 15IRX9 (Chrome 82) | |
| Moyenne Intel Core i5-13450HX, NVIDIA GeForce RTX 4060 Laptop GPU (n=1) | |
| HP Victus 16 (2024) (Chrome 82) | |
| Gigabyte G6X 9KG (2024) (Chrome 82) | |
| Dell G16, i7-13650HX, RTX 4060 (Chrome 82) | |
| Moyenne de la classe Gaming (409 - 674, n=139, 2 dernières années) | |
| SCHENKER XMG Core 15 (M24) (Chrome 82) | |
* ... Moindre est la valeur, meilleures sont les performances
| PCMark 10 Score | 6929 points | |
Aide | ||
| AIDA64 / Memory Copy | |
| SCHENKER XMG Core 15 (M24) (v6.92.6600) | |
| HP Victus 16 (2024) (v6.92.6600) | |
| Moyenne de la classe Gaming (21750 - 97515, n=147, 2 dernières années) | |
| Gigabyte G6X 9KG (2024) (v6.92.6600) | |
| Dell G16, i7-13650HX, RTX 4060 (v6.92.6600) | |
| Moyenne Intel Core i5-13450HX (58673 - 58861, n=3) | |
| Lenovo LOQ 15IRX9 (v6.92.6600) | |
| AIDA64 / Memory Read | |
| HP Victus 16 (2024) (v6.92.6600) | |
| Moyenne de la classe Gaming (22956 - 102937, n=147, 2 dernières années) | |
| Gigabyte G6X 9KG (2024) (v6.92.6600) | |
| Lenovo LOQ 15IRX9 (v6.92.6600) | |
| Moyenne Intel Core i5-13450HX (66626 - 69024, n=3) | |
| Dell G16, i7-13650HX, RTX 4060 (v6.92.6600) | |
| SCHENKER XMG Core 15 (M24) (v6.92.6600) | |
| AIDA64 / Memory Write | |
| SCHENKER XMG Core 15 (M24) (v6.92.6600) | |
| Moyenne de la classe Gaming (22297 - 108954, n=147, 2 dernières années) | |
| HP Victus 16 (2024) (v6.92.6600) | |
| Gigabyte G6X 9KG (2024) (v6.92.6600) | |
| Lenovo LOQ 15IRX9 (v6.92.6600) | |
| Moyenne Intel Core i5-13450HX (58540 - 60196, n=3) | |
| Dell G16, i7-13650HX, RTX 4060 (v6.92.6600) | |
| AIDA64 / Memory Latency | |
| HP Victus 16 (2024) (v6.92.6600) | |
| Moyenne de la classe Gaming (59.5 - 259, n=147, 2 dernières années) | |
| Lenovo LOQ 15IRX9 (v6.92.6600) | |
| Moyenne Intel Core i5-13450HX (90 - 94.2, n=3) | |
| Dell G16, i7-13650HX, RTX 4060 (v6.92.6600) | |
| Gigabyte G6X 9KG (2024) (v6.92.6600) | |
| SCHENKER XMG Core 15 (M24) (v6.92.6600) | |
* ... Moindre est la valeur, meilleures sont les performances
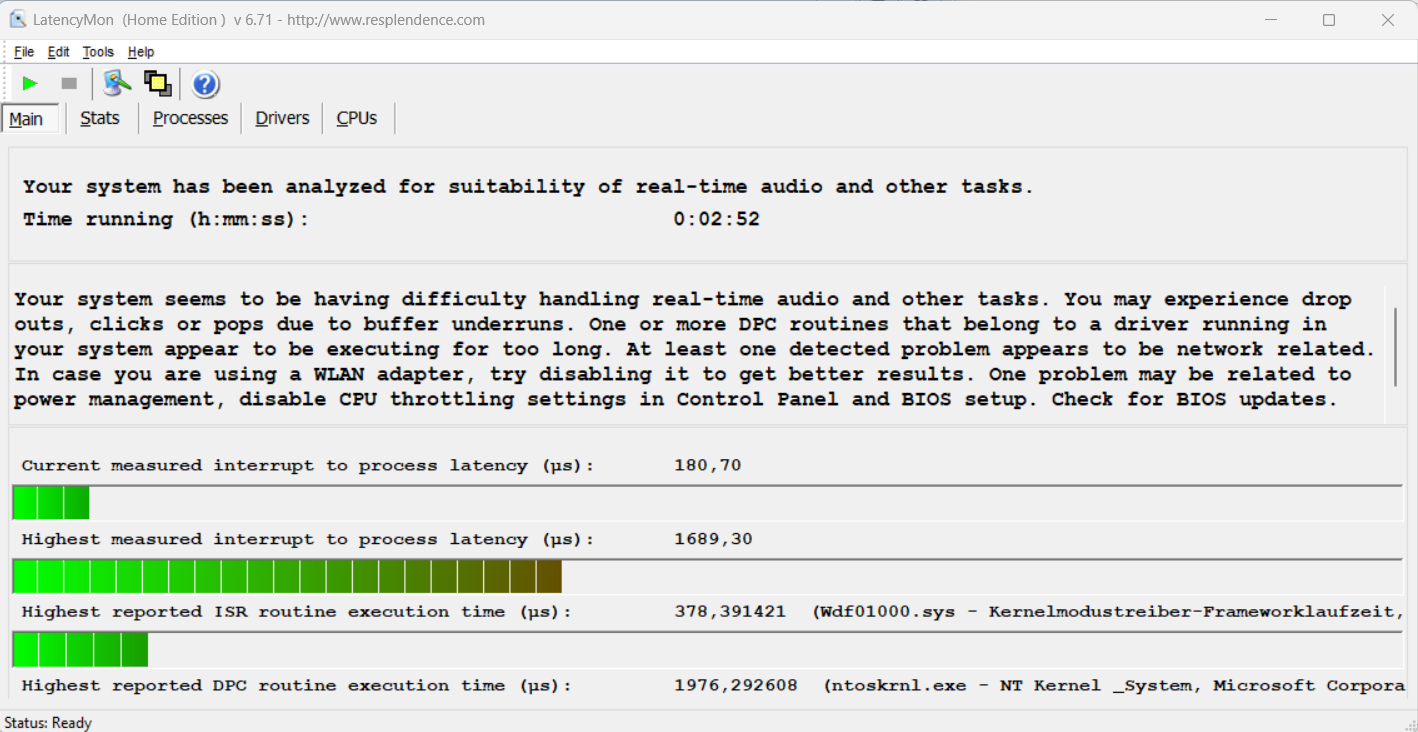
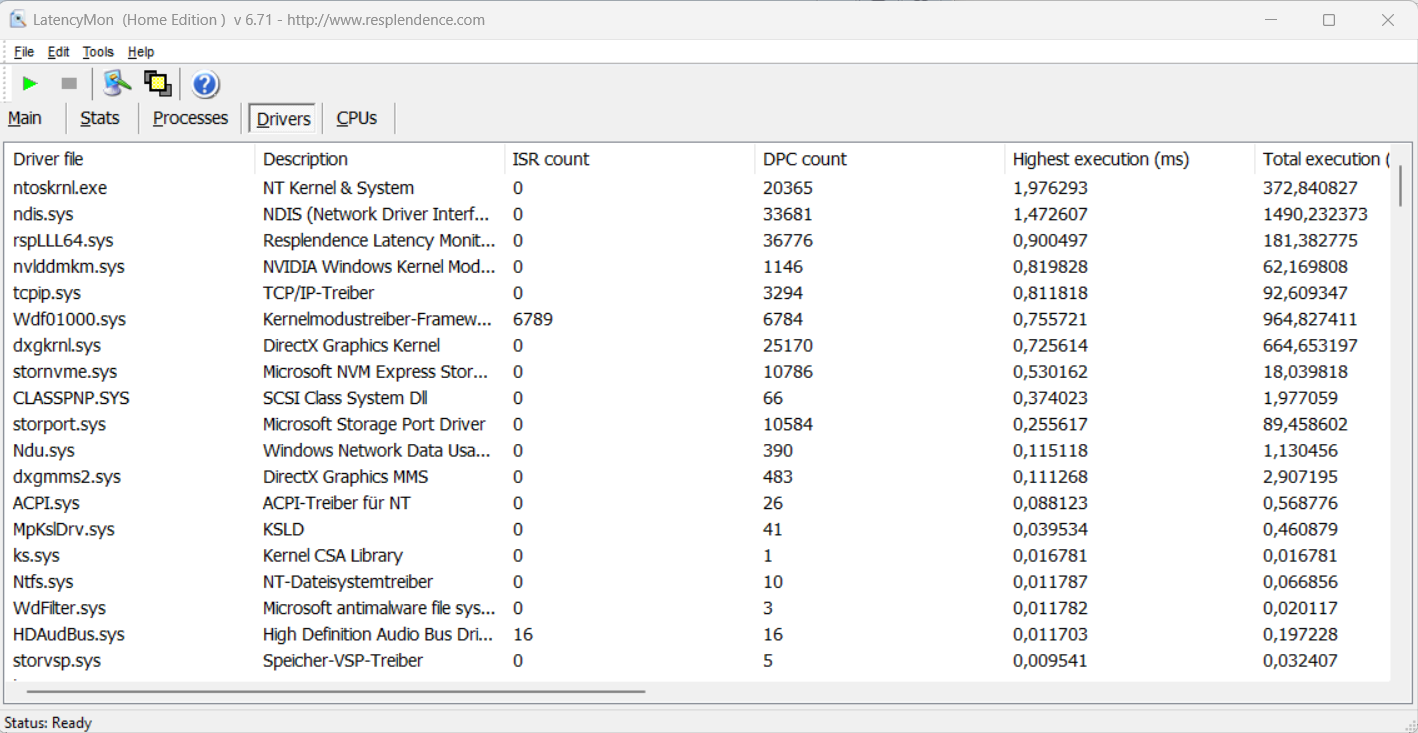
Latences DPC
Le test de latence standardisé (surf sur le web, lecture de vidéos 4k, Prime95 highload) a révélé quelques anomalies. Le système ne semble pas adapté à l'édition vidéo et audio en temps réel. De futures mises à jour logicielles pourraient apporter des améliorations, voire des détériorations.
| DPC Latencies / LatencyMon - interrupt to process latency (max), Web, Youtube, Prime95 | |
| Gigabyte G6X 9KG (2024) | |
| Lenovo LOQ 15IRX9 | |
| SCHENKER XMG Core 15 (M24) | |
| Dell G16, i7-13650HX, RTX 4060 | |
| HP Victus 16 (2024) | |
* ... Moindre est la valeur, meilleures sont les performances
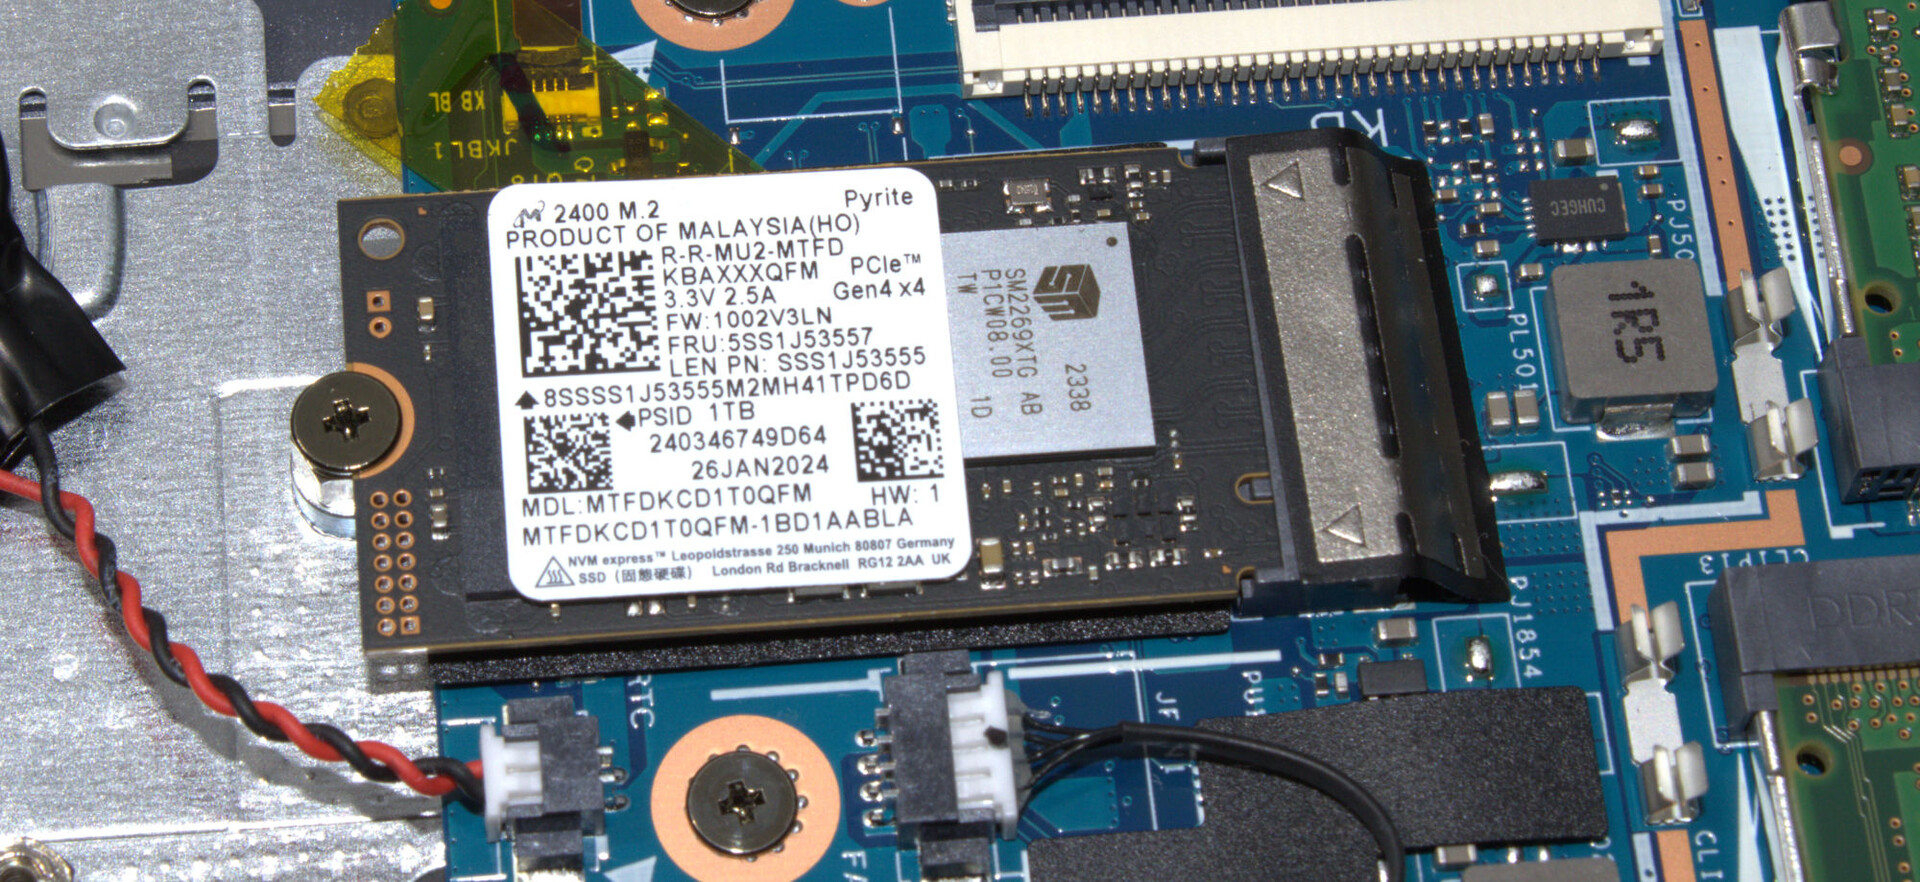
Dispositifs de stockage
Le LOQ peut accueillir au total deux SSD PCIe 4 (M.2 2280 ou M.2 2242). Le SSD Micron (1 TB, M.2 2242) dans notre appareil de test fournit de bons débits de données, mais il ne peut pas être classé parmi les modèles de SSD haut de gamme. Au cours de la boucle DiskSpd, nous avons constaté un certain étranglement dû à la chaleur.

* ... Moindre est la valeur, meilleures sont les performances
Reading continuous performance: DiskSpd Read Loop, Queue Depth 8
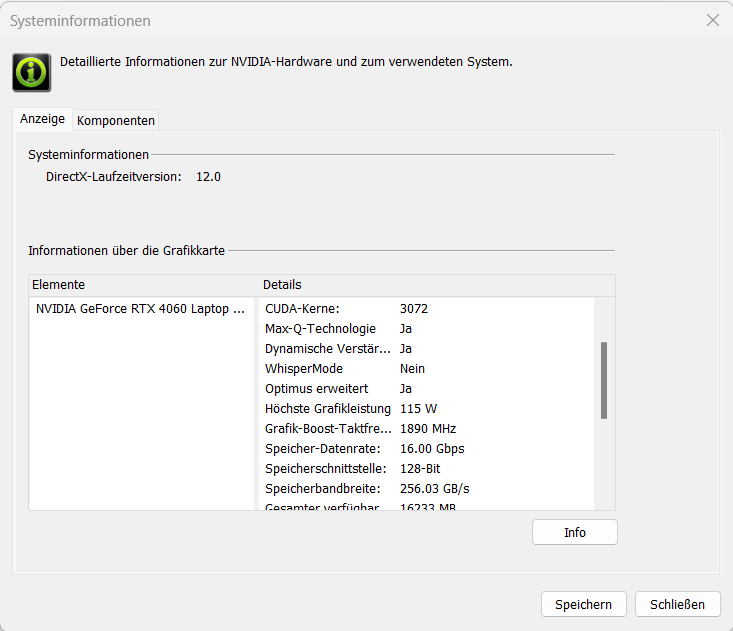
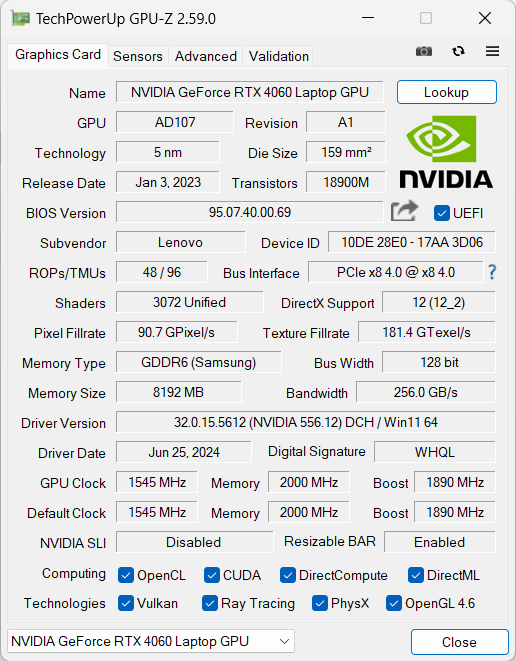
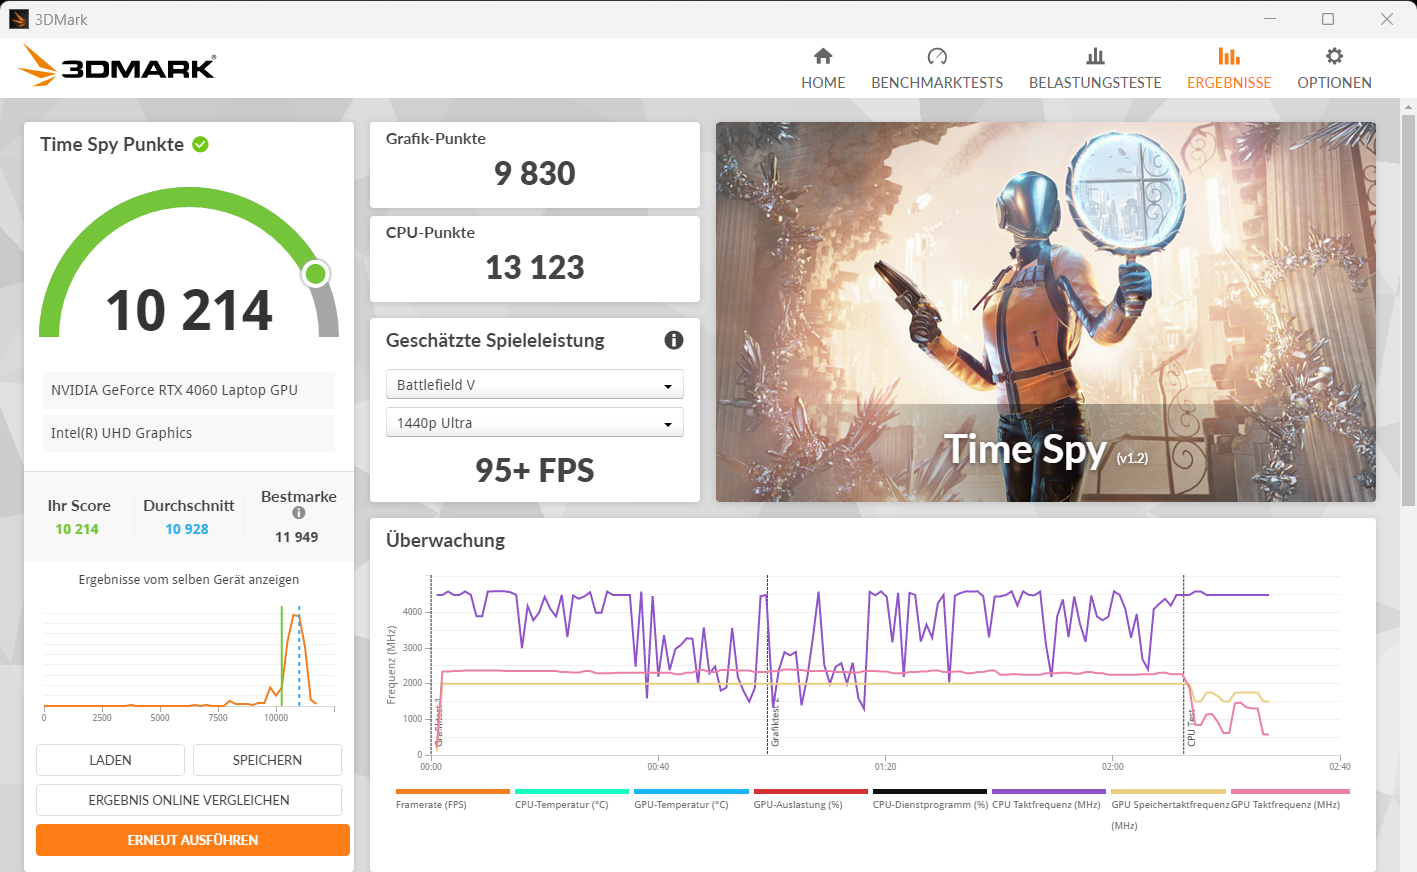
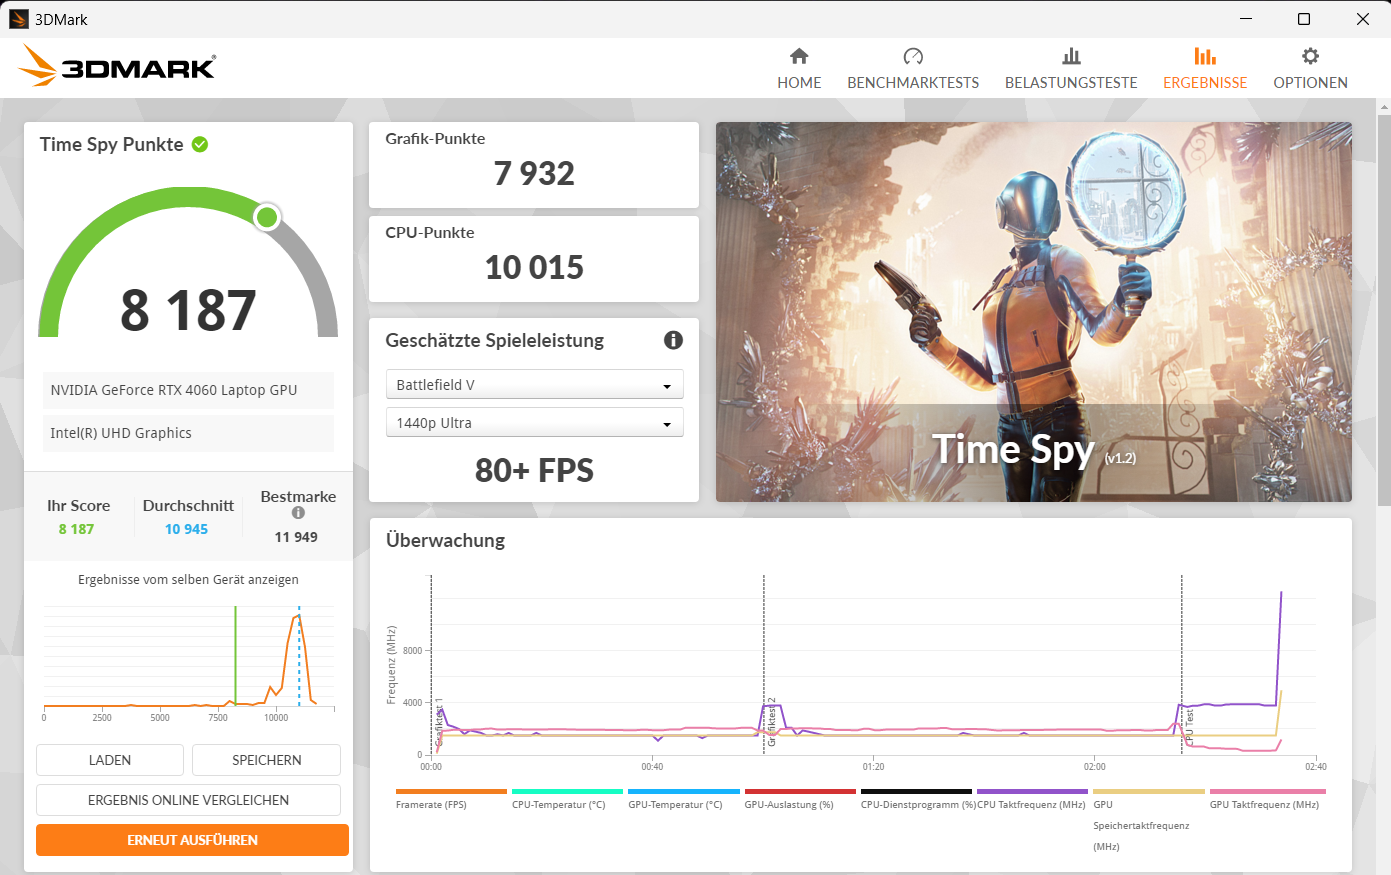
Carte graphique
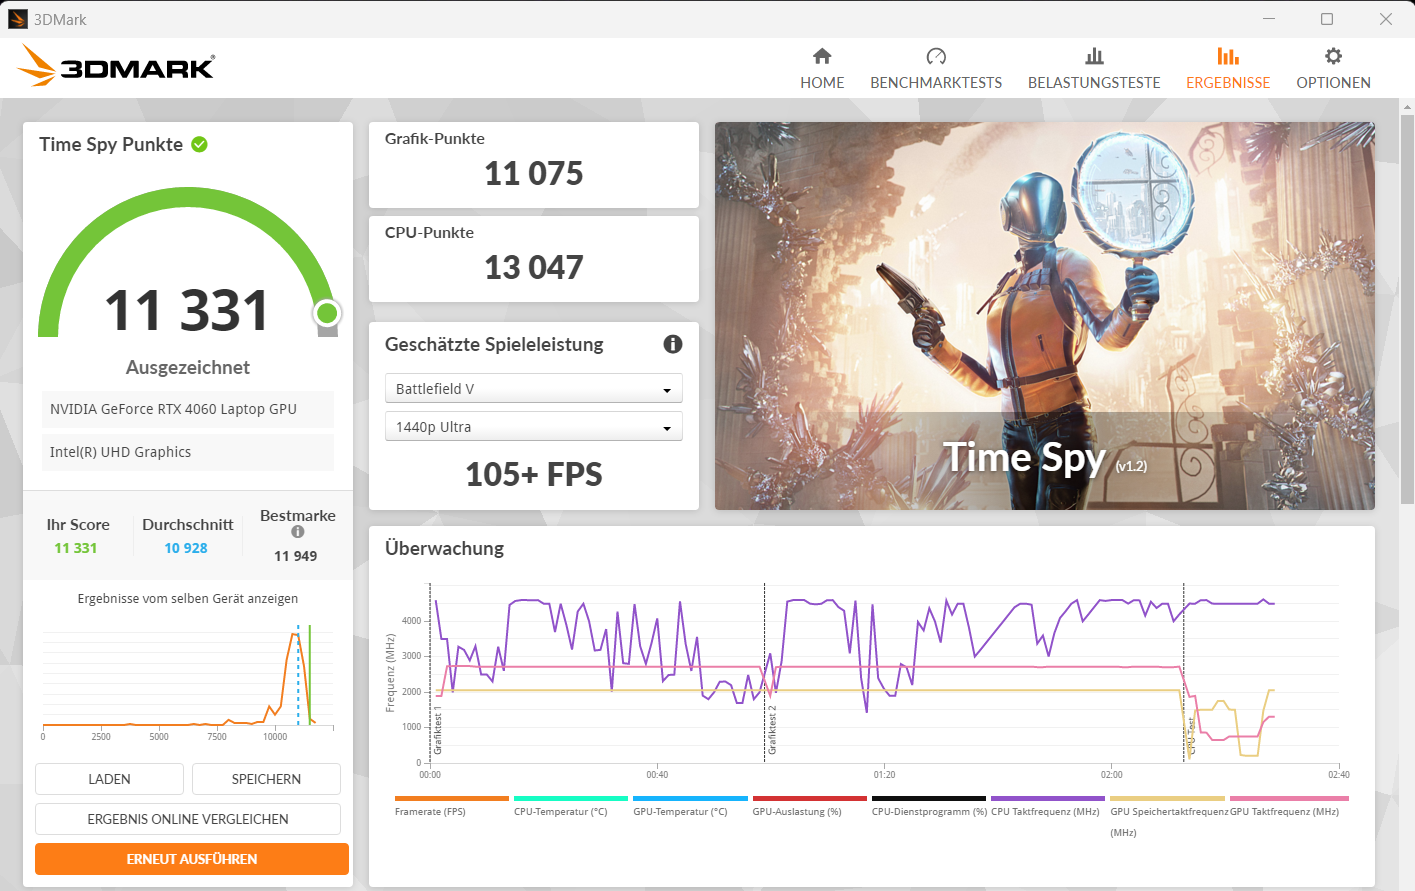
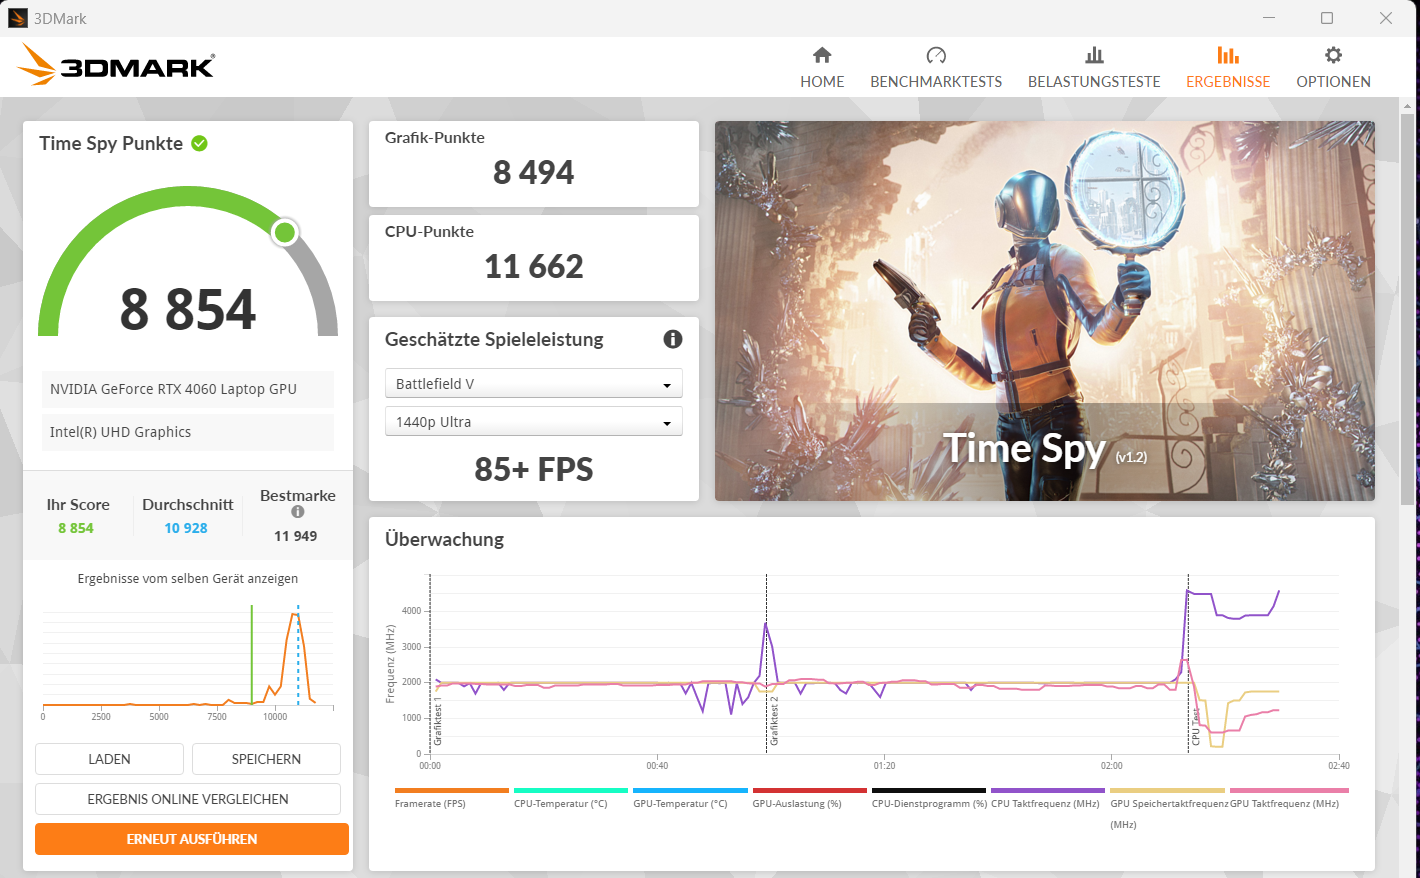
La GeForce RTX 4060 (3 072 shaders, bus 128 bits, 8 Go GDDR6, 115 watts) représente le milieu de gamme de la gamme actuelle de GPU mobiles de Nvidia. Il permet de jouer en FHD avec des paramètres élevés à maximaux. Les résultats des benchmarks et les taux de rafraîchissement sont à peu près équivalents à la moyenne de la RTX-4060( modeéquilibré ). Le mode Performance a permis d'améliorer les valeurs. Le passage du dGPU à l'Optimus ne nécessite pas de redémarrage : Advanced Optimus est pris en charge.
| 3DMark Performance Rating - Percent | |
| Moyenne de la classe Gaming | |
| SCHENKER XMG Core 15 (M24) | |
| Lenovo LOQ 15IRX9 | |
| Dell G16, i7-13650HX, RTX 4060 | |
| Lenovo LOQ 15IRX9 | |
| Gigabyte G6X 9KG (2024) | |
| HP Victus 16 (2024) | |
| Moyenne NVIDIA GeForce RTX 4060 Laptop GPU | |
| 3DMark 11 - 1280x720 Performance GPU | |
| Moyenne de la classe Gaming (10741 - 72178, n=143, 2 dernières années) | |
| SCHENKER XMG Core 15 (M24) | |
| Lenovo LOQ 15IRX9 (Leistungsmodus) | |
| Dell G16, i7-13650HX, RTX 4060 | |
| Lenovo LOQ 15IRX9 | |
| Gigabyte G6X 9KG (2024) | |
| HP Victus 16 (2024) | |
| Moyenne NVIDIA GeForce RTX 4060 Laptop GPU (28136 - 38912, n=57) | |
| 3DMark | |
| 1920x1080 Fire Strike Graphics | |
| Moyenne de la classe Gaming (2913 - 56116, n=155, 2 dernières années) | |
| SCHENKER XMG Core 15 (M24) | |
| Lenovo LOQ 15IRX9 (Leistungsmodus) | |
| Lenovo LOQ 15IRX9 | |
| Gigabyte G6X 9KG (2024) | |
| Dell G16, i7-13650HX, RTX 4060 | |
| HP Victus 16 (2024) | |
| Moyenne NVIDIA GeForce RTX 4060 Laptop GPU (20533 - 29656, n=54) | |
| 2560x1440 Time Spy Graphics | |
| Moyenne de la classe Gaming (2295 - 24599, n=151, 2 dernières années) | |
| SCHENKER XMG Core 15 (M24) | |
| Lenovo LOQ 15IRX9 (Leistungsmodus) | |
| Dell G16, i7-13650HX, RTX 4060 | |
| Moyenne NVIDIA GeForce RTX 4060 Laptop GPU (7484 - 11451, n=56) | |
| HP Victus 16 (2024) | |
| Gigabyte G6X 9KG (2024) | |
| Lenovo LOQ 15IRX9 | |
| 3DMark 11 Performance | 30755 points | |
| 3DMark Fire Strike Score | 22788 points | |
| 3DMark Time Spy Score | 10214 points | |
| 3DMark Steel Nomad Score | 2143 points | |
Aide | ||
| Geekbench 5.5 | |
| OpenCL Score | |
| Moyenne de la classe Gaming (5039 - 270235, n=150, 2 dernières années) | |
| SCHENKER XMG Core 15 (M24) | |
| Lenovo LOQ 15IRX9 (Leistungsmodus) | |
| Lenovo LOQ 15IRX9 | |
| Gigabyte G6X 9KG (2024) | |
| Dell G16, i7-13650HX, RTX 4060 | |
| HP Victus 16 (2024) | |
| Moyenne NVIDIA GeForce RTX 4060 Laptop GPU (5039 - 112238, n=53) | |
| Vulkan Score 5.5 | |
| SCHENKER XMG Core 15 (M24) | |
| Lenovo LOQ 15IRX9 (Leistungsmodus) | |
| Lenovo LOQ 15IRX9 | |
| Moyenne de la classe Gaming (9296 - 176078, n=103, 2 dernières années) | |
| Moyenne NVIDIA GeForce RTX 4060 Laptop GPU (28838 - 87612, n=31) | |
| HP Victus 16 (2024) | |
| Gigabyte G6X 9KG (2024) | |
| Geekbench 6.4 | |
| GPU OpenCL | |
| Moyenne de la classe Gaming (4321 - 234213, n=118, 2 dernières années) | |
| Gigabyte G6X 9KG (2024) (6.2.1) | |
| SCHENKER XMG Core 15 (M24) (6.2.1) | |
| HP Victus 16 (2024) (6.2.1) | |
| Dell G16, i7-13650HX, RTX 4060 (6.2.1) | |
| Lenovo LOQ 15IRX9 (6.2.1, Leistungsmodus) | |
| Lenovo LOQ 15IRX9 (6.2.1) | |
| Moyenne NVIDIA GeForce RTX 4060 Laptop GPU (4321 - 100831, n=40) | |
| GPU Vulkan | |
| SCHENKER XMG Core 15 (M24) (6.2.1) | |
| Lenovo LOQ 15IRX9 (6.2.1, Leistungsmodus) | |
| Gigabyte G6X 9KG (2024) (6.2.1) | |
| Lenovo LOQ 15IRX9 (6.2.1) | |
| HP Victus 16 (2024) (6.2.1) | |
| Moyenne de la classe Gaming (4286 - 231659, n=110, 2 dernières années) | |
| Moyenne NVIDIA GeForce RTX 4060 Laptop GPU (4286 - 101001, n=36) | |
| Dell G16, i7-13650HX, RTX 4060 (6.2.1) | |
| V-Ray 5 Benchmark | |
| GPU RTX | |
| Moyenne de la classe Gaming (556 - 4011, n=88, 2 dernières années) | |
| Gigabyte G6X 9KG (2024) (5.0.1) | |
| HP Victus 16 (2024) (5.0.1) | |
| Lenovo LOQ 15IRX9 (5.0.1, Leistungsmodus) | |
| Dell G16, i7-13650HX, RTX 4060 (5.0.1) | |
| Moyenne NVIDIA GeForce RTX 4060 Laptop GPU (1387 - 1817, n=28) | |
| Lenovo LOQ 15IRX9 (5.0.1) | |
| GPU CUDA | |
| Moyenne de la classe Gaming (300 - 3229, n=90, 2 dernières années) | |
| Lenovo LOQ 15IRX9 (5.0.1, Leistungsmodus) | |
| Gigabyte G6X 9KG (2024) (5.0.1) | |
| Lenovo LOQ 15IRX9 (5.0.1) | |
| HP Victus 16 (2024) (5.0.1) | |
| Moyenne NVIDIA GeForce RTX 4060 Laptop GPU (957 - 1294, n=29) | |
| Dell G16, i7-13650HX, RTX 4060 (5.0.1) | |
| CPU | |
| Moyenne de la classe Gaming (3562 - 30302, n=92, 2 dernières années) | |
| HP Victus 16 (2024) (5.0.1) | |
| Moyenne NVIDIA GeForce RTX 4060 Laptop GPU (8364 - 21065, n=28) | |
| Gigabyte G6X 9KG (2024) (5.0.1) | |
| Lenovo LOQ 15IRX9 (5.0.1, Leistungsmodus) | |
| Dell G16, i7-13650HX, RTX 4060 (5.0.1) | |
| Lenovo LOQ 15IRX9 (5.0.1) | |
| V-Ray Benchmark Next 4.10 | |
| GPU | |
| SCHENKER XMG Core 15 (M24) (v4.10.07 ) | |
| Moyenne de la classe Gaming (54 - 1317, n=122, 2 dernières années) | |
| Gigabyte G6X 9KG (2024) (v4.10.07 ) | |
| Lenovo LOQ 15IRX9 (v4.10.07, Leistungsmodus) | |
| Moyenne NVIDIA GeForce RTX 4060 Laptop GPU (483 - 715, n=46) | |
| HP Victus 16 (2024) (v4.10.07 ) | |
| Lenovo LOQ 15IRX9 (v4.10.07 ) | |
| CPU | |
| HP Victus 16 (2024) (v4.10.07 ) | |
| Moyenne de la classe Gaming (5413 - 44129, n=122, 2 dernières années) | |
| Moyenne NVIDIA GeForce RTX 4060 Laptop GPU (12680 - 32360, n=46) | |
| SCHENKER XMG Core 15 (M24) (v4.10.07 ) | |
| Gigabyte G6X 9KG (2024) (v4.10.07 ) | |
| Lenovo LOQ 15IRX9 (v4.10.07, Leistungsmodus) | |
| Lenovo LOQ 15IRX9 (v4.10.07 ) | |
* ... Moindre est la valeur, meilleures sont les performances
| Performance Rating - Percent | |
| Moyenne de la classe Gaming | |
| SCHENKER XMG Core 15 (M24) | |
| Dell G16, i7-13650HX, RTX 4060 | |
| Lenovo LOQ 15IRX9 | |
| Gigabyte G6X 9KG (2024) | |
| Moyenne NVIDIA GeForce RTX 4060 Laptop GPU | |
| HP Victus 16 (2024) | |
| Lenovo LOQ 15IRX9 | |
| Cyberpunk 2077 2.2 Phantom Liberty - 1920x1080 Ultra Preset (FSR off) | |
| SCHENKER XMG Core 15 (M24) (2.12) | |
| Moyenne de la classe Gaming (6.76 - 158, n=90, 2 dernières années) | |
| Lenovo LOQ 15IRX9 (2.02, Leistungsmodus) | |
| Moyenne NVIDIA GeForce RTX 4060 Laptop GPU (56.4 - 93.1, n=31) | |
| Lenovo LOQ 15IRX9 (2.02) | |
| Dell G16, i7-13650HX, RTX 4060 (2.11) | |
| Gigabyte G6X 9KG (2024) (2.02) | |
| HP Victus 16 (2024) (2.02) | |
| GTA V - 1920x1080 Highest Settings possible AA:4xMSAA + FX AF:16x | |
| Dell G16, i7-13650HX, RTX 4060 | |
| SCHENKER XMG Core 15 (M24) | |
| Lenovo LOQ 15IRX9 (Leistungsmodus) | |
| Gigabyte G6X 9KG (2024) | |
| Lenovo LOQ 15IRX9 | |
| Moyenne de la classe Gaming (12.1 - 168.2, n=132, 2 dernières années) | |
| HP Victus 16 (2024) | |
| Moyenne NVIDIA GeForce RTX 4060 Laptop GPU (76.9 - 126.3, n=48) | |
| Final Fantasy XV Benchmark - 1920x1080 High Quality | |
| Moyenne de la classe Gaming (19.2 - 201, n=144, 2 dernières années) | |
| Lenovo LOQ 15IRX9 (1.3, Leistungsmodus) | |
| SCHENKER XMG Core 15 (M24) (1.3) | |
| Dell G16, i7-13650HX, RTX 4060 (1.3) | |
| Gigabyte G6X 9KG (2024) (1.3) | |
| Lenovo LOQ 15IRX9 (1.3) | |
| HP Victus 16 (2024) (1.3) | |
| Moyenne NVIDIA GeForce RTX 4060 Laptop GPU (75.1 - 109.8, n=51) | |
| Strange Brigade - 1920x1080 ultra AA:ultra AF:16 | |
| Moyenne de la classe Gaming (38.9 - 420, n=140, 2 dernières années) | |
| SCHENKER XMG Core 15 (M24) (1.47.22.14 D3D12) | |
| Dell G16, i7-13650HX, RTX 4060 (1.47.22.14 D3D12) | |
| Lenovo LOQ 15IRX9 (1.47.22.14 D3D12, Leistungsmodus) | |
| Lenovo LOQ 15IRX9 (1.47.22.14 D3D12) | |
| Gigabyte G6X 9KG (2024) (1.47.22.14 D3D12) | |
| Moyenne NVIDIA GeForce RTX 4060 Laptop GPU (135.3 - 210, n=50) | |
| HP Victus 16 (2024) (1.47.22.14 D3D12) | |
| Dota 2 Reborn - 1920x1080 ultra (3/3) best looking | |
| HP Victus 16 (2024) | |
| Dell G16, i7-13650HX, RTX 4060 | |
| Moyenne de la classe Gaming (65.1 - 220, n=148, 2 dernières années) | |
| Moyenne NVIDIA GeForce RTX 4060 Laptop GPU (115 - 183.8, n=53) | |
| Lenovo LOQ 15IRX9 (Leistungsmodus) | |
| Gigabyte G6X 9KG (2024) | |
| Lenovo LOQ 15IRX9 | |
| SCHENKER XMG Core 15 (M24) | |
| X-Plane 11.11 - 1920x1080 high (fps_test=3) | |
| Dell G16, i7-13650HX, RTX 4060 | |
| Gigabyte G6X 9KG (2024) | |
| Moyenne de la classe Gaming (32.8 - 166.2, n=151, 2 dernières années) | |
| Moyenne NVIDIA GeForce RTX 4060 Laptop GPU (60.7 - 141.1, n=54) | |
| Lenovo LOQ 15IRX9 (Leistungsmodus) | |
| HP Victus 16 (2024) | |
| SCHENKER XMG Core 15 (M24) | |
| Lenovo LOQ 15IRX9 | |
| Dragon's Dogma 2 - 1920x1080 High Preset | |
| Moyenne de la classe Gaming (49.5 - 80, n=8, 2 dernières années) | |
| HP Victus 16 (2024) | |
| Lenovo LOQ 15IRX9 | |
| Moyenne NVIDIA GeForce RTX 4060 Laptop GPU (57.2 - 67.7, n=5) | |
| Razer Blade 14 Mid 23 | |
| F1 24 - 1920x1080 Ultra High Preset AA:T AF:16x | |
| Moyenne de la classe Gaming (54.1 - 148, n=19, 2 dernières années) | |
| Moyenne NVIDIA GeForce RTX 4060 Laptop GPU (47.5 - 61.6, n=10) | |
| Razer Blade 14 Mid 23 | |
| Lenovo LOQ 15IRX9 (1122588) | |
| Counter-Strike 2 - 1920x1080 Very High Preset | |
| Razer Blade 14 Mid 23 | |
| Moyenne NVIDIA GeForce RTX 4060 Laptop GPU (123.9 - 139.1, n=2) | |
| Lenovo LOQ 15IRX9 | |
| Moyenne de la classe Gaming (11.5 - 189.7, n=10, 2 dernières années) | |
| Senua's Saga Hellblade 2 - 1920x1080 High Preset | |
| Moyenne de la classe Gaming (38.4 - 78.8, n=6, 2 dernières années) | |
| Moyenne NVIDIA GeForce RTX 4060 Laptop GPU (37.6 - 39.5, n=3) | |
| Lenovo LOQ 15IRX9 | |
| Razer Blade 14 Mid 23 | |
| Ghost of Tsushima - 1920x1080 Very High Preset AA:T | |
| Lenovo LOQ 15IRX9 | |
| Moyenne NVIDIA GeForce RTX 4060 Laptop GPU (55.6 - 63.4, n=5) | |
| Moyenne de la classe Gaming (28.5 - 73.7, n=7, 2 dernières années) | |
| Razer Blade 14 Mid 23 | |
Cyberpunk 2077 ultra FPS diagram
| Bas | Moyen | Élevé | Ultra | |
|---|---|---|---|---|
| GTA V (2015) | 184.4 | 181.5 | 175.5 | 112.6 |
| Dota 2 Reborn (2015) | 171.2 | 156.8 | 149.4 | 141 |
| Final Fantasy XV Benchmark (2018) | 198.9 | 138.5 | 99.9 | |
| X-Plane 11.11 (2018) | 139.6 | 118.4 | 92.2 | |
| Strange Brigade (2018) | 425 | 260 | 209 | 182.7 |
| Cyberpunk 2077 2.2 Phantom Liberty (2023) | 118.9 | 94.3 | 80.1 | 71.4 |
| Counter-Strike 2 (2023) | 195.3 | 195 | 157 | 123.9 |
| Dragon's Dogma 2 (2024) | 70.6 | 63.3 | ||
| Ghost of Tsushima (2024) | 91 | 81.7 | 74.5 | 60.6 |
| Senua's Saga Hellblade 2 (2024) | 64.1 | 53.2 | 38.4 | |
| F1 24 (2024) | 216 | 201 | 162.5 | 54.1 |
Émissions et puissance - Le Lenovo LOQ avec une autonomie inférieure à la moyenne
Émissions sonores
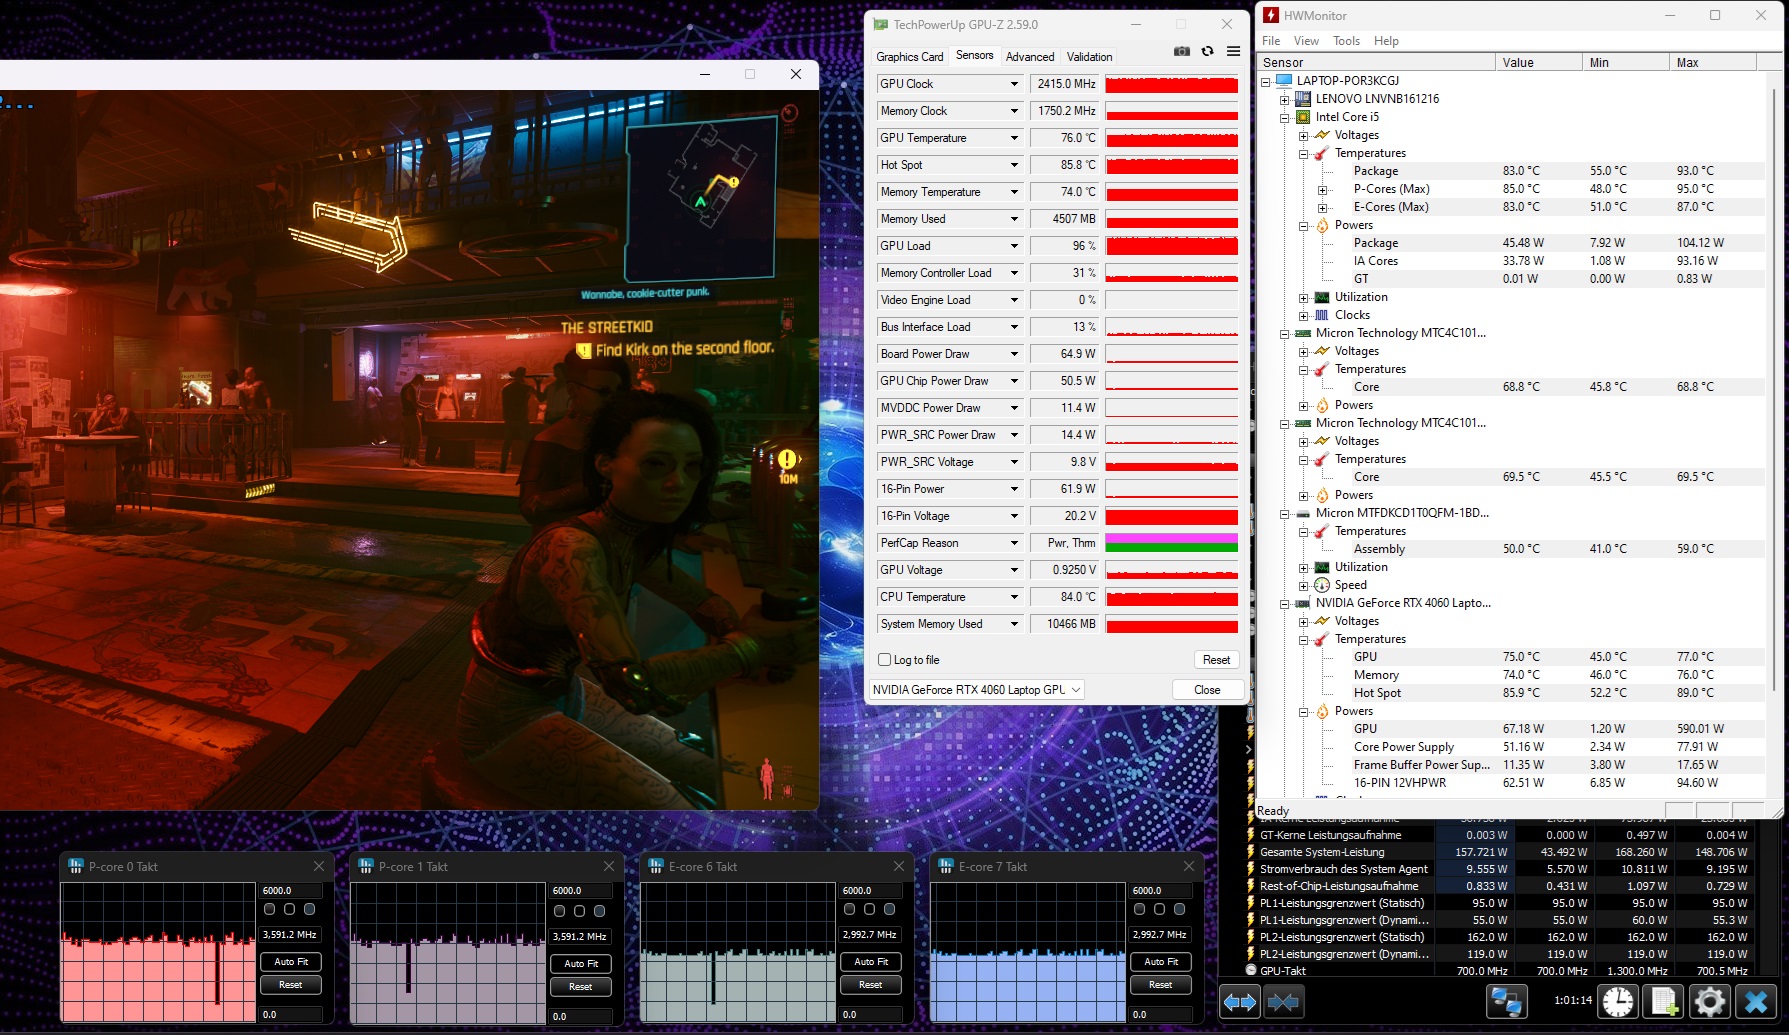
En ce qui concerne les émissions sonores, l'ordinateur portable se comporte comme prévu pour sa catégorie : Sous charge, il produit beaucoup de bruit. En jouant à Cyberpunk 2077, les émissions sonores atteignent 48 dB(A)( modeéquilibré ) et 54 dB(A) (modeperformance ). Le mode silencieux ramène les niveaux de bruit à des valeurs plus modérées, au détriment des performances de l'ordinateur portable. Les jeux devraient toujours être possibles - avec des paramètres réduits.
Le contrôle du ventilateur doit être réajusté : Lorsque l'ordinateur tourne au ralenti, les ventilateurs se mettent en marche brièvement et de manière répétée, ce qui est très ennuyeux à la longue. Parfois, ils fonctionnent en permanence à un niveau clairement audible.
Degré de la nuisance sonore
| Au repos |
| 26 / 34 / 36 dB(A) |
| Fortement sollicité |
| 48 / 50 dB(A) |
 | ||
30 dB silencieux 40 dB(A) audible 50 dB(A) bruyant |
||
min: | ||
| Lenovo LOQ 15IRX9 NVIDIA GeForce RTX 4060 Laptop GPU, i5-13450HX, Micron 2400 MTFDKCD1T0QFM | SCHENKER XMG Core 15 (M24) NVIDIA GeForce RTX 4060 Laptop GPU, R7 8845HS, Samsung 990 Pro 1 TB | Gigabyte G6X 9KG (2024) NVIDIA GeForce RTX 4060 Laptop GPU, i7-13650HX, Gigabyte AG450E1024-SI | HP Victus 16 (2024) NVIDIA GeForce RTX 4060 Laptop GPU, i7-14700HX, Kioxia XG8 KXG80ZNV512G | Dell G16, i7-13650HX, RTX 4060 NVIDIA GeForce RTX 4060 Laptop GPU, i7-13650HX, WD PC SN740 SDDPNQD-1T00 | |
|---|---|---|---|---|---|
| Noise | 14% | -4% | 4% | 20% | |
| arrêt / environnement * | 25 | 23 8% | 26 -4% | 25 -0% | 23 8% |
| Idle Minimum * | 26 | 23 12% | 30 -15% | 28 -8% | 23 12% |
| Idle Average * | 34 | 23 32% | 32 6% | 29 15% | 23 32% |
| Idle Maximum * | 36 | 23 36% | 35 3% | 33 8% | 27.96 22% |
| Load Average * | 48 | 38.92 19% | 51 -6% | 45 6% | 27.96 42% |
| Cyberpunk 2077 ultra * | 48 | 52.06 -8% | |||
| Load Maximum * | 50 | 52.09 -4% | 54 -8% | 48 4% | 47.89 4% |
| Witcher 3 ultra * | 50.96 | 51 | 43 | 47.89 |
* ... Moindre est la valeur, meilleures sont les performances
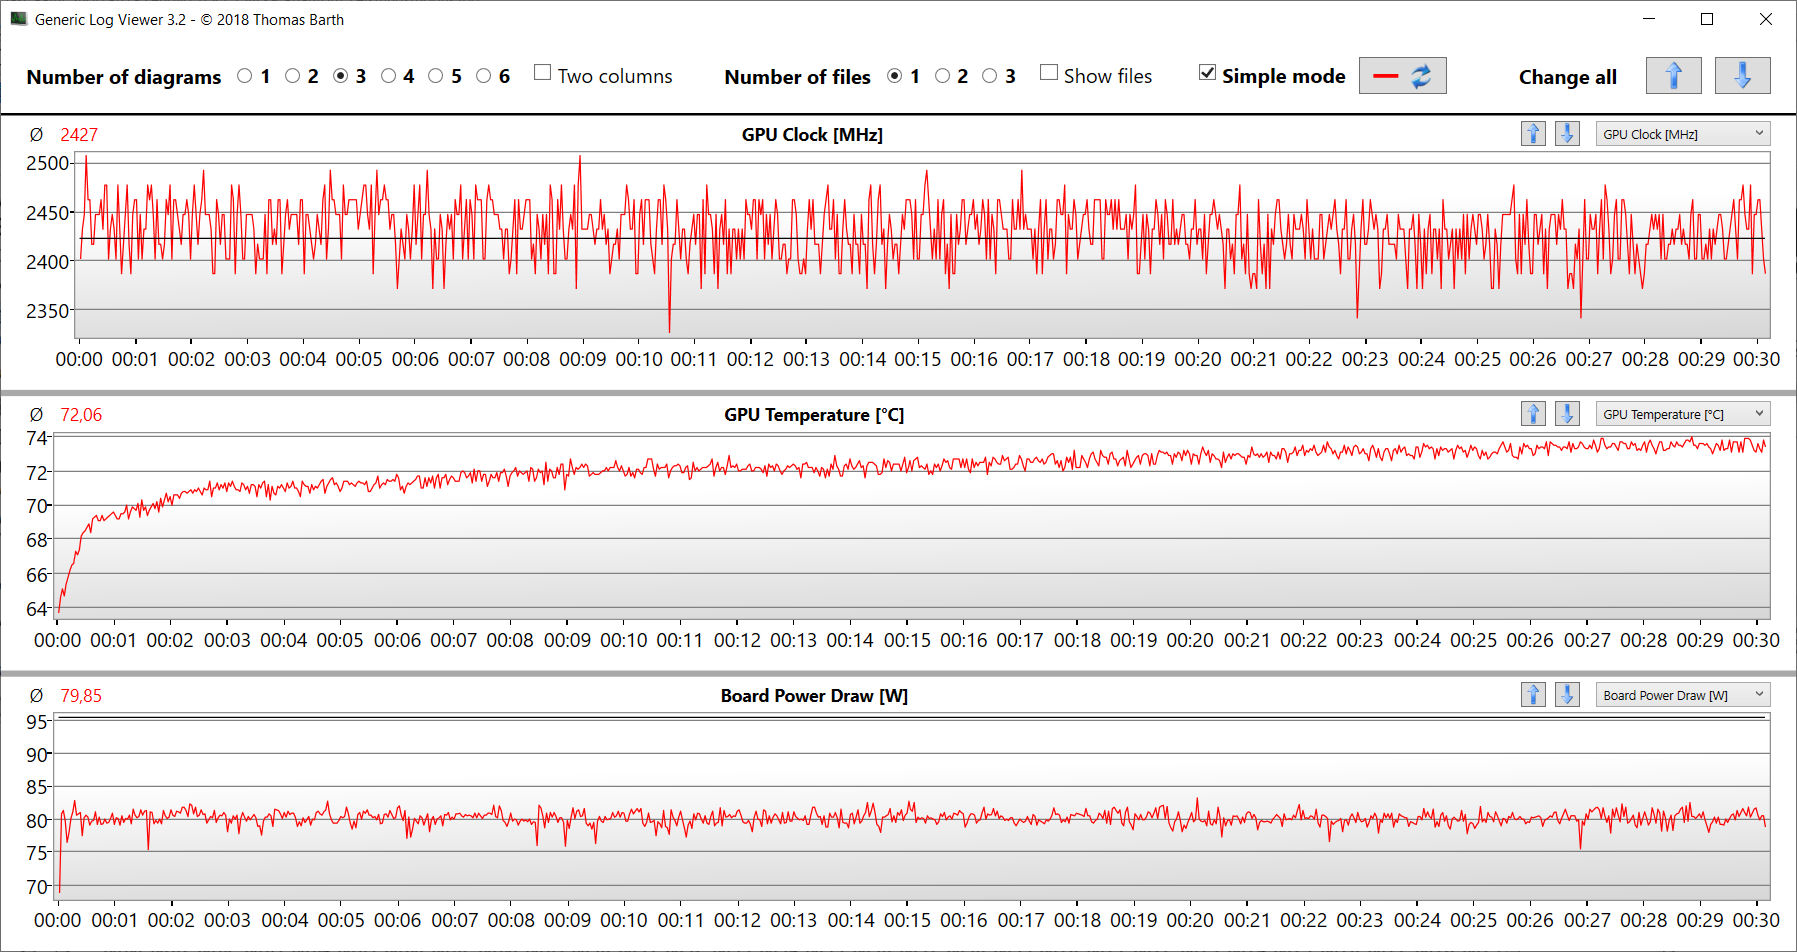
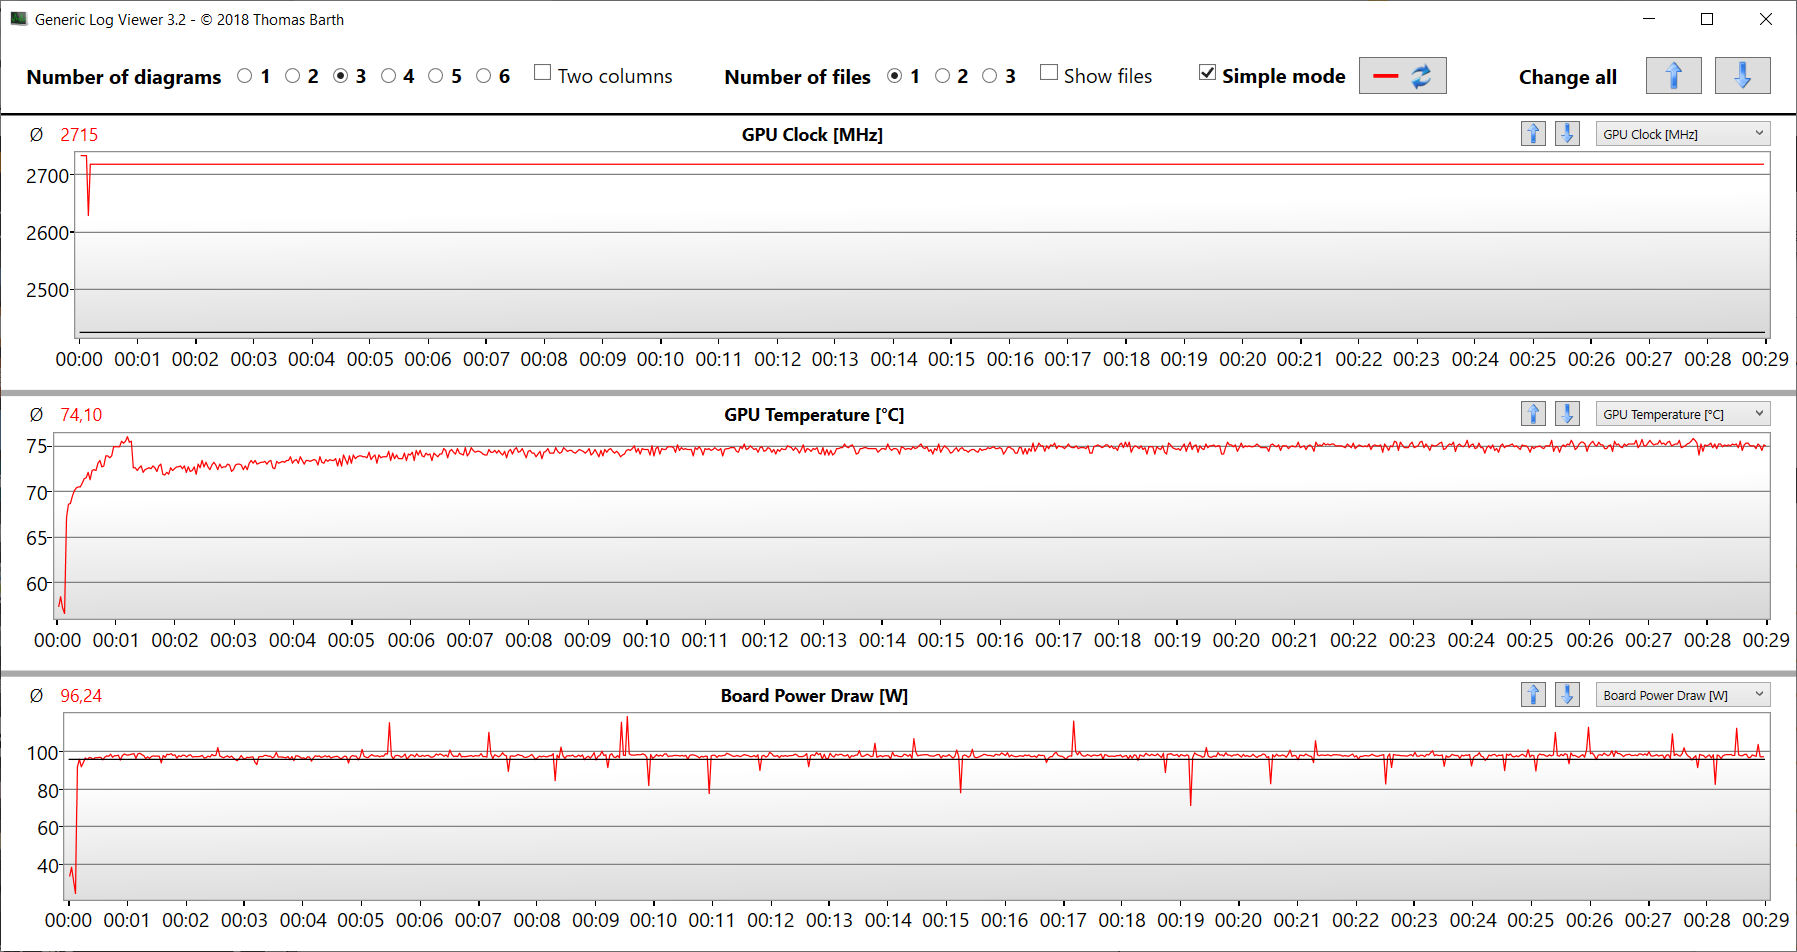
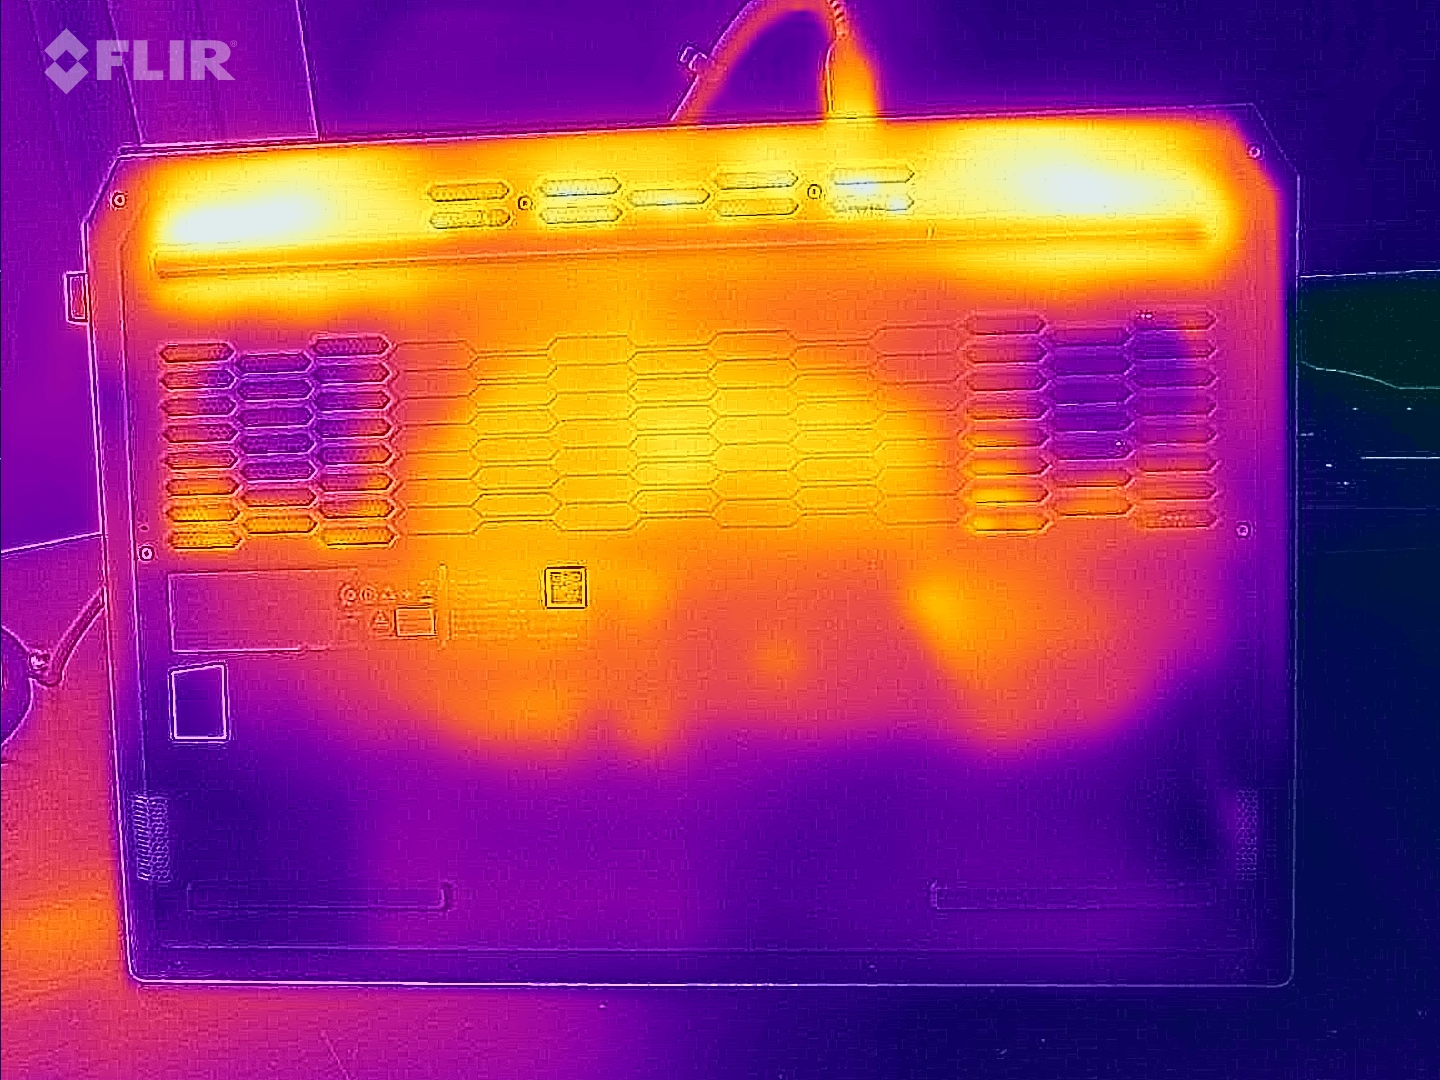
Température
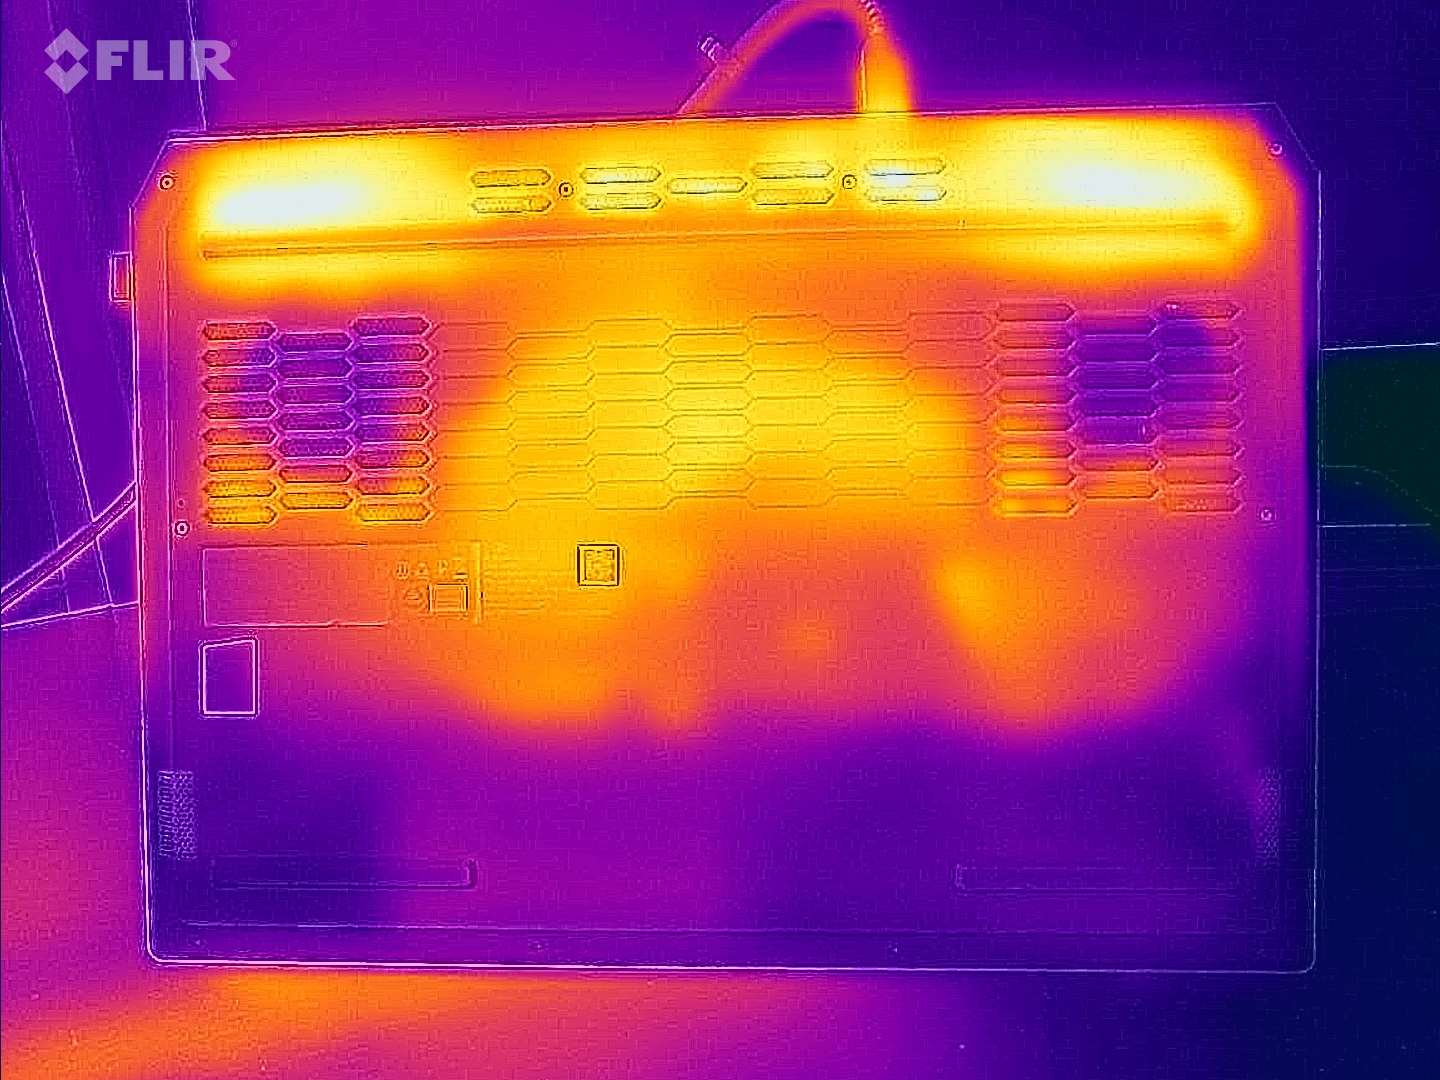
Sous charge (test de stress, Cyberpunk), l'ordinateur portable chauffe sensiblement : Il dépasse parfois la barre des 50 degrés Celsius. Il atteint également des valeurs plus élevées lors d'une utilisation quotidienne (bureau, Internet) que la plupart des appareils de comparaison. Les températures du repose-poignets restent à peu près raisonnables.
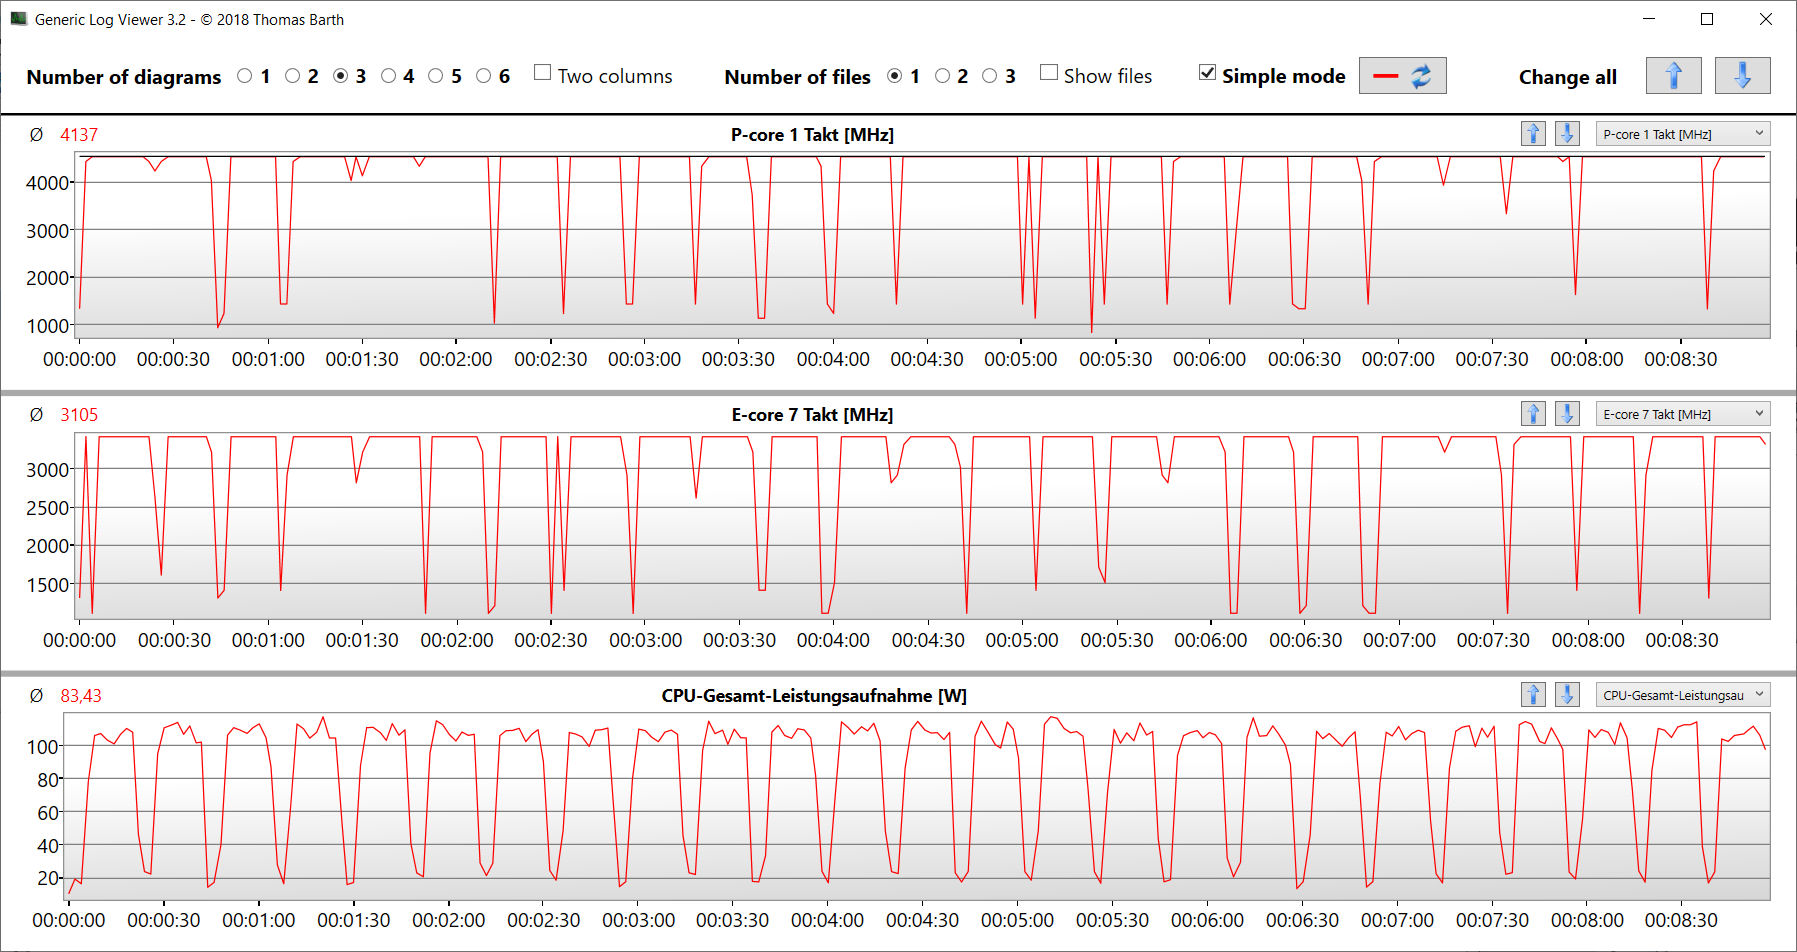
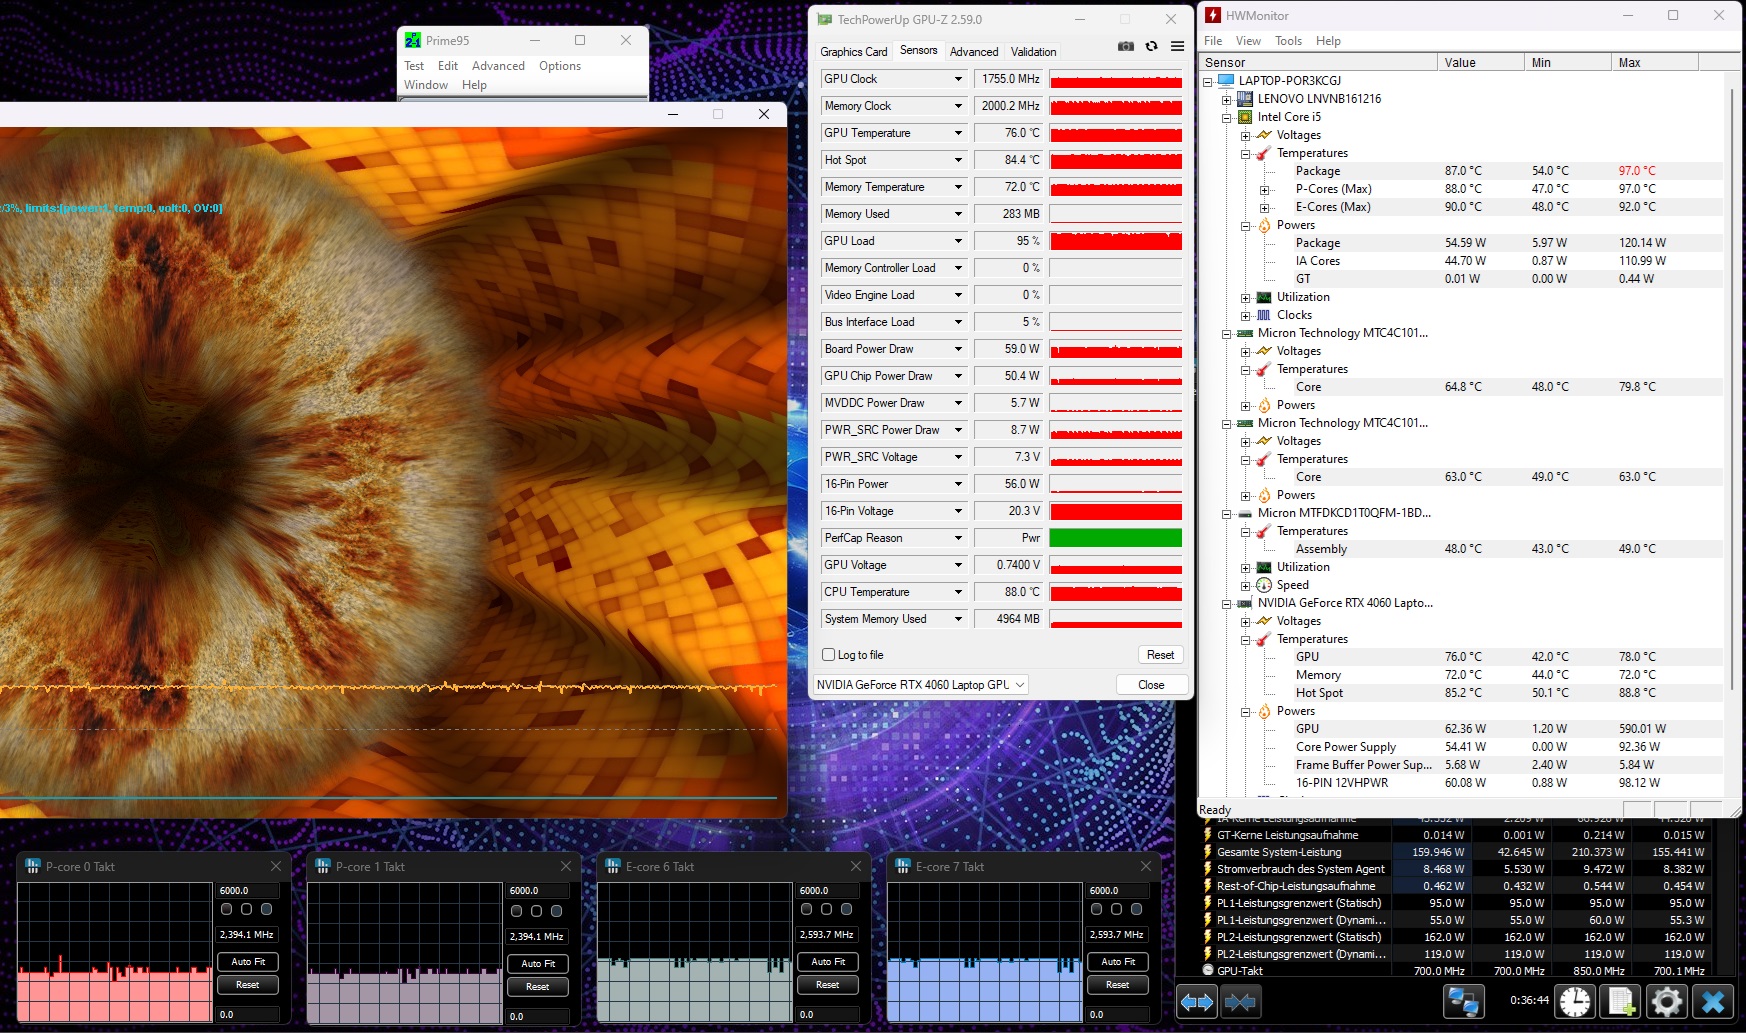
Le scénario extrême (test de stress utilisant Prime95 et Furmark en fonctionnement continu) vérifie la stabilité du système à pleine charge. Le processeur tourne à environ 2,4 GHz (P) et 2,6 GHz (E), tandis que le processeur graphique tourne à environ 1 800 MHz.
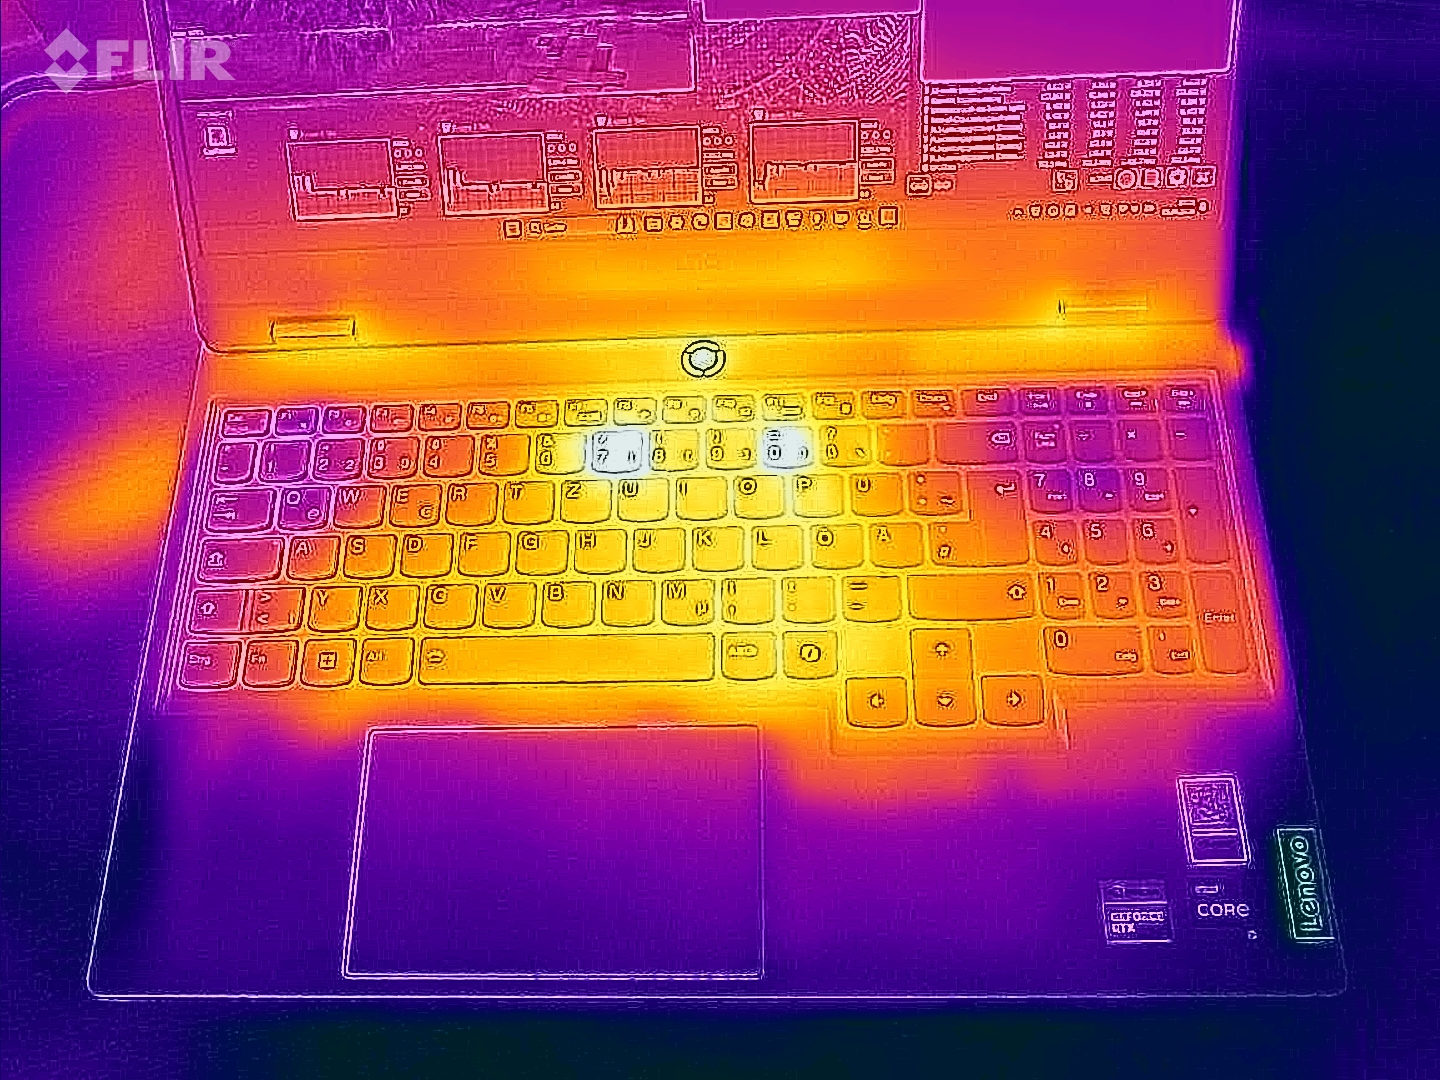
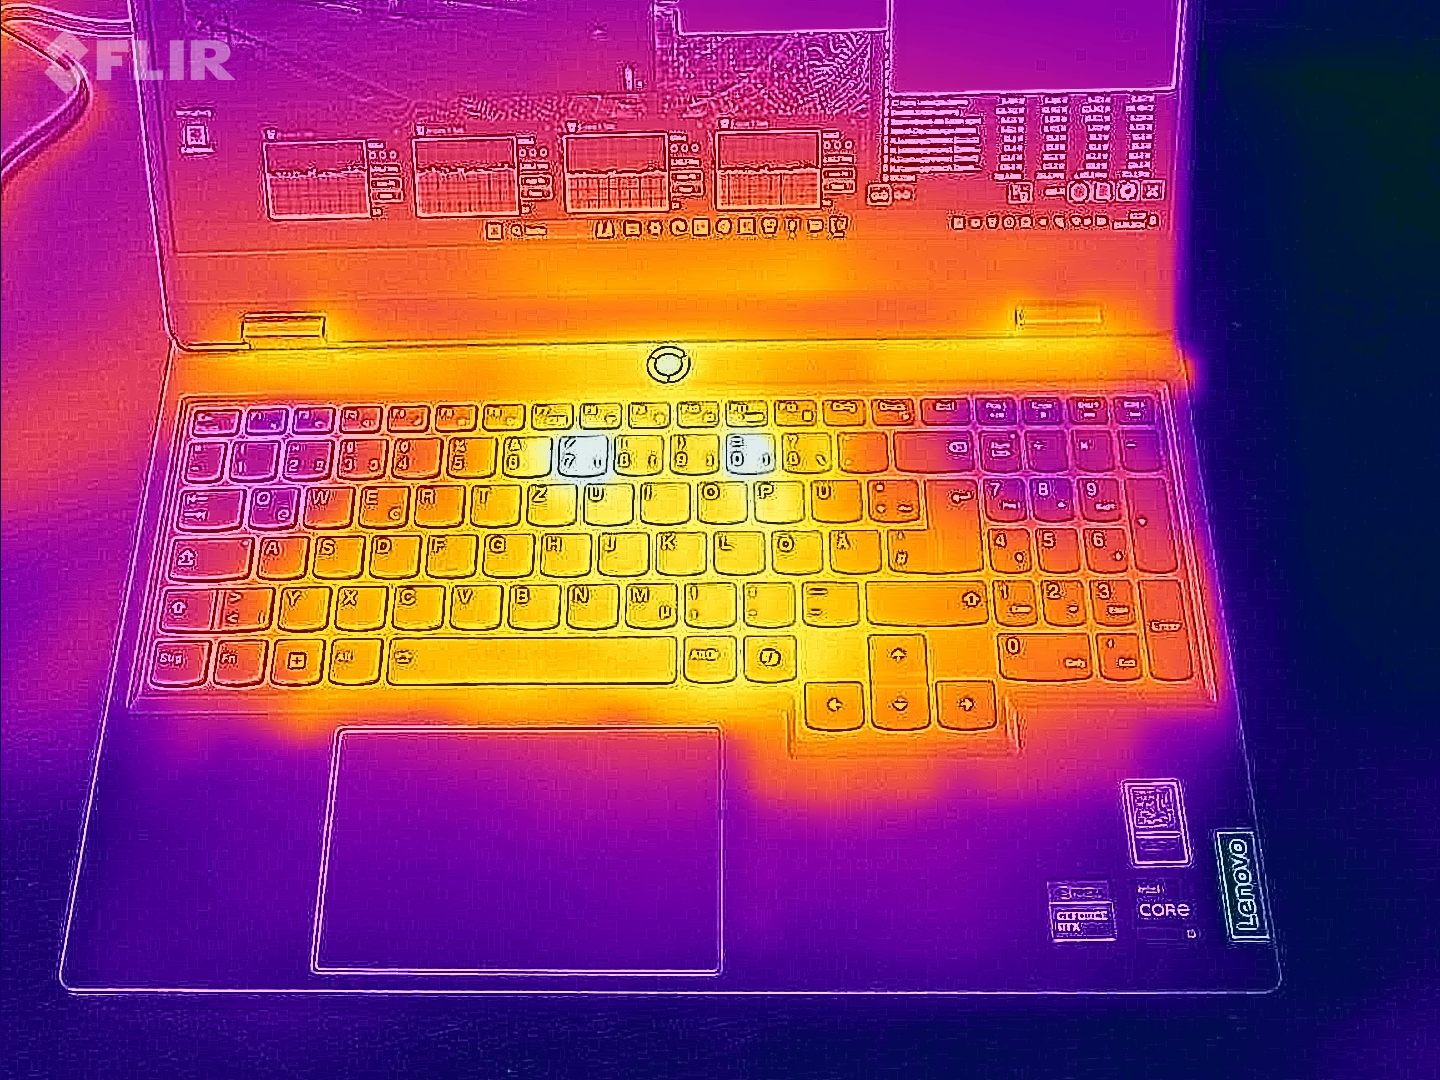
(-) La température maximale du côté supérieur est de 47 °C / 117 F, par rapport à la moyenne de 40.4 °C / 105 F, allant de 21.2 à 68.8 °C pour la classe Gaming.
(-) Le fond chauffe jusqu'à un maximum de 58 °C / 136 F, contre une moyenne de 43.2 °C / 110 F
(+) En utilisation inactive, la température moyenne du côté supérieur est de 30.2 °C / 86 F, par rapport à la moyenne du dispositif de 33.9 °C / 93 F.
(-) 3: The average temperature for the upper side is 41.7 °C / 107 F, compared to the average of 33.9 °C / 93 F for the class Gaming.
(±) Les repose-poignets et le pavé tactile peuvent devenir très chauds au toucher, avec un maximum de 38 °C / 100.4# F.
(-) La température moyenne de la zone de l'appui-paume de dispositifs similaires était de 28.9 °C / 84 F (-9.1 °C / #-16.4 F).
| Lenovo LOQ 15IRX9 Intel Core i5-13450HX, NVIDIA GeForce RTX 4060 Laptop GPU | SCHENKER XMG Core 15 (M24) AMD Ryzen 7 8845HS, NVIDIA GeForce RTX 4060 Laptop GPU | Gigabyte G6X 9KG (2024) Intel Core i7-13650HX, NVIDIA GeForce RTX 4060 Laptop GPU | HP Victus 16 (2024) Intel Core i7-14700HX, NVIDIA GeForce RTX 4060 Laptop GPU | Dell G16, i7-13650HX, RTX 4060 Intel Core i7-13650HX, NVIDIA GeForce RTX 4060 Laptop GPU | |
|---|---|---|---|---|---|
| Heat | -8% | 9% | 15% | -3% | |
| Maximum Upper Side * | 47 | 52 -11% | 41 13% | 50 -6% | 49 -4% |
| Maximum Bottom * | 58 | 61 -5% | 43 26% | 50 14% | 58 -0% |
| Idle Upper Side * | 32 | 35 -9% | 32 -0% | 25 22% | 35 -9% |
| Idle Bottom * | 36 | 39 -8% | 37 -3% | 26 28% | 35 3% |
* ... Moindre est la valeur, meilleures sont les performances
Intervenants
Les haut-parleurs stéréo produisent un son très acceptable dans l'ensemble. Toutefois, un peu plus de basses ne serait pas de trop.
Lenovo LOQ 15IRX9 analyse audio
(±) | le niveau sonore du haut-parleur est moyen mais bon (81# dB)
Basses 100 - 315 Hz
(±) | basse réduite - en moyenne 14.6% inférieure à la médiane
(±) | la linéarité des basses est moyenne (9.6% delta à la fréquence précédente)
Médiums 400 - 2000 Hz
(+) | médiane équilibrée - seulement 2.1% de la médiane
(+) | les médiums sont linéaires (3.6% delta à la fréquence précédente)
Aiguës 2 - 16 kHz
(±) | sommets plus élevés - en moyenne 5.9% plus élevés que la médiane
(±) | la linéarité des aigus est moyenne (8.2% delta à la fréquence précédente)
Globalement 100 - 16 000 Hz
(+) | le son global est linéaire (14.7% différence à la médiane)
Par rapport à la même classe
» 27% de tous les appareils testés de cette catégorie étaient meilleurs, 7% similaires, 66% pires
» Le meilleur avait un delta de 6%, la moyenne était de 18%, le pire était de 132%.
Par rapport à tous les appareils testés
» 17% de tous les appareils testés étaient meilleurs, 4% similaires, 79% pires
» Le meilleur avait un delta de 4%, la moyenne était de 24%, le pire était de 134%.
SCHENKER XMG Core 15 (M24) analyse audio
(±) | le niveau sonore du haut-parleur est moyen mais bon (79.12# dB)
Basses 100 - 315 Hz
(-) | presque aucune basse - en moyenne 16.7% plus bas que la médiane
(-) | les basses ne sont pas linéaires (15.7% delta à la fréquence précédente)
Médiums 400 - 2000 Hz
(+) | médiane équilibrée - seulement 4.5% de la médiane
(+) | les médiums sont linéaires (4.4% delta à la fréquence précédente)
Aiguës 2 - 16 kHz
(+) | des sommets équilibrés - à seulement 1% de la médiane
(+) | les aigus sont linéaires (2.7% delta à la fréquence précédente)
Globalement 100 - 16 000 Hz
(+) | le son global est linéaire (13.7% différence à la médiane)
Par rapport à la même classe
» 20% de tous les appareils testés de cette catégorie étaient meilleurs, 6% similaires, 74% pires
» Le meilleur avait un delta de 6%, la moyenne était de 18%, le pire était de 132%.
Par rapport à tous les appareils testés
» 13% de tous les appareils testés étaient meilleurs, 3% similaires, 83% pires
» Le meilleur avait un delta de 4%, la moyenne était de 24%, le pire était de 134%.
Consommation électrique
Sa consommation d'énergie est tout à fait normale pour le matériel installé. Cyberpunk et les tests de stress ont été exécutés avec une consommation d'énergie relativement constante. Le bloc d'alimentation est juste assez puissant avec 230 watts.
| Éteint/en veille | |
| Au repos | |
| Fortement sollicité |
|
Légende:
min: | |
| Lenovo LOQ 15IRX9 Intel Core i5-13450HX, NVIDIA GeForce RTX 4060 Laptop GPU | SCHENKER XMG Core 15 (M24) AMD Ryzen 7 8845HS, NVIDIA GeForce RTX 4060 Laptop GPU | Gigabyte G6X 9KG (2024) Intel Core i7-13650HX, NVIDIA GeForce RTX 4060 Laptop GPU | HP Victus 16 (2024) Intel Core i7-14700HX, NVIDIA GeForce RTX 4060 Laptop GPU | Dell G16, i7-13650HX, RTX 4060 Intel Core i7-13650HX, NVIDIA GeForce RTX 4060 Laptop GPU | |
|---|---|---|---|---|---|
| Power Consumption | 20% | 2% | 1% | 6% | |
| Idle Minimum * | 13 | 9.3 28% | 12 8% | 9 31% | 11 15% |
| Idle Average * | 18 | 12.9 28% | 13 28% | 15 17% | 14.8 18% |
| Idle Maximum * | 24 | 12.8 47% | 27 -13% | 23 4% | 16.8 30% |
| Load Average * | 85 | 105 -24% | 123 -45% | 103.7 -22% | |
| Cyberpunk 2077 ultra * | 155.7 | ||||
| Cyberpunk 2077 ultra external monitor * | 150.9 | ||||
| Load Maximum * | 232 | 286 -23% | 210 9% | 241 -4% | 255 -10% |
| Witcher 3 ultra * | 167 | 167.8 | 143.7 | 185 |
* ... Moindre est la valeur, meilleures sont les performances
Power consumption Cyberpunk 2077 / stress test
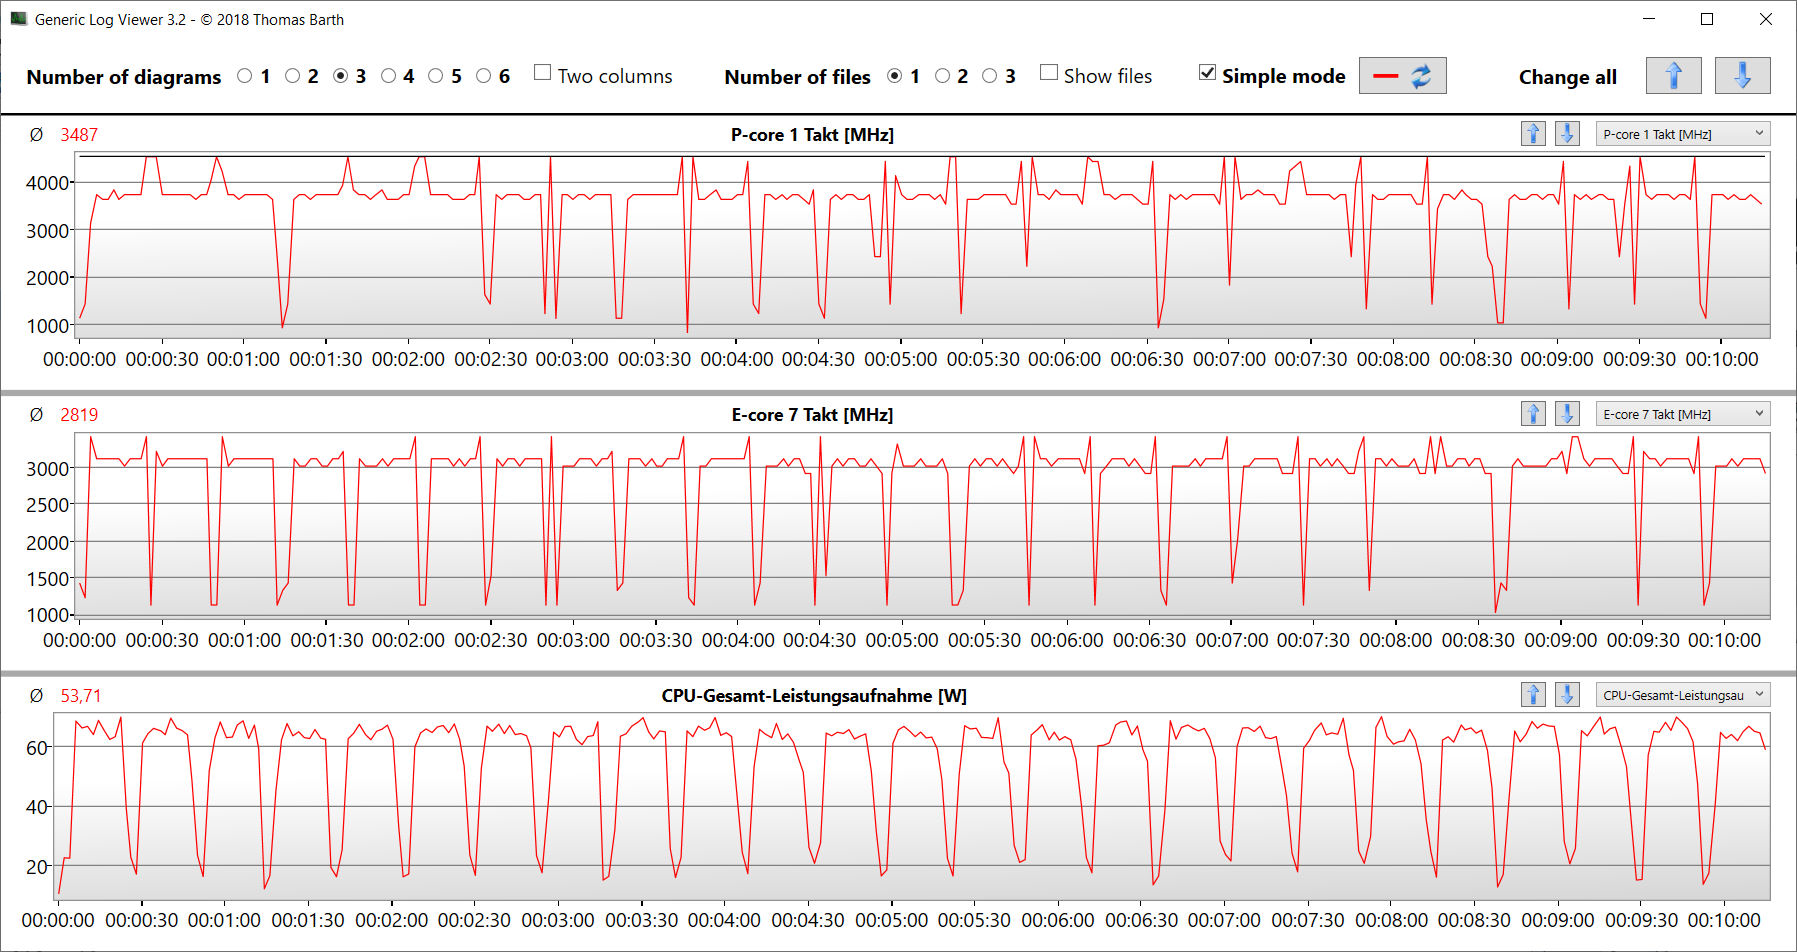
Power consumption with external monitor
Délais d'exécution
L'appareil de 15,6 pouces a obtenu une autonomie de 5:20 heures lors de notre test pratique WLAN (cartographie de la charge lors de l'accès à des sites Web à l'aide d'un script) - ce qui n'est pas une valeur exceptionnelle. La capacité relativement faible de la batterie (60 Wh) est ici mise en évidence.
Points positifs
Points négatifs
Verdict - Un jeu solide et économique

Le LOQ permet de jouer en FHD avec des paramètres élevés ou maximums Core i5-13450HX et la GeForce RTX 4060 rendent cela possible. Ce faisant, le CPU et le GPU fonctionnent avec des fréquences d'horloge élevées et constantes. Un disque SSD PCIe 4 (1 To) permet de réduire les temps de chargement.
Le LOQ 15IRX9 de Lenovo est un ordinateur portable de jeu FHD abordable qui souffre d'un ou deux défauts mineurs.
Les émissions élevées peuvent être réduites à des niveaux modérés en utilisant le mode silencieux, au détriment des performances de l'ordinateur portable. Le contrôle des ventilateurs pourrait être amélioré : En mode veille, les ventilateurs fonctionnent en permanence ou par pulsations, ce qui est totalement inutile.
Vous chercherez en vain un écran 16:10, Lenovo s'en tenant à un format 16:9. L'écran de 15,6 pouces (FHD, 144 Hz, G-Sync, sRGB) fonctionne très bien, mais il pourrait être un peu plus lumineux. L'ordinateur portable ne propose pas de Thunderbolt 4 ou d'USB 4. Néanmoins, son port USB-C (USB 3.2 Gen 2) prend en charge Power Delivery et le mode Display ALT. L'autonomie de l'appareil ne battra pas de record du monde.
Une alternative pourrait être le Gigabyte G6X 9KG. Il dispose d'un processeur légèrement plus puissant, d'un écran 16 pouces 16:10 et d'une meilleure autonomie. En termes de couverture de l'espace colorimétrique, il est à la traîne par rapport au LOQ.
Prix et disponibilité
Au moment où nous écrivons ces lignes, notre configuration du Lenovo LOQ 15IRX9 peut être achetée sur Amazon au prix de 1 279 dollars.
Veuillez noter que nous avons récemment mis à jour notre système d'évaluation et que les résultats de la version 8 ne sont pas comparables à ceux de la version 7. Vous trouverez de plus amples informations ici .
Lenovo LOQ 15IRX9
- 07/08/2024 v8
Sascha Mölck
 Total Sustainability Score:
 Transparency
La sélection des appareils à examiner est effectuée par notre équipe éditoriale. L'échantillon de test a été prêté à l'auteur par le fabricant ou le détaillant pour les besoins de cet examen. Le prêteur n'a pas eu d'influence sur cette évaluation et le fabricant n'a pas reçu de copie de cette évaluation avant sa publication. Il n'y avait aucune obligation de publier cet article. Nous n'acceptons jamais de compensation ou de paiement en échange de nos commentaires. En tant que média indépendant, Notebookcheck n'est pas soumis à l'autorité des fabricants, des détaillants ou des éditeurs.
Voici comment Notebookcheck teste
Chaque année, Notebookcheck examine de manière indépendante des centaines d'ordinateurs portables et de smartphones en utilisant des procédures standardisées afin de garantir que tous les résultats sont comparables. Nous avons continuellement développé nos méthodes de test depuis environ 20 ans et avons établi des normes industrielles dans le processus. Dans nos laboratoires de test, des équipements de mesure de haute qualité sont utilisés par des techniciens et des rédacteurs expérimentés. Ces tests impliquent un processus de validation en plusieurs étapes. Notre système d'évaluation complexe repose sur des centaines de mesures et de points de référence bien fondés, ce qui garantit l'objectivité.Price comparison

