

Test du Dell Inspiron 16 7640 2-en-1 : mini-LED sur un convertible de 16 pouces

L'Inspiron 16 7640 2-en-1 2024 succède à l'Inspiron 16 7630 2-en-1 2023 avec une mise à jour des composants internes de la 14e génération d'Intel et plusieurs changements extérieurs. Le modèle de cette année inclut notamment un écran tactile mini-LED 1600p 90 Hz qui remplace l'écran tactile OLED 2400p de l'Inspiron 16 7630 2-en-1. Par ailleurs, l'écran tactile IPS 60 Hz 1200p de l'Inspiron 16 7635 2-en-1 est de retour sur certains modèles bas de gamme.
Notre unité de test est une configuration haut de gamme avec le processeur Core Ultra 7 155H Meteor Lake-H et la carte graphique Arc 8 intégrée, pour un prix d'environ 1000 USD. Une option plus bas de gamme avec le Core Ultra 5 125U est disponible avec l'ancien écran IPS 1200p 60 Hz pour 200 $ de moins, mais il n'y a pas d'options de GPU discret dans les deux cas. Il est intéressant de noter que l'Inspiron 16 7640 2-en-1 est l'un des rares modèles convertibles à proposer à la fois des processeurs Core-U et Core-H, la plupart des modèles ne proposant que l'un d'entre eux.
Aucun processeur AMD Zen 4 n'est disponible à ce jour. S'il y en a à l'avenir, ils porteront probablement le nom de modèle Inspiron 16 7645 2-en-1, qui succédera à l'Inspiron 16 7635 2-en-1 basé sur AMD.
Les concurrents de l'Inspiron 16 7640 2-en-1 comprennent d'autres ordinateurs convertibles de 16 pouces de milieu à haut de gamme, comme le HP Envy x360 2-en-1 16 ou le Lenovo Yoga 7 2-en-1 16. L'Inspiron 16 7640 2-en-1 de Dell se distingue toutefois par son option mini-LED.
Plus d'avis sur Dell :
Comparaison avec les concurrents potentiels
Note | Version | Date | Modèle | Poids | Épaisseur | Taille | Résolution | Prix |
|---|---|---|---|---|---|---|---|---|
| 82.1 % | v8 | 07/24 | Dell Inspiron 16 7640 2-in-1 Ultra 7 155H, Arc 8-Core | 2.1 kg | 18.99 mm | 16.00" | 2560x1600 | |
| 83.4 % | v8 | 06/24 | Dell Inspiron 16 Plus 7640 Ultra 7 155H, NVIDIA GeForce RTX 4060 Laptop GPU | 2.2 kg | 19.9 mm | 16.00" | 2560x1600 | |
| 87.2 % v7 (old) | v7 (old) | 05/24 | HP Envy x360 2-in-1 16-ad0097nr R7 8840HS, Radeon 780M | 1.8 kg | 18.3 mm | 16.00" | 2880x1800 | |
| 87.9 % v7 (old) | v7 (old) | 05/24 | Lenovo IdeaPad Pro 5 16IMH G9 Ultra 7 155H, Arc 8-Core | 1.9 kg | 17.5 mm | 16.00" | 2560x1600 | |
| 88.7 % v7 (old) | v7 (old) | 02/24 | HP Pavilion Plus 16-ab0456tx i7-13700H, GeForce RTX 3050 6GB Laptop GPU | 1.9 kg | 19.9 mm | 16.00" | 2560x1600 | |
| 87.6 % v7 (old) | v7 (old) | 11/23 | Asus VivoBook Pro 16 K6602VU i9-13900H, NVIDIA GeForce RTX 4050 Laptop GPU | 1.9 kg | 19 mm | 16.00" | 3200x2000 |
Conseils : Notre système d'évaluation a été mis à jour récemment et les résultats de la version 8 ne sont pas comparables à ceux de la version 7. Vous trouverez d'autres informations à ce sujet ici sont disponibles ici.
Note : Nous avons récemment mis à jour notre système d'évaluation et les résultats de la version 8 ne sont pas comparables à ceux de la version 7. De plus amples informations sont disponibles ici .
Boîtier - solide mais lourd
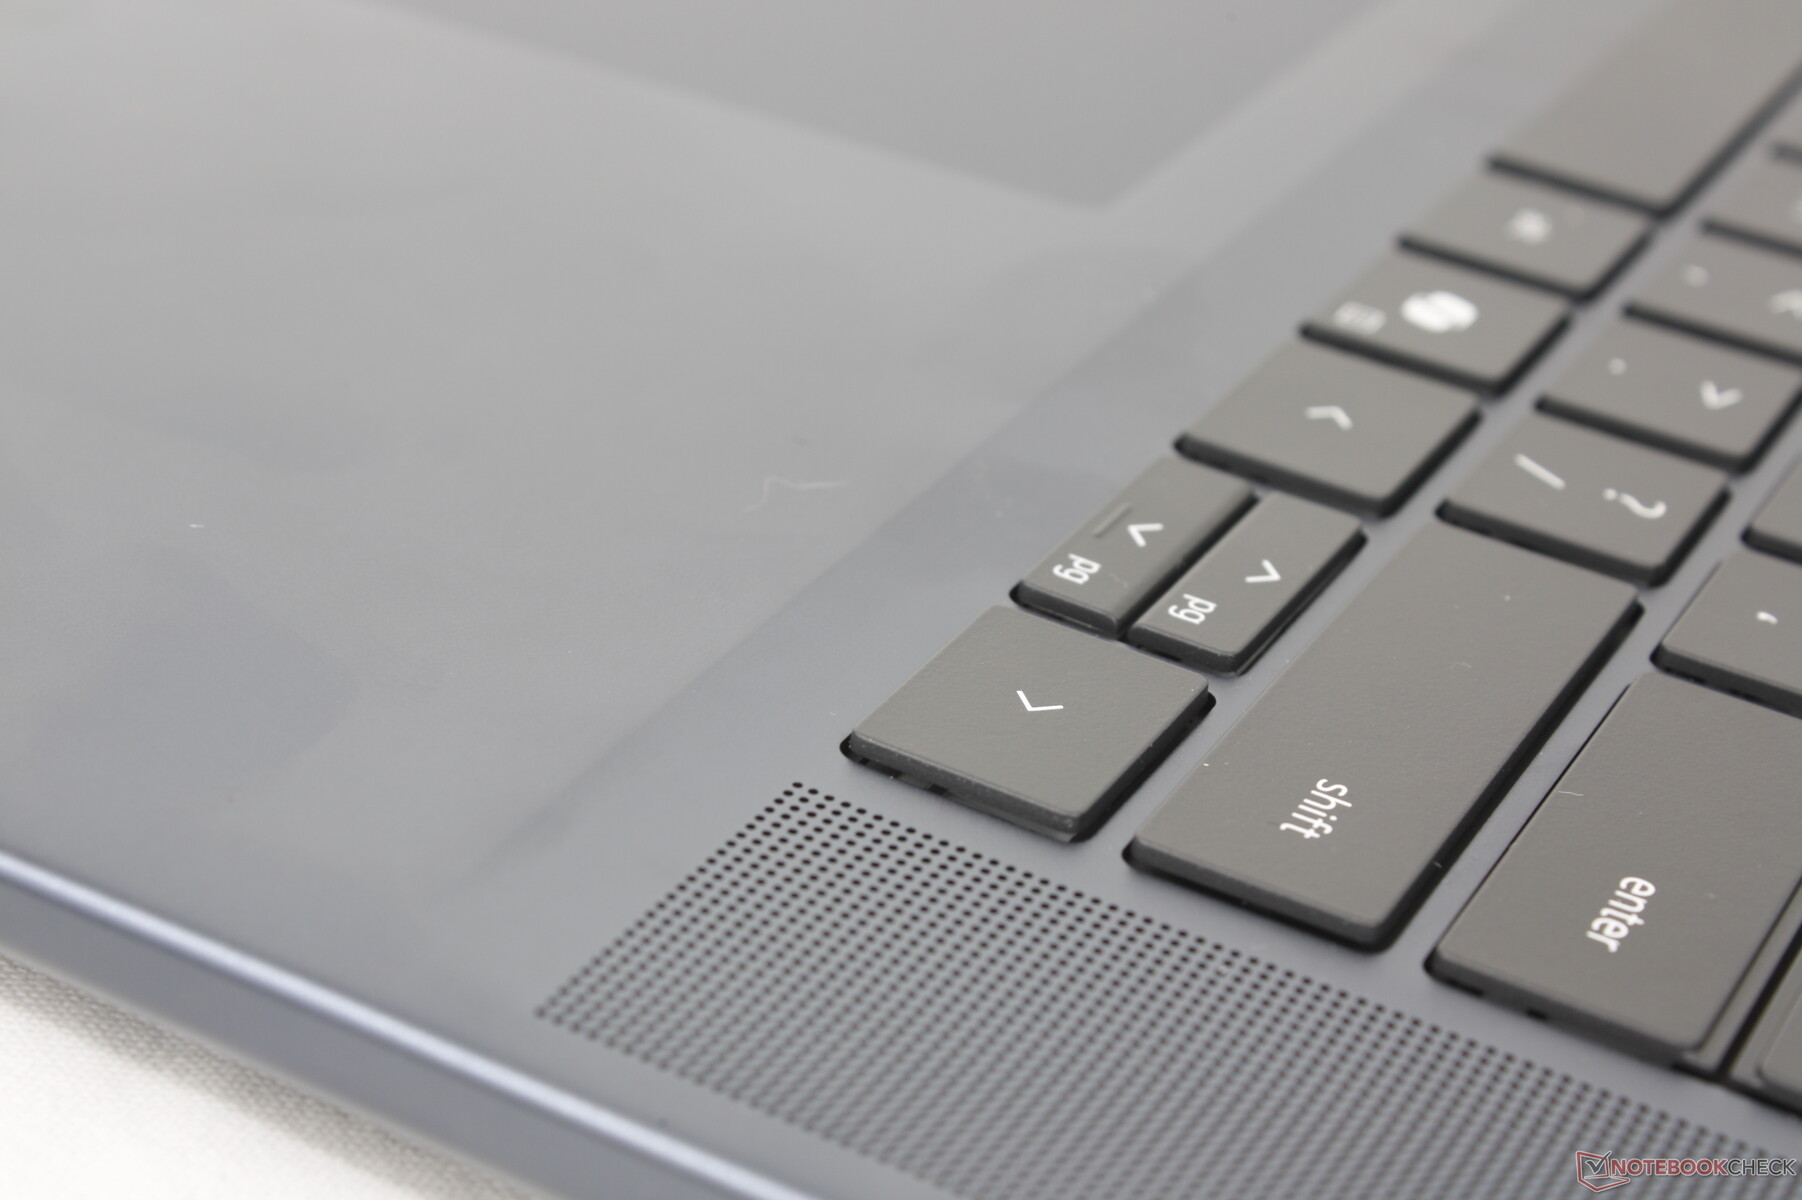
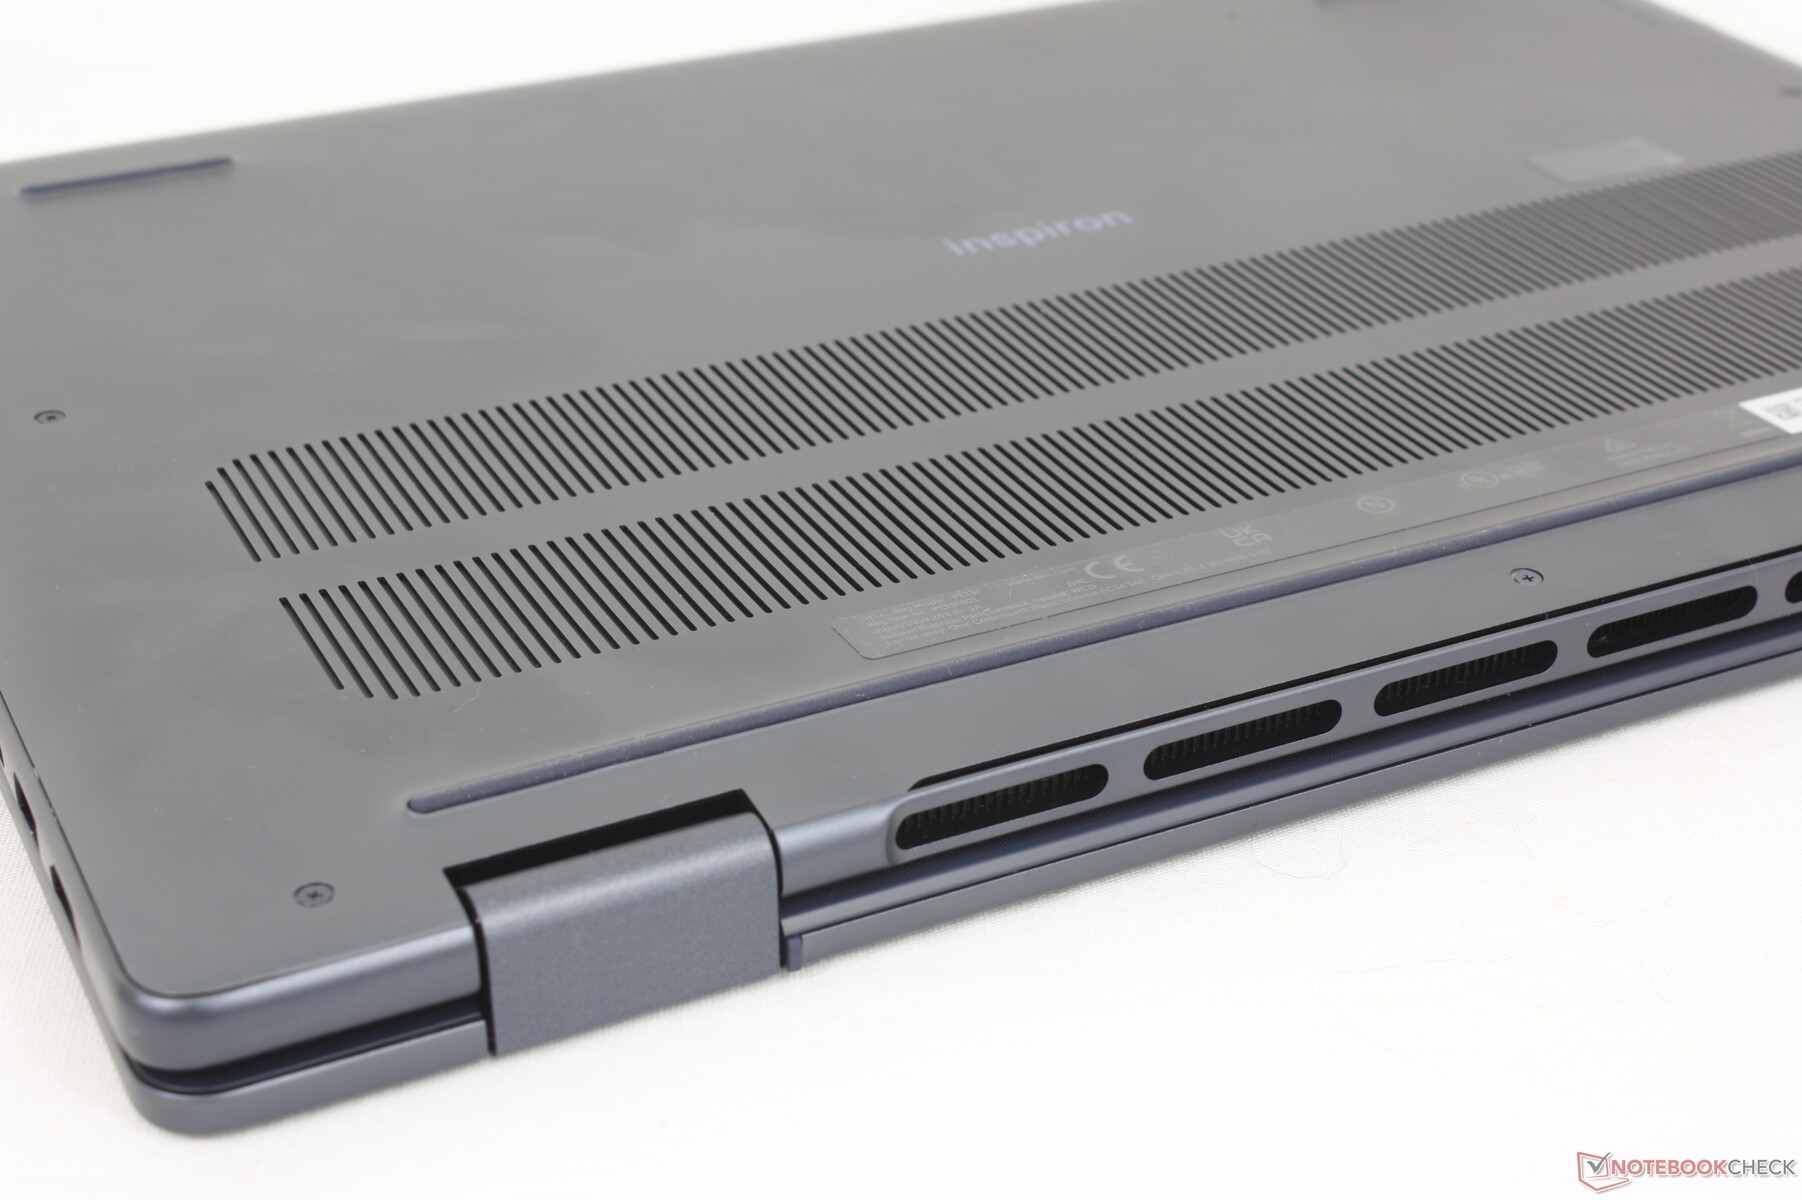
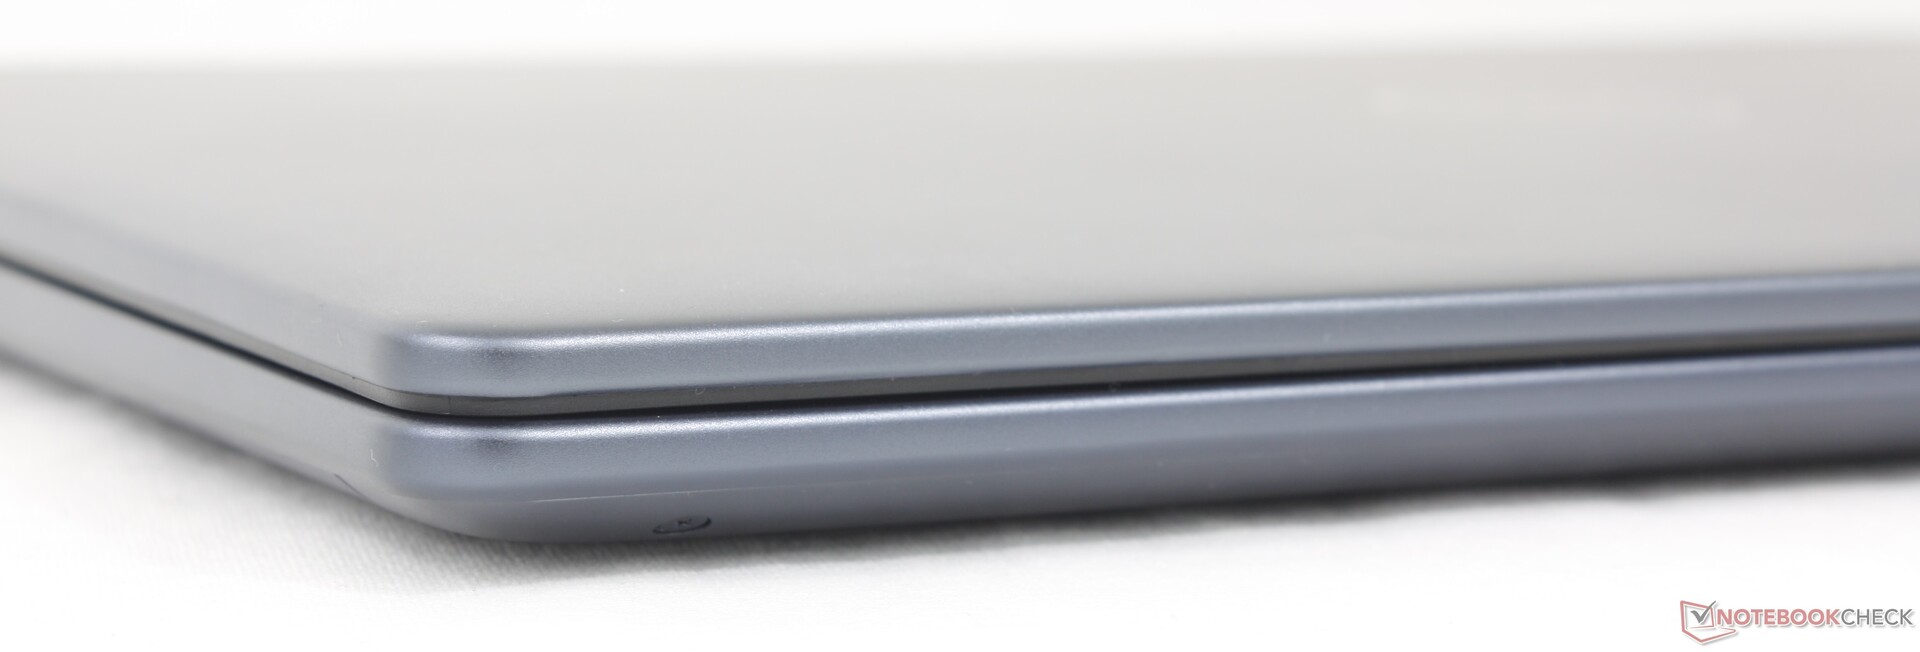
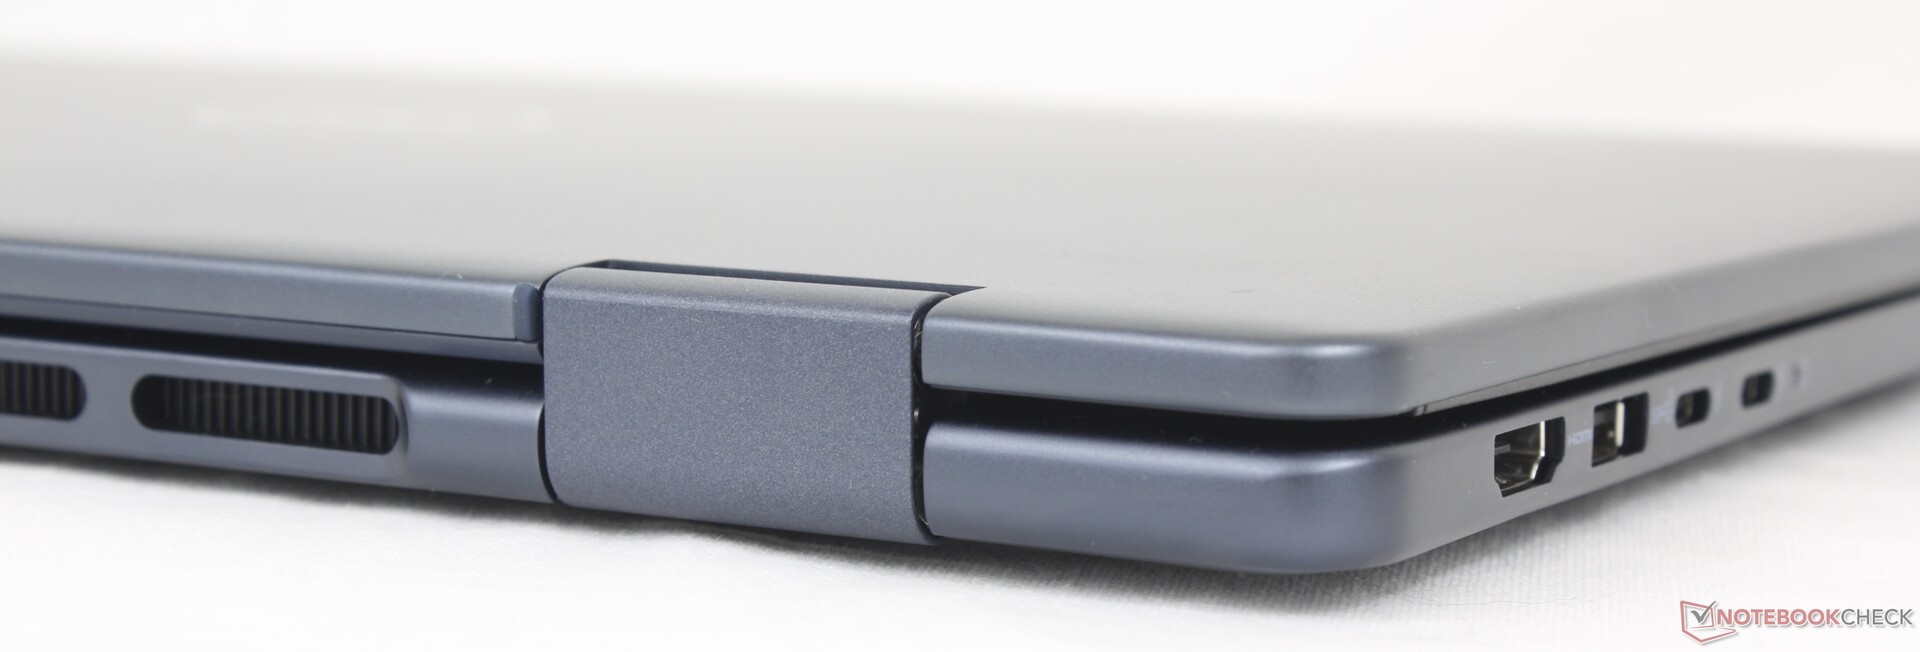
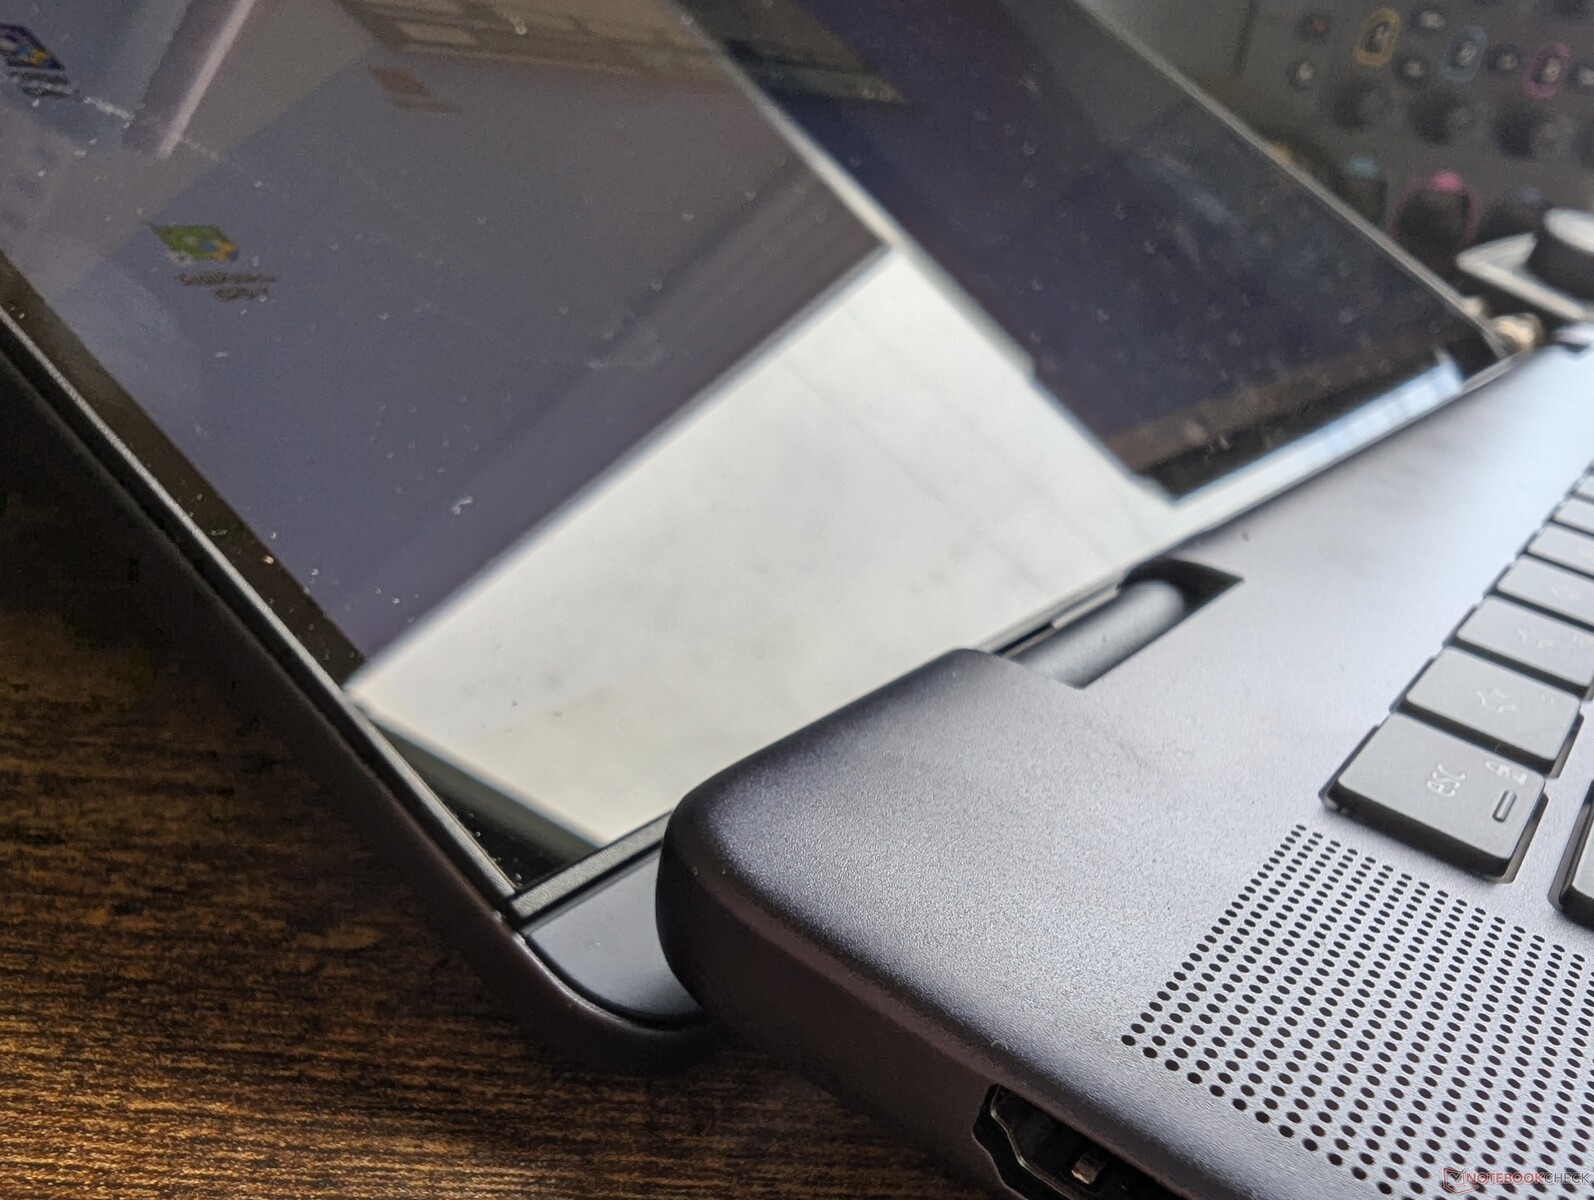
Il y a plusieurs changements extérieurs par rapport au modèle sortant. Tout d'abord, la partie du repose-paume n'est plus surélevée, ce qui permet d'obtenir un bord plus net entre le repose-paume et le clavier. Deuxièmement, les grilles d'aération situées en bas et à l'arrière ont été redessinées pour être légèrement plus grandes. Enfin, le bord arrière lui-même est plus audacieux, ce qui lui confère un aspect plus massif.
Outre les changements esthétiques mentionnés ci-dessus, les matériaux du châssis restent les mêmes qu'auparavant, sans amélioration majeure en termes de rigidité ou de qualité. Le couvercle et la base sont toujours en aluminium et en plastique, respectivement, avec une bonne résistance à la torsion et aux dépressions pour une première impression solide, surtout pour un modèle de milieu de gamme. Nous ne sommes pas tant préoccupés par la qualité de fabrication du modèle que par son poids en mode tablette.
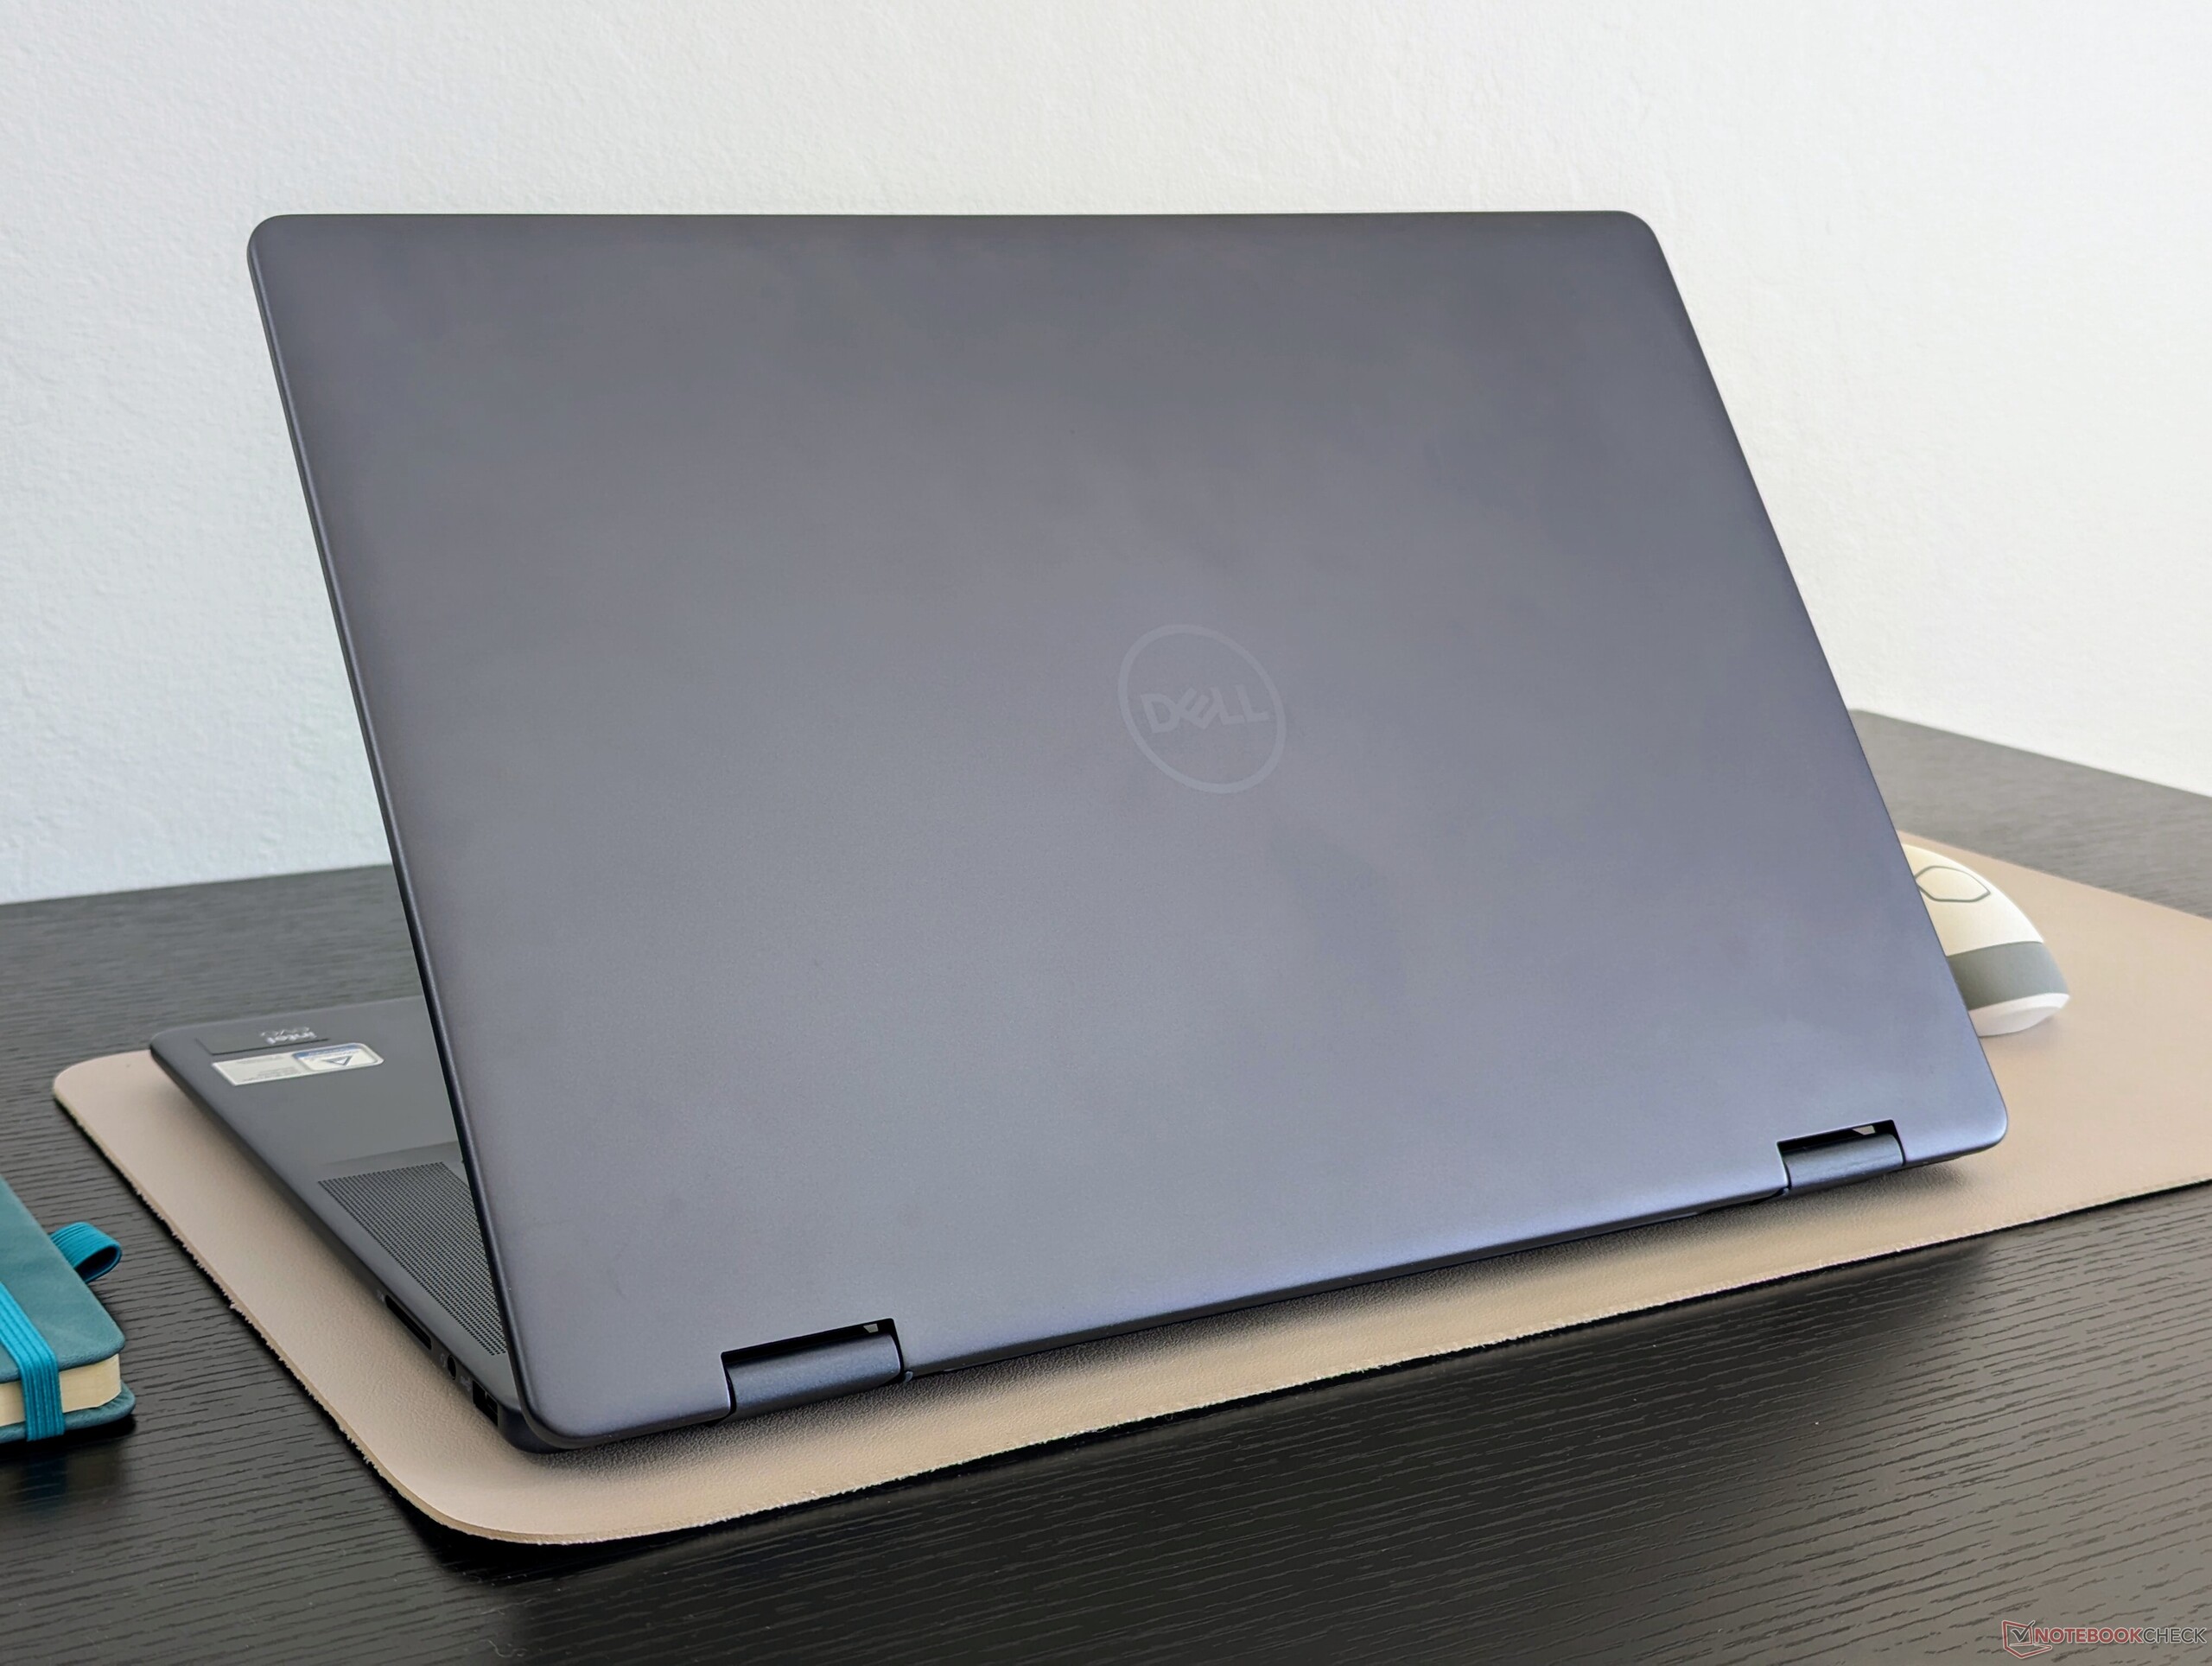
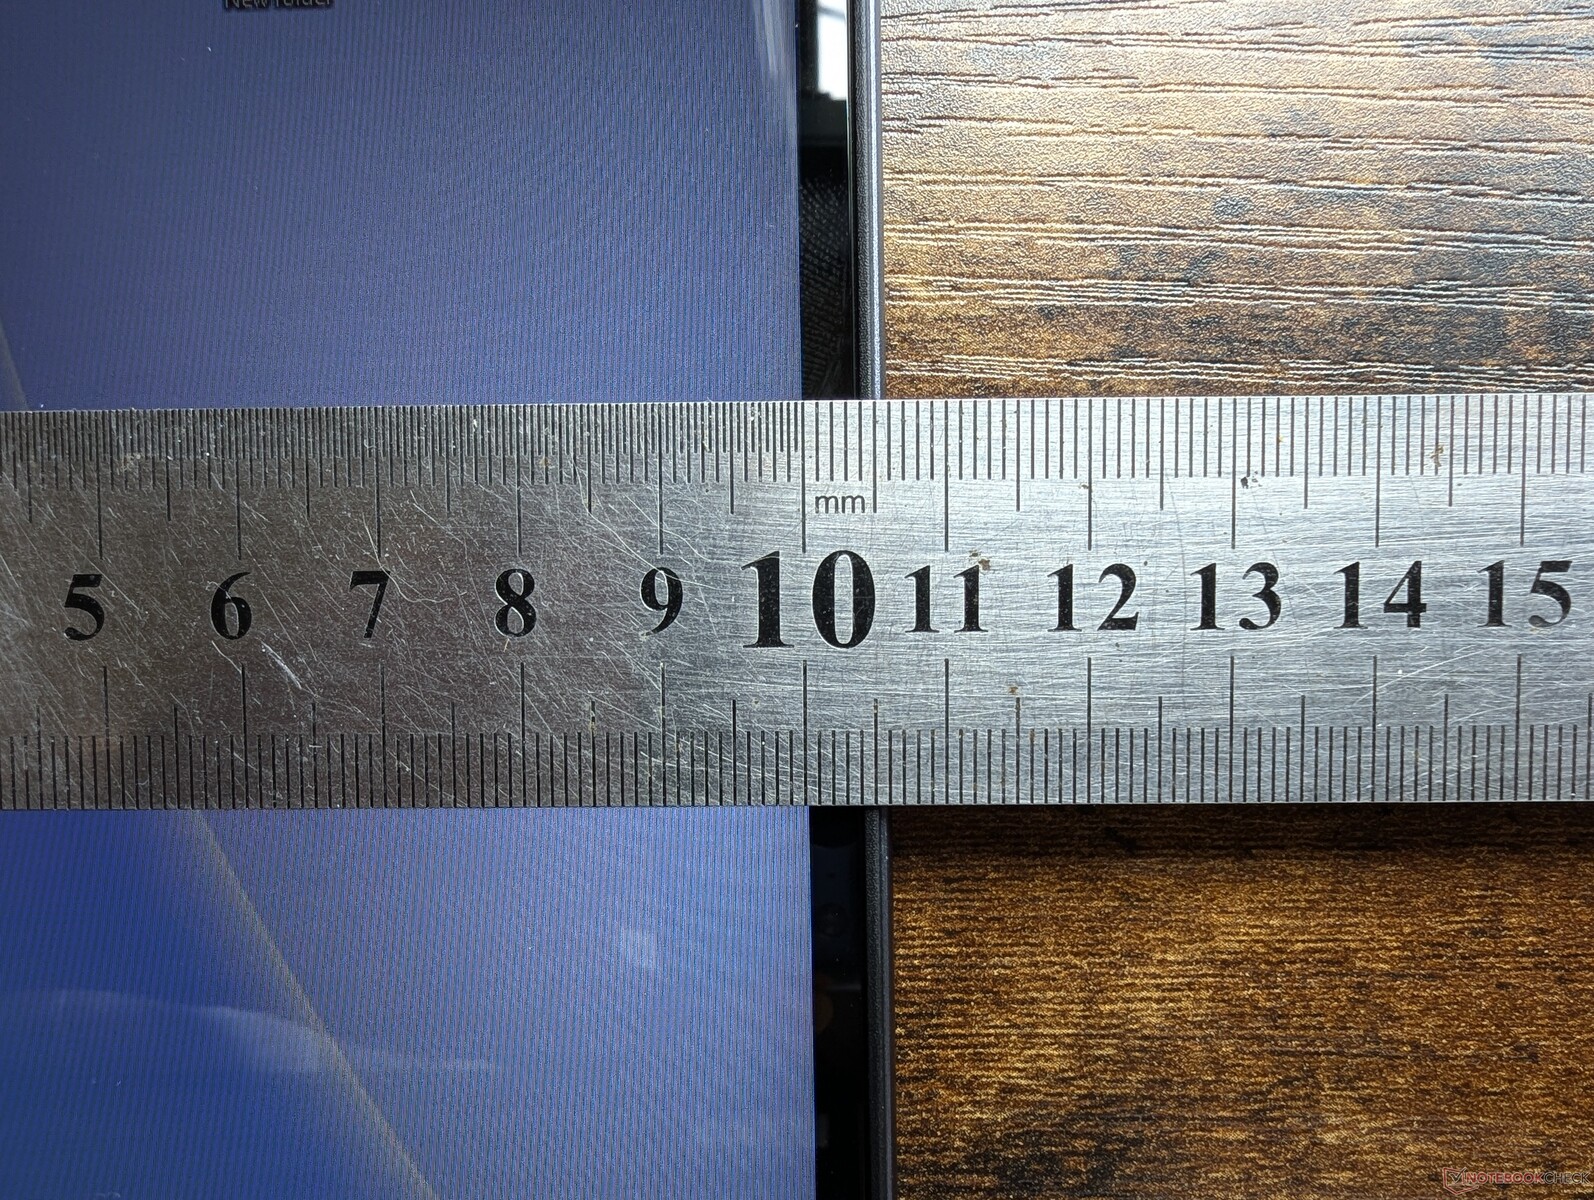
Les dimensions et le poids sont presque identiques à ceux de l'Inspiron 16 7630 2-en-1 2023 et de l'Inspiron 16 Plus 7640 à clapet 2024 2024 Inspiron 16 Plus 7640 à clapet même si ce dernier dispose d'un GPU discret en option. Nous aurions préféré un design plus léger, car les HP Envy x360 16 pouces et les Inspiron 16 Plus 7640 sont plus légers Samsung Galaxy Book4 Pro 360 sont tous deux nettement plus légers que notre Dell. Alors qu'un convertible 16 pouces sera toujours relativement lourd, l'Inspiron 16 7640 2-en-1 est probablement l'un des pires du lot pour les voyages.

Connectivité
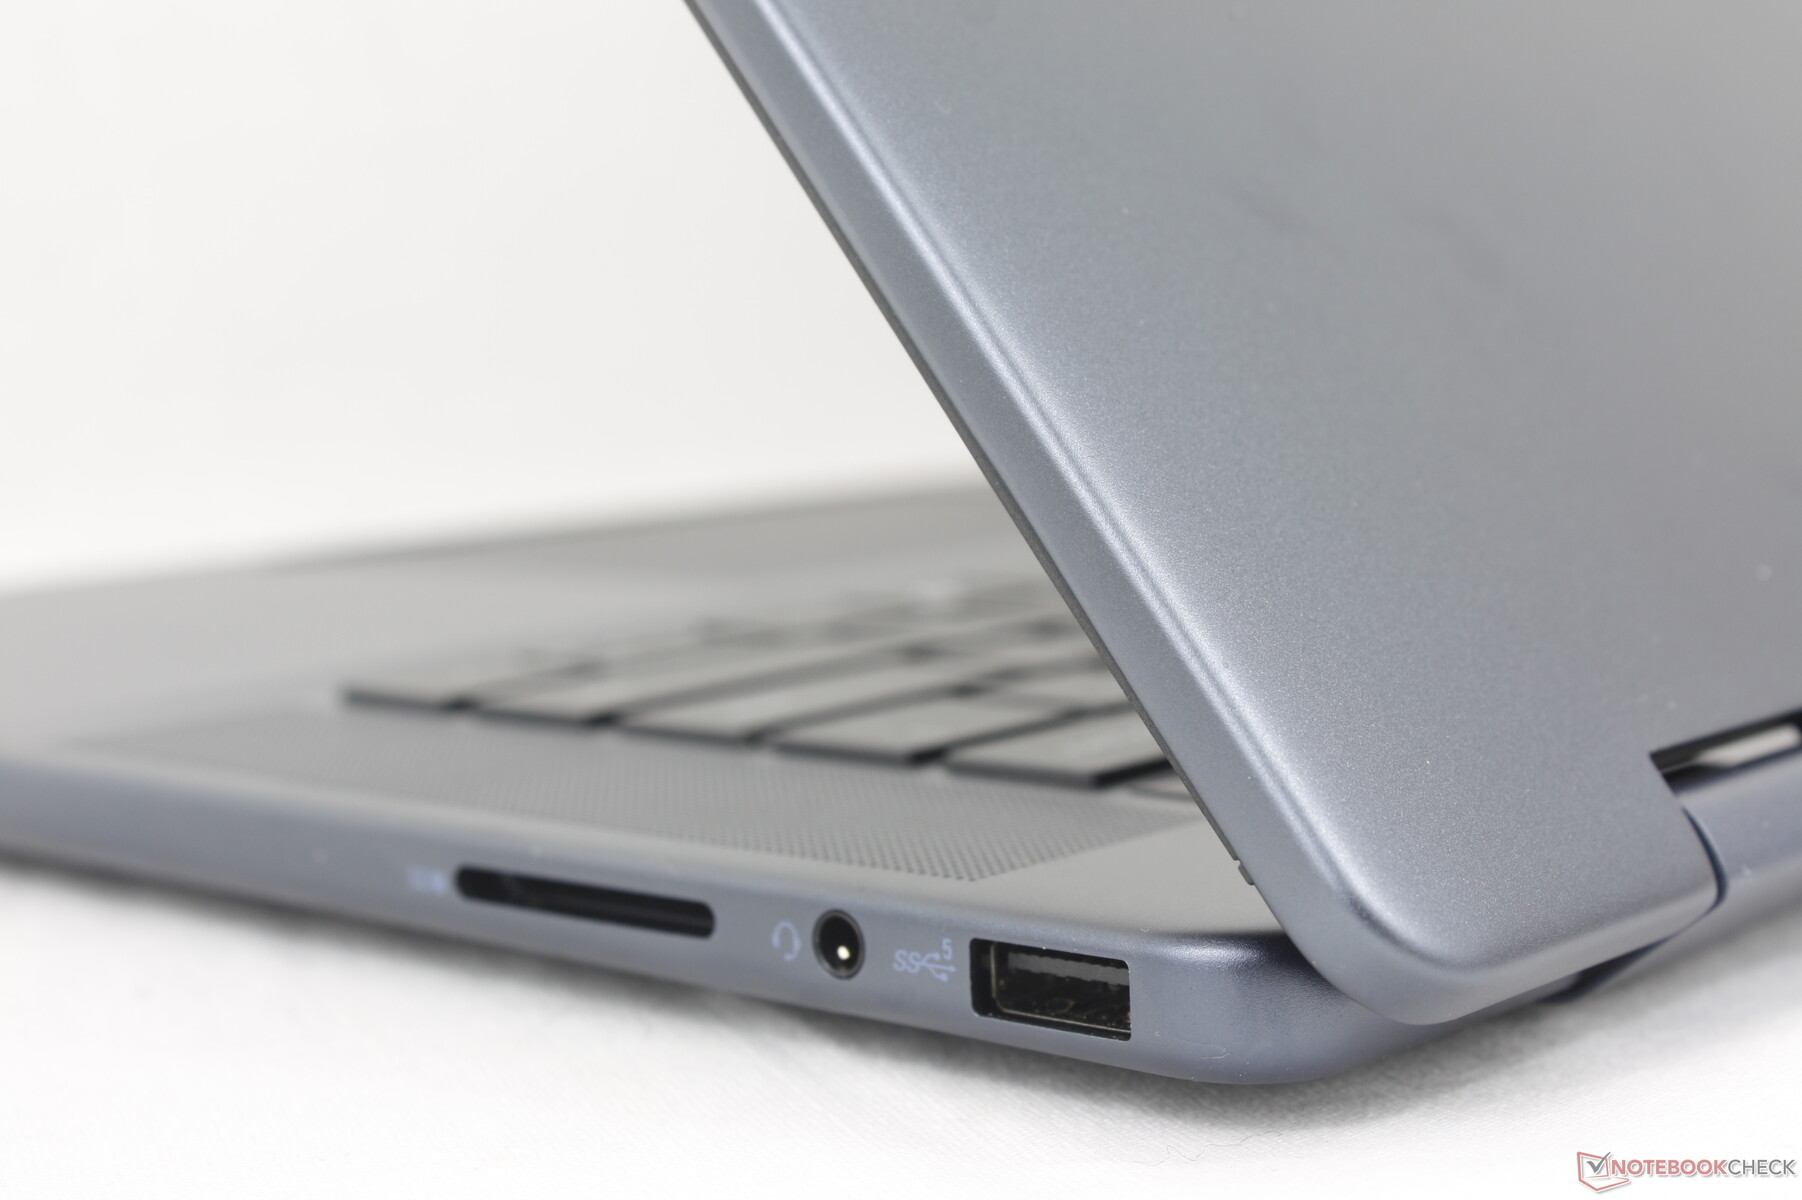
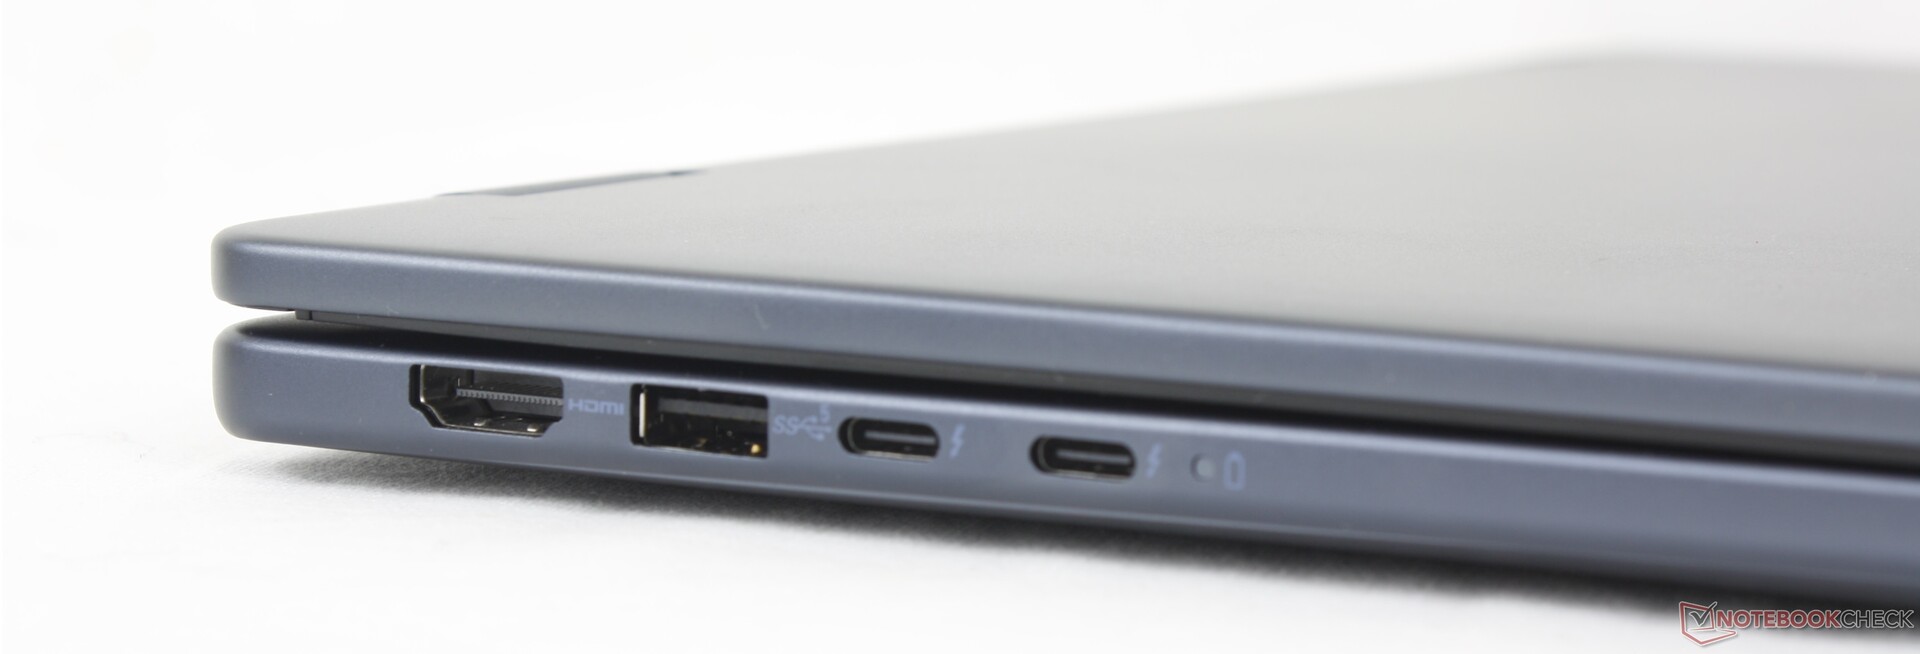
Les options et le positionnement des ports restent identiques à ceux de l Inspiron 16 7635 2-en-1 ou 7630 2-en-1 malgré les nombreux changements extérieurs. Notez que Thunderbolt 4 n'est à nouveau disponible que sur les modèles Intel et que le port HDMI n'est toujours disponible qu'en version 1.4.
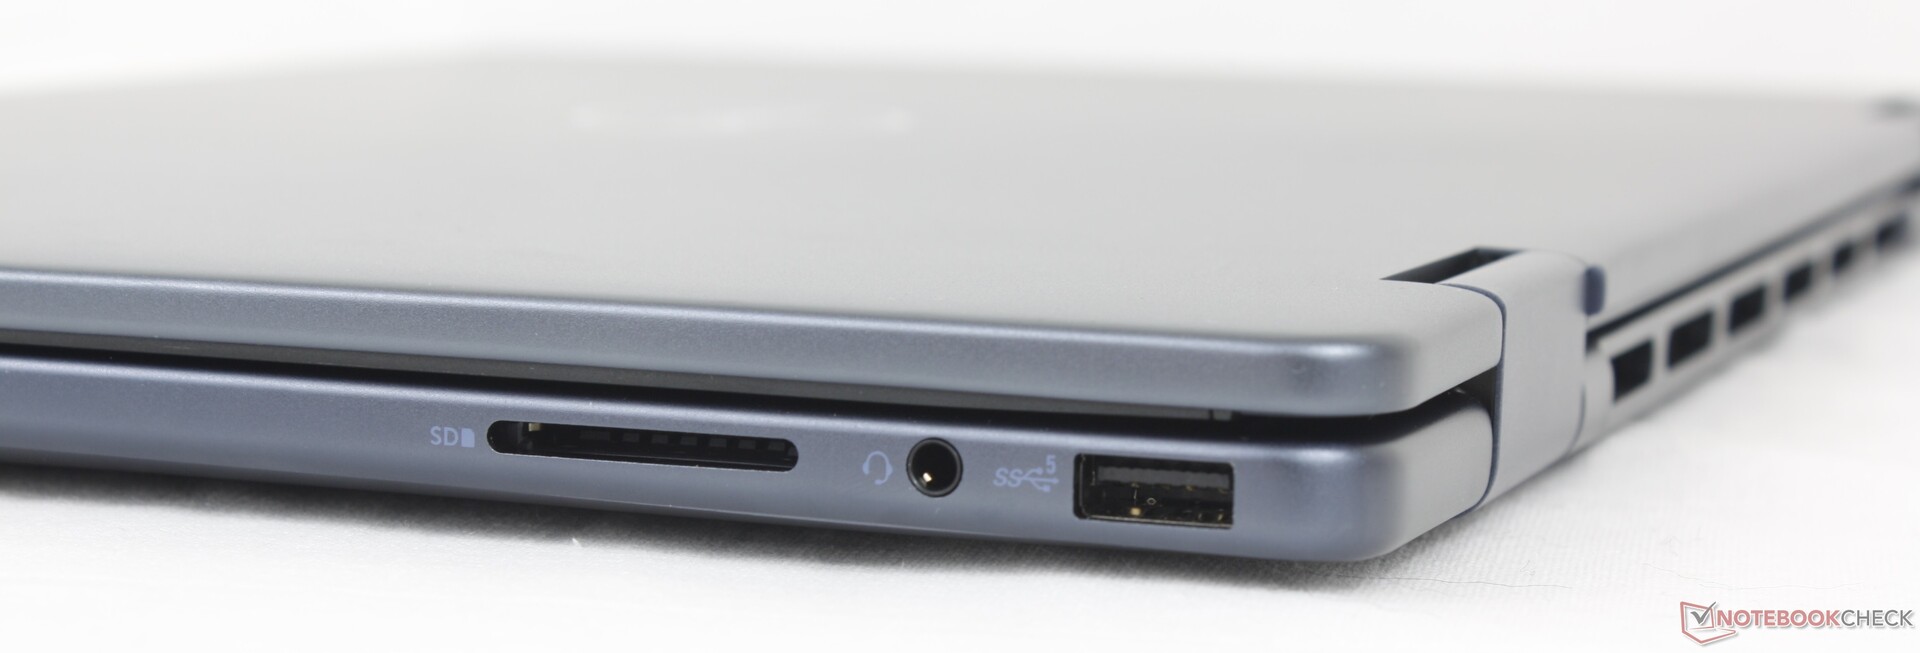
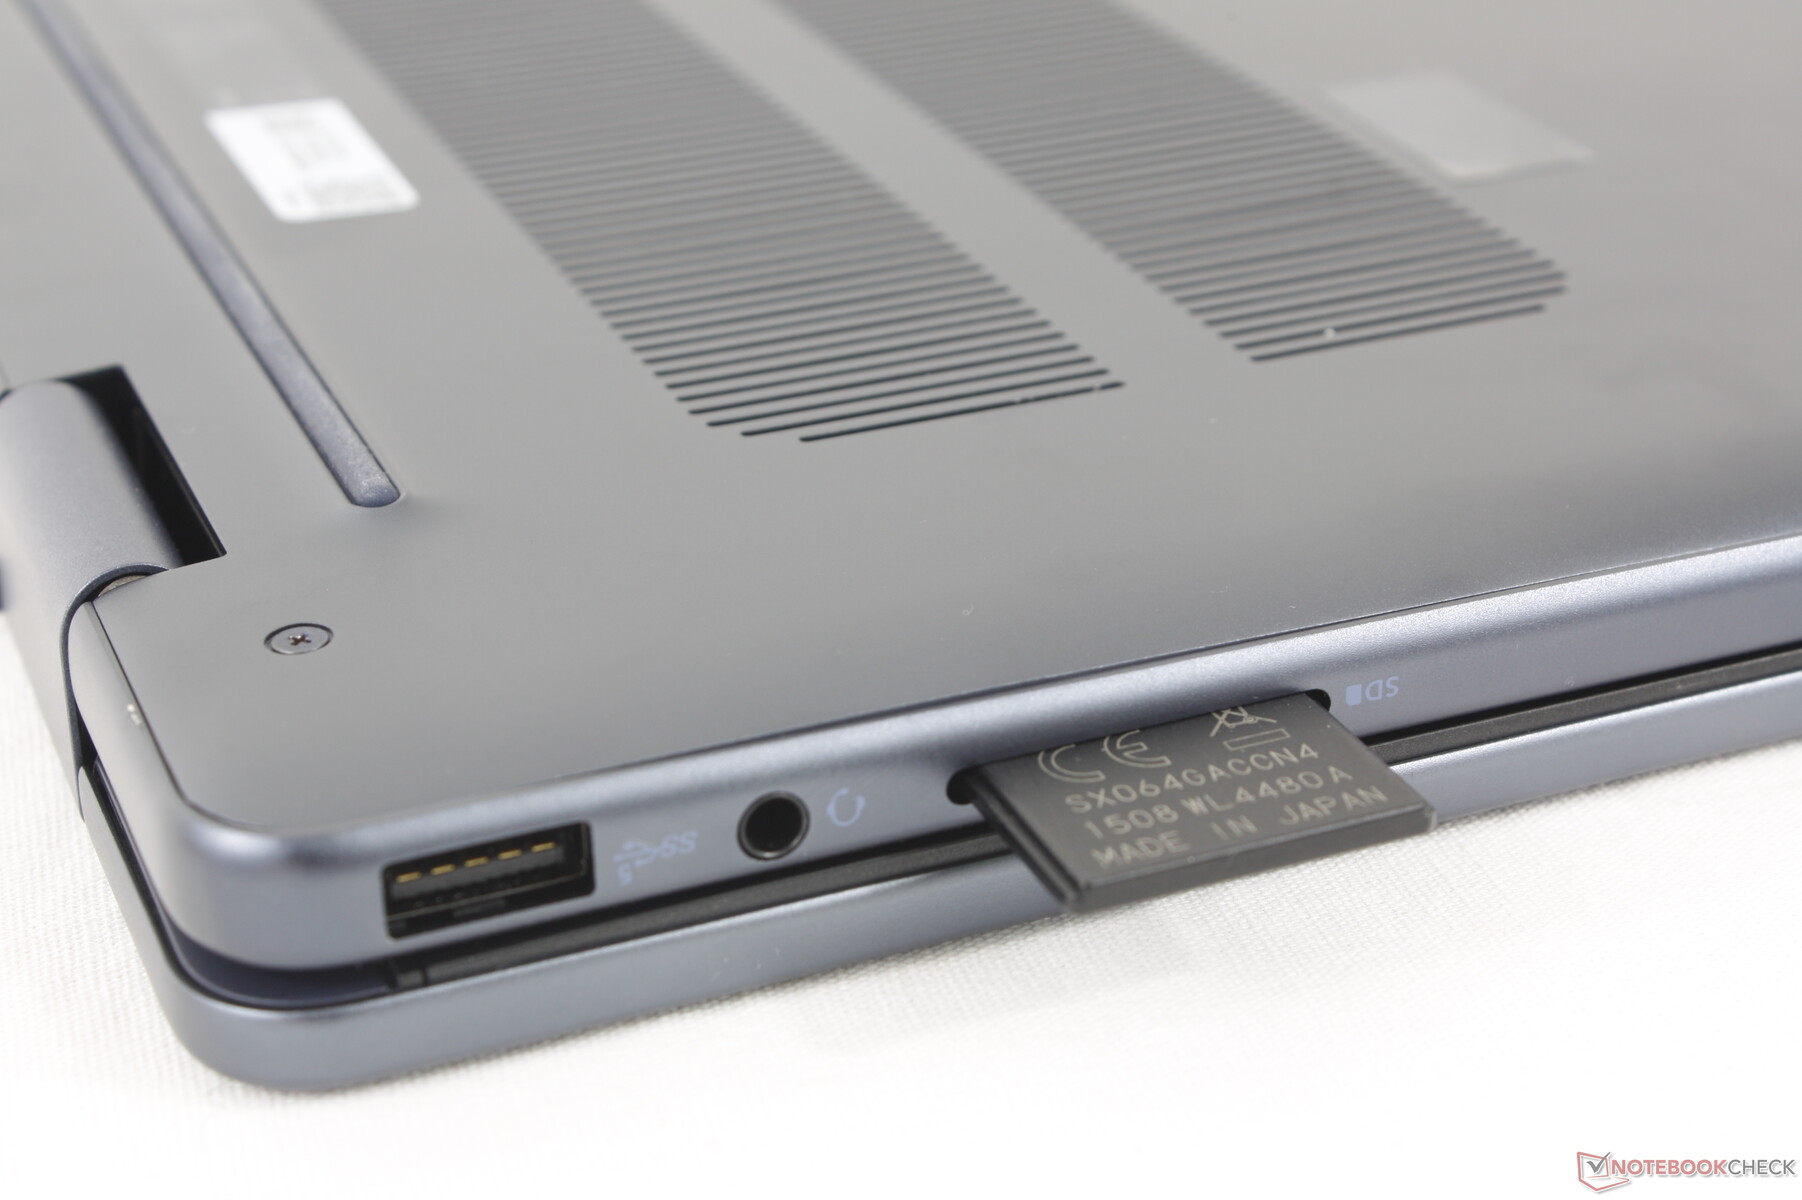
Lecteur de carte SD
Les taux de transfert avec le lecteur de carte SD intégré ne se sont pas améliorés par rapport au modèle de l'année dernière, avec un peu moins de 30 MB/s. les ordinateurs de 16 pouces comme le Lenovo IdeaPad Pro 5 16 peuvent être plus de deux fois plus rapides et le XPS 16 est encore plus rapide. Les utilisateurs qui dépendent des cartes SD apprécieront le lecteur de cartes intégré pratique de l'Inspiron, mais ils seront probablement déçus par la lenteur des vitesses.
| SD Card Reader | |
| average JPG Copy Test (av. of 3 runs) | |
| Samsung Galaxy Book4 Pro 360 (Angelbird AV Pro V60) | |
| Lenovo IdeaPad Pro 5 16IMH G9 (Angelbird AV Pro V60) | |
| Dell Inspiron 16 7635 2-in-1 (PNY EliteX-Pro60 V60 256 GB) | |
| Dell Inspiron 16 7640 2-in-1 (Toshiba Exceria Pro SDXC 64 GB UHS-II) | |
| Dell Inspiron 16 Plus 7640 (Angelbird AV Pro V60) | |
| maximum AS SSD Seq Read Test (1GB) | |
| Lenovo IdeaPad Pro 5 16IMH G9 (Angelbird AV Pro V60) | |
| Samsung Galaxy Book4 Pro 360 (Angelbird AV Pro V60) | |
| Dell Inspiron 16 7635 2-in-1 (PNY EliteX-Pro60 V60 256 GB) | |
| Dell Inspiron 16 7640 2-in-1 (Toshiba Exceria Pro SDXC 64 GB UHS-II) | |
| Dell Inspiron 16 Plus 7640 (Angelbird AV Pro V60) | |
Communication
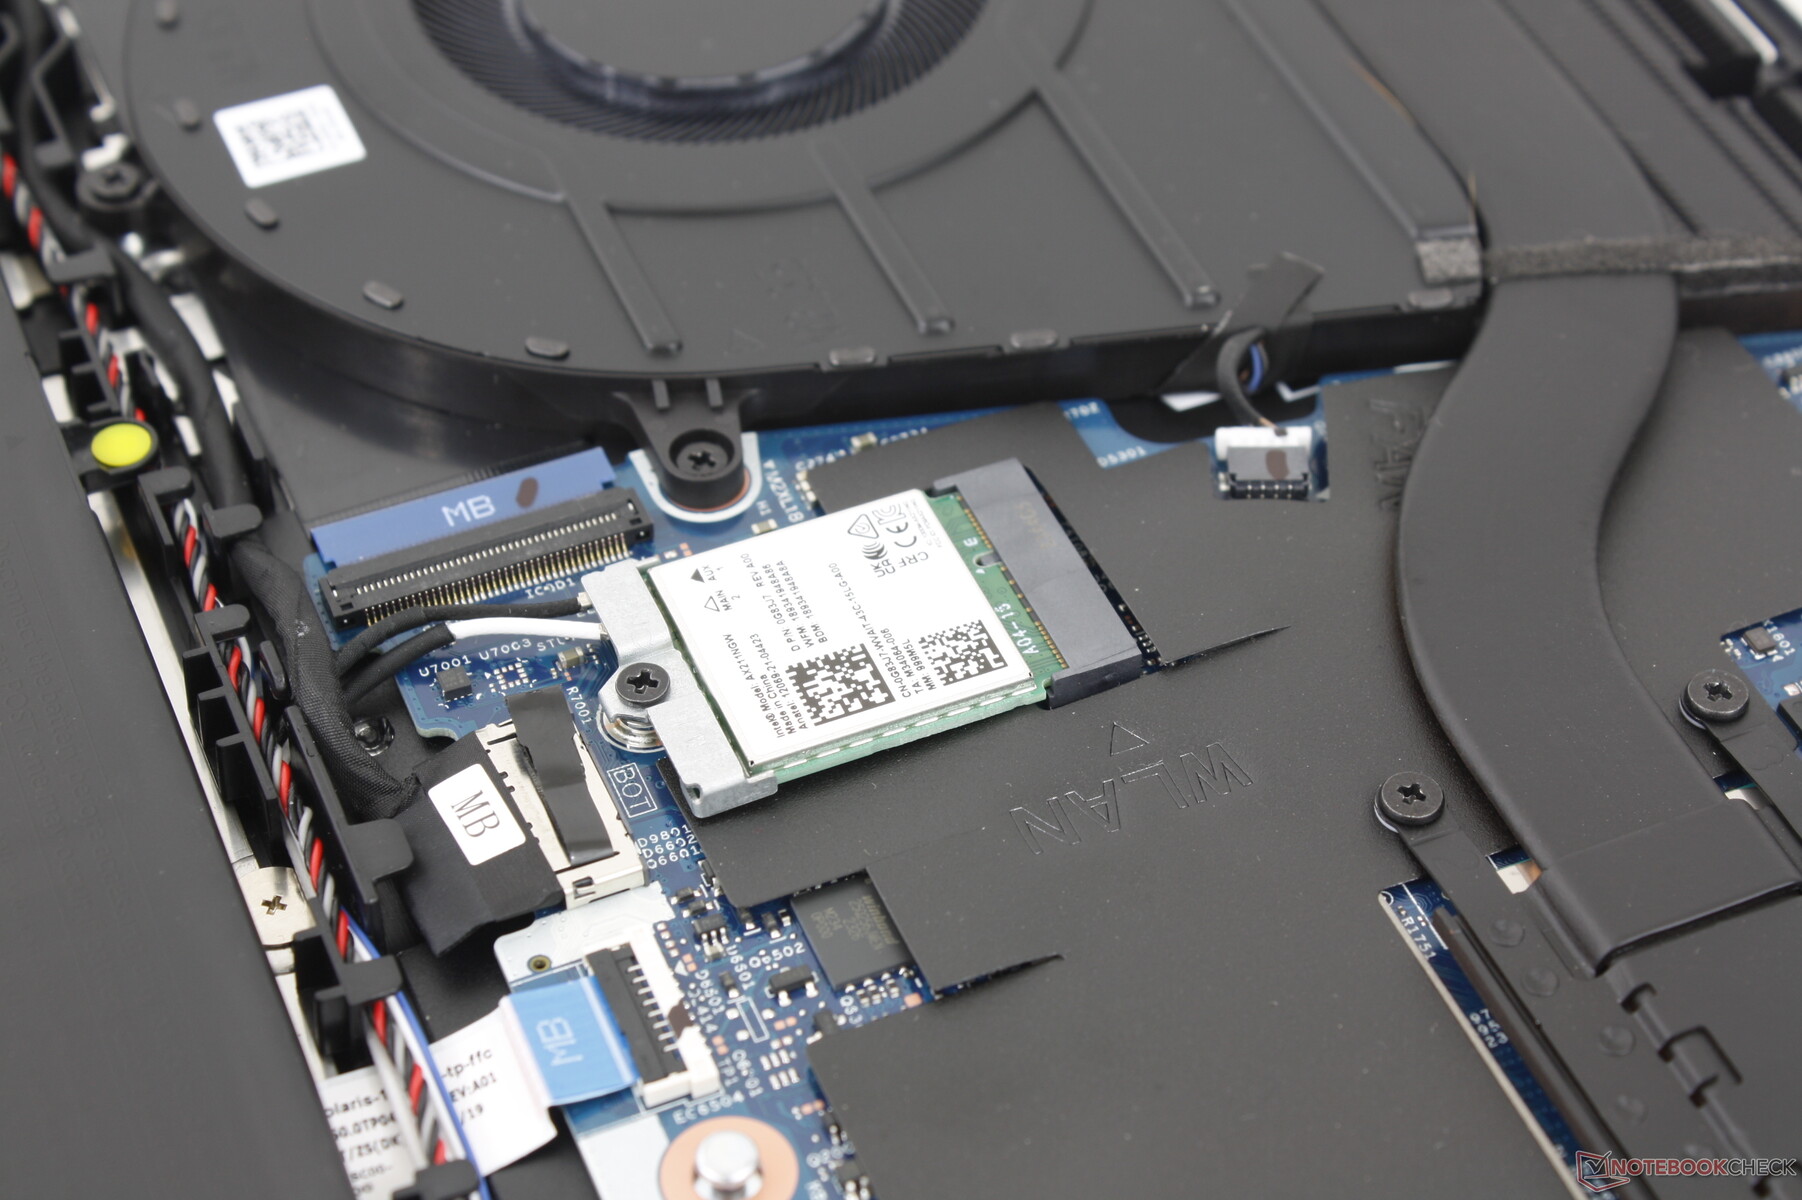
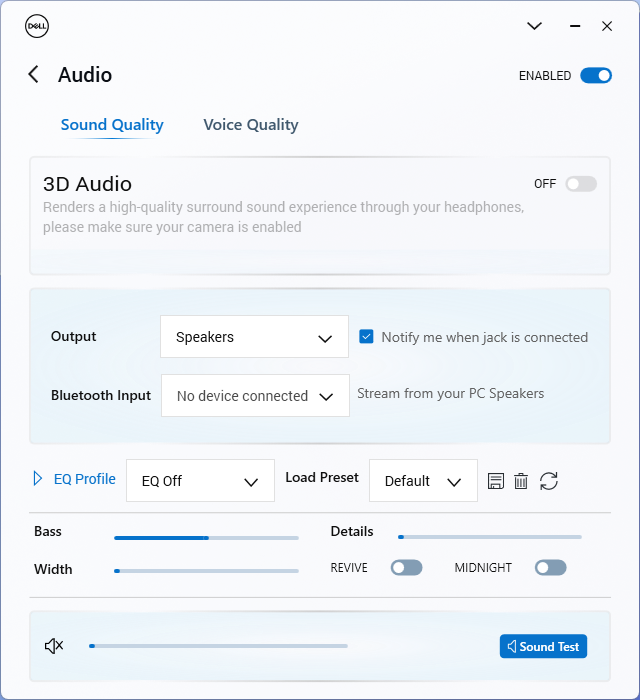
Le modèle est livré avec le même module WLAN Intel AX211 que celui de l'Inspiron 16 7640 pour la connectivité Wi-Fi 6E et Bluetooth 5.3. Les performances sont stables lorsqu'il est associé à notre routeur de test Asus AXE11000, mais les taux de transfert sur le réseau 6 GHz auraient pu être plus rapides.
Webcam
La webcam de 2 mégapixels est une fois de plus équipée d'un capteur IR et d'un obturateur physique.


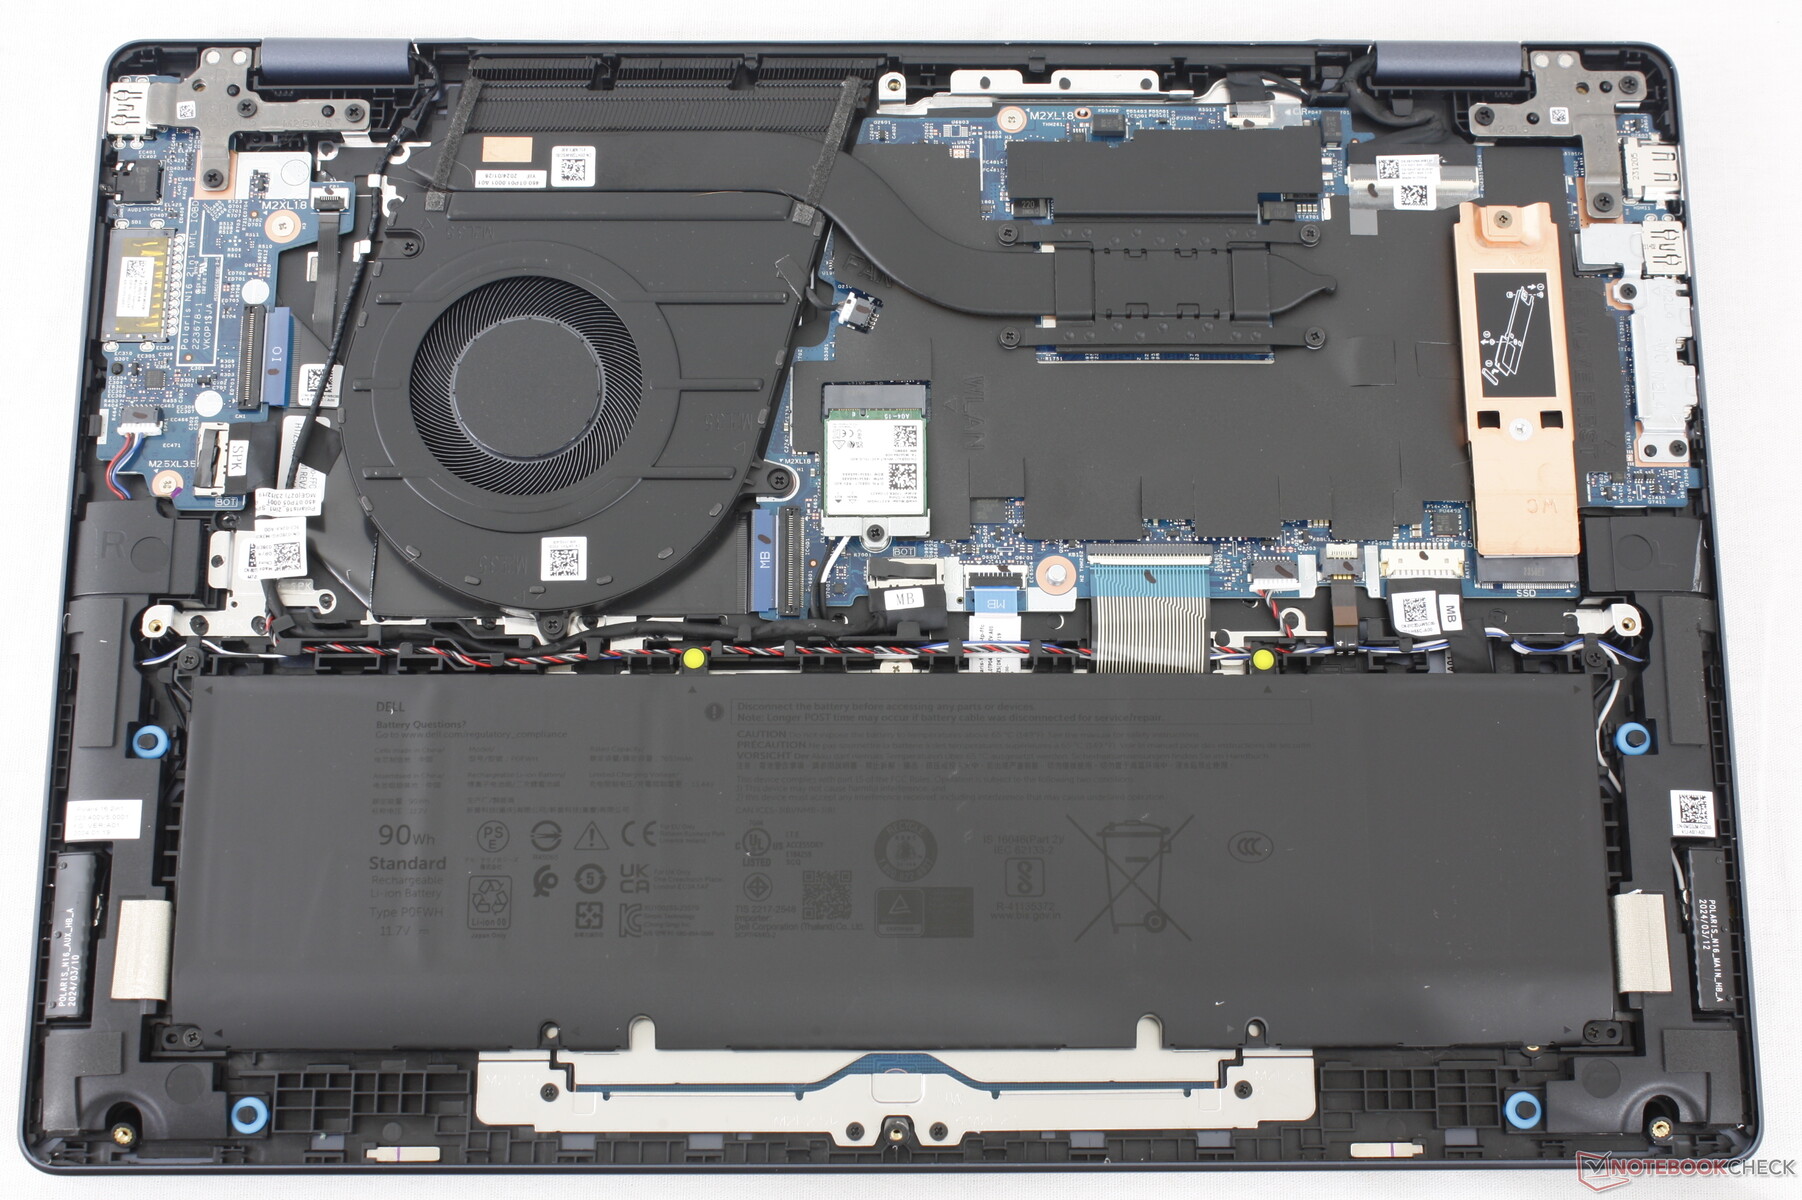
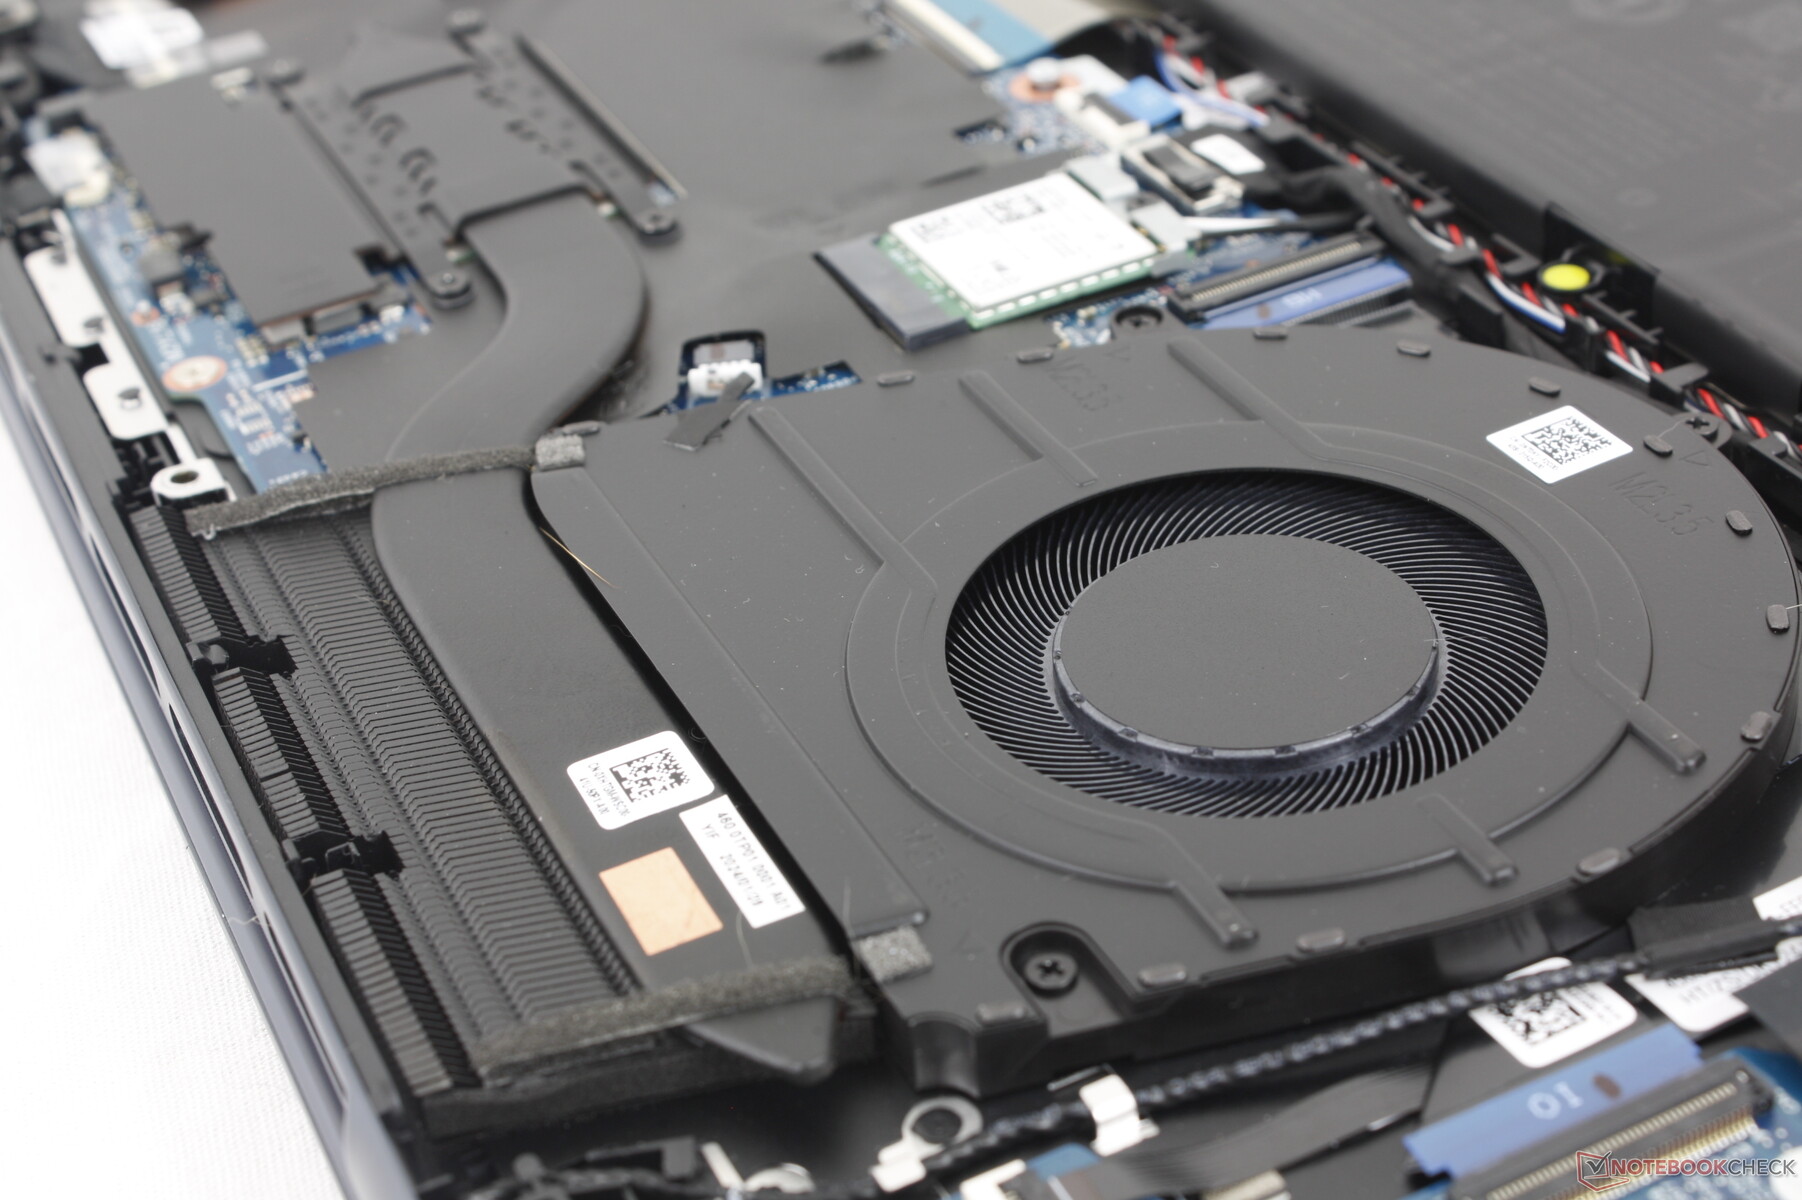
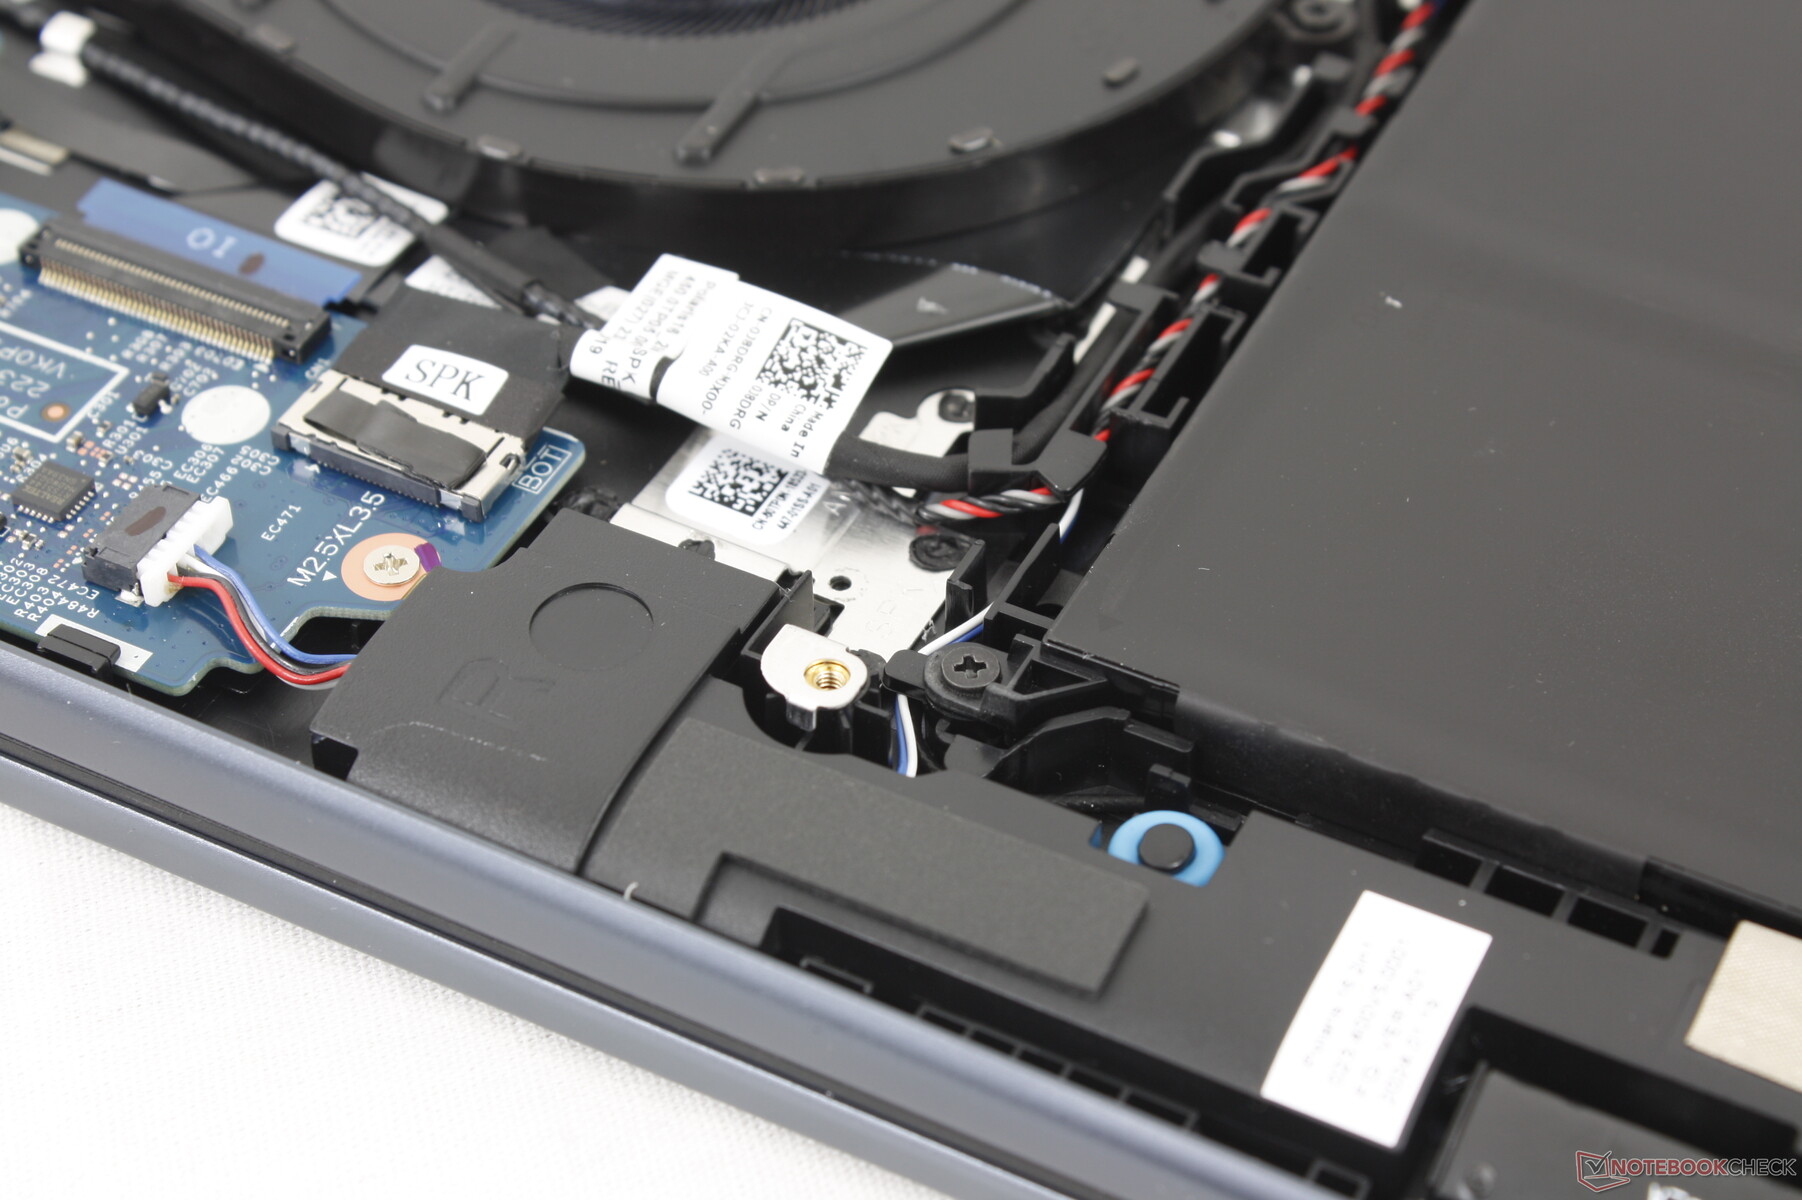
Maintenance
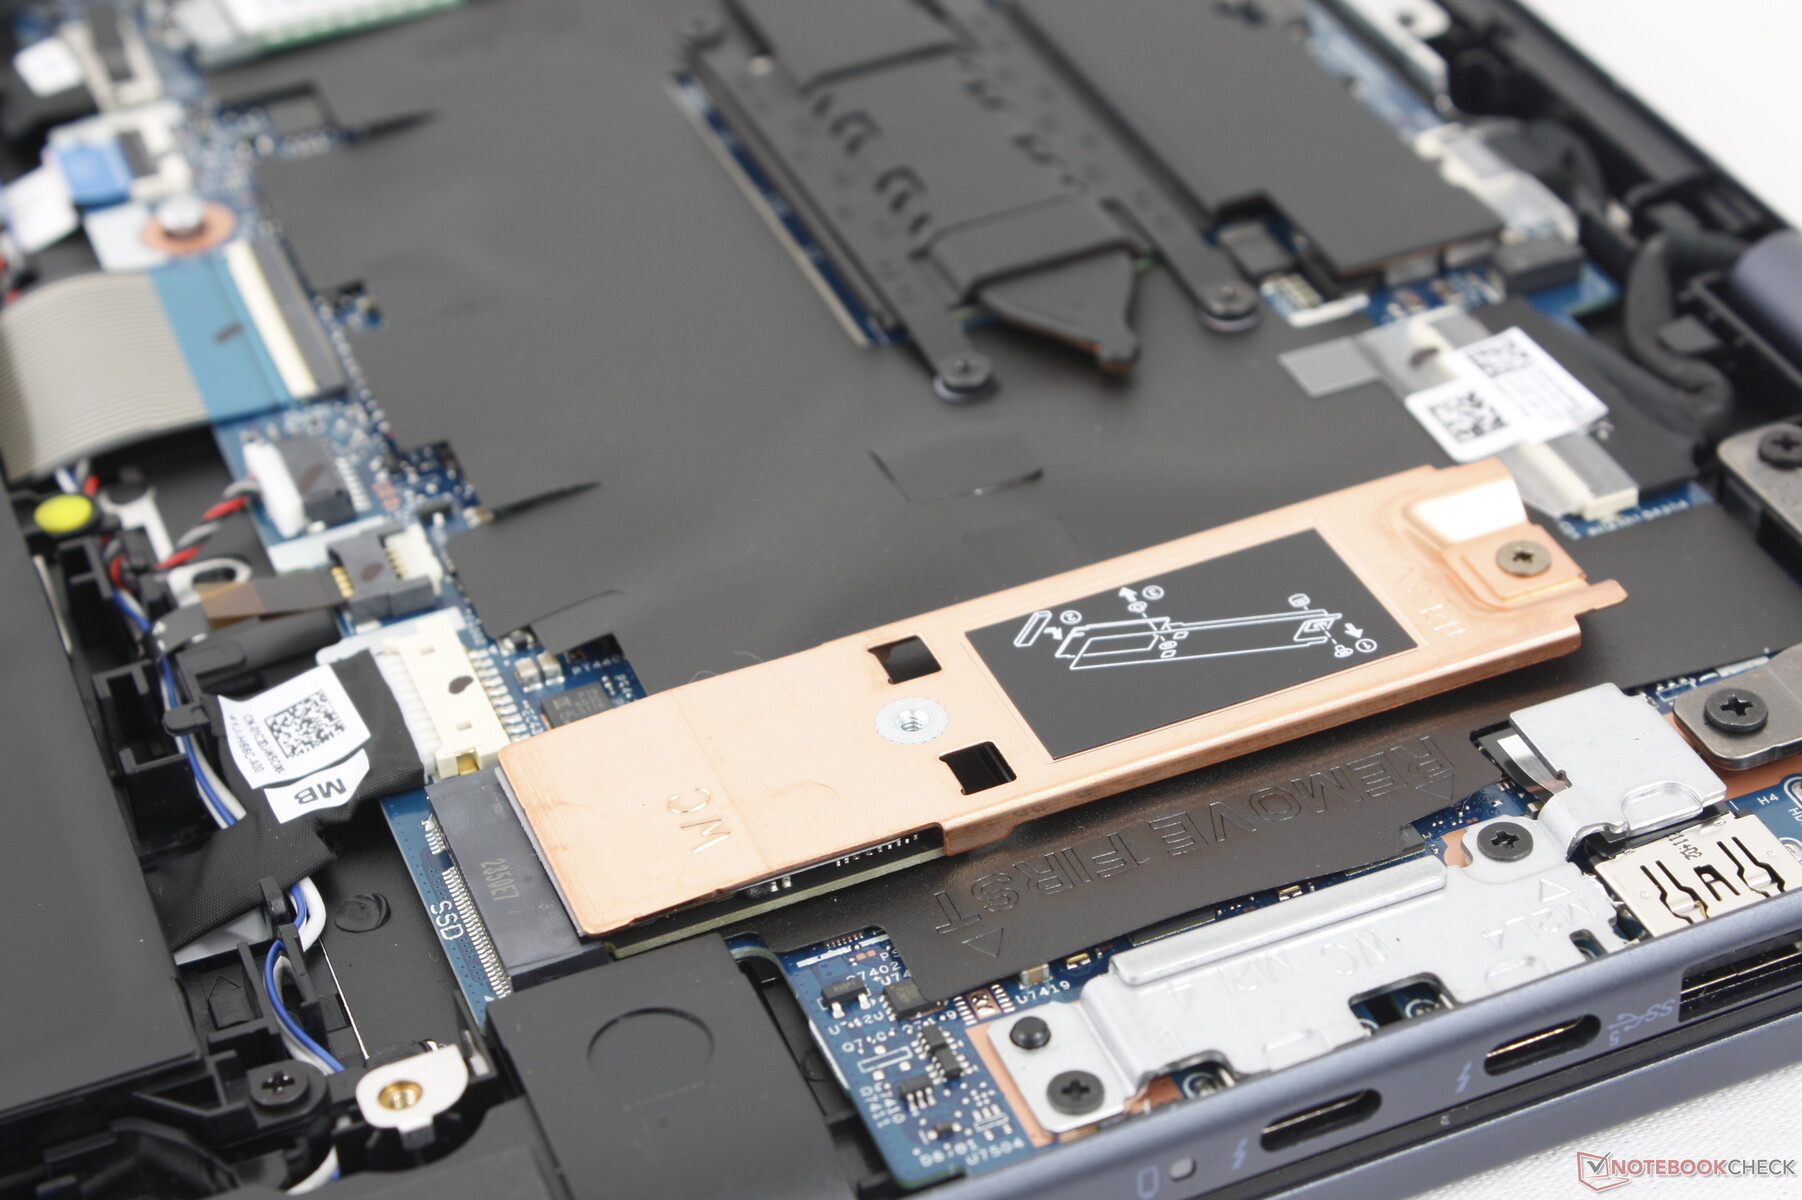
Il y a plusieurs différences internes entre notre modèle et l'Inspiron 16 7635 2-en-1 de l'année dernière. Le SSD en particulier a été repositionné pour faire de la place au ventilateur et à la batterie plus grands, tandis que le caloduc est maintenant légèrement plus épais pour compenser la longueur plus courte. Les SSD secondaires ne sont toujours pas pris en charge et la RAM n'est pas extensible par l'utilisateur.

Accessoires et garantie
La boîte contient un stylet actif (PN5122W) en plus de la documentation et de l'adaptateur secteur. La garantie limitée standard d'un an s'applique si l'appareil est acheté aux États-Unis.
Périphériques d'entrée - Bien mais encore un peu spongieux
Clavier et pavé tactile
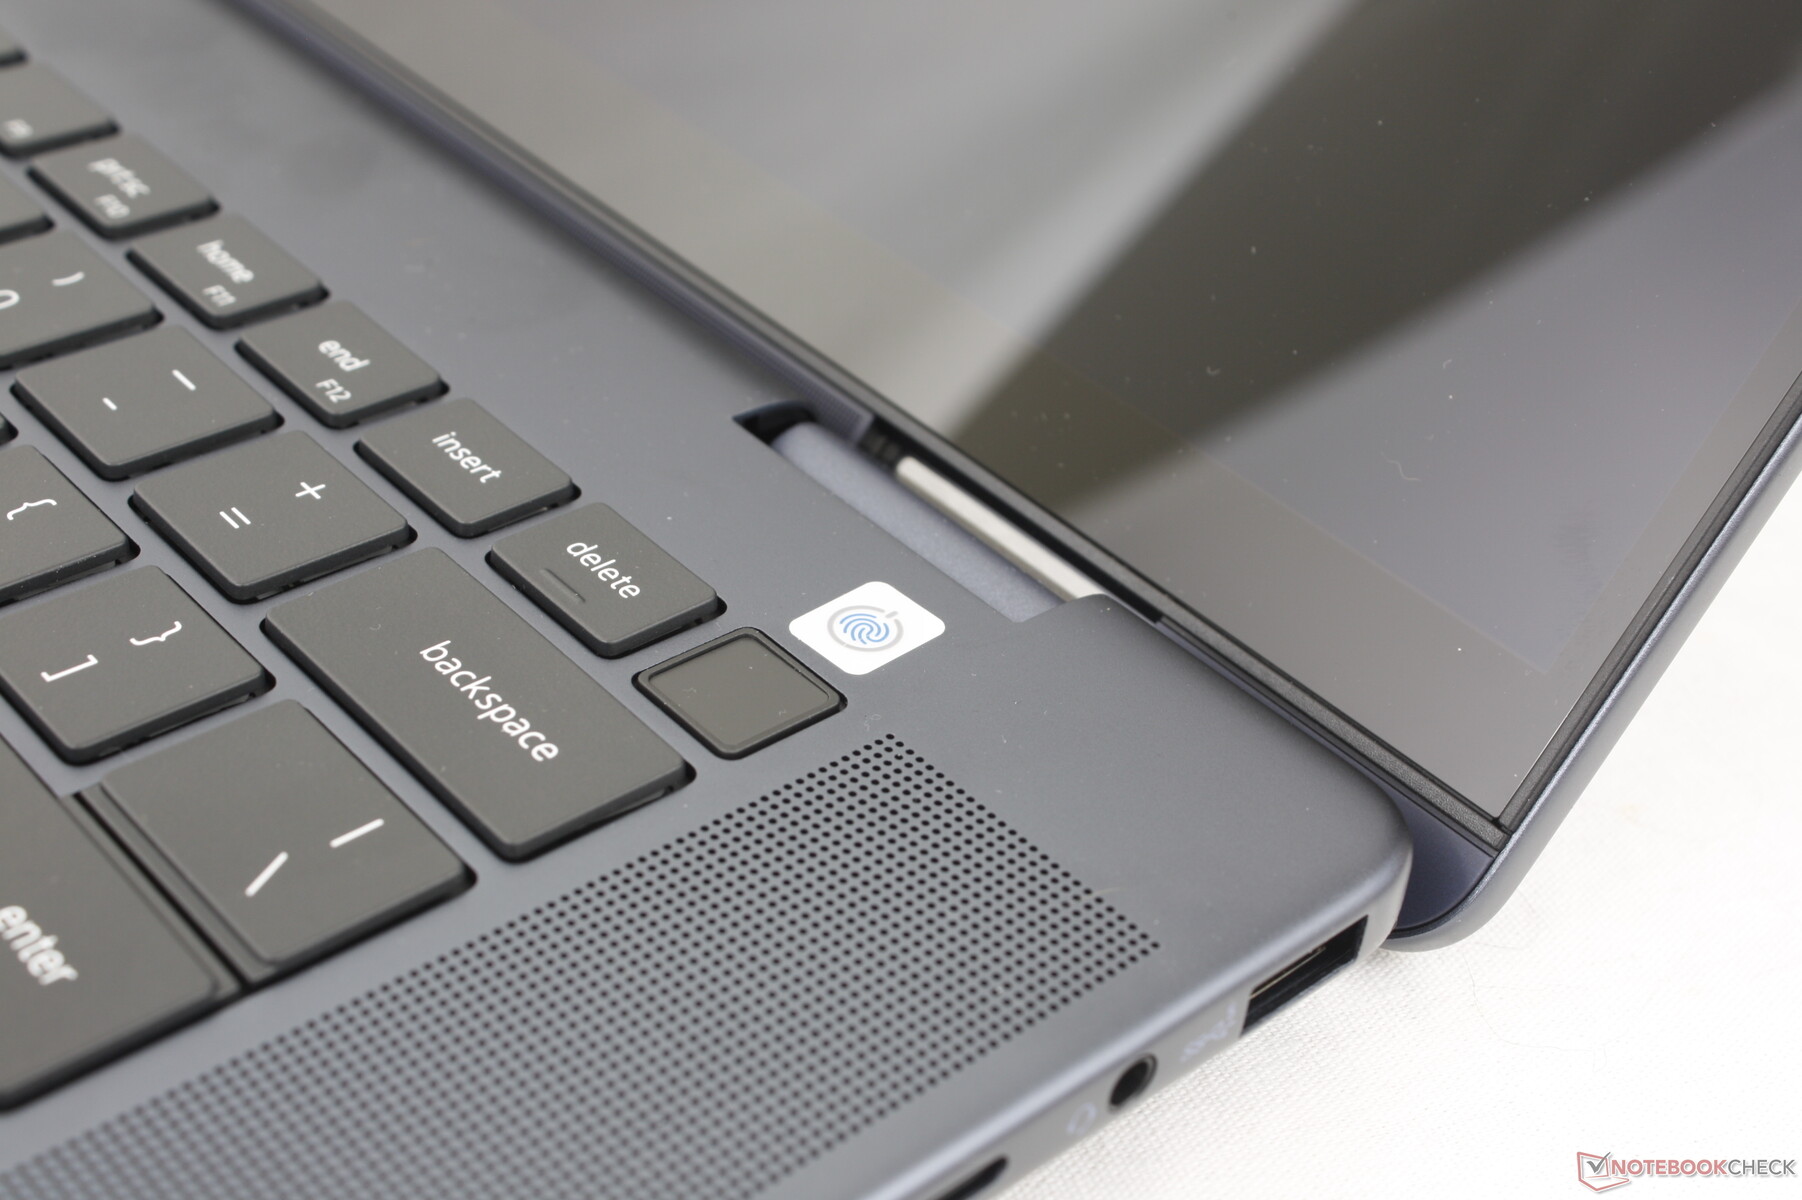
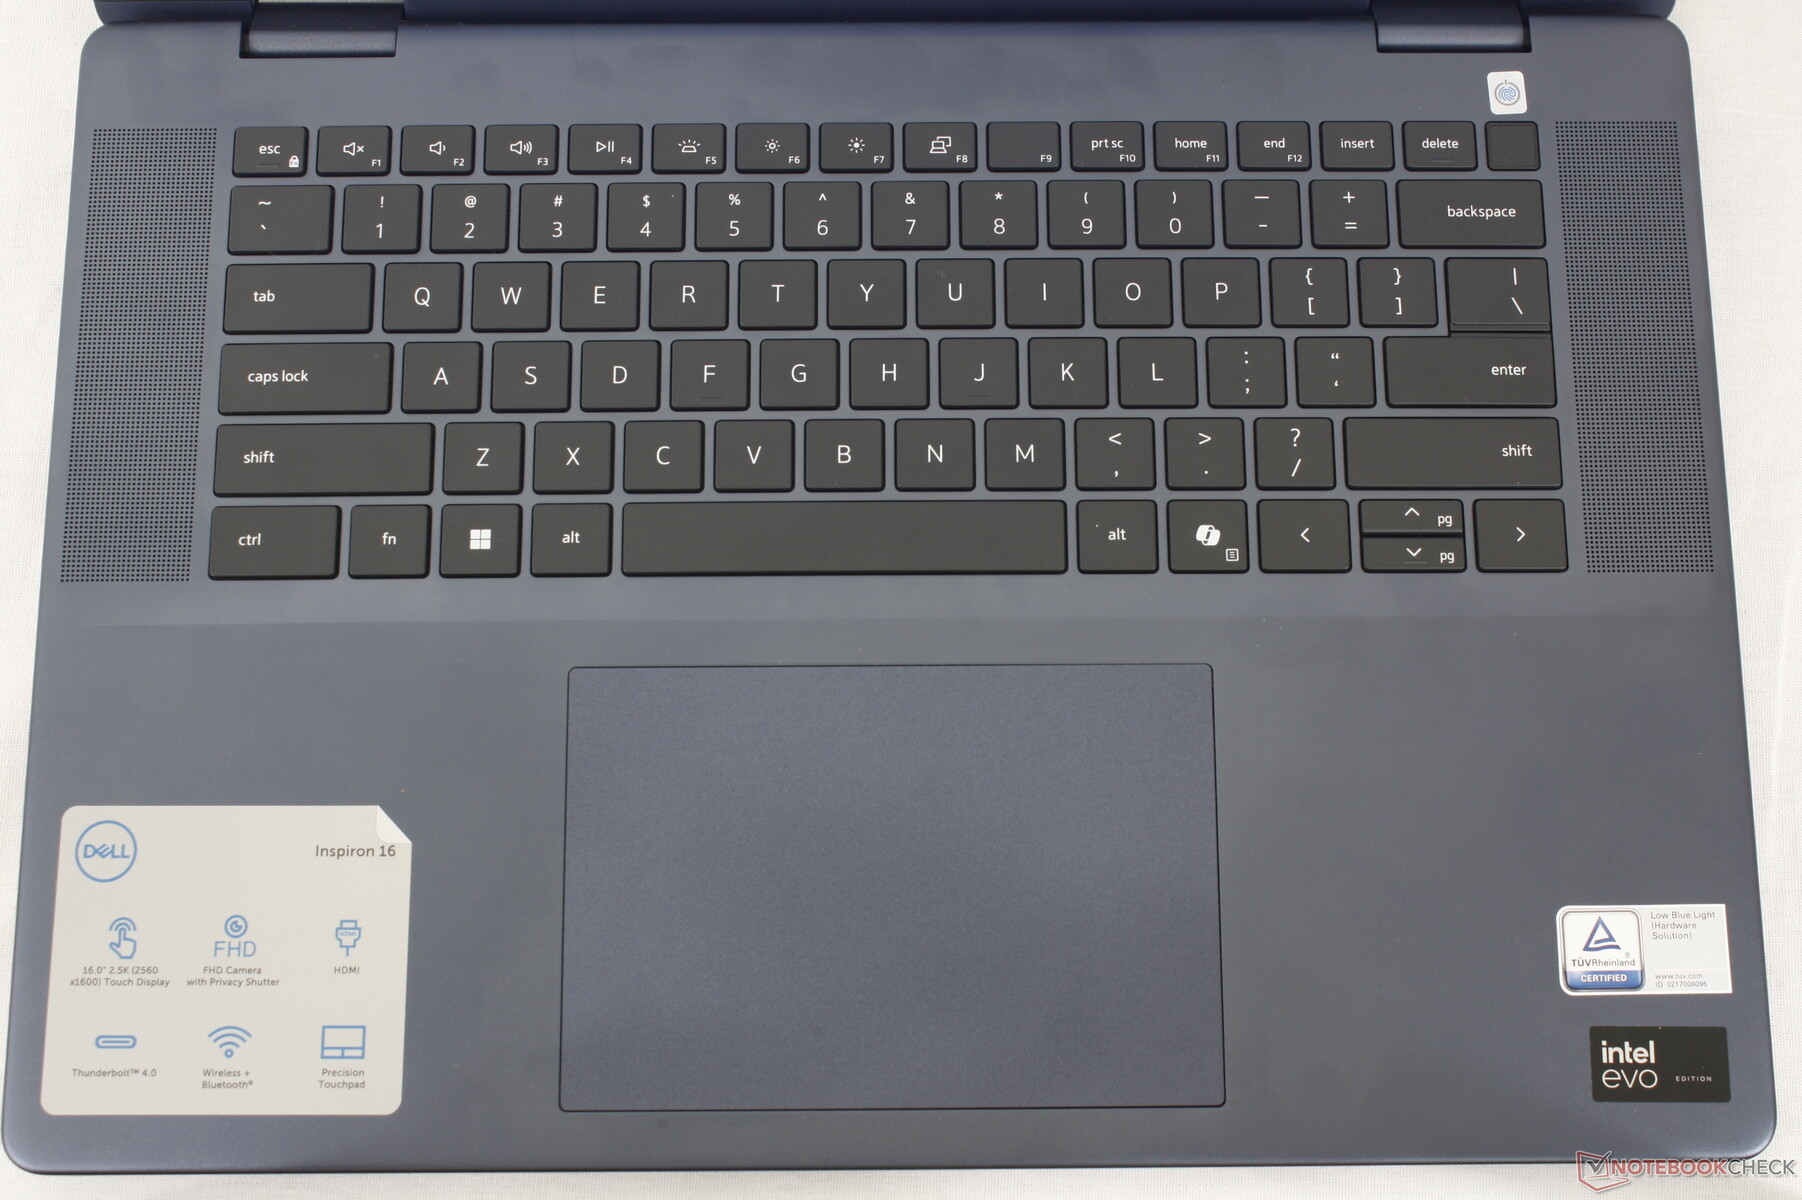
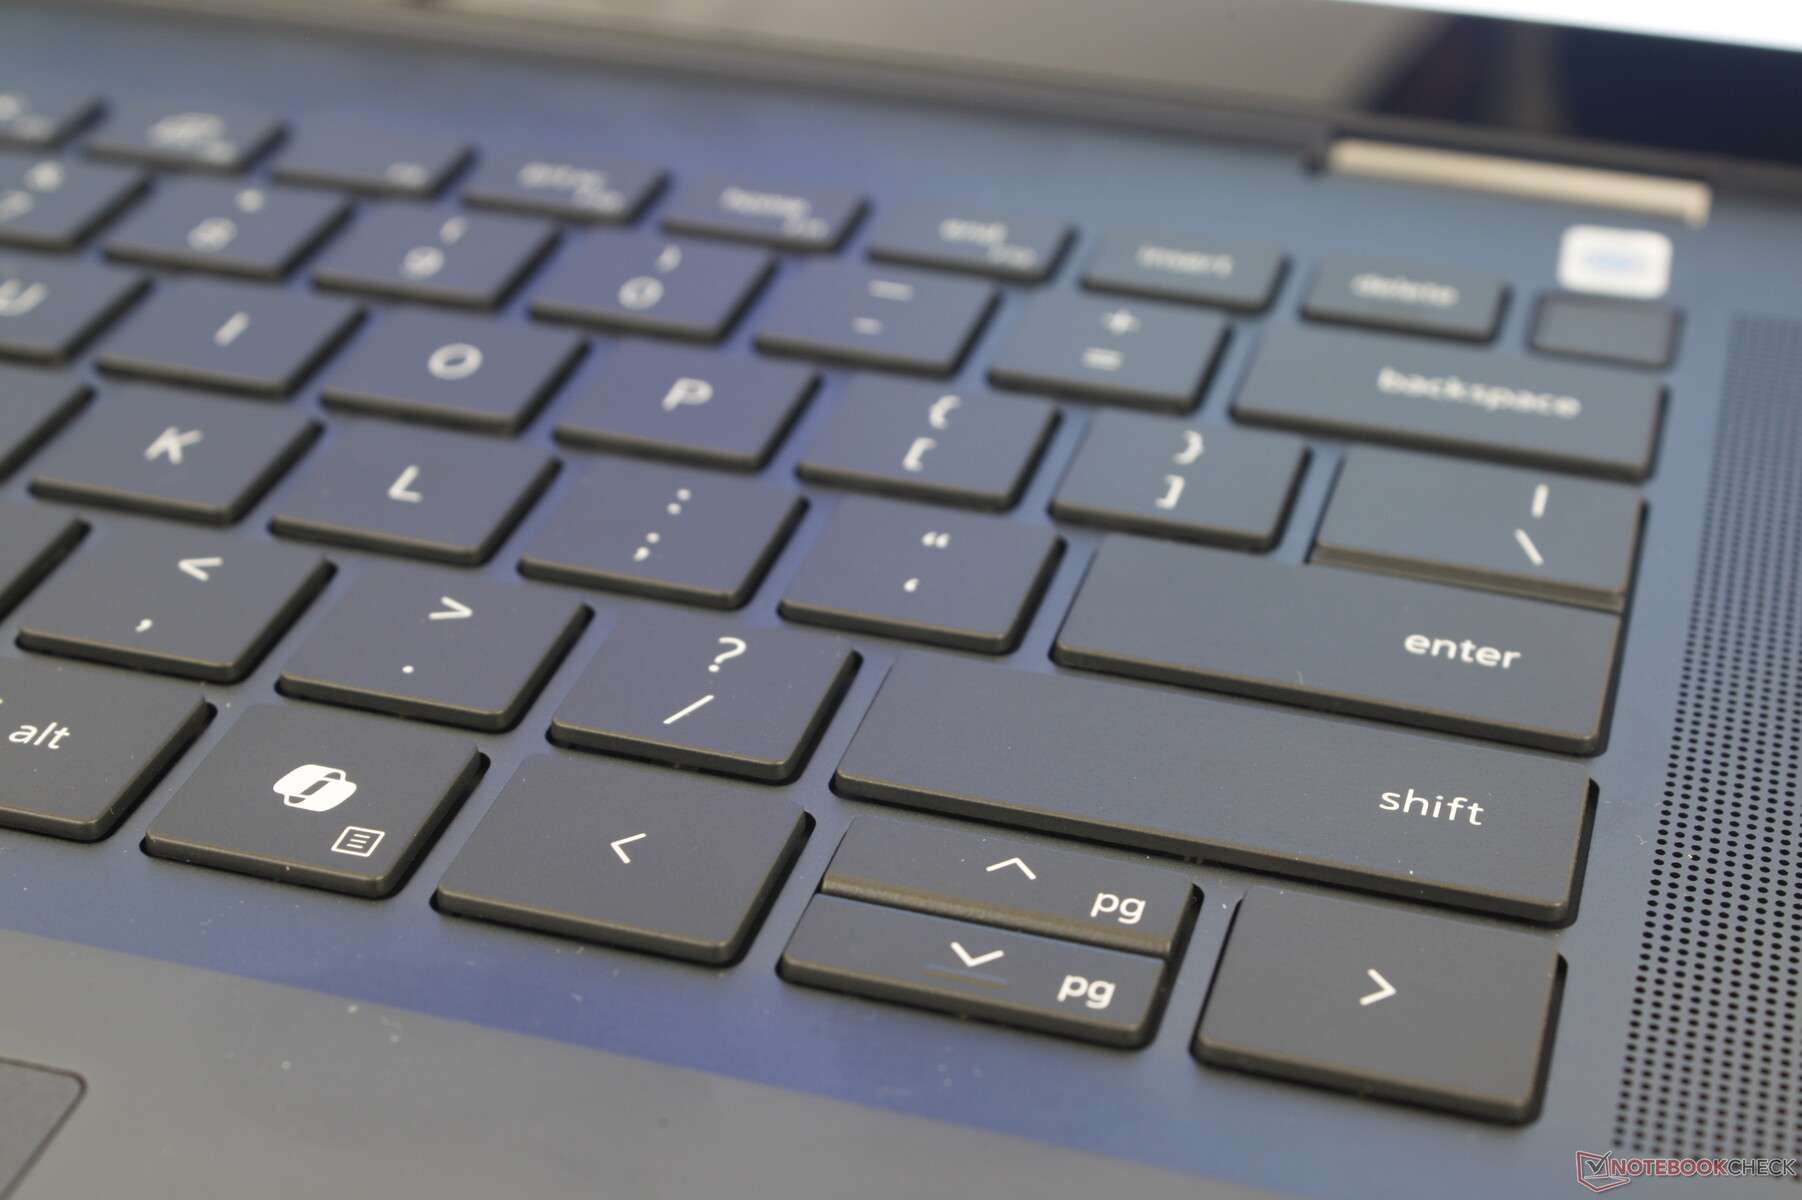
Le clavier et le pavé tactile n'ont pas changé par rapport à l'Inspiron 7630 2-en-1, malgré les modifications physiques apportées au châssis. Il y a quelques différences mineures comme le bouton Power légèrement plus petit sur notre nouveau modèle et l'introduction de la touche Co-Pilot dédiée, mais tout ce qui concerne la taille du pavé tactile (13,3 x 9 cm) et la rétroaction des touches est identique au modèle de l'année dernière. Il aurait été intéressant de voir des améliorations à cet égard, car nous trouvons toujours que les touches et le pavé tactile de l'Inspiron sont plus spongieux et avec un retour moins satisfaisant que les touches et le pavé tactile de la série HP Envy.

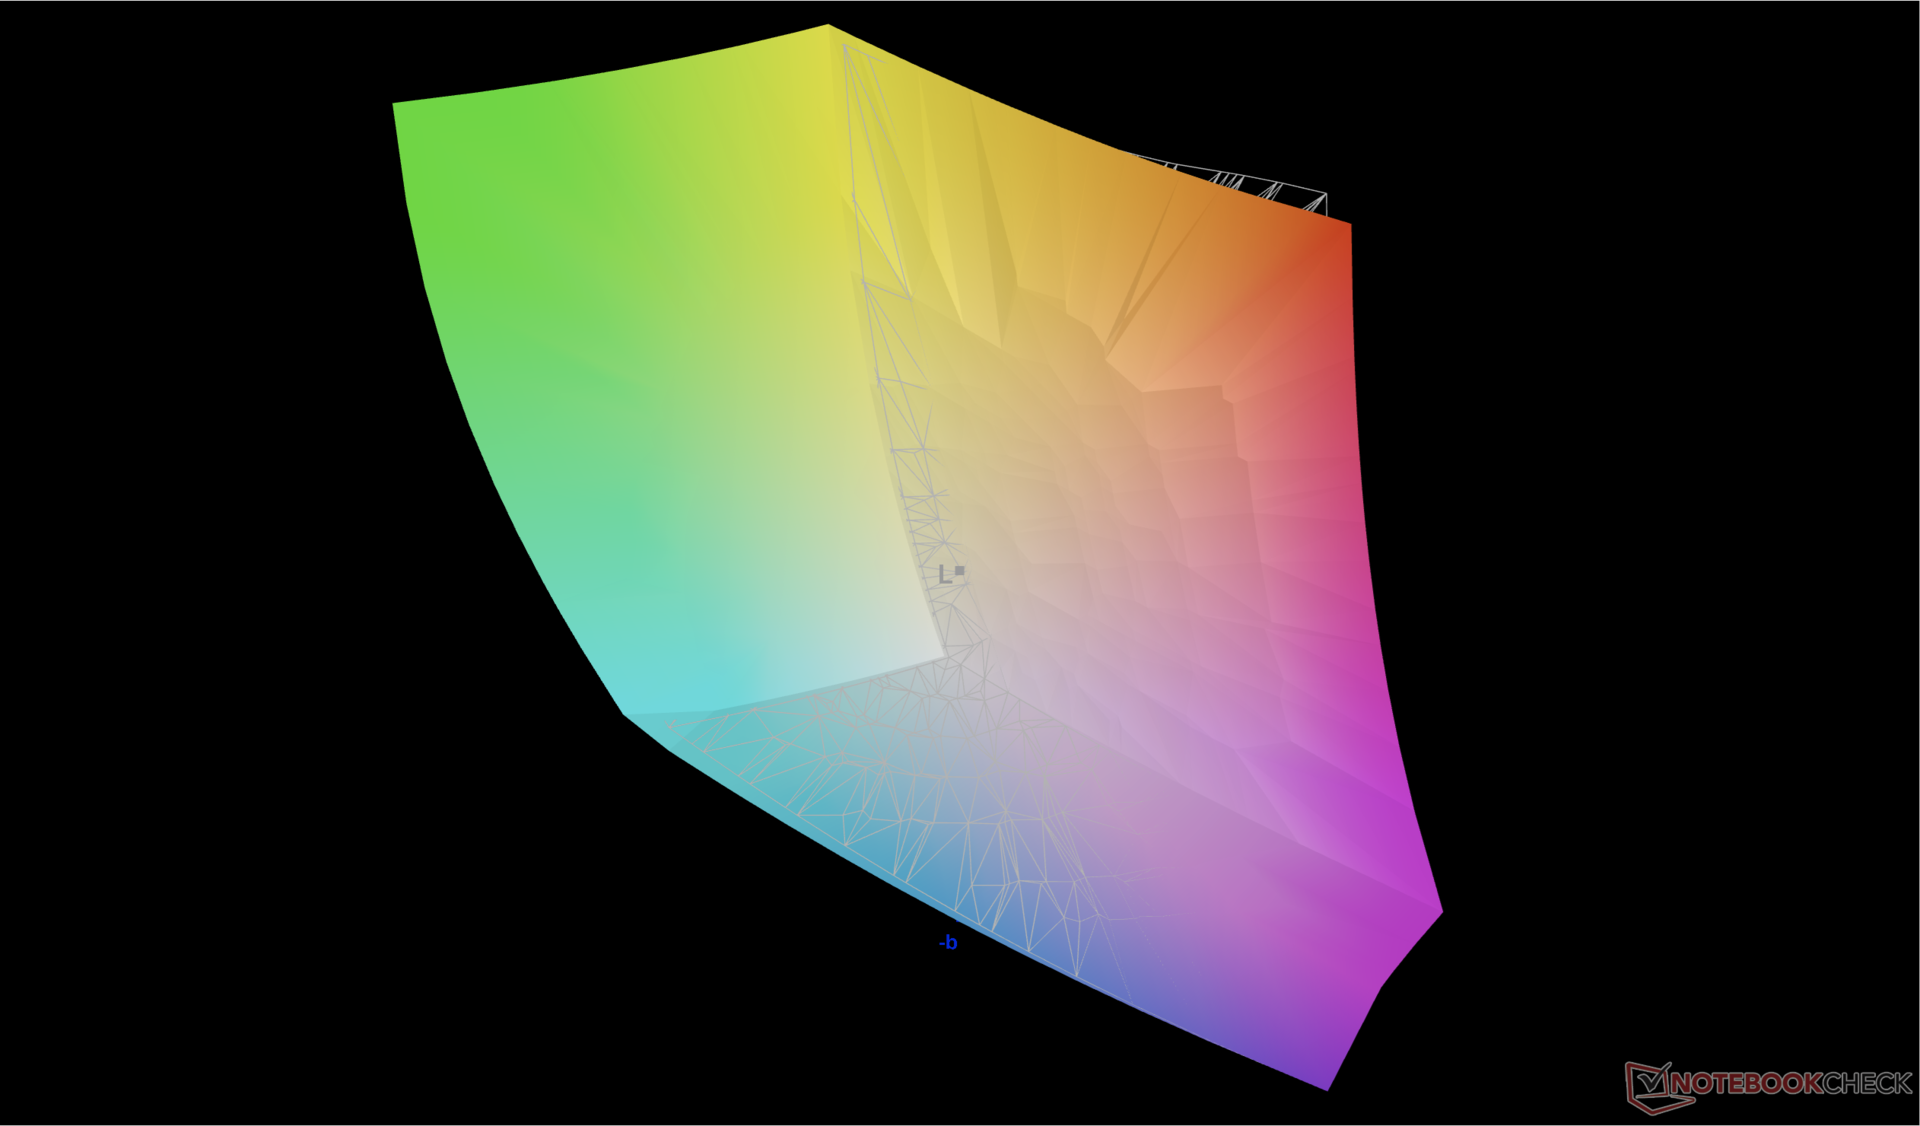
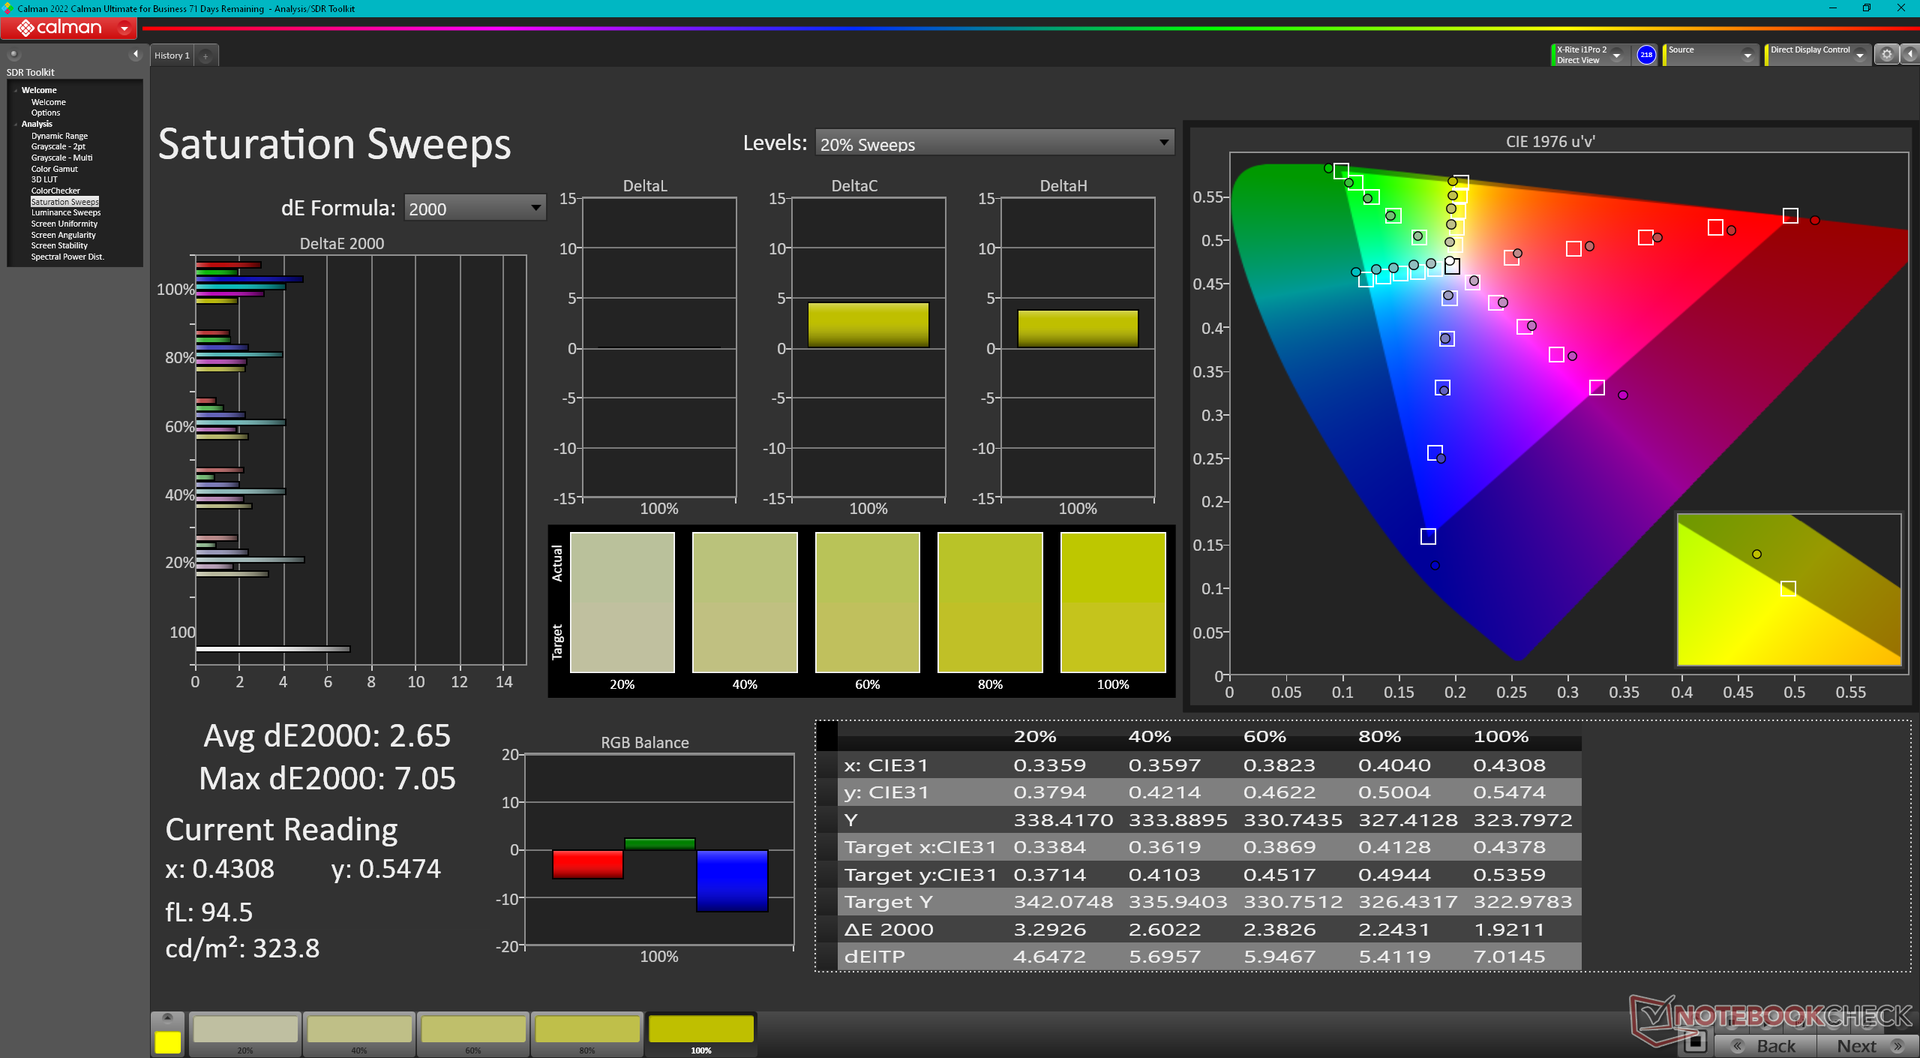
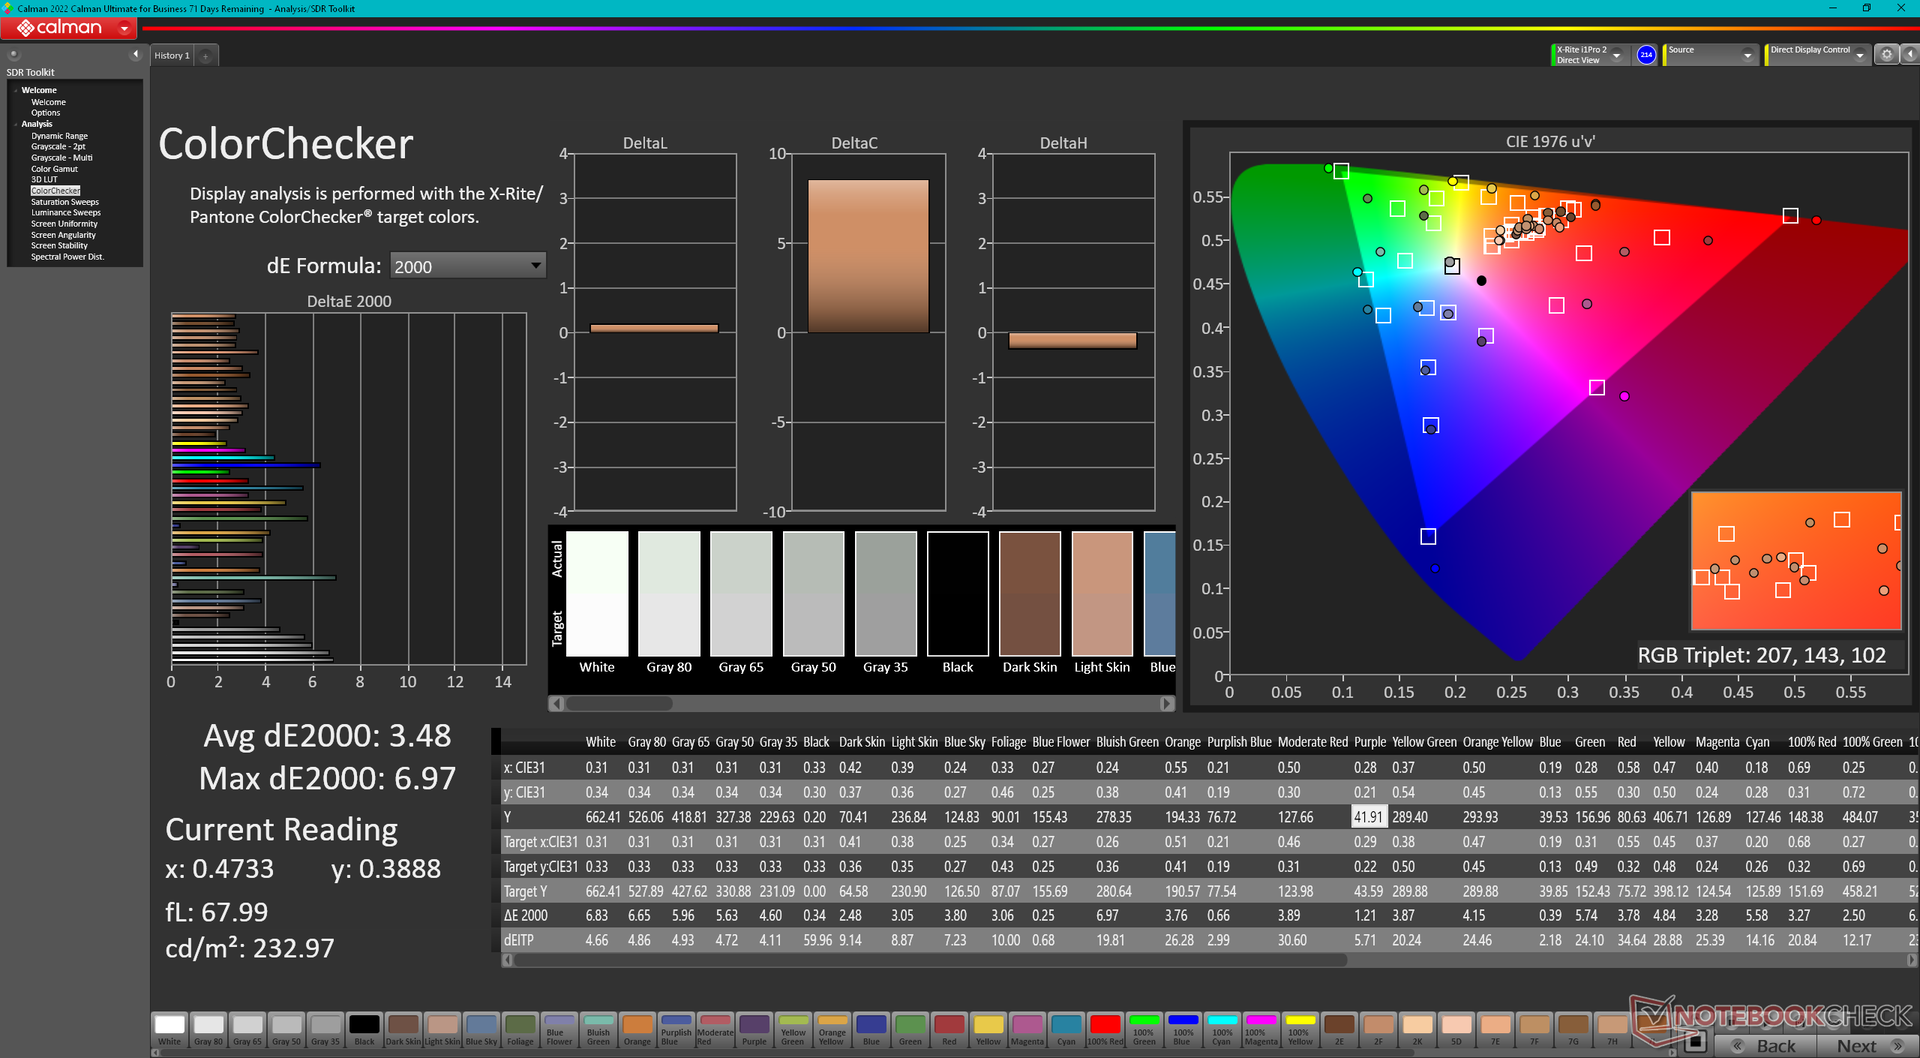
Écran - 2.5K Mini-LED HDR600
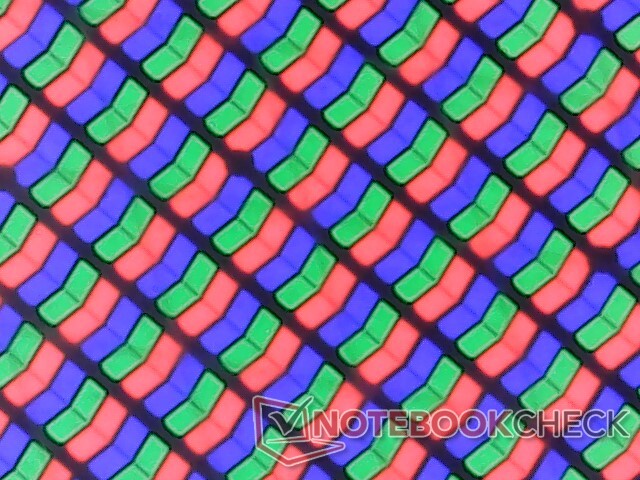
L'écran Mini-LED en option est un argument de vente clé pour l'Inspiron 16 2-en-1 de cette année. Bien qu'il n'offre pas la 4K et le HDR1000 comme sur certains ordinateurs portables de jeux extrêmes, il est possible d'obtenir des images de qualité ordinateurs portables pour jeux extrêmessa résolution de 2,5K et sa prise en charge du HDR600 sont tout de même impressionnantes pour un convertible de 16 pouces vendu aux alentours de 1 000 dollars. Les utilisateurs bénéficient toujours de l'excellent rapport de contraste de 3000:1 et des couleurs DCI-P3 comme sur la plupart des autres écrans mini-LED des ordinateurs portables plus chers.
Les couleurs et la luminosité sont automatiquement réglées sur sRGB et 400 nits maximum, respectivement, lorsque le HDR est désactivé. L'activation du HDR modifie le profil des couleurs en DCI-P3 et augmente la luminosité maximale à 663 nits lors de la lecture de contenu HDR.
Le taux de rafraîchissement natif de 90 Hz est respectable, mais l'écran ne prend pas en charge la synchronisation adaptative et le taux de rafraîchissement variable de Windows pour économiser de l'énergie.
| |||||||||||||||||||||||||
Homogénéité de la luminosité: 97 %
Valeur mesurée au centre, sur batterie: 413 cd/m²
Contraste: 2950:1 (Valeurs des noirs: 0.14 cd/m²)
ΔE Color 3.48 | 0.5-29.43 Ø4.87
ΔE Greyscale 4.5 | 0.5-98 Ø5.1
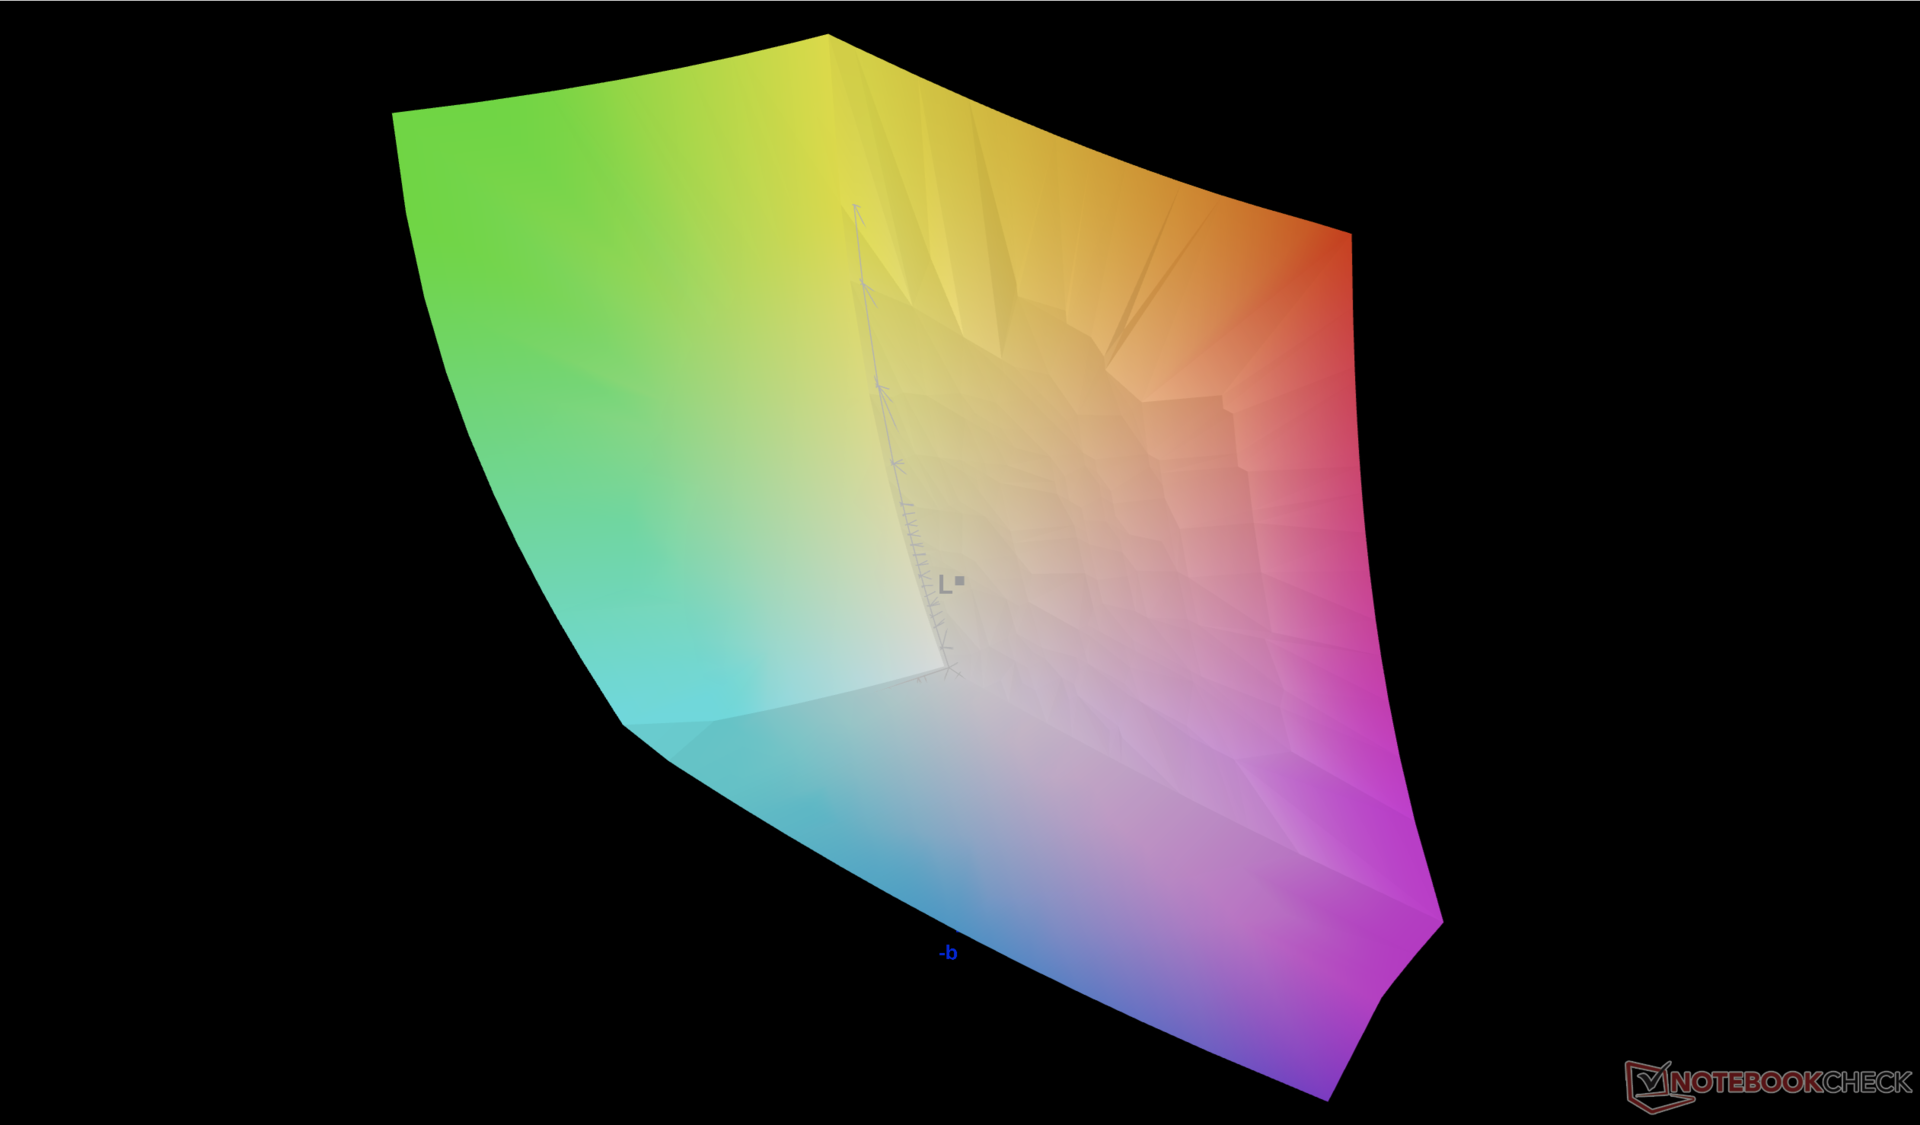
92.5% AdobeRGB 1998 (Argyll 2.2.0 3D)
100% sRGB (Argyll 2.2.0 3D)
99.4% Display P3 (Argyll 2.2.0 3D)
Gamma: 2.15
| Dell Inspiron 16 7640 2-in-1 AU Optronics B160QAT, Mini-LED, 2560x1600, 16", 90 Hz | Dell Inspiron 16 Plus 7640 AU Optronics B160QAN, IPS, 2560x1600, 16", 120 Hz | Dell Inspiron 16 7635 2-in-1 Chi Mei 160JCA, IPS, 1920x1200, 16", 60 Hz | HP Envy x360 2-in-1 16-ad0097nr Samsung SDC41A6, OLED, 2880x1800, 16", 120 Hz | Lenovo IdeaPad Pro 5 16IMH G9 NE160QDM-NY2, IPS, 2560x1600, 16", 120 Hz | Samsung Galaxy Book4 Pro 360 ATNA60CL09-0, OLED, 2880x1800, 16", 120 Hz | |
|---|---|---|---|---|---|---|
| Display | -14% | -20% | 1% | -23% | 2% | |
| Display P3 Coverage | 99.4 | 76 -24% | 67.4 -32% | 99.6 0% | 63.3 -36% | 99.9 1% |
| sRGB Coverage | 100 | 99.8 0% | 98.2 -2% | 100 0% | 95.2 -5% | 100 0% |
| AdobeRGB 1998 Coverage | 92.5 | 76.7 -17% | 69.5 -25% | 96.5 4% | 65.3 -29% | 96.6 4% |
| Response Times | 3% | -5% | 37% | 43% | 35% | |
| Response Time Grey 50% / Grey 80% * | 15.4 ? | 25.6 ? -66% | 27.6 ? -79% | 0.8 ? 95% | 15 ? 3% | 0.49 ? 97% |
| Response Time Black / White * | 60.6 ? | 17.6 ? 71% | 18.2 ? 70% | 0.89 ? 99% | 10.3 ? 83% | 0.67 ? 99% |
| PWM Frequency | 2753.7 ? | 491.8 ? -82% | 240 ? -91% | |||
| Screen | -5% | -25% | 10% | -21% | 33% | |
| Brightness middle | 413 | 314.7 -24% | 301.3 -27% | 399.4 -3% | 368 -11% | 387 -6% |
| Brightness | 409 | 291 -29% | 269 -34% | 405 -1% | 368 -10% | 392 -4% |
| Brightness Distribution | 97 | 89 -8% | 79 -19% | 98 1% | 91 -6% | 98 1% |
| Black Level * | 0.14 | 0.28 -100% | 0.28 -100% | 0.31 -121% | ||
| Contrast | 2950 | 1124 -62% | 1076 -64% | 1187 -60% | ||
| Colorchecker dE 2000 * | 3.48 | 1.62 53% | 3.1 11% | 4.05 -16% | 2.4 31% | 1 71% |
| Colorchecker dE 2000 max. * | 6.97 | 2.94 58% | 5.5 21% | 6.69 4% | 6.5 7% | 1.9 73% |
| Greyscale dE 2000 * | 4.5 | 1.3 71% | 3.9 13% | 1.1 76% | 4.5 -0% | 1.7 62% |
| Gamma | 2.15 102% | 2.26 97% | 2.19 100% | 2.27 97% | 2.21 100% | 2.25 98% |
| CCT | 6446 101% | 6385 102% | 6186 105% | 6419 101% | 6324 103% | 6325 103% |
| Colorchecker dE 2000 calibrated * | 1.08 | 0.49 | 1.02 | 0.8 | ||
| Moyenne finale (programmes/paramètres) | -5% /
-6% | -17% /
-21% | 16% /
15% | -0% /
-12% | 23% /
26% |
* ... Moindre est la valeur, meilleures sont les performances
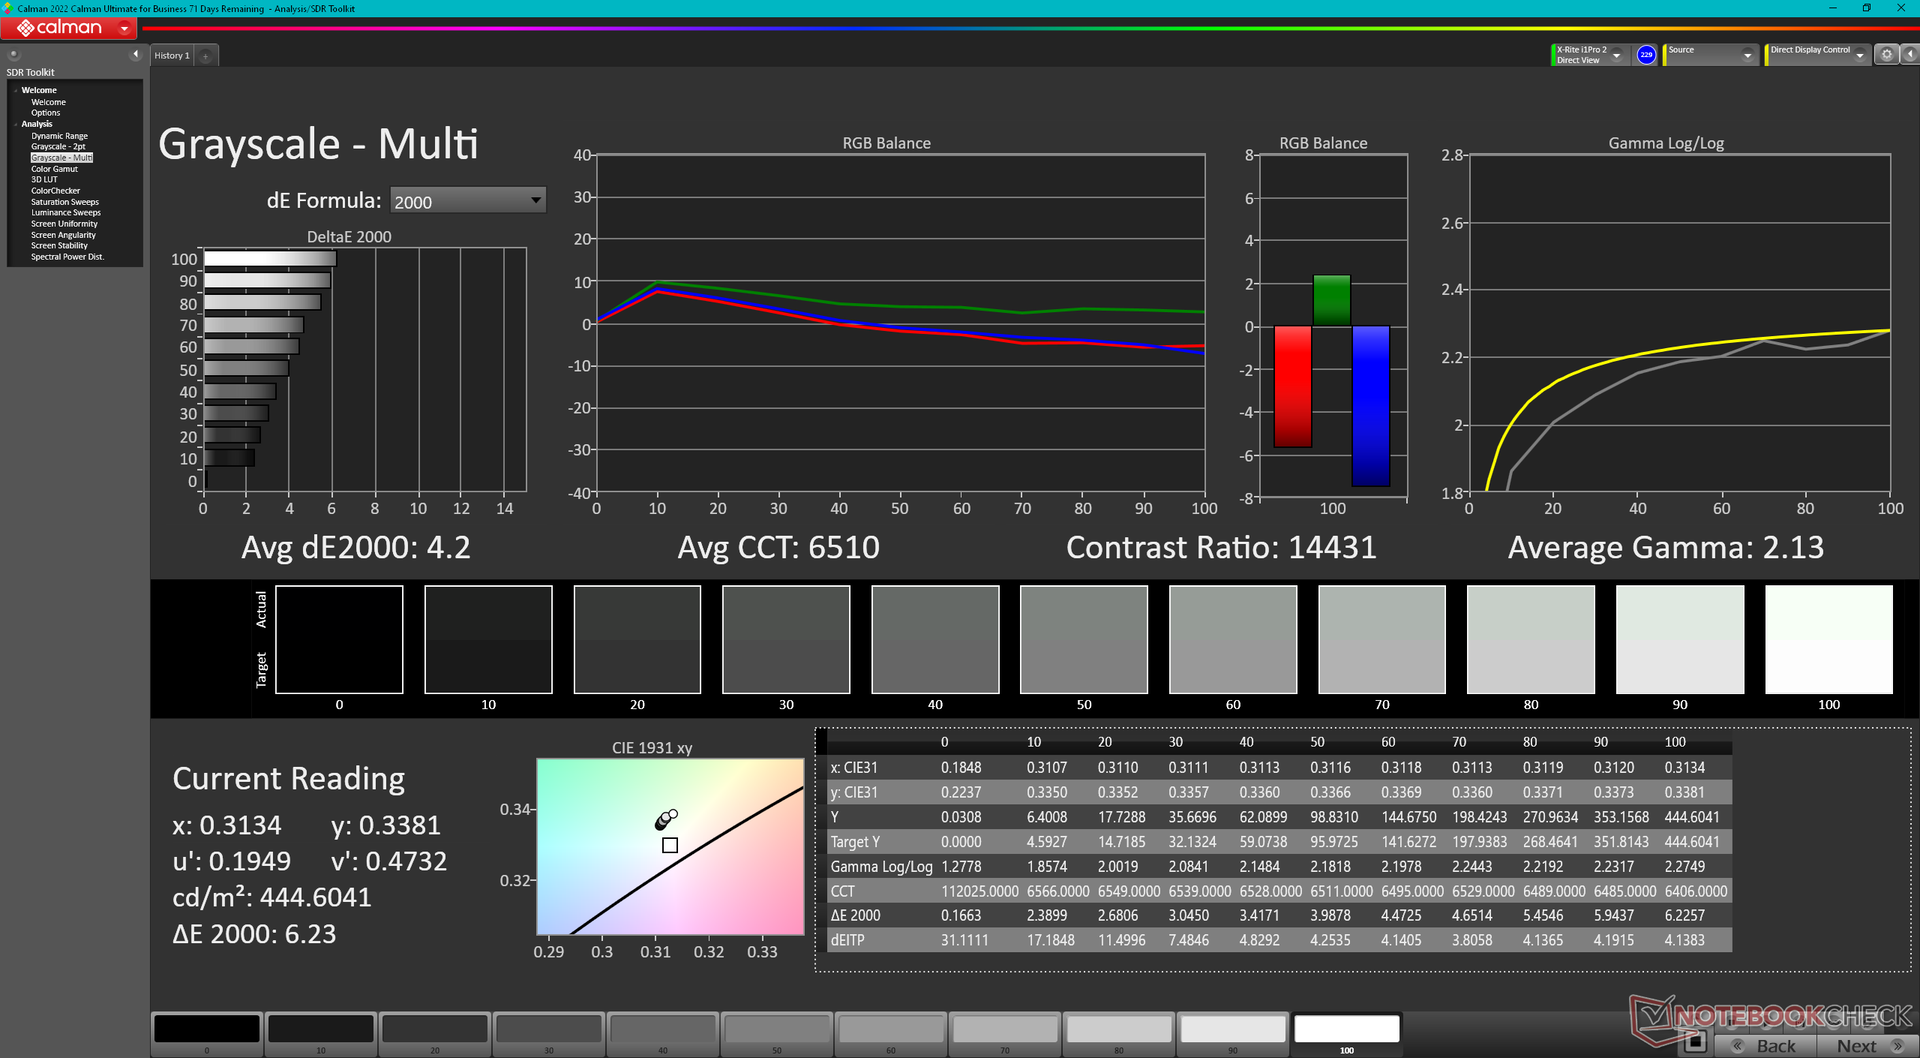
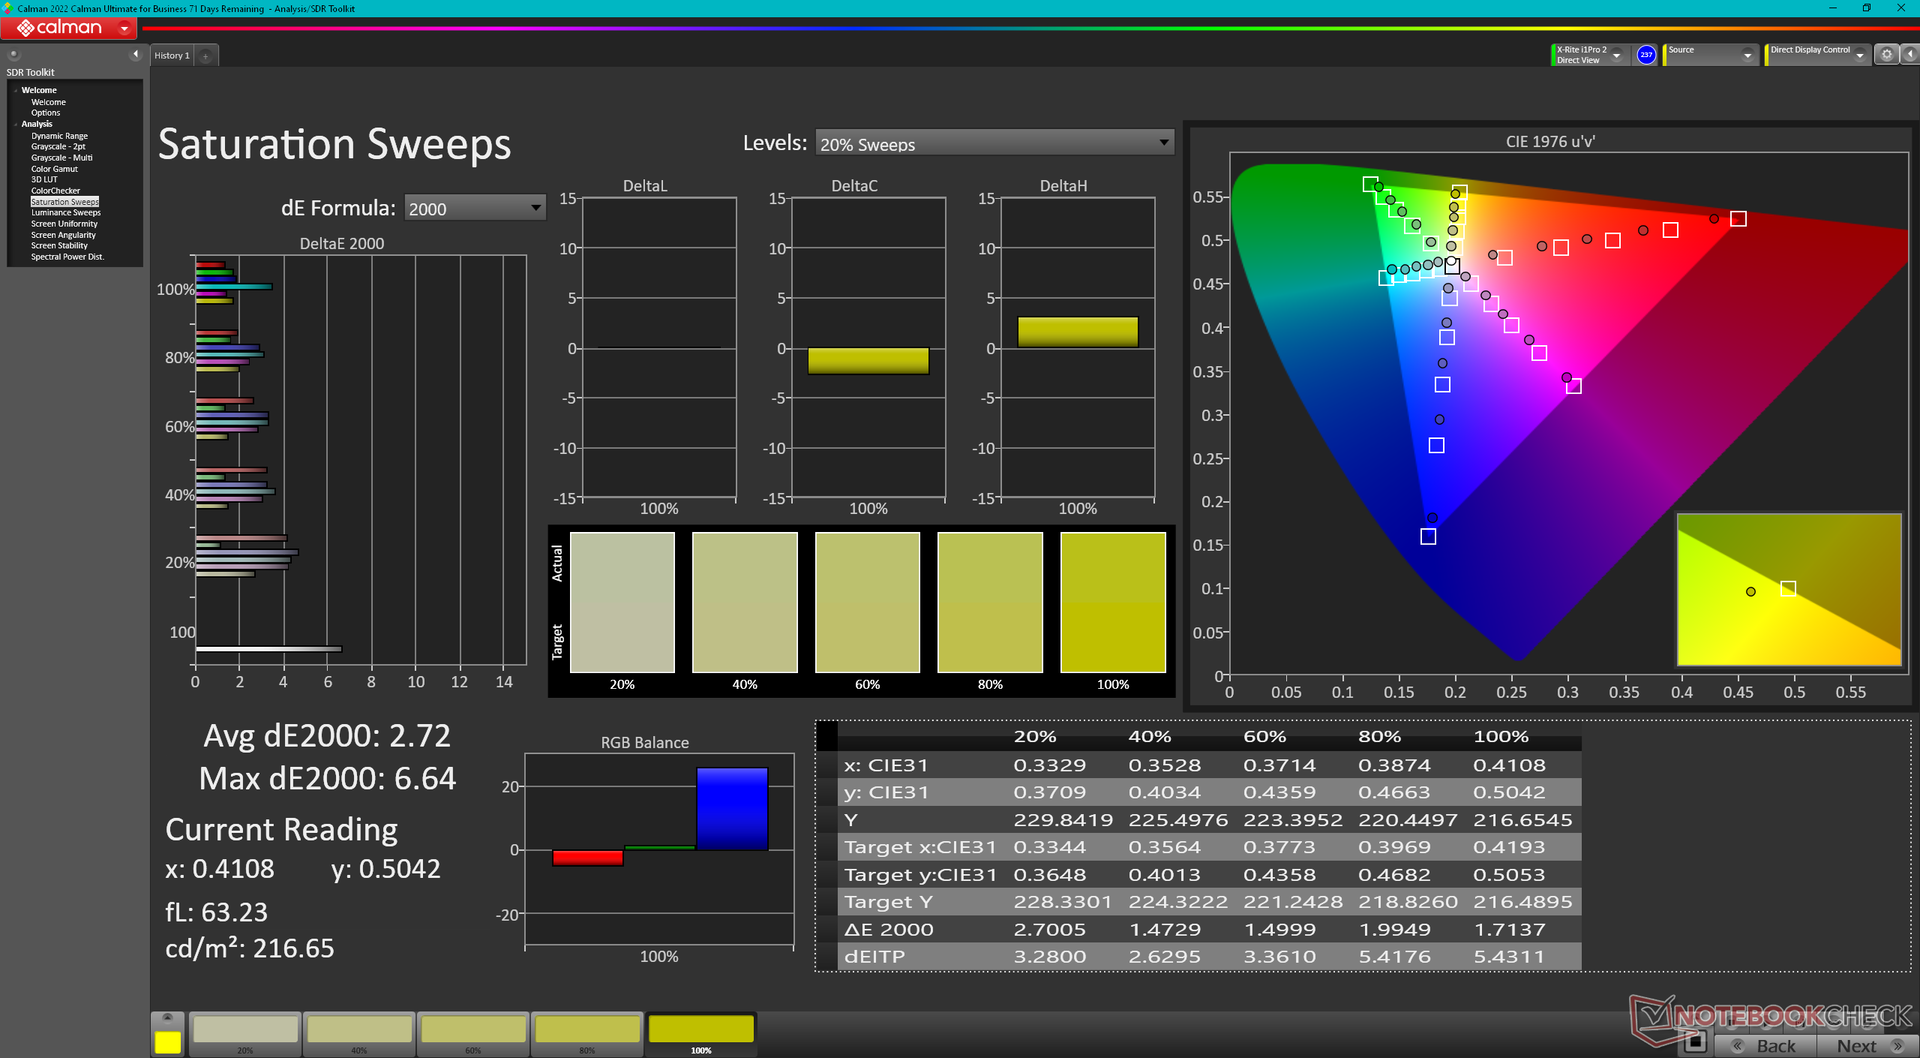
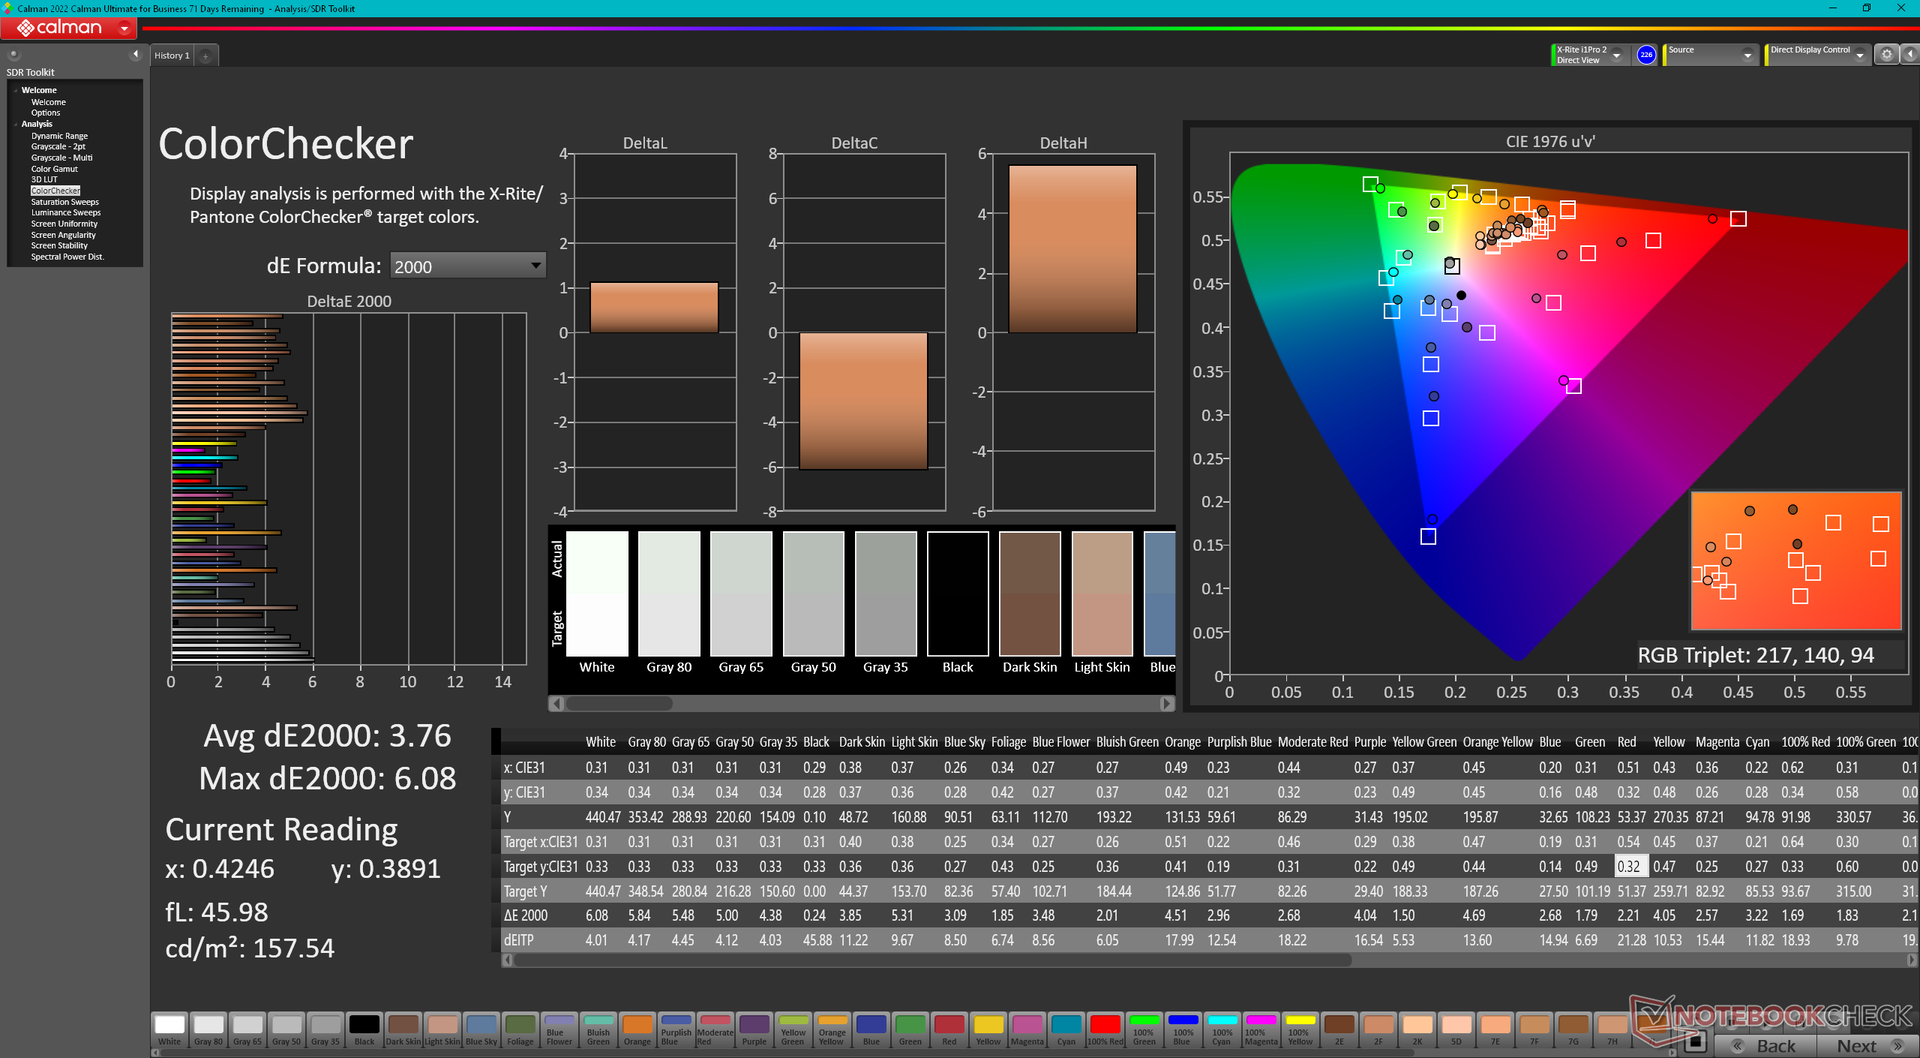
L'affichage est raisonnablement précis pour un PC de milieu de gamme, avec des valeurs moyennes de DeltaE en niveaux de gris et en couleurs de 4,2 et 3,76, respectivement. Ces valeurs restent relativement stables lorsque la fonction HDR est activée, ce qui fait automatiquement basculer le système vers les couleurs DCI-P3. Dans les deux cas, la température des couleurs est légèrement trop froide autour de 6500K.

Temps de réponse de l'écran
| ↔ Temps de réponse noir à blanc | ||
|---|---|---|
| 60.6 ms ... hausse ↗ et chute ↘ combinées | ↗ 56.2 ms hausse | 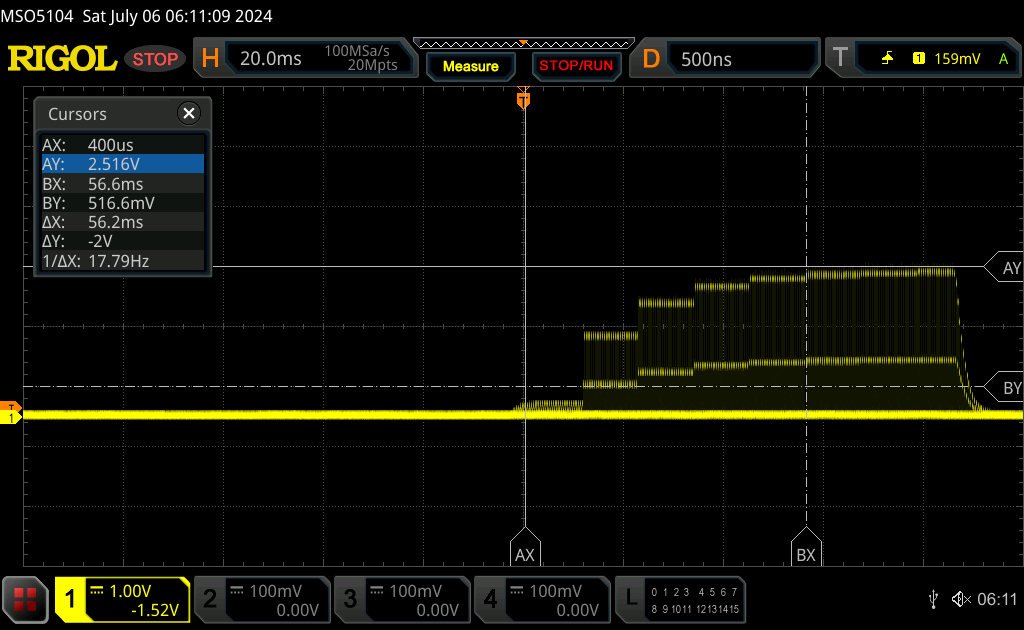 |
| ↘ 4.4 ms chute | ||
| L'écran souffre de latences très élevées, à éviter pour le jeu. En comparaison, tous les appareils testés affichent entre 0.1 (minimum) et 240 (maximum) ms. » 100 % des appareils testés affichent de meilleures performances. Cela signifie que les latences relevées sont moins bonnes que la moyenne (20.8 ms) de tous les appareils testés. | ||
| ↔ Temps de réponse gris 50% à gris 80% | ||
| 15.4 ms ... hausse ↗ et chute ↘ combinées | ↗ 8.6 ms hausse | 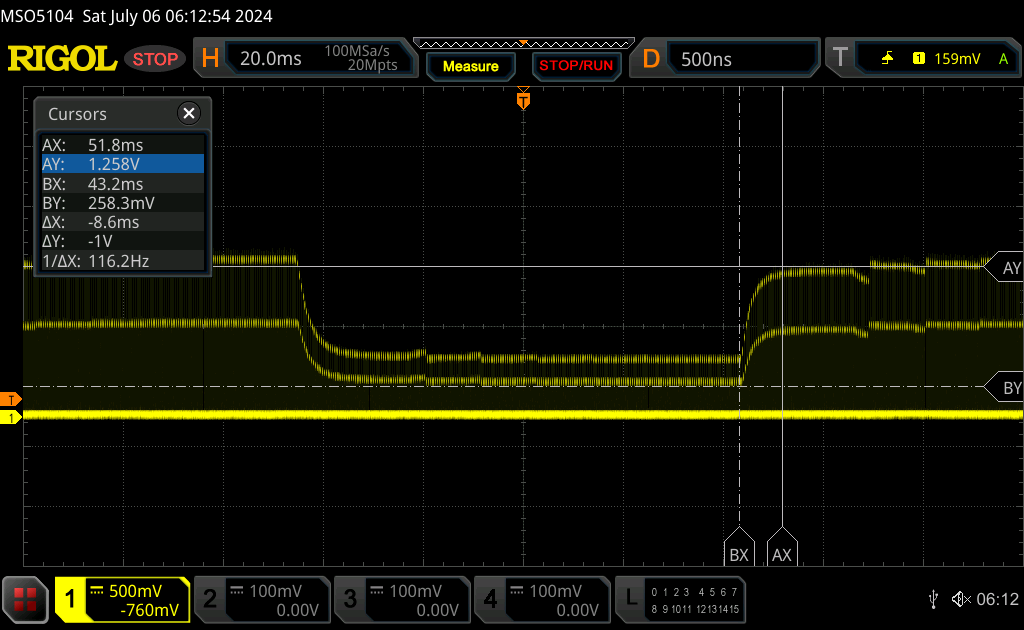 |
| ↘ 6.8 ms chute | ||
| L'écran montre de bons temps de réponse, mais insuffisant pour du jeu compétitif. En comparaison, tous les appareils testés affichent entre 0.165 (minimum) et 636 (maximum) ms. » 27 % des appareils testés affichent de meilleures performances. Cela signifie que les latences relevées sont meilleures que la moyenne (32.5 ms) de tous les appareils testés. | ||
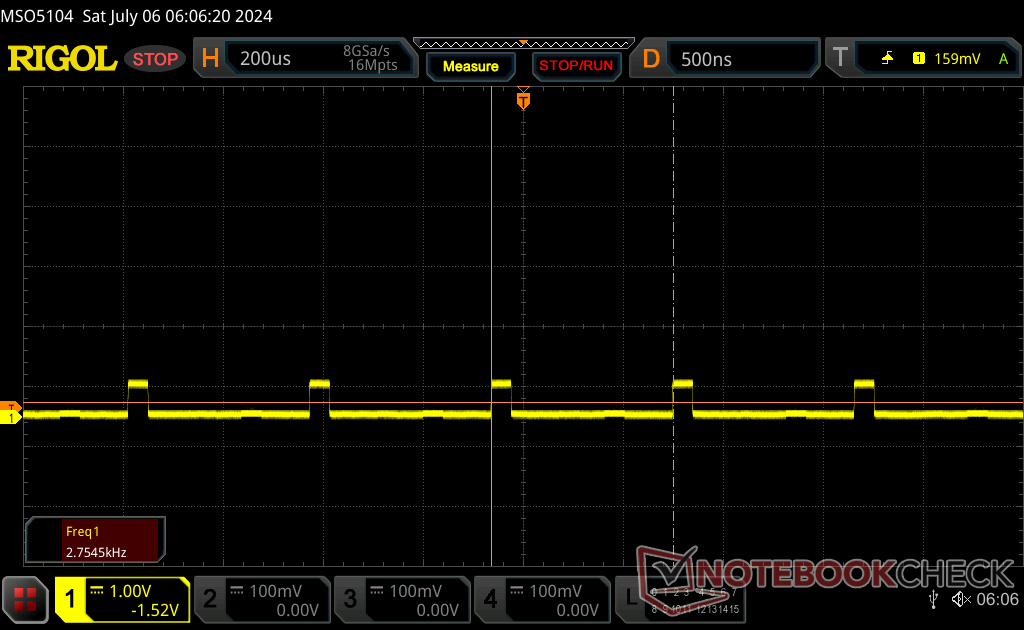
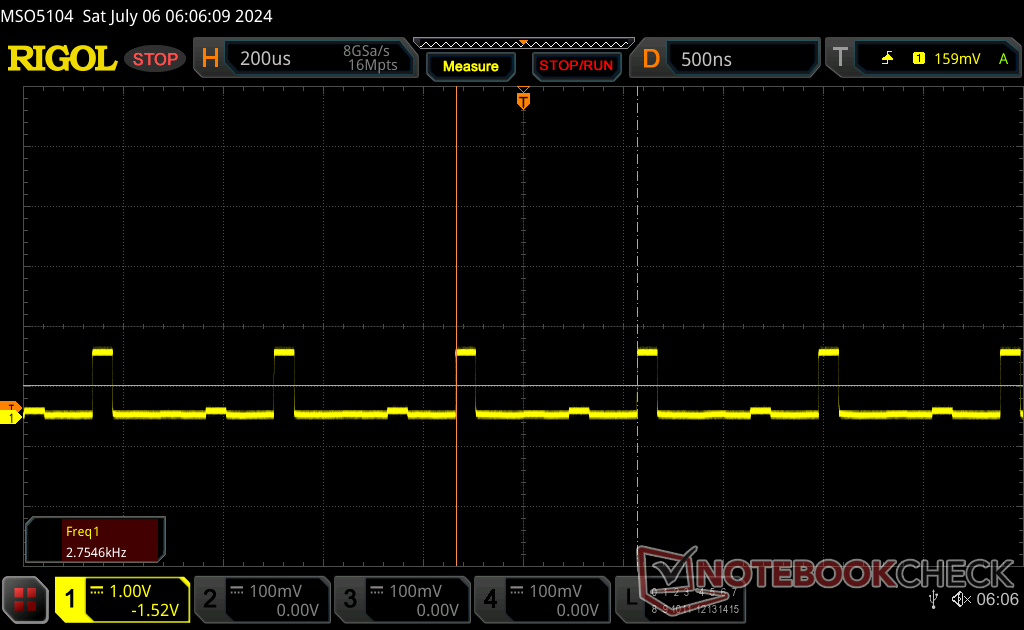
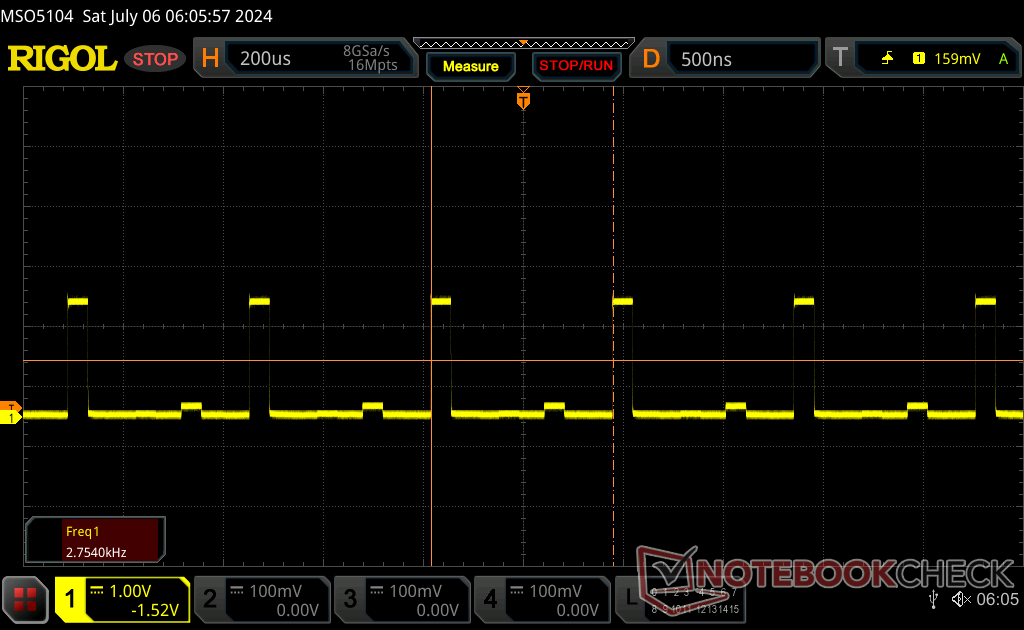
Scintillement / MLI (Modulation de largeur d'impulsion)
| Scintillement / MLI (Modulation de largeur d'impulsion) décelé | 2753.7 Hz | ≤ 100 Niveau de luminosité | 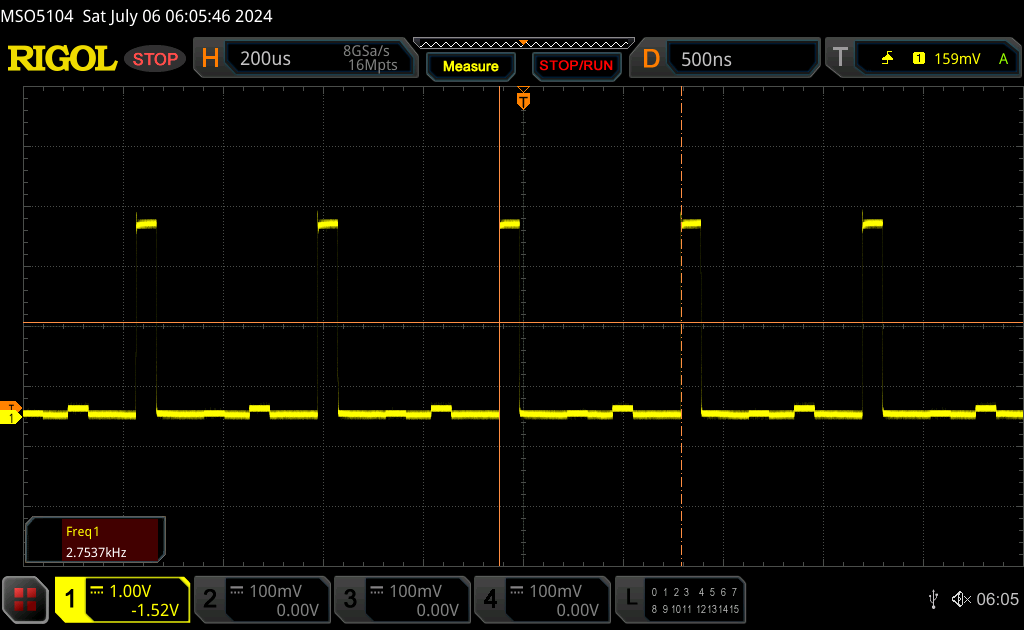 |
Le rétroéclairage de l'écran scintille à la fréquence de 2753.7 Hz (certainement du fait de l'utilisation d'une MDI - Modulation de largeur d'impulsion) à un niveau de luminosité inférieur ou égal à 100 % . Aucun scintillement ne devrait être perceptible au-dessus de cette valeur. La fréquence de rafraîchissement de 2753.7 Hz est élevée, la grande majorité des utilisateurs ne devrait pas percevoir de scintillements et être sujette à une fatigue oculaire accrue. En comparaison, 53 % des appareils testés n'emploient pas MDI pour assombrir leur écran. Nous avons relevé une moyenne à 8516 (minimum : 5 - maximum : 343500) Hz dans le cas où une MDI était active. | |||
La modulation de la largeur d'impulsion ou le scintillement est présent à tous les niveaux de luminosité à une fréquence constante de 2753 Hz. Ce comportement est normal pour un panneau mini-LED et la fréquence est heureusement suffisamment rapide pour passer inaperçue aux yeux de la plupart des téléspectateurs.

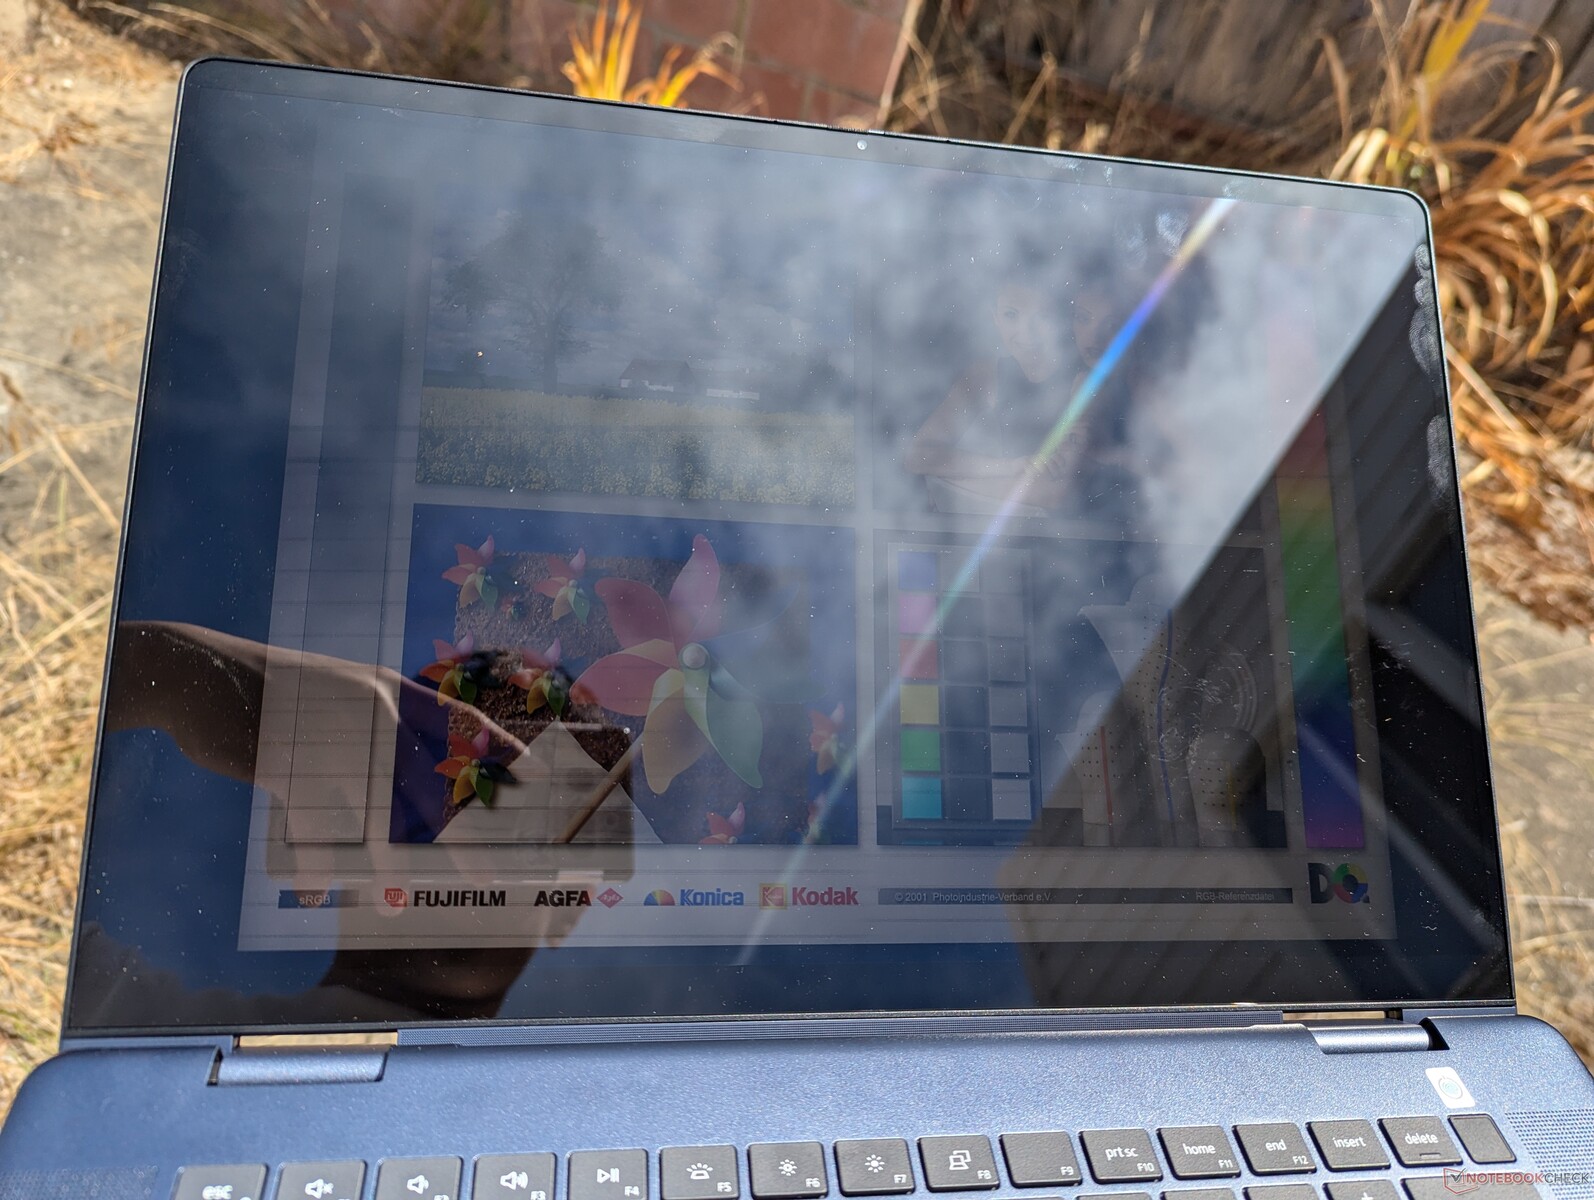
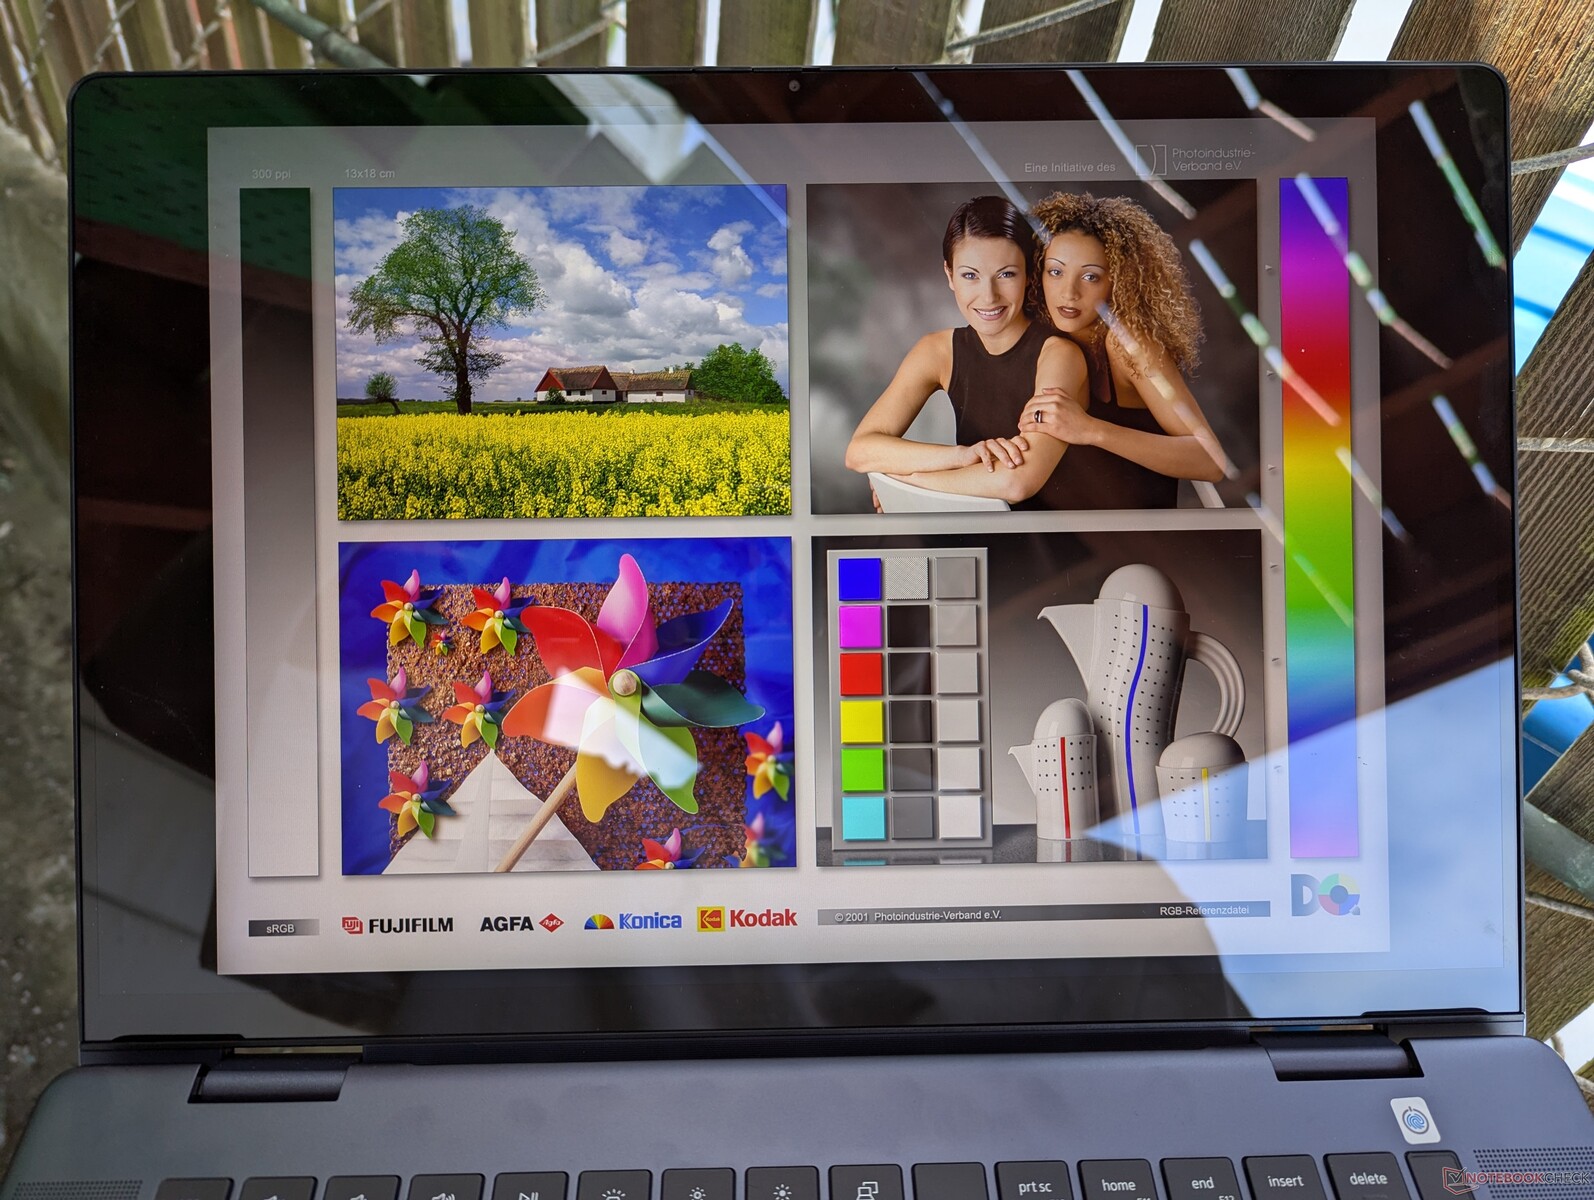
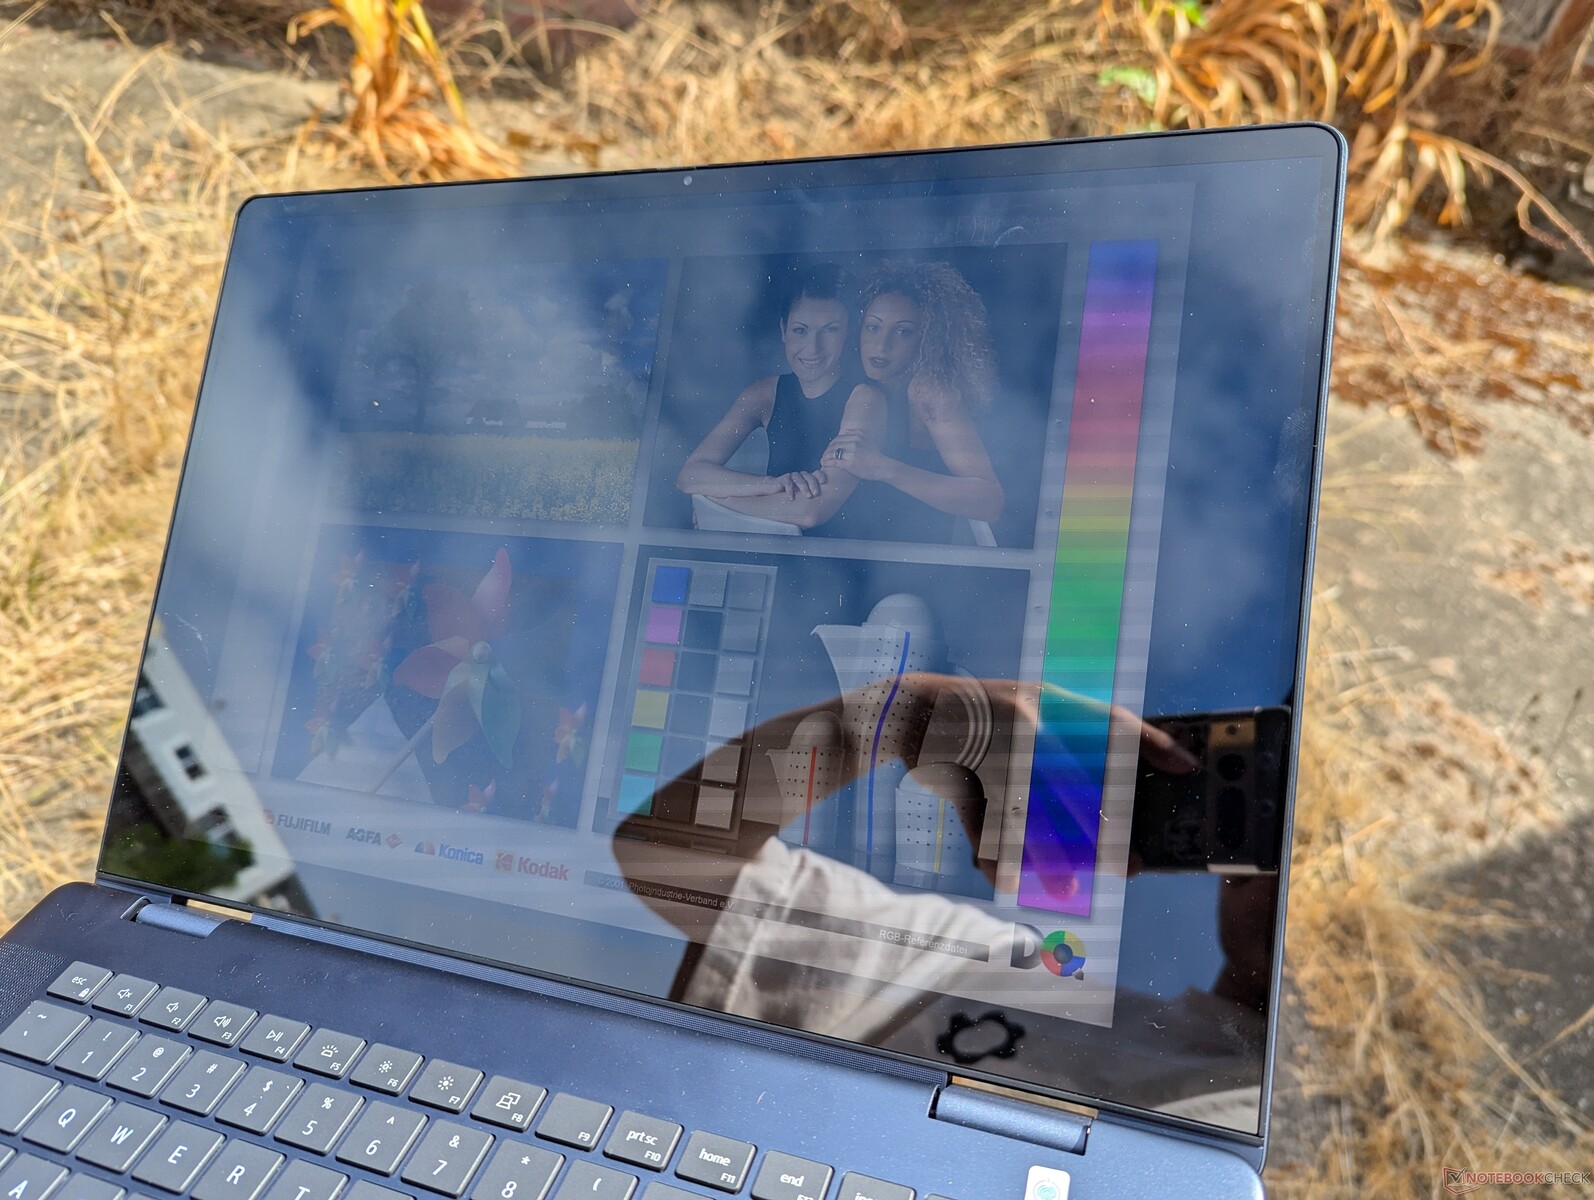
Avec 400 nits en mode SDR ou 600 nits en mode HDR, l'écran est plus lumineux que l'option IPS de base et l'option OLED du modèle sortant. L'Inspiron 16 2-en-1 n'est cependant pas encore assez lumineux pour les conditions extérieures où l'éblouissement devient rapidement un problème. Vous pourriez penser que l'activation du HDR peut atténuer le problème en augmentant le plafond de luminosité, mais gardez à l'esprit que le mode Windows HDR n'est pas disponible sur batterie.
Performance - Rapide pour un cabriolet
Conditions d'essai
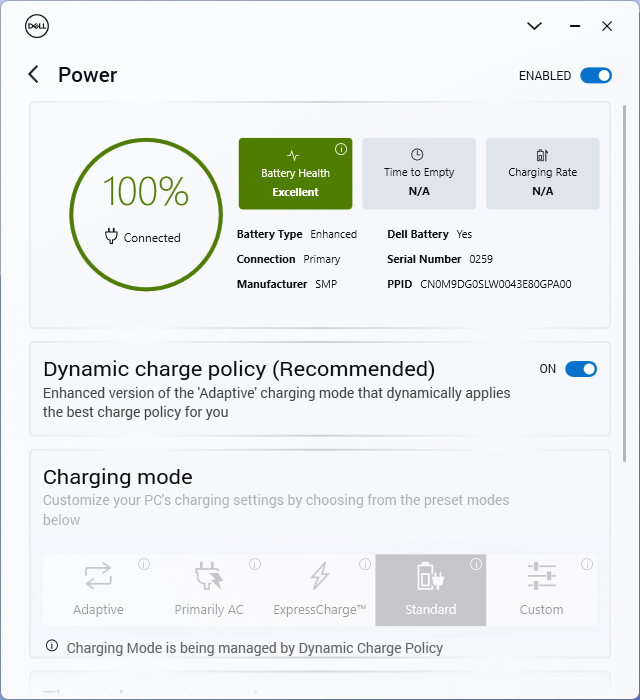
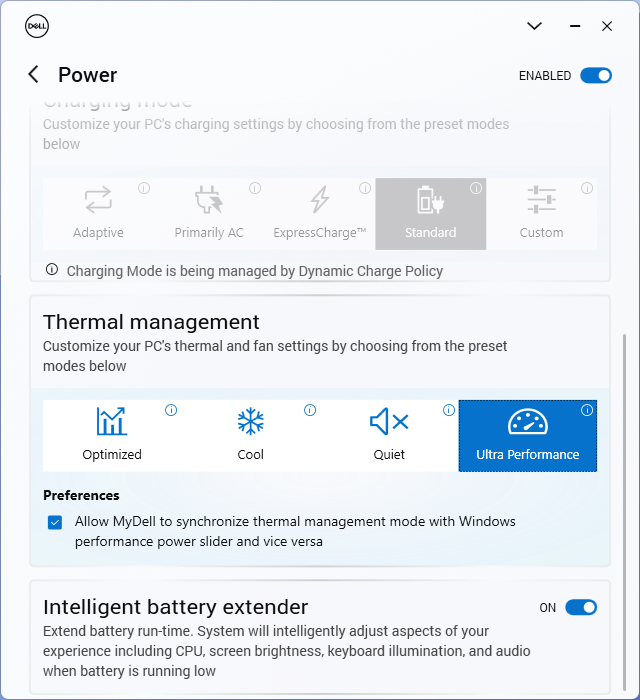
Nous avons réglé MyDell sur le mode Performance avant d'exécuter les tests de référence ci-dessous. Le logiciel dispose d'un bouton pratique pour synchroniser les profils d'alimentation Dell avec les profils d'alimentation Windows afin de simplifier le passage d'un paramètre d'alimentation à l'autre.
Processeur
Avoir un processeur Core H-series dans un format convertible peut parfois être inquiétant car le fabricant peut sous-cadencer ses performances. Heureusement, cela ne semble pas être le cas pour l'Inspiron 16 7640 2-en-1 puisque son Core Ultra 7 155H se situe à moins de 5 % de la moyenne des PC de notre base de données équipés du même processeur. Cela fait du modèle Dell l'un des convertibles les plus rapides dans la catégorie des 16 pouces, devançant des options très performantes comme le Ryzen 7 8840HS dans le HP Envy x360 16 2-en-1. Il est également intéressant de noter que ce même processeur se trouve également sur de nombreux ordinateurs portables de jeu, ce qui montre que ce convertible Dell ne plaisante pas lorsqu'il s'agit de performances de processeur.
La durabilité du Turbo Boost est bonne mais pas parfaite. Lors de l'exécution en boucle de CineBench R15 xT, notre score initial de 2680 points chutait d'environ 15 % après seulement trois exécutions. les ordinateurs de 16 pouces comme le Lenovo IdeaPad Pro 5 16 ou l'Inspiron 16 Plus 7640 avec le même processeur sont capables de maintenir des fréquences d'horloge Turbo Boost plus élevées pendant plus longtemps, comme le montre le graphique ci-dessous.
En optant pour le processeur bas de gamme Core Ultra 5 125U devrait avoir un impact significatif sur les performances multithread de 40 %, d'après notre expérience avec le Lenovo Yoga 7 2-en-1 16. Cependant, l'option de la série Core U pourrait être idéale pour ceux qui préfèrent l'autonomie de la batterie aux performances brutes.
Cinebench R15 Multi Loop
Cinebench R23: Multi Core | Single Core
Cinebench R20: CPU (Multi Core) | CPU (Single Core)
Cinebench R15: CPU Multi 64Bit | CPU Single 64Bit
Blender: v2.79 BMW27 CPU
7-Zip 18.03: 7z b 4 | 7z b 4 -mmt1
Geekbench 6.4: Multi-Core | Single-Core
Geekbench 5.5: Multi-Core | Single-Core
HWBOT x265 Benchmark v2.2: 4k Preset
LibreOffice : 20 Documents To PDF
R Benchmark 2.5: Overall mean
* ... Moindre est la valeur, meilleures sont les performances
AIDA64: FP32 Ray-Trace | FPU Julia | CPU SHA3 | CPU Queen | FPU SinJulia | FPU Mandel | CPU AES | CPU ZLib | FP64 Ray-Trace | CPU PhotoWorxx
| Performance Rating | |
| Lenovo IdeaPad Pro 5 16IMH G9 | |
| HP Envy x360 2-in-1 16-ad0097nr | |
| Dell Inspiron 16 7640 2-in-1 | |
| Dell Inspiron 16 Plus 7640 | |
| Moyenne Intel Core Ultra 7 155H | |
| Dell Inspiron 16 7635 2-in-1 | |
| Samsung Galaxy Book4 Pro 360 | |
| AIDA64 / FP32 Ray-Trace | |
| HP Envy x360 2-in-1 16-ad0097nr | |
| Lenovo IdeaPad Pro 5 16IMH G9 | |
| Dell Inspiron 16 7640 2-in-1 | |
| Dell Inspiron 16 Plus 7640 | |
| Moyenne Intel Core Ultra 7 155H (6670 - 18470, n=50) | |
| Dell Inspiron 16 7635 2-in-1 | |
| Samsung Galaxy Book4 Pro 360 | |
| AIDA64 / FPU Julia | |
| Lenovo IdeaPad Pro 5 16IMH G9 | |
| HP Envy x360 2-in-1 16-ad0097nr | |
| Dell Inspiron 16 7640 2-in-1 | |
| Dell Inspiron 16 Plus 7640 | |
| Moyenne Intel Core Ultra 7 155H (40905 - 93181, n=50) | |
| Dell Inspiron 16 7635 2-in-1 | |
| Samsung Galaxy Book4 Pro 360 | |
| AIDA64 / CPU SHA3 | |
| Lenovo IdeaPad Pro 5 16IMH G9 | |
| HP Envy x360 2-in-1 16-ad0097nr | |
| Dell Inspiron 16 7640 2-in-1 | |
| Dell Inspiron 16 Plus 7640 | |
| Moyenne Intel Core Ultra 7 155H (1940 - 4436, n=50) | |
| Samsung Galaxy Book4 Pro 360 | |
| Dell Inspiron 16 7635 2-in-1 | |
| AIDA64 / CPU Queen | |
| HP Envy x360 2-in-1 16-ad0097nr | |
| Dell Inspiron 16 7640 2-in-1 | |
| Dell Inspiron 16 Plus 7640 | |
| Lenovo IdeaPad Pro 5 16IMH G9 | |
| Moyenne Intel Core Ultra 7 155H (64698 - 94181, n=50) | |
| Samsung Galaxy Book4 Pro 360 | |
| Dell Inspiron 16 7635 2-in-1 | |
| AIDA64 / FPU SinJulia | |
| HP Envy x360 2-in-1 16-ad0097nr | |
| Lenovo IdeaPad Pro 5 16IMH G9 | |
| Dell Inspiron 16 7640 2-in-1 | |
| Dell Inspiron 16 Plus 7640 | |
| Moyenne Intel Core Ultra 7 155H (5639 - 10647, n=50) | |
| Dell Inspiron 16 7635 2-in-1 | |
| Samsung Galaxy Book4 Pro 360 | |
| AIDA64 / FPU Mandel | |
| HP Envy x360 2-in-1 16-ad0097nr | |
| Lenovo IdeaPad Pro 5 16IMH G9 | |
| Dell Inspiron 16 7640 2-in-1 | |
| Dell Inspiron 16 Plus 7640 | |
| Dell Inspiron 16 7635 2-in-1 | |
| Moyenne Intel Core Ultra 7 155H (18236 - 47685, n=50) | |
| Samsung Galaxy Book4 Pro 360 | |
| AIDA64 / CPU AES | |
| Lenovo IdeaPad Pro 5 16IMH G9 | |
| Moyenne Intel Core Ultra 7 155H (45713 - 152179, n=50) | |
| Dell Inspiron 16 7640 2-in-1 | |
| HP Envy x360 2-in-1 16-ad0097nr | |
| Dell Inspiron 16 Plus 7640 | |
| Samsung Galaxy Book4 Pro 360 | |
| Dell Inspiron 16 7635 2-in-1 | |
| AIDA64 / CPU ZLib | |
| Lenovo IdeaPad Pro 5 16IMH G9 | |
| Dell Inspiron 16 Plus 7640 | |
| Dell Inspiron 16 7640 2-in-1 | |
| Moyenne Intel Core Ultra 7 155H (557 - 1250, n=50) | |
| HP Envy x360 2-in-1 16-ad0097nr | |
| Samsung Galaxy Book4 Pro 360 | |
| Dell Inspiron 16 7635 2-in-1 | |
| AIDA64 / FP64 Ray-Trace | |
| HP Envy x360 2-in-1 16-ad0097nr | |
| Lenovo IdeaPad Pro 5 16IMH G9 | |
| Dell Inspiron 16 7640 2-in-1 | |
| Dell Inspiron 16 Plus 7640 | |
| Moyenne Intel Core Ultra 7 155H (3569 - 9802, n=50) | |
| Dell Inspiron 16 7635 2-in-1 | |
| Samsung Galaxy Book4 Pro 360 | |
| AIDA64 / CPU PhotoWorxx | |
| Lenovo IdeaPad Pro 5 16IMH G9 | |
| Moyenne Intel Core Ultra 7 155H (32719 - 54223, n=50) | |
| Samsung Galaxy Book4 Pro 360 | |
| Dell Inspiron 16 7640 2-in-1 | |
| Dell Inspiron 16 Plus 7640 | |
| HP Envy x360 2-in-1 16-ad0097nr | |
| Dell Inspiron 16 7635 2-in-1 | |
Test de stress
Le CPU passe à 3,2 GHz et 88 W pendant quelques secondes seulement avant d'atteindre une température très élevée de 109 C ( !). Il redescend ensuite rapidement à 2,3 GHz et 44 W afin de maintenir une température plus froide de 86 °C. Les plages de température sont néanmoins plus chaudes que celles que nous avons enregistrées sur l'Inspiron 16 7635 2-en-1, en particulier lors de l'exécution de jeux où notre CPU se stabilise dans la plage de 90 °C contre 70 °C sur l'ancien Inspiron 16 7635 2-en-1. Cette différence contribue également aux températures de surface globalement plus élevées, comme le montre la section Température ci-dessous.
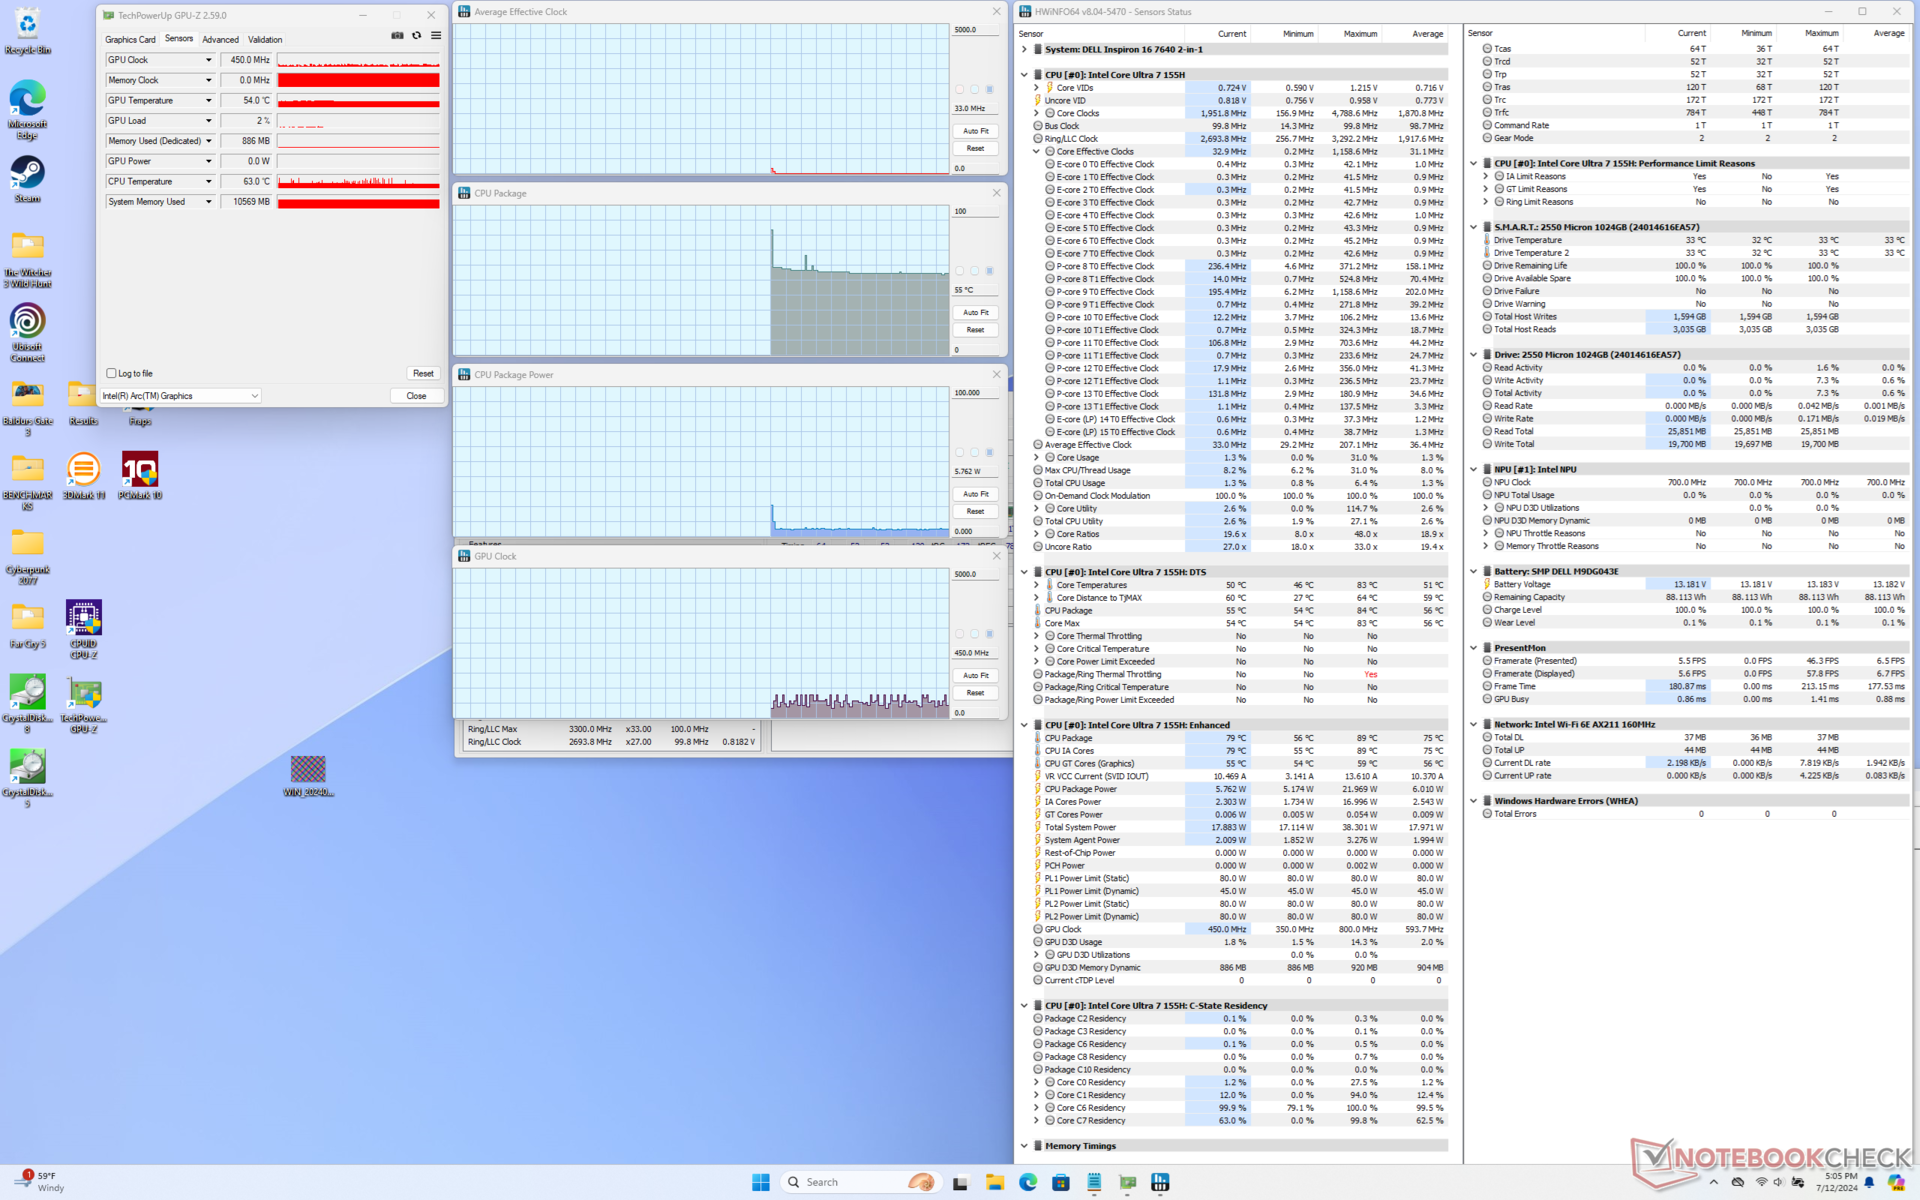
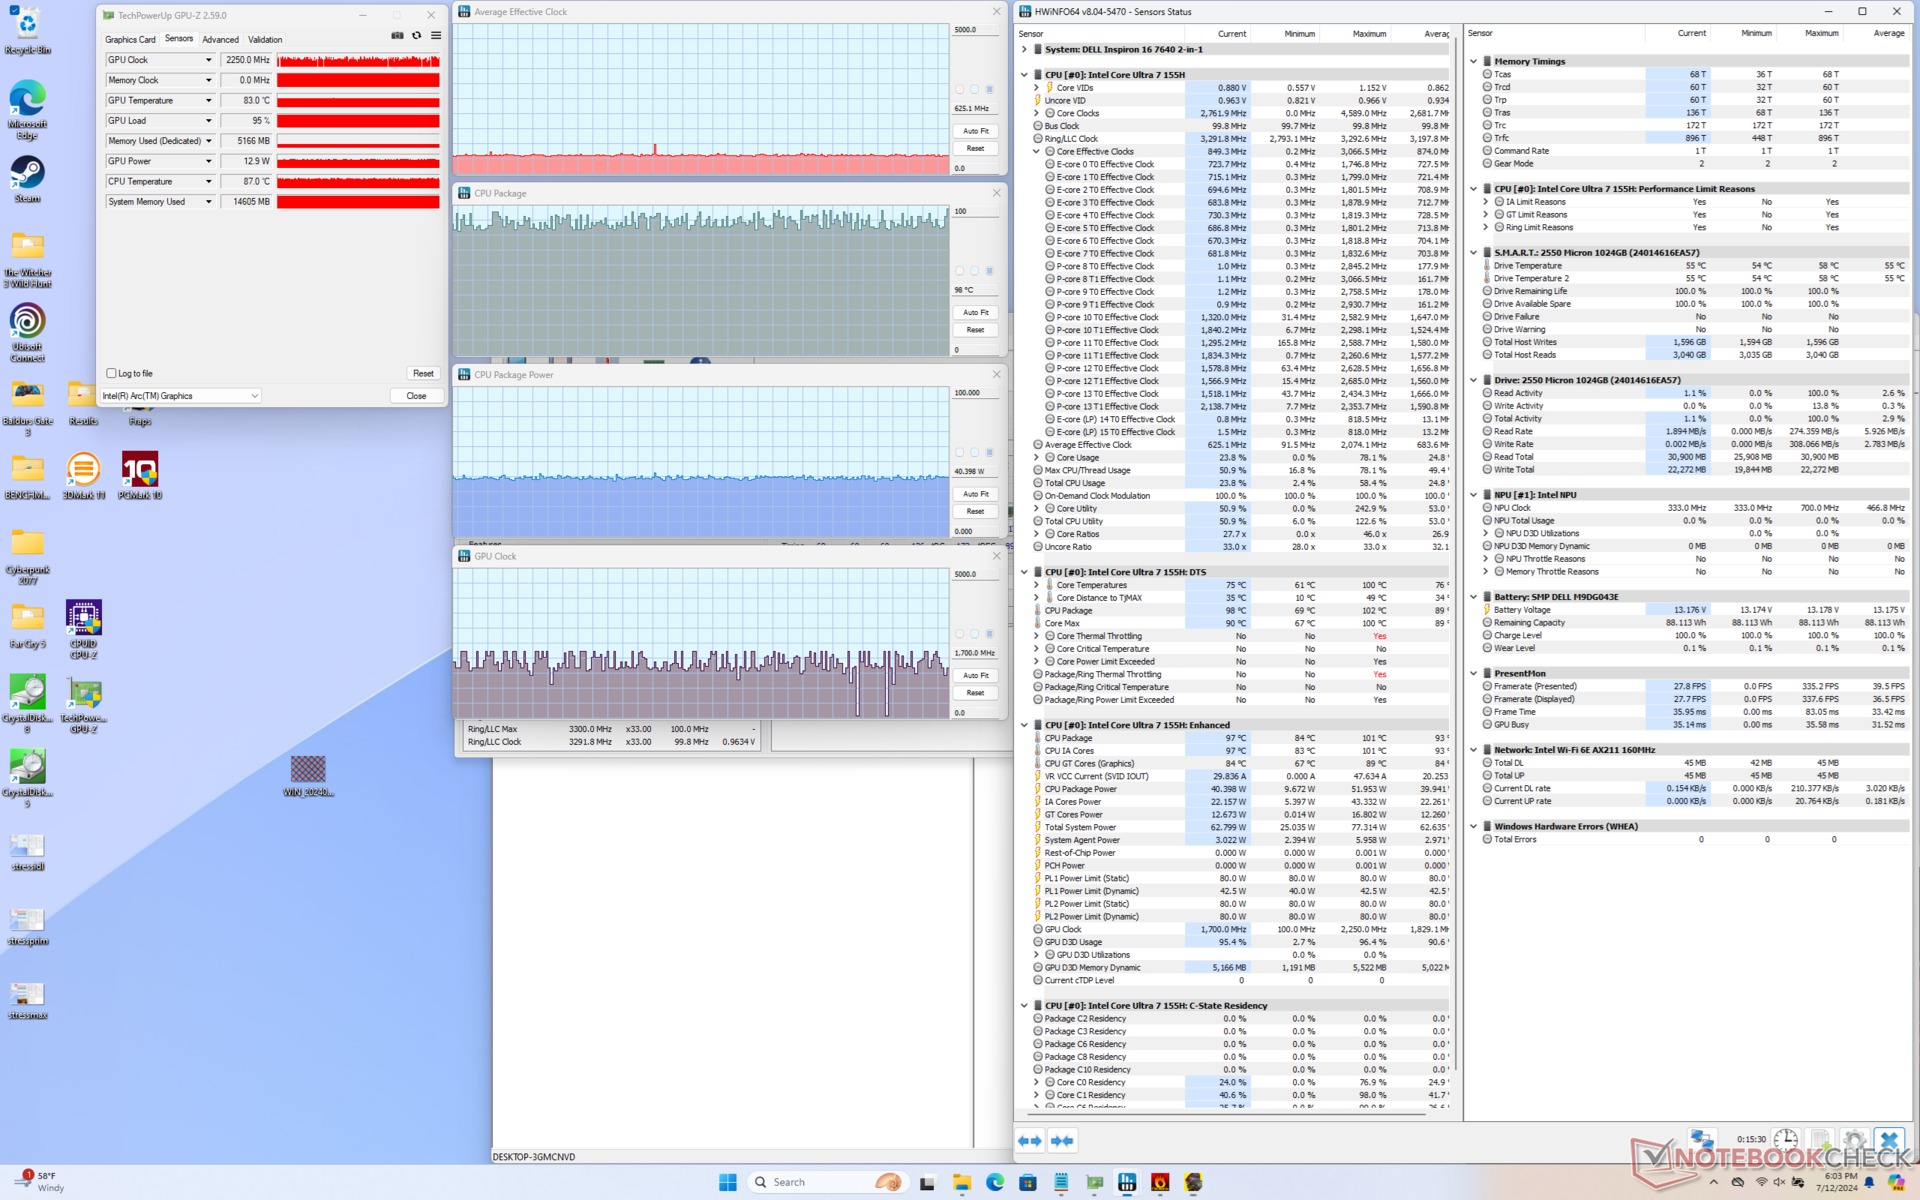
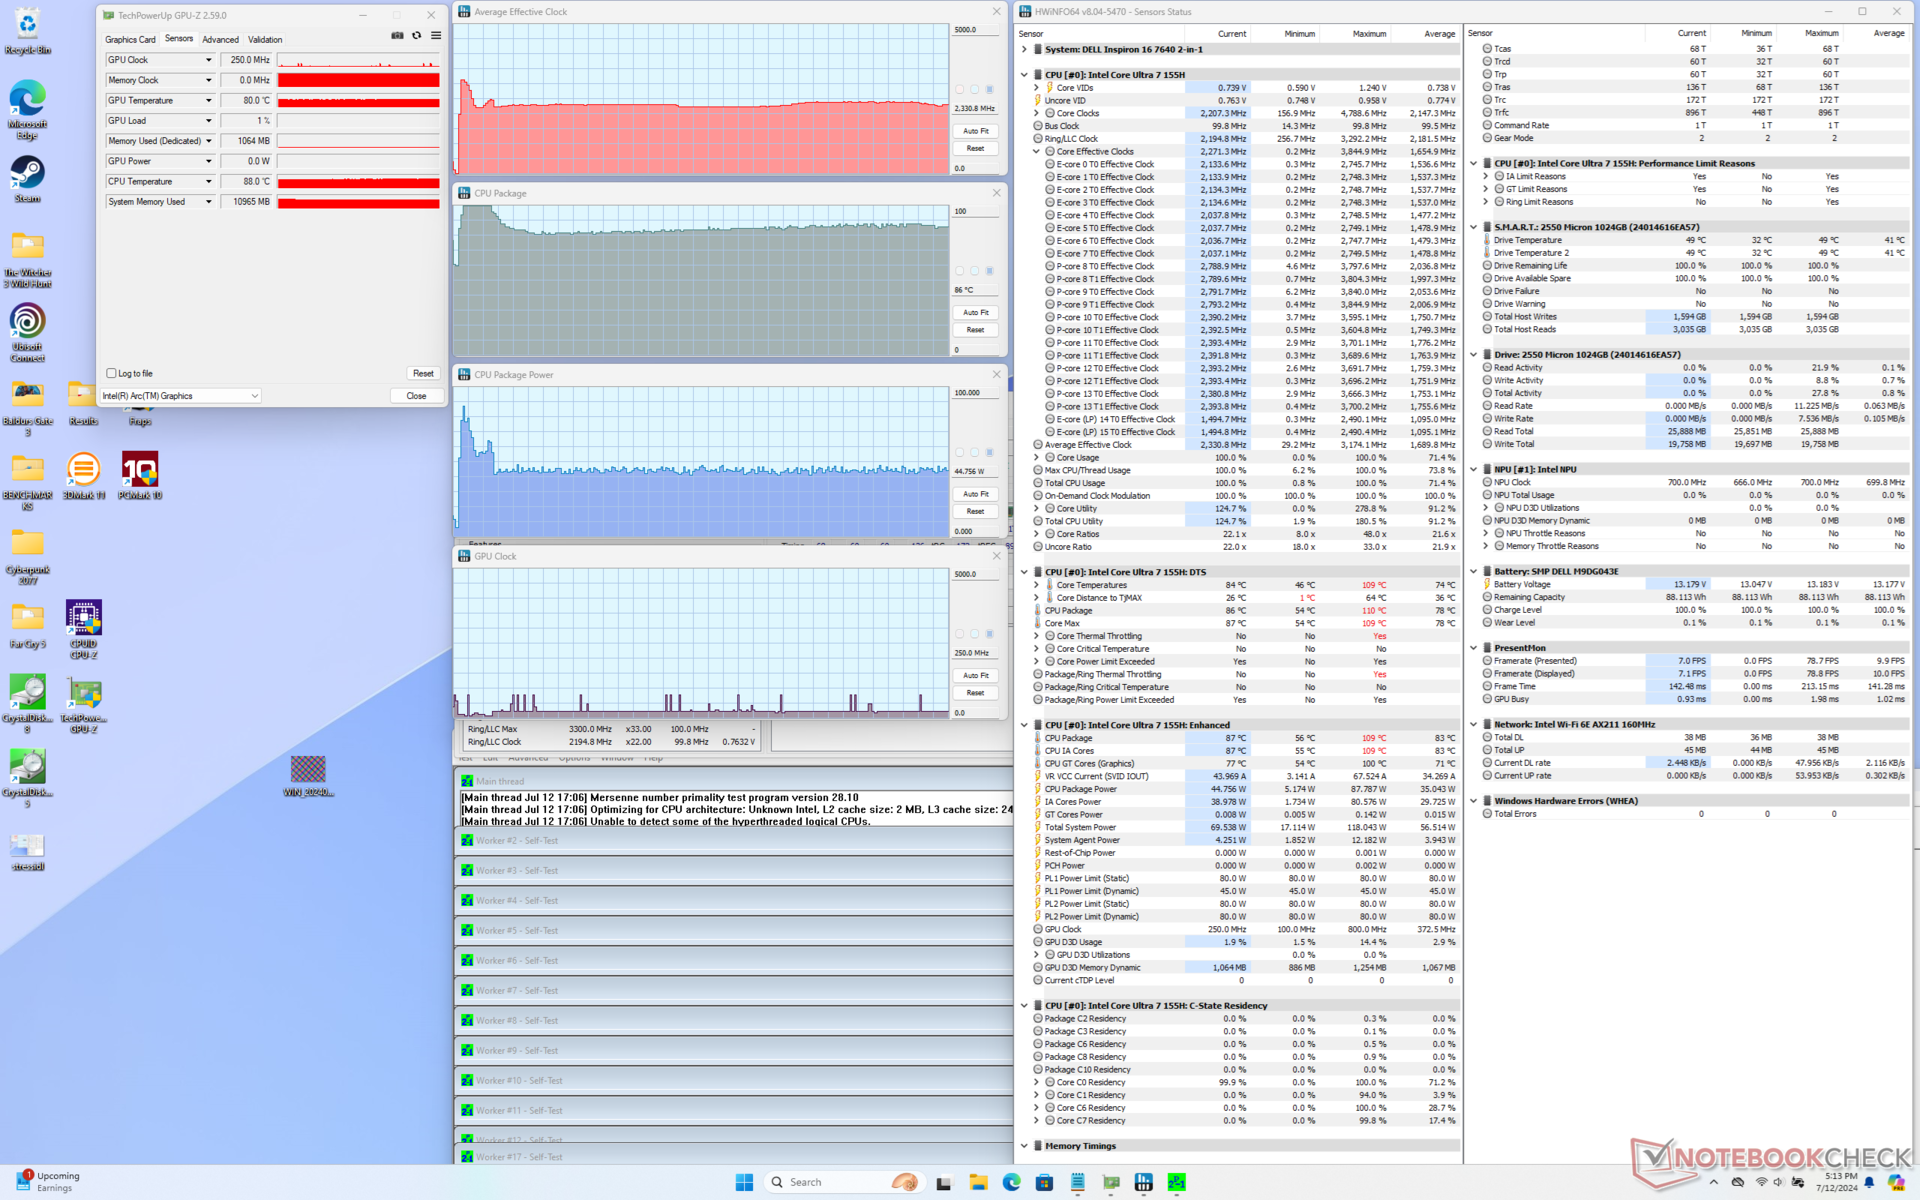
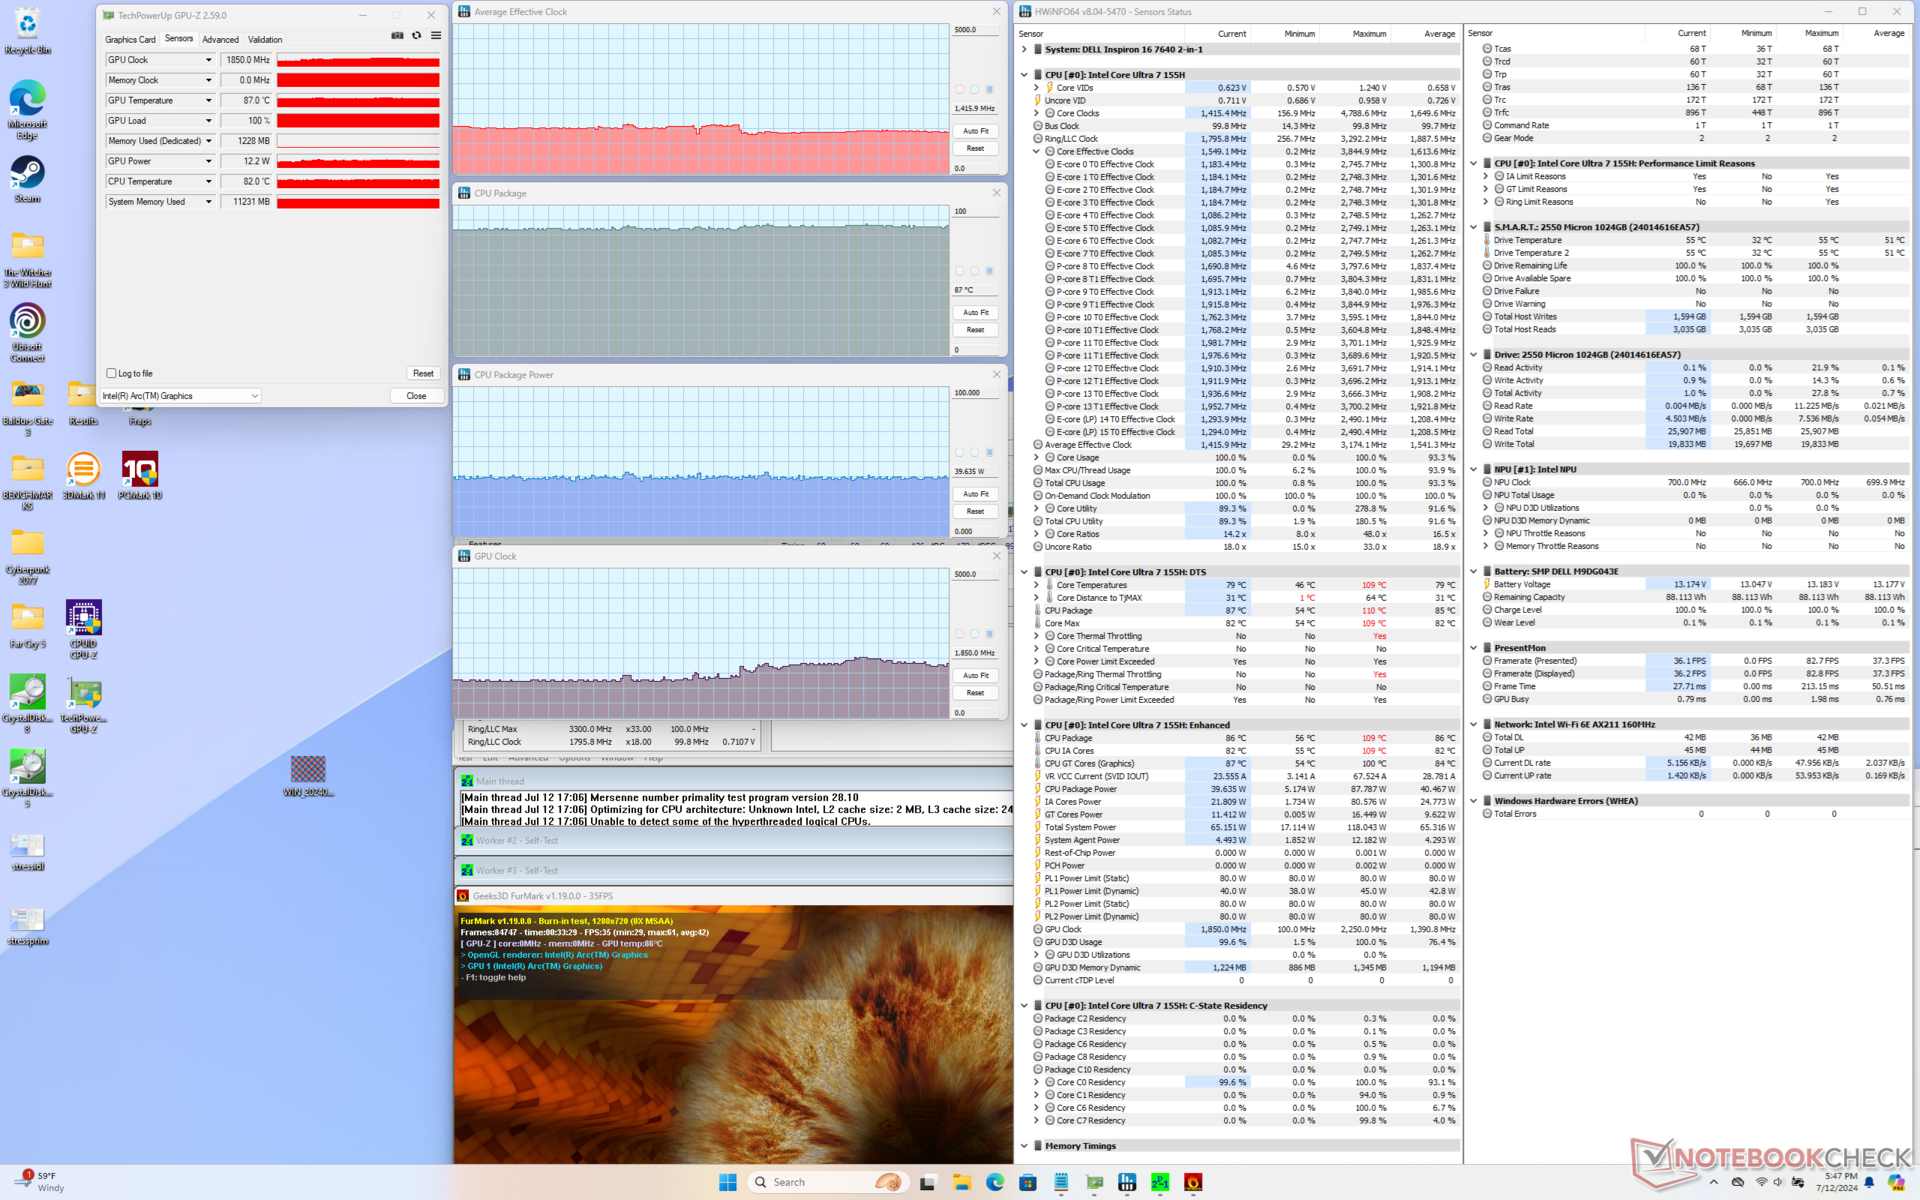
| Horloge moyenne du CPU (GHz) | Horloge du GPU (MHz) | Température moyenne du CPU (°C) | |
| Système au repos | -- | -- | 55 |
| Prime95 Stress | 2.3 | -- | 86 |
| Prime95 + FurMark Stress | 1.4 | 1250 - 1850 | 87 |
| Cyberpunk 2077 Stress | 0.6 | 1650 - 2250 | 90 - 98 |
Performance du système
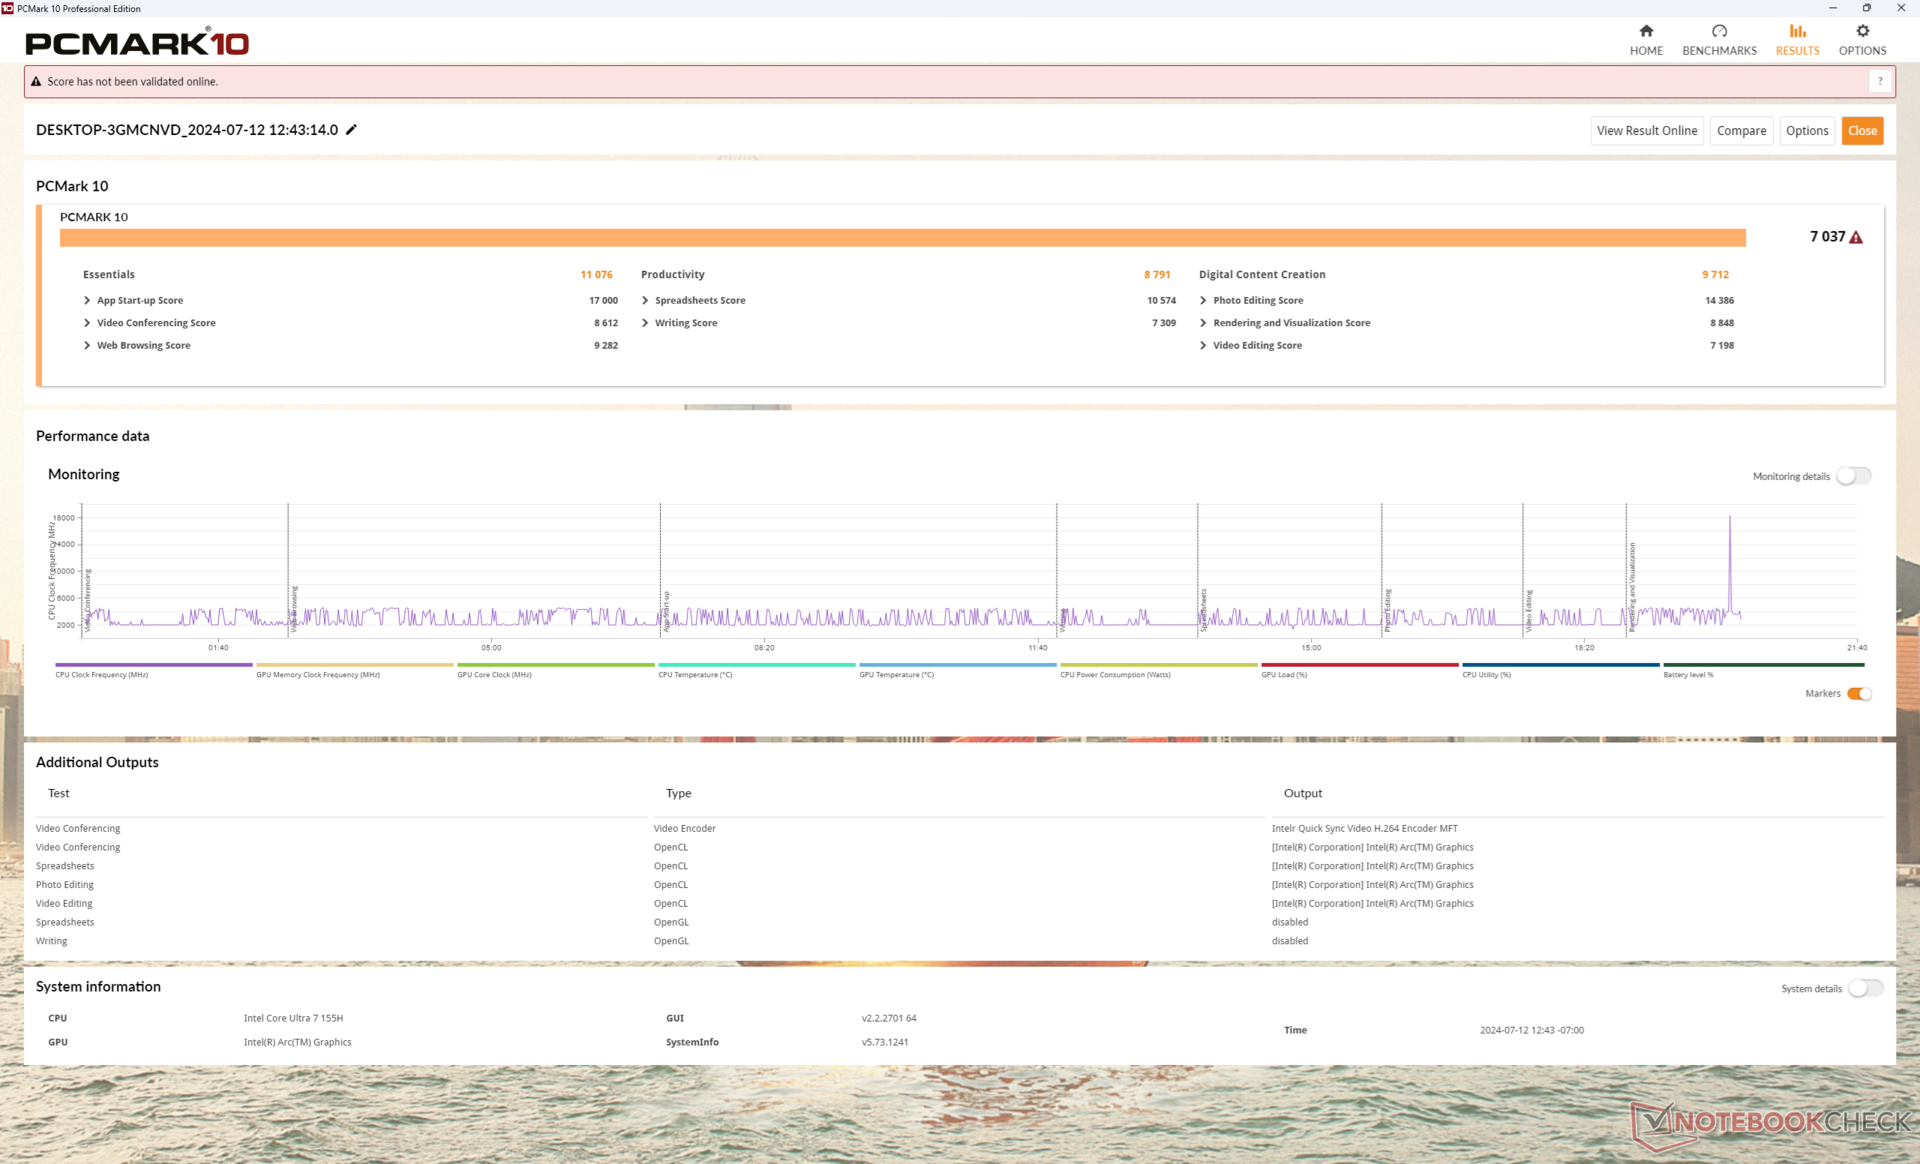
Les résultats de PCMark sont excellents et comparables à ceux d'autres machines de notre base de données dotées du même processeur et du même GPU intégré. Notre score moyen pour le Dell est l'un des plus élevés de tous les ordinateurs convertibles de 16 pouces, mais les alternatives dotées de GPU discrets comme le HP Spectre x360 16 offriront toujours des performances graphiques plus élevées.
CrossMark: Overall | Productivity | Creativity | Responsiveness
WebXPRT 3: Overall
WebXPRT 4: Overall
Mozilla Kraken 1.1: Total
| PCMark 10 / Score | |
| Lenovo IdeaPad Pro 5 16IMH G9 | |
| Dell Inspiron 16 Plus 7640 | |
| Dell Inspiron 16 7640 2-in-1 | |
| HP Envy x360 2-in-1 16-ad0097nr | |
| Moyenne Intel Core Ultra 7 155H, Intel Arc 8-Core iGPU (4809 - 7529, n=34) | |
| Samsung Galaxy Book4 Pro 360 | |
| Dell Inspiron 16 7635 2-in-1 | |
| PCMark 10 / Essentials | |
| Lenovo IdeaPad Pro 5 16IMH G9 | |
| Dell Inspiron 16 7640 2-in-1 | |
| Dell Inspiron 16 7635 2-in-1 | |
| Samsung Galaxy Book4 Pro 360 | |
| HP Envy x360 2-in-1 16-ad0097nr | |
| Moyenne Intel Core Ultra 7 155H, Intel Arc 8-Core iGPU (7605 - 11289, n=34) | |
| Dell Inspiron 16 Plus 7640 | |
| PCMark 10 / Productivity | |
| HP Envy x360 2-in-1 16-ad0097nr | |
| Dell Inspiron 16 7635 2-in-1 | |
| Lenovo IdeaPad Pro 5 16IMH G9 | |
| Dell Inspiron 16 7640 2-in-1 | |
| Moyenne Intel Core Ultra 7 155H, Intel Arc 8-Core iGPU (6042 - 10591, n=34) | |
| Dell Inspiron 16 Plus 7640 | |
| Samsung Galaxy Book4 Pro 360 | |
| PCMark 10 / Digital Content Creation | |
| Dell Inspiron 16 Plus 7640 | |
| Lenovo IdeaPad Pro 5 16IMH G9 | |
| Dell Inspiron 16 7640 2-in-1 | |
| Moyenne Intel Core Ultra 7 155H, Intel Arc 8-Core iGPU (4985 - 10709, n=34) | |
| HP Envy x360 2-in-1 16-ad0097nr | |
| Samsung Galaxy Book4 Pro 360 | |
| Dell Inspiron 16 7635 2-in-1 | |
| CrossMark / Overall | |
| Dell Inspiron 16 7640 2-in-1 | |
| Dell Inspiron 16 Plus 7640 | |
| Moyenne Intel Core Ultra 7 155H, Intel Arc 8-Core iGPU (1366 - 1903, n=34) | |
| HP Envy x360 2-in-1 16-ad0097nr | |
| Samsung Galaxy Book4 Pro 360 | |
| Lenovo IdeaPad Pro 5 16IMH G9 | |
| Dell Inspiron 16 7635 2-in-1 | |
| CrossMark / Productivity | |
| Dell Inspiron 16 7640 2-in-1 | |
| HP Envy x360 2-in-1 16-ad0097nr | |
| Dell Inspiron 16 Plus 7640 | |
| Moyenne Intel Core Ultra 7 155H, Intel Arc 8-Core iGPU (1291 - 1798, n=33) | |
| Samsung Galaxy Book4 Pro 360 | |
| Lenovo IdeaPad Pro 5 16IMH G9 | |
| Dell Inspiron 16 7635 2-in-1 | |
| CrossMark / Creativity | |
| Dell Inspiron 16 Plus 7640 | |
| Dell Inspiron 16 7640 2-in-1 | |
| Lenovo IdeaPad Pro 5 16IMH G9 | |
| Moyenne Intel Core Ultra 7 155H, Intel Arc 8-Core iGPU (1519 - 1929, n=33) | |
| HP Envy x360 2-in-1 16-ad0097nr | |
| Samsung Galaxy Book4 Pro 360 | |
| Dell Inspiron 16 7635 2-in-1 | |
| CrossMark / Responsiveness | |
| Samsung Galaxy Book4 Pro 360 | |
| Moyenne Intel Core Ultra 7 155H, Intel Arc 8-Core iGPU (939 - 1802, n=33) | |
| Dell Inspiron 16 7640 2-in-1 | |
| HP Envy x360 2-in-1 16-ad0097nr | |
| Dell Inspiron 16 Plus 7640 | |
| Lenovo IdeaPad Pro 5 16IMH G9 | |
| Dell Inspiron 16 7635 2-in-1 | |
| WebXPRT 3 / Overall | |
| HP Envy x360 2-in-1 16-ad0097nr | |
| Dell Inspiron 16 Plus 7640 | |
| Lenovo IdeaPad Pro 5 16IMH G9 | |
| Dell Inspiron 16 7640 2-in-1 | |
| Moyenne Intel Core Ultra 7 155H, Intel Arc 8-Core iGPU (252 - 299, n=34) | |
| Dell Inspiron 16 7635 2-in-1 | |
| Samsung Galaxy Book4 Pro 360 | |
| WebXPRT 4 / Overall | |
| Lenovo IdeaPad Pro 5 16IMH G9 | |
| Dell Inspiron 16 7640 2-in-1 | |
| Dell Inspiron 16 Plus 7640 | |
| Moyenne Intel Core Ultra 7 155H, Intel Arc 8-Core iGPU (166.4 - 309, n=29) | |
| HP Envy x360 2-in-1 16-ad0097nr | |
| Samsung Galaxy Book4 Pro 360 | |
| Dell Inspiron 16 7635 2-in-1 | |
| Mozilla Kraken 1.1 / Total | |
| Dell Inspiron 16 7635 2-in-1 | |
| Samsung Galaxy Book4 Pro 360 | |
| Moyenne Intel Core Ultra 7 155H, Intel Arc 8-Core iGPU (517 - 614, n=35) | |
| HP Envy x360 2-in-1 16-ad0097nr | |
| Dell Inspiron 16 7640 2-in-1 | |
| Dell Inspiron 16 Plus 7640 | |
| Lenovo IdeaPad Pro 5 16IMH G9 | |
* ... Moindre est la valeur, meilleures sont les performances
| PCMark 10 Score | 7037 points | |
Aide | ||
| AIDA64 / Memory Copy | |
| Lenovo IdeaPad Pro 5 16IMH G9 | |
| Samsung Galaxy Book4 Pro 360 | |
| Moyenne Intel Core Ultra 7 155H (62397 - 96791, n=50) | |
| Dell Inspiron 16 7640 2-in-1 | |
| HP Envy x360 2-in-1 16-ad0097nr | |
| Dell Inspiron 16 Plus 7640 | |
| Dell Inspiron 16 7635 2-in-1 | |
| AIDA64 / Memory Read | |
| Lenovo IdeaPad Pro 5 16IMH G9 | |
| Moyenne Intel Core Ultra 7 155H (60544 - 90647, n=50) | |
| Dell Inspiron 16 Plus 7640 | |
| Samsung Galaxy Book4 Pro 360 | |
| Dell Inspiron 16 7640 2-in-1 | |
| HP Envy x360 2-in-1 16-ad0097nr | |
| Dell Inspiron 16 7635 2-in-1 | |
| AIDA64 / Memory Write | |
| HP Envy x360 2-in-1 16-ad0097nr | |
| Dell Inspiron 16 7640 2-in-1 | |
| Lenovo IdeaPad Pro 5 16IMH G9 | |
| Moyenne Intel Core Ultra 7 155H (58692 - 93451, n=50) | |
| Samsung Galaxy Book4 Pro 360 | |
| Dell Inspiron 16 Plus 7640 | |
| Dell Inspiron 16 7635 2-in-1 | |
| AIDA64 / Memory Latency | |
| Dell Inspiron 16 7640 2-in-1 | |
| Moyenne Intel Core Ultra 7 155H (116.2 - 233, n=50) | |
| Lenovo IdeaPad Pro 5 16IMH G9 | |
| Samsung Galaxy Book4 Pro 360 | |
| HP Envy x360 2-in-1 16-ad0097nr | |
| Dell Inspiron 16 Plus 7640 | |
| Dell Inspiron 16 7635 2-in-1 | |
* ... Moindre est la valeur, meilleures sont les performances
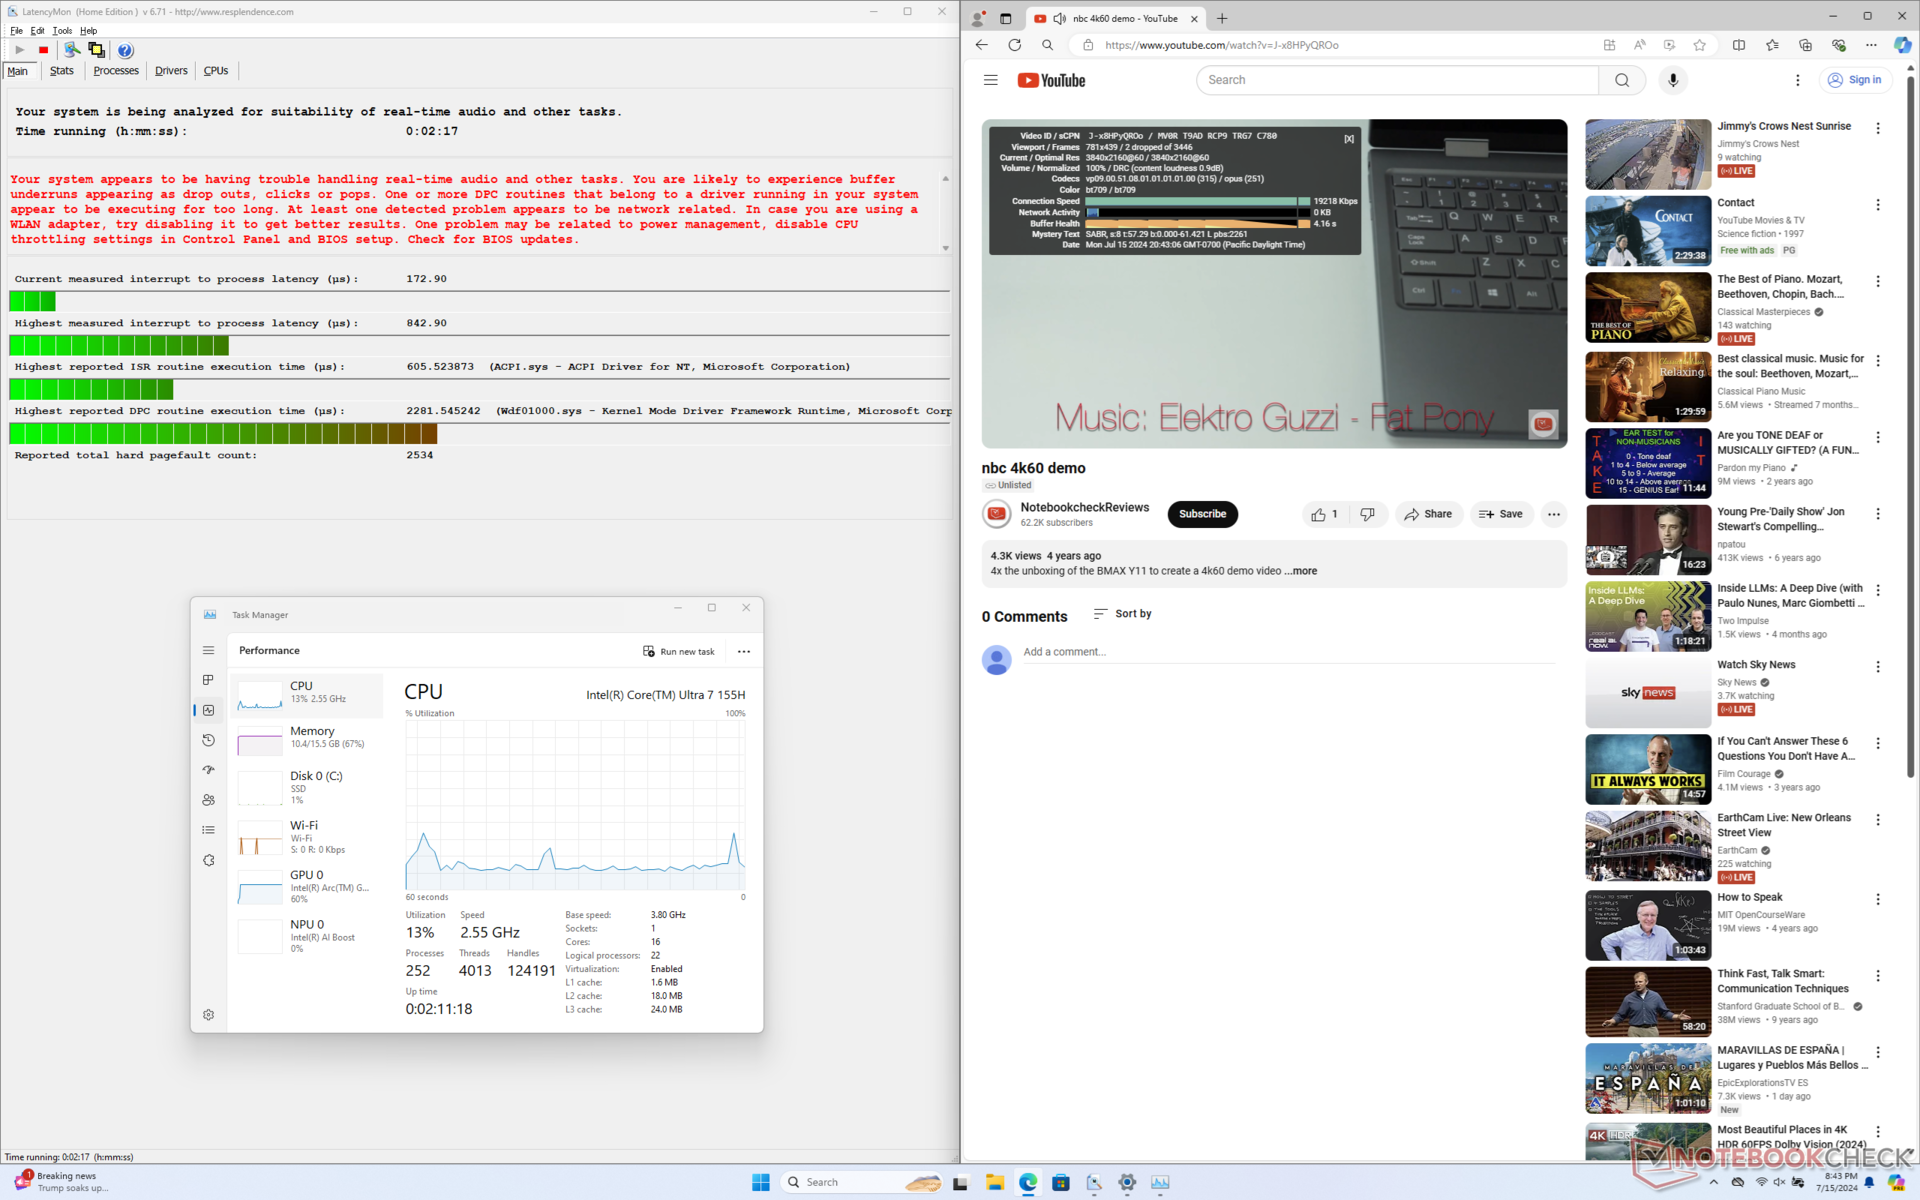
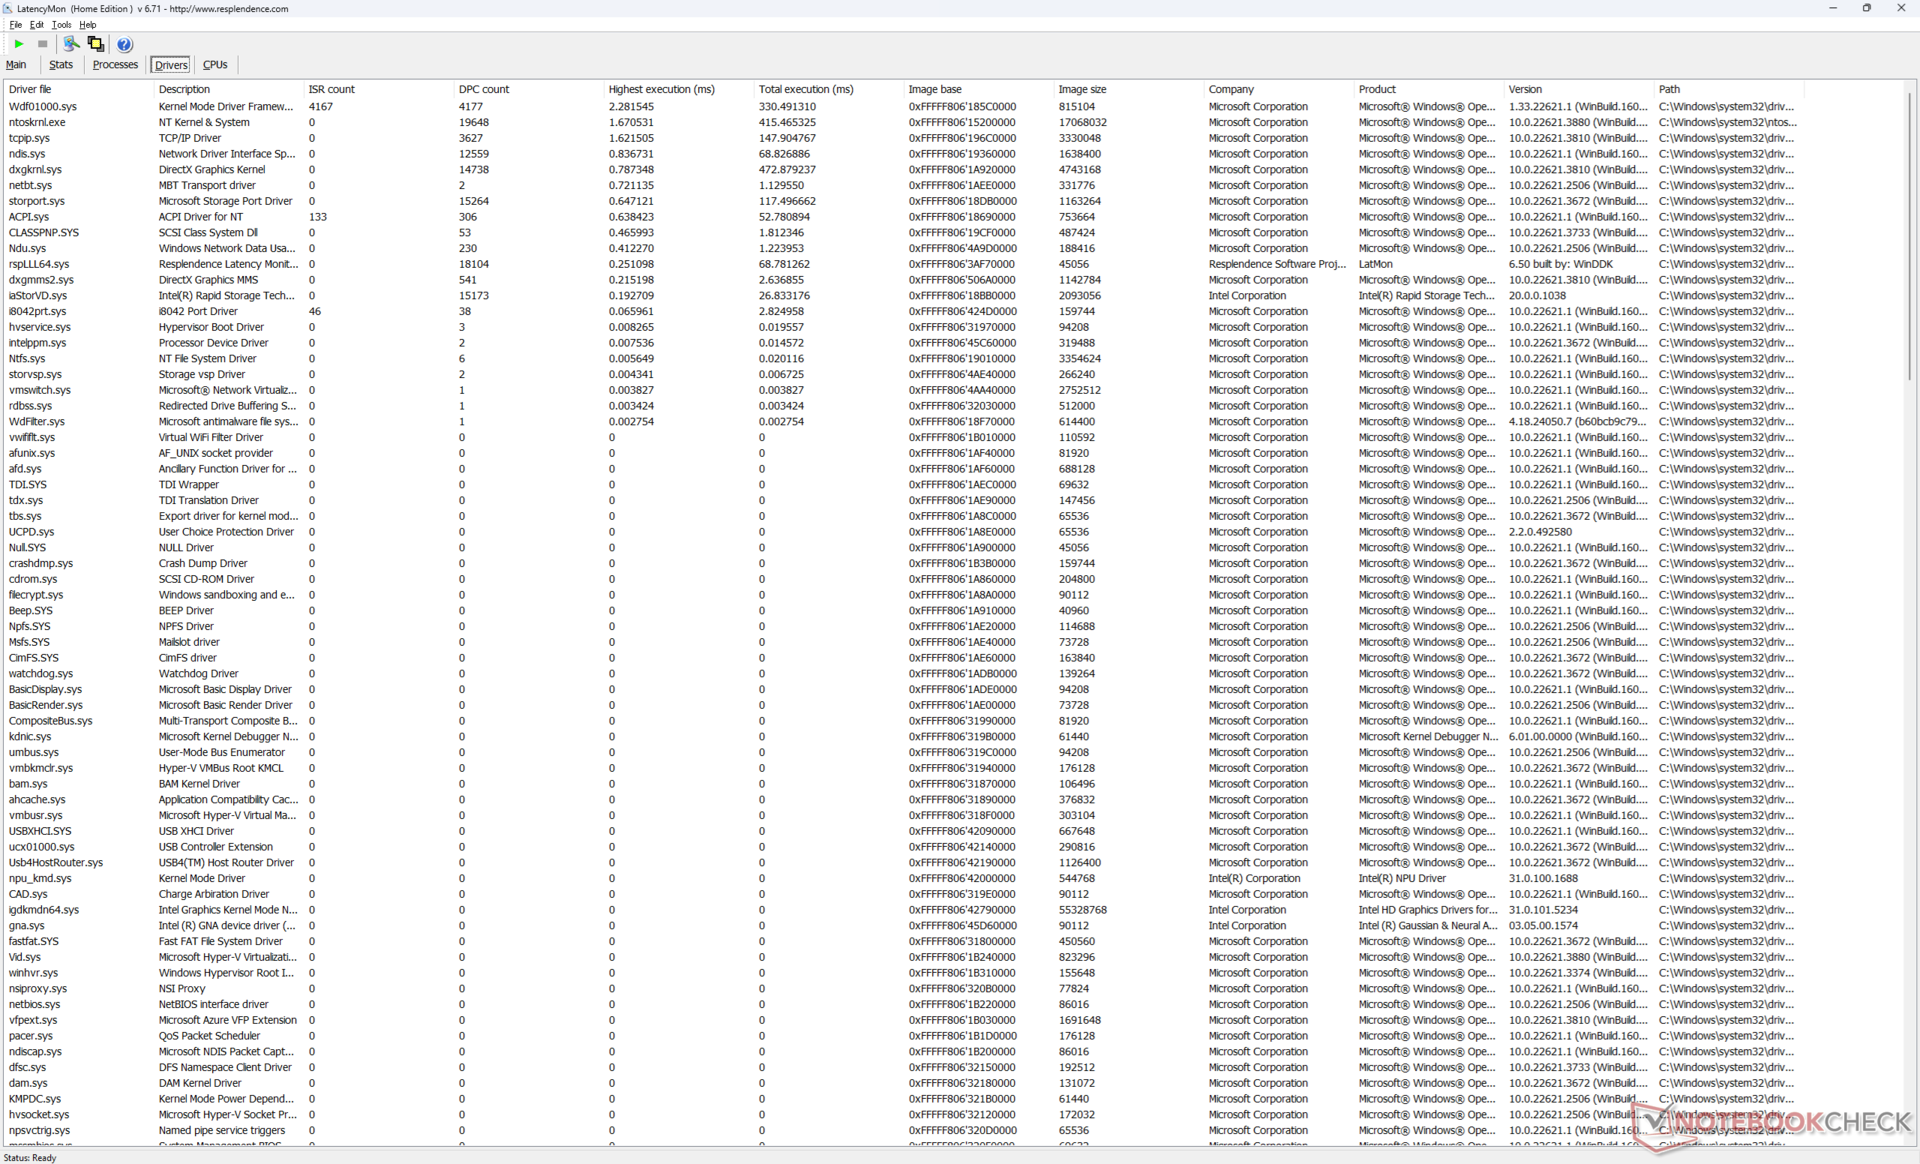
Latence DPC
LatencyMon révèle des problèmes mineurs de DPC lors de l'ouverture de plusieurs onglets de notre page d'accueil. Nous avons également pu enregistrer 2 images perdues lors d'un test vidéo 4K60 d'une durée d'une minute, alors qu'idéalement il ne devrait y en avoir aucune.
| DPC Latencies / LatencyMon - interrupt to process latency (max), Web, Youtube, Prime95 | |
| Samsung Galaxy Book4 Pro 360 | |
| HP Envy x360 2-in-1 16-ad0097nr | |
| Dell Inspiron 16 7640 2-in-1 | |
| Lenovo IdeaPad Pro 5 16IMH G9 | |
| Dell Inspiron 16 Plus 7640 | |
| Dell Inspiron 16 7635 2-in-1 | |
* ... Moindre est la valeur, meilleures sont les performances
Dispositifs de stockage
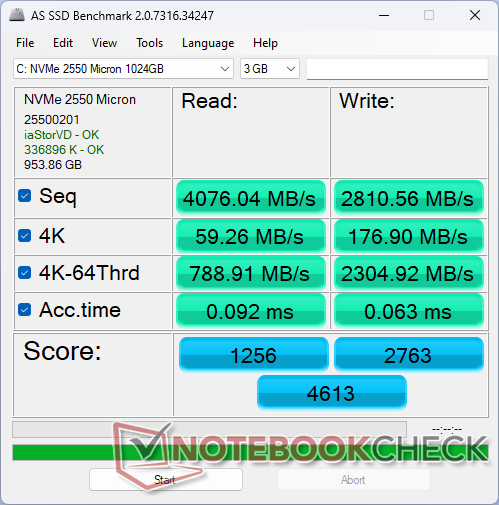
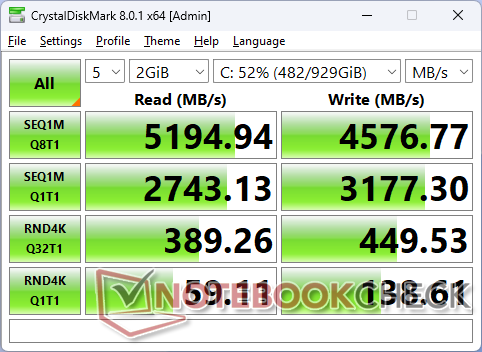
Dell s'approvisionne en disques SSD auprès de plusieurs fournisseurs pour sa gamme Inspiron, notamment Kioxia, SK Hynix et Micron. Notre unité de test spécifique est livrée avec le SSD Micron 2550 qui est un SSD NVMe PCIe4 de milieu de gamme capable d'atteindre des taux de lecture de 5200 MB/s. Des disques plus chers comme le Samsung PM9A1 peuvent atteindre plus de 7000 Mo/s en comparaison, mais le Micron 2550 est suffisant et approprié pour un modèle de milieu de gamme comme notre Inspiron 16 2-en-1.
Les taux de transfert sont largement supérieurs à ceux du Kioxia BG5 de l'Inspiron 16 7635 2-en-1 de l'année dernière, même si l'on tient compte d'un éventuel ralentissement en cas de sollicitation.

* ... Moindre est la valeur, meilleures sont les performances
Disk Throttling: DiskSpd Read Loop, Queue Depth 8
Performance du GPU
Les performances graphiques sont plutôt bonnes et l'une des plus rapides pour un convertible sans avoir recours à des options discrètes. L'Arc 8 Arc 8 Est comparable à la Radeon 780M et bien supérieur aux anciens GPU Iris Xe 96 EUs ou Radeon RX Vega de plus de 2 fois dans de nombreux cas. La Radeon RX Vega 7 de l'Inspiron 16 7635 2-en-1 de l'année dernière, par exemple, est presque 60% derrière.
Les utilisateurs qui exigent des performances de jeu et une accélération CUDA peuvent envisager le Spectre x360 16 avec la GeForce RTX 4050 qui multiplie encore par deux les performances graphiques par rapport à l'Arc 8. Bien sûr, le Spectre est également beaucoup plus cher que notre Dell.
N'oubliez pas que le GPU Arc 8 n'est disponible qu'avec la configuration Core Ultra 7 155H. Si vous optez pour le Core Ultra 5 125U, vous devrez vous contenter de la configuration Arc 4 ce qui implique une baisse significative de 40 à 45% des performances graphiques.
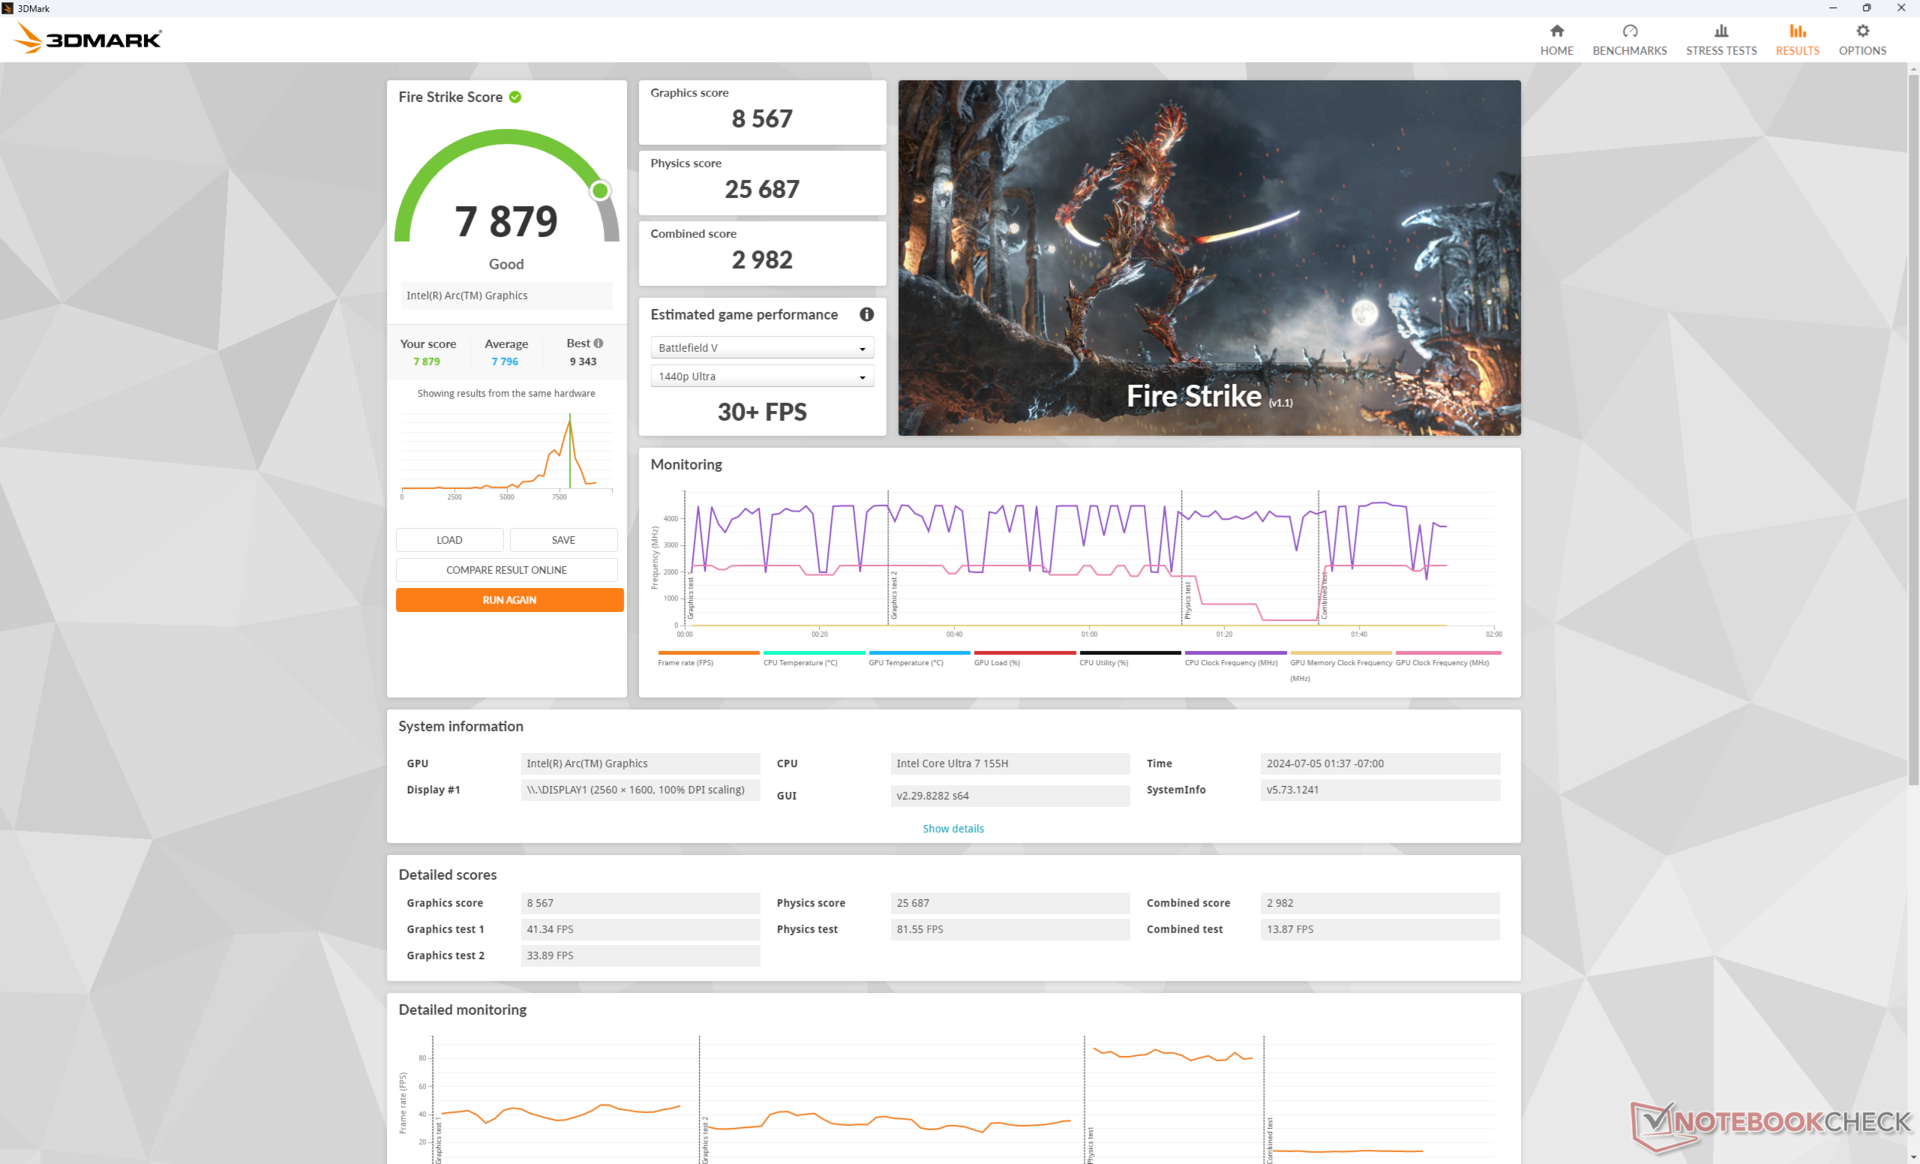
| Profil de puissance | Fire Strike Score graphique | Fire Strike Score physique | Score combiné |
| Mode Performance | 8567 | 25687 | 2982 |
| Mode équilibré | 8640 (-0%) | 26567 (-0%) | 2781 (-7%) |
| Alimentation par batterie | 7734 (-10%) | 25155 (-2%) | 2886 (-3%) |
L'utilisation du mode équilibré n'aurait qu'un impact minime sur les performances, si l'on en croit les résultats obtenus sur le site Fire Strike dans le tableau ci-dessus. Le déficit de performance lors de l'utilisation de la batterie est plus faible que prévu, avec seulement 10 %, ce qui assure une bonne cohérence entre les différents modes d'alimentation.
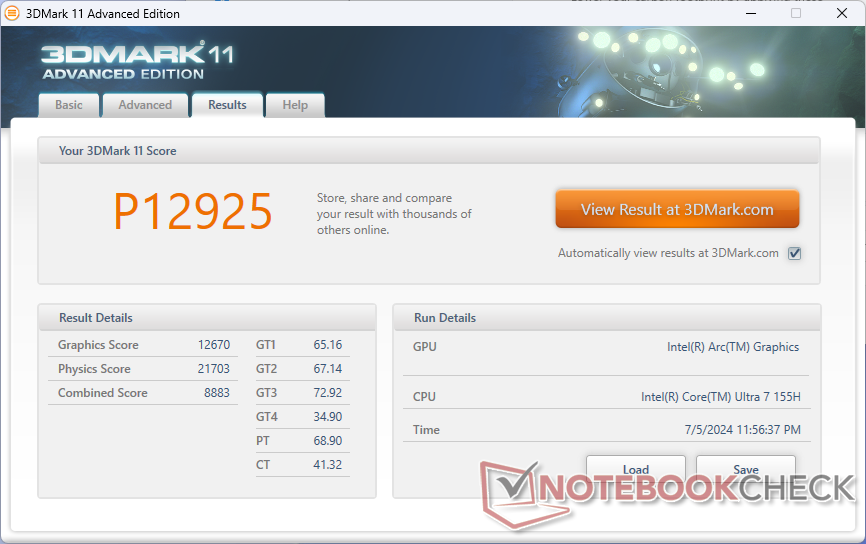
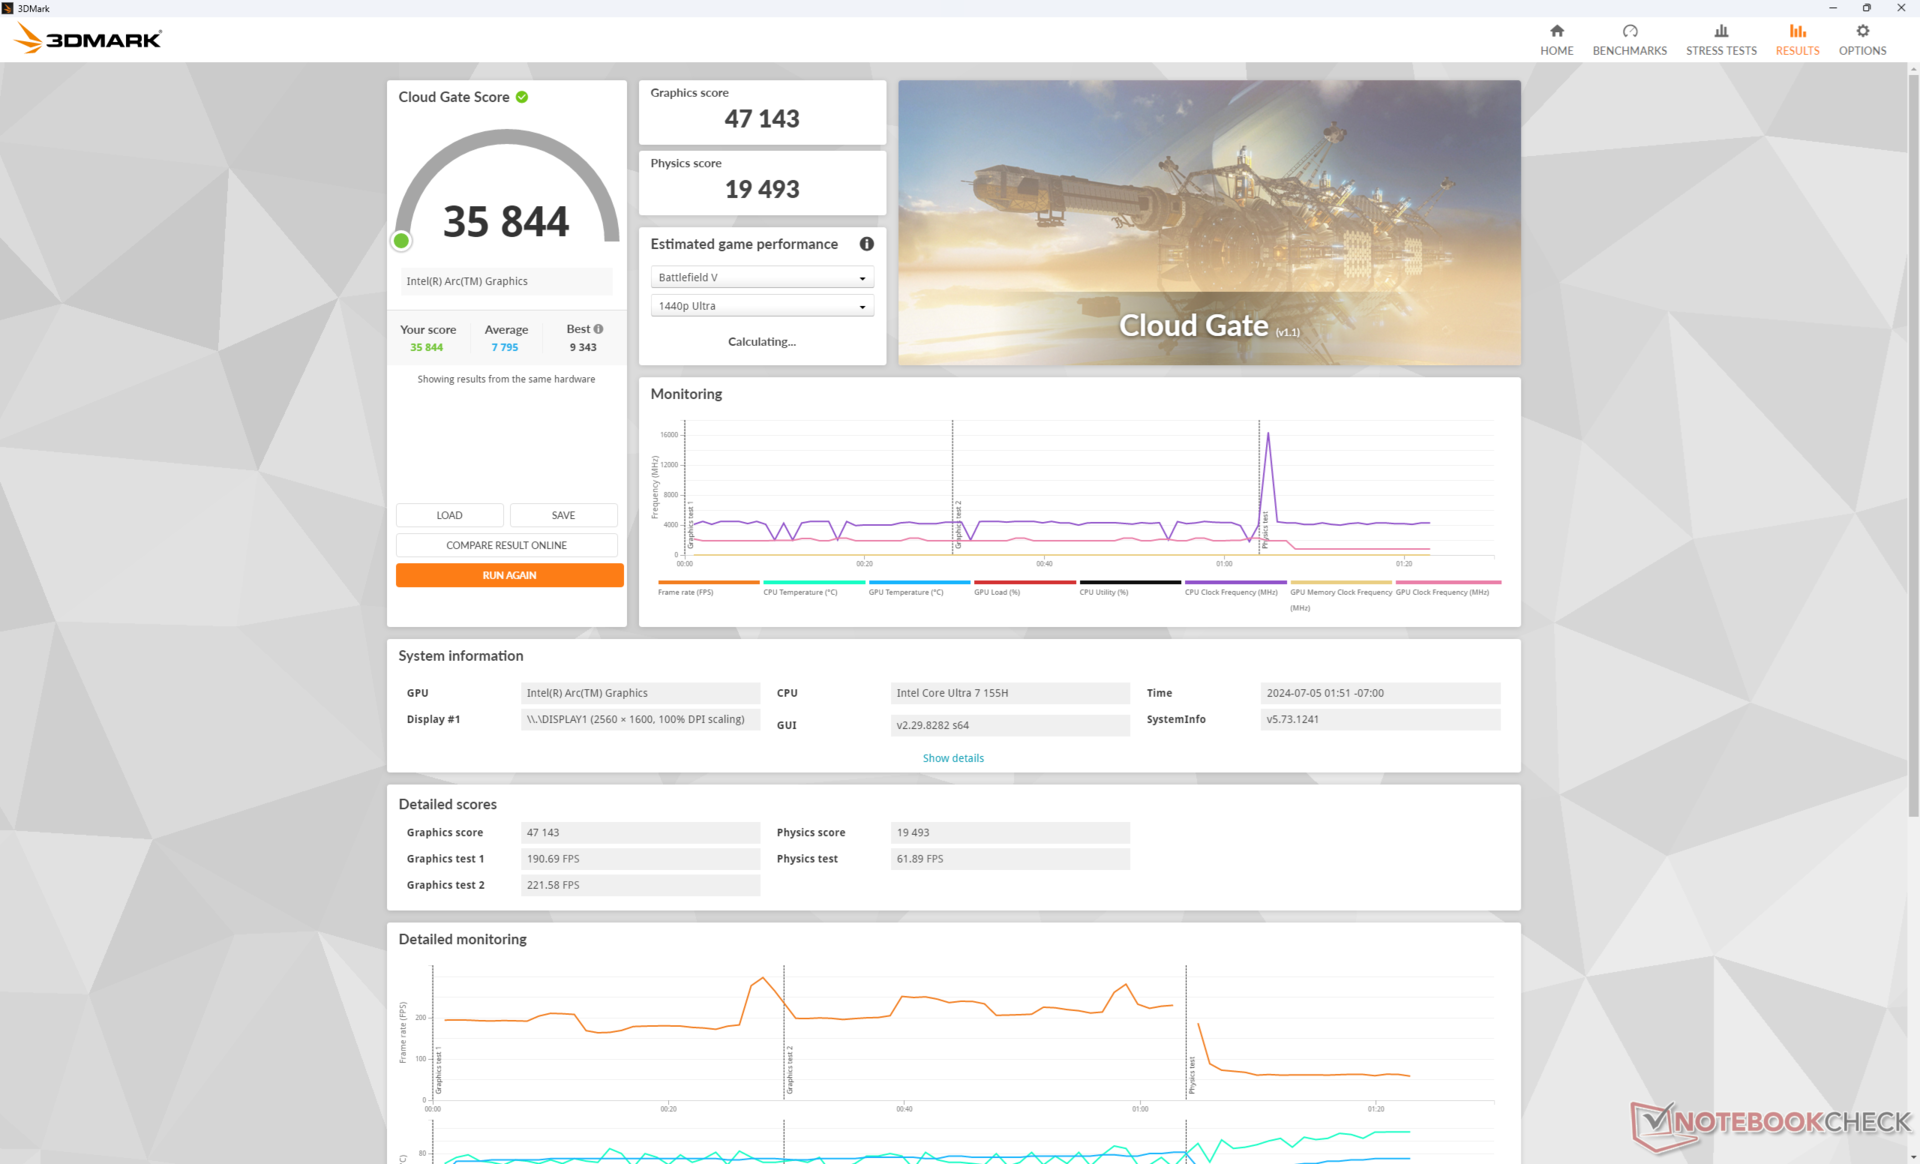
| 3DMark 11 Performance | 12925 points | |
| 3DMark Cloud Gate Standard Score | 35844 points | |
| 3DMark Fire Strike Score | 7879 points | |
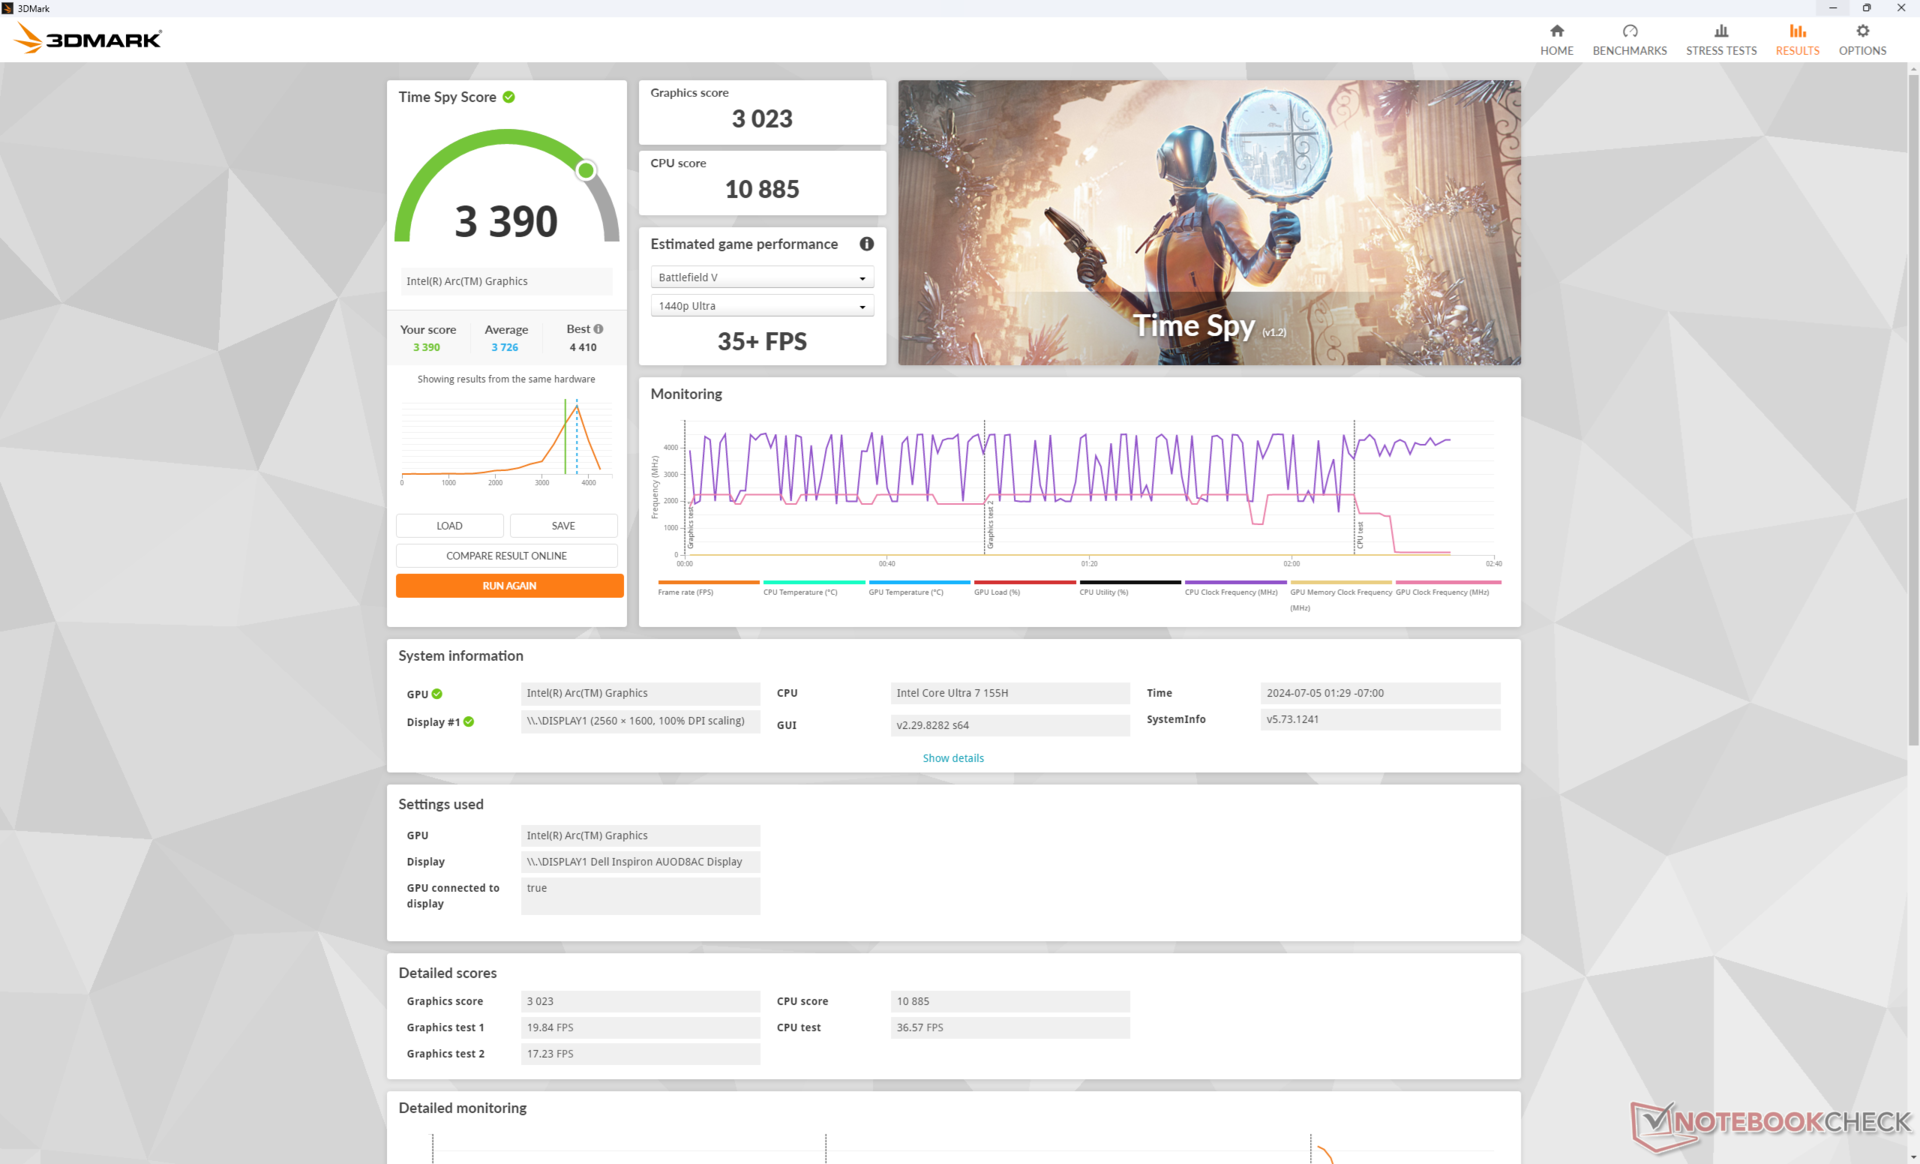
| 3DMark Time Spy Score | 3390 points | |
Aide | ||
* ... Moindre est la valeur, meilleures sont les performances
| The Witcher 3 - 1920x1080 Ultra Graphics & Postprocessing (HBAO+) | |
| Dell Inspiron 16 Plus 7640 | |
| HP Envy x360 2-in-1 16-ad0097nr | |
| Lenovo IdeaPad Pro 5 16IMH G9 | |
| Dell Inspiron 16 7640 2-in-1 | |
| Samsung Galaxy Book4 Pro 360 | |
| Dell Inspiron 16 7635 2-in-1 | |
| Final Fantasy XV Benchmark - 1920x1080 High Quality | |
| Dell Inspiron 16 Plus 7640 | |
| Lenovo IdeaPad Pro 5 16IMH G9 | |
| Dell Inspiron 16 7640 2-in-1 | |
| HP Envy x360 2-in-1 16-ad0097nr | |
| Samsung Galaxy Book4 Pro 360 | |
| Dell Inspiron 16 7635 2-in-1 | |
| Strange Brigade - 1920x1080 ultra AA:ultra AF:16 | |
| Dell Inspiron 16 Plus 7640 | |
| Lenovo IdeaPad Pro 5 16IMH G9 | |
| Dell Inspiron 16 7640 2-in-1 | |
| HP Envy x360 2-in-1 16-ad0097nr | |
| Samsung Galaxy Book4 Pro 360 | |
| Dell Inspiron 16 7635 2-in-1 | |
| Dota 2 Reborn - 1920x1080 ultra (3/3) best looking | |
| Dell Inspiron 16 Plus 7640 | |
| Lenovo IdeaPad Pro 5 16IMH G9 | |
| Dell Inspiron 16 7640 2-in-1 | |
| HP Envy x360 2-in-1 16-ad0097nr | |
| Samsung Galaxy Book4 Pro 360 | |
| Dell Inspiron 16 7635 2-in-1 | |
| X-Plane 11.11 - 1920x1080 high (fps_test=3) | |
| Dell Inspiron 16 Plus 7640 | |
| Dell Inspiron 16 7640 2-in-1 | |
| Lenovo IdeaPad Pro 5 16IMH G9 | |
| Samsung Galaxy Book4 Pro 360 | |
| HP Envy x360 2-in-1 16-ad0097nr | |
| Dell Inspiron 16 7635 2-in-1 | |
| Far Cry 5 - 1920x1080 Ultra Preset AA:T | |
| Dell Inspiron 16 Plus 7640 | |
| Lenovo IdeaPad Pro 5 16IMH G9 | |
| Dell Inspiron 16 7640 2-in-1 | |
| HP Envy x360 2-in-1 16-ad0097nr | |
Cyberpunk 2077 ultra FPS Chart
| Bas | Moyen | Élevé | Ultra | |
|---|---|---|---|---|
| The Witcher 3 (2015) | 141.5 | 81.2 | 44.5 | 23.9 |
| Dota 2 Reborn (2015) | 101.5 | 93.3 | 77.8 | 78 |
| Final Fantasy XV Benchmark (2018) | 65 | 36.5 | 26.8 | |
| X-Plane 11.11 (2018) | 50.8 | 40.8 | 40.1 | |
| Far Cry 5 (2018) | 68 | 38 | 36 | 34 |
| Strange Brigade (2018) | 145.6 | 71.8 | 55.4 | 45.4 |
| Tiny Tina's Wonderlands (2022) | 49.2 | 37.3 | 26.4 | 21.2 |
| F1 22 (2022) | 68.8 | 65.6 | ||
| Baldur's Gate 3 (2023) | 30.8 | 27.4 | 23.7 | 22 |
| Cyberpunk 2077 2.2 Phantom Liberty (2023) | 31 | 26.3 | 21.9 |
Émissions
System Noise - Loud And Proud
Sans changement majeur de la solution de refroidissement par rapport au modèle 2023, malgré un processeur plus exigeant, le ventilateur interne devra fonctionner aussi fort ou plus fort qu'auparavant et c'est exactement ce que nous avons constaté lors de nos tests. Le ventilateur de l'Inspiron 16 7640 2-en-1 passe plus rapidement de silencieux à bruyant lorsque des charges plus lourdes sont introduites. Par exemple, nous avons enregistré un bruit de ventilateur de 45 dB(A) moins de la moitié de la première scène du benchmark 3DMark 06, alors que l'Inspiron 16 7635 2-en-1 est plus silencieux Inspiron 16 7635 2-en-1 plafonne à 40 dB(A). Si vous jouez à des jeux, le bruit du ventilateur atteint également 45 dB(A), ce qui fait de notre Dell l'un des ordinateurs convertibles de 16 pouces les plus bruyants du marché.

Degré de la nuisance sonore
| Au repos |
| 22.9 / 22.9 / 25 dB(A) |
| Fortement sollicité |
| 45.1 / 44.9 dB(A) |
 | ||
30 dB silencieux 40 dB(A) audible 50 dB(A) bruyant |
||
min: | ||
| Dell Inspiron 16 7640 2-in-1 Arc 8-Core, Ultra 7 155H, Micron 2550 1TB | Dell Inspiron 16 Plus 7640 NVIDIA GeForce RTX 4060 Laptop GPU, Ultra 7 155H, SK hynix BC901 HFS001TEJ4X164N | Dell Inspiron 16 7635 2-in-1 Vega 7, R5 7530U, Kioxia BG5 KBG50ZNS512G | HP Envy x360 2-in-1 16-ad0097nr Radeon 780M, R7 8840HS, KIOXIA BG5 KBG50ZNV1T02 | Lenovo IdeaPad Pro 5 16IMH G9 Arc 8-Core, Ultra 7 155H, Samsung PM9C1a MZAL81T0HDLB | Samsung Galaxy Book4 Pro 360 Arc 7-Core, Ultra 5 125H, Samsung PM9B1 512GB MZVL4512HBLU | |
|---|---|---|---|---|---|---|
| Noise | 2% | 2% | 10% | -4% | 2% | |
| arrêt / environnement * | 22.9 | 23.8 -4% | 23.6 -3% | 22.9 -0% | 24.1 -5% | 24.1 -5% |
| Idle Minimum * | 22.9 | 24.2 -6% | 23.6 -3% | 23 -0% | 24.1 -5% | 24.1 -5% |
| Idle Average * | 22.9 | 24.2 -6% | 23.6 -3% | 23 -0% | 24.1 -5% | 24.1 -5% |
| Idle Maximum * | 25 | 24.2 3% | 23.6 6% | 23 8% | 28.2 -13% | 26.4 -6% |
| Load Average * | 45.1 | 28.9 36% | 40.3 11% | 23.8 47% | 44.4 2% | 35.2 22% |
| Cyberpunk 2077 ultra * | 44.9 | |||||
| Load Maximum * | 44.9 | 51 -14% | 44.2 2% | 43.8 2% | 44.4 1% | 39.2 13% |
| Witcher 3 ultra * | 51 | 44.2 | 43.8 | 36.5 | 38.5 |
* ... Moindre est la valeur, meilleures sont les performances
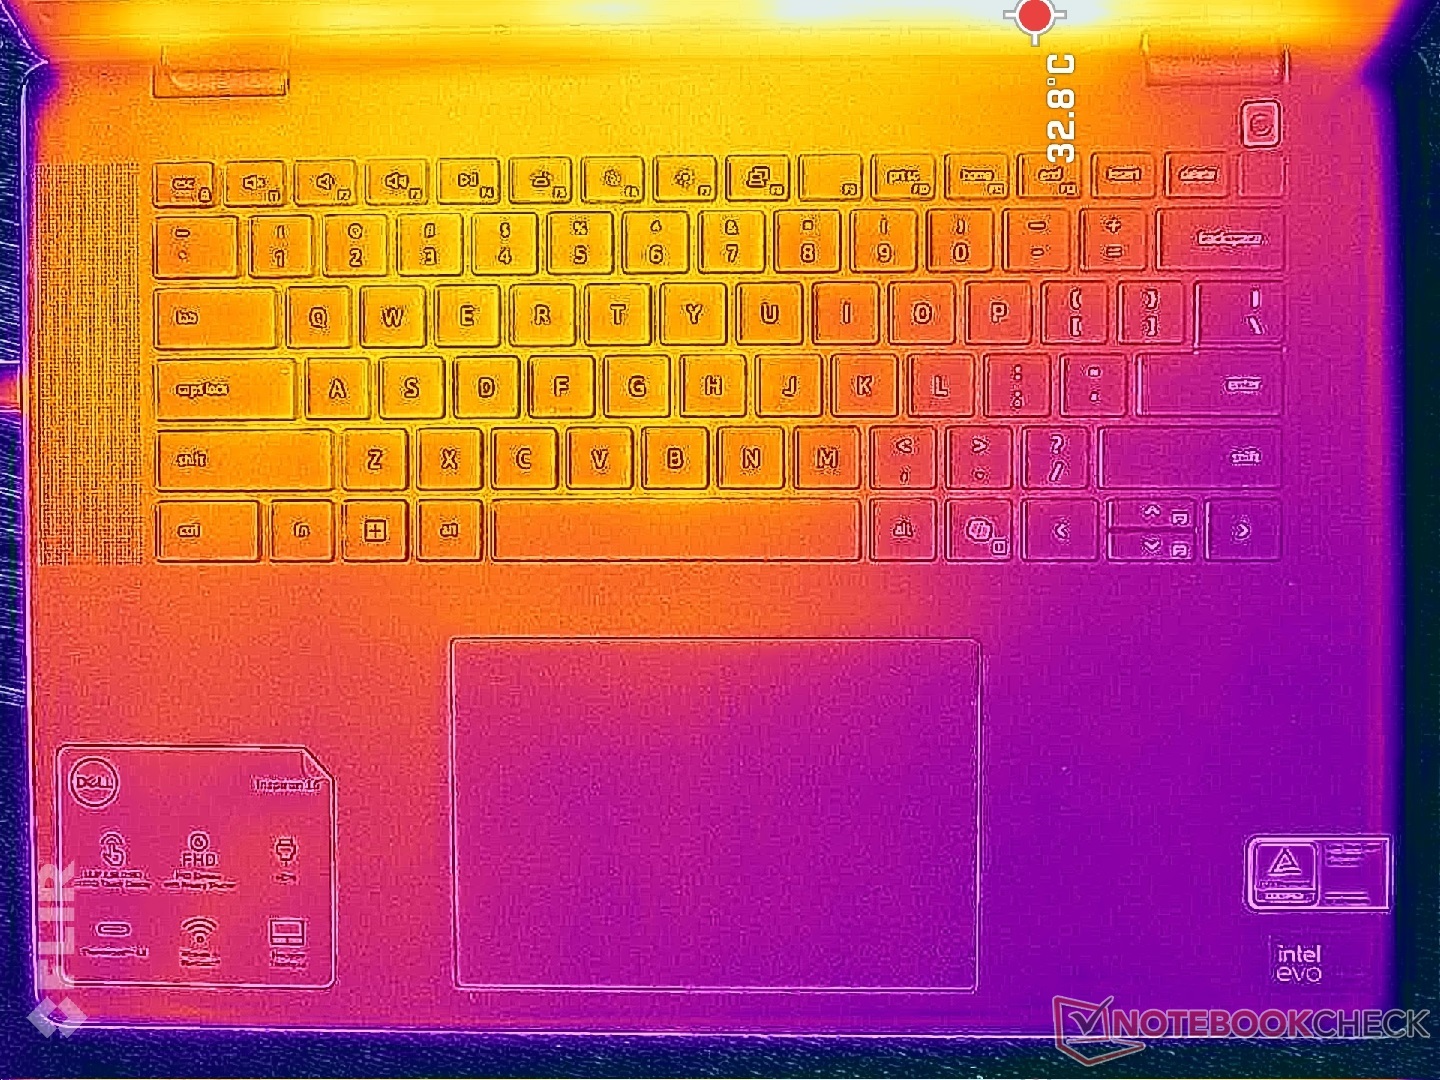
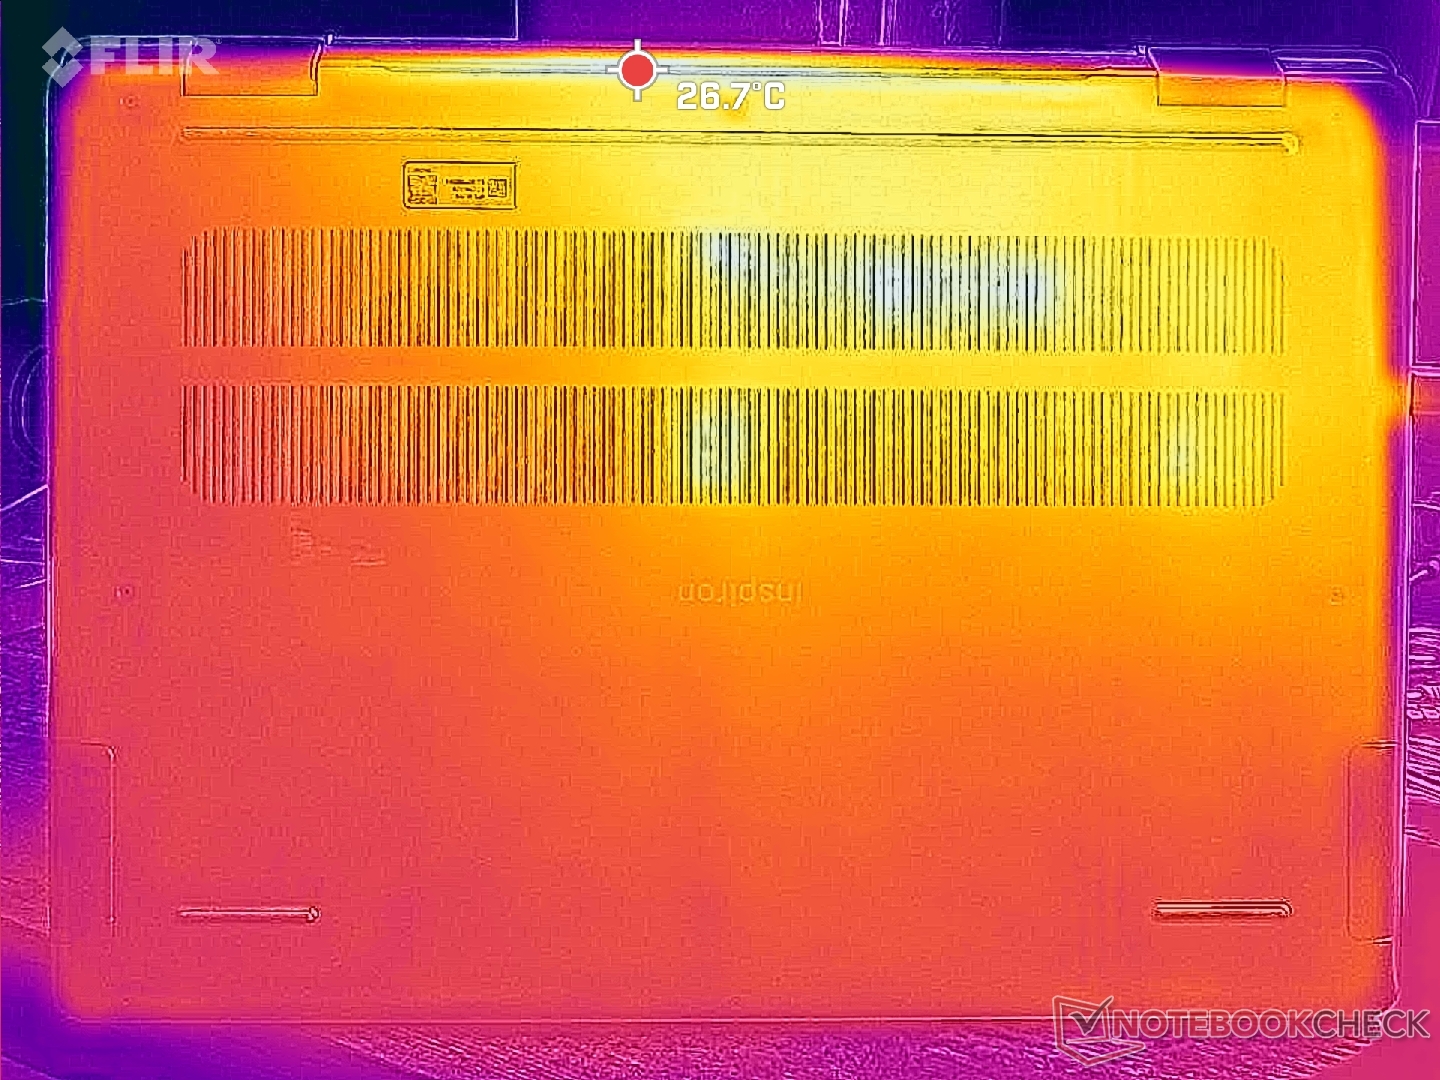
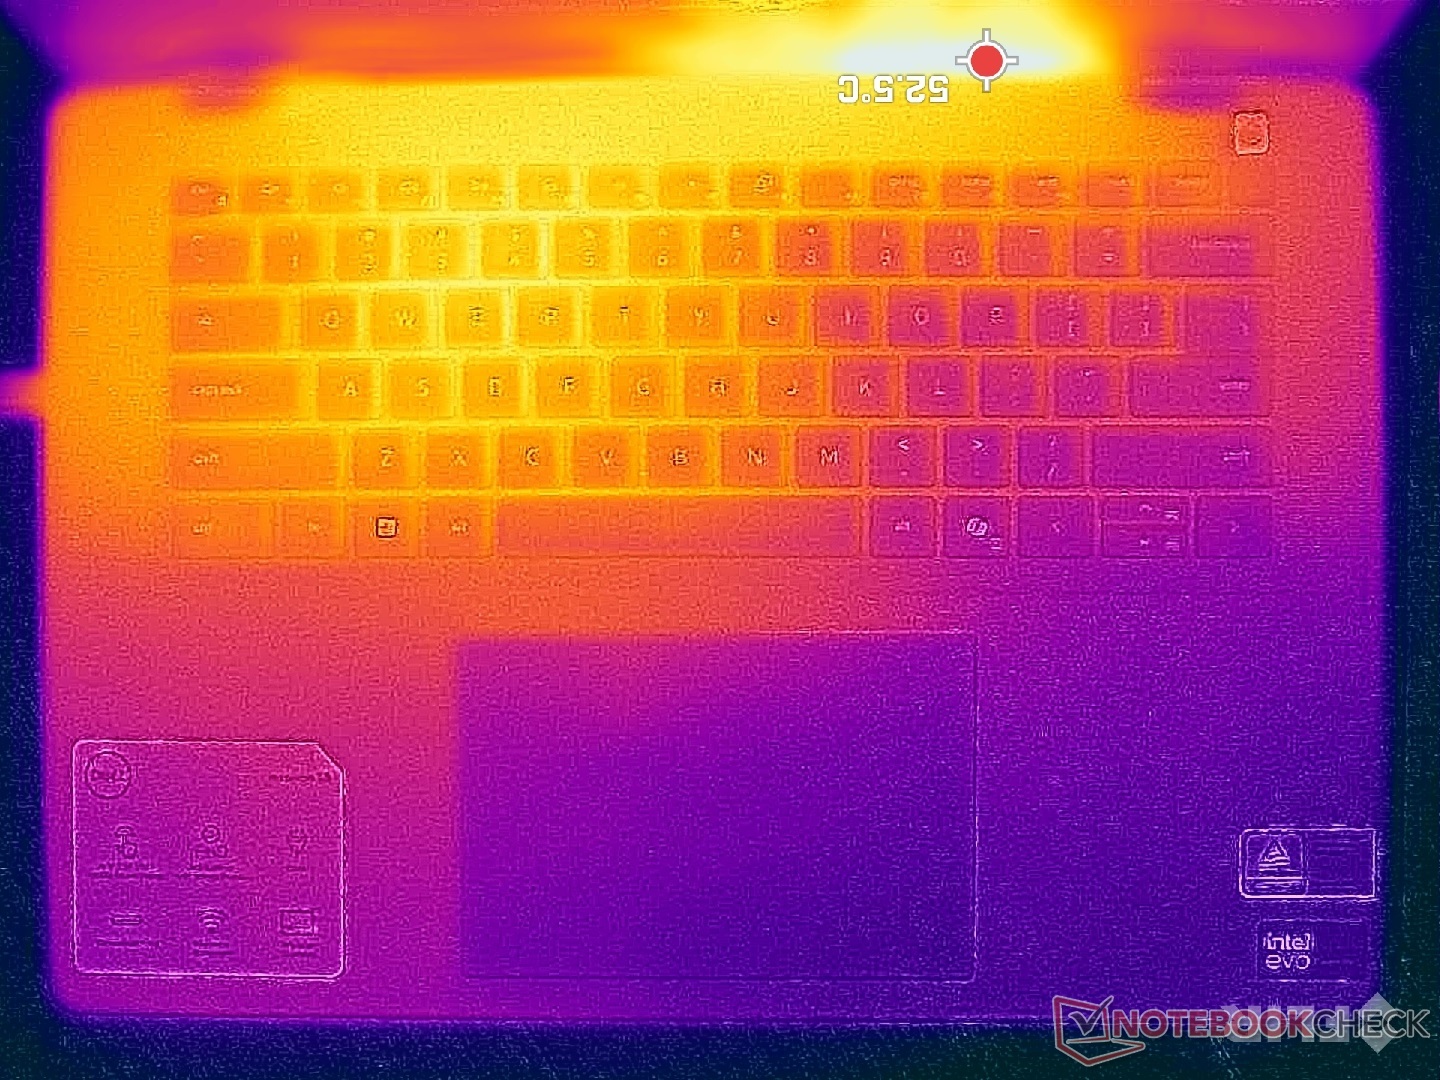
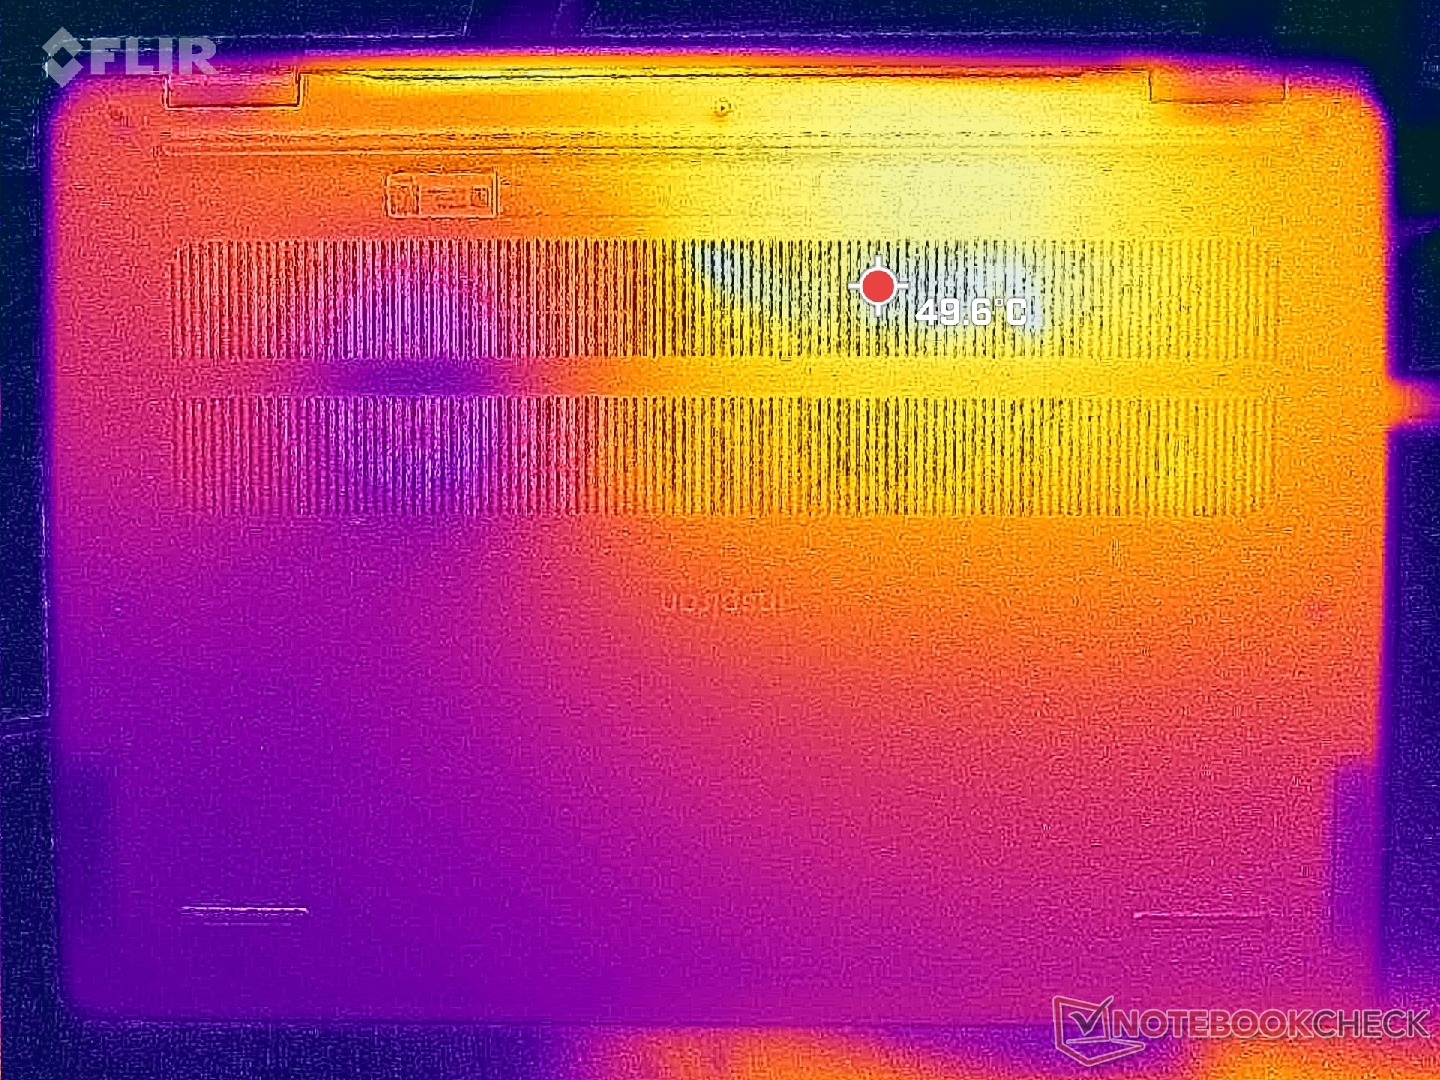
Température
Les températures de surface sont à nouveau plus élevées sur la moitié gauche du châssis que sur la droite en raison de la solution de refroidissement asymétrique. Cette fois, cependant, les températures moyennes peuvent être beaucoup plus élevées qu'auparavant en raison du CPU Core H-series plus puissant. Les points chauds de notre unité, par exemple, peuvent atteindre 47°C sur les couvercles C et D, contre 39°C à 42°C sur le modèle de l'année dernière. Ces points sont heureusement situés à l'arrière de l'appareil, là où les doigts ont le moins de chance de se toucher.
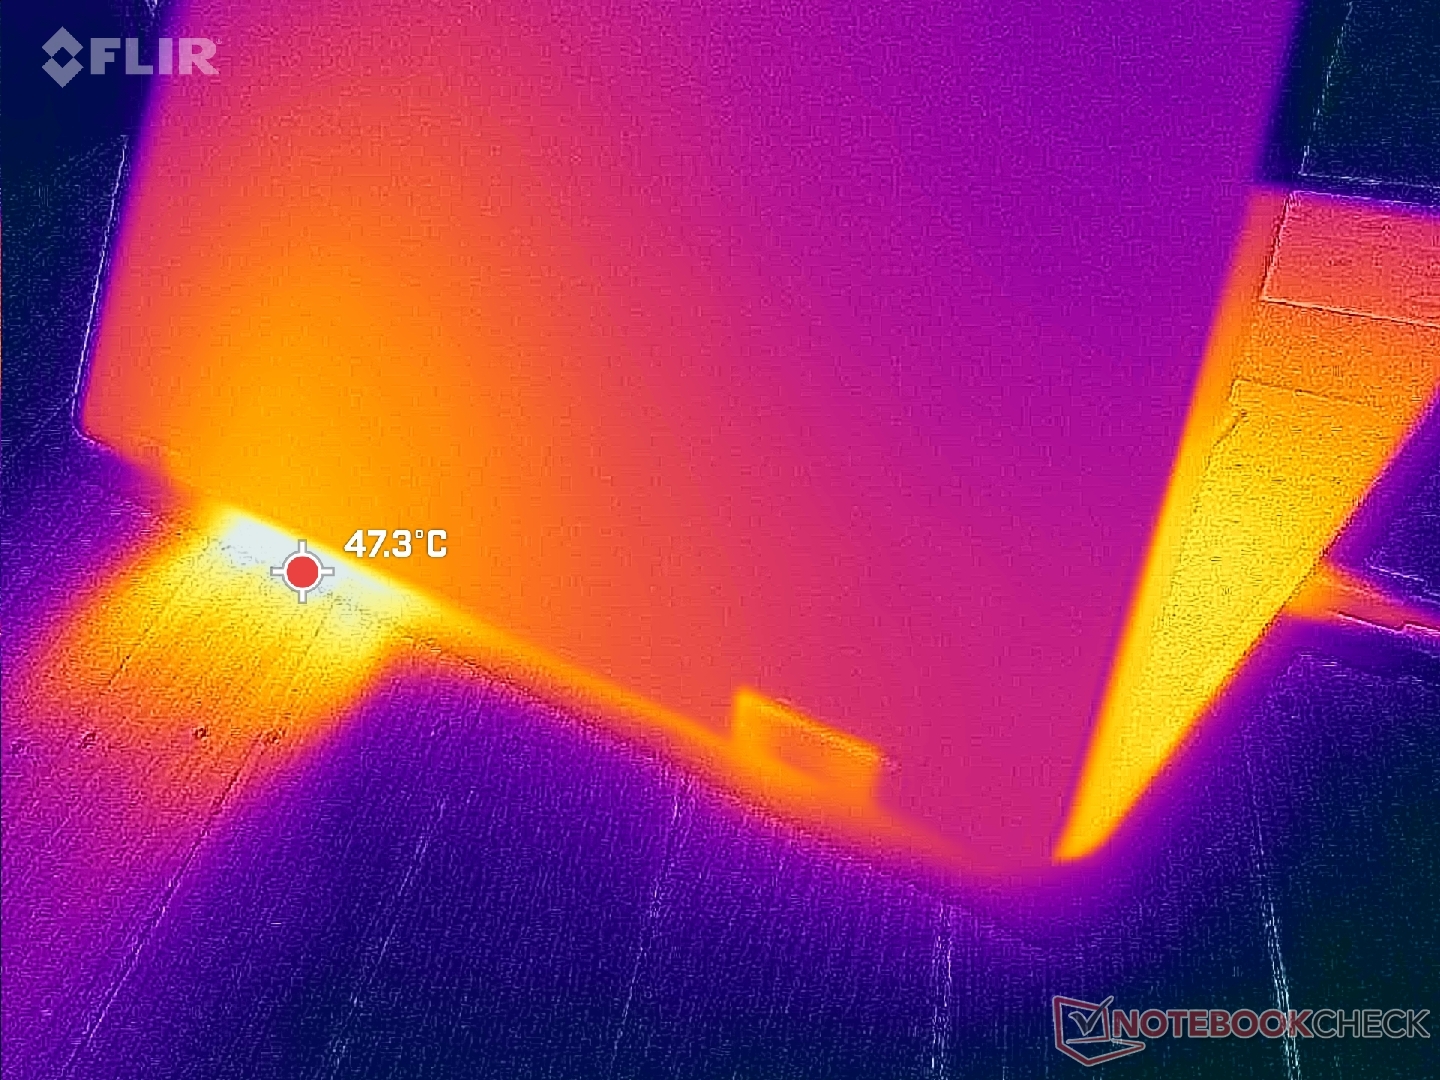
(-) La température maximale du côté supérieur est de 46.8 °C / 116 F, par rapport à la moyenne de 35.3 °C / 96 F, allant de 19.6 à 60 °C pour la classe Convertible.
(-) Le fond chauffe jusqu'à un maximum de 45.6 °C / 114 F, contre une moyenne de 36.8 °C / 98 F
(+) En utilisation inactive, la température moyenne du côté supérieur est de 29.9 °C / 86 F, par rapport à la moyenne du dispositif de 30.3 °C / 87 F.
(+) Les repose-poignets et le pavé tactile atteignent la température maximale de la peau (33.8 °C / 92.8 F) et ne sont donc pas chauds.
(-) La température moyenne de la zone de l'appui-paume de dispositifs similaires était de 28 °C / 82.4 F (-5.8 °C / #-10.4 F).
| Dell Inspiron 16 7640 2-in-1 Intel Core Ultra 7 155H, Intel Arc 8-Core iGPU | Dell Inspiron 16 Plus 7640 Intel Core Ultra 7 155H, NVIDIA GeForce RTX 4060 Laptop GPU | Dell Inspiron 16 7635 2-in-1 AMD Ryzen 5 7530U, AMD Radeon RX Vega 7 | HP Envy x360 2-in-1 16-ad0097nr AMD Ryzen 7 8840HS, AMD Radeon 780M | Lenovo IdeaPad Pro 5 16IMH G9 Intel Core Ultra 7 155H, Intel Arc 8-Core iGPU | Samsung Galaxy Book4 Pro 360 Intel Core Ultra 5 125H, Intel Arc 7-Core iGPU | |
|---|---|---|---|---|---|---|
| Heat | 3% | 11% | 8% | 19% | 18% | |
| Maximum Upper Side * | 46.8 | 43.4 7% | 41.6 11% | 42.6 9% | 36.3 22% | 38.6 18% |
| Maximum Bottom * | 45.6 | 41.6 9% | 39 14% | 47.8 -5% | 39.1 14% | 39.2 14% |
| Idle Upper Side * | 32.2 | 32.8 -2% | 29.4 9% | 27.4 15% | 24.9 23% | 25.2 22% |
| Idle Bottom * | 31.4 | 32.4 -3% | 28.6 9% | 27.8 11% | 26.1 17% | 25.7 18% |
* ... Moindre est la valeur, meilleures sont les performances
Intervenants
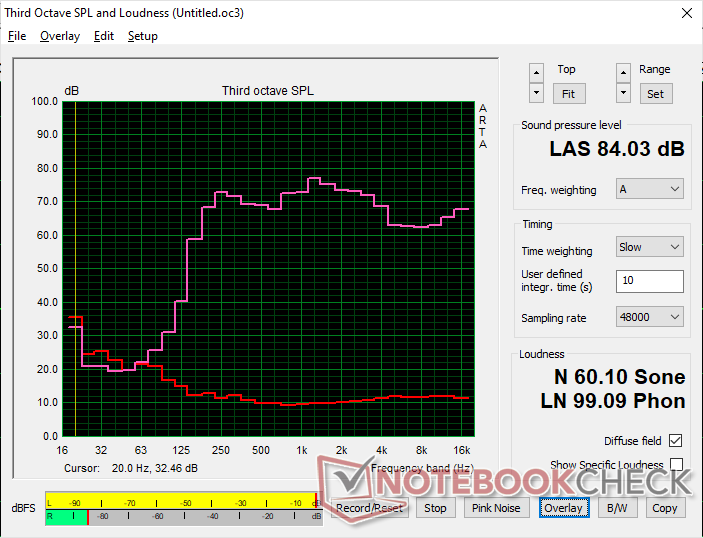
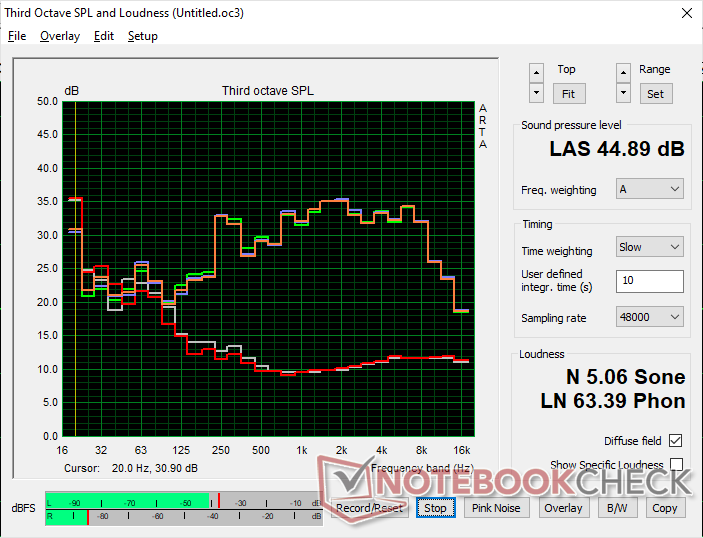
Dell Inspiron 16 7640 2-in-1 analyse audio
(+) | les haut-parleurs peuvent jouer relativement fort (84# dB)
Basses 100 - 315 Hz
(±) | basse réduite - en moyenne 13.9% inférieure à la médiane
(±) | la linéarité des basses est moyenne (14% delta à la fréquence précédente)
Médiums 400 - 2000 Hz
(+) | médiane équilibrée - seulement 3.6% de la médiane
(+) | les médiums sont linéaires (3.6% delta à la fréquence précédente)
Aiguës 2 - 16 kHz
(+) | des sommets équilibrés - à seulement 4.5% de la médiane
(+) | les aigus sont linéaires (2.8% delta à la fréquence précédente)
Globalement 100 - 16 000 Hz
(+) | le son global est linéaire (12% différence à la médiane)
Par rapport à la même classe
» 11% de tous les appareils testés de cette catégorie étaient meilleurs, 4% similaires, 85% pires
» Le meilleur avait un delta de 6%, la moyenne était de 20%, le pire était de 57%.
Par rapport à tous les appareils testés
» 8% de tous les appareils testés étaient meilleurs, 2% similaires, 90% pires
» Le meilleur avait un delta de 4%, la moyenne était de 24%, le pire était de 134%.
Apple MacBook Pro 16 2021 M1 Pro analyse audio
(+) | les haut-parleurs peuvent jouer relativement fort (84.7# dB)
Basses 100 - 315 Hz
(+) | bonne basse - seulement 3.8% loin de la médiane
(+) | les basses sont linéaires (5.2% delta à la fréquence précédente)
Médiums 400 - 2000 Hz
(+) | médiane équilibrée - seulement 1.3% de la médiane
(+) | les médiums sont linéaires (2.1% delta à la fréquence précédente)
Aiguës 2 - 16 kHz
(+) | des sommets équilibrés - à seulement 1.9% de la médiane
(+) | les aigus sont linéaires (2.7% delta à la fréquence précédente)
Globalement 100 - 16 000 Hz
(+) | le son global est linéaire (4.6% différence à la médiane)
Par rapport à la même classe
» 0% de tous les appareils testés de cette catégorie étaient meilleurs, 0% similaires, 100% pires
» Le meilleur avait un delta de 5%, la moyenne était de 18%, le pire était de 45%.
Par rapport à tous les appareils testés
» 0% de tous les appareils testés étaient meilleurs, 0% similaires, 100% pires
» Le meilleur avait un delta de 4%, la moyenne était de 24%, le pire était de 134%.
Gestion de l'énergie - Core-H et Mini-LED peuvent être exigeants
Consommation électrique
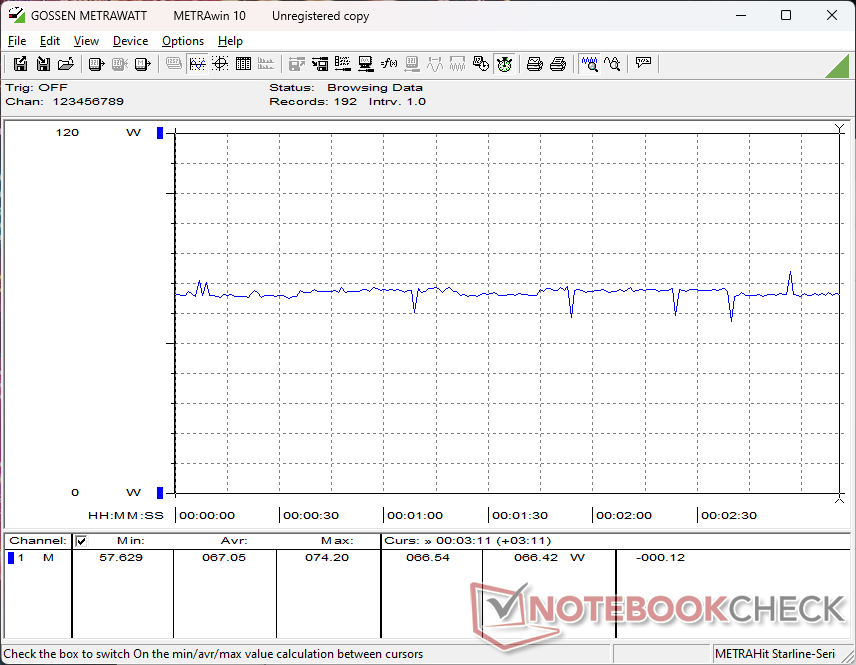
La marche au ralenti sur le bureau demande entre 6 W et 14 W selon le réglage de la luminosité, soit plusieurs watts de plus que ce que nous avons enregistré sur l'Inspiron 16 7635, un ordinateur de bureau Inspiron 16 7635 2-en-1. Bien sûr, le processeur de la série H plus exigeant et l'écran mini-LED à plus haute résolution sont tous deux responsables de la consommation généralement plus élevée.
La consommation est à nouveau supérieure à celle de l'Inspiron 16 7635 2-en-1 de plus de 40 % lorsque vous exécutez des applications plus exigeantes telles que des jeux. Avec une performance GPU multipliée par deux par rapport à la RX Vega 7, l'augmentation de la consommation devrait en valoir la peine pour la plupart des utilisateurs. Une conclusion similaire peut être tirée pour les tâches gourmandes en ressources processeur lors de l'exécution de Prime95. Si la durée de vie de la batterie est plus importante que les performances, alors opter pour la configuration Core Ultra 5 125U, moins chère et plus lente, devrait permettre d'économiser beaucoup d'énergie à cet égard.
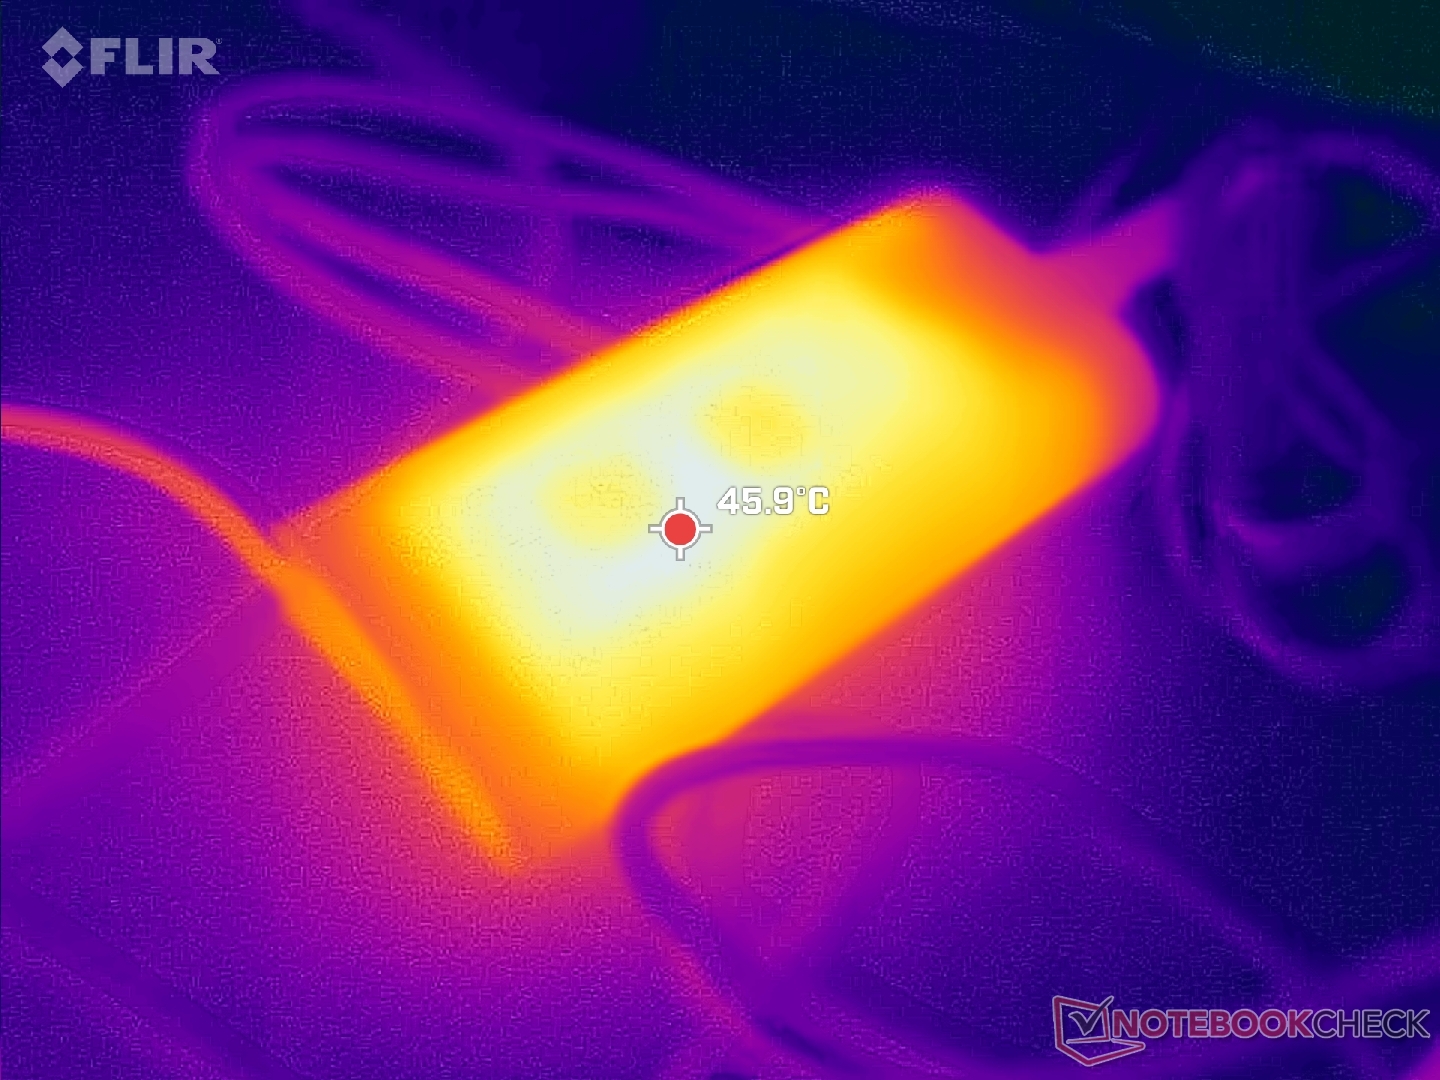
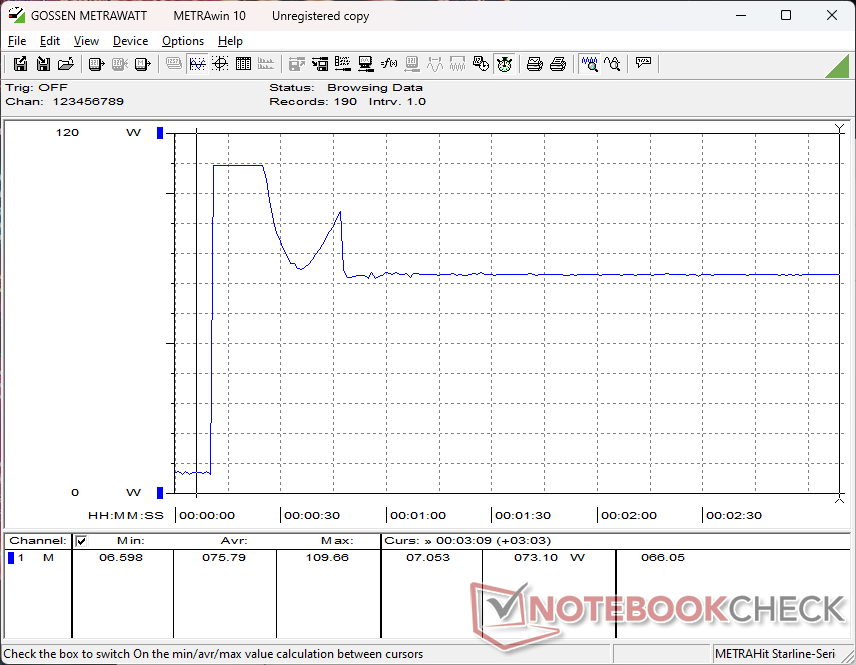
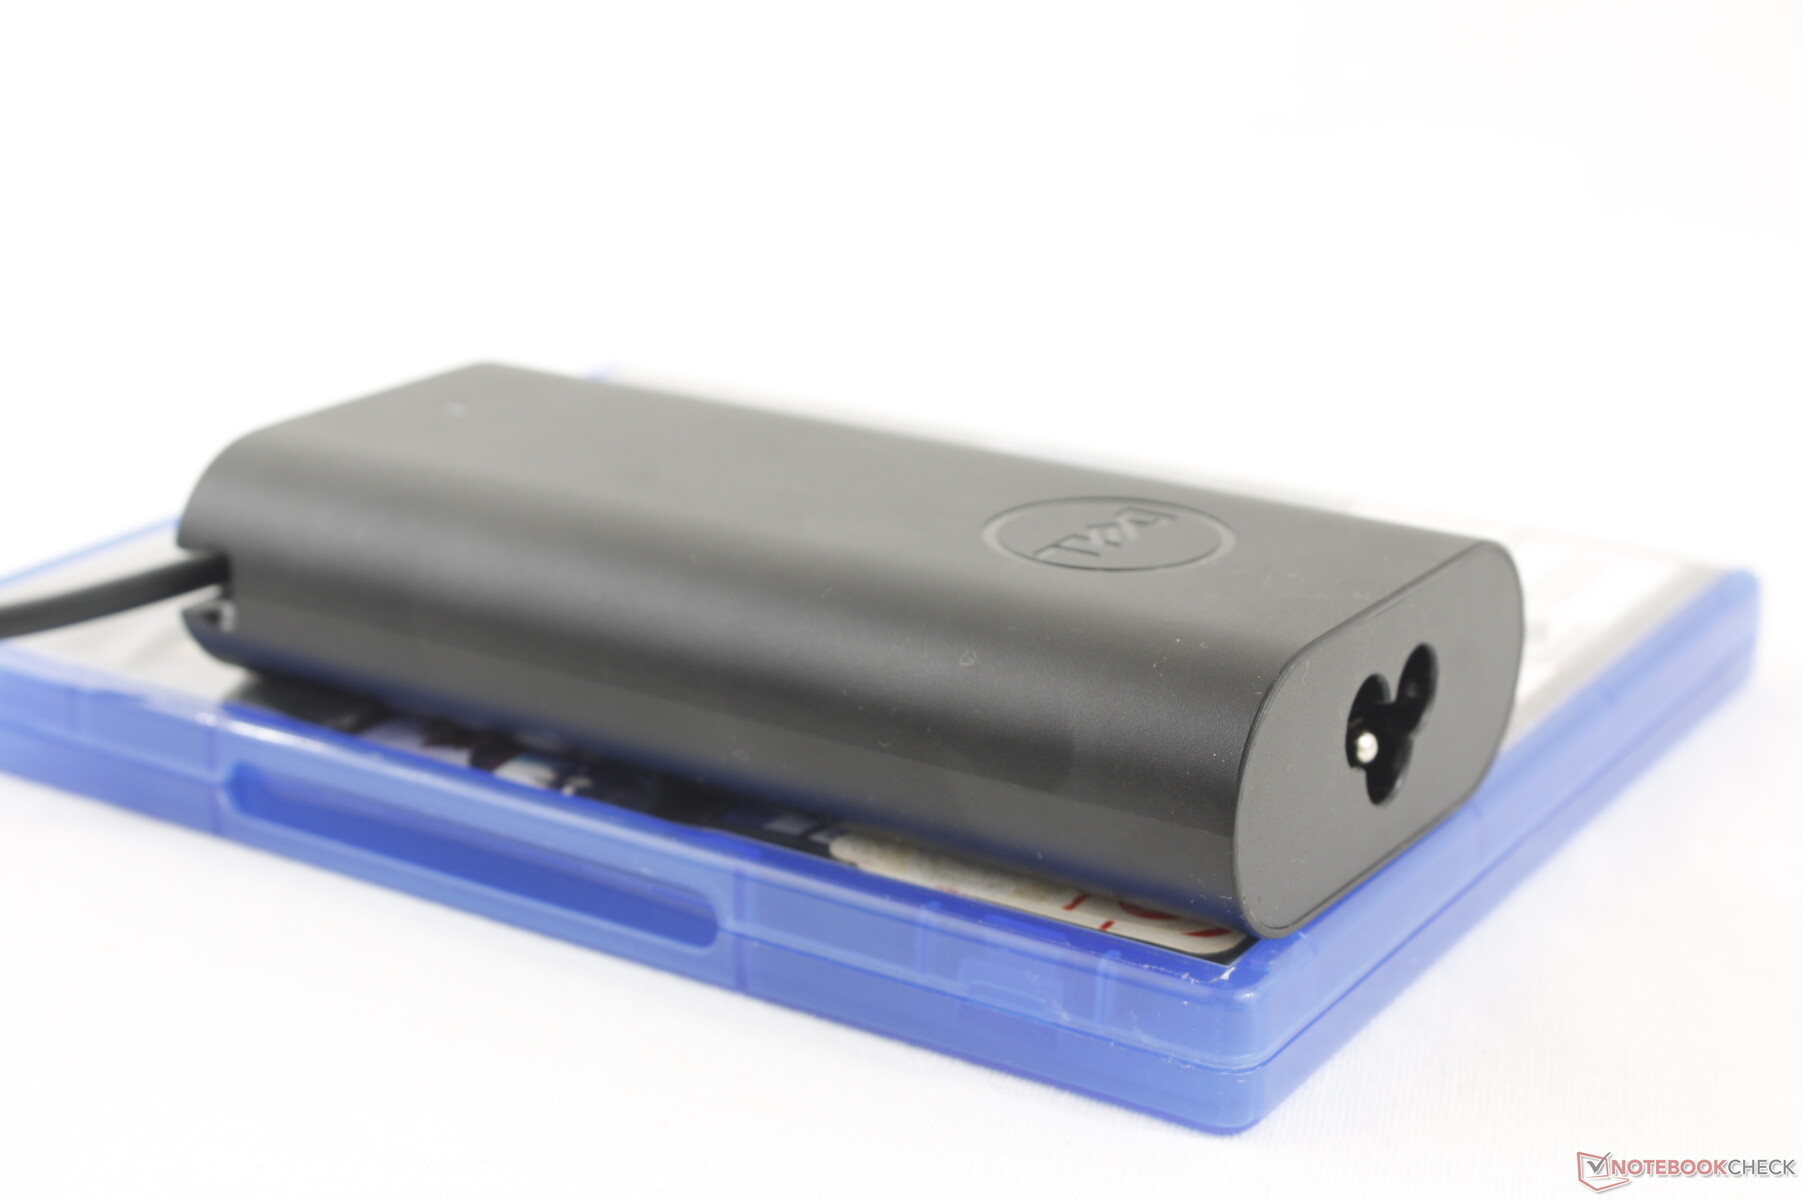
Nous sommes en mesure d'enregistrer une consommation maximale de 110 W alors que l'adaptateur secteur USB-C de taille petite-moyenne (~12,2 x 5,9 x 2,7 cm) n'est prévu que pour 100 W. Cette consommation maximale n'est que temporaire, comme le montre notre graphique ci-dessous, en raison des limitations thermiques. Elle est néanmoins bien plus élevée que celle que nous avons enregistrée sur l'Inspiron 16 7635 2-en-1 en raison du potentiel Turbo Boost plus élevé du CPU Core H-series.

| Éteint/en veille | |
| Au repos | |
| Fortement sollicité |
|
Légende:
min: | |
| Dell Inspiron 16 7640 2-in-1 Ultra 7 155H, Arc 8-Core, Micron 2550 1TB, Mini-LED, 2560x1600, 16" | Dell Inspiron 16 Plus 7640 Ultra 7 155H, NVIDIA GeForce RTX 4060 Laptop GPU, SK hynix BC901 HFS001TEJ4X164N, IPS, 2560x1600, 16" | Dell Inspiron 16 7635 2-in-1 R5 7530U, Vega 7, Kioxia BG5 KBG50ZNS512G, IPS, 1920x1200, 16" | HP Envy x360 2-in-1 16-ad0097nr R7 8840HS, Radeon 780M, KIOXIA BG5 KBG50ZNV1T02, OLED, 2880x1800, 16" | Lenovo IdeaPad Pro 5 16IMH G9 Ultra 7 155H, Arc 8-Core, Samsung PM9C1a MZAL81T0HDLB, IPS, 2560x1600, 16" | Samsung Galaxy Book4 Pro 360 Ultra 5 125H, Arc 7-Core, Samsung PM9B1 512GB MZVL4512HBLU, OLED, 2880x1800, 16" | |
|---|---|---|---|---|---|---|
| Power Consumption | 7% | 35% | 26% | 22% | 44% | |
| Idle Minimum * | 6.1 | 4.2 31% | 4.8 21% | 5 18% | 3.5 43% | 3 51% |
| Idle Average * | 13.5 | 6.9 49% | 7.6 44% | 6.2 54% | 9.6 29% | 6.3 53% |
| Idle Maximum * | 13.8 | 15.2 -10% | 8.7 37% | 14.7 -7% | 9.9 28% | 6.5 53% |
| Load Average * | 63.6 | 70.4 -11% | 47.1 26% | 49.9 22% | 62.7 1% | 49.3 22% |
| Cyberpunk 2077 ultra external monitor * | 64.6 | |||||
| Cyberpunk 2077 ultra * | 67 | |||||
| Load Maximum * | 109.7 | 137.4 -25% | 56.4 49% | 65 41% | 101.2 8% | 65.5 40% |
| Witcher 3 ultra * | 115.9 | 46.6 | 54.5 | 55.8 | 45.9 |
* ... Moindre est la valeur, meilleures sont les performances
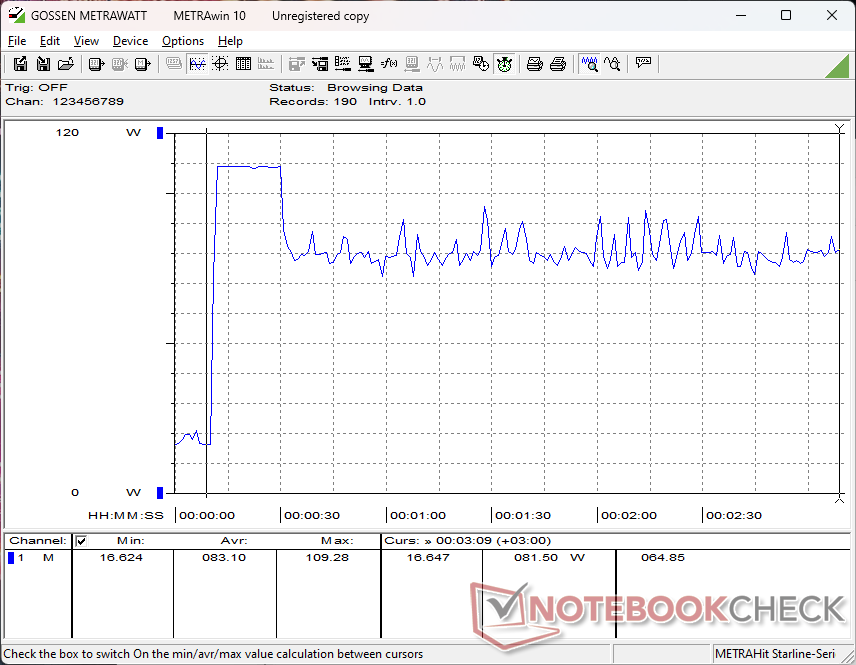
Power Consumption Cyberpunk / Stress Test
Power Consumption external Monitor
Autonomie de la batterie
La batterie de 90 Wh est plus importante que celle de 64 Wh de l'Inspiron 16 7635 2-en-1 de l'année dernière. Malgré cela, l'autonomie est plus courte de près de trois heures lors de notre test de navigation en raison de l'écran et du processeur plus exigeants, comme nous l'avons mentionné plus haut. Les différences d'autonomie se maintiennent même lorsque les écrans sont réglés sur un niveau de luminosité identique de 150 nits.
Le chargement de la grande batterie, de la position vide à la position pleine, est relativement lent : environ 2,5 heures, contre 1,5 heure pour la plupart des autres ultrabooks.
| Dell Inspiron 16 7640 2-in-1 Ultra 7 155H, Arc 8-Core, 90 Wh | Dell Inspiron 16 Plus 7640 Ultra 7 155H, NVIDIA GeForce RTX 4060 Laptop GPU, 90 Wh | Dell Inspiron 16 7635 2-in-1 R5 7530U, Vega 7, 64 Wh | HP Envy x360 2-in-1 16-ad0097nr R7 8840HS, Radeon 780M, 68 Wh | Lenovo IdeaPad Pro 5 16IMH G9 Ultra 7 155H, Arc 8-Core, 84 Wh | Samsung Galaxy Book4 Pro 360 Ultra 5 125H, Arc 7-Core, 76 Wh | |
|---|---|---|---|---|---|---|
| Autonomie de la batterie | 16% | 23% | -12% | -9% | 0% | |
| Reader / Idle | 1310 | 1560 19% | 935 -29% | |||
| WiFi v1.3 | 686 | 799 16% | 869 27% | 459 -33% | 756 10% | 531 -23% |
| Load | 93 | 114 23% | 116 25% | 68 -27% | 114 23% | |
| H.264 | 957 | 881 |
Points positifs
Points négatifs
Verdict - Grandeur et performance
L'Inspiron 16 7640 2-en-1 présente plusieurs points forts. Tout d'abord, ses performances avec le Core Ultra 7 155H sont excellentes, surtout si on les compare à celles d'autres ordinateurs convertibles de 16 pouces dotés d'une carte graphique intégrée. Il s'agit d'un processeur de classe jeu qui ne présente aucun problème d'étranglement majeur et qui devrait être capable de gérer n'importe quel contenu ou n'importe quelle application multitâche que vous pourrez lui confier. Par ailleurs, l'écran mini-LED fait de ce modèle un lecteur multimédia haut de gamme, doté d'un stylet actif et d'un format 2-en-1 très pratique.
L'Inspiron 16 7640 2-en-1 est grand et puissant. Si ses performances et son écran sont impressionnants pour son prix, les utilisateurs en font les frais avec un châssis encombrant et une autonomie de batterie réduite.
L'augmentation des performances et la luminosité des écrans s'accompagnent d'une hausse prévisible de la consommation d'énergie. Les composants plus exigeants génèrent plus de chaleur, ce qui se traduit par un bruit de ventilateur plus fort et des durées de fonctionnement plus courtes que sur le modèle de l'année dernière. Les différences ne sont pas négligeables, comme le montrent nos tests et mesures ci-dessus.
De plus, la grande taille et le poids élevé du modèle ne peuvent être ignorés. Il existe des ordinateurs convertibles de 16 pouces plus légers, notamment le LG Gram 16 2-en-1 ou le Samsung Galaxy Book4 Pro 360 pour une expérience plus facile à transporter. Le Dell est plus grand et plus lourd que le HP Spectre x360 16 qui offre notamment une carte graphique discrète GeForce.
L'Inspiron 16 7640 2-en-1 reste néanmoins attractif malgré ses défauts en raison de son prix de vente raisonnable de 1000 $. Il excelle en termes de vitesse et de qualité d'image par rapport à d'autres ordinateurs portables dans la même gamme de prix.
Prix et disponibilité
La configuration de base avec le Core Ultra 5 125U et l'écran tactile IPS 1200p standard démarre à 800 $, tandis que le Core Ultra 7 155H et la configuration mini-LED 2,5K que nous avons examinée sont actuellement expédiés au prix de 1000 $.
Conseils : Notre système d'évaluation a été mis à jour récemment et les résultats de la version 8 ne sont pas comparables à ceux de la version 7. Vous trouverez d'autres informations à ce sujet ici sont disponibles ici.
Note : Nous avons récemment mis à jour notre système d'évaluation et les résultats de la version 8 ne sont pas comparables à ceux de la version 7. De plus amples informations sont disponibles ici .
Dell Inspiron 16 7640 2-in-1
- 07/19/2024 v8
Allen Ngo
 Total Sustainability Score:
 Transparency
La sélection des appareils à examiner est effectuée par notre équipe éditoriale. L'échantillon de test a été prêté à l'auteur par le fabricant ou le détaillant pour les besoins de cet examen. Le prêteur n'a pas eu d'influence sur cette évaluation et le fabricant n'a pas reçu de copie de cette évaluation avant sa publication. Il n'y avait aucune obligation de publier cet article. Nous n'acceptons jamais de compensation ou de paiement en échange de nos commentaires. En tant que média indépendant, Notebookcheck n'est pas soumis à l'autorité des fabricants, des détaillants ou des éditeurs.
Voici comment Notebookcheck teste
Chaque année, Notebookcheck examine de manière indépendante des centaines d'ordinateurs portables et de smartphones en utilisant des procédures standardisées afin de garantir que tous les résultats sont comparables. Nous avons continuellement développé nos méthodes de test depuis environ 20 ans et avons établi des normes industrielles dans le processus. Dans nos laboratoires de test, des équipements de mesure de haute qualité sont utilisés par des techniciens et des rédacteurs expérimentés. Ces tests impliquent un processus de validation en plusieurs étapes. Notre système d'évaluation complexe repose sur des centaines de mesures et de points de référence bien fondés, ce qui garantit l'objectivité.Price comparison

