

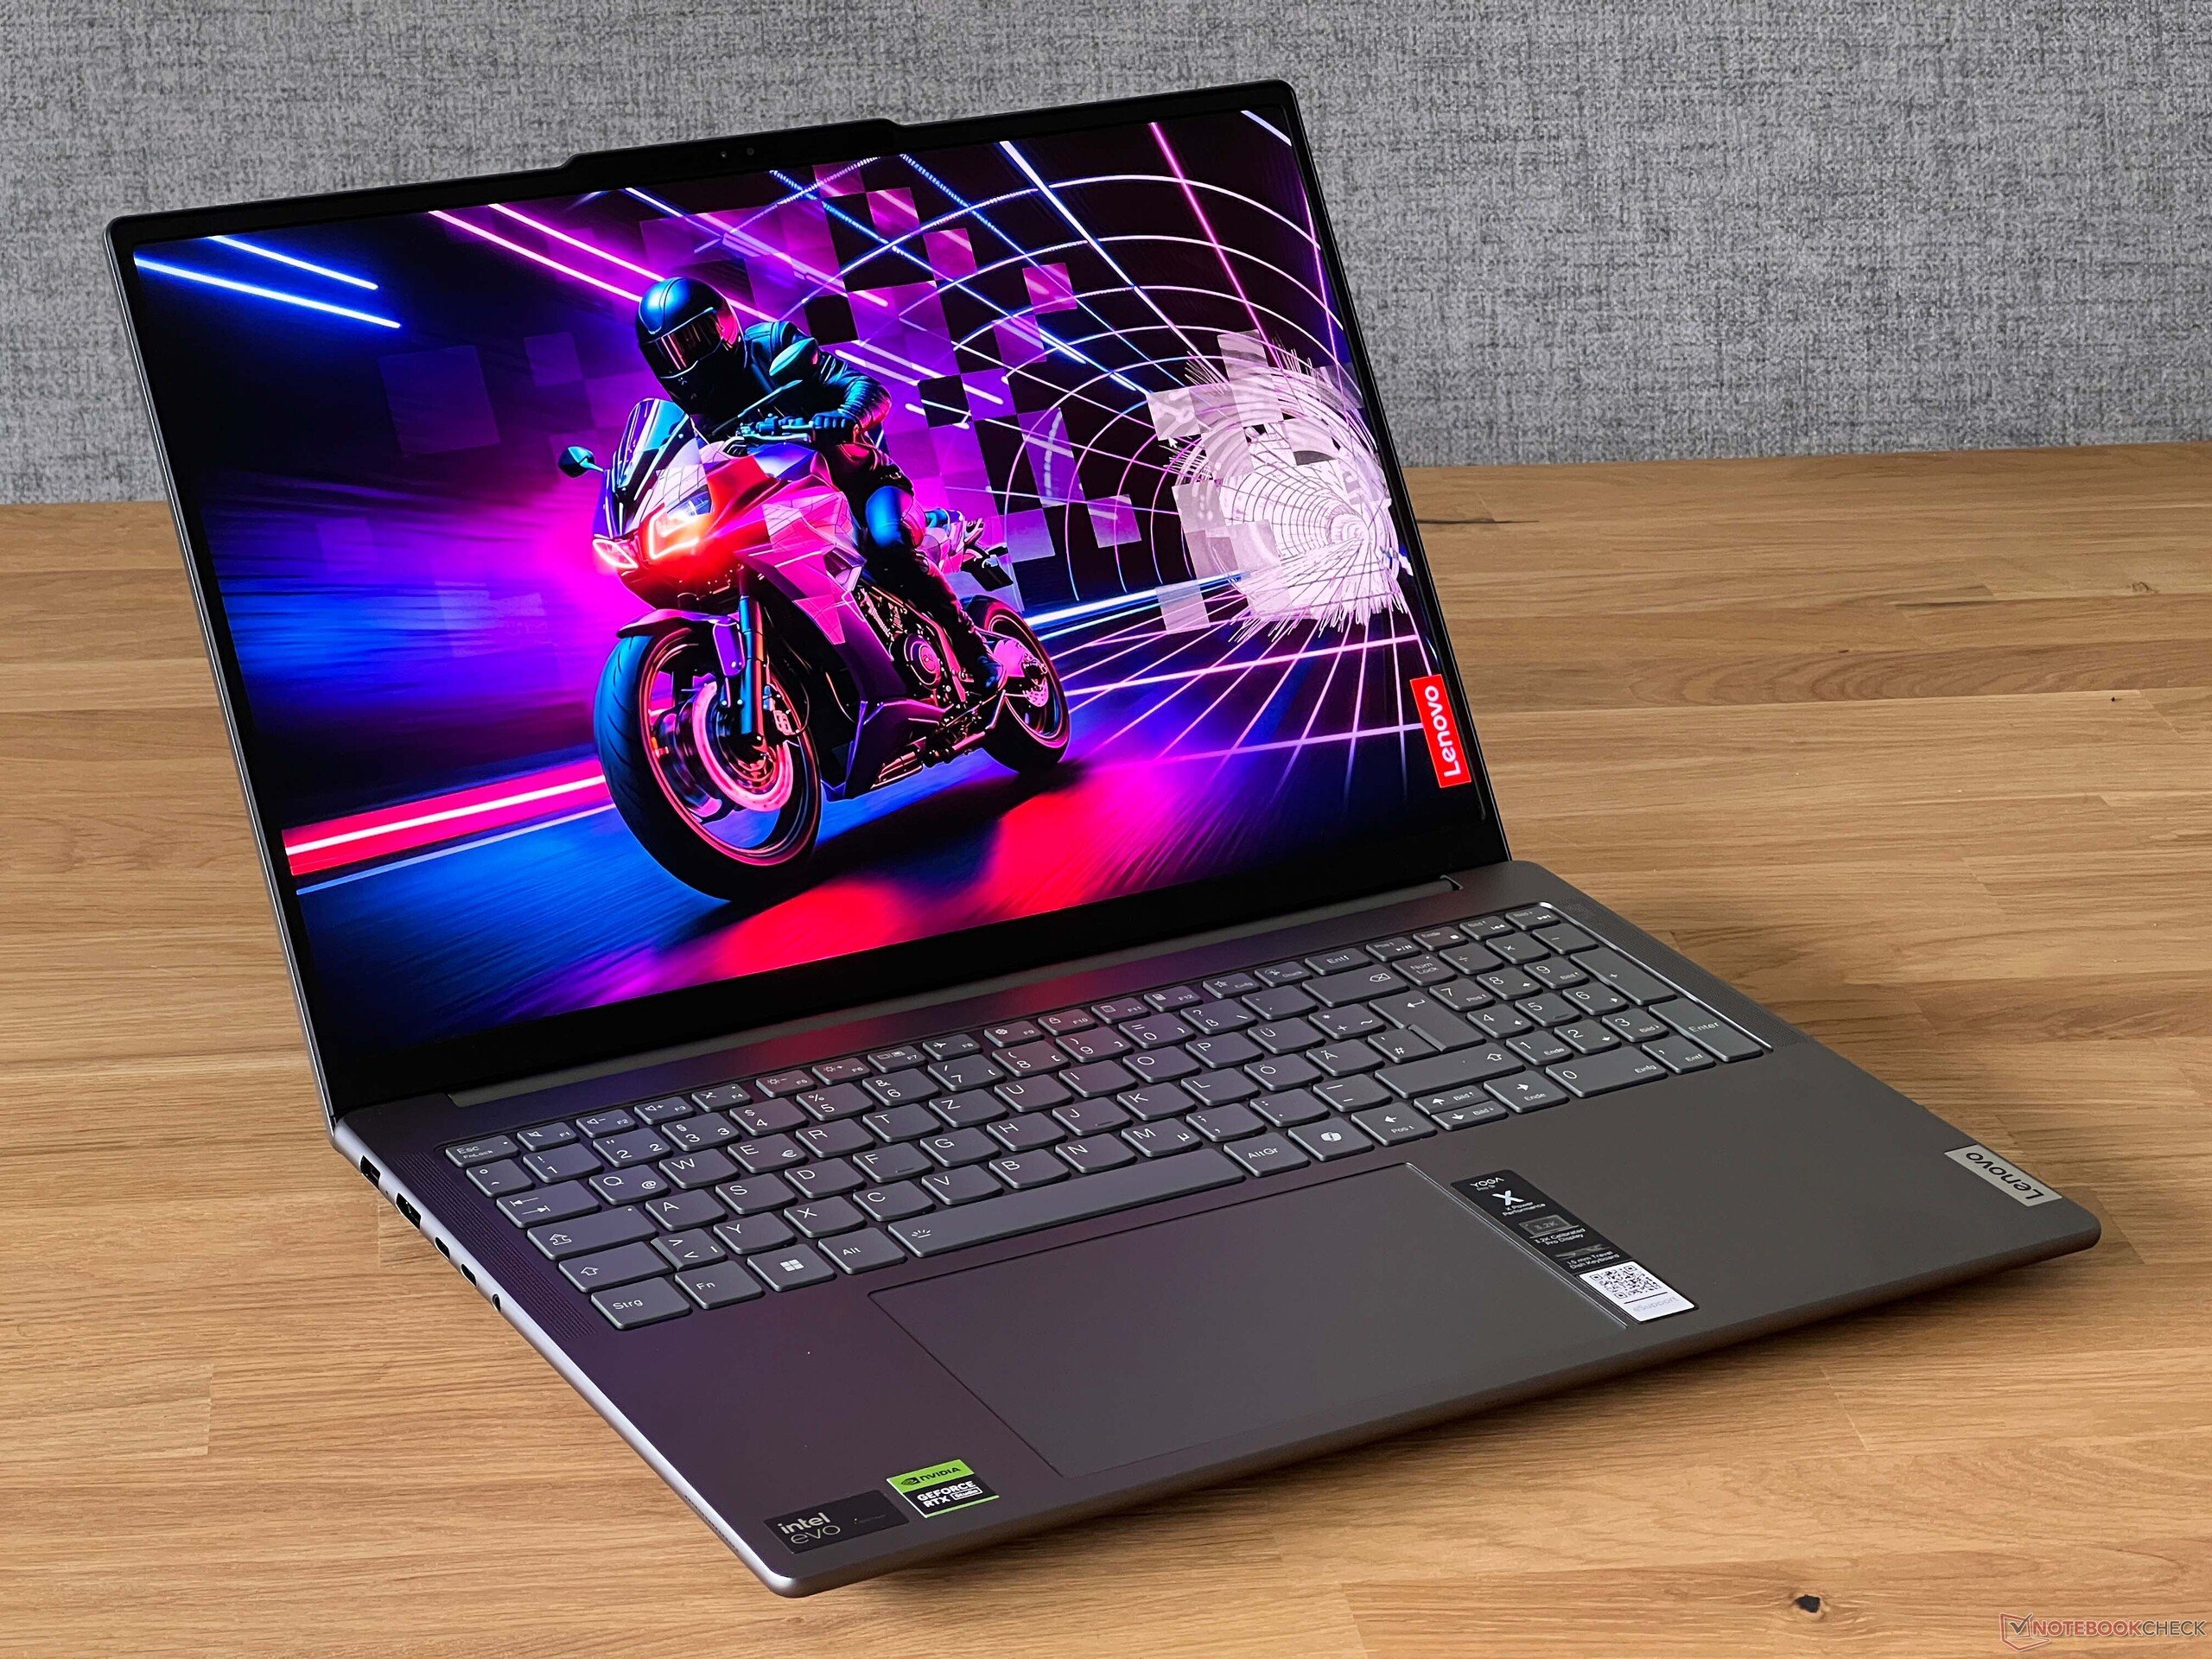
Test du Lenovo Yoga Pro 9 16IMH9 : la GeForce RTX 4050 75 W surpasse les attentes

La série Yoga Pro 9 est le fleuron de la gamme d'ordinateurs portables multimédias de Lenovo, au-dessus du milieu de gamme supérieur Série Yoga 7 16 et du bas de gamme Série IdeaPad Pro 5 16. Nous avons récemment été impressionnés par la configuration configuration haut de gamme du Yoga Pro 9 équipée d'un mini-LED et d'une carte graphique GeForce RTX 4070. Cette fois-ci, nous examinons un modèle moins cher doté d'un écran IPS standard et d'une carte graphique RTX 4050 ( GeForce ).
Notre configuration peut être trouvée en ligne pour environ 1700 $. Les alternatives incluent d'autres ordinateurs portables 16 pouces axés sur le multimédia ou le studio, comme le MSI Stealth 16,HP Envy x360 2-in-1 16, Dell XPS 16 9640ou Samsung Galaxy Book4 Ultra.
Plus de commentaires sur Lenovo :
Comparaison avec les concurrents potentiels
Note | Date | Modèle | Poids | Épaisseur | Taille | Résolution | Prix |
|---|---|---|---|---|---|---|---|
| 91.7 % v7 (old) | 06/24 | Lenovo Yoga Pro 9 16IMH9 RTX 4050 Ultra 9 185H, NVIDIA GeForce RTX 4050 Laptop GPU | 2.1 kg | 18.3 mm | 16.00" | 3200x2000 | |
| 88.7 % v7 (old) | 04/24 | Lenovo Yoga Pro 9 16IMH9 Ultra 9 185H, NVIDIA GeForce RTX 4070 Laptop GPU | 2.1 kg | 18.3 mm | 16.00" | 3200x2000 | |
| 87.2 % v7 (old) | 05/24 | HP Envy x360 2-in-1 16-ad0097nr R7 8840HS, Radeon 780M | 1.8 kg | 18.3 mm | 16.00" | 2880x1800 | |
| 88.6 % v7 (old) | 04/24 | Dell XPS 16 9640 Ultra 7 155H, NVIDIA GeForce RTX 4070 Laptop GPU | 2.3 kg | 18.7 mm | 16.30" | 3840x2400 | |
| 90.4 % v7 (old) | 03/24 | Samsung Galaxy Book4 Ultra Ultra 7 155H, NVIDIA GeForce RTX 4050 Laptop GPU | 1.8 kg | 17 mm | 16.00" | 2880x1800 | |
| 87.6 % v7 (old) | 11/23 | Asus VivoBook Pro 16 K6602VU i9-13900H, NVIDIA GeForce RTX 4050 Laptop GPU | 1.9 kg | 19 mm | 16.00" | 3200x2000 |
Cas

Connectivité


Lecteur de carte SD
| SD Card Reader | |
| average JPG Copy Test (av. of 3 runs) | |
| Asus VivoBook Pro 16 K6602VU (Angelbird AV Pro V60) | |
| Dell XPS 16 9640 (Angelbird AV Pro V60) | |
| Lenovo Yoga Pro 9 16IMH9 RTX 4050 (Angelbird AV Pro V60) | |
| Samsung Galaxy Book4 Ultra (Angelbird AV Pro V60) | |
| Lenovo Yoga Pro 9 16IMH9 (Angelbird AV Pro V60) | |
| maximum AS SSD Seq Read Test (1GB) | |
| Asus VivoBook Pro 16 K6602VU (Angelbird AV Pro V60) | |
| Dell XPS 16 9640 (Angelbird AV Pro V60) | |
| Lenovo Yoga Pro 9 16IMH9 RTX 4050 (Angelbird AV Pro V60) | |
| Lenovo Yoga Pro 9 16IMH9 (Angelbird AV Pro V60) | |
| Samsung Galaxy Book4 Ultra (Angelbird AV Pro V60) | |
Communication
Webcam


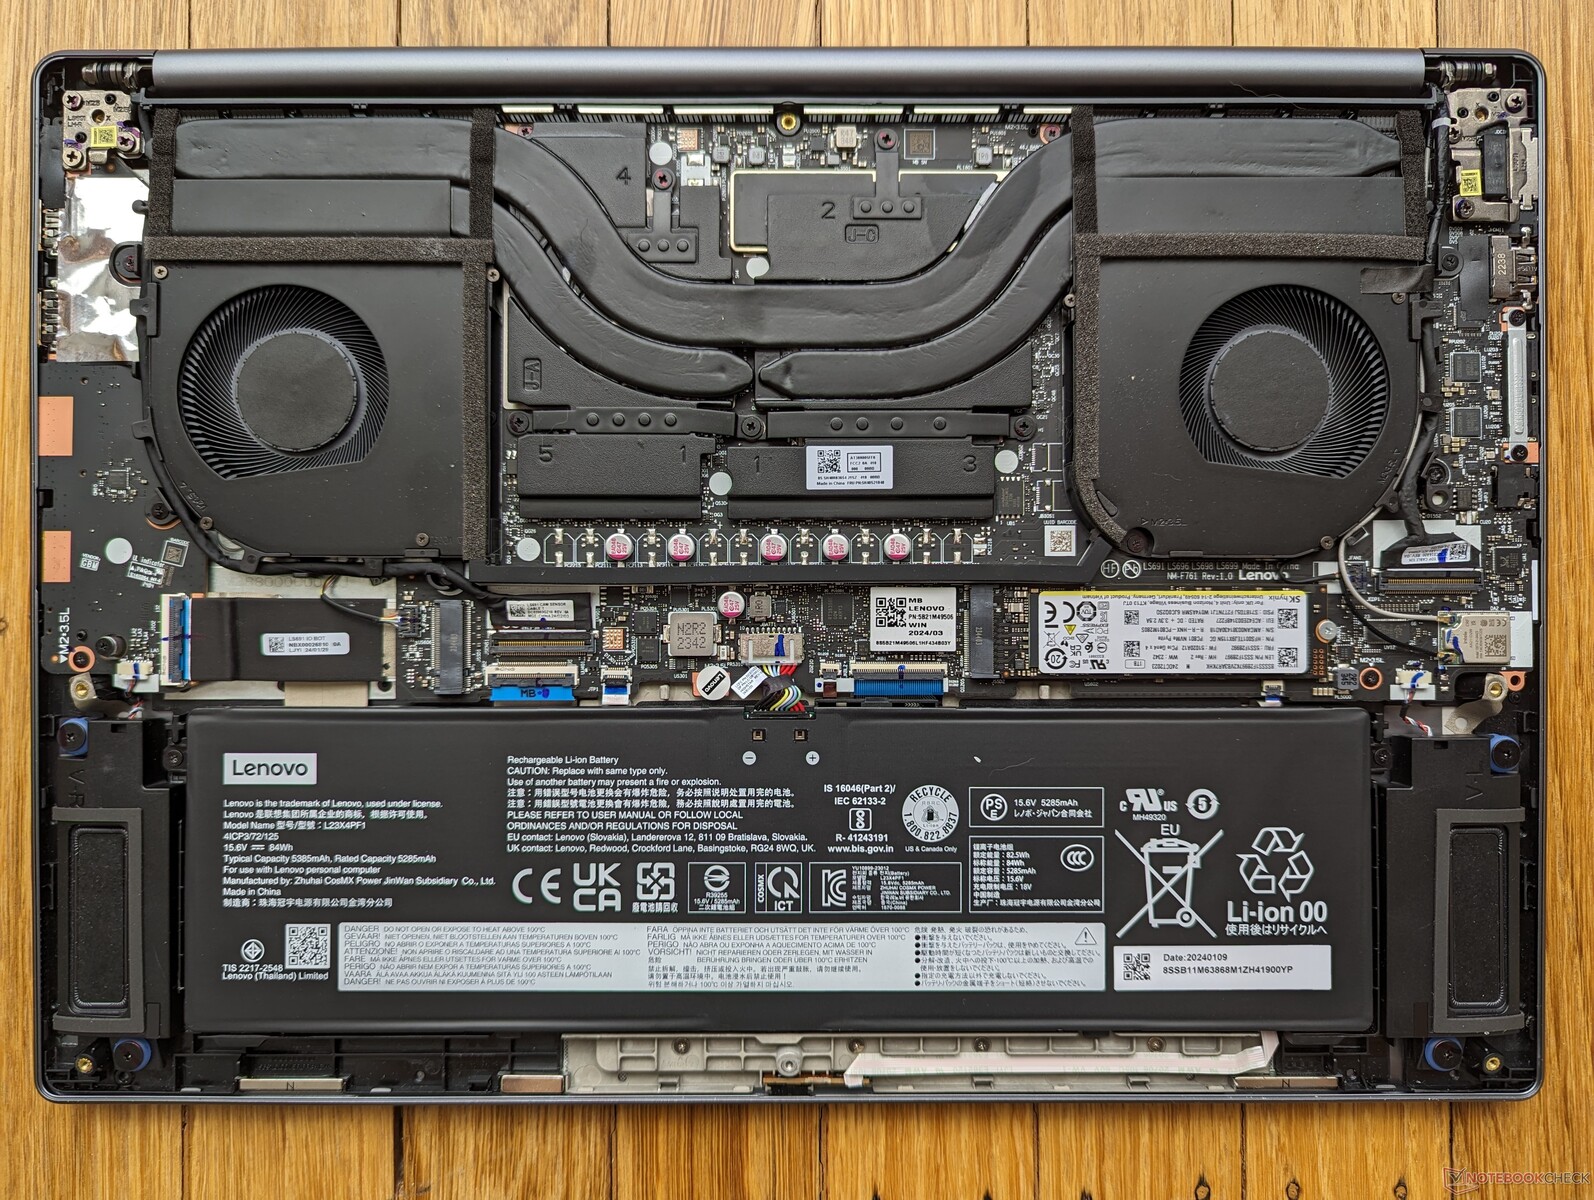
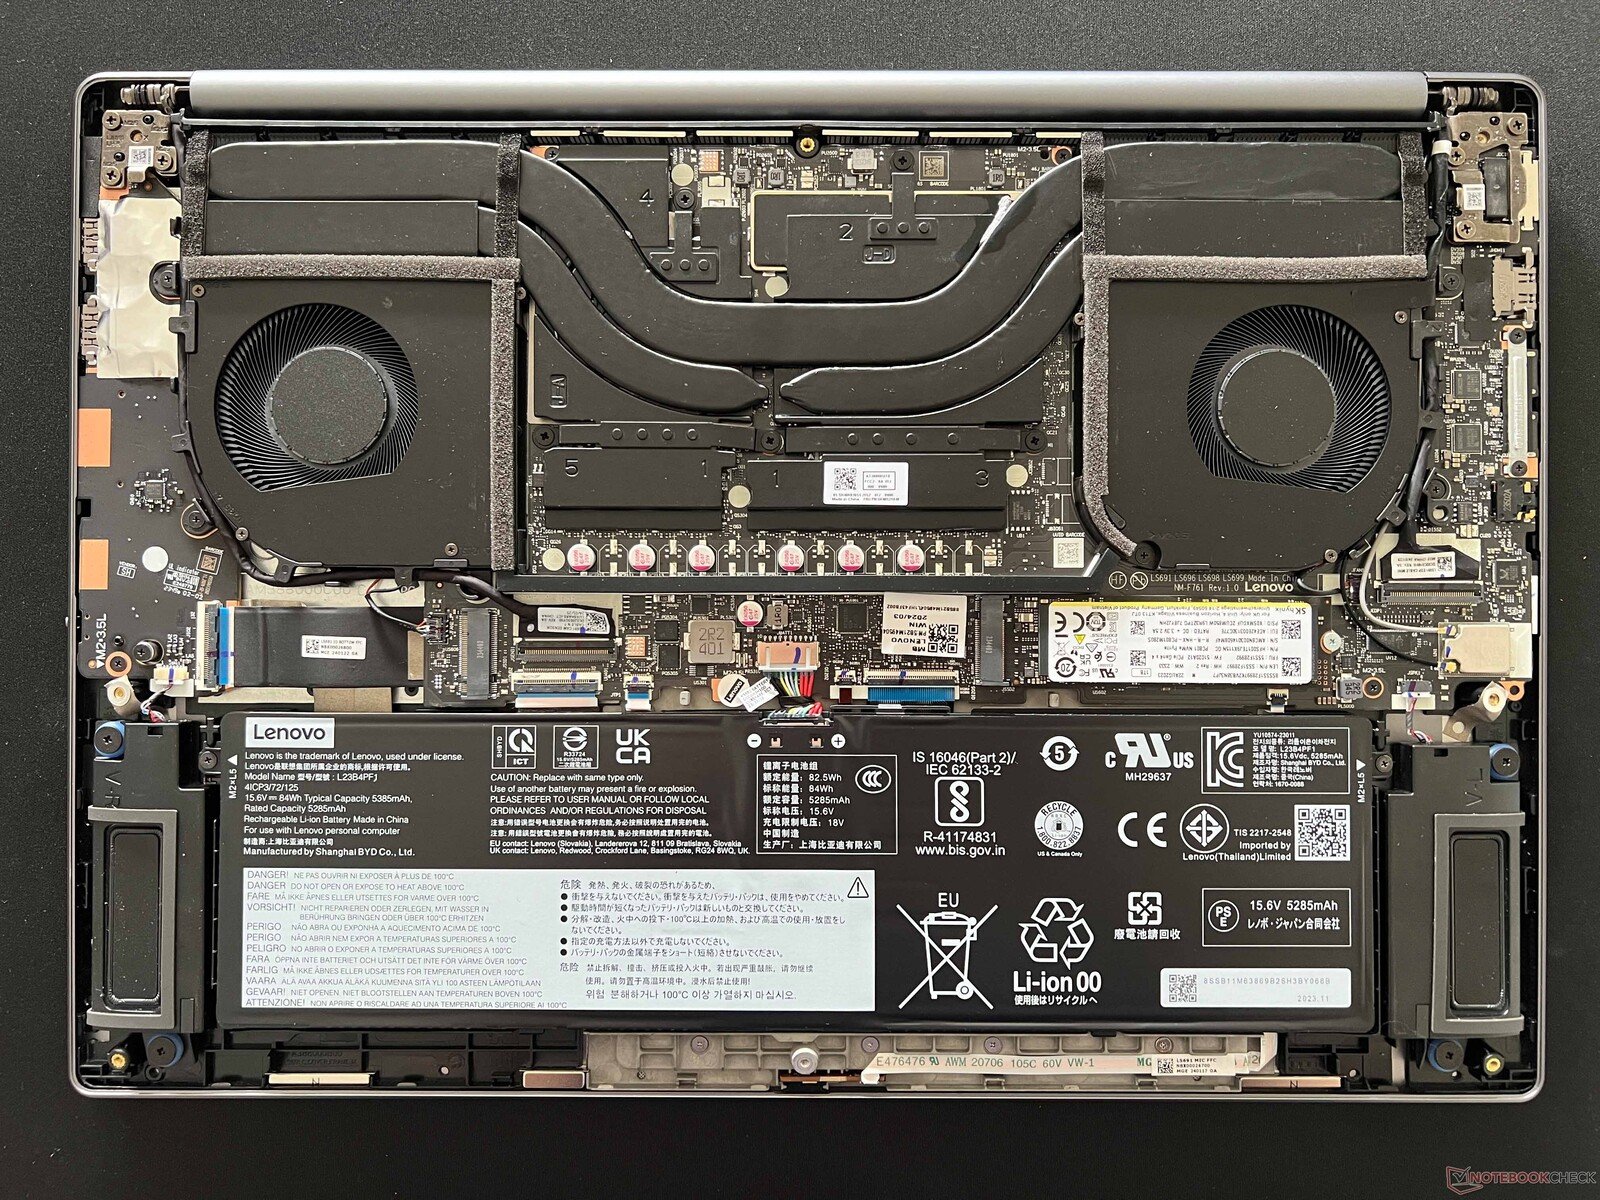
Maintenance
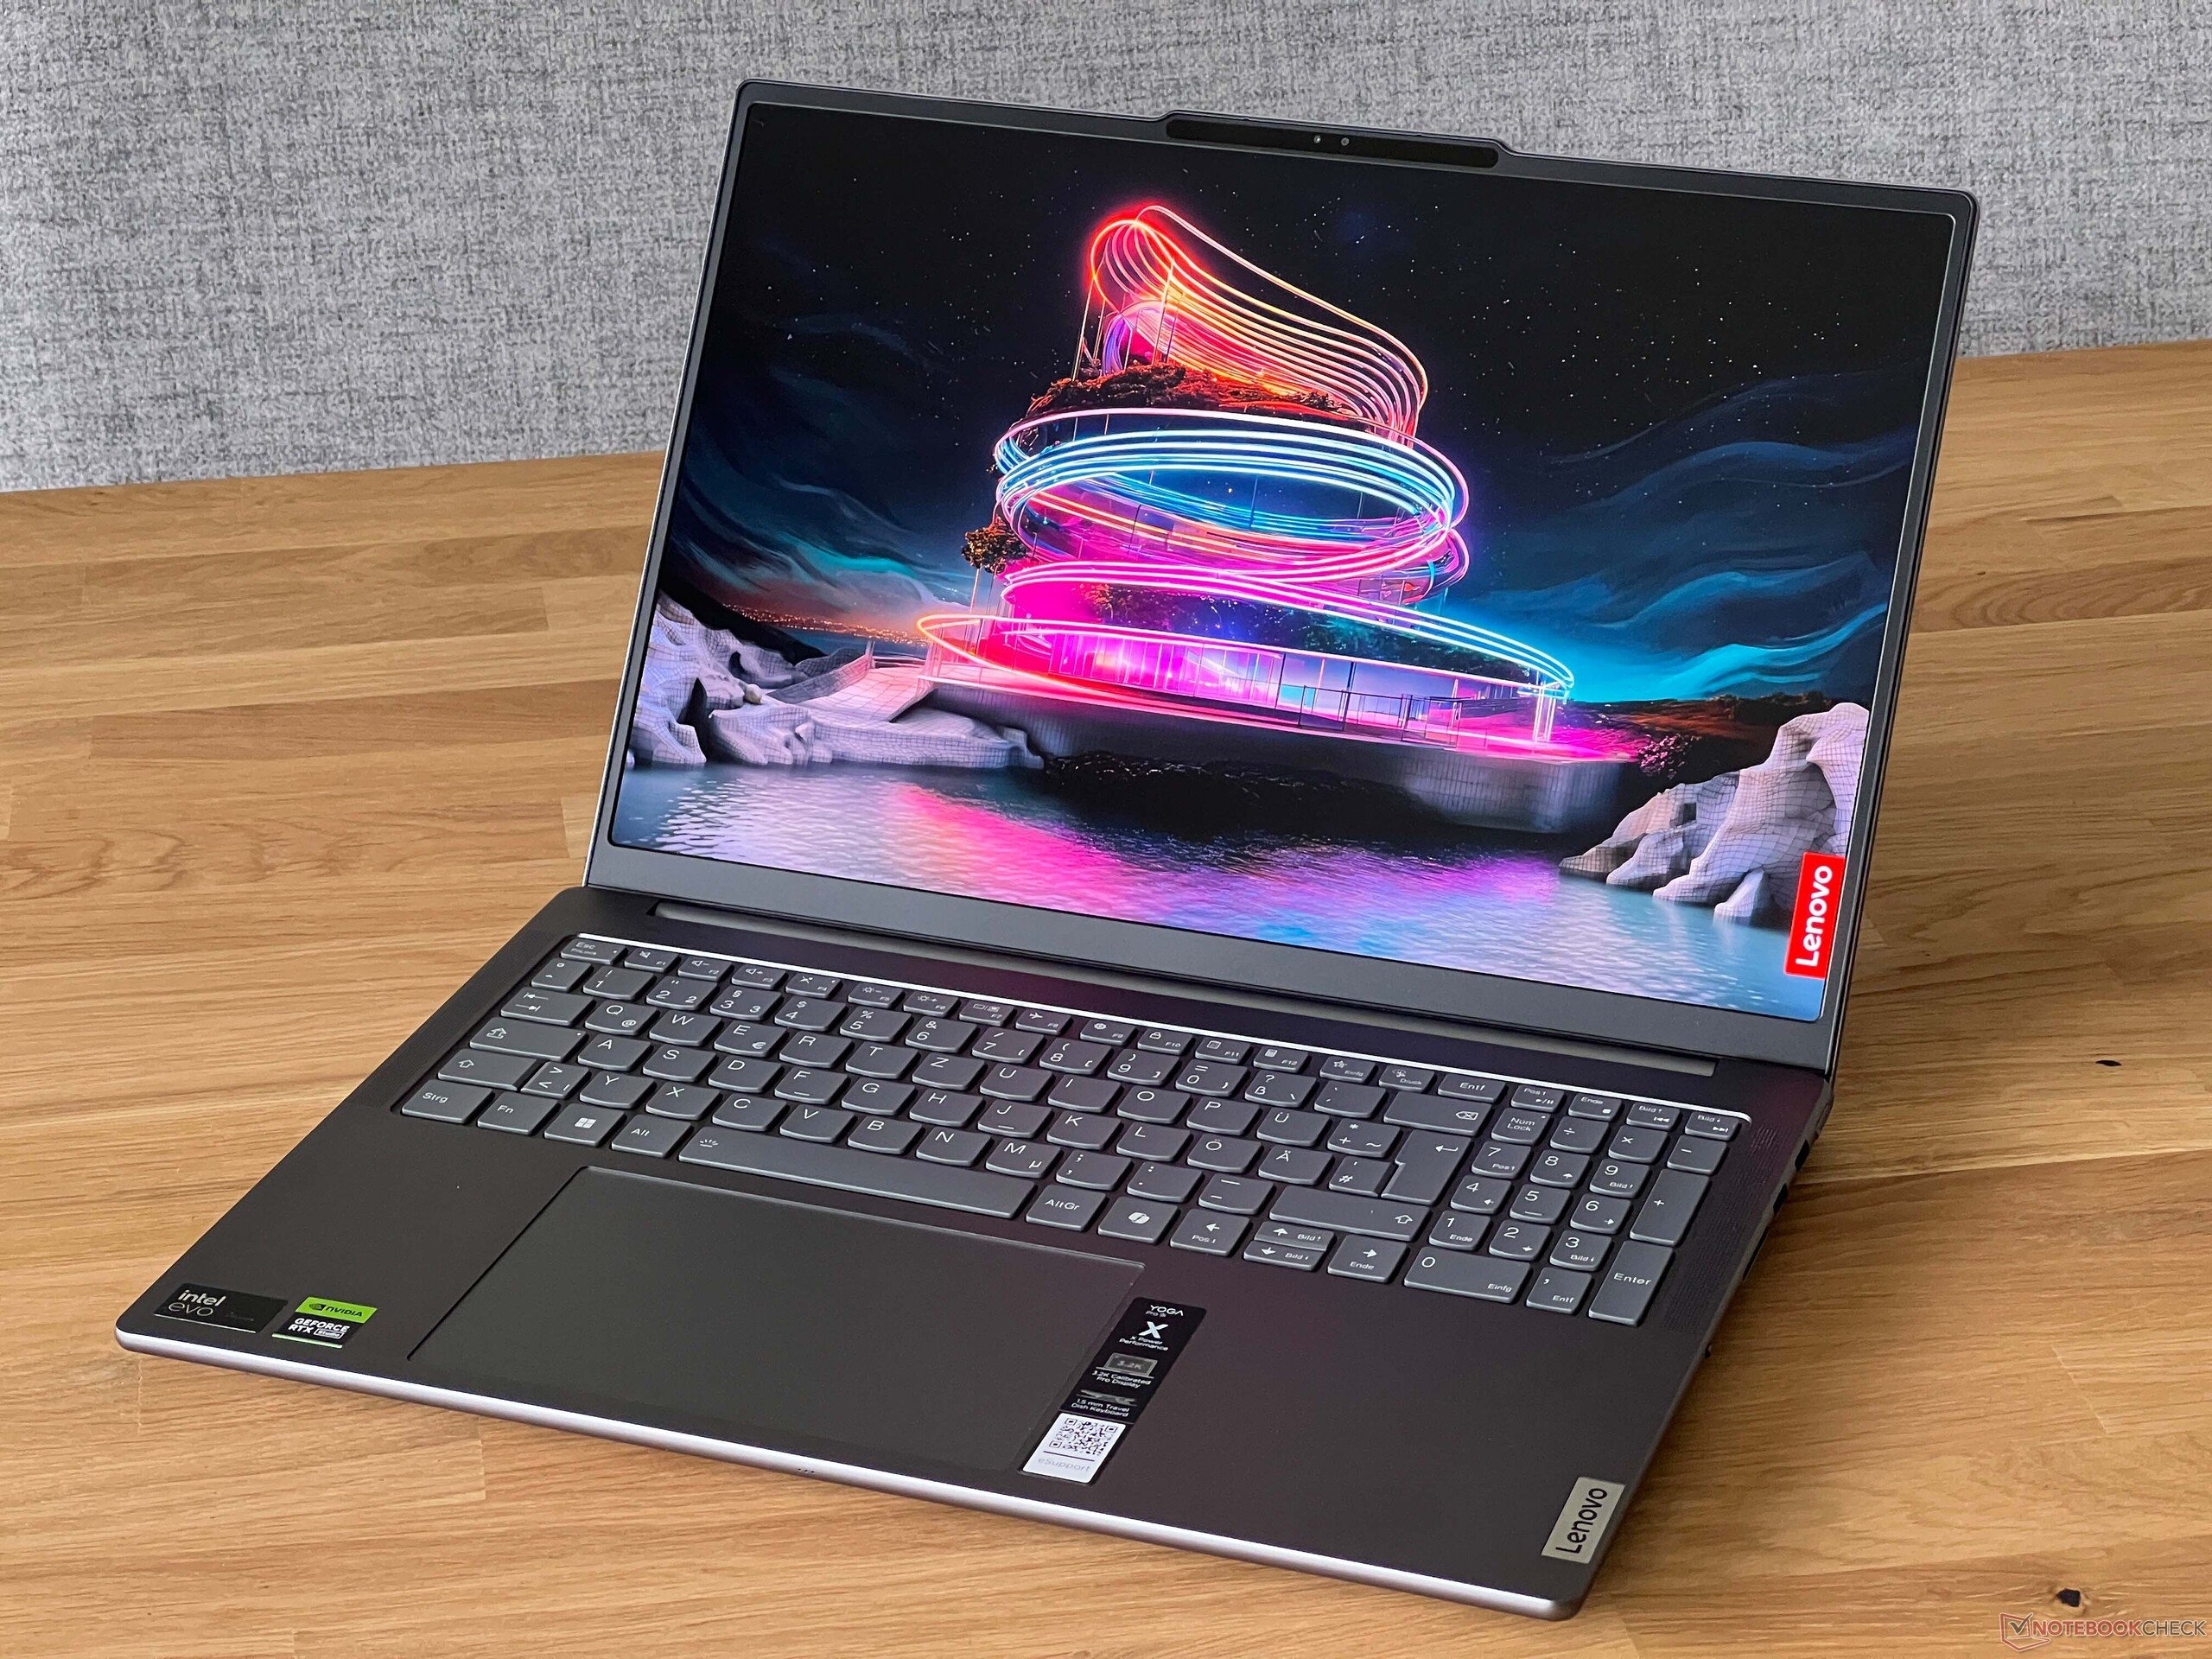
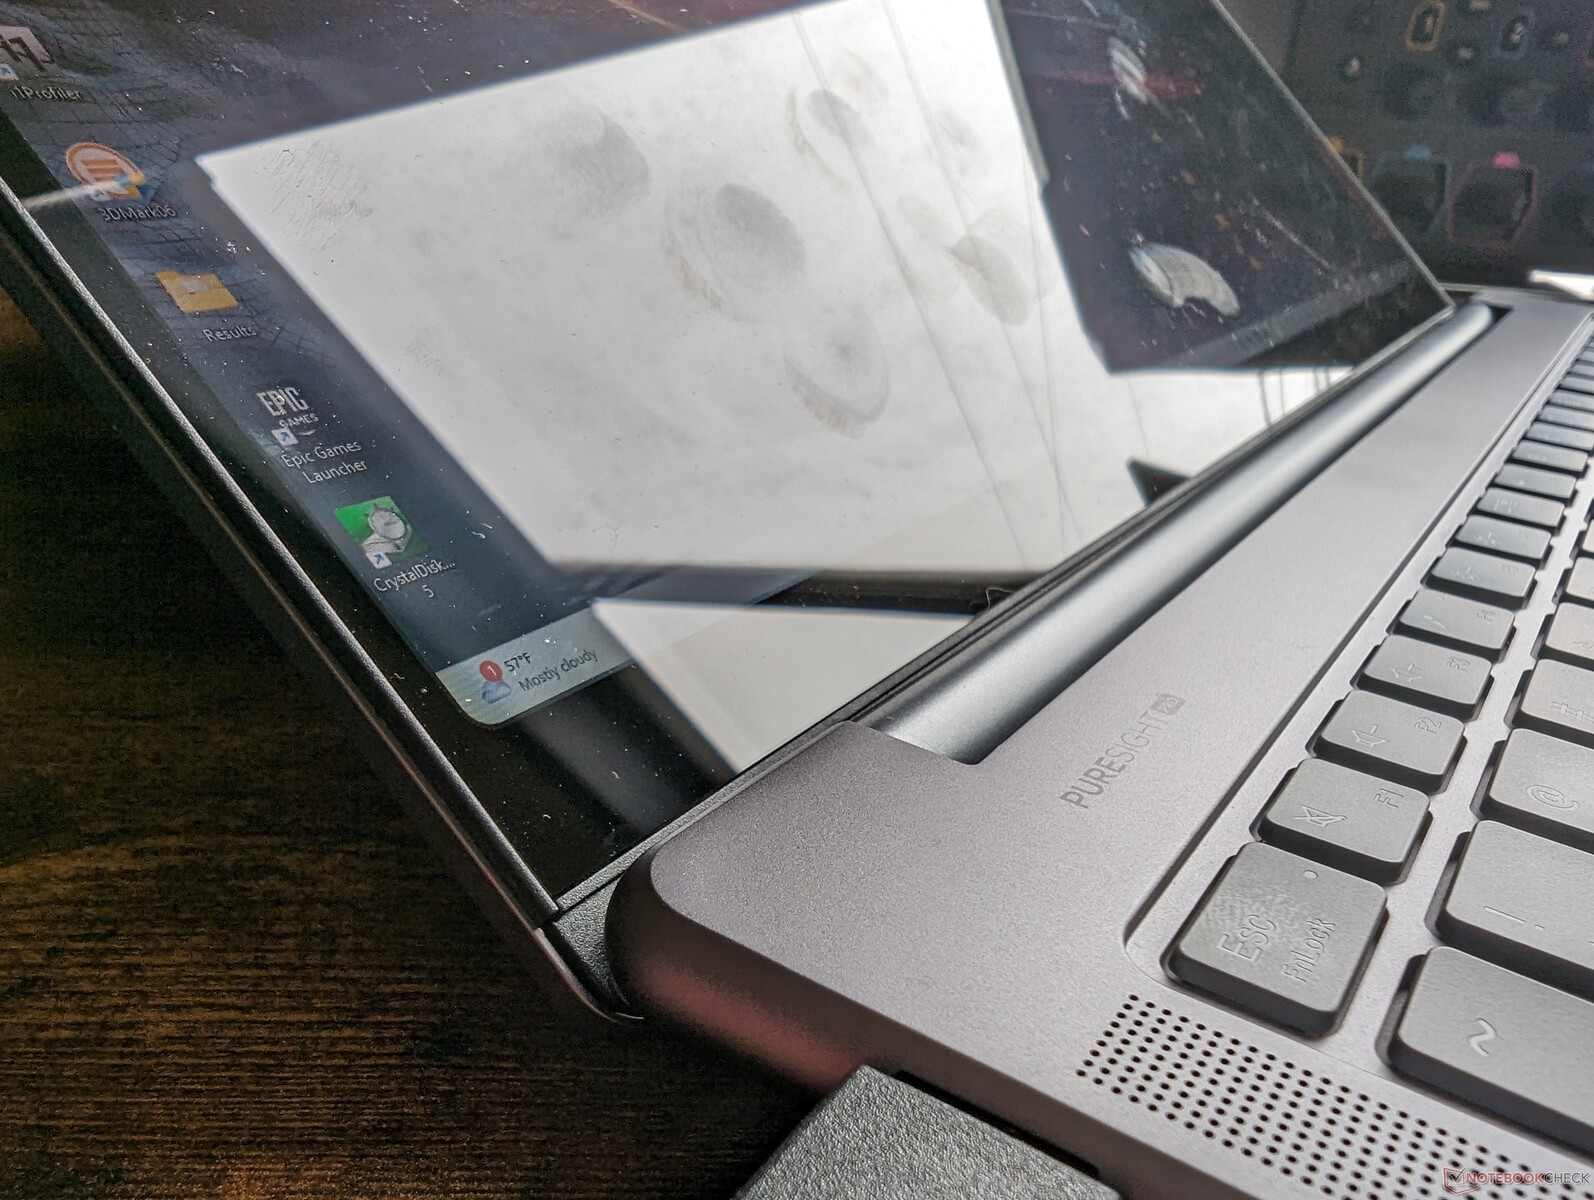
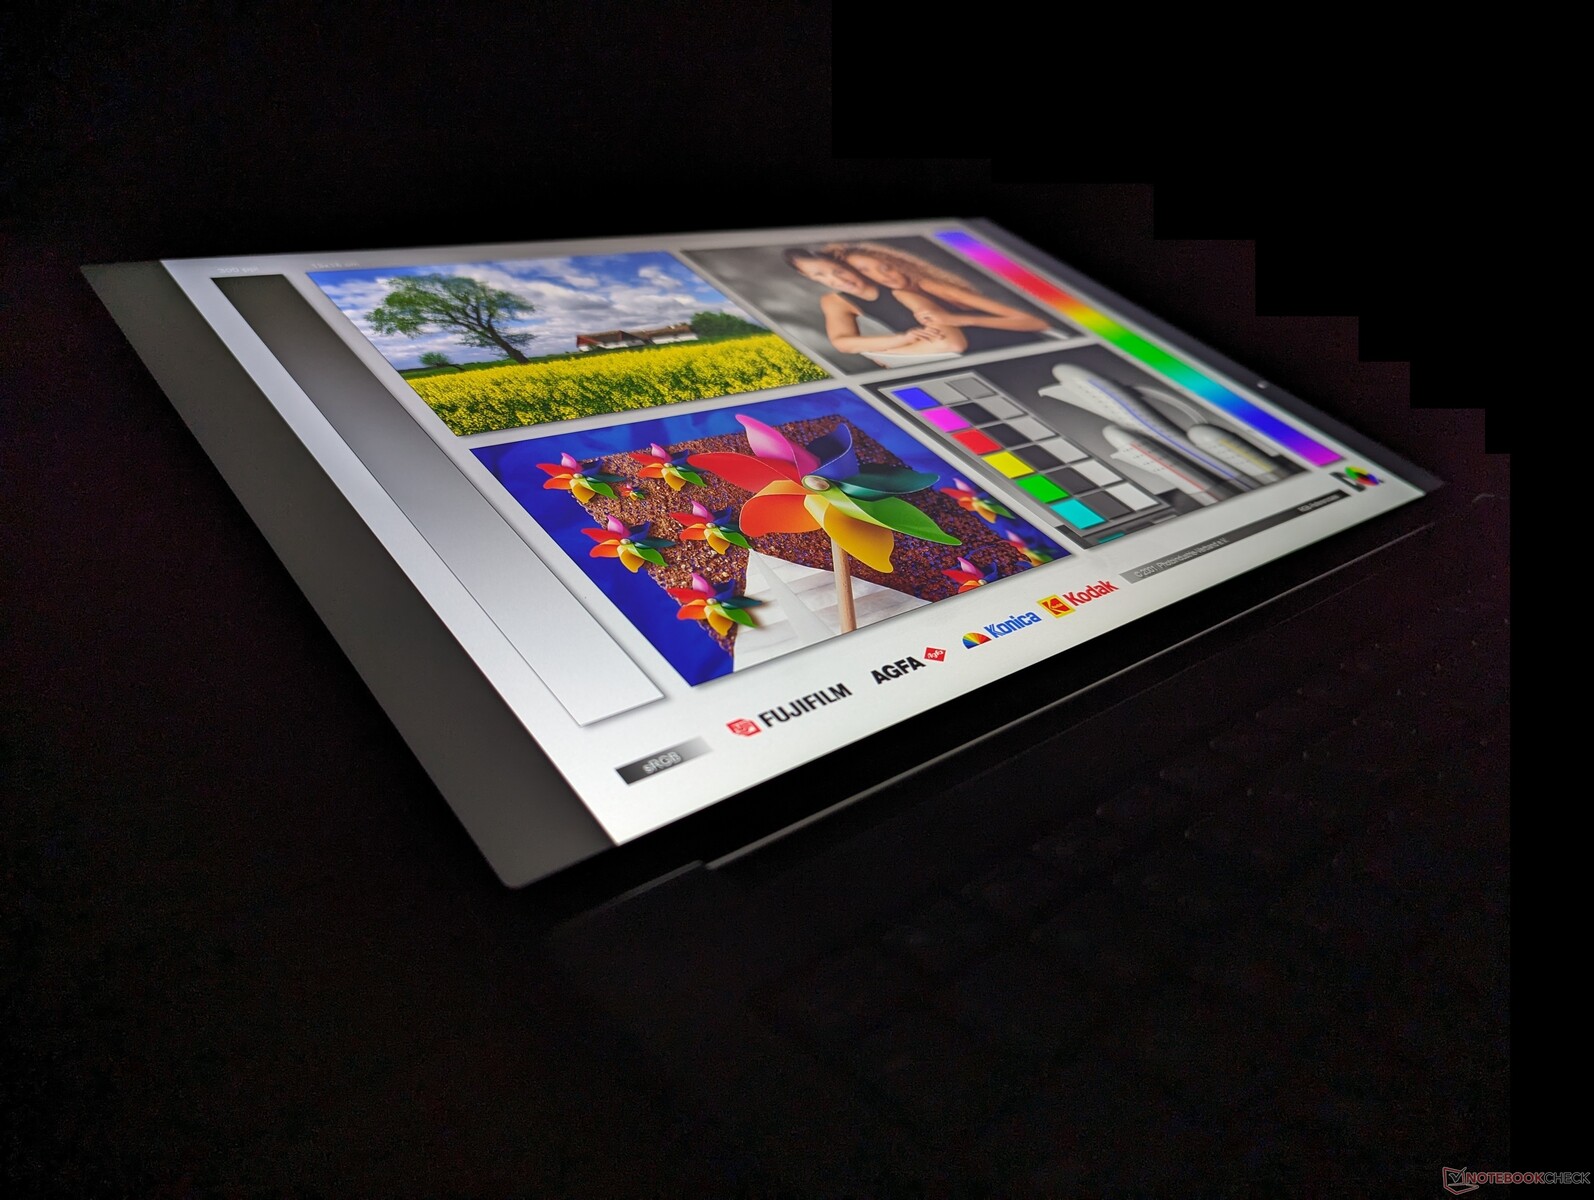
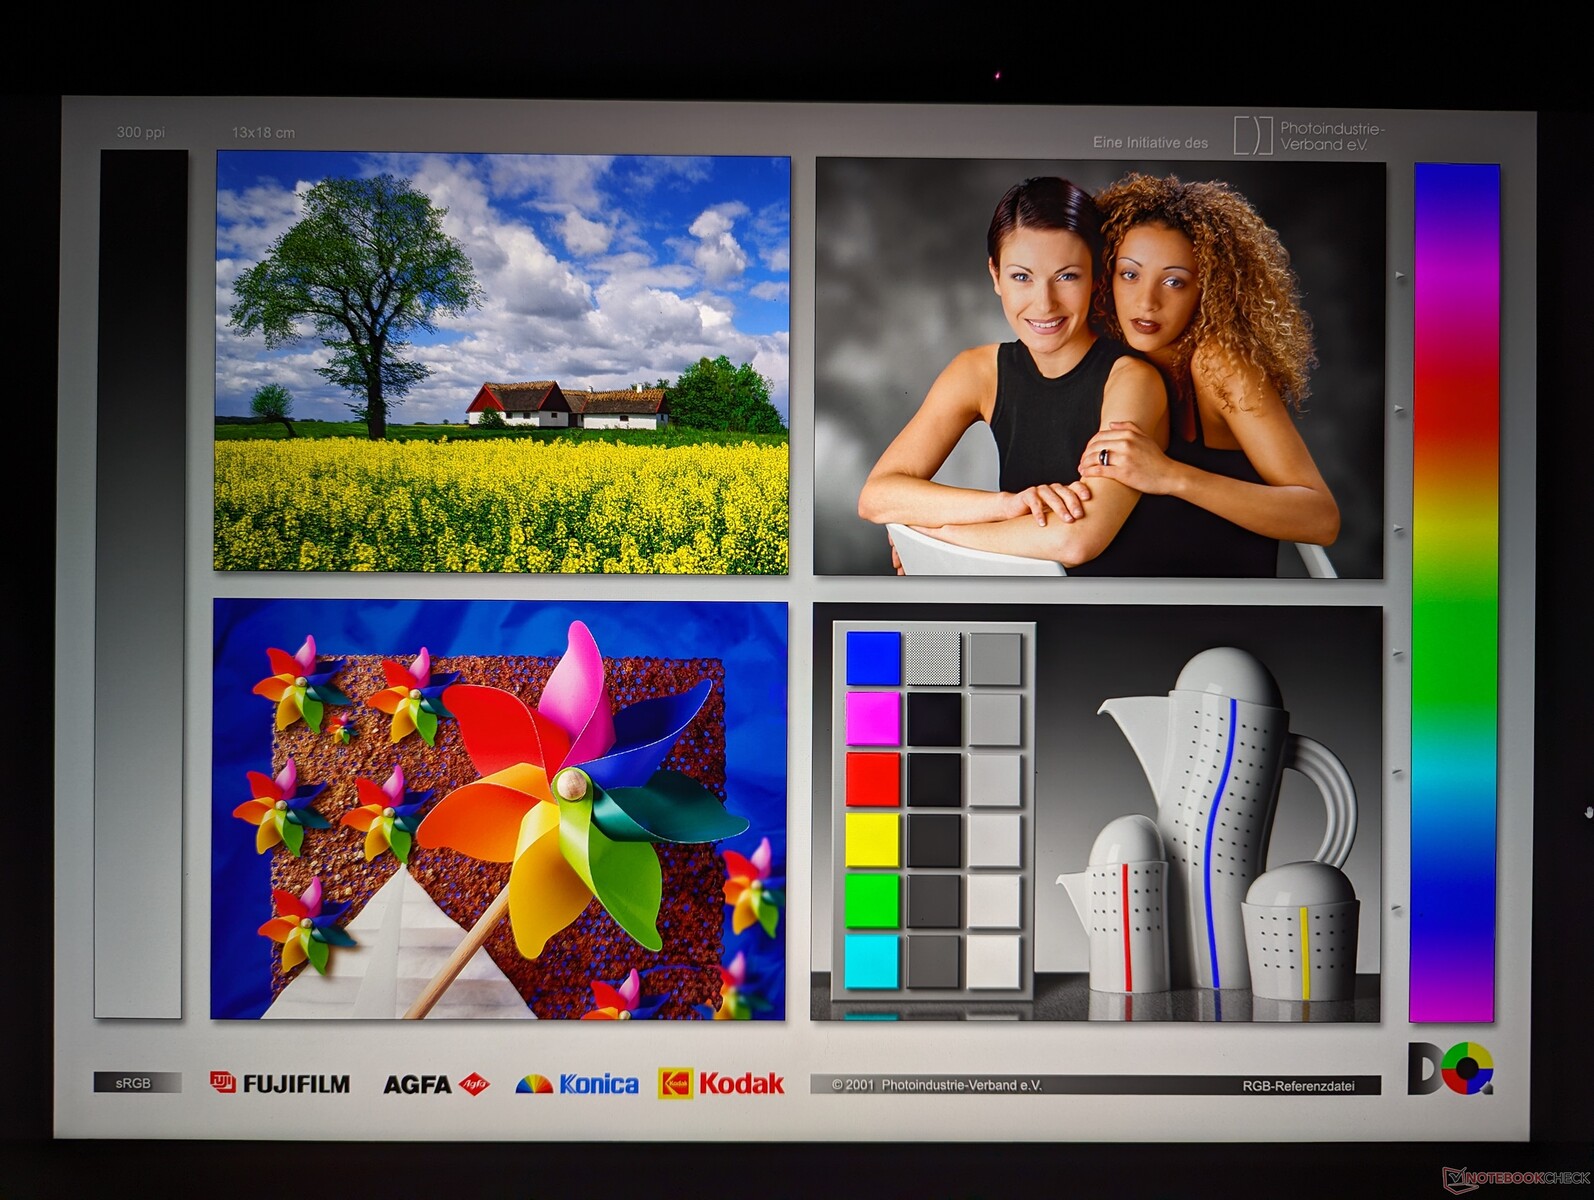
Écran - Options IPS 3.2K et Mini-LED
Lenovo propose les trois options d'affichage suivantes. Tous les écrans ont la même résolution native de 3200 x 2000 et le même taux de rafraîchissement avec le support Advanced Optimus mais pas de G-Sync. Notre unité de test dispose de l'option en gras ci-dessous tandis que la configuration RTX 4070 plus haut de gamme dispose de l'option mini-LED.
- 3.2K, 165 Hz, IPS, 400 nits, 100% P3, mat, non tactile
- 3.2K, 165 Hz, IPS, 400 nits, 100% P3, brillant, tactile
- 3.2K, 165 Hz, Mini-LED, 1200 nits, 100% P3, brillant, tactile
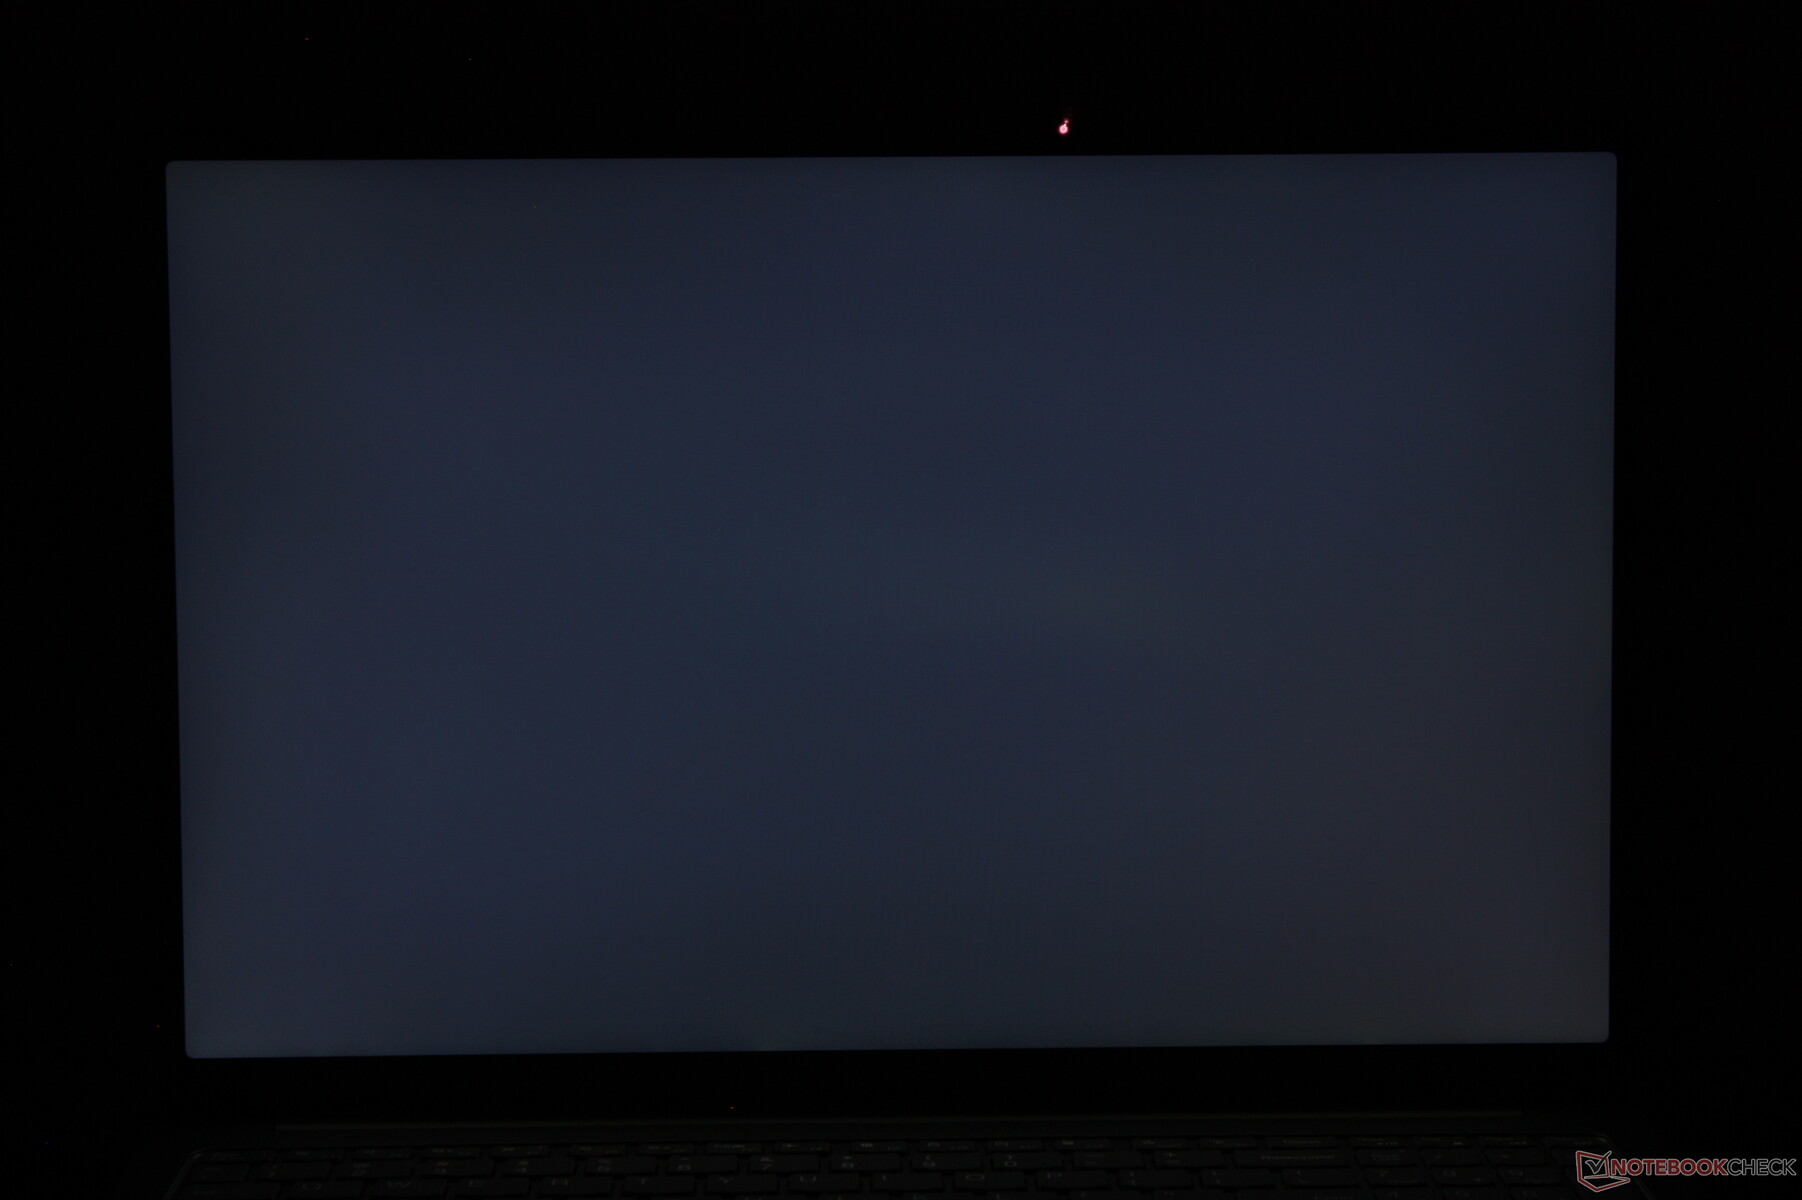
L'expérience visuelle entre les options IPS et mini-LED est étonnamment similaire puisque leurs gammes de couleurs et leurs taux de rafraîchissement sont essentiellement les mêmes. L'IPS, cependant, bénéficie à la fois de temps de réponse noir-blanc plus rapides et de l'absence d'effet de halo majeur par rapport au mini-LED. Les différences sont en revanche amplifiées lors de l'exécution de contenus HDR, où le mini-LED brille véritablement par ses niveaux de contraste et de luminosité supérieurs. Les utilisateurs qui regardent ou lisent beaucoup de médias HDR peuvent donc préférer le mini-LED, tandis que ceux qui veulent économiser de l'argent ou qui n'ont pas peur de renoncer au HDR peuvent obtenir une expérience plus traditionnelle avec l'IPS.

| |||||||||||||||||||||||||
Homogénéité de la luminosité: 91 %
Valeur mesurée au centre, sur batterie: 404.9 cd/m²
Contraste: 1012:1 (Valeurs des noirs: 0.4 cd/m²)
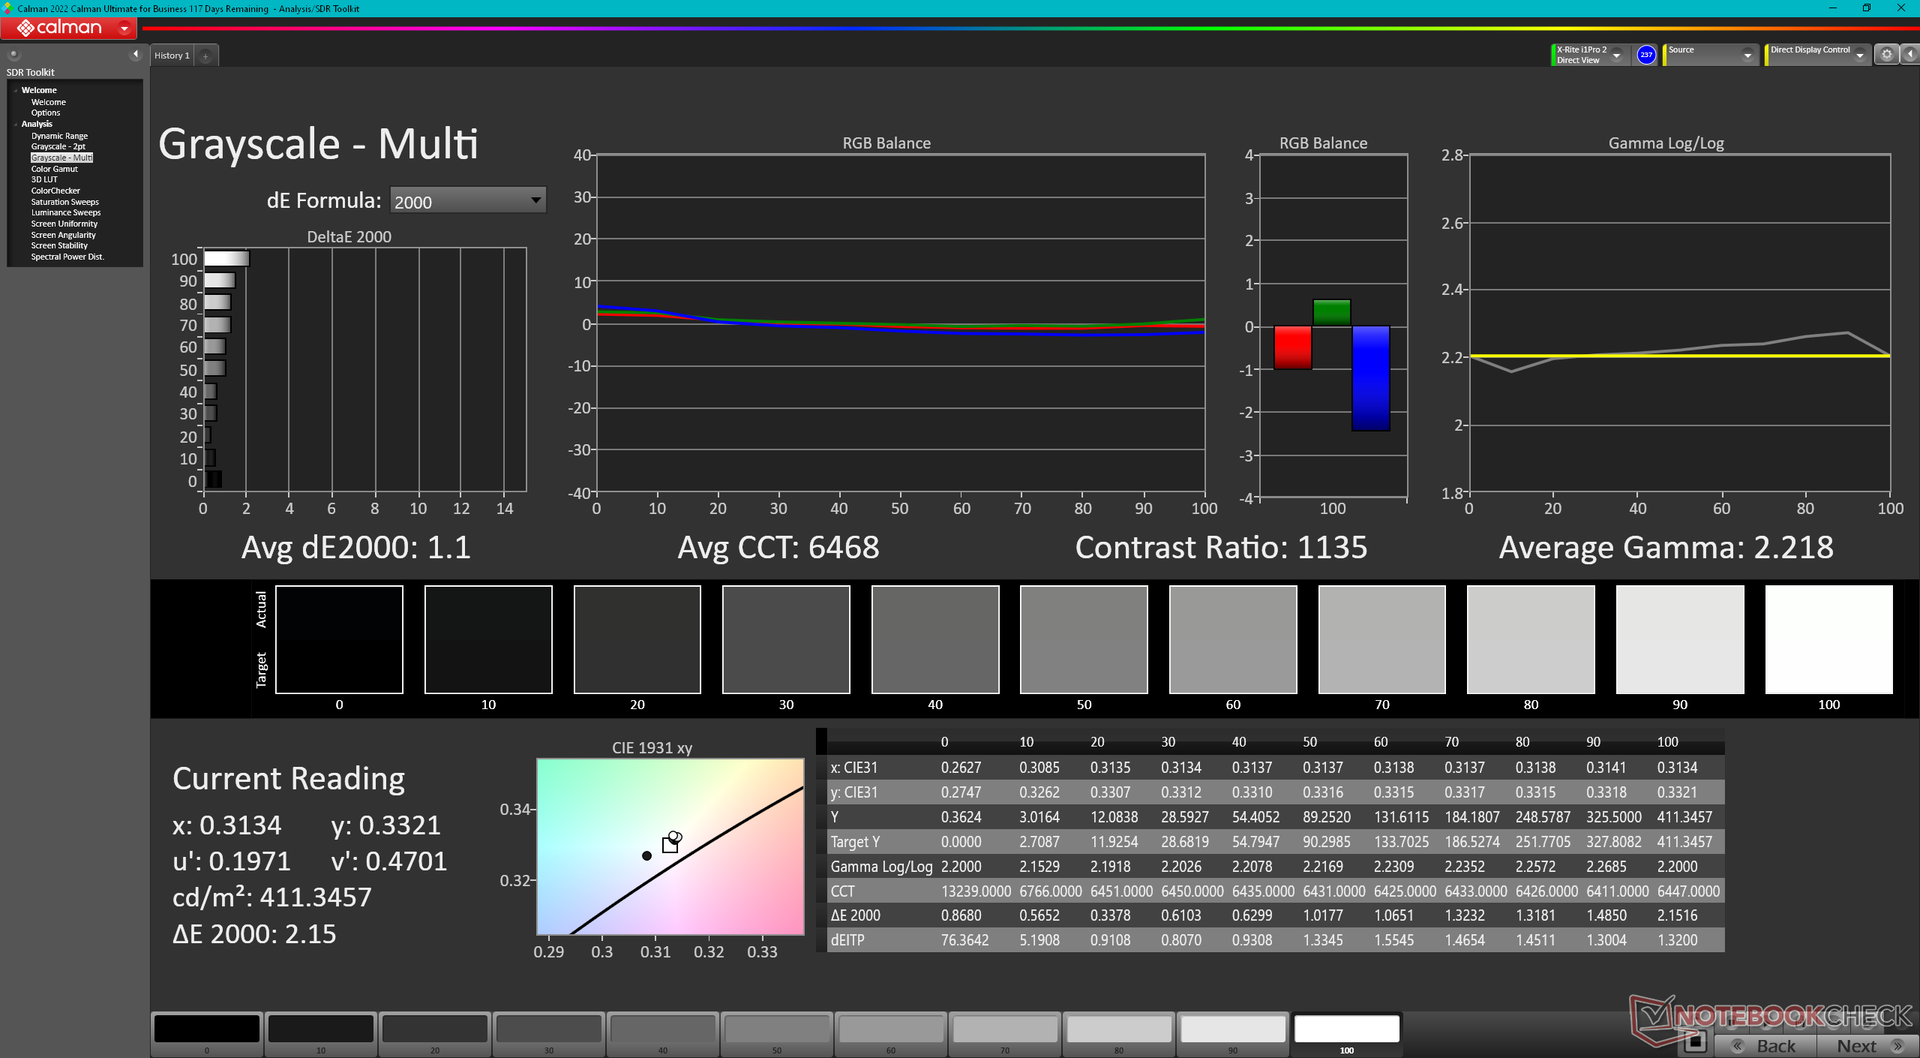
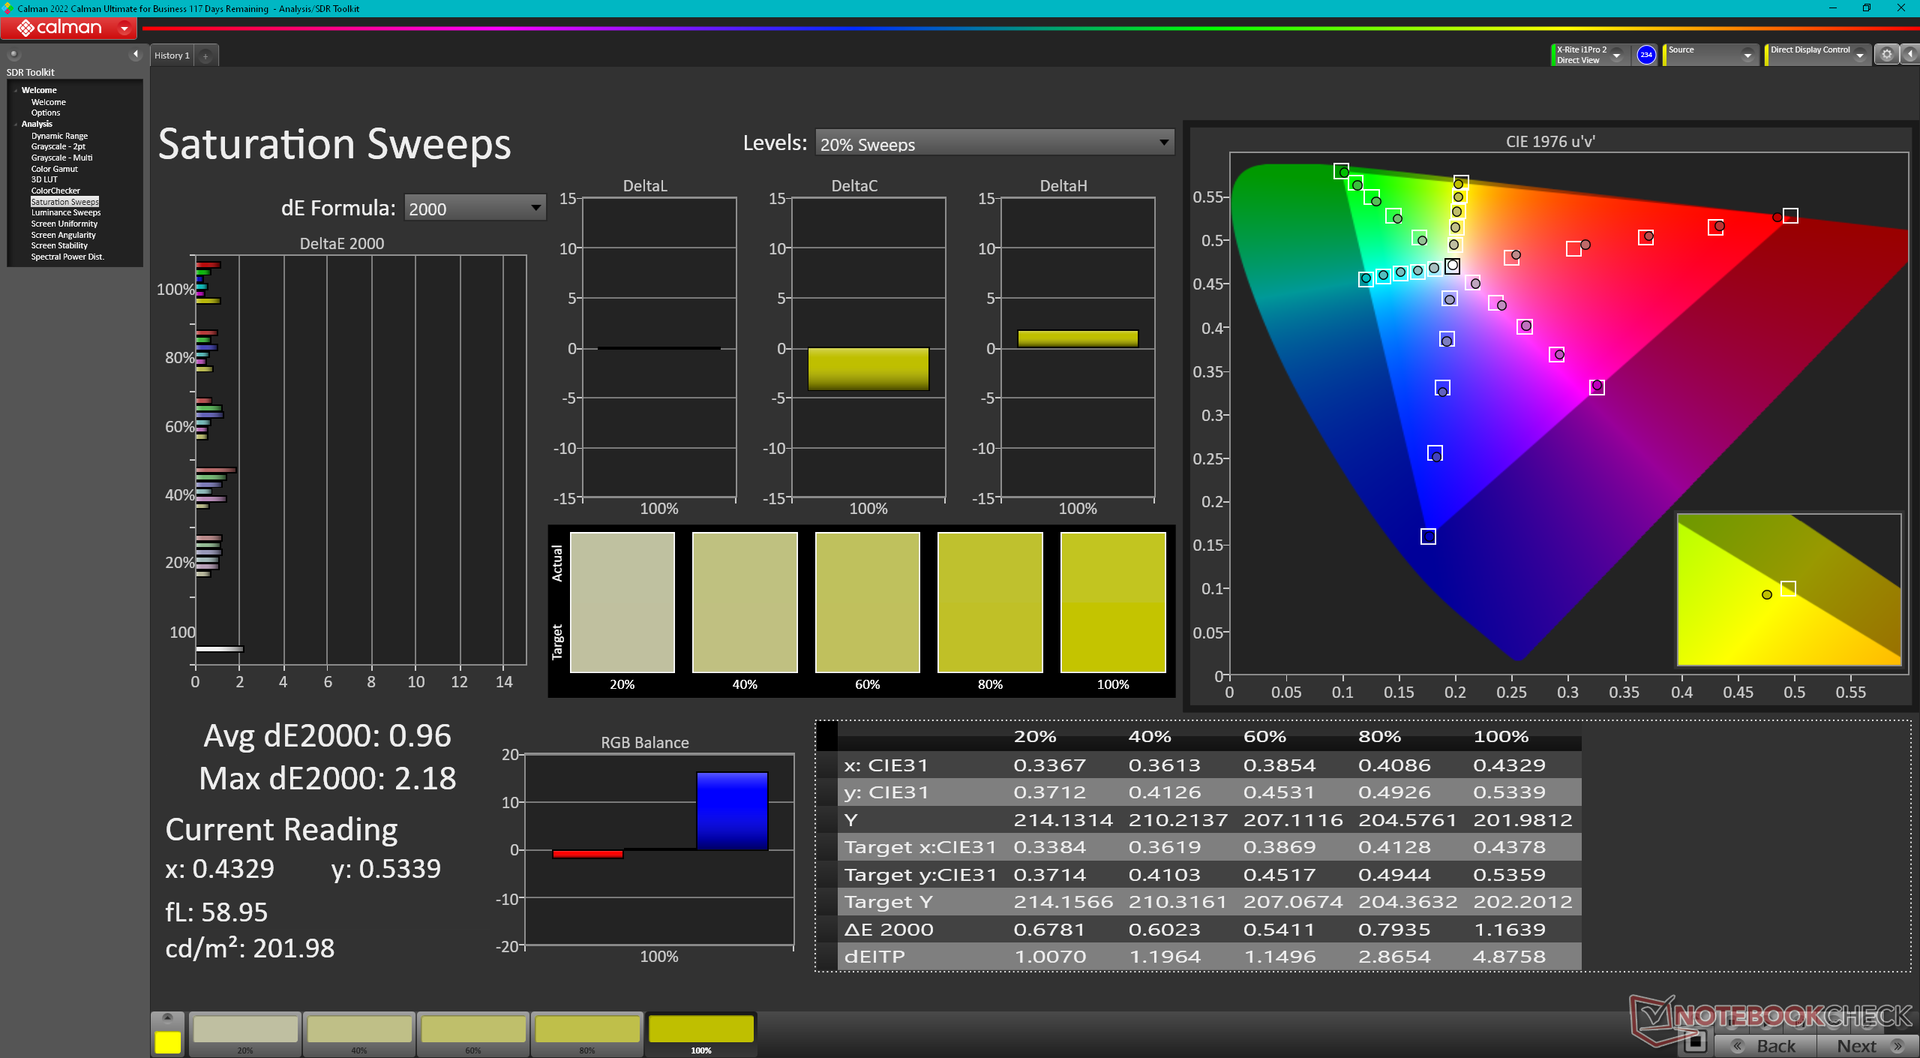
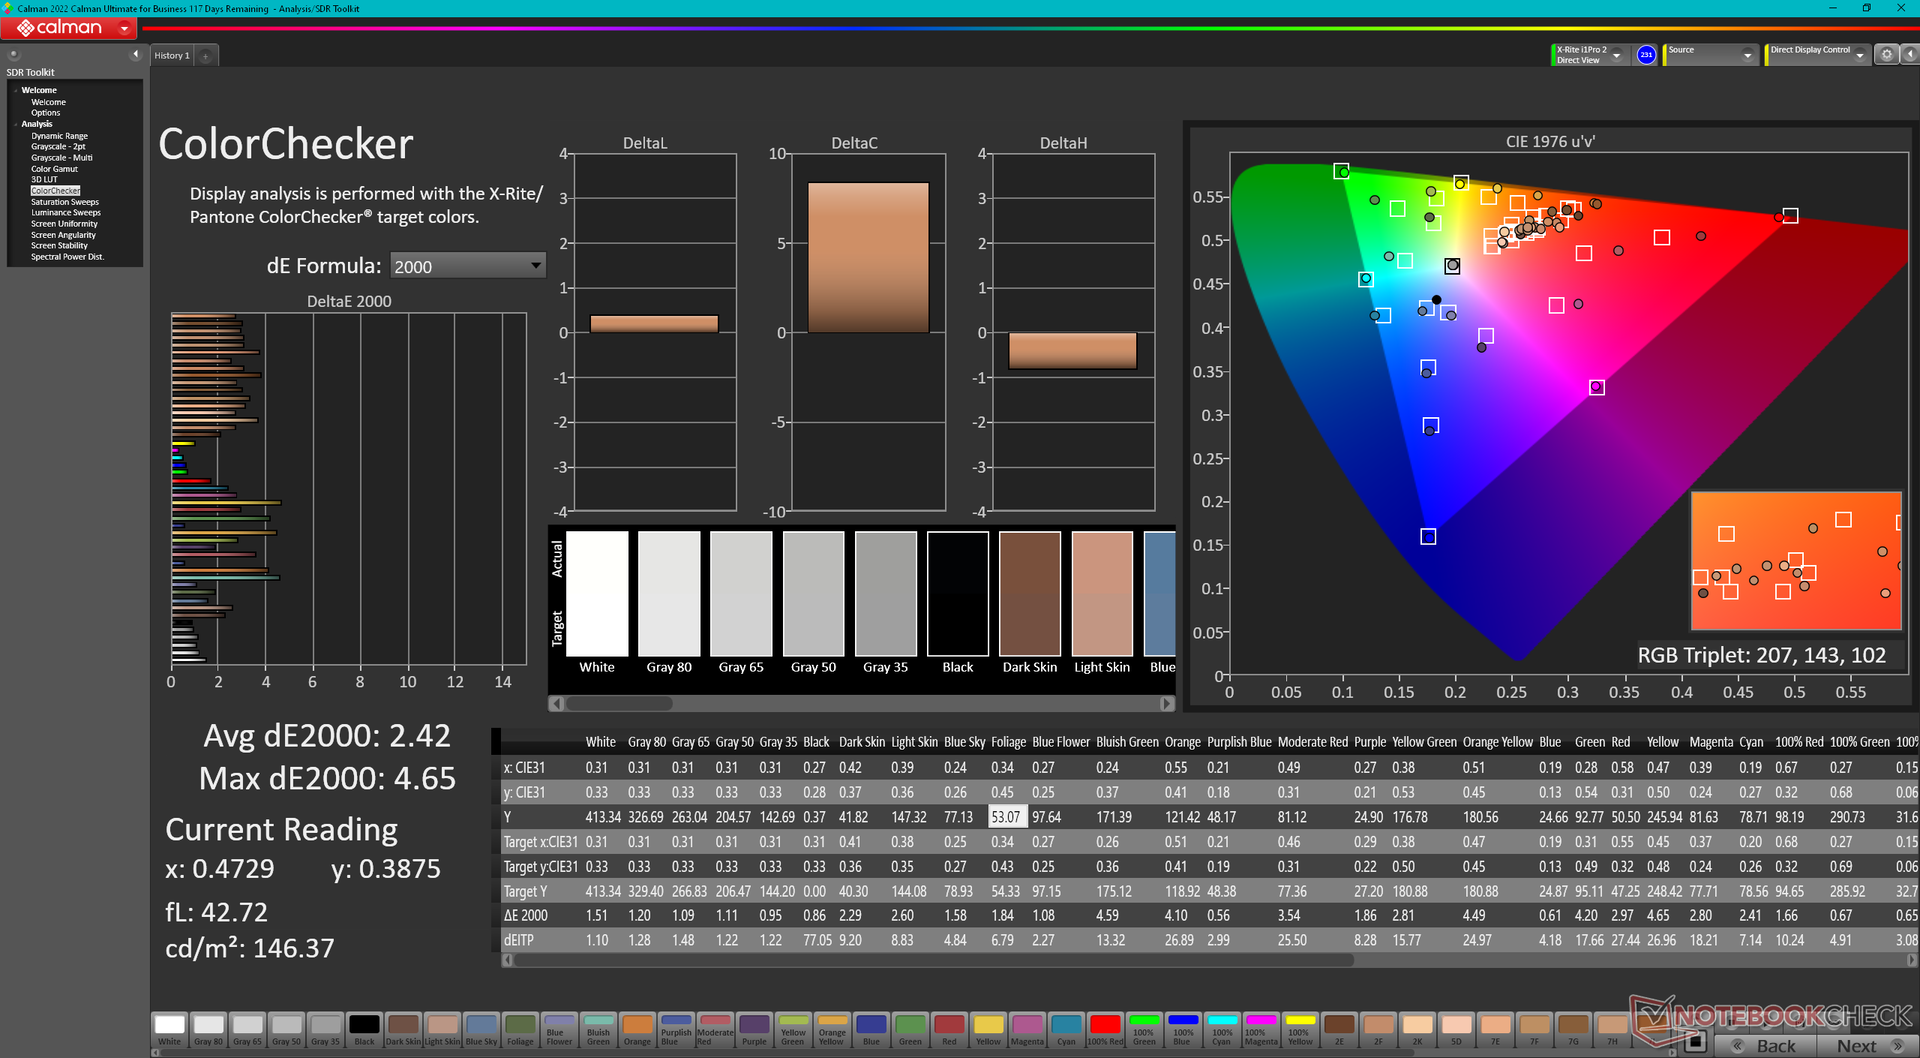
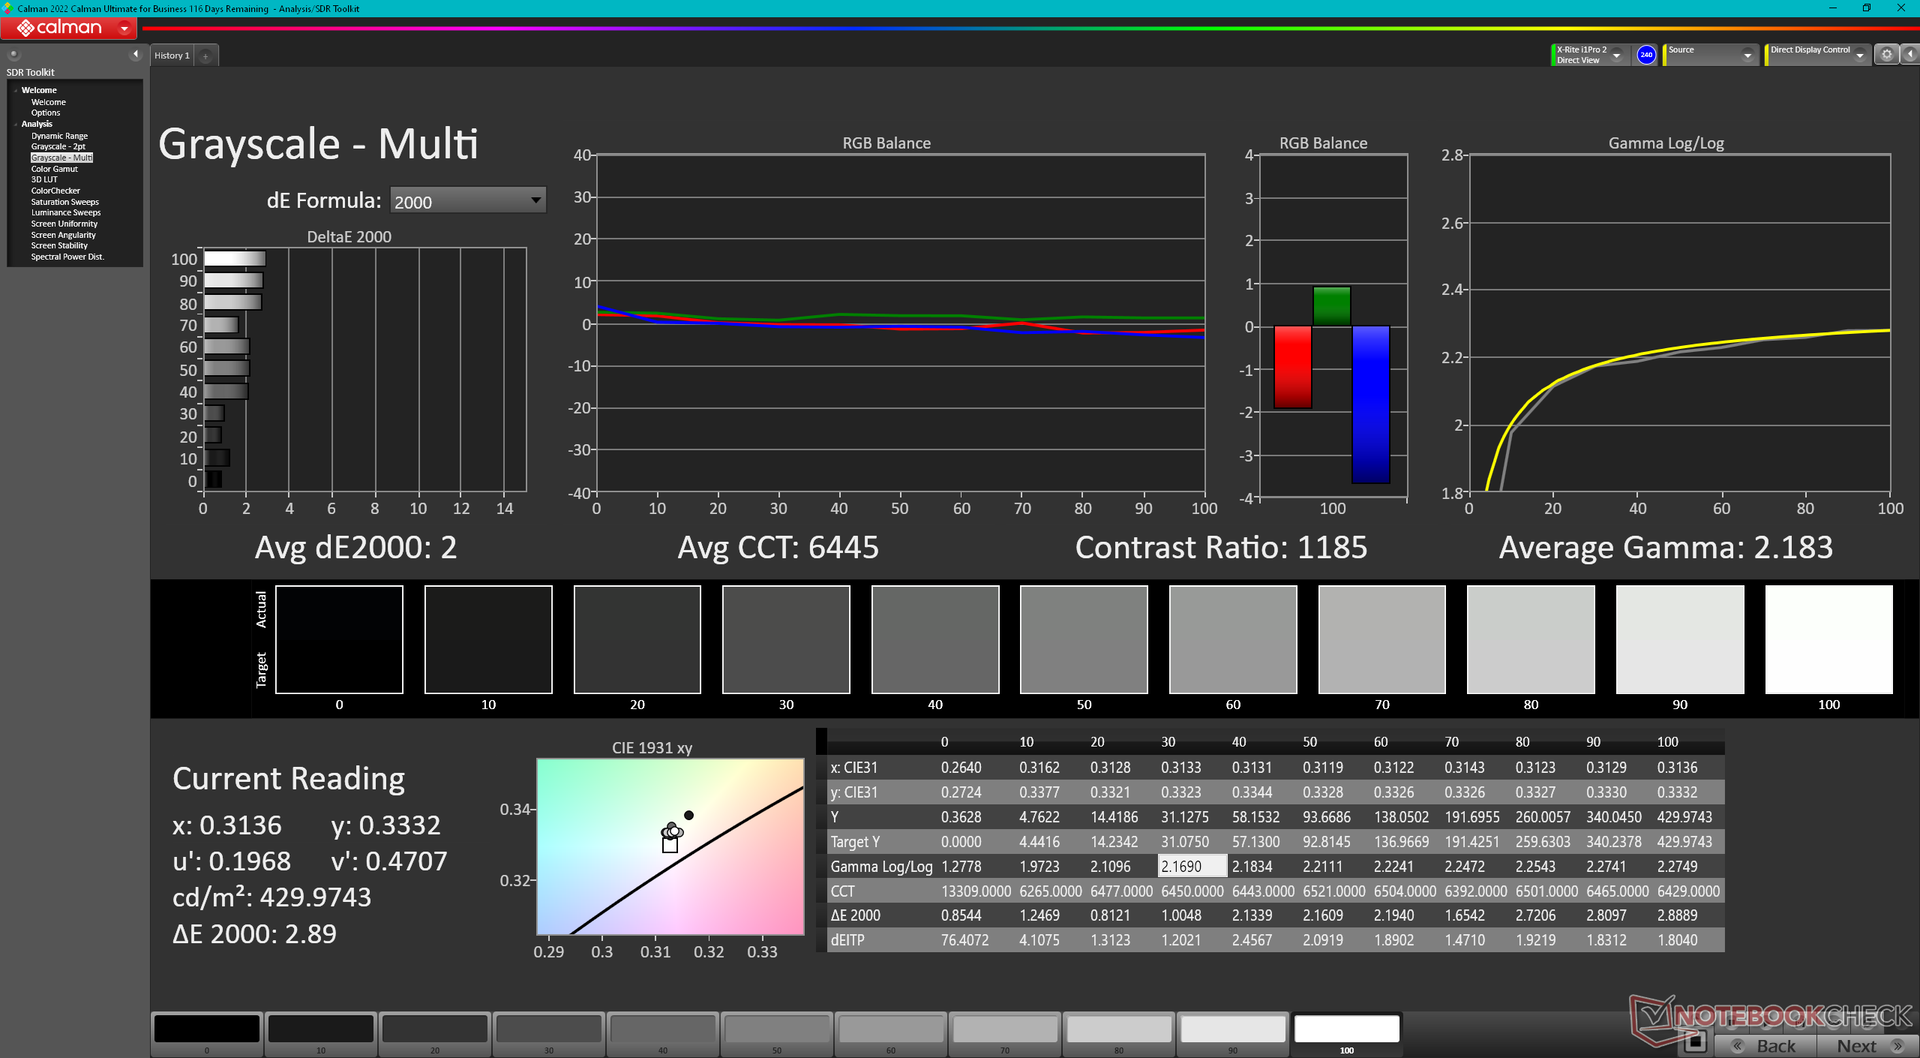
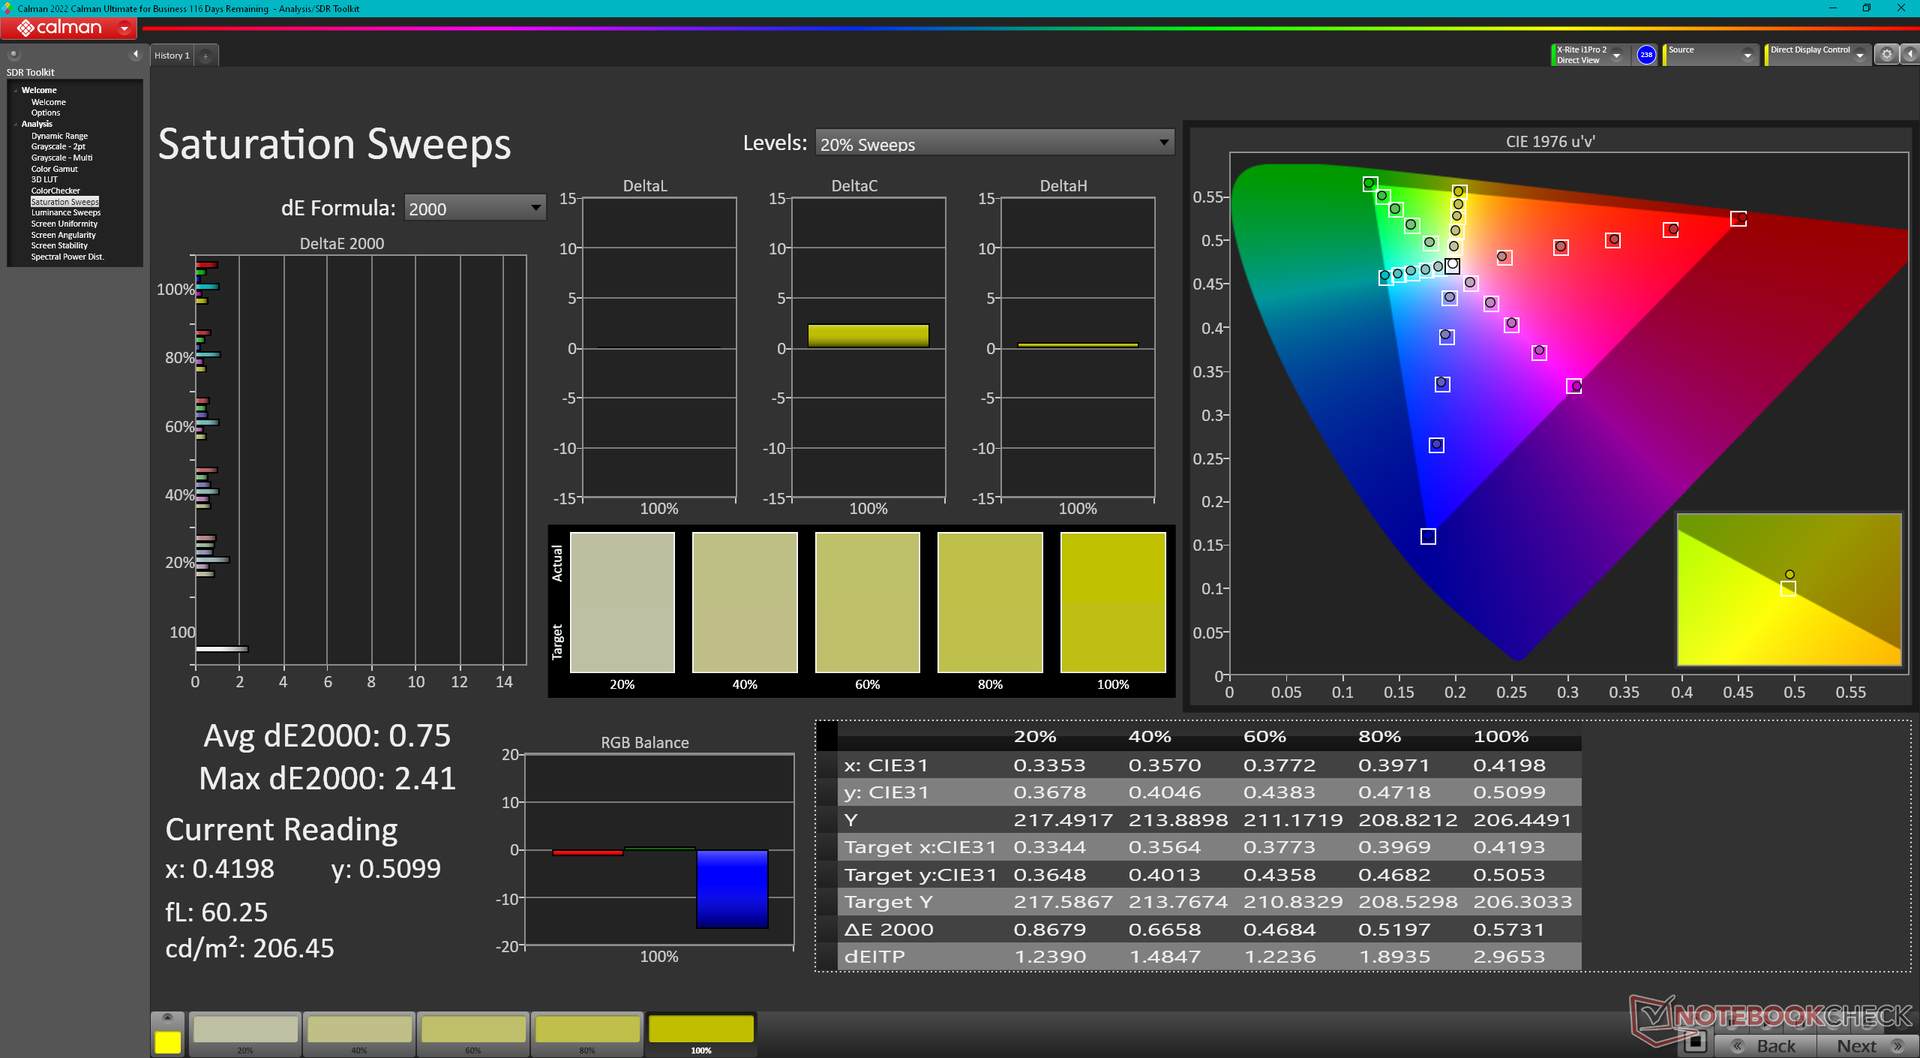
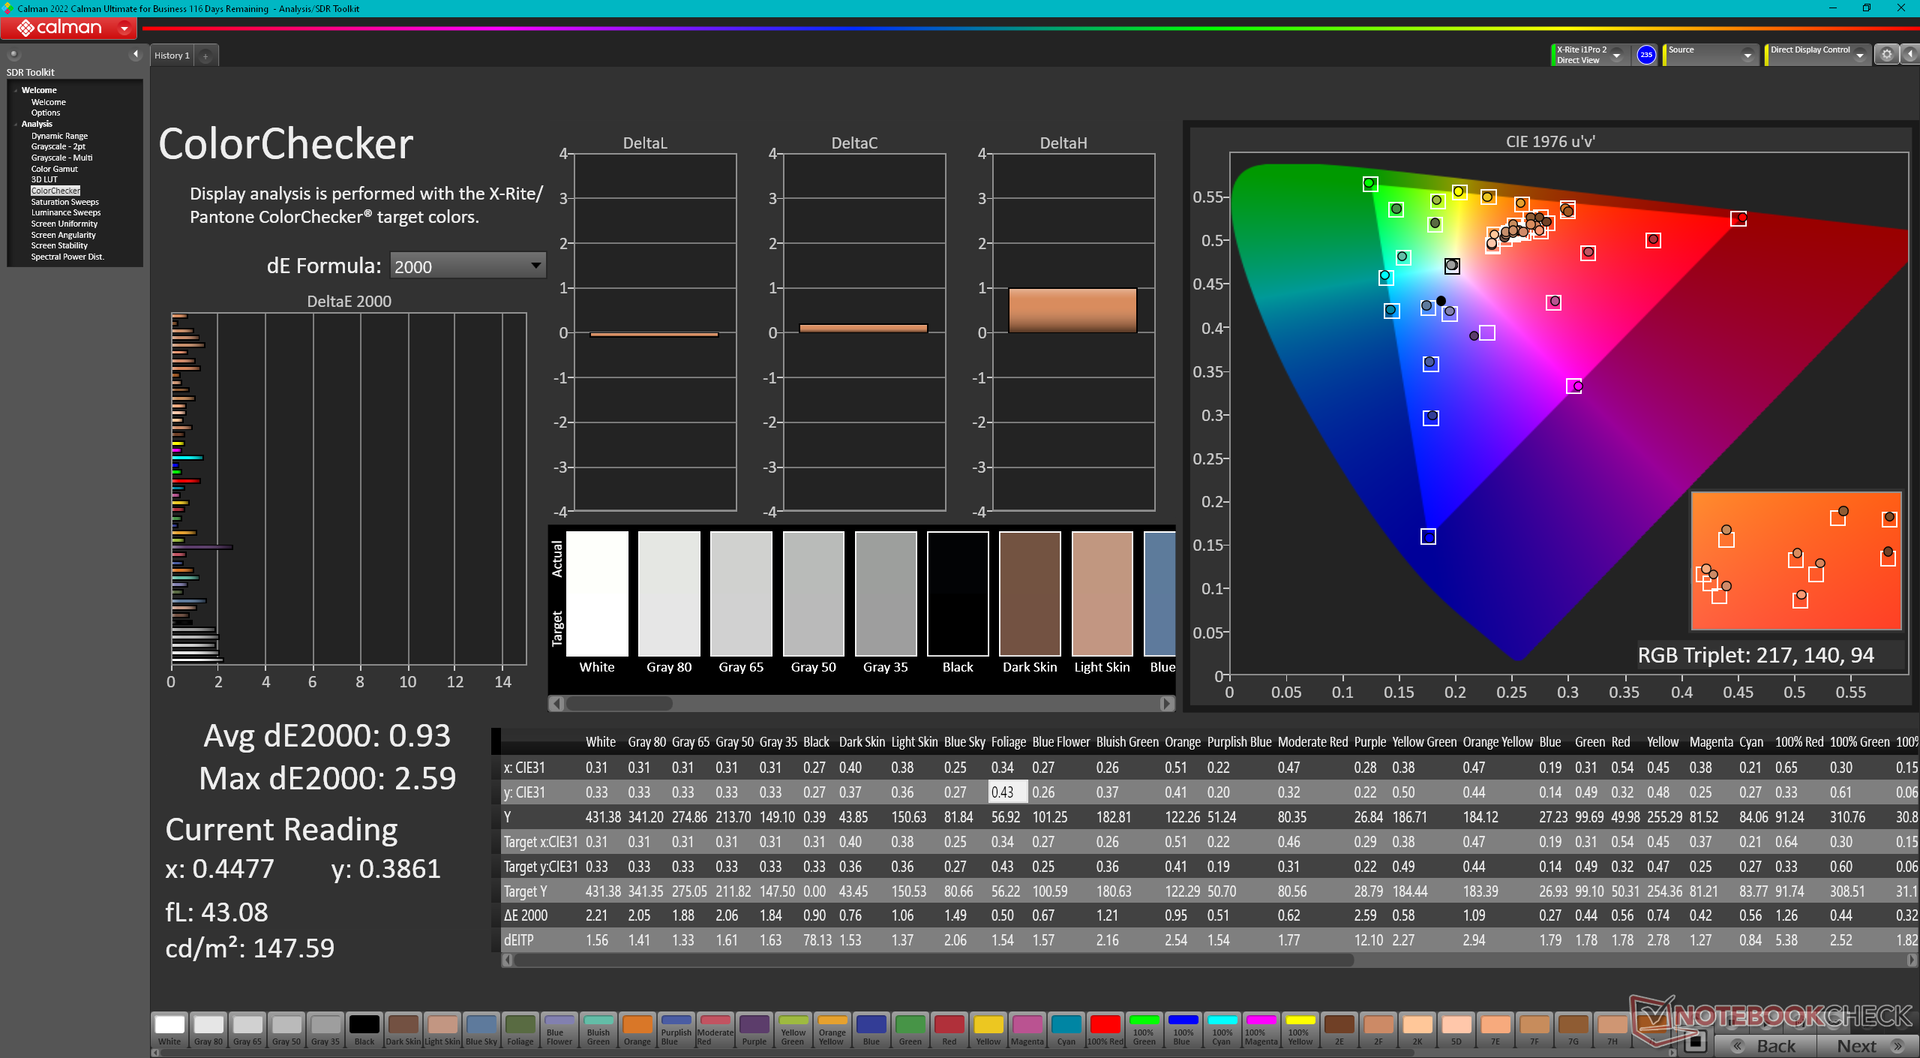
ΔE Color 2.42 | 0.5-29.43 Ø4.87, calibrated: 0.93
ΔE Greyscale 1.1 | 0.5-98 Ø5.1
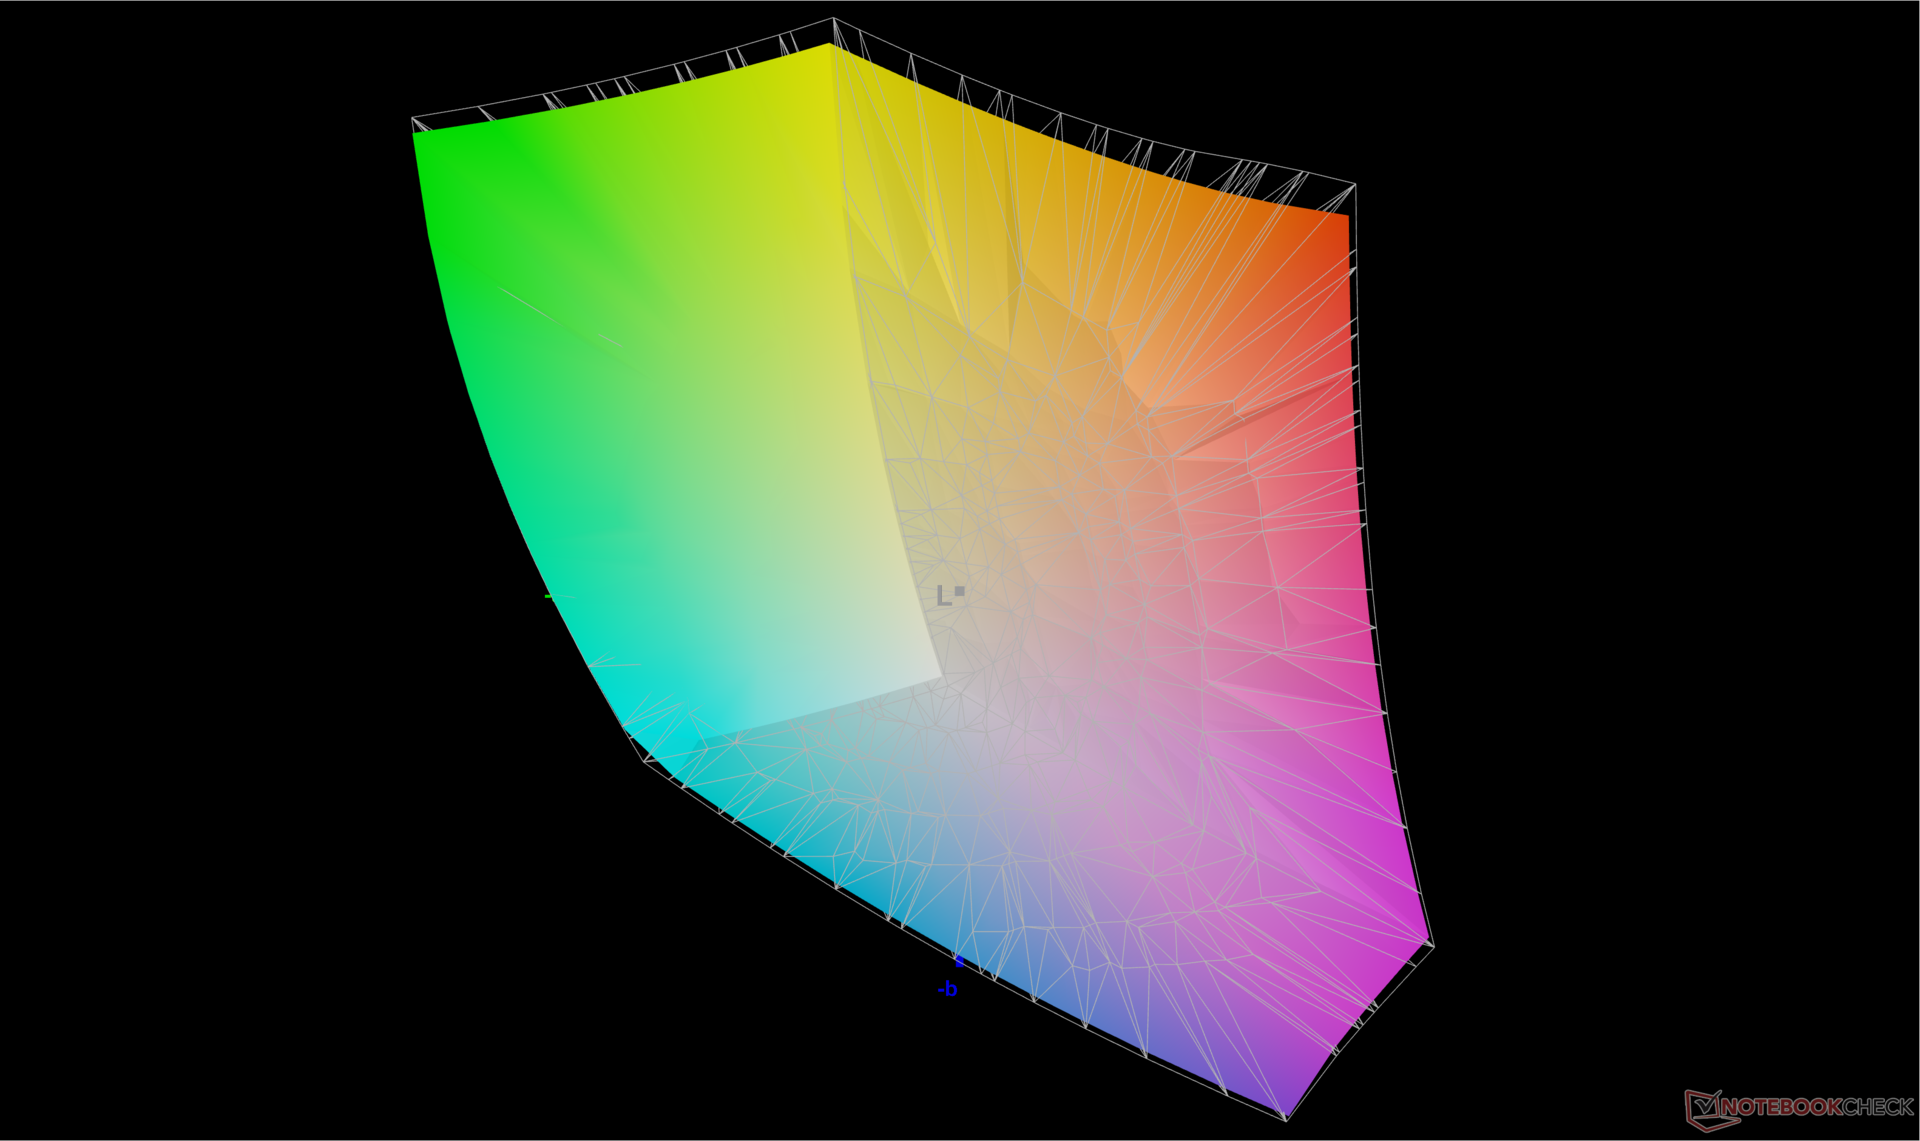
86.5% AdobeRGB 1998 (Argyll 2.2.0 3D)
99.9% sRGB (Argyll 2.2.0 3D)
95.6% Display P3 (Argyll 2.2.0 3D)
Gamma: 2.22
| Lenovo Yoga Pro 9 16IMH9 RTX 4050 LEN160-3.2K, IPS, 3200x2000, 16" | Lenovo Yoga Pro 9 16IMH9 LEN160-3.2K, Mini-LED, 3200x2000, 16" | HP Envy x360 2-in-1 16-ad0097nr Samsung SDC41A6, OLED, 2880x1800, 16" | Dell XPS 16 9640 SDC4196, OLED, 3840x2400, 16.3" | Samsung Galaxy Book4 Ultra ATNA60CL07-0, OLED, 2880x1800, 16" | Asus VivoBook Pro 16 K6602VU Samsung ATNA60BX01-1, OLED, 3200x2000, 16" | |
|---|---|---|---|---|---|---|
| Display | 0% | 5% | 2% | 2% | 5% | |
| Display P3 Coverage | 95.6 | 97 1% | 99.6 4% | 98.3 3% | 98.6 3% | 98.7 3% |
| sRGB Coverage | 99.9 | 99.9 0% | 100 0% | 100 0% | 99.9 0% | 99.7 0% |
| AdobeRGB 1998 Coverage | 86.5 | 86.6 0% | 96.5 12% | 87.8 2% | 88.5 2% | 96.5 12% |
| Response Times | -85% | 92% | 92% | 94% | 24% | |
| Response Time Grey 50% / Grey 80% * | 12.4 ? | 22.2 ? -79% | 0.8 ? 94% | 0.82 ? 93% | 0.54 ? 96% | 0.68 ? 95% |
| Response Time Black / White * | 8.9 ? | 17 ? -91% | 0.89 ? 90% | 0.85 ? 90% | 0.69 ? 92% | 13.2 ? -48% |
| PWM Frequency | 4840 ? | 491.8 ? | 360 ? | 240 ? | 240 ? | |
| Screen | 30% | -16% | -7% | -0% | -61% | |
| Brightness middle | 404.9 | 651 61% | 399.4 -1% | 366 -10% | 390 -4% | 353 -13% |
| Brightness | 390 | 673 73% | 405 4% | 367 -6% | 393 1% | 354 -9% |
| Brightness Distribution | 91 | 93 2% | 98 8% | 96 5% | 98 8% | 98 8% |
| Black Level * | 0.4 | 0.22 45% | ||||
| Contrast | 1012 | 2959 192% | ||||
| Colorchecker dE 2000 * | 2.42 | 1.9 21% | 4.05 -67% | 1.3 46% | 1.4 42% | 4.23 -75% |
| Colorchecker dE 2000 max. * | 4.65 | 4.2 10% | 6.69 -44% | 3.6 23% | 2.7 42% | 7.13 -53% |
| Colorchecker dE 2000 calibrated * | 0.93 | 0.6 35% | 1.02 -10% | 1 -8% | 2.42 -160% | |
| Greyscale dE 2000 * | 1.1 | 3 -173% | 1.1 -0% | 2.2 -100% | 2.1 -91% | 2.5 -127% |
| Gamma | 2.22 99% | 2.18 101% | 2.27 97% | 2.14 103% | 2.27 97% | 2.4 92% |
| CCT | 6468 100% | 6738 96% | 6419 101% | 6680 97% | 6431 101% | 6642 98% |
| Moyenne finale (programmes/paramètres) | -18% /
7% | 27% /
8% | 29% /
12% | 32% /
17% | -11% /
-31% |
* ... Moindre est la valeur, meilleures sont les performances

L'écran est calibré dès sa sortie de l'emballage en fonction de la norme P3, avec des valeurs moyennes de deltaE en niveaux de gris et en couleurs de seulement 1,1 et 2,42, respectivement. Un étalonnage par l'utilisateur final n'est donc pas nécessaire pour la majorité des utilisateurs.
Temps de réponse de l'écran
| ↔ Temps de réponse noir à blanc | ||
|---|---|---|
| 8.9 ms ... hausse ↗ et chute ↘ combinées | ↗ 4.8 ms hausse | 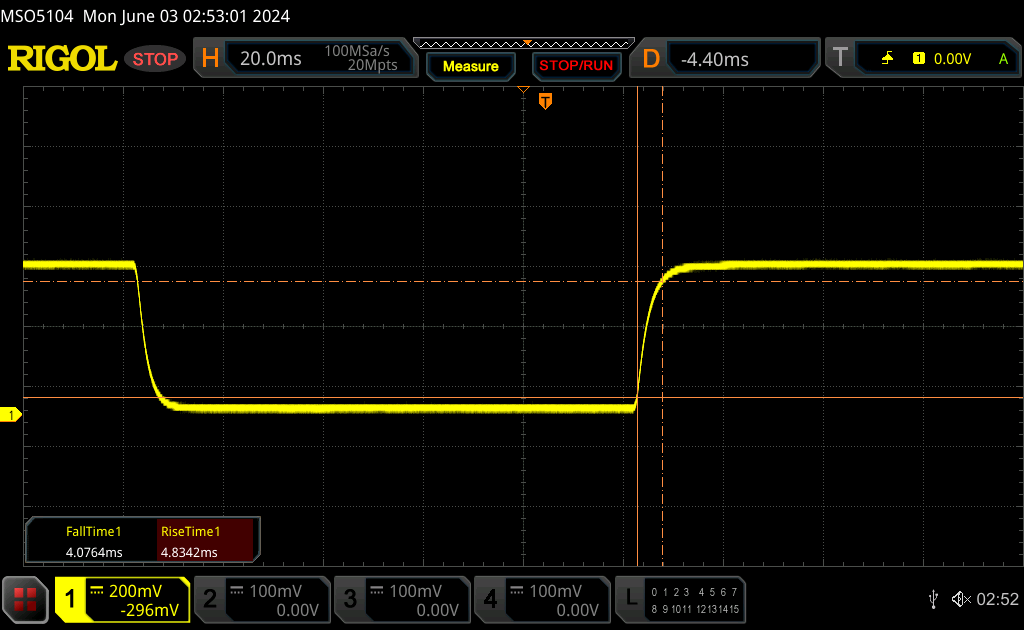 |
| ↘ 4.1 ms chute | ||
| L'écran montre de faibles temps de réponse, un bon écran pour jouer. En comparaison, tous les appareils testés affichent entre 0.1 (minimum) et 240 (maximum) ms. » 22 % des appareils testés affichent de meilleures performances. Cela signifie que les latences relevées sont meilleures que la moyenne (20.7 ms) de tous les appareils testés. | ||
| ↔ Temps de réponse gris 50% à gris 80% | ||
| 12.4 ms ... hausse ↗ et chute ↘ combinées | ↗ 6.3 ms hausse | 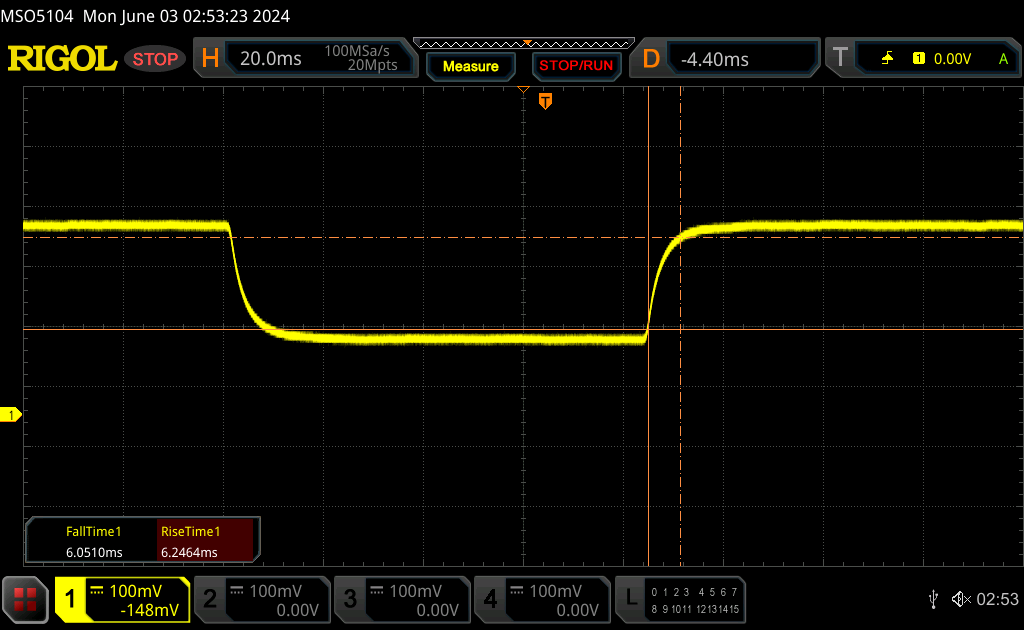 |
| ↘ 6.1 ms chute | ||
| L'écran montre de bons temps de réponse, mais insuffisant pour du jeu compétitif. En comparaison, tous les appareils testés affichent entre 0.165 (minimum) et 636 (maximum) ms. » 23 % des appareils testés affichent de meilleures performances. Cela signifie que les latences relevées sont meilleures que la moyenne (32.5 ms) de tous les appareils testés. | ||
Scintillement / MLI (Modulation de largeur d'impulsion)
| Scintillement / MLI (Modulation de largeur d'impulsion) non décelé | 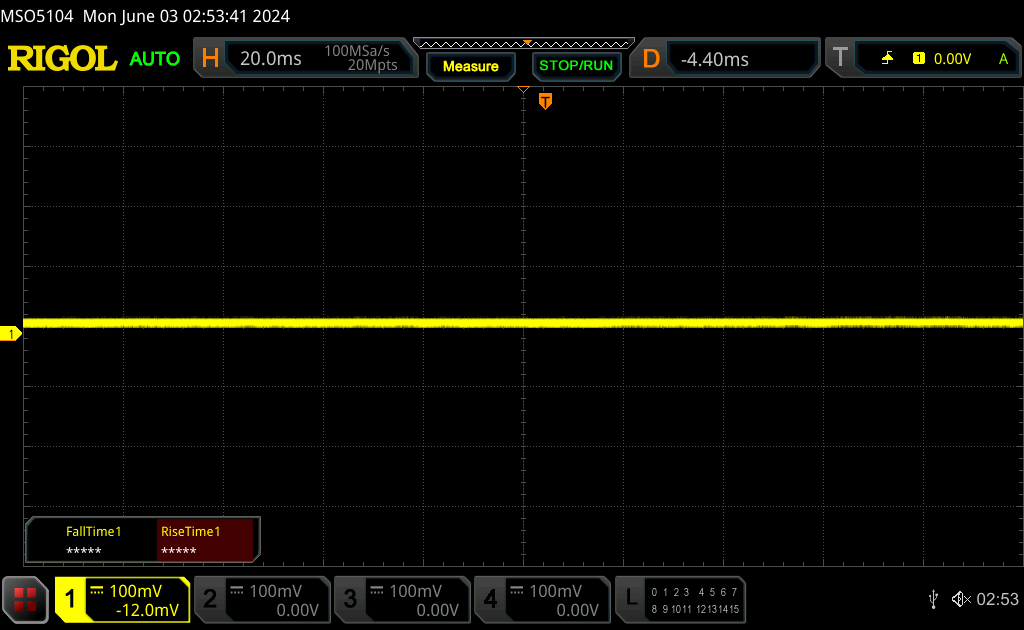 | ||
En comparaison, 53 % des appareils testés n'emploient pas MDI pour assombrir leur écran. Nous avons relevé une moyenne à 8492 (minimum : 5 - maximum : 343500) Hz dans le cas où une MDI était active. | |||


Performance - Machine de jeu multimédia polyvalente
Conditions d'essai
Nous avons réglé Lenovo Vantage sur le mode Performance et Nvidia sur le mode dGPU avant d'effectuer les tests ci-dessous.
Notez que si le GPU peut être réglé en mode discret uniquement, il n'existe pas de mode "iGPU uniquement" dans le panneau de configuration Nvidia.
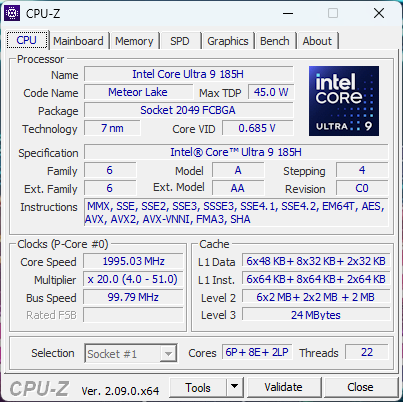
Processeur
Le Core Ultra 9 185H dans notre configuration RTX 4050 est à moins de 3 points de pourcentage du même CPU dans la configuration RTX 4070 plus haut de gamme. Il offre des performances plus rapides que le Core i7-13900H tout en intégrant un NPU pour les tâches accélérées par l'IA. La rétrogradation vers le Core Ultra 7 155H ne devrait avoir un impact sur les performances que de 5 à 10 %, d'après notre expérience avec le Dell XPS 16 9640.
Cinebench R15 Multi Loop
Cinebench R23: Multi Core | Single Core
Cinebench R20: CPU (Multi Core) | CPU (Single Core)
Cinebench R15: CPU Multi 64Bit | CPU Single 64Bit
Blender: v2.79 BMW27 CPU
7-Zip 18.03: 7z b 4 | 7z b 4 -mmt1
Geekbench 6.4: Multi-Core | Single-Core
Geekbench 5.5: Multi-Core | Single-Core
HWBOT x265 Benchmark v2.2: 4k Preset
LibreOffice : 20 Documents To PDF
R Benchmark 2.5: Overall mean
* ... Moindre est la valeur, meilleures sont les performances
AIDA64: FP32 Ray-Trace | FPU Julia | CPU SHA3 | CPU Queen | FPU SinJulia | FPU Mandel | CPU AES | CPU ZLib | FP64 Ray-Trace | CPU PhotoWorxx
| Performance Rating | |
| Lenovo Yoga Pro 9 16IMH9 | |
| Lenovo Yoga Pro 9 16IMH9 RTX 4050 | |
| Dell XPS 16 9640 | |
| HP Envy x360 2-in-1 16-ad0097nr | |
| Moyenne Intel Core Ultra 9 185H | |
| Asus VivoBook Pro 16 K6602VU | |
| Samsung Galaxy Book4 Ultra | |
| AIDA64 / FP32 Ray-Trace | |
| HP Envy x360 2-in-1 16-ad0097nr | |
| Lenovo Yoga Pro 9 16IMH9 RTX 4050 | |
| Lenovo Yoga Pro 9 16IMH9 | |
| Dell XPS 16 9640 | |
| Moyenne Intel Core Ultra 9 185H (9220 - 18676, n=19) | |
| Asus VivoBook Pro 16 K6602VU | |
| Samsung Galaxy Book4 Ultra | |
| AIDA64 / FPU Julia | |
| Lenovo Yoga Pro 9 16IMH9 | |
| Lenovo Yoga Pro 9 16IMH9 RTX 4050 | |
| Dell XPS 16 9640 | |
| Moyenne Intel Core Ultra 9 185H (48865 - 96463, n=19) | |
| HP Envy x360 2-in-1 16-ad0097nr | |
| Asus VivoBook Pro 16 K6602VU | |
| Samsung Galaxy Book4 Ultra | |
| AIDA64 / CPU SHA3 | |
| Lenovo Yoga Pro 9 16IMH9 RTX 4050 | |
| Lenovo Yoga Pro 9 16IMH9 | |
| Dell XPS 16 9640 | |
| Moyenne Intel Core Ultra 9 185H (2394 - 4534, n=19) | |
| HP Envy x360 2-in-1 16-ad0097nr | |
| Asus VivoBook Pro 16 K6602VU | |
| Samsung Galaxy Book4 Ultra | |
| AIDA64 / CPU Queen | |
| HP Envy x360 2-in-1 16-ad0097nr | |
| Lenovo Yoga Pro 9 16IMH9 RTX 4050 | |
| Asus VivoBook Pro 16 K6602VU | |
| Lenovo Yoga Pro 9 16IMH9 | |
| Dell XPS 16 9640 | |
| Moyenne Intel Core Ultra 9 185H (66785 - 95241, n=19) | |
| Samsung Galaxy Book4 Ultra | |
| AIDA64 / FPU SinJulia | |
| HP Envy x360 2-in-1 16-ad0097nr | |
| Lenovo Yoga Pro 9 16IMH9 | |
| Lenovo Yoga Pro 9 16IMH9 RTX 4050 | |
| Dell XPS 16 9640 | |
| Moyenne Intel Core Ultra 9 185H (7255 - 11392, n=19) | |
| Samsung Galaxy Book4 Ultra | |
| Asus VivoBook Pro 16 K6602VU | |
| AIDA64 / FPU Mandel | |
| Lenovo Yoga Pro 9 16IMH9 | |
| Lenovo Yoga Pro 9 16IMH9 RTX 4050 | |
| HP Envy x360 2-in-1 16-ad0097nr | |
| Dell XPS 16 9640 | |
| Moyenne Intel Core Ultra 9 185H (24004 - 48020, n=19) | |
| Samsung Galaxy Book4 Ultra | |
| Asus VivoBook Pro 16 K6602VU | |
| AIDA64 / CPU AES | |
| Asus VivoBook Pro 16 K6602VU | |
| Lenovo Yoga Pro 9 16IMH9 | |
| Lenovo Yoga Pro 9 16IMH9 RTX 4050 | |
| Moyenne Intel Core Ultra 9 185H (53116 - 154066, n=19) | |
| Dell XPS 16 9640 | |
| HP Envy x360 2-in-1 16-ad0097nr | |
| Samsung Galaxy Book4 Ultra | |
| AIDA64 / CPU ZLib | |
| Lenovo Yoga Pro 9 16IMH9 | |
| Lenovo Yoga Pro 9 16IMH9 RTX 4050 | |
| Dell XPS 16 9640 | |
| Moyenne Intel Core Ultra 9 185H (678 - 1341, n=19) | |
| Samsung Galaxy Book4 Ultra | |
| Asus VivoBook Pro 16 K6602VU | |
| HP Envy x360 2-in-1 16-ad0097nr | |
| AIDA64 / FP64 Ray-Trace | |
| HP Envy x360 2-in-1 16-ad0097nr | |
| Lenovo Yoga Pro 9 16IMH9 | |
| Lenovo Yoga Pro 9 16IMH9 RTX 4050 | |
| Dell XPS 16 9640 | |
| Moyenne Intel Core Ultra 9 185H (4428 - 10078, n=19) | |
| Asus VivoBook Pro 16 K6602VU | |
| Samsung Galaxy Book4 Ultra | |
| AIDA64 / CPU PhotoWorxx | |
| Lenovo Yoga Pro 9 16IMH9 | |
| Lenovo Yoga Pro 9 16IMH9 RTX 4050 | |
| Dell XPS 16 9640 | |
| Samsung Galaxy Book4 Ultra | |
| Moyenne Intel Core Ultra 9 185H (44547 - 53918, n=19) | |
| Asus VivoBook Pro 16 K6602VU | |
| HP Envy x360 2-in-1 16-ad0097nr | |
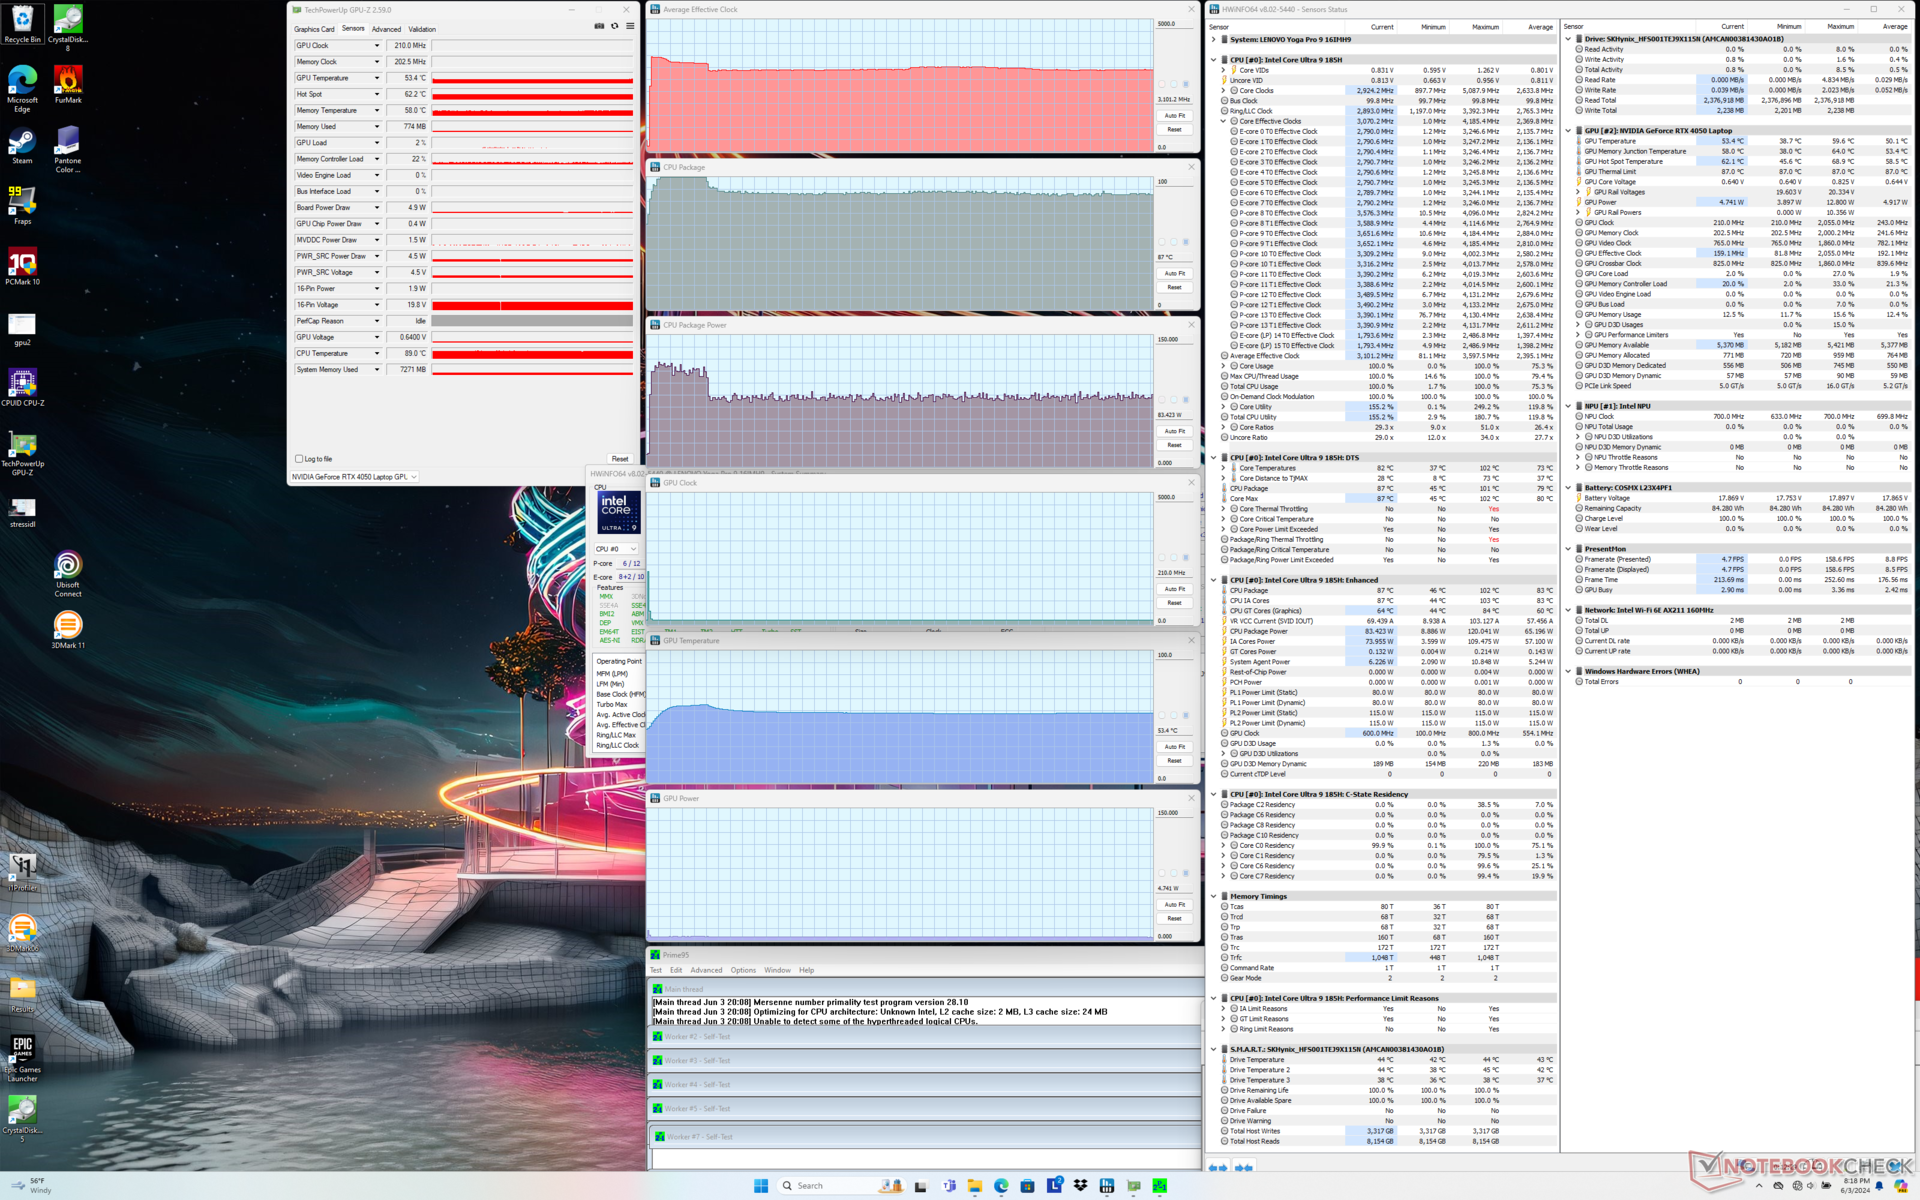
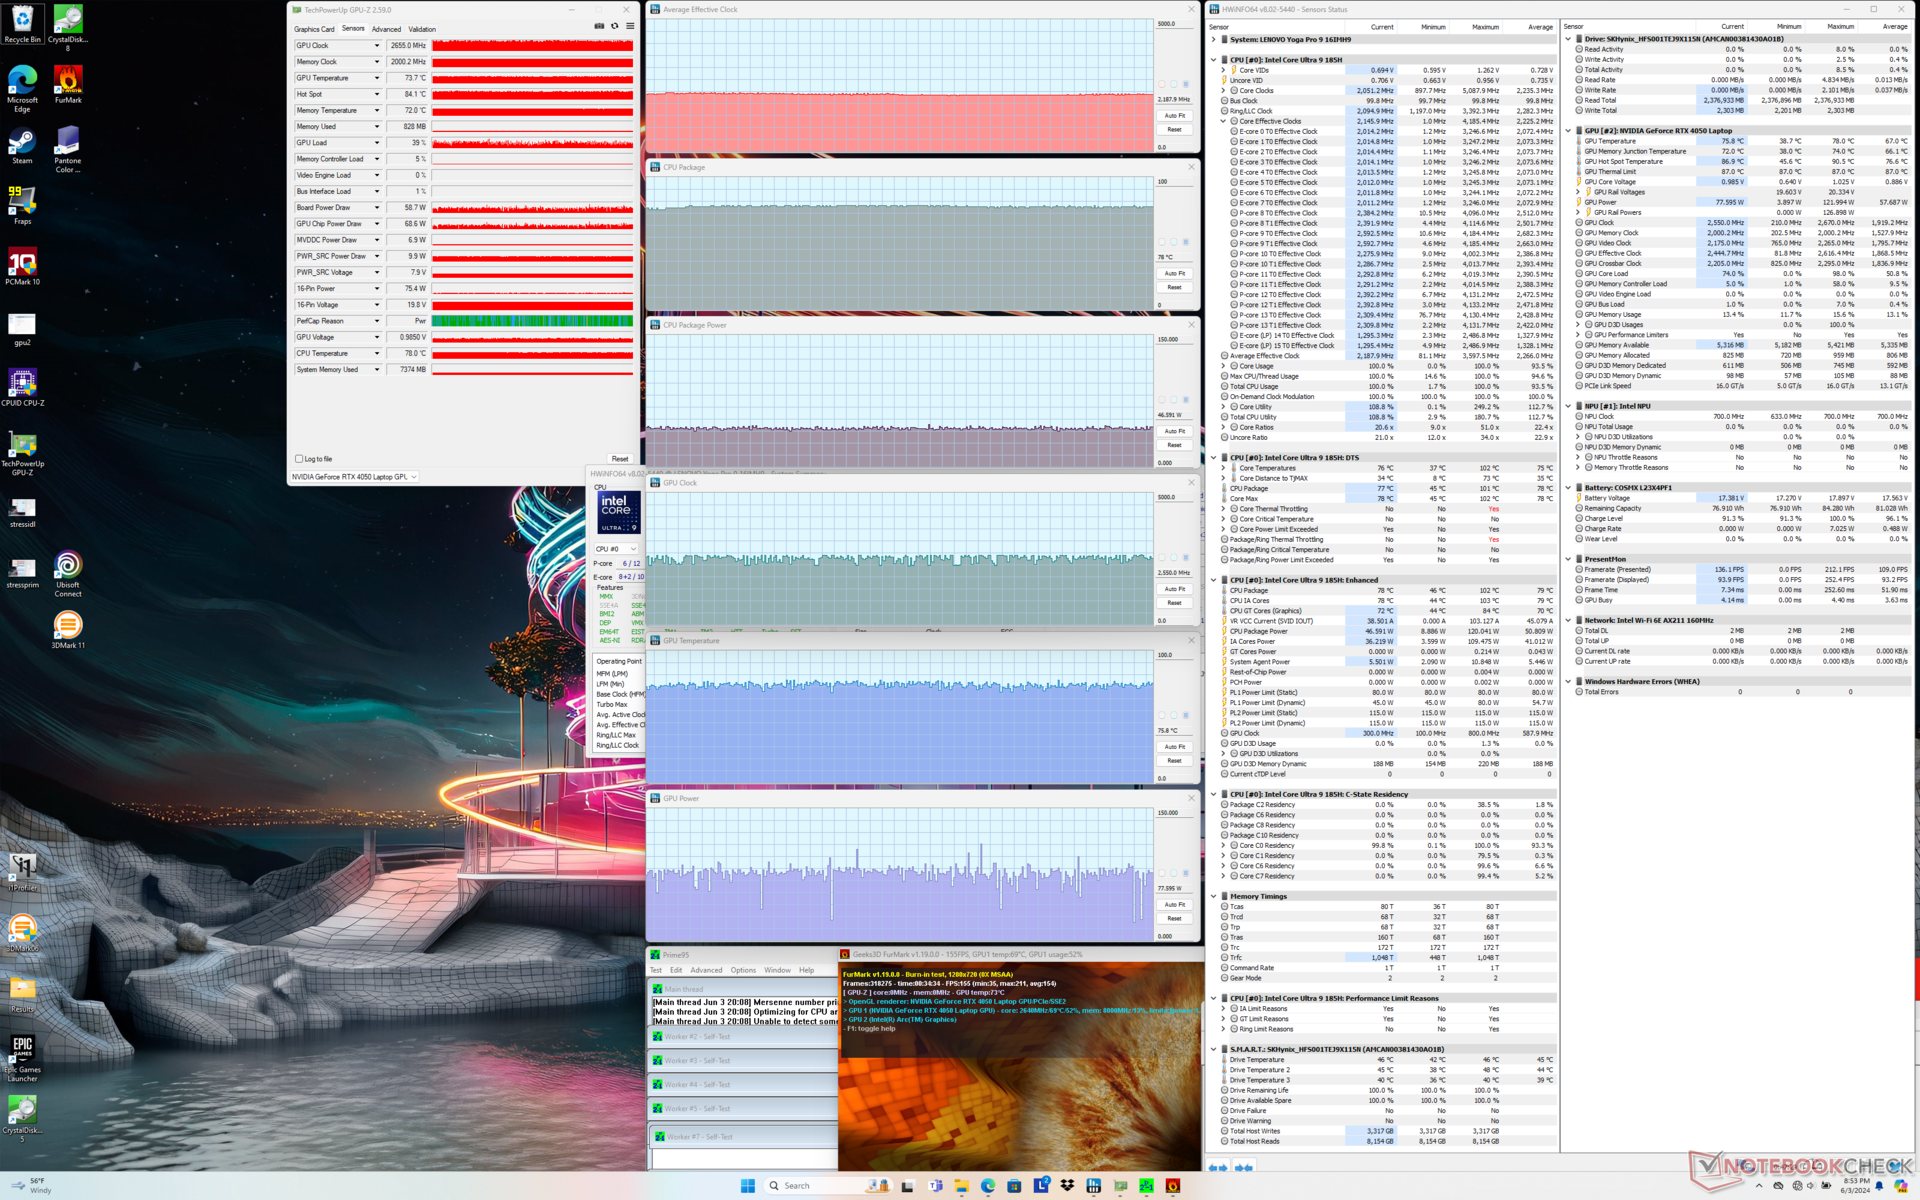
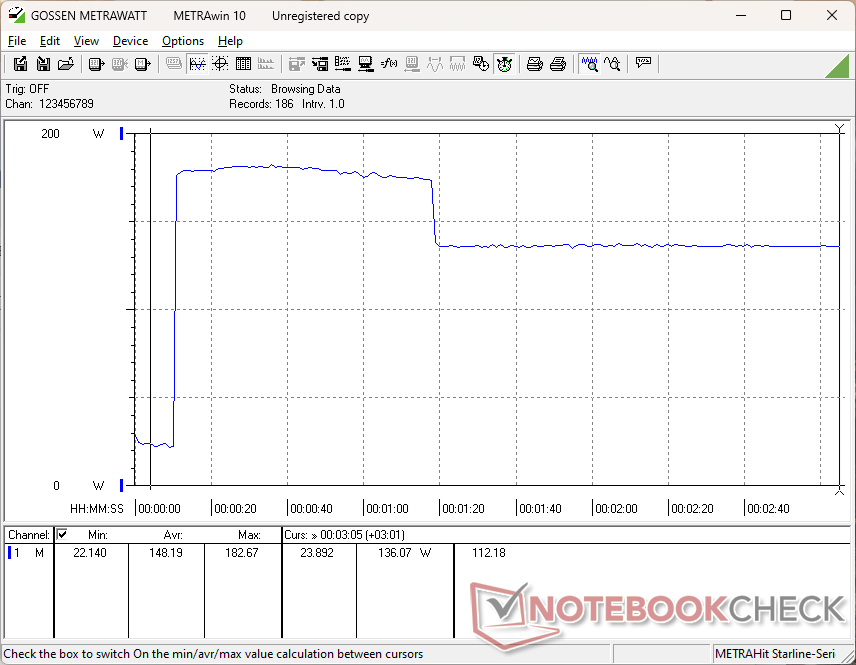
Test de stress
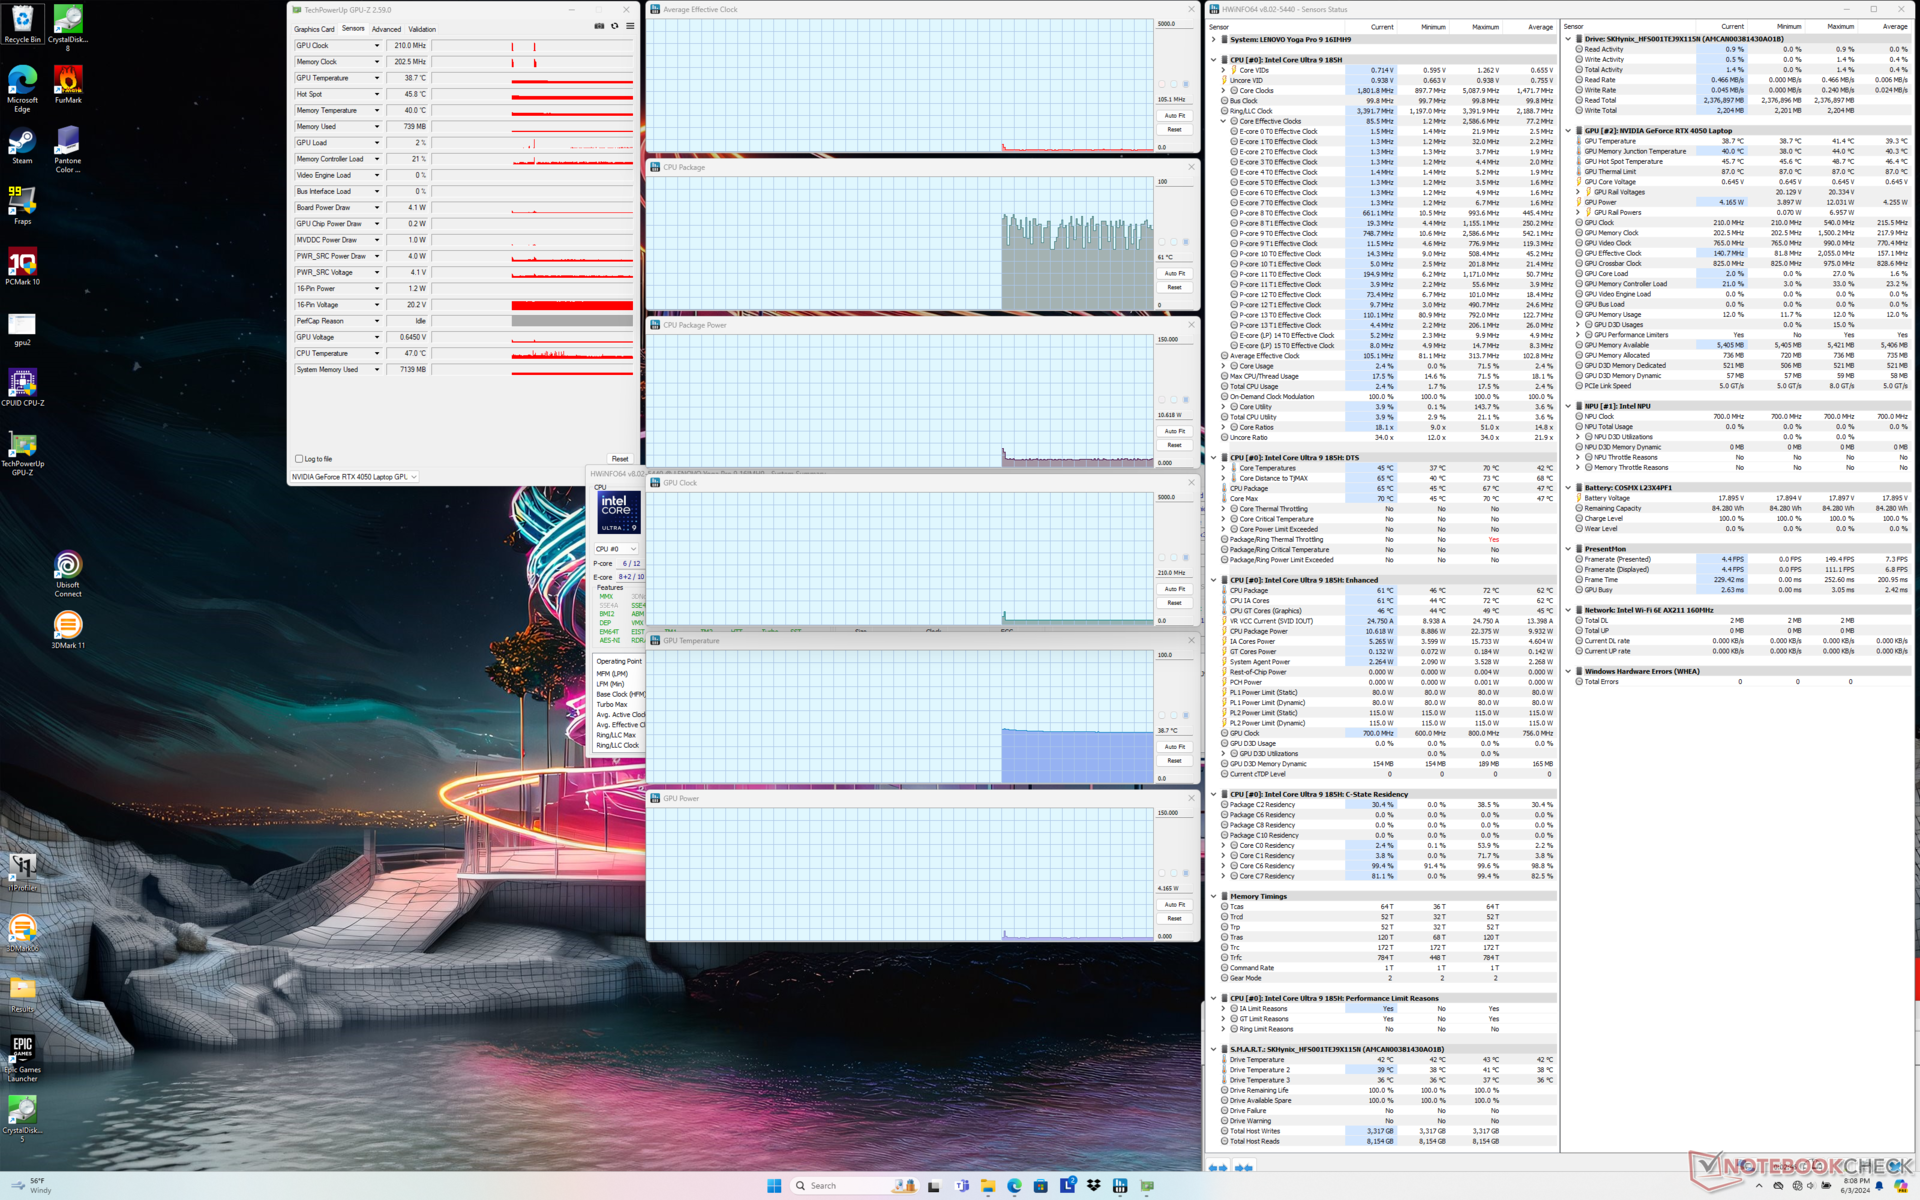
Le CPU a atteint 3,6 GHz, 100 C et 120 W après avoir lancé le stress Prime95, avant de retomber et de se stabiliser à 3,1 GHz, 90 C et 83 W environ 70 secondes plus tard.
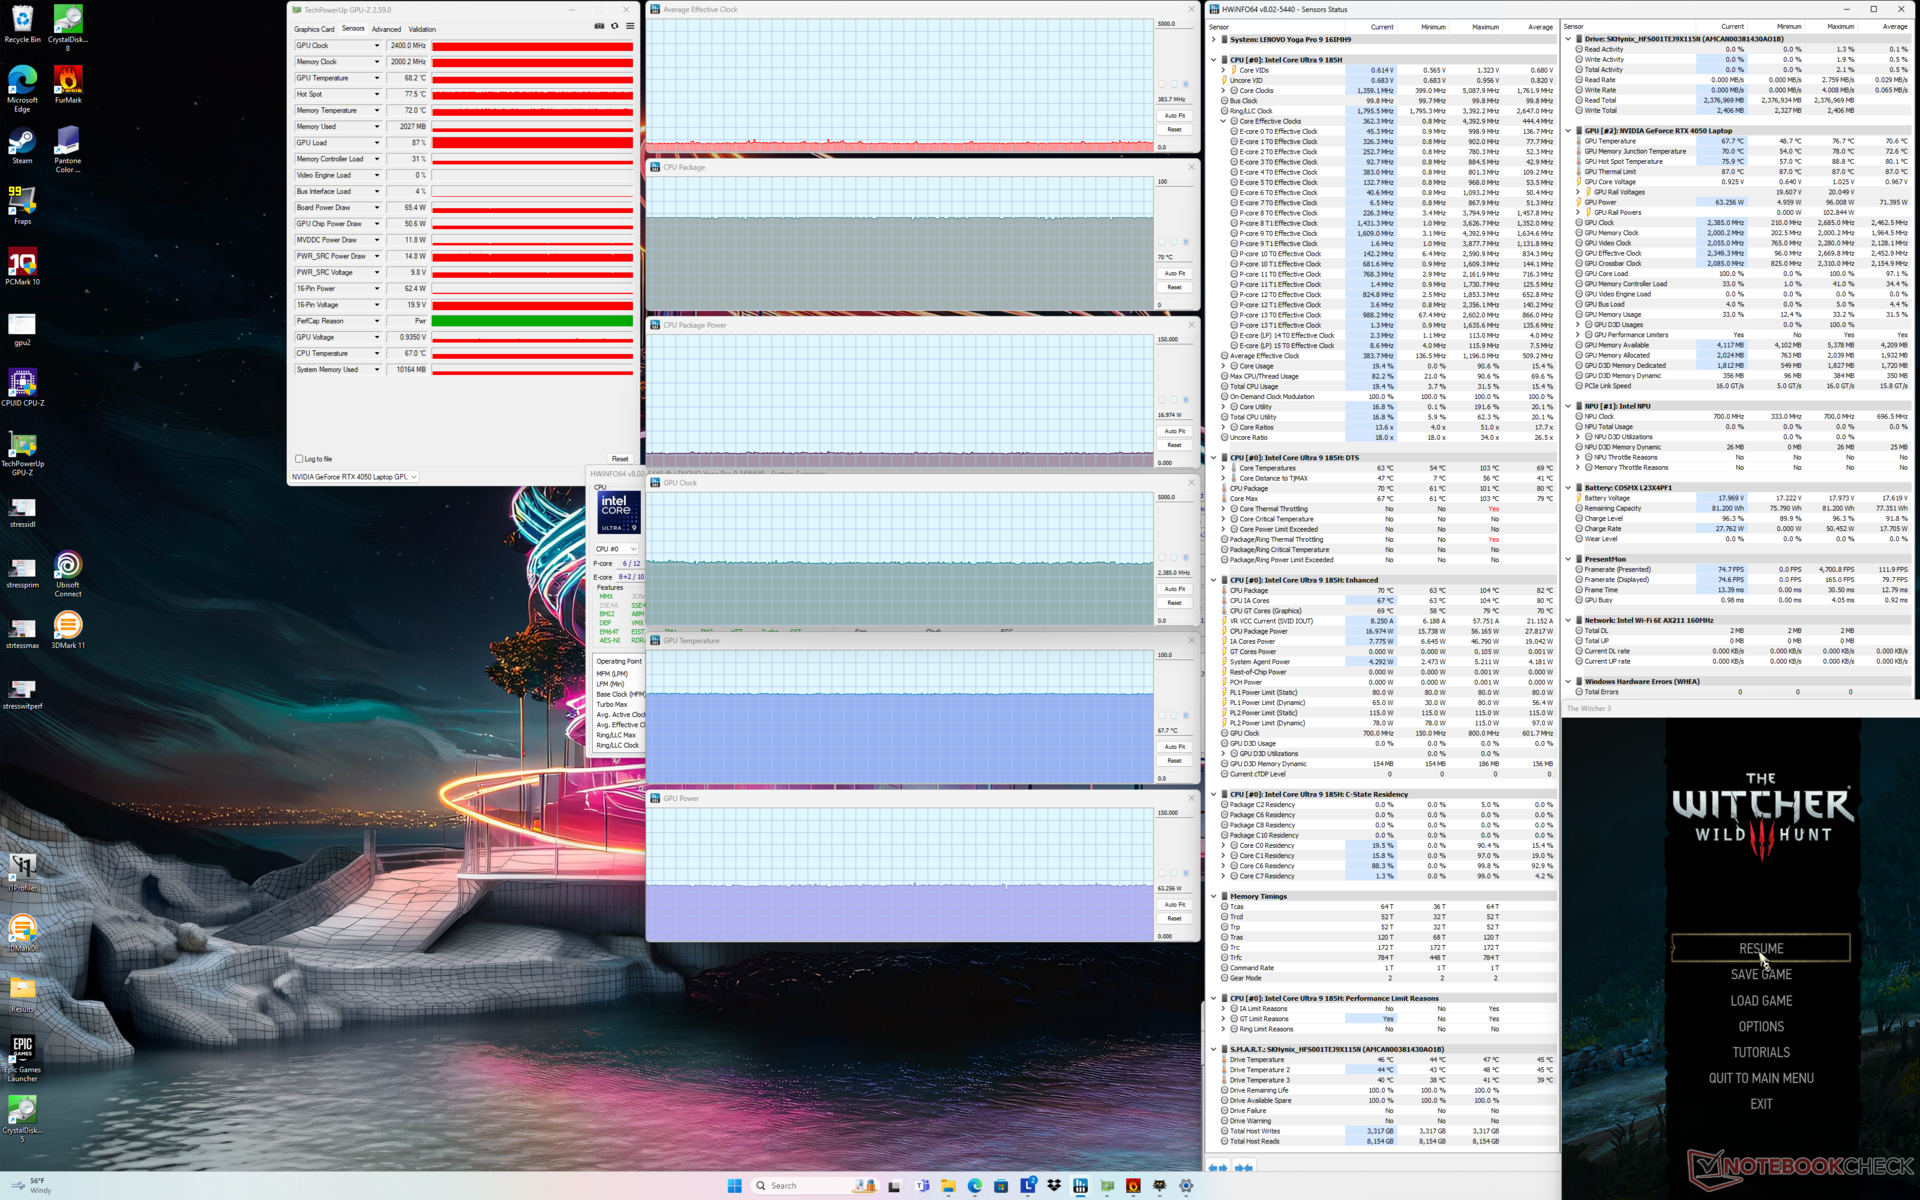
Les performances graphiques sont affectées si l'ordinateur fonctionne en mode équilibré plutôt qu'en mode performance, ce qui complète les résultats de performance du GPU ci-dessous. Le GPU Nvidia maintient une fréquence de 2855 MHz et une puissance de 78 W lorsqu'il fonctionne en mode Performance, contre 2385 MHz et 78 W en mode Performance Witcher 3 en mode Performance contre 2385 MHz et 63 W en mode Equilibré. La température du GPU est également plus élevée en mode Performance.

| Horloge moyenne du CPU (GHz) | Horloge du GPU (MHz) | Température moyenne du CPU (°C) | Température moyenne du GPU (°C) | |
| Système en veille | -- | -- | 61 | 39 |
| Prime95 Stress | 3.1 | -- | 87 | 53 |
| Prime95 + FurMark Stress | 2.2 | 2550 | 78 | 76 |
| Witcher 3 Stress(mode équilibré) | 0,4 | 2385 | 70 | 68 |
| Witcher 3 Stress (mode Performance) | 0.7 | 2655 | 99 | 76 |
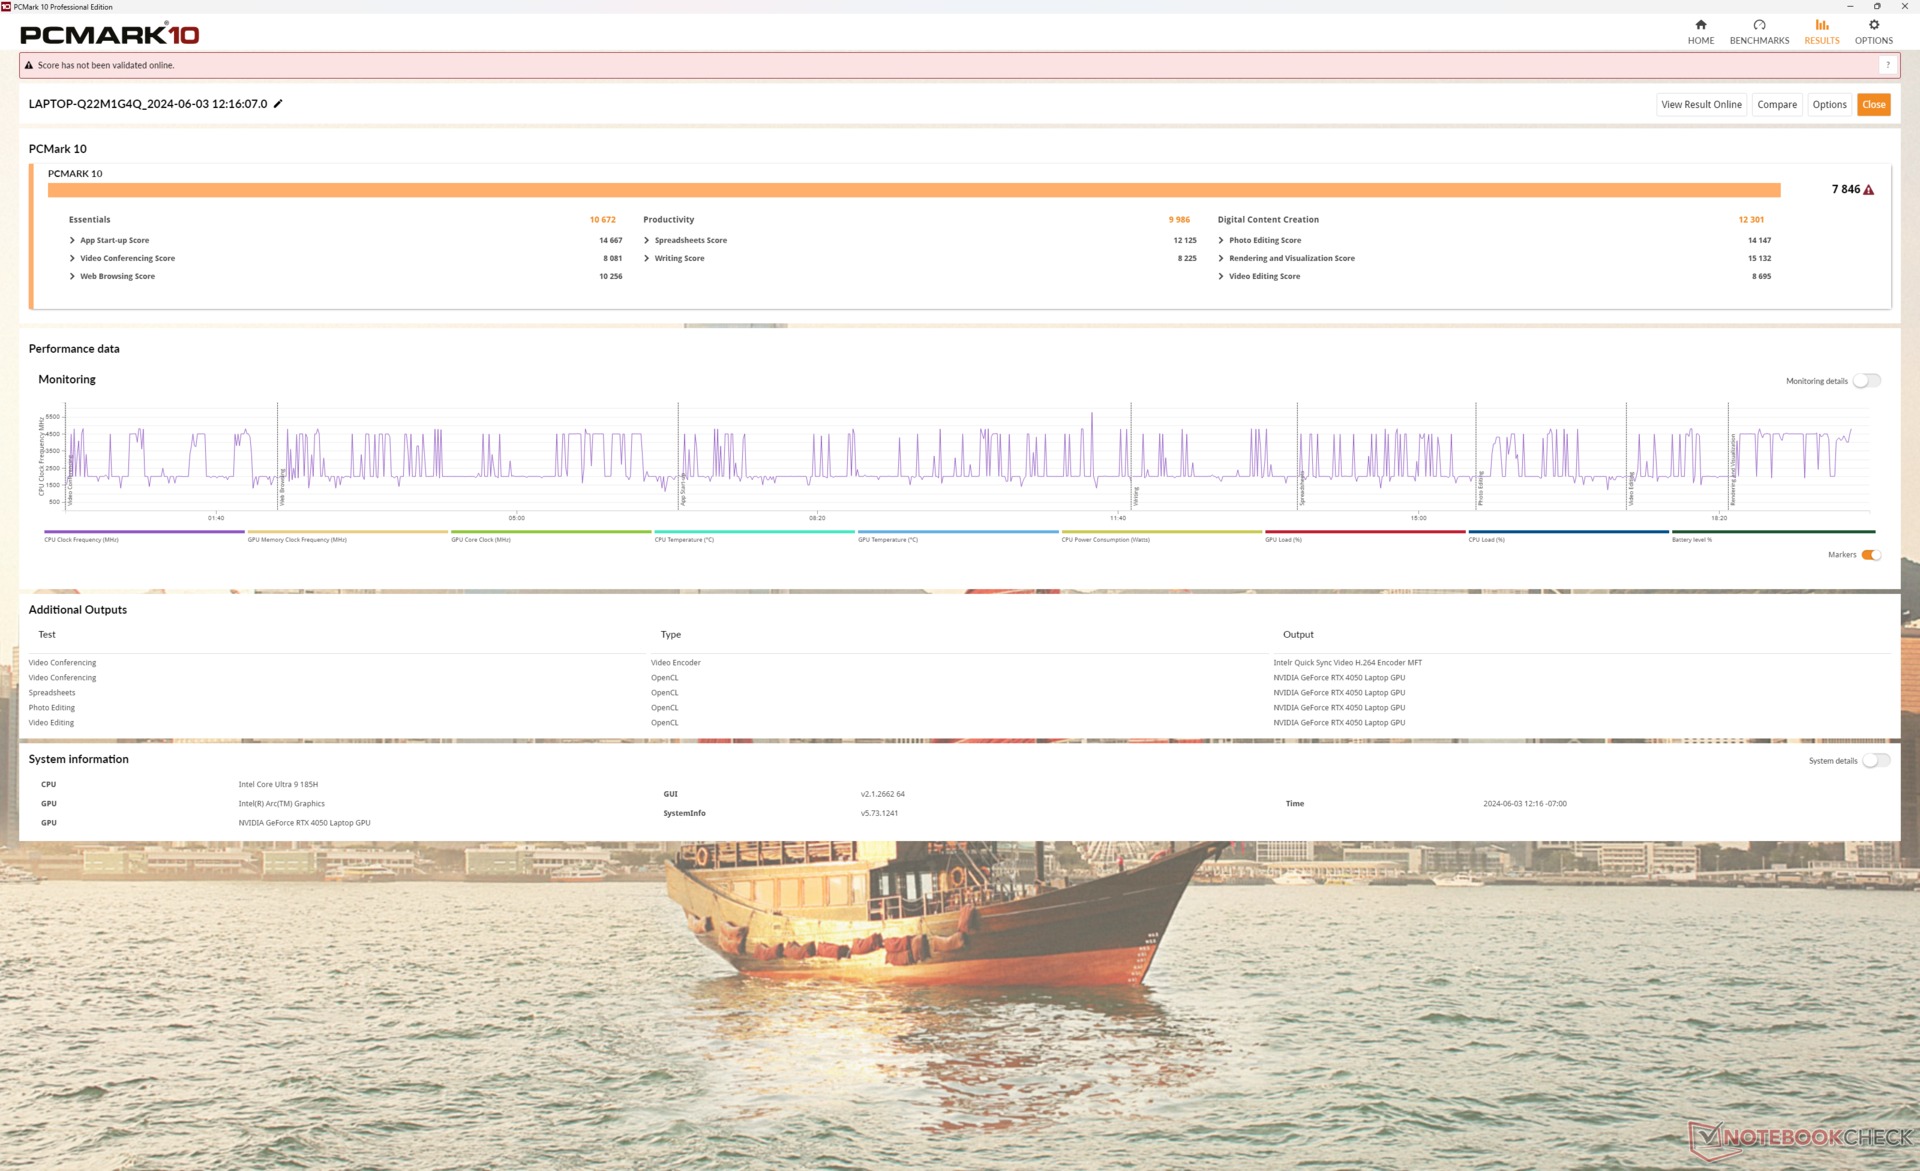
Performance du système
Les scores PCMark sont comparables à ceux de la plupart des autres ordinateurs portables multimédias, ce qui suggère que le Lenovo n'est pas significativement plus lent dans la plupart des charges de travail quotidiennes ou des tâches d'édition, malgré notre configuration RTX 4050 bas de gamme.
CrossMark: Overall | Productivity | Creativity | Responsiveness
WebXPRT 3: Overall
WebXPRT 4: Overall
Mozilla Kraken 1.1: Total
| PCMark 10 / Score | |
| Lenovo Yoga Pro 9 16IMH9 RTX 4050 | |
| Moyenne Intel Core Ultra 9 185H, NVIDIA GeForce RTX 4050 Laptop GPU (7431 - 7846, n=2) | |
| Lenovo Yoga Pro 9 16IMH9 | |
| Dell XPS 16 9640 | |
| Asus VivoBook Pro 16 K6602VU | |
| Samsung Galaxy Book4 Ultra | |
| HP Envy x360 2-in-1 16-ad0097nr | |
| PCMark 10 / Essentials | |
| Lenovo Yoga Pro 9 16IMH9 | |
| Moyenne Intel Core Ultra 9 185H, NVIDIA GeForce RTX 4050 Laptop GPU (10672 - 10807, n=2) | |
| Lenovo Yoga Pro 9 16IMH9 RTX 4050 | |
| HP Envy x360 2-in-1 16-ad0097nr | |
| Samsung Galaxy Book4 Ultra | |
| Dell XPS 16 9640 | |
| Asus VivoBook Pro 16 K6602VU | |
| PCMark 10 / Productivity | |
| Lenovo Yoga Pro 9 16IMH9 RTX 4050 | |
| HP Envy x360 2-in-1 16-ad0097nr | |
| Moyenne Intel Core Ultra 9 185H, NVIDIA GeForce RTX 4050 Laptop GPU (9717 - 9986, n=2) | |
| Dell XPS 16 9640 | |
| Samsung Galaxy Book4 Ultra | |
| Lenovo Yoga Pro 9 16IMH9 | |
| Asus VivoBook Pro 16 K6602VU | |
| PCMark 10 / Digital Content Creation | |
| Lenovo Yoga Pro 9 16IMH9 RTX 4050 | |
| Lenovo Yoga Pro 9 16IMH9 | |
| Moyenne Intel Core Ultra 9 185H, NVIDIA GeForce RTX 4050 Laptop GPU (10607 - 12301, n=2) | |
| Asus VivoBook Pro 16 K6602VU | |
| Dell XPS 16 9640 | |
| Samsung Galaxy Book4 Ultra | |
| HP Envy x360 2-in-1 16-ad0097nr | |
| CrossMark / Overall | |
| Dell XPS 16 9640 | |
| Lenovo Yoga Pro 9 16IMH9 RTX 4050 | |
| Moyenne Intel Core Ultra 9 185H, NVIDIA GeForce RTX 4050 Laptop GPU (1790 - 1811, n=2) | |
| Samsung Galaxy Book4 Ultra | |
| Asus VivoBook Pro 16 K6602VU | |
| Lenovo Yoga Pro 9 16IMH9 | |
| HP Envy x360 2-in-1 16-ad0097nr | |
| CrossMark / Productivity | |
| Dell XPS 16 9640 | |
| Lenovo Yoga Pro 9 16IMH9 RTX 4050 | |
| Moyenne Intel Core Ultra 9 185H, NVIDIA GeForce RTX 4050 Laptop GPU (1700 - 1717, n=2) | |
| Asus VivoBook Pro 16 K6602VU | |
| Samsung Galaxy Book4 Ultra | |
| Lenovo Yoga Pro 9 16IMH9 | |
| HP Envy x360 2-in-1 16-ad0097nr | |
| CrossMark / Creativity | |
| Moyenne Intel Core Ultra 9 185H, NVIDIA GeForce RTX 4050 Laptop GPU (2037 - 2038, n=2) | |
| Lenovo Yoga Pro 9 16IMH9 RTX 4050 | |
| Dell XPS 16 9640 | |
| Lenovo Yoga Pro 9 16IMH9 | |
| Samsung Galaxy Book4 Ultra | |
| Asus VivoBook Pro 16 K6602VU | |
| HP Envy x360 2-in-1 16-ad0097nr | |
| CrossMark / Responsiveness | |
| Dell XPS 16 9640 | |
| Asus VivoBook Pro 16 K6602VU | |
| Lenovo Yoga Pro 9 16IMH9 RTX 4050 | |
| Samsung Galaxy Book4 Ultra | |
| Moyenne Intel Core Ultra 9 185H, NVIDIA GeForce RTX 4050 Laptop GPU (1419 - 1493, n=2) | |
| HP Envy x360 2-in-1 16-ad0097nr | |
| Lenovo Yoga Pro 9 16IMH9 | |
| WebXPRT 3 / Overall | |
| HP Envy x360 2-in-1 16-ad0097nr | |
| Moyenne Intel Core Ultra 9 185H, NVIDIA GeForce RTX 4050 Laptop GPU (293 - 301, n=2) | |
| Lenovo Yoga Pro 9 16IMH9 | |
| Lenovo Yoga Pro 9 16IMH9 RTX 4050 | |
| Dell XPS 16 9640 | |
| Samsung Galaxy Book4 Ultra | |
| WebXPRT 4 / Overall | |
| Moyenne Intel Core Ultra 9 185H, NVIDIA GeForce RTX 4050 Laptop GPU (268 - 271, n=2) | |
| Lenovo Yoga Pro 9 16IMH9 | |
| Lenovo Yoga Pro 9 16IMH9 RTX 4050 | |
| Samsung Galaxy Book4 Ultra | |
| Dell XPS 16 9640 | |
| HP Envy x360 2-in-1 16-ad0097nr | |
| Asus VivoBook Pro 16 K6602VU | |
| Mozilla Kraken 1.1 / Total | |
| Asus VivoBook Pro 16 K6602VU | |
| HP Envy x360 2-in-1 16-ad0097nr | |
| Lenovo Yoga Pro 9 16IMH9 RTX 4050 | |
| Moyenne Intel Core Ultra 9 185H, NVIDIA GeForce RTX 4050 Laptop GPU (498 - 512, n=2) | |
| Lenovo Yoga Pro 9 16IMH9 | |
| Samsung Galaxy Book4 Ultra | |
* ... Moindre est la valeur, meilleures sont les performances
| PCMark 10 Score | 7846 points | |
Aide | ||
| AIDA64 / Memory Copy | |
| Lenovo Yoga Pro 9 16IMH9 | |
| Lenovo Yoga Pro 9 16IMH9 RTX 4050 | |
| Dell XPS 16 9640 | |
| Samsung Galaxy Book4 Ultra | |
| Moyenne Intel Core Ultra 9 185H (69929 - 95718, n=19) | |
| HP Envy x360 2-in-1 16-ad0097nr | |
| Asus VivoBook Pro 16 K6602VU | |
| AIDA64 / Memory Read | |
| Samsung Galaxy Book4 Ultra | |
| Lenovo Yoga Pro 9 16IMH9 | |
| Lenovo Yoga Pro 9 16IMH9 RTX 4050 | |
| Dell XPS 16 9640 | |
| Moyenne Intel Core Ultra 9 185H (64619 - 87768, n=19) | |
| Asus VivoBook Pro 16 K6602VU | |
| HP Envy x360 2-in-1 16-ad0097nr | |
| AIDA64 / Memory Write | |
| HP Envy x360 2-in-1 16-ad0097nr | |
| Samsung Galaxy Book4 Ultra | |
| Lenovo Yoga Pro 9 16IMH9 | |
| Lenovo Yoga Pro 9 16IMH9 RTX 4050 | |
| Dell XPS 16 9640 | |
| Moyenne Intel Core Ultra 9 185H (51114 - 93871, n=19) | |
| Asus VivoBook Pro 16 K6602VU | |
| AIDA64 / Memory Latency | |
| Moyenne Intel Core Ultra 9 185H (121.4 - 259, n=19) | |
| Samsung Galaxy Book4 Ultra | |
| Dell XPS 16 9640 | |
| Lenovo Yoga Pro 9 16IMH9 RTX 4050 | |
| Lenovo Yoga Pro 9 16IMH9 | |
| HP Envy x360 2-in-1 16-ad0097nr | |
| Asus VivoBook Pro 16 K6602VU | |
* ... Moindre est la valeur, meilleures sont les performances
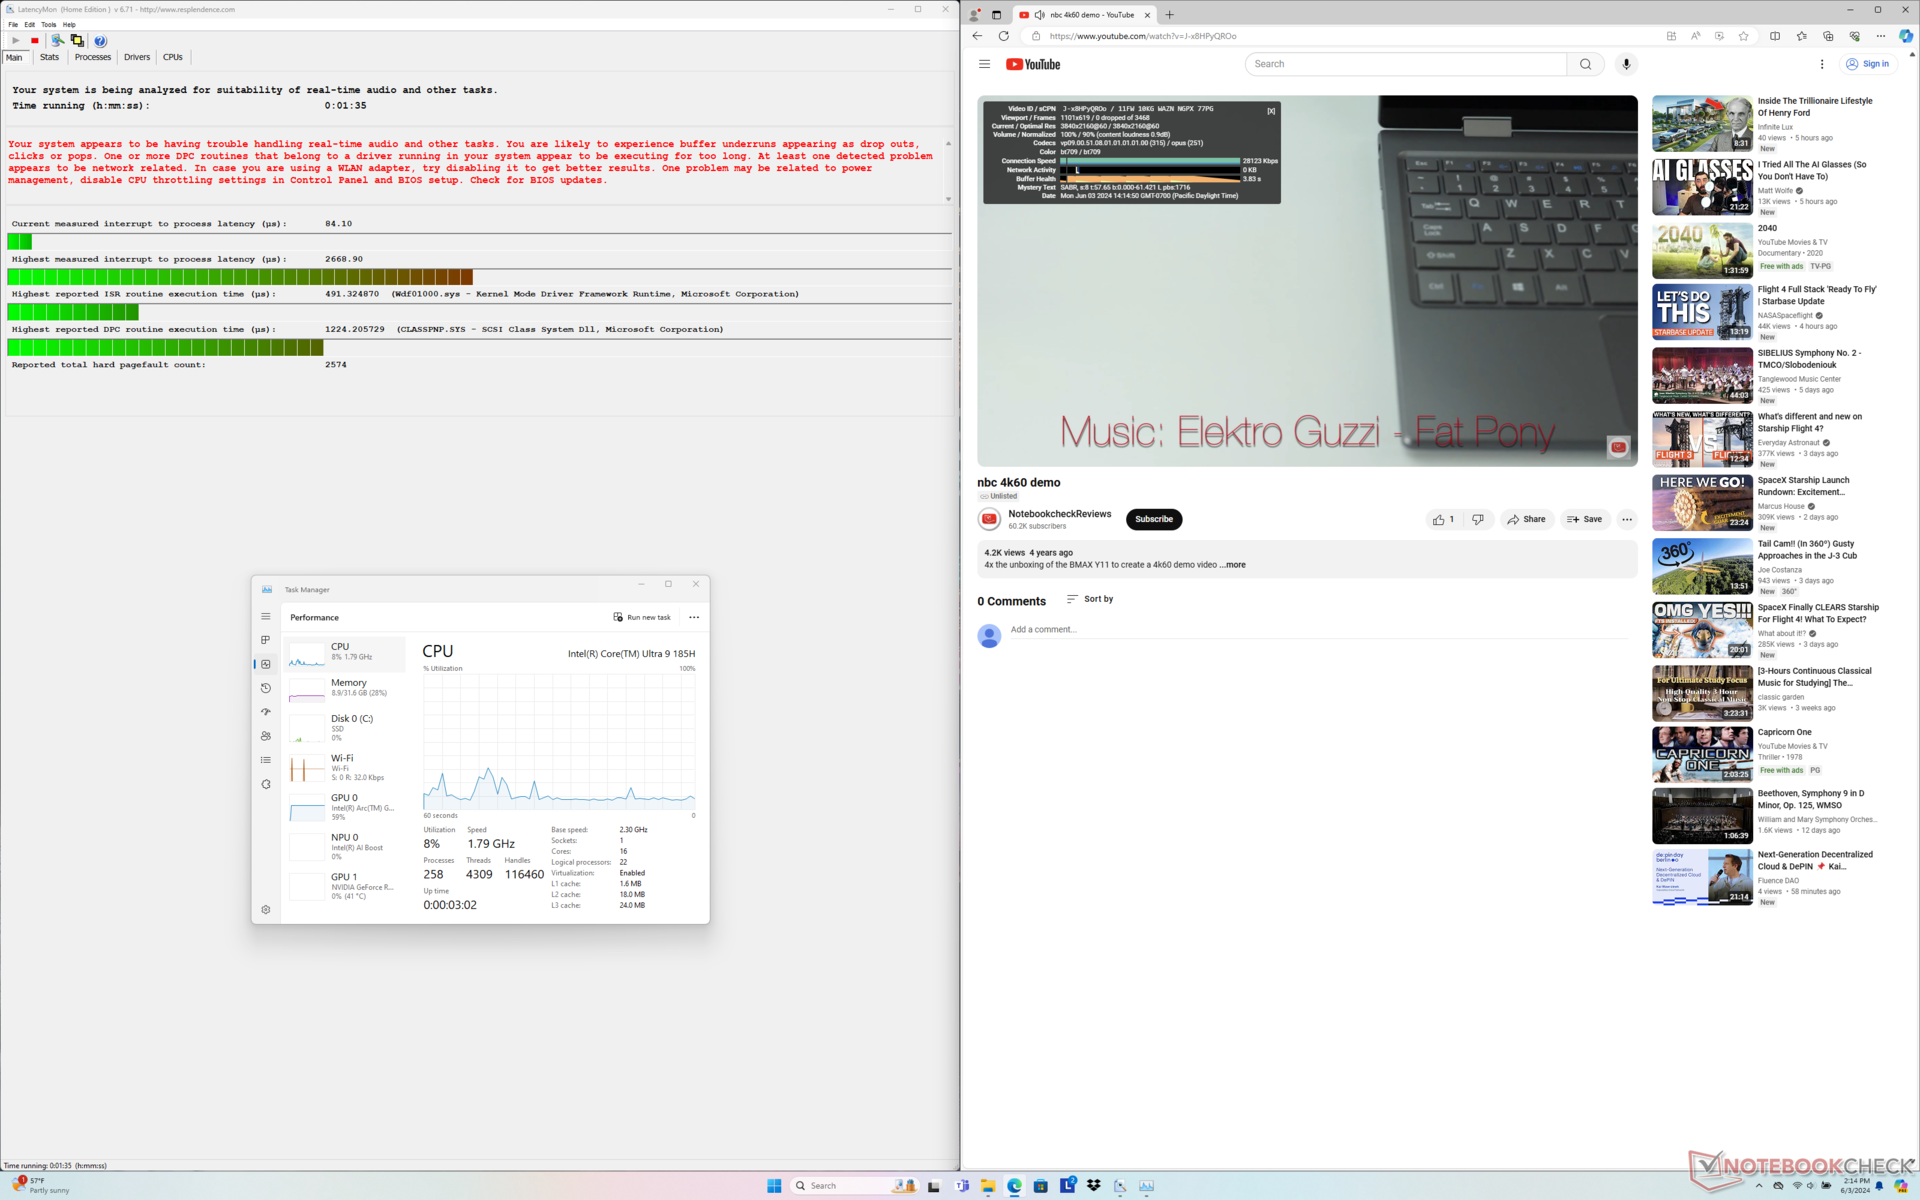
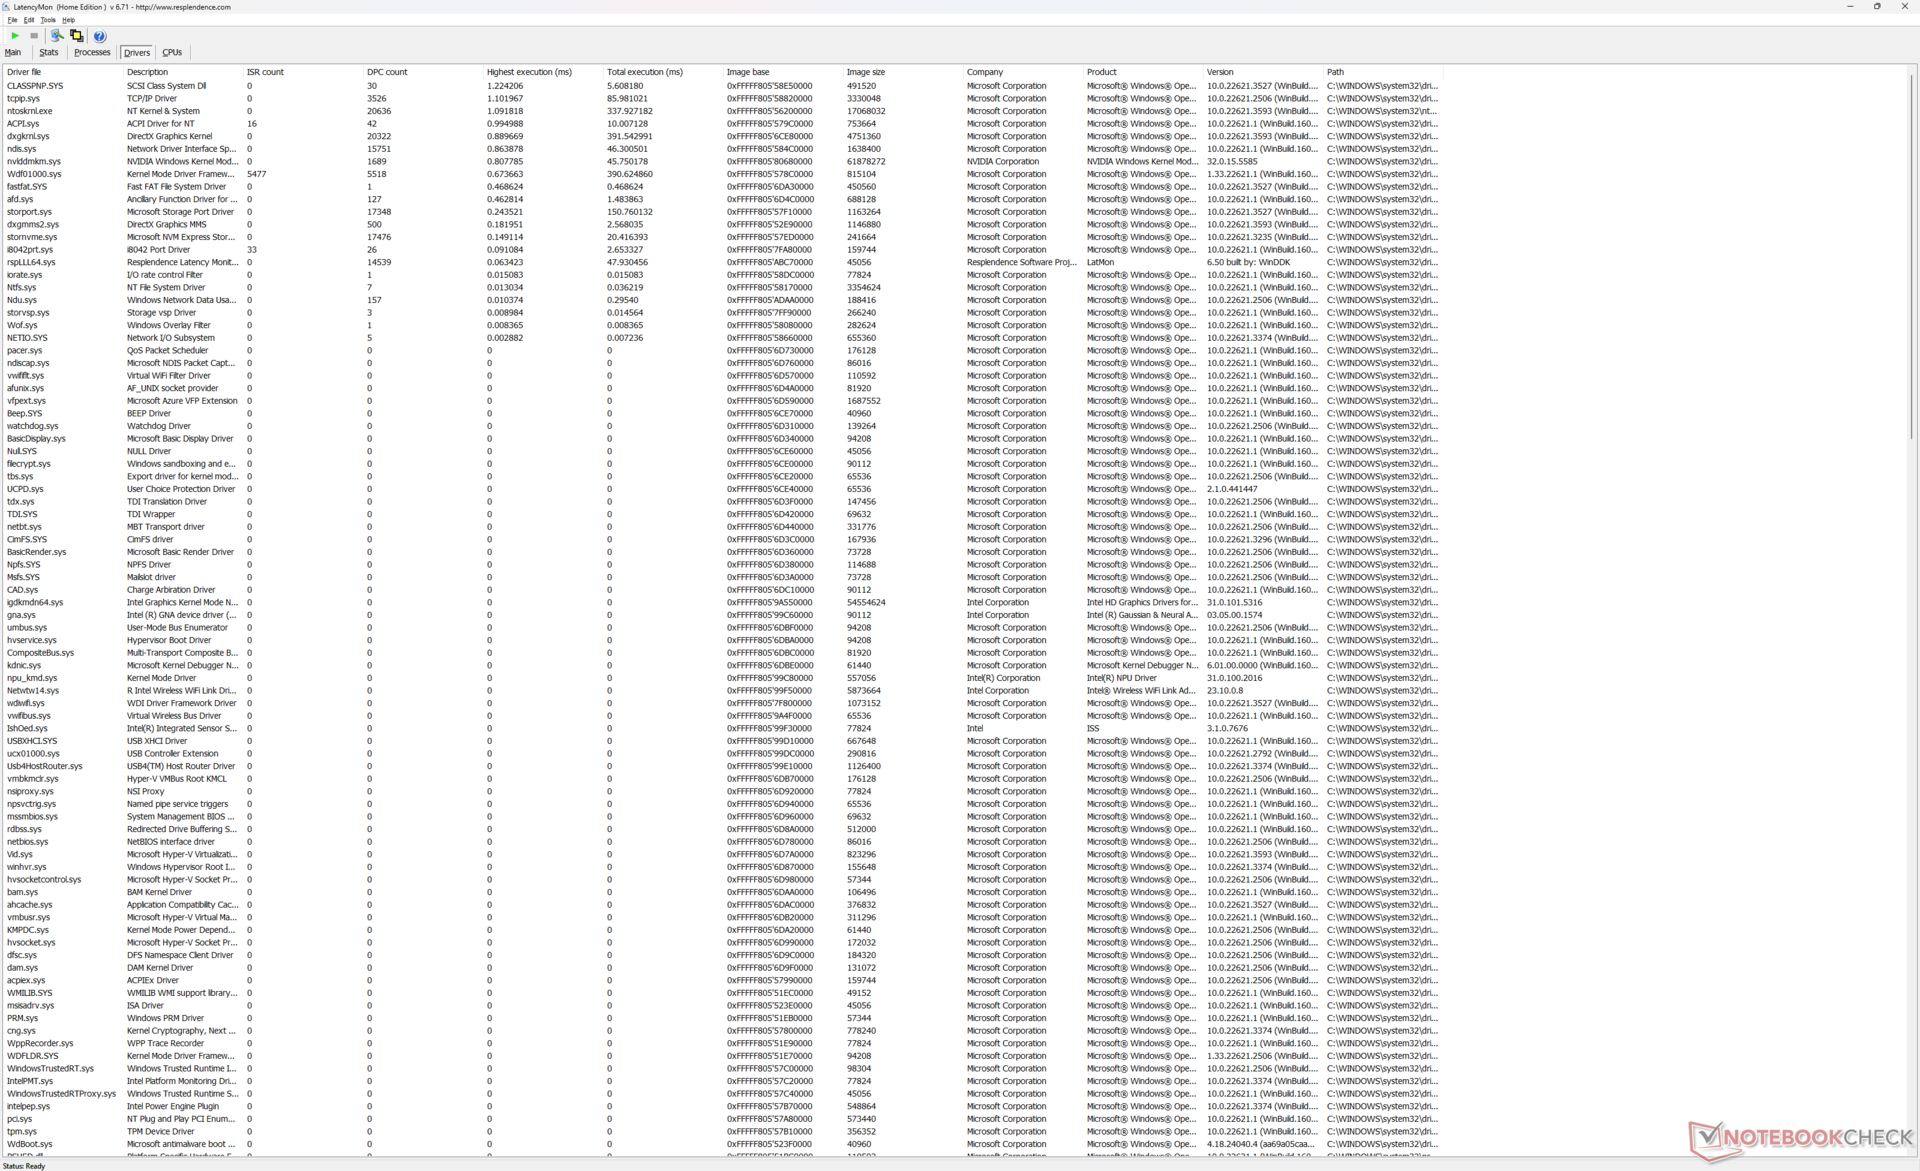
Latence DPC
LatencyMon révèle plus de problèmes DPC que la configuration RTX 4070 lors de l'ouverture de plusieurs onglets de notre page d'accueil. la lecture de vidéos 4K à 60 FPS est par ailleurs parfaite, sans aucune perte d'images.
| DPC Latencies / LatencyMon - interrupt to process latency (max), Web, Youtube, Prime95 | |
| Lenovo Yoga Pro 9 16IMH9 RTX 4050 | |
| Asus VivoBook Pro 16 K6602VU | |
| HP Envy x360 2-in-1 16-ad0097nr | |
| Dell XPS 16 9640 | |
| Samsung Galaxy Book4 Ultra | |
| Lenovo Yoga Pro 9 16IMH9 | |
* ... Moindre est la valeur, meilleures sont les performances
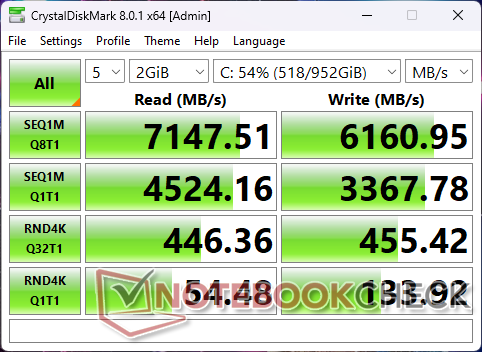
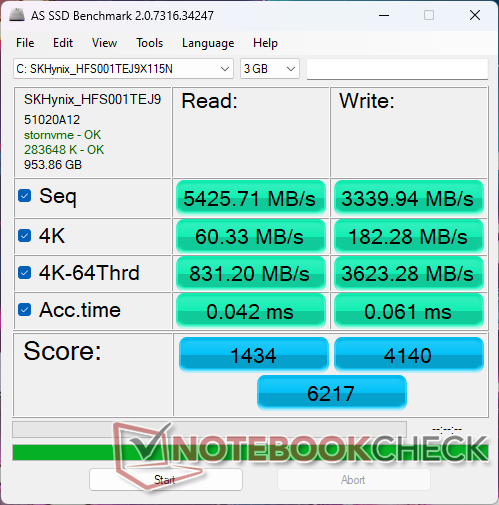
Dispositifs de stockage
Lenovo livre le même SK Hynix HFS001TEJ9X115N PCIe4 NVMe entre ses configurations RTX 4050 bas de gamme et RTX 4070 haut de gamme.

| Drive Performance Rating - Percent | |
| Dell XPS 16 9640 | |
| Samsung Galaxy Book4 Ultra | |
| Lenovo Yoga Pro 9 16IMH9 RTX 4050 | |
| Lenovo Yoga Pro 9 16IMH9 | |
| Asus VivoBook Pro 16 K6602VU | |
| HP Envy x360 2-in-1 16-ad0097nr | |
* ... Moindre est la valeur, meilleures sont les performances
Disk Throttling: DiskSpd Read Loop, Queue Depth 8
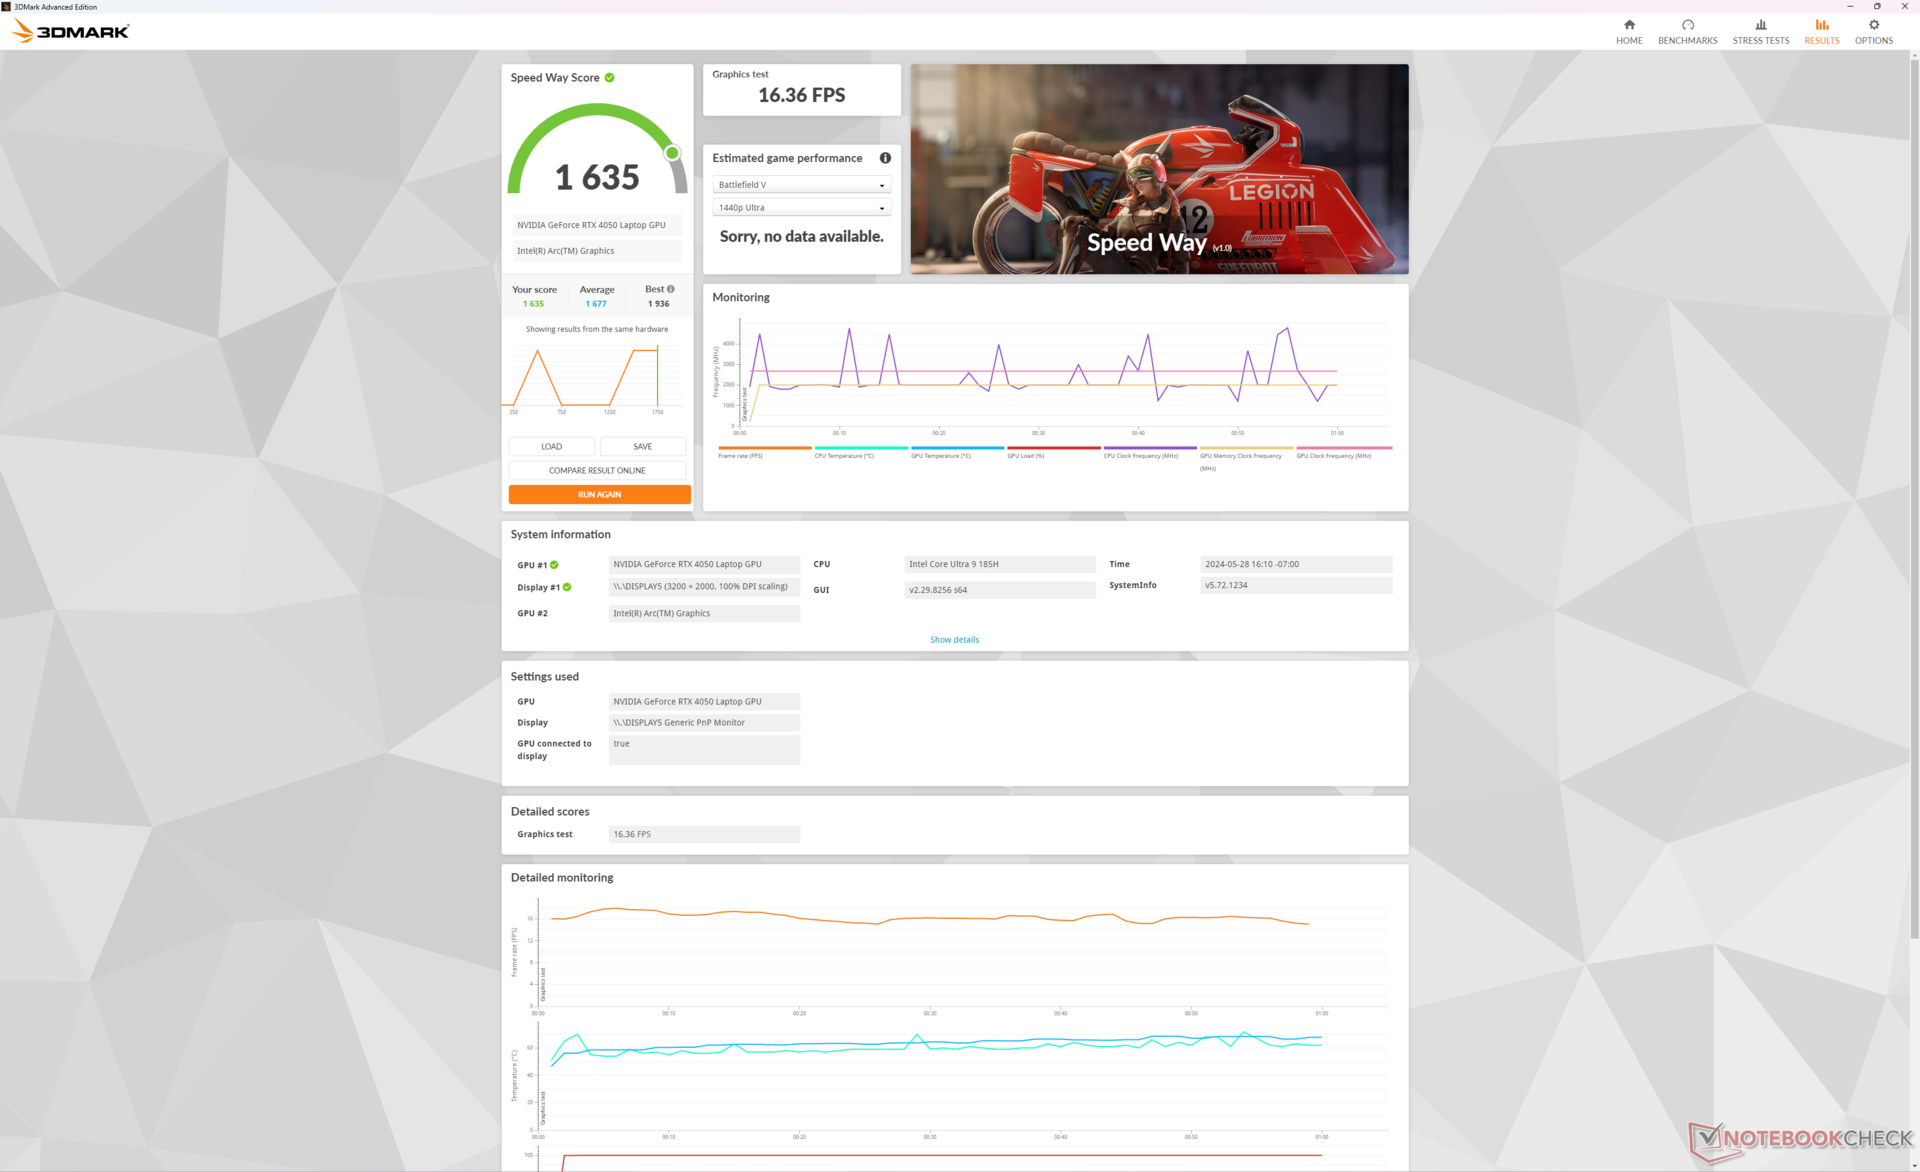
Performance du GPU
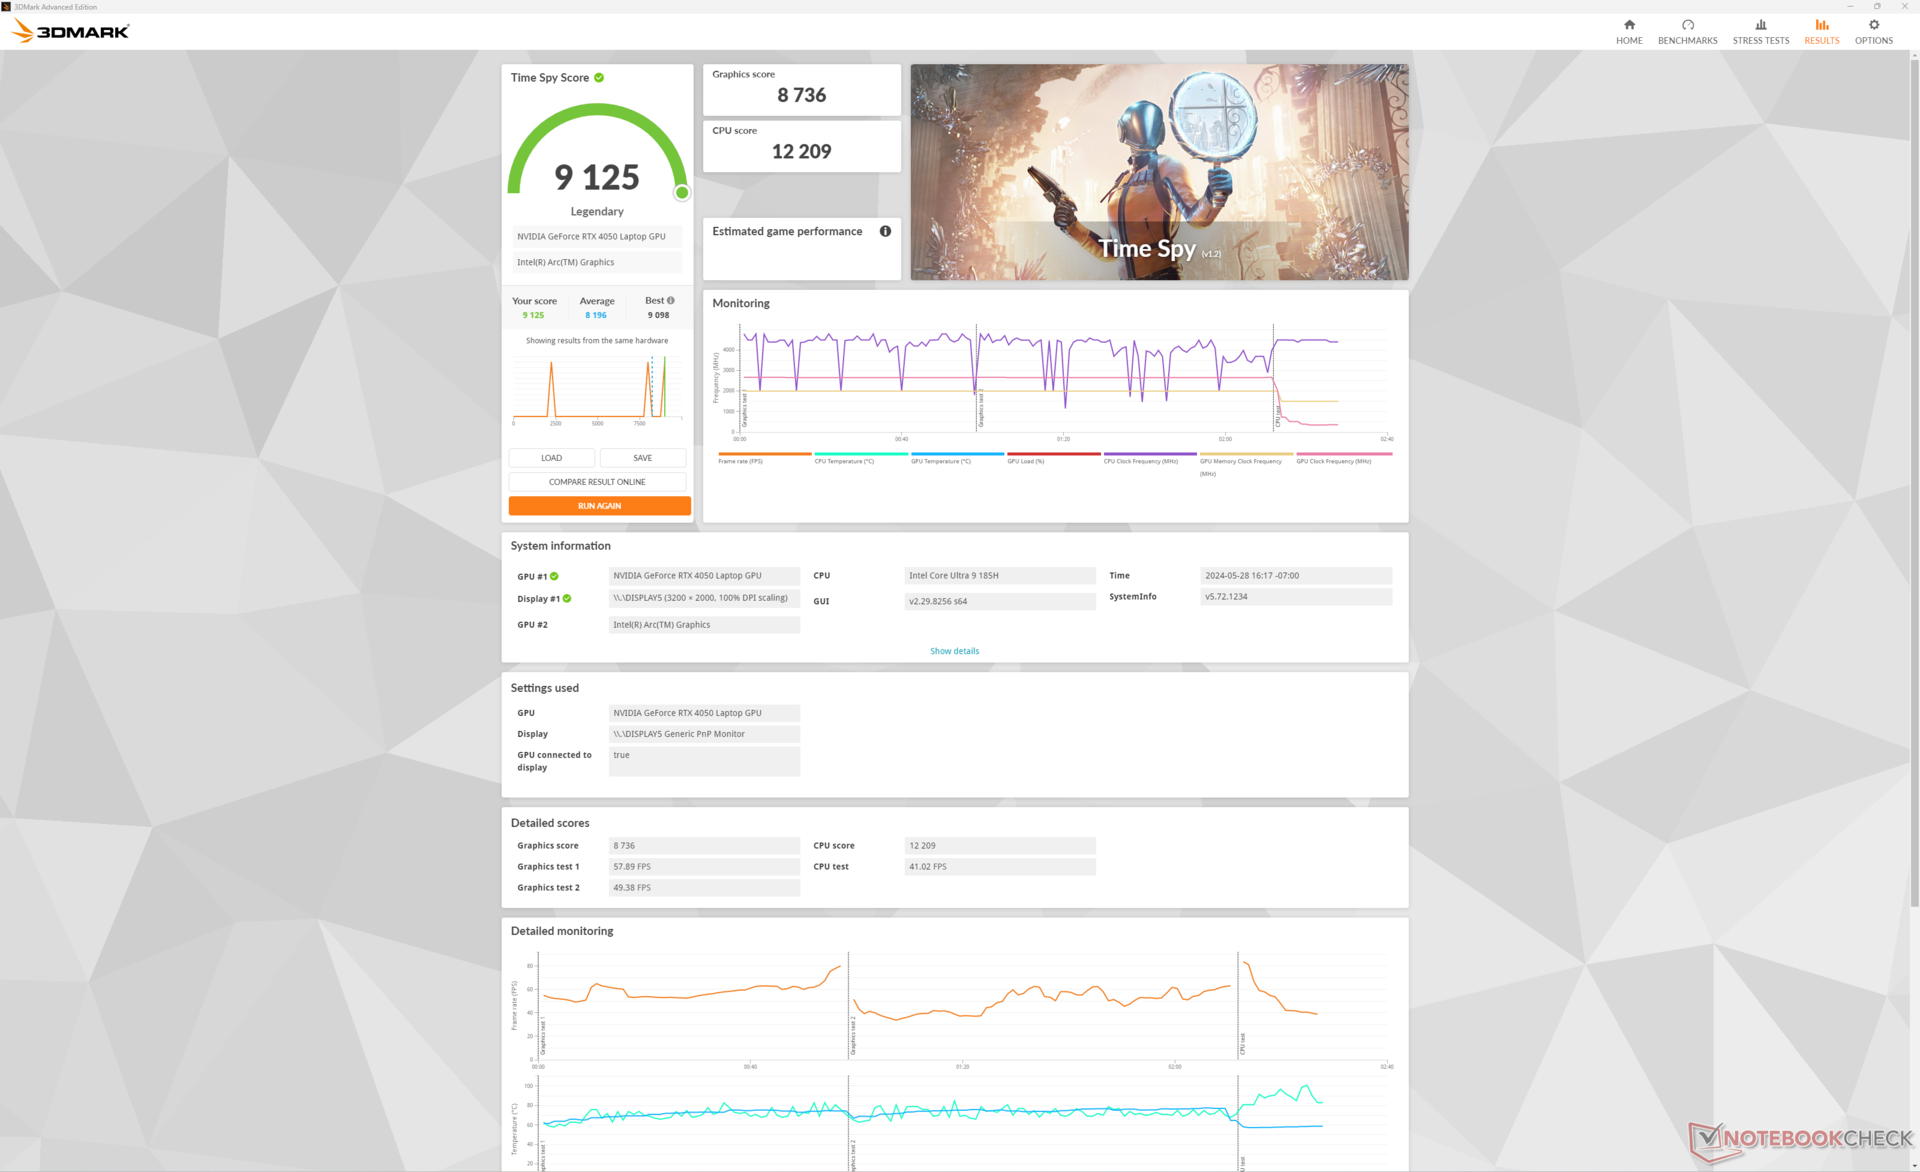
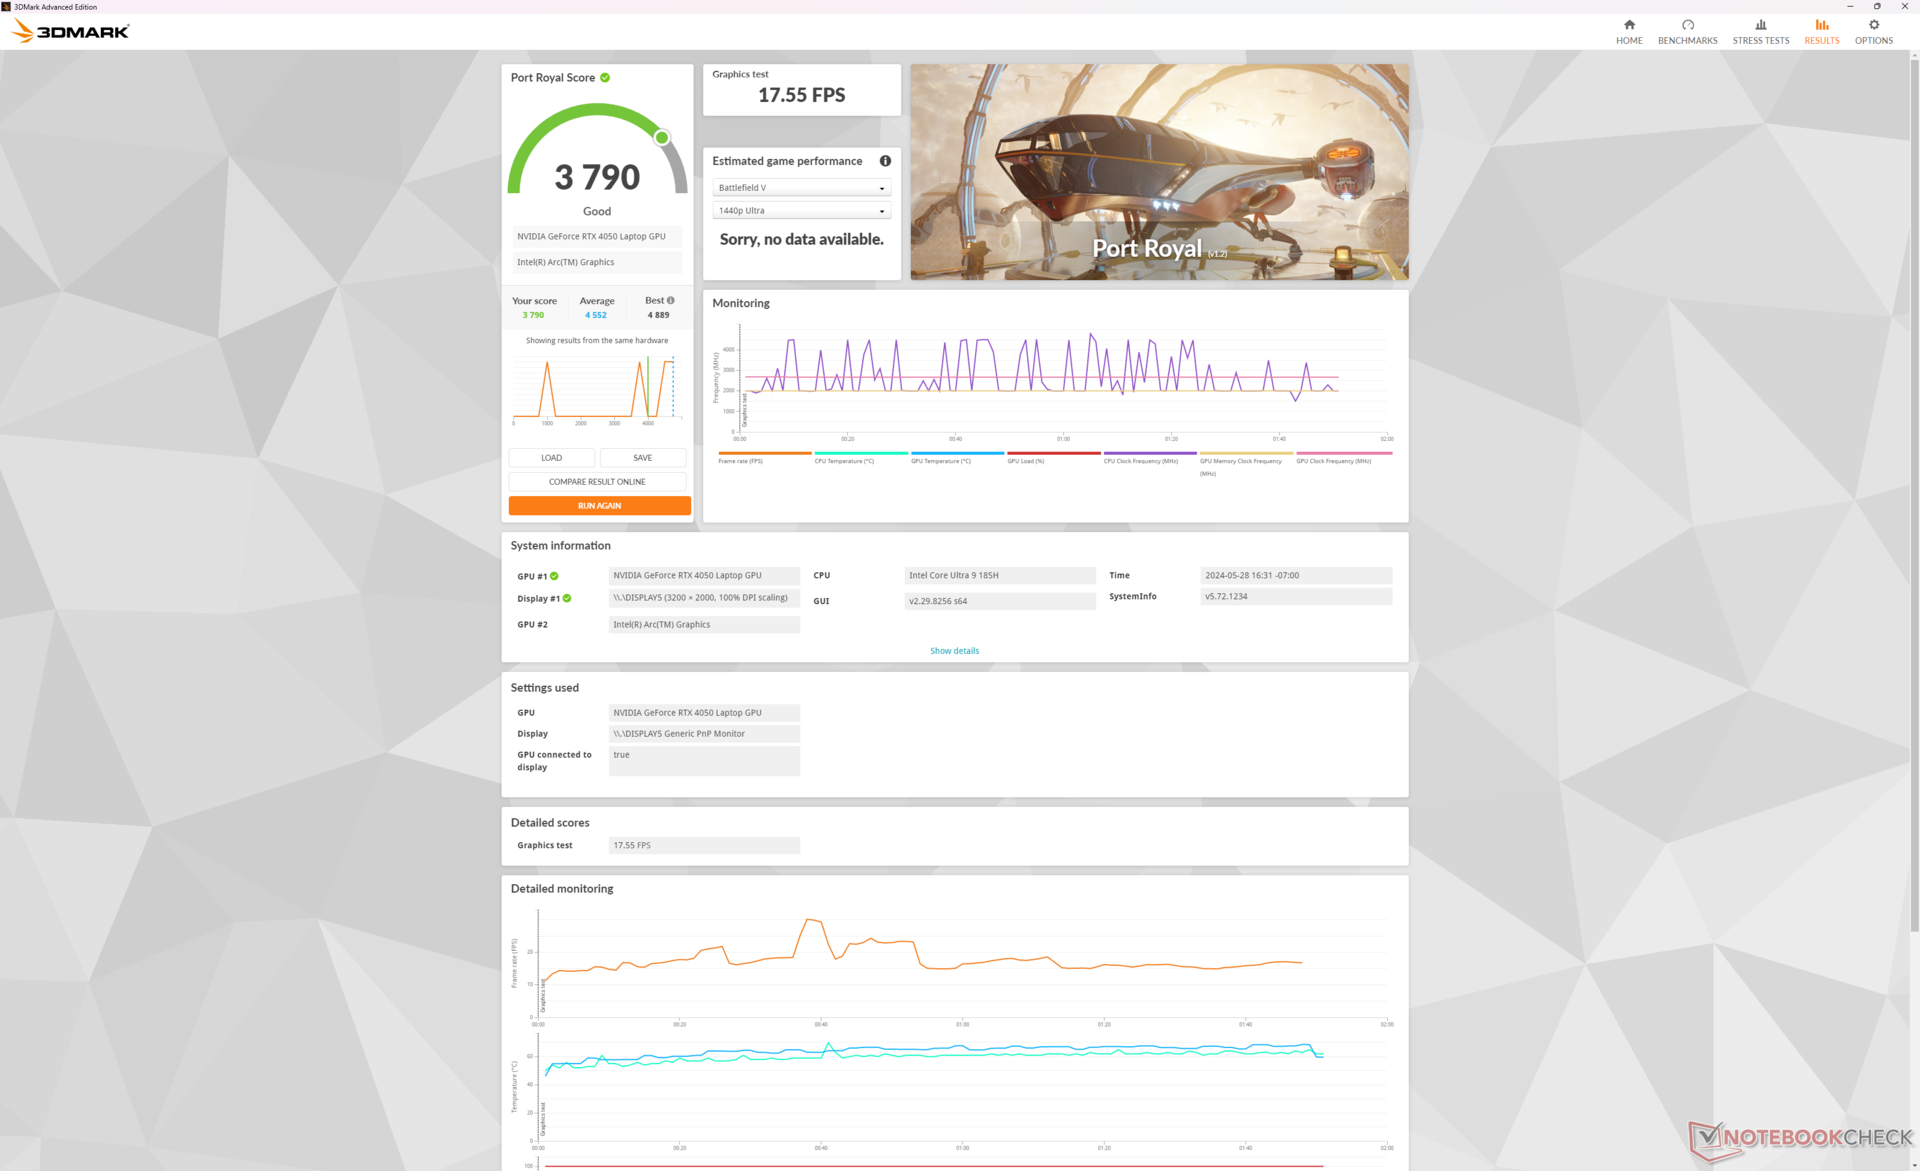
Les performances graphiques sont meilleures que prévu avec des scores 3DMark qui sont environ 10 % plus rapides que la moyenne des ordinateurs portables de notre base de données avec le même GPU GeForce RTX 4050. Cet avantage peut être largement attribué à l'objectif TGP élevé de 75 W à 100 W du Lenovo, car la plupart des autres ordinateurs portables avec le même GPU ont des plafonds TGP inférieurs. Alors que le panneau de contrôle de Nvidia annonce une puissance graphique totale de 100 W pour la RTX 4050, elle se stabiliserait plutôt autour de 75 W à 85 W lors de l'exécution des jeux, comme l'illustre notre section Stress Test ci-dessus.
La performance globale est environ 25 à 30 pour cent plus lente que la configuration RTX 4070 qui peut atteindre des plages de puissance plus élevées entre 90 W et 100 W. Il est important de le noter dans la section Consommation électrique ci-dessous pour les analyses de performance par watt.
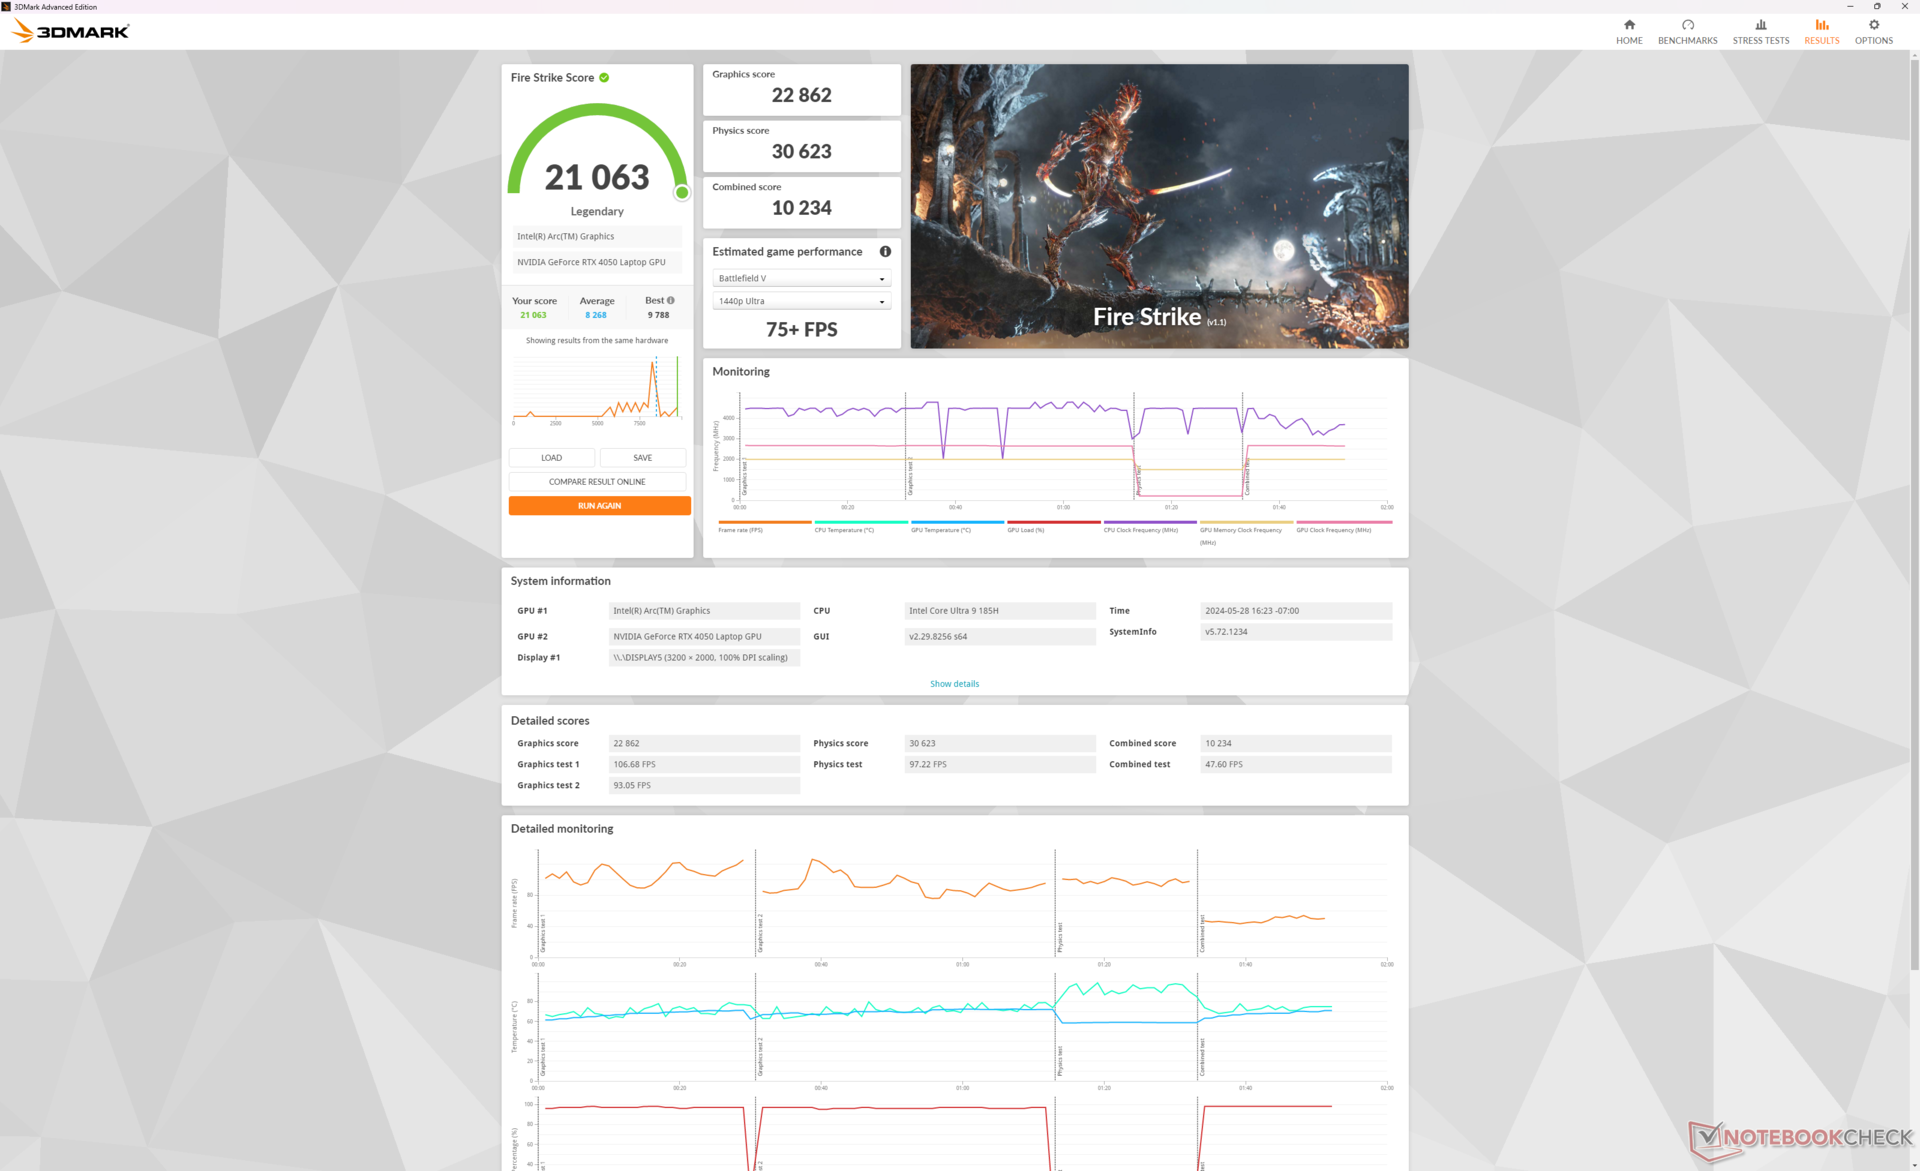
| Profil de puissance | Score graphique | Score physique | Score combiné |
| Mode Performance | 22862 | 30623 | 10234 |
| Mode équilibré | 21008 (-8%) | 29772 (-3%) | 8401 (-18%) |
| Alimentation par batterie | 20095 (-12%) | 30278 (-1%) | 7999 (-22%) |
L'exécution en mode équilibré a un impact plus important sur les performances du GPU que sur celles du CPU, comme le montre notre tableau de résultats Fire Strike.
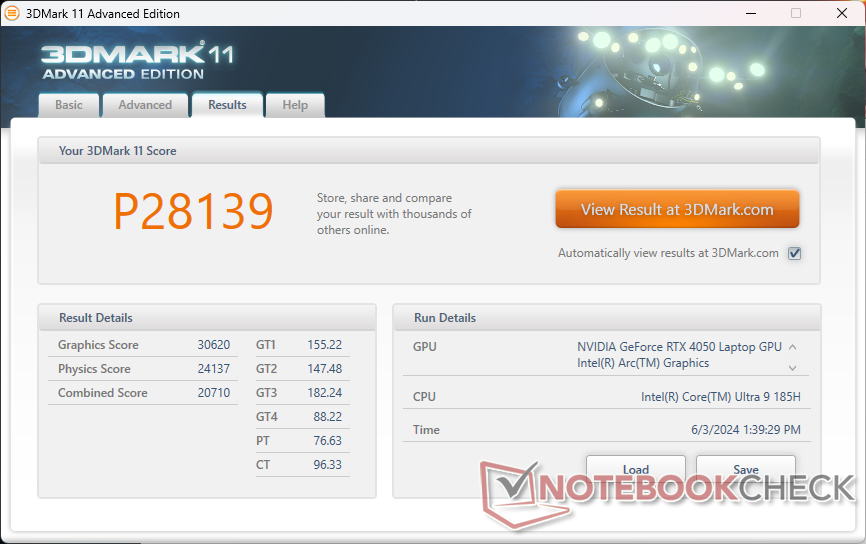
| 3DMark 11 Performance | 28139 points | |
| 3DMark Fire Strike Score | 21063 points | |
| 3DMark Time Spy Score | 9125 points | |
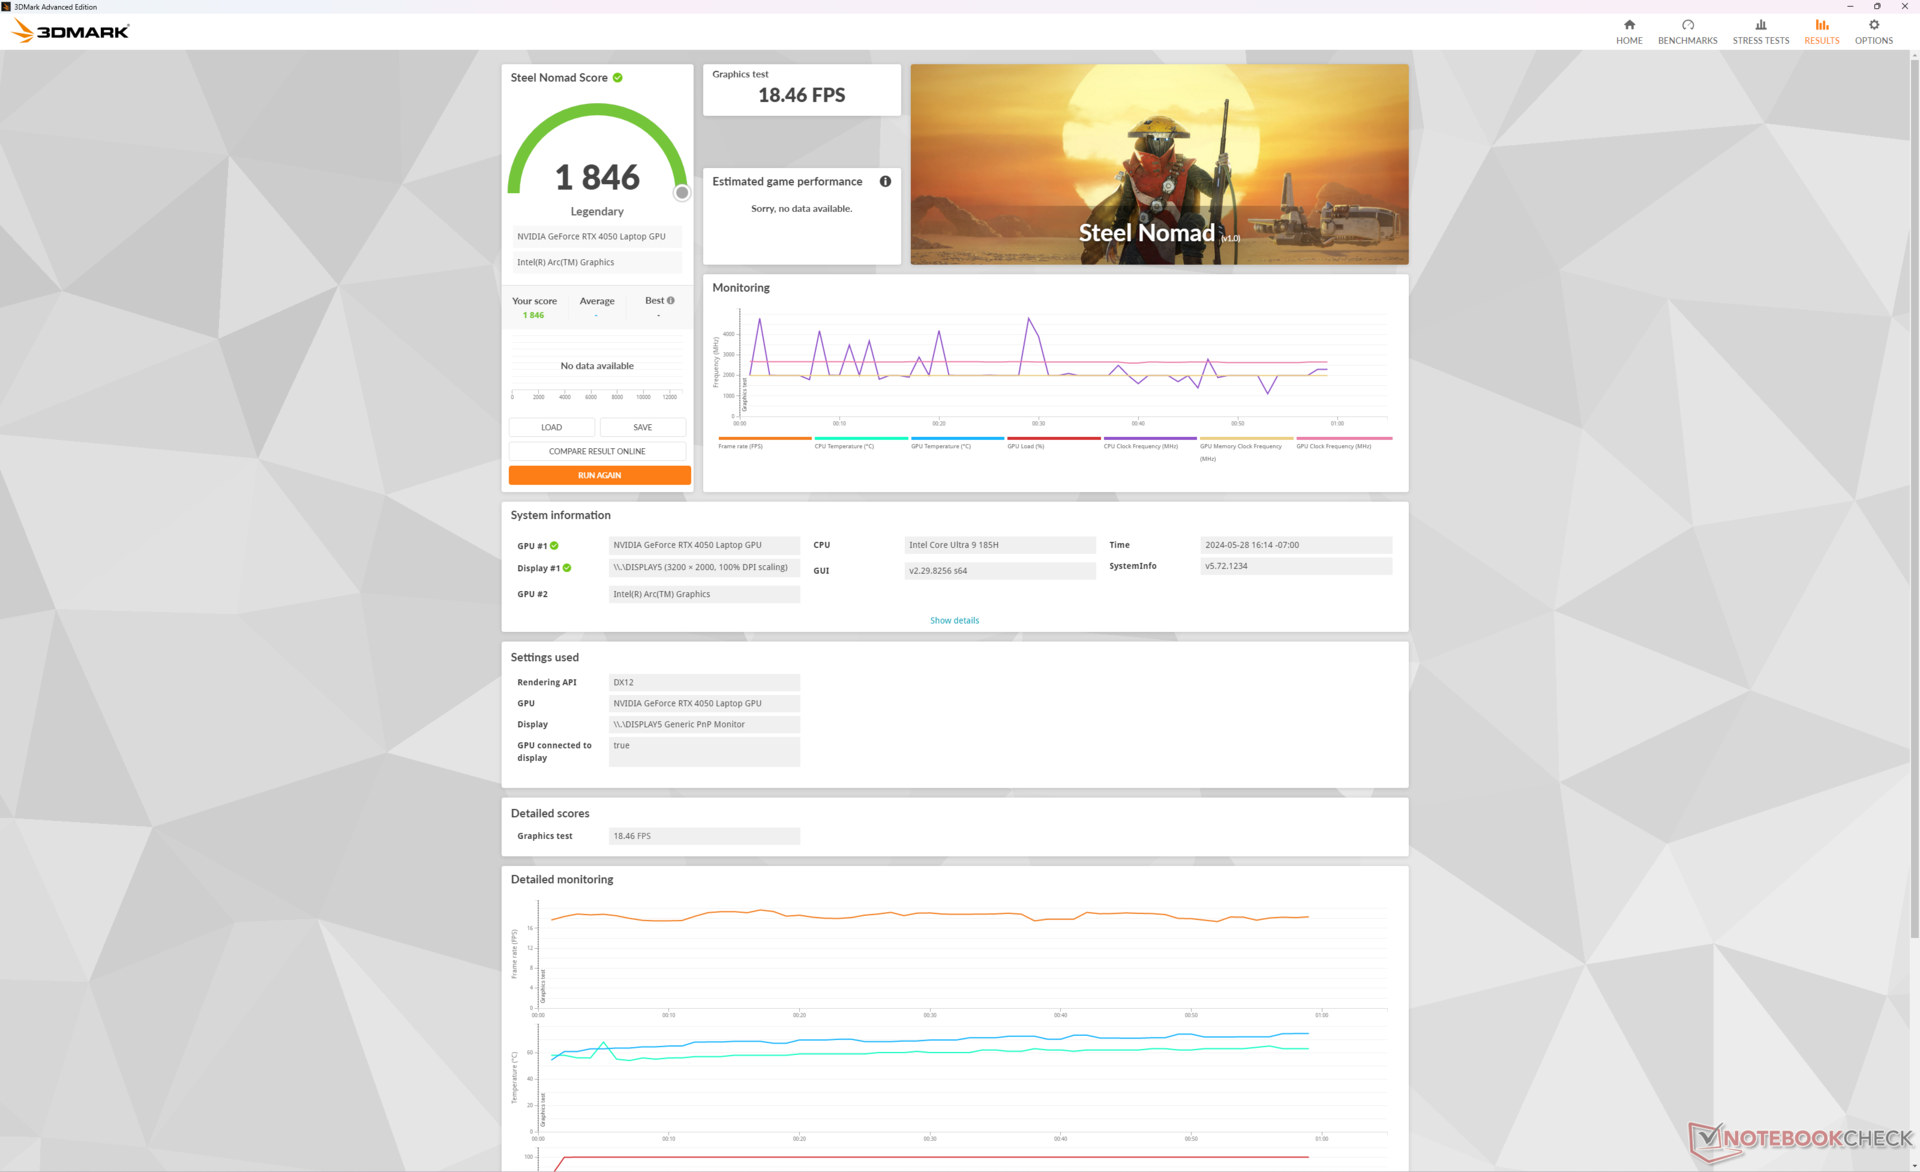
| 3DMark Steel Nomad Score | 1846 points | |
Aide | ||
* ... Moindre est la valeur, meilleures sont les performances
Performances des jeux
Le système est suffisamment puissant pour faire tourner des jeux exigeants comme Cyberpunk 2077 à la résolution native de 3200 x 2000 avec des paramètres moyens ou inférieurs. Pour obtenir les meilleurs résultats, il est toutefois recommandé d'activer DLSS dans la mesure du possible afin d'augmenter les taux de rafraîchissement à plus de 60 FPS.
| Performance Rating - Percent | |
| Lenovo Yoga Pro 9 16IMH9 | |
| Lenovo Yoga Pro 9 16IMH9 RTX 4050 | |
| Asus VivoBook Pro 16 K6602VU | |
| Dell XPS 16 9640 | |
| Samsung Galaxy Book4 Ultra | |
| HP Envy x360 2-in-1 16-ad0097nr | |
| The Witcher 3 - 1920x1080 Ultra Graphics & Postprocessing (HBAO+) | |
| Lenovo Yoga Pro 9 16IMH9 | |
| Dell XPS 16 9640 | |
| Lenovo Yoga Pro 9 16IMH9 RTX 4050 | |
| Asus VivoBook Pro 16 K6602VU | |
| Samsung Galaxy Book4 Ultra | |
| HP Envy x360 2-in-1 16-ad0097nr | |
| Final Fantasy XV Benchmark - 1920x1080 High Quality | |
| Lenovo Yoga Pro 9 16IMH9 | |
| Dell XPS 16 9640 | |
| Lenovo Yoga Pro 9 16IMH9 RTX 4050 | |
| Asus VivoBook Pro 16 K6602VU | |
| Samsung Galaxy Book4 Ultra | |
| HP Envy x360 2-in-1 16-ad0097nr | |
| Strange Brigade - 1920x1080 ultra AA:ultra AF:16 | |
| Lenovo Yoga Pro 9 16IMH9 | |
| Dell XPS 16 9640 | |
| Lenovo Yoga Pro 9 16IMH9 RTX 4050 | |
| Asus VivoBook Pro 16 K6602VU | |
| Samsung Galaxy Book4 Ultra | |
| HP Envy x360 2-in-1 16-ad0097nr | |
| Dota 2 Reborn - 1920x1080 ultra (3/3) best looking | |
| Lenovo Yoga Pro 9 16IMH9 | |
| Lenovo Yoga Pro 9 16IMH9 RTX 4050 | |
| Samsung Galaxy Book4 Ultra | |
| Asus VivoBook Pro 16 K6602VU | |
| Dell XPS 16 9640 | |
| HP Envy x360 2-in-1 16-ad0097nr | |
| X-Plane 11.11 - 1920x1080 high (fps_test=3) | |
| Asus VivoBook Pro 16 K6602VU | |
| Lenovo Yoga Pro 9 16IMH9 | |
| Lenovo Yoga Pro 9 16IMH9 RTX 4050 | |
| Dell XPS 16 9640 | |
| Dell XPS 16 9640 | |
| Samsung Galaxy Book4 Ultra | |
| HP Envy x360 2-in-1 16-ad0097nr | |
Witcher 3 FPS Chart
| Bas | Moyen | Élevé | Ultra | QHD | |
|---|---|---|---|---|---|
| The Witcher 3 (2015) | 395.6 | 290.5 | 164 | 83.7 | 61 |
| Dota 2 Reborn (2015) | 174.6 | 148.7 | 145.1 | 138.5 | |
| Final Fantasy XV Benchmark (2018) | 182.4 | 121.5 | 84.2 | 61.6 | |
| X-Plane 11.11 (2018) | 134.8 | 117.7 | 89.4 | ||
| Far Cry 5 (2018) | 151 | 129 | 121 | 113 | 86 |
| Strange Brigade (2018) | 432 | 213 | 170.9 | 150 | 99.7 |
| Tiny Tina's Wonderlands (2022) | 181.1 | 141.8 | 93.3 | 72.3 | 49.5 |
| F1 22 (2022) | 221 | 219 | 171.5 | 53.4 | 34 |
| Baldur's Gate 3 (2023) | 112.3 | 91.9 | 83.5 | 81.3 | 55 |
| Cyberpunk 2077 2.2 Phantom Liberty (2023) | 101.9 | 79.6 | 67.8 | 58.3 | 36.4 |
Émissions
Bruit du système
Le bruit du ventilateur est presque identique à celui que nous avons enregistré sur la configuration RTX 4070 la plus élevée, ce qui suggère que la configuration RTX 4050 la plus faible n'est pas plus silencieuse malgré son GPU plus lent.
Degré de la nuisance sonore
| Au repos |
| 23.6 / 25.4 / 25.4 dB(A) |
| Fortement sollicité |
| 44.2 / 52.6 dB(A) |
 | ||
30 dB silencieux 40 dB(A) audible 50 dB(A) bruyant |
||
min: | ||
| Lenovo Yoga Pro 9 16IMH9 RTX 4050 NVIDIA GeForce RTX 4050 Laptop GPU, Ultra 9 185H, SK Hynix HFS001TEJ9X115N | Lenovo Yoga Pro 9 16IMH9 NVIDIA GeForce RTX 4070 Laptop GPU, Ultra 9 185H, SK Hynix HFS001TEJ9X115N | HP Envy x360 2-in-1 16-ad0097nr Radeon 780M, R7 8840HS, KIOXIA BG5 KBG50ZNV1T02 | Dell XPS 16 9640 NVIDIA GeForce RTX 4070 Laptop GPU, Ultra 7 155H, Kioxia XG8 KXG80ZNV1T02 | Samsung Galaxy Book4 Ultra NVIDIA GeForce RTX 4050 Laptop GPU, Ultra 7 155H, Samsung PM9A1 MZVL2512HCJQ | Asus VivoBook Pro 16 K6602VU NVIDIA GeForce RTX 4050 Laptop GPU, i9-13900H, Micron 2400 MTFDKBA1T0QFM | |
|---|---|---|---|---|---|---|
| Noise | -2% | 14% | 0% | 8% | -2% | |
| arrêt / environnement * | 23.6 | 24.3 -3% | 22.9 3% | 24.5 -4% | 24.2 -3% | 20.96 11% |
| Idle Minimum * | 23.6 | 24.3 -3% | 23 3% | 24.5 -4% | 24.2 -3% | 25.28 -7% |
| Idle Average * | 25.4 | 24.3 4% | 23 9% | 24.5 4% | 24.2 5% | 25.28 -0% |
| Idle Maximum * | 25.4 | 25.8 -2% | 23 9% | 27.5 -8% | 24.2 5% | 25.28 -0% |
| Load Average * | 44.2 | 48.1 -9% | 23.8 46% | 39.6 10% | 37.9 14% | 51.88 -17% |
| Witcher 3 ultra * | 48.9 | 49.7 -2% | 43.8 10% | 49.7 -2% | 41.7 15% | 49 -0% |
| Load Maximum * | 52.6 | 53.9 -2% | 43.8 17% | 49.7 6% | 41.7 21% | 51.8 2% |
* ... Moindre est la valeur, meilleures sont les performances
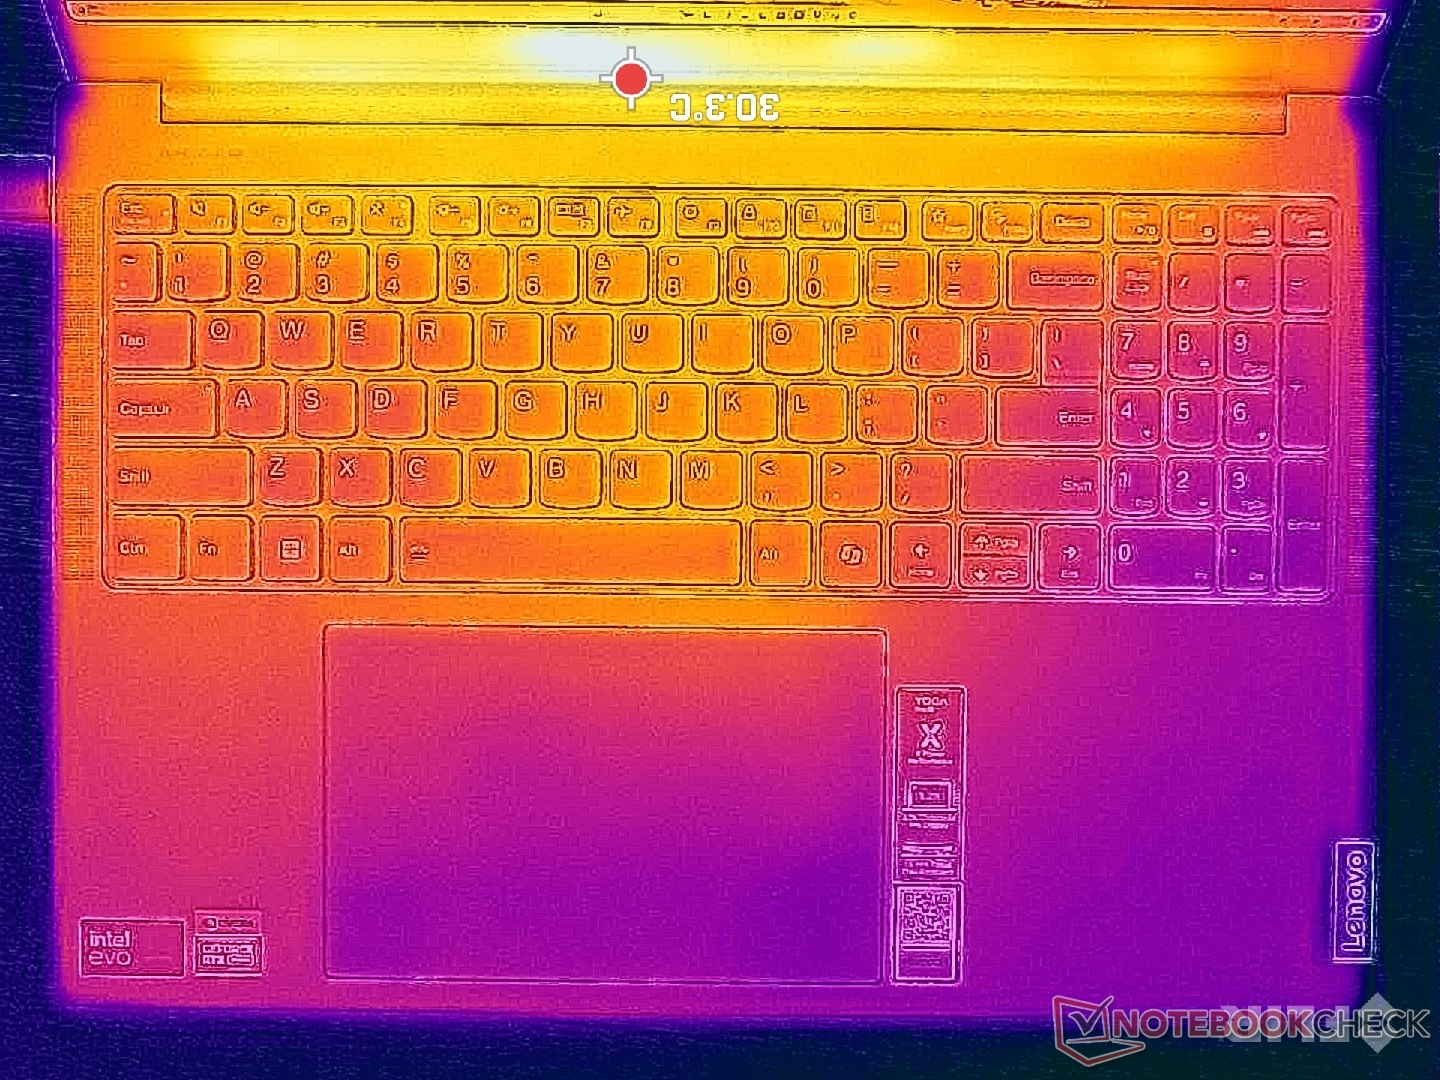
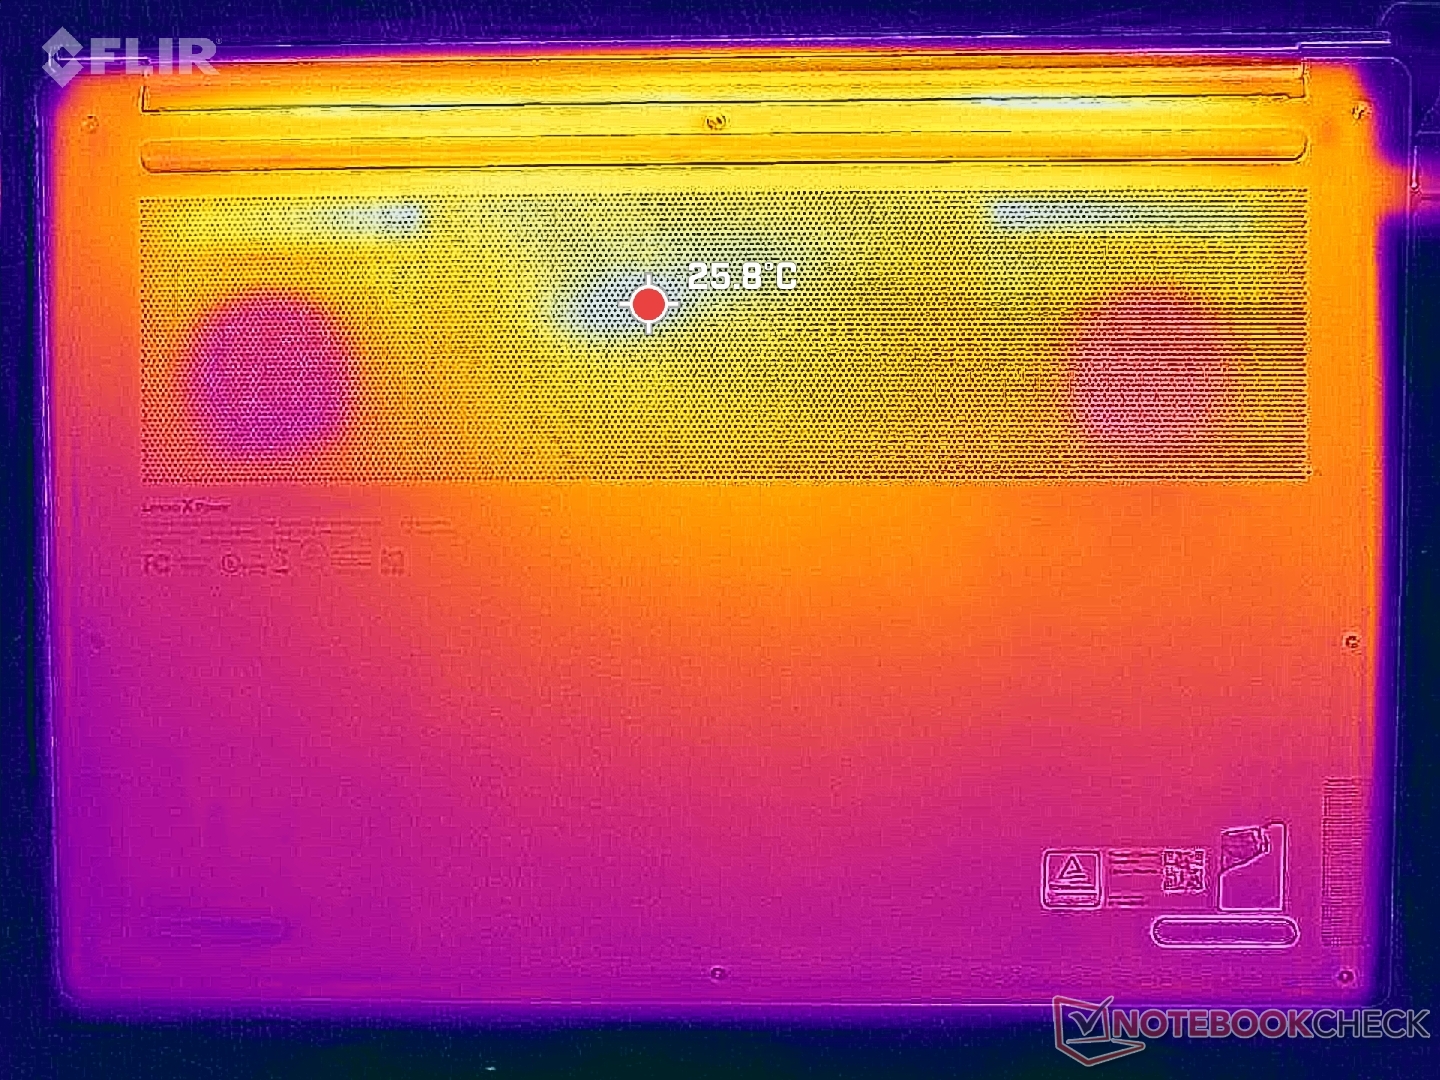
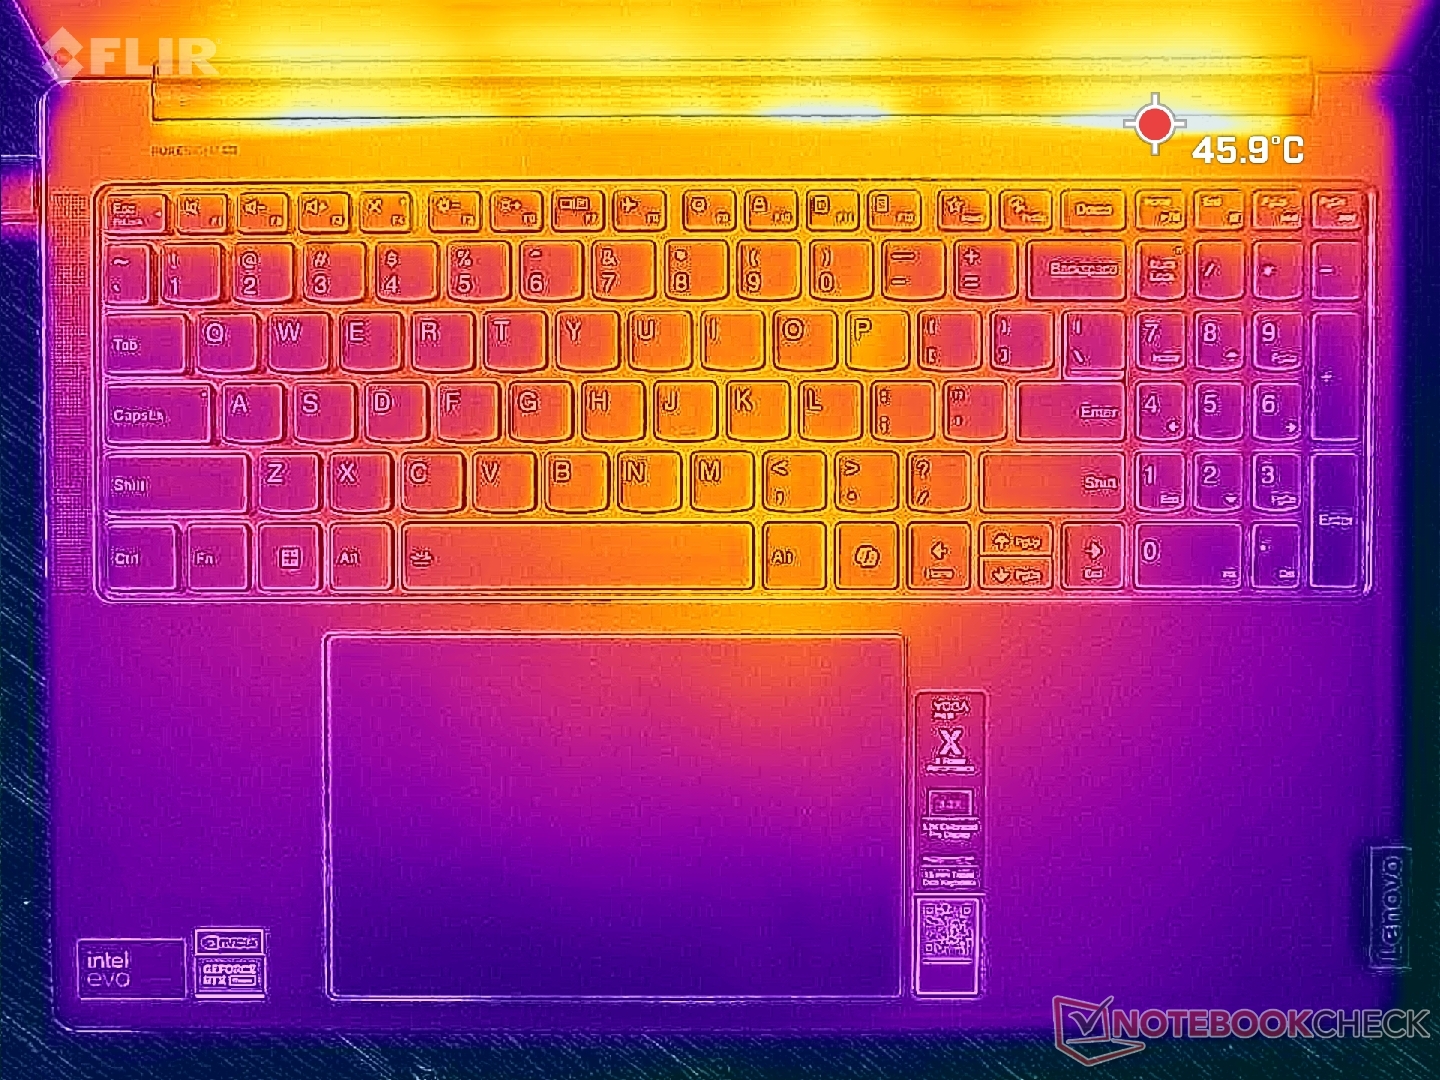
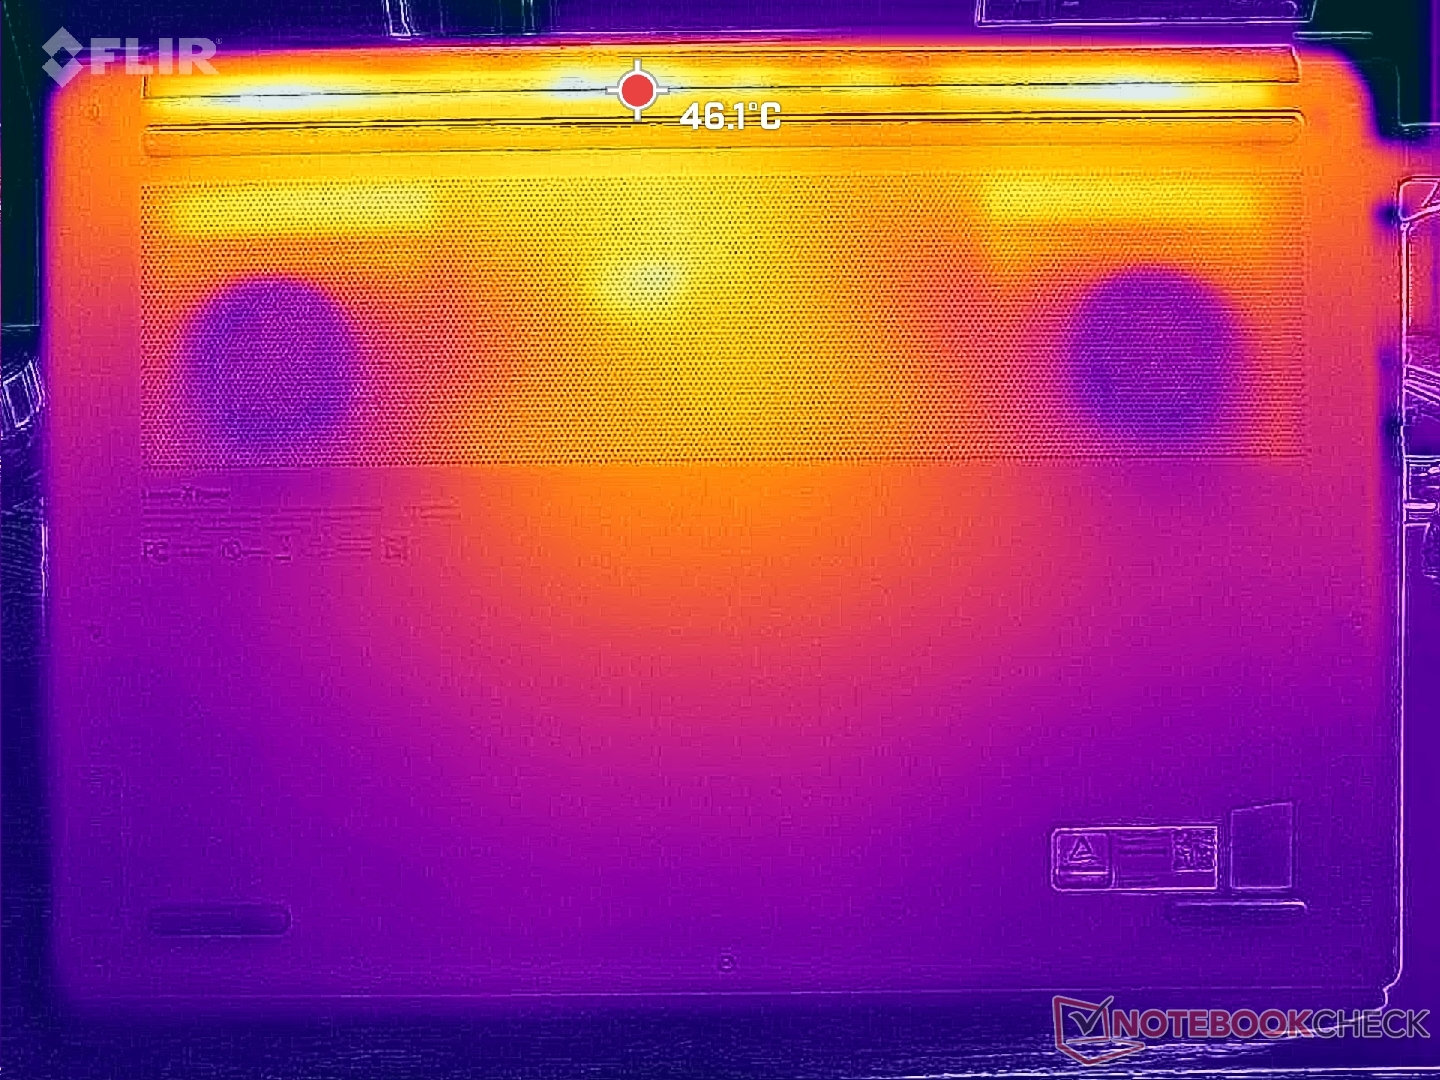
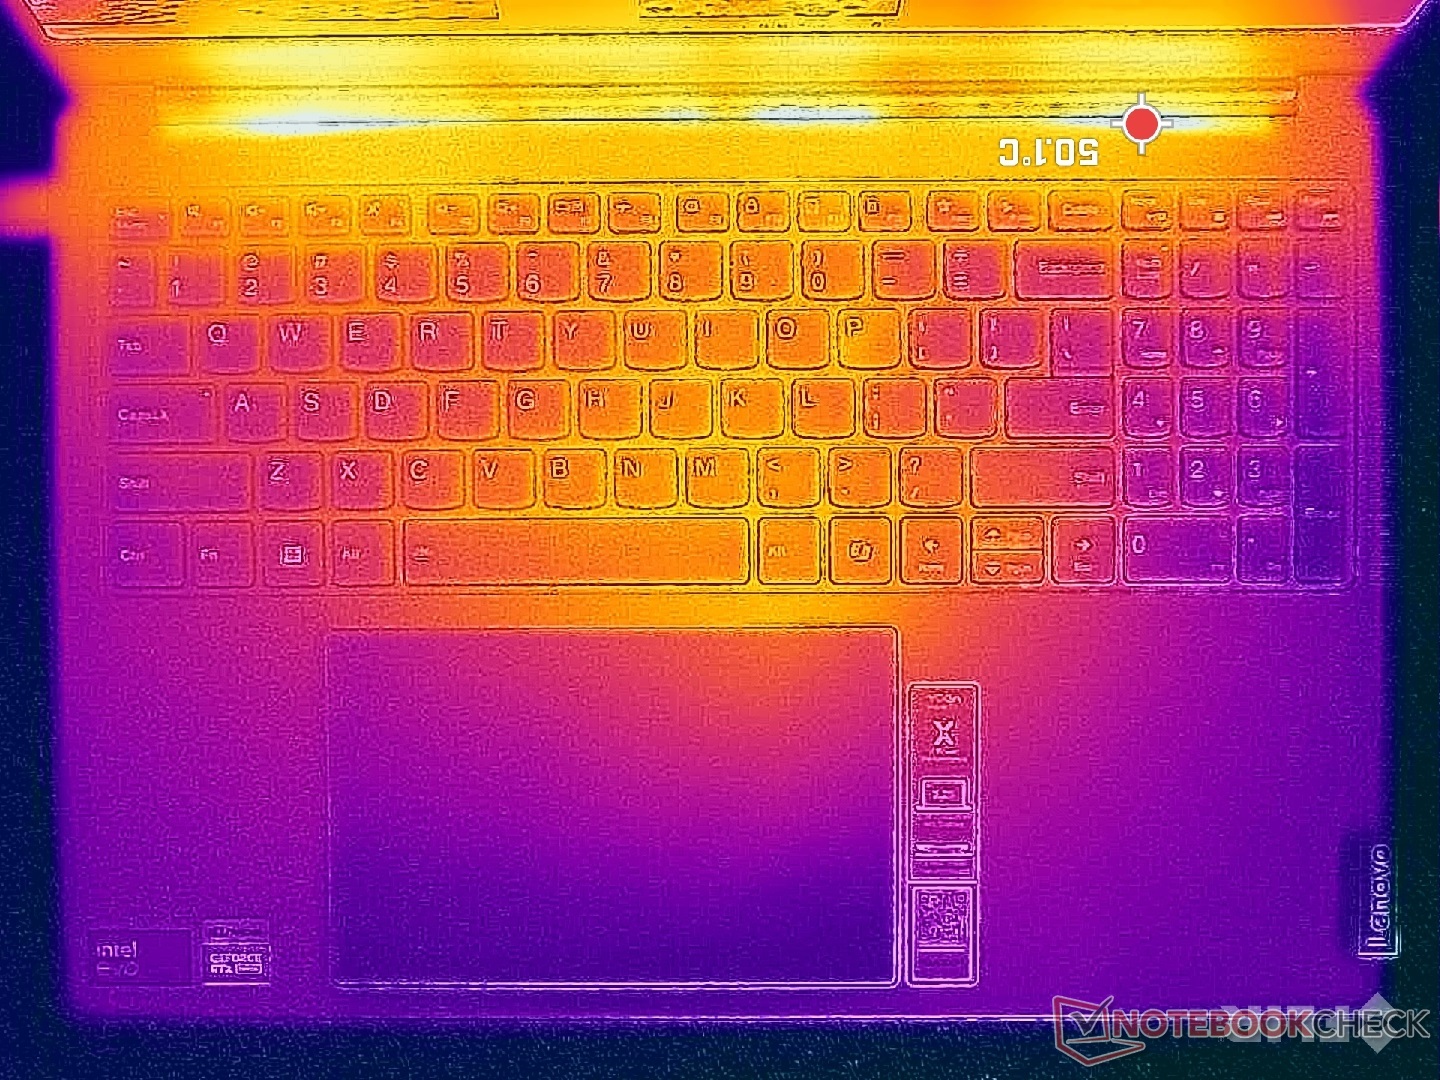
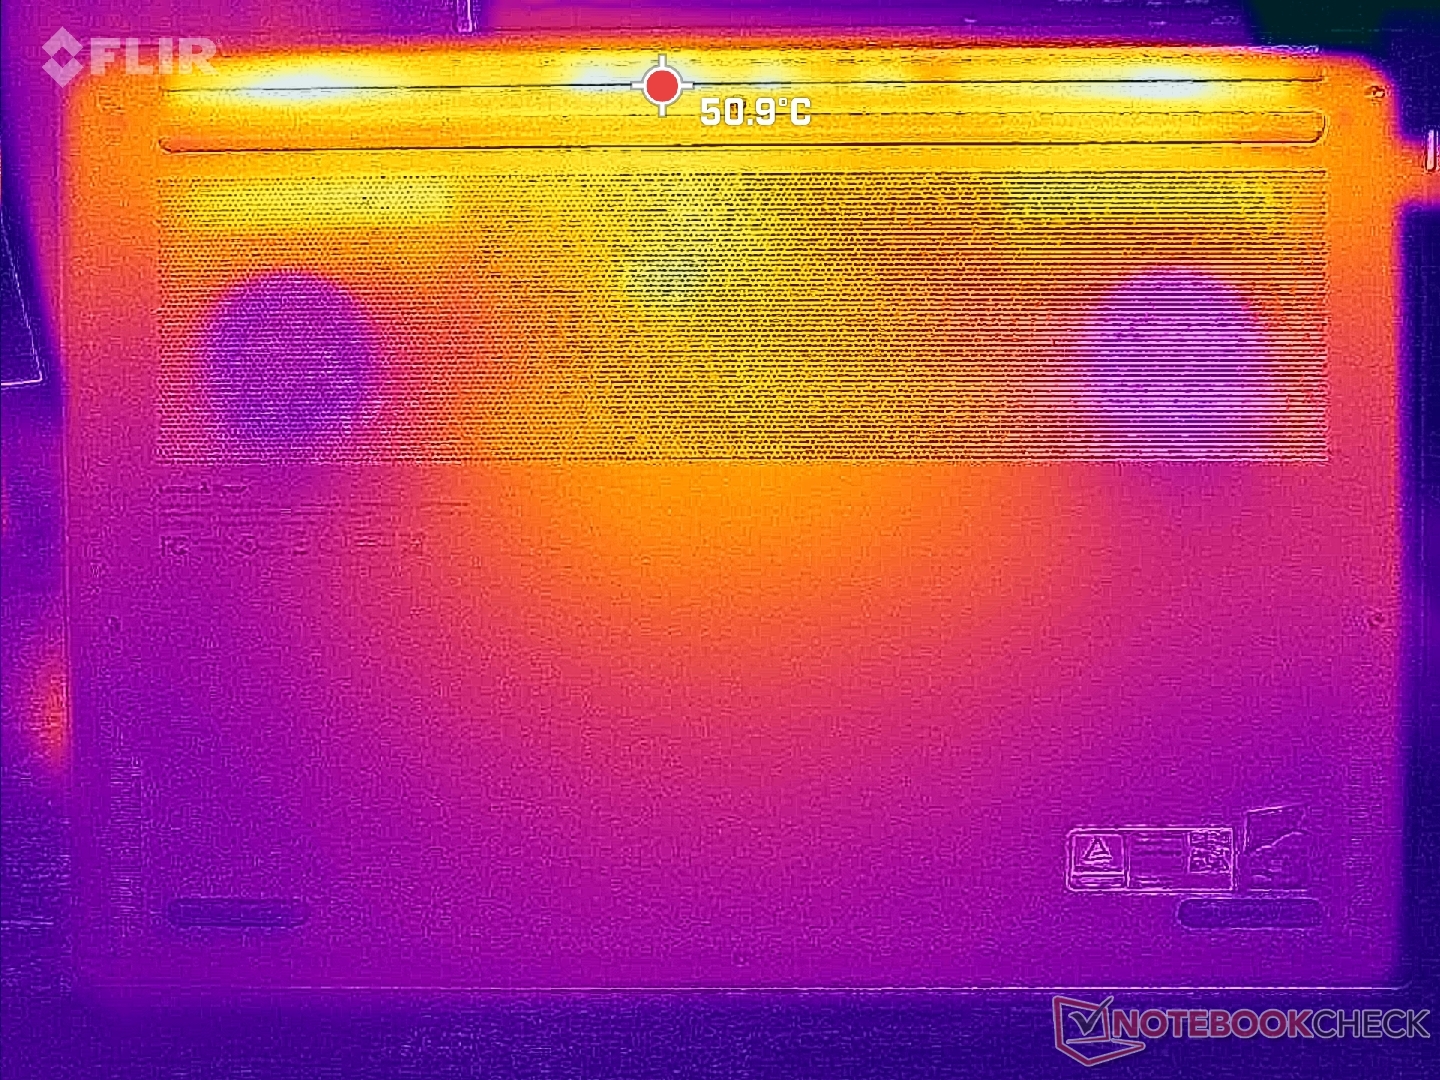
Température
Les points chauds peuvent atteindre plus de 41°C lors de l'exécution de charges exigeantes, ce qui est plusieurs degrés de moins que ce que nous avons enregistré sur le Asus VivoBook Pro 16 avec le même GPU RTX 4050.
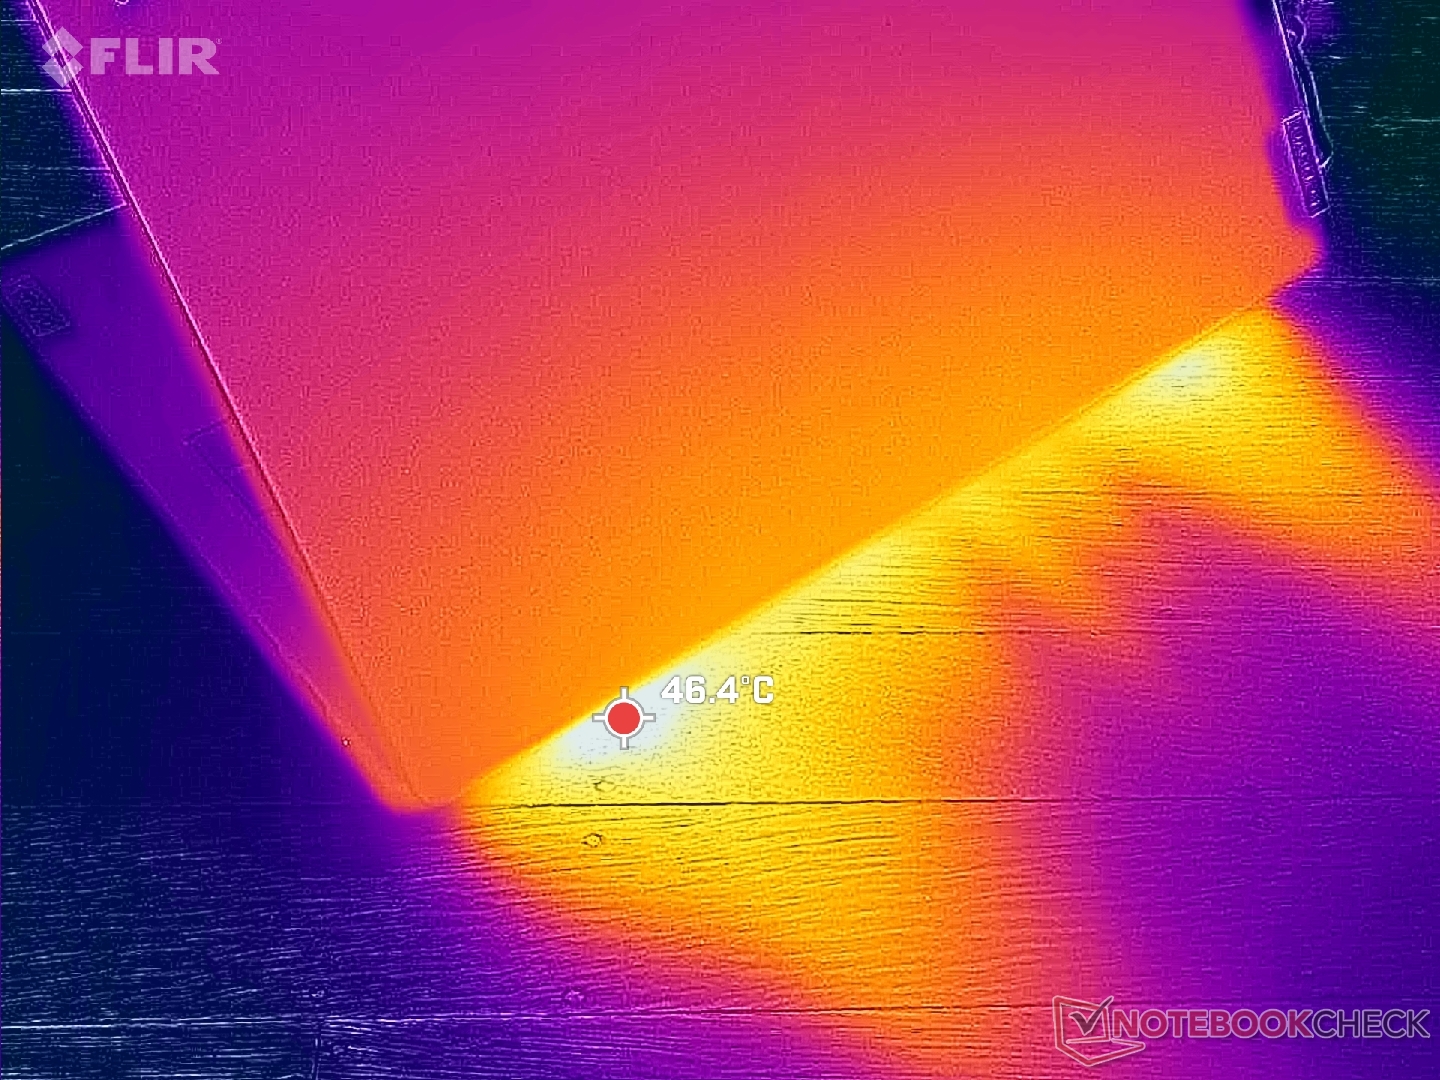
(±) La température maximale du côté supérieur est de 41 °C / 106 F, par rapport à la moyenne de 40.4 °C / 105 F, allant de 21.2 à 68.8 °C pour la classe Gaming.
(±) Le fond chauffe jusqu'à un maximum de 40.6 °C / 105 F, contre une moyenne de 43.2 °C / 110 F
(+) En utilisation inactive, la température moyenne du côté supérieur est de 27.8 °C / 82 F, par rapport à la moyenne du dispositif de 33.9 °C / 93 F.
(±) En jouant à The Witcher 3, la température moyenne du côté supérieur est de 33 °C / 91 F, alors que la moyenne de l'appareil est de 33.9 °C / 93 F.
(+) Les repose-poignets et le pavé tactile sont plus froids que la température de la peau avec un maximum de 29.6 °C / 85.3 F et sont donc froids au toucher.
(±) La température moyenne de la zone de l'appui-paume de dispositifs similaires était de 28.9 °C / 84 F (-0.7 °C / #-1.3 F).
| Lenovo Yoga Pro 9 16IMH9 RTX 4050 Intel Core Ultra 9 185H, NVIDIA GeForce RTX 4050 Laptop GPU | Lenovo Yoga Pro 9 16IMH9 Intel Core Ultra 9 185H, NVIDIA GeForce RTX 4070 Laptop GPU | HP Envy x360 2-in-1 16-ad0097nr AMD Ryzen 7 8840HS, AMD Radeon 780M | Dell XPS 16 9640 Intel Core Ultra 7 155H, NVIDIA GeForce RTX 4070 Laptop GPU | Samsung Galaxy Book4 Ultra Intel Core Ultra 7 155H, NVIDIA GeForce RTX 4050 Laptop GPU | Asus VivoBook Pro 16 K6602VU Intel Core i9-13900H, NVIDIA GeForce RTX 4050 Laptop GPU | |
|---|---|---|---|---|---|---|
| Heat | 3% | -1% | 8% | 13% | -20% | |
| Maximum Upper Side * | 41 | 41.7 -2% | 42.6 -4% | 39.4 4% | 38.5 6% | 42.6 -4% |
| Maximum Bottom * | 40.6 | 46.3 -14% | 47.8 -18% | 36.9 9% | 41.2 -1% | 48.4 -19% |
| Idle Upper Side * | 30.2 | 26.2 13% | 27.4 9% | 28.2 7% | 23.5 22% | 39.4 -30% |
| Idle Bottom * | 31.4 | 27.2 13% | 27.8 11% | 27.4 13% | 24.1 23% | 39.8 -27% |
* ... Moindre est la valeur, meilleures sont les performances
Intervenants
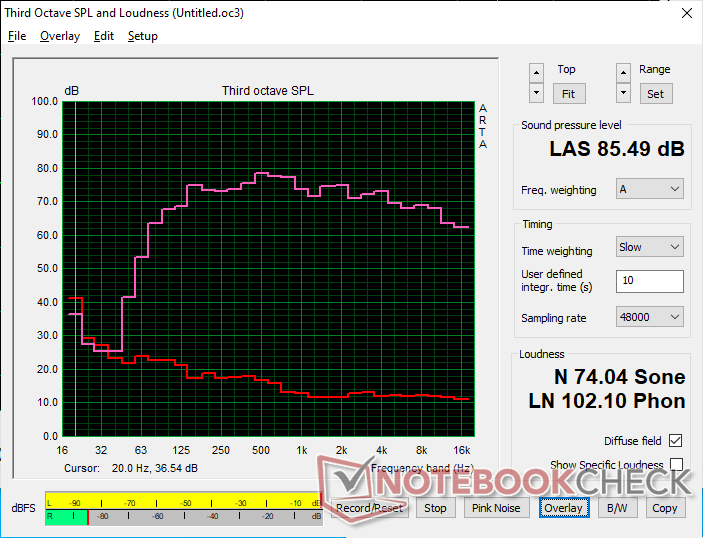
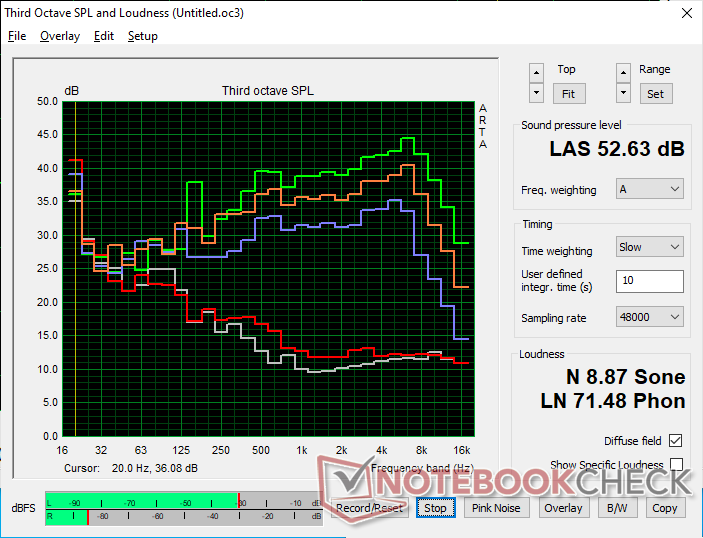
Lenovo Yoga Pro 9 16IMH9 RTX 4050 analyse audio
(+) | les haut-parleurs peuvent jouer relativement fort (85.5# dB)
Basses 100 - 315 Hz
(+) | bonne basse - seulement 2.1% loin de la médiane
(+) | les basses sont linéaires (3.8% delta à la fréquence précédente)
Médiums 400 - 2000 Hz
(+) | médiane équilibrée - seulement 2.6% de la médiane
(+) | les médiums sont linéaires (3.1% delta à la fréquence précédente)
Aiguës 2 - 16 kHz
(+) | des sommets équilibrés - à seulement 3.1% de la médiane
(+) | les aigus sont linéaires (3% delta à la fréquence précédente)
Globalement 100 - 16 000 Hz
(+) | le son global est linéaire (5.8% différence à la médiane)
Par rapport à la même classe
» 0% de tous les appareils testés de cette catégorie étaient meilleurs, 0% similaires, 100% pires
» Le meilleur avait un delta de 6%, la moyenne était de 18%, le pire était de 132%.
Par rapport à tous les appareils testés
» 0% de tous les appareils testés étaient meilleurs, 0% similaires, 100% pires
» Le meilleur avait un delta de 4%, la moyenne était de 24%, le pire était de 134%.
Apple MacBook Pro 16 2021 M1 Pro analyse audio
(+) | les haut-parleurs peuvent jouer relativement fort (84.7# dB)
Basses 100 - 315 Hz
(+) | bonne basse - seulement 3.8% loin de la médiane
(+) | les basses sont linéaires (5.2% delta à la fréquence précédente)
Médiums 400 - 2000 Hz
(+) | médiane équilibrée - seulement 1.3% de la médiane
(+) | les médiums sont linéaires (2.1% delta à la fréquence précédente)
Aiguës 2 - 16 kHz
(+) | des sommets équilibrés - à seulement 1.9% de la médiane
(+) | les aigus sont linéaires (2.7% delta à la fréquence précédente)
Globalement 100 - 16 000 Hz
(+) | le son global est linéaire (4.6% différence à la médiane)
Par rapport à la même classe
» 0% de tous les appareils testés de cette catégorie étaient meilleurs, 0% similaires, 100% pires
» Le meilleur avait un delta de 5%, la moyenne était de 18%, le pire était de 45%.
Par rapport à tous les appareils testés
» 0% de tous les appareils testés étaient meilleurs, 0% similaires, 100% pires
» Le meilleur avait un delta de 4%, la moyenne était de 24%, le pire était de 134%.
Gestion de l'énergie
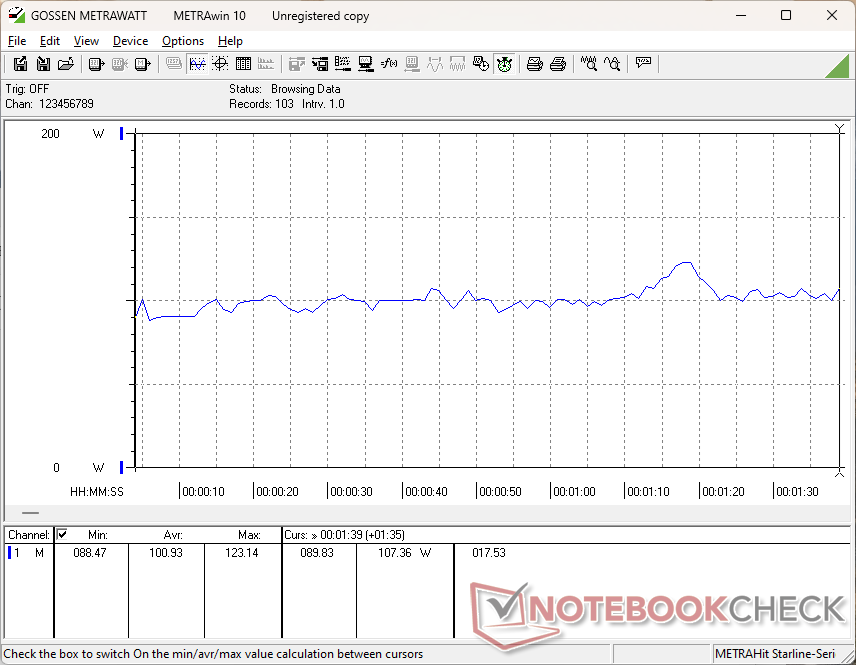
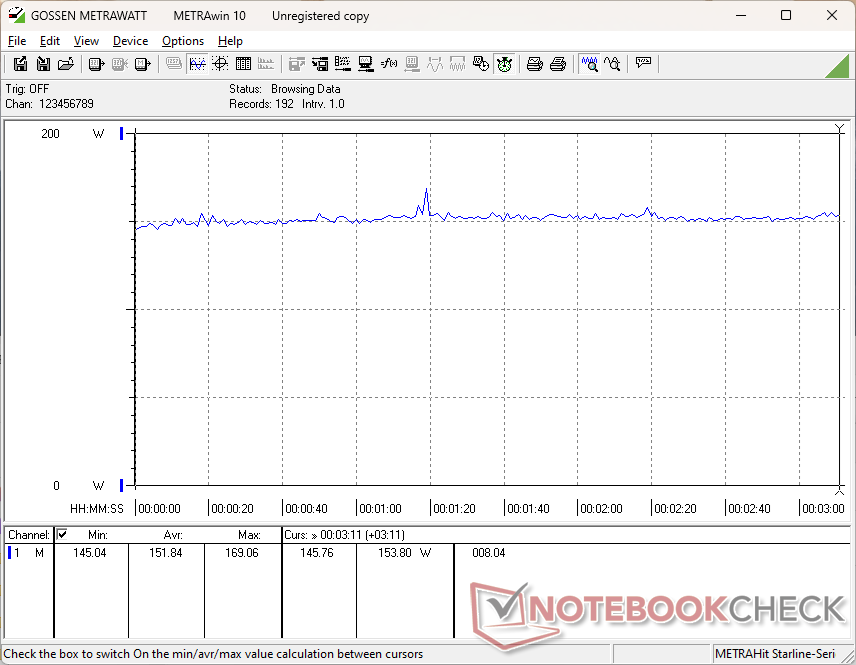
Consommation électrique
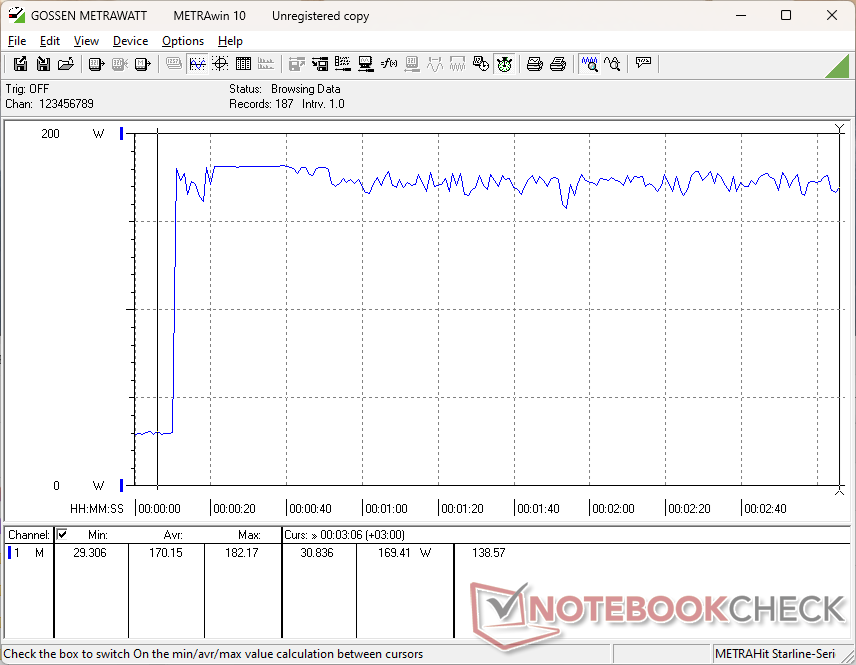
Les niveaux de consommation globale sont très proches de ceux que nous avons enregistrés sur la configuration Mini-LED RTX 4070 plus haut de gamme. En exécutant Witcher 3par exemple, notre configuration bas de gamme ne consommerait que 5 % de moins en moyenne, même si elle entraîne un déficit de 25 à 30 % des performances graphiques par rapport à la RTX 4070. La performance par watt favorise donc largement la RTX 4070.
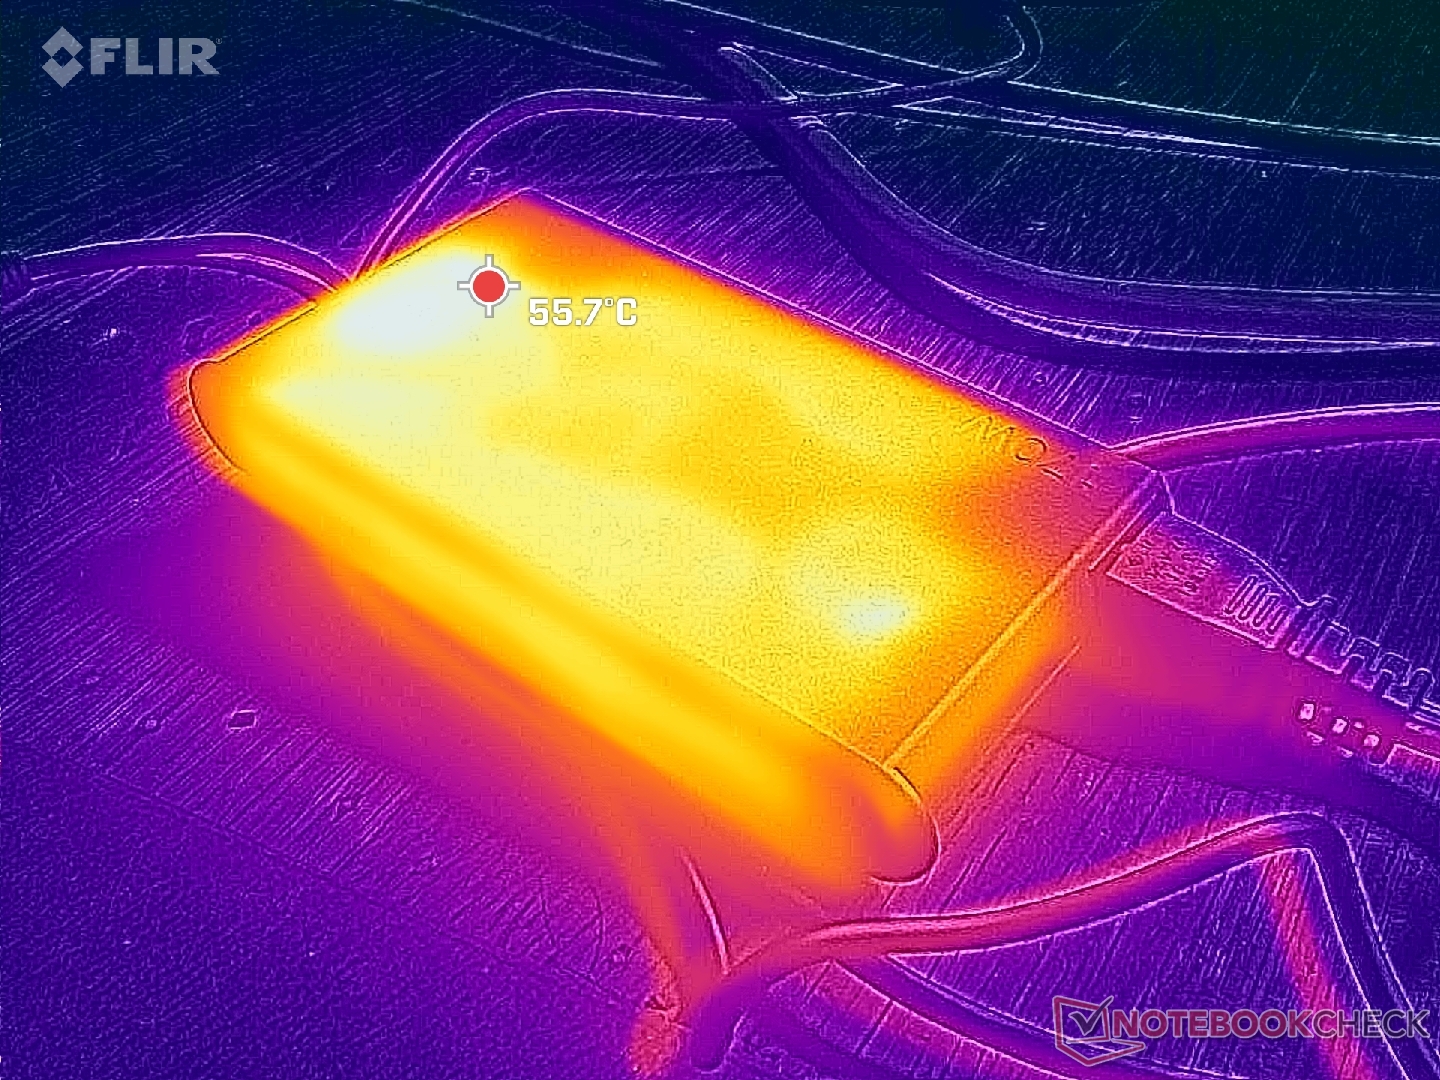
Les utilisateurs doivent garder à l'esprit que l'adaptateur secteur n'est prévu que pour 170 W. Étant donné que les jeux demandent déjà entre 150 W et 160 W, essayer de charger l'ordinateur portable pendant les jeux entraînera un taux de charge très lent.
| Éteint/en veille | |
| Au repos | |
| Fortement sollicité |
|
Légende:
min: | |
| Lenovo Yoga Pro 9 16IMH9 RTX 4050 Ultra 9 185H, NVIDIA GeForce RTX 4050 Laptop GPU, SK Hynix HFS001TEJ9X115N, IPS, 3200x2000, 16" | Lenovo Yoga Pro 9 16IMH9 Ultra 9 185H, NVIDIA GeForce RTX 4070 Laptop GPU, SK Hynix HFS001TEJ9X115N, Mini-LED, 3200x2000, 16" | HP Envy x360 2-in-1 16-ad0097nr R7 8840HS, Radeon 780M, KIOXIA BG5 KBG50ZNV1T02, OLED, 2880x1800, 16" | Dell XPS 16 9640 Ultra 7 155H, NVIDIA GeForce RTX 4070 Laptop GPU, Kioxia XG8 KXG80ZNV1T02, OLED, 3840x2400, 16.3" | Samsung Galaxy Book4 Ultra Ultra 7 155H, NVIDIA GeForce RTX 4050 Laptop GPU, Samsung PM9A1 MZVL2512HCJQ, OLED, 2880x1800, 16" | Asus VivoBook Pro 16 K6602VU i9-13900H, NVIDIA GeForce RTX 4050 Laptop GPU, Micron 2400 MTFDKBA1T0QFM, OLED, 3200x2000, 16" | |
|---|---|---|---|---|---|---|
| Power Consumption | -2% | 57% | 32% | 47% | -8% | |
| Idle Minimum * | 9.9 | 10.3 -4% | 5 49% | 7.7 22% | 4.8 52% | 21.06 -113% |
| Idle Average * | 16.6 | 21.9 -32% | 6.2 63% | 10.3 38% | 7.5 55% | 24.27 -46% |
| Idle Maximum * | 29.2 | 22.4 23% | 14.7 50% | 10.6 64% | 7.9 73% | 25.12 14% |
| Load Average * | 100.9 | 96.9 4% | 49.9 51% | 76.5 24% | 79.3 21% | 52.4 48% |
| Witcher 3 ultra * | 151.8 | 159.6 -5% | 54.5 64% | 126.4 17% | 79.2 48% | 110.2 27% |
| Load Maximum * | 182.2 | 173.8 5% | 65 64% | 138.5 24% | 125 31% | 146 20% |
* ... Moindre est la valeur, meilleures sont les performances
Power Consumption Witcher 3 / Stresstest
Power Consumption external Monitor
Autonomie de la batterie
Le temps d'utilisation du WLAN en modes Balanced et Optimus avec l'écran réglé à 150 nits durerait à peu près le même temps que la configuration RTX 4070 Mini-LED la plus chère. Les résultats sont un peu surprenants à première vue puisque le mini-LED et le GPU RTX 4070 peuvent être plus gourmands en énergie que l'IPS et la RTX 4050, mais les données sont logiques une fois que vous prenez en compte le mode Optimus et les paramètres de luminosité similaires pendant les tests. Le temps de navigation de 9 heures est toujours très bon pour un portable multimédia de 16 pouces avec des graphiques discrets, même si c'est un peu plus court que des concurrents comme le Dell XPS 16 ou le Samsung Book4 Ultra Samsung Galaxy Book4 Ultra.
| Lenovo Yoga Pro 9 16IMH9 RTX 4050 Ultra 9 185H, NVIDIA GeForce RTX 4050 Laptop GPU, 84 Wh | Lenovo Yoga Pro 9 16IMH9 Ultra 9 185H, NVIDIA GeForce RTX 4070 Laptop GPU, 84 Wh | HP Envy x360 2-in-1 16-ad0097nr R7 8840HS, Radeon 780M, 68 Wh | Dell XPS 16 9640 Ultra 7 155H, NVIDIA GeForce RTX 4070 Laptop GPU, 99.5 Wh | Samsung Galaxy Book4 Ultra Ultra 7 155H, NVIDIA GeForce RTX 4050 Laptop GPU, 76 Wh | Asus VivoBook Pro 16 K6602VU i9-13900H, NVIDIA GeForce RTX 4050 Laptop GPU, 96 Wh | |
|---|---|---|---|---|---|---|
| Autonomie de la batterie | -3% | -15% | 16% | 21% | 12% | |
| WiFi v1.3 | 540 | 526 -3% | 459 -15% | 629 16% | 656 21% | 606 12% |
| H.264 | 692 | 988 | 1076 | 585 | ||
| Load | 73 | 116 | 87 | 78 | ||
| Reader / Idle | 935 |
Points positifs
Points négatifs
Verdict - L'un des meilleurs appareils de Lenovo si vous êtes prêt à payer
Le Yoga Pro 9 16IMH9 est le modèle le plus impressionnant de la série jusqu'à présent, même dans la configuration d'entrée de gamme sans la carte graphique RTX 4070 ou l'écran mini-LED fantaisiste, pour être une véritable alternative au XPS 16 ou du MacBook Pro 16. Son écran IPS, ses performances et sa taille sont compétitifs par rapport aux équivalents Dell ou Apple tout en étant plus facile à entretenir et avec un clavier sans doute meilleur que celui du XPS. Nous pouvons certainement apprécier sa plus grande variété de ports alors que les deux modèles concurrents n'ont que l'USB-C.
D'autres facteurs comme la durée de vie de la batterie et le bruit du ventilateur ne sont pas sensiblement plus longs ou plus silencieux, respectivement, que la configuration RTX 4070 plus haut de gamme.
Le Lenovo Yoga Pro 9 16IMH9 prêt pour l'IA n'est pas seulement une excellente alternative au Dell XPS 16 ou au MacBook Pro 16, mais il fait aussi quelques choses de mieux que ces deux modèles.
Le prix de détail de 1700$ pour la configuration RTX 4050 est un peu élevé puisque les ordinateurs portables de jeu avec le même GPU comme le MSI Thin GF63 ou le Acer Nitro V peuvent être trouvés pour moins de 1000$ chacun. Cependant, comparé au XPS 16 ou au MacBook Pro 15, le Lenovo est moins cher de plusieurs centaines de dollars, ce qui en fait une solution intéressante pour ceux qui cherchent à économiser de l'argent tout en conservant une expérience utilisateur haut de gamme.
Prix et disponibilité
Best Buy propose actuellement la configuration Lenovo Yoga Pro 9 16, telle qu'elle a été examinée, au prix de 1700 $.
Lenovo Yoga Pro 9 16IMH9 RTX 4050
- 06/06/2024 v7 (old)
Allen Ngo
Transparency
La sélection des appareils à examiner est effectuée par notre équipe éditoriale. L'échantillon de test a été prêté à l'auteur par le fabricant ou le détaillant pour les besoins de cet examen. Le prêteur n'a pas eu d'influence sur cette évaluation et le fabricant n'a pas reçu de copie de cette évaluation avant sa publication. Il n'y avait aucune obligation de publier cet article. Nous n'acceptons jamais de compensation ou de paiement en échange de nos commentaires. En tant que média indépendant, Notebookcheck n'est pas soumis à l'autorité des fabricants, des détaillants ou des éditeurs.
Voici comment Notebookcheck teste
Chaque année, Notebookcheck examine de manière indépendante des centaines d'ordinateurs portables et de smartphones en utilisant des procédures standardisées afin de garantir que tous les résultats sont comparables. Nous avons continuellement développé nos méthodes de test depuis environ 20 ans et avons établi des normes industrielles dans le processus. Dans nos laboratoires de test, des équipements de mesure de haute qualité sont utilisés par des techniciens et des rédacteurs expérimentés. Ces tests impliquent un processus de validation en plusieurs étapes. Notre système d'évaluation complexe repose sur des centaines de mesures et de points de référence bien fondés, ce qui garantit l'objectivité.Price comparison

