

Test du Dell XPS 13 9345 Snapdragon X Elite : concurrent de l'Intel Core Ultra 7

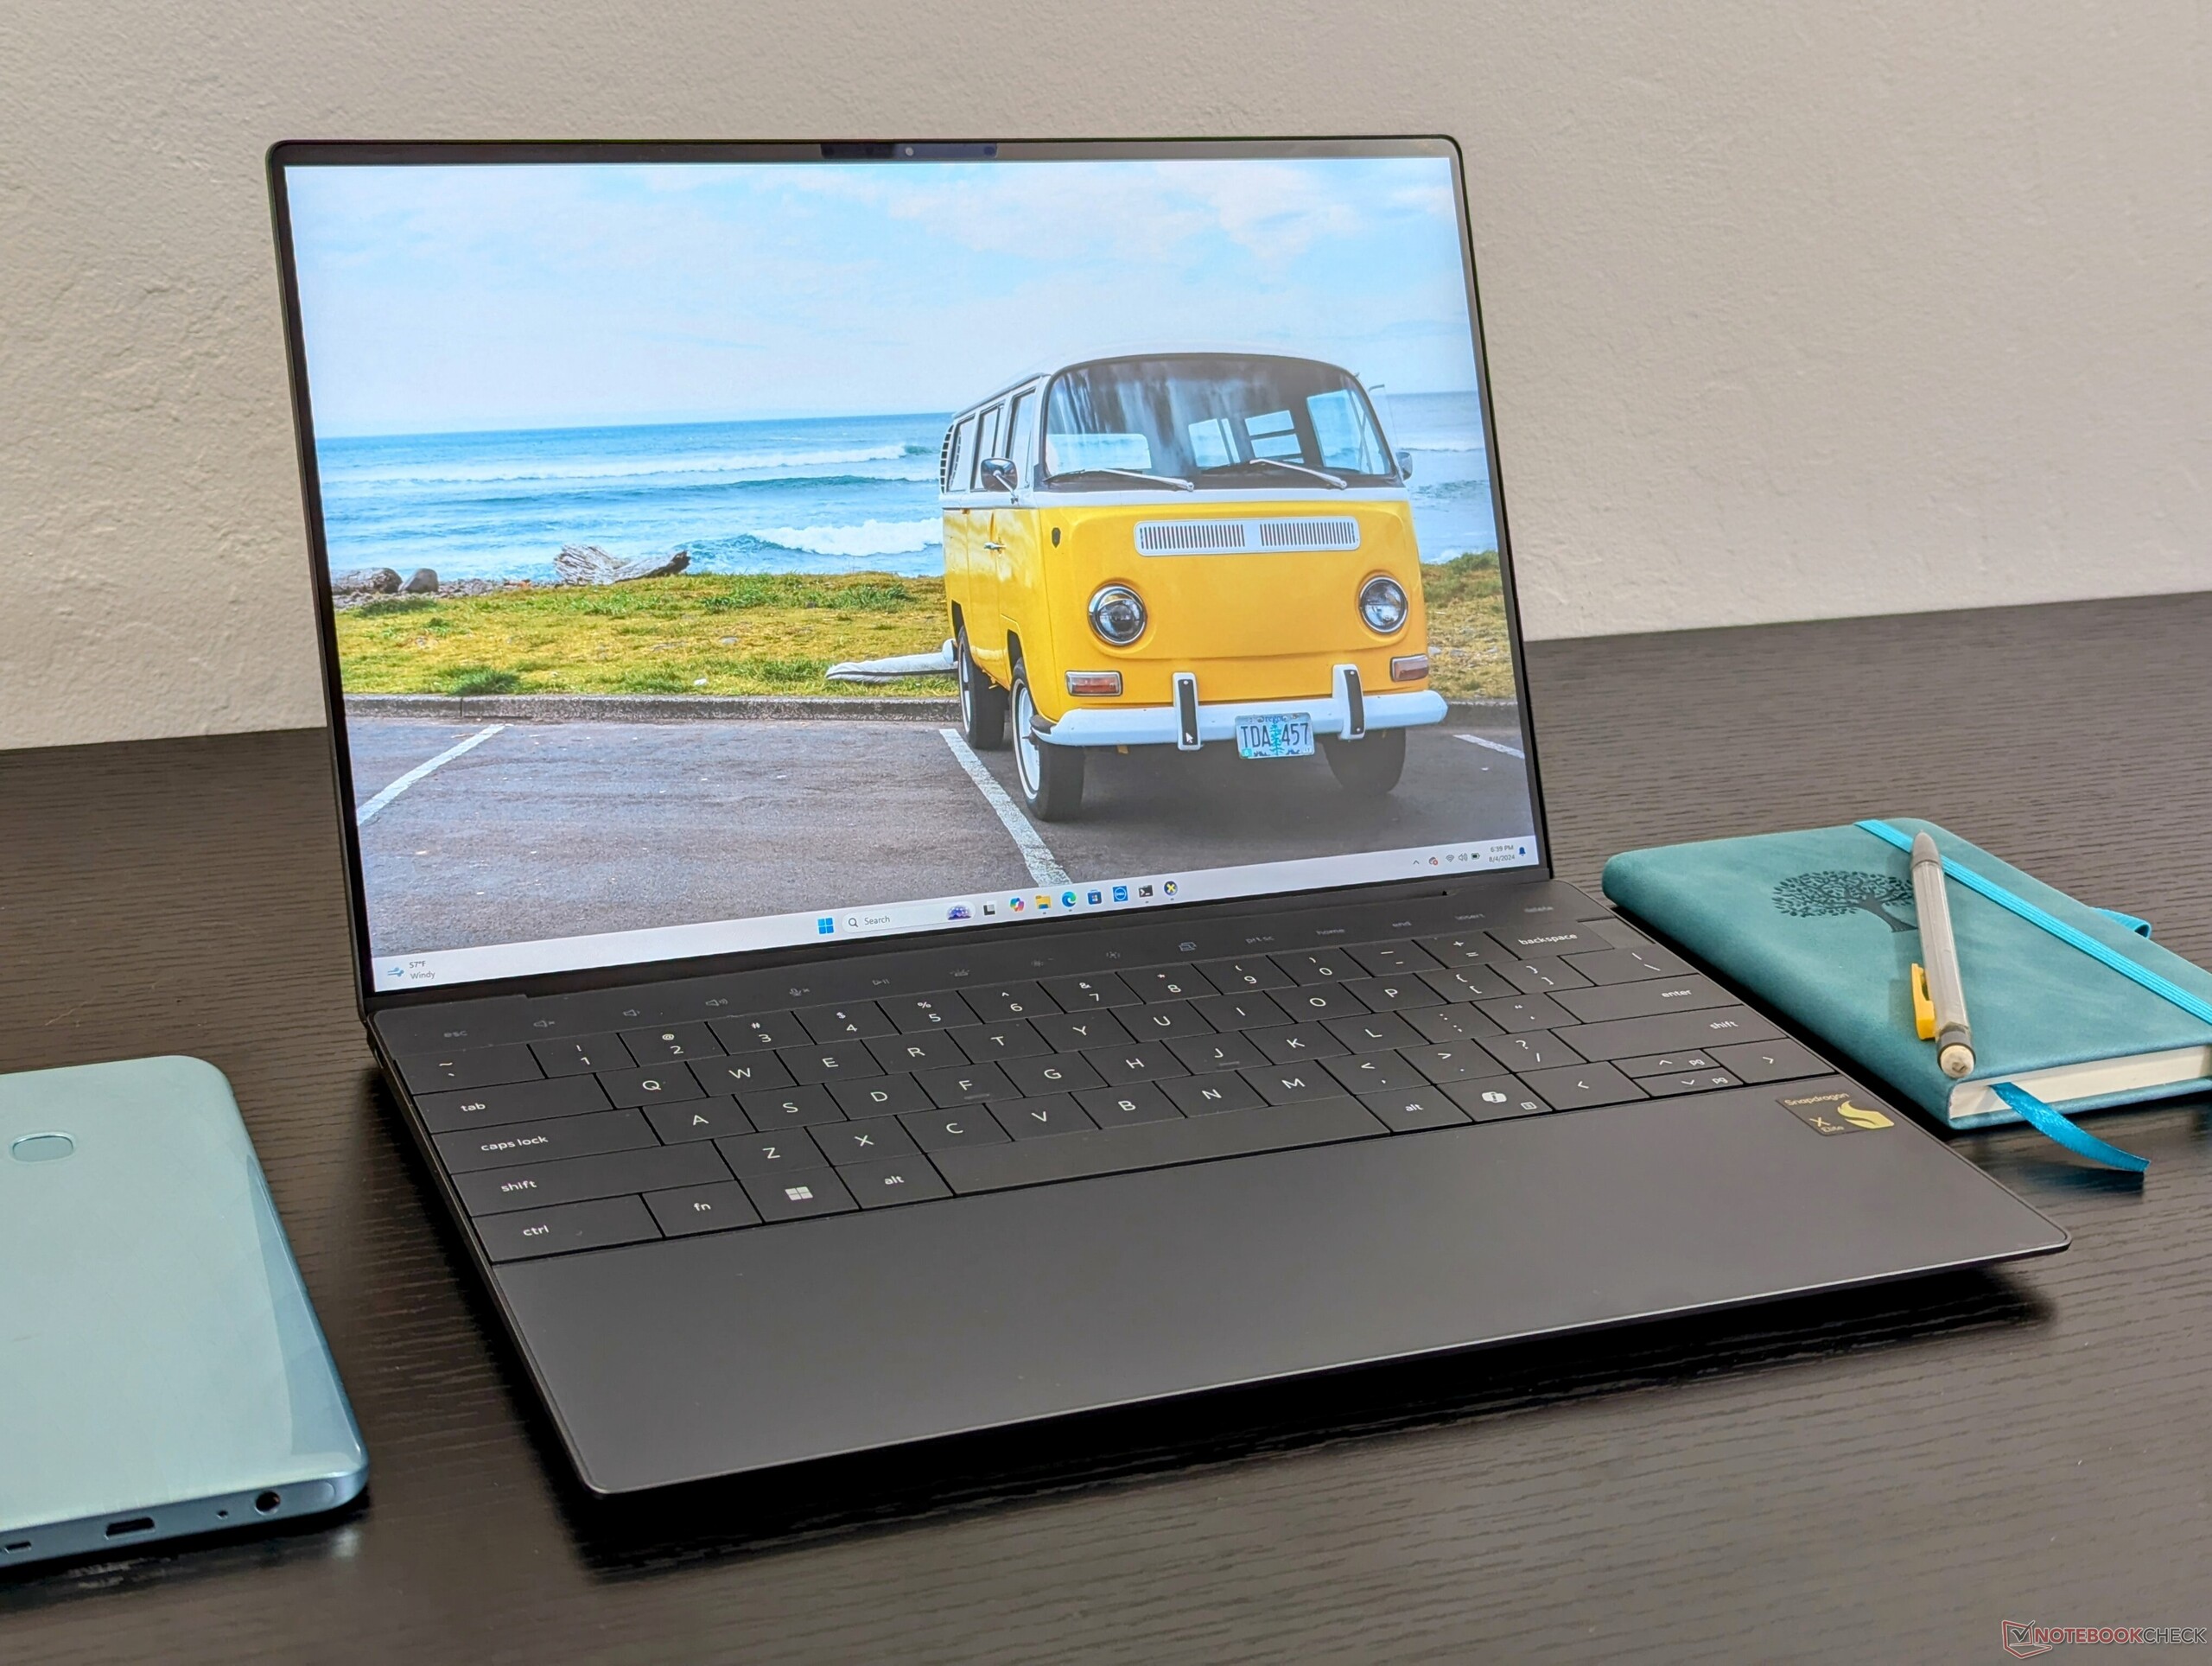
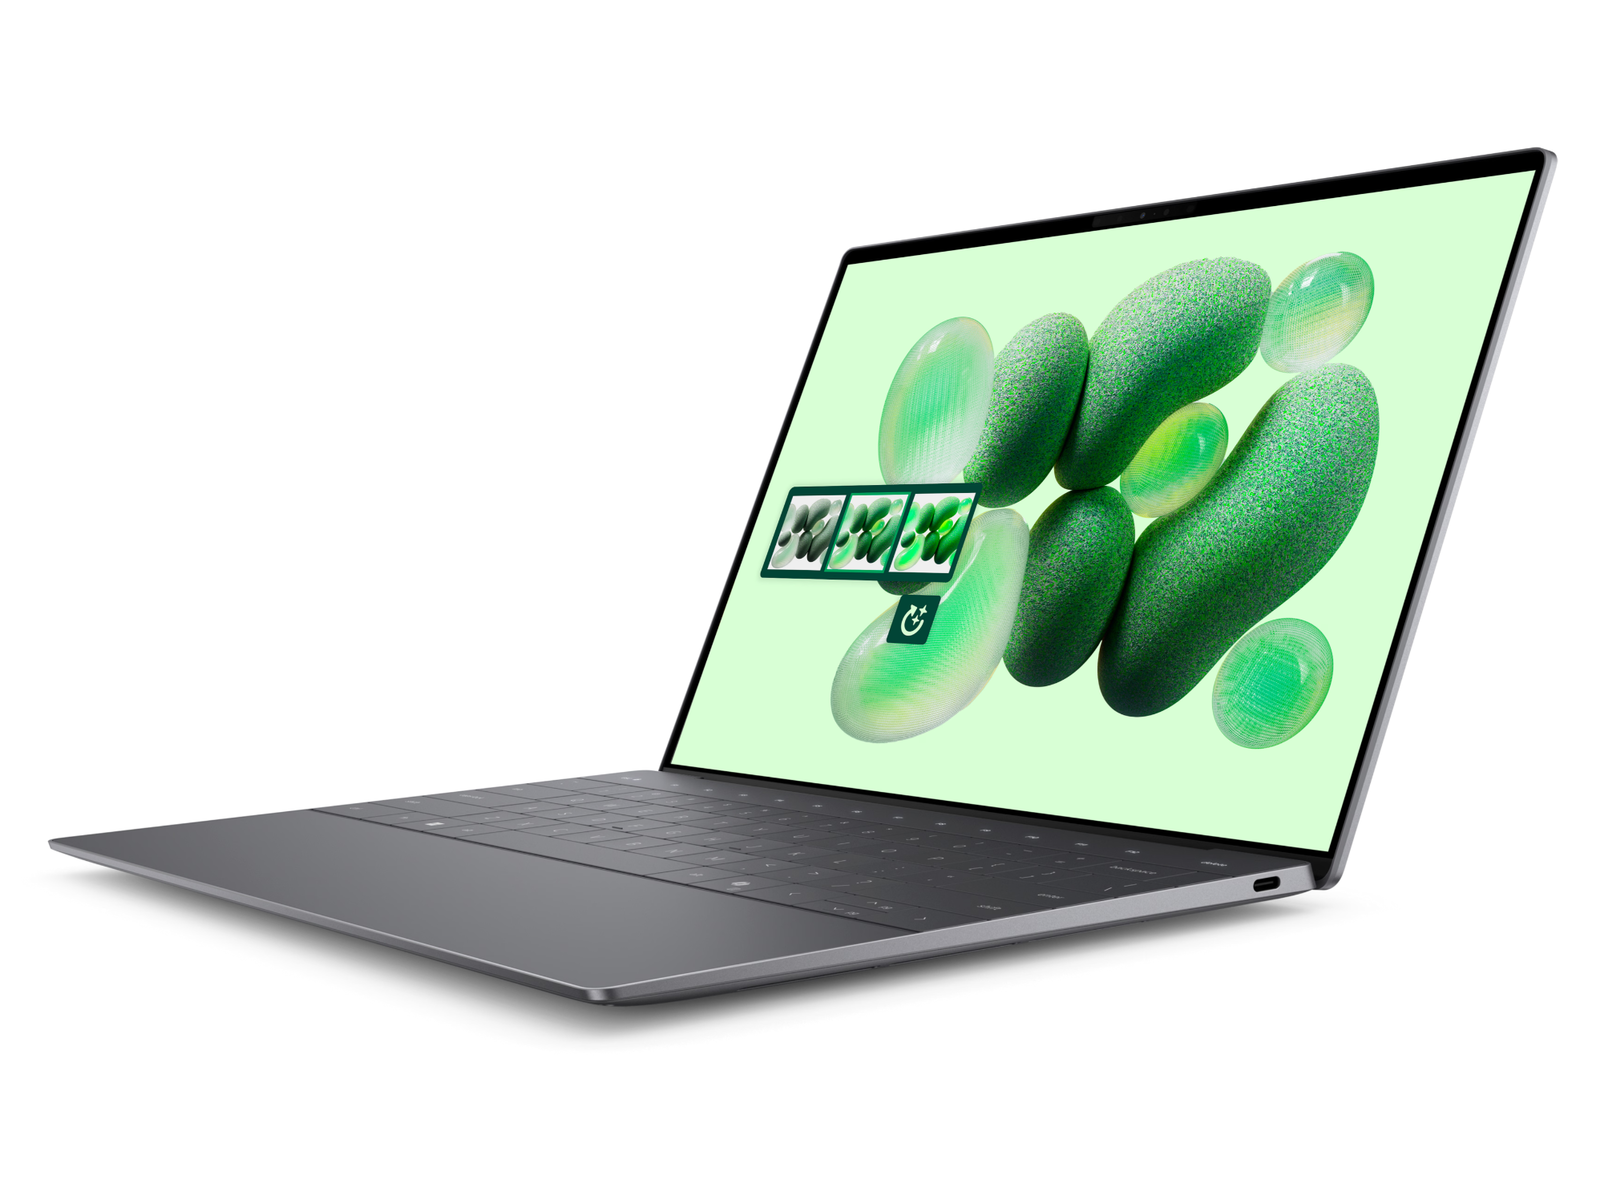
Quelle meilleure façon de mettre en valeur votre processeur que de l'intégrer à l'un des ordinateurs portables grand public les plus populaires de Dell ? Le châssis du XPS 13 Plus 9320/9340 a été reconverti avec le dernier processeur Snapdragon X Elite pour faire partie de la petite poignée d'ordinateurs portables Windows équipés de Qualcomm qui sortiront cette année. Baptisé XPS 13 9345, le modèle Snapdragon est par ailleurs visuellement identique à l'actuel XPS 13 Plus 9320 ou 9340 équipés de processeurs Intel traditionnels.
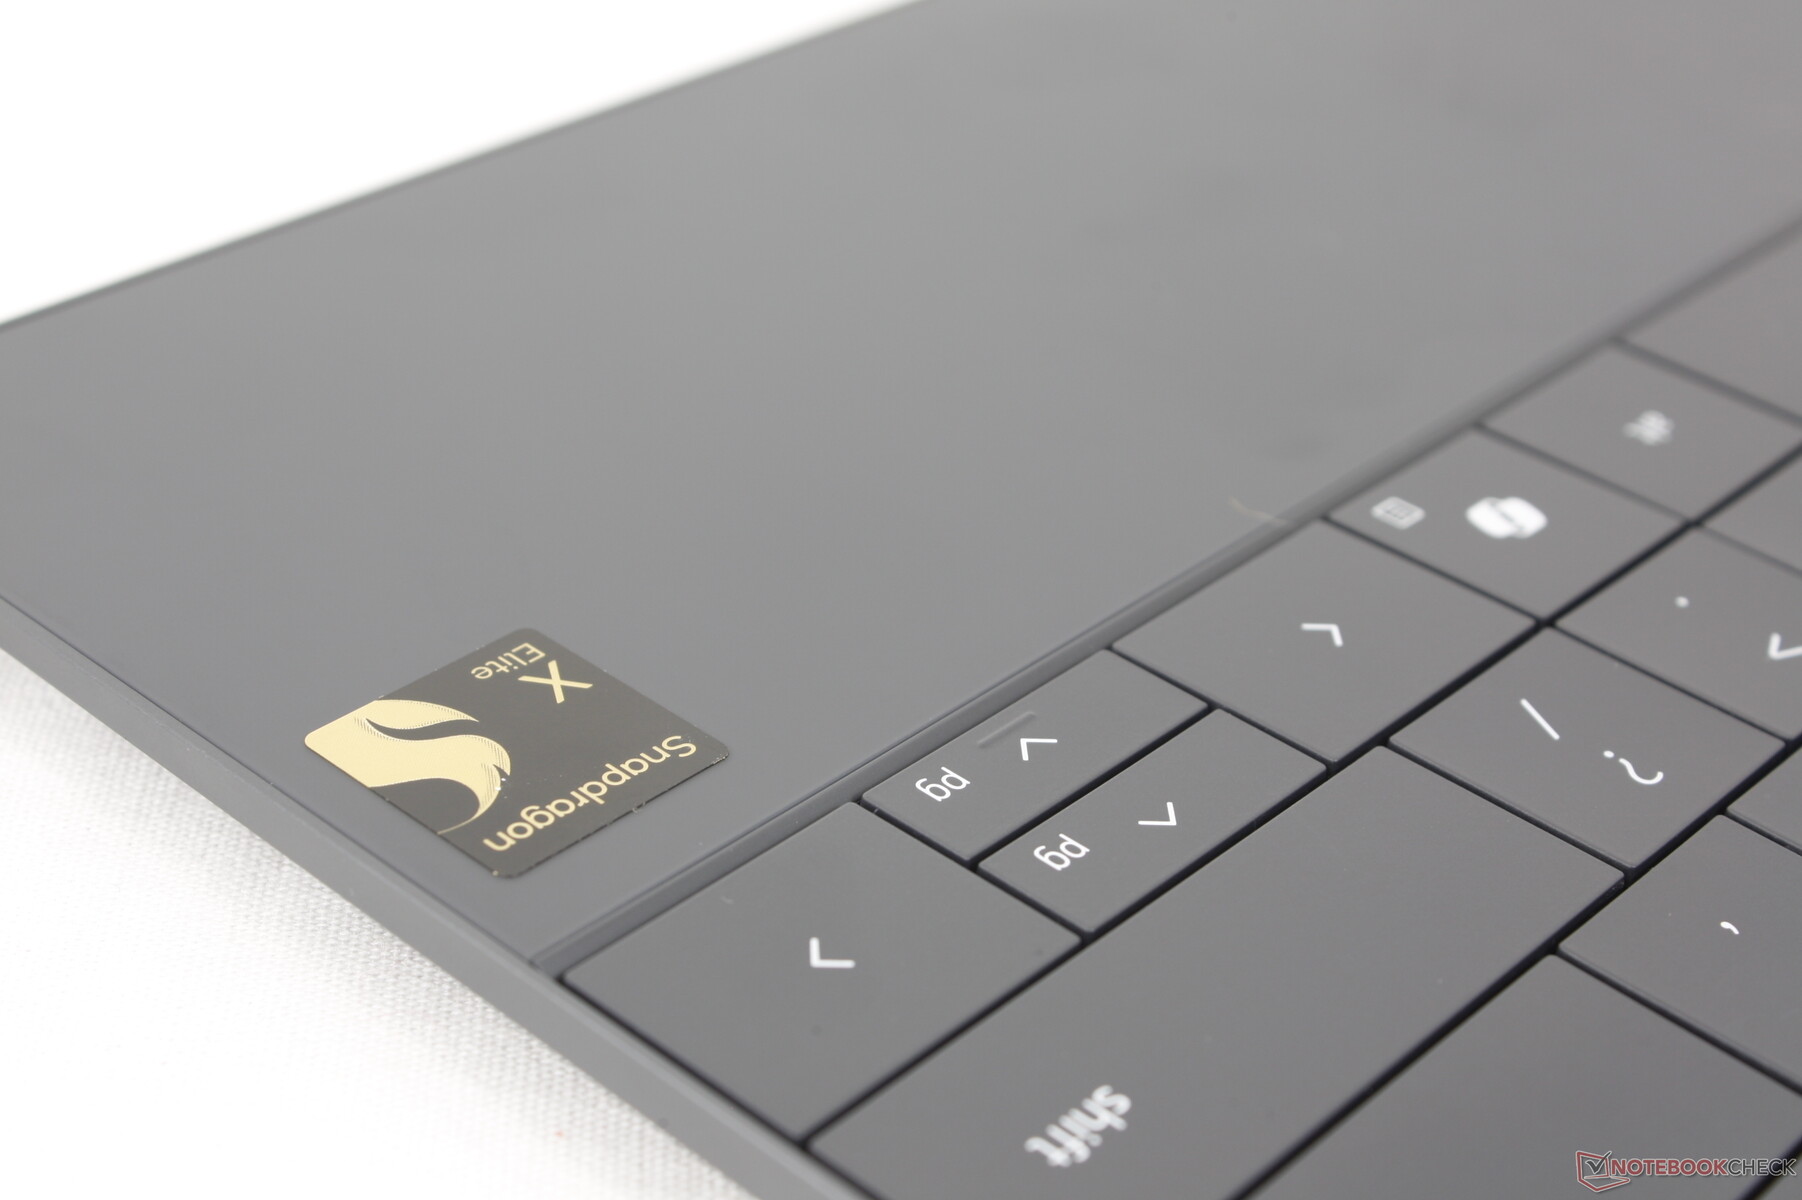
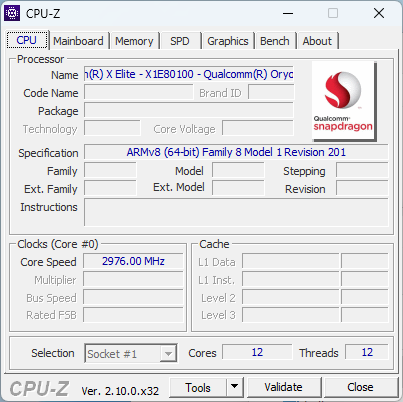
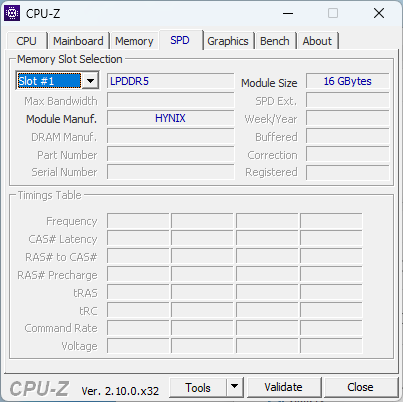
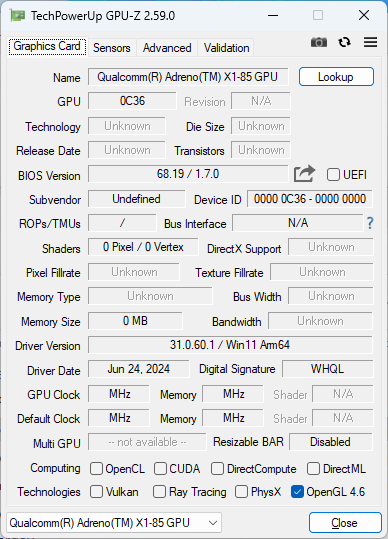
Notre configuration est équipée du Snapdragon X1 Elite X1E-80-100, de 16 Go de RAM LPDDR5X-8448 et d'un écran IPS 1200p 120 Hz pour un prix d'environ 1300 USD. Des panneaux OLED plus haut de gamme sont disponibles et certaines régions peuvent inclure une deuxième option de processeur Snapdragon X1 Plus X1P, mais le GPU intégré reste le même dans tous les cas.
Les alternatives au XPS 13 9345 sont les suivantes Microsoft Surface Pro ou le Samsung Galaxy Book4 Edge 16 tous deux équipés du même processeur Snapdragon X1 Elite X1E-80-100. Bien entendu, il est également en concurrence directe avec des ordinateurs portables de bureau de 13 et 14 pouces plus conventionnels, tels que le Lenovo ThinkBook 13x G4, Asus ZenBook S13ou le XPS 13 9340 de Dell.
Plus d'avis sur Dell :
Comparaison avec les concurrents potentiels
Note | Version | Date | Modèle | Poids | Épaisseur | Taille | Résolution | Prix |
|---|---|---|---|---|---|---|---|---|
| 84.5 % | v8 | 08/24 | Dell XPS 13 9345 SD X Elite X1E-80-100, Adreno X1-85 3.8 TFLOPS | 1.2 kg | 15.3 mm | 13.40" | 1920x1200 | |
| 86.5 % v7 (old) | v7 (old) | 05/24 | Dell XPS 13 9340 Core Ultra 7 Ultra 7 155H, Arc 8-Core | 1.2 kg | 15.3 mm | 13.40" | 1920x1200 | |
| 86.2 % | v8 | 07/24 | Microsoft Surface Laptop 7 13.8 Copilot+ SD X Elite X1E-80-100, Adreno X1-85 3.8 TFLOPS | 1.3 kg | 17.5 mm | 13.80" | 2304x1536 | |
| 90.1 % v7 (old) | v7 (old) | 05/24 | Lenovo ThinkBook 13x G4 21KR0008GE Ultra 5 125H, Arc 7-Core | 1.2 kg | 12.9 mm | 13.50" | 2880x1920 | |
| 82.3 % | v8 | 07/24 | HP EliteBook Ultra G1q 14 SD X Elite X1E-78-100, Adreno X1-85 3.8 TFLOPS | 1.3 kg | 11.2 mm | 14.00" | 2240x1400 | |
| 85.4 % v7 (old) | v7 (old) | 05/23 | Asus ZenBook S13 OLED UX5304 i7-1355U, Iris Xe G7 96EUs | 1 kg | 11.8 mm | 13.30" | 2880x1800 |
Conseils : Notre système d'évaluation a été mis à jour récemment et les résultats de la version 8 ne sont pas comparables à ceux de la version 7. Vous trouverez d'autres informations à ce sujet ici sont disponibles ici.
Note : Nous avons récemment mis à jour notre système d'évaluation et les résultats de la version 8 ne sont pas comparables à ceux de la version 7. De plus amples informations sont disponibles ici .
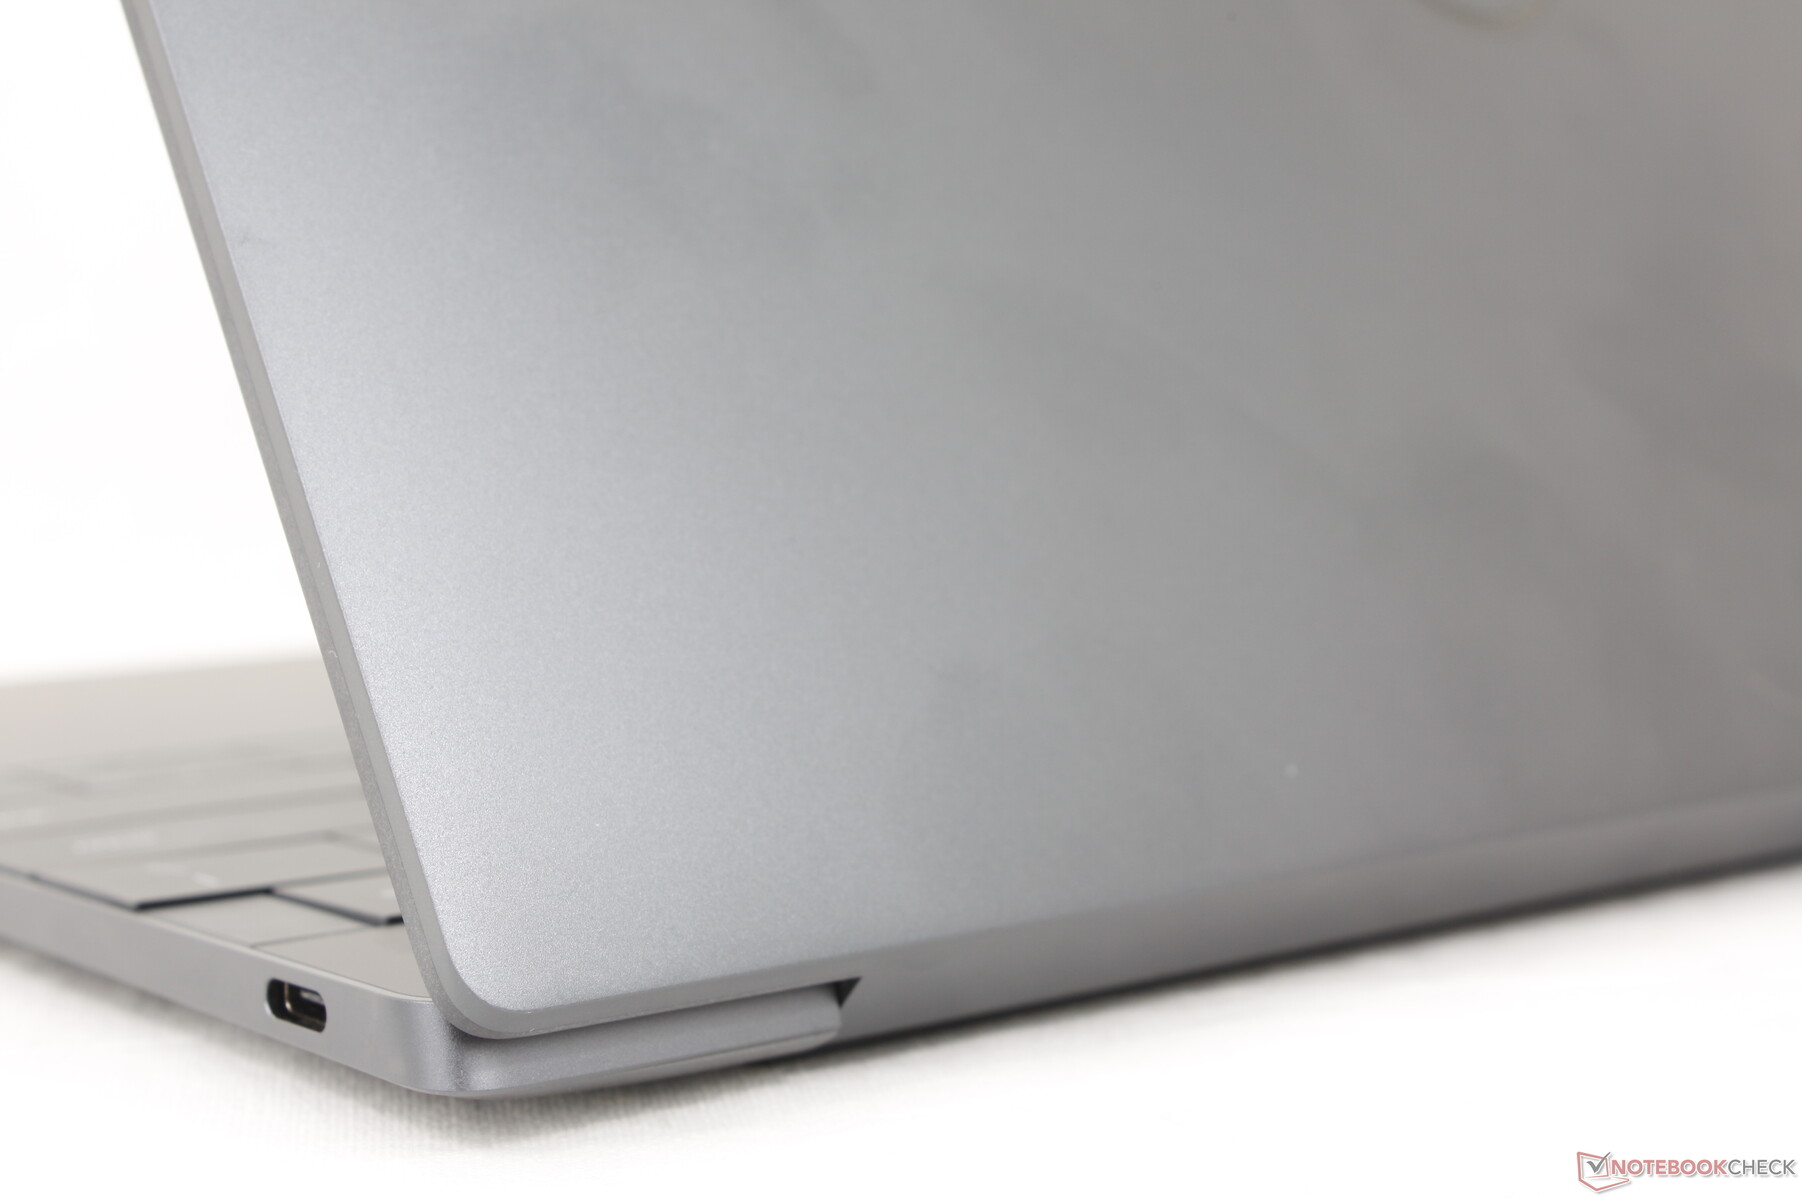
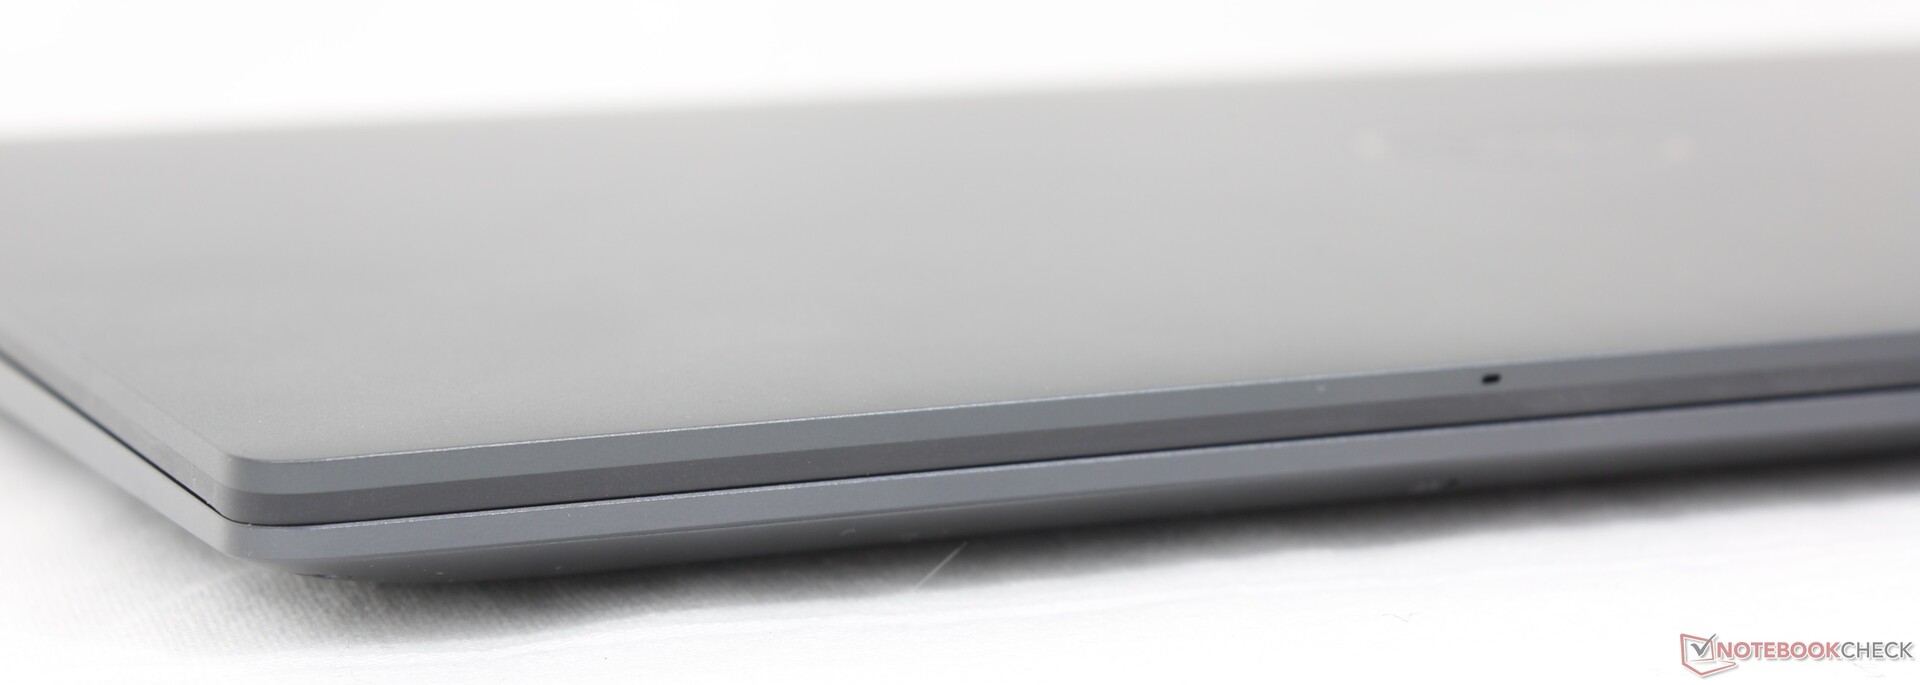
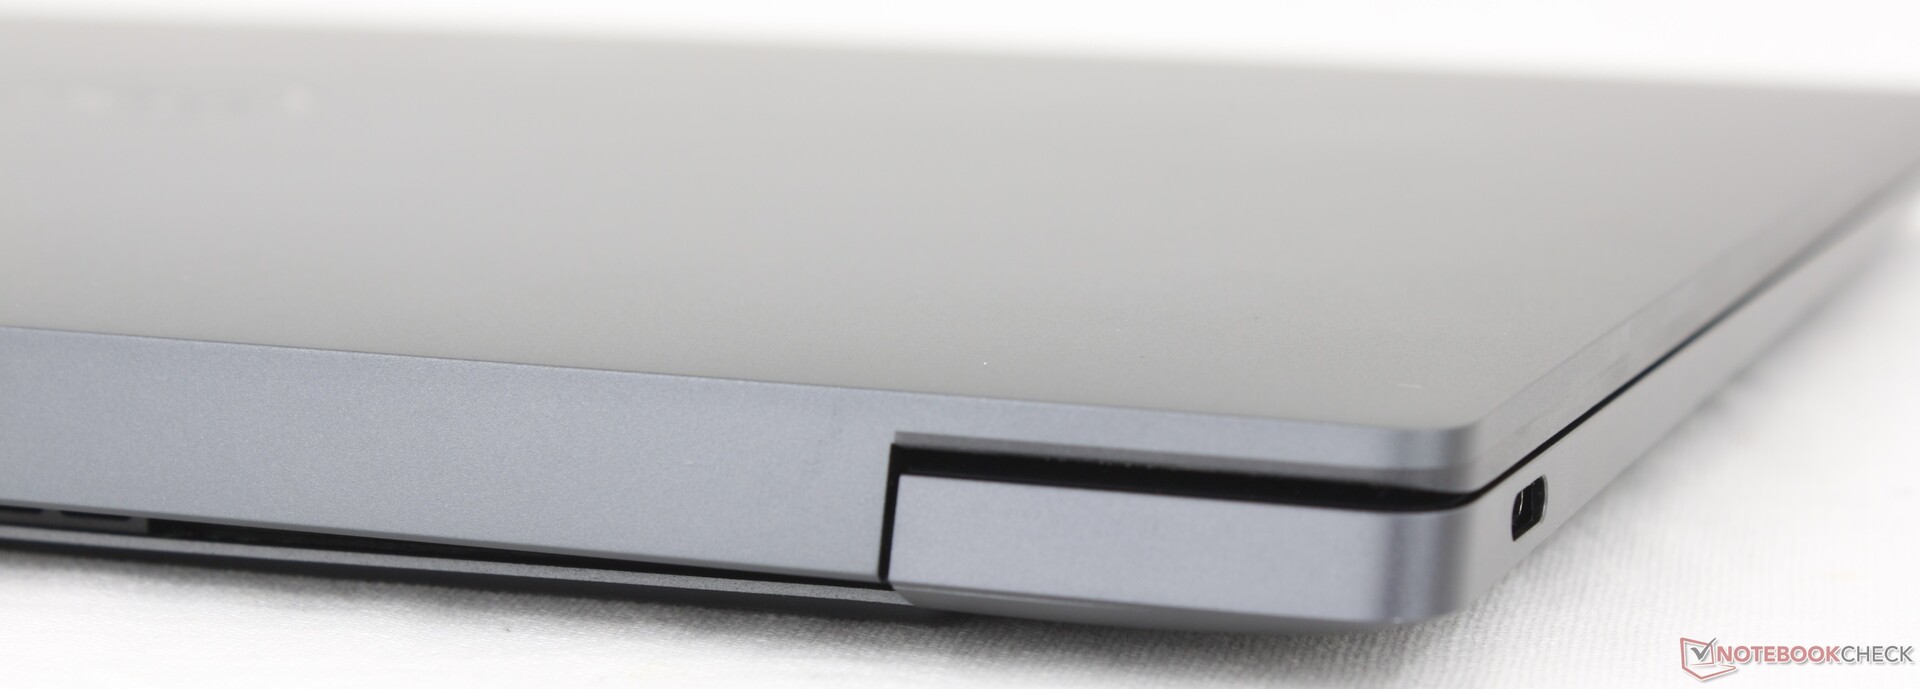
Cas - Une apparence familière
Il n'y a pas de différences externes entre le modèle Qualcomm et le modèle Intel nos commentaires sur le modèle Intel s'appliquent également. De nouvelles couleurs auraient été appréciées, mais les mêmes options Platinum et Graphite s'appliquent. Nous préférons légèrement l'option Platine car sa couleur blanche brillante masque mieux les traces de doigts que l'option Graphite plus sombre de notre unité de test Qualcomm, en particulier le long des repose-poignets et du couvercle extérieur.
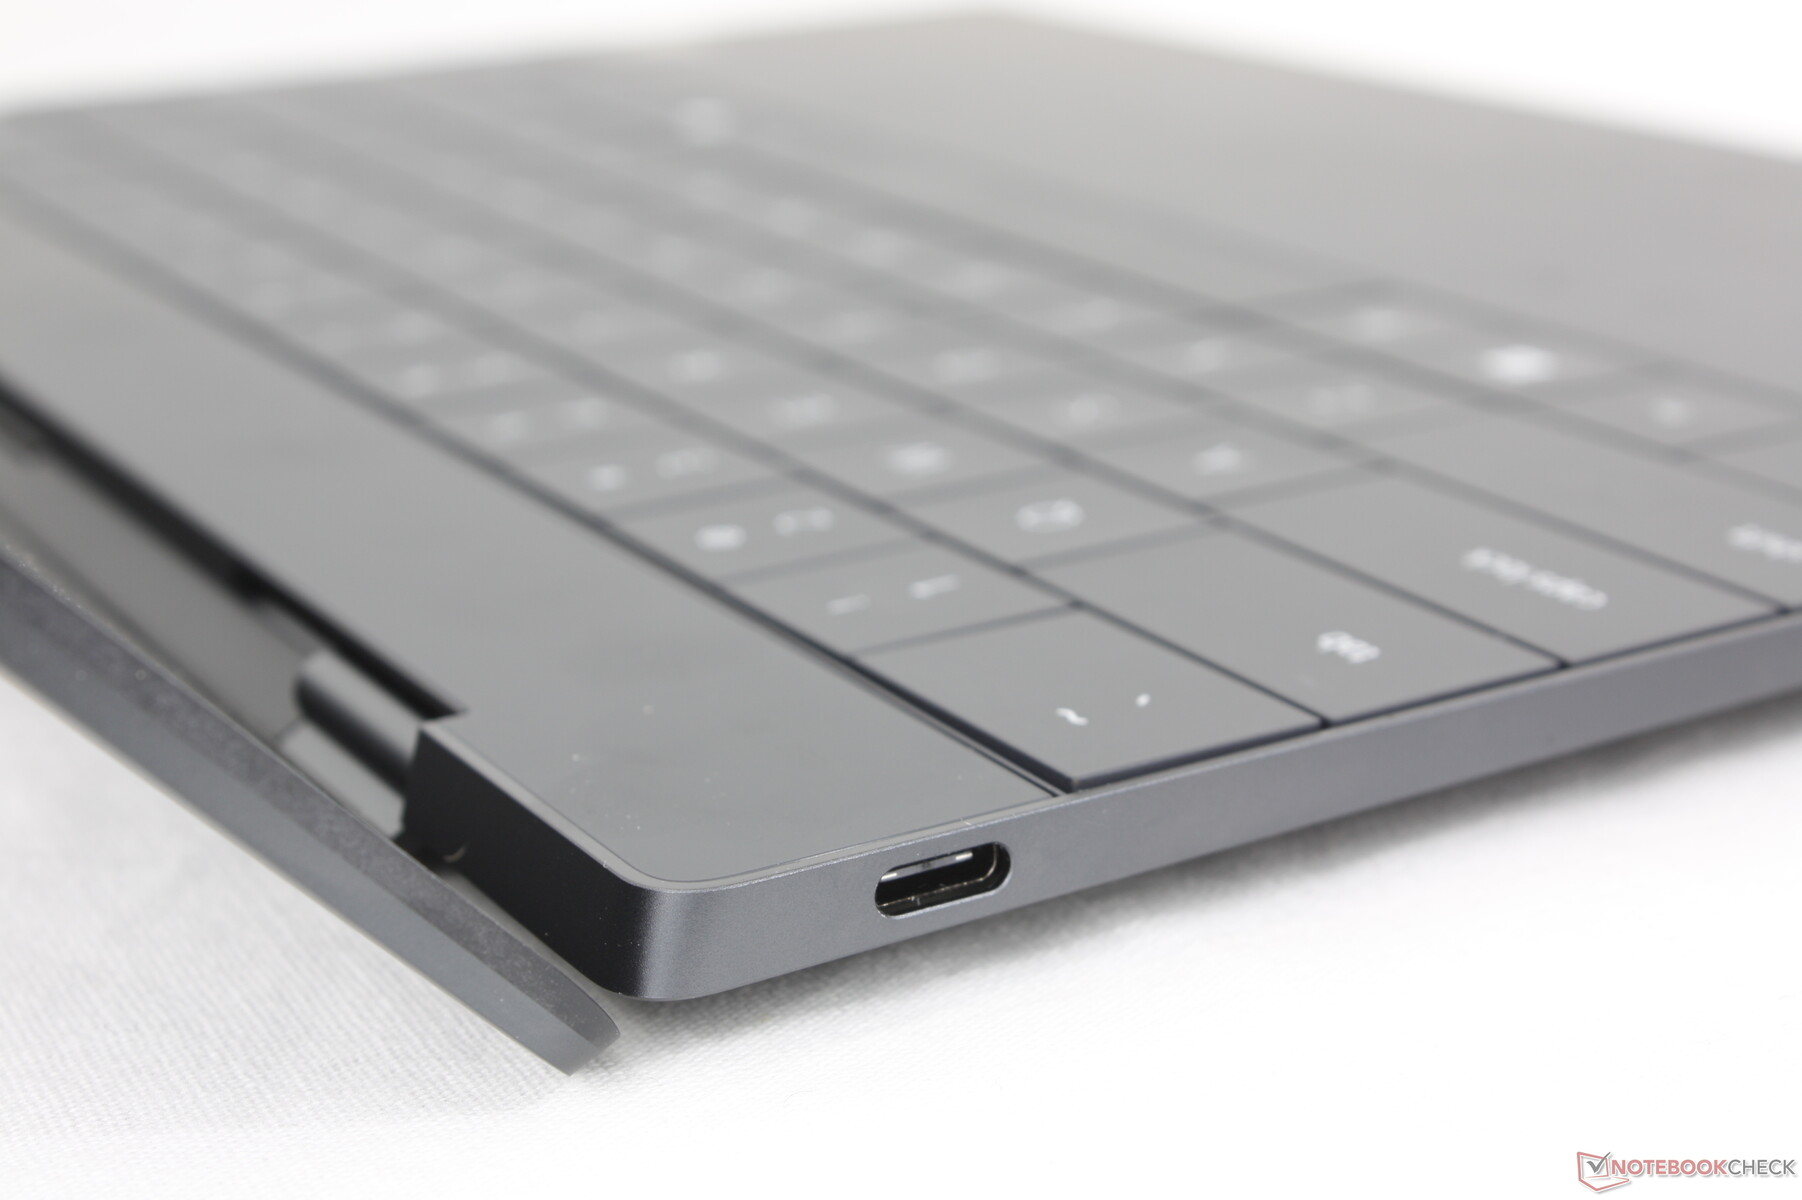
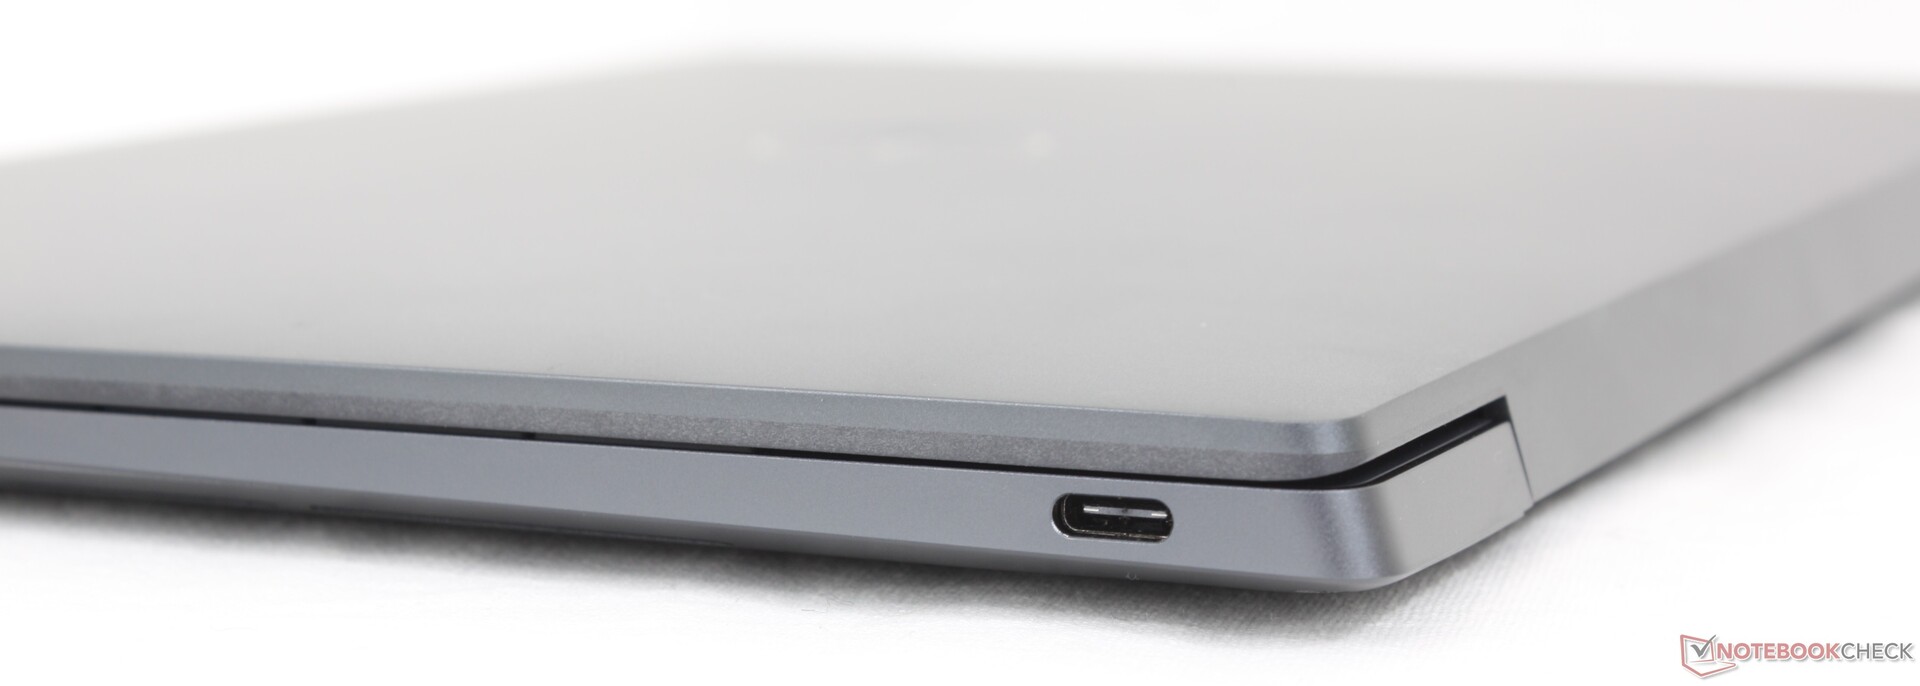
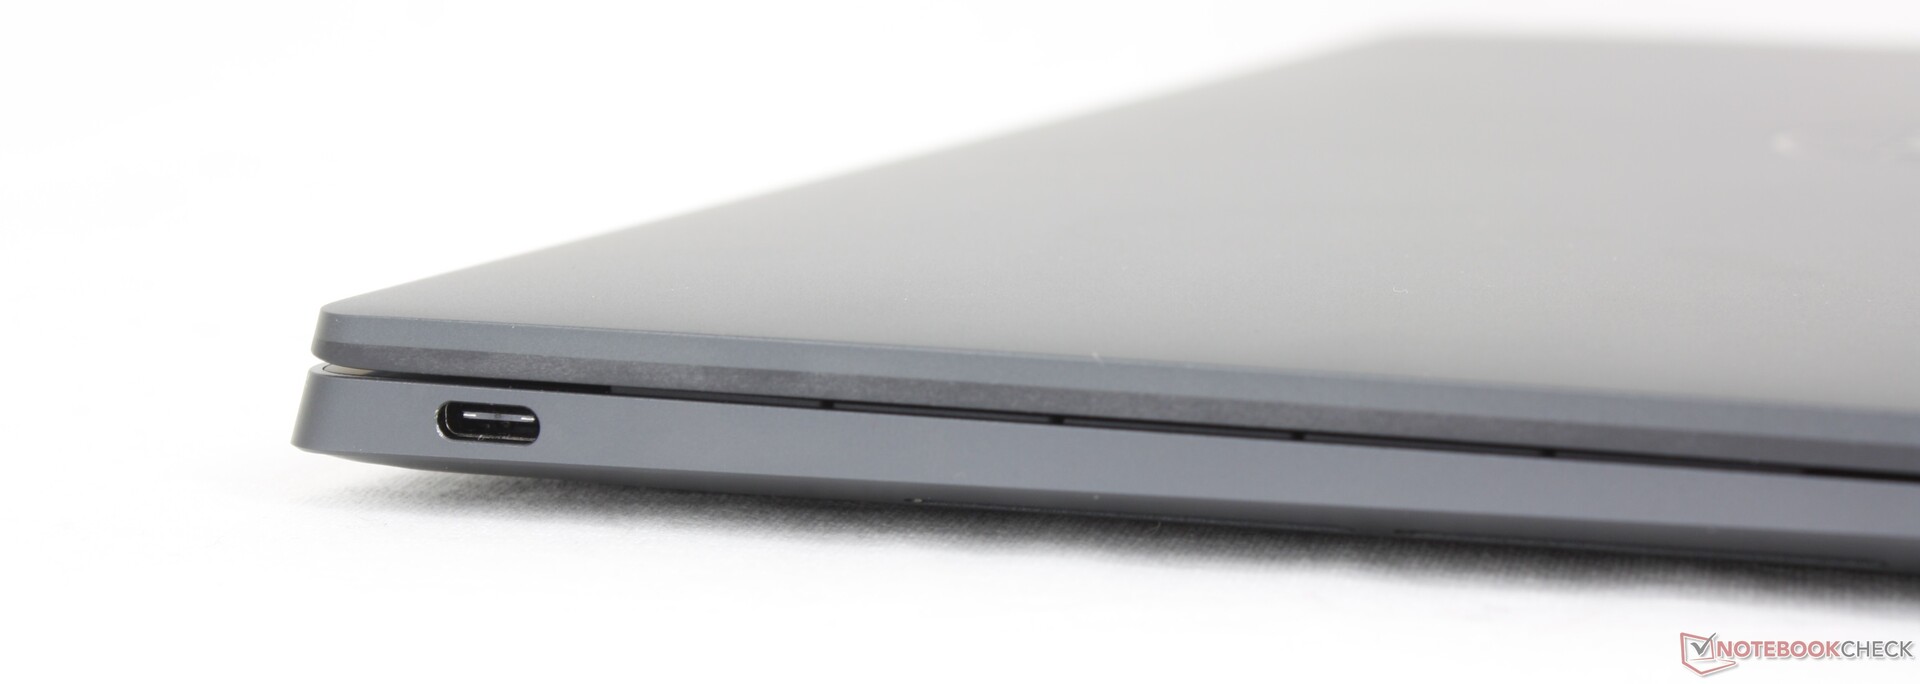
Connectivité
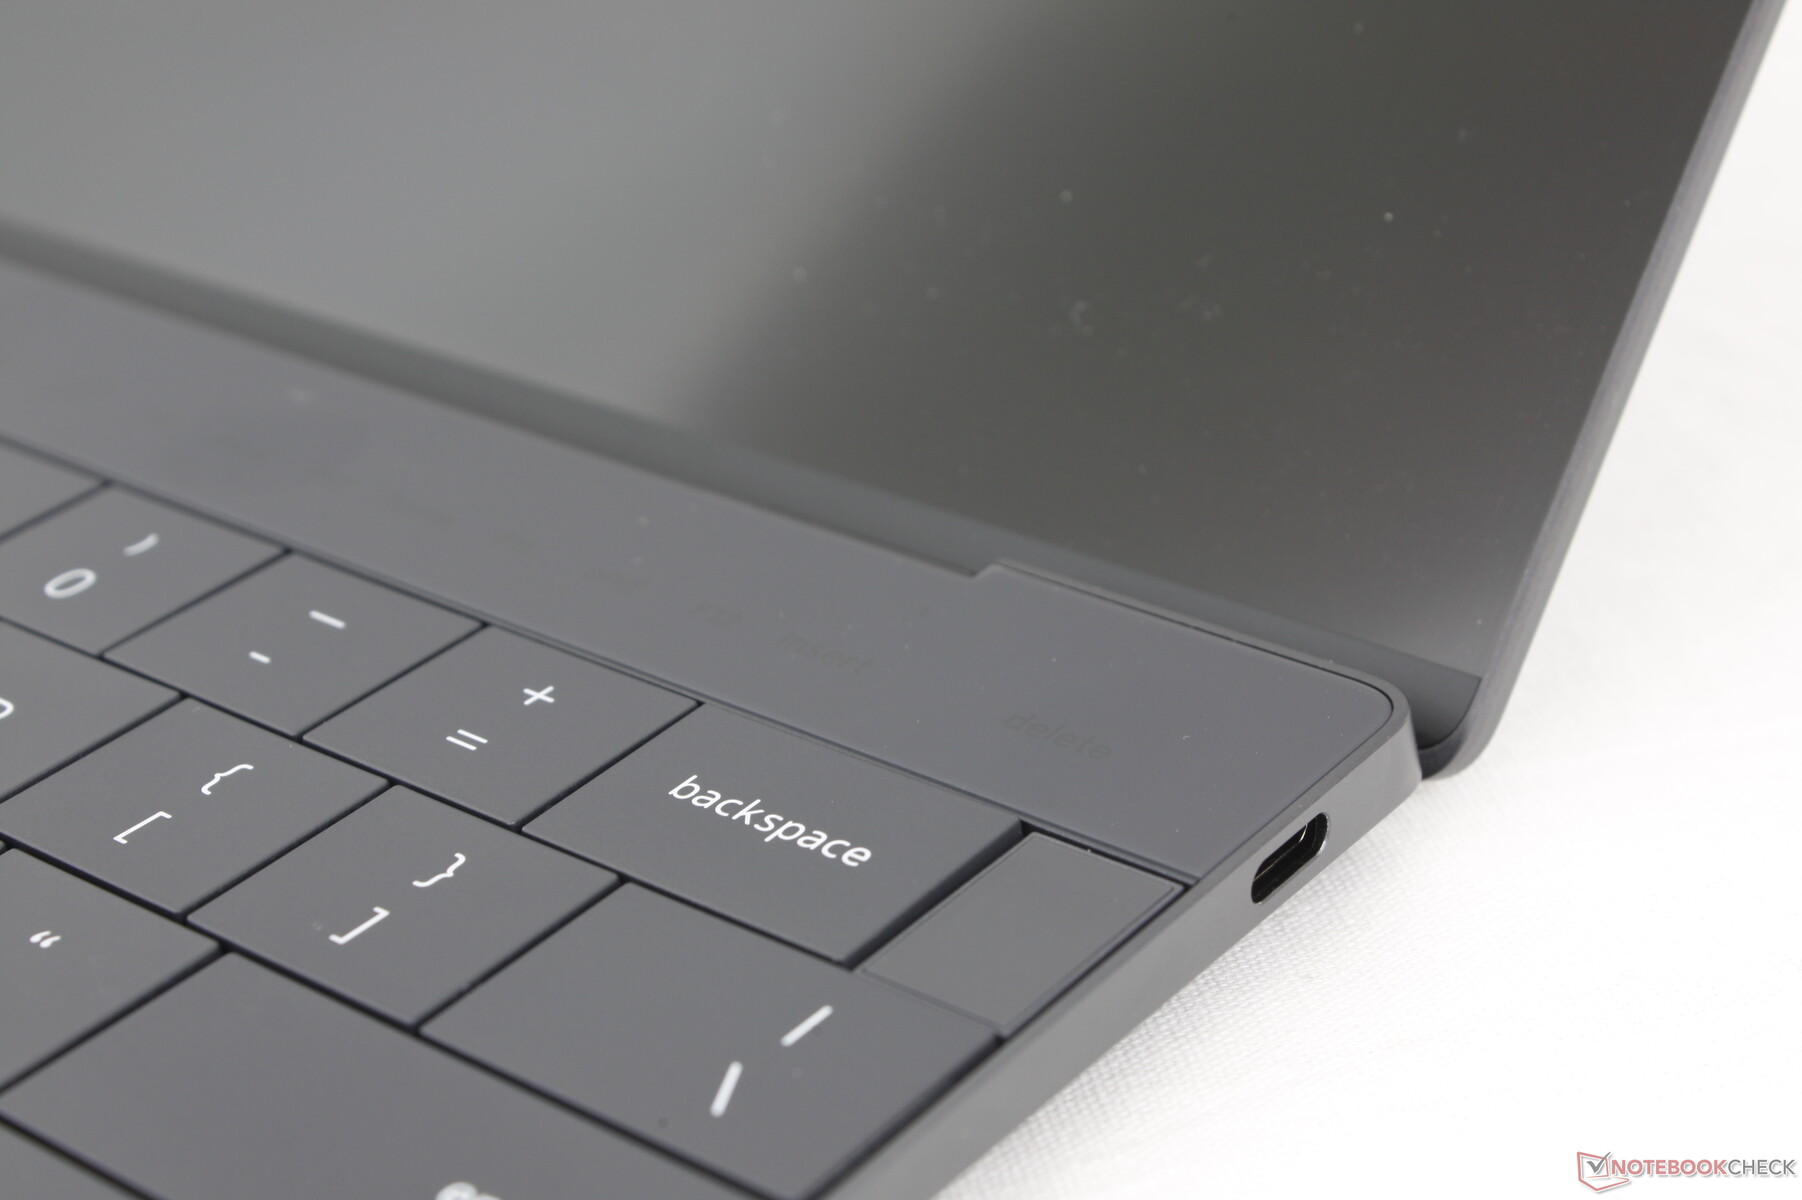
Il y a deux ports USB-C 4.0, comme sur la version Intel du XPS 13. Cependant, ces ports ne prennent pas en charge Thunderbolt et la compatibilité avec l'eGPU n'est donc pas garantie. Lorsque nous avons essayé de connecter notre Aorus RTX 2080 Ti Gaming Boxpar exemple, l'ordinateur portable Qualcomm n'a pas pu reconnaître l'eGPU, alors qu'un PC compatible avec Thunderbolt l'a reconnu automatiquement via le Gestionnaire de périphériques. Qualcomm a déclaré que l'assistance et les pilotes applicables relèveraient des fabricants d'eGPU, ce qui n'est pas très prometteur pour les propriétaires d'eGPU existants.
Communication
Dell a remplacé le BE200 du XPS 13 d'Intel par le FastConnect 7800 du XPS 13 de Qualcomm. Le module prend en charge la connectivité Wi-Fi 7, encore peu répandue dans la plupart des foyers. Les performances sont néanmoins stables lorsqu'il est associé à notre routeur de test Wi-Fi 6E AXE11000.
Webcam
Ce modèle est équipé en standard de la même webcam de 2 MP que celle du XPS 13 9340, au lieu de la webcam de 1 MP du XPS 13 9320 original. L'infrarouge est également intégré pour prendre en charge la reconnaissance faciale Windows Hello. Cependant, il n'y a toujours pas de couvercle pour la caméra ni de bouton d'arrêt.


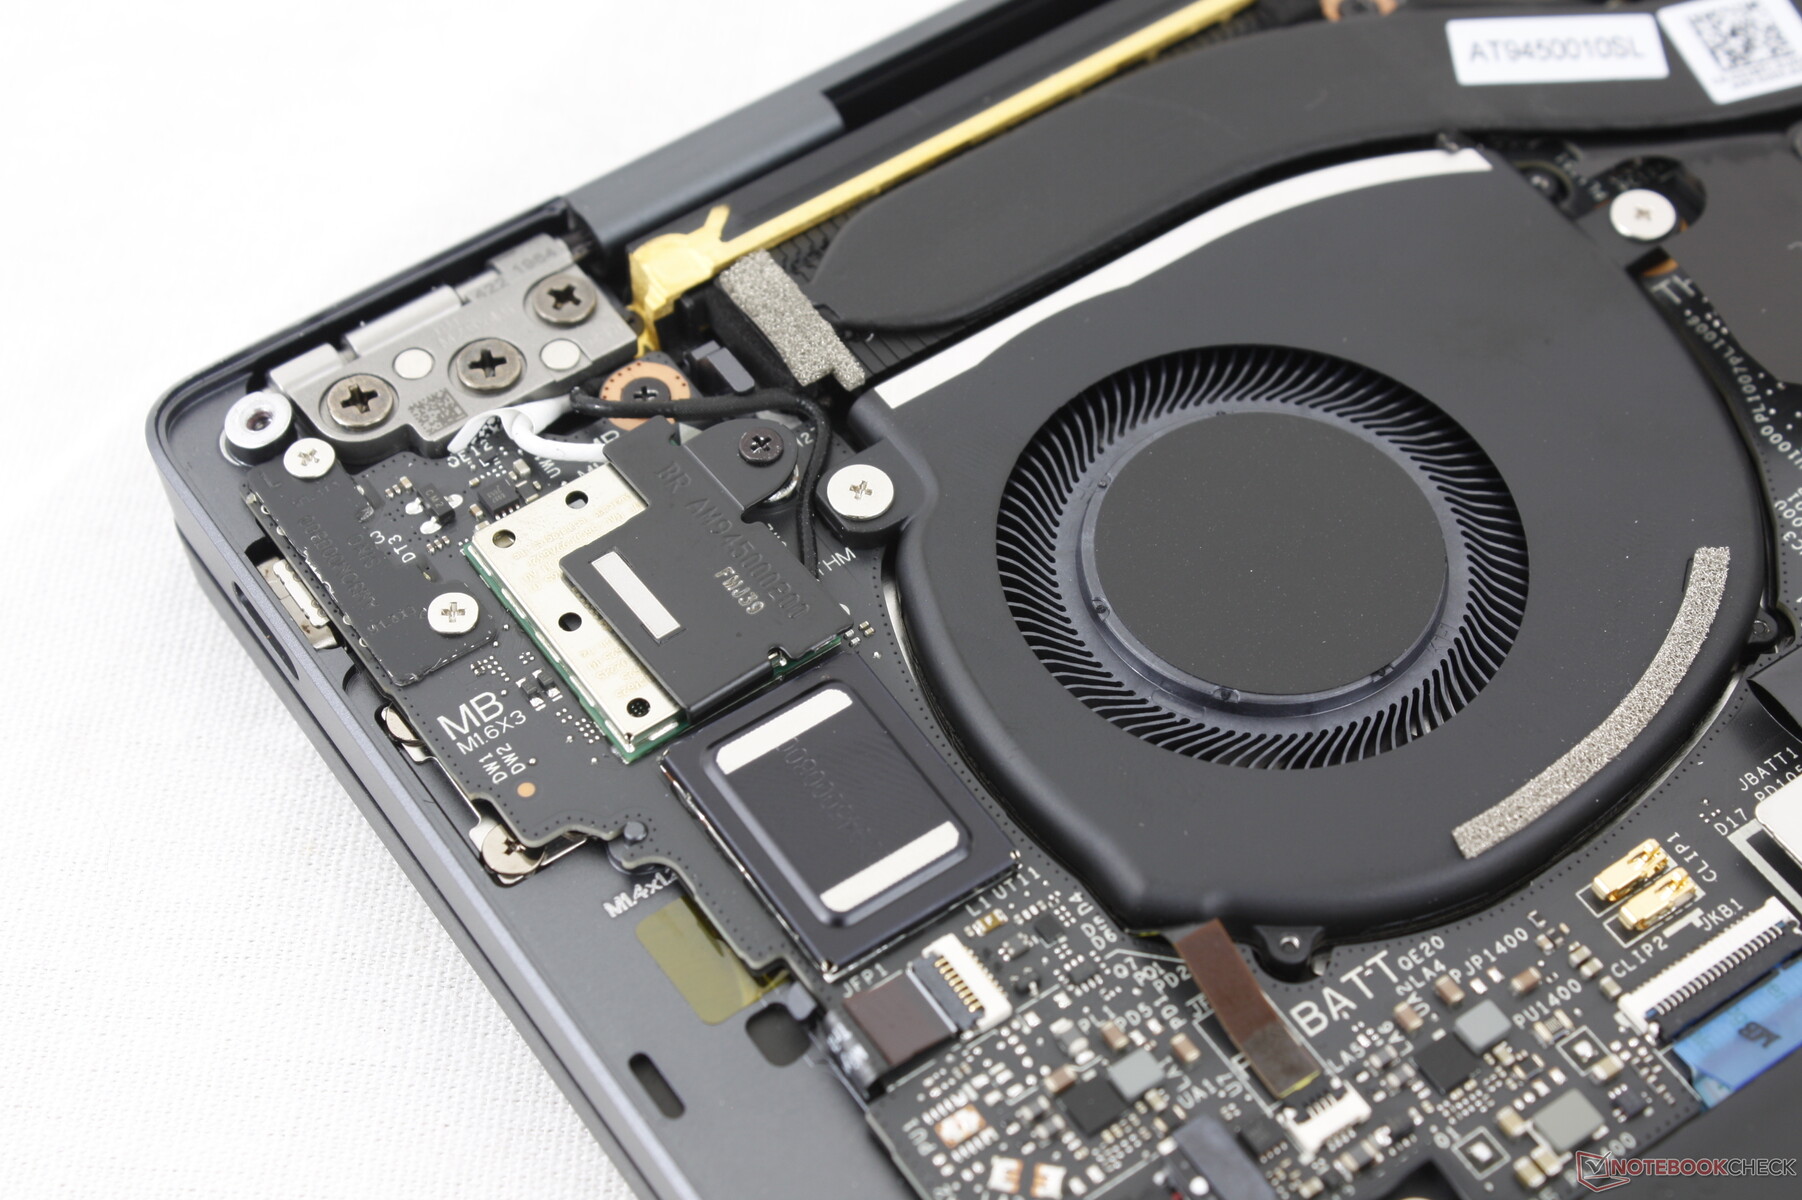
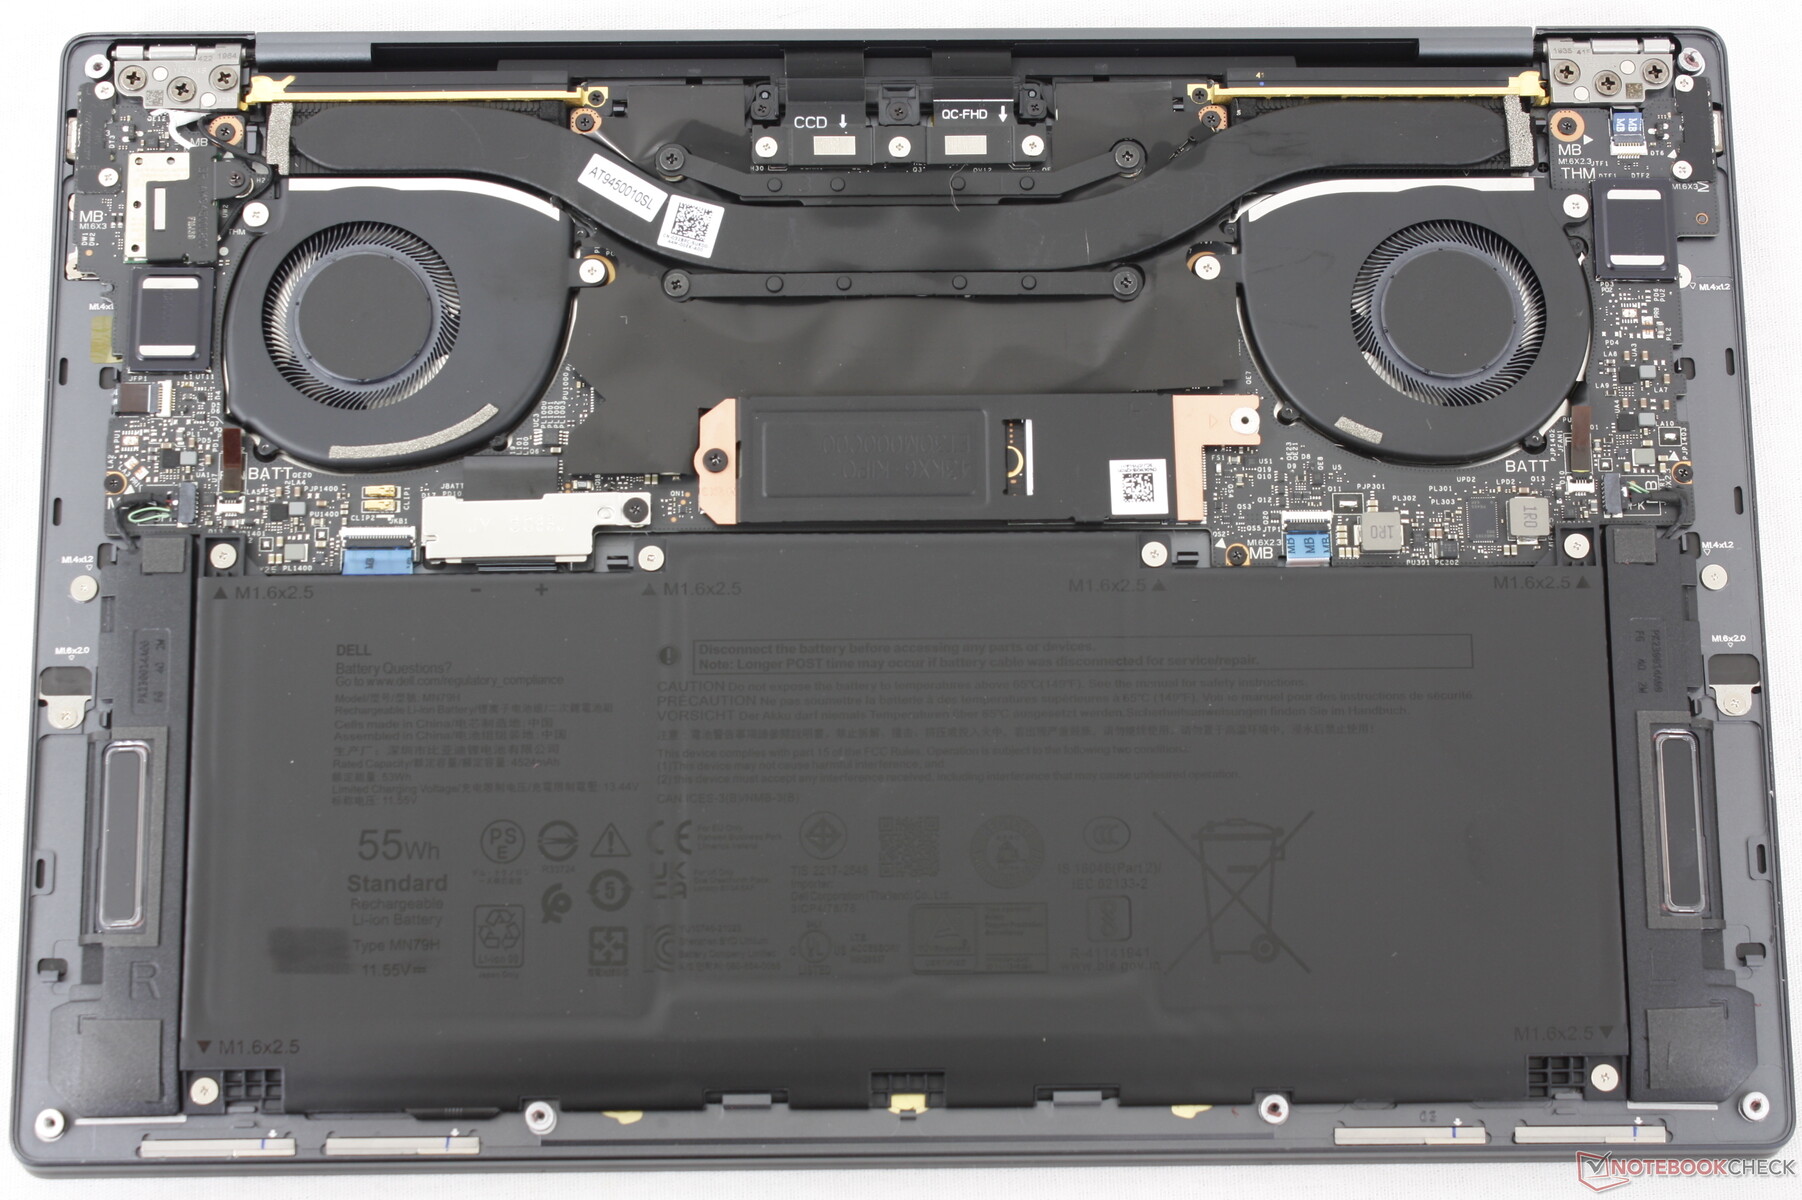
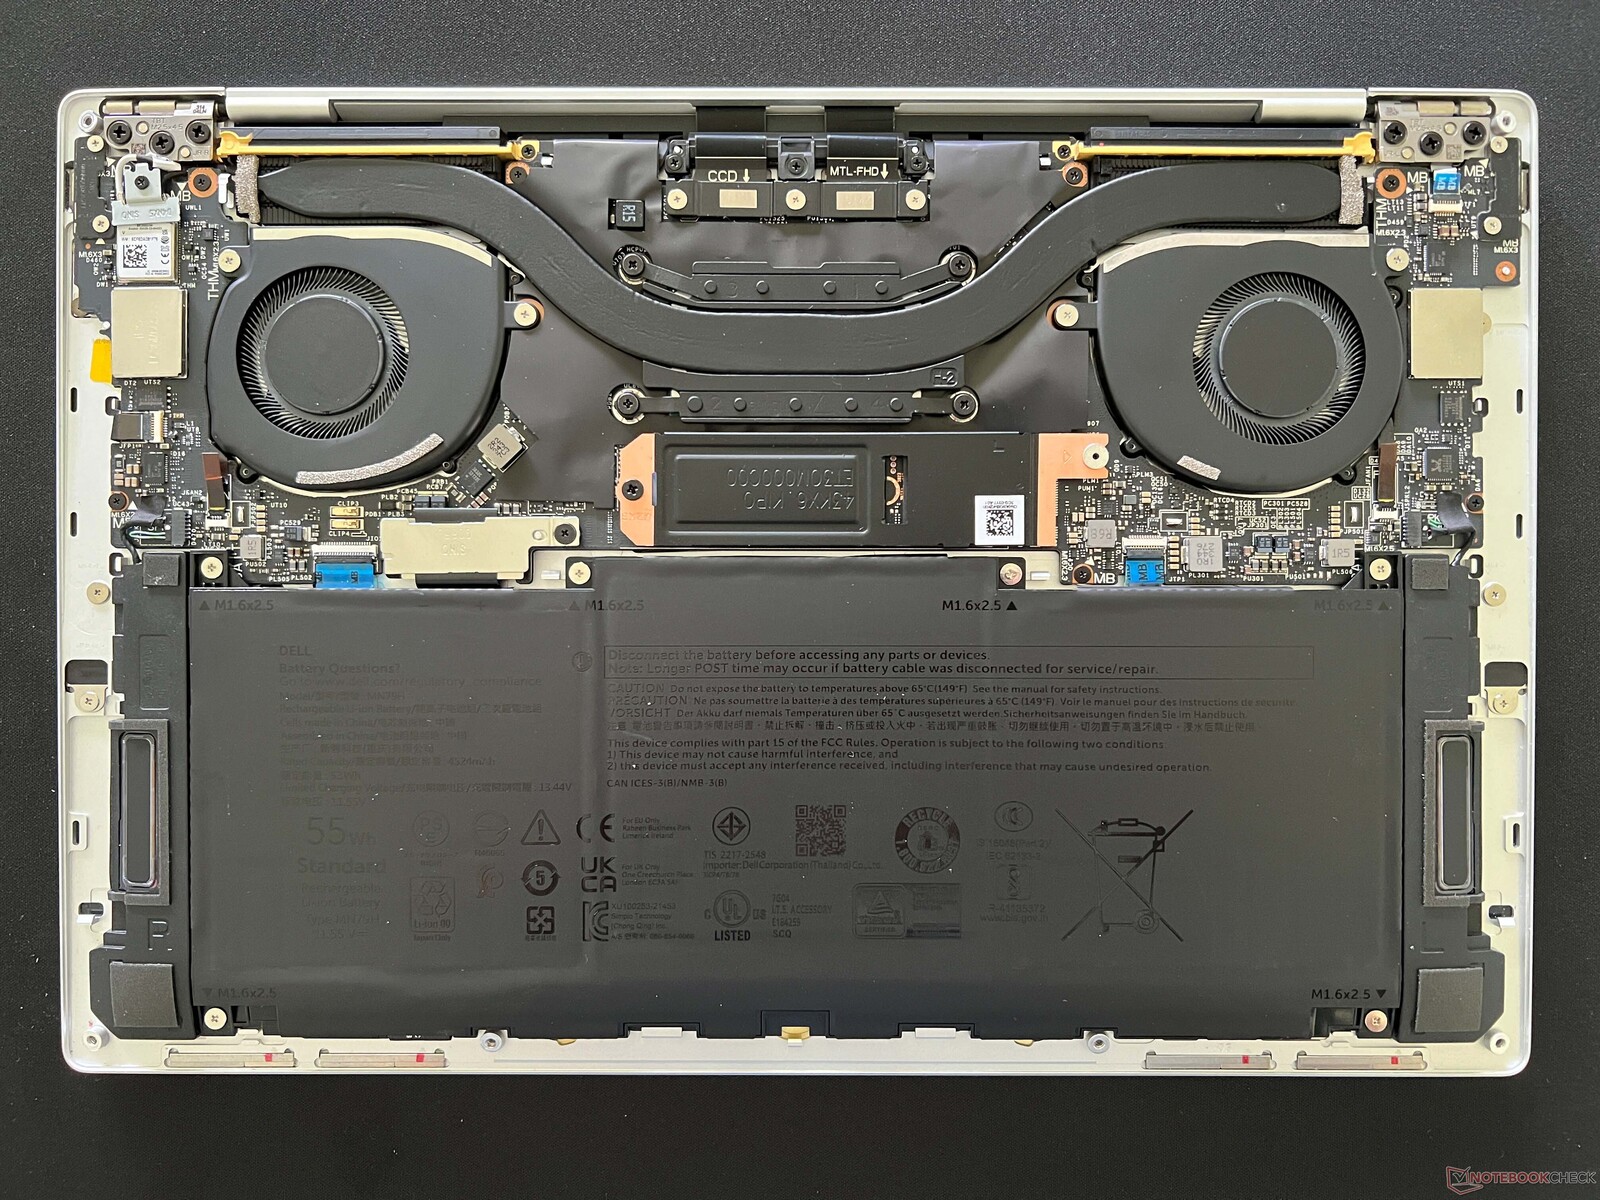
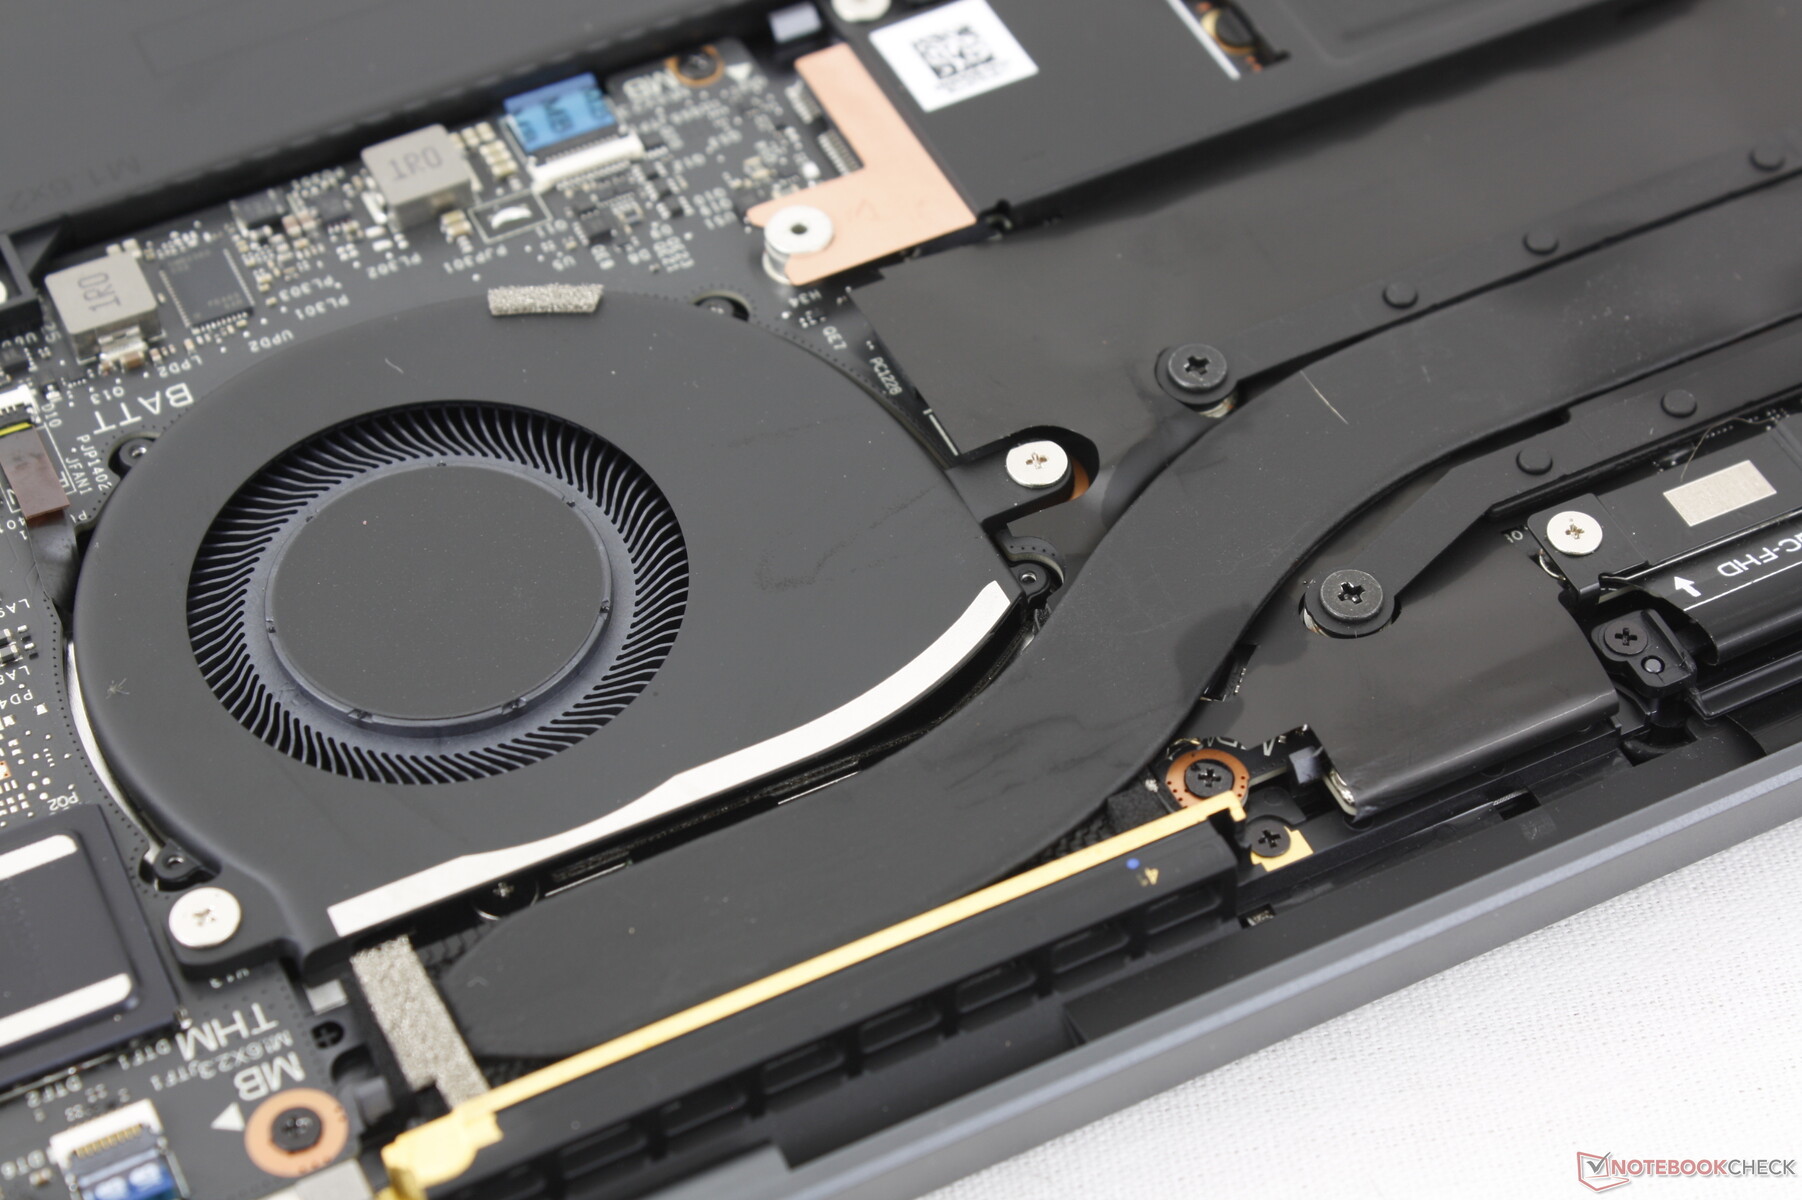
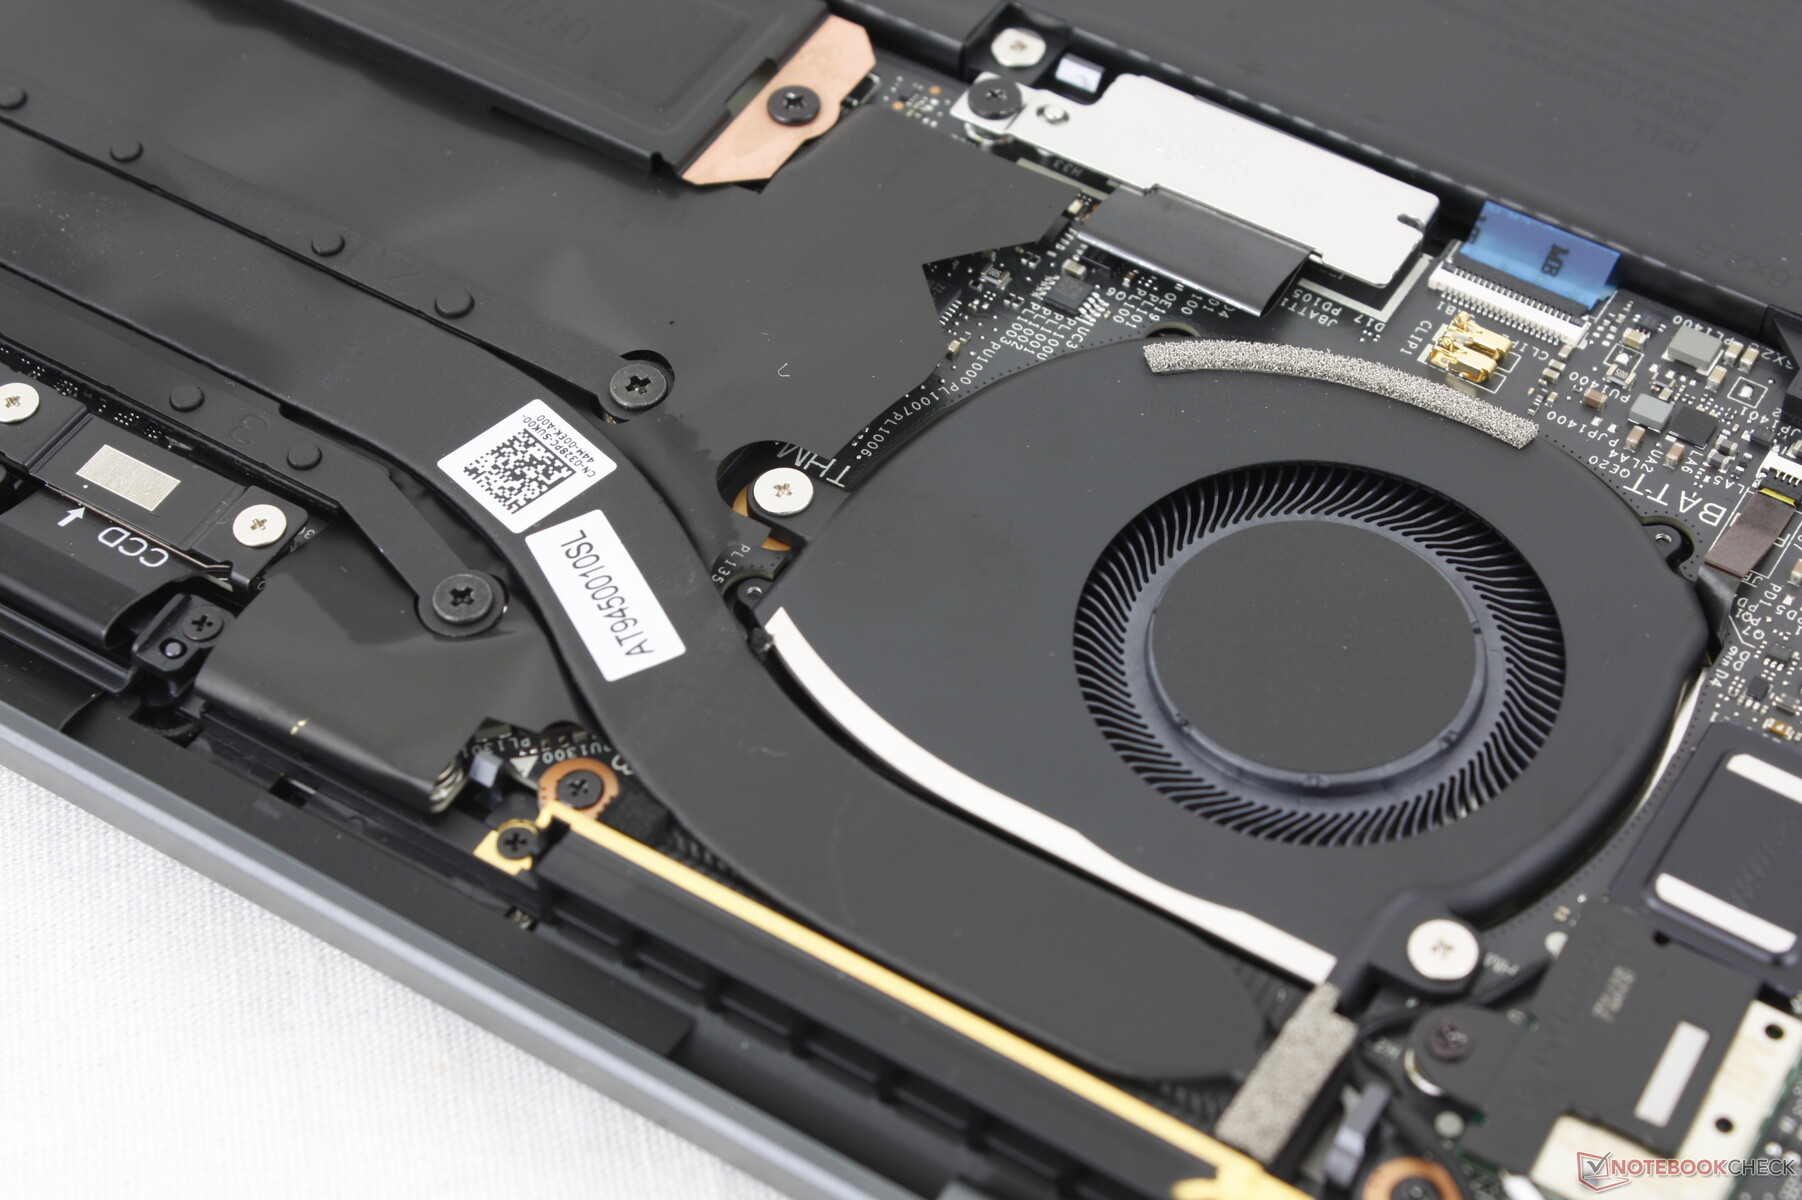
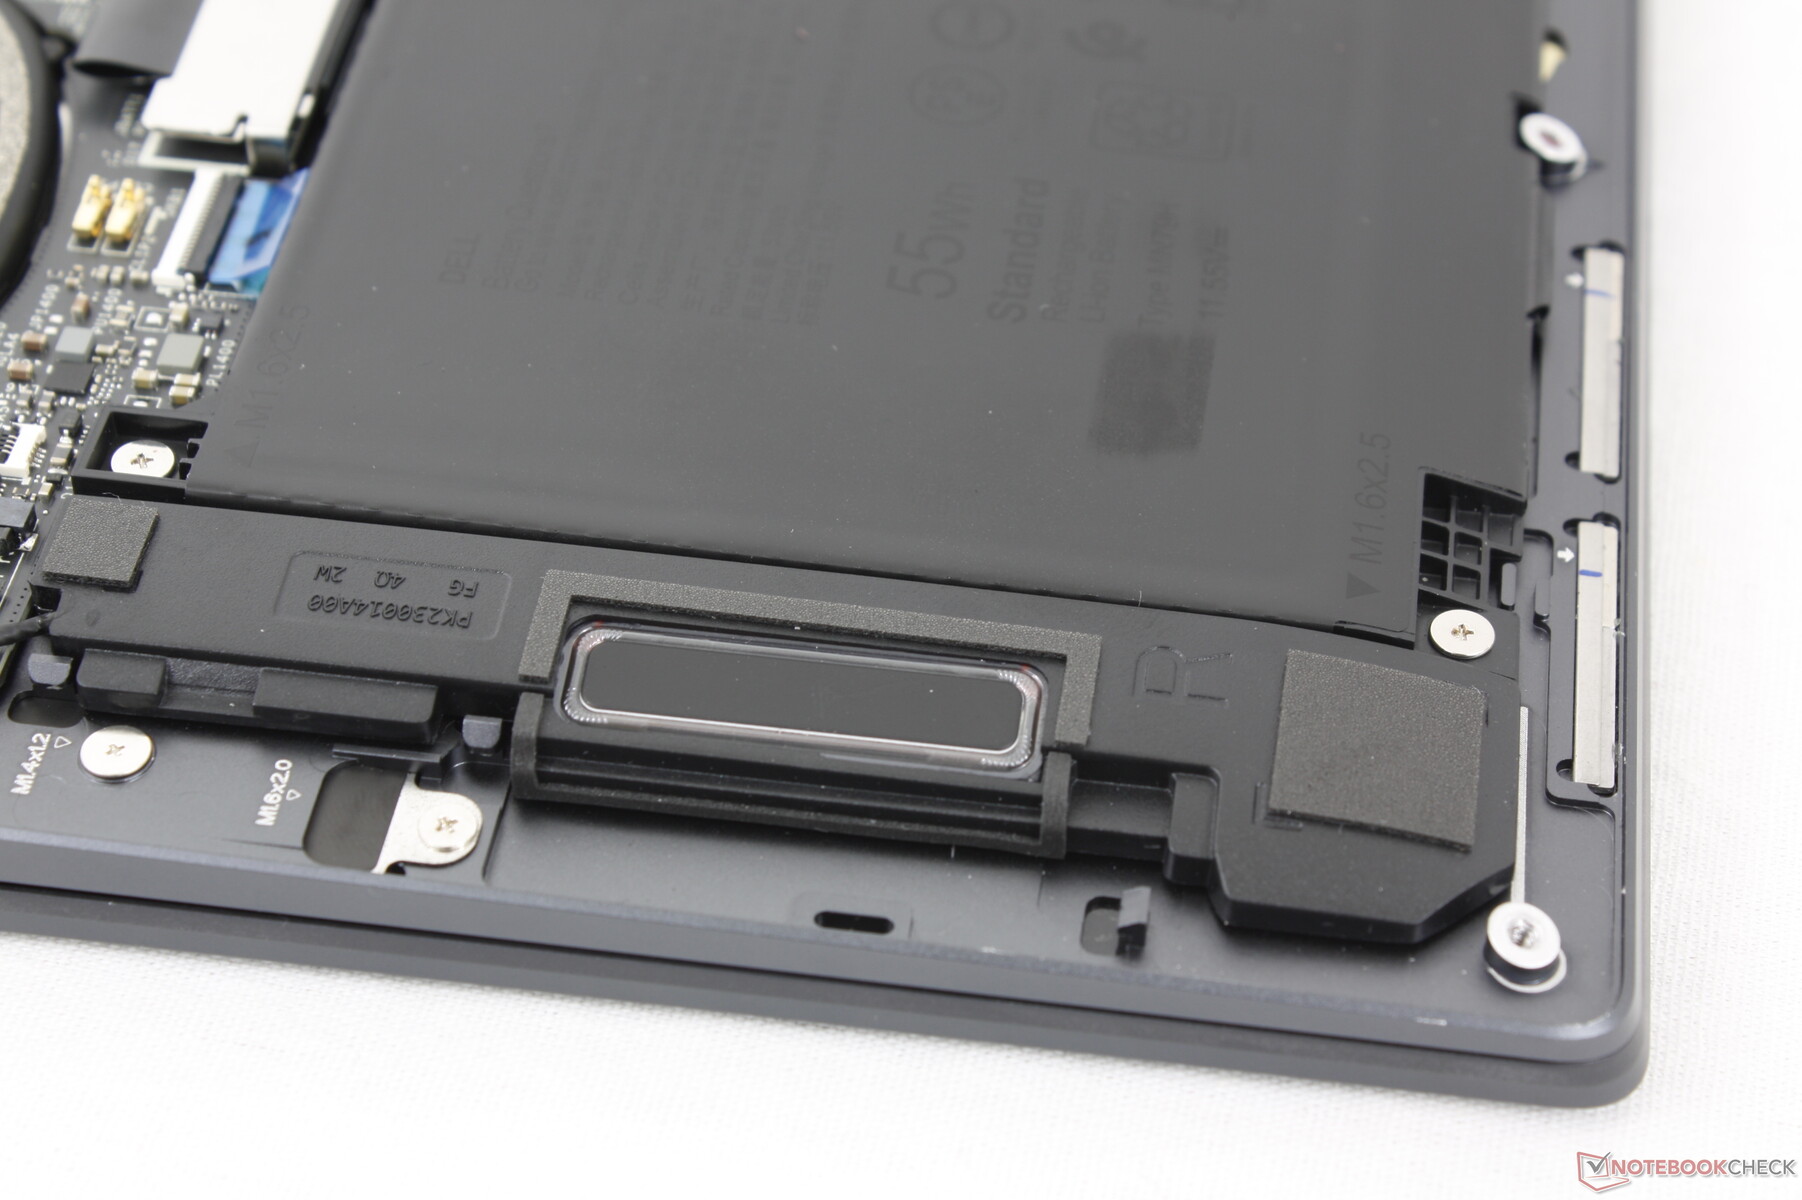
Maintenance
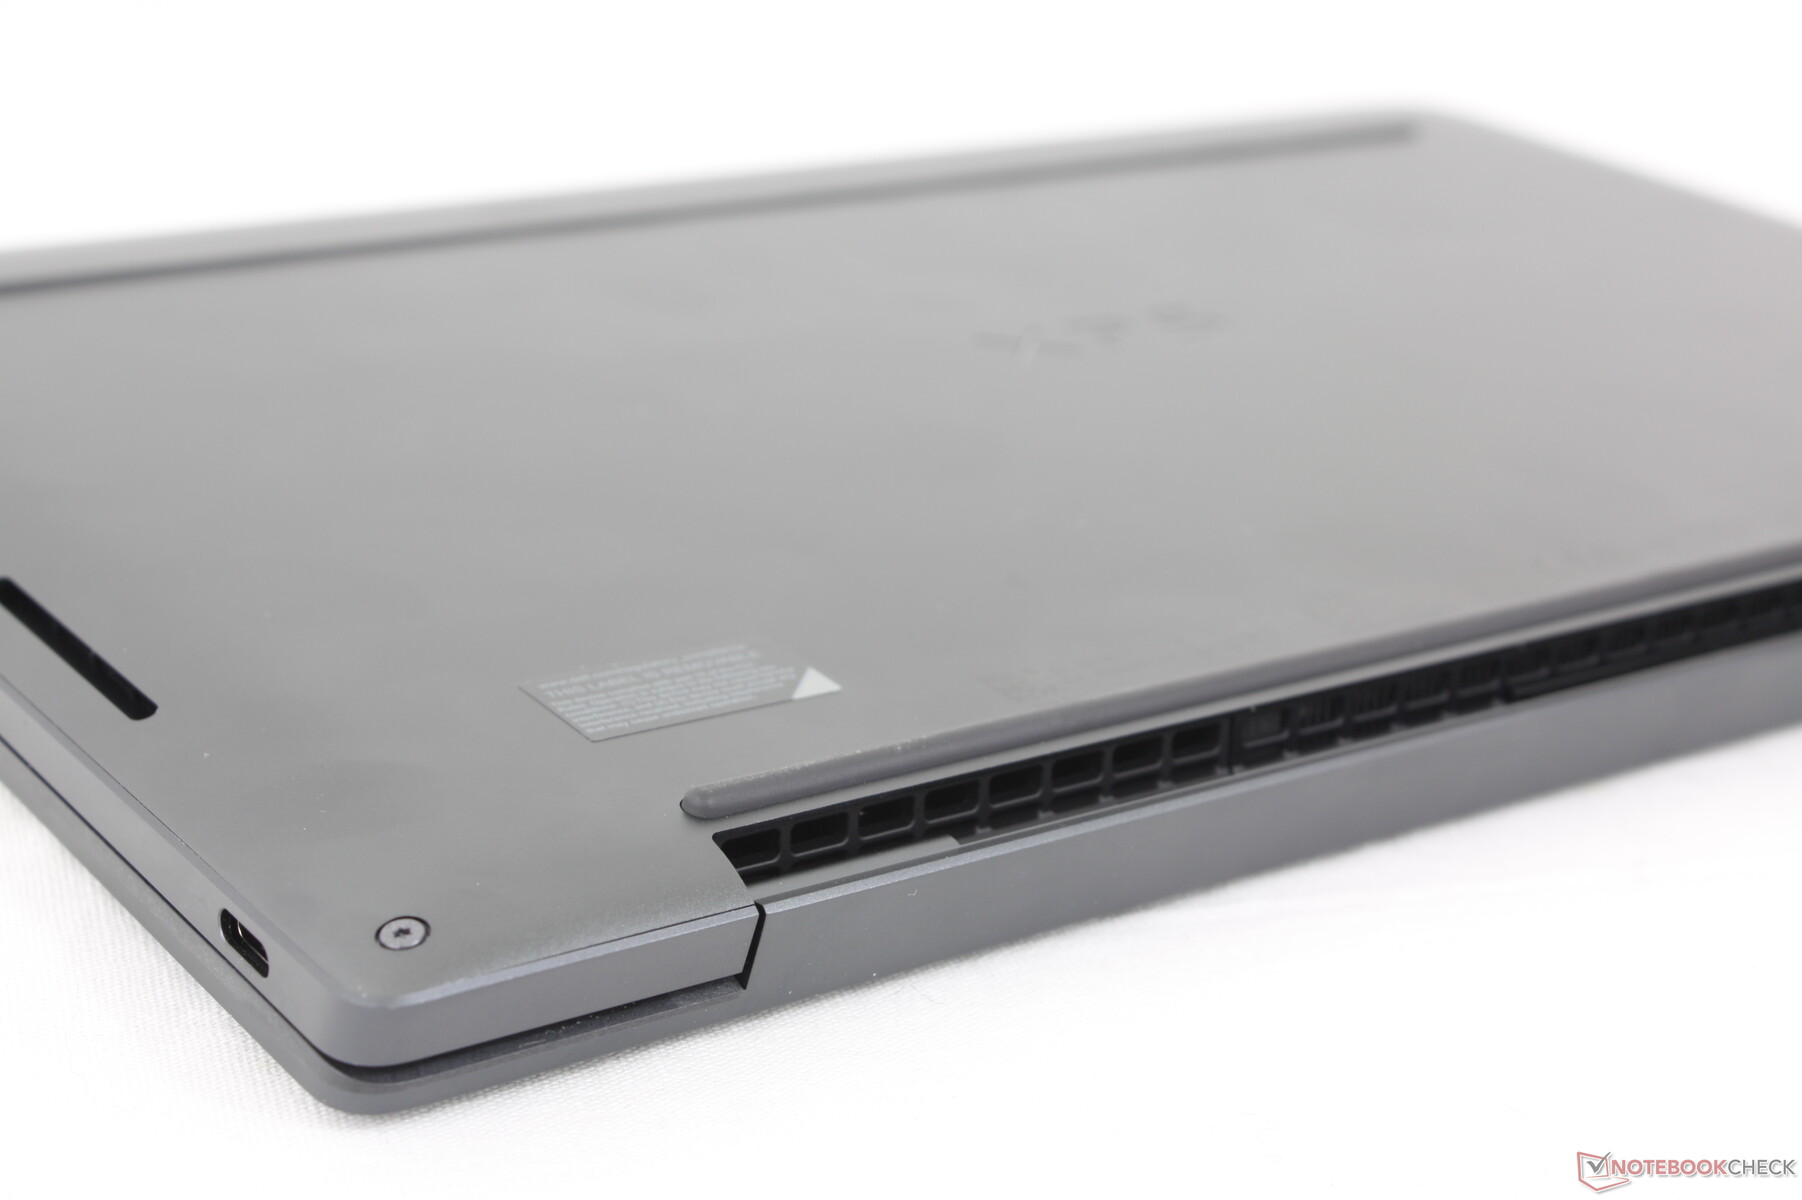
Le panneau inférieur ne nécessite qu'un tournevis Torx pour être retiré. Il n'y a rien d'autre à mettre à jour que l'unique SSD M.2 puisque la RAM et le WLAN sont soudés.
Durabilité
L'emballage est composé de 75 % de matériaux recyclés et de 25 % de matériaux renouvelables pour être entièrement recyclable. Quant à l'ordinateur portable lui-même, il a été fabriqué avec au moins 20 % d'aluminium et de verre recyclés.
Accessoires et garantie
Il n'y a pas d'extras dans la boîte autre que l'adaptateur secteur et les papiers, alors que les modèles XPS basés sur Intel incluraient souvent un adaptateur USB-C vers USB-A gratuitement.
La garantie limitée habituelle d'un an du fabricant s'applique si vous l'achetez aux États-Unis.
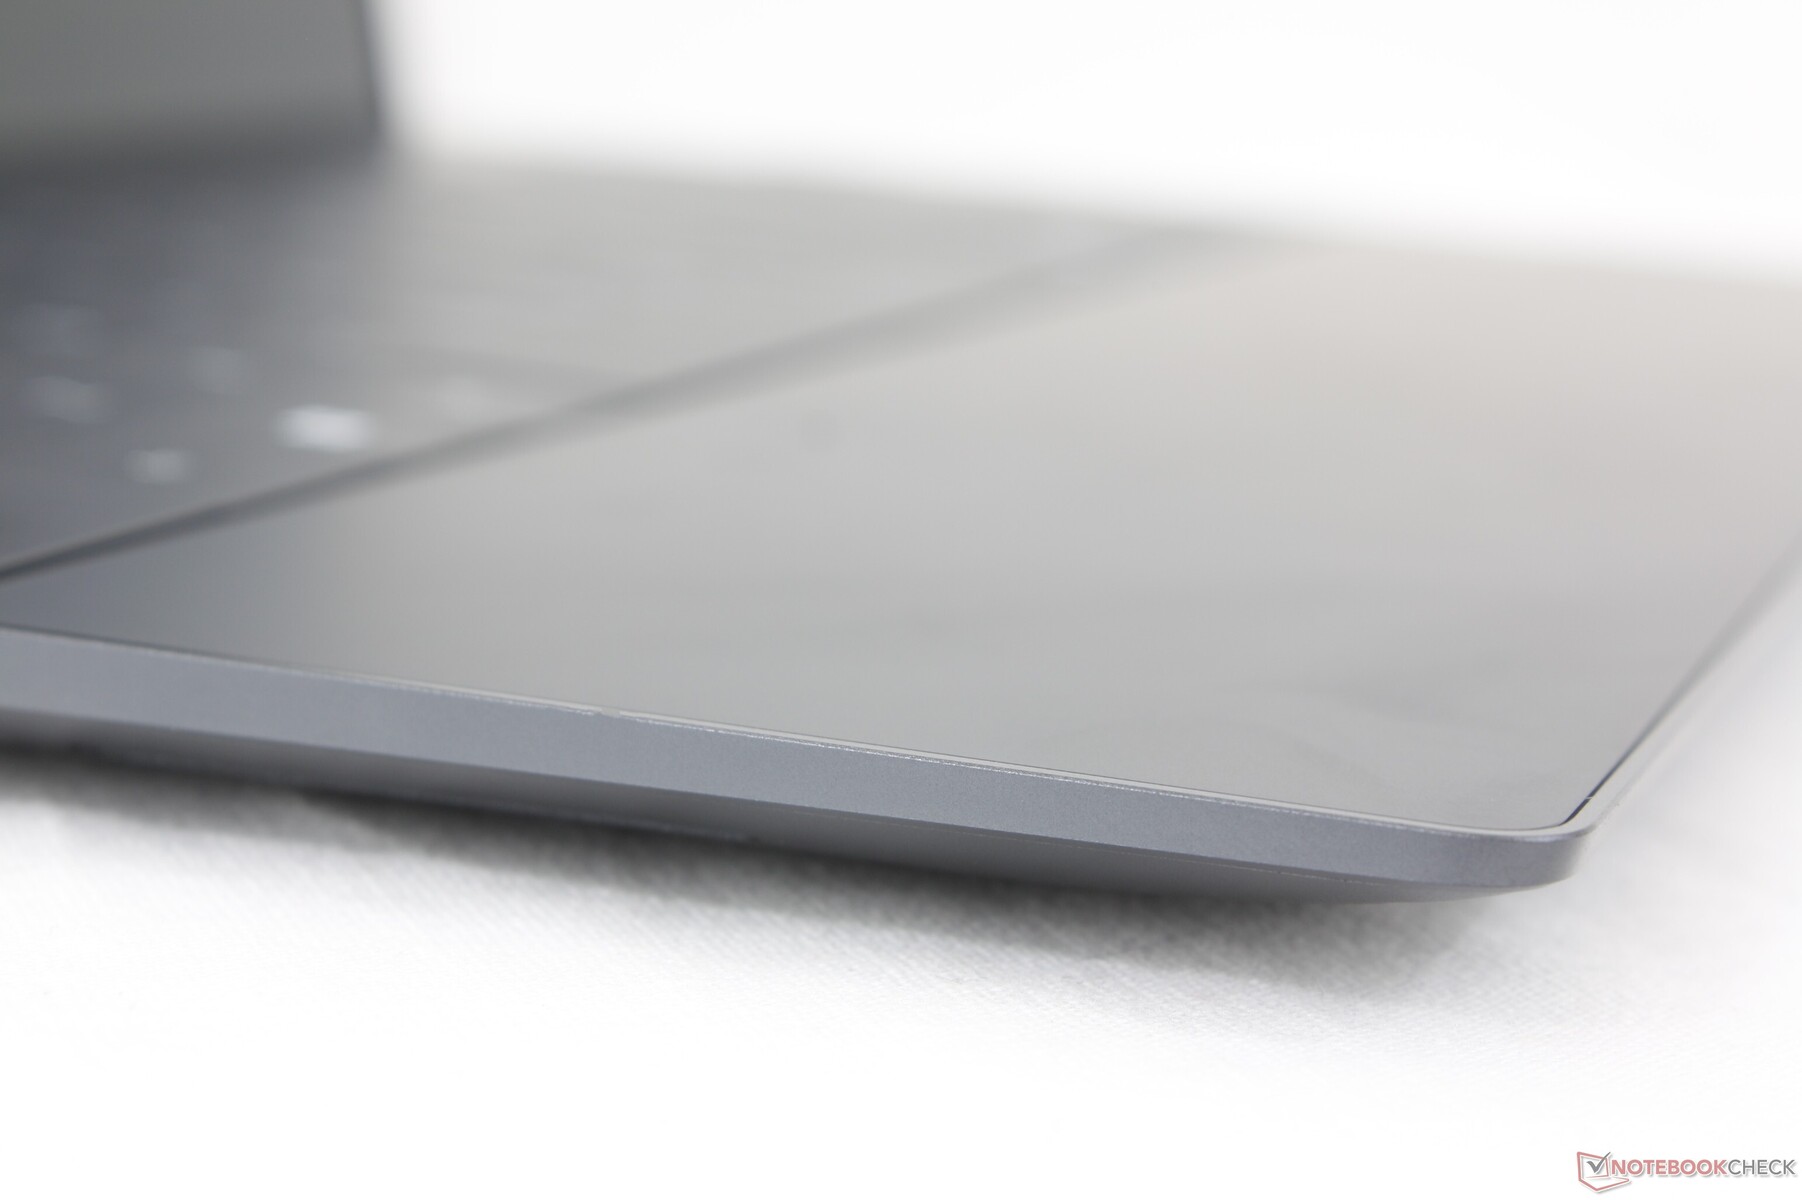
Dispositifs d'entrée - Une apparence plus nette au détriment de la facilité d'utilisation
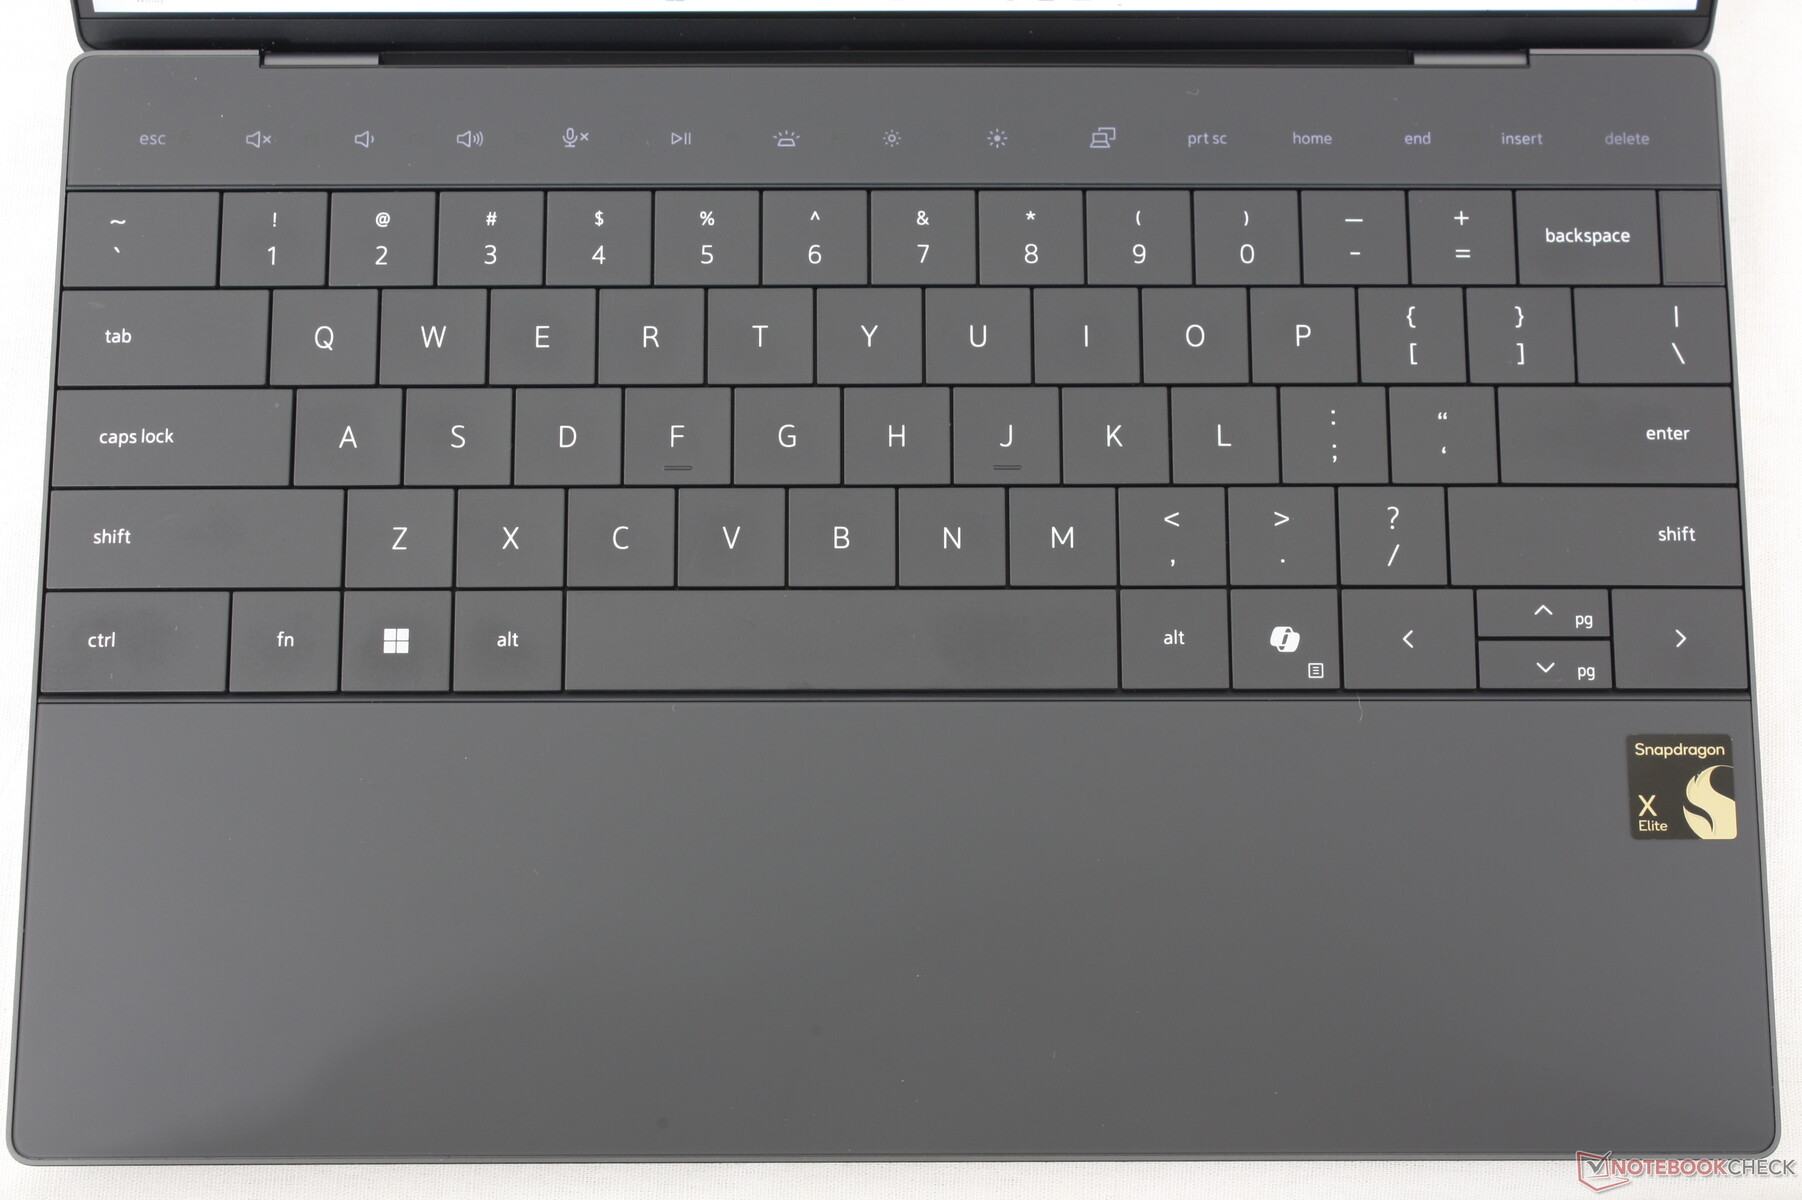
Clavier
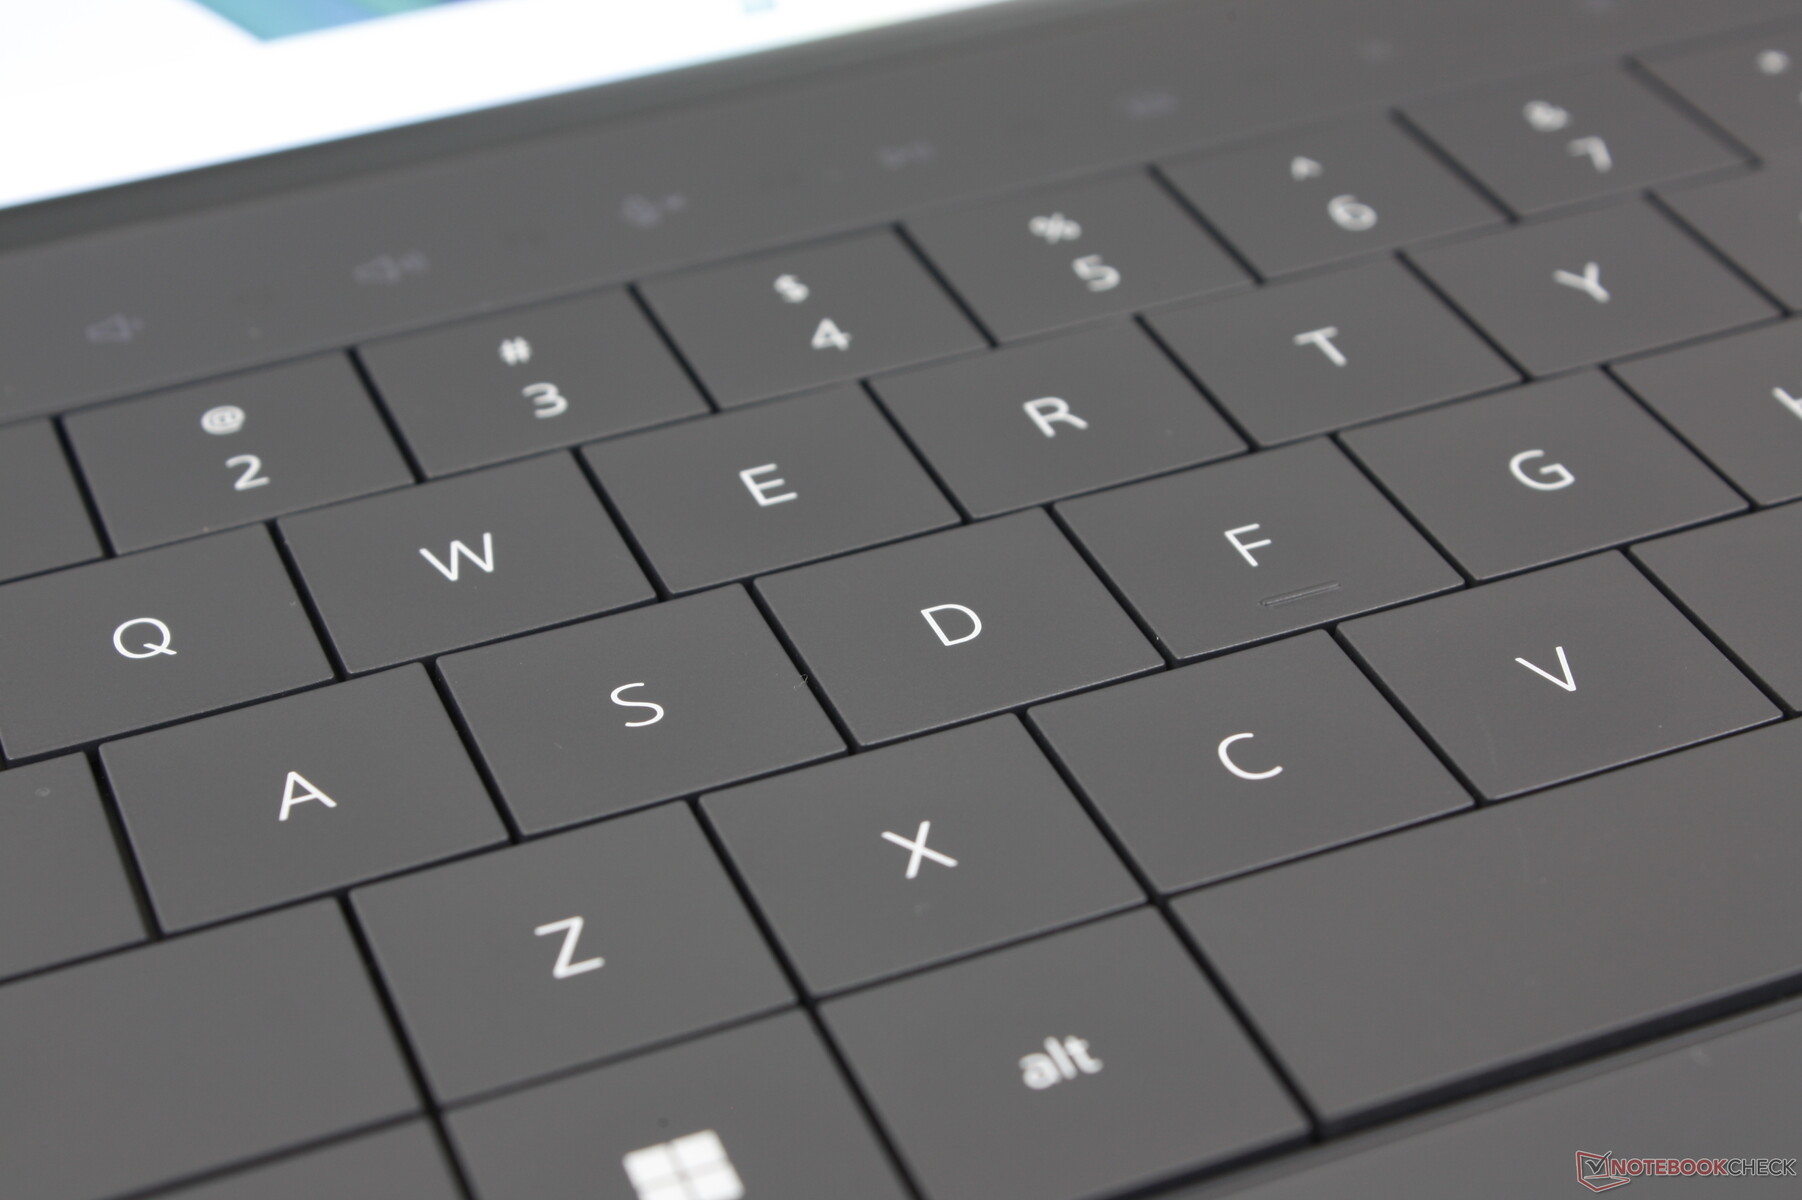
Il faut s'habituer au clavier sans lattes par rapport aux claviers traditionnels de la plupart des autres subnotebooks. La course des touches est encore plus faible que d'habitude, à seulement 1,0 mm, et le retour d'information est relativement doux pour une expérience de frappe plus spongieuse. La différence est flagrante entre le XPS 13 9345 et les touches plus fermes du HP Spectre x360 14.
Les touches de fonction tactiles sont elles aussi très hétérogènes. Lenovo a mis en place quelque chose de très similaire sur sa série ThinkPad il y a plusieurs années avant de l'abandonner rapidement et il est donc un peu surprenant de les voir réapparaître chez un fabricant concurrent. Le principal problème est que les touches sont sensibles au moindre contact, ce qui peut entraîner des saisies accidentelles.
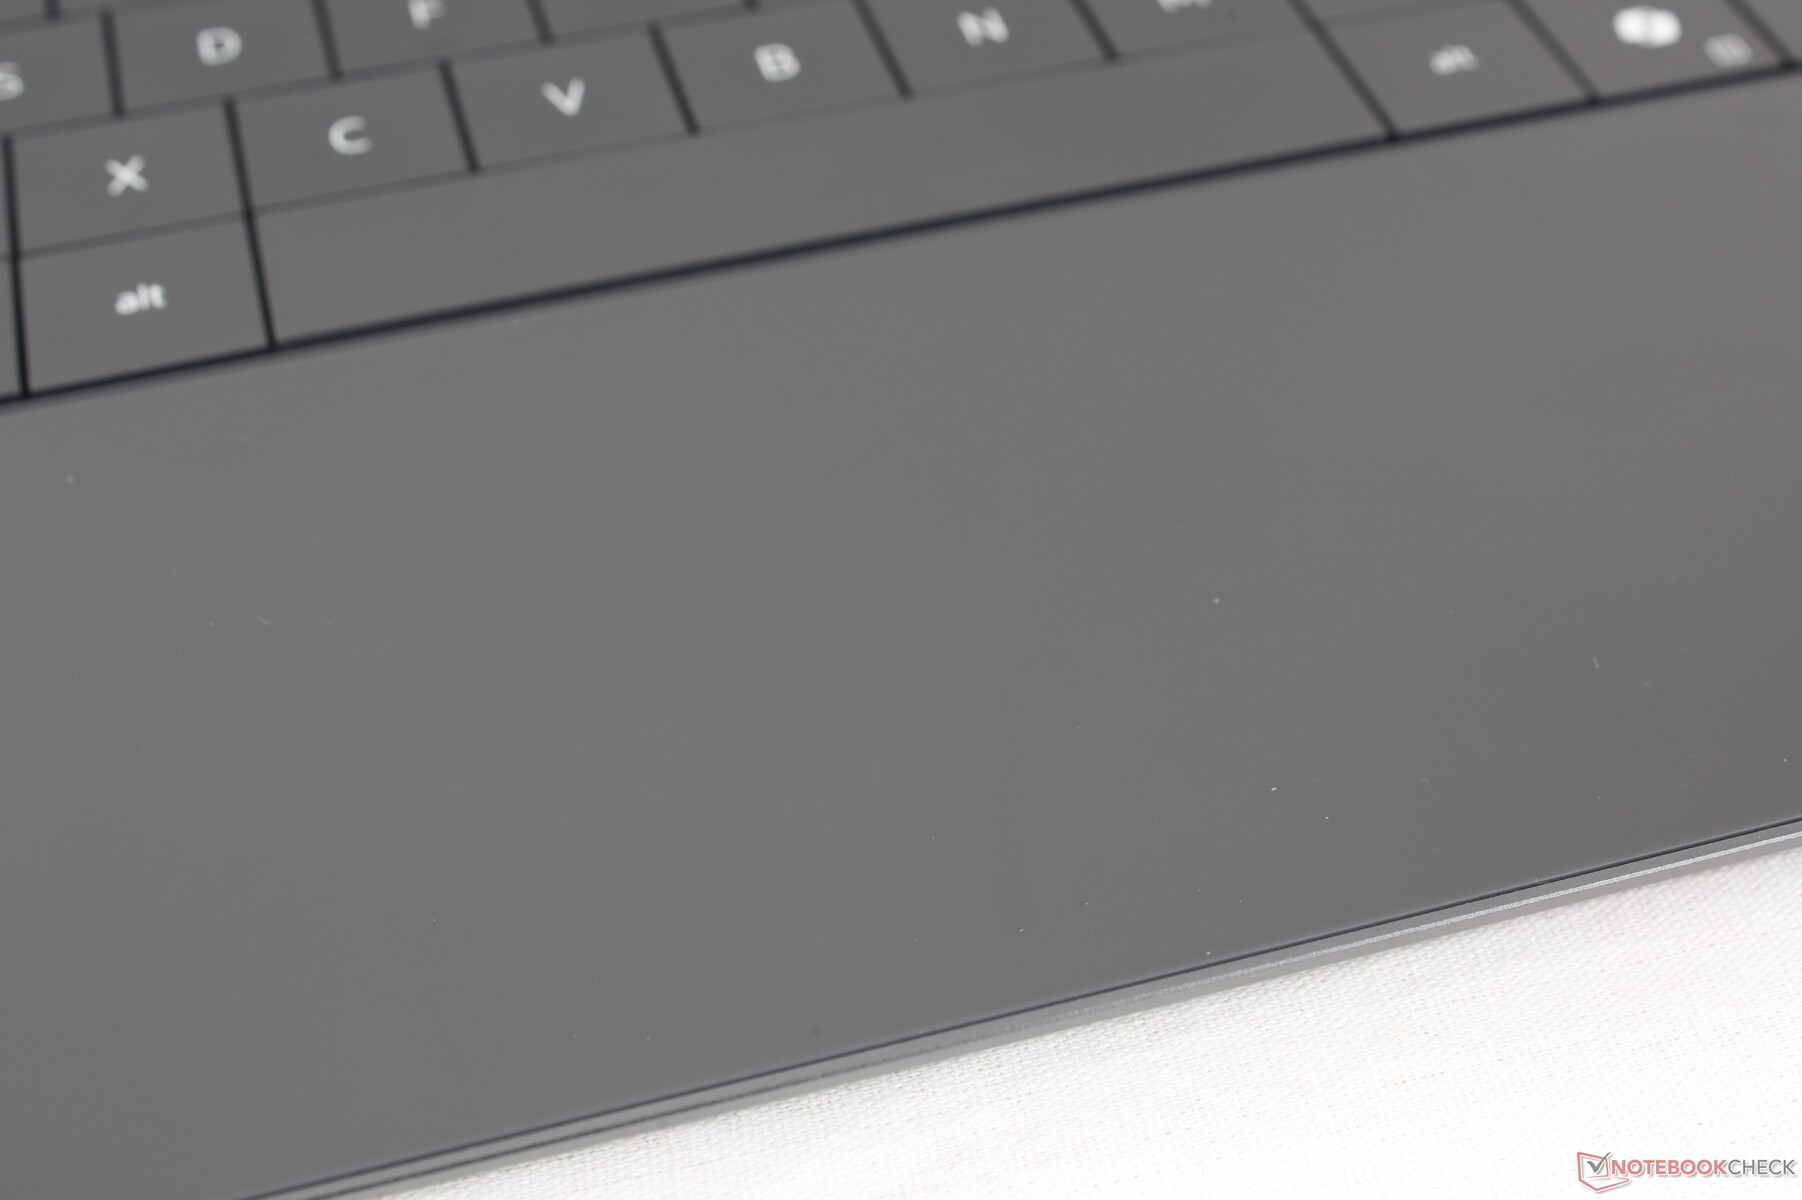
Pavé tactile
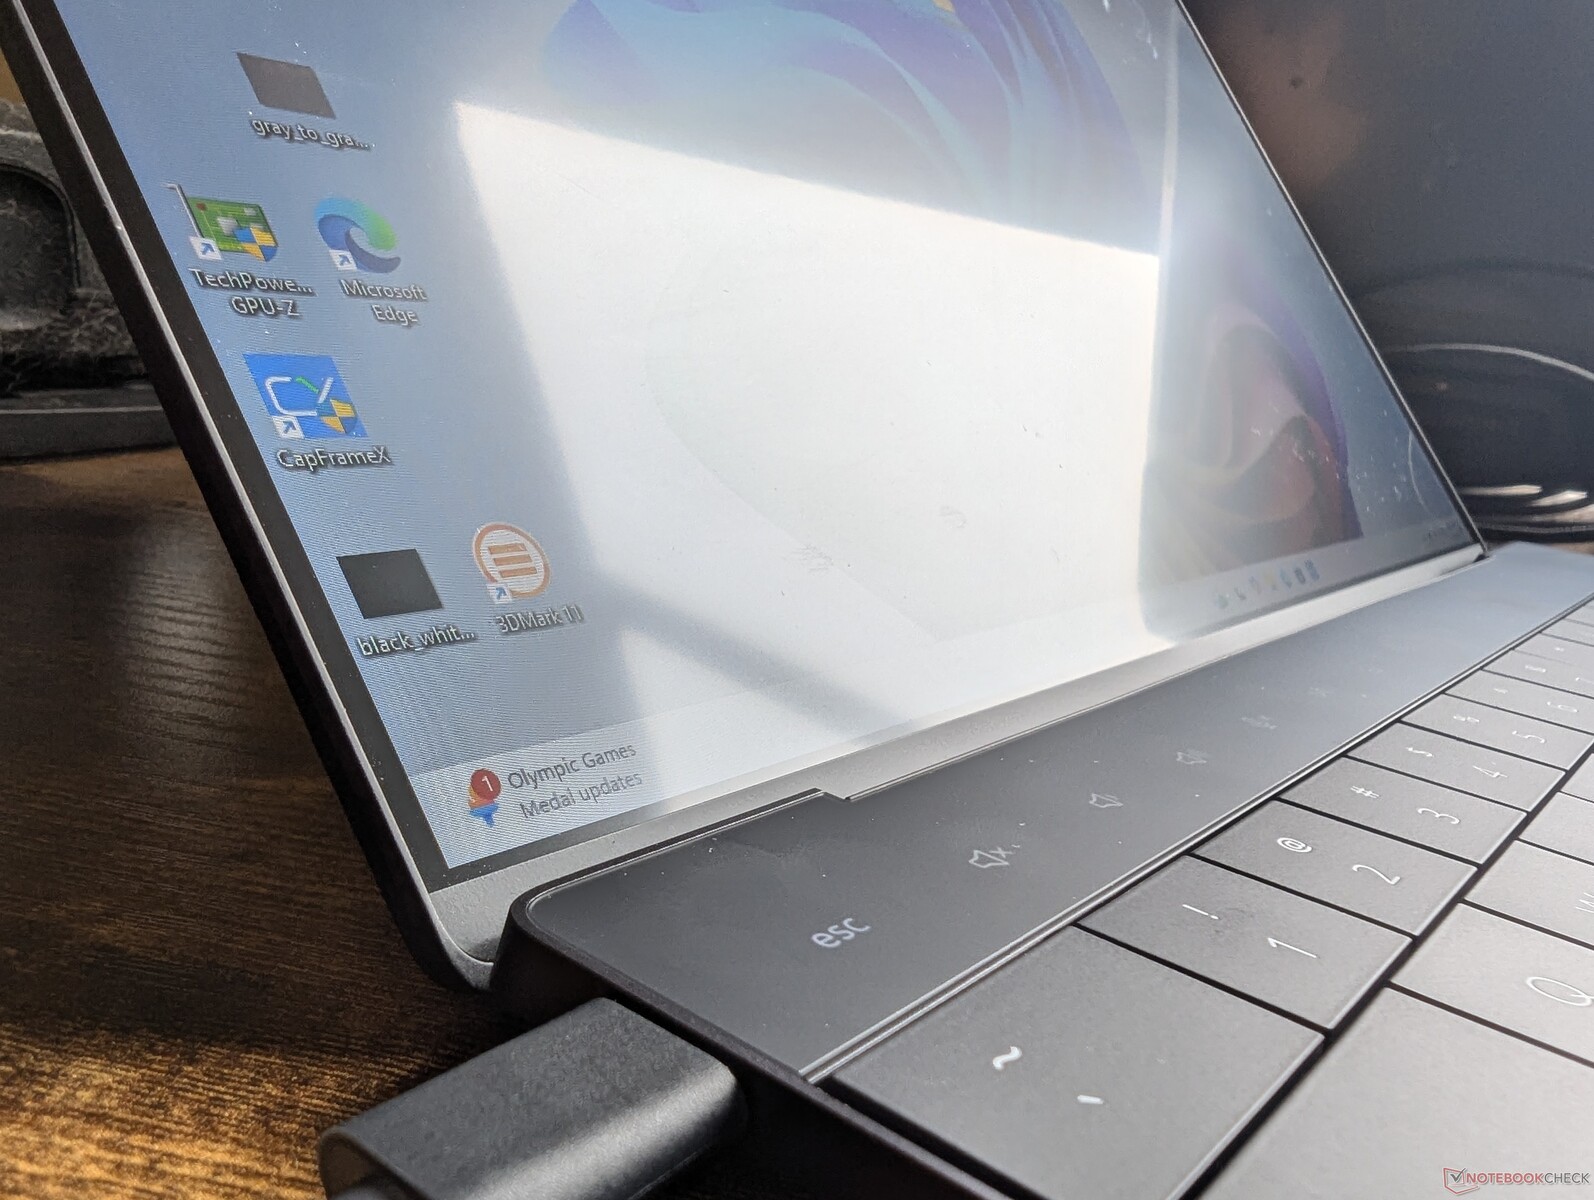
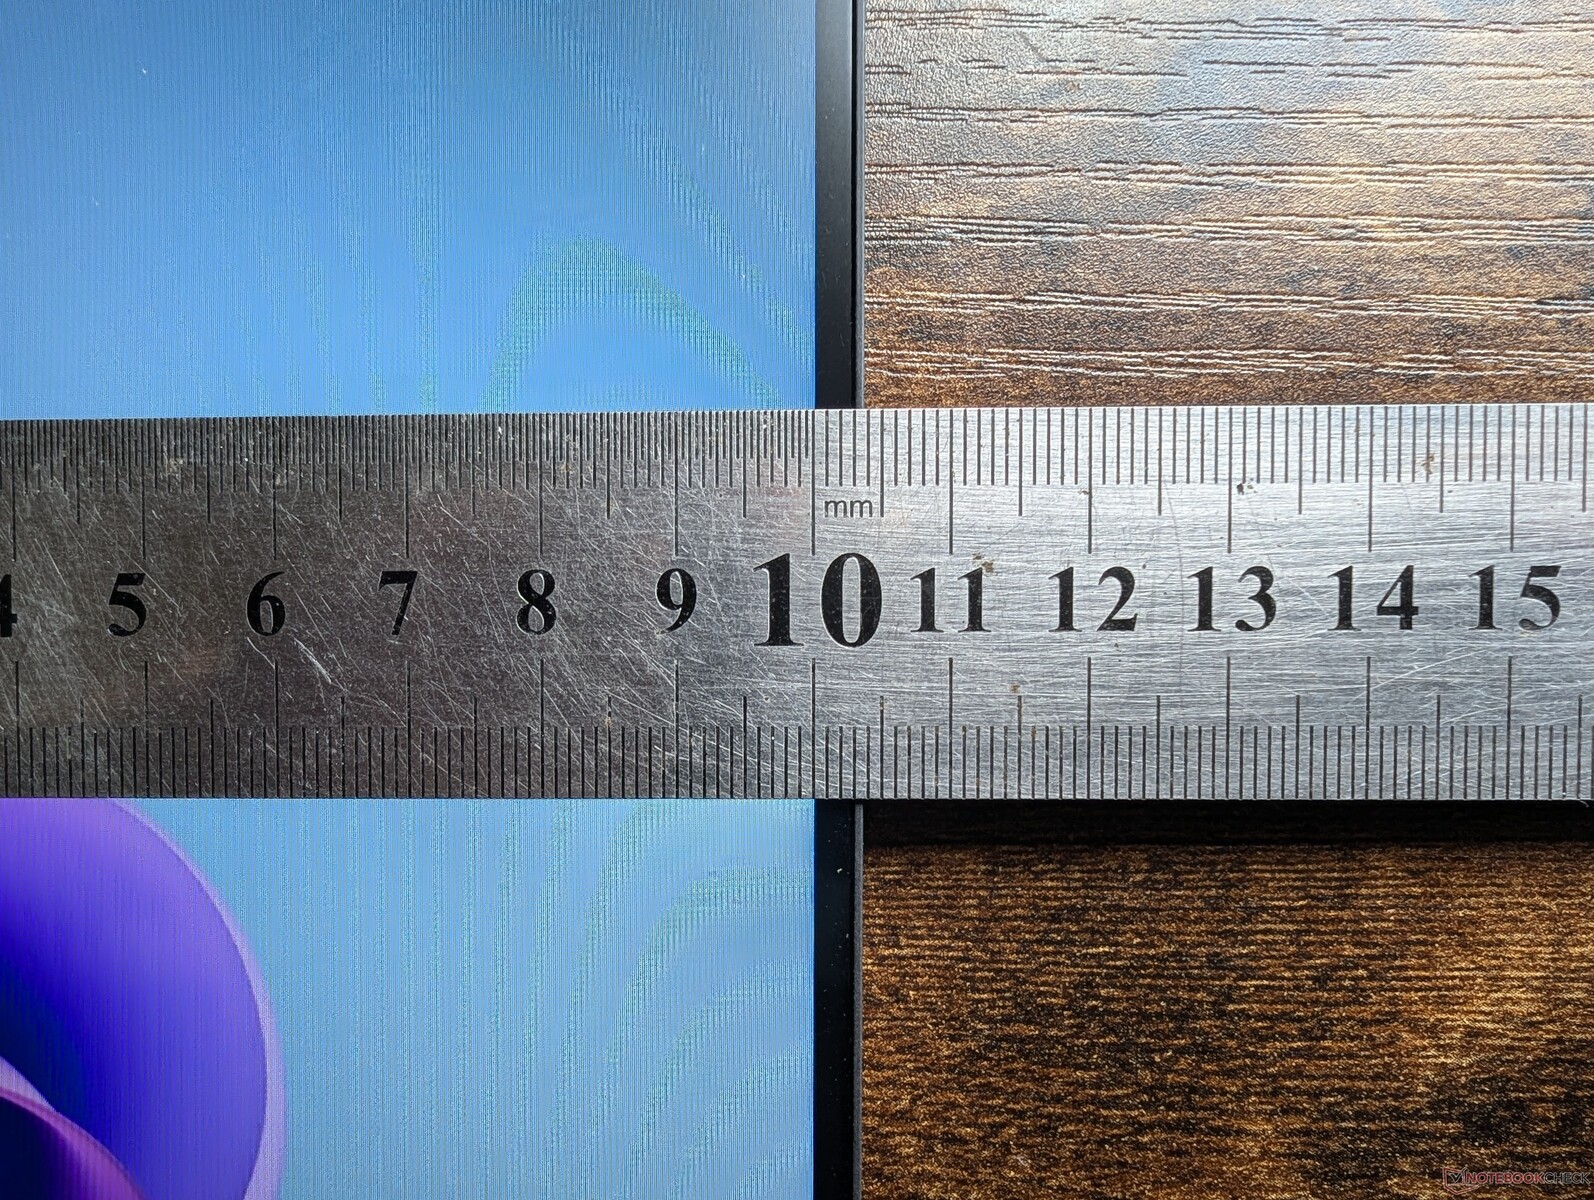
Le clavier invisible du XPS est devenu tristement célèbre pour son manque de convivialité et la tendance se poursuit sur le modèle Snapdragon. Bien que la surface utilisable soit assez spacieuse pour un 13 pouces (environ 11,5 x 7,5 cm), le clic n'est pas satisfaisant en raison de la faiblesse du retour d'information. Pire encore, la force nécessaire à l'entrée d'un clic est beaucoup plus faible que sur la plupart des autres ordinateurs portables, ce qui entraîne de nombreux clics et glissements accidentels lorsque vous essayez simplement de déplacer le curseur. Nous espérions des améliorations à cet égard après deux ans d'utilisation de ce modèle, mais ce n'est malheureusement pas le cas.

Affichage
Trois options d'affichage sont disponibles. Notre configuration d'évaluation est équipée de l'option en gras.
- 1920 x 1200, IPS, 120 Hz, non tactile, mat
- 2560 x 1600, IPS, 120 Hz, tactile, brillant
- 2880 x 1800, OLED, 60 Hz, tactile, brillant
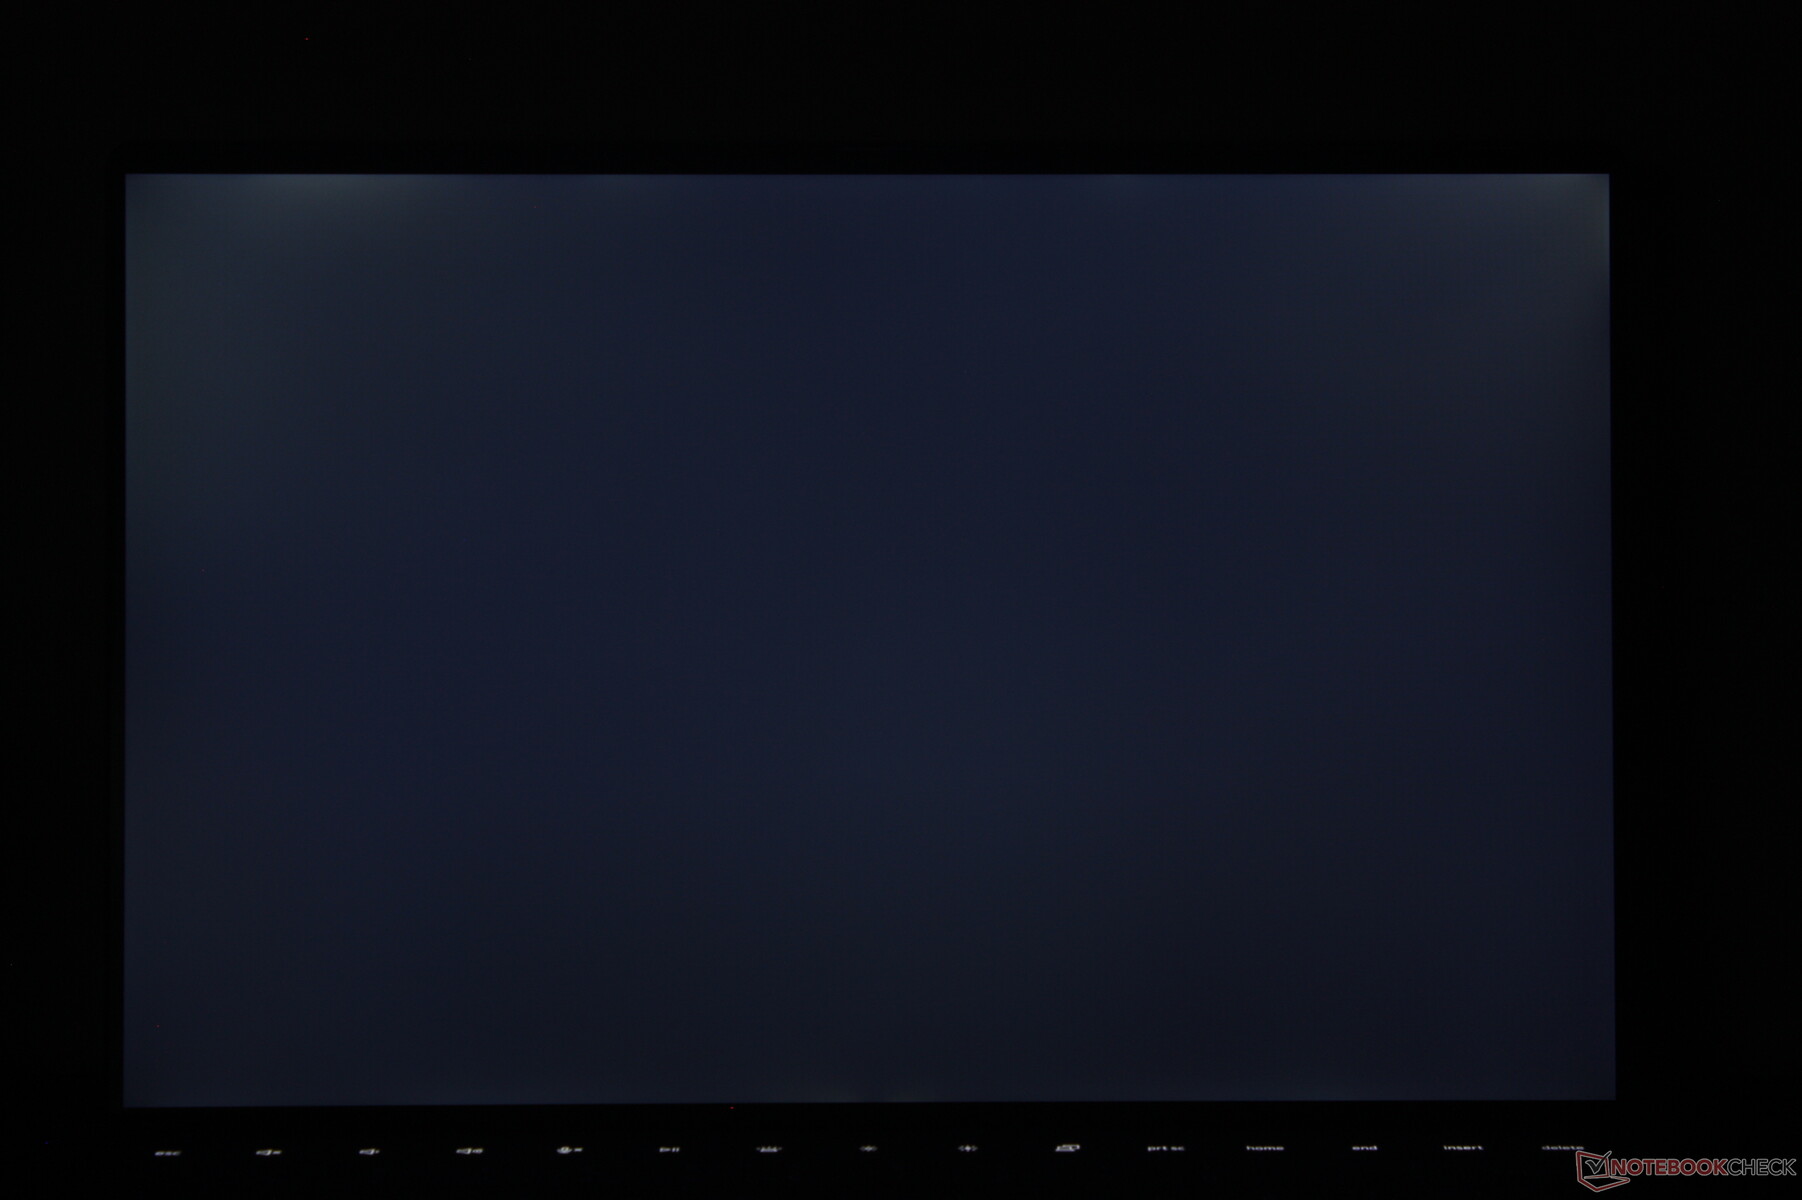
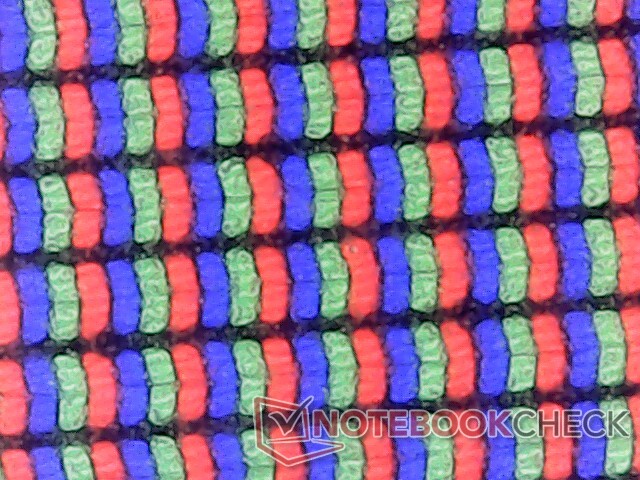
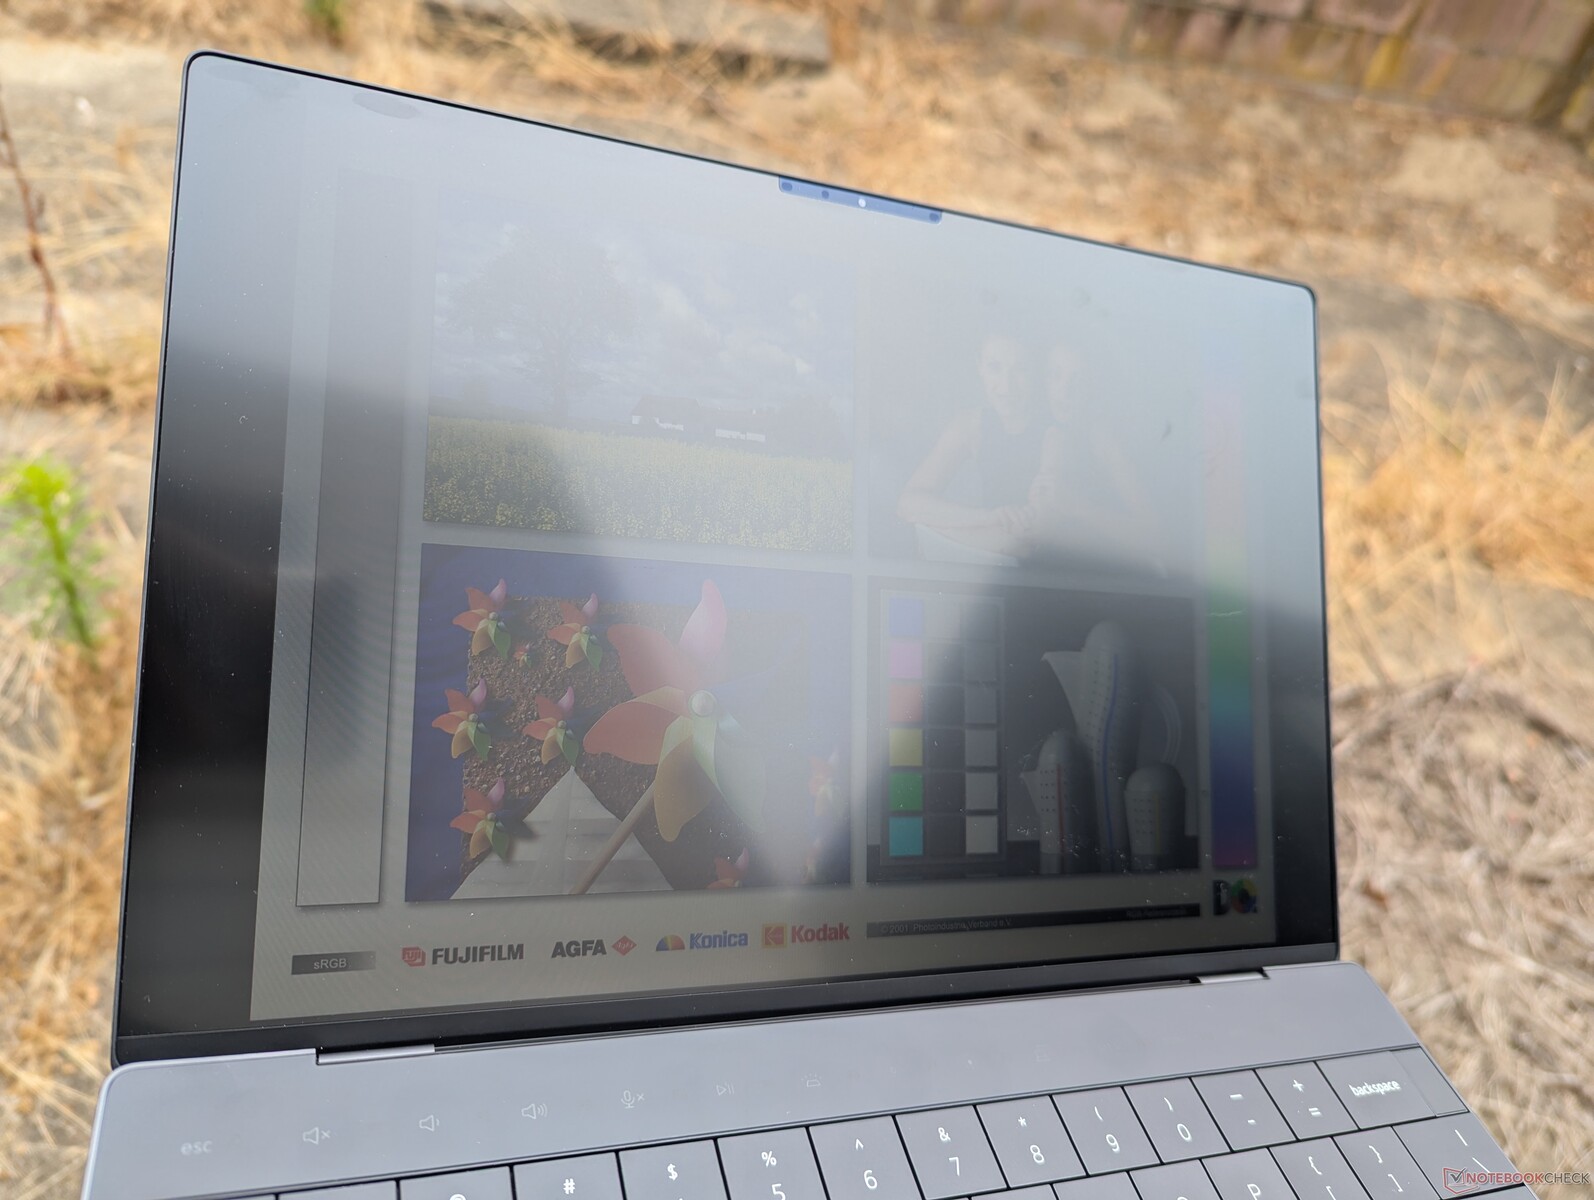
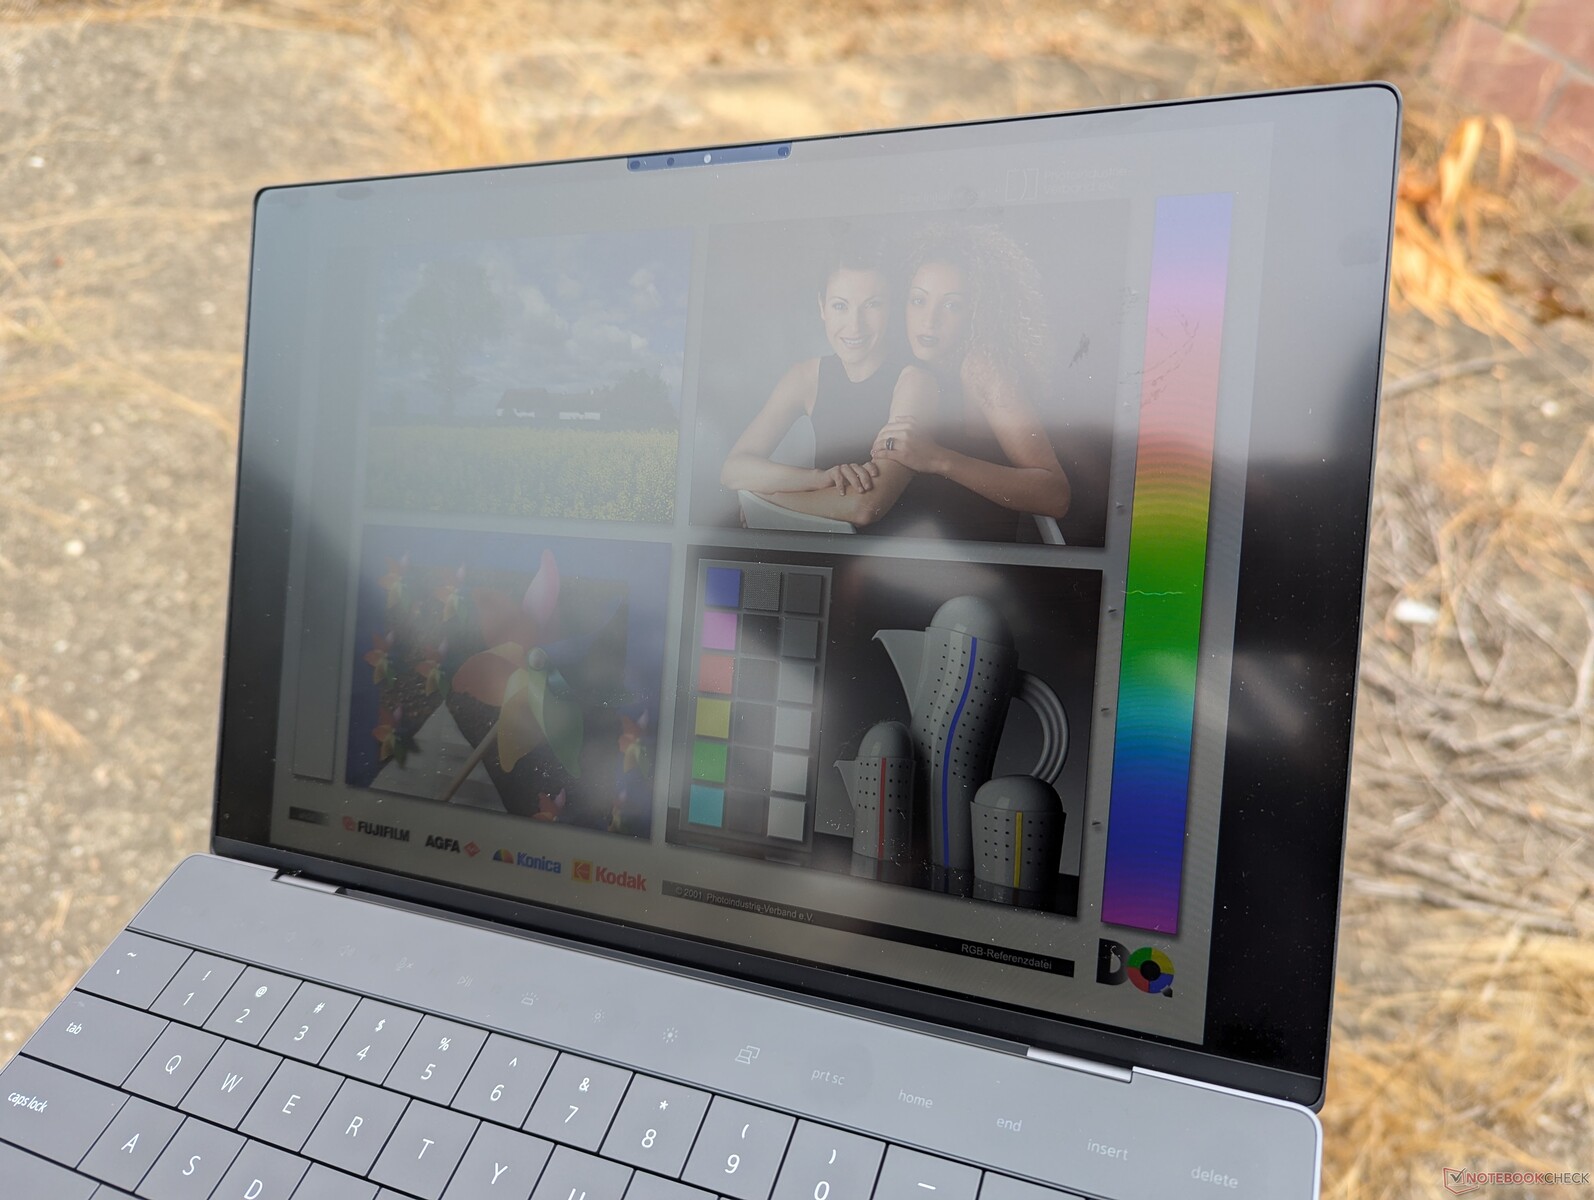
Tout porte à croire que notre écran 120 Hz est exactement le même que celui utilisé pour le XPS 13 basé sur Intel. La prise en charge du VRR jusqu'à 30 Hz, les temps de réponse adéquats et la luminosité maximale de 500 nits sont des caractéristiques similaires à celles de notre récent XPS 13 Core Ultra 7. Le plus remarquable est le rapport de contraste élevé de presque 2000:1 comparé à 1000:1 sur la plupart des panneaux IPS que l'on trouve sur d'autres ordinateurs portables. Les écrans des modèles XPS ont toujours été parmi les meilleurs de leur catégorie et même l'option IPS la moins chère reste fantastique.
La couverture des couleurs est limitée à >95% sRGB si l'option de base est configurée, tandis que les couleurs DCI-P3 sont réservées aux écrans IPS 1600p et OLED 1800p, plus coûteux. Les utilisateurs peuvent désactiver l'option Adaptive Color afin d'éviter tout changement de couleur infime lors de la retouche de photos.
Il convient de noter que la luminosité minimale de cet écran est relativement élevée (49 nits), ce que nous avons également remarqué sur notre modèle Core i7. En comparaison, les écrans de la plupart des autres ordinateurs portables atteignent généralement 15 nits ou moins lorsqu'ils sont réglés sur la luminosité minimale. Le niveau de luminosité plus élevé de l'écran Dell est susceptible de provoquer une fatigue oculaire dans les environnements sombres. Ce problème potentiel n'est pas présent sur la configuration OLED qui peut atteindre des niveaux de luminosité beaucoup plus faibles.
| |||||||||||||||||||||||||
Homogénéité de la luminosité: 86 %
Valeur mesurée au centre, sur batterie: 518.3 cd/m²
Contraste: 1993:1 (Valeurs des noirs: 0.26 cd/m²)
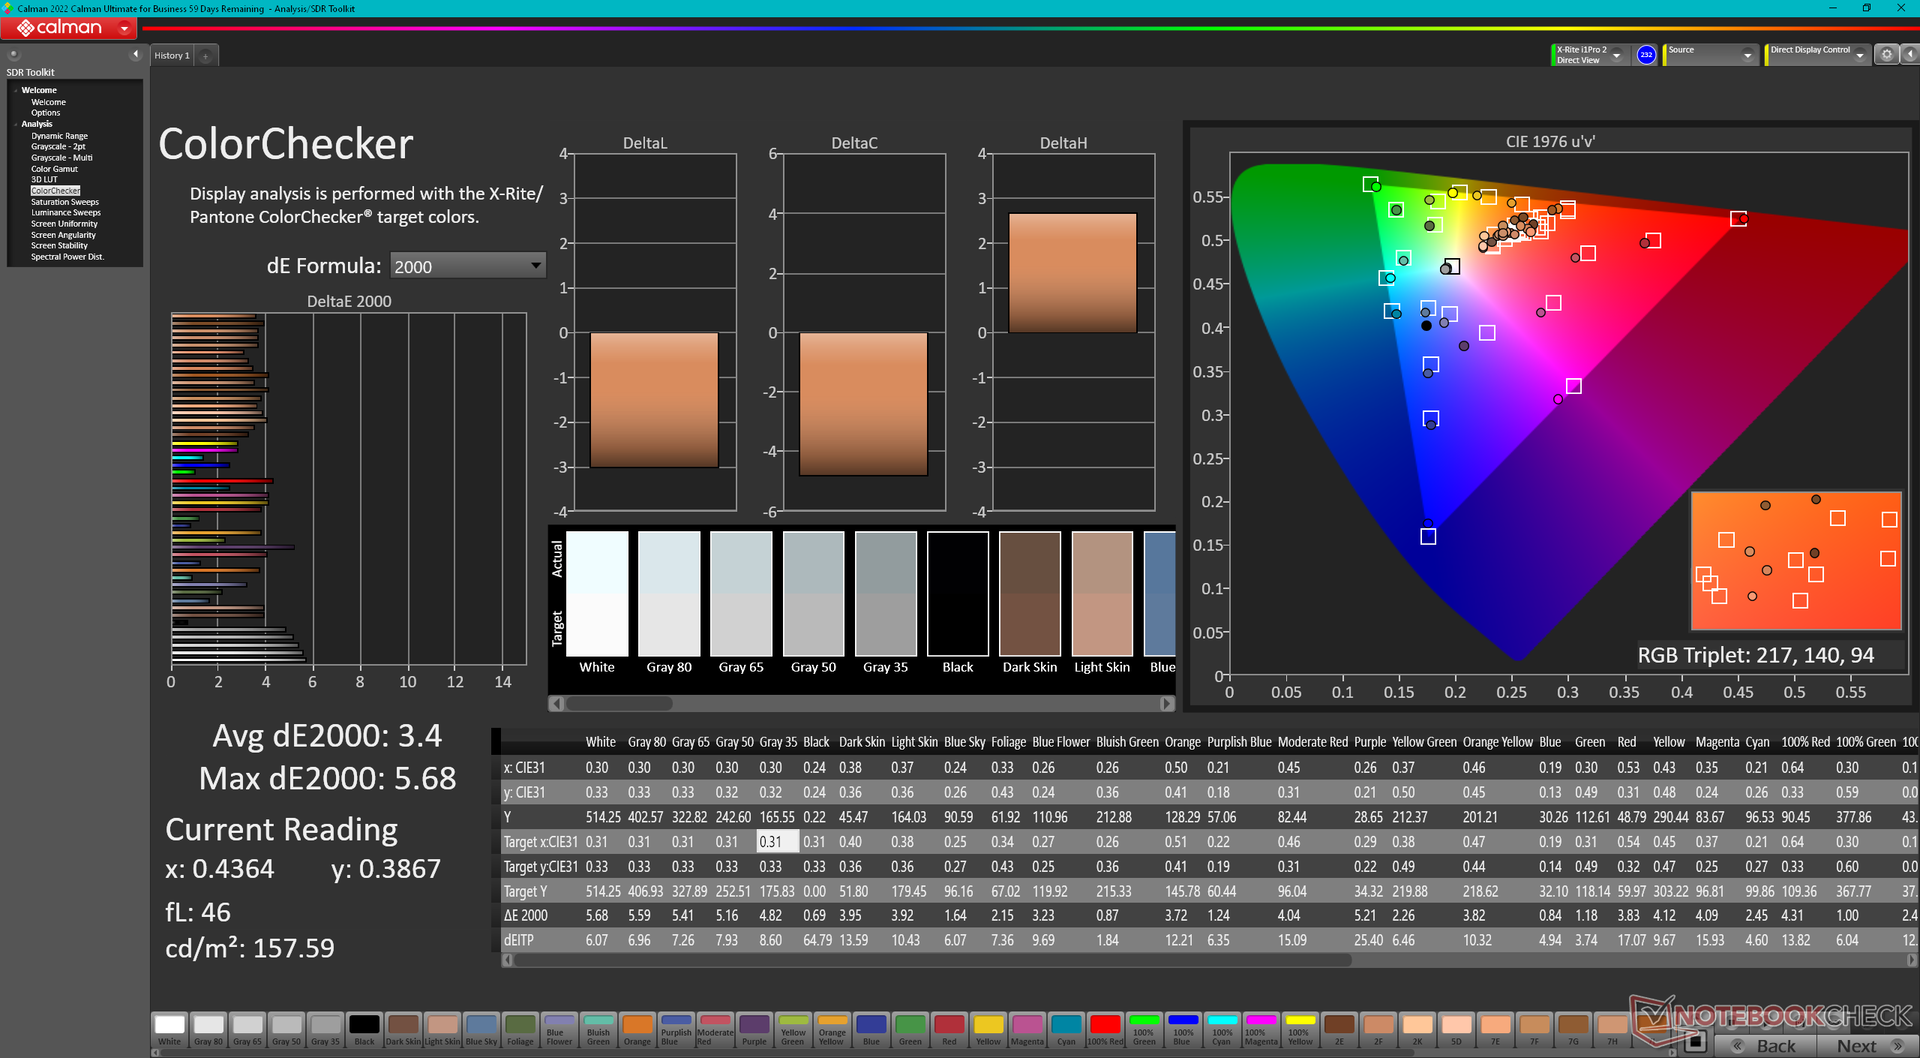
ΔE Color 3.4 | 0.5-29.43 Ø4.86
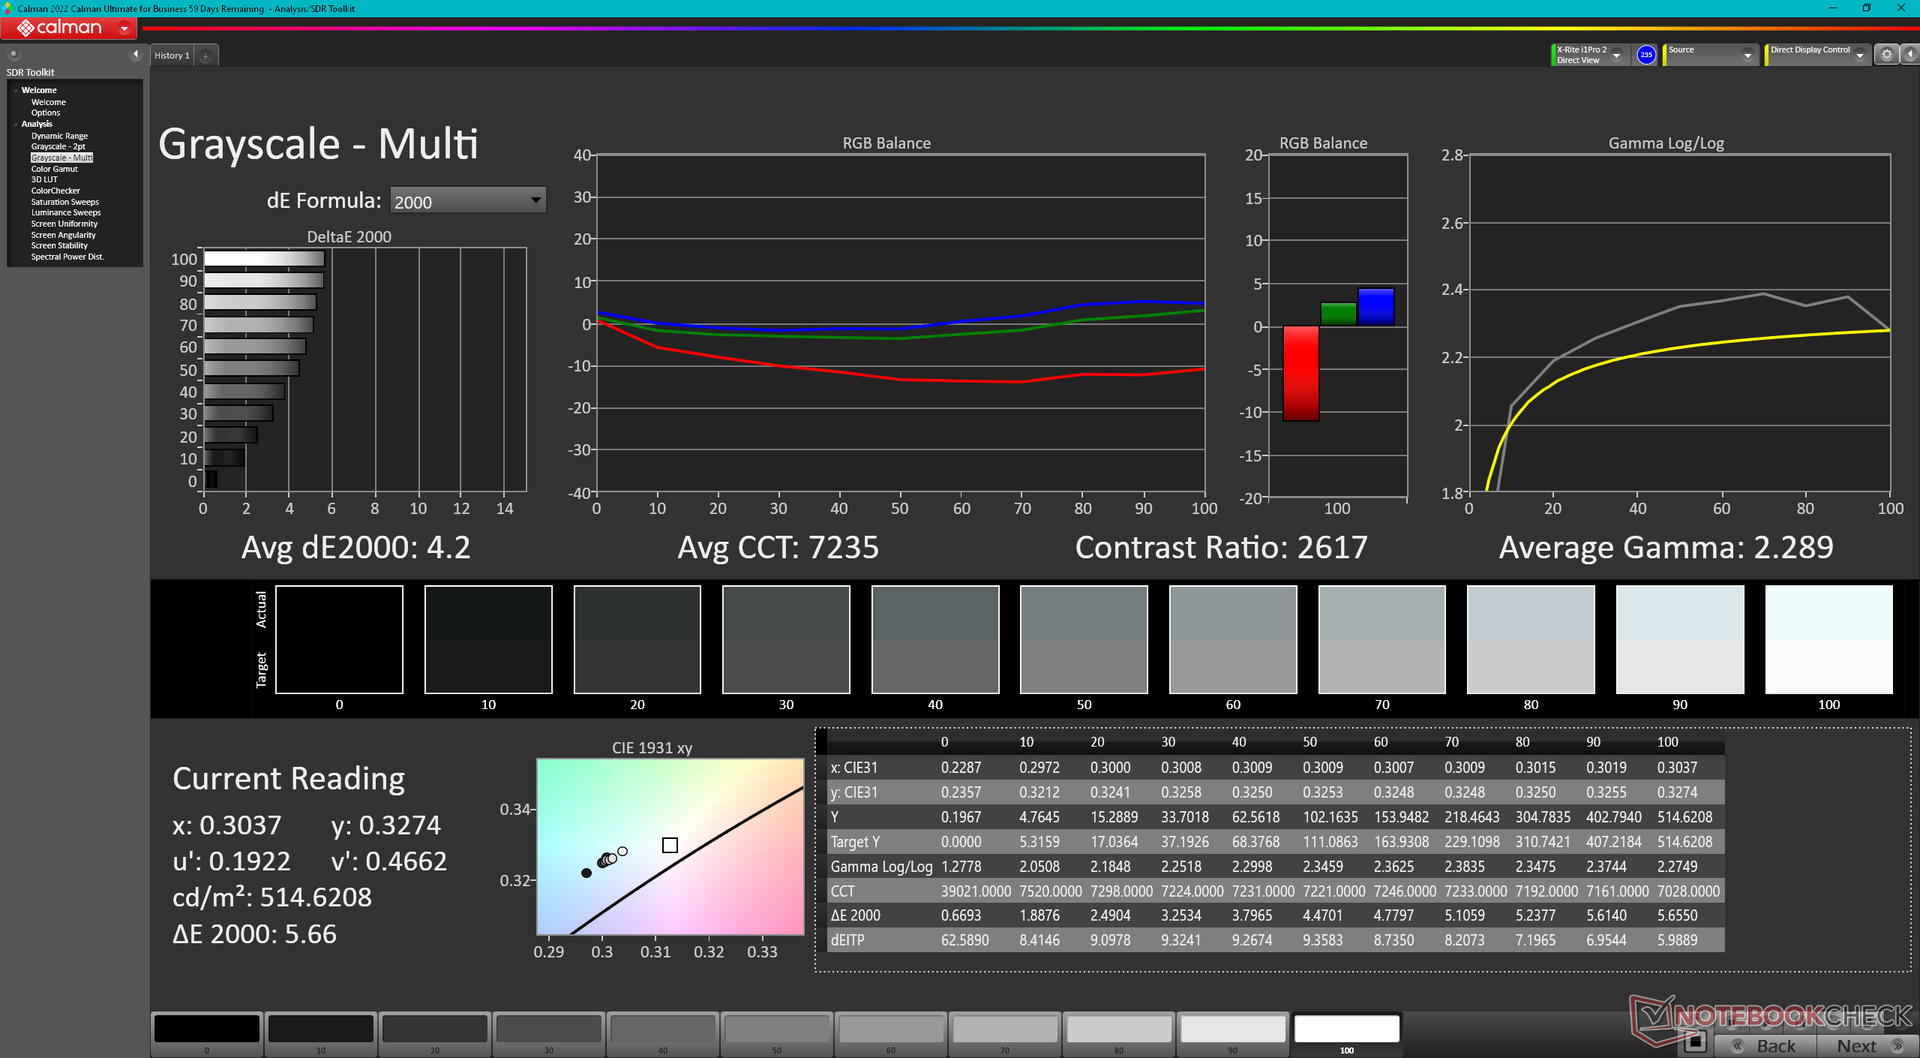
ΔE Greyscale 4.2 | 0.5-98 Ø5.1
71.7% AdobeRGB 1998 (Argyll 2.2.0 3D)
97.8% sRGB (Argyll 2.2.0 3D)
69.4% Display P3 (Argyll 2.2.0 3D)
Gamma: 2.29
| Dell XPS 13 9345 IPS, 1920x1200, 13.4", 120 Hz | Dell XPS 13 9340 Core Ultra 7 SHP1593, IPS, 1920x1200, 13.4", 120 Hz | Microsoft Surface Laptop 7 13.8 Copilot+ LQ138P1JX61, IPS, 2304x1536, 13.8", 120 Hz | Lenovo ThinkBook 13x G4 21KR0008GE LEN135WQ+, IPS, 2880x1920, 13.5", 120 Hz | HP EliteBook Ultra G1q 14 IPS, 2240x1400, 14", 60 Hz | Asus ZenBook S13 OLED UX5304 SDC417B, OLED, 2880x1800, 13.3", 60 Hz | |
|---|---|---|---|---|---|---|
| Display | 0% | 21% | -4% | 27% | ||
| Display P3 Coverage | 69.4 | 69.4 0% | 97.8 41% | 65.5 -6% | 99.7 44% | |
| sRGB Coverage | 97.8 | 97.8 0% | 98.2 0% | 97.3 -1% | 100 2% | |
| AdobeRGB 1998 Coverage | 71.7 | 71.7 0% | 87.3 22% | 67.7 -6% | 96.9 35% | |
| Response Times | -25% | 5% | 32% | 27% | 94% | |
| Response Time Grey 50% / Grey 80% * | 35.2 ? | 43.2 ? -23% | 38.9 ? -11% | 27.3 ? 22% | 22.8 ? 35% | 2 ? 94% |
| Response Time Black / White * | 21.8 ? | 27.6 ? -27% | 17.4 ? 20% | 12.8 ? 41% | 17.9 ? 18% | 1.6 ? 93% |
| PWM Frequency | 240 ? | |||||
| Screen | -6% | 16% | 10% | -58% | 27% | |
| Brightness middle | 518.3 | 429 -17% | 606 17% | 539 4% | 341.4 -34% | 361 -30% |
| Brightness | 487 | 407 -16% | 592 22% | 513 5% | 315 -35% | 365 -25% |
| Brightness Distribution | 86 | 90 5% | 94 9% | 89 3% | 87 1% | 98 14% |
| Black Level * | 0.26 | 0.28 -8% | 0.43 -65% | 0.38 -46% | 0.39 -50% | |
| Contrast | 1993 | 1532 -23% | 1409 -29% | 1418 -29% | 875 -56% | |
| Colorchecker dE 2000 * | 3.4 | 2.6 24% | 1.3 62% | 1.4 59% | 5.63 -66% | 1.2 65% |
| Colorchecker dE 2000 max. * | 5.68 | 6.6 -16% | 2.1 63% | 3.5 38% | 11.94 -110% | 1.9 67% |
| Greyscale dE 2000 * | 4.2 | 4 5% | 2.1 50% | 2.2 48% | 8.8 -110% | 1.2 71% |
| Gamma | 2.29 96% | 2.23 99% | 2.16 102% | 2.19 100% | 2.14 103% | 2.27 97% |
| CCT | 7235 90% | 7332 89% | 6842 95% | 6710 97% | 6034 108% | 6486 100% |
| Colorchecker dE 2000 calibrated * | 1.4 | 0.7 | ||||
| Moyenne finale (programmes/paramètres) | -10% /
-7% | 14% /
15% | 13% /
10% | -16% /
-41% | 49% /
39% |
* ... Moindre est la valeur, meilleures sont les performances
Notre colorimètre X-Rite montre que l'écran cible sRGB avec une échelle de gris moyenne décente et des valeurs deltaE de couleur de 4,2 et 3,4, respectivement. La température des couleurs, cependant, est légèrement trop froide à 7235, ce qui perturbe la précision des couleurs à des niveaux de saturation inférieurs. Il est dommage que Dell n'étalonne pas la dalle en usine car la plupart des logiciels d'étalonnage ne sont pas encore compatibles avec ARM, y compris i1Profiler.

Temps de réponse de l'écran
| ↔ Temps de réponse noir à blanc | ||
|---|---|---|
| 21.8 ms ... hausse ↗ et chute ↘ combinées | ↗ 10.5 ms hausse | 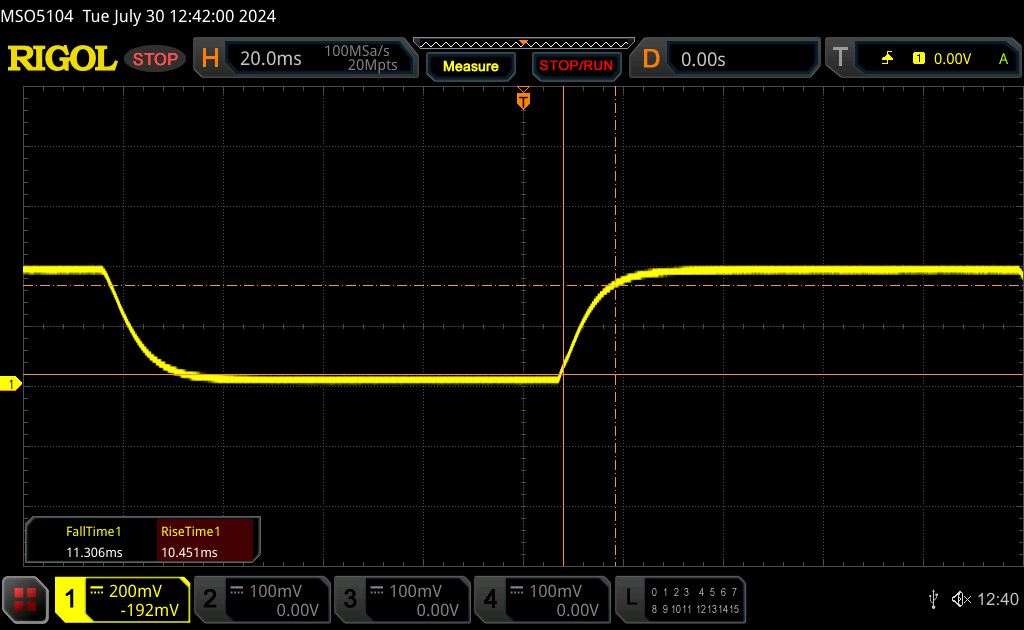 |
| ↘ 11.3 ms chute | ||
| L'écran montre de bons temps de réponse, mais insuffisant pour du jeu compétitif. En comparaison, tous les appareils testés affichent entre 0.1 (minimum) et 240 (maximum) ms. » 45 % des appareils testés affichent de meilleures performances. Cela signifie que les latences relevées sont similaires à la moyenne (20.7 ms) de tous les appareils testés. | ||
| ↔ Temps de réponse gris 50% à gris 80% | ||
| 35.2 ms ... hausse ↗ et chute ↘ combinées | ↗ 15.2 ms hausse | 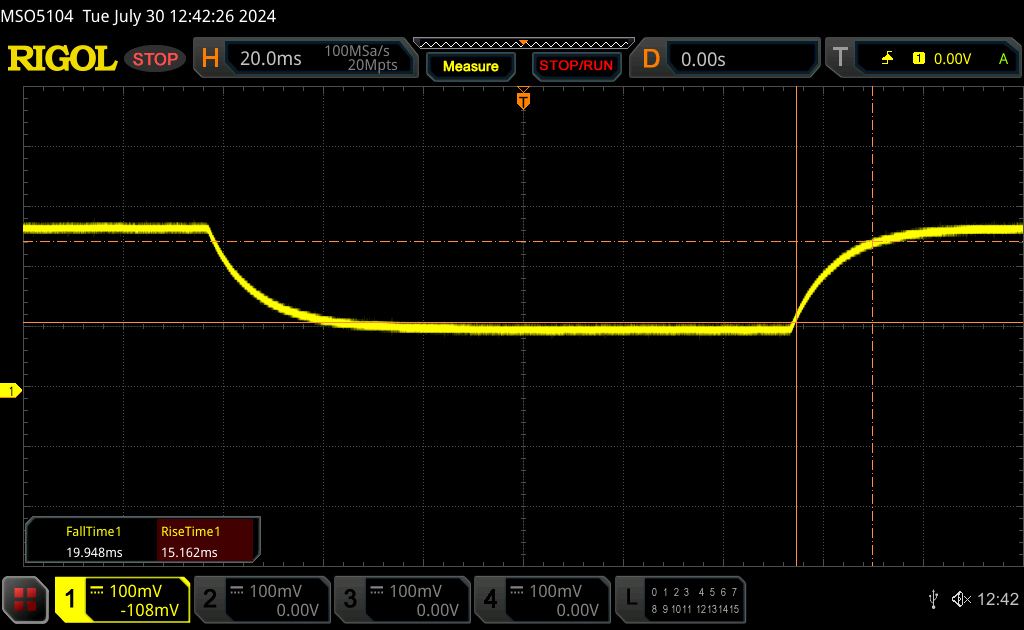 |
| ↘ 20 ms chute | ||
| L'écran souffre de latences très élevées, à éviter pour le jeu. En comparaison, tous les appareils testés affichent entre 0.165 (minimum) et 636 (maximum) ms. » 46 % des appareils testés affichent de meilleures performances. Cela signifie que les latences relevées sont similaires à la moyenne (32.4 ms) de tous les appareils testés. | ||
Scintillement / MLI (Modulation de largeur d'impulsion)
| Scintillement / MLI (Modulation de largeur d'impulsion) non décelé | 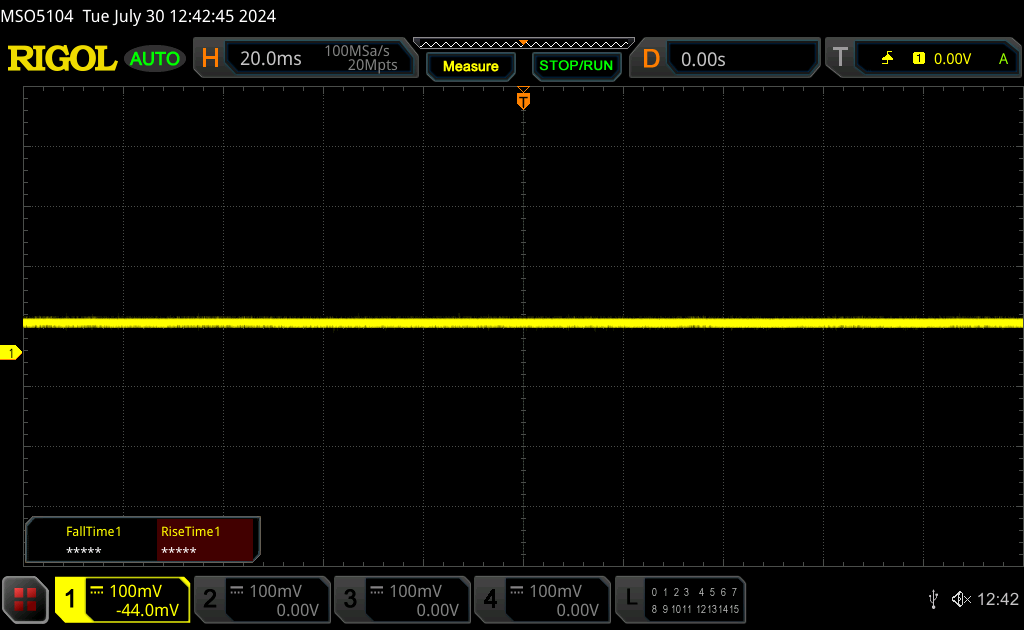 | ||
En comparaison, 53 % des appareils testés n'emploient pas MDI pour assombrir leur écran. Nous avons relevé une moyenne à 8482 (minimum : 5 - maximum : 343500) Hz dans le cas où une MDI était active. | |||


Performance
Conditions d'essai
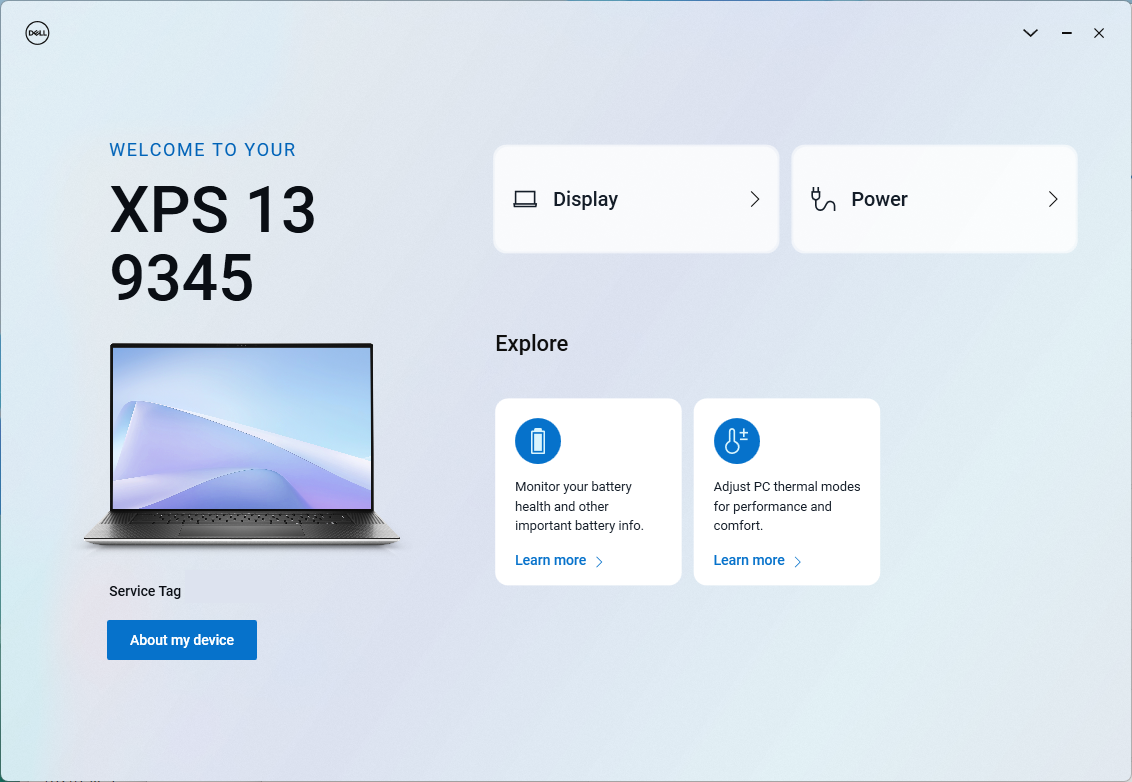
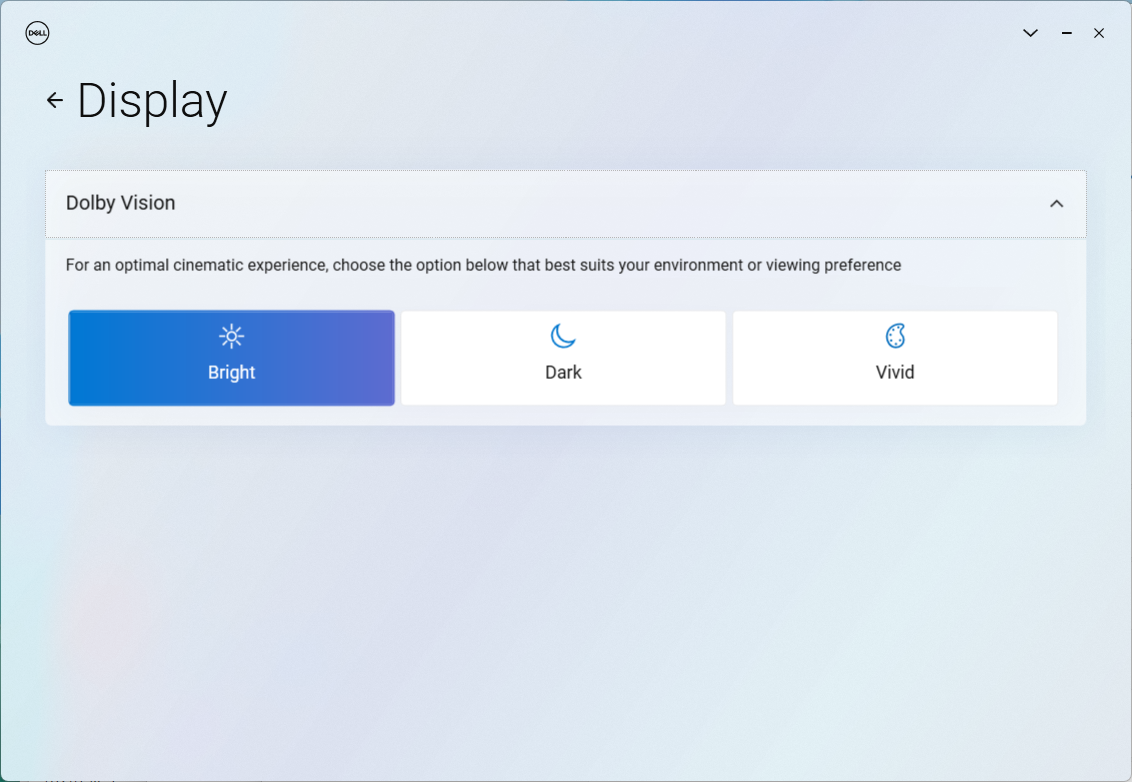
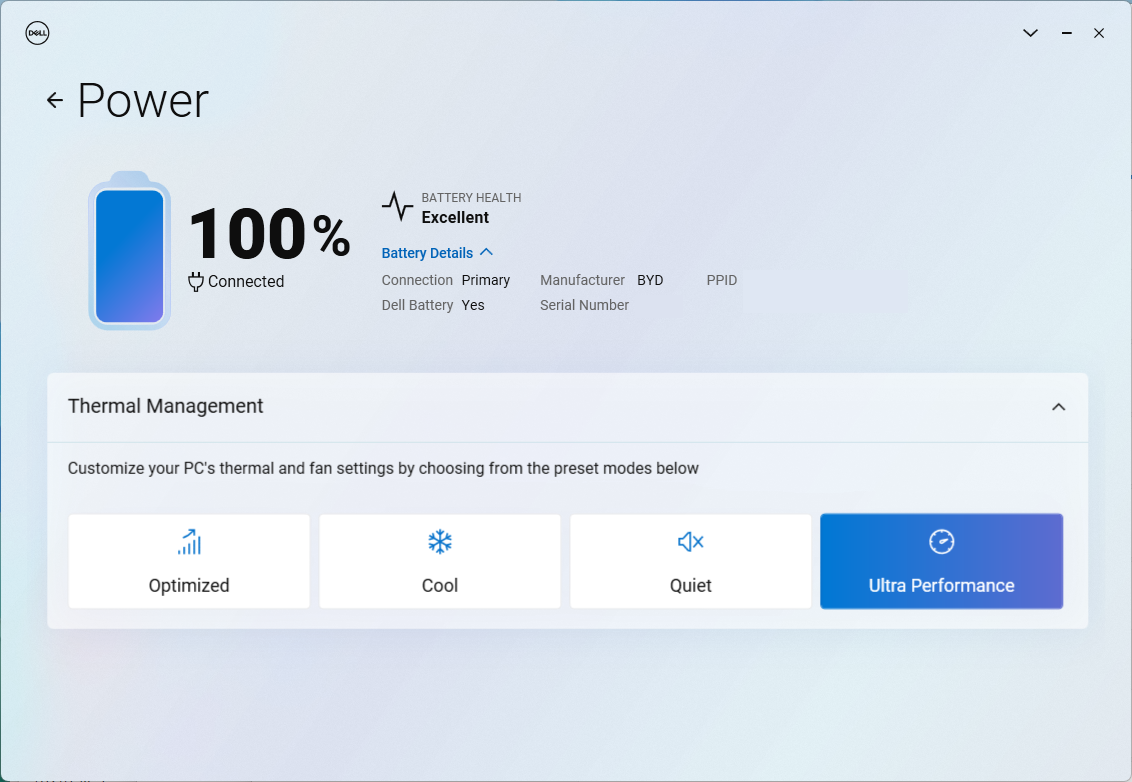
Nous avons réglé Windows et MyDell sur le mode Performance avant d'exécuter les tests ci-dessous. MyDell a été redessiné sur le modèle Snapdragon pour être plus simple à utiliser par rapport au même logiciel sur le XPS 13 basé sur Intel. Certaines fonctionnalités du logiciel, telles que la détection de présence, ont été déplacées dans le menu Alimentation et batterie de Windows.
Processeur
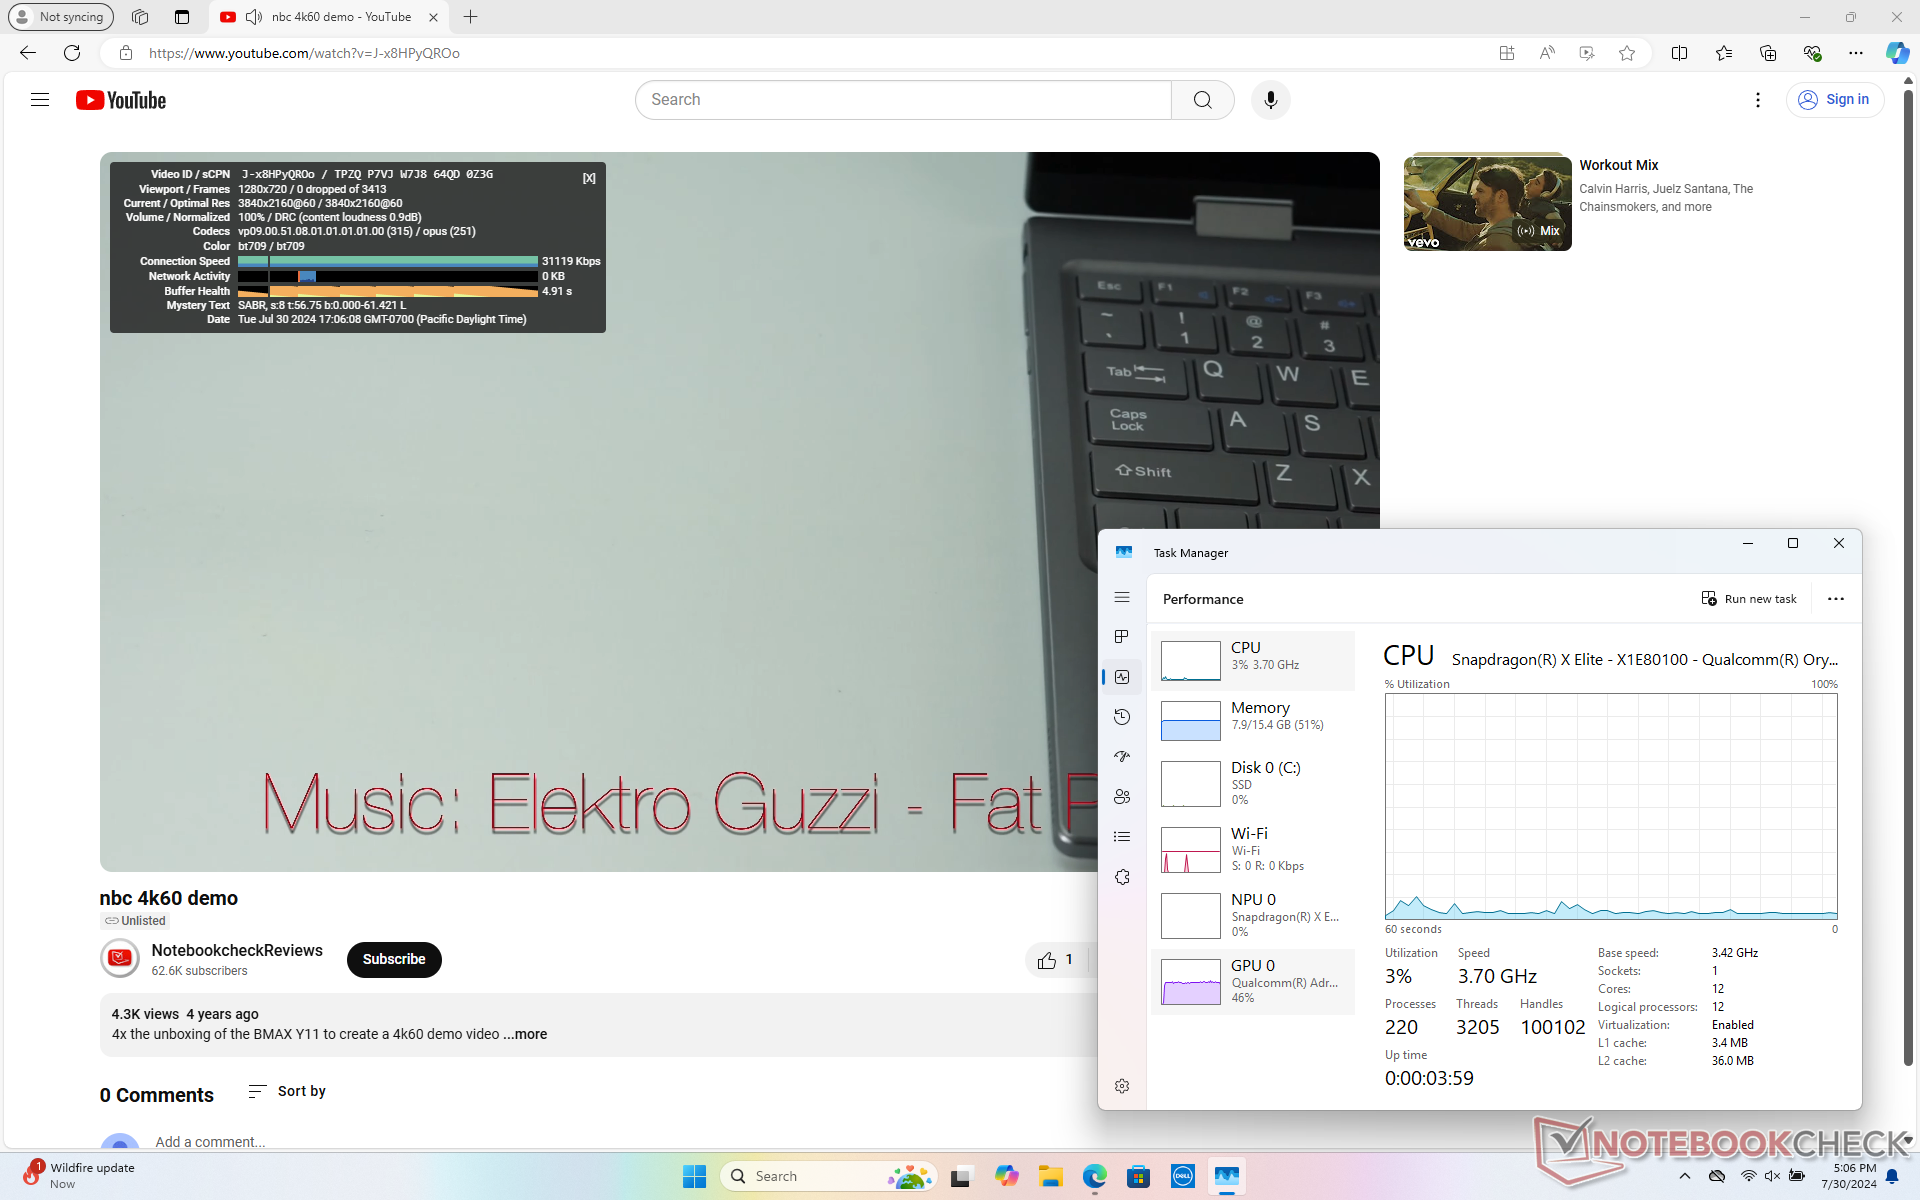
Les performances dépendent fortement du fait que l'application soit native ou émulée. Par exemple, le processeur excelle dans CineBench 2024 et GeekBench 6, qui ont tous deux été optimisés pour un environnement ARM. Notre Snapdragon X Elite X1E-80-100 serait plus performant que le Core Ultra 7 155H dans les opérations multithread et single-thread dans de telles conditions. Sinon, les benchmarks émulés ramènent notre processeur Snapdragon à des niveaux de performance plus proches de ceux de l'ancien Core i5-1240P ou Core i7-1260P. En d'autres termes, le processeur Qualcomm peut être compétitif par rapport au Core Ultra 7 155H, comme le fabricant aime à l'affirmer, mais les conditions et les applications doivent être idéales pour que ces avantages se manifestent.
La cohérence des performances peut également être difficile à mesurer entre les processeurs Snapdragon. Dans notre exemple, notre Snapdragon X Elite X1E-80-100 surpasserait largement le Snapdragon X Elite X1E-80-100 Snapdragon X Elite X1E-78-100 dans le EliteBook Ultra G1q 14 dans CineBench 2024, mais l'inverse est vrai dans CineBench R23 et R15.
Cinebench R15 Multi Loop
Cinebench 2024: CPU Multi Core | CPU Single Core
Cinebench R23: Multi Core | Single Core
Cinebench R20: CPU (Multi Core) | CPU (Single Core)
Cinebench R15: CPU Multi 64Bit | CPU Single 64Bit
Blender: v2.79 BMW27 CPU
7-Zip 18.03: 7z b 4 | 7z b 4 -mmt1
Geekbench 6.4: Multi-Core | Single-Core
HWBOT x265 Benchmark v2.2: 4k Preset
LibreOffice : 20 Documents To PDF
R Benchmark 2.5: Overall mean
| Cinebench 2024 / CPU Multi Core | |
| Dell XPS 13 9345 | |
| Microsoft Surface Laptop 7 13.8 Copilot+ | |
| Moyenne Qualcomm Snapdragon X Elite X1E-80-100 (621 - 927, n=7) | |
| Medion SPRCHRGD 14 S1 Elite | |
| HP EliteBook Ultra G1q 14 | |
| Lenovo ThinkPad T14s Gen 6 21N10007GE | |
| Dell XPS 13 9340 Core Ultra 7 | |
| Dell XPS 14 2024 OLED | |
| Cinebench 2024 / CPU Single Core | |
| Microsoft Surface Laptop 7 13.8 Copilot+ | |
| Moyenne Qualcomm Snapdragon X Elite X1E-80-100 (122 - 123, n=7) | |
| Dell XPS 13 9345 | |
| Lenovo ThinkPad T14s Gen 6 21N10007GE | |
| Medion SPRCHRGD 14 S1 Elite | |
| HP EliteBook Ultra G1q 14 | |
| Dell XPS 14 2024 OLED | |
| Dell XPS 13 9340 Core Ultra 7 | |
| Geekbench 6.4 / Multi-Core | |
| Lenovo ThinkPad T14s Gen 6 21N10007GE | |
| Dell XPS 13 9345 | |
| Medion SPRCHRGD 14 S1 Elite | |
| Microsoft Surface Laptop 7 13.8 Copilot+ | |
| Dell XPS 14 2024 OLED | |
| HP EliteBook Ultra G1q 14 | |
| Moyenne Qualcomm Snapdragon X Elite X1E-80-100 (7596 - 14998, n=9) | |
| Dell XPS 13 9340 Core Ultra 7 | |
| Geekbench 6.4 / Single-Core | |
| Dell XPS 13 9345 | |
| Microsoft Surface Laptop 7 13.8 Copilot+ | |
| Moyenne Qualcomm Snapdragon X Elite X1E-80-100 (1896 - 2845, n=9) | |
| Lenovo ThinkPad T14s Gen 6 21N10007GE | |
| Medion SPRCHRGD 14 S1 Elite | |
| Dell XPS 14 2024 OLED | |
| Dell XPS 13 9340 Core Ultra 7 | |
| HP EliteBook Ultra G1q 14 | |
Cinebench 2024: CPU Multi Core | CPU Single Core
Cinebench R23: Multi Core | Single Core
Cinebench R20: CPU (Multi Core) | CPU (Single Core)
Cinebench R15: CPU Multi 64Bit | CPU Single 64Bit
Blender: v2.79 BMW27 CPU
7-Zip 18.03: 7z b 4 | 7z b 4 -mmt1
Geekbench 6.4: Multi-Core | Single-Core
HWBOT x265 Benchmark v2.2: 4k Preset
LibreOffice : 20 Documents To PDF
R Benchmark 2.5: Overall mean
* ... Moindre est la valeur, meilleures sont les performances
AIDA64: FP32 Ray-Trace | FPU Julia | CPU SHA3 | CPU Queen | FPU SinJulia | FPU Mandel | CPU AES | CPU ZLib | FP64 Ray-Trace | CPU PhotoWorxx
| Performance Rating | |
| Dell XPS 13 9340 Core Ultra 7 | |
| Lenovo ThinkBook 13x G4 21KR0008GE | |
| Microsoft Surface Laptop 7 13.8 Copilot+ | |
| Dell XPS 13 9345 | |
| HP EliteBook Ultra G1q 14 | |
| Moyenne Qualcomm Snapdragon X Elite X1E-80-100 | |
| Asus ZenBook S13 OLED UX5304 | |
| AIDA64 / FP32 Ray-Trace | |
| Dell XPS 13 9340 Core Ultra 7 | |
| Lenovo ThinkBook 13x G4 21KR0008GE | |
| HP EliteBook Ultra G1q 14 | |
| Microsoft Surface Laptop 7 13.8 Copilot+ | |
| Dell XPS 13 9345 | |
| Moyenne Qualcomm Snapdragon X Elite X1E-80-100 (2184 - 7469, n=7) | |
| Asus ZenBook S13 OLED UX5304 | |
| AIDA64 / FPU Julia | |
| Dell XPS 13 9340 Core Ultra 7 | |
| Lenovo ThinkBook 13x G4 21KR0008GE | |
| Asus ZenBook S13 OLED UX5304 | |
| Microsoft Surface Laptop 7 13.8 Copilot+ | |
| Dell XPS 13 9345 | |
| HP EliteBook Ultra G1q 14 | |
| Moyenne Qualcomm Snapdragon X Elite X1E-80-100 (5687 - 26391, n=7) | |
| AIDA64 / CPU SHA3 | |
| HP EliteBook Ultra G1q 14 | |
| Microsoft Surface Laptop 7 13.8 Copilot+ | |
| Dell XPS 13 9340 Core Ultra 7 | |
| Dell XPS 13 9345 | |
| Moyenne Qualcomm Snapdragon X Elite X1E-80-100 (2607 - 3122, n=7) | |
| Lenovo ThinkBook 13x G4 21KR0008GE | |
| Asus ZenBook S13 OLED UX5304 | |
| AIDA64 / CPU Queen | |
| Lenovo ThinkBook 13x G4 21KR0008GE | |
| Dell XPS 13 9340 Core Ultra 7 | |
| Microsoft Surface Laptop 7 13.8 Copilot+ | |
| Moyenne Qualcomm Snapdragon X Elite X1E-80-100 (67219 - 69762, n=7) | |
| Dell XPS 13 9345 | |
| HP EliteBook Ultra G1q 14 | |
| Asus ZenBook S13 OLED UX5304 | |
| AIDA64 / FPU SinJulia | |
| Dell XPS 13 9340 Core Ultra 7 | |
| Lenovo ThinkBook 13x G4 21KR0008GE | |
| Asus ZenBook S13 OLED UX5304 | |
| Microsoft Surface Laptop 7 13.8 Copilot+ | |
| Dell XPS 13 9345 | |
| Moyenne Qualcomm Snapdragon X Elite X1E-80-100 (1521 - 2357, n=7) | |
| HP EliteBook Ultra G1q 14 | |
| AIDA64 / FPU Mandel | |
| Dell XPS 13 9340 Core Ultra 7 | |
| Lenovo ThinkBook 13x G4 21KR0008GE | |
| Asus ZenBook S13 OLED UX5304 | |
| HP EliteBook Ultra G1q 14 | |
| Microsoft Surface Laptop 7 13.8 Copilot+ | |
| Moyenne Qualcomm Snapdragon X Elite X1E-80-100 (10117 - 15669, n=7) | |
| Dell XPS 13 9345 | |
| AIDA64 / CPU AES | |
| HP EliteBook Ultra G1q 14 | |
| Dell XPS 13 9340 Core Ultra 7 | |
| Microsoft Surface Laptop 7 13.8 Copilot+ | |
| Moyenne Qualcomm Snapdragon X Elite X1E-80-100 (39956 - 71089, n=7) | |
| Dell XPS 13 9345 | |
| Lenovo ThinkBook 13x G4 21KR0008GE | |
| Asus ZenBook S13 OLED UX5304 | |
| AIDA64 / CPU ZLib | |
| Dell XPS 13 9340 Core Ultra 7 | |
| HP EliteBook Ultra G1q 14 | |
| Microsoft Surface Laptop 7 13.8 Copilot+ | |
| Dell XPS 13 9345 | |
| Moyenne Qualcomm Snapdragon X Elite X1E-80-100 (398 - 802, n=7) | |
| Lenovo ThinkBook 13x G4 21KR0008GE | |
| Asus ZenBook S13 OLED UX5304 | |
| AIDA64 / FP64 Ray-Trace | |
| Dell XPS 13 9340 Core Ultra 7 | |
| Lenovo ThinkBook 13x G4 21KR0008GE | |
| Microsoft Surface Laptop 7 13.8 Copilot+ | |
| Dell XPS 13 9345 | |
| Moyenne Qualcomm Snapdragon X Elite X1E-80-100 (2581 - 4044, n=7) | |
| Asus ZenBook S13 OLED UX5304 | |
| HP EliteBook Ultra G1q 14 | |
| AIDA64 / CPU PhotoWorxx | |
| Dell XPS 13 9340 Core Ultra 7 | |
| Lenovo ThinkBook 13x G4 21KR0008GE | |
| Asus ZenBook S13 OLED UX5304 | |
| Microsoft Surface Laptop 7 13.8 Copilot+ | |
| Dell XPS 13 9345 | |
| Moyenne Qualcomm Snapdragon X Elite X1E-80-100 (28474 - 38707, n=7) | |
| HP EliteBook Ultra G1q 14 | |
Performance du système
WebXPRT et Kraken, qui fonctionnent en mode natif sur le navigateur Edge optimisé pour ARM, classent tous deux notre XPS Qualcomm devant le XPS Intel avec des marges décentes.
WebXPRT 3: Overall
WebXPRT 4: Overall
Mozilla Kraken 1.1: Total
| CrossMark / Overall | |
| Dell XPS 13 9340 Core Ultra 7 | |
| Asus ZenBook S13 OLED UX5304 | |
| Lenovo ThinkBook 13x G4 21KR0008GE | |
| Microsoft Surface Laptop 7 13.8 Copilot+ | |
| Moyenne Qualcomm Snapdragon X Elite X1E-80-100, Qualcomm SD X Adreno X1-85 3.8 TFLOPS (1356 - 1443, n=7) | |
| Dell XPS 13 9345 | |
| HP EliteBook Ultra G1q 14 | |
| CrossMark / Productivity | |
| Dell XPS 13 9340 Core Ultra 7 | |
| Asus ZenBook S13 OLED UX5304 | |
| Lenovo ThinkBook 13x G4 21KR0008GE | |
| Microsoft Surface Laptop 7 13.8 Copilot+ | |
| Moyenne Qualcomm Snapdragon X Elite X1E-80-100, Qualcomm SD X Adreno X1-85 3.8 TFLOPS (1271 - 1375, n=7) | |
| Dell XPS 13 9345 | |
| HP EliteBook Ultra G1q 14 | |
| CrossMark / Creativity | |
| Dell XPS 13 9340 Core Ultra 7 | |
| Lenovo ThinkBook 13x G4 21KR0008GE | |
| Asus ZenBook S13 OLED UX5304 | |
| Microsoft Surface Laptop 7 13.8 Copilot+ | |
| Moyenne Qualcomm Snapdragon X Elite X1E-80-100, Qualcomm SD X Adreno X1-85 3.8 TFLOPS (1402 - 1537, n=7) | |
| Dell XPS 13 9345 | |
| HP EliteBook Ultra G1q 14 | |
| CrossMark / Responsiveness | |
| Dell XPS 13 9340 Core Ultra 7 | |
| Asus ZenBook S13 OLED UX5304 | |
| Microsoft Surface Laptop 7 13.8 Copilot+ | |
| Moyenne Qualcomm Snapdragon X Elite X1E-80-100, Qualcomm SD X Adreno X1-85 3.8 TFLOPS (1237 - 1401, n=7) | |
| Lenovo ThinkBook 13x G4 21KR0008GE | |
| Dell XPS 13 9345 | |
| HP EliteBook Ultra G1q 14 | |
| WebXPRT 3 / Overall | |
| Moyenne Qualcomm Snapdragon X Elite X1E-80-100, Qualcomm SD X Adreno X1-85 3.8 TFLOPS (430 - 455, n=7) | |
| Microsoft Surface Laptop 7 13.8 Copilot+ | |
| Dell XPS 13 9345 | |
| HP EliteBook Ultra G1q 14 | |
| Asus ZenBook S13 OLED UX5304 | |
| Dell XPS 13 9340 Core Ultra 7 | |
| Lenovo ThinkBook 13x G4 21KR0008GE | |
| WebXPRT 4 / Overall | |
| Dell XPS 13 9345 | |
| Moyenne Qualcomm Snapdragon X Elite X1E-80-100, Qualcomm SD X Adreno X1-85 3.8 TFLOPS (295 - 324, n=7) | |
| Microsoft Surface Laptop 7 13.8 Copilot+ | |
| HP EliteBook Ultra G1q 14 | |
| Dell XPS 13 9340 Core Ultra 7 | |
| Asus ZenBook S13 OLED UX5304 | |
| Lenovo ThinkBook 13x G4 21KR0008GE | |
| Mozilla Kraken 1.1 / Total | |
| Lenovo ThinkBook 13x G4 21KR0008GE | |
| Dell XPS 13 9340 Core Ultra 7 | |
| Asus ZenBook S13 OLED UX5304 | |
| HP EliteBook Ultra G1q 14 | |
| Dell XPS 13 9345 | |
| Moyenne Qualcomm Snapdragon X Elite X1E-80-100, Qualcomm SD X Adreno X1-85 3.8 TFLOPS (391 - 422, n=7) | |
| Microsoft Surface Laptop 7 13.8 Copilot+ | |
* ... Moindre est la valeur, meilleures sont les performances
| AIDA64 / Memory Copy | |
| Dell XPS 13 9340 Core Ultra 7 | |
| Lenovo ThinkBook 13x G4 21KR0008GE | |
| Dell XPS 13 9345 | |
| Microsoft Surface Laptop 7 13.8 Copilot+ | |
| Asus ZenBook S13 OLED UX5304 | |
| Moyenne Qualcomm Snapdragon X Elite X1E-80-100 (44795 - 63495, n=7) | |
| HP EliteBook Ultra G1q 14 | |
| AIDA64 / Memory Read | |
| Dell XPS 13 9345 | |
| Microsoft Surface Laptop 7 13.8 Copilot+ | |
| Moyenne Qualcomm Snapdragon X Elite X1E-80-100 (58855 - 125604, n=7) | |
| Dell XPS 13 9340 Core Ultra 7 | |
| Lenovo ThinkBook 13x G4 21KR0008GE | |
| HP EliteBook Ultra G1q 14 | |
| Asus ZenBook S13 OLED UX5304 | |
| AIDA64 / Memory Write | |
| Dell XPS 13 9340 Core Ultra 7 | |
| Asus ZenBook S13 OLED UX5304 | |
| Lenovo ThinkBook 13x G4 21KR0008GE | |
| Dell XPS 13 9345 | |
| Microsoft Surface Laptop 7 13.8 Copilot+ | |
| Moyenne Qualcomm Snapdragon X Elite X1E-80-100 (37270 - 45265, n=7) | |
| HP EliteBook Ultra G1q 14 | |
| AIDA64 / Memory Latency | |
| Lenovo ThinkBook 13x G4 21KR0008GE | |
| Dell XPS 13 9340 Core Ultra 7 | |
| Asus ZenBook S13 OLED UX5304 | |
| Moyenne Qualcomm Snapdragon X Elite X1E-80-100 (7.4 - 8.8, n=5) | |
| HP EliteBook Ultra G1q 14 | |
| Dell XPS 13 9345 | |
| Microsoft Surface Laptop 7 13.8 Copilot+ | |
* ... Moindre est la valeur, meilleures sont les performances
Dispositifs de stockage
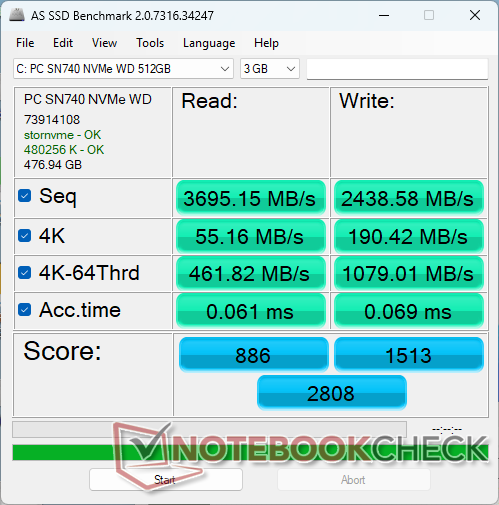
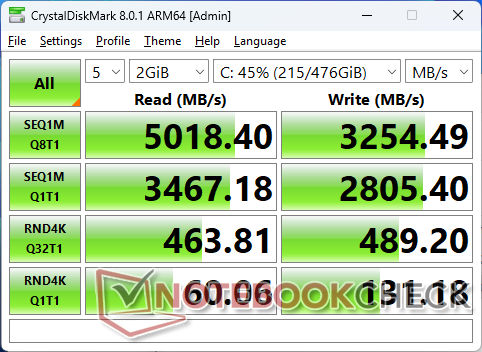
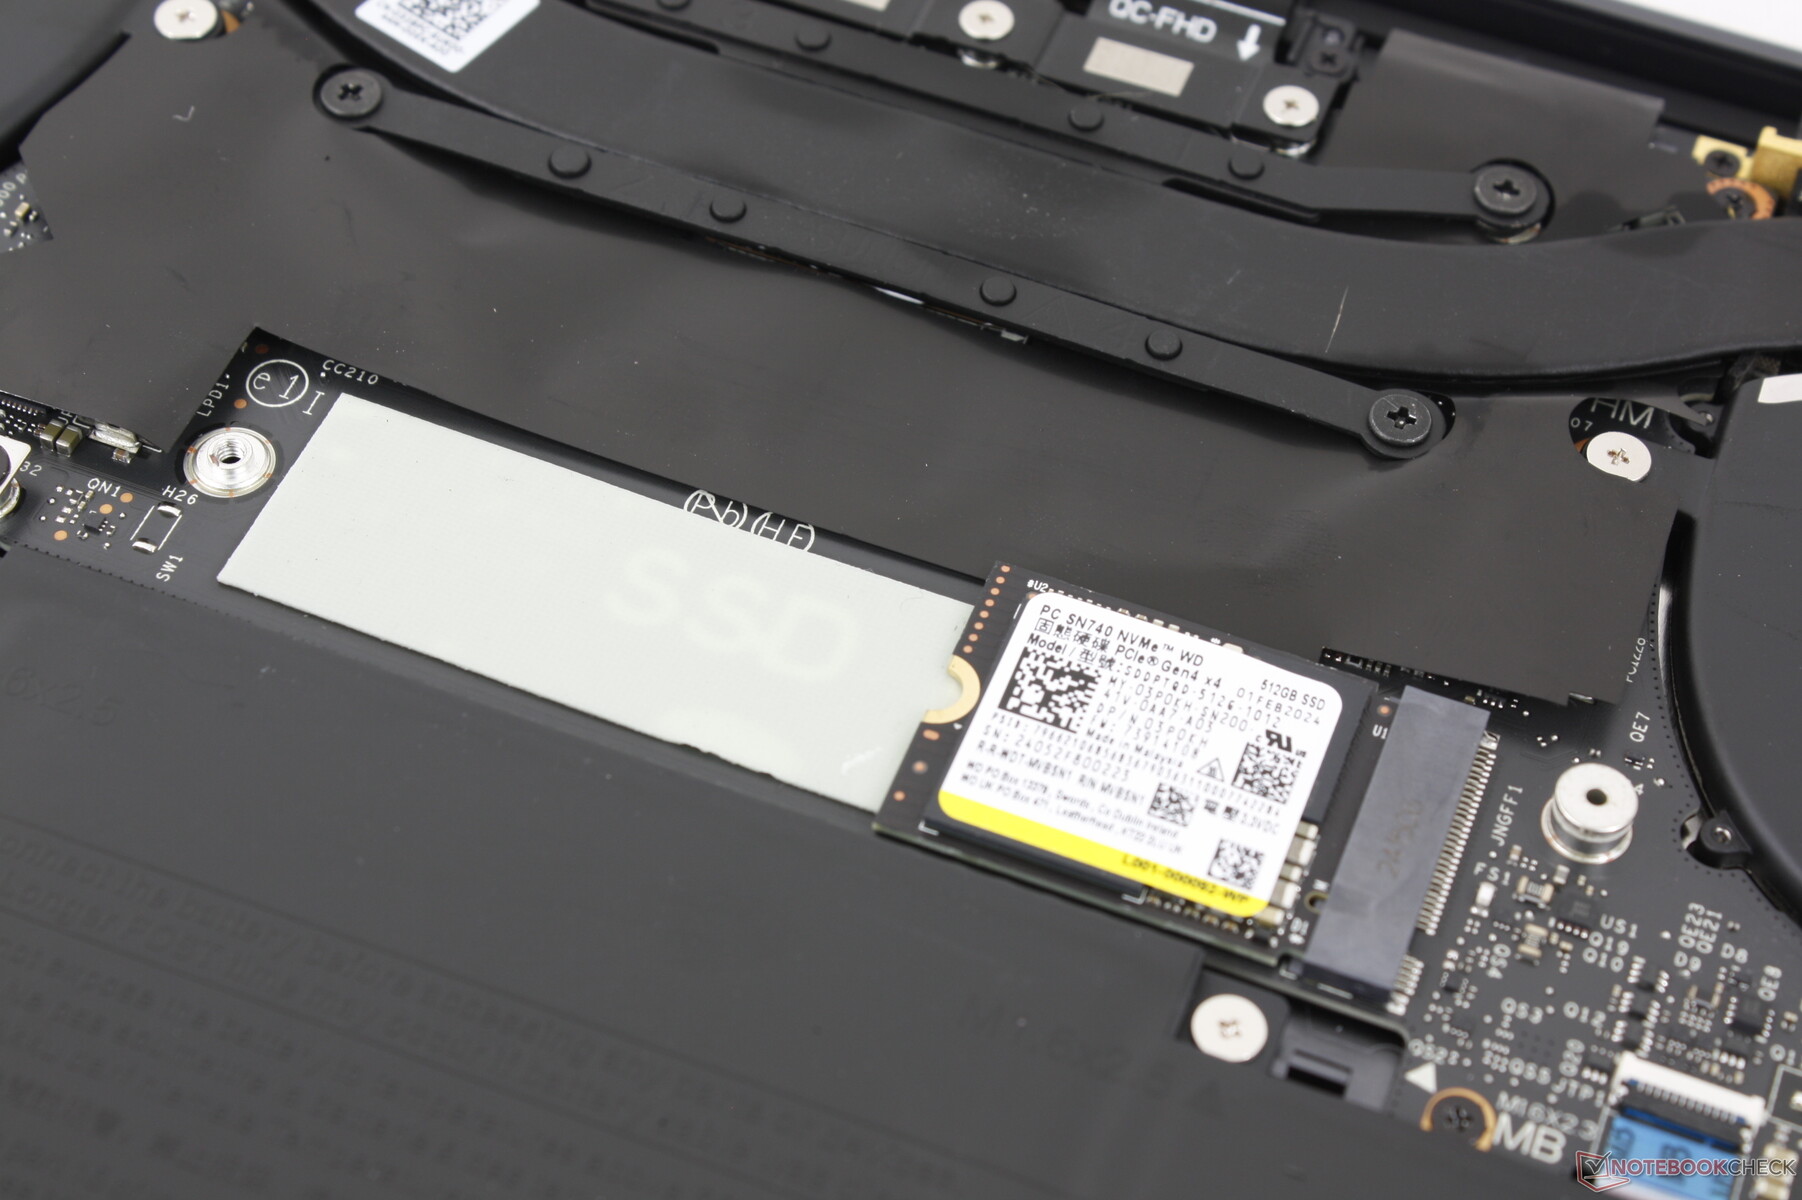
Dell s'approvisionne en disques SSD auprès d'une grande variété de fabricants et il est donc difficile de savoir quel disque vous obtiendrez avant l'achat. Par exemple, nous avons eu des disques de Micron, Samsung, WD, Toshiba et SK Hynix sur plus de 10 unités internes différentes du XPS 13. Notre unité Qualcomm spécifique est livrée avec le WD SN740 de milieu de gamme offrant des taux de transfert stables allant jusqu'à 5 000 Mo/s. Nous n'avons observé aucun comportement d'étranglement. Nous n'avons observé aucun comportement d'étranglement malgré la petite longueur de 42 mm, probablement en partie grâce au répartiteur de chaleur SSD inclus.

* ... Moindre est la valeur, meilleures sont les performances
Disk Throttling: DiskSpd Read Loop, Queue Depth 8
Performance du GPU
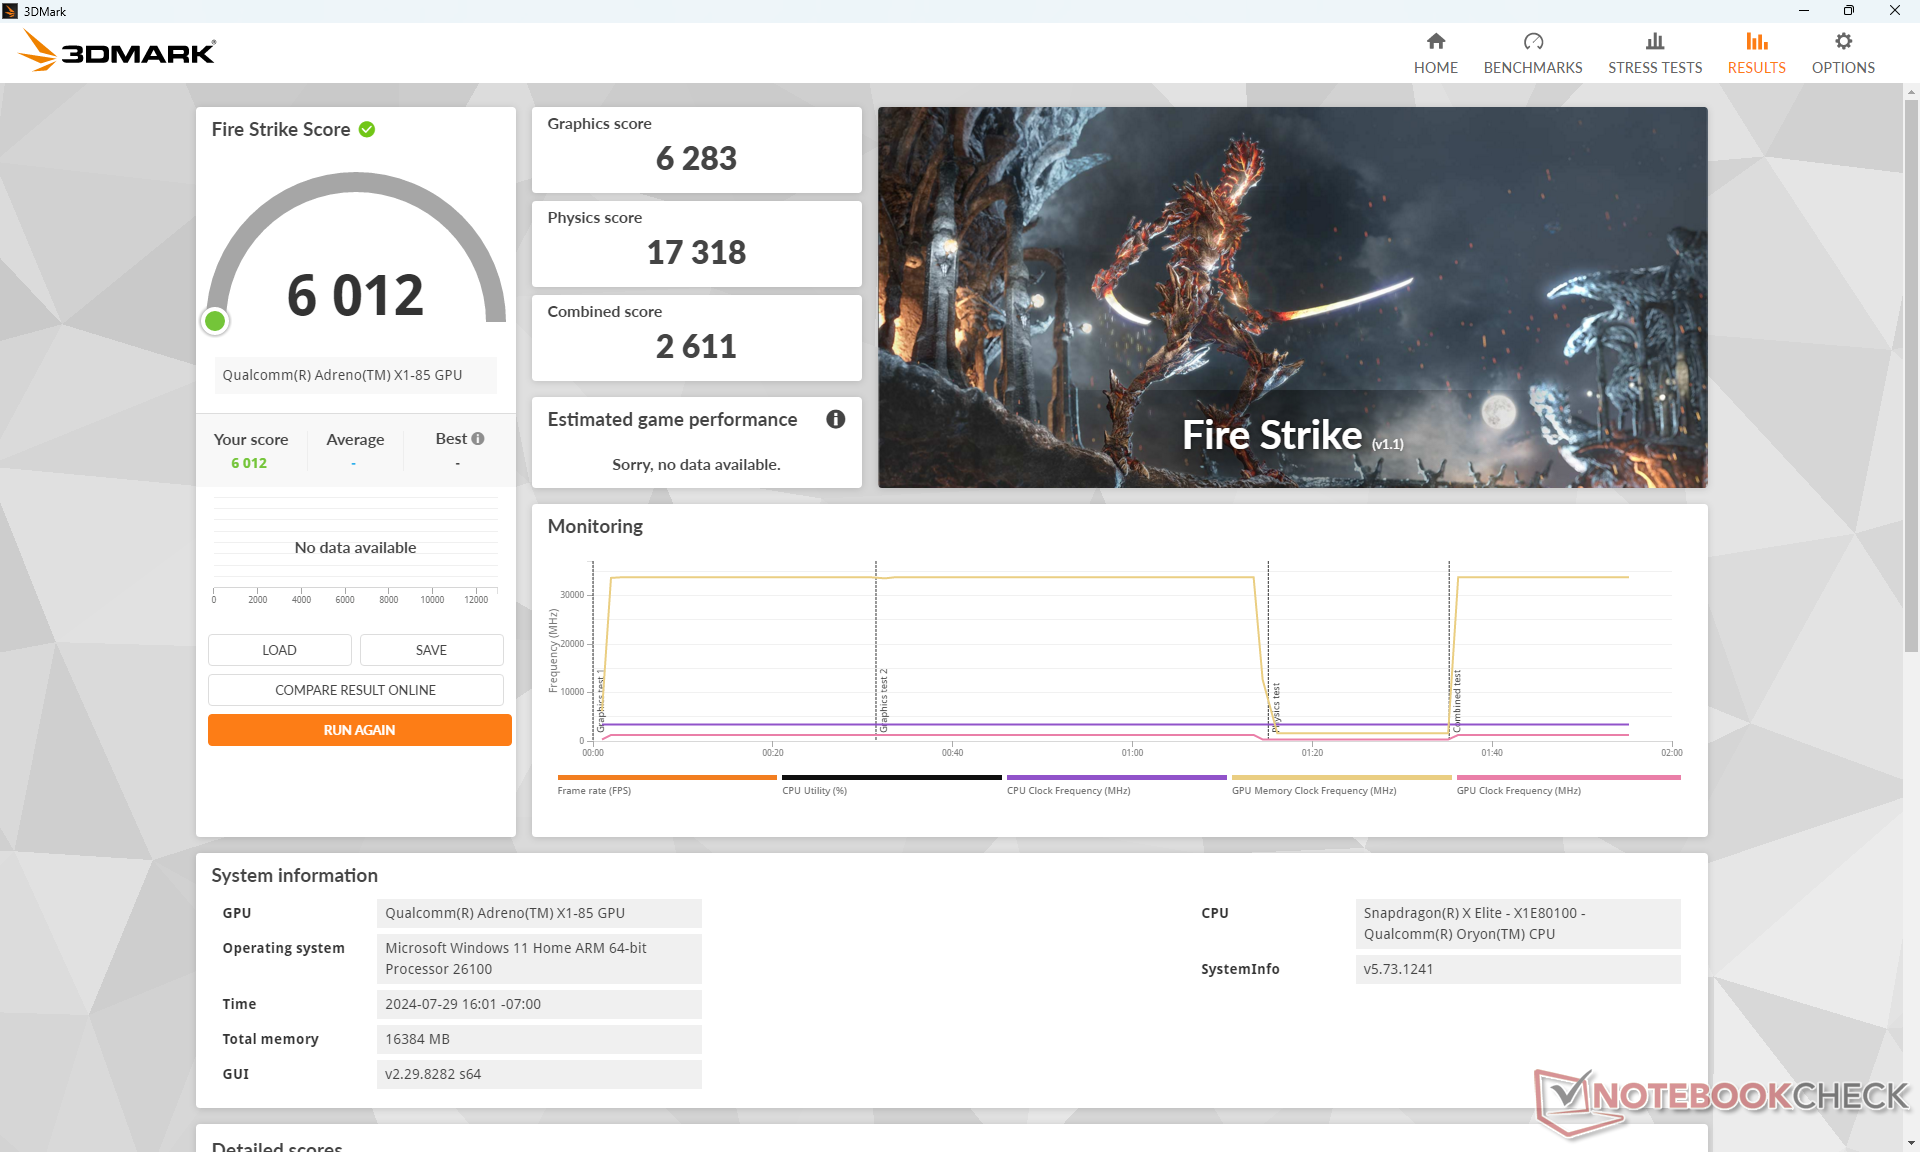
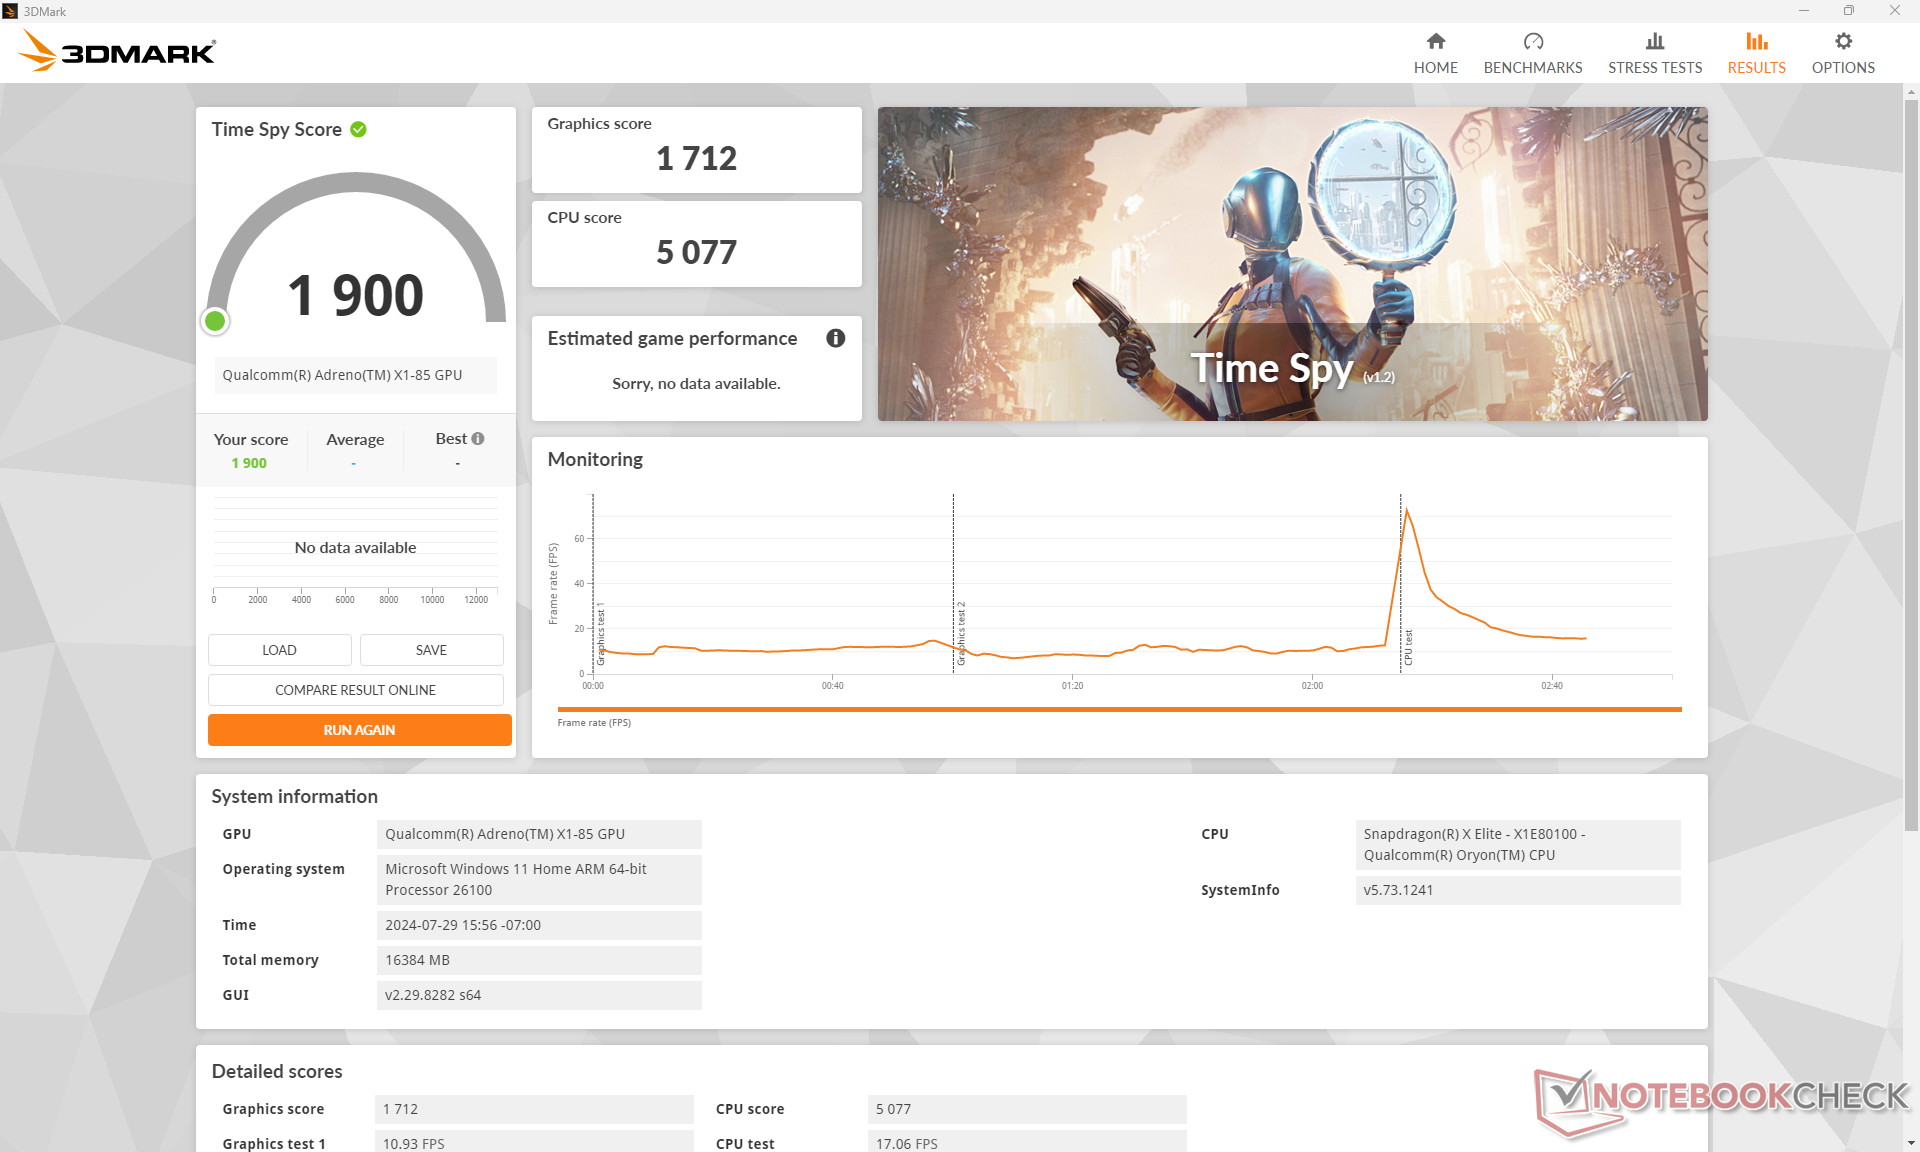
Les performances graphiques selon 3DMark émulé sont comparables à celles de la carte Iris Xe 96 EUs mais loin derrière l'Iris Xe 96 Arc 8 ou de la Radeon 680M/780M de 20 à 40 %. Cependant, les résultats sont toujours meilleurs que ceux du HP EliteBook Ultra G1q 14 même si les écarts sont mineurs en moyenne.
| Profil de puissance | Score graphique | Score physique | Score combiné |
| Mode performance | 6283 | 17318 | 2611 |
| Mode équilibré | 6209 | 18348 | 2643 |
| Puissance de la batterie | 6287 | 18156 | 2687 |
Il n'y a pas de baisse significative des performances lorsque vous passez du mode Performance au mode Équilibré ou au mode Alimentation par batterie, comme le montre notre tableau de résultats Fire Strike ci-dessus.
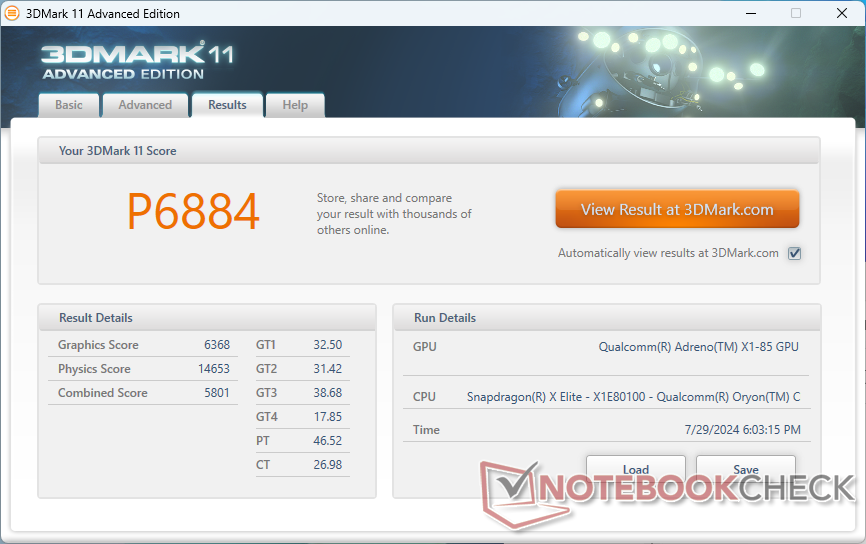
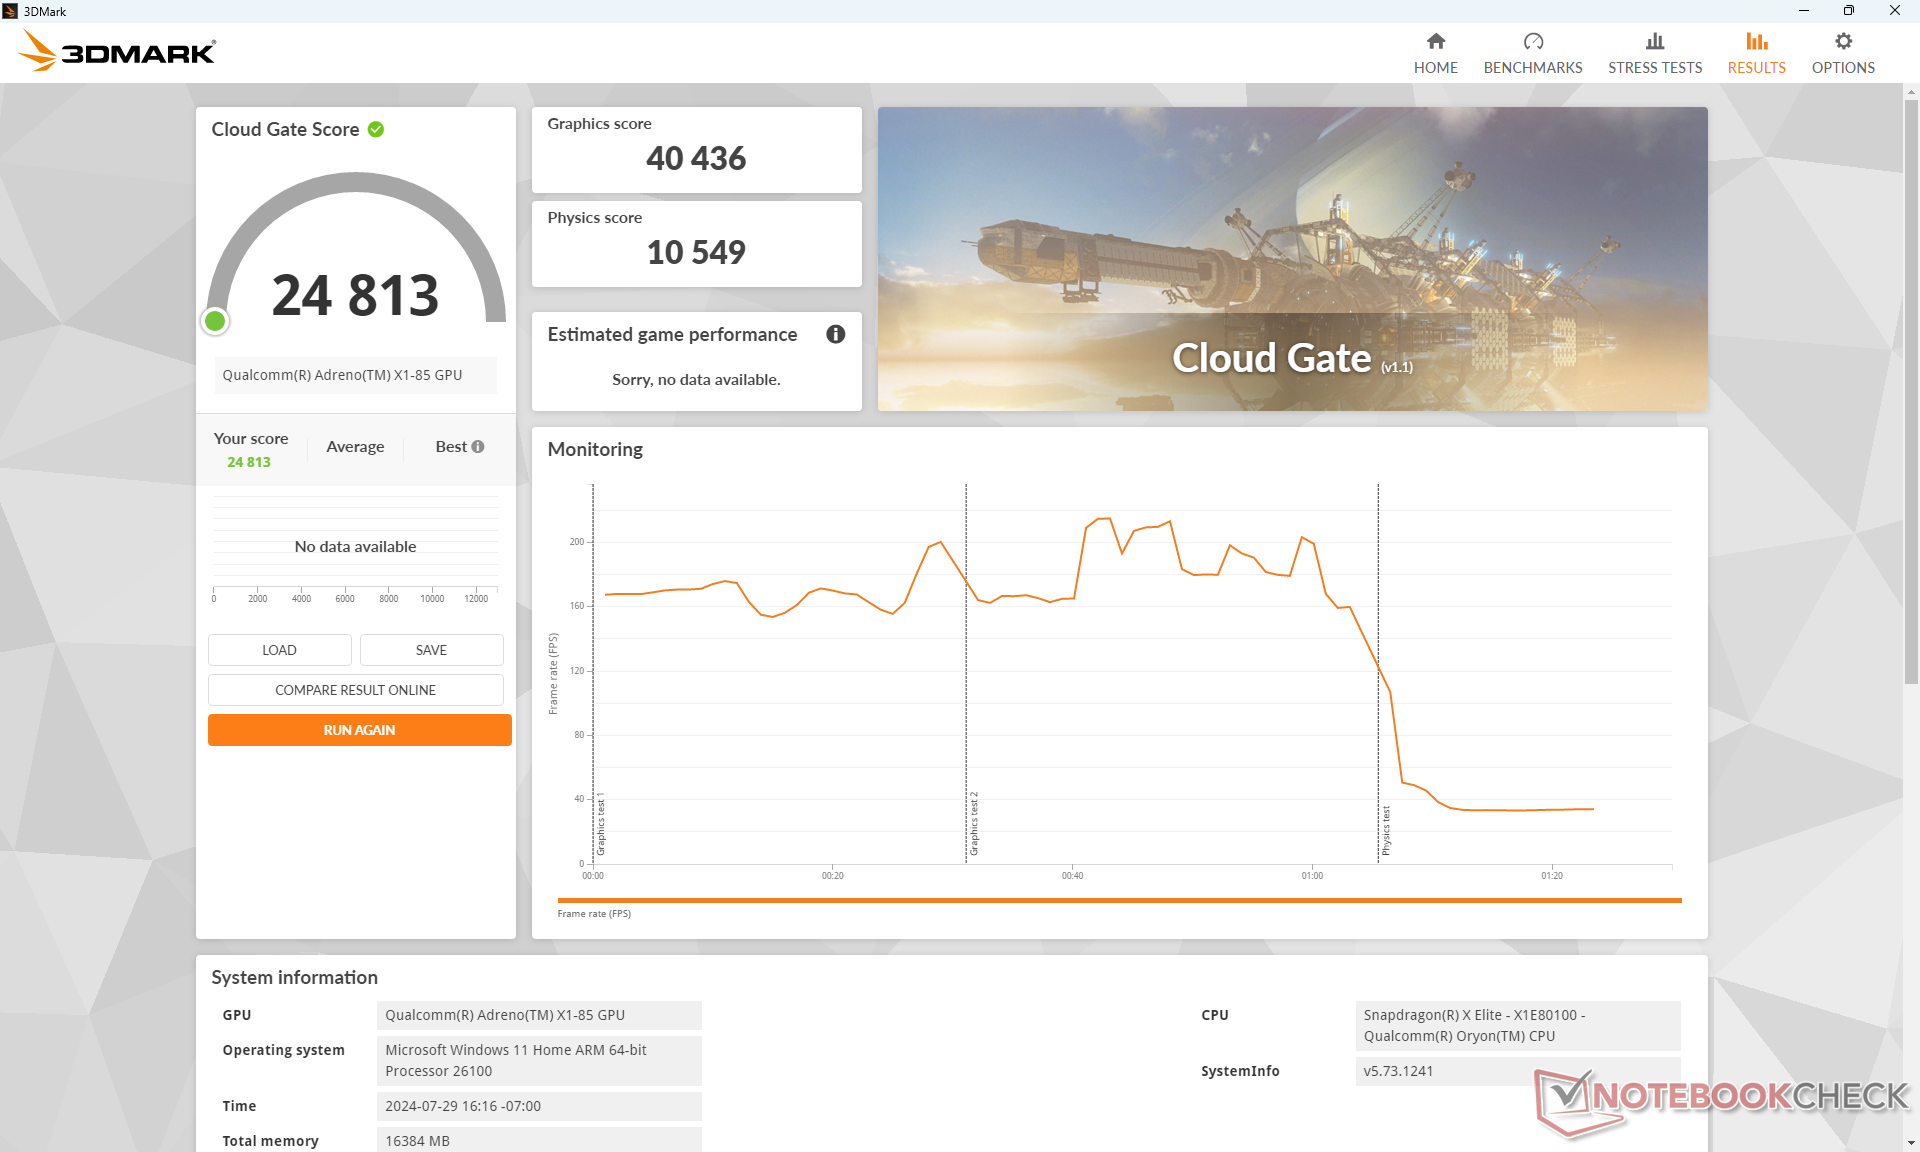
| 3DMark 11 Performance | 6884 points | |
| 3DMark Cloud Gate Standard Score | 24813 points | |
| 3DMark Fire Strike Score | 6012 points | |
| 3DMark Time Spy Score | 1900 points | |
Aide | ||
* ... Moindre est la valeur, meilleures sont les performances
Performances des jeux
Nos résultats 3DMark légèrement supérieurs à ceux de l'EliteBook Ultra G1q 14 se traduisent par des performances légèrement supérieures dans les titres testés ci-dessous. Il est intéressant de noter que certains titres fonctionnaient sur notre ordinateur Dell mais pas sur notre ordinateur HP et vice versa. Par exemple, Far Cry 5 fonctionnait sur notre Dell mais pas sur le HP et Baldur's Gate 3 fonctionnait sur notre HP mais pas sur le Dell, quel que soit le mode DirectX. L'écart peut être dû à des différences de pilotes entre les deux modèles, mais cela montre aussi qu'il y a encore du travail à faire en ce qui concerne le pilote graphique.
| Performance Rating - Percent | |
| Lenovo ThinkBook 13x G4 21KR0008GE -2! | |
| Dell XPS 13 9340 Core Ultra 7 -2! | |
| Dell XPS 13 9345 | |
| Microsoft Surface Laptop 7 13.8 Copilot+ -2! | |
| HP EliteBook Ultra G1q 14 -1! | |
| Asus ZenBook S13 OLED UX5304 -1! | |
| The Witcher 3 - 1920x1080 Ultra Graphics & Postprocessing (HBAO+) | |
| Lenovo ThinkBook 13x G4 21KR0008GE | |
| Dell XPS 13 9340 Core Ultra 7 | |
| Dell XPS 13 9345 | |
| HP EliteBook Ultra G1q 14 | |
| Asus ZenBook S13 OLED UX5304 | |
| GTA V - 1920x1080 Highest Settings possible AA:4xMSAA + FX AF:16x | |
| Microsoft Surface Laptop 7 13.8 Copilot+ | |
| Dell XPS 13 9345 | |
| Lenovo ThinkBook 13x G4 21KR0008GE | |
| Dell XPS 13 9340 Core Ultra 7 | |
| Asus ZenBook S13 OLED UX5304 | |
| Final Fantasy XV Benchmark - 1920x1080 High Quality | |
| Dell XPS 13 9340 Core Ultra 7 | |
| Lenovo ThinkBook 13x G4 21KR0008GE | |
| Microsoft Surface Laptop 7 13.8 Copilot+ | |
| Dell XPS 13 9345 | |
| Asus ZenBook S13 OLED UX5304 | |
| HP EliteBook Ultra G1q 14 | |
| Strange Brigade - 1920x1080 ultra AA:ultra AF:16 | |
| Lenovo ThinkBook 13x G4 21KR0008GE | |
| Dell XPS 13 9340 Core Ultra 7 | |
| Microsoft Surface Laptop 7 13.8 Copilot+ | |
| Dell XPS 13 9345 | |
| HP EliteBook Ultra G1q 14 | |
| Asus ZenBook S13 OLED UX5304 | |
| Dota 2 Reborn - 1920x1080 ultra (3/3) best looking | |
| Dell XPS 13 9340 Core Ultra 7 | |
| Lenovo ThinkBook 13x G4 21KR0008GE | |
| Microsoft Surface Laptop 7 13.8 Copilot+ | |
| Asus ZenBook S13 OLED UX5304 | |
| Dell XPS 13 9345 | |
| HP EliteBook Ultra G1q 14 | |
| Tiny Tina's Wonderlands - 1920x1080 Badass Preset (DX12) | |
| Dell XPS 13 9345 | |
| HP EliteBook Ultra G1q 14 | |
| F1 22 - 1920x1080 High Preset AA:T AF:16x | |
| Dell XPS 13 9345 | |
| Microsoft Surface Laptop 7 13.8 Copilot+ | |
| HP EliteBook Ultra G1q 14 | |
| Asus ZenBook S13 OLED UX5304 | |
| Tiny Tina's Wonderlands | |
| 1280x720 Lowest Preset (DX12) | |
| Dell XPS 13 9345 | |
| Moyenne Qualcomm SD X Adreno X1-85 3.8 TFLOPS (67.6 - 73.9, n=3) | |
| HP EliteBook Ultra G1q 14 | |
| Dell XPS 13 Plus 9320 Core i7-1360P | |
| 1920x1080 Low Preset (DX12) | |
| Dell XPS 13 9345 | |
| Moyenne Qualcomm SD X Adreno X1-85 3.8 TFLOPS (41.5 - 44.7, n=3) | |
| HP EliteBook Ultra G1q 14 | |
| Dell XPS 13 Plus 9320 Core i7-1360P | |
| 1920x1080 Medium Preset (DX12) | |
| Dell XPS 13 9345 | |
| Moyenne Qualcomm SD X Adreno X1-85 3.8 TFLOPS (30.8 - 33.7, n=3) | |
| HP EliteBook Ultra G1q 14 | |
| Dell XPS 13 Plus 9320 Core i7-1360P | |
| 1920x1080 High Preset (DX12) | |
| Dell XPS 13 9345 | |
| Moyenne Qualcomm SD X Adreno X1-85 3.8 TFLOPS (20.6 - 22.4, n=3) | |
| HP EliteBook Ultra G1q 14 | |
| Dell XPS 13 Plus 9320 Core i7-1360P | |
| 1920x1080 Badass Preset (DX12) | |
| Dell XPS 13 9345 | |
| Moyenne Qualcomm SD X Adreno X1-85 3.8 TFLOPS (16.8 - 18, n=3) | |
| HP EliteBook Ultra G1q 14 | |
| Dell XPS 13 Plus 9320 Core i7-1360P | |
Cyberpunk 2077 ultra FPS Chart
| Bas | Moyen | Élevé | Ultra | |
|---|---|---|---|---|
| GTA V (2015) | 96.3 | 94.2 | 49.5 | 21.2 |
| The Witcher 3 (2015) | 104 | 74.5 | 43.7 | 19.2 |
| Dota 2 Reborn (2015) | 80 | 60.7 | 57.4 | 50.7 |
| Final Fantasy XV Benchmark (2018) | 56.1 | 25 | 15.8 | |
| X-Plane 11.11 (2018) | 38 | |||
| Far Cry 5 (2018) | 42 | 33 | 31 | 28 |
| Strange Brigade (2018) | 123.9 | 50.8 | 41.8 | 33.9 |
| Tiny Tina's Wonderlands (2022) | 44.5 | 33.6 | 22.4 | 18 |
| F1 22 (2022) | 62.9 | 55.4 | 38.5 | |
| Cyberpunk 2077 2.2 Phantom Liberty (2023) | 24.1 | 19.5 | 16.9 | 14.7 |
Émissions
Bruit du système - Activité du ventilateur plus détendue
Le bruit du ventilateur est légèrement plus faible que celui du modèle Intel Core Ultra 7 dans le sens où les ventilateurs internes augmentent plus lentement en réponse à des charges accrues. Sinon, les ventilateurs des deux modèles atteindraient des vitesses maximales similaires lorsqu'ils sont soumis à des charges élevées pendant des périodes prolongées. Par exemple, le bruit du ventilateur atteint 32,8 dB(A) vers la fin de la première scène de référence de 90 secondes dans 3DMark 06, contre 37,4 dB(A) sur le modèle Intel dans des conditions similaires. En revanche, dans des jeux comme Cyberpunk 2077, les deux modèles s'installent dans la fourchette basse des 40 dB(A). Le système alimenté par Qualcomm n'est pas nécessairement plus silencieux lorsqu'il est soumis à des charges élevées, mais vous êtes également moins susceptible de remarquer l'activité du ventilateur lorsque vous naviguez sur le web ou que vous regardez des vidéos en streaming.
Degré de la nuisance sonore
| Au repos |
| 22.9 / 22.9 / 22.9 dB(A) |
| Fortement sollicité |
| 32.8 / 40.6 dB(A) |
 | ||
30 dB silencieux 40 dB(A) audible 50 dB(A) bruyant |
||
min: | ||
| Dell XPS 13 9345 Adreno X1-85 3.8 TFLOPS, SD X Elite X1E-80-100 | Dell XPS 13 9340 Core Ultra 7 Arc 8-Core, Ultra 7 155H, Micron 2550 512GB | Microsoft Surface Laptop 7 13.8 Copilot+ Adreno X1-85 3.8 TFLOPS, SD X Elite X1E-80-100, Samsung MZ9L4512HBLU-00BMV | Lenovo ThinkBook 13x G4 21KR0008GE Arc 7-Core, Ultra 5 125H, Samsung PM9C1a MZAL8512HDLU | HP EliteBook Ultra G1q 14 Adreno X1-85 3.8 TFLOPS, SD X Elite X1E-78-100, SK hynix PC801 HFS512GEJ9X101N BF | Asus ZenBook S13 OLED UX5304 Iris Xe G7 96EUs, i7-1355U, Samsung PM9A1 MZVL21T0HCLR | |
|---|---|---|---|---|---|---|
| Noise | -10% | 4% | -7% | 4% | -4% | |
| arrêt / environnement * | 22.9 | 25.1 -10% | 23.8 -4% | 24.5 -7% | 23.4 -2% | 23.3 -2% |
| Idle Minimum * | 22.9 | 25.1 -10% | 23.8 -4% | 24.5 -7% | 23.4 -2% | 23.3 -2% |
| Idle Average * | 22.9 | 25.1 -10% | 23.8 -4% | 24.5 -7% | 23.4 -2% | 23.3 -2% |
| Idle Maximum * | 22.9 | 25.1 -10% | 23.8 -4% | 27.1 -18% | 24.3 -6% | 23.3 -2% |
| Load Average * | 32.8 | 37.4 -14% | 26 21% | 33.3 -2% | 25 24% | 37.7 -15% |
| Cyberpunk 2077 ultra * | 40.6 | 31.5 22% | ||||
| Load Maximum * | 40.6 | 42.5 -5% | 40.3 1% | 40.7 -0% | 34.8 14% | 40.1 1% |
| Witcher 3 ultra * | 42.5 | 36.8 | 30.6 | 40.1 |
* ... Moindre est la valeur, meilleures sont les performances
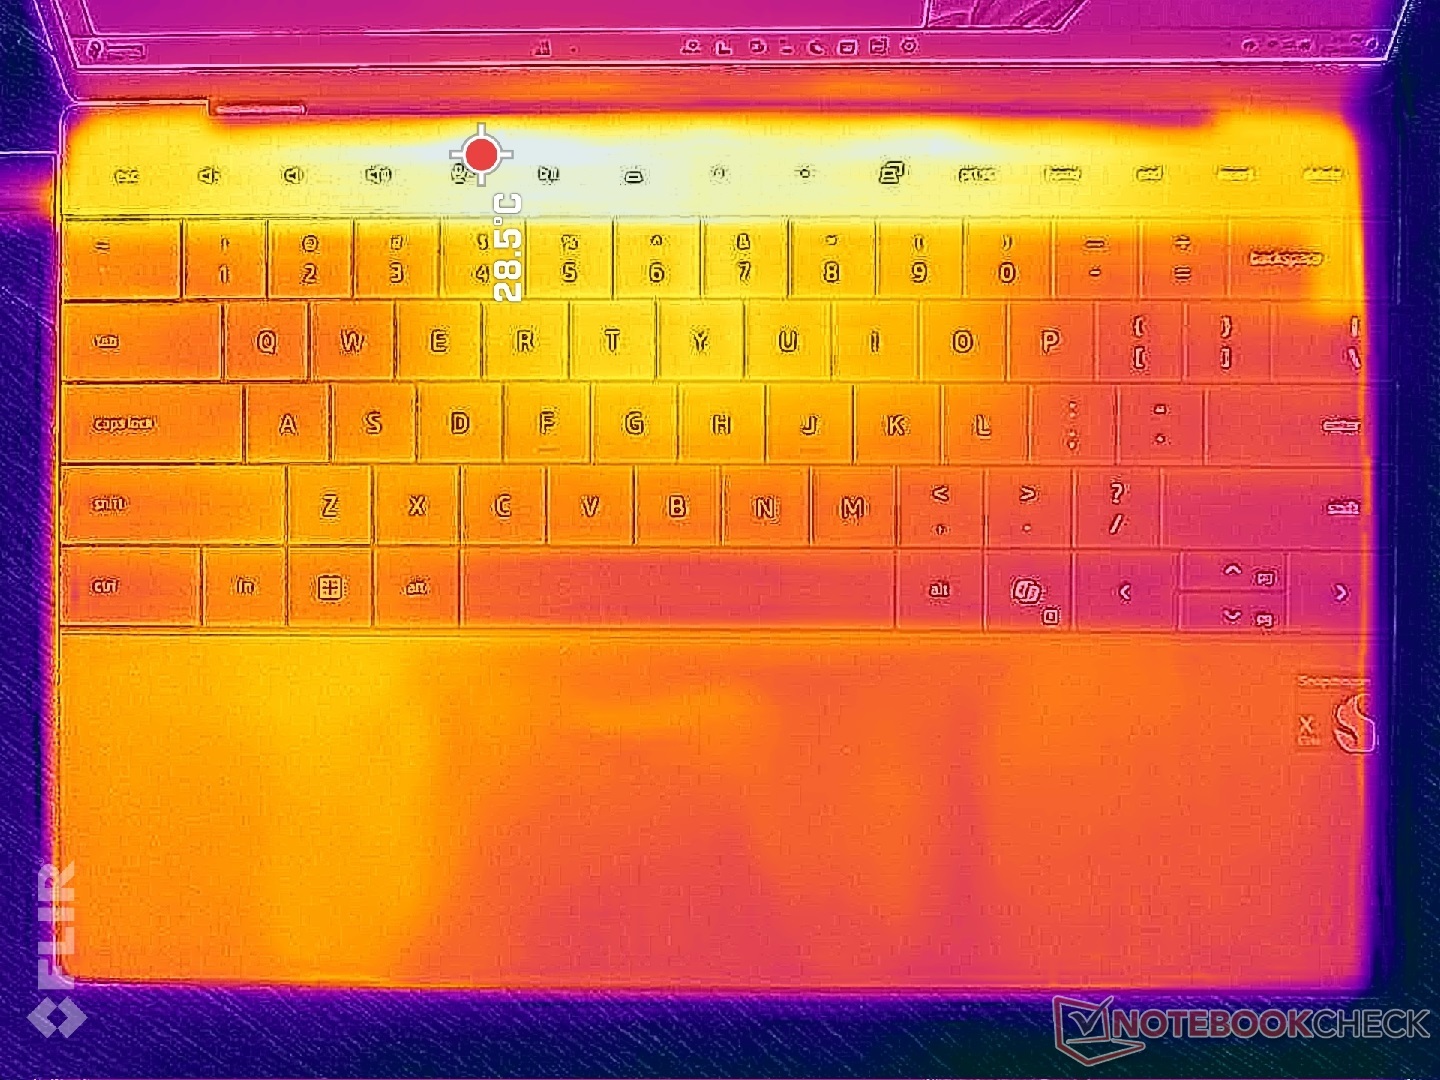
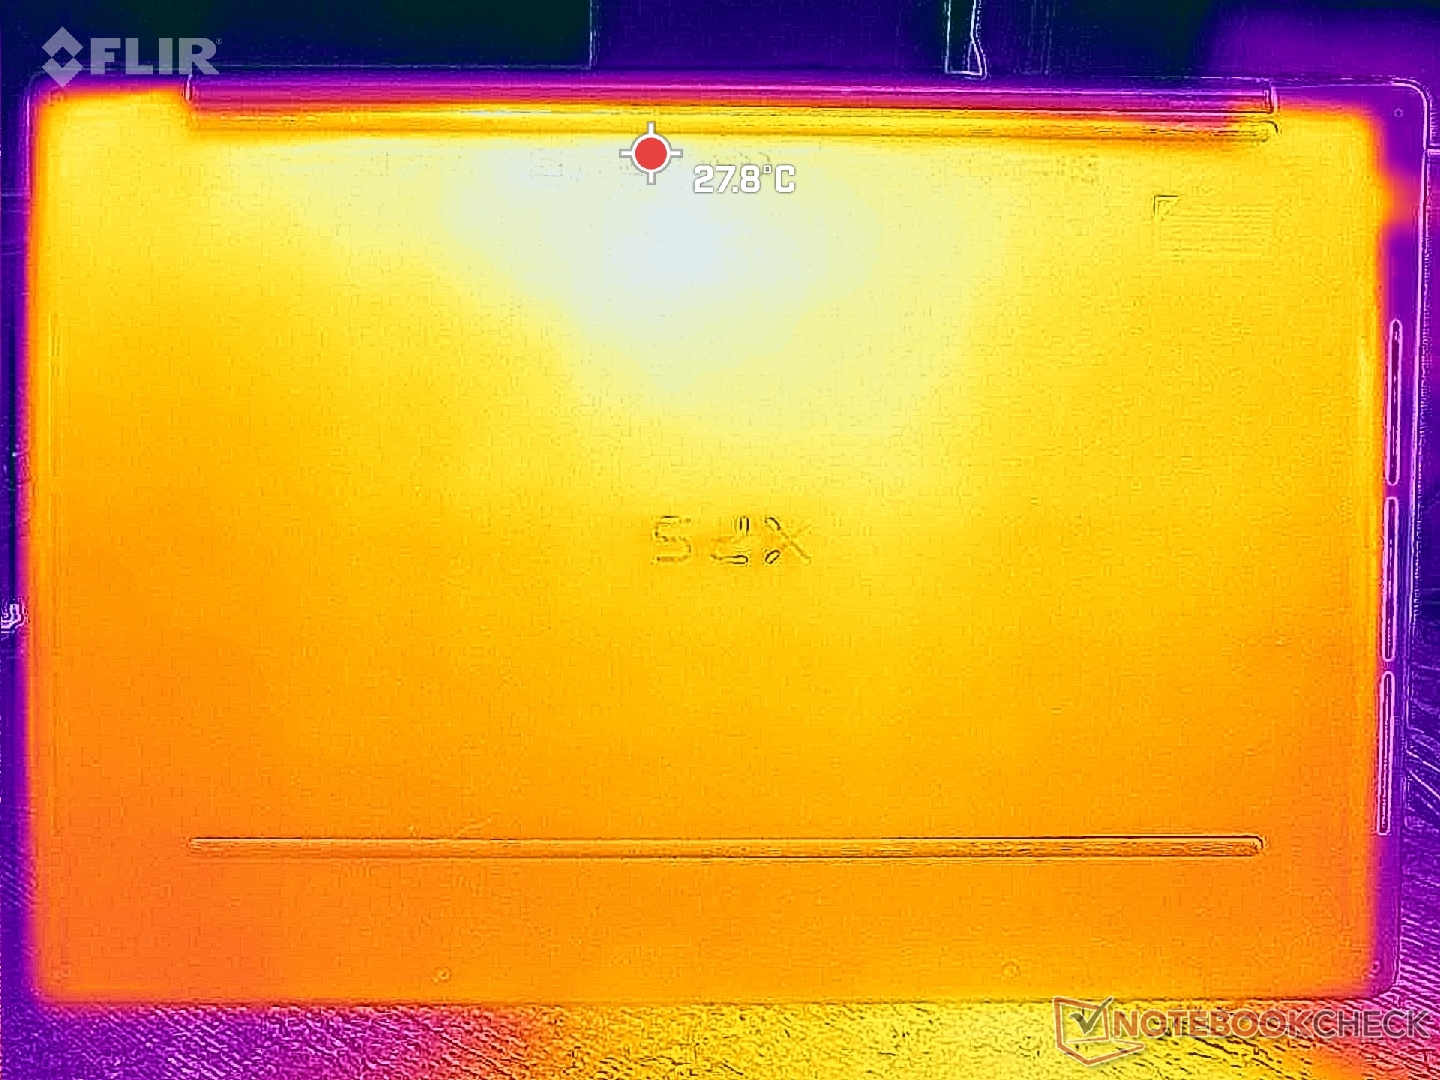
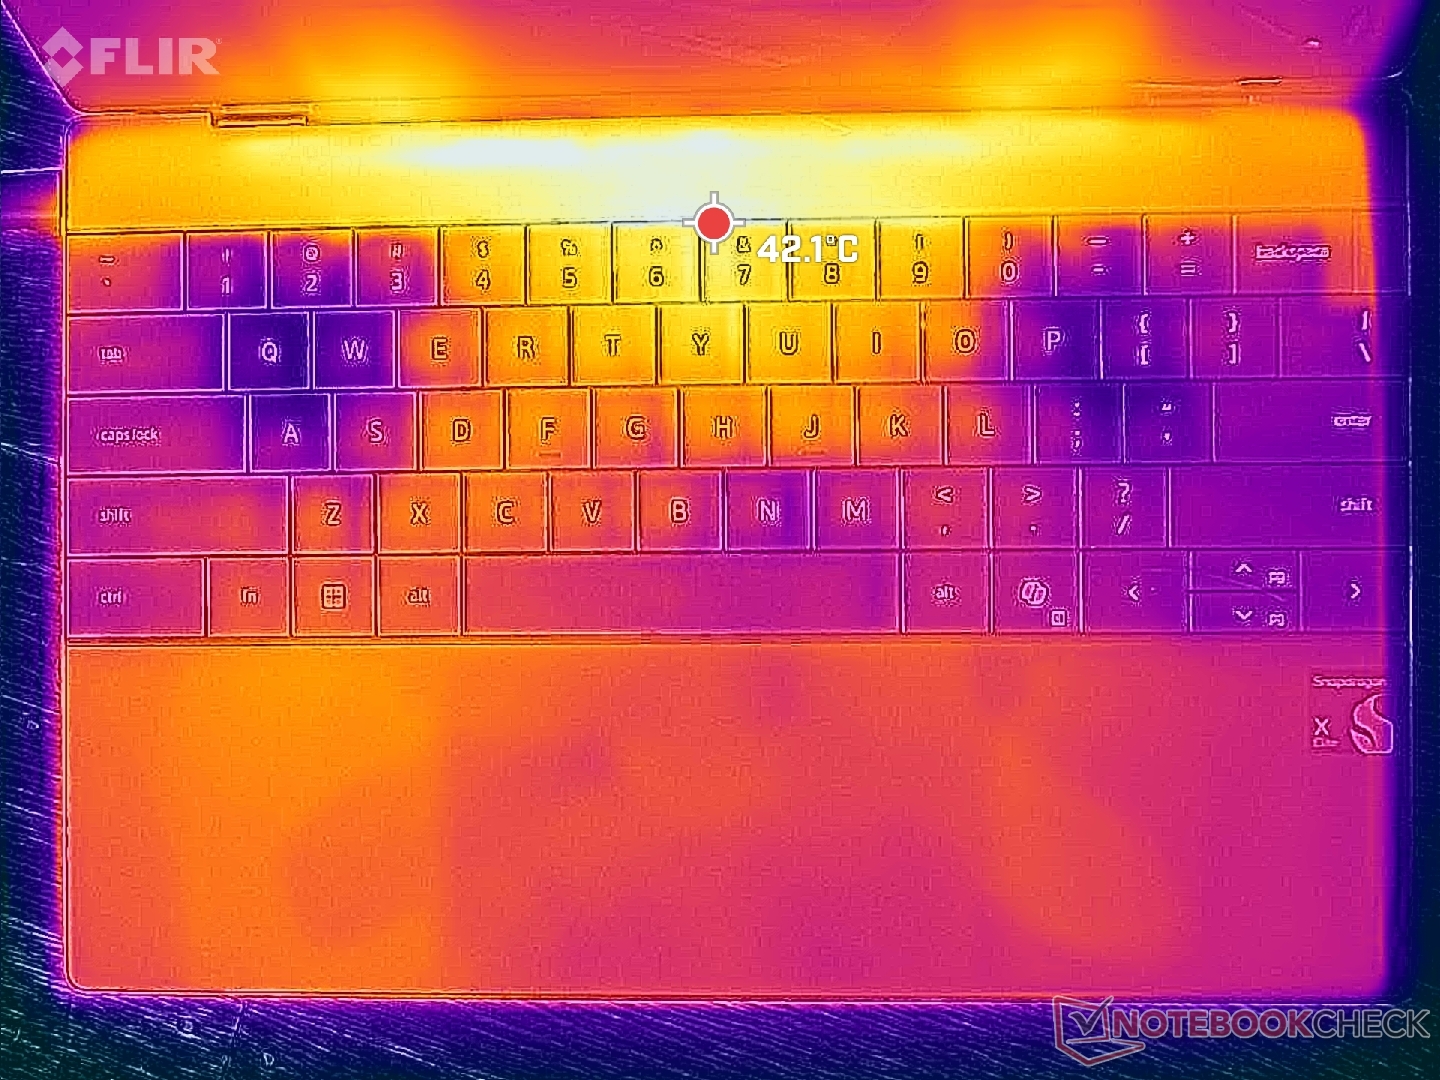
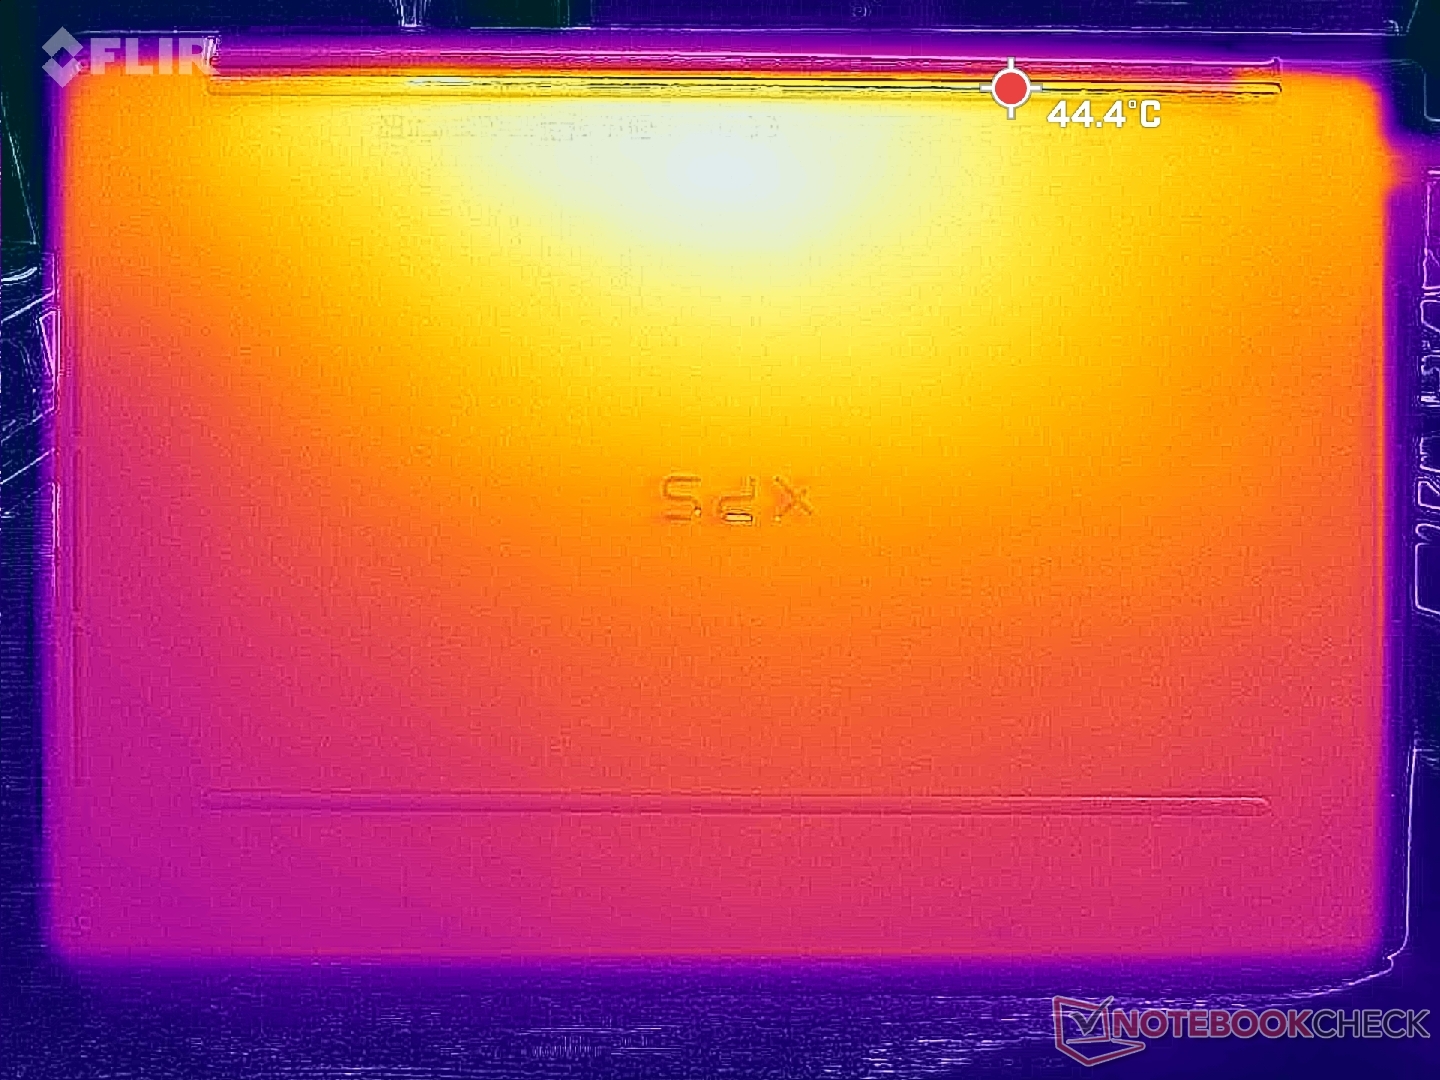
Température
Les températures de surface sont très proches de celles que nous avons enregistrées sur le XPS 13 9340 d'Intel, ce qui montre que le modèle Qualcomm ne fonctionne pas sensiblement plus chaud ou plus froid malgré le changement de processeur. Les points chauds au centre du système peuvent atteindre jusqu'à 45°C, ce qui est similaire au modèle Intel lorsque les deux modèles fonctionnent avec des charges exigeantes pendant des périodes prolongées. Les températures moyennes sont plus fraîches que celles que nous avons enregistrées sur le Microsoft Surface Laptop 7 13.8 mais plus chaudes que sur le HP EliteBook Ultra G1q 14 tous deux équipés de processeurs Snapdragon Elite similaires.
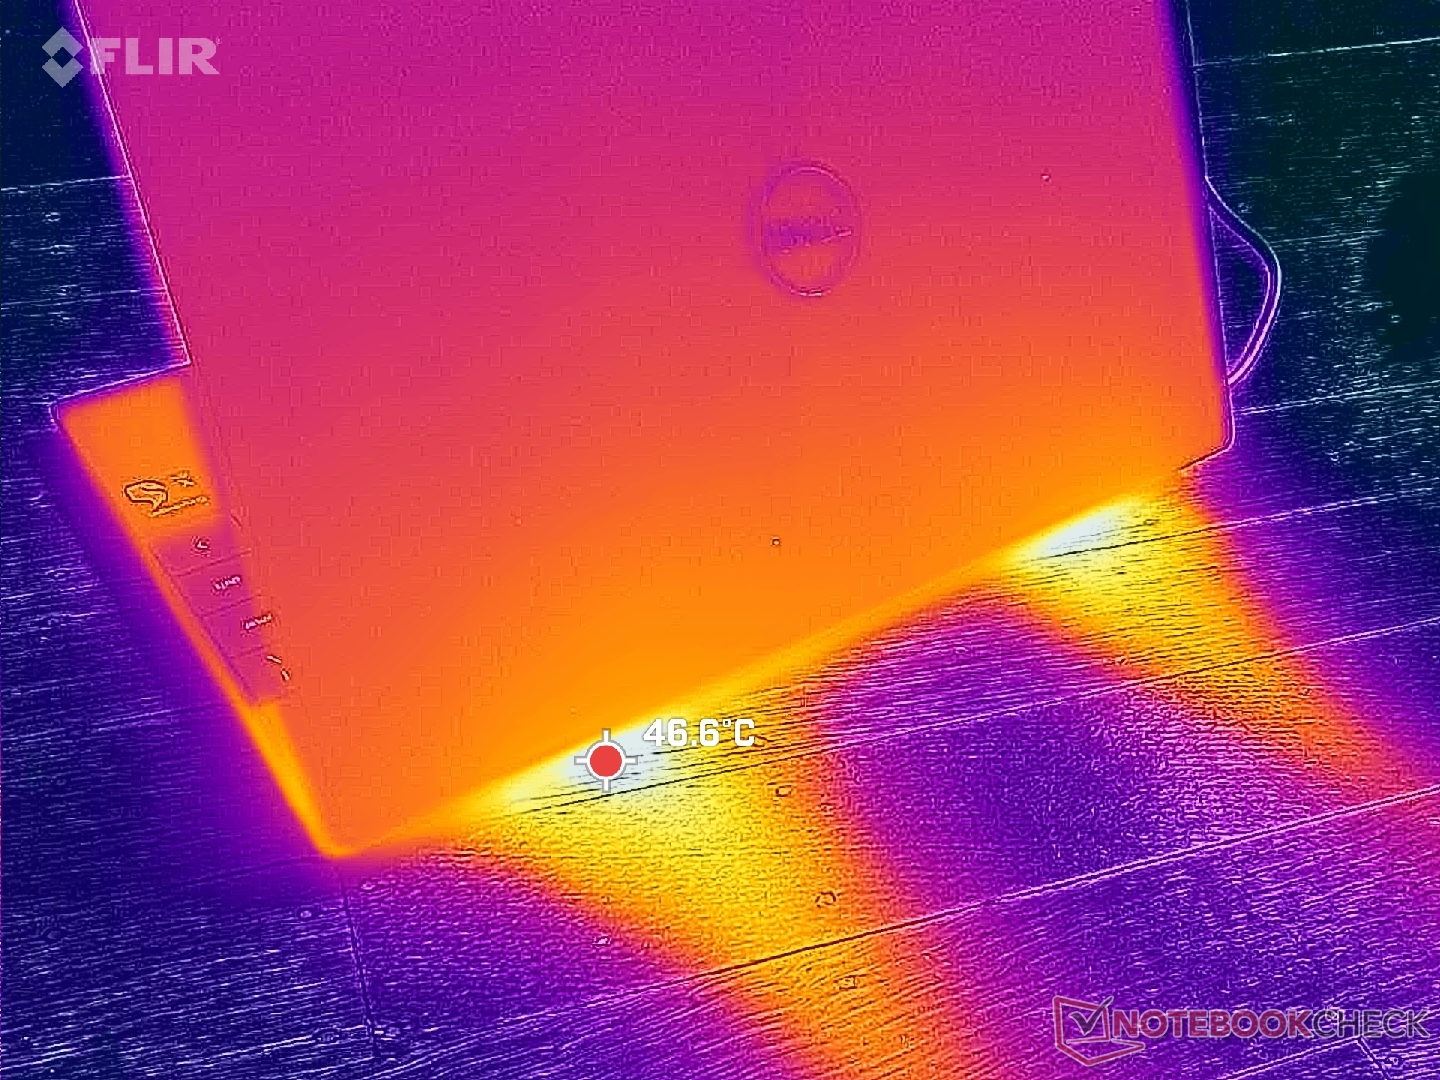
(-) La température maximale du côté supérieur est de 45.2 °C / 113 F, par rapport à la moyenne de 35.9 °C / 97 F, allant de 21.4 à 59 °C pour la classe Subnotebook.
(±) Le fond chauffe jusqu'à un maximum de 44.2 °C / 112 F, contre une moyenne de 39.3 °C / 103 F
(+) En utilisation inactive, la température moyenne du côté supérieur est de 29.1 °C / 84 F, par rapport à la moyenne du dispositif de 30.8 °C / 87 F.
(+) Les repose-poignets et le pavé tactile atteignent la température maximale de la peau (34.4 °C / 93.9 F) et ne sont donc pas chauds.
(-) La température moyenne de la zone de l'appui-paume de dispositifs similaires était de 28.2 °C / 82.8 F (-6.2 °C / #-11.1 F).
| Dell XPS 13 9345 Qualcomm Snapdragon X Elite X1E-80-100, Qualcomm SD X Adreno X1-85 3.8 TFLOPS | Dell XPS 13 9340 Core Ultra 7 Intel Core Ultra 7 155H, Intel Arc 8-Core iGPU | Microsoft Surface Laptop 7 13.8 Copilot+ Qualcomm Snapdragon X Elite X1E-80-100, Qualcomm SD X Adreno X1-85 3.8 TFLOPS | Lenovo ThinkBook 13x G4 21KR0008GE Intel Core Ultra 5 125H, Intel Arc 7-Core iGPU | HP EliteBook Ultra G1q 14 Qualcomm Snapdragon X Elite X1E-78-100, Qualcomm SD X Adreno X1-85 3.8 TFLOPS | Asus ZenBook S13 OLED UX5304 Intel Core i7-1355U, Intel Iris Xe Graphics G7 96EUs | |
|---|---|---|---|---|---|---|
| Heat | 12% | 9% | 9% | 4% | 6% | |
| Maximum Upper Side * | 45.2 | 41 9% | 47.1 -4% | 43.1 5% | 40.8 10% | 43.1 5% |
| Maximum Bottom * | 44.2 | 43.5 2% | 44.6 -1% | 39.2 11% | 40.4 9% | 45 -2% |
| Idle Upper Side * | 30.4 | 25.3 17% | 24.7 19% | 28.3 7% | 32.2 -6% | 27.3 10% |
| Idle Bottom * | 31.6 | 25.5 19% | 24.5 22% | 28 11% | 31.2 1% | 27.8 12% |
* ... Moindre est la valeur, meilleures sont les performances
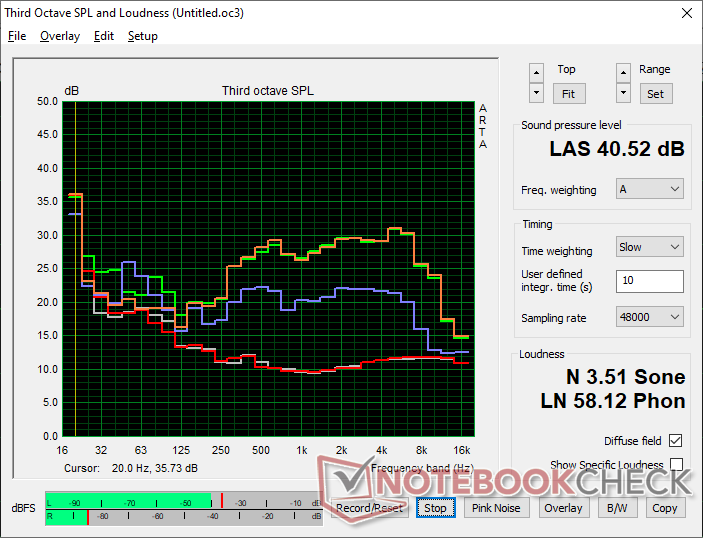
Intervenants
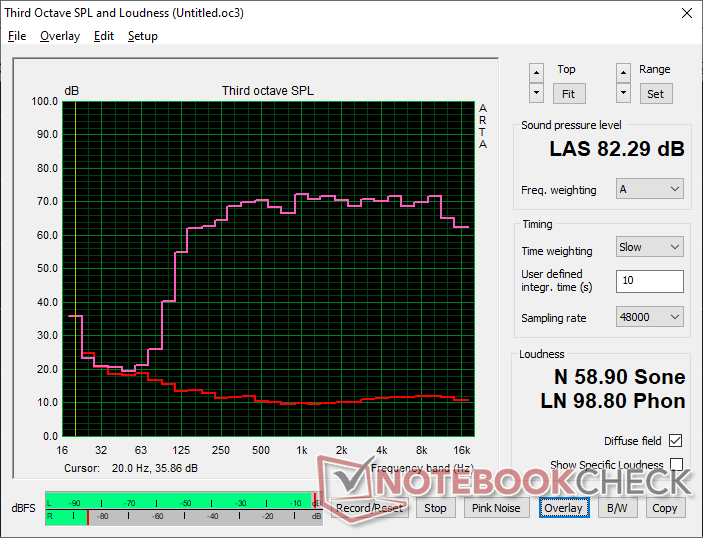
Dell XPS 13 9345 analyse audio
(+) | les haut-parleurs peuvent jouer relativement fort (82.3# dB)
Basses 100 - 315 Hz
(±) | basse réduite - en moyenne 9.9% inférieure à la médiane
(±) | la linéarité des basses est moyenne (12.4% delta à la fréquence précédente)
Médiums 400 - 2000 Hz
(+) | médiane équilibrée - seulement 1.9% de la médiane
(+) | les médiums sont linéaires (3.2% delta à la fréquence précédente)
Aiguës 2 - 16 kHz
(+) | des sommets équilibrés - à seulement 1.5% de la médiane
(+) | les aigus sont linéaires (3% delta à la fréquence précédente)
Globalement 100 - 16 000 Hz
(+) | le son global est linéaire (8.2% différence à la médiane)
Par rapport à la même classe
» 2% de tous les appareils testés de cette catégorie étaient meilleurs, 1% similaires, 97% pires
» Le meilleur avait un delta de 5%, la moyenne était de 19%, le pire était de 53%.
Par rapport à tous les appareils testés
» 1% de tous les appareils testés étaient meilleurs, 1% similaires, 98% pires
» Le meilleur avait un delta de 4%, la moyenne était de 24%, le pire était de 134%.
Apple MacBook Pro 16 2021 M1 Pro analyse audio
(+) | les haut-parleurs peuvent jouer relativement fort (84.7# dB)
Basses 100 - 315 Hz
(+) | bonne basse - seulement 3.8% loin de la médiane
(+) | les basses sont linéaires (5.2% delta à la fréquence précédente)
Médiums 400 - 2000 Hz
(+) | médiane équilibrée - seulement 1.3% de la médiane
(+) | les médiums sont linéaires (2.1% delta à la fréquence précédente)
Aiguës 2 - 16 kHz
(+) | des sommets équilibrés - à seulement 1.9% de la médiane
(+) | les aigus sont linéaires (2.7% delta à la fréquence précédente)
Globalement 100 - 16 000 Hz
(+) | le son global est linéaire (4.6% différence à la médiane)
Par rapport à la même classe
» 0% de tous les appareils testés de cette catégorie étaient meilleurs, 0% similaires, 100% pires
» Le meilleur avait un delta de 5%, la moyenne était de 18%, le pire était de 45%.
Par rapport à tous les appareils testés
» 0% de tous les appareils testés étaient meilleurs, 0% similaires, 100% pires
» Le meilleur avait un delta de 4%, la moyenne était de 24%, le pire était de 134%.
Gestion de l'énergie
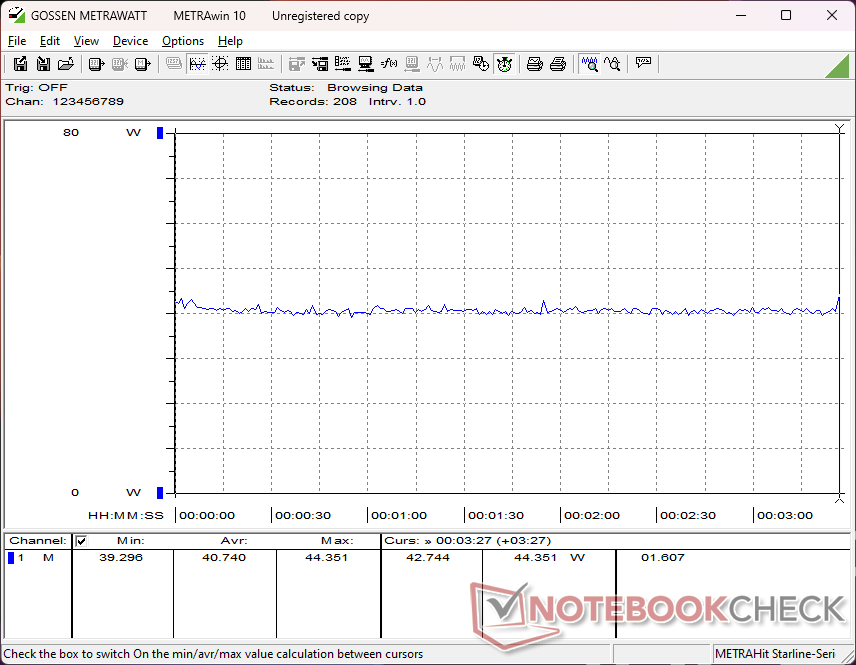
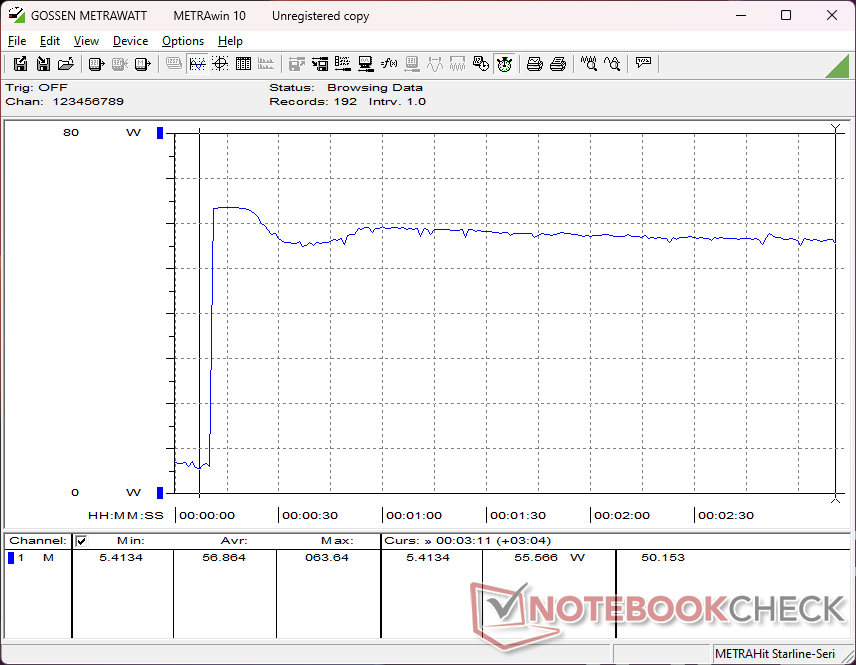
Consommation électrique
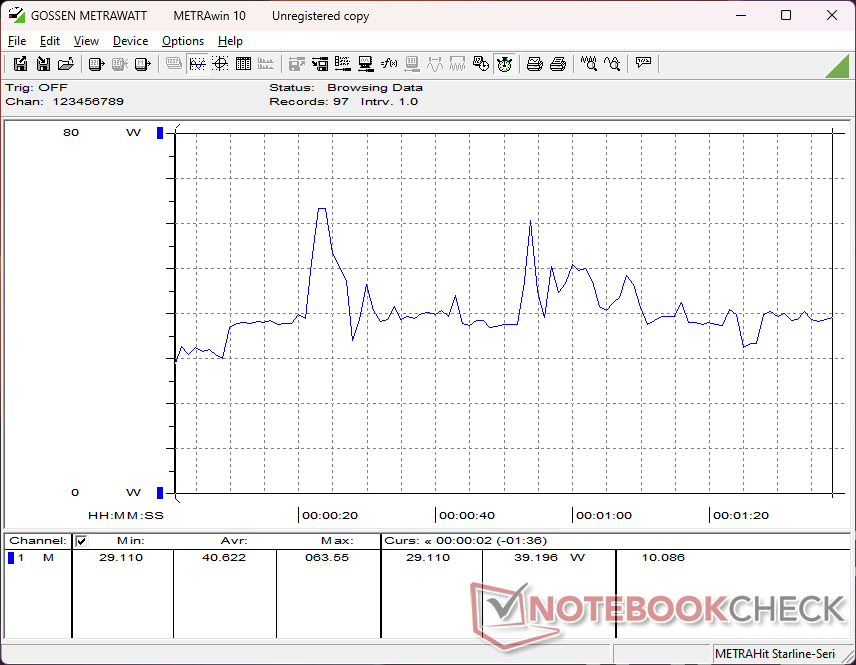
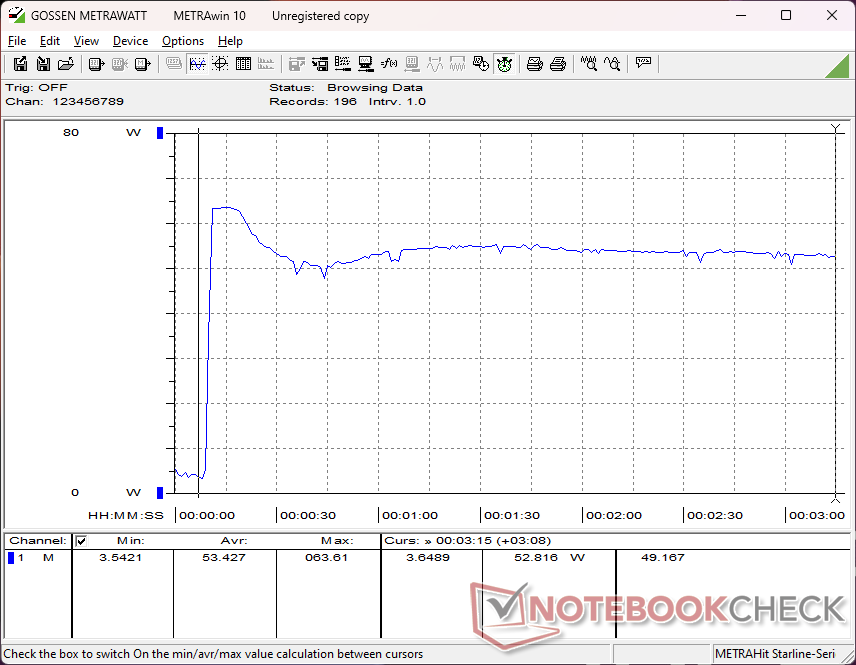
Les mesures de consommation d'énergie révèlent des résultats intéressants par rapport à la version Core Ultra 7 XPS 13. Lors de l'exécution de charges moyennes ou faibles, notre XPS 13 Snapdragon demande toujours moins d'énergie que la version Intel, ce qui ouvre la voie à une plus longue durée de vie de la batterie, comme l'illustre la section suivante. En revanche, lorsque les charges sont plus exigeantes, comme les jeux, la consommation moyenne est à peu près la même (40 W), même si le Core Ultra 7 offre généralement des performances graphiques plus élevées.
La consommation lors de l'exécution de Prime95 pour solliciter le CPU montre que le modèle Snapdragon demande plus d'énergie que le modèle Intel en moyenne, ce dernier s'étranglant plus fortement au fil du temps. En revanche, la consommation lors de l'exécution de FurMark pour solliciter le GPU n'est que de 18 W en moyenne, contre 34 W ou plus pour le modèle Intel. Cela suggère que Qualcomm consacre moins de surface ou de budget de silicium à son GPU intégré que la série Arc 8 concurrente, qui est à la fois plus puissante et plus exigeante en moyenne.
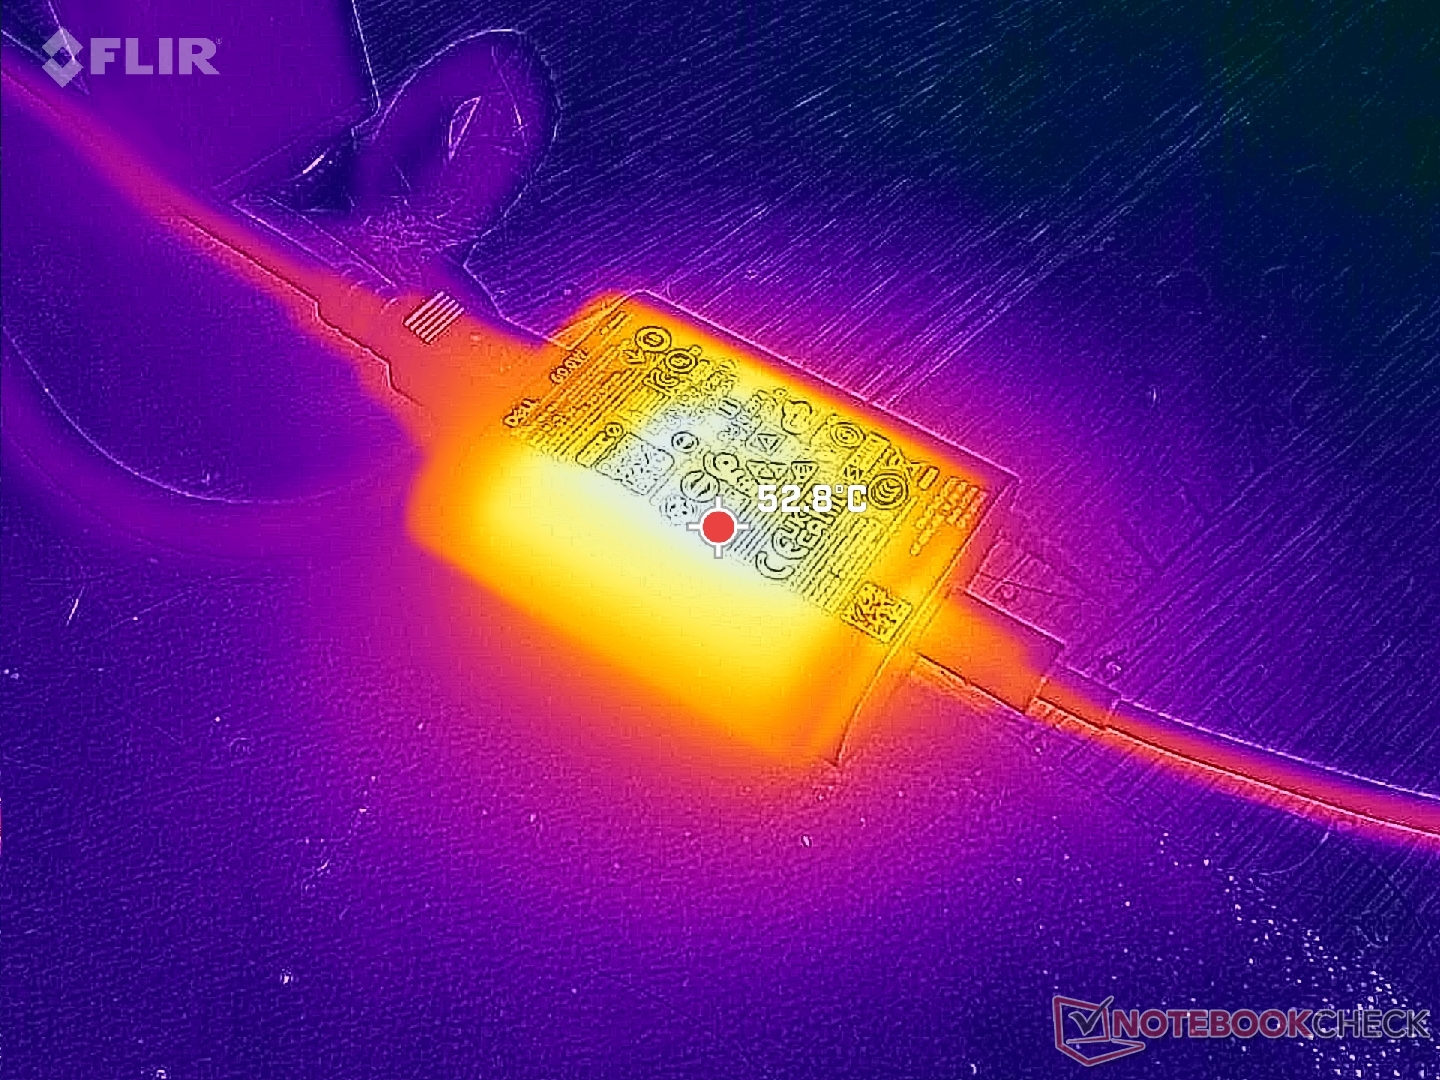
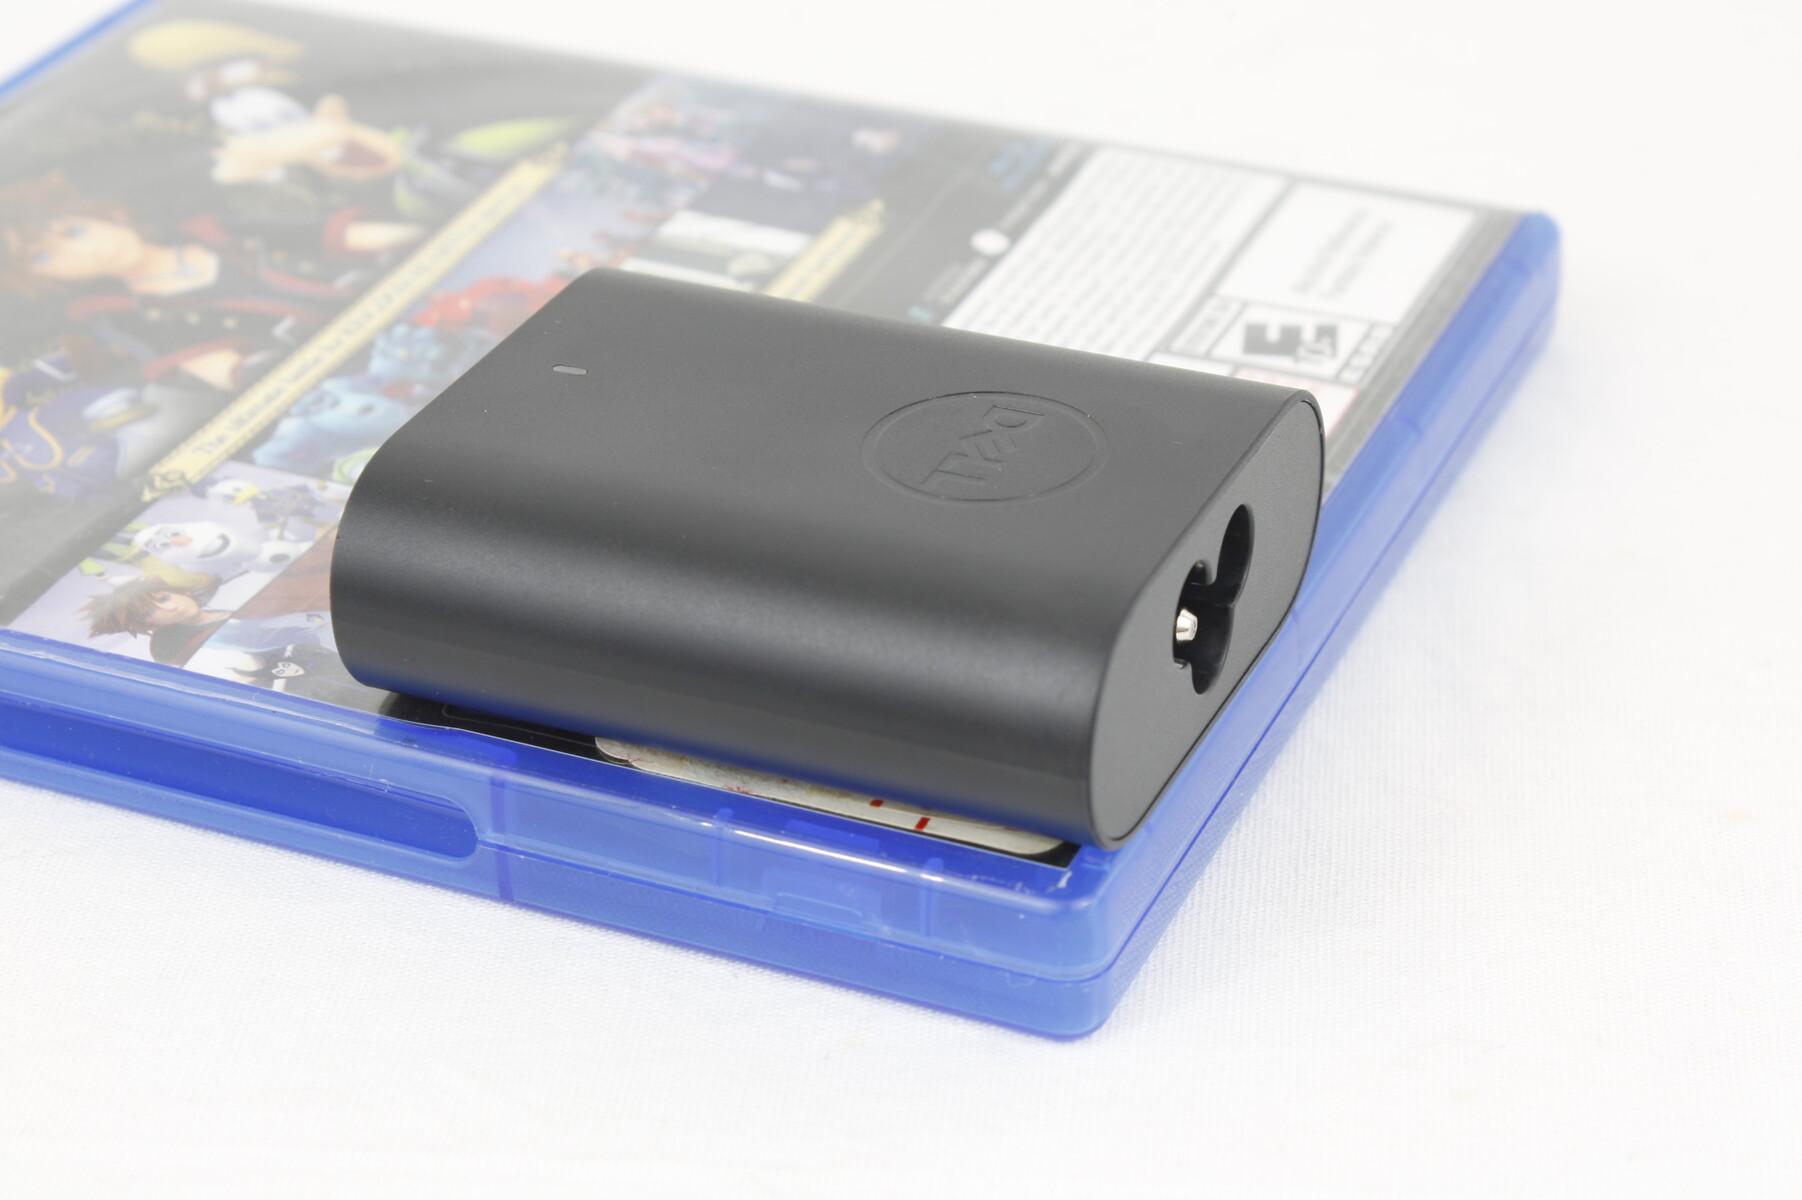
La consommation maximale peut atteindre 64 W à partir de l'adaptateur secteur USB-C 65 W extra-petit (~6,5 x 5,5 x 2,3 cm), tout comme sur le modèle Intel.
| Éteint/en veille | |
| Au repos | |
| Fortement sollicité |
|
Légende:
min: | |
| Dell XPS 13 9345 SD X Elite X1E-80-100, Adreno X1-85 3.8 TFLOPS, , IPS, 1920x1200, 13.4" | Dell XPS 13 9340 Core Ultra 7 Ultra 7 155H, Arc 8-Core, Micron 2550 512GB, IPS, 1920x1200, 13.4" | Microsoft Surface Laptop 7 13.8 Copilot+ SD X Elite X1E-80-100, Adreno X1-85 3.8 TFLOPS, Samsung MZ9L4512HBLU-00BMV, IPS, 2304x1536, 13.8" | Lenovo ThinkBook 13x G4 21KR0008GE Ultra 5 125H, Arc 7-Core, Samsung PM9C1a MZAL8512HDLU, IPS, 2880x1920, 13.5" | HP EliteBook Ultra G1q 14 SD X Elite X1E-78-100, Adreno X1-85 3.8 TFLOPS, SK hynix PC801 HFS512GEJ9X101N BF, IPS, 2240x1400, 14" | Asus ZenBook S13 OLED UX5304 i7-1355U, Iris Xe G7 96EUs, Samsung PM9A1 MZVL21T0HCLR, OLED, 2880x1800, 13.3" | |
|---|---|---|---|---|---|---|
| Power Consumption | -27% | 11% | -48% | 11% | -43% | |
| Idle Minimum * | 2.8 | 3.8 -36% | 1.4 50% | 5.4 -93% | 2.5 11% | 5.8 -107% |
| Idle Average * | 4.9 | 7 -43% | 6.3 -29% | 7.8 -59% | 5.7 -16% | 8.5 -73% |
| Idle Maximum * | 5.7 | 7.3 -28% | 7.6 -33% | 8.9 -56% | 5.8 -2% | 8.8 -54% |
| Load Average * | 40.6 | 52.6 -30% | 26.9 34% | 49.4 -22% | 24.2 40% | 35.1 14% |
| Cyberpunk 2077 ultra external monitor * | 39.4 | 26.8 32% | ||||
| Cyberpunk 2077 ultra * | 40.7 | 38.5 5% | 33.5 18% | |||
| Load Maximum * | 64 | 62.7 2% | 40.7 36% | 68.8 -8% | 66.4 -4% | 59.5 7% |
| Witcher 3 ultra * | 38.3 | 44.4 | 23.1 | 27.6 |
* ... Moindre est la valeur, meilleures sont les performances
Power Consumption Cyberpunk / Stress Test
Power Consumption external Monitor
Autonomie de la batterie
S'il y a un point sur lequel le système excelle sans équivoque, c'est bien l'autonomie de la batterie. Nous avons pu enregistrer une autonomie de près de 26,5 heures en navigation WLAN, soit deux fois plus que le XPS 13 9340 équipé du Core Ultra 7 155H et d'un écran IPS 1200p identique. Les durées d'utilisation sont garanties plus courtes si le XPS 13 9340 est équipé d'un écran OLED, mais elles sont tout de même incroyablement longues et parmi les plus longues de tous les subnotebooks de 13 pouces, y compris les MacBook Air.
Notre test a été effectué après avoir appliqué la dernière mise à jour du BIOS de Dell, spécialement conçue pour améliorer l'autonomie de la batterie sur le modèle Snapdragon. Nous vous recommandons d'installer la mise à jour ici.
Le chargement d'une batterie vide à une batterie pleine prend un peu plus de 90 minutes, ce qui est courant sur la plupart des ordinateurs portables.
| Dell XPS 13 9345 SD X Elite X1E-80-100, Adreno X1-85 3.8 TFLOPS, 55 Wh | Dell XPS 13 9340 Core Ultra 7 Ultra 7 155H, Arc 8-Core, 55 Wh | Microsoft Surface Laptop 7 13.8 Copilot+ SD X Elite X1E-80-100, Adreno X1-85 3.8 TFLOPS, 54 Wh | Lenovo ThinkBook 13x G4 21KR0008GE Ultra 5 125H, Arc 7-Core, 74 Wh | HP EliteBook Ultra G1q 14 SD X Elite X1E-78-100, Adreno X1-85 3.8 TFLOPS, 59 Wh | Asus ZenBook S13 OLED UX5304 i7-1355U, Iris Xe G7 96EUs, 63 Wh | |
|---|---|---|---|---|---|---|
| Autonomie de la batterie | 40% | -3% | 24% | 4% | 50% | |
| Reader / Idle | 2785 | 1222 -56% | ||||
| WiFi v1.3 | 1585 | 769 -51% | 852 -46% | 684 -57% | 792 -50% | 678 -57% |
| Load | 57 | 131 130% | 80 40% | 116 104% | 124 118% | 146 156% |
| H.264 | 1053 | 1181 | 1229 | 829 |
Points positifs
Points négatifs
Verdict - Une alternative respectable au XPS 13 d'Intel
Le XPS 13 Snapdragon à 1300 $ est légèrement moins cher que le XPS 13 à 1400 $ Core Ultra 7 XPS 13 à 1 400 $, tout en offrant une autonomie nettement supérieure, l'intégration de Co-Pilot+ et des caractéristiques matérielles identiques. L'expérience utilisateur réelle dépend toutefois fortement de la charge de travail et de l'application. Si vous l'utilisez principalement pour la navigation, le traitement de texte, la vidéo et le streaming, le Snapdragon XPS 13 a tendance à être plus efficace, surtout lorsque les programmes peuvent fonctionner en mode natif sur ARM. En revanche, les tâches plus exigeantes telles que l'édition graphique, l'encodage vidéo, la connexion Thunderbolt ou les applications spécifiques qui doivent être émulées sur ARM conviendront mieux au XPS 13 traditionnel d'Intel. À cette fin, le modèle Intel offre un niveau de performance plus prévisible dans tous les scénarios d'utilisation, ce qui l'emporte sans doute sur les quelques cas de figure où le modèle Snapdragon peut prendre l'avantage.
Le XPS 13 Snapdragon est une excellente alternative au XPS 13 Intel, dollar pour dollar. L'expérience utilisateur, cependant, variera considérablement en fonction des types d'applications et de tâches pour lesquelles vous avez l'intention d'utiliser le système.
Les avantages en termes d'autonomie et de compatibilité Co-Pilot+ ne suffiront peut-être pas à convaincre les acheteurs, alors que l'autonomie du XPS 13 d'Intel est déjà très bonne et que Co-Pilot+ devrait être intégré aux futurs processeurs Intel et AMD. Toutefois, les utilisateurs qui souhaitent maximiser l'autonomie et bénéficier des dernières fonctionnalités de l'IA de Microsoft dès aujourd'hui trouveront peut-être dans le XPS 13 à processeur Snapdragon l'option la plus productive.
Prix et disponibilité
Dell livre maintenant le XPS 13 9345 tel que configuré au prix de 1300$ et jusqu'à 1800$ et plus s'il est configuré avec la dalle OLED.
Conseils : Notre système d'évaluation a été mis à jour récemment et les résultats de la version 8 ne sont pas comparables à ceux de la version 7. Vous trouverez d'autres informations à ce sujet ici sont disponibles ici.
Note : Nous avons récemment mis à jour notre système d'évaluation et les résultats de la version 8 ne sont pas comparables à ceux de la version 7. De plus amples informations sont disponibles ici .
Dell XPS 13 9345
- 08/04/2024 v8
Allen Ngo
 Total Sustainability Score:
 Transparency
La sélection des appareils à examiner est effectuée par notre équipe éditoriale. L'échantillon de test a été prêté à l'auteur par le fabricant ou le détaillant pour les besoins de cet examen. Le prêteur n'a pas eu d'influence sur cette évaluation et le fabricant n'a pas reçu de copie de cette évaluation avant sa publication. Il n'y avait aucune obligation de publier cet article. Nous n'acceptons jamais de compensation ou de paiement en échange de nos commentaires. En tant que média indépendant, Notebookcheck n'est pas soumis à l'autorité des fabricants, des détaillants ou des éditeurs.
Voici comment Notebookcheck teste
Chaque année, Notebookcheck examine de manière indépendante des centaines d'ordinateurs portables et de smartphones en utilisant des procédures standardisées afin de garantir que tous les résultats sont comparables. Nous avons continuellement développé nos méthodes de test depuis environ 20 ans et avons établi des normes industrielles dans le processus. Dans nos laboratoires de test, des équipements de mesure de haute qualité sont utilisés par des techniciens et des rédacteurs expérimentés. Ces tests impliquent un processus de validation en plusieurs étapes. Notre système d'évaluation complexe repose sur des centaines de mesures et de points de référence bien fondés, ce qui garantit l'objectivité.Price comparison

