

Test de l'Alienware x16 R2 : un pas de côté par rapport au x16 R1

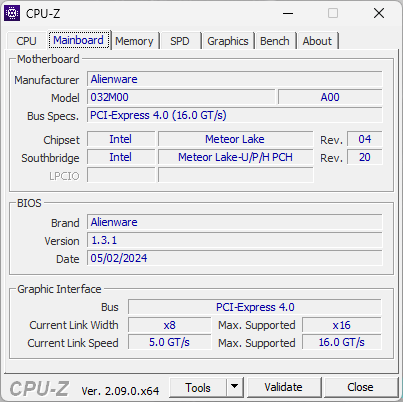
La série Alienware x16 ultra-mince a été lancée à la fin de l'année dernière avec le lancement de l'Alienware x16 R1. Pour 2024, la série a été rafraîchie avec le x16 R2. Le nouveau modèle remplace les anciennes options de processeurs Raptor Lake-H par des options Meteor Lake-H prêtes pour l'IA, tandis que tout le reste reste essentiellement le même que le design original du x16 R1. Nous vous recommandons donc de consulter notre article sur le x16 R1 car la plupart de nos commentaires s'appliquent également au x16 R2, visuellement identique. Toute différence notable sera notée dans cet article.
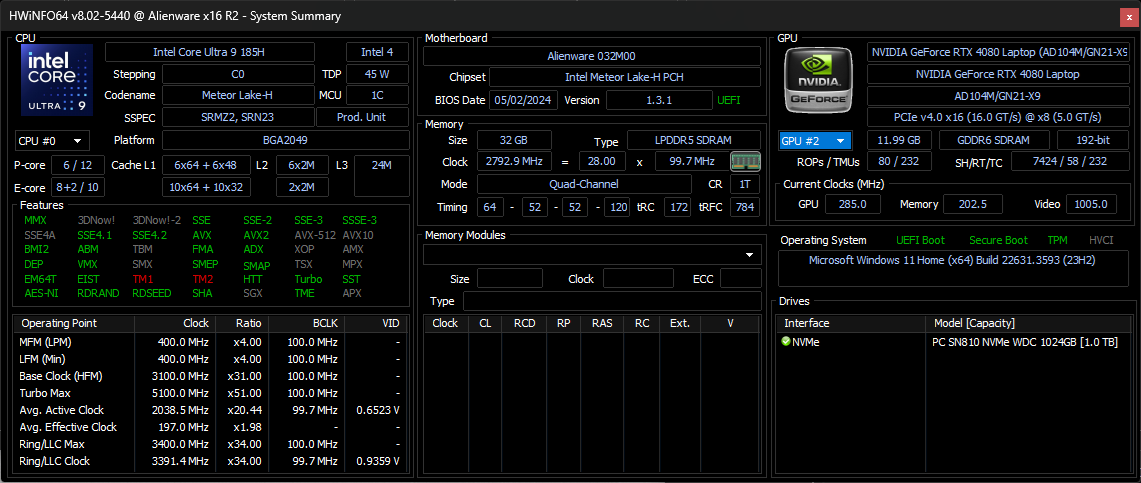
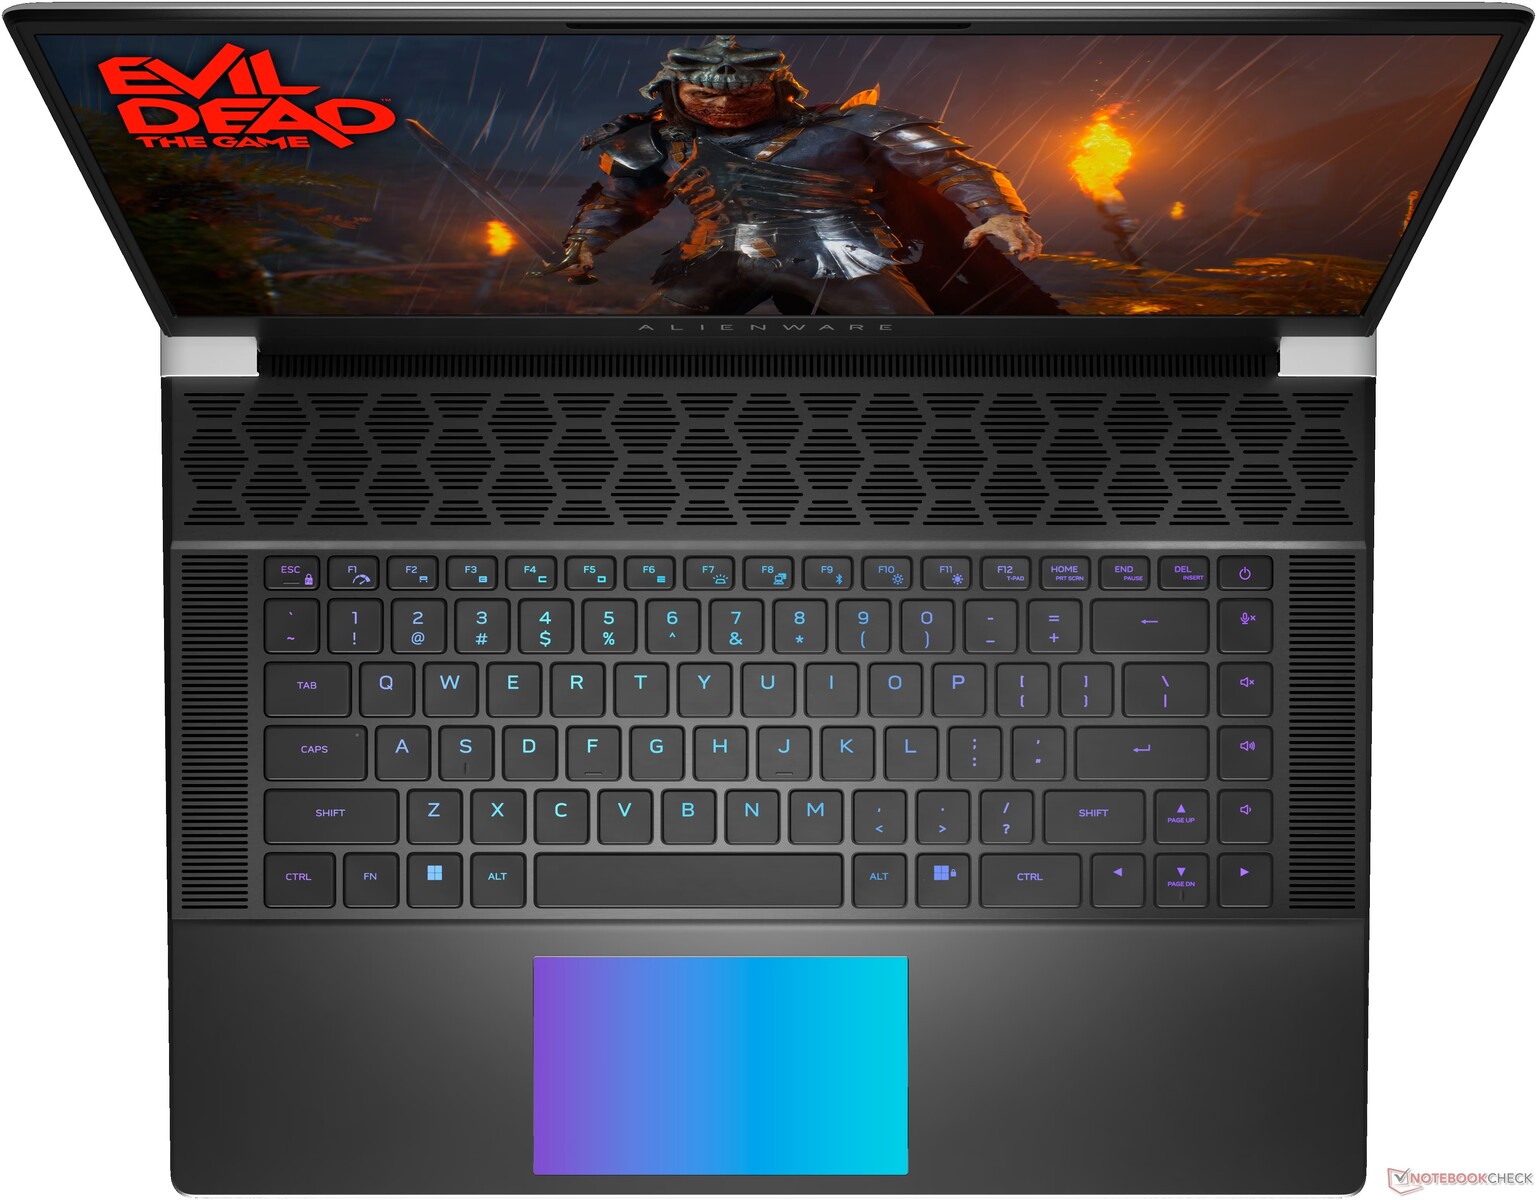
Notre modèle est une configuration haut de gamme avec un processeur Core Ultra 9 185H, un GPU RTX 4080 de 175 W GeForce, un écran 1600p 240 Hz et des touches mécaniques CherryMX à profil ultra bas pour un prix d'environ 3200 USD. Les autres modèles comprennent des touches à membrane classiques et le Core Ultra 7 155H avec GeForce RTX 4060, 4070 ou 4090 et un écran IPS 1200p 480 Hz.
Les alternatives à l'Alienware x16 R2 comprennent d'autres ordinateurs portables de jeu haut de gamme de 16 pouces comme le Razer Blade 16,Asus ROG Strix Scar 16,Lenovo Legion Pro 7 16ou MSI Vector 16 HX.
Plus d'avis Dell :
Comparaison avec les concurrents potentiels
Note | Date | Modèle | Poids | Épaisseur | Taille | Résolution | Prix |
|---|---|---|---|---|---|---|---|
| 88.4 % v7 (old) | 05/24 | Alienware x16 R2 P120F Ultra 9 185H, NVIDIA GeForce RTX 4080 Laptop GPU | 2.7 kg | 18.57 mm | 16.00" | 2560x1600 | |
| 88.4 % v7 (old) | 06/23 | Alienware x16 R1 i9-13900HK, NVIDIA GeForce RTX 4080 Laptop GPU | 2.6 kg | 18.57 mm | 16.00" | 2560x1600 | |
| 90.2 % v7 (old) | 03/24 | Alienware m16 R2 Ultra 7 155H, NVIDIA GeForce RTX 4070 Laptop GPU | 2.5 kg | 23.5 mm | 16.00" | 2560x1600 | |
| 87.6 % v7 (old) | 04/24 | Asus ROG Strix Scar 16 G634JZR i9-14900HX, NVIDIA GeForce RTX 4080 Laptop GPU | 2.7 kg | 30.4 mm | 16.00" | 2560x1600 | |
| 89.5 % v7 (old) | 03/24 | Lenovo Legion Pro 7 16IRX9H i9-14900HX, NVIDIA GeForce RTX 4080 Laptop GPU | 2.7 kg | 21.95 mm | 16.00" | 2560x1600 | |
| 88 % v7 (old) | 02/24 | MSI Vector 16 HX A14V i9-14900HX, NVIDIA GeForce RTX 4080 Laptop GPU | 2.7 kg | 28.55 mm | 16.00" | 2560x1600 |
Cas - Pas de changement externe

Connectivité


Lecteur de carte SD
Il est intéressant de noter que le lecteur MicroSD de notre x16 R2 ne présente aucun des problèmes de taux de transfert que nous avons rencontrés sur le x16 R1 de l'année dernière.
| SD Card Reader | |
| average JPG Copy Test (av. of 3 runs) | |
| Alienware x16 R2 P120F (AV PRO microSD 128 GB V60) | |
| MSI Vector 16 HX A14V (Toshiba Exceria Pro SDXC 64 GB UHS-II) | |
| Alienware m16 R2 (AV PRO microSD 128 GB V60) | |
| Alienware x16 R1 (AV PRO microSD 128 GB V60) | |
| maximum AS SSD Seq Read Test (1GB) | |
| Alienware x16 R2 P120F (AV PRO microSD 128 GB V60) | |
| Alienware x16 R1 (AV PRO microSD 128 GB V60) | |
| Alienware m16 R2 (AV PRO microSD 128 GB V60) | |
| MSI Vector 16 HX A14V (Toshiba Exceria Pro SDXC 64 GB UHS-II) | |
Communication
Dell a mis à jour le module WLAN pour la mise à jour de cette année afin de prendre en charge le Wi-Fi 7.
Webcam


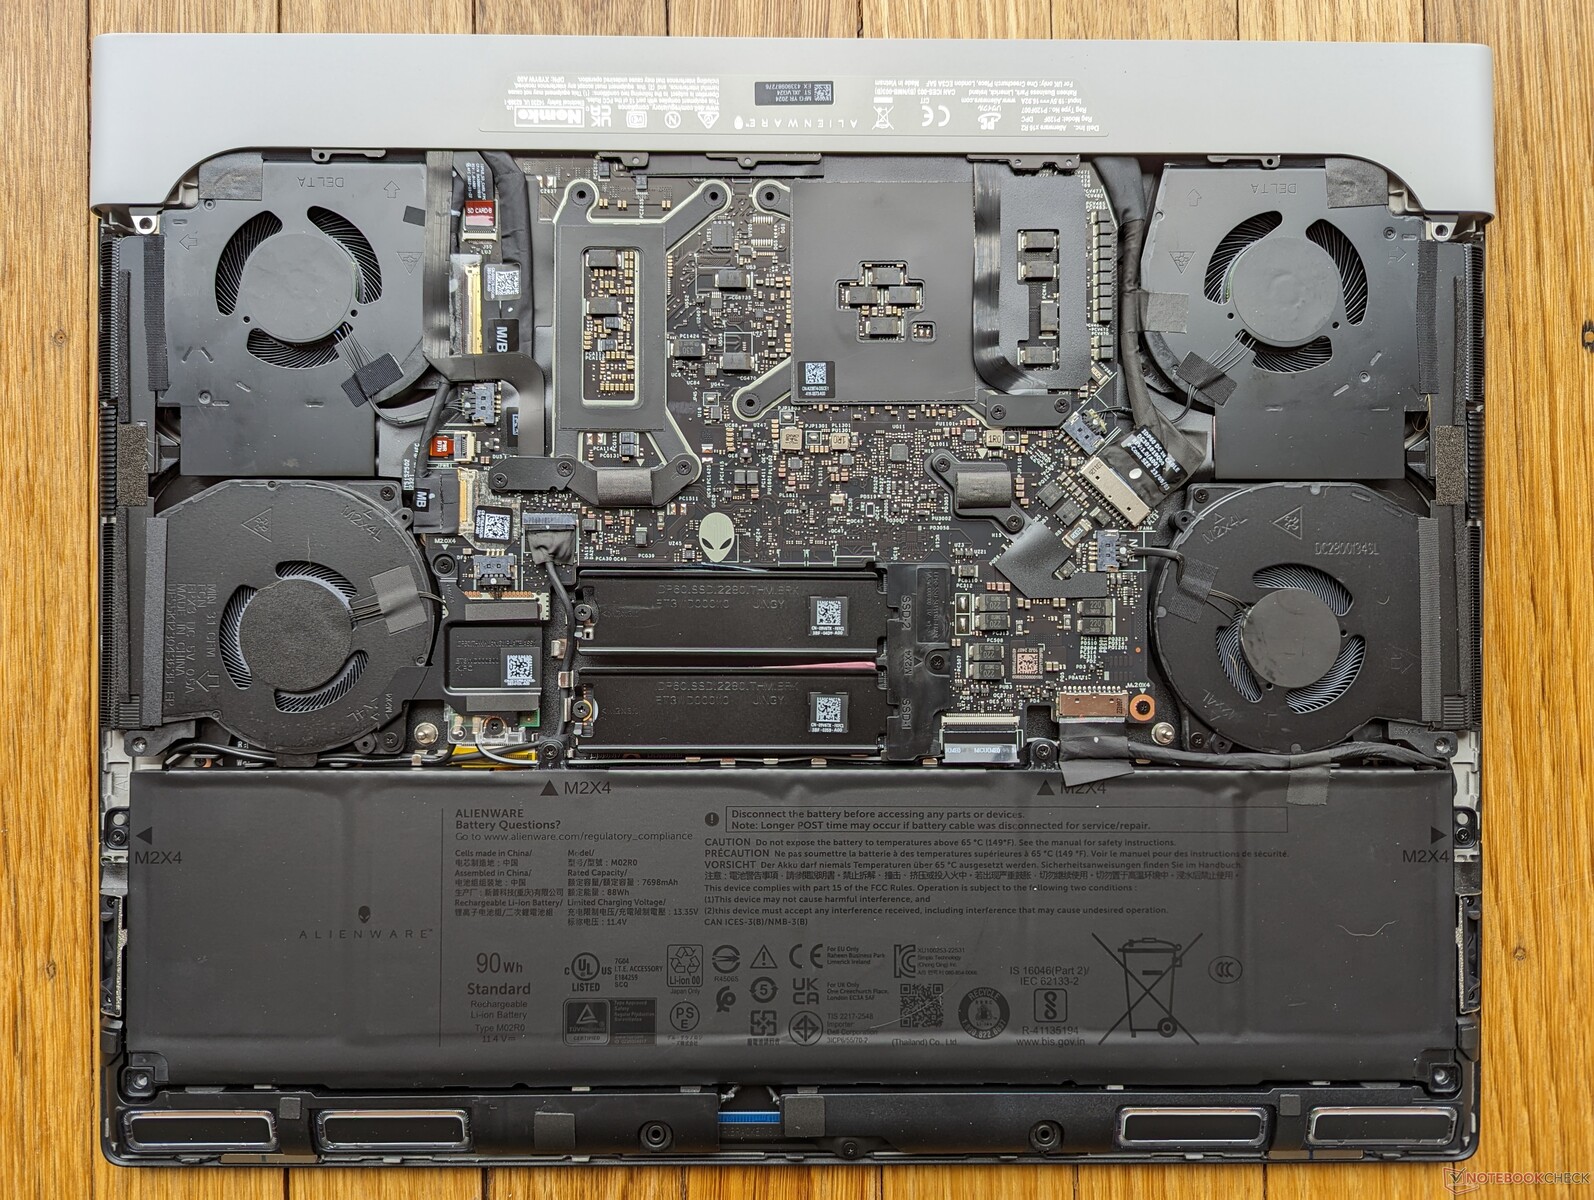
Maintenance

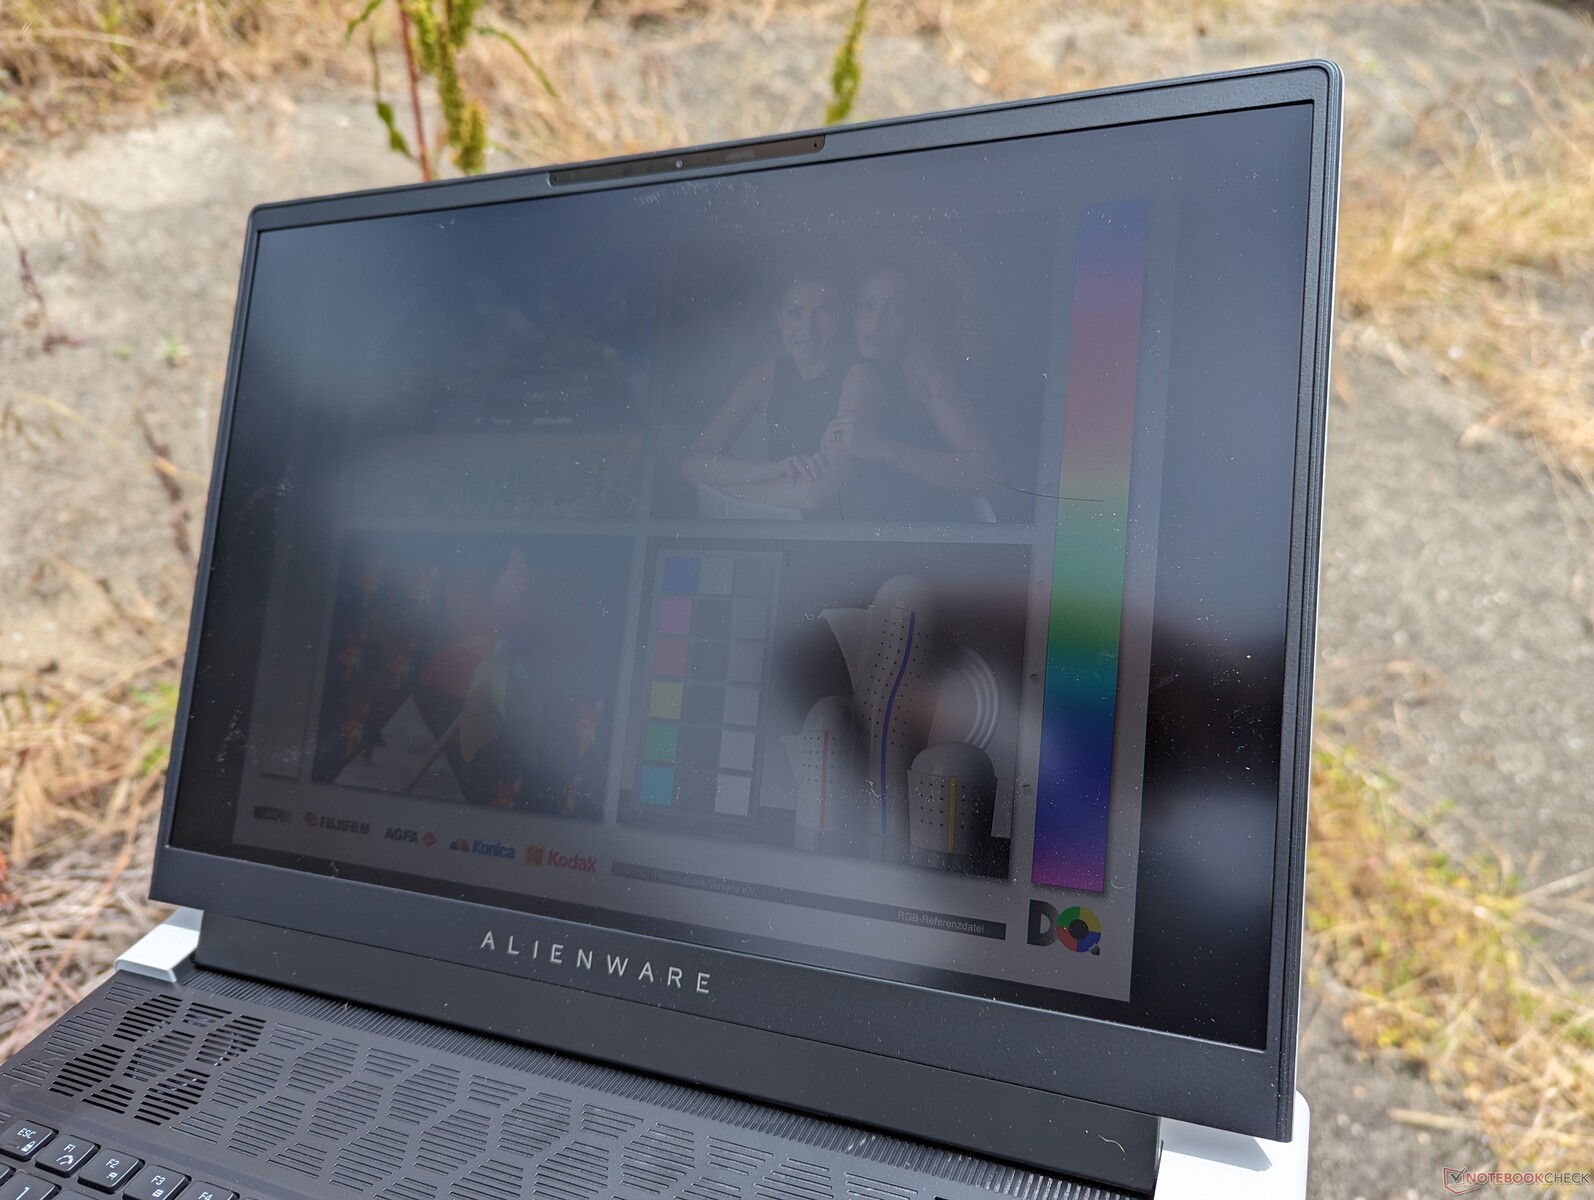
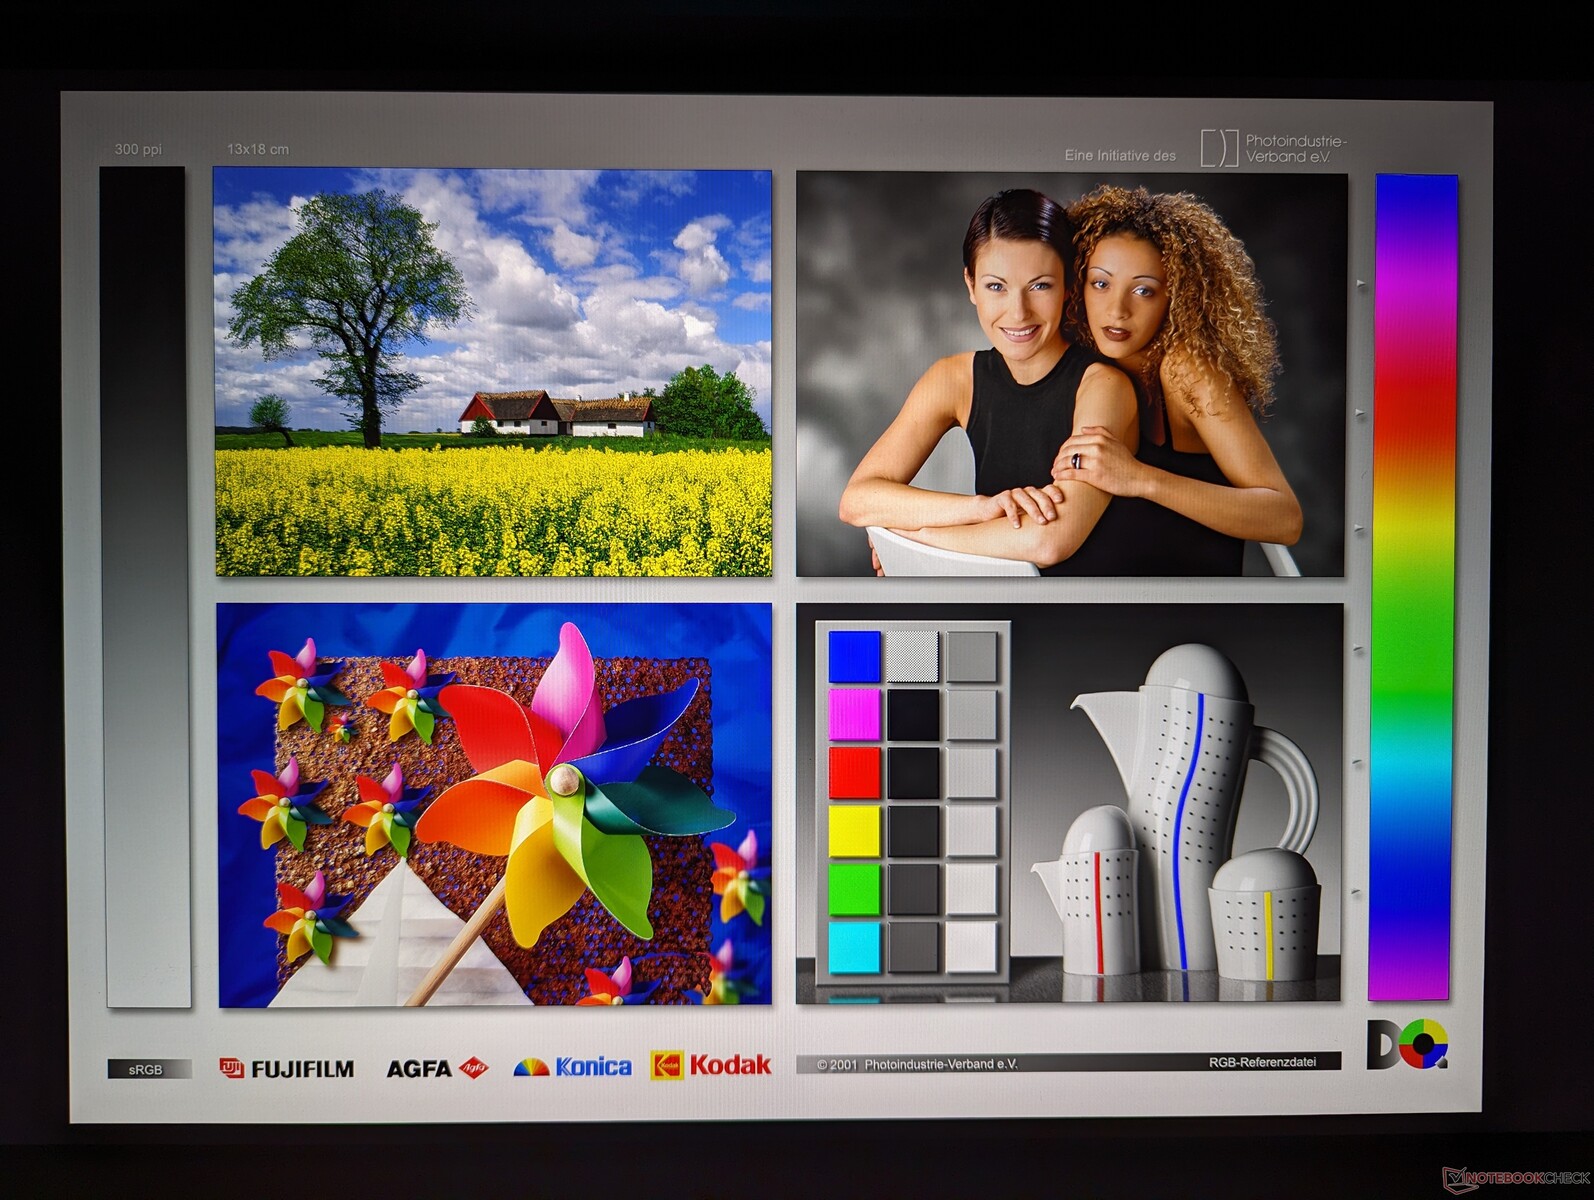
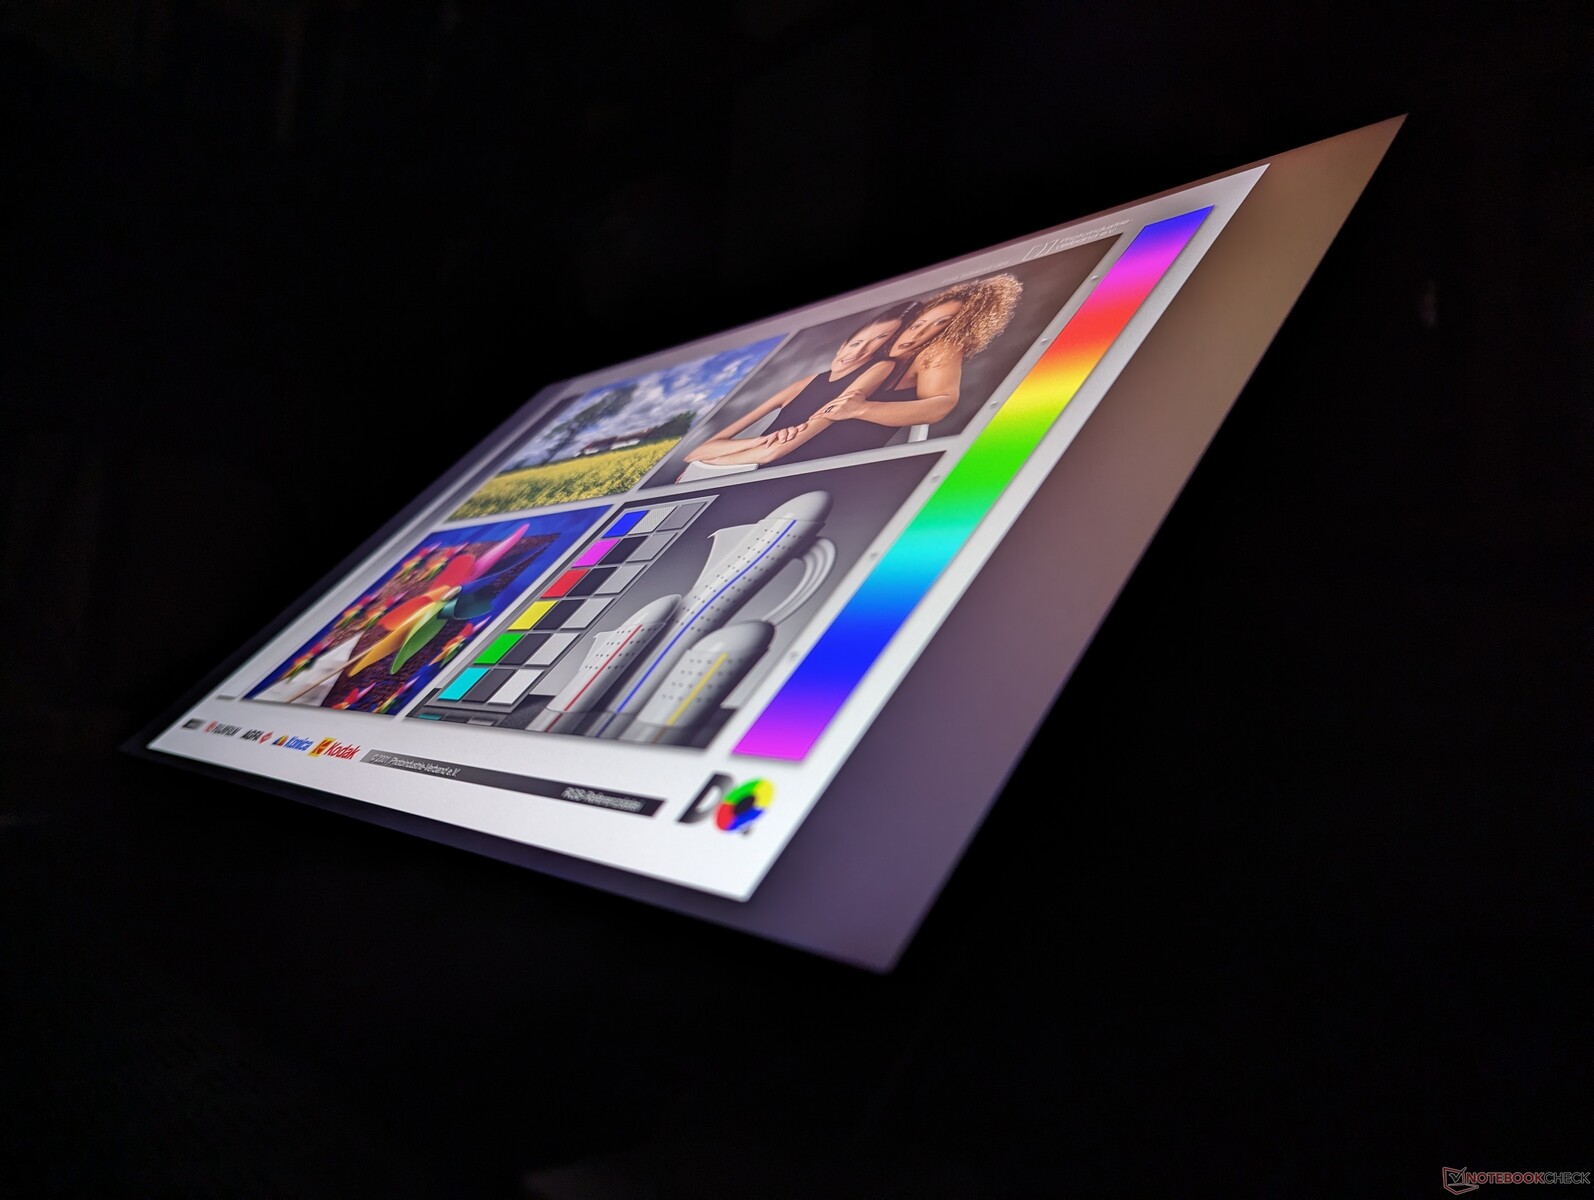
Affichage - Plus d'option 165 Hz
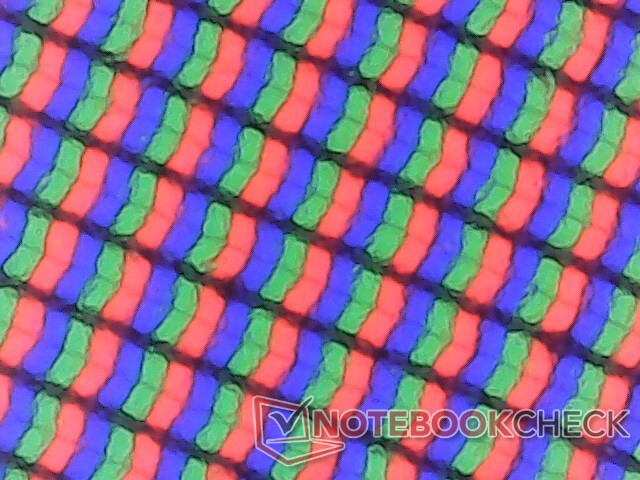
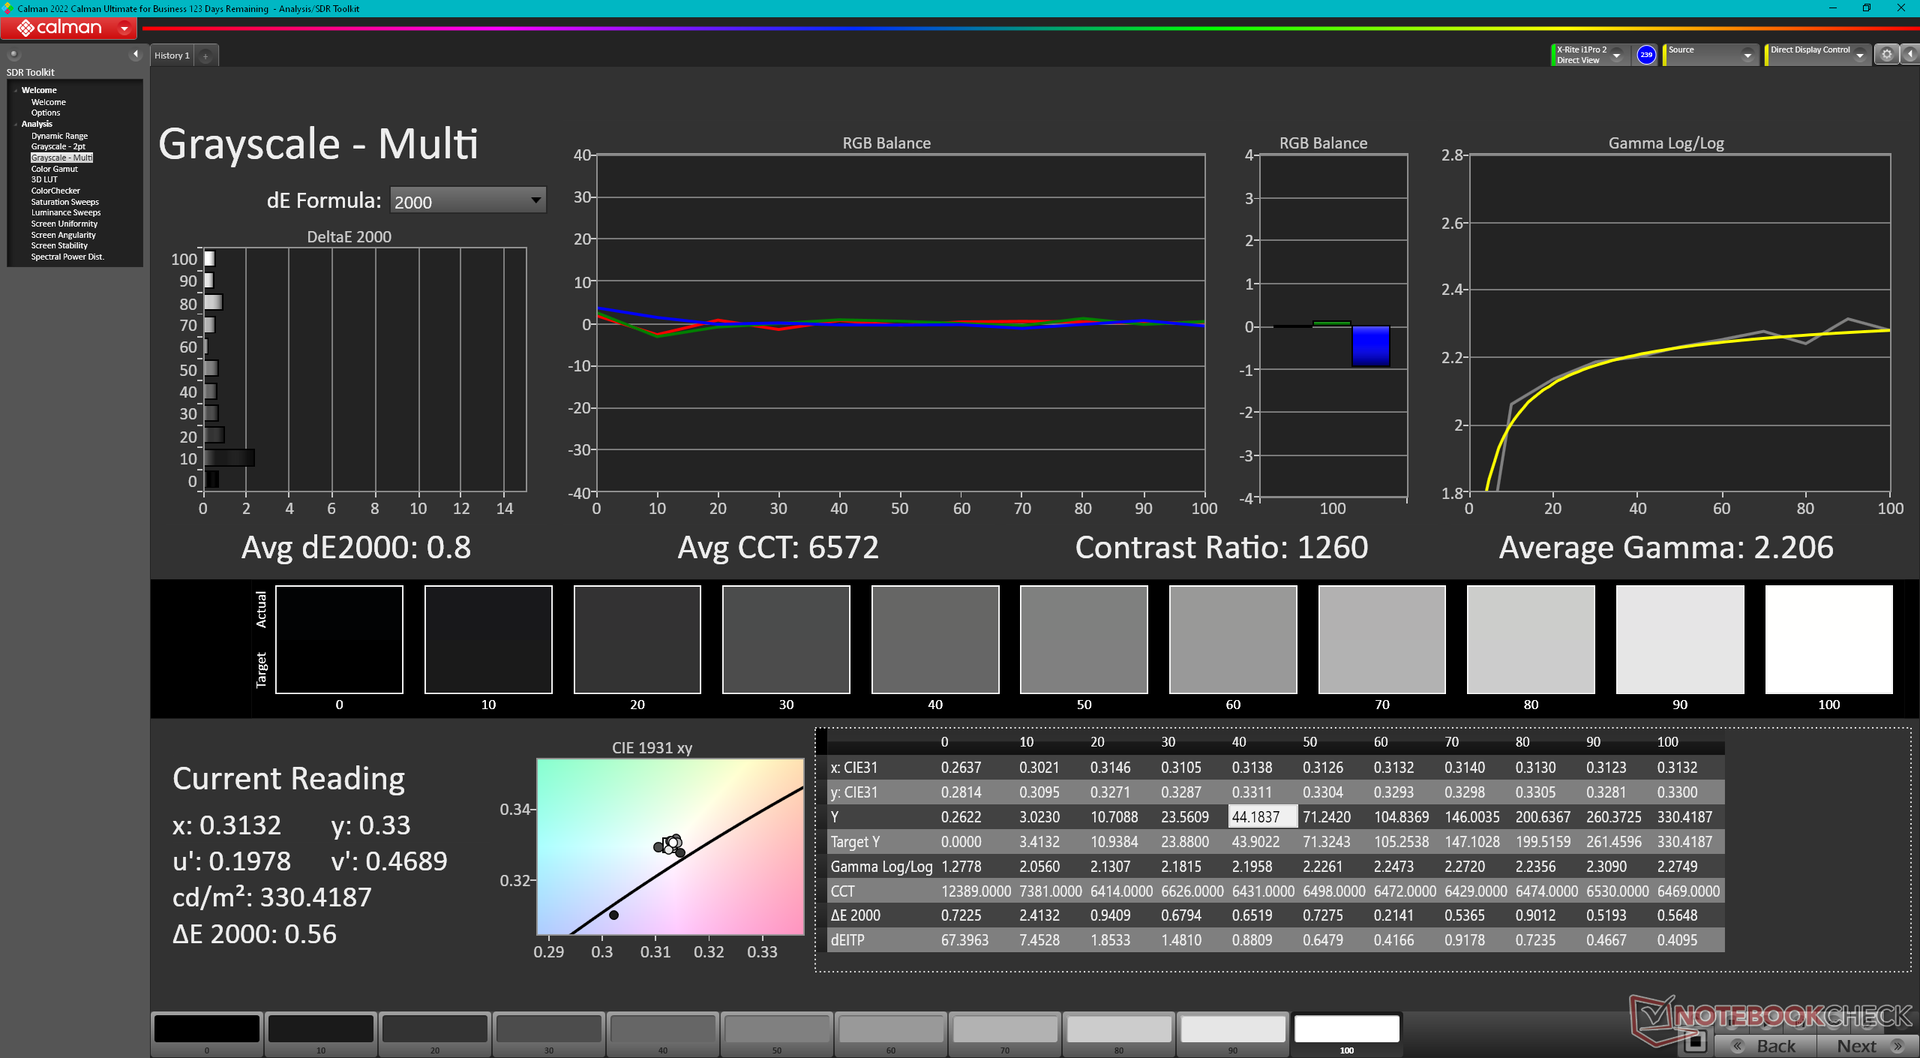
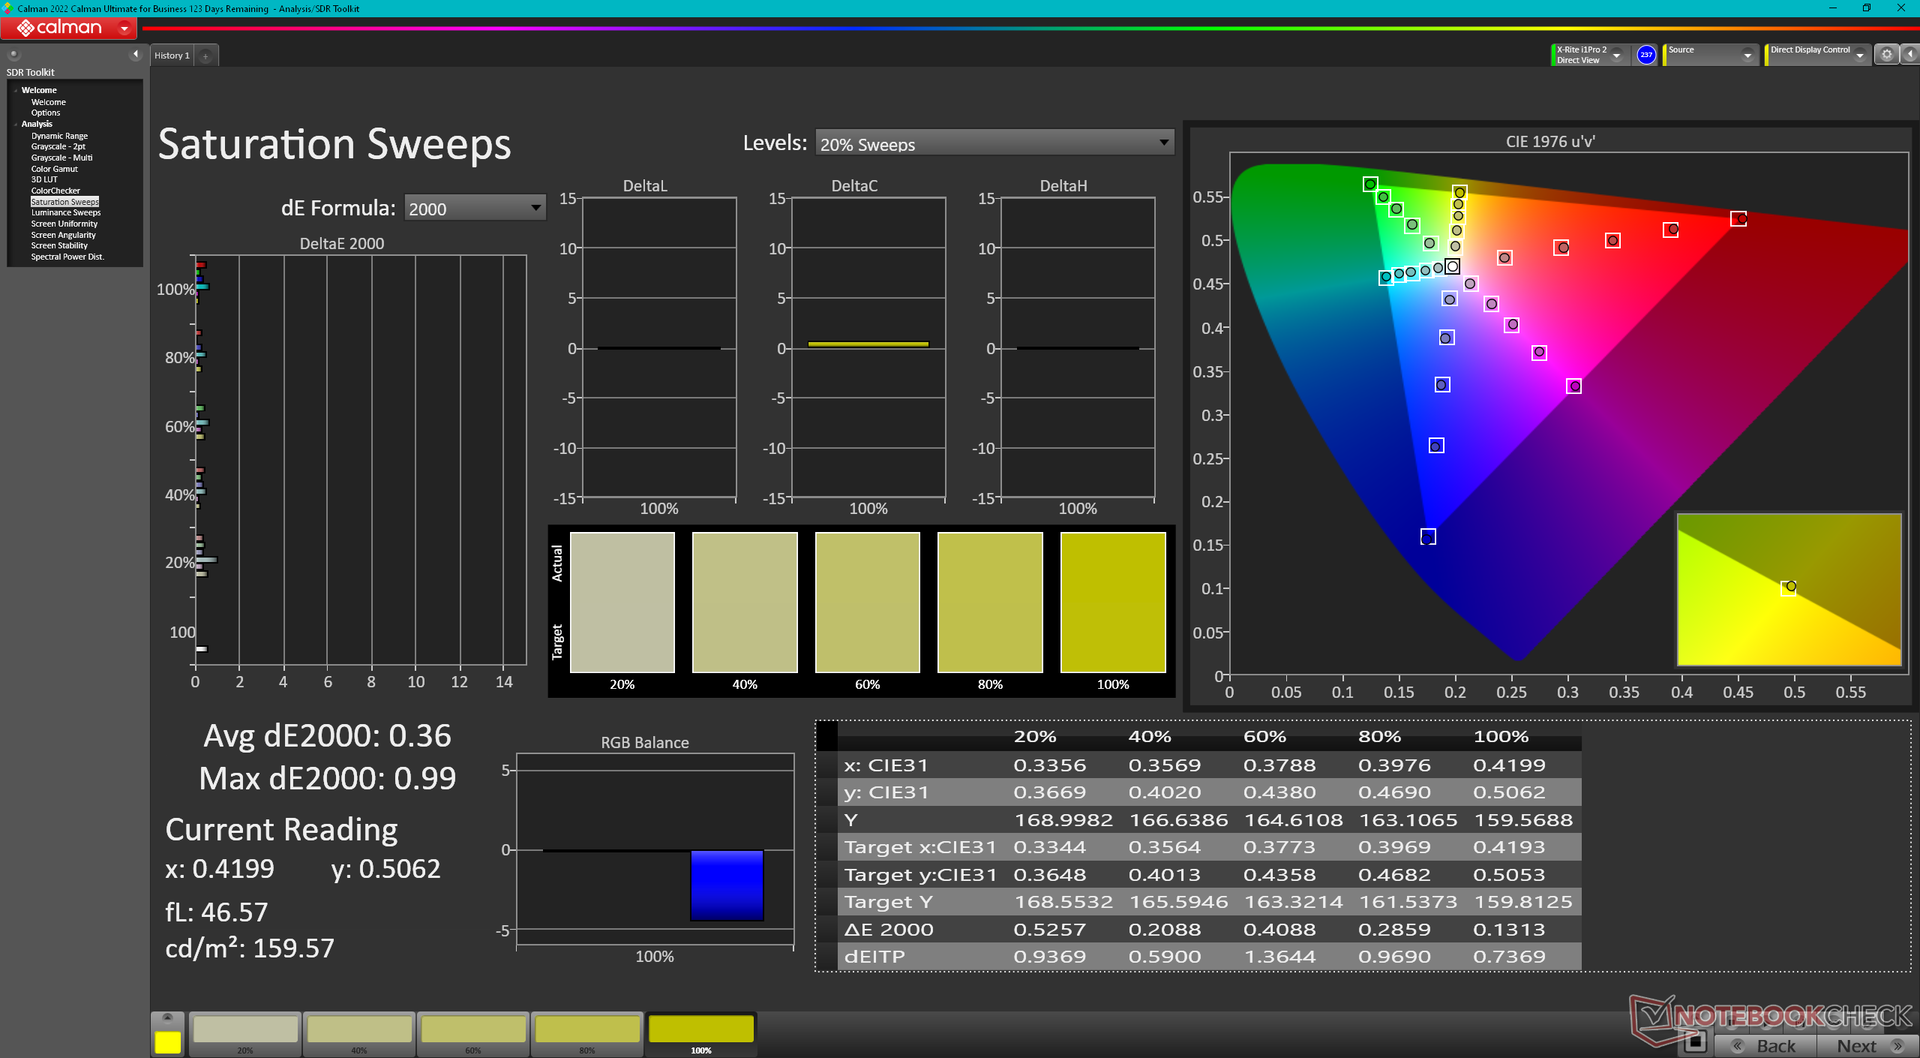
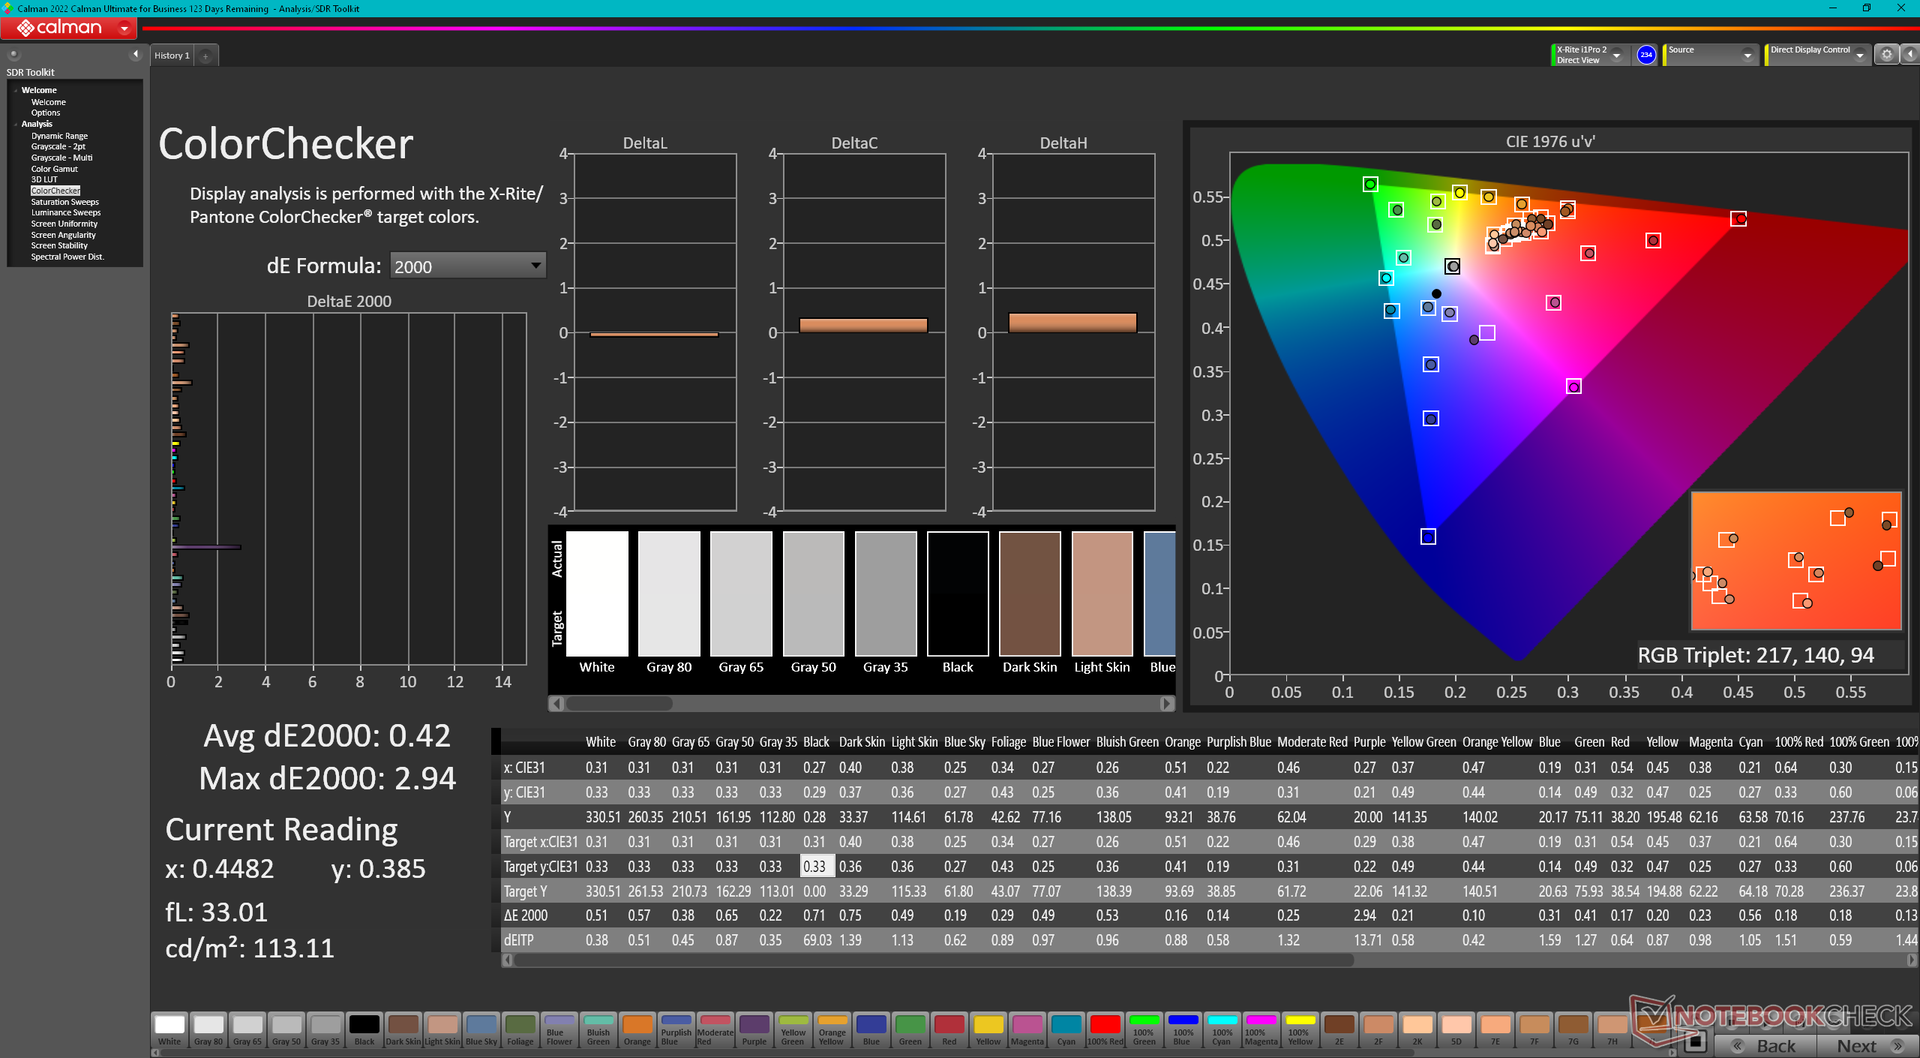
Dell a remplacé le panneau BOE NE16NZ4 du x16 R1 de l'année dernière par le BOE B160QAN du x16 R2 de cette année. Cependant, les deux panneaux sont pratiquement identiques en termes de reproduction des couleurs, de temps de réponse, de niveaux de luminosité et de contraste, pour une expérience visuelle pratiquement identique.
Le taux de rafraîchissement natif peut être réglé sur 240 Hz ou 60 Hz, sans aucune option variable. G-Sync n'est pris en charge qu'en mode dGPU et non en mode Optimus.
Les utilisateurs peuvent configurer deux écrans comme indiqué ci-dessous alors que le x16 R1 en avait trois :
- 2560 x 1600, 240 Hz, 100% DCI-P3, G-Sync, Advanced Optimus
- 1920 x 1200, 480 Hz, 100% DCI-P3, G-Sync, Advanced Optimus
| |||||||||||||||||||||||||
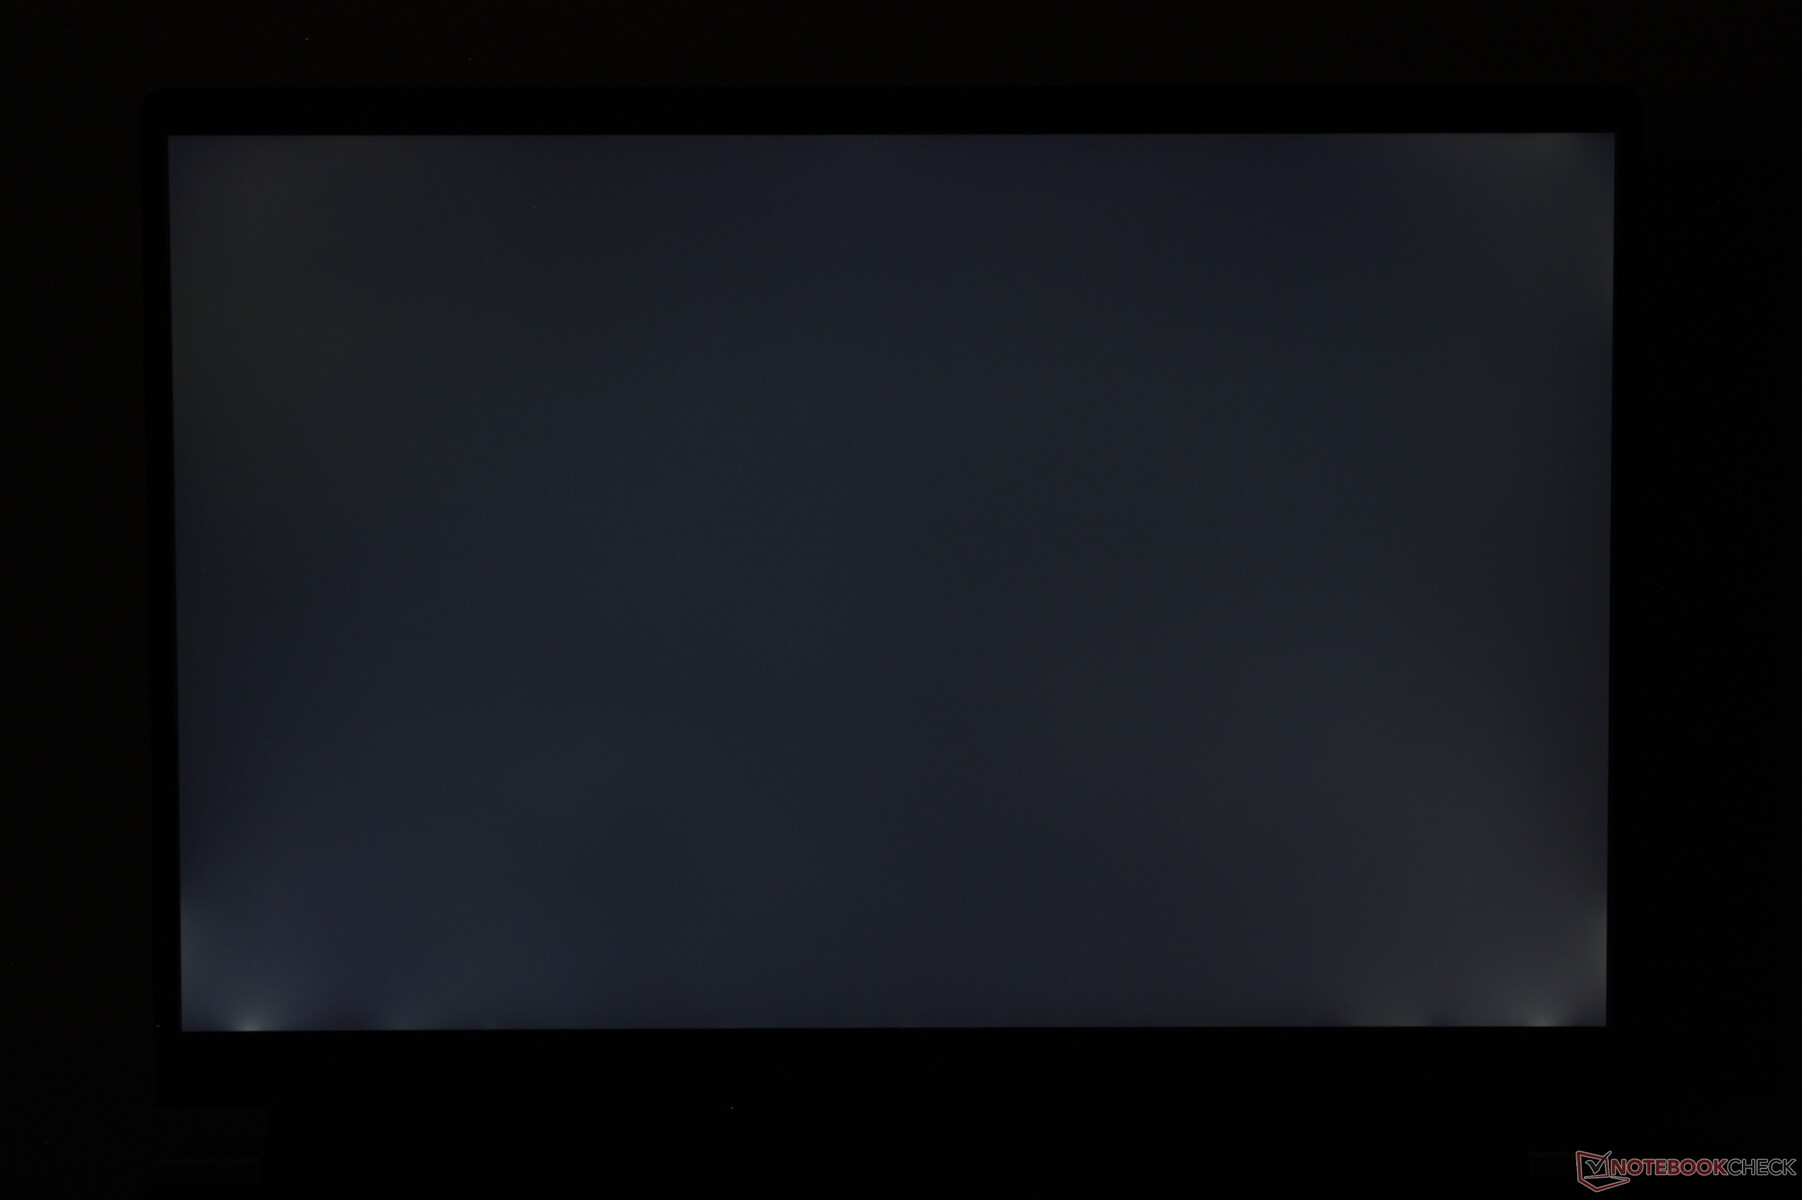
Homogénéité de la luminosité: 90 %
Valeur mesurée au centre, sur batterie: 348.4 cd/m²
Contraste: 1056:1 (Valeurs des noirs: 0.33 cd/m²)
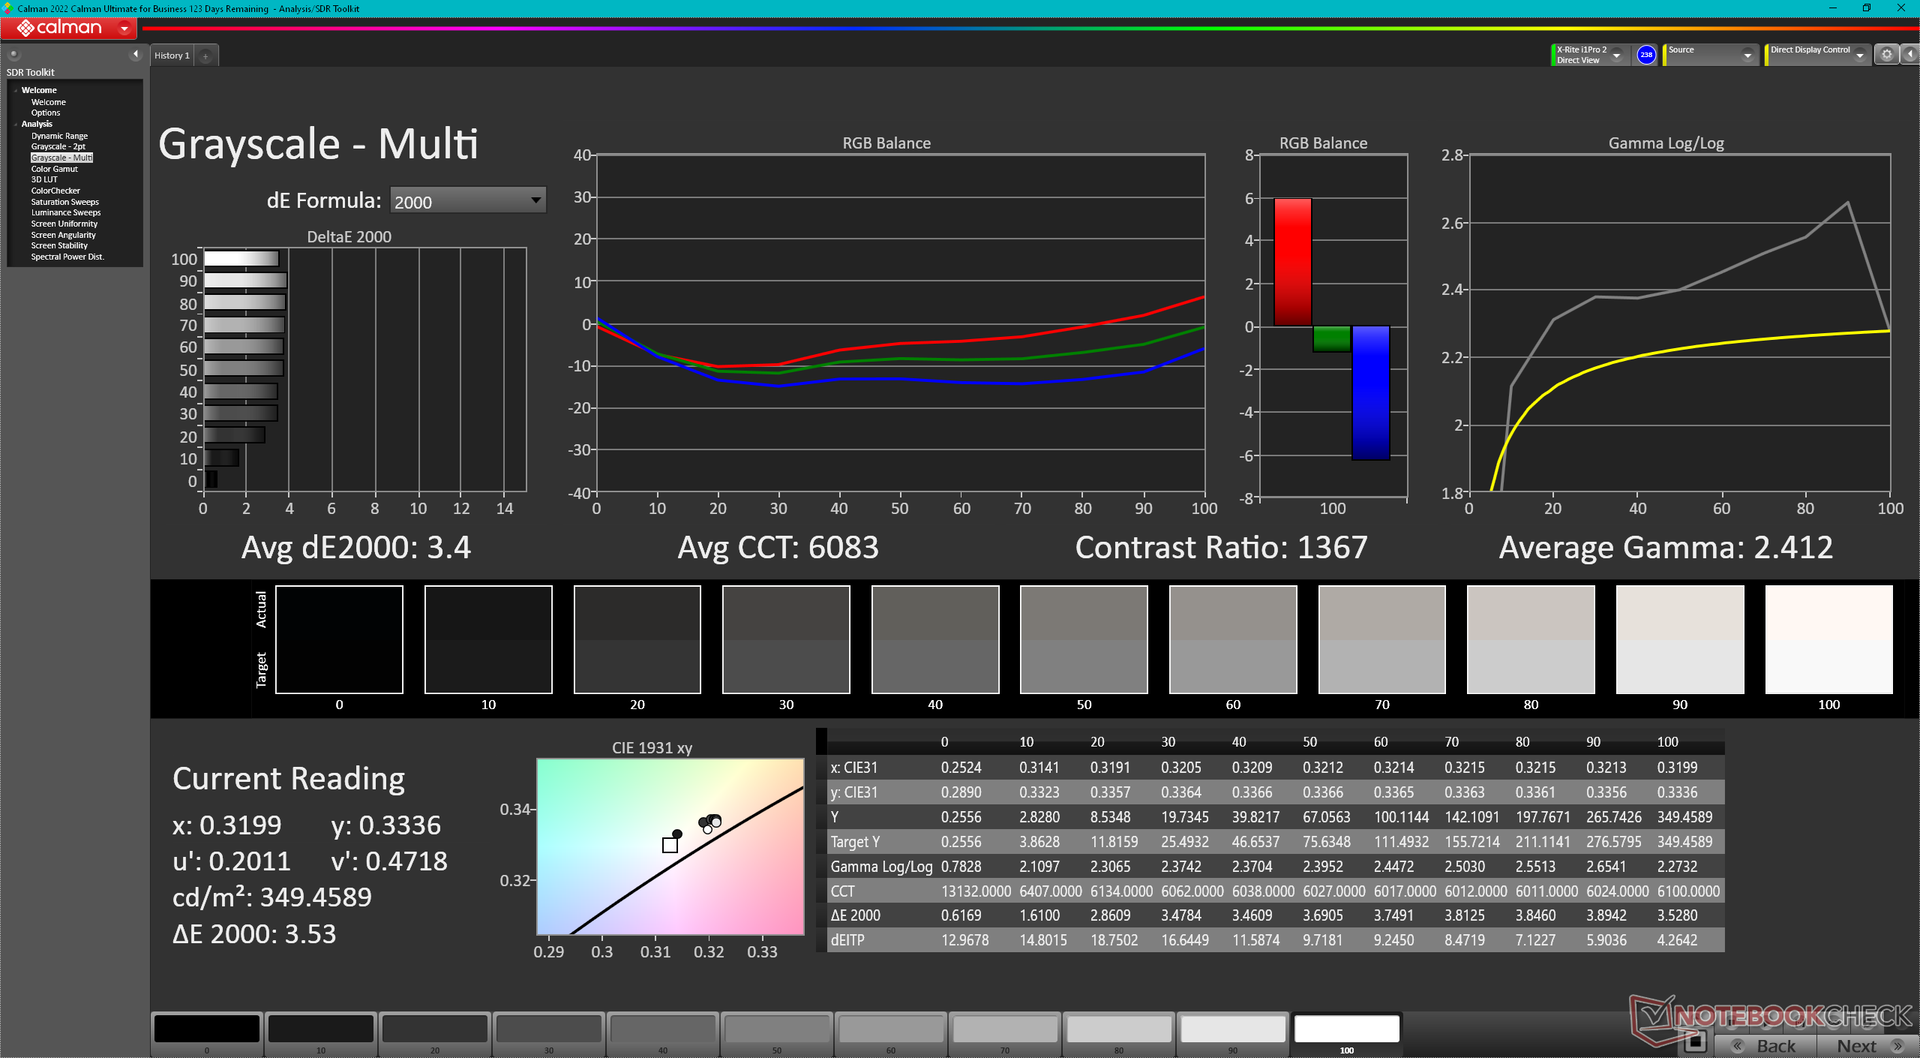
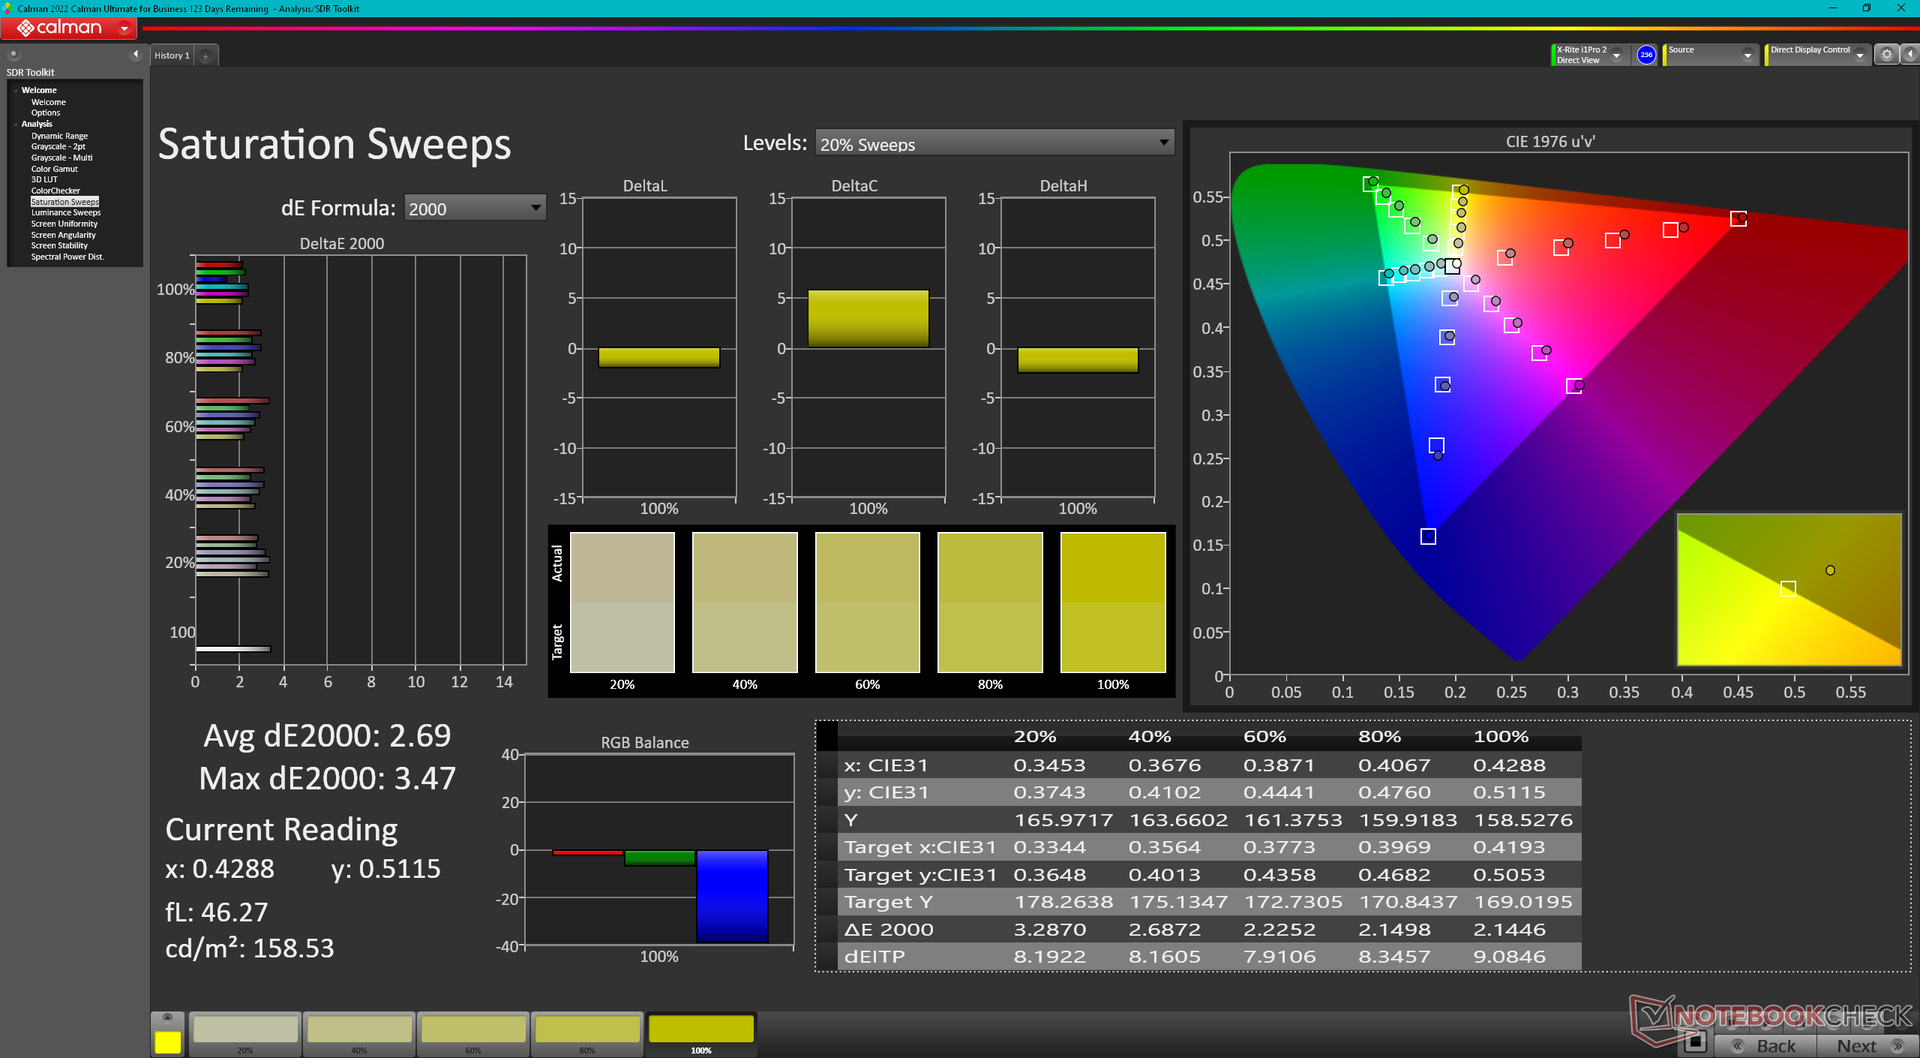
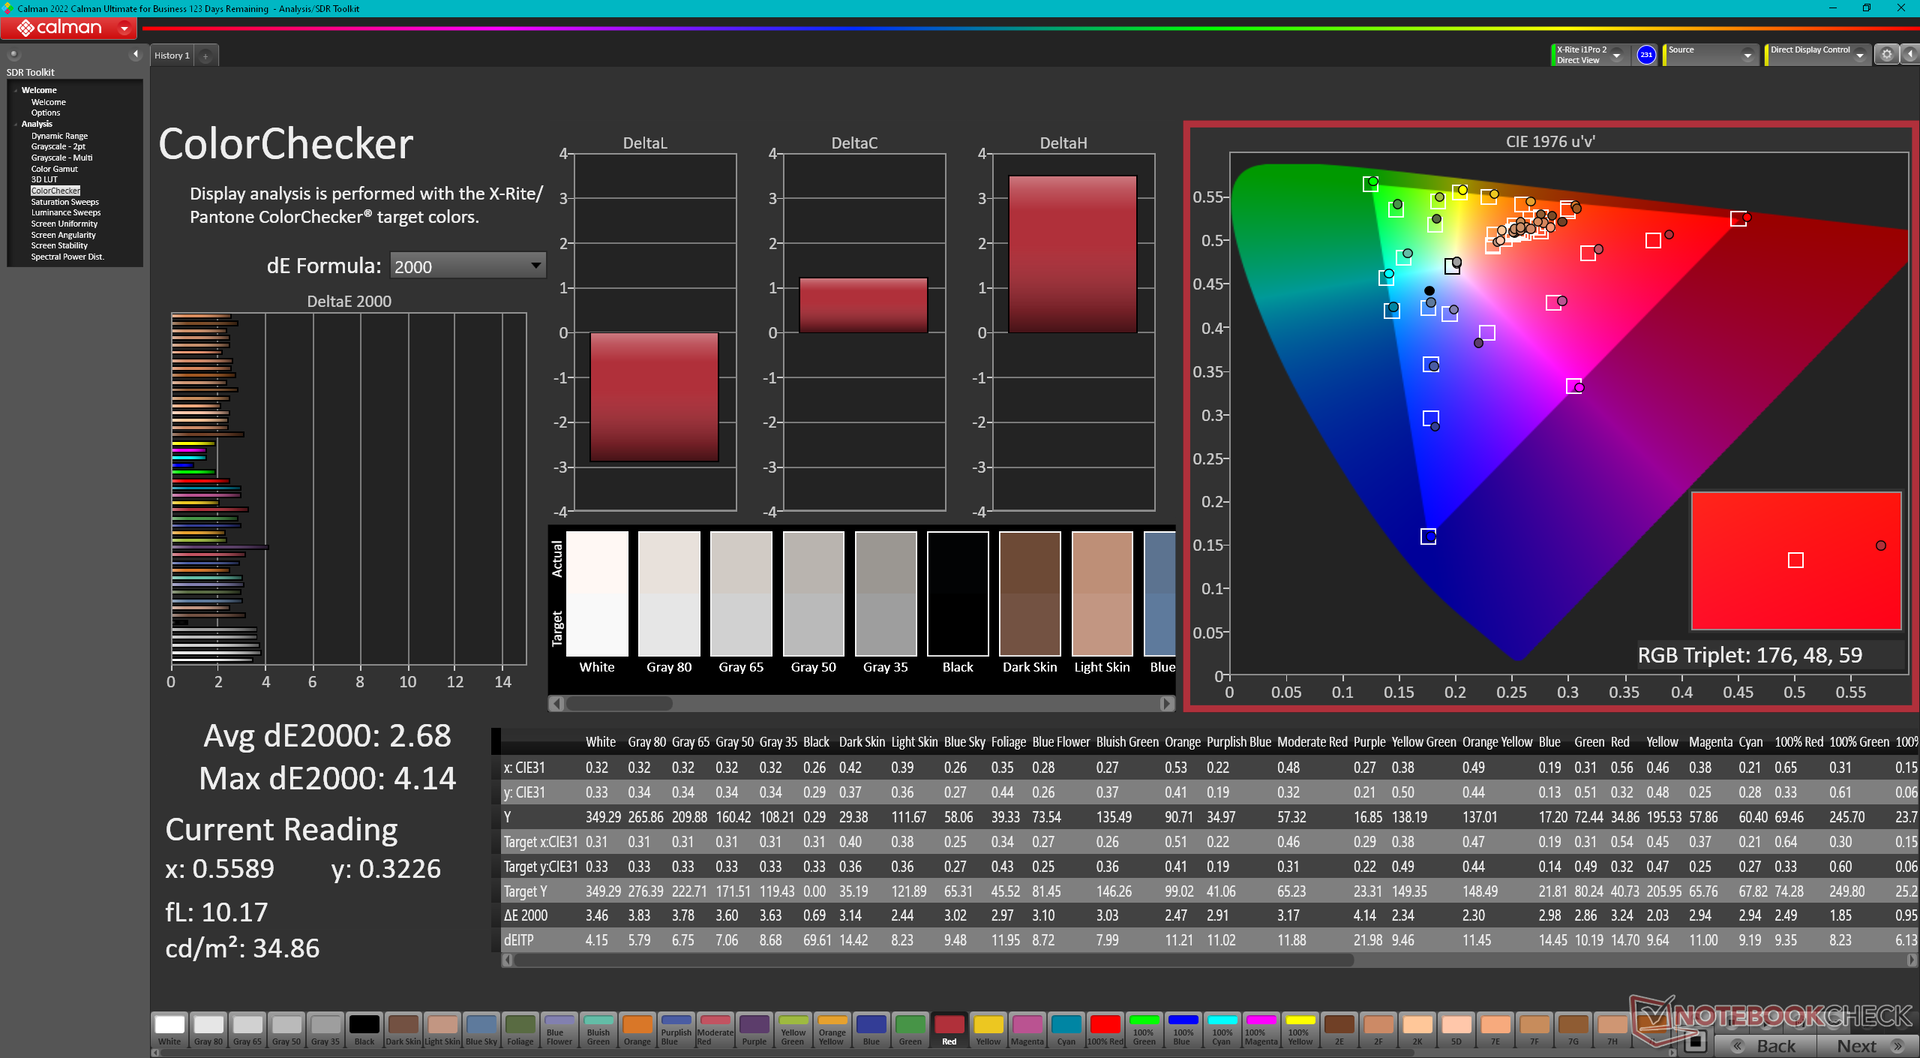
ΔE Color 2.68 | 0.5-29.43 Ø4.87, calibrated: 0.42
ΔE Greyscale 3.4 | 0.5-98 Ø5.1
88.8% AdobeRGB 1998 (Argyll 2.2.0 3D)
100% sRGB (Argyll 2.2.0 3D)
98.3% Display P3 (Argyll 2.2.0 3D)
Gamma: 2.41
| Alienware x16 R2 P120F BOE B160QAN, IPS, 2560x1600, 16" | Alienware x16 R1 BOE NE16NZ4, IPS, 2560x1600, 16" | Alienware m16 R2 BOE NE16NYH, IPS, 2560x1600, 16" | Asus ROG Strix Scar 16 G634JZR BOE NE160QDM-NM7, Mini LED, 2560x1600, 16" | Lenovo Legion Pro 7 16IRX9H BOE CQ NE16QDM-NZB, IPS, 2560x1600, 16" | MSI Vector 16 HX A14V Chi Mei N160GME-GTB, IPS, 2560x1600, 16" | |
|---|---|---|---|---|---|---|
| Display | 0% | -16% | 1% | -1% | -2% | |
| Display P3 Coverage | 98.3 | 99.2 1% | 71 -28% | 99.8 2% | 98.5 0% | 95.4 -3% |
| sRGB Coverage | 100 | 100 0% | 100 0% | 100 0% | 99.9 0% | 99.7 0% |
| AdobeRGB 1998 Coverage | 88.8 | 88.6 0% | 71.4 -20% | 90.8 2% | 86.7 -2% | 85.4 -4% |
| Response Times | -32% | -29% | -31% | -99% | -46% | |
| Response Time Grey 50% / Grey 80% * | 3.9 ? | 5.1 ? -31% | 5.7 ? -46% | 5 ? -28% | 12.6 ? -223% | 5.7 ? -46% |
| Response Time Black / White * | 7.8 ? | 10.3 ? -32% | 8.7 ? -12% | 10.4 ? -33% | 5.8 ? 26% | 11.4 ? -46% |
| PWM Frequency | 2040 ? | |||||
| Screen | -13% | 5% | 16% | 21% | -27% | |
| Brightness middle | 348.4 | 302.2 -13% | 345.8 -1% | 490 41% | 487 40% | 557.2 60% |
| Brightness | 340 | 285 -16% | 337 -1% | 487 43% | 460 35% | 506 49% |
| Brightness Distribution | 90 | 89 -1% | 87 -3% | 94 4% | 88 -2% | 83 -8% |
| Black Level * | 0.33 | 0.26 21% | 0.3 9% | 0.4 -21% | 0.42 -27% | 0.41 -24% |
| Contrast | 1056 | 1162 10% | 1153 9% | 1225 16% | 1160 10% | 1359 29% |
| Colorchecker dE 2000 * | 2.68 | 1.63 39% | 1.99 26% | 1.08 60% | 1.12 58% | 2.91 -9% |
| Colorchecker dE 2000 max. * | 4.14 | 4.13 -0% | 3.52 15% | 2.38 43% | 2.26 45% | 5.94 -43% |
| Colorchecker dE 2000 calibrated * | 0.42 | 1.17 -179% | 0.62 -48% | 0.9 -114% | 0.54 -29% | 1.63 -288% |
| Greyscale dE 2000 * | 3.4 | 2.5 26% | 2.1 38% | 1.1 68% | 1.4 59% | 3.8 -12% |
| Gamma | 2.41 91% | 2.23 99% | 2.32 95% | 2.13 103% | 2.242 98% | 2.23 99% |
| CCT | 6083 107% | 6590 99% | 6369 102% | 6724 97% | 6809 95% | 6408 101% |
| Moyenne finale (programmes/paramètres) | -15% /
-13% | -13% /
-4% | -5% /
6% | -26% /
-1% | -25% /
-25% |
* ... Moindre est la valeur, meilleures sont les performances
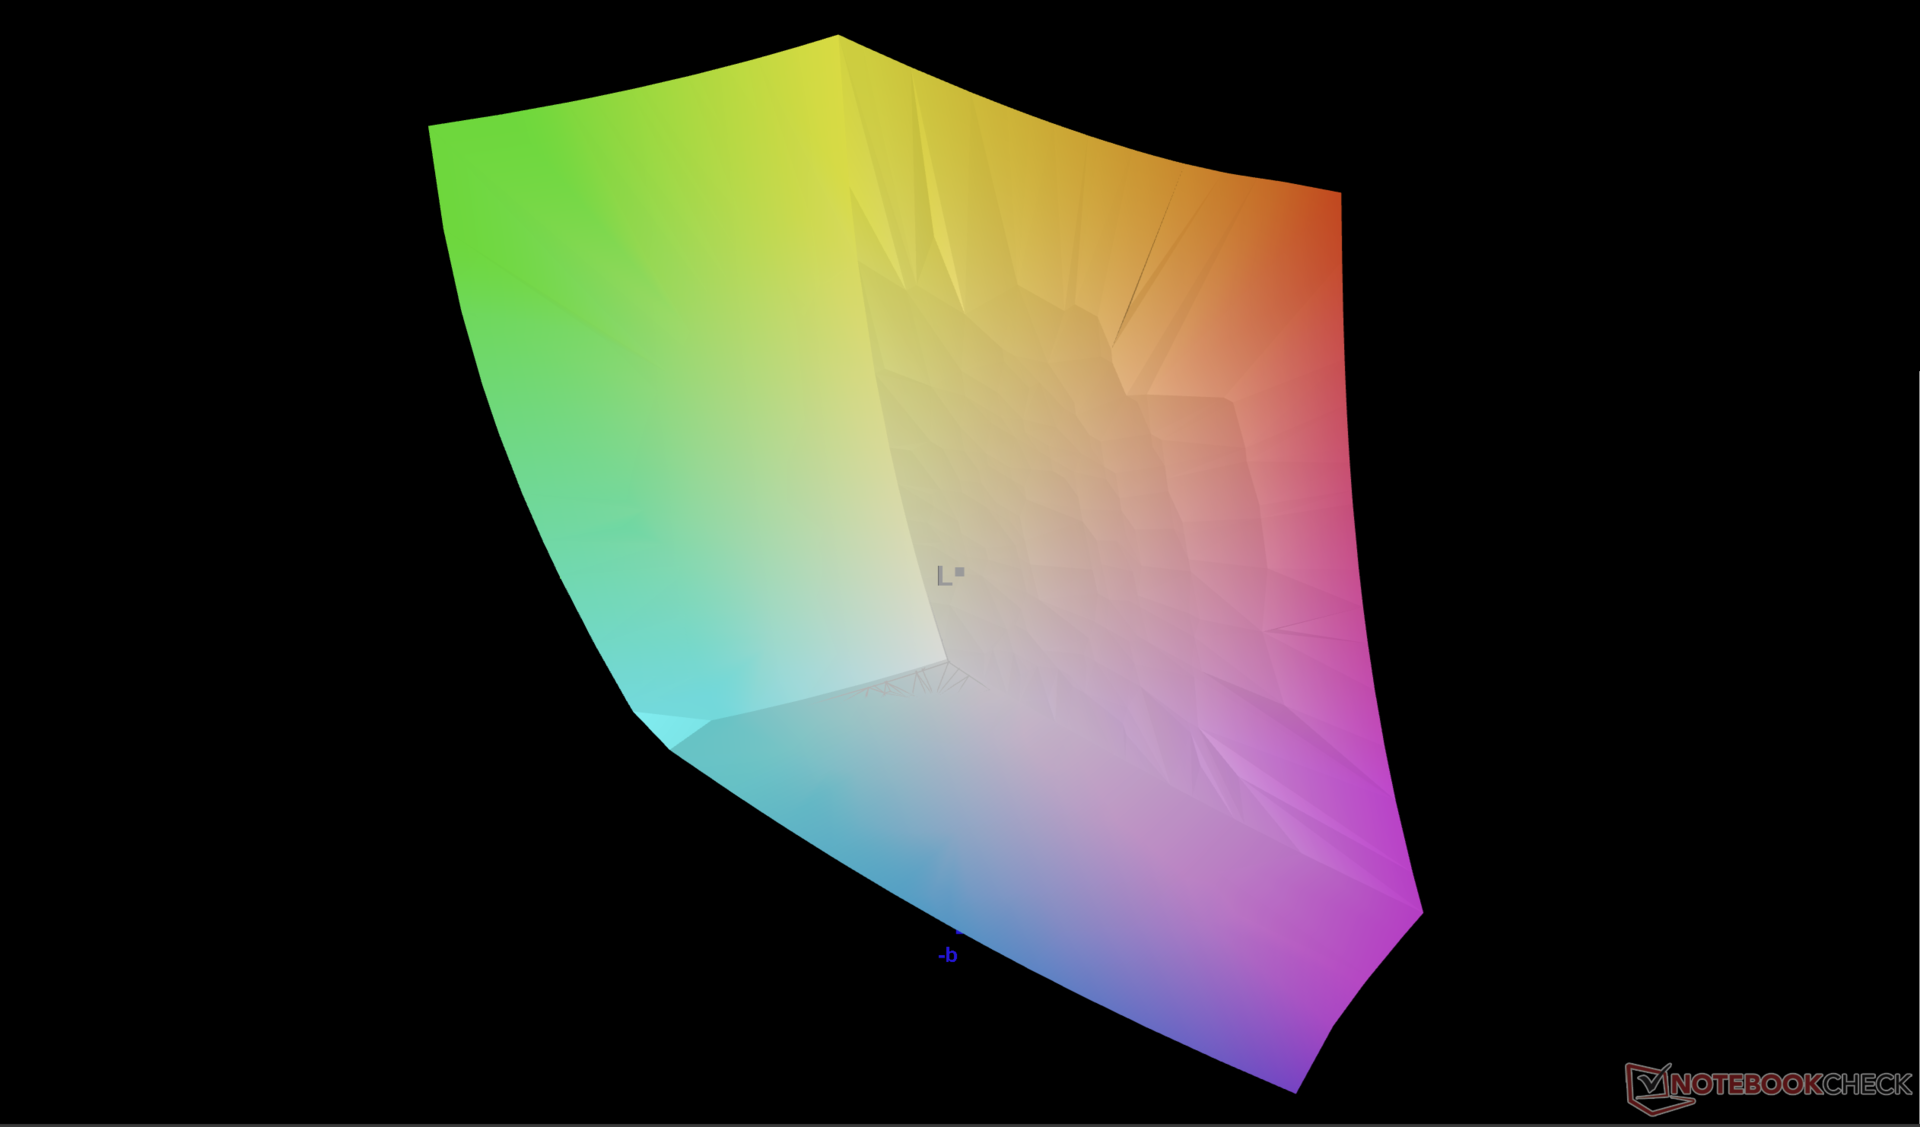
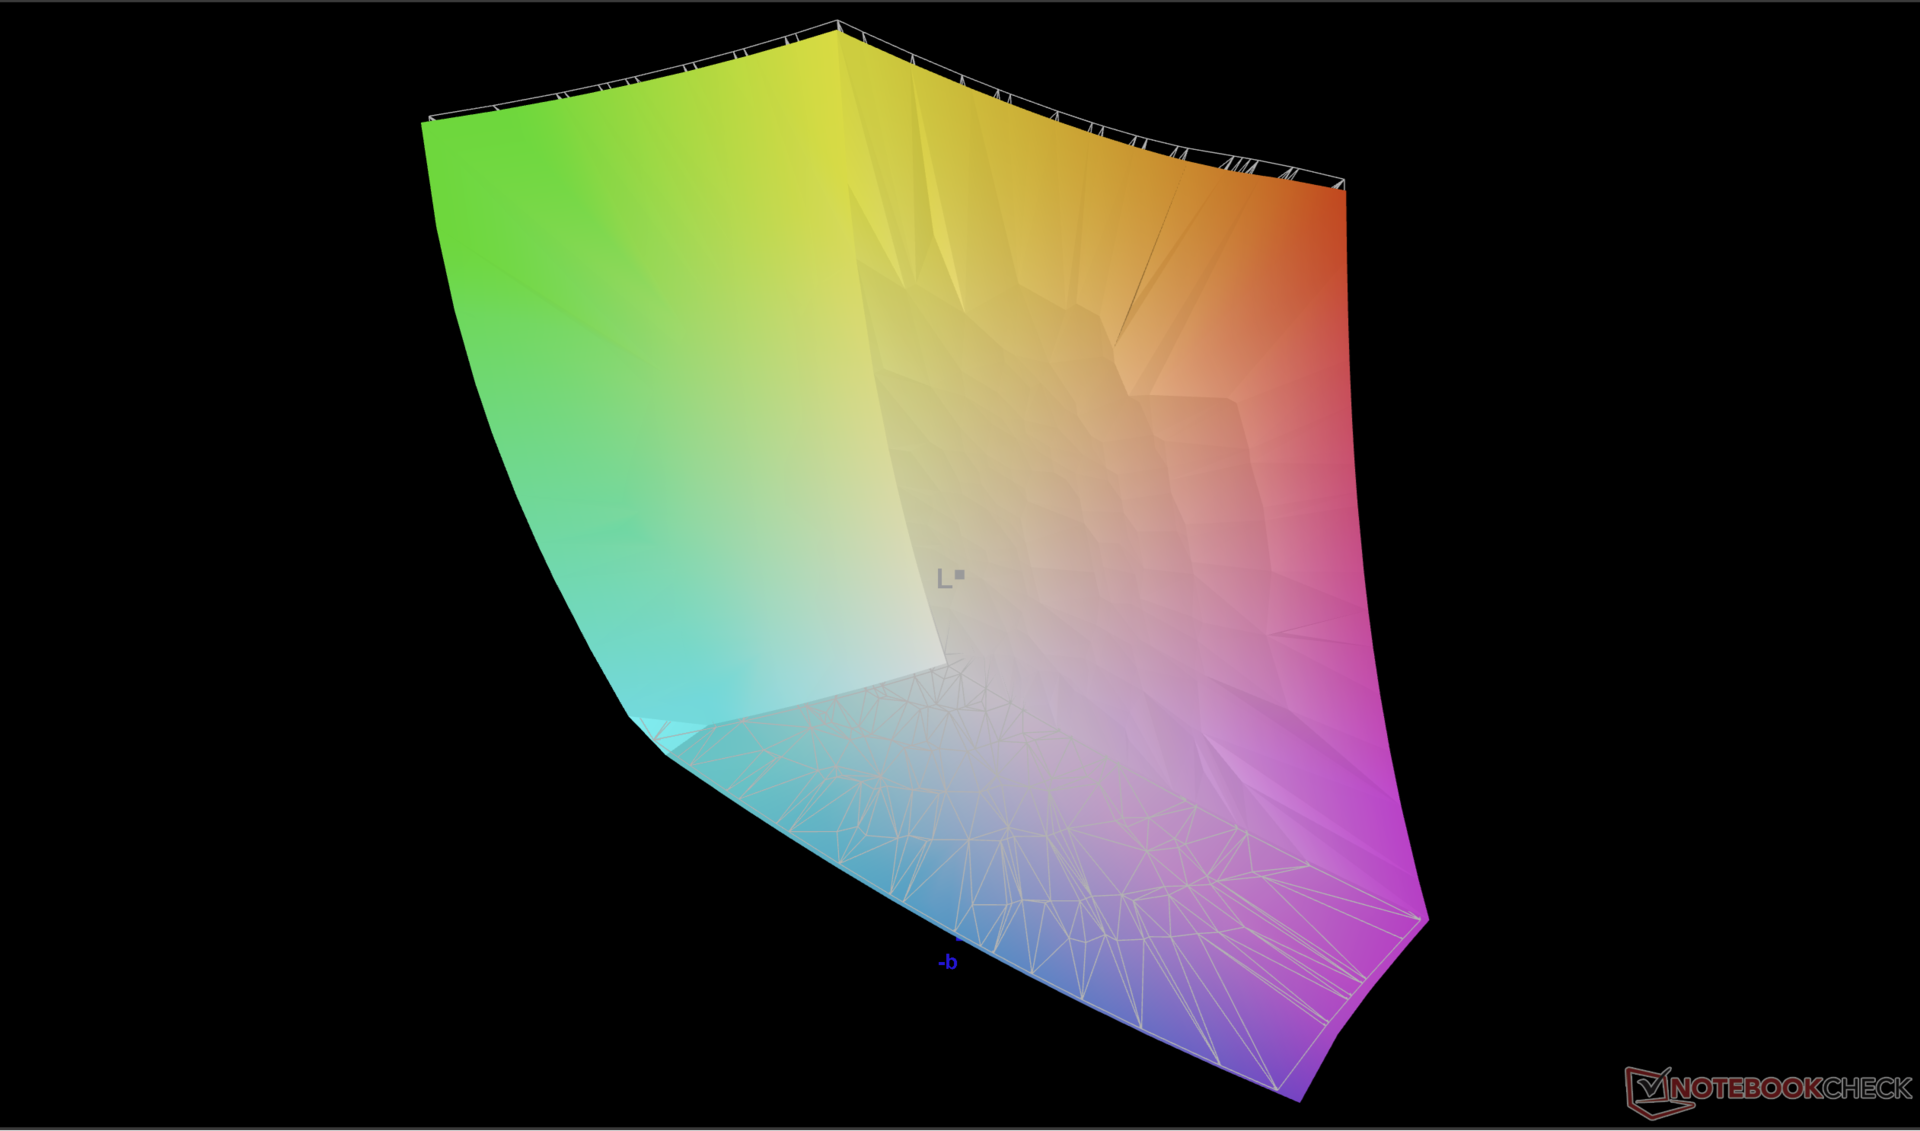
L'écran est réglé sur sRGB par défaut, même s'il prend en charge les couleurs P3. Il est néanmoins correctement calibré, bien que la température des couleurs soit légèrement trop chaude.
Temps de réponse de l'écran
| ↔ Temps de réponse noir à blanc | ||
|---|---|---|
| 7.8 ms ... hausse ↗ et chute ↘ combinées | ↗ 3.9 ms hausse | 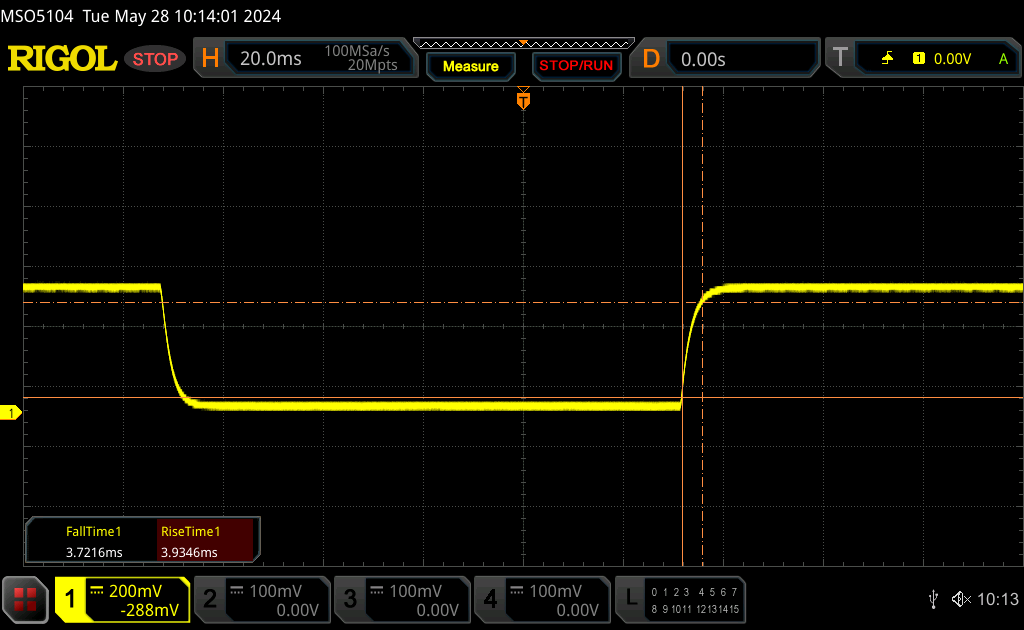 |
| ↘ 3.7 ms chute | ||
| L'écran montre de très faibles temps de réponse, parfait pour le jeu. En comparaison, tous les appareils testés affichent entre 0.1 (minimum) et 240 (maximum) ms. » 19 % des appareils testés affichent de meilleures performances. Cela signifie que les latences relevées sont meilleures que la moyenne (20.8 ms) de tous les appareils testés. | ||
| ↔ Temps de réponse gris 50% à gris 80% | ||
| 3.9 ms ... hausse ↗ et chute ↘ combinées | ↗ 1.7 ms hausse | 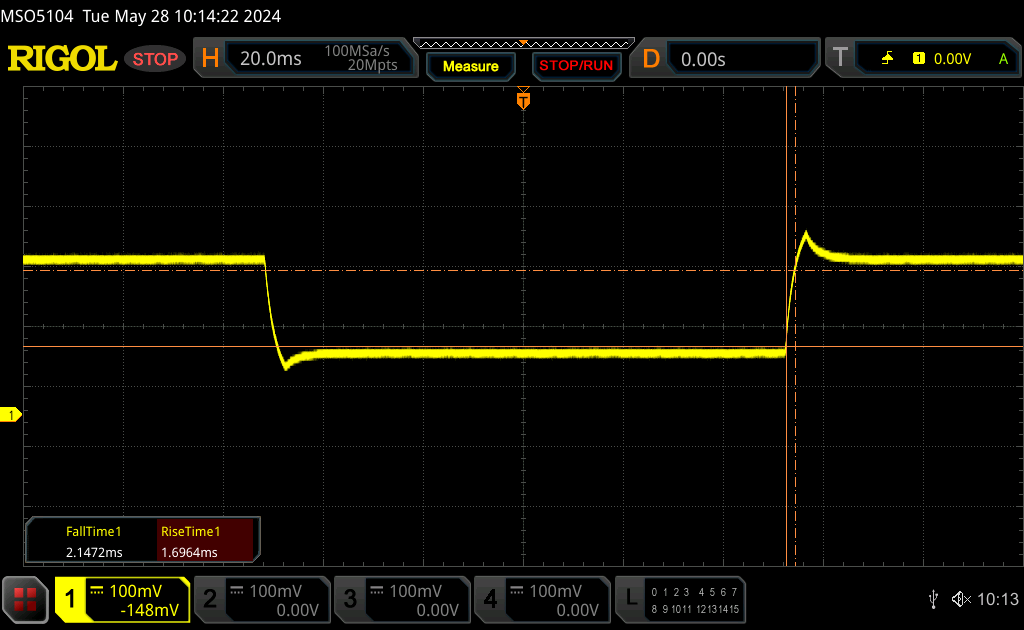 |
| ↘ 2.2 ms chute | ||
| L'écran montre de très faibles temps de réponse, parfait pour le jeu. En comparaison, tous les appareils testés affichent entre 0.165 (minimum) et 636 (maximum) ms. » 12 % des appareils testés affichent de meilleures performances. Cela signifie que les latences relevées sont meilleures que la moyenne (32.5 ms) de tous les appareils testés. | ||
Scintillement / MLI (Modulation de largeur d'impulsion)
| Scintillement / MLI (Modulation de largeur d'impulsion) non décelé | 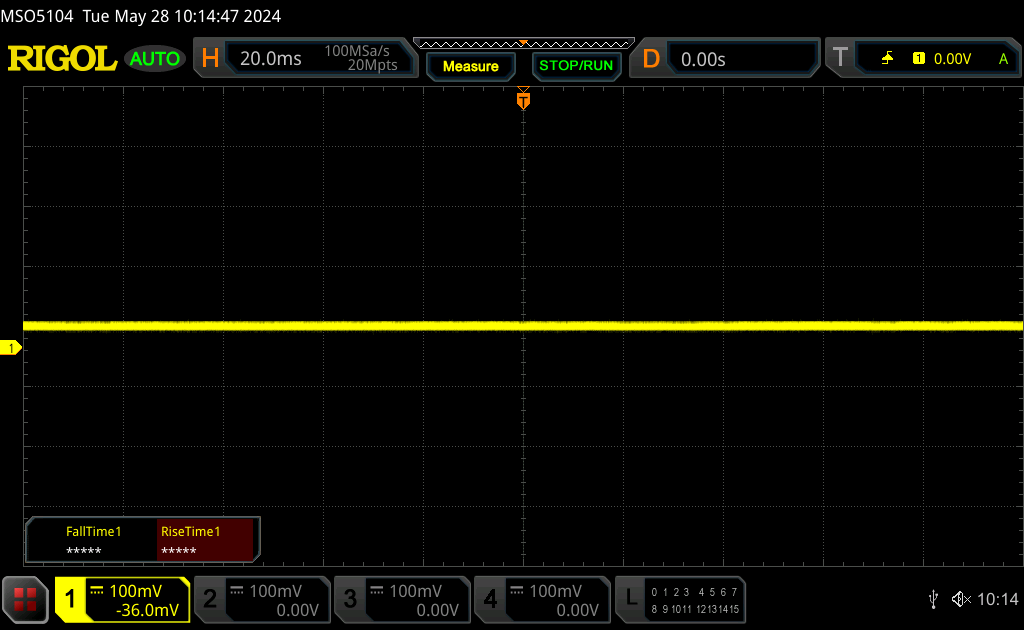 | ||
En comparaison, 53 % des appareils testés n'emploient pas MDI pour assombrir leur écran. Nous avons relevé une moyenne à 8516 (minimum : 5 - maximum : 343500) Hz dans le cas où une MDI était active. | |||

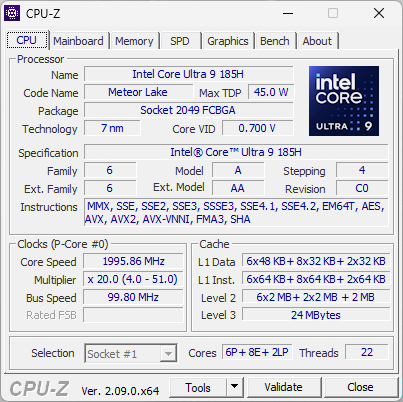
Performance - Core Ultra 9 185H vs. Core i9-13900HK
Conditions d'essai
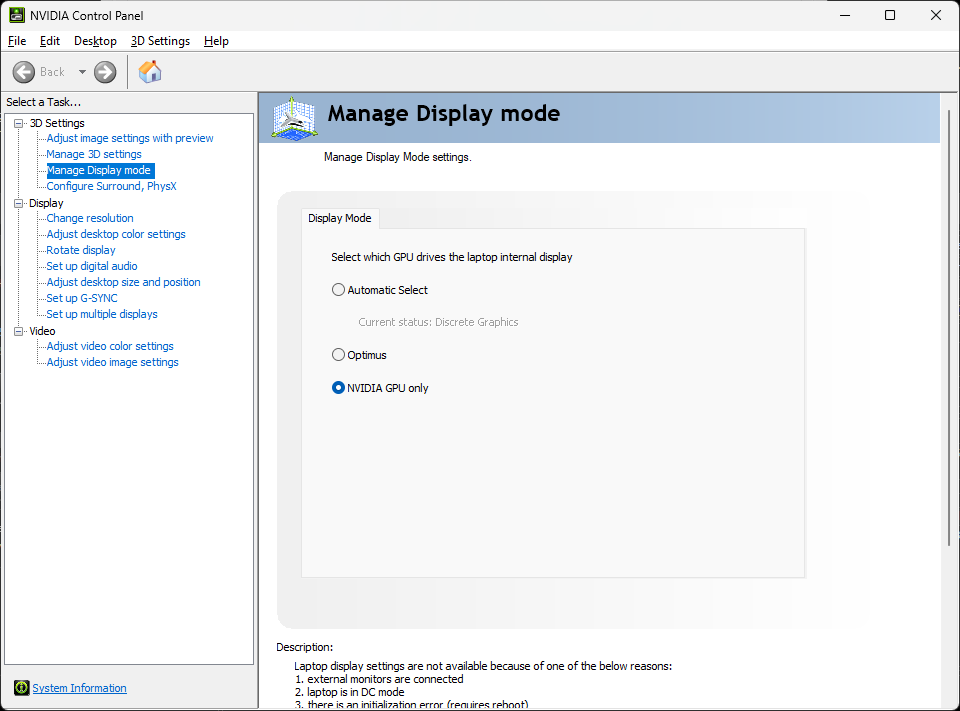
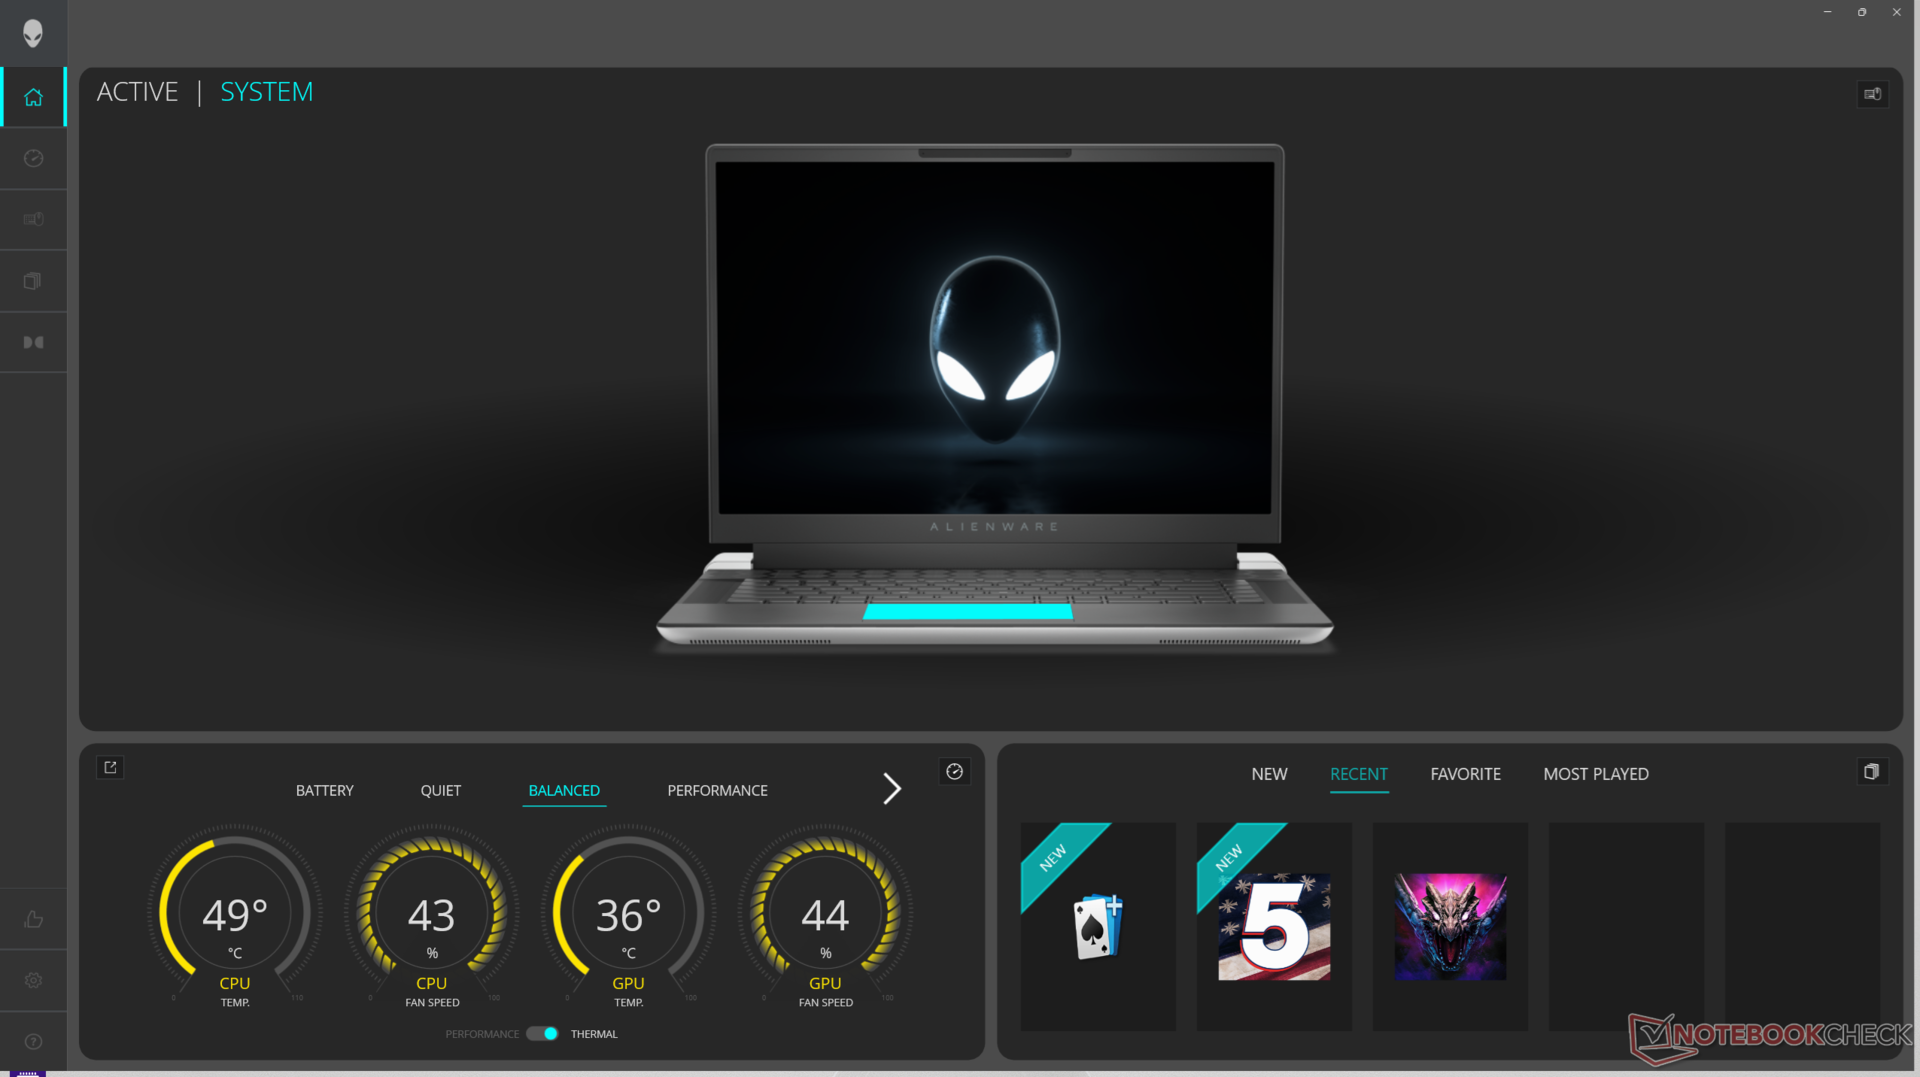
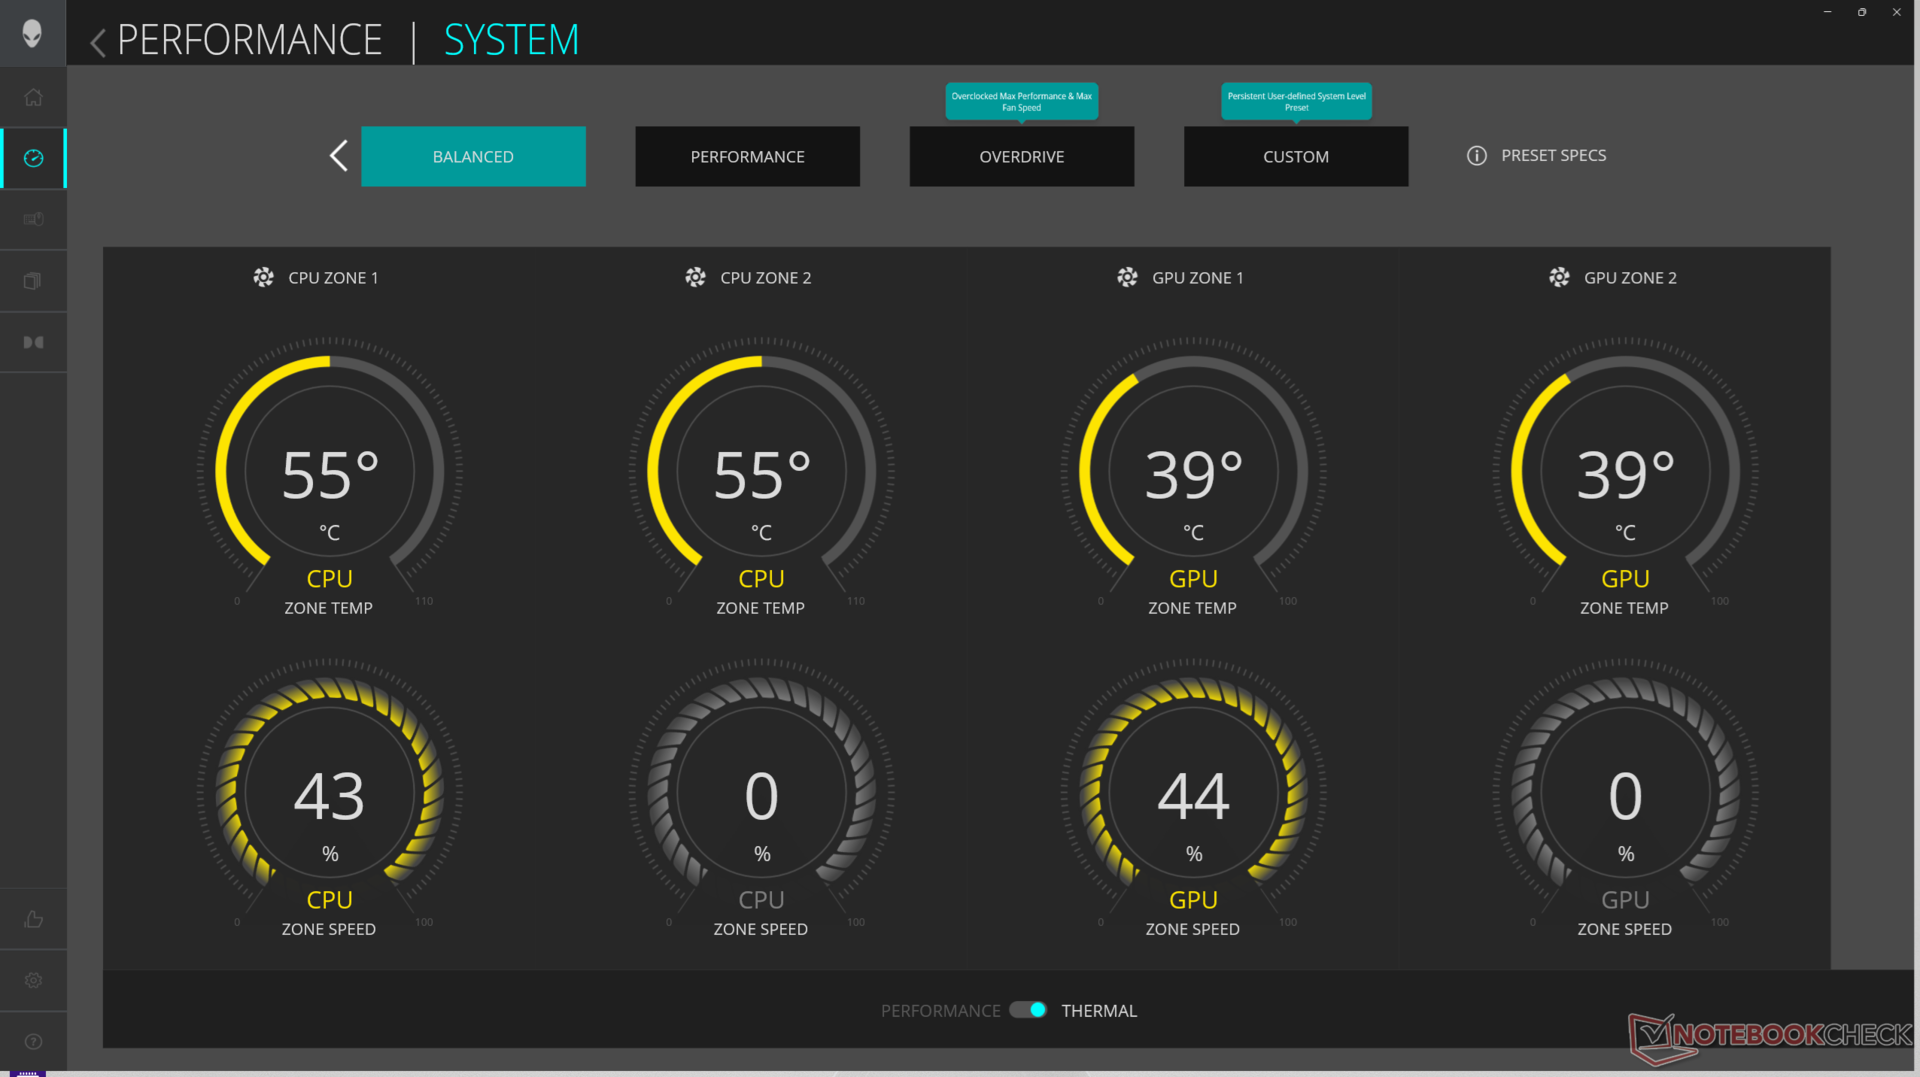
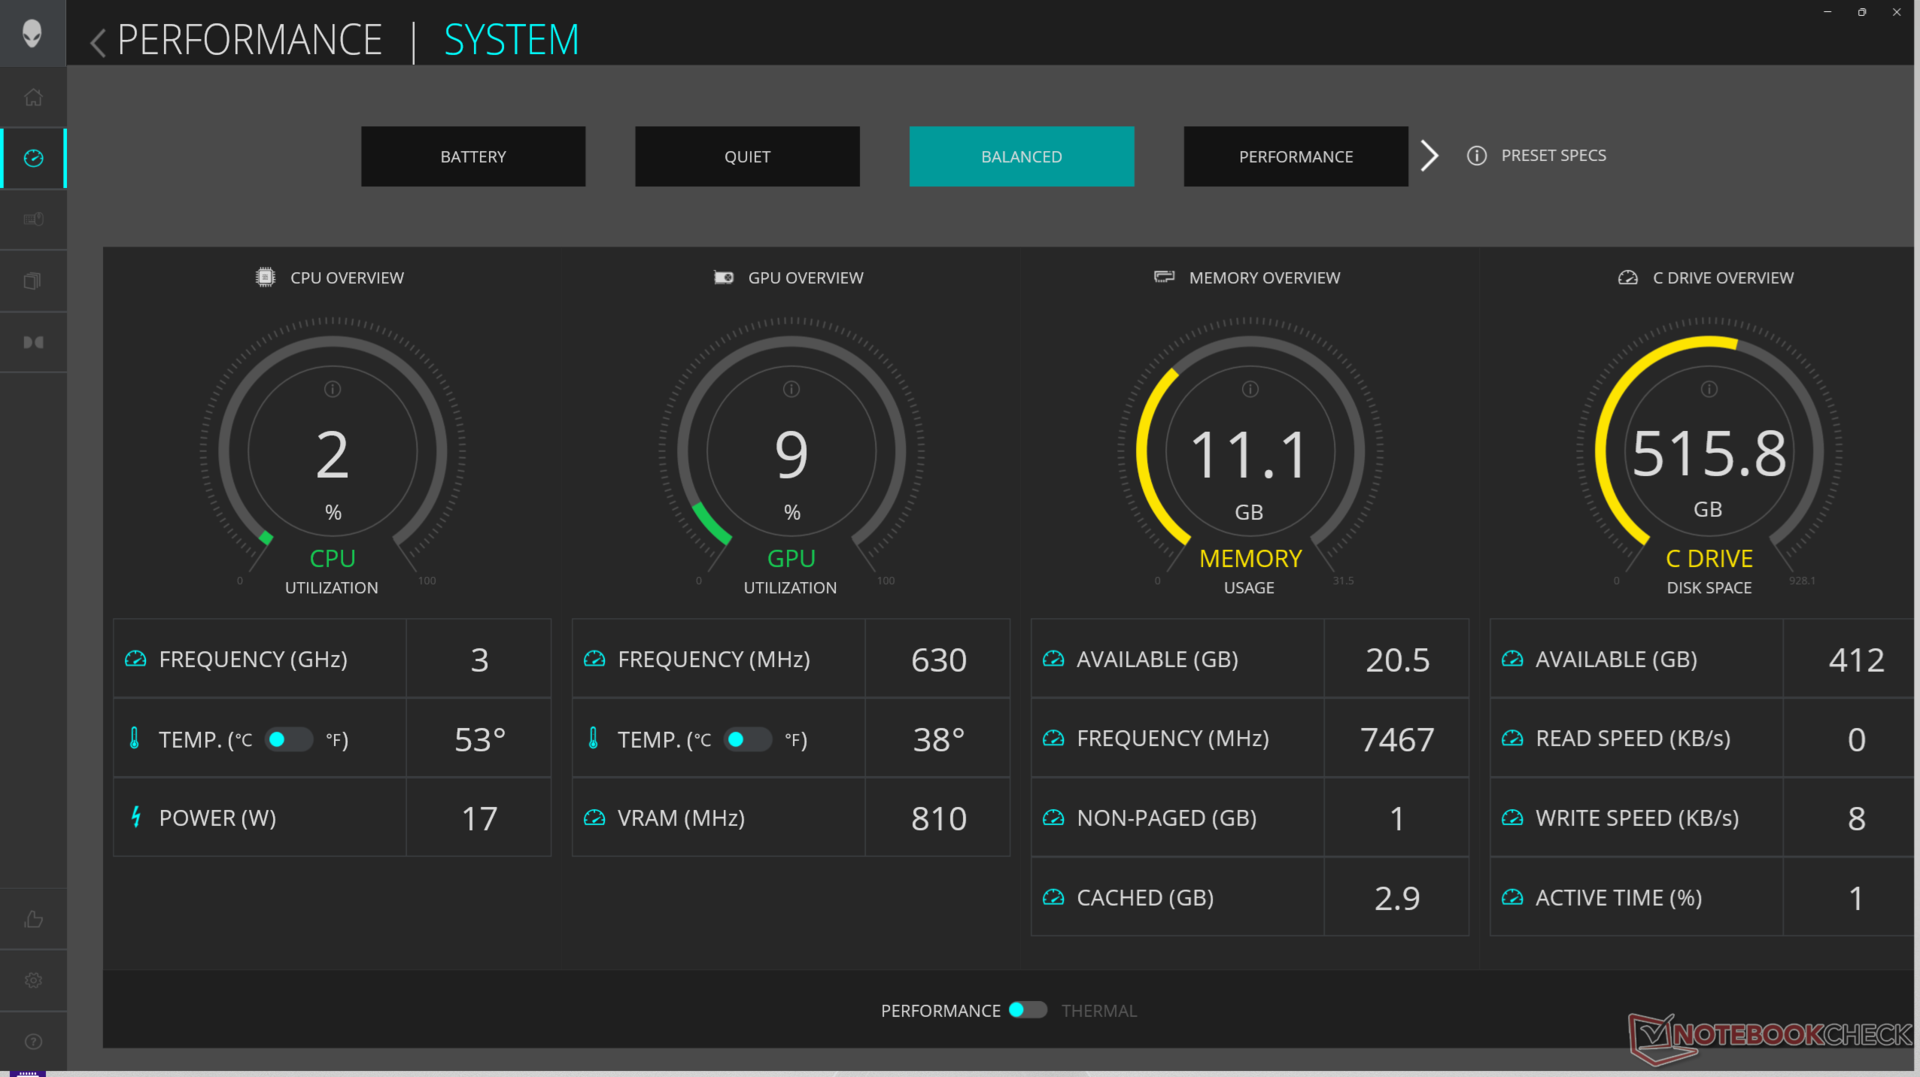
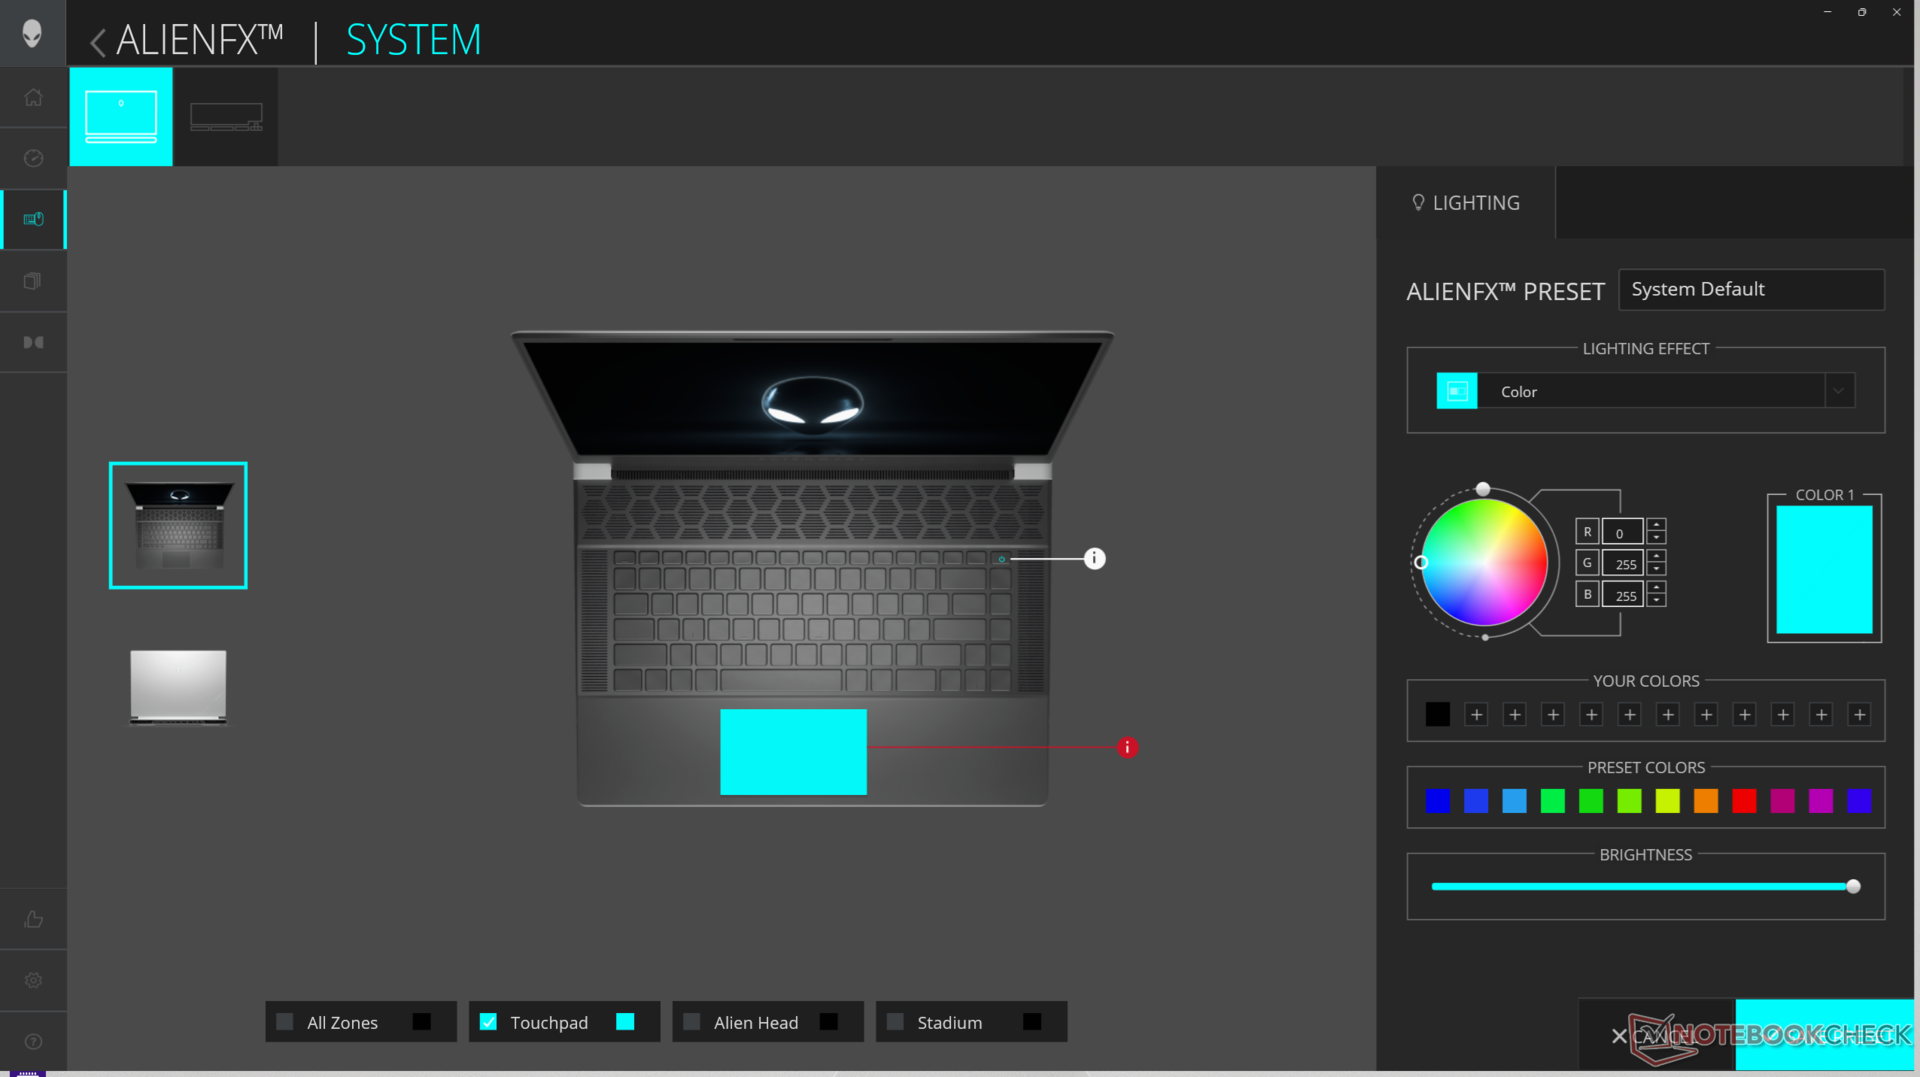
Nous avons réglé Alienware Command Center sur le mode Overdrive et les graphiques sur le mode dGPU pour obtenir les meilleurs résultats possibles. Nous encourageons les propriétaires à se familiariser avec le Command Center, car il s'agit du centre de réglage des effets d'éclairage RVB et des profils de performance.
Le panneau de configuration Nvidia ne propose pas de mode "iGPU uniquement", comme le montre la capture d'écran ci-dessus.
Processeur
Le Core Ultra 9 185H est environ 5 à 10 % et 15 à 20 % plus lent que le Core i9-13900HK dans la version x16 R1 de l'année dernière, respectivement pour les applications multithread et single-thread. Il est intéressant de noter que le passage au Core Ultra 7 155H ne devrait pas avoir d'impact significatif sur les performances lors de notre essai de l'Alienware m16 R2 Alienware m16 R2 comme le montre le tableau comparatif ci-dessous.
Les options Raptor Lake-HX telles que le Core i9-14900HX ne sont pas disponibles sur la série Alienware x16, probablement en raison de limitations thermiques, car ces processeurs nécessitent plus de puissance que la série Meteor Lake-H. Ces options auraient permis d'obtenir des performances nettement plus rapides. De telles options auraient offert des performances nettement plus rapides que le Core i9-13900HK ou le Core Ultra 9 185H.
Cinebench R15 Multi Loop
Cinebench R23: Multi Core | Single Core
Cinebench R20: CPU (Multi Core) | CPU (Single Core)
Cinebench R15: CPU Multi 64Bit | CPU Single 64Bit
Blender: v2.79 BMW27 CPU
7-Zip 18.03: 7z b 4 | 7z b 4 -mmt1
Geekbench 6.4: Multi-Core | Single-Core
Geekbench 5.5: Multi-Core | Single-Core
HWBOT x265 Benchmark v2.2: 4k Preset
LibreOffice : 20 Documents To PDF
R Benchmark 2.5: Overall mean
* ... Moindre est la valeur, meilleures sont les performances
AIDA64: FP32 Ray-Trace | FPU Julia | CPU SHA3 | CPU Queen | FPU SinJulia | FPU Mandel | CPU AES | CPU ZLib | FP64 Ray-Trace | CPU PhotoWorxx
| Performance Rating | |
| MSI Vector 16 HX A14V | |
| Lenovo Legion Pro 7 16IRX9H | |
| Asus ROG Strix Scar 16 G634JZR | |
| Alienware x16 R2 P120F | |
| Alienware x16 R1 | |
| Alienware m16 R2 | |
| Moyenne Intel Core Ultra 9 185H | |
| AIDA64 / FP32 Ray-Trace | |
| MSI Vector 16 HX A14V | |
| Lenovo Legion Pro 7 16IRX9H | |
| Asus ROG Strix Scar 16 G634JZR | |
| Alienware x16 R2 P120F | |
| Alienware m16 R2 | |
| Alienware x16 R1 | |
| Moyenne Intel Core Ultra 9 185H (9220 - 18676, n=19) | |
| AIDA64 / FPU Julia | |
| MSI Vector 16 HX A14V | |
| Lenovo Legion Pro 7 16IRX9H | |
| Asus ROG Strix Scar 16 G634JZR | |
| Alienware x16 R2 P120F | |
| Alienware m16 R2 | |
| Alienware x16 R1 | |
| Moyenne Intel Core Ultra 9 185H (48865 - 96463, n=19) | |
| AIDA64 / CPU SHA3 | |
| Lenovo Legion Pro 7 16IRX9H | |
| MSI Vector 16 HX A14V | |
| Asus ROG Strix Scar 16 G634JZR | |
| Alienware x16 R2 P120F | |
| Alienware m16 R2 | |
| Alienware x16 R1 | |
| Moyenne Intel Core Ultra 9 185H (2394 - 4534, n=19) | |
| AIDA64 / CPU Queen | |
| Asus ROG Strix Scar 16 G634JZR | |
| Lenovo Legion Pro 7 16IRX9H | |
| MSI Vector 16 HX A14V | |
| Alienware x16 R1 | |
| Alienware x16 R2 P120F | |
| Moyenne Intel Core Ultra 9 185H (66785 - 95241, n=19) | |
| Alienware m16 R2 | |
| AIDA64 / FPU SinJulia | |
| Lenovo Legion Pro 7 16IRX9H | |
| MSI Vector 16 HX A14V | |
| Asus ROG Strix Scar 16 G634JZR | |
| Alienware x16 R1 | |
| Alienware x16 R2 P120F | |
| Alienware m16 R2 | |
| Moyenne Intel Core Ultra 9 185H (7255 - 11392, n=19) | |
| AIDA64 / FPU Mandel | |
| MSI Vector 16 HX A14V | |
| Lenovo Legion Pro 7 16IRX9H | |
| Asus ROG Strix Scar 16 G634JZR | |
| Alienware x16 R2 P120F | |
| Alienware m16 R2 | |
| Alienware x16 R1 | |
| Moyenne Intel Core Ultra 9 185H (24004 - 48020, n=19) | |
| AIDA64 / CPU AES | |
| Asus ROG Strix Scar 16 G634JZR | |
| Lenovo Legion Pro 7 16IRX9H | |
| MSI Vector 16 HX A14V | |
| Moyenne Intel Core Ultra 9 185H (53116 - 154066, n=19) | |
| Alienware x16 R2 P120F | |
| Alienware m16 R2 | |
| Alienware x16 R1 | |
| AIDA64 / CPU ZLib | |
| Lenovo Legion Pro 7 16IRX9H | |
| MSI Vector 16 HX A14V | |
| Asus ROG Strix Scar 16 G634JZR | |
| Alienware x16 R2 P120F | |
| Alienware x16 R1 | |
| Alienware m16 R2 | |
| Moyenne Intel Core Ultra 9 185H (678 - 1341, n=19) | |
| AIDA64 / FP64 Ray-Trace | |
| MSI Vector 16 HX A14V | |
| Lenovo Legion Pro 7 16IRX9H | |
| Asus ROG Strix Scar 16 G634JZR | |
| Alienware x16 R2 P120F | |
| Alienware x16 R1 | |
| Alienware m16 R2 | |
| Moyenne Intel Core Ultra 9 185H (4428 - 10078, n=19) | |
| AIDA64 / CPU PhotoWorxx | |
| Alienware x16 R2 P120F | |
| Asus ROG Strix Scar 16 G634JZR | |
| Alienware x16 R1 | |
| MSI Vector 16 HX A14V | |
| Moyenne Intel Core Ultra 9 185H (44547 - 53918, n=19) | |
| Lenovo Legion Pro 7 16IRX9H | |
| Alienware m16 R2 | |
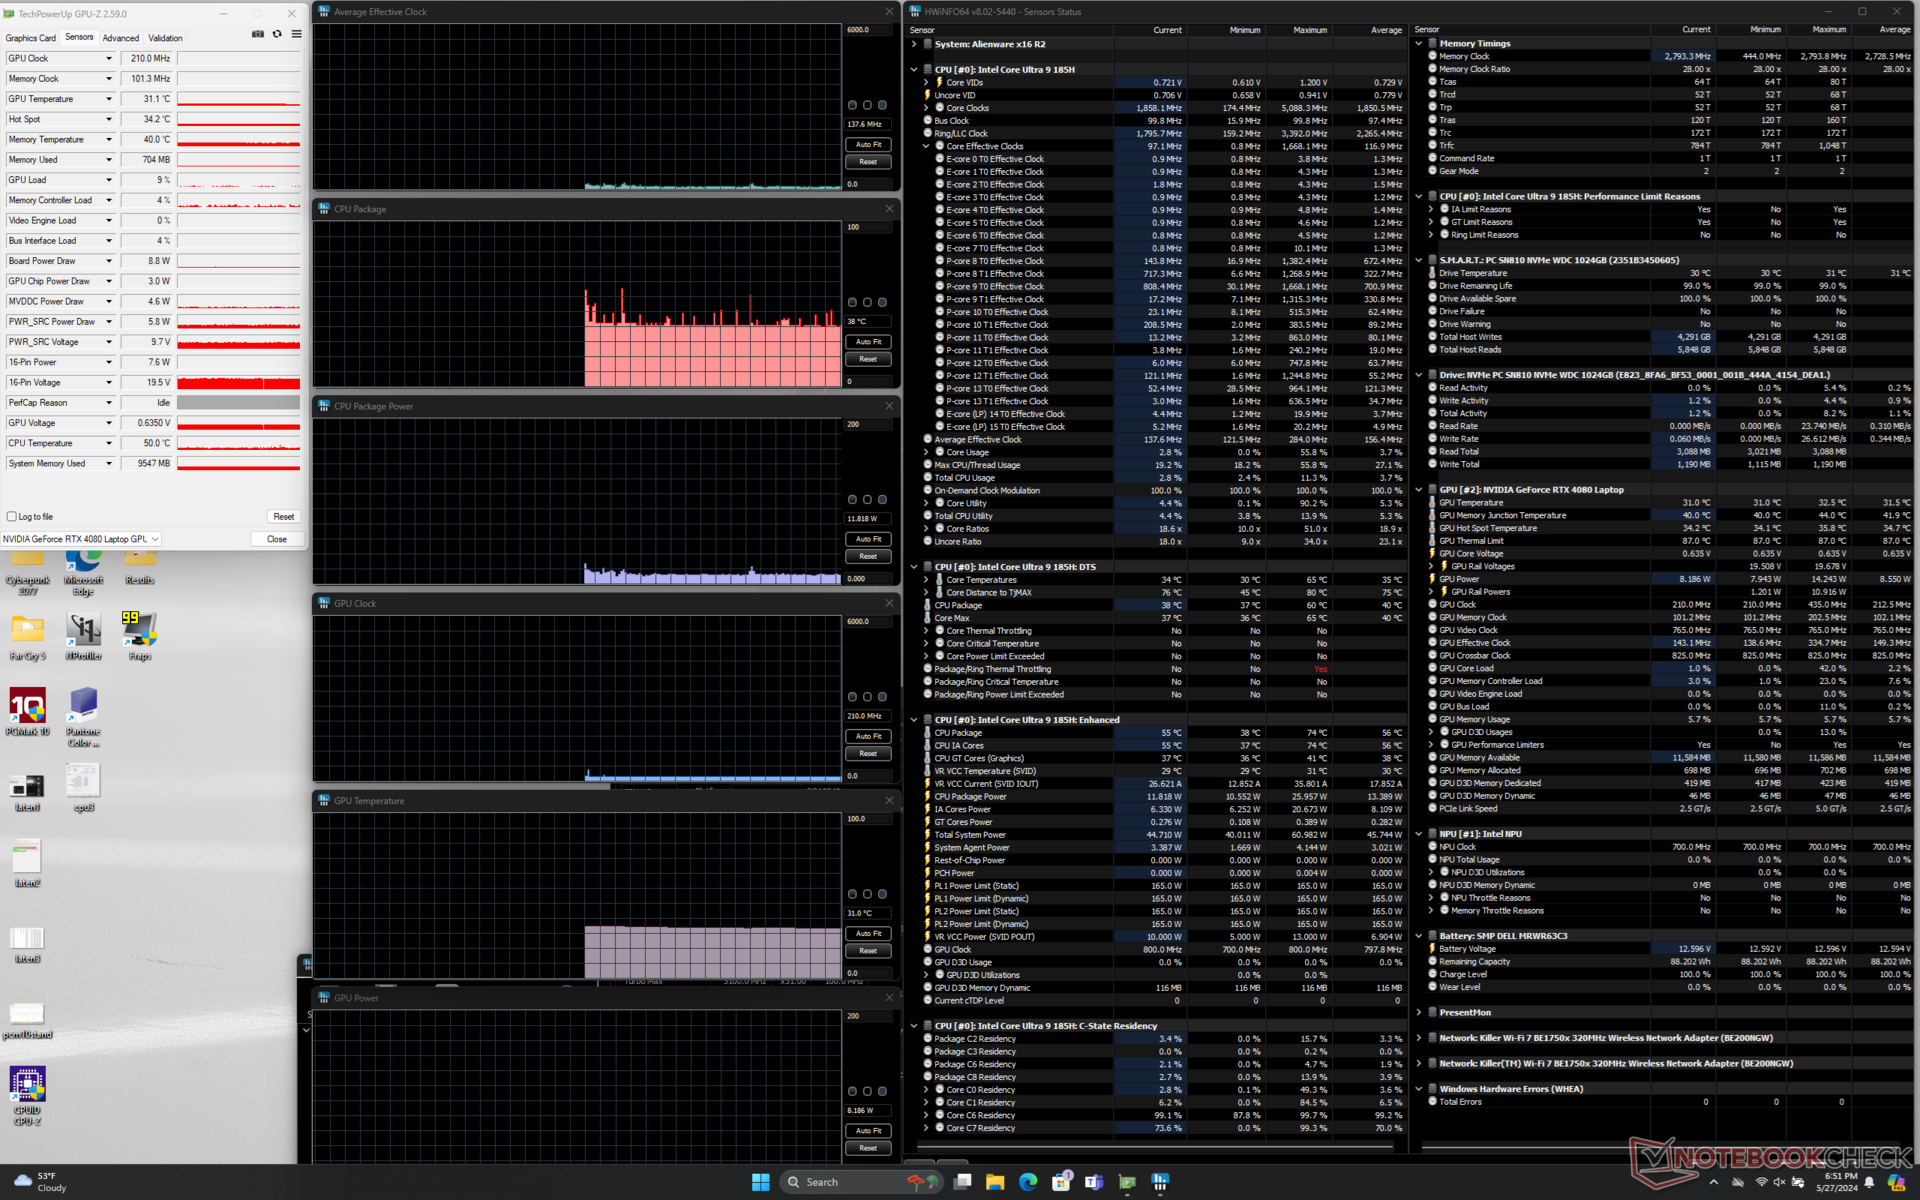
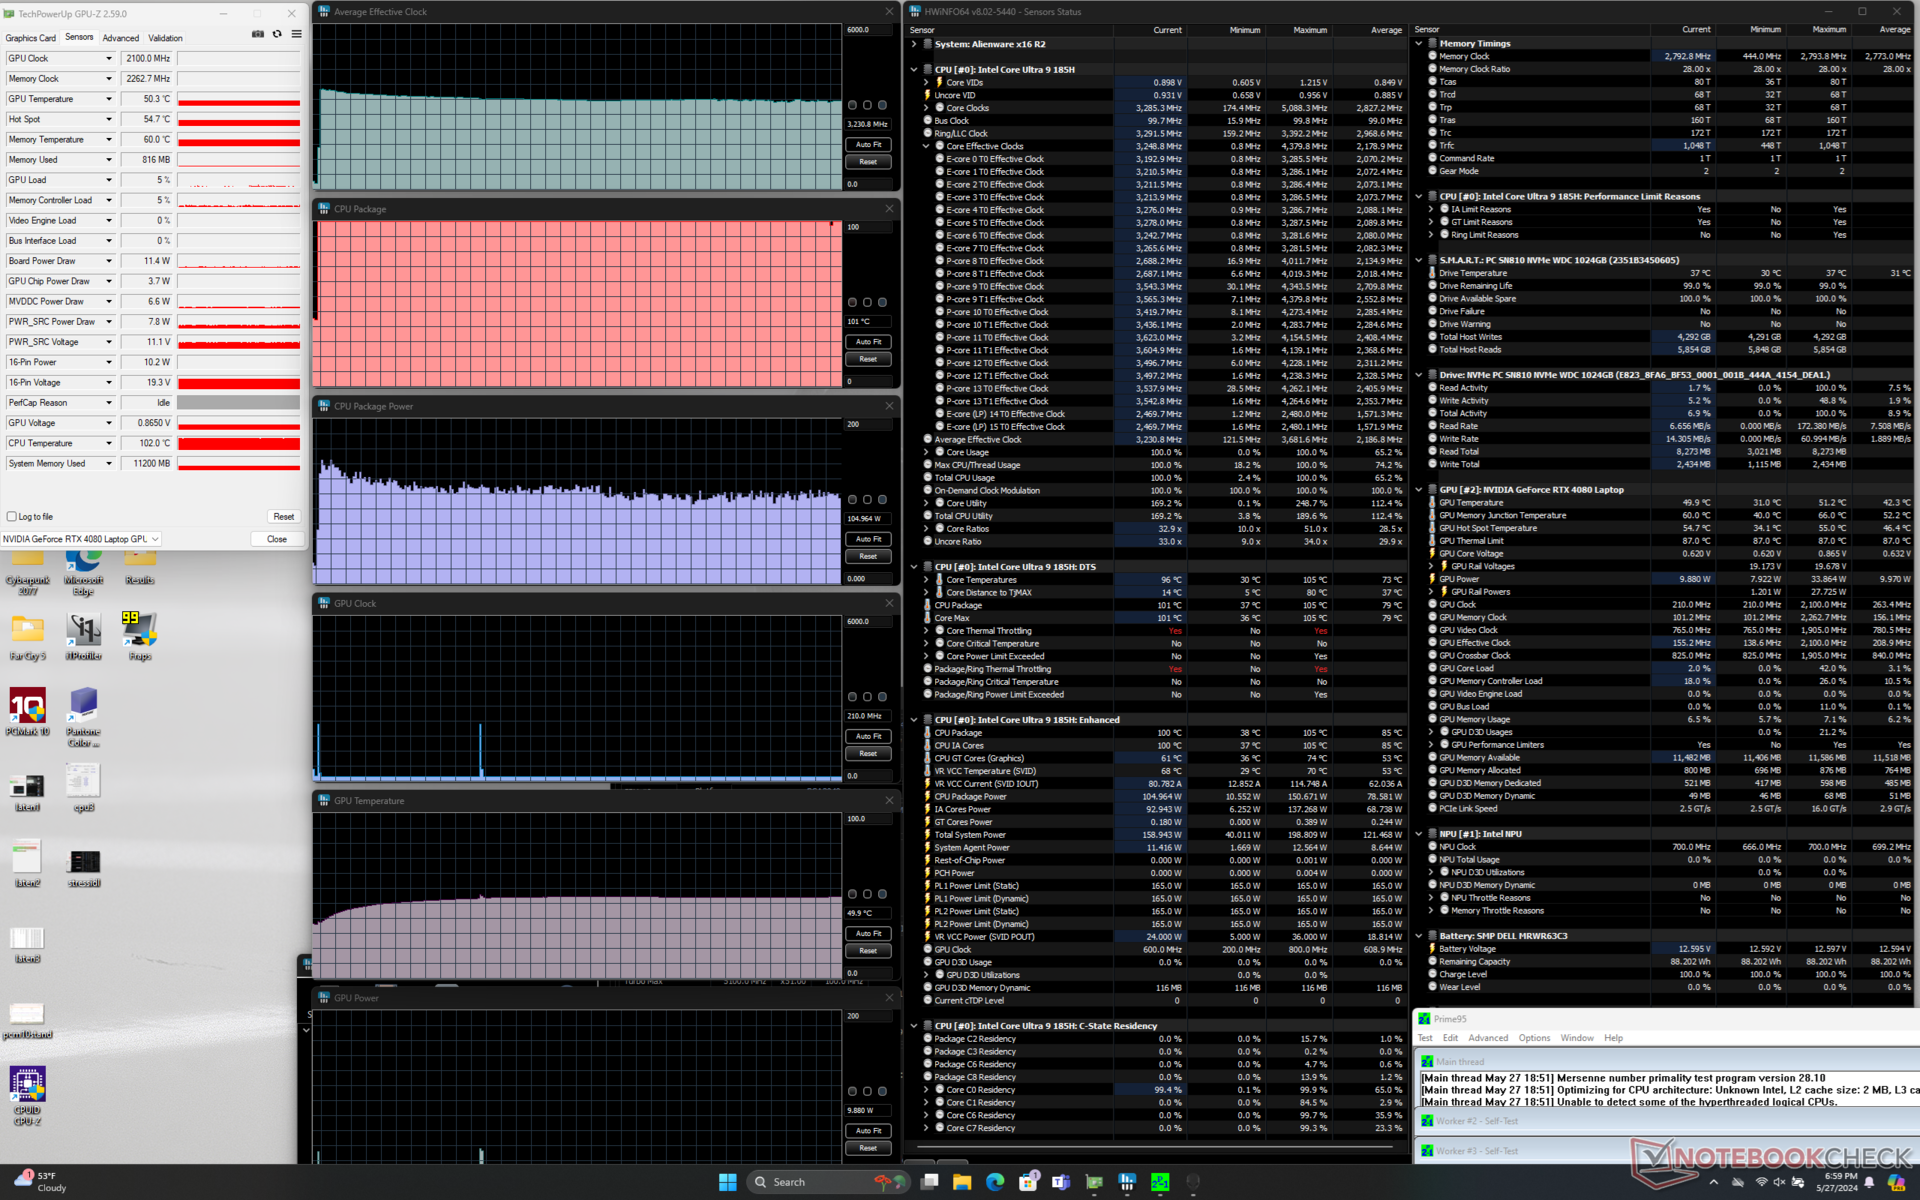
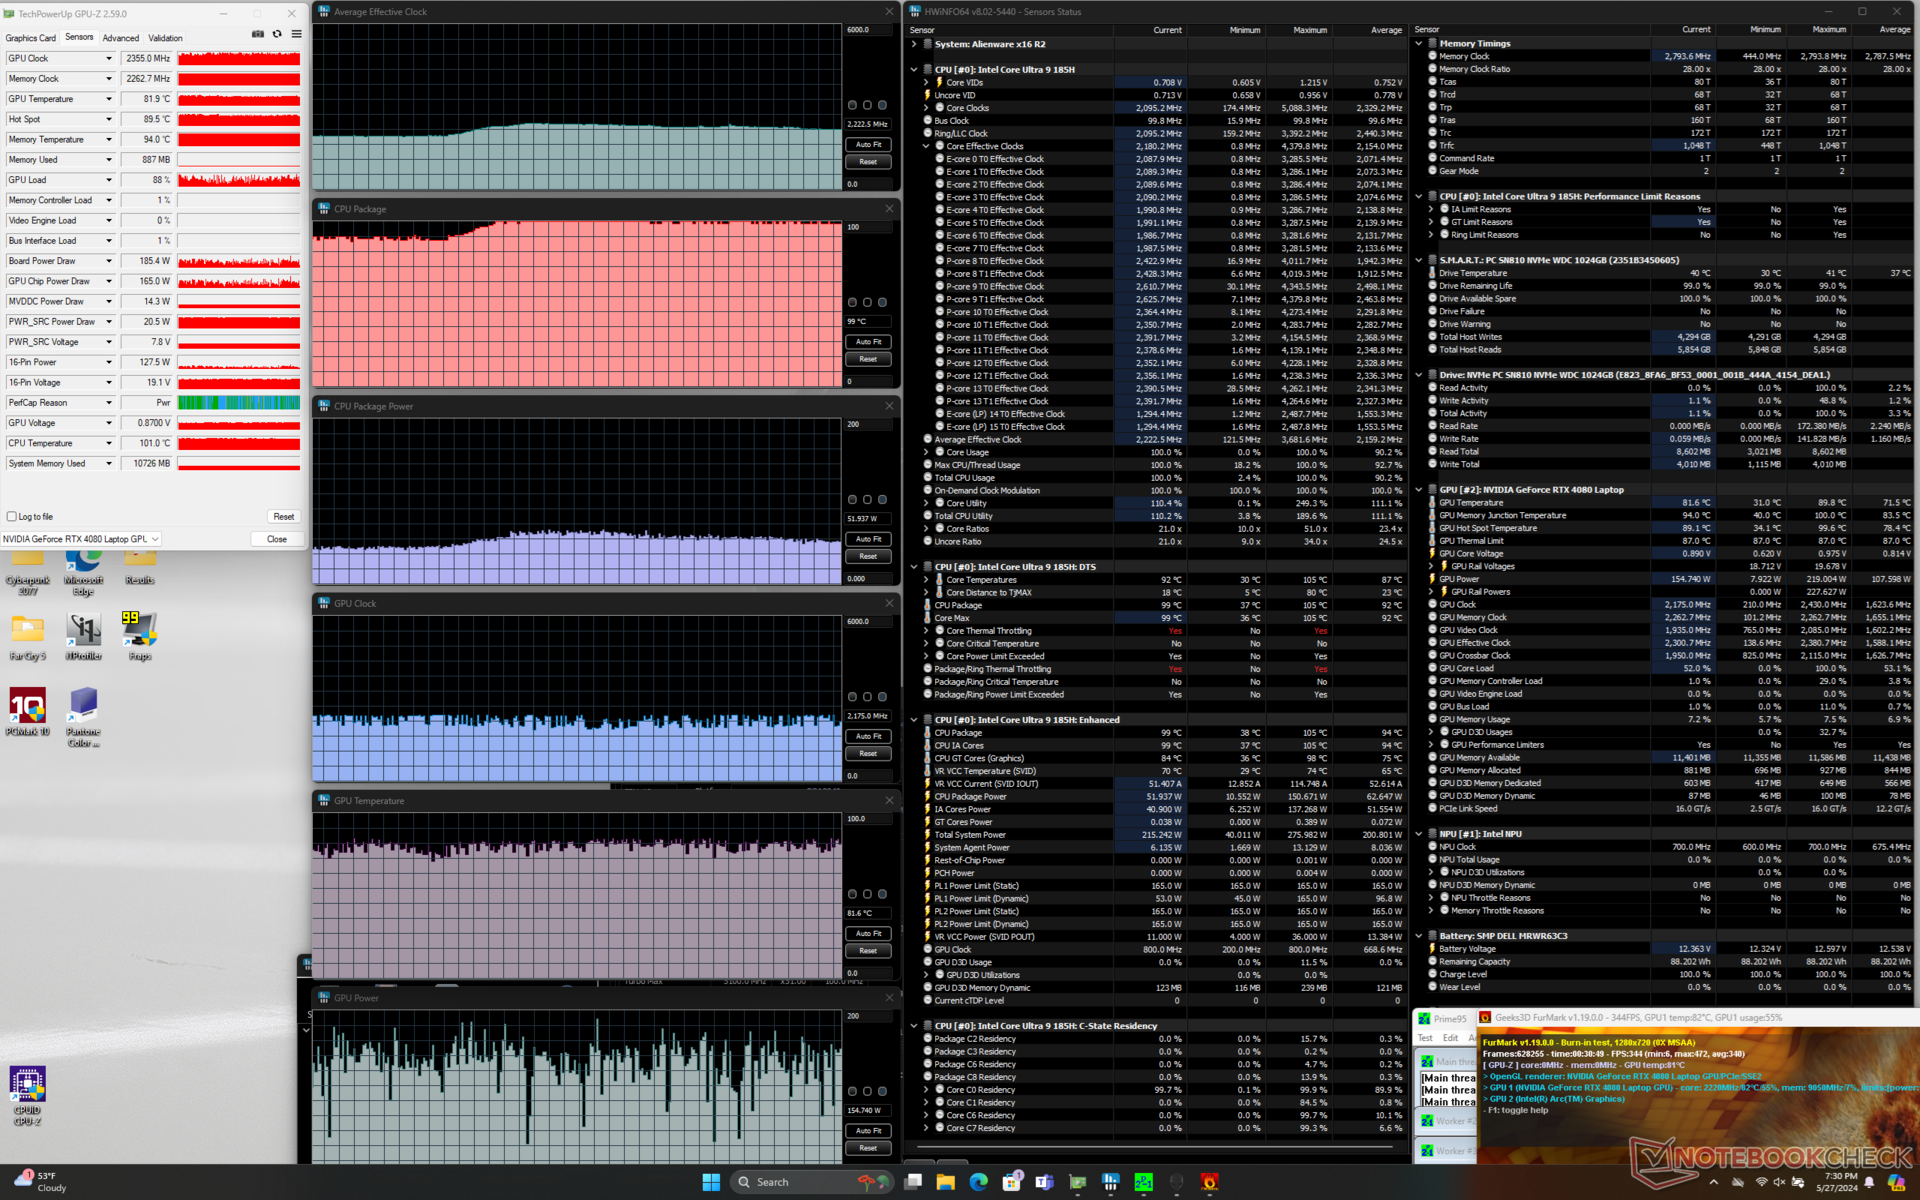
Test de stress
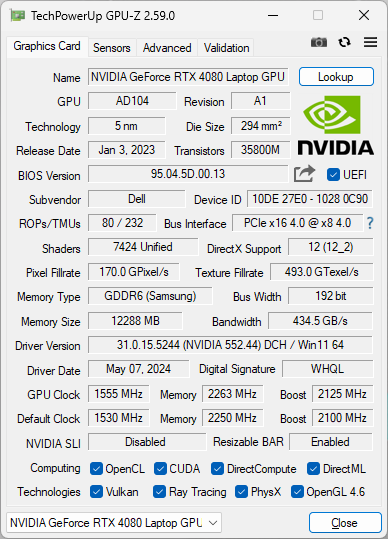
Les températures des cœurs entre le CPU et le GPU sont aussi chaudes que celles que nous avons enregistrées sur la x16 R1. Le CPU en particulier se stabilise toujours à près de 100°C ( !) en exécutant Prime95 tandis que le GPU se stabilise dans la moyenne des 80°C en exécutant Witcher 3. Il est intéressant de noter que la fréquence d'horloge du GPU est en baisse par rapport au x16 R1. Le GPU se situe entre 2100 et 2325 MHz selon le profil d'alimentation, contre 2460 MHz sur le x16 R1 original. La consommation d'énergie de la carte est également plus faible sur le nouveau modèle x16 R2 (150 W contre 165 W). Ces résultats sont en corrélation avec les performances graphiques généralement plus lentes dans la section Performances du GPU ci-dessous.
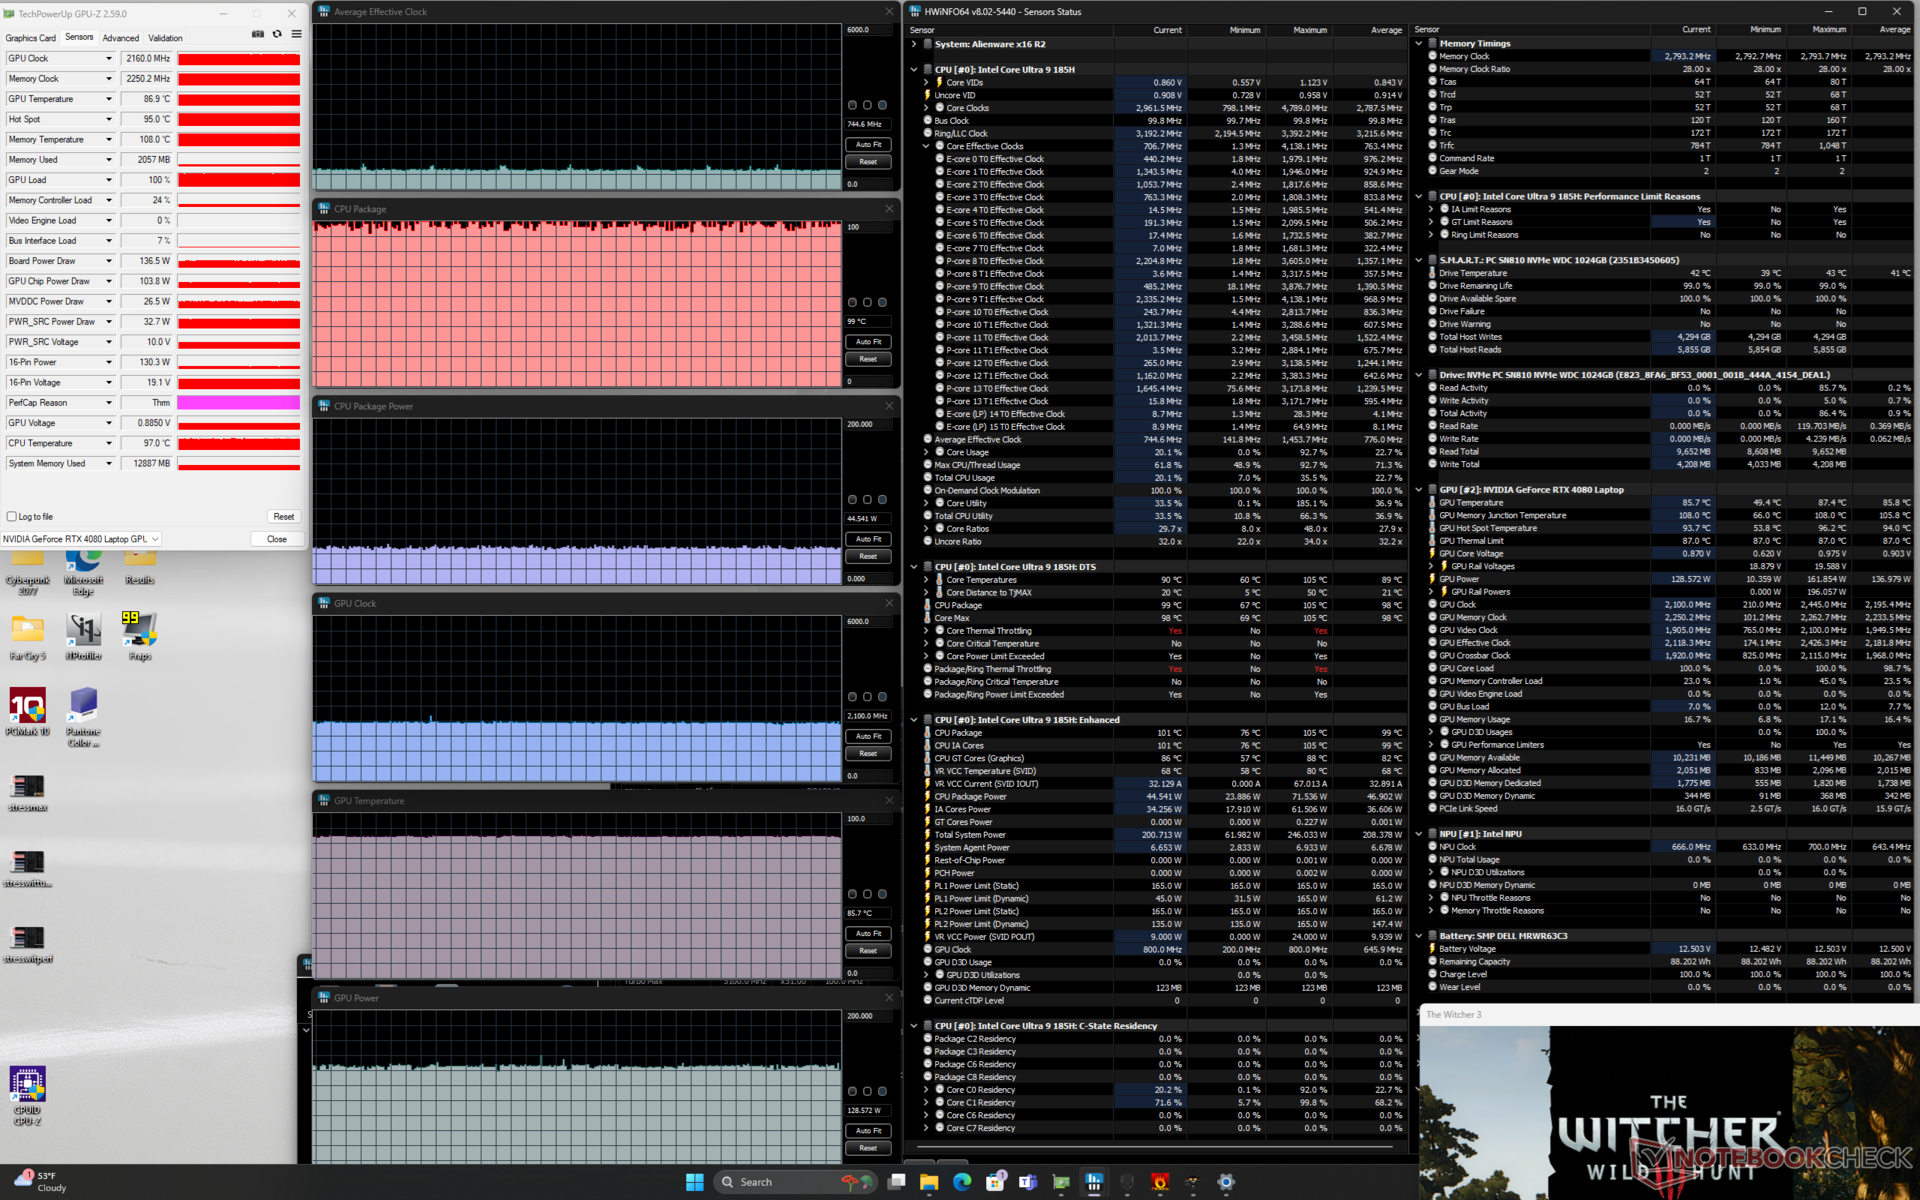
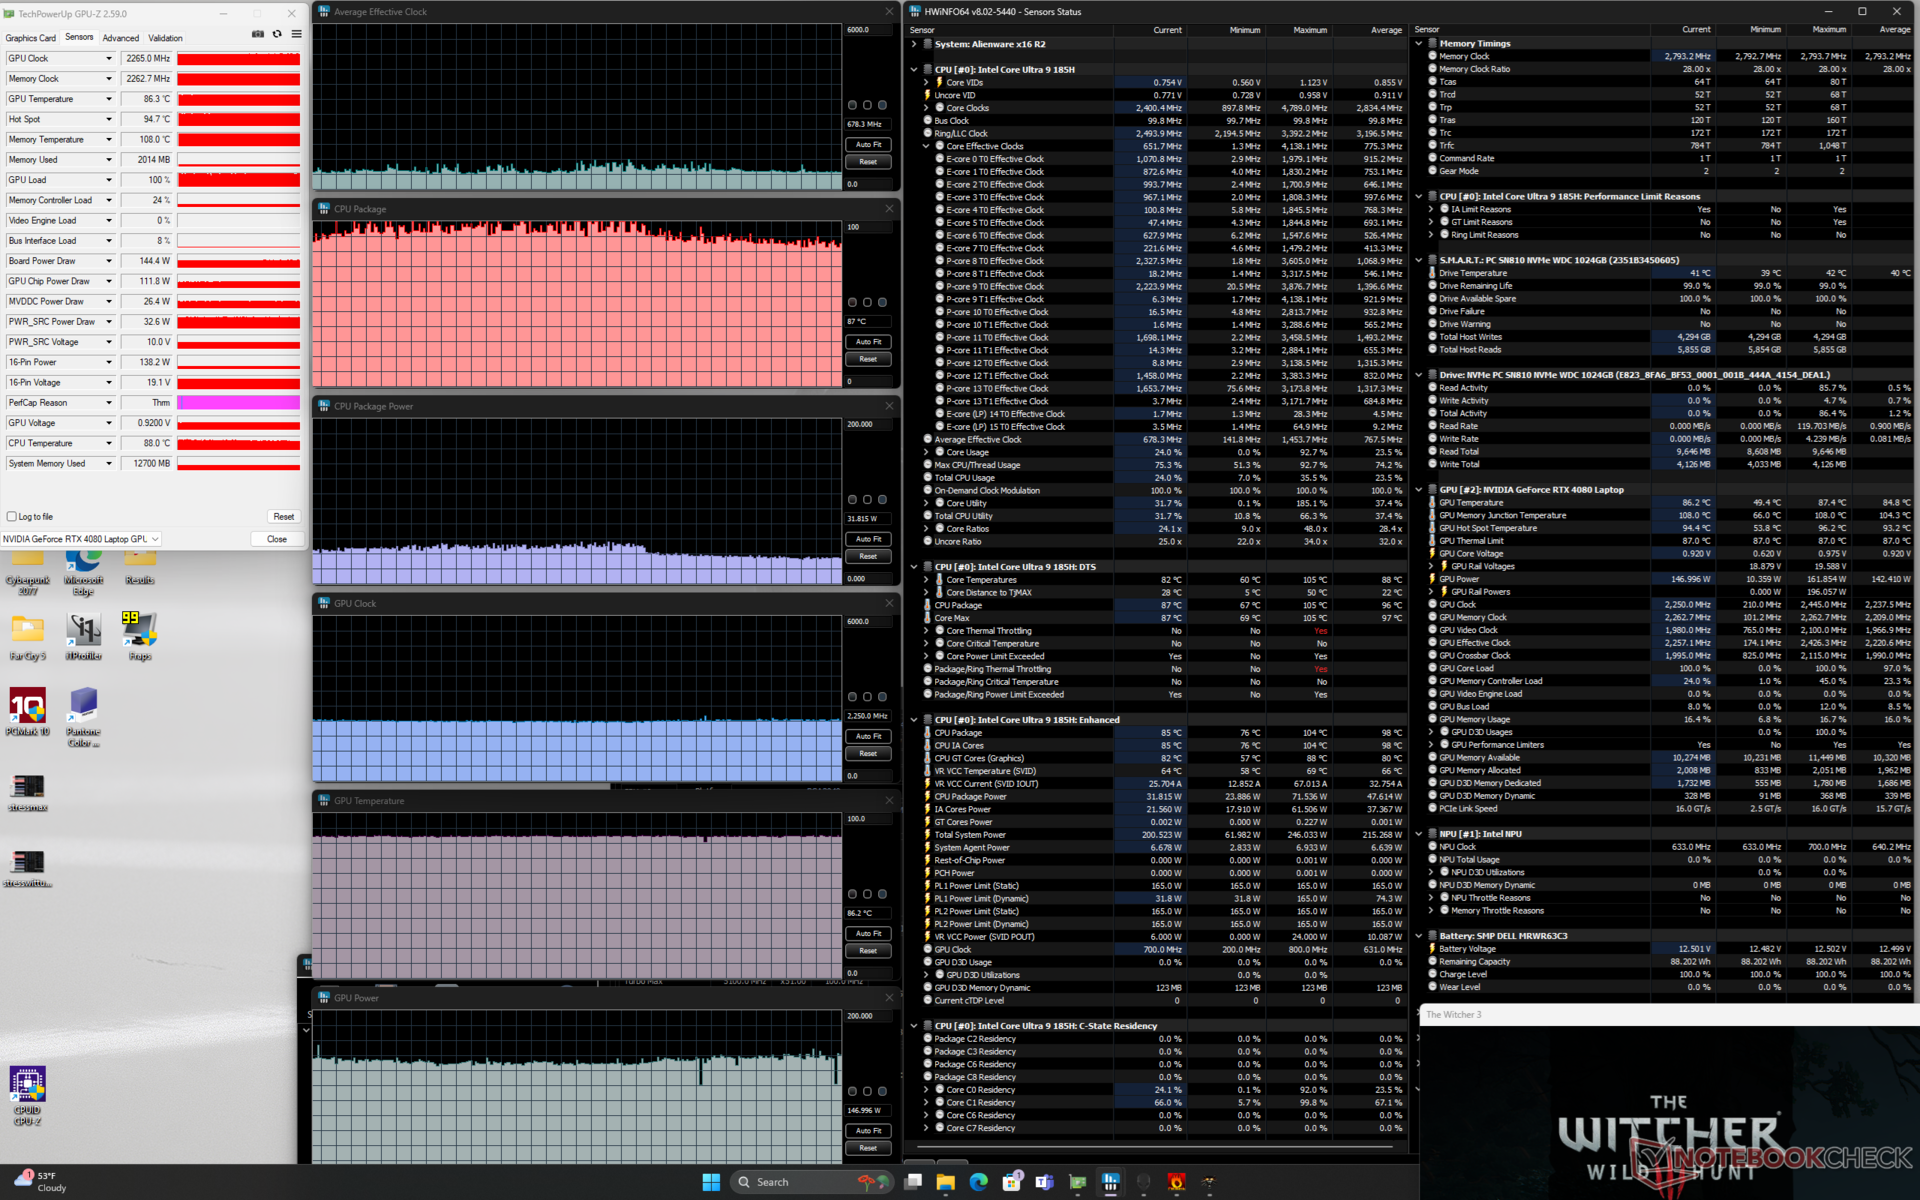
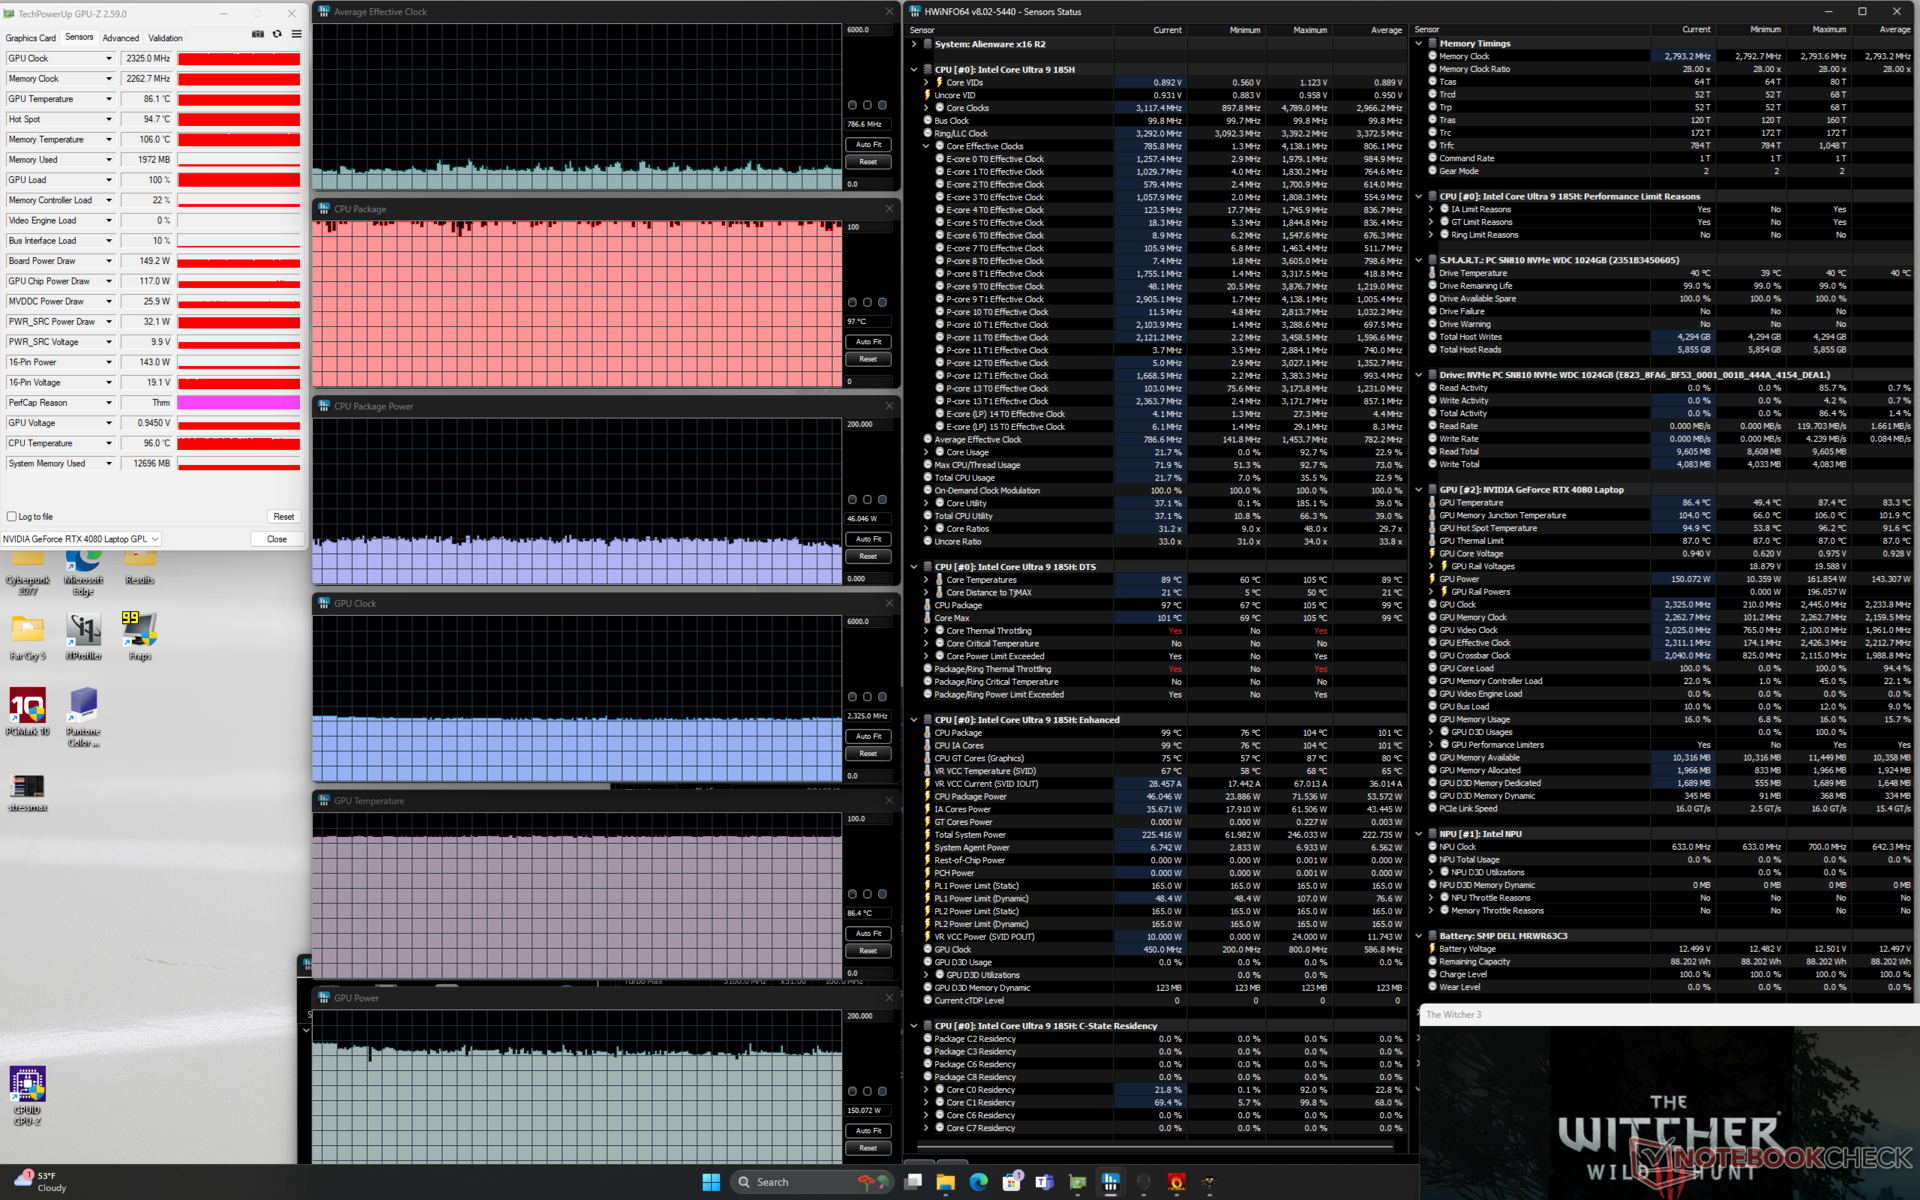
| Horloge moyenne du CPU (GHz) | Horloge du GPU (MHz) | Température moyenne du CPU (°C) | Température moyenne du GPU (°C) | |
| Système au repos | -- | -- | 38 | 31 |
| Prime95 Stress | 3.2 | -- | 101 | 50 |
| Prime95 + FurMark Stress | 2.2 | 2175 | 99 | 82 |
| Witcher 3 Stress(mode équilibré) | 0,7 | 2100 | 99 | 86 |
| Witcher 3 Stress (mode Performance) | 0.7 | 2250 | 87 | 86 |
| Witcher 3 Stress (mode Overdrive) | 0.8 | 2325 | 97 | 86 |
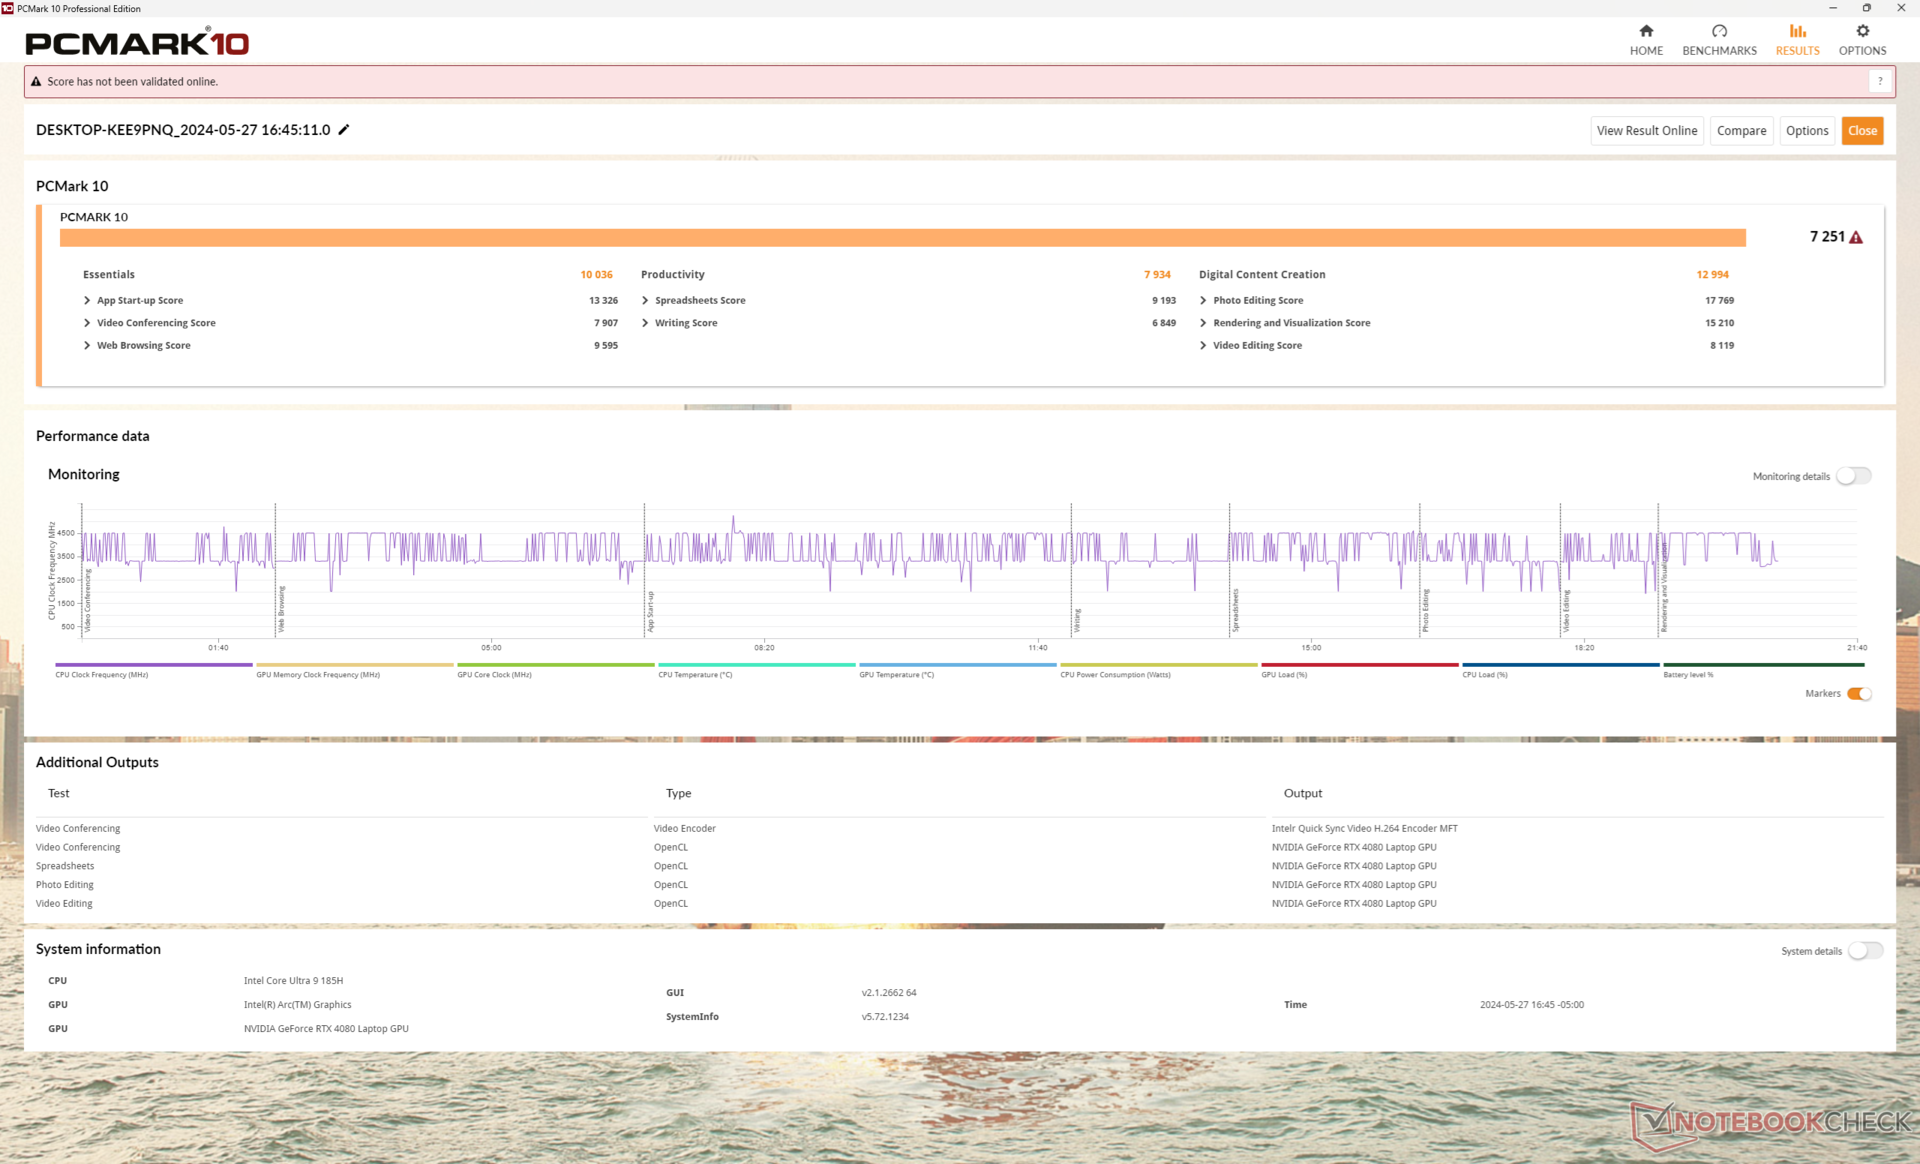
Performance du système
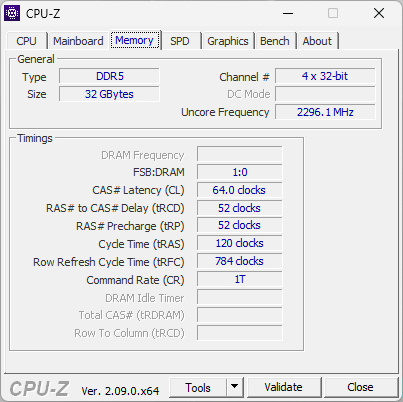
Les résultats de PCMark sont à peu près identiques, voire inférieurs, à ceux d'avant. Par ailleurs, la mémoire vive est légèrement plus rapide cette année (7467 MT/s contre 6000 MT/s), ce qui se traduit par des résultats de copie/lecture AIDA64 légèrement supérieurs, mais par des résultats d'écriture et de latence inférieurs.
CrossMark: Overall | Productivity | Creativity | Responsiveness
WebXPRT 3: Overall
WebXPRT 4: Overall
Mozilla Kraken 1.1: Total
| PCMark 10 / Score | |
| Lenovo Legion Pro 7 16IRX9H | |
| MSI Vector 16 HX A14V | |
| Alienware x16 R1 | |
| Alienware m16 R2 | |
| Asus ROG Strix Scar 16 G634JZR | |
| Alienware x16 R2 P120F | |
| Moyenne Intel Core Ultra 9 185H, NVIDIA GeForce RTX 4080 Laptop GPU (n=1) | |
| PCMark 10 / Essentials | |
| Lenovo Legion Pro 7 16IRX9H | |
| Asus ROG Strix Scar 16 G634JZR | |
| MSI Vector 16 HX A14V | |
| Alienware x16 R1 | |
| Alienware m16 R2 | |
| Alienware x16 R2 P120F | |
| Moyenne Intel Core Ultra 9 185H, NVIDIA GeForce RTX 4080 Laptop GPU (n=1) | |
| PCMark 10 / Productivity | |
| Lenovo Legion Pro 7 16IRX9H | |
| Alienware x16 R1 | |
| MSI Vector 16 HX A14V | |
| Alienware m16 R2 | |
| Alienware x16 R2 P120F | |
| Moyenne Intel Core Ultra 9 185H, NVIDIA GeForce RTX 4080 Laptop GPU (n=1) | |
| Asus ROG Strix Scar 16 G634JZR | |
| PCMark 10 / Digital Content Creation | |
| Asus ROG Strix Scar 16 G634JZR | |
| MSI Vector 16 HX A14V | |
| Lenovo Legion Pro 7 16IRX9H | |
| Alienware x16 R1 | |
| Alienware m16 R2 | |
| Alienware x16 R2 P120F | |
| Moyenne Intel Core Ultra 9 185H, NVIDIA GeForce RTX 4080 Laptop GPU (n=1) | |
| CrossMark / Overall | |
| Lenovo Legion Pro 7 16IRX9H | |
| MSI Vector 16 HX A14V | |
| Asus ROG Strix Scar 16 G634JZR | |
| Alienware x16 R1 | |
| Alienware m16 R2 | |
| Alienware x16 R2 P120F | |
| Moyenne Intel Core Ultra 9 185H, NVIDIA GeForce RTX 4080 Laptop GPU (n=1) | |
| CrossMark / Productivity | |
| Lenovo Legion Pro 7 16IRX9H | |
| MSI Vector 16 HX A14V | |
| Asus ROG Strix Scar 16 G634JZR | |
| Alienware x16 R1 | |
| Alienware m16 R2 | |
| Alienware x16 R2 P120F | |
| Moyenne Intel Core Ultra 9 185H, NVIDIA GeForce RTX 4080 Laptop GPU (n=1) | |
| CrossMark / Creativity | |
| Lenovo Legion Pro 7 16IRX9H | |
| MSI Vector 16 HX A14V | |
| Asus ROG Strix Scar 16 G634JZR | |
| Alienware x16 R1 | |
| Alienware m16 R2 | |
| Alienware x16 R2 P120F | |
| Moyenne Intel Core Ultra 9 185H, NVIDIA GeForce RTX 4080 Laptop GPU (n=1) | |
| CrossMark / Responsiveness | |
| Lenovo Legion Pro 7 16IRX9H | |
| MSI Vector 16 HX A14V | |
| Alienware x16 R1 | |
| Asus ROG Strix Scar 16 G634JZR | |
| Alienware x16 R2 P120F | |
| Moyenne Intel Core Ultra 9 185H, NVIDIA GeForce RTX 4080 Laptop GPU (n=1) | |
| Alienware m16 R2 | |
| WebXPRT 3 / Overall | |
| Lenovo Legion Pro 7 16IRX9H | |
| MSI Vector 16 HX A14V | |
| Asus ROG Strix Scar 16 G634JZR | |
| Alienware x16 R1 | |
| Alienware m16 R2 | |
| Alienware x16 R2 P120F | |
| Moyenne Intel Core Ultra 9 185H, NVIDIA GeForce RTX 4080 Laptop GPU (n=1) | |
| WebXPRT 4 / Overall | |
| Lenovo Legion Pro 7 16IRX9H | |
| Asus ROG Strix Scar 16 G634JZR | |
| MSI Vector 16 HX A14V | |
| Alienware x16 R1 | |
| Alienware m16 R2 | |
| Alienware x16 R2 P120F | |
| Moyenne Intel Core Ultra 9 185H, NVIDIA GeForce RTX 4080 Laptop GPU (n=1) | |
| Mozilla Kraken 1.1 / Total | |
| Alienware x16 R2 P120F | |
| Moyenne Intel Core Ultra 9 185H, NVIDIA GeForce RTX 4080 Laptop GPU (n=1) | |
| Alienware m16 R2 | |
| Alienware x16 R1 | |
| MSI Vector 16 HX A14V | |
| Asus ROG Strix Scar 16 G634JZR | |
| Lenovo Legion Pro 7 16IRX9H | |
* ... Moindre est la valeur, meilleures sont les performances
| PCMark 10 Score | 7251 points | |
Aide | ||
| AIDA64 / Memory Copy | |
| Alienware x16 R2 P120F | |
| Moyenne Intel Core Ultra 9 185H (69929 - 95718, n=19) | |
| Asus ROG Strix Scar 16 G634JZR | |
| Lenovo Legion Pro 7 16IRX9H | |
| MSI Vector 16 HX A14V | |
| Alienware x16 R1 | |
| Alienware m16 R2 | |
| AIDA64 / Memory Read | |
| Asus ROG Strix Scar 16 G634JZR | |
| Lenovo Legion Pro 7 16IRX9H | |
| MSI Vector 16 HX A14V | |
| Alienware x16 R2 P120F | |
| Moyenne Intel Core Ultra 9 185H (64619 - 87768, n=19) | |
| Alienware m16 R2 | |
| Alienware x16 R1 | |
| AIDA64 / Memory Write | |
| Alienware x16 R1 | |
| Asus ROG Strix Scar 16 G634JZR | |
| MSI Vector 16 HX A14V | |
| Alienware x16 R2 P120F | |
| Moyenne Intel Core Ultra 9 185H (51114 - 93871, n=19) | |
| Lenovo Legion Pro 7 16IRX9H | |
| Alienware m16 R2 | |
| AIDA64 / Memory Latency | |
| Moyenne Intel Core Ultra 9 185H (121.4 - 259, n=19) | |
| Alienware x16 R2 P120F | |
| Alienware m16 R2 | |
| Alienware x16 R1 | |
| MSI Vector 16 HX A14V | |
| Asus ROG Strix Scar 16 G634JZR | |
| Lenovo Legion Pro 7 16IRX9H | |
* ... Moindre est la valeur, meilleures sont les performances
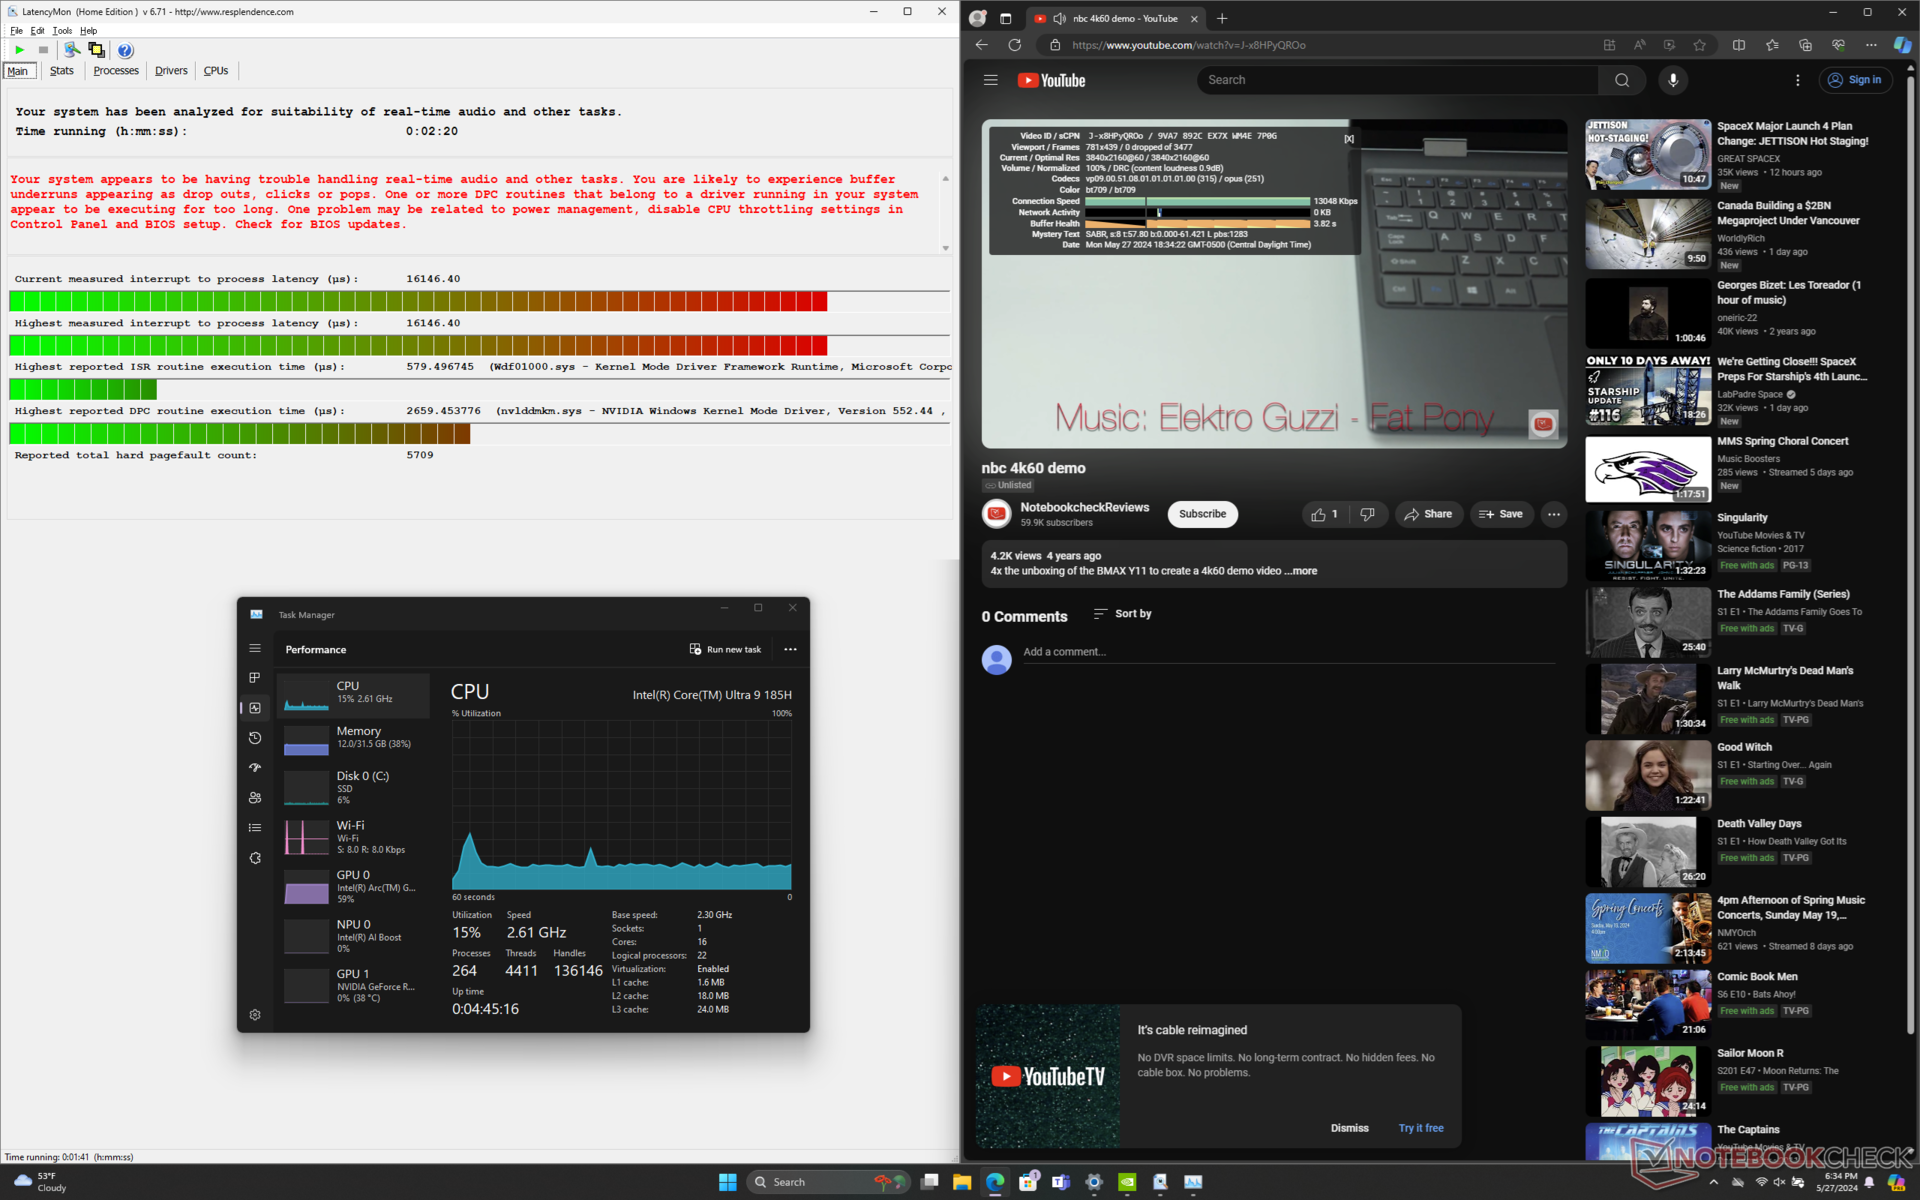
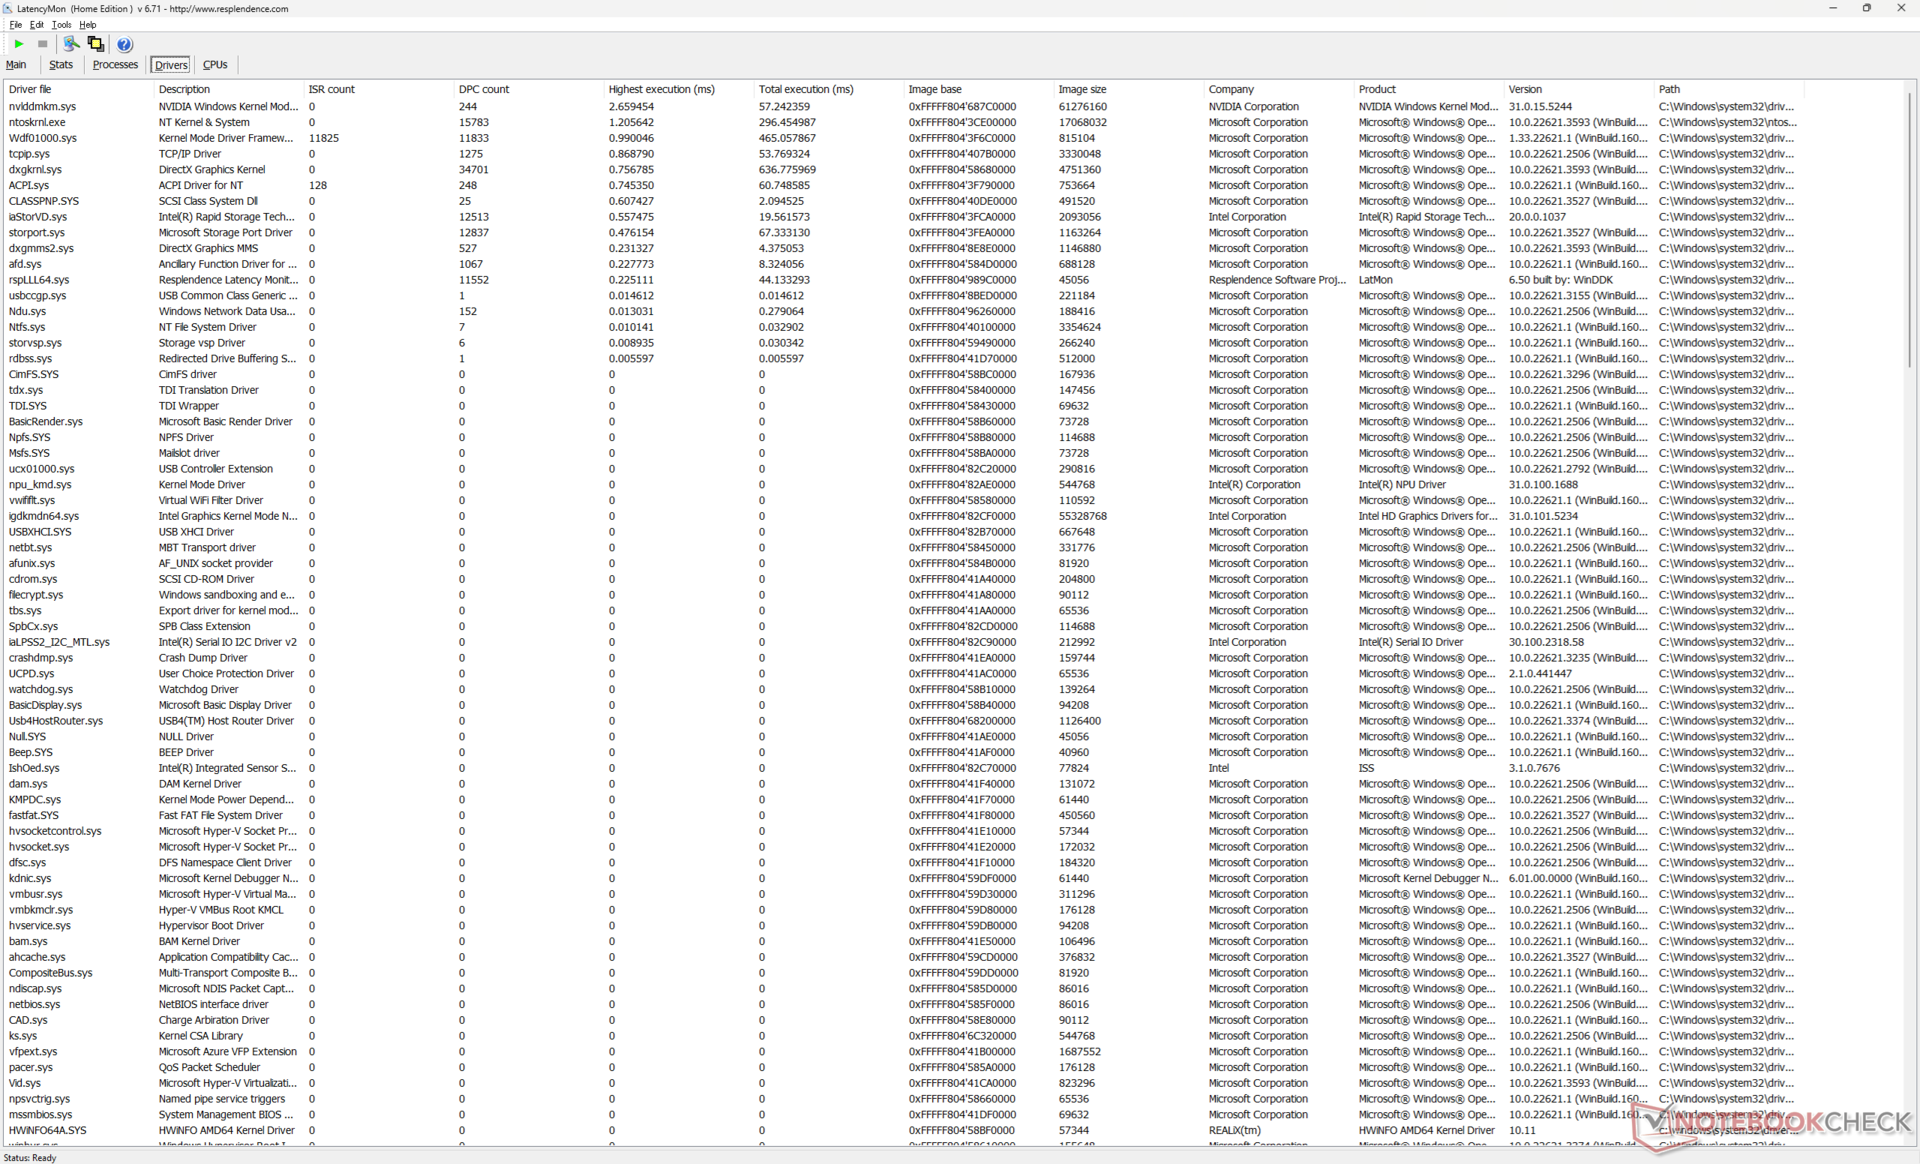
Latence DPC
LatencyMon révèle des problèmes DPC notables lors de l'ouverture de plusieurs onglets de notre page d'accueil, même après plusieurs tentatives en mode Optimus. Nous n'avons pas rencontré de tels problèmes avec la carte x16 R1 d'origine. la lecture vidéo 4K à 60 FPS est par ailleurs parfaite, sans aucune perte d'images.
| DPC Latencies / LatencyMon - interrupt to process latency (max), Web, Youtube, Prime95 | |
| Alienware x16 R2 P120F | |
| Asus ROG Strix Scar 16 G634JZR | |
| Alienware m16 R2 | |
| MSI Vector 16 HX A14V | |
| Alienware x16 R1 | |
| Lenovo Legion Pro 7 16IRX9H | |
* ... Moindre est la valeur, meilleures sont les performances
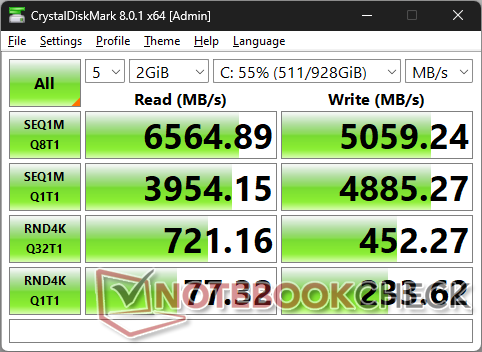
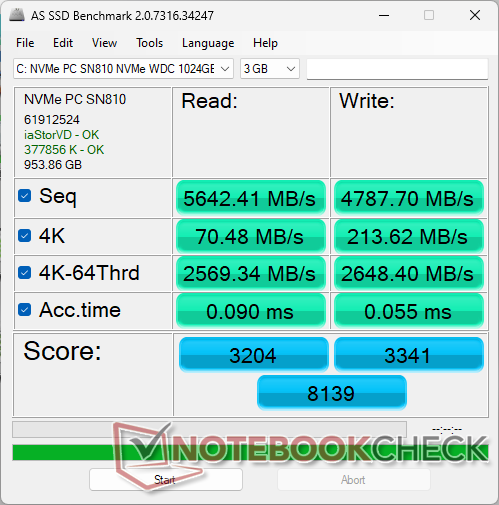
Dispositifs de stockage
Notre unité de test est livrée avec le WDC PC SN810 au lieu du SK Hynix PC801 du modèle de l'année dernière. Le disque Western Digital peut maintenir des taux de transfert maximum plus longtemps que le SK Hynix, comme le montre notre graphique en boucle DiskSpd ci-dessous, mais les taux d'écriture sont généralement plus lents.

| Drive Performance Rating - Percent | |
| Lenovo Legion Pro 7 16IRX9H | |
| Alienware x16 R1 | |
| Alienware x16 R2 P120F | |
| Alienware m16 R2 | |
| Asus ROG Strix Scar 16 G634JZR | |
| MSI Vector 16 HX A14V | |
* ... Moindre est la valeur, meilleures sont les performances
Disk Throttling: DiskSpd Read Loop, Queue Depth 8
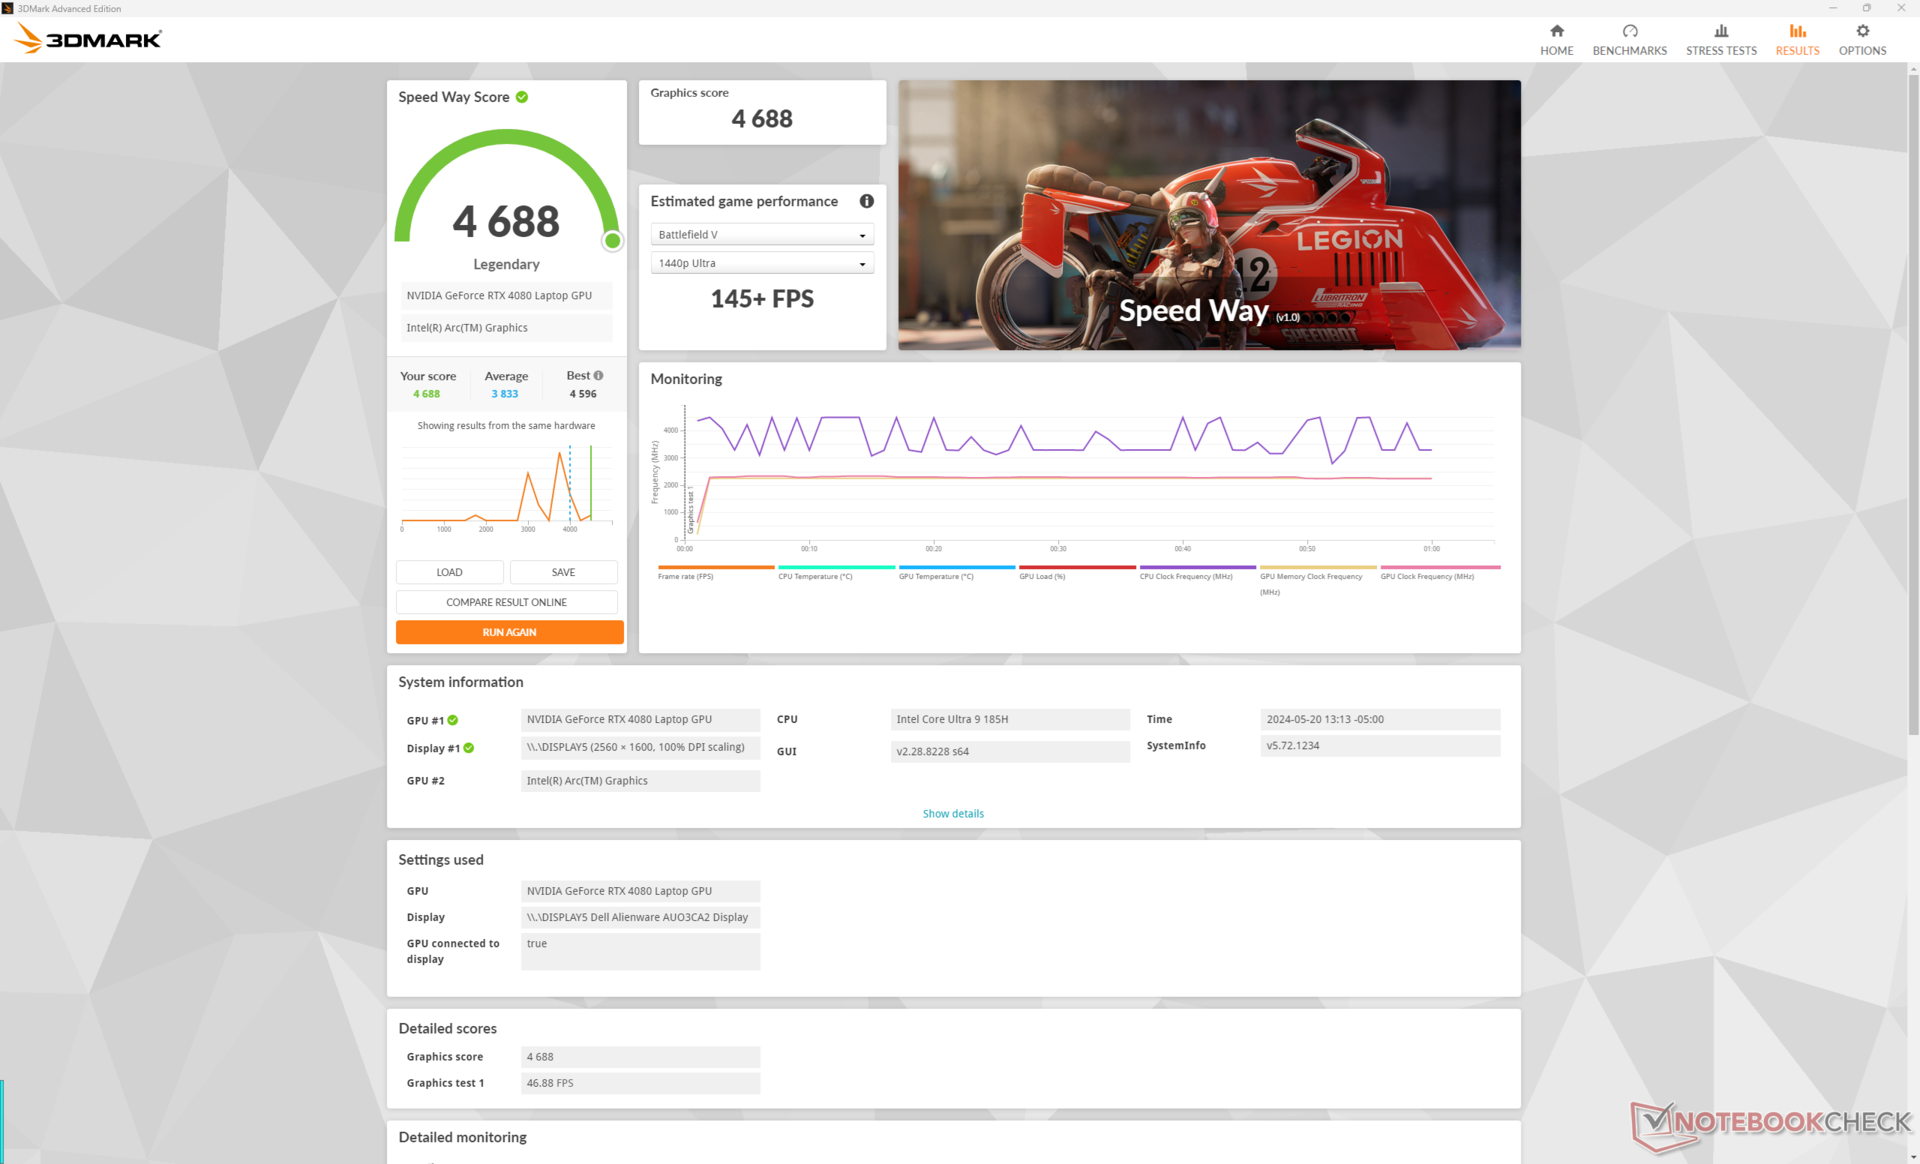
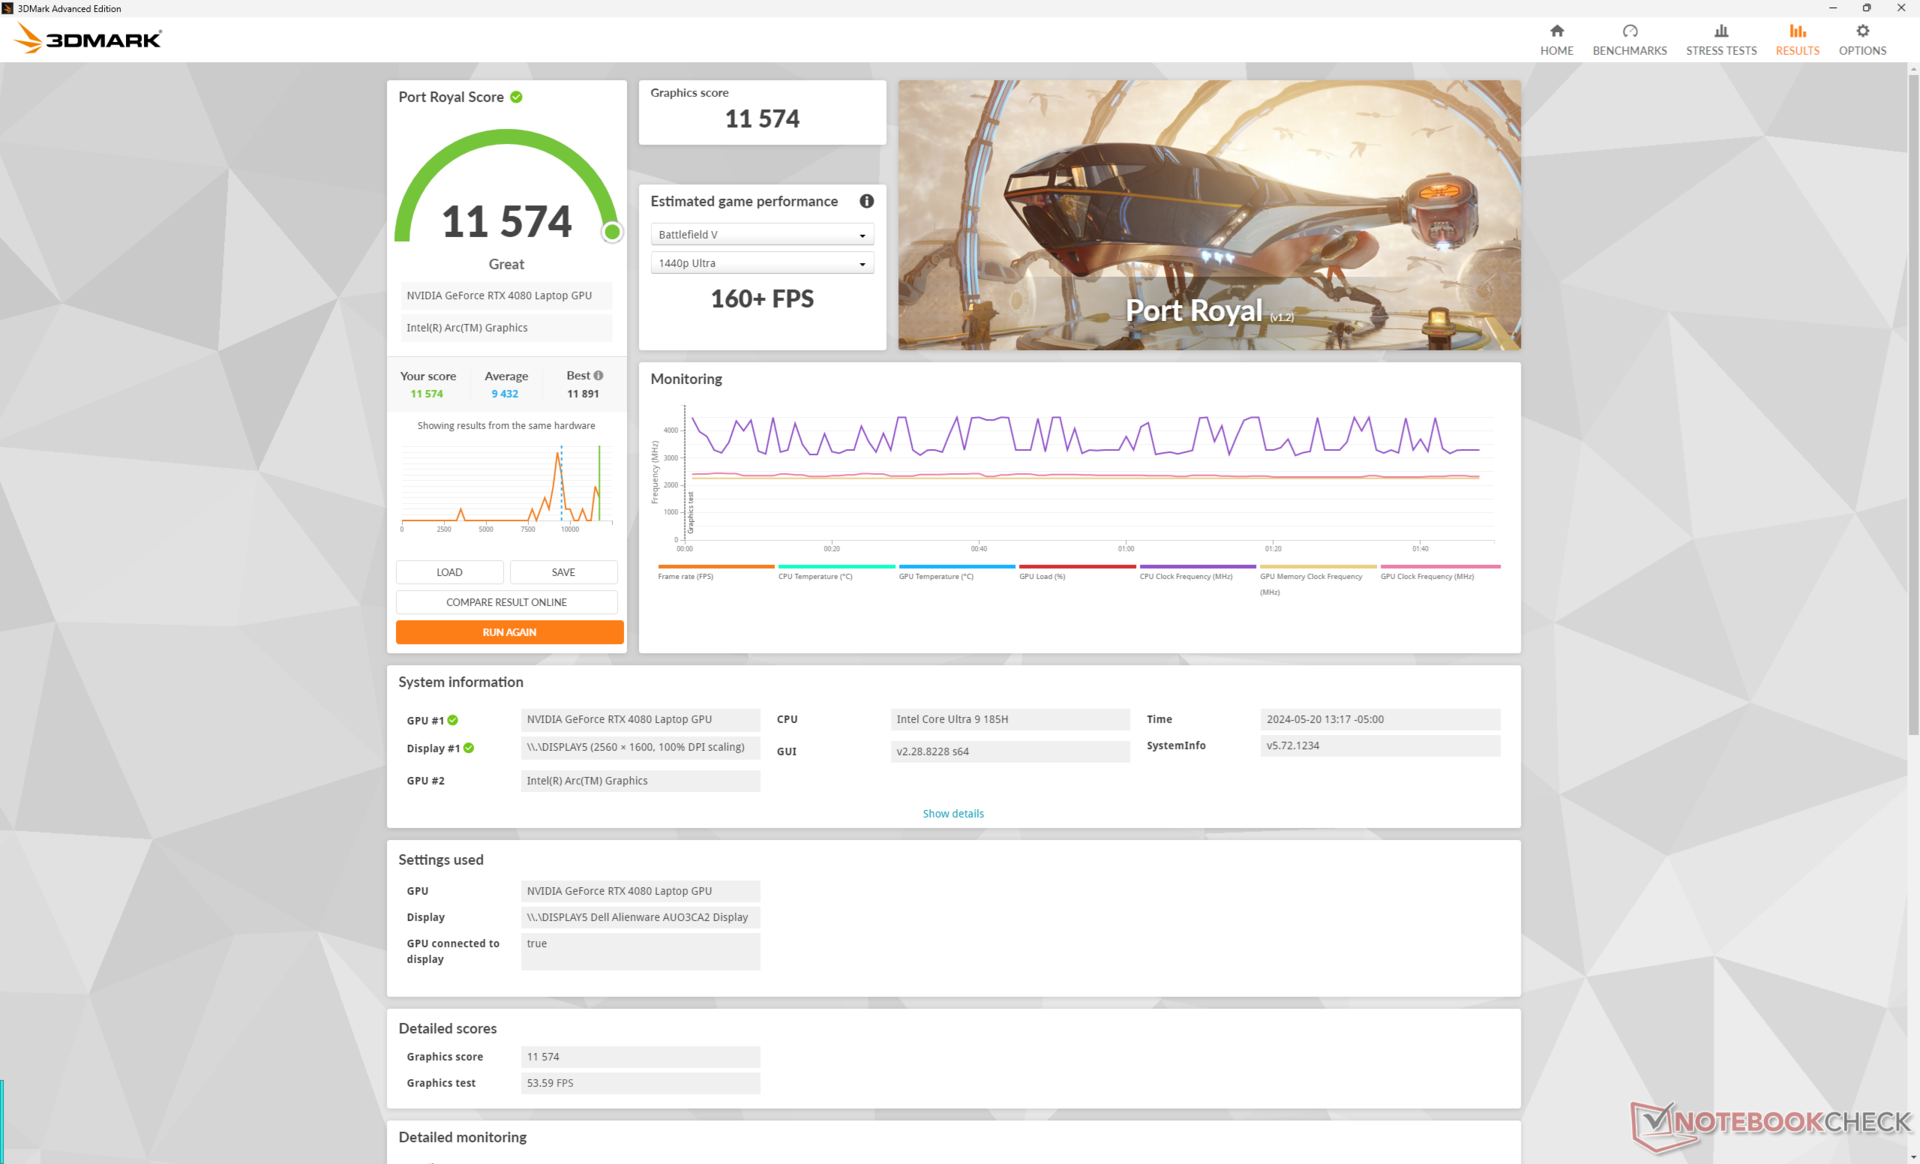
Performance du GPU
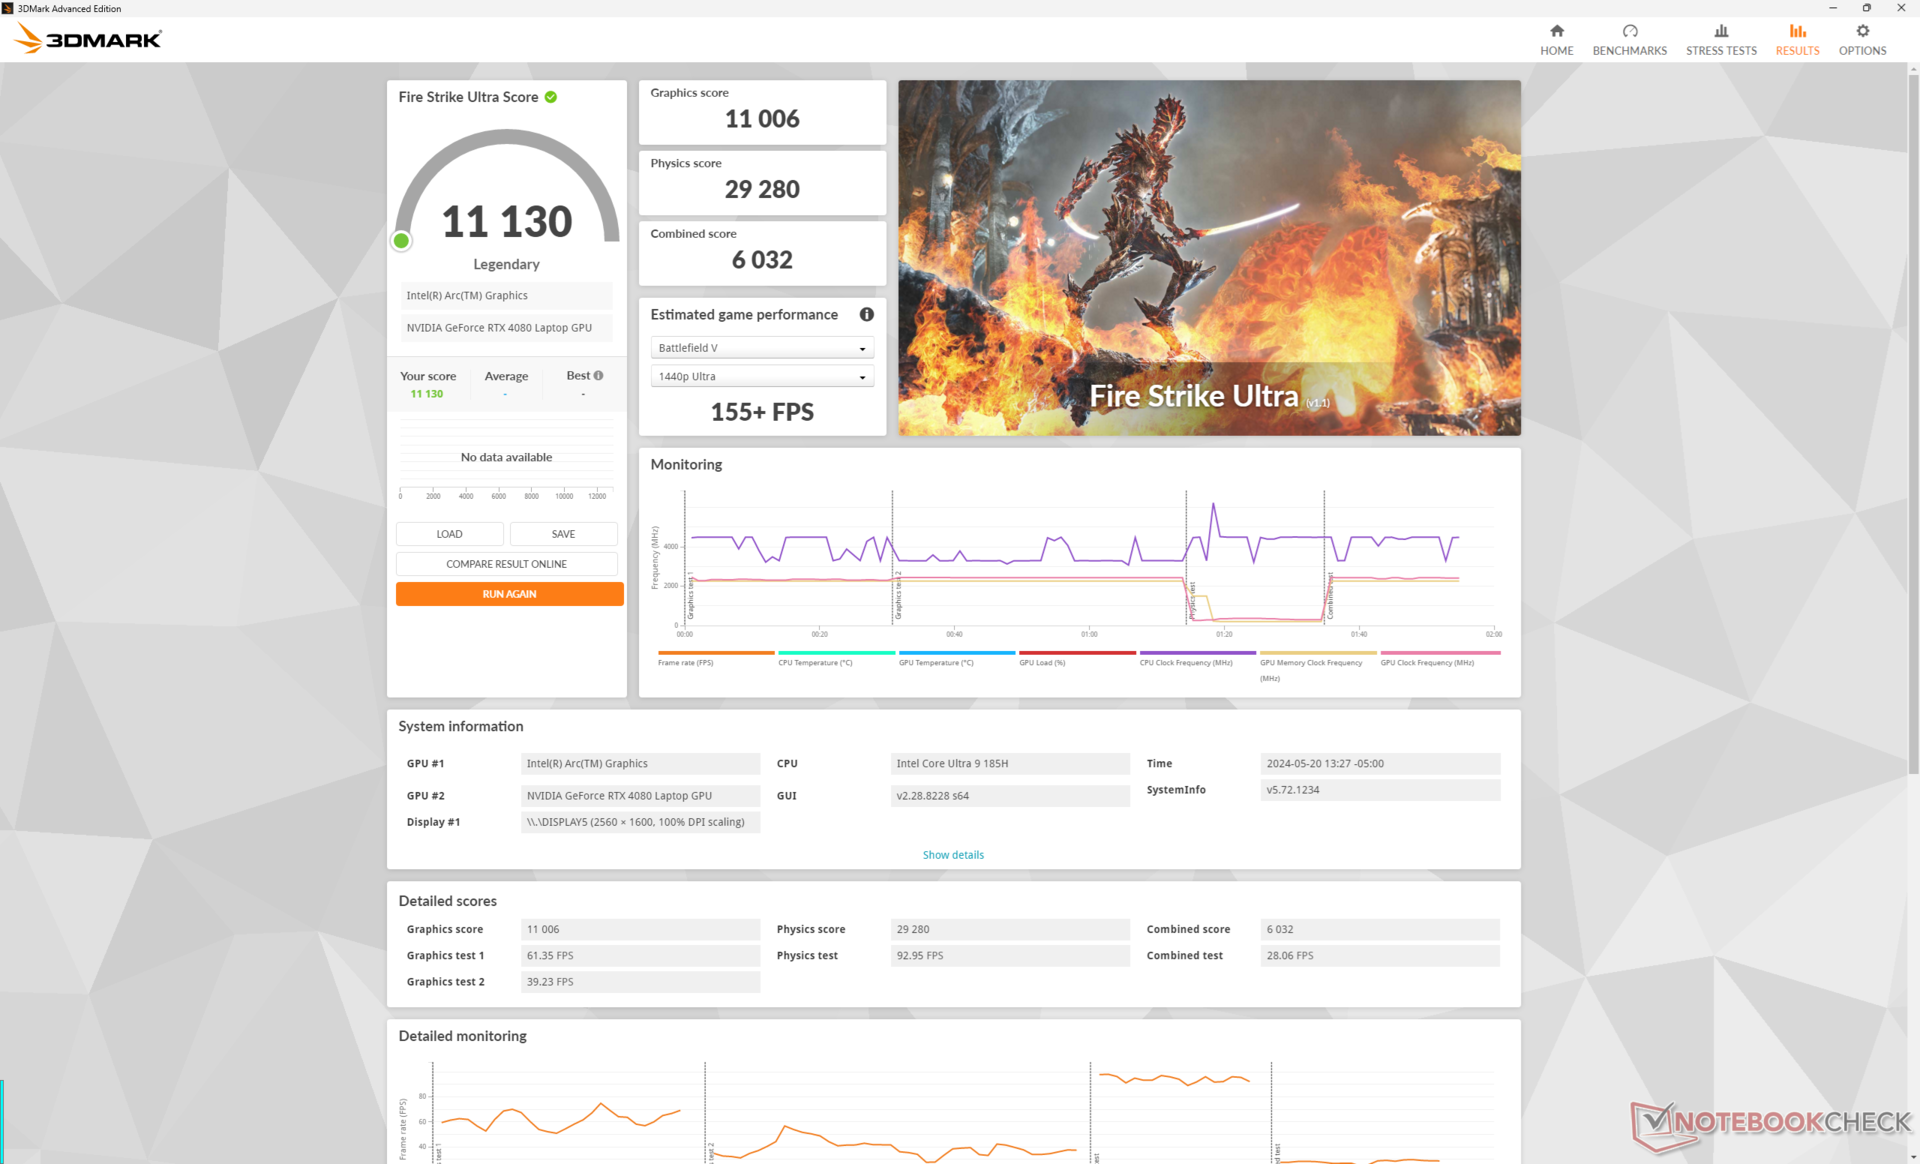
Le 175 W GeForce RTX 4080 Reste le même, bien que les scores 3DMark soient environ 5 % plus lents que ceux que nous avons enregistrés avec la x16 R1. La mise à niveau vers la RTX 4090 devrait améliorer les performances de 5 à 15 % seulement, tandis que le passage à la configuration RTX 4070 ou 4060 réduira les performances de 30 % et 45 %, respectivement.
| Profil de puissance | Score graphique | Score physique | Score combiné |
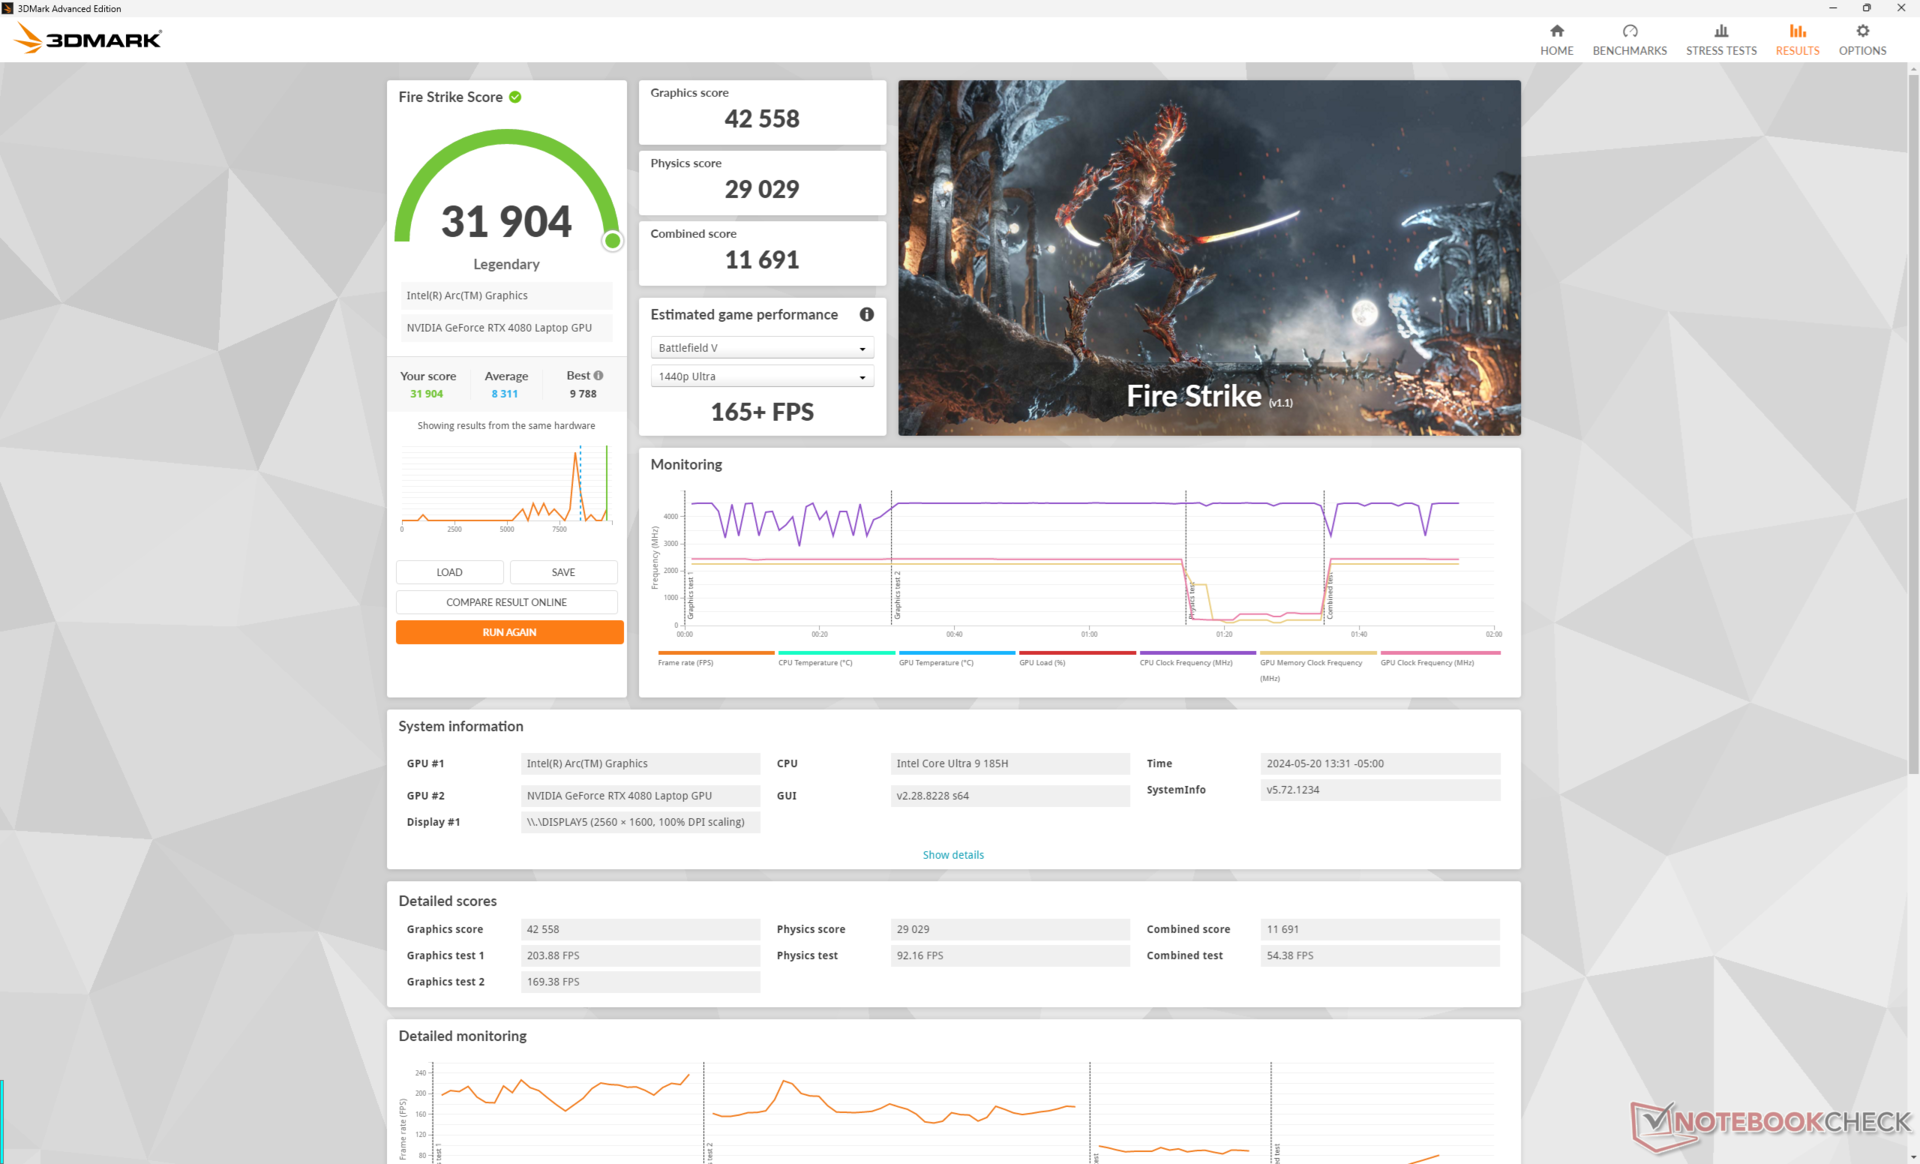
| Mode Overdrive | 42558 | 29029 | 11691 |
| Mode Performance | 40773 (-4%) | 26070 (-10%) | 12450 (-7%) |
| Mode équilibré | 40593 (-5%) | 26746 (-8%) | 12237 (-5%) |
| Alimentation par batterie | 21754 (-49%) | 25880 (-11%) | 9863 (-16%) |
Faire fonctionner le système en mode Performance au lieu du mode Overdrive aura un léger impact sur les performances globales, comme le montre notre tableau de résultats Fire Strike ci-dessus. Il est intéressant de noter que la différence entre les modes Performance et Équilibré est comparativement beaucoup plus faible.
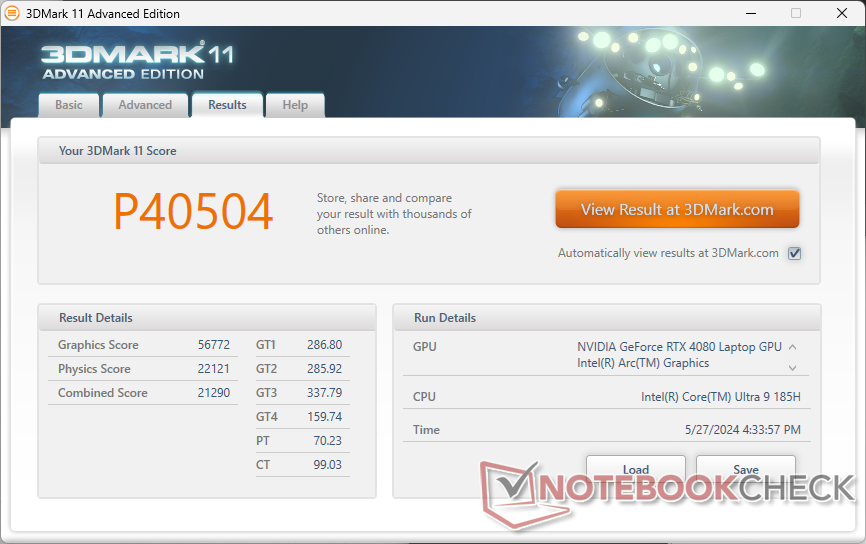
| 3DMark 11 Performance | 40504 points | |
| 3DMark Fire Strike Score | 31904 points | |
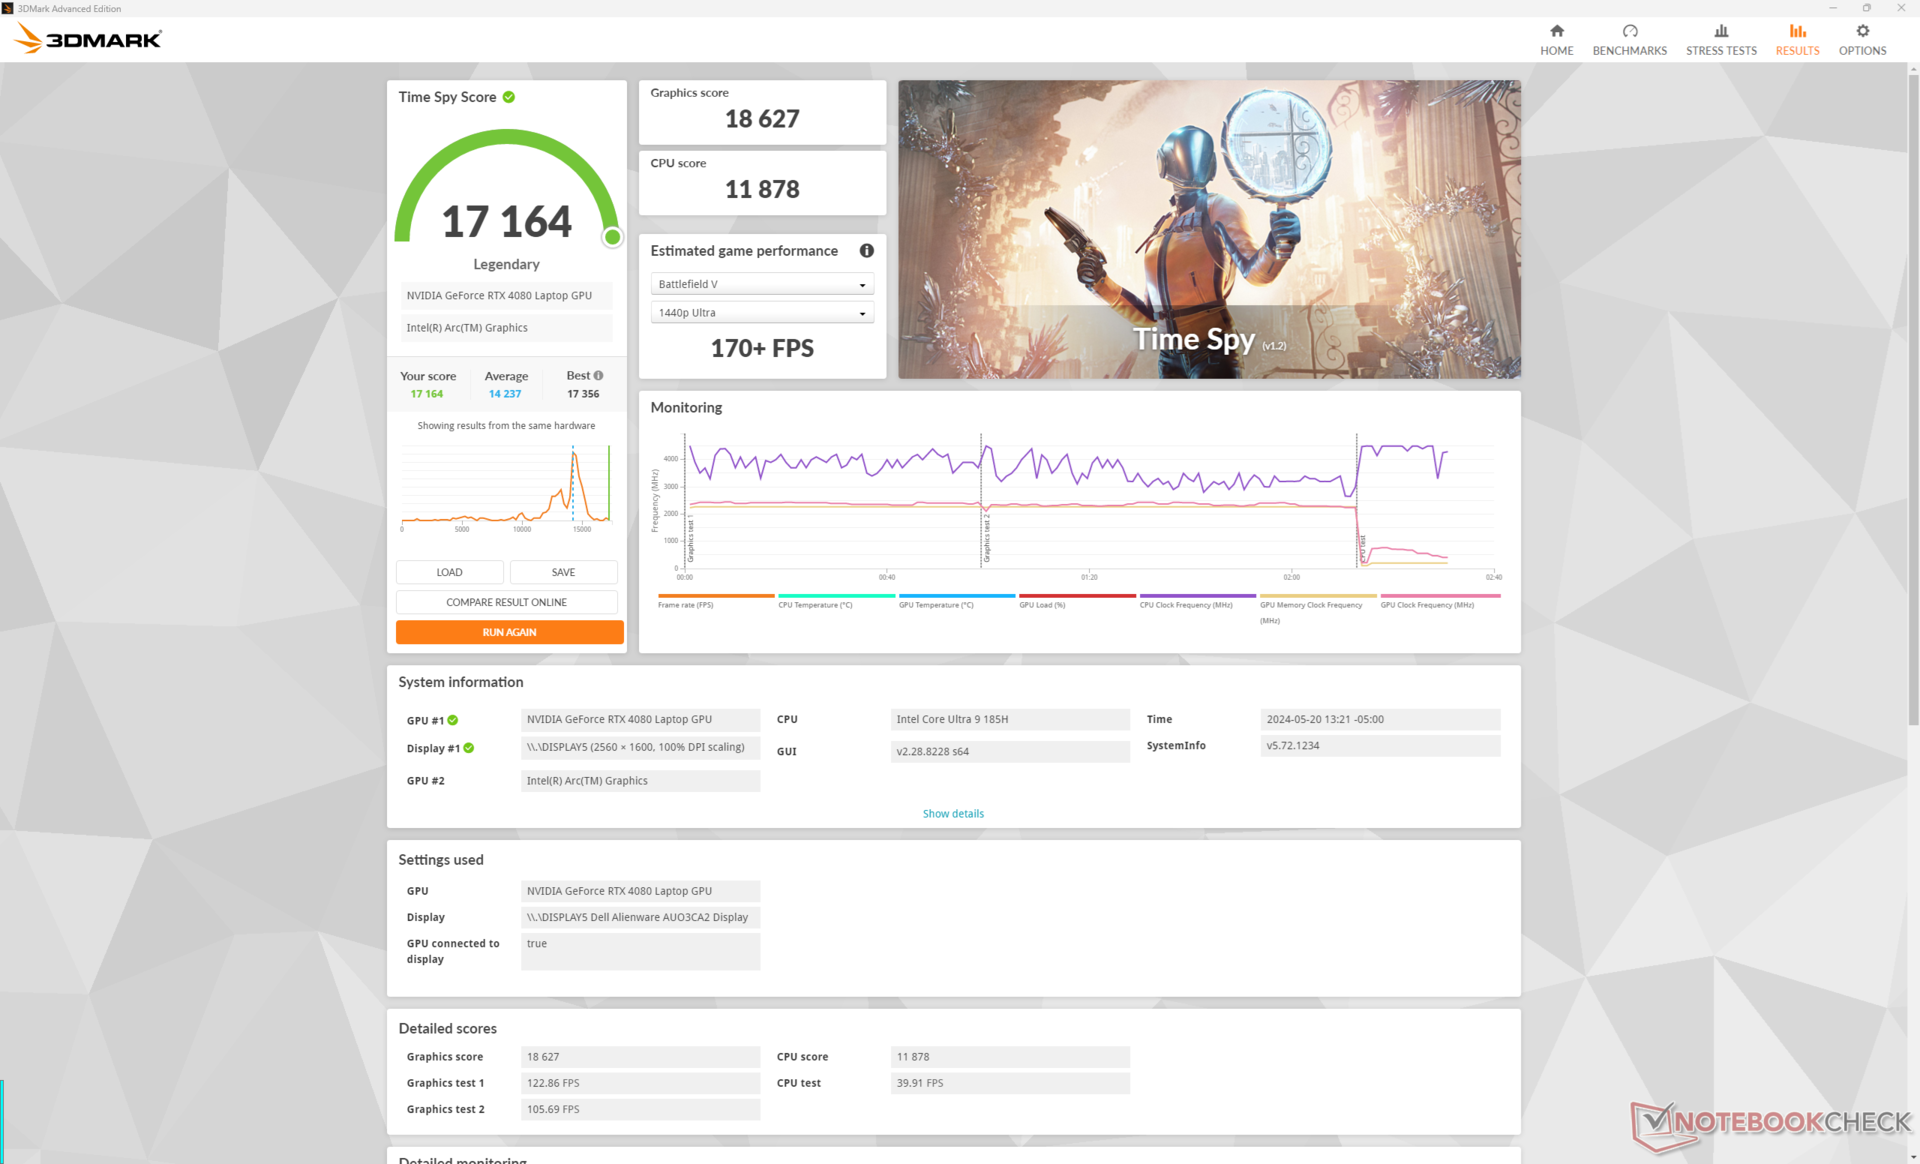
| 3DMark Time Spy Score | 17164 points | |
Aide | ||
* ... Moindre est la valeur, meilleures sont les performances
Performances des jeux
De manière décevante, les performances dans les jeux sont systématiquement inférieures à celles que nous avons enregistrées sur le x16 R1, d'environ 5 à 15 %. Les deltas les plus importants se produisent à des résolutions plus faibles, tandis que les deltas les plus faibles se produisent à des résolutions plus élevées, ce qui est cohérent avec les résultats plus lents des performances brutes du CPU par rapport au Core i9-14900HK mentionnés ci-dessus.
| Baldur's Gate 3 | |
| 1920x1080 Ultra Preset | |
| Alienware x16 R2 P120F | |
| Moyenne NVIDIA GeForce RTX 4080 Laptop GPU (111.8 - 181.2, n=6) | |
| Alienware m16 R2 | |
| Framework Laptop 16 | |
| 2560x1440 Ultra Preset | |
| Alienware x16 R2 P120F | |
| Moyenne NVIDIA GeForce RTX 4080 Laptop GPU (88.3 - 129.3, n=6) | |
| Alienware m16 R2 | |
| Framework Laptop 16 | |
| 3840x2160 Ultra Preset | |
| Alienware x16 R2 P120F | |
| Moyenne NVIDIA GeForce RTX 4080 Laptop GPU (48.8 - 68.4, n=4) | |
| Alienware m16 R2 | |
| Framework Laptop 16 | |
| 3840x2160 Ultra Preset + Quality DLSS | |
| Alienware x16 R2 P120F | |
| Moyenne NVIDIA GeForce RTX 4080 Laptop GPU (90.9 - 104.4, n=2) | |
| Cyberpunk 2077 2.2 Phantom Liberty | |
| 1920x1080 Ultra Preset (FSR off) | |
| Moyenne NVIDIA GeForce RTX 4080 Laptop GPU (83.9 - 127.1, n=13) | |
| Alienware x16 R2 P120F | |
| Alienware m16 R2 | |
| Framework Laptop 16 | |
| 2560x1440 Ultra Preset (FSR off) | |
| Moyenne NVIDIA GeForce RTX 4080 Laptop GPU (56.2 - 86.3, n=17) | |
| Alienware x16 R2 P120F | |
| Alienware m16 R2 | |
| Framework Laptop 16 | |
| 3840x2160 Ultra Preset (FSR off) | |
| Moyenne NVIDIA GeForce RTX 4080 Laptop GPU (25.8 - 39.8, n=7) | |
| Alienware x16 R2 P120F | |
| Alienware m16 R2 | |
| Framework Laptop 16 | |
| 1920x1080 Ray Tracing Ultra Preset (DLSS off) | |
| Alienware x16 R2 P120F | |
| Moyenne NVIDIA GeForce RTX 4080 Laptop GPU (43.8 - 67.2, n=12) | |
| Alienware m16 R2 | |
| Framework Laptop 16 | |
| 3840x2160 Ray Tracing Ultra Preset (DLSS off, no Path Tracing) | |
| Moyenne NVIDIA GeForce RTX 4080 Laptop GPU (16 - 20, n=4) | |
| Alienware x16 R2 P120F | |
| Alienware m16 R2 | |
Witcher 3 FPS Chart
| Bas | Moyen | Élevé | Ultra | QHD | 4K DLSS | 4K | |
|---|---|---|---|---|---|---|---|
| The Witcher 3 (2015) | 364.4 | 340.7 | 292.1 | 166.3 | 118.5 | ||
| Dota 2 Reborn (2015) | 155.7 | 142 | 139.2 | 133 | 127.9 | ||
| Final Fantasy XV Benchmark (2018) | 188 | 169.3 | 139.8 | 120.8 | 70.2 | ||
| X-Plane 11.11 (2018) | 134 | 117.4 | 89.3 | 78 | |||
| Far Cry 5 (2018) | 137 | 127 | 122 | 114 | 114 | 91 | |
| Strange Brigade (2018) | 427 | 336 | 317 | 293 | 226 | 112.9 | |
| Tiny Tina's Wonderlands (2022) | 220.8 | 199.6 | 166.7 | 144.5 | 99 | 50.1 | |
| F1 22 (2022) | 219 | 211 | 185.7 | 108.5 | 65.6 | 36.6 | |
| Baldur's Gate 3 (2023) | 186.8 | 172.9 | 161.2 | 159.4 | 124.3 | 104.4 | 65 |
| Cyberpunk 2077 2.2 Phantom Liberty (2023) | 121.5 | 118.7 | 109 | 99.7 | 75.4 | 32.5 |
Émissions
Bruit du système
Les ventilateurs du x16 R2 sont capables de rester plus longtemps silencieux avant de devoir augmenter leur vitesse et leur bruit. Autrement, le plafond sonore est similaire à celui que nous avons enregistré sur le x16 R1 à environ 50 dB(A) et 54 dB(A) lorsque vous jouez en mode Performance et en mode Overdrive, respectivement. Notez que le bruit du ventilateur en mode Balanced est exactement le même qu'en mode Performance, ce qui correspond à nos résultats 3DMark ci-dessus.
Degré de la nuisance sonore
| Au repos |
| 23.8 / 28.5 / 28.5 dB(A) |
| Fortement sollicité |
| 28.8 / 54.2 dB(A) |
 | ||
30 dB silencieux 40 dB(A) audible 50 dB(A) bruyant |
||
min: | ||
| Alienware x16 R2 P120F NVIDIA GeForce RTX 4080 Laptop GPU, Ultra 9 185H, WDC PC SN810 1TB | Alienware x16 R1 NVIDIA GeForce RTX 4080 Laptop GPU, i9-13900HK, SK hynix PC801 HFS001TEJ9X101N | Alienware m16 R2 NVIDIA GeForce RTX 4070 Laptop GPU, Ultra 7 155H, Samsung PM9A1 MZVL21T0HCLR | Asus ROG Strix Scar 16 G634JZR NVIDIA GeForce RTX 4080 Laptop GPU, i9-14900HX, SK hynix PC801 HFS002TEJ9X101N | Lenovo Legion Pro 7 16IRX9H NVIDIA GeForce RTX 4080 Laptop GPU, i9-14900HX, SK Hynix HFS001TEJ9X115N | MSI Vector 16 HX A14V NVIDIA GeForce RTX 4080 Laptop GPU, i9-14900HX, WD PC SN560 SDDPNQE-1T00 | |
|---|---|---|---|---|---|---|
| Noise | -2% | -3% | -20% | -22% | -28% | |
| arrêt / environnement * | 23.4 | 22.7 3% | 24.7 -6% | 21.07 10% | 24 -3% | 23.2 1% |
| Idle Minimum * | 23.8 | 23.1 3% | 25.3 -6% | 29.75 -25% | 25 -5% | 33.5 -41% |
| Idle Average * | 28.5 | 25.8 9% | 25.3 11% | 29.75 -4% | 30 -5% | 33.5 -18% |
| Idle Maximum * | 28.5 | 25.8 9% | 25.3 11% | 29.75 -4% | 45 -58% | 33.5 -18% |
| Load Average * | 28.8 | 39.3 -36% | 31.7 -10% | 54.85 -90% | 50 -74% | 52.1 -81% |
| Witcher 3 ultra * | 49.5 | 49.9 -1% | 53.8 -9% | 57.8 -17% | 54 -9% | 62 -25% |
| Load Maximum * | 54.2 | 54.8 -1% | 62 -14% | 58 -7% | 56 -3% | 62 -14% |
* ... Moindre est la valeur, meilleures sont les performances
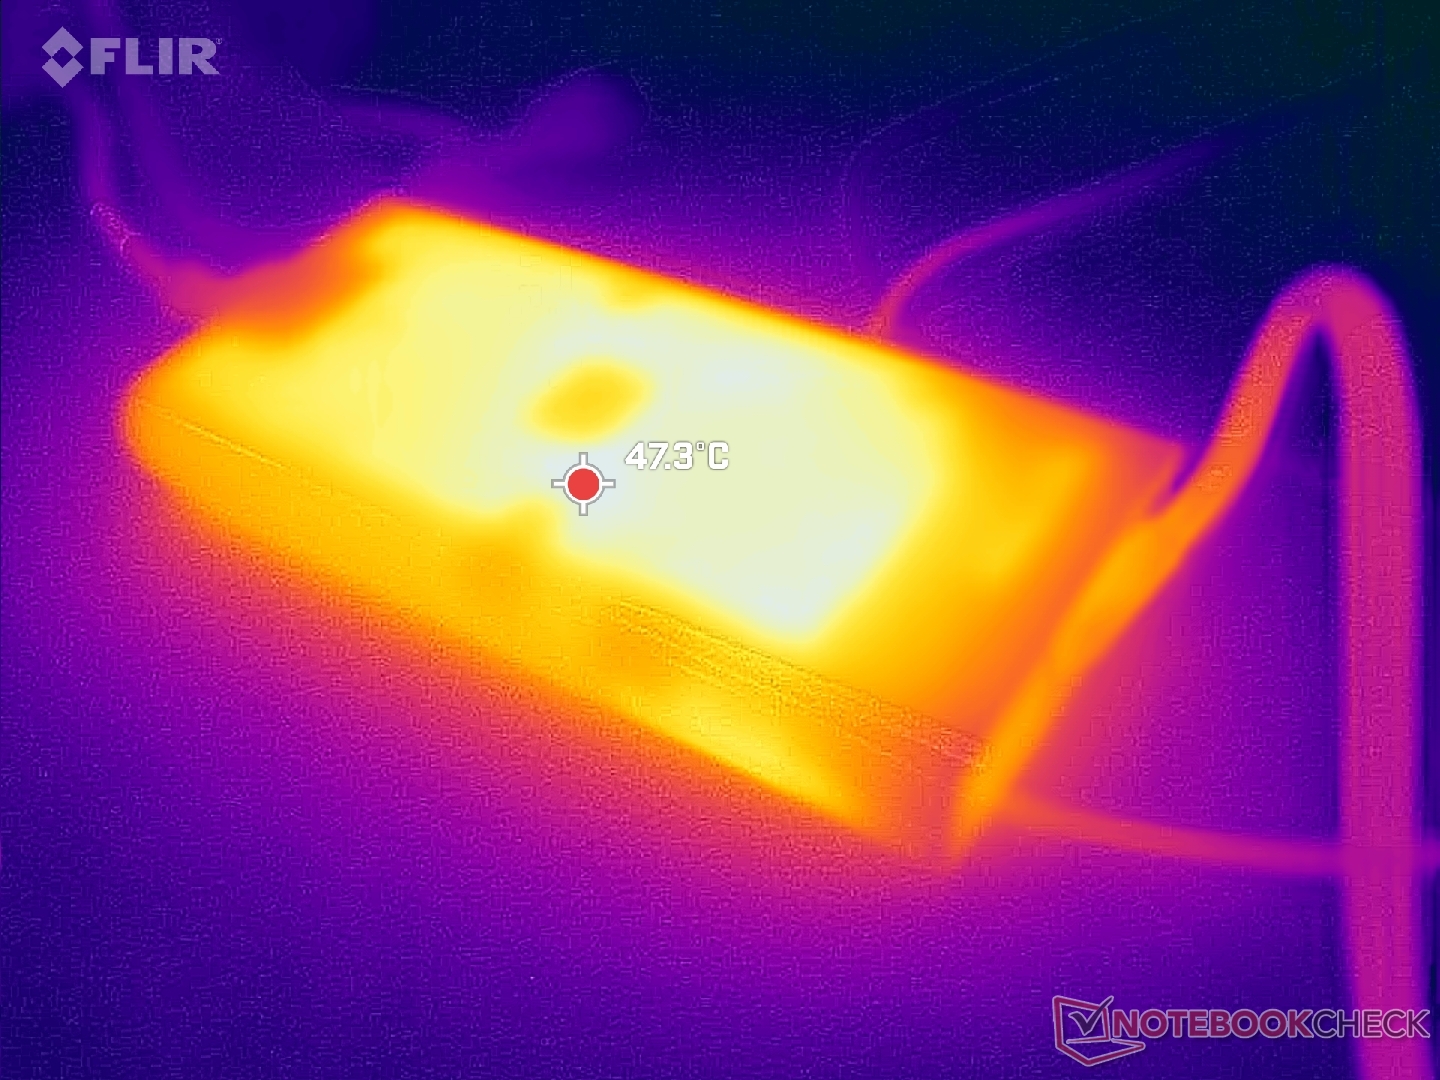
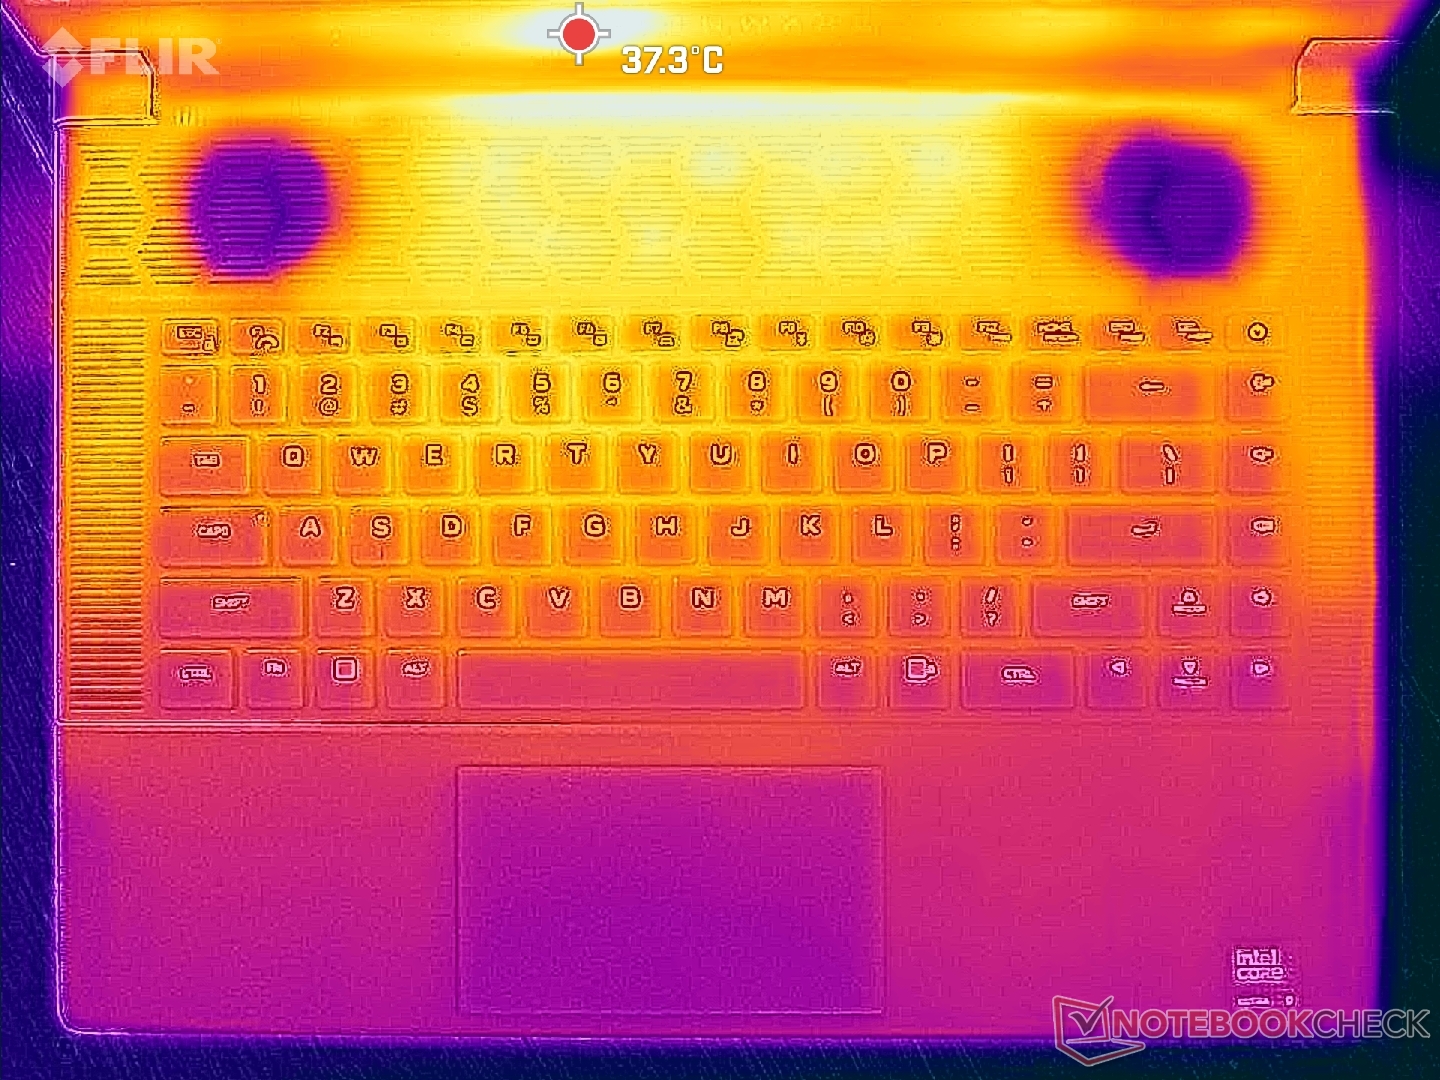
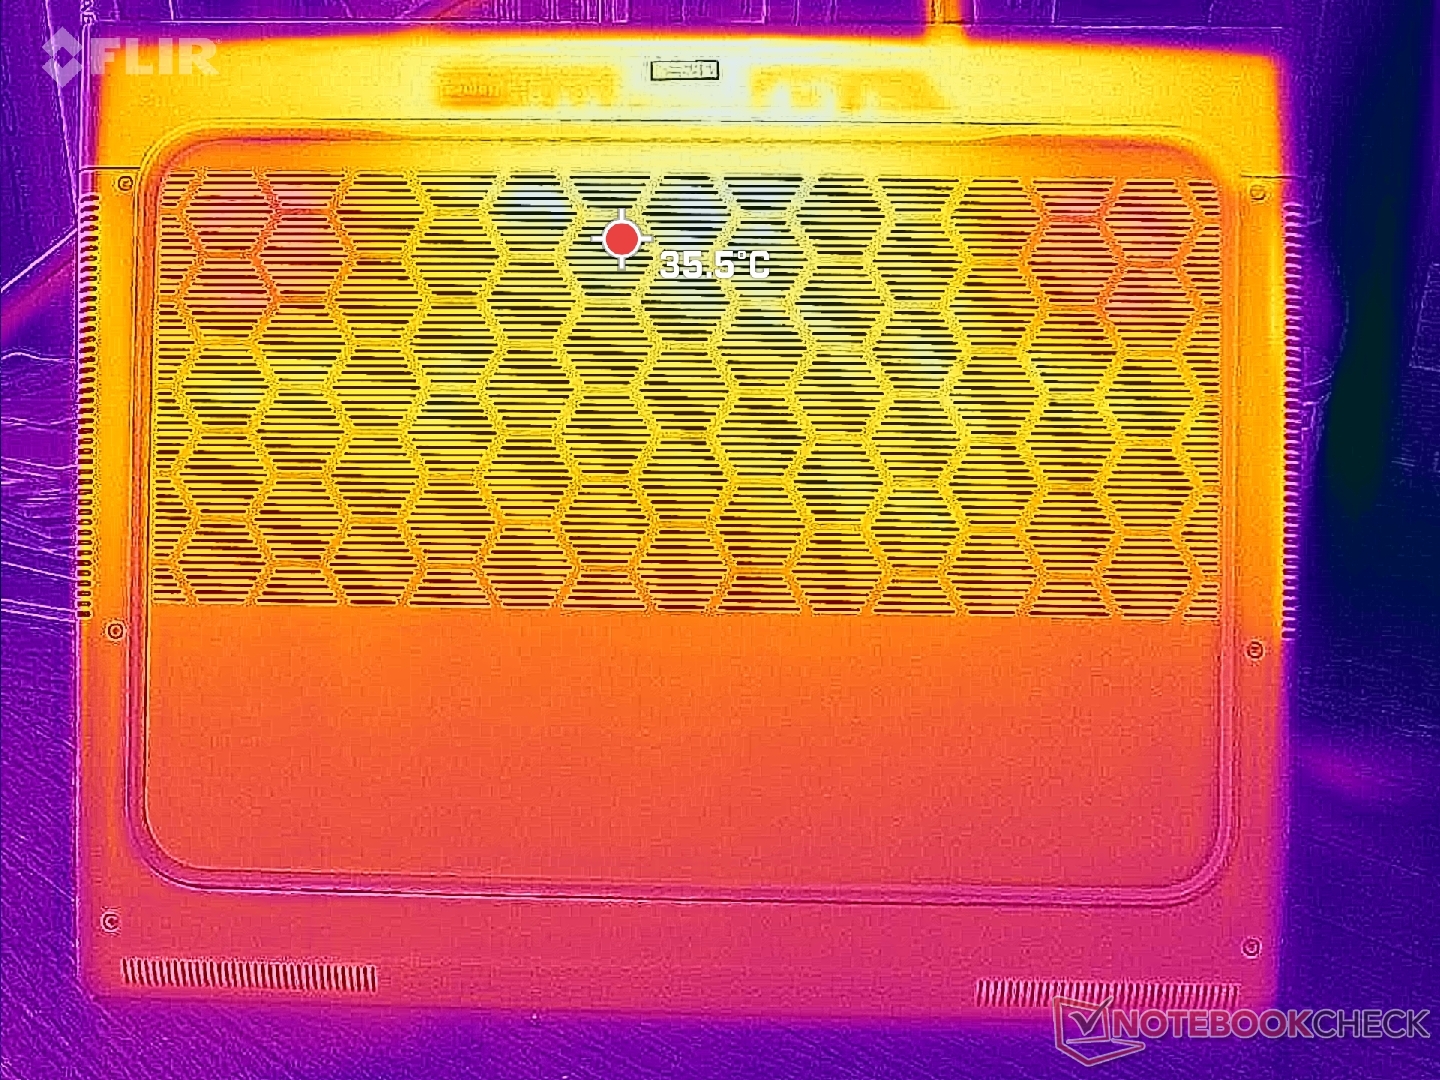
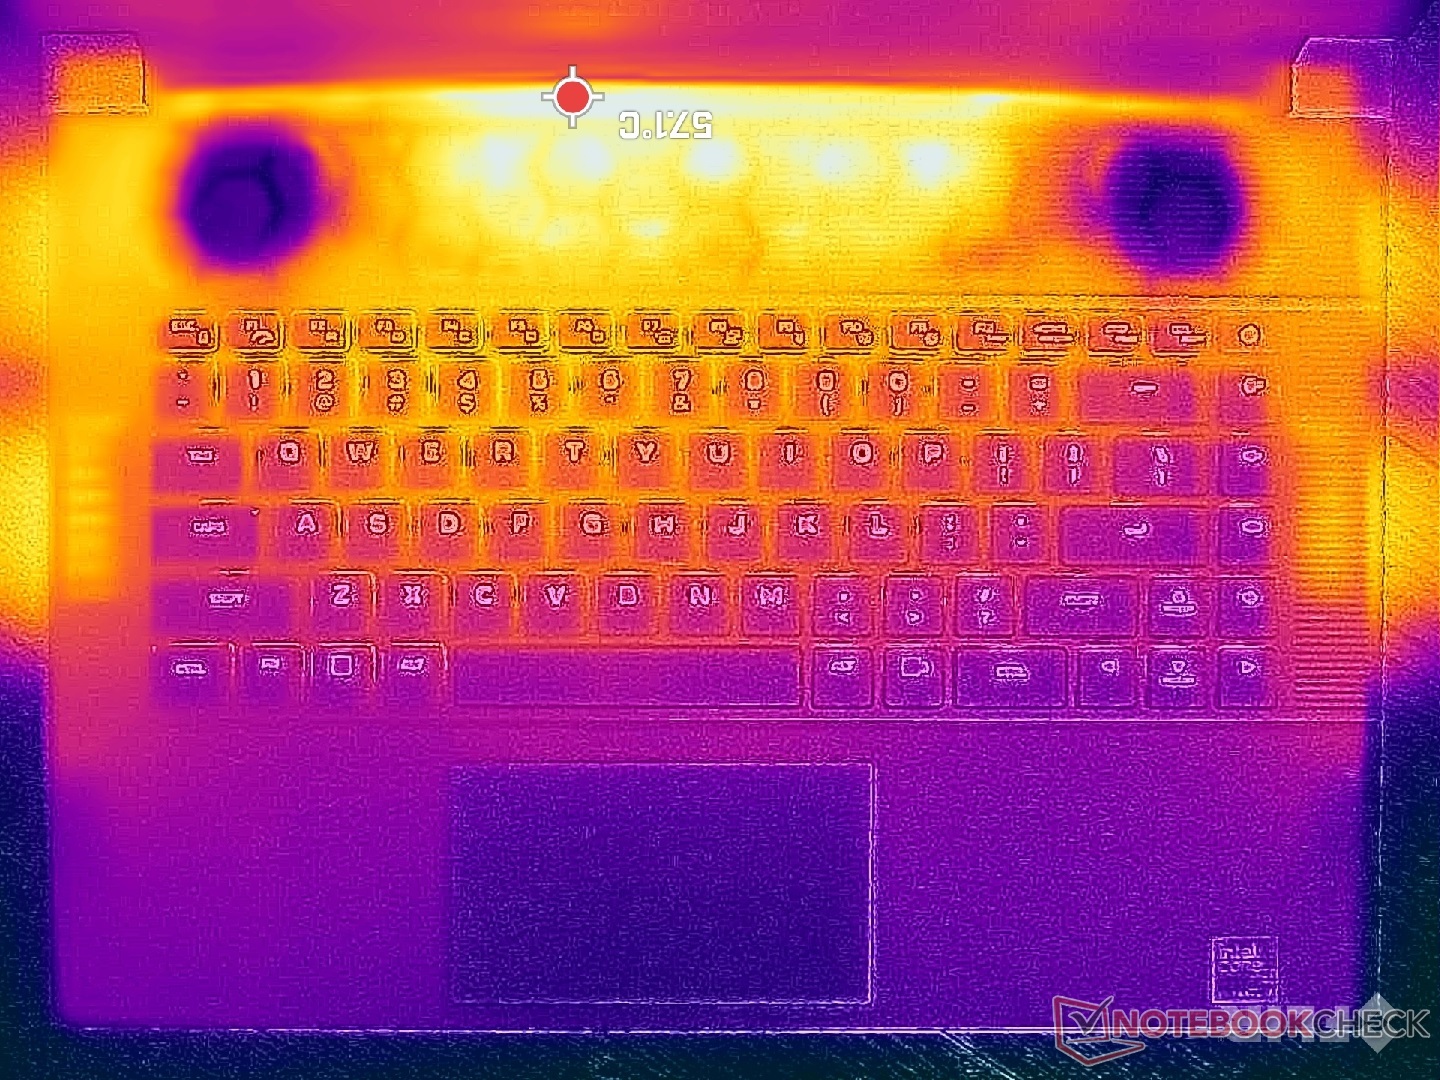
Température
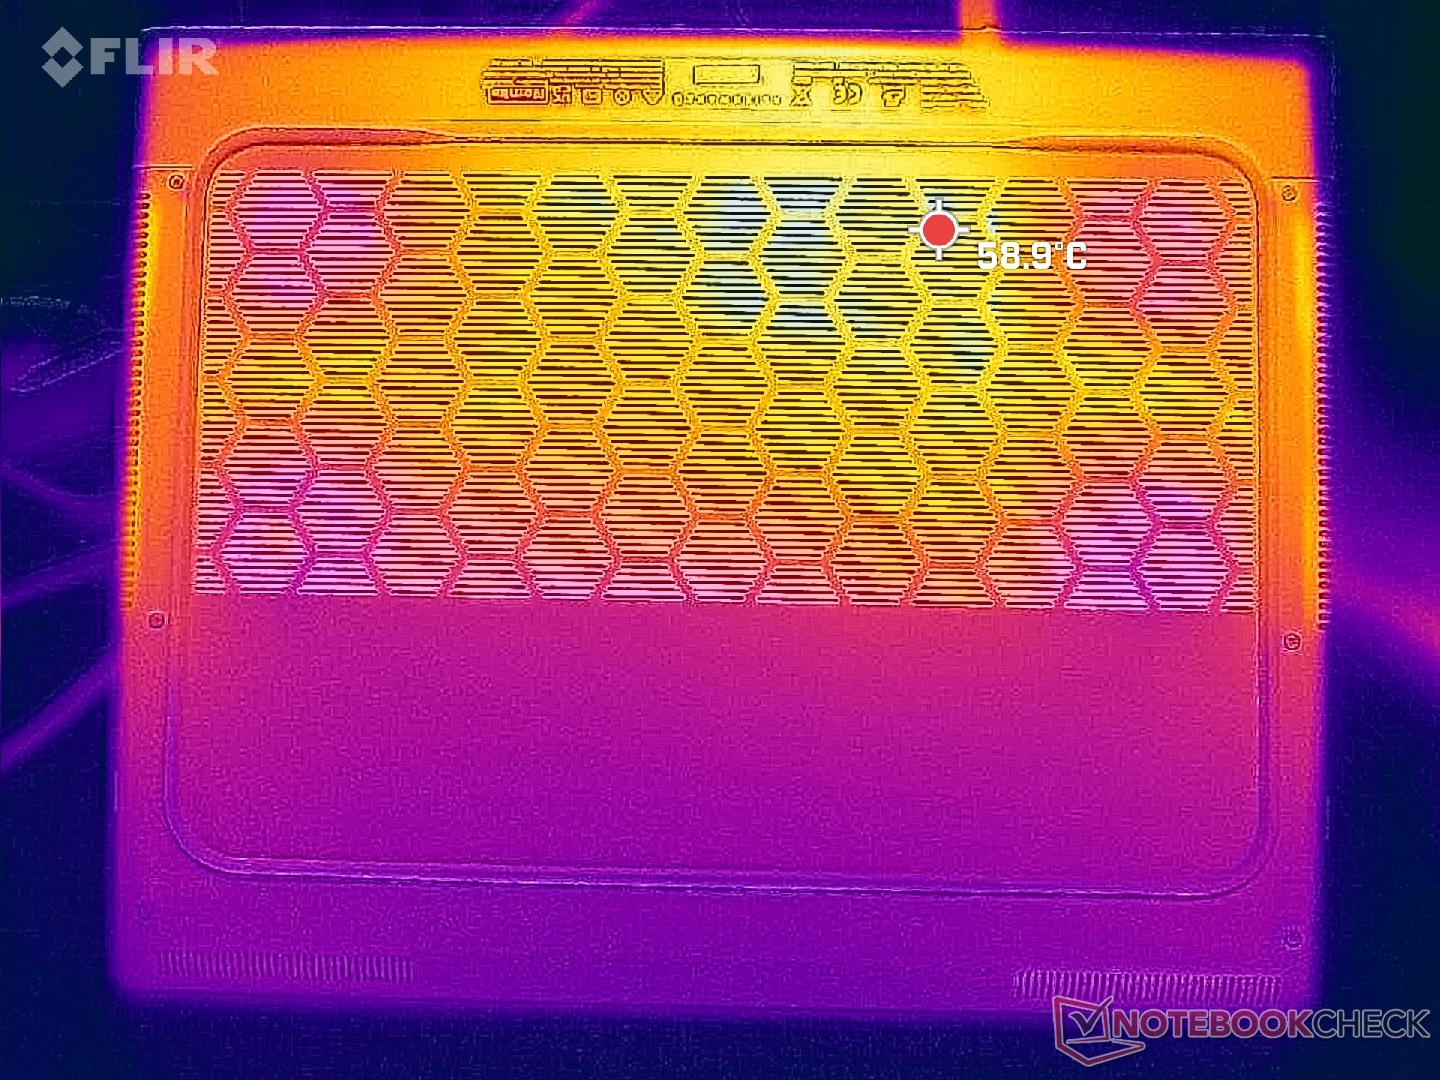
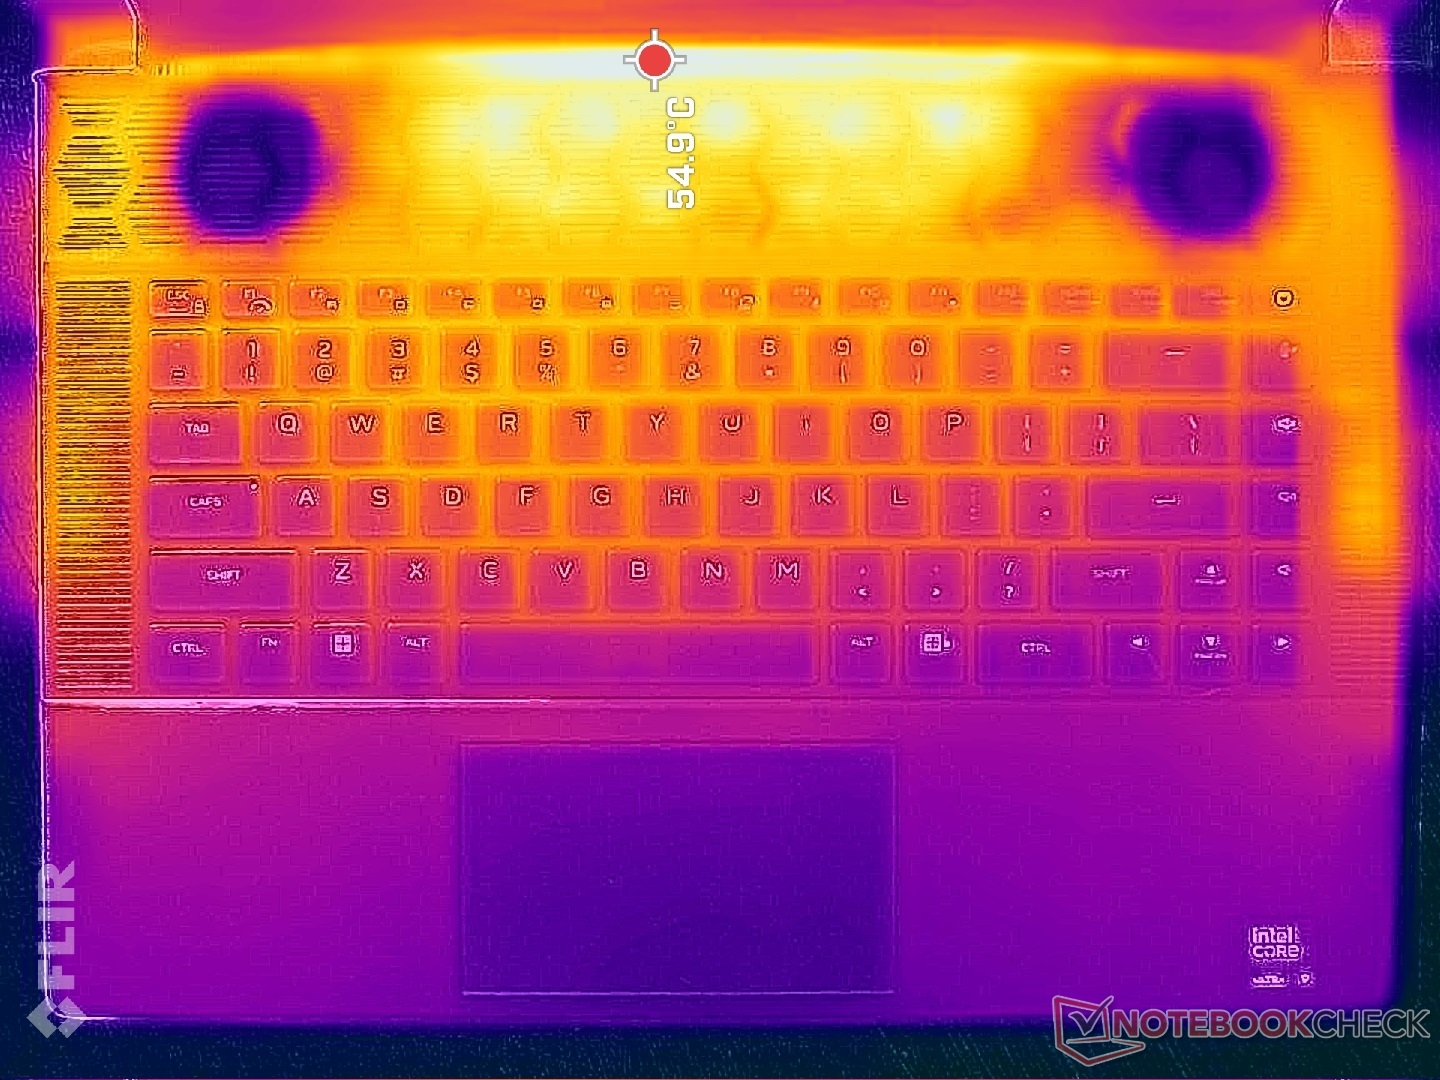
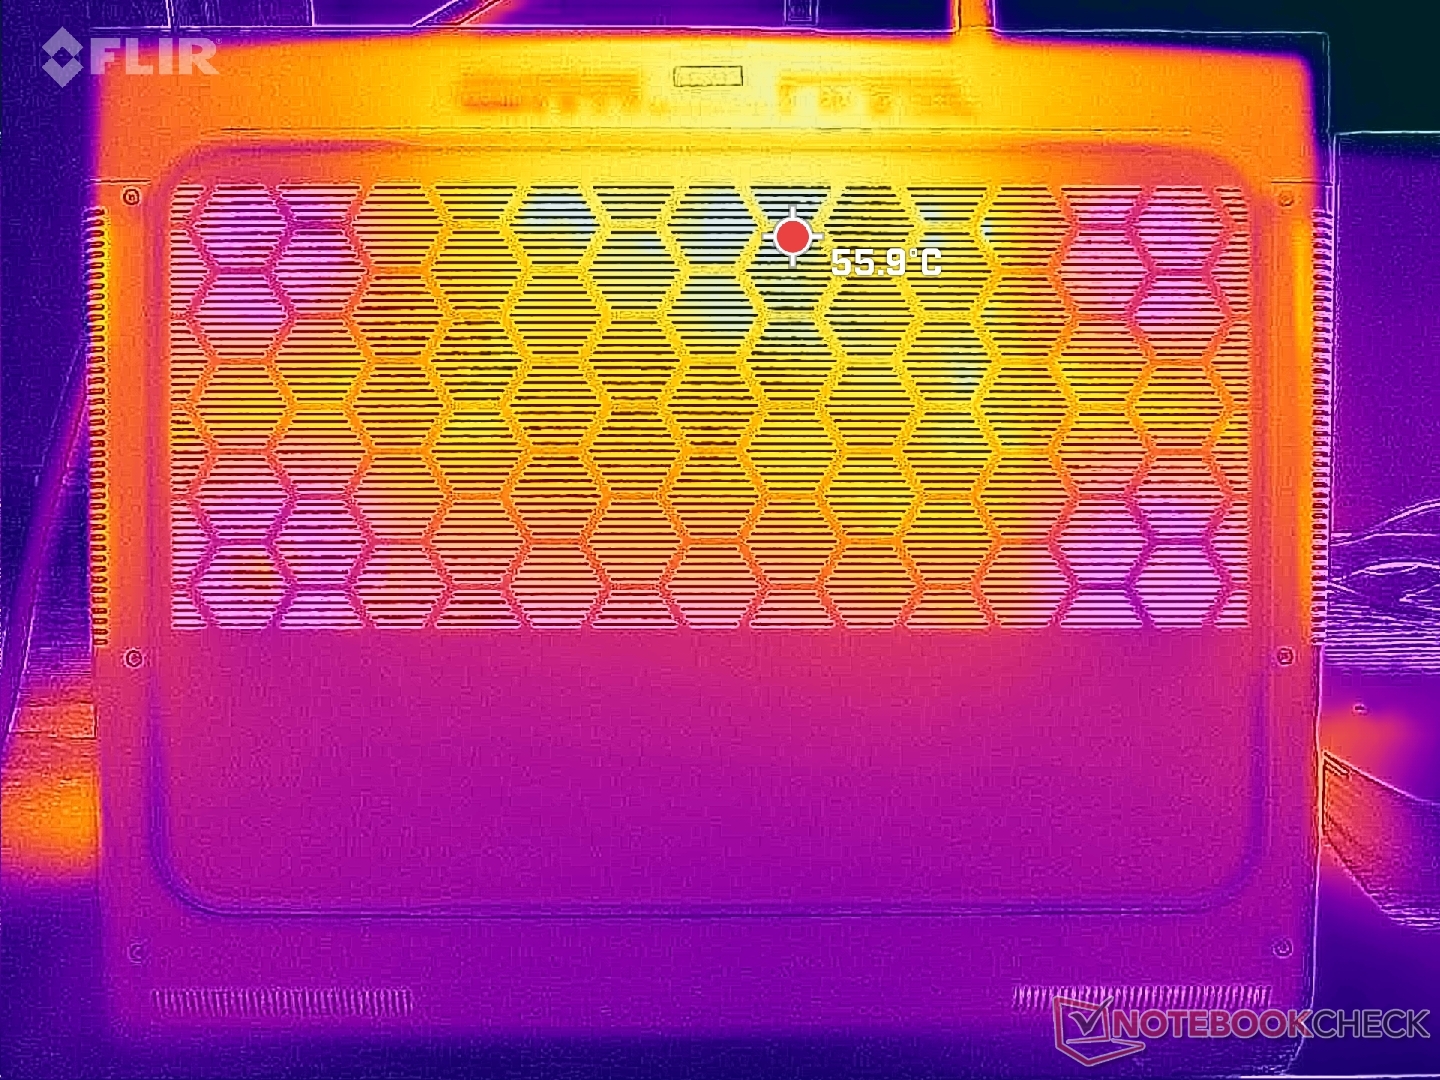
Les températures de surface sont très chaudes dans la moitié arrière du châssis, tandis que la moitié avant est nettement plus froide pour les paumes et les doigts. La série Alienware x16 utilise plus de grilles de ventilation que la série m16 par nécessité puisque le design x16 est défini par sa finesse.
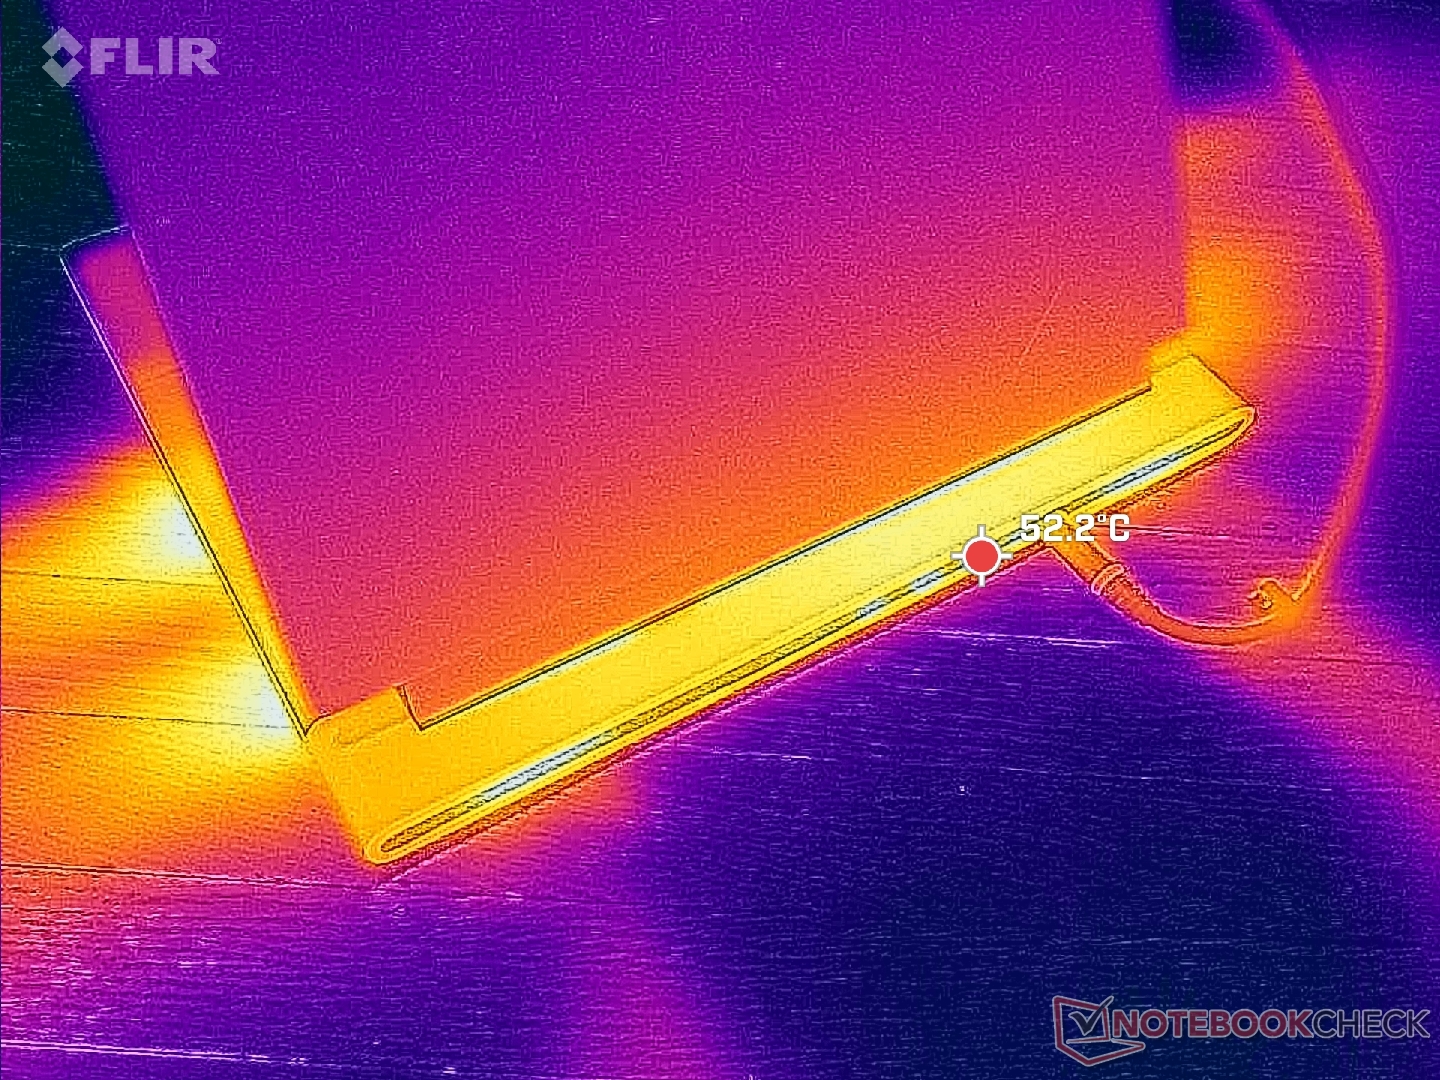
(-) La température maximale du côté supérieur est de 51 °C / 124 F, par rapport à la moyenne de 40.4 °C / 105 F, allant de 21.2 à 68.8 °C pour la classe Gaming.
(-) Le fond chauffe jusqu'à un maximum de 50.8 °C / 123 F, contre une moyenne de 43.2 °C / 110 F
(+) En utilisation inactive, la température moyenne du côté supérieur est de 31.3 °C / 88 F, par rapport à la moyenne du dispositif de 33.9 °C / 93 F.
(-) En jouant à The Witcher 3, la température moyenne du côté supérieur est de 42.4 °C / 108 F, alors que la moyenne de l'appareil est de 33.9 °C / 93 F.
(+) Les repose-poignets et le pavé tactile atteignent la température maximale de la peau (33.2 °C / 91.8 F) et ne sont donc pas chauds.
(-) La température moyenne de la zone de l'appui-paume de dispositifs similaires était de 28.9 °C / 84 F (-4.3 °C / #-7.8 F).
| Alienware x16 R2 P120F Intel Core Ultra 9 185H, NVIDIA GeForce RTX 4080 Laptop GPU | Alienware x16 R1 Intel Core i9-13900HK, NVIDIA GeForce RTX 4080 Laptop GPU | Alienware m16 R2 Intel Core Ultra 7 155H, NVIDIA GeForce RTX 4070 Laptop GPU | Asus ROG Strix Scar 16 G634JZR Intel Core i9-14900HX, NVIDIA GeForce RTX 4080 Laptop GPU | Lenovo Legion Pro 7 16IRX9H Intel Core i9-14900HX, NVIDIA GeForce RTX 4080 Laptop GPU | MSI Vector 16 HX A14V Intel Core i9-14900HX, NVIDIA GeForce RTX 4080 Laptop GPU | |
|---|---|---|---|---|---|---|
| Heat | 3% | -1% | 5% | 1% | 27% | |
| Maximum Upper Side * | 51 | 47.2 7% | 44.8 12% | 47.8 6% | 46 10% | 36.4 29% |
| Maximum Bottom * | 50.8 | 47.8 6% | 48 6% | 52.2 -3% | 49 4% | 35.6 30% |
| Idle Upper Side * | 36.6 | 36.8 -1% | 37.2 -2% | 32.4 11% | 38 -4% | 26.6 27% |
| Idle Bottom * | 35.2 | 35.8 -2% | 42 -19% | 33 6% | 37 -5% | 27 23% |
* ... Moindre est la valeur, meilleures sont les performances
Intervenants
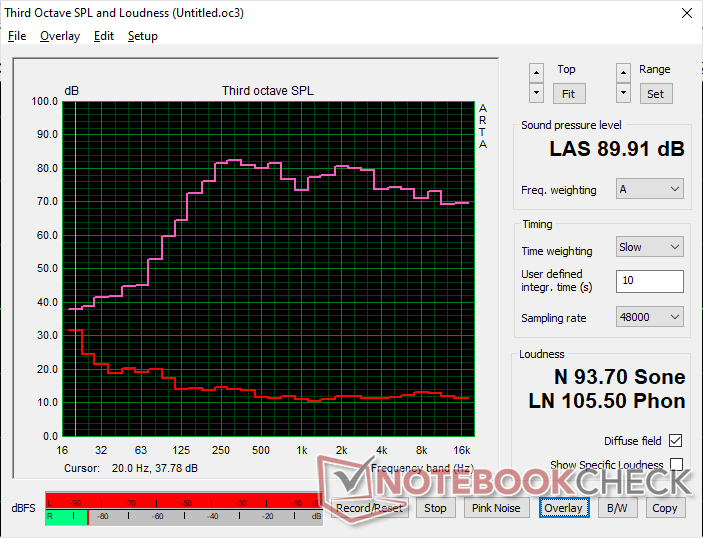
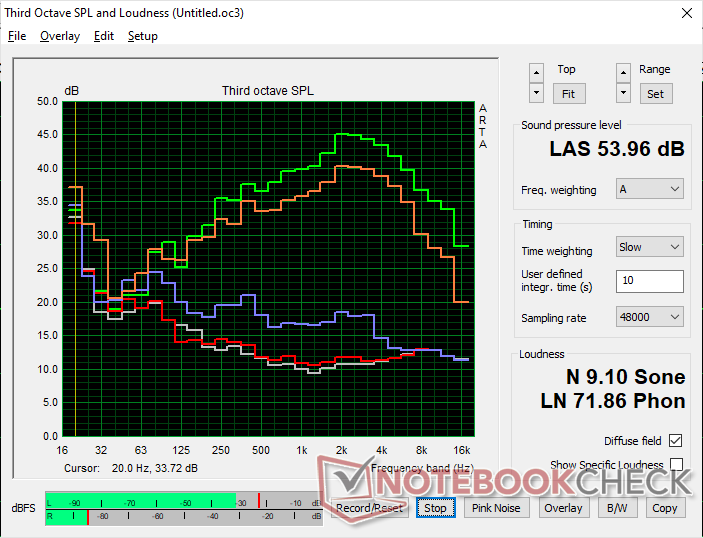
Alienware x16 R2 P120F analyse audio
(+) | les haut-parleurs peuvent jouer relativement fort (89.9# dB)
Basses 100 - 315 Hz
(±) | basse réduite - en moyenne 7.4% inférieure à la médiane
(±) | la linéarité des basses est moyenne (7.6% delta à la fréquence précédente)
Médiums 400 - 2000 Hz
(+) | médiane équilibrée - seulement 2.6% de la médiane
(+) | les médiums sont linéaires (3.6% delta à la fréquence précédente)
Aiguës 2 - 16 kHz
(+) | des sommets équilibrés - à seulement 3.4% de la médiane
(+) | les aigus sont linéaires (2.8% delta à la fréquence précédente)
Globalement 100 - 16 000 Hz
(+) | le son global est linéaire (8.2% différence à la médiane)
Par rapport à la même classe
» 1% de tous les appareils testés de cette catégorie étaient meilleurs, 1% similaires, 98% pires
» Le meilleur avait un delta de 6%, la moyenne était de 18%, le pire était de 132%.
Par rapport à tous les appareils testés
» 1% de tous les appareils testés étaient meilleurs, 1% similaires, 98% pires
» Le meilleur avait un delta de 4%, la moyenne était de 24%, le pire était de 134%.
Apple MacBook Pro 16 2021 M1 Pro analyse audio
(+) | les haut-parleurs peuvent jouer relativement fort (84.7# dB)
Basses 100 - 315 Hz
(+) | bonne basse - seulement 3.8% loin de la médiane
(+) | les basses sont linéaires (5.2% delta à la fréquence précédente)
Médiums 400 - 2000 Hz
(+) | médiane équilibrée - seulement 1.3% de la médiane
(+) | les médiums sont linéaires (2.1% delta à la fréquence précédente)
Aiguës 2 - 16 kHz
(+) | des sommets équilibrés - à seulement 1.9% de la médiane
(+) | les aigus sont linéaires (2.7% delta à la fréquence précédente)
Globalement 100 - 16 000 Hz
(+) | le son global est linéaire (4.6% différence à la médiane)
Par rapport à la même classe
» 0% de tous les appareils testés de cette catégorie étaient meilleurs, 0% similaires, 100% pires
» Le meilleur avait un delta de 5%, la moyenne était de 18%, le pire était de 45%.
Par rapport à tous les appareils testés
» 0% de tous les appareils testés étaient meilleurs, 0% similaires, 100% pires
» Le meilleur avait un delta de 4%, la moyenne était de 24%, le pire était de 134%.
Gestion de l'énergie
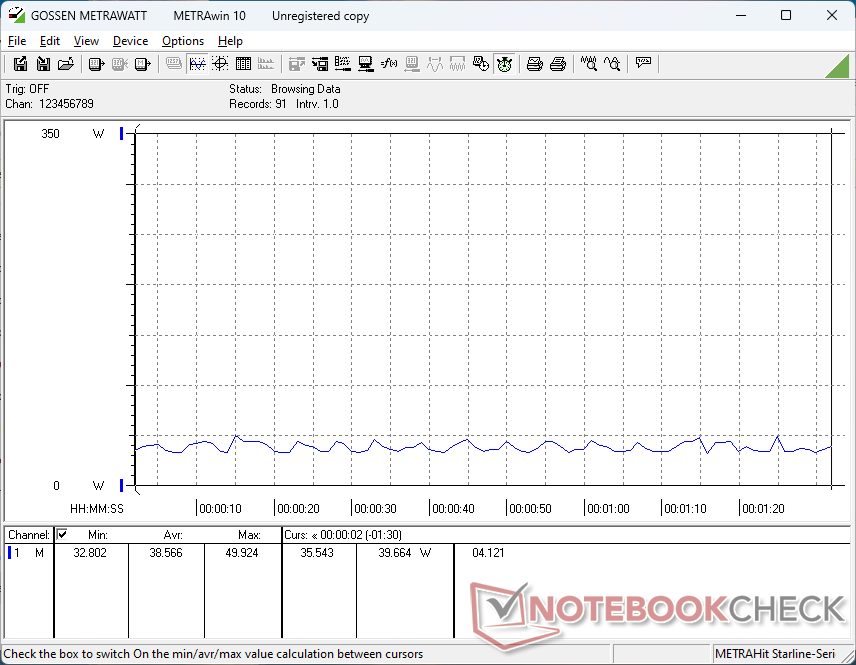
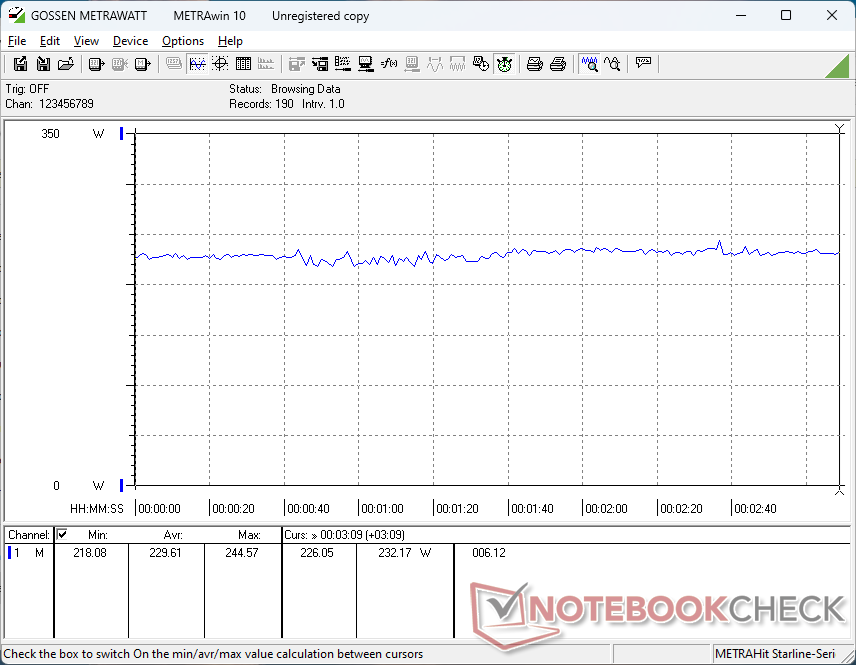
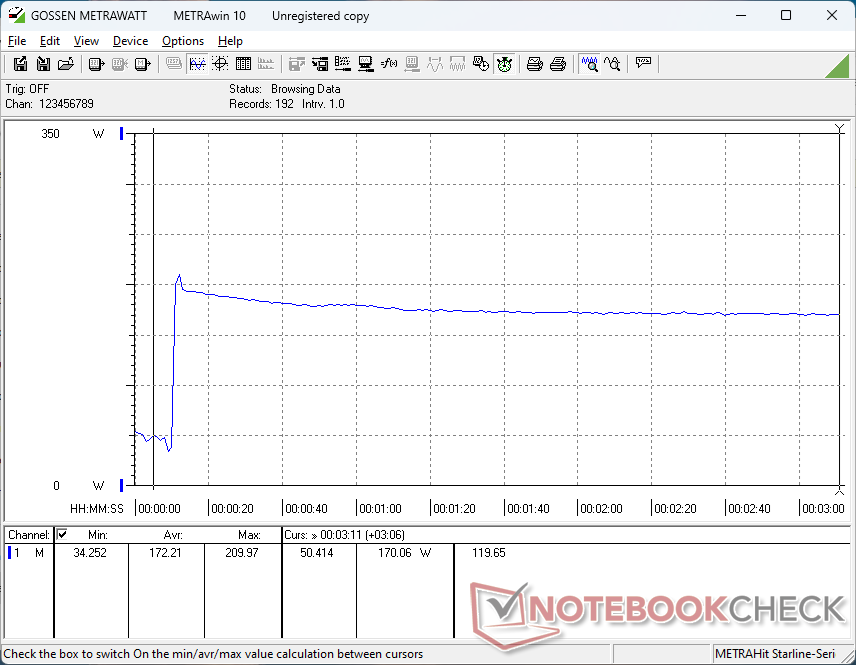
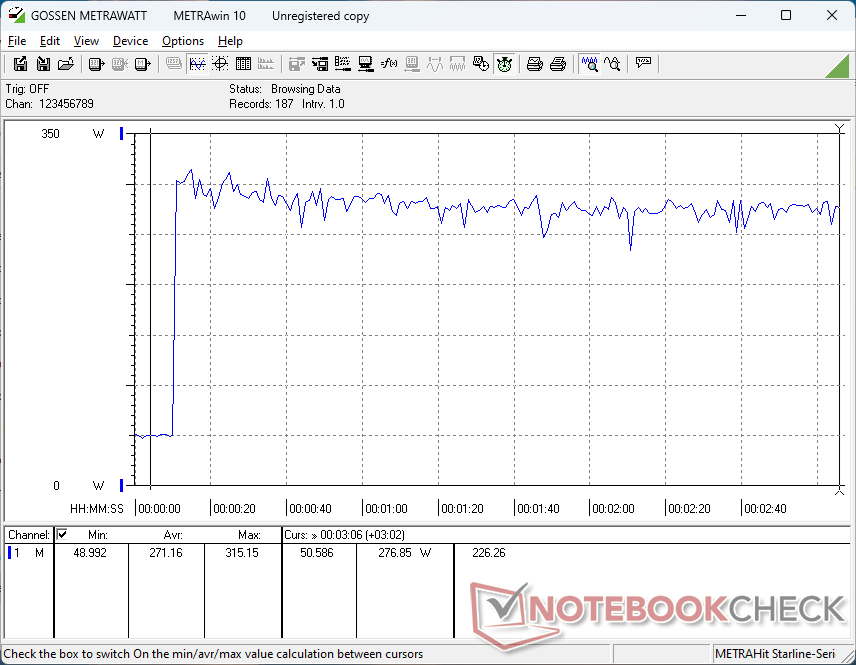
Consommation électrique
La consommation globale est généralement inférieure à celle que nous avons enregistrée sur la R1 x16 d'environ 10 à 15 % lors de l'exécution de charges exigeantes comme les jeux ou le stress Prime95. Cependant, ce déficit s'accompagne des résultats plus lents du CPU et du GPU mentionnés ci-dessus. La performance par watt est donc à peu près la même d'une année sur l'autre malgré le changement de CPU.
Nous avons rencontré un bogue en mode veille. S'il est réglé sur Optimus, le mode Veille fonctionne normalement avec une consommation d'énergie de <1 watt. En revanche, en mode dGPU et Overdrive, le mode veille demande 39 W, ce qui fait chauffer inutilement l'ordinateur portable et consomme beaucoup de batterie.
| Éteint/en veille | |
| Au repos | |
| Fortement sollicité |
|
Légende:
min: | |
| Alienware x16 R2 P120F Ultra 9 185H, NVIDIA GeForce RTX 4080 Laptop GPU, WDC PC SN810 1TB, IPS, 2560x1600, 16" | Alienware x16 R1 i9-13900HK, NVIDIA GeForce RTX 4080 Laptop GPU, SK hynix PC801 HFS001TEJ9X101N, IPS, 2560x1600, 16" | Alienware m16 R2 Ultra 7 155H, NVIDIA GeForce RTX 4070 Laptop GPU, Samsung PM9A1 MZVL21T0HCLR, IPS, 2560x1600, 16" | Asus ROG Strix Scar 16 G634JZR i9-14900HX, NVIDIA GeForce RTX 4080 Laptop GPU, SK hynix PC801 HFS002TEJ9X101N, Mini LED, 2560x1600, 16" | Lenovo Legion Pro 7 16IRX9H i9-14900HX, NVIDIA GeForce RTX 4080 Laptop GPU, SK Hynix HFS001TEJ9X115N, IPS, 2560x1600, 16" | MSI Vector 16 HX A14V i9-14900HX, NVIDIA GeForce RTX 4080 Laptop GPU, WD PC SN560 SDDPNQE-1T00, IPS, 2560x1600, 16" | |
|---|---|---|---|---|---|---|
| Power Consumption | -55% | 11% | -10% | -30% | -27% | |
| Idle Minimum * | 9.9 | 25.2 -155% | 8.1 18% | 10.71 -8% | 16 -62% | 15.8 -60% |
| Idle Average * | 14.5 | 29.9 -106% | 13 10% | 14.75 -2% | 21 -45% | 23.3 -61% |
| Idle Maximum * | 33.5 | 49.8 -49% | 40.3 -20% | 30 10% | 36 -7% | 30 10% |
| Load Average * | 97.5 | 105.4 -8% | 79 19% | 135 -38% | 132 -35% | 123.9 -27% |
| Witcher 3 ultra * | 230 | 263 -14% | 188.1 18% | 286 -24% | 267 -16% | 285 -24% |
| Load Maximum * | 315.2 | 313.8 -0% | 254.9 19% | 307 3% | 360 -14% | 306 3% |
* ... Moindre est la valeur, meilleures sont les performances
Power Consumption Witcher 3 / Stresstest
Power Consumption external Monitor
Autonomie de la batterie
Les durées d'exécution sont un peu plus longues cette fois-ci, probablement en raison de la consommation d'énergie plus faible mentionnée ci-dessus. Nous avons pu enregistrer une durée d'utilisation du WLAN de plus de 40 minutes de plus que sur le x16 R1, mais la plupart des autres ordinateurs portables de jeu sont encore capables de durer beaucoup plus longtemps, y compris l'ordinateur Dell Alienware m16 R2.
| Alienware x16 R2 P120F Ultra 9 185H, NVIDIA GeForce RTX 4080 Laptop GPU, 90 Wh | Alienware x16 R1 i9-13900HK, NVIDIA GeForce RTX 4080 Laptop GPU, 90 Wh | Alienware m16 R2 Ultra 7 155H, NVIDIA GeForce RTX 4070 Laptop GPU, 90 Wh | Asus ROG Strix Scar 16 G634JZR i9-14900HX, NVIDIA GeForce RTX 4080 Laptop GPU, 90 Wh | Lenovo Legion Pro 7 16IRX9H i9-14900HX, NVIDIA GeForce RTX 4080 Laptop GPU, 99.9 Wh | MSI Vector 16 HX A14V i9-14900HX, NVIDIA GeForce RTX 4080 Laptop GPU, 90 Wh | |
|---|---|---|---|---|---|---|
| Autonomie de la batterie | -23% | 150% | 125% | 93% | 72% | |
| WiFi v1.3 | 193 | 149 -23% | 483 150% | 434 125% | 373 93% | 332 72% |
| Reader / Idle | 436 | 758 | 641 | |||
| Load | 44 | 60 | 51 | 84 | ||
| H.264 | 451 | |||||
| Witcher 3 ultra | 57 |
Points positifs
Points négatifs
Verdict - L'Alienware x16 R1 est plus rapide pour le jeu pur
Le grand avantage de l'Alienware x16 R2 par rapport à l'Alienware x16 R1 est son NPU intégré qui permet d'accélérer les tâches d'intelligence artificielle de Windows. De telles fonctionnalités devraient devenir monnaie courante d'ici un an environ grâce à Microsoft Co-Pilot et à d'autres applications pilotées par l'IA. Pour les jeux, cependant, le NPU n'apporte rien à la table pour améliorer l'expérience à partir de 2024. On peut même dire qu'il est préjudiciable car les performances brutes du CPU ont chuté par rapport au Core i9-13900HK du x16 R1 de l'année dernière, car un espace précieux a été réservé pour le nouveau processeur neuronal.
L'Alienware x16 R2 introduit les nouveaux CPU Meteor Lake-H avec un NPU intégré pour la compatibilité avec les futures fonctionnalités Windows AI. Malheureusement, les performances de jeu brutes en ont souffert.
Les performances généralement plus lentes ont également conduit à une consommation d'énergie plus faible et à des durées d'exécution plus longues que le modèle de lancement original. Toutefois, les amateurs de jeux vidéo qui achètent Alienware ne sont probablement pas très enthousiastes à l'idée d'échanger des performances contre une autonomie de batterie. Une telle décision aurait été plus acceptable sur les modèles bas de gamme de la série Série G de Dell plus bas de gamme.
Nous vous recommandons de considérer l'original Alienware x16 R1 puisque le x16 R2 n'offre pas de nouvelles options de GPU, d'affichage, ni même de couleurs de châssis ou de changements extérieurs. La mise à jour du processeur n'est souhaitable que pour ceux qui veulent protéger leur espace de travail avec le NPU intégré.
Prix et disponibilité
Dell livre maintenant l'Alienware x16 R2 à partir de 2100$ pour le Core Ultra 7, GeForce RTX 4060, clavier standard, et configuration 1600p240 IPS ou jusqu'à 3500$ si configuré avec le Core Ultra 9, RTX 4090, et clavier mécanique.
Alienware x16 R2 P120F
- 05/29/2024 v7 (old)
Allen Ngo
Transparency
La sélection des appareils à examiner est effectuée par notre équipe éditoriale. L'échantillon de test a été prêté à l'auteur par le fabricant ou le détaillant pour les besoins de cet examen. Le prêteur n'a pas eu d'influence sur cette évaluation et le fabricant n'a pas reçu de copie de cette évaluation avant sa publication. Il n'y avait aucune obligation de publier cet article. Nous n'acceptons jamais de compensation ou de paiement en échange de nos commentaires. En tant que média indépendant, Notebookcheck n'est pas soumis à l'autorité des fabricants, des détaillants ou des éditeurs.
Voici comment Notebookcheck teste
Chaque année, Notebookcheck examine de manière indépendante des centaines d'ordinateurs portables et de smartphones en utilisant des procédures standardisées afin de garantir que tous les résultats sont comparables. Nous avons continuellement développé nos méthodes de test depuis environ 20 ans et avons établi des normes industrielles dans le processus. Dans nos laboratoires de test, des équipements de mesure de haute qualité sont utilisés par des techniciens et des rédacteurs expérimentés. Ces tests impliquent un processus de validation en plusieurs étapes. Notre système d'évaluation complexe repose sur des centaines de mesures et de points de référence bien fondés, ce qui garantit l'objectivité.Price comparison

