

Test du Dell Precision 5690 : station de travail prête pour la révolution de l'IA

Le Precision 5690 succède au Precision 5680 de l'année dernière en remplaçant les anciens CPU Raptor Lake-H par des CPU Meteor Lake-H plus récents, complets avec des NPU intégrés. Les deux modèles sont par ailleurs identiques avec les mêmes options d'affichage et de GPU. Nous vous recommandons de consulter notre revue sur le Precision 5680 pour en savoir plus sur les caractéristiques physiques de la série inspirées du XPS 16.
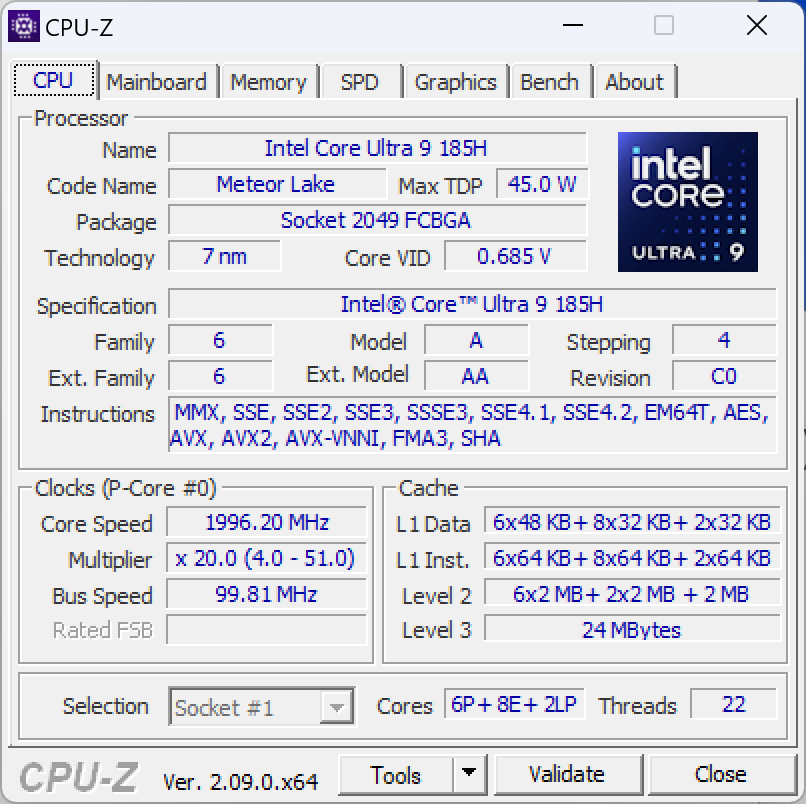
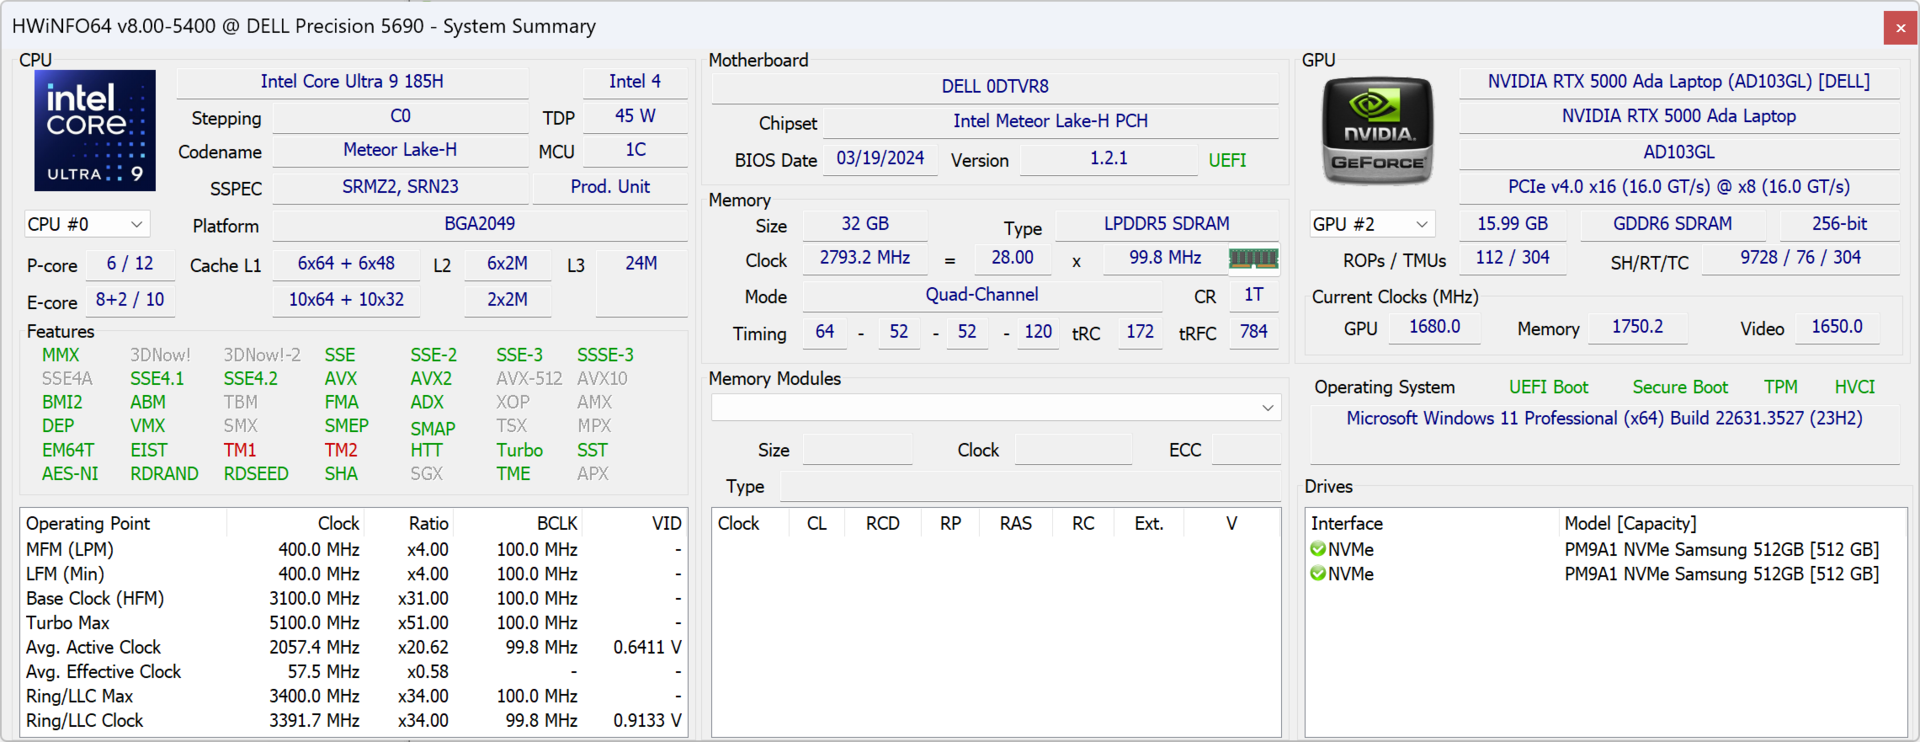
Notre modèle est la configuration la plus haut de gamme avec le CPU Core Ultra 9 185H vPro, le GPU Nvidia 5000 Ada et l'écran tactile OLED 2400p de 16 pouces pour un prix d'environ 5900 USD. Les SKU moins chers commencent avec le Core Ultra 5 135H vPro, les graphiques Arc intégrés uniquement, et l'écran IPS 1200p pour seulement 2300 USD.
Les alternatives au Precision 5690 comprennent d'autres stations de travail de 16 pouces comme le Lenovo ThinkPad P16 G2, HP ZBook Fury 16 G10ou le MSI CreatorPro Z16P.
Plus d'avis sur Dell :
Comparaison avec les concurrents potentiels
Note | Date | Modèle | Poids | Épaisseur | Taille | Résolution | Prix |
|---|---|---|---|---|---|---|---|
| 88.3 % v7 (old) | 05/24 | Dell Precision 5690 Ultra 9 185H, NVIDIA RTX 5000 Ada Generation Laptop GPU | 2.3 kg | 22.17 mm | 16.00" | 3840x2400 | |
| 89 % v7 (old) | 08/23 | Dell Precision 5000 5680 i9-13900H, NVIDIA RTX 5000 Ada Generation Laptop GPU | 2.3 kg | 22.17 mm | 16.00" | 3840x2400 | |
| 90.2 % v7 (old) | 03/24 | Lenovo ThinkPad P16 G2 21FA000FGE i7-13700HX, NVIDIA RTX 2000 Ada Generation Laptop GPU | 3 kg | 30.23 mm | 16.00" | 2560x1600 | |
| 91.7 % v7 (old) | 10/23 | Lenovo ThinkPad P1 G6-21FV000DGE i9-13900H, NVIDIA RTX 2000 Ada Generation Laptop GPU | 1.9 kg | 17.5 mm | 16.00" | 2560x1600 | |
| 92.3 % v7 (old) | 09/23 | HP ZBook Fury 16 G10 i9-13950HX, NVIDIA RTX 5000 Ada Generation Laptop GPU | 2.6 kg | 28.5 mm | 16.00" | 3840x2400 | |
| 84.3 % v7 (old) | 11/22 | MSI CreatorPro Z16P B12UKST i7-12700H, RTX A3000 Laptop GPU | 2.4 kg | 19 mm | 16.00" | 2560x1600 |
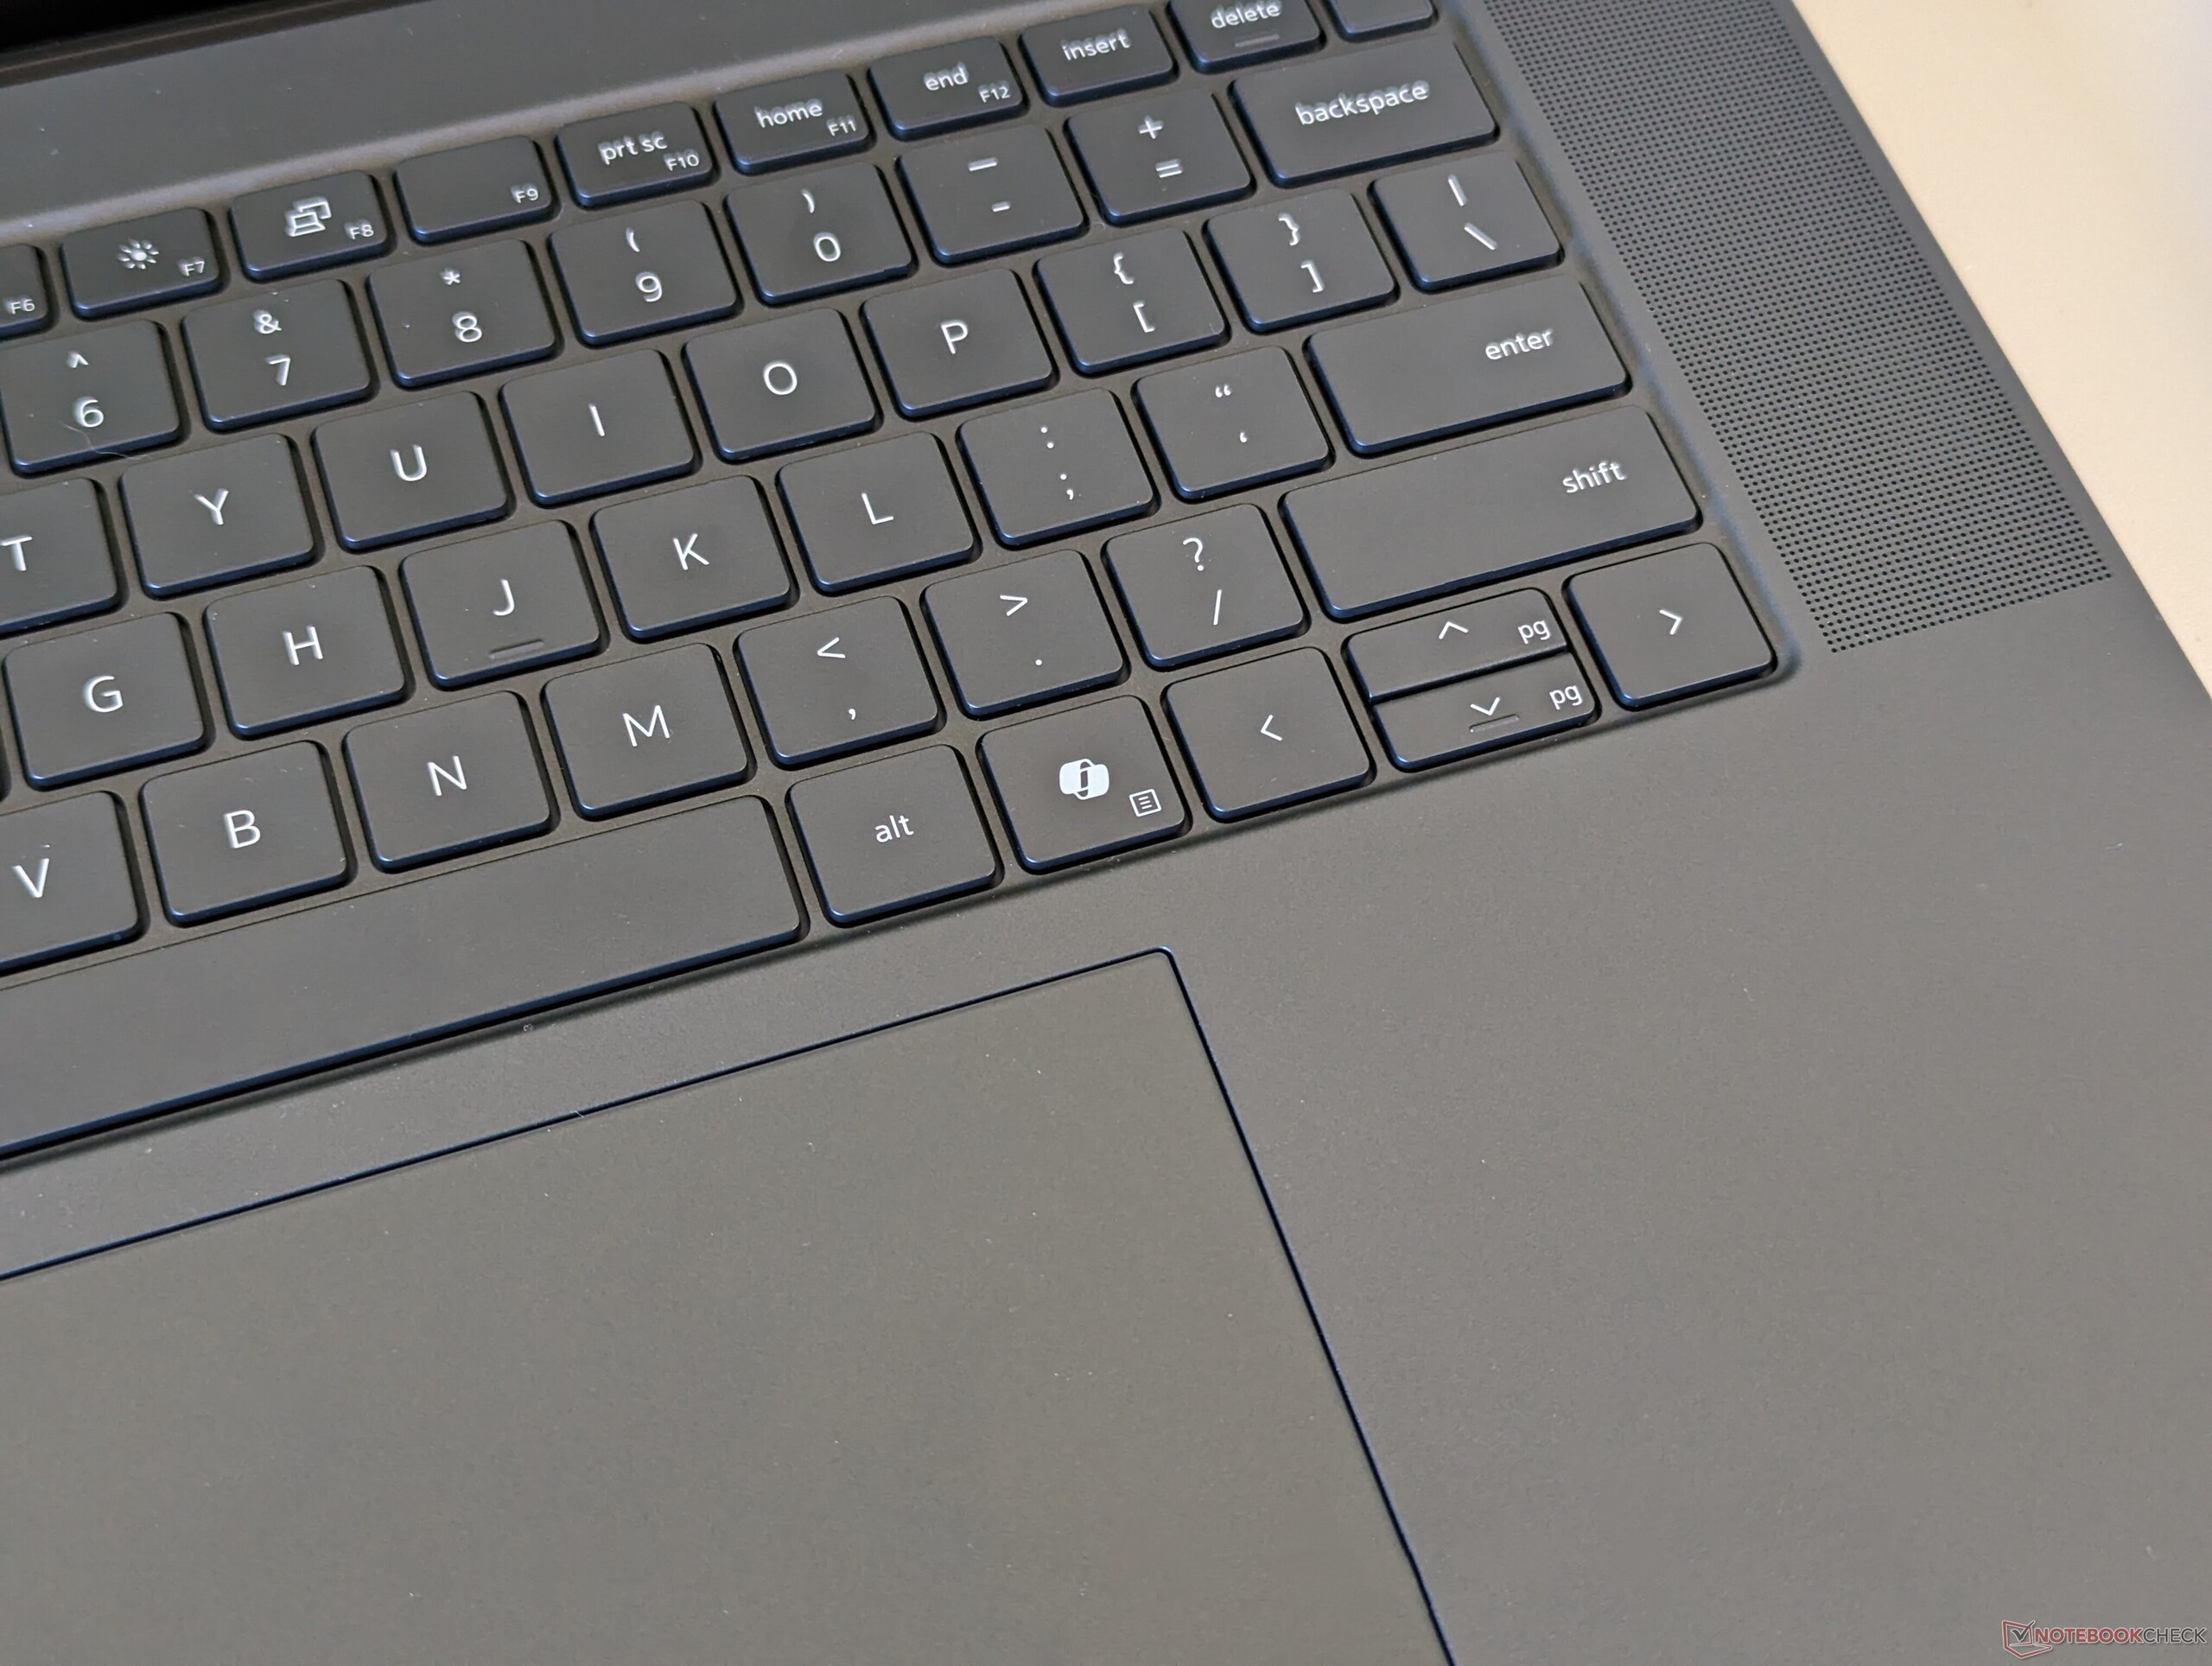
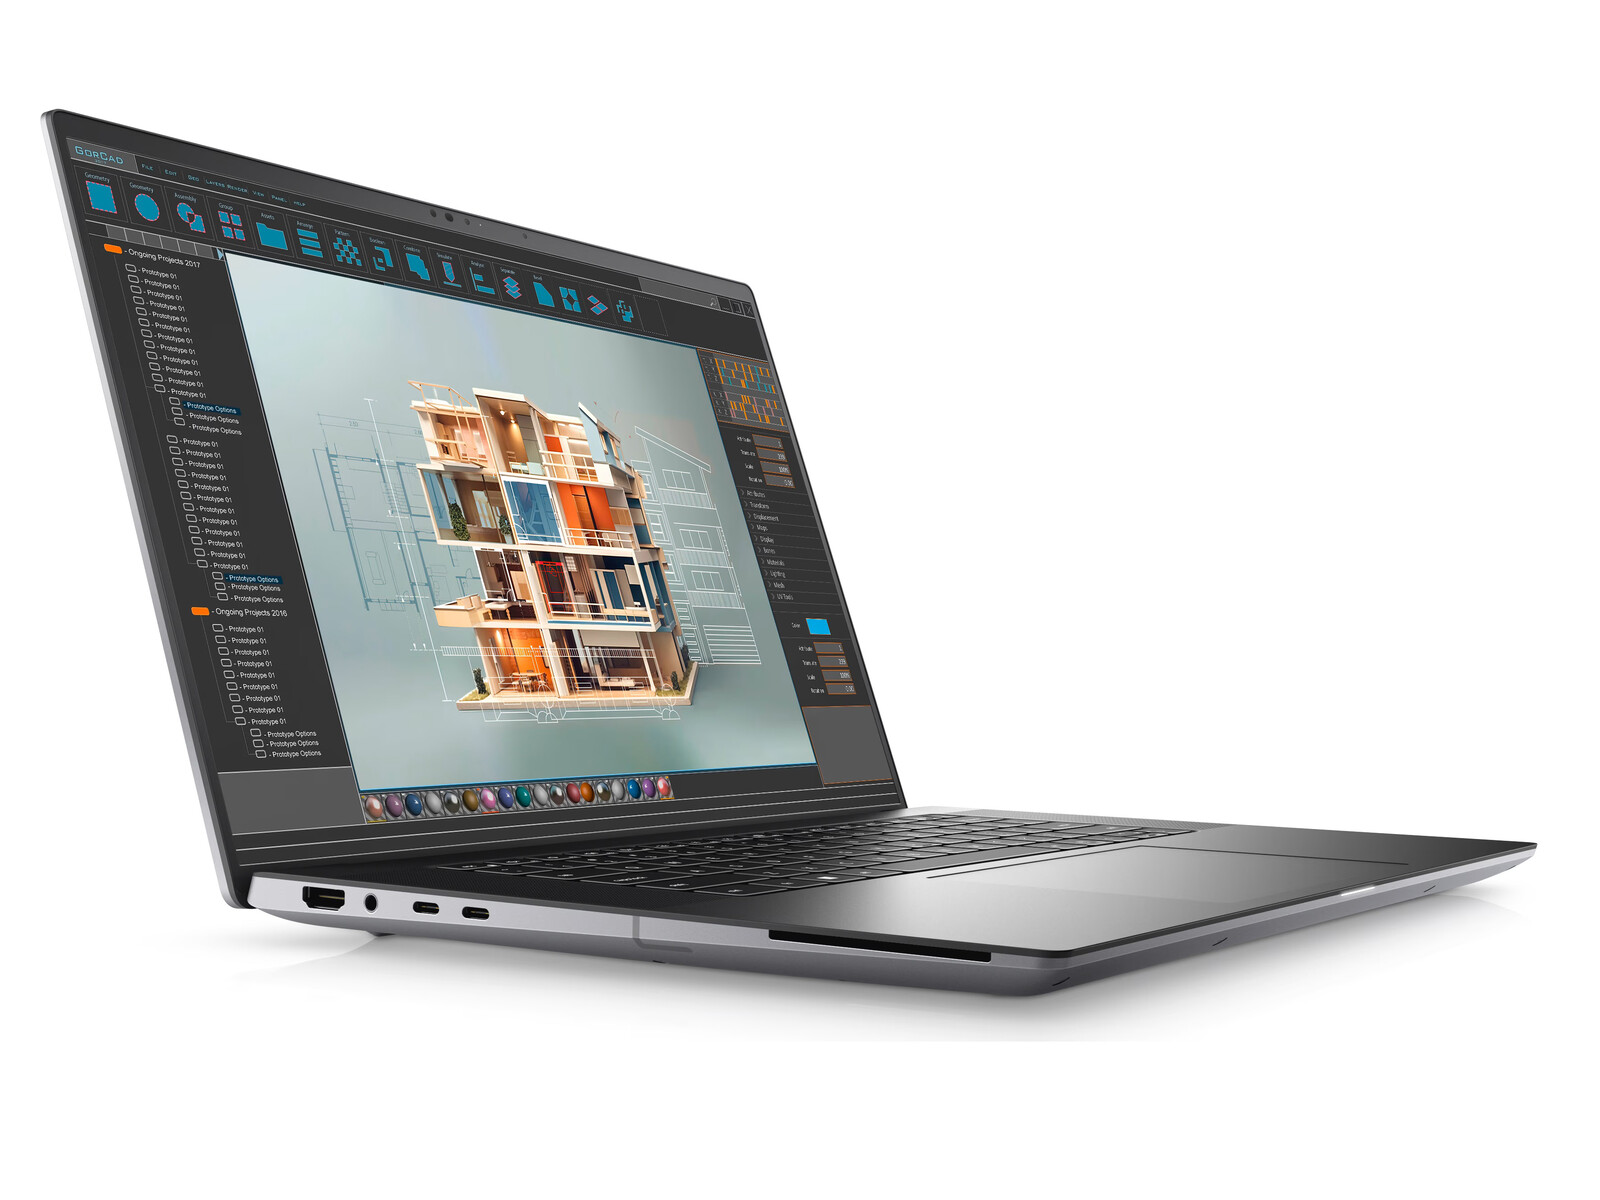
Boîtier - Inspiré par le XPS 16
Le clavier intègre désormais une touche Microsoft Co-Pilot dédiée à la place de la touche Ctrl droite afin de séparer visuellement le Precision 5690 du 5680.
Connectivité


Communication
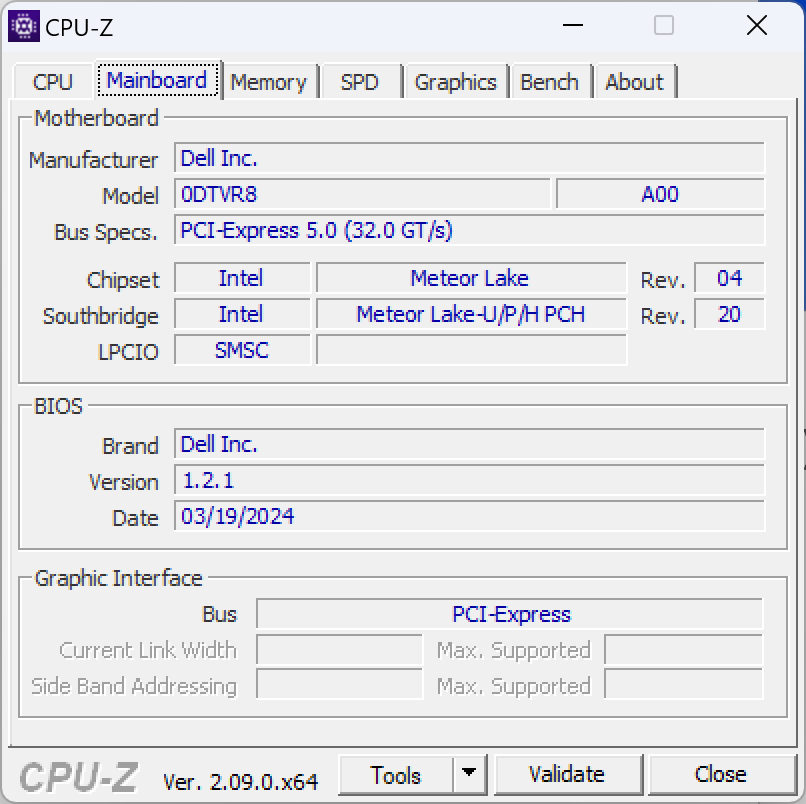
Le réseau local sans fil (WLAN) est passé de l'Intel AX211 à l'Intel BE200 pour prendre en charge la connectivité Wi-Fi 7. Cependant, la grande majorité des utilisateurs sont toujours limités au Wi-Fi 6E ou à des réseaux plus anciens, et la plupart d'entre eux ne remarqueront donc pas de gains de performance pour le moment.
Webcam

")
")
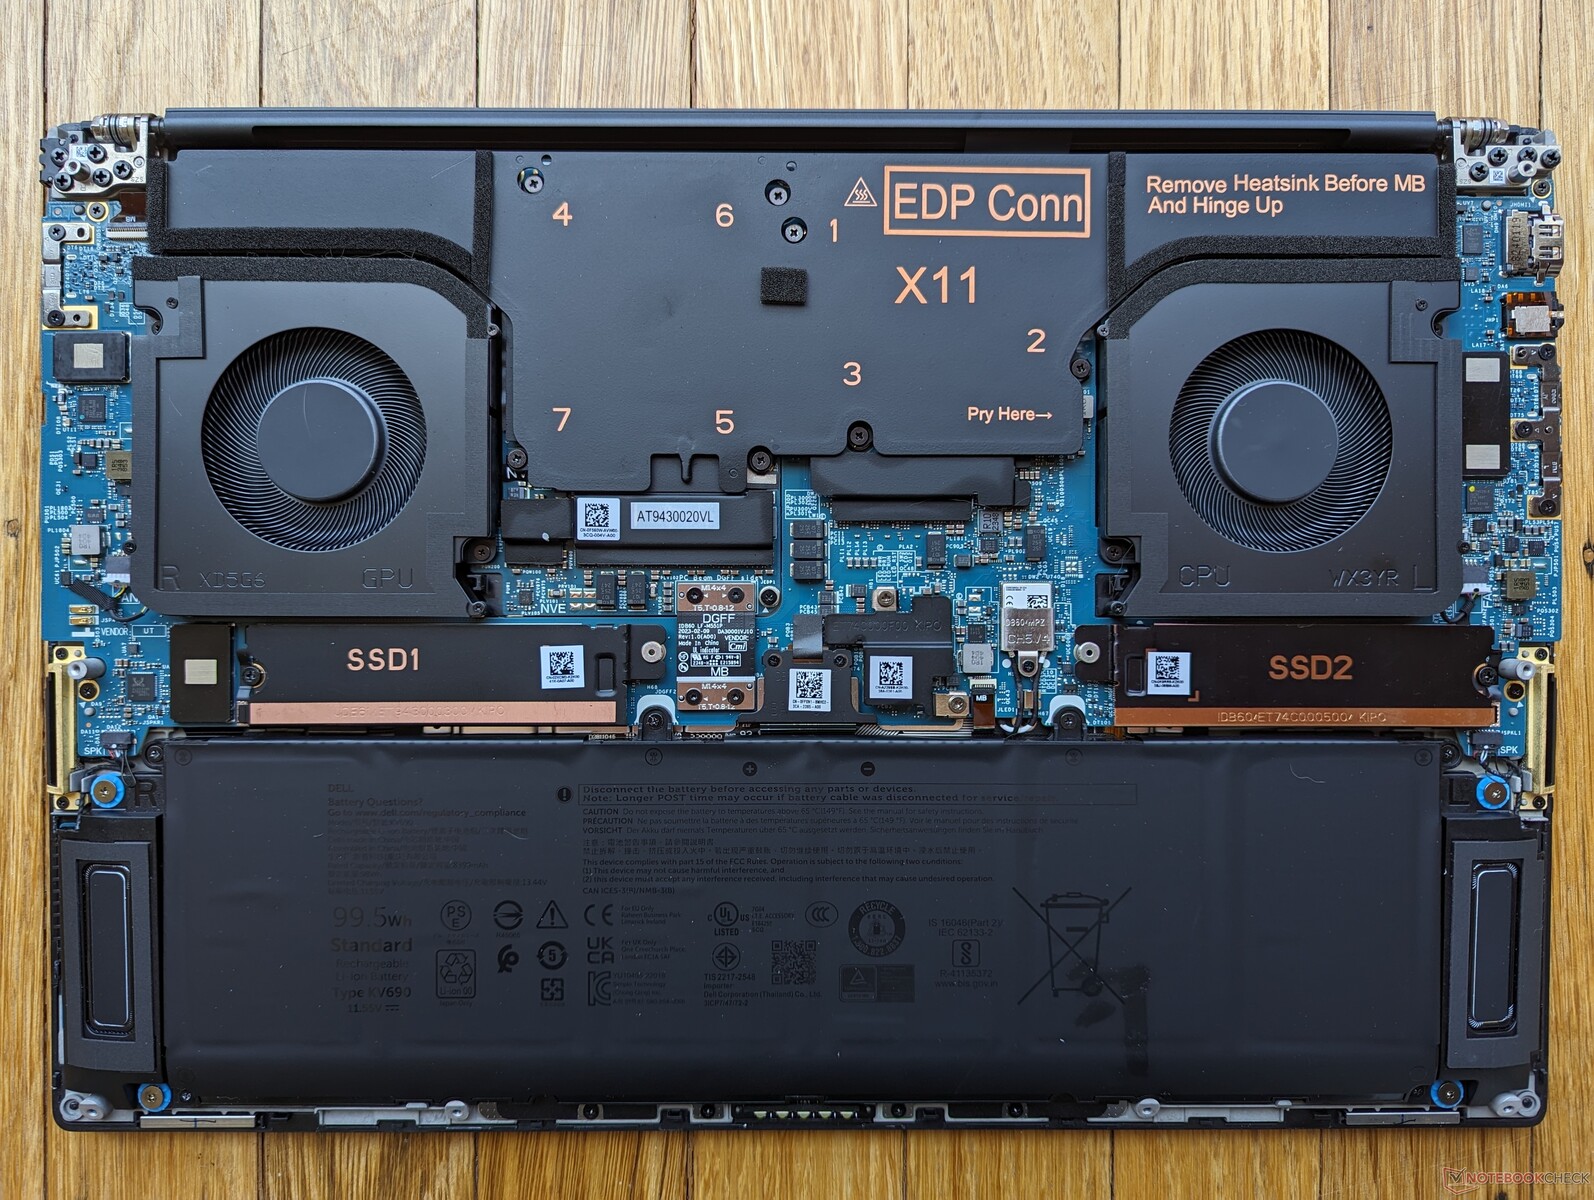
Maintenance
Il n'y a pas de différences internes notables entre le Precision 5690 et l'ancien 5680.

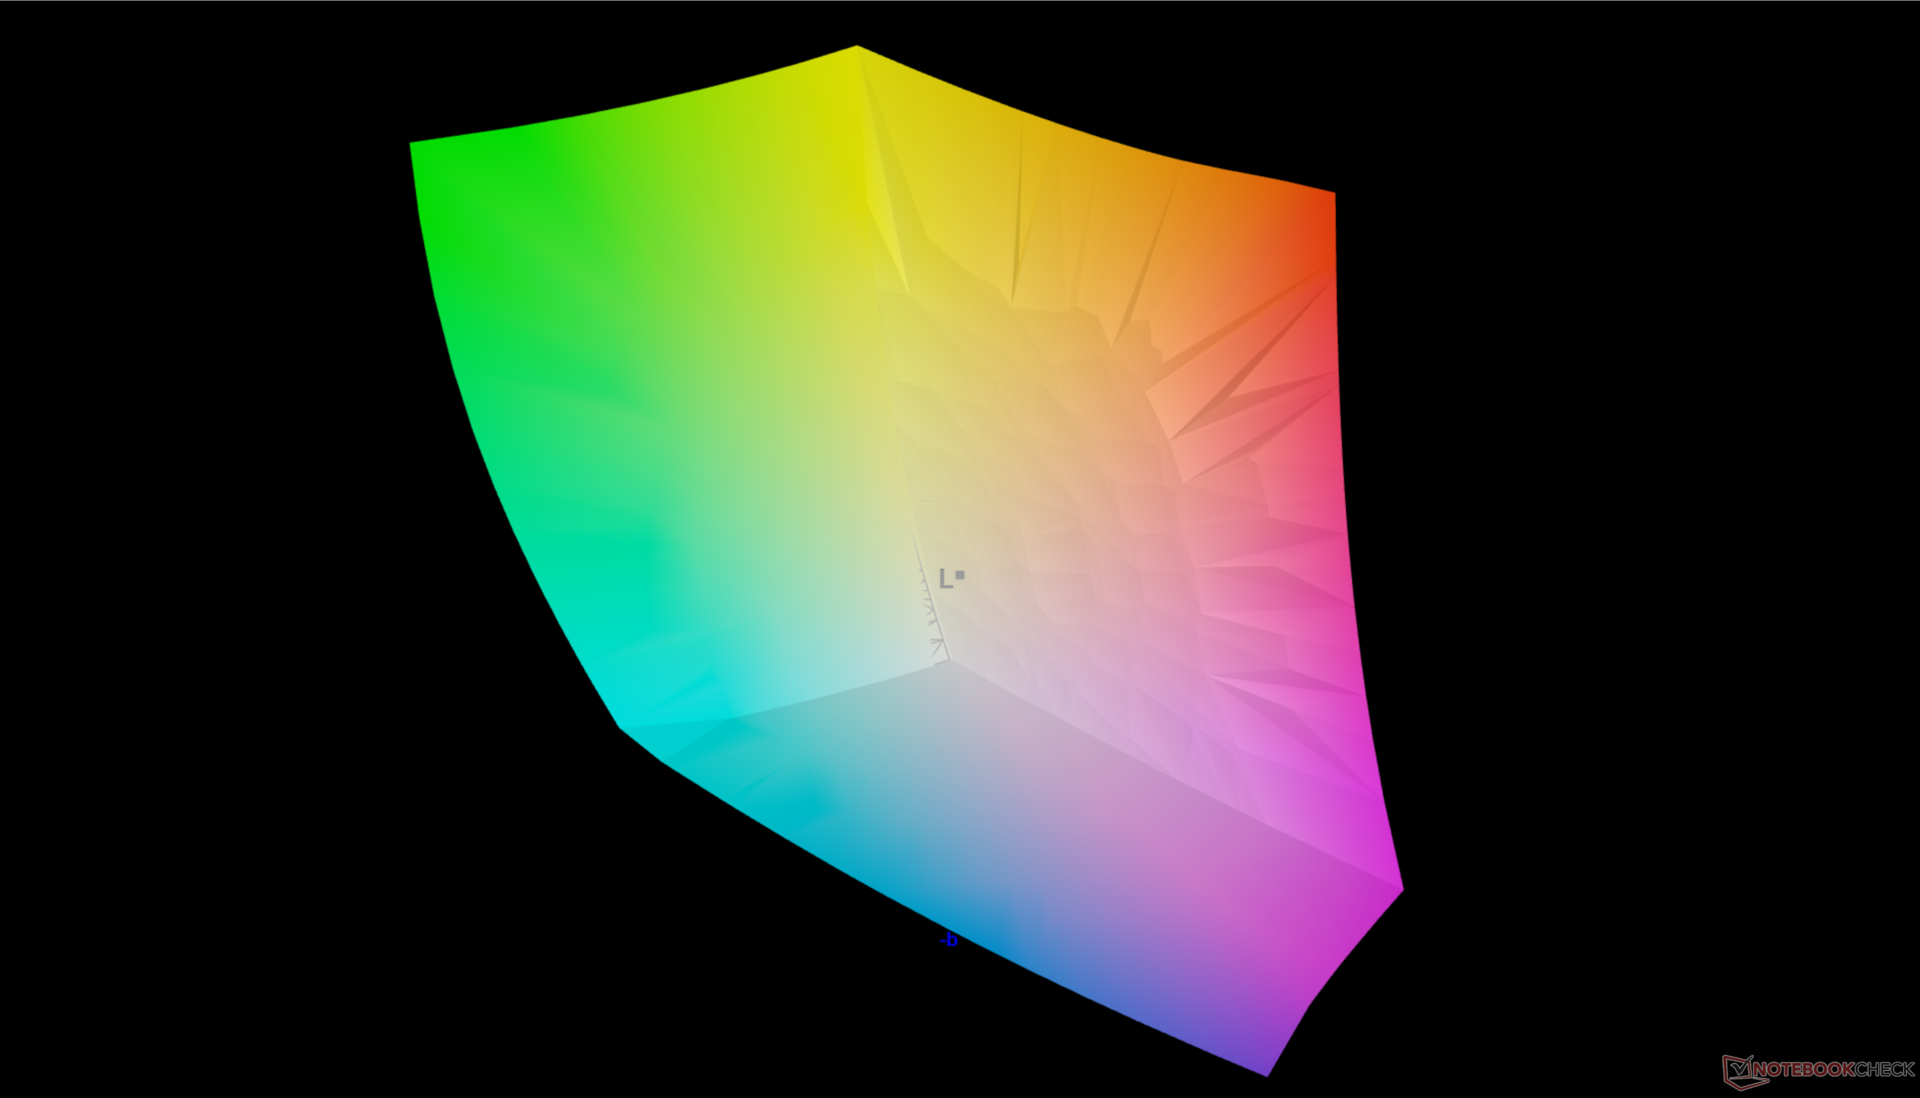
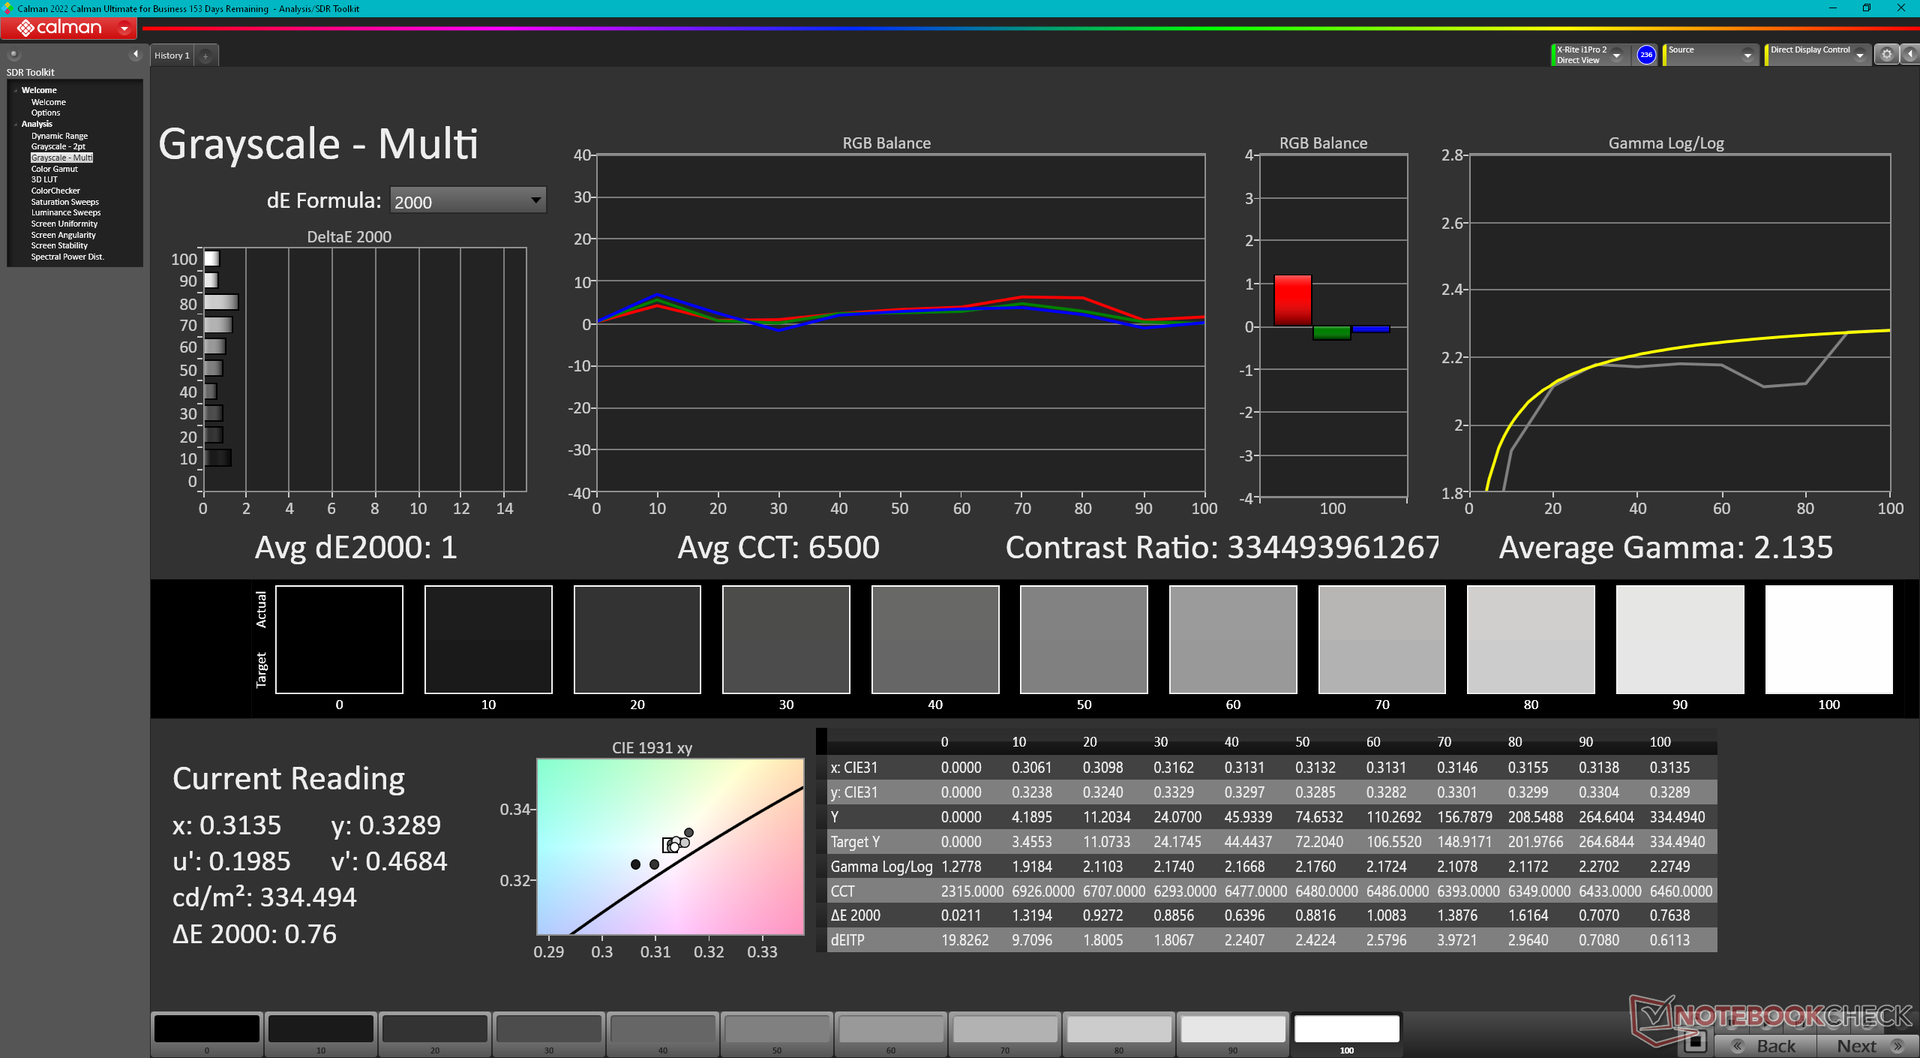
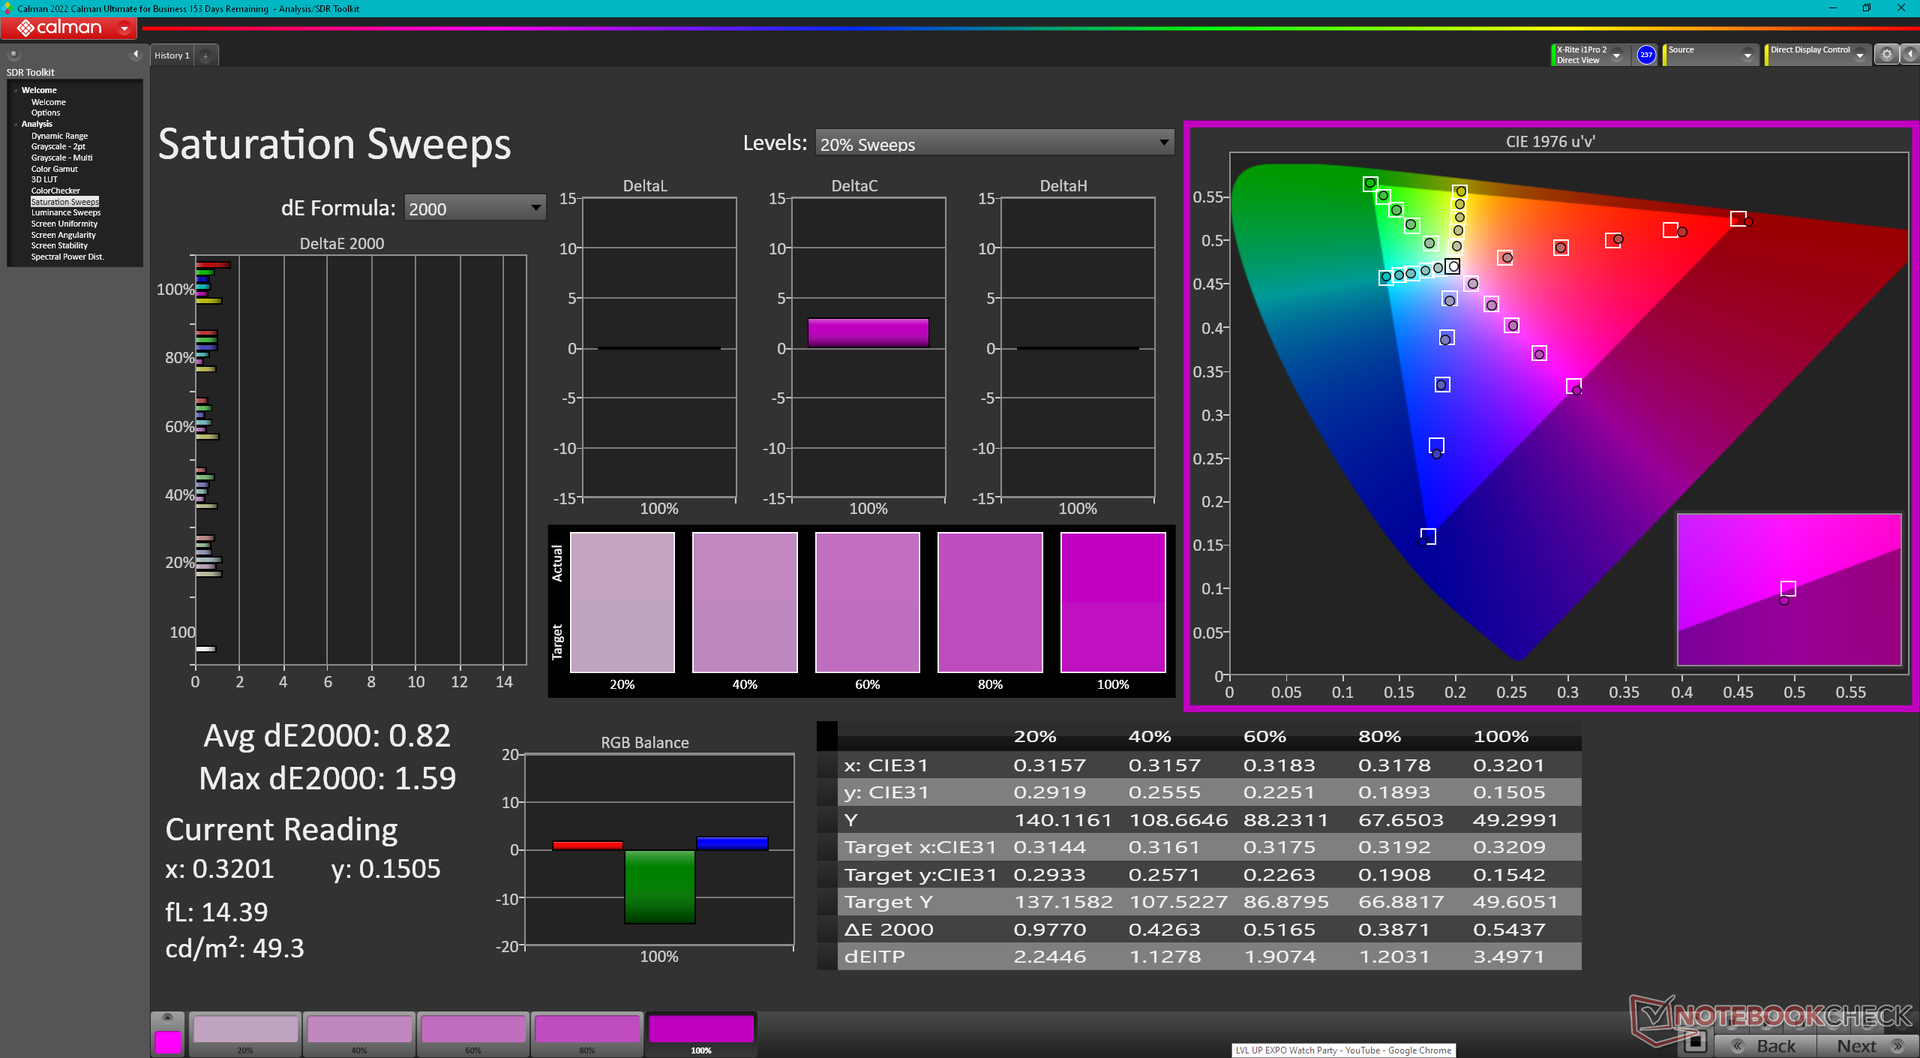
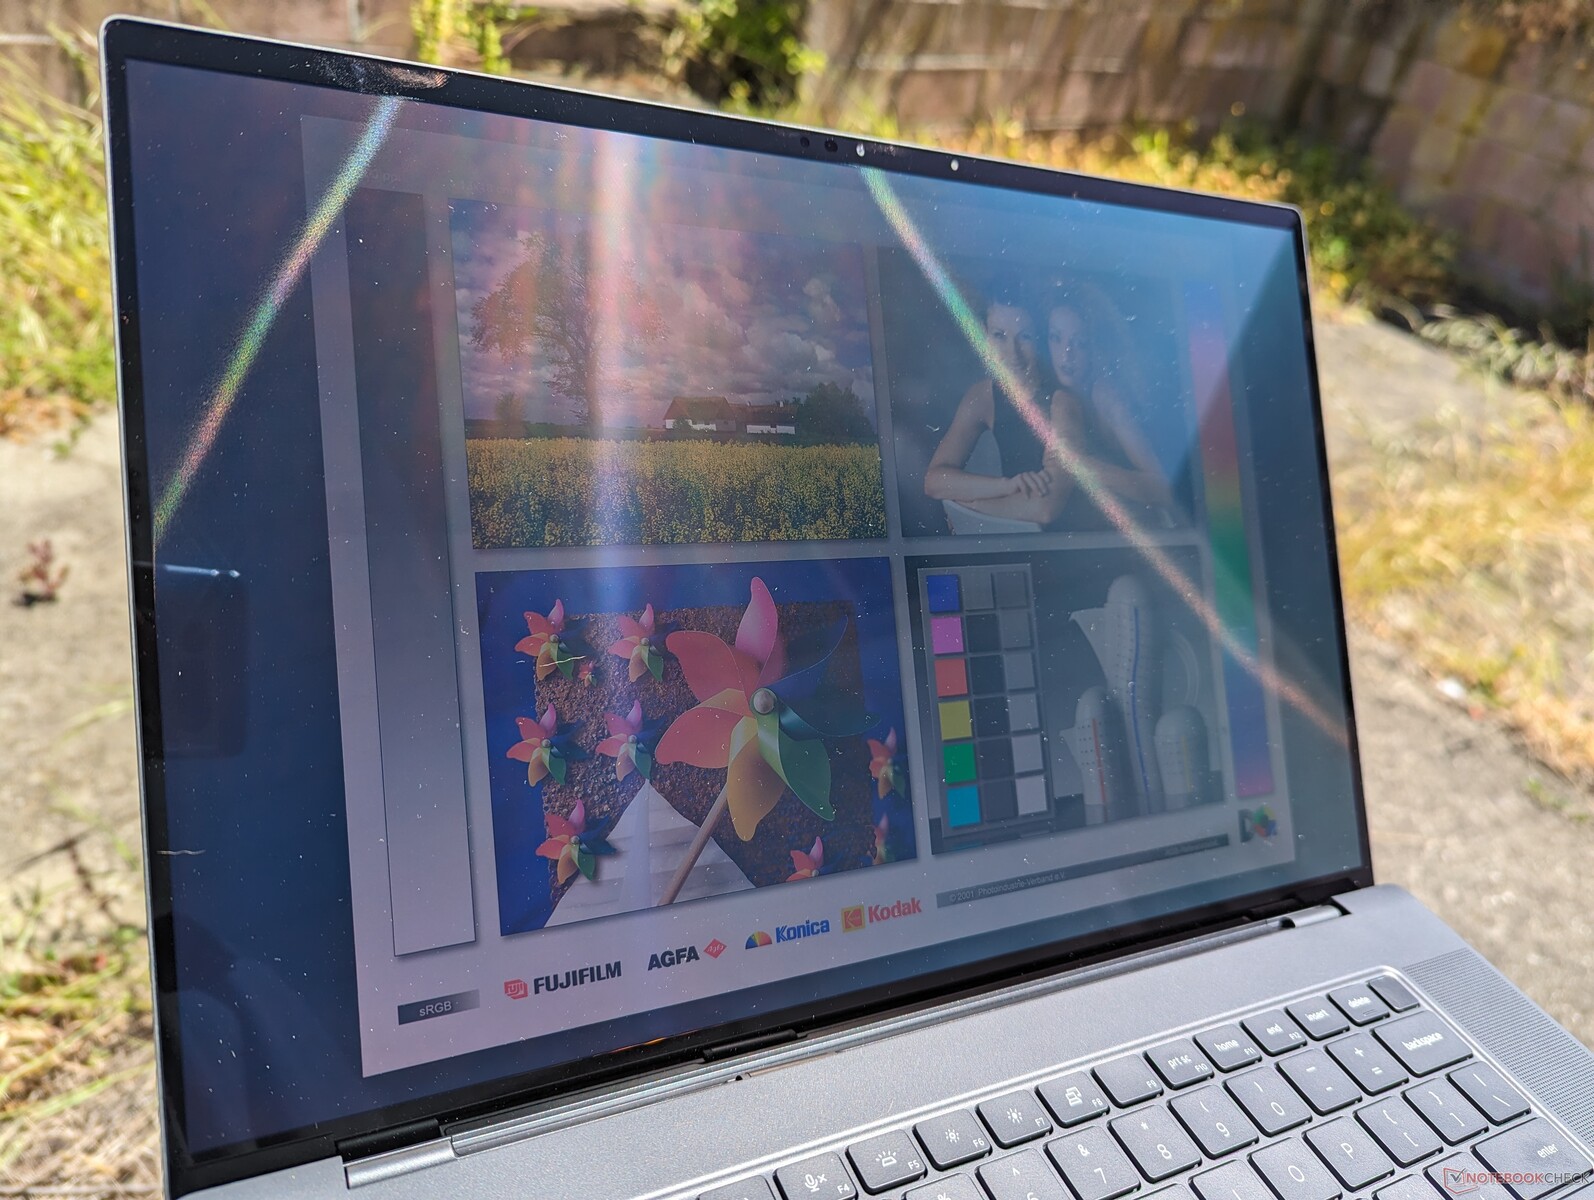
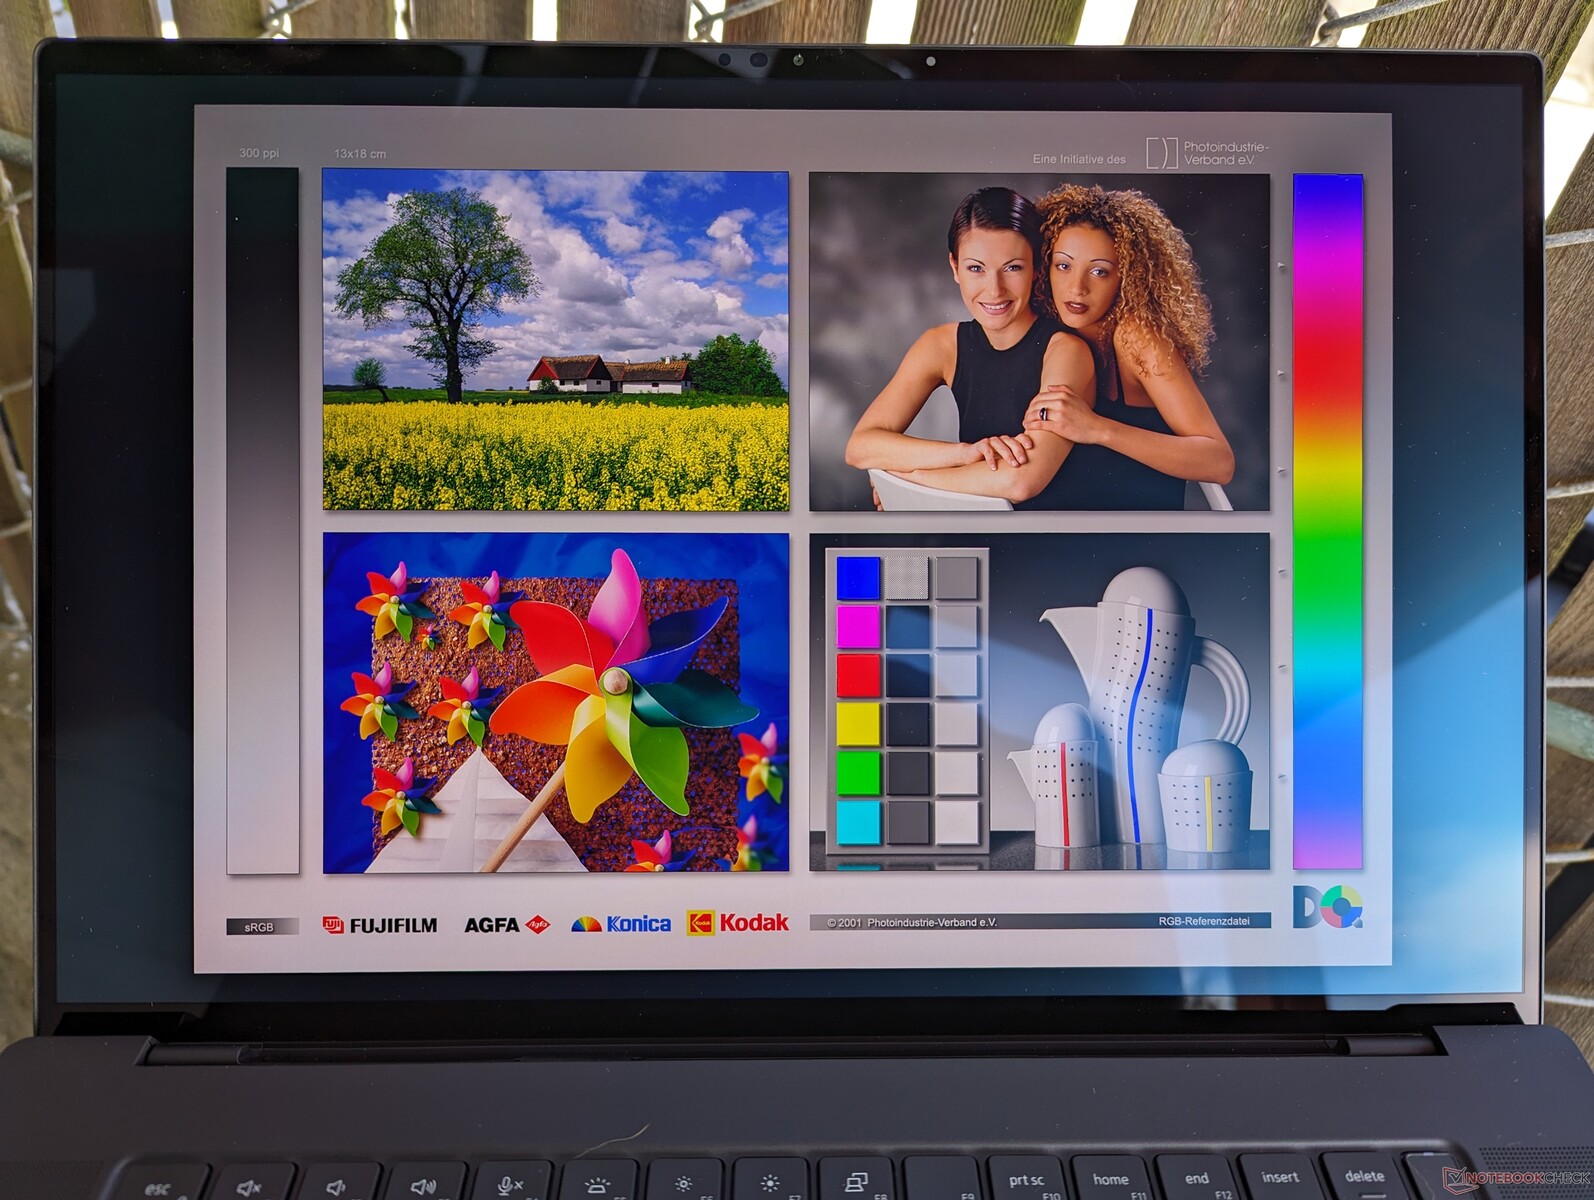
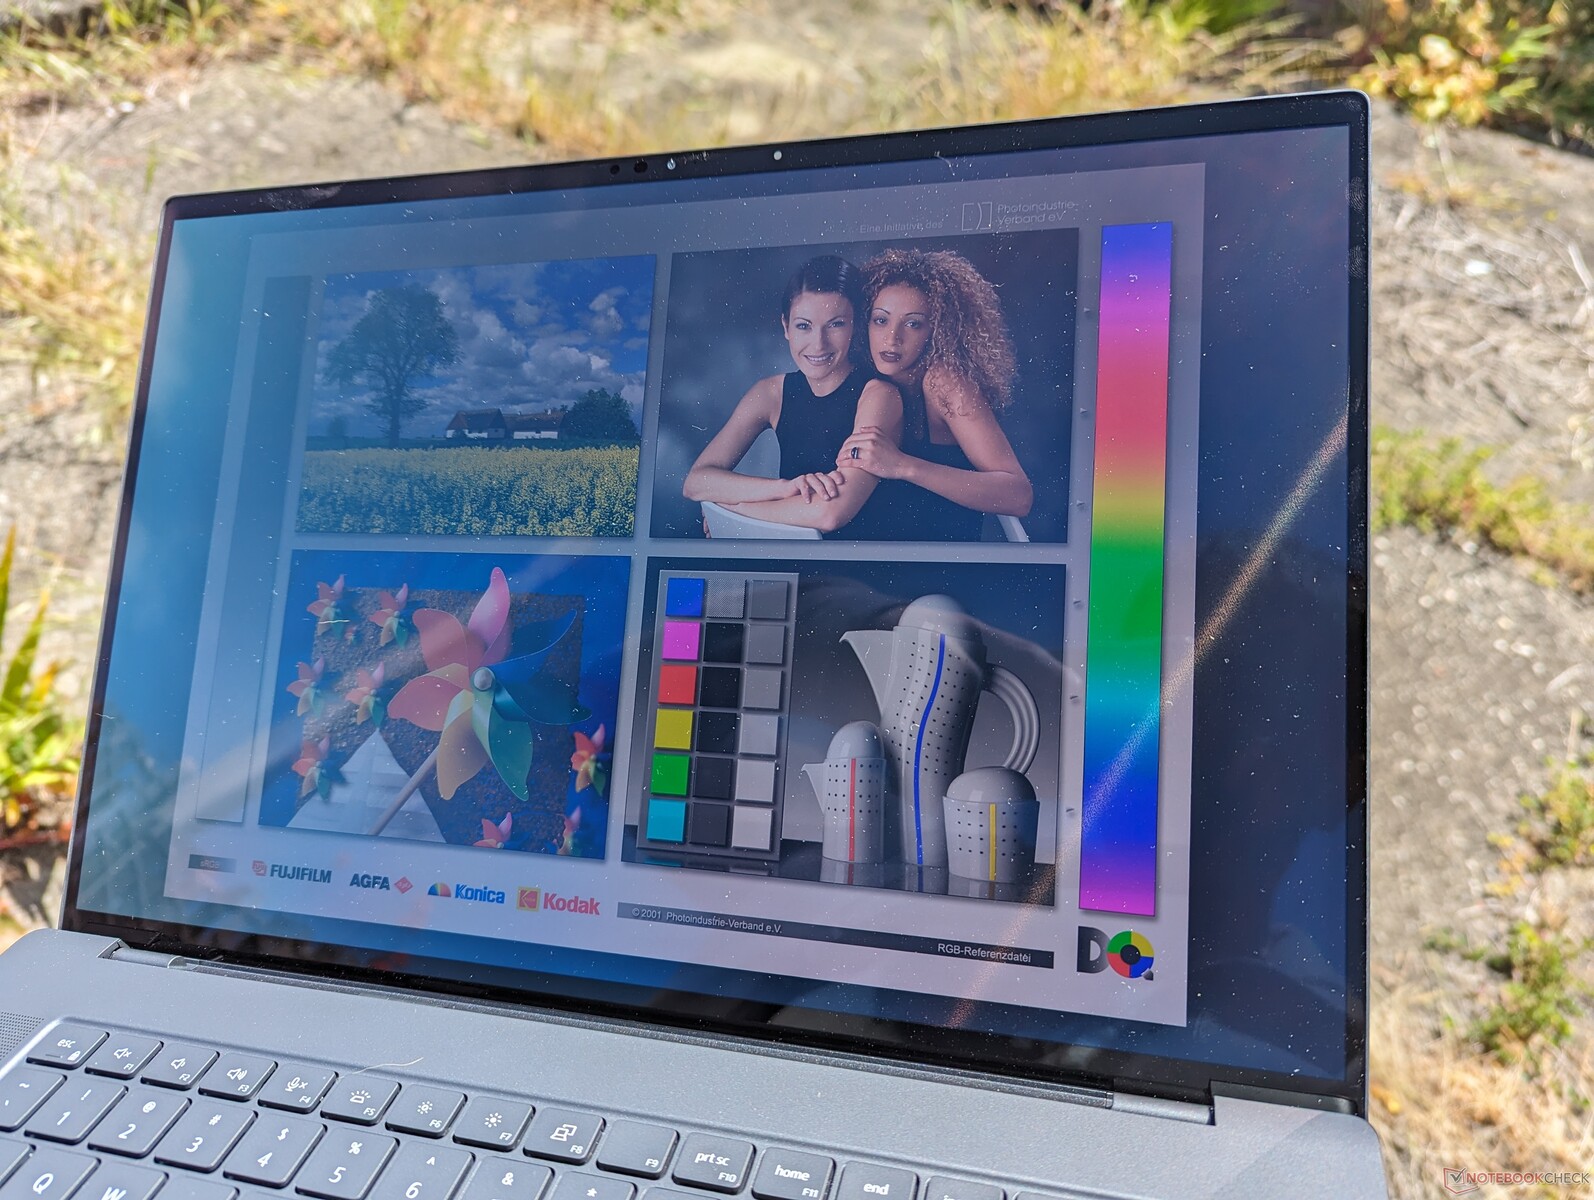
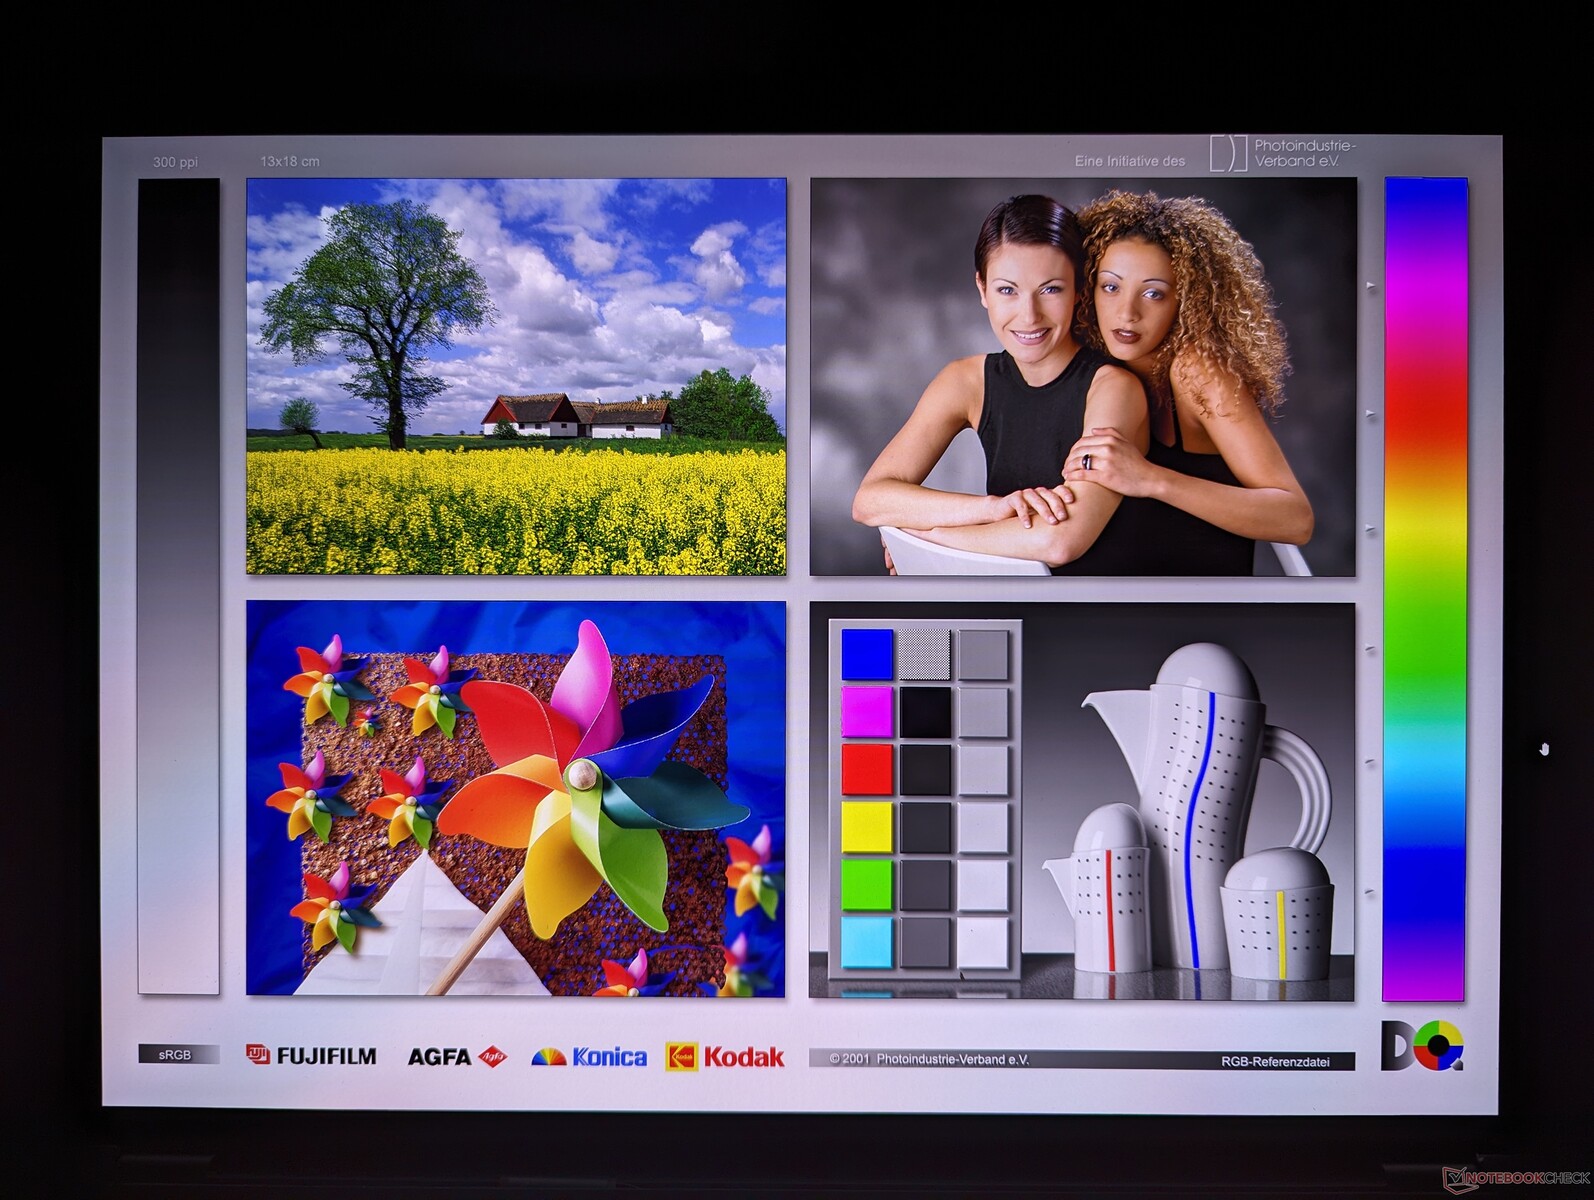
Affichage - HDR OLED à 60 Hz
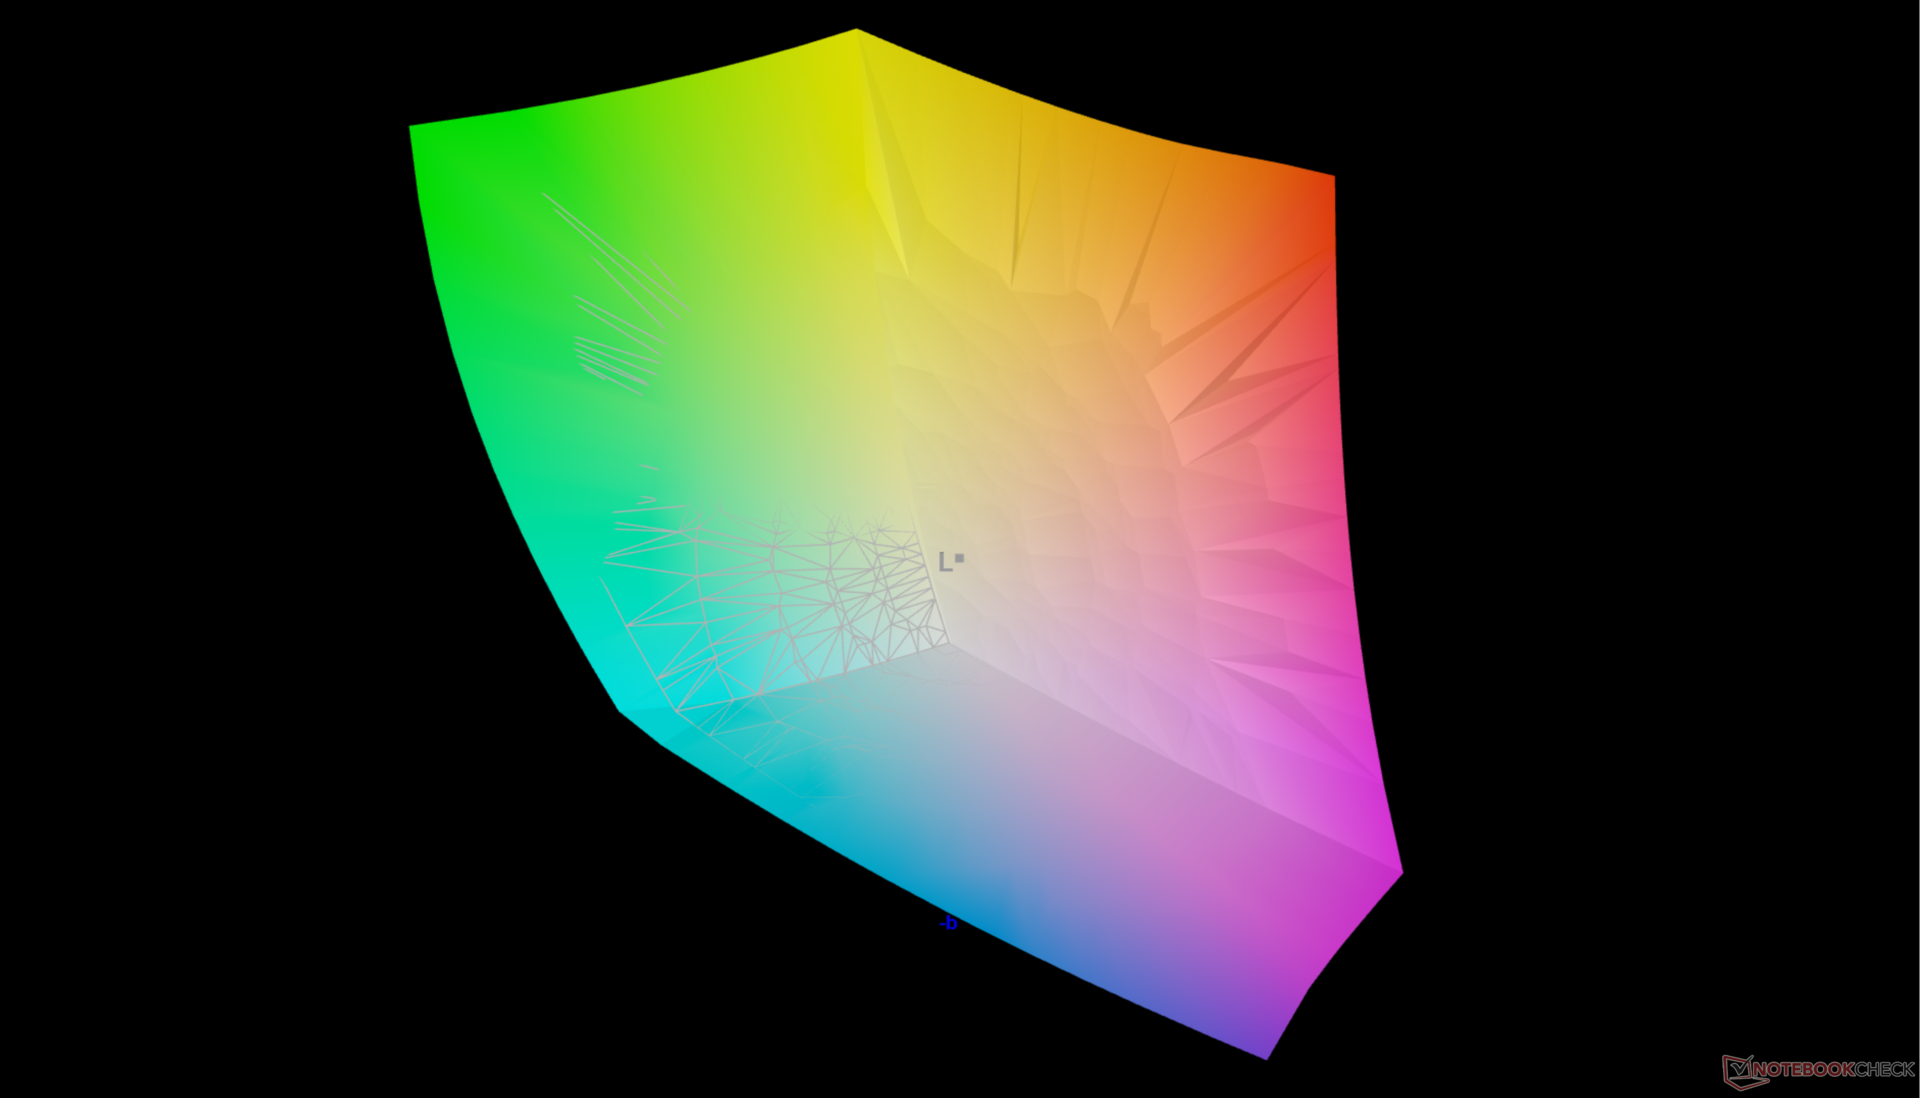
Le modèle 2024 utilise le même panneau OLED 4K Samsung 160YV03 et le même numéro de pièce D3KJF que l'année précédente pour ne rien changer à l'expérience visuelle. D'un côté, c'est excellent car le panneau OLED est pré-calibré avec des couleurs DCI-P3 complètes et un support tactile. D'autre part, il aurait été intéressant de voir des taux de rafraîchissement plus élevés avec des options adaptatives, car le taux de rafraîchissement standard de 60 Hz commence à vieillir.
La luminosité maximale en modes SDR et HDR peut atteindre 350 nits et 600 nits, respectivement.
| |||||||||||||||||||||||||
Homogénéité de la luminosité: 97 %
Valeur mesurée au centre, sur batterie: 348.1 cd/m²
Contraste: ∞:1 (Valeurs des noirs: 0 cd/m²)
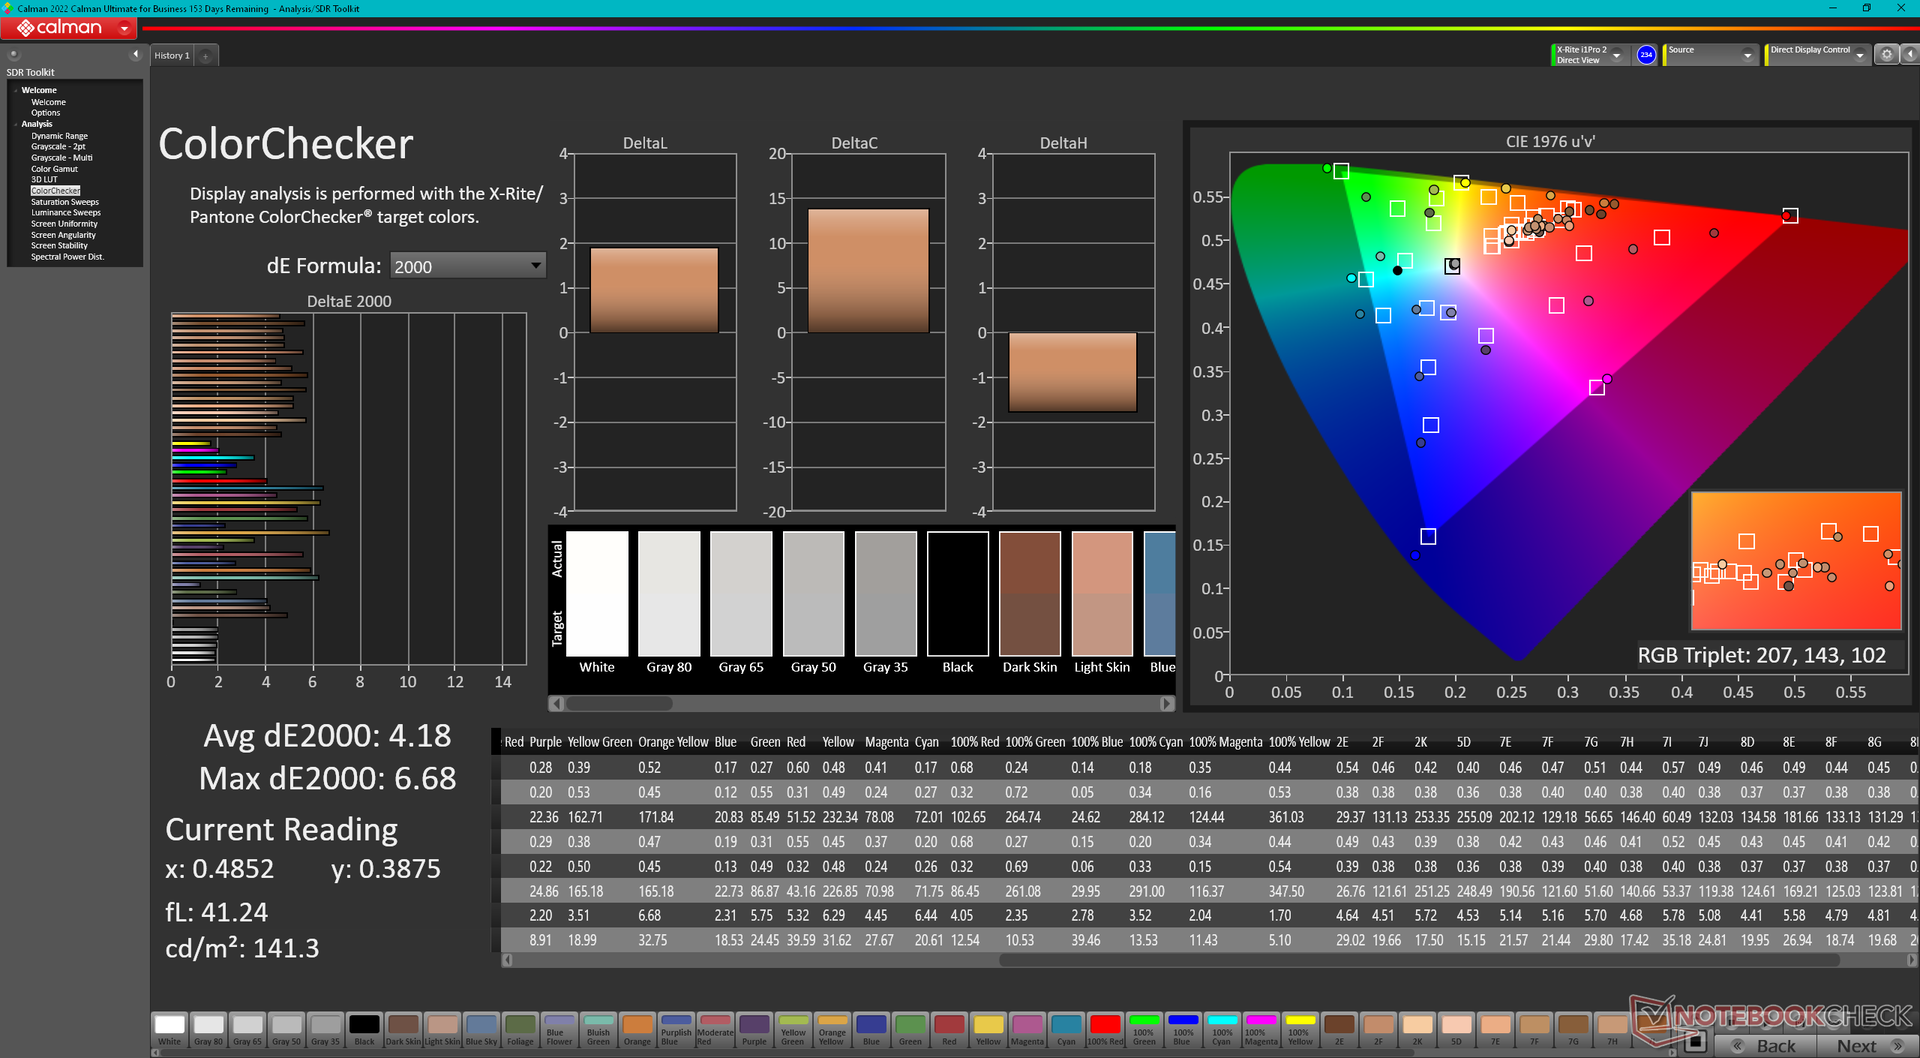
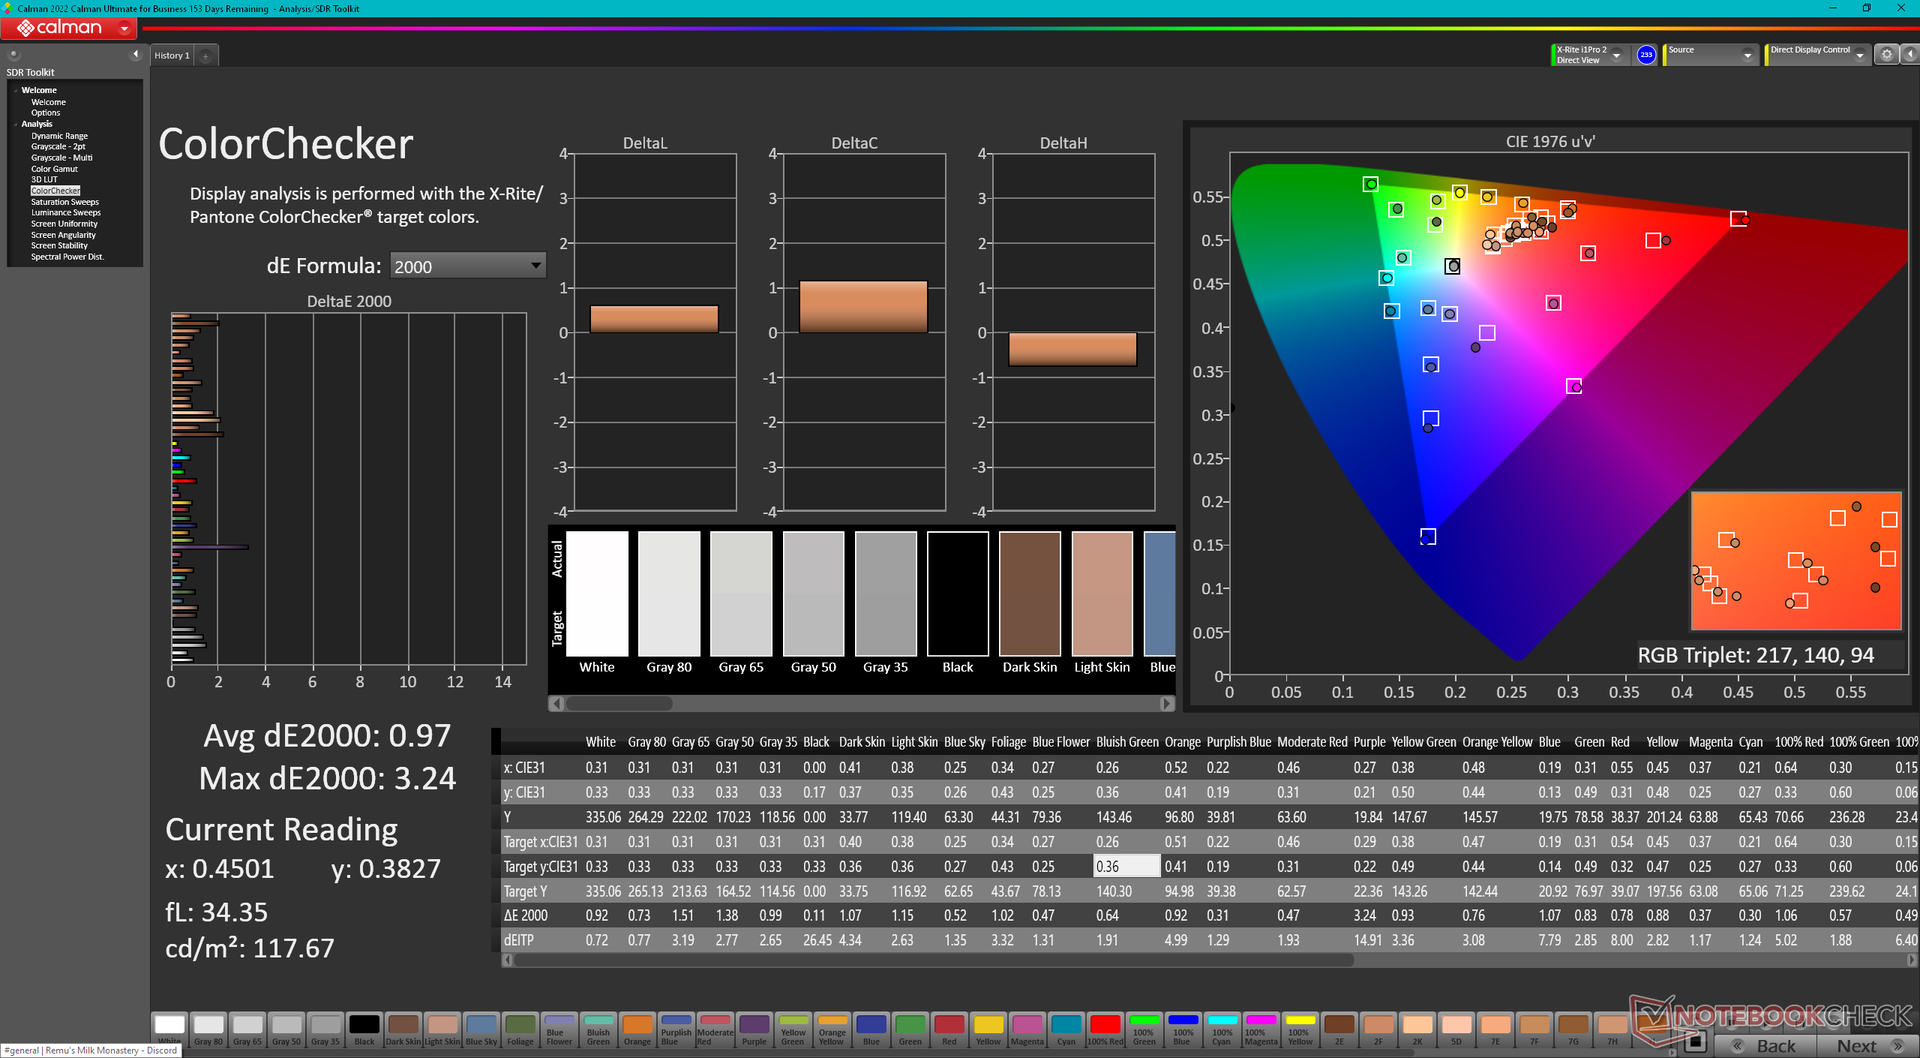
ΔE Color 4.18 | 0.5-29.43 Ø4.87, calibrated: 0.97
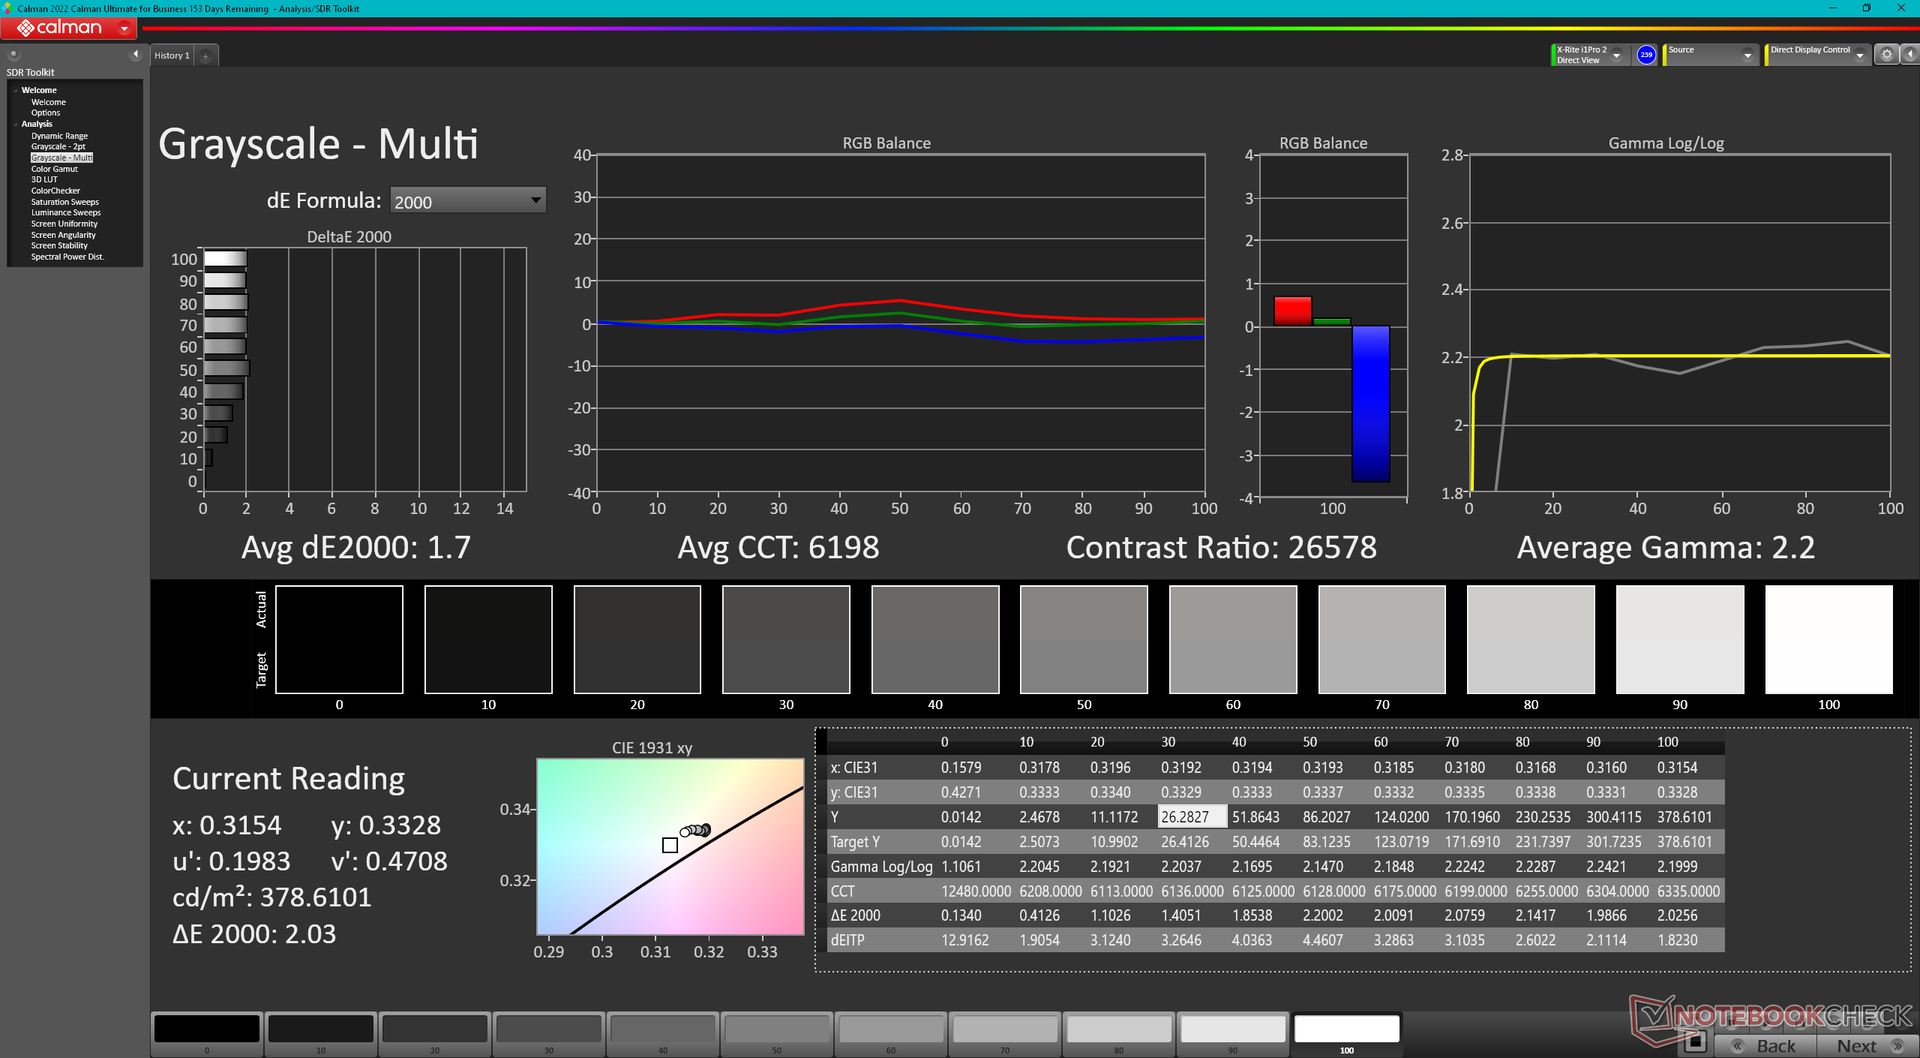
ΔE Greyscale 1.7 | 0.5-98 Ø5.1
96.6% AdobeRGB 1998 (Argyll 2.2.0 3D)
100% sRGB (Argyll 2.2.0 3D)
99.8% Display P3 (Argyll 2.2.0 3D)
Gamma: 2.2
| Dell Precision 5690 Samsung 160YV03, OLED, 3840x2400, 16" | Dell Precision 5000 5680 Samsung 160YV03, OLED, 3840x2400, 16" | Lenovo ThinkPad P16 G2 21FA000FGE MNG007DA1-9, IPS LED, 2560x1600, 16" | Lenovo ThinkPad P1 G6-21FV000DGE NE160QDM-NY1, IPS, 2560x1600, 16" | HP ZBook Fury 16 G10 AUO87A8, IPS, 3840x2400, 16" | MSI CreatorPro Z16P B12UKST B160QAN02.N, IPS, 2560x1600, 16" | |
|---|---|---|---|---|---|---|
| Display | 0% | -18% | -20% | -4% | -4% | |
| Display P3 Coverage | 99.8 | 99.9 0% | 71 -29% | 68.1 -32% | 98 -2% | 97.6 -2% |
| sRGB Coverage | 100 | 100 0% | 99.2 -1% | 97.5 -2% | 99.9 0% | 99.9 0% |
| AdobeRGB 1998 Coverage | 96.6 | 97.5 1% | 73.2 -24% | 70.2 -27% | 86.2 -11% | 87.4 -10% |
| Response Times | -1% | -574% | -586% | -533% | -494% | |
| Response Time Grey 50% / Grey 80% * | 1.7 ? | 1.68 ? 1% | 12.8 ? -653% | 13.7 ? -706% | 11.9 ? -600% | 12.8 ? -653% |
| Response Time Black / White * | 1.7 ? | 1.77 ? -4% | 10.1 ? -494% | 9.6 ? -465% | 9.6 ? -465% | 7.4 ? -335% |
| PWM Frequency | 60 ? | 60 ? 0% | ||||
| Screen | -11% | -15% | 33% | 36% | 22% | |
| Brightness middle | 348.1 | 345.7 -1% | 510 47% | 521 50% | 514.6 48% | 407 17% |
| Brightness | 351 | 349 -1% | 517 47% | 484 38% | 495 41% | 388 11% |
| Brightness Distribution | 97 | 98 1% | 89 -8% | 89 -8% | 90 -7% | 88 -9% |
| Black Level * | 0.37 | 0.36 | 0.46 | 0.36 | ||
| Colorchecker dE 2000 * | 4.18 | 3.59 14% | 2.6 38% | 1.2 71% | 2.4 43% | 1.3 69% |
| Colorchecker dE 2000 max. * | 6.68 | 7.02 -5% | 5.2 22% | 2.5 63% | 4.86 27% | 2.5 63% |
| Colorchecker dE 2000 calibrated * | 0.97 | 0.99 -2% | 2.3 -137% | 1 -3% | 0.4 59% | 0.7 28% |
| Greyscale dE 2000 * | 1.7 | 3.1 -82% | 3.6 -112% | 1.4 18% | 1 41% | 2.1 -24% |
| Gamma | 2.2 100% | 2.13 103% | 2.26 97% | 2.25 98% | 2.3 96% | 2.26 97% |
| CCT | 6198 105% | 6448 101% | 5969 109% | 6682 97% | 6553 99% | 6437 101% |
| Contrast | 1378 | 1447 | 1119 | 1131 | ||
| Moyenne finale (programmes/paramètres) | -4% /
-6% | -202% /
-109% | -191% /
-84% | -167% /
-69% | -159% /
-70% |
* ... Moindre est la valeur, meilleures sont les performances
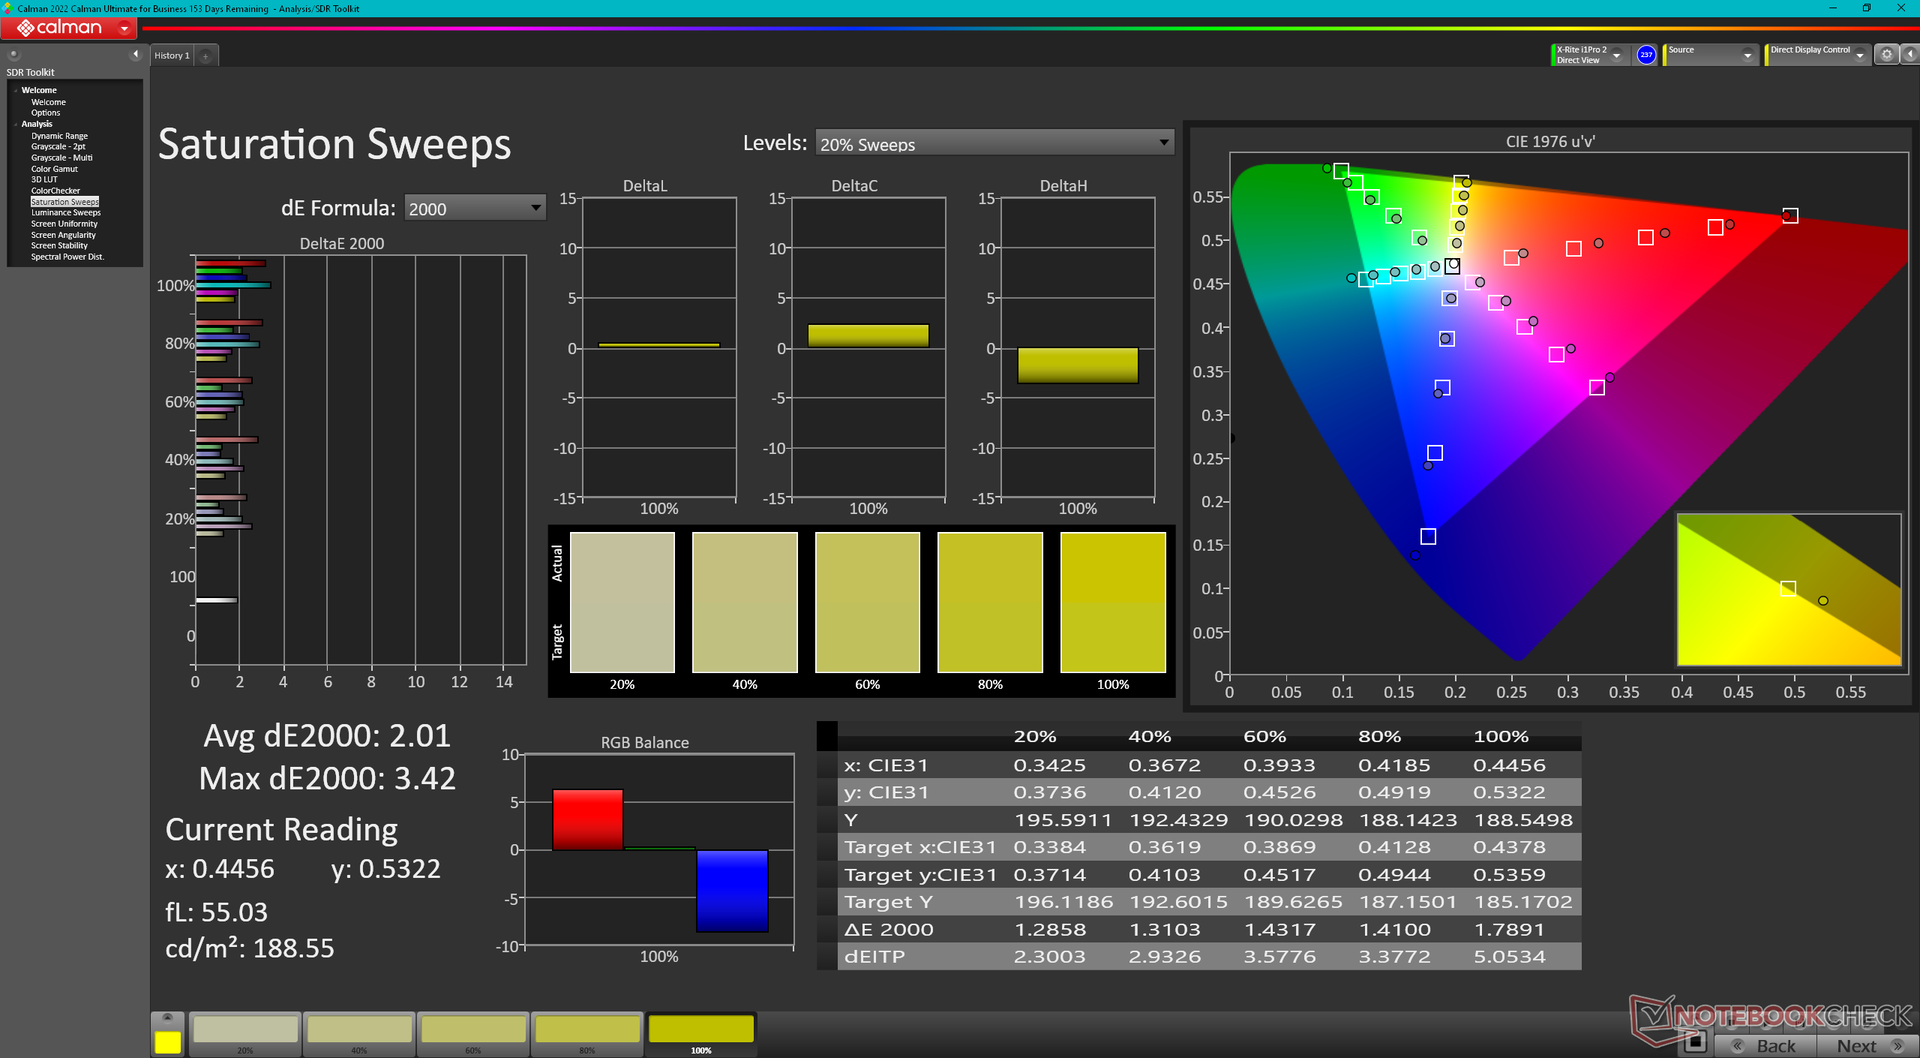
L'écran est bien calibré par rapport à la norme P3, avec des valeurs DeltaE moyennes en niveaux de gris et en couleurs de seulement 1,7 et 4,18, respectivement.
Temps de réponse de l'écran
| ↔ Temps de réponse noir à blanc | ||
|---|---|---|
| 1.7 ms ... hausse ↗ et chute ↘ combinées | ↗ 0.74 ms hausse | 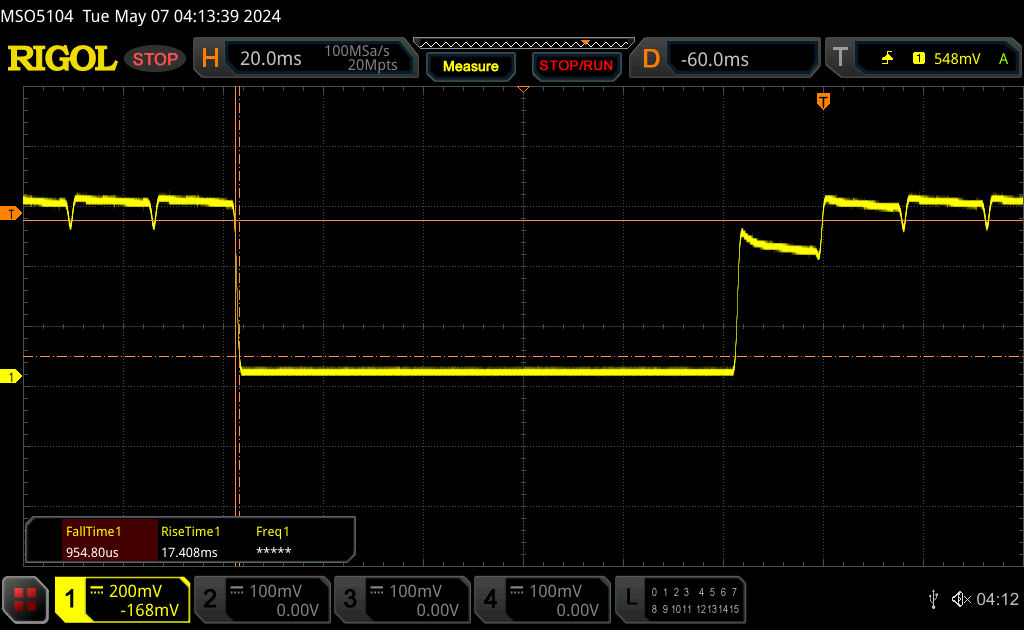 |
| ↘ 0.96 ms chute | ||
| L'écran montre de très faibles temps de réponse, parfait pour le jeu. En comparaison, tous les appareils testés affichent entre 0.1 (minimum) et 240 (maximum) ms. » 7 % des appareils testés affichent de meilleures performances. Cela signifie que les latences relevées sont meilleures que la moyenne (20.8 ms) de tous les appareils testés. | ||
| ↔ Temps de réponse gris 50% à gris 80% | ||
| 1.7 ms ... hausse ↗ et chute ↘ combinées | ↗ 0.88 ms hausse | 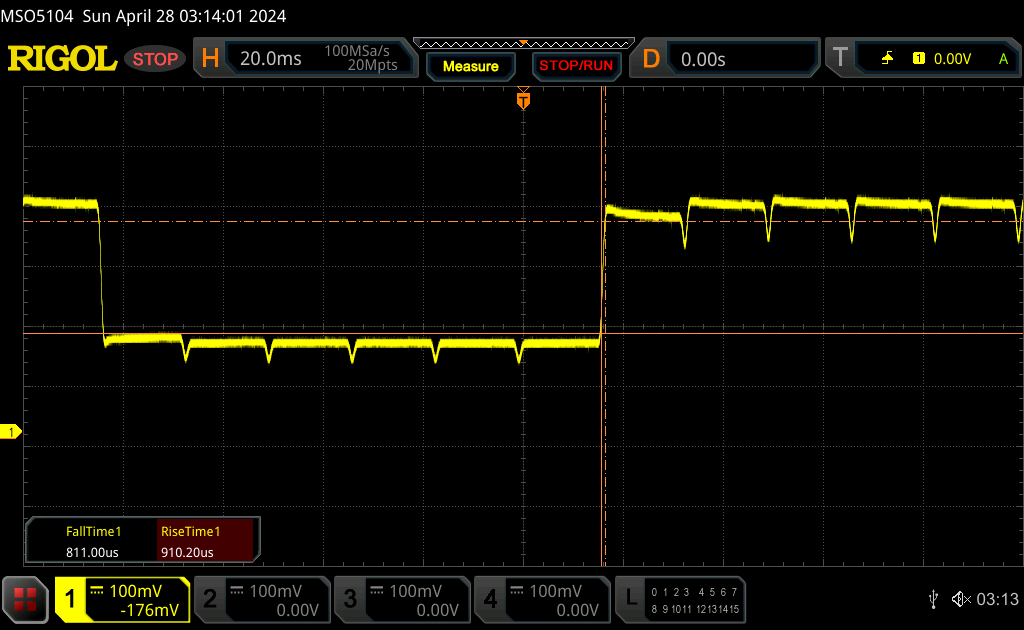 |
| ↘ 0.82 ms chute | ||
| L'écran montre de très faibles temps de réponse, parfait pour le jeu. En comparaison, tous les appareils testés affichent entre 0.165 (minimum) et 636 (maximum) ms. » 6 % des appareils testés affichent de meilleures performances. Cela signifie que les latences relevées sont meilleures que la moyenne (32.5 ms) de tous les appareils testés. | ||
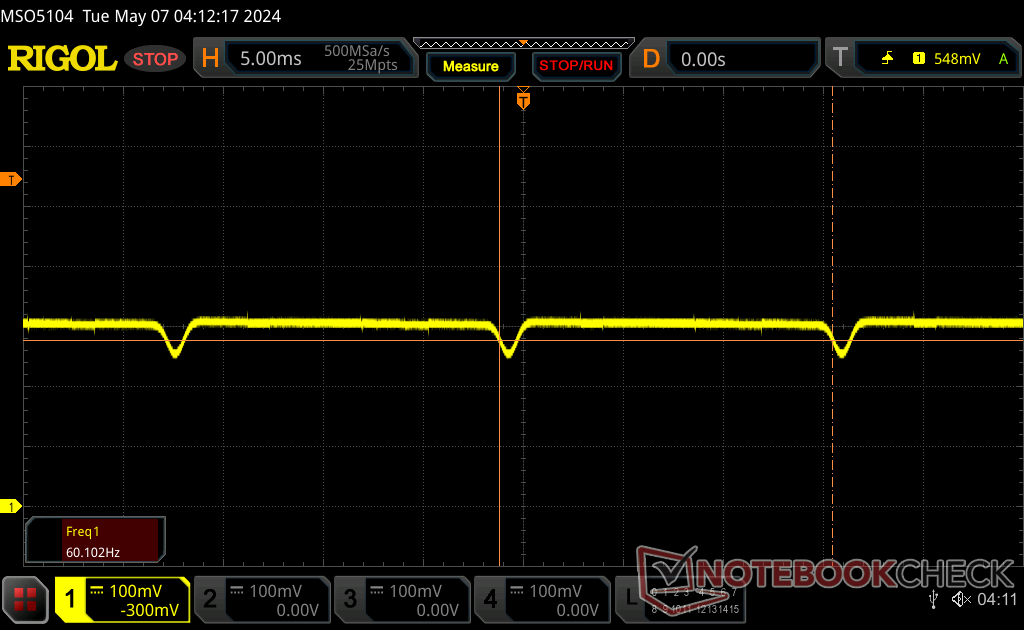
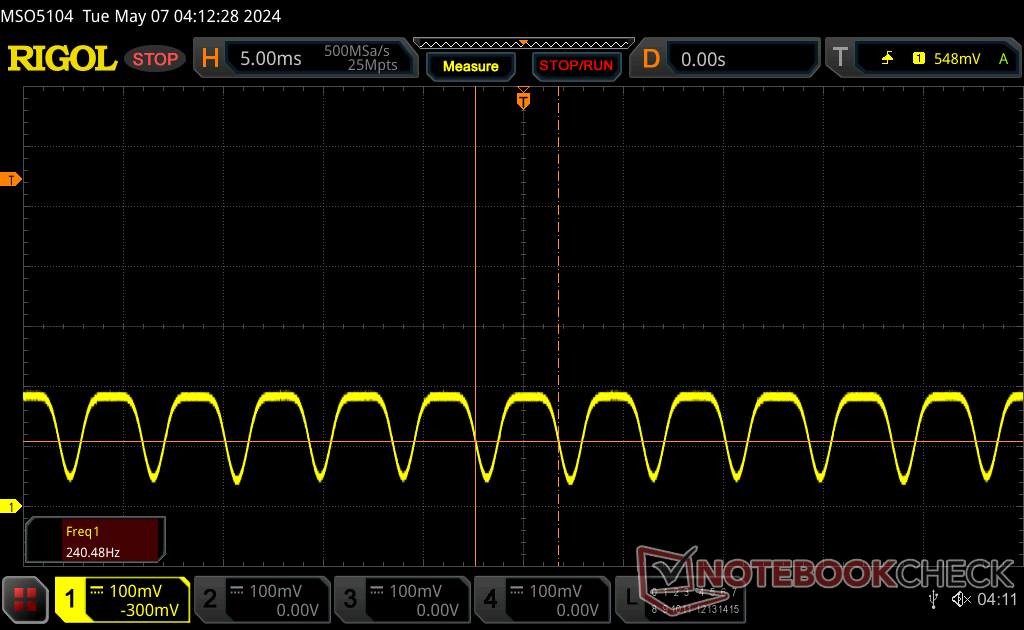
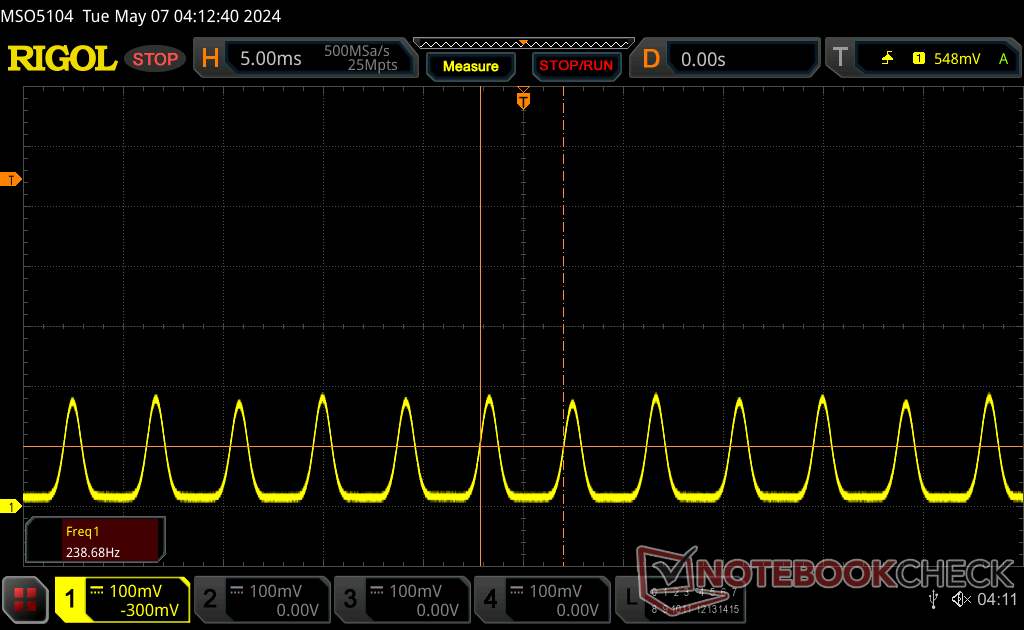
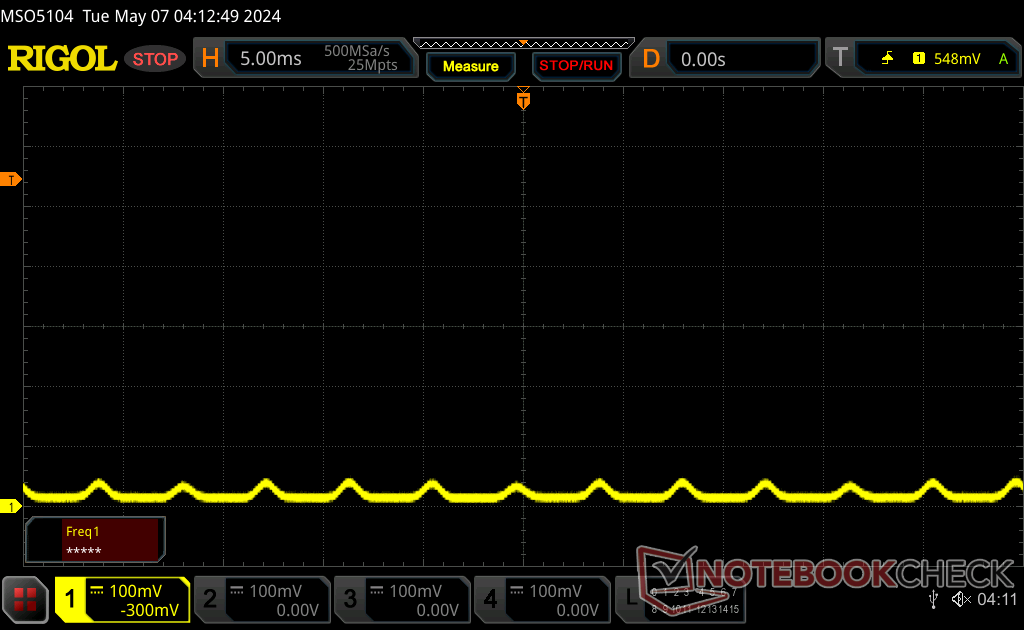
Scintillement / MLI (Modulation de largeur d'impulsion)
| Scintillement / MLI (Modulation de largeur d'impulsion) décelé | 60 Hz | ≤ 100 Niveau de luminosité | 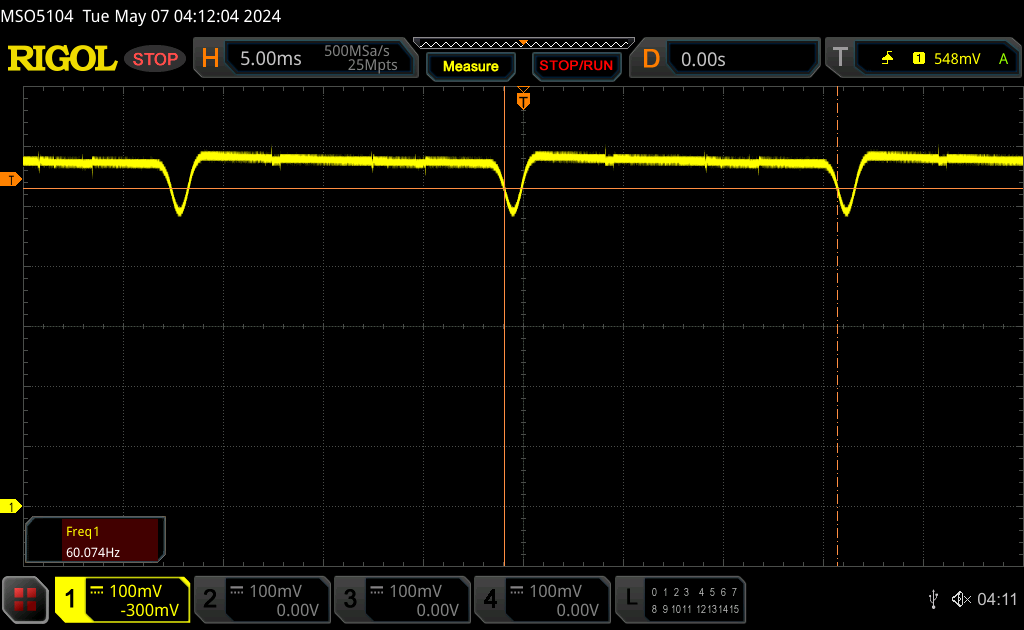 |
Le rétroéclairage de l'écran scintille à la fréquence de 60 Hz (certainement du fait de l'utilisation d'une MDI - Modulation de largeur d'impulsion) à un niveau de luminosité inférieur ou égal à 100 % . Aucun scintillement ne devrait être perceptible au-dessus de cette valeur. La fréquence de rafraîchissement de 60 Hz est extrêmement faible, de grands risques de fatigue oculaire accrue et de maux de tête en cas d'utilisation prolongée. En comparaison, 53 % des appareils testés n'emploient pas MDI pour assombrir leur écran. Nous avons relevé une moyenne à 8516 (minimum : 5 - maximum : 343500) Hz dans le cas où une MDI était active. | |||
Performance
Conditions d'essai
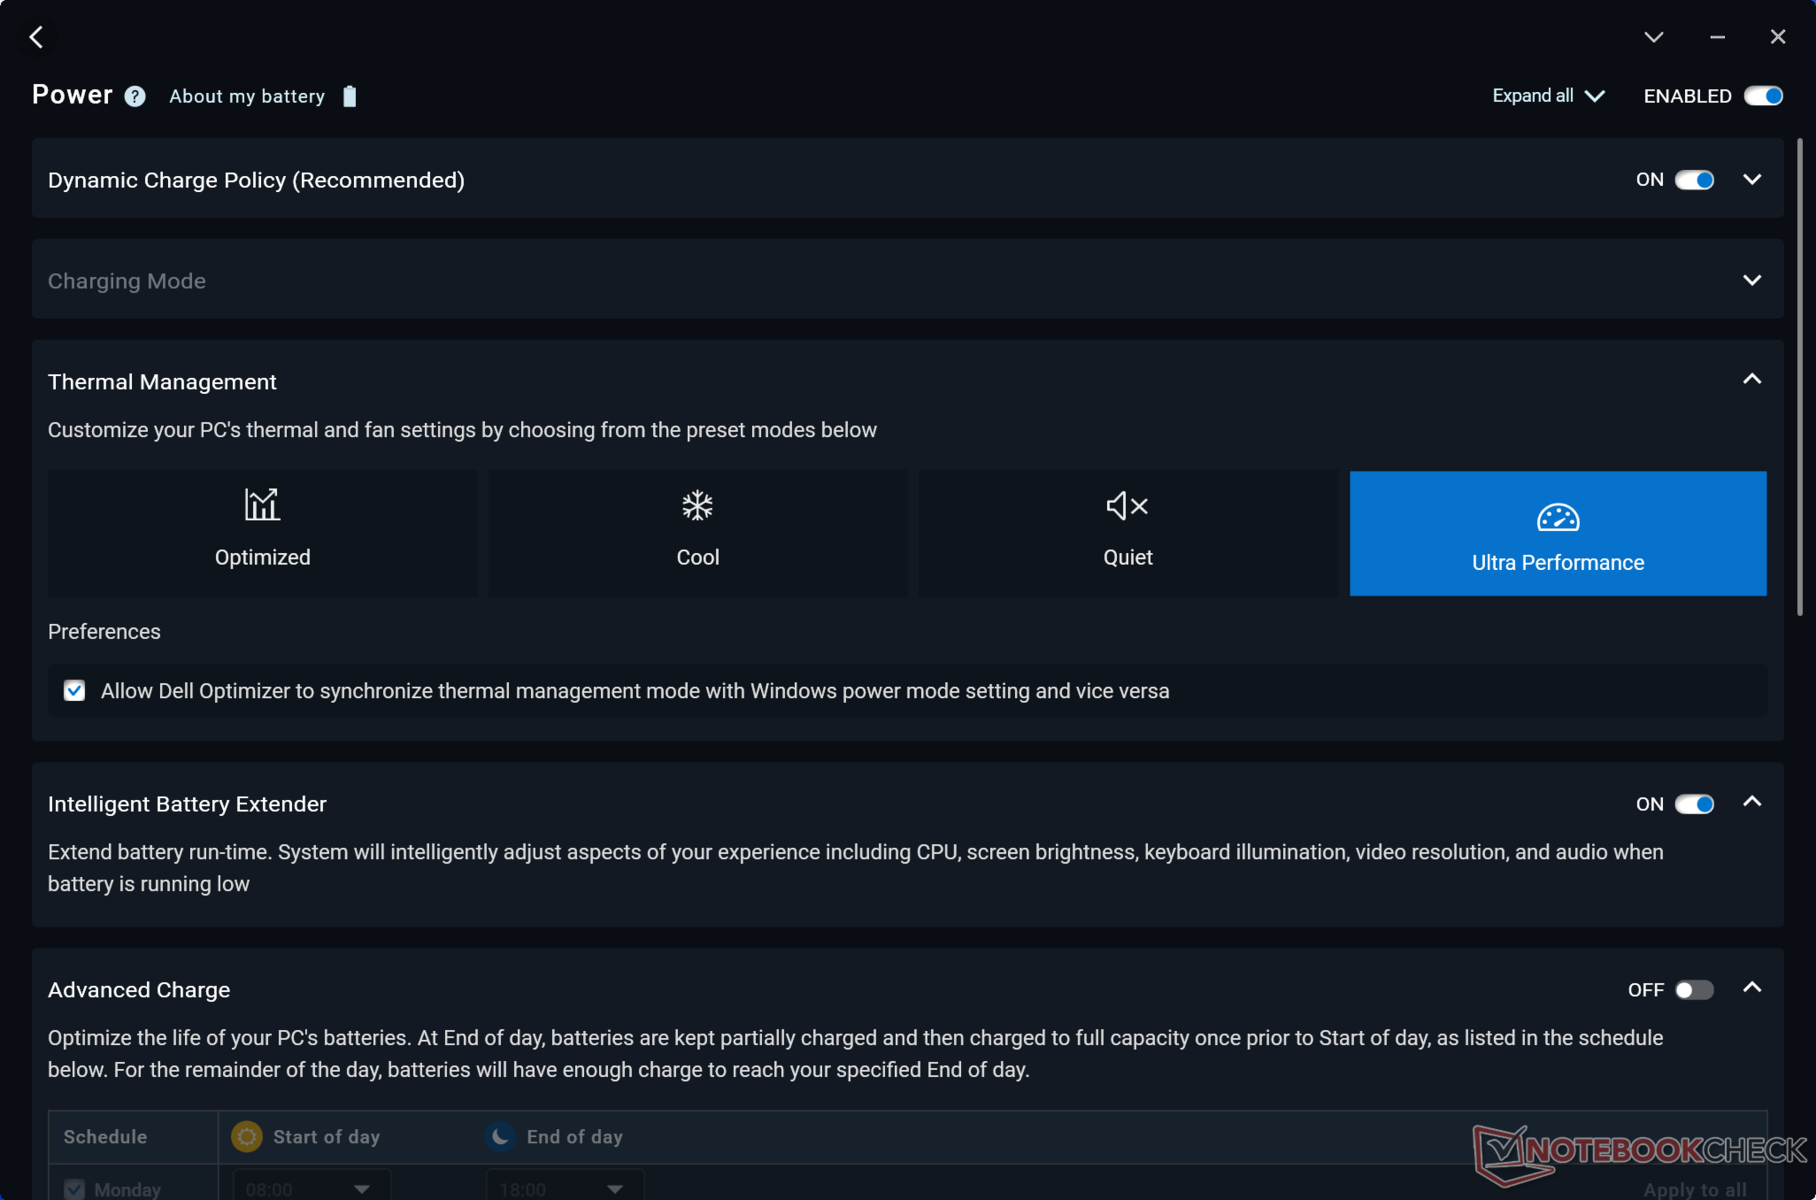
Nous avons réglé Dell Optimizer sur le mode Ultra Performance avant d'effectuer les tests ci-dessous. Nous avons également désactivé l'ECC VRAM via le panneau de configuration Nvidia. L'activation de l'ECC VRAM réduit la mémoire accessible d'environ 1 Go.
Processeur
Le Core Ultra 9 185H a des performances presque identiques à celles du Core i9-13900H dans les charges de travail mono et multithread. Il bénéficie davantage de la fonction Turbo Boost pour une première poussée de vitesse, mais cet avantage n'est que temporaire avant de se stabiliser à des niveaux de performance similaires à ceux de l'ancien Core i9 Precision 5680, comme le montre le graphique de comparaison ci-dessous.
En rétrogradant vers le Core Ultra 7 165H et Ultra 5 135H devrait avoir un impact sur les performances du processeur de 5 à 10 % et de 40 à 50 %, respectivement, ce qui signifie que l'écart de performances est nettement plus important entre les Core Ultra 5 et Ultra 7 qu'entre les Core Ultra 7 et Ultra 9. Le site Precision 5690 n'inclut aucun processeur Raptor Lake-HX de la 14e génération, ce qui aurait permis d'améliorer les performances encore plus rapidement que le Core Ultra 9 185H. En contrepartie, les CPU Core Ultra comprennent des NPU intégrés pour accélérer les tâches d'IA locales lorsqu'elles seront plus facilement disponibles dans un avenir proche.
Cinebench R15 Multi Loop
Cinebench R23: Multi Core | Single Core
Cinebench R20: CPU (Multi Core) | CPU (Single Core)
Cinebench R15: CPU Multi 64Bit | CPU Single 64Bit
Blender: v2.79 BMW27 CPU
7-Zip 18.03: 7z b 4 | 7z b 4 -mmt1
Geekbench 6.4: Multi-Core | Single-Core
Geekbench 5.5: Multi-Core | Single-Core
HWBOT x265 Benchmark v2.2: 4k Preset
LibreOffice : 20 Documents To PDF
R Benchmark 2.5: Overall mean
| Geekbench 6.4 / Multi-Core | |
| HP ZBook Fury 16 G10 | |
| Dell Precision 5000 5680 | |
| Dell Precision 5690 | |
| Dell XPS 16 9640 | |
| Moyenne Intel Core Ultra 9 185H (9140 - 14540, n=19) | |
| Lenovo ThinkPad P1 G6-21FV000DGE | |
| Lenovo ThinkPad P16s G2 21K9000CGE | |
| Samsung Galaxy Book4 Pro 360 | |
| Lenovo ThinkPad P16v G1 AMD | |
| Geekbench 6.4 / Single-Core | |
| HP ZBook Fury 16 G10 | |
| Lenovo ThinkPad P1 G6-21FV000DGE | |
| Dell Precision 5000 5680 | |
| Lenovo ThinkPad P16v G1 AMD | |
| Dell Precision 5690 | |
| Lenovo ThinkPad P16s G2 21K9000CGE | |
| Moyenne Intel Core Ultra 9 185H (1490 - 2573, n=19) | |
| Dell XPS 16 9640 | |
| Samsung Galaxy Book4 Pro 360 | |
Cinebench R23: Multi Core | Single Core
Cinebench R20: CPU (Multi Core) | CPU (Single Core)
Cinebench R15: CPU Multi 64Bit | CPU Single 64Bit
Blender: v2.79 BMW27 CPU
7-Zip 18.03: 7z b 4 | 7z b 4 -mmt1
Geekbench 6.4: Multi-Core | Single-Core
Geekbench 5.5: Multi-Core | Single-Core
HWBOT x265 Benchmark v2.2: 4k Preset
LibreOffice : 20 Documents To PDF
R Benchmark 2.5: Overall mean
* ... Moindre est la valeur, meilleures sont les performances
AIDA64: FP32 Ray-Trace | FPU Julia | CPU SHA3 | CPU Queen | FPU SinJulia | FPU Mandel | CPU AES | CPU ZLib | FP64 Ray-Trace | CPU PhotoWorxx
| Performance Rating | |
| HP ZBook Fury 16 G10 | |
| Dell Precision 5690 | |
| Lenovo ThinkPad P16 G2 21FA000FGE | |
| Moyenne Intel Core Ultra 9 185H | |
| Dell Precision 5000 5680 | |
| MSI CreatorPro Z16P B12UKST | |
| Lenovo ThinkPad P1 G6-21FV000DGE | |
| AIDA64 / FP32 Ray-Trace | |
| HP ZBook Fury 16 G10 | |
| Dell Precision 5690 | |
| Lenovo ThinkPad P16 G2 21FA000FGE | |
| Moyenne Intel Core Ultra 9 185H (9220 - 18676, n=19) | |
| Lenovo ThinkPad P1 G6-21FV000DGE | |
| Dell Precision 5000 5680 | |
| MSI CreatorPro Z16P B12UKST | |
| AIDA64 / FPU Julia | |
| HP ZBook Fury 16 G10 | |
| Dell Precision 5690 | |
| Lenovo ThinkPad P16 G2 21FA000FGE | |
| Moyenne Intel Core Ultra 9 185H (48865 - 96463, n=19) | |
| Lenovo ThinkPad P1 G6-21FV000DGE | |
| Dell Precision 5000 5680 | |
| MSI CreatorPro Z16P B12UKST | |
| AIDA64 / CPU SHA3 | |
| HP ZBook Fury 16 G10 | |
| Dell Precision 5690 | |
| Lenovo ThinkPad P16 G2 21FA000FGE | |
| Moyenne Intel Core Ultra 9 185H (2394 - 4534, n=19) | |
| Lenovo ThinkPad P1 G6-21FV000DGE | |
| MSI CreatorPro Z16P B12UKST | |
| Dell Precision 5000 5680 | |
| AIDA64 / CPU Queen | |
| HP ZBook Fury 16 G10 | |
| Dell Precision 5000 5680 | |
| Lenovo ThinkPad P1 G6-21FV000DGE | |
| Lenovo ThinkPad P16 G2 21FA000FGE | |
| MSI CreatorPro Z16P B12UKST | |
| Dell Precision 5690 | |
| Moyenne Intel Core Ultra 9 185H (66785 - 95241, n=19) | |
| AIDA64 / FPU SinJulia | |
| HP ZBook Fury 16 G10 | |
| Lenovo ThinkPad P16 G2 21FA000FGE | |
| Dell Precision 5690 | |
| Moyenne Intel Core Ultra 9 185H (7255 - 11392, n=19) | |
| Lenovo ThinkPad P1 G6-21FV000DGE | |
| Dell Precision 5000 5680 | |
| MSI CreatorPro Z16P B12UKST | |
| AIDA64 / FPU Mandel | |
| HP ZBook Fury 16 G10 | |
| Dell Precision 5690 | |
| Lenovo ThinkPad P16 G2 21FA000FGE | |
| Moyenne Intel Core Ultra 9 185H (24004 - 48020, n=19) | |
| Lenovo ThinkPad P1 G6-21FV000DGE | |
| Dell Precision 5000 5680 | |
| MSI CreatorPro Z16P B12UKST | |
| AIDA64 / CPU AES | |
| MSI CreatorPro Z16P B12UKST | |
| HP ZBook Fury 16 G10 | |
| Moyenne Intel Core Ultra 9 185H (53116 - 154066, n=19) | |
| Dell Precision 5690 | |
| Lenovo ThinkPad P16 G2 21FA000FGE | |
| Lenovo ThinkPad P1 G6-21FV000DGE | |
| Dell Precision 5000 5680 | |
| AIDA64 / CPU ZLib | |
| HP ZBook Fury 16 G10 | |
| Dell Precision 5690 | |
| Moyenne Intel Core Ultra 9 185H (678 - 1341, n=19) | |
| Lenovo ThinkPad P16 G2 21FA000FGE | |
| Lenovo ThinkPad P1 G6-21FV000DGE | |
| MSI CreatorPro Z16P B12UKST | |
| Dell Precision 5000 5680 | |
| AIDA64 / FP64 Ray-Trace | |
| HP ZBook Fury 16 G10 | |
| Lenovo ThinkPad P16 G2 21FA000FGE | |
| Dell Precision 5690 | |
| Lenovo ThinkPad P1 G6-21FV000DGE | |
| Moyenne Intel Core Ultra 9 185H (4428 - 10078, n=19) | |
| Dell Precision 5000 5680 | |
| MSI CreatorPro Z16P B12UKST | |
| AIDA64 / CPU PhotoWorxx | |
| Dell Precision 5690 | |
| Moyenne Intel Core Ultra 9 185H (44547 - 53918, n=19) | |
| Dell Precision 5000 5680 | |
| MSI CreatorPro Z16P B12UKST | |
| HP ZBook Fury 16 G10 | |
| Lenovo ThinkPad P16 G2 21FA000FGE | |
| Lenovo ThinkPad P1 G6-21FV000DGE | |
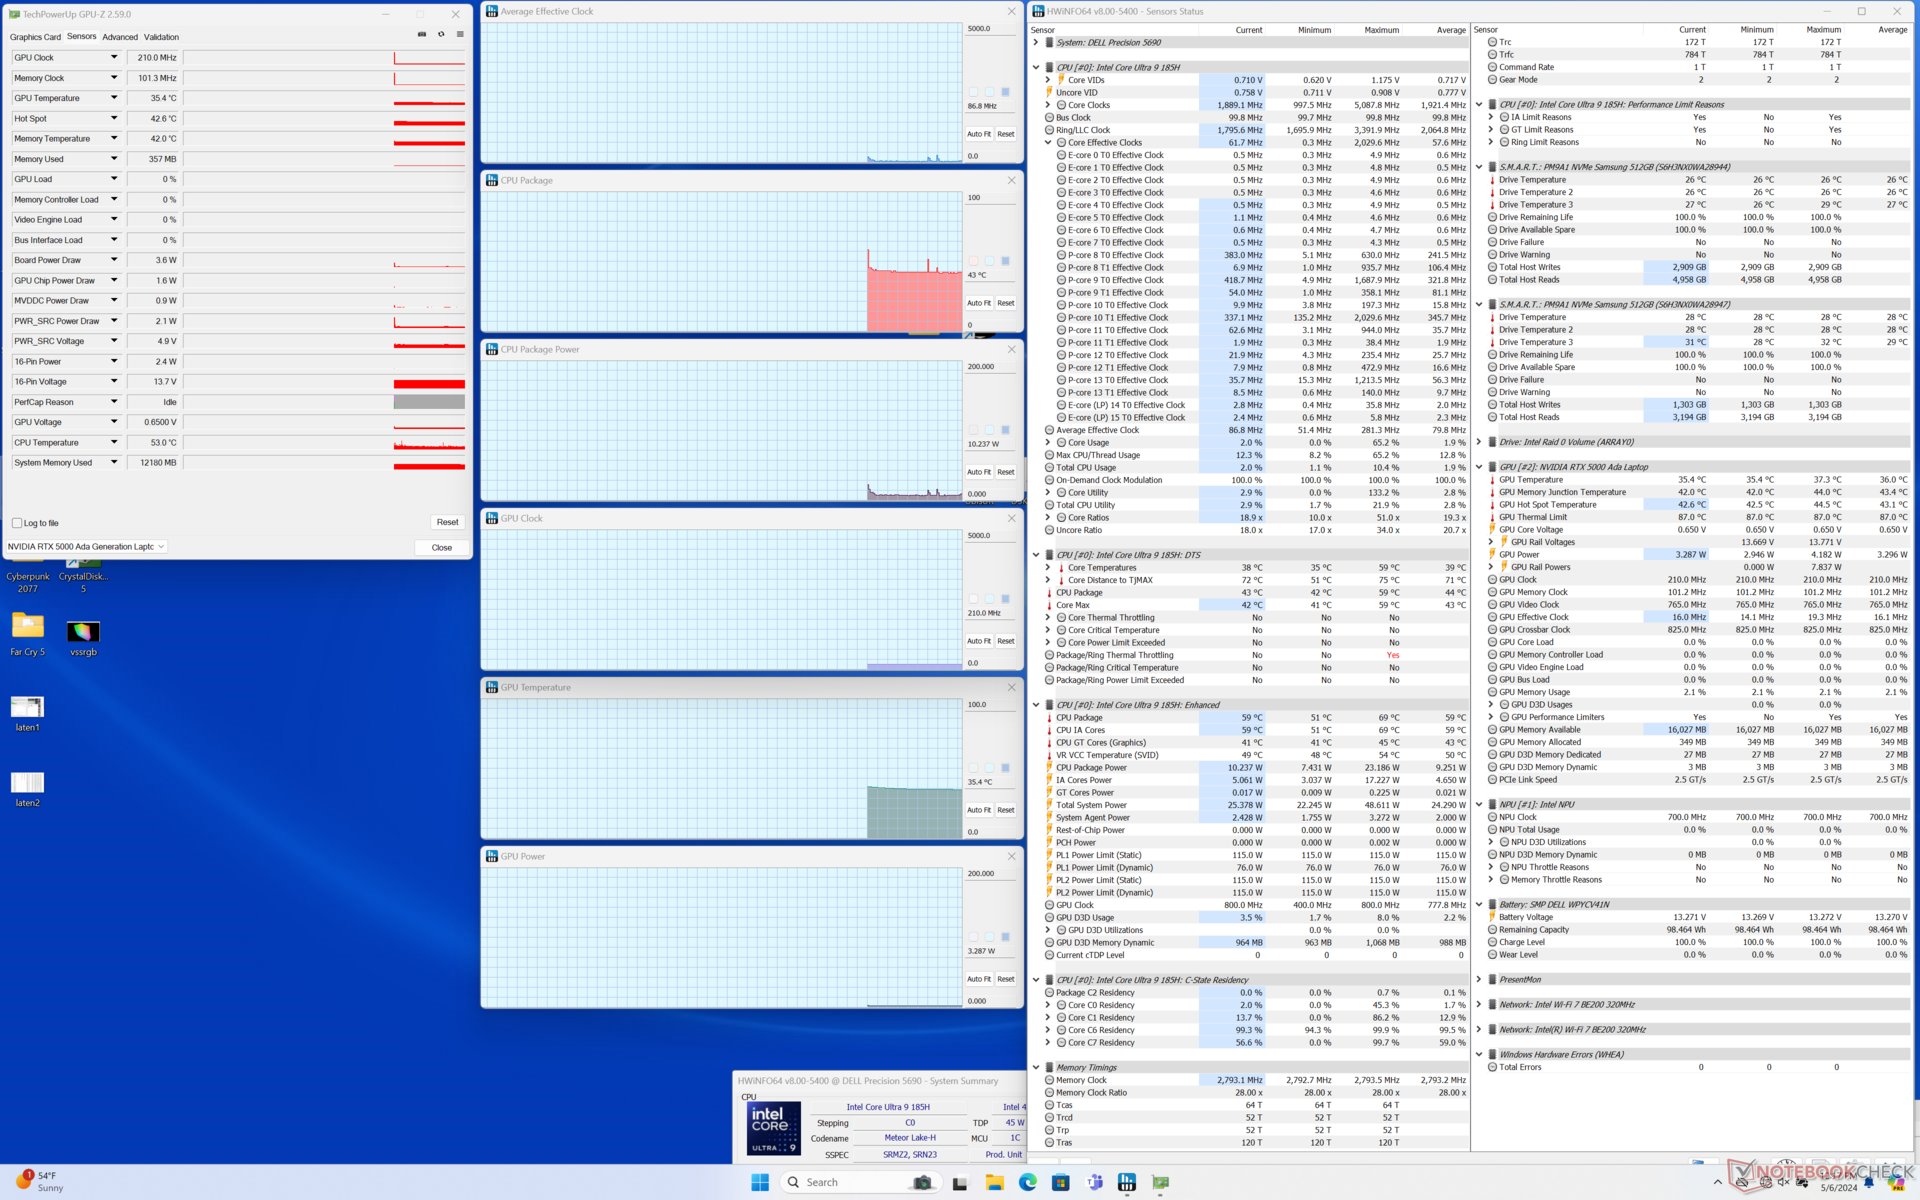
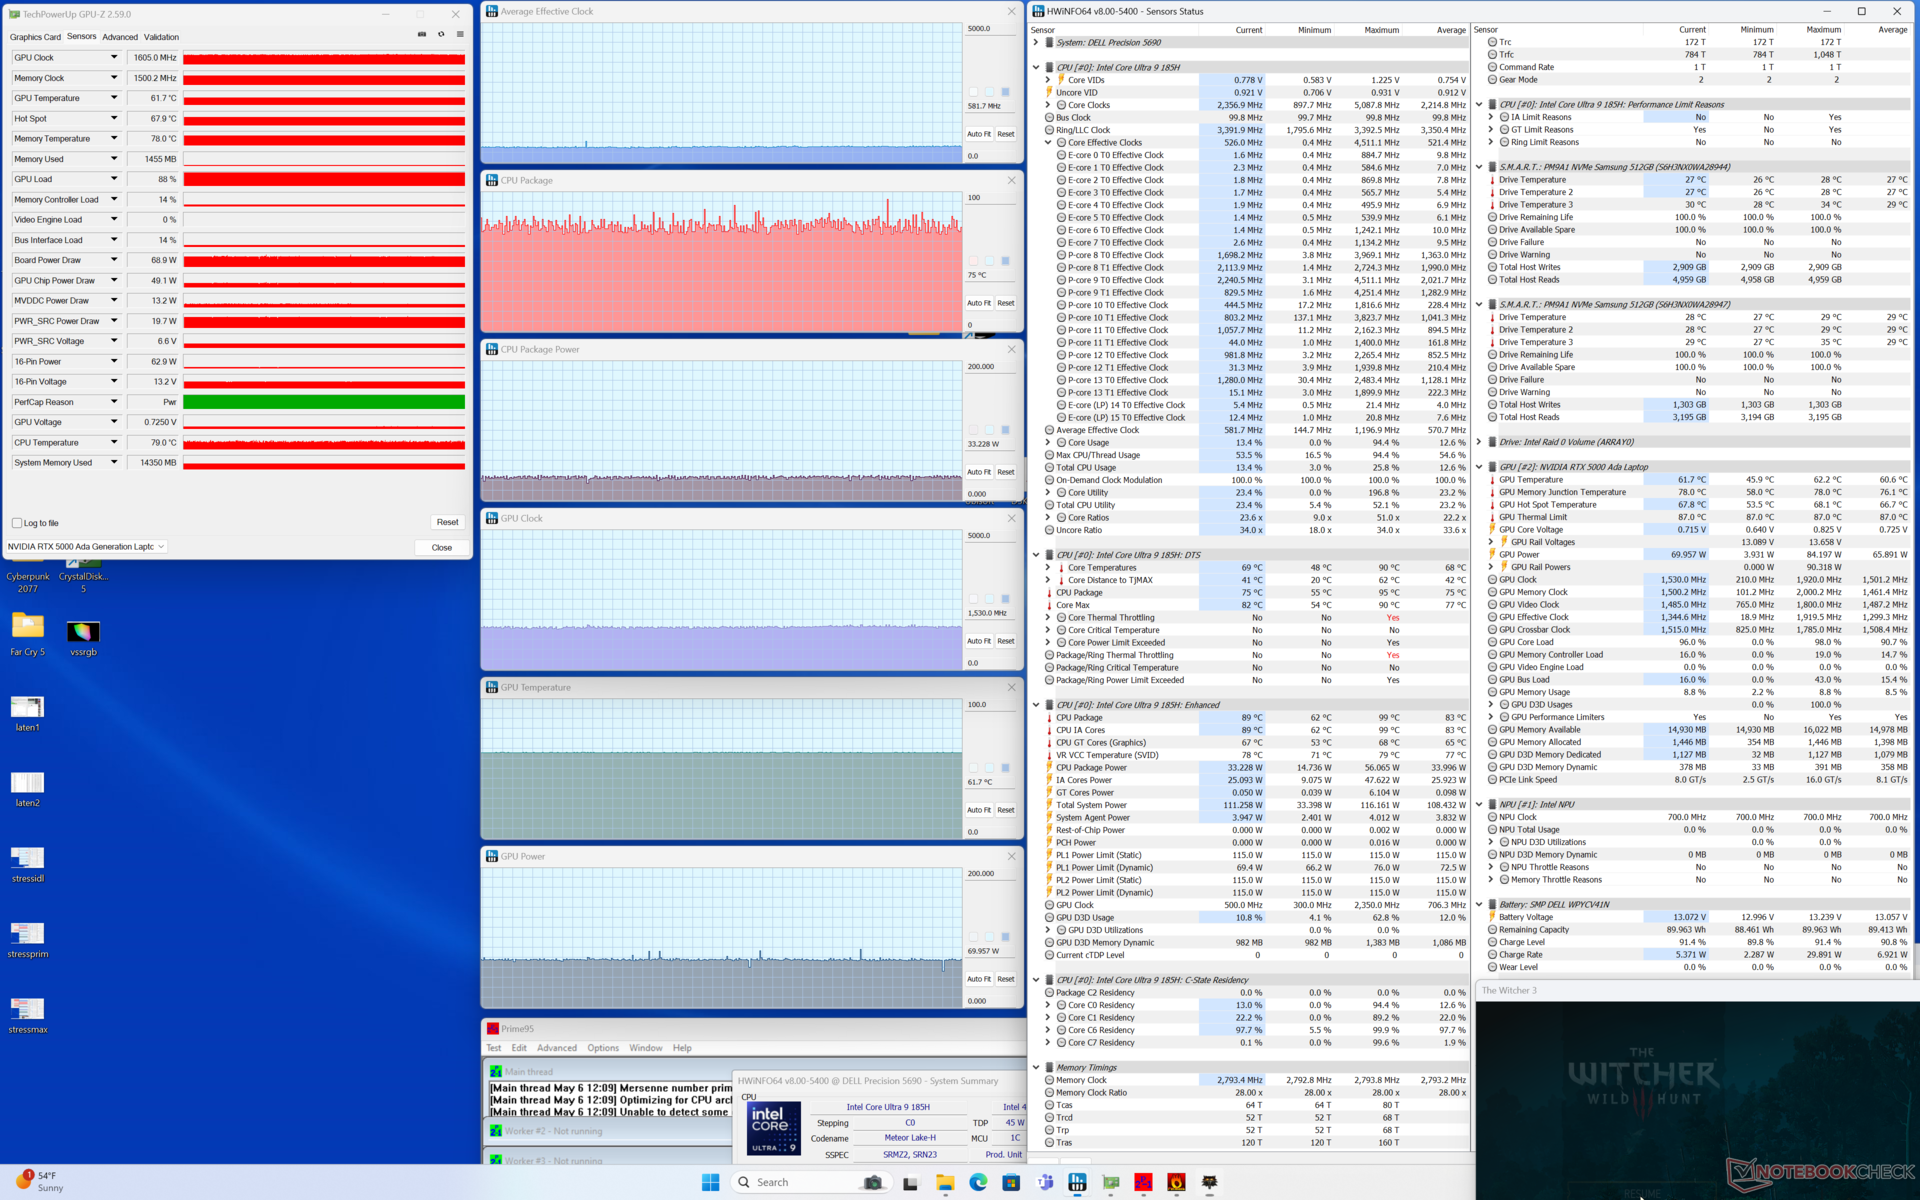
Test de stress
Lors du lancement du stress Prime95, le CPU atteignait 3,7 GHz et 120 W jusqu'à ce qu'il atteigne une température de 100 C quelques secondes plus tard. Il redescend alors à 3 GHz et 73 W et reste relativement stable tout au long de la période. La température du cœur et la consommation d'énergie du boîtier sont légèrement supérieures à celles que nous avons enregistrées sur le site Precision 5680.
La consommation d'énergie de la carte GPU en fonctionnement Witcher 3 est stable à 72 W alors que le GPU est listé à 90 W dans le centre de contrôle Nvidia. Les résultats sont similaires à ceux que nous avons enregistrés sur le modèle de l'année dernière.
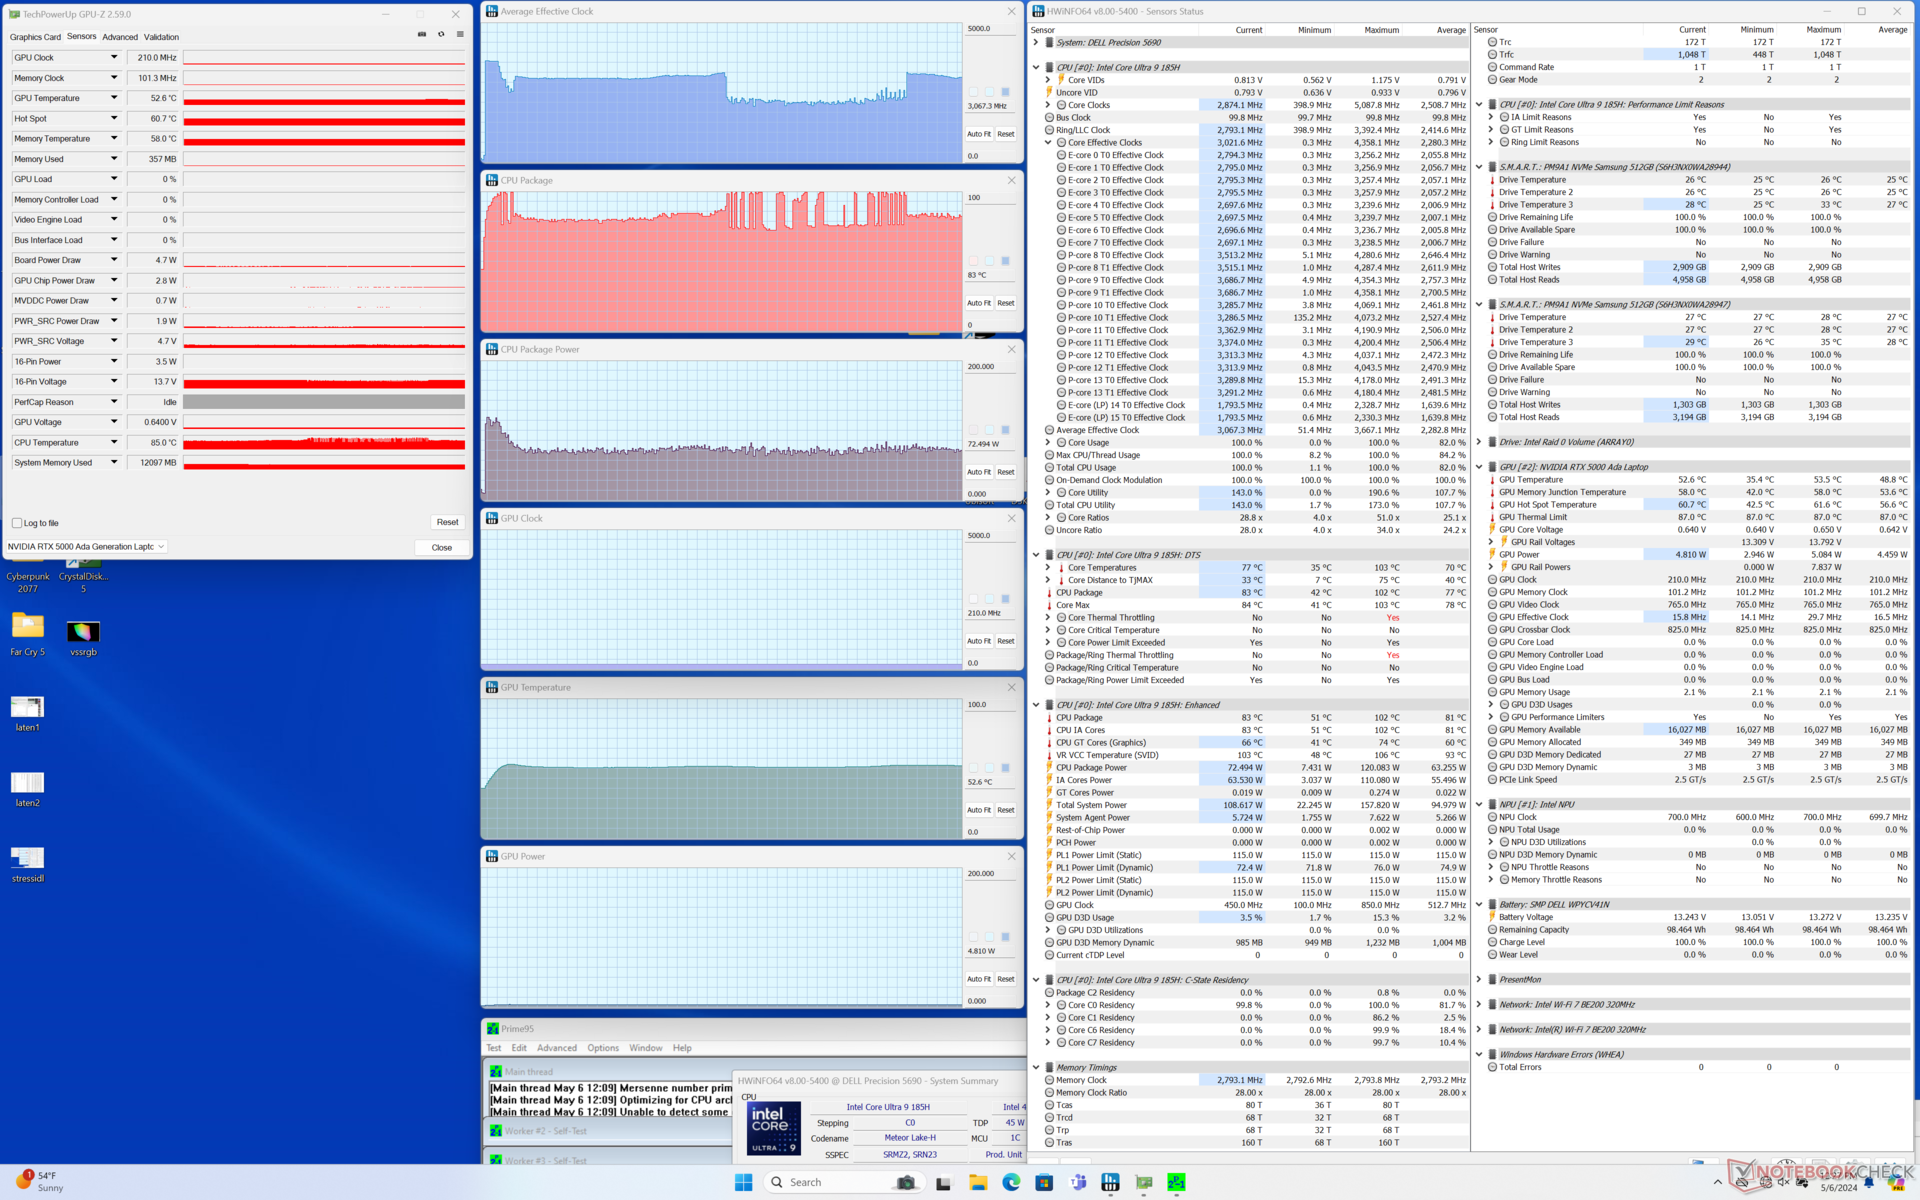
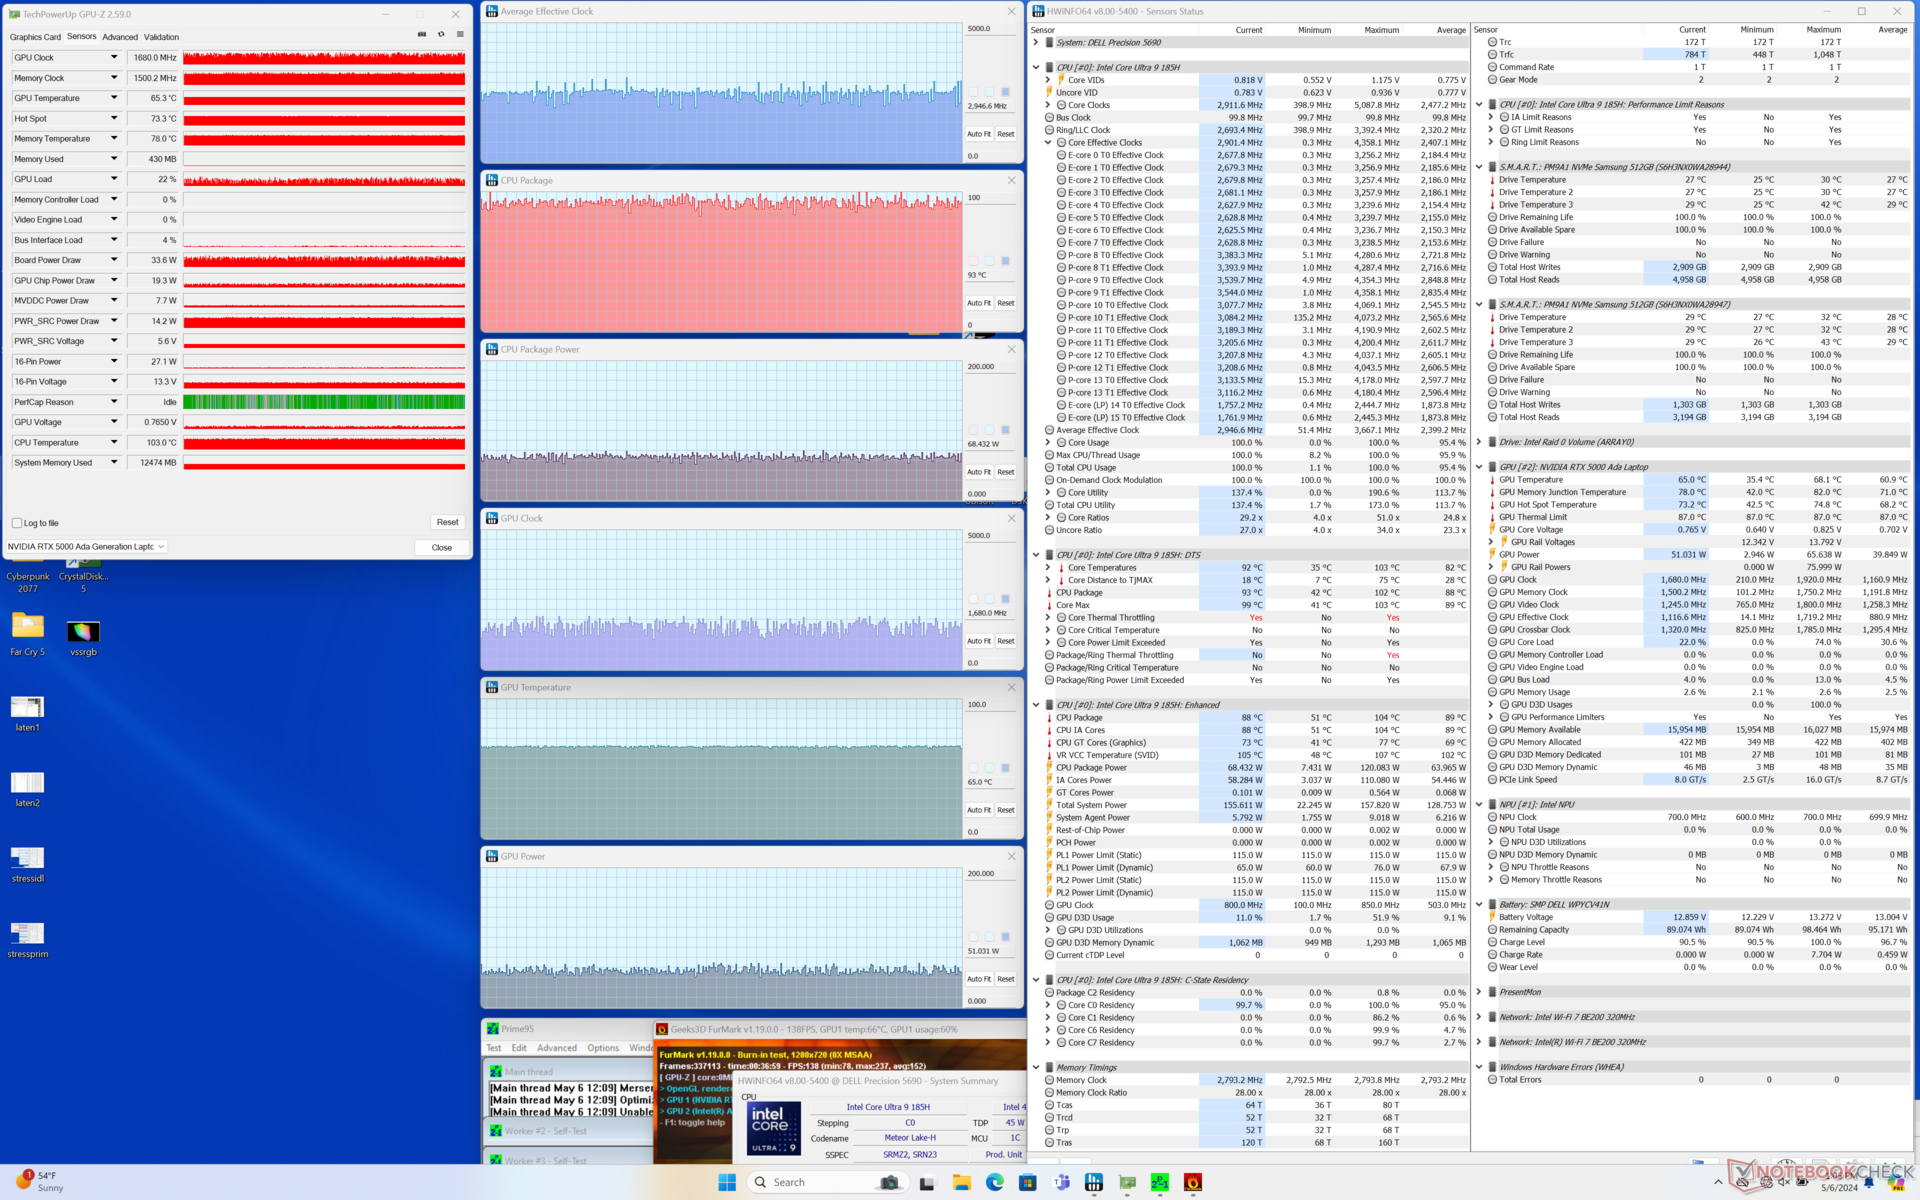
| Horloge du CPU (GHz) | Horloge du GPU (MHz) | Température moyenne du CPU (°C) | Température moyenne du GPU (°C) | |
| Système au repos | -- | -- | 43 | 35 |
| Prime95 Stress | 3.0 | -- | 83 | 53 |
| Prime95 + FurMark Stress | ~3.0 | ~1680 | 93 | 65 |
| Witcher 3 Stress | ~0,6 | 1530 | 75 | 62 |
Performance du système
Les résultats de PCMark 10 sont essentiellement identiques à ceux que nous avons enregistrés sur le Precision 5680, ce qui suggère qu'il n'y a pas de différences de performances majeures entre les deux modèles en ce qui concerne les tâches traditionnelles.
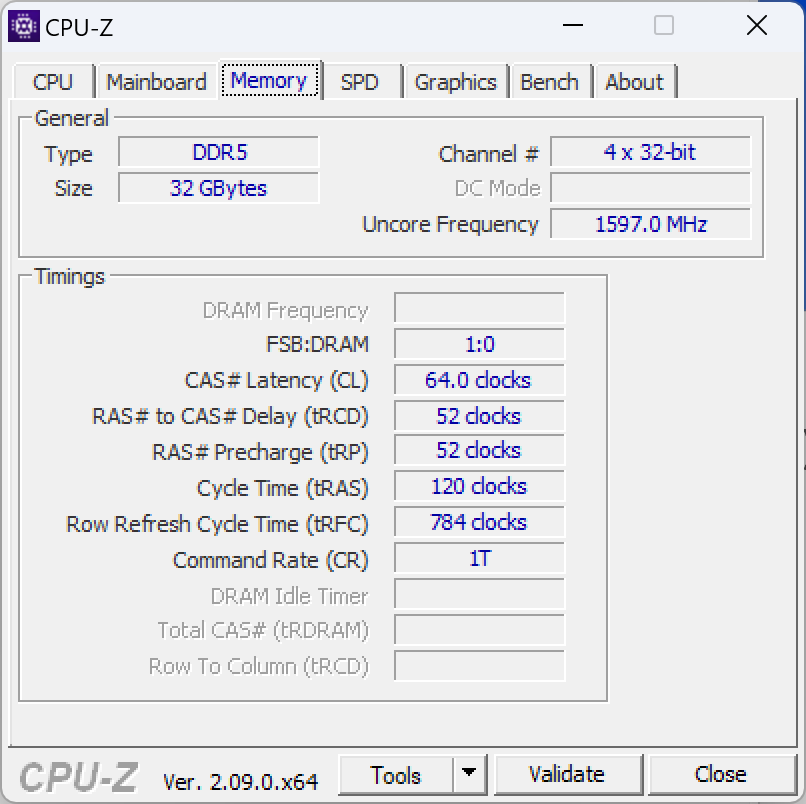
La RAM du système est légèrement plus rapide cette année (7467 contre 6000 MT/s), ce qui se reflète dans les meilleurs résultats du benchmark AIDA64.

CrossMark: Overall | Productivity | Creativity | Responsiveness
WebXPRT 3: Overall
WebXPRT 4: Overall
Mozilla Kraken 1.1: Total
| PCMark 10 / Score | |
| Dell Precision 5000 5680 | |
| HP ZBook Fury 16 G10 | |
| Dell Precision 5690 | |
| Moyenne Intel Core Ultra 9 185H, Nvidia RTX 5000 Ada Generation Laptop GPU (n=1) | |
| Lenovo ThinkPad P1 G6-21FV000DGE | |
| Lenovo ThinkPad P16 G2 21FA000FGE | |
| MSI CreatorPro Z16P B12UKST | |
| PCMark 10 / Essentials | |
| Dell Precision 5000 5680 | |
| Lenovo ThinkPad P1 G6-21FV000DGE | |
| HP ZBook Fury 16 G10 | |
| Dell Precision 5690 | |
| Moyenne Intel Core Ultra 9 185H, Nvidia RTX 5000 Ada Generation Laptop GPU (n=1) | |
| Lenovo ThinkPad P16 G2 21FA000FGE | |
| MSI CreatorPro Z16P B12UKST | |
| PCMark 10 / Productivity | |
| Dell Precision 5000 5680 | |
| Dell Precision 5690 | |
| Moyenne Intel Core Ultra 9 185H, Nvidia RTX 5000 Ada Generation Laptop GPU (n=1) | |
| Lenovo ThinkPad P1 G6-21FV000DGE | |
| Lenovo ThinkPad P16 G2 21FA000FGE | |
| MSI CreatorPro Z16P B12UKST | |
| HP ZBook Fury 16 G10 | |
| PCMark 10 / Digital Content Creation | |
| HP ZBook Fury 16 G10 | |
| Dell Precision 5000 5680 | |
| Dell Precision 5690 | |
| Moyenne Intel Core Ultra 9 185H, Nvidia RTX 5000 Ada Generation Laptop GPU (n=1) | |
| Lenovo ThinkPad P1 G6-21FV000DGE | |
| MSI CreatorPro Z16P B12UKST | |
| Lenovo ThinkPad P16 G2 21FA000FGE | |
| CrossMark / Overall | |
| MSI CreatorPro Z16P B12UKST | |
| Dell Precision 5000 5680 | |
| HP ZBook Fury 16 G10 | |
| Lenovo ThinkPad P1 G6-21FV000DGE | |
| Lenovo ThinkPad P16 G2 21FA000FGE | |
| Dell Precision 5690 | |
| Moyenne Intel Core Ultra 9 185H, Nvidia RTX 5000 Ada Generation Laptop GPU (n=1) | |
| CrossMark / Productivity | |
| HP ZBook Fury 16 G10 | |
| MSI CreatorPro Z16P B12UKST | |
| Dell Precision 5000 5680 | |
| Lenovo ThinkPad P1 G6-21FV000DGE | |
| Dell Precision 5690 | |
| Moyenne Intel Core Ultra 9 185H, Nvidia RTX 5000 Ada Generation Laptop GPU (n=1) | |
| Lenovo ThinkPad P16 G2 21FA000FGE | |
| CrossMark / Creativity | |
| Dell Precision 5000 5680 | |
| Lenovo ThinkPad P16 G2 21FA000FGE | |
| HP ZBook Fury 16 G10 | |
| MSI CreatorPro Z16P B12UKST | |
| Lenovo ThinkPad P1 G6-21FV000DGE | |
| Dell Precision 5690 | |
| Moyenne Intel Core Ultra 9 185H, Nvidia RTX 5000 Ada Generation Laptop GPU (n=1) | |
| CrossMark / Responsiveness | |
| MSI CreatorPro Z16P B12UKST | |
| HP ZBook Fury 16 G10 | |
| Lenovo ThinkPad P1 G6-21FV000DGE | |
| Dell Precision 5000 5680 | |
| Dell Precision 5690 | |
| Moyenne Intel Core Ultra 9 185H, Nvidia RTX 5000 Ada Generation Laptop GPU (n=1) | |
| Lenovo ThinkPad P16 G2 21FA000FGE | |
| WebXPRT 3 / Overall | |
| Dell Precision 5000 5680 | |
| HP ZBook Fury 16 G10 | |
| Lenovo ThinkPad P16 G2 21FA000FGE | |
| Lenovo ThinkPad P1 G6-21FV000DGE | |
| MSI CreatorPro Z16P B12UKST | |
| Dell Precision 5690 | |
| Moyenne Intel Core Ultra 9 185H, Nvidia RTX 5000 Ada Generation Laptop GPU (n=1) | |
| WebXPRT 4 / Overall | |
| Lenovo ThinkPad P1 G6-21FV000DGE | |
| HP ZBook Fury 16 G10 | |
| Dell Precision 5000 5680 | |
| Dell Precision 5690 | |
| Moyenne Intel Core Ultra 9 185H, Nvidia RTX 5000 Ada Generation Laptop GPU (n=1) | |
| MSI CreatorPro Z16P B12UKST | |
| Mozilla Kraken 1.1 / Total | |
| MSI CreatorPro Z16P B12UKST | |
| Dell Precision 5690 | |
| Moyenne Intel Core Ultra 9 185H, Nvidia RTX 5000 Ada Generation Laptop GPU (n=1) | |
| Lenovo ThinkPad P16 G2 21FA000FGE | |
| Dell Precision 5000 5680 | |
| Lenovo ThinkPad P1 G6-21FV000DGE | |
| HP ZBook Fury 16 G10 | |
* ... Moindre est la valeur, meilleures sont les performances
| PCMark 10 Score | 8065 points | |
Aide | ||
| AIDA64 / Memory Copy | |
| Dell Precision 5690 | |
| Moyenne Intel Core Ultra 9 185H (69929 - 95718, n=19) | |
| Dell Precision 5000 5680 | |
| MSI CreatorPro Z16P B12UKST | |
| HP ZBook Fury 16 G10 | |
| Lenovo ThinkPad P16 G2 21FA000FGE | |
| Lenovo ThinkPad P1 G6-21FV000DGE | |
| AIDA64 / Memory Read | |
| Dell Precision 5690 | |
| Moyenne Intel Core Ultra 9 185H (64619 - 87768, n=19) | |
| Dell Precision 5000 5680 | |
| MSI CreatorPro Z16P B12UKST | |
| HP ZBook Fury 16 G10 | |
| Lenovo ThinkPad P16 G2 21FA000FGE | |
| Lenovo ThinkPad P1 G6-21FV000DGE | |
| AIDA64 / Memory Write | |
| Dell Precision 5000 5680 | |
| Dell Precision 5690 | |
| Moyenne Intel Core Ultra 9 185H (51114 - 93871, n=19) | |
| MSI CreatorPro Z16P B12UKST | |
| HP ZBook Fury 16 G10 | |
| Lenovo ThinkPad P16 G2 21FA000FGE | |
| Lenovo ThinkPad P1 G6-21FV000DGE | |
| AIDA64 / Memory Latency | |
| Moyenne Intel Core Ultra 9 185H (121.4 - 259, n=19) | |
| Dell Precision 5690 | |
| HP ZBook Fury 16 G10 | |
| Lenovo ThinkPad P16 G2 21FA000FGE | |
| MSI CreatorPro Z16P B12UKST | |
| Dell Precision 5000 5680 | |
| Lenovo ThinkPad P1 G6-21FV000DGE | |
* ... Moindre est la valeur, meilleures sont les performances
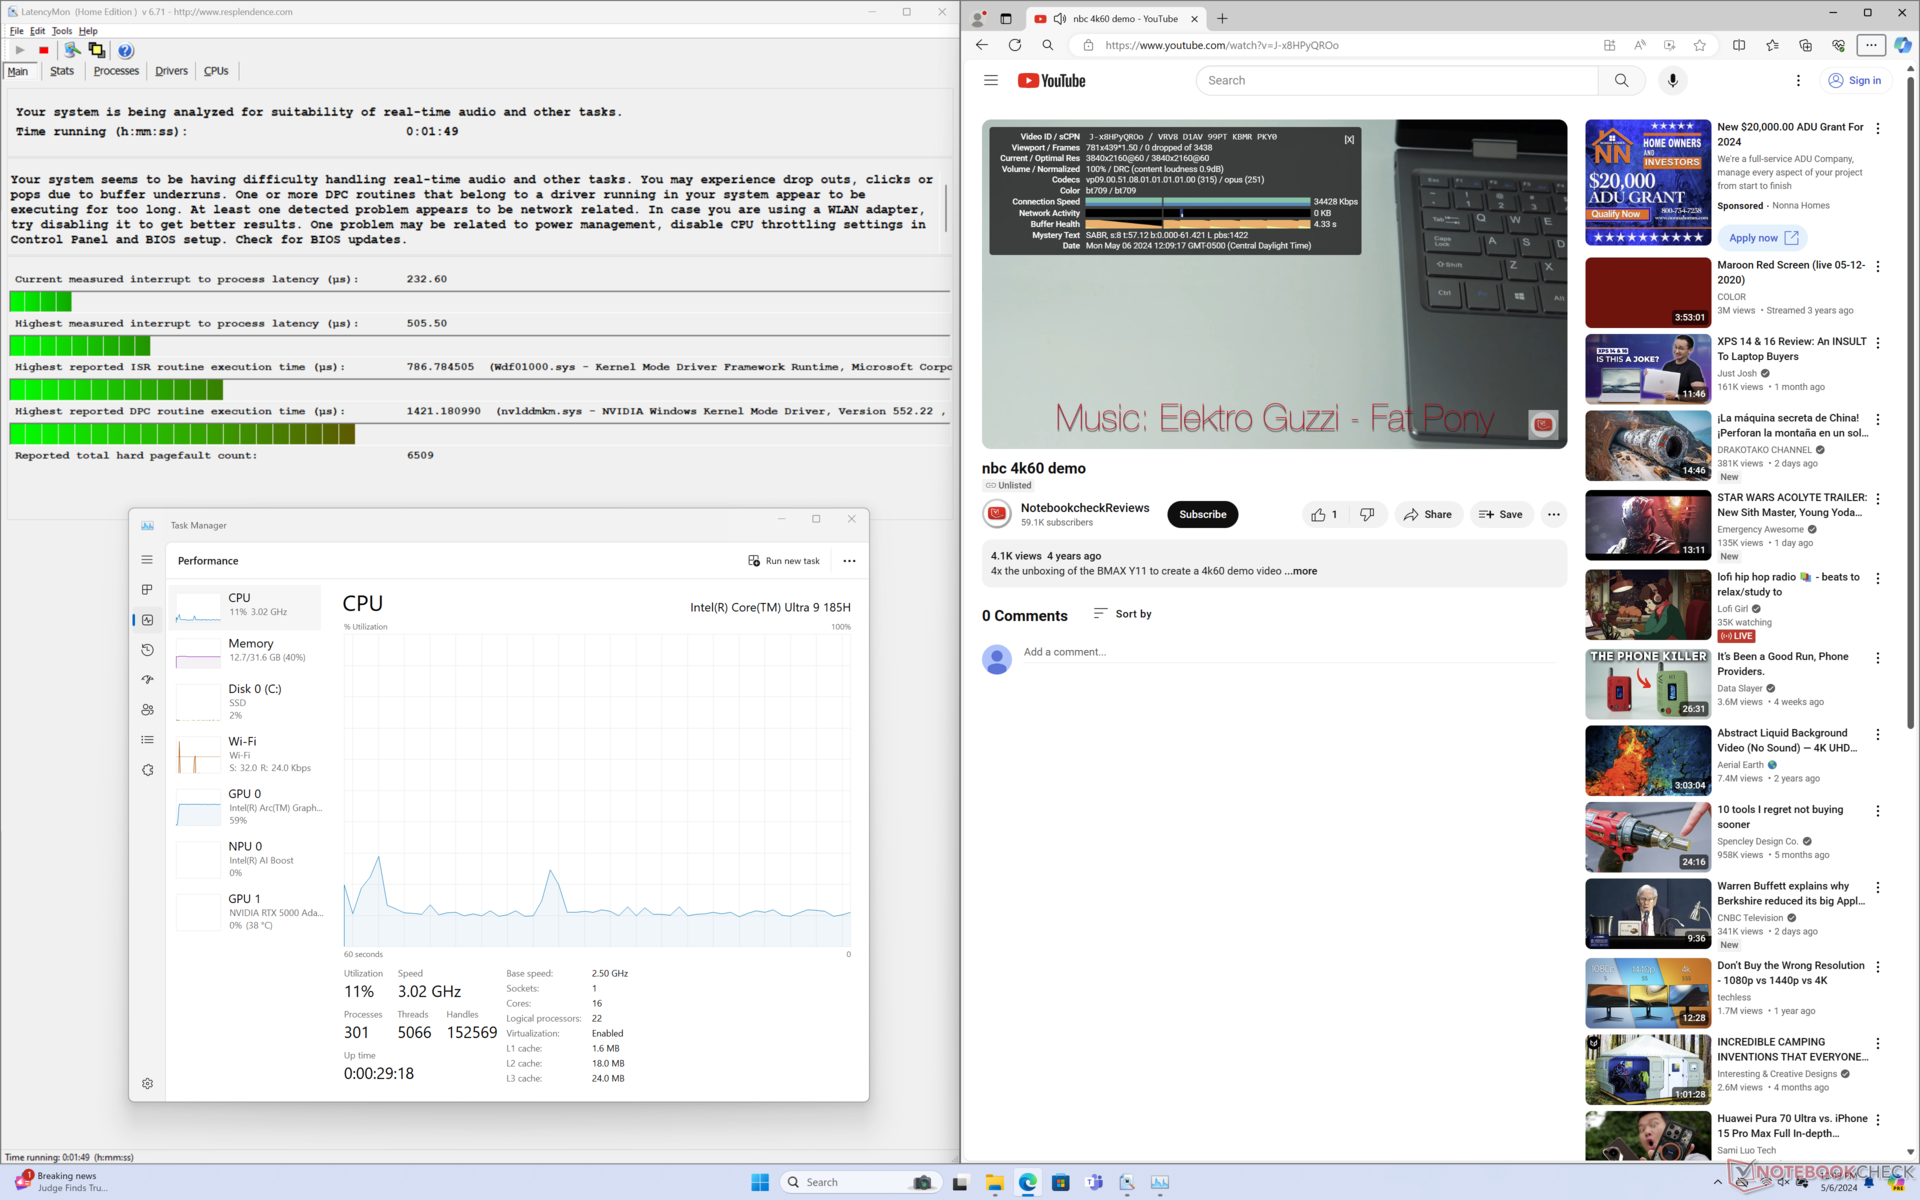
Latence DPC
LatencyMon ne révèle que des problèmes mineurs de DPC lors de l'ouverture de plusieurs onglets de notre page d'accueil. la lecture de vidéos 4K à 60 FPS est par ailleurs parfaite, sans aucune perte d'images.

| DPC Latencies / LatencyMon - interrupt to process latency (max), Web, Youtube, Prime95 | |
| HP ZBook Fury 16 G10 | |
| Lenovo ThinkPad P1 G6-21FV000DGE | |
| Dell Precision 5000 5680 | |
| Lenovo ThinkPad P16 G2 21FA000FGE | |
| MSI CreatorPro Z16P B12UKST | |
| Dell Precision 5690 | |
* ... Moindre est la valeur, meilleures sont les performances
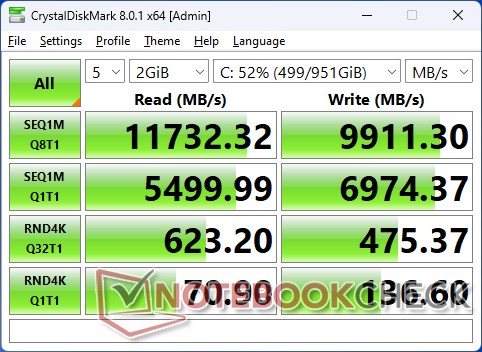
Dispositifs de stockage
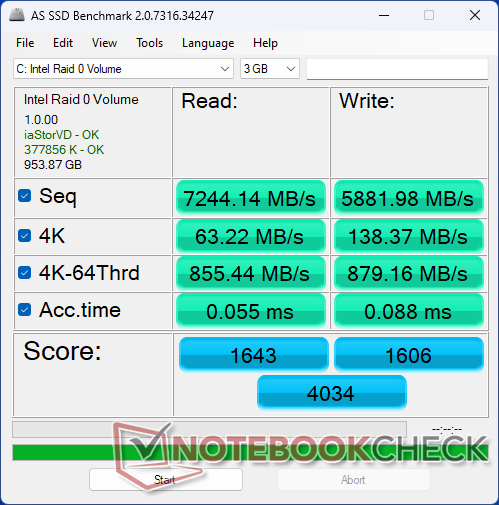
Notre unité de test est livrée avec deux Samsung PM9A1 PCIe4 x4 NVMe SSDs en configuration RAID 0 pour des taux de lecture et d'écriture dépassant 12000 MB/s et 9000 MB/s, respectivement. Les performances sont régulières et aucun ralentissement n'a été enregistré lors de l'exécution en boucle de DiskSpd.

| Drive Performance Rating - Percent | |
| MSI CreatorPro Z16P B12UKST -8! | |
| Lenovo ThinkPad P1 G6-21FV000DGE | |
| Dell Precision 5690 | |
| HP ZBook Fury 16 G10 | |
| Dell Precision 5000 5680 | |
| Lenovo ThinkPad P16 G2 21FA000FGE | |
* ... Moindre est la valeur, meilleures sont les performances
Disk Throttling: DiskSpd Read Loop, Queue Depth 8
Performance du GPU - Jusqu'à RTX 5000 Ada
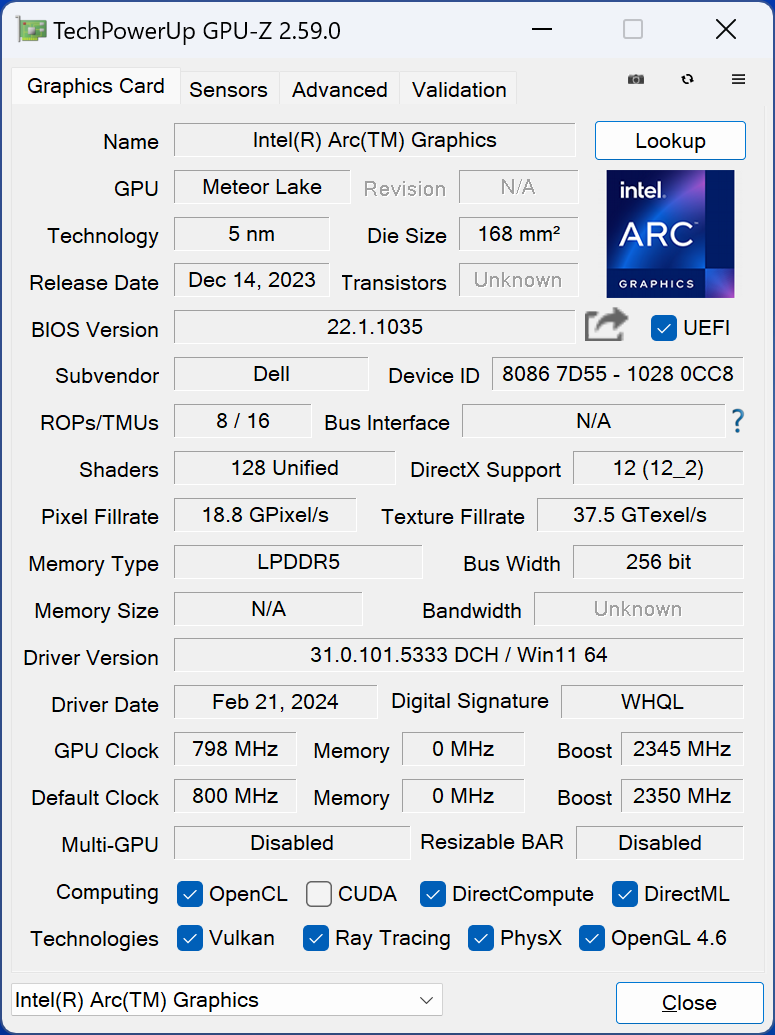
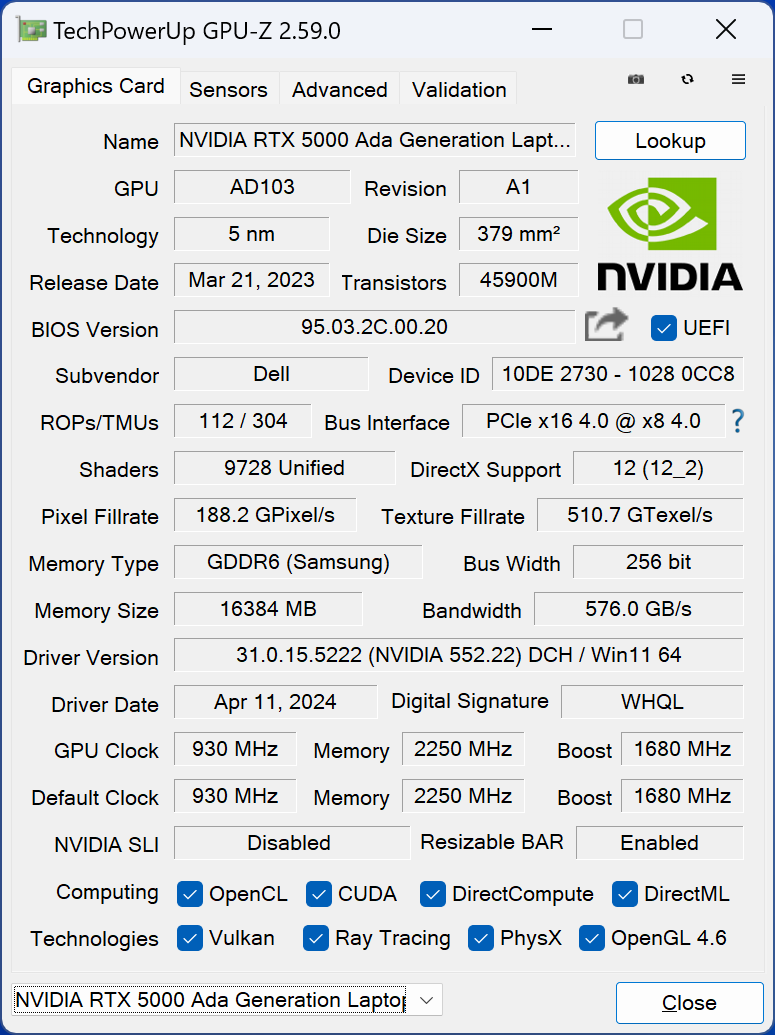
Les options des GPU Nvidia n'ont pas changé depuis longtemps et le RTX 5000 Ada reste l'option haut de gamme. Ce GPU est dérivé du GeForce RTX 4090 et comprend donc notamment 16 Go de VRAM au lieu de 12 Go s'il est configuré avec les RTX 4000 Ada ou 3500 Ada plus lents. Les utilisateurs disposent d'une large gamme de GPU RTX Ada à configurer, y compris le RTX 1000 Ada jusqu'à notre configuration RTX 5000 Ada.
| Profil de puissance | Score graphique | Score physique | Score combiné |
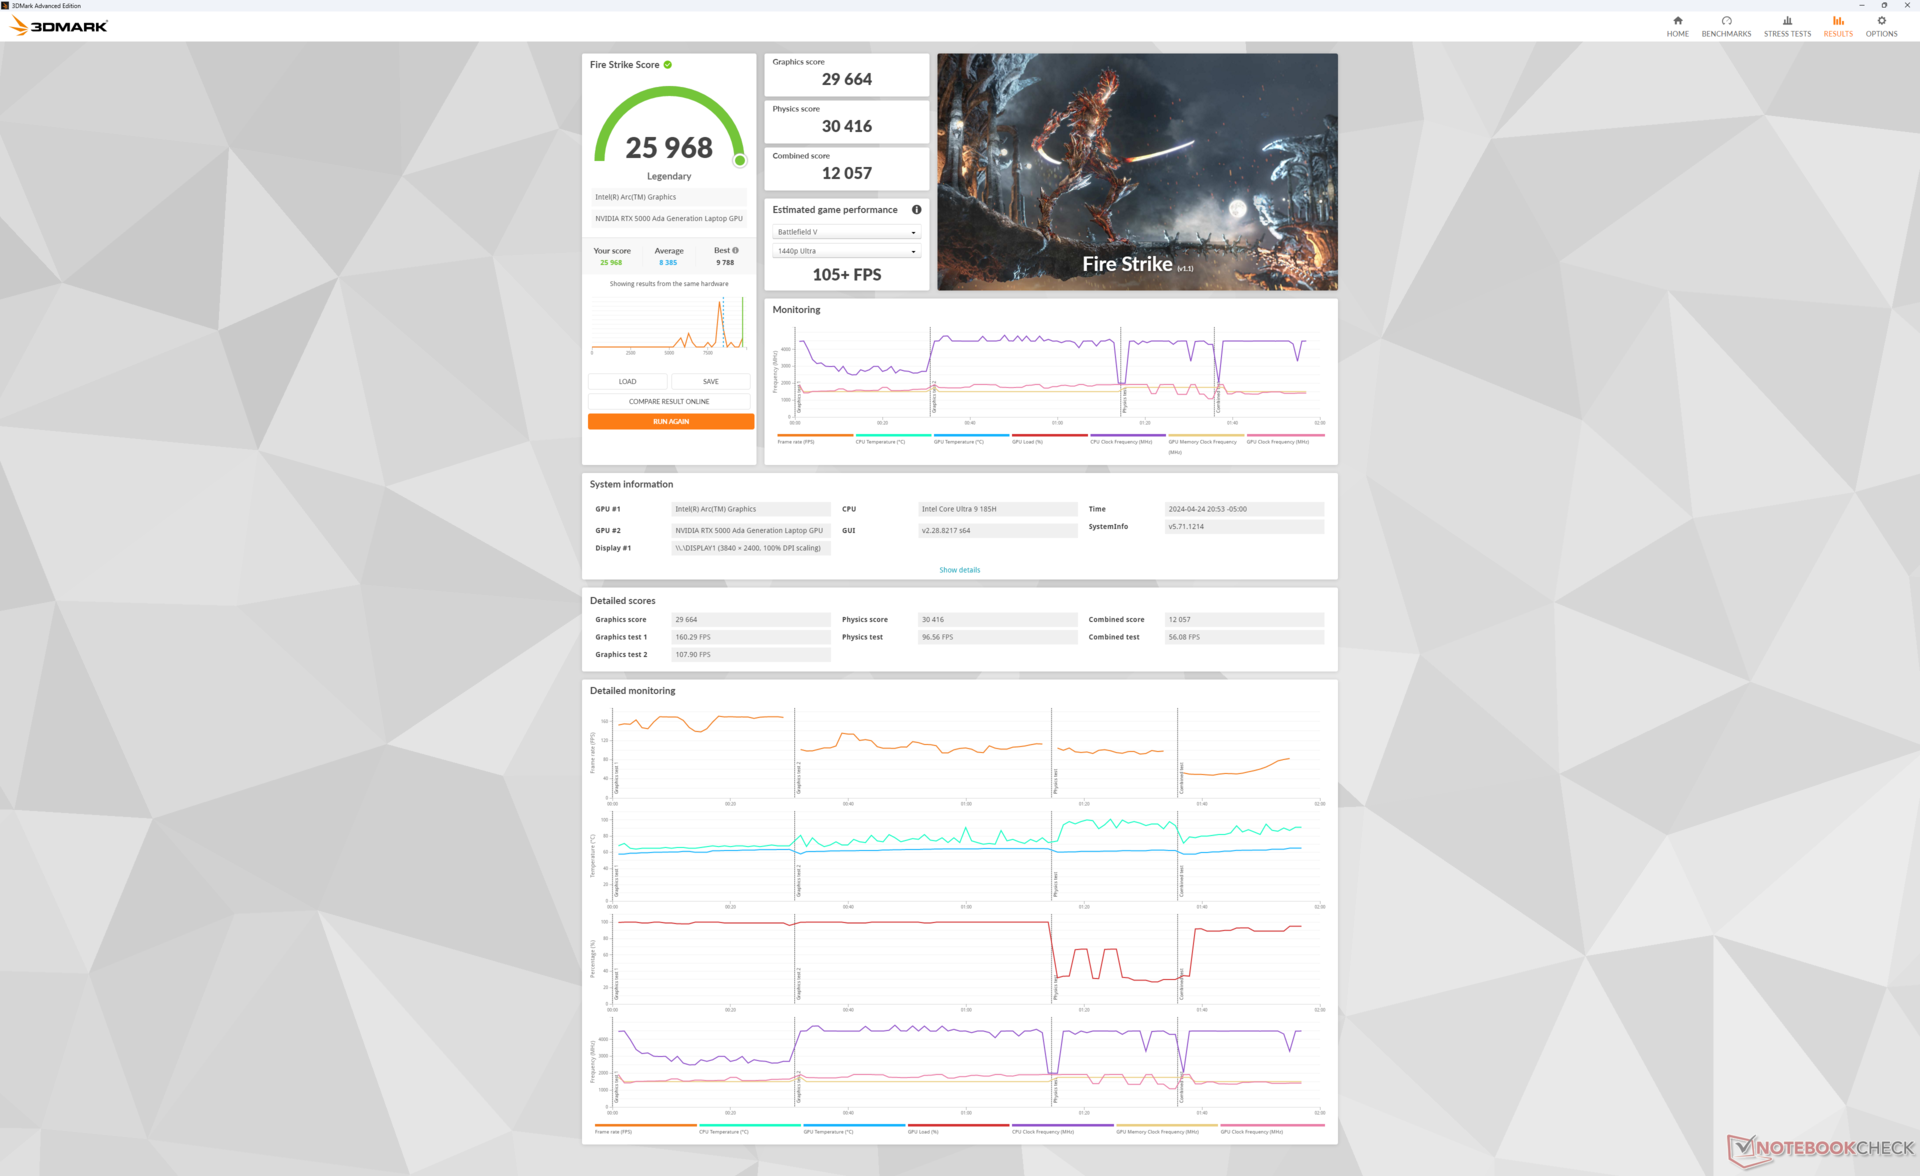
| Mode Performance | 29664 | 30416 | 12057 |
| Mode équilibré | 29771 (-0%) | 27199 (-11%) | 11770 (-2%) |
| Alimentation par batterie | 26674 (-10%) | 20268 (-33%) | 9539 (-21%) |
L'exécution en mode équilibré a un impact sur les performances du processeur, tandis que les performances graphiques restent inchangées, comme le montrent les résultats de notre site Fire Strike ci-dessus.
| 3DMark Performance Rating - Percent | |
| HP ZBook Fury 16 G10 -2! | |
| Moyenne Nvidia RTX 5000 Ada Generation Laptop GPU | |
| Dell Precision 5690 -2! | |
| Dell Precision 5000 5680 -2! | |
| Asus ProArt StudioBook 16 W7600H5A-2BL2 -20! | |
| HP ZBook Fury 16 G9 -2! | |
| Dell XPS 16 9640 -35! | |
| Lenovo ThinkPad P1 G6-21FV000DGE -16! | |
| Lenovo ThinkPad P16 G2 21FA000FGE -18! | |
| MSI CreatorPro Z16P B12UKST -17! | |
| Lenovo ThinkPad P16v G1 AMD -16! | |
| Lenovo ThinkPad P16 G1 21D6001DMB -18! | |
| Lenovo ThinkPad P1 G4-20Y30017GE -18! | |
| Lenovo ThinkPad P16s G2 21K9000CGE -18! | |
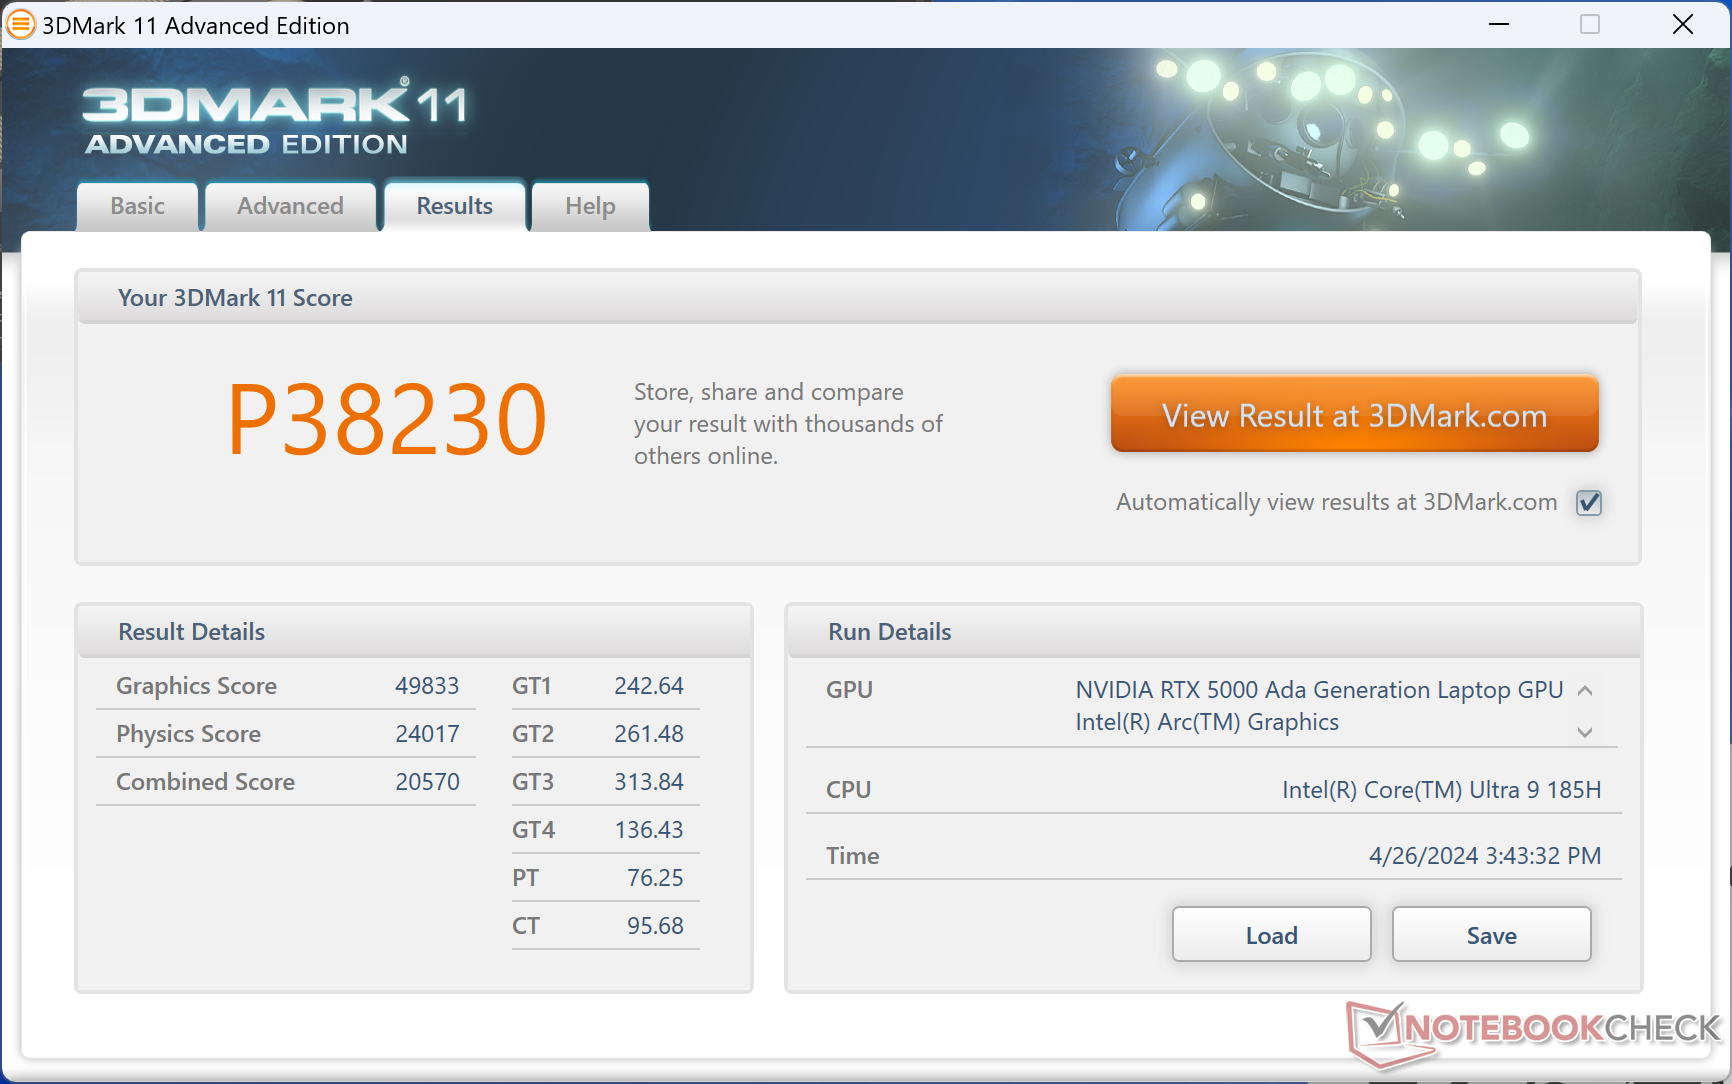
| 3DMark 11 Performance | 38230 points | |
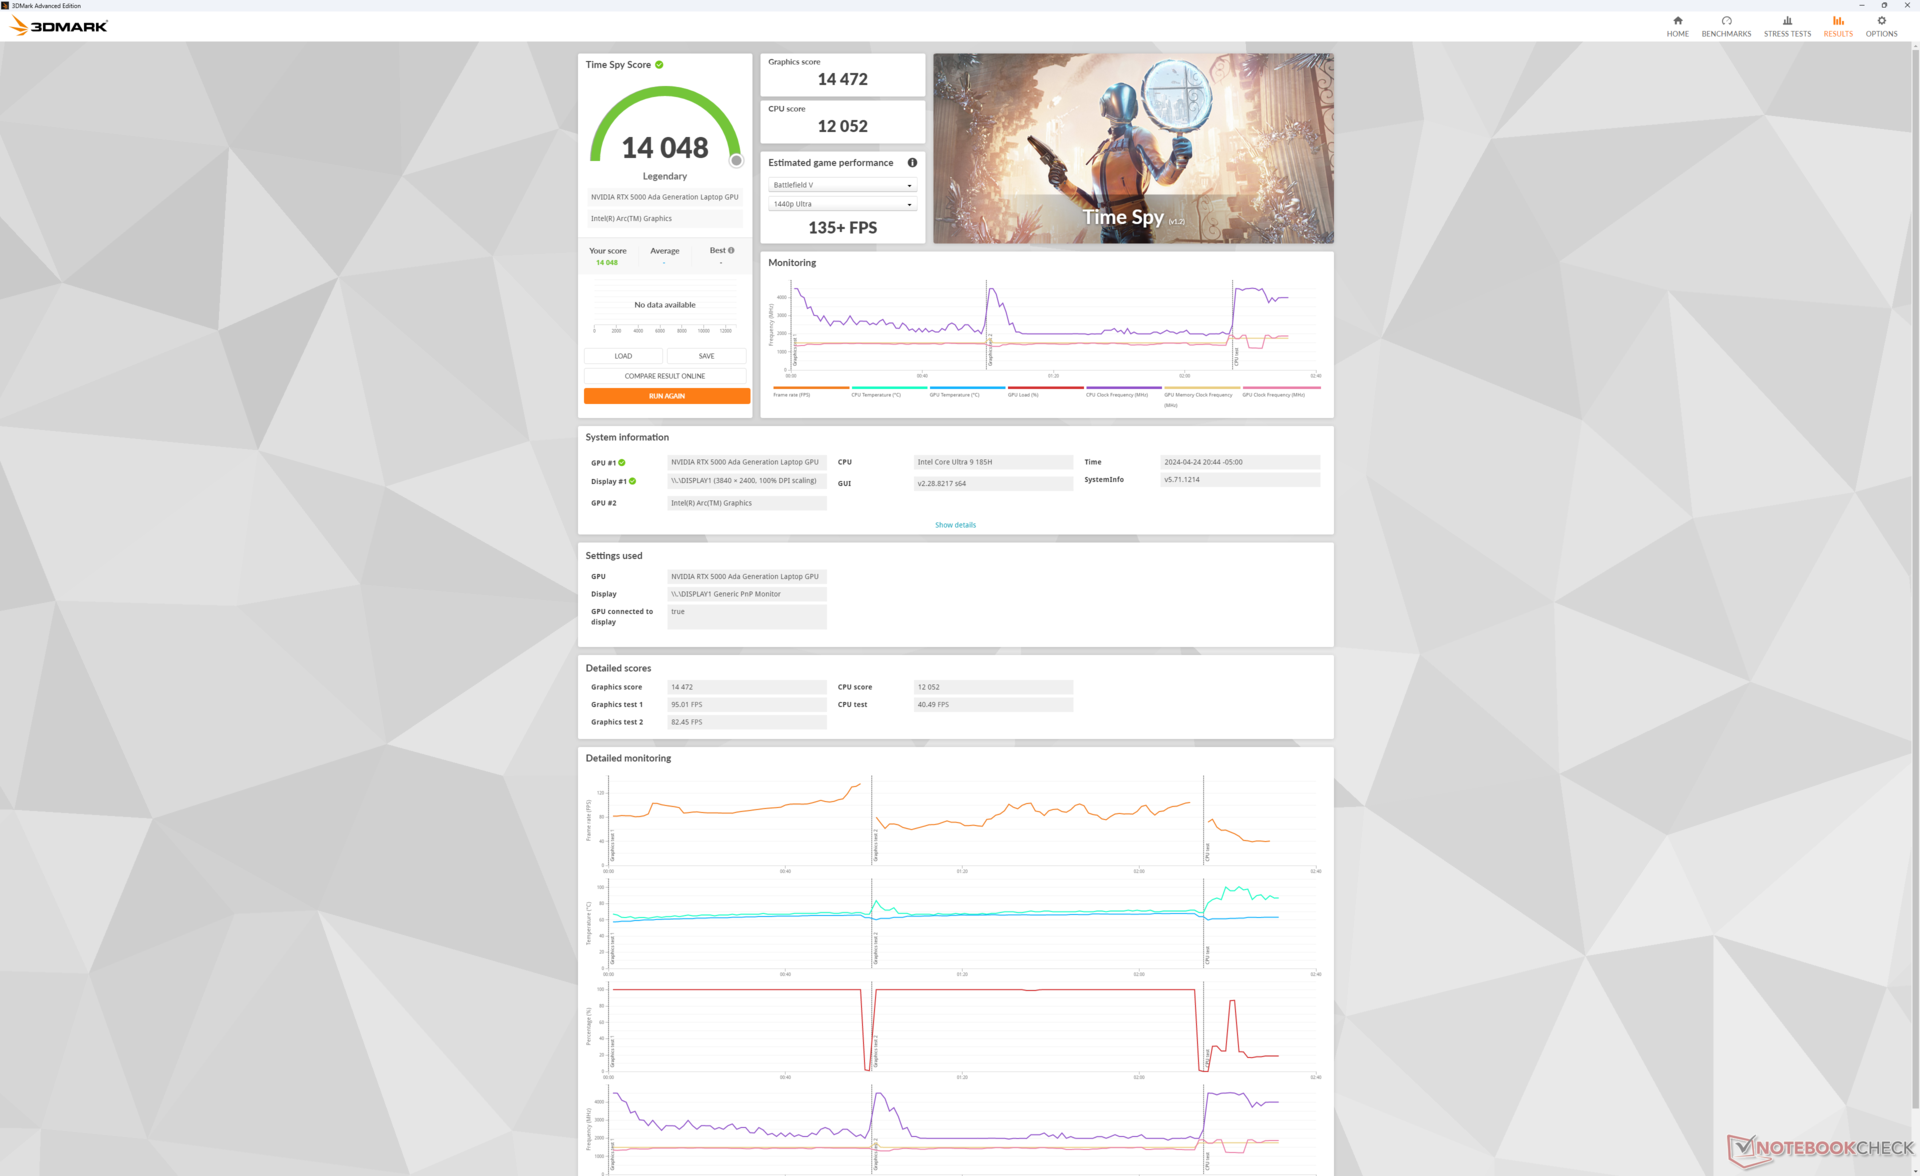
| 3DMark Fire Strike Score | 25968 points | |
| 3DMark Time Spy Score | 14048 points | |
Aide | ||
* ... Moindre est la valeur, meilleures sont les performances
| Performance Rating - Percent | |
| HP ZBook Fury 16 G10 | |
| Dell Precision 5000 5680 -1! | |
| Dell Precision 5690 | |
| Lenovo ThinkPad P16 G2 21FA000FGE | |
| Lenovo ThinkPad P1 G6-21FV000DGE | |
| MSI CreatorPro Z16P B12UKST | |
| The Witcher 3 - 1920x1080 Ultra Graphics & Postprocessing (HBAO+) | |
| HP ZBook Fury 16 G10 | |
| Dell Precision 5690 | |
| Dell Precision 5000 5680 | |
| Lenovo ThinkPad P16 G2 21FA000FGE | |
| Lenovo ThinkPad P1 G6-21FV000DGE | |
| MSI CreatorPro Z16P B12UKST | |
| Final Fantasy XV Benchmark - 1920x1080 High Quality | |
| HP ZBook Fury 16 G10 | |
| Dell Precision 5690 | |
| Dell Precision 5000 5680 | |
| Lenovo ThinkPad P16 G2 21FA000FGE | |
| Lenovo ThinkPad P1 G6-21FV000DGE | |
| MSI CreatorPro Z16P B12UKST | |
| Strange Brigade - 1920x1080 ultra AA:ultra AF:16 | |
| HP ZBook Fury 16 G10 | |
| Dell Precision 5690 | |
| Lenovo ThinkPad P16 G2 21FA000FGE | |
| Lenovo ThinkPad P1 G6-21FV000DGE | |
| MSI CreatorPro Z16P B12UKST | |
| Dota 2 Reborn - 1920x1080 ultra (3/3) best looking | |
| HP ZBook Fury 16 G10 | |
| Lenovo ThinkPad P16 G2 21FA000FGE | |
| MSI CreatorPro Z16P B12UKST | |
| Dell Precision 5000 5680 | |
| Dell Precision 5690 | |
| Lenovo ThinkPad P1 G6-21FV000DGE | |
| X-Plane 11.11 - 1920x1080 high (fps_test=3) | |
| HP ZBook Fury 16 G10 | |
| Lenovo ThinkPad P1 G6-21FV000DGE | |
| Lenovo ThinkPad P16 G2 21FA000FGE | |
| Dell Precision 5000 5680 | |
| MSI CreatorPro Z16P B12UKST | |
| Dell Precision 5690 | |
| Baldur's Gate 3 | |
| 1920x1080 High Preset | |
| Dell Precision 5690 | |
| Moyenne Nvidia RTX 5000 Ada Generation Laptop GPU (n=1) | |
| Dell XPS 16 9640 | |
| 1920x1080 Ultra Preset | |
| Dell Precision 5690 | |
| Moyenne Nvidia RTX 5000 Ada Generation Laptop GPU (n=1) | |
| Dell XPS 16 9640 | |
| 2560x1440 Ultra Preset | |
| Dell Precision 5690 | |
| Moyenne Nvidia RTX 5000 Ada Generation Laptop GPU (n=1) | |
| Dell XPS 16 9640 | |
| 3840x2160 Ultra Preset | |
| Dell Precision 5690 | |
| Moyenne Nvidia RTX 5000 Ada Generation Laptop GPU (n=1) | |
| 3840x2160 Ultra Preset + Quality DLSS | |
| Dell Precision 5690 | |
| Moyenne Nvidia RTX 5000 Ada Generation Laptop GPU (n=1) | |
| Cyberpunk 2077 2.2 Phantom Liberty | |
| 1920x1080 High Preset (FSR off) | |
| Dell Precision 5690 | |
| Moyenne Nvidia RTX 5000 Ada Generation Laptop GPU (n=1) | |
| Dell XPS 16 9640 | |
| Lenovo ThinkPad P16v G1 AMD | |
| 1920x1080 Ultra Preset (FSR off) | |
| Dell Precision 5690 | |
| Moyenne Nvidia RTX 5000 Ada Generation Laptop GPU (n=1) | |
| Dell XPS 16 9640 | |
| Lenovo ThinkPad P16v G1 AMD | |
| 2560x1440 Ultra Preset (FSR off) | |
| Dell Precision 5690 | |
| Moyenne Nvidia RTX 5000 Ada Generation Laptop GPU (n=1) | |
| Dell XPS 16 9640 | |
| 3840x2160 Ultra Preset (FSR off) | |
| Dell Precision 5690 | |
| Moyenne Nvidia RTX 5000 Ada Generation Laptop GPU (n=1) | |
| 1920x1080 Ray Tracing Ultra Preset (DLSS off) | |
| Dell Precision 5690 | |
| Moyenne Nvidia RTX 5000 Ada Generation Laptop GPU (n=1) | |
| Tiny Tina's Wonderlands | |
| 1920x1080 High Preset (DX12) | |
| HP ZBook Fury 16 G10 | |
| Moyenne Nvidia RTX 5000 Ada Generation Laptop GPU (145.5 - 171.7, n=3) | |
| Dell Precision 5000 5680 | |
| Dell Precision 5690 | |
| HP ZBook Fury 16 G9 | |
| 1920x1080 Badass Preset (DX12) | |
| HP ZBook Fury 16 G10 | |
| Moyenne Nvidia RTX 5000 Ada Generation Laptop GPU (124 - 139.4, n=3) | |
| Dell Precision 5000 5680 | |
| Dell Precision 5690 | |
| HP ZBook Fury 16 G9 | |
| 2560x1440 Badass Preset (DX12) | |
| HP ZBook Fury 16 G10 | |
| Moyenne Nvidia RTX 5000 Ada Generation Laptop GPU (87.1 - 99.4, n=3) | |
| Dell Precision 5000 5680 | |
| Dell Precision 5690 | |
| HP ZBook Fury 16 G9 | |
| 3840x2160 Badass Preset (DX12) | |
| HP ZBook Fury 16 G10 | |
| Moyenne Nvidia RTX 5000 Ada Generation Laptop GPU (48.4 - 53.9, n=3) | |
| Dell Precision 5000 5680 | |
| Dell Precision 5690 | |
| HP ZBook Fury 16 G9 | |
Witcher 3 FPS Chart
| Bas | Moyen | Élevé | Ultra | QHD | 4K DLSS | 4K | |
|---|---|---|---|---|---|---|---|
| The Witcher 3 (2015) | 411.3 | 351.2 | 258.7 | 137.6 | 103.9 | ||
| Dota 2 Reborn (2015) | 169.4 | 149.2 | 150.1 | 139.9 | 130 | ||
| Final Fantasy XV Benchmark (2018) | 196.6 | 165.4 | 132.5 | 103.8 | 63.2 | ||
| X-Plane 11.11 (2018) | 132.8 | 113.9 | 88.7 | 74.8 | |||
| Far Cry 5 (2018) | 144 | 134 | 127 | 119 | 113 | 72 | |
| Strange Brigade (2018) | 405 | 314 | 276 | 252 | 190.6 | 105.3 | |
| Tiny Tina's Wonderlands (2022) | 196.5 | 179.4 | 145.5 | 124 | 87.1 | 48.4 | |
| F1 22 (2022) | 228 | 224 | 217 | 91.1 | 60.1 | 29.6 | |
| Baldur's Gate 3 (2023) | 172.3 | 155.2 | 139.2 | 134.6 | 100.5 | 87.8 | 53.3 |
| Cyberpunk 2077 2.2 Phantom Liberty (2023) | 125 | 116.6 | 94.6 | 108.5 | 63.7 | 28.8 |
Émissions
Bruit du système - Fort et en charge
Le bruit du ventilateur est sensible au profil de puissance sélectionné. En mode silencieux, par exemple, le bruit du ventilateur tend à rester inférieur à 25 dB(A) sur un fond silencieux de 23,4 dB(A). À l'inverse, les ventilateurs ont tendance à pulser plus facilement jusqu'à 30 dB(A) s'ils sont réglés sur les modes Équilibré ou Performance, même pendant des tâches banales comme la navigation sur le web.
Le plafond de bruit du ventilateur est par ailleurs le même que celui que nous avons enregistré sur le Precision 5680 à 51 dB(A), ce qui est aussi bruyant que beaucoup d'ordinateurs portables de jeu. Ce maximum peut être atteint lorsque vous utilisez des charges exigeantes en GPU pendant plus de plusieurs minutes.
Degré de la nuisance sonore
| Au repos |
| 23.6 / 24.9 / 30.9 dB(A) |
| Fortement sollicité |
| 40.4 / 51.9 dB(A) |
 | ||
30 dB silencieux 40 dB(A) audible 50 dB(A) bruyant |
||
min: | ||
| Dell Precision 5690 NVIDIA RTX 5000 Ada Generation Laptop GPU, Ultra 9 185H, 2x Samsung PM9A1 1TB (RAID 0) | Dell Precision 5000 5680 NVIDIA RTX 5000 Ada Generation Laptop GPU, i9-13900H, 2x SK hynix PC801 HFS512GEJ9X101N RAID 0 | Lenovo ThinkPad P16 G2 21FA000FGE NVIDIA RTX 2000 Ada Generation Laptop GPU, i7-13700HX, SK hynix PC801 HFS001TEJ9X162N | Lenovo ThinkPad P1 G6-21FV000DGE NVIDIA RTX 2000 Ada Generation Laptop GPU, i9-13900H, SK Hynix PC711 1TB HFS001TDE9X084N | HP ZBook Fury 16 G10 NVIDIA RTX 5000 Ada Generation Laptop GPU, i9-13950HX, SK hynix PC801 HFS001TEJ9X101N | MSI CreatorPro Z16P B12UKST RTX A3000 Laptop GPU, i7-12700H, Samsung PM9A1 MZVL21T0HCLR | |
|---|---|---|---|---|---|---|
| Noise | 6% | -1% | 3% | 6% | -0% | |
| arrêt / environnement * | 23.4 | 22.8 3% | 23.5 -0% | 24.5 -5% | 22.9 2% | 24.1 -3% |
| Idle Minimum * | 23.6 | 23 3% | 23.5 -0% | 24.5 -4% | 22.9 3% | 27.1 -15% |
| Idle Average * | 24.9 | 23 8% | 29.2 -17% | 24.5 2% | 22.9 8% | 27.1 -9% |
| Idle Maximum * | 30.9 | 23 26% | 29.5 5% | 24.5 21% | 28.5 8% | 27.1 12% |
| Load Average * | 40.4 | 37.2 8% | 32.7 19% | 48 -19% | 40.6 -0% | 42.9 -6% |
| Witcher 3 ultra * | 48.3 | 51 -6% | 50.6 -5% | 40.7 16% | 44.1 9% | 44 9% |
| Load Maximum * | 51.9 | 51 2% | 56.6 -9% | 48 8% | 45.8 12% | 47 9% |
* ... Moindre est la valeur, meilleures sont les performances
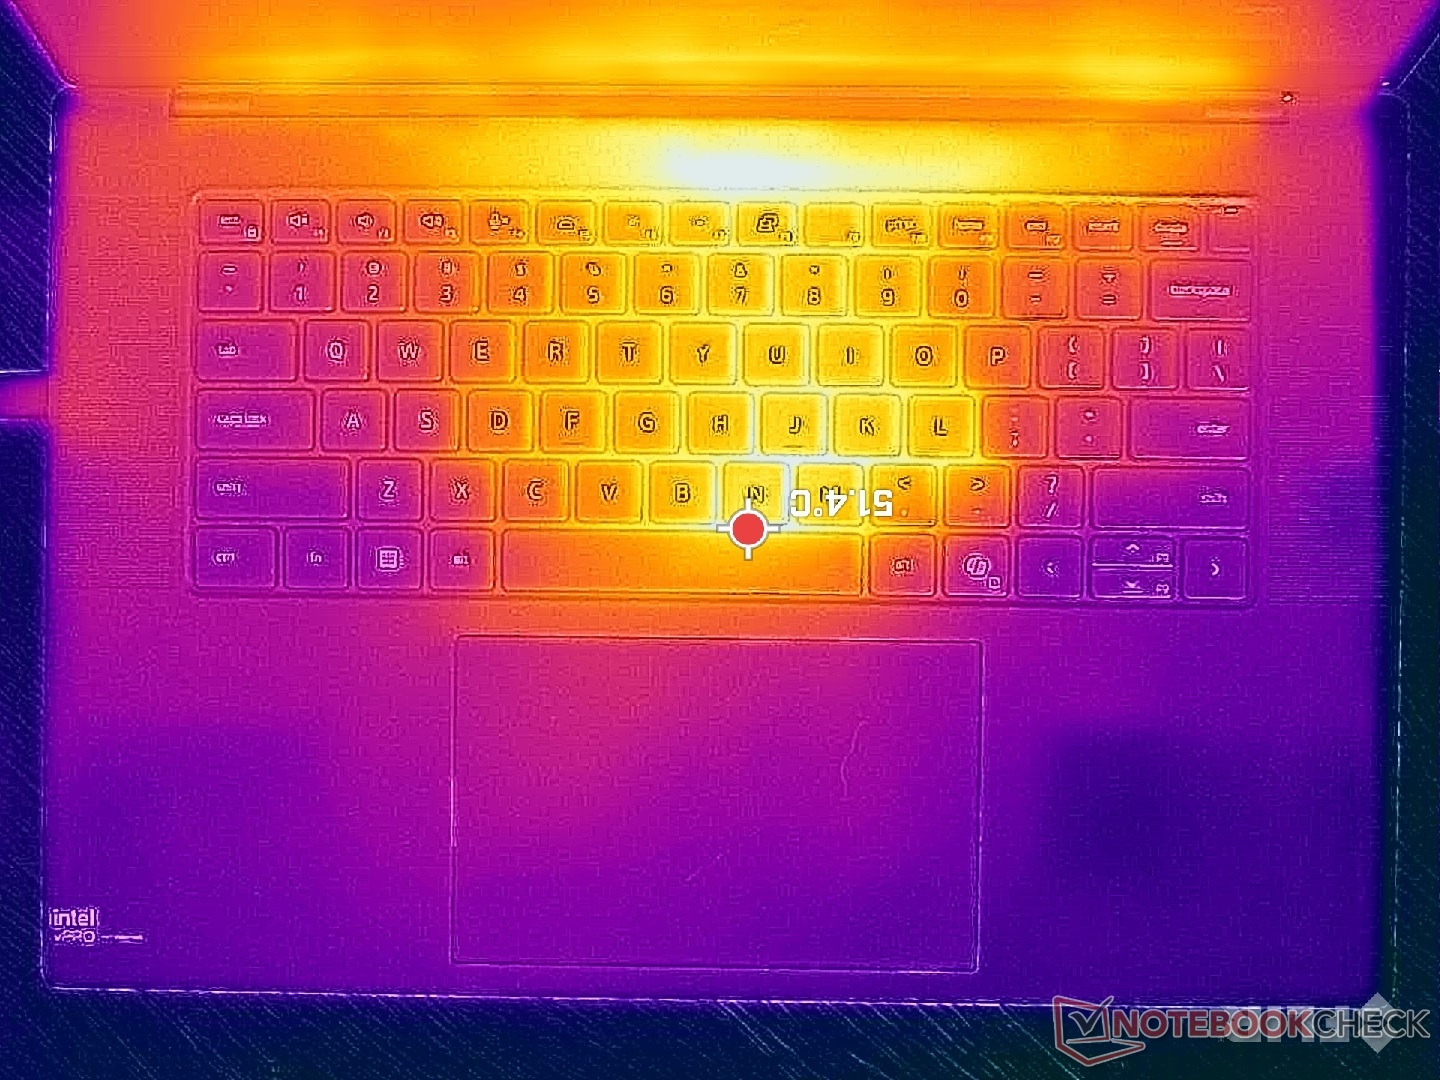
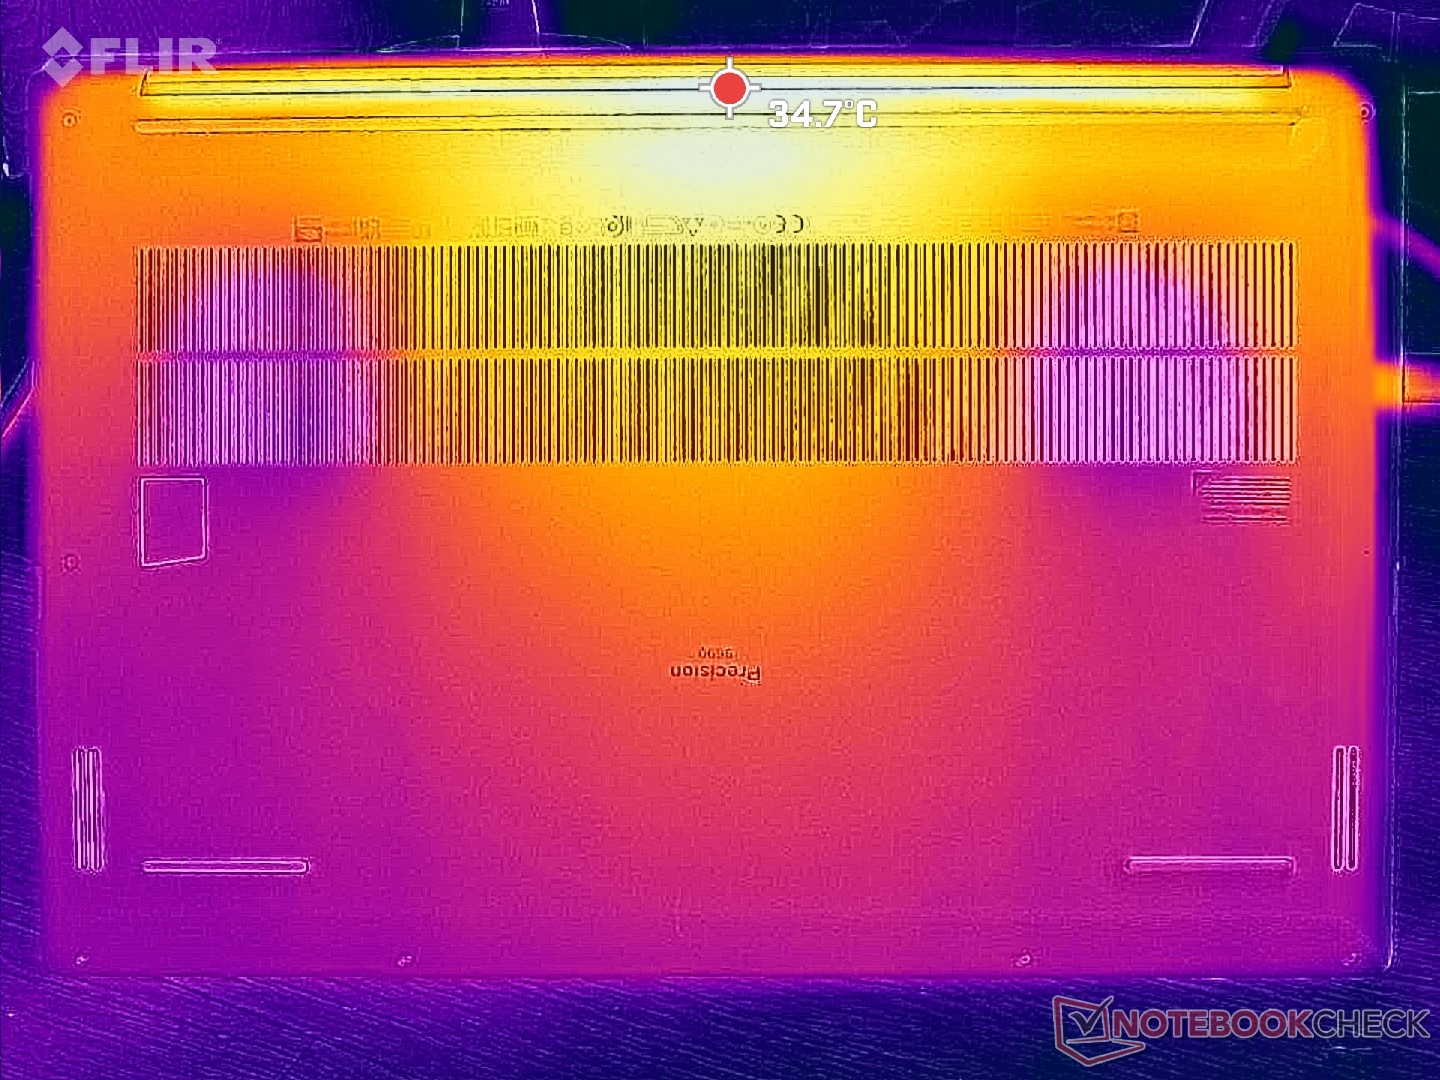
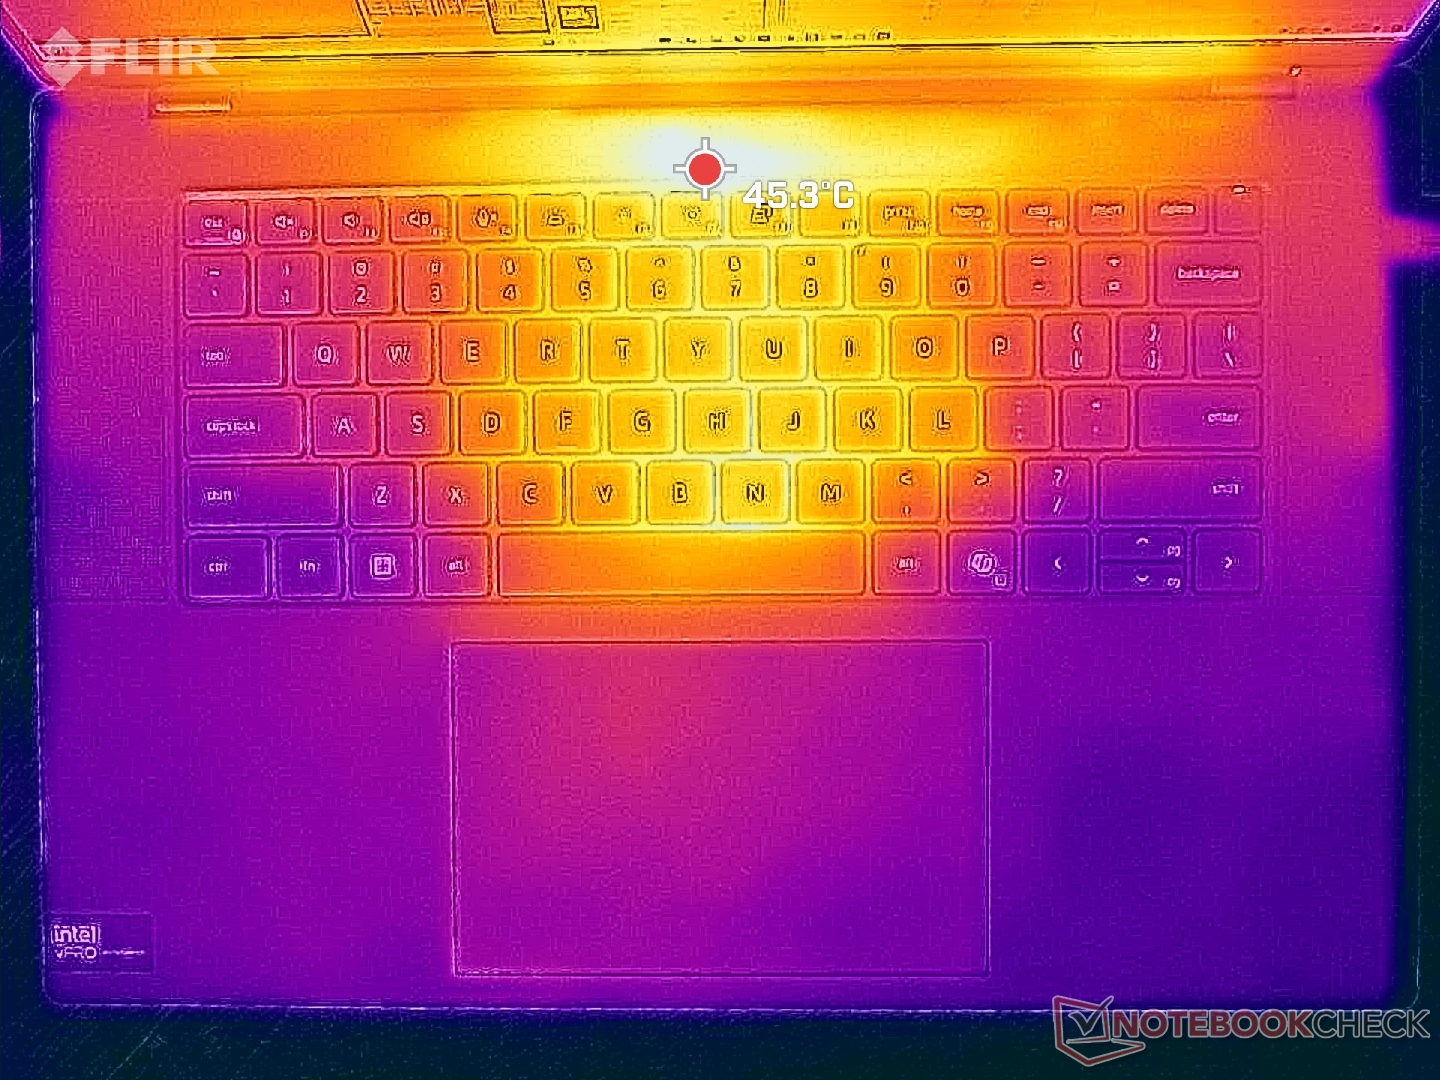
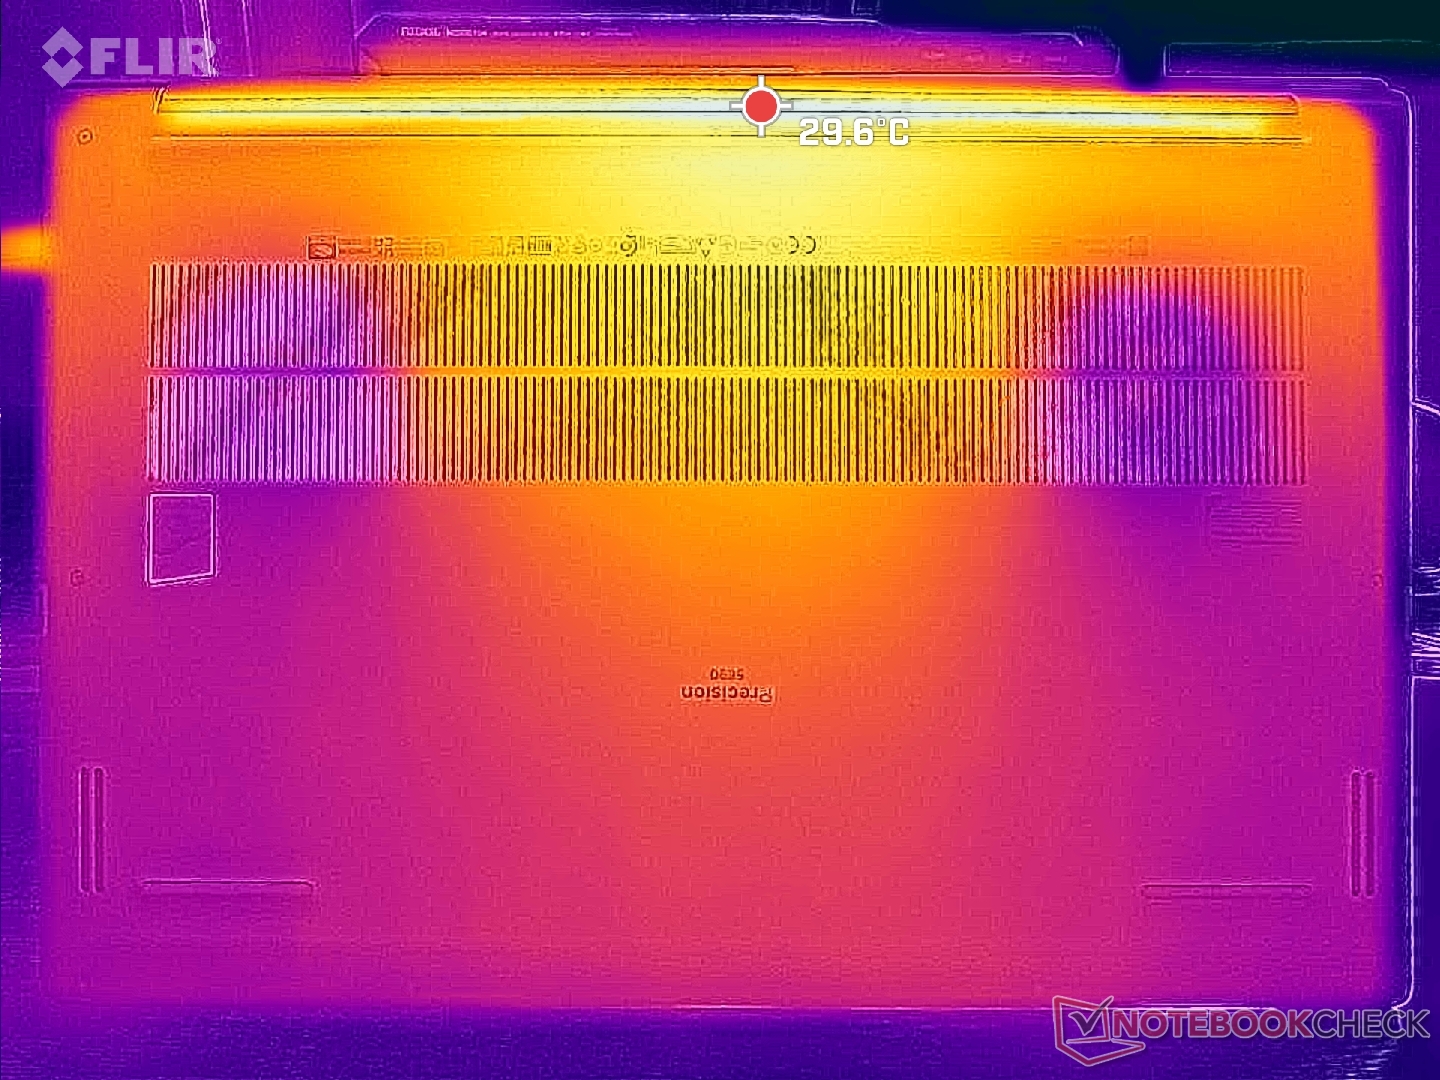
Température
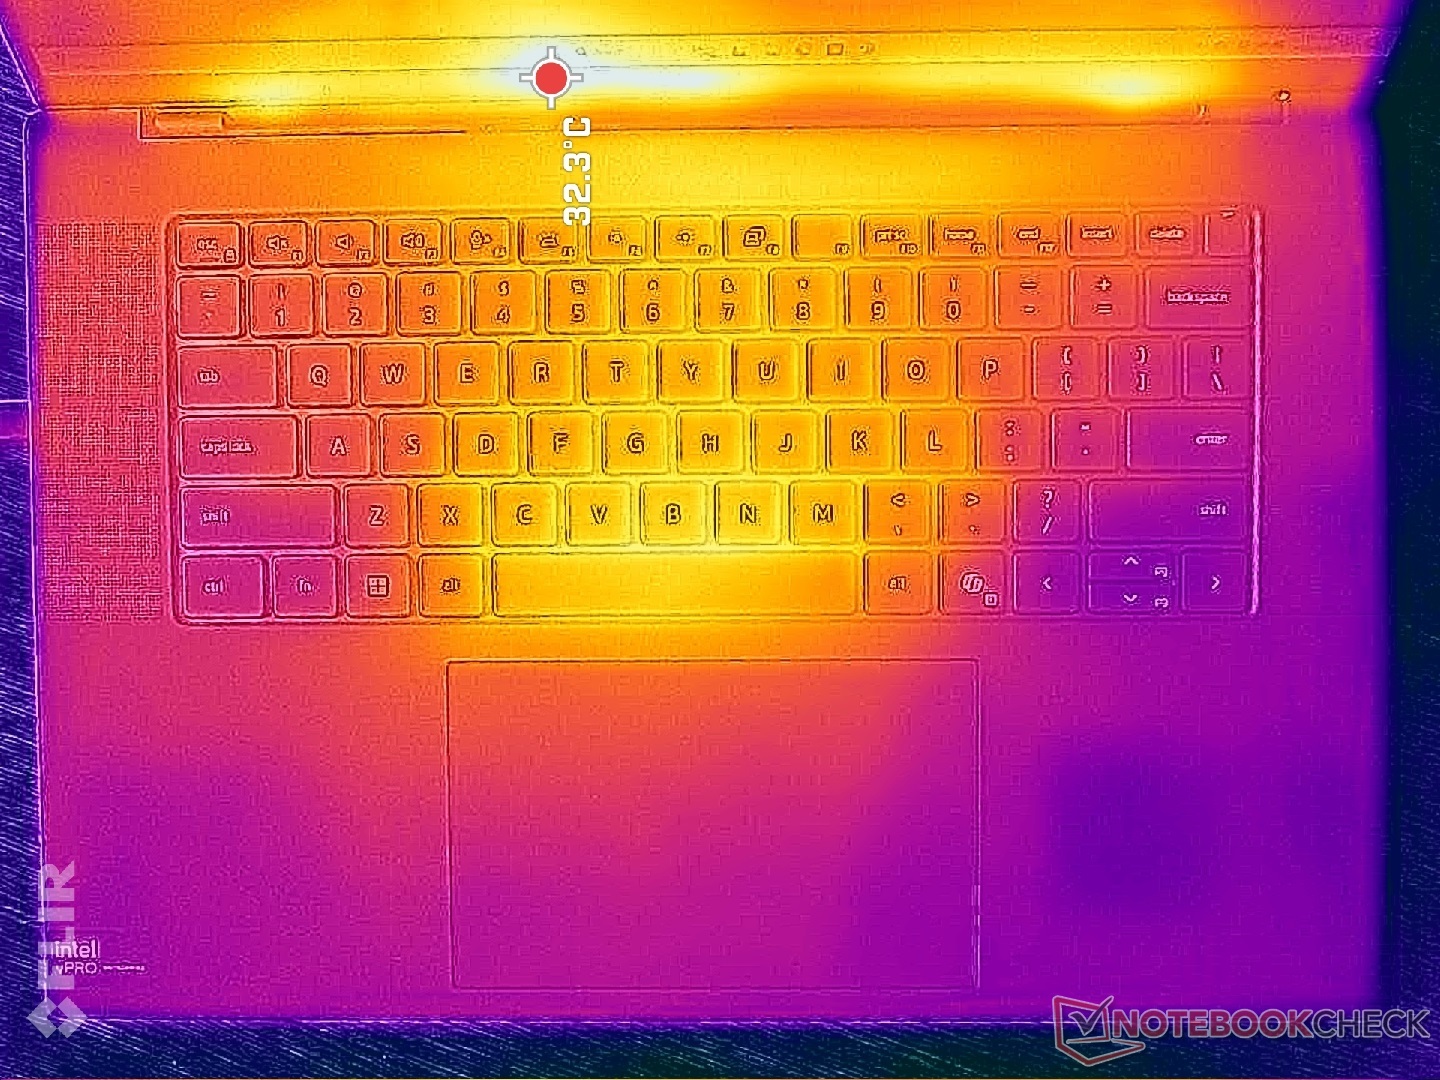
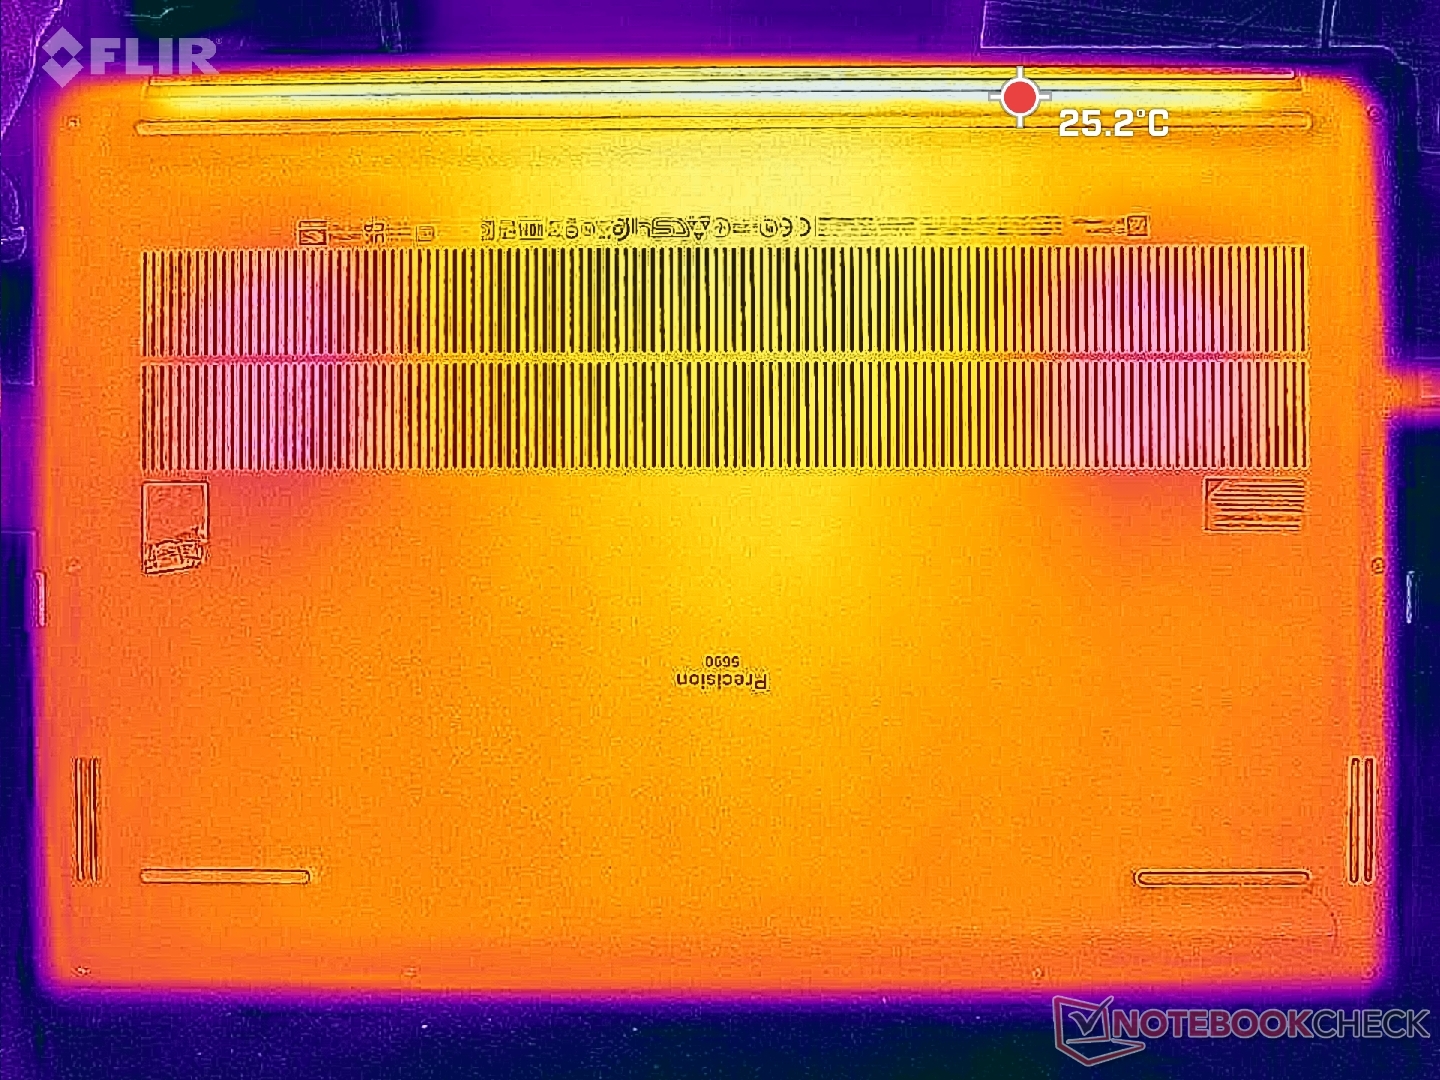
L'évolution de la température de surface est symétrique avec des points chauds allant de 43°C à 47°C près du centre du clavier. La face inférieure du châssis reste sensiblement plus froide que le clavier, même en cas d'utilisation intensive.
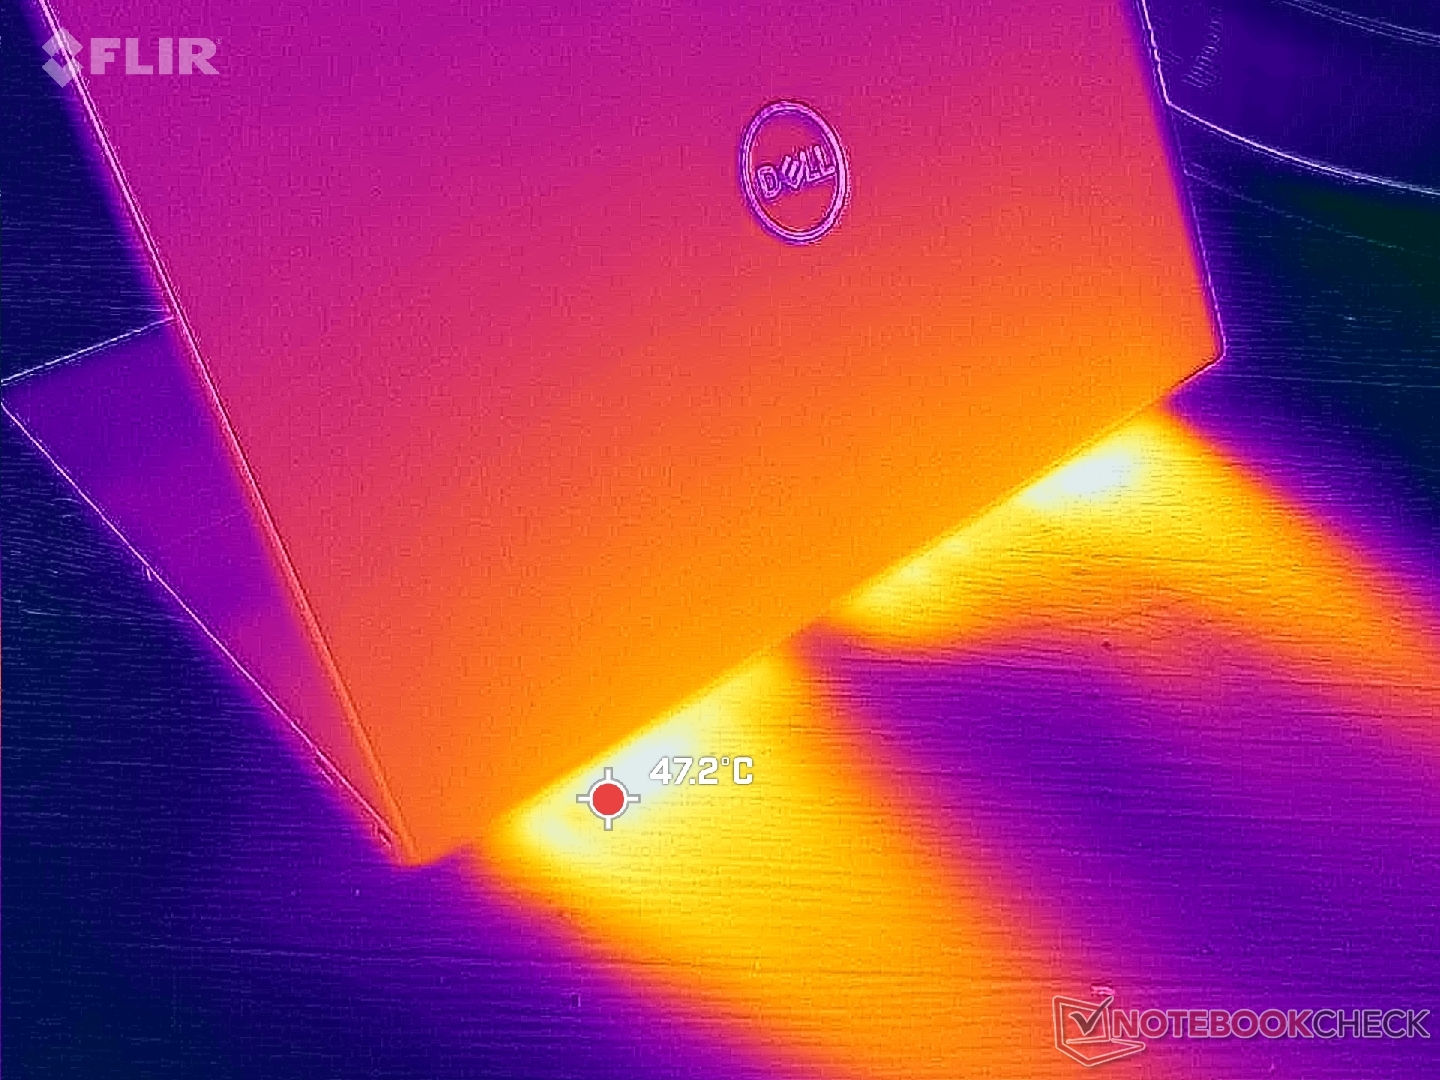
(-) La température maximale du côté supérieur est de 46.6 °C / 116 F, par rapport à la moyenne de 38.2 °C / 101 F, allant de 22.2 à 69.8 °C pour la classe Workstation.
(+) Le fond chauffe jusqu'à un maximum de 33 °C / 91 F, contre une moyenne de 41.2 °C / 106 F
(+) En utilisation inactive, la température moyenne du côté supérieur est de 29.2 °C / 85 F, par rapport à la moyenne du dispositif de 32 °C / 90 F.
(±) En jouant à The Witcher 3, la température moyenne du côté supérieur est de 34 °C / 93 F, alors que la moyenne de l'appareil est de 32 °C / 90 F.
(+) Les repose-poignets et le pavé tactile sont plus froids que la température de la peau avec un maximum de 27.6 °C / 81.7 F et sont donc froids au toucher.
(±) La température moyenne de la zone de l'appui-paume de dispositifs similaires était de 27.8 °C / 82 F (+0.2 °C / #0.3 F).
| Dell Precision 5690 Intel Core Ultra 9 185H, Nvidia RTX 5000 Ada Generation Laptop GPU | Dell Precision 5000 5680 Intel Core i9-13900H, Nvidia RTX 5000 Ada Generation Laptop GPU | Lenovo ThinkPad P16 G2 21FA000FGE Intel Core i7-13700HX, NVIDIA RTX 2000 Ada Generation Laptop GPU | Lenovo ThinkPad P1 G6-21FV000DGE Intel Core i9-13900H, NVIDIA RTX 2000 Ada Generation Laptop GPU | HP ZBook Fury 16 G10 Intel Core i9-13950HX, Nvidia RTX 5000 Ada Generation Laptop GPU | MSI CreatorPro Z16P B12UKST Intel Core i7-12700H, NVIDIA RTX A3000 Laptop GPU | |
|---|---|---|---|---|---|---|
| Heat | -7% | 2% | -13% | -16% | -24% | |
| Maximum Upper Side * | 46.6 | 50.2 -8% | 47.2 -1% | 47.1 -1% | 44.8 4% | 56.3 -21% |
| Maximum Bottom * | 33 | 32 3% | 39.5 -20% | 56.5 -71% | 50 -52% | 68.3 -107% |
| Idle Upper Side * | 32.4 | 37.4 -15% | 28.1 13% | 28.1 13% | 34.4 -6% | 25.2 22% |
| Idle Bottom * | 29.4 | 31.2 -6% | 25.3 14% | 27.6 6% | 31.8 -8% | 25.9 12% |
* ... Moindre est la valeur, meilleures sont les performances
Intervenants
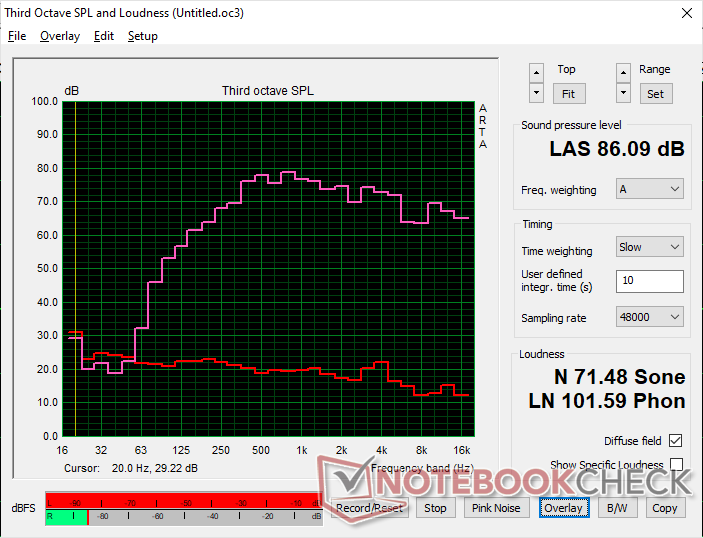
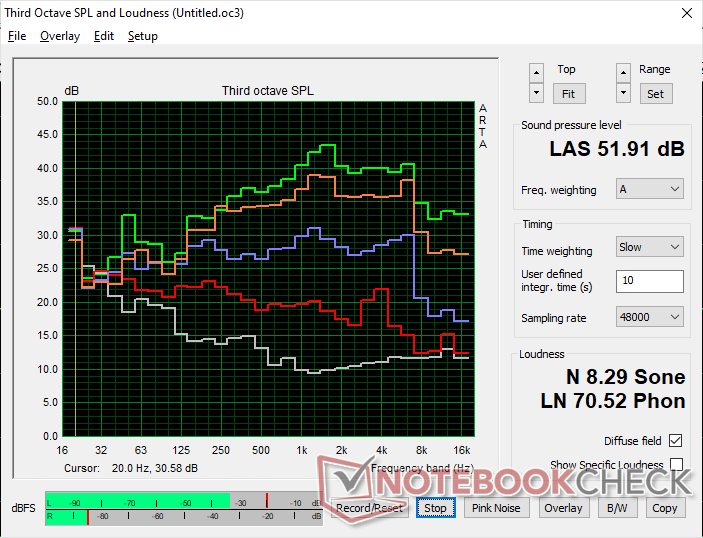
Dell Precision 5690 analyse audio
(+) | les haut-parleurs peuvent jouer relativement fort (86.1# dB)
Basses 100 - 315 Hz
(±) | basse réduite - en moyenne 9.4% inférieure à la médiane
(±) | la linéarité des basses est moyenne (7.6% delta à la fréquence précédente)
Médiums 400 - 2000 Hz
(+) | médiane équilibrée - seulement 4.7% de la médiane
(+) | les médiums sont linéaires (4.8% delta à la fréquence précédente)
Aiguës 2 - 16 kHz
(+) | des sommets équilibrés - à seulement 3.4% de la médiane
(±) | la linéarité des aigus est moyenne (7.3% delta à la fréquence précédente)
Globalement 100 - 16 000 Hz
(+) | le son global est linéaire (11.1% différence à la médiane)
Par rapport à la même classe
» 10% de tous les appareils testés de cette catégorie étaient meilleurs, 3% similaires, 87% pires
» Le meilleur avait un delta de 7%, la moyenne était de 18%, le pire était de 35%.
Par rapport à tous les appareils testés
» 6% de tous les appareils testés étaient meilleurs, 2% similaires, 93% pires
» Le meilleur avait un delta de 4%, la moyenne était de 24%, le pire était de 134%.
Apple MacBook Pro 16 2021 M1 Pro analyse audio
(+) | les haut-parleurs peuvent jouer relativement fort (84.7# dB)
Basses 100 - 315 Hz
(+) | bonne basse - seulement 3.8% loin de la médiane
(+) | les basses sont linéaires (5.2% delta à la fréquence précédente)
Médiums 400 - 2000 Hz
(+) | médiane équilibrée - seulement 1.3% de la médiane
(+) | les médiums sont linéaires (2.1% delta à la fréquence précédente)
Aiguës 2 - 16 kHz
(+) | des sommets équilibrés - à seulement 1.9% de la médiane
(+) | les aigus sont linéaires (2.7% delta à la fréquence précédente)
Globalement 100 - 16 000 Hz
(+) | le son global est linéaire (4.6% différence à la médiane)
Par rapport à la même classe
» 0% de tous les appareils testés de cette catégorie étaient meilleurs, 0% similaires, 100% pires
» Le meilleur avait un delta de 5%, la moyenne était de 18%, le pire était de 45%.
Par rapport à tous les appareils testés
» 0% de tous les appareils testés étaient meilleurs, 0% similaires, 100% pires
» Le meilleur avait un delta de 4%, la moyenne était de 24%, le pire était de 134%.
Gestion de l'énergie
Consommation électrique
Le ralenti sur l'ordinateur de bureau peut demander aussi peu que 8 W sur le réglage de luminosité minimum jusqu'à 29 W sur le réglage de luminosité maximum avec un arrière-plan entièrement blanc. Cette plage est plus large que sur la plupart des ordinateurs portables IPS en raison du fonctionnement de l'OLED. Les tâches telles que la navigation sur Internet, le traitement de texte ou la saisie de feuilles de calcul peuvent décharger la batterie plus rapidement qu'on ne le pense, car ces fenêtres sont principalement de couleur blanche. Réduire la luminosité ou choisir des couleurs plus sombres peut contribuer à prolonger l'autonomie de la batterie plus que sur un modèle IPS.
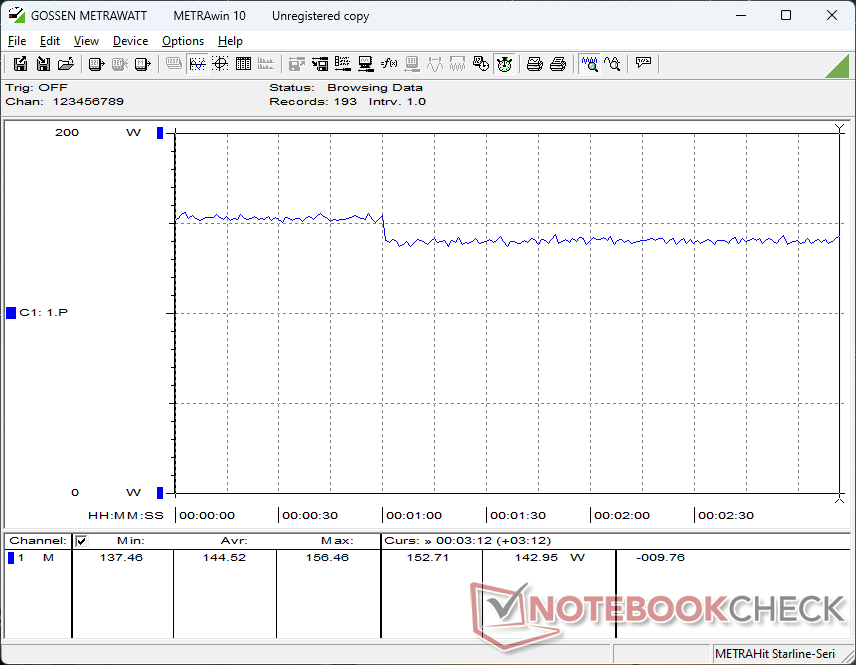
La consommation d'énergie lors de l'exécution de charges plus élevées comme Witcher 3 serait presque la même que celle que nous avons enregistrée sur l'ancien Precision 5680. Cela corrobore nos données de référence ci-dessus qui ne montrent que des différences de performances marginales entre les deux modèles.
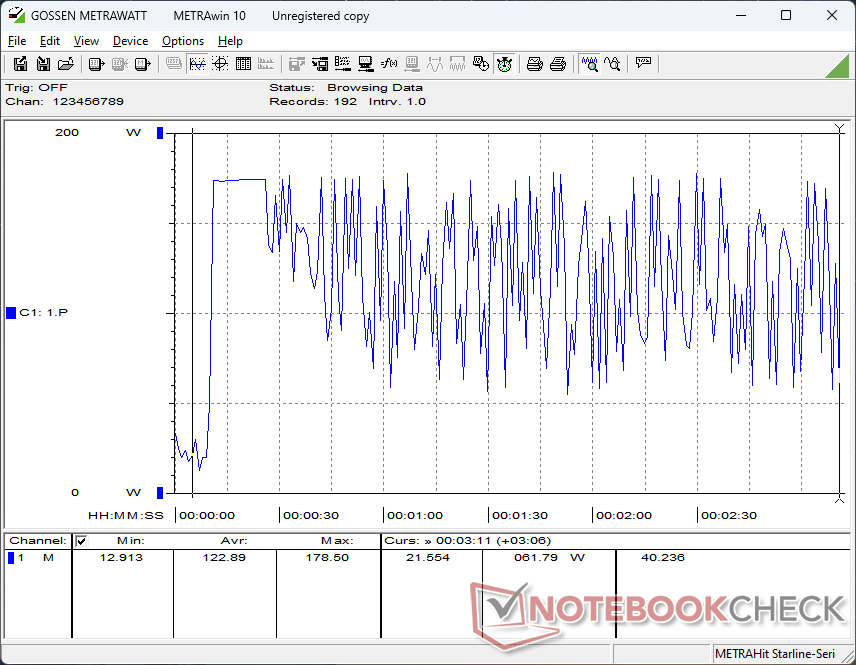
Étrangement, la consommation fluctue énormément lors de l'exécution du stress Prime95, même après de multiples tests. Pour le reste, les performances semblent stables.
| Éteint/en veille | |
| Au repos | |
| Fortement sollicité |
|
Légende:
min: | |
| Dell Precision 5690 Ultra 9 185H, NVIDIA RTX 5000 Ada Generation Laptop GPU, 2x Samsung PM9A1 1TB (RAID 0), OLED, 3840x2400, 16" | Dell Precision 5000 5680 i9-13900H, NVIDIA RTX 5000 Ada Generation Laptop GPU, 2x SK hynix PC801 HFS512GEJ9X101N RAID 0, OLED, 3840x2400, 16" | Lenovo ThinkPad P16 G2 21FA000FGE i7-13700HX, NVIDIA RTX 2000 Ada Generation Laptop GPU, SK hynix PC801 HFS001TEJ9X162N, IPS LED, 2560x1600, 16" | Lenovo ThinkPad P1 G6-21FV000DGE i9-13900H, NVIDIA RTX 2000 Ada Generation Laptop GPU, SK Hynix PC711 1TB HFS001TDE9X084N, IPS, 2560x1600, 16" | HP ZBook Fury 16 G10 i9-13950HX, NVIDIA RTX 5000 Ada Generation Laptop GPU, SK hynix PC801 HFS001TEJ9X101N, IPS, 3840x2400, 16" | MSI CreatorPro Z16P B12UKST i7-12700H, RTX A3000 Laptop GPU, Samsung PM9A1 MZVL21T0HCLR, IPS, 2560x1600, 16" | |
|---|---|---|---|---|---|---|
| Power Consumption | 6% | -5% | 10% | -39% | -9% | |
| Idle Minimum * | 7.9 | 8 -1% | 9.3 -18% | 8.3 -5% | 15.3 -94% | 10.8 -37% |
| Idle Average * | 12 | 10.4 13% | 14.1 -18% | 14.5 -21% | 18.2 -52% | 16.3 -36% |
| Idle Maximum * | 28.6 | 30.5 -7% | 15.5 46% | 15.3 47% | 28 2% | 16.9 41% |
| Load Average * | 98.8 | 75.4 24% | 133.6 -35% | 91.8 7% | 137.9 -40% | 111.7 -13% |
| Witcher 3 ultra * | 144.5 | 134 7% | 144.9 -0% | 104.7 28% | 189.4 -31% | 152.1 -5% |
| Load Maximum * | 174.8 | 175 -0% | 179.6 -3% | 164.5 6% | 202 -16% | 177.4 -1% |
* ... Moindre est la valeur, meilleures sont les performances
Power Consumption Witcher 3 / Stresstest
Power Consumption external Monitor
Autonomie de la batterie
Les durées d'utilisation sont à peu près les mêmes qu'auparavant, voire légèrement plus courtes. Notre test WLAN a duré un peu plus de 9 heures, tandis que le Precision 5680 a duré près de 10 heures dans des conditions similaires.
| Dell Precision 5690 Ultra 9 185H, NVIDIA RTX 5000 Ada Generation Laptop GPU, 98 Wh | Dell Precision 5000 5680 i9-13900H, NVIDIA RTX 5000 Ada Generation Laptop GPU, 98 Wh | Lenovo ThinkPad P16 G2 21FA000FGE i7-13700HX, NVIDIA RTX 2000 Ada Generation Laptop GPU, 94 Wh | Lenovo ThinkPad P1 G6-21FV000DGE i9-13900H, NVIDIA RTX 2000 Ada Generation Laptop GPU, 90 Wh | HP ZBook Fury 16 G10 i9-13950HX, NVIDIA RTX 5000 Ada Generation Laptop GPU, 95 Wh | MSI CreatorPro Z16P B12UKST i7-12700H, RTX A3000 Laptop GPU, 90 Wh | |
|---|---|---|---|---|---|---|
| Autonomie de la batterie | 8% | -6% | 3% | -21% | -37% | |
| WiFi v1.3 | 549 | 592 8% | 515 -6% | 567 3% | 435 -21% | 348 -37% |
| Reader / Idle | 1072 | |||||
| Load | 101 | 67 | ||||
| H.264 | 674 |
Points positifs
Points négatifs
Verdict - Prêt pour la révolution de l'IA
Le Precision 5680 a été lancé avec un nouveau design élégant dérivé du XPS 16 équipé de processeurs vPro et de cartes graphiques haut de gamme Nvidia RTX Ada. Il est devenu par la suite l'une des stations de travail de 16 pouces les plus rapides pour sa taille et son poids. Le problème est que le Precision 5680 a à peine six mois et est encore assez récent. Le nouveau Precision 5690 offre le même châssis, le même GPU, le même écran, les mêmes niveaux de consommation d'énergie, la même autonomie de batterie et les mêmes performances de processeur que le Precision 5680. Si vous cherchez à économiser un peu d'argent, le Precision 5680 de l'année dernière peut offrir essentiellement la même expérience utilisateur et les mêmes performances pour moins cher.
)(()()
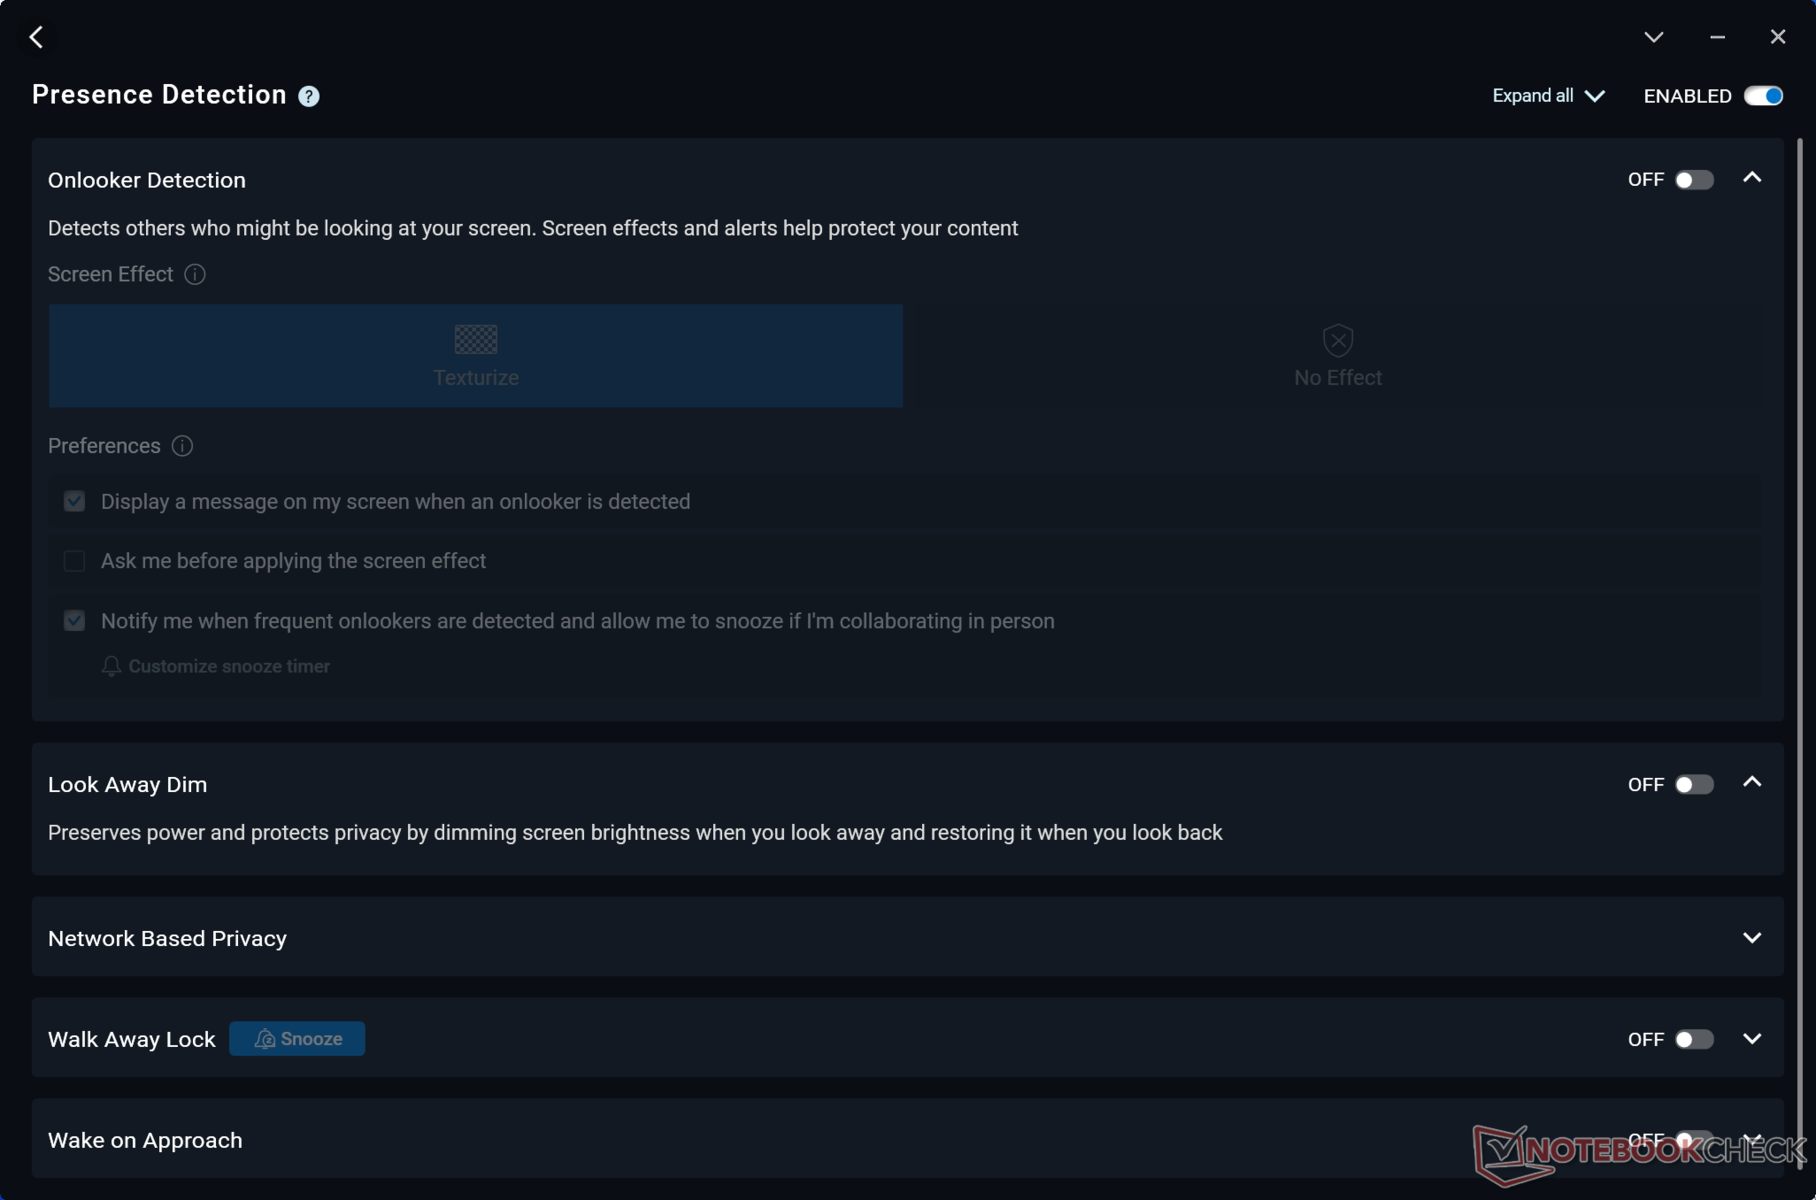
Le principal facteur de différenciation entre le 2024 Precision 5690 et le 2023 Precision 5680 réside dans le NPU intégré aux processeurs de la série Meteor Lake-H. Le nouveau modèle de Dell est donc un "ordinateur de bureau". Le modèle Dell le plus récent est donc "AI ready" lorsque Windows est optimisé pour les tâches d'IA locales. Si vous utilisez déjà Co-Pilot ou si vous prévoyez d'exécuter davantage d'applications améliorées par l'IA dans un avenir proche, par exemple, le Precision 5690 devrait avoir un avantage notable grâce à l'accélération NPU. Sinon, la plupart des tâches "traditionnelles" ne seront pas sensiblement plus rapides sur le dernier modèle.
Prix et disponibilité
Dell livre maintenant le Precision 5690 à partir de 2290 $ pour le CPU Core Ultra 5 135H, la carte graphique intégrée uniquement et l'écran IPS 1200p, et jusqu'à plus de 5000 $ s'il est configuré avec le Core Ultra 9 185H, la RTX 5000 Ada et l'écran tactile OLED 2400p.
Dell Precision 5690
- 05/08/2024 v7 (old)
Allen Ngo
Transparency
La sélection des appareils à examiner est effectuée par notre équipe éditoriale. L'échantillon de test a été prêté à l'auteur par le fabricant ou le détaillant pour les besoins de cet examen. Le prêteur n'a pas eu d'influence sur cette évaluation et le fabricant n'a pas reçu de copie de cette évaluation avant sa publication. Il n'y avait aucune obligation de publier cet article. Nous n'acceptons jamais de compensation ou de paiement en échange de nos commentaires. En tant que média indépendant, Notebookcheck n'est pas soumis à l'autorité des fabricants, des détaillants ou des éditeurs.
Voici comment Notebookcheck teste
Chaque année, Notebookcheck examine de manière indépendante des centaines d'ordinateurs portables et de smartphones en utilisant des procédures standardisées afin de garantir que tous les résultats sont comparables. Nous avons continuellement développé nos méthodes de test depuis environ 20 ans et avons établi des normes industrielles dans le processus. Dans nos laboratoires de test, des équipements de mesure de haute qualité sont utilisés par des techniciens et des rédacteurs expérimentés. Ces tests impliquent un processus de validation en plusieurs étapes. Notre système d'évaluation complexe repose sur des centaines de mesures et de points de référence bien fondés, ce qui garantit l'objectivité.Price comparison

