

Critique de l'ordinateur portable Lenovo Legion Pro 7i 16 Gen 10 : une alimentation de 400 W presque sans compromis
Toute la puissance.
Au lieu de devenir de plus en plus fin, le dernier Legion Pro 7i 16 est plus épais cette année afin de tirer plus de performances du matériel Intel Arrow Lake et Nvidia Blackwell. La consommation d'énergie est peut-être élevée, mais les performances brutes sont indéniables.Allen Ngo, 👁 Allen Ngo (traduit par DeepL / Ninh Duy) Publié 🇺🇸
Verdict - Arrow Lake fait un retour en force pour Intel
Le Legion Pro 7 16 10e génération est le modèle le plus raffiné de la série à ce jour. Contrairement au dernier Razer Blade 16, ce Lenovo n'a pas peur d'être plus grand ou plus épais que son prédécesseur afin de supporter des enveloppes de puissance plus élevées et des solutions de refroidissement plus puissantes. Les chasseurs de performances en particulier apprécieront cette approche par rapport aux designs toujours plus fins des concurrents qui doivent équilibrer les niveaux de performance du CPU et du GPU de manière beaucoup plus délicate.
L'écran mérite également des éloges car il est l'un des rares écrans OLED à supporter des taux de rafraîchissement natifs élevés, Windows VRR, DisplayHDR1000 et G-Sync à la fois. La luminosité maximale de 1000 nits en mode HDR est plus courante sur les ordinateurs portables équipés de Mini-LED, alors que la plupart des autres panneaux OLED ne sont que HDR600 ou moins. L'expérience visuelle est donc l'une des meilleures dans la catégorie des ordinateurs de jeu de 16 pouces.
Une puissance de 400 W dans un ordinateur portable de 16 pouces a ses inconvénients. Outre la consommation d'énergie plus élevée, des alternatives plus fines et plus légères comme le Asus ROG Zephyrus G16 ou le Razer Blade 16 peuvent être plus attrayantes pour les voyageurs, même si elles sont légèrement plus lentes. La température du cœur du Lenovo peut être assez élevée lors des jeux malgré la solution de refroidissement importante, tandis que le bruit des ventilateurs n'est pas plus silencieux que celui des concurrents en mode Performance.
Les acheteurs qui savent dans quoi ils s'engagent - des performances maximales au prix d'une taille plus importante - trouveront dans le Legion Pro 7i Gen 10 une option puissante.
Points positifs
Points négatifs
Prix et disponibilité
La configuration RTX 5080 est maintenant livrée directement par Lenovo à partir de 3400 $, tandis que la configuration RTX 5090 sera livrée à une date ultérieure.
Table des matières
- Verdict - Arrow Lake fait un retour en force pour Intel
- Spécifications
- Cas
- Connectivité
- Périphériques d'entrée - Spacieux et sans fantaisie
- Affichage - Presque tout ce que vous pourriez vouloir
- Performance - Arrow Lake avec 175 W TGP Graphics
- Émissions - Le son n'est fort que lorsqu'il doit l'être
- Gestion de l'énergie
- Notebookcheck Rating
- Potential Competitors in Comparison
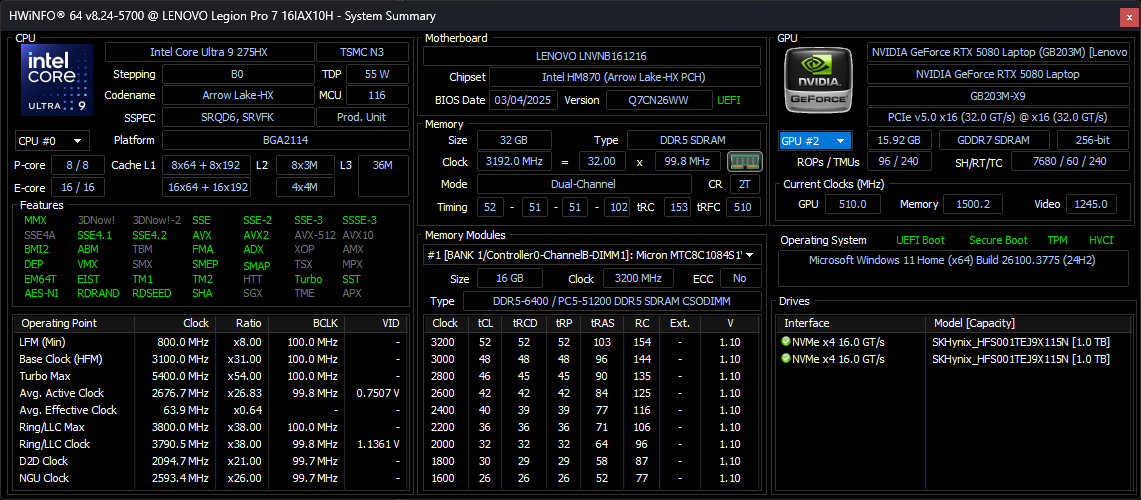
Le Legion Pro 7i 16 Gen 10 (ou Legion Pro 7 16 G10) succède au Pro 7i 16 Gen 9 de l'année dernière Legion Pro 7i 16 Gen 9 de l'année dernière, avec un design entièrement revu, tant à l'intérieur qu'à l'extérieur. Presque tout est nouveau dans ce modèle, y compris la mise à niveau du CPU de Raptor Lake-HX à Arrow Lake-HX, Nvidia Ada Lovelace à Blackwell, ainsi que l'aspect extérieur et l'affichage.
Notre unité de test est une configuration haut de gamme avec le CPU Core Ultra 9 275HX, le GPU RTX 5080 de 175 W GeForce et l'écran OLED 16:10 1600p 240 Hz pour un prix de détail d'environ 3400 USD. D'autres UGS peuvent être livrées avec la RTX 5090, la RTX 5080, ou la RTX 5070 Ti à la place, tandis que le CPU et l'écran sont les mêmes dans tous les cas.
Les concurrents du Legion Pro 7 16 G10 comprennent d'autres ordinateurs portables de jeu haut de gamme de 16 pouces comme le MSI Vector 16 HX, Asus ROG Zephyrus G16ou le Razer Blade 16. Lenovo propose une série pour passionnés encore plus coûteuse appelée Legion Pro 9 16 avec des fonctionnalités supplémentaires par rapport au Legion Pro 7 16, mais elle n'a pas encore été mise à jour pour 2025 à l'heure où nous écrivons ces lignes.
Plus d'avis sur Lenovo :
Spécifications
Cas
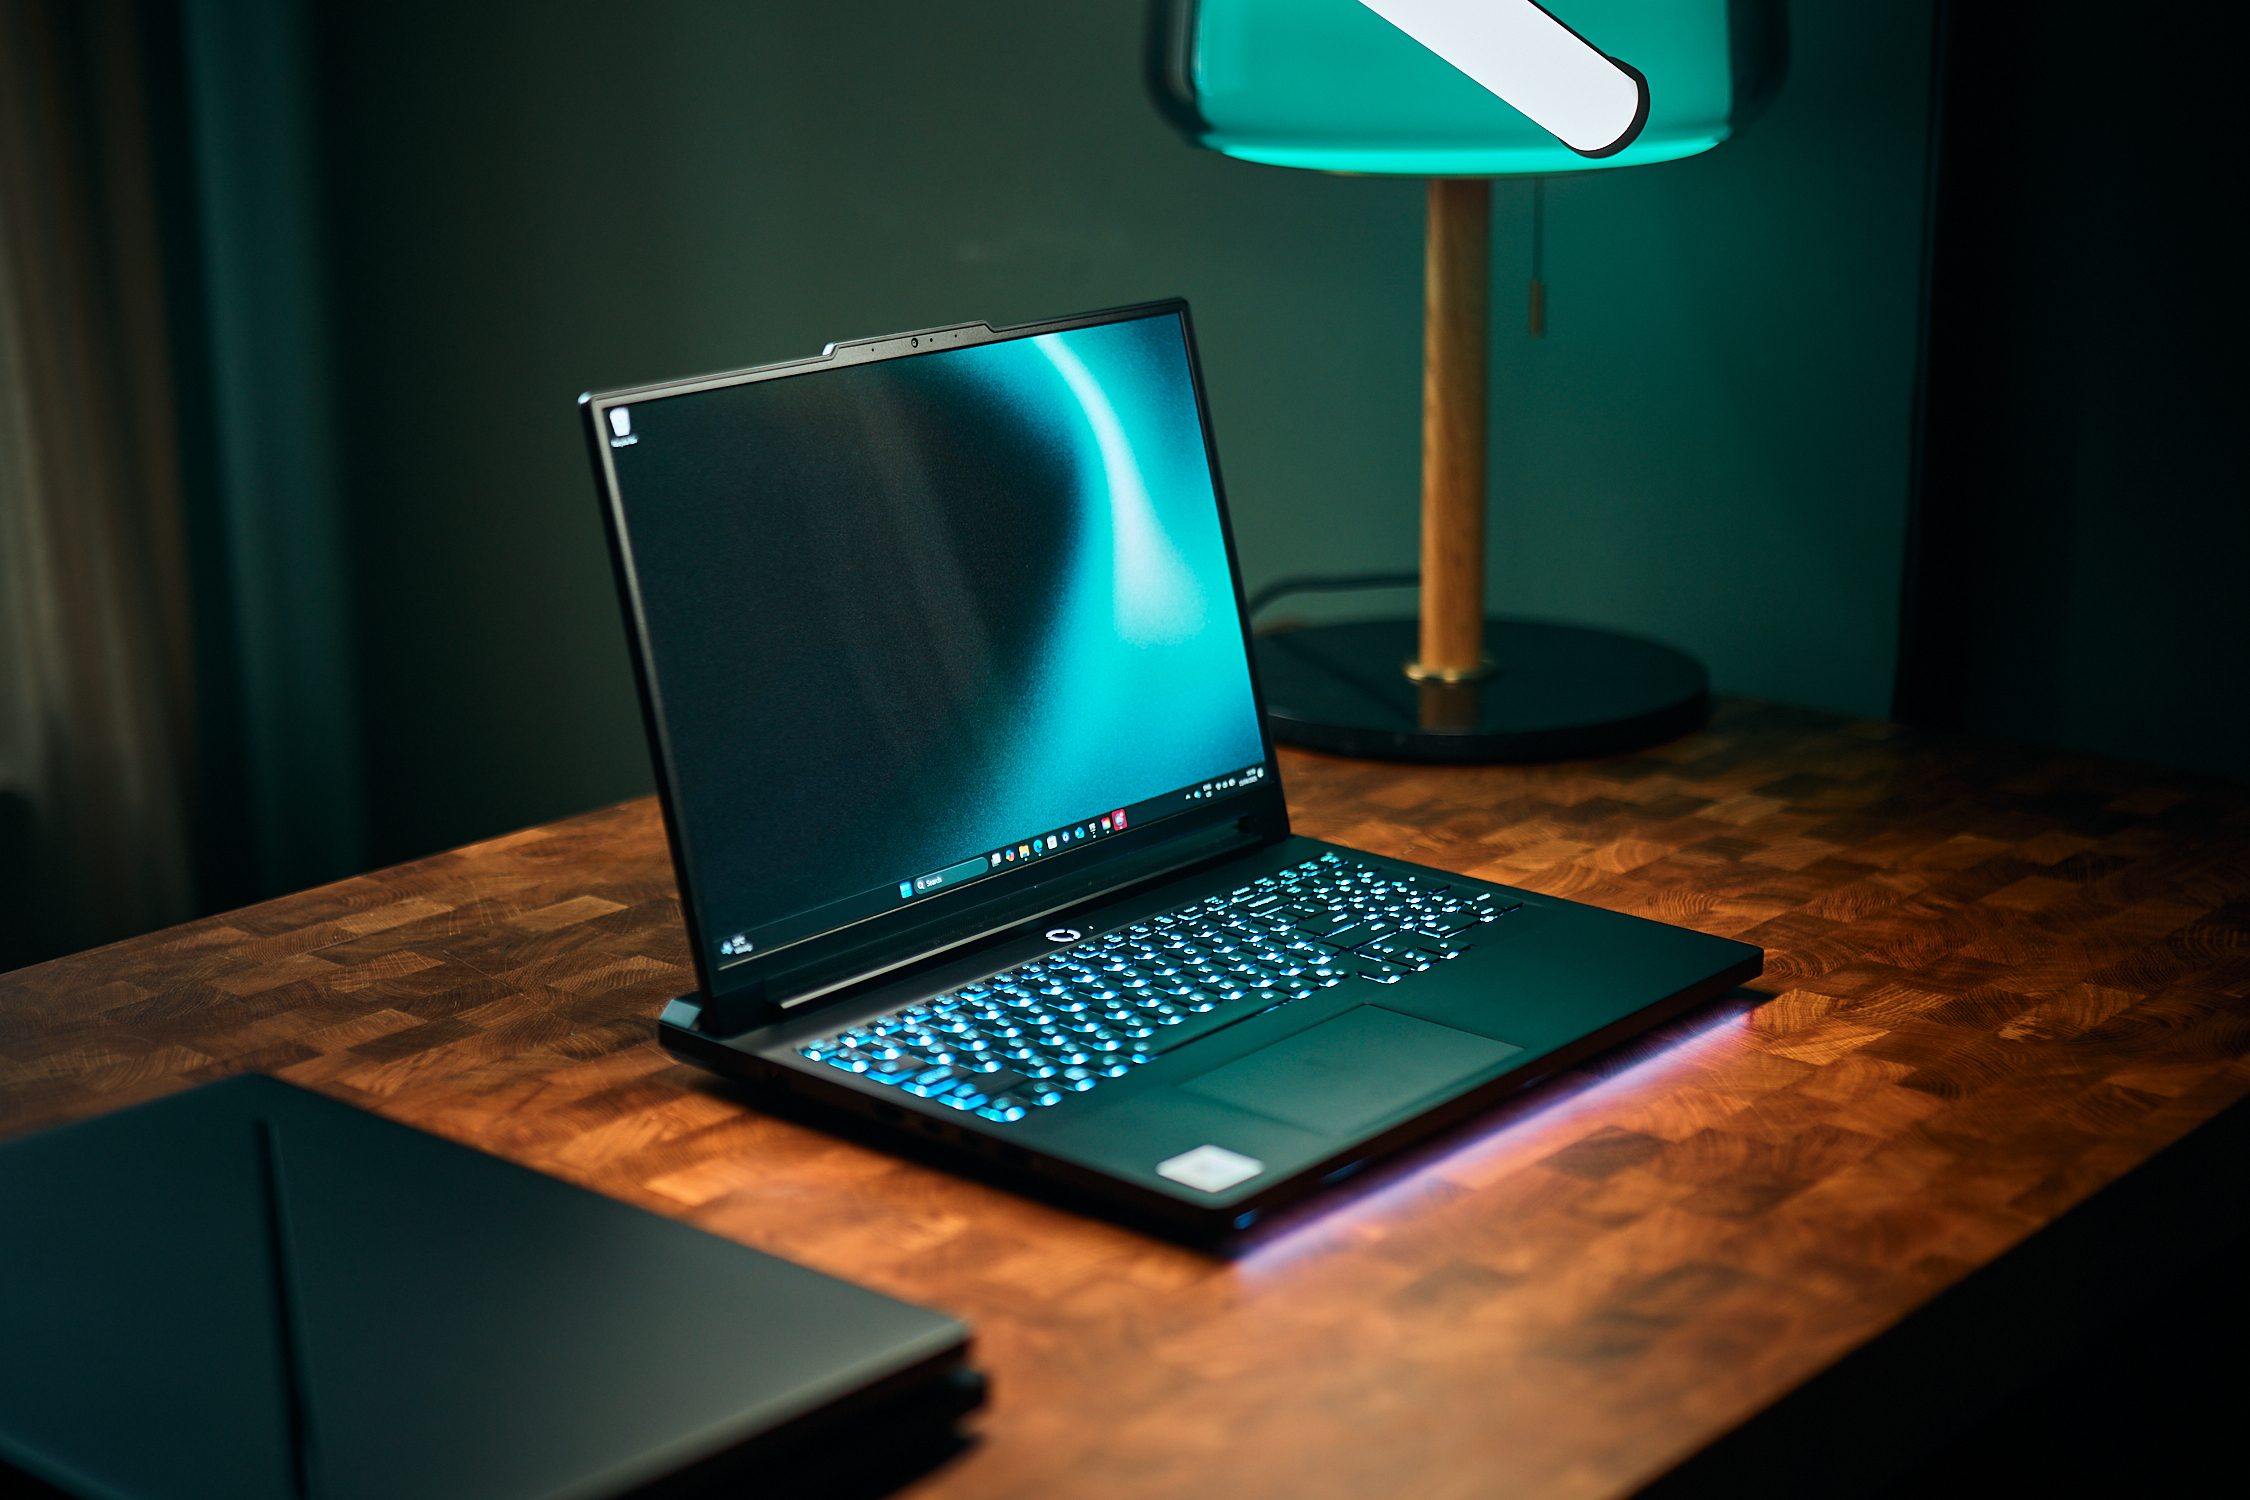
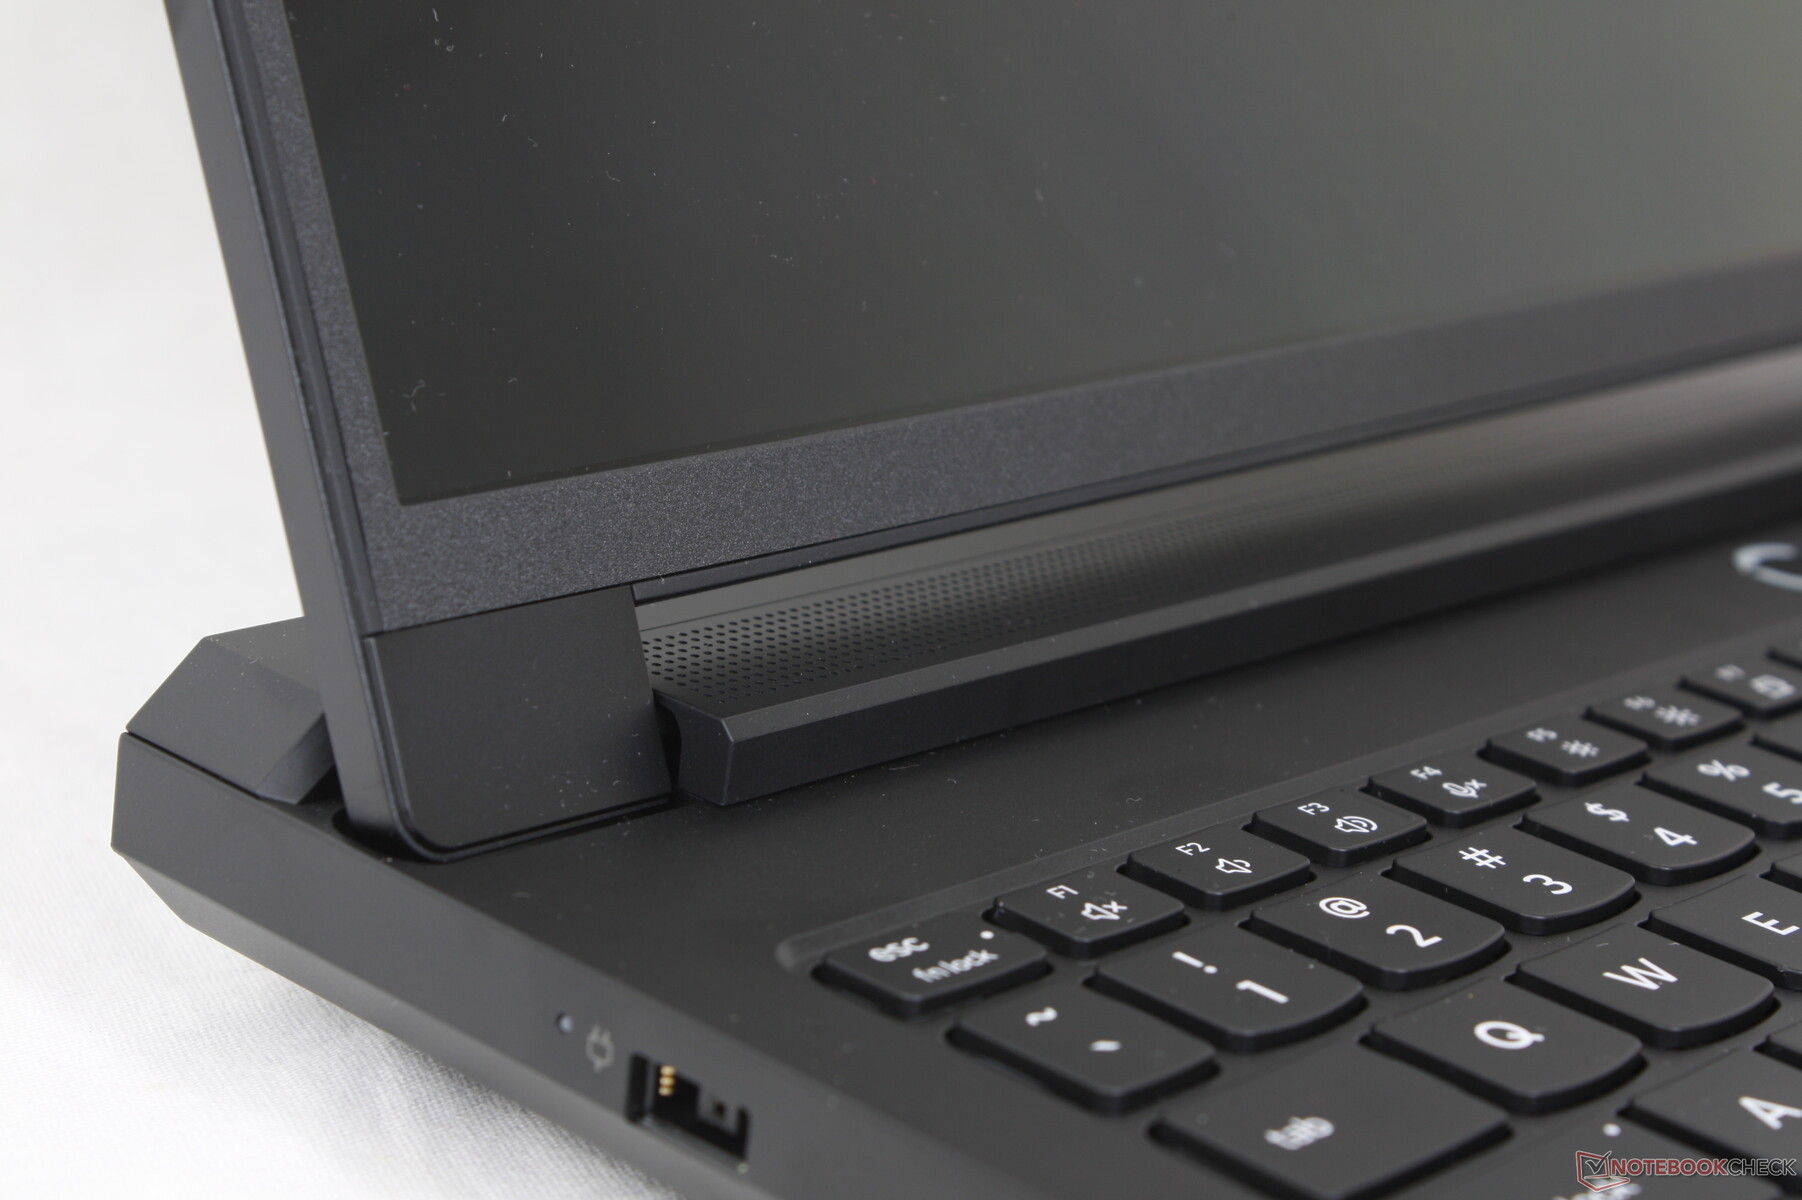
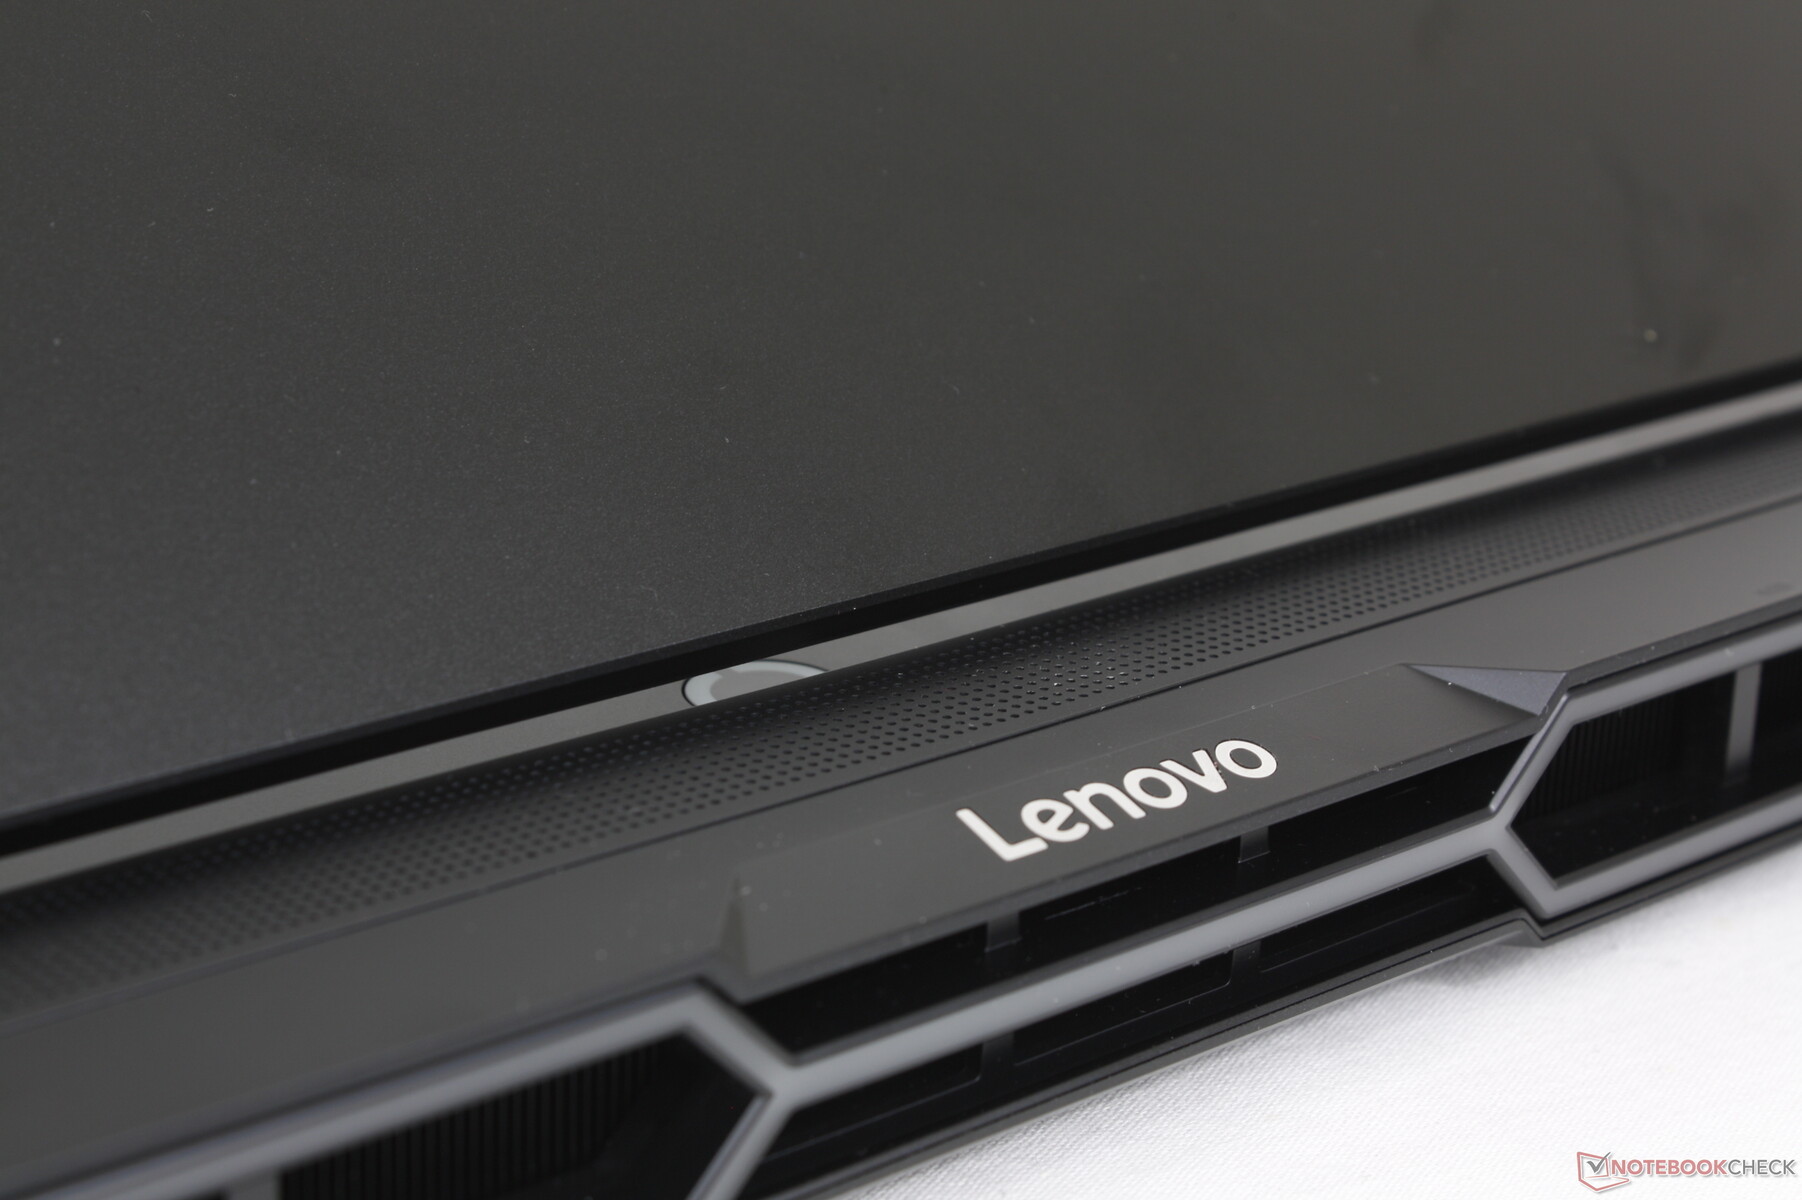
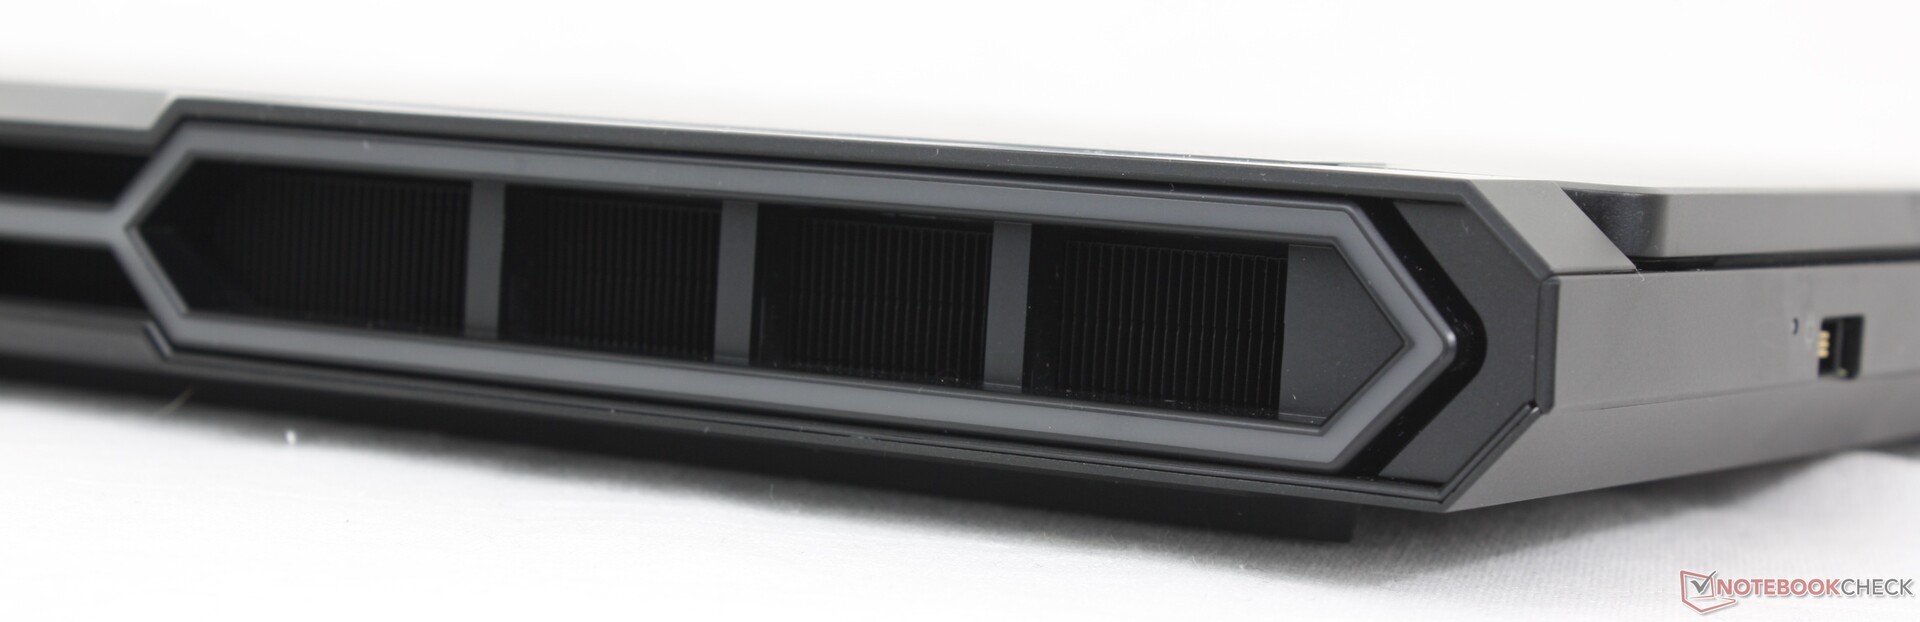
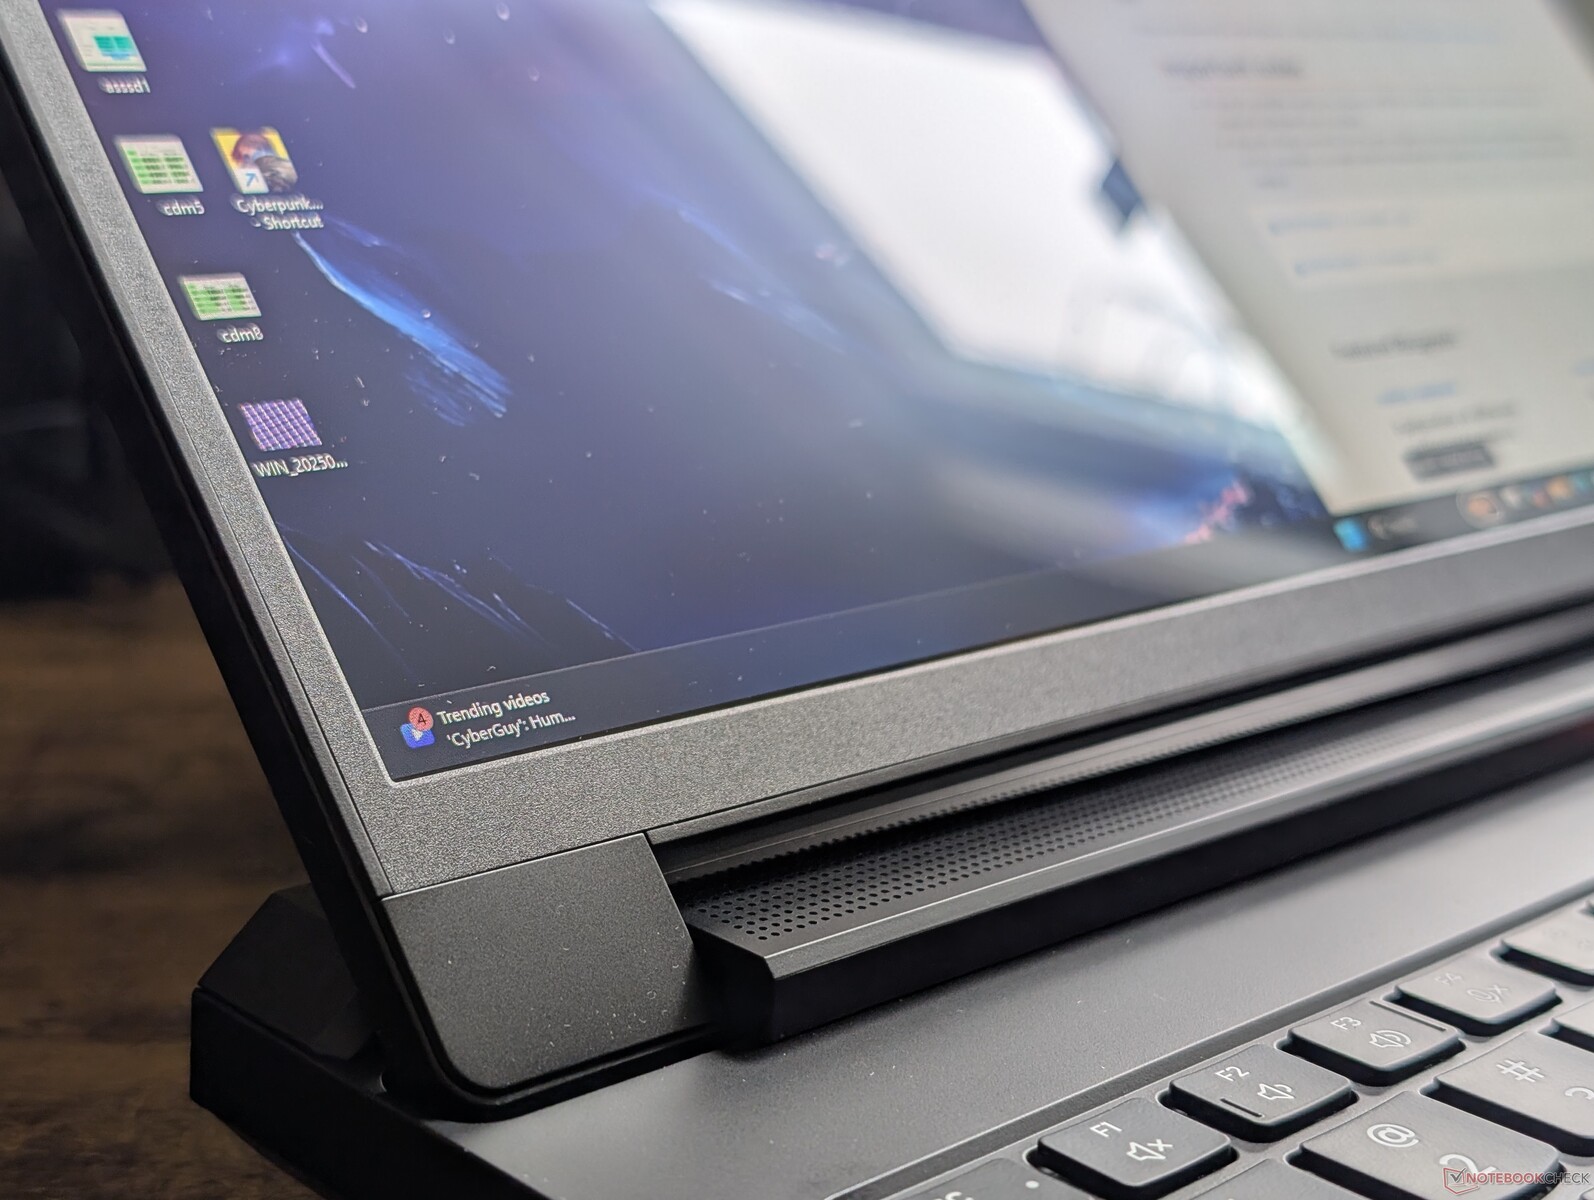
Le châssis redessiné est plus net, plus ferme et plus "gamer" qu'auparavant avec ses nouvelles barres LED sur les bords avant et arrière. Cependant, l'approche noir de jais évite le côté criard de certains concurrents plus brillants comme les modèles multicolores d'Alienware ou de MSI. C'est l'un des ordinateurs portables de jeu les mieux conçus de Lenovo à ce jour, tout bien considéré.
Malheureusement, les traces de doigts s'accumulent très facilement presque partout sur ce portable noir, comme sur le Razer Blade 16.
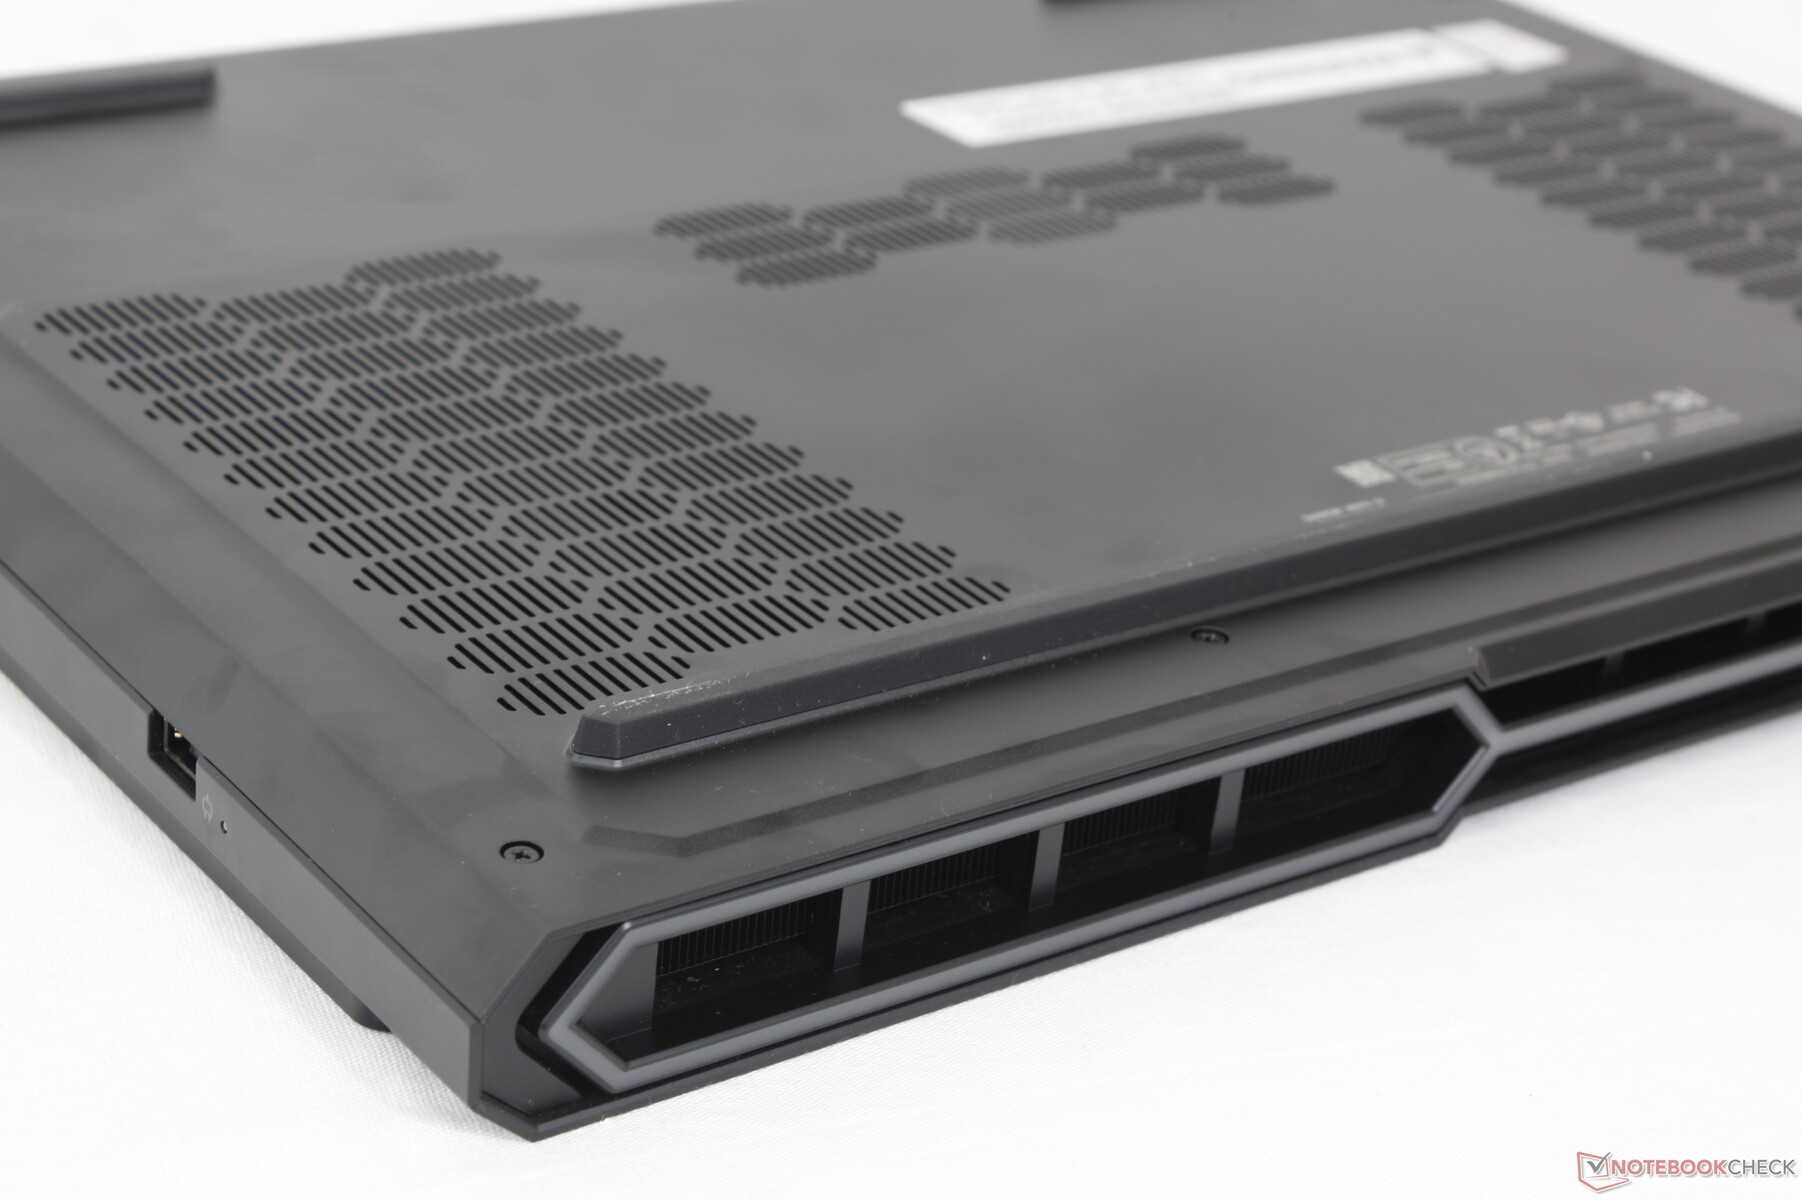
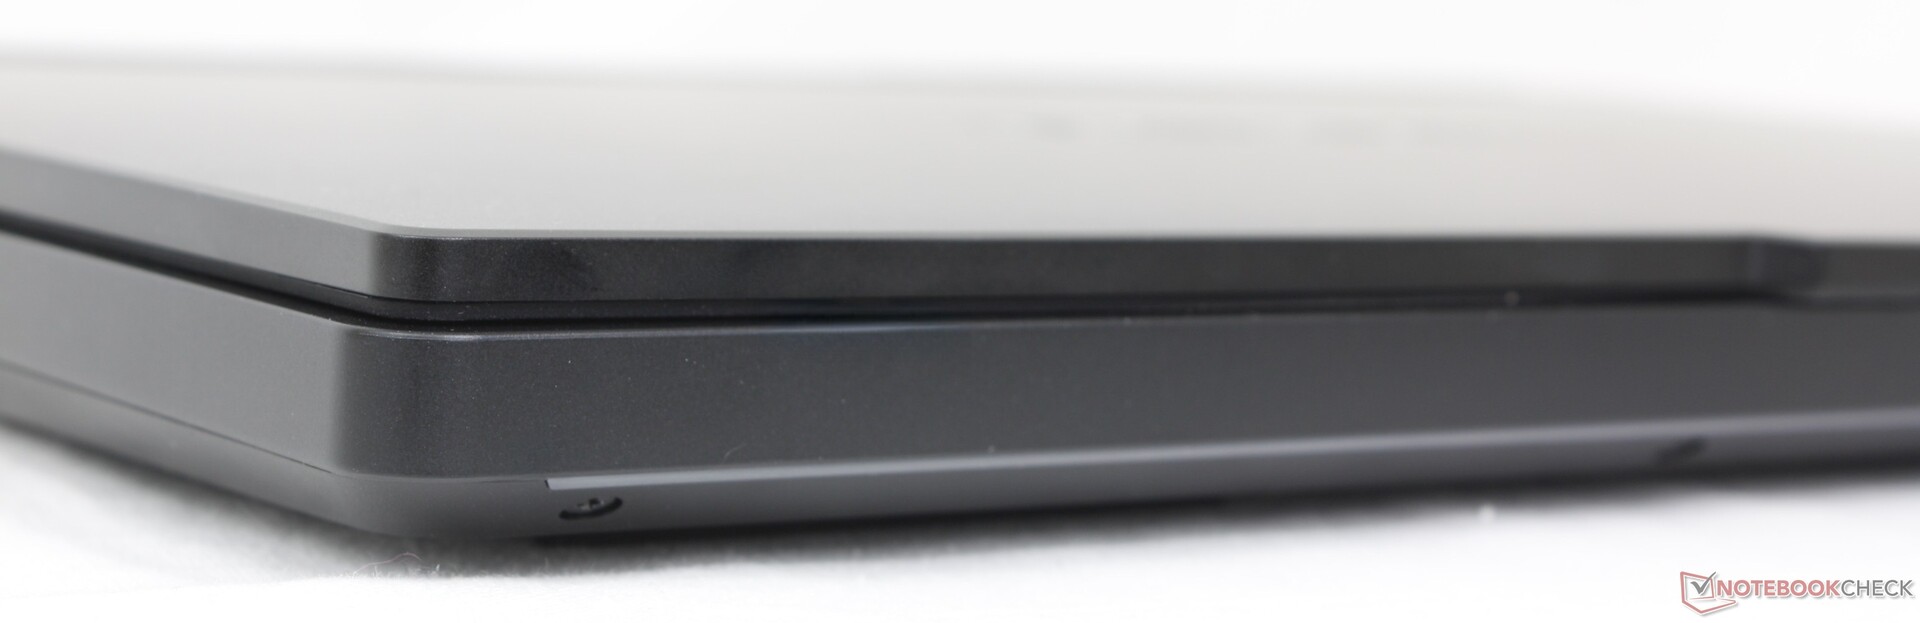
Le modèle présente un encombrement plus important que celui de l'année dernière en raison de la solution de refroidissement élargie à l'arrière, alors que le poids et l'épaisseur restent pratiquement les mêmes qu'auparavant. Il ne s'agit certainement pas d'une machine de jeu fine et légère comme le Blade 16 ou le Zephyrus G16, mais elle est tout de même plus petite et plus légère que d'autres alternatives de 16 pouces comme le MSI Vector 16 HX.
Connectivité
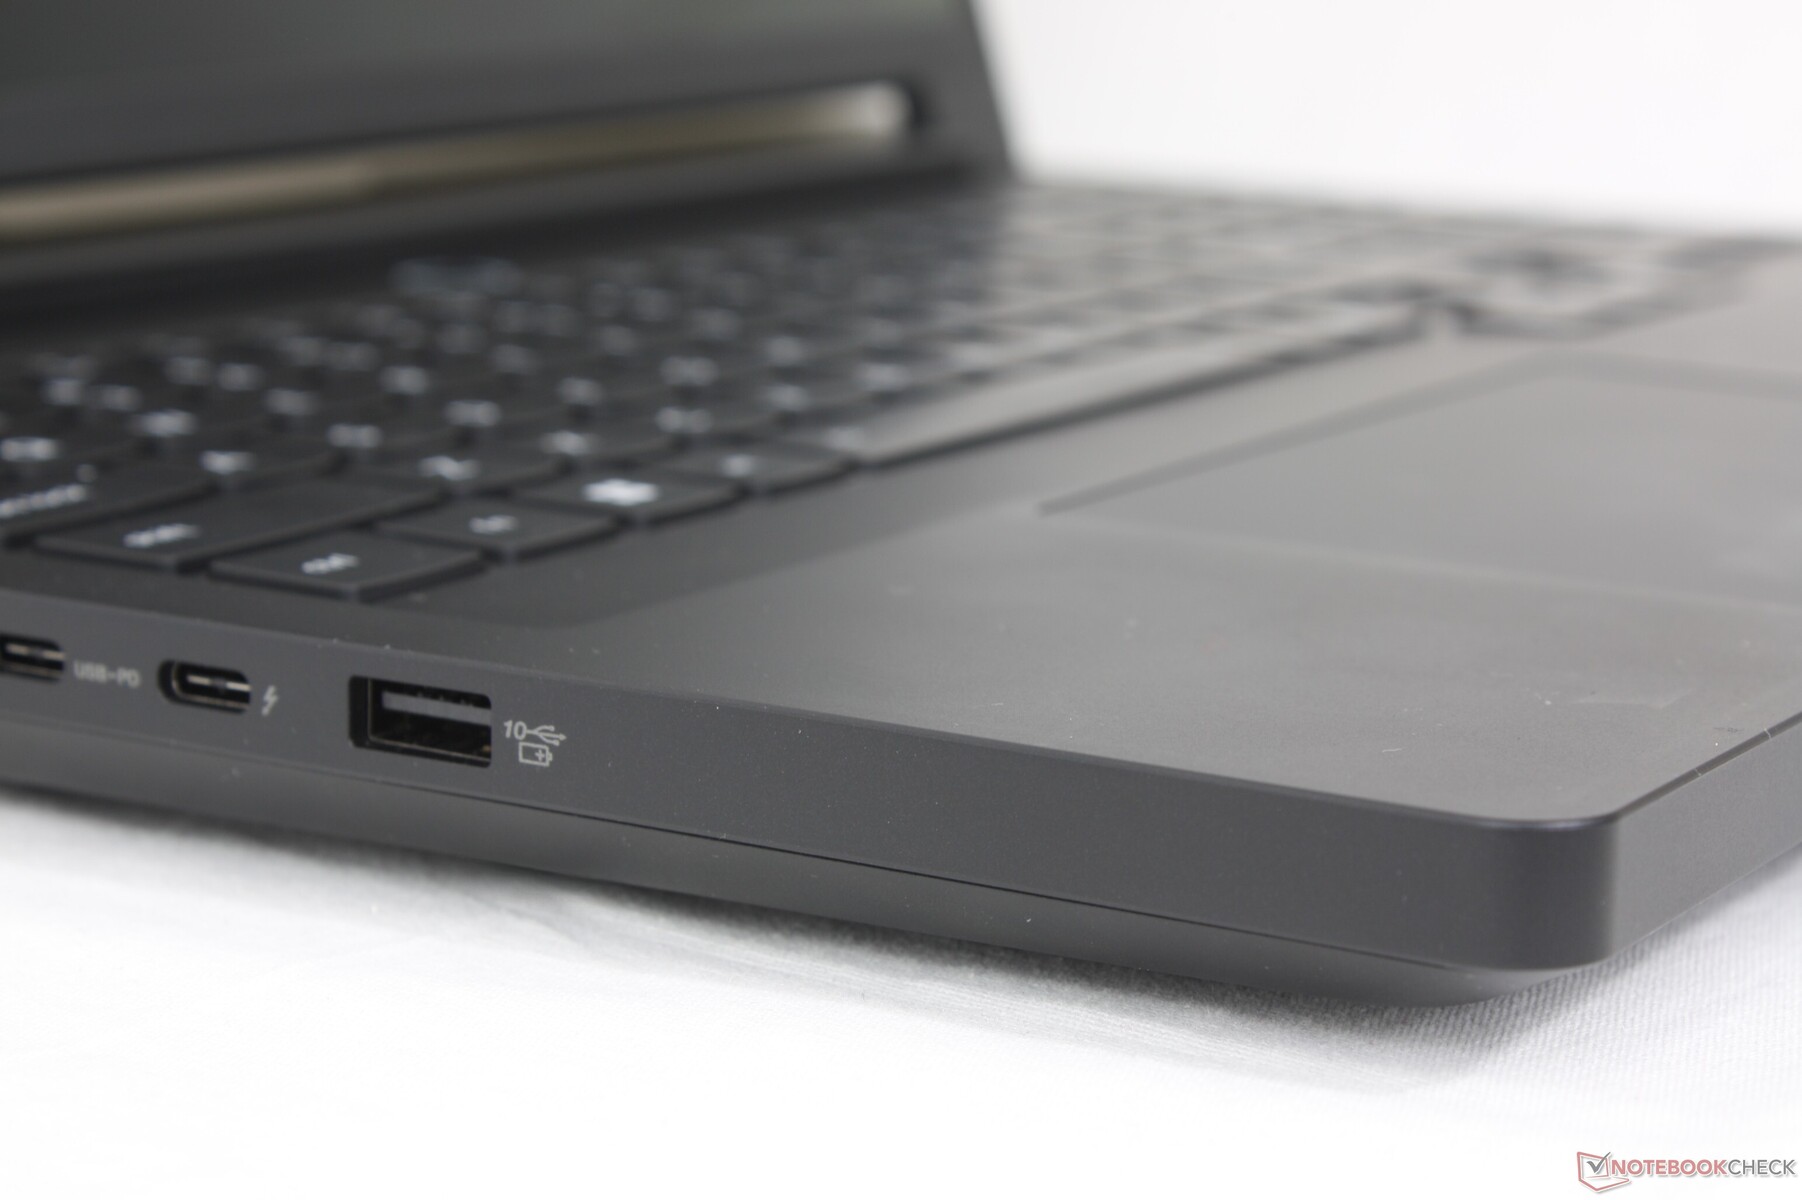
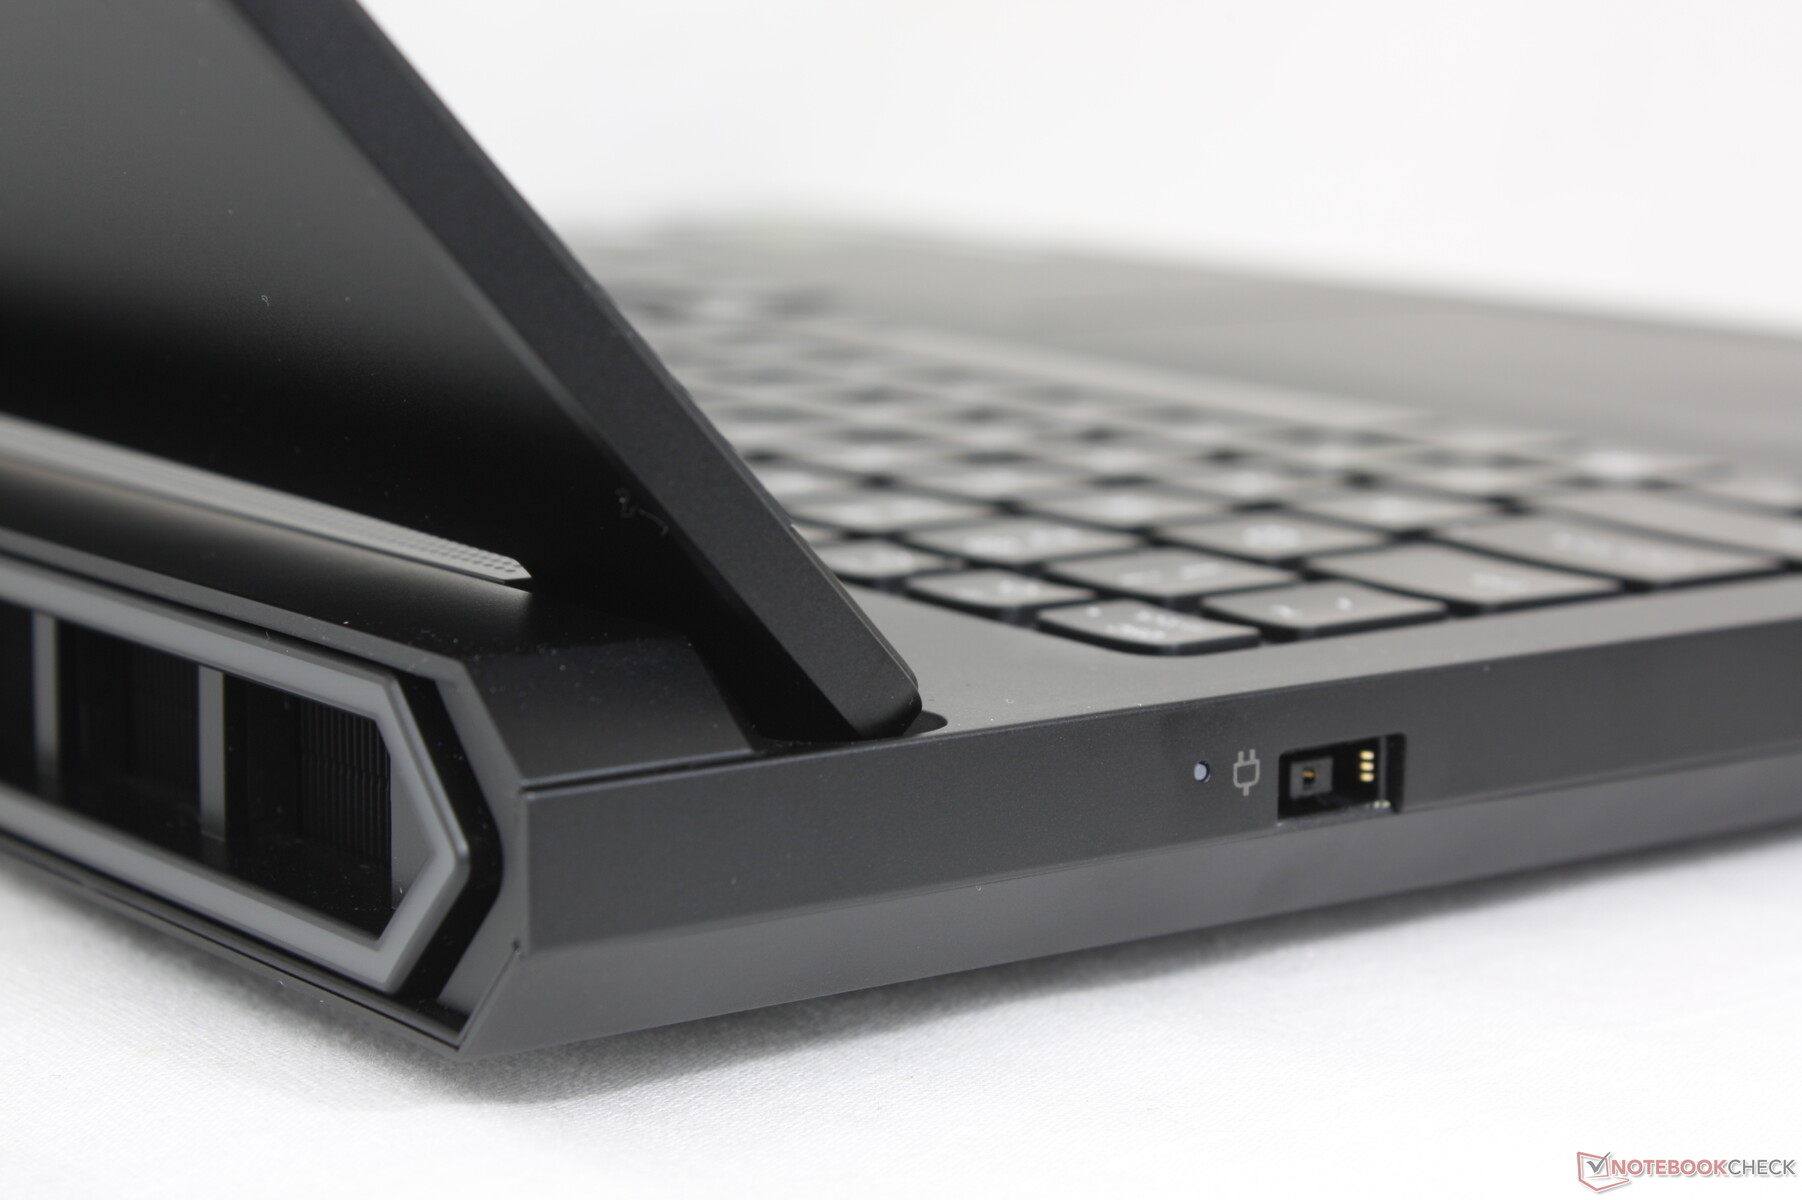
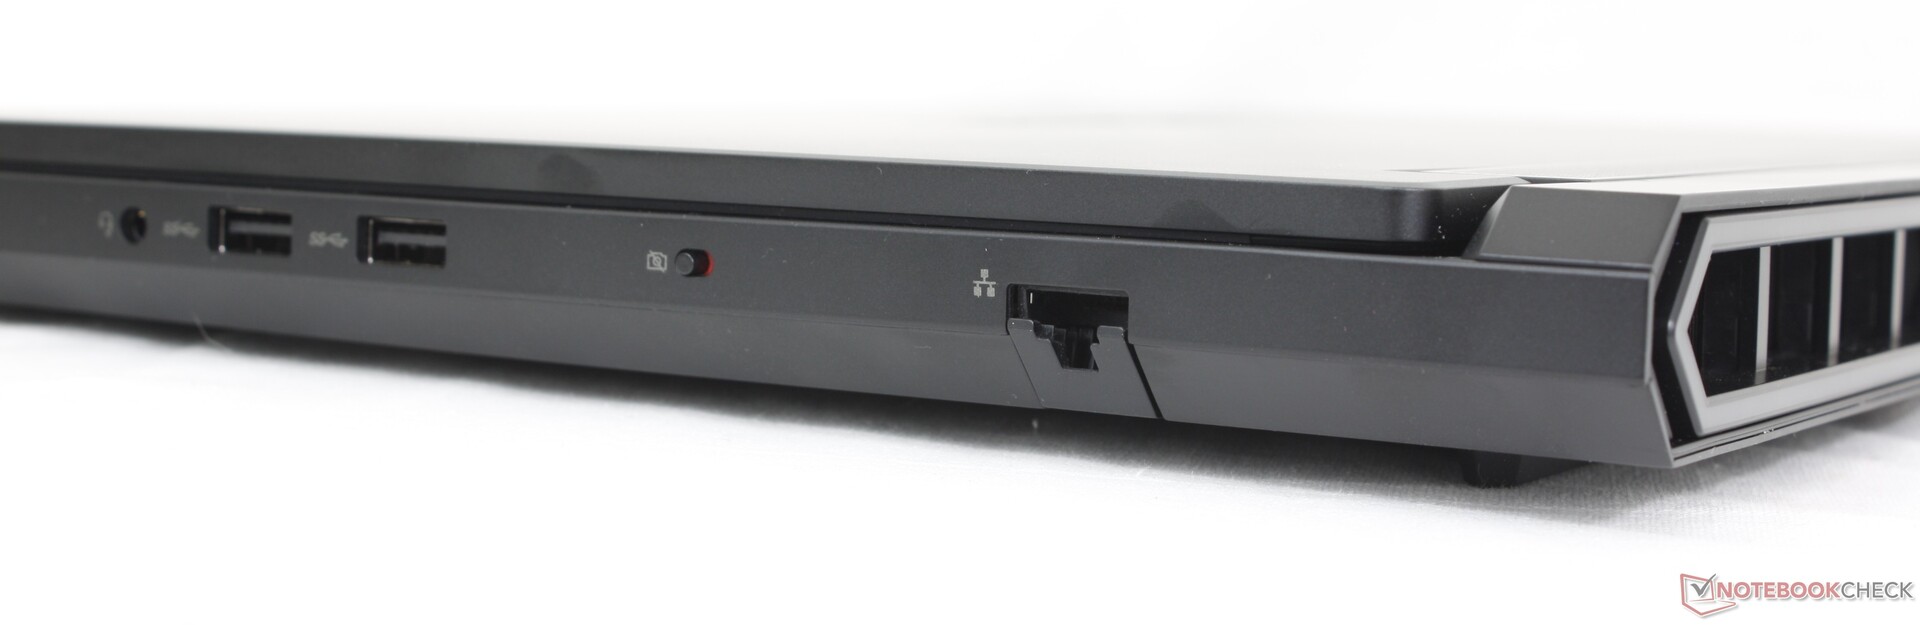
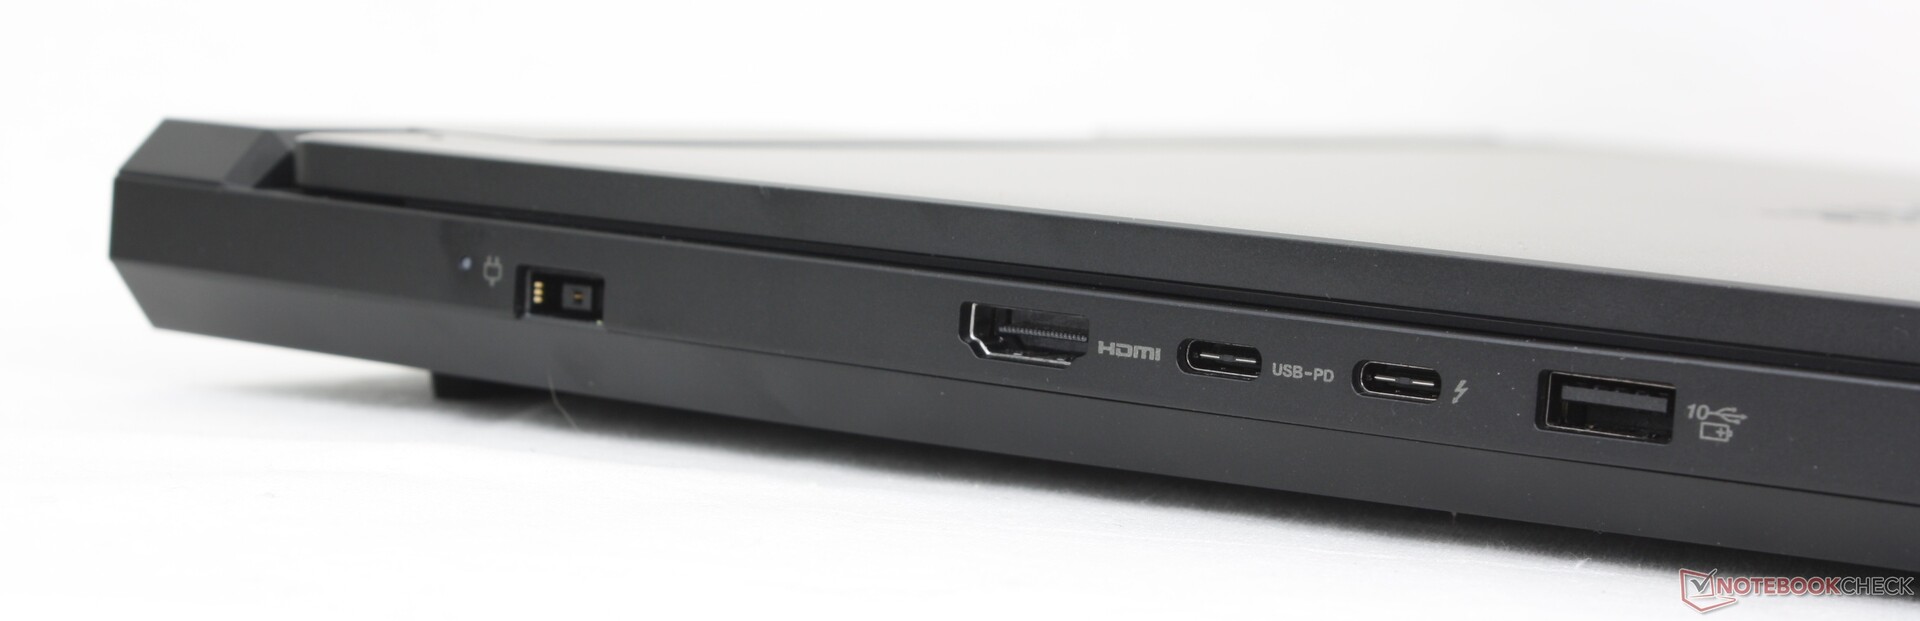
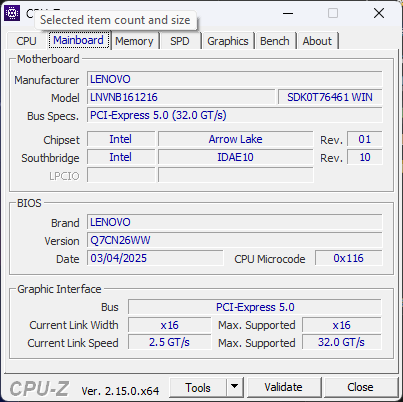
Les options et le positionnement des ports ont été entièrement revus par rapport à la version de l'année dernière Legion 9 16IRX9 ou le Legion 7 16 G9 de l'année dernière. Le lecteur de carte SD intégré et le troisième port USB-C ont disparu au profit d'un port RJ-45 et d'un port USB-A supplémentaire. Il n'y a pas de ports le long de l'arrière cette fois-ci pour faciliter l'accès.
Gardez à l'esprit que seul l'un des deux ports USB-C prend en charge DisplayPort 2.1 et la connectivité Thunderbolt 4, tandis que l'autre port USB-C (le plus éloigné de l'utilisateur) prend en charge la charge PD 140 W.
Communication
L'Intel BE200 est livré en standard avec une connectivité Wi-Fi 7 et Bluetooth 5.4.
Webcam
Une webcam de 5 mégapixels est fournie en standard, avec un obturateur électronique et sans capteur infrarouge.


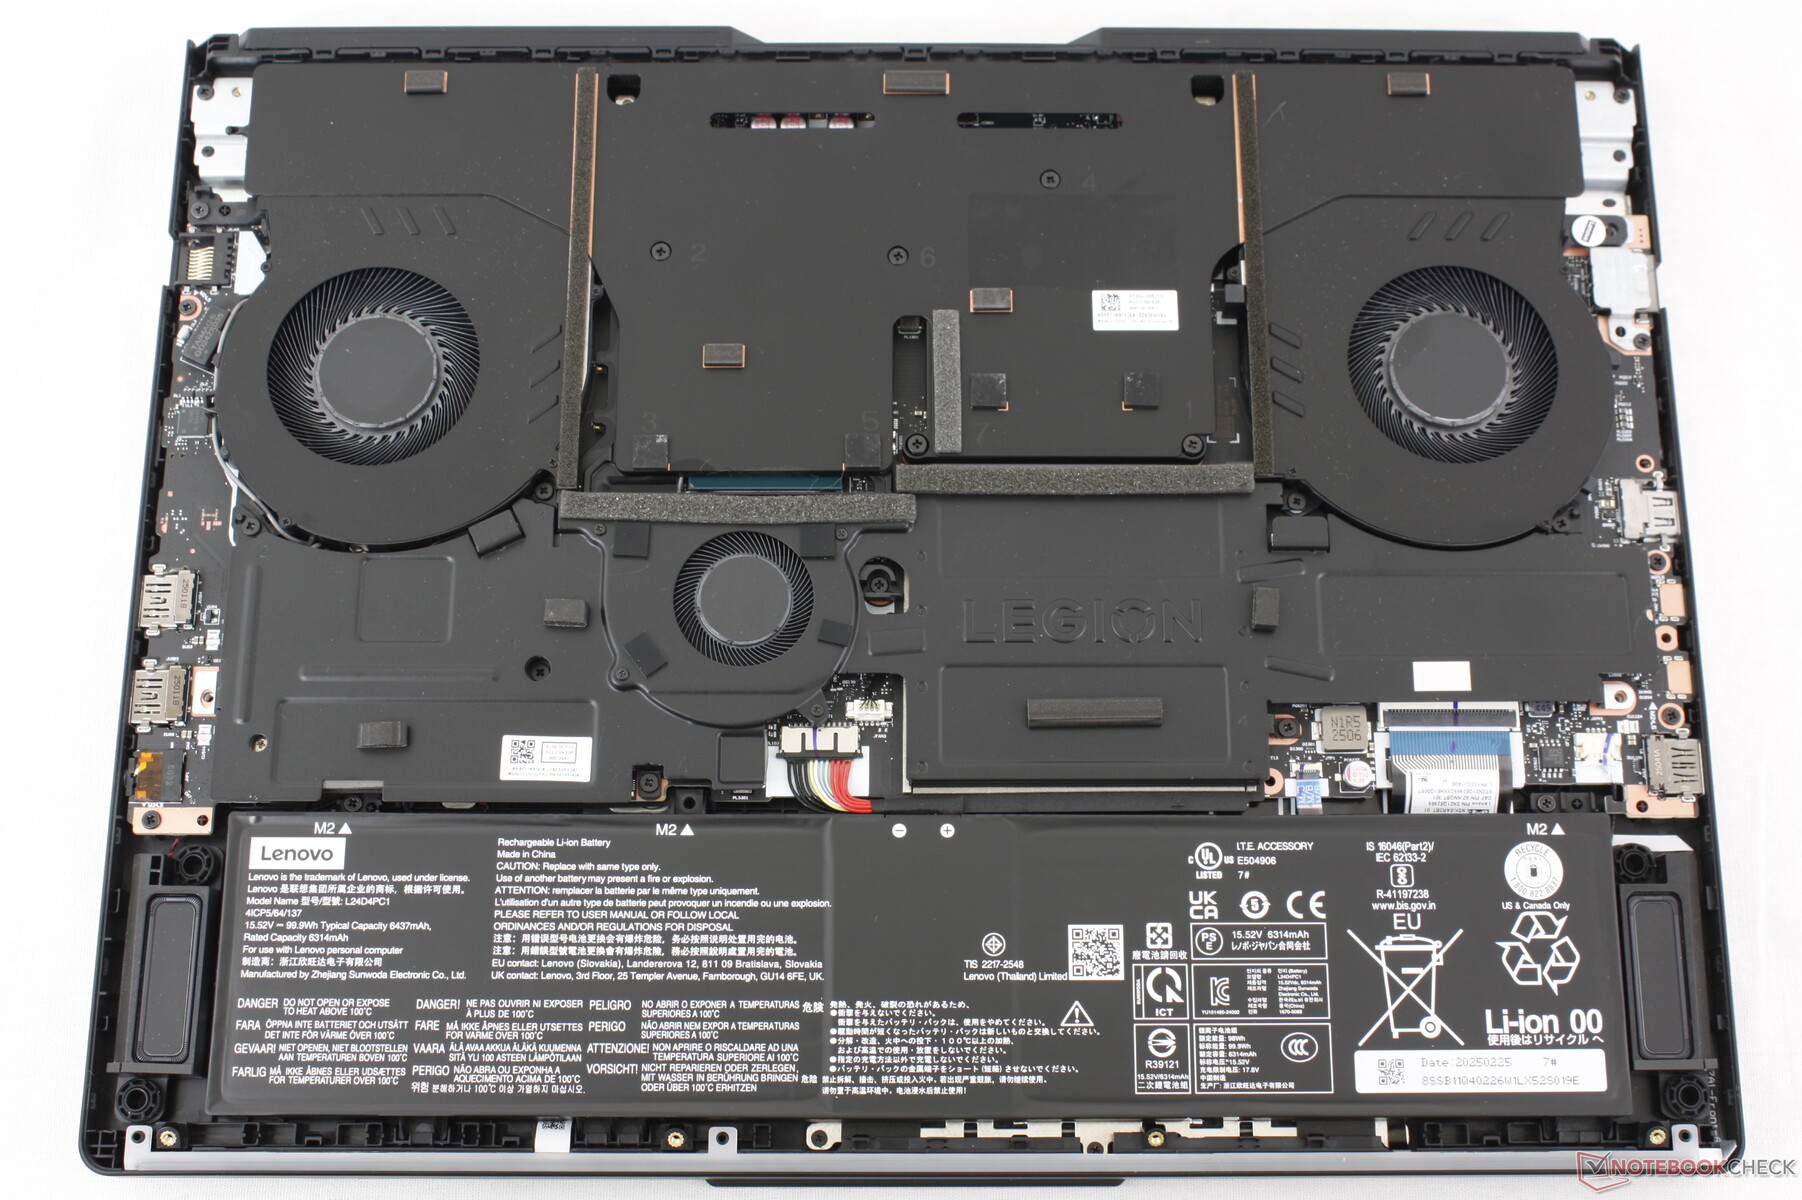
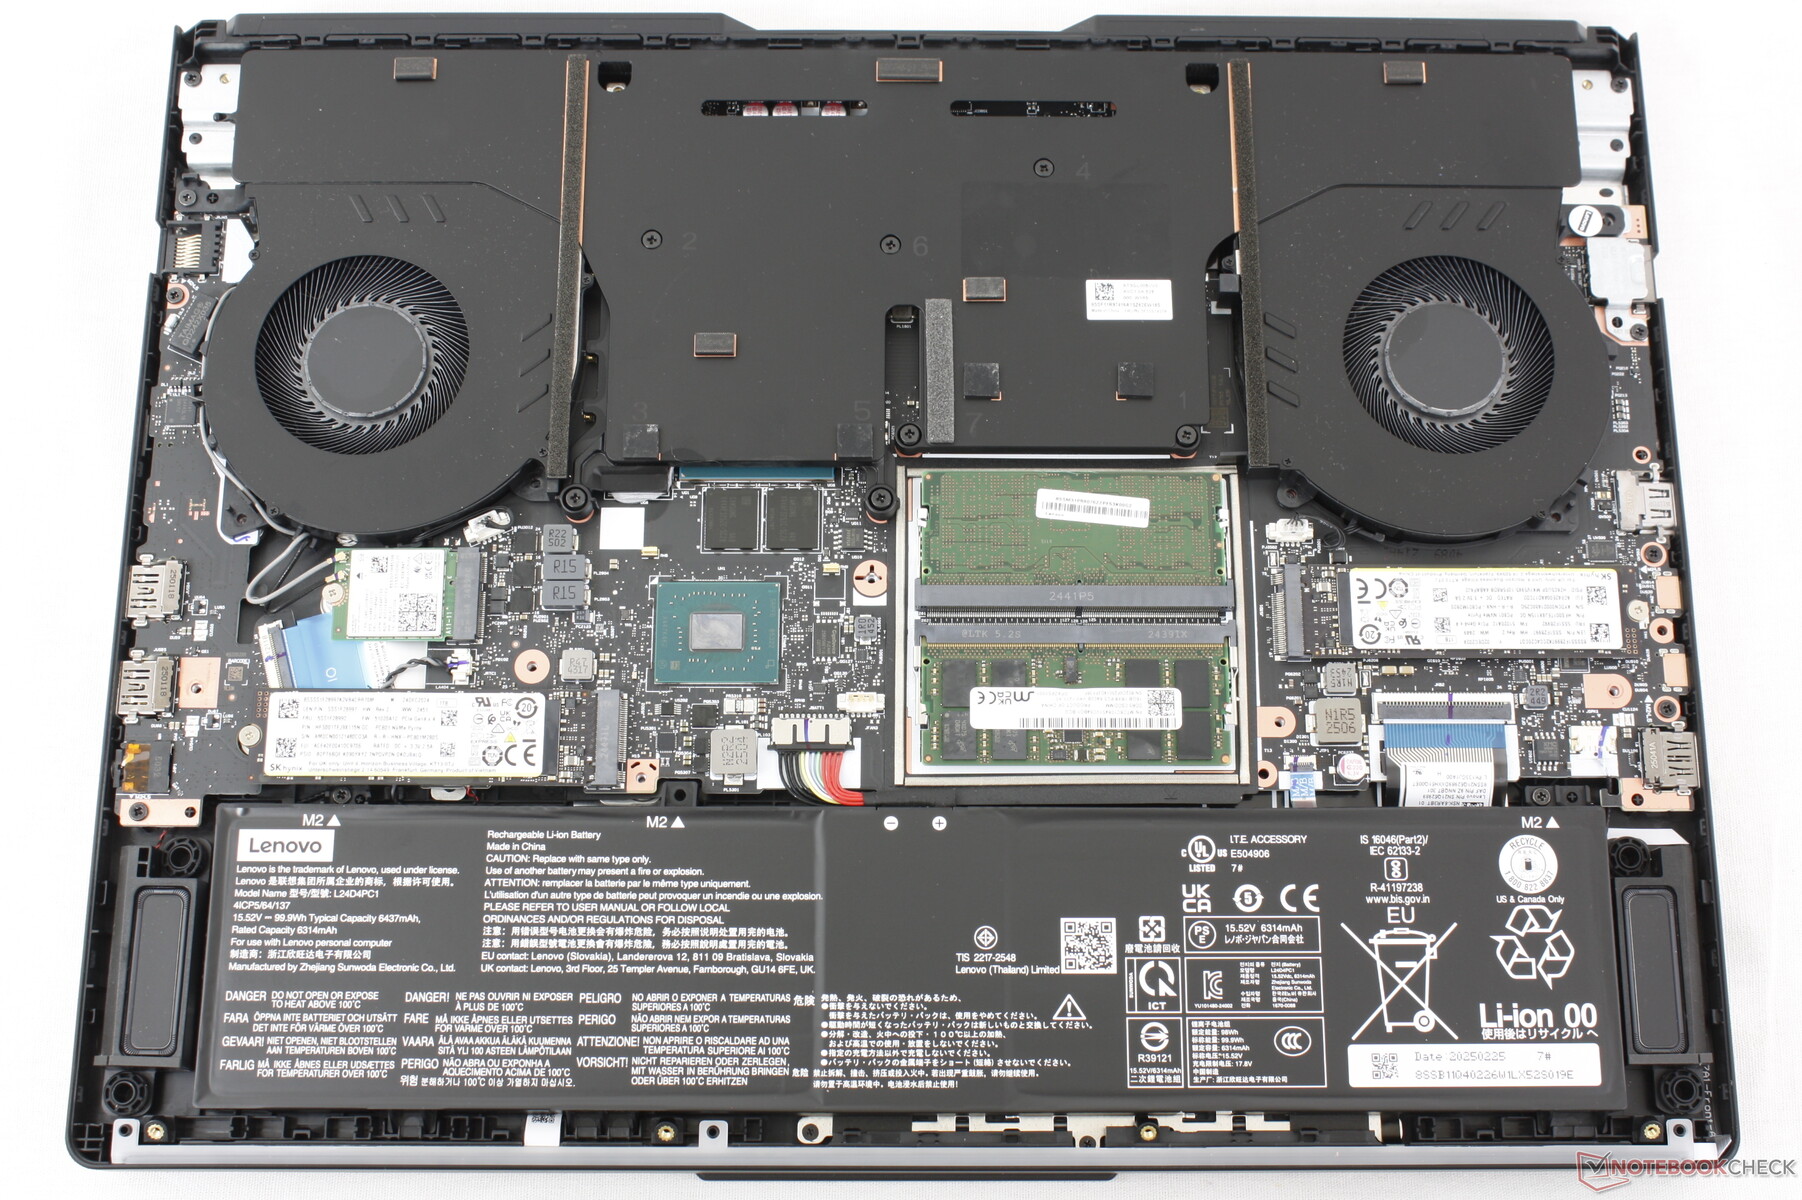
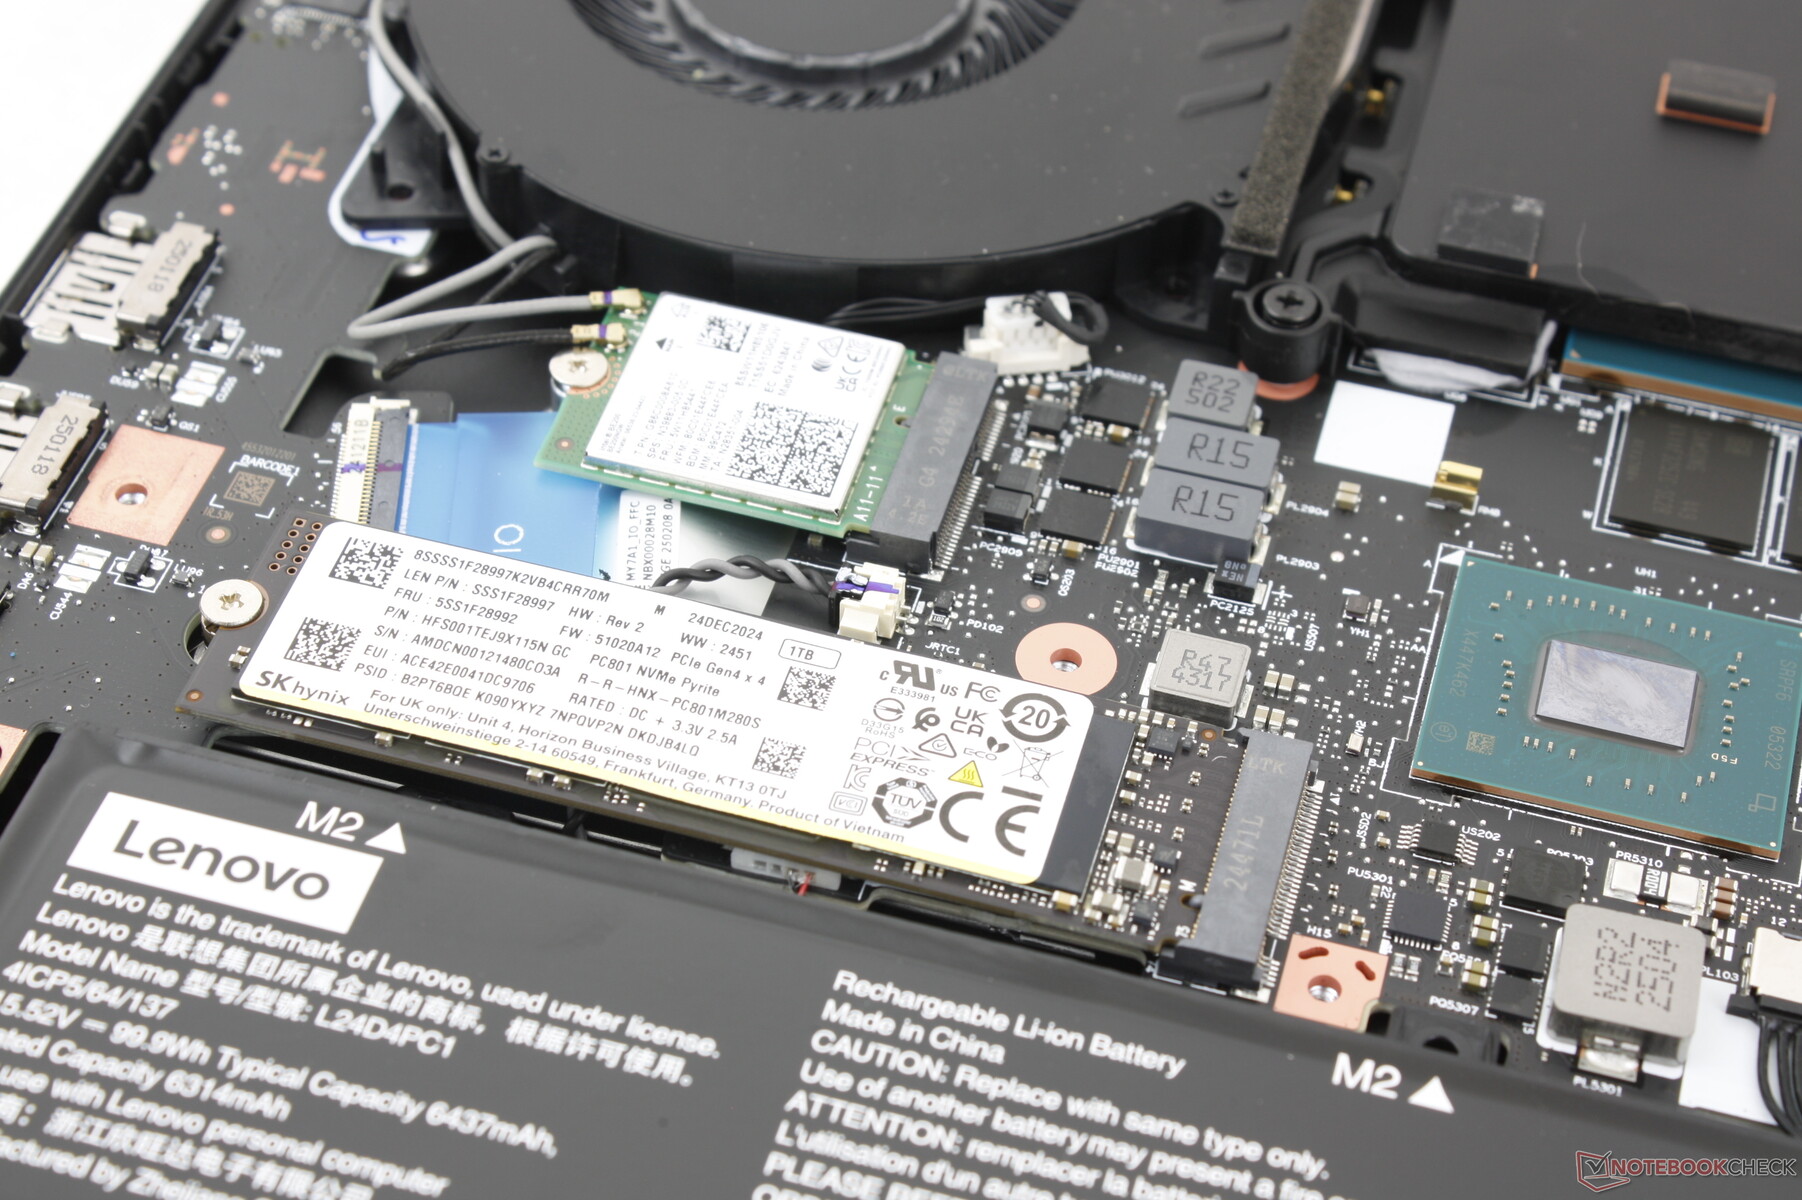
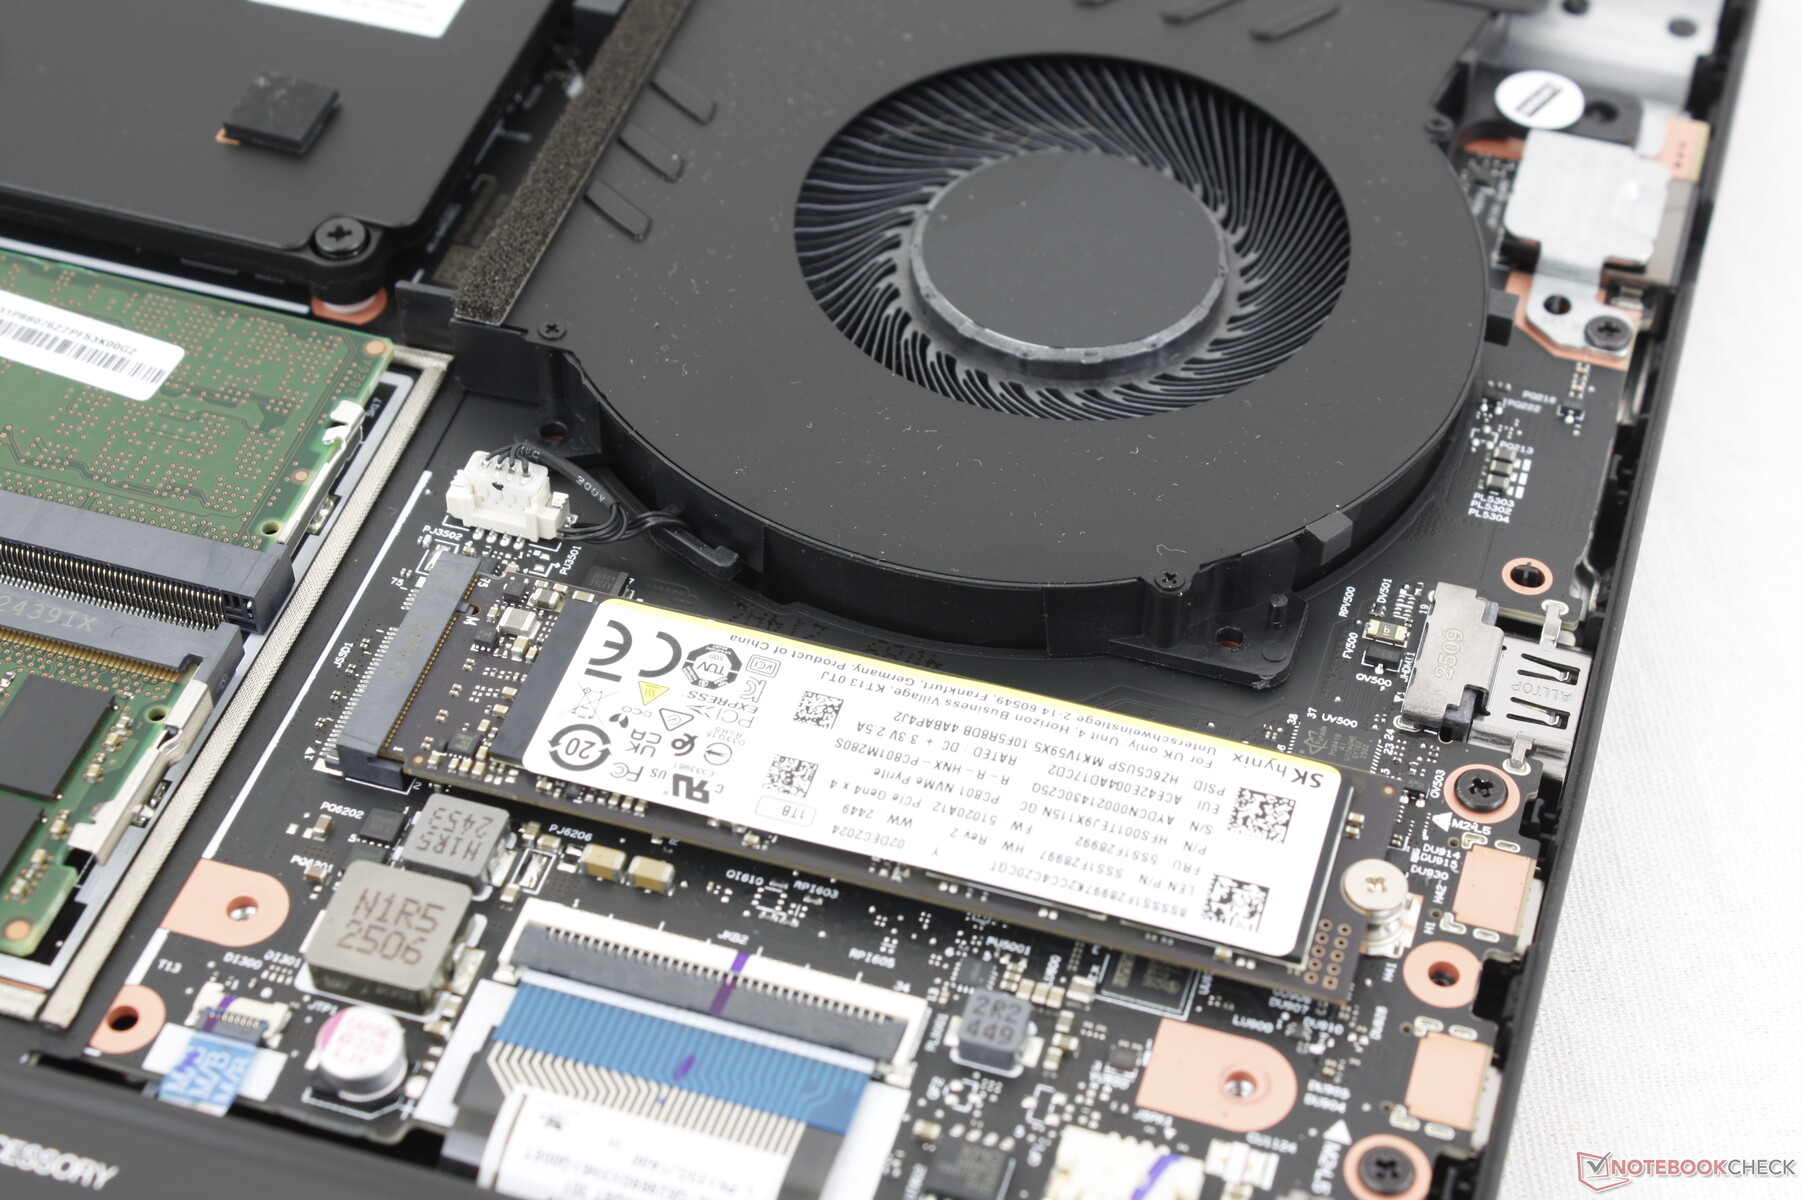
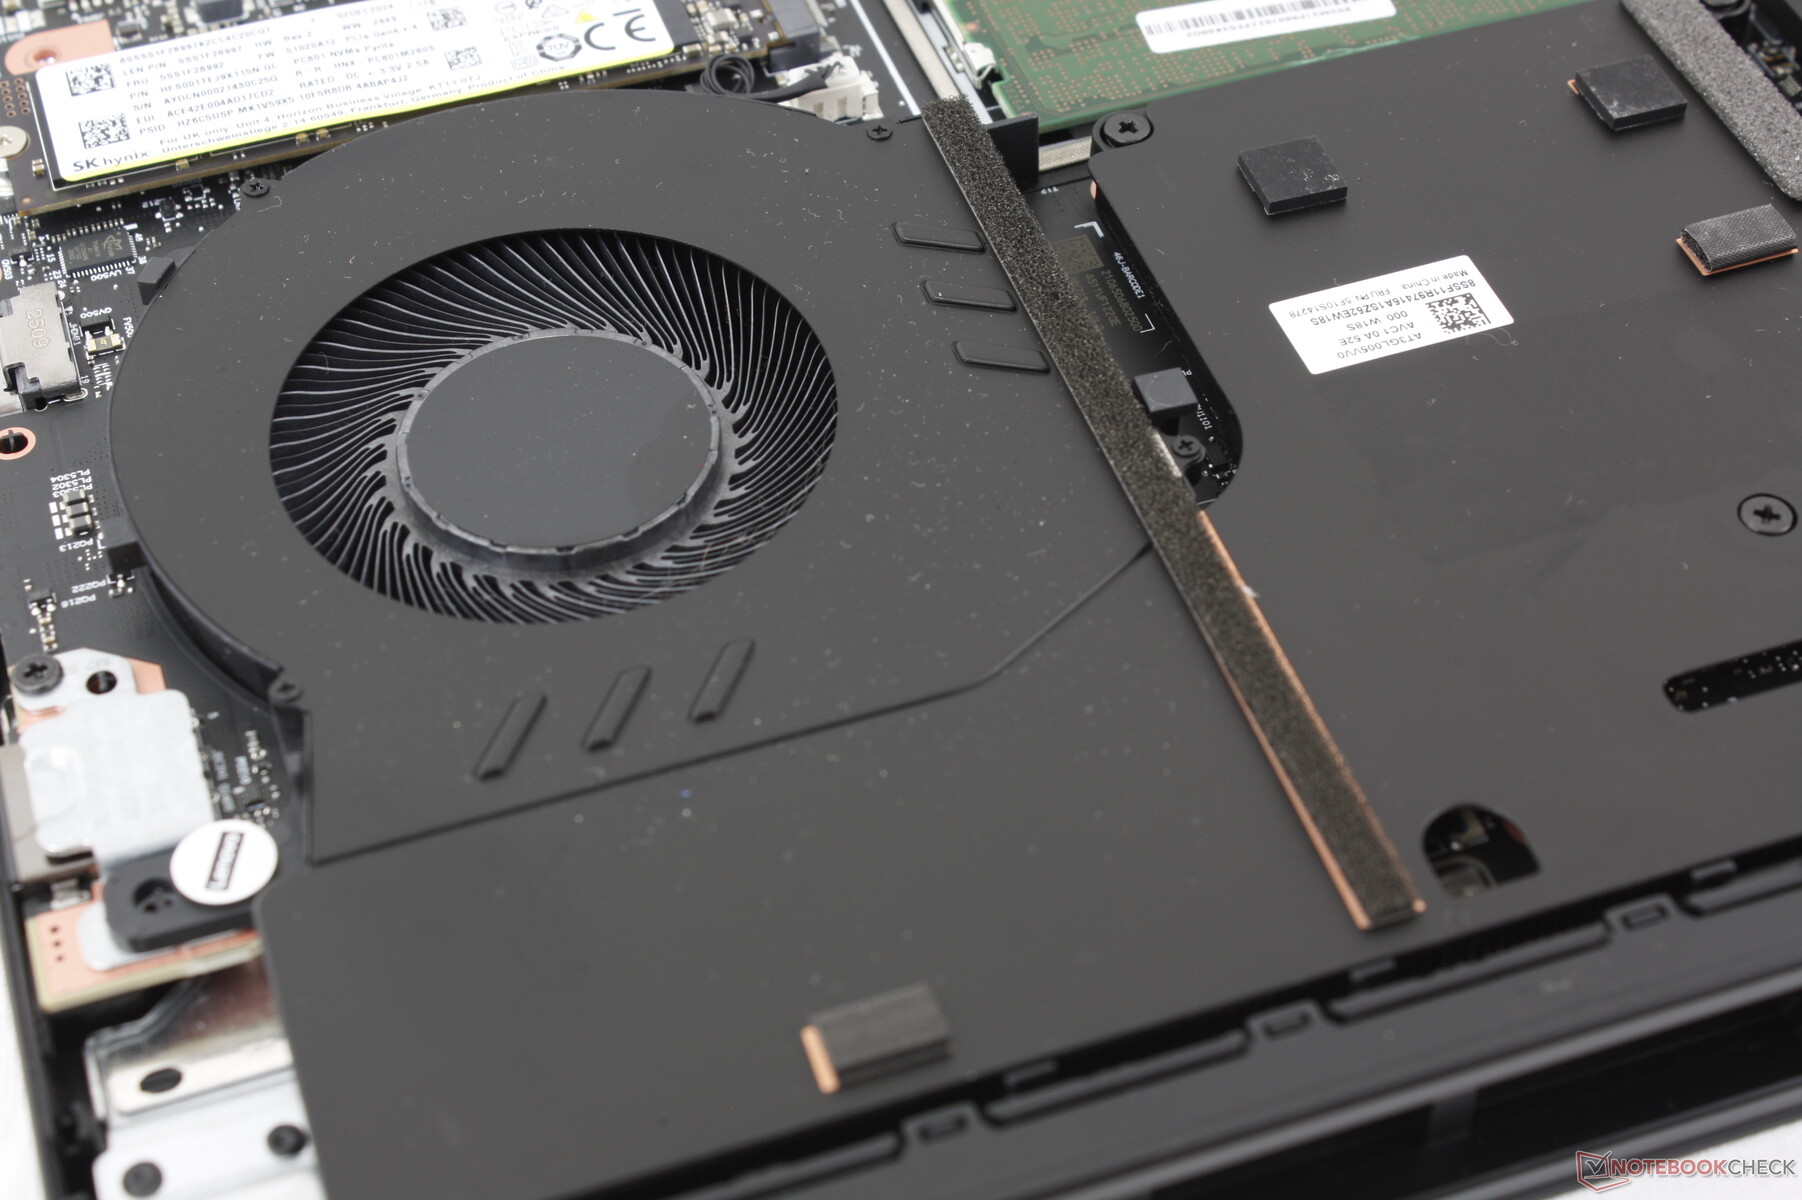
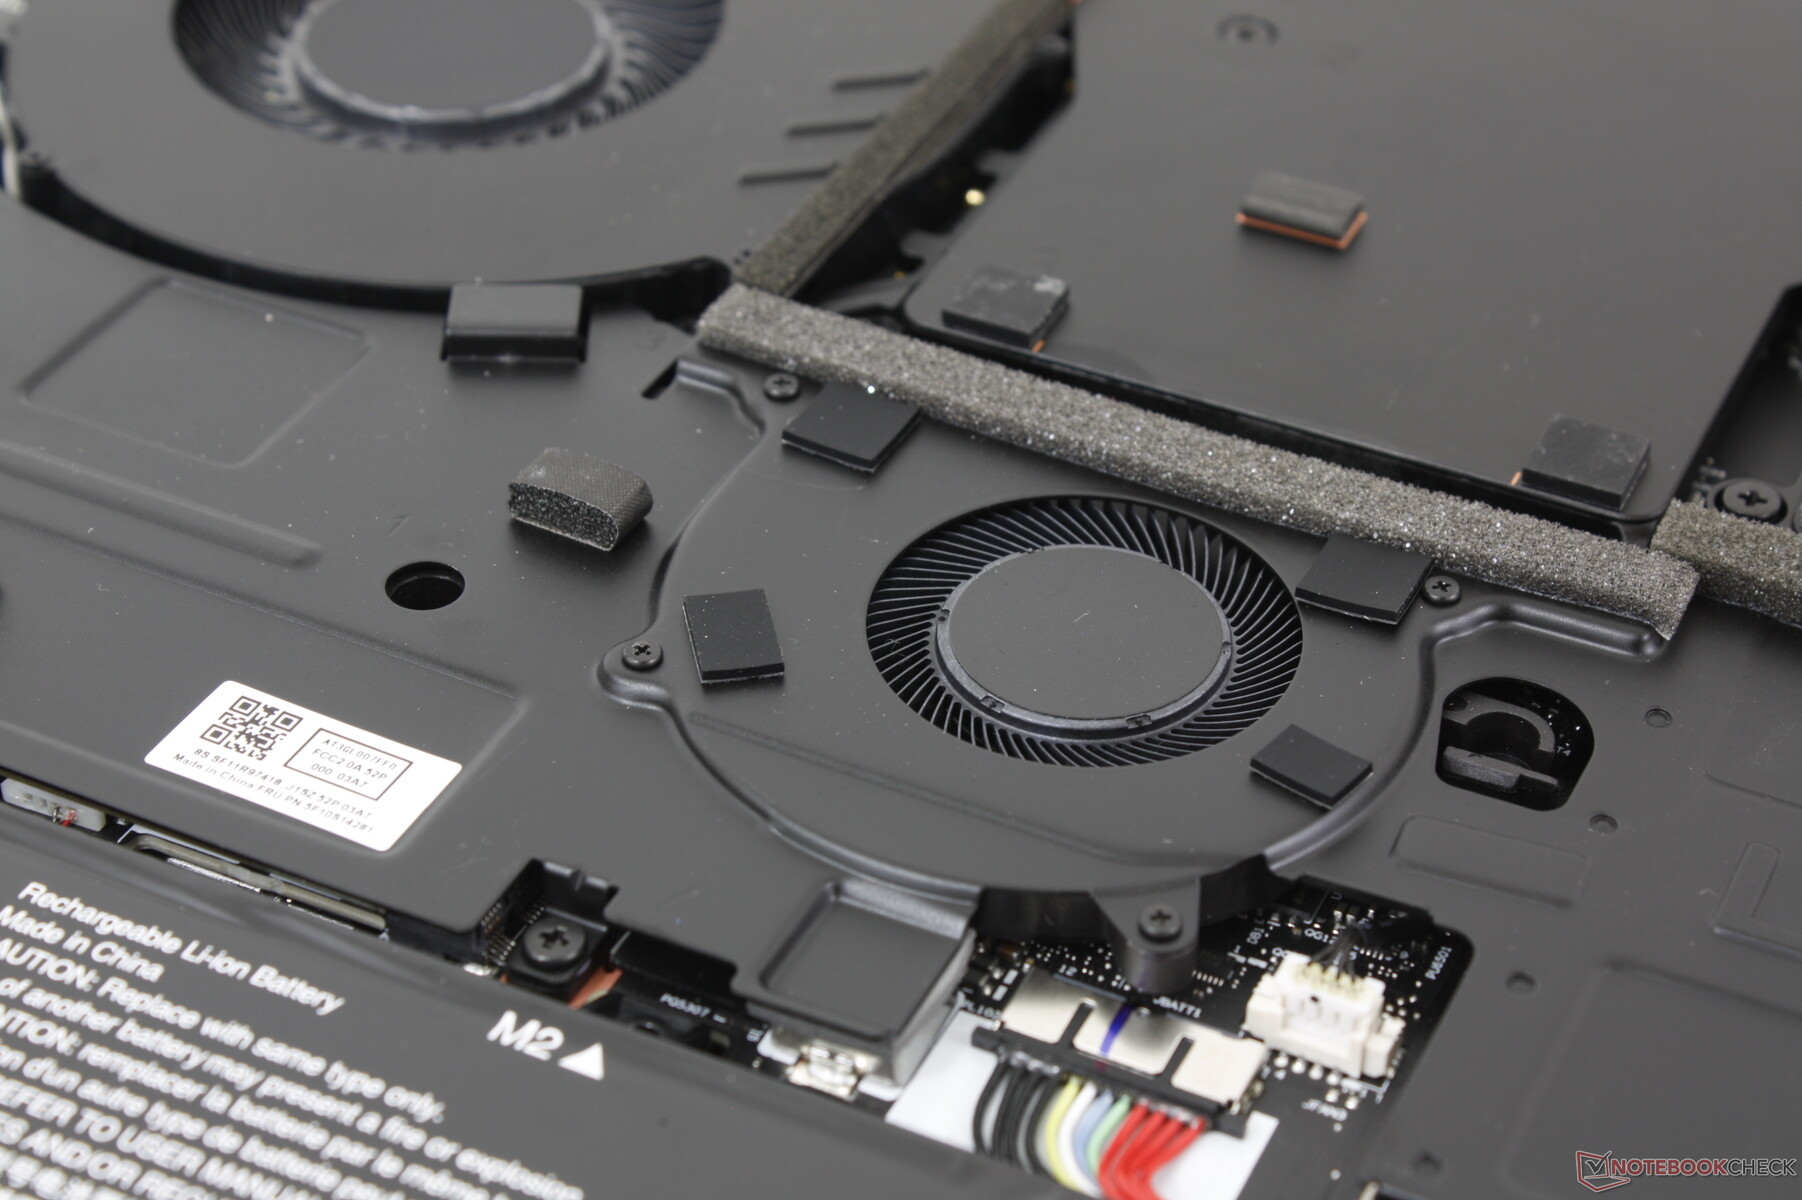
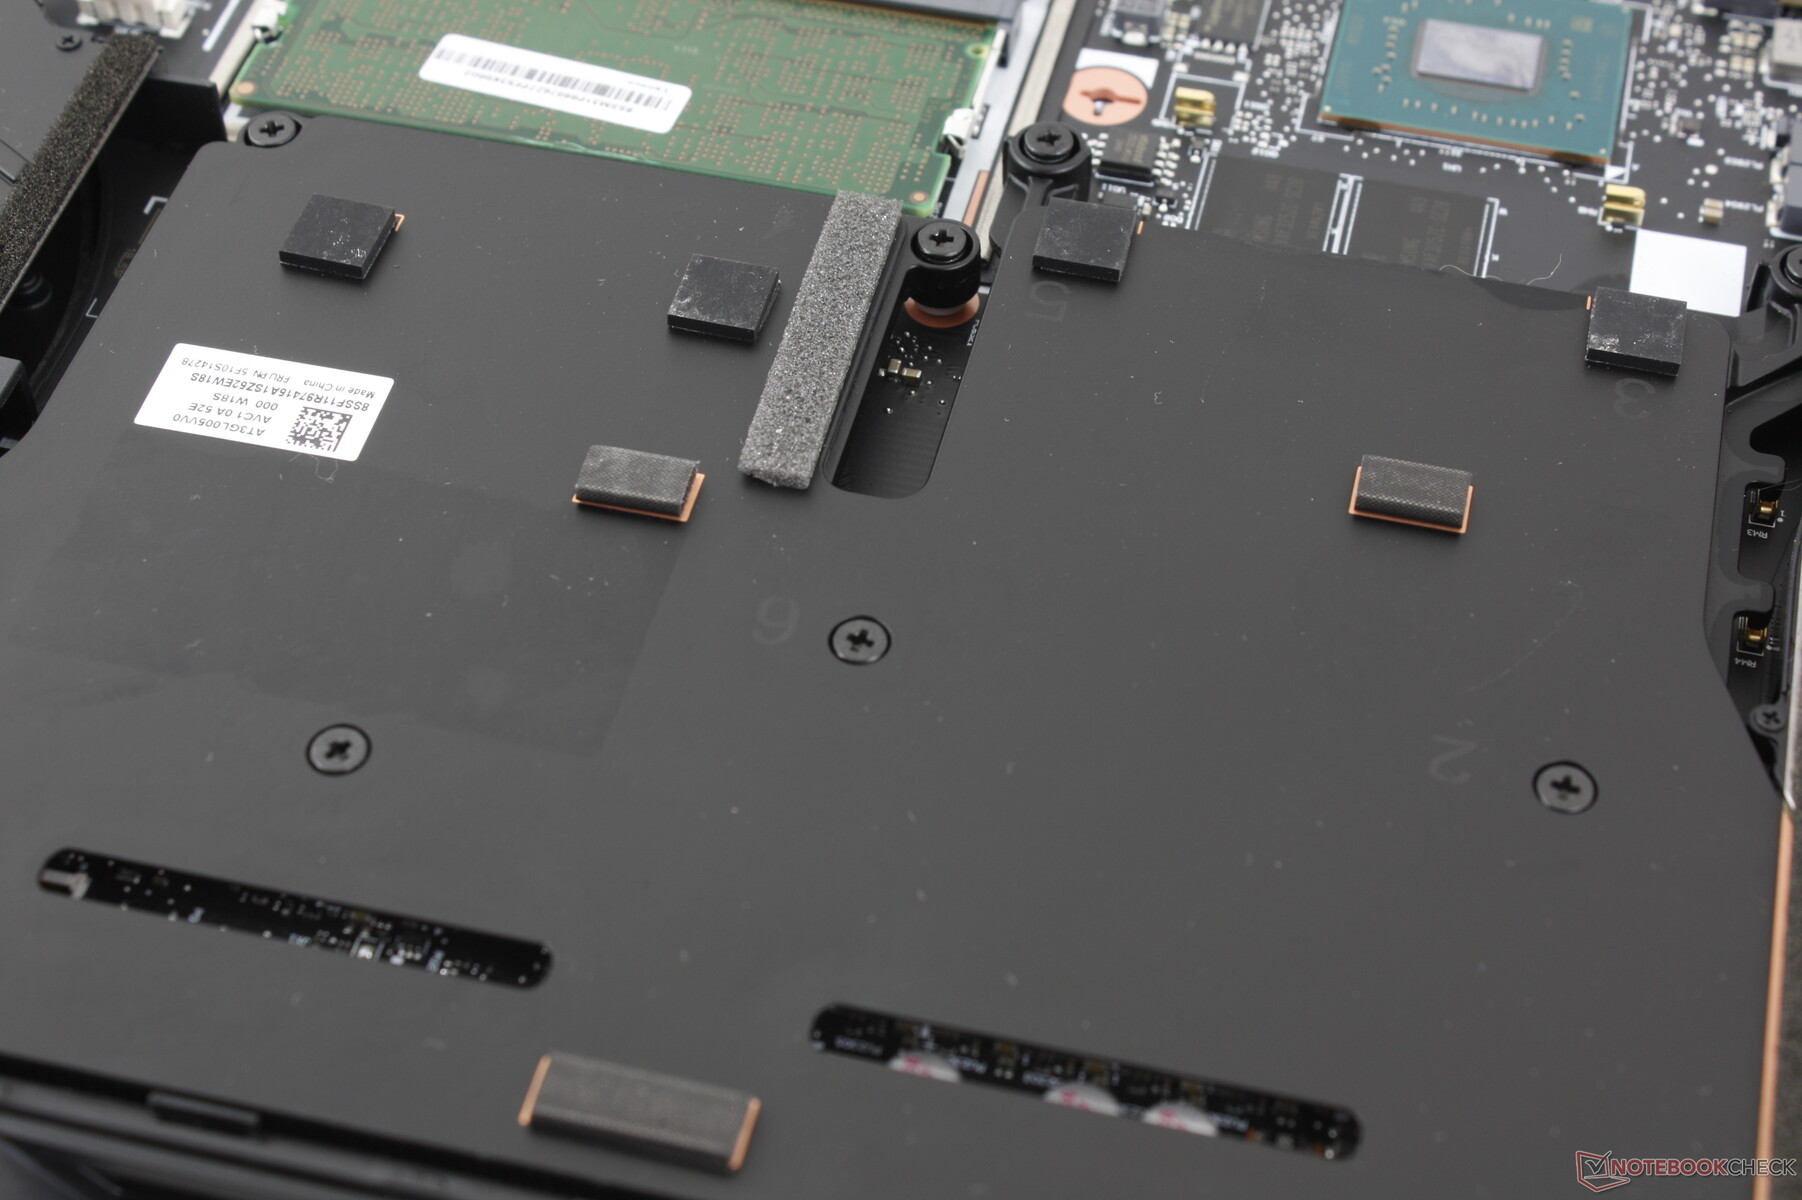
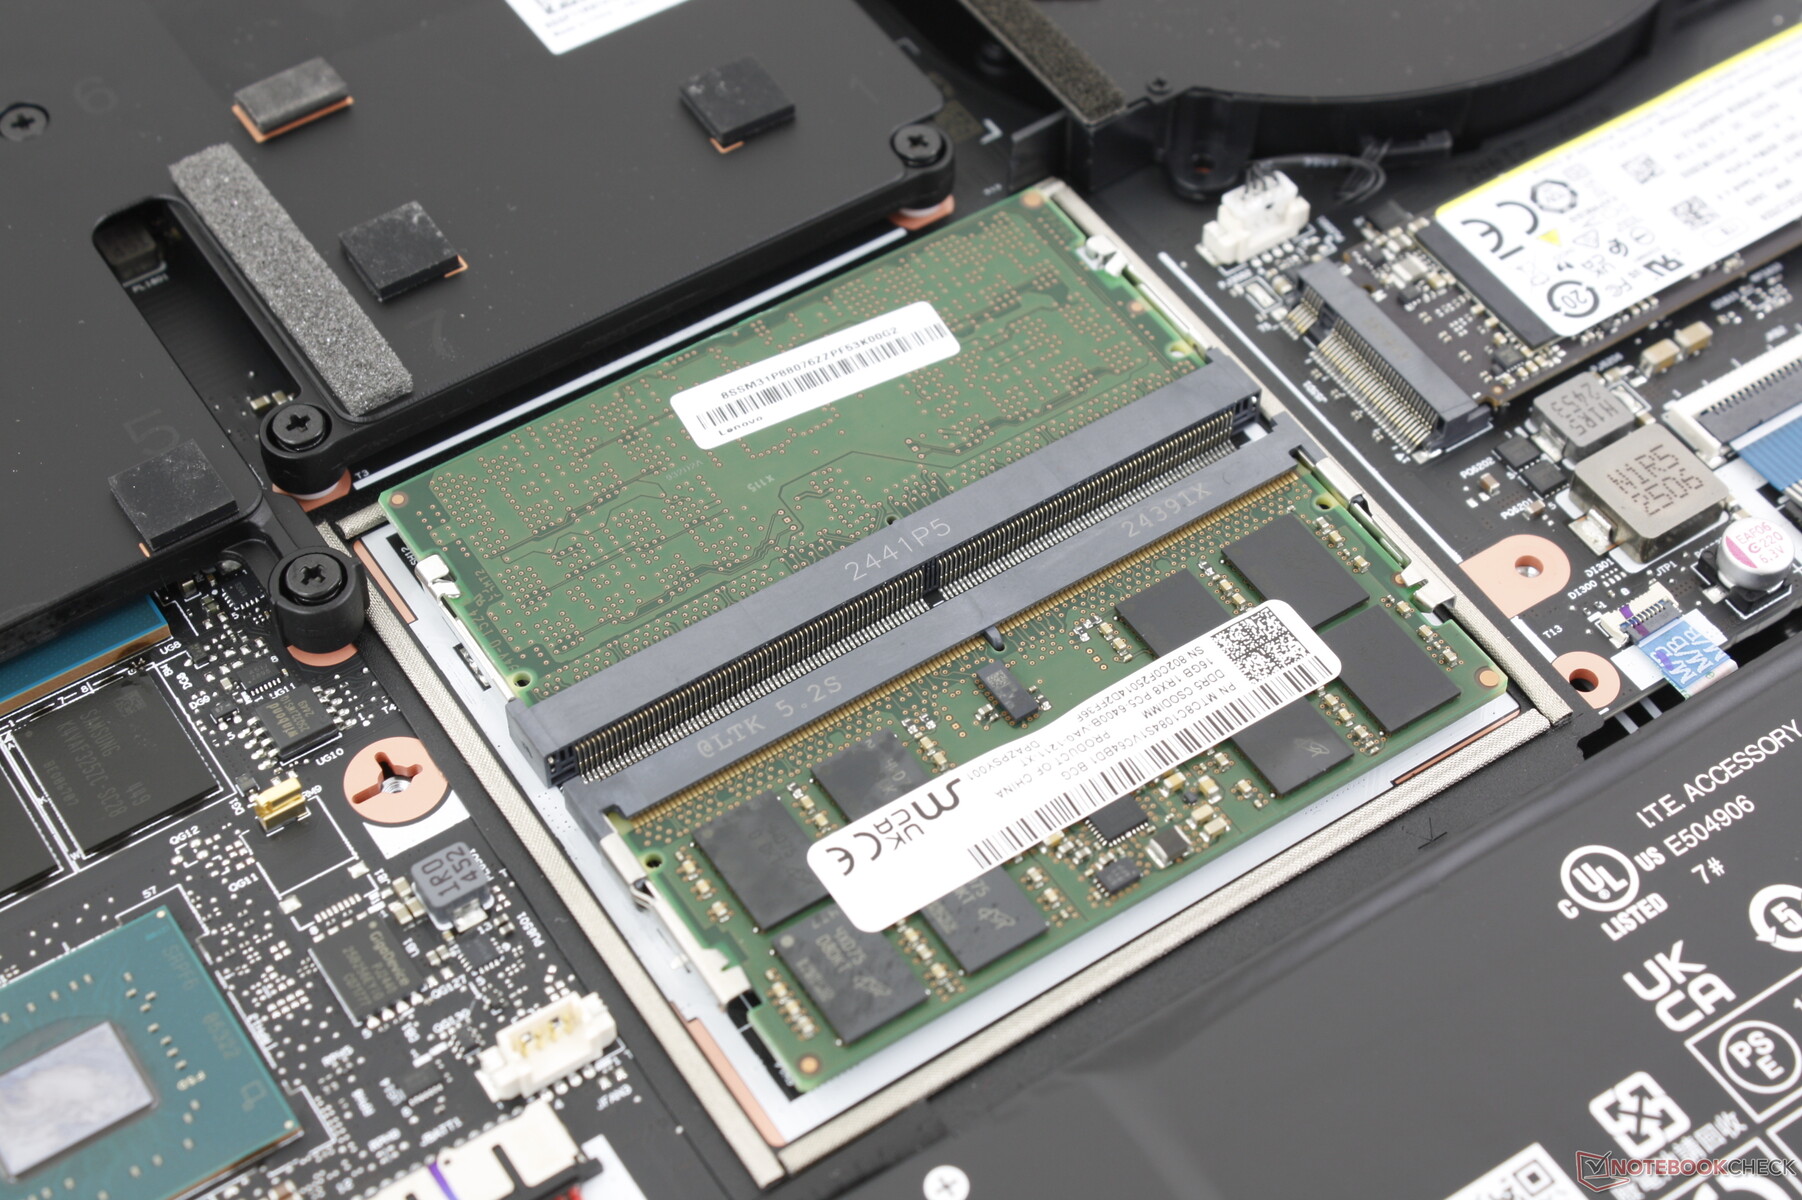
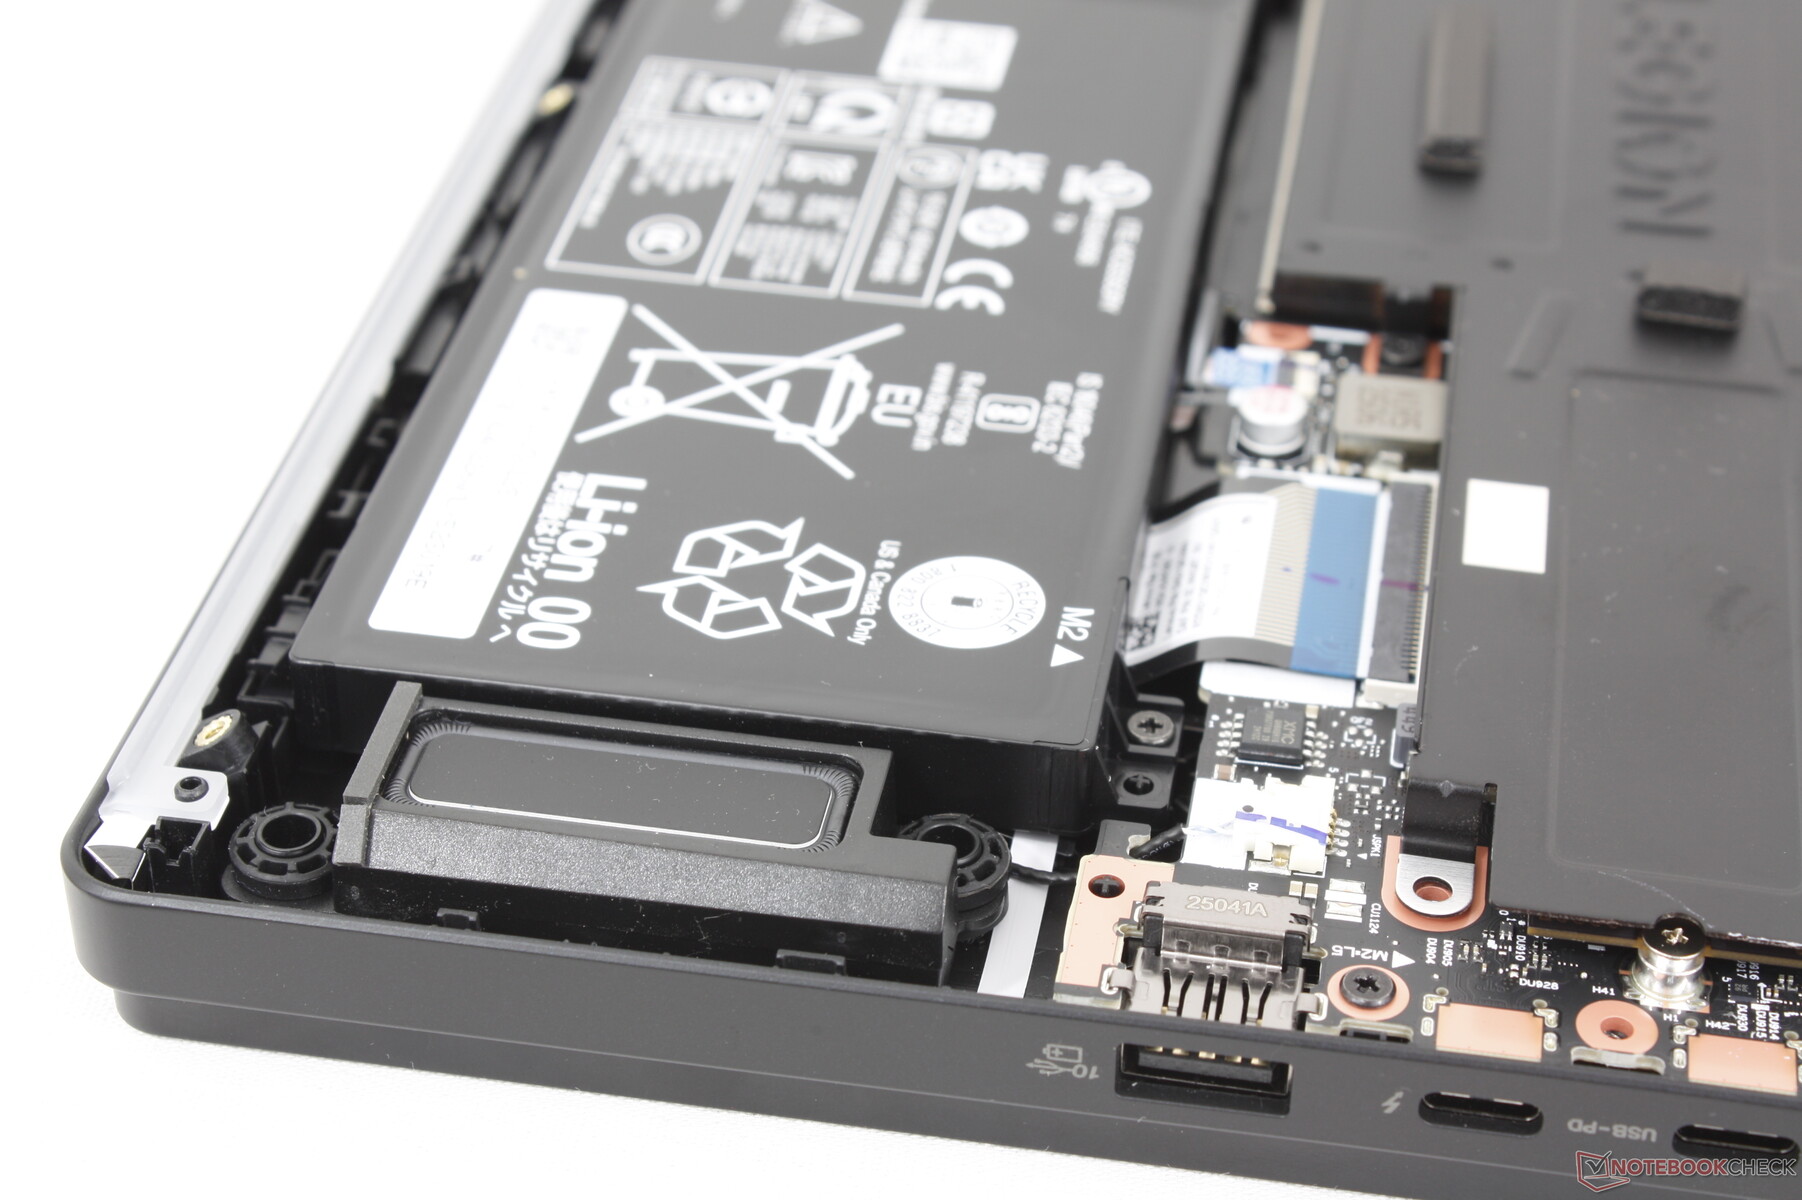
Maintenance
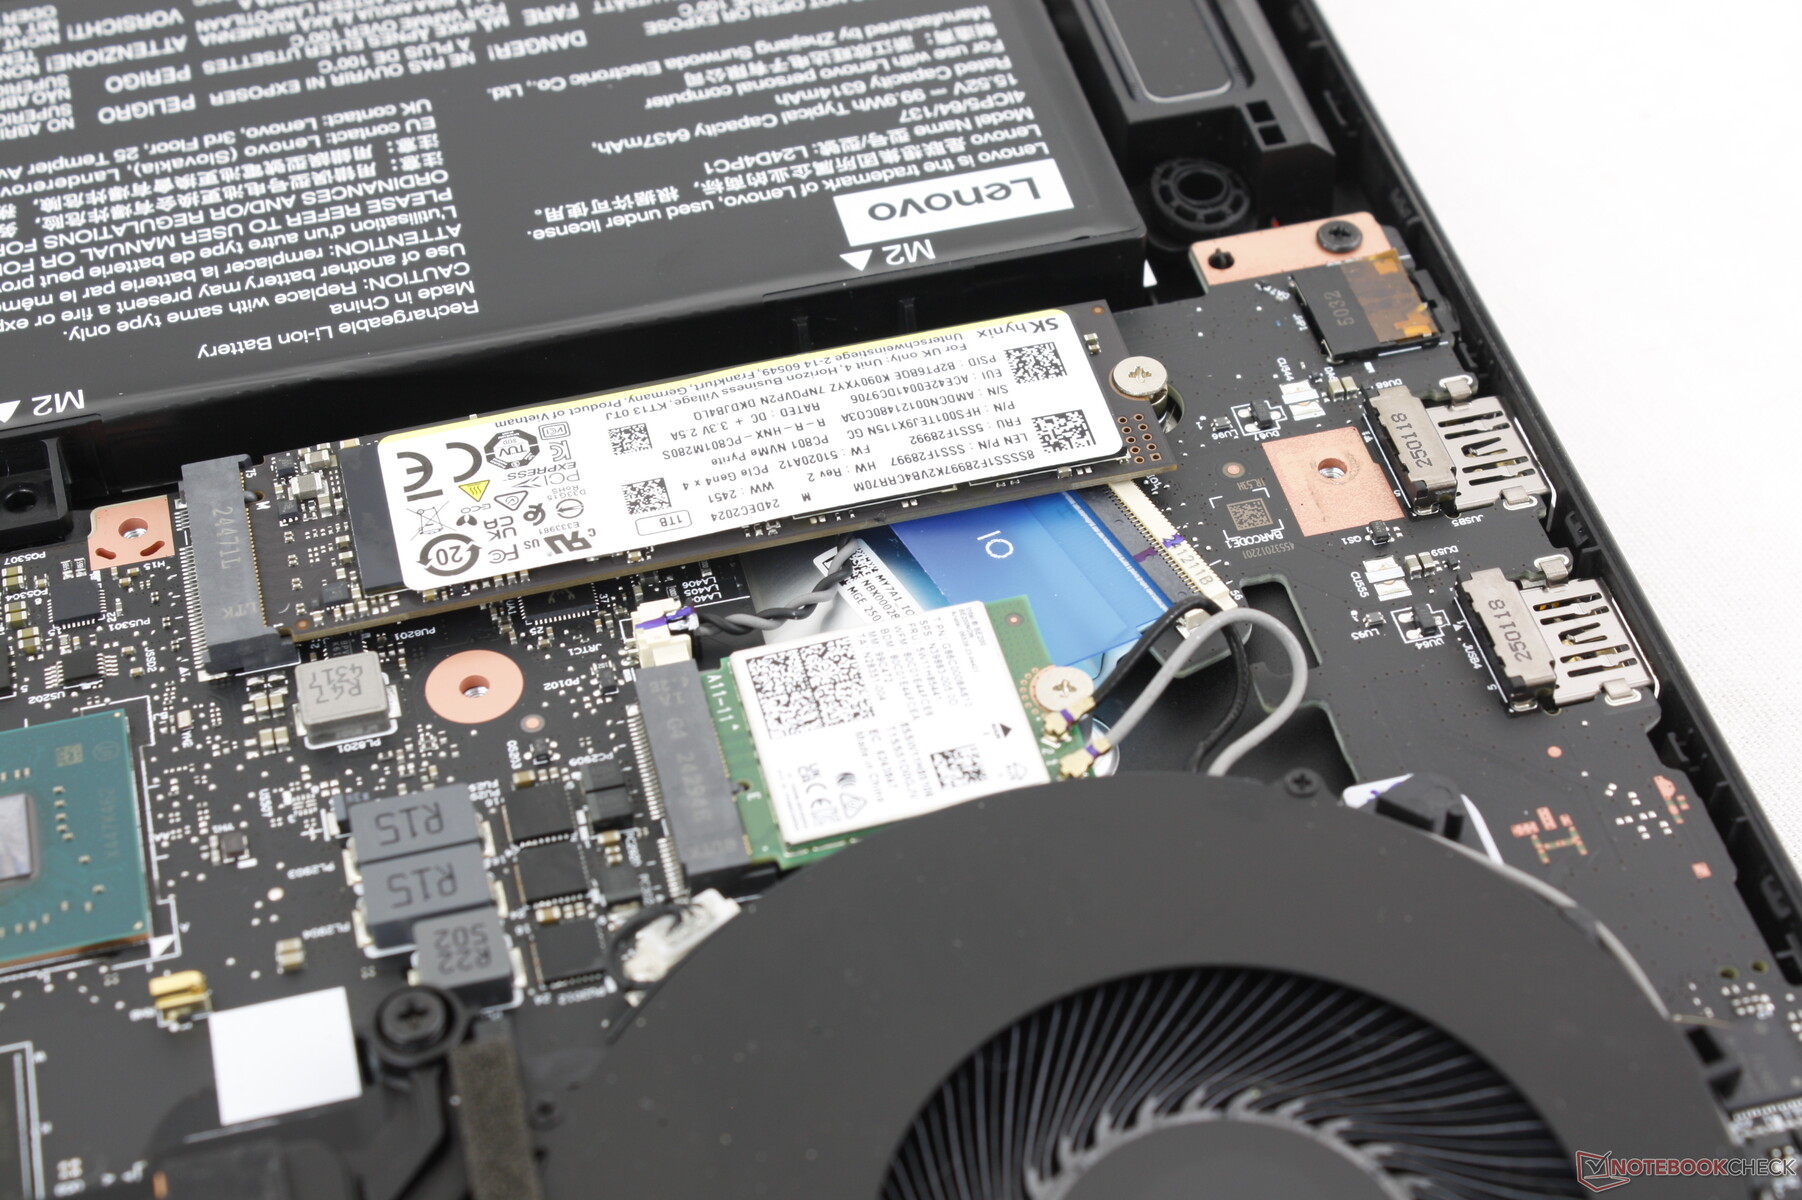
L'entretien est un peu plus compliqué que d'habitude. Contrairement à la plupart des autres ordinateurs portables, les deux emplacements SODIMM, les deux emplacements SSD M.2 et le module WLAN sont recouverts d'une grande plaque d'aluminium, comme indiqué ci-dessous, en plus du couvercle extérieur. L'appareil est facile à retirer, à condition que les utilisateurs fassent attention à ne pas déchirer le câble plat reliant le troisième ventilateur à la carte mère.
Durabilité
Bien que Lenovo ait mis en place un programme de développement durable sur le CO2, nous n'avons trouvé aucune information sur la quantité de matériaux recyclés utilisés pour fabriquer le Legion Pro 7i 16 Gen 10, si tant est qu'il y en ait eu. La boîte de vente au détail est essentiellement composée de papier et de carton, l'emballage étant constitué à 90 % de plastique provenant des océans.
Accessoires et garantie
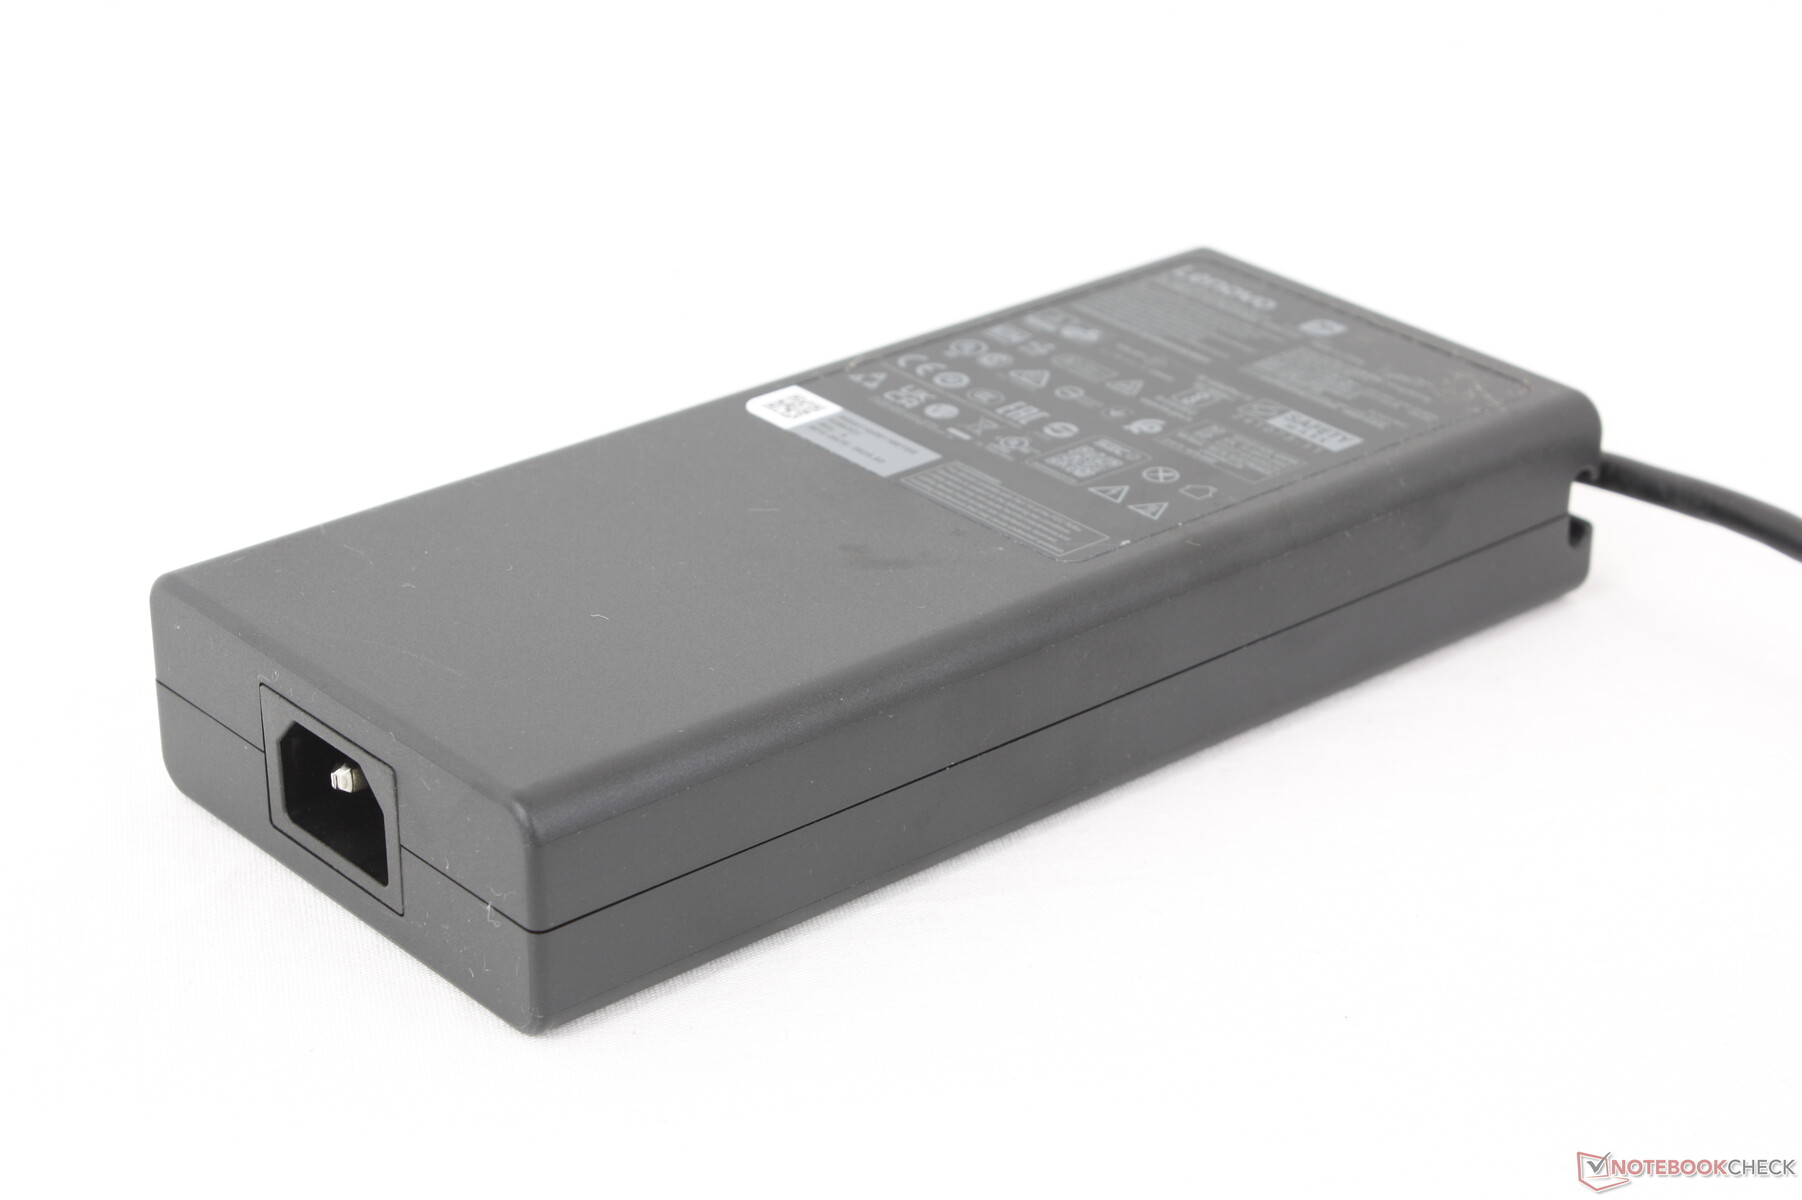
La boîte ne contient rien d'autre que l'adaptateur secteur de 400 W ( !) et la documentation. La garantie limitée habituelle d'un an du fabricant s'applique.
Périphériques d'entrée - Spacieux et sans fantaisie
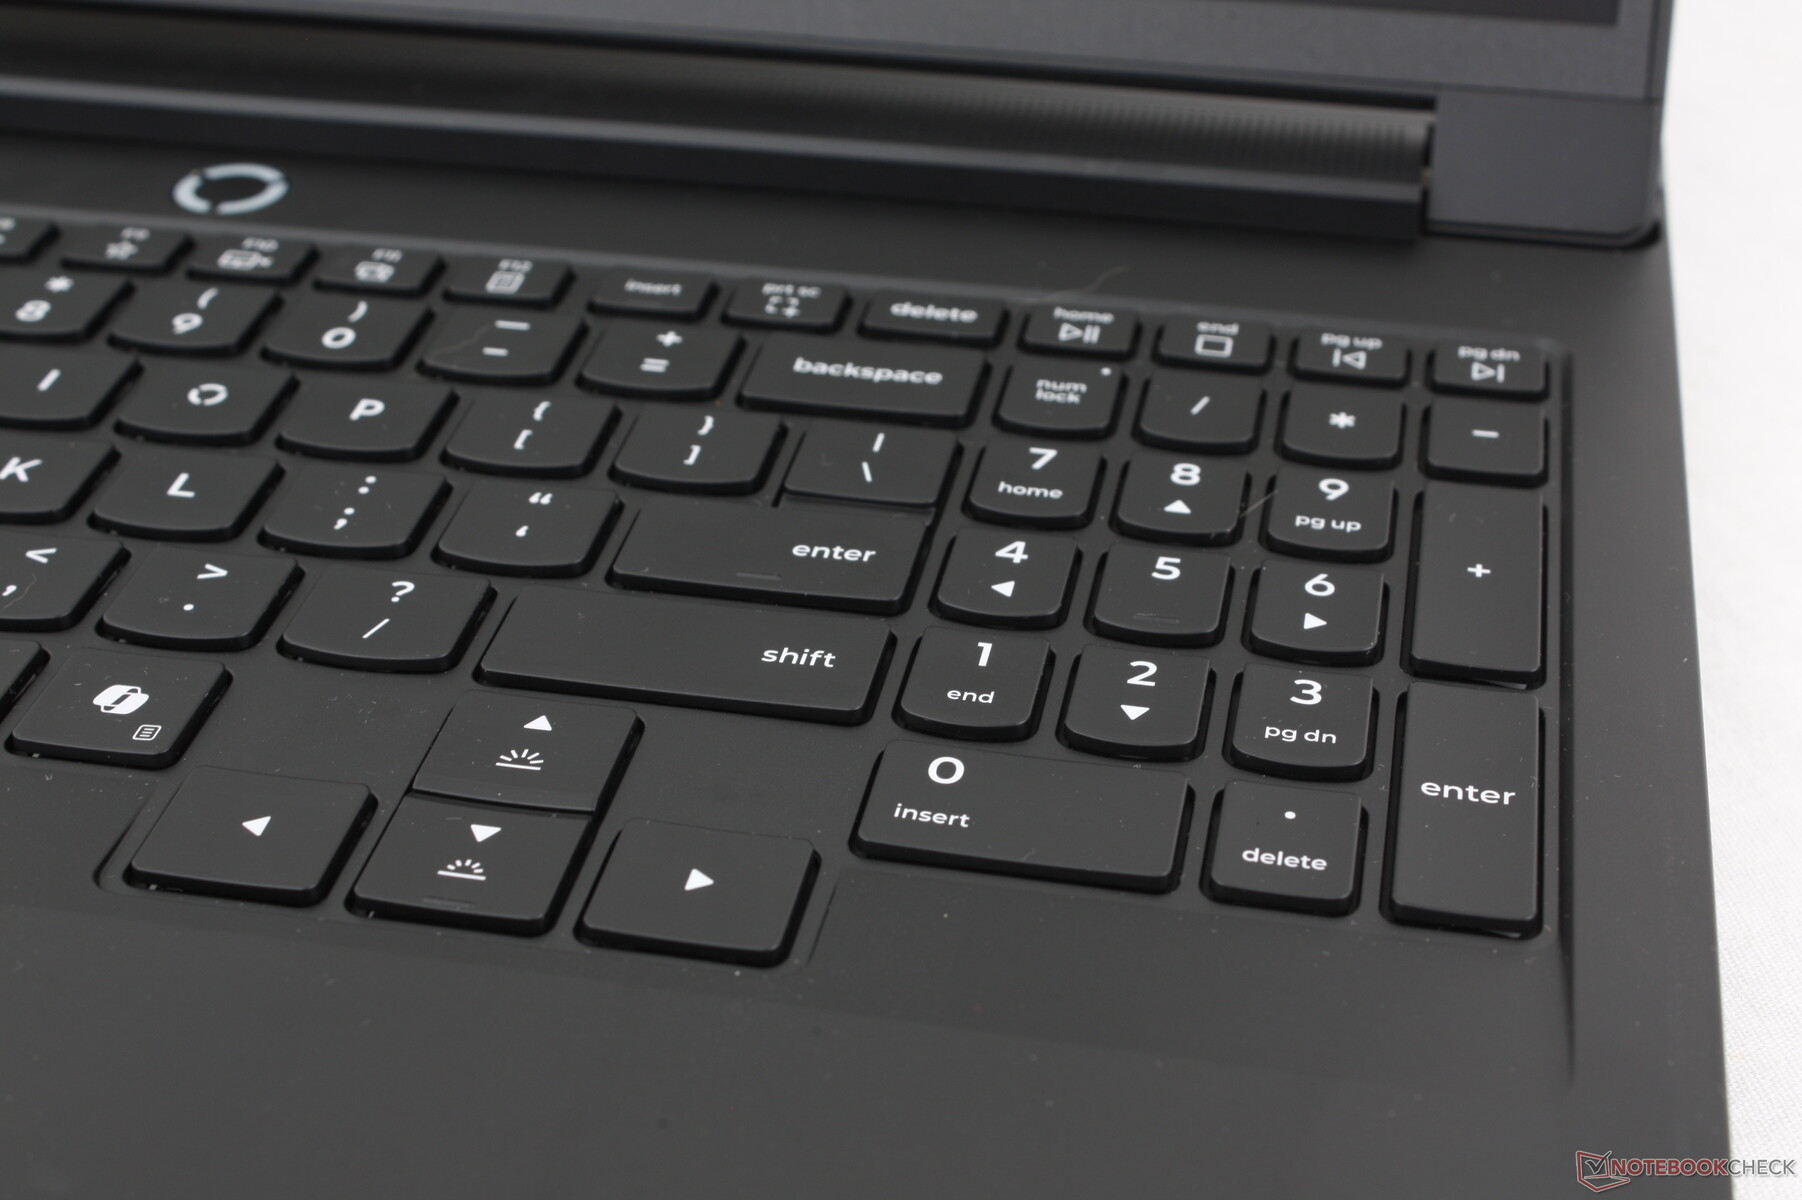
Clavier
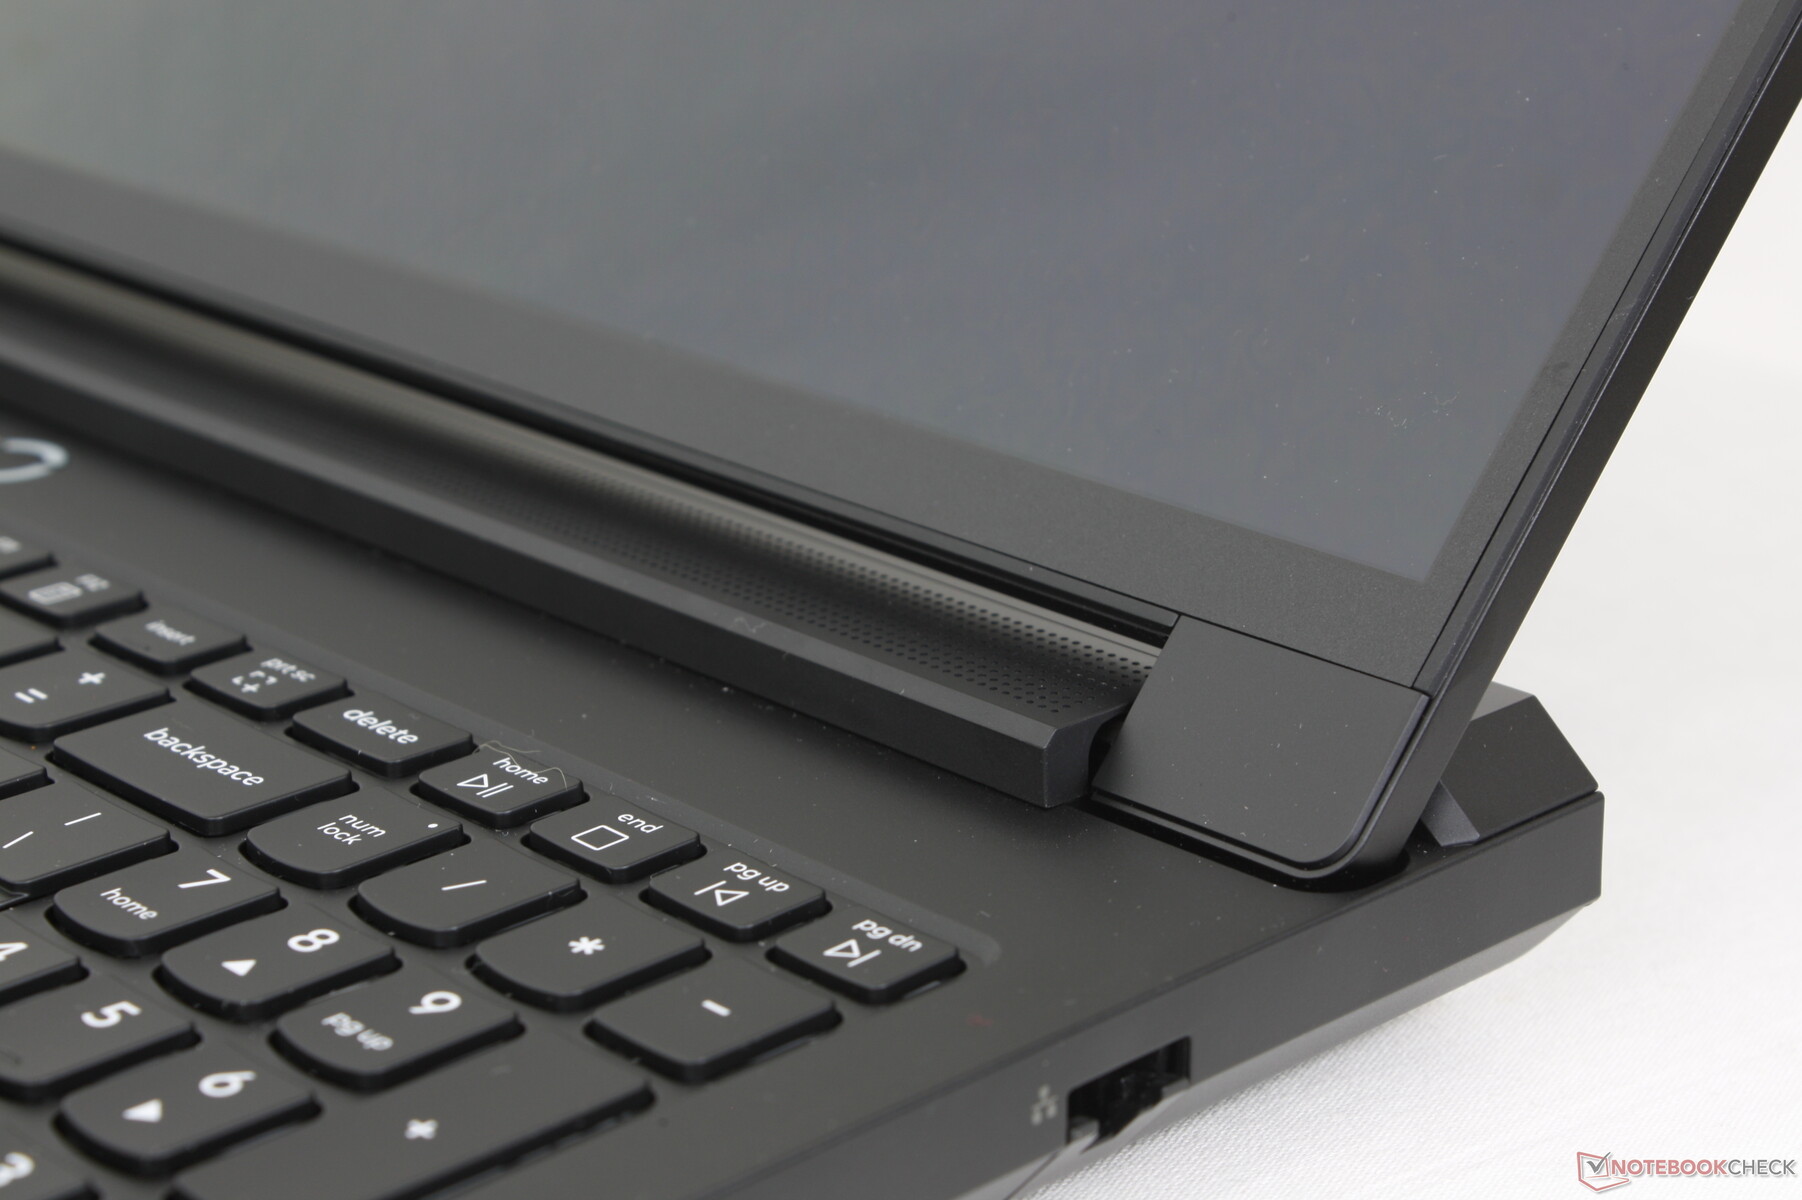
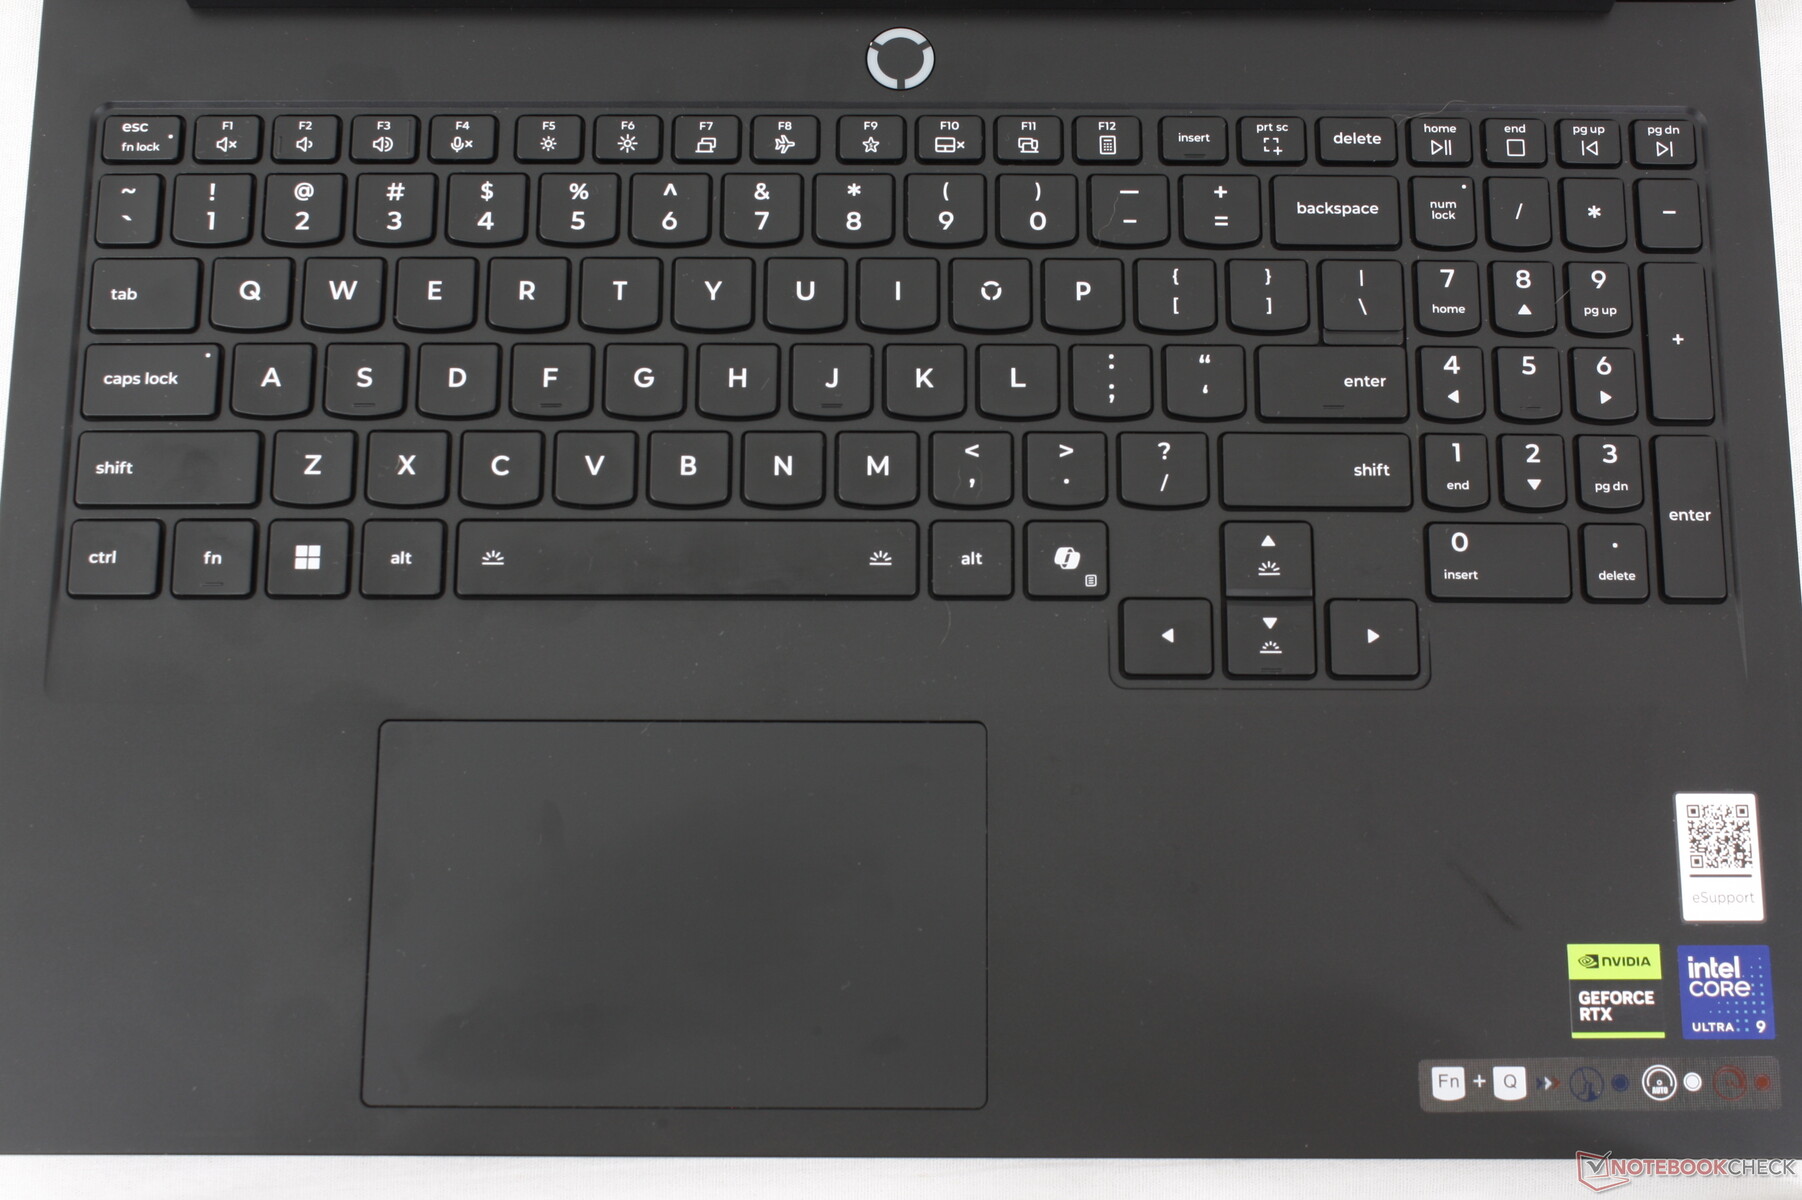
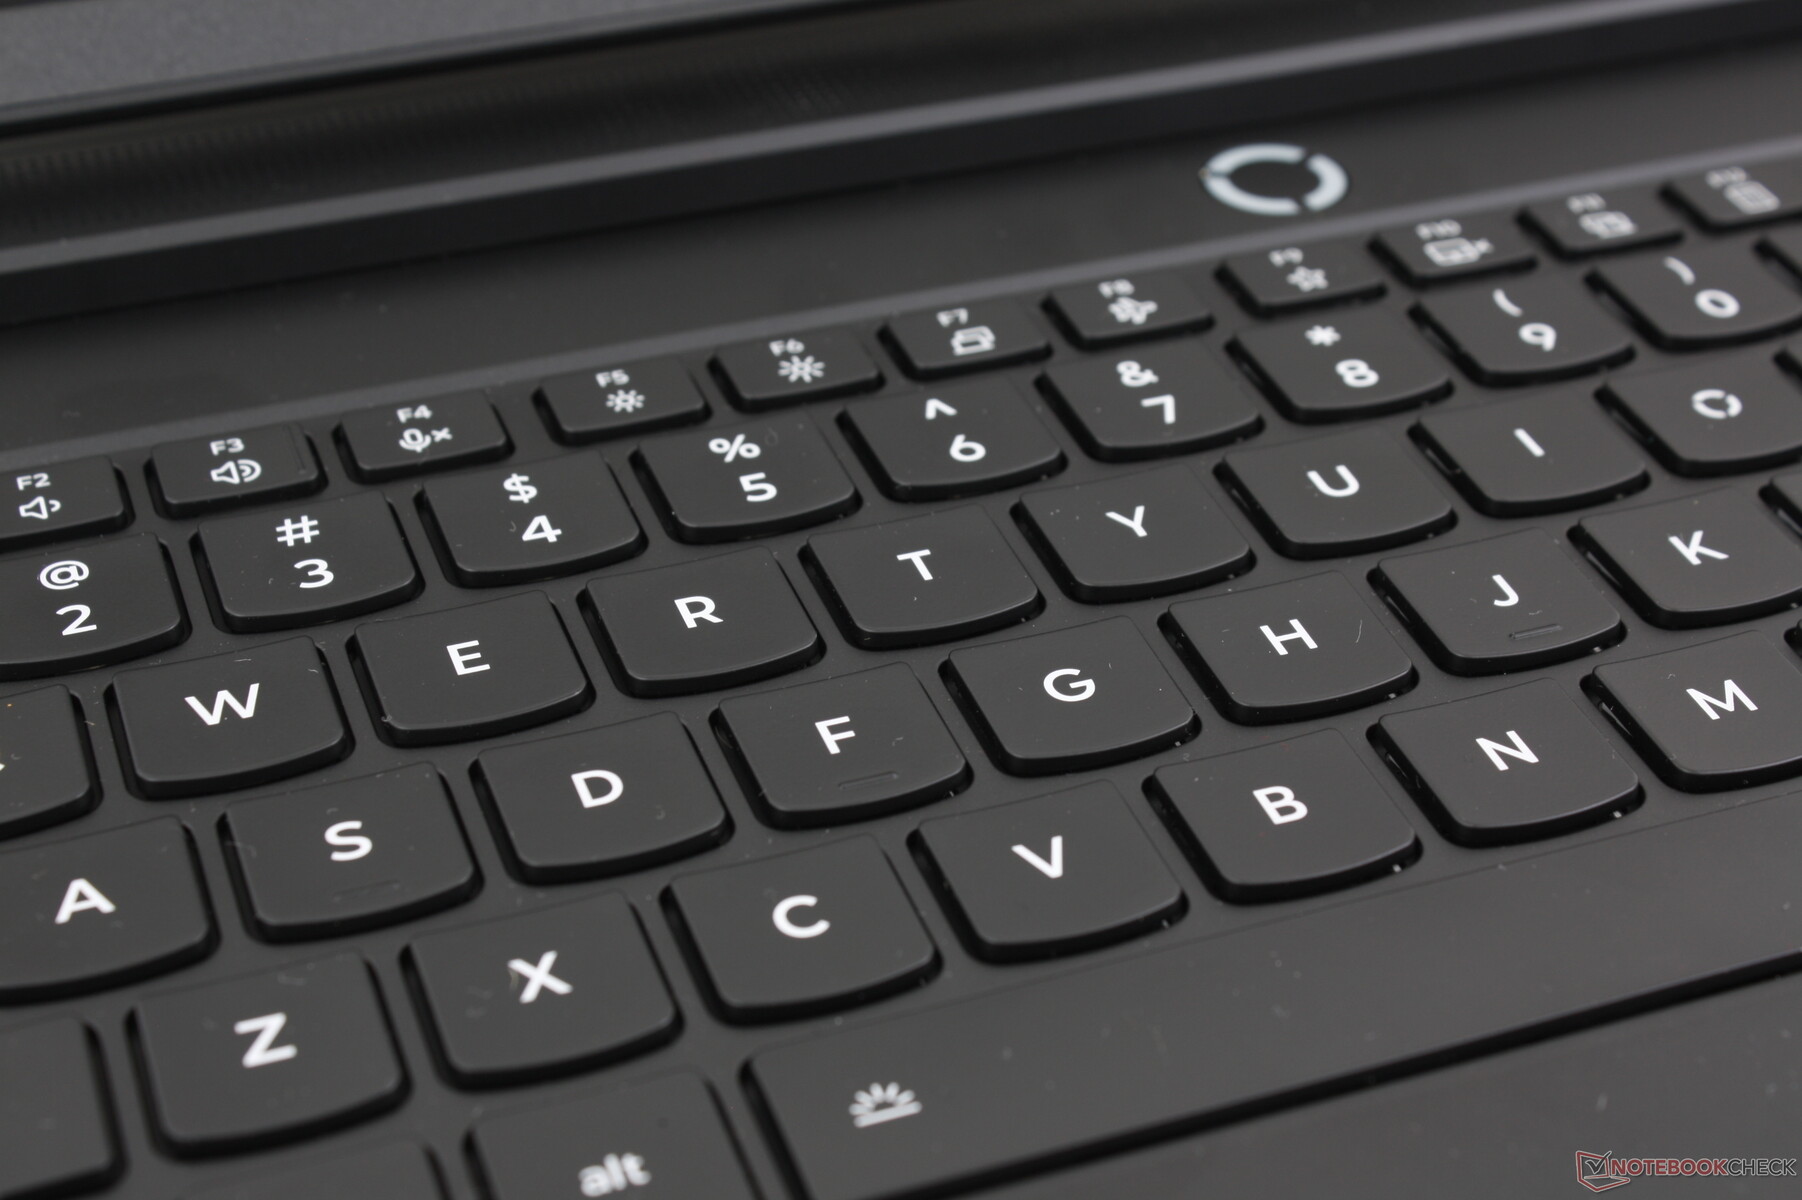
À l'exception de quelques légères modifications de la police de caractères, les touches à effleurement restent essentiellement les mêmes que sur le Legion 7 16 G9 ou Legion 9i 16 de l'année dernière, pour une expérience de frappe familière. Le toucher est plus profond et le retour d'information plus ferme que sur la plupart des ordinateurs portables plus fins, y compris le Blade 16.
Nous apprécions les touches fléchées de taille normale, car elles sont généralement plus petites et plus exiguës sur de nombreux autres ordinateurs portables de jeu, y compris sur l'Omen Max 16.
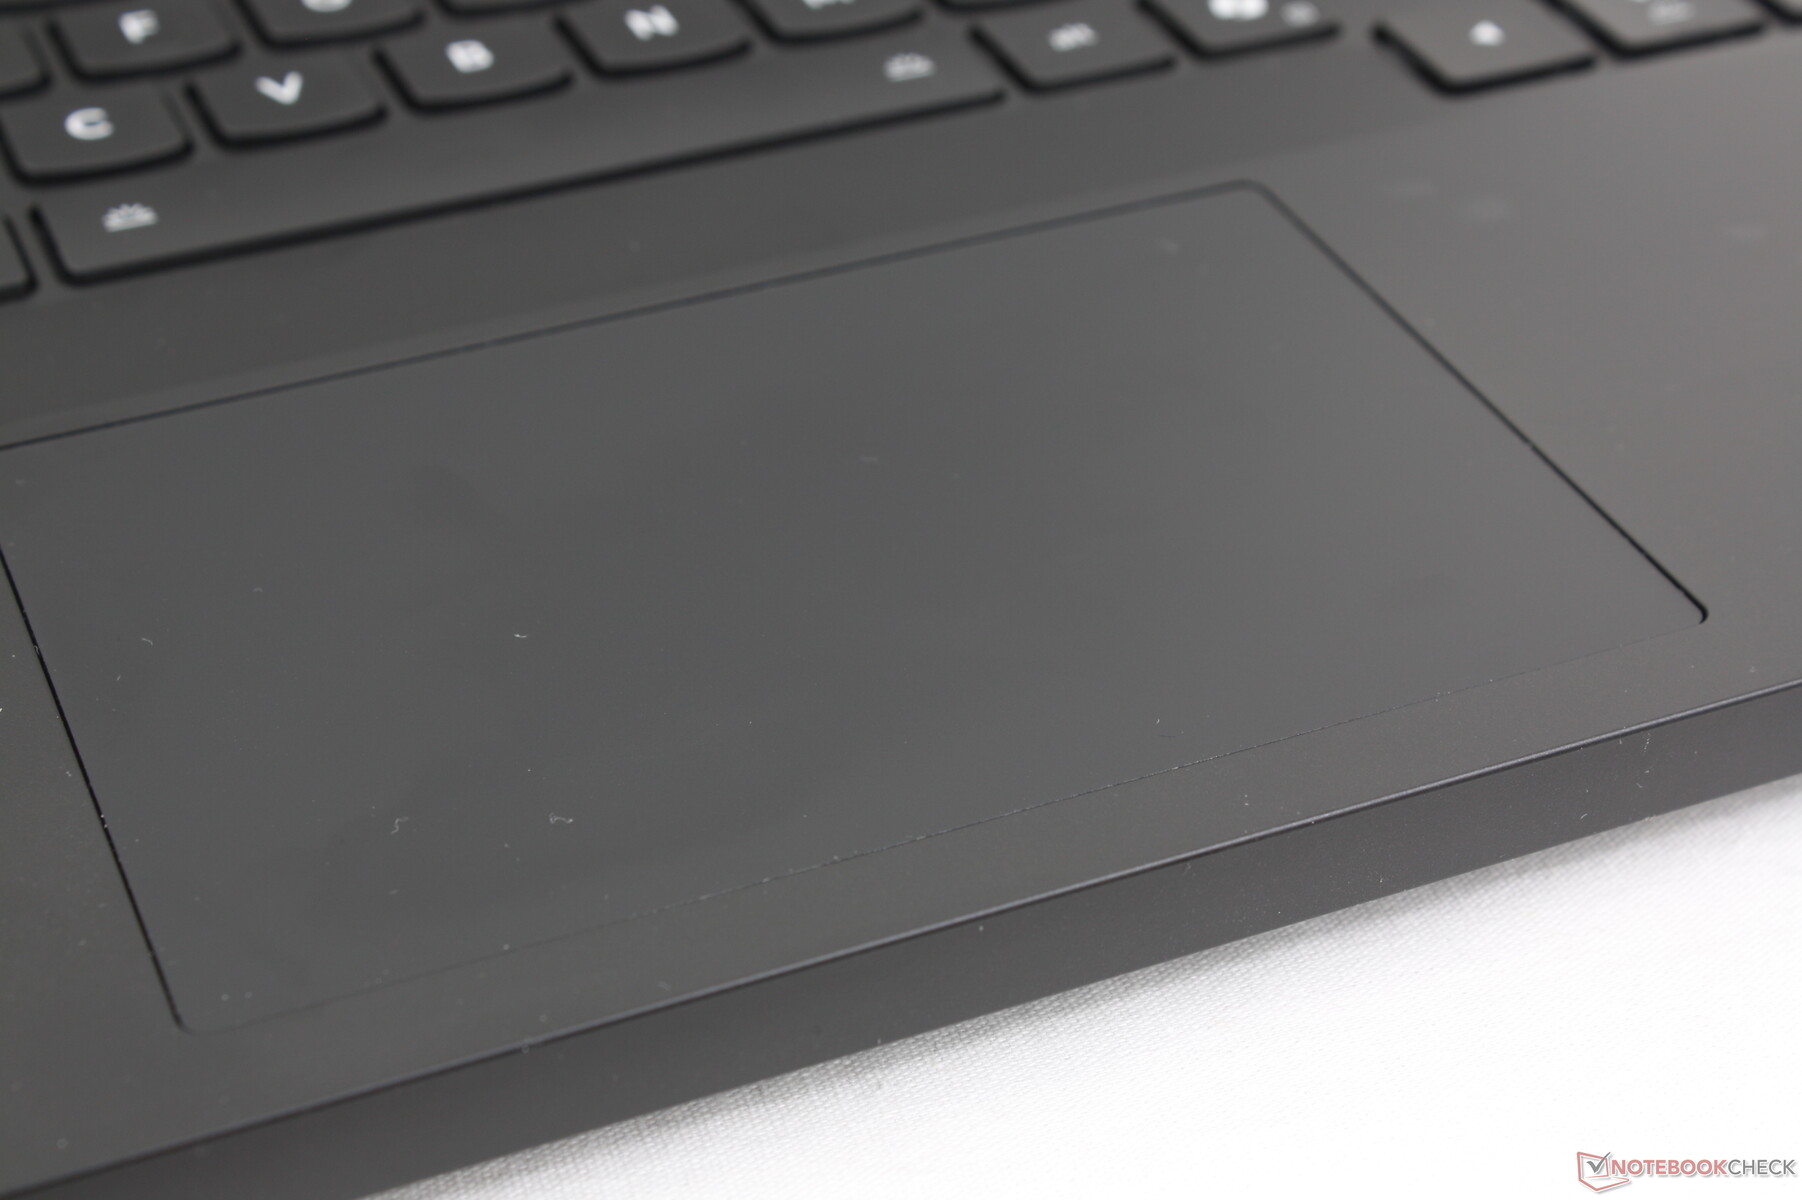
Pavé tactile
La taille du pavé numérique est identique à celle du modèle de l'année dernière (12 x 7,5 cm). Nous aurions aimé qu'il soit plus grand pour un meilleur contrôle vertical du curseur, mais les mouvements sont néanmoins fluides et précis, sans aucun problème de fiabilité. Le clic sur le pavé tactile est malheureusement encore trop superficiel et trop mou.
Affichage - Presque tout ce que vous pourriez vouloir

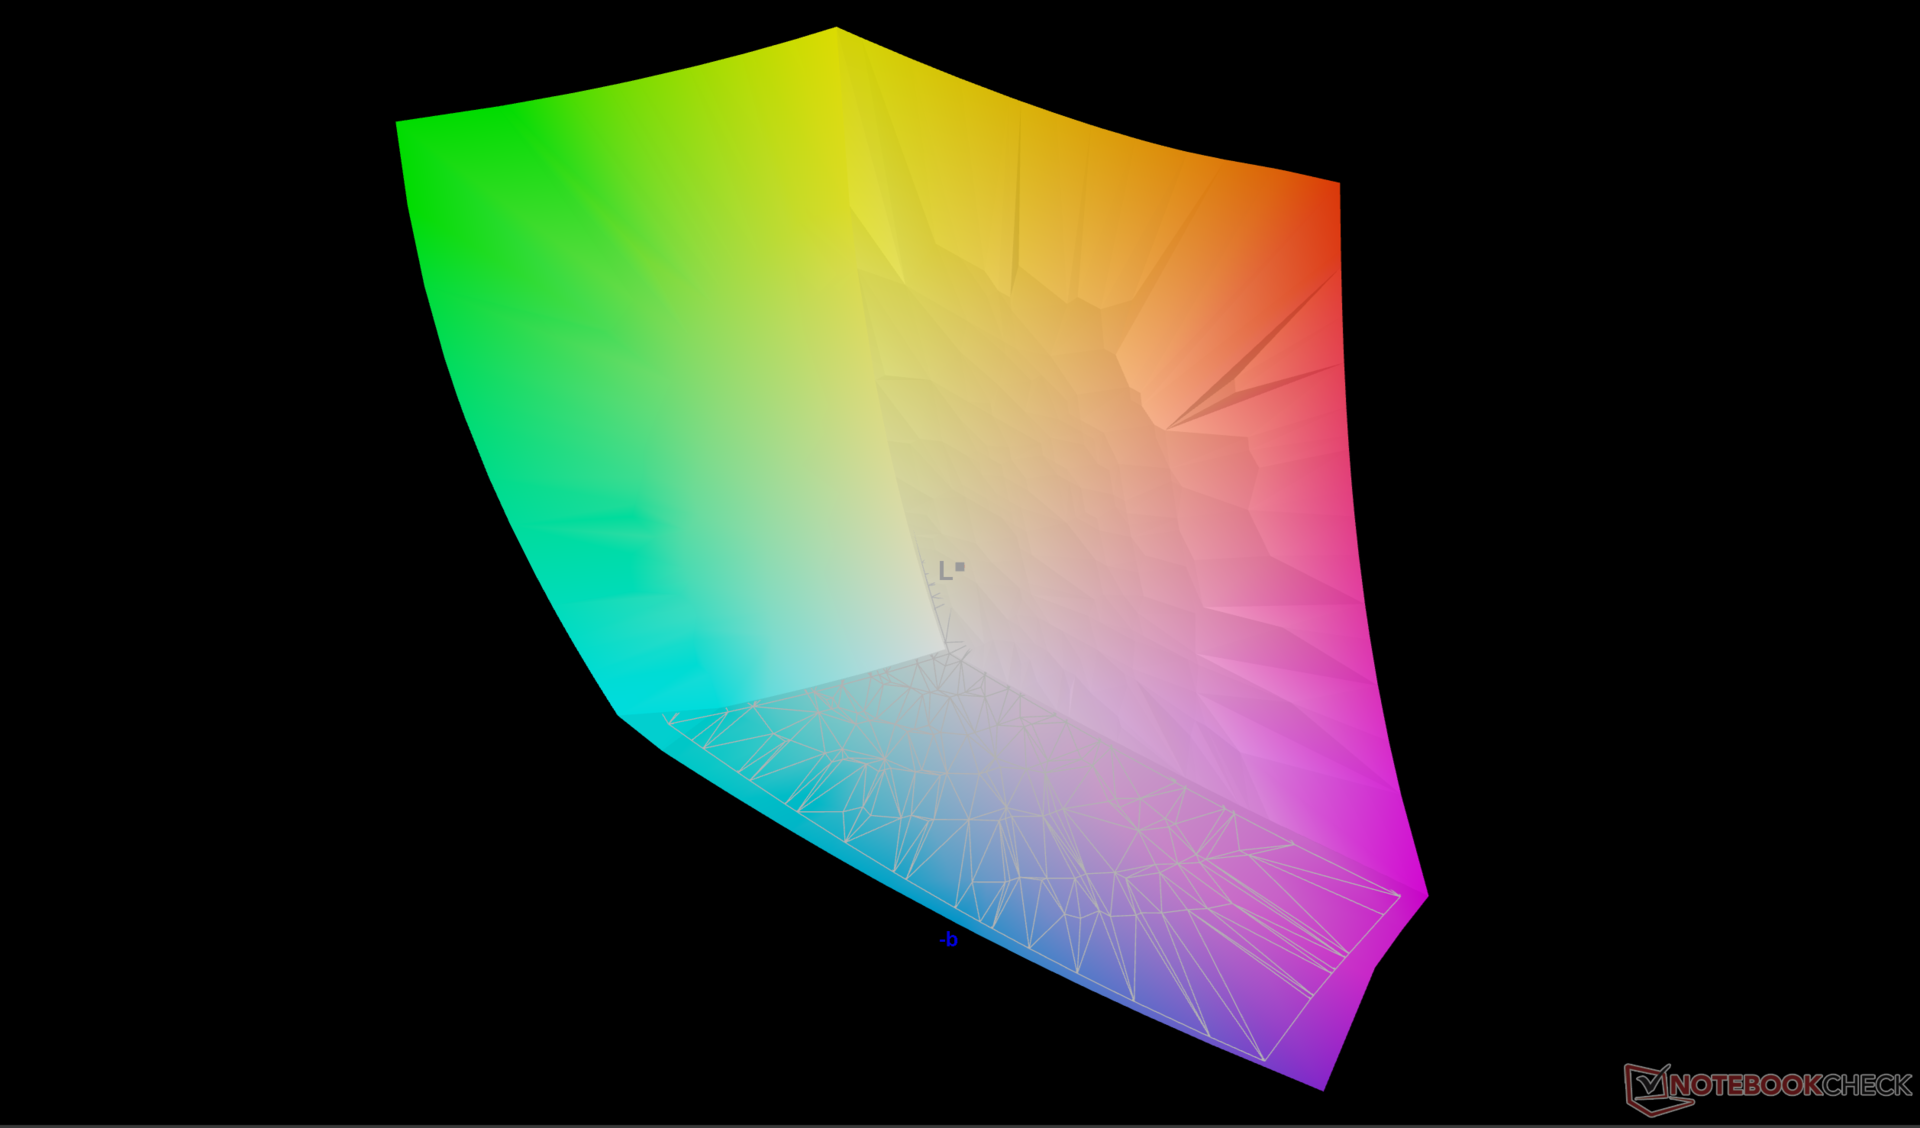
Le panneau OLED Samsung ATNA60HU01-0 de notre appareil Lenovo est très similaire au panneau OLED ATNA60DL01-0 de l'appareil concurrent, le Zephyrus G16 Zephyrus G16. Les deux écrans offrent une fréquence de rafraîchissement native de 240 Hz, une résolution native de 1600p et des couleurs P3. Les technologies G-Sync et Advanced Optimus sont également prises en charge, ce qui en fait un écran haut de gamme adapté aux jeux et à l'édition graphique. Il est subjectivement très net bien qu'il n'offre pas d'options 4K.
Windows VRR est pris en charge pour économiser de l'énergie, mais seulement jusqu'à 60 Hz. Nous pouvons également confirmer la prise en charge de DisplayHDR1000 avec un niveau de luminosité maximal mesuré de 970 nits en mode HDR. En mode SDR, la luminosité maximale atteint 500 nits, ce qui reste plus lumineux que de nombreuses dalles IPS et même que le Zephyrus G16 mentionné plus haut.

| |||||||||||||||||||||||||
Homogénéité de la luminosité: 97 %
Valeur mesurée au centre, sur batterie: 490.4 cd/m²
Contraste: ∞:1 (Valeurs des noirs: 0 cd/m²)
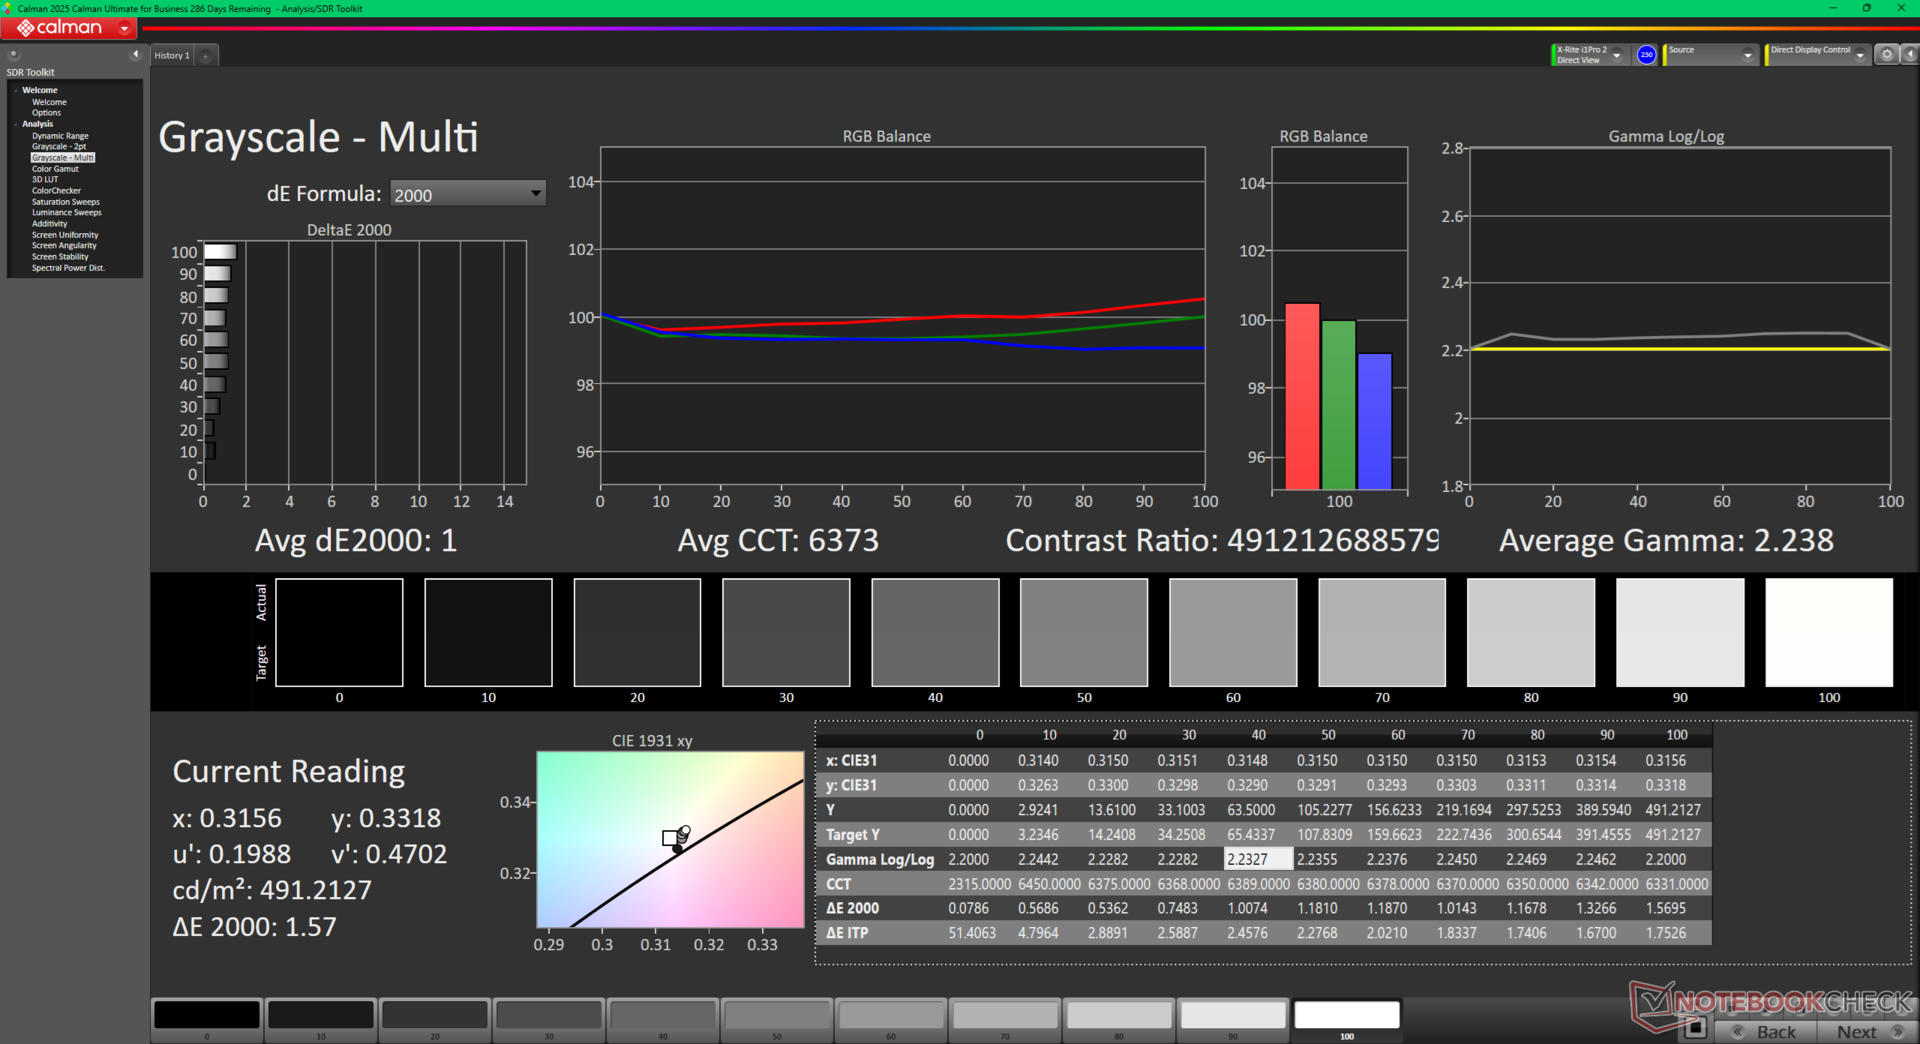
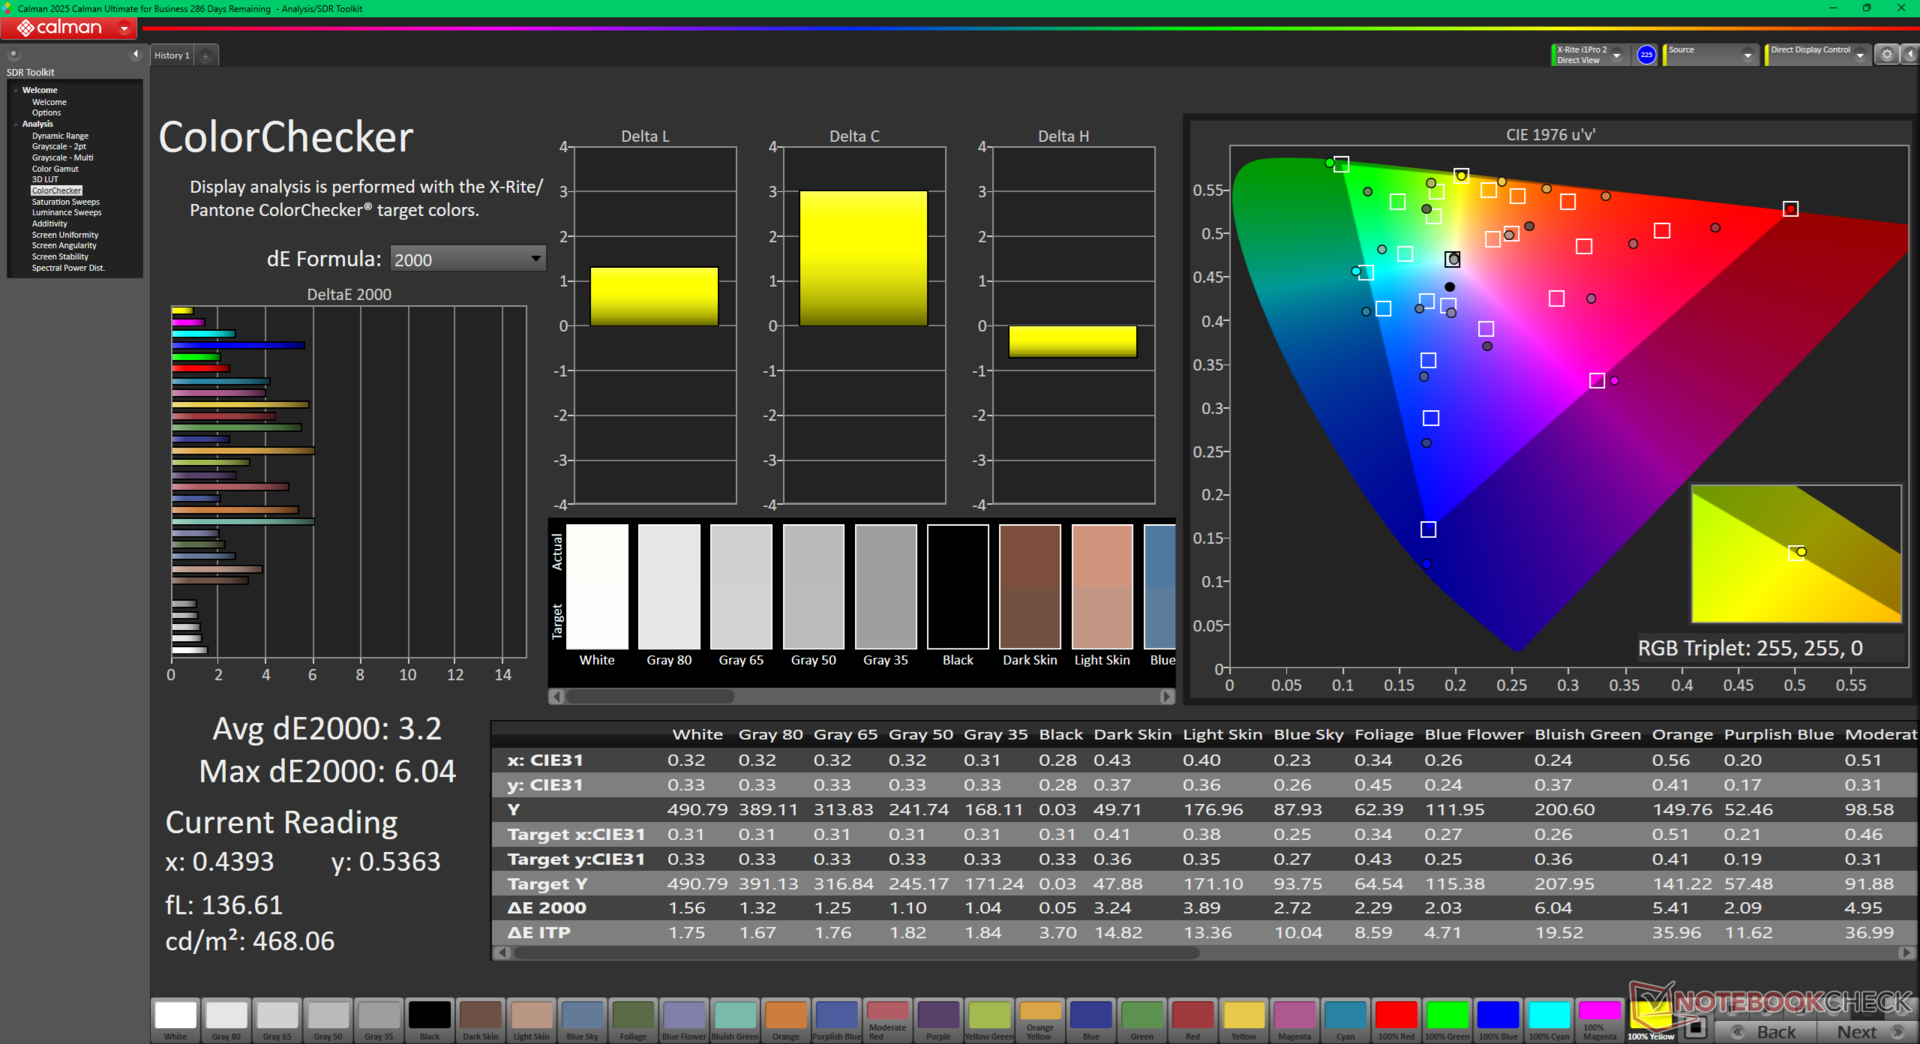
ΔE Color 3.2 | 0.5-29.43 Ø4.86, calibrated: 0.84
ΔE Greyscale 1 | 0.5-98 Ø5.1
94.4% AdobeRGB 1998 (Argyll 2.2.0 3D)
100% sRGB (Argyll 2.2.0 3D)
99.5% Display P3 (Argyll 2.2.0 3D)
Gamma: 2.24
| Lenovo Legion Pro 7i 16 Gen 10 Samsung ATNA60HU01-0, OLED, 2560x1600, 16", 240 Hz | Lenovo Legion 9 16IRX9, RTX 4090 CSOT T3 MNG007ZA2-2, MiniLED, 3200x2000, 16", 165 Hz | Razer Blade 16 2025 RTX 5090 ATNA60DL04-0, OLED, 2560x1600, 16", 240 Hz | Asus ROG Zephyrus G16 GU605MY ATNA60DL01-0, OLED, 2560x1600, 16", 240 Hz | MSI Vector 16 HX A14V Chi Mei N160GME-GTB, IPS, 2560x1600, 16", 240 Hz | Alienware x16 R2 P120F BOE B160QAN, IPS, 2560x1600, 16", 240 Hz | |
|---|---|---|---|---|---|---|
| Display | -4% | -4% | 1% | -5% | -2% | |
| Display P3 Coverage | 99.5 | 95.3 -4% | 96.1 -3% | 99.9 0% | 95.4 -4% | 98.3 -1% |
| sRGB Coverage | 100 | 99.9 0% | 99.9 0% | 100 0% | 99.7 0% | 100 0% |
| AdobeRGB 1998 Coverage | 94.4 | 86.6 -8% | 85 -10% | 96.9 3% | 85.4 -10% | 88.8 -6% |
| Response Times | -2116% | 13% | 10% | -2244% | -1504% | |
| Response Time Grey 50% / Grey 80% * | 0.28 ? | 12.6 ? -4400% | 0.2 ? 29% | 0.22 ? 21% | 5.7 ? -1936% | 3.9 ? -1293% |
| Response Time Black / White * | 0.43 ? | 10 ? -2226% | 0.25 ? 42% | 0.25 ? 42% | 11.4 ? -2551% | 7.8 ? -1714% |
| PWM Frequency | 1438 ? | 5430 278% | 960 ? -33% | 960 ? -33% | ||
| Screen | -46% | -2% | -15% | -52% | -30% | |
| Brightness middle | 490.4 | 631 29% | 391 -20% | 416 -15% | 557.2 14% | 348.4 -29% |
| Brightness | 498 | 664 33% | 393 -21% | 418 -16% | 506 2% | 340 -32% |
| Brightness Distribution | 97 | 91 -6% | 98 1% | 96 -1% | 83 -14% | 90 -7% |
| Black Level * | 0.03 | 0.41 | 0.33 | |||
| Colorchecker dE 2000 * | 3.2 | 2.68 16% | 1.2 62% | 1.6 50% | 2.91 9% | 2.68 16% |
| Colorchecker dE 2000 max. * | 6.04 | 6.41 -6% | 3.2 47% | 2.1 65% | 5.94 2% | 4.14 31% |
| Colorchecker dE 2000 calibrated * | 0.84 | 2.68 -219% | 1.63 -94% | 0.42 50% | ||
| Greyscale dE 2000 * | 1 | 2.71 -171% | 1.8 -80% | 2.7 -170% | 3.8 -280% | 3.4 -240% |
| Gamma | 2.24 98% | 2.27 97% | 2.2 100% | 2.16 102% | 2.23 99% | 2.41 91% |
| CCT | 6373 102% | 6135 106% | 6493 100% | 6331 103% | 6408 101% | 6083 107% |
| Contrast | 21033 | 1359 | 1056 | |||
| Moyenne finale (programmes/paramètres) | -722% /
-514% | 2% /
1% | -1% /
-5% | -767% /
-405% | -512% /
-269% |
* ... Moindre est la valeur, meilleures sont les performances
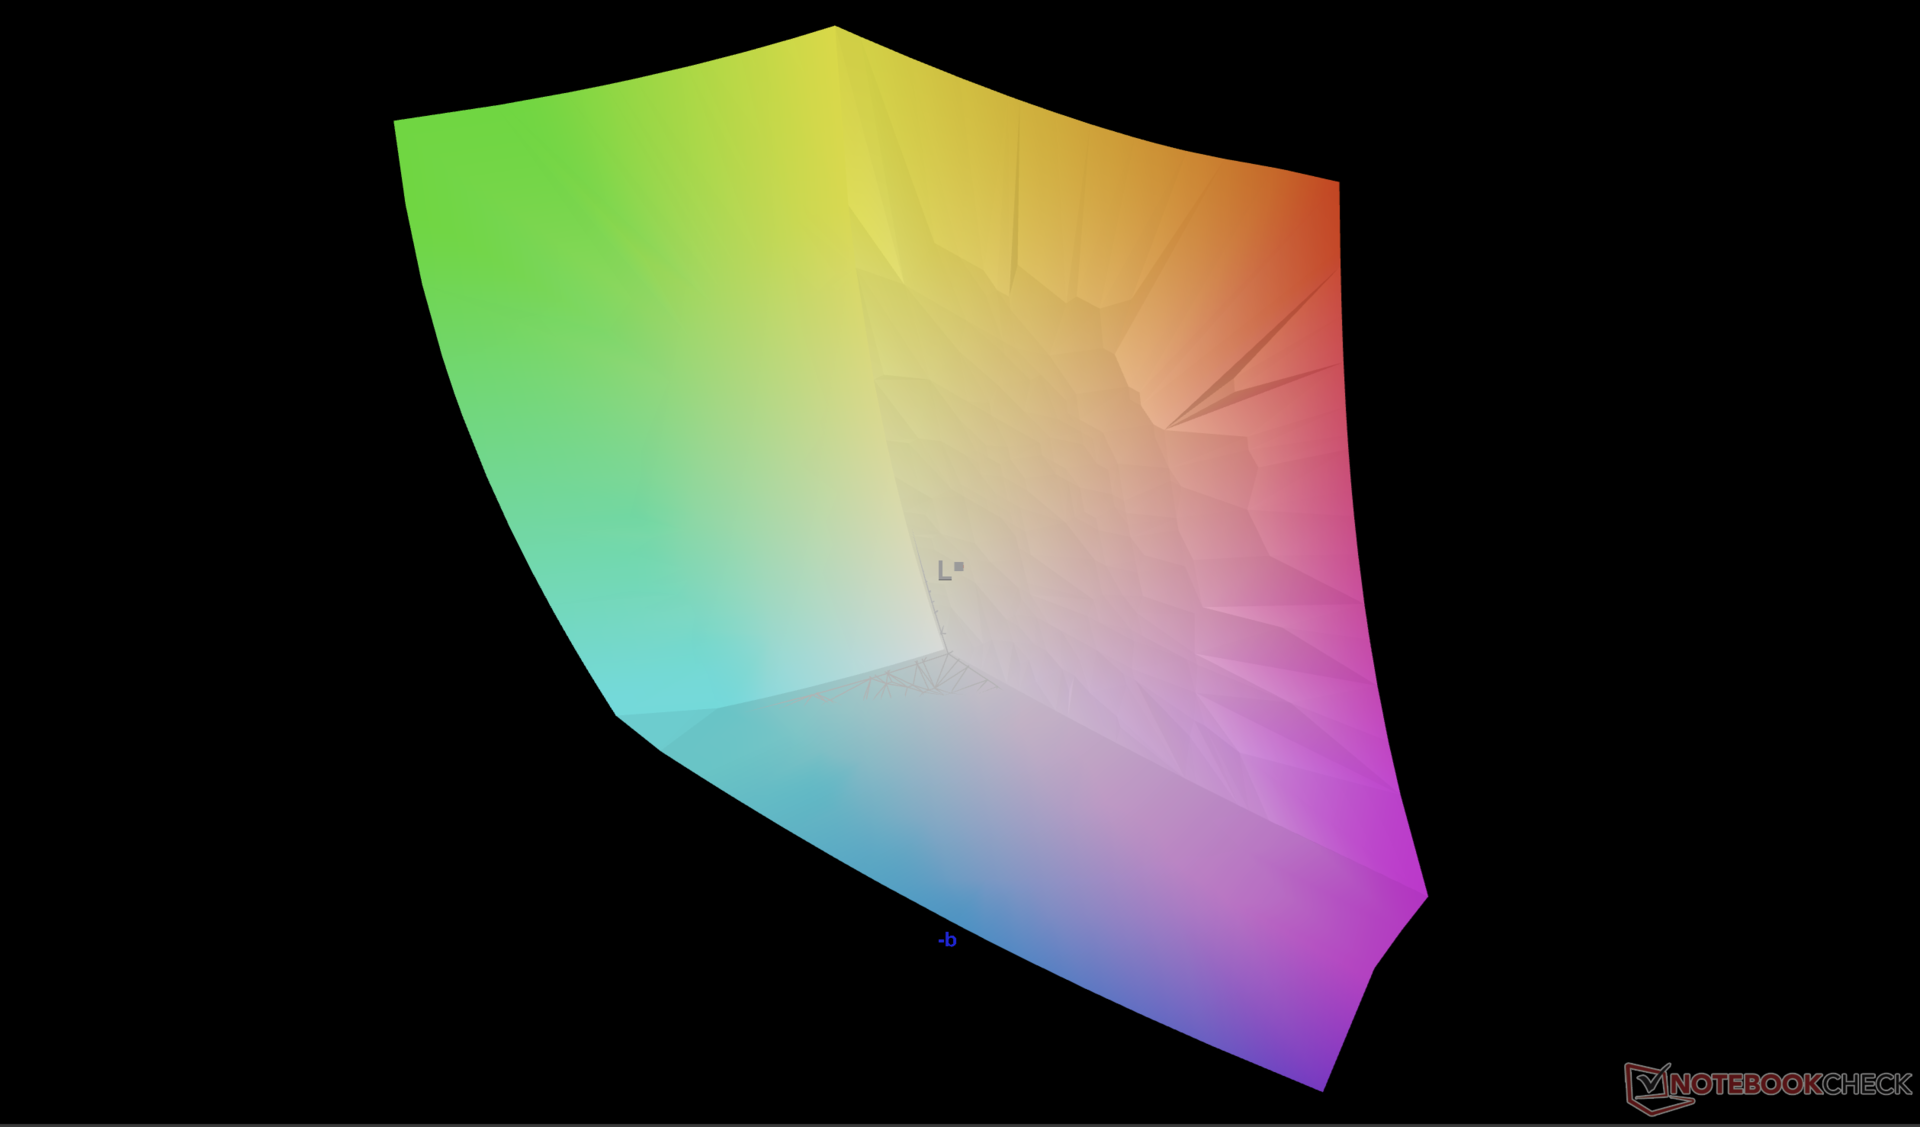
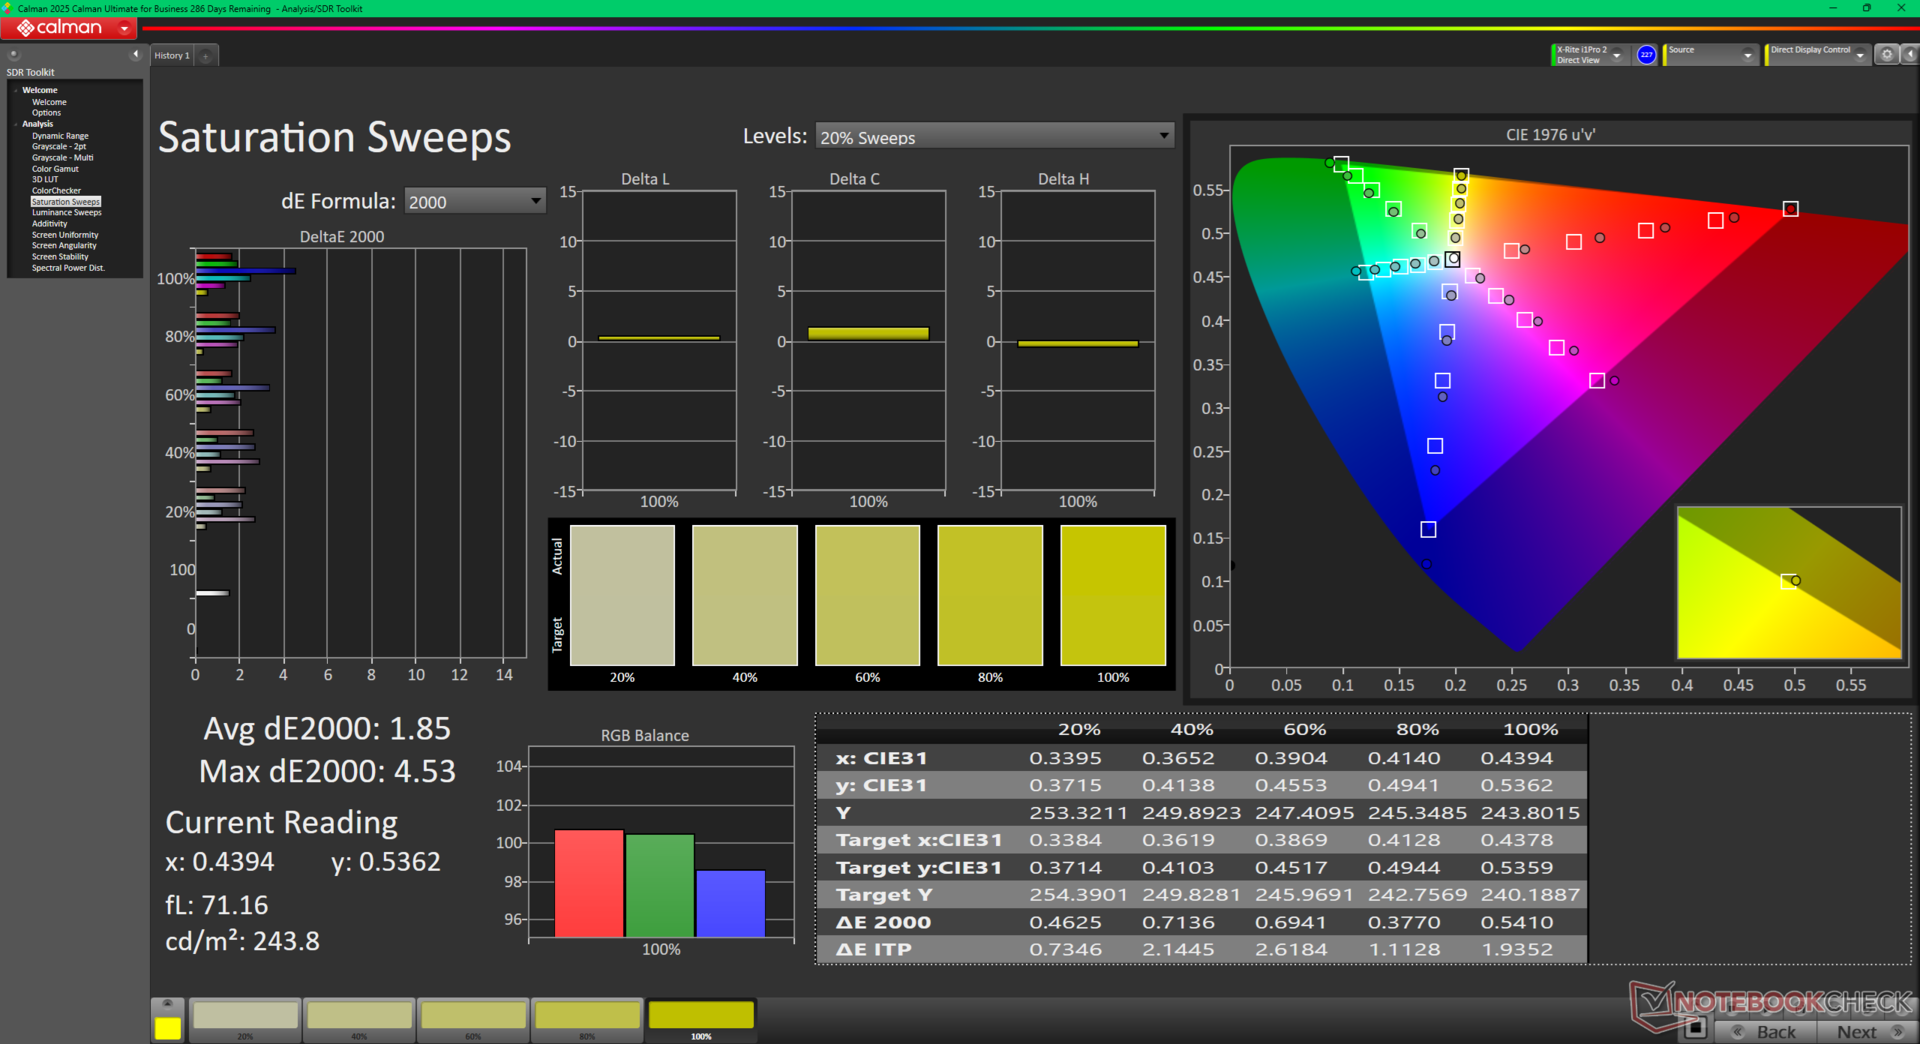
L'écran est étalonné de manière satisfaisante par rapport à la norme P3, avec des valeurs moyennes d'échelle de gris et de couleur deltaE de seulement 1,0 et 3,2, respectivement, ce qui signifie qu'un étalonnage par l'utilisateur final n'est pas nécessaire pour la plupart d'entre eux.
Temps de réponse de l'écran
| ↔ Temps de réponse noir à blanc | ||
|---|---|---|
| 0.43 ms ... hausse ↗ et chute ↘ combinées | ↗ 0.22 ms hausse | 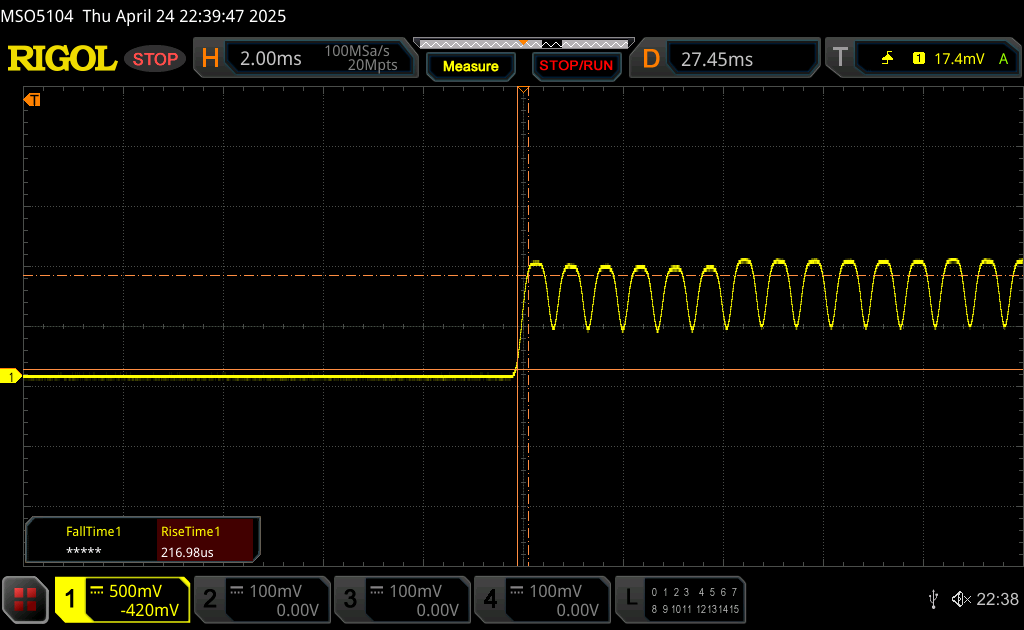 |
| ↘ 0.21 ms chute | ||
| L'écran montre de très faibles temps de réponse, parfait pour le jeu. En comparaison, tous les appareils testés affichent entre 0.1 (minimum) et 240 (maximum) ms. » 0 % des appareils testés affichent de meilleures performances. Cela signifie que les latences relevées sont meilleures que la moyenne (20.7 ms) de tous les appareils testés. | ||
| ↔ Temps de réponse gris 50% à gris 80% | ||
| 0.28 ms ... hausse ↗ et chute ↘ combinées | ↗ 0.14 ms hausse | 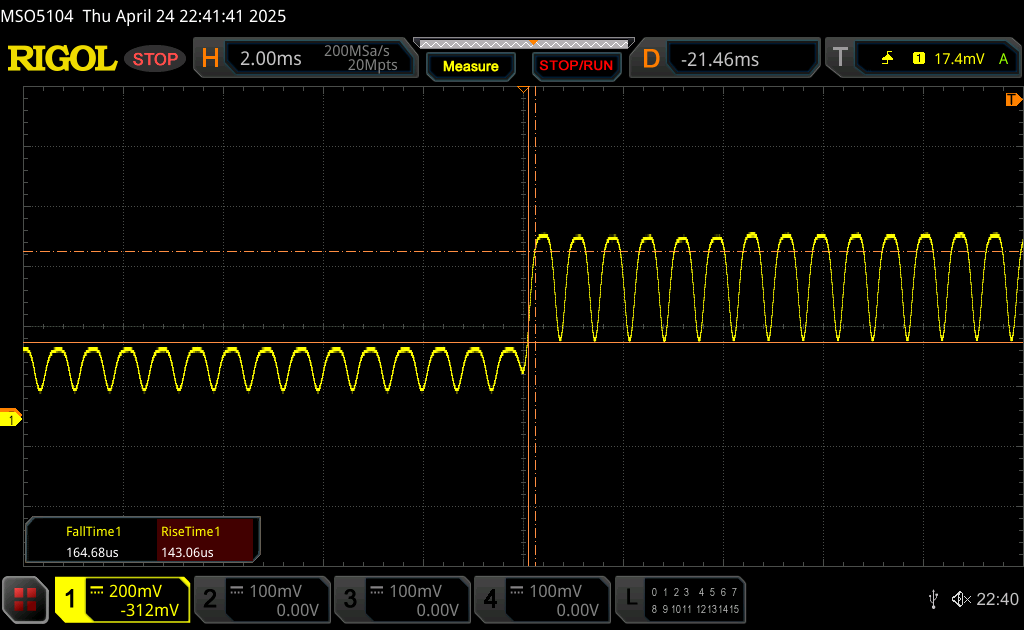 |
| ↘ 0.14 ms chute | ||
| L'écran montre de très faibles temps de réponse, parfait pour le jeu. En comparaison, tous les appareils testés affichent entre 0.165 (minimum) et 636 (maximum) ms. » 0 % des appareils testés affichent de meilleures performances. Cela signifie que les latences relevées sont meilleures que la moyenne (32.4 ms) de tous les appareils testés. | ||
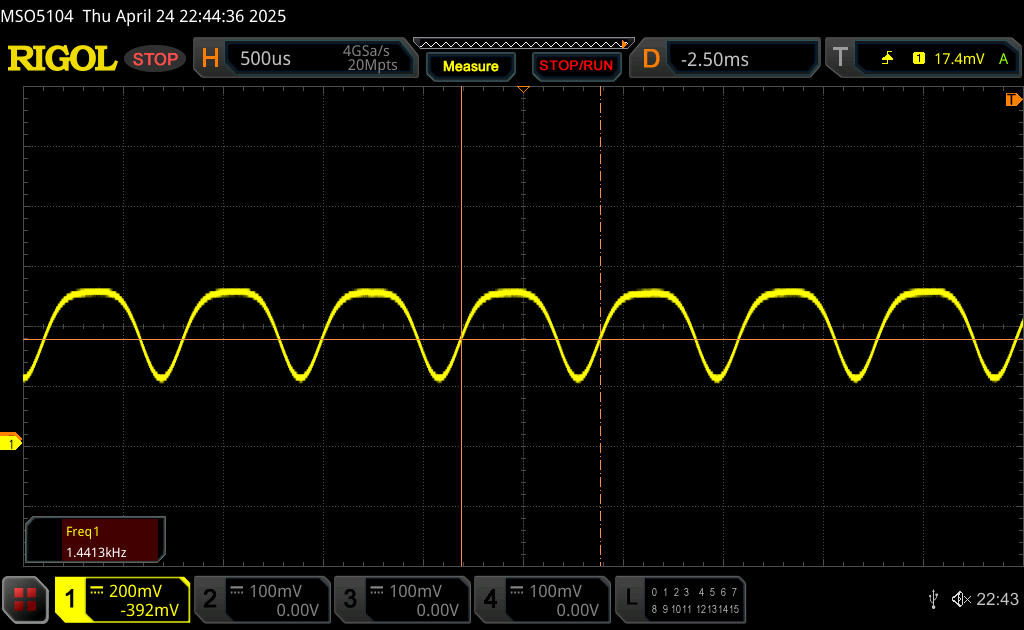
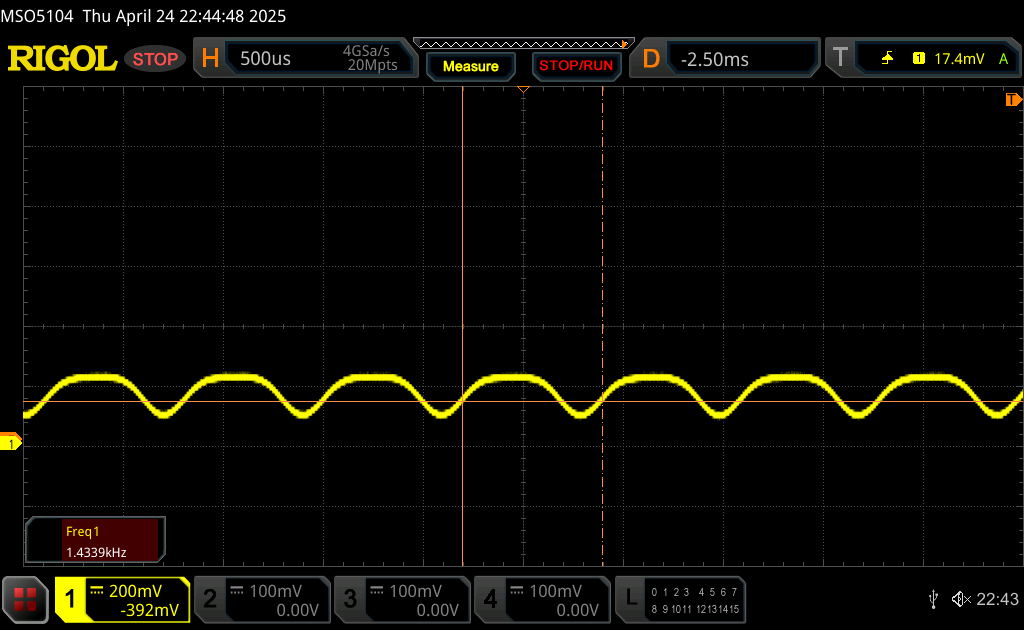
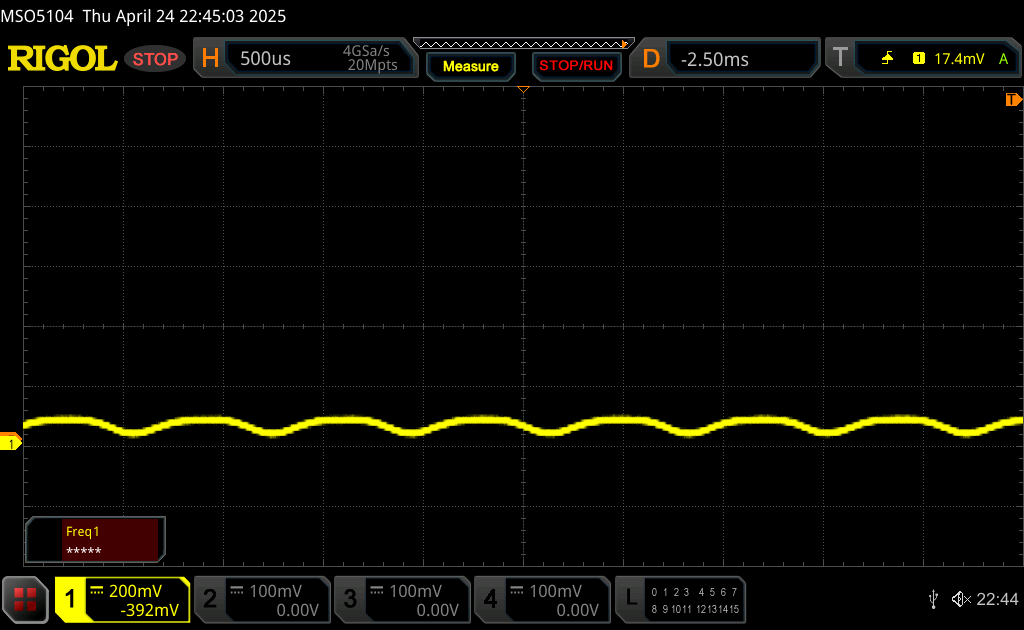
Scintillement / MLI (Modulation de largeur d'impulsion)
| Scintillement / MLI (Modulation de largeur d'impulsion) décelé | 1438 Hz Amplitude: 29 % | ≤ 100 Niveau de luminosité | 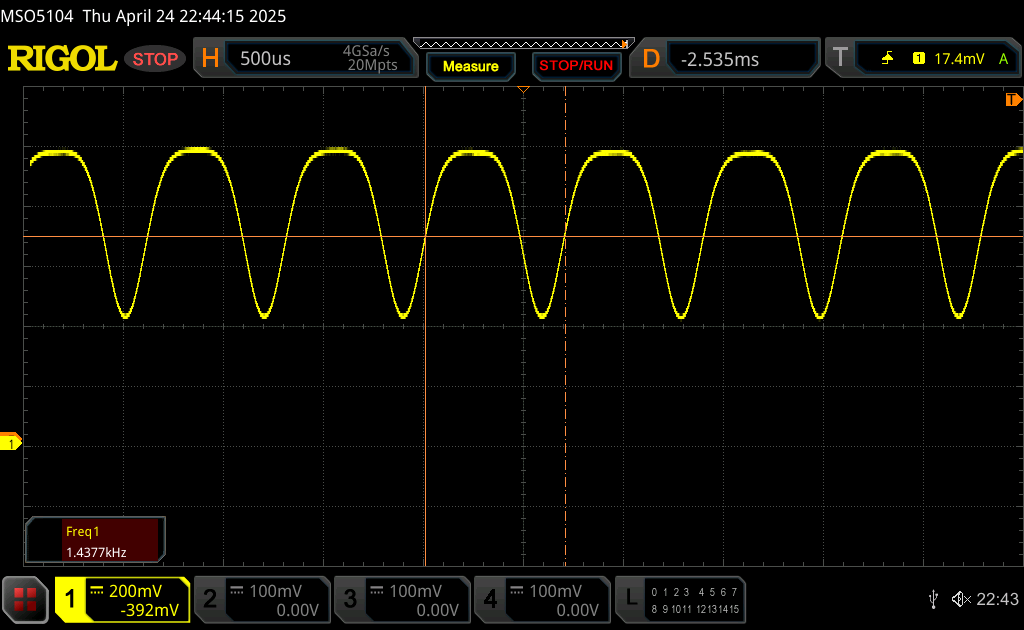 |
Le rétroéclairage de l'écran scintille à la fréquence de 1438 Hz (certainement du fait de l'utilisation d'une MDI - Modulation de largeur d'impulsion) à un niveau de luminosité inférieur ou égal à 100 % . Aucun scintillement ne devrait être perceptible au-dessus de cette valeur. La fréquence de rafraîchissement de 1438 Hz est élevée, la grande majorité des utilisateurs ne devrait pas percevoir de scintillements et être sujette à une fatigue oculaire accrue. En comparaison, 53 % des appareils testés n'emploient pas MDI pour assombrir leur écran. Nous avons relevé une moyenne à 8482 (minimum : 5 - maximum : 343500) Hz dans le cas où une MDI était active. | |||

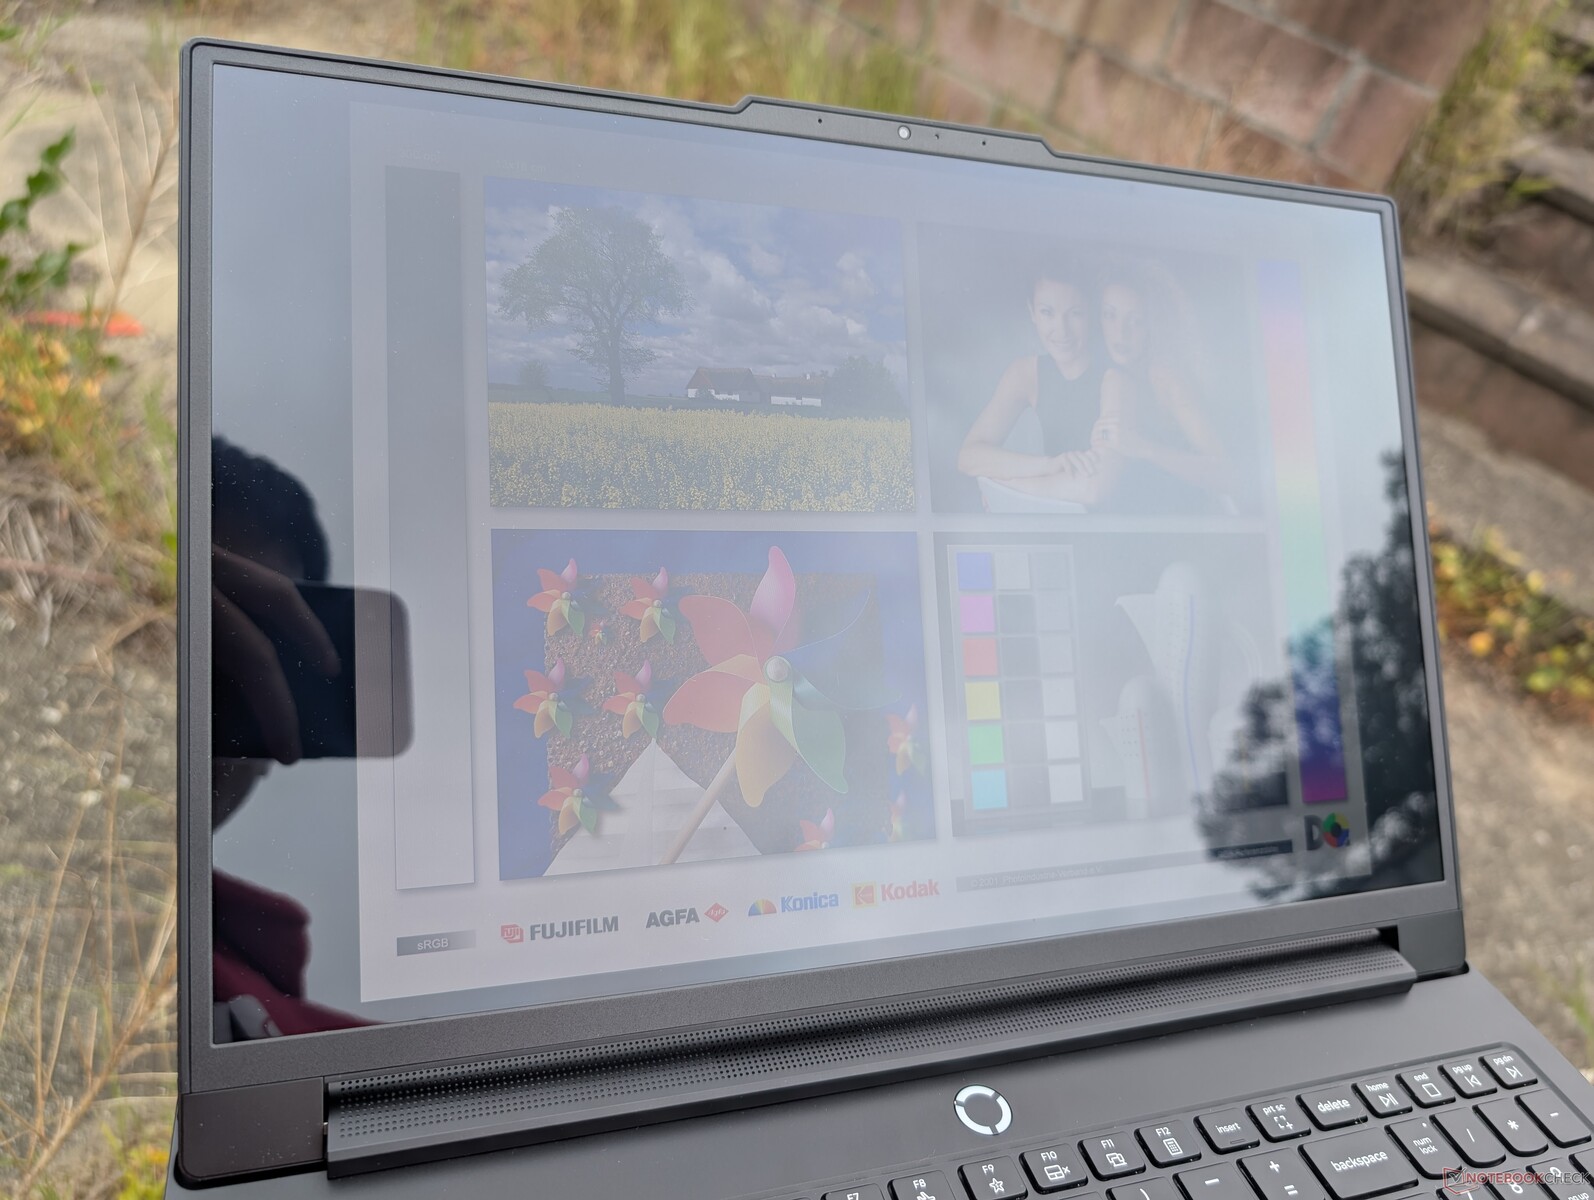
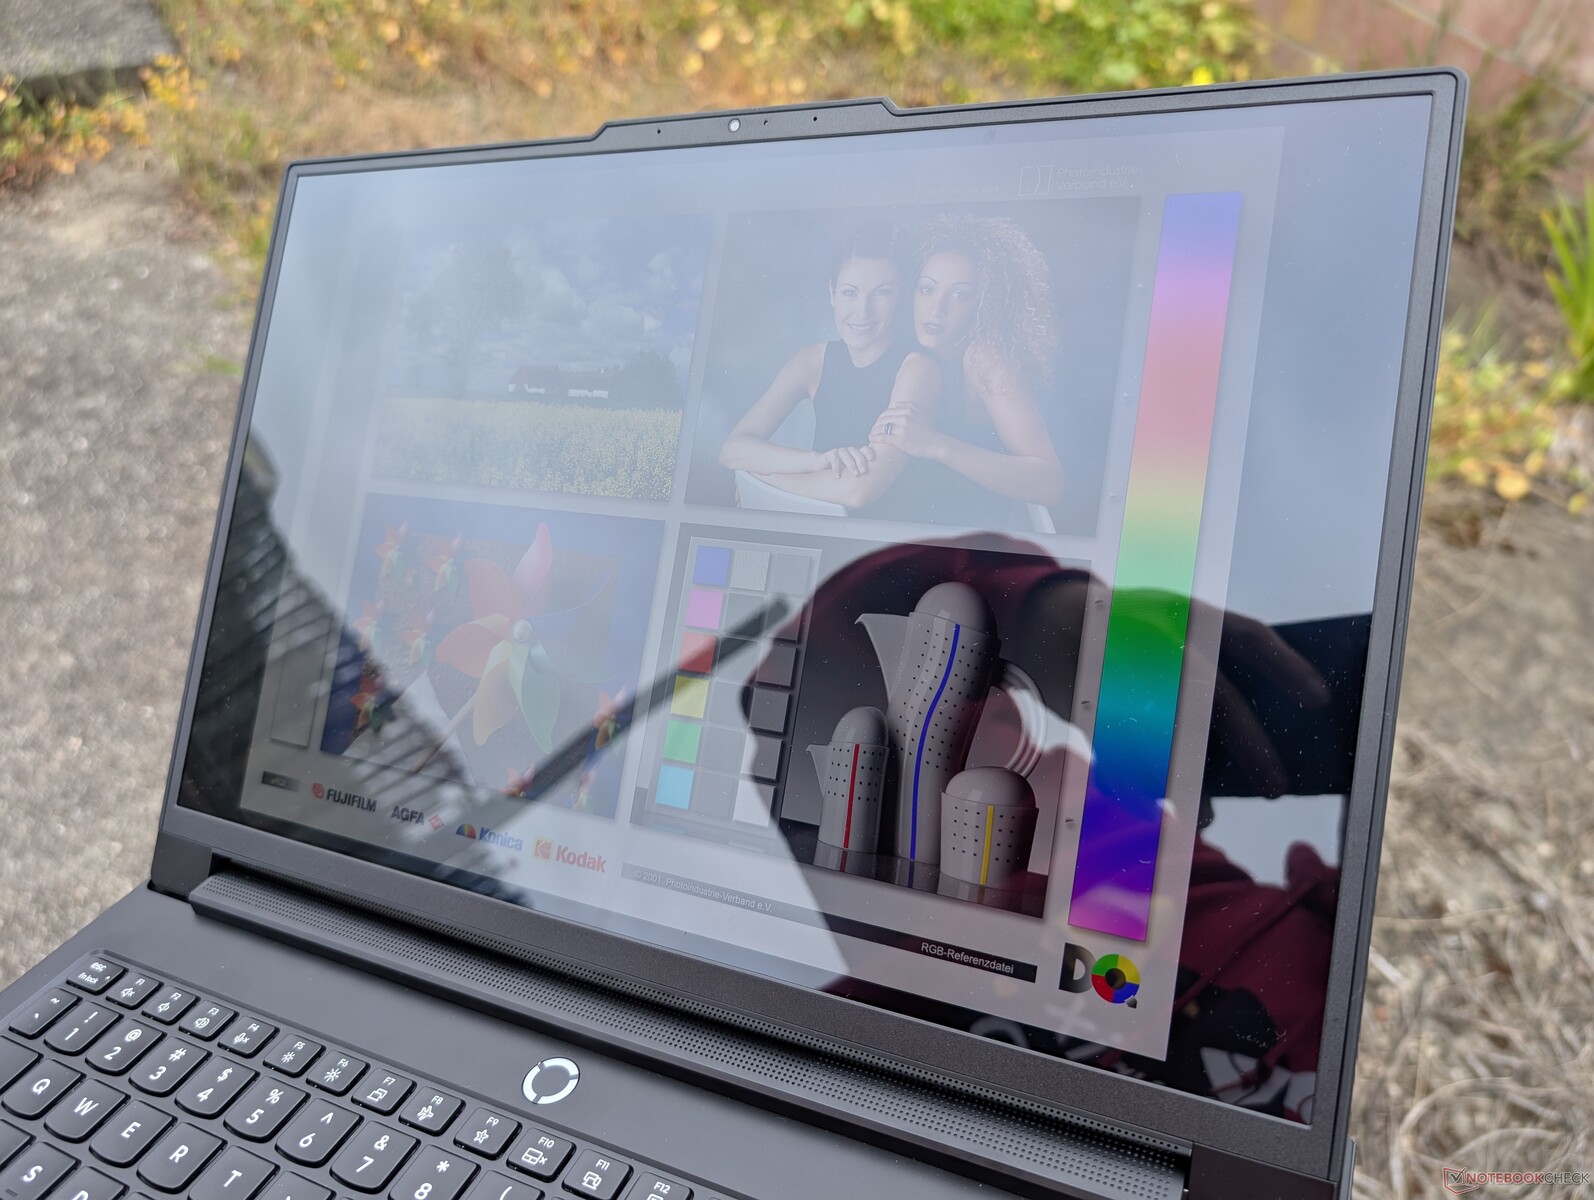
L'écran de 500 lumens est certes lumineux à l'intérieur, mais il n'a pas été conçu pour les conditions extérieures. Les reflets de l'écran brillant restent inévitables.


Performance - Arrow Lake avec 175 W TGP Graphics
Conditions d'essai
Nous avons réglé LegionSpace sur le mode Performance et le GPU sur le mode discret avant d'effectuer les tests de référence ci-dessous. Nous recommandons aux utilisateurs de se familiariser avec LegionSpace pour régler les aspects du système liés aux performances, au GPU ou aux effets LED. En attendant, Lenovo Vantage est toujours préinstallé pour ajuster les fonctionnalités non liées au jeu, telles que la charge de la batterie, la webcam ou le comportement du clavier.
Processeur
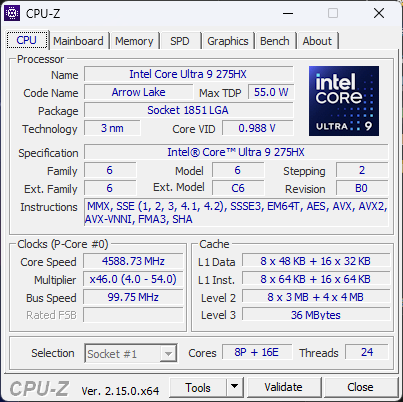
Le Core Ultra 9 275HX est l'un des processeurs les plus rapides d'Intel disponibles dans la famille Arrow Lake-HX. Il intègre le NPU de la série Meteor Lake-H (comme le Core Ultra 9 185H) avec les performances de la série Raptor Lake-HX (comme le Core i9-14900HX) pour offrir le meilleur des deux mondes, alors que les acheteurs devaient auparavant sacrifier l'un pour l'autre. Les performances multithread brutes sont nettement plus rapides que celles du Core Ultra 9 285H ou le Ryzen AI 9 HX 370 pour être au coude à coude avec le produit phare Ryzen 9 9955HX.
L'inconvénient le plus notable de ce nouveau processeur est sans doute sa forte consommation d'énergie, comme le montre notre section sur la gestion de l'énergie ci-dessous.
Cinebench R15 Multi Loop
Cinebench R23: Multi Core | Single Core
Cinebench R20: CPU (Multi Core) | CPU (Single Core)
Cinebench R15: CPU Multi 64Bit | CPU Single 64Bit
Blender: v2.79 BMW27 CPU
7-Zip 18.03: 7z b 4 | 7z b 4 -mmt1
Geekbench 6.4: Multi-Core | Single-Core
Geekbench 5.5: Multi-Core | Single-Core
HWBOT x265 Benchmark v2.2: 4k Preset
LibreOffice : 20 Documents To PDF
R Benchmark 2.5: Overall mean
* ... Moindre est la valeur, meilleures sont les performances
AIDA64: FP32 Ray-Trace | FPU Julia | CPU SHA3 | CPU Queen | FPU SinJulia | FPU Mandel | CPU AES | CPU ZLib | FP64 Ray-Trace | CPU PhotoWorxx
| Performance Rating | |
| Moyenne Intel Core Ultra 9 275HX | |
| Lenovo Legion Pro 7i 16 Gen 10 | |
| MSI Vector 16 HX A14V | |
| Lenovo Legion 9 16IRX9, RTX 4090 | |
| Razer Blade 16 2025 RTX 5090 | |
| Asus ROG Zephyrus G16 GU605CX | |
| Alienware x16 R2 P120F | |
| AIDA64 / FP32 Ray-Trace | |
| Moyenne Intel Core Ultra 9 275HX (32615 - 39551, n=6) | |
| Razer Blade 16 2025 RTX 5090 | |
| Lenovo Legion Pro 7i 16 Gen 10 | |
| MSI Vector 16 HX A14V | |
| Lenovo Legion 9 16IRX9, RTX 4090 | |
| Asus ROG Zephyrus G16 GU605CX | |
| Alienware x16 R2 P120F | |
| AIDA64 / FPU Julia | |
| Moyenne Intel Core Ultra 9 275HX (166245 - 194867, n=6) | |
| Lenovo Legion Pro 7i 16 Gen 10 | |
| MSI Vector 16 HX A14V | |
| Razer Blade 16 2025 RTX 5090 | |
| Lenovo Legion 9 16IRX9, RTX 4090 | |
| Asus ROG Zephyrus G16 GU605CX | |
| Alienware x16 R2 P120F | |
| AIDA64 / CPU SHA3 | |
| Moyenne Intel Core Ultra 9 275HX (7829 - 9482, n=6) | |
| Lenovo Legion Pro 7i 16 Gen 10 | |
| MSI Vector 16 HX A14V | |
| Lenovo Legion 9 16IRX9, RTX 4090 | |
| Razer Blade 16 2025 RTX 5090 | |
| Asus ROG Zephyrus G16 GU605CX | |
| Alienware x16 R2 P120F | |
| AIDA64 / CPU Queen | |
| MSI Vector 16 HX A14V | |
| Lenovo Legion Pro 7i 16 Gen 10 | |
| Moyenne Intel Core Ultra 9 275HX (125013 - 139608, n=6) | |
| Lenovo Legion 9 16IRX9, RTX 4090 | |
| Alienware x16 R2 P120F | |
| Razer Blade 16 2025 RTX 5090 | |
| Asus ROG Zephyrus G16 GU605CX | |
| AIDA64 / FPU SinJulia | |
| Razer Blade 16 2025 RTX 5090 | |
| MSI Vector 16 HX A14V | |
| Lenovo Legion 9 16IRX9, RTX 4090 | |
| Lenovo Legion Pro 7i 16 Gen 10 | |
| Moyenne Intel Core Ultra 9 275HX (13238 - 14112, n=6) | |
| Alienware x16 R2 P120F | |
| Asus ROG Zephyrus G16 GU605CX | |
| AIDA64 / FPU Mandel | |
| Moyenne Intel Core Ultra 9 275HX (87156 - 104057, n=6) | |
| Lenovo Legion Pro 7i 16 Gen 10 | |
| Razer Blade 16 2025 RTX 5090 | |
| MSI Vector 16 HX A14V | |
| Lenovo Legion 9 16IRX9, RTX 4090 | |
| Asus ROG Zephyrus G16 GU605CX | |
| Alienware x16 R2 P120F | |
| AIDA64 / CPU AES | |
| MSI Vector 16 HX A14V | |
| Lenovo Legion Pro 7i 16 Gen 10 | |
| Lenovo Legion 9 16IRX9, RTX 4090 | |
| Moyenne Intel Core Ultra 9 275HX (119356 - 134920, n=6) | |
| Alienware x16 R2 P120F | |
| Razer Blade 16 2025 RTX 5090 | |
| Asus ROG Zephyrus G16 GU605CX | |
| AIDA64 / CPU ZLib | |
| Moyenne Intel Core Ultra 9 275HX (1898 - 2220, n=6) | |
| MSI Vector 16 HX A14V | |
| Lenovo Legion Pro 7i 16 Gen 10 | |
| Lenovo Legion 9 16IRX9, RTX 4090 | |
| Razer Blade 16 2025 RTX 5090 | |
| Alienware x16 R2 P120F | |
| Asus ROG Zephyrus G16 GU605CX | |
| AIDA64 / FP64 Ray-Trace | |
| Razer Blade 16 2025 RTX 5090 | |
| Moyenne Intel Core Ultra 9 275HX (17631 - 21372, n=6) | |
| Lenovo Legion Pro 7i 16 Gen 10 | |
| MSI Vector 16 HX A14V | |
| Lenovo Legion 9 16IRX9, RTX 4090 | |
| Asus ROG Zephyrus G16 GU605CX | |
| Alienware x16 R2 P120F | |
| AIDA64 / CPU PhotoWorxx | |
| Asus ROG Zephyrus G16 GU605CX | |
| Lenovo Legion 9 16IRX9, RTX 4090 | |
| Lenovo Legion Pro 7i 16 Gen 10 | |
| Alienware x16 R2 P120F | |
| Moyenne Intel Core Ultra 9 275HX (47726 - 56613, n=6) | |
| Razer Blade 16 2025 RTX 5090 | |
| MSI Vector 16 HX A14V | |
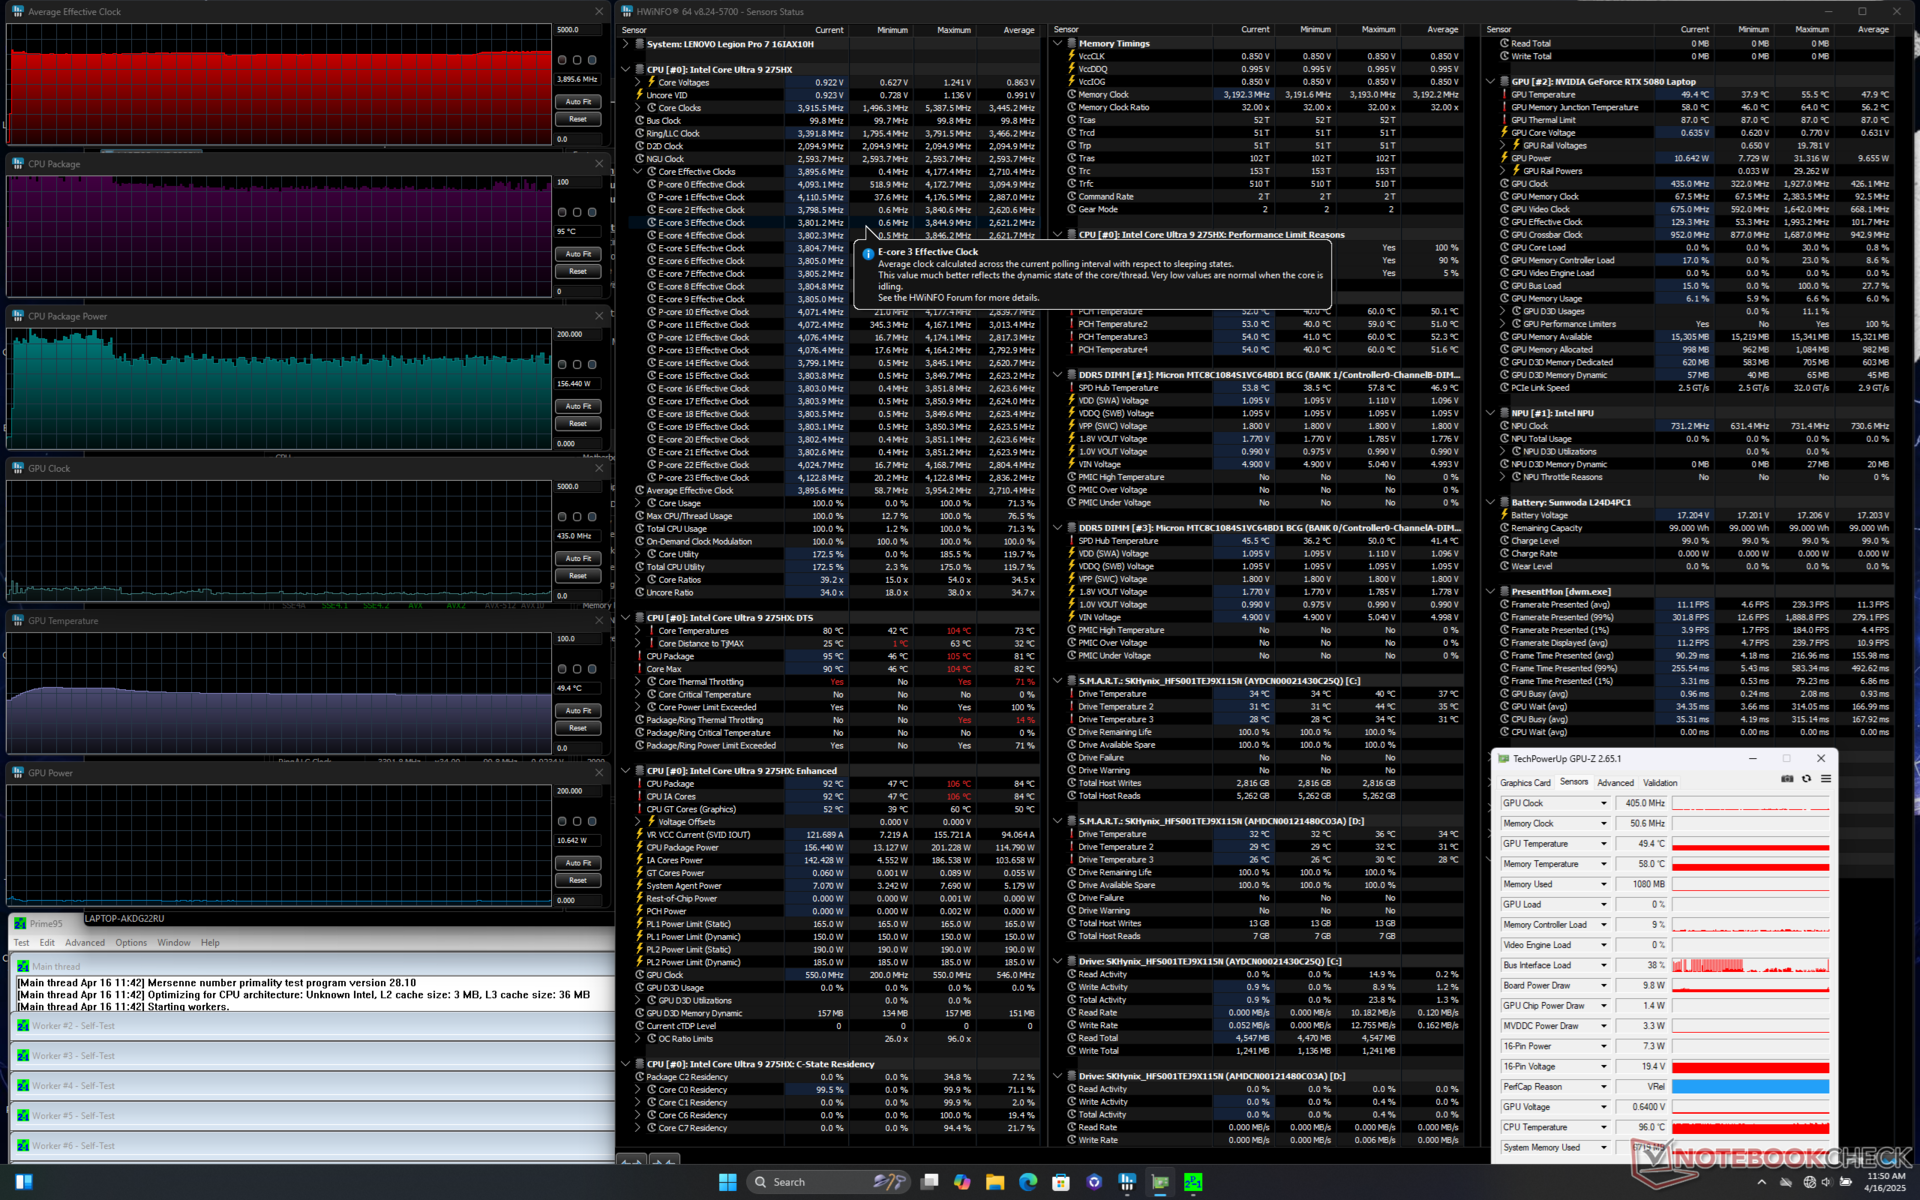
Test de stress
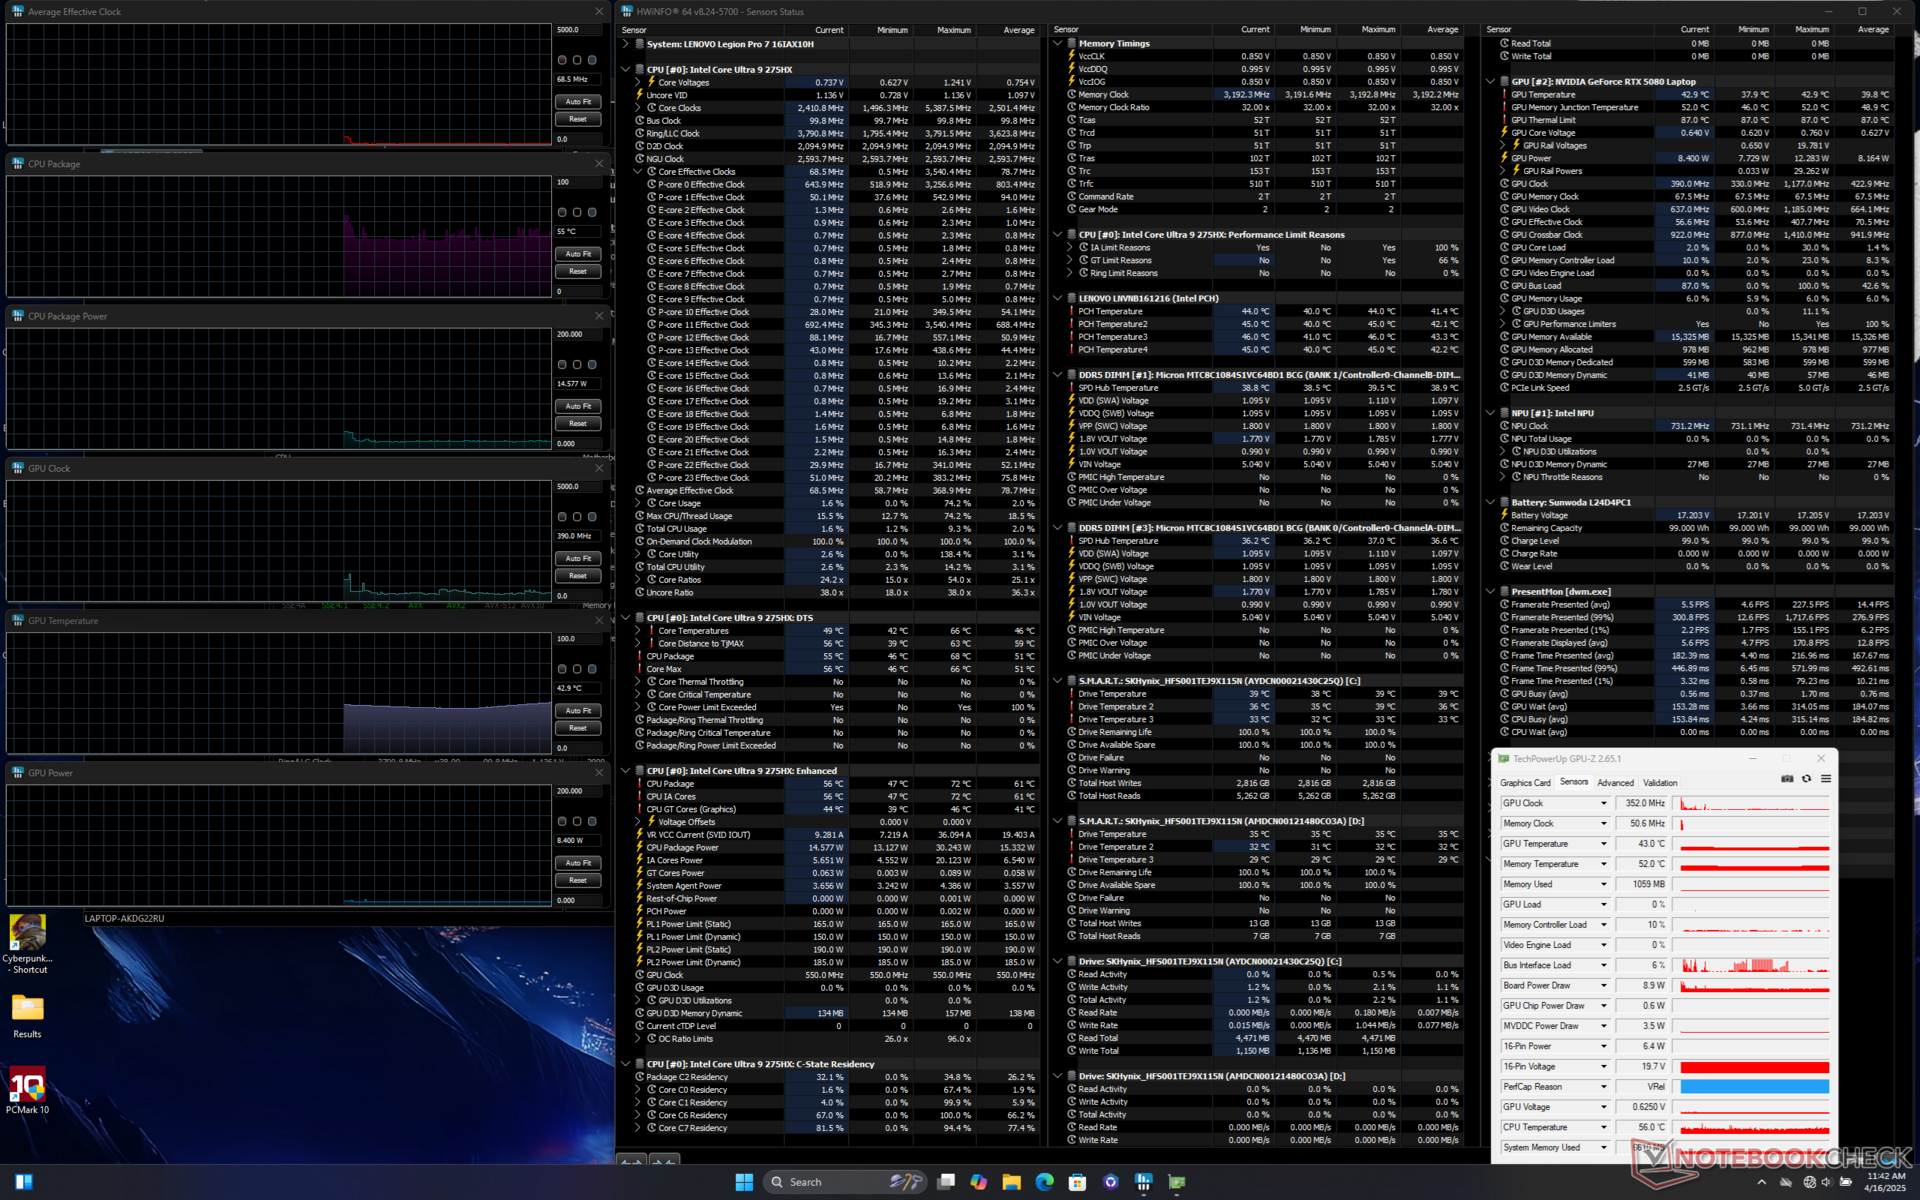
Les températures des cœurs peuvent être très élevées, en particulier pour le CPU, malgré la solution de refroidissement par chambre à vapeur surdimensionnée. Le CPU se stabilise à 3.9 GHz, ~156 W, et 95 C lors de l'exécution du stress Prime95, ce qui est encore plus chaud que la température déjà élevée du processeur Legion Pro 5 16IRX9 dans des conditions similaires.
En exécutant Cyberpunk 2077 en mode Performance pour représenter le stress typique des jeux, le GPU Nvidia se stabiliserait à 80 C et 155 W tandis que le CPU se stabiliserait à 90 C et 76 W. En descendant en mode Équilibré, le GPU se stabilise à 65 C et 95 W et le CPU à 70 C et 40 W avec des horloges processeur et mémoire plus lentes, comme le montrent les captures d'écran ci-dessous. Les économies d'énergie sont donc significatives entre les profils d'alimentation Balanced et Performance.
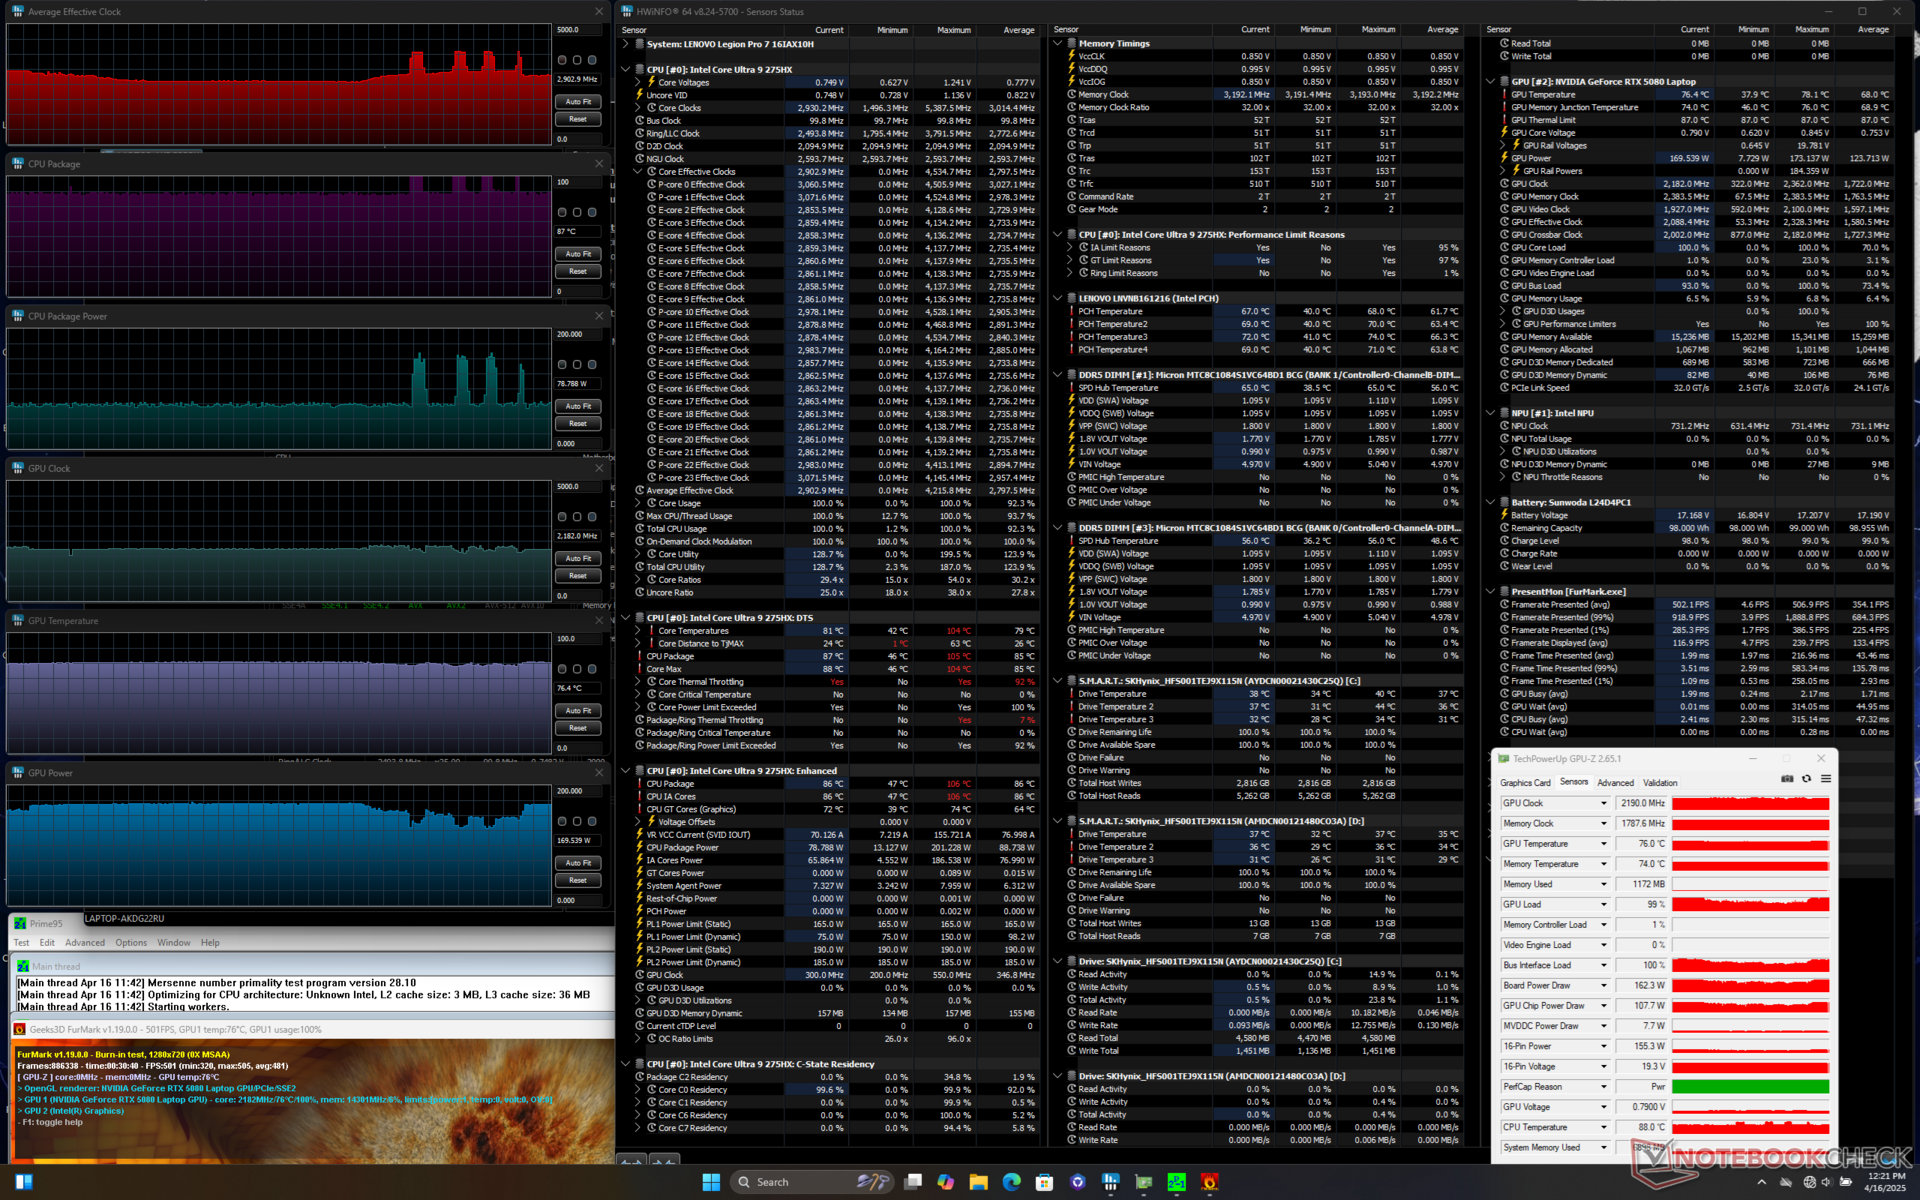
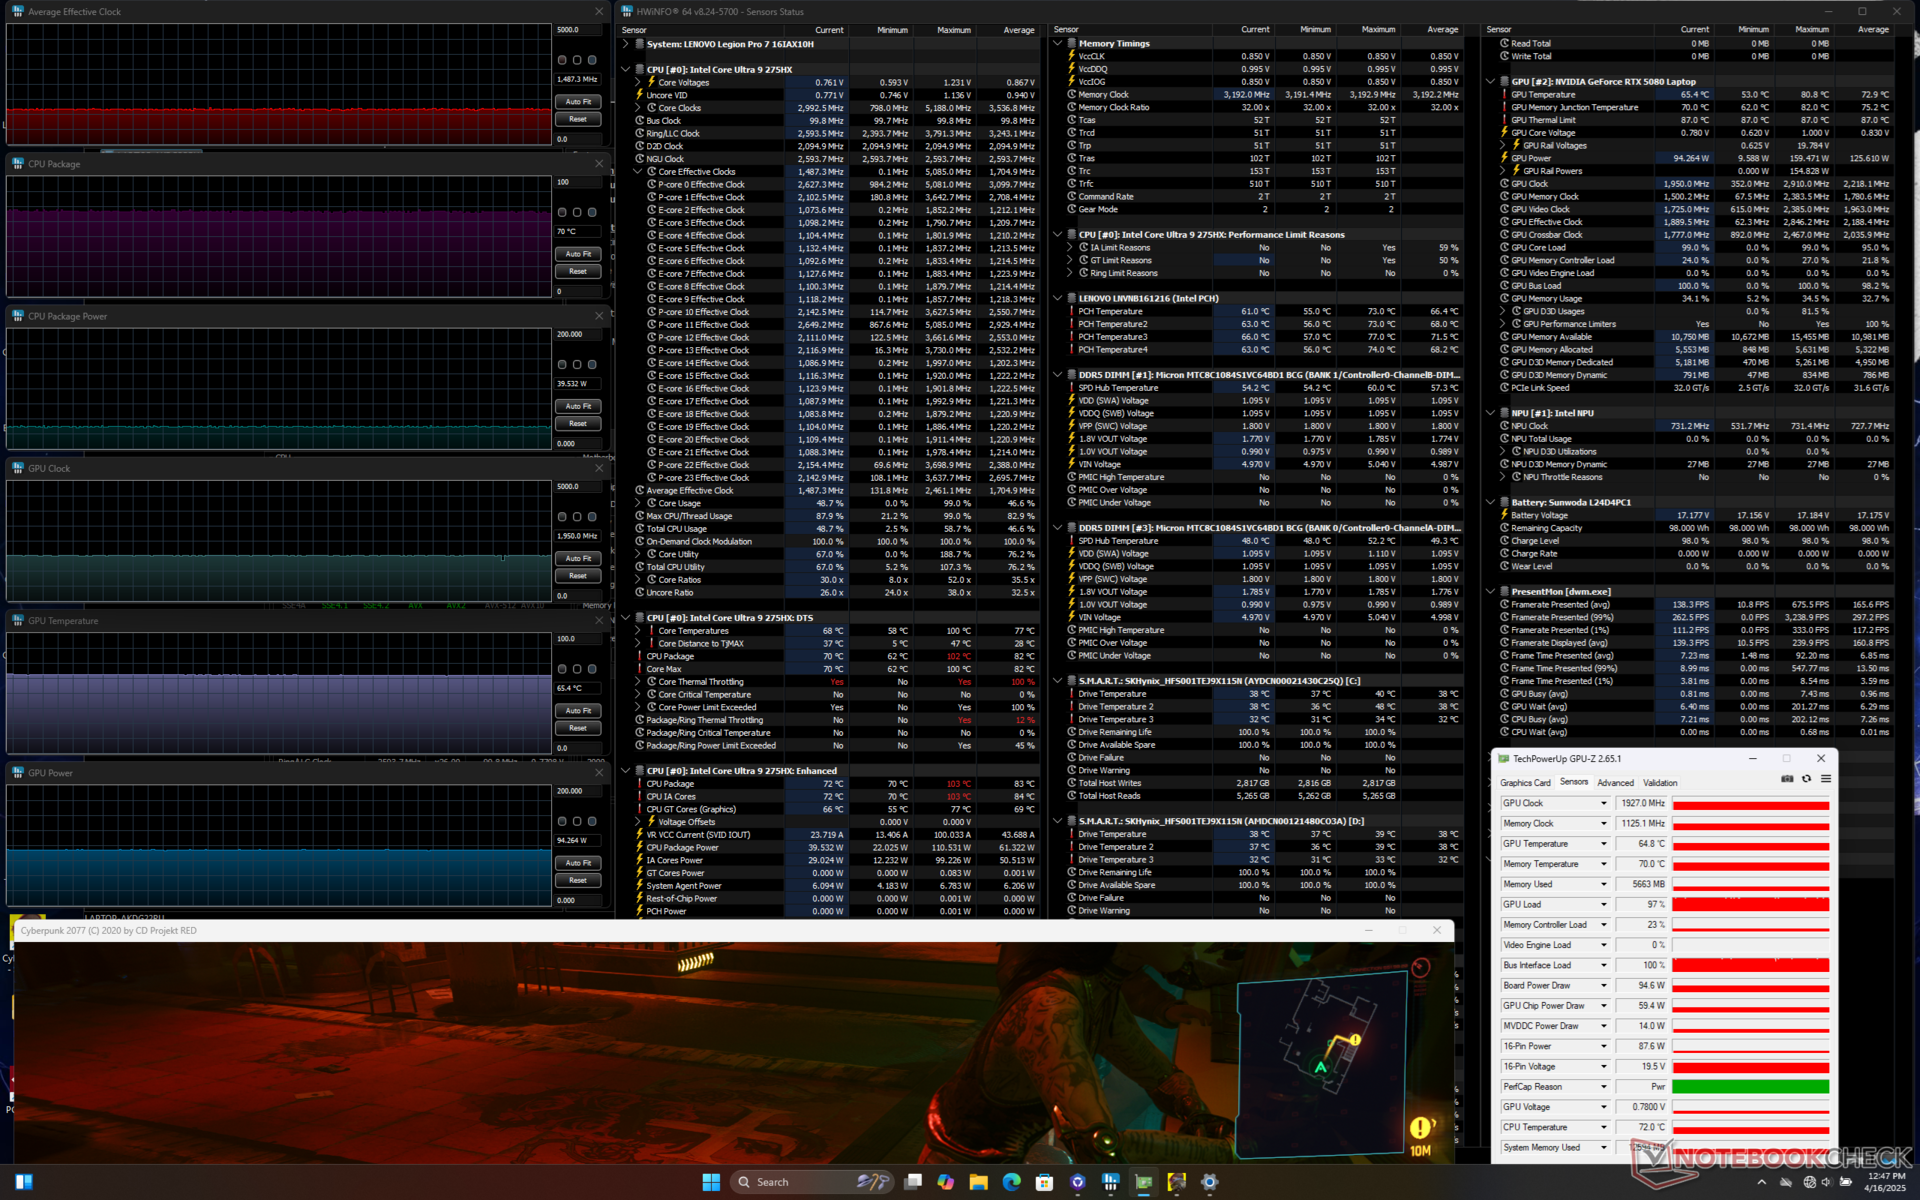
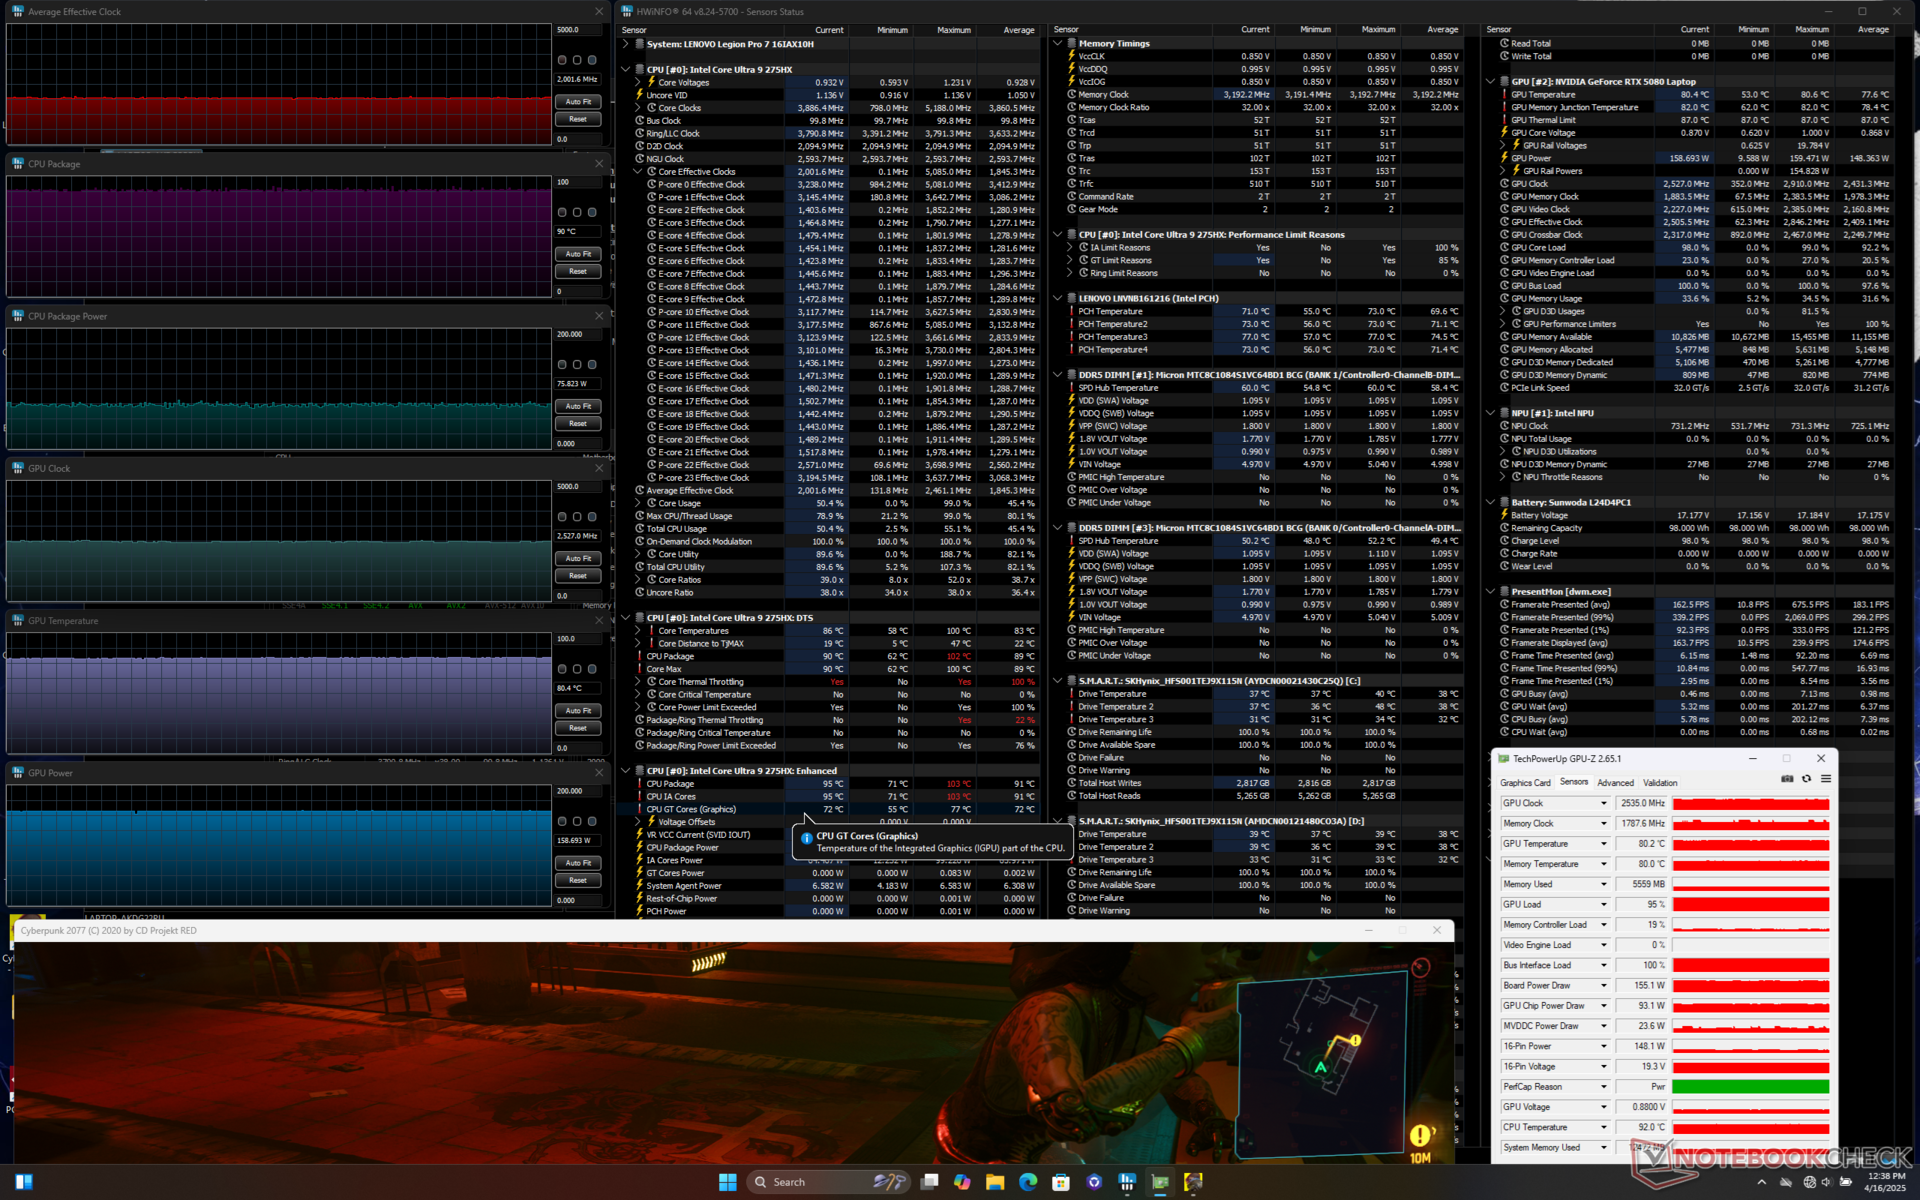
| Horloge moyenne du CPU (GHz) | Horloge du GPU (MHz) | Température moyenne du CPU (°C) | Température moyenne du GPU (°C) | |
| Système en veille | -- | -- | 55 | 43 |
| Prime95 Stress | 3.9 | -- | 95 | 49 |
| Prime95 + FurMark Stress | 2.9 | 2190 | 87 | 76 |
| Cyberpunk 2077 Stress (mode Performance) | 2.0 | 2535 | 90 | 80 |
| Cyberpunk 2077 Stress (mode équilibré) | 1.5 | 1927 | 70 | 65 |
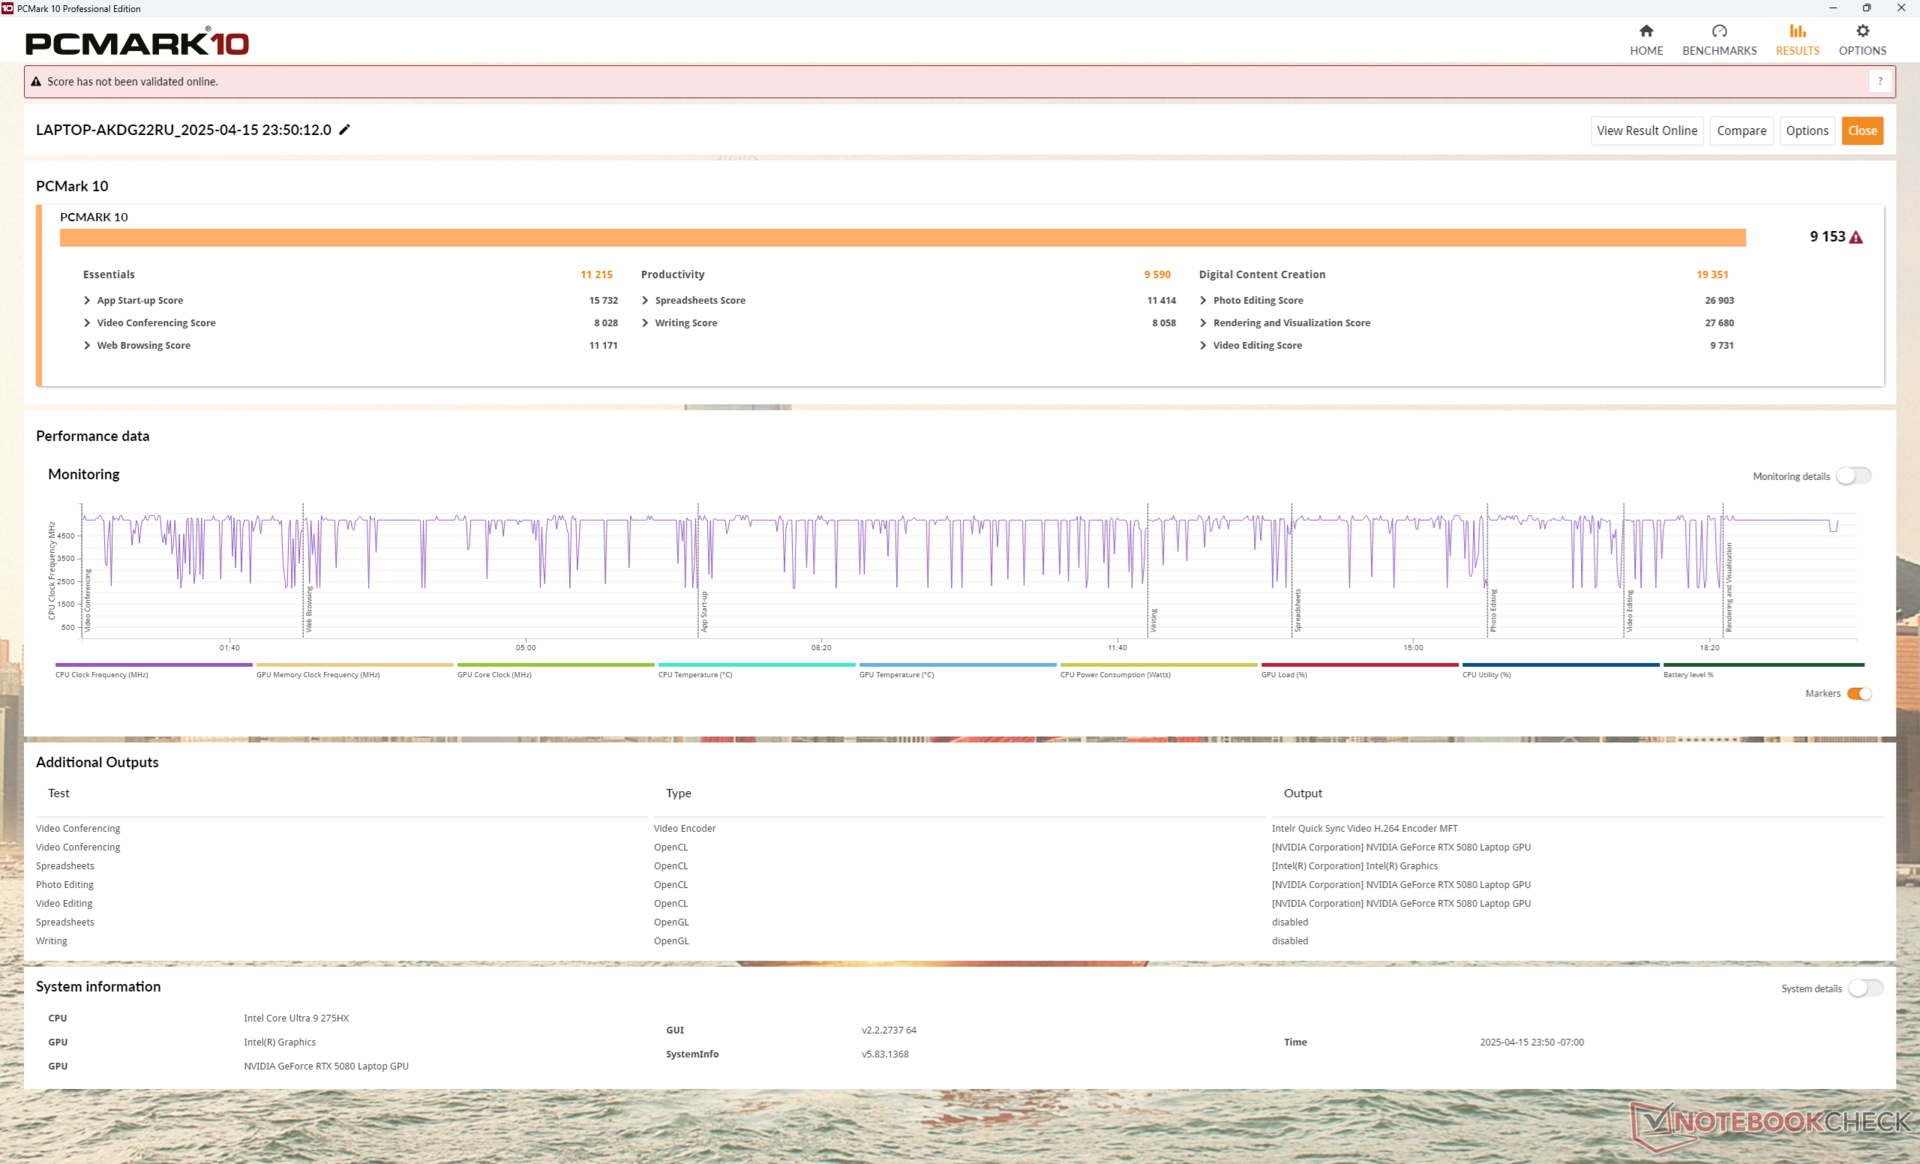
Performance du système
Le score PCMark moyen est plus élevé que la plupart des autres ordinateurs portables RTX 5090 de 16 pouces que nous avons testés jusqu'à présent, y compris le Razer Blade 16 et l'Asus ROG Zephyrus G16. Seul le Schenker Neo 16 A25 est capable de surpasser notre système Lenovo, en partie grâce à son CPU Ryzen 9 9955HX et son SSD PCIe5 Samsung 9100 Pro.
CrossMark: Overall | Productivity | Creativity | Responsiveness
WebXPRT 3: Overall
WebXPRT 4: Overall
Mozilla Kraken 1.1: Total
| PCMark 10 / Score | |
| Lenovo Legion Pro 7i 16 Gen 10 | |
| Moyenne Intel Core Ultra 9 275HX, Nvidia GeForce RTX 5080 Laptop (8856 - 9153, n=2) | |
| Asus ROG Zephyrus G16 GU605CX | |
| MSI Vector 16 HX A14V | |
| Razer Blade 16 2025 RTX 5090 | |
| Lenovo Legion 9 16IRX9, RTX 4090 | |
| Alienware x16 R2 P120F | |
| PCMark 10 / Essentials | |
| MSI Vector 16 HX A14V | |
| Lenovo Legion Pro 7i 16 Gen 10 | |
| Moyenne Intel Core Ultra 9 275HX, Nvidia GeForce RTX 5080 Laptop (11177 - 11215, n=2) | |
| Lenovo Legion 9 16IRX9, RTX 4090 | |
| Asus ROG Zephyrus G16 GU605CX | |
| Razer Blade 16 2025 RTX 5090 | |
| Alienware x16 R2 P120F | |
| PCMark 10 / Productivity | |
| Asus ROG Zephyrus G16 GU605CX | |
| Razer Blade 16 2025 RTX 5090 | |
| Lenovo Legion 9 16IRX9, RTX 4090 | |
| MSI Vector 16 HX A14V | |
| Lenovo Legion Pro 7i 16 Gen 10 | |
| Moyenne Intel Core Ultra 9 275HX, Nvidia GeForce RTX 5080 Laptop (9212 - 9590, n=2) | |
| Alienware x16 R2 P120F | |
| PCMark 10 / Digital Content Creation | |
| Lenovo Legion Pro 7i 16 Gen 10 | |
| Moyenne Intel Core Ultra 9 275HX, Nvidia GeForce RTX 5080 Laptop (18305 - 19351, n=2) | |
| MSI Vector 16 HX A14V | |
| Asus ROG Zephyrus G16 GU605CX | |
| Razer Blade 16 2025 RTX 5090 | |
| Lenovo Legion 9 16IRX9, RTX 4090 | |
| Alienware x16 R2 P120F | |
| CrossMark / Overall | |
| MSI Vector 16 HX A14V | |
| Moyenne Intel Core Ultra 9 275HX, Nvidia GeForce RTX 5080 Laptop (2017 - 2165, n=2) | |
| Asus ROG Zephyrus G16 GU605CX | |
| Lenovo Legion Pro 7i 16 Gen 10 | |
| Lenovo Legion 9 16IRX9, RTX 4090 | |
| Alienware x16 R2 P120F | |
| CrossMark / Productivity | |
| MSI Vector 16 HX A14V | |
| Moyenne Intel Core Ultra 9 275HX, Nvidia GeForce RTX 5080 Laptop (1922 - 2014, n=2) | |
| Lenovo Legion Pro 7i 16 Gen 10 | |
| Asus ROG Zephyrus G16 GU605CX | |
| Lenovo Legion 9 16IRX9, RTX 4090 | |
| Alienware x16 R2 P120F | |
| CrossMark / Creativity | |
| MSI Vector 16 HX A14V | |
| Asus ROG Zephyrus G16 GU605CX | |
| Moyenne Intel Core Ultra 9 275HX, Nvidia GeForce RTX 5080 Laptop (2288 - 2451, n=2) | |
| Lenovo Legion Pro 7i 16 Gen 10 | |
| Lenovo Legion 9 16IRX9, RTX 4090 | |
| Alienware x16 R2 P120F | |
| CrossMark / Responsiveness | |
| MSI Vector 16 HX A14V | |
| Lenovo Legion 9 16IRX9, RTX 4090 | |
| Moyenne Intel Core Ultra 9 275HX, Nvidia GeForce RTX 5080 Laptop (1597 - 1853, n=2) | |
| Alienware x16 R2 P120F | |
| Asus ROG Zephyrus G16 GU605CX | |
| Lenovo Legion Pro 7i 16 Gen 10 | |
| WebXPRT 3 / Overall | |
| Lenovo Legion Pro 7i 16 Gen 10 | |
| Moyenne Intel Core Ultra 9 275HX, Nvidia GeForce RTX 5080 Laptop (347 - 359, n=2) | |
| Asus ROG Zephyrus G16 GU605CX | |
| MSI Vector 16 HX A14V | |
| Razer Blade 16 2025 RTX 5090 | |
| Lenovo Legion 9 16IRX9, RTX 4090 | |
| Alienware x16 R2 P120F | |
| WebXPRT 4 / Overall | |
| Moyenne Intel Core Ultra 9 275HX, Nvidia GeForce RTX 5080 Laptop (333 - 336, n=2) | |
| Lenovo Legion Pro 7i 16 Gen 10 | |
| Asus ROG Zephyrus G16 GU605CX | |
| MSI Vector 16 HX A14V | |
| Razer Blade 16 2025 RTX 5090 | |
| Lenovo Legion 9 16IRX9, RTX 4090 | |
| Alienware x16 R2 P120F | |
| Mozilla Kraken 1.1 / Total | |
| Alienware x16 R2 P120F | |
| Lenovo Legion 9 16IRX9, RTX 4090 | |
| Asus ROG Zephyrus G16 GU605CX | |
| MSI Vector 16 HX A14V | |
| Razer Blade 16 2025 RTX 5090 | |
| Lenovo Legion Pro 7i 16 Gen 10 | |
| Moyenne Intel Core Ultra 9 275HX, Nvidia GeForce RTX 5080 Laptop (405 - 408, n=2) | |
* ... Moindre est la valeur, meilleures sont les performances
| PCMark 10 Score | 9153 points | |
Aide | ||
| AIDA64 / Memory Copy | |
| Asus ROG Zephyrus G16 GU605CX | |
| Razer Blade 16 2025 RTX 5090 | |
| Alienware x16 R2 P120F | |
| Lenovo Legion Pro 7i 16 Gen 10 | |
| Lenovo Legion 9 16IRX9, RTX 4090 | |
| Moyenne Intel Core Ultra 9 275HX (74558 - 86549, n=6) | |
| MSI Vector 16 HX A14V | |
| AIDA64 / Memory Read | |
| Razer Blade 16 2025 RTX 5090 | |
| Lenovo Legion Pro 7i 16 Gen 10 | |
| MSI Vector 16 HX A14V | |
| Alienware x16 R2 P120F | |
| Moyenne Intel Core Ultra 9 275HX (74094 - 95542, n=6) | |
| Lenovo Legion 9 16IRX9, RTX 4090 | |
| Asus ROG Zephyrus G16 GU605CX | |
| AIDA64 / Memory Write | |
| Razer Blade 16 2025 RTX 5090 | |
| Lenovo Legion Pro 7i 16 Gen 10 | |
| Lenovo Legion 9 16IRX9, RTX 4090 | |
| Moyenne Intel Core Ultra 9 275HX (72929 - 84581, n=6) | |
| MSI Vector 16 HX A14V | |
| Asus ROG Zephyrus G16 GU605CX | |
| Alienware x16 R2 P120F | |
| AIDA64 / Memory Latency | |
| Alienware x16 R2 P120F | |
| Asus ROG Zephyrus G16 GU605CX | |
| Moyenne Intel Core Ultra 9 275HX (108.9 - 125.1, n=6) | |
| Lenovo Legion Pro 7i 16 Gen 10 | |
| Razer Blade 16 2025 RTX 5090 | |
| Lenovo Legion 9 16IRX9, RTX 4090 | |
| MSI Vector 16 HX A14V | |
* ... Moindre est la valeur, meilleures sont les performances
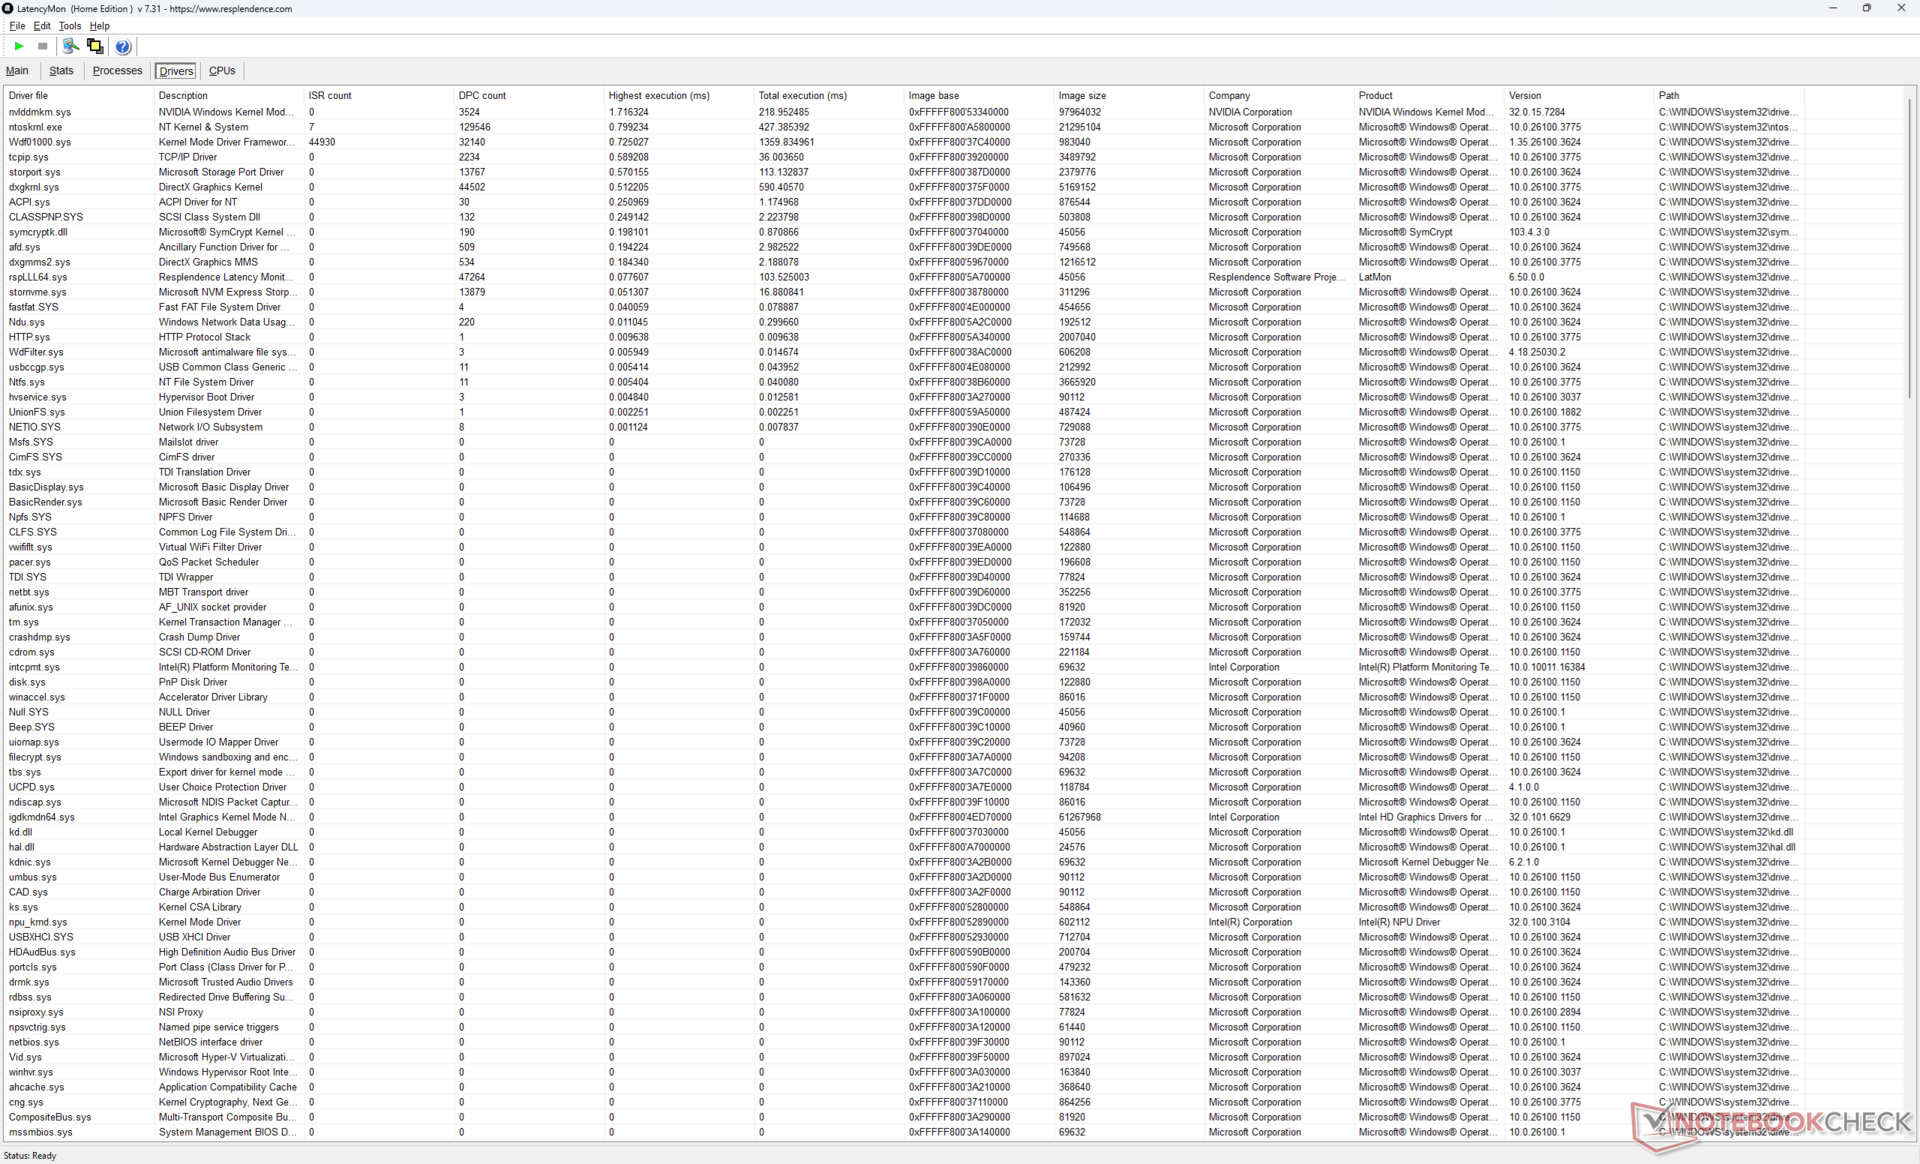
Latence DPC
LatencyMon ne révèle que des problèmes mineurs de DPC lors de l'ouverture de plusieurs onglets de notre page d'accueil et une seule image perdue lors de notre test de lecture vidéo 4K60.

| DPC Latencies / LatencyMon - interrupt to process latency (max), Web, Youtube, Prime95 | |
| Alienware x16 R2 P120F | |
| Asus ROG Zephyrus G16 GU605CX | |
| Lenovo Legion 9 16IRX9, RTX 4090 | |
| MSI Vector 16 HX A14V | |
| Razer Blade 16 2025 RTX 5090 | |
| Lenovo Legion Pro 7i 16 Gen 10 | |
* ... Moindre est la valeur, meilleures sont les performances
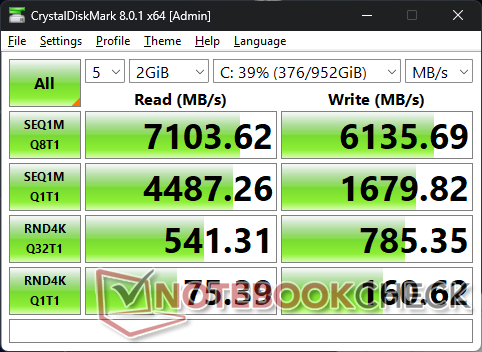
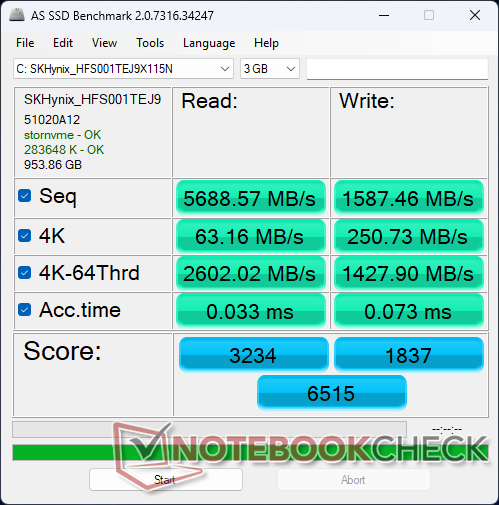
Dispositifs de stockage
Le modèle prend en charge jusqu'à deux disques SSD M.2 2280, avec un emplacement pour les disques PCIe5. Cependant, notre unité de test est livrée avec des disques PCIe4 uniquement et nous ne pouvons donc pas tester l'efficacité d'un disque PCIe5. Notre disque PCIe4 SK Hynix fonctionnerait néanmoins de manière plus stable et à des vitesses plus élevées que le Micron 3400 sur le Legion 9 16IRX9 de l'année dernière.

| Drive Performance Rating - Percent | |
| Alienware x16 R2 P120F | |
| Razer Blade 16 2025 RTX 5090 | |
| Lenovo Legion Pro 7i 16 Gen 10 | |
| Lenovo Legion 9 16IRX9, RTX 4090 | |
| Asus ROG Zephyrus G16 GU605CX | |
| MSI Vector 16 HX A14V | |
* ... Moindre est la valeur, meilleures sont les performances
Disk Throttling: DiskSpd Read Loop, Queue Depth 8
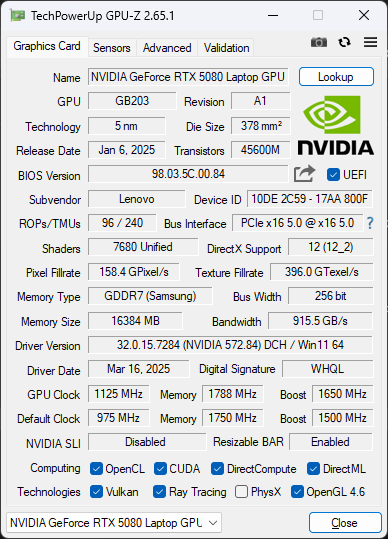
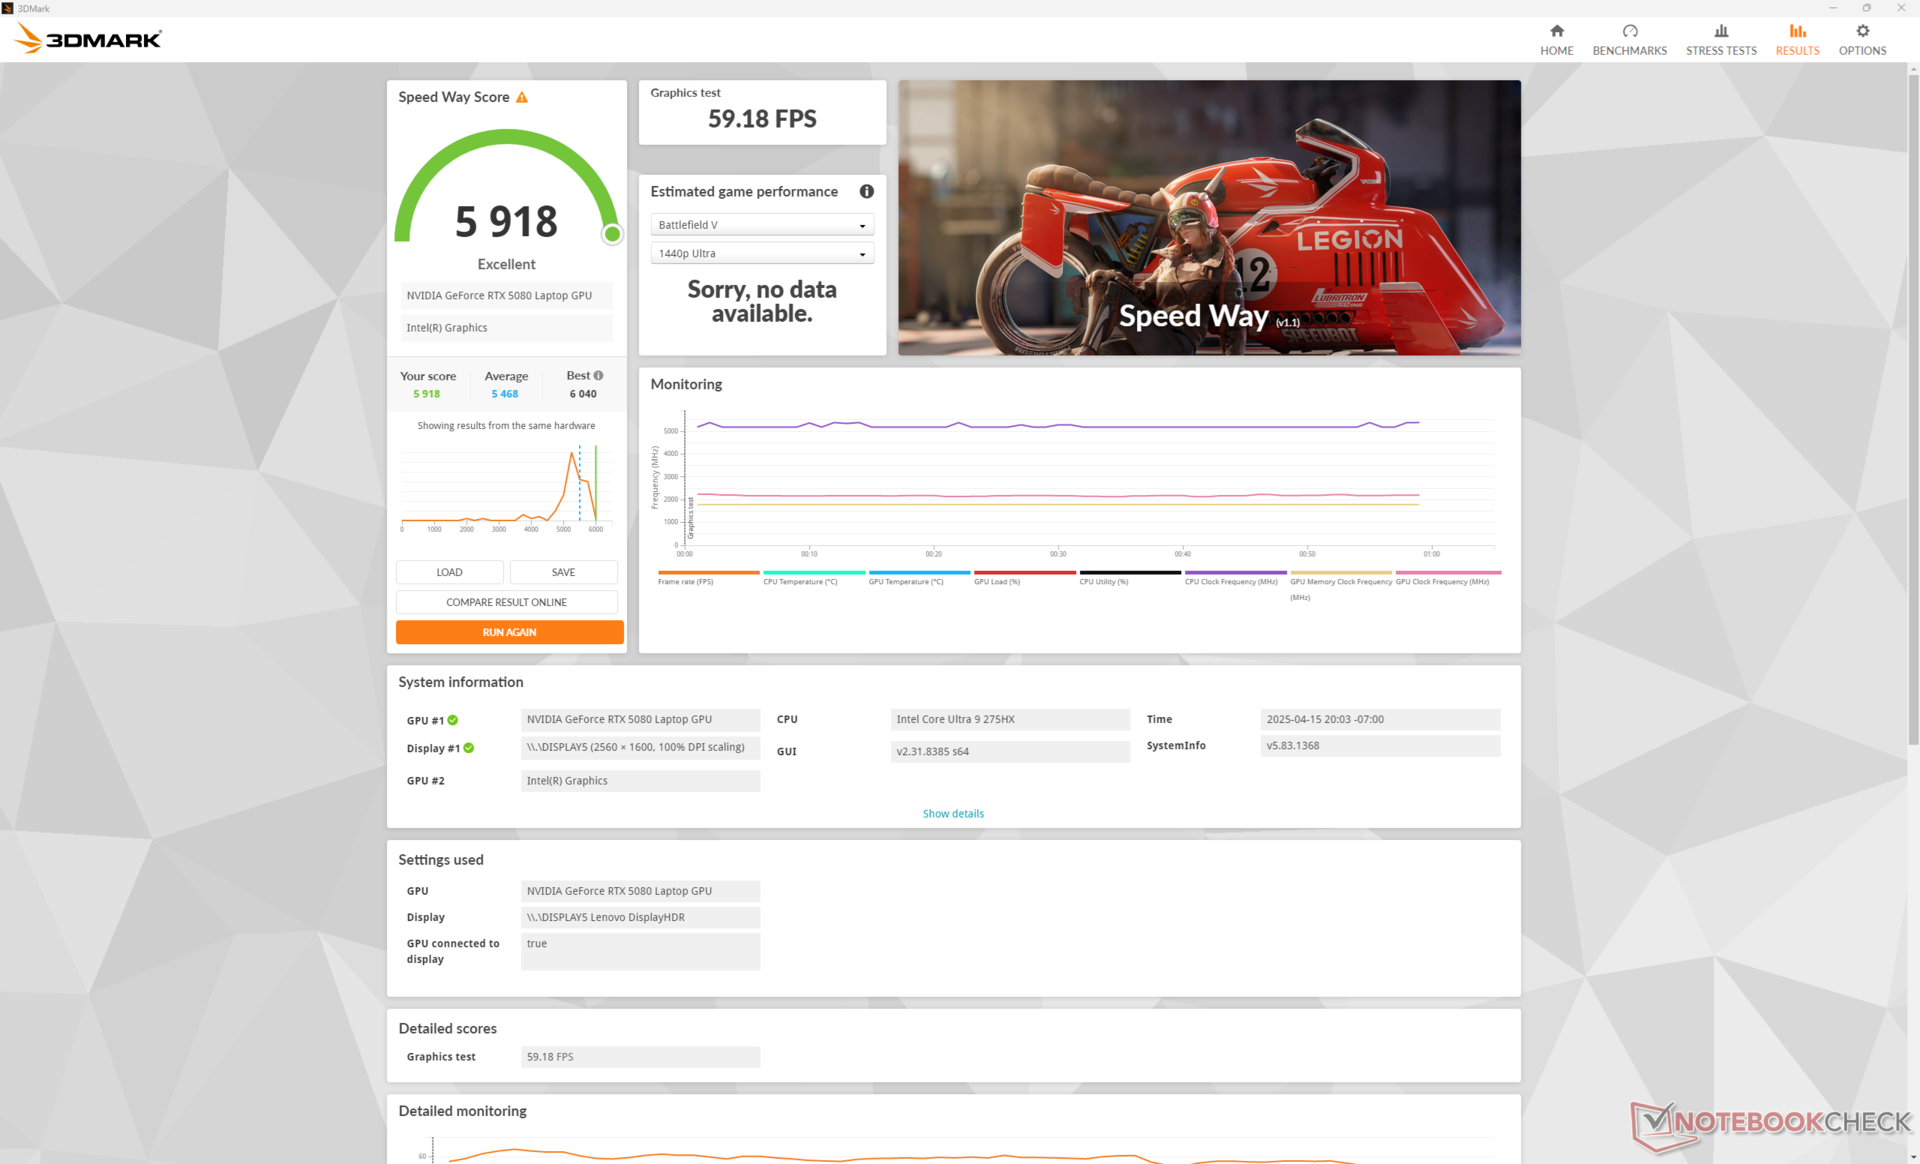
Performance du GPU
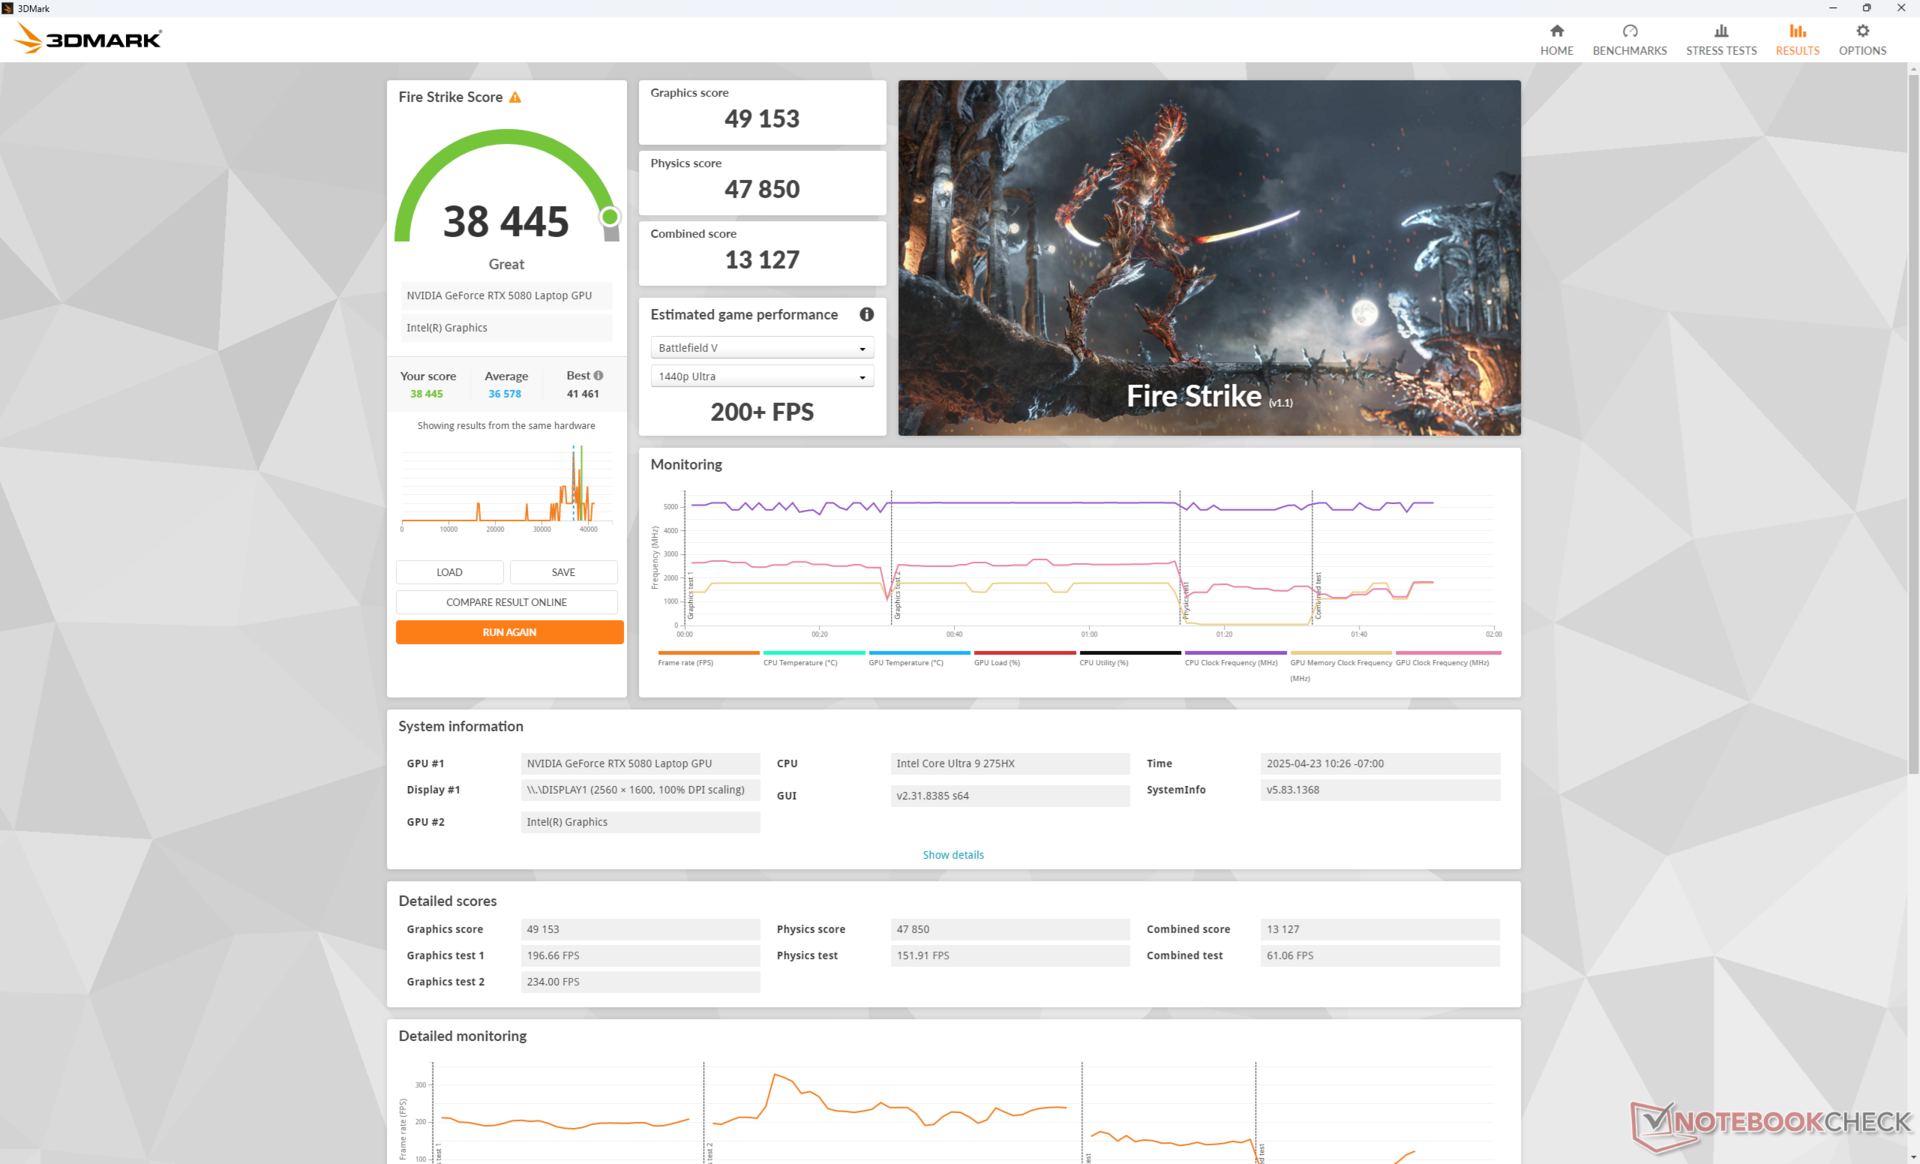
Notre revue complète sur la mobile GeForce RTX 5080 est disponible ici pour plus d'informations sur le GPU et ses performances attendues. Elle n'est que 10 à 20 % plus rapide que la rTX 4080 mobile de la MSI Vector 16 HX en ce qui concerne la rastérisation, ce qui signifie que ses principaux avantages résident dans ses cœurs Tensor plus efficaces, la prise en charge de la génération multi-images et l'encodage/décodage 4:2:2.
| Profil de puissance | Score graphique | Score physique | Score combiné |
| Mode Performance | 49153 | 47850 | 13127 |
| Mode équilibré | 42534 (-13%) | 47090 (-2%) | 13080 (-0%) |
| Puissance de la batterie | 28253 (-43%) | 26031 (-46%) | 7548 (-43%) |
Jouer en mode équilibré au lieu du mode performance réduirait les performances graphiques d'environ 13 %.
| 3DMark 11 Performance | 51894 points | |
| 3DMark Fire Strike Score | 38445 points | |
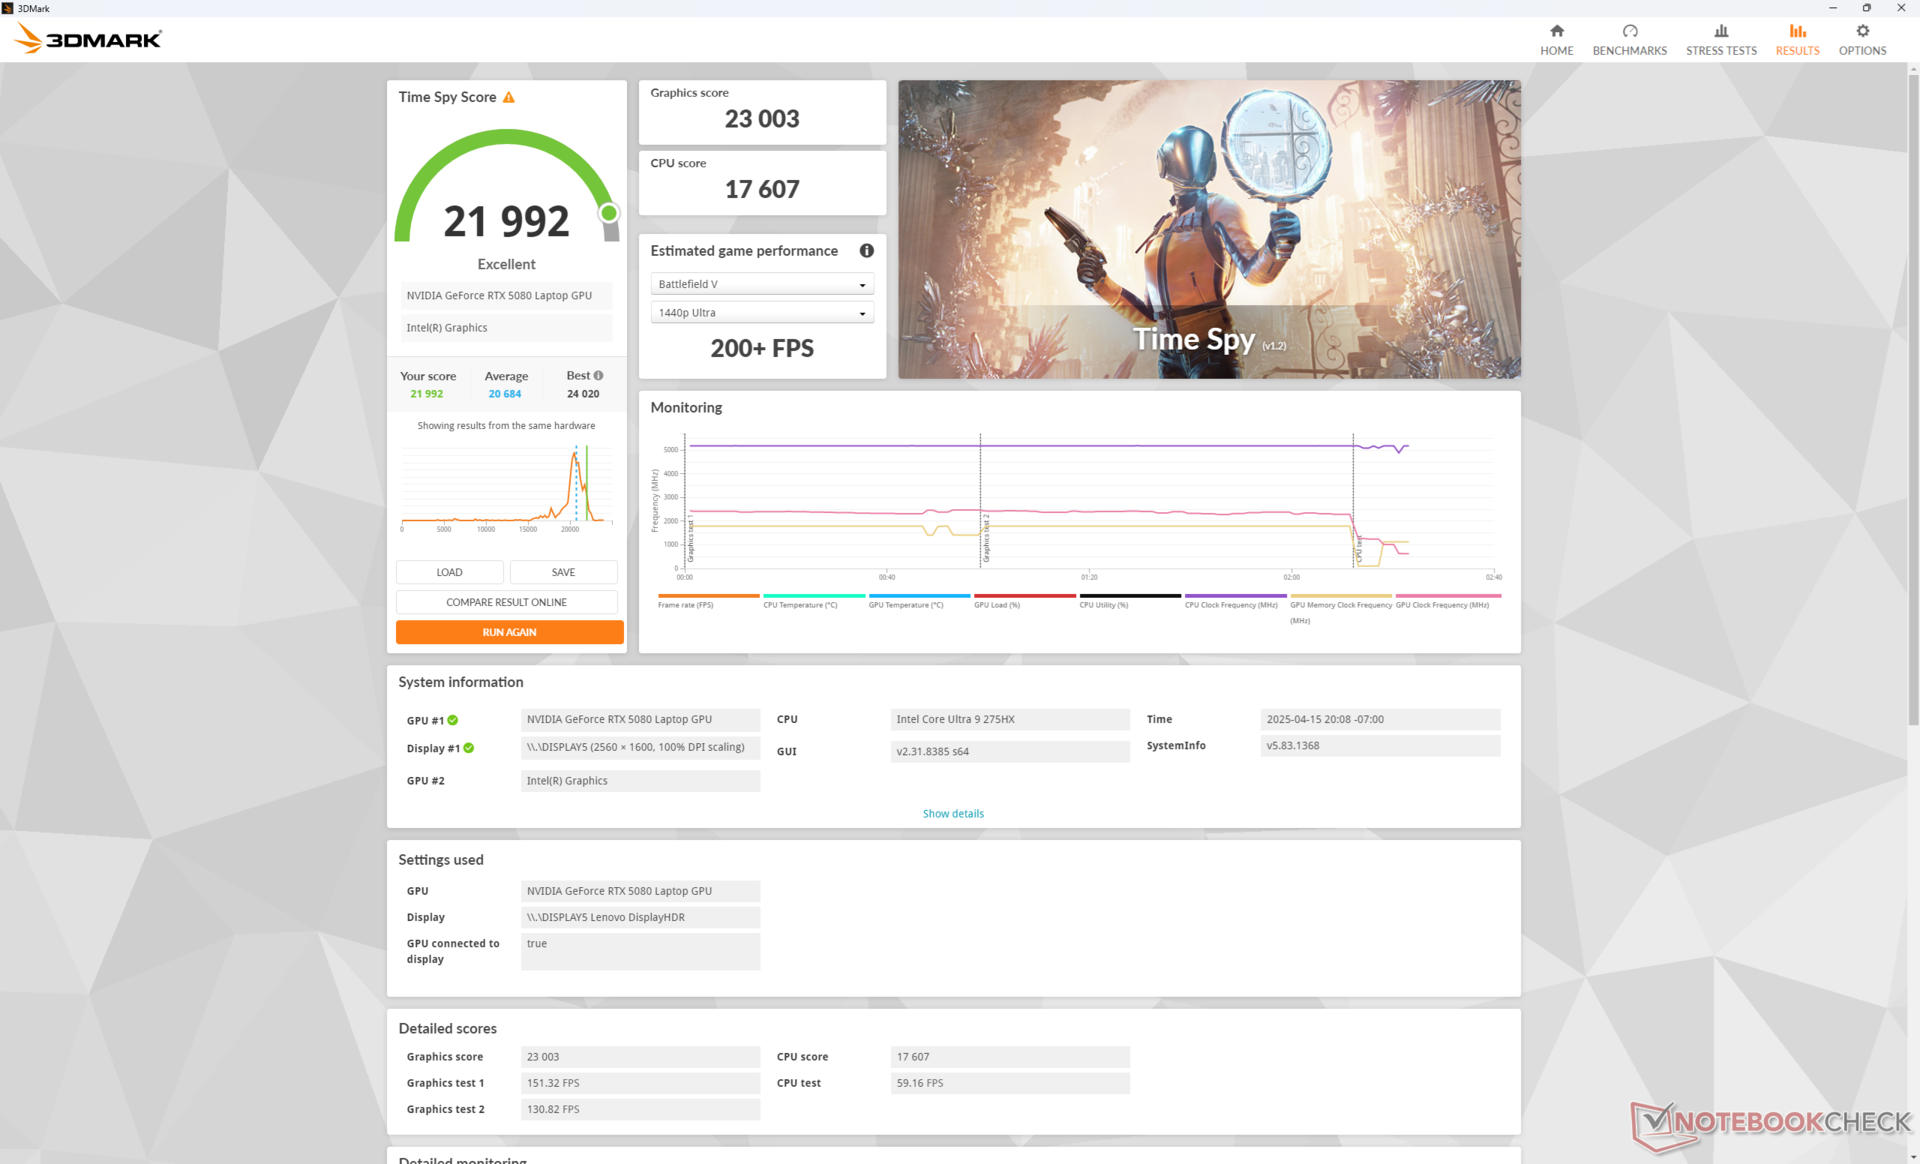
| 3DMark Time Spy Score | 21992 points | |
Aide | ||
* ... Moindre est la valeur, meilleures sont les performances
Performances des jeux
La RTX 5080 mobile est loin d'être aussi puissante que la RTX 5080 de bureau, qui peut facilement jouer en 4K avec des paramètres maximums. Notre version mobile a du mal à jouer sur des moniteurs 4K externes même avec DLSS actif ; Black Myth Wukong, par exemple, n'atteint en moyenne que 45 FPS avec des paramètres 4K maximum en mode DLSS Quality. Pour l'écran OLED 2K natif, cependant, la RTX 5080 mobile est parfaitement adaptée.
| Paramètres de Cyberpunk 2077 Phantom Liberty (préréglage rapide maximum à 1600p natif) | Qualité DLSS | Performance DLSS | Qualité DLSS avec 2x Frame Generation | Qualité DLSS avec 4x Frame Generation | DLAA |
| FPS moyen | 47.4 | 69.1 | 83.4 | 151 | 23 |
Cyberpunk 2077 ultra FPS Chart
| Bas | Moyen | Élevé | Ultra | QHD DLSS | QHD | 4K DLSS | 4K FSR | 4K | |
|---|---|---|---|---|---|---|---|---|---|
| Dota 2 Reborn (2015) | 240 | 216 | 203 | 188.9 | 182.1 | ||||
| Final Fantasy XV Benchmark (2018) | 210 | 173.1 | 101.3 | ||||||
| X-Plane 11.11 (2018) | 156.6 | 153.7 | 124.5 | 100.7 | |||||
| Strange Brigade (2018) | 481 | 434 | 304 | 169.7 | |||||
| Baldur's Gate 3 (2023) | 276.1 | 250.5 | 220.1 | 211.5 | 155.8 | 132.4 | 81.1 | ||
| Cyberpunk 2077 2.2 Phantom Liberty (2023) | 198.4 | 192 | 172.5 | 156.2 | 119 | 99.8 | 73.4 | 43 | 47.1 |
| Alan Wake 2 (2023) | 135.6 | 131.9 | 124.2 | 83.8 | 43.1 | ||||
| Black Myth: Wukong (2024) | 171 | 128 | 99 | 58 | 62 | 44 | 45 | 26 | |
| Indiana Jones and the Great Circle (2024) | 187.9 | 145.9 | 129.2 | 120.1 | 102.4 | 63.2 | |||
| Monster Hunter Wilds (2025) | 110.1 | 104.4 | 90 | 87.7 | 73.2 | 61.8 | 45.2 | ||
| Assassin's Creed Shadows (2025) | 111 | 104 | 90 | 64 | 65 | 55 | 55 | 40 |
Émissions - Le son n'est fort que lorsqu'il doit l'être
Bruit du système
Le bruit du ventilateur atteint pratiquement le même maximum que sur le Legion 9 16IRX9 en mode Performance. Il n'est donc pas plus silencieux que la plupart des autres ordinateurs portables de jeu malgré sa taille relativement grande. D'un autre côté, les ventilateurs s'arrêtent rapidement et restent à un faible nombre de tours par minute lorsque vous utilisez des charges peu exigeantes afin d'éviter toute pulsation, même en mode Performance. En d'autres termes, les ventilateurs ne sont bruyants que lorsqu'ils doivent l'être.
Notez que les jeux en mode équilibré réduisent considérablement le bruit des ventilateurs de 54 dB(A) à seulement 40 dB(A) pour une réduction de 15 % des performances graphiques, comme indiqué ci-dessus.
Degré de la nuisance sonore
| Au repos |
| 22.9 / 22.9 / 26.3 dB(A) |
| Fortement sollicité |
| 27.8 / 53.9 dB(A) |
 | ||
30 dB silencieux 40 dB(A) audible 50 dB(A) bruyant |
||
min: | ||
| Lenovo Legion Pro 7i 16 Gen 10 GeForce RTX 5080 Laptop, Ultra 9 275HX, SK Hynix HFS001TEJ9X115N | Lenovo Legion 9 16IRX9, RTX 4090 NVIDIA GeForce RTX 4090 Laptop GPU, i9-14900HX, Micron 3400 2TB MTFDKBA2T0TFH | Asus ROG Zephyrus G16 GU605CX GeForce RTX 5090 Laptop, Ultra 9 285H, Western Digital PC SN5000S SDEPNSJ-2T00-1006 | Razer Blade 16 2025 RTX 5090 GeForce RTX 5090 Laptop, Ryzen AI 9 HX 370, SSSTC CA6-8D2048 | MSI Vector 16 HX A14V NVIDIA GeForce RTX 4080 Laptop GPU, i9-14900HX, WD PC SN560 SDDPNQE-1T00 | Alienware x16 R2 P120F NVIDIA GeForce RTX 4080 Laptop GPU, Ultra 9 185H, WDC PC SN810 1TB | |
|---|---|---|---|---|---|---|
| Noise | -5% | -16% | -16% | -37% | -7% | |
| arrêt / environnement * | 22.9 | 23 -0% | 23.8 -4% | 24.1 -5% | 23.2 -1% | 23.4 -2% |
| Idle Minimum * | 22.9 | 23 -0% | 23.8 -4% | 24.1 -5% | 33.5 -46% | 23.8 -4% |
| Idle Average * | 22.9 | 23 -0% | 27.2 -19% | 30.6 -34% | 33.5 -46% | 28.5 -24% |
| Idle Maximum * | 26.3 | 23 13% | 31.3 -19% | 30.6 -16% | 33.5 -27% | 28.5 -8% |
| Load Average * | 27.8 | 39 -40% | 47.6 -71% | 45.5 -64% | 52.1 -87% | 28.8 -4% |
| Cyberpunk 2077 ultra * | 54.2 | 51.3 5% | 48.2 11% | |||
| Load Maximum * | 53.9 | 55.56 -3% | 53.3 1% | 53.4 1% | 62 -15% | 54.2 -1% |
| Witcher 3 ultra * | 55.32 | 62 | 49.5 |
* ... Moindre est la valeur, meilleures sont les performances
Température
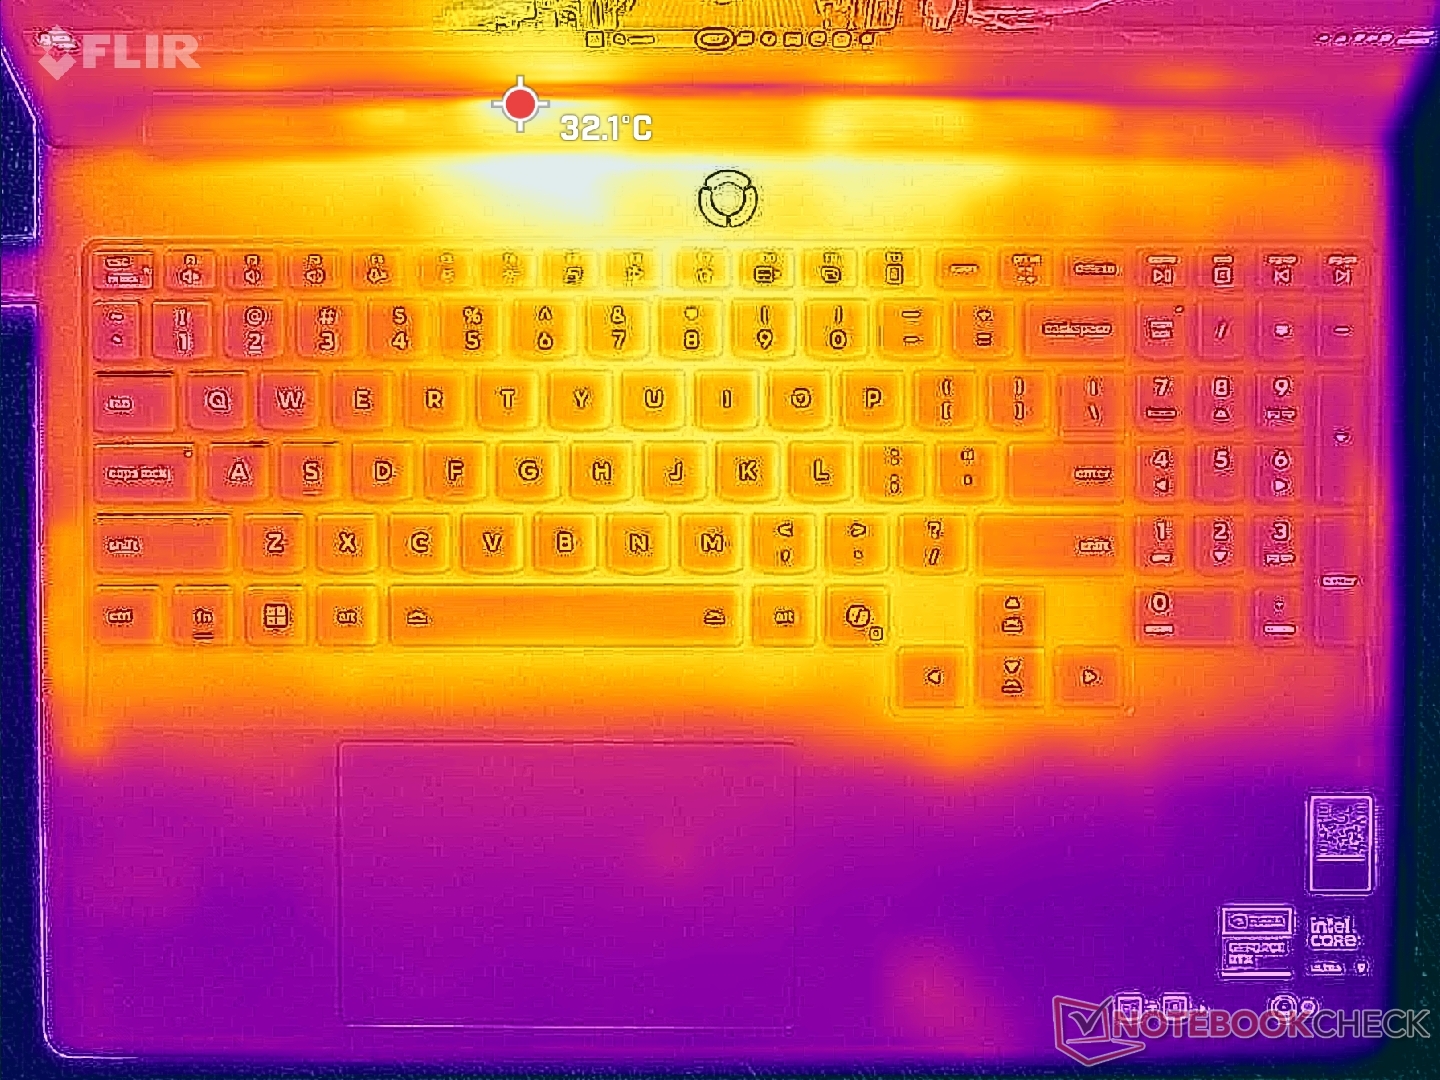
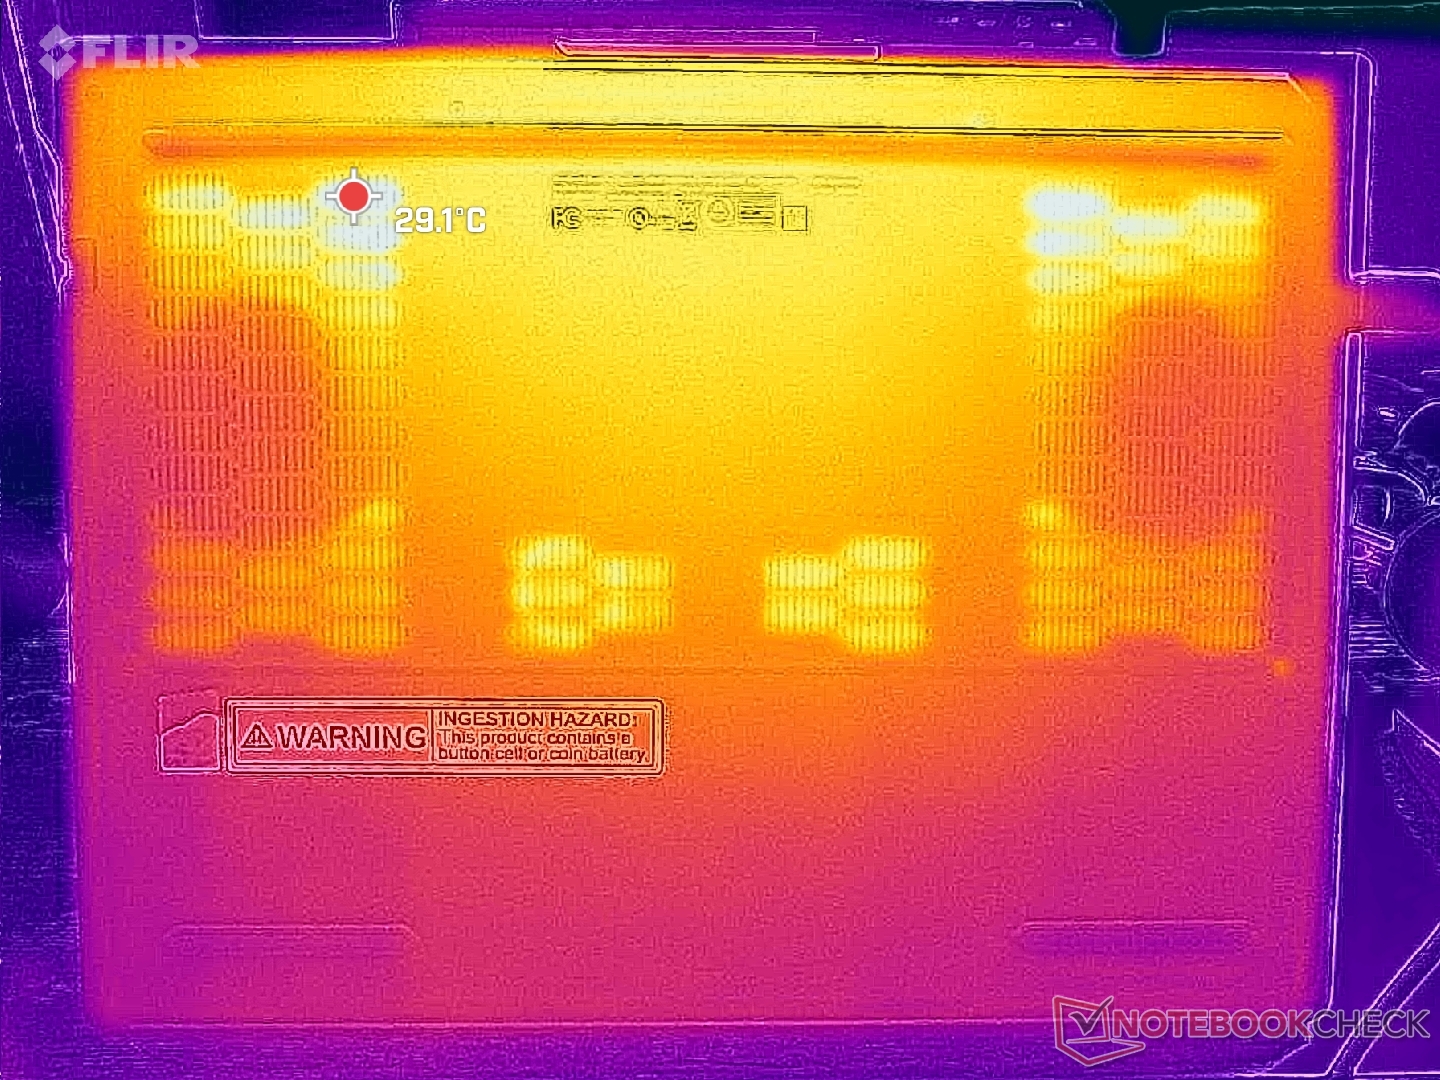
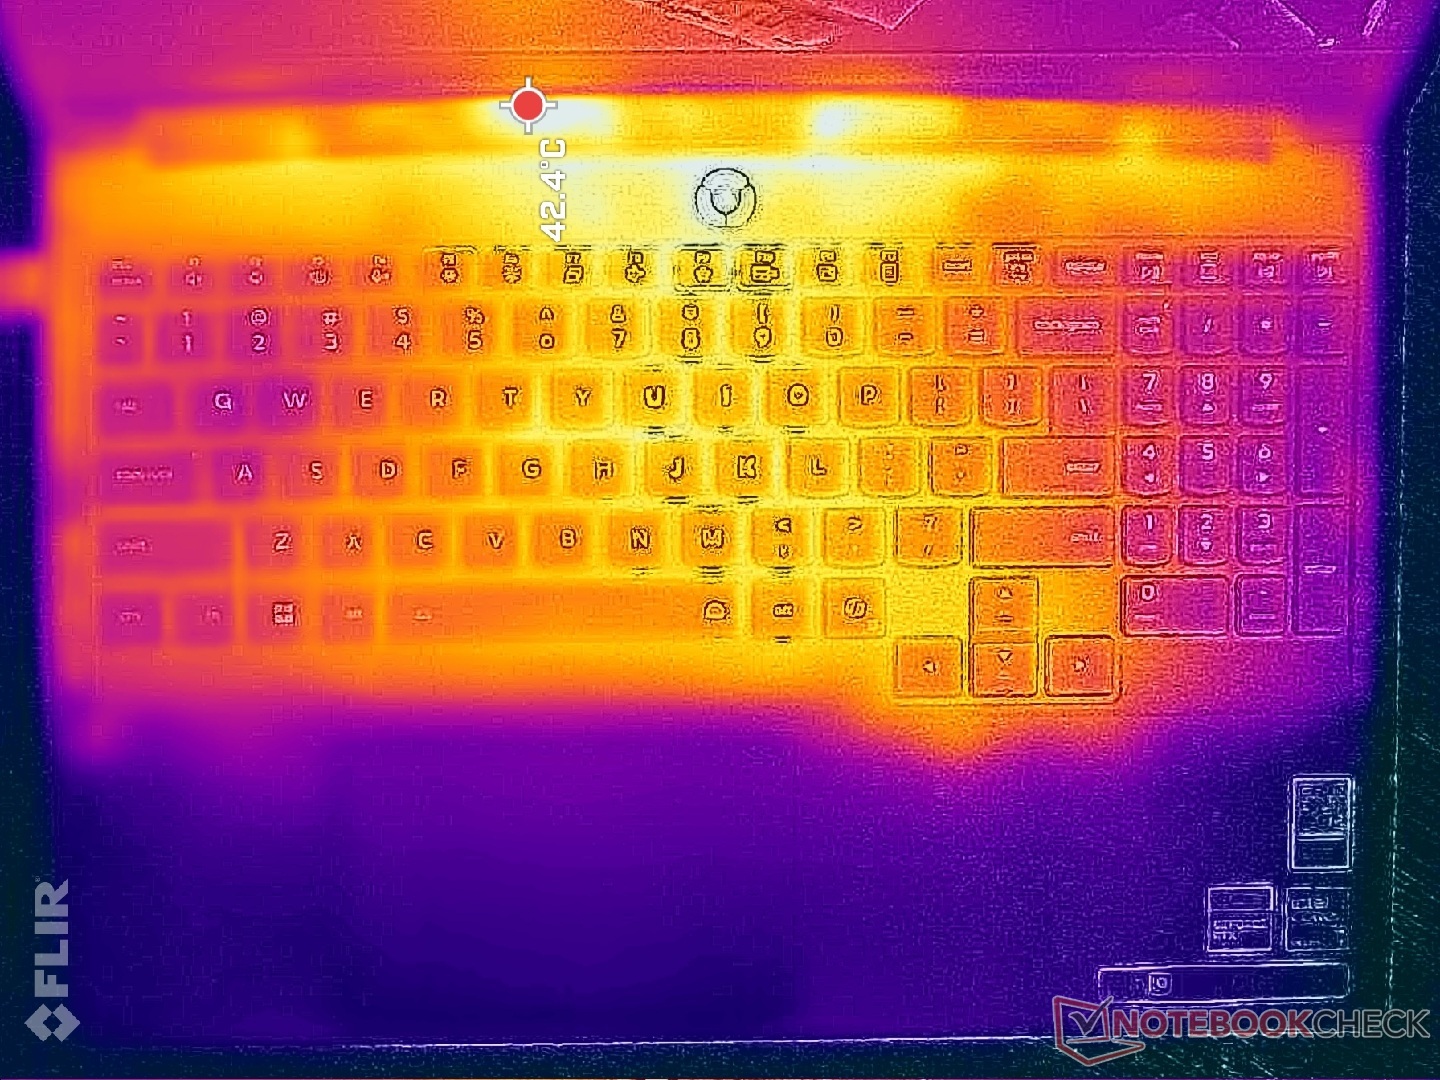
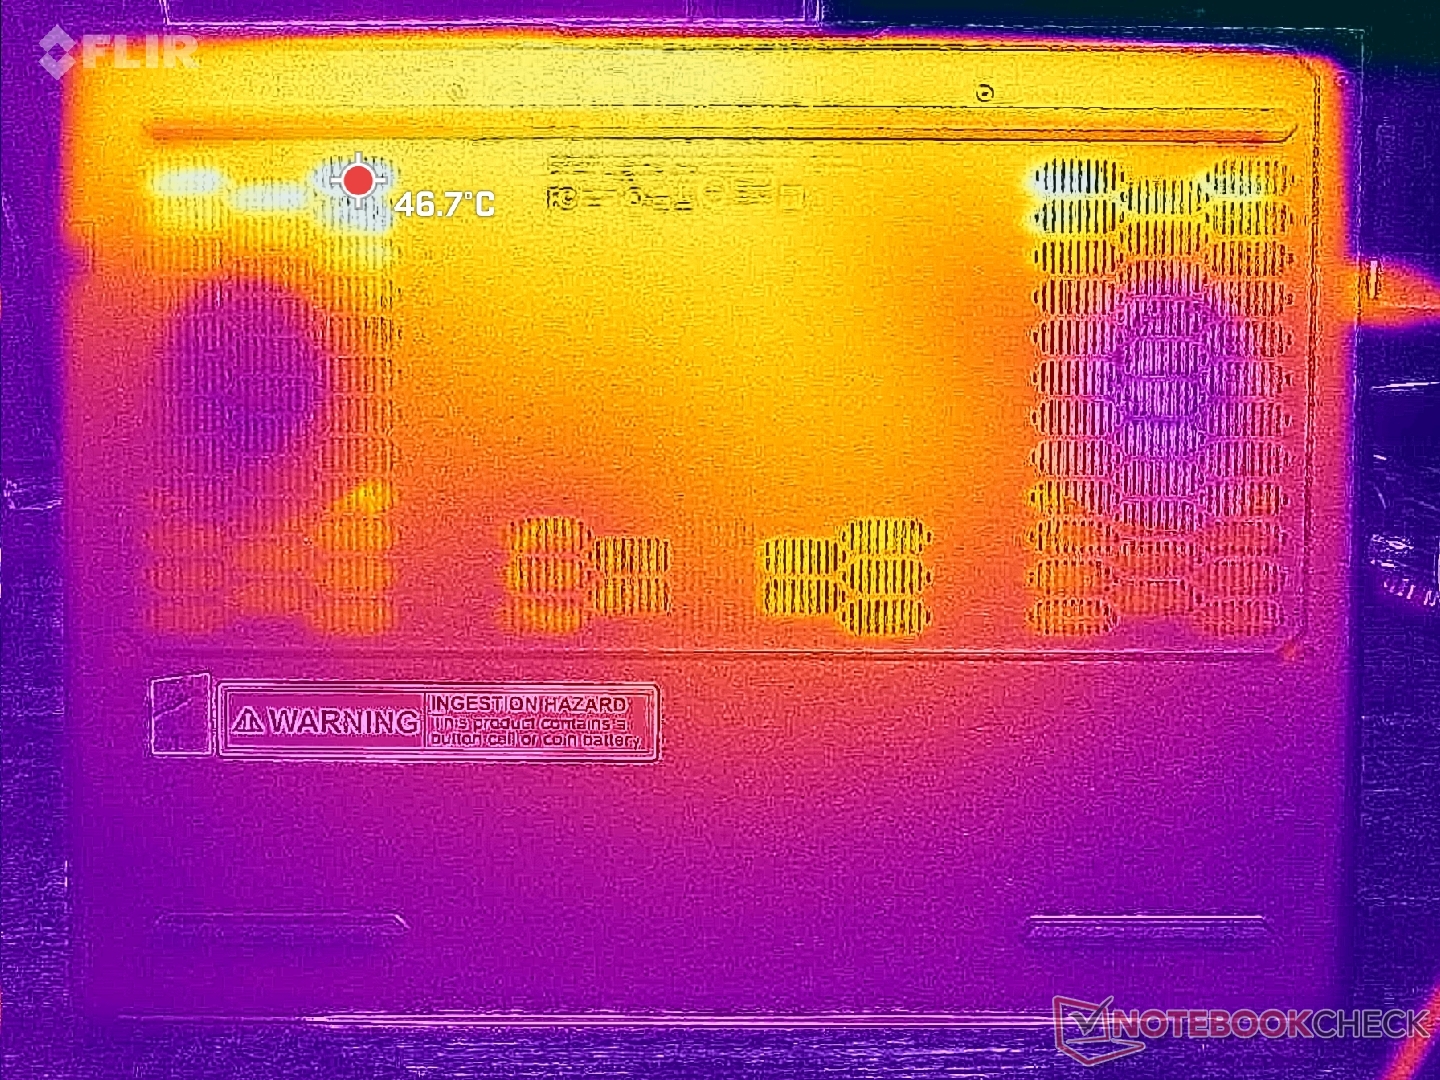
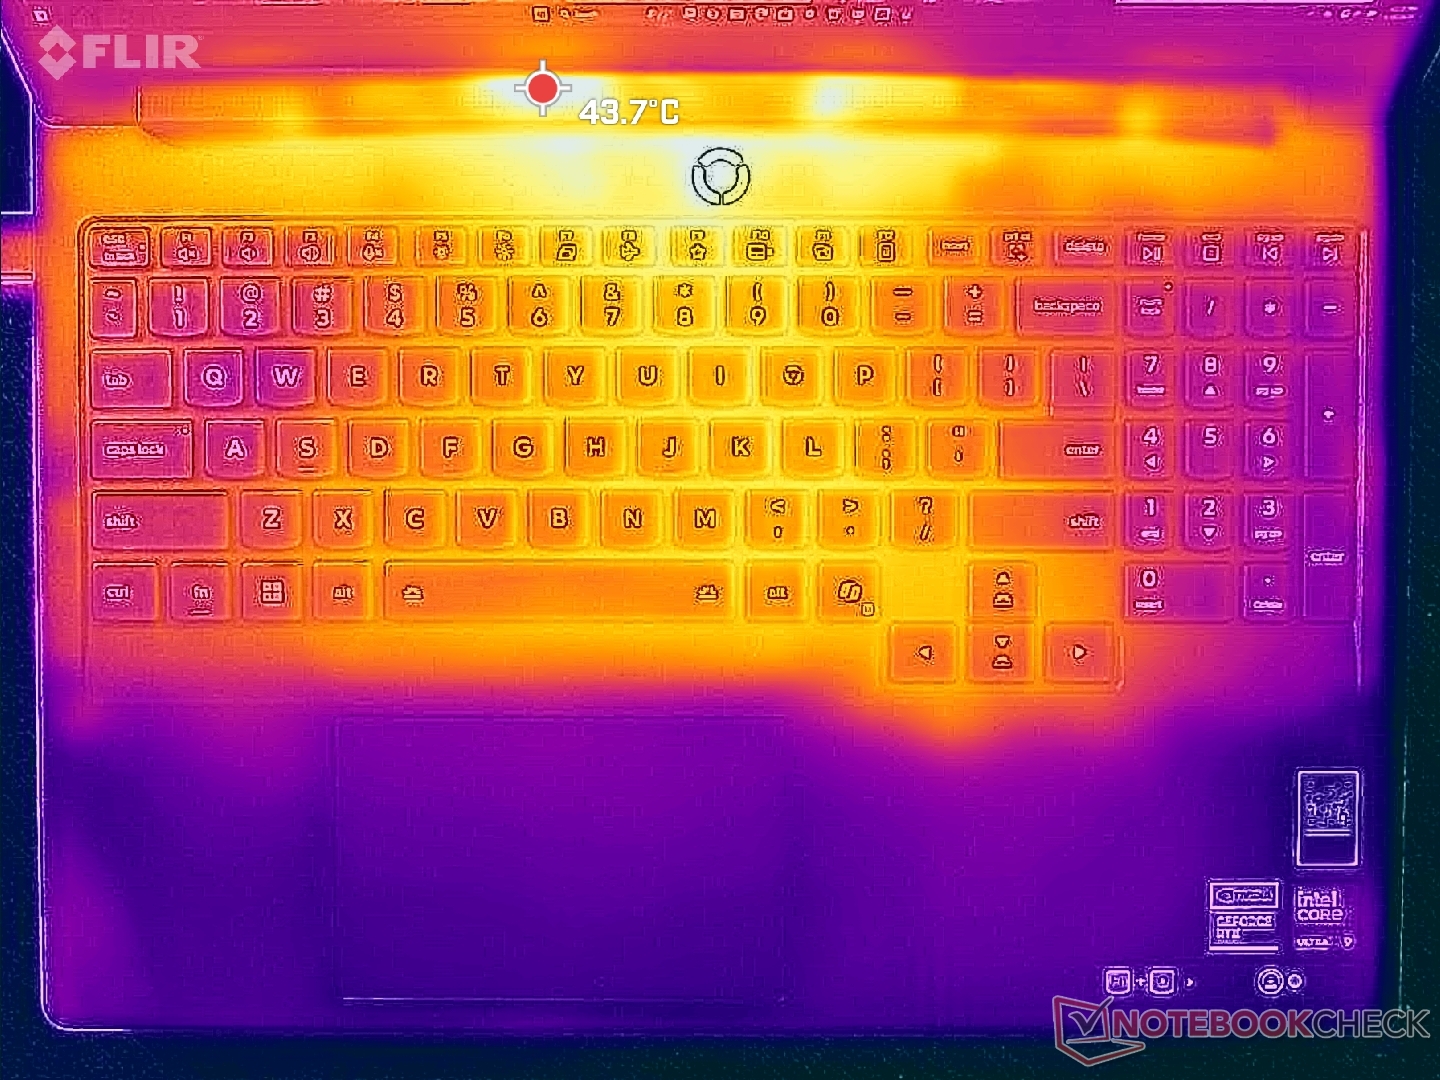
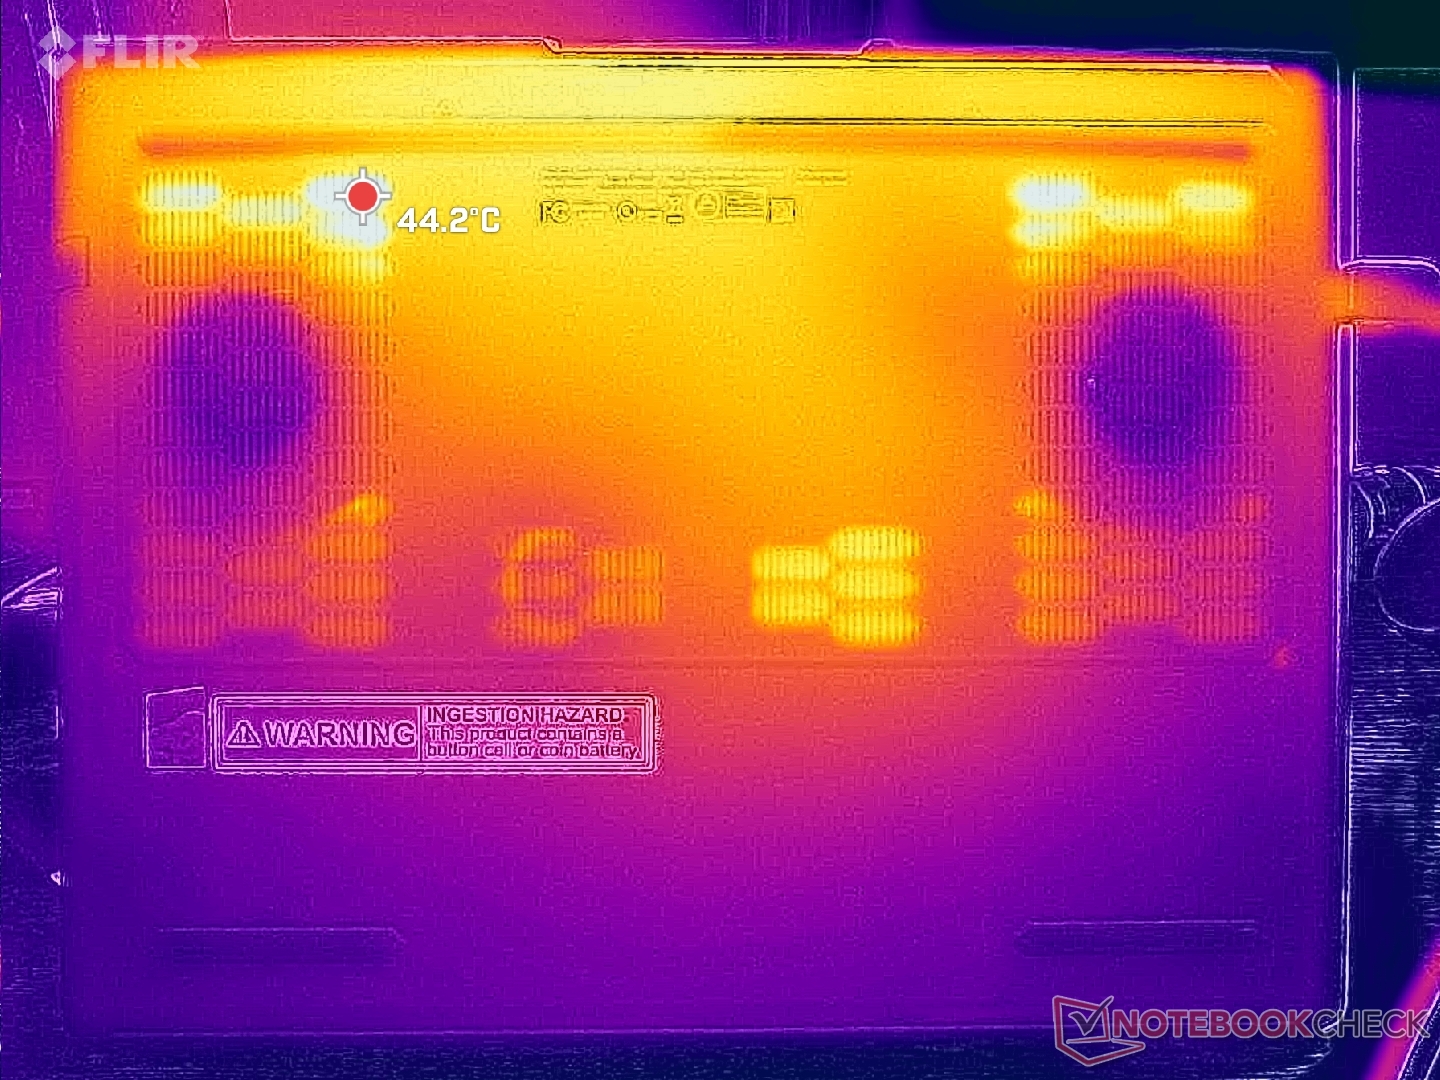
Les températures de surface ne sont pas aussi élevées que sur la Blade 16 grâce aux grilles d'aération plus grandes et à la conception arrière élargie du Lenovo. Les points chauds au centre du clavier peuvent atteindre jusqu'à 40°C, tandis que les touches WASD, les touches fléchées et les repose-poignets restent plus froids pour un jeu plus confortable.
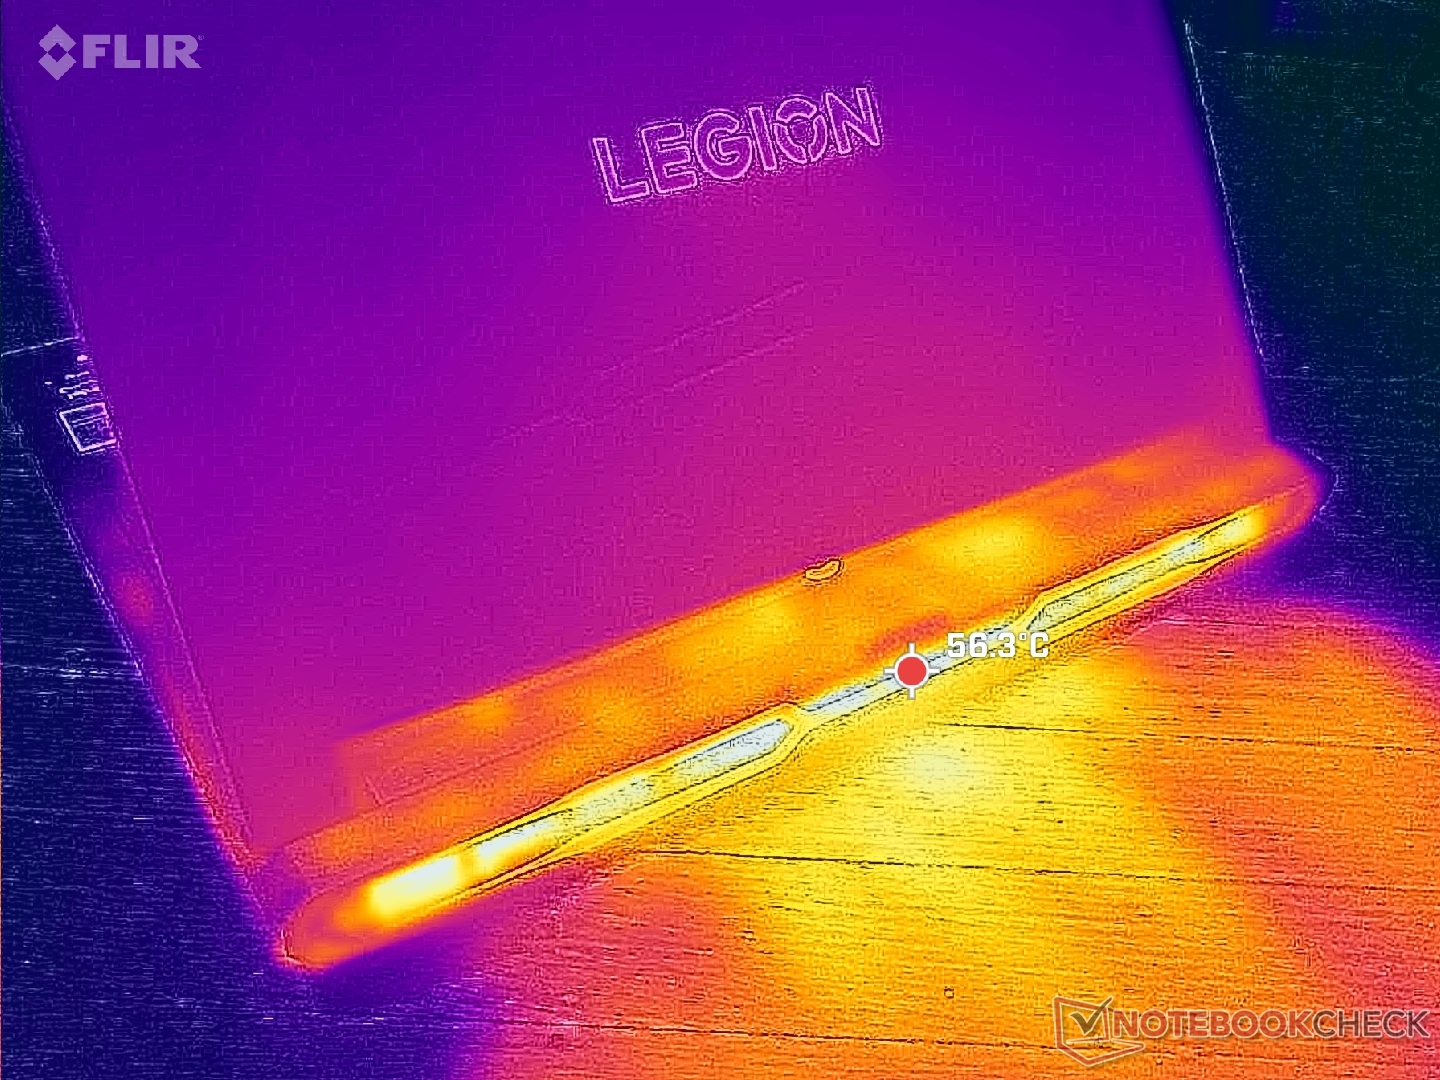
(±) La température maximale du côté supérieur est de 42.6 °C / 109 F, par rapport à la moyenne de 40.4 °C / 105 F, allant de 21.2 à 68.8 °C pour la classe Gaming.
(±) Le fond chauffe jusqu'à un maximum de 41.2 °C / 106 F, contre une moyenne de 43.2 °C / 110 F
(+) En utilisation inactive, la température moyenne du côté supérieur est de 27.4 °C / 81 F, par rapport à la moyenne du dispositif de 33.9 °C / 93 F.
(±) 3: The average temperature for the upper side is 33.4 °C / 92 F, compared to the average of 33.9 °C / 93 F for the class Gaming.
(+) Les repose-poignets et le pavé tactile sont plus froids que la température de la peau avec un maximum de 25.4 °C / 77.7 F et sont donc froids au toucher.
(+) La température moyenne de la zone de l'appui-paume de dispositifs similaires était de 28.9 °C / 84 F (+3.5 °C / #6.3 F).
| Lenovo Legion Pro 7i 16 Gen 10 Intel Core Ultra 9 275HX, Nvidia GeForce RTX 5080 Laptop | Lenovo Legion 9 16IRX9, RTX 4090 Intel Core i9-14900HX, NVIDIA GeForce RTX 4090 Laptop GPU | Asus ROG Zephyrus G16 GU605CX Intel Core Ultra 9 285H, Nvidia GeForce RTX 5090 Laptop | Razer Blade 16 2025 RTX 5090 AMD Ryzen AI 9 HX 370, Nvidia GeForce RTX 5090 Laptop | MSI Vector 16 HX A14V Intel Core i9-14900HX, NVIDIA GeForce RTX 4080 Laptop GPU | Alienware x16 R2 P120F Intel Core Ultra 9 185H, NVIDIA GeForce RTX 4080 Laptop GPU | |
|---|---|---|---|---|---|---|
| Heat | -24% | 8% | -6% | 16% | -16% | |
| Maximum Upper Side * | 42.6 | 56 -31% | 44 -3% | 48.3 -13% | 36.4 15% | 51 -20% |
| Maximum Bottom * | 41.2 | 53 -29% | 44.1 -7% | 53.3 -29% | 35.6 14% | 50.8 -23% |
| Idle Upper Side * | 32.6 | 38 -17% | 26.1 20% | 28.3 13% | 26.6 18% | 36.6 -12% |
| Idle Bottom * | 32.4 | 39 -20% | 25.5 21% | 30.3 6% | 27 17% | 35.2 -9% |
* ... Moindre est la valeur, meilleures sont les performances
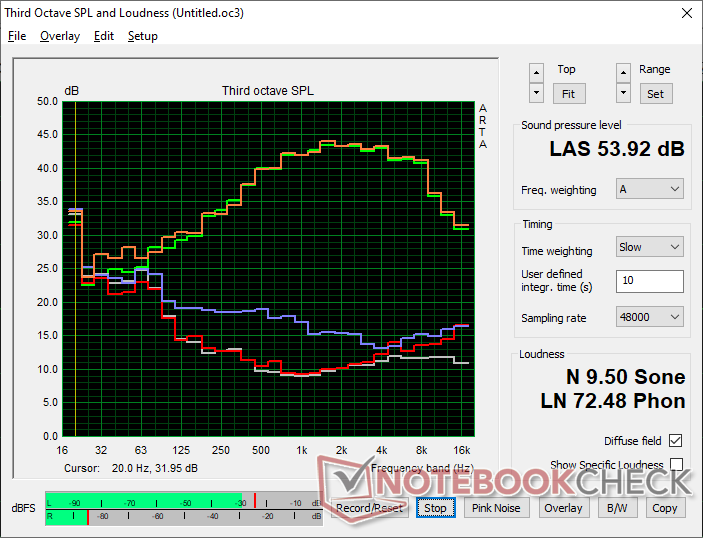
Intervenants
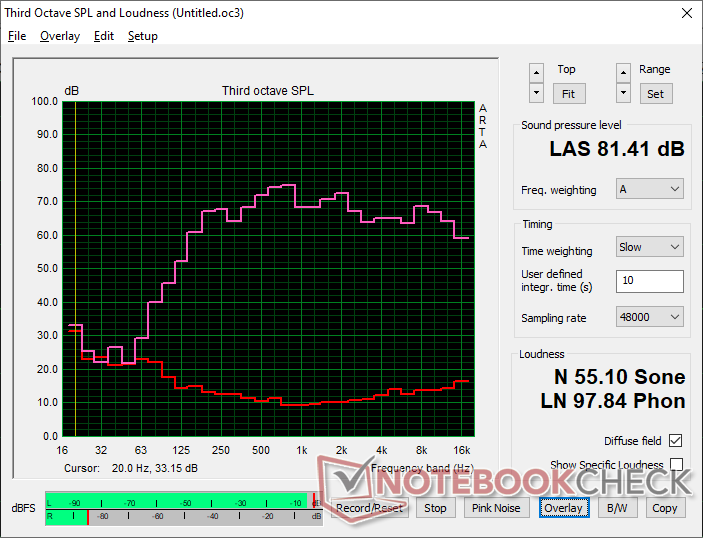
Lenovo Legion Pro 7i 16 Gen 10 analyse audio
(±) | le niveau sonore du haut-parleur est moyen mais bon (81.4# dB)
Basses 100 - 315 Hz
(±) | basse réduite - en moyenne 7.6% inférieure à la médiane
(±) | la linéarité des basses est moyenne (9.4% delta à la fréquence précédente)
Médiums 400 - 2000 Hz
(+) | médiane équilibrée - seulement 4.1% de la médiane
(+) | les médiums sont linéaires (4.8% delta à la fréquence précédente)
Aiguës 2 - 16 kHz
(+) | des sommets équilibrés - à seulement 1.9% de la médiane
(+) | les aigus sont linéaires (4.8% delta à la fréquence précédente)
Globalement 100 - 16 000 Hz
(+) | le son global est linéaire (9.4% différence à la médiane)
Par rapport à la même classe
» 3% de tous les appareils testés de cette catégorie étaient meilleurs, 2% similaires, 95% pires
» Le meilleur avait un delta de 6%, la moyenne était de 18%, le pire était de 132%.
Par rapport à tous les appareils testés
» 3% de tous les appareils testés étaient meilleurs, 1% similaires, 96% pires
» Le meilleur avait un delta de 4%, la moyenne était de 24%, le pire était de 134%.
Apple MacBook Pro 16 2021 M1 Pro analyse audio
(+) | les haut-parleurs peuvent jouer relativement fort (84.7# dB)
Basses 100 - 315 Hz
(+) | bonne basse - seulement 3.8% loin de la médiane
(+) | les basses sont linéaires (5.2% delta à la fréquence précédente)
Médiums 400 - 2000 Hz
(+) | médiane équilibrée - seulement 1.3% de la médiane
(+) | les médiums sont linéaires (2.1% delta à la fréquence précédente)
Aiguës 2 - 16 kHz
(+) | des sommets équilibrés - à seulement 1.9% de la médiane
(+) | les aigus sont linéaires (2.7% delta à la fréquence précédente)
Globalement 100 - 16 000 Hz
(+) | le son global est linéaire (4.6% différence à la médiane)
Par rapport à la même classe
» 0% de tous les appareils testés de cette catégorie étaient meilleurs, 0% similaires, 100% pires
» Le meilleur avait un delta de 5%, la moyenne était de 18%, le pire était de 45%.
Par rapport à tous les appareils testés
» 0% de tous les appareils testés étaient meilleurs, 0% similaires, 100% pires
» Le meilleur avait un delta de 4%, la moyenne était de 24%, le pire était de 134%.
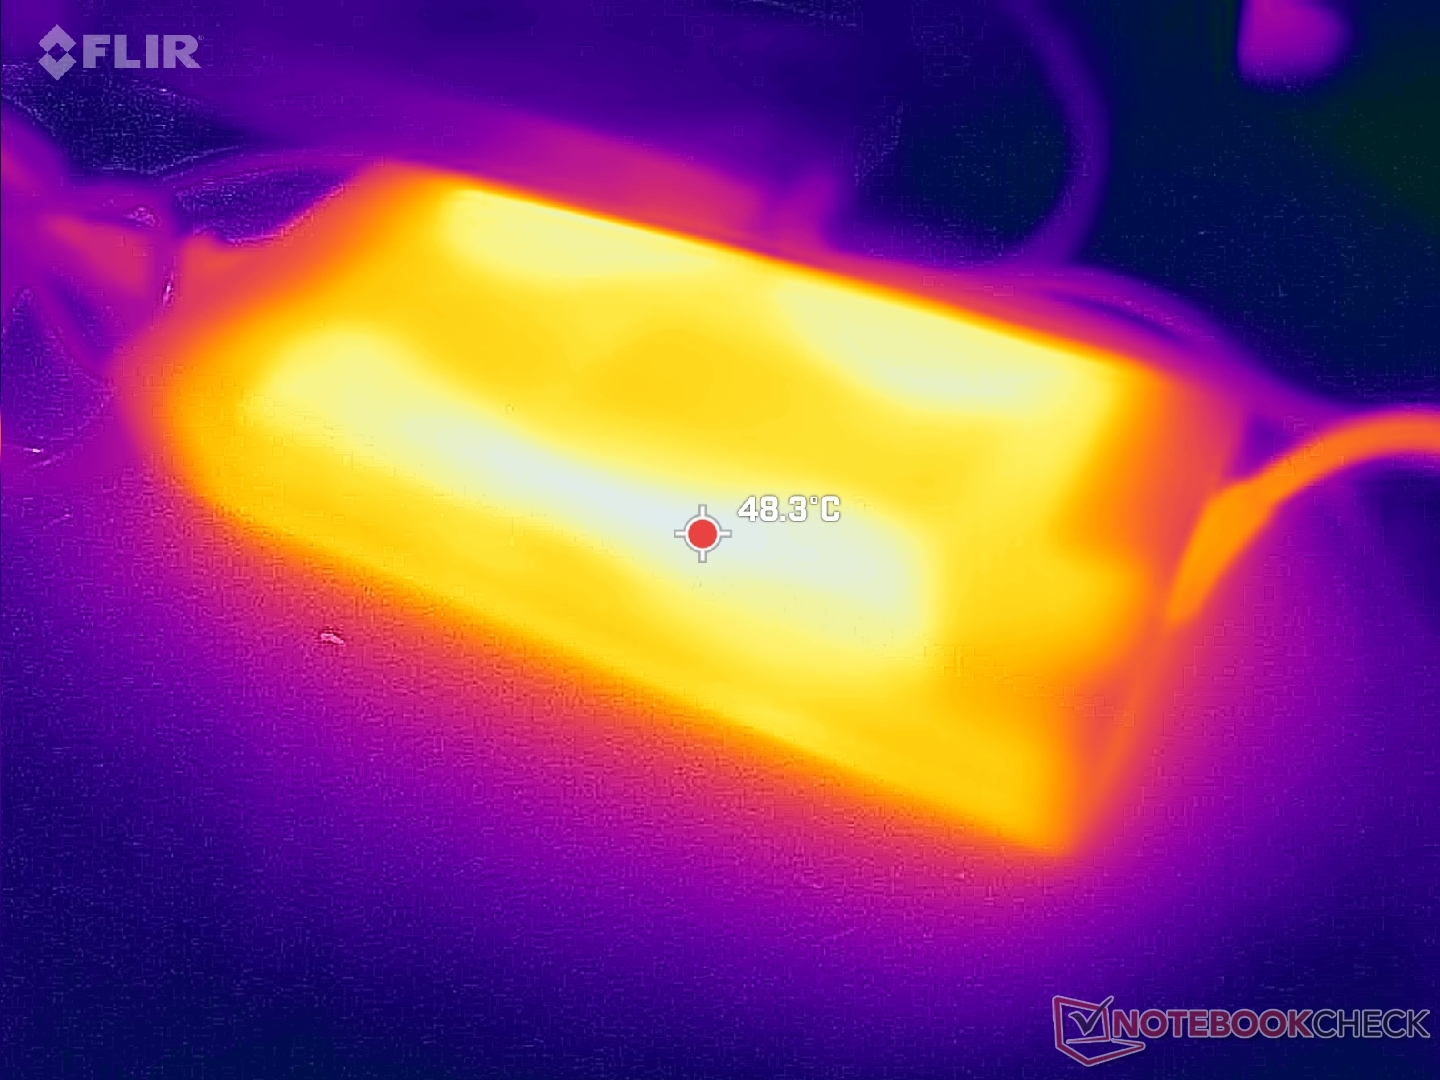
Gestion de l'énergie
Consommation électrique
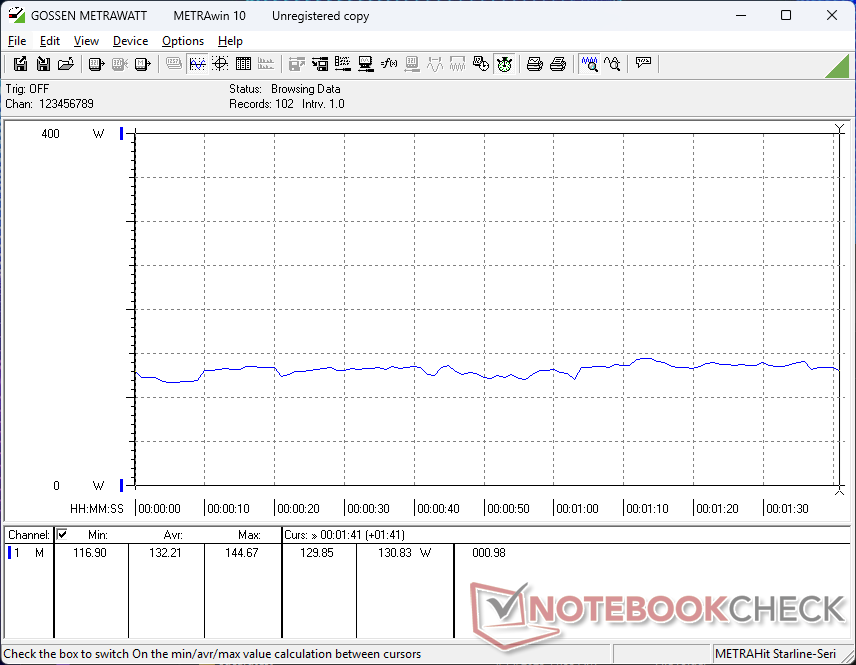
Le Legion Pro 7i G10 est l'un des rares ordinateurs portables de jeu à être livré avec une brique d'alimentation de 400 W, alors que la plupart des autres ne dépassent généralement pas 280 W ou 300 W. La consommation d'énergie est sans surprise assez élevée et plus exigeante que la plupart des autres ordinateurs portables de jeu, même lorsqu'ils tournent au ralenti sur le bureau avec le réglage de luminosité le plus bas, comme le montre le tableau de comparaison ci-dessous.
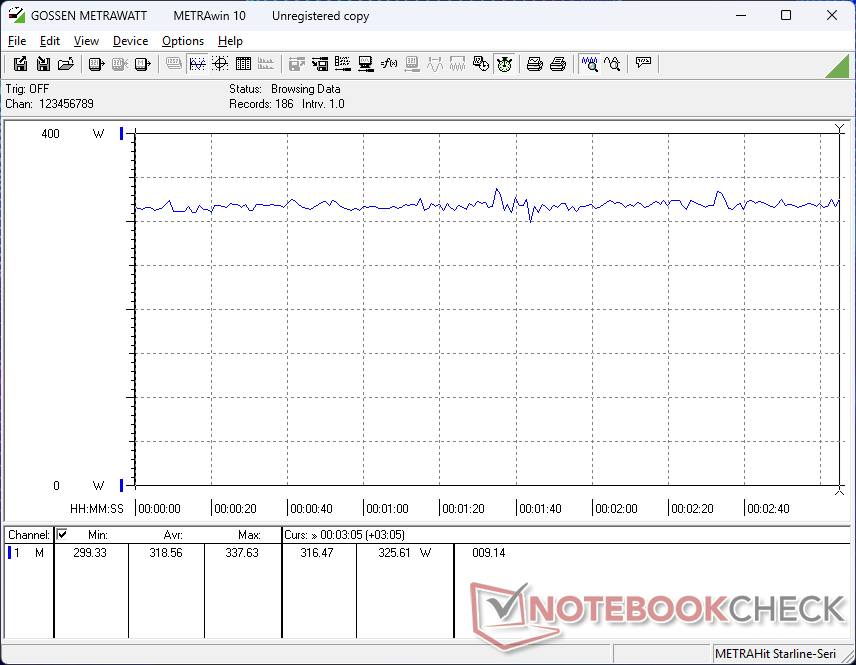
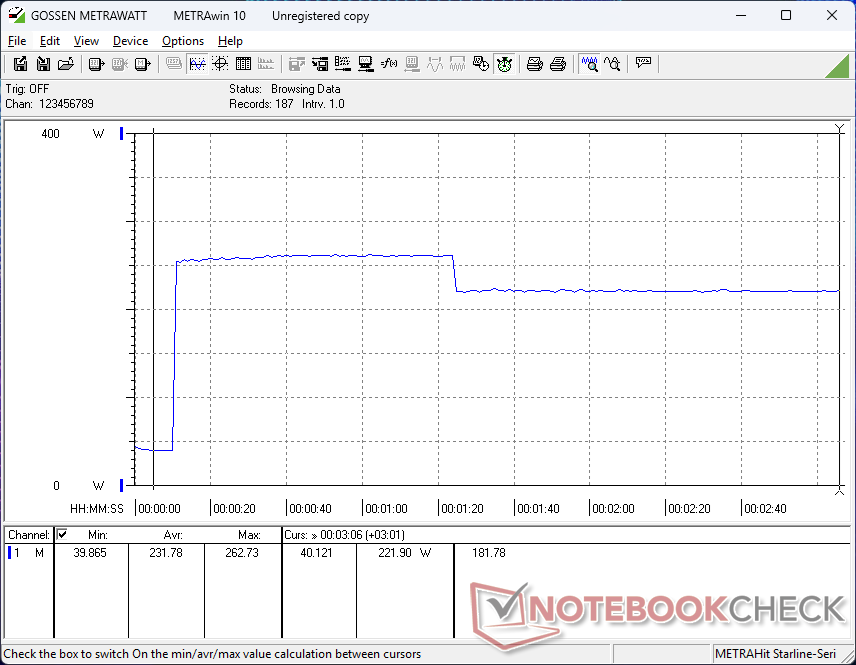
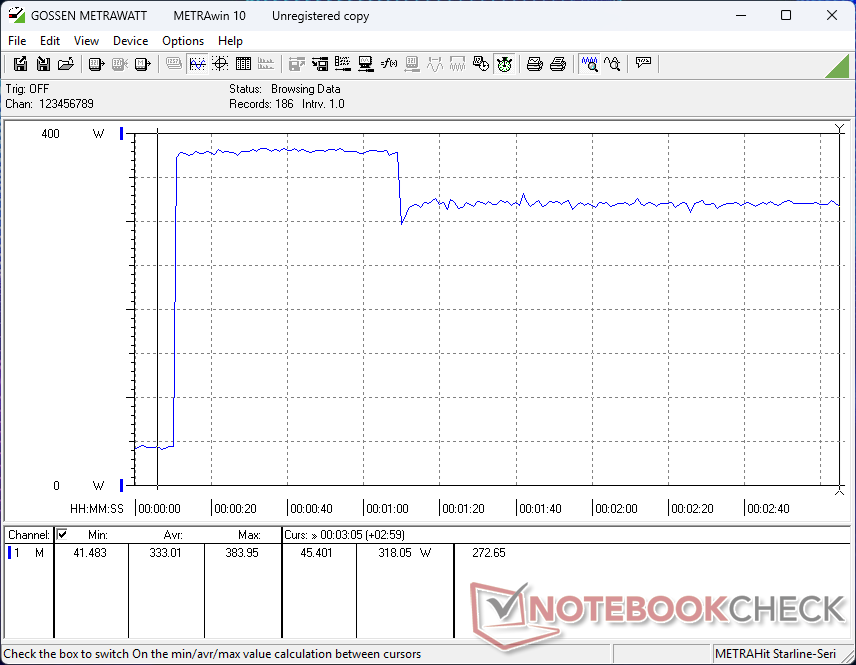
L'exécution de Prime95 consomme environ 222 W contre seulement 98 W sur le Razer Blade 16 alimenté par AMD. En d'autres termes, notre système Intel est plus de 2,2x plus exigeant que le Razer tout en offrant un boost de 1,5x en performance multithread pour une performance par watt généralement plus faible. Cet écart important se poursuit lors de l'exécution de jeux tels que Cyberpunk 2077 , où notre Lenovo consommerait environ 320 W contre 178 W pour le Razer susmentionné.
L'adaptateur secteur de 400 W est logiquement plus grand (19,5 x 8,8 x 3,3 cm) et plus lourd (1206 g) que la plupart des ordinateurs portables légers et légers.
| Éteint/en veille | |
| Au repos | |
| Fortement sollicité |
|
Légende:
min: | |
| Lenovo Legion Pro 7i 16 Gen 10 Ultra 9 275HX, GeForce RTX 5080 Laptop, SK Hynix HFS001TEJ9X115N, OLED, 2560x1600, 16" | Lenovo Legion 9 16IRX9, RTX 4090 i9-14900HX, NVIDIA GeForce RTX 4090 Laptop GPU, Micron 3400 2TB MTFDKBA2T0TFH, MiniLED, 3200x2000, 16" | Asus ROG Zephyrus G16 GU605CX Ultra 9 285H, GeForce RTX 5090 Laptop, Western Digital PC SN5000S SDEPNSJ-2T00-1006, OLED, 2560x1600, 16" | Razer Blade 16 2025 RTX 5090 Ryzen AI 9 HX 370, GeForce RTX 5090 Laptop, SSSTC CA6-8D2048, OLED, 2560x1600, 16" | MSI Vector 16 HX A14V i9-14900HX, NVIDIA GeForce RTX 4080 Laptop GPU, WD PC SN560 SDDPNQE-1T00, IPS, 2560x1600, 16" | Alienware x16 R2 P120F Ultra 9 185H, NVIDIA GeForce RTX 4080 Laptop GPU, WDC PC SN810 1TB, IPS, 2560x1600, 16" | |
|---|---|---|---|---|---|---|
| Power Consumption | 28% | 51% | 48% | 31% | 41% | |
| Idle Minimum * | 36.8 | 20.5 44% | 9.4 74% | 10.9 70% | 15.8 57% | 9.9 73% |
| Idle Average * | 38.8 | 27.7 29% | 13.6 65% | 13.5 65% | 23.3 40% | 14.5 63% |
| Idle Maximum * | 45.6 | 32.1 30% | 15.8 65% | 13.7 70% | 30 34% | 33.5 27% |
| Load Average * | 132.2 | 105 21% | 115.4 13% | 120.2 9% | 123.9 6% | 97.5 26% |
| Cyberpunk 2077 ultra external monitor * | 319 | 160.4 50% | 177.6 44% | |||
| Cyberpunk 2077 ultra * | 318 | 164.5 48% | 178.2 44% | |||
| Load Maximum * | 384 | 323 16% | 216.7 44% | 246.1 36% | 306 20% | 315.2 18% |
| Witcher 3 ultra * | 246 | 285 | 230 |
* ... Moindre est la valeur, meilleures sont les performances
Power Consumption Cyberpunk / Stress Test
Power Consumption external Monitor
Autonomie de la batterie
La durée d'utilisation du WLAN est à peine meilleure que sur le Legion 9 16IRX9 de l'année dernière, même en mode équilibré et iGPU. Des durées d'exécution plus longues peuvent être obtenues avec le Razer Blade 16 ou le Zephyrus G16 d'au moins une heure ou deux dans chaque cas.
Le chargement de la batterie vide à la batterie pleine ne prend que 90 minutes avec l'adaptateur secteur fourni. Le chargement plus lent via un port USB-C tiers est pris en charge.
| Lenovo Legion Pro 7i 16 Gen 10 Ultra 9 275HX, GeForce RTX 5080 Laptop, 99 Wh | Lenovo Legion 9 16IRX9, RTX 4090 i9-14900HX, NVIDIA GeForce RTX 4090 Laptop GPU, 99.99 Wh | Asus ROG Zephyrus G16 GU605CX Ultra 9 285H, GeForce RTX 5090 Laptop, 90 Wh | Razer Blade 16 2025 RTX 5090 Ryzen AI 9 HX 370, GeForce RTX 5090 Laptop, 90 Wh | MSI Vector 16 HX A14V i9-14900HX, NVIDIA GeForce RTX 4080 Laptop GPU, 90 Wh | Alienware x16 R2 P120F Ultra 9 185H, NVIDIA GeForce RTX 4080 Laptop GPU, 90 Wh | |
|---|---|---|---|---|---|---|
| Autonomie de la batterie | 80% | 67% | 47% | 39% | -40% | |
| WiFi v1.3 | 323 | 290 -10% | 540 67% | 475 47% | 332 3% | 193 -40% |
| Load | 48 | 129 169% | 84 75% | |||
| H.264 | 294 | 592 | ||||
| Cyberpunk 2077 ultra 150cd | 71 | |||||
| Reader / Idle | 641 |
Notebookcheck Rating
Lenovo Legion Pro 7i 16 Gen 10
- 04/25/2025 v8
Allen Ngo
 Total Sustainability Score:
 Potential Competitors in Comparison
Image | Modèle | Prix | Poids | Épaisseur | Écran |
|---|---|---|---|---|---|
1. 87.5%  | Lenovo Legion Pro 7i 16 Gen 10 Intel Core Ultra 9 275HX ⎘ Nvidia GeForce RTX 5080 Laptop ⎘ 32 Go Mémoire, 1024 Go SSD | Amazon: $3,799.95 Prix de liste: 4200 USD | 2.6 kg | 26.65 mm | 16.00" 2560x1600 189 PPI OLED |
2. 83.9%  | Lenovo Legion 9 16IRX9, RTX 4090 Intel Core i9-14900HX ⎘ NVIDIA GeForce RTX 4090 Laptop GPU ⎘ 64 Go Mémoire, 2048 Go SSD | Amazon: $4,799.00 Prix de liste: 4899 Euro | 2.5 kg | 22.7 mm | 16.00" 3200x2000 236 PPI MiniLED |
3. 90%  | Asus ROG Zephyrus G16 GU605CX Intel Core Ultra 9 285H ⎘ Nvidia GeForce RTX 5090 Laptop ⎘ 64 Go Mémoire, 2048 Go SSD | Amazon: 1. $20.98 Puccy 2 Pack Film Protector,... 2. $99.99 240W Rectangle Conn Charger ... 3. $1,479.00 ASUS ROG Zephyrus G16 Gaming... Prix de liste: 4799€ | 1.9 kg | 17.4 mm | 16.00" 2560x1600 189 PPI OLED |
4. 87%  | Razer Blade 16 2025 RTX 5090 AMD Ryzen AI 9 HX 370 ⎘ Nvidia GeForce RTX 5090 Laptop ⎘ 32 Go Mémoire, 2048 Go SSD | Amazon: 1. $4,159.99 Razer Blade 16 Gaming Laptop... 2. $5,495.00 Razer Blade 18 Gaming Laptop... 3. $5,698.00 Razer Blade 16 Gaming Laptop... Prix de liste: 4399€ | 2.1 kg | 17.4 mm | 16.00" 2560x1600 189 PPI OLED |
5. 88% v7 (old)  | MSI Vector 16 HX A14V Intel Core i9-14900HX ⎘ NVIDIA GeForce RTX 4080 Laptop GPU ⎘ 32 Go Mémoire, 1024 Go SSD | Amazon: 1. $2,419.99 MSI Vector 16 HX 16” 240Hz... 2. $45.99 Smatree Hard EVA Protective ... 3. $59.99 Smatree 16 inch Laptop Sleev... Prix de liste: 2700 USD | 2.7 kg | 28.55 mm | 16.00" 2560x1600 189 PPI IPS |
6. 88.4% v7 (old)  | Alienware x16 R2 P120F Intel Core Ultra 9 185H ⎘ NVIDIA GeForce RTX 4080 Laptop GPU ⎘ 32 Go Mémoire, 1024 Go SSD | Amazon: $3,099.99 Prix de liste: 3200 USD | 2.7 kg | 18.57 mm | 16.00" 2560x1600 189 PPI IPS |
Transparency
La sélection des appareils à examiner est effectuée par notre équipe éditoriale. L'échantillon de test a été prêté à l'auteur par le fabricant ou le détaillant pour les besoins de cet examen. Le prêteur n'a pas eu d'influence sur cette évaluation et le fabricant n'a pas reçu de copie de cette évaluation avant sa publication. Il n'y avait aucune obligation de publier cet article. Nous n'acceptons jamais de compensation ou de paiement en échange de nos commentaires. En tant que média indépendant, Notebookcheck n'est pas soumis à l'autorité des fabricants, des détaillants ou des éditeurs.
Voici comment Notebookcheck teste
Chaque année, Notebookcheck examine de manière indépendante des centaines d'ordinateurs portables et de smartphones en utilisant des procédures standardisées afin de garantir que tous les résultats sont comparables. Nous avons continuellement développé nos méthodes de test depuis environ 20 ans et avons établi des normes industrielles dans le processus. Dans nos laboratoires de test, des équipements de mesure de haute qualité sont utilisés par des techniciens et des rédacteurs expérimentés. Ces tests impliquent un processus de validation en plusieurs étapes. Notre système d'évaluation complexe repose sur des centaines de mesures et de points de référence bien fondés, ce qui garantit l'objectivité.
