Notebookcheck Logo

Test du Lenovo Legion 9 16IRX9 (Legion 9i) : RTX 4090 gamer haut-de-gamme ?
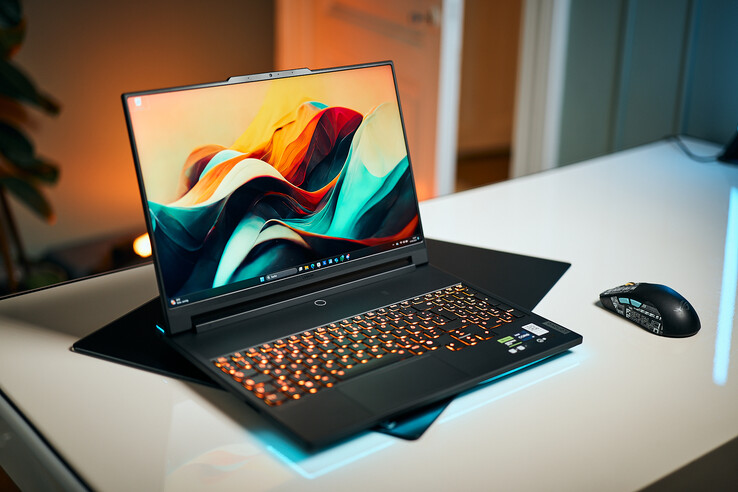
Machine méchante.

"Carbone forgé", "renforcé avec 90 % de magnésium recyclé", ainsi qu'une mise à jour des processeurs Intel Gen14 incluant des fonctions d'intelligence artificielle. Ces éléments, ainsi que la RTX 4090, sont inclus dans la console de jeu de luxe à 3 800 dollars. Notre test révélera si le nouveau processeur améliore vraiment le Legion 9 ou si vous pouvez économiser un peu en achetant le modèle de l'année dernière.

L'année dernière, nous avons qualifié le Legion 9i d'"ordinateur portable de jeu le plus ambitieux de Lenovo à ce jour". La nouvelle génération n'est peut-être pas moins ambitieuse, mais les changements apportés à l'ordinateur de jeu haut de gamme sont très limités. Seul le processeur a été remplacé par la dernière 14e génération d'Intel, ce qui rend l'ordinateur portable plus performant en matière d'intelligence artificielle.

Comme les ordinateurs portables de 16 pouces ne sont pas souvent équipés de la RTX 4090nous la comparerons à son prédécesseur, la prédécesseur, le Razer Blade 16 (2024) ainsi qu'à des gamers de 18 pouces tels que le Alienware m18 R2 et le Asus ROG Strix Scar 18 (2024)et le 17 pouces Medion Erazer Beast X40 (2024).

Mise à jour : en raison des problèmes mentionnés dans ce test (baisse de la fréquence d'images, faible score à cœur unique), nous avons pris contact avec le fabricant (par l'intermédiaire de son agence). Un appareil de remplacement potentiel a affiché le même score à cœur unique (mesuré par l'agence), ce qui a au moins été confirmé. Nous sommes toujours en contact avec le fabricant au sujet des taux de rafraîchissement et nous publierons une réponse dès que possible.

Legion 9 16IRX9 (Legion 9 16 Gamme)
Processeur
Intel Core i9-14900HX 24 x 1.6 - 5.8 GHz, Raptor Lake-HX Refresh
Carte graphique
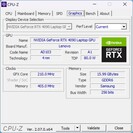
NVIDIA GeForce RTX 4090 Laptop GPU - 16 Go VRAM, 175 W TDP ( y compris 25 W Dynamic Boost), Geforce 552.22, Optimus
Mémoire
64 Go 
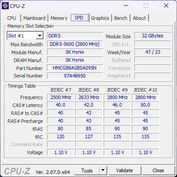
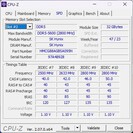
, 2x 32 GB DDR5-5600
Écran
16.00 pouces 16:10, 3200 x 2000 pixel 236 PPP, CSOT T3 MNG007ZA2-2, MiniLED, brillant: non, HDR, 165 Hz, Adaptive Sync
Carte mère
Intel HM770 (Raptor Lake-S PCH)
Disque dur
Micron 3400 2TB MTFDKBA2T0TFH, 2048 Go 
, 1700 Go libres
Connexions
3 USB 3.0 / 3.1 Gen1, 2 USB 4.0 40 Gbps, 2 Thunderbolt, USB-C Power Delivery (PD), 1 HDMI, 2 DisplayPort, Connectique audio: 3.5 mm headset, Lecteur de cartes mémoires: Full SD card reader
Réseau
Killer E3000 2.5 Gigabit Ethernet Controller (10/100/1000/2500MBit/s), Killer Wi-Fi 6E AX1675i 160MHz Wireless Network Adapter (a/b/g/n = Wi-Fi 4/ac = Wi-Fi 5/ax = Wi-Fi 6/), Bluetooth Bluetooth 5
Taille
Hauteur x Largeur x Profondeur (en mm): 22.7 x 357.7 x 277.7
Batterie
99.99 Wh, Super Rapid Charge
Charge
charge rapide / Quickcharge
Système d'exploitation
Microsoft Windows 11 Pro
Appareil photo
Webcam: FHD webcam (1,080p)
Appareil photo primaire: 2 MPix
Fonctionnalités additionnelles
Haut-parleurs: 2x 2 W, Clavier: Chiclet, Rétroéclairage du clavier: oui, 36 Mois Garantie, 3 years PremiumCare
Poids
2.541 kg, Alimentation: 1.037 kg
Prix
4899 Euro
Amazon
Remarque : le fabricant peut utiliser des composants provenant de différents fournisseurs, notamment des panneaux d'affichage, des lecteurs ou des clés USB ayant des spécifications similaires.


Comparaison avec les concurrents potentiels

Note
Version
Date
Modèle
Poids
Épaisseur
Taille
Résolution
Meilleur prix
83.9 %v8
06/24
Lenovo Legion 9 16IRX9, RTX 4090
i9-14900HX, NVIDIA GeForce RTX 4090 Laptop GPU
2.5 kg22.7 mm16.00"3200x2000
90.2 %
v7 (old)
v7 (old)
10/23
Lenovo Legion 9 16IRX8
i9-13980HX, NVIDIA GeForce RTX 4090 Laptop GPU
2.6 kg22.7 mm16.00"3200x2000
91.1 %
v7 (old)
v7 (old)
02/24
Razer Blade 16 2024, RTX 4090
i9-14900HX, NVIDIA GeForce RTX 4090 Laptop GPU
2.5 kg22 mm16.00"2560x1600
89.5 %
v7 (old)
v7 (old)
03/24
Alienware m18 R2
i9-14900HX, NVIDIA GeForce RTX 4090 Laptop GPU
4 kg26.7 mm18.00"2560x1600
88.3 %
v7 (old)
v7 (old)
02/24
Asus ROG Strix Scar 18 G834JYR (2024)
i9-14900HX, NVIDIA GeForce RTX 4090 Laptop GPU
3.1 kg30.8 mm18.00"2560x1600
89.2 %
v7 (old)
v7 (old)
02/24
Medion Erazer Beast X40 2024
i9-14900HX, NVIDIA GeForce RTX 4090 Laptop GPU
2.9 kg36 mm17.00"2560x1600

Boîtier et connectique - Carbone forgé

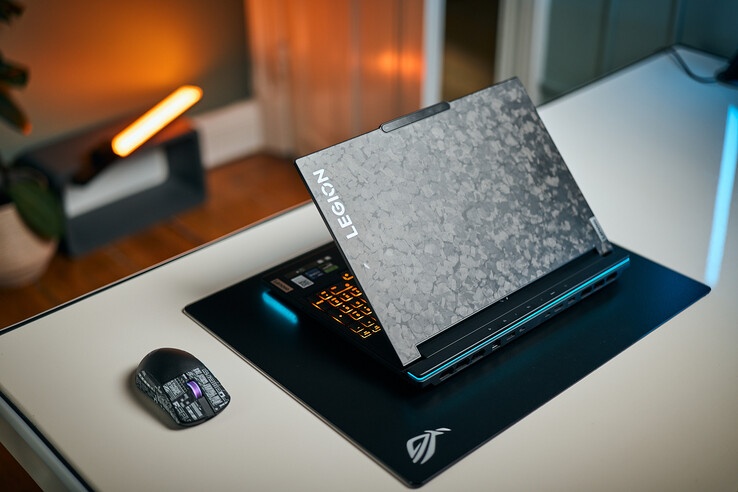
Parce qu'au moins visuellement tout est resté inchangé sur le nouveau modèle, nous vous recommandons de jeter un coup d'œil à notre examen du Lenovo Legion 9i Gen8 pour en savoir plus sur son boîtier forgé au carbone, ses options de maintenance et ses périphériques d'entrée.

Comparaison des tailles

383 mm 272 mm 36 mm 2.9 kg357.7 mm 277.7 mm 22.7 mm 2.5 kg357.7 mm 277.7 mm 22.7 mm 2.6 kg355 mm 244 mm 22 mm 2.5 kg297 mm 210 mm 1 mm 5.7 g
A gauche : casque d'écoute 3,5 mm, lecteur de carte SD
À droite : obturateur de webcam, USB-C (5Gb/s), USB-A (5Gb/s)
Arrière : alimentation, USB-A (5Gb/s, toujours activé), 2x Thunderbolt 4 (DP 1.4 & PD 3.0 140 W), HDMI 2.1, LAN
Avant : aucune connexion

Lecteur de carte SD

Pour un ordinateur portable haut de gamme, les taux de transfert du lecteur de carte SD sont décevants. Ils sont légèrement inférieurs à ceux de l'année dernière et sont à mille lieues des taux de transfert d'un Razer Blade 16 ou d'un Alienware m18 R2.

SD Card Reader
average JPG Copy Test (av. of 3 runs)
Alienware m18 R2
Intel Core i9-14900HX (Toshiba Exceria Pro SDXC 64 GB UHS-II)
190.3 MB/s +161%
Razer Blade 16 2024, RTX 4090
Intel Core i9-14900HX
171 (169.48min - 194.55max) MB/s +134%
Moyenne de la classe Gaming
  (19 - 202, n=88, 2 dernières années)
95.7 MB/s +31%
Lenovo Legion 9 16IRX8
Intel Core i9-13980HX (Toshiba Exceria Pro SDXC 64 GB UHS-II)
84.8 MB/s +16%
Medion Erazer Beast X40 2024
Intel Core i9-14900HX (AV PRO microSD 128 GB V60)
77 MB/s +5%
Lenovo Legion 9 16IRX9, RTX 4090
Intel Core i9-14900HX
73 (51.3min - 77.05max) MB/s
maximum AS SSD Seq Read Test (1GB)
Alienware m18 R2
Intel Core i9-14900HX (Toshiba Exceria Pro SDXC 64 GB UHS-II)
219.7 MB/s +149%
Razer Blade 16 2024, RTX 4090
Intel Core i9-14900HX
181.81 MB/s +106%
Moyenne de la classe Gaming
  (25.8 - 269, n=89, 2 dernières années)
119.6 MB/s +36%
Medion Erazer Beast X40 2024
Intel Core i9-14900HX (AV PRO microSD 128 GB V60)
90 MB/s +2%
Lenovo Legion 9 16IRX9, RTX 4090
Intel Core i9-14900HX
88.2 MB/s
Lenovo Legion 9 16IRX8
Intel Core i9-13980HX (Toshiba Exceria Pro SDXC 64 GB UHS-II)
87.9 MB/s 0%
Networking
iperf3 transmit AXE11000
Razer Blade 16 2024, RTX 4090
Intel Killer Wi-Fi 7 BE1750W 320 MHz (BE200NGW)
1577 (796min - 1617max) MBit/s +14%
Lenovo Legion 9 16IRX9, RTX 4090
Killer Wi-Fi 6E AX1675i 160MHz Wireless Network Adapter
1378 (539min - 1507max) MBit/s
Moyenne Killer Wi-Fi 6E AX1675i 160MHz Wireless Network Adapter
  (942 - 1622, n=26)
1358 MBit/s -1%
Lenovo Legion 9 16IRX8
Killer Wi-Fi 6E AX1675i 160MHz Wireless Network Adapter
1308 (606min - 1544max) MBit/s -5%
Moyenne de la classe Gaming
  (469 - 1843, n=149, 2 dernières années)
1238 MBit/s -10%
Asus ROG Strix Scar 18 G834JYR (2024)
Intel Wi-Fi 6E AX211
968 (656min - 1200max) MBit/s -30%
Alienware m18 R2
Intel Killer Wi-Fi 7 BE1750x BE200NGW
791 (736min - 894max) MBit/s -43%
Medion Erazer Beast X40 2024
Intel Wi-Fi 6E AX211
636 (501min - 571max) MBit/s -54%
iperf3 receive AXE11000
Asus ROG Strix Scar 18 G834JYR (2024)
Intel Wi-Fi 6E AX211
1681 (1662min - 1704max) MBit/s +8%
Medion Erazer Beast X40 2024
Intel Wi-Fi 6E AX211
1650 (1031min - 1711max) MBit/s +6%
Razer Blade 16 2024, RTX 4090
Intel Killer Wi-Fi 7 BE1750W 320 MHz (BE200NGW)
1604 (1554min - 1623max) MBit/s +3%
Lenovo Legion 9 16IRX9, RTX 4090
Killer Wi-Fi 6E AX1675i 160MHz Wireless Network Adapter
1562 (657min - 1677max) MBit/s
Moyenne Killer Wi-Fi 6E AX1675i 160MHz Wireless Network Adapter
  (872 - 1714, n=28)
1473 MBit/s -6%
Moyenne de la classe Gaming
  (680 - 1890, n=149, 2 dernières années)
1387 MBit/s -11%
Alienware m18 R2
Intel Killer Wi-Fi 7 BE1750x BE200NGW
1381 (1277min - 1427max) MBit/s -12%
Lenovo Legion 9 16IRX8
Killer Wi-Fi 6E AX1675i 160MHz Wireless Network Adapter
1178 (483min - 1393max) MBit/s -25%
iperf3 transmit AXE11000 6GHz
Lenovo Legion 9 16IRX9, RTX 4090
Killer Wi-Fi 6E AX1675i 160MHz Wireless Network Adapter
1569 (771min - 1600max) MBit/s
Razer Blade 16 2024, RTX 4090
Intel Killer Wi-Fi 7 BE1750W 320 MHz (BE200NGW)
1538 (784min - 1597max) MBit/s -2%
Moyenne Killer Wi-Fi 6E AX1675i 160MHz Wireless Network Adapter
  (1229 - 1693, n=19)
1519 MBit/s -3%
Lenovo Legion 9 16IRX8
Killer Wi-Fi 6E AX1675i 160MHz Wireless Network Adapter
1472 (1007min - 1545max) MBit/s -6%
Moyenne de la classe Gaming
  (648 - 1878, n=70, 2 dernières années)
1434 MBit/s -9%
Alienware m18 R2
Intel Killer Wi-Fi 7 BE1750x BE200NGW
648 (595min - 759max) MBit/s -59%
iperf3 receive AXE11000 6GHz
Lenovo Legion 9 16IRX9, RTX 4090
Killer Wi-Fi 6E AX1675i 160MHz Wireless Network Adapter
1660 (1606min - 1685max) MBit/s
Moyenne Killer Wi-Fi 6E AX1675i 160MHz Wireless Network Adapter
  (1327 - 1788, n=20)
1553 MBit/s -6%
Razer Blade 16 2024, RTX 4090
Intel Killer Wi-Fi 7 BE1750W 320 MHz (BE200NGW)
1518 (762min - 1536max) MBit/s -9%
Lenovo Legion 9 16IRX8
Killer Wi-Fi 6E AX1675i 160MHz Wireless Network Adapter
1498 (754min - 1540max) MBit/s -10%
Moyenne de la classe Gaming
  (853 - 1788, n=70, 2 dernières années)
1489 MBit/s -10%
Alienware m18 R2
Intel Killer Wi-Fi 7 BE1750x BE200NGW
1292 (1215min - 1327max) MBit/s -22%
05010015020025030035040045050055060065070075080085090095010001050110011501200125013001350140014501500155016001650Tooltip
Lenovo Legion 9 16IRX9, RTX 4090 Killer Wi-Fi 6E AX1675i 160MHz Wireless Network Adapter; iperf3 transmit AXE11000 6GHz; iperf 3.1.3: Ø1543 (771-1600)
Lenovo Legion 9 16IRX8 Killer Wi-Fi 6E AX1675i 160MHz Wireless Network Adapter; iperf3 transmit AXE11000 6GHz; iperf 3.1.3: Ø1472 (1007-1545)
Razer Blade 16 2024, RTX 4090 Intel Killer Wi-Fi 7 BE1750W 320 MHz (BE200NGW); iperf3 transmit AXE11000 6GHz; iperf 3.1.3: Ø1512 (784-1597)
Lenovo Legion 9 16IRX9, RTX 4090 Killer Wi-Fi 6E AX1675i 160MHz Wireless Network Adapter; iperf3 receive AXE11000 6GHz; iperf 3.1.3: Ø1659 (1606-1685)
Lenovo Legion 9 16IRX8 Killer Wi-Fi 6E AX1675i 160MHz Wireless Network Adapter; iperf3 receive AXE11000 6GHz; iperf 3.1.3: Ø1472 (754-1540)
Razer Blade 16 2024, RTX 4090 Intel Killer Wi-Fi 7 BE1750W 320 MHz (BE200NGW); iperf3 receive AXE11000 6GHz; iperf 3.1.3: Ø1492 (762-1536)

Webcam

La webcam Full HD 1 080p présente des écarts de couleur moyens à élevés et la netteté de l'image est correcte.
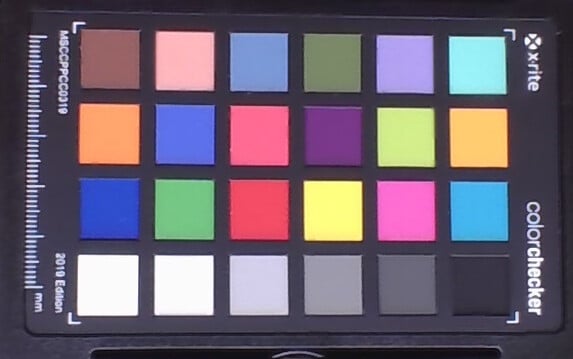
ColorChecker
13.6 ∆E
16.7 ∆E
11.7 ∆E
12.5 ∆E
13.8 ∆E
16.3 ∆E
12.9 ∆E
12.3 ∆E
14.9 ∆E
7.7 ∆E
12.9 ∆E
10.7 ∆E
8.5 ∆E
15.3 ∆E
17.9 ∆E
14.5 ∆E
15.3 ∆E
18.2 ∆E
1.8 ∆E
11.3 ∆E
17.3 ∆E
15.6 ∆E
12.6 ∆E
9.9 ∆E
ColorChecker Lenovo Legion 9 16IRX9, RTX 4090: 13.09 ∆E min: 1.76 - max: 18.23 ∆E
No screenshots found ()

Périphériques d'entrée - Maintenant avec Co-Pilot

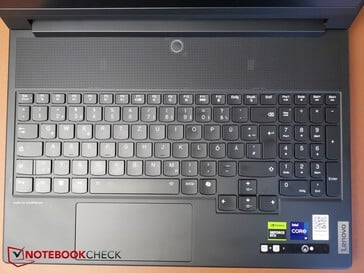
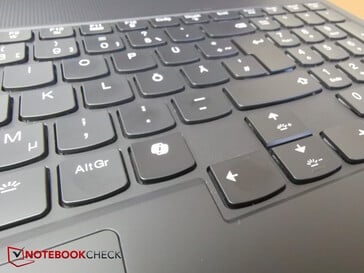
Son confortable clavier à membrane et son pavé tactile n'ont pratiquement pas changé. Ce dernier est toujours très étroit (5,9 cm). Une touche Co-Pilot a été ajoutée au clavier. La touche Ctrl de droite a dû être remplacée.

Clavier
Clavier
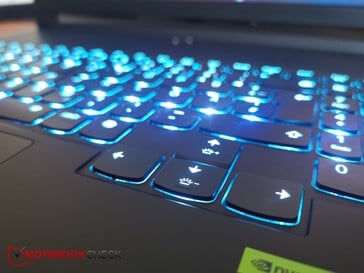
Rétro-éclairage
Rétro-éclairage
Désormais avec une clé de copilote
Le pavé tactile étroit

Écran - MiniLED de 1 200 lumens

Sous-pixels mats
Sous-pixels mats
Pas de saignement du rétroéclairage

Le mini-écran LED 16 pouces 3,2K (3 200 x 2 000) avec Dolby Vision et G-Sync reste l'une des principales attractions du Legion 9. Il est dit qu'il a une luminosité allant jusqu'à 1 200 nits et qu'il répond donc à la norme HDR 1000. Nous avons effectivement mesuré plus de 1 000 nits en mode HDR.

En mode SD, avec une meilleure précision des couleurs, l'écran brille encore avec une moyenne de 664 nits ! À 43 % de luminosité, sa valeur de luminosité est d'environ 150 nits, valeur que nous utilisons pour certains de nos tests de batterie. Le niveau de noir est excellent grâce aux mini LED qui peuvent être désactivées dans de nombreuses zones, ce qui permet d'obtenir des contrastes très élevés.

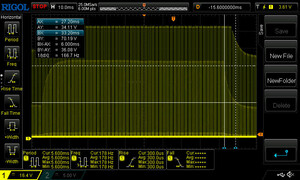
Il n'y a pas de saignement du rétroéclairage et les temps de réponse sont suffisamment rapides, même s'ils n'atteignent pas le niveau de l'OLED. Nous avons pu mesurer le PWM, bien qu'à une fréquence assez élevée de 5 kHz à 40 kHz, ce qui ne devrait pas être un problème même pour les personnes sensibles.

663
cd/m²
691
cd/m²
670
cd/m²
662
cd/m²
631
cd/m²
670
cd/m²
684
cd/m²
633
cd/m²
669
cd/m²
Homogénéité de la luminosité
CSOT T3 MNG007ZA2-2 tested with X-Rite i1Pro 3
Maximum: 691 cd/m² (Nits) Moyenne: 663.7 cd/m² Minimum: 23.4 cd/m²
Homogénéité de la luminosité: 91 %
Valeur mesurée au centre, sur batterie: 630 cd/m²
Contraste: 21033:1 (Valeurs des noirs: 0.03 cd/m²)
ΔE Color 2.68 | 0.5-29.43 Ø4.92, calibrated: 2.68
ΔE Greyscale 2.71 | 0.5-98 Ø5.2
86.6% AdobeRGB 1998 (Argyll 2.2.0 3D)
99.9% sRGB (Argyll 2.2.0 3D)
95.3% Display P3 (Argyll 2.2.0 3D)
Gamma: 2.27
Lenovo Legion 9 16IRX9, RTX 4090
CSOT T3 MNG007ZA2-2, MiniLED, 3200x2000, 16"
Lenovo Legion 9 16IRX8
CSOT T3 MNG007ZA2-2, Mini-LED, 3200x2000, 16"
Razer Blade 16 2024, RTX 4090
Samsung SDC41AB (ATNA60DL03-0), OLED, 2560x1600, 16"
Alienware m18 R2
BOE NE18NZ1, IPS, 2560x1600, 18"
Asus ROG Strix Scar 18 G834JYR (2024)
BOE NE180QDM-NM1, Mini LED, 2560x1600, 18"
Medion Erazer Beast X40 2024
BOE NE170QDM-NZ1, IPS, 2560x1600, 17"
Display
1%
5%
2%
3%
-16%
Display P3 Coverage
95.3
97.2
2%
99.1
4%
97.8
3%
99.9
5%
68.1
-29%
sRGB Coverage
99.9
99.9
0%
99.9
0%
99.5
0%
100
0%
99.5
0%
AdobeRGB 1998 Coverage
86.6
87
0%
95.6
10%
88.9
3%
90
4%
69
-20%
Response Times
-12%
37%
27%
1%
19%
Response Time Grey 50% / Grey 80% *
12.6 ?(6.6, 6)
13.3 ?(5.7, 7.6)
-6%
0.24 ?(0.15, 0.09)
98%
5.3 ?(2.2, 3.1)
58%
12 ?(8, 4)
5%
11.7 ?(5.7, 6)
7%
Response Time Black / White *
10 ?(5.2, 4.8)
11.6 ?(5.1, 6.5)
-16%
0.4 ?(0.2, 0.2)
96%
10.4 ?(4.8, 5.6)
-4%
10.7 ?(7.6, 3.1)
-7%
6.9 ?(2.8, 4.1)
31%
PWM Frequency
5430
4742
-13%
960
-82%
5733 ?(94)
6%
Screen
-0%
21%
-107%
14%
-136%
Brightness middle
631
674.9
7%
418
-34%
271.8
-57%
937
48%
422
-33%
Brightness
664
682
3%
420
-37%
275
-59%
934
41%
388
-42%
Brightness Distribution
91
96
5%
98
8%
78
-14%
89
-2%
87
-4%
Black Level *
0.03
0.04
-33%
0.02
33%
0.27
-800%
0.066
-120%
0.42
-1300%
Contrast
21033
16873
-20%
20900
-1%
1007
-95%
14197
-33%
1005
-95%
Colorchecker dE 2000 *
2.68
2.56
4%
1.07
60%
2.48
7%
1.52
43%
1.42
47%
Colorchecker dE 2000 max. *
6.41
4.16
35%
4.04
37%
5.59
13%
2.82
56%
1.97
69%
Colorchecker dE 2000 calibrated *
2.68
2.47
8%
1.07
60%
0.56
79%
1.21
55%
0.7
74%
Greyscale dE 2000 *
2.71
3
-11%
1.12
59%
3.7
-37%
1.7
37%
1.2
56%
Gamma
2.27 97%
2.38 92%
2.29 96%
2.2 100%
2.042 108%
2.078 106%
CCT
6135 106%
6799 96%
6417 101%
6355 102%
6578 99%
6581 99%
Moyenne finale (programmes/paramètres)
-4% / -2%
21% / 21%
-26% / -65%
6% / 9%
-44% / -89%

* ... Moindre est la valeur, meilleures sont les performances

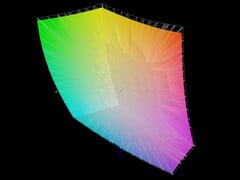
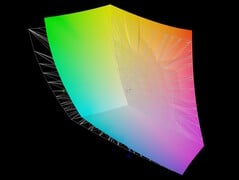
DisplayP3 est couvert à environ 95 %, sRGB à 100 % et AdobeRGB à 86-87 %.

sRGB
sRGB
Affichage P3
Affichage P3
AdobeRGB
AdobeRGB

Ex fonctionne, l'écran est correctement étalonné par rapport à la norme P3. Notre recalibrage a amélioré ses valeurs DeltaE en niveaux de gris mais a détérioré ses valeurs DeltaE ClocChecker, c'est pourquoi il ne vaut pas la peine de faire cet effort. Cependant, ses écarts de couleur ne sont pas idéaux, avec une moyenne de 2,68 et des valeurs aberrantes allant jusqu'à 6,41.

Niveaux de gris
Niveaux de gris
Saturation
Saturation
Contrôleur de couleurs
Niveaux de gris après étalonnage
Saturation après étalonnage
ColorChecker après étalonnage

Temps de réponse de l'écran

Le temps de réponse d'un écran mesure la rapidité à laquelle l'écran est capable de changer une couleur pour une autre. Un temps de réponse élevé se traduit par une image floutée pour les objets en mouvement. Les joueurs bénéficieront de faibles latences d'affichage en jeu.
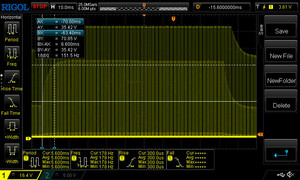
       Temps de réponse noir à blanc
10 ms ... hausse ↗ et chute ↘ combinées↗ 5.2 ms hausse
↘ 4.8 ms chute
L'écran montre de bons temps de réponse, mais insuffisant pour du jeu compétitif.
En comparaison, tous les appareils testés affichent entre 0.1 (minimum) et 240 (maximum) ms. » 23 % des appareils testés affichent de meilleures performances.
Cela signifie que les latences relevées sont meilleures que la moyenne (21 ms) de tous les appareils testés.
       Temps de réponse gris 50% à gris 80%
12.6 ms ... hausse ↗ et chute ↘ combinées↗ 6.6 ms hausse
↘ 6 ms chute
L'écran montre de bons temps de réponse, mais insuffisant pour du jeu compétitif.
En comparaison, tous les appareils testés affichent entre 0.165 (minimum) et 636 (maximum) ms. » 22 % des appareils testés affichent de meilleures performances.
Cela signifie que les latences relevées sont meilleures que la moyenne (32.9 ms) de tous les appareils testés.

Scintillement / MLI (Modulation de largeur d'impulsion)

Afin d'abaisser la luminosité de l'écran, certains ordinateurs portables font varier très rapidement le rétroéclairage entre éteint et allumé. La fréquence à laquelle le rétroéclairage s'éteint et se rallume est normalement fixée à une valeur qui permet de rendre la variation indétectable à l'œil nu? Si la fréquence est trop basse, certaines personnes peuvent être sujettes à une fatigue oculaire, des maux de tête ou même percevoir les variations.
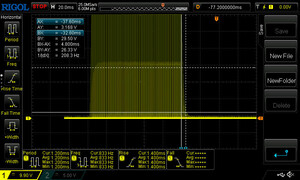
Scintillement / MLI (Modulation de largeur d'impulsion) décelé 5430 Hz
Amplitude: 8 %

Le rétroéclairage de l'écran scintille à la fréquence de 5430 Hz (certainement du fait de l'utilisation d'une MDI - Modulation de largeur d'impulsion) .

La fréquence de rafraîchissement de 5430 Hz est élevée, la grande majorité des utilisateurs ne devrait pas percevoir de scintillements et être sujette à une fatigue oculaire accrue.

En comparaison, 53 % des appareils testés n'emploient pas MDI pour assombrir leur écran. Nous avons relevé une moyenne à 8743 (minimum : 5 - maximum : 343500) Hz dans le cas où une MDI était active.

0 % de luminosité
0 % de luminosité
25 % de luminosité
25 % de luminosité
50 % de luminosité
50 % de luminosité
75 % de luminosité
75 % de luminosité
100 % de luminosité
100 % de luminosité

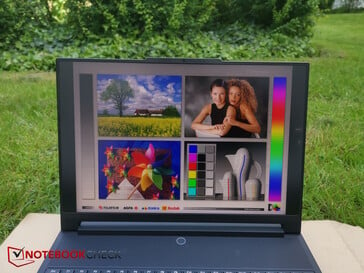
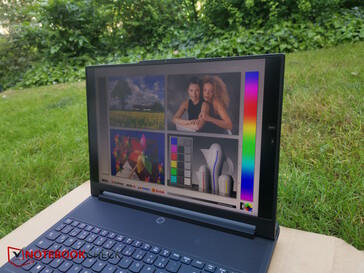
À l'extérieur, la visibilité est assez bonne grâce à la luminosité élevée de l'écran et à sa surface mate. Il convient néanmoins d'éviter la lumière directe du soleil.

A l'extérieur, à l'ombre
Angle de vue extérieur, incliné
Très bonne stabilité de l'angle de vue

Performance - élevée, mais non sans problèmes

Les nouveaux modèles i9-14900HX associé à la puissante RTX 4090 et 64 Go de RAM font clairement du Legion 9i un joueur haut de gamme. Cela est également suggéré par son design proéminent à l'arrière, ce qui explique pourquoi les créateurs peuvent chercher des alternatives plus subtiles malgré les performances potentiellement élevées de l'appareil.

Conditions d'essai

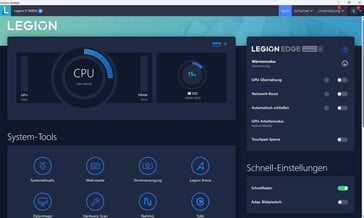
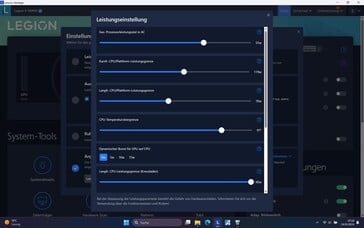
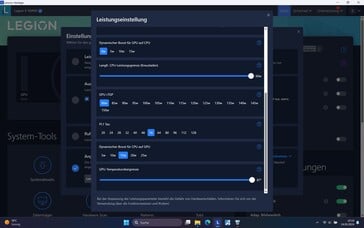
Lenovo Vantage est le nom du centre de contrôle du Legion 9, et il comprend les profils de performance Performance, Équilibré (vous pouvez également sélectionner AI pour l'optimisation) et Silencieux. Il existe également un mode personnalisé qui vous permet de régler manuellement divers paramètres.

Malheureusement, Vantage nous a parfois importunés avec de la publicité, par exemple pour Amazon Music, les applications YouTube, etc. En effet, les messages marketing sont actifs par défaut dans Vantage et vous devez d'abord les désactiver pour ne plus être dérangé par eux.

Nous avons sélectionné le mode Performance pour nos benchmarks, mais nous avons laissé désactivé le commutateur pour l'overclocking du GPU.

Écran d'accueil du Lenovo Vantage
Les modes de performance
Valeurs caractéristiques mode personnalisé
Valeurs caractéristiques mode personnalisé page 2
Publicité pour Amazon Music
Des applications supplémentaires sont proposées lors de la configuration initiale

Processeur

Mode performance
Mode performance
Mode équilibré avec IA
Mode équilibré sans IA
Mode silencieux
Mode silencieux
Mode batterie
Mode batterie
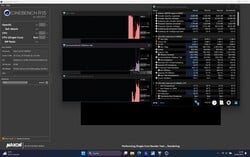
CB15 single core : les fréquences d'horloge chutent brièvement après 50 secondes

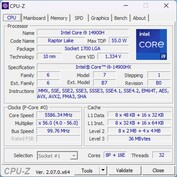
Le i9-14900HX est un processeur haut de gamme de la dernière série Raptor Lake Refresh d'Intel. Ses 8 cœurs P sont cadencés à 5,8 GHz et les 16 cœurs E sont cadencés à 1,6 GHz. Ensemble, ils peuvent traiter un total de 32 threads.

Au cours de la boucle Cinebench R15, notre Legion 9i a eu la performance initiale la plus élevée, cependant, contrairement à la concurrence avec le même CPU, sa performance a constamment chuté au fil du temps - d'environ 7,5 pour cent après une demi-heure. Ensuite, ses performances étaient à peine supérieures à celles de son prédécesseur équipé du i9-13980HX. Malgré cela, le processeur de l'ordinateur Legion 9 reste l'un des plus rapides de la comparaison, même si l'augmentation de ses performances par rapport à son prédécesseur est plutôt faible.

Alors que ses performances multithread ne font aucun doute, le

Legion 9i s'est clairement affaibli en ce qui concerne ses performances monocœur dans tous les benchmarks de CPU. Cela est reproductible - apparemment, ses réserves de performance monocœur ne sont pas épuisées en mode Performance, pour lequel vous devez augmenter manuellement les chiffres clés en utilisant le mode Personnalisé.

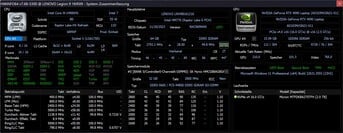
Nous avons donc jeté un coup d'œil aux chiffres clés : Dans Cinebench R15 Single Core, le cœur a d'abord été cadencé à 4,6 GHz. Après environ 50 secondes, l'horloge du cœur a brièvement chuté à 1,2 GHz, puis s'est stabilisée entre 3 et 3,5 GHz. Le TDP était d'environ 30 watts. Lors d'un autre test, la chute a été nettement moins prononcée.

Une fois la prise d'alimentation débranchée, les performances multithread dans Cinebench R15 ont chuté d'environ 48,5 %, soit près de la moitié par rapport à l'utilisation de l'ordinateur portable branché sur le secteur !

Profil de performance/valeur mesurée Cinebench-15-Score 1st run Consommation d'énergie du CPU en watts
Performances sans overclocking du CPU 4,879 140 - 180
Équilibré avec AI 4,115 120 - 130
Équilibré sans AI 4,091 115 - 127
Silencieux 2,938 65 - 70
Batterie 2,516 40 - 58

Cinebench R15 Multi continuous test

0245490735980122514701715196022052450269529403185343036753920416544104655Tooltip
Lenovo Legion 9 16IRX9, RTX 4090 Intel Core i9-14900HX: Ø4648 (4505.52-4878.64)
Lenovo Legion 9 16IRX8 Intel Core i9-13980HX: Ø4416 (4337.45-4565.69)
Razer Blade 16 2024, RTX 4090 Intel Core i9-14900HX: Ø4396 (4349.72-4455.83)
Alienware m18 R2 Intel Core i9-14900HX: Ø4743 (4458.81-4807.11)
Asus ROG Strix Scar 18 G834JYR (2024) Intel Core i9-14900HX: Ø4024 (3961.18-4098.11)
Medion Erazer Beast X40 2024 Intel Core i9-14900HX: Ø3224 (3189.54-3263.11)
CPU Performance Rating: Percent
Cinebench R23: Multi Core | Single Core
Cinebench R20: CPU (Multi Core) | CPU (Single Core)
Cinebench R15: CPU Multi 64Bit | CPU Single 64Bit
Blender: v2.79 BMW27 CPU
7-Zip 18.03: 7z b 4 | 7z b 4 -mmt1
Geekbench 6.3: Multi-Core | Single-Core
Geekbench 5.5: Multi-Core | Single-Core
HWBOT x265 Benchmark v2.2: 4k Preset
LibreOffice : 20 Documents To PDF
R Benchmark 2.5: Overall mean
CPU Performance Rating
Alienware m18 R2
Intel Core i9-14900HX
85.5 pt
Lenovo Legion 9 16IRX8
Intel Core i9-13980HX
82.8 pt
Razer Blade 16 2024, RTX 4090
Intel Core i9-14900HX
80.6 pt
Moyenne Intel Core i9-14900HX
 
80.6 pt
Asus ROG Strix Scar 18 G834JYR (2024)
Intel Core i9-14900HX
80.3 pt
Lenovo Legion 9 16IRX9, RTX 4090
Intel Core i9-14900HX
74.6 pt
Medion Erazer Beast X40 2024
Intel Core i9-14900HX
73.7 pt
Moyenne de la classe Gaming
 
64.2 pt
Cinebench R23 / Multi Core
Lenovo Legion 9 16IRX9, RTX 4090
Intel Core i9-14900HX
31889 Points
Alienware m18 R2
Intel Core i9-14900HX
31391 (28656min - 31390.7max) Points -2%
Lenovo Legion 9 16IRX8
Intel Core i9-13980HX
29892 (28505.8min - 29891.7max) Points -6%
Moyenne Intel Core i9-14900HX
  (17078 - 36249, n=34)
29130 Points -9%
Razer Blade 16 2024, RTX 4090
Intel Core i9-14900HX
28867 Points -9%
Asus ROG Strix Scar 18 G834JYR (2024)
Intel Core i9-14900HX
28516 Points -11%
Medion Erazer Beast X40 2024
Intel Core i9-14900HX
22238 Points -30%
Moyenne de la classe Gaming
  (5668 - 36249, n=191, 2 dernières années)
21701 Points -32%
Cinebench R23 / Single Core
Alienware m18 R2
Intel Core i9-14900HX
2235 Points +30%
Medion Erazer Beast X40 2024
Intel Core i9-14900HX
2227 Points +29%
Asus ROG Strix Scar 18 G834JYR (2024)
Intel Core i9-14900HX
2177 Points +27%
Moyenne Intel Core i9-14900HX
  (1720 - 2245, n=34)
2157 Points +25%
Lenovo Legion 9 16IRX8
Intel Core i9-13980HX
2129 Points +24%
Razer Blade 16 2024, RTX 4090
Intel Core i9-14900HX
2117 Points +23%
Moyenne de la classe Gaming
  (1088 - 2235, n=189, 2 dernières années)
1880 Points +9%
Lenovo Legion 9 16IRX9, RTX 4090
Intel Core i9-14900HX
1720 Points
Cinebench R20 / CPU (Multi Core)
Lenovo Legion 9 16IRX9, RTX 4090
Intel Core i9-14900HX
11960 Points
Alienware m18 R2
Intel Core i9-14900HX
11816 Points -1%
Lenovo Legion 9 16IRX8
Intel Core i9-13980HX
11155 Points -7%
Moyenne Intel Core i9-14900HX
  (6579 - 13832, n=34)
11084 Points -7%
Razer Blade 16 2024, RTX 4090
Intel Core i9-14900HX
10968 Points -8%
Asus ROG Strix Scar 18 G834JYR (2024)
Intel Core i9-14900HX
10787 Points -10%
Medion Erazer Beast X40 2024
Intel Core i9-14900HX
8495 Points -29%
Moyenne de la classe Gaming
  (2179 - 13832, n=189, 2 dernières années)
8258 Points -31%
Cinebench R20 / CPU (Single Core)
Medion Erazer Beast X40 2024
Intel Core i9-14900HX
855 Points +30%
Alienware m18 R2
Intel Core i9-14900HX
853 Points +30%
Asus ROG Strix Scar 18 G834JYR (2024)
Intel Core i9-14900HX
833 Points +27%
Moyenne Intel Core i9-14900HX
  (657 - 859, n=34)
826 Points +26%
Razer Blade 16 2024, RTX 4090
Intel Core i9-14900HX
810 Points +23%
Lenovo Legion 9 16IRX8
Intel Core i9-13980HX
723 Points +10%
Moyenne de la classe Gaming
  (427 - 856, n=189, 2 dernières années)
722 Points +10%
Lenovo Legion 9 16IRX9, RTX 4090
Intel Core i9-14900HX
657 Points
Cinebench R15 / CPU Multi 64Bit
Lenovo Legion 9 16IRX9, RTX 4090
Intel Core i9-14900HX
4879 (4505.52min - 4878.64max) Points
Alienware m18 R2
Intel Core i9-14900HX
4807 (4458.81min - 4807.11max) Points -1%
Lenovo Legion 9 16IRX8
Intel Core i9-13980HX
4566 (4337.45min - 4565.69max) Points -6%
Moyenne Intel Core i9-14900HX
  (3263 - 5589, n=35)
4462 Points -9%
Razer Blade 16 2024, RTX 4090
Intel Core i9-14900HX
4456 (4349.72min - 4455.83max) Points -9%
Asus ROG Strix Scar 18 G834JYR (2024)
Intel Core i9-14900HX
4098 Points -16%
Moyenne de la classe Gaming
  (905 - 5663, n=196, 2 dernières années)
3402 Points -30%
Medion Erazer Beast X40 2024
Intel Core i9-14900HX
3263 Points -33%
Cinebench R15 / CPU Single 64Bit
Alienware m18 R2
Intel Core i9-14900HX
318 Points +29%
Medion Erazer Beast X40 2024
Intel Core i9-14900HX
314 Points +27%
Razer Blade 16 2024, RTX 4090
Intel Core i9-14900HX
311 Points +26%
Moyenne Intel Core i9-14900HX
  (247 - 323, n=34)
306 Points +24%
Lenovo Legion 9 16IRX8
Intel Core i9-13980HX
303 Points +23%
Asus ROG Strix Scar 18 G834JYR (2024)
Intel Core i9-14900HX
302 Points +22%
Moyenne de la classe Gaming
  (176.6 - 318, n=193, 2 dernières années)
277 Points +12%
Lenovo Legion 9 16IRX9, RTX 4090
Intel Core i9-14900HX
247 Points
Blender / v2.79 BMW27 CPU
Moyenne de la classe Gaming
  (87 - 555, n=184, 2 dernières années)
171.9 Seconds * -62%
Medion Erazer Beast X40 2024
Intel Core i9-14900HX
143 Seconds * -35%
Moyenne Intel Core i9-14900HX
  (91 - 206, n=34)
119.5 Seconds * -13%
Asus ROG Strix Scar 18 G834JYR (2024)
Intel Core i9-14900HX
118 Seconds * -11%
Razer Blade 16 2024, RTX 4090
Intel Core i9-14900HX
113 Seconds * -7%
Lenovo Legion 9 16IRX9, RTX 4090
Intel Core i9-14900HX
106 Seconds *
Lenovo Legion 9 16IRX8
Intel Core i9-13980HX
103 Seconds * +3%
Alienware m18 R2
Intel Core i9-14900HX
102 Seconds * +4%
7-Zip 18.03 / 7z b 4
Lenovo Legion 9 16IRX9, RTX 4090
Intel Core i9-14900HX
125676 MIPS
Alienware m18 R2
Intel Core i9-14900HX
122772 MIPS -2%
Lenovo Legion 9 16IRX8
Intel Core i9-13980HX
117479 MIPS -7%
Razer Blade 16 2024, RTX 4090
Intel Core i9-14900HX
115695 MIPS -8%
Asus ROG Strix Scar 18 G834JYR (2024)
Intel Core i9-14900HX
114546 MIPS -9%
Moyenne Intel Core i9-14900HX
  (66769 - 136645, n=34)
112494 MIPS -10%
Medion Erazer Beast X40 2024
Intel Core i9-14900HX
92386 MIPS -26%
Moyenne de la classe Gaming
  (23795 - 140932, n=188, 2 dernières années)
84837 MIPS -32%
7-Zip 18.03 / 7z b 4 -mmt1
Medion Erazer Beast X40 2024
Intel Core i9-14900HX
7340 MIPS +35%
Asus ROG Strix Scar 18 G834JYR (2024)
Intel Core i9-14900HX
7172 MIPS +32%
Alienware m18 R2
Intel Core i9-14900HX
7103 MIPS +30%
Razer Blade 16 2024, RTX 4090
Intel Core i9-14900HX
7018 MIPS +29%
Moyenne Intel Core i9-14900HX
  (5452 - 7545, n=34)
7017 MIPS +29%
Lenovo Legion 9 16IRX8
Intel Core i9-13980HX
6965 MIPS +28%
Moyenne de la classe Gaming
  (4168 - 7581, n=188, 2 dernières années)
6286 MIPS +15%
Lenovo Legion 9 16IRX9, RTX 4090
Intel Core i9-14900HX
5452 MIPS
Geekbench 6.3 / Multi-Core
Alienware m18 R2
Intel Core i9-14900HX
18233 Points +4%
Asus ROG Strix Scar 18 G834JYR (2024)
Intel Core i9-14900HX
17695 Points +1%
Razer Blade 16 2024, RTX 4090
Intel Core i9-14900HX
17559 Points 0%
Lenovo Legion 9 16IRX9, RTX 4090
Intel Core i9-14900HX
17499 Points
Lenovo Legion 9 16IRX8
Intel Core i9-13980HX
17472 Points 0%
Moyenne Intel Core i9-14900HX
  (13158 - 19665, n=34)
17369 Points -1%
Medion Erazer Beast X40 2024
Intel Core i9-14900HX
15849 Points -9%
Moyenne de la classe Gaming
  (5340 - 19665, n=110, 2 dernières années)
14171 Points -19%
Geekbench 6.3 / Single-Core
Medion Erazer Beast X40 2024
Intel Core i9-14900HX
3077 Points +27%
Alienware m18 R2
Intel Core i9-14900HX
3057 Points +26%
Asus ROG Strix Scar 18 G834JYR (2024)
Intel Core i9-14900HX
2999 Points +24%
Moyenne Intel Core i9-14900HX
  (2419 - 3129, n=34)
2973 Points +23%
Razer Blade 16 2024, RTX 4090
Intel Core i9-14900HX
2964 Points +23%
Lenovo Legion 9 16IRX8
Intel Core i9-13980HX
2961 Points +22%
Moyenne de la classe Gaming
  (1490 - 3129, n=110, 2 dernières années)
2641 Points +9%
Lenovo Legion 9 16IRX9, RTX 4090
Intel Core i9-14900HX
2419 Points
Geekbench 5.5 / Multi-Core
Lenovo Legion 9 16IRX9, RTX 4090
Intel Core i9-14900HX
21642 Points
Alienware m18 R2
Intel Core i9-14900HX
21284 Points -2%
Lenovo Legion 9 16IRX8
Intel Core i9-13980HX
20639 Points -5%
Asus ROG Strix Scar 18 G834JYR (2024)
Intel Core i9-14900HX
19975 Points -8%
Moyenne Intel Core i9-14900HX
  (8618 - 23194, n=34)
19540 Points -10%
Razer Blade 16 2024, RTX 4090
Intel Core i9-14900HX
19372 Points -10%
Medion Erazer Beast X40 2024
Intel Core i9-14900HX
17082 Points -21%
Moyenne de la classe Gaming
  (4557 - 23194, n=189, 2 dernières années)
14925 Points -31%
Geekbench 5.5 / Single-Core
Alienware m18 R2
Intel Core i9-14900HX
2193 Points +27%
Medion Erazer Beast X40 2024
Intel Core i9-14900HX
2168 Points +25%
Lenovo Legion 9 16IRX8
Intel Core i9-13980HX
2135 Points +23%
Razer Blade 16 2024, RTX 4090
Intel Core i9-14900HX
2131 Points +23%
Asus ROG Strix Scar 18 G834JYR (2024)
Intel Core i9-14900HX
2118 Points +22%
Moyenne Intel Core i9-14900HX
  (1669 - 2210, n=34)
2092 Points +21%
Moyenne de la classe Gaming
  (986 - 2210, n=189, 2 dernières années)
1885 Points +9%
Lenovo Legion 9 16IRX9, RTX 4090
Intel Core i9-14900HX
1729 Points
HWBOT x265 Benchmark v2.2 / 4k Preset
Alienware m18 R2
Intel Core i9-14900HX
32.1 fps +5%
Lenovo Legion 9 16IRX8
Intel Core i9-13980HX
31.7 fps +3%
Lenovo Legion 9 16IRX9, RTX 4090
Intel Core i9-14900HX
30.7 fps
Razer Blade 16 2024, RTX 4090
Intel Core i9-14900HX
30.1 fps -2%
Moyenne Intel Core i9-14900HX
  (16.8 - 38.9, n=34)
29.7 fps -3%
Asus ROG Strix Scar 18 G834JYR (2024)
Intel Core i9-14900HX
29.2 fps -5%
Medion Erazer Beast X40 2024
Intel Core i9-14900HX
23.7 fps -23%
Moyenne de la classe Gaming
  (6.72 - 38.9, n=188, 2 dernières années)
23.4 fps -24%
LibreOffice / 20 Documents To PDF
Lenovo Legion 9 16IRX9, RTX 4090
Intel Core i9-14900HX
53.6 s *
Razer Blade 16 2024, RTX 4090
Intel Core i9-14900HX
47.5 s * +11%
Moyenne de la classe Gaming
  (31.4 - 96.6, n=185, 2 dernières années)
47.5 s * +11%
Alienware m18 R2
Intel Core i9-14900HX
44.8 s * +16%
Asus ROG Strix Scar 18 G834JYR (2024)
Intel Core i9-14900HX
43.8 s * +18%
Moyenne Intel Core i9-14900HX
  (31.4 - 85.1, n=34)
43.4 s * +19%
Medion Erazer Beast X40 2024
Intel Core i9-14900HX
42.8 s * +20%
Lenovo Legion 9 16IRX8
Intel Core i9-13980HX
35 s * +35%
R Benchmark 2.5 / Overall mean
Lenovo Legion 9 16IRX9, RTX 4090
Intel Core i9-14900HX
0.4859 sec *
Moyenne de la classe Gaming
  (0.3609 - 0.759, n=189, 2 dernières années)
0.4399 sec * +9%
Asus ROG Strix Scar 18 G834JYR (2024)
Intel Core i9-14900HX
0.3944 sec * +19%
Moyenne Intel Core i9-14900HX
  (0.3604 - 0.4859, n=34)
0.3845 sec * +21%
Lenovo Legion 9 16IRX8
Intel Core i9-13980HX
0.3797 sec * +22%
Razer Blade 16 2024, RTX 4090
Intel Core i9-14900HX
0.3789 sec * +22%
Alienware m18 R2
Intel Core i9-14900HX
0.3767 sec * +22%
Medion Erazer Beast X40 2024
Intel Core i9-14900HX
0.3717 sec * +24%

* ... Moindre est la valeur, meilleures sont les performances

Cinebench R15 CPU Multi 64Bit
4879 Points
Cinebench R15 OpenGL 64Bit
241 fps
Cinebench R15 Ref. Match 64Bit
99.6 %
Cinebench R15 CPU Single 64Bit
247 Points
Cinebench R20 CPU (Multi Core)
11960 Points
Cinebench R20 CPU (Single Core)
657 Points
Cinebench R23 Single Core
1720 Points
Cinebench R23 Multi Core
31889 Points
Aide
Performance Rating
Alienware m18 R2
Intel Core i9-14900HX, NVIDIA GeForce RTX 4090 Laptop GPU
98.7 pt
Lenovo Legion 9 16IRX9, RTX 4090
Intel Core i9-14900HX, NVIDIA GeForce RTX 4090 Laptop GPU
96.3 pt
Lenovo Legion 9 16IRX8
Intel Core i9-13980HX, NVIDIA GeForce RTX 4090 Laptop GPU
93.7 pt
Razer Blade 16 2024, RTX 4090
Intel Core i9-14900HX, NVIDIA GeForce RTX 4090 Laptop GPU
90.6 pt
Asus ROG Strix Scar 18 G834JYR (2024)
Intel Core i9-14900HX, NVIDIA GeForce RTX 4090 Laptop GPU
90.3 pt
Moyenne Intel Core i9-14900HX
 
89.6 pt
Medion Erazer Beast X40 2024
Intel Core i9-14900HX, NVIDIA GeForce RTX 4090 Laptop GPU
75.7 pt
Moyenne de la classe Gaming
 
74.5 pt
AIDA64 / FP32 Ray-Trace
Alienware m18 R2
Intel Core i9-14900HX, NVIDIA GeForce RTX 4090 Laptop GPU
29280 KRay/s +6%
Lenovo Legion 9 16IRX9, RTX 4090
Intel Core i9-14900HX, NVIDIA GeForce RTX 4090 Laptop GPU
27535 KRay/s
Lenovo Legion 9 16IRX8
Intel Core i9-13980HX, NVIDIA GeForce RTX 4090 Laptop GPU
27175 KRay/s -1%
Razer Blade 16 2024, RTX 4090
Intel Core i9-14900HX, NVIDIA GeForce RTX 4090 Laptop GPU
25682 KRay/s -7%
Asus ROG Strix Scar 18 G834JYR (2024)
Intel Core i9-14900HX, NVIDIA GeForce RTX 4090 Laptop GPU
25444 KRay/s -8%
Moyenne Intel Core i9-14900HX
  (13098 - 33474, n=33)
25096 KRay/s -9%
Moyenne de la classe Gaming
  (4986 - 60169, n=185, 2 dernières années)
21686 KRay/s -21%
Medion Erazer Beast X40 2024
Intel Core i9-14900HX, NVIDIA GeForce RTX 4090 Laptop GPU
20114 KRay/s -27%
AIDA64 / FPU Julia
Alienware m18 R2
Intel Core i9-14900HX, NVIDIA GeForce RTX 4090 Laptop GPU
142791 Points +5%
Lenovo Legion 9 16IRX9, RTX 4090
Intel Core i9-14900HX, NVIDIA GeForce RTX 4090 Laptop GPU
136486 Points
Lenovo Legion 9 16IRX8
Intel Core i9-13980HX, NVIDIA GeForce RTX 4090 Laptop GPU
133962 Points -2%
Asus ROG Strix Scar 18 G834JYR (2024)
Intel Core i9-14900HX, NVIDIA GeForce RTX 4090 Laptop GPU
128826 Points -6%
Razer Blade 16 2024, RTX 4090
Intel Core i9-14900HX, NVIDIA GeForce RTX 4090 Laptop GPU
127908 Points -6%
Moyenne Intel Core i9-14900HX
  (67573 - 166040, n=33)
125765 Points -8%
Moyenne de la classe Gaming
  (25360 - 252486, n=185, 2 dernières années)
106189 Points -22%
Medion Erazer Beast X40 2024
Intel Core i9-14900HX, NVIDIA GeForce RTX 4090 Laptop GPU
103901 Points -24%
AIDA64 / CPU SHA3
Alienware m18 R2
Intel Core i9-14900HX, NVIDIA GeForce RTX 4090 Laptop GPU
7095 MB/s +1%
Lenovo Legion 9 16IRX9, RTX 4090
Intel Core i9-14900HX, NVIDIA GeForce RTX 4090 Laptop GPU
7000 MB/s
Lenovo Legion 9 16IRX8
Intel Core i9-13980HX, NVIDIA GeForce RTX 4090 Laptop GPU
6692 MB/s -4%
Moyenne Intel Core i9-14900HX
  (3589 - 7979, n=33)
6212 MB/s -11%
Asus ROG Strix Scar 18 G834JYR (2024)
Intel Core i9-14900HX, NVIDIA GeForce RTX 4090 Laptop GPU
6204 MB/s -11%
Razer Blade 16 2024, RTX 4090
Intel Core i9-14900HX, NVIDIA GeForce RTX 4090 Laptop GPU
6188 MB/s -12%
Medion Erazer Beast X40 2024
Intel Core i9-14900HX, NVIDIA GeForce RTX 4090 Laptop GPU
4905 MB/s -30%
Moyenne de la classe Gaming
  (1339 - 10389, n=185, 2 dernières années)
4862 MB/s -31%
AIDA64 / CPU Queen
Asus ROG Strix Scar 18 G834JYR (2024)
Intel Core i9-14900HX, NVIDIA GeForce RTX 4090 Laptop GPU
141681 Points +8%
Alienware m18 R2
Intel Core i9-14900HX, NVIDIA GeForce RTX 4090 Laptop GPU
139323 Points +7%
Moyenne Intel Core i9-14900HX
  (118405 - 148966, n=33)
138709 Points +6%
Razer Blade 16 2024, RTX 4090
Intel Core i9-14900HX, NVIDIA GeForce RTX 4090 Laptop GPU
138473 Points +6%
Lenovo Legion 9 16IRX8
Intel Core i9-13980HX, NVIDIA GeForce RTX 4090 Laptop GPU
134299 Points +3%
Medion Erazer Beast X40 2024
Intel Core i9-14900HX, NVIDIA GeForce RTX 4090 Laptop GPU
132613 Points +1%
Lenovo Legion 9 16IRX9, RTX 4090
Intel Core i9-14900HX, NVIDIA GeForce RTX 4090 Laptop GPU
130803 Points
Moyenne de la classe Gaming
  (50699 - 200651, n=185, 2 dernières années)
116446 Points -11%
AIDA64 / FPU SinJulia
Alienware m18 R2
Intel Core i9-14900HX, NVIDIA GeForce RTX 4090 Laptop GPU
16279 Points 0%
Lenovo Legion 9 16IRX9, RTX 4090
Intel Core i9-14900HX, NVIDIA GeForce RTX 4090 Laptop GPU
16268 Points
Asus ROG Strix Scar 18 G834JYR (2024)
Intel Core i9-14900HX, NVIDIA GeForce RTX 4090 Laptop GPU
16121 Points -1%
Razer Blade 16 2024, RTX 4090
Intel Core i9-14900HX, NVIDIA GeForce RTX 4090 Laptop GPU
15857 Points -3%
Lenovo Legion 9 16IRX8
Intel Core i9-13980HX, NVIDIA GeForce RTX 4090 Laptop GPU
15467 Points -5%
Moyenne Intel Core i9-14900HX
  (10475 - 18517, n=33)
15369 Points -6%
Medion Erazer Beast X40 2024
Intel Core i9-14900HX, NVIDIA GeForce RTX 4090 Laptop GPU
13541 Points -17%
Moyenne de la classe Gaming
  (4800 - 32988, n=185, 2 dernières années)
13194 Points -19%
AIDA64 / FPU Mandel
Alienware m18 R2
Intel Core i9-14900HX, NVIDIA GeForce RTX 4090 Laptop GPU
72594 Points +6%
Lenovo Legion 9 16IRX9, RTX 4090
Intel Core i9-14900HX, NVIDIA GeForce RTX 4090 Laptop GPU
68467 Points
Lenovo Legion 9 16IRX8
Intel Core i9-13980HX, NVIDIA GeForce RTX 4090 Laptop GPU
68019 Points -1%
Razer Blade 16 2024, RTX 4090
Intel Core i9-14900HX, NVIDIA GeForce RTX 4090 Laptop GPU
64134 Points -6%
Asus ROG Strix Scar 18 G834JYR (2024)
Intel Core i9-14900HX, NVIDIA GeForce RTX 4090 Laptop GPU
63748 Points -7%
Moyenne Intel Core i9-14900HX
  (32543 - 83662, n=33)
61872 Points -10%
Moyenne de la classe Gaming
  (12321 - 134044, n=185, 2 dernières années)
53500 Points -22%
Medion Erazer Beast X40 2024
Intel Core i9-14900HX, NVIDIA GeForce RTX 4090 Laptop GPU
50393 Points -26%
AIDA64 / CPU AES
Moyenne Intel Core i9-14900HX
  (86964 - 241777, n=33)
137399 MB/s +3%
Alienware m18 R2
Intel Core i9-14900HX, NVIDIA GeForce RTX 4090 Laptop GPU
134675 MB/s +1%
Lenovo Legion 9 16IRX9, RTX 4090
Intel Core i9-14900HX, NVIDIA GeForce RTX 4090 Laptop GPU
133395 MB/s
Lenovo Legion 9 16IRX8
Intel Core i9-13980HX, NVIDIA GeForce RTX 4090 Laptop GPU
127602 MB/s -4%
Razer Blade 16 2024, RTX 4090
Intel Core i9-14900HX, NVIDIA GeForce RTX 4090 Laptop GPU
122937 MB/s -8%
Asus ROG Strix Scar 18 G834JYR (2024)
Intel Core i9-14900HX, NVIDIA GeForce RTX 4090 Laptop GPU
122250 MB/s -8%
Moyenne de la classe Gaming
  (19065 - 328679, n=185, 2 dernières années)
109209 MB/s -18%
Medion Erazer Beast X40 2024
Intel Core i9-14900HX, NVIDIA GeForce RTX 4090 Laptop GPU
99333 MB/s -26%
AIDA64 / CPU ZLib
Alienware m18 R2
Intel Core i9-14900HX, NVIDIA GeForce RTX 4090 Laptop GPU
2053 MB/s 0%
Lenovo Legion 9 16IRX9, RTX 4090
Intel Core i9-14900HX, NVIDIA GeForce RTX 4090 Laptop GPU
2043 MB/s
Lenovo Legion 9 16IRX8
Intel Core i9-13980HX, NVIDIA GeForce RTX 4090 Laptop GPU
1929 MB/s -6%
Razer Blade 16 2024, RTX 4090
Intel Core i9-14900HX, NVIDIA GeForce RTX 4090 Laptop GPU
1863 MB/s -9%
Moyenne Intel Core i9-14900HX
  (1054 - 2292, n=33)
1815 MB/s -11%
Asus ROG Strix Scar 18 G834JYR (2024)
Intel Core i9-14900HX, NVIDIA GeForce RTX 4090 Laptop GPU
1789 MB/s -12%
Medion Erazer Beast X40 2024
Intel Core i9-14900HX, NVIDIA GeForce RTX 4090 Laptop GPU
1443 MB/s -29%
Moyenne de la classe Gaming
  (373 - 2409, n=185, 2 dernières années)
1352 MB/s -34%
AIDA64 / FP64 Ray-Trace
Alienware m18 R2
Intel Core i9-14900HX, NVIDIA GeForce RTX 4090 Laptop GPU
16128 KRay/s +9%
Lenovo Legion 9 16IRX8
Intel Core i9-13980HX, NVIDIA GeForce RTX 4090 Laptop GPU
14940 KRay/s +1%
Lenovo Legion 9 16IRX9, RTX 4090
Intel Core i9-14900HX, NVIDIA GeForce RTX 4090 Laptop GPU
14791 KRay/s
Razer Blade 16 2024, RTX 4090
Intel Core i9-14900HX, NVIDIA GeForce RTX 4090 Laptop GPU
13993 KRay/s -5%
Asus ROG Strix Scar 18 G834JYR (2024)
Intel Core i9-14900HX, NVIDIA GeForce RTX 4090 Laptop GPU
13608 KRay/s -8%
Moyenne Intel Core i9-14900HX
  (6809 - 18349, n=33)
13525 KRay/s -9%
Moyenne de la classe Gaming
  (2540 - 31796, n=185, 2 dernières années)
11679 KRay/s -21%
Medion Erazer Beast X40 2024
Intel Core i9-14900HX, NVIDIA GeForce RTX 4090 Laptop GPU
10990 KRay/s -26%
AIDA64 / CPU PhotoWorxx
Lenovo Legion 9 16IRX9, RTX 4090
Intel Core i9-14900HX, NVIDIA GeForce RTX 4090 Laptop GPU
54702 MPixel/s
Lenovo Legion 9 16IRX8
Intel Core i9-13980HX, NVIDIA GeForce RTX 4090 Laptop GPU
50656 MPixel/s -7%
Alienware m18 R2
Intel Core i9-14900HX, NVIDIA GeForce RTX 4090 Laptop GPU
49716 MPixel/s -9%
Asus ROG Strix Scar 18 G834JYR (2024)
Intel Core i9-14900HX, NVIDIA GeForce RTX 4090 Laptop GPU
49710 MPixel/s -9%
Razer Blade 16 2024, RTX 4090
Intel Core i9-14900HX, NVIDIA GeForce RTX 4090 Laptop GPU
49616 MPixel/s -9%
Medion Erazer Beast X40 2024
Intel Core i9-14900HX, NVIDIA GeForce RTX 4090 Laptop GPU
49089 MPixel/s -10%
Moyenne Intel Core i9-14900HX
  (23903 - 54702, n=33)
46637 MPixel/s -15%
Moyenne de la classe Gaming
  (10805 - 60161, n=186, 2 dernières années)
39997 MPixel/s -27%

Performance du système

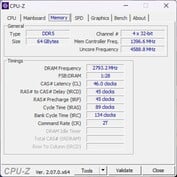
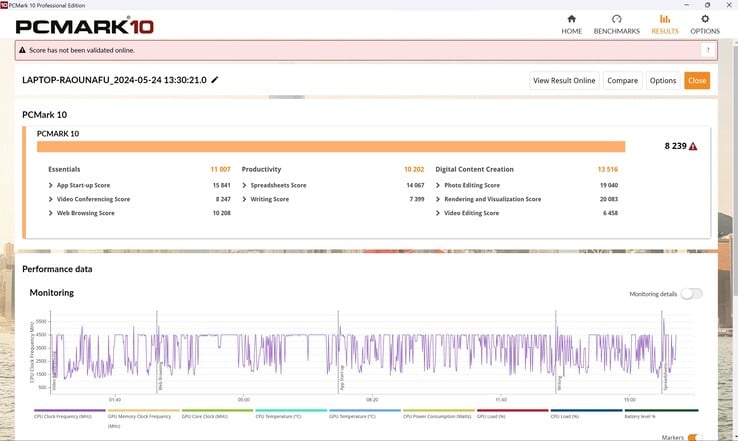
Ses performances dans PCMark 10 étaient inférieures d'environ 5 % à celles d'un ordinateur portable moyen doté de la même combinaison CPU/GPU. L'Aida a également montré que, bien que sa RAM offre de bons taux de lecture et d'écriture, sa latence mémoire est anormalement élevée, conduisant à des résultats plus mauvais que prévu dans certains benchmarks, comme ici.

D'un point de vue subjectif, nous avons remarqué que, bien que l'ordinateur portable fonctionne de manière fluide la plupart du temps, il a parfois des "ratés" lors de l'exécution de jeux. Cela a été confirmé par le graphique du taux de rafraîchissement pour Far Cry 5, par exemple, où le taux de rafraîchissement semble chuter brièvement, ce qui semble se produire plus souvent. Ses latences DPC sont également assez élevées, voir la section suivante. Les résultats obtenus avec les applications web ont également été faibles à plusieurs reprises.

PCMark 10
PCMark 10
PCMark 10 / Score
Alienware m18 R2
NVIDIA GeForce RTX 4090 Laptop GPU, i9-14900HX, SK Hynix PC811 HFS002TEM9X152N
9234 Points +12%
Lenovo Legion 9 16IRX8
NVIDIA GeForce RTX 4090 Laptop GPU, i9-13980HX, 2x SK Hynix HFS001TEJ9X115N (RAID 0)
9068 Points +10%
Medion Erazer Beast X40 2024
NVIDIA GeForce RTX 4090 Laptop GPU, i9-14900HX, Phison E18-1TB-PHISON-SSD-BICS5
8963 Points +9%
Asus ROG Strix Scar 18 G834JYR (2024)
NVIDIA GeForce RTX 4090 Laptop GPU, i9-14900HX, Samsung PM9A1a MZVL22T0HDLB
8801 Points +7%
Moyenne Intel Core i9-14900HX, NVIDIA GeForce RTX 4090 Laptop GPU
  (8230 - 9234, n=13)
8674 Points +5%
Razer Blade 16 2024, RTX 4090
NVIDIA GeForce RTX 4090 Laptop GPU, i9-14900HX, Samsung PM9A1 MZVL22T0HBLB
8401 Points +2%
Lenovo Legion 9 16IRX9, RTX 4090
NVIDIA GeForce RTX 4090 Laptop GPU, i9-14900HX, Micron 3400 2TB MTFDKBA2T0TFH
8239 Points
Moyenne de la classe Gaming
  (5776 - 9852, n=166, 2 dernières années)
7775 Points -6%
PCMark 10 / Essentials
Lenovo Legion 9 16IRX8
NVIDIA GeForce RTX 4090 Laptop GPU, i9-13980HX, 2x SK Hynix HFS001TEJ9X115N (RAID 0)
11644 Points +6%
Alienware m18 R2
NVIDIA GeForce RTX 4090 Laptop GPU, i9-14900HX, SK Hynix PC811 HFS002TEM9X152N
11415 Points +4%
Asus ROG Strix Scar 18 G834JYR (2024)
NVIDIA GeForce RTX 4090 Laptop GPU, i9-14900HX, Samsung PM9A1a MZVL22T0HDLB
11394 Points +4%
Moyenne Intel Core i9-14900HX, NVIDIA GeForce RTX 4090 Laptop GPU
  (10778 - 11628, n=13)
11125 Points +1%
Lenovo Legion 9 16IRX9, RTX 4090
NVIDIA GeForce RTX 4090 Laptop GPU, i9-14900HX, Micron 3400 2TB MTFDKBA2T0TFH
11007 Points
Razer Blade 16 2024, RTX 4090
NVIDIA GeForce RTX 4090 Laptop GPU, i9-14900HX, Samsung PM9A1 MZVL22T0HBLB
10915 Points -1%
Medion Erazer Beast X40 2024
NVIDIA GeForce RTX 4090 Laptop GPU, i9-14900HX, Phison E18-1TB-PHISON-SSD-BICS5
10871 Points -1%
Moyenne de la classe Gaming
  (9057 - 12334, n=165, 2 dernières années)
10833 Points -2%
PCMark 10 / Productivity
Medion Erazer Beast X40 2024
NVIDIA GeForce RTX 4090 Laptop GPU, i9-14900HX, Phison E18-1TB-PHISON-SSD-BICS5
11759 Points +15%
Alienware m18 R2
NVIDIA GeForce RTX 4090 Laptop GPU, i9-14900HX, SK Hynix PC811 HFS002TEM9X152N
11415 Points +12%
Razer Blade 16 2024, RTX 4090
NVIDIA GeForce RTX 4090 Laptop GPU, i9-14900HX, Samsung PM9A1 MZVL22T0HBLB
11150 Points +9%
Lenovo Legion 9 16IRX8
NVIDIA GeForce RTX 4090 Laptop GPU, i9-13980HX, 2x SK Hynix HFS001TEJ9X115N (RAID 0)
11067 Points +8%
Moyenne Intel Core i9-14900HX, NVIDIA GeForce RTX 4090 Laptop GPU
  (9458 - 11759, n=13)
10610 Points +4%
Asus ROG Strix Scar 18 G834JYR (2024)
NVIDIA GeForce RTX 4090 Laptop GPU, i9-14900HX, Samsung PM9A1a MZVL22T0HDLB
10528 Points +3%
Lenovo Legion 9 16IRX9, RTX 4090
NVIDIA GeForce RTX 4090 Laptop GPU, i9-14900HX, Micron 3400 2TB MTFDKBA2T0TFH
10202 Points
Moyenne de la classe Gaming
  (6662 - 14612, n=165, 2 dernières années)
9877 Points -3%
PCMark 10 / Digital Content Creation
Alienware m18 R2
NVIDIA GeForce RTX 4090 Laptop GPU, i9-14900HX, SK Hynix PC811 HFS002TEM9X152N
16398 Points +21%
Lenovo Legion 9 16IRX8
NVIDIA GeForce RTX 4090 Laptop GPU, i9-13980HX, 2x SK Hynix HFS001TEJ9X115N (RAID 0)
15702 Points +16%
Asus ROG Strix Scar 18 G834JYR (2024)
NVIDIA GeForce RTX 4090 Laptop GPU, i9-14900HX, Samsung PM9A1a MZVL22T0HDLB
15421 Points +14%
Medion Erazer Beast X40 2024
NVIDIA GeForce RTX 4090 Laptop GPU, i9-14900HX, Phison E18-1TB-PHISON-SSD-BICS5
15287 Points +13%
Moyenne Intel Core i9-14900HX, NVIDIA GeForce RTX 4090 Laptop GPU
  (13219 - 16462, n=13)
15042 Points +11%
Lenovo Legion 9 16IRX9, RTX 4090
NVIDIA GeForce RTX 4090 Laptop GPU, i9-14900HX, Micron 3400 2TB MTFDKBA2T0TFH
13516 Points
Razer Blade 16 2024, RTX 4090
NVIDIA GeForce RTX 4090 Laptop GPU, i9-14900HX, Samsung PM9A1 MZVL22T0HBLB
13219 Points -2%
Moyenne de la classe Gaming
  (6703 - 18475, n=165, 2 dernières années)
12039 Points -11%
CrossMark / Overall
Asus ROG Strix Scar 18 G834JYR (2024)
NVIDIA GeForce RTX 4090 Laptop GPU, i9-14900HX, Samsung PM9A1a MZVL22T0HDLB
2208 Points +14%
Razer Blade 16 2024, RTX 4090
NVIDIA GeForce RTX 4090 Laptop GPU, i9-14900HX, Samsung PM9A1 MZVL22T0HBLB
2149 Points +11%
Medion Erazer Beast X40 2024
NVIDIA GeForce RTX 4090 Laptop GPU, i9-14900HX, Phison E18-1TB-PHISON-SSD-BICS5
2144 Points +11%
Moyenne Intel Core i9-14900HX, NVIDIA GeForce RTX 4090 Laptop GPU
  (1877 - 2344, n=10)
2119 Points +9%
Alienware m18 R2
NVIDIA GeForce RTX 4090 Laptop GPU, i9-14900HX, SK Hynix PC811 HFS002TEM9X152N
2073 Points +7%
Lenovo Legion 9 16IRX9, RTX 4090
NVIDIA GeForce RTX 4090 Laptop GPU, i9-14900HX, Micron 3400 2TB MTFDKBA2T0TFH
1939 Points
Lenovo Legion 9 16IRX8
NVIDIA GeForce RTX 4090 Laptop GPU, i9-13980HX, 2x SK Hynix HFS001TEJ9X115N (RAID 0)
1935 Points 0%
Moyenne de la classe Gaming
  (1247 - 2344, n=149, 2 dernières années)
1900 Points -2%
CrossMark / Productivity
Medion Erazer Beast X40 2024
NVIDIA GeForce RTX 4090 Laptop GPU, i9-14900HX, Phison E18-1TB-PHISON-SSD-BICS5
2070 Points +18%
Asus ROG Strix Scar 18 G834JYR (2024)
NVIDIA GeForce RTX 4090 Laptop GPU, i9-14900HX, Samsung PM9A1a MZVL22T0HDLB
2055 Points +17%
Razer Blade 16 2024, RTX 4090
NVIDIA GeForce RTX 4090 Laptop GPU, i9-14900HX, Samsung PM9A1 MZVL22T0HBLB
2007 Points +14%
Moyenne Intel Core i9-14900HX, NVIDIA GeForce RTX 4090 Laptop GPU
  (1738 - 2162, n=10)
1968 Points +12%
Alienware m18 R2
NVIDIA GeForce RTX 4090 Laptop GPU, i9-14900HX, SK Hynix PC811 HFS002TEM9X152N
1881 Points +7%
Moyenne de la classe Gaming
  (1299 - 2204, n=149, 2 dernières années)
1802 Points +3%
Lenovo Legion 9 16IRX8
NVIDIA GeForce RTX 4090 Laptop GPU, i9-13980HX, 2x SK Hynix HFS001TEJ9X115N (RAID 0)
1764 Points +1%
Lenovo Legion 9 16IRX9, RTX 4090
NVIDIA GeForce RTX 4090 Laptop GPU, i9-14900HX, Micron 3400 2TB MTFDKBA2T0TFH
1755 Points
CrossMark / Creativity
Asus ROG Strix Scar 18 G834JYR (2024)
NVIDIA GeForce RTX 4090 Laptop GPU, i9-14900HX, Samsung PM9A1a MZVL22T0HDLB
2478 Points +12%
Razer Blade 16 2024, RTX 4090
NVIDIA GeForce RTX 4090 Laptop GPU, i9-14900HX, Samsung PM9A1 MZVL22T0HBLB
2418 Points +10%
Alienware m18 R2
NVIDIA GeForce RTX 4090 Laptop GPU, i9-14900HX, SK Hynix PC811 HFS002TEM9X152N
2393 Points +8%
Moyenne Intel Core i9-14900HX, NVIDIA GeForce RTX 4090 Laptop GPU
  (2195 - 2660, n=10)
2387 Points +8%
Medion Erazer Beast X40 2024
NVIDIA GeForce RTX 4090 Laptop GPU, i9-14900HX, Phison E18-1TB-PHISON-SSD-BICS5
2323 Points +5%
Lenovo Legion 9 16IRX8
NVIDIA GeForce RTX 4090 Laptop GPU, i9-13980HX, 2x SK Hynix HFS001TEJ9X115N (RAID 0)
2267 Points +3%
Lenovo Legion 9 16IRX9, RTX 4090
NVIDIA GeForce RTX 4090 Laptop GPU, i9-14900HX, Micron 3400 2TB MTFDKBA2T0TFH
2207 Points
Moyenne de la classe Gaming
  (1275 - 2660, n=149, 2 dernières années)
2085 Points -6%
CrossMark / Responsiveness
Asus ROG Strix Scar 18 G834JYR (2024)
NVIDIA GeForce RTX 4090 Laptop GPU, i9-14900HX, Samsung PM9A1a MZVL22T0HDLB
1944 Points +10%
Medion Erazer Beast X40 2024
NVIDIA GeForce RTX 4090 Laptop GPU, i9-14900HX, Phison E18-1TB-PHISON-SSD-BICS5
1874 Points +6%
Moyenne Intel Core i9-14900HX, NVIDIA GeForce RTX 4090 Laptop GPU
  (1478 - 2327, n=10)
1862 Points +5%
Razer Blade 16 2024, RTX 4090
NVIDIA GeForce RTX 4090 Laptop GPU, i9-14900HX, Samsung PM9A1 MZVL22T0HBLB
1851 Points +5%
Alienware m18 R2
NVIDIA GeForce RTX 4090 Laptop GPU, i9-14900HX, SK Hynix PC811 HFS002TEM9X152N
1806 Points +2%
Lenovo Legion 9 16IRX9, RTX 4090
NVIDIA GeForce RTX 4090 Laptop GPU, i9-14900HX, Micron 3400 2TB MTFDKBA2T0TFH
1769 Points
Moyenne de la classe Gaming
  (1030 - 2330, n=149, 2 dernières années)
1698 Points -4%
Lenovo Legion 9 16IRX8
NVIDIA GeForce RTX 4090 Laptop GPU, i9-13980HX, 2x SK Hynix HFS001TEJ9X115N (RAID 0)
1586 Points -10%
WebXPRT 3 / Overall
Lenovo Legion 9 16IRX8
NVIDIA GeForce RTX 4090 Laptop GPU, i9-13980HX, 2x SK Hynix HFS001TEJ9X115N (RAID 0)
349 Points +25%
Razer Blade 16 2024, RTX 4090
NVIDIA GeForce RTX 4090 Laptop GPU, i9-14900HX, Samsung PM9A1 MZVL22T0HBLB
330 Points +18%
Medion Erazer Beast X40 2024
NVIDIA GeForce RTX 4090 Laptop GPU, i9-14900HX, Phison E18-1TB-PHISON-SSD-BICS5
326 Points +17%
Alienware m18 R2
NVIDIA GeForce RTX 4090 Laptop GPU, i9-14900HX, SK Hynix PC811 HFS002TEM9X152N
326 Points +17%
Moyenne Intel Core i9-14900HX, NVIDIA GeForce RTX 4090 Laptop GPU
  (279 - 339, n=10)
323 Points +16%
Asus ROG Strix Scar 18 G834JYR (2024)
NVIDIA GeForce RTX 4090 Laptop GPU, i9-14900HX, Samsung PM9A1a MZVL22T0HDLB
322 Points +15%
Moyenne de la classe Gaming
  (215 - 480, n=163, 2 dernières années)
303 Points +9%
Lenovo Legion 9 16IRX9, RTX 4090
NVIDIA GeForce RTX 4090 Laptop GPU, i9-14900HX, Micron 3400 2TB MTFDKBA2T0TFH
279 Points
WebXPRT 4 / Overall
Alienware m18 R2
NVIDIA GeForce RTX 4090 Laptop GPU, i9-14900HX, SK Hynix PC811 HFS002TEM9X152N
309 Points +26%
Lenovo Legion 9 16IRX8
NVIDIA GeForce RTX 4090 Laptop GPU, i9-13980HX, 2x SK Hynix HFS001TEJ9X115N (RAID 0)
306 Points +24%
Asus ROG Strix Scar 18 G834JYR (2024)
NVIDIA GeForce RTX 4090 Laptop GPU, i9-14900HX, Samsung PM9A1a MZVL22T0HDLB
304 Points +24%
Medion Erazer Beast X40 2024
NVIDIA GeForce RTX 4090 Laptop GPU, i9-14900HX, Phison E18-1TB-PHISON-SSD-BICS5
295 Points +20%
Moyenne Intel Core i9-14900HX, NVIDIA GeForce RTX 4090 Laptop GPU
  (246 - 309, n=8)
291 Points +18%
Moyenne de la classe Gaming
  (157.9 - 328, n=151, 2 dernières années)
266 Points +8%
Lenovo Legion 9 16IRX9, RTX 4090
NVIDIA GeForce RTX 4090 Laptop GPU, i9-14900HX, Micron 3400 2TB MTFDKBA2T0TFH
246 Points
Mozilla Kraken 1.1 / Total
Lenovo Legion 9 16IRX9, RTX 4090
NVIDIA GeForce RTX 4090 Laptop GPU, i9-14900HX, Micron 3400 2TB MTFDKBA2T0TFH
535 ms *
Moyenne de la classe Gaming
  (421 - 779, n=177, 2 dernières années)
506 ms * +5%
Moyenne Intel Core i9-14900HX, NVIDIA GeForce RTX 4090 Laptop GPU
  (428 - 535, n=11)
456 ms * +15%
Razer Blade 16 2024, RTX 4090
NVIDIA GeForce RTX 4090 Laptop GPU, i9-14900HX, Samsung PM9A1 MZVL22T0HBLB
450 ms * +16%
Asus ROG Strix Scar 18 G834JYR (2024)
NVIDIA GeForce RTX 4090 Laptop GPU, i9-14900HX, Samsung PM9A1a MZVL22T0HDLB
449 ms * +16%
Lenovo Legion 9 16IRX8
NVIDIA GeForce RTX 4090 Laptop GPU, i9-13980HX, 2x SK Hynix HFS001TEJ9X115N (RAID 0)
447 ms * +16%
Medion Erazer Beast X40 2024
NVIDIA GeForce RTX 4090 Laptop GPU, i9-14900HX, Phison E18-1TB-PHISON-SSD-BICS5
437 ms * +18%
Alienware m18 R2
NVIDIA GeForce RTX 4090 Laptop GPU, i9-14900HX, SK Hynix PC811 HFS002TEM9X152N
430 ms * +20%

* ... Moindre est la valeur, meilleures sont les performances

PCMark 10 Score
8239 points
Aide
AIDA64 / Memory Copy
Asus ROG Strix Scar 18 G834JYR (2024)
Intel Core i9-14900HX, NVIDIA GeForce RTX 4090 Laptop GPU
83392 MB/s +2%
Lenovo Legion 9 16IRX9, RTX 4090
Intel Core i9-14900HX, NVIDIA GeForce RTX 4090 Laptop GPU
81940 MB/s
Alienware m18 R2
Intel Core i9-14900HX, NVIDIA GeForce RTX 4090 Laptop GPU
79243 MB/s -3%
Razer Blade 16 2024, RTX 4090
Intel Core i9-14900HX, NVIDIA GeForce RTX 4090 Laptop GPU
78799 MB/s -4%
Lenovo Legion 9 16IRX8
Intel Core i9-13980HX, NVIDIA GeForce RTX 4090 Laptop GPU
78266 MB/s -4%
Medion Erazer Beast X40 2024
Intel Core i9-14900HX, NVIDIA GeForce RTX 4090 Laptop GPU
77961 MB/s -5%
Moyenne Intel Core i9-14900HX
  (38028 - 83392, n=33)
74739 MB/s -9%
Moyenne de la classe Gaming
  (21842 - 94222, n=185, 2 dernières années)
65054 MB/s -21%
AIDA64 / Memory Read
Asus ROG Strix Scar 18 G834JYR (2024)
Intel Core i9-14900HX, NVIDIA GeForce RTX 4090 Laptop GPU
86788 MB/s +3%
Razer Blade 16 2024, RTX 4090
Intel Core i9-14900HX, NVIDIA GeForce RTX 4090 Laptop GPU
86387 MB/s +3%
Alienware m18 R2
Intel Core i9-14900HX, NVIDIA GeForce RTX 4090 Laptop GPU
85791 MB/s +2%
Lenovo Legion 9 16IRX8
Intel Core i9-13980HX, NVIDIA GeForce RTX 4090 Laptop GPU
85683 MB/s +2%
Medion Erazer Beast X40 2024
Intel Core i9-14900HX, NVIDIA GeForce RTX 4090 Laptop GPU
85340 MB/s +1%
Lenovo Legion 9 16IRX9, RTX 4090
Intel Core i9-14900HX, NVIDIA GeForce RTX 4090 Laptop GPU
84192 MB/s
Moyenne Intel Core i9-14900HX
  (43306 - 87568, n=33)
80919 MB/s -4%
Moyenne de la classe Gaming
  (23681 - 99713, n=185, 2 dernières années)
68795 MB/s -18%
AIDA64 / Memory Write
Lenovo Legion 9 16IRX9, RTX 4090
Intel Core i9-14900HX, NVIDIA GeForce RTX 4090 Laptop GPU
80589 MB/s
Asus ROG Strix Scar 18 G834JYR (2024)
Intel Core i9-14900HX, NVIDIA GeForce RTX 4090 Laptop GPU
77534 MB/s -4%
Medion Erazer Beast X40 2024
Intel Core i9-14900HX, NVIDIA GeForce RTX 4090 Laptop GPU
77302 MB/s -4%
Alienware m18 R2
Intel Core i9-14900HX, NVIDIA GeForce RTX 4090 Laptop GPU
77089 MB/s -4%
Lenovo Legion 9 16IRX8
Intel Core i9-13980HX, NVIDIA GeForce RTX 4090 Laptop GPU
76314 MB/s -5%
Razer Blade 16 2024, RTX 4090
Intel Core i9-14900HX, NVIDIA GeForce RTX 4090 Laptop GPU
75421 MB/s -6%
Moyenne Intel Core i9-14900HX
  (37146 - 80589, n=33)
71949 MB/s -11%
Moyenne de la classe Gaming
  (22986 - 108954, n=185, 2 dernières années)
66829 MB/s -17%
AIDA64 / Memory Latency
Lenovo Legion 9 16IRX9, RTX 4090
Intel Core i9-14900HX, NVIDIA GeForce RTX 4090 Laptop GPU
96.2 ns *
Moyenne de la classe Gaming
  (59.5 - 259, n=185, 2 dernières années)
94.2 ns * +2%
Alienware m18 R2
Intel Core i9-14900HX, NVIDIA GeForce RTX 4090 Laptop GPU
86.4 ns * +10%
Moyenne Intel Core i9-14900HX
  (76.1 - 105, n=33)
84.8 ns * +12%
Lenovo Legion 9 16IRX8
Intel Core i9-13980HX, NVIDIA GeForce RTX 4090 Laptop GPU
84 ns * +13%
Razer Blade 16 2024, RTX 4090
Intel Core i9-14900HX, NVIDIA GeForce RTX 4090 Laptop GPU
83.4 ns * +13%
Asus ROG Strix Scar 18 G834JYR (2024)
Intel Core i9-14900HX, NVIDIA GeForce RTX 4090 Laptop GPU
82.8 ns * +14%
Medion Erazer Beast X40 2024
Intel Core i9-14900HX, NVIDIA GeForce RTX 4090 Laptop GPU
80.9 ns * +16%

* ... Moindre est la valeur, meilleures sont les performances

Latences DPC

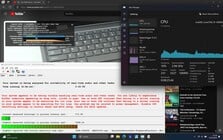
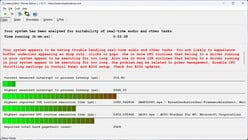
Les premières latences sont apparues dès l'ouverture du navigateur. La valeur a augmenté de façon minime lors de l'ouverture de plusieurs onglets sur notre site web. Cependant, c'est surtout la lecture de notre vidéo YouTube en 4K/60 fps qui a fait grimper en flèche la valeur de latence.

En outre, la charge interne du GPU - qui était active dans ce cas - était constamment à un niveau inhabituellement élevé de 79 % ; des valeurs de l'ordre de 20 % seraient normales ! Néanmoins, il n'y a pas eu de perte d'images à déplorer.

YouTube : Chargement élevé du GPU
LatencyMon main
LatencyMon main
Pilotes LatencyMon
Pilotes LatencyMon
DPC Latencies / LatencyMon - interrupt to process latency (max), Web, Youtube, Prime95
Alienware m18 R2
NVIDIA GeForce RTX 4090 Laptop GPU, i9-14900HX, SK Hynix PC811 HFS002TEM9X152N
2815.1 μs * -15%
Lenovo Legion 9 16IRX9, RTX 4090
NVIDIA GeForce RTX 4090 Laptop GPU, i9-14900HX, Micron 3400 2TB MTFDKBA2T0TFH
2448.1 μs *
Lenovo Legion 9 16IRX8
NVIDIA GeForce RTX 4090 Laptop GPU, i9-13980HX, 2x SK Hynix HFS001TEJ9X115N (RAID 0)
2026.5 μs * +17%
Razer Blade 16 2024, RTX 4090
NVIDIA GeForce RTX 4090 Laptop GPU, i9-14900HX, Samsung PM9A1 MZVL22T0HBLB
1389.7 μs * +43%
Medion Erazer Beast X40 2024
NVIDIA GeForce RTX 4090 Laptop GPU, i9-14900HX, Phison E18-1TB-PHISON-SSD-BICS5
1305.5 μs * +47%
Asus ROG Strix Scar 18 G834JYR (2024)
NVIDIA GeForce RTX 4090 Laptop GPU, i9-14900HX, Samsung PM9A1a MZVL22T0HDLB
1117.4 μs * +54%

* ... Moindre est la valeur, meilleures sont les performances

Dispositif de stockage

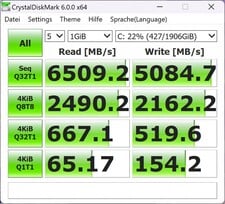
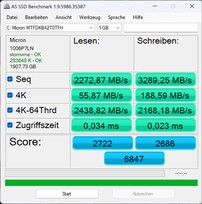
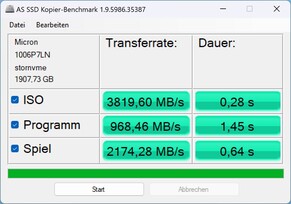
Lenovo a installé un Micron 3400 avec 2 To de stockage dans notre modèle de test. Il est classé 121e dans notre Liste des meilleurs SSDce qui signifie qu'il s'agit au mieux d'un SSD de milieu de gamme. Selon Micron, il devrait atteindre des taux de lecture séquentielle de 6 600 Mo/s et des taux d'écriture séquentielle de 5 000 Mo/s, mais notre modèle en était aussi éloigné que l'ordinateur portable moyen équipé du même SSD dans notre base de données. Seul Crystaldiskmark a pu confirmer des valeurs élevées, tandis que DiskSpd et AS SSD ont mesuré des taux de données nettement inférieurs.

Le comportement en charge continue de l'ordinateur portable est inhabituel : alors que d'autres modèles chauffent parfois après un certain temps et sont ensuite étranglés, le périphérique de stockage à l'intérieur du Legion 9 s'est comporté exactement à l'opposé. Au début du test, ses performances ont fortement fluctué et ont chuté à plusieurs reprises. Cependant, le SSD a ensuite fonctionné en permanence à la vitesse maximale pendant les deux derniers tiers du test. C'est peut-être le signe que le système de refroidissement du Legion 9i intervient un peu trop tard, ou qu'il n'atteint sa capacité de refroidissement optimale que tardivement.

Marque de cristal 6
Marque de cristal 6
AS SSD
AS SSD
Copie SSD ASD
Copie SSD ASD
Micron 3400 2TB MTFDKBA2T0TFH
CDM 5/6 Read Seq Q32T1: 6509 MB/s
CDM 5/6 Write Seq Q32T1: 5085 MB/s
CDM 5/6 Read 4K Q32T1: 667 MB/s
CDM 5/6 Write 4K Q32T1: 520 MB/s
CDM 5/6 Read 4K: 65.2 MB/s
CDM 5/6 Write 4K: 154.2 MB/s
CDM 6 Write 4K Q8T8: 2162 MB/s
CDM 6 Read 4K Q8T8: 2490 MB/s
Drive Performance Rating - Percent
Alienware m18 R2
SK Hynix PC811 HFS002TEM9X152N
84.7 pt
Medion Erazer Beast X40 2024
Phison E18-1TB-PHISON-SSD-BICS5
71.3 pt
Asus ROG Strix Scar 18 G834JYR (2024)
Samsung PM9A1a MZVL22T0HDLB
71.1 pt
Razer Blade 16 2024, RTX 4090
Samsung PM9A1 MZVL22T0HBLB
64.6 pt
Moyenne Micron 3400 2TB MTFDKBA2T0TFH
 
60.3 pt
Lenovo Legion 9 16IRX8
2x SK Hynix HFS001TEJ9X115N (RAID 0)
60.1 pt
Lenovo Legion 9 16IRX9, RTX 4090
Micron 3400 2TB MTFDKBA2T0TFH
60 pt
Moyenne de la classe Gaming
 
58.1 pt
DiskSpd
seq read
Alienware m18 R2
SK Hynix PC811 HFS002TEM9X152N
5588 (5540.05min - 5587.65max) MB/s +67%
Asus ROG Strix Scar 18 G834JYR (2024)
Samsung PM9A1a MZVL22T0HDLB
3908 (3887.48min - 3908.2max) MB/s +17%
Razer Blade 16 2024, RTX 4090
Samsung PM9A1 MZVL22T0HBLB
3795 (3693.04min - 3794.8max) MB/s +13%
Moyenne de la classe Gaming
  (1319 - 7045, n=166, 2 dernières années)
3477 MB/s +4%
Moyenne Micron 3400 2TB MTFDKBA2T0TFH
  (3347 - 3455, n=3)
3384 MB/s +1%
Lenovo Legion 9 16IRX9, RTX 4090
Micron 3400 2TB MTFDKBA2T0TFH
3347 (3203.49min - 3347.47max) MB/s
Medion Erazer Beast X40 2024
Phison E18-1TB-PHISON-SSD-BICS5
3238 (3056.39min - 3237.58max) MB/s -3%
Lenovo Legion 9 16IRX8
2x SK Hynix HFS001TEJ9X115N (RAID 0)
3087 (3070.23min - 3086.59max) MB/s -8%
seq write
Lenovo Legion 9 16IRX8
2x SK Hynix HFS001TEJ9X115N (RAID 0)
8109 (7978.61min - 8108.5max) MB/s +116%
Alienware m18 R2
SK Hynix PC811 HFS002TEM9X152N
5153 (5139.7min - 5152.91max) MB/s +37%
Asus ROG Strix Scar 18 G834JYR (2024)
Samsung PM9A1a MZVL22T0HDLB
4335 (4306.29min - 4335.44max) MB/s +16%
Moyenne Micron 3400 2TB MTFDKBA2T0TFH
  (3655 - 4485, n=3)
3963 MB/s +6%
Medion Erazer Beast X40 2024
Phison E18-1TB-PHISON-SSD-BICS5
3940 (3577.56min - 3940.13max) MB/s +5%
Razer Blade 16 2024, RTX 4090
Samsung PM9A1 MZVL22T0HBLB
3794 (3745.51min - 3793.5max) MB/s +1%
Moyenne de la classe Gaming
  (535 - 9307, n=166, 2 dernières années)
3794 MB/s +1%
Lenovo Legion 9 16IRX9, RTX 4090
Micron 3400 2TB MTFDKBA2T0TFH
3750 (3377.21min - 3749.92max) MB/s
seq q8 t1 read
Lenovo Legion 9 16IRX8
2x SK Hynix HFS001TEJ9X115N (RAID 0)
7439 (6642.31min - 7439.43max) MB/s +14%
Alienware m18 R2
SK Hynix PC811 HFS002TEM9X152N
7110 (6256.85min - 7110.18max) MB/s +9%
Asus ROG Strix Scar 18 G834JYR (2024)
Samsung PM9A1a MZVL22T0HDLB
7084 (6413.06min - 7083.97max) MB/s +9%
Medion Erazer Beast X40 2024
Phison E18-1TB-PHISON-SSD-BICS5
6929 (6183.66min - 6928.97max) MB/s +6%
Razer Blade 16 2024, RTX 4090
Samsung PM9A1 MZVL22T0HBLB
6673 (5801.28min - 6672.72max) MB/s +2%
Lenovo Legion 9 16IRX9, RTX 4090
Micron 3400 2TB MTFDKBA2T0TFH
6523 (5649.96min - 6522.56max) MB/s
Moyenne Micron 3400 2TB MTFDKBA2T0TFH
  (6449 - 6523, n=3)
6477 MB/s -1%
Moyenne de la classe Gaming
  (2594 - 16089, n=166, 2 dernières années)
6320 MB/s -3%
seq q8 t1 write
Lenovo Legion 9 16IRX8
2x SK Hynix HFS001TEJ9X115N (RAID 0)
11187 (11074.2min - 11187.3max) MB/s +120%
Alienware m18 R2
SK Hynix PC811 HFS002TEM9X152N
6779 (6710.47min - 6778.83max) MB/s +33%
Medion Erazer Beast X40 2024
Phison E18-1TB-PHISON-SSD-BICS5
5740 (5704.67min - 5740.32max) MB/s +13%
Asus ROG Strix Scar 18 G834JYR (2024)
Samsung PM9A1a MZVL22T0HDLB
5255 (5183.65min - 5254.62max) MB/s +3%
Lenovo Legion 9 16IRX9, RTX 4090
Micron 3400 2TB MTFDKBA2T0TFH
5092 (4641.78min - 5091.77max) MB/s
Moyenne Micron 3400 2TB MTFDKBA2T0TFH
  (4803 - 5092, n=3)
4986 MB/s -2%
Razer Blade 16 2024, RTX 4090
Samsung PM9A1 MZVL22T0HBLB
4936 (4909.47min - 4936.28max) MB/s -3%
Moyenne de la classe Gaming
  (539 - 14571, n=166, 2 dernières années)
4842 MB/s -5%
4k q1 t1 read
Asus ROG Strix Scar 18 G834JYR (2024)
Samsung PM9A1a MZVL22T0HDLB
80.7 (80.11min - 80.66max) MB/s +37%
Alienware m18 R2
SK Hynix PC811 HFS002TEM9X152N
75.4 (73.49min - 75.43max) MB/s +28%
Razer Blade 16 2024, RTX 4090
Samsung PM9A1 MZVL22T0HBLB
71.4 (66.19min - 71.35max) MB/s +21%
Lenovo Legion 9 16IRX8
2x SK Hynix HFS001TEJ9X115N (RAID 0)
68.8 (67.29min - 68.75max) MB/s +16%
Moyenne de la classe Gaming
  (30.6 - 95.9, n=166, 2 dernières années)
65.8 MB/s +11%
Moyenne Micron 3400 2TB MTFDKBA2T0TFH
  (59.1 - 69.5, n=3)
65.5 MB/s +11%
Lenovo Legion 9 16IRX9, RTX 4090
Micron 3400 2TB MTFDKBA2T0TFH
59.1 (58.3min - 59.06max) MB/s
Medion Erazer Beast X40 2024
Phison E18-1TB-PHISON-SSD-BICS5
54.5 (53.38min - 54.47max) MB/s -8%
4k q1 t1 write
Medion Erazer Beast X40 2024
Phison E18-1TB-PHISON-SSD-BICS5
324 (322.91min - 324.37max) MB/s +55%
Alienware m18 R2
SK Hynix PC811 HFS002TEM9X152N
300 (297.27min - 299.6max) MB/s +44%
Asus ROG Strix Scar 18 G834JYR (2024)
Samsung PM9A1a MZVL22T0HDLB
230 (219.52min - 229.87max) MB/s +10%
Moyenne de la classe Gaming
  (66.6 - 397, n=166, 2 dernières années)
221 MB/s +6%
Lenovo Legion 9 16IRX9, RTX 4090
Micron 3400 2TB MTFDKBA2T0TFH
209 (203.44min - 208.84max) MB/s
Razer Blade 16 2024, RTX 4090
Samsung PM9A1 MZVL22T0HBLB
205 (202.97min - 204.75max) MB/s -2%
Moyenne Micron 3400 2TB MTFDKBA2T0TFH
  (147.3 - 253, n=3)
203 MB/s -3%
Lenovo Legion 9 16IRX8
2x SK Hynix HFS001TEJ9X115N (RAID 0)
178.4 (174.74min - 178.37max) MB/s -15%
4k q32 t16 read
Alienware m18 R2
SK Hynix PC811 HFS002TEM9X152N
6067 (5596.15min - 6066.73max) MB/s +102%
Asus ROG Strix Scar 18 G834JYR (2024)
Samsung PM9A1a MZVL22T0HDLB
3732 (3273.44min - 3732.1max) MB/s +25%
Razer Blade 16 2024, RTX 4090
Samsung PM9A1 MZVL22T0HBLB
3726 (3704.12min - 3725.6max) MB/s +24%
Medion Erazer Beast X40 2024
Phison E18-1TB-PHISON-SSD-BICS5
3653 (3636.8min - 3652.63max) MB/s +22%
Lenovo Legion 9 16IRX9, RTX 4090
Micron 3400 2TB MTFDKBA2T0TFH
2997 (2834.64min - 2996.72max) MB/s
Moyenne de la classe Gaming
  (417 - 6172, n=166, 2 dernières années)
2553 MB/s -15%
Moyenne Micron 3400 2TB MTFDKBA2T0TFH
  (729 - 3013, n=3)
2246 MB/s -25%
Lenovo Legion 9 16IRX8
2x SK Hynix HFS001TEJ9X115N (RAID 0)
1666 (1310.98min - 1665.65max) MB/s -44%
4k q32 t16 write
Alienware m18 R2
SK Hynix PC811 HFS002TEM9X152N
4176 (3805.57min - 4175.9max) MB/s +56%
Razer Blade 16 2024, RTX 4090
Samsung PM9A1 MZVL22T0HBLB
3548 (3533.85min - 3548.33max) MB/s +33%
Medion Erazer Beast X40 2024
Phison E18-1TB-PHISON-SSD-BICS5
3447 (3336.65min - 3446.75max) MB/s +29%
Asus ROG Strix Scar 18 G834JYR (2024)
Samsung PM9A1a MZVL22T0HDLB
2900 MB/s +8%
Lenovo Legion 9 16IRX9, RTX 4090
Micron 3400 2TB MTFDKBA2T0TFH
2673 (2401.6min - 2673.33max) MB/s
Moyenne de la classe Gaming
  (162.3 - 4869, n=166, 2 dernières années)
2112 MB/s -21%
Moyenne Micron 3400 2TB MTFDKBA2T0TFH
  (542 - 2736, n=3)
1984 MB/s -26%
Lenovo Legion 9 16IRX8
2x SK Hynix HFS001TEJ9X115N (RAID 0)
1433 (1370.49min - 1433.18max) MB/s -46%
AS SSD
Score Total
Alienware m18 R2
SK Hynix PC811 HFS002TEM9X152N
10655 Points +56%
Medion Erazer Beast X40 2024
Phison E18-1TB-PHISON-SSD-BICS5
8462 Points +24%
Asus ROG Strix Scar 18 G834JYR (2024)
Samsung PM9A1a MZVL22T0HDLB
8367 Points +22%
Razer Blade 16 2024, RTX 4090
Samsung PM9A1 MZVL22T0HBLB
7040 Points +3%
Lenovo Legion 9 16IRX9, RTX 4090
Micron 3400 2TB MTFDKBA2T0TFH
6847 Points
Moyenne de la classe Gaming
  (2271 - 13854, n=157, 2 dernières années)
6729 Points -2%
Moyenne Micron 3400 2TB MTFDKBA2T0TFH
  (5068 - 7774, n=3)
6563 Points -4%
Lenovo Legion 9 16IRX8
2x SK Hynix HFS001TEJ9X115N (RAID 0)
4895 Points -29%
Score Read
Alienware m18 R2
SK Hynix PC811 HFS002TEM9X152N
3753 Points +38%
Asus ROG Strix Scar 18 G834JYR (2024)
Samsung PM9A1a MZVL22T0HDLB
3272 Points +20%
Medion Erazer Beast X40 2024
Phison E18-1TB-PHISON-SSD-BICS5
3033 Points +11%
Razer Blade 16 2024, RTX 4090
Samsung PM9A1 MZVL22T0HBLB
2848 Points +5%
Lenovo Legion 9 16IRX9, RTX 4090
Micron 3400 2TB MTFDKBA2T0TFH
2722 Points
Moyenne de la classe Gaming
  (776 - 4721, n=157, 2 dernières années)
2440 Points -10%
Moyenne Micron 3400 2TB MTFDKBA2T0TFH
  (1517 - 2959, n=3)
2399 Points -12%
Lenovo Legion 9 16IRX8
2x SK Hynix HFS001TEJ9X115N (RAID 0)
2002 Points -26%
Score Write
Alienware m18 R2
SK Hynix PC811 HFS002TEM9X152N
4993 Points +86%
Medion Erazer Beast X40 2024
Phison E18-1TB-PHISON-SSD-BICS5
3948 Points +47%
Asus ROG Strix Scar 18 G834JYR (2024)
Samsung PM9A1a MZVL22T0HDLB
3490 Points +30%
Moyenne de la classe Gaming
  (515 - 7208, n=157, 2 dernières années)
3106 Points +16%
Moyenne Micron 3400 2TB MTFDKBA2T0TFH
  (2686 - 3331, n=3)
2999 Points +12%
Razer Blade 16 2024, RTX 4090
Samsung PM9A1 MZVL22T0HBLB
2766 Points +3%
Lenovo Legion 9 16IRX9, RTX 4090
Micron 3400 2TB MTFDKBA2T0TFH
2686 Points
Lenovo Legion 9 16IRX8
2x SK Hynix HFS001TEJ9X115N (RAID 0)
1903 Points -29%
Seq Read
Lenovo Legion 9 16IRX8
2x SK Hynix HFS001TEJ9X115N (RAID 0)
8168.77 MB/s +260%
Alienware m18 R2
SK Hynix PC811 HFS002TEM9X152N
5916.27 MB/s +160%
Asus ROG Strix Scar 18 G834JYR (2024)
Samsung PM9A1a MZVL22T0HDLB
5636.54 MB/s +148%
Medion Erazer Beast X40 2024
Phison E18-1TB-PHISON-SSD-BICS5
5459.84 MB/s +140%
Moyenne de la classe Gaming
  (2260 - 12763, n=157, 2 dernières années)
4939 MB/s +117%
Razer Blade 16 2024, RTX 4090
Samsung PM9A1 MZVL22T0HBLB
4371 MB/s +92%
Moyenne Micron 3400 2TB MTFDKBA2T0TFH
  (2272 - 5126, n=3)
4078 MB/s +79%
Lenovo Legion 9 16IRX9, RTX 4090
Micron 3400 2TB MTFDKBA2T0TFH
2272 MB/s
Seq Write
Lenovo Legion 9 16IRX8
2x SK Hynix HFS001TEJ9X115N (RAID 0)
7332.87 MB/s +123%
Alienware m18 R2
SK Hynix PC811 HFS002TEM9X152N
5929.42 MB/s +80%
Asus ROG Strix Scar 18 G834JYR (2024)
Samsung PM9A1a MZVL22T0HDLB
4294.95 MB/s +31%
Medion Erazer Beast X40 2024
Phison E18-1TB-PHISON-SSD-BICS5
3914.76 MB/s +19%
Razer Blade 16 2024, RTX 4090
Samsung PM9A1 MZVL22T0HBLB
3791 MB/s +15%
Moyenne de la classe Gaming
  (495 - 11316, n=157, 2 dernières années)
3737 MB/s +14%
Lenovo Legion 9 16IRX9, RTX 4090
Micron 3400 2TB MTFDKBA2T0TFH
3289 MB/s
Moyenne Micron 3400 2TB MTFDKBA2T0TFH
  (462 - 4546, n=3)
2766 MB/s -16%
4K Read
Medion Erazer Beast X40 2024
Phison E18-1TB-PHISON-SSD-BICS5
82.84 MB/s +48%
Asus ROG Strix Scar 18 G834JYR (2024)
Samsung PM9A1a MZVL22T0HDLB
75.56 MB/s +35%
Moyenne de la classe Gaming
  (27.8 - 112.1, n=157, 2 dernières années)
65 MB/s +16%
Alienware m18 R2
SK Hynix PC811 HFS002TEM9X152N
64.97 MB/s +16%
Lenovo Legion 9 16IRX8
2x SK Hynix HFS001TEJ9X115N (RAID 0)
62.87 MB/s +12%
Moyenne Micron 3400 2TB MTFDKBA2T0TFH
  (55.9 - 67.7, n=3)
62.5 MB/s +12%
Razer Blade 16 2024, RTX 4090
Samsung PM9A1 MZVL22T0HBLB
61.1 MB/s +9%
Lenovo Legion 9 16IRX9, RTX 4090
Micron 3400 2TB MTFDKBA2T0TFH
55.9 MB/s
4K Write
Alienware m18 R2
SK Hynix PC811 HFS002TEM9X152N
238.28 MB/s +26%
Medion Erazer Beast X40 2024
Phison E18-1TB-PHISON-SSD-BICS5
237.11 MB/s +26%
Moyenne de la classe Gaming
  (108.8 - 512, n=157, 2 dernières années)
211 MB/s +12%
Asus ROG Strix Scar 18 G834JYR (2024)
Samsung PM9A1a MZVL22T0HDLB
207.25 MB/s +10%
Moyenne Micron 3400 2TB MTFDKBA2T0TFH
  (188.6 - 207, n=3)
197.7 MB/s +5%
Lenovo Legion 9 16IRX9, RTX 4090
Micron 3400 2TB MTFDKBA2T0TFH
188.6 MB/s
Lenovo Legion 9 16IRX8
2x SK Hynix HFS001TEJ9X115N (RAID 0)
162.28 MB/s -14%
Razer Blade 16 2024, RTX 4090
Samsung PM9A1 MZVL22T0HBLB
160.6 MB/s -15%
4K-64 Read
Alienware m18 R2
SK Hynix PC811 HFS002TEM9X152N
3096 MB/s +27%
Asus ROG Strix Scar 18 G834JYR (2024)
Samsung PM9A1a MZVL22T0HDLB
2636.61 MB/s +8%
Lenovo Legion 9 16IRX9, RTX 4090
Micron 3400 2TB MTFDKBA2T0TFH
2439 MB/s
Medion Erazer Beast X40 2024
Phison E18-1TB-PHISON-SSD-BICS5
2404.46 MB/s -1%
Razer Blade 16 2024, RTX 4090
Samsung PM9A1 MZVL22T0HBLB
2350 MB/s -4%
Moyenne Micron 3400 2TB MTFDKBA2T0TFH
  (969 - 2439, n=3)
1929 MB/s -21%
Moyenne de la classe Gaming
  (451 - 3475, n=157, 2 dernières années)
1875 MB/s -23%
Lenovo Legion 9 16IRX8
2x SK Hynix HFS001TEJ9X115N (RAID 0)
1122.07 MB/s -54%
4K-64 Write
Alienware m18 R2
SK Hynix PC811 HFS002TEM9X152N
4161.9 MB/s +92%
Medion Erazer Beast X40 2024
Phison E18-1TB-PHISON-SSD-BICS5
3319.37 MB/s +53%
Asus ROG Strix Scar 18 G834JYR (2024)
Samsung PM9A1a MZVL22T0HDLB
2866.57 MB/s +32%
Moyenne Micron 3400 2TB MTFDKBA2T0TFH
  (2168 - 2736, n=3)
2524 MB/s +16%
Moyenne de la classe Gaming
  (277 - 5909, n=157, 2 dernières années)
2524 MB/s +16%
Razer Blade 16 2024, RTX 4090
Samsung PM9A1 MZVL22T0HBLB
2226 MB/s +3%
Lenovo Legion 9 16IRX9, RTX 4090
Micron 3400 2TB MTFDKBA2T0TFH
2168 MB/s
Lenovo Legion 9 16IRX8
2x SK Hynix HFS001TEJ9X115N (RAID 0)
1007.57 MB/s -54%
Access Time Read
Medion Erazer Beast X40 2024
Phison E18-1TB-PHISON-SSD-BICS5
0.057 ms * -68%
Moyenne de la classe Gaming
  (0.016 - 0.379, n=156, 2 dernières années)
0.05537 ms * -63%
Asus ROG Strix Scar 18 G834JYR (2024)
Samsung PM9A1a MZVL22T0HDLB
0.046 ms * -35%
Lenovo Legion 9 16IRX9, RTX 4090
Micron 3400 2TB MTFDKBA2T0TFH
0.034 ms *
Lenovo Legion 9 16IRX8
2x SK Hynix HFS001TEJ9X115N (RAID 0)
0.033 ms * +3%
Razer Blade 16 2024, RTX 4090
Samsung PM9A1 MZVL22T0HBLB
0.033 ms * +3%
Alienware m18 R2
SK Hynix PC811 HFS002TEM9X152N
0.029 ms * +15%
Moyenne Micron 3400 2TB MTFDKBA2T0TFH
  (0.022 - 0.034, n=3)
0.02767 ms * +19%
Access Time Write
Lenovo Legion 9 16IRX8
2x SK Hynix HFS001TEJ9X115N (RAID 0)
0.071 ms * -209%
Alienware m18 R2
SK Hynix PC811 HFS002TEM9X152N
0.055 ms * -139%
Moyenne de la classe Gaming
  (0.011 - 1.028, n=157, 2 dernières années)
0.04852 ms * -111%
Razer Blade 16 2024, RTX 4090
Samsung PM9A1 MZVL22T0HBLB
0.025 ms * -9%
Lenovo Legion 9 16IRX9, RTX 4090
Micron 3400 2TB MTFDKBA2T0TFH
0.023 ms *
Asus ROG Strix Scar 18 G834JYR (2024)
Samsung PM9A1a MZVL22T0HDLB
0.022 ms * +4%
Moyenne Micron 3400 2TB MTFDKBA2T0TFH
  (0.02 - 0.023, n=3)
0.021 ms * +9%
Medion Erazer Beast X40 2024
Phison E18-1TB-PHISON-SSD-BICS5
0.016 ms * +30%

* ... Moindre est la valeur, meilleures sont les performances

Reading continuous performance: DiskSpd Read Loop, Queue Depth 8

037575011251500187522502625300033753750412545004875525056256000637567507125Tooltip
Lenovo Legion 9 16IRX9, RTX 4090 Micron 3400 2TB MTFDKBA2T0TFH; diskspd 2.0.17 f: Ø5061 (3927.87-5317.18)
Lenovo Legion 9 16IRX8 2x SK Hynix HFS001TEJ9X115N (RAID 0): Ø6539 (4611.21-7454.56)
Razer Blade 16 2024, RTX 4090 Samsung PM9A1 MZVL22T0HBLB; diskspd 2.0.17 f: Ø5414 (3853.78-6701.45)
Alienware m18 R2 SK Hynix PC811 HFS002TEM9X152N; diskspd 2.0.17 f: Ø7089 (6353.66-7123.8)

Carte graphique

La Nvidia Geforce RTX 4090 à l'intérieur du Legion 9i est le fer de lance actuel des cartes graphiques pour ordinateurs portables. Elle devrait donc être capable de faire tourner tous les jeux actuels en haute résolution et avec un maximum de détails.

Dans les tests synthétiques 3DMark, sa performance était à peu près au niveau attendu, mais encore une fois, elle était un peu en dessous et la concurrence directe était souvent quelques points de pourcentage plus rapide - incidemment aussi le Blade 16 significativement plus petit et plus mince.

Si vous déconnectez l'ordinateur portable de l'alimentation, son score sur Fire Strike chute d'environ 40 % en ce qui concerne les performances 3D.

Dans les jeux, ses performances sont à peu près comparables à celles du Razer Blade 16. Ses résultats pourraient être plus élevés sans les brèves baisses du taux de rafraîchissement mentionnées plus haut. Vous pouvez voir le problème très clairement dans les valeurs de fréquence d'images de notre test Witcher 3 d'une durée d'une heure. Les baisses de taux d'images se sont surtout produites au début, après quoi le système a fonctionné de manière stable et ses performances ont été comparables à celles de la concurrence.

Ce n'est que lors de l'exécution de jeux très récents et exigeants tels que Skull & Bones que la fréquence d'images en 4K passe parfois sous la barre des 60 fps, sinon tous les jeux se déroulent sans problème à plus de 60 fps, même en 4K.

Profil de performance/valeur mesurée Witcher 3 fps au démarrage Witcher 3 fps après 10 min Consommation en watts Consommation d'énergie du GPU en watts Horloge GPU moyenne en MHz Émissions de bruit en dB
Performances 203 192 246 162 2 120 55,32
Performance avec GPU boost 201 193 254 160.5 2,180 55.32
Équilibré avec IA 197 182 254 159 2,080 54.81
Équilibré sans IA 161 145 184 103 1,530 47.98
Calme 108 60 101 43 d'abord 1 000, après 2 min 800 32,19
3DMark Performance Rating - Percent
Alienware m18 R2 -1!
NVIDIA GeForce RTX 4090 Laptop GPU, Intel Core i9-14900HX
98.5 pt
Razer Blade 16 2024, RTX 4090
NVIDIA GeForce RTX 4090 Laptop GPU, Intel Core i9-14900HX
96.1 pt
Lenovo Legion 9 16IRX8 -1!
NVIDIA GeForce RTX 4090 Laptop GPU, Intel Core i9-13980HX
96 pt
Moyenne NVIDIA GeForce RTX 4090 Laptop GPU
 
95.2 pt
Medion Erazer Beast X40 2024 -1!
NVIDIA GeForce RTX 4090 Laptop GPU, Intel Core i9-14900HX
94 pt
Lenovo Legion 9 16IRX9, RTX 4090
NVIDIA GeForce RTX 4090 Laptop GPU, Intel Core i9-14900HX
93.9 pt
Asus ROG Strix Scar 18 G834JYR (2024)
NVIDIA GeForce RTX 4090 Laptop GPU, Intel Core i9-14900HX
91.4 pt
Moyenne de la classe Gaming
 
70.8 pt
3DMark 11 - 1280x720 Performance GPU
Alienware m18 R2
NVIDIA GeForce RTX 4090 Laptop GPU, Intel Core i9-14900HX
69254 Points +8%
Razer Blade 16 2024, RTX 4090
NVIDIA GeForce RTX 4090 Laptop GPU, Intel Core i9-14900HX
65956 Points +3%
Moyenne NVIDIA GeForce RTX 4090 Laptop GPU
  (54073 - 73027, n=42)
65041 Points +1%
Medion Erazer Beast X40 2024
NVIDIA GeForce RTX 4090 Laptop GPU, Intel Core i9-14900HX
64540 Points 0%
Lenovo Legion 9 16IRX9, RTX 4090
NVIDIA GeForce RTX 4090 Laptop GPU, Intel Core i9-14900HX
64341 Points
Lenovo Legion 9 16IRX8
NVIDIA GeForce RTX 4090 Laptop GPU, Intel Core i9-13980HX
63925 Points -1%
Asus ROG Strix Scar 18 G834JYR (2024)
NVIDIA GeForce RTX 4090 Laptop GPU, Intel Core i9-14900HX
61833 Points -4%
Moyenne de la classe Gaming
  (1029 - 72178, n=184, 2 dernières années)
43666 Points -32%
3DMark
1280x720 Cloud Gate Standard Graphics
Razer Blade 16 2024, RTX 4090
NVIDIA GeForce RTX 4090 Laptop GPU, Intel Core i9-14900HX
152306 Points +3%
Lenovo Legion 9 16IRX9, RTX 4090
NVIDIA GeForce RTX 4090 Laptop GPU, Intel Core i9-14900HX
148437 Points
Moyenne de la classe Gaming
  (15902 - 193851, n=100, 2 dernières années)
143183 Points -4%
Moyenne NVIDIA GeForce RTX 4090 Laptop GPU
  (95671 - 164399, n=14)
142227 Points -4%
Asus ROG Strix Scar 18 G834JYR (2024)
NVIDIA GeForce RTX 4090 Laptop GPU, Intel Core i9-14900HX
141676 Points -5%
1920x1080 Fire Strike Graphics
Razer Blade 16 2024, RTX 4090
NVIDIA GeForce RTX 4090 Laptop GPU, Intel Core i9-14900HX
46527 Points +7%
Lenovo Legion 9 16IRX8
NVIDIA GeForce RTX 4090 Laptop GPU, Intel Core i9-13980HX
46386 Points +7%
Moyenne NVIDIA GeForce RTX 4090 Laptop GPU
  (40259 - 53059, n=41)
46365 Points +7%
Alienware m18 R2
NVIDIA GeForce RTX 4090 Laptop GPU, Intel Core i9-14900HX
44492 Points +2%
Medion Erazer Beast X40 2024
NVIDIA GeForce RTX 4090 Laptop GPU, Intel Core i9-14900HX
44366 Points +2%
Lenovo Legion 9 16IRX9, RTX 4090
NVIDIA GeForce RTX 4090 Laptop GPU, Intel Core i9-14900HX
43518 Points
Asus ROG Strix Scar 18 G834JYR (2024)
NVIDIA GeForce RTX 4090 Laptop GPU, Intel Core i9-14900HX
43477 Points 0%
Moyenne de la classe Gaming
  (781 - 53059, n=194, 2 dernières années)
31337 Points -28%
2560x1440 Time Spy Graphics
Alienware m18 R2
NVIDIA GeForce RTX 4090 Laptop GPU, Intel Core i9-14900HX
22290 Points +9%
Lenovo Legion 9 16IRX8
NVIDIA GeForce RTX 4090 Laptop GPU, Intel Core i9-13980HX
21391 Points +5%
Moyenne NVIDIA GeForce RTX 4090 Laptop GPU
  (16950 - 23292, n=43)
20950 Points +3%
Medion Erazer Beast X40 2024
NVIDIA GeForce RTX 4090 Laptop GPU, Intel Core i9-14900HX
20806 Points +2%
Lenovo Legion 9 16IRX9, RTX 4090
NVIDIA GeForce RTX 4090 Laptop GPU, Intel Core i9-14900HX
20416 Points
Asus ROG Strix Scar 18 G834JYR (2024)
NVIDIA GeForce RTX 4090 Laptop GPU, Intel Core i9-14900HX
20070 Points -2%
Razer Blade 16 2024, RTX 4090
NVIDIA GeForce RTX 4090 Laptop GPU, Intel Core i9-14900HX
19878 Points -3%
Moyenne de la classe Gaming
  (224 - 22717, n=189, 2 dernières années)
13077 Points -36%
3DMark 11 Performance
46826 points
3DMark Cloud Gate Standard Score
67697 points
3DMark Fire Strike Score
34686 points
3DMark Time Spy Score
20099 points
Aide
Blender
v3.3 Classroom OPTIX/RTX
Moyenne de la classe Gaming
  (9 - 95, n=175, 2 dernières années)
20.9 Seconds * -61%
Lenovo Legion 9 16IRX9, RTX 4090
NVIDIA GeForce RTX 4090 Laptop GPU, Intel Core i9-14900HX
13 Seconds *
Moyenne NVIDIA GeForce RTX 4090 Laptop GPU
  (9 - 19, n=39)
12.1 Seconds * +7%
Asus ROG Strix Scar 18 G834JYR (2024)
NVIDIA GeForce RTX 4090 Laptop GPU, Intel Core i9-14900HX
12 Seconds * +8%
Razer Blade 16 2024, RTX 4090
NVIDIA GeForce RTX 4090 Laptop GPU, Intel Core i9-14900HX
12 Seconds * +8%
Alienware m18 R2
NVIDIA GeForce RTX 4090 Laptop GPU, Intel Core i9-14900HX
12 Seconds * +8%
Medion Erazer Beast X40 2024
NVIDIA GeForce RTX 4090 Laptop GPU, Intel Core i9-14900HX
11 Seconds * +15%
Lenovo Legion 9 16IRX8
NVIDIA GeForce RTX 4090 Laptop GPU, Intel Core i9-13980HX
10 Seconds * +23%
v3.3 Classroom CUDA
Moyenne de la classe Gaming
  (16 - 175, n=181, 2 dernières années)
36.5 Seconds * -103%
Moyenne NVIDIA GeForce RTX 4090 Laptop GPU
  (16 - 24, n=39)
18.3 Seconds * -2%
Razer Blade 16 2024, RTX 4090
NVIDIA GeForce RTX 4090 Laptop GPU, Intel Core i9-14900HX
18 Seconds * -0%
Alienware m18 R2
NVIDIA GeForce RTX 4090 Laptop GPU, Intel Core i9-14900HX
18 Seconds * -0%
Lenovo Legion 9 16IRX9, RTX 4090
NVIDIA GeForce RTX 4090 Laptop GPU, Intel Core i9-14900HX
18 Seconds *
Asus ROG Strix Scar 18 G834JYR (2024)
NVIDIA GeForce RTX 4090 Laptop GPU, Intel Core i9-14900HX
17 Seconds * +6%
Medion Erazer Beast X40 2024
NVIDIA GeForce RTX 4090 Laptop GPU, Intel Core i9-14900HX
17 Seconds * +6%
Lenovo Legion 9 16IRX8
NVIDIA GeForce RTX 4090 Laptop GPU, Intel Core i9-13980HX
16 Seconds * +11%
v3.3 Classroom CPU
Moyenne de la classe Gaming
  (138 - 962, n=189, 2 dernières années)
297 Seconds * -54%
Medion Erazer Beast X40 2024
NVIDIA GeForce RTX 4090 Laptop GPU, Intel Core i9-14900HX
253 Seconds * -31%
Asus ROG Strix Scar 18 G834JYR (2024)
NVIDIA GeForce RTX 4090 Laptop GPU, Intel Core i9-14900HX
209 Seconds * -8%
Razer Blade 16 2024, RTX 4090
NVIDIA GeForce RTX 4090 Laptop GPU, Intel Core i9-14900HX
202 Seconds * -5%
Moyenne NVIDIA GeForce RTX 4090 Laptop GPU
  (144 - 305, n=39)
199.1 Seconds * -3%
Lenovo Legion 9 16IRX8
NVIDIA GeForce RTX 4090 Laptop GPU, Intel Core i9-13980HX
194 Seconds * -1%
Lenovo Legion 9 16IRX9, RTX 4090
NVIDIA GeForce RTX 4090 Laptop GPU, Intel Core i9-14900HX
193 Seconds *
Alienware m18 R2
NVIDIA GeForce RTX 4090 Laptop GPU, Intel Core i9-14900HX
180 Seconds * +7%

* ... Moindre est la valeur, meilleures sont les performances

Performance Rating - Percent
Lenovo Legion 9 16IRX8
Intel Core i9-13980HX, NVIDIA GeForce RTX 4090 Laptop GPU
98.3 pt
Medion Erazer Beast X40 2024
Intel Core i9-14900HX, NVIDIA GeForce RTX 4090 Laptop GPU
96.3 pt
Alienware m18 R2
Intel Core i9-14900HX, NVIDIA GeForce RTX 4090 Laptop GPU
95 pt
Razer Blade 16 2024, RTX 4090
Intel Core i9-14900HX, NVIDIA GeForce RTX 4090 Laptop GPU
91.5 pt
Lenovo Legion 9 16IRX9, RTX 4090
Intel Core i9-14900HX, NVIDIA GeForce RTX 4090 Laptop GPU
90 pt
Asus ROG Strix Scar 18 G834JYR (2024)
Intel Core i9-14900HX, NVIDIA GeForce RTX 4090 Laptop GPU
88.3 pt
Moyenne de la classe Gaming
 
67.9 pt
The Witcher 3 - 1920x1080 Ultra Graphics & Postprocessing (HBAO+)
Lenovo Legion 9 16IRX8
Intel Core i9-13980HX, NVIDIA GeForce RTX 4090 Laptop GPU
208.7 (191min) fps +3%
Alienware m18 R2
Intel Core i9-14900HX, NVIDIA GeForce RTX 4090 Laptop GPU
205.7 (193min) fps +1%
Medion Erazer Beast X40 2024
Intel Core i9-14900HX, NVIDIA GeForce RTX 4090 Laptop GPU
204 fps 0%
Lenovo Legion 9 16IRX9, RTX 4090
Intel Core i9-14900HX, NVIDIA GeForce RTX 4090 Laptop GPU
203.4 fps
Razer Blade 16 2024, RTX 4090
Intel Core i9-14900HX, NVIDIA GeForce RTX 4090 Laptop GPU
200 fps -2%
Asus ROG Strix Scar 18 G834JYR (2024)
Intel Core i9-14900HX, NVIDIA GeForce RTX 4090 Laptop GPU
189.4 (165min) fps -7%
Moyenne de la classe Gaming
  (18.4 - 216, n=166, 2 dernières années)
127.4 fps -37%
GTA V - 1920x1080 Highest Settings possible AA:4xMSAA + FX AF:16x
Lenovo Legion 9 16IRX8
Intel Core i9-13980HX, NVIDIA GeForce RTX 4090 Laptop GPU
150.7 (3min, 111.1P1) fps +11%
Medion Erazer Beast X40 2024
Intel Core i9-14900HX, NVIDIA GeForce RTX 4090 Laptop GPU
141.5 (3.53min, 100P1) fps +4%
Razer Blade 16 2024, RTX 4090
Intel Core i9-14900HX, NVIDIA GeForce RTX 4090 Laptop GPU
138.1 (4.19min, 83.3P1) fps +1%
Alienware m18 R2
Intel Core i9-14900HX, NVIDIA GeForce RTX 4090 Laptop GPU
137 (7.81min, 83.3P1) fps +1%
Lenovo Legion 9 16IRX9, RTX 4090
Intel Core i9-14900HX, NVIDIA GeForce RTX 4090 Laptop GPU
136.2 (0.938min, 111.1P1) fps
Asus ROG Strix Scar 18 G834JYR (2024)
Intel Core i9-14900HX, NVIDIA GeForce RTX 4090 Laptop GPU
136 (8.67min, 100P1) fps 0%
Moyenne de la classe Gaming
  (12.1 - 167.7, n=169, 2 dernières années)
113.1 fps -17%
Final Fantasy XV Benchmark - 1920x1080 High Quality
Alienware m18 R2
Intel Core i9-14900HX, NVIDIA GeForce RTX 4090 Laptop GPU
193.2 fps +17%
Lenovo Legion 9 16IRX8
Intel Core i9-13980HX, NVIDIA GeForce RTX 4090 Laptop GPU
181.3 fps +10%
Medion Erazer Beast X40 2024
Intel Core i9-14900HX, NVIDIA GeForce RTX 4090 Laptop GPU
181.1 fps +10%
Asus ROG Strix Scar 18 G834JYR (2024)
Intel Core i9-14900HX, NVIDIA GeForce RTX 4090 Laptop GPU
166.1 fps +1%
Lenovo Legion 9 16IRX9, RTX 4090
Intel Core i9-14900HX, NVIDIA GeForce RTX 4090 Laptop GPU
165.1 fps
Razer Blade 16 2024, RTX 4090
Intel Core i9-14900HX, NVIDIA GeForce RTX 4090 Laptop GPU
137.5 fps -17%
Moyenne de la classe Gaming
  (19.2 - 201, n=182, 2 dernières années)
119.3 fps -28%
Strange Brigade - 1920x1080 ultra AA:ultra AF:16
Lenovo Legion 9 16IRX8
Intel Core i9-13980HX, NVIDIA GeForce RTX 4090 Laptop GPU
387 (23.7min, 277P1) fps +5%
Medion Erazer Beast X40 2024
Intel Core i9-14900HX, NVIDIA GeForce RTX 4090 Laptop GPU
371 (5min, 273P1) fps +1%
Alienware m18 R2
Intel Core i9-14900HX, NVIDIA GeForce RTX 4090 Laptop GPU
369 (31.4min, 266P1) fps 0%
Lenovo Legion 9 16IRX9, RTX 4090
Intel Core i9-14900HX, NVIDIA GeForce RTX 4090 Laptop GPU
369 (5min, 269P1) fps
Razer Blade 16 2024, RTX 4090
Intel Core i9-14900HX, NVIDIA GeForce RTX 4090 Laptop GPU
359.8 (30.2min, 253P1) fps -2%
Asus ROG Strix Scar 18 G834JYR (2024)
Intel Core i9-14900HX, NVIDIA GeForce RTX 4090 Laptop GPU
331 (34.1min, 238P1) fps -10%
Moyenne de la classe Gaming
  (38.9 - 421, n=180, 2 dernières années)
228 fps -38%
Dota 2 Reborn - 1920x1080 ultra (3/3) best looking
Lenovo Legion 9 16IRX8
Intel Core i9-13980HX, NVIDIA GeForce RTX 4090 Laptop GPU
193.1 (162.4min) fps +17%
Medion Erazer Beast X40 2024
Intel Core i9-14900HX, NVIDIA GeForce RTX 4090 Laptop GPU
189.9 (162.8min) fps +15%
Razer Blade 16 2024, RTX 4090
Intel Core i9-14900HX, NVIDIA GeForce RTX 4090 Laptop GPU
188.1 (155.2min) fps +14%
Alienware m18 R2
Intel Core i9-14900HX, NVIDIA GeForce RTX 4090 Laptop GPU
171.8 (143.6min) fps +4%
Lenovo Legion 9 16IRX9, RTX 4090
Intel Core i9-14900HX, NVIDIA GeForce RTX 4090 Laptop GPU
164.5 (136min) fps
Asus ROG Strix Scar 18 G834JYR (2024)
Intel Core i9-14900HX, NVIDIA GeForce RTX 4090 Laptop GPU
161.3 (135.6min) fps -2%
Moyenne de la classe Gaming
  (30.8 - 220, n=188, 2 dernières années)
149.4 fps -9%
X-Plane 11.11 - 1920x1080 high (fps_test=3)
Razer Blade 16 2024, RTX 4090
Intel Core i9-14900HX, NVIDIA GeForce RTX 4090 Laptop GPU
146.2 fps +16%
Medion Erazer Beast X40 2024
Intel Core i9-14900HX, NVIDIA GeForce RTX 4090 Laptop GPU
143.9 fps +15%
Alienware m18 R2
Intel Core i9-14900HX, NVIDIA GeForce RTX 4090 Laptop GPU
140.6 fps +12%
Lenovo Legion 9 16IRX8
Intel Core i9-13980HX, NVIDIA GeForce RTX 4090 Laptop GPU
140.1 fps +12%
Asus ROG Strix Scar 18 G834JYR (2024)
Intel Core i9-14900HX, NVIDIA GeForce RTX 4090 Laptop GPU
136.8 fps +9%
Lenovo Legion 9 16IRX9, RTX 4090
Intel Core i9-14900HX, NVIDIA GeForce RTX 4090 Laptop GPU
125.6 fps
Moyenne de la classe Gaming
  (31.5 - 166.2, n=194, 2 dernières années)
107.3 fps -15%
Far Cry 5
1920x1080 Ultra Preset AA:T
Alienware m18 R2
Intel Core i9-14900HX, NVIDIA GeForce RTX 4090 Laptop GPU
160 (124min) fps +3%
Lenovo Legion 9 16IRX8
Intel Core i9-13980HX, NVIDIA GeForce RTX 4090 Laptop GPU
158 (102min) fps +2%
Lenovo Legion 9 16IRX9, RTX 4090
Intel Core i9-14900HX, NVIDIA GeForce RTX 4090 Laptop GPU
155 fps
Moyenne NVIDIA GeForce RTX 4090 Laptop GPU
  (117 - 218, n=21)
153.5 fps -1%
Asus ROG Strix Scar 18 G834JYR (2024)
Intel Core i9-14900HX, NVIDIA GeForce RTX 4090 Laptop GPU
145 (103min) fps -6%
Moyenne de la classe Gaming
  (34 - 218, n=102, 2 dernières années)
130.7 fps -16%
Razer Blade 16 2024, RTX 4090
Intel Core i9-14900HX, NVIDIA GeForce RTX 4090 Laptop GPU
127 fps -18%
2560x1440 Ultra Preset AA:T
Lenovo Legion 9 16IRX8
Intel Core i9-13980HX, NVIDIA GeForce RTX 4090 Laptop GPU
157 (111min) fps +8%
Alienware m18 R2
Intel Core i9-14900HX, NVIDIA GeForce RTX 4090 Laptop GPU
154 (113min) fps +5%
Moyenne NVIDIA GeForce RTX 4090 Laptop GPU
  (115 - 194, n=23)
148.8 fps +2%
Lenovo Legion 9 16IRX9, RTX 4090
Intel Core i9-14900HX, NVIDIA GeForce RTX 4090 Laptop GPU
146 fps
Asus ROG Strix Scar 18 G834JYR (2024)
Intel Core i9-14900HX, NVIDIA GeForce RTX 4090 Laptop GPU
145 (108min) fps -1%
Razer Blade 16 2024, RTX 4090
Intel Core i9-14900HX, NVIDIA GeForce RTX 4090 Laptop GPU
125 fps -14%
Moyenne de la classe Gaming
  (71 - 194, n=81, 2 dernières années)
119.3 fps -18%
3840x2160 Ultra Preset AA:T
Alienware m18 R2
Intel Core i9-14900HX, NVIDIA GeForce RTX 4090 Laptop GPU
112 (100min) fps +8%
Lenovo Legion 9 16IRX9, RTX 4090
Intel Core i9-14900HX, NVIDIA GeForce RTX 4090 Laptop GPU
104 fps
Razer Blade 16 2024, RTX 4090
Intel Core i9-14900HX, NVIDIA GeForce RTX 4090 Laptop GPU
103 fps -1%
Moyenne NVIDIA GeForce RTX 4090 Laptop GPU
  (75 - 113, n=13)
102.7 fps -1%
Moyenne de la classe Gaming
  (39 - 113, n=29, 2 dernières années)
84.5 fps -19%

Witcher 3 FPS diagram

0153045607590105120135150165180195210Tooltip
Lenovo Legion 9 16IRX9, RTX 4090 i9-14900HX, NVIDIA GeForce RTX 4090 Laptop GPU: Ø195.6 (67-209)
Lenovo Legion 9 16IRX8 i9-13980HX, NVIDIA GeForce RTX 4090 Laptop GPU: Ø198.7 (181-213)
Razer Blade 16 2024, RTX 4090 i9-14900HX, NVIDIA GeForce RTX 4090 Laptop GPU: Ø192.6 (177-211)
Alienware m18 R2 i9-14900HX, NVIDIA GeForce RTX 4090 Laptop GPU: Ø196.9 (185-209)
BasMoyenÉlevéUltraQHD4K DLSS4K FSR4K
GTA V (2015) 186.9 185.2 183.3 136.2 138.9 95
The Witcher 3 (2015) 540 494 370 203.4 165 104.5
Dota 2 Reborn (2015) 201 181.8 174.4 164.5 160.8
Final Fantasy XV Benchmark (2018) 228 194.9 165.1 142
X-Plane 11.11 (2018) 193.5 166.3 125.6 109.6
Far Cry 5 (2018) 201 173 166 155 146 104
Strange Brigade (2018) 499 403 387 369 290
F1 23 (2023) 151.5 149.2 144.6
Cyberpunk 2077 2.1 Phantom Liberty (2023) 127 86
Skull & Bones (2024) 164 140 149 118 98 90 81 61
F1 24 (2024) 339 304 113.6 72.1

Émissions et puissance - Fortes et chaudes

Émissions sonores

Lorsqu'ils sont au repos sur l'ordinateur de bureau, les ventilateurs de l'ordinateur portable sont généralement silencieux. Il arrive qu'ils s'accélèrent brièvement, puis se calment à nouveau. Cependant, dès que vous placez l'appareil sous une charge quotidienne telle que la navigation sur le web, les ventilateurs se mettent rapidement au travail, même en mode silencieux.

Lors de 3DMark06, les ventilateurs ont d'abord accéléré en continu jusqu'à un peu plus de 40 dB, puis se sont calmés à 35 dB avant de se stabiliser à environ 39 dB dans le dernier tiers. Cela peut également être un signe que le système ajuste son refroidissement et ses performances aux conditions thermiques trop tard et qu'il n'atteint les valeurs optimales qu'au bout d'un certain temps.

Dans les jeux et en mode Performance, les ventilateurs tournent à environ 55 dB au maximum, ce qui est assez bruyant en comparaison ; le Blade 16, par exemple, reste plus silencieux. En mode équilibré (sans AI), les émissions sonores de l'ordinateur portable tombent à un niveau plus modéré de 47 dB, mais ses performances de jeu diminuent alors sensiblement, à savoir de 20 à 25 %.

Degré de la nuisance sonore

Au repos
23 / 23 / 23 dB(A)
Fortement sollicité
39 / 55.56 dB(A)
  red to green bar
 
 
30 dB
silencieux
40 dB(A)
audible
50 dB(A)
bruyant
 
min: dark, med: mid, max: light   Earthworks M23R, Arta (à 15 cm de distance)   bruit ambiant: 23 dB(A)
dB(A) 0102030405060708090Deep BassMiddle BassHigh BassLower RangeMidsHigher MidsLower HighsMid HighsUpper HighsSuper Highs2029.224.829.22526.223.426.23129.228.229.24026.216.526.25027.122.127.16327.923.827.9802612.32610026.819.726.812525.814.925.816027.11127.120027.516.527.525031.814.731.831534.812.434.840037.110.937.150038.79.238.7630397.83980038.28.738.2100040.38.640.3125042942160044.79.844.7200045.510.145.5250046.91146.9315046.711.246.7400045.511.745.5500043.411.843.4630041.31241.3800037.712.137.71000035.512.135.51250033.312.533.31600030.911.130.9SPL55.62355.6N9.80.49.8median 38.2median 11.2median 38.2Delta6.11.96.1hearing rangehide median Fan NoiseLenovo Legion 9 16IRX9, RTX 4090
Lenovo Legion 9 16IRX9, RTX 4090
NVIDIA GeForce RTX 4090 Laptop GPU, i9-14900HX, Micron 3400 2TB MTFDKBA2T0TFH
Lenovo Legion 9 16IRX8
NVIDIA GeForce RTX 4090 Laptop GPU, i9-13980HX, 2x SK Hynix HFS001TEJ9X115N (RAID 0)
Razer Blade 16 2024, RTX 4090
NVIDIA GeForce RTX 4090 Laptop GPU, i9-14900HX, Samsung PM9A1 MZVL22T0HBLB
Alienware m18 R2
NVIDIA GeForce RTX 4090 Laptop GPU, i9-14900HX, SK Hynix PC811 HFS002TEM9X152N
Asus ROG Strix Scar 18 G834JYR (2024)
NVIDIA GeForce RTX 4090 Laptop GPU, i9-14900HX, Samsung PM9A1a MZVL22T0HDLB
Medion Erazer Beast X40 2024
NVIDIA GeForce RTX 4090 Laptop GPU, i9-14900HX, Phison E18-1TB-PHISON-SSD-BICS5
Noise
-2%
-1%
-5%
-13%
-15%
off / environment *
23
23.7
-3%
23
-0%
23.6
-3%
24
-4%
25
-9%
Idle Minimum *
23
24
-4%
23
-0%
23.8
-3%
27
-17%
28
-22%
Idle Average *
23
24
-4%
23
-0%
26.1
-13%
28
-22%
29
-26%
Idle Maximum *
23
30.4
-32%
27.66
-20%
31.5
-37%
32
-39%
32
-39%
Load Average *
39
30.4
22%
43.76
-12%
31.5
19%
50
-28%
48
-23%
Witcher 3 ultra *
55.32
52.2
6%
46.81
15%
52.1
6%
50
10%
50
10%
Load Maximum *
55.56
54.9
1%
50.37
9%
56.6
-2%
52
6%
52
6%

* ... Moindre est la valeur, meilleures sont les performances

Température

Malgré un système de refroidissement plutôt bruyant, les températures de l'ordinateur portable sont assez élevées en comparaison. Les points chauds dans les jeux et sous d'autres charges lourdes se situent au centre et vers l'écran. Il peut également faire très chaud autour des touches WASD - nous avons mesuré 46 °C. Au moins, les repose-paumes restent corrects. Même son prédécesseur n'était pas idéal à cet égard, mais Lenovo n'a manifestement pas apporté d'améliorations.

 56 °C56 °C48 °C 
 46 °C50 °C44 °C 
 36 °C36 °C34 °C 
Maximum: 56 °C
Moyenne: 45.1 °C
50 °C53 °C51 °C
50 °C53 °C48 °C
35 °C40 °C39 °C
Maximum: 53 °C
Moyenne: 46.6 °C
Alimentation (valeur maximale)  50 °C | Température ambiante de la pièce 22 °C | Fluke t3000FC (calibrated), Fluke 62 Mini
(-) La température moyenne de la face supérieure sous charge maximale est de 45.1 °C / 113 F, par rapport à la moyenne de 33.9 °C / 93 F pour les appareils de la classe Gaming.
(-) La température maximale du côté supérieur est de 56 °C / 133 F, par rapport à la moyenne de 40.5 °C / 105 F, allant de 21.2 à 68.8 °C pour la classe Gaming.
(-) Le fond chauffe jusqu'à un maximum de 53 °C / 127 F, contre une moyenne de 43.2 °C / 110 F
(±) En utilisation inactive, la température moyenne du côté supérieur est de 33.6 °C / 92 F, par rapport à la moyenne du dispositif de 33.9 °C / 93 F.
(-) En jouant à The Witcher 3, la température moyenne du côté supérieur est de 42.3 °C / 108 F, alors que la moyenne de l'appareil est de 33.9 °C / 93 F.
(±) Les repose-poignets et le pavé tactile peuvent devenir très chauds au toucher, avec un maximum de 36 °C / 96.8# F.
(-) La température moyenne de la zone de l'appui-paume de dispositifs similaires était de 28.9 °C / 84 F (-7.1 °C / #-12.8 F).
Witcher 3 sommet
Witcher 3 sommet
Witcher 3 alimentation électrique
Witcher 3 fond
Witcher 3 fond
Haut de page du stress
Alimentation électrique en cas de stress
Fond de stress
Fond de stress
Lenovo Legion 9 16IRX9, RTX 4090
Intel Core i9-14900HX, NVIDIA GeForce RTX 4090 Laptop GPU
Lenovo Legion 9 16IRX8
Intel Core i9-13980HX, NVIDIA GeForce RTX 4090 Laptop GPU
Razer Blade 16 2024, RTX 4090
Intel Core i9-14900HX, NVIDIA GeForce RTX 4090 Laptop GPU
Alienware m18 R2
Intel Core i9-14900HX, NVIDIA GeForce RTX 4090 Laptop GPU
Asus ROG Strix Scar 18 G834JYR (2024)
Intel Core i9-14900HX, NVIDIA GeForce RTX 4090 Laptop GPU
Medion Erazer Beast X40 2024
Intel Core i9-14900HX, NVIDIA GeForce RTX 4090 Laptop GPU
Heat
11%
21%
9%
17%
13%
Maximum Upper Side *
56
49.6
11%
45
20%
41.2
26%
49
12%
47
16%
Maximum Bottom *
53
48.6
8%
45
15%
34.6
35%
47
11%
54
-2%
Idle Upper Side *
38
33.2
13%
29
24%
42.8
-13%
29
24%
30
21%
Idle Bottom *
39
34.2
12%
30
23%
43.6
-12%
31
21%
32
18%

* ... Moindre est la valeur, meilleures sont les performances

Intervenants

La gamme audible est très linéaire, les aigus et les médiums sont bien équilibrés. Cependant, les basses sont naturellement réduites, mais restent perceptibles. Les enceintes mériteraient également d'être un peu plus puissantes, c'est-à-dire plus bruyantes.

dB(A) 0102030405060708090Deep BassMiddle BassHigh BassLower RangeMidsHigher MidsLower HighsMid HighsUpper HighsSuper Highs2032.124.832.12528.423.428.43129.728.229.74025.716.525.75029.222.129.26332.123.832.18035.412.335.410041.319.741.312544.314.944.316050.61150.620054.616.554.625055.414.755.43156412.46440066.110.966.150065.89.265.8630667.86680070.78.770.7100068.88.668.8125067.8967.8160067.59.867.5200071.210.171.2250066.31166.3315066.811.266.8400061.111.761.1500061.511.861.5630063.21263.2800064.212.164.21000064.812.164.81250064.812.564.81600065.711.165.7SPL792379N45.80.445.8median 64.8median 11.2median 64.8Delta4.81.94.83032.83030.931.430.935.742.935.723.728.123.726.219.726.231.216.431.245.113.845.145.919.845.951.414.551.45913.95964.117.864.168.614.368.667.19.667.167.68.567.672.97.572.977.47.477.4717.77164.88.164.865.88.265.867.58.867.568.89.868.868.710.568.77010.67066.410.966.467.311.267.36411.56464.711.664.767126763.211.863.25510.75581.222.581.254.70.454.7median 67median 10.7median 673.62.53.6hearing rangehide median Pink NoiseLenovo Legion 9 16IRX9, RTX 4090Razer Blade 16 2024, RTX 4090
Diagramme de fréquence (les cases peuvent être cochées et décochées pour comparer les appareils)
Lenovo Legion 9 16IRX9, RTX 4090 analyse audio

(±) | le niveau sonore du haut-parleur est moyen mais bon (78.96# dB)
Bass 100 - 315 Hz
(±) | basse réduite - en moyenne 13.2% inférieure à la médiane
(±) | la linéarité des basses est moyenne (8.9% delta à la fréquence précédente)
Mids 400 - 2000 Hz
(+) | médiane équilibrée - seulement 3.2% de la médiane
(+) | les médiums sont linéaires (3.4% delta à la fréquence précédente)
Aiguës 2 - 16 kHz
(+) | des sommets équilibrés - à seulement 1.8% de la médiane
(+) | les aigus sont linéaires (4% delta à la fréquence précédente)
Overall 100 - 16.000 Hz
(+) | le son global est linéaire (11.3% différence à la médiane)
Par rapport à la même classe
» 8% de tous les appareils testés de cette catégorie étaient meilleurs, 3% similaires, 89% pires
» Le meilleur avait un delta de 6%, la moyenne était de 18%, le pire était de 132%.
Par rapport à tous les appareils testés
» 6% de tous les appareils testés étaient meilleurs, 2% similaires, 92% pires
» Le meilleur avait un delta de 4%, la moyenne était de 25%, le pire était de 134%.

Razer Blade 16 2024, RTX 4090 analyse audio

(±) | le niveau sonore du haut-parleur est moyen mais bon (81.16# dB)
Bass 100 - 315 Hz
(±) | basse réduite - en moyenne 8.2% inférieure à la médiane
(±) | la linéarité des basses est moyenne (7.4% delta à la fréquence précédente)
Mids 400 - 2000 Hz
(+) | médiane équilibrée - seulement 3.3% de la médiane
(+) | les médiums sont linéaires (5.9% delta à la fréquence précédente)
Aiguës 2 - 16 kHz
(+) | des sommets équilibrés - à seulement 1.6% de la médiane
(+) | les aigus sont linéaires (3.1% delta à la fréquence précédente)
Overall 100 - 16.000 Hz
(+) | le son global est linéaire (9.2% différence à la médiane)
Par rapport à la même classe
» 3% de tous les appareils testés de cette catégorie étaient meilleurs, 1% similaires, 96% pires
» Le meilleur avait un delta de 6%, la moyenne était de 18%, le pire était de 132%.
Par rapport à tous les appareils testés
» 3% de tous les appareils testés étaient meilleurs, 1% similaires, 97% pires
» Le meilleur avait un delta de 4%, la moyenne était de 25%, le pire était de 134%.

Consommation électrique

Sa consommation peut être légèrement améliorée par rapport au modèle précédent, que ce soit au ralenti ou non. Cependant, ce n'est pas beaucoup - même la concurrence de 18 pouces est souvent plus frugale, du moins au ralenti.

Le problème supposé du nouveau Legion 9 apparaît à nouveau dans ses graphiques de consommation, car sa consommation (et donc aussi ses performances) chute très brièvement de temps en temps au cours des différents tests. Ce qui était encore normal dans Cinebench 23 ne l'était plus dans les tests Witcher 3 ou Furmark.

Nous avons mesuré une consommation maximale à court terme de 323 watts en utilisant le bloc d'alimentation plat et relativement petit. Ce bloc est conçu pour 330 watts et devrait donc pouvoir alimenter l'ordinateur portable sans problème dans toutes les situations.

Une caractéristique unique : Le Legion 9 est également livré avec un deuxième bloc d'alimentation, un bloc d'alimentation USB-C beaucoup plus petit de 140 watts. Si vous ne jouez pas, l'adaptateur plus petit est bien sûr encore mieux adapté à une utilisation en déplacement.

L'alimentation de 330 watts
L'alimentation USB-C de 140 watts, plus petite
Consommation énergétique
Éteint/en veilledarklight 0.21 / 0.23 Watts
Au reposdarkmidlight 20.5 / 27.7 / 32.1 Watts
Fortement sollicité midlight 105 / 323 Watts
 color bar
Légende: min: dark, med: mid, max: light        Metrahit Energy
Lenovo Legion 9 16IRX9, RTX 4090
i9-14900HX, NVIDIA GeForce RTX 4090 Laptop GPU, Micron 3400 2TB MTFDKBA2T0TFH, MiniLED, 3200x2000, 16"
Lenovo Legion 9 16IRX8
i9-13980HX, NVIDIA GeForce RTX 4090 Laptop GPU, 2x SK Hynix HFS001TEJ9X115N (RAID 0), Mini-LED, 3200x2000, 16"
Razer Blade 16 2024, RTX 4090
i9-14900HX, NVIDIA GeForce RTX 4090 Laptop GPU, Samsung PM9A1 MZVL22T0HBLB, OLED, 2560x1600, 16"
Asus ROG Strix Scar 18 G834JYR (2024)
i9-14900HX, NVIDIA GeForce RTX 4090 Laptop GPU, Samsung PM9A1a MZVL22T0HDLB, Mini LED, 2560x1600, 18"
Medion Erazer Beast X40 2024
i9-14900HX, NVIDIA GeForce RTX 4090 Laptop GPU, Phison E18-1TB-PHISON-SSD-BICS5, IPS, 2560x1600, 17"
Moyenne NVIDIA GeForce RTX 4090 Laptop GPU
 
Moyenne de la classe Gaming
 
Power Consumption
-34%
12%
11%
13%
-0%
21%
Idle Minimum *
20.5
32.3
-58%
16.9
18%
14
32%
7
66%
16.9 ?(6 - 33.8, n=29)
18%
Idle Average *
27.7
42.6
-54%
17.8
36%
17
39%
15
46%
Idle Maximum *
32.1
57.9
-80%
19.6
39%
24
25%
33
-3%
Load Average *
105
121
-15%
128
-22%
143
-36%
134
-28%
130.5 ?(79 - 201, n=29)
-24%
Witcher 3 ultra *
246
254
-3%
243
1%
251
-2%
280
-14%
Load Maximum *
323
297.7
8%
328
-2%
302
7%
294
9%

* ... Moindre est la valeur, meilleures sont les performances

Power consumption Witcher 3 / stress test

020406080100120140160180200220240260280300320Tooltip
Lenovo Legion 9 16IRX9, RTX 4090; Witcher 3 ultra: Ø246 (96.7-323.15)
Lenovo Legion 9 16IRX9, RTX 4090; 1280x720 Prime95 28.10 and Furmark 1.25: Ø233 (140.46-311.94)
Lenovo Legion 9 16IRX9, RTX 4090; Idle 150cd/m2: Ø25.2 (19.368-36.719)

Power consumption with external monitor

0153045607590105120135150165180195210225240Tooltip
Lenovo Legion 9 16IRX9, RTX 4090; Prime95 V2810 Stress (external Monitor): Ø219 (192.21-241.01)
Lenovo Legion 9 16IRX9, RTX 4090; Cinebench R15 Multi (external Monitor): Ø238 (236.92-239.74)
Lenovo Legion 9 16IRX9, RTX 4090; Cinebench R23 Multi (external Monitor): Ø214 (74.98-247.35)
Lenovo Legion 9 16IRX9, RTX 4090; 1280x720 FurMark 1.19 GPU Stress Test (external Monitor): Ø222 (86.99-228.52)
Lenovo Legion 9 16IRX9, RTX 4090; 1920x1080 The Witcher 3 ultra (external Monitor): Ø231 (88.59-243.99)
Lenovo Legion 9 16IRX9, RTX 4090; Idle 1min (external Monitor): Ø29.4 (21.519-38.919)

Délais d'exécution

La batterie intégrée a une capacité d'environ 100 Wh, ce qui est similaire à la concurrence. Néanmoins, son autonomie est souvent plus courte, un problème auquel son prédécesseur et d'autres ordinateurs portables dotés d'écrans MiniLED sont déjà confrontés. Bien que l'autonomie ait été améliorée, les appareils de comparaison (à l'exception de l'ordinateur portable Alienware) obtiennent des durées d'utilisation plus longues de leurs batteries. Il en va de même pour l'Asus ROG Scar Strix, par exemple, qui dispose également d'un écran MiniLED.

Néanmoins, il suffit d'un peu moins de 5 heures pour regarder des vidéos ou surfer sur le web avec une luminosité réduite à 150 nits. L'appareil d'Asus offre une autonomie de plus de 6 heures.

L'ordinateur portable Lenovo est doté d'une fonction de charge rapide, qui doit d'abord être activée dans le logiciel Vantage. Ensuite, une charge complète ne prend qu'une heure environ.

Autonomie
WiFi Websurfing
4h 50min
WiFi Websurfing max. Brightness
3h 17min
En lecture de Big Buck Bunny encodé en H.264 1080p
4h 54min
Fortement sollicité (luminosité au maximum)
2h 9min
Lenovo Legion 9 16IRX9, RTX 4090
i9-14900HX, NVIDIA GeForce RTX 4090 Laptop GPU, 99.99 Wh
Lenovo Legion 9 16IRX8
i9-13980HX, NVIDIA GeForce RTX 4090 Laptop GPU, 99.9 Wh
Razer Blade 16 2024, RTX 4090
i9-14900HX, NVIDIA GeForce RTX 4090 Laptop GPU, 95.2 Wh
Alienware m18 R2
i9-14900HX, NVIDIA GeForce RTX 4090 Laptop GPU, 97 Wh
Asus ROG Strix Scar 18 G834JYR (2024)
i9-14900HX, NVIDIA GeForce RTX 4090 Laptop GPU, 90 Wh
Medion Erazer Beast X40 2024
i9-14900HX, NVIDIA GeForce RTX 4090 Laptop GPU, 99.8 Wh
Moyenne de la classe Gaming
 
Autonomie de la batterie
-50%
10%
0%
24%
29%
12%
H.264
294
456
55%
447
52%
WiFi v1.3
290
159
-45%
329
13%
290
0%
461
59%
374
29%
Load
129
58
-55%
79
-39%
77
-40%
Reader / Idle
404
612

Points positifs

+ design cool, matériaux de qualité
+ touches confortables avec capuchons interchangeables
+ combinaison matérielle puissante
+ 2 x Thunderbolt 4
+ Écran MiniLED avec HDR1000, G-Sync
+ bloc d'alimentation plat de 330 watts + bloc d'alimentation USB-C de 140 watts

Points négatifs

- RAM difficile d'accès
- petit pavé tactile
- problèmes de latence et courtes baisses de performance
- Accélération du disque dur SSD
- système de refroidissement sous-optimal, bruyant et chaud
- consommation en veille trop élevée
- faible autonomie de la batterie

Verdict - Plus de problèmes que prévu

Examen du Lenovo Legion 9i. Appareil de test fourni par Lenovo

Au regard de son prix, le Lenovo Legion 9i est un gamer haut de gamme avec un design attractif, de bons matériaux, une bonne qualité de fabrication et un écran Mini LED lumineux avec HDR1000. Son alimentation plate que l'on ne retrouve pas chez ses concurrents ainsi que son alimentation USB-C supplémentaire de 140 watts peuvent être classées comme des atouts supplémentaires.

Cependant, alors que les petits modèles Legion impressionnent par leur bonne optimisation du système, le modèle supérieur souffre de beaucoup plus de faiblesses et de problèmes que prévu. Tout d'abord, ses problèmes de latence ne sont pas seulement apparus lors du test LatencyMon - nous les avons également remarqués lors du test de latence de la RAM et même lors des jeux, vous pouvez voir quelques images perdues visibles. À cela s'ajoutent des performances anormalement faibles pour un seul cœur. Un autre problème plus important est son système de refroidissement sous-optimal. Il semble qu'il refroidisse trop tard et parfois trop peu, ce qui entraîne un ralentissement du SSD, par exemple. De plus, il devient très bruyant sous charge, tout en n'empêchant pas les températures de surface élevées comme le font ses concurrents. Bien que l'autonomie de la batterie ait été améliorée, elle n'est pas aussi bonne que celle de la concurrence. Au total, il y a donc beaucoup de place pour l'amélioration.

La Legion 9i est une console de jeu haut de gamme élégante, mais contrairement aux modèles plus petits de la Legion, le modèle haut de gamme coûteux finit par souffrir de problèmes gênants tels qu'un système de refroidissement sous-optimal et de gros problèmes de latence.

Une alternative pourrait être le Razer Blade 16, par exemple, qui offre des performances comparables dans un boîtier plus petit et n'a pas autant de problèmes que le Legion 9i. En outre, son prédécesseur semblait être un système plus mature et il peut même se vanter d'être plus performant en raison des nombreux problèmes du modèle successeur. Par conséquent, le nouveau Legion 9i ne vaut pas la peine d'être acheté.

Mise à jour de septembre 2024 : Une mise à jour du BIOS est arrivée et corrige les problèmes de taux de rafraîchissement.
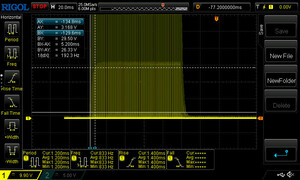
Prix et disponibilité

Notre configuration du Lenovo Legion 9 16IRX9 ou du Lenovo Legion 9i peut être achetée directement auprès de Lenovo au prix de 3 804,66 USD.

Note : Nous avons récemment mis à jour notre système d'évaluation et les résultats de la version 8 ne sont pas comparables à ceux de la version 7. Vous trouverez de plus amples informations ici .

Lenovo Legion 9 16IRX9, RTX 4090 - 09/27/2024 v8
Christian Hintze

Châssis
86 / 98 → 88%
Clavier
87%
Dispositif de pointage
73%
Connectivité
71 / 80 → 89%
Poids
60 / 10-68 → 85%
Autonomie
60 / 95 → 63%
Écran
92%
Performances en jeu
91%
Performances dans les applications
87%
AI Performance
97%
Chauffe
73 / 95 → 77%
Nuisance sonore
73 / 90 → 81%
Audio
80%
Appareil photo
38 / 75 → 51%
Extras
-2%
Moyenne
60%
84%
Gaming - Moyenne compensée
CO2 Emissions
No Data
Materials
25%
Packaging
55%
Power Use
60.6%
Repairability
55%
Software Updates
22.3%
Recycle Logo Total Sustainability Score: 36.3%

Transparency

The selection of devices to be reviewed is made by our editorial team. The test sample was provided to the author as a loan by the manufacturer or retailer for the purpose of this review. The lender had no influence on this review, nor did the manufacturer receive a copy of this review before publication. There was no obligation to publish this review. We never accept compensation or payment in return for our reviews. As an independent media company, Notebookcheck is not subjected to the authority of manufacturers, retailers or publishers.

This is how Notebookcheck is testing

Every year, Notebookcheck independently reviews hundreds of laptops and smartphones using standardized procedures to ensure that all results are comparable. We have continuously developed our test methods for around 20 years and set industry standards in the process. In our test labs, high-quality measuring equipment is utilized by experienced technicians and editors. These tests involve a multi-stage validation process. Our complex rating system is based on hundreds of well-founded measurements and benchmarks, which maintains objectivity. Further information on our test methods can be found here.

Price comparison

Please share our article, every link counts!
Mail Logo
> Revues et rapports de ordinateurs portatifs et smartphones, ordiphones > Critiques > Test du Lenovo Legion 9 16IRX9 (Legion 9i) : RTX 4090 gamer haut-de-gamme ?
Christian Hintze, 2024-06-27 (Update: 2024-09-27)