Notebookcheck Logo

Analyse AMD Ryzen AI Max+ 395 - Strix Halo rivalise avec Apple M4 Pro/Max avec 16 cœurs Zen 5 et un iGPU à la hauteur de la RTX 4070 Ordinateur portable

Strix Halo avec jusqu'à 96 Go de VRAM.

Le nouveau Ryzen AI Max+ 395 est le dernier processeur mobile haut de gamme d'AMD. Avec jusqu'à 16 cœurs Zen 5, un puissant GPU Radeon, un NPU rapide et jusqu'à 128 Go de RAM, le Ryzen AI Max+ est censé être le compagnon idéal pour les jeux, la création de contenu et le développement de l'IA.

AMD lance les nouvelles puces Ryzen AI Max en tant que nouveaux processeurs mobiles avec des processeurs puissants et des iGPU rapides, qui peuvent utiliser la mémoire partagée. Selon la configuration, vous pouvez allouer jusqu'à 96 Go de VRAM, ce qui peut être un avantage pour le montage photo/vidéo exigeant ou le développement de l'IA. Nous examinons le Ryzen AI Max+ 395le fleuron de la nouvelle série Strix Halo, et nous le comparons aux performances CPU/GPU de la concurrence. Nous vérifions également comment ce monstrueux APU gère les jeux et s'il y a des avantages en termes d'efficacité par rapport aux systèmes dotés de CPU et de GPU dédiés.

Vue d'ensemble - AMD Ryzen AI Max

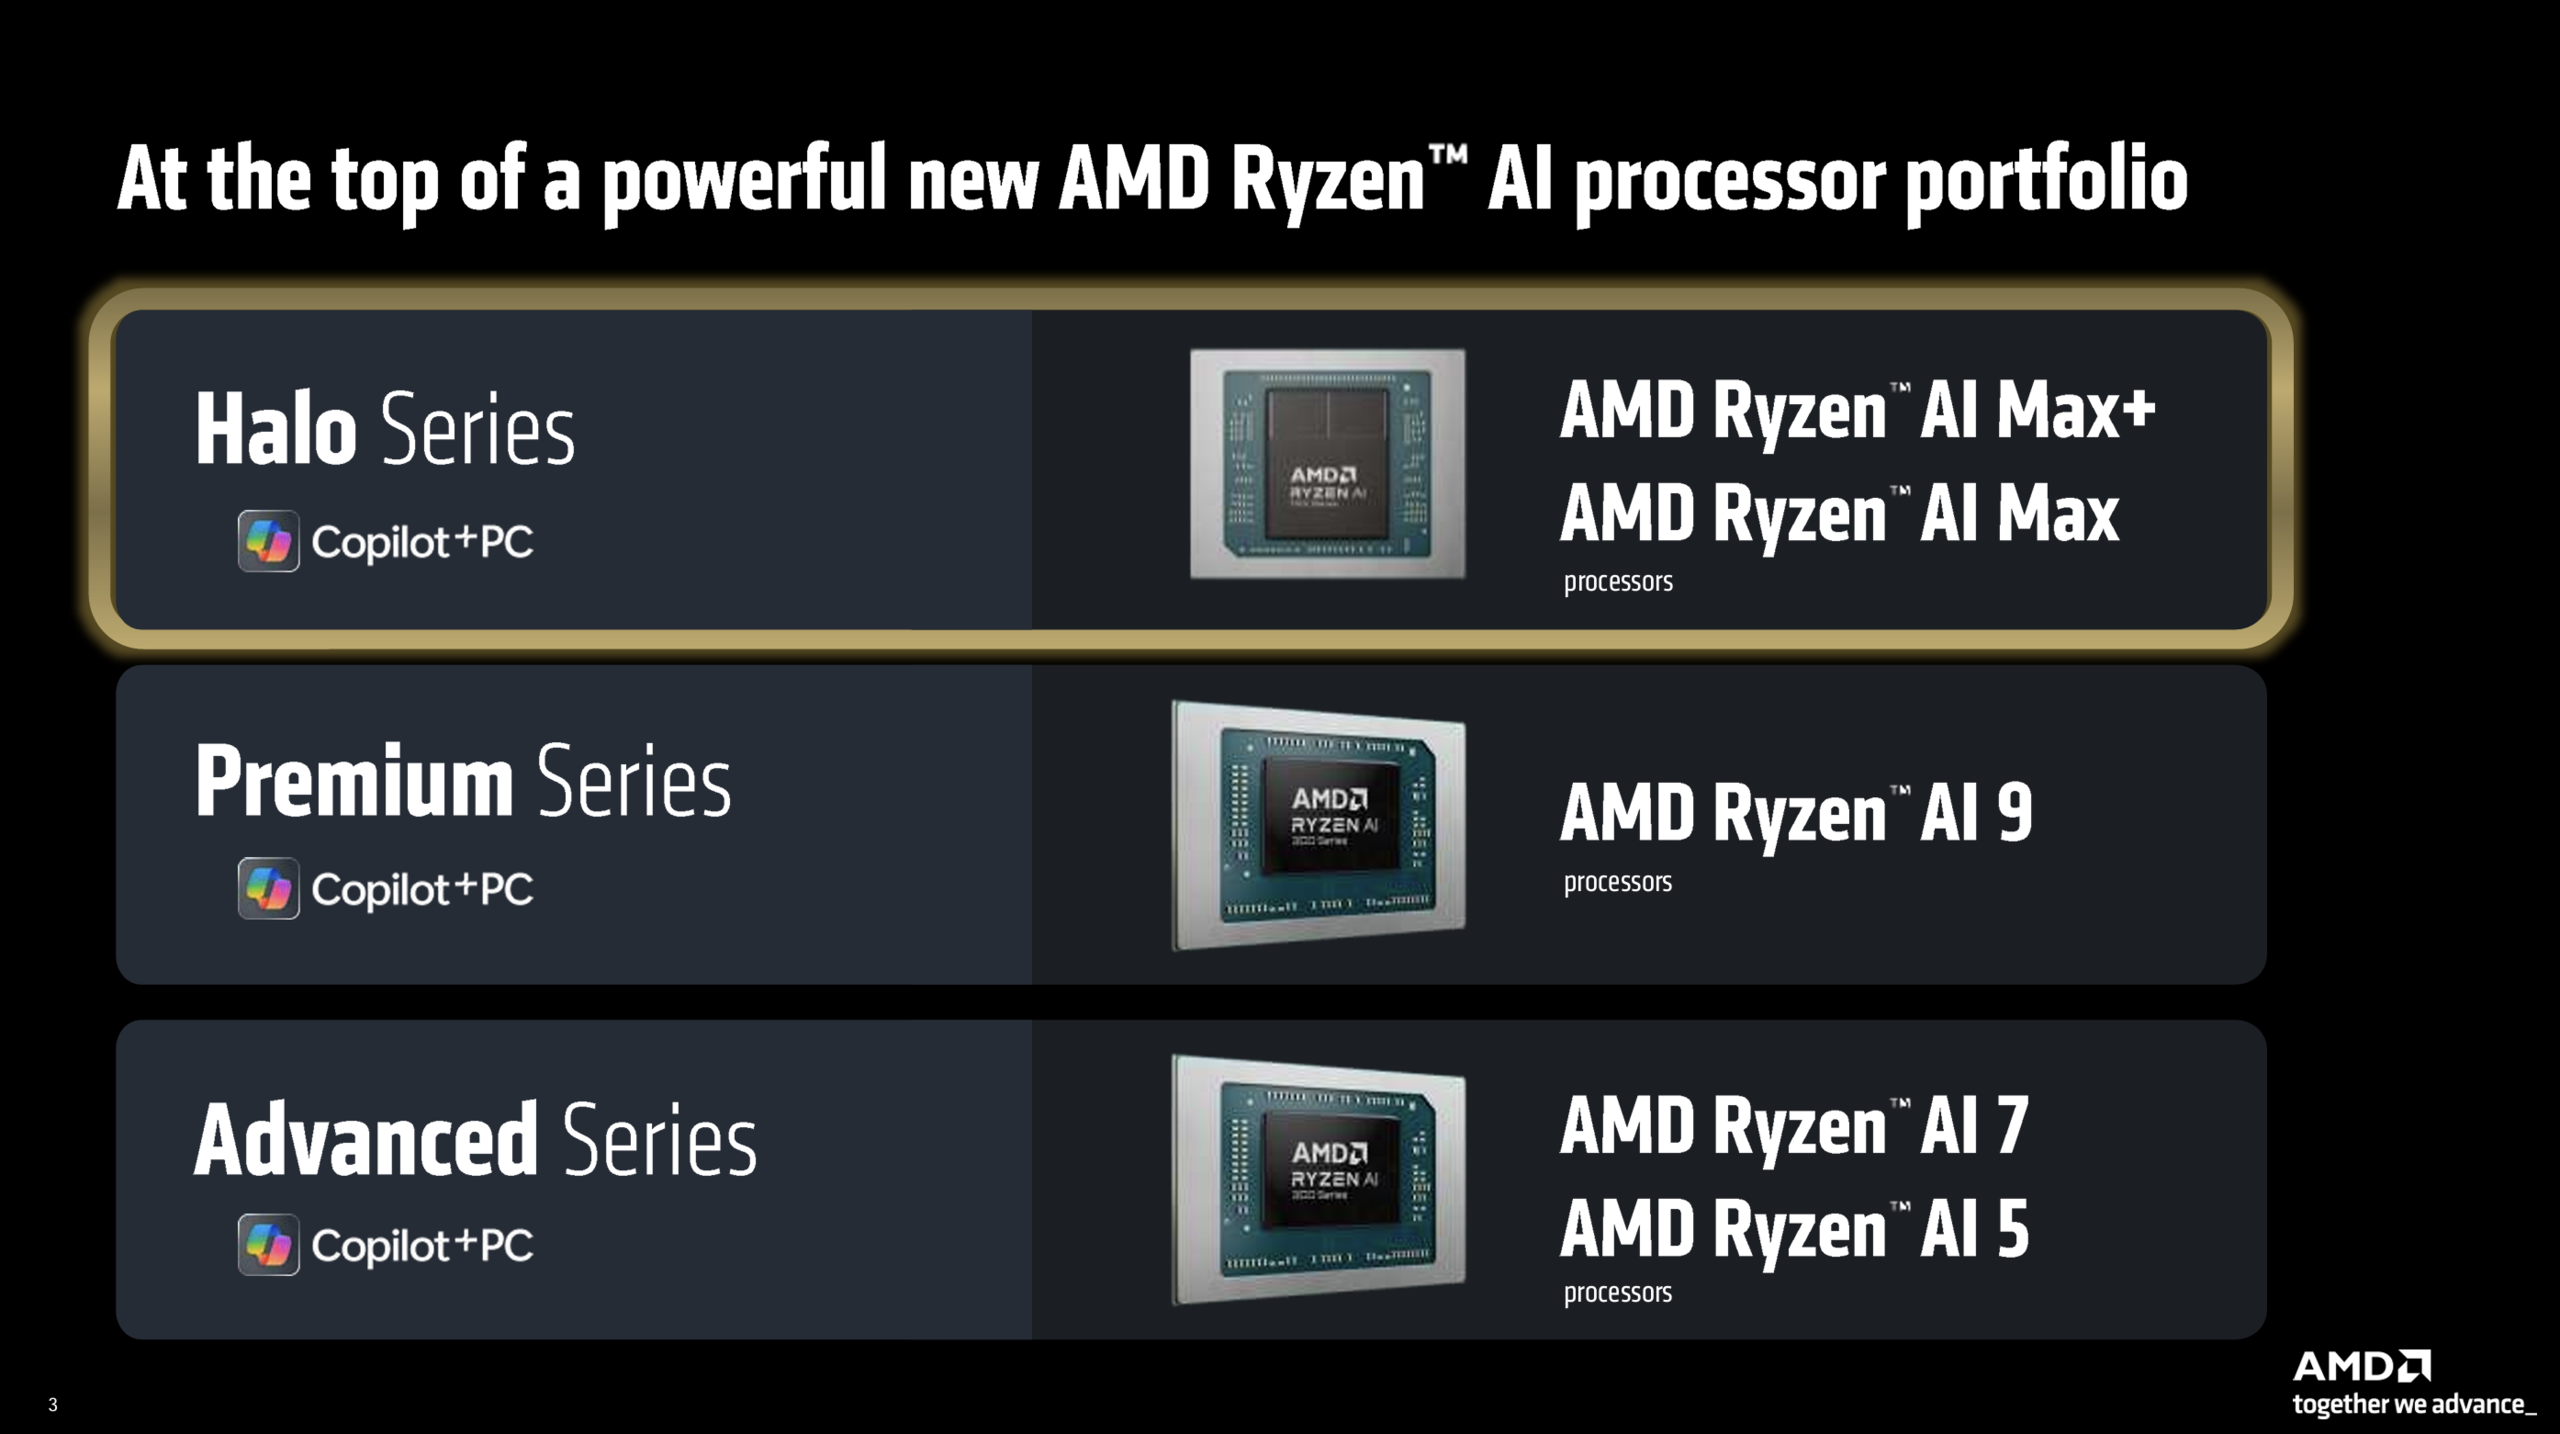
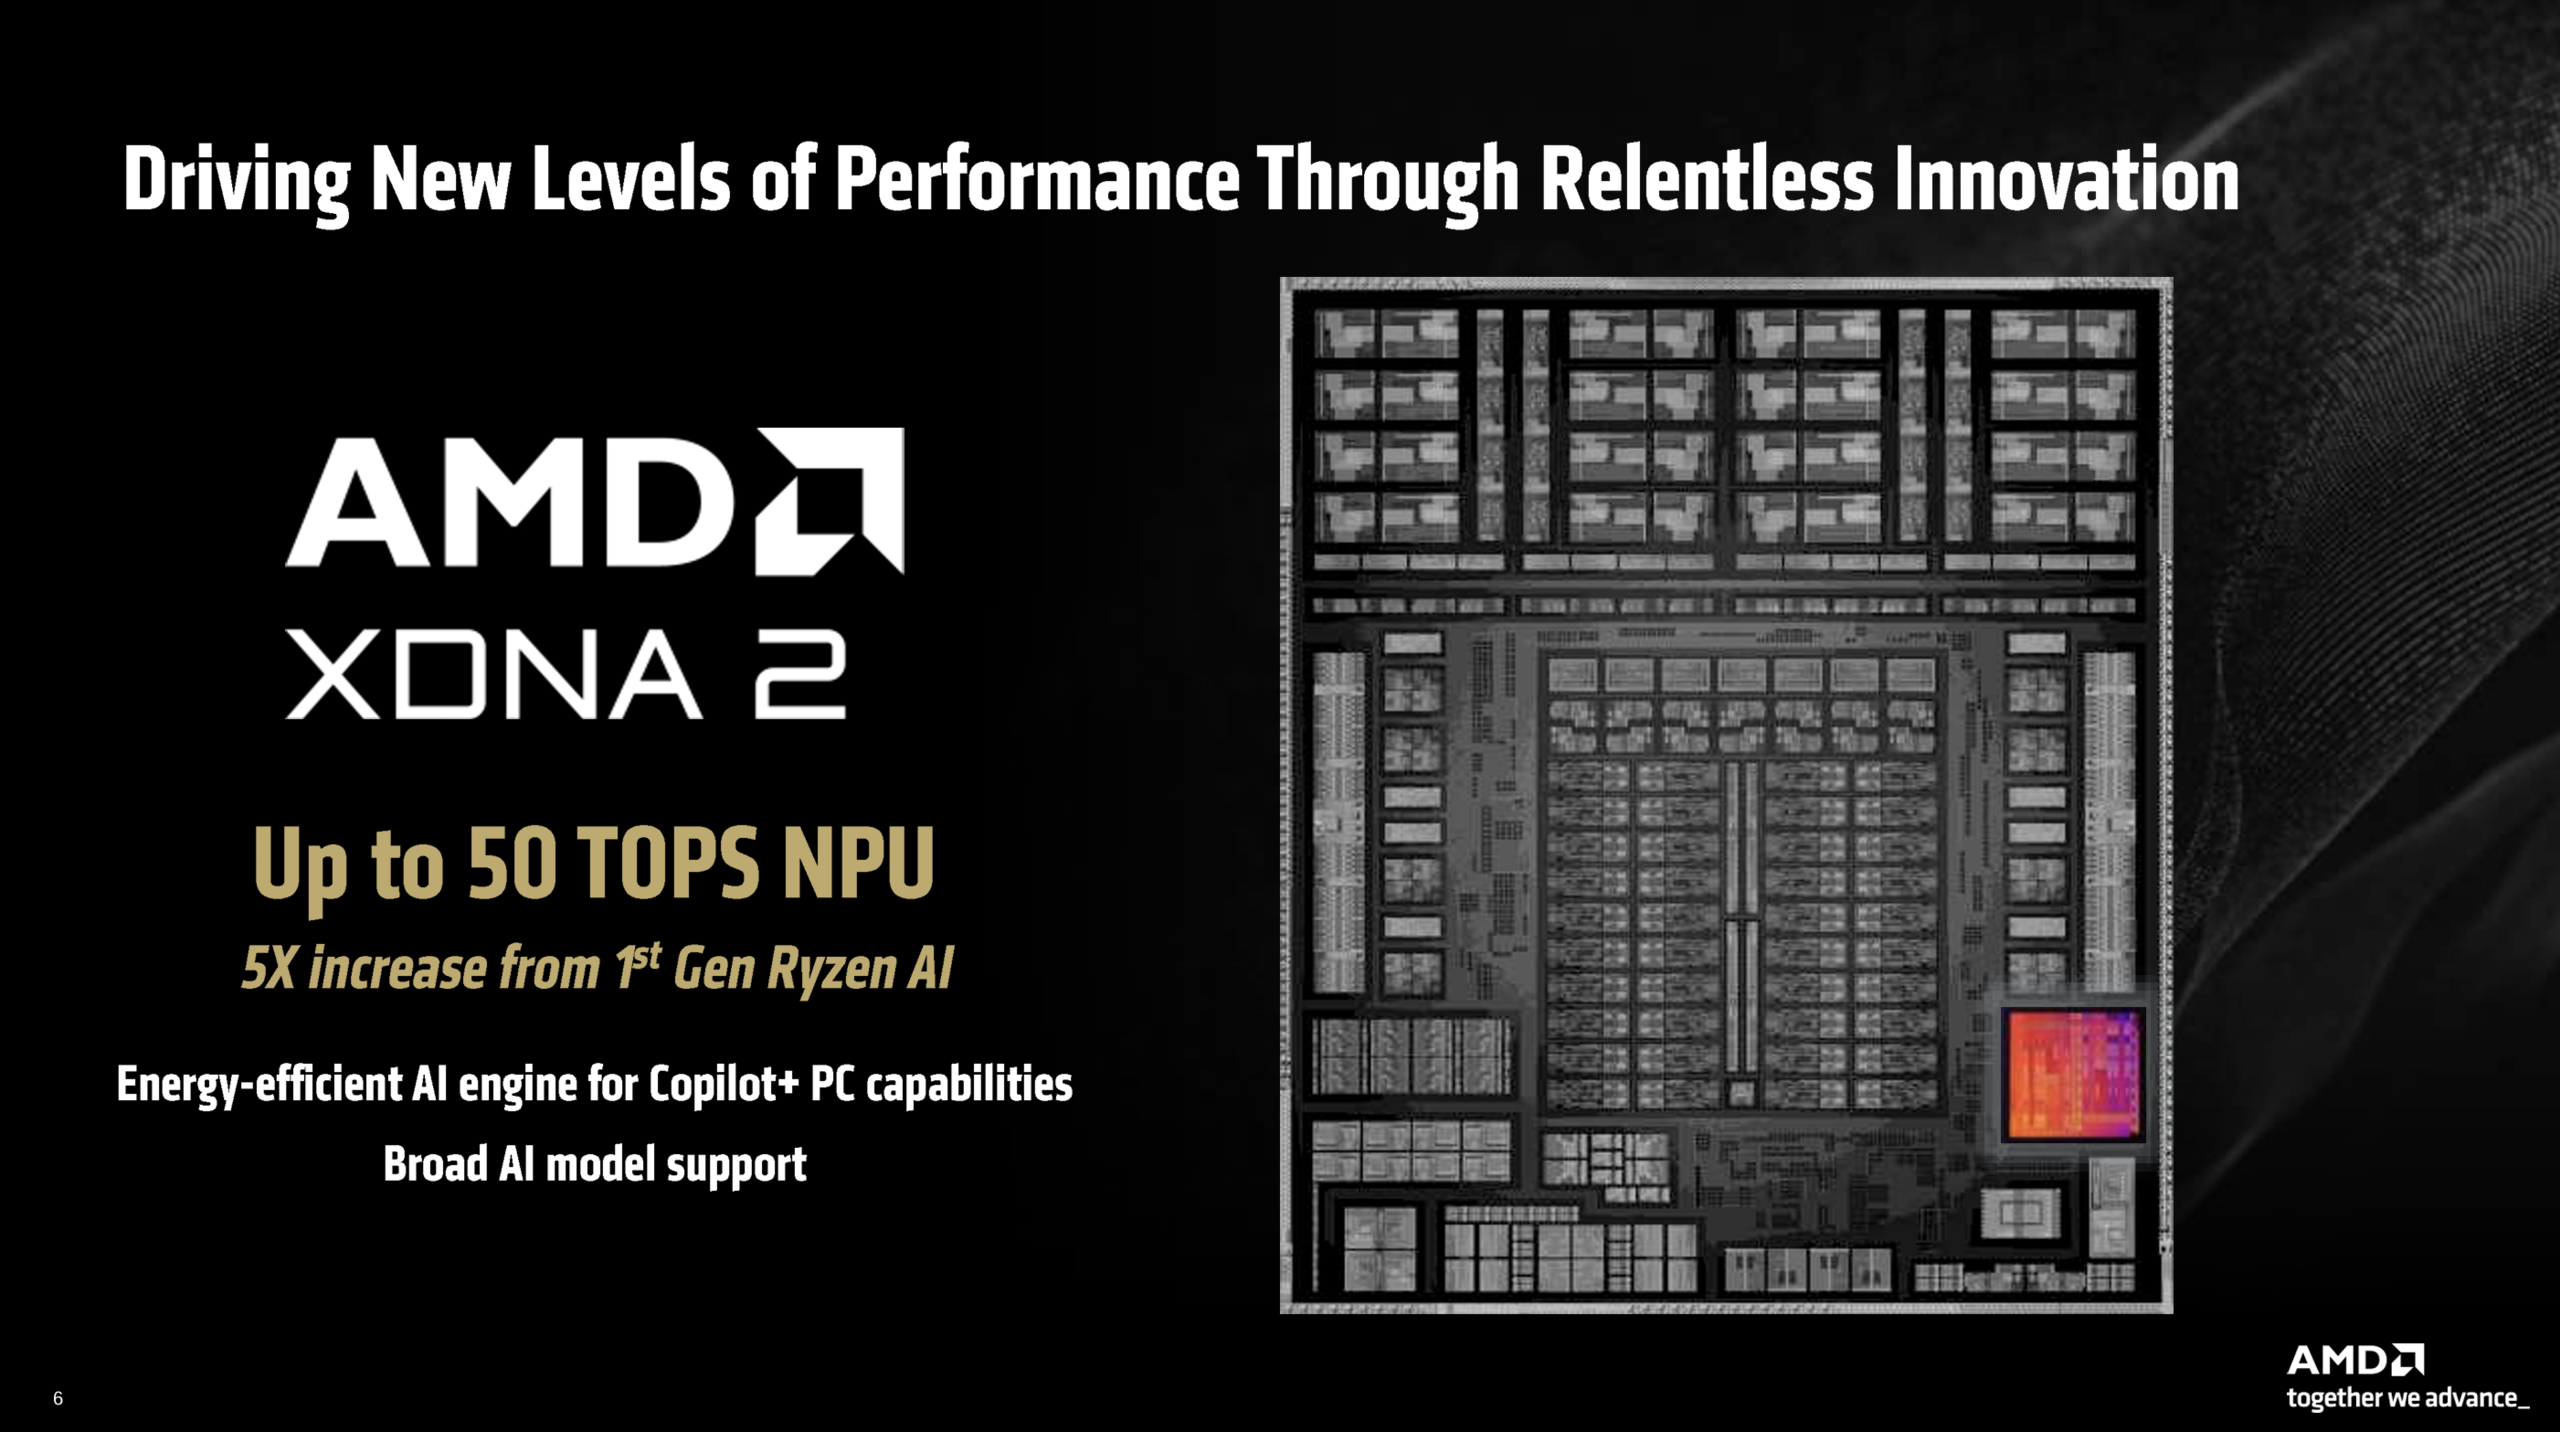
AMD élargit son portefeuille d'APU avec des APU Ryzen AI Max plus puissants. Il s'agit toujours d'une architecture CPU Strix Point (4 nm TSMC) et d'une architecture GPU RDNA 3.5. AMD appelle les nouvelles puces de la série Halo, ses modèles phares. D'où le nom populaire de Strix Halo, souvent utilisé pour les APU Ryzen AI Max. En dessous de la série Halo, nous avons les APU Ryzen AI 9 de la série Premium (comme le Ryzen AI 9 365) et les APU Ryzen AI 7/5 de la série Advanced (comme le Ryzen AI 7 Pro 360) Ryzen AI 7 Pro 360). Tous les APU Ryzen AI sont équipés du même NPU XDNA 2 avec une performance de 50 TOPS, de sorte que tous les modèles obtiennent la certification Copilot+.

Aperçu du Strix Halo (source : AMD)
Modèles Strix Halo (source : AMD)
CPU Strix Halo (source : AMD)
GPU Strix Halo (source : AMD)
Strix Halo NPU (source : AMD)
RAM Strix Halo (source : AMD)

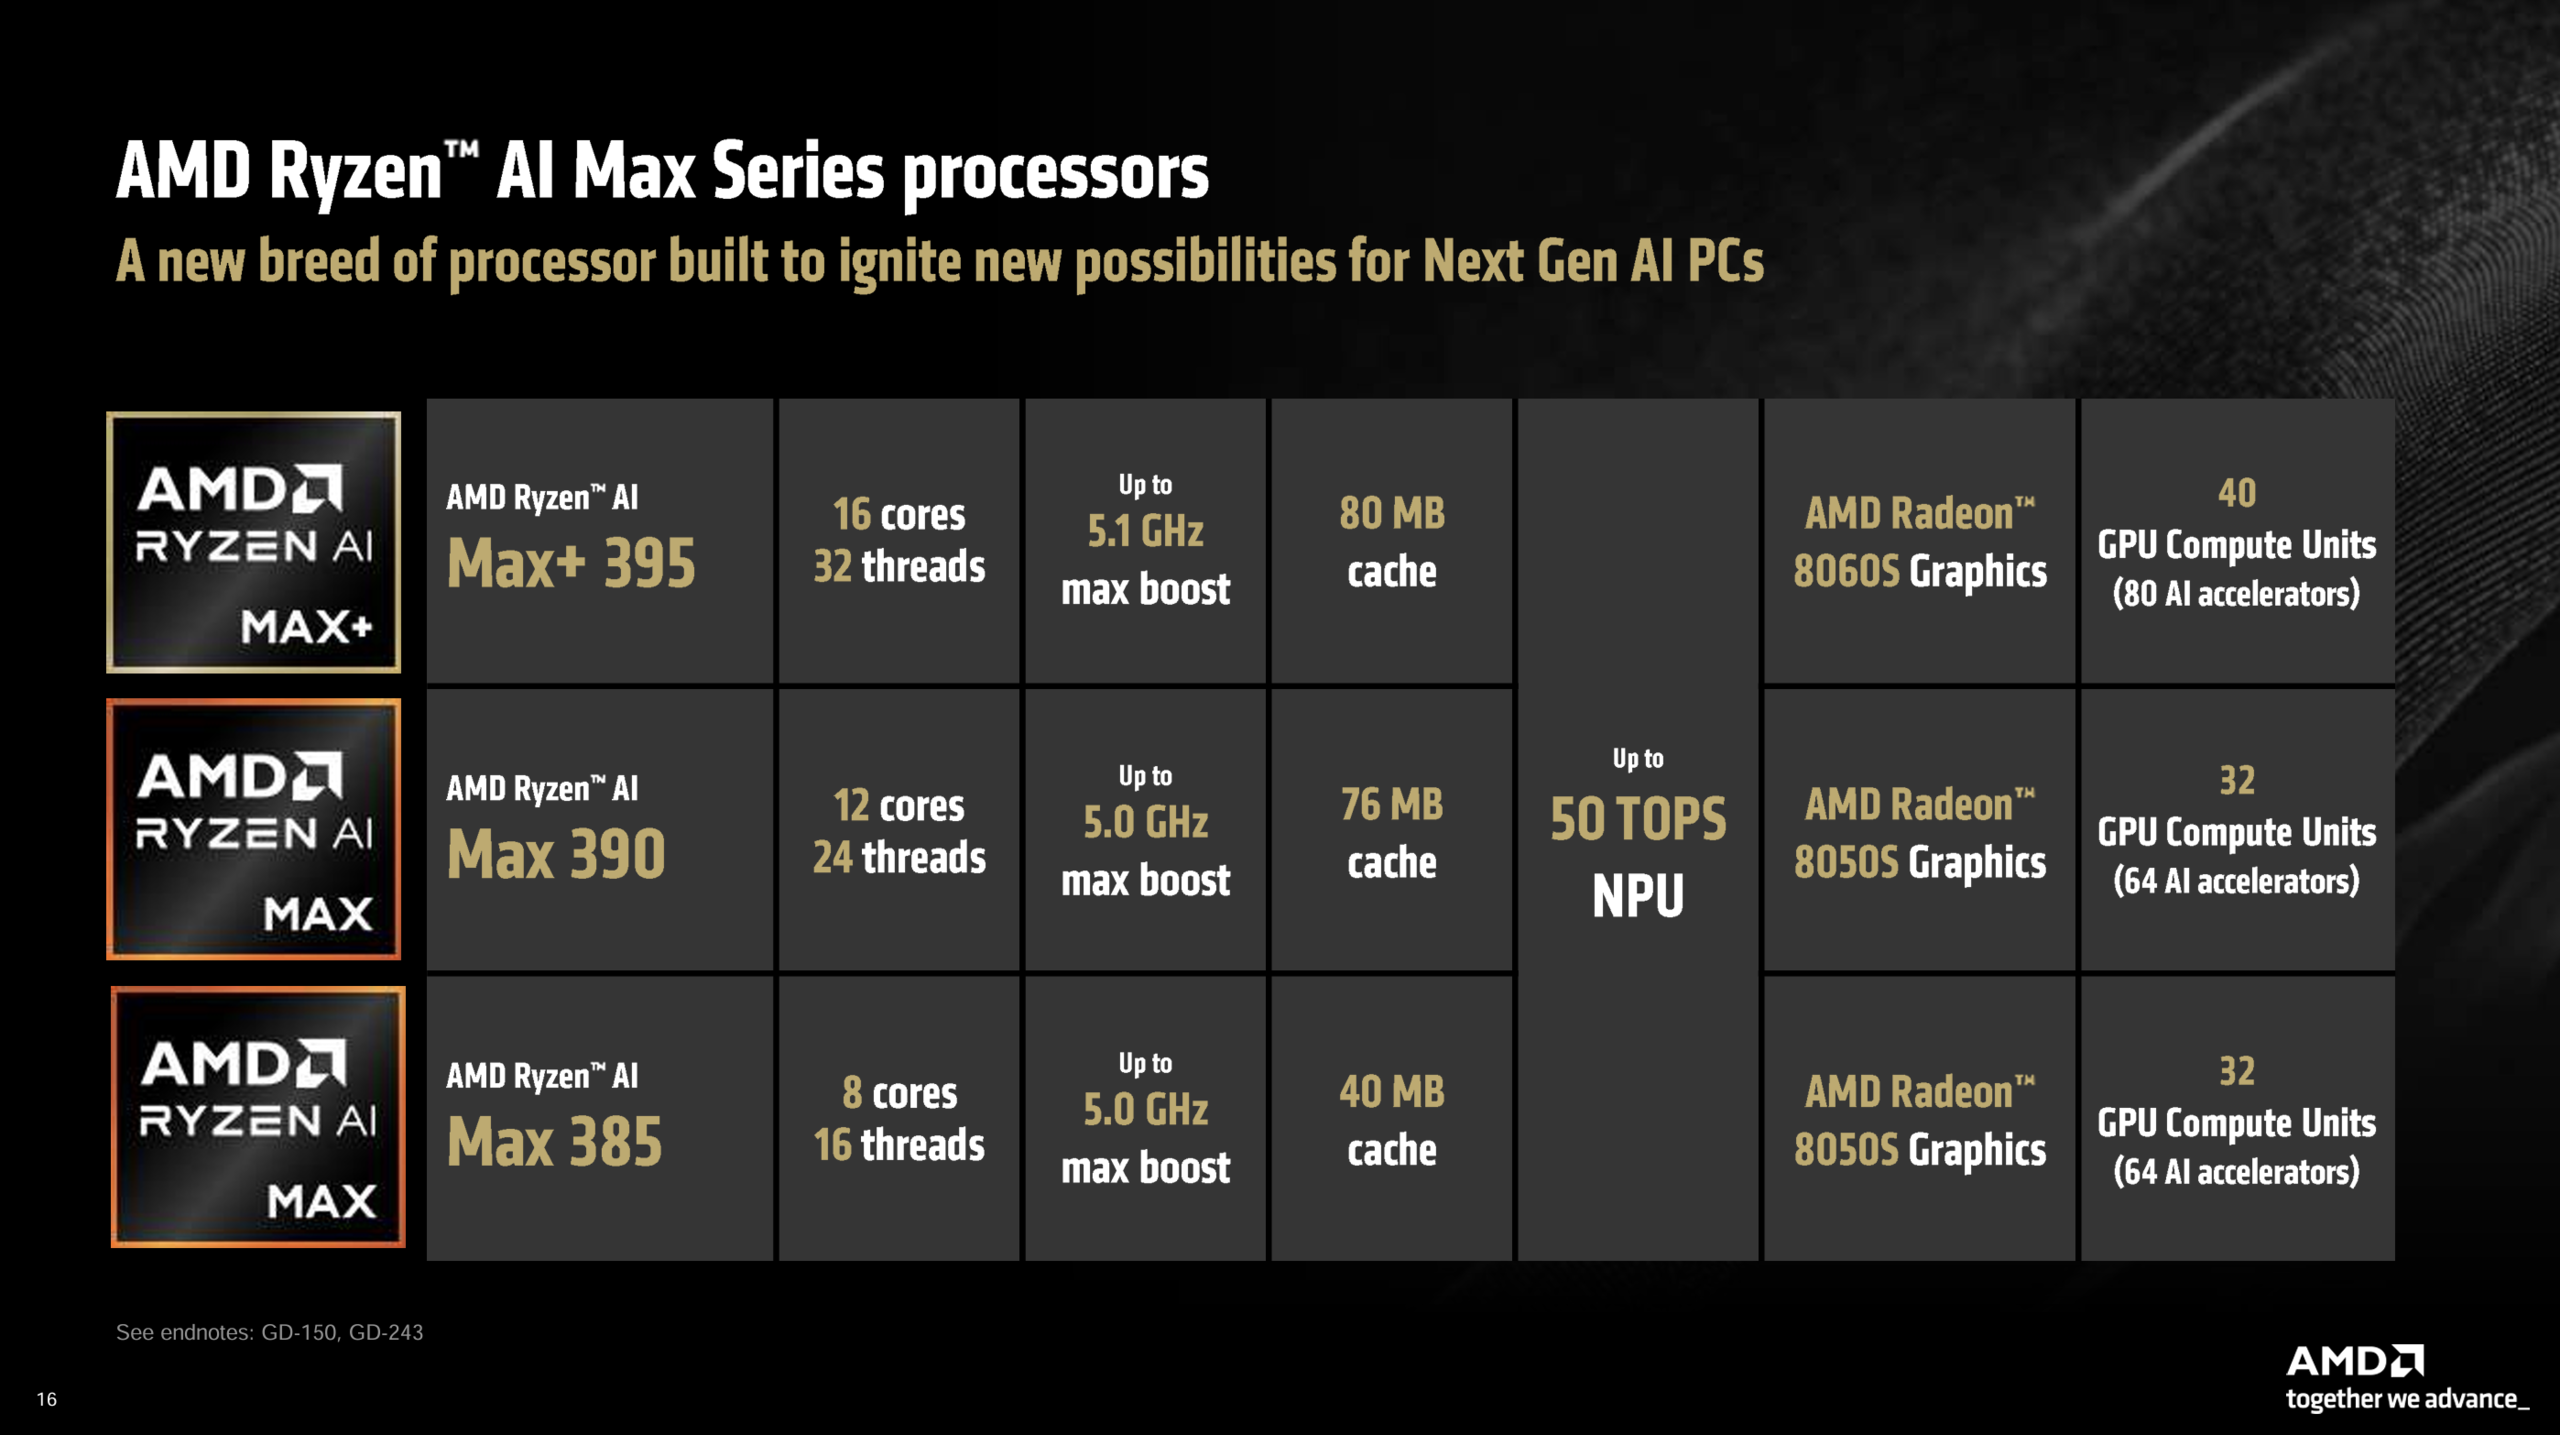
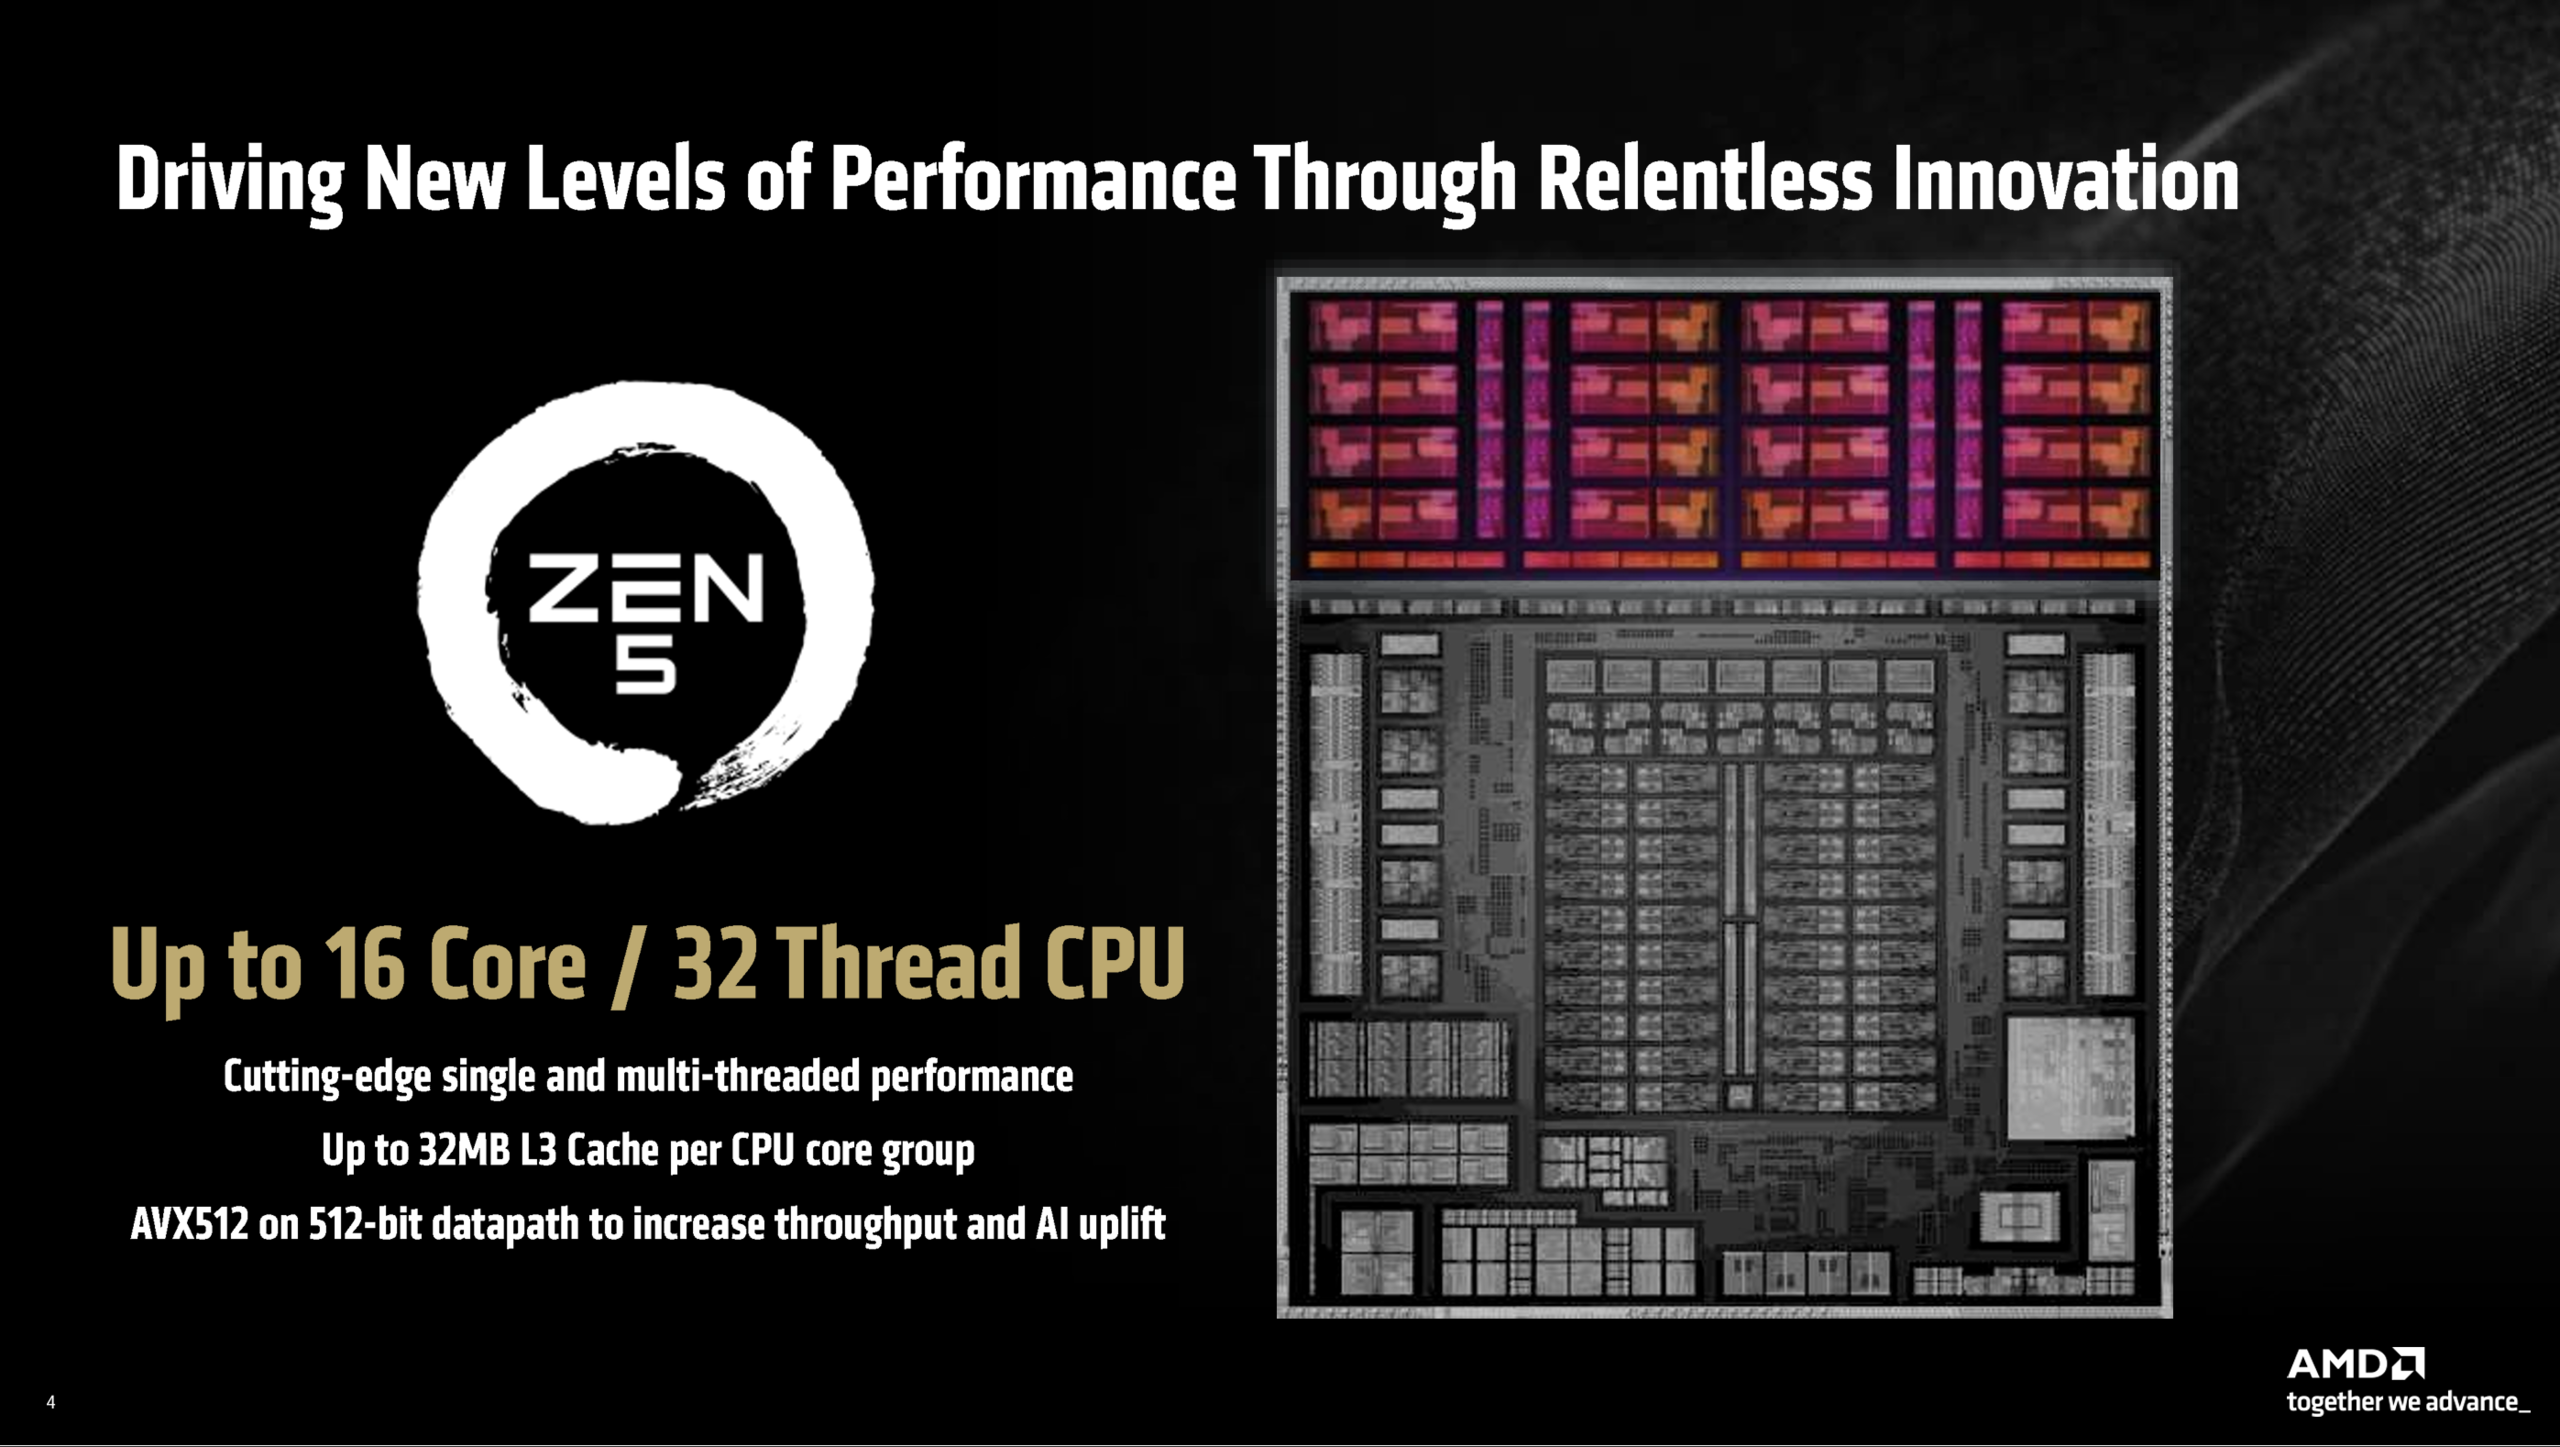
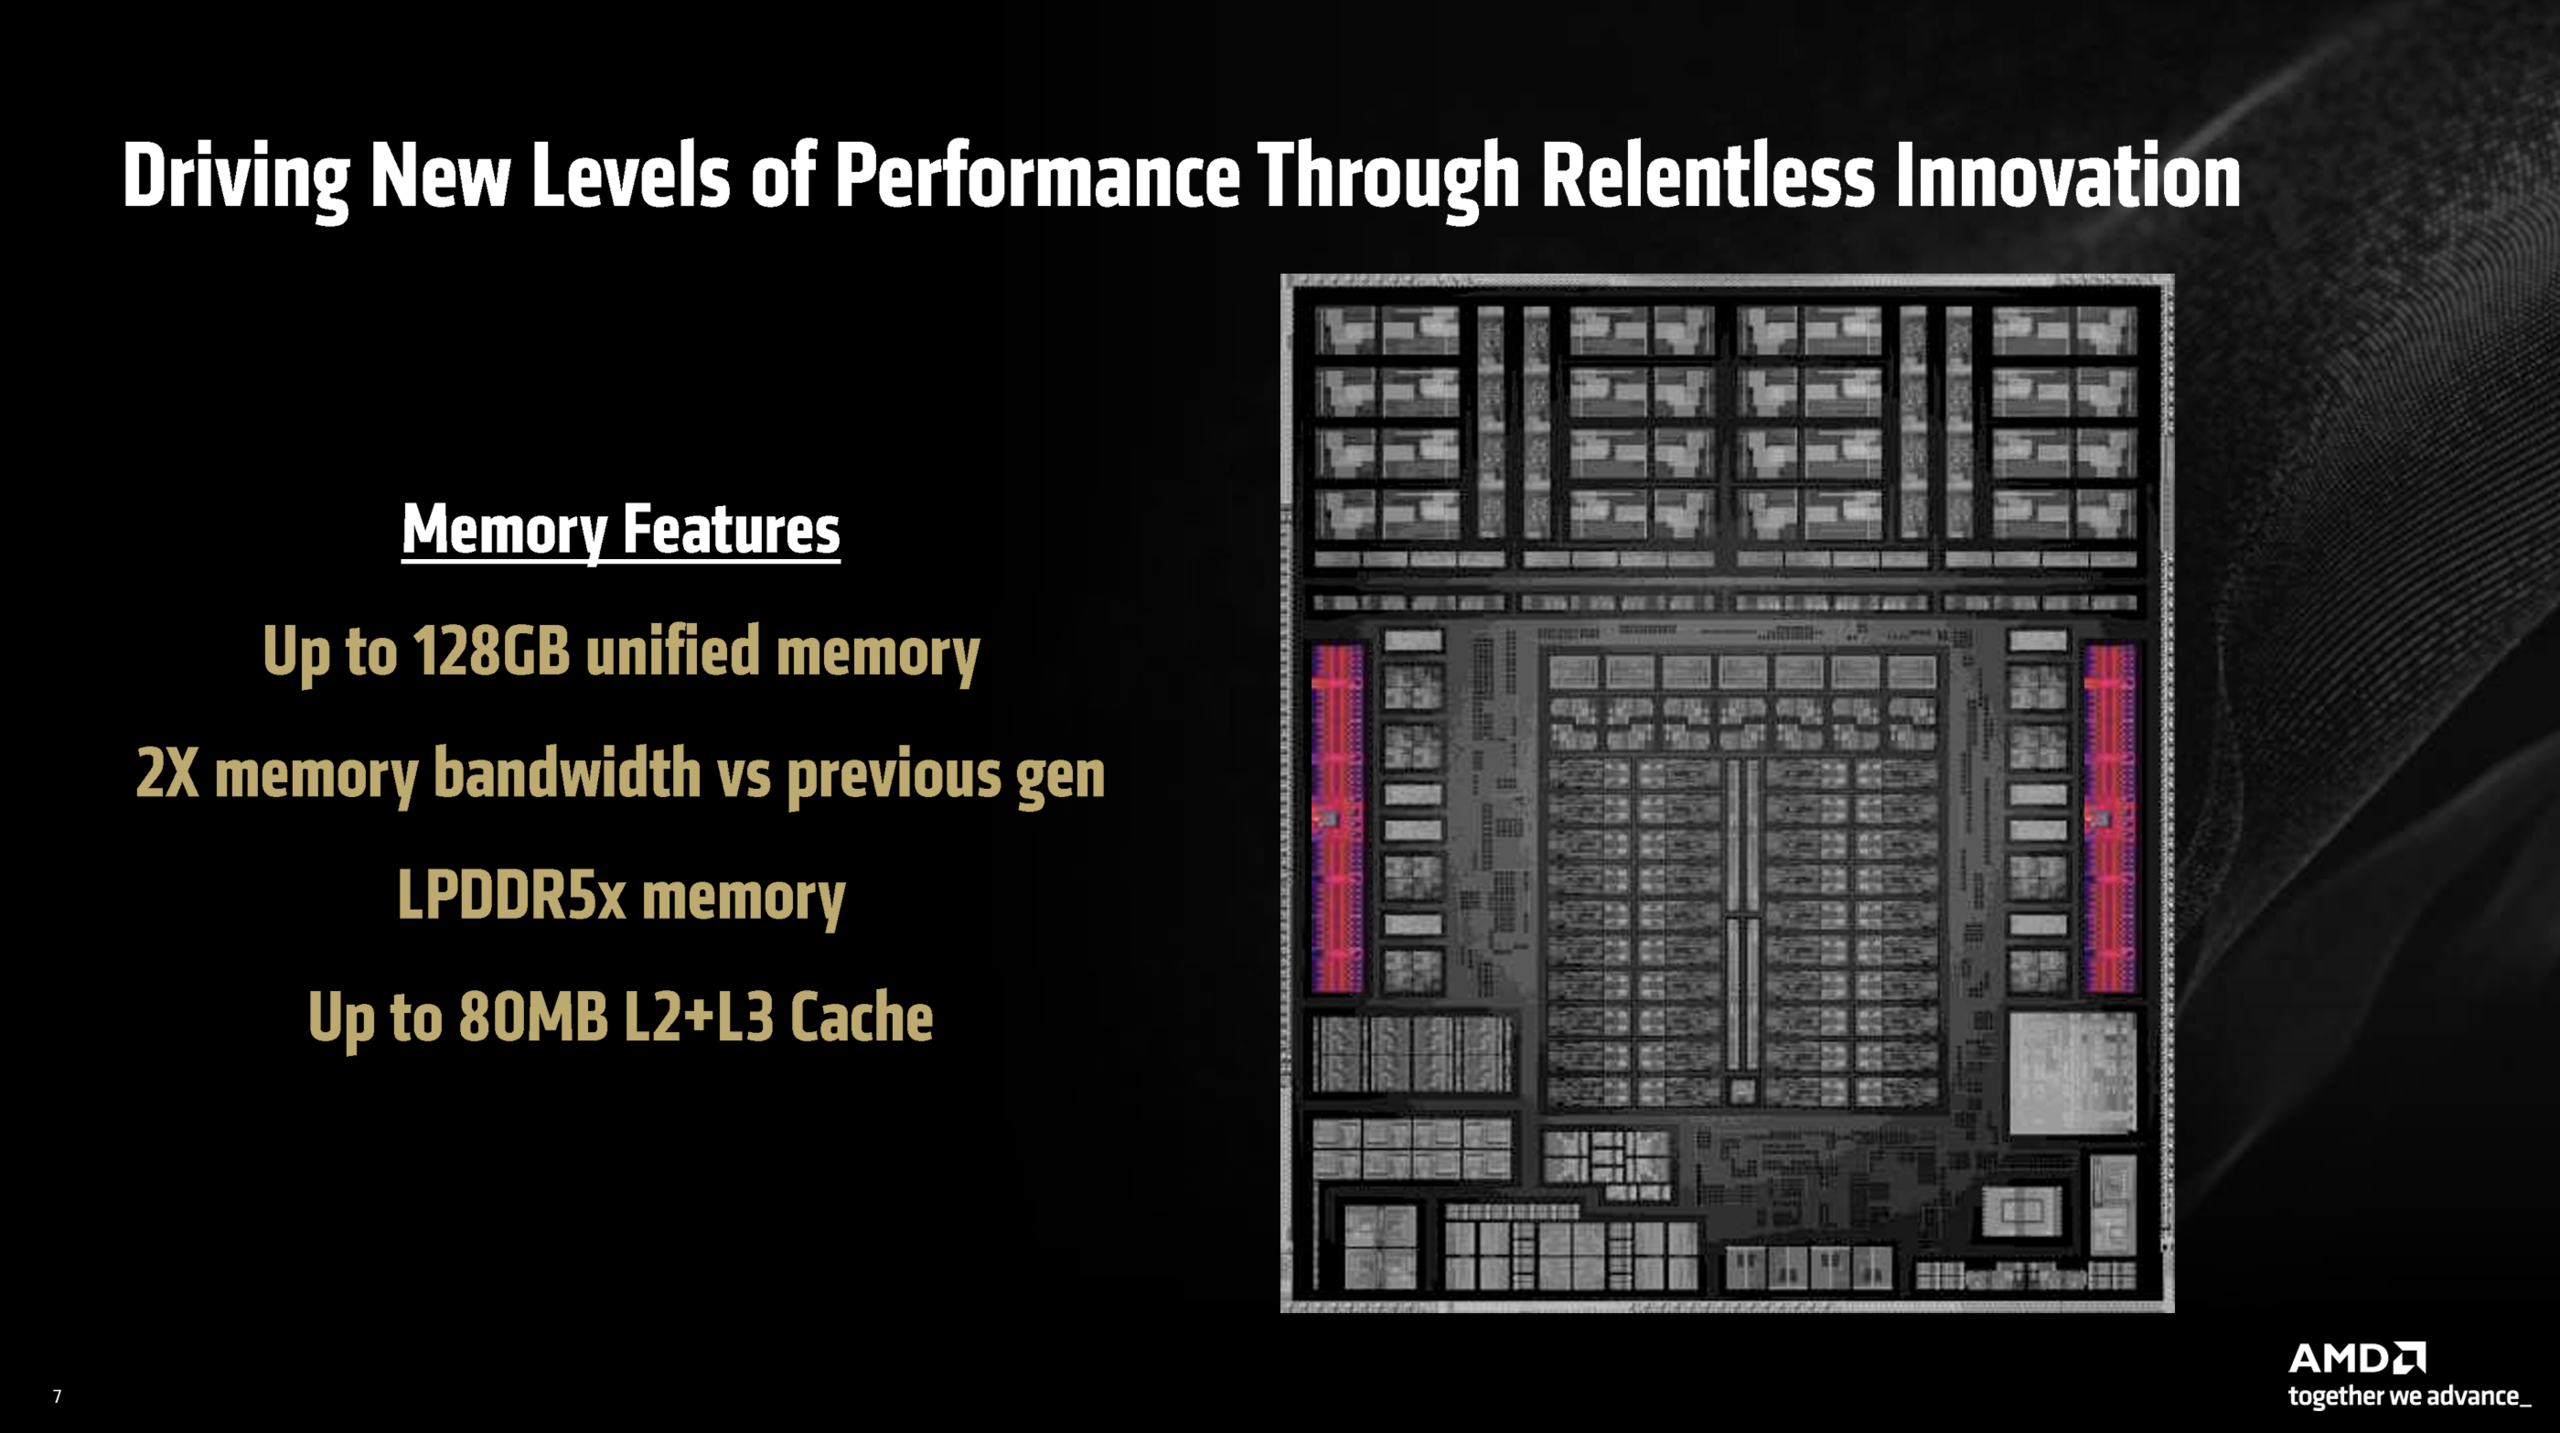
Alors que tous les APU Strix Point utilisaient jusqu'à présent une combinaison de cœurs Zen 5 et de cœurs Zen 5c plus compacts avec moins de cache, les APU Strix Halo n'utilisent que des cœurs Zen 5 à part entière avec la même fréquence maximale de 5,1 GHz que précédemment. Le modèle haut de gamme Ryzen AI Max+ 395 dispose de 16 cœurs avec 32 threads et 80 Mo de cache ; le Ryzen AI Max 390 dispose de 12 cœurs/24 threads avec 64 Mo de cache et le Ryzen AI Max 385 dispose de 8 cœurs/16 threads avec 40 Mo de cache. La mémoire vive (LPDDR5x-8000) fait également partie de l'APU et vous pouvez choisir entre 32, 64 ou 128 Go.

Les APU Strix Halo sont également équipés de puissants GPU intégrés basés sur l'architecture RDNA 3.5. Le modèle haut de gamme Ryzen AI Max+ 395 est équipé de la Radeon 8060S avec 40 unités de calcul, tandis que les deux autres modèles sont équipés de la Radeon 8050S avec 32 unités de calcul. En fonction de la configuration de la RAM, vous pouvez allouer de la VRAM dédiée au GPU (jusqu'à 24 Go pour les modèles de 32 Go, 48 Go pour les modèles de 64 Go et 96 Go pour les modèles de 128 Go).

AMD précise que le TDP se situe entre 45 et 125 watts, ce qui signifie que les nouveaux APU Strix Halo sont principalement conçus pour des ordinateurs portables multimédias puissants avec des solutions de refroidissement correspondantes. Selon la fiche technique du HP ZBook Ultra 14il y aura une quatrième puce Strix Halo appelée Ryzen AI Max 380 avec 6 cœurs ainsi qu'un iGPU Radeon 8040S encore plus lent.

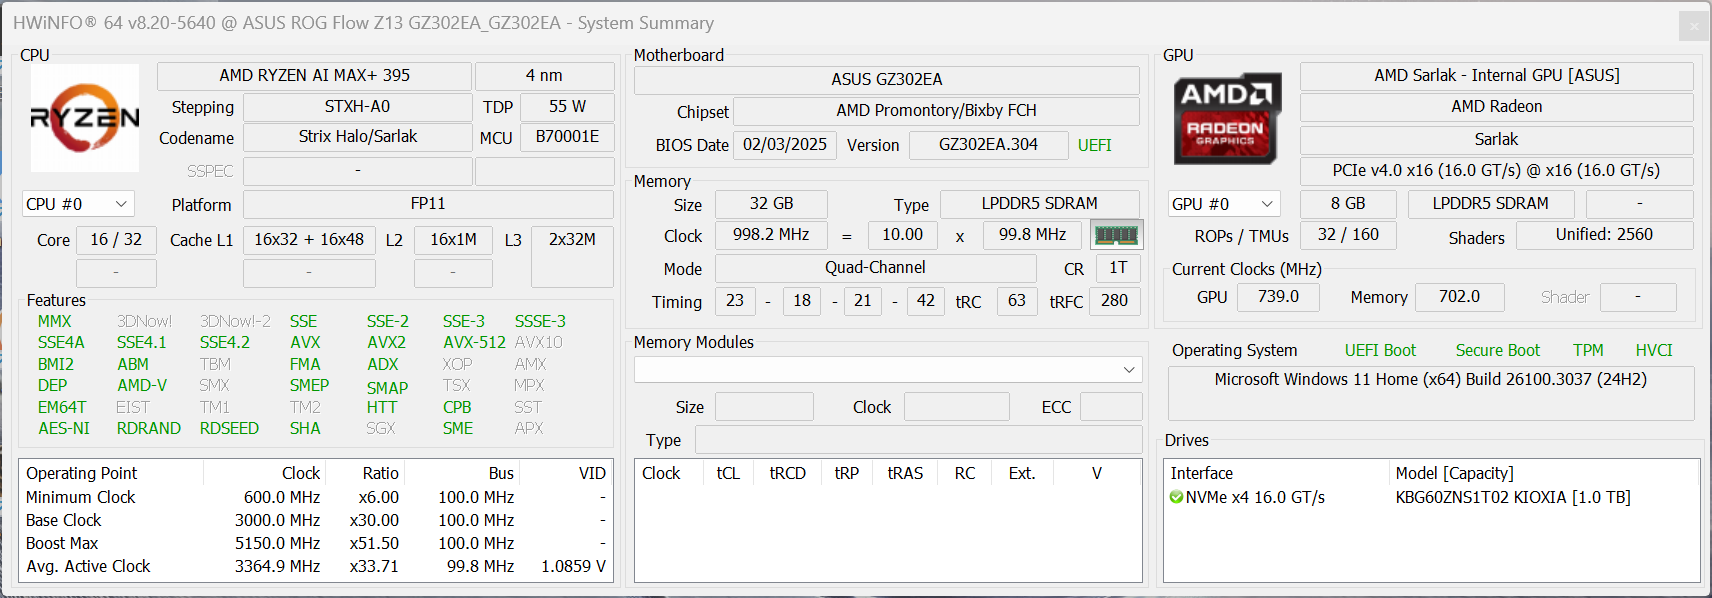
Système de test - Asus ROG Flow Z13 GZ302

Asus ROG Flow Z13 GZ302EA

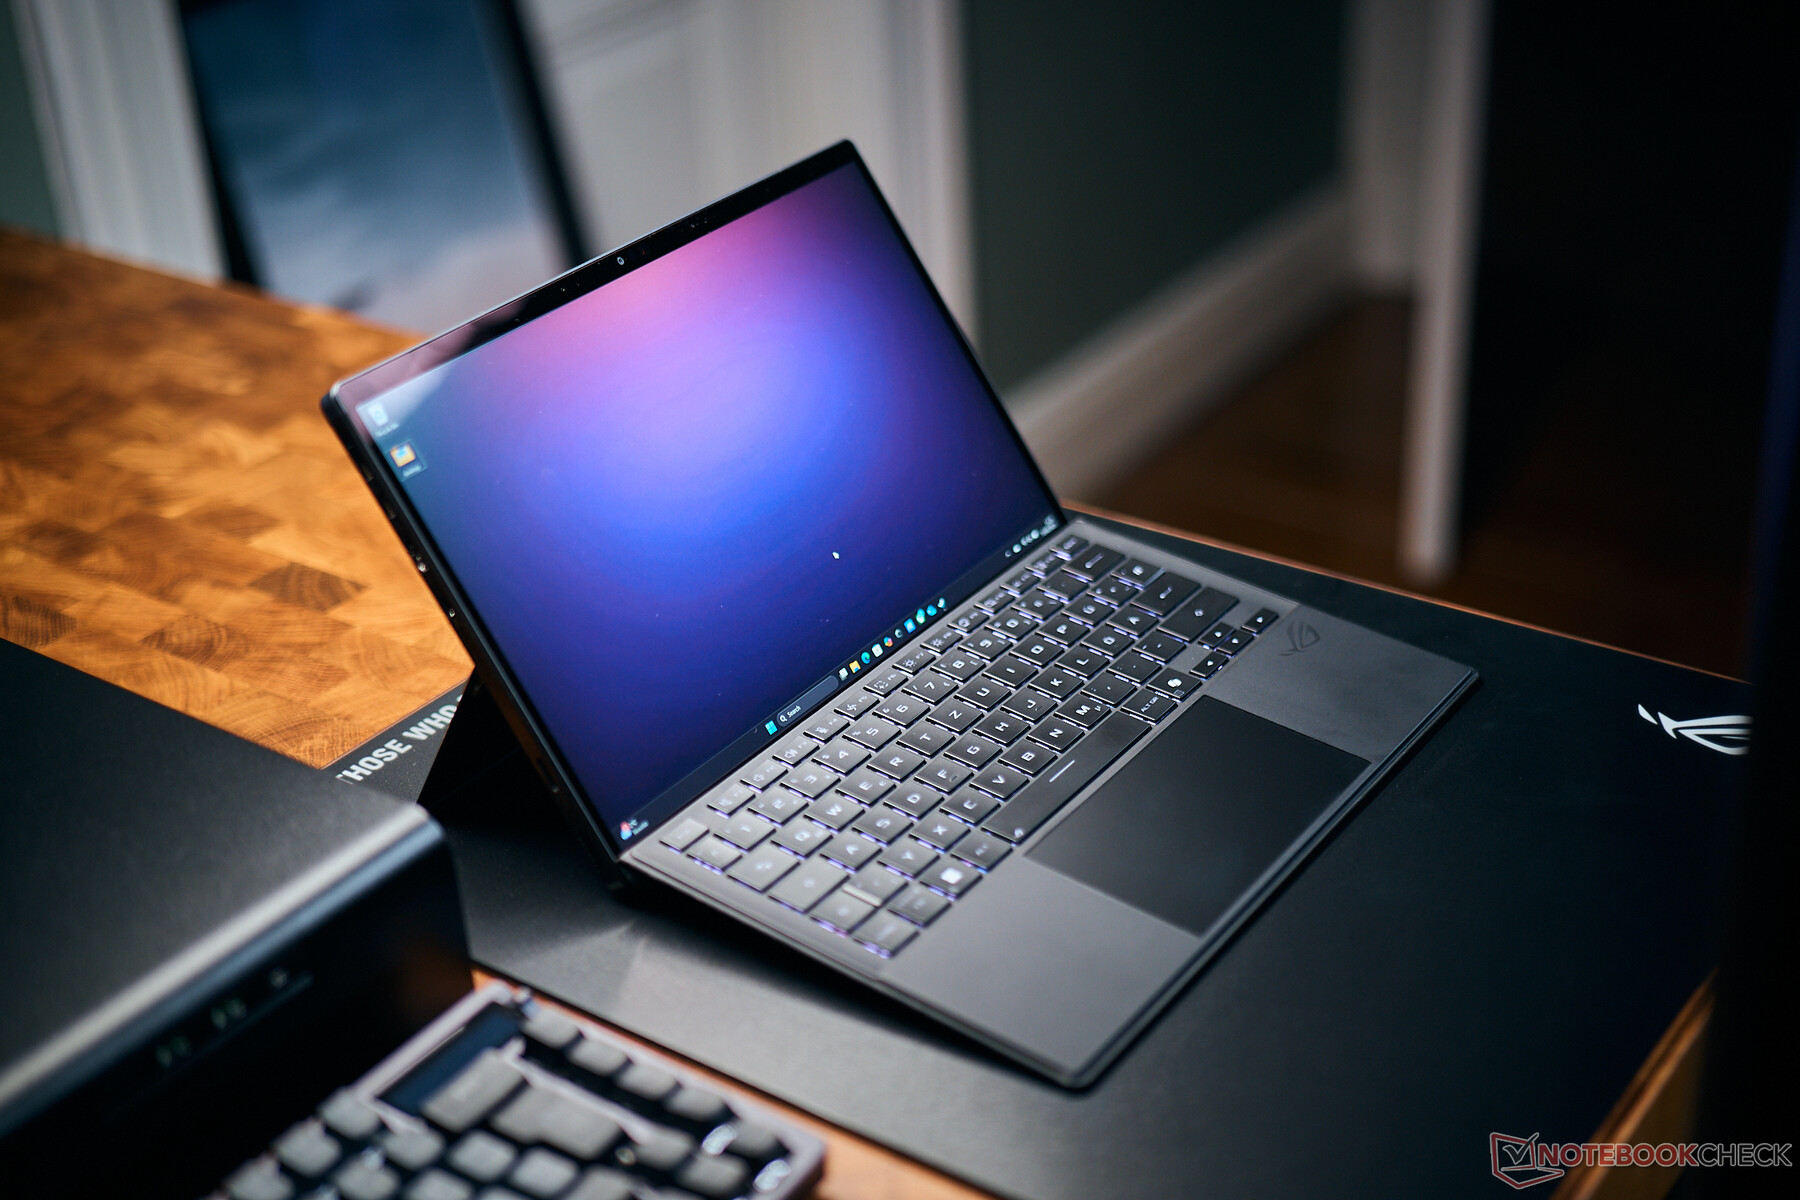
Notre système de test est le modèle 2025 du convertible gaming Asus ROG Flow Z13 GZ302EA que nous avons déjà examiné. Il est équipé du modèle phare Ryzen AI Max+ 395, le modèle phare de la nouvelle série Strix Halo avec 16 cœurs de CPU et la Radeon 8060S. Il s'agit de la SKU avec 32 Go de RAM (LPDDR5x-8000), qui peut également être utilisée par le GPU. Vous pouvez également allouer jusqu'à 24 Go de VRAM dédiée. La VRAM dédiée peut avoir un effet positif dans certains jeux ou applications créatives, mais le mode Auto fonctionne bien en général. Nous avons suivi les recommandations d'Asus avec 8 Go de VRAM dédiée pour nos benchmarks.

En mode Turbo, le Ryzen AI Max+ 395 peut consommer jusqu'à 86 Watts pendant une courte période, puis se stabilise à 70 Watts lorsque vous ne sollicitez que le CPU ou le GPU. Les charges de travail combinées se traduiront par un TDP de 60 Watts.

HWiNFO Asus ROG Flow Z13 avec Ryzen AI Max+ 395

Procédure de test

Pour garantir une comparaison pertinente entre les différents processeurs et cartes graphiques, nous évaluons la consommation d'énergie en même temps que les performances de référence synthétiques, ce qui nous permet de déterminer l'efficacité globale. Nos mesures de la consommation d'énergie sont effectuées à l'aide d'un écran externe, ce qui élimine toute influence des variations de la consommation d'énergie de l'écran interne. Cependant, il est important de noter que nous mesurons la consommation totale du système, plutôt que de comparer uniquement les valeurs brutes du TDP.

Performance de l'unité centrale

Nous commençons notre section sur les performances du processeur par des scénarios à cœur unique. Le nouvel APU utilise les cœurs Zen 5 habituels avec la même fréquence maximale de 5,1 GHz, il n'est donc pas surprenant que nous obtenions des résultats comparables à ceux d'autres APU Zen 5 comme le Ryzen AI 9 HX 370 dans les tests Cinebench. Les résultats sont comparables à ceux de l'ancienne gamme Dragon HX (comme le Ryzen 9 7945HX3) Ryzen 9 7945HX3D), mais aussi plus lents que les dernières puces Arrow Lake et Lunar Lake d'Intel (au moins les variantes rapides du Core Ultra 9). Les SoC rapides Snapdragon X Elite avec double cœur turbo (X1E-80-100 et plus) sont également en tête, mais les modèles ARM X1E-78-100 et moins sont plus lents. Apple est dans une toute autre catégorie avec ses SoC M4 et les derniers CPU de bureau d'AMD et d'Intel sont également plus rapides que les Ryzen AI Max 395.

Le nouveau Strix Halo APU est plus performant dans le dernier test Geekbench 6 et peut battre tous les processeurs mobiles actuels d'AMD, d'Intel et de Qualcomm. L'ancien Raptor Lake Core i9-14900HX est comparable ; les processeurs de bureau actuels et en particulier les puces M4 de Apple sont une fois de plus en tête.

Cinebench 2024: CPU Single Core | Cinebench R23: Single Core | Geekbench 6.3: Single-Core
Cinebench 2024 / CPU Single Core
Apple M4 Pro (14 cores)
Apple MacBook Pro 16 2024 M4 Pro
178 Points +52%
Apple M4 Max (16 cores)
Apple MacBook Pro 16 M4 Max
178 Points +52%
Intel Core Ultra 9 285K
144 Points +23%
AMD Ryzen 9 9900X
AMD Ryzen 9 9900X
138 Points +18%
AMD Ryzen 7 9700X
AMD Ryzen 7 9700X
136 Points +16%
AMD Ryzen 9 9950X
AMD Ryzen 9 9950X
136 Points +16%
Intel Core i9-14900HX
SCHENKER XMG Neo 17 E24
130 Points +11%
Intel Core i9-14900HX
Asus ROG Strix Scar 16 G634JZR
128 Points +10%
Qualcomm Snapdragon X Elite X1E-84-100
Samsung Galaxy Book4 Edge 16 X1E-84-100
127 Points +9%
Intel Core Ultra 9 285H
MSI Prestige 16 AI Evo B2HMG
127 Points +9%
Intel Core i9-14900HX
Lenovo Legion 7 16 IRX G9
126.4 Points +8%
Qualcomm Snapdragon X Elite X1E-80-100
Microsoft Surface Laptop 15 Snapdragon X Elite
123 Points +5%
Intel Core i9-14900HX
Acer Predator Helios 16 PH16-72
122.9 Points +5%
Intel Core Ultra 9 288V
Asus Zenbook S 14 UX5406 Core Ultra 9
122 Points +4%
Intel Core i7-14650HX
Lenovo Legion 5 16IRX G9
117 Points 0%
AMD Ryzen AI Max+ 395
Asus ROG Flow Z13 GZ302EA-RU073W
116.8 Points
AMD Ryzen AI 9 HX 370
Asus ProArt P16 H7606WI
116 Points -1%
AMD Ryzen 9 7945HX3D
Asus ROG Strix Scar 17 G733PYV-LL053X
115 Points -2%
AMD Ryzen 9 7945HX
Minisforum BD790i
114 Points -2%
AMD Ryzen AI 9 365
Lenovo Yoga Pro 7 14ASP G9
113.5 Points -3%
AMD Ryzen 9 7945HX
Tuxedo Gemini 17 Gen3 AMD
111 Points -5%
AMD Ryzen AI 7 PRO 360
Lenovo ThinkPad T14s Gen 6 21M2S00G00
108.5 Points -7%
Qualcomm Snapdragon X Elite X1E-78-100
Lenovo Yoga Slim 7X 14Q8X9
108 Points -8%
Intel Core i9-13900H
Minisforum MS-01
101 Points -14%
Cinebench R23 / Single Core
Intel Core Ultra 9 285K
2353 Points +16%
Apple M4 Pro (14 cores)
Apple MacBook Pro 16 2024 M4 Pro
2290 Points +13%
AMD Ryzen 9 9900X
AMD Ryzen 9 9900X
2253 Points +11%
Intel Core i9-14900HX
SCHENKER XMG Neo 17 E24
2233 Points +10%
AMD Ryzen 7 9700X
AMD Ryzen 7 9700X
2211 Points +9%
Apple M4 Max (16 cores)
Apple MacBook Pro 16 M4 Max
2209 Points +9%
AMD Ryzen 9 9950X
AMD Ryzen 9 9950X
2202 Points +8%
Intel Core i9-14900HX
Lenovo Legion 7 16 IRX G9
2195 Points +8%
Intel Core i9-14900HX
Asus ROG Strix Scar 16 G634JZR
2193 Points +8%
Intel Core Ultra 9 285H
MSI Prestige 16 AI Evo B2HMG
2126 Points +5%
Intel Core i9-14900HX
Acer Predator Helios 16 PH16-72
2122 Points +4%
Intel Core i9-13980HX
Asus ProArt Studiobook 16 OLED H7604
2110 Points +4%
AMD Ryzen AI 9 HX 370
Asus ProArt P16 H7606WI
2049 Points +1%
AMD Ryzen AI Max+ 395
Asus ROG Flow Z13 GZ302EA-RU073W
2034 Points
AMD Ryzen AI 9 365
Lenovo Yoga Pro 7 14ASP G9
1992 Points -2%
Intel Core i7-14650HX
Lenovo Legion 5 16IRX G9
1963 Points -3%
AMD Ryzen AI 7 PRO 360
Lenovo ThinkPad T14s Gen 6 21M2S00G00
1958 Points -4%
AMD Ryzen 9 7945HX
Minisforum BD790i
1942 Points -5%
AMD Ryzen 9 7945HX3D
Asus ROG Strix Scar 17 G733PYV-LL053X
1935 Points -5%
AMD Ryzen 9 7945HX
Tuxedo Gemini 17 Gen3 AMD
1861 Points -9%
Intel Core i9-13900H
Minisforum MS-01
1806 Points -11%
Qualcomm Snapdragon X Elite X1E-84-100
Samsung Galaxy Book4 Edge 16 X1E-84-100
1350 Points -34%
Qualcomm Snapdragon X Elite X1E-80-100
Microsoft Surface Laptop 15 Snapdragon X Elite
1297 Points -36%
Qualcomm Snapdragon X Elite X1E-78-100
Lenovo Yoga Slim 7X 14Q8X9
1130 Points -44%
Geekbench 6.3 / Single-Core
Apple M4 Max (16 cores)
Apple MacBook Pro 16 M4 Max
3880 Points +30%
Apple M4 Pro (14 cores)
Apple MacBook Pro 16 2024 M4 Pro
3836 Points +29%
AMD Ryzen 9 9900X
AMD Ryzen 9 9900X
3429 Points +15%
AMD Ryzen 9 9950X
AMD Ryzen 9 9950X
3408 Points +14%
AMD Ryzen 7 9700X
AMD Ryzen 7 9700X
3373 Points +13%
Intel Core Ultra 9 285K
3306 Points +11%
Intel Core i9-14900HX
SCHENKER XMG Neo 17 E24
3074 Points +3%
Intel Core i9-14900HX
Asus ROG Strix Scar 16 G634JZR
3025 Points +2%
Intel Core i9-14900HX
Lenovo Legion 7 16 IRX G9
2980 Points 0%
AMD Ryzen AI Max+ 395
Asus ROG Flow Z13 GZ302EA-RU073W
2978 Points
Intel Core i9-14900HX
Acer Predator Helios 16 PH16-72
2970 Points 0%
AMD Ryzen 9 7945HX
Minisforum BD790i
2940 Points -1%
AMD Ryzen 9 7945HX3D
Asus ROG Strix Scar 17 G733PYV-LL053X
2916 Points -2%
Intel Core Ultra 9 285H
MSI Prestige 16 AI Evo B2HMG
2912 Points -2%
Intel Core Ultra 9 288V
Asus Zenbook S 14 UX5406 Core Ultra 9
2864 Points -4%
AMD Ryzen AI 9 HX 370
Asus ProArt P16 H7606WI
2857 Points -4%
Qualcomm Snapdragon X Elite X1E-84-100
Samsung Galaxy Book4 Edge 16 X1E-84-100
2834 Points -5%
AMD Ryzen AI 9 365
Lenovo Yoga Pro 7 14ASP G9
2815 Points -5%
Qualcomm Snapdragon X Elite X1E-80-100
Microsoft Surface Laptop 15 Snapdragon X Elite
2812 Points -6%
Qualcomm Snapdragon X Elite X1E-80-100
Microsoft Surface Laptop 15 Snapdragon X Elite
1896 Points -36%
Qualcomm Snapdragon X Elite X1E-80-100
Microsoft Surface Laptop 15 Snapdragon X Elite
1896 Points -36%
AMD Ryzen 9 7945HX
Tuxedo Gemini 17 Gen3 AMD
2797 Points -6%
Intel Core i7-14650HX
Lenovo Legion 5 16IRX G9
2761 Points -7%
AMD Ryzen AI 7 PRO 360
Lenovo ThinkPad T14s Gen 6 21M2S00G00
2699 Points -9%
Intel Core i9-13900H
Minisforum MS-01
2624 Points -12%
Qualcomm Snapdragon X Elite X1E-78-100
Lenovo Yoga Slim 7X 14Q8X9
2464 Points -17%
Cinebench 2024: CPU Single Core | Cinebench R23: Single Core | Geekbench 6.3: Single-Core

Pour la comparaison de l'efficacité des cœurs simples, nous utilisons Cinebench 2024 ainsi que l'ancien Cinebench R23 où nous avons plus de données de comparaison (en particulier avec les CPU HX). Le nouveau Ryzen AI Max+ 395 est clairement moins bon que les autres CPU mobiles actuels dans Cinebench 2024 (aussi bien Ryzen AI qu'Intel Arrow Lake-H/Lunar Lake-V). La concurrence ARM de Apple et Qualcomm est également beaucoup plus efficace dans les scénarios à cœur unique. Seules les puces de bureau sont encore plus mauvaises en termes d'efficacité.

L'ancien test Cinebench R23 montre également un avantage pour les processeurs mobiles actuels, mais les anciennes puces de la série HX (qui sont beaucoup plus proches de la Ryzen AI Max en termes de performance globale) sont clairement battues par l'APU Strix Halo. C'est également le cas pour les processeurs de bureau actuels d'AMD et d'Intel.

Power Consumption / Cinebench 2024 Single Power Efficiency - external Monitor
Apple M4 Pro (14 cores)
Apple MacBook Pro 16 2024 M4 Pro
9.52 Points per Watt +263%
Apple M4 Max (16 cores)
Apple MacBook Pro 16 M4 Max
8.24 Points per Watt +215%
Qualcomm Snapdragon X Elite X1E-78-100
Lenovo Yoga Slim 7X 14Q8X9
6.84 Points per Watt +161%
Qualcomm Snapdragon X Elite X1E-84-100
Samsung Galaxy Book4 Edge 16 X1E-84-100
6.32 Points per Watt +141%
Qualcomm Snapdragon X Elite X1E-80-100
Microsoft Surface Laptop 7 13.8 Copilot+
5.89 Points per Watt +125%
Intel Core Ultra 9 288V
Asus Zenbook S 14 UX5406 Core Ultra 9
4.78 Points per Watt +82%
AMD Ryzen AI 9 365
Lenovo Yoga Pro 7 14ASP G9
4.01 Points per Watt +53%
Intel Core Ultra 9 285H
MSI Prestige 16 AI Evo B2HMG
3.76 Points per Watt +44%
AMD Ryzen AI 7 PRO 360
Lenovo ThinkPad T14s Gen 6 21M2S00G00
3.65 Points per Watt +39%
AMD Ryzen AI 9 HX 370
Asus ProArt P16 H7606WI
3.4 Points per Watt +30%
AMD Ryzen AI Max+ 395
Asus ROG Flow Z13 GZ302EA-RU073W
2.62 Points per Watt
Intel Core Ultra 9 285K
1.321 Points per Watt -50%
AMD Ryzen 7 9700X
AMD Ryzen 7 9700X
1.236 Points per Watt -53%
AMD Ryzen 9 9900X
AMD Ryzen 9 9900X
1.095 Points per Watt -58%
AMD Ryzen 9 9950X
AMD Ryzen 9 9950X
0.997 Points per Watt -62%
Power Consumption / Cinebench R23 Single Power Efficiency - external Monitor
Apple M4 Pro (14 cores)
Apple MacBook Pro 16 2024 M4 Pro
131.6 Points per Watt +188%
Apple M4 Max (16 cores)
Apple MacBook Pro 16 M4 Max
109.4 Points per Watt +139%
Qualcomm Snapdragon X Elite X1E-78-100
Lenovo Yoga Slim 7X 14Q8X9
70.6 Points per Watt +54%
AMD Ryzen AI 9 365
Lenovo Yoga Pro 7 14ASP G9
67.3 Points per Watt +47%
AMD Ryzen AI 7 PRO 360
Lenovo ThinkPad T14s Gen 6 21M2S00G00
66.4 Points per Watt +45%
Intel Core Ultra 9 285H
MSI Prestige 16 AI Evo B2HMG
63.7 Points per Watt +39%
Qualcomm Snapdragon X Elite X1E-80-100
Microsoft Surface Laptop 7 13.8 Copilot+
61.2 Points per Watt +34%
Qualcomm Snapdragon X Elite X1E-84-100
Samsung Galaxy Book4 Edge 16 X1E-84-100
59.2 Points per Watt +30%
AMD Ryzen AI 9 HX 370
Asus ProArt P16 H7606WI
58.9 Points per Watt +29%
AMD Ryzen AI Max+ 395
Asus ROG Flow Z13 GZ302EA-RU073W
45.7 Points per Watt
Intel Core i9-13900H
Minisforum MS-01
36.4 Points per Watt -20%
AMD Ryzen 9 7945HX
Minisforum BD790i
34 Points per Watt -26%
Intel Core i9-14900HX
Lenovo Legion 7 16 IRX G9
32.7 Points per Watt -28%
Intel Core i7-14650HX
Lenovo Legion 5 16IRX G9
31.9 Points per Watt -30%
Intel Core i9-14900HX
SCHENKER XMG Neo 17 E24
28.4 Points per Watt -38%
AMD Ryzen 9 7945HX
Tuxedo Gemini 17 Gen3 AMD
27.7 Points per Watt -39%
AMD Ryzen 9 7945HX3D
Asus ROG Strix Scar 17 G733PYV-LL053X
26.9 Points per Watt -41%
Intel Core i9-14900HX
Asus ROG Strix Scar 16 G634JZR
26.3 Points per Watt -42%
Intel Core i9-13980HX
Asus ProArt Studiobook 16 OLED H7604
25.4 Points per Watt -44%
Intel Core i9-14900HX
Acer Predator Helios 16 PH16-72
23.9 Points per Watt -48%
Intel Core Ultra 9 285K
21.2 Points per Watt -54%
AMD Ryzen 7 9700X
AMD Ryzen 7 9700X
19.7 Points per Watt -57%
AMD Ryzen 9 9900X
AMD Ryzen 9 9900X
17.6 Points per Watt -61%
AMD Ryzen 9 9950X
AMD Ryzen 9 9950X
15.8 Points per Watt -65%

Comme prévu, la nouvelle Ryzen AI Max+ 395 est beaucoup plus performante dans les scénarios multi-cœurs, mais gardez à l'esprit que nous avons testé la nouvelle puce dans un convertible 13 pouces avec des limites de puissance limitées (86/70 Watts). Les performances seraient nettement meilleures avec la puissance maximale de 125 watts. Les puces mobiles actuelles d'AMD, Intel et Qualcomm n'ont aucune chance, seuls les CPU de la série HX sont à un niveau comparable (mais généralement avec des valeurs de consommation beaucoup plus élevées, en particulier pour les rivaux du Core i9-14900HX). Apple a un petit avantage avec le M4 Pro, et la majorité des puces d'ordinateur de bureau actuelles est également plus rapide.

Le nouveau Ryzen AI Max+ 395 est à nouveau beaucoup plus performant dans Geekbench et est l'un des modèles les plus rapides. Apple les SoC M4 Pro et M4 Max d'Intel restent en tête, mais le Ryzen AI Max+ 395 est entouré de puces de bureau actuelles comme le Core Ultra 9 285K d'Intel ou le Ryzen 9950X d'AMD.

Cinebench 2024: CPU Multi Core | Cinebench R23: Multi Core | Geekbench 6.3: Multi-Core
Cinebench 2024 / CPU Multi Core
Intel Core Ultra 9 285K
2436 Points +48%
AMD Ryzen 9 9950X
AMD Ryzen 9 9950X
2254 Points +37%
Apple M4 Max (16 cores)
Apple MacBook Pro 16 M4 Max
2069 Points +26%
Apple M4 Max (16 cores)
Apple MacBook Pro 16 M4 Max
2015 Points +22%
AMD Ryzen 9 7945HX
Minisforum BD790i
1828 Points +11%
AMD Ryzen 9 9900X
AMD Ryzen 9 9900X
1818 Points +10%
AMD Ryzen 9 7945HX3D
Asus ROG Strix Scar 17 G733PYV-LL053X
1772 Points +8%
Intel Core i9-14900HX
SCHENKER XMG Neo 17 E24
1731 Points +5%
Apple M4 Pro (14 cores)
Apple MacBook Pro 16 2024 M4 Pro
1729 Points +5%
AMD Ryzen 9 7945HX
Tuxedo Gemini 17 Gen3 AMD
1677 Points +2%
AMD Ryzen AI Max+ 395
Asus ROG Flow Z13 GZ302EA-RU073W
1648 Points
Intel Core i9-14900HX
Asus ROG Strix Scar 16 G634JZR
1639 Points -1%
Intel Core i9-14900HX
Acer Predator Helios 16 PH16-72
1479 Points -10%
Intel Core i9-14900HX
Lenovo Legion 7 16 IRX G9
1450 Points -12%
AMD Ryzen 7 9800X3D
AMD Ryzen 7 9800X3D
1358 Points -18%
Intel Core i7-14650HX
Lenovo Legion 5 16IRX G9
1235 Points -25%
AMD Ryzen AI 9 HX 370
Asus ProArt P16 H7606WI
1213 Points -26%
AMD Ryzen 7 9700X
AMD Ryzen 7 9700X
1203 Points -27%
AMD Ryzen AI 9 365
Lenovo Yoga Pro 7 14ASP G9
996 Points -40%
Intel Core Ultra 9 285H
MSI Prestige 16 AI Evo B2HMG
991 Points -40%
Qualcomm Snapdragon X Elite X1E-84-100
Samsung Galaxy Book4 Edge 16 X1E-84-100
866 Points -47%
Intel Core i9-13900H
Minisforum MS-01
818 Points -50%
AMD Ryzen AI 7 PRO 360
Lenovo ThinkPad T14s Gen 6 21M2S00G00
708 Points -57%
Intel Core Ultra 9 288V
Asus Zenbook S 14 UX5406 Core Ultra 9
598 Points -64%
Cinebench R23 / Multi Core
Intel Core Ultra 9 285K
42705 Points +47%
AMD Ryzen 9 9950X
AMD Ryzen 9 9950X
40924 Points +41%
AMD Ryzen 9 7945HX
Minisforum BD790i
33459 Points +15%
AMD Ryzen 9 7945HX3D
Asus ROG Strix Scar 17 G733PYV-LL053X
32782 Points +13%
AMD Ryzen 9 9900X
AMD Ryzen 9 9900X
32172 Points +11%
Intel Core i9-14900HX
SCHENKER XMG Neo 17 E24
31740 Points +9%
Intel Core i9-14900HX
Lenovo Legion 7 16 IRX G9
31127 Points +7%
Intel Core i9-13980HX
Asus ProArt Studiobook 16 OLED H7604
30789 Points +6%
AMD Ryzen 9 7945HX
Tuxedo Gemini 17 Gen3 AMD
30783 Points +6%
Intel Core i9-14900HX
Asus ROG Strix Scar 16 G634JZR
30411 Points +5%
Intel Core i9-14900HX
Acer Predator Helios 16 PH16-72
30155 Points +4%
AMD Ryzen AI Max+ 395
Asus ROG Flow Z13 GZ302EA-RU073W
29063 Points
Apple M4 Max (16 cores)
Apple MacBook Pro 16 M4 Max
27595 Points -5%
Intel Core i7-14650HX
Lenovo Legion 5 16IRX G9
24455 Points -16%
AMD Ryzen AI 9 HX 370
Asus ProArt P16 H7606WI
23786 Points -18%
Apple M4 Pro (14 cores)
Apple MacBook Pro 16 2024 M4 Pro
23437 Points -19%
AMD Ryzen 7 9800X3D
AMD Ryzen 7 9800X3D
23230 Points -20%
AMD Ryzen 7 9700X
AMD Ryzen 7 9700X
20485 Points -30%
Intel Core Ultra 9 285H
MSI Prestige 16 AI Evo B2HMG
20442 Points -30%
AMD Ryzen AI 9 365
Lenovo Yoga Pro 7 14ASP G9
18748 Points -35%
Intel Core i9-13900H
Minisforum MS-01
16209 Points -44%
AMD Ryzen AI 7 PRO 360
Lenovo ThinkPad T14s Gen 6 21M2S00G00
13794 Points -53%
Qualcomm Snapdragon X Elite X1E-84-100
Samsung Galaxy Book4 Edge 16 X1E-84-100
9471 Points -67%
Geekbench 6.3 / Multi-Core
Apple M4 Max (16 cores)
Apple MacBook Pro 16 M4 Max
25760 Points +21%
Apple M4 Pro (14 cores)
Apple MacBook Pro 16 2024 M4 Pro
22509 Points +6%
Intel Core Ultra 9 285K
21688 Points +2%
AMD Ryzen 9 9950X
AMD Ryzen 9 9950X
21383 Points +1%
AMD Ryzen AI Max+ 395
Asus ROG Flow Z13 GZ302EA-RU073W
21269 Points
AMD Ryzen 9 9900X
AMD Ryzen 9 9900X
20380 Points -4%
Intel Core i9-14900HX
Asus ROG Strix Scar 16 G634JZR
18590 Points -13%
Intel Core i9-14900HX
SCHENKER XMG Neo 17 E24
18572 Points -13%
Intel Core i9-14900HX
Lenovo Legion 7 16 IRX G9
18079 Points -15%
AMD Ryzen 7 9800X3D
AMD Ryzen 7 9800X3D
18074 Points -15%
AMD Ryzen 9 7945HX
Minisforum BD790i
17892 Points -16%
Intel Core i9-14900HX
Acer Predator Helios 16 PH16-72
17654 Points -17%
Intel Core Ultra 9 285H
MSI Prestige 16 AI Evo B2HMG
17262 Points -19%
AMD Ryzen 9 7945HX3D
Asus ROG Strix Scar 17 G733PYV-LL053X
16957 Points -20%
AMD Ryzen 7 9700X
AMD Ryzen 7 9700X
16817 Points -21%
AMD Ryzen 9 7945HX
Tuxedo Gemini 17 Gen3 AMD
16223 Points -24%
Intel Core i7-14650HX
Lenovo Legion 5 16IRX G9
16010 Points -25%
Qualcomm Snapdragon X Elite X1E-84-100
Samsung Galaxy Book4 Edge 16 X1E-84-100
15665 Points -26%
AMD Ryzen AI 9 HX 370
Asus ProArt P16 H7606WI
15221 Points -28%
AMD Ryzen AI 9 365
Lenovo Yoga Pro 7 14ASP G9
14118 Points -34%
Intel Core i9-13900H
Minisforum MS-01
12677 Points -40%
AMD Ryzen AI 7 PRO 360
Lenovo ThinkPad T14s Gen 6 21M2S00G00
12344 Points -42%
Intel Core Ultra 9 288V
Asus Zenbook S 14 UX5406 Core Ultra 9
11069 Points -48%
Cinebench 2024: CPU Multi Core | Cinebench R23: Multi Core | Geekbench 6.3: Multi-Core

Nous commençons à nouveau par l'efficacité de Cinebench 2024, où la Ryzen AI Max se comporte bien et n'est battue que par la nouvelle puce Arrow Lake-H Core Ultra 9 285H parmi les concurrents x86. Tous les autres modèles sont soit comparables, soit moins bons, mais la concurrence ARM est une fois de plus plus efficace.

L'ancien test R23 Multi est plus intéressant pour la comparaison avec les concurrents x86 car les CPU ARM émulent ce benchmark, ce qui affecte les performances. Dans ce scénario, le nouveau processeur Ryzen AI Max est l'une des puces les plus efficaces et bat tous les concurrents HX ainsi que les modèles de bureau.

Power Consumption / Cinebench 2024 Multi Power Efficiency - external Monitor
Apple M4 Max (16 cores)
Apple MacBook Pro 16 M4 Max
22.4 Points per Watt +52%
Qualcomm Snapdragon X Elite X1E-80-100
Microsoft Surface Laptop 7 13.8 Copilot+
22.2 Points per Watt +51%
Qualcomm Snapdragon X Elite X1E-84-100
Samsung Galaxy Book4 Edge 16 X1E-84-100
22.1 Points per Watt +50%
Apple M4 Pro (14 cores)
Apple MacBook Pro 16 2024 M4 Pro
20.2 Points per Watt +37%
Intel Core Ultra 9 285H
MSI Prestige 16 AI Evo B2HMG
19.1 Points per Watt +30%
Qualcomm Snapdragon X Elite X1E-78-100
Lenovo Yoga Slim 7X 14Q8X9
18 Points per Watt +22%
AMD Ryzen AI 7 PRO 360
Lenovo ThinkPad T14s Gen 6 21M2S00G00
15 Points per Watt +2%
AMD Ryzen AI Max+ 395
Asus ROG Flow Z13 GZ302EA-RU073W
14.7 Points per Watt
Intel Core Ultra 9 288V
Asus Zenbook S 14 UX5406 Core Ultra 9
14 Points per Watt -5%
AMD Ryzen AI 9 365
Lenovo Yoga Pro 7 14ASP G9
12.5 Points per Watt -15%
AMD Ryzen AI 9 HX 370
Asus ProArt P16 H7606WI
10.2 Points per Watt -31%
Intel Core Ultra 9 285K
7.43 Points per Watt -49%
AMD Ryzen 9 9950X
AMD Ryzen 9 9950X
7.18 Points per Watt -51%
AMD Ryzen 7 9700X
AMD Ryzen 7 9700X
6.86 Points per Watt -53%
AMD Ryzen 9 9900X
AMD Ryzen 9 9900X
6.61 Points per Watt -55%
Power Consumption / Cinebench R23 Multi Power Efficiency - external Monitor
Apple M4 Pro (14 cores)
Apple MacBook Pro 16 2024 M4 Pro
296 Points per Watt +19%
Apple M4 Max (16 cores)
Apple MacBook Pro 16 M4 Max
281 Points per Watt +13%
AMD Ryzen AI 7 PRO 360
Lenovo ThinkPad T14s Gen 6 21M2S00G00
259 Points per Watt +4%
AMD Ryzen AI Max+ 395
Asus ROG Flow Z13 GZ302EA-RU073W
249 Points per Watt
Qualcomm Snapdragon X Elite X1E-80-100
Microsoft Surface Laptop 7 13.8 Copilot+
247 Points per Watt -1%
AMD Ryzen 9 7945HX
Minisforum BD790i
237 Points per Watt -5%
AMD Ryzen AI 9 365
Lenovo Yoga Pro 7 14ASP G9
235 Points per Watt -6%
Qualcomm Snapdragon X Elite X1E-84-100
Samsung Galaxy Book4 Edge 16 X1E-84-100
234 Points per Watt -6%
Intel Core Ultra 9 285H
MSI Prestige 16 AI Evo B2HMG
218 Points per Watt -12%
AMD Ryzen AI 9 HX 370
Asus ProArt P16 H7606WI
208 Points per Watt -16%
AMD Ryzen 9 7945HX3D
Asus ROG Strix Scar 17 G733PYV-LL053X
207 Points per Watt -17%
AMD Ryzen 9 7945HX
Tuxedo Gemini 17 Gen3 AMD
198 Points per Watt -20%
Qualcomm Snapdragon X Elite X1E-78-100
Lenovo Yoga Slim 7X 14Q8X9
173.7 Points per Watt -30%
Intel Core i9-13900H
Minisforum MS-01
164.2 Points per Watt -34%
Intel Core i9-14900HX
Lenovo Legion 7 16 IRX G9
158.6 Points per Watt -36%
Intel Core i9-14900HX
Asus ROG Strix Scar 16 G634JZR
144.8 Points per Watt -42%
Intel Core i7-14650HX
Lenovo Legion 5 16IRX G9
143.3 Points per Watt -42%
Intel Core i9-14900HX
SCHENKER XMG Neo 17 E24
142.3 Points per Watt -43%
Intel Core i9-14900HX
Acer Predator Helios 16 PH16-72
139.6 Points per Watt -44%
Intel Core i9-13980HX
Asus ProArt Studiobook 16 OLED H7604
135 Points per Watt -46%
AMD Ryzen 9 9950X
AMD Ryzen 9 9950X
129.5 Points per Watt -48%
Intel Core Ultra 9 285K
127.5 Points per Watt -49%
AMD Ryzen 9 9900X
AMD Ryzen 9 9900X
117 Points per Watt -53%
AMD Ryzen 7 9700X
AMD Ryzen 7 9700X
116.9 Points per Watt -53%
AMD Ryzen 7 9800X3D
AMD Ryzen 7 9800X3D
96.4 Points per Watt -61%

Performance du GPU

En plus du puissant CPU, vous disposez également d'une puissante carte graphique intégrée appelée Radeon 8060S. AMD affirme qu'il s'agit de la carte graphique intégrée x86 la plus rapide et nous pouvons le confirmer dès à présent, puisque ni la Radeon 890Mni la carte Intel Arc Graphics 140V/140T n'ont aucune chance face à la nouvelle Radeon 8060S.

Nous commençons par les différents benchmarks 3DMark qui montrent clairement que la Radeon 8060S est au même niveau que l'ordinateur portable GeForce RTX 4070 avec une valeur TGP comprise entre 65 et 75 Watts. C'est le cas pour 3DMark 11 ainsi que 3DMark Fire Strike et Time Spy, mais la Radeon 8060S perd un peu de terrain par rapport à la RTX 4070 Laptop dans les tests Speed Way et Steel Nomad.

3DMark 11 / Performance GPU
NVIDIA GeForce RTX 4070 Laptop GPU
Razer Blade 14 RZ09-0508, R9 8945HS, 140
44315 Points +9%
NVIDIA GeForce RTX 4070 Laptop GPU
Razer Blade 14 RTX 4070, R9 7940HS, 140
42318 Points +4%
AMD Radeon RX 8060S
Asus ROG Flow Z13 GZ302EA-RU073W, Ryzen AI Max+ 395, 80
40732 Points
NVIDIA GeForce RTX 4070 Laptop GPU
Asus ProArt PX13 HN7306, Ryzen AI 9 HX 370, 75
38156 Points -6%
NVIDIA GeForce RTX 4060 Laptop GPU
Acer Nitro 14 AN14-41-R3MX, R5 8645HS, 110
37827 Points -7%
NVIDIA GeForce RTX 4070 Laptop GPU
Asus ROG Zephyrus G14 2024 GA403U, R9 8945HS, 90
37023 Points -9%
NVIDIA GeForce RTX 4070 Laptop GPU
Acer Predator Helios Neo 14 (2024), Ultra 9 185H, 125
36209 Points -11%
NVIDIA GeForce RTX 4070 Laptop GPU
Asus ROG Flow Z13 ACRNM, i9-13900H, 65
32783 Points -20%
NVIDIA GeForce RTX 4060 Laptop GPU
Asus ROG Flow Z13 GZ301V, i9-13900H, 65
28200 Points -31%
AMD Radeon 890M
Beelink SER9, Ryzen AI 9 HX 370, 0
16800 Points -59%
Intel Arc Graphics 140V
Asus Zenbook S 14 UX5406 Core Ultra 9, Core Ultra 9 288V, 0
11102 Points -73%
3DMark / Fire Strike Graphics
NVIDIA GeForce RTX 4070 Laptop GPU
Razer Blade 14 RZ09-0508, R9 8945HS, 140
33451 Points +29%
NVIDIA GeForce RTX 4070 Laptop GPU
Razer Blade 14 RTX 4070, R9 7940HS, 140
30668 Points +18%
NVIDIA GeForce RTX 4060 Laptop GPU
Acer Nitro 14 AN14-41-R3MX, R5 8645HS, 110
28191 Points +8%
NVIDIA GeForce RTX 4070 Laptop GPU
Asus ProArt PX13 HN7306, Ryzen AI 9 HX 370, 75
28172 Points +8%
NVIDIA GeForce RTX 4070 Laptop GPU
Asus ROG Zephyrus G14 2024 GA403U, R9 8945HS, 90
27525 Points +6%
NVIDIA GeForce RTX 4070 Laptop GPU
Acer Predator Helios Neo 14 (2024), Ultra 9 185H, 125
26653 Points +3%
AMD Radeon RX 8060S
Asus ROG Flow Z13 GZ302EA-RU073W, Ryzen AI Max+ 395, 80
25992 Points
NVIDIA GeForce RTX 4070 Laptop GPU
Asus ROG Flow Z13 ACRNM, i9-13900H, 65
23000 Points -12%
NVIDIA GeForce RTX 4060 Laptop GPU
Asus ROG Flow Z13 GZ301V, i9-13900H, 65
20533 Points -21%
AMD Radeon 890M
Beelink SER9, Ryzen AI 9 HX 370, 0
10037 Points -61%
Intel Arc Graphics 140V
Asus Zenbook S 14 UX5406 Core Ultra 9, Core Ultra 9 288V, 0
9831 Points -62%
3DMark / Time Spy Graphics
NVIDIA GeForce RTX 4070 Laptop GPU
Razer Blade 14 RZ09-0508, R9 8945HS, 140
13215 Points +29%
NVIDIA GeForce RTX 4070 Laptop GPU
Razer Blade 14 RTX 4070, R9 7940HS, 140
12153 Points +19%
NVIDIA GeForce RTX 4060 Laptop GPU
Acer Nitro 14 AN14-41-R3MX, R5 8645HS, 110
10799 Points +6%
NVIDIA GeForce RTX 4070 Laptop GPU
Asus ProArt PX13 HN7306, Ryzen AI 9 HX 370, 75
10693 Points +5%
NVIDIA GeForce RTX 4070 Laptop GPU
Asus ROG Zephyrus G14 2024 GA403U, R9 8945HS, 90
10392 Points +2%
AMD Radeon RX 8060S
Asus ROG Flow Z13 GZ302EA-RU073W, Ryzen AI Max+ 395, 80
10224 Points
NVIDIA GeForce RTX 4070 Laptop GPU
Acer Predator Helios Neo 14 (2024), Ultra 9 185H, 125
10182 Points 0%
NVIDIA GeForce RTX 4070 Laptop GPU
Asus ROG Flow Z13 ACRNM, i9-13900H, 65
9513 Points -7%
NVIDIA GeForce RTX 4060 Laptop GPU
Asus ROG Flow Z13 GZ301V, i9-13900H, 65
7655 Points -25%
Intel Arc Graphics 140V
Asus Zenbook S 14 UX5406 Core Ultra 9, Core Ultra 9 288V, 0
4227 Points -59%
AMD Radeon 890M
Beelink SER9, Ryzen AI 9 HX 370, 0
3546 Points -65%
3DMark / Steel Nomad Light Score
NVIDIA GeForce RTX 4070 Laptop GPU
Asus ProArt PX13 HN7306, Ryzen AI 9 HX 370, 75
10952 Points +13%
NVIDIA GeForce RTX 4070 Laptop GPU
Asus ROG Flow Z13 ACRNM, i9-13900H, 65
9949 Points +3%
AMD Radeon RX 8060S
Asus ROG Flow Z13 GZ302EA-RU073W, Ryzen AI Max+ 395, 80
9653 Points
Intel Arc Graphics 140V
Asus Zenbook S 14 UX5406 Core Ultra 9, Core Ultra 9 288V, 0
3406 Points -65%
3DMark / Steel Nomad Score
NVIDIA GeForce RTX 4070 Laptop GPU
Asus ProArt PX13 HN7306, Ryzen AI 9 HX 370, 75
2386 Points +27%
NVIDIA GeForce RTX 4060 Laptop GPU
Acer Nitro 14 AN14-41-R3MX, R5 8645HS, 110
2351 Points +25%
NVIDIA GeForce RTX 4070 Laptop GPU
Acer Predator Helios Neo 14 (2024), Ultra 9 185H, 125
2230 Points +19%
NVIDIA GeForce RTX 4070 Laptop GPU
Asus ROG Flow Z13 ACRNM, i9-13900H, 65
2228 Points +19%
AMD Radeon RX 8060S
Asus ROG Flow Z13 GZ302EA-RU073W, Ryzen AI Max+ 395, 80
1874 Points
Intel Arc Graphics 140V
Asus Zenbook S 14 UX5406 Core Ultra 9, Core Ultra 9 288V, 0
915 Points -51%
AMD Radeon 890M
Beelink SER9, Ryzen AI 9 HX 370, 0
502 Points -73%
3DMark / Solar Bay Score
NVIDIA GeForce RTX 4070 Laptop GPU
Acer Predator Helios Neo 14 (2024), Ultra 9 185H, 125
44190 Points
NVIDIA GeForce RTX 4070 Laptop GPU
Razer Blade 14 RTX 4070, R9 7940HS, 140
29.13 Points
3DMark / Speed Way Score
NVIDIA GeForce RTX 4070 Laptop GPU
Razer Blade 14 RZ09-0508, R9 8945HS, 140
3054 Points +127%
NVIDIA GeForce RTX 4070 Laptop GPU
Razer Blade 14 RTX 4070, R9 7940HS, 140
2913 Points +117%
NVIDIA GeForce RTX 4070 Laptop GPU
Asus ROG Zephyrus G14 2024 GA403U, R9 8945HS, 90
2566 Points +91%
NVIDIA GeForce RTX 4070 Laptop GPU
Acer Predator Helios Neo 14 (2024), Ultra 9 185H, 125
2515 Points +87%
NVIDIA GeForce RTX 4070 Laptop GPU
Asus ROG Flow Z13 ACRNM, i9-13900H, 65
2477 Points +84%
AMD Radeon RX 8060S
Asus ROG Flow Z13 GZ302EA-RU073W, Ryzen AI Max+ 395, 80
1343 Points
AMD Radeon 890M
Beelink SER9, Ryzen AI 9 HX 370, 0
328 Points -76%

Nous avons également testé la nouvelle Radeon 8060S contre la concurrence ARM de Apple et Qualcomm. La version la plus rapide de la carte Qualcomm Adreno X1-85 (4,6 TFLOPS) n'a aucune chance face au nouveau iGPU Strix Halo. La situation est différente en ce qui concerne les GPU de Appleet, selon le benchmark, le 8060S se situe entre les deux GPU M4 Pro ou les devance légèrement. Le GPU M4 Max est quant à lui hors de portée.

3DMark / Wild Life Extreme Unlimited
Apple MacBook Pro 16 M4 Max
M4 Max 40-Core GPU, M4 Max (16 cores), Apple SSD AP1024Z
37434 Points +91%
Apple MacBook Pro 14 2023 M3 Max
M3 Max 40-Core GPU, Apple M3 Max 16-Core, Apple SSD AP2048Z
31403 Points +60%
Asus ROG Flow Z13 GZ302EA-RU073W
Radeon RX 8060S, Ryzen AI Max+ 395, Kioxia BG6 KBG60ZNS1T02
19615 Points
Apple MacBook Pro 16 2024 M4 Pro
M4 Pro 20-Core GPU, M4 Pro (14 cores), Apple SSD AP2048Z
19345 Points -1%
Apple MacBook Pro 16 2023 M3 Pro
M3 Pro 18-Core GPU, Apple M3 Pro 12-Core, Apple SSD AP0512Z
14545 Points -26%
Apple MacBook Pro 14 2023 M3 Pro
M3 Pro 14-Core GPU, Apple M3 Pro 11-Core, Apple SSD AP0512Z
12094 Points -38%
Samsung Galaxy Book4 Edge 16 X1E-84-100
Adreno X1-85 4.6 TFLOPS, SD X Elite X1E-84-100
6978 Points -64%
3DMark / Steel Nomad Light Score
Apple MacBook Pro 16 M4 Max
M4 Max 40-Core GPU, M4 Max (16 cores), Apple SSD AP1024Z
13989 Points +45%
Asus ROG Flow Z13 GZ302EA-RU073W
Radeon RX 8060S, Ryzen AI Max+ 395, Kioxia BG6 KBG60ZNS1T02
9653 Points
Apple MacBook Pro 16 2024 M4 Pro
M4 Pro 20-Core GPU, M4 Pro (14 cores), Apple SSD AP2048Z
7781 Points -19%
Apple MacBook Pro 14 2024 M4 Pro Entry
M4 Pro 16-Core GPU, M4 Pro (12 cores), Apple SSD AP1024Z
6739 Points -30%
Samsung Galaxy Book4 Edge 16 X1E-84-100
Adreno X1-85 4.6 TFLOPS, SD X Elite X1E-84-100
2467 Points -74%
GFXBench / 4K Aztec Ruins High Tier Offscreen
Apple MacBook Pro 16 M4 Max
M4 Max 40-Core GPU, M4 Max (16 cores), Apple SSD AP1024Z
231.7 fps +103%
Apple MacBook Pro 14 2023 M3 Max
M3 Max 40-Core GPU, Apple M3 Max 16-Core, Apple SSD AP2048Z
188.2 fps +65%
Apple MacBook Pro 16 2024 M4 Pro
M4 Pro 20-Core GPU, M4 Pro (14 cores), Apple SSD AP2048Z
125.8 fps +10%
Asus ROG Flow Z13 GZ302EA-RU073W
Radeon RX 8060S, Ryzen AI Max+ 395, Kioxia BG6 KBG60ZNS1T02
114.1 fps
Apple MacBook Pro 14 2024 M4 Pro Entry
M4 Pro 16-Core GPU, M4 Pro (12 cores), Apple SSD AP1024Z
103.3 fps -9%
Apple MacBook Pro 16 2023 M3 Pro
M3 Pro 18-Core GPU, Apple M3 Pro 12-Core, Apple SSD AP0512Z
97.8 fps -14%
Apple MacBook Pro 14 2023 M3 Pro
M3 Pro 14-Core GPU, Apple M3 Pro 11-Core, Apple SSD AP0512Z
79 fps -31%
GFXBench / Aztec Ruins High Tier Onscreen
Apple MacBook Pro 16 M4 Max
M4 Max 40-Core GPU, M4 Max (16 cores), Apple SSD AP1024Z
120 fps +5%
Apple MacBook Pro 14 2023 M3 Max
M3 Max 40-Core GPU, Apple M3 Max 16-Core, Apple SSD AP2048Z
119.8 fps +5%
Apple MacBook Pro 14 2024 M4 Pro Entry
M4 Pro 16-Core GPU, M4 Pro (12 cores), Apple SSD AP1024Z
119.8 fps +5%
Asus ROG Flow Z13 GZ302EA-RU073W
Radeon RX 8060S, Ryzen AI Max+ 395, Kioxia BG6 KBG60ZNS1T02
114.2 fps
Apple MacBook Pro 14 2023 M3 Pro
M3 Pro 14-Core GPU, Apple M3 Pro 11-Core, Apple SSD AP0512Z
109.2 fps -4%
Apple MacBook Pro 16 2023 M3 Pro
M3 Pro 18-Core GPU, Apple M3 Pro 12-Core, Apple SSD AP0512Z
104.9 fps -8%
Apple MacBook Pro 16 2024 M4 Pro
M4 Pro 20-Core GPU, M4 Pro (14 cores), Apple SSD AP2048Z
94.7 fps -17%
Geekbench 6.3 / GPU OpenCL
Apple MacBook Pro 16 M4 Max
M4 Max 40-Core GPU, M4 Max (16 cores), Apple SSD AP1024Z
116455 Points +29%
Apple MacBook Pro 14 2023 M3 Max
M3 Max 40-Core GPU, Apple M3 Max 16-Core, Apple SSD AP2048Z
91418 Points +1%
Asus ROG Flow Z13 GZ302EA-RU073W
Radeon RX 8060S, Ryzen AI Max+ 395, Kioxia BG6 KBG60ZNS1T02
90181 Points
Apple MacBook Pro 16 2024 M4 Pro
M4 Pro 20-Core GPU, M4 Pro (14 cores), Apple SSD AP2048Z
69778 Points -23%
Apple MacBook Pro 14 2024 M4 Pro Entry
M4 Pro 16-Core GPU, M4 Pro (12 cores), Apple SSD AP1024Z
60506 Points -33%
Apple MacBook Pro 16 2023 M3 Pro
M3 Pro 18-Core GPU, Apple M3 Pro 12-Core, Apple SSD AP0512Z
50373 Points -44%
Apple MacBook Pro 14 2023 M3 Pro
M3 Pro 14-Core GPU, Apple M3 Pro 11-Core, Apple SSD AP0512Z
42798 Points -53%
Samsung Galaxy Book4 Edge 16 X1E-84-100
Adreno X1-85 4.6 TFLOPS, SD X Elite X1E-84-100
23854 Points -74%

Performances des jeux

Nous effectuons des tests de référence pour les jeux dans chaque évaluation d'ordinateur portable et la Radeon 8060S est au même niveau que la Radeon RX 7600M XT et légèrement supérieure à la version la plus rapide de la GeForce RTX 4050 Laptop (90W TGP) dans le Lenovo IdeaPad Pro 5 16. Les deux portables RTX 4070 comparables Asus ROG Flow Z13 et Asus ProArt PX13 ont un léger avantage, mais cela est principalement dû à certains résultats dans des benchmarks plus anciens comme GTA V. C'est également le cas pour les versions rapides du portable RTX 4060. Les deux titres plus récents Cyberpunk 2077 et Baldur's Gate 3 affichent de meilleurs résultats pour la Radeon 8060S. Dans l'ensemble, vous pouvez jouer à presque tous les jeux en 1080p avec un maximum de détails, tandis que certains titres sont un peu trop exigeants pour la résolution QHD (plus d'informations à ce sujet dans les paragraphes suivants).

Performance Rating - Percent
NVIDIA RTX 3500 Ada Generation Laptop GPU
HP ZBook Fury 16 G11, i9-14900HX, 105
100 pt
NVIDIA GeForce RTX 4060 Laptop GPU
Asus TUF Gaming A16 FA608WV, Ryzen AI 9 HX 370, 140
83.4 pt
NVIDIA GeForce RTX 4070 Laptop GPU
Acer Predator Helios Neo 14 (2024), Ultra 9 185H, 125
83.1 pt
NVIDIA GeForce RTX 4060 Laptop GPU
Acer Nitro 14 AN14-41-R3MX, R5 8645HS, 110
81.4 pt
NVIDIA GeForce RTX 4070 Laptop GPU
Asus ROG Flow Z13 ACRNM, i9-13900H, 65
81.1 pt
NVIDIA GeForce RTX 4070 Laptop GPU
Asus ProArt PX13 HN7306, Ryzen AI 9 HX 370, 75
77.5 pt
AMD Radeon RX 7600M XT
Minisforum MS-A1 (MGA1 Radeon RX 7600M XT @OCuLink) , Ryzen 7 8700G, 120
76.8 pt
AMD Radeon RX 8060S
Asus ROG Flow Z13 GZ302EA-RU073W, Ryzen AI Max+ 395, 80
76.1 pt
NVIDIA GeForce RTX 4050 Laptop GPU
Lenovo IdeaPad Pro 5 16IMH G9 RTX 4050, Ultra 9 185H, 90
74.8 pt
NVIDIA GeForce RTX 4060 Laptop GPU
SCHENKER Key 14 (M24), Ultra 7 155H, 100
71.5 pt
NVIDIA RTX 2000 Ada Generation Laptop GPU
HP ZBook Power 16 G11 A, R7 8845HS, 50
61.5 pt
NVIDIA GeForce RTX 3050 4GB Laptop GPU
HP Envy 17-da0076ng, Ultra 7 155U, 0
37.3 pt
Intel Arc Graphics 140T
MSI Prestige 16 AI Evo B2HMG, Ultra 9 285H, 0
29.7 pt
AMD Radeon 890M
Asus ProArt PX13 HN7306, Ryzen AI 9 HX 370, 0
29 pt
Intel Arc Graphics 140V
Asus Zenbook S 14 UX5406, Core Ultra 7 258V, 0
26 pt
Moyenne de la classe Convertible
 
23.8 pt
Cyberpunk 2077 2.1 Phantom Liberty - 1920x1080 Ultra Preset (FSR off)
NVIDIA RTX 3500 Ada Generation Laptop GPU
HP ZBook Fury 16 G11, i9-14900HX, 105
90.3 (73.1min) fps +19%
NVIDIA GeForce RTX 4060 Laptop GPU
Acer Nitro 14 AN14-41-R3MX, R5 8645HS, 110
75.8 (63.1min) fps 0%
NVIDIA GeForce RTX 4060 Laptop GPU
Asus TUF Gaming A16 FA608WV, Ryzen AI 9 HX 370, 140
75.6 (62.9min) fps 0%
AMD Radeon RX 8060S
Asus ROG Flow Z13 GZ302EA-RU073W, Ryzen AI Max+ 395, 80
75.6 (62min) fps
NVIDIA GeForce RTX 4070 Laptop GPU
Asus ProArt PX13 HN7306, Ryzen AI 9 HX 370, 75
74.1 (60.8min) fps -2%
AMD Radeon RX 7600M XT
Minisforum MS-A1 (MGA1 Radeon RX 7600M XT @OCuLink) , Ryzen 7 8700G, 120
73.2 (60.3min) fps -3%
NVIDIA GeForce RTX 4070 Laptop GPU
Acer Predator Helios Neo 14 (2024), Ultra 9 185H, 125
72.4 (59.8min) fps -4%
NVIDIA GeForce RTX 4070 Laptop GPU
Asus ROG Flow Z13 ACRNM, i9-13900H, 65
66.79 (52.29min) fps -12%
NVIDIA GeForce RTX 4050 Laptop GPU
Lenovo IdeaPad Pro 5 16IMH G9 RTX 4050, Ultra 9 185H, 90
59.8 (49.3min) fps -21%
NVIDIA GeForce RTX 4060 Laptop GPU
SCHENKER Key 14 (M24), Ultra 7 155H, 100
56.4 (39.3min) fps -25%
NVIDIA RTX 2000 Ada Generation Laptop GPU
HP ZBook Power 16 G11 A, R7 8845HS, 50
44.8 (37.6min) fps -41%
AMD Radeon 890M
Asus ProArt PX13 HN7306, Ryzen AI 9 HX 370, 0
27.8 (23.1min) fps -63%
Intel Arc Graphics 140T
MSI Prestige 16 AI Evo B2HMG, Ultra 9 285H, 0
27.3 (23.6min) fps -64%
NVIDIA GeForce RTX 3050 4GB Laptop GPU
HP Envy 17-da0076ng, Ultra 7 155U, 0
26.4 (10.2min) fps -65%
NVIDIA GeForce RTX 3050 4GB Laptop GPU
HP Envy 17-da0076ng, Ultra 7 155U, 0
21.1 (8.56min, 12.4P0.1, 18P1) fps -72%
Intel Arc Graphics 140V
Asus Zenbook S 14 UX5406, Core Ultra 7 258V, 0
24.3 (19.9min) fps -68%
Moyenne de la classe Convertible
  (8.2 - 83.5, n=31, 2 dernières années)
20.9 fps -72%
Baldur's Gate 3 - 1920x1080 Ultra Preset
NVIDIA RTX 3500 Ada Generation Laptop GPU
HP ZBook Fury 16 G11, i9-14900HX, 105
117.3 fps +38%
NVIDIA GeForce RTX 4070 Laptop GPU
Acer Predator Helios Neo 14 (2024), Ultra 9 185H, 125
107.9 (57.2min, 71.4P0.1, 87.3P1) fps +26%
NVIDIA GeForce RTX 4060 Laptop GPU
Acer Nitro 14 AN14-41-R3MX, R5 8645HS, 110
100.4 (33.6min, 83P0.1, 88.8P1) fps +18%
NVIDIA GeForce RTX 4060 Laptop GPU
Asus TUF Gaming A16 FA608WV, Ryzen AI 9 HX 370, 140
99 fps +16%
AMD Radeon RX 7600M XT
Minisforum MS-A1 (MGA1 Radeon RX 7600M XT @OCuLink) , Ryzen 7 8700G, 120
87.7 (37.2min, 74.4P0.1, 79.1P1) fps +3%
NVIDIA GeForce RTX 4070 Laptop GPU
Asus ROG Flow Z13 ACRNM, i9-13900H, 65
86.1 (50.7P0.1, 70.2P1) fps +1%
AMD Radeon RX 8060S
Asus ROG Flow Z13 GZ302EA-RU073W, Ryzen AI Max+ 395, 80
85.3 fps
NVIDIA GeForce RTX 4050 Laptop GPU
Lenovo IdeaPad Pro 5 16IMH G9 RTX 4050, Ultra 9 185H, 90
78.6 fps -8%
NVIDIA GeForce RTX 4060 Laptop GPU
SCHENKER Key 14 (M24), Ultra 7 155H, 100
66.9 fps -22%
NVIDIA GeForce RTX 4070 Laptop GPU
Asus ProArt PX13 HN7306, Ryzen AI 9 HX 370, 75
66.7 fps -22%
NVIDIA RTX 2000 Ada Generation Laptop GPU
HP ZBook Power 16 G11 A, R7 8845HS, 50
66.1 fps -23%
NVIDIA GeForce RTX 3050 4GB Laptop GPU
HP Envy 17-da0076ng, Ultra 7 155U, 0
35.7 fps -58%
AMD Radeon 890M
Asus ProArt PX13 HN7306, Ryzen AI 9 HX 370, 0
29.1 fps -66%
Intel Arc Graphics 140T
MSI Prestige 16 AI Evo B2HMG, Ultra 9 285H, 0
26.4 fps -69%
Moyenne de la classe Convertible
  (9.2 - 85.3, n=21, 2 dernières années)
23.5 fps -72%
Intel Arc Graphics 140V
Asus Zenbook S 14 UX5406, Core Ultra 7 258V, 0
23 fps -73%
GTA V - 1920x1080 Highest Settings possible AA:4xMSAA + FX AF:16x
NVIDIA RTX 3500 Ada Generation Laptop GPU
HP ZBook Fury 16 G11, i9-14900HX, 105
115.5 (4.64min, 76.9P1) fps +38%
NVIDIA GeForce RTX 4060 Laptop GPU
Asus TUF Gaming A16 FA608WV, Ryzen AI 9 HX 370, 140
114 (4.02min, 71.4P1) fps +37%
NVIDIA GeForce RTX 4070 Laptop GPU
Acer Predator Helios Neo 14 (2024), Ultra 9 185H, 125
104.8 (4.53min, 71.4P1) fps +26%
NVIDIA GeForce RTX 4070 Laptop GPU
Asus ProArt PX13 HN7306, Ryzen AI 9 HX 370, 75
104.5 (9.04min, 66.7P1) fps +25%
NVIDIA GeForce RTX 4060 Laptop GPU
Acer Nitro 14 AN14-41-R3MX, R5 8645HS, 110
100.6 (7.3min, 71.4P1) fps +20%
NVIDIA GeForce RTX 4050 Laptop GPU
Lenovo IdeaPad Pro 5 16IMH G9 RTX 4050, Ultra 9 185H, 90
98.7 (4.28min, 66.7P1) fps +18%
AMD Radeon RX 7600M XT
Minisforum MS-A1 (MGA1 Radeon RX 7600M XT @OCuLink) , Ryzen 7 8700G, 120
97.2 (8.06min, 62.5P1) fps +16%
NVIDIA GeForce RTX 4070 Laptop GPU
Asus ROG Flow Z13 ACRNM, i9-13900H, 65
94.8 (4.6min, 62.5P1) fps +14%
NVIDIA RTX 2000 Ada Generation Laptop GPU
HP ZBook Power 16 G11 A, R7 8845HS, 50
90.3 (5.49min, 55.6P1) fps +8%
AMD Radeon RX 8060S
Asus ROG Flow Z13 GZ302EA-RU073W, Ryzen AI Max+ 395, 80
83.5 (7.23min, 55.6P1) fps
NVIDIA GeForce RTX 4060 Laptop GPU
SCHENKER Key 14 (M24), Ultra 7 155H, 100
79.7 (4.26min, 47.6P1) fps -5%
NVIDIA GeForce RTX 3050 4GB Laptop GPU
HP Envy 17-da0076ng, Ultra 7 155U, 0
48.3 (11.4min, 30.3P1) fps -42%
AMD Radeon 890M
Asus ProArt PX13 HN7306, Ryzen AI 9 HX 370, 0
31.6 (2.04min, 22.7P1) fps -62%
Intel Arc Graphics 140V
Asus Zenbook S 14 UX5406, Core Ultra 7 258V, 0
23.4 (2.44min, 13.3P1) fps -72%
Moyenne de la classe Convertible
  (7.2 - 114.3, n=49, 2 dernières années)
19.4 fps -77%
Intel Arc Graphics 140T
MSI Prestige 16 AI Evo B2HMG, Ultra 9 285H, 0
17 (6.65min, 13P1) fps -80%
Final Fantasy XV Benchmark - 1920x1080 High Quality
NVIDIA RTX 3500 Ada Generation Laptop GPU
HP ZBook Fury 16 G11, i9-14900HX, 105
128.9 fps +49%
NVIDIA GeForce RTX 4060 Laptop GPU
Acer Nitro 14 AN14-41-R3MX, R5 8645HS, 110
106 fps +22%
NVIDIA GeForce RTX 4070 Laptop GPU
Acer Predator Helios Neo 14 (2024), Ultra 9 185H, 125
104.6 fps +21%
NVIDIA GeForce RTX 4070 Laptop GPU
Asus ProArt PX13 HN7306, Ryzen AI 9 HX 370, 75
104 fps +20%
NVIDIA GeForce RTX 4060 Laptop GPU
Asus TUF Gaming A16 FA608WV, Ryzen AI 9 HX 370, 140
102.5 fps +18%
NVIDIA GeForce RTX 4060 Laptop GPU
SCHENKER Key 14 (M24), Ultra 7 155H, 100
94 fps +9%
AMD Radeon RX 7600M XT
Minisforum MS-A1 (MGA1 Radeon RX 7600M XT @OCuLink) , Ryzen 7 8700G, 120
93.6 fps +8%
NVIDIA GeForce RTX 4070 Laptop GPU
Asus ROG Flow Z13 ACRNM, i9-13900H, 65
93.3 fps +8%
NVIDIA GeForce RTX 4050 Laptop GPU
Lenovo IdeaPad Pro 5 16IMH G9 RTX 4050, Ultra 9 185H, 90
87.8 fps +1%
AMD Radeon RX 8060S
Asus ROG Flow Z13 GZ302EA-RU073W, Ryzen AI Max+ 395, 80
86.6 fps
NVIDIA RTX 2000 Ada Generation Laptop GPU
HP ZBook Power 16 G11 A, R7 8845HS, 50
66.3 fps -23%
NVIDIA GeForce RTX 3050 4GB Laptop GPU
HP Envy 17-da0076ng, Ultra 7 155U, 0
39.5 fps -54%
AMD Radeon 890M
Asus ProArt PX13 HN7306, Ryzen AI 9 HX 370, 0
33.2 fps -62%
Intel Arc Graphics 140T
MSI Prestige 16 AI Evo B2HMG, Ultra 9 285H, 0
30.6 fps -65%
Intel Arc Graphics 140V
Asus Zenbook S 14 UX5406, Core Ultra 7 258V, 0
30 fps -65%
Moyenne de la classe Convertible
  (4.48 - 107.1, n=59, 2 dernières années)
23.2 fps -73%
Strange Brigade - 1920x1080 ultra AA:ultra AF:16
NVIDIA RTX 3500 Ada Generation Laptop GPU
HP ZBook Fury 16 G11, i9-14900HX, 105
223 (52.5min, 159.8P1) fps +33%
NVIDIA GeForce RTX 4060 Laptop GPU
Acer Nitro 14 AN14-41-R3MX, R5 8645HS, 110
193.2 (28.8min, 141.1P1) fps +15%
NVIDIA GeForce RTX 4060 Laptop GPU
Asus TUF Gaming A16 FA608WV, Ryzen AI 9 HX 370, 140
191.9 (103.2min, 137.2P1) fps +14%
NVIDIA GeForce RTX 4070 Laptop GPU
Asus ProArt PX13 HN7306, Ryzen AI 9 HX 370, 75
191.7 (74.9min, 144.8P1) fps +14%
NVIDIA GeForce RTX 4060 Laptop GPU
SCHENKER Key 14 (M24), Ultra 7 155H, 100
186 fps +11%
NVIDIA GeForce RTX 4070 Laptop GPU
Acer Predator Helios Neo 14 (2024), Ultra 9 185H, 125
183 (33.8min, 138.5P1) fps +9%
AMD Radeon RX 7600M XT
Minisforum MS-A1 (MGA1 Radeon RX 7600M XT @OCuLink) , Ryzen 7 8700G, 120
179.5 (125.3min, 133.7P1) fps +7%
NVIDIA GeForce RTX 4070 Laptop GPU
Asus ROG Flow Z13 ACRNM, i9-13900H, 65
174.8 (57min, 127.6P1) fps +4%
AMD Radeon RX 8060S
Asus ROG Flow Z13 GZ302EA-RU073W, Ryzen AI Max+ 395, 80
167.9 (68.9min, 108.1P1) fps
NVIDIA GeForce RTX 4050 Laptop GPU
Lenovo IdeaPad Pro 5 16IMH G9 RTX 4050, Ultra 9 185H, 90
149.4 (44.5min, 115.4P1) fps -11%
NVIDIA RTX 2000 Ada Generation Laptop GPU
HP ZBook Power 16 G11 A, R7 8845HS, 50
138.5 (80.1min, 104.4P1) fps -18%
Intel Arc Graphics 140T
MSI Prestige 16 AI Evo B2HMG, Ultra 9 285H, 0
61.6 (45.2min, 49.5P1) fps -63%
NVIDIA GeForce RTX 3050 4GB Laptop GPU
HP Envy 17-da0076ng, Ultra 7 155U, 0
60.4 (44.9min, 47.5P1) fps -64%
AMD Radeon 890M
Asus ProArt PX13 HN7306, Ryzen AI 9 HX 370, 0
55.7 (36min, 42.8P1) fps -67%
Intel Arc Graphics 140V
Asus Zenbook S 14 UX5406, Core Ultra 7 258V, 0
54 (32min, 42.8P1) fps -68%
Moyenne de la classe Convertible
  (10.8 - 196.9, n=54, 2 dernières années)
42.1 fps -75%
Dota 2 Reborn - 1920x1080 ultra (3/3) best looking
NVIDIA RTX 3500 Ada Generation Laptop GPU
HP ZBook Fury 16 G11, i9-14900HX, 105
153.9 (131.9min) fps +8%
AMD Radeon RX 8060S
Asus ROG Flow Z13 GZ302EA-RU073W, Ryzen AI Max+ 395, 80
142 (123.4min) fps
NVIDIA GeForce RTX 4050 Laptop GPU
Lenovo IdeaPad Pro 5 16IMH G9 RTX 4050, Ultra 9 185H, 90
137.4 (115.6min) fps -3%
NVIDIA GeForce RTX 4060 Laptop GPU
Asus TUF Gaming A16 FA608WV, Ryzen AI 9 HX 370, 140
136.2 (117.8min) fps -4%
NVIDIA GeForce RTX 4070 Laptop GPU
Asus ROG Flow Z13 ACRNM, i9-13900H, 65
135 (117.4min) fps -5%
NVIDIA GeForce RTX 4070 Laptop GPU
Acer Predator Helios Neo 14 (2024), Ultra 9 185H, 125
130.8 (114.6min) fps -8%
NVIDIA GeForce RTX 4070 Laptop GPU
Asus ProArt PX13 HN7306, Ryzen AI 9 HX 370, 75
122.8 (106.2min) fps -14%
NVIDIA GeForce RTX 4060 Laptop GPU
SCHENKER Key 14 (M24), Ultra 7 155H, 100
122.6 (97.3min) fps -14%
AMD Radeon RX 7600M XT
Minisforum MS-A1 (MGA1 Radeon RX 7600M XT @OCuLink) , Ryzen 7 8700G, 120
120.8 (106.1min) fps -15%
NVIDIA GeForce RTX 4060 Laptop GPU
Acer Nitro 14 AN14-41-R3MX, R5 8645HS, 110
120.5 (104.4min) fps -15%
NVIDIA RTX 2000 Ada Generation Laptop GPU
HP ZBook Power 16 G11 A, R7 8845HS, 50
119.9 (104.6min) fps -16%
NVIDIA GeForce RTX 3050 4GB Laptop GPU
HP Envy 17-da0076ng, Ultra 7 155U, 0
90 (77.6min) fps -37%
Intel Arc Graphics 140T
MSI Prestige 16 AI Evo B2HMG, Ultra 9 285H, 0
83.8 (45.3min) fps -41%
Intel Arc Graphics 140V
Asus Zenbook S 14 UX5406, Core Ultra 7 258V, 0
62.9 fps -56%
Moyenne de la classe Convertible
  (18.8 - 158.3, n=60, 2 dernières années)
61.2 fps -57%
AMD Radeon 890M
Asus ProArt PX13 HN7306, Ryzen AI 9 HX 370, 0
36 (20.4min) fps -75%
X-Plane 11.11 - 1920x1080 high (fps_test=3)
NVIDIA RTX 3500 Ada Generation Laptop GPU
HP ZBook Fury 16 G11, i9-14900HX, 105
110.9 fps +45%
NVIDIA GeForce RTX 4070 Laptop GPU
Asus ROG Flow Z13 ACRNM, i9-13900H, 65
110.3 fps +44%
NVIDIA GeForce RTX 4050 Laptop GPU
Lenovo IdeaPad Pro 5 16IMH G9 RTX 4050, Ultra 9 185H, 90
89 fps +16%
NVIDIA GeForce RTX 4060 Laptop GPU
SCHENKER Key 14 (M24), Ultra 7 155H, 100
84.6 fps +10%
NVIDIA GeForce RTX 4070 Laptop GPU
Acer Predator Helios Neo 14 (2024), Ultra 9 185H, 125
78 fps +2%
AMD Radeon RX 8060S
Asus ROG Flow Z13 GZ302EA-RU073W, Ryzen AI Max+ 395, 80
76.7 fps
NVIDIA GeForce RTX 4070 Laptop GPU
Asus ProArt PX13 HN7306, Ryzen AI 9 HX 370, 75
74.1 fps -3%
NVIDIA GeForce RTX 4060 Laptop GPU
Acer Nitro 14 AN14-41-R3MX, R5 8645HS, 110
73.4 fps -4%
AMD Radeon RX 7600M XT
Minisforum MS-A1 (MGA1 Radeon RX 7600M XT @OCuLink) , Ryzen 7 8700G, 120
73.2 fps -5%
NVIDIA GeForce RTX 4060 Laptop GPU
Asus TUF Gaming A16 FA608WV, Ryzen AI 9 HX 370, 140
69.9 fps -9%
NVIDIA RTX 2000 Ada Generation Laptop GPU
HP ZBook Power 16 G11 A, R7 8845HS, 50
60.6 fps -21%
NVIDIA GeForce RTX 3050 4GB Laptop GPU
HP Envy 17-da0076ng, Ultra 7 155U, 0
51.6 fps -33%
AMD Radeon 890M
Asus ProArt PX13 HN7306, Ryzen AI 9 HX 370, 0
51.1 fps -33%
Intel Arc Graphics 140T
MSI Prestige 16 AI Evo B2HMG, Ultra 9 285H, 0
38.4 fps -50%
Moyenne de la classe Convertible
  (12.8 - 101.4, n=59, 2 dernières années)
33.5 fps -56%
Intel Arc Graphics 140V
Asus Zenbook S 14 UX5406, Core Ultra 7 258V, 0
29.8 fps -61%

Nous avions également l'ancien Flow Z13 avec la RTX 4070 Laptop, nous l'avons donc utilisée pour une comparaison directe dans des titres modernes (mode Turbo sur les deux appareils). La situation semble meilleure pour la nouvelle Radeon 8060S en 1080p et avec le maximum de détails. Des titres comme Cyberpunk 2077 ou Call of Duty Black Ops 6 montrent un avantage de 13-17 % pour le GPU AMD, alors que de nombreux titres montrent des résultats comparables. Il y a aussi quelques exemples négatifs comme GTA V ou F1 24 (-12 à -21 %). Dans l'ensemble, les deux appareils sont à peu près sur un pied d'égalité.

Gaming 1080p Ultra Performance Rating - Percent
Asus ROG Flow Z13 ACRNM
Intel Core i9-13900H, NVIDIA GeForce RTX 4070 Laptop GPU
97 pt
Asus ROG Flow Z13 GZ302EA-RU073W
AMD Ryzen AI Max+ 395, AMD Radeon RX 8060S
94.7 pt
Cyberpunk 2077 2.1 Phantom Liberty - 1920x1080 Ultra Preset (FSR off)
Asus ROG Flow Z13 GZ302EA-RU073W
AMD Ryzen AI Max+ 395, AMD Radeon RX 8060S
75.6 (62min - 97.7max) fps
Asus ROG Flow Z13 ACRNM
Intel Core i9-13900H, NVIDIA GeForce RTX 4070 Laptop GPU
66.79 (52.29min - 85.64max) fps -12%
Baldur's Gate 3 - 1920x1080 Ultra Preset
Asus ROG Flow Z13 ACRNM
Intel Core i9-13900H, NVIDIA GeForce RTX 4070 Laptop GPU
86.1 (50.7P0.1, 70.2P1) fps +1%
Asus ROG Flow Z13 GZ302EA-RU073W
AMD Ryzen AI Max+ 395, AMD Radeon RX 8060S
85.3 fps
GTA V - 1920x1080 Highest Settings possible AA:4xMSAA + FX AF:16x
Asus ROG Flow Z13 ACRNM
Intel Core i9-13900H, NVIDIA GeForce RTX 4070 Laptop GPU
94.8 (4.6min, 62.5P1 - 170.5max) fps +14%
Asus ROG Flow Z13 GZ302EA-RU073W
AMD Ryzen AI Max+ 395, AMD Radeon RX 8060S
83.5 (7.23min, 55.6P1 - 146.4max) fps
Horizon Forbidden West - 1920x1080 Very High Preset AA:T
Asus ROG Flow Z13 ACRNM
Intel Core i9-13900H, NVIDIA GeForce RTX 4070 Laptop GPU
56.1 (39.5P0.1, 45.4P1) fps +15%
Asus ROG Flow Z13 GZ302EA-RU073W
AMD Ryzen AI Max+ 395, AMD Radeon RX 8060S
48.7 (34.9P0.1, 38.9P1) fps
F1 24 - 1920x1080 Ultra High Preset AA:T AF:16x
Asus ROG Flow Z13 ACRNM
Intel Core i9-13900H, NVIDIA GeForce RTX 4070 Laptop GPU
58.4 (48min, 47P1 - 70max) fps +27%
Asus ROG Flow Z13 GZ302EA-RU073W
AMD Ryzen AI Max+ 395, AMD Radeon RX 8060S
46 (34min - 56max) fps
Black Myth: Wukong - 1920x1080 cinematic TSR 100
Asus ROG Flow Z13 GZ302EA-RU073W
AMD Ryzen AI Max+ 395, AMD Radeon RX 8060S
27 (22min - 31max) fps
Asus ROG Flow Z13 ACRNM
Intel Core i9-13900H, NVIDIA GeForce RTX 4070 Laptop GPU
25 (7min - 28max) fps -7%
God of War Ragnarök - 1920x1080 Ultra Preset AA:T
Asus ROG Flow Z13 ACRNM
Intel Core i9-13900H, NVIDIA GeForce RTX 4070 Laptop GPU
76.2 (42.7P0.1, 51.2P1) fps 0%
Asus ROG Flow Z13 GZ302EA-RU073W
AMD Ryzen AI Max+ 395, AMD Radeon RX 8060S
76.1 fps
Call of Duty Black Ops 6 - 1920x1080 Extreme Preset
Asus ROG Flow Z13 GZ302EA-RU073W
AMD Ryzen AI Max+ 395, AMD Radeon RX 8060S
83 fps
Asus ROG Flow Z13 ACRNM
Intel Core i9-13900H, NVIDIA GeForce RTX 4070 Laptop GPU
71 (50P0.1) fps -14%
Ghost of Tsushima - 1920x1080 Very High Preset AA:T
Asus ROG Flow Z13 ACRNM
Intel Core i9-13900H, NVIDIA GeForce RTX 4070 Laptop GPU
55.3 (32.8P0.1, 41.6P1) fps +8%
Asus ROG Flow Z13 GZ302EA-RU073W
AMD Ryzen AI Max+ 395, AMD Radeon RX 8060S
51.2 fps
Monster Hunter Wilds - 1920x1080 ultra, RT: high, no upscaling
Asus ROG Flow Z13 ACRNM
Intel Core i9-13900H, NVIDIA GeForce RTX 4070 Laptop GPU
39.7 fps +1%
Asus ROG Flow Z13 GZ302EA-RU073W
AMD Ryzen AI Max+ 395, AMD Radeon RX 8060S
39.2 fps
Indiana Jones and the Great Circle - 1920x1080 Very Ultra Preset
Asus ROG Flow Z13 GZ302EA-RU073W
AMD Ryzen AI Max+ 395, AMD Radeon RX 8060S
40.3 (28.5P0.1, 33.3P1) fps
Asus ROG Flow Z13 ACRNM
Intel Core i9-13900H, NVIDIA GeForce RTX 4070 Laptop GPU
39.4 (24.9P0.1, 31.4P1) fps -2%
Star Wars Outlaws - 1920x1080 cinem. ultra
Asus ROG Flow Z13 ACRNM
Intel Core i9-13900H, NVIDIA GeForce RTX 4070 Laptop GPU
35.4 (18.1P0.1, 25.9P1) fps +8%
Asus ROG Flow Z13 GZ302EA-RU073W
AMD Ryzen AI Max+ 395, AMD Radeon RX 8060S
32.7 (11.7P0.1, 16P1) fps

La situation est très similaire en résolution QHD, même si la GeForce Flow Z13 a une avance légèrement plus importante (+5 %). De nombreux titres sont généralement jouables en QHD et avec le maximum de détails, seuls les jeux très exigeants comme Black Myth : Wukong, Star Wars Outlaws, Indiana Jones ou Monster Hunter Wilds descendent en dessous de la barre des 30 fps.

Gaming QHD Ultra Performance Rating - Percent
Asus ROG Flow Z13 ACRNM
Intel Core i9-13900H, NVIDIA GeForce RTX 4070 Laptop GPU
96.2 pt
Asus ROG Flow Z13 GZ302EA-RU073W
AMD Ryzen AI Max+ 395, AMD Radeon RX 8060S
91.9 pt
Cyberpunk 2077 2.1 Phantom Liberty - 2560x1440 Ultra Preset (FSR off)
Asus ROG Flow Z13 GZ302EA-RU073W
AMD Ryzen AI Max+ 395, AMD Radeon RX 8060S
46.4 (39.2min - 60.2max) fps
Asus ROG Flow Z13 ACRNM
Intel Core i9-13900H, NVIDIA GeForce RTX 4070 Laptop GPU
40.1 (33.3min - 52.6max) fps -14%
Baldur's Gate 3 - 2560x1440 Ultra Preset
Asus ROG Flow Z13 ACRNM
Intel Core i9-13900H, NVIDIA GeForce RTX 4070 Laptop GPU
62.3 (48.5P0.1, 52P1) fps +13%
Asus ROG Flow Z13 GZ302EA-RU073W
AMD Ryzen AI Max+ 395, AMD Radeon RX 8060S
55.2 fps
GTA V - 2560x1440 Highest Settings possible AA:4xMSAA + FX AF:16x
Asus ROG Flow Z13 ACRNM
Intel Core i9-13900H, NVIDIA GeForce RTX 4070 Laptop GPU
75.9 (3.4min, 43.5P1 - 128.1max) fps +18%
Asus ROG Flow Z13 GZ302EA-RU073W
AMD Ryzen AI Max+ 395, AMD Radeon RX 8060S
64.3 (8.92min, 45.5P1 - 110.8max) fps
Horizon Forbidden West - 2560x1440 Very High Preset AA:T
Asus ROG Flow Z13 ACRNM
Intel Core i9-13900H, NVIDIA GeForce RTX 4070 Laptop GPU
45.5 (33.7P0.1, 36.4P1) fps +19%
Asus ROG Flow Z13 GZ302EA-RU073W
AMD Ryzen AI Max+ 395, AMD Radeon RX 8060S
38.3 (27P0.1, 31.2P1) fps
F1 24 - 2560x1440 Ultra High Preset AA:T AF:16x
Asus ROG Flow Z13 ACRNM
Intel Core i9-13900H, NVIDIA GeForce RTX 4070 Laptop GPU
36.8 (31min, 30P1 - 44max) fps +28%
Asus ROG Flow Z13 GZ302EA-RU073W
AMD Ryzen AI Max+ 395, AMD Radeon RX 8060S
28.8 (19min, 14P1 - 36max) fps
Black Myth: Wukong - 2560x1440 cinematic TSR 100
Asus ROG Flow Z13 GZ302EA-RU073W
AMD Ryzen AI Max+ 395, AMD Radeon RX 8060S
20 (16min - 22max) fps
Asus ROG Flow Z13 ACRNM
Intel Core i9-13900H, NVIDIA GeForce RTX 4070 Laptop GPU
18 (15min - 20max) fps -10%
God of War Ragnarök - 2560x1440 Ultra Preset AA:T
Asus ROG Flow Z13 ACRNM
Intel Core i9-13900H, NVIDIA GeForce RTX 4070 Laptop GPU
60.5 (40.2P0.1, 47.1P1) fps +5%
Asus ROG Flow Z13 GZ302EA-RU073W
AMD Ryzen AI Max+ 395, AMD Radeon RX 8060S
57.5 fps
Call of Duty Black Ops 6 - 2560x1440 Extreme Preset
Asus ROG Flow Z13 GZ302EA-RU073W
AMD Ryzen AI Max+ 395, AMD Radeon RX 8060S
64 fps
Asus ROG Flow Z13 ACRNM
Intel Core i9-13900H, NVIDIA GeForce RTX 4070 Laptop GPU
52 (38P0.1) fps -19%
Ghost of Tsushima - 2560x1440 Very High Preset AA:T
Asus ROG Flow Z13 ACRNM
Intel Core i9-13900H, NVIDIA GeForce RTX 4070 Laptop GPU
43.6 (28.7P0.1, 36.2P1) fps +9%
Asus ROG Flow Z13 GZ302EA-RU073W
AMD Ryzen AI Max+ 395, AMD Radeon RX 8060S
40.1 fps
Monster Hunter Wilds - 2560x1440 ultra, RT: high, no upscaling
Asus ROG Flow Z13 ACRNM
Intel Core i9-13900H, NVIDIA GeForce RTX 4070 Laptop GPU
29 fps +1%
Asus ROG Flow Z13 GZ302EA-RU073W
AMD Ryzen AI Max+ 395, AMD Radeon RX 8060S
28.8 fps
Star Wars Outlaws - 2560x1440 cinem. ultra
Asus ROG Flow Z13 ACRNM
Intel Core i9-13900H, NVIDIA GeForce RTX 4070 Laptop GPU
25.9 (14.2P0.1, 19.3P1) fps +12%
Asus ROG Flow Z13 GZ302EA-RU073W
AMD Ryzen AI Max+ 395, AMD Radeon RX 8060S
23.1 (5.3P0.1, 12.4P1) fps

Certains titres prennent également en charge l'upscaling FSR 3 pour améliorer les performances, mais cette prise en charge est plus limitée que la technologie DLSS de Nvidia. Nous avons vérifié les résultats dans quelques titres modernes et même si FSR 3 améliore déjà sensiblement les performances, vous constaterez les plus grandes améliorations avec la génération d'images supplémentaires. Les résultats natifs peuvent souvent être plus que doublés et même des titres exigeants comme Black Myth Wukong, Monster Hunter Wilds ou Star Wars Outlaws atteindront des taux d'images par seconde fluides. Du moins en théorie, car l'expérience de jeu peut varier considérablement. Star Wars Outlaws ou Horizon Forbidden West, par exemple, ont souffert d'artefacts visibles et de distorsions d'image, en particulier lors des mouvements.

Gaming performance QHD Ultra settings
Jeu Native FSR 3 FSR3 + FG
Ghost of Tsushima 40.1 fps 52.4 fps 90.8 fps
GoW Ragnarök 57.5 fps 49.7 fps 81.4 fps
Cyberpunk 2077 46.4 fps 64.5 fps 109.7 fps
Monster Hunter Wilds 28.4 fps 36.4 fps 59.3 fps
Horizon Forbidden West 38.3 fps 44.8 fps 69 fps
Black Myth : Wukong 16 fps 25 fps 48 fps
Star Wars Outlaws 19.8 fps 27.4 fps 54.3 fps
CoD Black Ops 6 64 fps 79 fps 114 fps
BasMoyenÉlevéUltraQHD FSRQHD4K
GTA V (2015) 166.9 83.5 64.3 72.9
The Witcher 3 (2015) 101
Dota 2 Reborn (2015) 223 192.3 164.4 142 87
Final Fantasy XV Benchmark (2018) 182.7 117.6 86.6 63.6 34.7
X-Plane 11.11 (2018) 138.8 104.9 76.7 60.4
Strange Brigade (2018) 453 221 192.7 167.9 109.9 57.6
Baldur's Gate 3 (2023) 128.8 100.9 87.9 85.3 55.2 28.6
Cyberpunk 2077 2.1 Phantom Liberty (2023) 124.8 105.3 85 75.6 46.4 18.8
Horizon Forbidden West (2024) 48.7 44.8 38.3
Ghost of Tsushima (2024) 78.1 65.1 59.2 51.2 40.1 23
F1 24 (2024) 207 185.6 147.7 46 28.8 13
Black Myth: Wukong (2024) 27 28 20
Star Wars Outlaws (2024) 32.7 33.3 23.1
God of War Ragnarök (2024) 111.8 96.4 82.8 76.1 49.7 57.5 33.2
Call of Duty Black Ops 6 (2024) 83 79 64
Indiana Jones and the Great Circle (2024) 77.2 49.4 40.3 27.4
Monster Hunter Wilds (2025) 59.8 50.2 39.2 28.8 15.9

Nous utilisons Cyberpunk 2077 pour évaluer l'efficacité du GPU et nous disposons de données pour toutes les plateformes actuelles, mais n'oubliez pas que le jeu est émulé sur des systèmes ARM, ce qui affecte les performances ainsi que l'efficacité. Cela changera très bientôt pour Apple silicon lorsque la version native du jeu sera publiée. Nous avons tout de même inclus les données dans un souci d'exhaustivité.

L'iGPU Radeon 8060S est l'un des modèles les plus efficaces de notre base de données et n'est battu que par certaines versions de l'Arc Graphics 140V, mais le niveau de performance global n'est pas comparable à celui de l'iGPU Strix Halo. La RTX 4070 Laptop du MSI Katana (avec CPU AMD) est également comparable, mais les autres GPU GeForce sont moins performants, surtout lorsqu'ils sont associés à des CPU Intel.

Power Consumption / Cyberpunk 2077 ultra Efficiency
Intel Arc Graphics 140V
Asus Zenbook S 14 UX5406, Core Ultra 7 258V, 0
0.696 fps per Watt +24%
AMD Radeon RX 8060S
Asus ROG Flow Z13 GZ302EA-RU073W, Ryzen AI Max+ 395, 80
0.562 fps per Watt
NVIDIA GeForce RTX 4070 Laptop GPU
MSI Katana A17 AI B8VG, R7 8845HS, 105
0.552 fps per Watt -2%
Intel Arc Graphics 140V
MSI Prestige 13 AI Plus Evo A2VMG, Core Ultra 7 258V, 0
0.542 fps per Watt -4%
NVIDIA GeForce RTX 4070 Laptop GPU
MSI Katana A15 AI B8VG, R9 8945HS, 105
0.507 fps per Watt -10%
NVIDIA GeForce RTX 4050 Laptop GPU
Lenovo Yoga Pro 7 14IMH9, RTX 4050, Ultra 7 155H, 60
0.4984 fps per Watt -11%
Apple M4 Pro 20-Core GPU
Apple MacBook Pro 14 2024 M4 Pro, M4 Pro (14 cores), 32
0.4547 fps per Watt -19%
Apple M4 Max 40-Core GPU
Apple MacBook Pro 16 M4 Max, M4 Max (16 cores), 75
0.4496 fps per Watt -20%
NVIDIA RTX 4000 Ada Generation Laptop GPU
Lenovo ThinkPad P16 Gen 2, i7-14700HX, 130
0.4466 fps per Watt -21%
NVIDIA GeForce RTX 4050 Laptop GPU
Lenovo IdeaPad Pro 5 16IMH G9 RTX 4050, Ultra 9 185H, 90
0.4205 fps per Watt -25%
AMD Radeon 890M
Asus Zenbook S 16 UM5606-RK333W, Ryzen AI 9 HX 370, 0
0.4176 fps per Watt -26%
NVIDIA GeForce RTX 4060 Laptop GPU
Gigabyte G5 KF5 2024, i7-13620H, 75
0.3965 fps per Watt -29%
NVIDIA GeForce RTX 4070 Laptop GPU
Tuxedo Gemini 17 Gen3 AMD, R9 7945HX, 125
0.3749 fps per Watt -33%
Intel Arc Graphics 140T
MSI Prestige 16 AI Evo B2HMG, Ultra 9 285H, 0
0.368 fps per Watt -35%
NVIDIA GeForce RTX 4080 Laptop GPU
SCHENKER XMG Neo 17 E24, i9-14900HX, 175
0.3616 fps per Watt -36%
AMD Radeon 880M
Lenovo ThinkBook 16 G7+ AMD, Ryzen AI 9 365, 0
0.3226 fps per Watt -43%
Qualcomm SD X Adreno X1-85 3.8 TFLOPS
Microsoft Surface Laptop 15 Snapdragon X Elite, SD X Elite X1E-80-100, 0
0.3171 fps per Watt -44%
NVIDIA GeForce RTX 4060 Laptop GPU
Lenovo ThinkBook 16p G5 IRX 21N50011GE, i9-14900HX, 115
0.3004 fps per Watt -47%
NVIDIA GeForce RTX 4060 Laptop GPU
Lenovo ThinkPad P1 Gen 7 21KV001SGE, Ultra 7 155H, 80
0.277 fps per Watt -51%

Performances du système et applications créatives

Les performances du système sont excellentes dans tous les benchmarks. Dans PCMark 10 et CrossMark, le ROG Flow Z13 avec Ryzen AI Max+ 395 bat tous les concurrents, y compris le MacBook Pro 16 M4 Max. Les concurrents ARM de Apple et Qualcomm (au moins les versions rapides du Snapdragon X Elite) sont un peu plus performants dans les tests de navigation.

PCMark 10 / Score
Ryzen AI Max+ 395, Radeon RX 8060S
Asus ROG Flow Z13 GZ302EA-RU073W, 32768
9125 Points
Moyenne AMD Ryzen AI Max+ 395, AMD Radeon RX 8060S
  ()
9125 Points 0%
R9 8945HS, NVIDIA GeForce RTX 4070 Laptop GPU
Razer Blade 14 RZ09-0508, 32768
8312 Points -9%
R9 7940HS, NVIDIA GeForce RTX 4070 Laptop GPU
Razer Blade 14 RTX 4070, 16384
8205 Points -10%
i9-13900H, NVIDIA GeForce RTX 4070 Laptop GPU
Asus ROG Flow Z13 ACRNM, 32768
8018 Points -12%
Ryzen AI 9 HX 370, NVIDIA GeForce RTX 4070 Laptop GPU
Asus ProArt PX13 HN7306, 32768
7696 Points -16%
Ultra 9 185H, NVIDIA GeForce RTX 4070 Laptop GPU
Acer Predator Helios Neo 14 (2024), 32768
7490 Points -18%
R5 8645HS, NVIDIA GeForce RTX 4060 Laptop GPU
Acer Nitro 14 AN14-41-R3MX, 16384
7453 Points -18%
R9 8945HS, NVIDIA GeForce RTX 4070 Laptop GPU
Asus ROG Zephyrus G14 2024 GA403U, 32768
7436 Points -19%
i7-13700H, NVIDIA GeForce RTX 4060 Laptop GPU
Microsoft Surface Laptop Studio 2 RTX 4060, 65536
7351 Points -19%
Moyenne de la classe Convertible
  (3229 - 9125, n=57, 2 dernières années)
6209 Points -32%
PCMark 10 / Essentials
Ryzen AI Max+ 395, Radeon RX 8060S
Asus ROG Flow Z13 GZ302EA-RU073W, 32768
12005 Points
Moyenne AMD Ryzen AI Max+ 395, AMD Radeon RX 8060S
  ()
12005 Points 0%
R9 8945HS, NVIDIA GeForce RTX 4070 Laptop GPU
Razer Blade 14 RZ09-0508, 32768
11290 Points -6%
i9-13900H, NVIDIA GeForce RTX 4070 Laptop GPU
Asus ROG Flow Z13 ACRNM, 32768
11088 Points -8%
R9 7940HS, NVIDIA GeForce RTX 4070 Laptop GPU
Razer Blade 14 RTX 4070, 16384
10952 Points -9%
Ultra 9 185H, NVIDIA GeForce RTX 4070 Laptop GPU
Acer Predator Helios Neo 14 (2024), 32768
10752 Points -10%
Moyenne de la classe Convertible
  (7233 - 12005, n=57, 2 dernières années)
10706 Points -11%
i7-13700H, NVIDIA GeForce RTX 4060 Laptop GPU
Microsoft Surface Laptop Studio 2 RTX 4060, 65536
10696 Points -11%
Ryzen AI 9 HX 370, NVIDIA GeForce RTX 4070 Laptop GPU
Asus ProArt PX13 HN7306, 32768
10144 Points -16%
R9 8945HS, NVIDIA GeForce RTX 4070 Laptop GPU
Asus ROG Zephyrus G14 2024 GA403U, 32768
9861 Points -18%
R5 8645HS, NVIDIA GeForce RTX 4060 Laptop GPU
Acer Nitro 14 AN14-41-R3MX, 16384
9861 Points -18%
PCMark 10 / Productivity
R9 7940HS, NVIDIA GeForce RTX 4070 Laptop GPU
Razer Blade 14 RTX 4070, 16384
10805 Points +4%
Ryzen AI Max+ 395, Radeon RX 8060S
Asus ROG Flow Z13 GZ302EA-RU073W, 32768
10377 Points
Moyenne AMD Ryzen AI Max+ 395, AMD Radeon RX 8060S
  ()
10377 Points 0%
R9 8945HS, NVIDIA GeForce RTX 4070 Laptop GPU
Razer Blade 14 RZ09-0508, 32768
10332 Points 0%
Ryzen AI 9 HX 370, NVIDIA GeForce RTX 4070 Laptop GPU
Asus ProArt PX13 HN7306, 32768
10027 Points -3%
R5 8645HS, NVIDIA GeForce RTX 4060 Laptop GPU
Acer Nitro 14 AN14-41-R3MX, 16384
9972 Points -4%
i9-13900H, NVIDIA GeForce RTX 4070 Laptop GPU
Asus ROG Flow Z13 ACRNM, 32768
9882 Points -5%
R9 8945HS, NVIDIA GeForce RTX 4070 Laptop GPU
Asus ROG Zephyrus G14 2024 GA403U, 32768
9502 Points -8%
i7-13700H, NVIDIA GeForce RTX 4060 Laptop GPU
Microsoft Surface Laptop Studio 2 RTX 4060, 65536
9364 Points -10%
Ultra 9 185H, NVIDIA GeForce RTX 4070 Laptop GPU
Acer Predator Helios Neo 14 (2024), 32768
9330 Points -10%
Moyenne de la classe Convertible
  (4777 - 10800, n=57, 2 dernières années)
8266 Points -20%
PCMark 10 / Digital Content Creation
Ryzen AI Max+ 395, Radeon RX 8060S
Asus ROG Flow Z13 GZ302EA-RU073W, 32768
16551 Points
Moyenne AMD Ryzen AI Max+ 395, AMD Radeon RX 8060S
  ()
16551 Points 0%
R9 8945HS, NVIDIA GeForce RTX 4070 Laptop GPU
Razer Blade 14 RZ09-0508, 32768
13363 Points -19%
i9-13900H, NVIDIA GeForce RTX 4070 Laptop GPU
Asus ROG Flow Z13 ACRNM, 32768
12766 Points -23%
R9 7940HS, NVIDIA GeForce RTX 4070 Laptop GPU
Razer Blade 14 RTX 4070, 16384
12666 Points -23%
Ryzen AI 9 HX 370, NVIDIA GeForce RTX 4070 Laptop GPU
Asus ProArt PX13 HN7306, 32768
12165 Points -26%
R9 8945HS, NVIDIA GeForce RTX 4070 Laptop GPU
Asus ROG Zephyrus G14 2024 GA403U, 32768
11907 Points -28%
R5 8645HS, NVIDIA GeForce RTX 4060 Laptop GPU
Acer Nitro 14 AN14-41-R3MX, 16384
11428 Points -31%
Ultra 9 185H, NVIDIA GeForce RTX 4070 Laptop GPU
Acer Predator Helios Neo 14 (2024), 32768
11369 Points -31%
i7-13700H, NVIDIA GeForce RTX 4060 Laptop GPU
Microsoft Surface Laptop Studio 2 RTX 4060, 65536
10763 Points -35%
Moyenne de la classe Convertible
  (2496 - 16551, n=57, 2 dernières années)
7529 Points -55%
CrossMark / Overall
Ryzen AI Max+ 395, Radeon RX 8060S
Asus ROG Flow Z13 GZ302EA-RU073W, 32768
2274 Points
Moyenne AMD Ryzen AI Max+ 395, AMD Radeon RX 8060S
  ()
2274 Points 0%
M4 Max (16 cores), M4 Max 40-Core GPU
Apple MacBook Pro 16 M4 Max, 49152
2255 Points -1%
M4 Pro (14 cores), M4 Pro 20-Core GPU
Apple MacBook Pro 16 2024 M4 Pro, 49152
2148 Points -6%
M4 Pro (12 cores), M4 Pro 16-Core GPU
Apple MacBook Pro 14 2024 M4 Pro Entry, 24576
2123 Points -7%
M4 (10 cores), M4 10-Core GPU
Apple MacBook Pro 14 2024 M4, 16384
2066 Points -9%
i9-13900H, NVIDIA GeForce RTX 4070 Laptop GPU
Asus ROG Flow Z13 ACRNM, 32768
1937 Points -15%
Ultra 9 185H, NVIDIA GeForce RTX 4070 Laptop GPU
Acer Predator Helios Neo 14 (2024), 32768
1917 Points -16%
R9 8945HS, NVIDIA GeForce RTX 4070 Laptop GPU
Razer Blade 14 RZ09-0508, 32768
1830 Points -20%
R9 7940HS, NVIDIA GeForce RTX 4070 Laptop GPU
Razer Blade 14 RTX 4070, 16384
1812 Points -20%
Ryzen AI 9 HX 370, NVIDIA GeForce RTX 4070 Laptop GPU
Asus ProArt PX13 HN7306, 32768
1785 Points -22%
R9 8945HS, NVIDIA GeForce RTX 4070 Laptop GPU
Asus ROG Zephyrus G14 2024 GA403U, 32768
1767 Points -22%
R5 8645HS, NVIDIA GeForce RTX 4060 Laptop GPU
Acer Nitro 14 AN14-41-R3MX, 16384
1765 Points -22%
i7-13700H, NVIDIA GeForce RTX 4060 Laptop GPU
Microsoft Surface Laptop Studio 2 RTX 4060, 65536
1733 Points -24%
Moyenne de la classe Convertible
  (524 - 2274, n=60, 2 dernières années)
1500 Points -34%
SD X Elite X1E-84-100, Adreno X1-85 4.6 TFLOPS
Samsung Galaxy Book4 Edge 16 X1E-84-100, 16384
1416 Points -38%
SD X Elite X1E-80-100, Adreno X1-85 3.8 TFLOPS
Microsoft Surface Laptop 15 Snapdragon X Elite, 16384
1385 Points -39%
SD X Elite X1E-78-100, Adreno X1-85 3.8 TFLOPS
Lenovo Yoga Slim 7X 14Q8X9, 32768
1255 Points -45%
CrossMark / Productivity
M4 Max (16 cores), M4 Max 40-Core GPU
Apple MacBook Pro 16 M4 Max, 49152
2042 Points +6%
M4 Pro (14 cores), M4 Pro 20-Core GPU
Apple MacBook Pro 16 2024 M4 Pro, 49152
1980 Points +3%
M4 Pro (12 cores), M4 Pro 16-Core GPU
Apple MacBook Pro 14 2024 M4 Pro Entry, 24576
1936 Points +1%
M4 (10 cores), M4 10-Core GPU
Apple MacBook Pro 14 2024 M4, 16384
1933 Points 0%
Ryzen AI Max+ 395, Radeon RX 8060S
Asus ROG Flow Z13 GZ302EA-RU073W, 32768
1925 Points
Moyenne AMD Ryzen AI Max+ 395, AMD Radeon RX 8060S
  ()
1925 Points 0%
Ultra 9 185H, NVIDIA GeForce RTX 4070 Laptop GPU
Acer Predator Helios Neo 14 (2024), 32768
1849 Points -4%
i9-13900H, NVIDIA GeForce RTX 4070 Laptop GPU
Asus ROG Flow Z13 ACRNM, 32768
1820 Points -5%
R9 8945HS, NVIDIA GeForce RTX 4070 Laptop GPU
Razer Blade 14 RZ09-0508, 32768
1783 Points -7%
R9 7940HS, NVIDIA GeForce RTX 4070 Laptop GPU
Razer Blade 14 RTX 4070, 16384
1762 Points -8%
R5 8645HS, NVIDIA GeForce RTX 4060 Laptop GPU
Acer Nitro 14 AN14-41-R3MX, 16384
1736 Points -10%
R9 8945HS, NVIDIA GeForce RTX 4070 Laptop GPU
Asus ROG Zephyrus G14 2024 GA403U, 32768
1686 Points -12%
i7-13700H, NVIDIA GeForce RTX 4060 Laptop GPU
Microsoft Surface Laptop Studio 2 RTX 4060, 65536
1618 Points -16%
Ryzen AI 9 HX 370, NVIDIA GeForce RTX 4070 Laptop GPU
Asus ProArt PX13 HN7306, 32768
1611 Points -16%
Moyenne de la classe Convertible
  (554 - 1925, n=60, 2 dernières années)
1456 Points -24%
SD X Elite X1E-84-100, Adreno X1-85 4.6 TFLOPS
Samsung Galaxy Book4 Edge 16 X1E-84-100, 16384
1330 Points -31%
SD X Elite X1E-80-100, Adreno X1-85 3.8 TFLOPS
Microsoft Surface Laptop 15 Snapdragon X Elite, 16384
1303 Points -32%
SD X Elite X1E-78-100, Adreno X1-85 3.8 TFLOPS
Lenovo Yoga Slim 7X 14Q8X9, 32768
1152 Points -40%
CrossMark / Creativity
Ryzen AI Max+ 395, Radeon RX 8060S
Asus ROG Flow Z13 GZ302EA-RU073W, 32768
2949 Points
Moyenne AMD Ryzen AI Max+ 395, AMD Radeon RX 8060S
  ()
2949 Points 0%
M4 Max (16 cores), M4 Max 40-Core GPU
Apple MacBook Pro 16 M4 Max, 49152
2795 Points -5%
M4 Pro (12 cores), M4 Pro 16-Core GPU
Apple MacBook Pro 14 2024 M4 Pro Entry, 24576
2594 Points -12%
M4 Pro (14 cores), M4 Pro 20-Core GPU
Apple MacBook Pro 16 2024 M4 Pro, 49152
2590 Points -12%
M4 (10 cores), M4 10-Core GPU
Apple MacBook Pro 14 2024 M4, 16384
2420 Points -18%
Ryzen AI 9 HX 370, NVIDIA GeForce RTX 4070 Laptop GPU
Asus ProArt PX13 HN7306, 32768
2212 Points -25%
i9-13900H, NVIDIA GeForce RTX 4070 Laptop GPU
Asus ROG Flow Z13 ACRNM, 32768
2172 Points -26%
Ultra 9 185H, NVIDIA GeForce RTX 4070 Laptop GPU
Acer Predator Helios Neo 14 (2024), 32768
2008 Points -32%
i7-13700H, NVIDIA GeForce RTX 4060 Laptop GPU
Microsoft Surface Laptop Studio 2 RTX 4060, 65536
2001 Points -32%
R9 8945HS, NVIDIA GeForce RTX 4070 Laptop GPU
Asus ROG Zephyrus G14 2024 GA403U, 32768
1960 Points -34%
R9 7940HS, NVIDIA GeForce RTX 4070 Laptop GPU
Razer Blade 14 RTX 4070, 16384
1952 Points -34%
R9 8945HS, NVIDIA GeForce RTX 4070 Laptop GPU
Razer Blade 14 RZ09-0508, 32768
1935 Points -34%
R5 8645HS, NVIDIA GeForce RTX 4060 Laptop GPU
Acer Nitro 14 AN14-41-R3MX, 16384
1823 Points -38%
Moyenne de la classe Convertible
  (550 - 2949, n=60, 2 dernières années)
1629 Points -45%
SD X Elite X1E-84-100, Adreno X1-85 4.6 TFLOPS
Samsung Galaxy Book4 Edge 16 X1E-84-100, 16384
1595 Points -46%
SD X Elite X1E-80-100, Adreno X1-85 3.8 TFLOPS
Microsoft Surface Laptop 15 Snapdragon X Elite, 16384
1496 Points -49%
SD X Elite X1E-78-100, Adreno X1-85 3.8 TFLOPS
Lenovo Yoga Slim 7X 14Q8X9, 32768
1423 Points -52%
CrossMark / Responsiveness
Ultra 9 185H, NVIDIA GeForce RTX 4070 Laptop GPU
Acer Predator Helios Neo 14 (2024), 32768
1856 Points +8%
Ryzen AI Max+ 395, Radeon RX 8060S
Asus ROG Flow Z13 GZ302EA-RU073W, 32768
1719 Points
Moyenne AMD Ryzen AI Max+ 395, AMD Radeon RX 8060S
  ()
1719 Points 0%
R5 8645HS, NVIDIA GeForce RTX 4060 Laptop GPU
Acer Nitro 14 AN14-41-R3MX, 16384
1681 Points -2%
R9 8945HS, NVIDIA GeForce RTX 4070 Laptop GPU
Razer Blade 14 RZ09-0508, 32768
1672 Points -3%
i9-13900H, NVIDIA GeForce RTX 4070 Laptop GPU
Asus ROG Flow Z13 ACRNM, 32768
1654 Points -4%
M4 Max (16 cores), M4 Max 40-Core GPU
Apple MacBook Pro 16 M4 Max, 49152
1595 Points -7%
R9 7940HS, NVIDIA GeForce RTX 4070 Laptop GPU
Razer Blade 14 RTX 4070, 16384
1575 Points -8%
M4 (10 cores), M4 10-Core GPU
Apple MacBook Pro 14 2024 M4, 16384
1569 Points -9%
M4 Pro (14 cores), M4 Pro 20-Core GPU
Apple MacBook Pro 16 2024 M4 Pro, 49152
1566 Points -9%
M4 Pro (12 cores), M4 Pro 16-Core GPU
Apple MacBook Pro 14 2024 M4 Pro Entry, 24576
1533 Points -11%
R9 8945HS, NVIDIA GeForce RTX 4070 Laptop GPU
Asus ROG Zephyrus G14 2024 GA403U, 32768
1489 Points -13%
i7-13700H, NVIDIA GeForce RTX 4060 Laptop GPU
Microsoft Surface Laptop Studio 2 RTX 4060, 65536
1381 Points -20%
SD X Elite X1E-80-100, Adreno X1-85 3.8 TFLOPS
Microsoft Surface Laptop 15 Snapdragon X Elite, 16384
1320 Points -23%
Ryzen AI 9 HX 370, NVIDIA GeForce RTX 4070 Laptop GPU
Asus ProArt PX13 HN7306, 32768
1274 Points -26%
Moyenne de la classe Convertible
  (381 - 1868, n=60, 2 dernières années)
1264 Points -26%
SD X Elite X1E-84-100, Adreno X1-85 4.6 TFLOPS
Samsung Galaxy Book4 Edge 16 X1E-84-100, 16384
1197 Points -30%
SD X Elite X1E-78-100, Adreno X1-85 3.8 TFLOPS
Lenovo Yoga Slim 7X 14Q8X9, 32768
1116 Points -35%
WebXPRT 3 / Overall
M4 Max (16 cores), M4 Max 40-Core GPU
Apple MacBook Pro 16 M4 Max, 49152
543 Points +52%
M4 Pro (12 cores), M4 Pro 16-Core GPU
Apple MacBook Pro 14 2024 M4 Pro Entry, 24576
525 Points +47%
M4 Pro (14 cores), M4 Pro 20-Core GPU
Apple MacBook Pro 16 2024 M4 Pro, 49152
525 Points +47%
SD X Elite X1E-84-100, Adreno X1-85 4.6 TFLOPS
Samsung Galaxy Book4 Edge 16 X1E-84-100, 16384
476 Points +33%
M4 (10 cores), M4 10-Core GPU
Apple MacBook Pro 14 2024 M4, 16384
469 Points +31%
SD X Elite X1E-80-100, Adreno X1-85 3.8 TFLOPS
Microsoft Surface Laptop 15 Snapdragon X Elite, 16384
444 Points +24%
SD X Elite X1E-78-100, Adreno X1-85 3.8 TFLOPS
Lenovo Yoga Slim 7X 14Q8X9, 32768
421 Points +18%
Ryzen AI Max+ 395, Radeon RX 8060S
Asus ROG Flow Z13 GZ302EA-RU073W, 32768
358 Points
Moyenne AMD Ryzen AI Max+ 395, AMD Radeon RX 8060S
  ()
358 Points 0%
R9 8945HS, NVIDIA GeForce RTX 4070 Laptop GPU
Razer Blade 14 RZ09-0508, 32768
324 Points -9%
R9 7940HS, NVIDIA GeForce RTX 4070 Laptop GPU
Razer Blade 14 RTX 4070, 16384
317 Points -11%
i9-13900H, NVIDIA GeForce RTX 4070 Laptop GPU
Asus ROG Flow Z13 ACRNM, 32768
314 Points -12%
i7-13700H, NVIDIA GeForce RTX 4060 Laptop GPU
Microsoft Surface Laptop Studio 2 RTX 4060, 65536
303 Points -15%
R9 8945HS, NVIDIA GeForce RTX 4070 Laptop GPU
Asus ROG Zephyrus G14 2024 GA403U, 32768
303 Points -15%
R5 8645HS, NVIDIA GeForce RTX 4060 Laptop GPU
Acer Nitro 14 AN14-41-R3MX, 16384
295 Points -18%
Ultra 9 185H, NVIDIA GeForce RTX 4070 Laptop GPU
Acer Predator Helios Neo 14 (2024), 32768
287 Points -20%
Ryzen AI 9 HX 370, NVIDIA GeForce RTX 4070 Laptop GPU
Asus ProArt PX13 HN7306, 32768
282 Points -21%
Moyenne de la classe Convertible
  (171 - 426, n=61, 2 dernières années)
278 Points -22%
WebXPRT 4 / Overall
M4 Max (16 cores), M4 Max 40-Core GPU
Apple MacBook Pro 16 M4 Max, 49152
353 Points +11%
M4 Pro (12 cores), M4 Pro 16-Core GPU
Apple MacBook Pro 14 2024 M4 Pro Entry, 24576
338 Points +7%
M4 Pro (14 cores), M4 Pro 20-Core GPU
Apple MacBook Pro 16 2024 M4 Pro, 49152
337 Points +6%
SD X Elite X1E-84-100, Adreno X1-85 4.6 TFLOPS
Samsung Galaxy Book4 Edge 16 X1E-84-100, 16384
334 Points +5%
M4 (10 cores), M4 10-Core GPU
Apple MacBook Pro 14 2024 M4, 16384
333 Points +5%
Ryzen AI Max+ 395, Radeon RX 8060S
Asus ROG Flow Z13 GZ302EA-RU073W, 32768
317 Points
Moyenne AMD Ryzen AI Max+ 395, AMD Radeon RX 8060S
  ()
317 Points 0%
SD X Elite X1E-80-100, Adreno X1-85 3.8 TFLOPS
Microsoft Surface Laptop 15 Snapdragon X Elite, 16384
313 Points -1%
SD X Elite X1E-78-100, Adreno X1-85 3.8 TFLOPS
Lenovo Yoga Slim 7X 14Q8X9, 32768
291 Points -8%
i9-13900H, NVIDIA GeForce RTX 4070 Laptop GPU
Asus ROG Flow Z13 ACRNM, 32768
288 Points -9%
i7-13700H, NVIDIA GeForce RTX 4060 Laptop GPU
Microsoft Surface Laptop Studio 2 RTX 4060, 65536
272 Points -14%
R9 8945HS, NVIDIA GeForce RTX 4070 Laptop GPU
Razer Blade 14 RZ09-0508, 32768
269 Points -15%
R9 7940HS, NVIDIA GeForce RTX 4070 Laptop GPU
Razer Blade 14 RTX 4070, 16384
260 Points -18%
Ultra 9 185H, NVIDIA GeForce RTX 4070 Laptop GPU
Acer Predator Helios Neo 14 (2024), 32768
260 Points -18%
R9 8945HS, NVIDIA GeForce RTX 4070 Laptop GPU
Asus ROG Zephyrus G14 2024 GA403U, 32768
250 Points -21%
R5 8645HS, NVIDIA GeForce RTX 4060 Laptop GPU
Acer Nitro 14 AN14-41-R3MX, 16384
248 Points -22%
Ryzen AI 9 HX 370, NVIDIA GeForce RTX 4070 Laptop GPU
Asus ProArt PX13 HN7306, 32768
247 Points -22%
Moyenne de la classe Convertible
  (91.2 - 317, n=58, 2 dernières années)
238 Points -25%
Mozilla Kraken 1.1 / Total
Moyenne de la classe Convertible
  (407 - 1089, n=61, 2 dernières années)
560 ms * -32%
R5 8645HS, NVIDIA GeForce RTX 4060 Laptop GPU
Acer Nitro 14 AN14-41-R3MX, 16384
547 ms * -29%
R9 8945HS, NVIDIA GeForce RTX 4070 Laptop GPU
Asus ROG Zephyrus G14 2024 GA403U, 32768
509 ms * -20%
Ultra 9 185H, NVIDIA GeForce RTX 4070 Laptop GPU
Acer Predator Helios Neo 14 (2024), 32768
508 ms * -20%
R9 7940HS, NVIDIA GeForce RTX 4070 Laptop GPU
Razer Blade 14 RTX 4070, 16384
499 ms * -17%
i7-13700H, NVIDIA GeForce RTX 4060 Laptop GPU
Microsoft Surface Laptop Studio 2 RTX 4060, 65536
495 ms * -16%
R9 8945HS, NVIDIA GeForce RTX 4070 Laptop GPU
Razer Blade 14 RZ09-0508, 32768
488 ms * -15%
i9-13900H, NVIDIA GeForce RTX 4070 Laptop GPU
Asus ROG Flow Z13 ACRNM, 32768
469 ms * -10%
Ryzen AI 9 HX 370, NVIDIA GeForce RTX 4070 Laptop GPU
Asus ProArt PX13 HN7306, 32768
460 ms * -8%
SD X Elite X1E-78-100, Adreno X1-85 3.8 TFLOPS
Lenovo Yoga Slim 7X 14Q8X9, 32768
453.1 ms * -7%
Ryzen AI Max+ 395, Radeon RX 8060S
Asus ROG Flow Z13 GZ302EA-RU073W, 32768
425 ms *
Moyenne AMD Ryzen AI Max+ 395, AMD Radeon RX 8060S
  ()
425 ms * -0%
SD X Elite X1E-80-100, Adreno X1-85 3.8 TFLOPS
Microsoft Surface Laptop 15 Snapdragon X Elite, 16384
399.4 ms * +6%
SD X Elite X1E-84-100, Adreno X1-85 4.6 TFLOPS
Samsung Galaxy Book4 Edge 16 X1E-84-100, 16384
381.2 ms * +10%
M4 (10 cores), M4 10-Core GPU
Apple MacBook Pro 14 2024 M4, 16384
263.7 ms * +38%
M4 Max (16 cores), M4 Max 40-Core GPU
Apple MacBook Pro 16 M4 Max, 49152
256.2 ms * +40%
M4 Pro (12 cores), M4 Pro 16-Core GPU
Apple MacBook Pro 14 2024 M4 Pro Entry, 24576
256 ms * +40%
M4 Pro (14 cores), M4 Pro 20-Core GPU
Apple MacBook Pro 16 2024 M4 Pro, 49152
254.3 ms * +40%

* ... Moindre est la valeur, meilleures sont les performances

Les résultats des deux tests PugetBench pour Adobe Photoshop et Premiere Pro sont également décents, mais il y a eu des limitations pour DaVinci Resolve. Le résultat du test Basic est meilleur que celui de la RTX 4070 Laptop, mais nous avons rencontré deux plantages lors de l'édition d'une de nos vidéos, ce qui n'arrive presque jamais avec les GPU Nvidia. Pour l'instant, nous ne pouvons pas vérifier si ce problème est dû au logiciel ou aux pilotes du GPU.

Photoshop PugetBench: Overall Score 1.01 | Premiere Pro PugetBench: Overall Score 1.1 | DaVinci Resolve PugetBench: Basic Score 1.1
Photoshop PugetBench / Overall Score 1.01
M4 Max (16 cores), M4 Max 40-Core GPU
Apple MacBook Pro 16 M4 Max, 49152
13859 Points +27%
M4 Pro (14 cores), M4 Pro 20-Core GPU
Apple MacBook Pro 16 2024 M4 Pro, 49152
12494 Points +15%
Ryzen AI Max+ 395, Radeon RX 8060S
Asus ROG Flow Z13 GZ302EA-RU073W, 32768
10901 Points
M4 (10 cores), M4 10-Core GPU
Apple MacBook Pro 14 2024 M4, 16384
10502 Points -4%
R9 7945HX, NVIDIA GeForce RTX 4070 Laptop GPU
Tuxedo Gemini 17 Gen3 AMD, 32768
8197 Points -25%
Ultra 9 285H, Arc 140T
Asus ZenBook Duo OLED UX8406CA, 32768
7934 Points -27%
i9-13900H, NVIDIA GeForce RTX 4070 Laptop GPU
Asus ROG Flow Z13 ACRNM, 32768
7829 Points -28%
Ryzen AI 7 PRO 360, Radeon 880M
Lenovo ThinkPad T14s Gen 6 21M2S00G00, 32768
7343 Points -33%
Core Ultra 7 256V, Arc 140V
Dell XPS 13 9350, 16384
6854 Points -37%
Premiere Pro PugetBench / Overall Score 1.1
M4 Max (16 cores), M4 Max 40-Core GPU
Apple MacBook Pro 16 M4 Max, 49152
12412 Points +63%
R9 7945HX, NVIDIA GeForce RTX 4070 Laptop GPU
Tuxedo Gemini 17 Gen3 AMD, 32768
9303 Points +22%
M4 Pro (14 cores), M4 Pro 20-Core GPU
Apple MacBook Pro 16 2024 M4 Pro, 49152
8835 Points +16%
Ryzen AI Max+ 395, Radeon RX 8060S
Asus ROG Flow Z13 GZ302EA-RU073W, 32768
7632 Points
i9-13900H, NVIDIA GeForce RTX 4070 Laptop GPU
Asus ROG Flow Z13 ACRNM, 32768
7436 Points -3%
M4 (10 cores), M4 10-Core GPU
Apple MacBook Pro 14 2024 M4, 16384
4903 Points -36%
Ultra 9 285H, Arc 140T
Asus ZenBook Duo OLED UX8406CA, 32768
3627 Points -52%
Core Ultra 7 256V, Arc 140V
Dell XPS 13 9350, 16384
3330 Points -56%
Ryzen AI 7 PRO 360, Radeon 880M
Lenovo ThinkPad T14s Gen 6 21M2S00G00, 32768
2661 Points -65%
DaVinci Resolve PugetBench / Basic Score 1.1
i9-14900HX, NVIDIA GeForce RTX 4090 Laptop GPU
Razer Blade 16 2024, RTX 4090, 32768
8573 Points +16%
Ryzen AI Max+ 395, Radeon RX 8060S
Asus ROG Flow Z13 GZ302EA-RU073W, 32768
7387 Points
Ryzen AI 9 HX 370, NVIDIA GeForce RTX 4070 Laptop GPU
Asus ROG Zephyrus G16 GA605WI, 32768
6998 Points -5%
i9-13900H, NVIDIA GeForce RTX 4070 Laptop GPU
Asus ROG Flow Z13 ACRNM, 32768
6659 Points -10%
Ultra 9 285H, Arc 140T
Asus ZenBook Duo OLED UX8406CA, 32768
2762 Points -63%
Photoshop PugetBench: Overall Score 1.01 | Premiere Pro PugetBench: Overall Score 1.1 | DaVinci Resolve PugetBench: Basic Score 1.1

Verdict - Des performances impressionnantes, mais des questions sur la disponibilité et le prix

Les nouveaux AMD Ryzen AI Max+ 395 est un matériel impressionnant et c'est certainement le processeur graphique x86 le plus rapide, et de loin. Les performances du processeur multicœur sont également excellentes et la Radeon 8060S peut rivaliser avec les performances de jeu de l'ordinateur portable GeForce RTX 4070 dans des plages de TDP similaires. La puce est également adaptée aux appareils plus compacts car vous ne devez implémenter qu'un seul processeur. Grâce à la mémoire partagée, il peut également y avoir des avantages pour l'édition d'images et de vidéos, où les 8 à 12 Go de VRAM des dGPU actuels peuvent rapidement devenir une limite. Par rapport à la génération M4 actuelle de Apple, le modèle phare Ryzen AI Max+ 395 peut rivaliser assez bien avec le modèle plus rapide M4 Pro plus rapide (à l'exception des performances à cœur unique, où Apple bat tous les concurrents à l'heure actuelle), mais le modèle M4 Max est hors de portée.

Il reste encore quelques questions sans réponse, car les deux plus petites APU Strix Halo offrent moins de cœurs de CPU et des iGPU Radeon 8050S plus lents. Reste à savoir si ces APU auront du succès, surtout si l'on tient compte de leur prix élevé. Le ROG Flow Z13 avec le Ryzen AI Max+ 395 et 32 Go de RAM coûte déjà 2499 euros, bien qu'il s'agisse du SKU le plus petit en termes de RAM. Nous n'avons pas encore de prix pour les modèles avec 64 ou 128 Go de RAM.

Cela nous amène au problème suivant, la disponibilité. Jusqu'à présent, seuls les modèles Asus ROG Flow Z13 GZ302 ainsi que le HP ZBook Ultra 14 G1a ont été annoncés avec des APU Strix Halo. Si vous combinez tous ces facteurs, les Strix Halo seront probablement assez rares et les exceptions pour les appareils multimédias, qui seront probablement à nouveau dominés par la combinaison des CPU Intel et des GPU Nvidia.

Please share our article, every link counts!
Mail Logo
> Revues et rapports de ordinateurs portatifs et smartphones, ordiphones > Critiques > Analyse AMD Ryzen AI Max+ 395 - Strix Halo rivalise avec Apple M4 Pro/Max avec 16 cœurs Zen 5 et un iGPU à la hauteur de la RTX 4070 Ordinateur portable
Andreas Osthoff, 2025-02-19 (Update: 2025-02-19)