Notebookcheck Logo
Teaser

Revue du Beelink SER9 : Le Zen 5 d'AMD rend ce mini PC plus rapide que jamais

Le nouveau processeur Ryzen AI 9 améliore encore les performances.

Beelink fait monter les enchères dans le domaine des mini-PC en intégrant le dernier CPU Ryzen 9 d'AMD avant la plupart des autres concurrents. Le prix a également augmenté en conséquence, ce qui en fait l'une des offres les plus chères du fabricant.
Allen Ngo, 👁 Allen Ngo (traduit par DeepL / Ninh Duy) Published 🇺🇸
Zen 5 AMD Mini PC

Verdict

Le SER8 était déjà un excellent mini PC avec sa refonte complète, son processeur moderne AMD Zen 4 et ses ports révisés. Le SER9 double les performances en passant à un processeur Zen 5 encore plus rapide que les utilisateurs intensifs apprécieront. Le nouveau processeur Ryzen 9 AI est plus rapide et plus silencieux que prévu compte tenu de la taille du SER9.

Le SER9 n'est pas parfait, bien sûr, car des fonctions communes à d'autres mini-PC comme le montage VESA, la RAM évolutive ou le verrouillage Kensington sont toutes absentes sur le Beelink. En outre, le système est légèrement plus grand et plus lourd que de nombreux concurrents, en partie à cause des haut-parleurs stéréo intégrés et du refroidissement par chambre à vapeur. Il est certainement plus rapide que beaucoup d'autres options disponibles, mais vous en paierez le prix en termes de taille et de consommation d'énergie.

Points positifs

+ performances très rapides du CPU et du GPU pour la taille de l'appareil
+ amélioration respectable des performances par rapport au Zen 4
+ haut-parleurs stéréo intégrés
+ châssis métallique de haute qualité
+ petite brique d'alimentation de 100 W
+ plusieurs ports USB-C

Points négatifs

- La RAM est désormais soudée et ne peut pas être mise à niveau par l'utilisateur
- lecture vidéo 4K60 imparfaite
- pas de prise en charge du Wi-Fi 6E ou du Wi-Fi 7
- pas de prise en charge du montage VESA
- risque de bégaiement lors des jeux
- prix élevé

Prix et disponibilité

Amazon propose actuellement le SER9 pour un peu moins de 1000 $ en promotion.

Amazon Logo
$999.00
Beelink SER9 Mini Desktop PC with AMD Ryzen AI 9 HX 370 12C/24T, 32GB DDR5 1TB NVMe M.2 SSD, Triple Display Output, WiFi 6, 2.5G RJ45, Bluetooth 5.2 W-11 Mini Computer

Comparaison des alternatives possibles

Image
Modèle
Price
Poids
Épaisseur
Display
1.
77.1%
Beelink SER9
Beelink SER9
AMD Ryzen AI 9 HX 370 ⎘
AMD Radeon 890M ⎘
32 Go Mémoire, 1024 Go SSD
Amazon: $999.00
List Price: 1000 USD
814 g44.7 mmx
2.
74.9%
Beelink SER8
Beelink SER8
AMD Ryzen 7 8845HS ⎘
AMD Radeon 780M ⎘
32 Go Mémoire, 1024 Go SSD
Amazon:
1. $749.00
Beelink SER8 Mini PC, AMD Ry...
2. $619.00
Beelink SER8 Mini PC, AMD Ry...
3. $619.00
Beelink SER8 Mini PC W11 Pro...
List Price: 650 USD
776 g44.7 mmx
3.
Beelink SEi11 Pro
Beelink SEi11 Pro
Intel Core i5-11320H ⎘
Intel Iris Xe Graphics G7 96EUs ⎘
16 Go Mémoire, 500 Go SSD
Amazon:
1. $19.99
CASIMY 19V 3.42A Mini PC Ada...
2. $18.99
GRNPOWCN Mini PC Adapter 19V...
3. 
Beelink EQi12 Mini PC, Intel...
List Price: 430 USD
440 g40 mmx
4.
66.1%
MSI Cubi NUC 1M
MSI Cubi NUC 1M
Intel Core 7 150U ⎘
Intel Iris Xe Graphics G7 96EUs ⎘
16 Go Mémoire, 1024 Go SSD
Amazon: $689.00
List Price: 950 USD
660 g50.1 mmx
5.
67.3%
GMK NucBox K9
GMK NucBox K9
Intel Core Ultra 5 125H ⎘
Intel Arc 7-Core iGPU ⎘
32 Go Mémoire, 1024 Go SSD
Amazon: $759.98
List Price: 560 USD
528 g47 mmx
6.
75.3%
Asus NUC 14 Pro+
Asus NUC 14 Pro+
Intel Core Ultra 9 185H ⎘
Intel Arc 8-Core iGPU ⎘
32 Go Mémoire, 1024 Go SSD
Amazon:
1. $649.00
ASUS NUC 14 Pro Tall Barebon...
2. $1,050.00
ASUS NUC 14 Pro+ Full System...
3. $1,099.00
ASUS NUC 14 Pro AI Mini Pc, ...
List Price: 1250 EUR
622 g41 mmx

Le SER9 succède au SER8 en remplaçant le CPU Zen 4 Ryzen 7 8845HS par le plus récent Zen 5 Ryzen AI 9 HX 370. Le châssis est par ailleurs identique.

Notre configuration est équipée du CPU Zen 5 susmentionné, de 32 Go de RAM et d'un SSD NVMe de 1 To pour un prix de détail de 1000 USD. Aucun autre SKU n'est disponible à l'heure où nous écrivons ces lignes.

Les alternatives au SER9 comprennent d'autres mini PC haut de gamme de la série H, comme le GMK NucBox K9, Asus NUC 14 Proou le Bosgame M1.

Plus d'avis sur Beelink :

Spécifications

Beelink SER9
Processeur
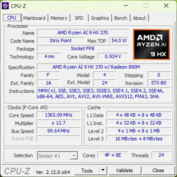
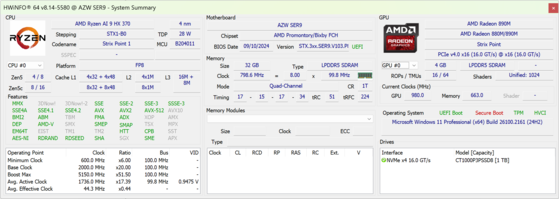
AMD Ryzen AI 9 HX 370 12 x 2 - 5.1 GHz, 54 W PL2 / Short Burst, 54 W PL1 / Sustained, Strix Point-HX (Zen 5/5c)
Carte graphique
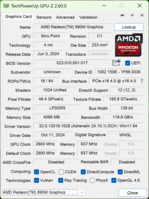
AMD Radeon 890M - 4 Go VRAM, Processeur: 2900 MHz, Mémoire: 937 MHz, LPDDR5, 32.0.12019.1028
Mémoire
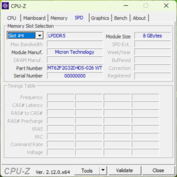
32 Go 
, LPDDR5x, 7500 MHz
Carte mère
AMD Promontory/Bixby FCH
Disque dur
Crucial P3 Plus CT1000P3PSSD8, 1024 Go 
Carte son
AMD Zen - Audio Processor - HD Audio Controller
Connexions
2 USB 2.0, 3 USB 3.0 / 3.1 Gen1, 1 USB 4.0 40 Gbps, 1 Thunderbolt, USB-C Power Delivery (PD), 1 HDMI, 2 DisplayPort, Connectique audio: 2x 3.5 mm combo
Réseau
Realtek RTL8125 2.5GBe Family Ethernet Controller (10/100/1000/2500MBit/s), Intel Wi-Fi 6 AX200 (a/b/g/n = Wi-Fi 4/ac = Wi-Fi 5/ax = Wi-Fi 6/), Bluetooth 5.2
Taille
Hauteur x Largeur x Profondeur (en mm): 44.7 x 135 x 135
Système d'exploitation
Microsoft Windows 11 Pro
Fonctionnalités additionnelles
HDMI cable, 12 Mois Garantie
Poids
814 g, Alimentation: 277 g
Prix
1000 USD
Amazon
Remarque : le fabricant peut utiliser des composants provenant de différents fournisseurs, notamment des panneaux d'affichage, des lecteurs ou des clés USB ayant des spécifications similaires.


Cas

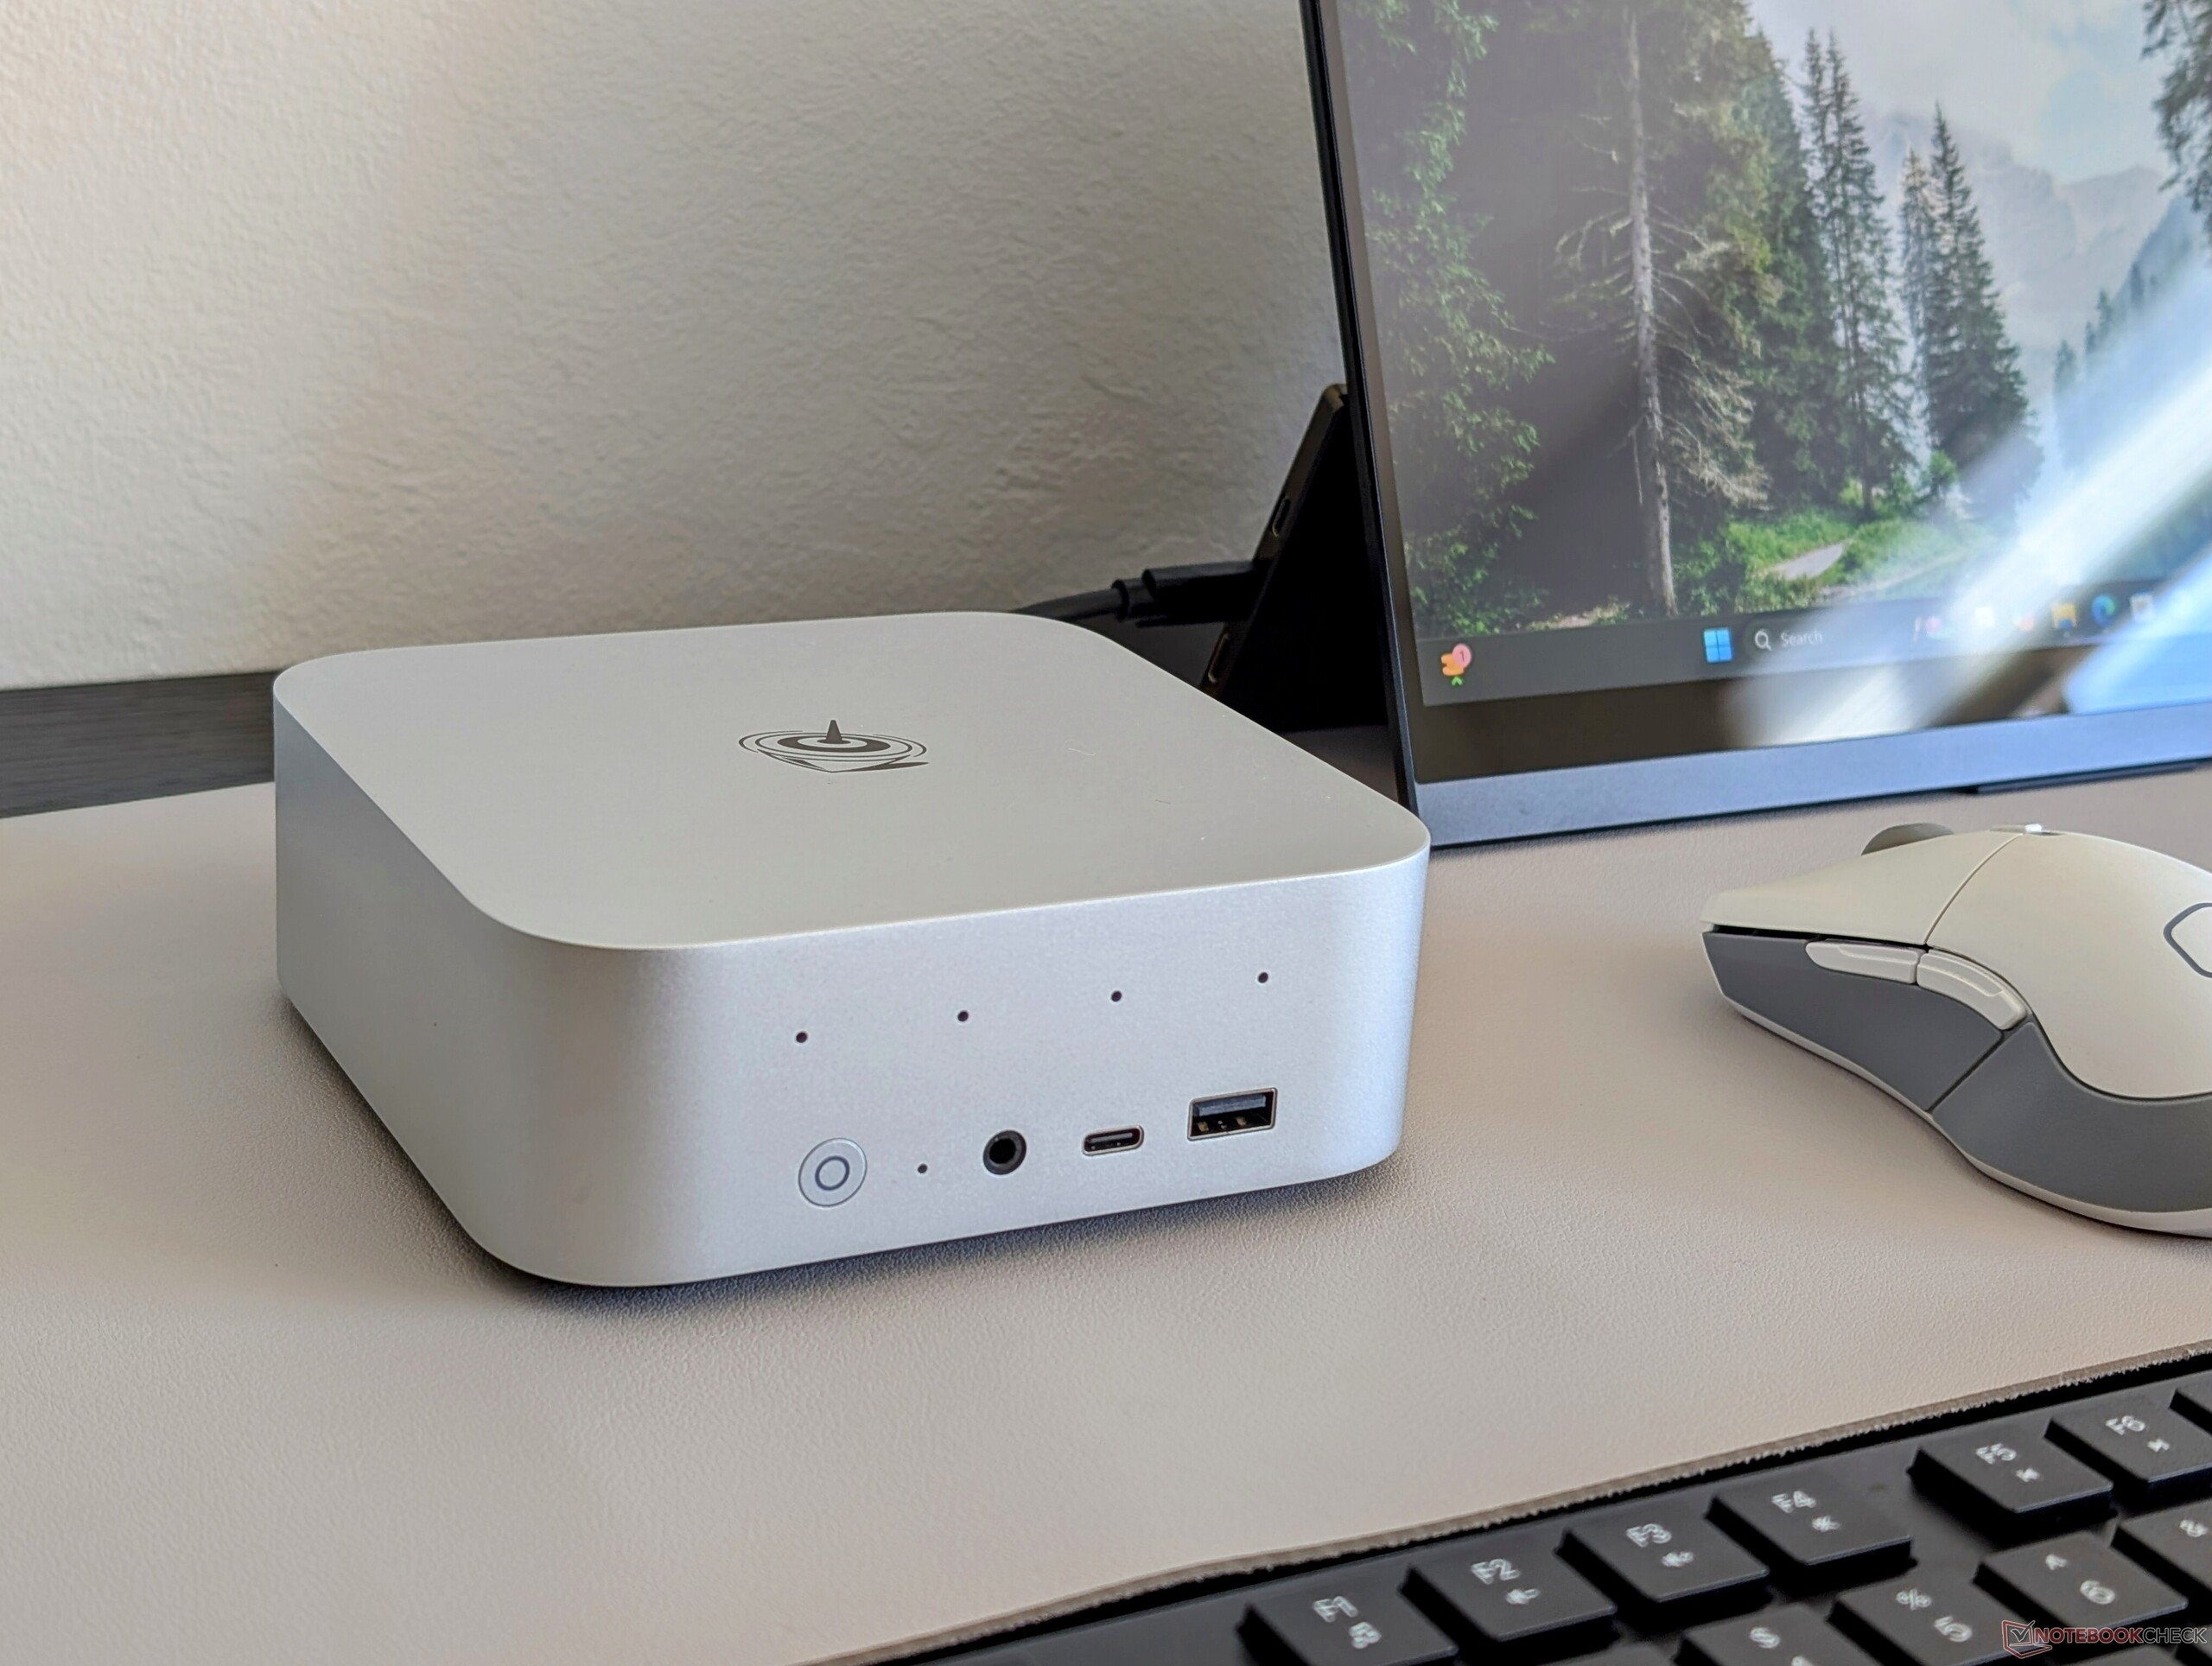
Le SER8 était déjà un changement complet par rapport au SER7 et le SER9 n'est donc qu'un petit rafraîchissement du SER8, sans différences physiques majeures. Le châssis métallique gris et le fond en plastique sont beaucoup plus professionnels que l'ancien design de l'ère SER7.

Comparaison des tailles

135.6 mm 132.6 mm 50.1 mm 660 g135 mm 135 mm 44.7 mm 814 g135 mm 135 mm 44.7 mm 776 g128 mm 126 mm 47 mm 528 g126 mm 113 mm 40 mm 440 g117 mm 112 mm 37 mm 525 g210 mm 148 mm 1 mm 2.9 g

Connectivité

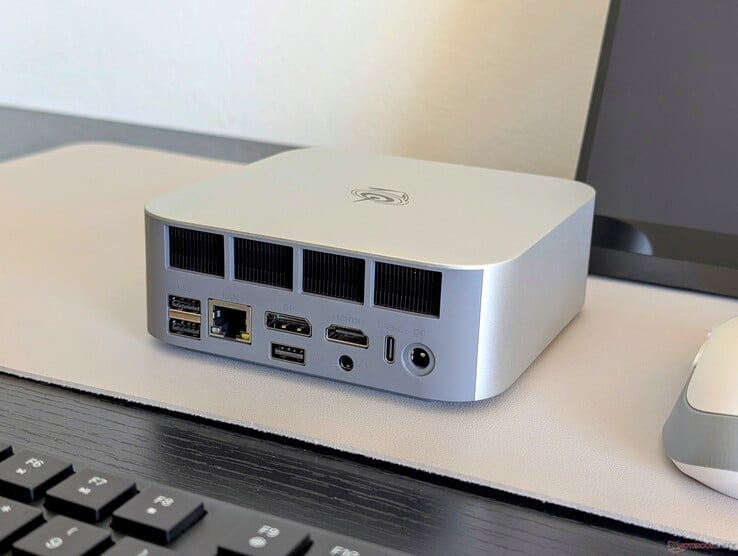
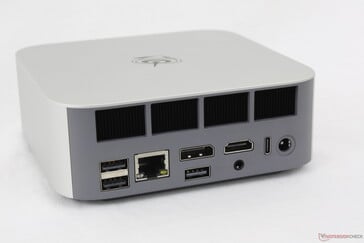
Les options de port n'ont pas changé par rapport au SER8. Notez que le système peut être alimenté par des adaptateurs secteur USB-C tiers à la place de l'adaptateur secteur de type tonneau livré dans la boîte.

Face avant : Bouton d'alimentation, bouton de réinitialisation, casque d'écoute de 3,5 mm, USB-C (10 Gbps), USB-A 3.2 (10 Gbps)
Arrière : USB-A 3.2 (10 Gbps), USB-A 2.0 (480 Mbps), RJ-45 (2,5 Gbps), DisplayPort 1.4 (4K@144), USB-A 2.0 (480 Mbps), HDMI 2.1 (4K@120), casque 3,5 mm, USB-C 4.0 avec DisplayPort + Power Delivery (40 Gbps), adaptateur secteur

Communication

L'Intel AX200 est livré en standard avec la prise en charge du Wi-Fi 6 et du Bluetooth 5.2. Le Wi-Fi 6E et le Wi-Fi 7 ne sont pas pris en charge.

Networking
iperf3 transmit AXE11000
GMK NucBox K9
Intel Wi-Fi 6 AX201
823 (607min - 901max) MBit/s +35%
Beelink SER8
Intel Wi-Fi 6 AX200
812 (641min - 888max) MBit/s +33%
Asus NUC 14 Pro+
Intel Wi-Fi 6E AX211
707 (666min - 737max) MBit/s +16%
MSI Cubi NUC 1M
Intel Wi-Fi 6E AX211
636 (430min - 784max) MBit/s +4%
Beelink SER9
Intel Wi-Fi 6 AX200
609 (334min - 677max) MBit/s
iperf3 receive AXE11000
Asus NUC 14 Pro+
Intel Wi-Fi 6E AX211
951 (926min - 965max) MBit/s +17%
Beelink SER9
Intel Wi-Fi 6 AX200
814 (717min - 861max) MBit/s
Beelink SER8
Intel Wi-Fi 6 AX200
784 (679min - 845max) MBit/s -4%
GMK NucBox K9
Intel Wi-Fi 6 AX201
764 (635min - 829max) MBit/s -6%
MSI Cubi NUC 1M
Intel Wi-Fi 6E AX211
692 (506min - 872max) MBit/s -15%
iperf3 transmit AXE11000 6GHz
MSI Cubi NUC 1M
Intel Wi-Fi 6E AX211
1400 (1199min - 1463max) MBit/s
Asus NUC 14 Pro+
Intel Wi-Fi 6E AX211
1223 (1160min - 1303max) MBit/s
Beelink SEi11 Pro
MediaTek RZ608
722 (447min - 789max) MBit/s
iperf3 receive AXE11000 6GHz
MSI Cubi NUC 1M
Intel Wi-Fi 6E AX211
1560 (1528min - 1585max) MBit/s
Asus NUC 14 Pro+
Intel Wi-Fi 6E AX211
1446 (1321min - 1486max) MBit/s
Beelink SEi11 Pro
MediaTek RZ608
743 (453min - 793max) MBit/s
050100150200250300350400450500550600650700750800850Tooltip
Beelink SER9; iperf3 receive AXE11000; iperf 3.1.3: Ø814 (717-861)
Beelink SER9; iperf3 transmit AXE11000; iperf 3.1.3: Ø598 (334-677)

Maintenance

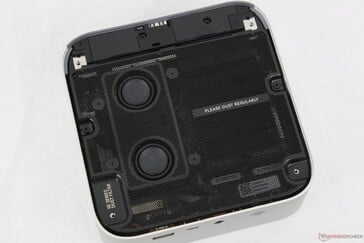
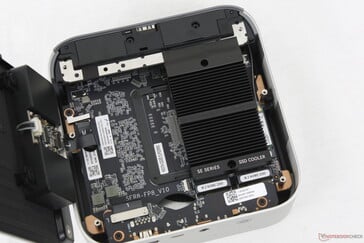
L'entretien est similaire à celui du SER8, mais avec une différence notable : il n'y a plus d'emplacements SODIMM puisque la RAM est soudée sur le SER9.

En retirant le panneau inférieur, vous découvrirez les haut-parleurs stéréo internes
En retirant les haut-parleurs, vous découvrirez les deux emplacements pour SSD M.2 2280 évolutifs

Durabilité

L'emballage est principalement composé de papier et de carton, avec un peu d'emballage plastique pour les accessoires. Le fabricant n'annonce aucune autre mesure de développement durable.

Accessoires et garantie

L'emballage comprend un câble HDMI, les documents habituels et un adaptateur secteur. Il n'y a pas de fixation VESA.

Une garantie constructeur d'un an s'applique si vous l'achetez aux États-Unis.

Performance


Conditions d'essai

Nous avons réglé Windows sur le mode Performance avant d'effectuer les tests ci-dessous.

Processeur

Les performances brutes du processeur sont excellentes, avec des performances Turbo Boost constantes et une amélioration sensible par rapport à la génération précédente Ryzen 7 8845HS d'environ 30 %. Il en va de même pour le Core Ultra 9 185H qui est environ 10 à 15 % plus lent que notre Core Ultra 9 185H Ryzen AI 9 HX 370.

Cinebench R15 Multi Loop

01653304956608259901155132014851650181519802145231024752640280529703135Tooltip
Beelink SER9 AMD Ryzen AI 9 HX 370: Ø3253 (3218.02-3282.46)
Beelink SER8 AMD Ryzen 7 8845HS: Ø2607 (2586.82-2626.57)
Beelink SEi11 Pro Intel Core i5-11320H: Ø851 (845.25-856.84)
MSI Cubi NUC 1M Intel Core 7 150U: Ø971 (535.59-1039.66)
GMK NucBox K9 Intel Core Ultra 5 125H: Ø1902 (1827.4-1965.8)
Asus NUC 14 Pro+ Intel Core Ultra 9 185H: Ø2588 (2519.69-2910.57)
CPU Performance Rating: Percent
Cinebench R23: Multi Core | Single Core
Cinebench R20: CPU (Multi Core) | CPU (Single Core)
Cinebench R15: CPU Multi 64Bit | CPU Single 64Bit
Blender: v2.79 BMW27 CPU
7-Zip 18.03: 7z b 4 | 7z b 4 -mmt1
Geekbench 6.3: Multi-Core | Single-Core
Geekbench 5.5: Multi-Core | Single-Core
HWBOT x265 Benchmark v2.2: 4k Preset
LibreOffice : 20 Documents To PDF
R Benchmark 2.5: Overall mean
CPU Performance Rating
Lenovo ThinkStation P3 Tiny-30H0006AGE
Intel Core i9-14900
90.6 pt
Beelink SER9
AMD Ryzen AI 9 HX 370
77 pt
Moyenne AMD Ryzen AI 9 HX 370
 
75.6 pt
Minisforum MS-A1
AMD Ryzen 7 8700G
70.4 pt
Beelink SER8
AMD Ryzen 7 8845HS
68.8 pt
GMK NucBox K6
AMD Ryzen 7 7840HS
67.9 pt
BOSGAME M1
AMD Ryzen 7 7840HS
67.2 pt
Geekom AX8 Pro
AMD Ryzen 9 8945H
67 pt
Asus NUC 14 Pro+
Intel Core Ultra 9 185H
66.8 pt
Geekom XT13 Pro
Intel Core i9-13900H
58.9 pt
GMK NucBox K9 -1!
Intel Core Ultra 5 125H
57.1 pt
HP Pro Mini 400 G9-937U0EA
Intel Core i5-14500T
56.6 pt
Khadas Mind 2
Intel Core Ultra 7 155H
55.2 pt
MSI Cubi NUC 1M
Intel Core 7 150U
51.1 pt
GMK NucBox M6
AMD Ryzen 5 6600H
50.7 pt
Beelink SEi11 Pro -2!
Intel Core i5-11320H
35.4 pt
Cinebench R23 / Multi Core
Lenovo ThinkStation P3 Tiny-30H0006AGE
Intel Core i9-14900
31070 Points +42%
Beelink SER9
AMD Ryzen AI 9 HX 370
21897 (21441.9min - 21897.4max) Points
Moyenne AMD Ryzen AI 9 HX 370
  (10435 - 23786, n=15)
19869 Points -9%
Asus NUC 14 Pro+
Intel Core Ultra 9 185H
17615 Points -20%
Minisforum MS-A1
AMD Ryzen 7 8700G
17128 Points -22%
Beelink SER8
AMD Ryzen 7 8845HS
16661 (16363.9min - 16661max) Points -24%
BOSGAME M1
AMD Ryzen 7 7840HS
16123 (15200.9min - 16122.9max) Points -26%
GMK NucBox K6
AMD Ryzen 7 7840HS
15947 (9378.75min - 15947.3max) Points -27%
Geekom AX8 Pro
AMD Ryzen 9 8945H
15516 Points -29%
Khadas Mind 2
Intel Core Ultra 7 155H
14099 Points -36%
GMK NucBox K9
Intel Core Ultra 5 125H
12989 (12625.3min - 12989.4max) Points -41%
Geekom XT13 Pro
Intel Core i9-13900H
11997 Points -45%
HP Pro Mini 400 G9-937U0EA
Intel Core i5-14500T
11790 Points -46%
GMK NucBox M6
AMD Ryzen 5 6600H
10418 (10142.8min - 10418max) Points -52%
MSI Cubi NUC 1M
Intel Core 7 150U
7226 (6983.97min - 7226.42max) Points -67%
Beelink SEi11 Pro
Intel Core i5-11320H
5720 (5681.08min - 5720.38max) Points -74%
Cinebench R23 / Single Core
Lenovo ThinkStation P3 Tiny-30H0006AGE
Intel Core i9-14900
2212 Points +9%
Beelink SER9
AMD Ryzen AI 9 HX 370
2035 Points
Moyenne AMD Ryzen AI 9 HX 370
  (1953 - 2049, n=8)
2009 Points -1%
MSI Cubi NUC 1M
Intel Core 7 150U
1878 Points -8%
HP Pro Mini 400 G9-937U0EA
Intel Core i5-14500T
1838 Points -10%
Minisforum MS-A1
AMD Ryzen 7 8700G
1817 Points -11%
Geekom AX8 Pro
AMD Ryzen 9 8945H
1808 Points -11%
Beelink SER8
AMD Ryzen 7 8845HS
1783 Points -12%
GMK NucBox K6
AMD Ryzen 7 7840HS
1770 Points -13%
Asus NUC 14 Pro+
Intel Core Ultra 9 185H
1764 Points -13%
GMK NucBox K9
Intel Core Ultra 5 125H
1735 Points -15%
Geekom XT13 Pro
Intel Core i9-13900H
1719 Points -16%
BOSGAME M1
AMD Ryzen 7 7840HS
1718 Points -16%
Khadas Mind 2
Intel Core Ultra 7 155H
1643 Points -19%
GMK NucBox M6
AMD Ryzen 5 6600H
1486 Points -27%
Beelink SEi11 Pro
Intel Core i5-11320H
1467 Points -28%
Cinebench R20 / CPU (Multi Core)
Lenovo ThinkStation P3 Tiny-30H0006AGE
Intel Core i9-14900
11291 Points +31%
Beelink SER9
AMD Ryzen AI 9 HX 370
8605 Points
Moyenne AMD Ryzen AI 9 HX 370
  (6469 - 9246, n=7)
8515 Points -1%
Asus NUC 14 Pro+
Intel Core Ultra 9 185H
6997 Points -19%
Minisforum MS-A1
AMD Ryzen 7 8700G
6736 Points -22%
Beelink SER8
AMD Ryzen 7 8845HS
6431 Points -25%
BOSGAME M1
AMD Ryzen 7 7840HS
6349 Points -26%
GMK NucBox K6
AMD Ryzen 7 7840HS
6250 Points -27%
Geekom AX8 Pro
AMD Ryzen 9 8945H
6153 Points -28%
Khadas Mind 2
Intel Core Ultra 7 155H
5448 Points -37%
GMK NucBox K9
Intel Core Ultra 5 125H
4948 Points -42%
Geekom XT13 Pro
Intel Core i9-13900H
4935 Points -43%
HP Pro Mini 400 G9-937U0EA
Intel Core i5-14500T
4319 Points -50%
GMK NucBox M6
AMD Ryzen 5 6600H
4106 Points -52%
MSI Cubi NUC 1M
Intel Core 7 150U
2821 Points -67%
Beelink SEi11 Pro
Intel Core i5-11320H
2208 Points -74%
Cinebench R20 / CPU (Single Core)
Lenovo ThinkStation P3 Tiny-30H0006AGE
Intel Core i9-14900
846 Points +7%
Beelink SER9
AMD Ryzen AI 9 HX 370
793 Points
Moyenne AMD Ryzen AI 9 HX 370
  (772 - 804, n=7)
789 Points -1%
MSI Cubi NUC 1M
Intel Core 7 150U
718 Points -9%
HP Pro Mini 400 G9-937U0EA
Intel Core i5-14500T
706 Points -11%
Minisforum MS-A1
AMD Ryzen 7 8700G
705 Points -11%
Geekom AX8 Pro
AMD Ryzen 9 8945H
703 Points -11%
Asus NUC 14 Pro+
Intel Core Ultra 9 185H
702 Points -11%
Beelink SER8
AMD Ryzen 7 8845HS
698 Points -12%
GMK NucBox K6
AMD Ryzen 7 7840HS
688 Points -13%
BOSGAME M1
AMD Ryzen 7 7840HS
682 Points -14%
GMK NucBox K9
Intel Core Ultra 5 125H
664 Points -16%
Geekom XT13 Pro
Intel Core i9-13900H
649 Points -18%
Khadas Mind 2
Intel Core Ultra 7 155H
609 Points -23%
GMK NucBox M6
AMD Ryzen 5 6600H
584 Points -26%
Beelink SEi11 Pro
Intel Core i5-11320H
561 Points -29%
Cinebench R15 / CPU Multi 64Bit
Lenovo ThinkStation P3 Tiny-30H0006AGE
Intel Core i9-14900
4793 Points +46%
Beelink SER9
AMD Ryzen AI 9 HX 370
3282 (3218.02min - 3282.46max) Points
Moyenne AMD Ryzen AI 9 HX 370
  (2498 - 3498, n=7)
3275 Points 0%
Asus NUC 14 Pro+
Intel Core Ultra 9 185H
2863 Points -13%
Minisforum MS-A1
AMD Ryzen 7 8700G
2693 Points -18%
Beelink SER8
AMD Ryzen 7 8845HS
2627 (2586.82min - 2626.57max) Points -20%
BOSGAME M1
AMD Ryzen 7 7840HS
2597 (2501.09min - 2597.23max) Points -21%
GMK NucBox K6
AMD Ryzen 7 7840HS
2537 (2510.2min - 2537.27max) Points -23%
Geekom AX8 Pro
AMD Ryzen 9 8945H
2521 Points -23%
Geekom XT13 Pro
Intel Core i9-13900H
2448 Points -25%
Khadas Mind 2
Intel Core Ultra 7 155H
2280 Points -31%
HP Pro Mini 400 G9-937U0EA
Intel Core i5-14500T
2022 Points -38%
GMK NucBox K9
Intel Core Ultra 5 125H
1966 (1827.4min - 1965.8max) Points -40%
GMK NucBox M6
AMD Ryzen 5 6600H
1737 (1708.16min - 1737.02max) Points -47%
MSI Cubi NUC 1M
Intel Core 7 150U
1040 (535.59min - 1039.66max) Points -68%
Beelink SEi11 Pro
Intel Core i5-11320H
857 (845.25min - 856.84max) Points -74%
Cinebench R15 / CPU Single 64Bit
Lenovo ThinkStation P3 Tiny-30H0006AGE
Intel Core i9-14900
315 Points 0%
Beelink SER9
AMD Ryzen AI 9 HX 370
315 Points
Moyenne AMD Ryzen AI 9 HX 370
  (298 - 315, n=7)
306 Points -3%
Minisforum MS-A1
AMD Ryzen 7 8700G
286 Points -9%
Geekom AX8 Pro
AMD Ryzen 9 8945H
284 Points -10%
Beelink SER8
AMD Ryzen 7 8845HS
283 Points -10%
GMK NucBox K6
AMD Ryzen 7 7840HS
280 Points -11%
BOSGAME M1
AMD Ryzen 7 7840HS
275 Points -13%
Asus NUC 14 Pro+
Intel Core Ultra 9 185H
262 Points -17%
MSI Cubi NUC 1M
Intel Core 7 150U
258 Points -18%
HP Pro Mini 400 G9-937U0EA
Intel Core i5-14500T
252 Points -20%
GMK NucBox K9
Intel Core Ultra 5 125H
251 Points -20%
Geekom XT13 Pro
Intel Core i9-13900H
245 Points -22%
GMK NucBox M6
AMD Ryzen 5 6600H
243 Points -23%
Khadas Mind 2
Intel Core Ultra 7 155H
234 Points -26%
Beelink SEi11 Pro
Intel Core i5-11320H
214 Points -32%
Blender / v2.79 BMW27 CPU
Beelink SEi11 Pro
Intel Core i5-11320H
541 Seconds * -266%
MSI Cubi NUC 1M
Intel Core 7 150U
451 Seconds * -205%
GMK NucBox M6
AMD Ryzen 5 6600H
293 Seconds * -98%
HP Pro Mini 400 G9-937U0EA
Intel Core i5-14500T
288 Seconds * -95%
Geekom XT13 Pro
Intel Core i9-13900H
261 Seconds * -76%
GMK NucBox K9
Intel Core Ultra 5 125H
248 Seconds * -68%
Khadas Mind 2
Intel Core Ultra 7 155H
248 Seconds * -68%
Geekom AX8 Pro
AMD Ryzen 9 8945H
206 Seconds * -39%
GMK NucBox K6
AMD Ryzen 7 7840HS
199 Seconds * -34%
BOSGAME M1
AMD Ryzen 7 7840HS
196 Seconds * -32%
Beelink SER8
AMD Ryzen 7 8845HS
191 Seconds * -29%
Minisforum MS-A1
AMD Ryzen 7 8700G
186 Seconds * -26%
Asus NUC 14 Pro+
Intel Core Ultra 9 185H
184 Seconds * -24%
Moyenne AMD Ryzen AI 9 HX 370
  (140 - 192, n=7)
154.3 Seconds * -4%
Beelink SER9
AMD Ryzen AI 9 HX 370
148 Seconds *
Lenovo ThinkStation P3 Tiny-30H0006AGE
Intel Core i9-14900
131 Seconds * +11%
7-Zip 18.03 / 7z b 4
Lenovo ThinkStation P3 Tiny-30H0006AGE
Intel Core i9-14900
101652 MIPS +25%
Beelink SER9
AMD Ryzen AI 9 HX 370
81175 MIPS
Moyenne AMD Ryzen AI 9 HX 370
  (67615 - 83572, n=7)
79123 MIPS -3%
Minisforum MS-A1
AMD Ryzen 7 8700G
75427 MIPS -7%
Beelink SER8
AMD Ryzen 7 8845HS
70937 MIPS -13%
GMK NucBox K6
AMD Ryzen 7 7840HS
70782 MIPS -13%
BOSGAME M1
AMD Ryzen 7 7840HS
70417 MIPS -13%
Asus NUC 14 Pro+
Intel Core Ultra 9 185H
69720 MIPS -14%
Geekom AX8 Pro
AMD Ryzen 9 8945H
66557 MIPS -18%
Geekom XT13 Pro
Intel Core i9-13900H
56068 MIPS -31%
Khadas Mind 2
Intel Core Ultra 7 155H
55271 MIPS -32%
GMK NucBox M6
AMD Ryzen 5 6600H
49353 MIPS -39%
HP Pro Mini 400 G9-937U0EA
Intel Core i5-14500T
45820 MIPS -44%
MSI Cubi NUC 1M
Intel Core 7 150U
31447 MIPS -61%
Beelink SEi11 Pro
Intel Core i5-11320H
24798 MIPS -69%
7-Zip 18.03 / 7z b 4 -mmt1
Lenovo ThinkStation P3 Tiny-30H0006AGE
Intel Core i9-14900
7276 MIPS +17%
Beelink SER8
AMD Ryzen 7 8845HS
6714 MIPS +8%
Geekom AX8 Pro
AMD Ryzen 9 8945H
6691 MIPS +8%
GMK NucBox K6
AMD Ryzen 7 7840HS
6676 MIPS +8%
Minisforum MS-A1
AMD Ryzen 7 8700G
6665 MIPS +7%
BOSGAME M1
AMD Ryzen 7 7840HS
6602 MIPS +6%
Beelink SER9
AMD Ryzen AI 9 HX 370
6208 MIPS
Moyenne AMD Ryzen AI 9 HX 370
  (6063 - 6208, n=7)
6137 MIPS -1%
HP Pro Mini 400 G9-937U0EA
Intel Core i5-14500T
5980 MIPS -4%
MSI Cubi NUC 1M
Intel Core 7 150U
5898 MIPS -5%
Geekom XT13 Pro
Intel Core i9-13900H
5828 MIPS -6%
GMK NucBox M6
AMD Ryzen 5 6600H
5720 MIPS -8%
Asus NUC 14 Pro+
Intel Core Ultra 9 185H
5713 MIPS -8%
Beelink SEi11 Pro
Intel Core i5-11320H
5105 MIPS -18%
GMK NucBox K9
Intel Core Ultra 5 125H
5004 MIPS -19%
Khadas Mind 2
Intel Core Ultra 7 155H
4795 MIPS -23%
Geekbench 6.3 / Multi-Core
Lenovo ThinkStation P3 Tiny-30H0006AGE
Intel Core i9-14900
15962 Points +6%
Beelink SER9
AMD Ryzen AI 9 HX 370
15043 Points
Moyenne AMD Ryzen AI 9 HX 370
  (13648 - 15367, n=8)
14838 Points -1%
Asus NUC 14 Pro+
Intel Core Ultra 9 185H
13848 Points -8%
Minisforum MS-A1
AMD Ryzen 7 8700G
13741 Points -9%
Beelink SER8
AMD Ryzen 7 8845HS
13362 Points -11%
BOSGAME M1
AMD Ryzen 7 7840HS
13326 Points -11%
GMK NucBox K6
AMD Ryzen 7 7840HS
13184 Points -12%
Geekom AX8 Pro
AMD Ryzen 9 8945H
13162 Points -13%
Khadas Mind 2
Intel Core Ultra 7 155H
11782 Points -22%
Geekom XT13 Pro
Intel Core i9-13900H
11541 Points -23%
GMK NucBox K9
Intel Core Ultra 5 125H
11087 Points -26%
GMK NucBox M6
AMD Ryzen 5 6600H
9240 Points -39%
HP Pro Mini 400 G9-937U0EA
Intel Core i5-14500T
9225 Points -39%
MSI Cubi NUC 1M
Intel Core 7 150U
8756 Points -42%
Geekbench 6.3 / Single-Core
Lenovo ThinkStation P3 Tiny-30H0006AGE
Intel Core i9-14900
3022 Points +6%
Beelink SER9
AMD Ryzen AI 9 HX 370
2863 Points
Moyenne AMD Ryzen AI 9 HX 370
  (2785 - 2884, n=8)
2854 Points 0%
Minisforum MS-A1
AMD Ryzen 7 8700G
2711 Points -5%
Beelink SER8
AMD Ryzen 7 8845HS
2694 Points -6%
GMK NucBox K6
AMD Ryzen 7 7840HS
2687 Points -6%
Geekom AX8 Pro
AMD Ryzen 9 8945H
2651 Points -7%
MSI Cubi NUC 1M
Intel Core 7 150U
2646 Points -8%
BOSGAME M1
AMD Ryzen 7 7840HS
2640 Points -8%
HP Pro Mini 400 G9-937U0EA
Intel Core i5-14500T
2546 Points -11%
Asus NUC 14 Pro+
Intel Core Ultra 9 185H
2465 Points -14%
Geekom XT13 Pro
Intel Core i9-13900H
2415 Points -16%
GMK NucBox K9
Intel Core Ultra 5 125H
2297 Points -20%
Khadas Mind 2
Intel Core Ultra 7 155H
2218 Points -23%
GMK NucBox M6
AMD Ryzen 5 6600H
2042 Points -29%
Geekbench 5.5 / Multi-Core
Lenovo ThinkStation P3 Tiny-30H0006AGE
Intel Core i9-14900
17395 Points +22%
Beelink SER9
AMD Ryzen AI 9 HX 370
14301 Points
Moyenne AMD Ryzen AI 9 HX 370
  (12487 - 15012, n=7)
14252 Points 0%
Asus NUC 14 Pro+
Intel Core Ultra 9 185H
13566 Points -5%
Minisforum MS-A1
AMD Ryzen 7 8700G
12618 Points -12%
Beelink SER8
AMD Ryzen 7 8845HS
12196 Points -15%
BOSGAME M1
AMD Ryzen 7 7840HS
12116 Points -15%
Geekom AX8 Pro
AMD Ryzen 9 8945H
11980 Points -16%
GMK NucBox K6
AMD Ryzen 7 7840HS
11769 Points -18%
Geekom XT13 Pro
Intel Core i9-13900H
11536 Points -19%
Khadas Mind 2
Intel Core Ultra 7 155H
11449 Points -20%
GMK NucBox K9
Intel Core Ultra 5 125H
10025 Points -30%
HP Pro Mini 400 G9-937U0EA
Intel Core i5-14500T
9122 Points -36%
GMK NucBox M6
AMD Ryzen 5 6600H
8195 Points -43%
MSI Cubi NUC 1M
Intel Core 7 150U
7788 Points -46%
Beelink SEi11 Pro
Intel Core i5-11320H
4959 Points -65%
Geekbench 5.5 / Single-Core
Lenovo ThinkStation P3 Tiny-30H0006AGE
Intel Core i9-14900
2140 Points +9%
Moyenne AMD Ryzen AI 9 HX 370
  (1957 - 2108, n=7)
2053 Points +5%
Minisforum MS-A1
AMD Ryzen 7 8700G
2012 Points +3%
Beelink SER8
AMD Ryzen 7 8845HS
2004 Points +2%
Geekom AX8 Pro
AMD Ryzen 9 8945H
1994 Points +2%
GMK NucBox K6
AMD Ryzen 7 7840HS
1986 Points +1%
Beelink SER9
AMD Ryzen AI 9 HX 370
1957 Points
BOSGAME M1
AMD Ryzen 7 7840HS
1928 Points -1%
MSI Cubi NUC 1M
Intel Core 7 150U
1910 Points -2%
HP Pro Mini 400 G9-937U0EA
Intel Core i5-14500T
1838 Points -6%
Asus NUC 14 Pro+
Intel Core Ultra 9 185H
1743 Points -11%
Geekom XT13 Pro
Intel Core i9-13900H
1708 Points -13%
GMK NucBox K9
Intel Core Ultra 5 125H
1668 Points -15%
Khadas Mind 2
Intel Core Ultra 7 155H
1578 Points -19%
Beelink SEi11 Pro
Intel Core i5-11320H
1518 Points -22%
GMK NucBox M6
AMD Ryzen 5 6600H
1513 Points -23%
HWBOT x265 Benchmark v2.2 / 4k Preset
Lenovo ThinkStation P3 Tiny-30H0006AGE
Intel Core i9-14900
31.6 fps +21%
Beelink SER9
AMD Ryzen AI 9 HX 370
26.1 fps
Moyenne AMD Ryzen AI 9 HX 370
  (20.3 - 26.9, n=7)
24.5 fps -6%
Minisforum MS-A1
AMD Ryzen 7 8700G
22.3 fps -15%
Beelink SER8
AMD Ryzen 7 8845HS
21.1 fps -19%
Geekom AX8 Pro
AMD Ryzen 9 8945H
20.6 fps -21%
GMK NucBox K6
AMD Ryzen 7 7840HS
20.5 fps -21%
BOSGAME M1
AMD Ryzen 7 7840HS
20.3 fps -22%
Asus NUC 14 Pro+
Intel Core Ultra 9 185H
19.7 fps -25%
Khadas Mind 2
Intel Core Ultra 7 155H
15.7 fps -40%
Geekom XT13 Pro
Intel Core i9-13900H
14.7 fps -44%
GMK NucBox M6
AMD Ryzen 5 6600H
13.9 fps -47%
GMK NucBox K9
Intel Core Ultra 5 125H
13.8 fps -47%
HP Pro Mini 400 G9-937U0EA
Intel Core i5-14500T
12.7 fps -51%
MSI Cubi NUC 1M
Intel Core 7 150U
8.57 fps -67%
Beelink SEi11 Pro
Intel Core i5-11320H
7.28 fps -72%
LibreOffice / 20 Documents To PDF
Khadas Mind 2
Intel Core Ultra 7 155H
63.2 s * -22%
Moyenne AMD Ryzen AI 9 HX 370
  (49.6 - 58.5, n=7)
53.5 s * -4%
GMK NucBox M6
AMD Ryzen 5 6600H
52.4 s * -2%
Asus NUC 14 Pro+
Intel Core Ultra 9 185H
51.8 s * -0%
Beelink SER9
AMD Ryzen AI 9 HX 370
51.6 s *
Geekom AX8 Pro
AMD Ryzen 9 8945H
49.8 s * +3%
Beelink SEi11 Pro
Intel Core i5-11320H
49.1 s * +5%
HP Pro Mini 400 G9-937U0EA
Intel Core i5-14500T
48.4 s * +6%
BOSGAME M1
AMD Ryzen 7 7840HS
47.4 s * +8%
Geekom XT13 Pro
Intel Core i9-13900H
46.8 s * +9%
Beelink SER8
AMD Ryzen 7 8845HS
46.1 s * +11%
Minisforum MS-A1
AMD Ryzen 7 8700G
45.5 s * +12%
GMK NucBox K6
AMD Ryzen 7 7840HS
44.1 s * +15%
GMK NucBox K9
Intel Core Ultra 5 125H
44 s * +15%
Lenovo ThinkStation P3 Tiny-30H0006AGE
Intel Core i9-14900
38.2 s * +26%
MSI Cubi NUC 1M
Intel Core 7 150U
37.9 s * +27%
R Benchmark 2.5 / Overall mean
Beelink SEi11 Pro
Intel Core i5-11320H
0.581 sec * -43%
Khadas Mind 2
Intel Core Ultra 7 155H
0.522 sec * -29%
GMK NucBox M6
AMD Ryzen 5 6600H
0.4995 sec * -23%
GMK NucBox K9
Intel Core Ultra 5 125H
0.4898 sec * -21%
Geekom XT13 Pro
Intel Core i9-13900H
0.4693 sec * -16%
Geekom AX8 Pro
AMD Ryzen 9 8945H
0.4576 sec * -13%
Asus NUC 14 Pro+
Intel Core Ultra 9 185H
0.4504 sec * -11%
HP Pro Mini 400 G9-937U0EA
Intel Core i5-14500T
0.4457 sec * -10%
MSI Cubi NUC 1M
Intel Core 7 150U
0.4438 sec * -9%
BOSGAME M1
AMD Ryzen 7 7840HS
0.4418 sec * -9%
GMK NucBox K6
AMD Ryzen 7 7840HS
0.4343 sec * -7%
Beelink SER8
AMD Ryzen 7 8845HS
0.4336 sec * -7%
Minisforum MS-A1
AMD Ryzen 7 8700G
0.4285 sec * -6%
Moyenne AMD Ryzen AI 9 HX 370
  (0.4041 - 0.4257, n=7)
0.4123 sec * -2%
Beelink SER9
AMD Ryzen AI 9 HX 370
0.406 sec *
Lenovo ThinkStation P3 Tiny-30H0006AGE
Intel Core i9-14900
0.3803 sec * +6%
CPU Performance Rating: Percent
Cinebench R23: Multi Core | Single Core
Cinebench R20: CPU (Multi Core) | CPU (Single Core)
Cinebench R15: CPU Multi 64Bit | CPU Single 64Bit
Blender: v2.79 BMW27 CPU
7-Zip 18.03: 7z b 4 | 7z b 4 -mmt1
Geekbench 6.3: Multi-Core | Single-Core
Geekbench 5.5: Multi-Core | Single-Core
HWBOT x265 Benchmark v2.2: 4k Preset
LibreOffice : 20 Documents To PDF
R Benchmark 2.5: Overall mean

* ... Moindre est la valeur, meilleures sont les performances

Cinebench R15 CPU Multi 64Bit
3282 Points
Cinebench R15 OpenGL 64Bit
304 fps
Cinebench R15 Ref. Match 64Bit
97.9 %
Cinebench R15 CPU Single 64Bit
315 Points
Cinebench R20 CPU (Multi Core)
8605 Points
Cinebench R20 CPU (Single Core)
793 Points
Cinebench R23 Multi Core
21897 Points
Cinebench R23 Single Core
2035 Points
Cinebench 2024 CPU Single Core
115.5 Points
Cinebench 2024 CPU Multi Core
1100 Points
Aide
Performance Rating
Beelink SER9
AMD Ryzen AI 9 HX 370, Radeon 890M
93.3 pt
Moyenne AMD Ryzen AI 9 HX 370
 
91.2 pt
Beelink SER8
AMD Ryzen 7 8845HS, Radeon 780M
84.5 pt
Asus NUC 14 Pro+
Intel Core Ultra 9 185H, Arc 8-Core
62.8 pt
GMK NucBox K9
Intel Core Ultra 5 125H, Arc 7-Core
52.2 pt
MSI Cubi NUC 1M
Intel Core 7 150U, Iris Xe G7 96EUs
32.1 pt
Beelink SEi11 Pro
Intel Core i5-11320H, Iris Xe G7 96EUs
30.9 pt
AIDA64 / FP32 Ray-Trace
Beelink SER9
AMD Ryzen AI 9 HX 370, Radeon 890M
34743 KRay/s
Moyenne AMD Ryzen AI 9 HX 370
  (24673 - 37654, n=6)
33870 KRay/s -3%
Beelink SER8
AMD Ryzen 7 8845HS, Radeon 780M
26305 KRay/s -24%
Asus NUC 14 Pro+
Intel Core Ultra 9 185H, Arc 8-Core
15589 KRay/s -55%
GMK NucBox K9
Intel Core Ultra 5 125H, Arc 7-Core
10755 KRay/s -69%
Beelink SEi11 Pro
Intel Core i5-11320H, Iris Xe G7 96EUs
7047 KRay/s -80%
MSI Cubi NUC 1M
Intel Core 7 150U, Iris Xe G7 96EUs
6306 KRay/s -82%
AIDA64 / FPU Julia
Moyenne AMD Ryzen AI 9 HX 370
  (97073 - 147937, n=7)
132633 Points 0%
Beelink SER9
AMD Ryzen AI 9 HX 370, Radeon 890M
132394 Points
Beelink SER8
AMD Ryzen 7 8845HS, Radeon 780M
111508 Points -16%
Asus NUC 14 Pro+
Intel Core Ultra 9 185H, Arc 8-Core
80501 Points -39%
GMK NucBox K9
Intel Core Ultra 5 125H, Arc 7-Core
58422 Points -56%
MSI Cubi NUC 1M
Intel Core 7 150U, Iris Xe G7 96EUs
32582 Points -75%
Beelink SEi11 Pro
Intel Core i5-11320H, Iris Xe G7 96EUs
29972 Points -77%
AIDA64 / CPU SHA3
Beelink SER9
AMD Ryzen AI 9 HX 370, Radeon 890M
5656 MB/s
Moyenne AMD Ryzen AI 9 HX 370
  (4421 - 5843, n=7)
5498 MB/s -3%
Beelink SER8
AMD Ryzen 7 8845HS, Radeon 780M
4933 MB/s -13%
Asus NUC 14 Pro+
Intel Core Ultra 9 185H, Arc 8-Core
3909 MB/s -31%
GMK NucBox K9
Intel Core Ultra 5 125H, Arc 7-Core
2922 MB/s -48%
Beelink SEi11 Pro
Intel Core i5-11320H, Iris Xe G7 96EUs
1992 MB/s -65%
MSI Cubi NUC 1M
Intel Core 7 150U, Iris Xe G7 96EUs
1656 MB/s -71%
AIDA64 / CPU Queen
Beelink SER8
AMD Ryzen 7 8845HS, Radeon 780M
115546 Points +17%
Beelink SER9
AMD Ryzen AI 9 HX 370, Radeon 890M
99023 Points
Asus NUC 14 Pro+
Intel Core Ultra 9 185H, Arc 8-Core
94503 Points -5%
Moyenne AMD Ryzen AI 9 HX 370
  (84460 - 99023, n=7)
93036 Points -6%
GMK NucBox K9
Intel Core Ultra 5 125H, Arc 7-Core
78797 Points -20%
MSI Cubi NUC 1M
Intel Core 7 150U, Iris Xe G7 96EUs
62280 Points -37%
Beelink SEi11 Pro
Intel Core i5-11320H, Iris Xe G7 96EUs
48212 Points -51%
AIDA64 / FPU SinJulia
Beelink SER9
AMD Ryzen AI 9 HX 370, Radeon 890M
18959 Points
Moyenne AMD Ryzen AI 9 HX 370
  (16445 - 19021, n=7)
18508 Points -2%
Beelink SER8
AMD Ryzen 7 8845HS, Radeon 780M
15420 Points -19%
Asus NUC 14 Pro+
Intel Core Ultra 9 185H, Arc 8-Core
10406 Points -45%
GMK NucBox K9
Intel Core Ultra 5 125H, Arc 7-Core
7780 Points -59%
Beelink SEi11 Pro
Intel Core i5-11320H, Iris Xe G7 96EUs
4771 Points -75%
MSI Cubi NUC 1M
Intel Core 7 150U, Iris Xe G7 96EUs
4387 Points -77%
AIDA64 / FPU Mandel
Beelink SER9
AMD Ryzen AI 9 HX 370, Radeon 890M
70450 Points
Moyenne AMD Ryzen AI 9 HX 370
  (51277 - 79251, n=6)
69376 Points -2%
Beelink SER8
AMD Ryzen 7 8845HS, Radeon 780M
59522 Points -16%
Asus NUC 14 Pro+
Intel Core Ultra 9 185H, Arc 8-Core
39506 Points -44%
GMK NucBox K9
Intel Core Ultra 5 125H, Arc 7-Core
27972 Points -60%
Beelink SEi11 Pro
Intel Core i5-11320H, Iris Xe G7 96EUs
17987 Points -74%
MSI Cubi NUC 1M
Intel Core 7 150U, Iris Xe G7 96EUs
16042 Points -77%
AIDA64 / CPU AES
Beelink SER8
AMD Ryzen 7 8845HS, Radeon 780M
172642 MB/s +112%
GMK NucBox K9
Intel Core Ultra 5 125H, Arc 7-Core
108402 MB/s +33%
Beelink SER9
AMD Ryzen AI 9 HX 370, Radeon 890M
81324 MB/s
Moyenne AMD Ryzen AI 9 HX 370
  (68042 - 81929, n=7)
78633 MB/s -3%
Asus NUC 14 Pro+
Intel Core Ultra 9 185H, Arc 8-Core
75293 MB/s -7%
Beelink SEi11 Pro
Intel Core i5-11320H, Iris Xe G7 96EUs
68683 MB/s -16%
MSI Cubi NUC 1M
Intel Core 7 150U, Iris Xe G7 96EUs
33007 MB/s -59%
AIDA64 / CPU ZLib
Beelink SER9
AMD Ryzen AI 9 HX 370, Radeon 890M
1444 MB/s
Moyenne AMD Ryzen AI 9 HX 370
  (1086 - 1520, n=7)
1421 MB/s -2%
Asus NUC 14 Pro+
Intel Core Ultra 9 185H, Arc 8-Core
1155 MB/s -20%
Beelink SER8
AMD Ryzen 7 8845HS, Radeon 780M
1073 MB/s -26%
GMK NucBox K9
Intel Core Ultra 5 125H, Arc 7-Core
844 MB/s -42%
MSI Cubi NUC 1M
Intel Core 7 150U, Iris Xe G7 96EUs
491 MB/s -66%
Beelink SEi11 Pro
Intel Core i5-11320H, Iris Xe G7 96EUs
368 MB/s -75%
AIDA64 / FP64 Ray-Trace
Beelink SER9
AMD Ryzen AI 9 HX 370, Radeon 890M
18694 KRay/s
Moyenne AMD Ryzen AI 9 HX 370
  (13959 - 20608, n=7)
18523 KRay/s -1%
Beelink SER8
AMD Ryzen 7 8845HS, Radeon 780M
14041 KRay/s -25%
Asus NUC 14 Pro+
Intel Core Ultra 9 185H, Arc 8-Core
8272 KRay/s -56%
GMK NucBox K9
Intel Core Ultra 5 125H, Arc 7-Core
5657 KRay/s -70%
Beelink SEi11 Pro
Intel Core i5-11320H, Iris Xe G7 96EUs
3811 KRay/s -80%
MSI Cubi NUC 1M
Intel Core 7 150U, Iris Xe G7 96EUs
3417 KRay/s -82%
AIDA64 / CPU PhotoWorxx
Beelink SER9
AMD Ryzen AI 9 HX 370, Radeon 890M
48813 MPixel/s
Moyenne AMD Ryzen AI 9 HX 370
  (37747 - 50118, n=7)
47587 MPixel/s -3%
GMK NucBox K9
Intel Core Ultra 5 125H, Arc 7-Core
46296 MPixel/s -5%
Asus NUC 14 Pro+
Intel Core Ultra 9 185H, Arc 8-Core
45293 MPixel/s -7%
Beelink SER8
AMD Ryzen 7 8845HS, Radeon 780M
40489 MPixel/s -17%
MSI Cubi NUC 1M
Intel Core 7 150U, Iris Xe G7 96EUs
37889 MPixel/s -22%
Beelink SEi11 Pro
Intel Core i5-11320H, Iris Xe G7 96EUs
25964 MPixel/s -47%

Performance du système

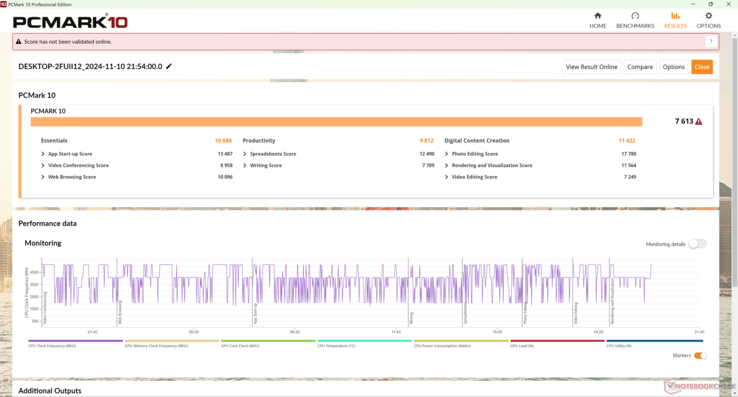
Les résultats de PCMark 10 sont parmi les plus élevés de tous les mini-PC fonctionnant avec des cartes graphiques intégrées
PCMark 10 / Score
Beelink SER8
Radeon 780M, R7 8845HS, Crucial P3 Plus CT1000P3PSSD8
7641 Points 0%
Beelink SER9
Radeon 890M, Ryzen AI 9 HX 370, Crucial P3 Plus CT1000P3PSSD8
7613 Points
Moyenne AMD Ryzen AI 9 HX 370, AMD Radeon 890M
  (7487 - 7646, n=3)
7582 Points 0%
Asus NUC 14 Pro+
Arc 8-Core, Ultra 9 185H, Samsung PM9A1a MZVL21T0HDLU
7103 Points -7%
GMK NucBox K9
Arc 7-Core, Ultra 5 125H, MasonSemi 1TB MC7000
6463 Points -15%
MSI Cubi NUC 1M
Iris Xe G7 96EUs, Core 7 150U, WD PC SN560 SDDPNQE-1T00
6080 Points -20%
Beelink SEi11 Pro
Iris Xe G7 96EUs, i5-11320H, Kingston NV1 SNVS/500GCN
5095 Points -33%
PCMark 10 / Essentials
Beelink SER8
Radeon 780M, R7 8845HS, Crucial P3 Plus CT1000P3PSSD8
11570 Points +8%
MSI Cubi NUC 1M
Iris Xe G7 96EUs, Core 7 150U, WD PC SN560 SDDPNQE-1T00
10856 Points +2%
Moyenne AMD Ryzen AI 9 HX 370, AMD Radeon 890M
  (10678 - 10918, n=3)
10760 Points +1%
GMK NucBox K9
Arc 7-Core, Ultra 5 125H, MasonSemi 1TB MC7000
10697 Points 0%
Beelink SER9
Radeon 890M, Ryzen AI 9 HX 370, Crucial P3 Plus CT1000P3PSSD8
10684 Points
Beelink SEi11 Pro
Iris Xe G7 96EUs, i5-11320H, Kingston NV1 SNVS/500GCN
10281 Points -4%
Asus NUC 14 Pro+
Arc 8-Core, Ultra 9 185H, Samsung PM9A1a MZVL21T0HDLU
10135 Points -5%
PCMark 10 / Productivity
Beelink SER8
Radeon 780M, R7 8845HS, Crucial P3 Plus CT1000P3PSSD8
10457 Points +7%
Moyenne AMD Ryzen AI 9 HX 370, AMD Radeon 890M
  (9812 - 10615, n=3)
10257 Points +5%
Beelink SER9
Radeon 890M, Ryzen AI 9 HX 370, Crucial P3 Plus CT1000P3PSSD8
9812 Points
Asus NUC 14 Pro+
Arc 8-Core, Ultra 9 185H, Samsung PM9A1a MZVL21T0HDLU
9058 Points -8%
MSI Cubi NUC 1M
Iris Xe G7 96EUs, Core 7 150U, WD PC SN560 SDDPNQE-1T00
8387 Points -15%
GMK NucBox K9
Arc 7-Core, Ultra 5 125H, MasonSemi 1TB MC7000
7659 Points -22%
Beelink SEi11 Pro
Iris Xe G7 96EUs, i5-11320H, Kingston NV1 SNVS/500GCN
6915 Points -30%
PCMark 10 / Digital Content Creation
Beelink SER9
Radeon 890M, Ryzen AI 9 HX 370, Crucial P3 Plus CT1000P3PSSD8
11422 Points
Moyenne AMD Ryzen AI 9 HX 370, AMD Radeon 890M
  (9828 - 11422, n=3)
10744 Points -6%
Asus NUC 14 Pro+
Arc 8-Core, Ultra 9 185H, Samsung PM9A1a MZVL21T0HDLU
10593 Points -7%
Beelink SER8
Radeon 780M, R7 8845HS, Crucial P3 Plus CT1000P3PSSD8
10009 Points -12%
GMK NucBox K9
Arc 7-Core, Ultra 5 125H, MasonSemi 1TB MC7000
8940 Points -22%
MSI Cubi NUC 1M
Iris Xe G7 96EUs, Core 7 150U, WD PC SN560 SDDPNQE-1T00
6701 Points -41%
Beelink SEi11 Pro
Iris Xe G7 96EUs, i5-11320H, Kingston NV1 SNVS/500GCN
5048 Points -56%
CrossMark / Overall
Beelink SER8
Radeon 780M, R7 8845HS, Crucial P3 Plus CT1000P3PSSD8
1875 Points +11%
MSI Cubi NUC 1M
Iris Xe G7 96EUs, Core 7 150U, WD PC SN560 SDDPNQE-1T00
1734 Points +2%
Moyenne AMD Ryzen AI 9 HX 370, AMD Radeon 890M
  (1692 - 1749, n=2)
1721 Points +2%
Asus NUC 14 Pro+
Arc 8-Core, Ultra 9 185H, Samsung PM9A1a MZVL21T0HDLU
1713 Points +1%
Beelink SER9
Radeon 890M, Ryzen AI 9 HX 370, Crucial P3 Plus CT1000P3PSSD8
1692 Points
GMK NucBox K9
Arc 7-Core, Ultra 5 125H, MasonSemi 1TB MC7000
1633 Points -3%
Beelink SEi11 Pro
Iris Xe G7 96EUs, i5-11320H, Kingston NV1 SNVS/500GCN
1335 Points -21%
CrossMark / Productivity
Beelink SER8
Radeon 780M, R7 8845HS, Crucial P3 Plus CT1000P3PSSD8
1802 Points +13%
MSI Cubi NUC 1M
Iris Xe G7 96EUs, Core 7 150U, WD PC SN560 SDDPNQE-1T00
1778 Points +12%
Moyenne AMD Ryzen AI 9 HX 370, AMD Radeon 890M
  (1588 - 1625, n=2)
1607 Points +1%
GMK NucBox K9
Arc 7-Core, Ultra 5 125H, MasonSemi 1TB MC7000
1594 Points 0%
Asus NUC 14 Pro+
Arc 8-Core, Ultra 9 185H, Samsung PM9A1a MZVL21T0HDLU
1591 Points 0%
Beelink SER9
Radeon 890M, Ryzen AI 9 HX 370, Crucial P3 Plus CT1000P3PSSD8
1588 Points
Beelink SEi11 Pro
Iris Xe G7 96EUs, i5-11320H, Kingston NV1 SNVS/500GCN
1419 Points -11%
CrossMark / Creativity
Beelink SER8
Radeon 780M, R7 8845HS, Crucial P3 Plus CT1000P3PSSD8
2009 Points +8%
Asus NUC 14 Pro+
Arc 8-Core, Ultra 9 185H, Samsung PM9A1a MZVL21T0HDLU
1984 Points +6%
Moyenne AMD Ryzen AI 9 HX 370, AMD Radeon 890M
  (1868 - 2029, n=2)
1949 Points +4%
Beelink SER9
Radeon 890M, Ryzen AI 9 HX 370, Crucial P3 Plus CT1000P3PSSD8
1868 Points
GMK NucBox K9
Arc 7-Core, Ultra 5 125H, MasonSemi 1TB MC7000
1714 Points -8%
MSI Cubi NUC 1M
Iris Xe G7 96EUs, Core 7 150U, WD PC SN560 SDDPNQE-1T00
1708 Points -9%
Beelink SEi11 Pro
Iris Xe G7 96EUs, i5-11320H, Kingston NV1 SNVS/500GCN
1256 Points -33%
CrossMark / Responsiveness
Beelink SER8
Radeon 780M, R7 8845HS, Crucial P3 Plus CT1000P3PSSD8
1718 Points +13%
MSI Cubi NUC 1M
Iris Xe G7 96EUs, Core 7 150U, WD PC SN560 SDDPNQE-1T00
1685 Points +11%
GMK NucBox K9
Arc 7-Core, Ultra 5 125H, MasonSemi 1TB MC7000
1520 Points 0%
Beelink SER9
Radeon 890M, Ryzen AI 9 HX 370, Crucial P3 Plus CT1000P3PSSD8
1520 Points
Moyenne AMD Ryzen AI 9 HX 370, AMD Radeon 890M
  (1398 - 1520, n=2)
1459 Points -4%
Asus NUC 14 Pro+
Arc 8-Core, Ultra 9 185H, Samsung PM9A1a MZVL21T0HDLU
1378 Points -9%
Beelink SEi11 Pro
Iris Xe G7 96EUs, i5-11320H, Kingston NV1 SNVS/500GCN
1336 Points -12%
WebXPRT 3 / Overall
Beelink SER8
Radeon 780M, R7 8845HS, Crucial P3 Plus CT1000P3PSSD8
334 Points +17%
MSI Cubi NUC 1M
Iris Xe G7 96EUs, Core 7 150U, WD PC SN560 SDDPNQE-1T00
311 Points +9%
Moyenne AMD Ryzen AI 9 HX 370, AMD Radeon 890M
  (286 - 321, n=2)
304 Points +6%
Beelink SER9
Radeon 890M, Ryzen AI 9 HX 370, Crucial P3 Plus CT1000P3PSSD8
286 Points
Asus NUC 14 Pro+
Arc 8-Core, Ultra 9 185H, Samsung PM9A1a MZVL21T0HDLU
268 Points -6%
Beelink SEi11 Pro
Iris Xe G7 96EUs, i5-11320H, Kingston NV1 SNVS/500GCN
264 Points -8%
GMK NucBox K9
Arc 7-Core, Ultra 5 125H, MasonSemi 1TB MC7000
262 Points -8%
WebXPRT 4 / Overall
MSI Cubi NUC 1M
Iris Xe G7 96EUs, Core 7 150U, WD PC SN560 SDDPNQE-1T00
271 Points +17%
Beelink SER8
Radeon 780M, R7 8845HS, Crucial P3 Plus CT1000P3PSSD8
266 Points +15%
Moyenne AMD Ryzen AI 9 HX 370, AMD Radeon 890M
  (231 - 266, n=3)
252 Points +9%
Asus NUC 14 Pro+
Arc 8-Core, Ultra 9 185H, Samsung PM9A1a MZVL21T0HDLU
248 Points +7%
GMK NucBox K9
Arc 7-Core, Ultra 5 125H, MasonSemi 1TB MC7000
231 Points 0%
Beelink SER9
Radeon 890M, Ryzen AI 9 HX 370, Crucial P3 Plus CT1000P3PSSD8
231 Points
Beelink SEi11 Pro
Iris Xe G7 96EUs, i5-11320H, Kingston NV1 SNVS/500GCN
206 Points -11%
Mozilla Kraken 1.1 / Total
Beelink SEi11 Pro
Iris Xe G7 96EUs, i5-11320H, Kingston NV1 SNVS/500GCN
663 ms * -49%
GMK NucBox K9
Arc 7-Core, Ultra 5 125H, MasonSemi 1TB MC7000
566 ms * -27%
Asus NUC 14 Pro+
Arc 8-Core, Ultra 9 185H, Samsung PM9A1a MZVL21T0HDLU
528 ms * -19%
Beelink SER8
Radeon 780M, R7 8845HS, Crucial P3 Plus CT1000P3PSSD8
501 ms * -13%
MSI Cubi NUC 1M
Iris Xe G7 96EUs, Core 7 150U, WD PC SN560 SDDPNQE-1T00
489 ms * -10%
Beelink SER9
Radeon 890M, Ryzen AI 9 HX 370, Crucial P3 Plus CT1000P3PSSD8
445 ms *
Moyenne AMD Ryzen AI 9 HX 370, AMD Radeon 890M
  (433 - 445, n=4)
438 ms * +2%

* ... Moindre est la valeur, meilleures sont les performances

PCMark 10 Score
7613 points
Aide
AIDA64 / Memory Copy
Moyenne AMD Ryzen AI 9 HX 370
  (89287 - 92030, n=7)
89967 MB/s +1%
Beelink SER9
AMD Ryzen AI 9 HX 370, Radeon 890M
89287 MB/s
Asus NUC 14 Pro+
Intel Core Ultra 9 185H, Arc 8-Core
69929 MB/s -22%
Beelink SER8
AMD Ryzen 7 8845HS, Radeon 780M
68283 MB/s -24%
GMK NucBox K9
Intel Core Ultra 5 125H, Arc 7-Core
67482 MB/s -24%
MSI Cubi NUC 1M
Intel Core 7 150U, Iris Xe G7 96EUs
59609 MB/s -33%
Beelink SEi11 Pro
Intel Core i5-11320H, Iris Xe G7 96EUs
41106 MB/s -54%
AIDA64 / Memory Read
Moyenne AMD Ryzen AI 9 HX 370
  (98398 - 100903, n=7)
99935 MB/s +2%
Beelink SER9
AMD Ryzen AI 9 HX 370, Radeon 890M
98398 MB/s
Asus NUC 14 Pro+
Intel Core Ultra 9 185H, Arc 8-Core
76074 MB/s -23%
GMK NucBox K9
Intel Core Ultra 5 125H, Arc 7-Core
70520 MB/s -28%
MSI Cubi NUC 1M
Intel Core 7 150U, Iris Xe G7 96EUs
68780 MB/s -30%
Beelink SER8
AMD Ryzen 7 8845HS, Radeon 780M
61976 MB/s -37%
Beelink SEi11 Pro
Intel Core i5-11320H, Iris Xe G7 96EUs
46516 MB/s -53%
AIDA64 / Memory Write
Moyenne AMD Ryzen AI 9 HX 370
  (98583 - 108954, n=7)
100651 MB/s +2%
Beelink SER9
AMD Ryzen AI 9 HX 370, Radeon 890M
98583 MB/s
Beelink SER8
AMD Ryzen 7 8845HS, Radeon 780M
85464 MB/s -13%
Asus NUC 14 Pro+
Intel Core Ultra 9 185H, Arc 8-Core
72287 MB/s -27%
GMK NucBox K9
Intel Core Ultra 5 125H, Arc 7-Core
71218 MB/s -28%
MSI Cubi NUC 1M
Intel Core 7 150U, Iris Xe G7 96EUs
60626 MB/s -39%
Beelink SEi11 Pro
Intel Core i5-11320H, Iris Xe G7 96EUs
46760 MB/s -53%
AIDA64 / Memory Latency
GMK NucBox K9
Intel Core Ultra 5 125H, Arc 7-Core
140.2 ns * -22%
Asus NUC 14 Pro+
Intel Core Ultra 9 185H, Arc 8-Core
121.4 ns * -5%
Beelink SER9
AMD Ryzen AI 9 HX 370, Radeon 890M
115.2 ns *
Moyenne AMD Ryzen AI 9 HX 370
  (111.4 - 119.4, n=7)
114.6 ns * +1%
Beelink SER8
AMD Ryzen 7 8845HS, Radeon 780M
88.9 ns * +23%
Beelink SEi11 Pro
Intel Core i5-11320H, Iris Xe G7 96EUs
81 ns * +30%
MSI Cubi NUC 1M
Intel Core 7 150U, Iris Xe G7 96EUs
74.5 ns * +35%

* ... Moindre est la valeur, meilleures sont les performances

Latence DPC

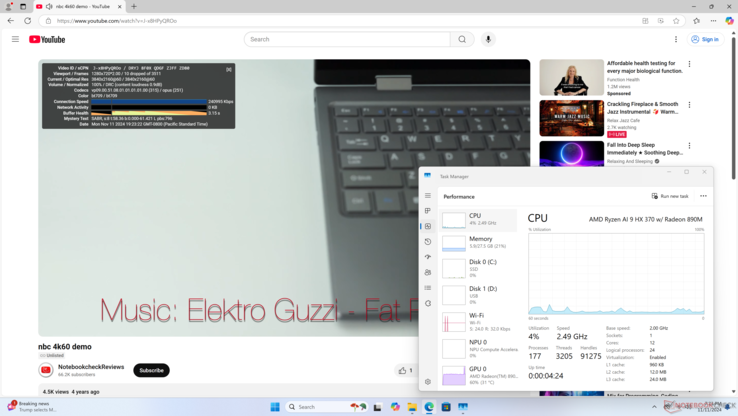
la lecture de vidéos 4K à 60 FPS est malheureusement imparfaite, avec 10 images perdues enregistrées sur une période de 60 secondes. En comparaison, la plupart des mini PC équipés de processeurs Intel, comme le MSI Cubi NUC 1M ne renvoient aucune image perdue.

LatencyMon est incompatible avec le processeur Strix Point.

test de lecture vidéo 4K60

Dispositifs de stockage

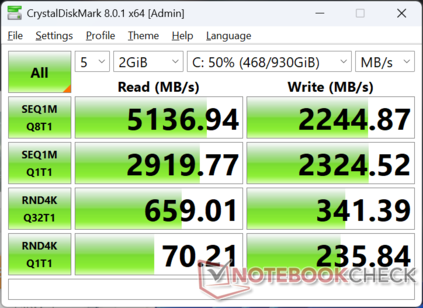
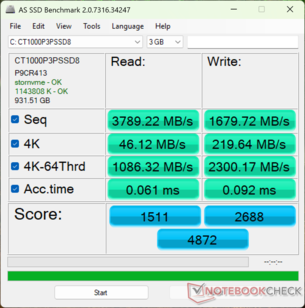
Le système est livré avec le même CT1000P3PSSD8 PCIe4 x4 NVMe SSD que l'on trouve sur le SER8. Les taux de transfert sont légèrement plus lents à ~4500 Mo/s contre ~5000 Mo/s sur le SER8.

CDM 8
CDM 8
AS SSD
AS SSD
Crucial P3 Plus CT1000P3PSSD8
CDM 5/6 Read Seq Q32T1: 5189 MB/s
CDM 5/6 Write Seq Q32T1: 2247 MB/s
CDM 5/6 Read 4K Q32T1: 657.3 MB/s
CDM 5/6 Write 4K Q32T1: 335.4 MB/s
CDM 5 Read Seq: 3030 MB/s
CDM 5 Write Seq: 2236 MB/s
CDM 5/6 Read 4K: 73.38 MB/s
CDM 5/6 Write 4K: 233.3 MB/s
Drive Performance Rating - Percent
GMK NucBox K9
MasonSemi 1TB MC7000
83.4 pt
Beelink SER8
Crucial P3 Plus CT1000P3PSSD8
63.5 pt
Asus NUC 14 Pro
Kingston KC3000 2048G SKC3000D2048G
63 pt
Beelink SER9
Crucial P3 Plus CT1000P3PSSD8
60.3 pt
MSI Cubi NUC 1M
WD PC SN560 SDDPNQE-1T00
56.3 pt
Beelink SEi11 Pro
Kingston NV1 SNVS/500GCN
37.2 pt
DiskSpd
seq read
MSI Cubi NUC 1M
WD PC SN560 SDDPNQE-1T00
4128 (4092.8min - 4128.38max) MB/s +83%
GMK NucBox K9
MasonSemi 1TB MC7000
3783 (3597.81min - 3782.84max) MB/s +68%
Asus NUC 14 Pro
Kingston KC3000 2048G SKC3000D2048G
3706 (3594.04min - 3706.37max) MB/s +64%
Beelink SER8
Crucial P3 Plus CT1000P3PSSD8
3106 (3062.47min - 3106.43max) MB/s +38%
Beelink SER9
Crucial P3 Plus CT1000P3PSSD8
2257 (2254.02min - 2257.37max) MB/s
Beelink SEi11 Pro
Kingston NV1 SNVS/500GCN
1638 (1628.34min - 1637.59max) MB/s -27%
seq write
GMK NucBox K9
MasonSemi 1TB MC7000
5556 (1352.45min - 5556.19max) MB/s +197%
Beelink SER8
Crucial P3 Plus CT1000P3PSSD8
4604 (4532.99min - 4603.88max) MB/s +146%
MSI Cubi NUC 1M
WD PC SN560 SDDPNQE-1T00
3215 (3133.8min - 3214.8max) MB/s +72%
Asus NUC 14 Pro
Kingston KC3000 2048G SKC3000D2048G
2928 (1958.53min - 2927.62max) MB/s +56%
Beelink SER9
Crucial P3 Plus CT1000P3PSSD8
1873 (688.38min - 1873.41max) MB/s
Beelink SEi11 Pro
Kingston NV1 SNVS/500GCN
1661 (336.85min - 1661.33max) MB/s -11%
seq q8 t1 read
Asus NUC 14 Pro
Kingston KC3000 2048G SKC3000D2048G
7110 (6058.21min - 7110.02max) MB/s +53%
GMK NucBox K9
MasonSemi 1TB MC7000
7066 (6607.49min - 7066.35max) MB/s +52%
Beelink SER8
Crucial P3 Plus CT1000P3PSSD8
5195 (4594.02min - 5195.39max) MB/s +12%
MSI Cubi NUC 1M
WD PC SN560 SDDPNQE-1T00
4987 (4558.37min - 4987.33max) MB/s +7%
Beelink SER9
Crucial P3 Plus CT1000P3PSSD8
4658 (3456.11min - 4657.77max) MB/s
Beelink SEi11 Pro
Kingston NV1 SNVS/500GCN
2374 (2218.75min - 2374.19max) MB/s -49%
seq q8 t1 write
GMK NucBox K9
MasonSemi 1TB MC7000
6647 (1260.59min - 6647.13max) MB/s +225%
Beelink SER8
Crucial P3 Plus CT1000P3PSSD8
4725 (4657.36min - 4724.88max) MB/s +131%
Asus NUC 14 Pro
Kingston KC3000 2048G SKC3000D2048G
4712 (3064.99min - 4711.88max) MB/s +130%
MSI Cubi NUC 1M
WD PC SN560 SDDPNQE-1T00
3308 (3211.45min - 3307.84max) MB/s +62%
Beelink SER9
Crucial P3 Plus CT1000P3PSSD8
2047 (794.1min - 2047.34max) MB/s
Beelink SEi11 Pro
Kingston NV1 SNVS/500GCN
1433 (67.32min - 1432.98max) MB/s -30%
4k q1 t1 read
Beelink SER8
Crucial P3 Plus CT1000P3PSSD8
79.7 (77.93min - 79.74max) MB/s +48%
GMK NucBox K9
MasonSemi 1TB MC7000
79.5 (78.92min - 79.5max) MB/s +48%
MSI Cubi NUC 1M
WD PC SN560 SDDPNQE-1T00
73.3 (72.01min - 73.31max) MB/s +36%
Beelink SER9
Crucial P3 Plus CT1000P3PSSD8
53.7 (52.17min - 53.71max) MB/s
Asus NUC 14 Pro
Kingston KC3000 2048G SKC3000D2048G
53.4 (49.89min - 53.35max) MB/s -1%
Beelink SEi11 Pro
Kingston NV1 SNVS/500GCN
50.5 (48.13min - 50.48max) MB/s -6%
4k q1 t1 write
Beelink SER8
Crucial P3 Plus CT1000P3PSSD8
289 (283.17min - 289.07max) MB/s +22%
MSI Cubi NUC 1M
WD PC SN560 SDDPNQE-1T00
282 (265.11min - 281.58max) MB/s +19%
Beelink SER9
Crucial P3 Plus CT1000P3PSSD8
236 (212.83min - 235.59max) MB/s
GMK NucBox K9
MasonSemi 1TB MC7000
205 (173.87min - 205.2max) MB/s -13%
Beelink SEi11 Pro
Kingston NV1 SNVS/500GCN
173.6 (113.3min - 173.62max) MB/s -26%
Asus NUC 14 Pro
Kingston KC3000 2048G SKC3000D2048G
83.1 (75.3min - 83.11max) MB/s -65%
4k q32 t16 read
Beelink SER9
Crucial P3 Plus CT1000P3PSSD8
3162 (3155.7min - 3161.51max) MB/s
Beelink SER8
Crucial P3 Plus CT1000P3PSSD8
3139 (3067min - 3138.94max) MB/s -1%
GMK NucBox K9
MasonSemi 1TB MC7000
2243 (1941.91min - 2243.48max) MB/s -29%
MSI Cubi NUC 1M
WD PC SN560 SDDPNQE-1T00
1533 (1419.74min - 1533.25max) MB/s -52%
Beelink SEi11 Pro
Kingston NV1 SNVS/500GCN
745 (742.2min - 744.53max) MB/s -76%
Asus NUC 14 Pro
Kingston KC3000 2048G SKC3000D2048G
731 (660.89min - 731.29max) MB/s -77%
4k q32 t16 write
Beelink SER8
Crucial P3 Plus CT1000P3PSSD8
4288 (4275.2min - 4287.55max) MB/s +141%
GMK NucBox K9
MasonSemi 1TB MC7000
3232 (3002.64min - 3232.41max) MB/s +81%
MSI Cubi NUC 1M
WD PC SN560 SDDPNQE-1T00
2010 (1622.95min - 2010.14max) MB/s +13%
Beelink SER9
Crucial P3 Plus CT1000P3PSSD8
1782 (864.63min - 1781.78max) MB/s
Beelink SEi11 Pro
Kingston NV1 SNVS/500GCN
733 (332min - 733.18max) MB/s -59%
Asus NUC 14 Pro
Kingston KC3000 2048G SKC3000D2048G
186.7 (155.05min - 186.74max) MB/s -90%
AS SSD
Score Total
GMK NucBox K9
MasonSemi 1TB MC7000
7509 Points +54%
Asus NUC 14 Pro
Kingston KC3000 2048G SKC3000D2048G
5131 Points +5%
Beelink SER9
Crucial P3 Plus CT1000P3PSSD8
4872 Points
MSI Cubi NUC 1M
WD PC SN560 SDDPNQE-1T00
2750 Points -44%
Beelink SEi11 Pro
Kingston NV1 SNVS/500GCN
2742 Points -44%
Beelink SER8
Crucial P3 Plus CT1000P3PSSD8
2646 Points -46%
Score Read
GMK NucBox K9
MasonSemi 1TB MC7000
3258 Points +116%
Beelink SER9
Crucial P3 Plus CT1000P3PSSD8
1511 Points
MSI Cubi NUC 1M
WD PC SN560 SDDPNQE-1T00
1443 Points -5%
Asus NUC 14 Pro
Kingston KC3000 2048G SKC3000D2048G
1275 Points -16%
Beelink SER8
Crucial P3 Plus CT1000P3PSSD8
1108 Points -27%
Beelink SEi11 Pro
Kingston NV1 SNVS/500GCN
975 Points -35%
Score Write
Asus NUC 14 Pro
Kingston KC3000 2048G SKC3000D2048G
3313 Points +23%
Beelink SER9
Crucial P3 Plus CT1000P3PSSD8
2688 Points
GMK NucBox K9
MasonSemi 1TB MC7000
2593 Points -4%
Beelink SEi11 Pro
Kingston NV1 SNVS/500GCN
1282 Points -52%
Beelink SER8
Crucial P3 Plus CT1000P3PSSD8
1057 Points -61%
MSI Cubi NUC 1M
WD PC SN560 SDDPNQE-1T00
651 Points -76%
Seq Read
GMK NucBox K9
MasonSemi 1TB MC7000
5766.47 MB/s +52%
Asus NUC 14 Pro
Kingston KC3000 2048G SKC3000D2048G
5158 MB/s +36%
MSI Cubi NUC 1M
WD PC SN560 SDDPNQE-1T00
4327.67 MB/s +14%
Beelink SER8
Crucial P3 Plus CT1000P3PSSD8
3913.46 MB/s +3%
Beelink SER9
Crucial P3 Plus CT1000P3PSSD8
3789.22 MB/s
Beelink SEi11 Pro
Kingston NV1 SNVS/500GCN
2246.84 MB/s -41%
Seq Write
GMK NucBox K9
MasonSemi 1TB MC7000
5653.88 MB/s +237%
Asus NUC 14 Pro
Kingston KC3000 2048G SKC3000D2048G
2646 MB/s +58%
MSI Cubi NUC 1M
WD PC SN560 SDDPNQE-1T00
2606.84 MB/s +55%
Beelink SER8
Crucial P3 Plus CT1000P3PSSD8
1944.73 MB/s +16%
Beelink SEi11 Pro
Kingston NV1 SNVS/500GCN
1764.26 MB/s +5%
Beelink SER9
Crucial P3 Plus CT1000P3PSSD8
1679.72 MB/s
4K Read
GMK NucBox K9
MasonSemi 1TB MC7000
67.66 MB/s +47%
Asus NUC 14 Pro
Kingston KC3000 2048G SKC3000D2048G
63.6 MB/s +38%
Beelink SER8
Crucial P3 Plus CT1000P3PSSD8
51.6 MB/s +12%
Beelink SER9
Crucial P3 Plus CT1000P3PSSD8
46.12 MB/s
Beelink SEi11 Pro
Kingston NV1 SNVS/500GCN
44.12 MB/s -4%
MSI Cubi NUC 1M
WD PC SN560 SDDPNQE-1T00
42.24 MB/s -8%
4K Write
Beelink SER9
Crucial P3 Plus CT1000P3PSSD8
219.64 MB/s
Beelink SER8
Crucial P3 Plus CT1000P3PSSD8
219.02 MB/s 0%
MSI Cubi NUC 1M
WD PC SN560 SDDPNQE-1T00
217.48 MB/s -1%
Beelink SEi11 Pro
Kingston NV1 SNVS/500GCN
192.62 MB/s -12%
Asus NUC 14 Pro
Kingston KC3000 2048G SKC3000D2048G
169.5 MB/s -23%
GMK NucBox K9
MasonSemi 1TB MC7000
148.58 MB/s -32%
4K-64 Read
GMK NucBox K9
MasonSemi 1TB MC7000
2614.06 MB/s +141%
Beelink SER9
Crucial P3 Plus CT1000P3PSSD8
1086.32 MB/s
MSI Cubi NUC 1M
WD PC SN560 SDDPNQE-1T00
967.82 MB/s -11%
Beelink SEi11 Pro
Kingston NV1 SNVS/500GCN
706.35 MB/s -35%
Asus NUC 14 Pro
Kingston KC3000 2048G SKC3000D2048G
695 MB/s -36%
Beelink SER8
Crucial P3 Plus CT1000P3PSSD8
664.76 MB/s -39%
4K-64 Write
Asus NUC 14 Pro
Kingston KC3000 2048G SKC3000D2048G
2878 MB/s +25%
Beelink SER9
Crucial P3 Plus CT1000P3PSSD8
2300.17 MB/s
GMK NucBox K9
MasonSemi 1TB MC7000
1879.53 MB/s -18%
Beelink SEi11 Pro
Kingston NV1 SNVS/500GCN
912.72 MB/s -60%
Beelink SER8
Crucial P3 Plus CT1000P3PSSD8
643.31 MB/s -72%
MSI Cubi NUC 1M
WD PC SN560 SDDPNQE-1T00
172.85 MB/s -92%
Access Time Read
Beelink SER8
Crucial P3 Plus CT1000P3PSSD8
0.077 ms * -26%
MSI Cubi NUC 1M
WD PC SN560 SDDPNQE-1T00
0.072 ms * -18%
Beelink SER9
Crucial P3 Plus CT1000P3PSSD8
0.061 ms *
GMK NucBox K9
MasonSemi 1TB MC7000
0.06 ms * +2%
Beelink SEi11 Pro
Kingston NV1 SNVS/500GCN
0.053 ms * +13%
Asus NUC 14 Pro
Kingston KC3000 2048G SKC3000D2048G
0.053 ms * +13%
Access Time Write
Beelink SEi11 Pro
Kingston NV1 SNVS/500GCN
0.342 ms * -272%
GMK NucBox K9
MasonSemi 1TB MC7000
0.195 ms * -112%
Beelink SER9
Crucial P3 Plus CT1000P3PSSD8
0.092 ms *
MSI Cubi NUC 1M
WD PC SN560 SDDPNQE-1T00
0.088 ms * +4%
Beelink SER8
Crucial P3 Plus CT1000P3PSSD8
0.075 ms * +18%
Asus NUC 14 Pro
Kingston KC3000 2048G SKC3000D2048G
0.043 ms * +53%

* ... Moindre est la valeur, meilleures sont les performances

Disk Throttling: DiskSpd Read Loop, Queue Depth 8

02605207801040130015601820208023402600286031203380364039004160442046804940Tooltip
Beelink SER9 Crucial P3 Plus CT1000P3PSSD8; diskspd 2.0.17 f: Ø4560 (4050.44-4915.49)
Beelink SER8 Crucial P3 Plus CT1000P3PSSD8; diskspd 2.0.17 f: Ø5188 (4957.94-5197.46)

Performance du GPU

Les performances graphiques sont parmi les plus rapides de tous les mini-PC à carte graphique intégrée. Notre Radeon 890M surpasse la machine concurrente Arc 8 ou Arc 140V dans les jeux. AMD a également mis à jour les pilotes afin de corriger les problèmes de performances que nous avons rencontrés lors de l'exécution de DOTA 2 Reborn.

Malheureusement, les taux de rafraîchissement dans les jeux peuvent souffrir de chutes périodiques. Lorsque vous jouez à Cyberpunk 2077 en configuration 1080p Ultra, par exemple, le taux de rafraîchissement passe parfois de 25 à 22 au lieu de rester constant à 25.

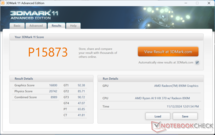
3DMark 11
3DMark 11
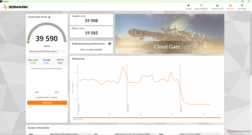
Cloud Gate
Cloud Gate
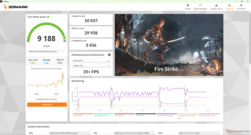
Fire Strike
Fire Strike
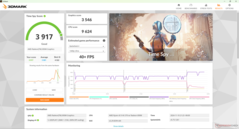
Time Spy
Time Spy
Voie rapide
Voie rapide
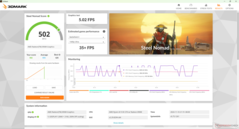
Nomade d'acier
Nomade d'acier
3DMark Performance Rating - Percent
Beelink SER9
AMD Radeon 890M, AMD Ryzen AI 9 HX 370
100 pt
Moyenne AMD Radeon 890M
 
96.3 pt
BOSGAME M1
AMD Radeon 780M, AMD Ryzen 7 7840HS
89.7 pt
Asus NUC 14 Pro+
Intel Arc 8-Core iGPU, Intel Core Ultra 9 185H
88.6 pt
Beelink SER8
AMD Radeon 780M, AMD Ryzen 7 8845HS
85.6 pt
Lenovo ThinkStation P3 Tiny-30H0006AGE
NVIDIA T1000, Intel Core i9-14900
84.4 pt
Khadas Mind 2
Intel Arc 8-Core iGPU, Intel Core Ultra 7 155H
83.9 pt
Minisforum MS-A1
AMD Radeon 780M, AMD Ryzen 7 8700G
82.2 pt
GMK NucBox K6 -1!
AMD Radeon 780M, AMD Ryzen 7 7840HS
82 pt
Geekom AX8 Pro
AMD Radeon 780M, AMD Ryzen 9 8945H
81.7 pt
GMK NucBox K9
Intel Arc 7-Core iGPU, Intel Core Ultra 5 125H
74.2 pt
Geekom XT13 Pro
Intel Iris Xe Graphics G7 96EUs, Intel Core i9-13900H
52.1 pt
GMK NucBox M6
AMD Radeon 660M, AMD Ryzen 5 6600H
48 pt
MSI Cubi NUC 1M
Intel Iris Xe Graphics G7 96EUs, Intel Core 7 150U
44 pt
Beelink SEi11 Pro
Intel Iris Xe Graphics G7 96EUs, Intel Core i5-11320H
42.5 pt
HP Pro Mini 400 G9-937U0EA
Intel UHD Graphics 770, Intel Core i5-14500T
23.9 pt
3DMark 11 - 1280x720 Performance GPU
Beelink SER9
AMD Radeon 890M, AMD Ryzen AI 9 HX 370
16800 Points
Moyenne AMD Radeon 890M
  (13345 - 16800, n=5)
15551 Points -7%
BOSGAME M1
AMD Radeon 780M, AMD Ryzen 7 7840HS
14249 Points -15%
GMK NucBox K6
AMD Radeon 780M, AMD Ryzen 7 7840HS
13716 Points -18%
Beelink SER8
AMD Radeon 780M, AMD Ryzen 7 8845HS
13673 Points -19%
Geekom AX8 Pro
AMD Radeon 780M, AMD Ryzen 9 8945H
13281 Points -21%
Minisforum MS-A1
AMD Radeon 780M, AMD Ryzen 7 8700G
13248 Points -21%
Asus NUC 14 Pro+
Intel Arc 8-Core iGPU, Intel Core Ultra 9 185H
13163 Points -22%
Khadas Mind 2
Intel Arc 8-Core iGPU, Intel Core Ultra 7 155H
11902 Points -29%
Lenovo ThinkStation P3 Tiny-30H0006AGE
NVIDIA T1000, Intel Core i9-14900
11793 Points -30%
GMK NucBox K9
Intel Arc 7-Core iGPU, Intel Core Ultra 5 125H
10737 Points -36%
Geekom XT13 Pro
Intel Iris Xe Graphics G7 96EUs, Intel Core i9-13900H
7428 Points -56%
GMK NucBox M6
AMD Radeon 660M, AMD Ryzen 5 6600H
7184 Points -57%
Beelink SEi11 Pro
Intel Iris Xe Graphics G7 96EUs, Intel Core i5-11320H
6571 Points -61%
MSI Cubi NUC 1M
Intel Iris Xe Graphics G7 96EUs, Intel Core 7 150U
6282 Points -63%
HP Pro Mini 400 G9-937U0EA
Intel UHD Graphics 770, Intel Core i5-14500T
3422 Points -80%
3DMark
1280x720 Cloud Gate Standard Graphics
Beelink SER9
AMD Radeon 890M, AMD Ryzen AI 9 HX 370
55908 Points
Moyenne AMD Radeon 890M
  (53940 - 58319, n=4)
55718 Points 0%
BOSGAME M1
AMD Radeon 780M, AMD Ryzen 7 7840HS
53972 Points -3%
Beelink SER8
AMD Radeon 780M, AMD Ryzen 7 8845HS
53347 Points -5%
Lenovo ThinkStation P3 Tiny-30H0006AGE
NVIDIA T1000, Intel Core i9-14900
50553 Points -10%
Minisforum MS-A1
AMD Radeon 780M, AMD Ryzen 7 8700G
48717 Points -13%
Geekom AX8 Pro
AMD Radeon 780M, AMD Ryzen 9 8945H
48166 Points -14%
Asus NUC 14 Pro+
Intel Arc 8-Core iGPU, Intel Core Ultra 9 185H
47040 Points -16%
Khadas Mind 2
Intel Arc 8-Core iGPU, Intel Core Ultra 7 155H
45726 Points -18%
GMK NucBox K9
Intel Arc 7-Core iGPU, Intel Core Ultra 5 125H
39695 Points -29%
Geekom XT13 Pro
Intel Iris Xe Graphics G7 96EUs, Intel Core i9-13900H
34469 Points -38%
GMK NucBox M6
AMD Radeon 660M, AMD Ryzen 5 6600H
31849 Points -43%
MSI Cubi NUC 1M
Intel Iris Xe Graphics G7 96EUs, Intel Core 7 150U
29301 Points -48%
Beelink SEi11 Pro
Intel Iris Xe Graphics G7 96EUs, Intel Core i5-11320H
26093 Points -53%
HP Pro Mini 400 G9-937U0EA
Intel UHD Graphics 770, Intel Core i5-14500T
16983 Points -70%
1920x1080 Fire Strike Graphics
Beelink SER9
AMD Radeon 890M, AMD Ryzen AI 9 HX 370
10037 Points
Moyenne AMD Radeon 890M
  (8188 - 10037, n=5)
9114 Points -9%
BOSGAME M1
AMD Radeon 780M, AMD Ryzen 7 7840HS
8816 Points -12%
Beelink SER8
AMD Radeon 780M, AMD Ryzen 7 8845HS
8572 Points -15%
Lenovo ThinkStation P3 Tiny-30H0006AGE
NVIDIA T1000, Intel Core i9-14900
8450 Points -16%
Asus NUC 14 Pro+
Intel Arc 8-Core iGPU, Intel Core Ultra 9 185H
8396 Points -16%
Khadas Mind 2
Intel Arc 8-Core iGPU, Intel Core Ultra 7 155H
8260 Points -18%
GMK NucBox K6
AMD Radeon 780M, AMD Ryzen 7 7840HS
8164 Points -19%
Geekom AX8 Pro
AMD Radeon 780M, AMD Ryzen 9 8945H
8117 Points -19%
Minisforum MS-A1
AMD Radeon 780M, AMD Ryzen 7 8700G
8061 Points -20%
GMK NucBox K9
Intel Arc 7-Core iGPU, Intel Core Ultra 5 125H
7325 Points -27%
Geekom XT13 Pro
Intel Iris Xe Graphics G7 96EUs, Intel Core i9-13900H
5845 Points -42%
GMK NucBox M6
AMD Radeon 660M, AMD Ryzen 5 6600H
4984 Points -50%
MSI Cubi NUC 1M
Intel Iris Xe Graphics G7 96EUs, Intel Core 7 150U
4899 Points -51%
Beelink SEi11 Pro
Intel Iris Xe Graphics G7 96EUs, Intel Core i5-11320H
4523 Points -55%
HP Pro Mini 400 G9-937U0EA
Intel UHD Graphics 770, Intel Core i5-14500T
2655 Points -74%
2560x1440 Time Spy Graphics
Beelink SER9
AMD Radeon 890M, AMD Ryzen AI 9 HX 370
3546 Points
Moyenne AMD Radeon 890M
  (3421 - 3676, n=6)
3525 Points -1%
Asus NUC 14 Pro+
Intel Arc 8-Core iGPU, Intel Core Ultra 9 185H
3476 Points -2%
Khadas Mind 2
Intel Arc 8-Core iGPU, Intel Core Ultra 7 155H
3269 Points -8%
BOSGAME M1
AMD Radeon 780M, AMD Ryzen 7 7840HS
3178 Points -10%
Lenovo ThinkStation P3 Tiny-30H0006AGE
NVIDIA T1000, Intel Core i9-14900
3088 Points -13%
Beelink SER8
AMD Radeon 780M, AMD Ryzen 7 8845HS
2917 Points -18%
GMK NucBox K6
AMD Radeon 780M, AMD Ryzen 7 7840HS
2906 Points -18%
Minisforum MS-A1
AMD Radeon 780M, AMD Ryzen 7 8700G
2890 Points -18%
GMK NucBox K9
Intel Arc 7-Core iGPU, Intel Core Ultra 5 125H
2881 Points -19%
Geekom AX8 Pro
AMD Radeon 780M, AMD Ryzen 9 8945H
2852 Points -20%
Geekom XT13 Pro
Intel Iris Xe Graphics G7 96EUs, Intel Core i9-13900H
1682 Points -53%
GMK NucBox M6
AMD Radeon 660M, AMD Ryzen 5 6600H
1582 Points -55%
Beelink SEi11 Pro
Intel Iris Xe Graphics G7 96EUs, Intel Core i5-11320H
1443 Points -59%
MSI Cubi NUC 1M
Intel Iris Xe Graphics G7 96EUs, Intel Core 7 150U
1428 Points -60%
HP Pro Mini 400 G9-937U0EA
Intel UHD Graphics 770, Intel Core i5-14500T
731 Points -79%
2560x1440 Time Spy Score
Beelink SER9
AMD Radeon 890M, AMD Ryzen AI 9 HX 370
3917 Points
Moyenne AMD Radeon 890M
  (3768 - 4073, n=5)
3889 Points -1%
Asus NUC 14 Pro+
Intel Arc 8-Core iGPU, Intel Core Ultra 9 185H
3881 Points -1%
Khadas Mind 2
Intel Arc 8-Core iGPU, Intel Core Ultra 7 155H
3621 Points -8%
Lenovo ThinkStation P3 Tiny-30H0006AGE
NVIDIA T1000, Intel Core i9-14900
3534 Points -10%
BOSGAME M1
AMD Radeon 780M, AMD Ryzen 7 7840HS
3517 Points -10%
Beelink SER8
AMD Radeon 780M, AMD Ryzen 7 8845HS
3274 Points -16%
GMK NucBox K6
AMD Radeon 780M, AMD Ryzen 7 7840HS
3260 Points -17%
Minisforum MS-A1
AMD Radeon 780M, AMD Ryzen 7 8700G
3254 Points -17%
Geekom AX8 Pro
AMD Radeon 780M, AMD Ryzen 9 8945H
3206 Points -18%
GMK NucBox K9
Intel Arc 7-Core iGPU, Intel Core Ultra 5 125H
3200 Points -18%
Geekom XT13 Pro
Intel Iris Xe Graphics G7 96EUs, Intel Core i9-13900H
1920 Points -51%
GMK NucBox M6
AMD Radeon 660M, AMD Ryzen 5 6600H
1793 Points -54%
Beelink SEi11 Pro
Intel Iris Xe Graphics G7 96EUs, Intel Core i5-11320H
1612 Points -59%
MSI Cubi NUC 1M
Intel Iris Xe Graphics G7 96EUs, Intel Core 7 150U
1602 Points -59%
HP Pro Mini 400 G9-937U0EA
Intel UHD Graphics 770, Intel Core i5-14500T
847 Points -78%
3DMark 11 Performance
15873 points
3DMark Cloud Gate Standard Score
39590 points
3DMark Fire Strike Score
9188 points
3DMark Time Spy Score
3917 points
3DMark Steel Nomad Score
502 points
Aide
Blender
v3.3 Classroom OPTIX/RTX
Lenovo ThinkStation P3 Tiny-30H0006AGE
NVIDIA T1000, Intel Core i9-14900
159 Seconds *
v3.3 Classroom CUDA
Lenovo ThinkStation P3 Tiny-30H0006AGE
NVIDIA T1000, Intel Core i9-14900
159 Seconds *
v3.3 Classroom CPU
Beelink SEi11 Pro
Intel Iris Xe Graphics G7 96EUs, Intel Core i5-11320H
995 Seconds * -334%
MSI Cubi NUC 1M
Intel Iris Xe Graphics G7 96EUs, Intel Core 7 150U
829 Seconds * -262%
HP Pro Mini 400 G9-937U0EA
Intel UHD Graphics 770, Intel Core i5-14500T
513 Seconds * -124%
GMK NucBox M6
AMD Radeon 660M, AMD Ryzen 5 6600H
497 Seconds * -117%
Khadas Mind 2
Intel Arc 8-Core iGPU, Intel Core Ultra 7 155H
448 Seconds * -96%
GMK NucBox K9
Intel Arc 7-Core iGPU, Intel Core Ultra 5 125H
435 Seconds * -90%
GMK NucBox K6
AMD Radeon 780M, AMD Ryzen 7 7840HS
327 Seconds * -43%
Geekom AX8 Pro
AMD Radeon 780M, AMD Ryzen 9 8945H
326 Seconds * -42%
Asus NUC 14 Pro+
Intel Arc 8-Core iGPU, Intel Core Ultra 9 185H
326 Seconds * -42%
BOSGAME M1
AMD Radeon 780M, AMD Ryzen 7 7840HS
319 Seconds * -39%
Beelink SER8
AMD Radeon 780M, AMD Ryzen 7 8845HS
310 Seconds * -35%
Minisforum MS-A1
AMD Radeon 780M, AMD Ryzen 7 8700G
300 Seconds * -31%
Lenovo ThinkStation P3 Tiny-30H0006AGE
NVIDIA T1000, Intel Core i9-14900
263 Seconds * -15%
Moyenne AMD Radeon 890M
  (229 - 306, n=4)
258 Seconds * -13%
Beelink SER9
AMD Radeon 890M, AMD Ryzen AI 9 HX 370
229 Seconds *
v3.3 Classroom oneAPI/Intel
GMK NucBox K9
Intel Arc 7-Core iGPU, Intel Core Ultra 5 125H
308 Seconds *
Khadas Mind 2
Intel Arc 8-Core iGPU, Intel Core Ultra 7 155H
225 Seconds *
Asus NUC 14 Pro+
Intel Arc 8-Core iGPU, Intel Core Ultra 9 185H
215 Seconds *

* ... Moindre est la valeur, meilleures sont les performances

Performance Rating - Percent
Beelink SER9 -1!
AMD Ryzen AI 9 HX 370, AMD Radeon 890M
99.9 pt
Beelink SER8 -1!
AMD Ryzen 7 8845HS, AMD Radeon 780M
90.3 pt
Asus NUC 14 Pro -1!
Intel Core Ultra 5 125H, Intel Arc 7-Core iGPU
71.1 pt
GMK NucBox K9
Intel Core Ultra 5 125H, Intel Arc 7-Core iGPU
70 pt
Beelink SEi11 Pro -3!
Intel Core i5-11320H, Intel Iris Xe Graphics G7 96EUs
51.7 pt
MSI Cubi NUC 1M -2!
Intel Core 7 150U, Intel Iris Xe Graphics G7 96EUs
45 pt
Cyberpunk 2077 2.1 Phantom Liberty - 1920x1080 Ultra Preset (FSR off)
Beelink SER9
AMD Ryzen AI 9 HX 370, AMD Radeon 890M
25.5 (20.9min) fps
Beelink SER8
AMD Ryzen 7 8845HS, AMD Radeon 780M
23.4 (19min) fps -8%
Asus NUC 14 Pro
Intel Core Ultra 5 125H, Intel Arc 7-Core iGPU
19.6 (16.7min) fps -23%
GMK NucBox K9
Intel Core Ultra 5 125H, Intel Arc 7-Core iGPU
18.8 (10.9min) fps -26%
MSI Cubi NUC 1M
Intel Core 7 150U, Intel Iris Xe Graphics G7 96EUs
9.46 (7.99min) fps -63%
Baldur's Gate 3 - 1920x1080 Ultra Preset
Beelink SER8
AMD Ryzen 7 8845HS, AMD Radeon 780M
28 fps
GMK NucBox K9
Intel Core Ultra 5 125H, Intel Arc 7-Core iGPU
23.1 fps
Asus NUC 14 Pro
Intel Core Ultra 5 125H, Intel Arc 7-Core iGPU
21.5 (13.6min, 13.7P0.1, 14.1P1) fps
GTA V - 1920x1080 Highest Settings possible AA:4xMSAA + FX AF:16x
Beelink SER9
AMD Ryzen AI 9 HX 370, AMD Radeon 890M
31.5 (3.06min, 21.7P1) fps
Asus NUC 14 Pro
Intel Core Ultra 5 125H, Intel Arc 7-Core iGPU
16.6 (2.85min, 11.4P1) fps -47%
GMK NucBox K9
Intel Core Ultra 5 125H, Intel Arc 7-Core iGPU
12.7 (2.89min, 8.93P1) fps -60%
MSI Cubi NUC 1M
Intel Core 7 150U, Intel Iris Xe Graphics G7 96EUs
9.98 (4.2min, 6.21P1) fps -68%
Final Fantasy XV Benchmark - 1920x1080 High Quality
Beelink SER9
AMD Ryzen AI 9 HX 370, AMD Radeon 890M
33.3 fps
Beelink SER8
AMD Ryzen 7 8845HS, AMD Radeon 780M
29.4 fps -12%
Asus NUC 14 Pro
Intel Core Ultra 5 125H, Intel Arc 7-Core iGPU
25.3 fps -24%
GMK NucBox K9
Intel Core Ultra 5 125H, Intel Arc 7-Core iGPU
22.3 fps -33%
MSI Cubi NUC 1M
Intel Core 7 150U, Intel Iris Xe Graphics G7 96EUs
16.6 fps -50%
Beelink SEi11 Pro
Intel Core i5-11320H, Intel Iris Xe Graphics G7 96EUs
14.9 fps -55%
Strange Brigade - 1920x1080 ultra AA:ultra AF:16
Beelink SER9
AMD Ryzen AI 9 HX 370, AMD Radeon 890M
59.7 (43.6min, 46.2P1) fps
Beelink SER8
AMD Ryzen 7 8845HS, AMD Radeon 780M
50.8 (24.5min, 33.9P1) fps -15%
GMK NucBox K9
Intel Core Ultra 5 125H, Intel Arc 7-Core iGPU
43.5 (8.2min, 17.8P1) fps -27%
MSI Cubi NUC 1M
Intel Core 7 150U, Intel Iris Xe Graphics G7 96EUs
25.2 (5.3min, 6.89P1) fps -58%
Beelink SEi11 Pro
Intel Core i5-11320H, Intel Iris Xe Graphics G7 96EUs
22.2 (5.6min, 7.76P1) fps -63%
Dota 2 Reborn - 1920x1080 ultra (3/3) best looking
Beelink SER8
AMD Ryzen 7 8845HS, AMD Radeon 780M
90.4 (71.8min) fps +1%
Beelink SER9
AMD Ryzen AI 9 HX 370, AMD Radeon 890M
89.8 (79.5min) fps
GMK NucBox K9
Intel Core Ultra 5 125H, Intel Arc 7-Core iGPU
73.3 (48.5min) fps -18%
Asus NUC 14 Pro
Intel Core Ultra 5 125H, Intel Arc 7-Core iGPU
72.9 (47.2min) fps -19%
MSI Cubi NUC 1M
Intel Core 7 150U, Intel Iris Xe Graphics G7 96EUs
57.8 (39.9min) fps -36%
Beelink SEi11 Pro
Intel Core i5-11320H, Intel Iris Xe Graphics G7 96EUs
47.4 (40.8min) fps -47%
X-Plane 11.11 - 1920x1080 high (fps_test=3)
Beelink SER9
AMD Ryzen AI 9 HX 370, AMD Radeon 890M
51.6 fps
Beelink SER8
AMD Ryzen 7 8845HS, AMD Radeon 780M
39.6 fps -23%
Beelink SEi11 Pro
Intel Core i5-11320H, Intel Iris Xe Graphics G7 96EUs
37.3 fps -28%
GMK NucBox K9
Intel Core Ultra 5 125H, Intel Arc 7-Core iGPU
37.3 fps -28%
Asus NUC 14 Pro
Intel Core Ultra 5 125H, Intel Arc 7-Core iGPU
32.9 fps -36%
Tiny Tina's Wonderlands
1280x720 Lowest Preset (DX12)
Moyenne AMD Radeon 890M
  (170.3 - 172.1, n=2)
171.2 fps +1%
Beelink SER9
AMD Ryzen AI 9 HX 370, AMD Radeon 890M
170.3 fps
BOSGAME M1
AMD Ryzen 7 7840HS, AMD Radeon 780M
142.1 fps -17%
Lenovo ThinkStation P3 Tiny-30H0006AGE
Intel Core i9-14900, NVIDIA T1000
139.9 fps -18%
GMK NucBox K6
AMD Ryzen 7 7840HS, AMD Radeon 780M
139 fps -18%
Beelink SER8
AMD Ryzen 7 8845HS, AMD Radeon 780M
127.9 fps -25%
GMK NucBox K9
Intel Core Ultra 5 125H, Intel Arc 7-Core iGPU
89 fps -48%
GMK NucBox M6
AMD Ryzen 5 6600H, AMD Radeon 660M
80.8 fps -53%
MSI Cubi NUC 1M
Intel Core 7 150U, Intel Iris Xe Graphics G7 96EUs
37.9 fps -78%
1920x1080 Low Preset (DX12)
Beelink SER9
AMD Ryzen AI 9 HX 370, AMD Radeon 890M
88.3 fps
Moyenne AMD Radeon 890M
  (86.9 - 88.3, n=2)
87.6 fps -1%
BOSGAME M1
AMD Ryzen 7 7840HS, AMD Radeon 780M
77.7 fps -12%
GMK NucBox K6
AMD Ryzen 7 7840HS, AMD Radeon 780M
74.6 fps -16%
Beelink SER8
AMD Ryzen 7 8845HS, AMD Radeon 780M
72.8 fps -18%
Lenovo ThinkStation P3 Tiny-30H0006AGE
Intel Core i9-14900, NVIDIA T1000
69.2 fps -22%
GMK NucBox K9
Intel Core Ultra 5 125H, Intel Arc 7-Core iGPU
50.7 fps -43%
GMK NucBox M6
AMD Ryzen 5 6600H, AMD Radeon 660M
40 fps -55%
MSI Cubi NUC 1M
Intel Core 7 150U, Intel Iris Xe Graphics G7 96EUs
27.5 fps -69%
1920x1080 Medium Preset (DX12)
Beelink SER9
AMD Ryzen AI 9 HX 370, AMD Radeon 890M
62.3 fps
Moyenne AMD Radeon 890M
  (62.1 - 62.3, n=2)
62.2 fps 0%
BOSGAME M1
AMD Ryzen 7 7840HS, AMD Radeon 780M
55.9 fps -10%
Lenovo ThinkStation P3 Tiny-30H0006AGE
Intel Core i9-14900, NVIDIA T1000
55.6 fps -11%
Beelink SER8
AMD Ryzen 7 8845HS, AMD Radeon 780M
52.8 fps -15%
GMK NucBox K6
AMD Ryzen 7 7840HS, AMD Radeon 780M
52.2 fps -16%
GMK NucBox K9
Intel Core Ultra 5 125H, Intel Arc 7-Core iGPU
39.4 fps -37%
GMK NucBox M6
AMD Ryzen 5 6600H, AMD Radeon 660M
31.3 fps -50%
MSI Cubi NUC 1M
Intel Core 7 150U, Intel Iris Xe Graphics G7 96EUs
20.3 fps -67%
1920x1080 High Preset (DX12)
Beelink SER9
AMD Ryzen AI 9 HX 370, AMD Radeon 890M
41.8 fps
Moyenne AMD Radeon 890M
  (41.2 - 41.8, n=2)
41.5 fps -1%
BOSGAME M1
AMD Ryzen 7 7840HS, AMD Radeon 780M
37.9 fps -9%
Beelink SER8
AMD Ryzen 7 8845HS, AMD Radeon 780M
36.8 fps -12%
GMK NucBox K6
AMD Ryzen 7 7840HS, AMD Radeon 780M
36.6 fps -12%
Lenovo ThinkStation P3 Tiny-30H0006AGE
Intel Core i9-14900, NVIDIA T1000
35.3 fps -16%
GMK NucBox K9
Intel Core Ultra 5 125H, Intel Arc 7-Core iGPU
26.8 fps -36%
GMK NucBox M6
AMD Ryzen 5 6600H, AMD Radeon 660M
20.5 fps -51%
MSI Cubi NUC 1M
Intel Core 7 150U, Intel Iris Xe Graphics G7 96EUs
14 fps -67%
1920x1080 Badass Preset (DX12)
Moyenne AMD Radeon 890M
  (32.5 - 34.1, n=2)
33.3 fps +2%
Beelink SER9
AMD Ryzen AI 9 HX 370, AMD Radeon 890M
32.5 fps
BOSGAME M1
AMD Ryzen 7 7840HS, AMD Radeon 780M
30.3 fps -7%
Beelink SER8
AMD Ryzen 7 8845HS, AMD Radeon 780M
29.6 fps -9%
GMK NucBox K6
AMD Ryzen 7 7840HS, AMD Radeon 780M
29.5 fps -9%
Lenovo ThinkStation P3 Tiny-30H0006AGE
Intel Core i9-14900, NVIDIA T1000
27.6 fps -15%
GMK NucBox K9
Intel Core Ultra 5 125H, Intel Arc 7-Core iGPU
22.4 fps -31%
GMK NucBox M6
AMD Ryzen 5 6600H, AMD Radeon 660M
15.6 fps -52%
MSI Cubi NUC 1M
Intel Core 7 150U, Intel Iris Xe Graphics G7 96EUs
10.9 fps -66%
GTA V
1024x768 Lowest Settings possible
Lenovo ThinkStation P3 Tiny-30H0006AGE
Intel Core i9-14900, NVIDIA T1000
187.4 (1.697min, 200P1) fps +13%
Geekom AX8 Pro
AMD Ryzen 9 8945H, AMD Radeon 780M
169.4 (3.69min, 125P1) fps +2%
Beelink SER9
AMD Ryzen AI 9 HX 370, AMD Radeon 890M
166.1 (4.25min, 100P1) fps
Moyenne AMD Radeon 890M
  (157.8 - 174.3, n=7)
166 fps 0%
Minisforum MS-A1
AMD Ryzen 7 8700G, AMD Radeon 780M
164.1 (4.56min, 100P1) fps -1%
GMK NucBox K6
AMD Ryzen 7 7840HS, AMD Radeon 780M
163.4 (2.4min, 100P1) fps -2%
Asus NUC 14 Pro+
Intel Core Ultra 9 185H, Intel Arc 8-Core iGPU
162.9 (3.78min, 111.1P1) fps -2%
Khadas Mind 2
Intel Core Ultra 7 155H, Intel Arc 8-Core iGPU
145.4 (4.75min, 83.3P1) fps -12%
GMK NucBox K9
Intel Core Ultra 5 125H, Intel Arc 7-Core iGPU
143.6 (5.11min, 83.3P1) fps -14%
Geekom XT13 Pro
Intel Core i9-13900H, Intel Iris Xe Graphics G7 96EUs
123.5 (30.5min, 66.7P1) fps -26%
MSI Cubi NUC 1M
Intel Core 7 150U, Intel Iris Xe Graphics G7 96EUs
100.3 (39.9min, 62.5P1) fps -40%
HP Pro Mini 400 G9-937U0EA
Intel Core i5-14500T, Intel UHD Graphics 770
95 (19.9min, 62.5P1) fps -43%
Beelink SEi11 Pro
Intel Core i5-11320H, Intel Iris Xe Graphics G7 96EUs
94.2 (16.5min, 58.8P1) fps -43%
1920x1080 Lowest Settings possible
Lenovo ThinkStation P3 Tiny-30H0006AGE
Intel Core i9-14900, NVIDIA T1000
187.3 (4.93min, 166.7P1) fps +24%
Beelink SER9
AMD Ryzen AI 9 HX 370, AMD Radeon 890M
150.9 (4.46min, 100P1) fps
Moyenne AMD Radeon 890M
  (146.6 - 150.9, n=3)
149.3 fps -1%
Geekom AX8 Pro
AMD Ryzen 9 8945H, AMD Radeon 780M
129.3 (19.9min, 90.9P1) fps -14%
Asus NUC 14 Pro+
Intel Core Ultra 9 185H, Intel Arc 8-Core iGPU
124.8 (38.5min, 83.3P1) fps -17%
GMK NucBox K6
AMD Ryzen 7 7840HS, AMD Radeon 780M
124.7 (11.8min, 83.3P1) fps -17%
Khadas Mind 2
Intel Core Ultra 7 155H, Intel Arc 8-Core iGPU
121.4 (39.2min, 83.3P1) fps -20%
Minisforum MS-A1
AMD Ryzen 7 8700G, AMD Radeon 780M
119.9 (4.07min, 76.9P1) fps -21%
GMK NucBox K9
Intel Core Ultra 5 125H, Intel Arc 7-Core iGPU
118.7 (7.47min, 83.3P1) fps -21%
Geekom XT13 Pro
Intel Core i9-13900H, Intel Iris Xe Graphics G7 96EUs
91.3 (21.4min, 52.6P1) fps -39%
MSI Cubi NUC 1M
Intel Core 7 150U, Intel Iris Xe Graphics G7 96EUs
78.6 (26min, 50P1) fps -48%
Beelink SEi11 Pro
Intel Core i5-11320H, Intel Iris Xe Graphics G7 96EUs
65.9 (13.2min, 45.5P1) fps -56%
HP Pro Mini 400 G9-937U0EA
Intel Core i5-14500T, Intel UHD Graphics 770
50.2 (16.7min, 38.5P1) fps -67%
1366x768 Normal/Off AF:4x
Lenovo ThinkStation P3 Tiny-30H0006AGE
Intel Core i9-14900, NVIDIA T1000
187.1 (1.566min, 200P1) fps +18%
Beelink SER9
AMD Ryzen AI 9 HX 370, AMD Radeon 890M
158.9 (4.43min, 100P1) fps
Geekom AX8 Pro
AMD Ryzen 9 8945H, AMD Radeon 780M
158.3 (4.14min, 111.1P1) fps 0%
Asus NUC 14 Pro+
Intel Core Ultra 9 185H, Intel Arc 8-Core iGPU
154.1 (4.46min, 100P1) fps -3%
GMK NucBox K6
AMD Ryzen 7 7840HS, AMD Radeon 780M
153.8 (4.97min, 90.9P1) fps -3%
Moyenne AMD Radeon 890M
  (129.6 - 161.5, n=6)
153 fps -4%
Minisforum MS-A1
AMD Ryzen 7 8700G, AMD Radeon 780M
152.6 (5.62min, 100P1) fps -4%
Khadas Mind 2
Intel Core Ultra 7 155H, Intel Arc 8-Core iGPU
131.5 (4.53min, 47.6P1) fps -17%
GMK NucBox K9
Intel Core Ultra 5 125H, Intel Arc 7-Core iGPU
125.5 (15.3min, 76.9P1) fps -21%
Geekom XT13 Pro
Intel Core i9-13900H, Intel Iris Xe Graphics G7 96EUs
105.9 (23.9min, 47.6P1) fps -33%
MSI Cubi NUC 1M
Intel Core 7 150U, Intel Iris Xe Graphics G7 96EUs
86.1 (7.7min, 50P1) fps -46%
HP Pro Mini 400 G9-937U0EA
Intel Core i5-14500T, Intel UHD Graphics 770
84.7 (20.1min, 58.8P1) fps -47%
Beelink SEi11 Pro
Intel Core i5-11320H, Intel Iris Xe Graphics G7 96EUs
77.6 (21.9min, 50P1) fps -51%
1920x1080 Normal/Off AF:4x
Lenovo ThinkStation P3 Tiny-30H0006AGE
Intel Core i9-14900, NVIDIA T1000
185.8 (1.693min, 142.9P1) fps +28%
Beelink SER9
AMD Ryzen AI 9 HX 370, AMD Radeon 890M
145.5 (4.84min, 90.9P1) fps
Moyenne AMD Radeon 890M
  (143.2 - 146.1, n=3)
144.9 fps 0%
Geekom AX8 Pro
AMD Ryzen 9 8945H, AMD Radeon 780M
132.3 (12min, 90.9P1) fps -9%
GMK NucBox K6
AMD Ryzen 7 7840HS, AMD Radeon 780M
128.7 (21.5min, 76.9P1) fps -12%
Minisforum MS-A1
AMD Ryzen 7 8700G, AMD Radeon 780M
124 (11.3min, 83.3P1) fps -15%
Asus NUC 14 Pro+
Intel Core Ultra 9 185H, Intel Arc 8-Core iGPU
112.9 (17.1min, 76.9P1) fps -22%
Khadas Mind 2
Intel Core Ultra 7 155H, Intel Arc 8-Core iGPU
109.8 (7.83min, 50P1) fps -25%
GMK NucBox K9
Intel Core Ultra 5 125H, Intel Arc 7-Core iGPU
95.2 (10.5min, 66.7P1) fps -35%
Geekom XT13 Pro
Intel Core i9-13900H, Intel Iris Xe Graphics G7 96EUs
78.5 (6.01min, 40P1) fps -46%
MSI Cubi NUC 1M
Intel Core 7 150U, Intel Iris Xe Graphics G7 96EUs
71 (6.44min, 40P1) fps -51%
Beelink SEi11 Pro
Intel Core i5-11320H, Intel Iris Xe Graphics G7 96EUs
57.3 (22.2min, 38.5P1) fps -61%
HP Pro Mini 400 G9-937U0EA
Intel Core i5-14500T, Intel UHD Graphics 770
50.5 (10.2min, 37P1) fps -65%
1920x1080 High/On (Advanced Graphics Off) AA:2xMSAA + FX AF:8x
Lenovo ThinkStation P3 Tiny-30H0006AGE
Intel Core i9-14900, NVIDIA T1000
103.5 (6.88min, 76.9P1) fps +31%
Beelink SER9
AMD Ryzen AI 9 HX 370, AMD Radeon 890M
79 (9.77min, 52.6P1) fps
Moyenne AMD Radeon 890M
  (68.4 - 80.2, n=7)
76.9 fps -3%
Geekom AX8 Pro
AMD Ryzen 9 8945H, AMD Radeon 780M
65.9 (2.44min, 41.7P1) fps -17%
GMK NucBox K6
AMD Ryzen 7 7840HS, AMD Radeon 780M
65.7 (3.85min, 40P1) fps -17%
Minisforum MS-A1
AMD Ryzen 7 8700G, AMD Radeon 780M
61.9 (2.97min, 41.7P1) fps -22%
Asus NUC 14 Pro+
Intel Core Ultra 9 185H, Intel Arc 8-Core iGPU
40.6 (3.3min, 30.3P1) fps -49%
Khadas Mind 2
Intel Core Ultra 7 155H, Intel Arc 8-Core iGPU
35.9 (2.99min, 27P1) fps -55%
GMK NucBox K9
Intel Core Ultra 5 125H, Intel Arc 7-Core iGPU
33.6 (6.68min, 22.7P1) fps -57%
MSI Cubi NUC 1M
Intel Core 7 150U, Intel Iris Xe Graphics G7 96EUs
23.6 (8.96min, 17.2P1) fps -70%
Beelink SEi11 Pro
Intel Core i5-11320H, Intel Iris Xe Graphics G7 96EUs
23.2 (11.5min, 15.9P1) fps -71%
Geekom XT13 Pro
Intel Core i9-13900H, Intel Iris Xe Graphics G7 96EUs
22.1 (7.08min, 16.4P1) fps -72%
HP Pro Mini 400 G9-937U0EA
Intel Core i5-14500T, Intel UHD Graphics 770
12 (4.17min, 9.17P1) fps -85%
1920x1080 Highest Settings possible AA:4xMSAA + FX AF:16x
Lenovo ThinkStation P3 Tiny-30H0006AGE
Intel Core i9-14900, NVIDIA T1000
50.2 (6.23min, 34.5P1) fps +59%
Moyenne AMD Radeon 890M
  (30.4 - 32.4, n=7)
31.6 fps 0%
Beelink SER9
AMD Ryzen AI 9 HX 370, AMD Radeon 890M
31.5 (3.06min, 21.7P1) fps
Geekom AX8 Pro
AMD Ryzen 9 8945H, AMD Radeon 780M
27.7 (13.2min, 18.2P1) fps -12%
GMK NucBox K6
AMD Ryzen 7 7840HS, AMD Radeon 780M
26 (2.62min, 17.5P1) fps -17%
Minisforum MS-A1
AMD Ryzen 7 8700G, AMD Radeon 780M
24.6 (1.758min, 16.9P1) fps -22%
Asus NUC 14 Pro+
Intel Core Ultra 9 185H, Intel Arc 8-Core iGPU
15.8 (3.06min, 12P1) fps -50%
Khadas Mind 2
Intel Core Ultra 7 155H, Intel Arc 8-Core iGPU
13.9 (2.71min, 10.6P1) fps -56%
GMK NucBox K9
Intel Core Ultra 5 125H, Intel Arc 7-Core iGPU
12.7 (2.89min, 8.93P1) fps -60%
MSI Cubi NUC 1M
Intel Core 7 150U, Intel Iris Xe Graphics G7 96EUs
9.98 (4.2min, 6.21P1) fps -68%
Geekom XT13 Pro
Intel Core i9-13900H, Intel Iris Xe Graphics G7 96EUs
9 (3.72min, 7.14P1) fps -71%
Dota 2 Reborn
1280x720 min (0/3) fastest
Lenovo ThinkStation P3 Tiny-30H0006AGE
Intel Core i9-14900, NVIDIA T1000
246.2 (207.1min) fps +40%
Beelink SER9
AMD Ryzen AI 9 HX 370, AMD Radeon 890M
175.6 (150.3min) fps
Minisforum MS-A1
AMD Ryzen 7 8700G, AMD Radeon 780M
164.8 (145.3min) fps -6%
Moyenne AMD Radeon 890M
  (154.3 - 175.6, n=7)
163.9 fps -7%
GMK NucBox K6
AMD Ryzen 7 7840HS, AMD Radeon 780M
161.2 (11.9min) fps -8%
BOSGAME M1
AMD Ryzen 7 7840HS, AMD Radeon 780M
159.5 (137.7min) fps -9%
Geekom AX8 Pro
AMD Ryzen 9 8945H, AMD Radeon 780M
157.5 (136min) fps -10%
Beelink SER8
AMD Ryzen 7 8845HS, AMD Radeon 780M
151.9 (101.9min) fps -13%
GMK NucBox M6
AMD Ryzen 5 6600H, AMD Radeon 660M
144.9 (123.5min) fps -17%
Beelink SEi11 Pro
Intel Core i5-11320H, Intel Iris Xe Graphics G7 96EUs
119.6 (108.4min) fps -32%
Geekom XT13 Pro
Intel Core i9-13900H, Intel Iris Xe Graphics G7 96EUs
117.2 (74.5min) fps -33%
Asus NUC 14 Pro+
Intel Core Ultra 9 185H, Intel Arc 8-Core iGPU
104.7 (61.7min) fps -40%
HP Pro Mini 400 G9-937U0EA
Intel Core i5-14500T, Intel UHD Graphics 770
102.4 (80.7min) fps -42%
Khadas Mind 2
Intel Core Ultra 7 155H, Intel Arc 8-Core iGPU
101.5 (54.9min) fps -42%
GMK NucBox K9
Intel Core Ultra 5 125H, Intel Arc 7-Core iGPU
97.7 (67.3min) fps -44%
MSI Cubi NUC 1M
Intel Core 7 150U, Intel Iris Xe Graphics G7 96EUs
97.7 (57.3min) fps -44%
1366x768 med (1/3)
Lenovo ThinkStation P3 Tiny-30H0006AGE
Intel Core i9-14900, NVIDIA T1000
217.7 (183.7min) fps +63%
Beelink SER9
AMD Ryzen AI 9 HX 370, AMD Radeon 890M
133.6 (115.4min) fps
Minisforum MS-A1
AMD Ryzen 7 8700G, AMD Radeon 780M
130.2 (106.6min) fps -3%
Beelink SER8
AMD Ryzen 7 8845HS, AMD Radeon 780M
130.1 (91.5min) fps -3%
Moyenne AMD Radeon 890M
  (121.4 - 135.7, n=7)
129.9 fps -3%
BOSGAME M1
AMD Ryzen 7 7840HS, AMD Radeon 780M
126.5 (104.4min) fps -5%
GMK NucBox K6
AMD Ryzen 7 7840HS, AMD Radeon 780M
124.8 (104.5min) fps -7%
Geekom AX8 Pro
AMD Ryzen 9 8945H, AMD Radeon 780M
116.1 (93.2min) fps -13%
GMK NucBox M6
AMD Ryzen 5 6600H, AMD Radeon 660M
107.9 (92.8min) fps -19%
GMK NucBox K9
Intel Core Ultra 5 125H, Intel Arc 7-Core iGPU
83.1 (60.5min) fps -38%
Geekom XT13 Pro
Intel Core i9-13900H, Intel Iris Xe Graphics G7 96EUs
82.9 (52.4min) fps -38%
Beelink SEi11 Pro
Intel Core i5-11320H, Intel Iris Xe Graphics G7 96EUs
78.6 (66.2min) fps -41%
Asus NUC 14 Pro+
Intel Core Ultra 9 185H, Intel Arc 8-Core iGPU
78 (58.5min) fps -42%
HP Pro Mini 400 G9-937U0EA
Intel Core i5-14500T, Intel UHD Graphics 770
74.4 (58.9min) fps -44%
MSI Cubi NUC 1M
Intel Core 7 150U, Intel Iris Xe Graphics G7 96EUs
61.9 (45.9min) fps -54%
Khadas Mind 2
Intel Core Ultra 7 155H, Intel Arc 8-Core iGPU
54.2 (30.3min) fps -59%
1920x1080 high (2/3)
Lenovo ThinkStation P3 Tiny-30H0006AGE
Intel Core i9-14900, NVIDIA T1000
150.4 (134.4min) fps +50%
Beelink SER9
AMD Ryzen AI 9 HX 370, AMD Radeon 890M
100 (89min) fps
BOSGAME M1
AMD Ryzen 7 7840HS, AMD Radeon 780M
98.8 (88.1min) fps -1%
Beelink SER8
AMD Ryzen 7 8845HS, AMD Radeon 780M
98.8 (80.5min) fps -1%
GMK NucBox K6
AMD Ryzen 7 7840HS, AMD Radeon 780M
96.8 (17.4min) fps -3%
Minisforum MS-A1
AMD Ryzen 7 8700G, AMD Radeon 780M
95.9 (85.7min) fps -4%
Geekom AX8 Pro
AMD Ryzen 9 8945H, AMD Radeon 780M
88 (69.2min) fps -12%
GMK NucBox K9
Intel Core Ultra 5 125H, Intel Arc 7-Core iGPU
75.6 (48.6min) fps -24%
Geekom XT13 Pro
Intel Core i9-13900H, Intel Iris Xe Graphics G7 96EUs
72.5 (53min) fps -27%
GMK NucBox M6
AMD Ryzen 5 6600H, AMD Radeon 660M
70 (63.6min) fps -30%
MSI Cubi NUC 1M
Intel Core 7 150U, Intel Iris Xe Graphics G7 96EUs
62.5 (42.1min) fps -37%
Asus NUC 14 Pro+
Intel Core Ultra 9 185H, Intel Arc 8-Core iGPU
54.8 (35.3min) fps -45%
Beelink SEi11 Pro
Intel Core i5-11320H, Intel Iris Xe Graphics G7 96EUs
50.4 (41.9min) fps -50%
Moyenne AMD Radeon 890M
  (34.8 - 100, n=7)
48.1 fps -52%
Khadas Mind 2
Intel Core Ultra 7 155H, Intel Arc 8-Core iGPU
47 (29min) fps -53%
HP Pro Mini 400 G9-937U0EA
Intel Core i5-14500T, Intel UHD Graphics 770
38 (35.3min) fps -62%
1920x1080 ultra (3/3) best looking
Lenovo ThinkStation P3 Tiny-30H0006AGE
Intel Core i9-14900, NVIDIA T1000
136.5 (120.3min) fps +52%
Beelink SER8
AMD Ryzen 7 8845HS, AMD Radeon 780M
90.4 (71.8min) fps +1%
Beelink SER9
AMD Ryzen AI 9 HX 370, AMD Radeon 890M
89.8 (79.5min) fps
BOSGAME M1
AMD Ryzen 7 7840HS, AMD Radeon 780M
88.5 (78.9min) fps -1%
GMK NucBox K6
AMD Ryzen 7 7840HS, AMD Radeon 780M
87.4 (16.1min) fps -3%
Minisforum MS-A1
AMD Ryzen 7 8700G, AMD Radeon 780M
86.5 (77.2min) fps -4%
Geekom AX8 Pro
AMD Ryzen 9 8945H, AMD Radeon 780M
81.2 (64.4min) fps -10%
Asus NUC 14 Pro+
Intel Core Ultra 9 185H, Intel Arc 8-Core iGPU
76 (33.1min) fps -15%
GMK NucBox K9
Intel Core Ultra 5 125H, Intel Arc 7-Core iGPU
73.3 (48.5min) fps -18%
Geekom XT13 Pro
Intel Core i9-13900H, Intel Iris Xe Graphics G7 96EUs
66.5 (50.4min) fps -26%
GMK NucBox M6
AMD Ryzen 5 6600H, AMD Radeon 660M
60.8 (54.4min) fps -32%
MSI Cubi NUC 1M
Intel Core 7 150U, Intel Iris Xe Graphics G7 96EUs
57.8 (39.9min) fps -36%
Beelink SEi11 Pro
Intel Core i5-11320H, Intel Iris Xe Graphics G7 96EUs
47.4 (40.8min) fps -47%
Moyenne AMD Radeon 890M
  (32.4 - 89.8, n=7)
44.7 fps -50%
Khadas Mind 2
Intel Core Ultra 7 155H, Intel Arc 8-Core iGPU
41.8 (27.6min) fps -53%
HP Pro Mini 400 G9-937U0EA
Intel Core i5-14500T, Intel UHD Graphics 770
35.4 (33.1min) fps -61%
Strange Brigade
1280x720 lowest AF:1
Lenovo ThinkStation P3 Tiny-30H0006AGE
Intel Core i9-14900, NVIDIA T1000
226 (39.2min, 192.3P1) fps +13%
Beelink SER9
AMD Ryzen AI 9 HX 370, AMD Radeon 890M
199.8 (147.5min, 170.3P1) fps
Moyenne AMD Radeon 890M
  (165.1 - 199.8, n=7)
183.8 fps -8%
BOSGAME M1
AMD Ryzen 7 7840HS, AMD Radeon 780M
175.9 (26.4min, 151.8P1) fps -12%
Beelink SER8
AMD Ryzen 7 8845HS, AMD Radeon 780M
173.7 (119.2min, 145.2P1) fps -13%
GMK NucBox K6
AMD Ryzen 7 7840HS, AMD Radeon 780M
167.7 (34.3min, 142.9P1) fps -16%
GMK NucBox K9
Intel Core Ultra 5 125H, Intel Arc 7-Core iGPU
148.6 (45.8min, 118.4P1) fps -26%
GMK NucBox M6
AMD Ryzen 5 6600H, AMD Radeon 660M
120.2 (78.3min, 104.5P1) fps -40%
MSI Cubi NUC 1M
Intel Core 7 150U, Intel Iris Xe Graphics G7 96EUs
88.2 (20min, 29.9P1) fps -56%
Beelink SEi11 Pro
Intel Core i5-11320H, Intel Iris Xe Graphics G7 96EUs
79.3 (18.8min, 25.6P1) fps -60%
1920x1080 medium AA:medium AF:4
Lenovo ThinkStation P3 Tiny-30H0006AGE
Intel Core i9-14900, NVIDIA T1000
87.2 (73.7min, 77P1) fps +6%
Beelink SER9
AMD Ryzen AI 9 HX 370, AMD Radeon 890M
82 (48.6min, 70.5P1) fps
Moyenne AMD Radeon 890M
  (71.1 - 82, n=7)
76.2 fps -7%
BOSGAME M1
AMD Ryzen 7 7840HS, AMD Radeon 780M
70.9 (5min, 61.9P1) fps -14%
Beelink SER8
AMD Ryzen 7 8845HS, AMD Radeon 780M
68.9 (55.3min, 59.1P1) fps -16%
GMK NucBox K6
AMD Ryzen 7 7840HS, AMD Radeon 780M
67.9 (43.7min, 58.3P1) fps -17%
GMK NucBox K9
Intel Core Ultra 5 125H, Intel Arc 7-Core iGPU
63.9 (33.2min, 54.3P1) fps -22%
GMK NucBox M6
AMD Ryzen 5 6600H, AMD Radeon 660M
43 (36.6min, 37.4P1) fps -48%
MSI Cubi NUC 1M
Intel Core 7 150U, Intel Iris Xe Graphics G7 96EUs
38.9 (14.7min, 28.5P1) fps -53%
Beelink SEi11 Pro
Intel Core i5-11320H, Intel Iris Xe Graphics G7 96EUs
33.9 (10.3min, 19.8P1) fps -59%
1920x1080 high AA:high AF:8
Beelink SER9
AMD Ryzen AI 9 HX 370, AMD Radeon 890M
69.8 (49.9min, 54.1P1) fps
Lenovo ThinkStation P3 Tiny-30H0006AGE
Intel Core i9-14900, NVIDIA T1000
69.4 (49.4min, 53.4P1) fps -1%
Moyenne AMD Radeon 890M
  (59.7 - 69.8, n=7)
64.2 fps -8%
BOSGAME M1
AMD Ryzen 7 7840HS, AMD Radeon 780M
60.6 (32.5min, 47.4P1) fps -13%
Beelink SER8
AMD Ryzen 7 8845HS, AMD Radeon 780M
58.7 (43.2min, 45.6P1) fps -16%
GMK NucBox K6
AMD Ryzen 7 7840HS, AMD Radeon 780M
57.9 (7min, 45P1) fps -17%
GMK NucBox K9
Intel Core Ultra 5 125H, Intel Arc 7-Core iGPU
53.5 (28.6min, 42P1) fps -23%
GMK NucBox M6
AMD Ryzen 5 6600H, AMD Radeon 660M
35.9 (28.5min, 29.1P1) fps -49%
MSI Cubi NUC 1M
Intel Core 7 150U, Intel Iris Xe Graphics G7 96EUs
31.1 (8.7min, 16.3P1) fps -55%
Beelink SEi11 Pro
Intel Core i5-11320H, Intel Iris Xe Graphics G7 96EUs
27.7 (10min, 15.1P1) fps -60%
1920x1080 ultra AA:ultra AF:16
Lenovo ThinkStation P3 Tiny-30H0006AGE
Intel Core i9-14900, NVIDIA T1000
59.9 (44.2min, 47.8P1) fps 0%
Beelink SER9
AMD Ryzen AI 9 HX 370, AMD Radeon 890M
59.7 (43.6min, 46.2P1) fps
Moyenne AMD Radeon 890M
  (49.8 - 59.7, n=7)
54.7 fps -8%
BOSGAME M1
AMD Ryzen 7 7840HS, AMD Radeon 780M
52.1 (5.2min, 33.8P1) fps -13%
Beelink SER8
AMD Ryzen 7 8845HS, AMD Radeon 780M
50.8 (24.5min, 33.9P1) fps -15%
GMK NucBox K6
AMD Ryzen 7 7840HS, AMD Radeon 780M
48.8 (11.1min, 31.1P1) fps -18%
GMK NucBox K9
Intel Core Ultra 5 125H, Intel Arc 7-Core iGPU
43.5 (8.2min, 17.8P1) fps -27%
GMK NucBox M6
AMD Ryzen 5 6600H, AMD Radeon 660M
29.6 (21min, 24.7P1) fps -50%
MSI Cubi NUC 1M
Intel Core 7 150U, Intel Iris Xe Graphics G7 96EUs
25.2 (5.3min, 6.89P1) fps -58%
Beelink SEi11 Pro
Intel Core i5-11320H, Intel Iris Xe Graphics G7 96EUs
22.2 (5.6min, 7.76P1) fps -63%
Final Fantasy XV Benchmark
1280x720 Lite Quality
Lenovo ThinkStation P3 Tiny-30H0006AGE
Intel Core i9-14900, NVIDIA T1000
101.3 fps +7%
Beelink SER9
AMD Ryzen AI 9 HX 370, AMD Radeon 890M
94.6 fps
BOSGAME M1
AMD Ryzen 7 7840HS, AMD Radeon 780M
84.5 fps -11%
Moyenne AMD Radeon 890M
  (75.5 - 94.6, n=6)
83.4 fps -12%
GMK NucBox K6
AMD Ryzen 7 7840HS, AMD Radeon 780M
80.8 fps -15%
Beelink SER8
AMD Ryzen 7 8845HS, AMD Radeon 780M
79.7 fps -16%
Geekom AX8 Pro
AMD Ryzen 9 8945H, AMD Radeon 780M
77.9 fps -18%
Minisforum MS-A1
AMD Ryzen 7 8700G, AMD Radeon 780M
75.8 fps -20%
Asus NUC 14 Pro+
Intel Core Ultra 9 185H, Intel Arc 8-Core iGPU
75.3 fps -20%
Khadas Mind 2
Intel Core Ultra 7 155H, Intel Arc 8-Core iGPU
64.8 fps -32%
GMK NucBox K9
Intel Core Ultra 5 125H, Intel Arc 7-Core iGPU
59.6 fps -37%
GMK NucBox M6
AMD Ryzen 5 6600H, AMD Radeon 660M
48.3 fps -49%
Geekom XT13 Pro
Intel Core i9-13900H, Intel Iris Xe Graphics G7 96EUs
46 fps -51%
MSI Cubi NUC 1M
Intel Core 7 150U, Intel Iris Xe Graphics G7 96EUs
40.9 fps -57%
Beelink SEi11 Pro
Intel Core i5-11320H, Intel Iris Xe Graphics G7 96EUs
38.6 fps -59%
HP Pro Mini 400 G9-937U0EA
Intel Core i5-14500T, Intel UHD Graphics 770
24.2 fps -74%
1920x1080 Standard Quality
Lenovo ThinkStation P3 Tiny-30H0006AGE
Intel Core i9-14900, NVIDIA T1000
49.3 fps +4%
Beelink SER9
AMD Ryzen AI 9 HX 370, AMD Radeon 890M
47.5 fps
Moyenne AMD Radeon 890M
  (37 - 47.5, n=6)
42.9 fps -10%
BOSGAME M1
AMD Ryzen 7 7840HS, AMD Radeon 780M
40.9 fps -14%
Beelink SER8
AMD Ryzen 7 8845HS, AMD Radeon 780M
40.2 fps -15%
Asus NUC 14 Pro+
Intel Core Ultra 9 185H, Intel Arc 8-Core iGPU
40.2 fps -15%
GMK NucBox K6
AMD Ryzen 7 7840HS, AMD Radeon 780M
39.3 fps -17%
Geekom AX8 Pro
AMD Ryzen 9 8945H, AMD Radeon 780M
38.8 fps -18%
Minisforum MS-A1
AMD Ryzen 7 8700G, AMD Radeon 780M
37.4 fps -21%
Khadas Mind 2
Intel Core Ultra 7 155H, Intel Arc 8-Core iGPU
37 fps -22%
GMK NucBox K9
Intel Core Ultra 5 125H, Intel Arc 7-Core iGPU
33.3 fps -30%
Geekom XT13 Pro
Intel Core i9-13900H, Intel Iris Xe Graphics G7 96EUs
25.7 fps -46%
GMK NucBox M6
AMD Ryzen 5 6600H, AMD Radeon 660M
24.7 fps -48%
MSI Cubi NUC 1M
Intel Core 7 150U, Intel Iris Xe Graphics G7 96EUs
23 fps -52%
Beelink SEi11 Pro
Intel Core i5-11320H, Intel Iris Xe Graphics G7 96EUs
20.3 fps -57%
HP Pro Mini 400 G9-937U0EA
Intel Core i5-14500T, Intel UHD Graphics 770
12.9 fps -73%
1920x1080 High Quality
Lenovo ThinkStation P3 Tiny-30H0006AGE
Intel Core i9-14900, NVIDIA T1000
36.2 fps +9%
Beelink SER9
AMD Ryzen AI 9 HX 370, AMD Radeon 890M
33.3 fps
BOSGAME M1
AMD Ryzen 7 7840HS, AMD Radeon 780M
30.8 fps -8%
Moyenne AMD Radeon 890M
  (26.6 - 33.3, n=6)
30.7 fps -8%
Beelink SER8
AMD Ryzen 7 8845HS, AMD Radeon 780M
29.4 fps -12%
GMK NucBox K6
AMD Ryzen 7 7840HS, AMD Radeon 780M
29.3 fps -12%
Asus NUC 14 Pro+
Intel Core Ultra 9 185H, Intel Arc 8-Core iGPU
28.6 fps -14%
Geekom AX8 Pro
AMD Ryzen 9 8945H, AMD Radeon 780M
28.5 fps -14%
Minisforum MS-A1
AMD Ryzen 7 8700G, AMD Radeon 780M
27.6 fps -17%
Khadas Mind 2
Intel Core Ultra 7 155H, Intel Arc 8-Core iGPU
26.1 fps -22%
GMK NucBox K9
Intel Core Ultra 5 125H, Intel Arc 7-Core iGPU
22.3 fps -33%
Geekom XT13 Pro
Intel Core i9-13900H, Intel Iris Xe Graphics G7 96EUs
18.2 fps -45%
GMK NucBox M6
AMD Ryzen 5 6600H, AMD Radeon 660M
17.9 fps -46%
MSI Cubi NUC 1M
Intel Core 7 150U, Intel Iris Xe Graphics G7 96EUs
16.6 fps -50%
Beelink SEi11 Pro
Intel Core i5-11320H, Intel Iris Xe Graphics G7 96EUs
14.9 fps -55%
HP Pro Mini 400 G9-937U0EA
Intel Core i5-14500T, Intel UHD Graphics 770
9.17 fps -72%
X-Plane 11.11
1280x720 low (fps_test=1)
Lenovo ThinkStation P3 Tiny-30H0006AGE
Intel Core i9-14900, NVIDIA T1000
211 fps +148%
Beelink SER9
AMD Ryzen AI 9 HX 370, AMD Radeon 890M
85.1 fps
Moyenne AMD Radeon 890M
  (66.5 - 87, n=6)
77.6 fps -9%
Minisforum MS-A1
AMD Ryzen 7 8700G, AMD Radeon 780M
69.1 fps -19%
GMK NucBox K6
AMD Ryzen 7 7840HS, AMD Radeon 780M
65.9 fps -23%
Beelink SER8
AMD Ryzen 7 8845HS, AMD Radeon 780M
65.9 fps -23%
Asus NUC 14 Pro+
Intel Core Ultra 9 185H, Intel Arc 8-Core iGPU
65.5 fps -23%
BOSGAME M1
AMD Ryzen 7 7840HS, AMD Radeon 780M
64.2 fps -25%
Geekom AX8 Pro
AMD Ryzen 9 8945H, AMD Radeon 780M
64.2 fps -25%
Beelink SEi11 Pro
Intel Core i5-11320H, Intel Iris Xe Graphics G7 96EUs
58.2 fps -32%
GMK NucBox K9
Intel Core Ultra 5 125H, Intel Arc 7-Core iGPU
57 fps -33%
Khadas Mind 2
Intel Core Ultra 7 155H, Intel Arc 8-Core iGPU
52.7 fps -38%
GMK NucBox M6
AMD Ryzen 5 6600H, AMD Radeon 660M
51.8 fps -39%
HP Pro Mini 400 G9-937U0EA
Intel Core i5-14500T, Intel UHD Graphics 770
28.5 fps -67%
1920x1080 med (fps_test=2)
Lenovo ThinkStation P3 Tiny-30H0006AGE
Intel Core i9-14900, NVIDIA T1000
145.8 fps +116%
Beelink SER9
AMD Ryzen AI 9 HX 370, AMD Radeon 890M
67.6 fps
Moyenne AMD Radeon 890M
  (54.4 - 67.9, n=6)
60.8 fps -10%
Asus NUC 14 Pro+
Intel Core Ultra 9 185H, Intel Arc 8-Core iGPU
49.8 fps -26%
Minisforum MS-A1
AMD Ryzen 7 8700G, AMD Radeon 780M
48.9 fps -28%
Beelink SER8
AMD Ryzen 7 8845HS, AMD Radeon 780M
47.8 fps -29%
GMK NucBox K6
AMD Ryzen 7 7840HS, AMD Radeon 780M
47.3 fps -30%
Geekom AX8 Pro
AMD Ryzen 9 8945H, AMD Radeon 780M
46.8 fps -31%
BOSGAME M1
AMD Ryzen 7 7840HS, AMD Radeon 780M
46.3 fps -32%
GMK NucBox K9
Intel Core Ultra 5 125H, Intel Arc 7-Core iGPU
44.8 fps -34%
Beelink SEi11 Pro
Intel Core i5-11320H, Intel Iris Xe Graphics G7 96EUs
41.2 fps -39%
Khadas Mind 2
Intel Core Ultra 7 155H, Intel Arc 8-Core iGPU
39.4 fps -42%
GMK NucBox M6
AMD Ryzen 5 6600H, AMD Radeon 660M
38.5 fps -43%
HP Pro Mini 400 G9-937U0EA
Intel Core i5-14500T, Intel UHD Graphics 770
21.7 fps -68%
1920x1080 high (fps_test=3)
Lenovo ThinkStation P3 Tiny-30H0006AGE
Intel Core i9-14900, NVIDIA T1000
130.1 fps +152%
Beelink SER9
AMD Ryzen AI 9 HX 370, AMD Radeon 890M
51.6 fps
Moyenne AMD Radeon 890M
  (44 - 51.6, n=6)
47.3 fps -8%
Asus NUC 14 Pro+
Intel Core Ultra 9 185H, Intel Arc 8-Core iGPU
42.2 fps -18%
Minisforum MS-A1
AMD Ryzen 7 8700G, AMD Radeon 780M
41.5 fps -20%
Geekom AX8 Pro
AMD Ryzen 9 8945H, AMD Radeon 780M
40.1 fps -22%
GMK NucBox K6
AMD Ryzen 7 7840HS, AMD Radeon 780M
39.7 fps -23%
Beelink SER8
AMD Ryzen 7 8845HS, AMD Radeon 780M
39.6 fps -23%
BOSGAME M1
AMD Ryzen 7 7840HS, AMD Radeon 780M
38.7 fps -25%
Beelink SEi11 Pro
Intel Core i5-11320H, Intel Iris Xe Graphics G7 96EUs
37.3 fps -28%
GMK NucBox K9
Intel Core Ultra 5 125H, Intel Arc 7-Core iGPU
37.3 fps -28%
Khadas Mind 2
Intel Core Ultra 7 155H, Intel Arc 8-Core iGPU
34.1 fps -34%
GMK NucBox M6
AMD Ryzen 5 6600H, AMD Radeon 660M
33.2 fps -36%
HP Pro Mini 400 G9-937U0EA
Intel Core i5-14500T, Intel UHD Graphics 770
18.8 fps -64%
Far Cry 5
1280x720 Low Preset AA:T
Lenovo ThinkStation P3 Tiny-30H0006AGE
Intel Core i9-14900, NVIDIA T1000
127 (102min) fps +26%
Beelink SER9
AMD Ryzen AI 9 HX 370, AMD Radeon 890M
101 (84min) fps
Moyenne AMD Radeon 890M
  (75 - 101, n=7)
92 fps -9%
Beelink SER8
AMD Ryzen 7 8845HS, AMD Radeon 780M
89 (77min) fps -12%
BOSGAME M1
AMD Ryzen 7 7840HS, AMD Radeon 780M
88 (77min) fps -13%
GMK NucBox K6
AMD Ryzen 7 7840HS, AMD Radeon 780M
86 (75min) fps -15%
GMK NucBox M6
AMD Ryzen 5 6600H, AMD Radeon 660M
71 (62min) fps -30%
GMK NucBox K9
Intel Core Ultra 5 125H, Intel Arc 7-Core iGPU
71 (63min) fps -30%
MSI Cubi NUC 1M
Intel Core 7 150U, Intel Iris Xe Graphics G7 96EUs
49 (43min) fps -51%
1920x1080 Medium Preset AA:T
Lenovo ThinkStation P3 Tiny-30H0006AGE
Intel Core i9-14900, NVIDIA T1000
62 (53min) fps +3%
Beelink SER9
AMD Ryzen AI 9 HX 370, AMD Radeon 890M
60 (53min) fps
Moyenne AMD Radeon 890M
  (42 - 60, n=7)
54.9 fps -8%
BOSGAME M1
AMD Ryzen 7 7840HS, AMD Radeon 780M
54 (48min) fps -10%
Beelink SER8
AMD Ryzen 7 8845HS, AMD Radeon 780M
51 (45min) fps -15%
GMK NucBox K6
AMD Ryzen 7 7840HS, AMD Radeon 780M
49 (44min) fps -18%
GMK NucBox K9
Intel Core Ultra 5 125H, Intel Arc 7-Core iGPU
40 (37min) fps -33%
GMK NucBox M6
AMD Ryzen 5 6600H, AMD Radeon 660M
33 (29min) fps -45%
MSI Cubi NUC 1M
Intel Core 7 150U, Intel Iris Xe Graphics G7 96EUs
28 (24min) fps -53%
1920x1080 High Preset AA:T
Lenovo ThinkStation P3 Tiny-30H0006AGE
Intel Core i9-14900, NVIDIA T1000
57 (48min) fps +4%
Beelink SER9
AMD Ryzen AI 9 HX 370, AMD Radeon 890M
55 (48min) fps
Moyenne AMD Radeon 890M
  (39 - 55, n=7)
50.4 fps -8%
BOSGAME M1
AMD Ryzen 7 7840HS, AMD Radeon 780M
49 (43min) fps -11%
Beelink SER8
AMD Ryzen 7 8845HS, AMD Radeon 780M
47 (42min) fps -15%
GMK NucBox K6
AMD Ryzen 7 7840HS, AMD Radeon 780M
45 (41min) fps -18%
GMK NucBox K9
Intel Core Ultra 5 125H, Intel Arc 7-Core iGPU
37 (34min) fps -33%
GMK NucBox M6
AMD Ryzen 5 6600H, AMD Radeon 660M
30 (26min) fps -45%
MSI Cubi NUC 1M
Intel Core 7 150U, Intel Iris Xe Graphics G7 96EUs
26 (22min) fps -53%
1920x1080 Ultra Preset AA:T
Lenovo ThinkStation P3 Tiny-30H0006AGE
Intel Core i9-14900, NVIDIA T1000
53 (46min) fps +2%
Beelink SER9
AMD Ryzen AI 9 HX 370, AMD Radeon 890M
52 (46min) fps
BOSGAME M1
AMD Ryzen 7 7840HS, AMD Radeon 780M
47 (41min) fps -10%
Moyenne AMD Radeon 890M
  (33 - 52, n=7)
46.1 fps -11%
Beelink SER8
AMD Ryzen 7 8845HS, AMD Radeon 780M
45 (40min) fps -13%
GMK NucBox K6
AMD Ryzen 7 7840HS, AMD Radeon 780M
43 (38min) fps -17%
GMK NucBox K9
Intel Core Ultra 5 125H, Intel Arc 7-Core iGPU
35 (32min) fps -33%
GMK NucBox M6
AMD Ryzen 5 6600H, AMD Radeon 660M
27 (20min) fps -48%
MSI Cubi NUC 1M
Intel Core 7 150U, Intel Iris Xe Graphics G7 96EUs
24 (21min) fps -54%
F1 22
1280x720 Ultra Low Preset AA:T AF:16x
Beelink SER9
AMD Ryzen AI 9 HX 370, AMD Radeon 890M
186.8 (137min, 123P1) fps
BOSGAME M1
AMD Ryzen 7 7840HS, AMD Radeon 780M
186.7 (148min, 125P1) fps 0%
Moyenne AMD Radeon 890M
  (178.8 - 186.8, n=2)
182.8 fps -2%
GMK NucBox K6
AMD Ryzen 7 7840HS, AMD Radeon 780M
170 (137min, 113P1) fps -9%
Beelink SER8
AMD Ryzen 7 8845HS, AMD Radeon 780M
145.7 (108min, 89P1) fps -22%
GMK NucBox K9
Intel Core Ultra 5 125H, Intel Arc 7-Core iGPU
130.2 (112min, 96P1) fps -30%
GMK NucBox M6
AMD Ryzen 5 6600H, AMD Radeon 660M
107.3 (86min, 79P1) fps -43%
MSI Cubi NUC 1M
Intel Core 7 150U, Intel Iris Xe Graphics G7 96EUs
71.8 (51min, 58P1) fps -62%
1920x1080 Low Preset AA:T AF:16x
Beelink SER9
AMD Ryzen AI 9 HX 370, AMD Radeon 890M
110.1 (87min, 54P1) fps
BOSGAME M1
AMD Ryzen 7 7840HS, AMD Radeon 780M
109.9 (95min, 85P1) fps 0%
Moyenne AMD Radeon 890M
  (81 - 111.2, n=5)
104 fps -6%
GMK NucBox K6
AMD Ryzen 7 7840HS, AMD Radeon 780M
99.8 (12min, 70P1) fps -9%
Beelink SER8
AMD Ryzen 7 8845HS, AMD Radeon 780M
99 (86min, 76P1) fps -10%
GMK NucBox K9
Intel Core Ultra 5 125H, Intel Arc 7-Core iGPU
79.4 (63min, 66P1) fps -28%
GMK NucBox M6
AMD Ryzen 5 6600H, AMD Radeon 660M
58.3 (43min, 42P1) fps -47%
MSI Cubi NUC 1M
Intel Core 7 150U, Intel Iris Xe Graphics G7 96EUs
42.3 (35min, 32P1) fps -62%
1920x1080 Medium Preset AA:T AF:16x
Beelink SER9
AMD Ryzen AI 9 HX 370, AMD Radeon 890M
100.8 (78min, 63P1) fps
Moyenne AMD Radeon 890M
  (76.8 - 102.9, n=5)
95.8 fps -5%
BOSGAME M1
AMD Ryzen 7 7840HS, AMD Radeon 780M
95 (81min, 76P1) fps -6%
GMK NucBox K6
AMD Ryzen 7 7840HS, AMD Radeon 780M
85.9 (67min, 59P1) fps -15%
Beelink SER8
AMD Ryzen 7 8845HS, AMD Radeon 780M
85.9 (73min, 68P1) fps -15%
GMK NucBox K9
Intel Core Ultra 5 125H, Intel Arc 7-Core iGPU
71.9 (61min, 59P1) fps -29%
GMK NucBox M6
AMD Ryzen 5 6600H, AMD Radeon 660M
52.3 (41min, 39P1) fps -48%
MSI Cubi NUC 1M
Intel Core 7 150U, Intel Iris Xe Graphics G7 96EUs
38.2 (32min, 31P1) fps -62%
1920x1080 High Preset AA:T AF:16x
Beelink SER9
AMD Ryzen AI 9 HX 370, AMD Radeon 890M
76.8 (55min, 44P1) fps
Moyenne AMD Radeon 890M
  (64.2 - 78.1, n=5)
74.1 fps -4%
BOSGAME M1
AMD Ryzen 7 7840HS, AMD Radeon 780M
70.6 (60min, 59P1) fps -8%
GMK NucBox K6
AMD Ryzen 7 7840HS, AMD Radeon 780M
66.7 (53min, 36P1) fps -13%
Beelink SER8
AMD Ryzen 7 8845HS, AMD Radeon 780M
65.6 (54min, 52P1) fps -15%
GMK NucBox K9
Intel Core Ultra 5 125H, Intel Arc 7-Core iGPU
52.9 (46min, 45P1) fps -31%
GMK NucBox M6
AMD Ryzen 5 6600H, AMD Radeon 660M
37.2 (31min, 29P1) fps -52%
MSI Cubi NUC 1M
Intel Core 7 150U, Intel Iris Xe Graphics G7 96EUs
28.3 (24min, 22P1) fps -63%
1920x1080 Ultra High Preset AA:T AF:16x
MSI Cubi NUC 1M
Intel Core 7 150U, Intel Iris Xe Graphics G7 96EUs
21.4 (17min, 16P1) fps +1%
Beelink SER9
AMD Ryzen AI 9 HX 370, AMD Radeon 890M
21.2 (12min, 13P1) fps
Moyenne AMD Radeon 890M
  (16.7 - 22, n=5)
20.6 fps -3%
BOSGAME M1
AMD Ryzen 7 7840HS, AMD Radeon 780M
19.2 (14min, 14P1) fps -9%
GMK NucBox K6
AMD Ryzen 7 7840HS, AMD Radeon 780M
18.4 (12min, 12P1) fps -13%
Beelink SER8
AMD Ryzen 7 8845HS, AMD Radeon 780M
17.9 (13min, 13P1) fps -16%
GMK NucBox M6
AMD Ryzen 5 6600H, AMD Radeon 660M
8.43 (6min, 6P1) fps -60%
Baldur's Gate 3
1280x720 Low Preset
Lenovo ThinkStation P3 Tiny-30H0006AGE
Intel Core i9-14900, NVIDIA T1000
75.9 (36.6min, 56P0.1, 65.8P1) fps +29%
Minisforum MS-A1
AMD Ryzen 7 8700G, AMD Radeon 780M
65.9 (33.4min, 33.9P0.1, 36.6P1) fps +12%
BOSGAME M1
AMD Ryzen 7 7840HS, AMD Radeon 780M
64.7 fps +10%
Beelink SER8
AMD Ryzen 7 8845HS, AMD Radeon 780M
63.4 fps +8%
Moyenne AMD Radeon 890M
  (58.9 - 64.2, n=2)
61.6 fps +5%
Geekom AX8 Pro
AMD Ryzen 9 8945H, AMD Radeon 780M
60.8 (21.6min, 28.1P0.1, 35.6P1) fps +3%
Beelink SER9
AMD Ryzen AI 9 HX 370, AMD Radeon 890M
58.9 fps
Asus NUC 14 Pro+
Intel Core Ultra 9 185H, Intel Arc 8-Core iGPU
56.4 (29min, 30.5P0.1, 37.9P1) fps -4%
GMK NucBox K9
Intel Core Ultra 5 125H, Intel Arc 7-Core iGPU
50.8 fps -14%
Khadas Mind 2
Intel Core Ultra 7 155H, Intel Arc 8-Core iGPU
48.5 (16.6min, 27.3P0.1, 31.4P1) fps -18%
GMK NucBox M6
AMD Ryzen 5 6600H, AMD Radeon 660M
37.3 fps -37%
Geekom XT13 Pro
Intel Core i9-13900H, Intel Iris Xe Graphics G7 96EUs
28.2 (13.8min, 15.1P0.1, 19.8P1) fps -52%
MSI Cubi NUC 1M
Intel Core 7 150U, Intel Iris Xe Graphics G7 96EUs
22.9 fps -61%
HP Pro Mini 400 G9-937U0EA
Intel Core i5-14500T, Intel UHD Graphics 770
14.4 (8.68min, 9.6P0.1, 11.1P1) fps -76%
1920x1080 Low Preset
Lenovo ThinkStation P3 Tiny-30H0006AGE
Intel Core i9-14900, NVIDIA T1000
45 (22.4min, 36.9P0.1, 38.2P1) fps +29%
BOSGAME M1
AMD Ryzen 7 7840HS, AMD Radeon 780M
43.9 fps +25%
Minisforum MS-A1
AMD Ryzen 7 8700G, AMD Radeon 780M
42.5 (20.1min, 21.1P0.1, 35.7P1) fps +21%
Moyenne AMD Radeon 890M
  (35 - 47.1, n=7)
42.5 fps +21%
Beelink SER8
AMD Ryzen 7 8845HS, AMD Radeon 780M
41.6 fps +19%
GMK NucBox K6
AMD Ryzen 7 7840HS, AMD Radeon 780M
40.5 fps +16%
Geekom AX8 Pro
AMD Ryzen 9 8945H, AMD Radeon 780M
38.5 (19.4min, 19.8P0.1, 29.1P1) fps +10%
Asus NUC 14 Pro+
Intel Core Ultra 9 185H, Intel Arc 8-Core iGPU
37.9 (22.7min, 23.2P0.1, 26.9P1) fps +8%
Beelink SER9
AMD Ryzen AI 9 HX 370, AMD Radeon 890M
35 fps
GMK NucBox K9
Intel Core Ultra 5 125H, Intel Arc 7-Core iGPU
33.7 fps -4%
Khadas Mind 2
Intel Core Ultra 7 155H, Intel Arc 8-Core iGPU
32.9 (20.4min, 20.8P0.1, 22.7P1) fps -6%
GMK NucBox M6
AMD Ryzen 5 6600H, AMD Radeon 660M
22.9 fps -35%
Geekom XT13 Pro
Intel Core i9-13900H, Intel Iris Xe Graphics G7 96EUs
19.9 (15.5min, 15.6P0.1, 16.4P1) fps -43%
MSI Cubi NUC 1M
Intel Core 7 150U, Intel Iris Xe Graphics G7 96EUs
15.3 fps -56%
HP Pro Mini 400 G9-937U0EA
Intel Core i5-14500T, Intel UHD Graphics 770
8.87 (6.27min, 6.29P0.1, 6.74P1) fps -75%
1920x1080 Medium Preset
BOSGAME M1
AMD Ryzen 7 7840HS, AMD Radeon 780M
36.8 fps +26%
Lenovo ThinkStation P3 Tiny-30H0006AGE
Intel Core i9-14900, NVIDIA T1000
35.2 (20.6min, 26.7P0.1, 30.6P1) fps +21%
Beelink SER8
AMD Ryzen 7 8845HS, AMD Radeon 780M
34.8 fps +20%
Moyenne AMD Radeon 890M
  (29.1 - 37.9, n=7)
34.5 fps +19%
GMK NucBox K6
AMD Ryzen 7 7840HS, AMD Radeon 780M
33.7 fps +16%
Minisforum MS-A1
AMD Ryzen 7 8700G, AMD Radeon 780M
32.7 (16.3min, 16.7P0.1, 17.9P1) fps +12%
Geekom AX8 Pro
AMD Ryzen 9 8945H, AMD Radeon 780M
29.9 (11.8min, 18.6P0.1, 23.5P1) fps +3%
Asus NUC 14 Pro+
Intel Core Ultra 9 185H, Intel Arc 8-Core iGPU
29.7 (17.5min, 18.4P0.1, 19.7P1) fps +2%
Beelink SER9
AMD Ryzen AI 9 HX 370, AMD Radeon 890M
29.1 fps
GMK NucBox K9
Intel Core Ultra 5 125H, Intel Arc 7-Core iGPU
27.9 fps -4%
Khadas Mind 2
Intel Core Ultra 7 155H, Intel Arc 8-Core iGPU
25 (9.42min, 11.3P0.1, 16.1P1) fps -14%
Geekom XT13 Pro
Intel Core i9-13900H, Intel Iris Xe Graphics G7 96EUs
15.4 (11.8min, 11.9P0.1, 12.7P1) fps -47%
GMK NucBox M6
AMD Ryzen 5 6600H, AMD Radeon 660M
15.1 fps -48%
HP Pro Mini 400 G9-937U0EA
Intel Core i5-14500T, Intel UHD Graphics 770
6.97 (5.1min, 5.12P0.1, 5.36P1) fps -76%
1920x1080 High Preset
Lenovo ThinkStation P3 Tiny-30H0006AGE
Intel Core i9-14900, NVIDIA T1000
30.2 (10.5min, 12.6P0.1, 26.4P1) fps +7%
BOSGAME M1
AMD Ryzen 7 7840HS, AMD Radeon 780M
29.9 fps +6%
Beelink SER8
AMD Ryzen 7 8845HS, AMD Radeon 780M
28.9 fps +2%
Beelink SER9
AMD Ryzen AI 9 HX 370, AMD Radeon 890M
28.2 fps
GMK NucBox K6
AMD Ryzen 7 7840HS, AMD Radeon 780M
28.1 fps 0%
Moyenne AMD Radeon 890M
  (24.1 - 31.2, n=7)
28.1 fps 0%
Minisforum MS-A1
AMD Ryzen 7 8700G, AMD Radeon 780M
27 (14min, 14.4P0.1, 22.7P1) fps -4%
Asus NUC 14 Pro+
Intel Core Ultra 9 185H, Intel Arc 8-Core iGPU
25.2 (14.5min, 14.6P0.1, 16.2P1) fps -11%
Geekom AX8 Pro
AMD Ryzen 9 8945H, AMD Radeon 780M
24.5 (17.7min, 17.7P0.1, 19.8P1) fps -13%
GMK NucBox K9
Intel Core Ultra 5 125H, Intel Arc 7-Core iGPU
24.2 fps -14%
Khadas Mind 2
Intel Core Ultra 7 155H, Intel Arc 8-Core iGPU
21.6 (11.7min, 12.4P0.1, 13.9P1) fps -23%
Geekom XT13 Pro
Intel Core i9-13900H, Intel Iris Xe Graphics G7 96EUs
13.5 (11.2min, 11.2P0.1, 11.6P1) fps -52%
GMK NucBox M6
AMD Ryzen 5 6600H, AMD Radeon 660M
13.3 fps -53%
HP Pro Mini 400 G9-937U0EA
Intel Core i5-14500T, Intel UHD Graphics 770
6.12 (4.49min, 4.52P0.1, 4.8P1) fps -78%
1920x1080 Ultra Preset
Lenovo ThinkStation P3 Tiny-30H0006AGE
Intel Core i9-14900, NVIDIA T1000
29.5 (13.3min, 21.5P0.1, 25.7P1) fps
BOSGAME M1
AMD Ryzen 7 7840HS, AMD Radeon 780M
29.2 fps
Beelink SER8
AMD Ryzen 7 8845HS, AMD Radeon 780M
28 fps
Moyenne AMD Radeon 890M
  (24 - 31.1, n=6)
27.9 fps
GMK NucBox K6
AMD Ryzen 7 7840HS, AMD Radeon 780M
27 fps
Minisforum MS-A1
AMD Ryzen 7 8700G, AMD Radeon 780M
26 (13.8min, 14.3P0.1, 22.5P1) fps
Geekom AX8 Pro
AMD Ryzen 9 8945H, AMD Radeon 780M
24.4 (8.81min, 15.2P0.1, 19.3P1) fps
Asus NUC 14 Pro+
Intel Core Ultra 9 185H, Intel Arc 8-Core iGPU
24.4 (8.14min, 11.8P0.1, 15.7P1) fps
GMK NucBox K9
Intel Core Ultra 5 125H, Intel Arc 7-Core iGPU
23.1 fps
Khadas Mind 2
Intel Core Ultra 7 155H, Intel Arc 8-Core iGPU
21 (12.8min, 12.9P0.1, 13.6P1) fps
Geekom XT13 Pro
Intel Core i9-13900H, Intel Iris Xe Graphics G7 96EUs
13 (10.1min, 10.1P0.1, 11P1) fps
GMK NucBox M6
AMD Ryzen 5 6600H, AMD Radeon 660M
12.6 fps
Cyberpunk 2077 2.1 Phantom Liberty
1920x1080 Ultra Preset (FSR on)
BOSGAME M1
AMD Ryzen 7 7840HS, AMD Radeon 780M
33.3 (24.2min) fps
GMK NucBox K6
AMD Ryzen 7 7840HS, AMD Radeon 780M
31.6 (11.4min) fps
1280x720 Low Preset (FSR off)
Beelink SER9
AMD Ryzen AI 9 HX 370, AMD Radeon 890M
82.2 (67.7min) fps
BOSGAME M1
AMD Ryzen 7 7840HS, AMD Radeon 780M
80.6 (51.6min) fps -2%
Moyenne AMD Radeon 890M
  (76.7 - 82.2, n=2)
79.5 fps -3%
GMK NucBox K6
AMD Ryzen 7 7840HS, AMD Radeon 780M
77.4 (28.7min) fps -6%
Lenovo ThinkStation P3 Tiny-30H0006AGE
Intel Core i9-14900, NVIDIA T1000
77.1 (60.4min) fps -6%
Beelink SER8
AMD Ryzen 7 8845HS, AMD Radeon 780M
72.6 (60.1min) fps -12%
Minisforum MS-A1
AMD Ryzen 7 8700G, AMD Radeon 780M
69.1 (58.9min) fps -16%
Geekom AX8 Pro
AMD Ryzen 9 8945H, AMD Radeon 780M
69 (56.9min) fps -16%
Khadas Mind 2
Intel Core Ultra 7 155H, Intel Arc 8-Core iGPU
50.5 (42.1min) fps -39%
Asus NUC 14 Pro+
Intel Core Ultra 9 185H, Intel Arc 8-Core iGPU
48.5 (39.4min) fps -41%
GMK NucBox K9
Intel Core Ultra 5 125H, Intel Arc 7-Core iGPU
46.4 (37.7min) fps -44%
Geekom XT13 Pro
Intel Core i9-13900H, Intel Iris Xe Graphics G7 96EUs
31.8 (24.6min) fps -61%
MSI Cubi NUC 1M
Intel Core 7 150U, Intel Iris Xe Graphics G7 96EUs
25.5 (19.8min) fps -69%
HP Pro Mini 400 G9-937U0EA
Intel Core i5-14500T, Intel UHD Graphics 770
15.4 (11.7min) fps -81%
1920x1080 Low Preset (FSR off)
Beelink SER9
AMD Ryzen AI 9 HX 370, AMD Radeon 890M
49.6 (42min) fps
BOSGAME M1
AMD Ryzen 7 7840HS, AMD Radeon 780M
47.9 (37.5min) fps -3%
Moyenne AMD Radeon 890M
  (40 - 51.5, n=7)
46.7 fps -6%
GMK NucBox K6
AMD Ryzen 7 7840HS, AMD Radeon 780M
46.3 (32.3min) fps -7%
Lenovo ThinkStation P3 Tiny-30H0006AGE
Intel Core i9-14900, NVIDIA T1000
45.1 (36.7min) fps -9%
Beelink SER8
AMD Ryzen 7 8845HS, AMD Radeon 780M
43.8 (37.3min) fps -12%
Geekom AX8 Pro
AMD Ryzen 9 8945H, AMD Radeon 780M
41.3 (34.5min) fps -17%
Minisforum MS-A1
AMD Ryzen 7 8700G, AMD Radeon 780M
41 (35.2min) fps -17%
Asus NUC 14 Pro+
Intel Core Ultra 9 185H, Intel Arc 8-Core iGPU
34.7 (30.4min) fps -30%
Khadas Mind 2
Intel Core Ultra 7 155H, Intel Arc 8-Core iGPU
33.9 (29.4min) fps -32%
GMK NucBox K9
Intel Core Ultra 5 125H, Intel Arc 7-Core iGPU
30.9 (24.8min) fps -38%
GMK NucBox M6
AMD Ryzen 5 6600H, AMD Radeon 660M
24.3 (20.5min) fps -51%
Geekom XT13 Pro
Intel Core i9-13900H, Intel Iris Xe Graphics G7 96EUs
18.6 (15.4min) fps -62%
MSI Cubi NUC 1M
Intel Core 7 150U, Intel Iris Xe Graphics G7 96EUs
15.4 (12.1min) fps -69%
HP Pro Mini 400 G9-937U0EA
Intel Core i5-14500T, Intel UHD Graphics 770
8.82 (6.82min) fps -82%
1920x1080 Medium Preset (FSR off)
Beelink SER9
AMD Ryzen AI 9 HX 370, AMD Radeon 890M
40.5 (35.1min) fps
BOSGAME M1
AMD Ryzen 7 7840HS, AMD Radeon 780M
37.5 (30.6min) fps -7%
Moyenne AMD Radeon 890M
  (31.3 - 40.7, n=7)
36.9 fps -9%
GMK NucBox K6
AMD Ryzen 7 7840HS, AMD Radeon 780M
35.2 (10.9min) fps -13%
Beelink SER8
AMD Ryzen 7 8845HS, AMD Radeon 780M
34.5 (29.8min) fps -15%
Lenovo ThinkStation P3 Tiny-30H0006AGE
Intel Core i9-14900, NVIDIA T1000
34.2 (28.8min) fps -16%
Minisforum MS-A1
AMD Ryzen 7 8700G, AMD Radeon 780M
33.4 (29.1min) fps -18%
Geekom AX8 Pro
AMD Ryzen 9 8945H, AMD Radeon 780M
31.8 (27.5min) fps -21%
Asus NUC 14 Pro+
Intel Core Ultra 9 185H, Intel Arc 8-Core iGPU
28.9 (25.6min) fps -29%
Khadas Mind 2
Intel Core Ultra 7 155H, Intel Arc 8-Core iGPU
28 (24.4min) fps -31%
GMK NucBox K9
Intel Core Ultra 5 125H, Intel Arc 7-Core iGPU
25.2 (19.2min) fps -38%
GMK NucBox M6
AMD Ryzen 5 6600H, AMD Radeon 660M
18.1 (15.7min) fps -55%
Geekom XT13 Pro
Intel Core i9-13900H, Intel Iris Xe Graphics G7 96EUs
15 (12.4min) fps -63%
MSI Cubi NUC 1M
Intel Core 7 150U, Intel Iris Xe Graphics G7 96EUs
12.4 (10.3min) fps -69%
HP Pro Mini 400 G9-937U0EA
Intel Core i5-14500T, Intel UHD Graphics 770
6.75 (5.5min) fps -83%
1920x1080 High Preset (FSR off)
BOSGAME M1
AMD Ryzen 7 7840HS, AMD Radeon 780M
29.6 (23.3min) fps +3%
Moyenne AMD Radeon 890M
  (25.4 - 31.6, n=7)
29 fps +1%
Beelink SER9
AMD Ryzen AI 9 HX 370, AMD Radeon 890M
28.7 (24.8min) fps
Lenovo ThinkStation P3 Tiny-30H0006AGE
Intel Core i9-14900, NVIDIA T1000
28.3 (23.5min) fps -1%
GMK NucBox K6
AMD Ryzen 7 7840HS, AMD Radeon 780M
27.7 (9.25min) fps -3%
Beelink SER8
AMD Ryzen 7 8845HS, AMD Radeon 780M
27.1 (22.6min) fps -6%
Minisforum MS-A1
AMD Ryzen 7 8700G, AMD Radeon 780M
26.7 (22.9min) fps -7%
Geekom AX8 Pro
AMD Ryzen 9 8945H, AMD Radeon 780M
25.8 (21.7min) fps -10%
Asus NUC 14 Pro+
Intel Core Ultra 9 185H, Intel Arc 8-Core iGPU
24.1 (21.1min) fps -16%
Khadas Mind 2
Intel Core Ultra 7 155H, Intel Arc 8-Core iGPU
24 (20.7min) fps -16%
GMK NucBox K9
Intel Core Ultra 5 125H, Intel Arc 7-Core iGPU
21.3 (14.6min) fps -26%
Geekom XT13 Pro
Intel Core i9-13900H, Intel Iris Xe Graphics G7 96EUs
13 (11min) fps -55%
GMK NucBox M6
AMD Ryzen 5 6600H, AMD Radeon 660M
11.6 (10min) fps -60%
MSI Cubi NUC 1M
Intel Core 7 150U, Intel Iris Xe Graphics G7 96EUs
10.8 (8.83min) fps -62%
HP Pro Mini 400 G9-937U0EA
Intel Core i5-14500T, Intel UHD Graphics 770
5.86 (4.84min) fps -80%
1920x1080 Ultra Preset (FSR off)
BOSGAME M1
AMD Ryzen 7 7840HS, AMD Radeon 780M
25.8 (19.9min) fps +1%
Beelink SER9
AMD Ryzen AI 9 HX 370, AMD Radeon 890M
25.5 (20.9min) fps
Moyenne AMD Radeon 890M
  (23.1 - 27.8, n=7)
25.5 fps 0%
GMK NucBox K6
AMD Ryzen 7 7840HS, AMD Radeon 780M
24.5 (9.31min) fps -4%
Lenovo ThinkStation P3 Tiny-30H0006AGE
Intel Core i9-14900, NVIDIA T1000
23.8 (20min) fps -7%
Beelink SER8
AMD Ryzen 7 8845HS, AMD Radeon 780M
23.4 (19min) fps -8%
Minisforum MS-A1
AMD Ryzen 7 8700G, AMD Radeon 780M
23.4 (19.7min) fps -8%
Asus NUC 14 Pro+
Intel Core Ultra 9 185H, Intel Arc 8-Core iGPU
22 (18.9min) fps -14%
Geekom AX8 Pro
AMD Ryzen 9 8945H, AMD Radeon 780M
21.7 (18.2min) fps -15%
GMK NucBox K9
Intel Core Ultra 5 125H, Intel Arc 7-Core iGPU
18.8 (10.9min) fps -26%
Geekom XT13 Pro
Intel Core i9-13900H, Intel Iris Xe Graphics G7 96EUs
11.4 (9.68min) fps -55%
MSI Cubi NUC 1M
Intel Core 7 150U, Intel Iris Xe Graphics G7 96EUs
9.46 (7.99min) fps -63%
HP Pro Mini 400 G9-937U0EA
Intel Core i5-14500T, Intel UHD Graphics 770
5.03 (4.23min) fps -80%

Cyberpunk 2077 ultra FPS Chart

0510152025Tooltip
Beelink SER9 Ryzen AI 9 HX 370, Radeon 890M: Ø24.9 (21.6-25.9)
BasMoyenÉlevéUltra
GTA V (2015) 166.1 158.9 79 31.5
Dota 2 Reborn (2015) 175.6 133.6 100 89.8
Final Fantasy XV Benchmark (2018) 94.6 47.5 33.3
X-Plane 11.11 (2018) 85.1 67.6 51.6
Far Cry 5 (2018) 101 60 55 52
Strange Brigade (2018) 199.8 82 69.8 59.7
Tiny Tina's Wonderlands (2022) 88.3 62.3 41.8 32.5
F1 22 (2022) 110.1 100.8 76.8 21.2
Baldur's Gate 3 (2023) 35 29.1 28.2
Cyberpunk 2077 2.1 Phantom Liberty (2023) 49.6 40.5 28.7 25.5

Émissions

Bruit du système

Les caractéristiques et le plafond du bruit du ventilateur sont très proches de ce que nous avons enregistré sur le SER8 de l'année dernière, ce qui signifie que les performances supplémentaires fournies par le nouveau processeur Zen 5 ne se traduisent heureusement pas par un mini PC plus bruyant.

Profil de bruit du ventilateur (Blanc : Arrière-plan, Rouge : Système au ralenti, Bleu : 3DMark 06, Orange : Cyberpunk 2077, Vert : Prime95+FurMark stress)

Degré de la nuisance sonore

Au repos
26.6 / 26.8 / 26.8 dB(A)
Fortement sollicité
33.4 / 33.8 dB(A)
  red to green bar
 
 
30 dB
silencieux
40 dB(A)
audible
50 dB(A)
bruyant
 
min: dark, med: mid, max: light   Earthworks M23R, Arta (à 15 cm de distance)   bruit ambiant: 23.2 dB(A)
dB(A) 0102030405060708090Deep BassMiddle BassHigh BassLower RangeMidsHigher MidsLower HighsMid HighsUpper HighsSuper Highs203434.233.134.433.92526.830.627.826.927.63126.132.823.725.625.44024.92823.523.625.25028.227.825.325.326.96326.73230.129.927.88029.931.227.525.52710025.826.522.220.624.912523.324.822.919.224.216023.623.919.217.123.620023.32318.818.122.825022.522.218.914.323.531524.223.219.515.323.540025.823.718.714.523.950026.125.518.812.225.363029.526.917.19.124.180026.522.916.29.624.1100022.32114.69.222.2125024.423.6179.425.1160024.424.114.99.725.3200021.120.212.69.921.7250020.520.3131021.6315018.518.612.210.719.5400016.416.91210.916.7500014.815.613.111.214630012.914.111.511.412800012.713.911.611.511.91000012.915.911.811.611.91250013.215.411.612.311.81600012.814.711.110.611.1SPL34.633.426.823.233.8N1.91.80.80.51.8median 22.5median 22.2median 14.9median 11.4median 22.8Delta4.84.13.52.34.2hearing rangehide median Fan NoiseBeelink SER9
Beelink SER9
Radeon 890M, Ryzen AI 9 HX 370, Crucial P3 Plus CT1000P3PSSD8
Beelink SER8
Radeon 780M, R7 8845HS, Crucial P3 Plus CT1000P3PSSD8
Beelink SEi11 Pro
Iris Xe G7 96EUs, i5-11320H, Kingston NV1 SNVS/500GCN
MSI Cubi NUC 1M
Iris Xe G7 96EUs, Core 7 150U, WD PC SN560 SDDPNQE-1T00
GMK NucBox K9
Arc 7-Core, Ultra 5 125H, MasonSemi 1TB MC7000
Asus NUC 14 Pro+
Arc 8-Core, Ultra 9 185H, Samsung PM9A1a MZVL21T0HDLU
Noise
-5%
2%
-11%
-23%
-19%
off / environment *
23.2
23.6
-2%
22.8
2%
23.5
-1%
23
1%
24.6
-6%
Idle Minimum *
26.6
28.8
-8%
24.7
7%
29.9
-12%
29.8
-12%
24.7
7%
Idle Average *
26.8
28.8
-7%
24.7
8%
29.9
-12%
35.7
-33%
29.6
-10%
Idle Maximum *
26.8
30.5
-14%
25.3
6%
32
-19%
35.7
-33%
29.8
-11%
Load Average *
33.4
34.6
-4%
33.2
1%
33.5
-0%
41.9
-25%
45.7
-37%
Cyberpunk 2077 ultra *
34.6
34.1
1%
39.1
-13%
43.8
-27%
47.7
-38%
Load Maximum *
33.8
34.5
-2%
37.8
-12%
40.5
-20%
44
-30%
47.4
-40%
Witcher 3 ultra *
34.5

* ... Moindre est la valeur, meilleures sont les performances

Température

Adaptateur secteur
Adaptateur secteur

Les températures de surface ne posent pas de problème malgré l'absence de grilles d'aération sur les côtés et les bords. La partie supérieure n'atteint que ~30 C lors de l'exécution de charges exigeantes, tandis que l'adaptateur secteur peut devenir plus chaud à plus de 40 C.

Système en veille
Système en veille
Système en veille
Système en veille
Prime95+FurMark stress

Test de stress

Le processeur se stabilise à 3,3 GHz, 71 C et 54 W lors de l'exécution du stress Prime95. La température du cœur se stabilise à seulement 68 °C lors de l'exécution de Cyberpunk 2077, contre 62 °C sur la SER8 de l'année dernière.

Système en veille
Système en veille
Cyberpunk 2077 stress
Prime95 stress
Prime95 stress
Prime95+FurMark stress
Horloge moyenne du CPU (GHz) Horloge du GPU (MHz) Température moyenne du CPU (°C)
Système au repos -- -- 31
Prime95 Stress 3.3 -- 71
Prime95 + FurMark Stress 3.5 1598 71
Cyberpunk 2077 Stress 0.9 2327 68

Intervenants

Bruit rose au volume maximum. Les haut-parleurs internes peuvent faire l'affaire si vous avez besoin d'un peu de son, mais le faible volume maximal et la mauvaise reproduction des basses sont loin d'être idéaux pour des usages multimédias
dB(A) 0102030405060708090Deep BassMiddle BassHigh BassLower RangeMidsHigher MidsLower HighsMid HighsUpper HighsSuper Highs2035.233.135.22531.227.831.2312723.7274026.623.526.65027.125.327.16328.630.128.68030.427.530.410030.522.230.512535.722.935.716047.119.247.120050.218.850.225055.418.955.431559.719.559.74006718.76750072.618.872.663076.517.176.580073.316.273.3100061.614.661.6125063.11763.1160068.114.968.1200059.612.659.6250062.81362.8315064.412.264.4400065.11265.150005813.158630063.611.563.680006011.6601000057.311.857.31250062.411.662.41600063.711.163.7SPL79.526.879.5N45.60.845.6median 62.4median 14.9median 62.4Delta4.63.54.626.325.821.422.12624.925.127.622.532.523.448.72655.818.860.922.167.2267019.372.317.674.217.774.319.575.31571.711.871.311.27410.574.21072.710.17210.67210.97511.374.811.671.71269.71269.612.371.112.669.61270.111.269.824.784.70.666.6median 12median 71.73.42.2hearing rangehide median Pink NoiseBeelink SER9Apple MacBook Pro 16 2021 M1 Pro
Diagramme de fréquence (les cases peuvent être cochées et décochées pour comparer les appareils)
Beelink SER9 analyse audio

(±) | le niveau sonore du haut-parleur est moyen mais bon (79.5# dB)
Bass 100 - 315 Hz
(-) | presque aucune basse - en moyenne 16% plus bas que la médiane
(±) | la linéarité des basses est moyenne (10.3% delta à la fréquence précédente)
Mids 400 - 2000 Hz
(±) | médiane supérieure - en moyenne 6.2% supérieure à la médiane
(±) | la linéarité des médiums est moyenne (12.3% delta à la fréquence précédente)
Aiguës 2 - 16 kHz
(+) | des sommets équilibrés - à seulement 2.6% de la médiane
(±) | la linéarité des aigus est moyenne (7.3% delta à la fréquence précédente)
Overall 100 - 16.000 Hz
(±) | la linéarité du son global est moyenne (16.7% de différence avec la médiane)
Par rapport à la même classe
» 14% de tous les appareils testés de cette catégorie étaient meilleurs, 7% similaires, 79% pires
» Le meilleur avait un delta de 14%, la moyenne était de 25%, le pire était de 40%.
Par rapport à tous les appareils testés
» 26% de tous les appareils testés étaient meilleurs, 7% similaires, 68% pires
» Le meilleur avait un delta de 4%, la moyenne était de 25%, le pire était de 134%.

Apple MacBook Pro 16 2021 M1 Pro analyse audio

(+) | les haut-parleurs peuvent jouer relativement fort (84.7# dB)
Bass 100 - 315 Hz
(+) | bonne basse - seulement 3.8% loin de la médiane
(+) | les basses sont linéaires (5.2% delta à la fréquence précédente)
Mids 400 - 2000 Hz
(+) | médiane équilibrée - seulement 1.3% de la médiane
(+) | les médiums sont linéaires (2.1% delta à la fréquence précédente)
Aiguës 2 - 16 kHz
(+) | des sommets équilibrés - à seulement 1.9% de la médiane
(+) | les aigus sont linéaires (2.7% delta à la fréquence précédente)
Overall 100 - 16.000 Hz
(+) | le son global est linéaire (4.6% différence à la médiane)
Par rapport à la même classe
» 0% de tous les appareils testés de cette catégorie étaient meilleurs, 0% similaires, 100% pires
» Le meilleur avait un delta de 5%, la moyenne était de 18%, le pire était de 45%.
Par rapport à tous les appareils testés
» 0% de tous les appareils testés étaient meilleurs, 0% similaires, 100% pires
» Le meilleur avait un delta de 4%, la moyenne était de 25%, le pire était de 134%.

Gestion de l'énergie

Consommation électrique

Le Beelink est nettement plus exigeant que beaucoup d'autres mini PC, ce qui est le prix à payer pour ses performances supérieures. Dans les jeux, par exemple, notre SER9 demande deux fois plus d'énergie que le MSI Cubi NUC 1M qui est plus de deux fois plus lent.

Le petit adaptateur secteur mural de 100 W (7 x 7 x 3 cm) est suffisant lorsque le système est soumis à un stress de traitement élevé et qu'il peut demander un peu plus de 80 W.

consommation de 3DMark 06
Cyberpunk 2077 1080p Ultra consommation
La consommation atteindrait 81 W lors de l'initialisation du stress Prime95
Prime95+FurMark stress initié au bout de 10s
Consommation énergétique
Éteint/en veilledarklight 0.7 / 0.84 Watts
Au reposdarkmidlight 5.7 / 5.9 / 6 Watts
Fortement sollicité midlight 68.7 / 82 Watts
 color bar
Légende: min: dark, med: mid, max: light        Metrahit Energy
Beelink SER9
Ryzen AI 9 HX 370, Radeon 890M, Crucial P3 Plus CT1000P3PSSD8, , x,
Beelink SER8
R7 8845HS, Radeon 780M, Crucial P3 Plus CT1000P3PSSD8, , x,
Beelink SEi11 Pro
i5-11320H, Iris Xe G7 96EUs, Kingston NV1 SNVS/500GCN, , x,
MSI Cubi NUC 1M
Core 7 150U, Iris Xe G7 96EUs, WD PC SN560 SDDPNQE-1T00, , x,
GMK NucBox K9
Ultra 5 125H, Arc 7-Core, MasonSemi 1TB MC7000, , x,
Asus NUC 14 Pro
Ultra 5 125H, Arc 7-Core, Kingston KC3000 2048G SKC3000D2048G, , x,
Power Consumption
-19%
-35%
1%
-34%
-21%
Idle Minimum *
5.7
7.3
-28%
9.8
-72%
6.4
-12%
10.9
-91%
5.1
11%
Idle Average *
5.9
7.3
-24%
10.3
-75%
8.3
-41%
11
-86%
6.4
-8%
Idle Maximum *
6
8.4
-40%
10.5
-75%
10.4
-73%
11.4
-90%
14.7
-145%
Load Average *
68.7
68.2
1%
54.2
21%
38.5
44%
52.8
23%
55.5
19%
Cyberpunk 2077 ultra external monitor *
78.2
36.1
54%
57.1
27%
59.1
24%
Load Maximum *
82
84.3
-3%
59
28%
52.5
36%
72.2
12%
103.3
-26%
Witcher 3 ultra *
75.1
53.1

* ... Moindre est la valeur, meilleures sont les performances

Power Consumption Cyberpunk / Stress Test

05101520253035404550556065707580Tooltip
Beelink SER9 Ryzen AI 9 HX 370, Radeon 890M: Ø80.7 (79.4-82)
GMK NucBox K9 Ultra 5 125H, Arc 7-Core: Ø72 (71.3-72.6)

Power Consumption external Monitor

05101520253035404550556065707580Tooltip
Beelink SER9 Ryzen AI 9 HX 370, Radeon 890M; Prime95 V2810 Stress (external Monitor): Ø80.8 (79.9-81.3)
GMK NucBox K9 Ultra 5 125H, Arc 7-Core; Prime95 V2810 Stress (external Monitor): Ø70.5 (69.4-71)
Beelink SER9 Ryzen AI 9 HX 370, Radeon 890M; Cinebench R15 Multi (external Monitor): Ø75.5 (75.3-75.7)
GMK NucBox K9 Ultra 5 125H, Arc 7-Core; Cinebench R15 Multi (external Monitor): Ø62.9 (31.3-65.1)
Beelink SER9 Ryzen AI 9 HX 370, Radeon 890M; 1280x720 FurMark 1.19 GPU Stress Test (external Monitor): Ø54.5 (52.2-58.1)
GMK NucBox K9 Ultra 5 125H, Arc 7-Core; 1280x720 FurMark 1.19 GPU Stress Test (external Monitor): Ø48.5 (47-52.2)
Beelink SER9 Ryzen AI 9 HX 370, Radeon 890M; Idle 1min (external Monitor): Ø6.02 (5.77-7.59)
GMK NucBox K9 Ultra 5 125H, Arc 7-Core; Idle 1min (external Monitor): Ø11.1 (10.8-13.9)
Beelink SER9 Ryzen AI 9 HX 370, Radeon 890M; Cyberpunk 2077 FHD ultra no FSR - external Monitor: Ø78.2 (75-80.2)
GMK NucBox K9 Ultra 5 125H, Arc 7-Core; Cyberpunk 2077 FHD ultra no FSR - external Monitor: Ø57.1 (56.3-59.8)

Notebookcheck Rating

Beelink SER9 - 11/14/2024 v8
Allen Ngo

Châssis
87 / 98 → 89%
Connectivité
63 / 81 → 78%
Poids
78%
Performances en jeu
54 / 80 → 68%
Performances dans les applications
86 / 92 → 93%
AI Performance
90%
Nuisance sonore
91%
Audio
67%
Moyenne
56%
77%
Mini PC - Moyenne compensée
CO2 Emissions
No Data
Materials
0%
Packaging
50%
Power Use
77.8%
Repairability
40%
Software Updates
22.3%
Recycle Logo Total Sustainability Score: 31.7%

Transparency

The selection of devices to be reviewed is made by our editorial team. The test sample was provided to the author as a loan by the manufacturer or retailer for the purpose of this review. The lender had no influence on this review, nor did the manufacturer receive a copy of this review before publication. There was no obligation to publish this review. We never accept compensation or payment in return for our reviews. As an independent media company, Notebookcheck is not subjected to the authority of manufacturers, retailers or publishers.

This is how Notebookcheck is testing

Every year, Notebookcheck independently reviews hundreds of laptops and smartphones using standardized procedures to ensure that all results are comparable. We have continuously developed our test methods for around 20 years and set industry standards in the process. In our test labs, high-quality measuring equipment is utilized by experienced technicians and editors. These tests involve a multi-stage validation process. Our complex rating system is based on hundreds of well-founded measurements and benchmarks, which maintains objectivity. Further information on our test methods can be found here.

Please share our article, every link counts!
> Revues et rapports de ordinateurs portatifs et smartphones, ordiphones > Critiques > Revue du Beelink SER9 : Le Zen 5 d'AMD rend ce mini PC plus rapide que jamais
Allen Ngo, 2024-11-16 (Update: 2024-11-16)