

Test du Beelink GTI12 Ultra EX Docking Station : plus abordable que prévu

L'un des principaux reproches faits aux mini PC Beelink jusqu'à présent est qu'ils sont tous équipés uniquement de cartes graphiques intégrées. Bien que la dernière série GTI Ultra ne réponde pas directement à ce problème, il s'agit de la première incursion de Beelink dans la prise en charge officielle des eGPU via la station d'accueil EX afin de séduire les utilisateurs intensifs ou les joueurs.
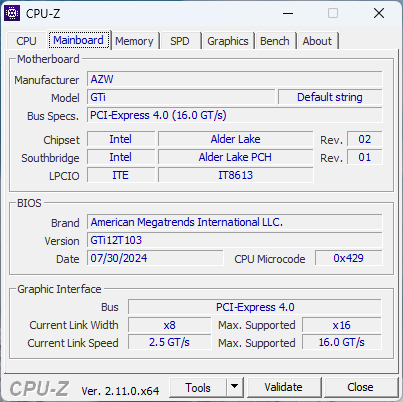
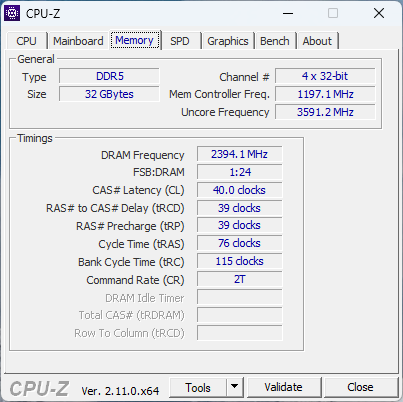
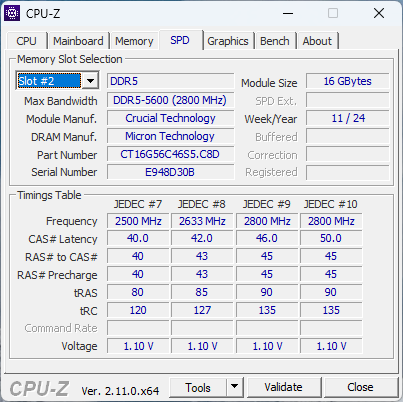
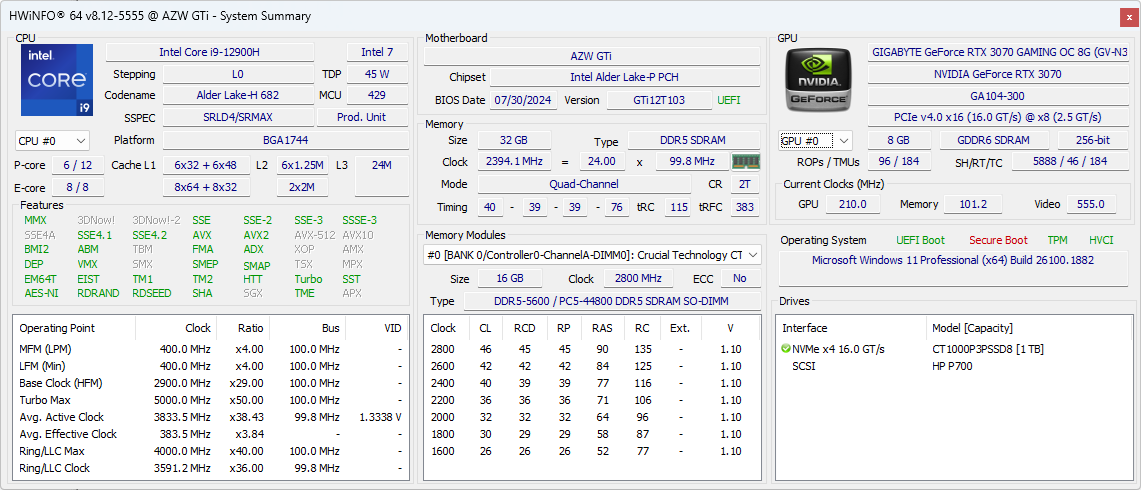
Notre unité de test est le GTI12 Ultra équipé du Core i9-12900H, d'un SSD de 1 To et de 32 Go de RAM DDR5-5600 pour environ 740 USD lorsqu'il est associé à la station d'accueil EX. Les CPU Meteor Lake plus récents sont disponibles sous le nom de modèle GTI14 Ultra qui est visuellement identique au GTI12 Ultra.
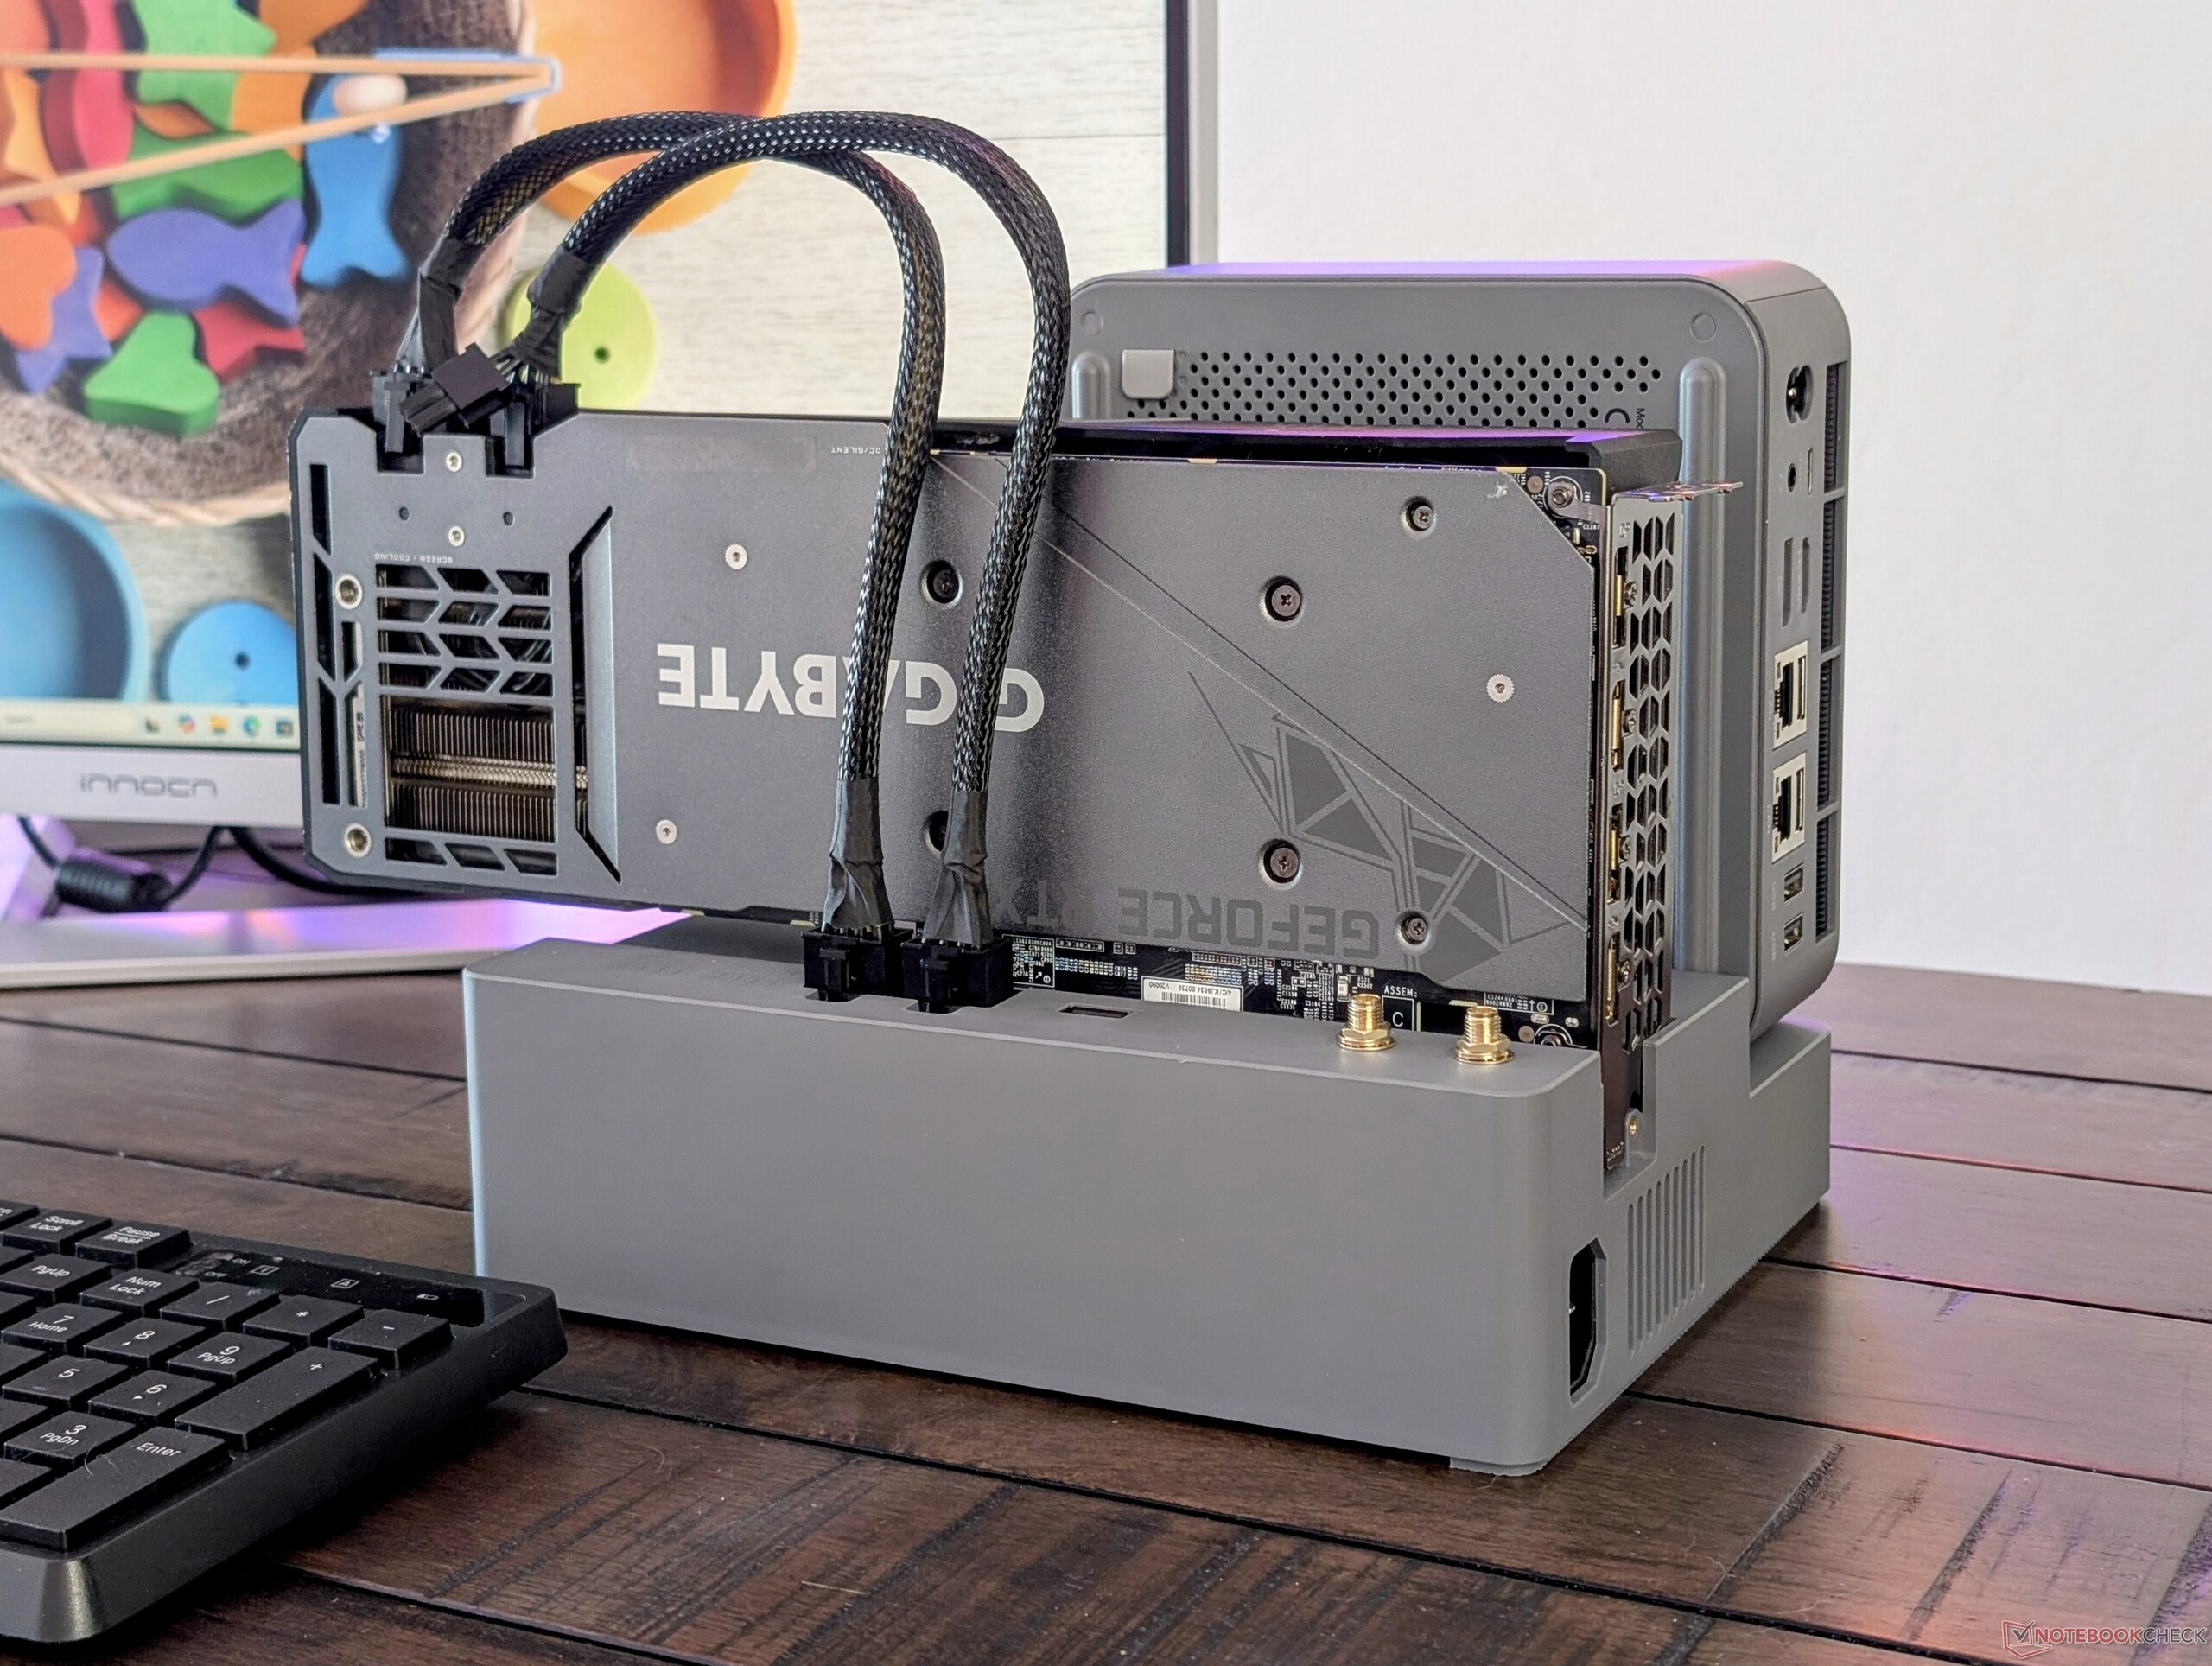
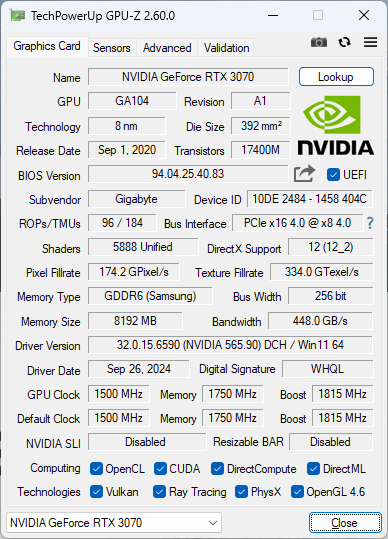
Nous avons acquis un GPU personnel Gigabyte GeForce RTX 3070 pour tester la station d'accueil EX, mais la station elle-même peut prendre en charge des GPU jusqu'à la RTX 4090 à 600 W maximum.
Plus d'avis Beelink :
Comparaison avec les concurrents potentiels
Note | Version | Date | Modèle | Poids | Épaisseur | Taille | Résolution | Prix |
|---|---|---|---|---|---|---|---|---|
| 76.5 % | v8 | 10/24 | Beelink GTI12 Ultra EX Docking Station i9-12900H, NVIDIA GeForce RTX 3070 | 1.3 kg | 55.8 mm | x | ||
| 76.7 % | v8 | 10/24 | Minisforum MS-A1 Ryzen 7 8700G, Radeon 780M | 1.7 kg | 48 mm | x | ||
| 67.3 % | v8 | 09/24 | GMK NucBox K9 Ultra 5 125H, Arc 7-Core | 528 g | 47 mm | x | ||
| 74.7 % | v8 | 08/24 | Asus NUC 14 Pro Ultra 5 125H, Arc 7-Core | 525 g | 37 mm | x | ||
| 78.4 % | v8 | 08/24 | Geekom AX8 Pro R9 8945HS, Radeon 780M | 548 g | 37 mm | x | ||
| 86 % | v8 | 08/24 | Asus ROG NUC 14-90AS0051 Ultra 9 185H, NVIDIA GeForce RTX 4070 Laptop GPU | 2.6 kg | 50 mm | x |
Cas
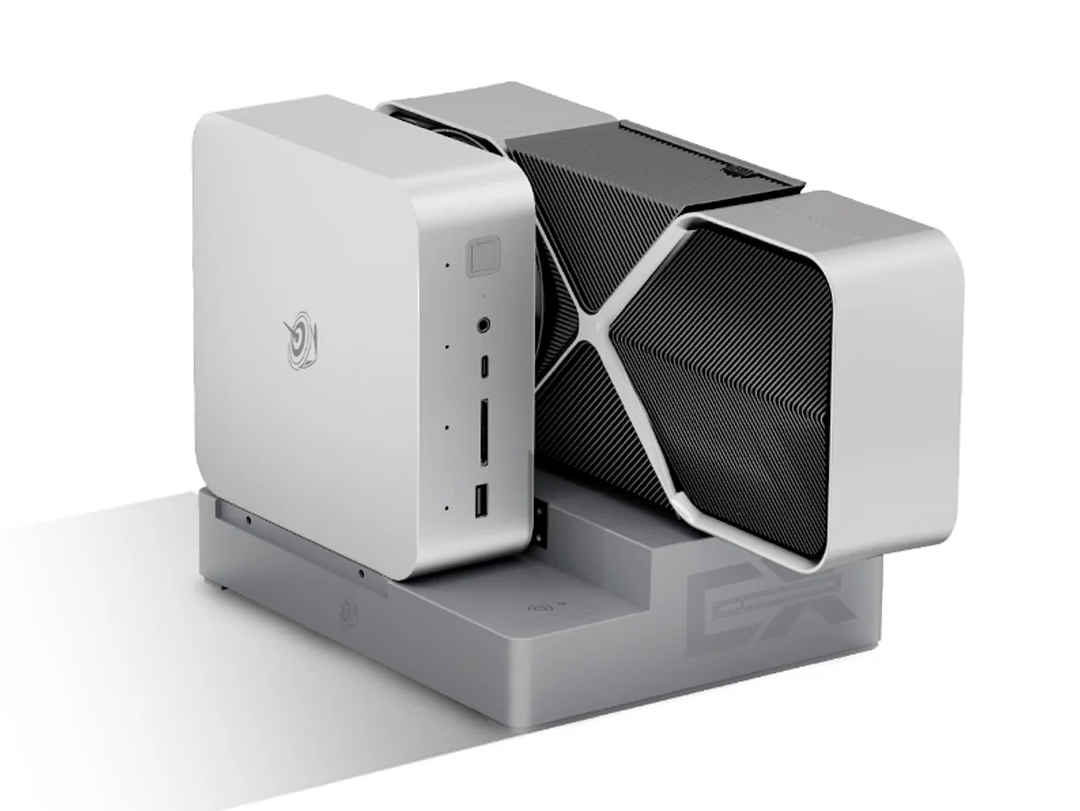
La GTI12 Ultra est essentiellement une SER8 utilisant les mêmes matériaux de châssis métalliques, le même fond en plastique et la même finition lisse et mate. A l'intérieur, cependant, les deux modèles sont très différents car le GTI12 Ultra intègre un bloc d'alimentation de 145 W au lieu de dépendre d'une brique d'alimentation externe. Il intègre également deux haut-parleurs, ce qui en fait l'un des rares mini-PC à disposer à la fois d'un système audio intégré et d'un bloc d'alimentation.
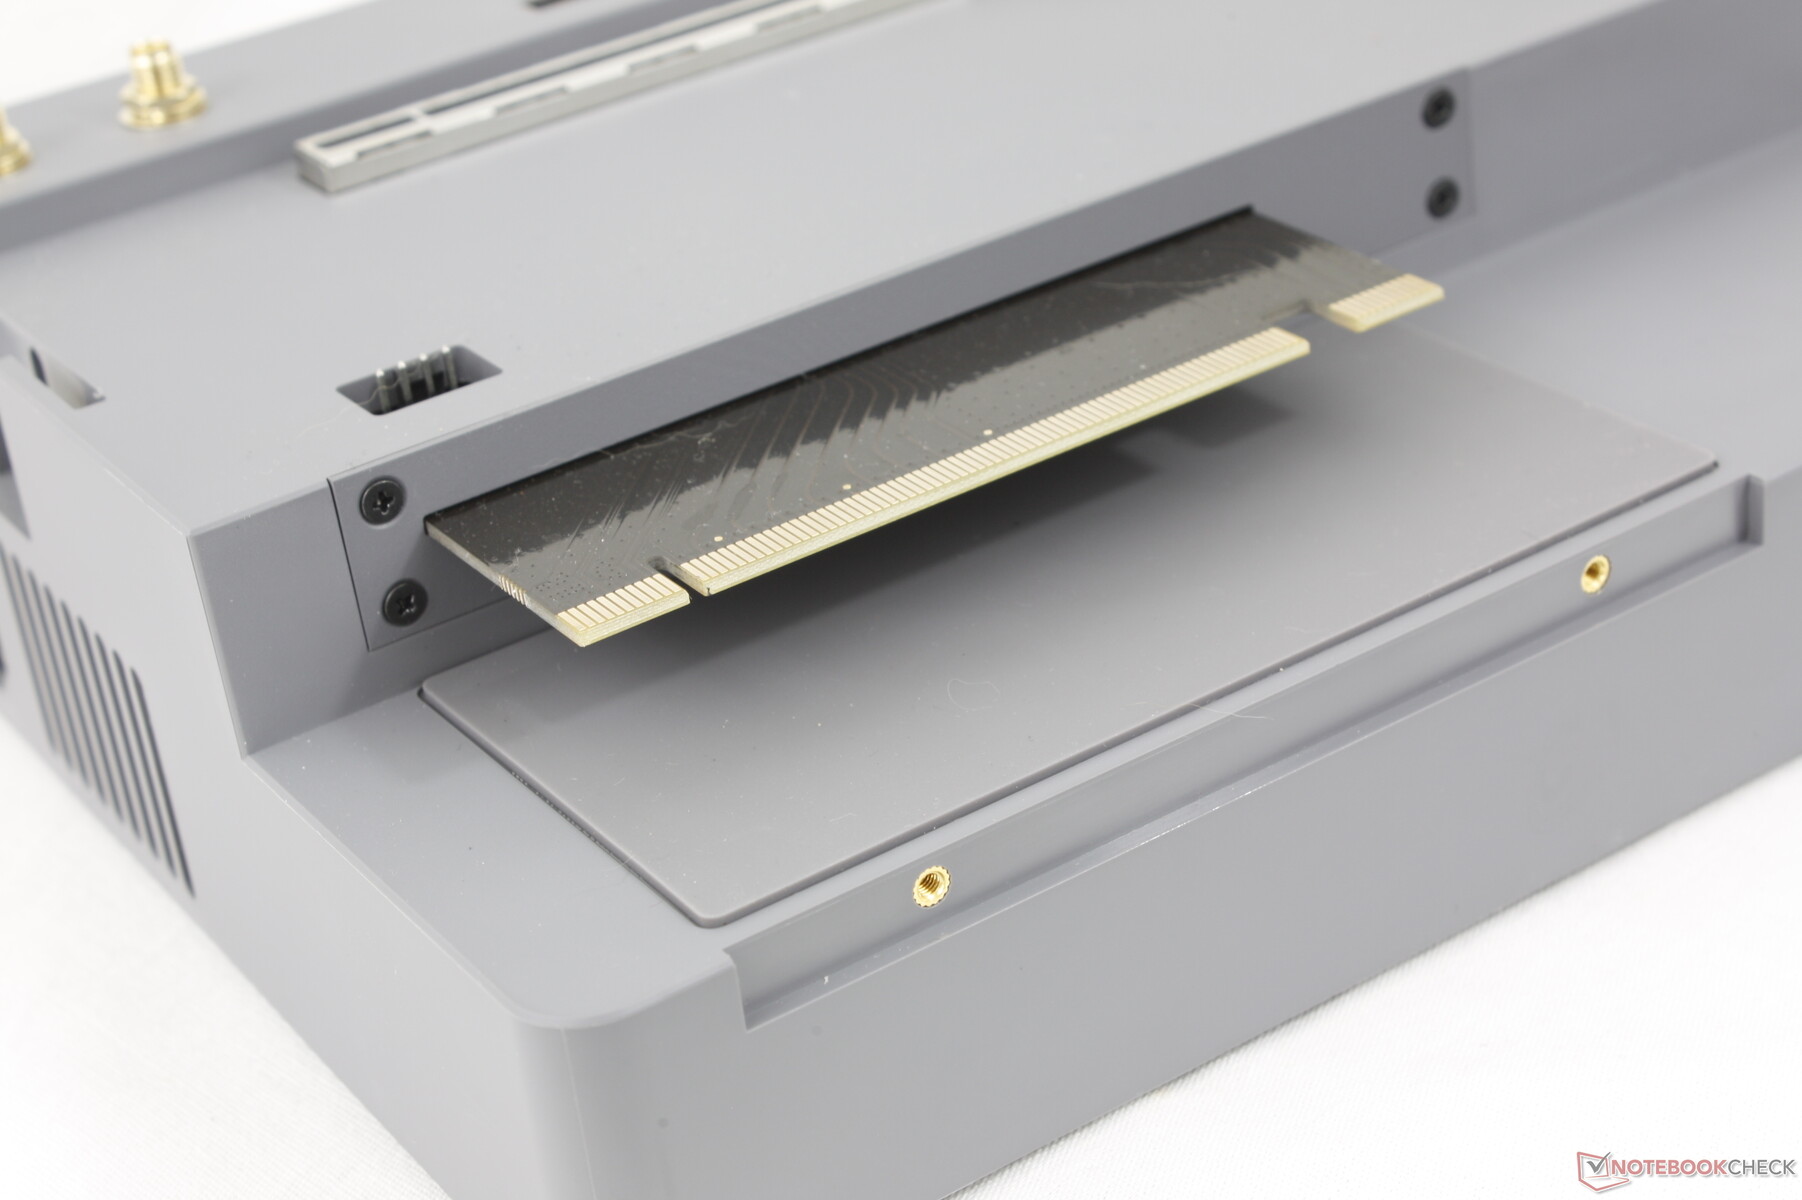
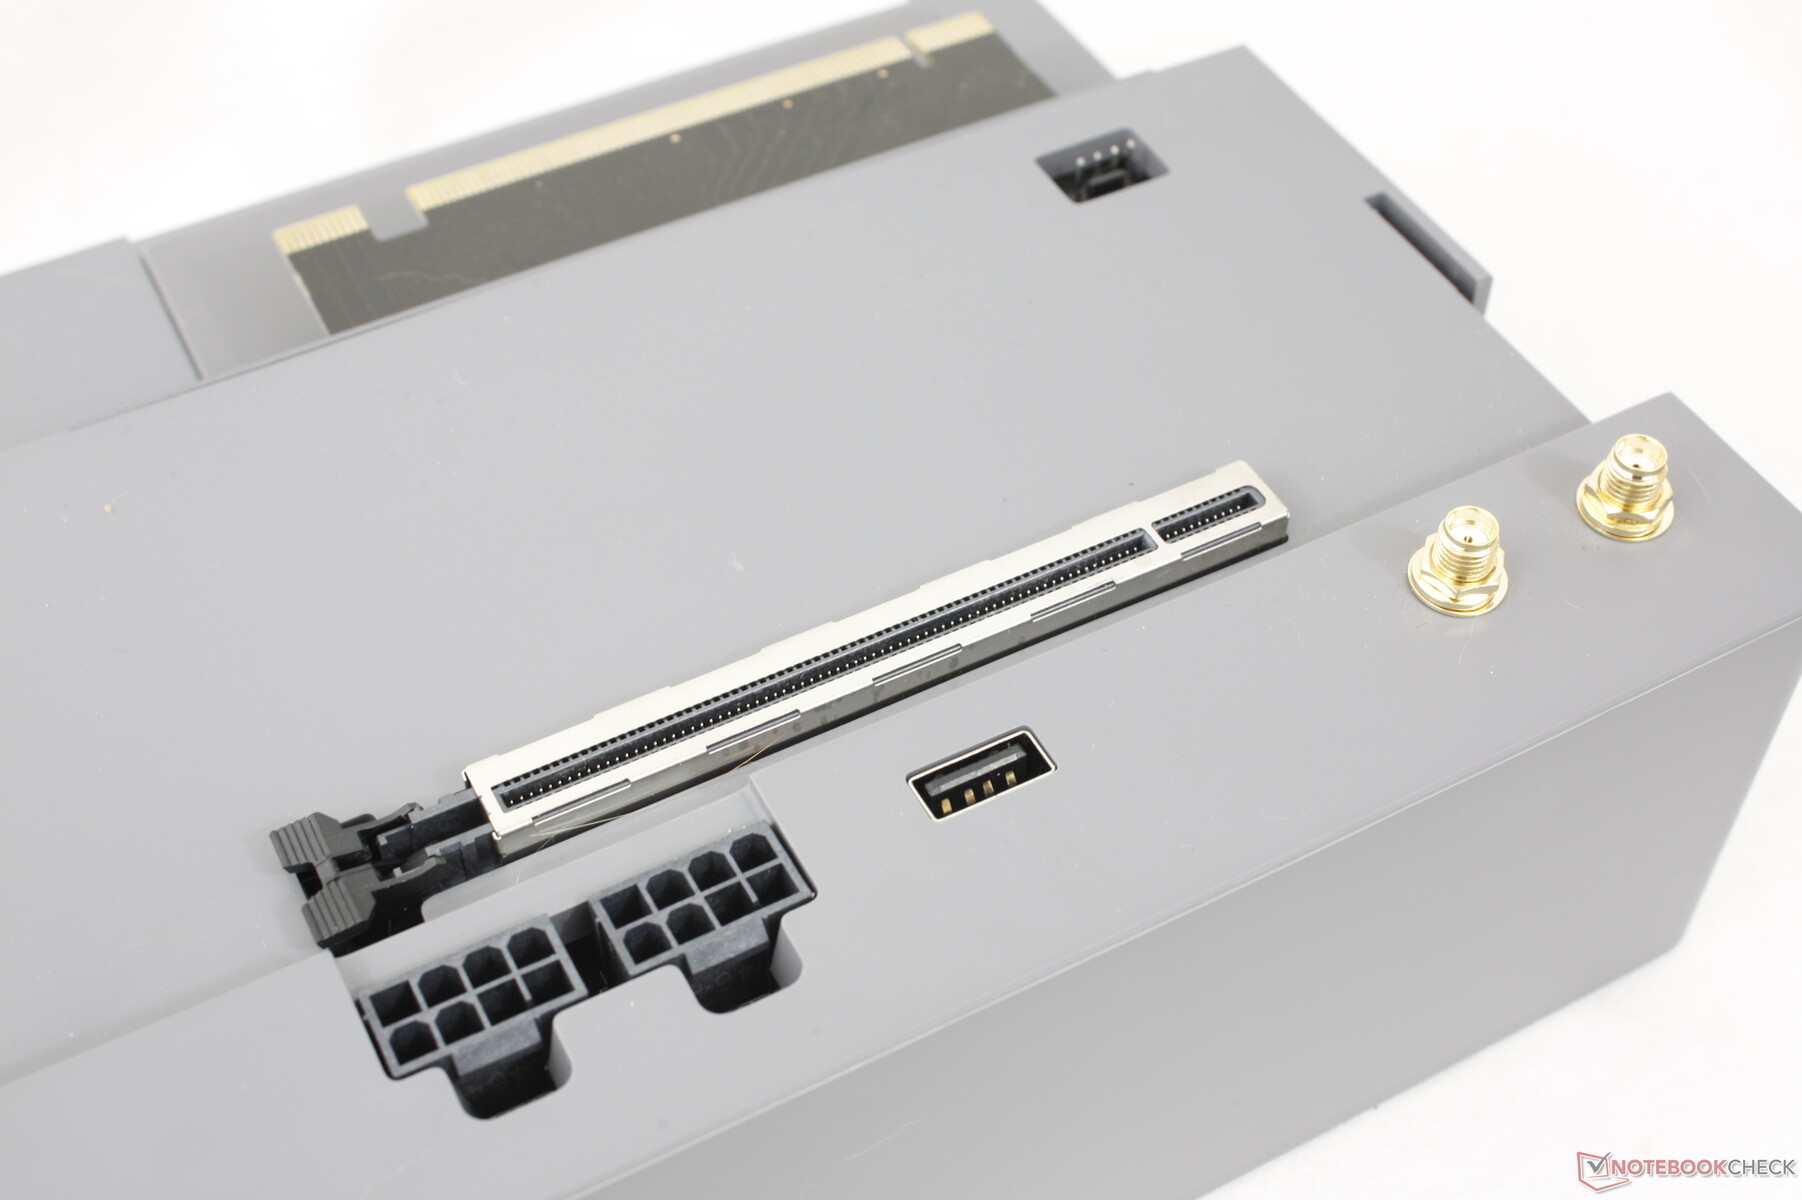
Une autre caractéristique unique est l'emplacement PCI x8 sur la partie inférieure de l'unité pour la fixation de la station d'accueil EX, comme le montre l'image ci-dessous. Nous apprécions le fait que le connecteur ne soit pas propriétaire, contrairement à l'Asus ROG XG Mobile Asus ROG XG Mobile.
L'appareil est nettement plus grand et plus lourd que la plupart des autres mini-PC avec graphiques intégrés en raison des caractéristiques uniques mentionnées ci-dessus.
| Mini PC | Station d'accueil EX | Mini PC + station d'accueil EX |
| 1316 g | 1419 g | 2735 g |

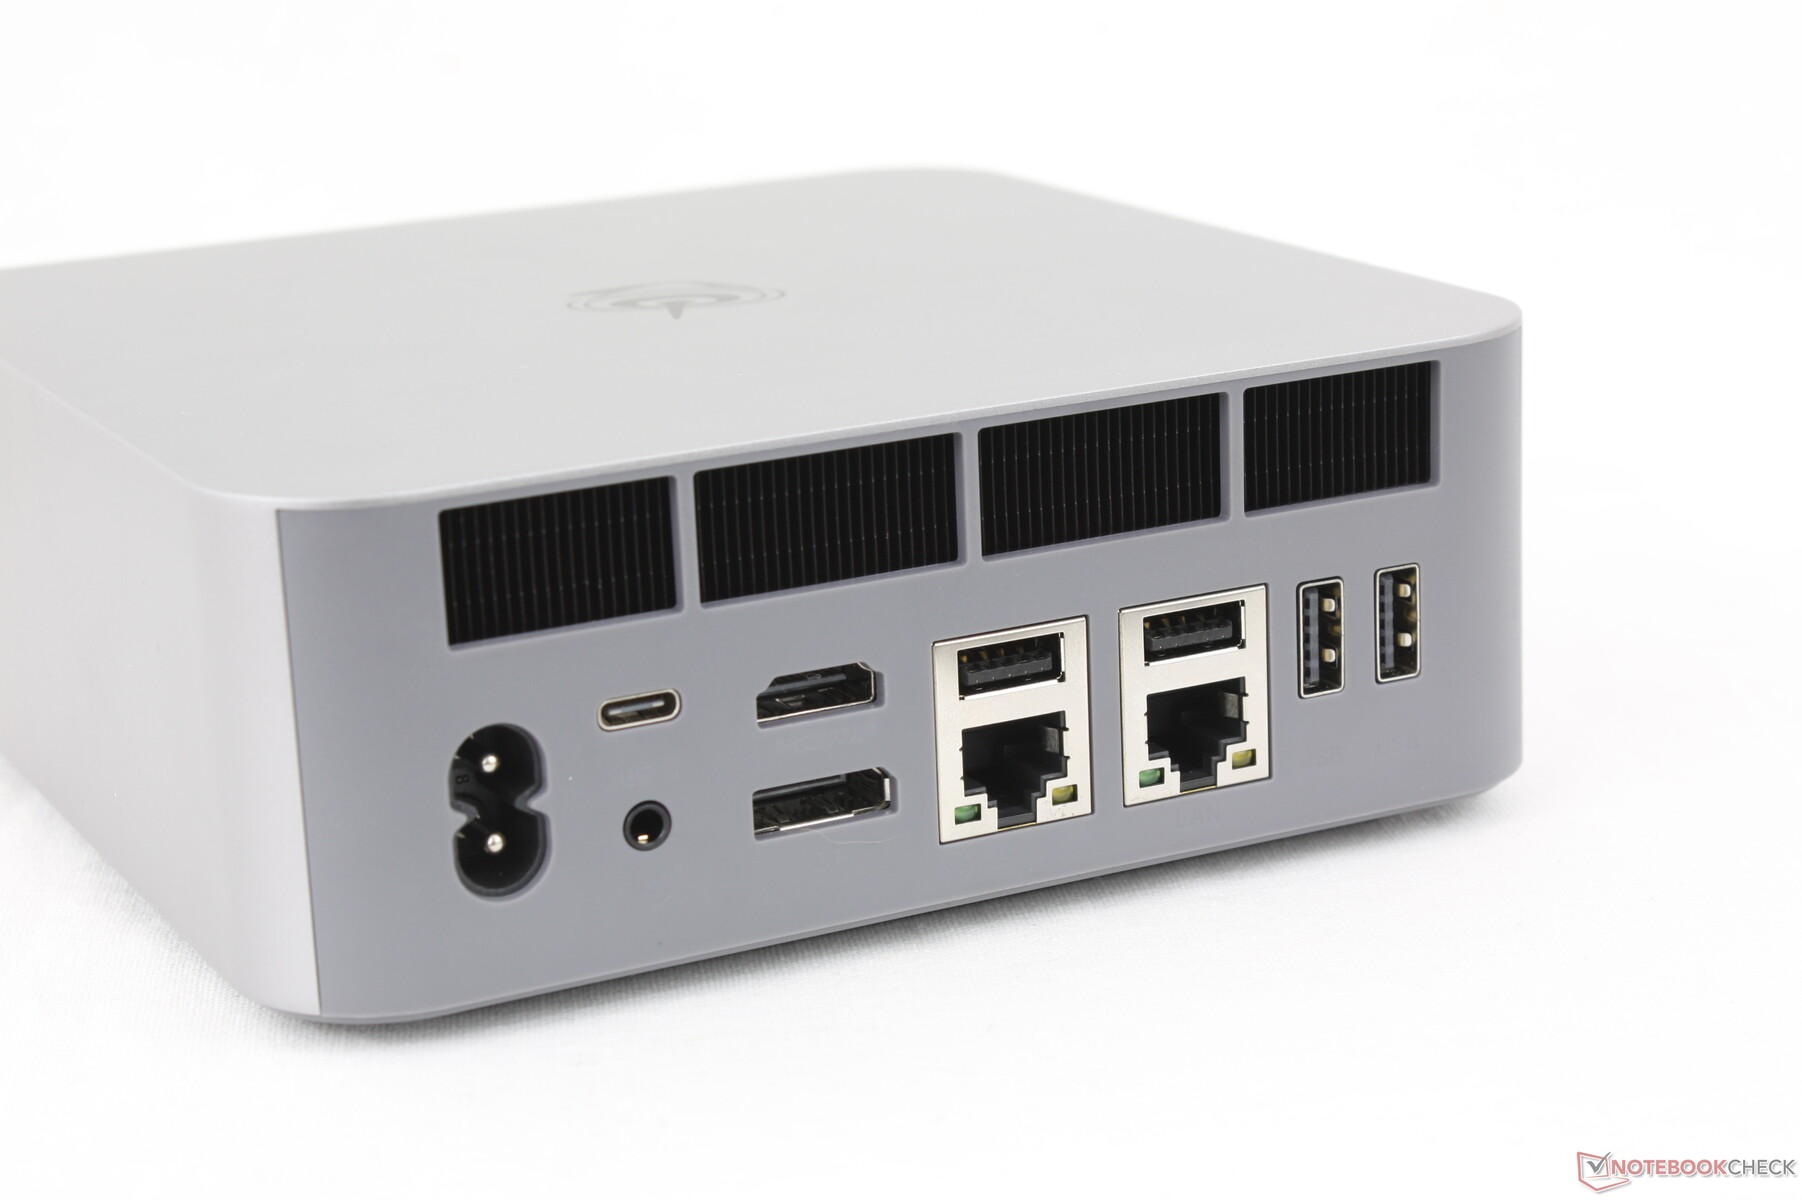
Connectivité
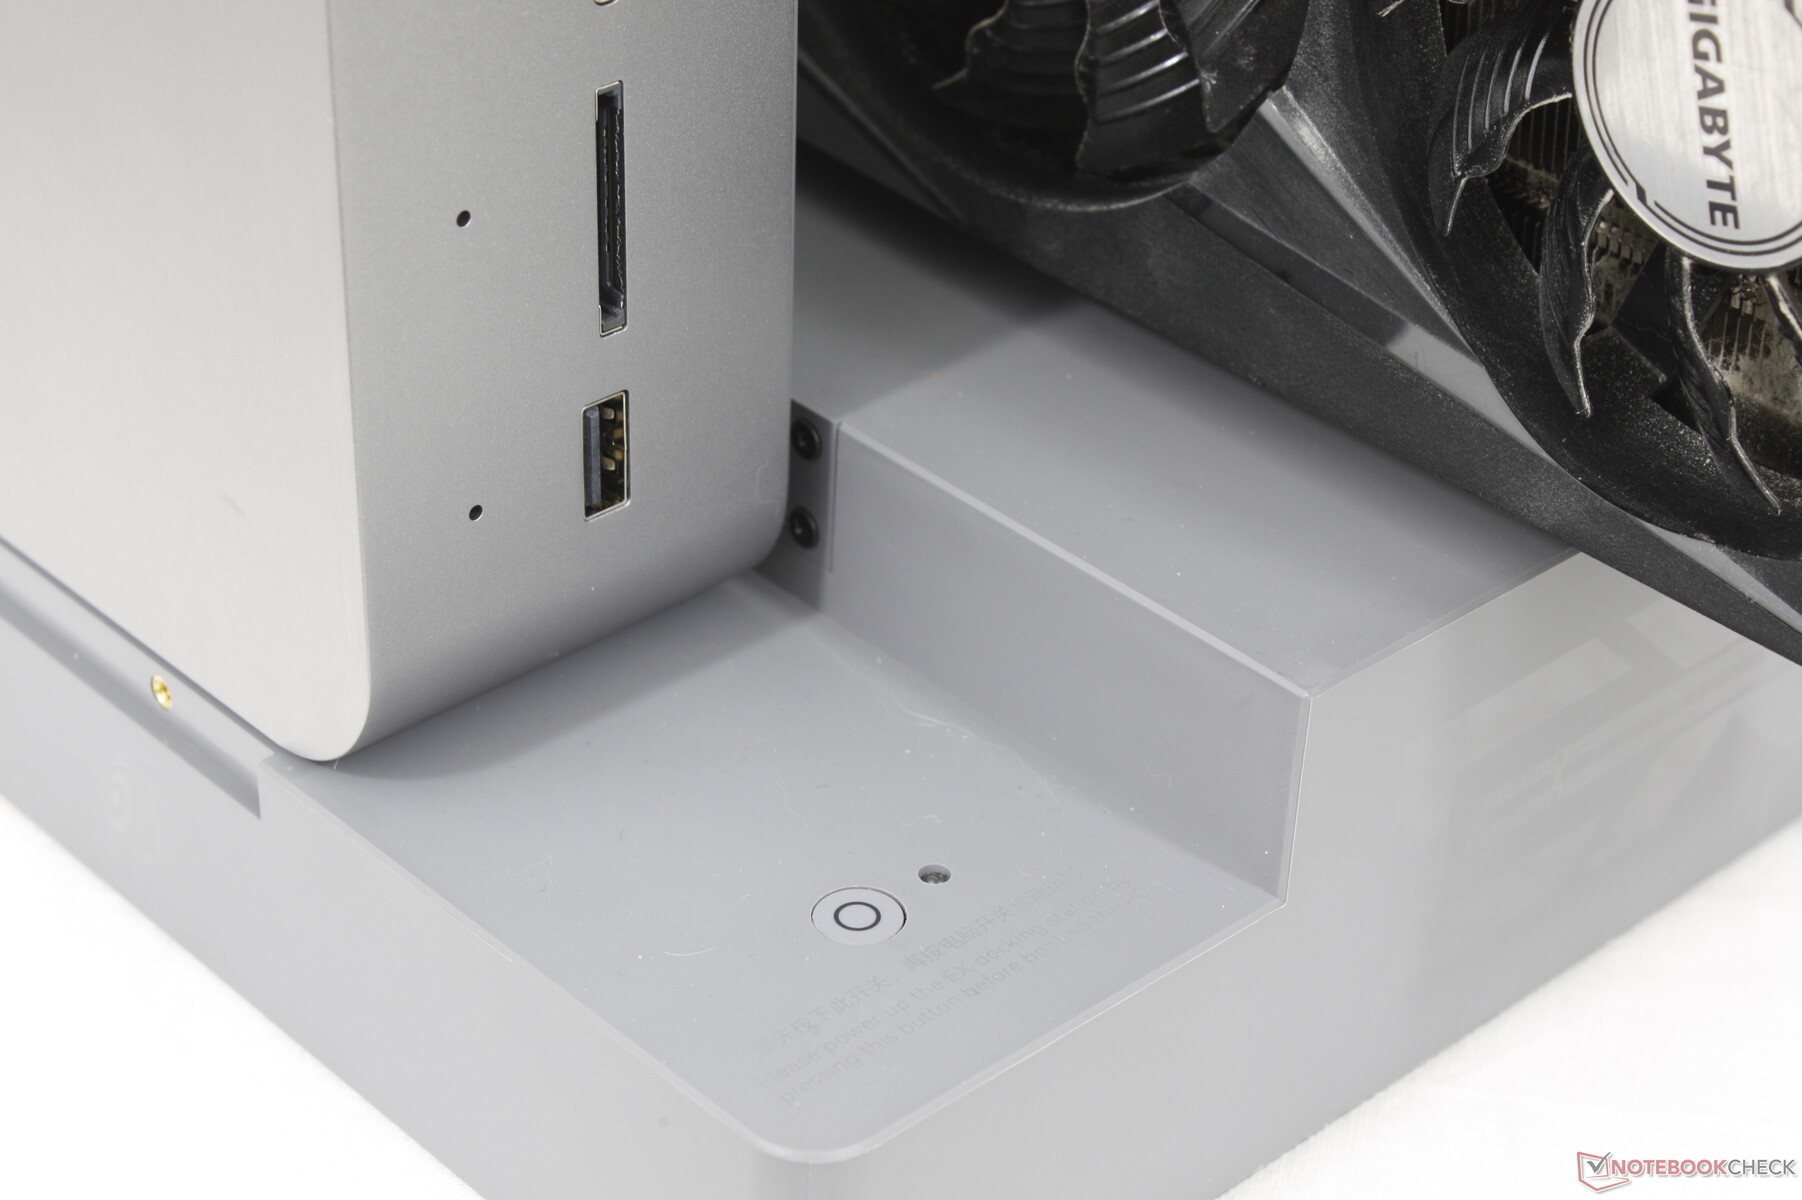
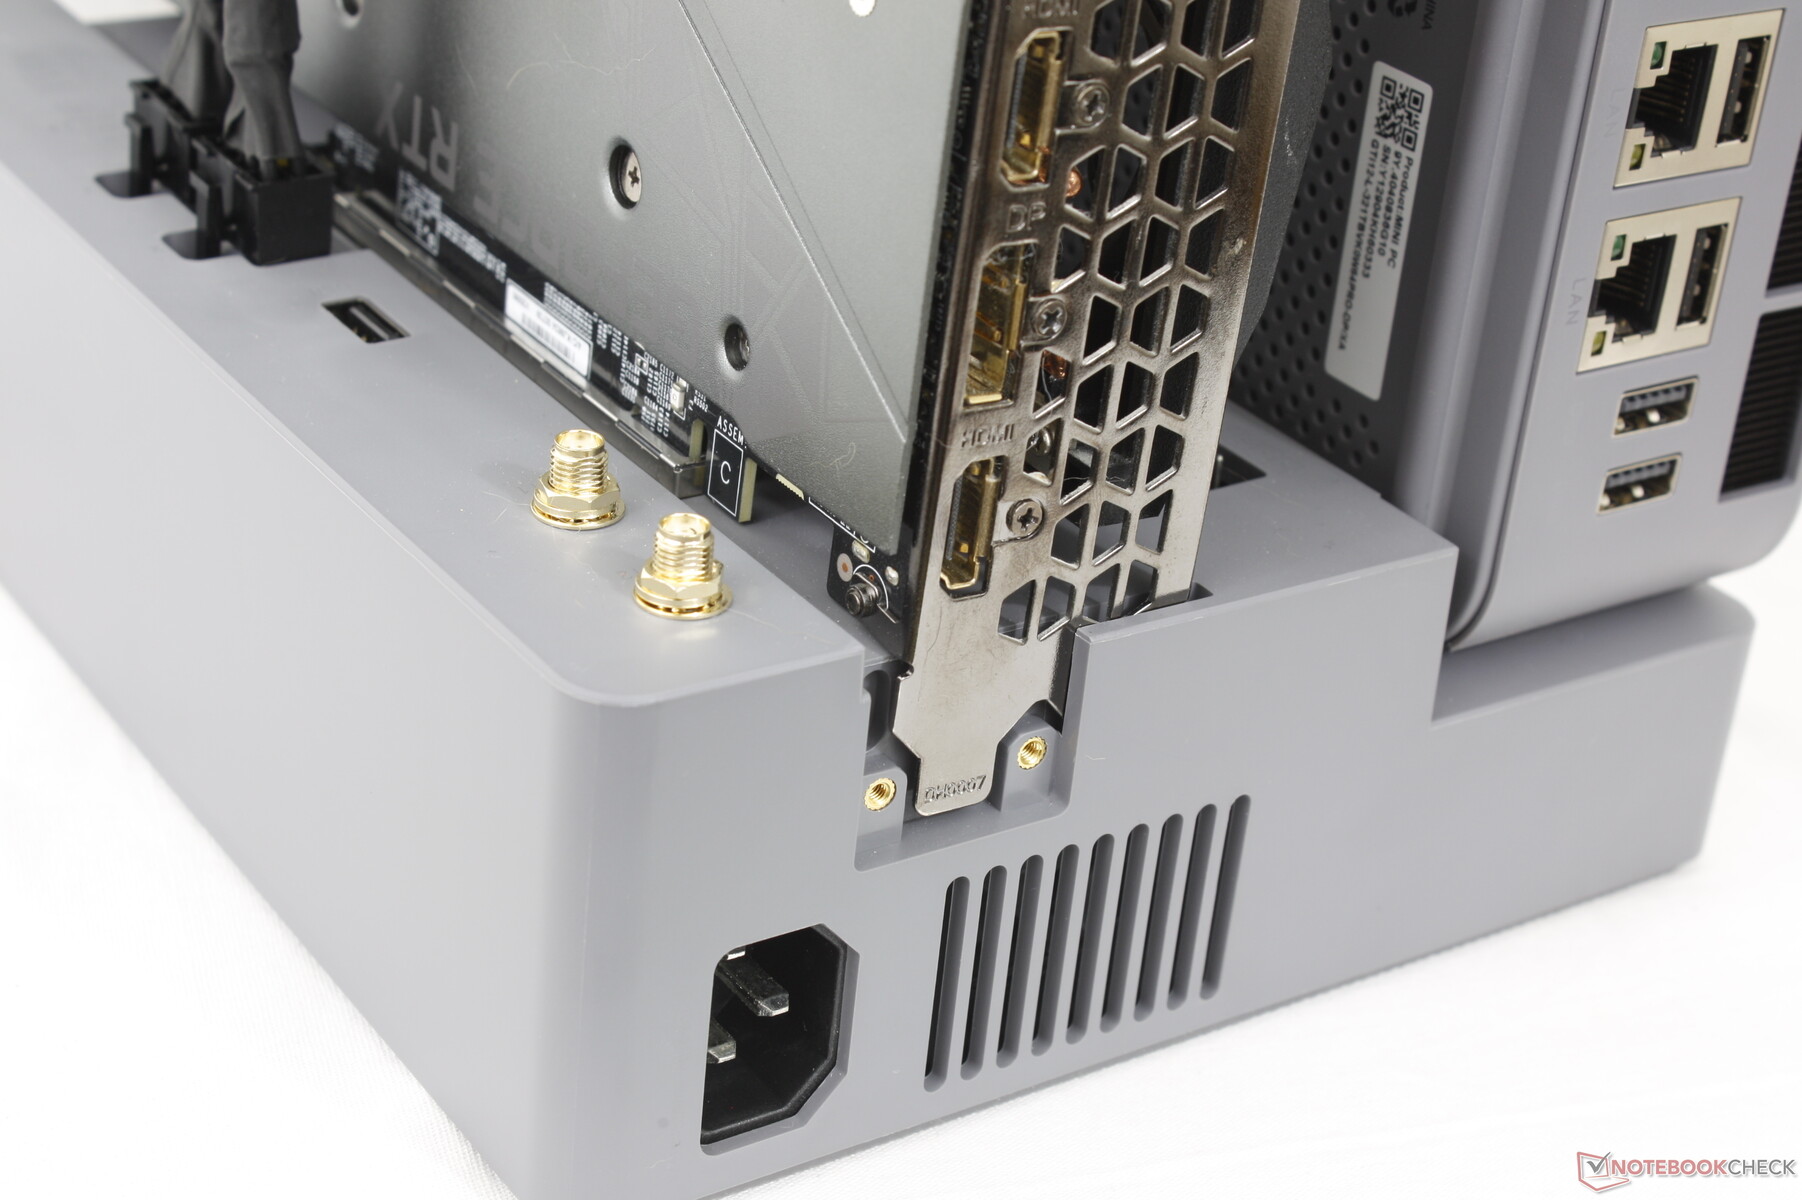
Les options de port sont plus nombreuses que celles offertes par le SER8 et de nombreux autres mini-PC de la taille d'un NUC, car le GTI12 Ultra est si grand. Le modèle intègre un lecteur de carte SD ainsi que des ports USB-A et RJ-45 supplémentaires.
Il n'y a pas de verrou Kensington.

Lecteur de carte SD
| SD Card Reader | |
| average JPG Copy Test (av. of 3 runs) | |
| Asus ROG NUC 14-90AS0051 (AV Pro SD microSD 128 GB V60) | |
| Beelink GTI12 Ultra EX Docking Station (Toshiba Exceria Pro SDXC 64 GB UHS-II) | |
| maximum AS SSD Seq Read Test (1GB) | |
| Asus ROG NUC 14-90AS0051 (AV Pro SD microSD 128 GB V60) | |
| Beelink GTI12 Ultra EX Docking Station (Toshiba Exceria Pro SDXC 64 GB UHS-II) | |
Communication
Les normes Wi-Fi 6E et Wi-Fi 7 ne sont pas prises en charge, ce qui devrait permettre de réduire les coûts.
| Networking | |
| iperf3 transmit AXE11000 | |
| Asus NUC 14 Pro | |
| Beelink GTI12 Ultra EX Docking Station | |
| Asus ROG NUC 14-90AS0051 | |
| Geekom AX8 Pro | |
| Minisforum MS-A1 | |
| GMK NucBox K9 | |
| iperf3 receive AXE11000 | |
| Asus NUC 14 Pro | |
| Beelink GTI12 Ultra EX Docking Station | |
| Geekom AX8 Pro | |
| Asus ROG NUC 14-90AS0051 | |
| Minisforum MS-A1 | |
| GMK NucBox K9 | |
| iperf3 transmit AXE11000 6GHz | |
| Geekom AX8 Pro | |
| Asus ROG NUC 14-90AS0051 | |
| Minisforum MS-A1 | |
| Asus NUC 14 Pro | |
| iperf3 receive AXE11000 6GHz | |
| Minisforum MS-A1 | |
| Asus ROG NUC 14-90AS0051 | |
| Asus NUC 14 Pro | |
| Geekom AX8 Pro | |
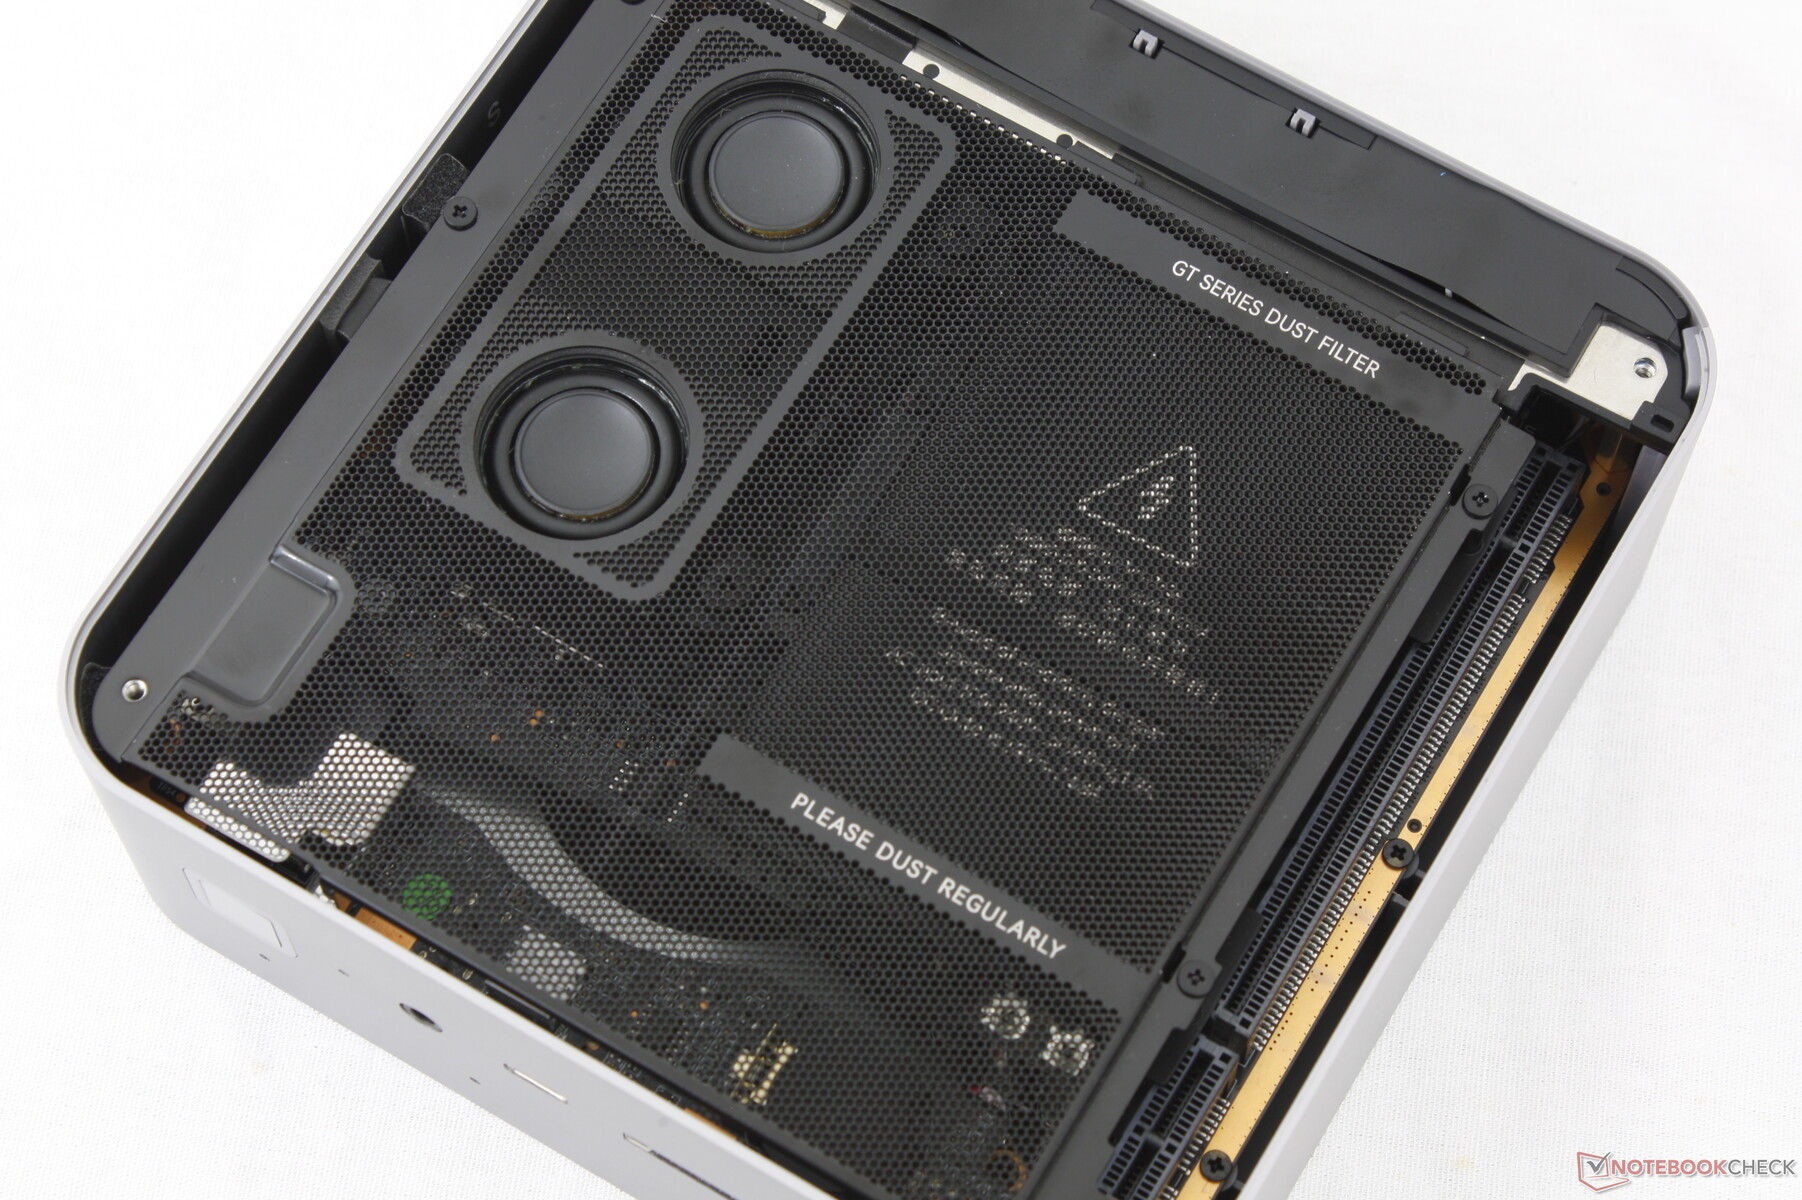
Maintenance
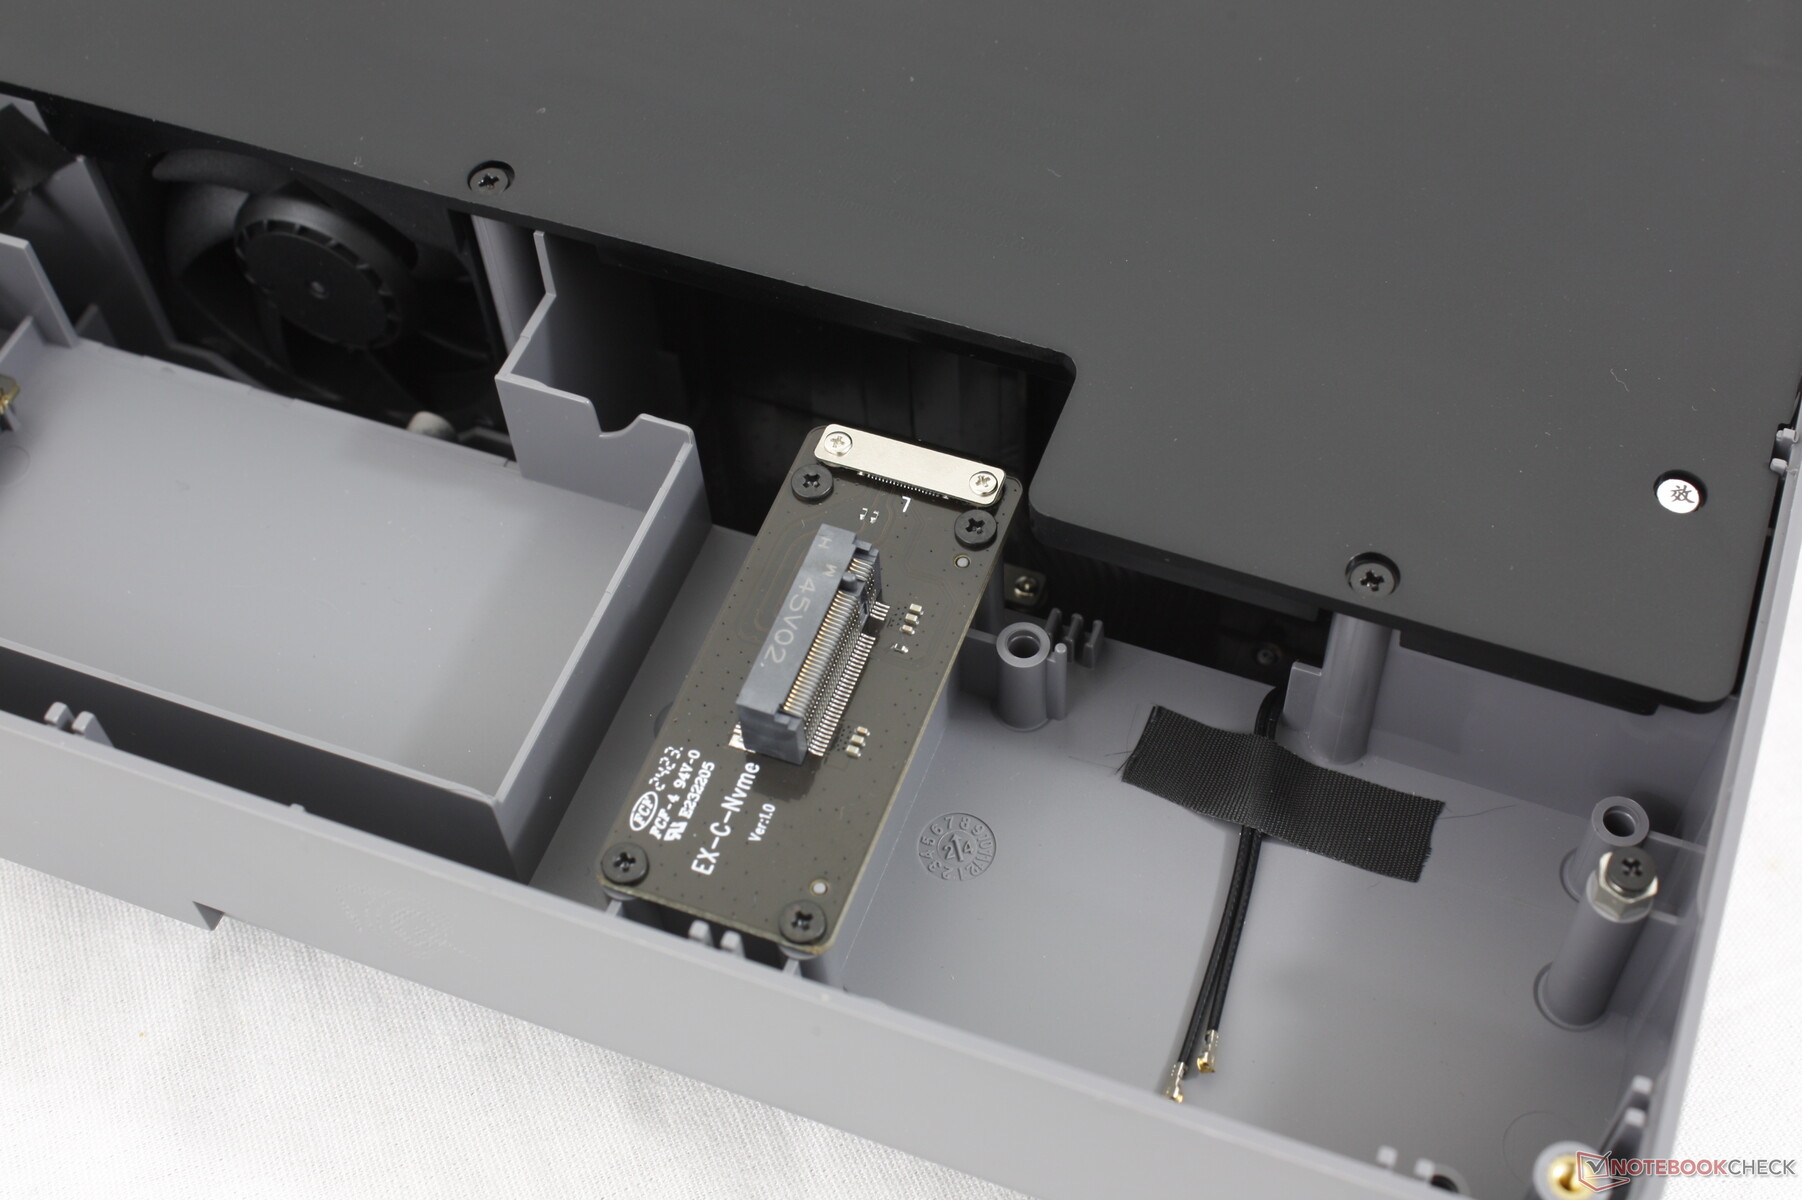
Le GTI12 Ultra est beaucoup plus difficile à entretenir que ses petits frères et sœurs, car il comporte plus de pièces intégrées que les autres modèles. Les haut-parleurs, le filtre anti-poussière et le bloc d'alimentation intégré se trouvent sur la carte mère et ont chacun des vis de taille différente, ce qui rend l'entretien encore plus difficile.
Durabilité
Beelink n'annonce aucune mesure de développement durable pour la fabrication du GTI12. L'emballage se compose principalement de papier, avec un peu d'emballage LDPE et de plastique.
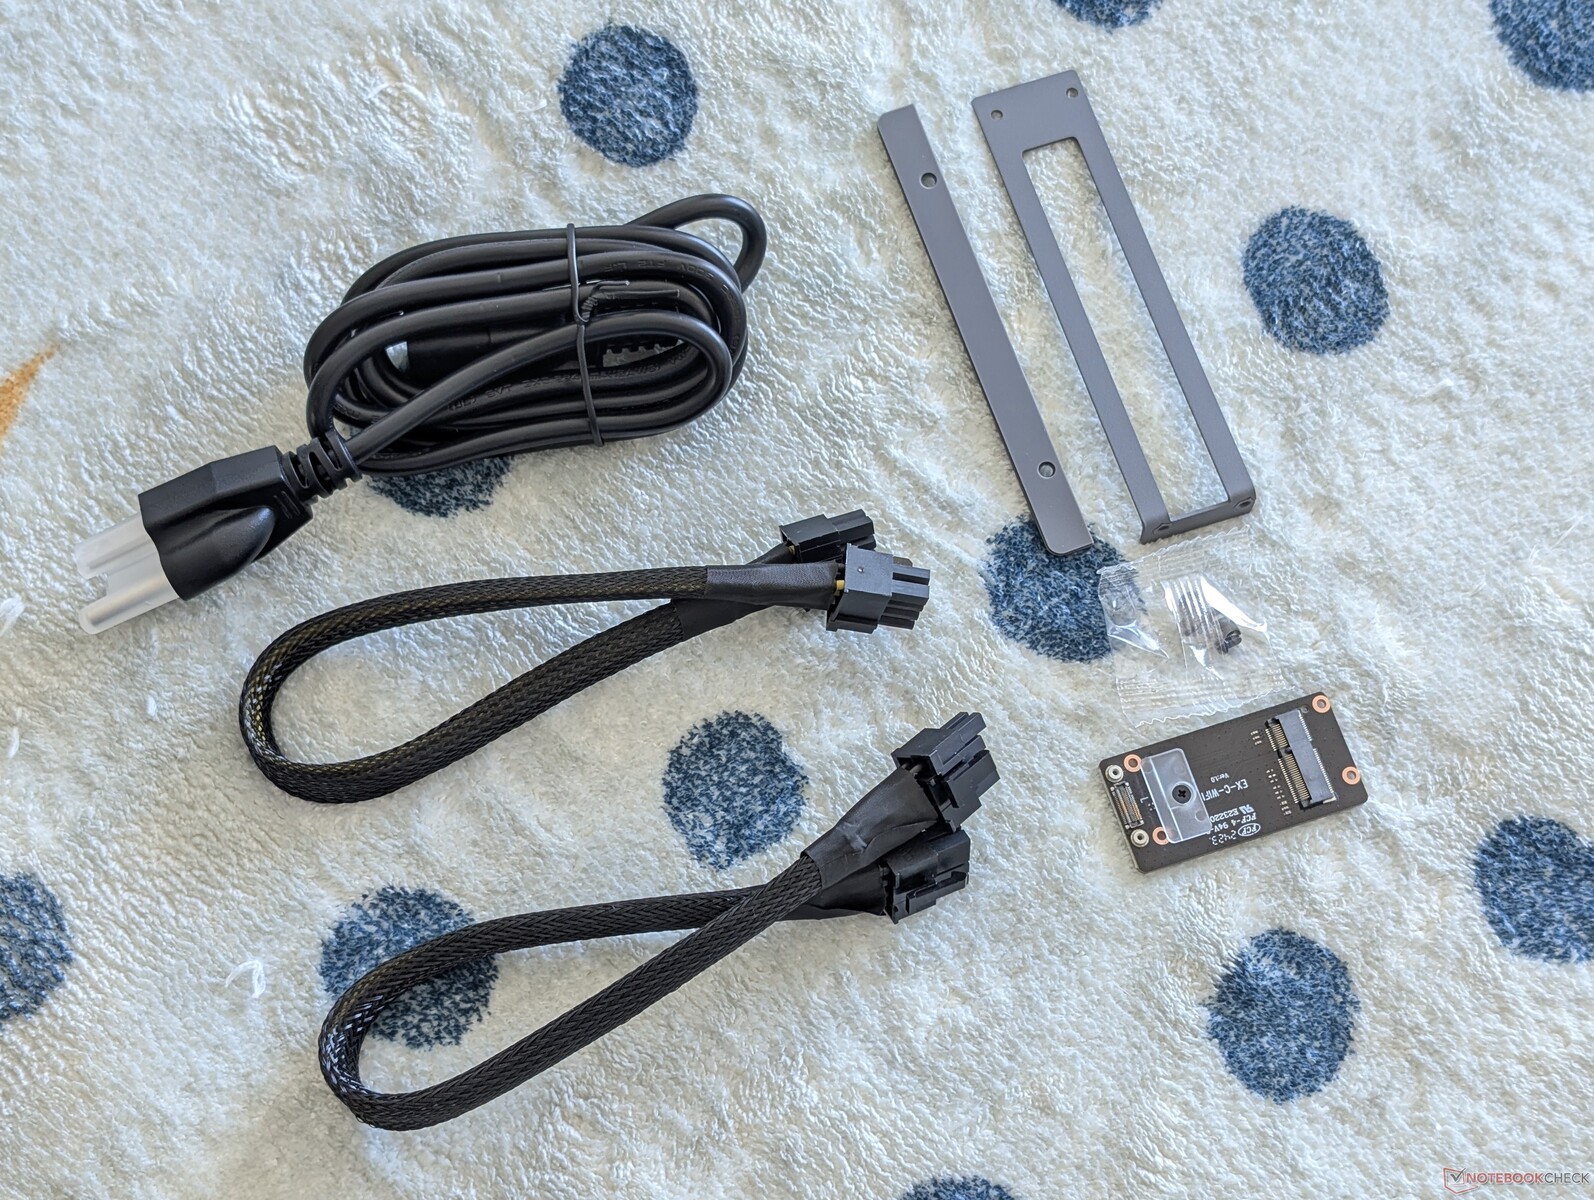
Accessoires et garantie
La station d'accueil EX comprend deux câbles d'alimentation 6+2 broches et deux petites plaques pour fixer le GPU et le mini PC sur la station d'accueil. Le slot Wi-Fi M.2 et l'antenne sont optionnels pour ceux qui souhaitent installer un module WLAN sur la station d'accueil plutôt qu'à l'intérieur du mini PC. Pratiquement tous les mini-PC sont équipés d'un WLAN intégré et cette caractéristique spécifique de la station d'accueil peut donc être ignorée par la plupart des utilisateurs.
Performance
Conditions d'essai
Nous avons réglé Windows sur le mode Performance avant d'effectuer les tests ci-dessous.
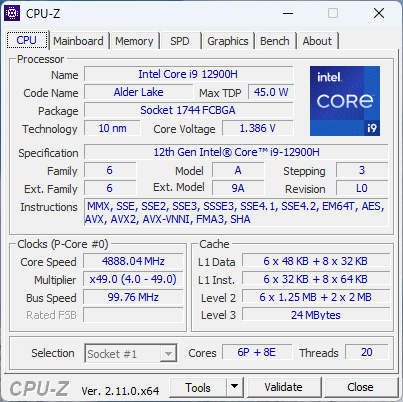
Processeur
Le Core i9-12900H a deux ou trois générations de retard sur la série Raptor Lake-R actuelle et les résultats du benchmark le reflètent. Le plus récent Core i9-14900HXplus récent, par exemple, offre des performances multithread presque deux fois supérieures à celles de notre unité Beelink. Même les mini PC moins chers comme le Beelink SER7 peuvent offrir des performances de processeur presque identiques.
Des options de processeur Meteor Lake Core Ultra plus récentes sont disponibles pour ce modèle appelé GTI14.
Cinebench R15 Multi Loop
Cinebench R23: Multi Core | Single Core
Cinebench R20: CPU (Multi Core) | CPU (Single Core)
Cinebench R15: CPU Multi 64Bit | CPU Single 64Bit
Blender: v2.79 BMW27 CPU
7-Zip 18.03: 7z b 4 | 7z b 4 -mmt1
Geekbench 6.4: Multi-Core | Single-Core
Geekbench 5.5: Multi-Core | Single-Core
HWBOT x265 Benchmark v2.2: 4k Preset
LibreOffice : 20 Documents To PDF
R Benchmark 2.5: Overall mean
* ... Moindre est la valeur, meilleures sont les performances
AIDA64: FP32 Ray-Trace | FPU Julia | CPU SHA3 | CPU Queen | FPU SinJulia | FPU Mandel | CPU AES | CPU ZLib | FP64 Ray-Trace | CPU PhotoWorxx
| Performance Rating | |
| Minisforum MS-A1 | |
| Geekom AX8 Pro | |
| Asus ROG NUC 14-90AS0051 | |
| Beelink GTI12 Ultra EX Docking Station | |
| Asus NUC 14 Pro | |
| Moyenne Intel Core i9-12900H | |
| GMK NucBox K9 | |
| AIDA64 / FP32 Ray-Trace | |
| Minisforum MS-A1 | |
| Geekom AX8 Pro | |
| Asus ROG NUC 14-90AS0051 | |
| Beelink GTI12 Ultra EX Docking Station | |
| Asus NUC 14 Pro | |
| Moyenne Intel Core i9-12900H (4074 - 18289, n=28) | |
| GMK NucBox K9 | |
| AIDA64 / FPU Julia | |
| Minisforum MS-A1 | |
| Geekom AX8 Pro | |
| Asus ROG NUC 14-90AS0051 | |
| Beelink GTI12 Ultra EX Docking Station | |
| Asus NUC 14 Pro | |
| GMK NucBox K9 | |
| Moyenne Intel Core i9-12900H (22307 - 93236, n=28) | |
| AIDA64 / CPU SHA3 | |
| Minisforum MS-A1 | |
| Geekom AX8 Pro | |
| Asus ROG NUC 14-90AS0051 | |
| Beelink GTI12 Ultra EX Docking Station | |
| Asus NUC 14 Pro | |
| Moyenne Intel Core i9-12900H (1378 - 4215, n=28) | |
| GMK NucBox K9 | |
| AIDA64 / CPU Queen | |
| Minisforum MS-A1 | |
| Geekom AX8 Pro | |
| Moyenne Intel Core i9-12900H (78172 - 111241, n=28) | |
| Beelink GTI12 Ultra EX Docking Station | |
| Asus ROG NUC 14-90AS0051 | |
| Asus NUC 14 Pro | |
| GMK NucBox K9 | |
| AIDA64 / FPU SinJulia | |
| Minisforum MS-A1 | |
| Geekom AX8 Pro | |
| Asus ROG NUC 14-90AS0051 | |
| Beelink GTI12 Ultra EX Docking Station | |
| Moyenne Intel Core i9-12900H (5709 - 10410, n=28) | |
| Asus NUC 14 Pro | |
| GMK NucBox K9 | |
| AIDA64 / FPU Mandel | |
| Minisforum MS-A1 | |
| Geekom AX8 Pro | |
| Asus ROG NUC 14-90AS0051 | |
| Beelink GTI12 Ultra EX Docking Station | |
| Asus NUC 14 Pro | |
| Moyenne Intel Core i9-12900H (11257 - 45581, n=28) | |
| GMK NucBox K9 | |
| AIDA64 / CPU AES | |
| Minisforum MS-A1 | |
| Geekom AX8 Pro | |
| GMK NucBox K9 | |
| Asus ROG NUC 14-90AS0051 | |
| Moyenne Intel Core i9-12900H (31935 - 151546, n=28) | |
| Beelink GTI12 Ultra EX Docking Station | |
| Asus NUC 14 Pro | |
| AIDA64 / CPU ZLib | |
| Asus ROG NUC 14-90AS0051 | |
| Minisforum MS-A1 | |
| Beelink GTI12 Ultra EX Docking Station | |
| Geekom AX8 Pro | |
| Asus NUC 14 Pro | |
| Moyenne Intel Core i9-12900H (449 - 1193, n=28) | |
| GMK NucBox K9 | |
| AIDA64 / FP64 Ray-Trace | |
| Minisforum MS-A1 | |
| Geekom AX8 Pro | |
| Asus ROG NUC 14-90AS0051 | |
| Beelink GTI12 Ultra EX Docking Station | |
| Asus NUC 14 Pro | |
| Moyenne Intel Core i9-12900H (2235 - 10511, n=28) | |
| GMK NucBox K9 | |
| AIDA64 / CPU PhotoWorxx | |
| Asus NUC 14 Pro | |
| GMK NucBox K9 | |
| Asus ROG NUC 14-90AS0051 | |
| Beelink GTI12 Ultra EX Docking Station | |
| Minisforum MS-A1 | |
| Geekom AX8 Pro | |
| Moyenne Intel Core i9-12900H (20960 - 48269, n=29) | |
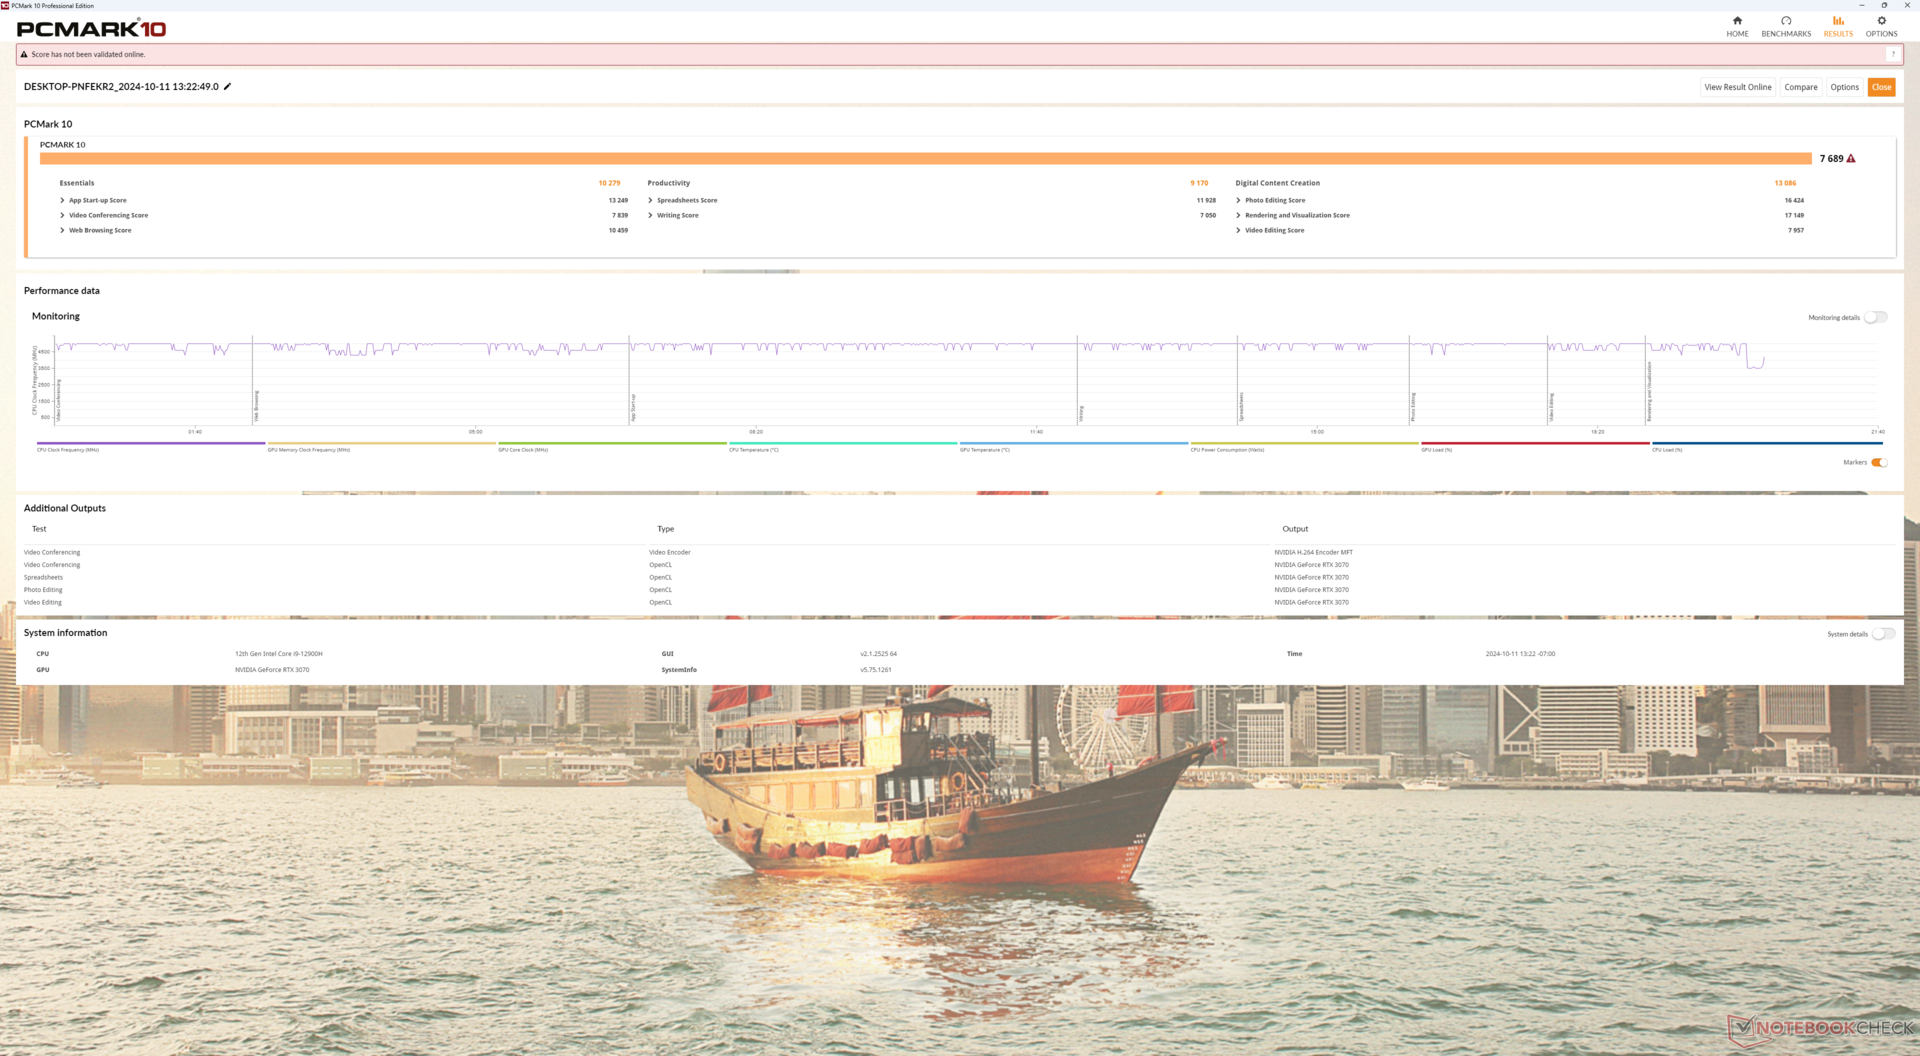
Performance du système
Les résultats de PCMark sont comparables à ceux d'ordinateurs portables et d'autres mini-PC dotés d'une carte graphique discrète, y compris l'Asus NOG NUC 14 et l'Asus NUC 15 Asus ROG NUC 14. Notre score de productivité est cependant relativement faible, probablement en raison de l'ancienneté du processeur Intel de 12ème génération.
CrossMark: Overall | Productivity | Creativity | Responsiveness
WebXPRT 3: Overall
WebXPRT 4: Overall
Mozilla Kraken 1.1: Total
* ... Moindre est la valeur, meilleures sont les performances
| PCMark 10 Score | 7689 points | |
Aide | ||
| AIDA64 / Memory Copy | |
| Asus ROG NUC 14-90AS0051 | |
| Asus NUC 14 Pro | |
| Geekom AX8 Pro | |
| GMK NucBox K9 | |
| Minisforum MS-A1 | |
| Beelink GTI12 Ultra EX Docking Station | |
| Moyenne Intel Core i9-12900H (34438 - 74264, n=28) | |
| AIDA64 / Memory Read | |
| Asus NUC 14 Pro | |
| Asus ROG NUC 14-90AS0051 | |
| GMK NucBox K9 | |
| Beelink GTI12 Ultra EX Docking Station | |
| Moyenne Intel Core i9-12900H (36365 - 74642, n=28) | |
| Geekom AX8 Pro | |
| Minisforum MS-A1 | |
| AIDA64 / Memory Write | |
| Geekom AX8 Pro | |
| Minisforum MS-A1 | |
| Asus NUC 14 Pro | |
| GMK NucBox K9 | |
| Asus ROG NUC 14-90AS0051 | |
| Beelink GTI12 Ultra EX Docking Station | |
| Moyenne Intel Core i9-12900H (32276 - 67858, n=28) | |
| AIDA64 / Memory Latency | |
| Asus ROG NUC 14-90AS0051 | |
| GMK NucBox K9 | |
| Asus NUC 14 Pro | |
| Geekom AX8 Pro | |
| Beelink GTI12 Ultra EX Docking Station | |
| Minisforum MS-A1 | |
| Moyenne Intel Core i9-12900H (74.7 - 118.1, n=27) | |
* ... Moindre est la valeur, meilleures sont les performances
Latence DPC
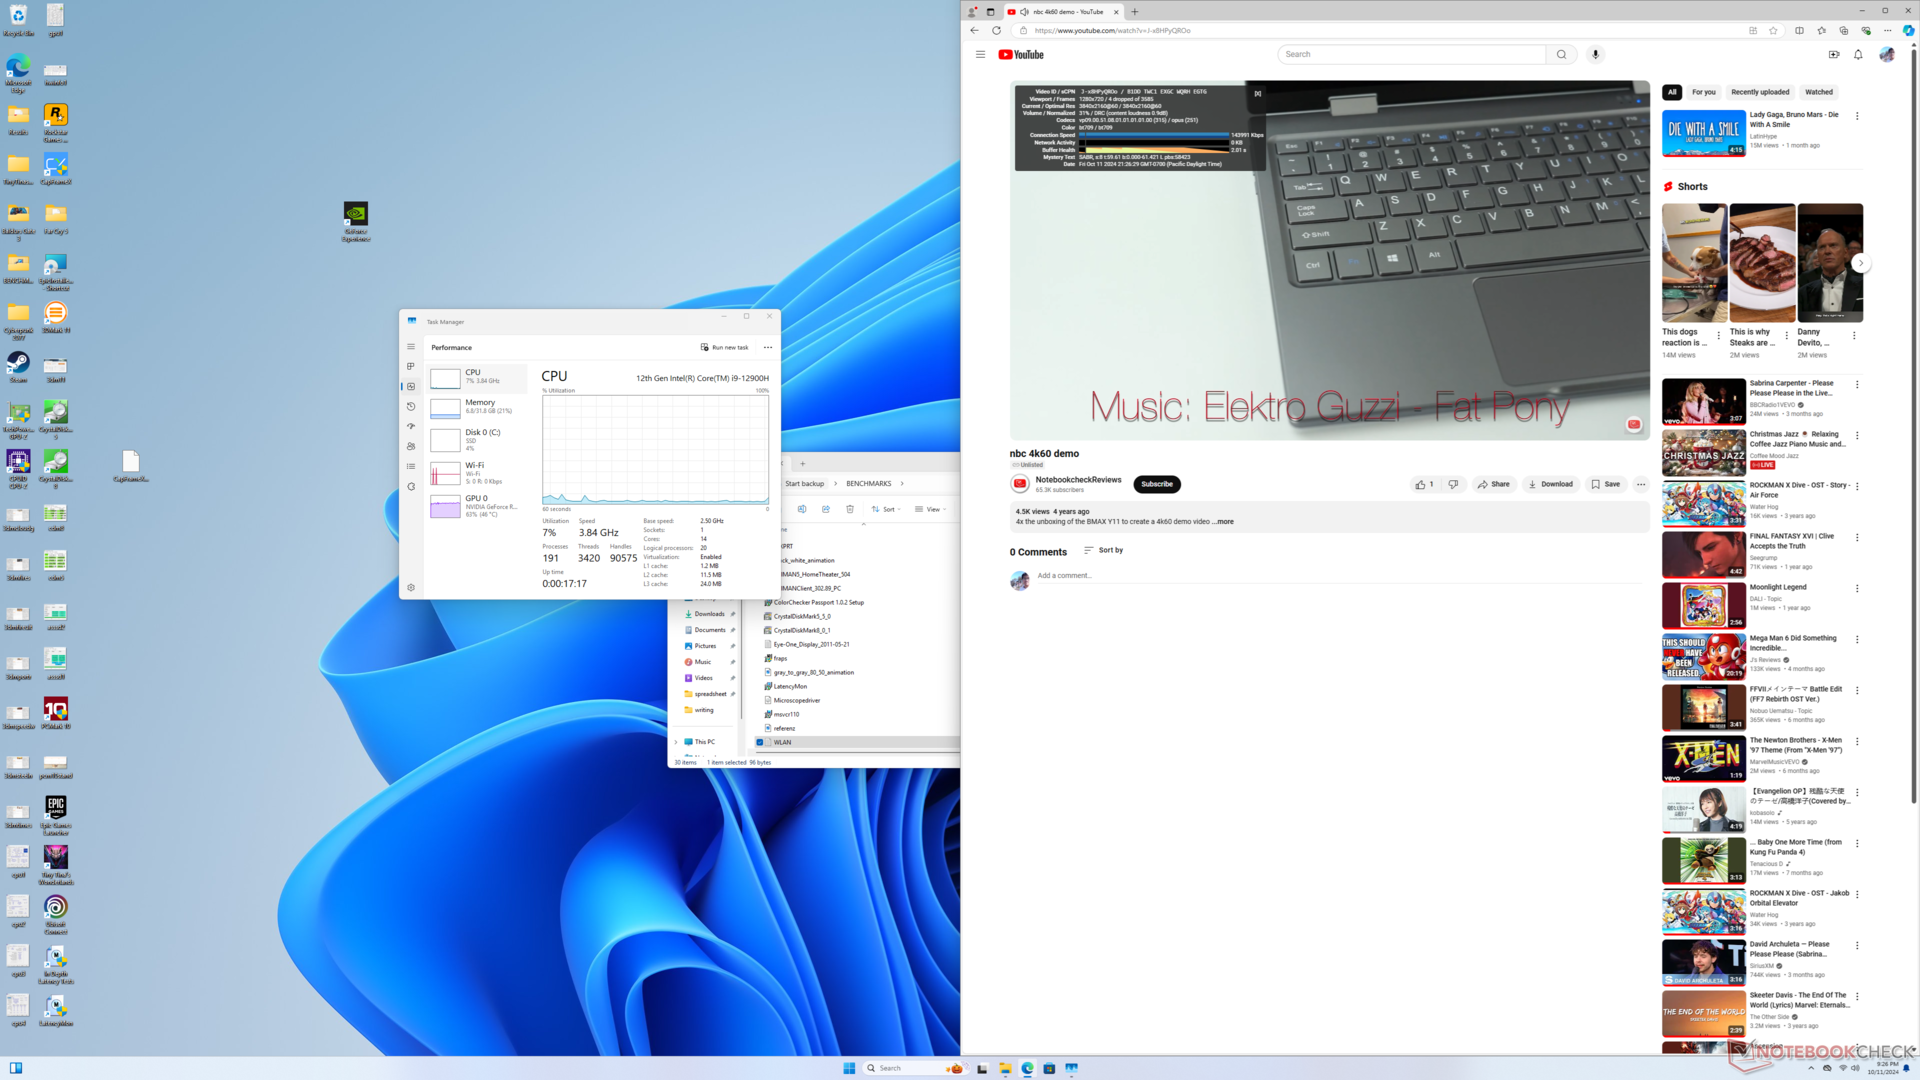
la lecture de vidéos 4K à 60 FPS est presque parfaite. Étrangement, il y a toujours quelques images sautées immédiatement après avoir appuyé sur le bouton Play, ce qui n'est pas le cas sur d'autres PC. Sinon, il n'y a pas d'images sautées pendant le reste de la vidéo de test.
LatencyMon est incompatible avec la version actuelle du système.
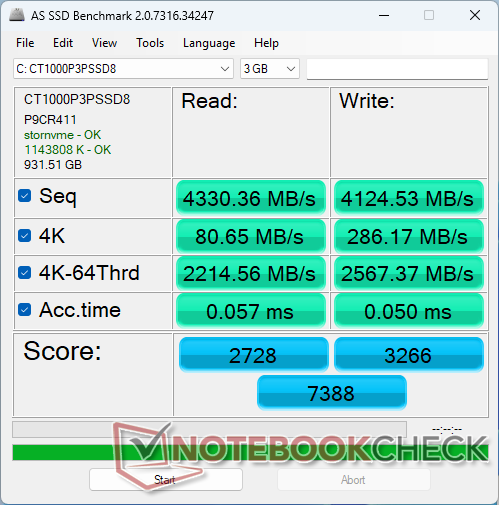
Dispositifs de stockage
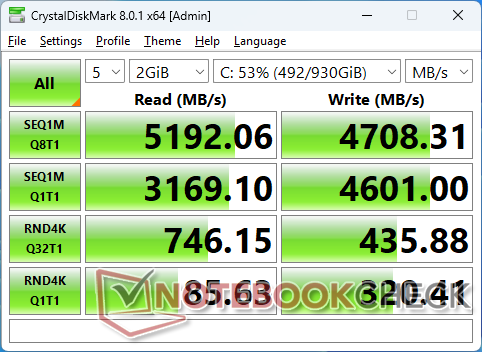
Notre unité est livrée avec un SSD de 1 TB Crucial P3 Plus SSD. Les taux de transfert maximum atteignent 5200 MB/s avant de retomber à 4800 MB/s après quelques minutes de stress. En comparaison, le Samsung PM9A1a de l'Asus NUC 14, plus rapide, peut supporter 6700 Mo/s.

| Drive Performance Rating - Percent | |
| Beelink GTI12 Ultra EX Docking Station | |
| GMK NucBox K9 | |
| Minisforum MS-A1 | |
| Geekom AX8 Pro | |
| Asus ROG NUC 14-90AS0051 | |
| Asus NUC 14 Pro | |
* ... Moindre est la valeur, meilleures sont les performances
Disk Throttling: DiskSpd Read Loop, Queue Depth 8
Performance du GPU
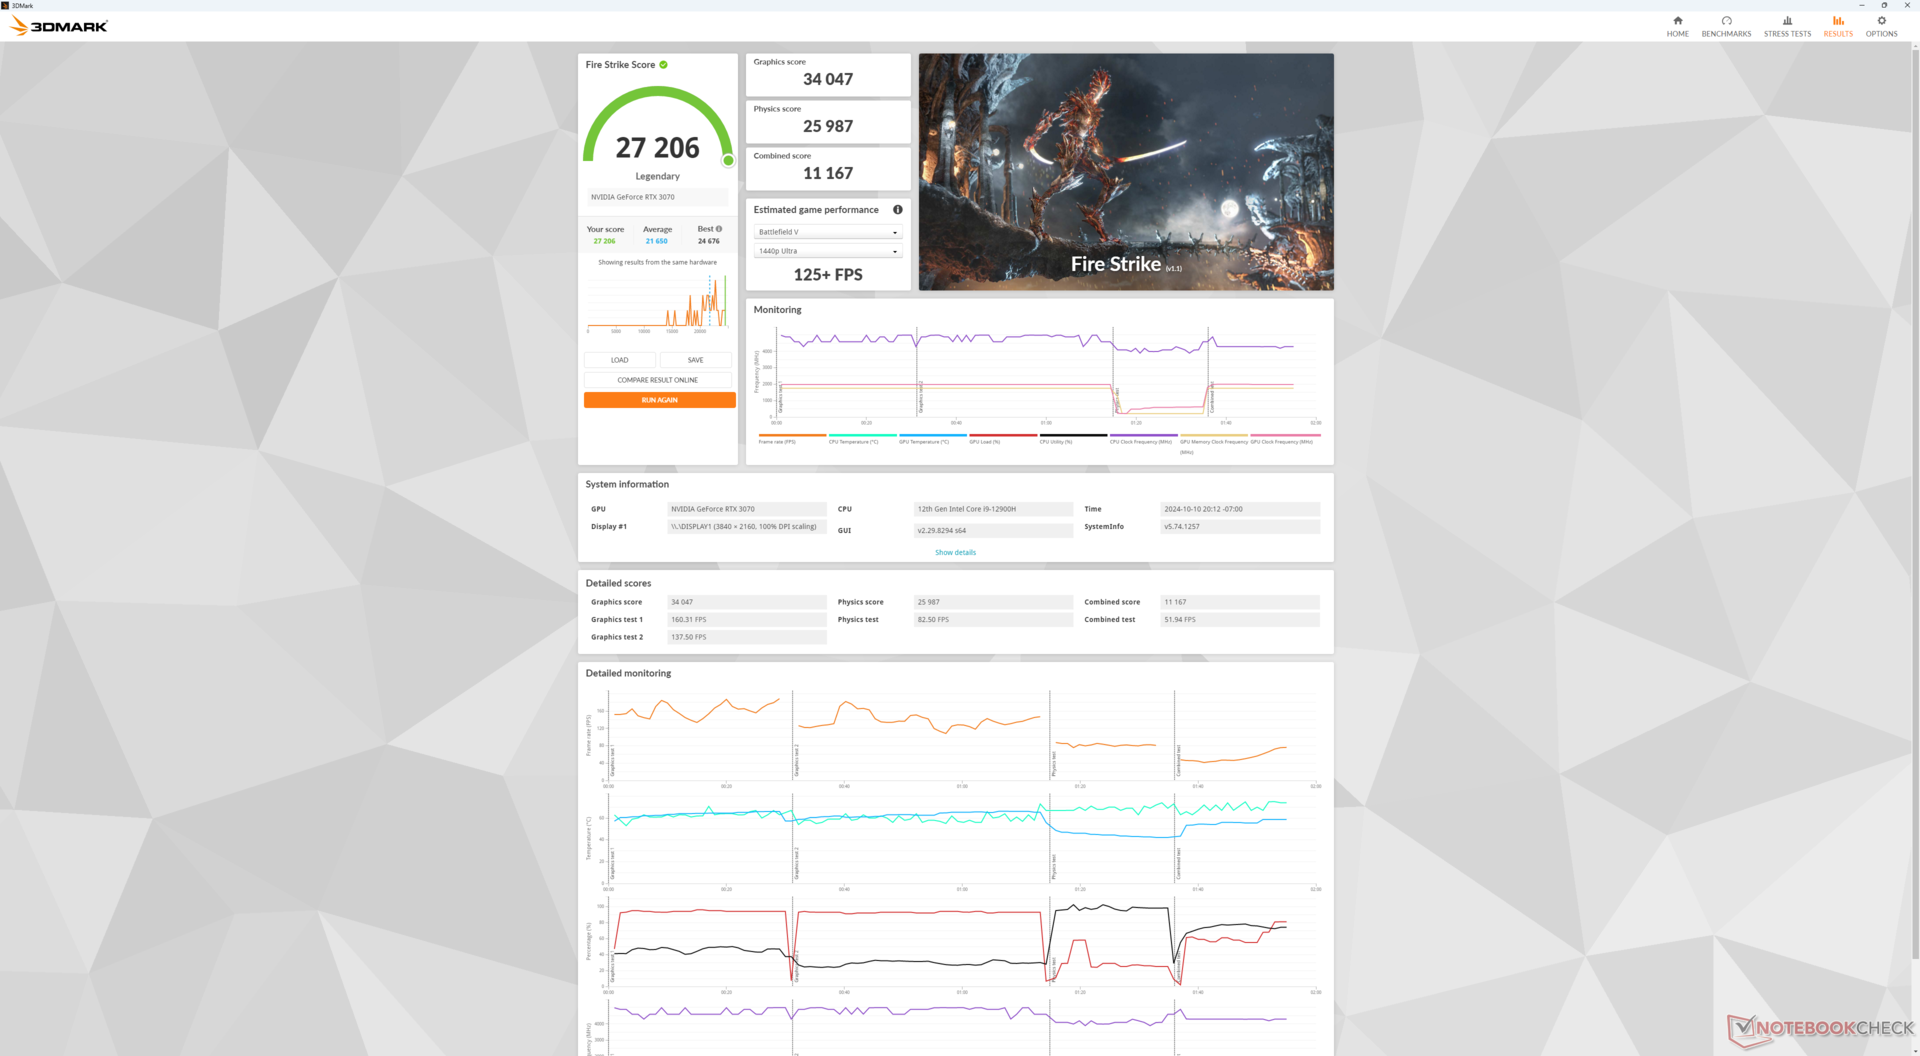
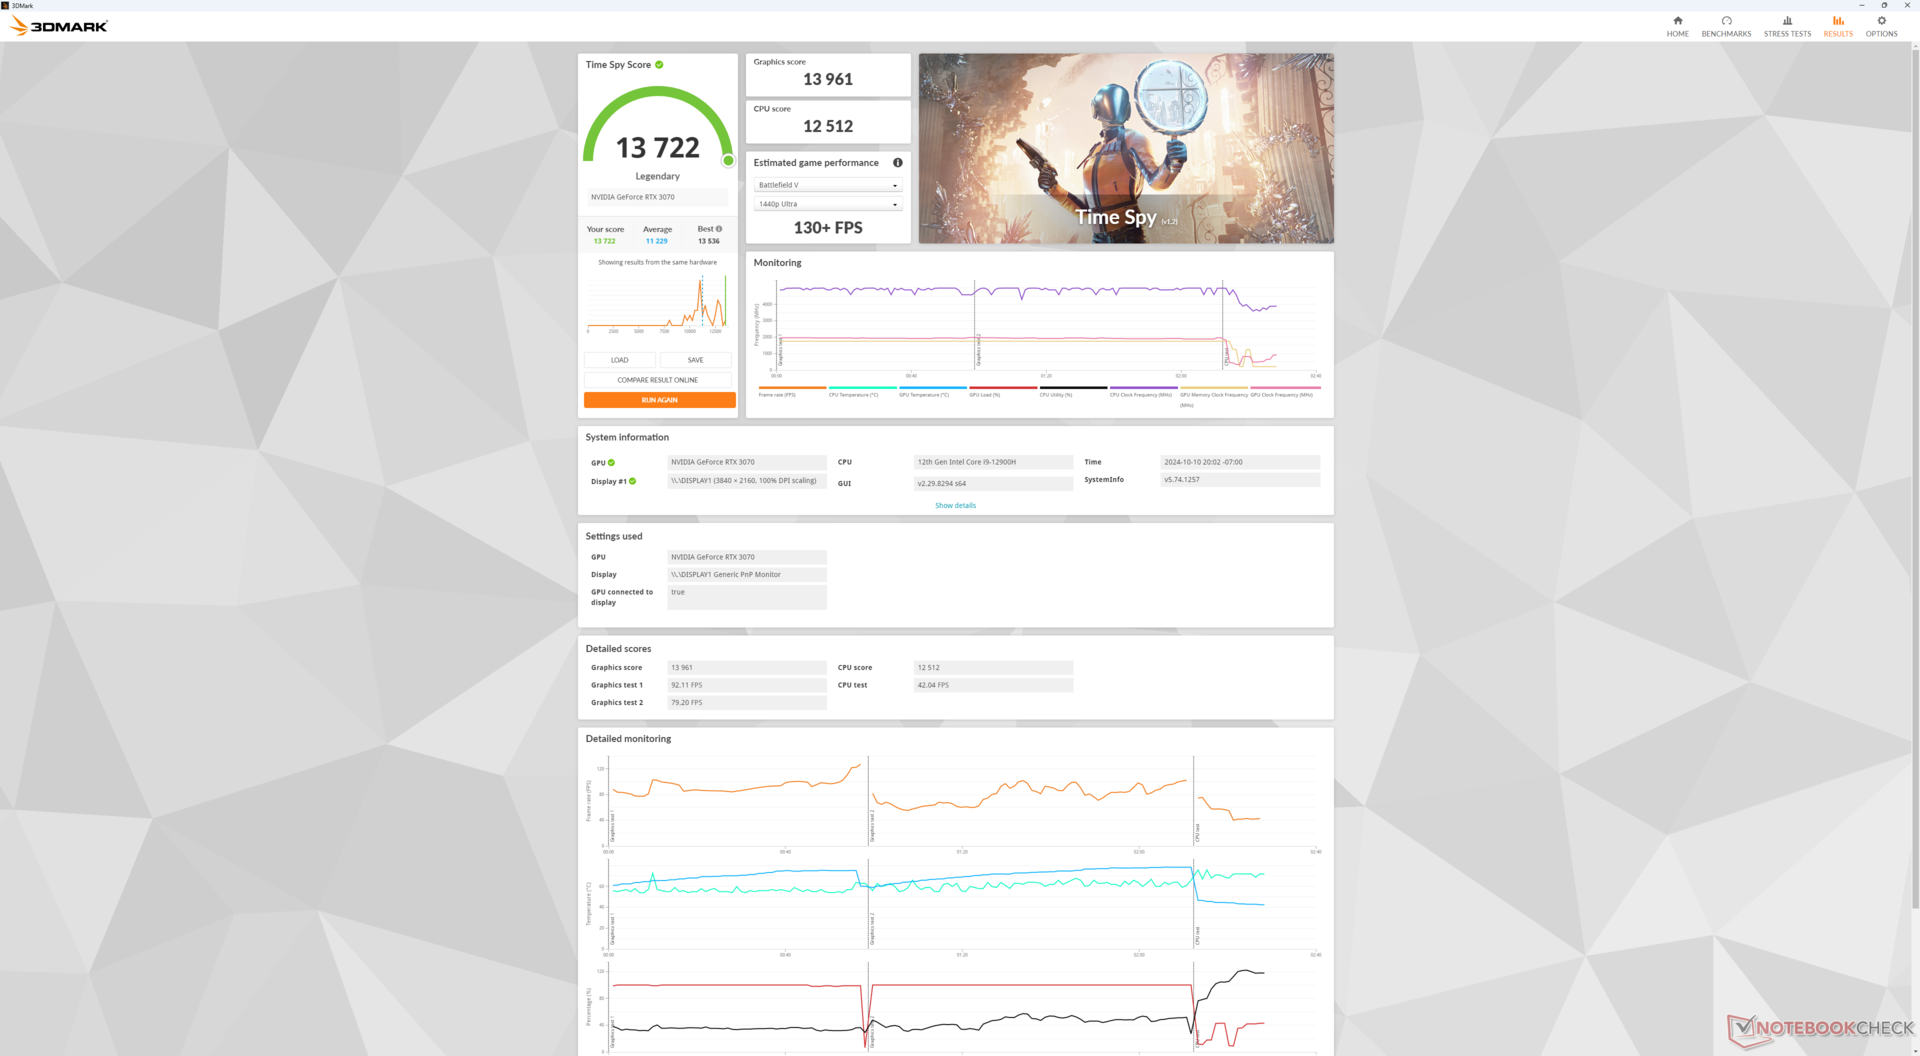
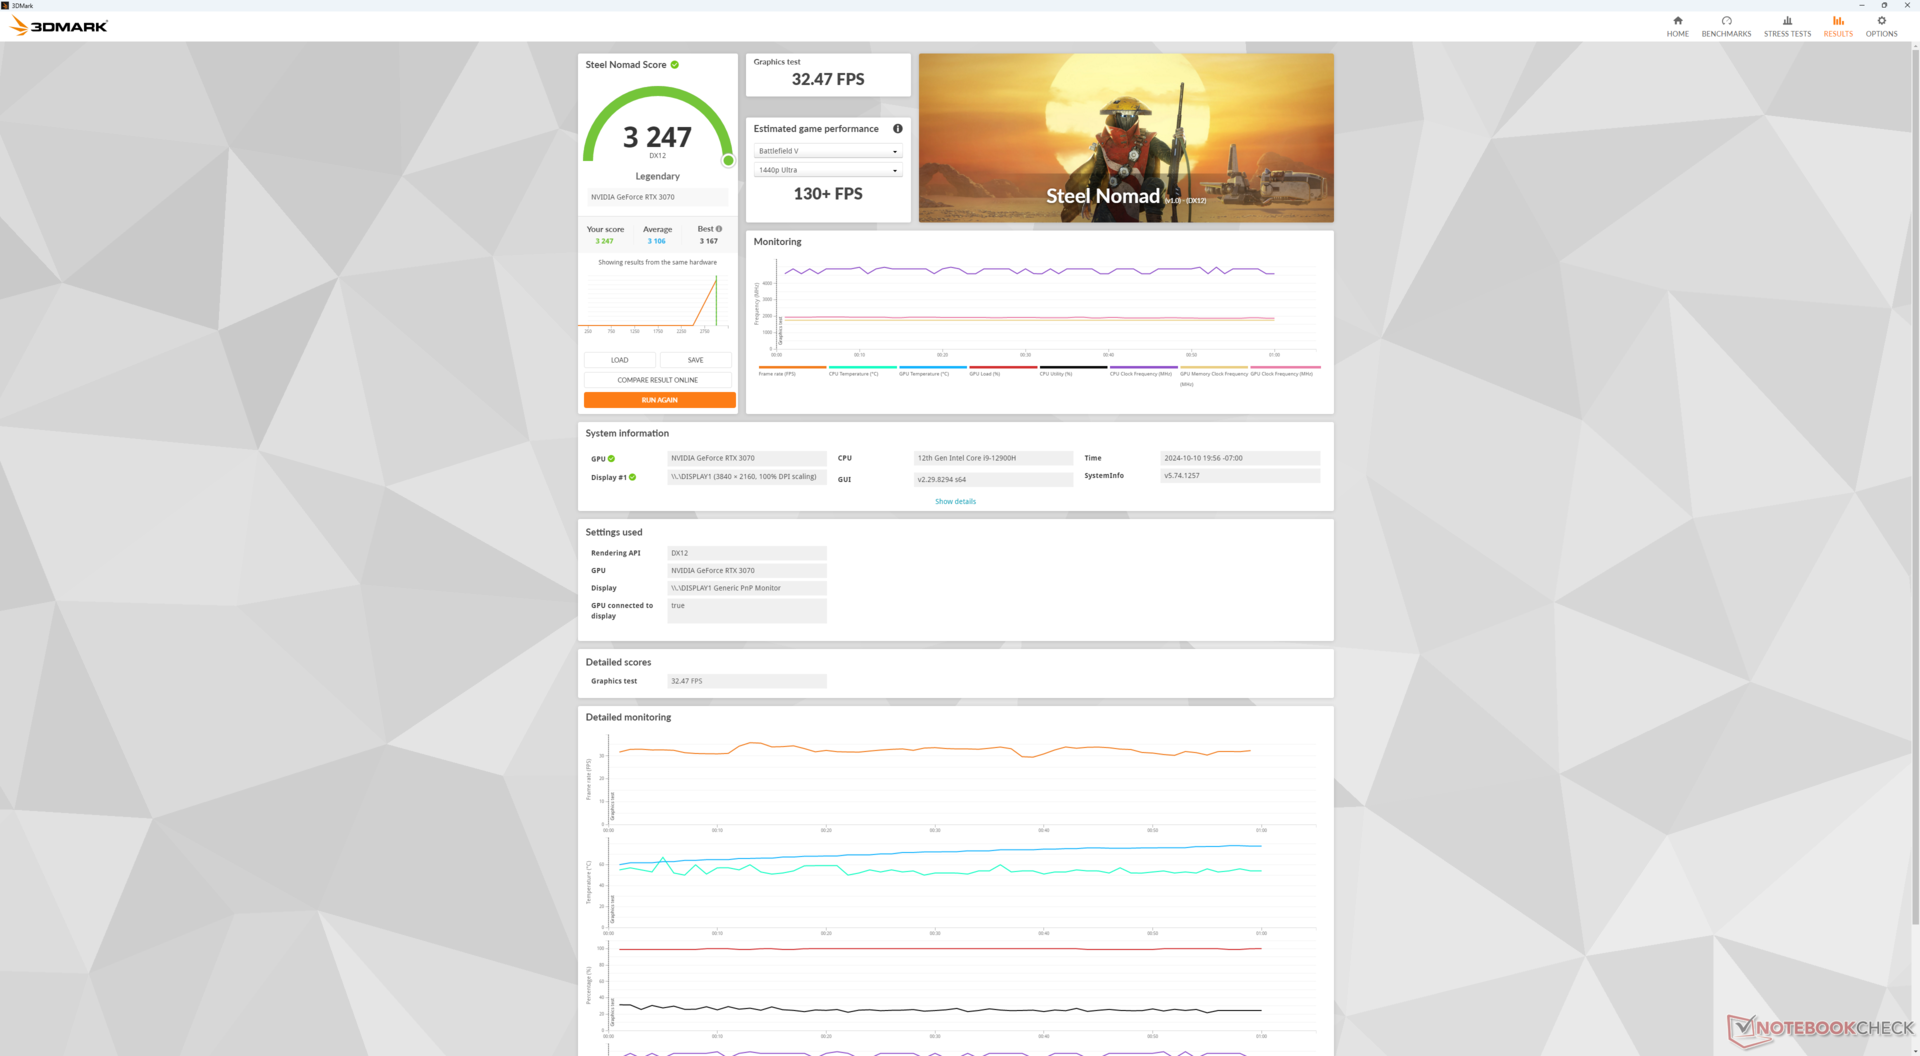
La GeForce RTX 3070 a été lourdement testée et ses performances n'offrent donc aucune surprise. Nous sommes plutôt intéressés par les déficits de performance que notre RTX 3070 dockée peut avoir par rapport à un PC de bureau "correct" avec la RTX 3070. Dans ce cas, les performances sont essentiellement identiques à celles de notre PC de bureau RTX 3070 de référence, voire légèrement supérieures de quelques points de pourcentage pour ne pas montrer de pertes de performances tangibles. Bien sûr, les résultats peuvent varier si vous installez des GPU beaucoup plus rapides comme la RTX 4090 où l'interface PCIe x8 peut devenir un facteur plus limitant.
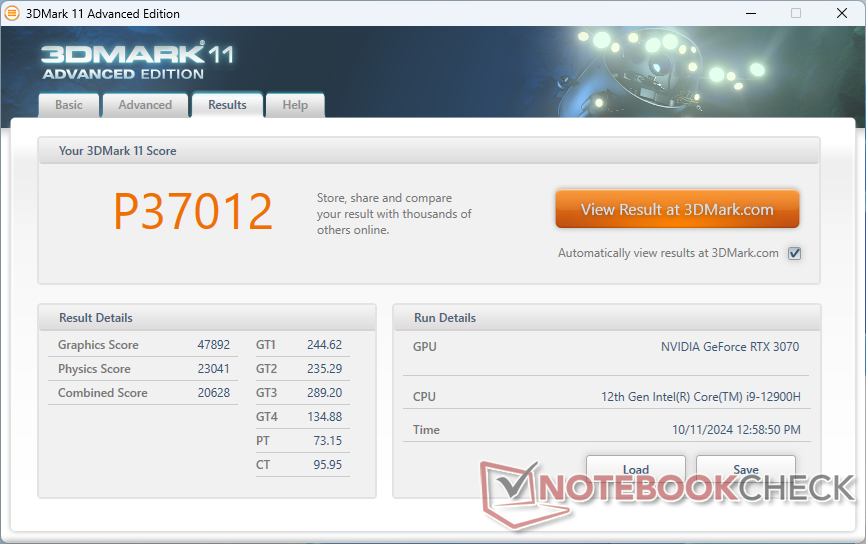
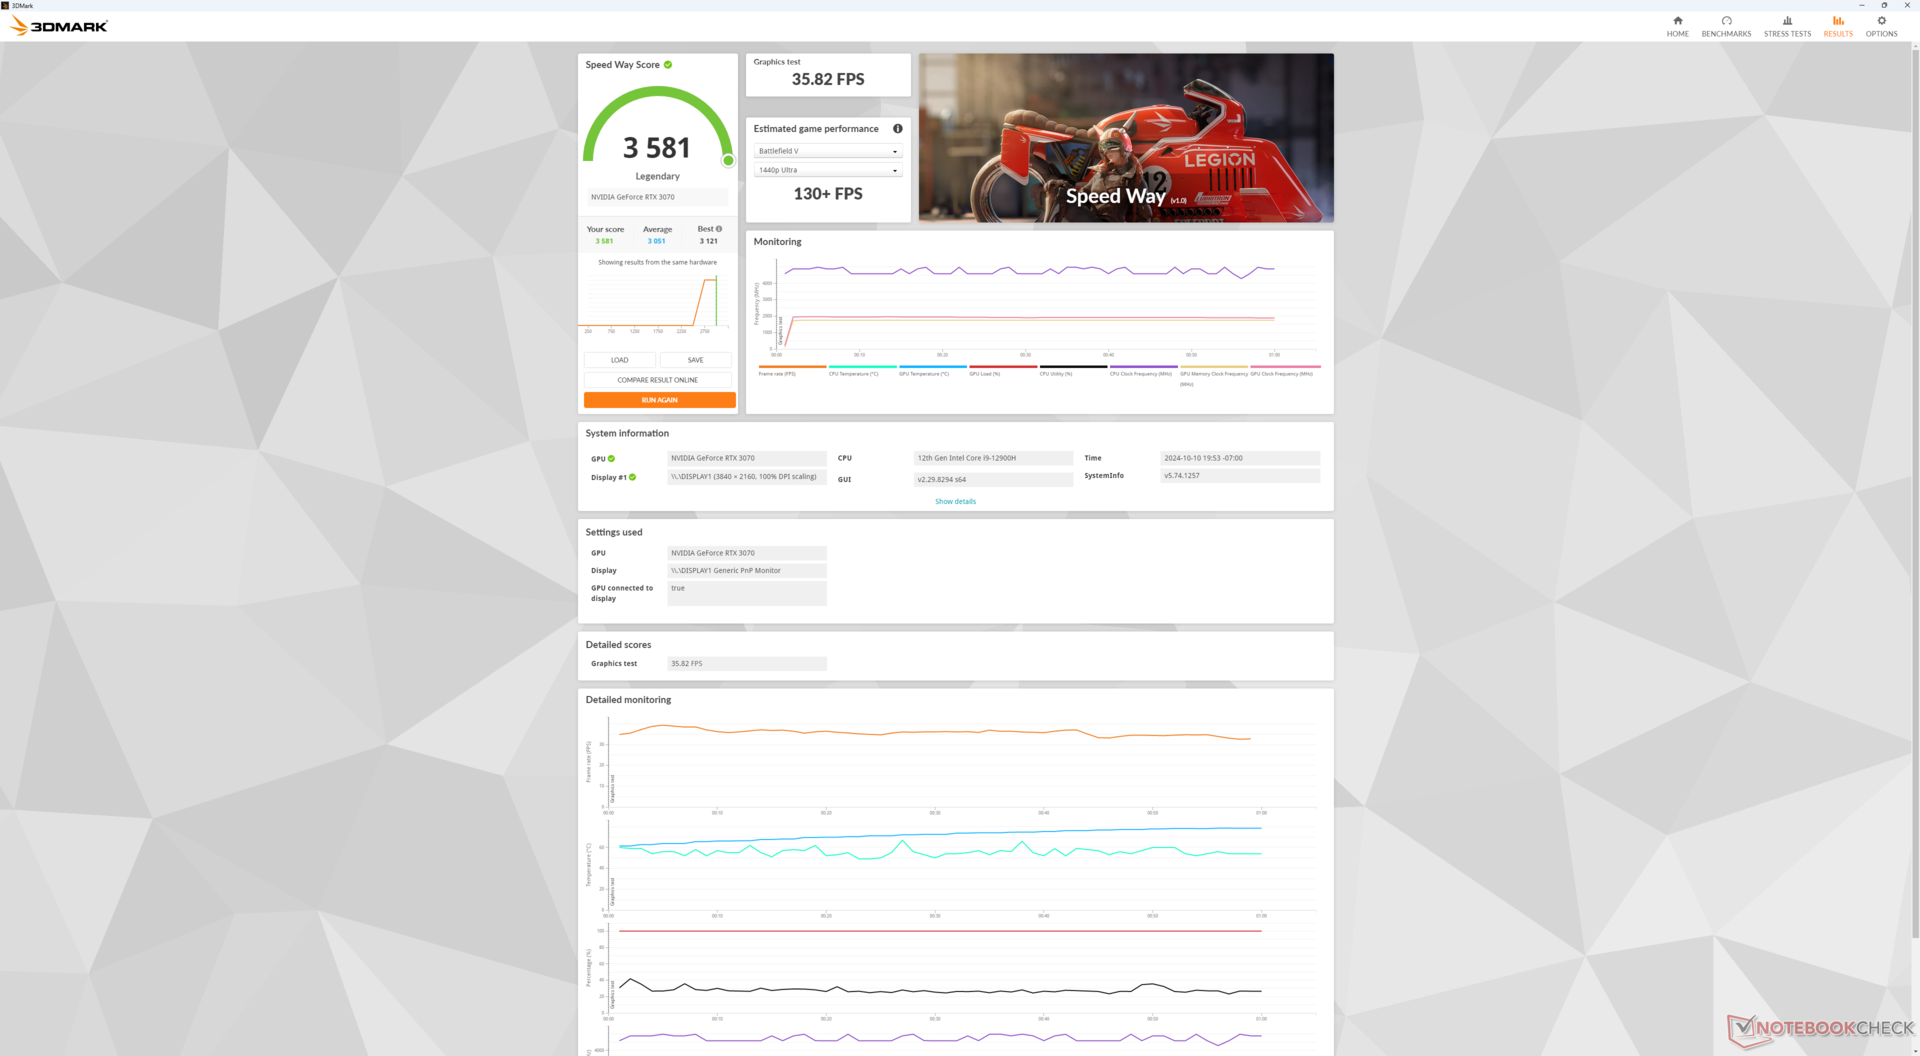
| 3DMark 11 Performance | 37012 points | |
| 3DMark Cloud Gate Standard Score | 57634 points | |
| 3DMark Fire Strike Score | 27206 points | |
| 3DMark Time Spy Score | 13722 points | |
| 3DMark Steel Nomad Score | 3247 points | |
Aide | ||
* ... Moindre est la valeur, meilleures sont les performances
Performances des jeux
Bien qu'il s'agisse d'un GPU vieux de quatre ans ( !), la GeForce RTX 3070 de bureau est encore puissante, surtout si on la compare aux ordinateurs portables de jeu où les enveloppes de puissance sont beaucoup plus petites. Notre GTI12 Ultra et l'eGPU de notre choix peuvent largement surpasser les ordinateurs portables équipés de la GeForce RTX 4070 tels que le Maingear ML-16 MK2 pour être plus en phase avec la rTX 4080 mobile. Notez que cela ne tient pas compte des méthodes d'upscaling DLSS et que la série RTX 40 mobile peut encore potentiellement fonctionner mieux si le titre prend en charge DLSS 3.
| GTA V - 1920x1080 Highest Settings possible AA:4xMSAA + FX AF:16x | |
| Lenovo Legion 9 16IRX9, RTX 4090 | |
| Acemagic M2A | |
| Beelink GTI12 Ultra EX Docking Station | |
| Acemagic Tank03 | |
| Asus TUF Gaming A14 FA401WV-WB94 | |
| MSI GeForce RTX 3070 Ventus 3X | |
| Asus ROG NUC 14-90AS0051 | |
| Minisforum G7 PT | |
| Lenovo IdeaPad Pro 5 16IMH G9 RTX 4050 | |
| Cyberpunk 2077 2.2 Phantom Liberty - 1920x1080 Ultra Preset (FSR off) | |
| Lenovo Legion 9 16IRX9, RTX 4090 | |
| Beelink GTI12 Ultra EX Docking Station | |
| Minisforum G7 PT | |
| Asus ROG NUC 14-90AS0051 | |
| Acemagic M2A | |
| Acemagic Tank03 | |
| Asus TUF Gaming A14 FA401WV-WB94 | |
| Lenovo IdeaPad Pro 5 16IMH G9 RTX 4050 | |
Cyberpunk 2077 ultra FPS Chart
| Bas | Moyen | Élevé | Ultra | QHD | 4K | |
|---|---|---|---|---|---|---|
| GTA V (2015) | 184.3 | 178.9 | 176.5 | 111.3 | 108.8 | 129 |
| Dota 2 Reborn (2015) | 175.9 | 162 | 158.5 | 149.3 | 144.3 | |
| Final Fantasy XV Benchmark (2018) | 209 | 184.8 | 138.7 | 104.9 | 61.5 | |
| X-Plane 11.11 (2018) | 118.2 | 106.1 | 89.5 | 79.4 | ||
| Far Cry 5 (2018) | 170 | 154 | 148 | 142 | 130 | 75 |
| Strange Brigade (2018) | 459 | 339 | 280 | 245 | 181.1 | 104.6 |
| Tiny Tina's Wonderlands (2022) | 268.9 | 216.7 | 154.9 | 122.6 | 87.1 | 48.9 |
| F1 22 (2022) | 282 | 277 | 264 | 91.8 | 58.8 | 28.8 |
| Baldur's Gate 3 (2023) | 174.5 | 152.6 | 137.1 | 132.9 | 93.5 | 49.7 |
| Cyberpunk 2077 2.2 Phantom Liberty (2023) | 148.5 | 133.9 | 115.3 | 102.2 | 65.7 | 29.9 |
Émissions
Bruit du système
Le bruit du ventilateur est toujours présent car le ventilateur interne de l'alimentation dans la station d'accueil EX est toujours actif même si les ventilateurs du mini PC et du GPU sont inactifs. Les niveaux de bruit sont généralement plus élevés que sur la plupart des autres mini PC à la même distance d'enregistrement de 15 cm, mais la courbe de bruit est plus large et moins nette que ce à quoi nous sommes habitués. Les fréquences les plus basses sont moins gênantes et plus tolérables que les ventilateurs des ordinateurs portables de jeu, qui sont généralement plus aigus et plus bruyants.
Degré de la nuisance sonore
| Au repos |
| 32.7 / 32.7 / 35.3 dB(A) |
| Fortement sollicité |
| 36.8 / 52.9 dB(A) |
 | ||
30 dB silencieux 40 dB(A) audible 50 dB(A) bruyant |
||
min: | ||
| Beelink GTI12 Ultra EX Docking Station NVIDIA GeForce RTX 3070, i9-12900H, Crucial P3 Plus CT1000P3PSSD8 | Minisforum MS-A1 Radeon 780M, Ryzen 7 8700G, Kingston OM8PGP41024Q-A0 | GMK NucBox K9 Arc 7-Core, Ultra 5 125H, MasonSemi 1TB MC7000 | Asus NUC 14 Pro Arc 7-Core, Ultra 5 125H, Kingston KC3000 2048G SKC3000D2048G | Geekom AX8 Pro Radeon 780M, R9 8945HS, Acer N7000 2 TB | Asus ROG NUC 14-90AS0051 NVIDIA GeForce RTX 4070 Laptop GPU, Ultra 9 185H, Samsung PM9A1a MZVL21T0HDLU | |
|---|---|---|---|---|---|---|
| Noise | 1% | 2% | 9% | 5% | 15% | |
| arrêt / environnement * | 22.8 | 24.8 -9% | 23 -1% | 24 -5% | 24.9 -9% | 24.9 -9% |
| Idle Minimum * | 32.7 | 33.9 -4% | 29.8 9% | 26 20% | 24.9 24% | 24.9 24% |
| Idle Average * | 32.7 | 34 -4% | 35.7 -9% | 26.2 20% | 24.9 24% | 24.9 24% |
| Idle Maximum * | 35.3 | 34 4% | 35.7 -1% | 26.2 26% | 24.9 29% | 24.9 29% |
| Load Average * | 36.8 | 41.1 -12% | 41.9 -14% | 42.4 -15% | 50.1 -36% | 37.9 -3% |
| Cyberpunk 2077 ultra * | 50.3 | 42.2 16% | 43.8 13% | 47.7 5% | 50 1% | 38.3 24% |
| Load Maximum * | 52.9 | 46.2 13% | 44 17% | 47.8 10% | 50.2 5% | 44.2 16% |
* ... Moindre est la valeur, meilleures sont les performances
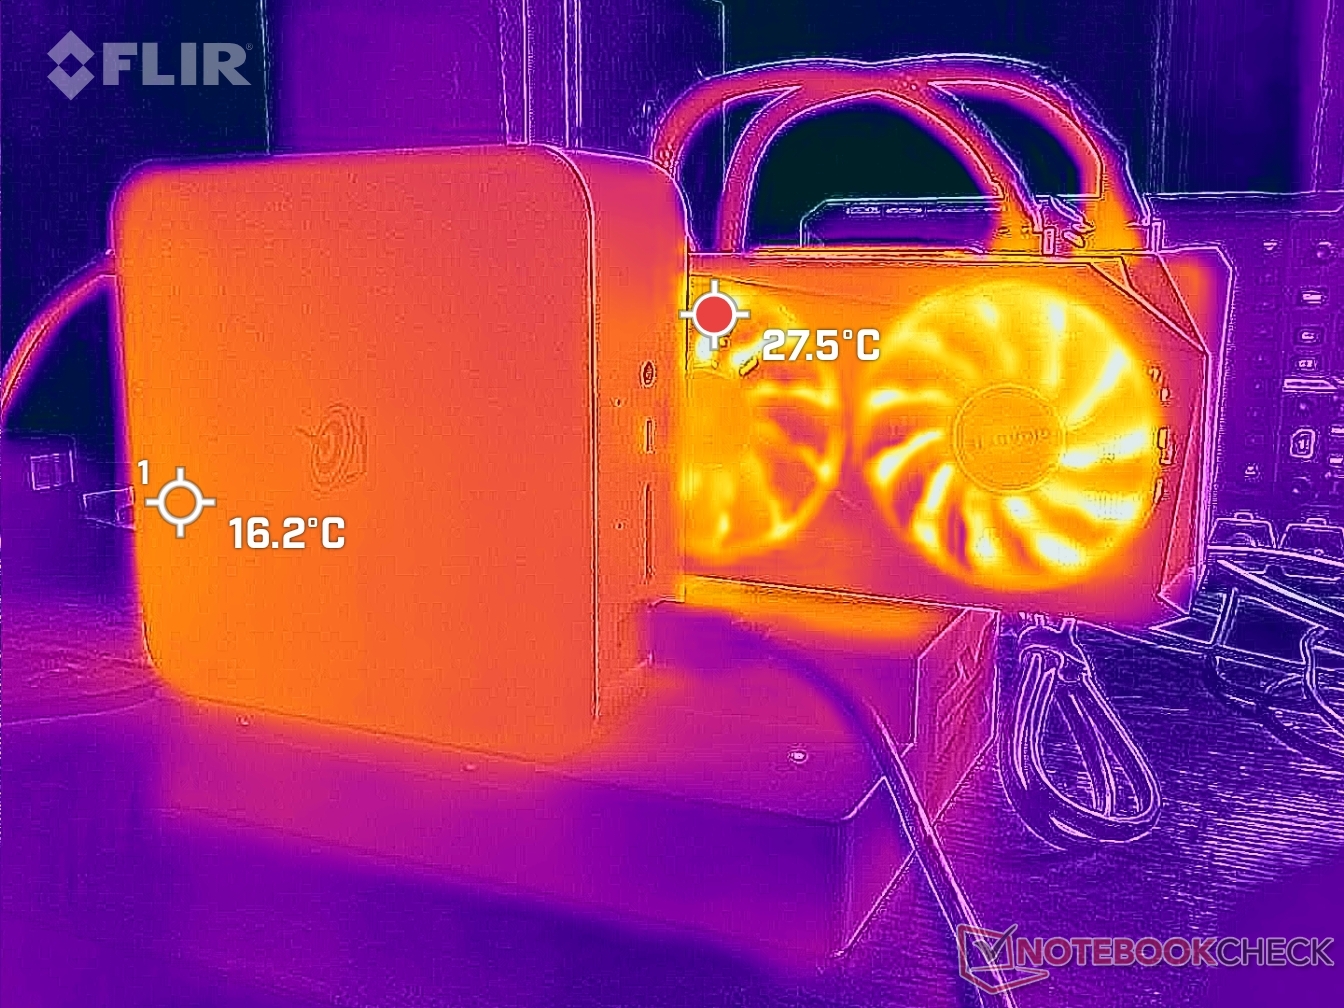
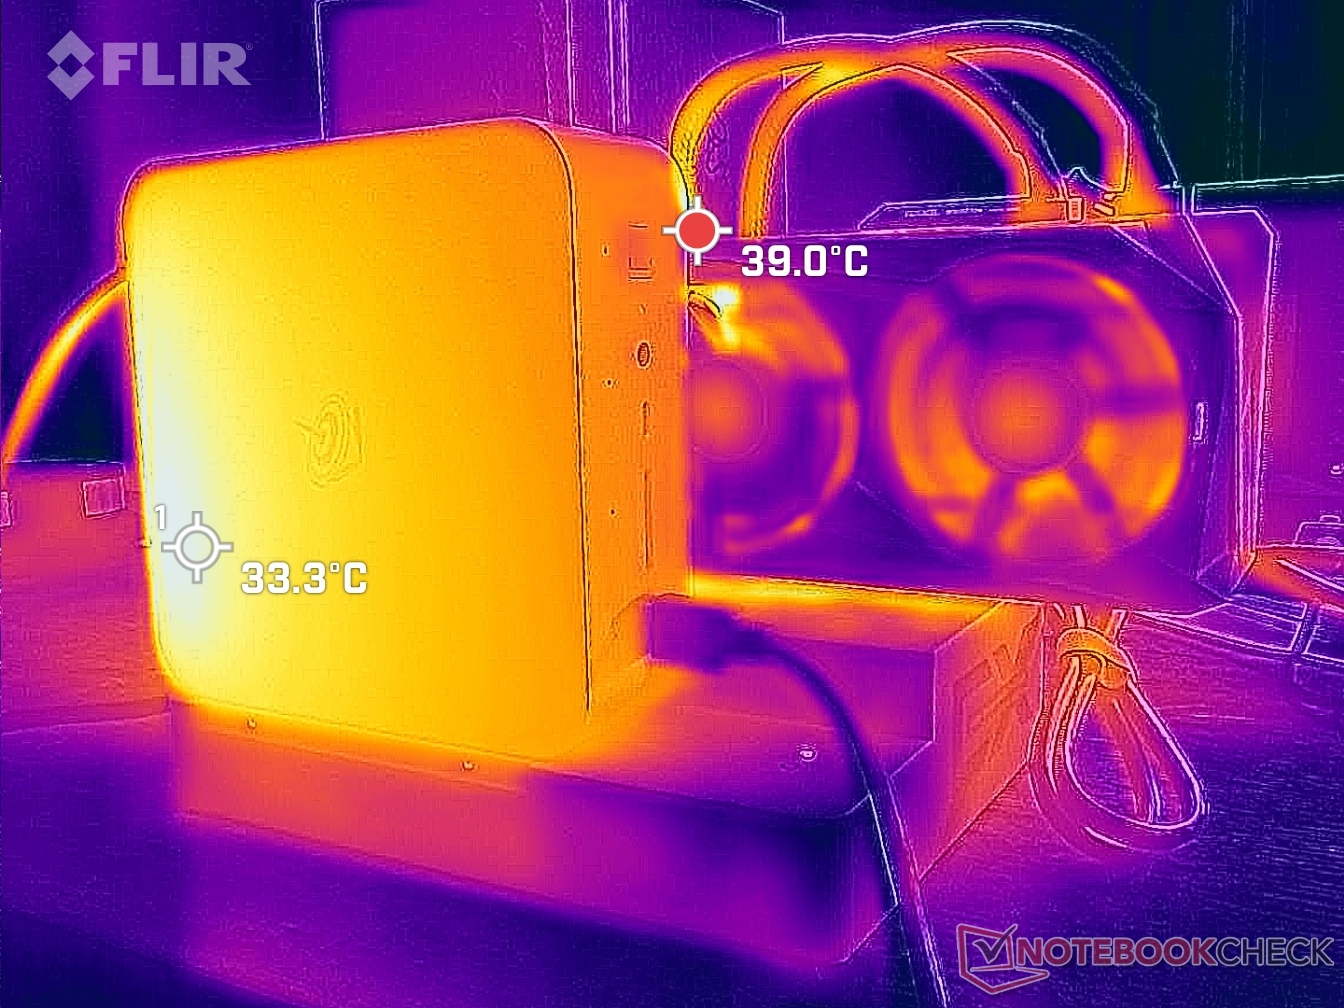
Température
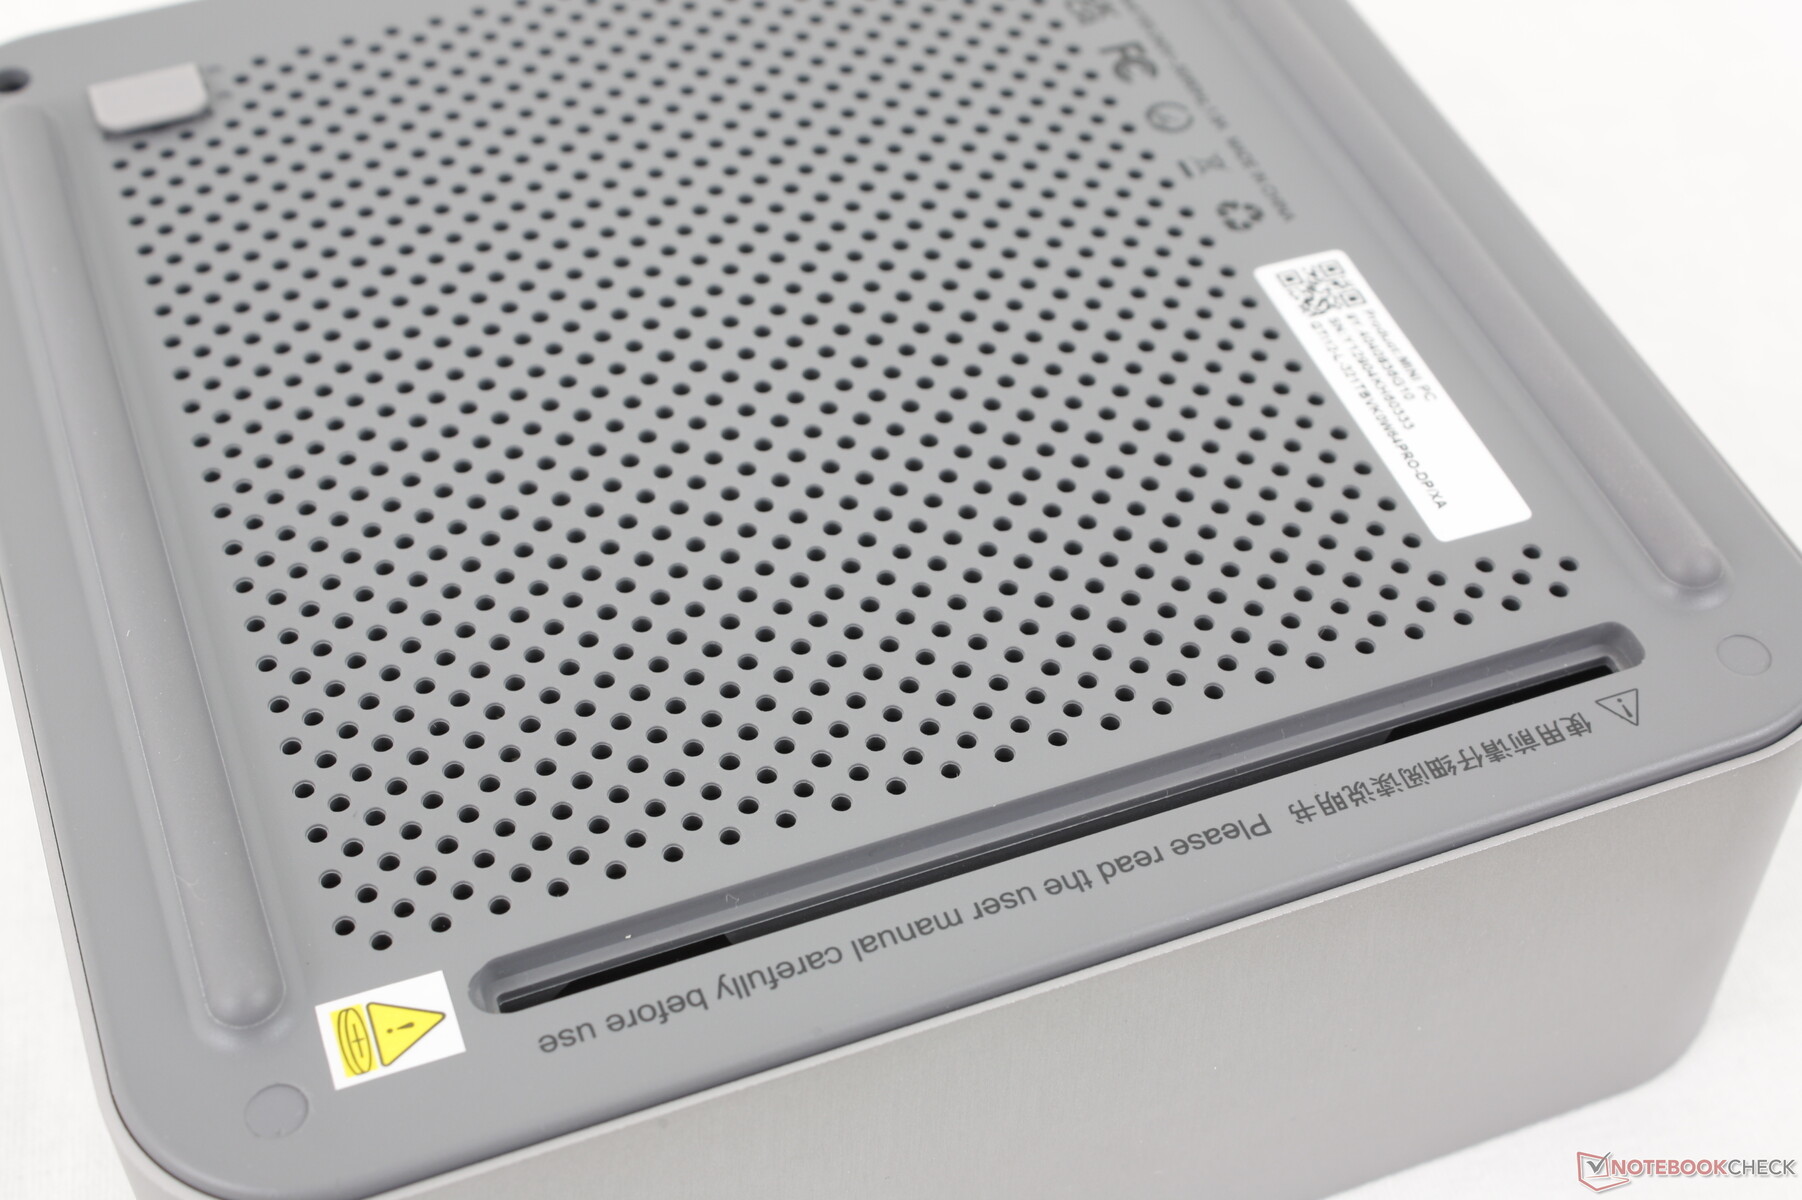
La surface supérieure du mini PC peut atteindre environ 34°C pendant les jeux ou plus de 41°C lorsque le CPU est utilisé à 100%, ce qui est plus chaud que beaucoup d'autres mini PC. Ceci est principalement dû au fait que l'unité intègre l'ensemble du PSU à l'intérieur du châssis et ne comporte pas de grilles de ventilation sur les côtés.
Test de stress
Le processeur atteignait 3,2 GHz et 69 W lorsqu'il était soumis au stress Prime95. Cependant, après une ou deux minutes, il redescend à 2,9 GHz et 61 W afin de maintenir une température raisonnable de 78°C. Le Turbo Boost maximum n'est malheureusement pas indéfini malgré la taille importante du châssis, mais au moins la baisse de performance est relativement mineure.
La température du cœur se stabilise à 83°C pendant les jeux, ce qui est plus chaud que prévu pour un mini-PC.
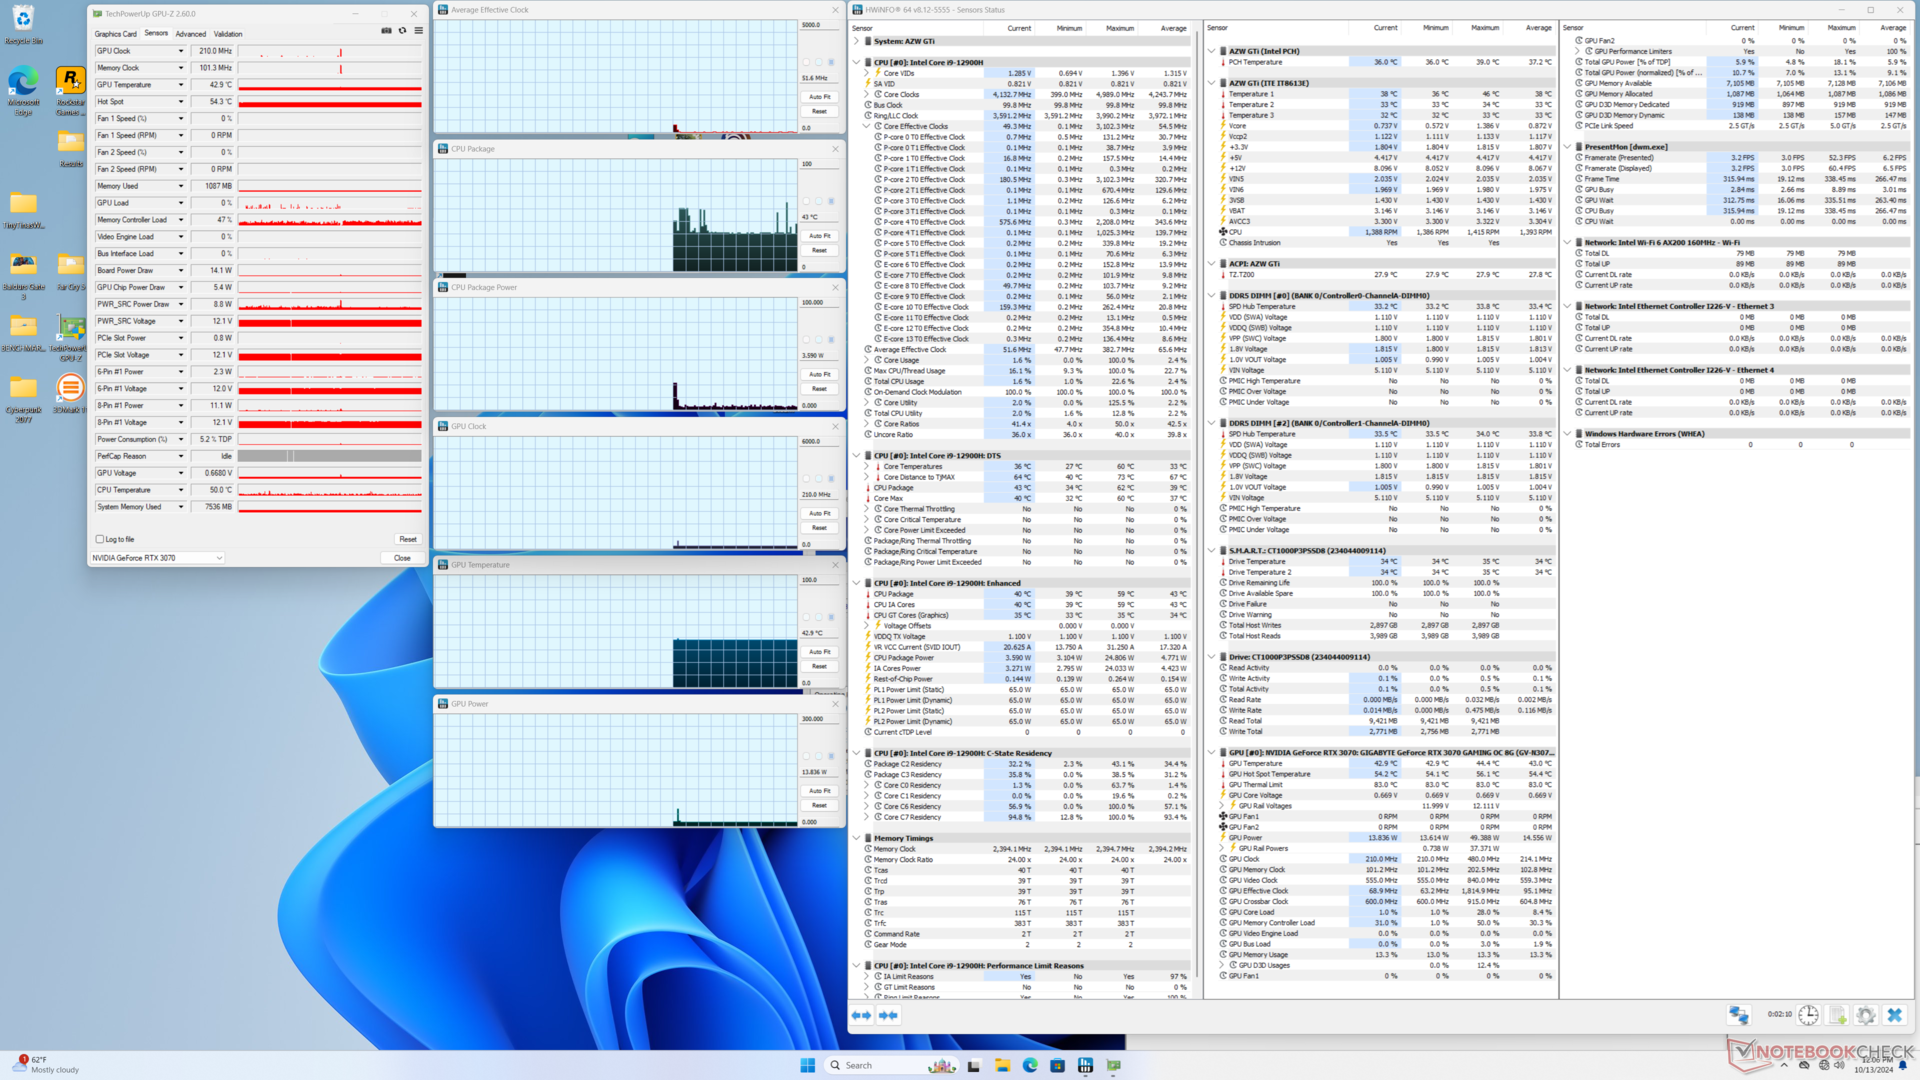
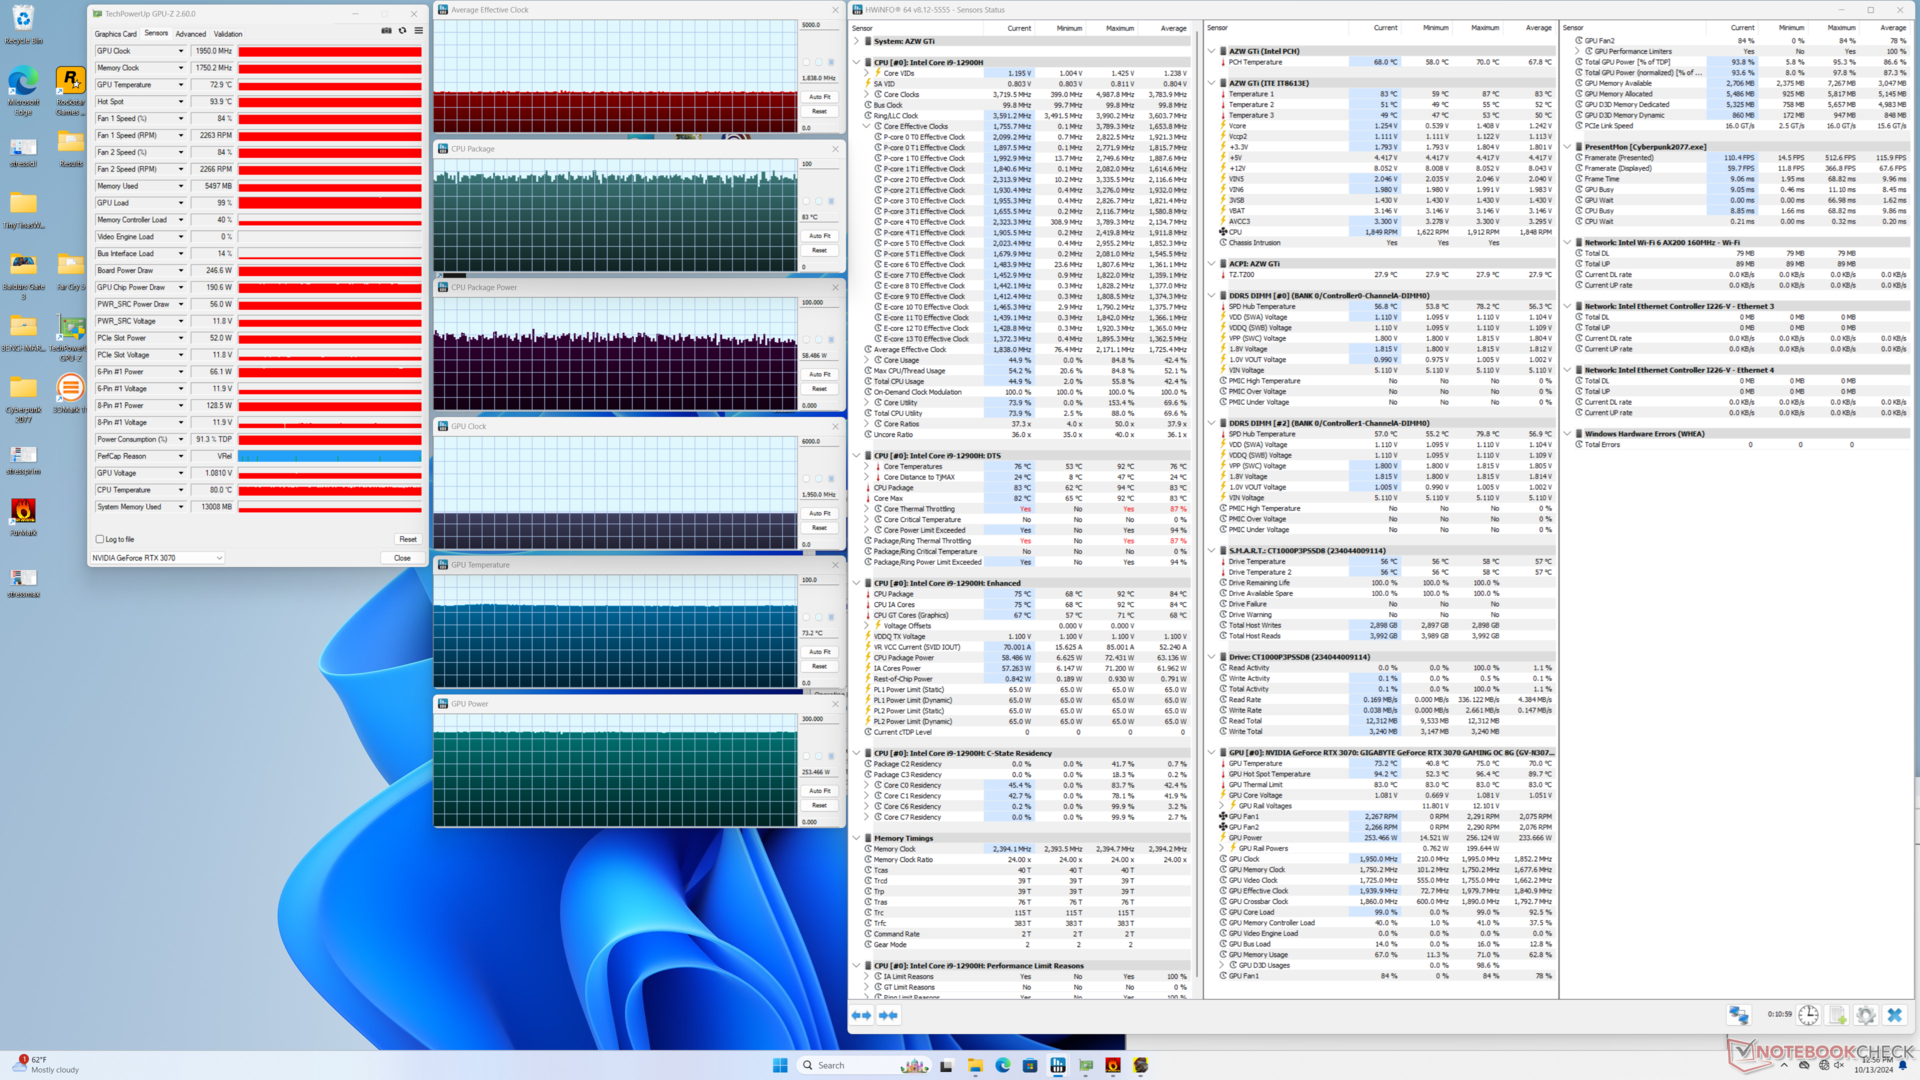
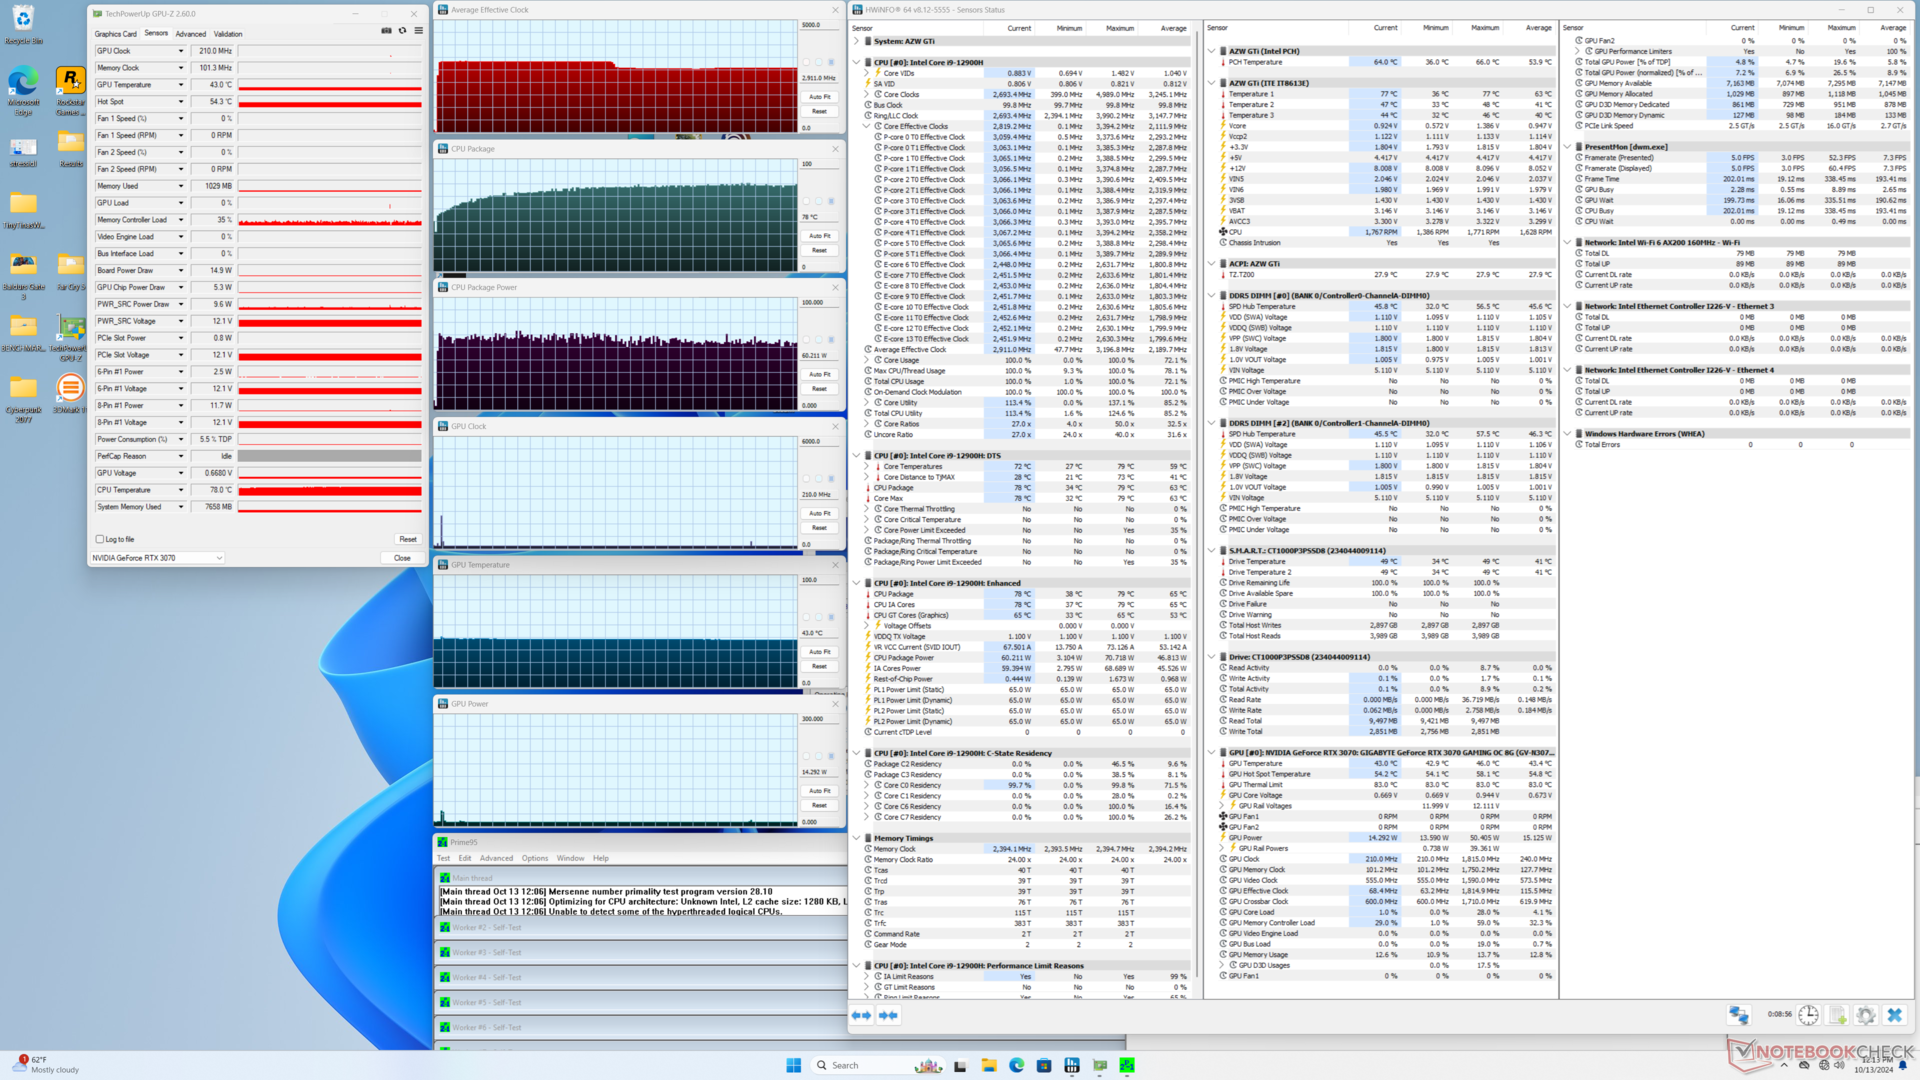
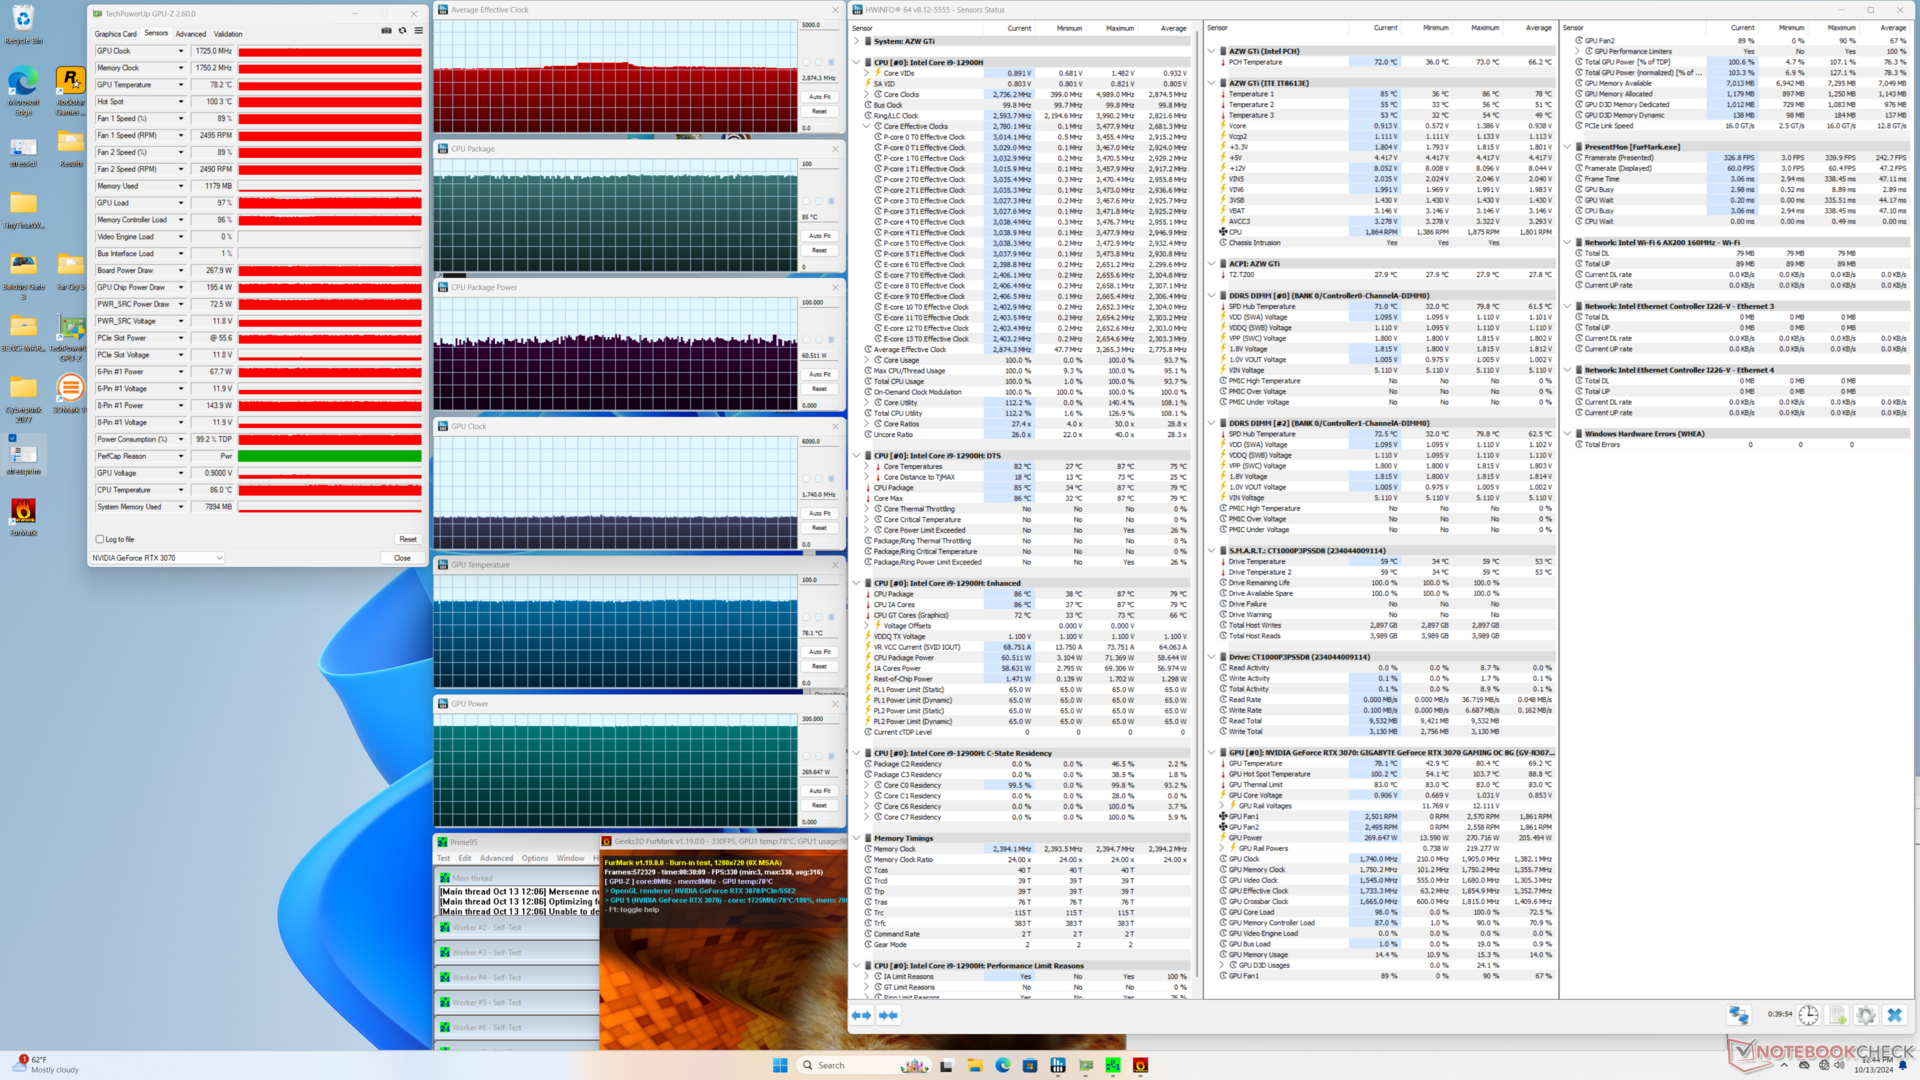
| Horloge moyenne du CPU (GHz) | Horloge du GPU (MHz) | Température moyenne du CPU (°C) | Température moyenne du GPU (°C) | |
| Système au repos | -- | -- | 40 | 43 |
| Prime95 Stress | 2.9 | -- | 78 | 43 |
| Prime95 + FurMark Stress | 2.9 | 1725 | 85 | 78 |
| Cyberpunk 2077 Stress | 1.8 | 1950 | 83 | 73 |
Intervenants
Les haut-parleurs internes ne sont pas très bruyants ni impressionnants, à l'instar de ce que nous avons pu constater lors de la récente édition de récent Bosgame. Ils sont plus adaptés à des fonctions auxiliaires telles que les conférences ou les petites salles où la qualité audio importe moins. Il est recommandé d'utiliser des haut-parleurs externes appropriés pour tout type de lecture multimédia.
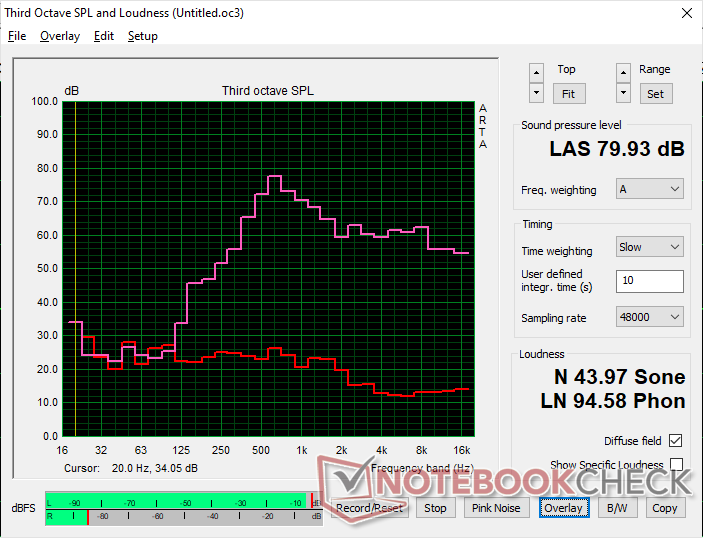
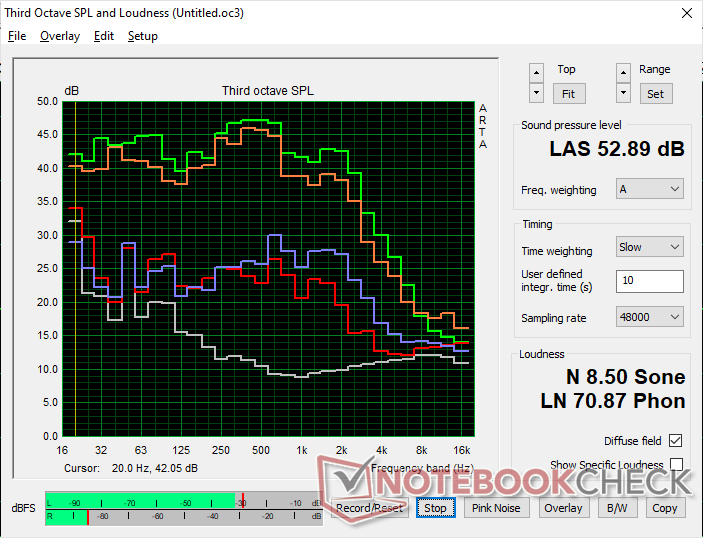
Beelink GTI12 Ultra EX Docking Station analyse audio
(±) | le niveau sonore du haut-parleur est moyen mais bon (79.9# dB)
Basses 100 - 315 Hz
(-) | presque aucune basse - en moyenne 17.1% plus bas que la médiane
(±) | la linéarité des basses est moyenne (14.3% delta à la fréquence précédente)
Médiums 400 - 2000 Hz
(±) | médiane supérieure - en moyenne 8.9% supérieure à la médiane
(±) | la linéarité des médiums est moyenne (13% delta à la fréquence précédente)
Aiguës 2 - 16 kHz
(+) | des sommets équilibrés - à seulement 1.7% de la médiane
(+) | les aigus sont linéaires (6.7% delta à la fréquence précédente)
Globalement 100 - 16 000 Hz
(±) | la linéarité du son global est moyenne (24.2% de différence avec la médiane)
Par rapport à la même classe
» 58% de tous les appareils testés de cette catégorie étaient meilleurs, 11% similaires, 32% pires
» Le meilleur avait un delta de 13%, la moyenne était de 25%, le pire était de 64%.
Par rapport à tous les appareils testés
» 71% de tous les appareils testés étaient meilleurs, 6% similaires, 23% pires
» Le meilleur avait un delta de 4%, la moyenne était de 24%, le pire était de 134%.
Apple MacBook Pro 16 2021 M1 Pro analyse audio
(+) | les haut-parleurs peuvent jouer relativement fort (84.7# dB)
Basses 100 - 315 Hz
(+) | bonne basse - seulement 3.8% loin de la médiane
(+) | les basses sont linéaires (5.2% delta à la fréquence précédente)
Médiums 400 - 2000 Hz
(+) | médiane équilibrée - seulement 1.3% de la médiane
(+) | les médiums sont linéaires (2.1% delta à la fréquence précédente)
Aiguës 2 - 16 kHz
(+) | des sommets équilibrés - à seulement 1.9% de la médiane
(+) | les aigus sont linéaires (2.7% delta à la fréquence précédente)
Globalement 100 - 16 000 Hz
(+) | le son global est linéaire (4.6% différence à la médiane)
Par rapport à la même classe
» 0% de tous les appareils testés de cette catégorie étaient meilleurs, 0% similaires, 100% pires
» Le meilleur avait un delta de 5%, la moyenne était de 18%, le pire était de 45%.
Par rapport à tous les appareils testés
» 0% de tous les appareils testés étaient meilleurs, 0% similaires, 100% pires
» Le meilleur avait un delta de 4%, la moyenne était de 24%, le pire était de 134%.
Gestion de l'énergie
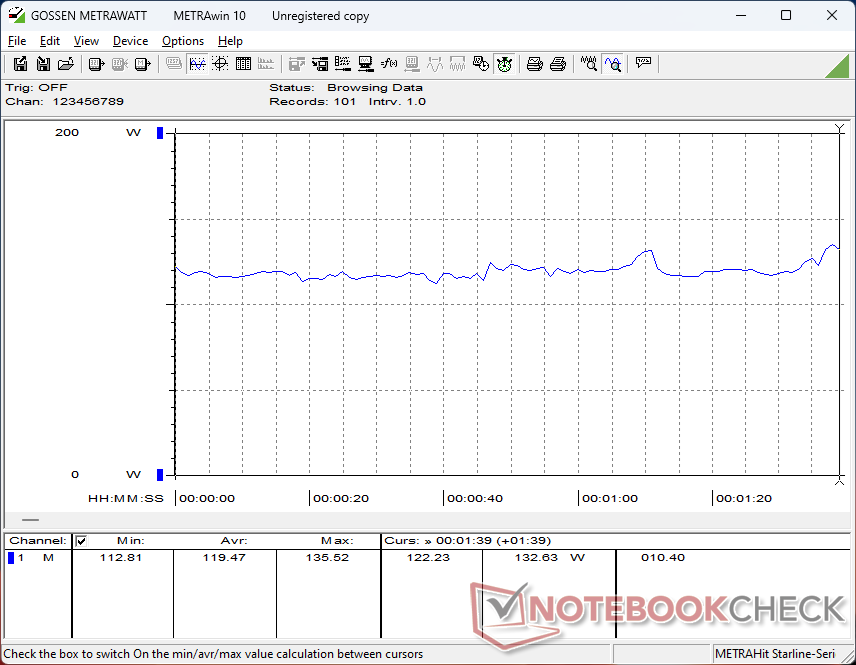
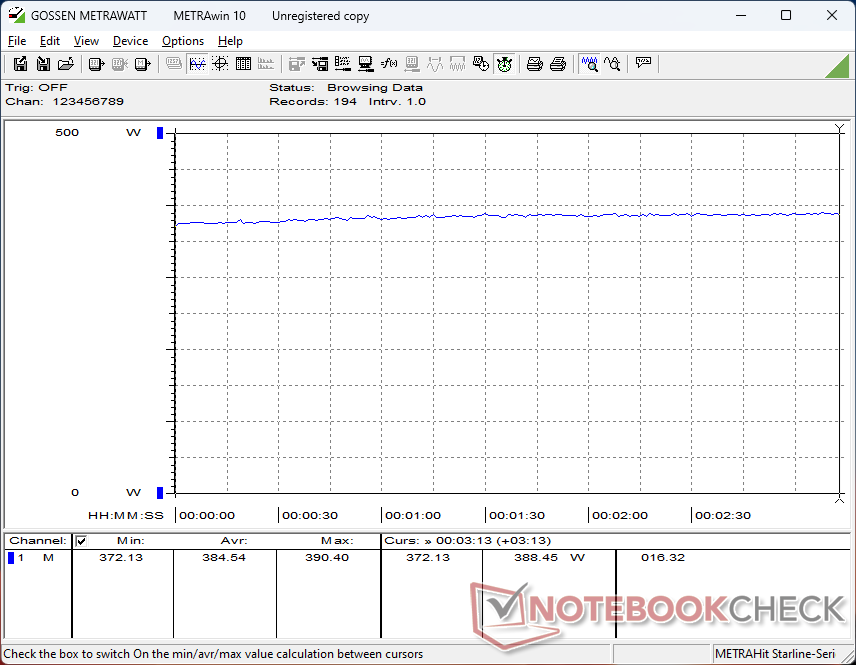
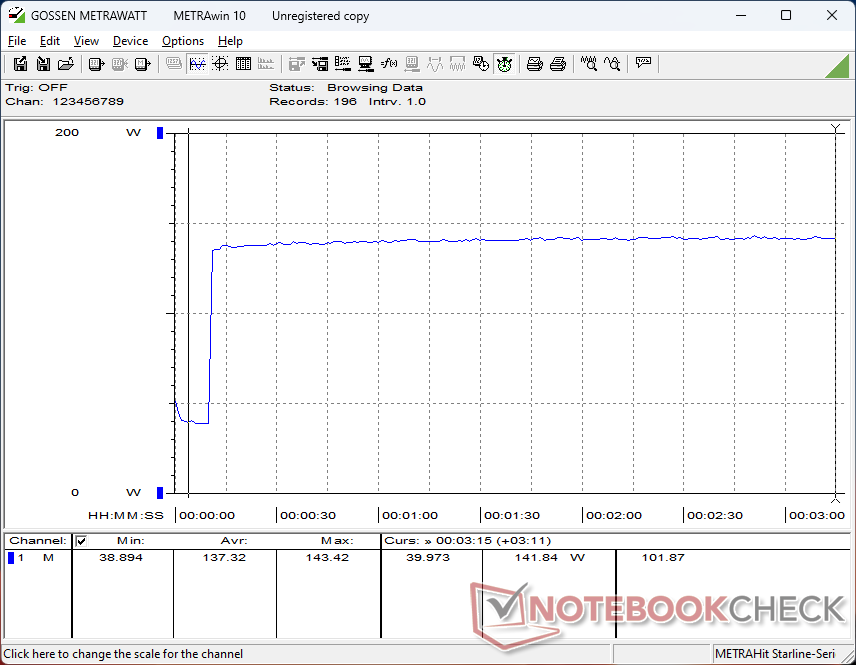
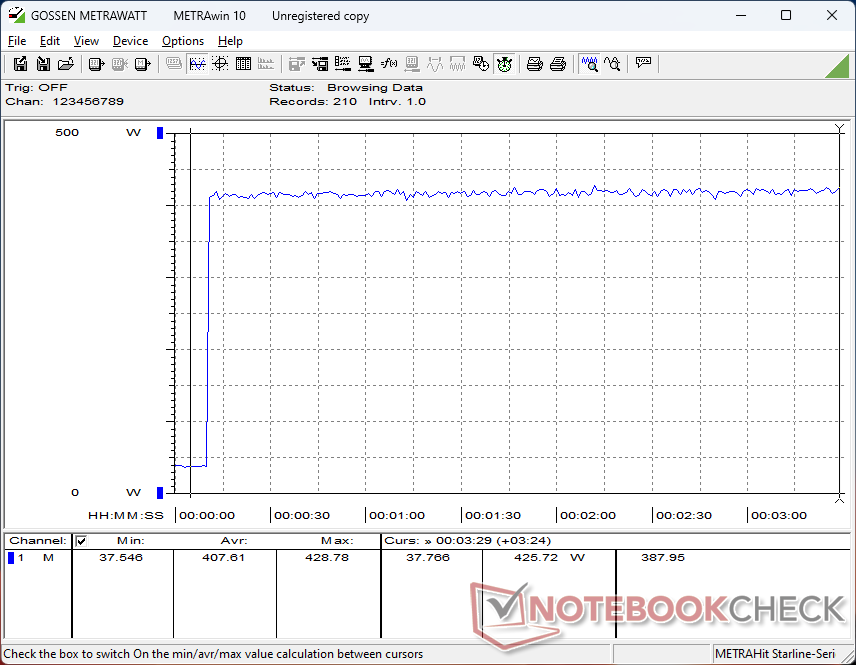
Consommation électrique
Le GTI12 Ultra et la station d'accueil EX sont, comme on peut s'y attendre, beaucoup plus exigeants que d'autres mini PC, y compris le Asus ROG NUC 14 et sa propre solution d'accueil RTX 4070. Le ralenti sur un ordinateur de bureau consomme déjà deux fois plus d'énergie que sur la plupart des ordinateurs portables, tandis que les jeux peuvent exiger plus de 380 W, contre 336 W pour la solution d'accueil RTX 4070 de MSI MSI Titan 18 HX qui est l'un des ordinateurs portables de jeu les plus rapides actuellement disponibles.
Comme mentionné ci-dessus, le GTI12 Ultra et la station d'accueil EX n'ont pas de brique d'alimentation externe, contrairement à la plupart des autres mini-PC et ordinateurs portables.
| Éteint/en veille | |
| Au repos | |
| Fortement sollicité |
|
Légende:
min: | |
| Beelink GTI12 Ultra EX Docking Station i9-12900H, NVIDIA GeForce RTX 3070, Crucial P3 Plus CT1000P3PSSD8, , x, | Minisforum MS-A1 Ryzen 7 8700G, Radeon 780M, Kingston OM8PGP41024Q-A0, , x, | GMK NucBox K9 Ultra 5 125H, Arc 7-Core, MasonSemi 1TB MC7000, , x, | Asus NUC 14 Pro Ultra 5 125H, Arc 7-Core, Kingston KC3000 2048G SKC3000D2048G, , x, | Geekom AX8 Pro R9 8945HS, Radeon 780M, Acer N7000 2 TB, , x, | Asus ROG NUC 14-90AS0051 Ultra 9 185H, NVIDIA GeForce RTX 4070 Laptop GPU, Samsung PM9A1a MZVL21T0HDLU, , x, | |
|---|---|---|---|---|---|---|
| Power Consumption | 62% | 72% | 74% | 60% | 47% | |
| Idle Minimum * | 35.9 | 8.8 75% | 10.9 70% | 5.1 86% | 14 61% | 10.6 70% |
| Idle Average * | 35.9 | 12.6 65% | 11 69% | 6.4 82% | 15.9 56% | 14.8 59% |
| Idle Maximum * | 36 | 14 61% | 11.4 68% | 14.7 59% | 19.5 46% | 27.5 24% |
| Load Average * | 119.5 | 93.2 22% | 52.8 56% | 55.5 54% | 76.4 36% | 84.6 29% |
| Cyberpunk 2077 ultra external monitor * | 384 | 102.1 73% | 57.1 85% | 59.1 85% | 54.3 86% | 171.4 55% |
| Load Maximum * | 422.9 | 105.4 75% | 72.2 83% | 103.3 76% | 99.1 77% | 244 42% |
* ... Moindre est la valeur, meilleures sont les performances
Power Consumption Cyberpunk / Stress Test
Power Consumption external Monitor
Points positifs
Points négatifs
Verdict - Excellente qualité de construction pour le prix
Le GTI12 Ultra est à la hauteur de son nom "Ultra" avec son design de châssis élargi et ses caractéristiques supplémentaires par rapport aux séries Beelink GTI ou SER. Son bloc d'alimentation intégré en particulier est quelque chose que nous aimerions voir devenir la norme, car certains blocs d'alimentation peuvent être presque aussi grands que les mini PC eux-mêmes. Le design et la qualité du châssis sont également de haut niveau, comme sur la SER8.
Le principal inconvénient devient évident lorsque vous avez besoin d'entretenir l'appareil. Les haut-parleurs et le bloc d'alimentation doivent d'abord être retirés pour accéder au SSD M.2 et aux emplacements de la RAM, ce qui est plus gênant que sur la plupart des autres mini-PC. Il fonctionne également plus chaudement que nous l'aurions souhaité, bien qu'il soit sensiblement plus grand et plus lourd que d'autres dans la catégorie. Le lecteur SD intégré, très lent, est une gifle pour les créateurs de contenu, d'autant plus que le modèle est commercialisé comme un mini-PC haut de gamme.
Quant à la station d'accueil EX, elle est solide mais peu élégante avec ses câbles d'alimentation et ses antennes apparents, même si vous décidez de ne pas utiliser les fonctions WLAN de la station d'accueil. Le design "ouvert" de l'EX va attirer plus de poussière visible et de cheveux par rapport à une solution eGPU en boîte comme la Aorus Gaming Box où des pré-filtres sont généralement intégrés. L'EX n'est pas non plus idéal pour mettre en valeur la carte graphique car le GPU doit être installé face au mini PC et non pas à l'opposé.
Le GTI12 Ultra et la station d'accueil EX sont étonnamment abordables compte tenu de la qualité de fabrication et de la concurrence.
La suppression de la fonction Wi-Fi de l'EX, rarement utilisée, ou son remplacement par davantage de ports pourrait potentiellement réduire la taille et le prix de la station d'accueil encore davantage.
Prix et disponibilité
Beelink livre actuellement le GTI12 Ultra avec 1 TB SSD, 32 GB RAM, et EX Docking Station en bundle pour seulement $738 USD. Des options de CPU Meteor Lake plus récentes sont disponibles à partir de 200 $ de plus.
Beelink GTI12 Ultra EX Docking Station
- 10/21/2024 v8
Allen Ngo
 Total Sustainability Score:
 Transparency
La sélection des appareils à examiner est effectuée par notre équipe éditoriale. L'échantillon de test a été prêté à l'auteur par le fabricant ou le détaillant pour les besoins de cet examen. Le prêteur n'a pas eu d'influence sur cette évaluation et le fabricant n'a pas reçu de copie de cette évaluation avant sa publication. Il n'y avait aucune obligation de publier cet article. Nous n'acceptons jamais de compensation ou de paiement en échange de nos commentaires. En tant que média indépendant, Notebookcheck n'est pas soumis à l'autorité des fabricants, des détaillants ou des éditeurs.
Voici comment Notebookcheck teste
Chaque année, Notebookcheck examine de manière indépendante des centaines d'ordinateurs portables et de smartphones en utilisant des procédures standardisées afin de garantir que tous les résultats sont comparables. Nous avons continuellement développé nos méthodes de test depuis environ 20 ans et avons établi des normes industrielles dans le processus. Dans nos laboratoires de test, des équipements de mesure de haute qualité sont utilisés par des techniciens et des rédacteurs expérimentés. Ces tests impliquent un processus de validation en plusieurs étapes. Notre système d'évaluation complexe repose sur des centaines de mesures et de points de référence bien fondés, ce qui garantit l'objectivité.Price comparison

