

MSI Summit E13 AI Evo - Test du cabriolet : De sérieux problèmes d'étranglement avec le Core Ultra 7
Trop rapide pour être géré.
Le dernier Summit E13 A1MTG montre ce qui se passe lorsque vous placez un CPU Core Ultra-H dans un ordinateur portable conçu à l'origine pour un processeur Core-U. Cela peut sembler très rapide sur le papier, mais l'étranglement et les niveaux de température qui s'ensuivent requièrent une attention particulière.Allen Ngo, 👁 Allen Ngo (traduit par DeepL / Ninh Duy) Publié 🇺🇸
Verdict - Un pas en avant et deux pas en arrière
Le Summit E13 AI Evo A1MTG peut donner l'impression d'être en retrait par rapport à son prédécesseur. Il semble bon sur le papier avec son processeur Core Ultra H, mais en pratique le processeur s'étrangle beaucoup plus rapidement et brusquement que la plupart des autres ordinateurs portables avec la même option de processeur, car le Summit E13 a été conçu à l'origine pour les processeurs ULV Core U-series. Le nouveau modèle est certainement plus rapide que la version originale de 2021, mais la différence n'est pas aussi importante qu'elle aurait pu l'être compte tenu de notre expérience avec d'autres ordinateurs portables équipés de processeurs Core Ultra H comme le Ordinateur portable Framework 13.5. Des aspects comme l'autonomie de la batterie et la température du cœur souffrent également du changement de processeur.
D'autres changements décevants incluent moins de ports USB-C et la suppression du lecteur MicroSD. Même l'écran IPS de base a été rétrogradé de 120 Hz à seulement 60 Hz, sans amélioration des temps de réponse noir-blanc lents.
Il est peut-être temps de revoir la conception du châssis, maintenant que le Summit E13 a presque quatre ans. Le processeur Core Ultra-H permet de distinguer le modèle MSI des autres convertibles 13 pouces, mais son implémentation aurait pu être mieux gérée en améliorant d'abord la solution de refroidissement pour supporter les exigences plus élevées du processeur. Les températures plus élevées que la moyenne et le bruit du ventilateur sont tous deux révélateurs d'une solution de refroidissement qui a du mal à maintenir le nouveau processeur à flot.
Points positifs
Points négatifs
Prix et disponibilité
Amazon propose actuellement le Summit E13 AI Evo avec le Core Ultra 7, 16 Go de RAM LPDDR5 et 1 To de SSD pour 1100 $.
Comparaison des alternatives possibles
Image | Modèle | Prix | Poids | Épaisseur | Écran |
|---|---|---|---|---|---|
1. 78.6% 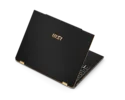 | MSI Summit E13 AI Evo A1MTG Intel Core Ultra 7 155H ⎘ Intel Arc 8-Core iGPU ⎘ 16 Go Mémoire, 1024 Go SSD | Amazon: $1,099.00 Prix de liste: 1100 USD | 1.3 kg | 16.2 mm | 13.30" 1920x1200 170 PPI IPS |
2. 86.9% v7 (old)  | MSI Summit E13 Flip Evo A11MT Intel Core i7-1185G7 ⎘ Intel Iris Xe Graphics G7 96EUs ⎘ 32 Go Mémoire, 1024 Go SSD | Amazon: 1. $800.00 MSI Summit E13 Flip Evo (202... 2. $909.00 MSI Summit E13 Flip Evo Prof... 3. $45.99 90W 65W Type-C AC Charger Fi... Prix de liste: 1900 USD | 1.4 kg | 14.9 mm | 13.40" 1920x1200 169 PPI IPS |
3. 87% v7 (old)  | Lenovo Yoga Book 9 13IMU9 Intel Core Ultra 7 155U ⎘ Intel Graphics 4-Core iGPU (Arc) ⎘ 16 Go Mémoire | Amazon: $1,899.00 Prix de liste: 2000 USD | 1.4 kg | 15.95 mm | 13.30" 2880x1800 255 PPI OLED |
4. 88.1% v7 (old) 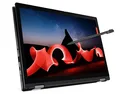 | Lenovo ThinkPad L13 Yoga G4 i7-1355U Intel Core i7-1355U ⎘ Intel Iris Xe Graphics G7 96EUs ⎘ 16 Go Mémoire, 512 Go SSD | Amazon: 1. $1,369.00 Lenovo ThinkPad T14 G4 Home ... 2. $649.00 Lenovo - ThinkPad L13 Yoga 2... 3. $799.99 Lenovo| Yoga 7i Intel Core i... Prix de liste: 1589 USD | 1.4 kg | 17.1 mm | 13.30" 1920x1200 170 PPI IPS |
5. 90.3% v7 (old)  | HP Elite Dragonfly Folio 13.5 G3 Intel Core i7-1265U ⎘ Intel Iris Xe Graphics G7 96EUs ⎘ 16 Go Mémoire, 512 Go SSD | Amazon: 1. $39.99 Smatree Hard EVA Protective ... 2. $28.99 Vaxson Privacy Screen Protec... 3. $54.99 Broonel - Contour Series - B... Prix de liste: 3900 USD | 1.4 kg | 17.8 mm | 13.50" 1920x1280 171 PPI IPS |
6. 89% v7 (old)  | Dell Latitude 9330 Intel Core i7-1260U ⎘ Intel Iris Xe Graphics G7 96EUs ⎘ 16 Go Mémoire | Amazon: 1. $42.93 Berfea Protective Cover Case... 2. $25.99 65W USB C Charger Genuine Re... 3. $39.99 Smatree Hard EVA Protective ... | 1.2 kg | 14.1 mm | 13.30" 2560x1600 227 PPI IPS |
Table des matières
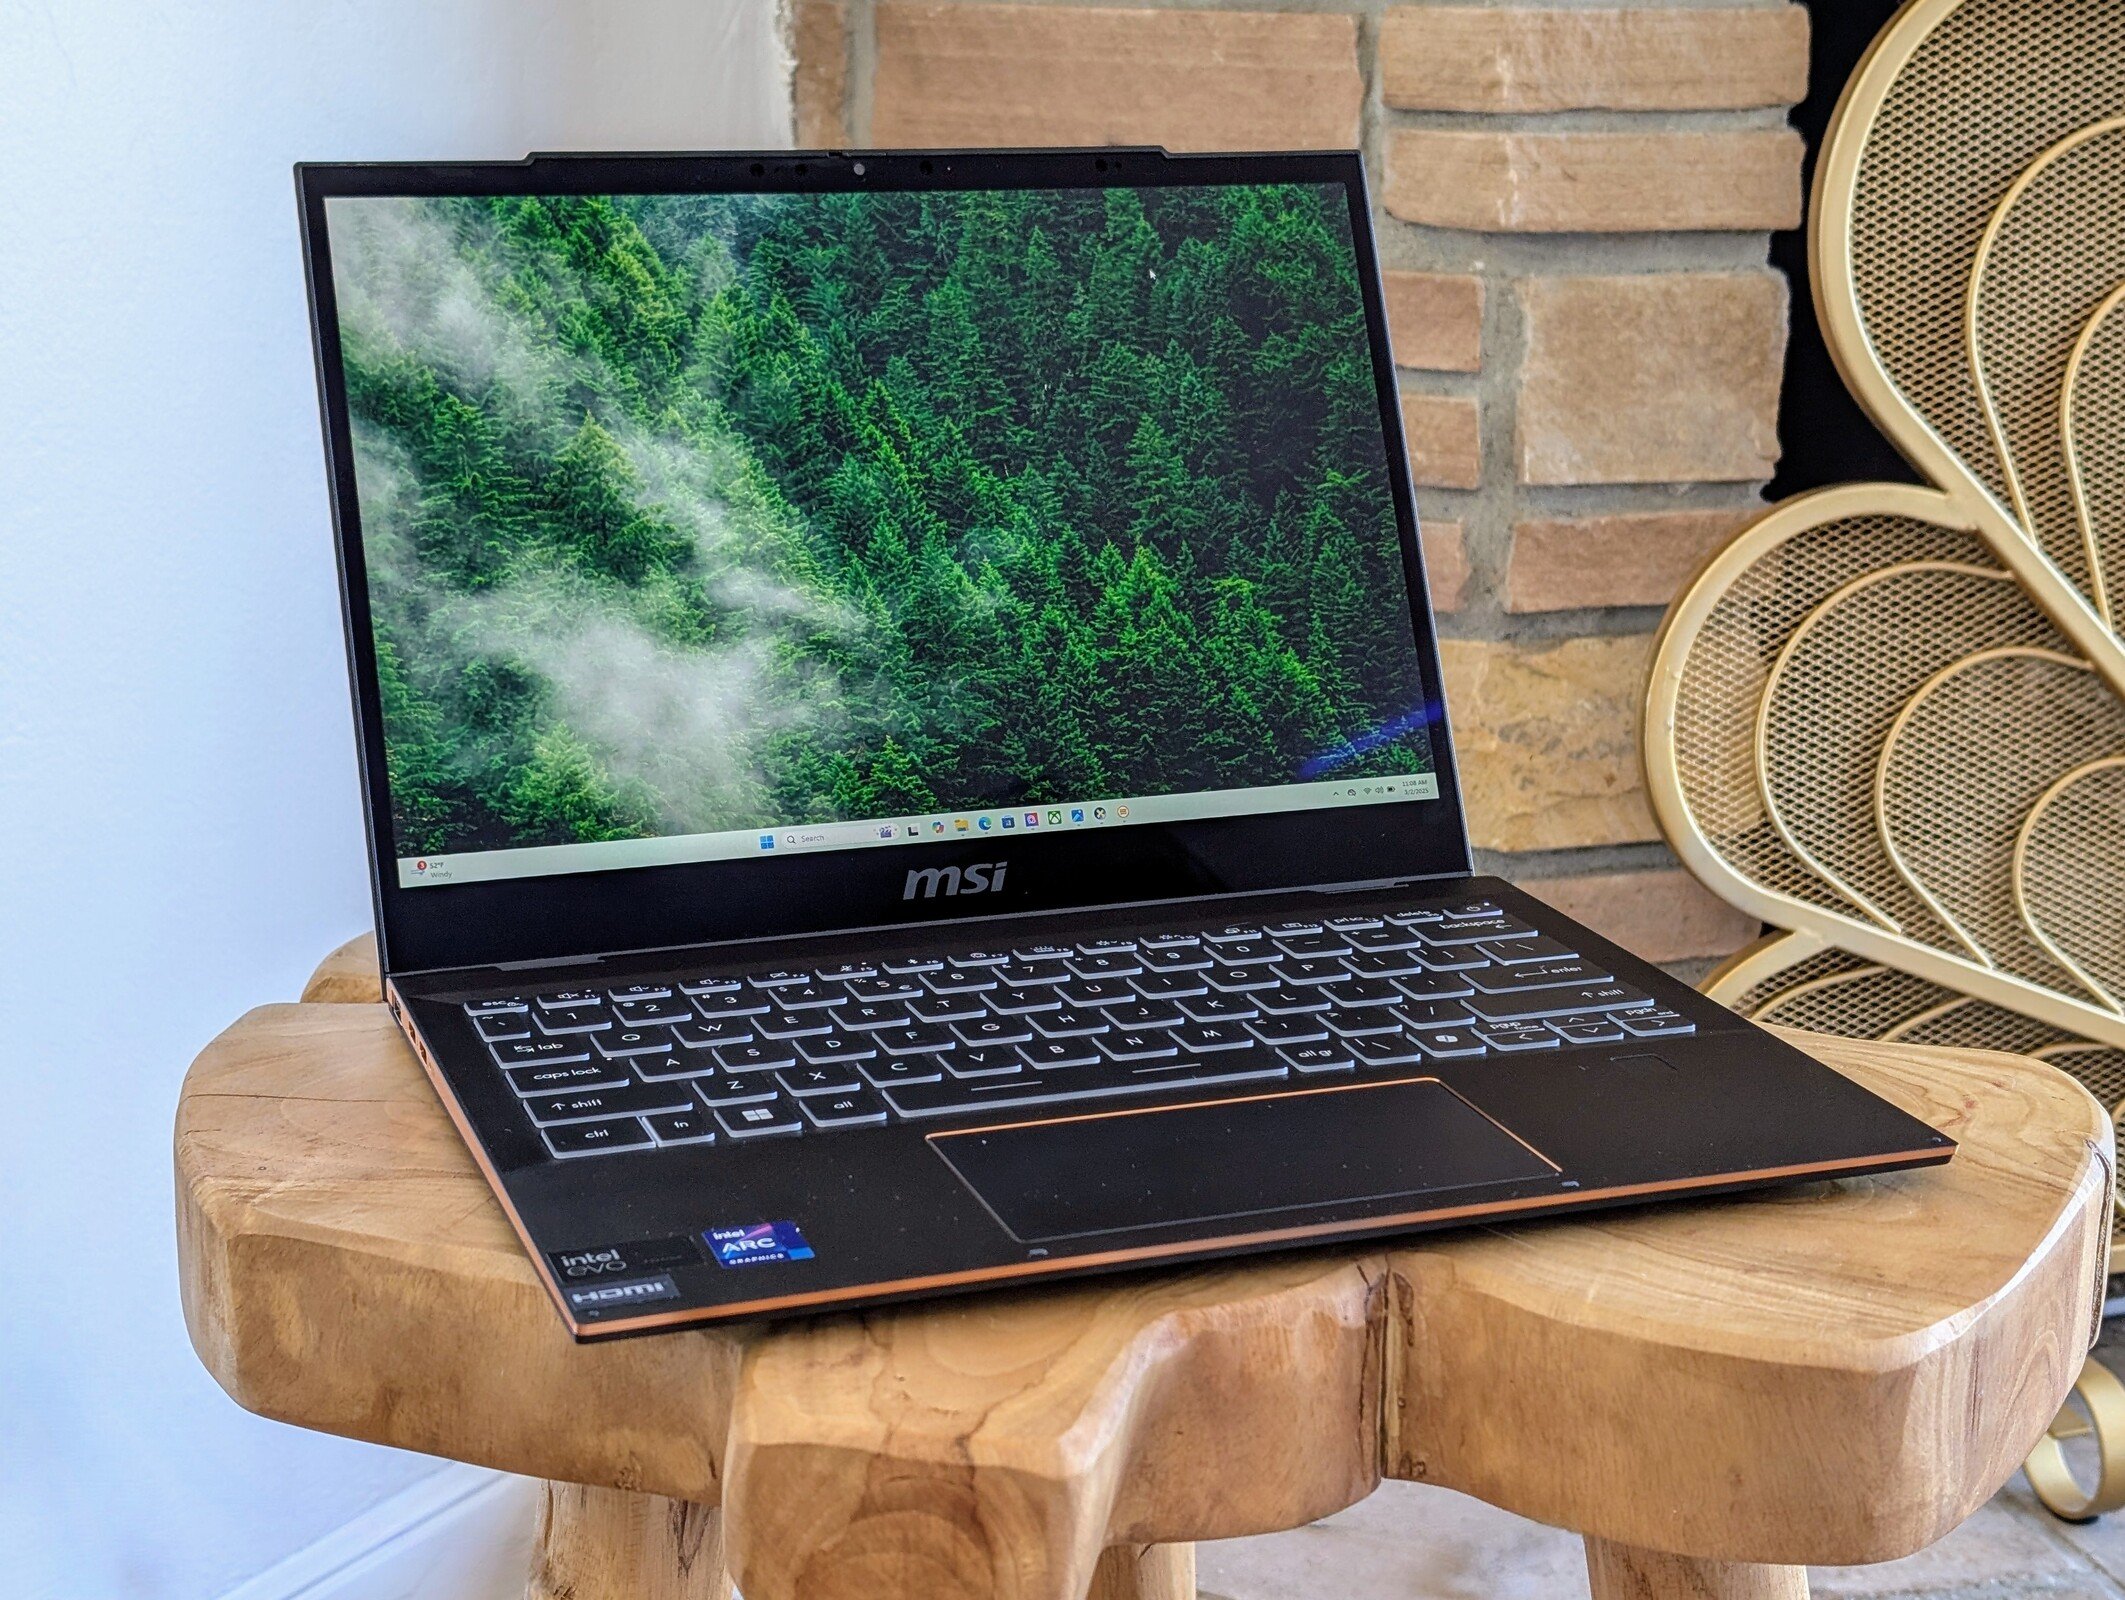
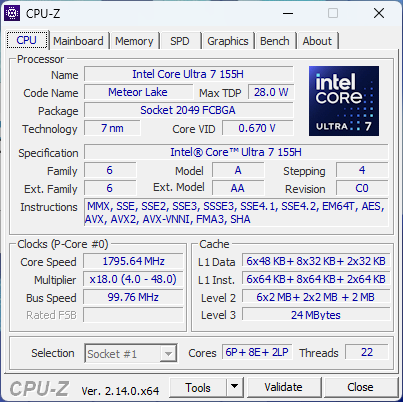
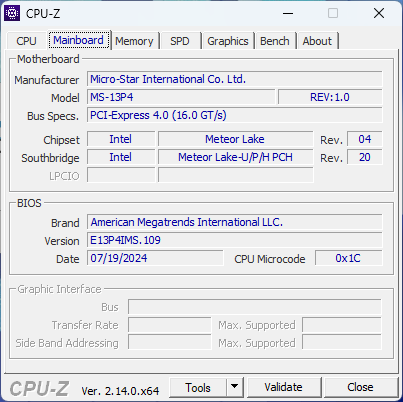
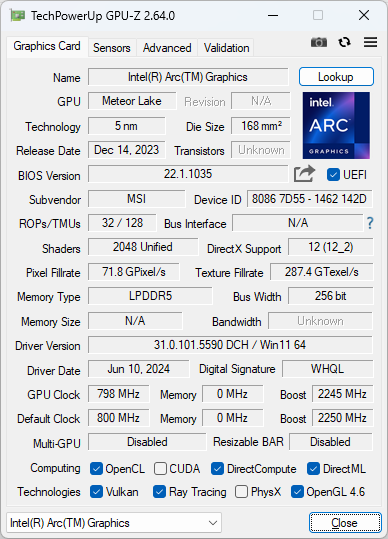
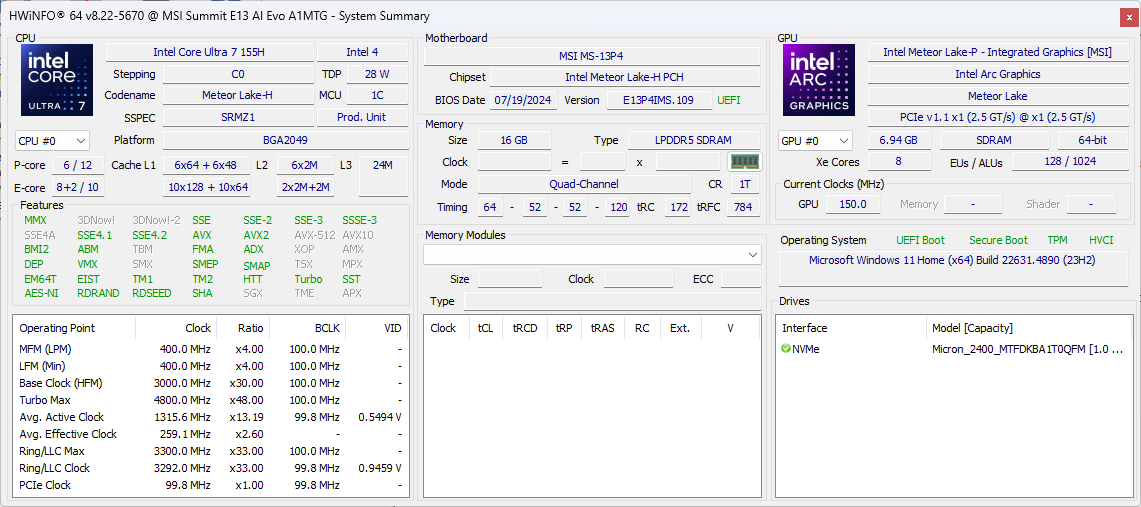
Le 2024 Summit E13 AI Evo A1MTG est la version mise à jour du 2021 Summit E13 Flip Evo. Bien que le surnom "Flip" ait été abandonné, le modèle est toujours un facteur de forme 2-en-1, tout comme son prédécesseur. Il est équipé d'un nouveau processeur Intel Core Meteor Lake-H qui remplace l'ancienne option Tiger Lake-U du modèle 2021.
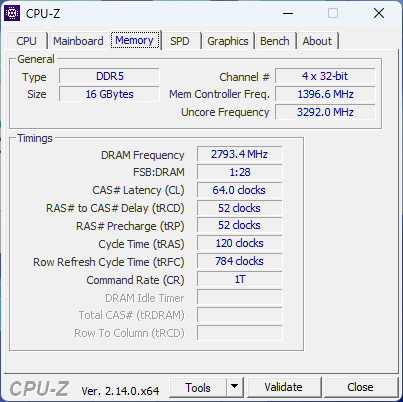
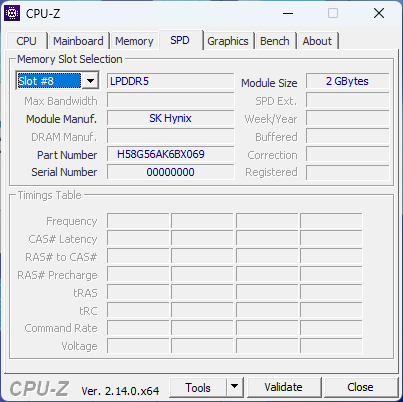
Notre unité de test est équipée du processeur Core Ultra 7 155H, de 16 Go de RAM LPDDR5-5600 et d'un disque dur SSD de 1 To pour environ 1100 $. D'autres modèles peuvent proposer 32 Go de RAM LPDDR5-6400 ou le Core Ultra 5 125H, plus lent, mais l'écran tactile IPS 1200p semble être le même sur toute la gamme.
Les concurrents comprennent d'autres ordinateurs portables de bureau de 13 pouces comme le Dell Latitude 9330, HP Elite Dragonfly Folio, ou Lenovo ThinkPad L13 Yoga G4.
Plus d'avis sur MSI :
Spécifications
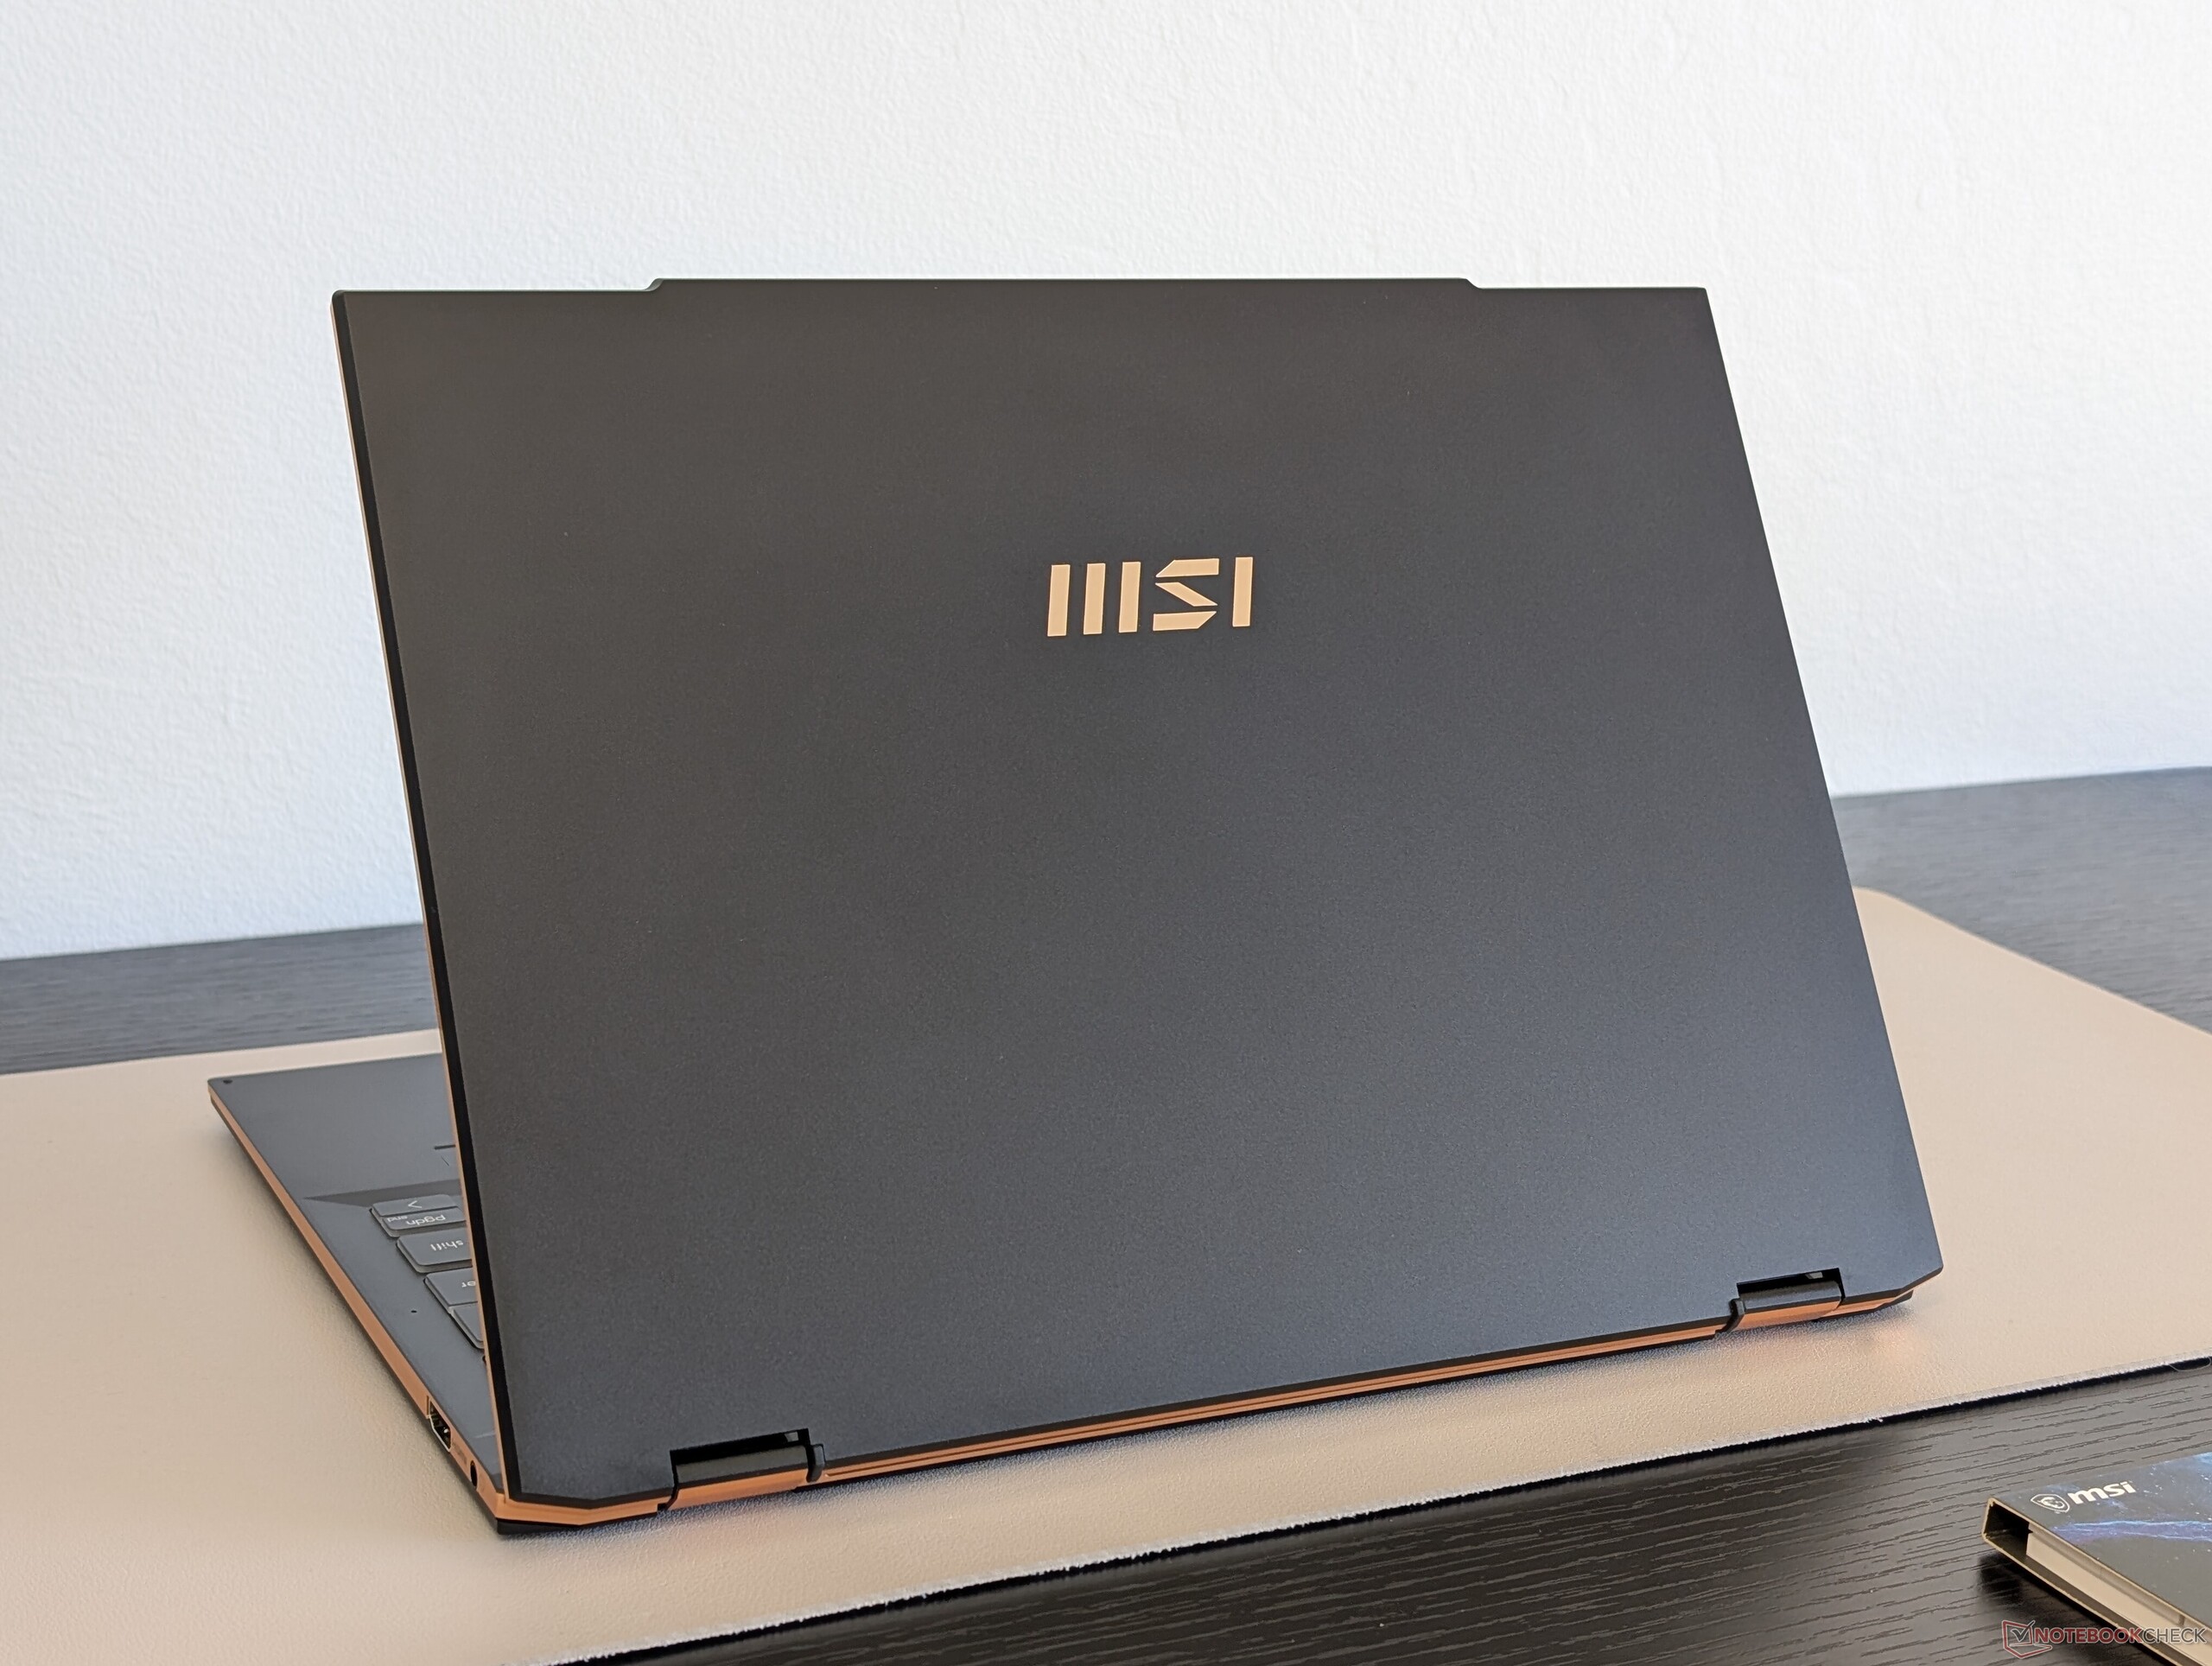
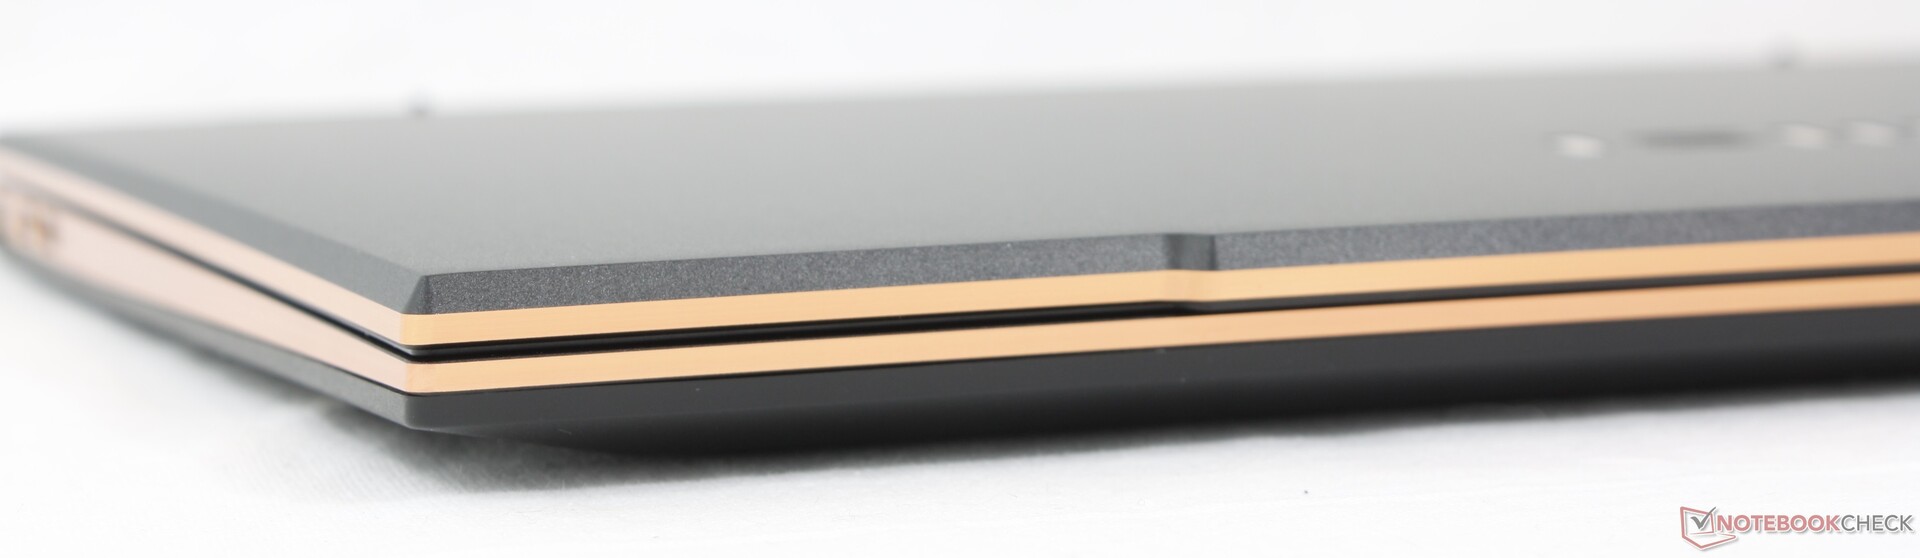
Boîtier - Garnitures dorées
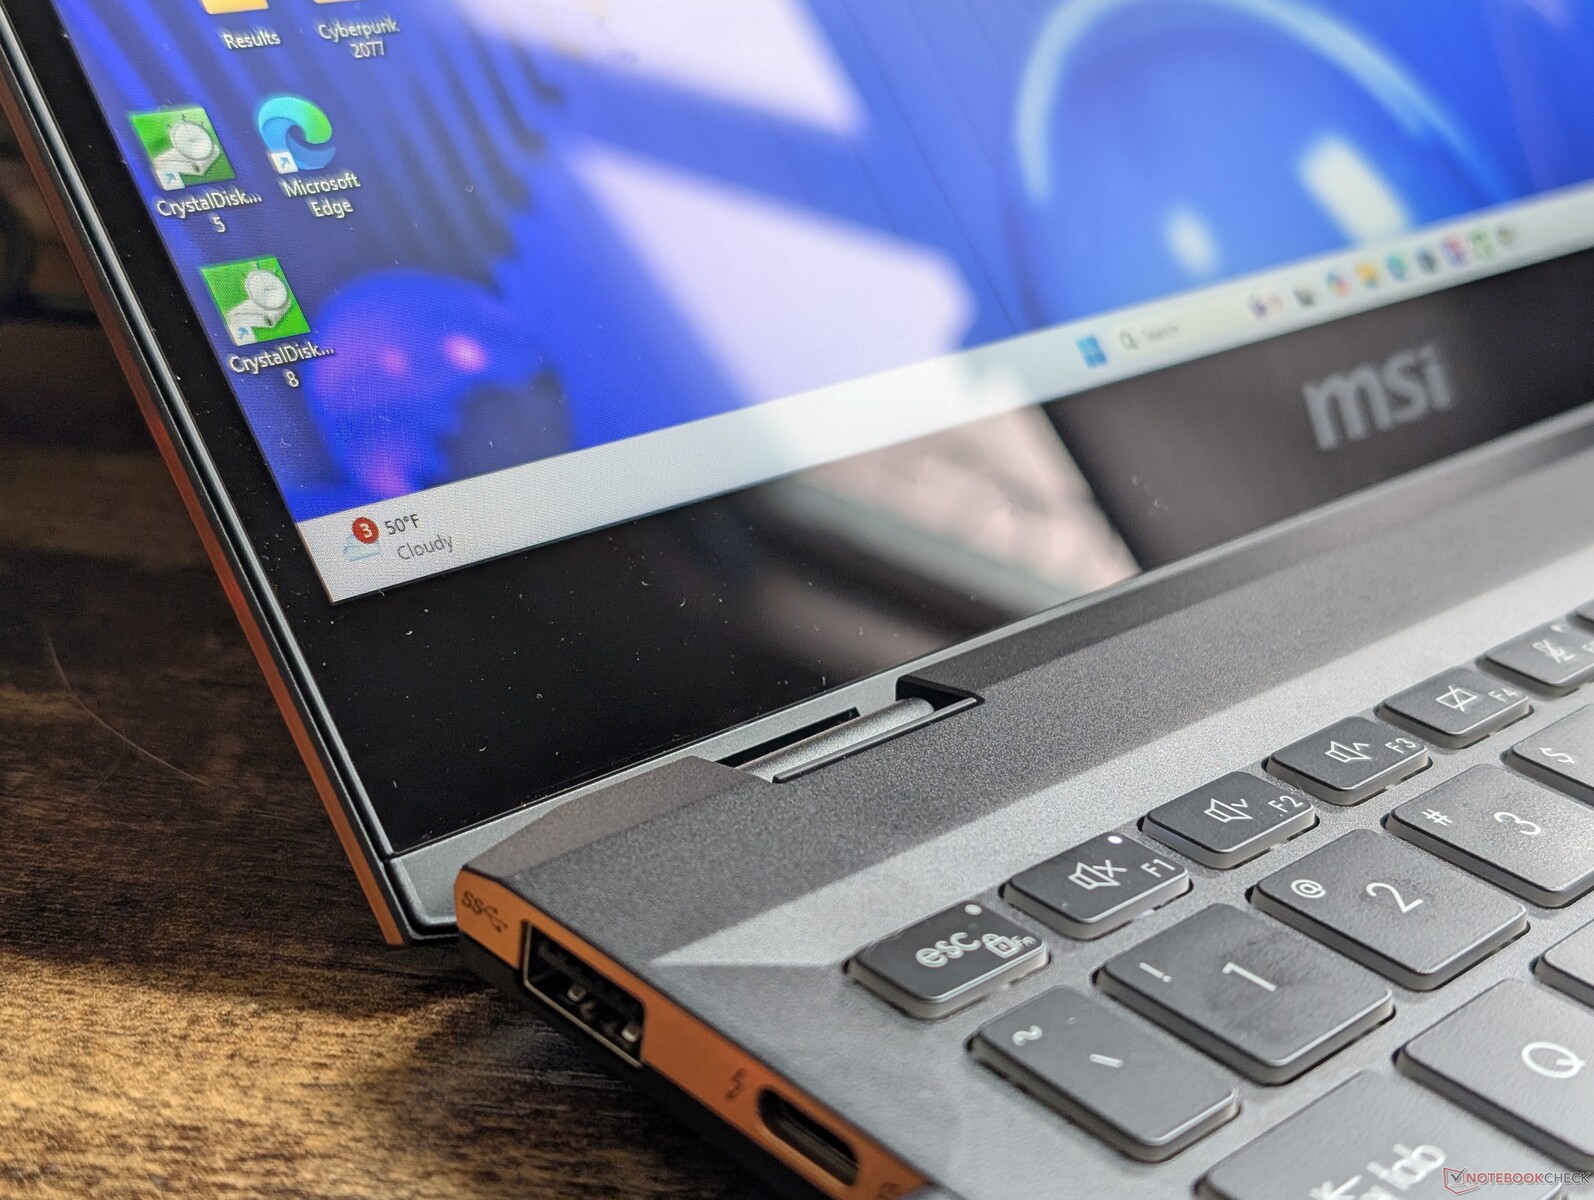
Le Summit E13 2024 dispose de ports différents et d'un nouvel obturateur de webcam par rapport à la version 2021. Pour le reste, les châssis sont identiques et ne présentent aucun changement majeur, tant à l'extérieur qu'à l'intérieur.
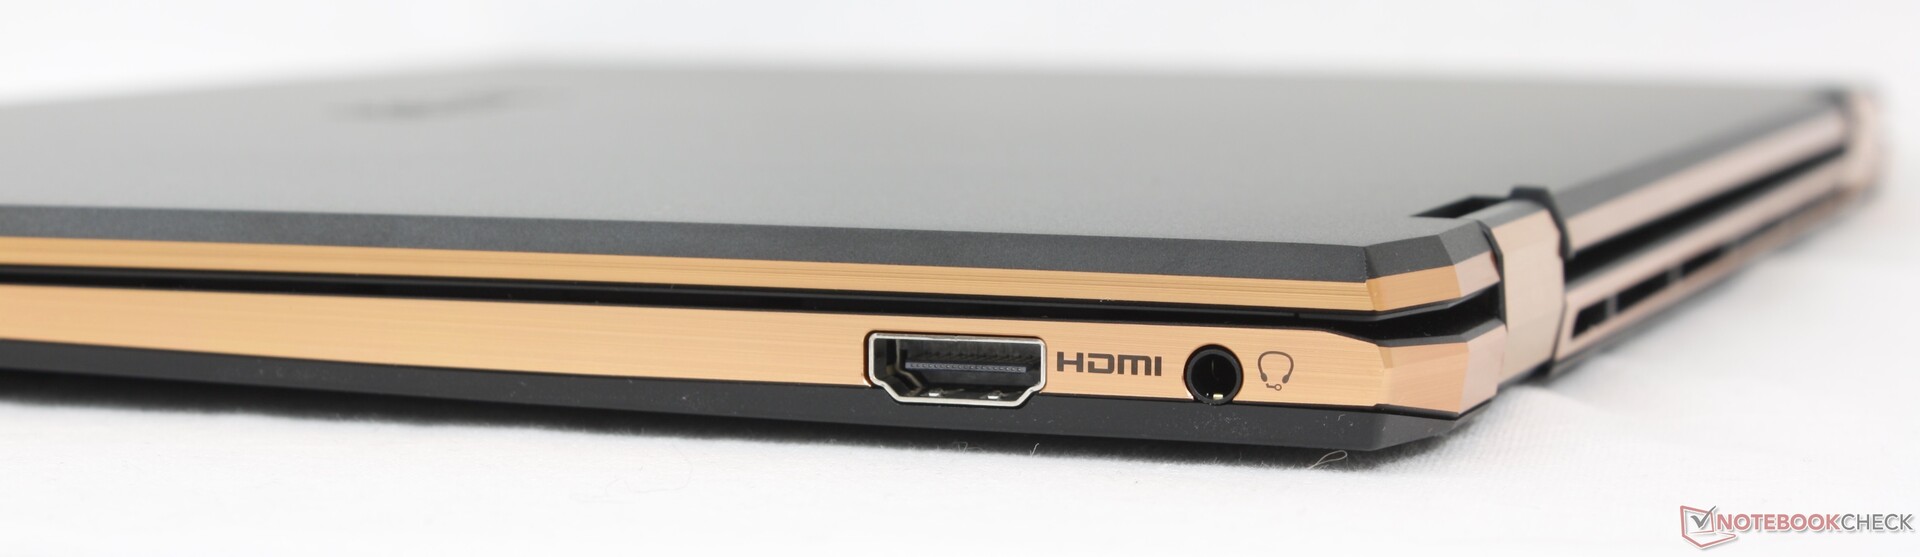
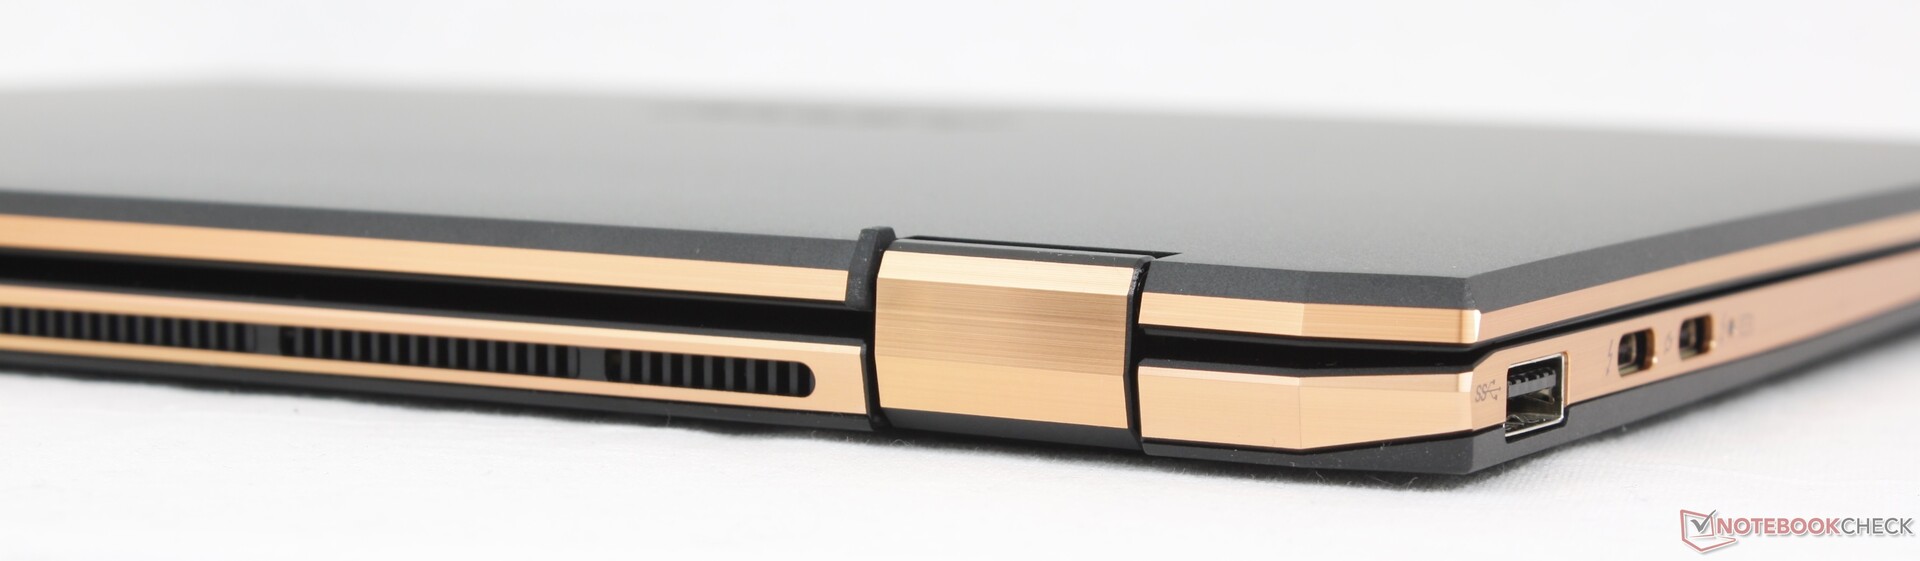
Connectivité - Nouveaux ports cette année
Les options de port ont changé par rapport au modèle 2021 et pas nécessairement pour le mieux. L'un des ports USB-C a été supprimé au profit de l'HDMI, tandis que le lecteur MicroSD a été complètement abandonné.

Communication
| Networking | |
| iperf3 transmit AX12 | |
| MSI Summit E13 Flip Evo A11MT | |
| iperf3 receive AX12 | |
| MSI Summit E13 Flip Evo A11MT | |
| iperf3 transmit AXE11000 | |
| Lenovo ThinkPad L13 Yoga G4 i7-1355U | |
| HP Elite Dragonfly Folio 13.5 G3 | |
| Dell Latitude 9330 | |
| Lenovo Yoga Book 9 13IMU9 | |
| MSI Summit E13 AI Evo A1MTG | |
| iperf3 receive AXE11000 | |
| Lenovo ThinkPad L13 Yoga G4 i7-1355U | |
| Lenovo Yoga Book 9 13IMU9 | |
| HP Elite Dragonfly Folio 13.5 G3 | |
| Dell Latitude 9330 | |
| MSI Summit E13 AI Evo A1MTG | |
| iperf3 transmit AXE11000 6GHz | |
| HP Elite Dragonfly Folio 13.5 G3 | |
| Dell Latitude 9330 | |
| MSI Summit E13 AI Evo A1MTG | |
| Lenovo Yoga Book 9 13IMU9 | |
| iperf3 receive AXE11000 6GHz | |
| HP Elite Dragonfly Folio 13.5 G3 | |
| MSI Summit E13 AI Evo A1MTG | |
| Dell Latitude 9330 | |
| Lenovo Yoga Book 9 13IMU9 | |
Webcam
La webcam reste inchangée à 1080p ou 2 MP avec prise en charge de l'infrarouge.


Maintenance
L'entretien est similaire à celui du modèle 2021, jusqu'à la disposition de la carte mère, selon la vidéo d'entretien de LaptopMedia. La RAM n'est pas extensible et seul un SSD M.2 2280 est pris en charge.
Durabilité
MSI n'annonce aucune mesure de développement durable lors de la fabrication. La boîte est essentiellement composée de papier et de carton, avec un emballage en plastique pour l'adaptateur secteur.
Accessoires et garantie
La boîte contient le stylet actif MSI Pen 2 ainsi que l'adaptateur secteur et la documentation. La garantie limitée habituelle d'un an du fabricant s'applique si vous l'achetez aux États-Unis.
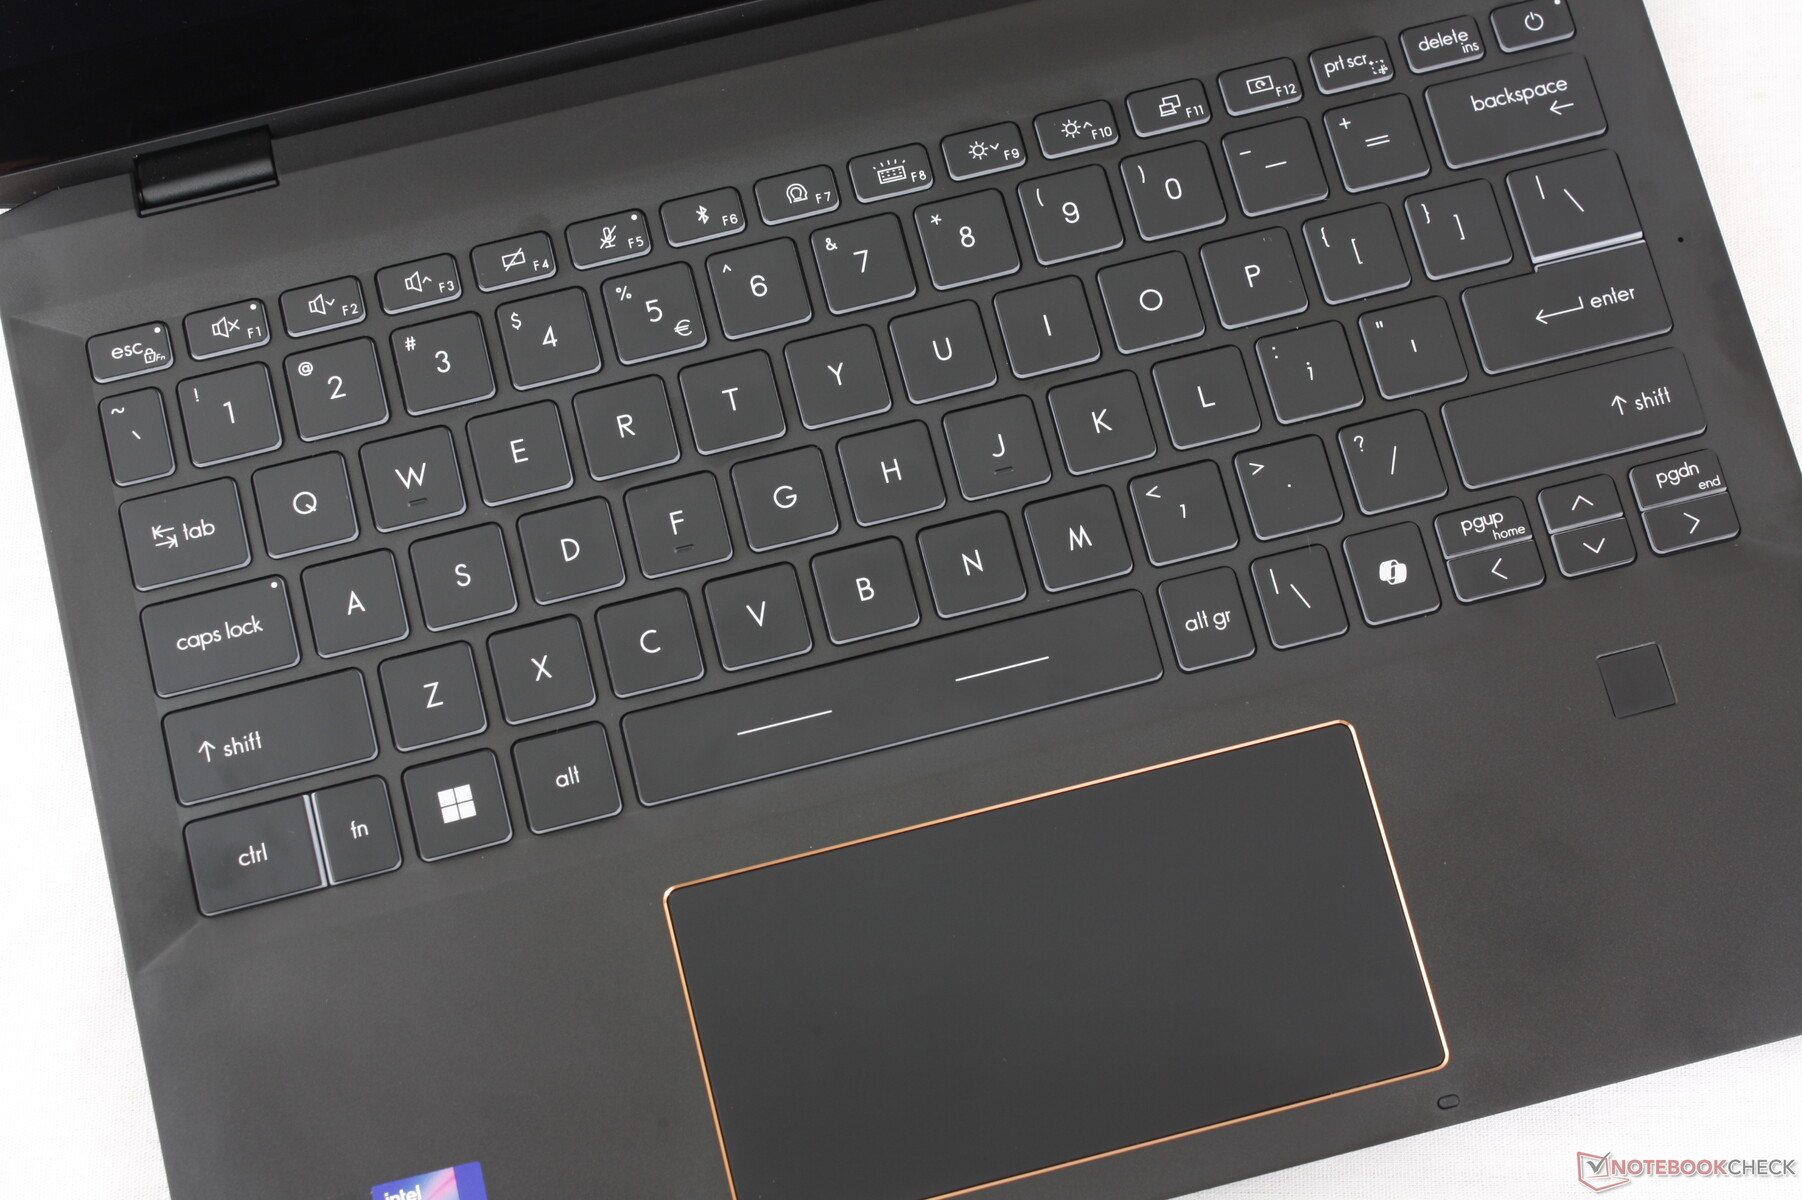
Périphériques d'entrée
Le clavier et le pavé tactile n'ont pas changé en termes de taille ou de retour d'informations, pour une expérience de frappe identique à celle du modèle 2021. La nouveauté de cette année est la touche Co-Pilote dédiée et les touches Fn et Ctrl légèrement révisées. Malheureusement, les petites touches PgUp, PgDn et les touches fléchées sont toujours aussi exiguës, spongieuses et généralement peu fiables.
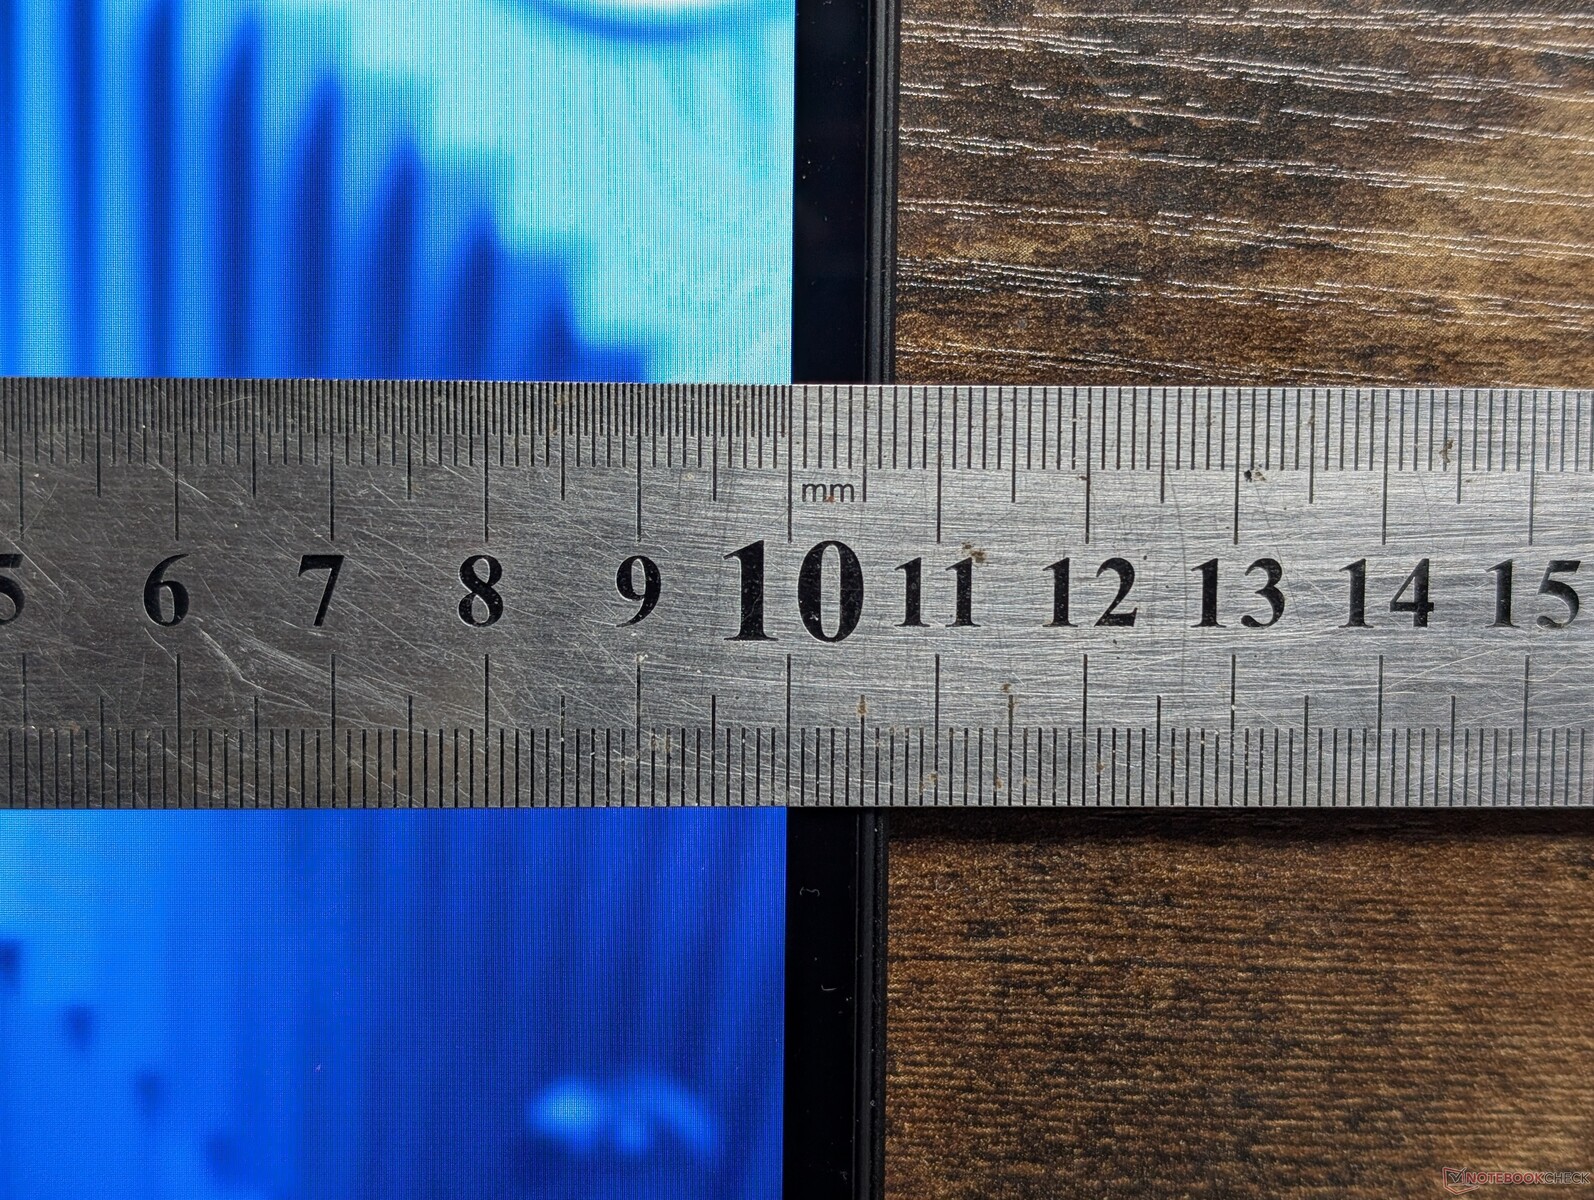
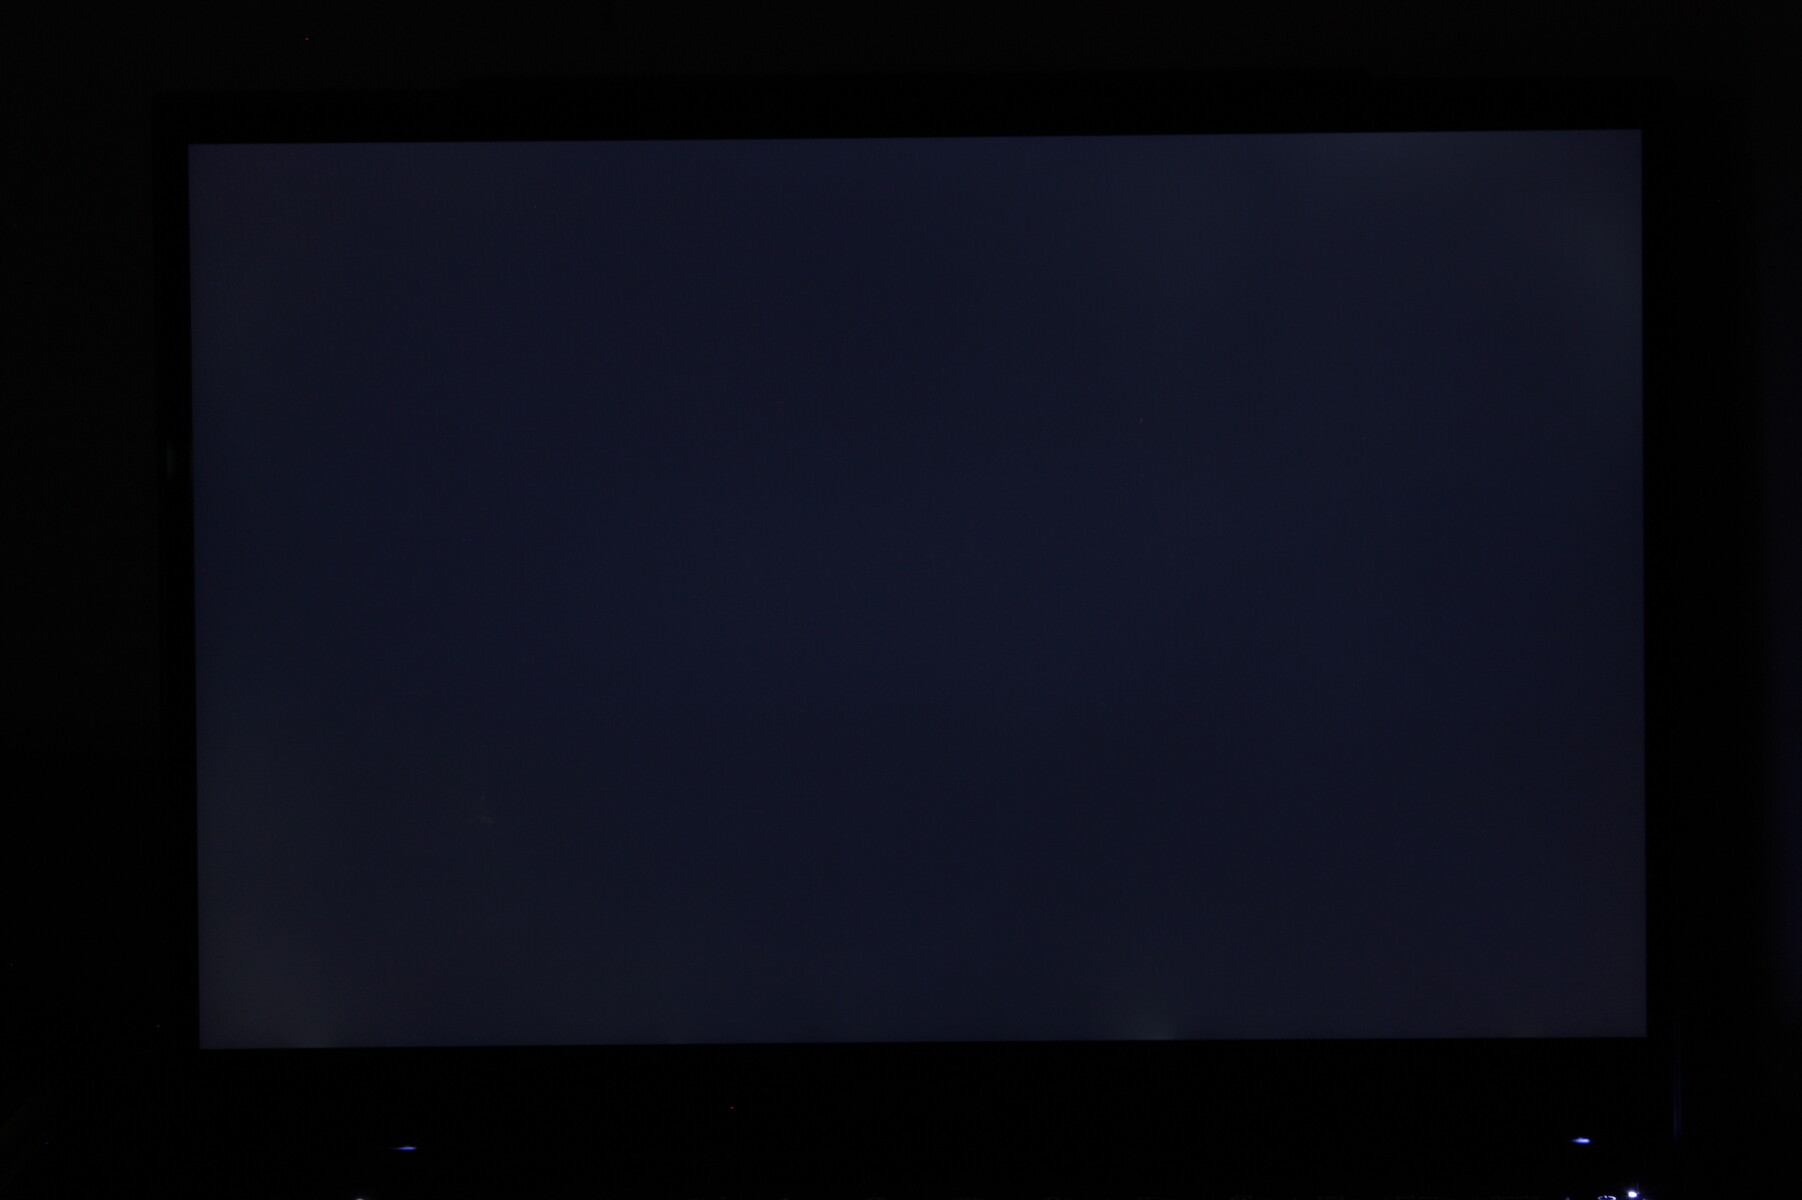
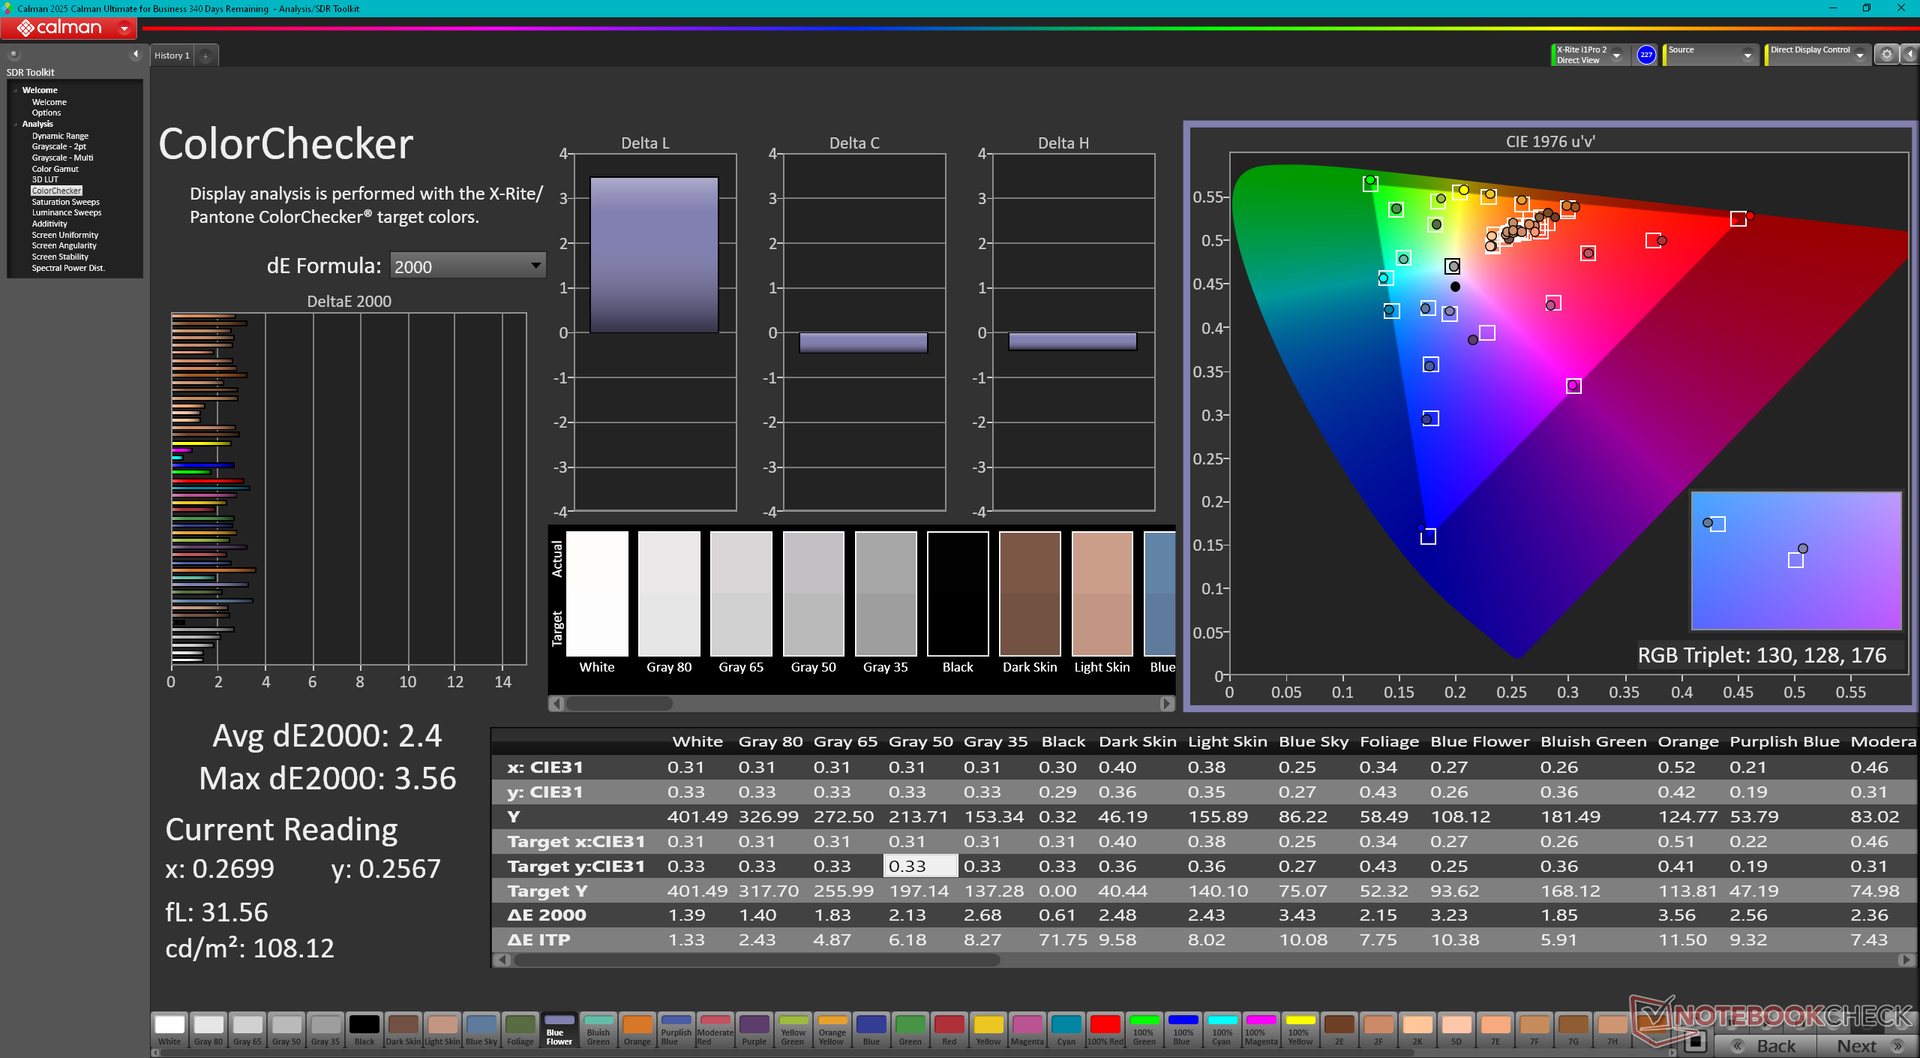
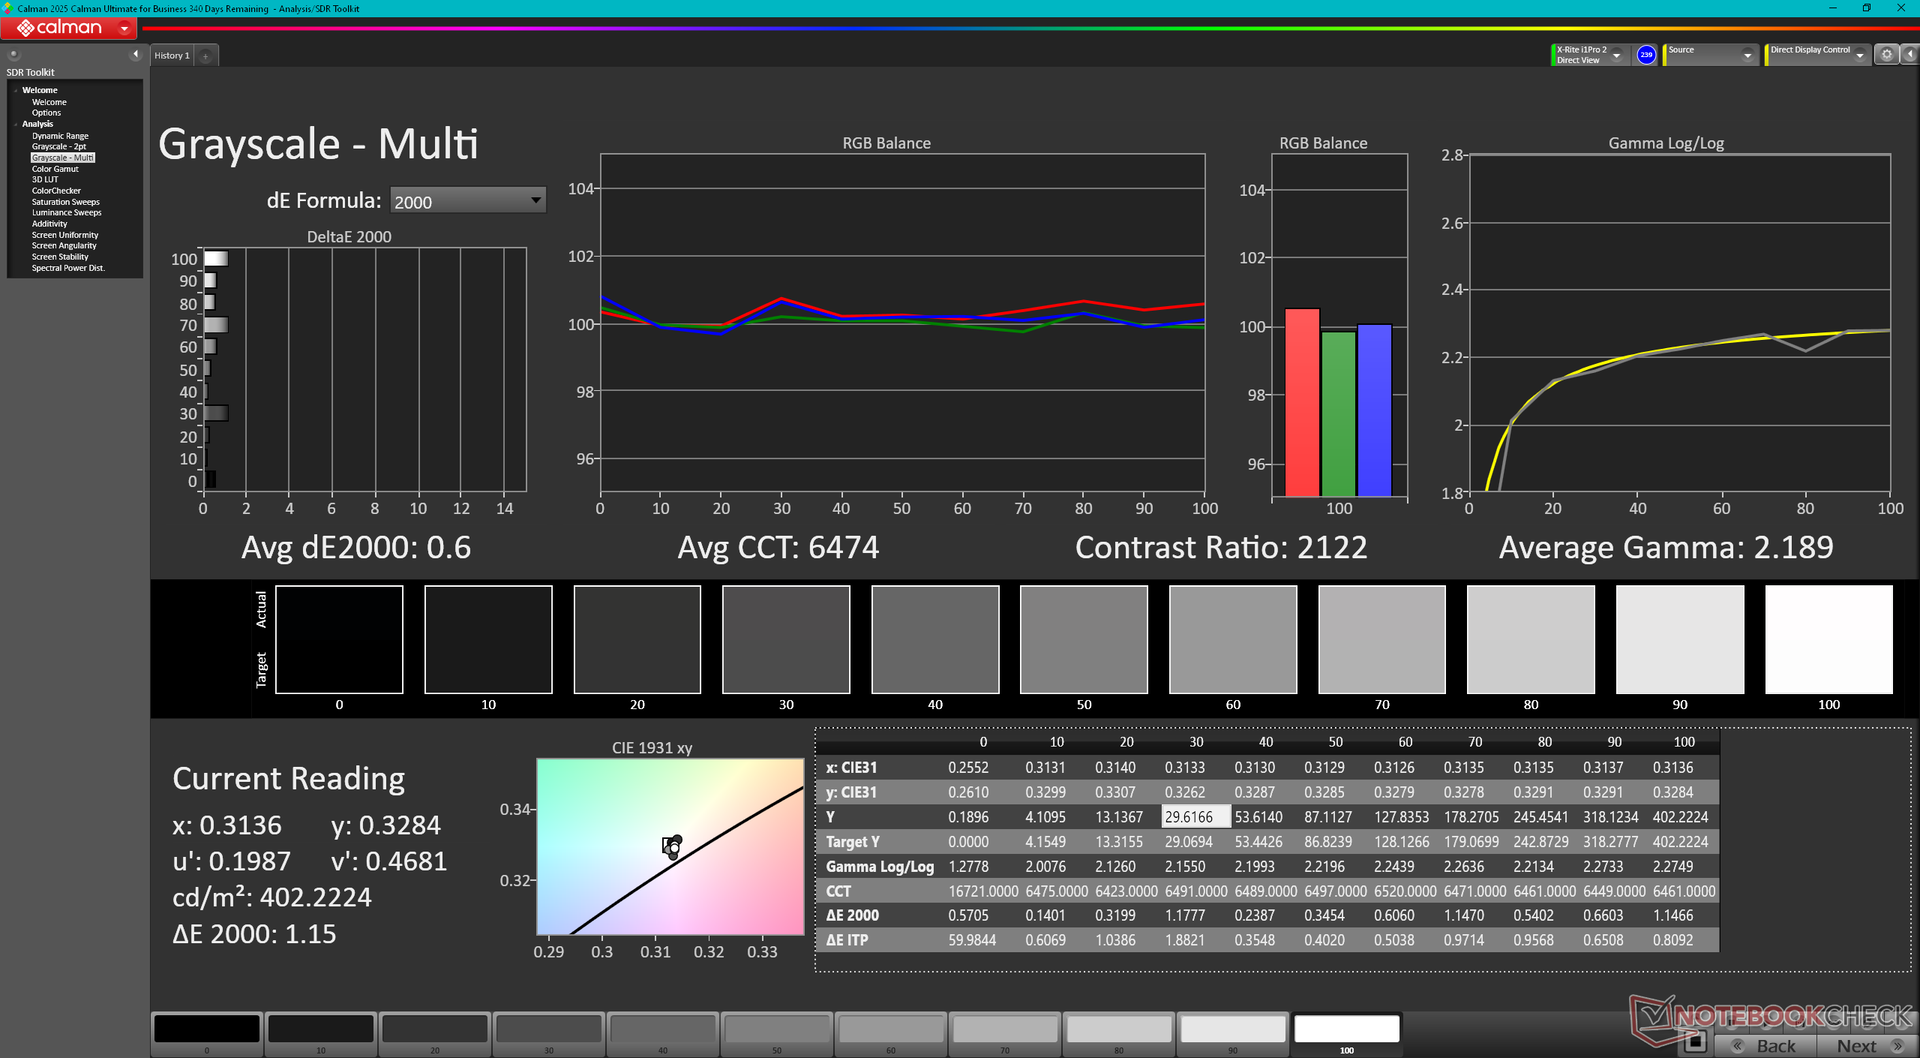
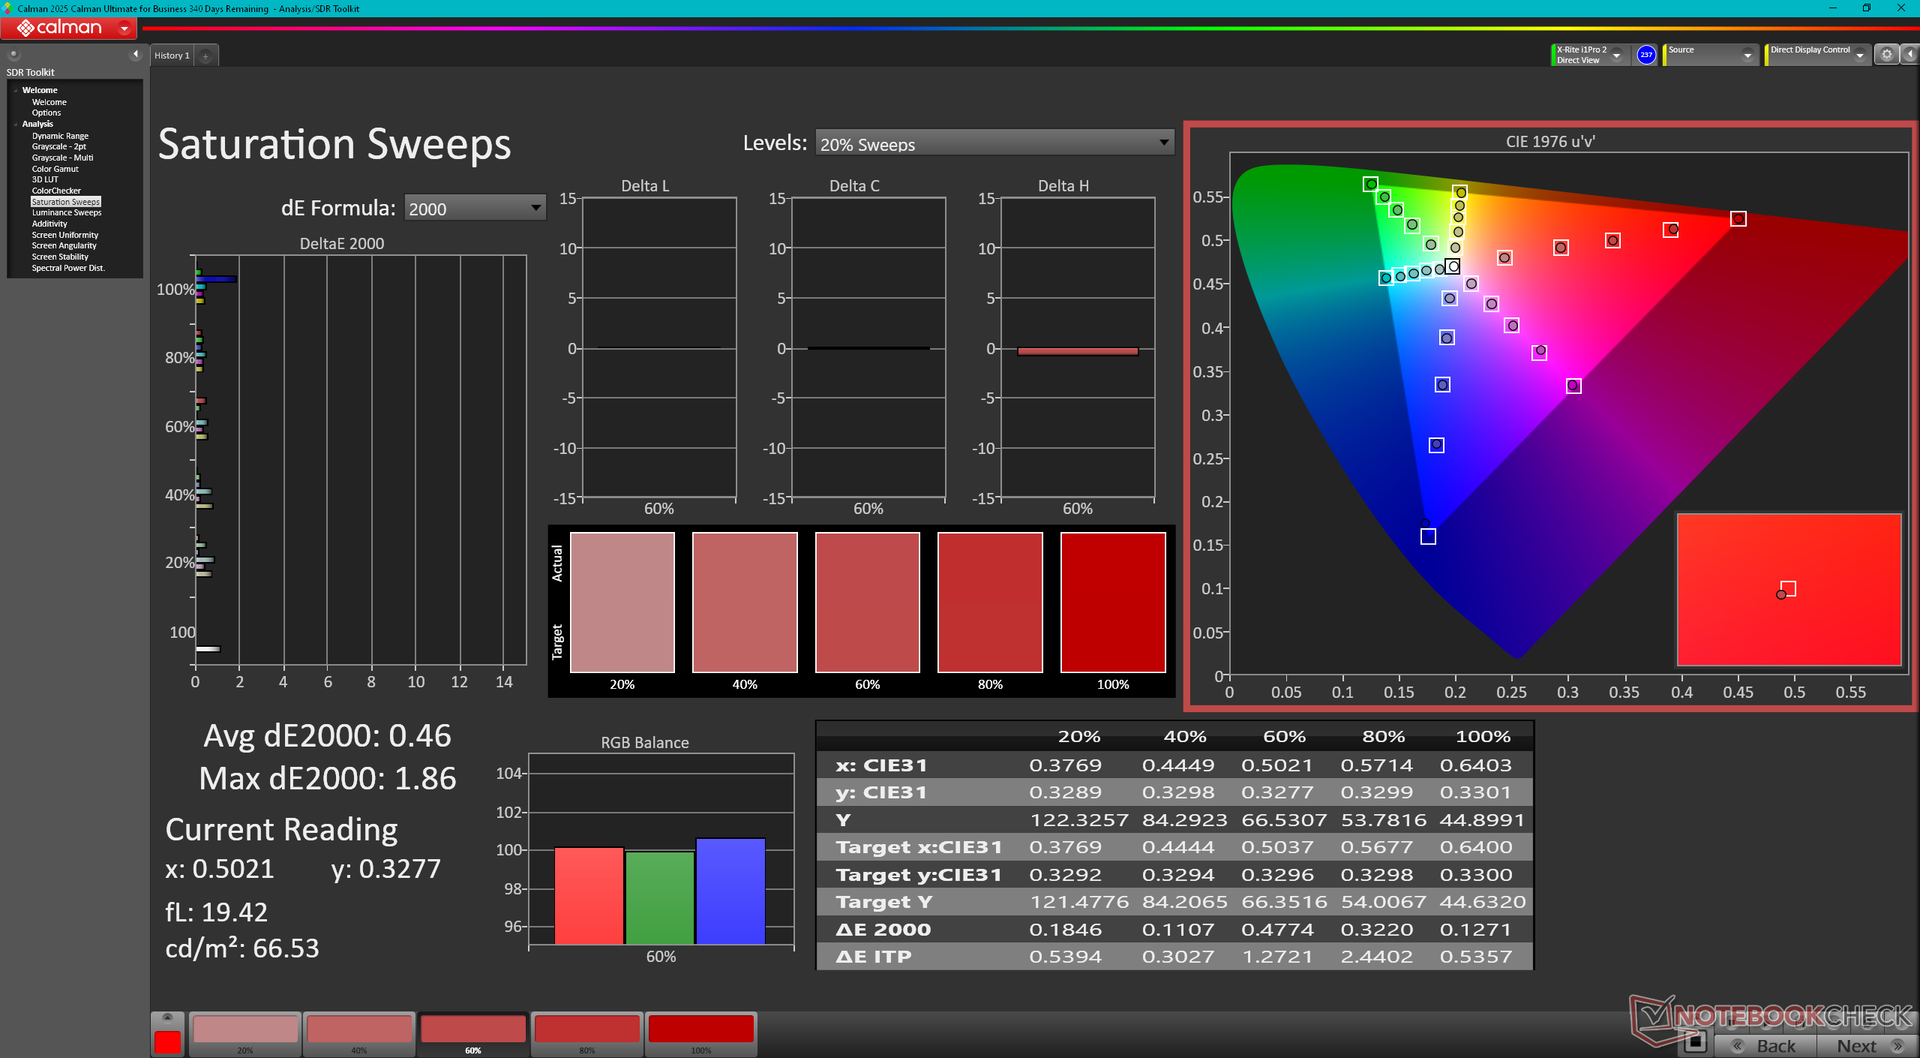
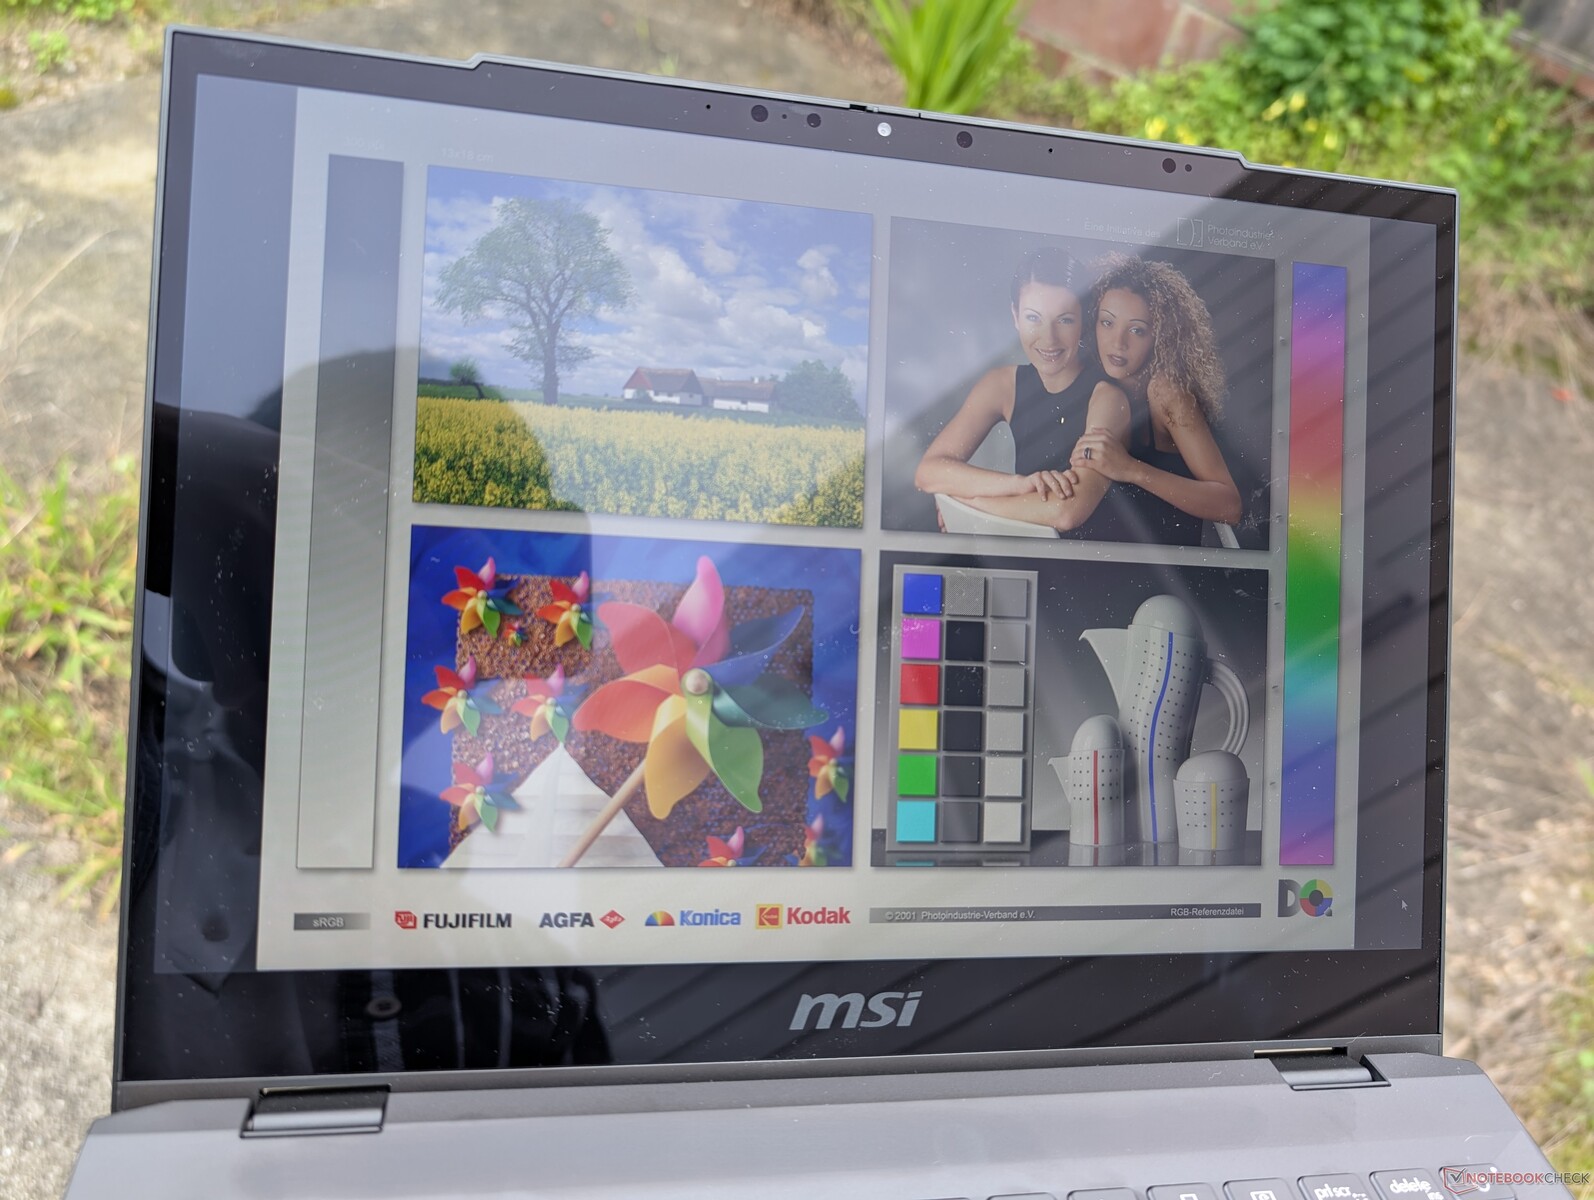
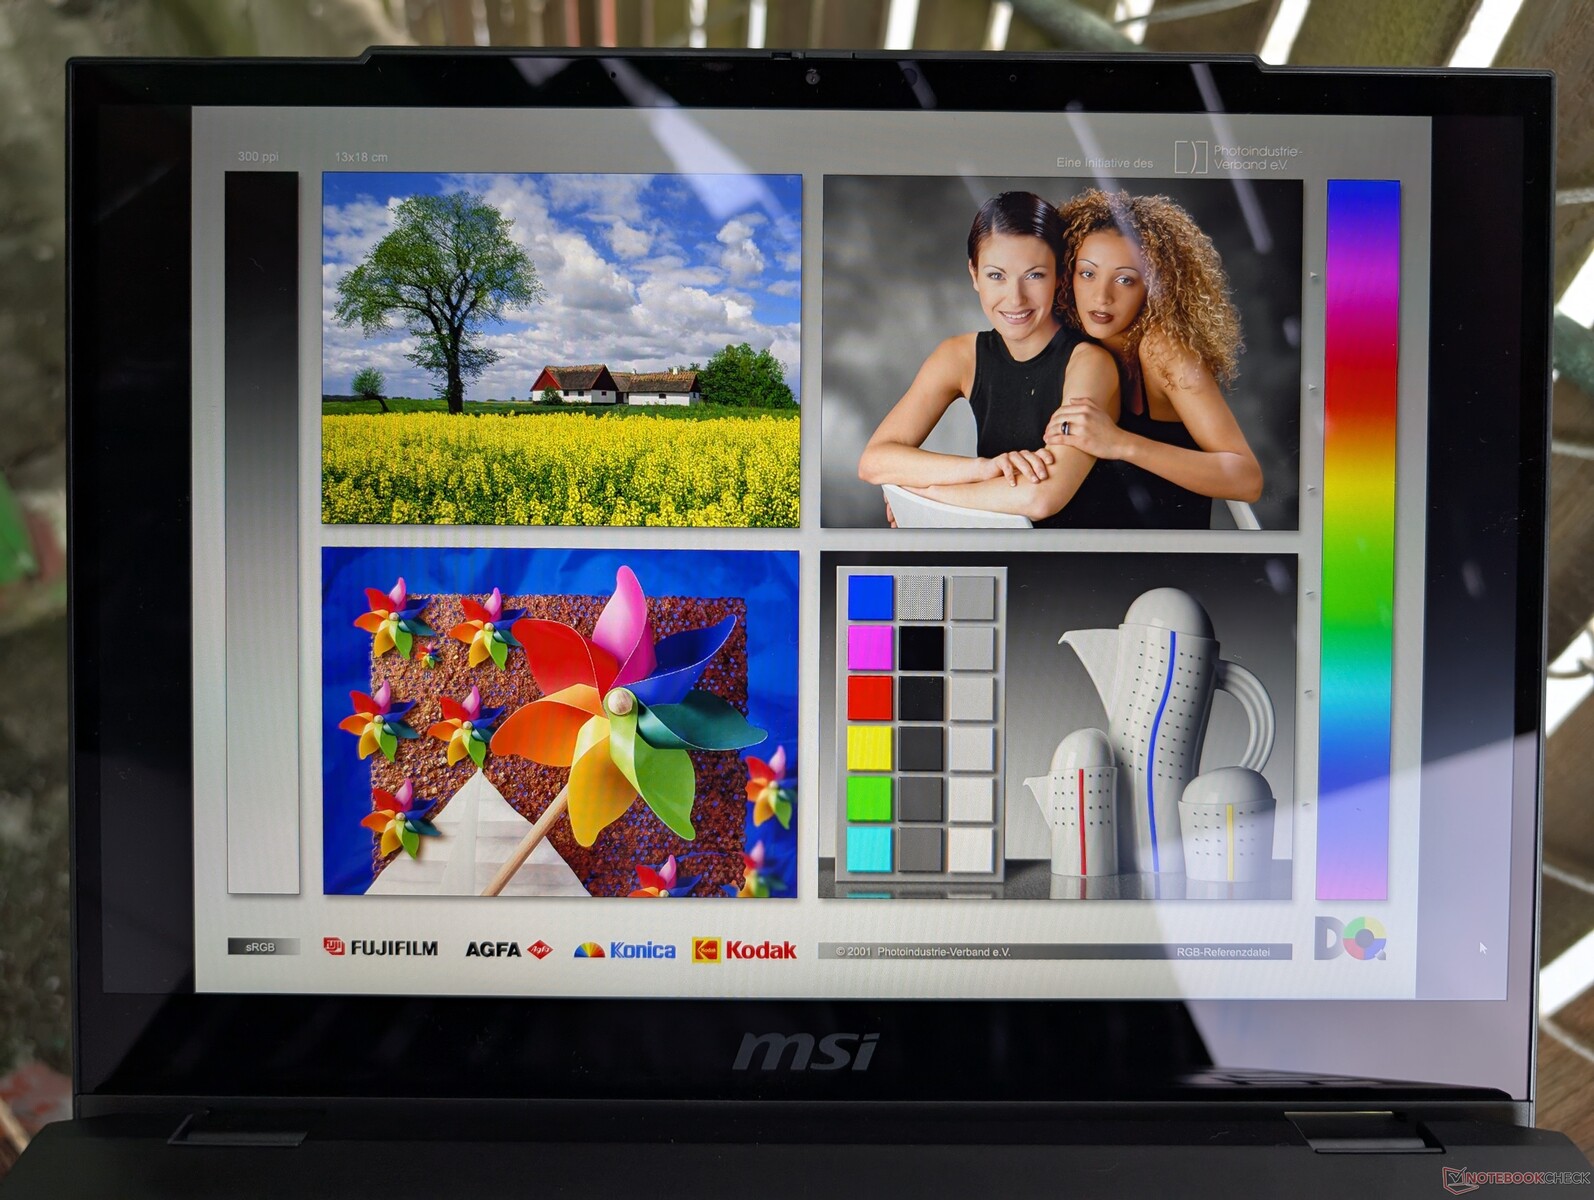
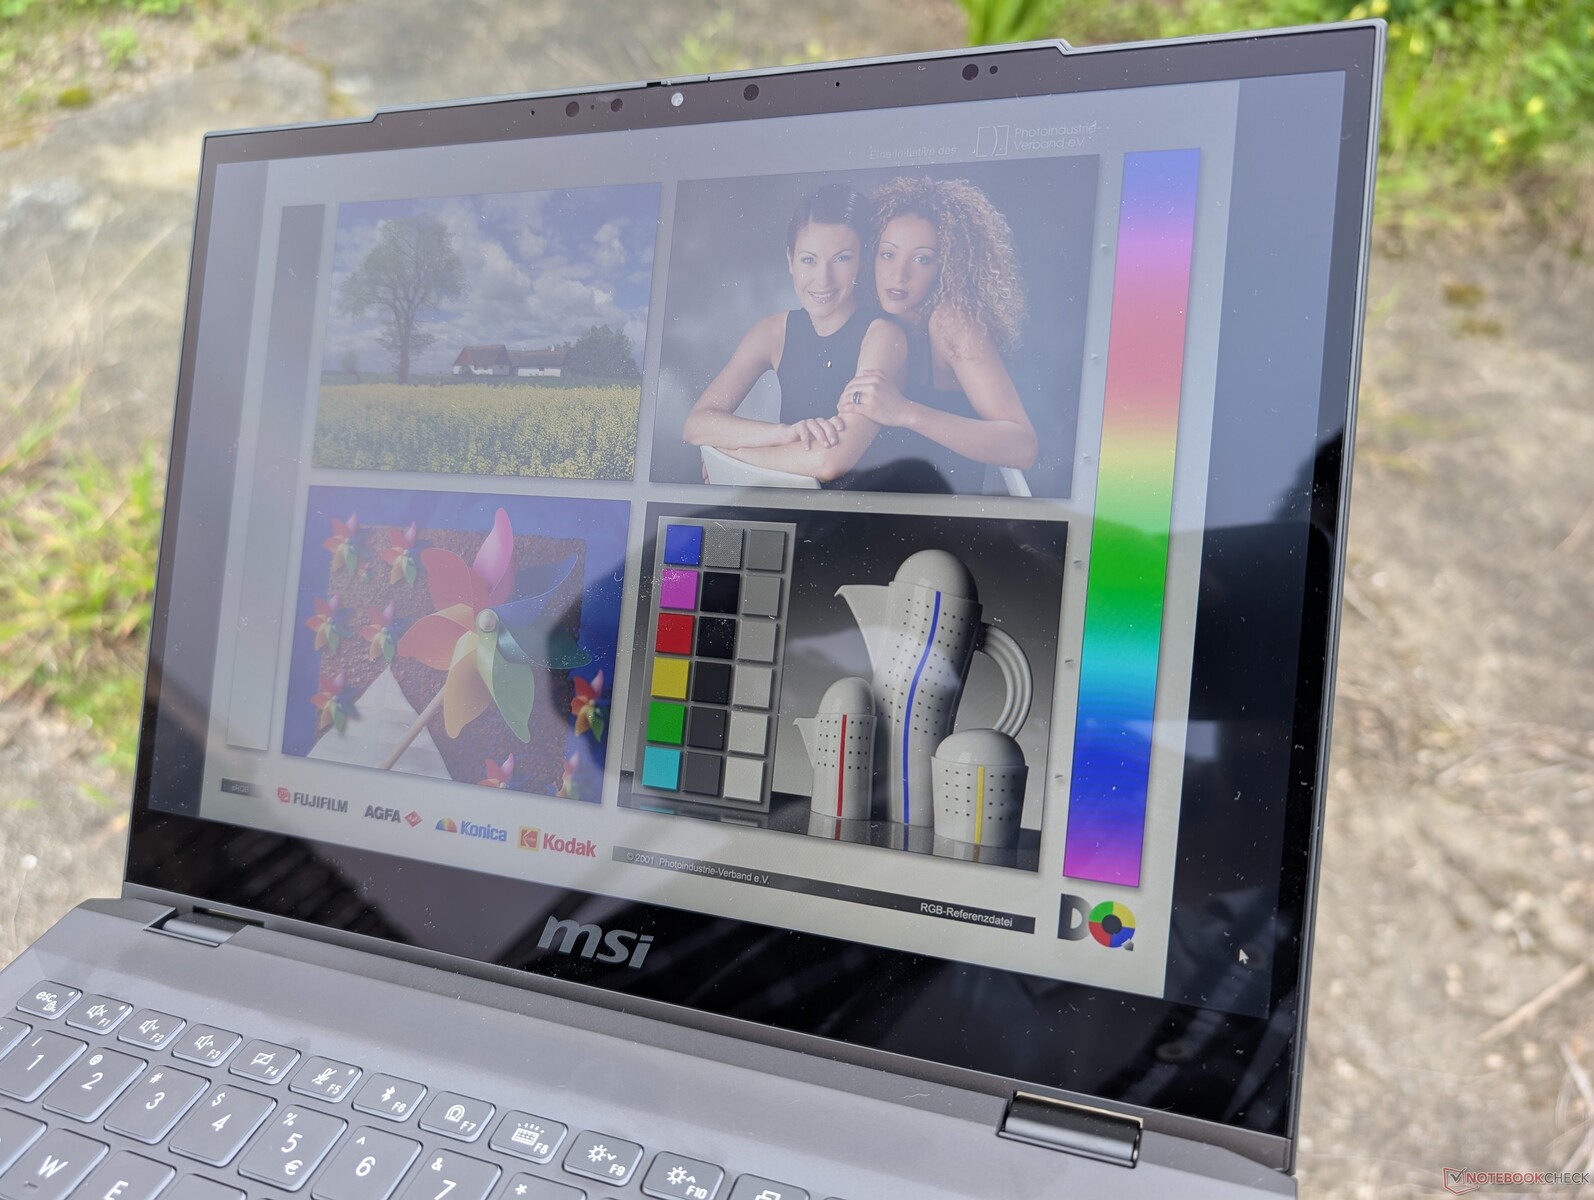
Affichage - Moyen pour le prix
Notre appareil utilise un écran Chi Mei de 60 Hz au lieu de l'écran Sharp de 120 Hz du modèle 2021. L'écran Chi Mei offre des couleurs sRGB similaires, mais avec des niveaux de contraste légèrement inférieurs. Les temps de réponse noir-blanc et gris-gris sont toujours très lents, même en dehors des jeux vidéo.
| |||||||||||||||||||||||||
Homogénéité de la luminosité: 88 %
Valeur mesurée au centre, sur batterie: 405.2 cd/m²
Contraste: 1192:1 (Valeurs des noirs: 0.34 cd/m²)
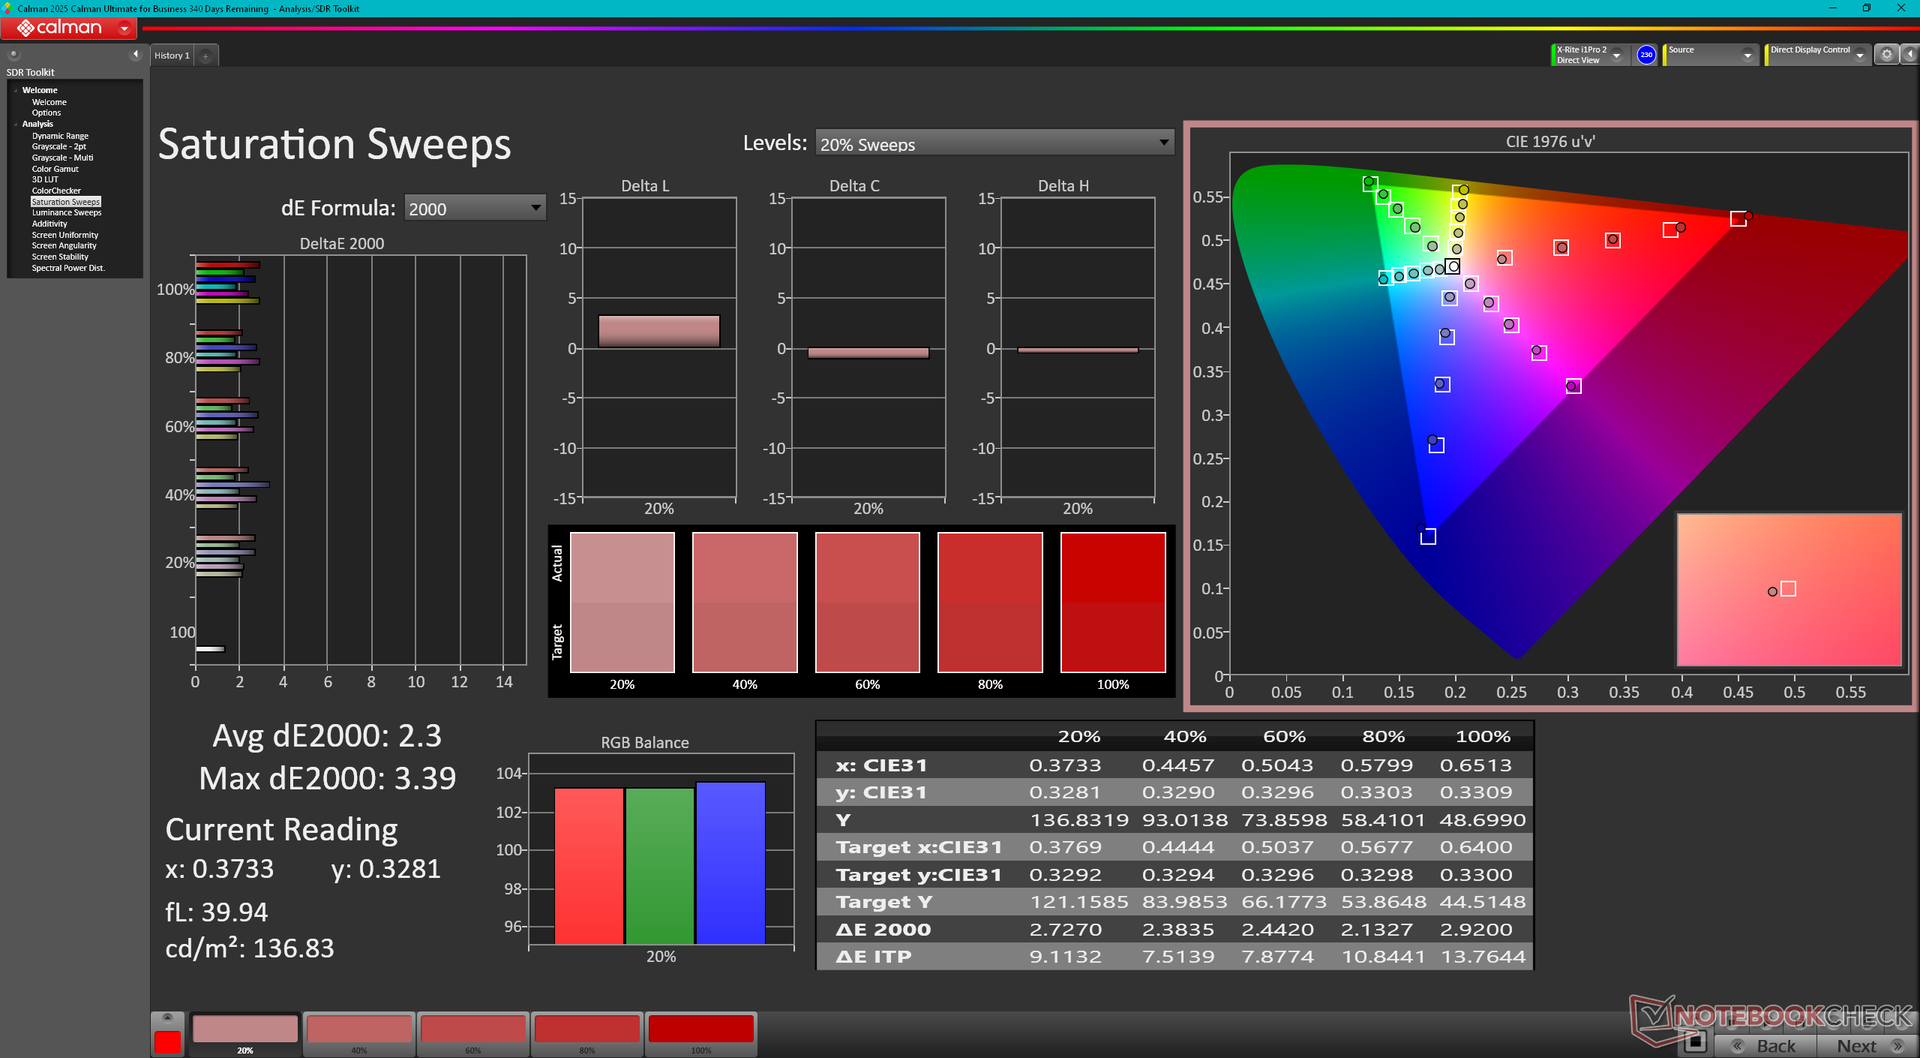
ΔE Color 2.4 | 0.5-29.43 Ø4.89, calibrated: 0.54
ΔE Greyscale 1.9 | 0.5-98 Ø5.1
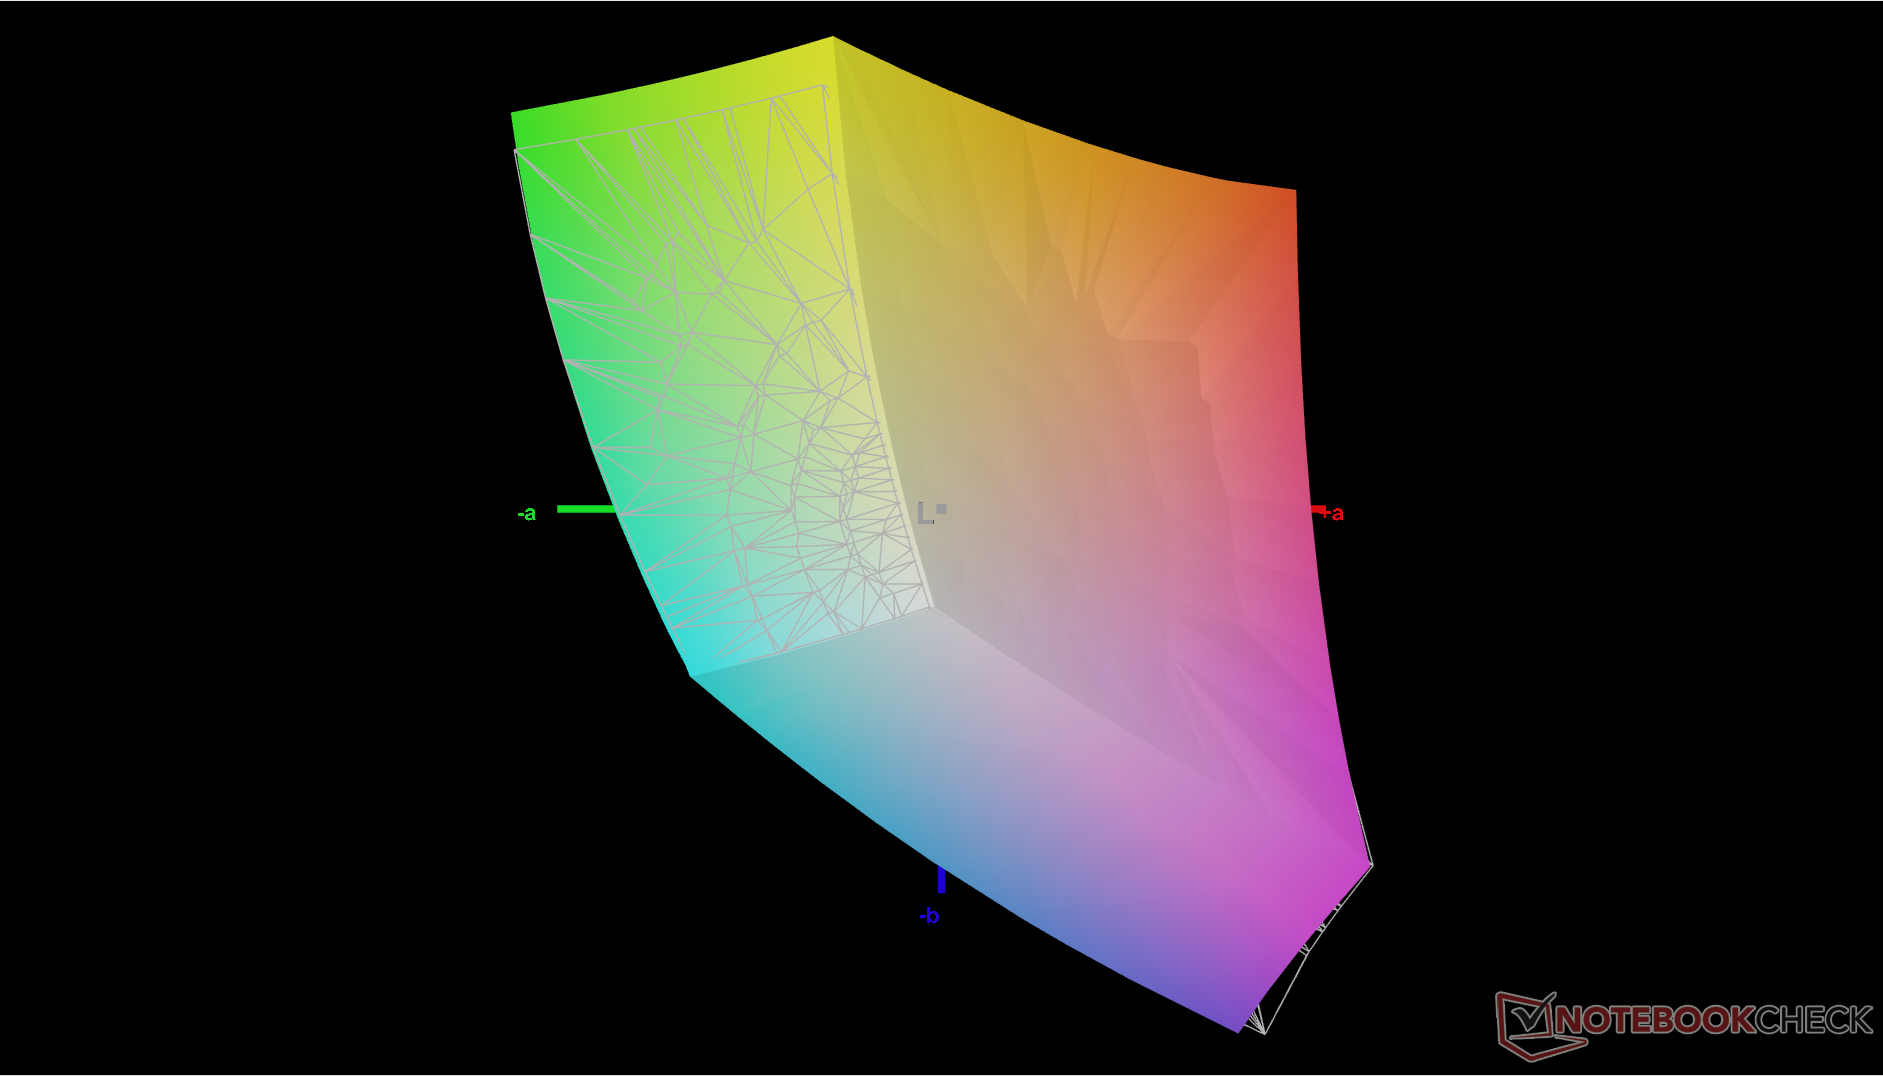
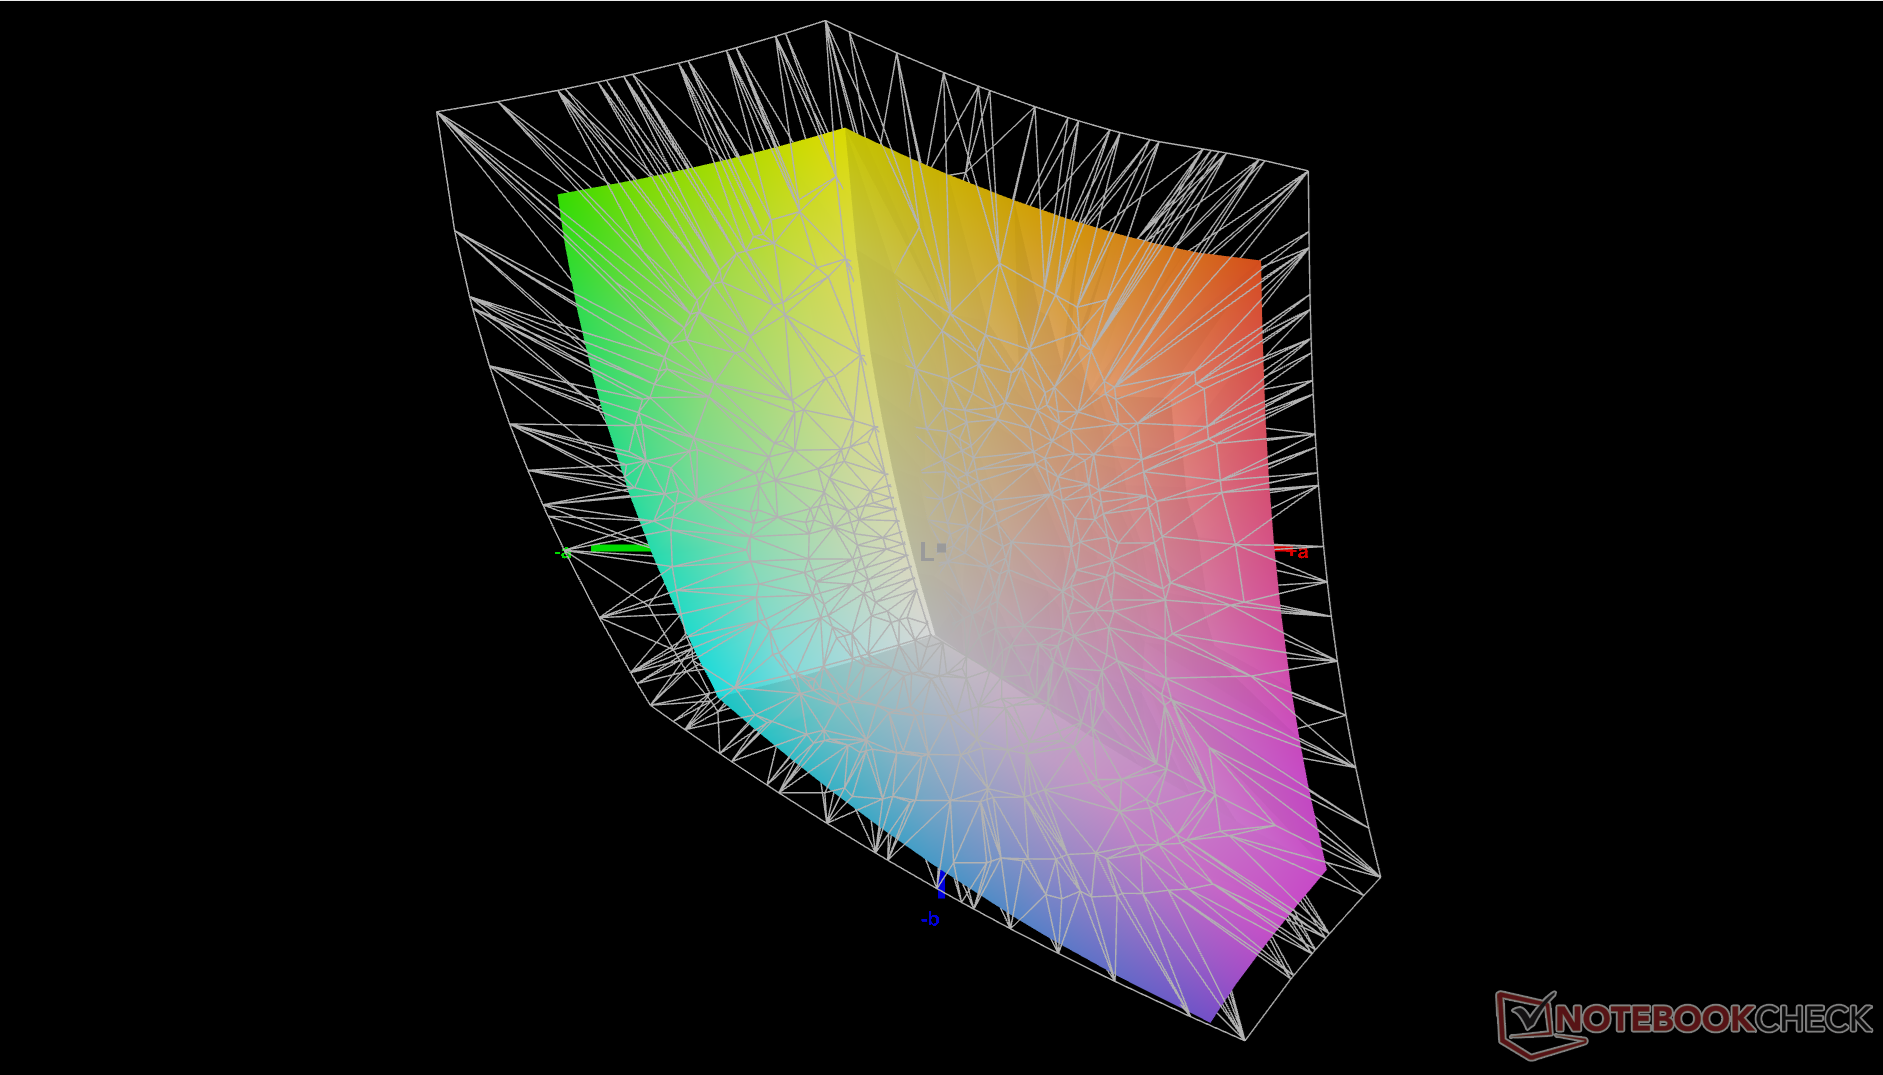
73.1% AdobeRGB 1998 (Argyll 2.2.0 3D)
98.6% sRGB (Argyll 2.2.0 3D)
71.6% Display P3 (Argyll 2.2.0 3D)
Gamma: 2
| 352184 MSI Summit E13 AI Evo A1MTG CMN13C6, IPS, 1920x1200, 13.3", 60 Hz | 322533 MSI Summit E13 Flip Evo A11MT Sharp LQ134N1JW53, IPS, 1920x1200, 13.4", 120 Hz | 345702 Lenovo Yoga Book 9 13IMU9 SDC ATNA33AA02-0, OLED, 2880x1800, 13.3", 60 Hz | 341895 Lenovo ThinkPad L13 Yoga G4 i7-1355U NV133WUM-N61, IPS, 1920x1200, 13.3", 60 Hz | 334015 HP Elite Dragonfly Folio 13.5 G3 Chi Mei CMN13C0, IPS, 1920x1280, 13.5", 60 Hz | 333549 Dell Latitude 9330 AU Optronics B133QAA, IPS, 2560x1600, 13.3", 60 Hz | |
|---|---|---|---|---|---|---|
| Display | -2% | 24% | -0% | -3% | 5% | |
| Display P3 Coverage | 71.6 | 69.8 -3% | 99.7 39% | 71.6 0% | 68.3 -5% | 77.8 9% |
| sRGB Coverage | 98.6 | 98.8 0% | 100 1% | 99.8 1% | 98.6 0% | 99.9 1% |
| AdobeRGB 1998 Coverage | 73.1 | 70.6 -3% | 97 33% | 71.9 -2% | 70.2 -4% | 77.5 6% |
| Response Times | -16% | 96% | 52% | -19% | -29% | |
| Response Time Grey 50% / Grey 80% * | 60 ? | 64 ? -7% | 1.88 ? 97% | 27.3 ? 54% | 66.8 ? -11% | 67.6 ? -13% |
| Response Time Black / White * | 35.1 ? | 44 ? -25% | 2.1 ? 94% | 17.9 ? 49% | 44.4 ? -26% | 50.4 ? -44% |
| PWM Frequency | 60 ? | |||||
| Screen | -3% | -34% | -25% | -6% | -12% | |
| Brightness middle | 405.2 | 551.3 36% | 362.6 -11% | 278.1 -31% | 369.5 -9% | 542.3 34% |
| Brightness | 372 | 517 39% | 368 -1% | 280 -25% | 350 -6% | 516 39% |
| Brightness Distribution | 88 | 91 3% | 97 10% | 92 5% | 87 -1% | 85 -3% |
| Black Level * | 0.34 | 0.37 -9% | 0.34 -0% | 0.24 29% | 0.38 -12% | |
| Contrast | 1192 | 1490 25% | 818 -31% | 1540 29% | 1427 20% | |
| Colorchecker dE 2000 * | 2.4 | 1.45 40% | 4.66 -94% | 2.6 -8% | 2.3 4% | 3.18 -33% |
| Colorchecker dE 2000 max. * | 3.56 | 2.86 20% | 7.25 -104% | 4.81 -35% | 4.34 -22% | 6.05 -70% |
| Colorchecker dE 2000 calibrated * | 0.54 | 1.7 -215% | 0.56 -4% | 0.51 6% | 0.6 -11% | 0.67 -24% |
| Greyscale dE 2000 * | 1.9 | 1.3 32% | 2.6 -37% | 3.9 -105% | 3.1 -63% | 3.1 -63% |
| Gamma | 2 110% | 2.14 103% | 2.2 100% | 2.29 96% | 2.1 105% | 2.08 106% |
| CCT | 6503 100% | 6580 99% | 6055 107% | 5877 111% | 6248 104% | 6140 106% |
| Color Space (Percent of AdobeRGB 1998) | 65 | |||||
| Color Space (Percent of sRGB) | 99 | |||||
| Moyenne finale (programmes/paramètres) | -7% /
-5% | 29% /
2% | 9% /
-9% | -9% /
-7% | -12% /
-11% |
* ... Moindre est la valeur, meilleures sont les performances
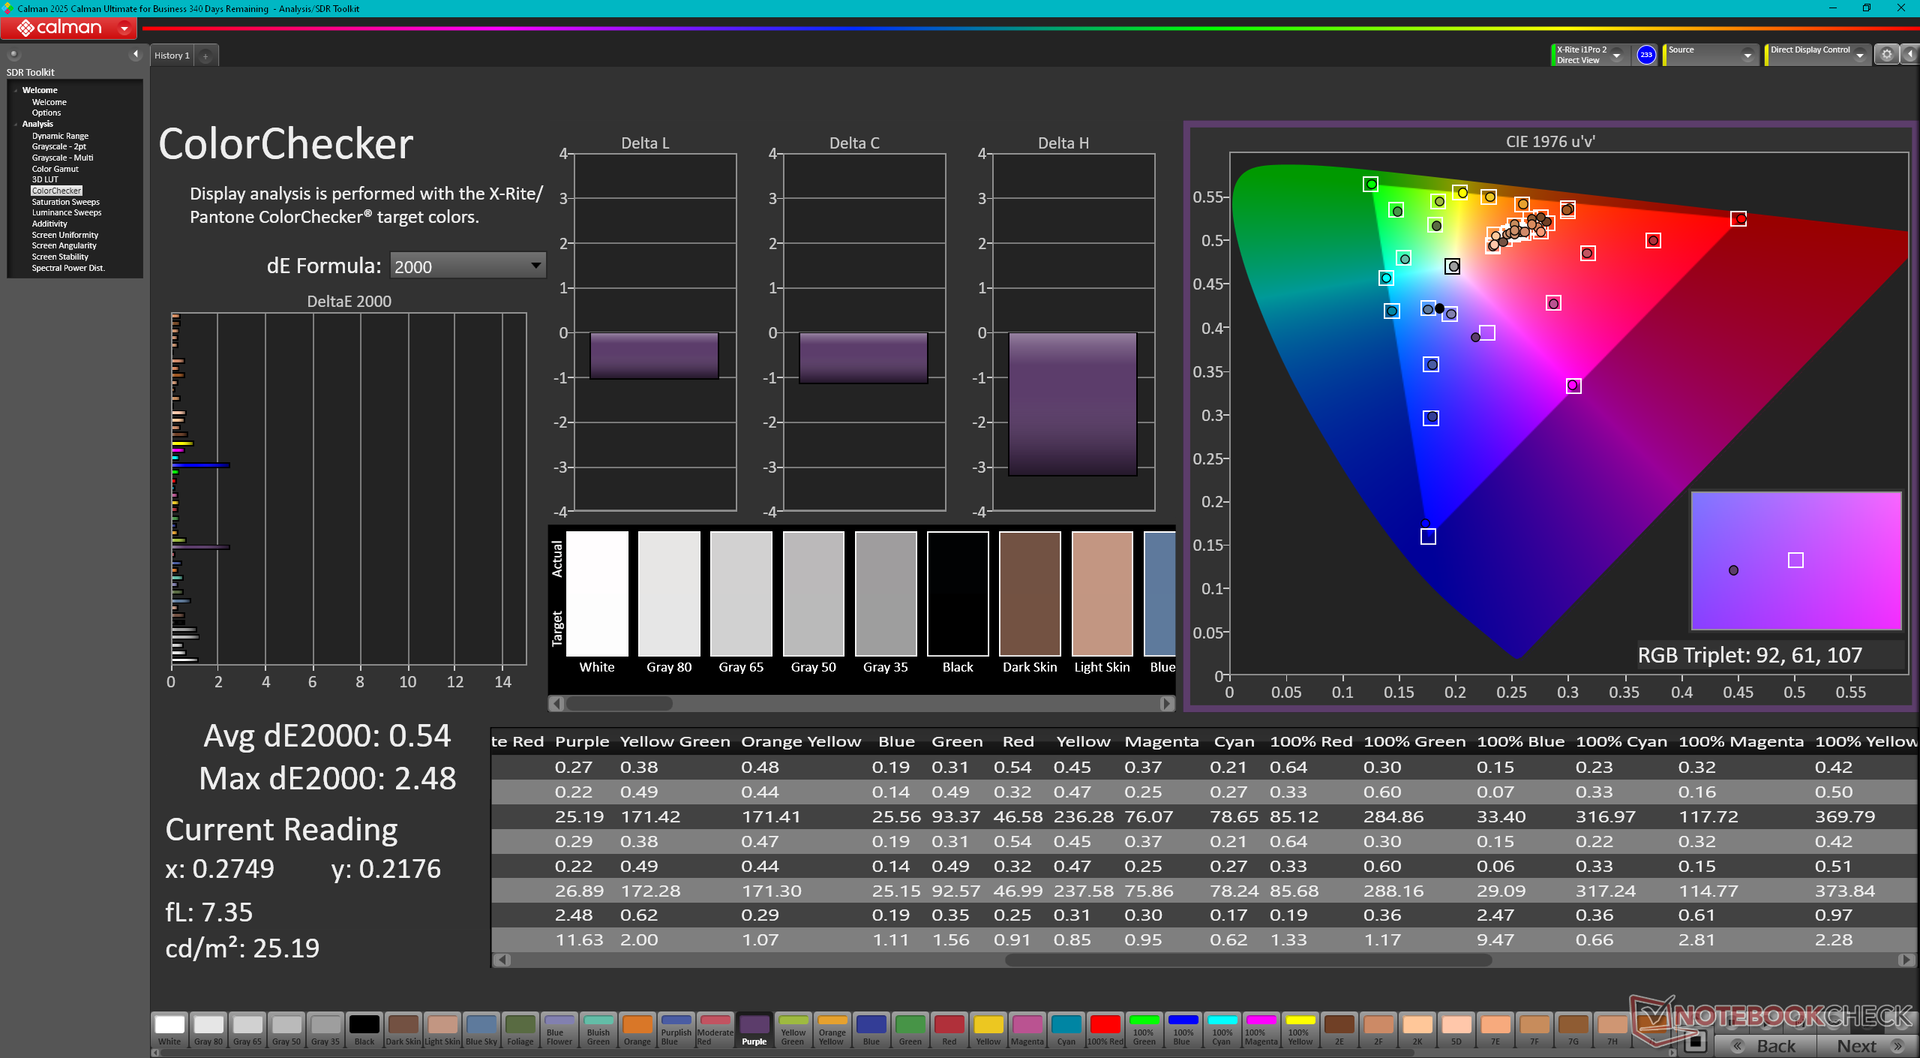
L'écran peut être calibré de manière décente, mais notre propre calibrage X-Rite améliorerait encore les couleurs. Les valeurs moyennes de DeltaE en niveaux de gris et en couleurs peuvent être aussi basses que 0,6 et 0,54, respectivement.

Temps de réponse de l'écran
| ↔ Temps de réponse noir à blanc | ||
|---|---|---|
| 35.1 ms ... hausse ↗ et chute ↘ combinées | ↗ 17 ms hausse | 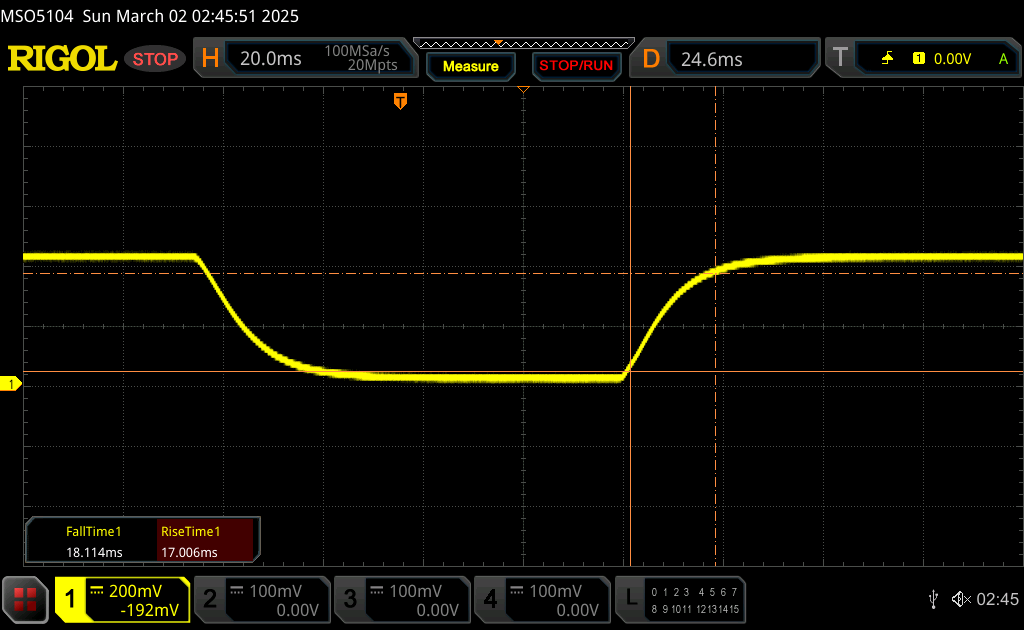 |
| ↘ 18.1 ms chute | ||
| L'écran souffre de latences très élevées, à éviter pour le jeu. En comparaison, tous les appareils testés affichent entre 0.1 (minimum) et 240 (maximum) ms. » 92 % des appareils testés affichent de meilleures performances. Cela signifie que les latences relevées sont moins bonnes que la moyenne (20.8 ms) de tous les appareils testés. | ||
| ↔ Temps de réponse gris 50% à gris 80% | ||
| 60 ms ... hausse ↗ et chute ↘ combinées | ↗ 27.2 ms hausse | 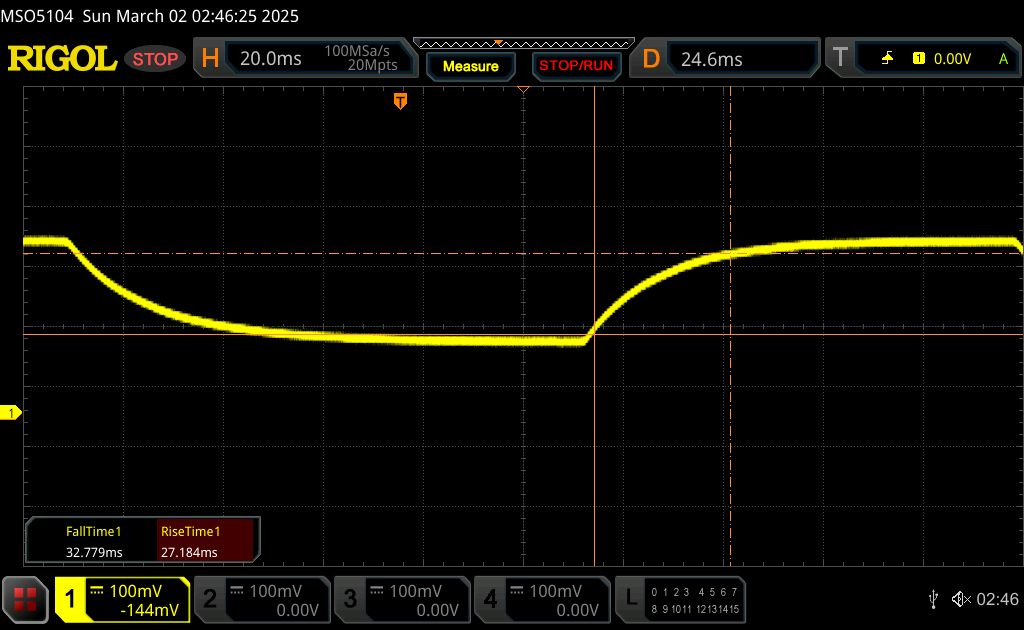 |
| ↘ 32.8 ms chute | ||
| L'écran souffre de latences très élevées, à éviter pour le jeu. En comparaison, tous les appareils testés affichent entre 0.165 (minimum) et 636 (maximum) ms. » 95 % des appareils testés affichent de meilleures performances. Cela signifie que les latences relevées sont moins bonnes que la moyenne (32.6 ms) de tous les appareils testés. | ||
Scintillement / MLI (Modulation de largeur d'impulsion)
| Scintillement / MLI (Modulation de largeur d'impulsion) non décelé | 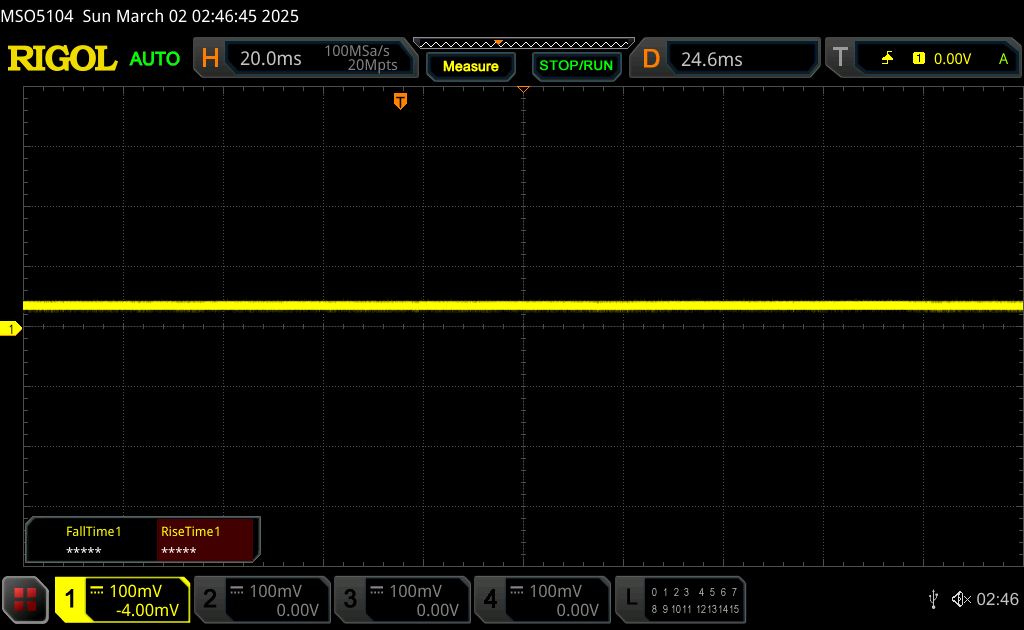 | ||
En comparaison, 53 % des appareils testés n'emploient pas MDI pour assombrir leur écran. Nous avons relevé une moyenne à 8588 (minimum : 5 - maximum : 343500) Hz dans le cas où une MDI était active. | |||

Performance - Core Ultra-H est trop difficile à gérer
Conditions d'essai
Nous avons réglé Windows sur le mode Performance et MSI Center sur le mode Performance extrême avant d'effectuer les tests ci-dessous.
Processeur
Les performances brutes du processeur multithread ont chuté de plus de 20 % après la première boucle de notre test de stress CineBench R15 xT. Par conséquent, notre système serait environ 20 % plus lent que l'ordinateur portable moyen de notre base de données équipé du même processeur Core Ultra 7 155H de notre base de données.
Cinebench R15 Multi Loop
Cinebench R23: Multi Core | Single Core
Cinebench R20: CPU (Multi Core) | CPU (Single Core)
Cinebench R15: CPU Multi 64Bit | CPU Single 64Bit
Blender: v2.79 BMW27 CPU
7-Zip 18.03: 7z b 4 | 7z b 4 -mmt1
Geekbench 6.4: Multi-Core | Single-Core
Geekbench 5.5: Multi-Core | Single-Core
HWBOT x265 Benchmark v2.2: 4k Preset
LibreOffice : 20 Documents To PDF
R Benchmark 2.5: Overall mean
| Geekbench 6.4 / Multi-Core | |
| Asus ROG Flow Z13 GZ302EA-RU073W | |
| Moyenne Intel Core Ultra 7 155H (7732 - 13656, n=54) | |
| Framework Laptop 13.5 Ryzen 7 7840U | |
| MSI Prestige 13 AI Plus Evo A2VMG | |
| MSI Summit E13 AI Evo A1MTG | |
| Lenovo Yoga Book 9 13IMU9 | |
| Lenovo ThinkPad L13 Yoga G4 i7-1355U | |
| Geekbench 6.4 / Single-Core | |
| Asus ROG Flow Z13 GZ302EA-RU073W | |
| MSI Prestige 13 AI Plus Evo A2VMG | |
| Framework Laptop 13.5 Ryzen 7 7840U | |
| Lenovo ThinkPad L13 Yoga G4 i7-1355U | |
| Moyenne Intel Core Ultra 7 155H (1901 - 2473, n=51) | |
| Lenovo Yoga Book 9 13IMU9 | |
| MSI Summit E13 AI Evo A1MTG | |
* ... Moindre est la valeur, meilleures sont les performances
AIDA64: FP32 Ray-Trace | FPU Julia | CPU SHA3 | CPU Queen | FPU SinJulia | FPU Mandel | CPU AES | CPU ZLib | FP64 Ray-Trace | CPU PhotoWorxx
| Performance Rating | |
| Moyenne Intel Core Ultra 7 155H | |
| MSI Summit E13 AI Evo A1MTG | |
| Lenovo Yoga Book 9 13IMU9 | |
| MSI Summit E13 Flip Evo A11MT | |
| HP Elite Dragonfly Folio 13.5 G3 | |
| Lenovo ThinkPad L13 Yoga G4 i7-1355U | |
| Dell Latitude 9330 | |
| AIDA64 / FP32 Ray-Trace | |
| Moyenne Intel Core Ultra 7 155H (6670 - 18470, n=49) | |
| MSI Summit E13 AI Evo A1MTG | |
| Lenovo Yoga Book 9 13IMU9 | |
| MSI Summit E13 Flip Evo A11MT | |
| Dell Latitude 9330 | |
| HP Elite Dragonfly Folio 13.5 G3 | |
| Lenovo ThinkPad L13 Yoga G4 i7-1355U | |
| AIDA64 / FPU Julia | |
| Moyenne Intel Core Ultra 7 155H (40905 - 93181, n=49) | |
| MSI Summit E13 AI Evo A1MTG | |
| Lenovo Yoga Book 9 13IMU9 | |
| HP Elite Dragonfly Folio 13.5 G3 | |
| Dell Latitude 9330 | |
| Lenovo ThinkPad L13 Yoga G4 i7-1355U | |
| MSI Summit E13 Flip Evo A11MT | |
| AIDA64 / CPU SHA3 | |
| Moyenne Intel Core Ultra 7 155H (1940 - 4436, n=49) | |
| MSI Summit E13 AI Evo A1MTG | |
| Lenovo Yoga Book 9 13IMU9 | |
| MSI Summit E13 Flip Evo A11MT | |
| Dell Latitude 9330 | |
| Lenovo ThinkPad L13 Yoga G4 i7-1355U | |
| HP Elite Dragonfly Folio 13.5 G3 | |
| AIDA64 / CPU Queen | |
| Moyenne Intel Core Ultra 7 155H (64698 - 94181, n=49) | |
| MSI Summit E13 AI Evo A1MTG | |
| HP Elite Dragonfly Folio 13.5 G3 | |
| Lenovo ThinkPad L13 Yoga G4 i7-1355U | |
| MSI Summit E13 Flip Evo A11MT | |
| Dell Latitude 9330 | |
| Lenovo Yoga Book 9 13IMU9 | |
| AIDA64 / FPU SinJulia | |
| Moyenne Intel Core Ultra 7 155H (5639 - 10647, n=49) | |
| MSI Summit E13 AI Evo A1MTG | |
| Lenovo Yoga Book 9 13IMU9 | |
| MSI Summit E13 Flip Evo A11MT | |
| HP Elite Dragonfly Folio 13.5 G3 | |
| Lenovo ThinkPad L13 Yoga G4 i7-1355U | |
| Dell Latitude 9330 | |
| AIDA64 / FPU Mandel | |
| Moyenne Intel Core Ultra 7 155H (18236 - 47685, n=49) | |
| MSI Summit E13 AI Evo A1MTG | |
| Lenovo Yoga Book 9 13IMU9 | |
| MSI Summit E13 Flip Evo A11MT | |
| HP Elite Dragonfly Folio 13.5 G3 | |
| Dell Latitude 9330 | |
| Lenovo ThinkPad L13 Yoga G4 i7-1355U | |
| AIDA64 / CPU AES | |
| Moyenne Intel Core Ultra 7 155H (45713 - 152179, n=49) | |
| MSI Summit E13 Flip Evo A11MT | |
| MSI Summit E13 AI Evo A1MTG | |
| Lenovo Yoga Book 9 13IMU9 | |
| HP Elite Dragonfly Folio 13.5 G3 | |
| Lenovo ThinkPad L13 Yoga G4 i7-1355U | |
| Dell Latitude 9330 | |
| AIDA64 / CPU ZLib | |
| Moyenne Intel Core Ultra 7 155H (557 - 1250, n=49) | |
| MSI Summit E13 AI Evo A1MTG | |
| Lenovo Yoga Book 9 13IMU9 | |
| HP Elite Dragonfly Folio 13.5 G3 | |
| Lenovo ThinkPad L13 Yoga G4 i7-1355U | |
| Dell Latitude 9330 | |
| MSI Summit E13 Flip Evo A11MT | |
| AIDA64 / FP64 Ray-Trace | |
| Moyenne Intel Core Ultra 7 155H (3569 - 9802, n=49) | |
| MSI Summit E13 AI Evo A1MTG | |
| Lenovo Yoga Book 9 13IMU9 | |
| MSI Summit E13 Flip Evo A11MT | |
| Dell Latitude 9330 | |
| HP Elite Dragonfly Folio 13.5 G3 | |
| Lenovo ThinkPad L13 Yoga G4 i7-1355U | |
| AIDA64 / CPU PhotoWorxx | |
| Moyenne Intel Core Ultra 7 155H (32719 - 54223, n=49) | |
| Lenovo Yoga Book 9 13IMU9 | |
| HP Elite Dragonfly Folio 13.5 G3 | |
| MSI Summit E13 AI Evo A1MTG | |
| MSI Summit E13 Flip Evo A11MT | |
| Dell Latitude 9330 | |
| Lenovo ThinkPad L13 Yoga G4 i7-1355U | |
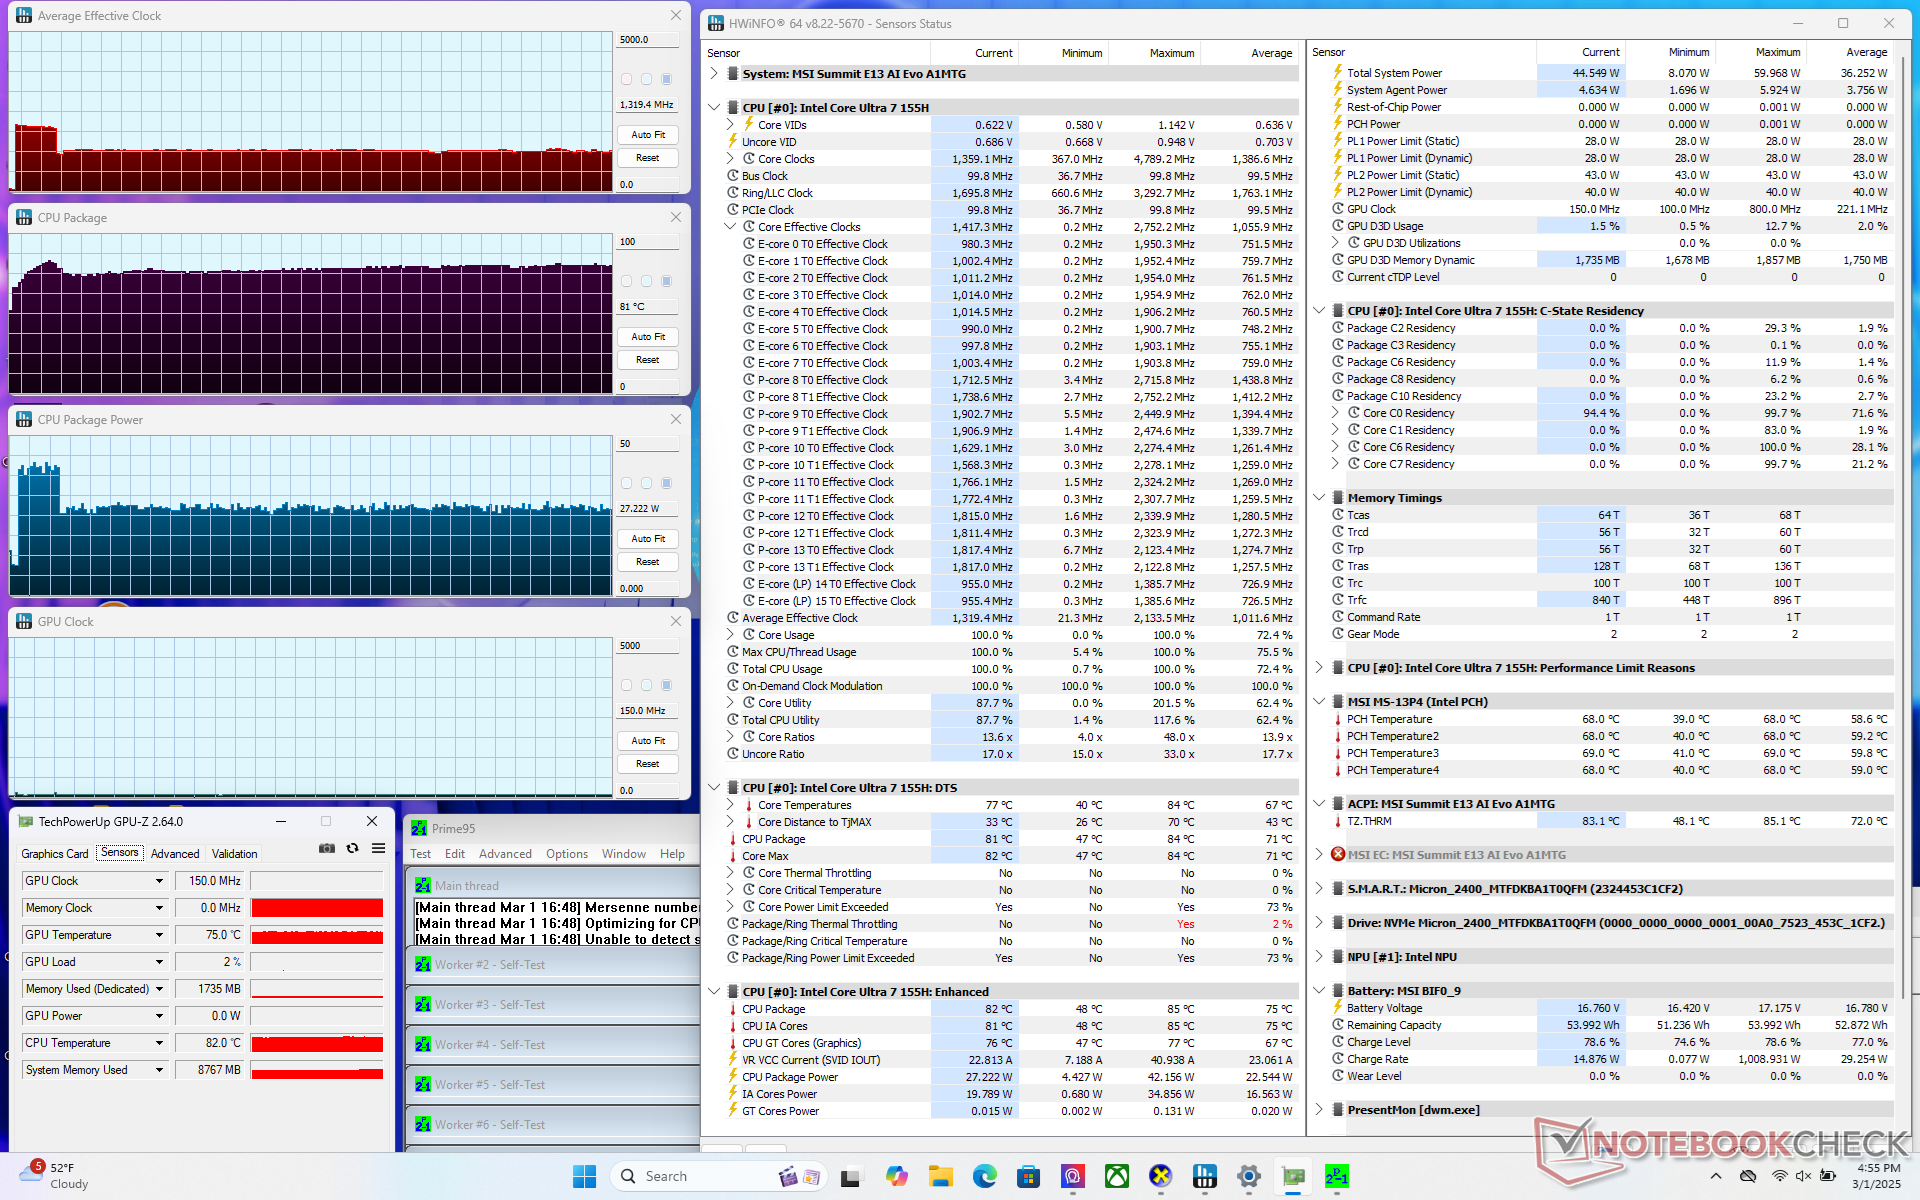
Test de stress
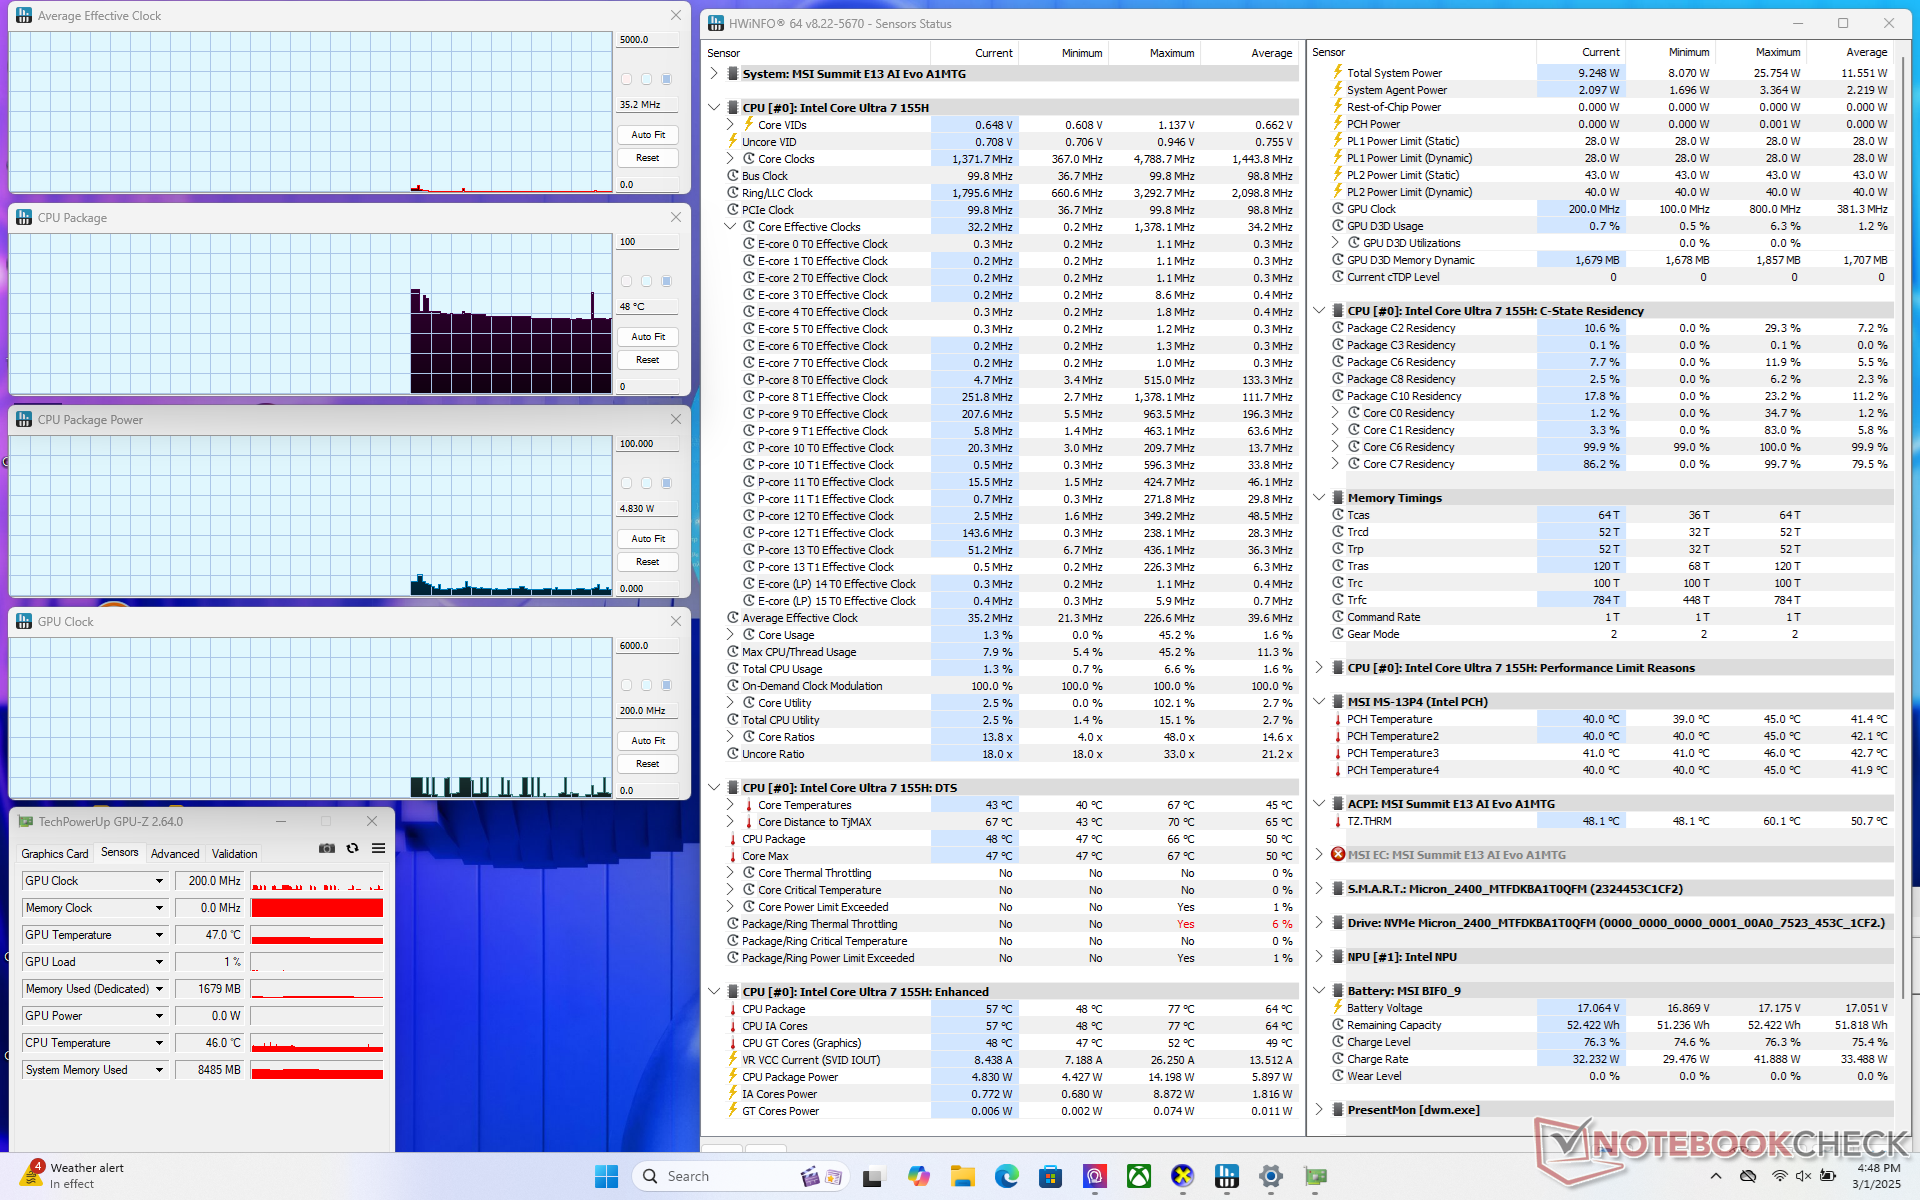
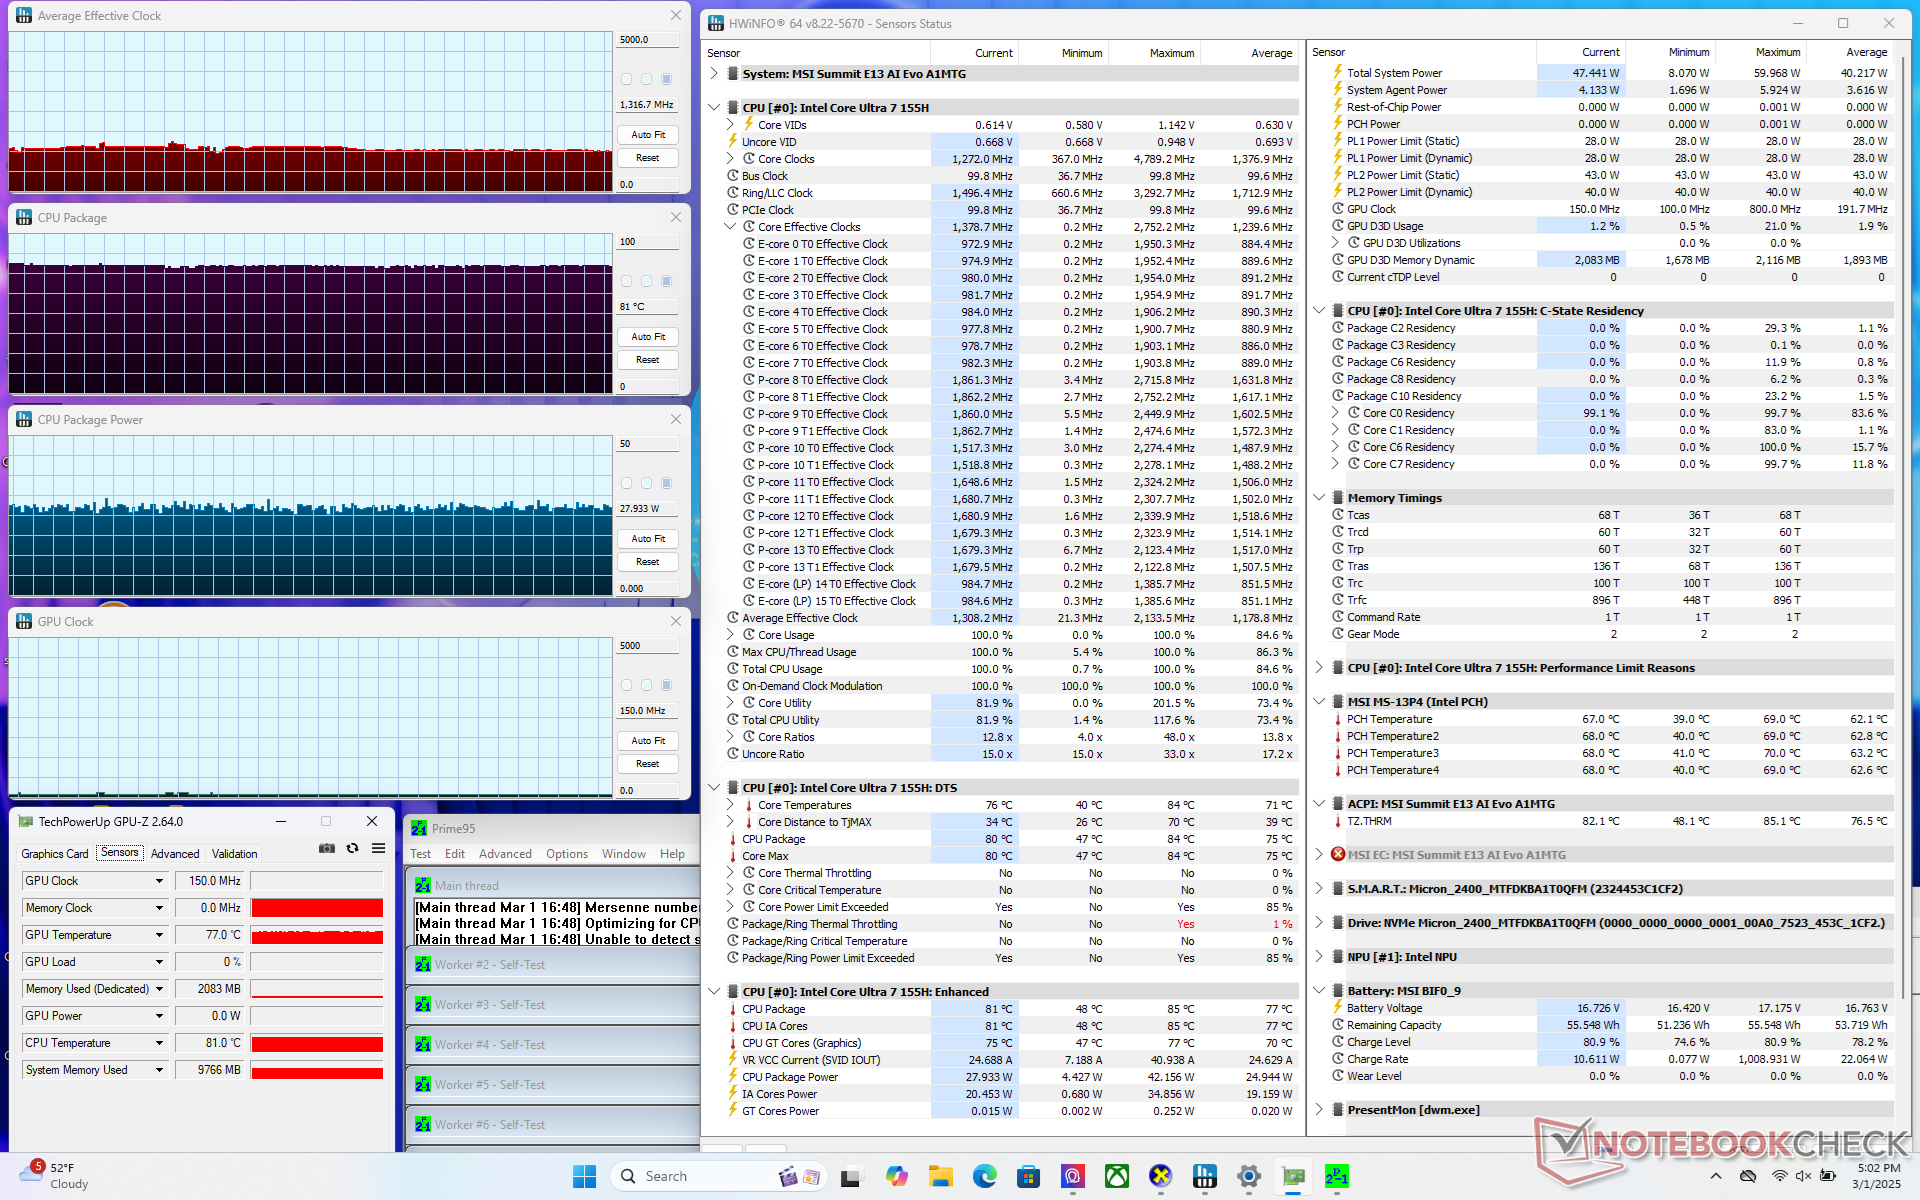
Lors de l'exécution de Prime95, le processeur atteignait 2,1 GHz et 41 W jusqu'à ce qu'il atteigne une température de 84°C quelques instants plus tard. Il se stabilise ensuite à 1,3 GHz et 28 W afin de maintenir la température du cœur à 81 °C lorsque Cooler Boost est activé. La température du cœur n'augmente que de quelques degrés si Cooler Boost est désactivé.
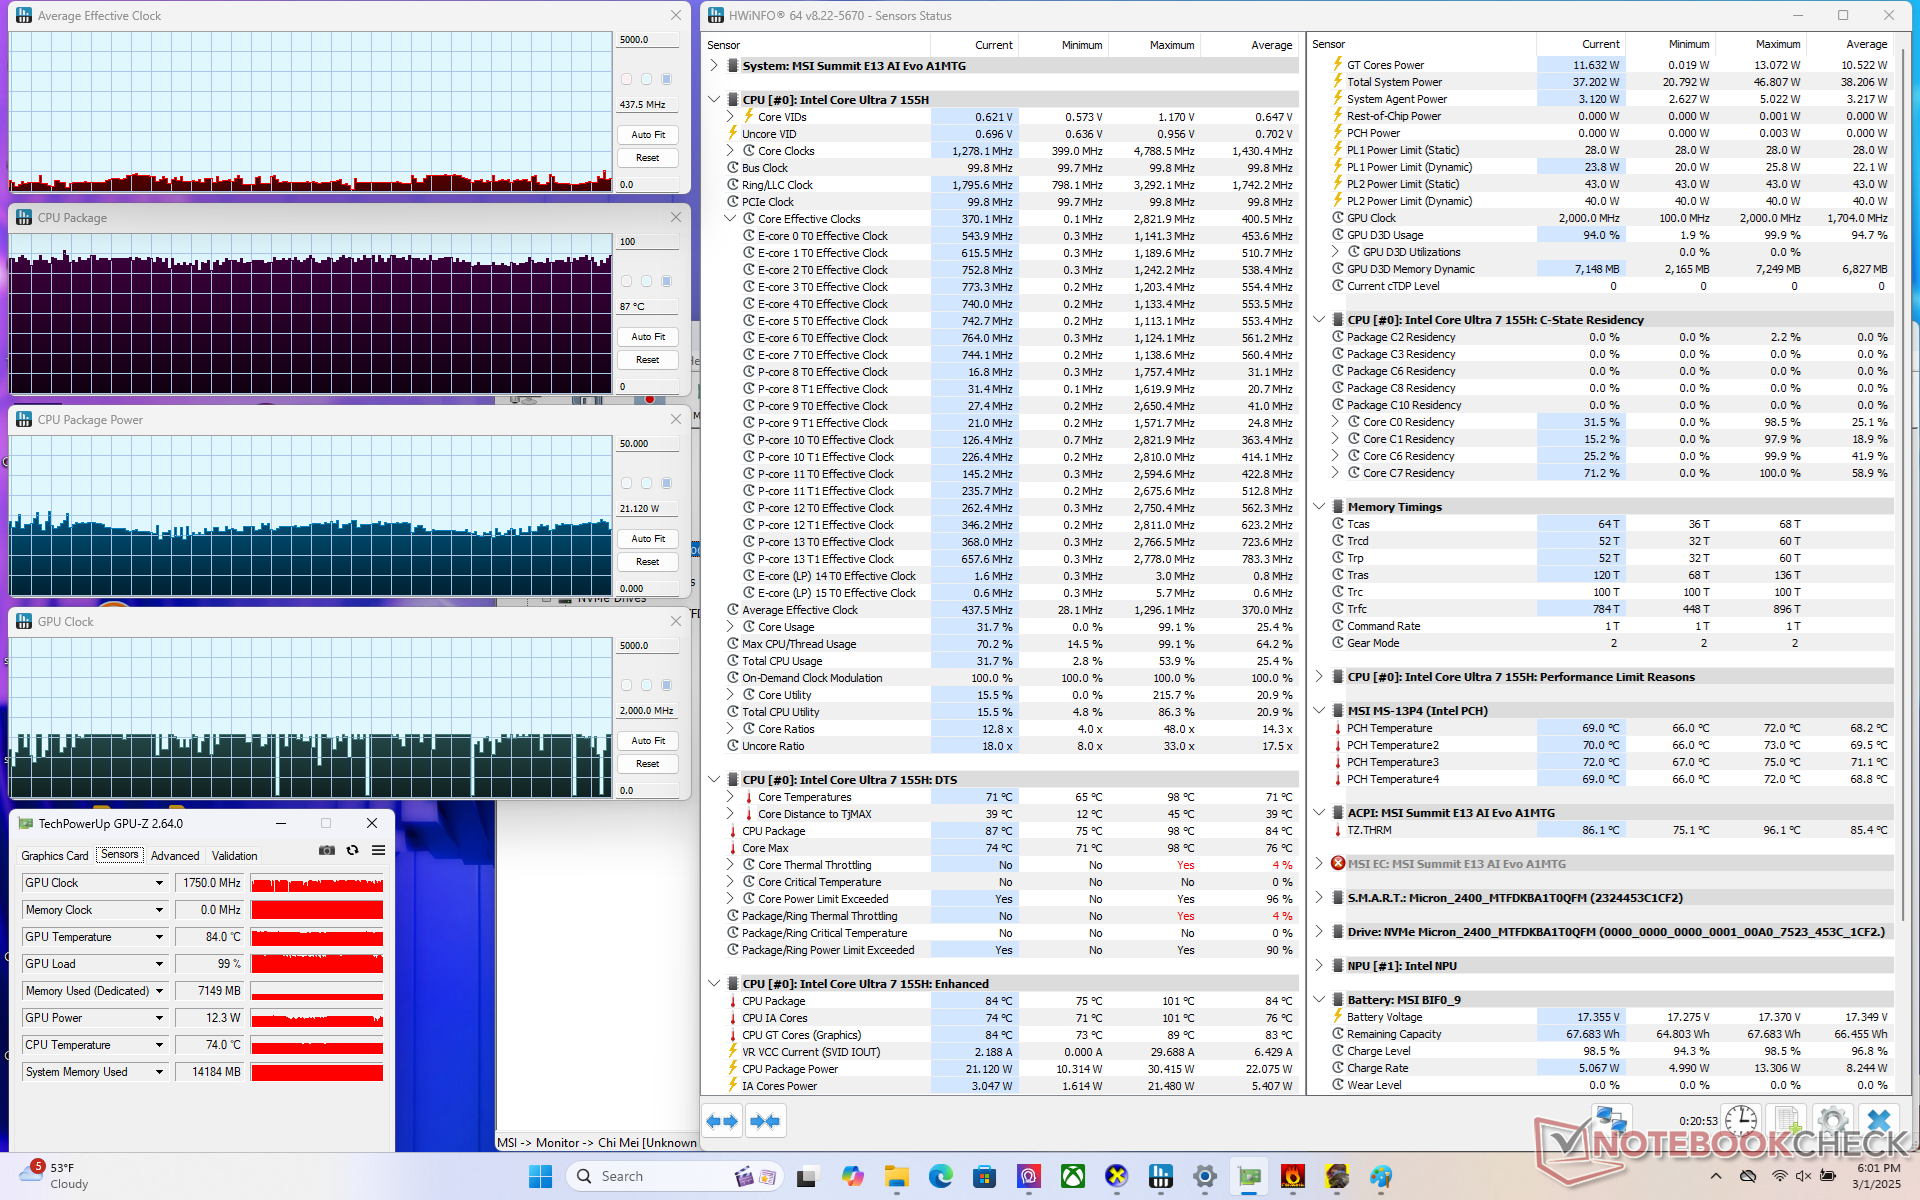
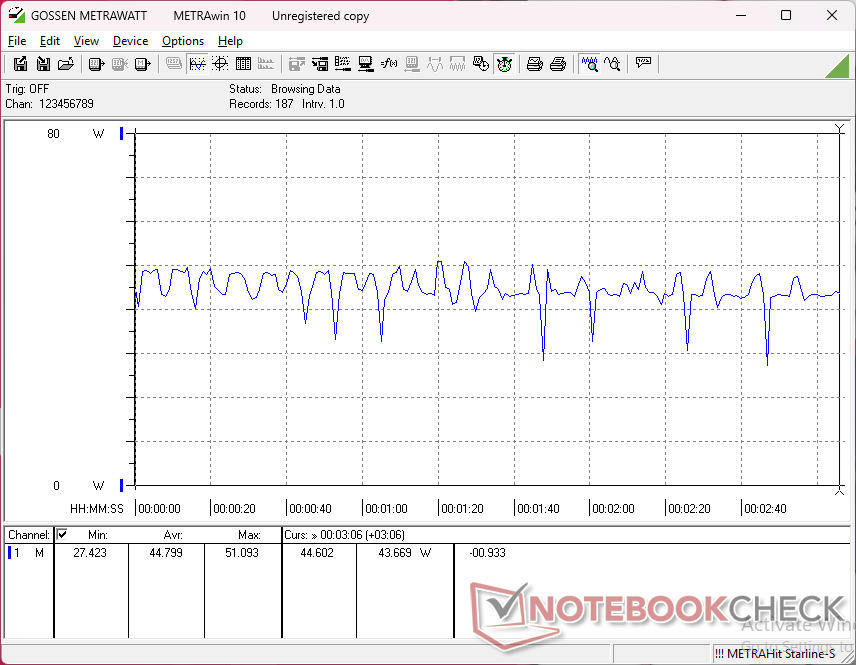
Lors de l'exécution de Cyberpunk 2077, la fréquence d'horloge du GPU est relativement instable, comme le montre la capture d'écran ci-dessous, même lorsque la machine est au ralenti dans le jeu. Cela reflète les taux d'images instables comme indiqué dans la section Performances du GPU ci-dessous. La température du cœur est également très élevée (87°C), soit 10°C de plus que sur le modèle 2021.
| Horloge moyenne du CPU (GHz) | Horloge du GPU (MHz) | Température moyenne du CPU (°C) | |
| Système au repos | -- | -- | 48 |
| Prime95 Stress (Cooler Boost On) | 1.3 | -- | 81 |
| Prime95 Stress (Cooler Boost Off) | 1.3 | -- | 81 |
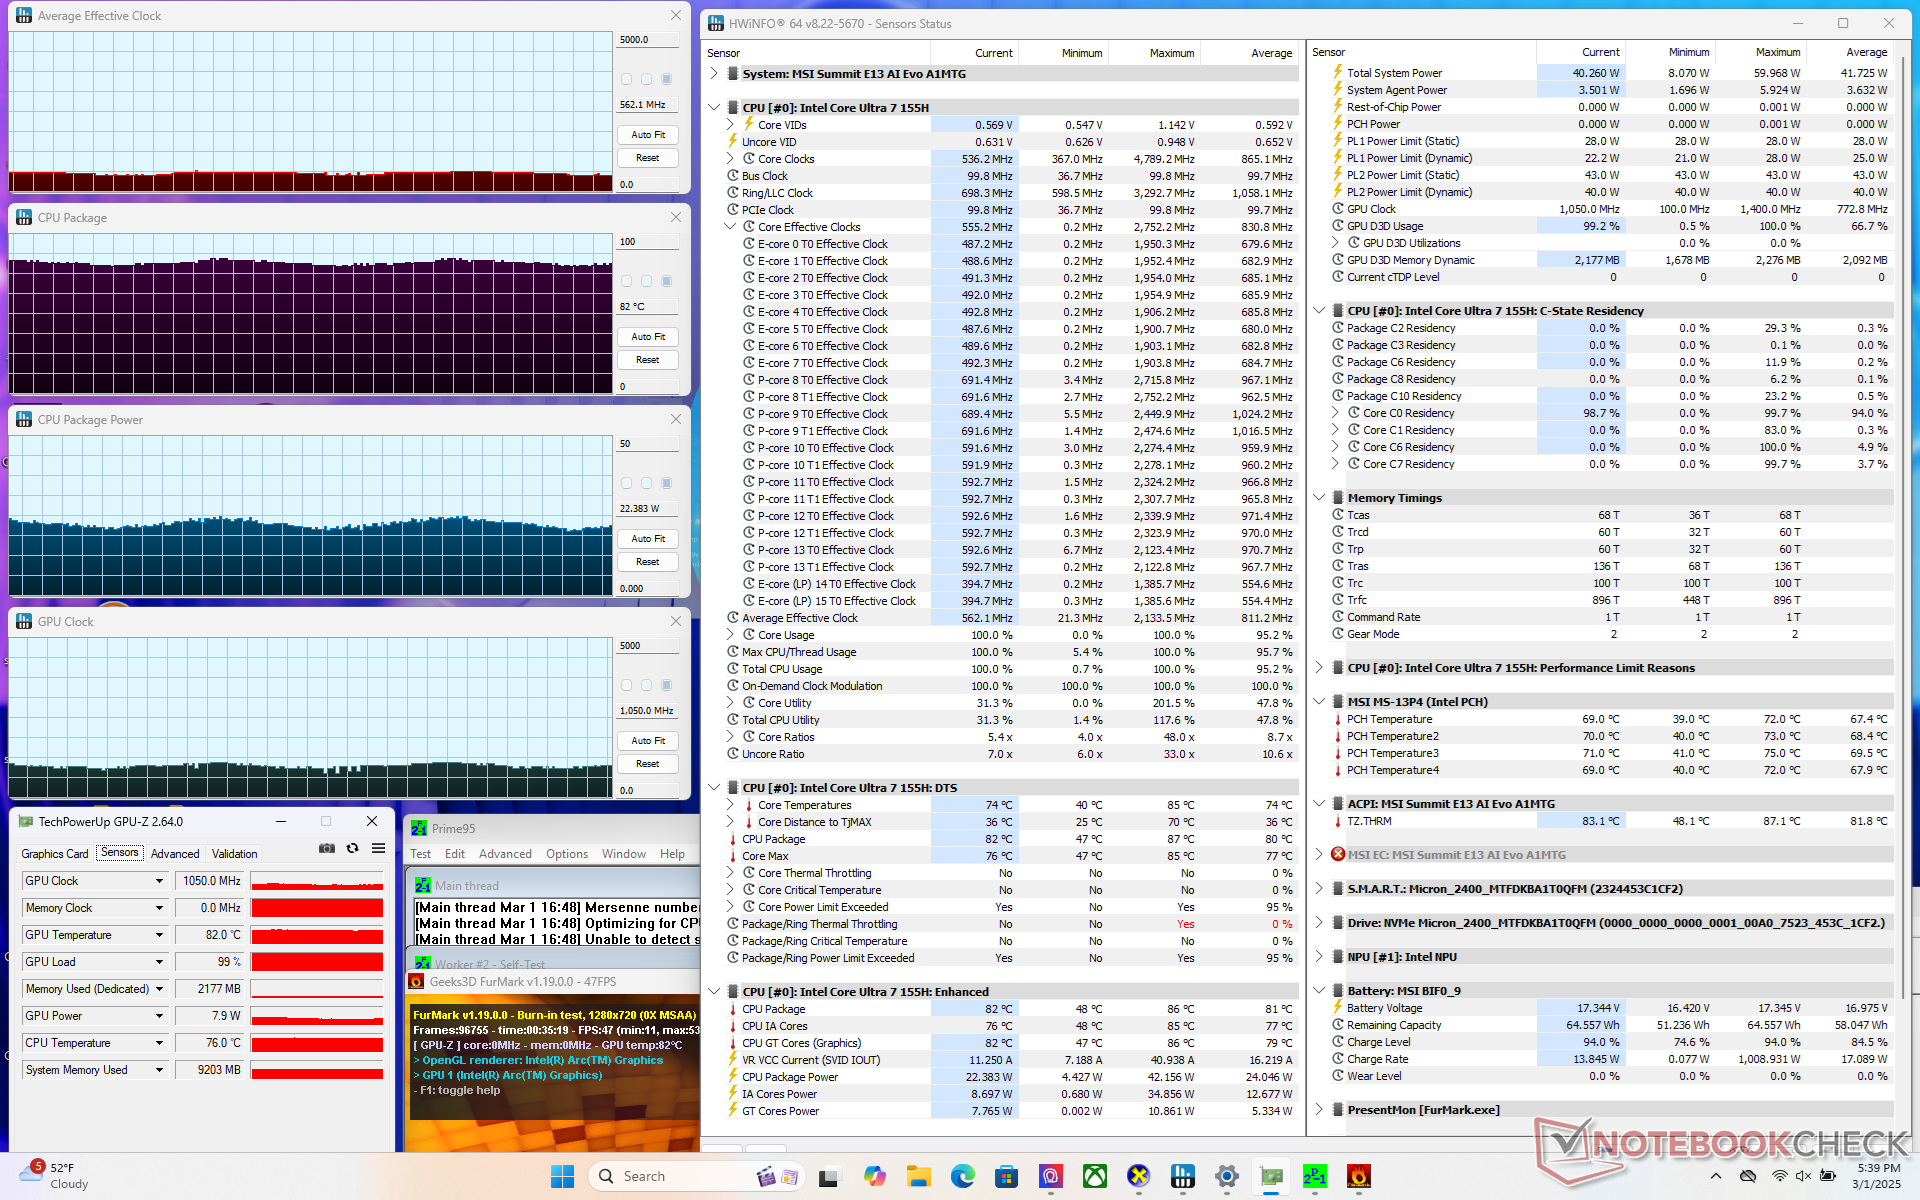
| Prime95 + FurMark Stress | 0.6 | 1050 | 82 |
| Cyberpunk 2077 Stress | 0.4 | ~2000 | 87 |
Performance du système
CrossMark: Overall | Productivity | Creativity | Responsiveness
WebXPRT 3: Overall
WebXPRT 4: Overall
Mozilla Kraken 1.1: Total
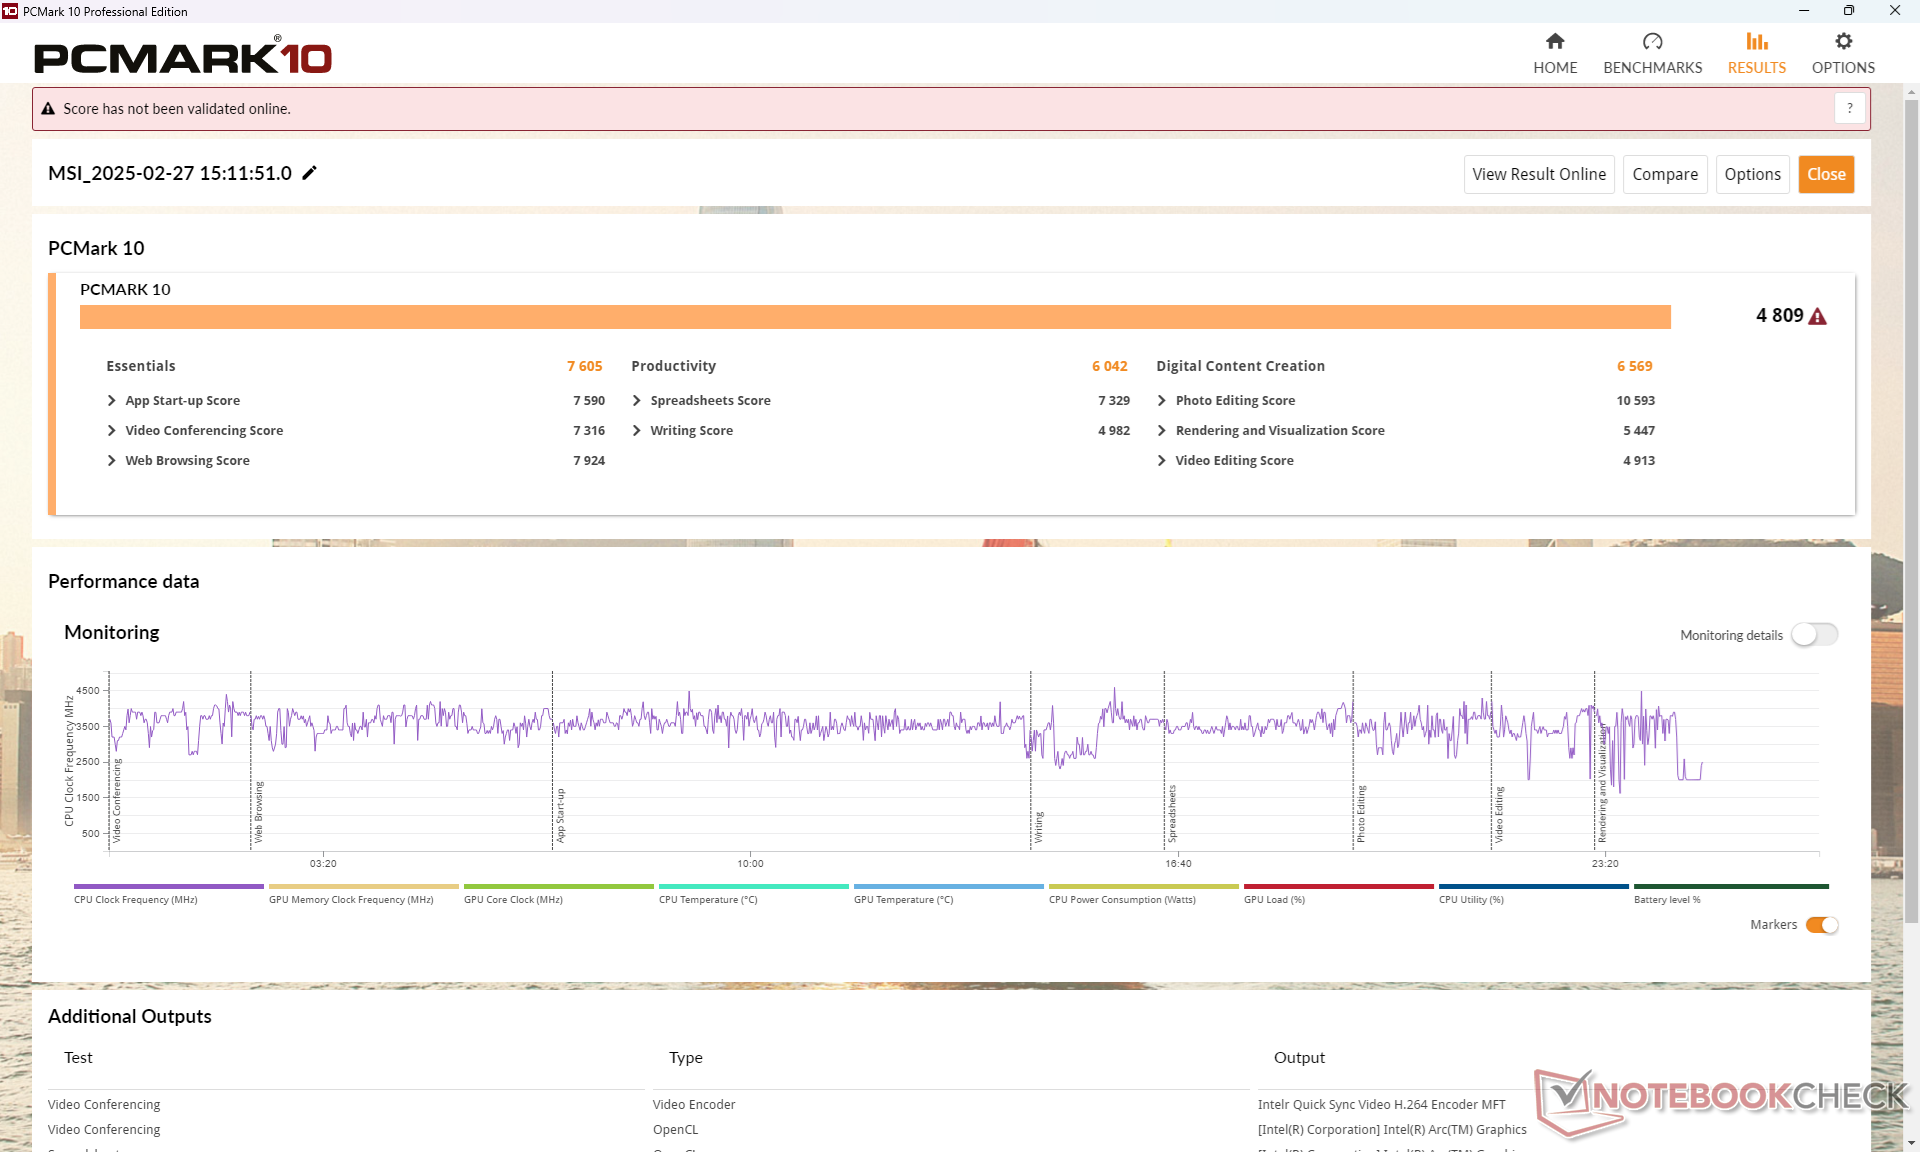
| PCMark 10 / Score | |
| Moyenne Intel Core Ultra 7 155H, Intel Arc 8-Core iGPU (4809 - 7529, n=34) | |
| Lenovo Yoga Book 9 13IMU9 | |
| Lenovo ThinkPad L13 Yoga G4 i7-1355U | |
| HP Elite Dragonfly Folio 13.5 G3 | |
| Dell Latitude 9330 | |
| MSI Summit E13 AI Evo A1MTG | |
| MSI Summit E13 Flip Evo A11MT | |
| PCMark 10 / Essentials | |
| HP Elite Dragonfly Folio 13.5 G3 | |
| Lenovo ThinkPad L13 Yoga G4 i7-1355U | |
| Lenovo Yoga Book 9 13IMU9 | |
| Moyenne Intel Core Ultra 7 155H, Intel Arc 8-Core iGPU (7605 - 11289, n=34) | |
| Dell Latitude 9330 | |
| MSI Summit E13 Flip Evo A11MT | |
| MSI Summit E13 AI Evo A1MTG | |
| PCMark 10 / Productivity | |
| Moyenne Intel Core Ultra 7 155H, Intel Arc 8-Core iGPU (6042 - 10591, n=34) | |
| Lenovo Yoga Book 9 13IMU9 | |
| Lenovo ThinkPad L13 Yoga G4 i7-1355U | |
| HP Elite Dragonfly Folio 13.5 G3 | |
| Dell Latitude 9330 | |
| MSI Summit E13 Flip Evo A11MT | |
| MSI Summit E13 AI Evo A1MTG | |
| PCMark 10 / Digital Content Creation | |
| Moyenne Intel Core Ultra 7 155H, Intel Arc 8-Core iGPU (4985 - 10709, n=34) | |
| Lenovo Yoga Book 9 13IMU9 | |
| MSI Summit E13 AI Evo A1MTG | |
| Lenovo ThinkPad L13 Yoga G4 i7-1355U | |
| HP Elite Dragonfly Folio 13.5 G3 | |
| Dell Latitude 9330 | |
| MSI Summit E13 Flip Evo A11MT | |
| CrossMark / Overall | |
| Moyenne Intel Core Ultra 7 155H, Intel Arc 8-Core iGPU (1366 - 1903, n=34) | |
| MSI Summit E13 AI Evo A1MTG | |
| HP Elite Dragonfly Folio 13.5 G3 | |
| Lenovo ThinkPad L13 Yoga G4 i7-1355U | |
| Lenovo Yoga Book 9 13IMU9 | |
| CrossMark / Productivity | |
| Moyenne Intel Core Ultra 7 155H, Intel Arc 8-Core iGPU (1291 - 1798, n=33) | |
| HP Elite Dragonfly Folio 13.5 G3 | |
| MSI Summit E13 AI Evo A1MTG | |
| Lenovo ThinkPad L13 Yoga G4 i7-1355U | |
| Lenovo Yoga Book 9 13IMU9 | |
| CrossMark / Creativity | |
| Moyenne Intel Core Ultra 7 155H, Intel Arc 8-Core iGPU (1519 - 1929, n=33) | |
| MSI Summit E13 AI Evo A1MTG | |
| HP Elite Dragonfly Folio 13.5 G3 | |
| Lenovo ThinkPad L13 Yoga G4 i7-1355U | |
| Lenovo Yoga Book 9 13IMU9 | |
| CrossMark / Responsiveness | |
| HP Elite Dragonfly Folio 13.5 G3 | |
| MSI Summit E13 AI Evo A1MTG | |
| Moyenne Intel Core Ultra 7 155H, Intel Arc 8-Core iGPU (939 - 1802, n=33) | |
| Lenovo Yoga Book 9 13IMU9 | |
| Lenovo ThinkPad L13 Yoga G4 i7-1355U | |
| WebXPRT 3 / Overall | |
| Lenovo ThinkPad L13 Yoga G4 i7-1355U | |
| HP Elite Dragonfly Folio 13.5 G3 | |
| MSI Summit E13 AI Evo A1MTG | |
| Moyenne Intel Core Ultra 7 155H, Intel Arc 8-Core iGPU (252 - 299, n=34) | |
| Lenovo Yoga Book 9 13IMU9 | |
| MSI Summit E13 Flip Evo A11MT | |
| Dell Latitude 9330 | |
| WebXPRT 4 / Overall | |
| Lenovo ThinkPad L13 Yoga G4 i7-1355U | |
| Moyenne Intel Core Ultra 7 155H, Intel Arc 8-Core iGPU (166.4 - 309, n=29) | |
| Lenovo Yoga Book 9 13IMU9 | |
| HP Elite Dragonfly Folio 13.5 G3 | |
| Dell Latitude 9330 | |
| MSI Summit E13 AI Evo A1MTG | |
| Mozilla Kraken 1.1 / Total | |
| MSI Summit E13 Flip Evo A11MT | |
| Dell Latitude 9330 | |
| HP Elite Dragonfly Folio 13.5 G3 | |
| Lenovo Yoga Book 9 13IMU9 | |
| MSI Summit E13 AI Evo A1MTG | |
| Moyenne Intel Core Ultra 7 155H, Intel Arc 8-Core iGPU (517 - 614, n=35) | |
| Lenovo ThinkPad L13 Yoga G4 i7-1355U | |
* ... Moindre est la valeur, meilleures sont les performances
| PCMark 10 Score | 4809 points | |
Aide | ||
| AIDA64 / Memory Copy | |
| Moyenne Intel Core Ultra 7 155H (62397 - 96791, n=49) | |
| Lenovo Yoga Book 9 13IMU9 | |
| MSI Summit E13 AI Evo A1MTG | |
| Dell Latitude 9330 | |
| HP Elite Dragonfly Folio 13.5 G3 | |
| Lenovo ThinkPad L13 Yoga G4 i7-1355U | |
| MSI Summit E13 Flip Evo A11MT | |
| AIDA64 / Memory Read | |
| Moyenne Intel Core Ultra 7 155H (60544 - 90647, n=49) | |
| MSI Summit E13 AI Evo A1MTG | |
| HP Elite Dragonfly Folio 13.5 G3 | |
| Lenovo Yoga Book 9 13IMU9 | |
| Dell Latitude 9330 | |
| MSI Summit E13 Flip Evo A11MT | |
| Lenovo ThinkPad L13 Yoga G4 i7-1355U | |
| AIDA64 / Memory Write | |
| HP Elite Dragonfly Folio 13.5 G3 | |
| MSI Summit E13 AI Evo A1MTG | |
| Moyenne Intel Core Ultra 7 155H (58692 - 93451, n=49) | |
| Lenovo ThinkPad L13 Yoga G4 i7-1355U | |
| Dell Latitude 9330 | |
| Lenovo Yoga Book 9 13IMU9 | |
| MSI Summit E13 Flip Evo A11MT | |
| AIDA64 / Memory Latency | |
| Lenovo Yoga Book 9 13IMU9 | |
| Moyenne Intel Core Ultra 7 155H (116.2 - 233, n=49) | |
| MSI Summit E13 AI Evo A1MTG | |
| HP Elite Dragonfly Folio 13.5 G3 | |
| Dell Latitude 9330 | |
| Lenovo ThinkPad L13 Yoga G4 i7-1355U | |
| MSI Summit E13 Flip Evo A11MT | |
* ... Moindre est la valeur, meilleures sont les performances
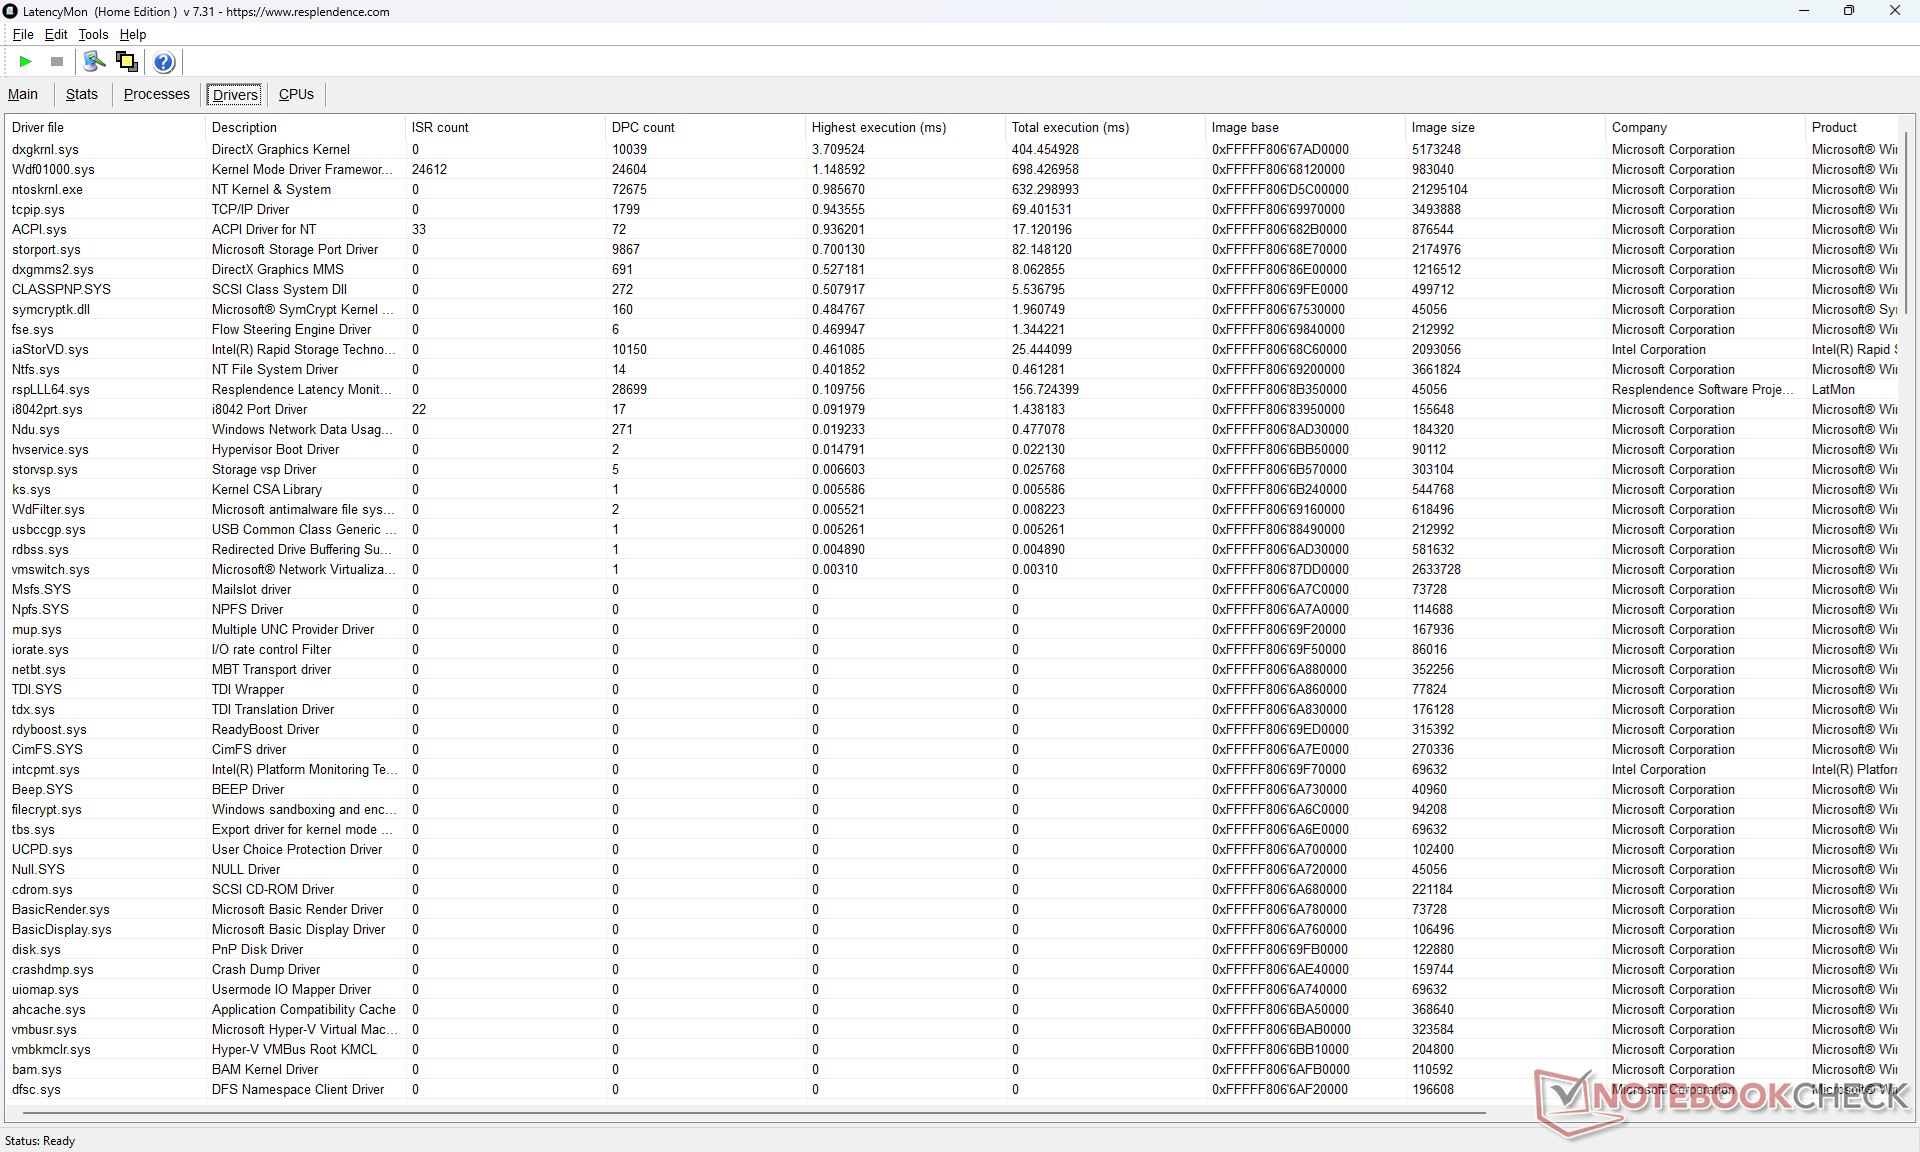
Latence DPC
LatencyMon révèle des problèmes de DPC lors de l'ouverture de plusieurs onglets de notre page d'accueil. la lecture de vidéos 4K60 est imparfaite mais fluide, avec seulement 3 images perdues au début du test.

| DPC Latencies / LatencyMon - interrupt to process latency (max), Web, Youtube, Prime95 | |
| Dell Latitude 9330 | |
| HP Elite Dragonfly Folio 13.5 G3 | |
| MSI Summit E13 AI Evo A1MTG | |
| MSI Summit E13 Flip Evo A11MT | |
| Lenovo ThinkPad L13 Yoga G4 i7-1355U | |
| Lenovo Yoga Book 9 13IMU9 | |
* ... Moindre est la valeur, meilleures sont les performances
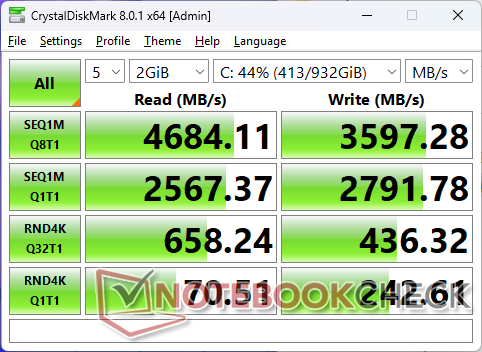
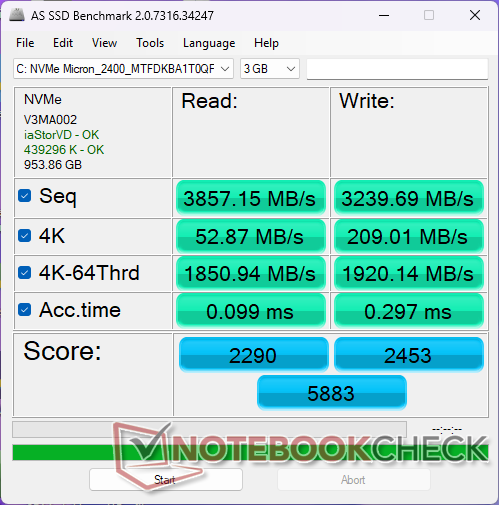
Dispositifs de stockage
Les Micron 2400 PCIe4 x4 NVMe SSD s'étrangle sous l'effet du stress. Lorsque DiskSpd fonctionne en boucle, par exemple, les taux de transfert atteignent ~4300 Mo/s avant de chuter à ~2600 Mo/s après environ 5 minutes de test.

* ... Moindre est la valeur, meilleures sont les performances
Disk Throttling: DiskSpd Read Loop, Queue Depth 8
Performance du GPU
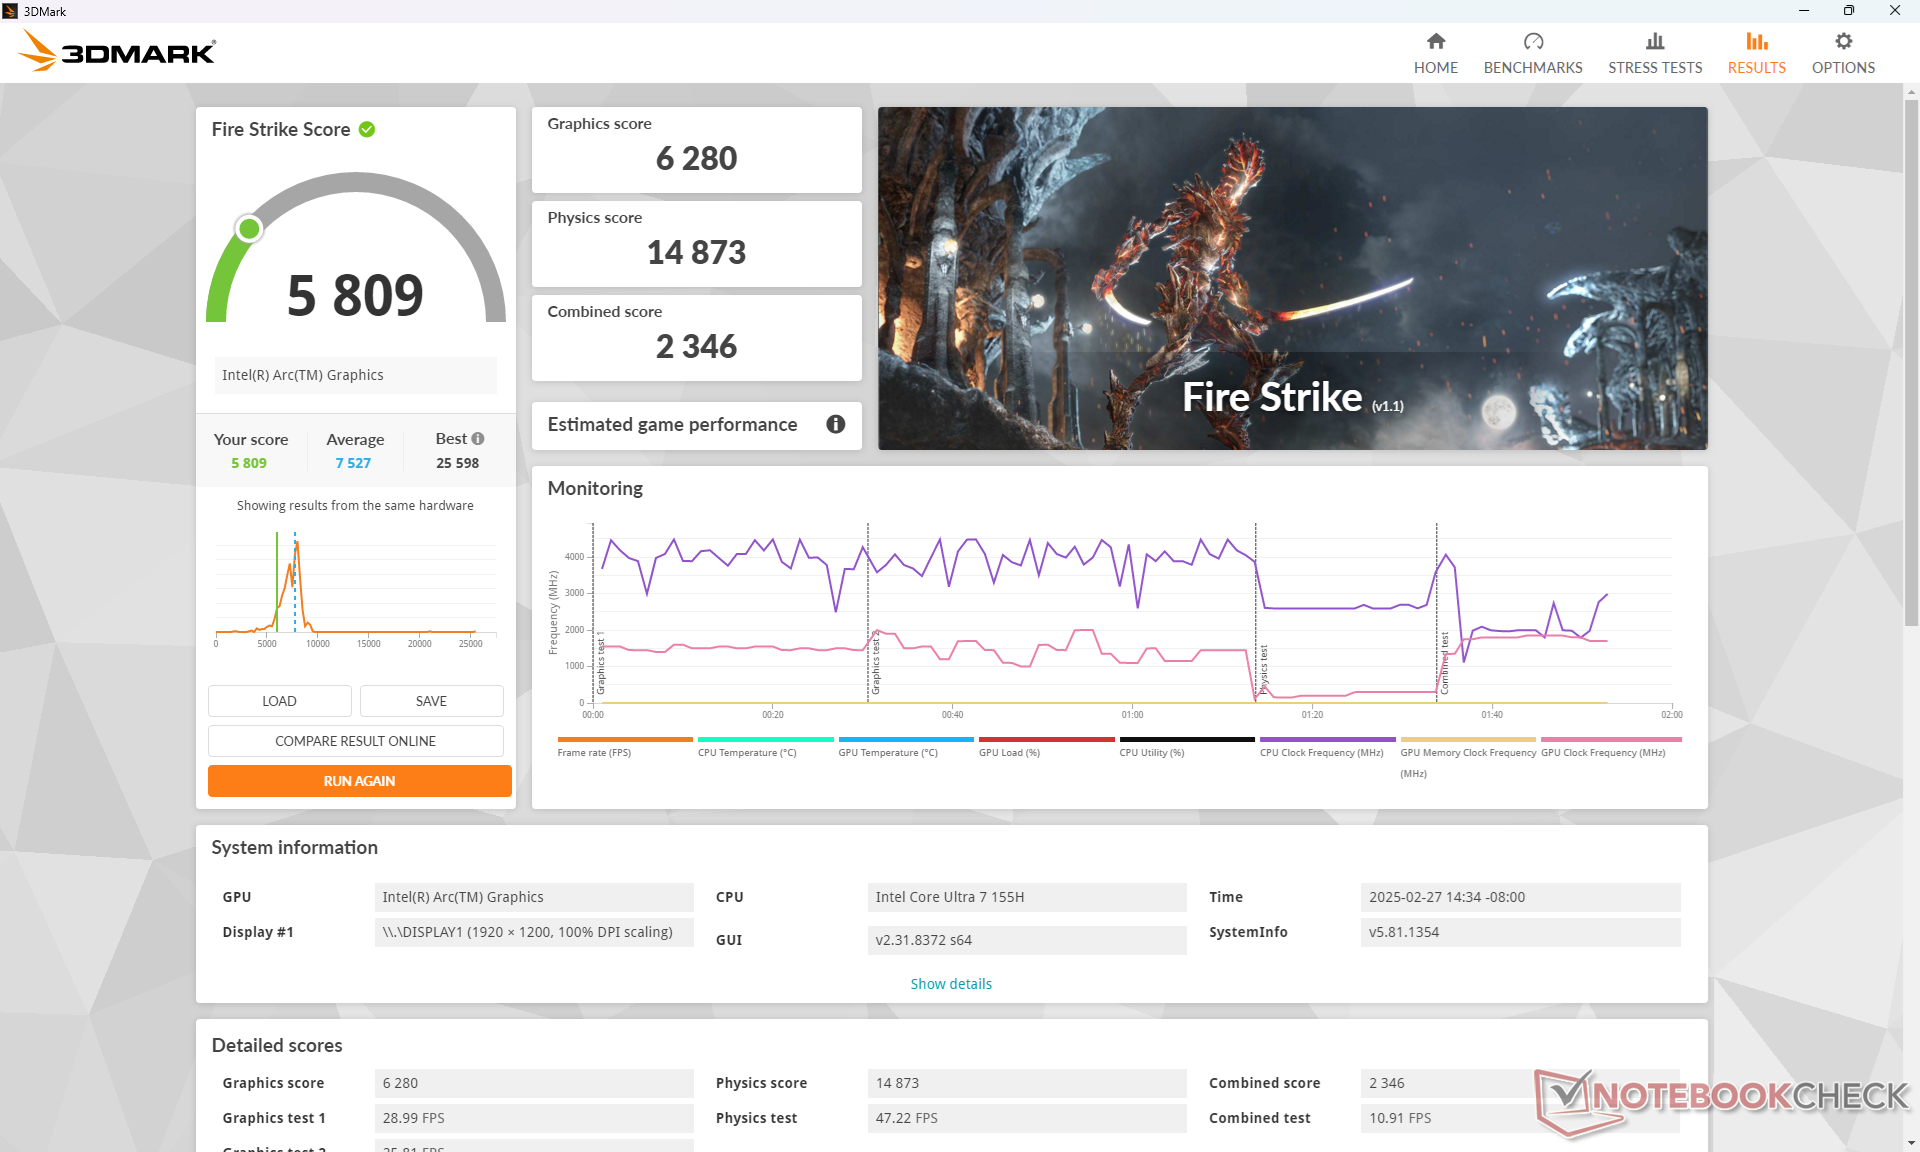
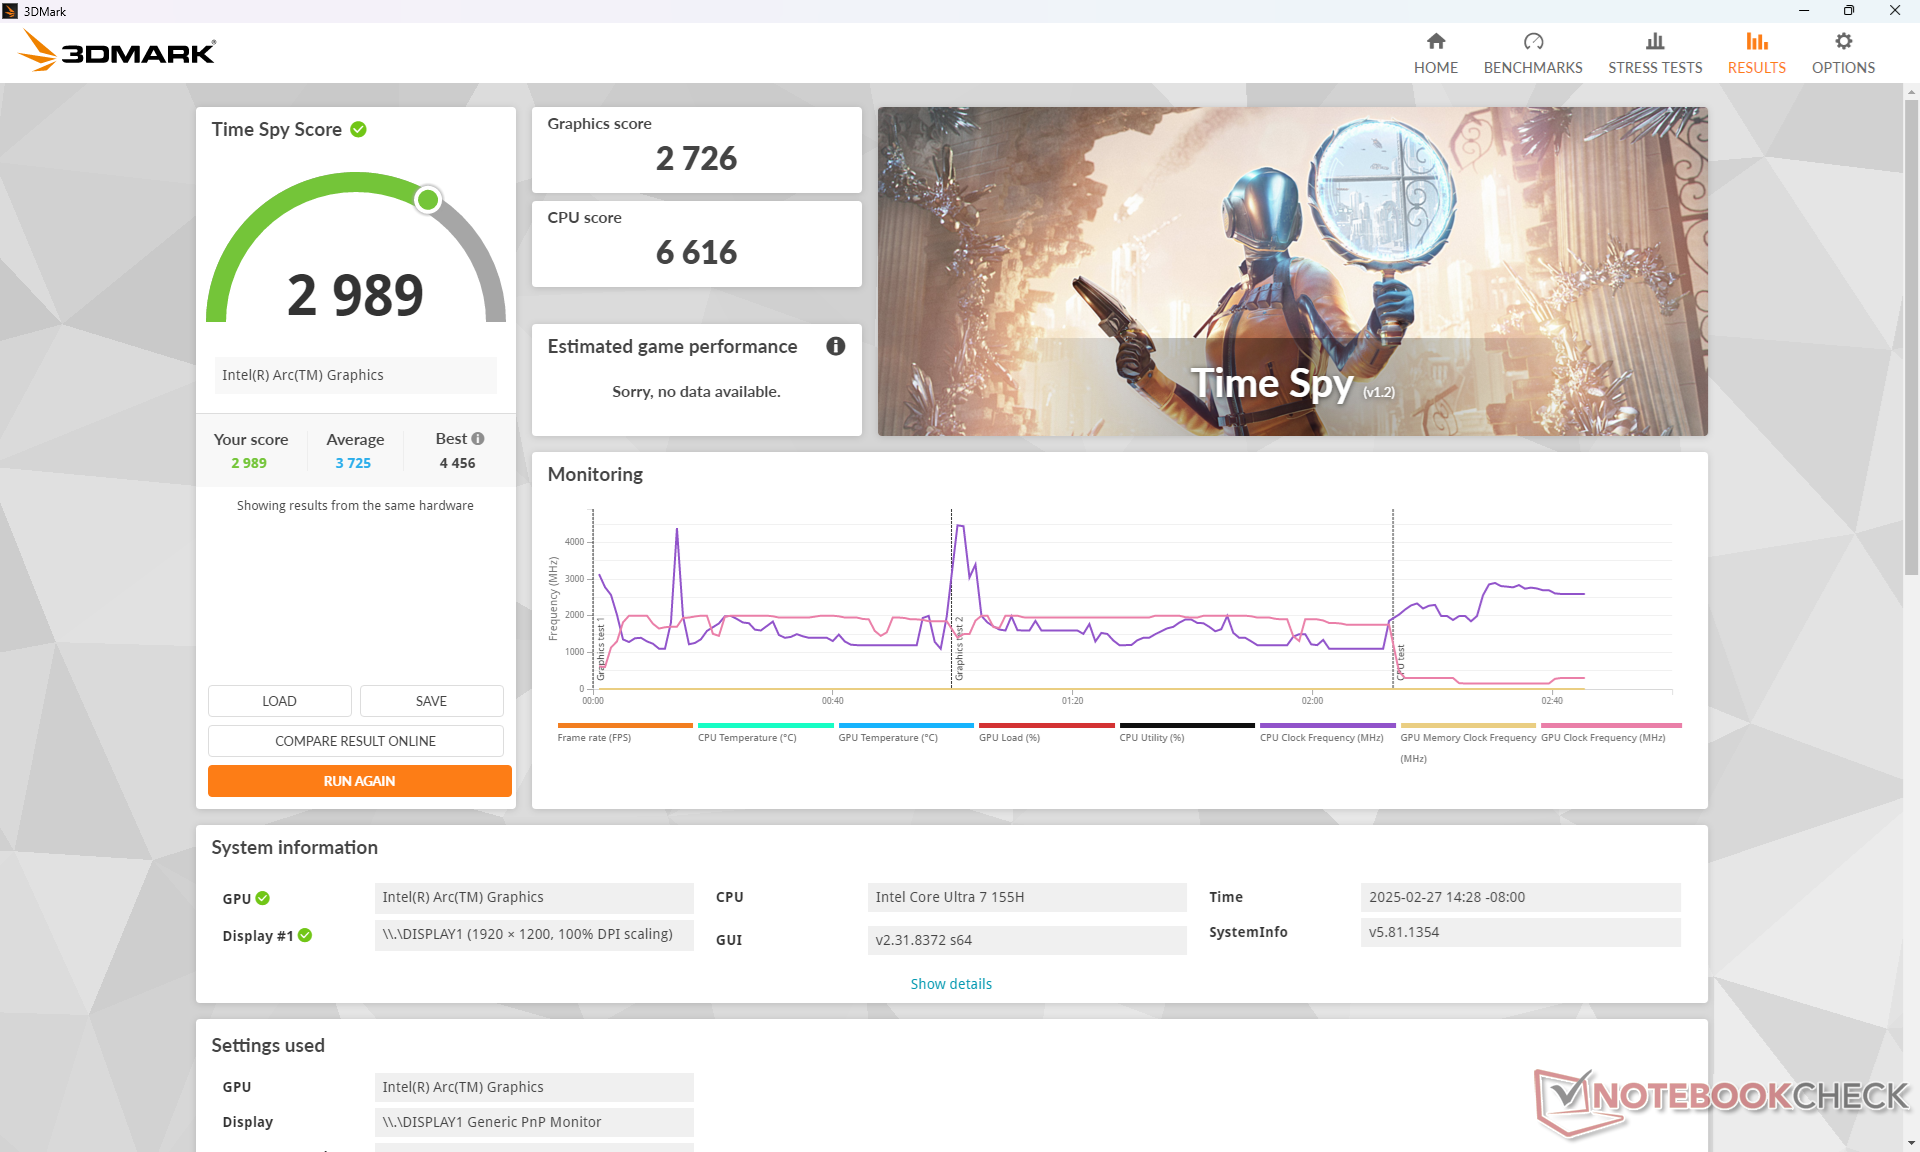
Les performances plus lentes que prévu du processeur mentionnées ci-dessus ont conduit à des performances graphiques plus lentes que prévu. Les performances de l Arc 8 de notre MSI sont environ 15 à 25 % plus lents que la moyenne des ordinateurs portables de notre base de données avec la même carte graphique intégrée, d'après les benchmarks 3DMark.
F1 22 et Cyberpunk 2077 plantent lorsque les paramètres sont réglés sur High ou Ultra.
| Profil de puissance | Score graphique | Score physique | Score combiné |
| Mode Performance | 6280 | 14873 | 2346 |
| Mode équilibré | 5786 (-8%) | 9842 (-34%) | 1685 (-28%) |
| Alimentation par batterie | 5196 (-17%) | 15031 (-0%) | 2267 (-3%) |
L'exécution en mode équilibré peut avoir un impact significatif sur les performances du processeur, d'après le tableau des résultats de Fire Strike ci-dessus.
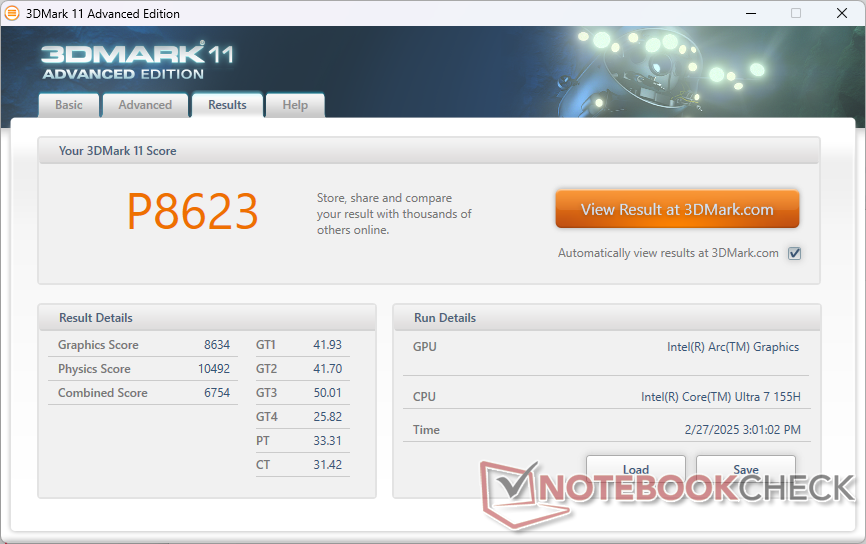

| 3DMark 11 Performance | 8623 points | |
| 3DMark Cloud Gate Standard Score | 22120 points | |
| 3DMark Fire Strike Score | 5809 points | |
| 3DMark Time Spy Score | 2989 points | |
Aide | ||
* ... Moindre est la valeur, meilleures sont les performances
Performances des jeux
Les performances de jeu sont médiocres. En plus des déficits du CPU et du GPU mentionnés ci-dessus, les problèmes d'images fantômes et de bégaiement peuvent être gênants, même lorsque vous utilisez des titres peu exigeants comme DOTA 2 Reborn.
| Cyberpunk 2077 2.2 Phantom Liberty | |
| 1280x720 Low Preset (FSR off) | |
| MSI Prestige 13 AI Plus Evo A2VMG | |
| Moyenne Intel Arc 8-Core iGPU (34.5 - 58, n=17) | |
| MSI Summit E13 AI Evo A1MTG | |
| Lenovo Yoga Book 9 13IMU9 | |
| 1920x1080 Low Preset (FSR off) | |
| Asus ROG Flow Z13 GZ302EA-RU073W | |
| MSI Prestige 13 AI Plus Evo A2VMG | |
| Moyenne Intel Arc 8-Core iGPU (11.3 - 38, n=35) | |
| MSI Summit E13 AI Evo A1MTG | |
| Lenovo Yoga Book 9 13IMU9 | |
| 1920x1080 Medium Preset (FSR off) | |
| Asus ROG Flow Z13 GZ302EA-RU073W | |
| MSI Prestige 13 AI Plus Evo A2VMG | |
| Moyenne Intel Arc 8-Core iGPU (9.42 - 31.4, n=32) | |
| MSI Summit E13 AI Evo A1MTG | |
| Lenovo Yoga Book 9 13IMU9 | |
| 1920x1080 High Preset (FSR off) | |
| Asus ROG Flow Z13 GZ302EA-RU073W | |
| MSI Prestige 13 AI Plus Evo A2VMG | |
| Moyenne Intel Arc 8-Core iGPU (7.3 - 27.6, n=33) | |
| Lenovo Yoga Book 9 13IMU9 | |
| 1920x1080 Ultra Preset (FSR off) | |
| Asus ROG Flow Z13 GZ302EA-RU073W | |
| MSI Prestige 13 AI Plus Evo A2VMG | |
| Moyenne Intel Arc 8-Core iGPU (13 - 24.7, n=25) | |
| Lenovo Yoga Book 9 13IMU9 | |
Cyberpunk 2077 ultra FPS Chart
| Bas | Moyen | Élevé | Ultra | |
|---|---|---|---|---|
| GTA V (2015) | 50.6 | 51.1 | 23.9 | 12 |
| Dota 2 Reborn (2015) | 93.2 | 83.5 | 65.2 | 63 |
| Final Fantasy XV Benchmark (2018) | 49.2 | 29.4 | 20.7 | |
| X-Plane 11.11 (2018) | 46.2 | 37.5 | 31.4 | |
| Strange Brigade (2018) | 131.2 | 61.3 | 45.7 | 33.9 |
| Tiny Tina's Wonderlands (2022) | 41.5 | 31.7 | 22 | 17.7 |
| F1 22 (2022) | 57.8 | 53.5 | ||
| Baldur's Gate 3 (2023) | 22.8 | 19.5 | 16.8 | 16.3 |
| Cyberpunk 2077 2.2 Phantom Liberty (2023) | 28.3 | 23.4 |
Émissions
Bruit du système
Le bruit du ventilateur est silencieux lorsque vous ne faites que naviguer ou regarder du contenu en streaming, mais il s'intensifie rapidement lorsque vous augmentez la charge. De plus, le bruit est relativement aigu et tout changement de régime est perceptible. Les ventilateurs sont plus bruyants que sur la plupart des autres ordinateurs portables professionnels de 13 pouces lorsque vous exécutez des charges exigeantes telles que des jeux, en raison du CPU Core Ultra-H plus exigeant.
Degré de la nuisance sonore
| Au repos |
| 24.1 / 24.8 / 26.5 dB(A) |
| Fortement sollicité |
| 39.3 / 49.1 dB(A) |
 | ||
30 dB silencieux 40 dB(A) audible 50 dB(A) bruyant |
||
min: | ||
| 352184 MSI Summit E13 AI Evo A1MTG Arc 8-Core, Ultra 7 155H, Micron 2400 MTFDKBA1T0QFM | 322533 MSI Summit E13 Flip Evo A11MT Iris Xe G7 96EUs, i7-1185G7, Phison 1TB SM2801T24GKBB4S-E162 | 345702 Lenovo Yoga Book 9 13IMU9 Graphics 4-Core, Ultra 7 155U | 341895 Lenovo ThinkPad L13 Yoga G4 i7-1355U Iris Xe G7 96EUs, i7-1355U, Samsung PM9B1 512GB MZAL4512HBLU | 334015 HP Elite Dragonfly Folio 13.5 G3 Iris Xe G7 96EUs, i7-1265U, Samsung PM9A1 MZVL2512HCJQ | 333549 Dell Latitude 9330 Iris Xe G7 96EUs, i7-1260U | |
|---|---|---|---|---|---|---|
| Noise | 0% | 16% | 11% | 11% | 9% | |
| arrêt / environnement * | 24 | 24.5 -2% | 23.3 3% | 23.1 4% | 24.6 -3% | 23 4% |
| Idle Minimum * | 24.1 | 24.7 -2% | 23.3 3% | 23.4 3% | 24.6 -2% | 23 5% |
| Idle Average * | 24.8 | 24.7 -0% | 23.3 6% | 23.4 6% | 24.6 1% | 23.1 7% |
| Idle Maximum * | 26.5 | 26.4 -0% | 24.6 7% | 23.4 12% | 24.6 7% | 23.1 13% |
| Load Average * | 39.3 | 37.8 4% | 26.2 33% | 33.9 14% | 27.8 29% | 37.1 6% |
| Cyberpunk 2077 ultra * | 45 | |||||
| Load Maximum * | 49.1 | 48.8 1% | 27.3 44% | 36.9 25% | 33.4 32% | 40.5 18% |
| Witcher 3 ultra * | 41.4 | 27.3 | 36.9 | 33.4 | 40.6 |
* ... Moindre est la valeur, meilleures sont les performances
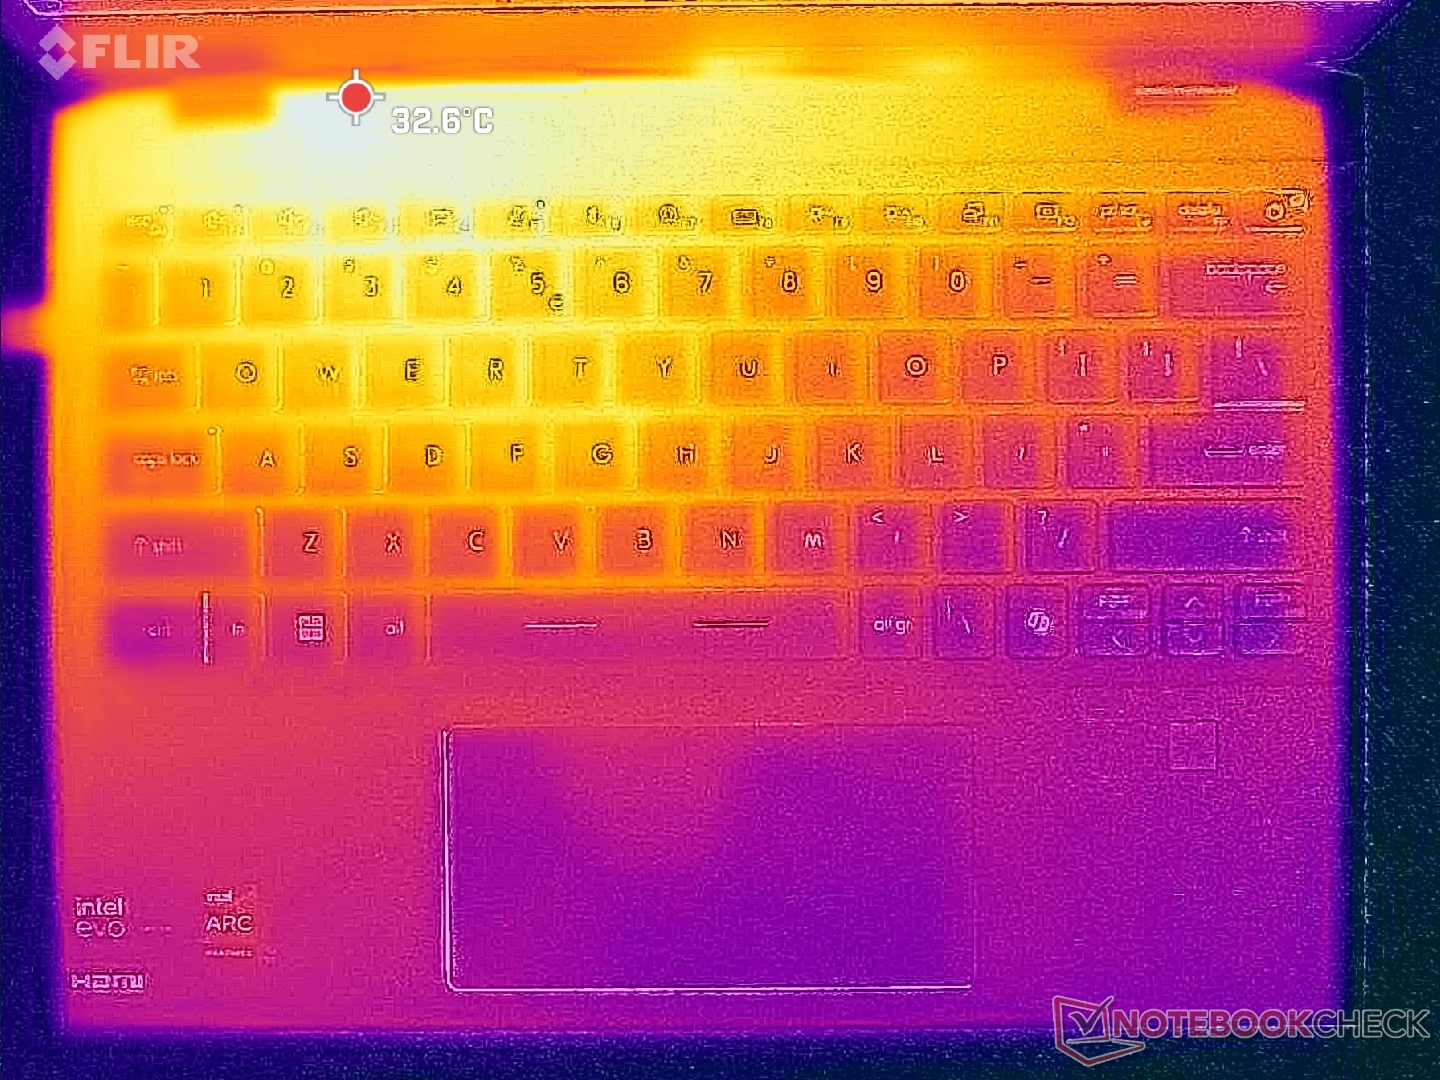
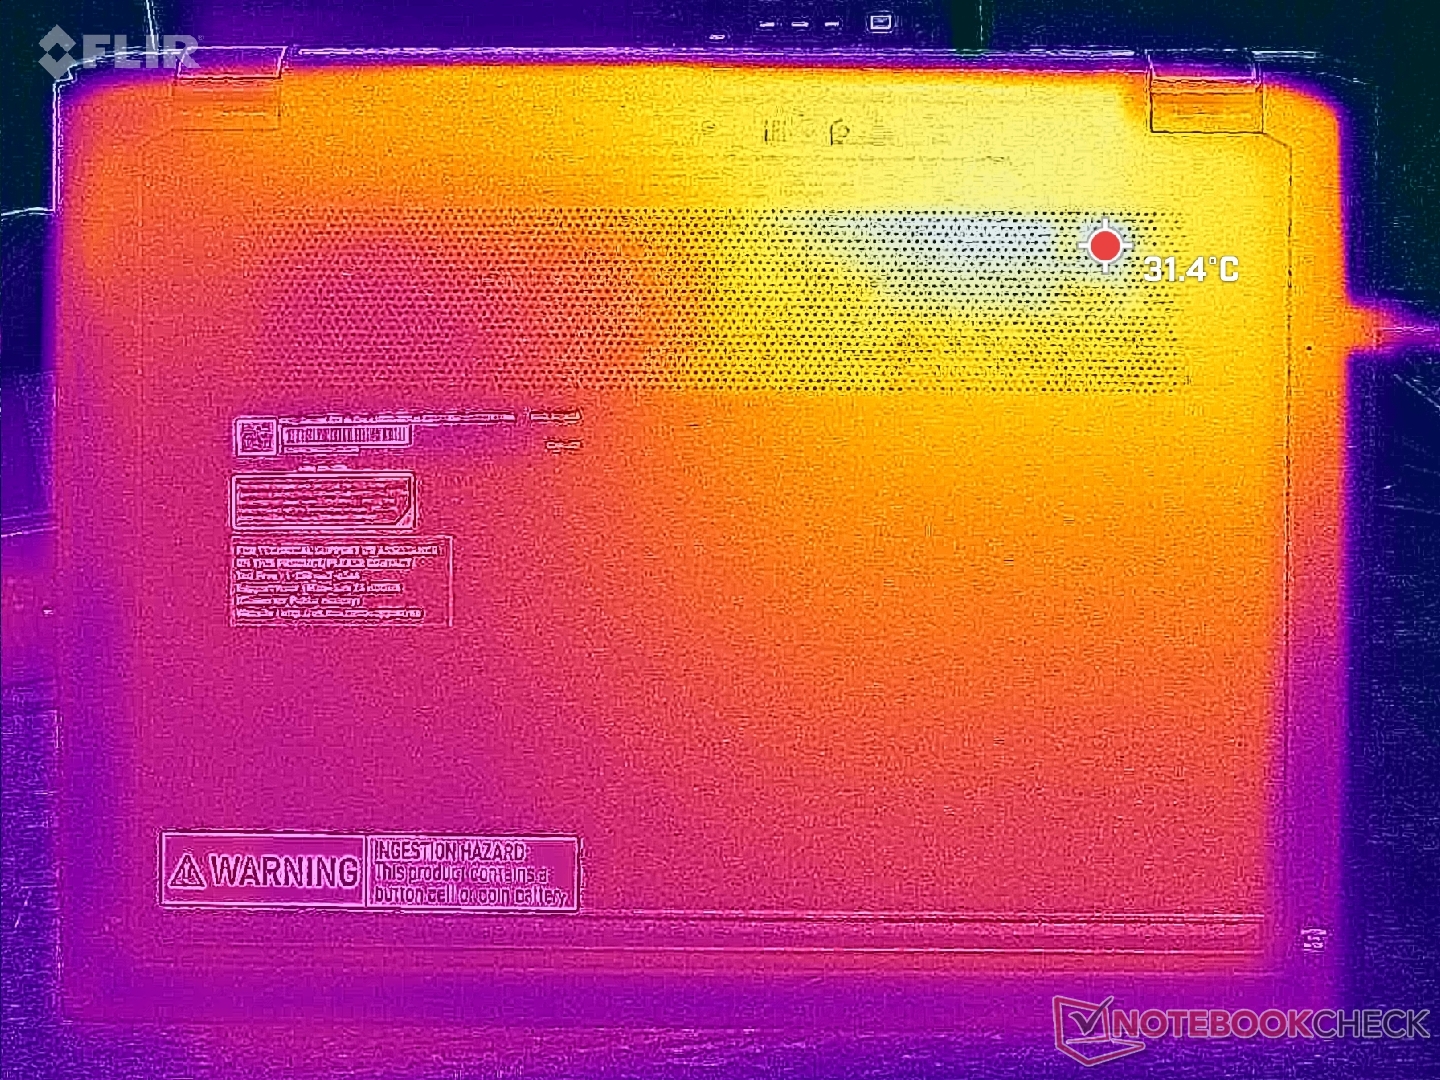
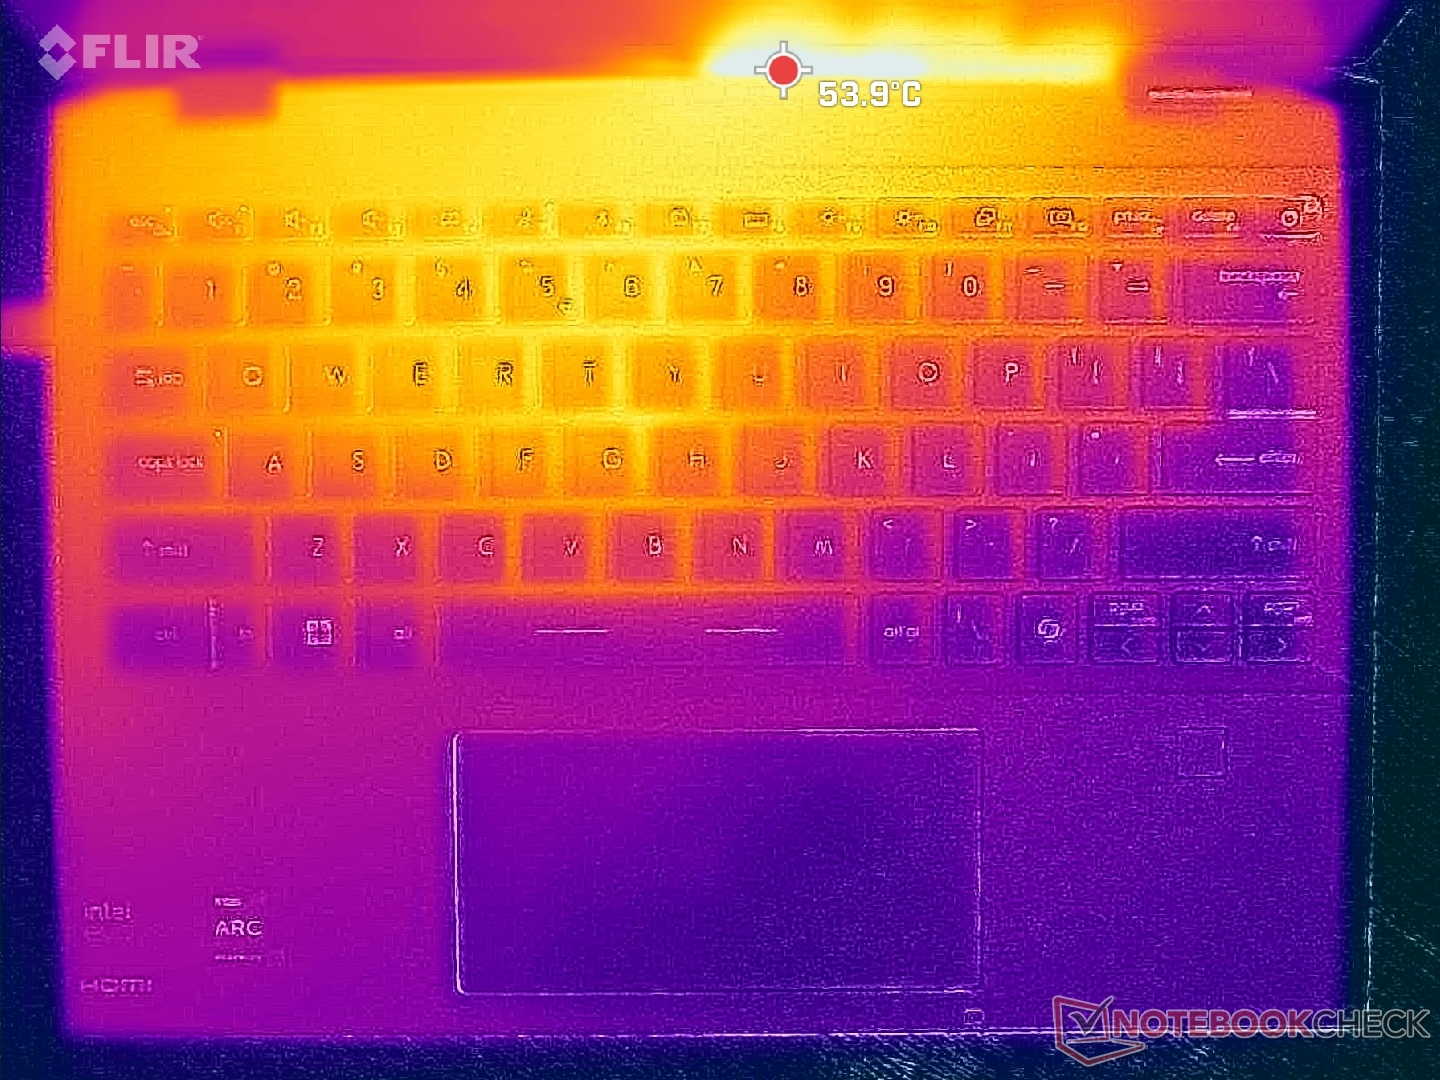
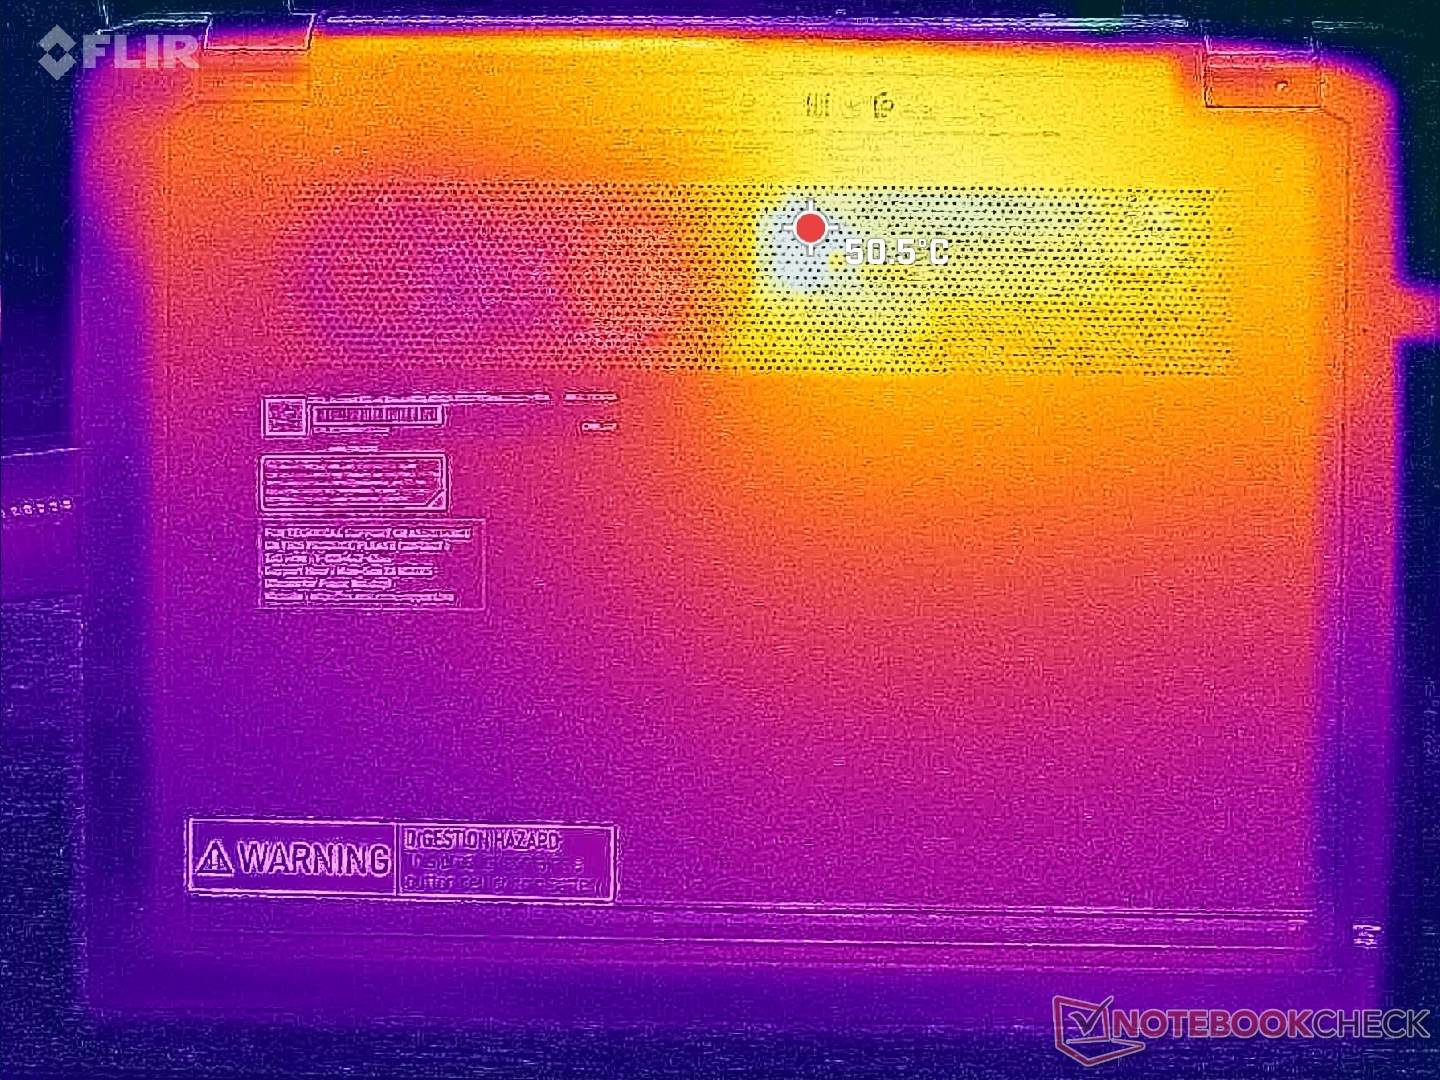
Température
Les températures de surface sont très élevées, même lorsque l'ordinateur tourne au ralenti. Les points chauds vont de 36°C au ralenti à plus de 45°C lorsque vous utilisez des charges exigeantes, ce qui est plus chaud que la plupart des autres ordinateurs convertibles de 13 pouces.
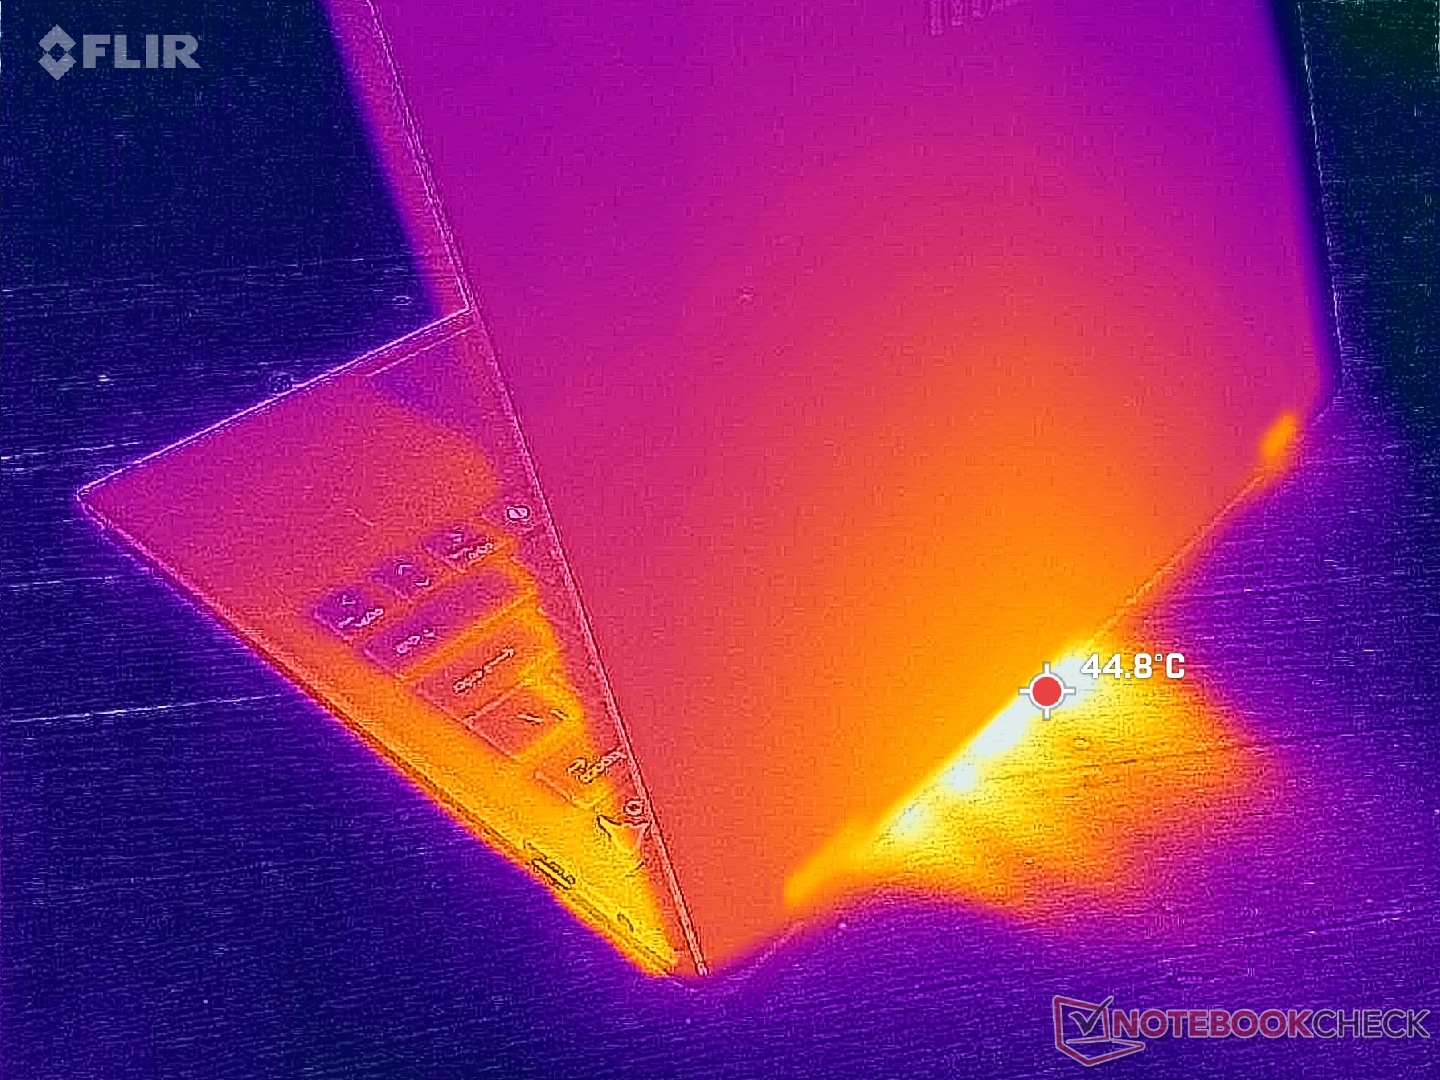

(-) La température maximale du côté supérieur est de 45.2 °C / 113 F, par rapport à la moyenne de 35.4 °C / 96 F, allant de 19.6 à 60 °C pour la classe Convertible.
(±) Le fond chauffe jusqu'à un maximum de 44.8 °C / 113 F, contre une moyenne de 36.8 °C / 98 F
(+) En utilisation inactive, la température moyenne du côté supérieur est de 30.1 °C / 86 F, par rapport à la moyenne du dispositif de 30.3 °C / 87 F.
(+) Les repose-poignets et le pavé tactile sont plus froids que la température de la peau avec un maximum de 28.8 °C / 83.8 F et sont donc froids au toucher.
(±) La température moyenne de la zone de l'appui-paume de dispositifs similaires était de 28 °C / 82.4 F (-0.8 °C / #-1.4 F).
| 352184 MSI Summit E13 AI Evo A1MTG Intel Core Ultra 7 155H, Intel Arc 8-Core iGPU | 322533 MSI Summit E13 Flip Evo A11MT Intel Core i7-1185G7, Intel Iris Xe Graphics G7 96EUs | 345702 Lenovo Yoga Book 9 13IMU9 Intel Core Ultra 7 155U, Intel Graphics 4-Core iGPU (Arc) | 341895 Lenovo ThinkPad L13 Yoga G4 i7-1355U Intel Core i7-1355U, Intel Iris Xe Graphics G7 96EUs | 334015 HP Elite Dragonfly Folio 13.5 G3 Intel Core i7-1265U, Intel Iris Xe Graphics G7 96EUs | 333549 Dell Latitude 9330 Intel Core i7-1260U, Intel Iris Xe Graphics G7 96EUs | |
|---|---|---|---|---|---|---|
| Heat | -7% | 10% | 6% | 28% | 12% | |
| Maximum Upper Side * | 45.2 | 52 -15% | 39.2 13% | 38.4 15% | 32.8 27% | 40.6 10% |
| Maximum Bottom * | 44.8 | 57.4 -28% | 41 8% | 46 -3% | 33.4 25% | 50.2 -12% |
| Idle Upper Side * | 34.8 | 30.4 13% | 32.2 7% | 31.2 10% | 24.6 29% | 25 28% |
| Idle Bottom * | 35.8 | 34.2 4% | 31.6 12% | 34.8 3% | 24.6 31% | 27.6 23% |
* ... Moindre est la valeur, meilleures sont les performances
Intervenants
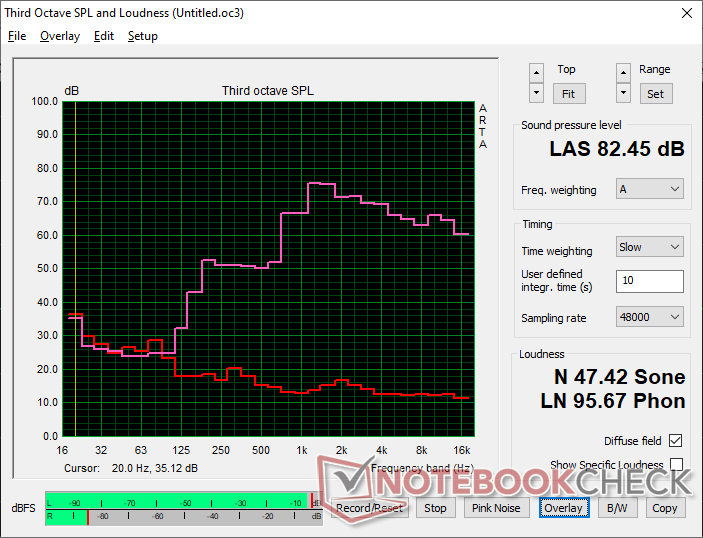
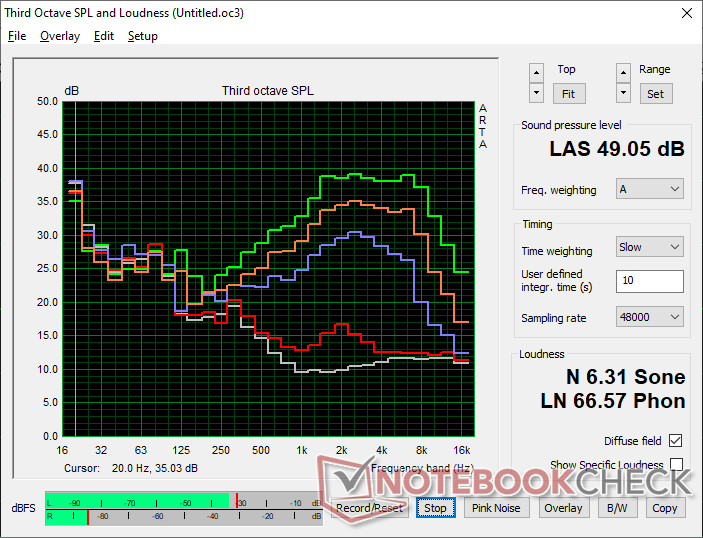
MSI Summit E13 AI Evo A1MTG analyse audio
(+) | les haut-parleurs peuvent jouer relativement fort (82.5# dB)
Basses 100 - 315 Hz
(-) | presque aucune basse - en moyenne 21.9% plus bas que la médiane
(±) | la linéarité des basses est moyenne (9.9% delta à la fréquence précédente)
Médiums 400 - 2000 Hz
(±) | médiane réduite - en moyenne 9.2% inférieure à la médiane
(±) | la linéarité des médiums est moyenne (7.6% delta à la fréquence précédente)
Aiguës 2 - 16 kHz
(+) | des sommets équilibrés - à seulement 3.2% de la médiane
(+) | les aigus sont linéaires (3.3% delta à la fréquence précédente)
Globalement 100 - 16 000 Hz
(±) | la linéarité du son global est moyenne (21.4% de différence avec la médiane)
Par rapport à la même classe
» 54% de tous les appareils testés de cette catégorie étaient meilleurs, 13% similaires, 34% pires
» Le meilleur avait un delta de 6%, la moyenne était de 21%, le pire était de 57%.
Par rapport à tous les appareils testés
» 57% de tous les appareils testés étaient meilleurs, 7% similaires, 36% pires
» Le meilleur avait un delta de 4%, la moyenne était de 24%, le pire était de 134%.
Apple MacBook Pro 16 2021 M1 Pro analyse audio
(+) | les haut-parleurs peuvent jouer relativement fort (84.7# dB)
Basses 100 - 315 Hz
(+) | bonne basse - seulement 3.8% loin de la médiane
(+) | les basses sont linéaires (5.2% delta à la fréquence précédente)
Médiums 400 - 2000 Hz
(+) | médiane équilibrée - seulement 1.3% de la médiane
(+) | les médiums sont linéaires (2.1% delta à la fréquence précédente)
Aiguës 2 - 16 kHz
(+) | des sommets équilibrés - à seulement 1.9% de la médiane
(+) | les aigus sont linéaires (2.7% delta à la fréquence précédente)
Globalement 100 - 16 000 Hz
(+) | le son global est linéaire (4.6% différence à la médiane)
Par rapport à la même classe
» 0% de tous les appareils testés de cette catégorie étaient meilleurs, 0% similaires, 100% pires
» Le meilleur avait un delta de 5%, la moyenne était de 18%, le pire était de 45%.
Par rapport à tous les appareils testés
» 0% de tous les appareils testés étaient meilleurs, 0% similaires, 100% pires
» Le meilleur avait un delta de 4%, la moyenne était de 24%, le pire était de 134%.
Gestion de l'énergie
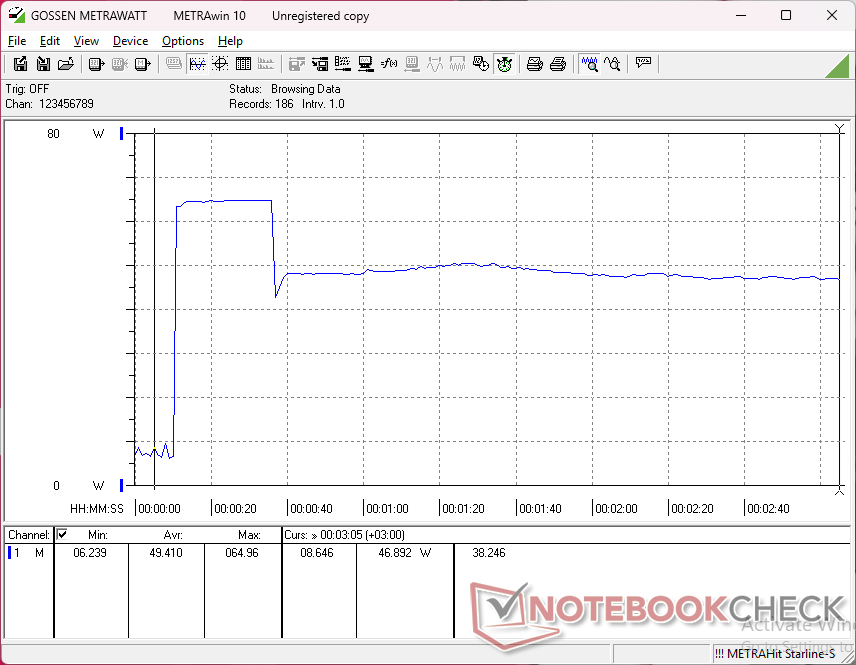
Consommation électrique
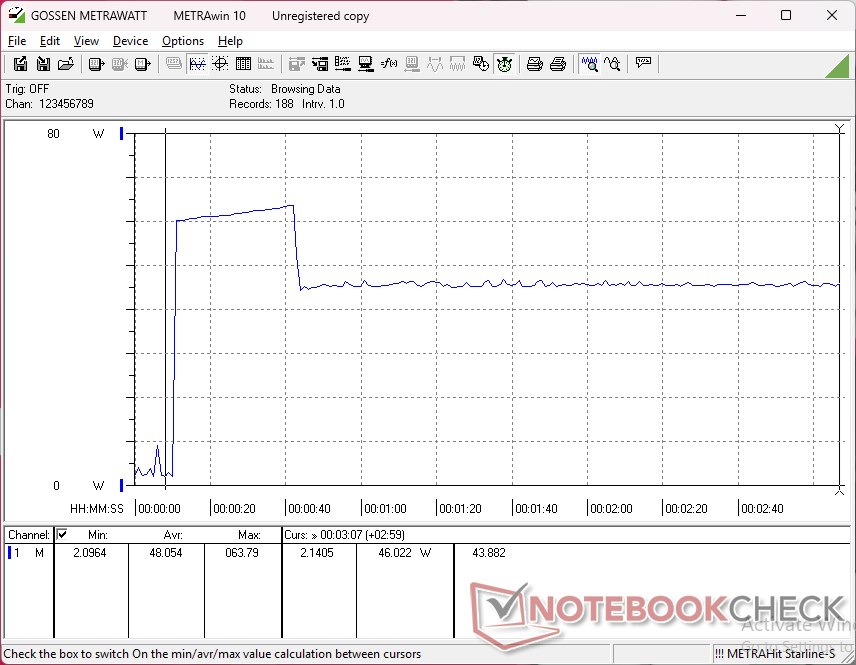
La consommation d'énergie peut être instable lors de l'exécution de charges GPU exigeantes comme Cyberpunk 2077 , ce qui correspond aux baisses de la fréquence d'images notées ci-dessus. Ceci est en contraste avec le Framework 13.5 qui est livré avec le même CPU Core Ultra 7 155H mais avec une consommation beaucoup plus stable sous charge.
| Éteint/en veille | |
| Au repos | |
| Fortement sollicité |
|
Légende:
min: | |
| 352184 MSI Summit E13 AI Evo A1MTG Ultra 7 155H, Arc 8-Core, Micron 2400 MTFDKBA1T0QFM, IPS, 1920x1200, 13.3" | 322533 MSI Summit E13 Flip Evo A11MT i7-1185G7, Iris Xe G7 96EUs, Phison 1TB SM2801T24GKBB4S-E162, IPS, 1920x1200, 13.4" | 345702 Lenovo Yoga Book 9 13IMU9 Ultra 7 155U, Graphics 4-Core, , OLED, 2880x1800, 13.3" | 341895 Lenovo ThinkPad L13 Yoga G4 i7-1355U i7-1355U, Iris Xe G7 96EUs, Samsung PM9B1 512GB MZAL4512HBLU, IPS, 1920x1200, 13.3" | 334015 HP Elite Dragonfly Folio 13.5 G3 i7-1265U, Iris Xe G7 96EUs, Samsung PM9A1 MZVL2512HCJQ, IPS, 1920x1280, 13.5" | 333549 Dell Latitude 9330 i7-1260U, Iris Xe G7 96EUs, , IPS, 2560x1600, 13.3" | |
|---|---|---|---|---|---|---|
| Power Consumption | -52% | -116% | -59% | -26% | -40% | |
| Idle Minimum * | 2.3 | 4.8 -109% | 7.1 -209% | 5.5 -139% | 3.4 -48% | 4.7 -104% |
| Idle Average * | 4.8 | 8.4 -75% | 9.1 -90% | 8.3 -73% | 4.9 -2% | 8.2 -71% |
| Idle Maximum * | 5 | 8.6 -72% | 18.4 -268% | 9.1 -82% | 9.3 -86% | 8.4 -68% |
| Load Average * | 46.2 | 47.1 -2% | 51.3 -11% | 49.9 -8% | 41.9 9% | 36.8 20% |
| Cyberpunk 2077 ultra external monitor * | 41.9 | |||||
| Cyberpunk 2077 ultra * | 44.8 | |||||
| Load Maximum * | 65 | 65.9 -1% | 65.5 -1% | 60 8% | 67.5 -4% | 49.9 23% |
| Witcher 3 ultra * | 51.6 | 41.5 | 42.4 | 36.4 | 30.4 |
* ... Moindre est la valeur, meilleures sont les performances
Power Consumption Cyberpunk / Stress Test
Power Consumption external Monitor
Autonomie de la batterie
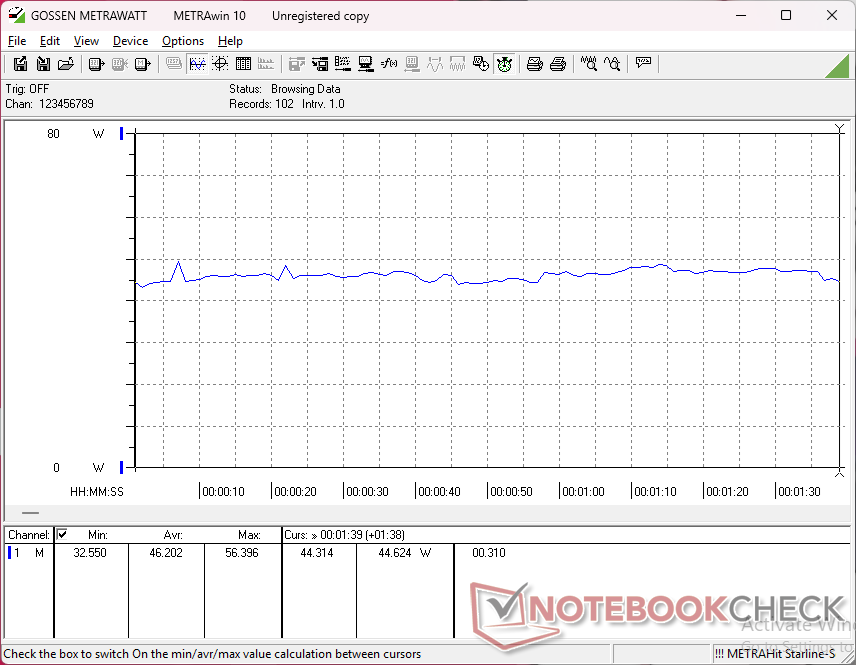
L'autonomie du réseau local sans fil est inférieure de quelques heures à celle de l'ancien Summit E13, mais reste bonne dans l'ensemble avec près de 9,5 heures d'utilisation en conditions réelles.
| 352184 MSI Summit E13 AI Evo A1MTG Ultra 7 155H, Arc 8-Core, 70 Wh | 322533 MSI Summit E13 Flip Evo A11MT i7-1185G7, Iris Xe G7 96EUs, 70 Wh | 345702 Lenovo Yoga Book 9 13IMU9 Ultra 7 155U, Graphics 4-Core, 80 Wh | 341895 Lenovo ThinkPad L13 Yoga G4 i7-1355U i7-1355U, Iris Xe G7 96EUs, 46 Wh | 334015 HP Elite Dragonfly Folio 13.5 G3 i7-1265U, Iris Xe G7 96EUs, 53 Wh | 333549 Dell Latitude 9330 i7-1260U, Iris Xe G7 96EUs, 50 Wh | |
|---|---|---|---|---|---|---|
| Autonomie de la batterie | 18% | 7% | -35% | -1% | -1% | |
| WiFi v1.3 | 568 | 672 18% | 608 7% | 371 -35% | 565 -1% | 564 -1% |
| Reader / Idle | 1267 | 1637 | 923 | |||
| Load | 109 | 158 | 140 |
Notebookcheck Rating
MSI Summit E13 AI Evo A1MTG
- 03/04/2025 v8
Allen Ngo
 Total Sustainability Score:
 Transparency
La sélection des appareils à examiner est effectuée par notre équipe éditoriale. L'échantillon de test a été acheté gratuitement par l'auteur, à ses propres frais. Le prêteur n'a eu aucune influence sur cette évaluation et le fabricant n'a pas reçu de copie de cette évaluation avant sa publication. Il n'y avait aucune obligation de publier cet article. Nous n'acceptons jamais de compensation ou de paiement en échange de nos commentaires. En tant que média indépendant, Notebookcheck n'est pas soumis à l'autorité des fabricants, des détaillants ou des éditeurs.
Voici comment Notebookcheck teste
Chaque année, Notebookcheck examine de manière indépendante des centaines d'ordinateurs portables et de smartphones en utilisant des procédures standardisées afin de garantir que tous les résultats sont comparables. Nous avons continuellement développé nos méthodes de test depuis environ 20 ans et avons établi des normes industrielles dans le processus. Dans nos laboratoires de test, des équipements de mesure de haute qualité sont utilisés par des techniciens et des rédacteurs expérimentés. Ces tests impliquent un processus de validation en plusieurs étapes. Notre système d'évaluation complexe repose sur des centaines de mesures et de points de référence bien fondés, ce qui garantit l'objectivité.
