

Test du MSI Sword 16 HX : une puissance de jeu gâchée par un écran peu impressionnant
Il faut passer plus de temps à soigner les détails.
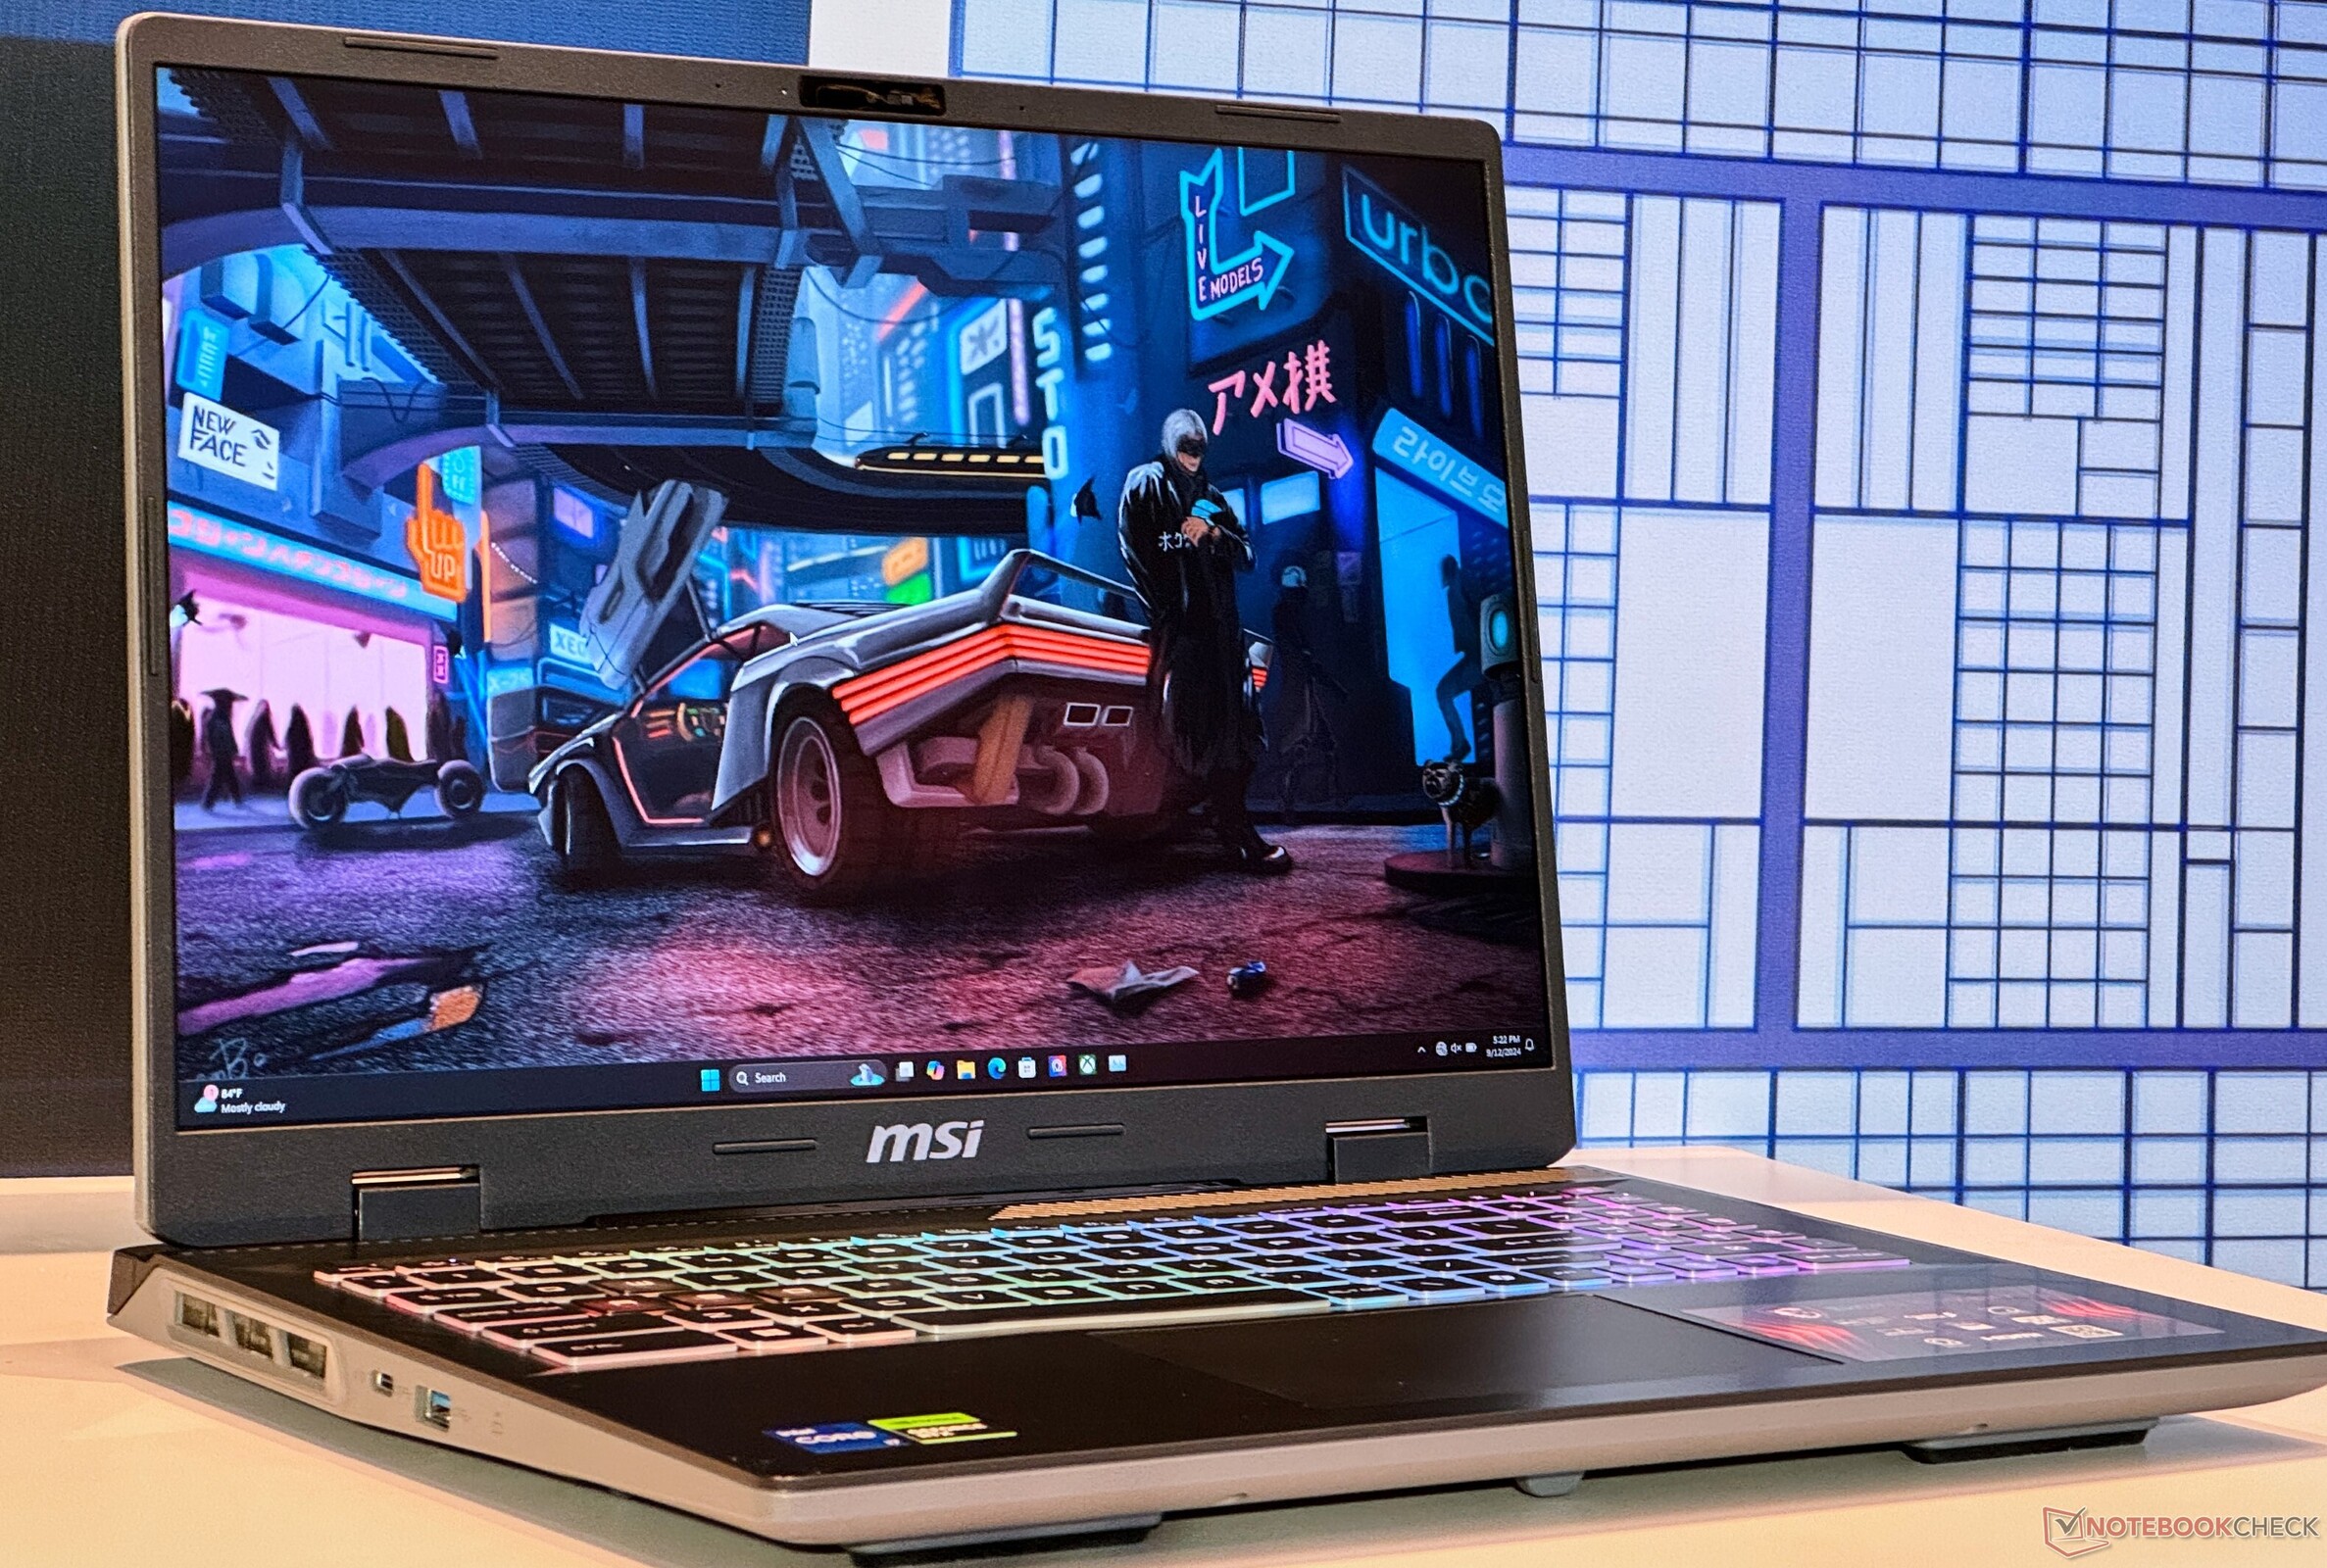
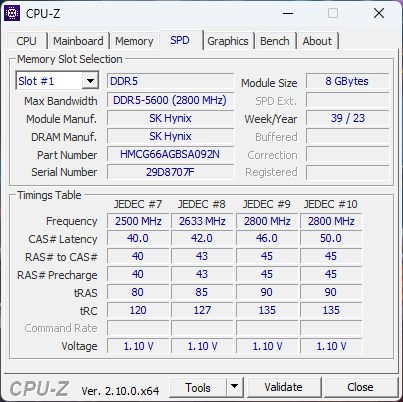
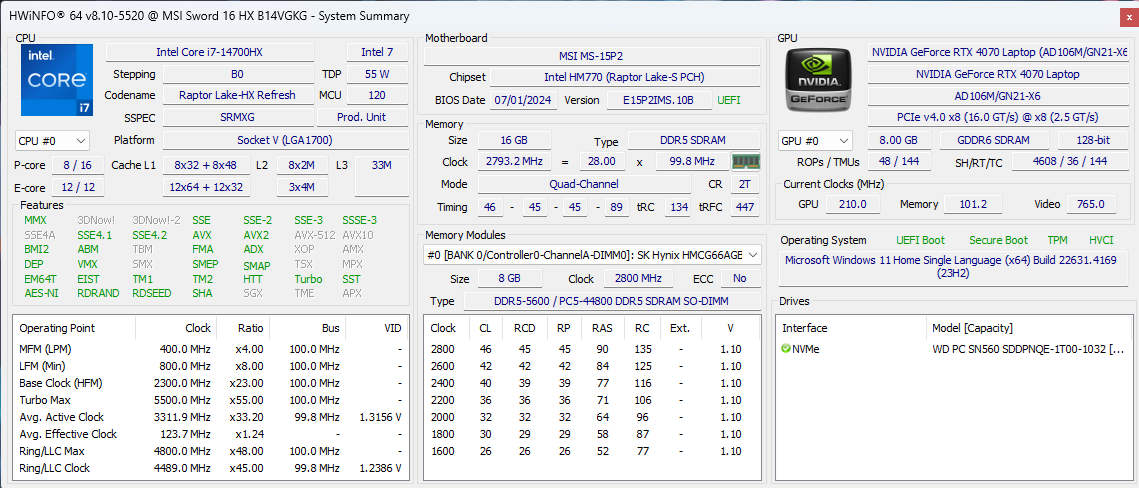
Le MSI Sword 16 HX possède toutes les caractéristiques d'un ordinateur portable de jeu moderne, avec un Intel Core i7-14700HX, une Nvidia GeForce RTX 4070 de 115 Watts, 16 Go de RAM DDR5, 1 TB SSD et un écran WUXGA (1 920 x 1 200) de 16 pouces à 144 Hz. Dans cet article, nous déterminons comment le Sword 16 HX se situe par rapport à d'autres ordinateurs dotés d'un matériel similaire et nous examinons certains de ses points forts et de ses compromis.Anil Ganti, 👁 Vaidyanathan Subramaniam (traduit par DeepL / Ninh Duy) Publié 🇺🇸 🇩🇪 ...
Le MSI Sword 16 HX se situe au milieu du répertoire de la société et vise à équilibrer le prix et les performances. Cette variante particulière est livrée avec du matériel puissant, notamment le processeur Intel Core i7-14700HX basé sur Raptor Lake HX Intel Core i7-14700HXbasé sur Ada Lovelace Nvidia GeForce RTX 407016 Go de RAM DDR5-5600 et 1 To de stockage embarqué.
Il s'agit essentiellement de l'un des meilleurs ordinateurs portables de jeu Intel/Nvidia que vous puissiez acheter aujourd'hui, car Raptor Lake-HX l'emporte sur Meteor Lake en termes de performances brutes. En Inde, le Sword 16 HX coûte ₹1,73,990 (2,071 $), mais il peut être acheté pour ₹1,38,790 (1,654 $) au moment de la rédaction.
Comparaison avec les concurrents potentiels
Note | Version | Date | Modèle | Poids | Épaisseur | Taille | Résolution | Prix |
|---|---|---|---|---|---|---|---|---|
| 79 % | v8 | 10/24 | MSI Sword 16 HX B14VGKG i7-14700HX, NVIDIA GeForce RTX 4070 Laptop GPU | 2.3 kg | 27.7 mm | 16.00" | 1920x1200 | |
| 80.4 % | v8 | 07/24 | HP Omen 17-db0079ng R7 8845HS, NVIDIA GeForce RTX 4070 Laptop GPU | 2.8 kg | 30.1 mm | 17.30" | 2560x1440 | |
| 90.8 % v7 (old) | v7 (old) | 04/24 | Lenovo Legion 7 16 IRX G9 i9-14900HX, NVIDIA GeForce RTX 4070 Laptop GPU | 2.3 kg | 19.8 mm | 16.00" | 3200x2000 | |
| 86.8 % v7 (old) | v7 (old) | 05/24 | Acer Predator Helios Neo 16 (2024) i7-14700HX, NVIDIA GeForce RTX 4070 Laptop GPU | 2.6 kg | 25.95 mm | 16.00" | 2560x1600 | |
| 90.2 % v7 (old) | v7 (old) | 03/24 | Alienware m16 R2 Ultra 7 155H, NVIDIA GeForce RTX 4070 Laptop GPU | 2.5 kg | 23.5 mm | 16.00" | 2560x1600 | |
| 88.4 % v7 (old) | v7 (old) | 04/23 | Asus ROG Strix G17 G713PI R9 7945HX, NVIDIA GeForce RTX 4070 Laptop GPU | 2.8 kg | 30.7 mm | 17.30" | 2560x1440 | |
| 85.1 % v7 (old) | v7 (old) | 09/23 | HP Victus 16-r0077ng i7-13700H, NVIDIA GeForce RTX 4070 Laptop GPU | 2.4 kg | 24 mm | 16.10" | 1920x1080 |
Note : Nous avons récemment mis à jour notre système d'évaluation et les résultats de la version 8 ne sont pas comparables à ceux de la version 7. De plus amples informations sont disponibles ici .
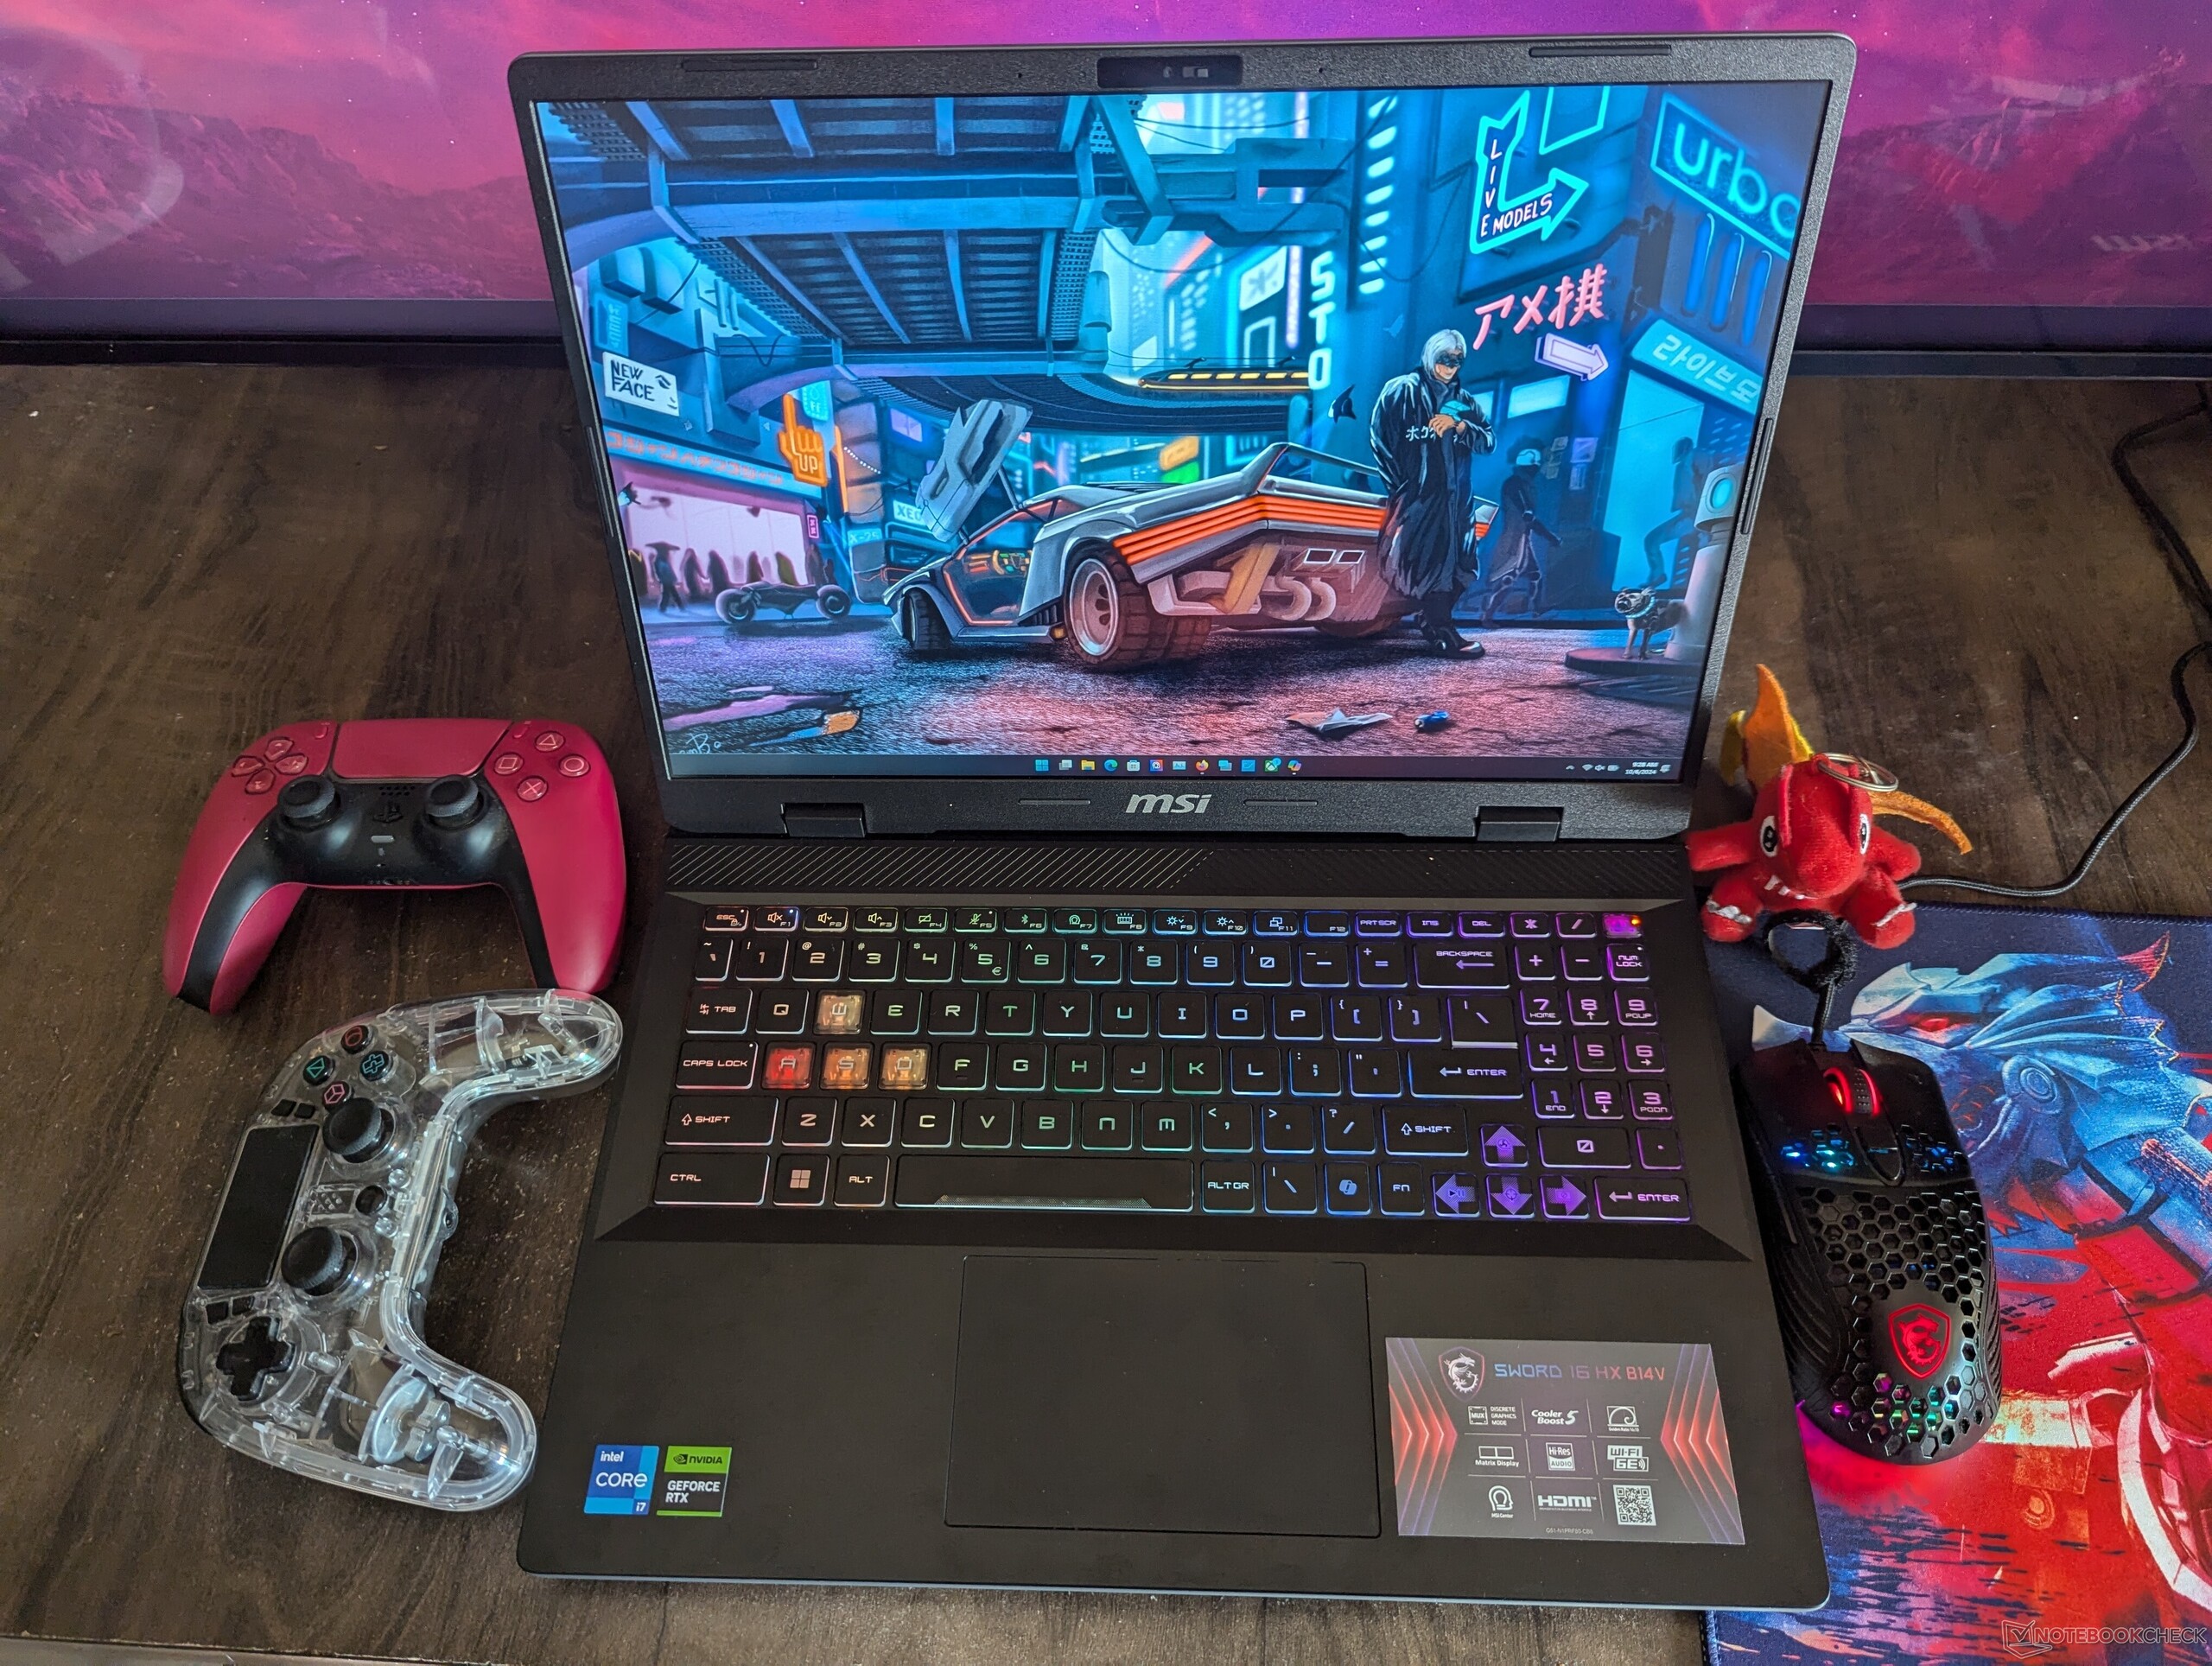
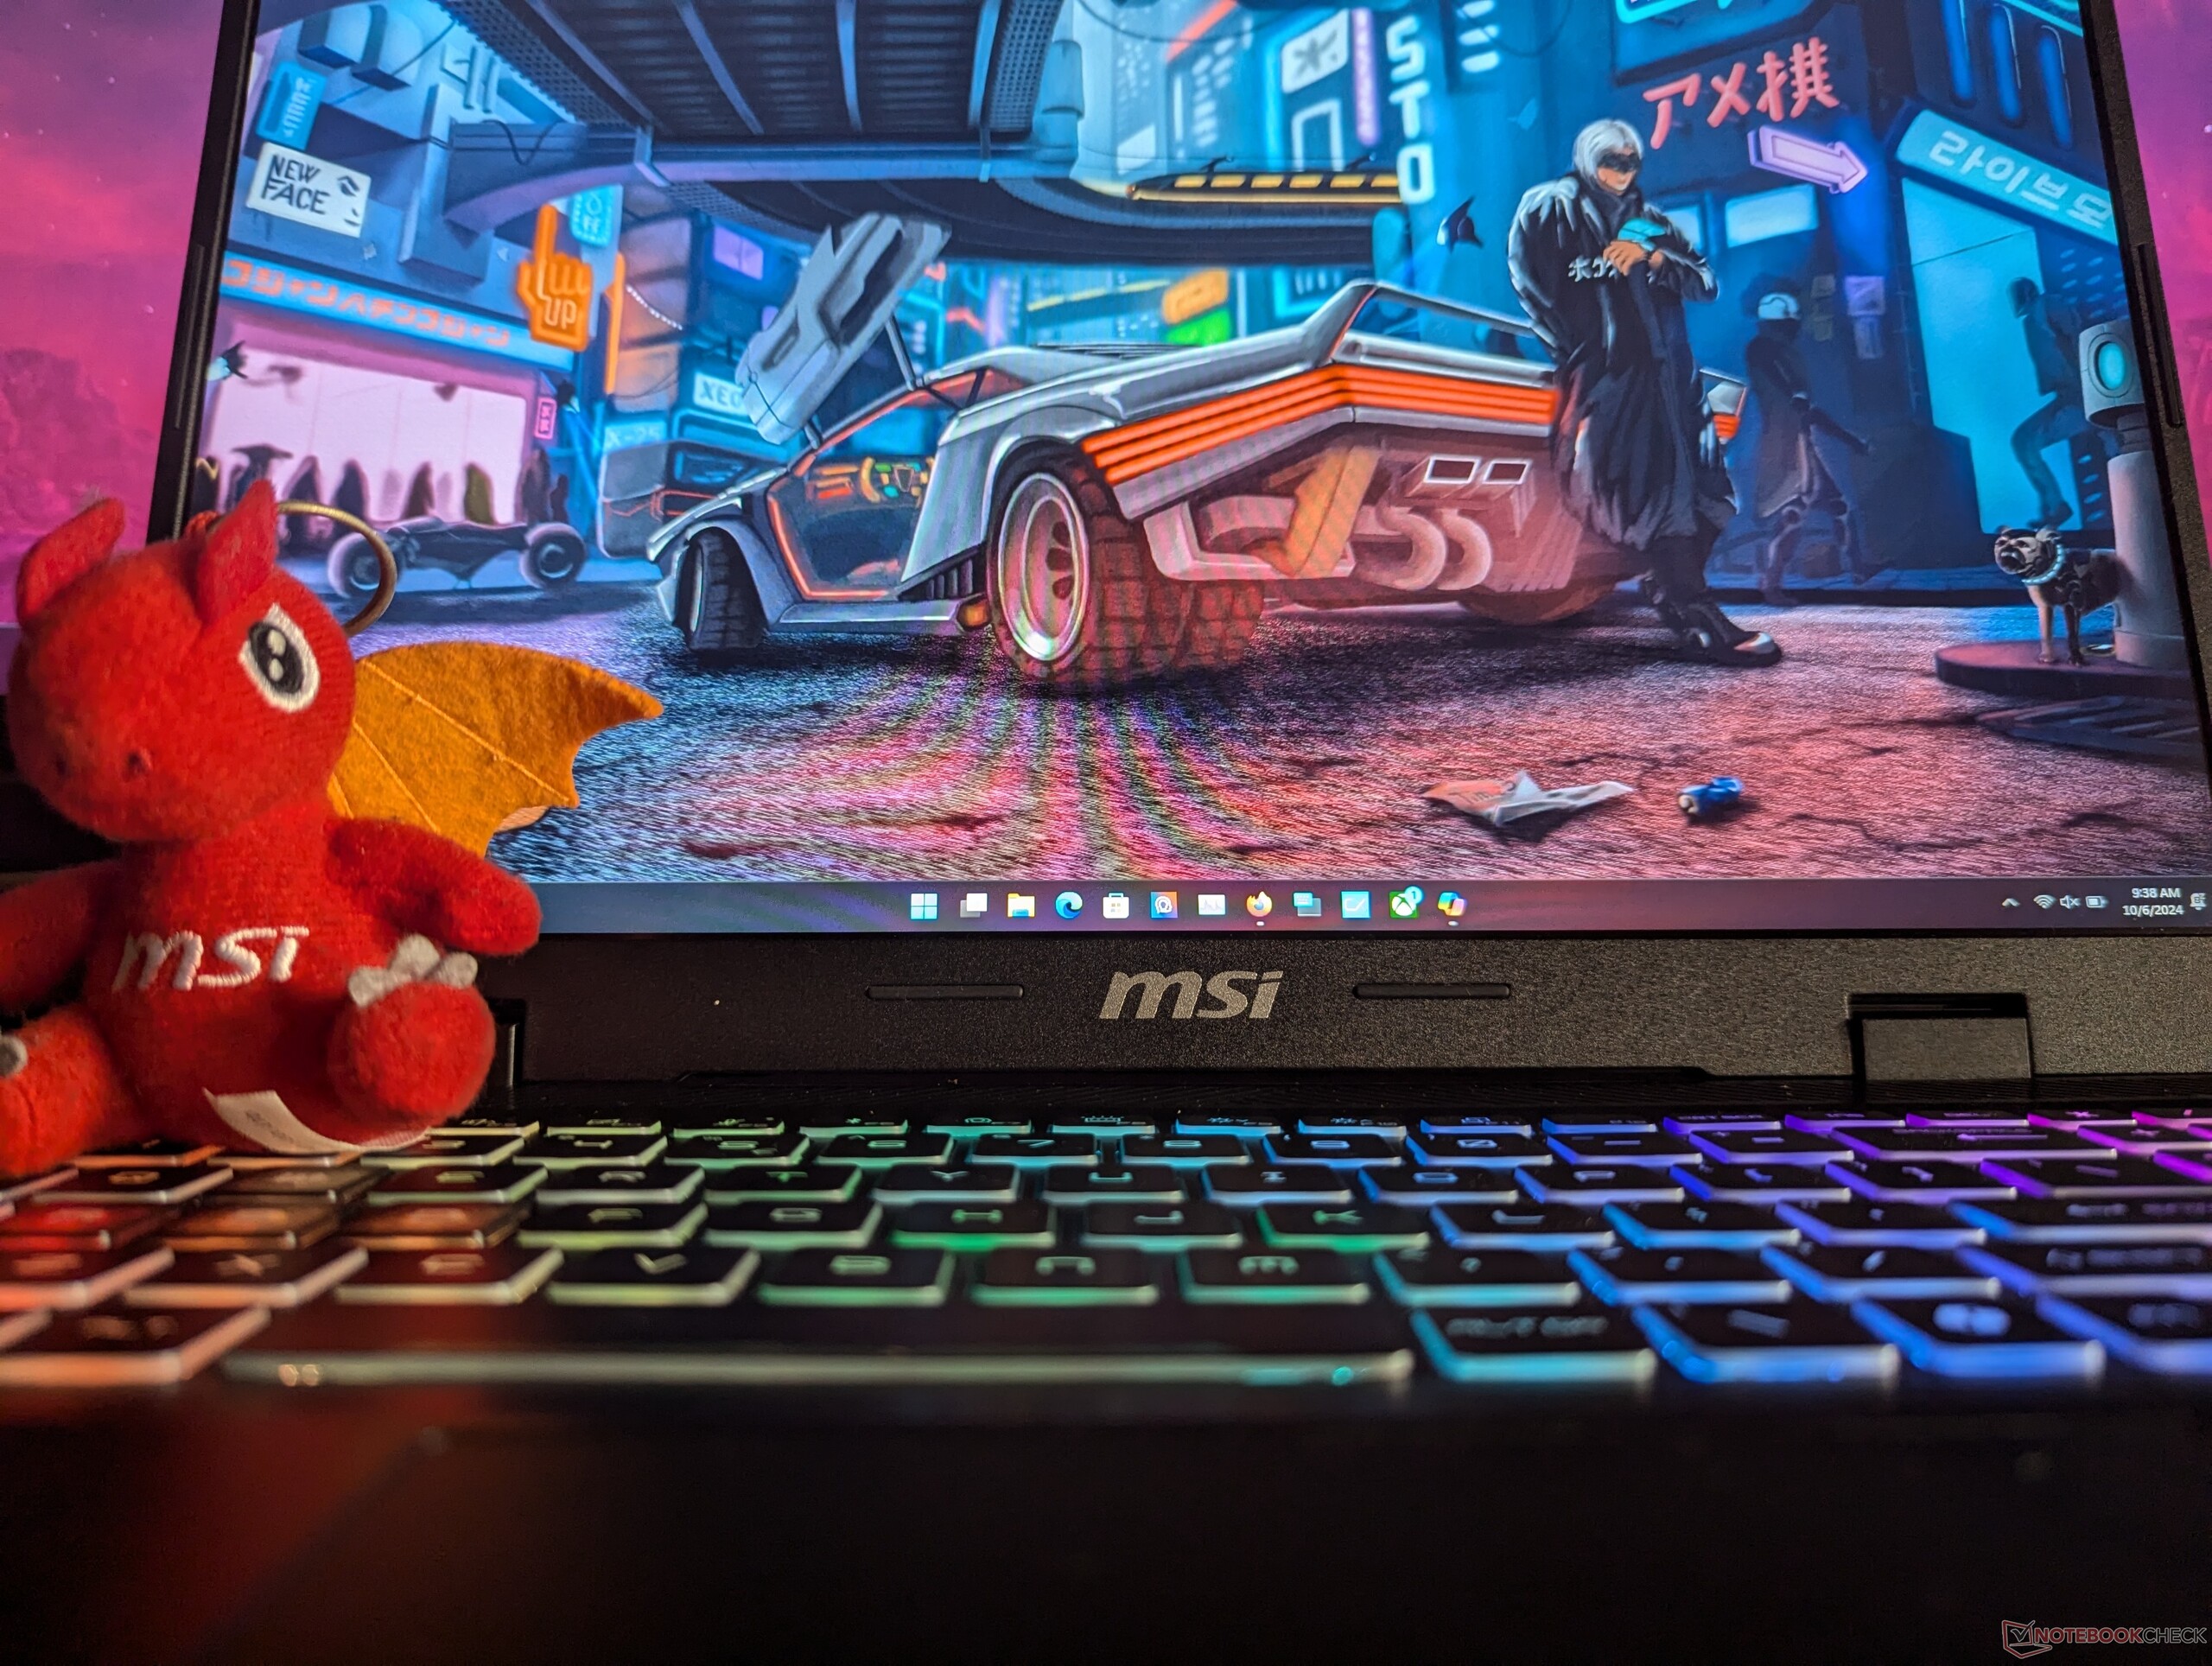
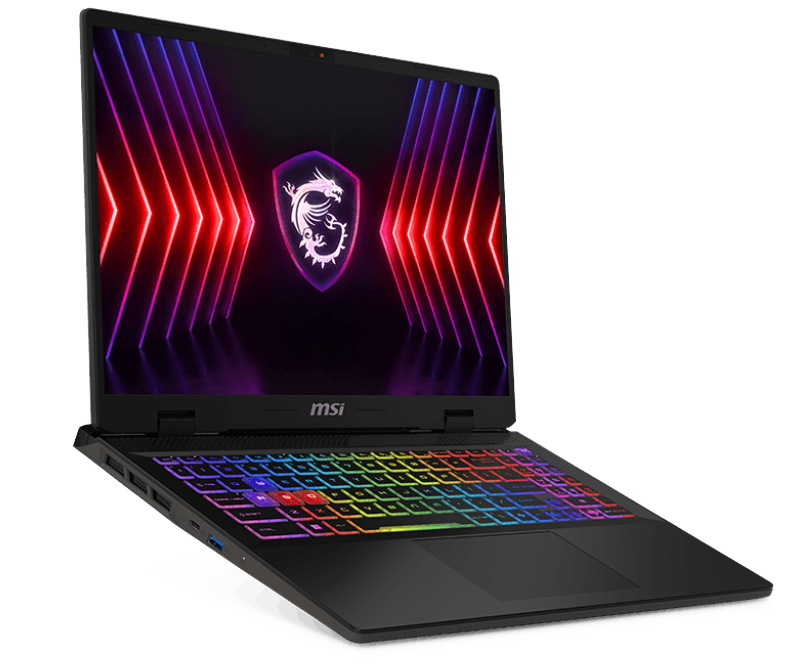
Châssis : Plastique de construction robuste
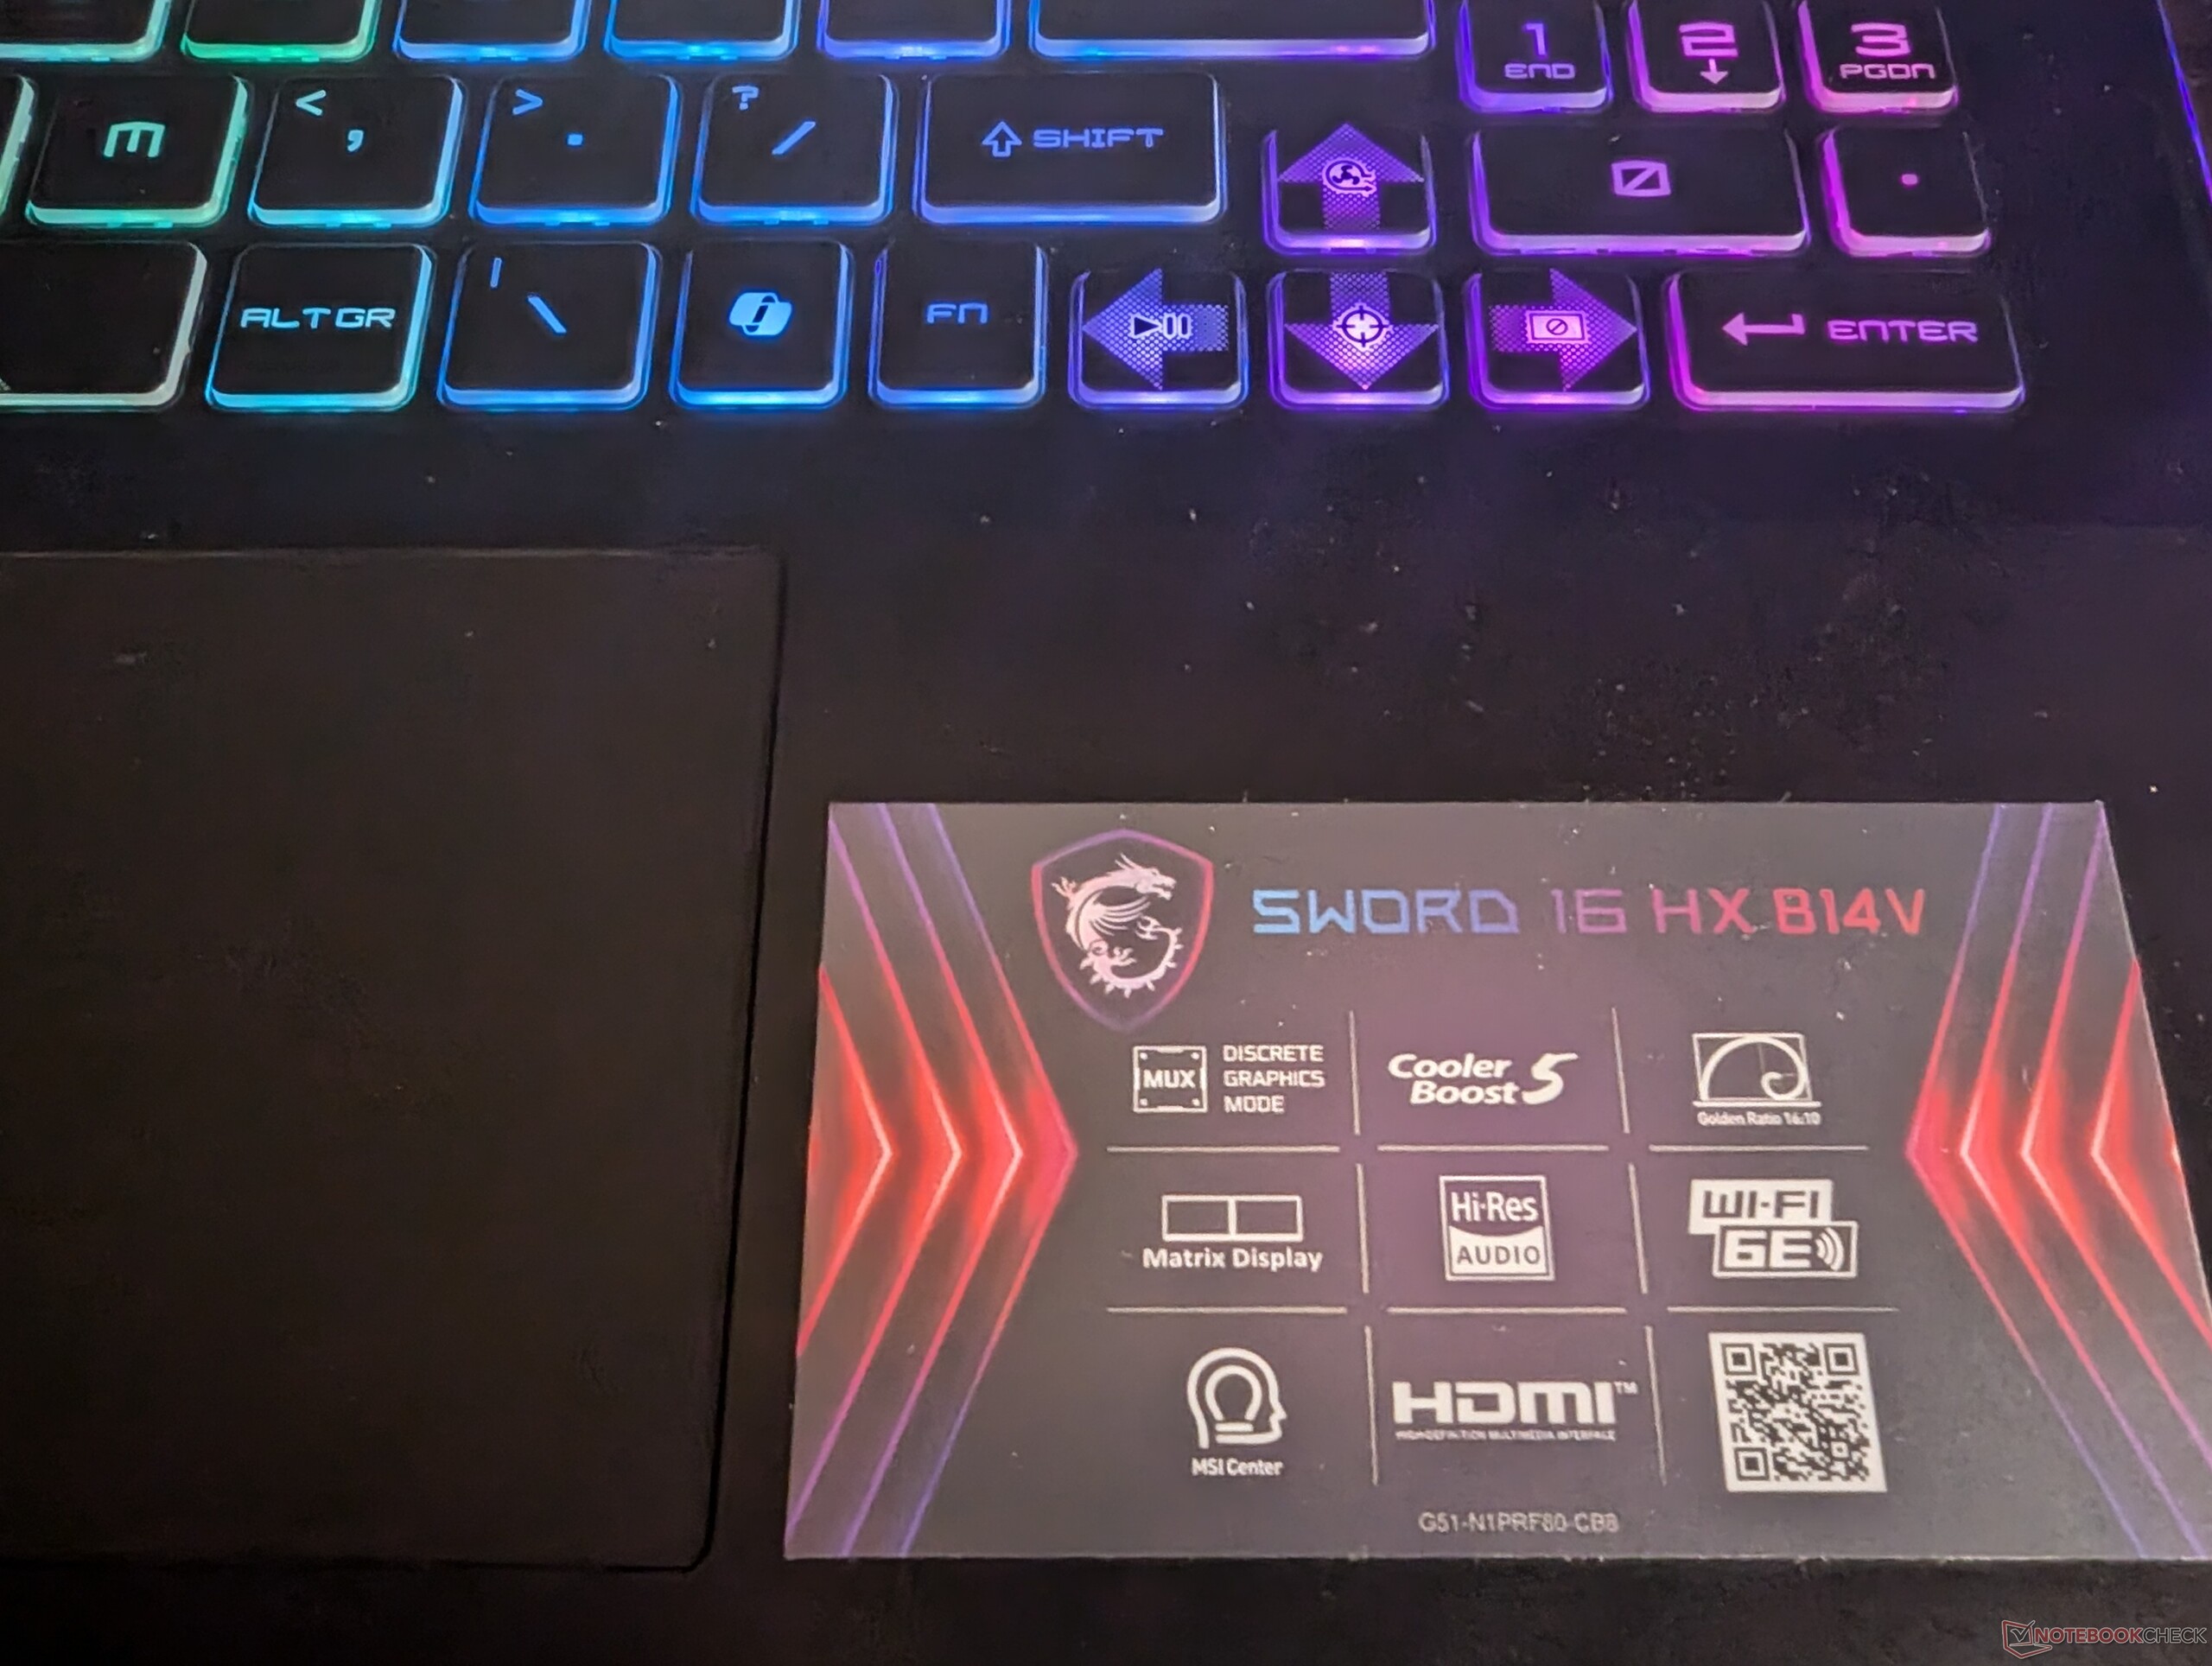
Le MSI Sword 16 HX est livré avec un châssis en plastique standard. Nous avons choisi l'une des couleurs les plus sombres et c'est, malheureusement, un aimant à traces de doigts et de graisse. Il y a un logo MSI à l'arrière (et un minuscule sous l'écran) et des autocollants soulignant les principales caractéristiques à côté du trackpad.
Malgré sa construction en plastique, le châssis est robuste et ne présente qu'un minimum de flexion. L'écran et les charnières sont rigides et ne se tordent pas lorsqu'une faible pression est exercée. Contrairement à certaines offres plus haut de gamme, vous ne pouvez pas ouvrir l'écran avec un doigt sans que le portable ne bouge.
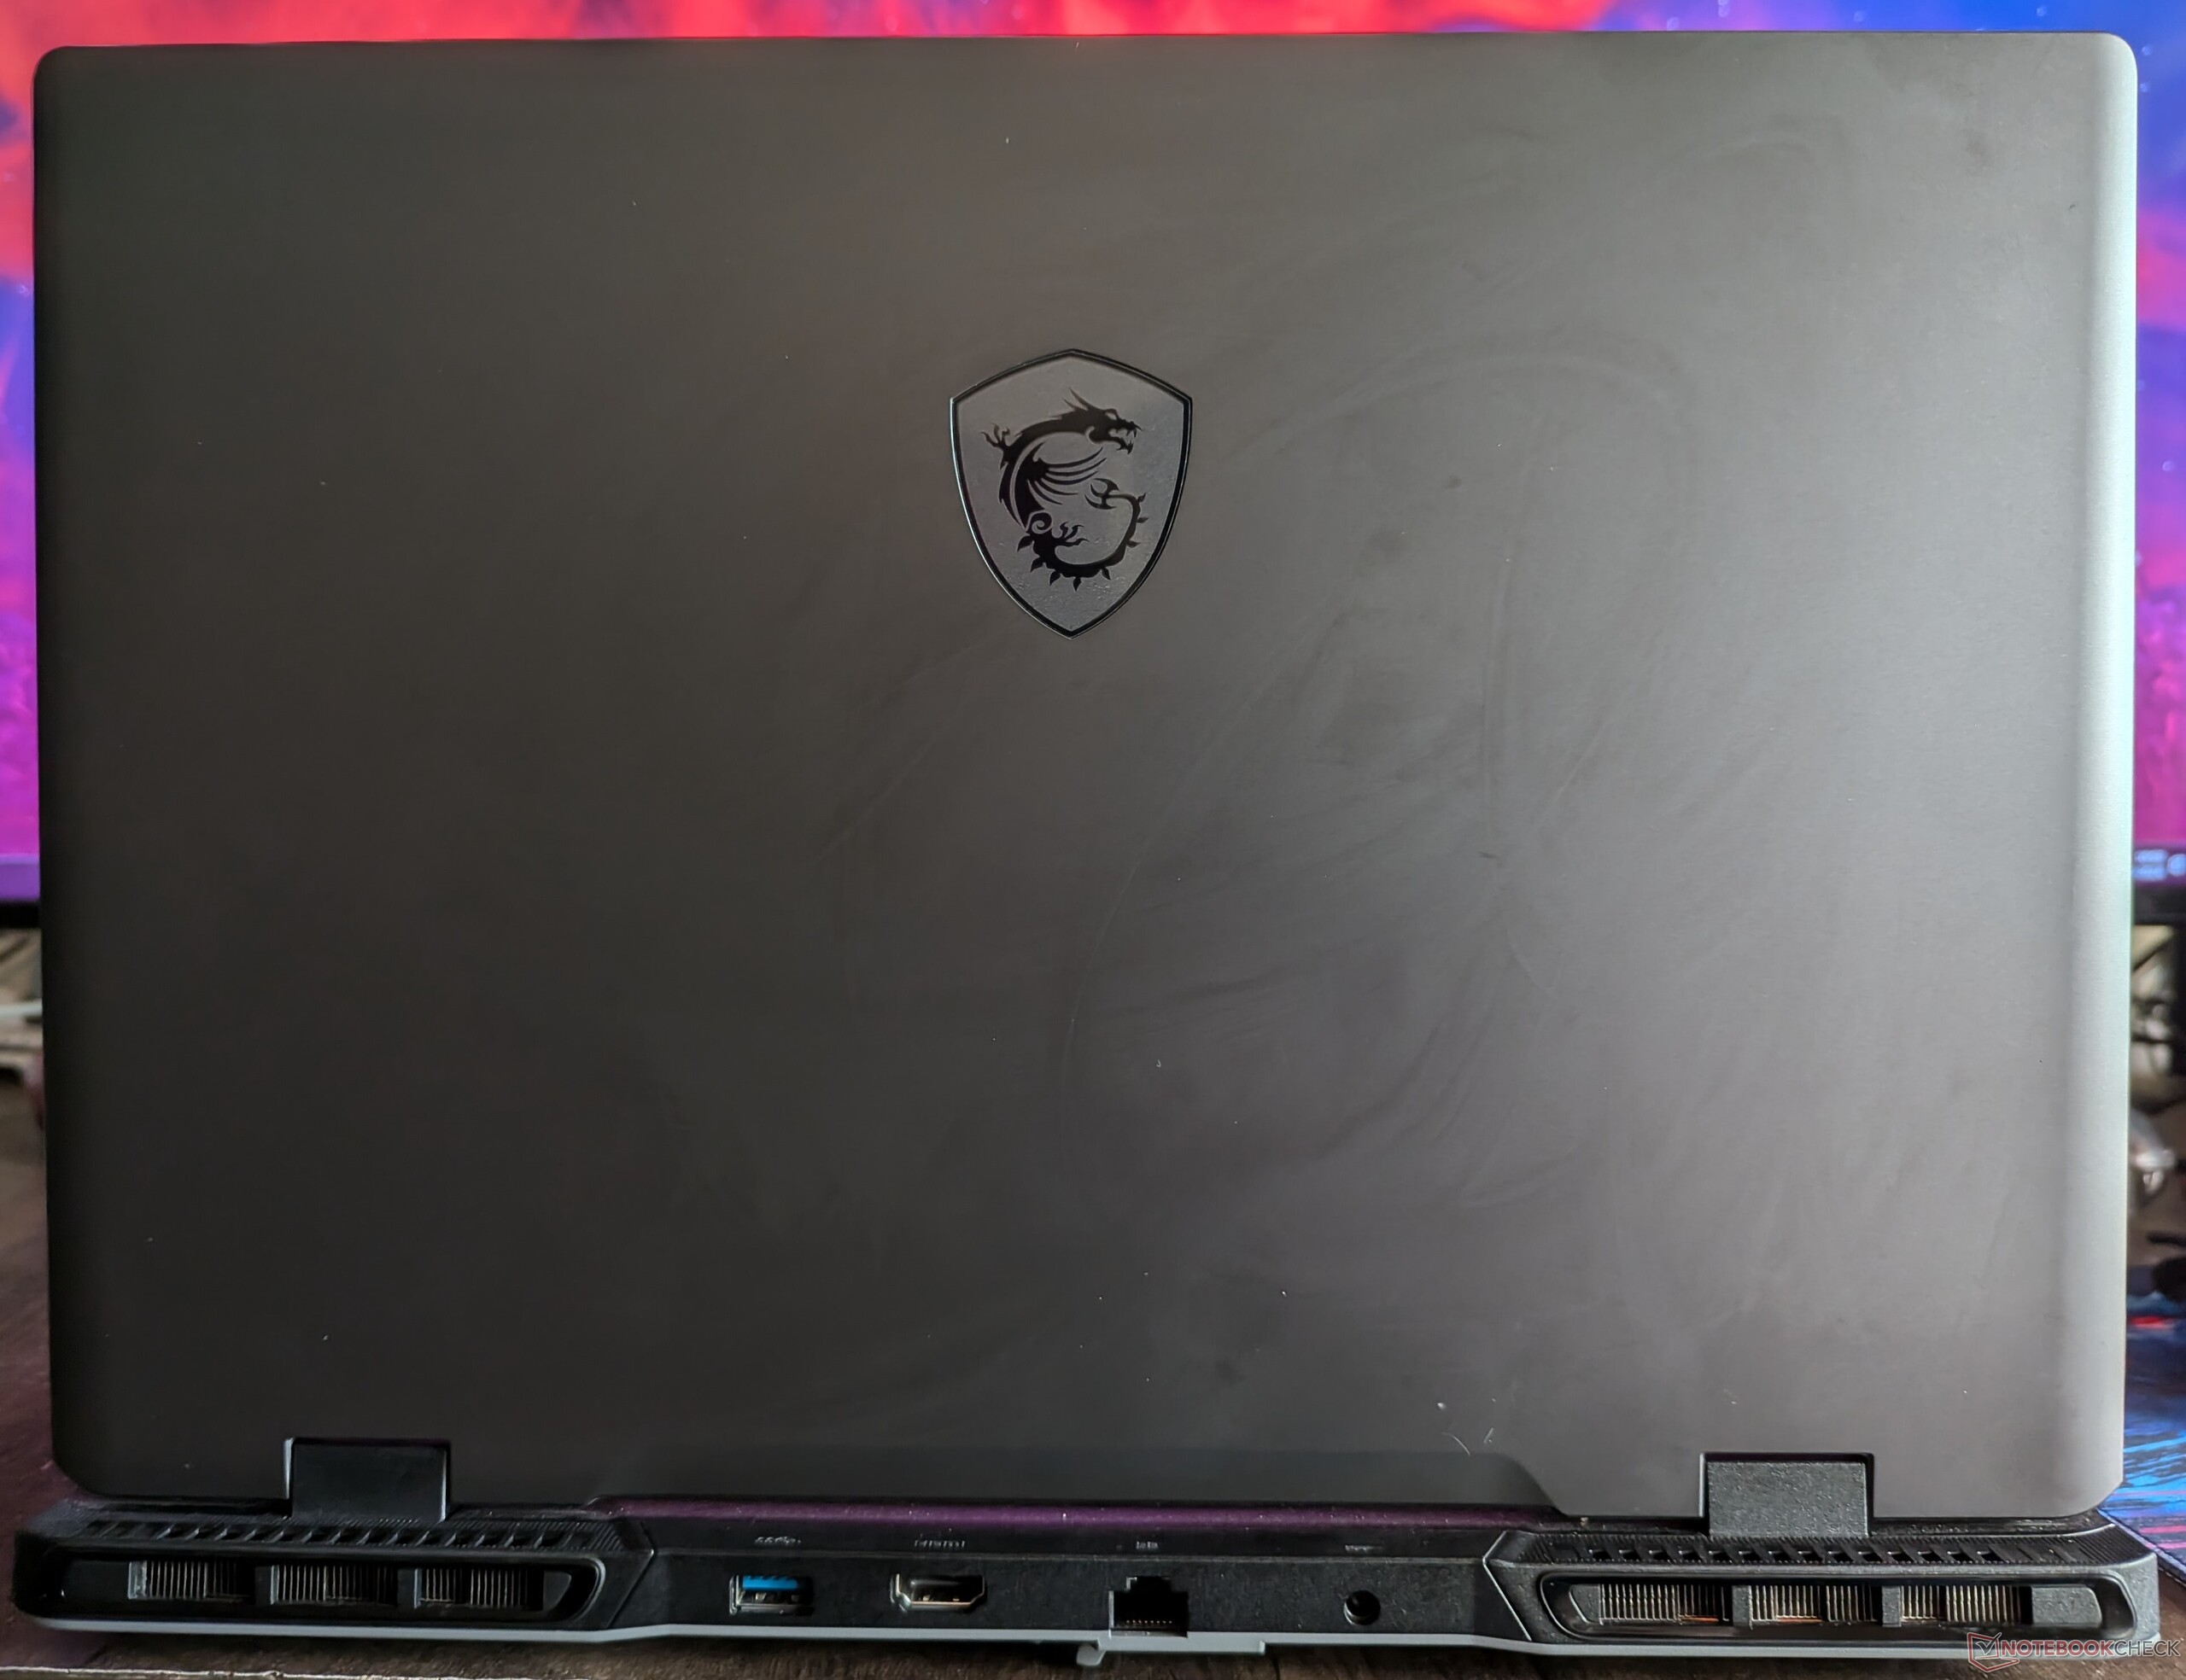
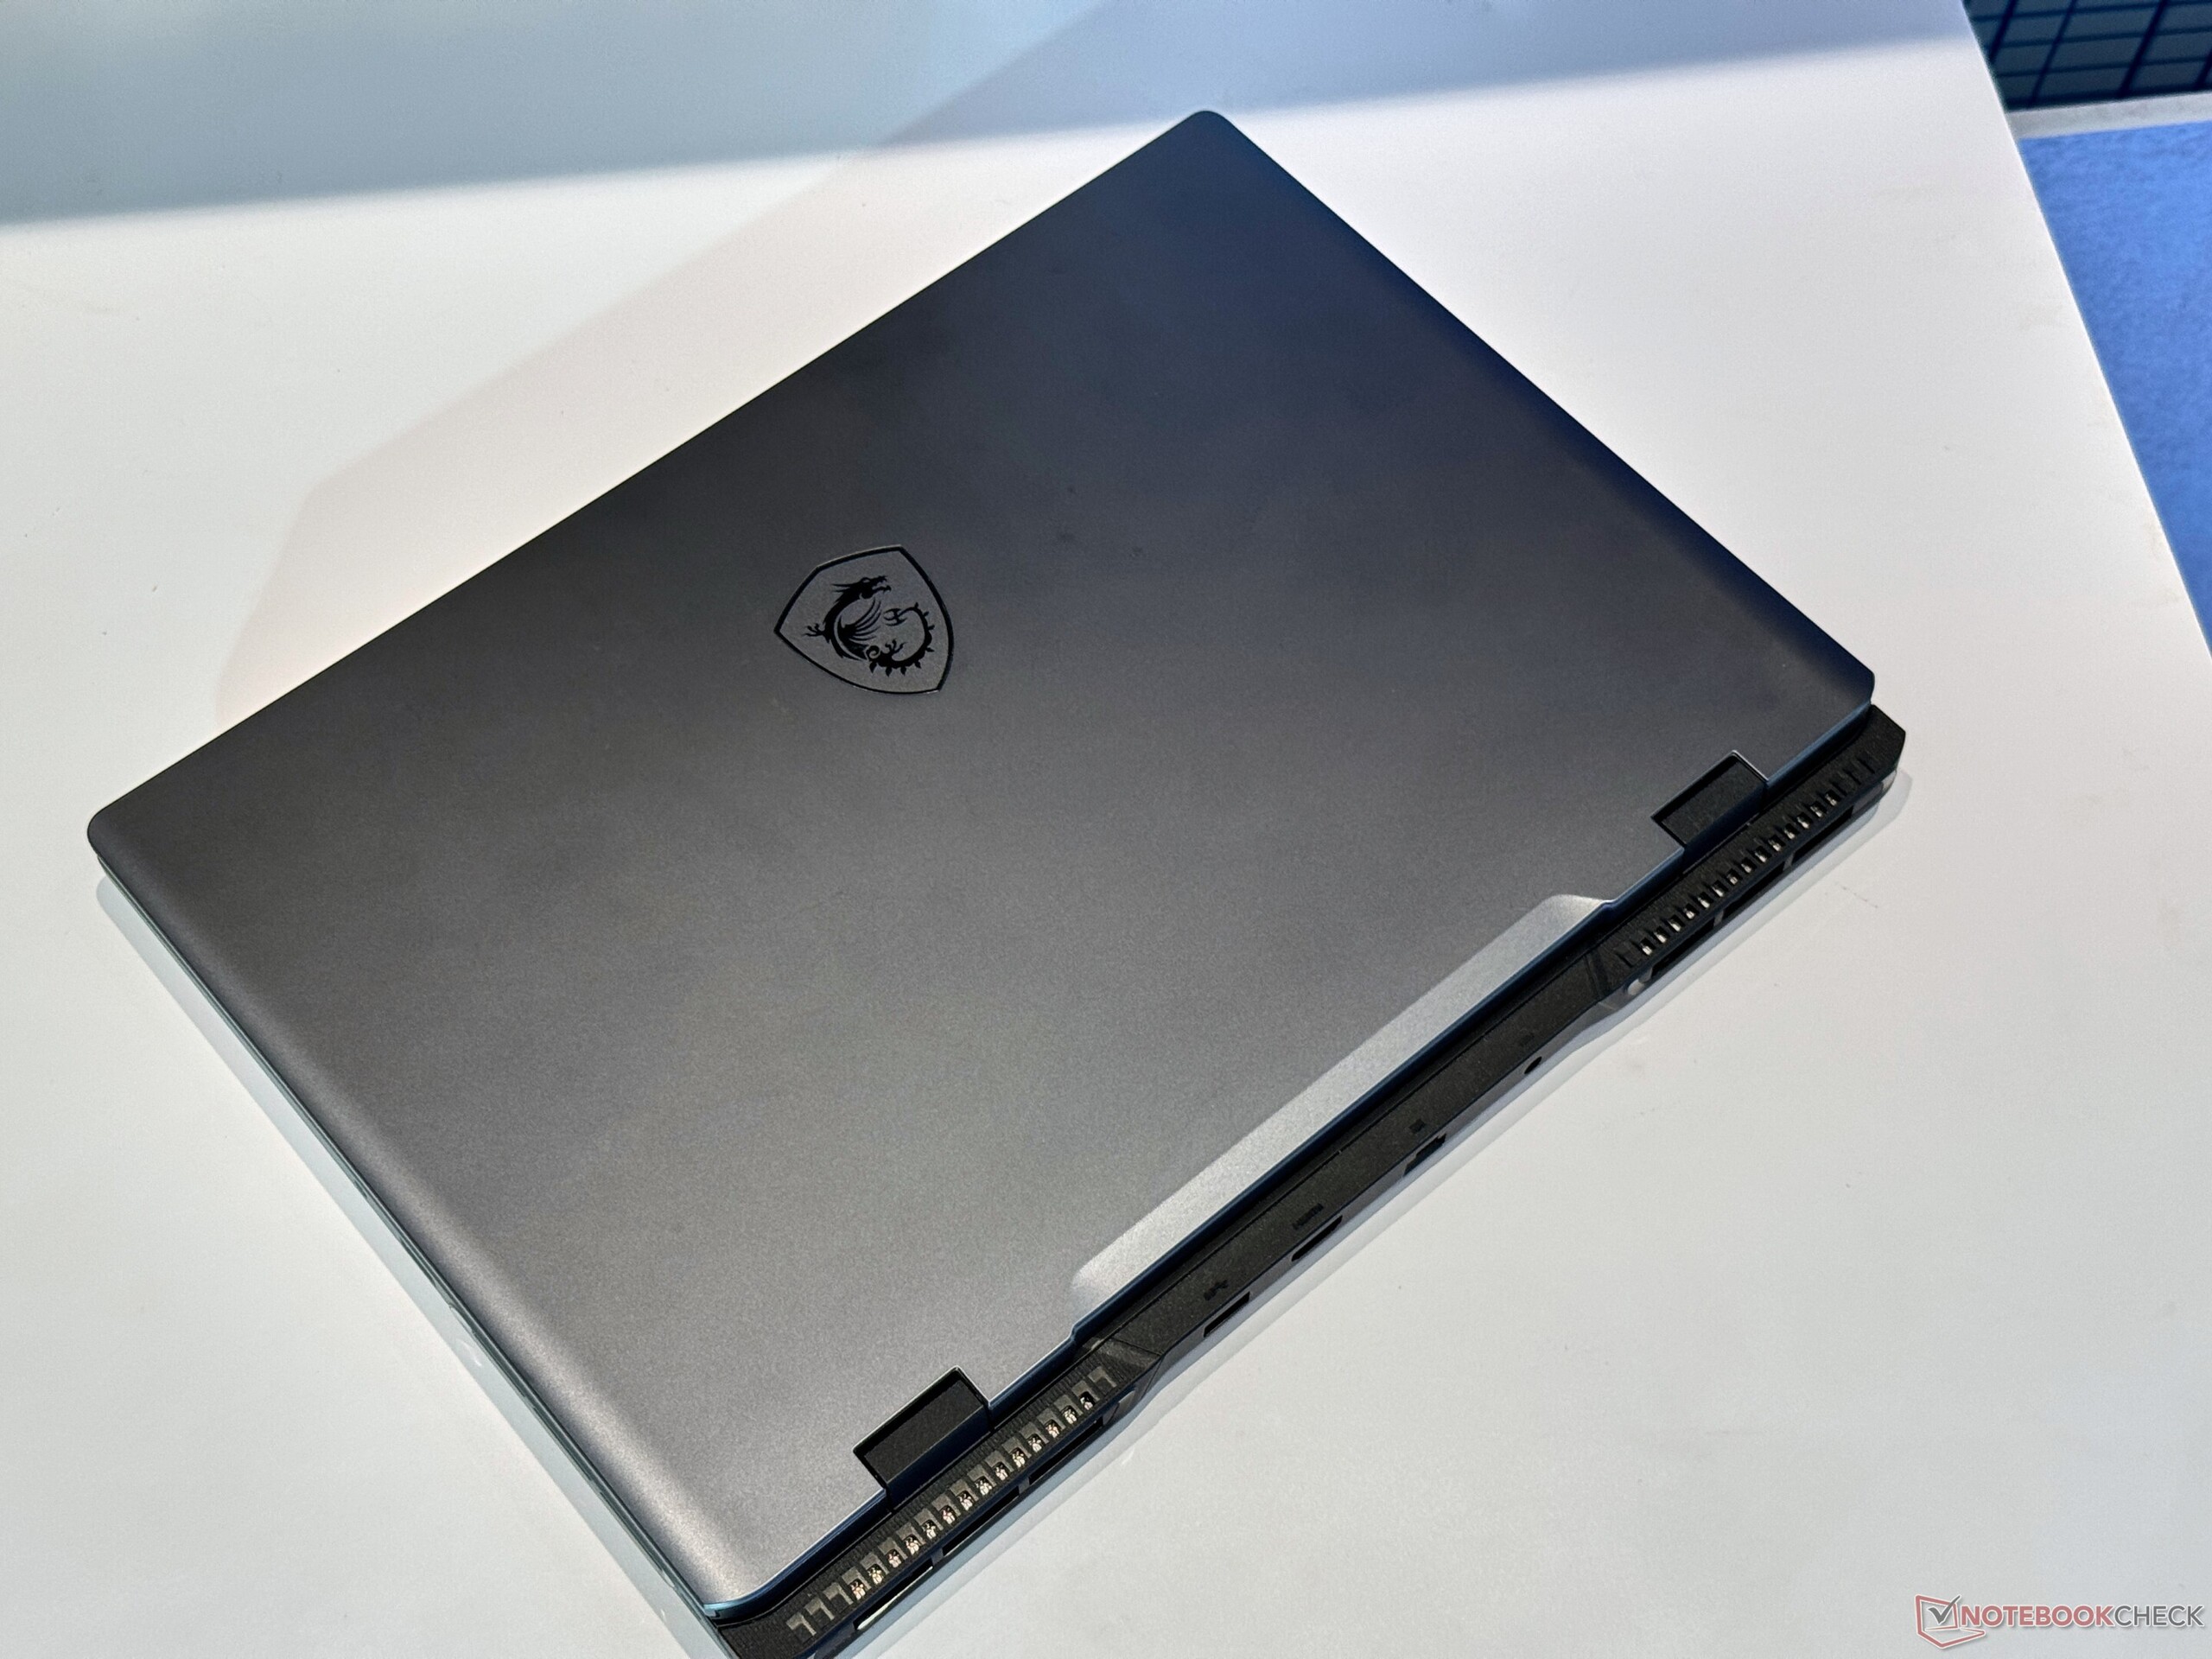
Avec un poids de 2,3 kg, le MSI Sword 16 HX n'est pas ce que l'on pourrait appeler portable, mais vous pouvez le transporter dans votre sac à dos si vous le souhaitez.
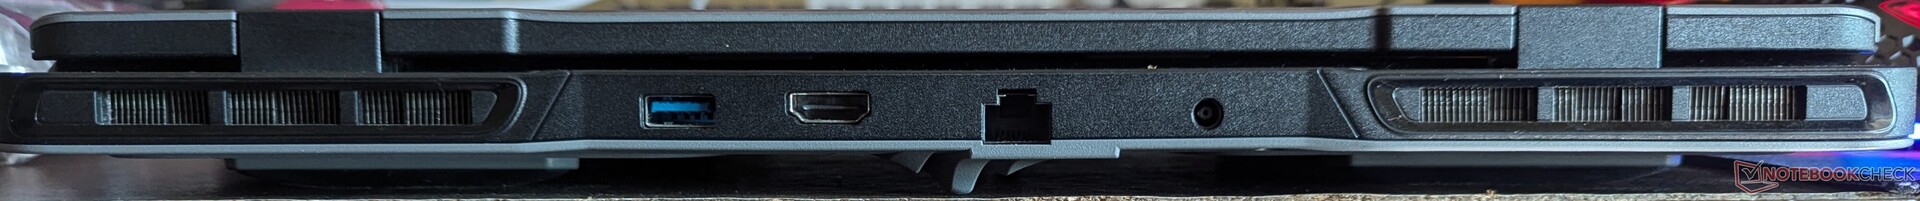
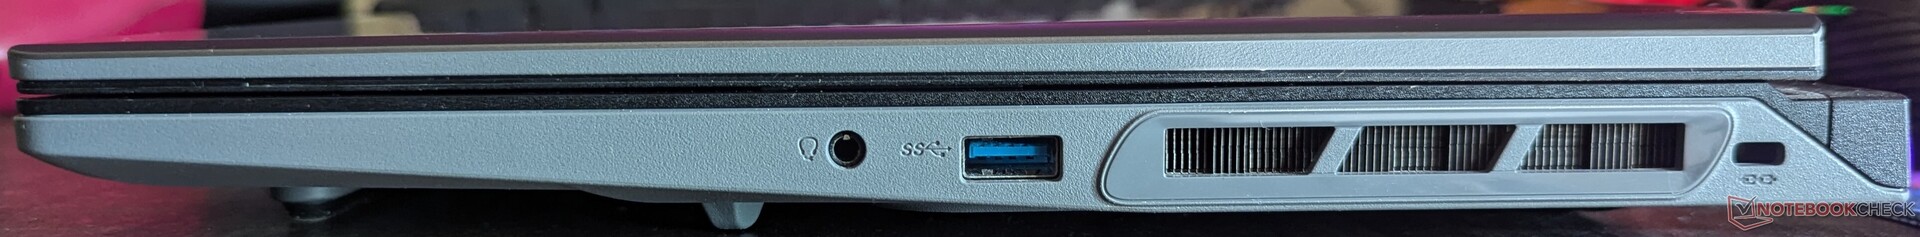
Connectivité : Wi-Fi 6E ultrarapide et Ethernet
Les ordinateurs portables de jeu sont souvent utilisés comme des ordinateurs de bureau et ont besoin de beaucoup d'E/S pour remplir ce rôle. Nous avons toutefois remarqué quelques problèmes avec les ports. Pour commencer, vous ne pouvez pas charger votre ordinateur portable avec le port USB Type-C. Cela vous oblige à utiliser le chargeur à broche en barillet à l'arrière, qui est positionné juste à côté des évents.
Le câble de charge à angle droit se trouve donc juste devant l'aération et est soumis à un flux d'air chaud continu. Avec le temps, la chaleur risque de ronger l'isolation en plastique et de rendre le câble inutilisable.
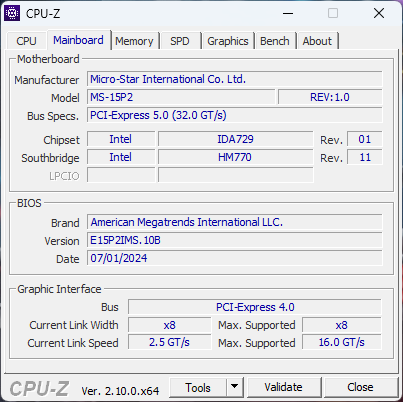
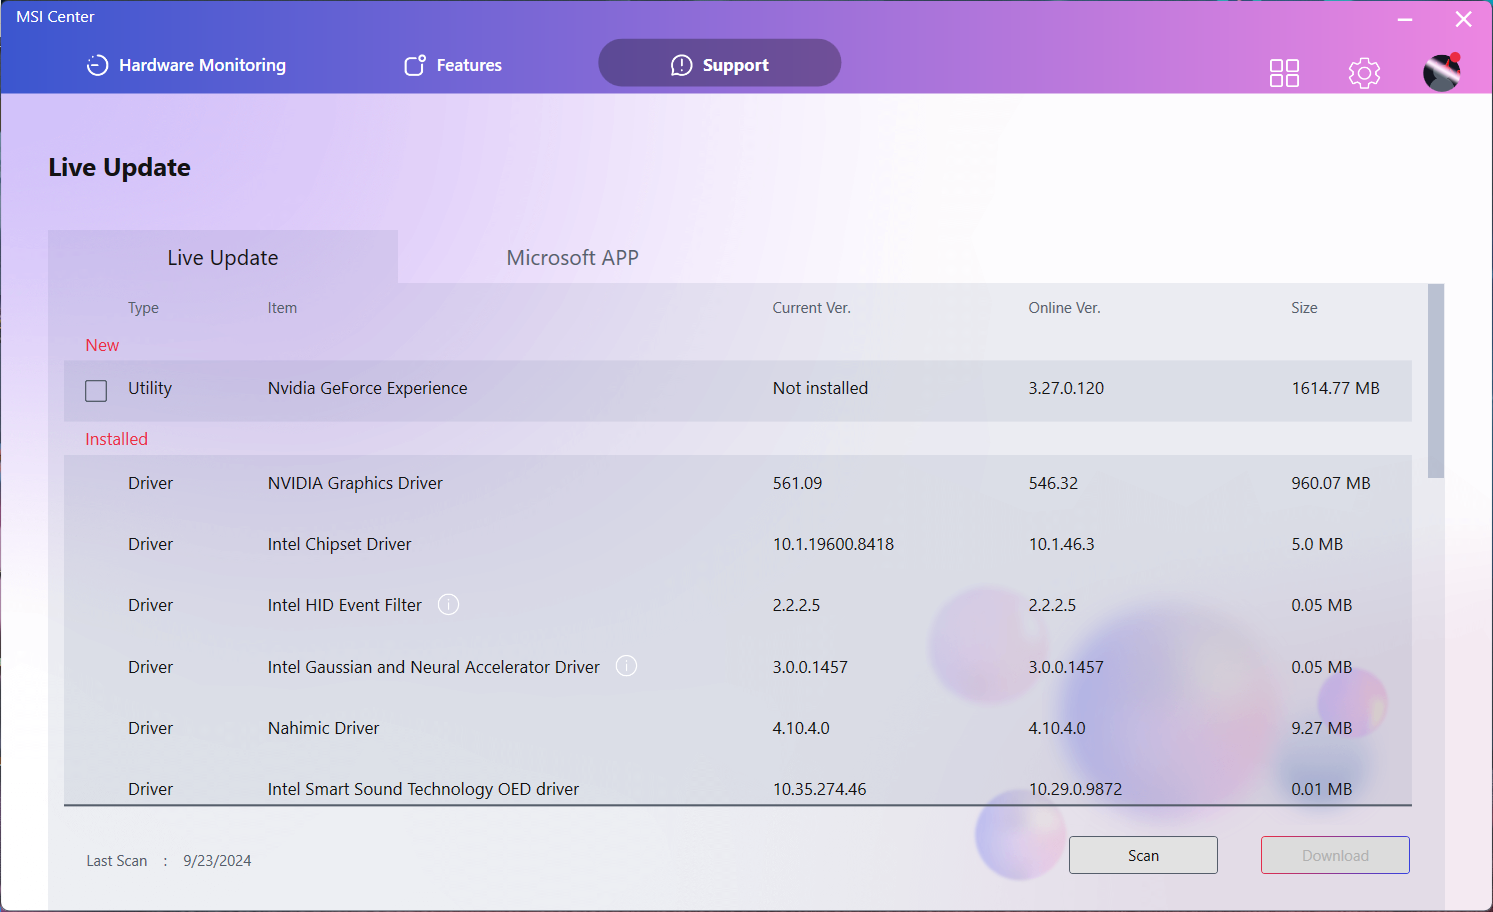
De plus, le port HDMI inclus refusait catégoriquement de fonctionner à 1440p 144 Hz sur notre moniteur externe et plafonnait à 100 Hz pour une raison quelconque. Nous avons contacté MSI qui nous a fourni un BIOS mis à jour (E15P2IMS.10D) qui résout ce problème. Ce BIOS est également disponible sur la page de support de l'ordinateur portable https://www.msi.com/Laptop/Sword-16-HX-B14VX/support?sub_product=Sword-16-HX-B14VGKGmais nous n'avons pas pu le flasher dans notre unité de test.

Communication
Le Sword 16 HX est équipé d'une radio Wi-Fi 6E d'Intel. Dans des conditions idéales, vous pouvez facilement obtenir des taux de transfert supérieurs à 1 Gbps dans les bandes 5 GHz et 6 GHz.
Ceux qui recherchent une vitesse garantie et une faible latence peuvent compter sur la prise Ethernet RJ45.
| Networking / iperf3 transmit AXE11000 | |
| Lenovo Legion 7 16 IRX G9 | |
| Asus ROG Strix G17 G713PI | |
| MSI Sword 16 HX B14VGKG | |
| Moyenne Intel Wi-Fi 6E AX211 (64 - 1921, n=251) | |
| Moyenne de la classe Gaming (469 - 1843, n=122, 2 dernières années) | |
| Alienware m16 R2 | |
| Acer Predator Helios Neo 16 (2024) | |
| HP Omen 17-db0079ng | |
| HP Victus 16-r0077ng | |
| Networking / iperf3 receive AXE11000 | |
| Lenovo Legion 7 16 IRX G9 | |
| Asus ROG Strix G17 G713PI | |
| MSI Sword 16 HX B14VGKG | |
| Moyenne de la classe Gaming (680 - 1744, n=122, 2 dernières années) | |
| Moyenne Intel Wi-Fi 6E AX211 (582 - 1890, n=251) | |
| Alienware m16 R2 | |
| Acer Predator Helios Neo 16 (2024) | |
| HP Omen 17-db0079ng | |
| HP Victus 16-r0077ng | |
| Networking / iperf3 transmit AXE11000 6GHz | |
| MSI Sword 16 HX B14VGKG | |
| Acer Predator Helios Neo 16 (2024) | |
| Moyenne de la classe Gaming (648 - 2355, n=56, 2 dernières années) | |
| Alienware m16 R2 | |
| Moyenne Intel Wi-Fi 6E AX211 (385 - 1851, n=217) | |
| Networking / iperf3 receive AXE11000 6GHz | |
| Acer Predator Helios Neo 16 (2024) | |
| MSI Sword 16 HX B14VGKG | |
| Moyenne Intel Wi-Fi 6E AX211 (700 - 1857, n=217) | |
| Moyenne de la classe Gaming (853 - 1788, n=56, 2 dernières années) | |
| Alienware m16 R2 | |
Webcam
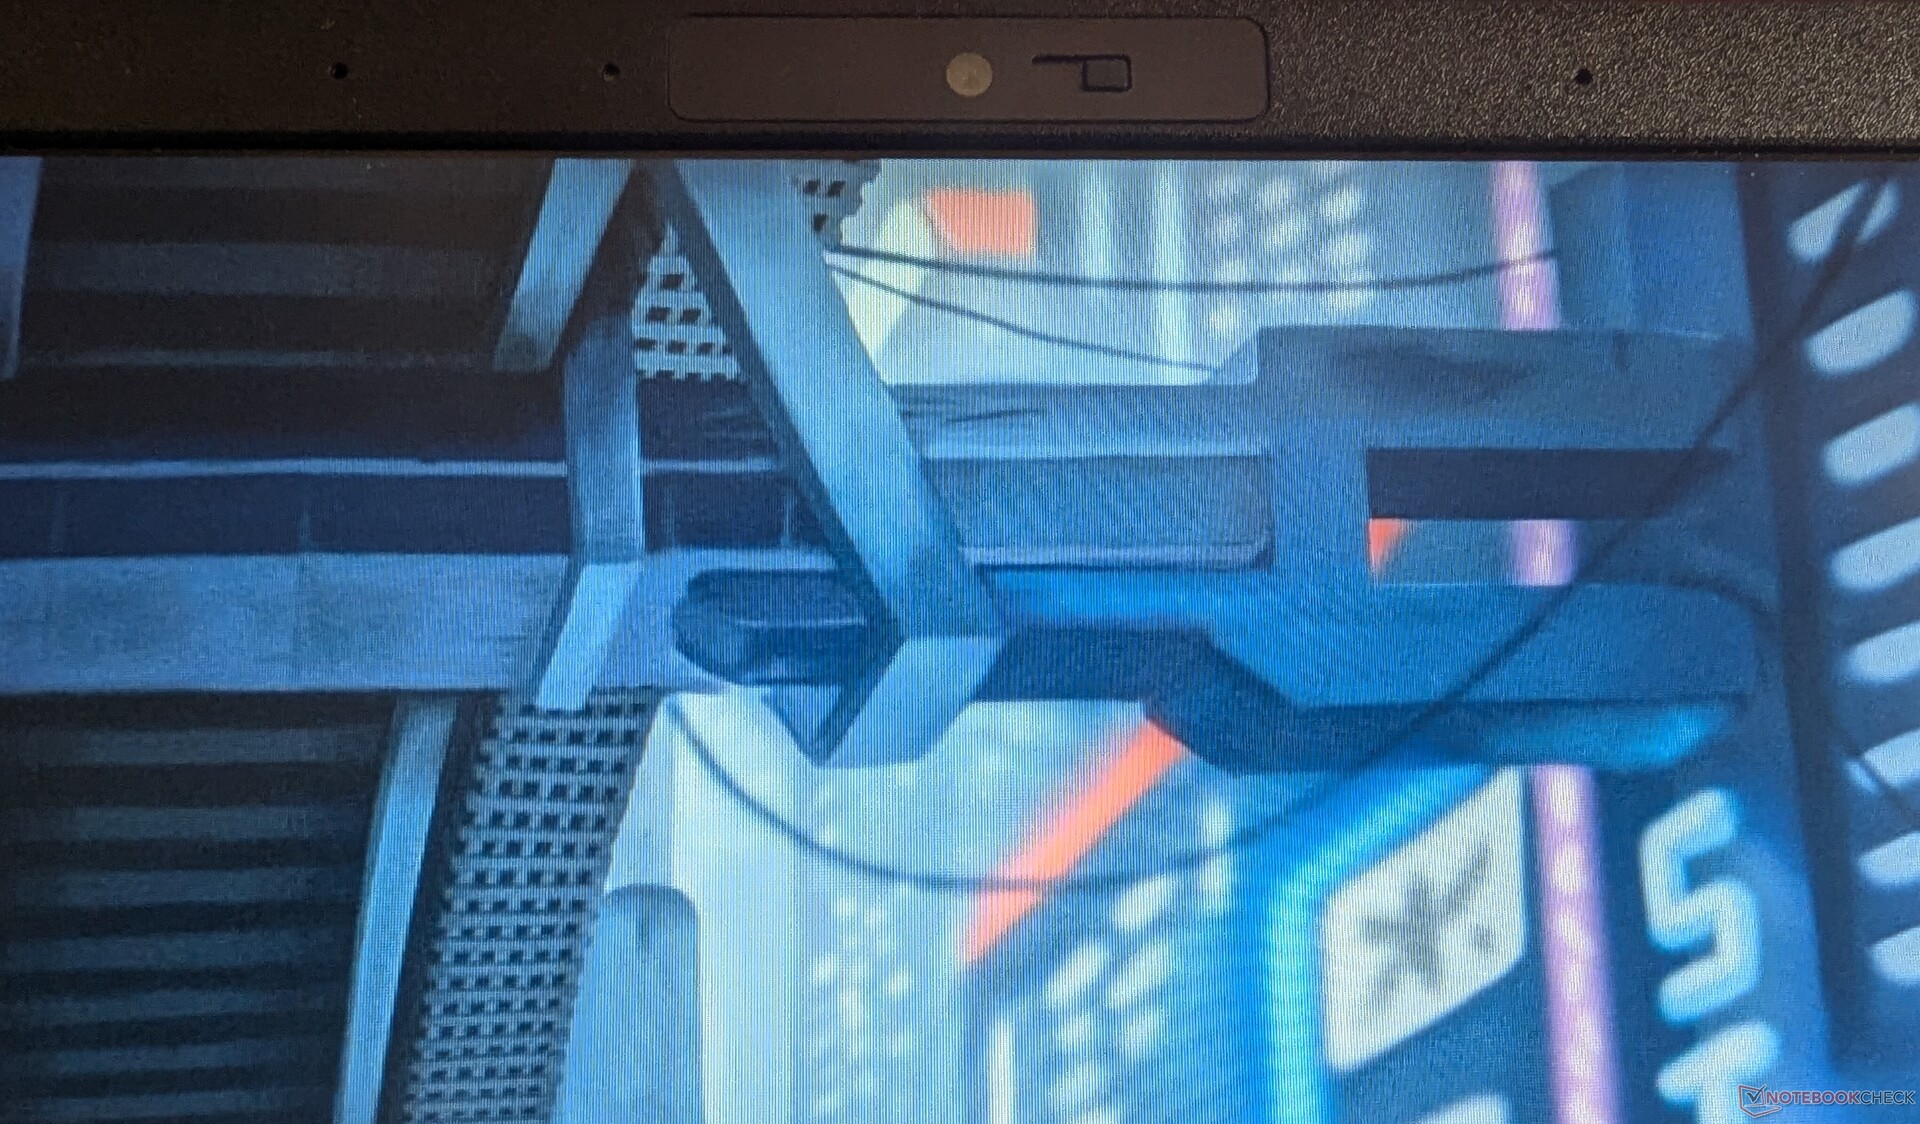
MSI utilise une vieille webcam 1080p sur le Sword 16 HX. Elle n'est pas particulièrement fidèle aux couleurs et ne parvient pas à reproduire correctement les teintes bleues.
Si vous souhaitez faire du livestream, il est préférable d'investir dans une webcam externe. Sinon, elle devrait fonctionner correctement pour une utilisation quotidienne et est même équipée d'un volet physique de protection de la vie privée.


Sécurité
Outre l'obturateur de la webcam, le MSI Sword 16 HX est équipé d'un module TPM 2.0 standard et d'une fente de verrouillage Kensington pour la sécurité.
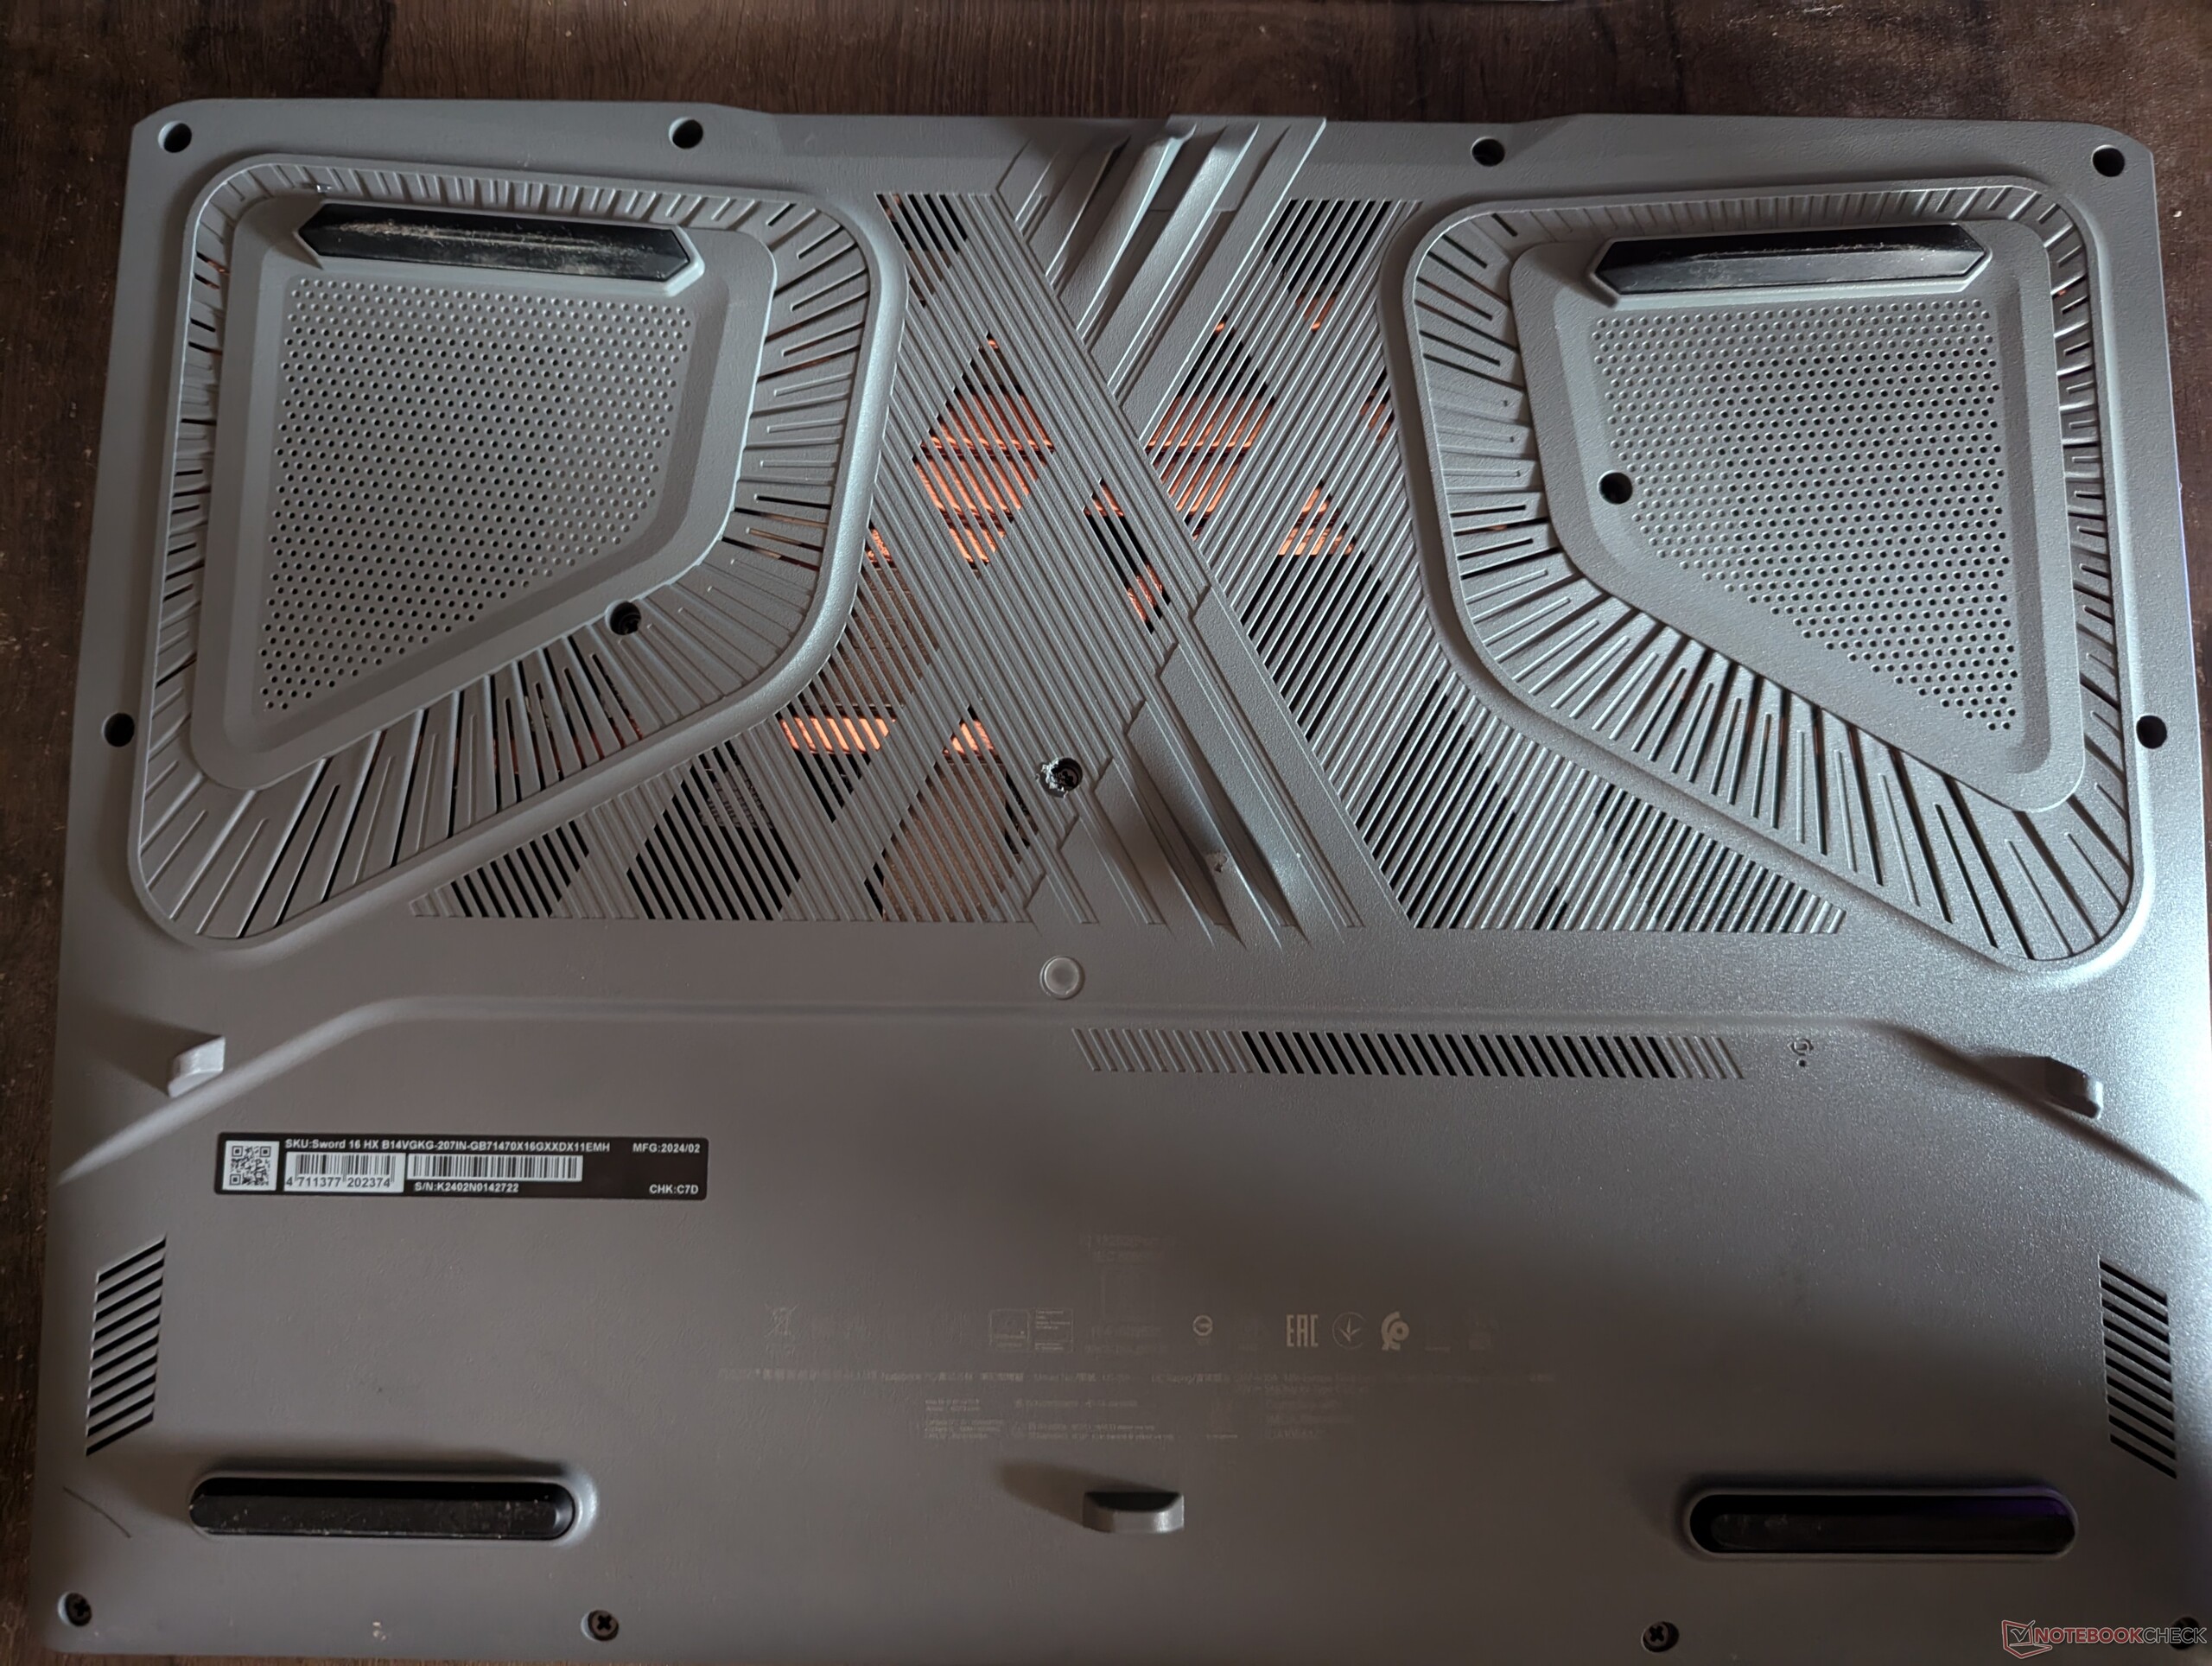
Maintenance
L'ouverture du MSI Sword 16 HX peut s'avérer un peu fastidieuse. Il y a 12 vis au total, dont l'une est cachée sous un autocollant " Warranty void if removed " (annulation de la garantie en cas de retrait).
Cependant, une fois à l'intérieur, la RAM et le SSD sont remplaçables par l'utilisateur. La première peut être portée à 96 Go, et le second comprend un emplacement PCIe Gen4 et un emplacement PCIe Gen5.
Malheureusement, nous ne pouvons pas afficher d'images de l'intérieur du Sword 16 car MSI nous a demandé de ne pas le démonter.
Durabilité
La boîte du MSI Sword 16 HX contient beaucoup d'emballages en carton inutiles. À l'exception d'un peu de polystyrène et de plastique superflu, la majeure partie du contenu est en carton et peut être recyclée.
Le site web de MSI consacré à la RSE indique que l'entreprise a réalisé une réduction de 58,9 % des émissions de CO2 de portée 1+2 à la fin de 2022 et qu'elle vise une réduction de 80 % des émissions de CO2 d'ici 2030.
Accessoires et garantie
MSI offre une garantie internationale standard d'un an et une garantie nationale de deux ans avec le Sword 16 HX en Inde. Actuellement, aucun plan d'extension de garantie n'est disponible directement auprès de MSI, mais votre kilométrage peut varier auprès des revendeurs tiers.
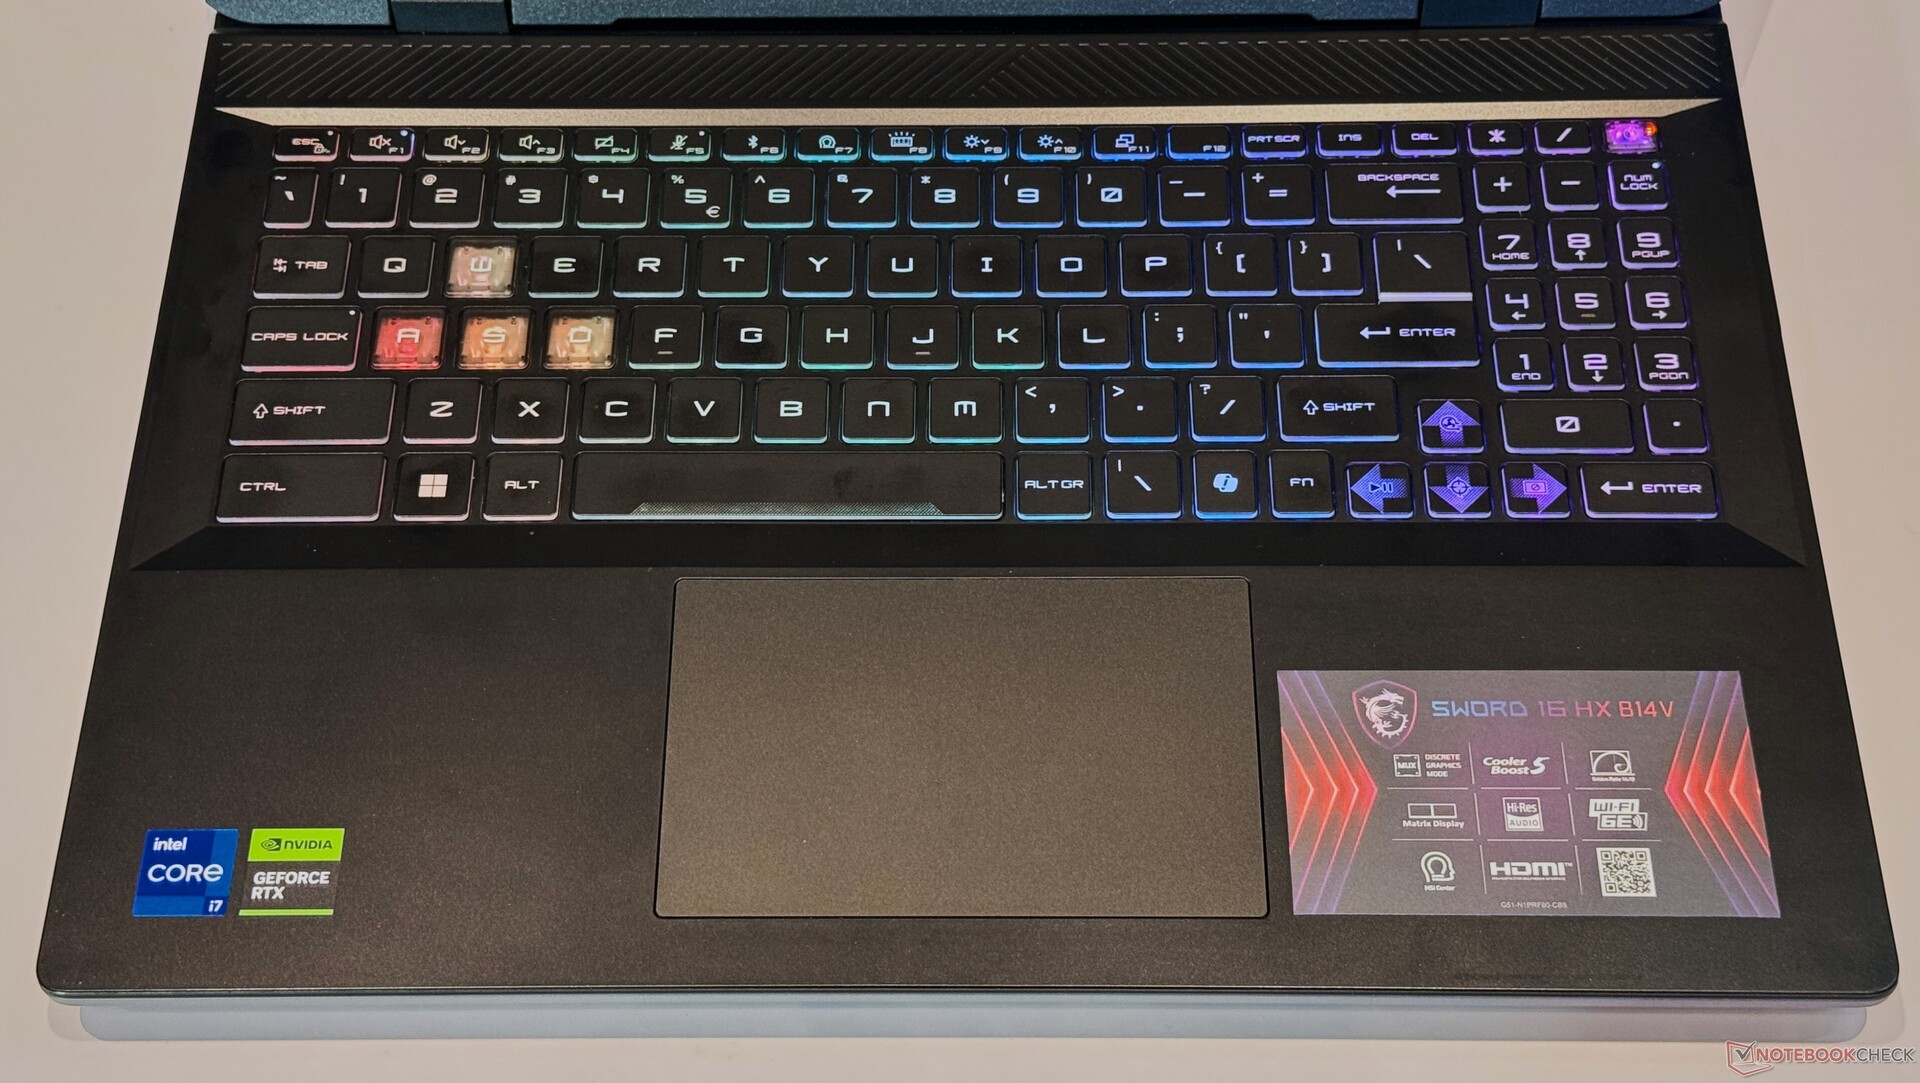
Périphériques d'entrée : Grand clavier RGB avec trackpad moins qu'idéal
Le Sword 16 HX est équipé d'un clavier et d'un trackpad standard que l'on retrouve sur la plupart des ordinateurs portables de jeu.
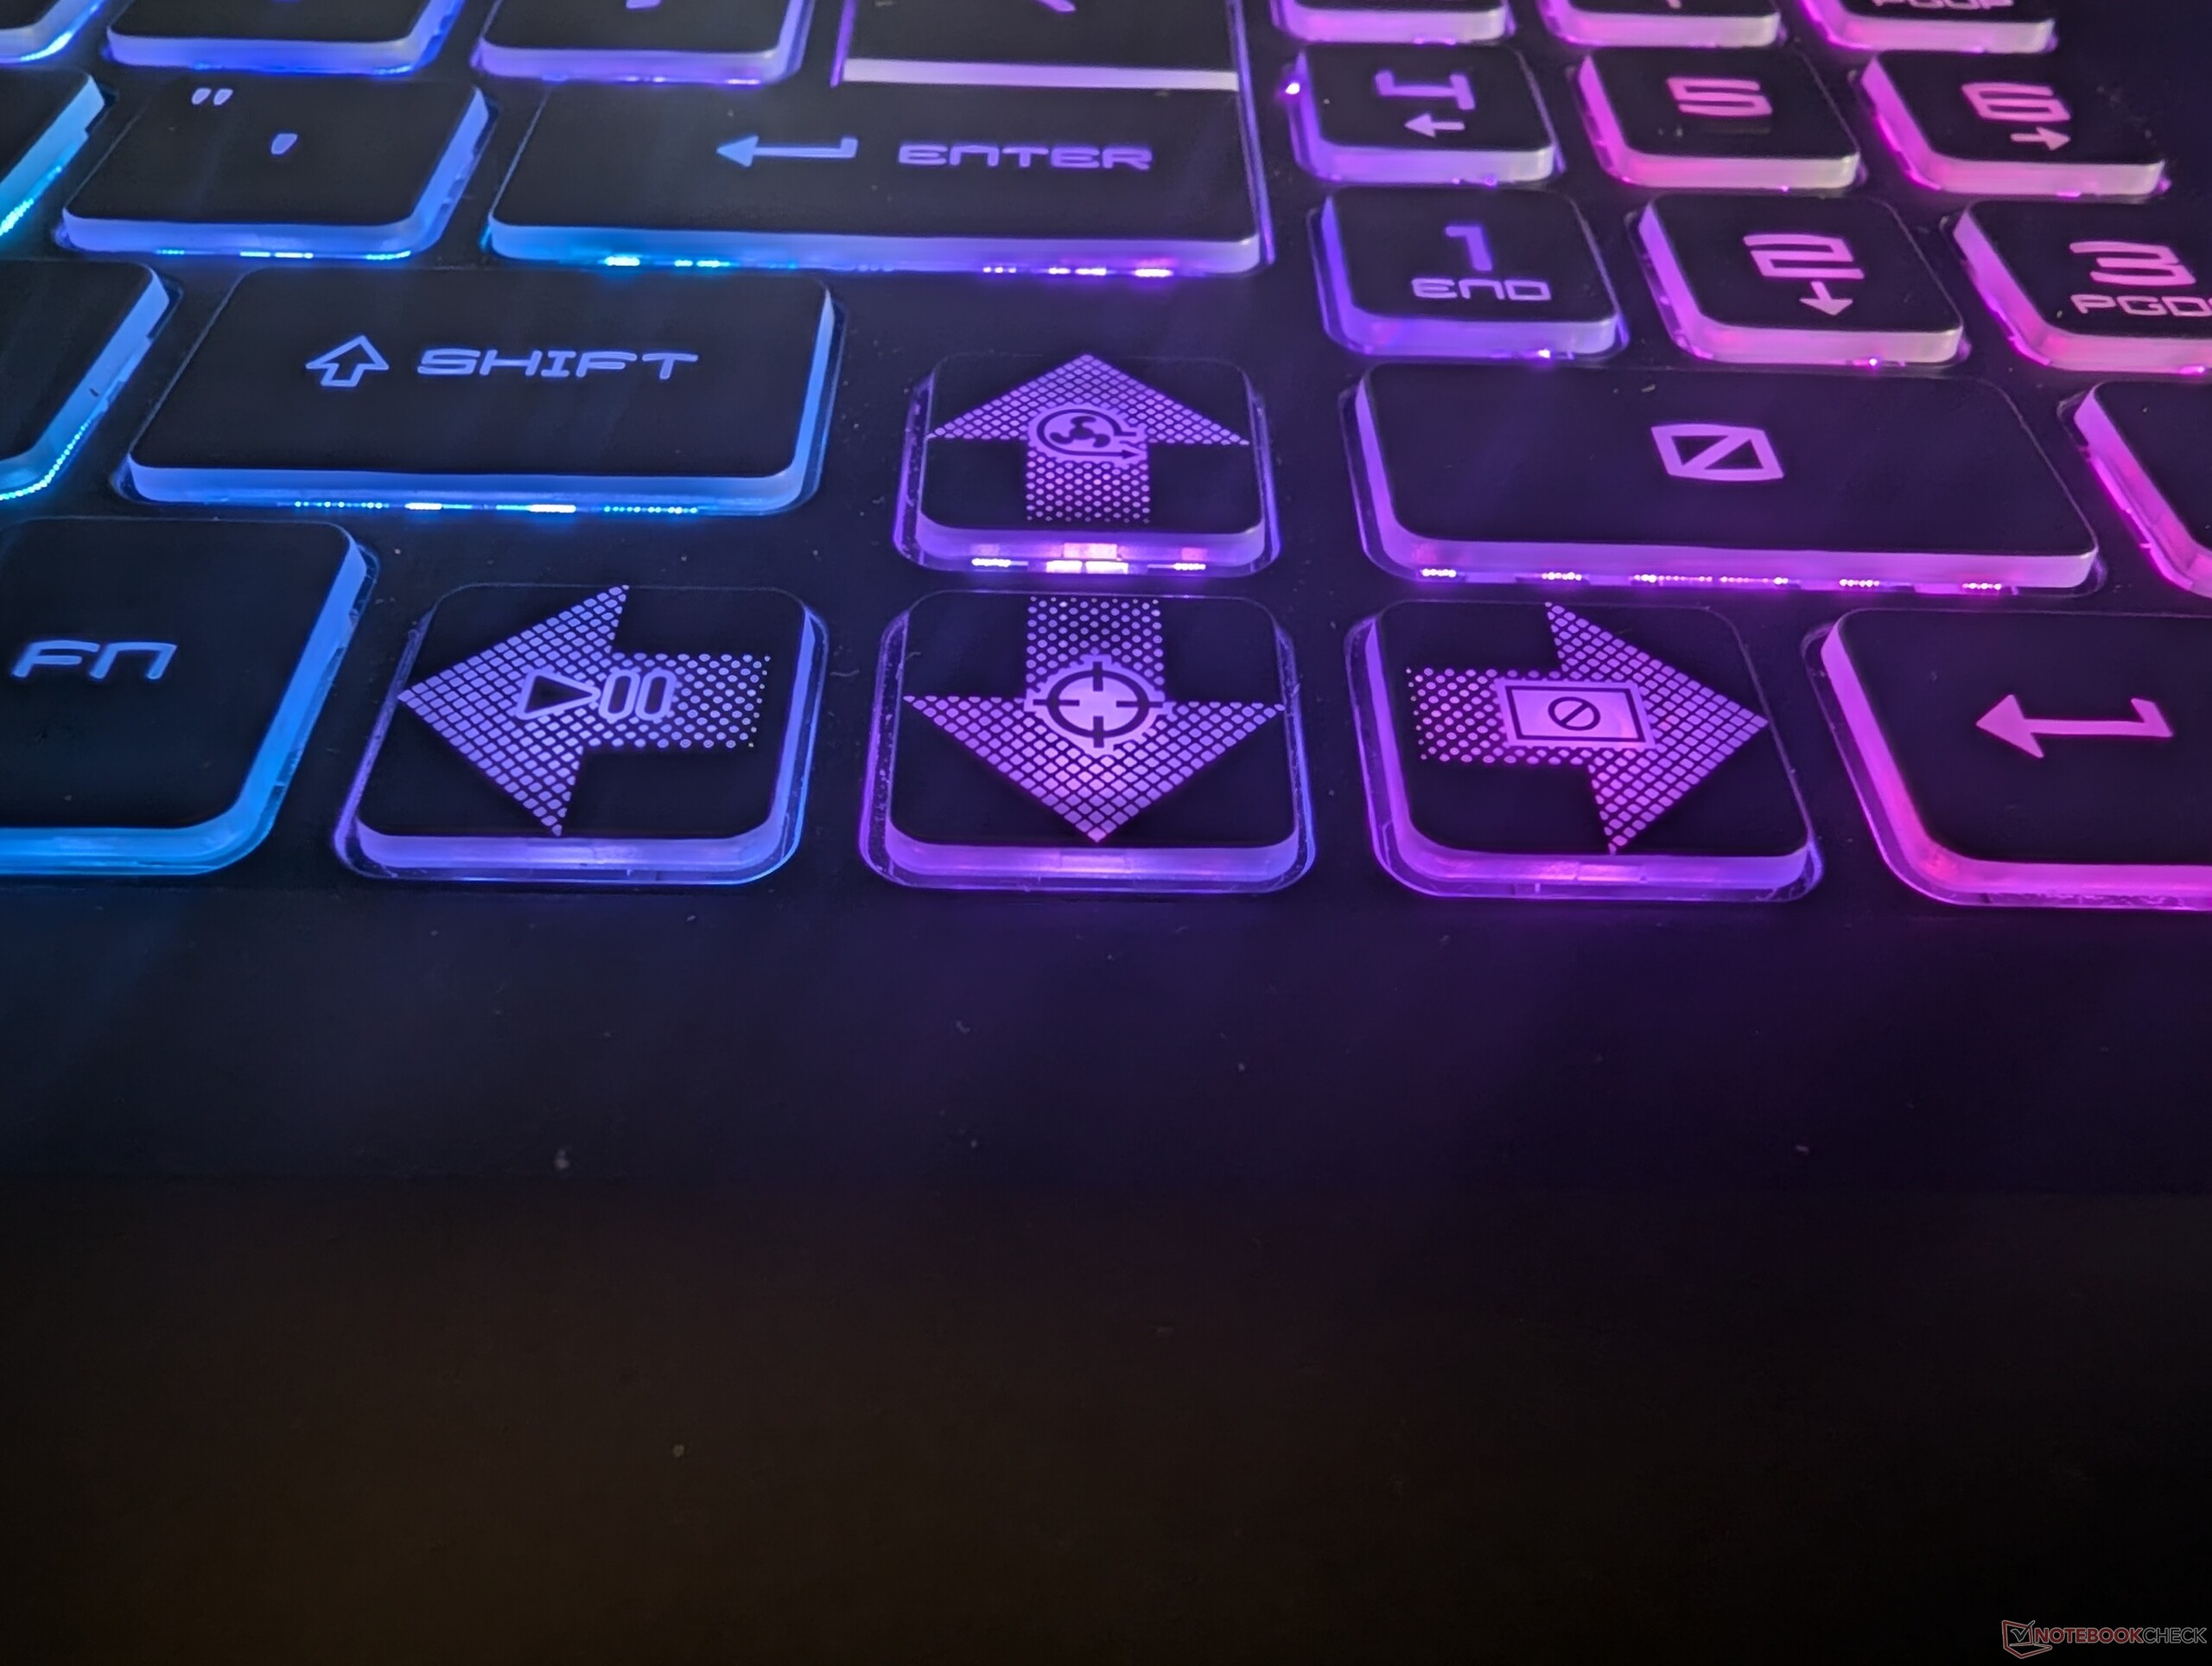
Clavier
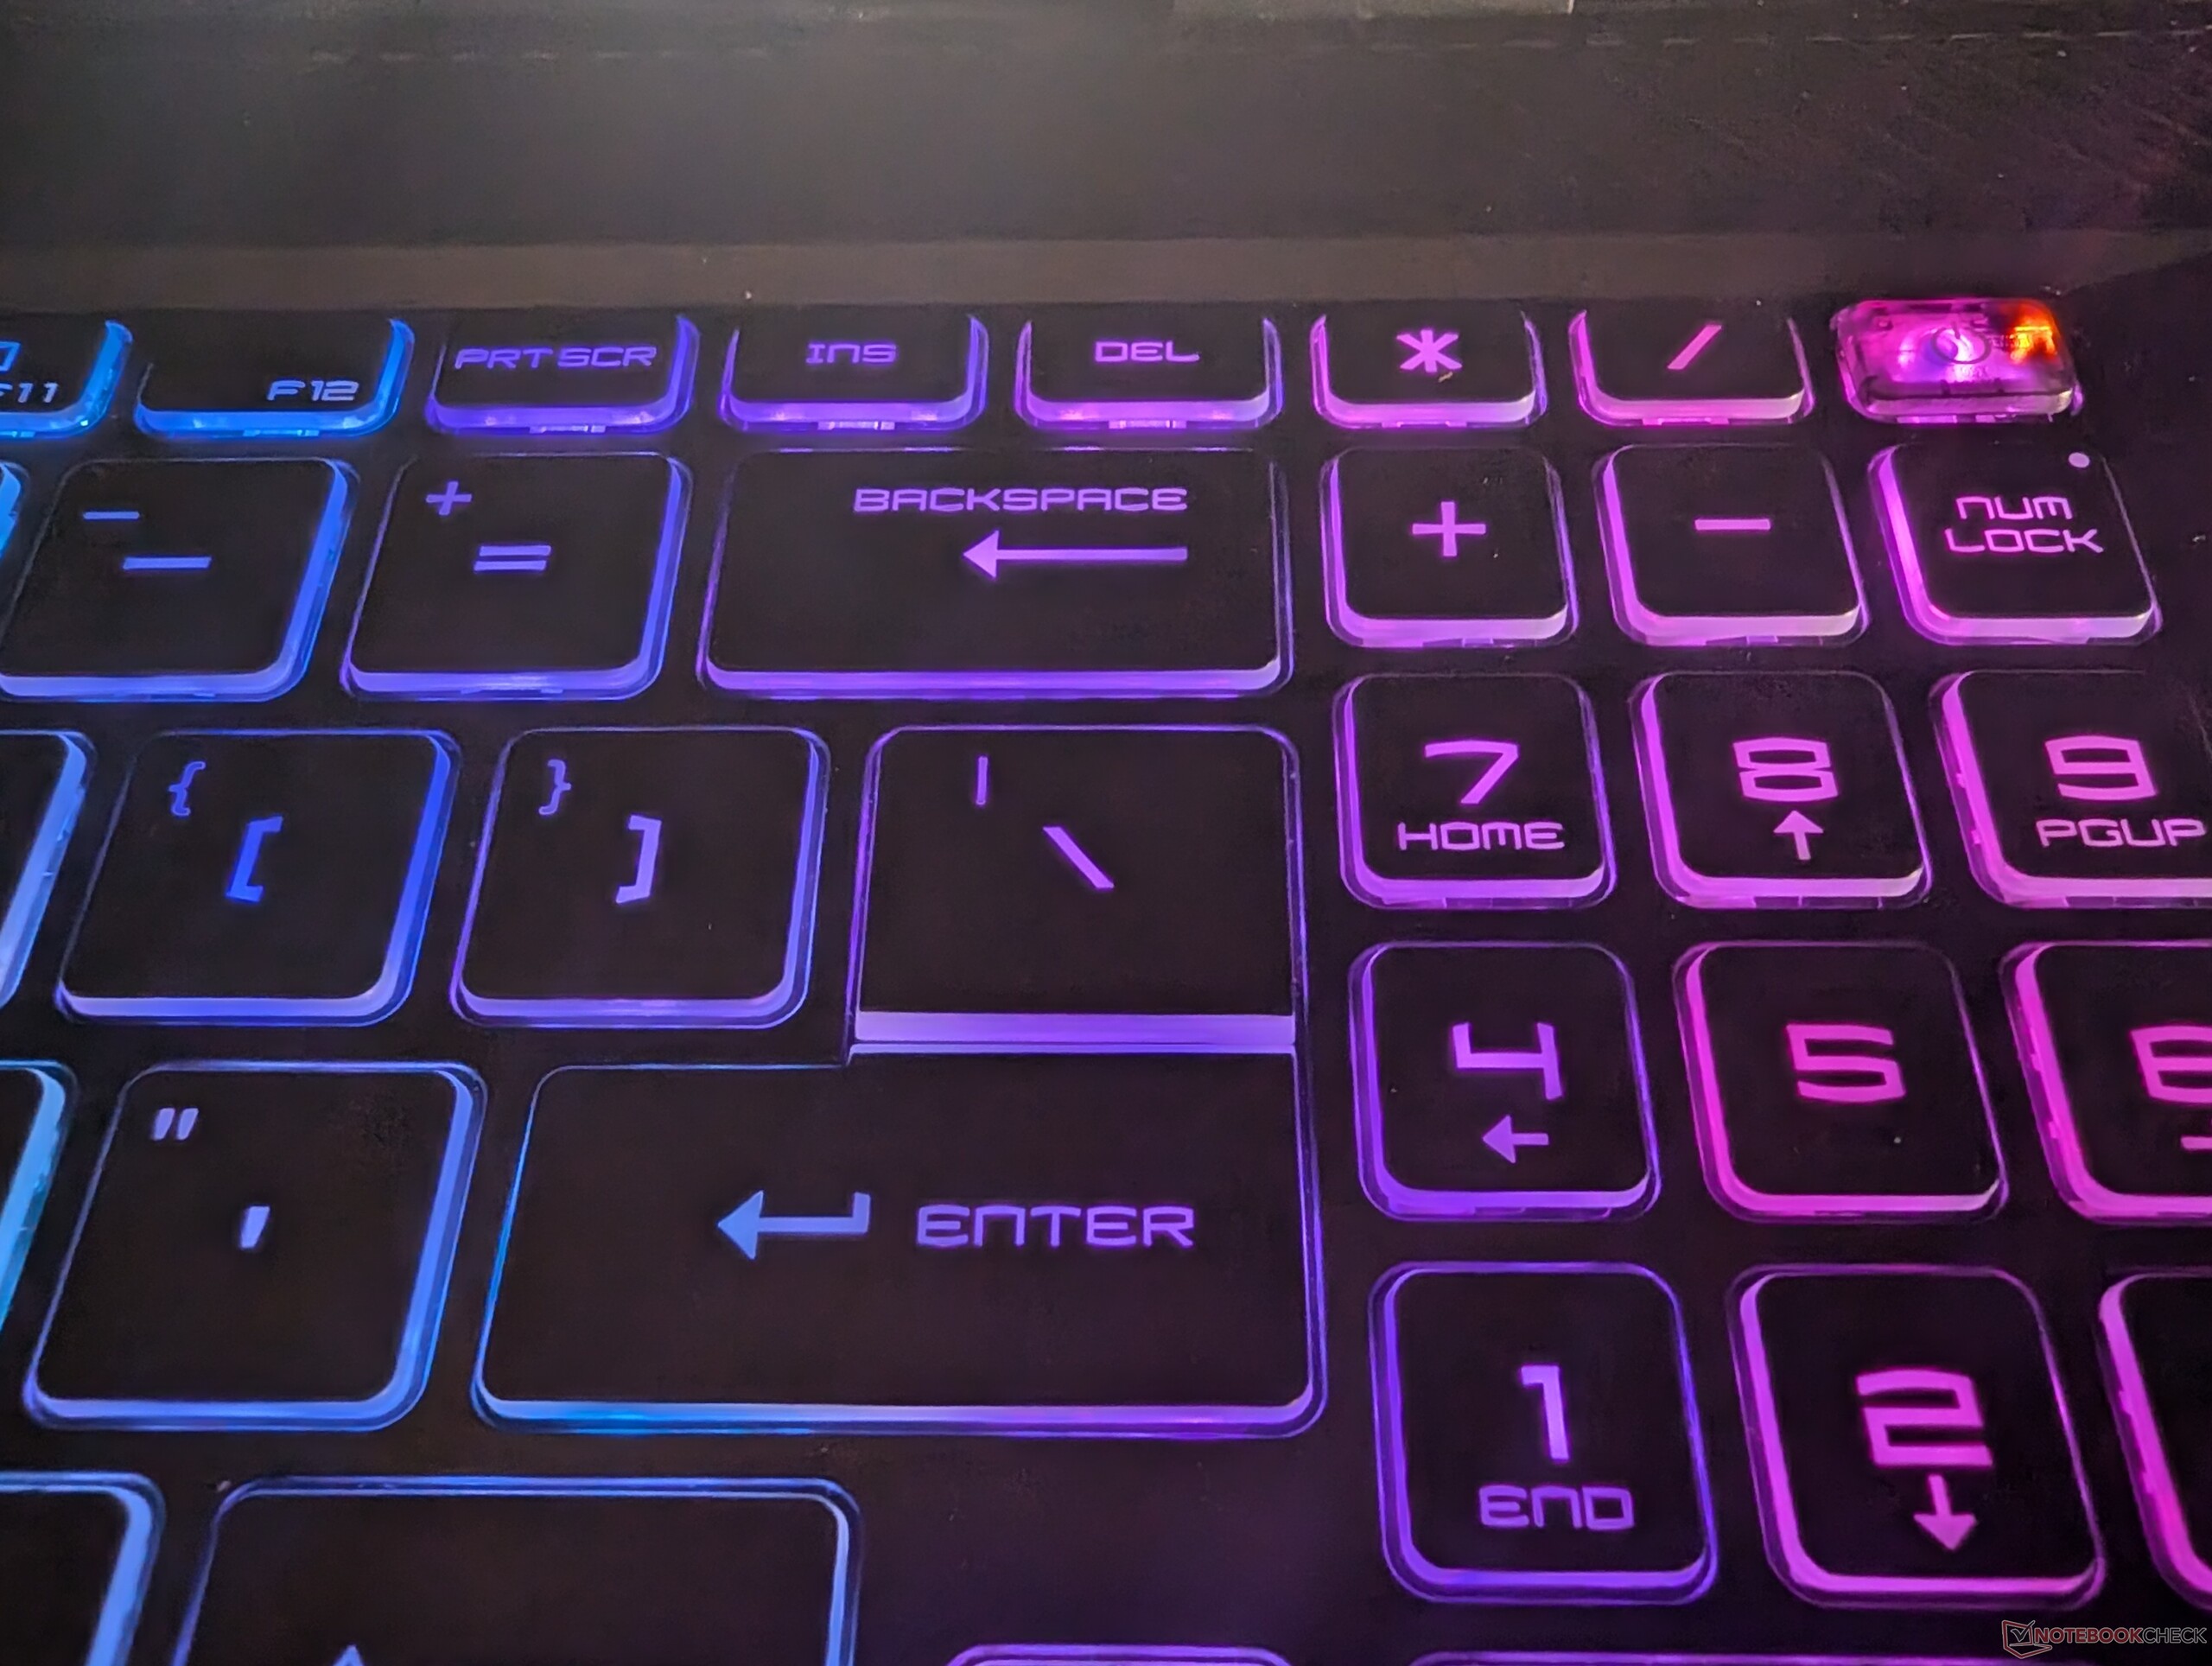
Son format de 16 pouces permet à MSI d'inclure un Numpad complet avec le Sword 16. Les touches du Numpad peuvent être un peu petites pour les personnes ayant de gros doigts.
Le clavier en lui-même est robuste et ne fléchit pas sous la pression. De plus, les touches elles-mêmes sont agréables à taper et ne nécessitent pas une grande force d'activation.
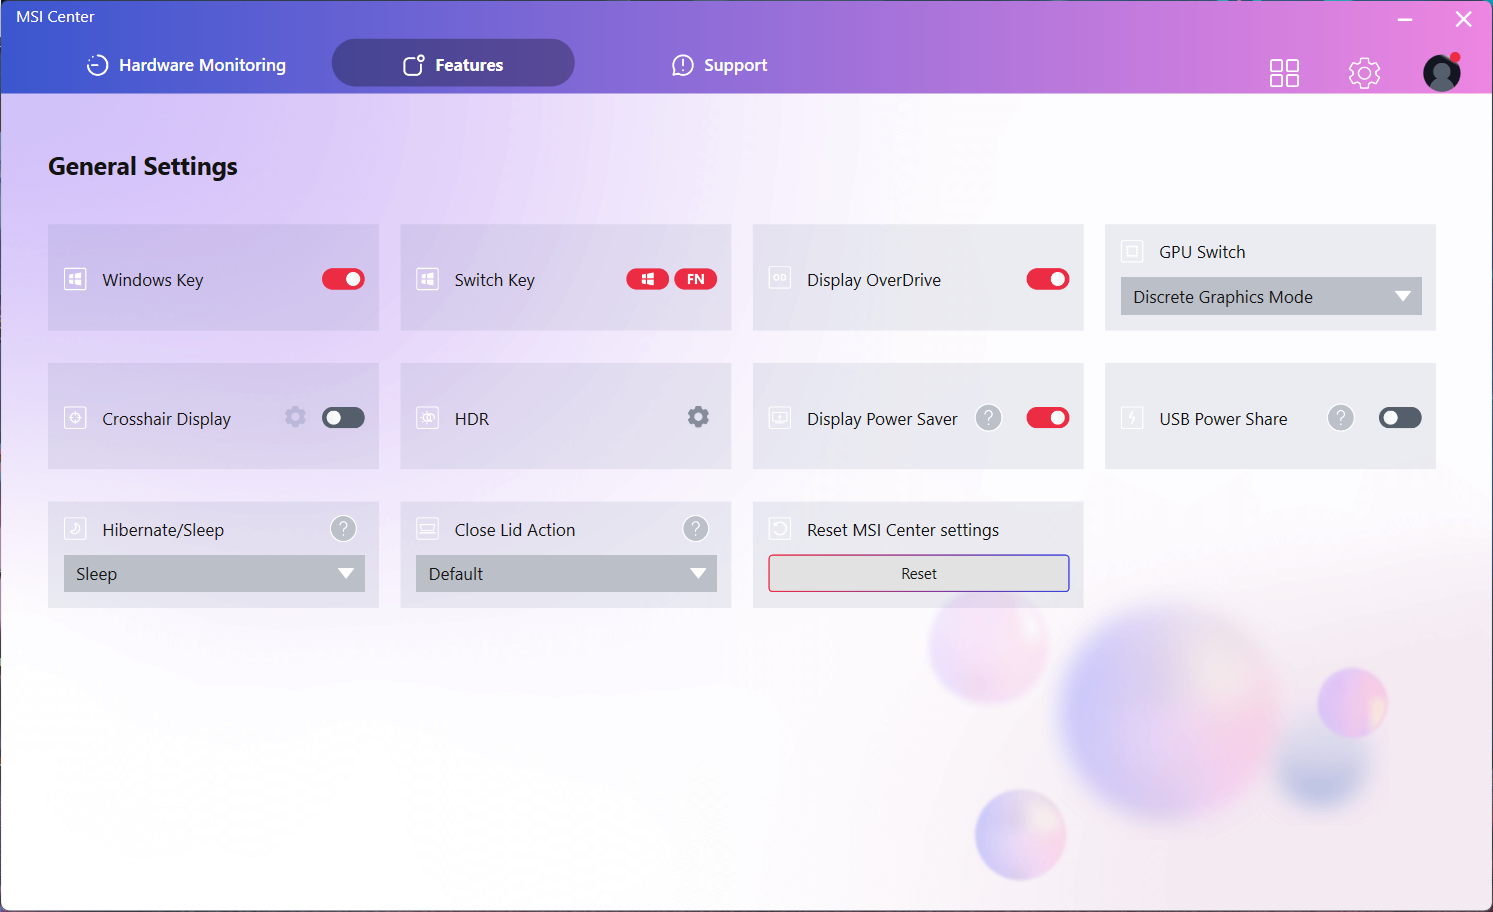
Vous pouvez améliorer votre clavier avec RGB, qui peut être configuré via Mystic Light dans le MSI Center. Le bouton d'alimentation et les touches W/A/S/D sont transparents et peuvent ne pas plaire à tout le monde.
Même s'il n'est pas équipé d'un NPU dédié, le Sword 16 HX dispose d'une touche Windows Copilot dédiée, au détriment de la touche Ctrl droite.
La touche de fonction dédiée peut être utilisée pour accéder aux fonctions les plus courantes telles que le changement de profil à la volée, le son, la luminosité de l'écran et la luminosité du rétroéclairage du clavier. Le centre MSI vous permet d'intervertir les touches 'Win' et 'Fn'.
Pavé tactile
Le MSI Sword 16 HX prend en charge tous les gestes tactiles de Windows. Bien que le trackpad soit assez précis et parvienne à suivre votre doigt même sur les bords, son rejet de la paume de la main laisse à désirer.
Le plus souvent, vous obtiendrez des clics accidentels si vous appuyez trop fort sur le trackpad. Heureusement, vous pouvez désactiver le trackpad en appuyant simultanément sur les touches "Fn" et "F4". Si vous devez utiliser le trackpad comme périphérique de saisie principal, veillez à vous en tenir à la partie inférieure pour cliquer, car la partie supérieure ne clique pas aussi facilement.
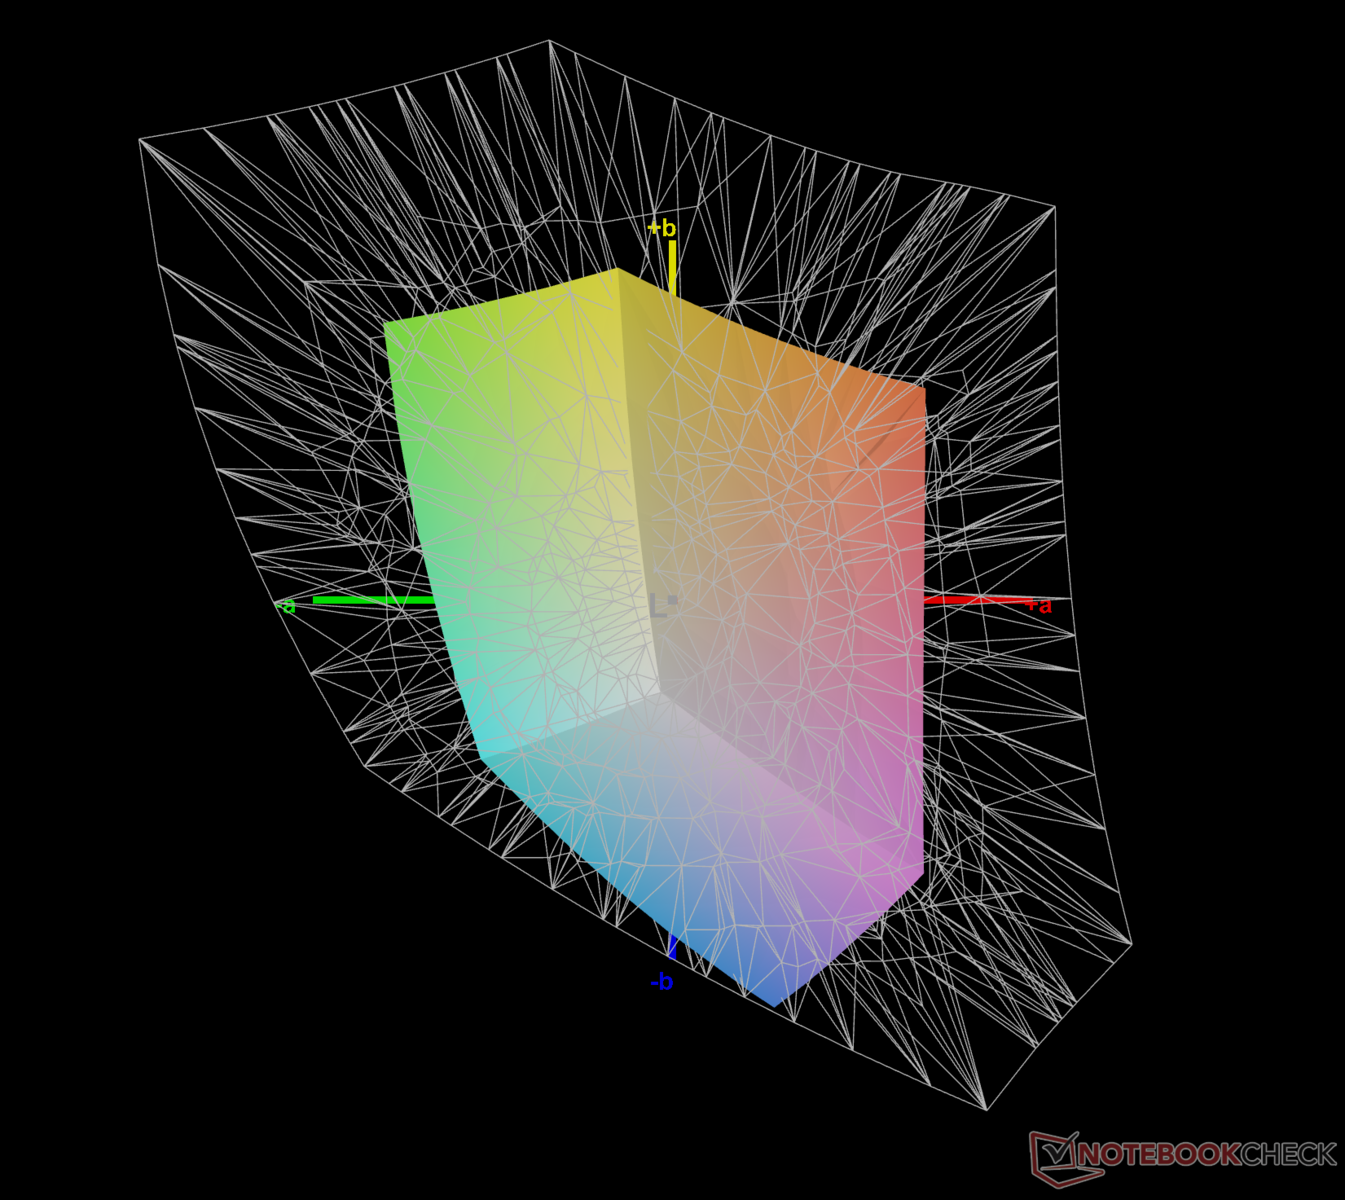
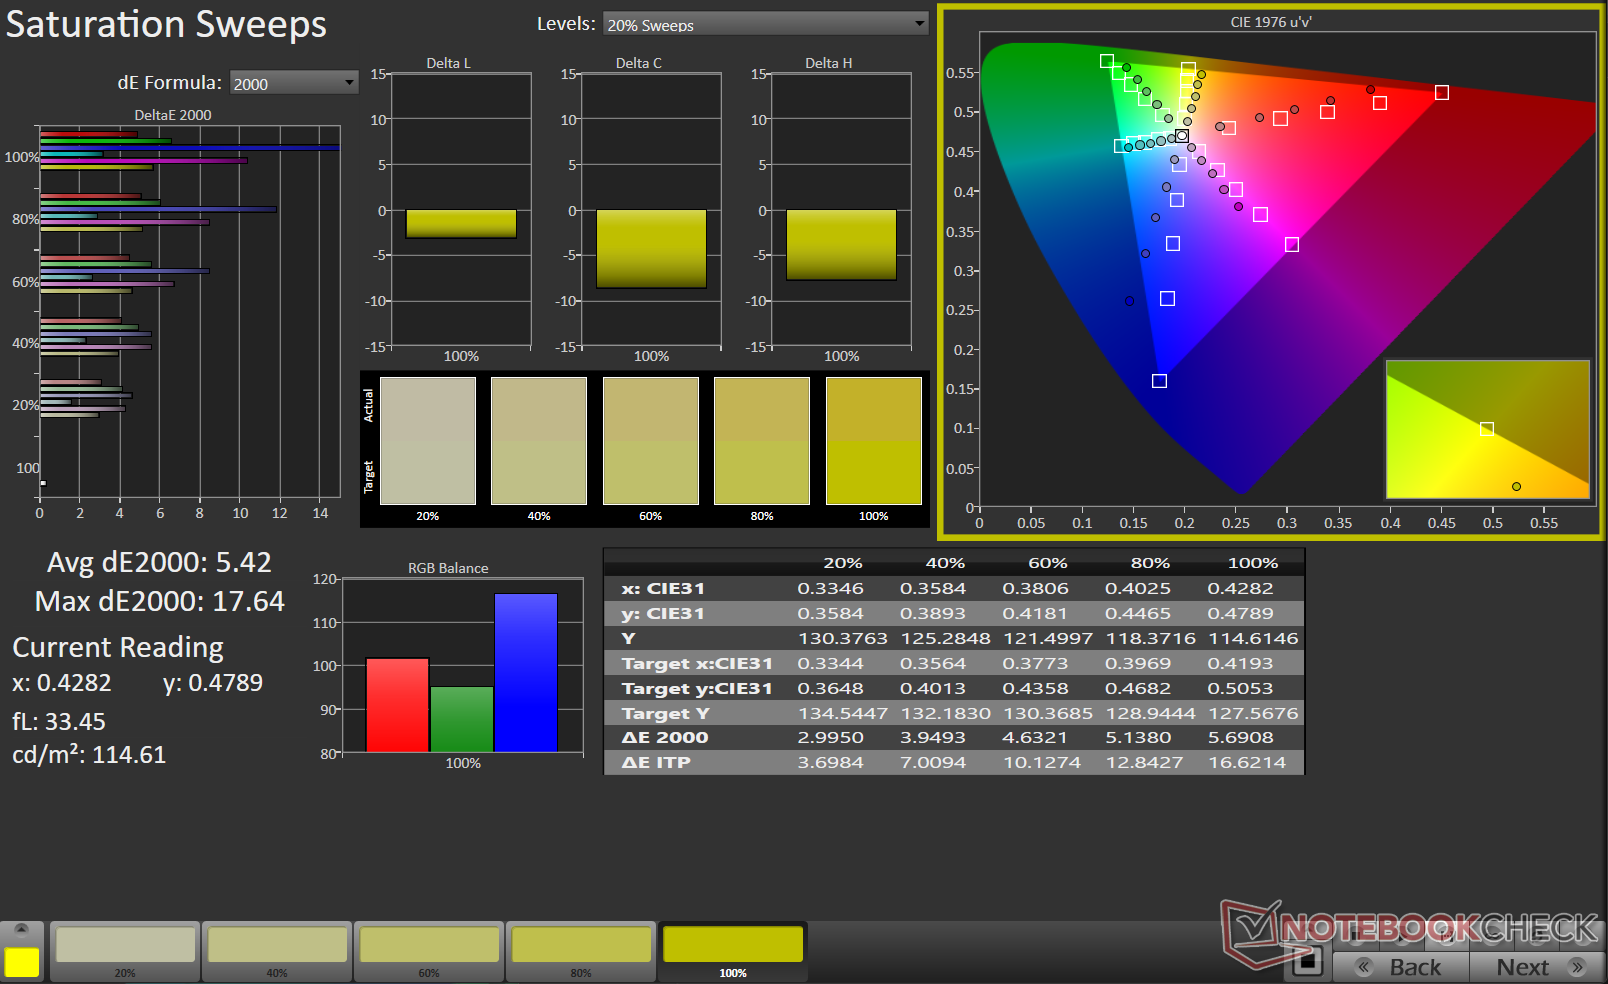
Écran : Écran médiocre avec une mauvaise précision des couleurs et une luminosité médiocre
Notre variante Sword 16 HX utilise le même écran que le MSI Raider GE68 HX 13VF que nous avons testé l'année dernière. Le Sword 16 HX est équipé d'une dalle IPS 16 pouces FHD+ (1 920 x 1 200) cadencée à 144 Hz. Une version à plus haute résolution avec une résolution QHD+ (2 560 x 1 600) et le même taux de rafraîchissement est également disponible.
La luminosité maximale atteint 312 nits, mais pas de manière uniforme. Heureusement, l'écran mat n'a qu'une faible incidence sur le rétroéclairage. Cependant, son temps de réponse de gris à gris est assez élevé (26,32 ms), tout comme le temps de réponse de blanc à blanc (17,17 ms).
Vous feriez mieux de le connecter à un écran externe si vous voulez jouer de manière compétitive. Le choix de la dalle de MSI est surprenant, car le Sword 16 est tout à fait capable de faire tourner des titres de haute fidélité, mais l'expérience visuelle est atténuée par son écran médiocre.


| |||||||||||||||||||||||||
Homogénéité de la luminosité: 87 %
Valeur mesurée au centre, sur batterie: 283 cd/m²
Contraste: 1196:1 (Valeurs des noirs: 0.24 cd/m²)
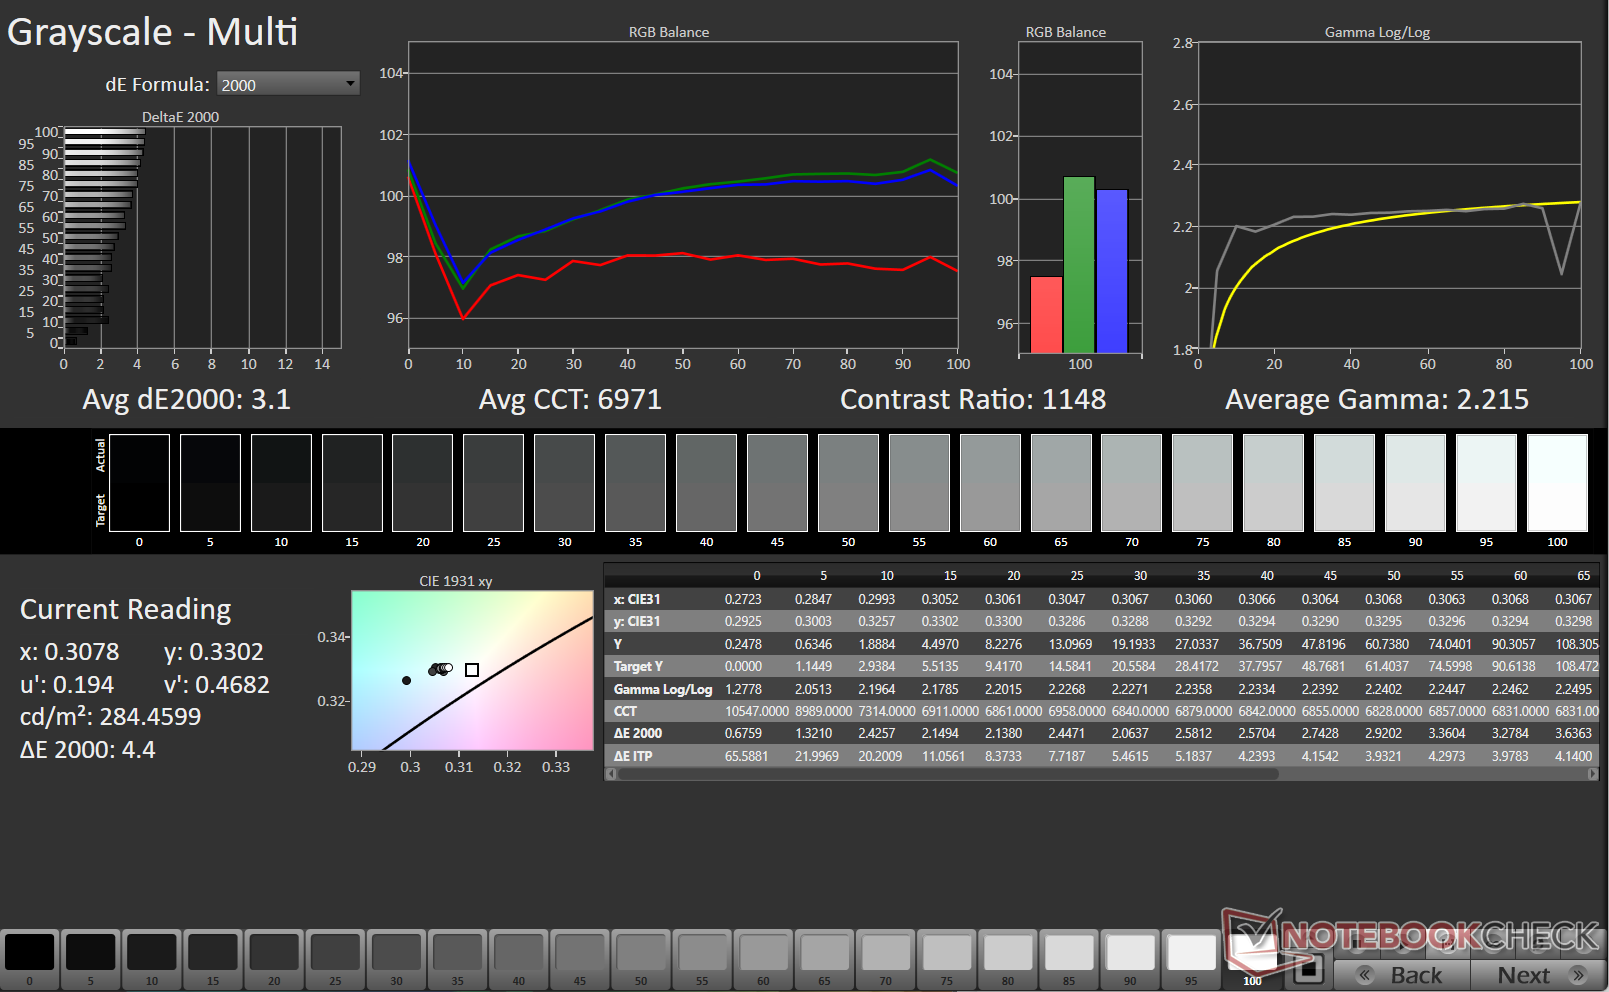
ΔE Color 4.24 | 0.5-29.43 Ø4.87, calibrated: 3.39
ΔE Greyscale 3.1 | 0.5-98 Ø5.1
43.3% AdobeRGB 1998 (Argyll 2.2.0 3D)
62.2% sRGB (Argyll 2.2.0 3D)
41.8% Display P3 (Argyll 2.2.0 3D)
Gamma: 2.21
| MSI Sword 16 HX B14VGKG Chi Mei N160JME-GTK, IPS, 1920x1200, 16", 144 Hz | HP Omen 17-db0079ng BOE0B67, IPS, 2560x1440, 17.3", 240 Hz | Lenovo Legion 7 16 IRX G9 MNG007ZA1-2, IPS, 3200x2000, 16", 165 Hz | Acer Predator Helios Neo 16 (2024) Chi Mei N160GME-GTB, LED, 2560x1600, 16", 240 Hz | Alienware m16 R2 BOE NE16NYH, IPS, 2560x1600, 16", 240 Hz | Asus ROG Strix G17 G713PI BOE0B69, IPS, 2560x1440, 17.3", 240 Hz | HP Victus 16-r0077ng CMN162D, IPS, 1920x1080, 16.1", 144 Hz | |
|---|---|---|---|---|---|---|---|
| Display | 56% | 96% | 96% | 65% | 98% | 59% | |
| Display P3 Coverage | 41.8 | 66.2 58% | 95 127% | 95.9 129% | 71 70% | 98.3 135% | 66.7 60% |
| sRGB Coverage | 62.2 | 95.5 54% | 100 61% | 99.8 60% | 100 61% | 100 61% | 98 58% |
| AdobeRGB 1998 Coverage | 43.3 | 68.1 57% | 87.2 101% | 86.4 100% | 71.4 65% | 85.9 98% | 69 59% |
| Response Times | 49% | 52% | 65% | 64% | 65% | 51% | |
| Response Time Grey 50% / Grey 80% * | 26.32 ? | 14.4 ? 45% | 14.4 ? 45% | 5 ? 81% | 5.7 ? 78% | 5.3 ? 80% | 13.3 ? 49% |
| Response Time Black / White * | 17.17 ? | 8.3 ? 52% | 7.2 ? 58% | 8.8 ? 49% | 8.7 ? 49% | 8.6 ? 50% | 8.2 ? 52% |
| PWM Frequency | |||||||
| Screen | 24% | 32% | 33% | 29% | 26% | 31% | |
| Brightness middle | 287 | 363 26% | 412 44% | 521 82% | 345.8 20% | 327 14% | 308 7% |
| Brightness | 289 | 341 18% | 396 37% | 506 75% | 337 17% | 320 11% | 285 -1% |
| Brightness Distribution | 87 | 84 -3% | 89 2% | 85 -2% | 87 0% | 89 2% | 85 -2% |
| Black Level * | 0.24 | 0.38 -58% | 0.43 -79% | 0.44 -83% | 0.3 -25% | 0.38 -58% | 0.25 -4% |
| Contrast | 1196 | 955 -20% | 958 -20% | 1184 -1% | 1153 -4% | 861 -28% | 1232 3% |
| Colorchecker dE 2000 * | 4.24 | 1.74 59% | 0.9 79% | 1.74 59% | 1.99 53% | 1.01 76% | 1.3 69% |
| Colorchecker dE 2000 max. * | 21.42 | 5.39 75% | 2 91% | 3.88 82% | 3.52 84% | 4.01 81% | 2.76 87% |
| Colorchecker dE 2000 calibrated * | 3.39 | 1.43 58% | 0.6 82% | 0.52 85% | 0.62 82% | 0.41 88% | 0.92 73% |
| Greyscale dE 2000 * | 3.1 | 1.3 58% | 1.4 55% | 3 3% | 2.1 32% | 1.6 48% | 1.7 45% |
| Gamma | 2.21 100% | 2.235 98% | 2.23 99% | 2.164 102% | 2.32 95% | 2.168 101% | 2.167 102% |
| CCT | 6971 93% | 6346 102% | 6731 97% | 6816 95% | 6369 102% | 6659 98% | 6767 96% |
| Moyenne finale (programmes/paramètres) | 43% /
34% | 60% /
49% | 65% /
51% | 53% /
42% | 63% /
47% | 47% /
40% |
* ... Moindre est la valeur, meilleures sont les performances
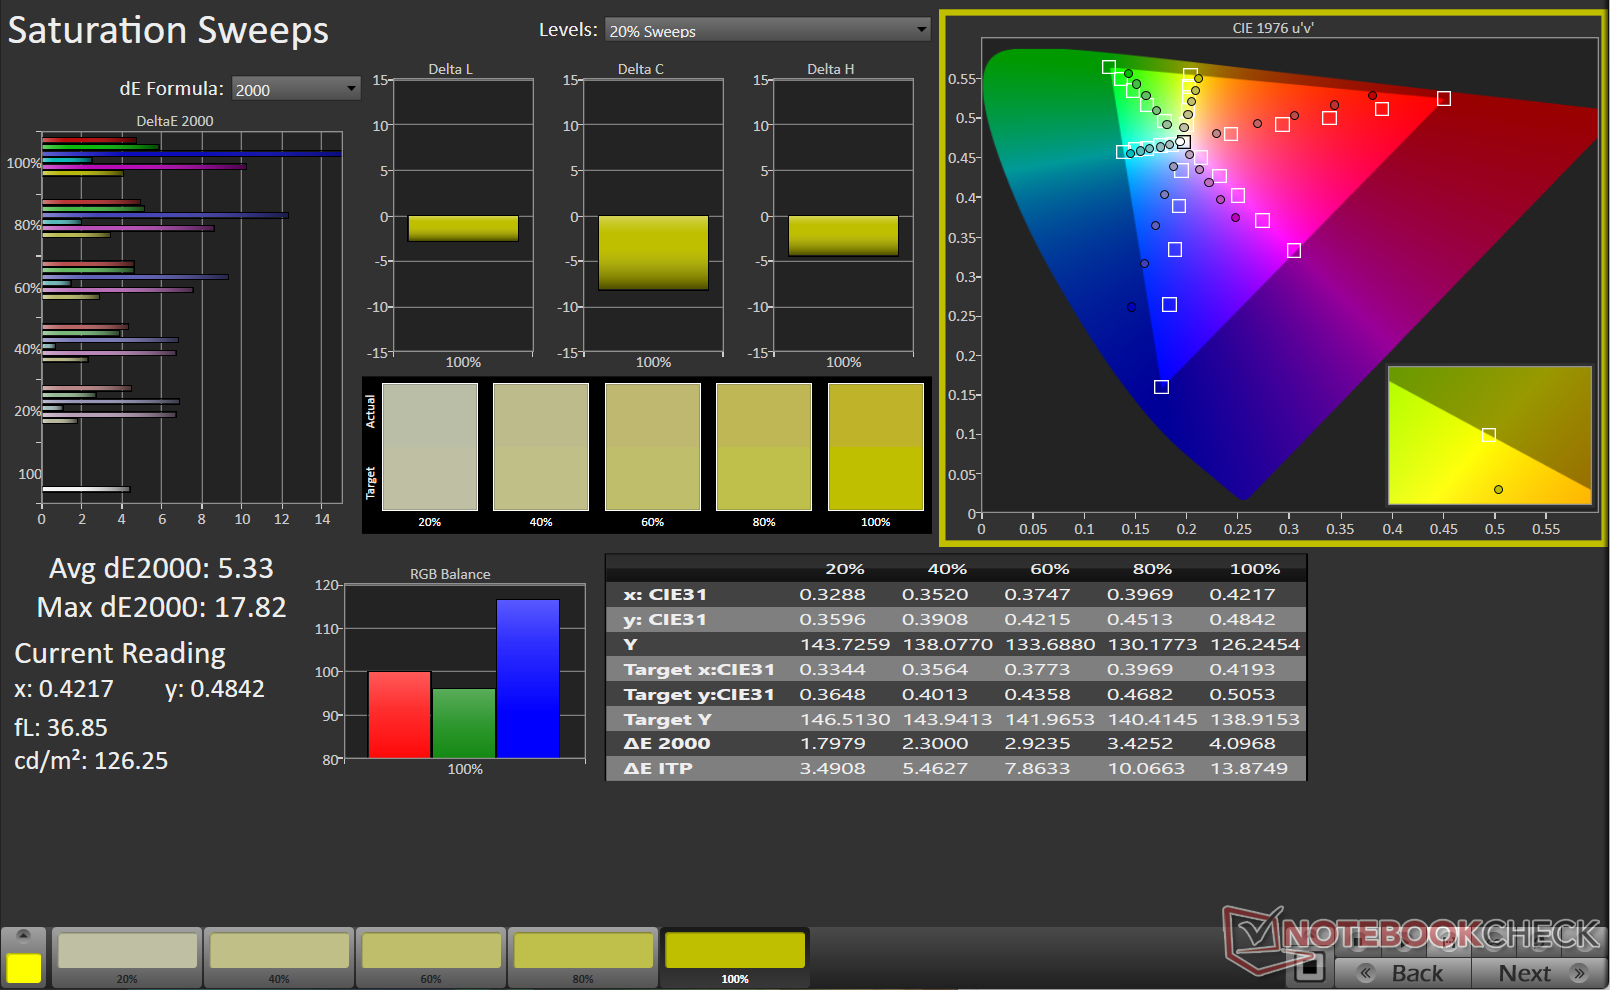
Malheureusement, la précision des couleurs n'est pas l'un des points forts de la Sword 16, comme le montre sa couverture médiocre des gammes de couleurs sRGB, Adobe RGB et Display P3.
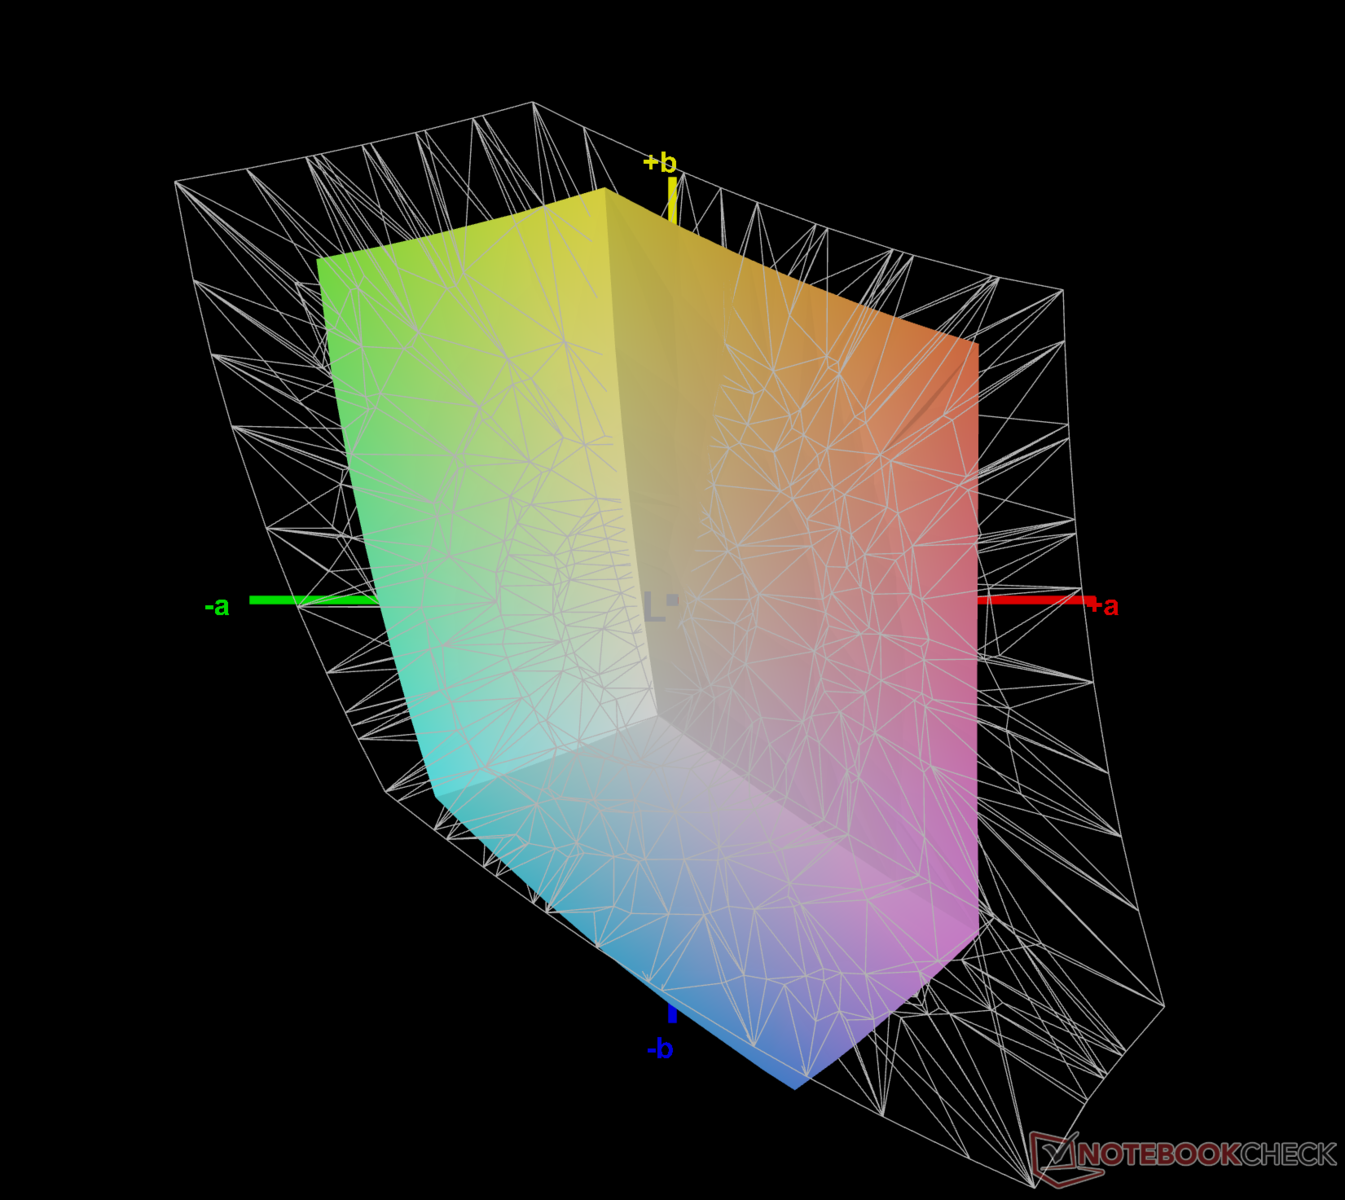
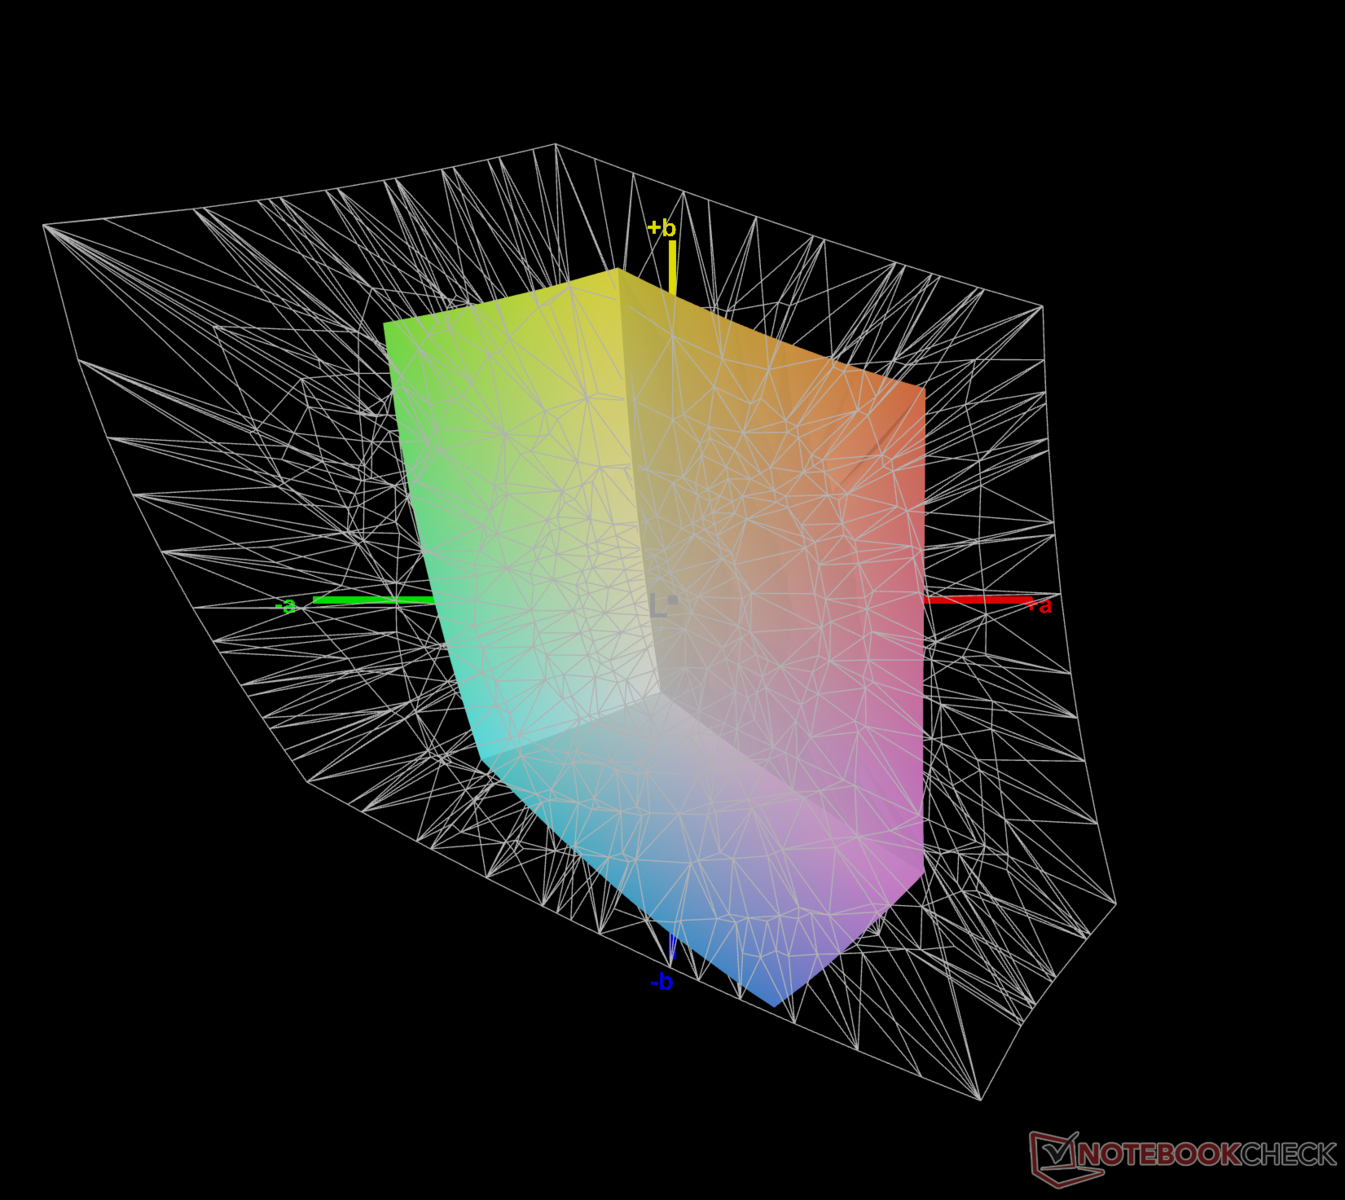
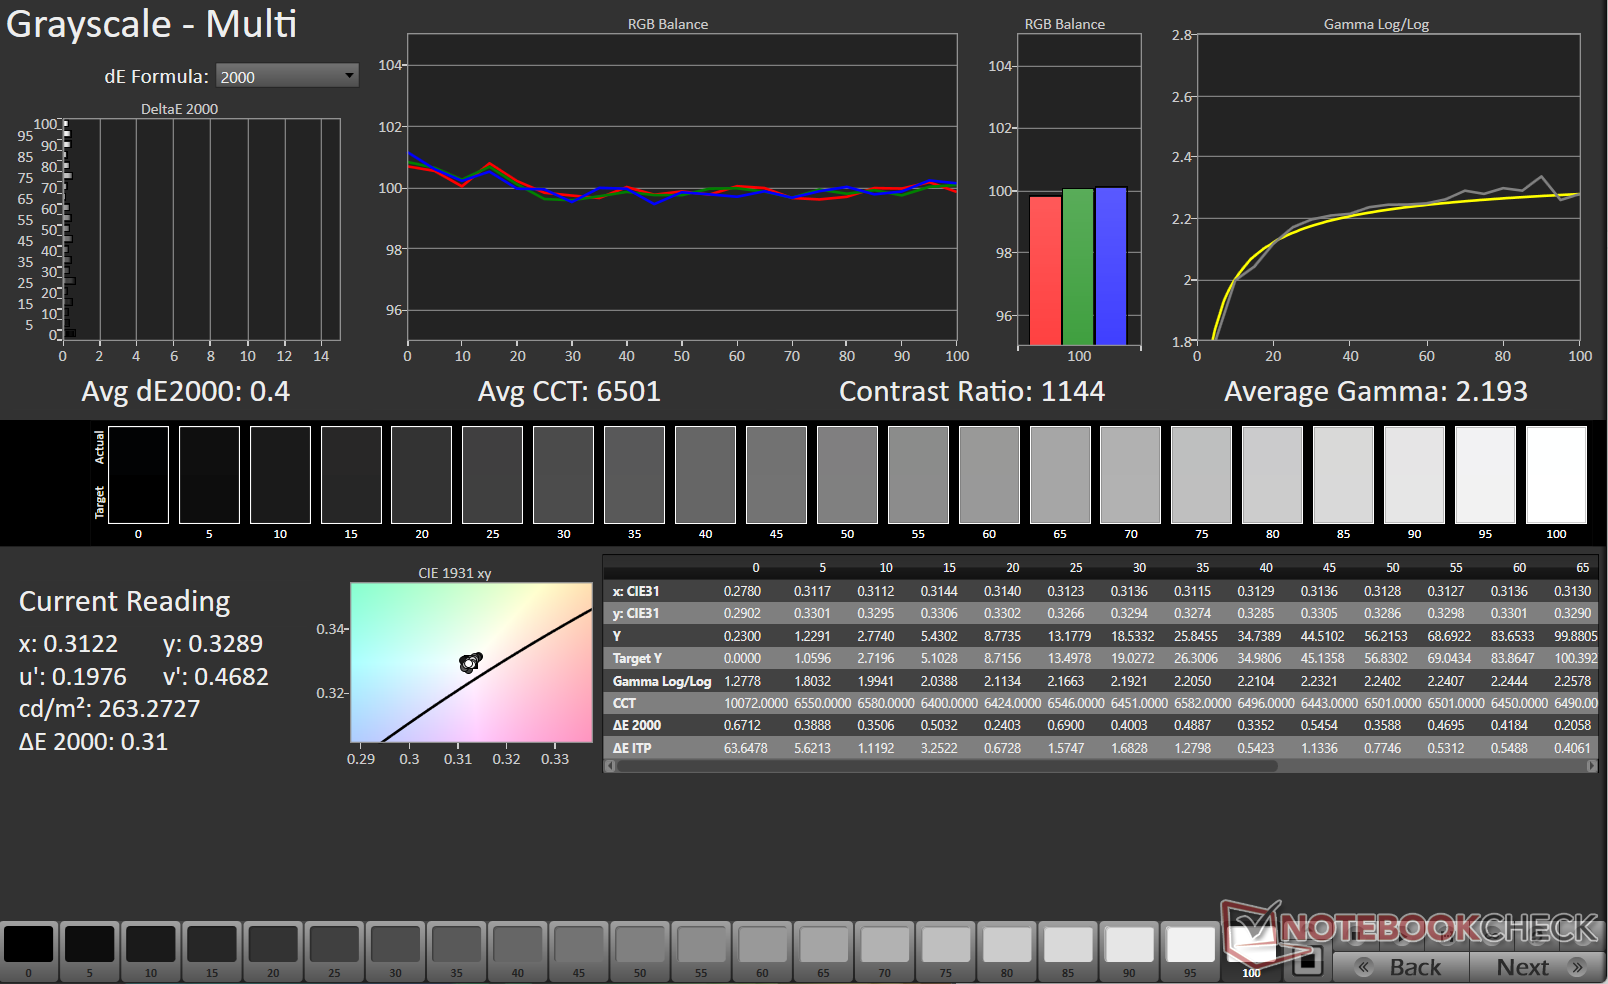
En utilisant le calibrage des couleurs Calman de Portrait Displays avec un spectrophotomètre X-Rite i1Basic Pro 3, nous avons pu réduire le deltaE 2000 en niveaux de gris. Cependant, les valeurs ColorChecker ne se sont pas beaucoup améliorées, même après l'étalonnage.


Temps de réponse de l'écran
| ↔ Temps de réponse noir à blanc | ||
|---|---|---|
| 17.17 ms ... hausse ↗ et chute ↘ combinées | ↗ 9.26 ms hausse | 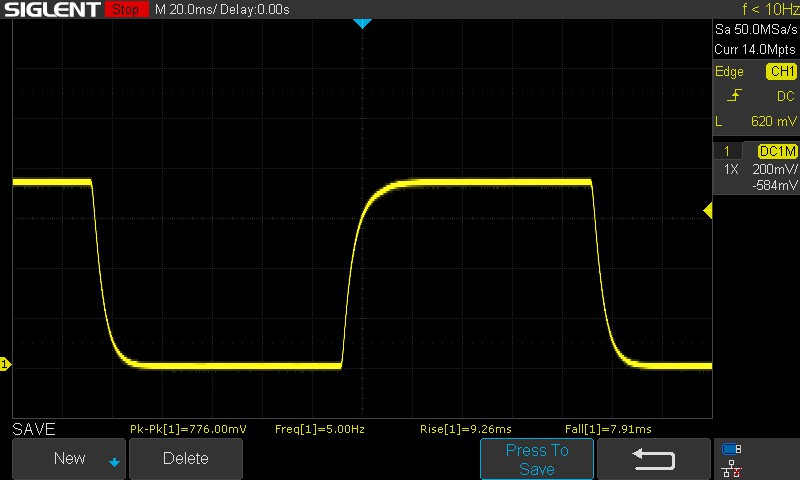 |
| ↘ 7.91 ms chute | ||
| L'écran montre de bons temps de réponse, mais insuffisant pour du jeu compétitif. En comparaison, tous les appareils testés affichent entre 0.1 (minimum) et 240 (maximum) ms. » 36 % des appareils testés affichent de meilleures performances. Cela signifie que les latences relevées sont meilleures que la moyenne (20.8 ms) de tous les appareils testés. | ||
| ↔ Temps de réponse gris 50% à gris 80% | ||
| 26.32 ms ... hausse ↗ et chute ↘ combinées | ↗ 13.37 ms hausse | 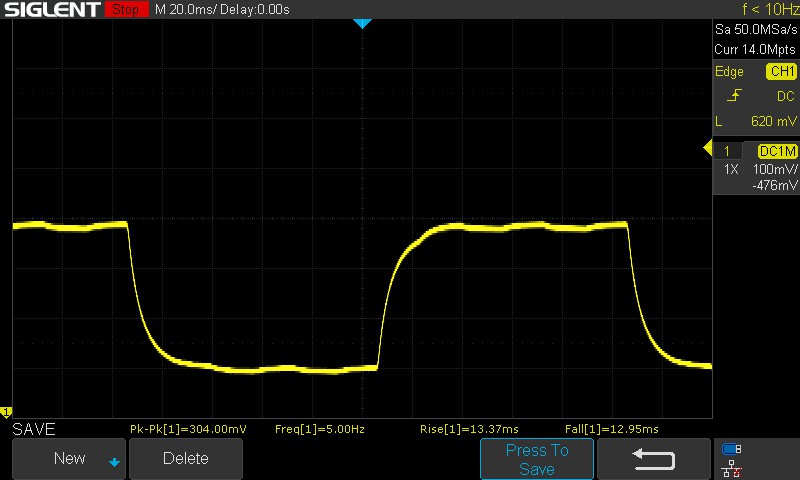 |
| ↘ 12.95 ms chute | ||
| L'écran souffre de latences relativement élevées, insuffisant pour le jeu. En comparaison, tous les appareils testés affichent entre 0.165 (minimum) et 636 (maximum) ms. » 33 % des appareils testés affichent de meilleures performances. Cela signifie que les latences relevées sont meilleures que la moyenne (32.5 ms) de tous les appareils testés. | ||
Scintillement / MLI (Modulation de largeur d'impulsion)
| Scintillement / MLI (Modulation de largeur d'impulsion) non décelé | ≤ 100 Niveau de luminosité |  | |
En comparaison, 53 % des appareils testés n'emploient pas MDI pour assombrir leur écran. Nous avons relevé une moyenne à 8516 (minimum : 5 - maximum : 343500) Hz dans le cas où une MDI était active. | |||
Nous n'avons pas détecté de PWM dans tous les niveaux de luminosité testés.
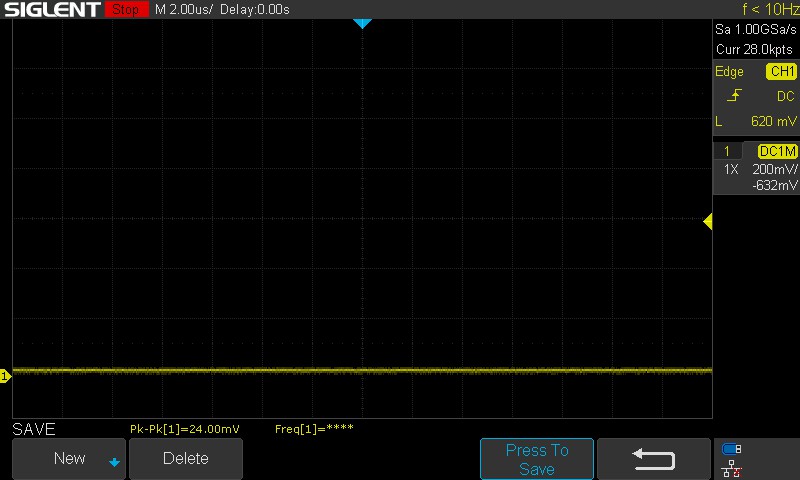

Pour plus d'informations, consultez notre article "Pourquoi le PWM est-il un casse-tête ?"ainsi que notre Tableau de classement PWM pour une comparaison des PWM mesurés sur tous les appareils examinés.
L'écran du MSI Sword 16 est suffisamment lumineux pour une utilisation en extérieur. Cependant, nous vous déconseillons de l'utiliser sous la lumière directe du soleil car elle peut facilement submerger l'écran de l'ordinateur portable.
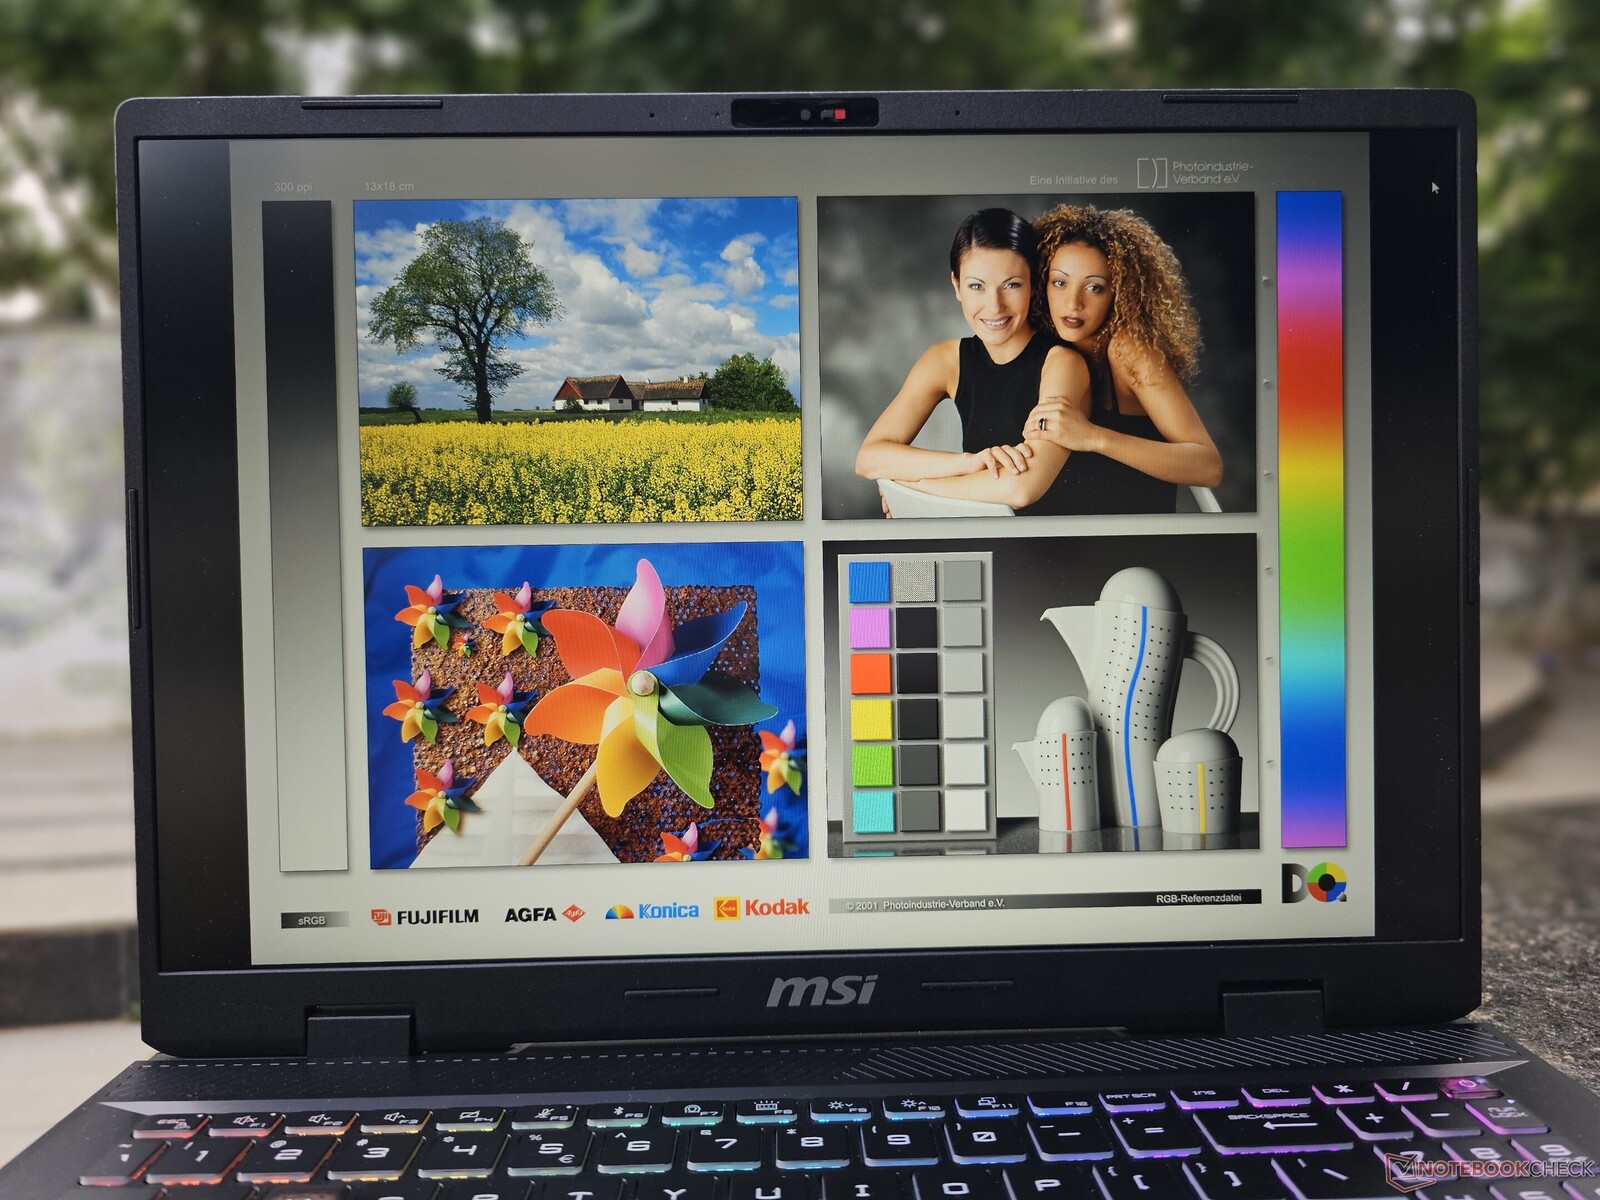
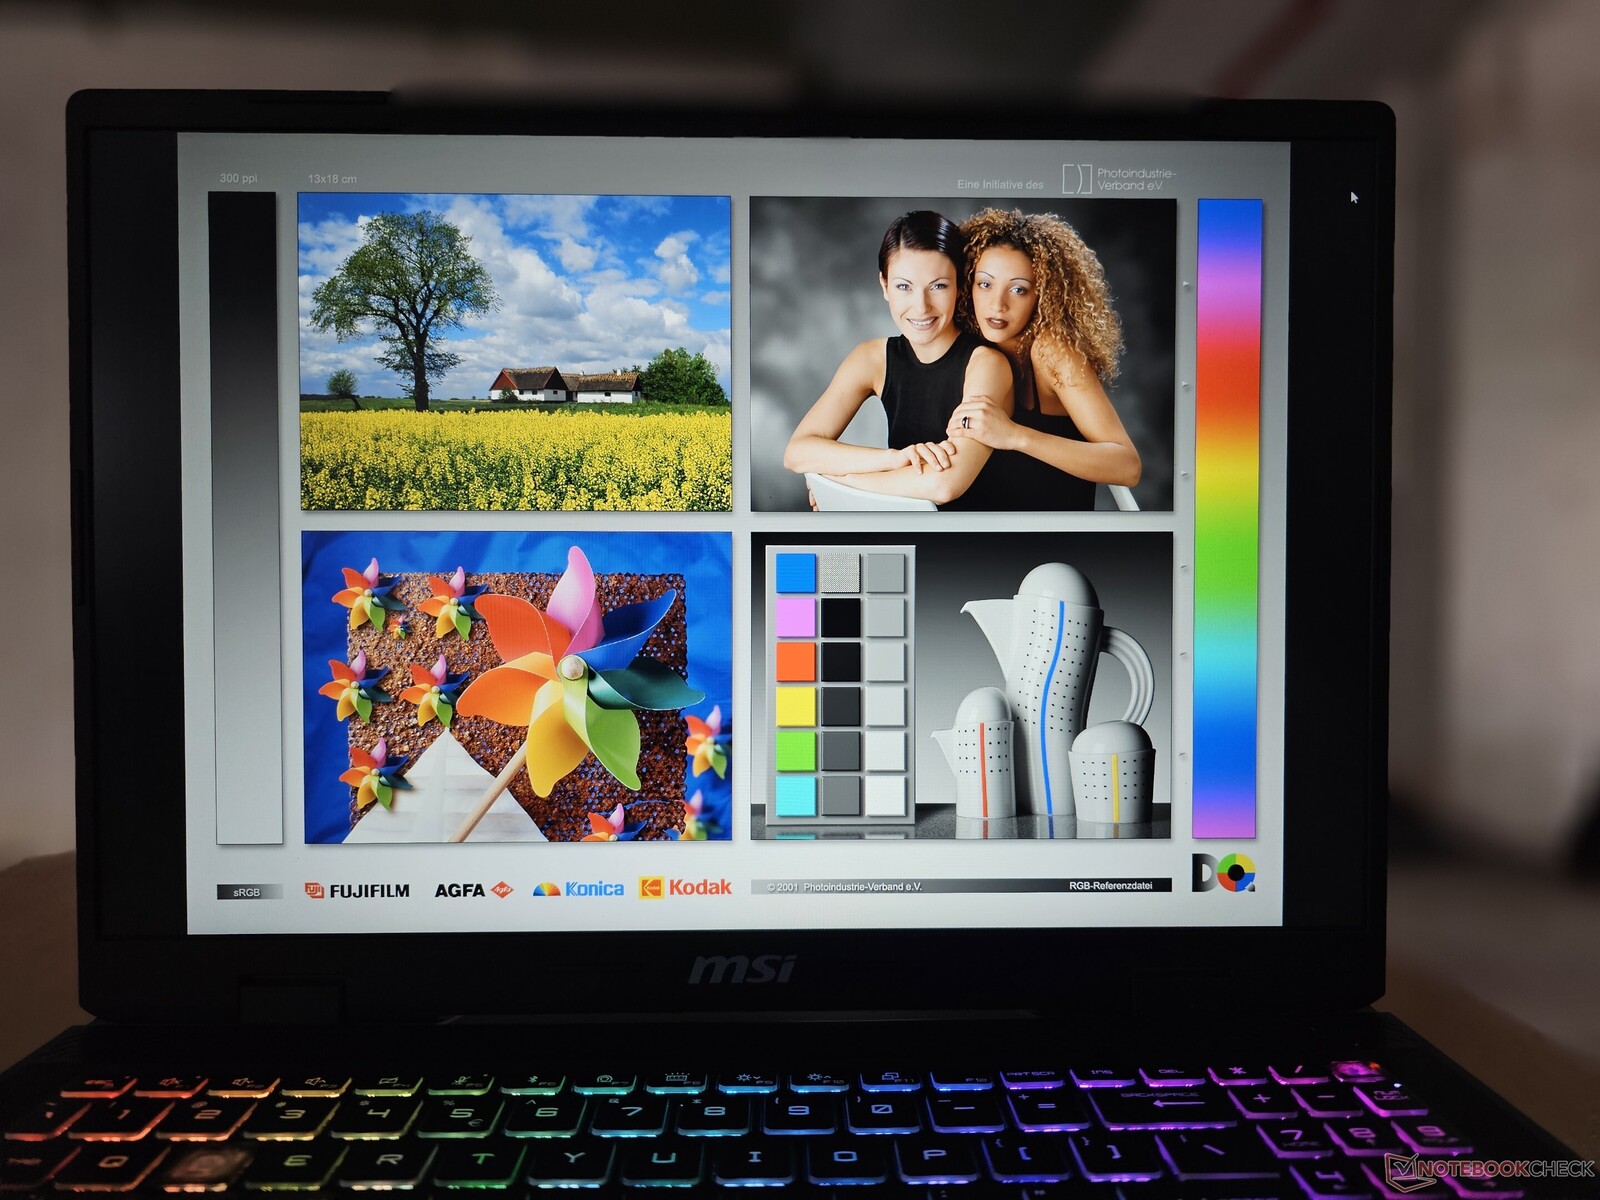

La dalle IPS offre des angles de vision corrects, mais il y a une perte notable de détails en raison de la précision des couleurs de la dalle, qui n'est pas idéale.
Performances : Le Core i7-14700HX et la GeForce RTX 4070 forment une combinaison puissante
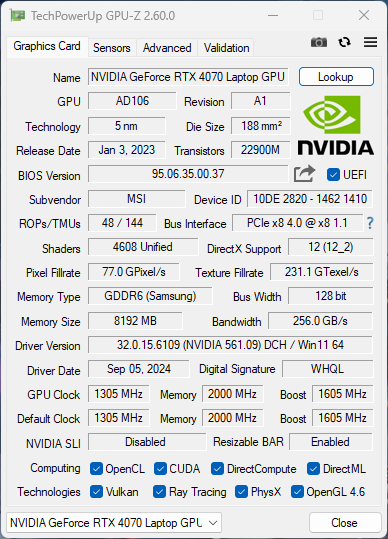
Nous avons ici la variante équipée du MSI Sword 16 HX avec un GPU Nvidia TX 4070 GPU pour ordinateur portable Nvidia GeForce TX 4070 et un Intel Core i7-14700HX. D'autres configurations possibles conservent le même CPU mais remplacent le GPU par une RTX 4060 et une RTX 4050.
Bien que beaucoup considèrent (à juste titre) que 8 Go de VRAM est un peu insuffisant, vous pouvez quand même jouer avec jusqu'à 4K avec quelques compromis.
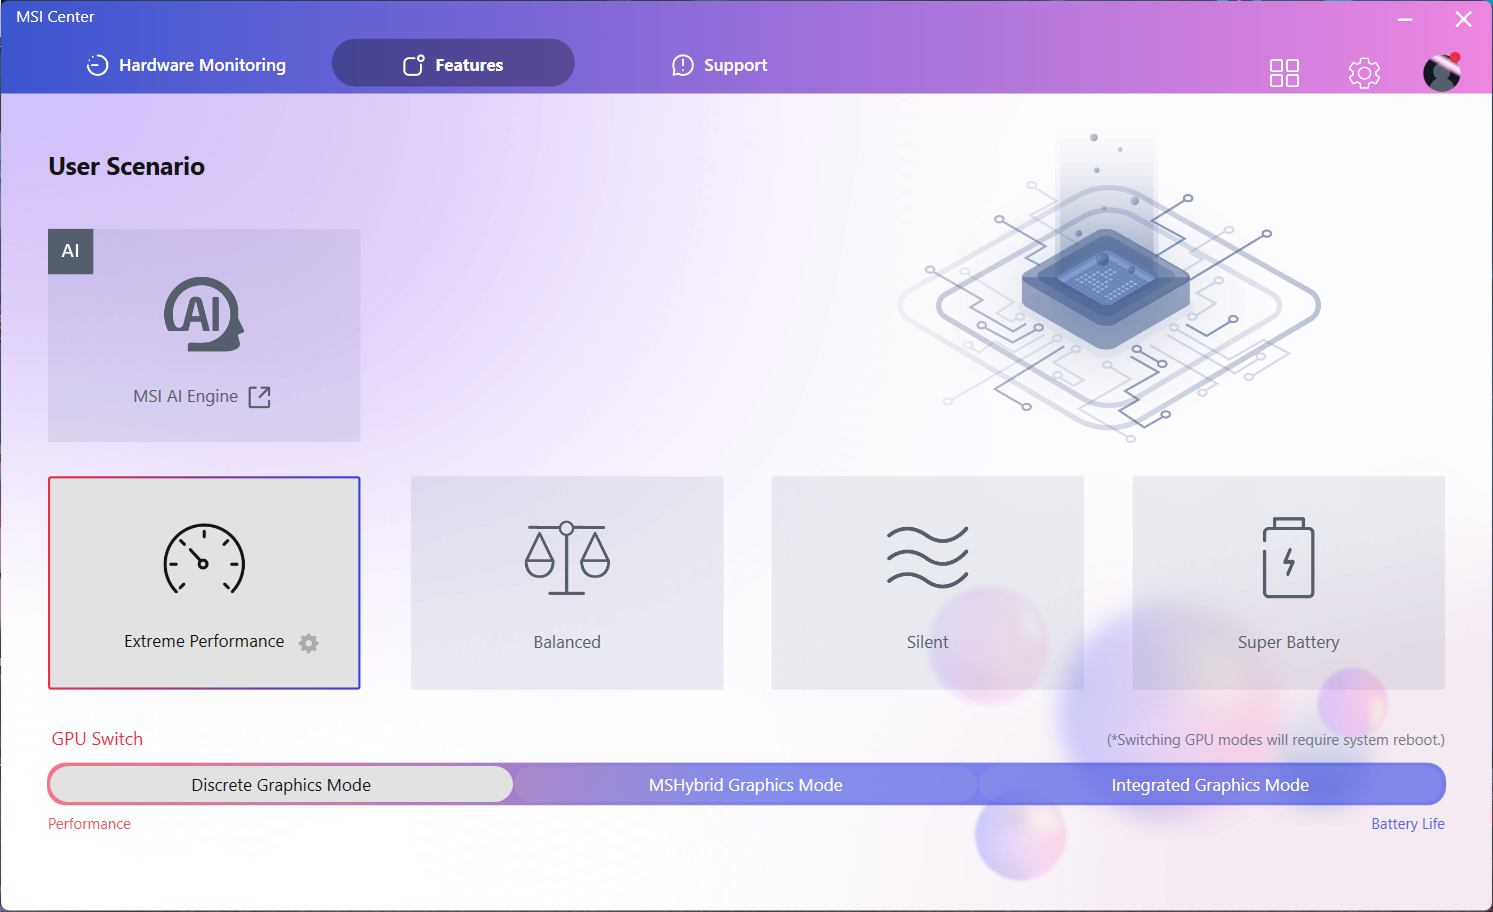
Conditions d'essai
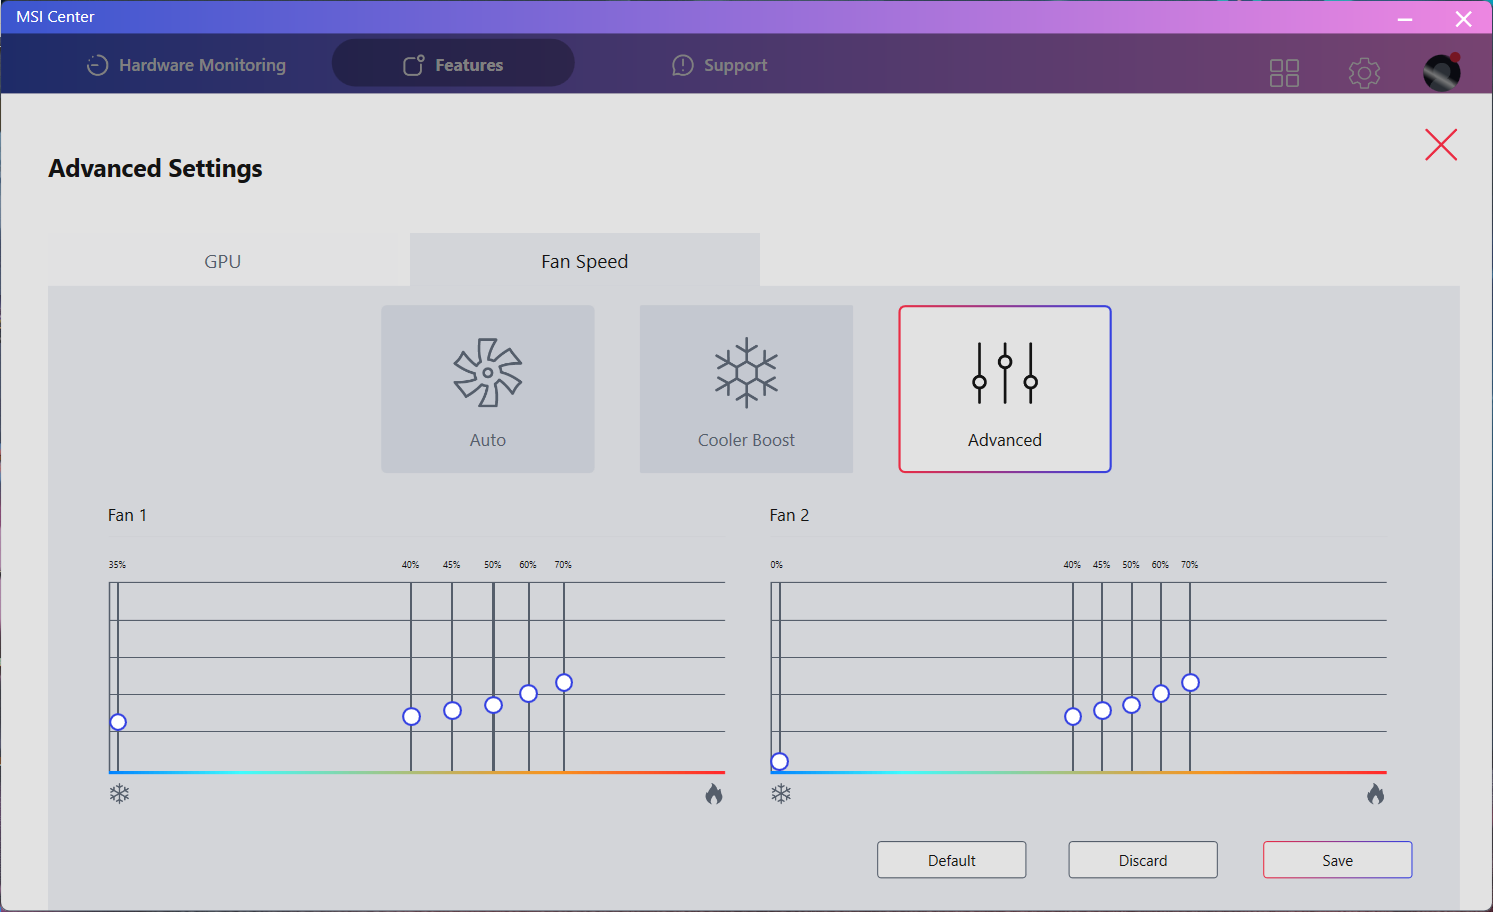
MSI propose quatre modes de performance sur le Sword 16 : Extreme Performance, Balanced, Silent et Super Battery. Nous avons utilisé Extreme Performance pour tous nos tests de jeu et Super Battery pour les tests d'autonomie. Les valeurs PL1 et PL2 pour le CPU ont été plafonnées à 100 et 120 watts, respectivement, tandis que le GPU est annoncé comme pouvant aller jusqu'à 115 watts. Le passage d'un profil à l'autre peut se faire manuellement via le MSI Center ou en appuyant sur les touches 'Fn' et 'F7'.
| Mode de performance | PL1 | PL2 | Cinebench R15 | CinebenchR15 (25 boucles) |
|---|---|---|---|---|
| Performance extrême | 100 | 120 | 3 264 (100%) | 3 198 (100%) |
| Équilibré | 60 | 80 | 2 978 (-8,76%) | 2 728 (-14%) |
| Silencieux | 45 | 60 | 2 198 (-32%) | 1 361 (-57%) |
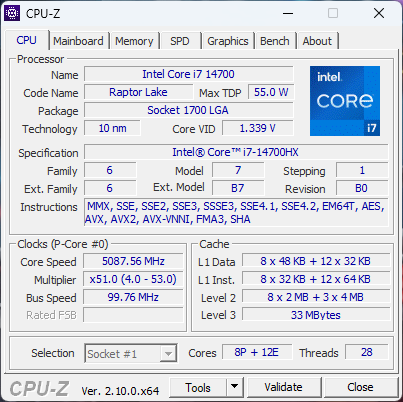
Processeur
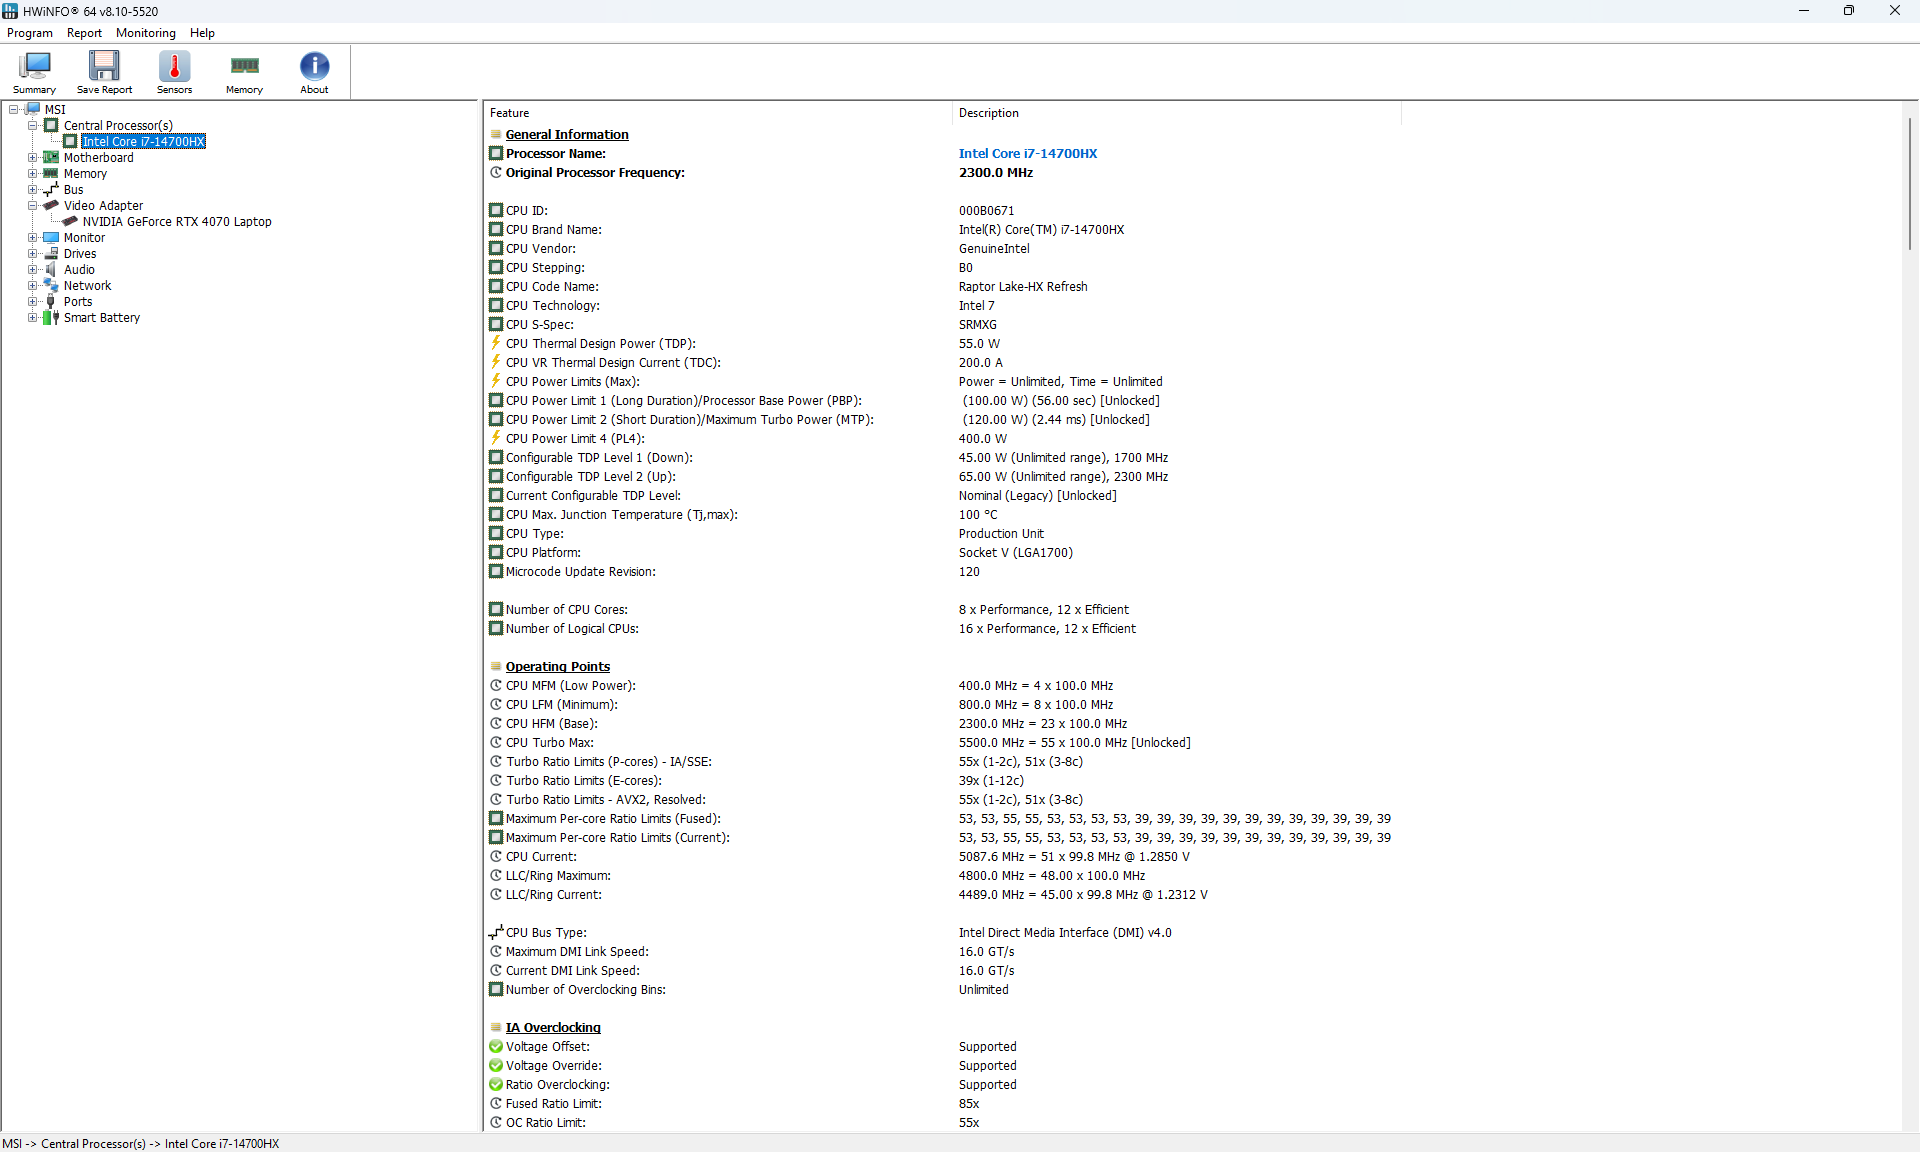
L'Intel Core i7-14700HX est un processeur Raptor Lake-HX de deuxième génération avec 8 cœurs de performance et 12 cœurs d'efficacité. La fiche technique officielle d'Intel indique que le premier peut monter en puissance jusqu'à 5,2 GHz et le second jusqu'à 3,9 GHz.
En mode Extreme Performance, une exécution multicœur Cinebench R15 en 25 boucles révèle que le CPU est capable d'atteindre des pics d'horloge de 4,3 GHz tout en consommant jusqu'à 96 Watts d'énergie. Son score reste plus ou moins constant tout au long de l'exécution, oscillant entre 3 327 et 3 250 points.
En mode équilibré, vous pouvez voir la puissance du CPU atteindre 85 watts avant de se stabiliser à 55 watts. De même, le processeur monte en puissance jusqu'à 3,6 GHz, puis redescend à 2,3 GHz, où il reste pendant toute la durée de l'essai.
Consultez notre page dédiée aux processeurs Intel Core i7-14700HX pour plus d'informations sur ce processeur.
Cinebench R15 Multi Loop
Cinebench R23: Multi Core | Single Core
Cinebench R20: CPU (Multi Core) | CPU (Single Core)
Cinebench R15: CPU Multi 64Bit | CPU Single 64Bit
Blender: v2.79 BMW27 CPU
7-Zip 18.03: 7z b 4 | 7z b 4 -mmt1
Geekbench 6.4: Multi-Core | Single-Core
Geekbench 5.5: Multi-Core | Single-Core
HWBOT x265 Benchmark v2.2: 4k Preset
LibreOffice : 20 Documents To PDF
R Benchmark 2.5: Overall mean
| CPU Performance Rating | |
| Lenovo Legion 7 16 IRX G9 | |
| Asus ROG Strix G17 G713PI -2! | |
| Acer Predator Helios Neo 16 (2024) | |
| Moyenne Intel Core i7-14700HX | |
| MSI Sword 16 HX B14VGKG | |
| Moyenne de la classe Gaming | |
| Alienware m16 R2 -1! | |
| HP Omen 17-db0079ng | |
| HP Victus 16-r0077ng | |
| Cinebench R23 / Multi Core | |
| Asus ROG Strix G17 G713PI | |
| Lenovo Legion 7 16 IRX G9 | |
| Moyenne Intel Core i7-14700HX (22313 - 28122, n=7) | |
| Acer Predator Helios Neo 16 (2024) | |
| MSI Sword 16 HX B14VGKG | |
| Moyenne de la classe Gaming (5668 - 39652, n=151, 2 dernières années) | |
| Alienware m16 R2 | |
| HP Omen 17-db0079ng | |
| HP Victus 16-r0077ng | |
| Cinebench R23 / Single Core | |
| Lenovo Legion 7 16 IRX G9 | |
| MSI Sword 16 HX B14VGKG | |
| Acer Predator Helios Neo 16 (2024) | |
| Moyenne Intel Core i7-14700HX (1702 - 2144, n=7) | |
| Moyenne de la classe Gaming (1136 - 2252, n=151, 2 dernières années) | |
| Asus ROG Strix G17 G713PI | |
| Alienware m16 R2 | |
| HP Victus 16-r0077ng | |
| HP Omen 17-db0079ng | |
| Cinebench R20 / CPU (Multi Core) | |
| Lenovo Legion 7 16 IRX G9 | |
| Asus ROG Strix G17 G713PI | |
| Moyenne Intel Core i7-14700HX (8361 - 10498, n=7) | |
| MSI Sword 16 HX B14VGKG | |
| Acer Predator Helios Neo 16 (2024) | |
| Moyenne de la classe Gaming (2179 - 15517, n=151, 2 dernières années) | |
| Alienware m16 R2 | |
| HP Omen 17-db0079ng | |
| HP Victus 16-r0077ng | |
| Cinebench R20 / CPU (Single Core) | |
| Lenovo Legion 7 16 IRX G9 | |
| MSI Sword 16 HX B14VGKG | |
| Acer Predator Helios Neo 16 (2024) | |
| Moyenne Intel Core i7-14700HX (651 - 821, n=7) | |
| Moyenne de la classe Gaming (439 - 866, n=151, 2 dernières années) | |
| Asus ROG Strix G17 G713PI | |
| HP Omen 17-db0079ng | |
| Alienware m16 R2 | |
| HP Victus 16-r0077ng | |
| Cinebench R15 / CPU Multi 64Bit | |
| Asus ROG Strix G17 G713PI | |
| Lenovo Legion 7 16 IRX G9 | |
| Moyenne Intel Core i7-14700HX (3328 - 4137, n=7) | |
| Acer Predator Helios Neo 16 (2024) | |
| MSI Sword 16 HX B14VGKG | |
| Moyenne de la classe Gaming (905 - 6074, n=154, 2 dernières années) | |
| Alienware m16 R2 | |
| HP Omen 17-db0079ng | |
| HP Victus 16-r0077ng | |
| Cinebench R15 / CPU Single 64Bit | |
| Lenovo Legion 7 16 IRX G9 | |
| MSI Sword 16 HX B14VGKG | |
| Asus ROG Strix G17 G713PI | |
| Acer Predator Helios Neo 16 (2024) | |
| Moyenne Intel Core i7-14700HX (238 - 304, n=7) | |
| Moyenne de la classe Gaming (191.9 - 343, n=151, 2 dernières années) | |
| HP Omen 17-db0079ng | |
| Alienware m16 R2 | |
| HP Victus 16-r0077ng | |
| Blender / v2.79 BMW27 CPU | |
| HP Victus 16-r0077ng | |
| HP Omen 17-db0079ng | |
| Moyenne de la classe Gaming (81 - 555, n=144, 2 dernières années) | |
| Moyenne Intel Core i7-14700HX (126 - 184, n=7) | |
| MSI Sword 16 HX B14VGKG | |
| Acer Predator Helios Neo 16 (2024) | |
| Lenovo Legion 7 16 IRX G9 | |
| Asus ROG Strix G17 G713PI | |
| 7-Zip 18.03 / 7z b 4 | |
| Asus ROG Strix G17 G713PI | |
| Lenovo Legion 7 16 IRX G9 | |
| Moyenne Intel Core i7-14700HX (84799 - 104730, n=7) | |
| Acer Predator Helios Neo 16 (2024) | |
| MSI Sword 16 HX B14VGKG | |
| Moyenne de la classe Gaming (23795 - 144064, n=149, 2 dernières années) | |
| Alienware m16 R2 | |
| HP Victus 16-r0077ng | |
| HP Omen 17-db0079ng | |
| 7-Zip 18.03 / 7z b 4 -mmt1 | |
| Asus ROG Strix G17 G713PI | |
| Lenovo Legion 7 16 IRX G9 | |
| MSI Sword 16 HX B14VGKG | |
| Acer Predator Helios Neo 16 (2024) | |
| Moyenne Intel Core i7-14700HX (5641 - 7041, n=7) | |
| Moyenne de la classe Gaming (4199 - 7573, n=149, 2 dernières années) | |
| HP Victus 16-r0077ng | |
| HP Omen 17-db0079ng | |
| Alienware m16 R2 | |
| Geekbench 6.4 / Multi-Core | |
| Lenovo Legion 7 16 IRX G9 | |
| Acer Predator Helios Neo 16 (2024) | |
| Moyenne Intel Core i7-14700HX (14807 - 17562, n=7) | |
| MSI Sword 16 HX B14VGKG | |
| Moyenne de la classe Gaming (5340 - 21668, n=119, 2 dernières années) | |
| HP Omen 17-db0079ng | |
| Alienware m16 R2 | |
| HP Victus 16-r0077ng | |
| Geekbench 6.4 / Single-Core | |
| Lenovo Legion 7 16 IRX G9 | |
| Acer Predator Helios Neo 16 (2024) | |
| MSI Sword 16 HX B14VGKG | |
| Moyenne Intel Core i7-14700HX (2378 - 2975, n=7) | |
| Moyenne de la classe Gaming (1490 - 3219, n=119, 2 dernières années) | |
| HP Omen 17-db0079ng | |
| HP Victus 16-r0077ng | |
| Alienware m16 R2 | |
| Geekbench 5.5 / Multi-Core | |
| Lenovo Legion 7 16 IRX G9 | |
| Asus ROG Strix G17 G713PI | |
| Acer Predator Helios Neo 16 (2024) | |
| Moyenne Intel Core i7-14700HX (15705 - 19597, n=7) | |
| MSI Sword 16 HX B14VGKG | |
| Moyenne de la classe Gaming (4557 - 25855, n=148, 2 dernières années) | |
| Alienware m16 R2 | |
| HP Omen 17-db0079ng | |
| HP Victus 16-r0077ng | |
| Geekbench 5.5 / Single-Core | |
| Acer Predator Helios Neo 16 (2024) | |
| Lenovo Legion 7 16 IRX G9 | |
| MSI Sword 16 HX B14VGKG | |
| Asus ROG Strix G17 G713PI | |
| Moyenne Intel Core i7-14700HX (1700 - 2133, n=7) | |
| Moyenne de la classe Gaming (986 - 2423, n=148, 2 dernières années) | |
| HP Omen 17-db0079ng | |
| Alienware m16 R2 | |
| HP Victus 16-r0077ng | |
| HWBOT x265 Benchmark v2.2 / 4k Preset | |
| Asus ROG Strix G17 G713PI | |
| Lenovo Legion 7 16 IRX G9 | |
| Moyenne Intel Core i7-14700HX (22 - 27.4, n=7) | |
| Acer Predator Helios Neo 16 (2024) | |
| MSI Sword 16 HX B14VGKG | |
| Moyenne de la classe Gaming (6.72 - 42.9, n=148, 2 dernières années) | |
| Alienware m16 R2 | |
| HP Omen 17-db0079ng | |
| HP Victus 16-r0077ng | |
| LibreOffice / 20 Documents To PDF | |
| HP Omen 17-db0079ng | |
| HP Victus 16-r0077ng | |
| Alienware m16 R2 | |
| Moyenne de la classe Gaming (19 - 96.6, n=147, 2 dernières années) | |
| Moyenne Intel Core i7-14700HX (41.9 - 55.3, n=7) | |
| Asus ROG Strix G17 G713PI | |
| Lenovo Legion 7 16 IRX G9 | |
| MSI Sword 16 HX B14VGKG | |
| Acer Predator Helios Neo 16 (2024) | |
| R Benchmark 2.5 / Overall mean | |
| HP Victus 16-r0077ng | |
| HP Omen 17-db0079ng | |
| Alienware m16 R2 | |
| Moyenne de la classe Gaming (0.3609 - 0.759, n=150, 2 dernières années) | |
| Moyenne Intel Core i7-14700HX (0.3821 - 0.4896, n=7) | |
| Asus ROG Strix G17 G713PI | |
| MSI Sword 16 HX B14VGKG | |
| Lenovo Legion 7 16 IRX G9 | |
| Acer Predator Helios Neo 16 (2024) | |
* ... Moindre est la valeur, meilleures sont les performances
AIDA64: FP32 Ray-Trace | FPU Julia | CPU SHA3 | CPU Queen | FPU SinJulia | FPU Mandel | CPU AES | CPU ZLib | FP64 Ray-Trace | CPU PhotoWorxx
| Performance Rating | |
| Asus ROG Strix G17 G713PI | |
| Lenovo Legion 7 16 IRX G9 | |
| Acer Predator Helios Neo 16 (2024) | |
| Moyenne Intel Core i7-14700HX | |
| HP Omen 17-db0079ng | |
| Moyenne de la classe Gaming | |
| MSI Sword 16 HX B14VGKG | |
| Alienware m16 R2 | |
| HP Victus 16-r0077ng | |
| AIDA64 / FP32 Ray-Trace | |
| Asus ROG Strix G17 G713PI | |
| HP Omen 17-db0079ng | |
| Lenovo Legion 7 16 IRX G9 | |
| Moyenne de la classe Gaming (4986 - 81639, n=147, 2 dernières années) | |
| Acer Predator Helios Neo 16 (2024) | |
| Moyenne Intel Core i7-14700HX (16932 - 23676, n=7) | |
| MSI Sword 16 HX B14VGKG | |
| Alienware m16 R2 | |
| HP Victus 16-r0077ng | |
| AIDA64 / FPU Julia | |
| Asus ROG Strix G17 G713PI | |
| Lenovo Legion 7 16 IRX G9 | |
| HP Omen 17-db0079ng | |
| Moyenne Intel Core i7-14700HX (86338 - 116556, n=7) | |
| Acer Predator Helios Neo 16 (2024) | |
| Moyenne de la classe Gaming (25360 - 252486, n=147, 2 dernières années) | |
| MSI Sword 16 HX B14VGKG | |
| Alienware m16 R2 | |
| HP Victus 16-r0077ng | |
| AIDA64 / CPU SHA3 | |
| Asus ROG Strix G17 G713PI | |
| Lenovo Legion 7 16 IRX G9 | |
| Moyenne Intel Core i7-14700HX (4008 - 5567, n=7) | |
| Acer Predator Helios Neo 16 (2024) | |
| Moyenne de la classe Gaming (1339 - 10389, n=147, 2 dernières années) | |
| HP Omen 17-db0079ng | |
| MSI Sword 16 HX B14VGKG | |
| Alienware m16 R2 | |
| HP Victus 16-r0077ng | |
| AIDA64 / CPU Queen | |
| Asus ROG Strix G17 G713PI | |
| Acer Predator Helios Neo 16 (2024) | |
| Lenovo Legion 7 16 IRX G9 | |
| Moyenne Intel Core i7-14700HX (129836 - 152200, n=7) | |
| MSI Sword 16 HX B14VGKG | |
| HP Omen 17-db0079ng | |
| Moyenne de la classe Gaming (50699 - 200651, n=147, 2 dernières années) | |
| HP Victus 16-r0077ng | |
| Alienware m16 R2 | |
| AIDA64 / FPU SinJulia | |
| Asus ROG Strix G17 G713PI | |
| HP Omen 17-db0079ng | |
| Lenovo Legion 7 16 IRX G9 | |
| Acer Predator Helios Neo 16 (2024) | |
| Moyenne Intel Core i7-14700HX (11704 - 14434, n=7) | |
| Moyenne de la classe Gaming (4800 - 32988, n=147, 2 dernières années) | |
| MSI Sword 16 HX B14VGKG | |
| Alienware m16 R2 | |
| HP Victus 16-r0077ng | |
| AIDA64 / FPU Mandel | |
| Asus ROG Strix G17 G713PI | |
| HP Omen 17-db0079ng | |
| Acer Predator Helios Neo 16 (2024) | |
| Moyenne de la classe Gaming (12321 - 134044, n=147, 2 dernières années) | |
| Moyenne Intel Core i7-14700HX (42125 - 58380, n=7) | |
| MSI Sword 16 HX B14VGKG | |
| Alienware m16 R2 | |
| Lenovo Legion 7 16 IRX G9 | |
| HP Victus 16-r0077ng | |
| AIDA64 / CPU AES | |
| Asus ROG Strix G17 G713PI | |
| Lenovo Legion 7 16 IRX G9 | |
| Moyenne de la classe Gaming (19065 - 328679, n=147, 2 dernières années) | |
| Moyenne Intel Core i7-14700HX (82161 - 113157, n=7) | |
| Acer Predator Helios Neo 16 (2024) | |
| MSI Sword 16 HX B14VGKG | |
| HP Omen 17-db0079ng | |
| Alienware m16 R2 | |
| HP Victus 16-r0077ng | |
| AIDA64 / CPU ZLib | |
| Asus ROG Strix G17 G713PI | |
| Lenovo Legion 7 16 IRX G9 | |
| Moyenne Intel Core i7-14700HX (1177 - 1682, n=7) | |
| Acer Predator Helios Neo 16 (2024) | |
| MSI Sword 16 HX B14VGKG | |
| Moyenne de la classe Gaming (373 - 2531, n=147, 2 dernières années) | |
| Alienware m16 R2 | |
| HP Omen 17-db0079ng | |
| HP Victus 16-r0077ng | |
| AIDA64 / FP64 Ray-Trace | |
| Asus ROG Strix G17 G713PI | |
| HP Omen 17-db0079ng | |
| Lenovo Legion 7 16 IRX G9 | |
| Moyenne de la classe Gaming (2540 - 43430, n=147, 2 dernières années) | |
| Acer Predator Helios Neo 16 (2024) | |
| Moyenne Intel Core i7-14700HX (9029 - 12928, n=7) | |
| MSI Sword 16 HX B14VGKG | |
| Alienware m16 R2 | |
| HP Victus 16-r0077ng | |
| AIDA64 / CPU PhotoWorxx | |
| Lenovo Legion 7 16 IRX G9 | |
| Acer Predator Helios Neo 16 (2024) | |
| Moyenne Intel Core i7-14700HX (39151 - 49671, n=7) | |
| HP Omen 17-db0079ng | |
| Moyenne de la classe Gaming (10805 - 60161, n=147, 2 dernières années) | |
| Alienware m16 R2 | |
| MSI Sword 16 HX B14VGKG | |
| HP Victus 16-r0077ng | |
| Asus ROG Strix G17 G713PI | |
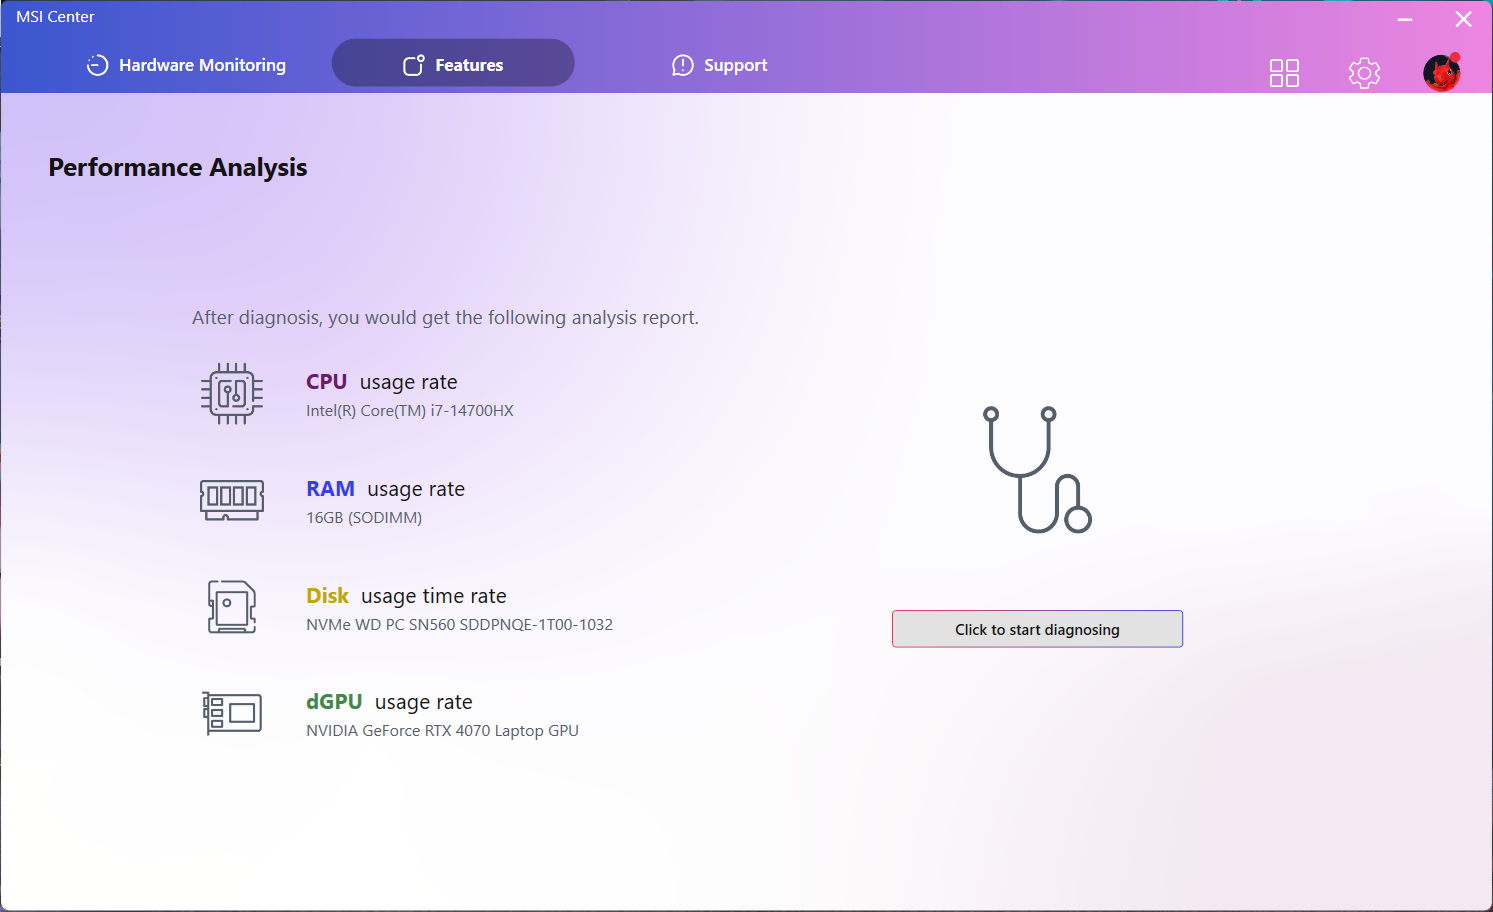
Performance du système
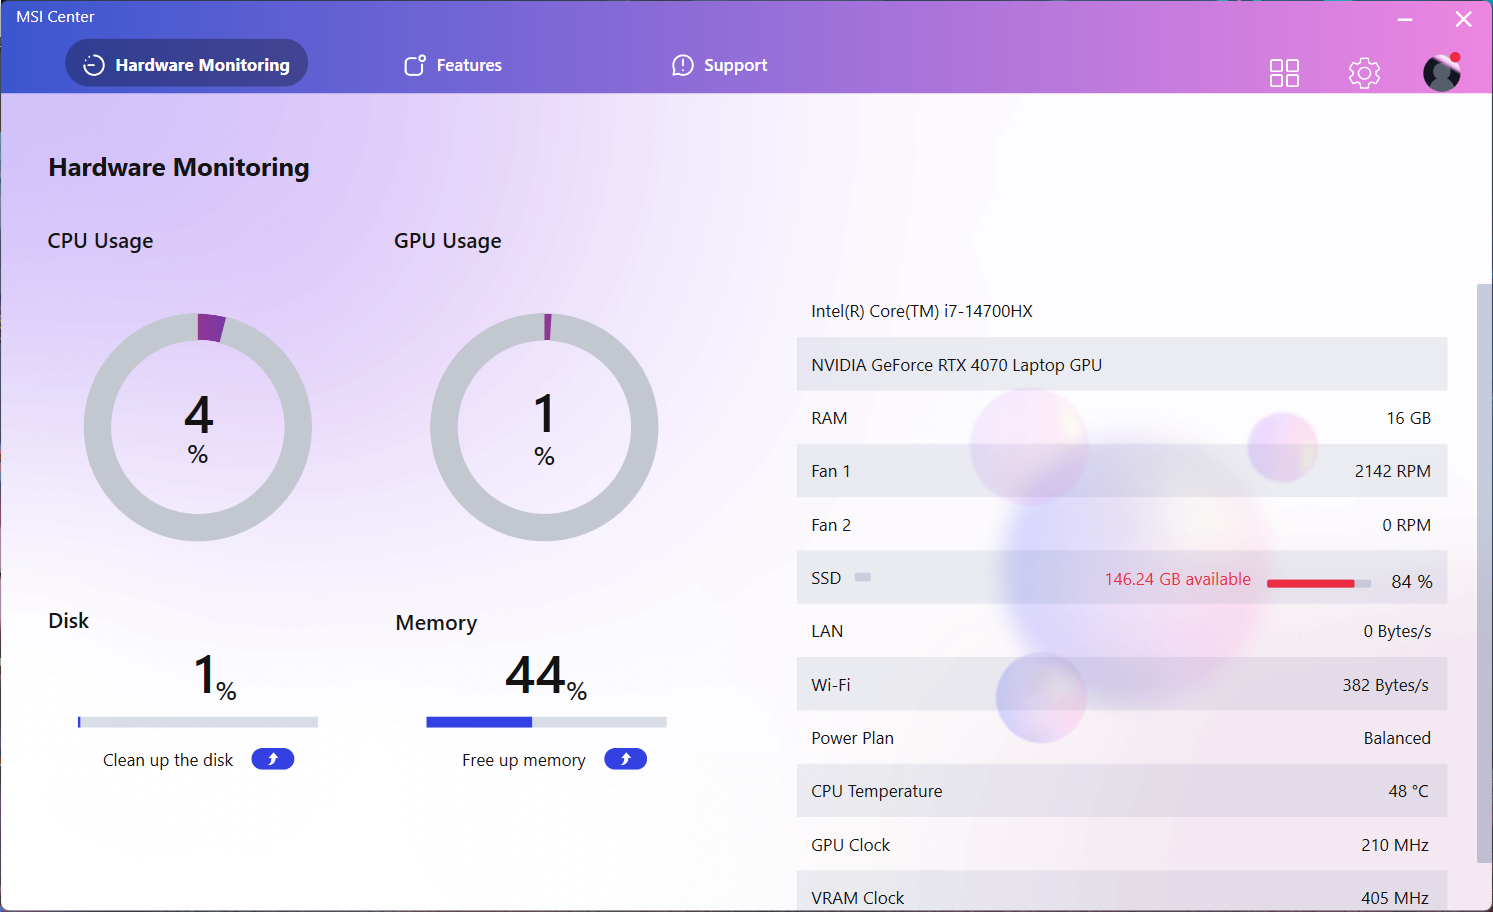
Le puissant processeur et le processeur graphique du Sword 16 HX permettent d'effectuer rapidement les tâches quotidiennes telles que les appels vidéo, les feuilles Excel, etc. Cependant, il se peut que vous deviez passer à un mode moins énergivore (Silencieux/Equilibré) pour augmenter l'autonomie de la batterie.
CrossMark: Overall | Productivity | Creativity | Responsiveness
WebXPRT 3: Overall
WebXPRT 4: Overall
Mozilla Kraken 1.1: Total
| PCMark 10 / Score | |
| MSI Sword 16 HX B14VGKG | |
| Moyenne Intel Core i7-14700HX, NVIDIA GeForce RTX 4070 Laptop GPU (8302 - 8512, n=2) | |
| Acer Predator Helios Neo 16 (2024) | |
| Lenovo Legion 7 16 IRX G9 | |
| Moyenne de la classe Gaming (5776 - 9852, n=133, 2 dernières années) | |
| HP Omen 17-db0079ng | |
| Alienware m16 R2 | |
| Asus ROG Strix G17 G713PI | |
| HP Victus 16-r0077ng | |
| PCMark 10 / Essentials | |
| Acer Predator Helios Neo 16 (2024) | |
| Moyenne Intel Core i7-14700HX, NVIDIA GeForce RTX 4070 Laptop GPU (10939 - 11708, n=2) | |
| Asus ROG Strix G17 G713PI | |
| Lenovo Legion 7 16 IRX G9 | |
| MSI Sword 16 HX B14VGKG | |
| Moyenne de la classe Gaming (9057 - 12600, n=133, 2 dernières années) | |
| HP Victus 16-r0077ng | |
| HP Omen 17-db0079ng | |
| Alienware m16 R2 | |
| PCMark 10 / Productivity | |
| Asus ROG Strix G17 G713PI | |
| MSI Sword 16 HX B14VGKG | |
| Moyenne Intel Core i7-14700HX, NVIDIA GeForce RTX 4070 Laptop GPU (10273 - 10925, n=2) | |
| Acer Predator Helios Neo 16 (2024) | |
| HP Omen 17-db0079ng | |
| Moyenne de la classe Gaming (6662 - 14612, n=133, 2 dernières années) | |
| Lenovo Legion 7 16 IRX G9 | |
| Alienware m16 R2 | |
| HP Victus 16-r0077ng | |
| PCMark 10 / Digital Content Creation | |
| MSI Sword 16 HX B14VGKG | |
| Moyenne Intel Core i7-14700HX, NVIDIA GeForce RTX 4070 Laptop GPU (12909 - 14003, n=2) | |
| Lenovo Legion 7 16 IRX G9 | |
| Alienware m16 R2 | |
| Acer Predator Helios Neo 16 (2024) | |
| Moyenne de la classe Gaming (6807 - 18475, n=133, 2 dernières années) | |
| HP Omen 17-db0079ng | |
| HP Victus 16-r0077ng | |
| Asus ROG Strix G17 G713PI | |
| CrossMark / Overall | |
| Lenovo Legion 7 16 IRX G9 | |
| Acer Predator Helios Neo 16 (2024) | |
| Moyenne Intel Core i7-14700HX, NVIDIA GeForce RTX 4070 Laptop GPU (2138 - 2235, n=2) | |
| MSI Sword 16 HX B14VGKG | |
| Asus ROG Strix G17 G713PI | |
| Moyenne de la classe Gaming (1247 - 2344, n=114, 2 dernières années) | |
| Alienware m16 R2 | |
| HP Omen 17-db0079ng | |
| CrossMark / Productivity | |
| Lenovo Legion 7 16 IRX G9 | |
| Acer Predator Helios Neo 16 (2024) | |
| Moyenne Intel Core i7-14700HX, NVIDIA GeForce RTX 4070 Laptop GPU (2035 - 2093, n=2) | |
| MSI Sword 16 HX B14VGKG | |
| Asus ROG Strix G17 G713PI | |
| Moyenne de la classe Gaming (1299 - 2204, n=114, 2 dernières années) | |
| Alienware m16 R2 | |
| HP Omen 17-db0079ng | |
| CrossMark / Creativity | |
| Acer Predator Helios Neo 16 (2024) | |
| Lenovo Legion 7 16 IRX G9 | |
| Moyenne Intel Core i7-14700HX, NVIDIA GeForce RTX 4070 Laptop GPU (2311 - 2455, n=2) | |
| Asus ROG Strix G17 G713PI | |
| MSI Sword 16 HX B14VGKG | |
| Moyenne de la classe Gaming (1275 - 2660, n=114, 2 dernières années) | |
| Alienware m16 R2 | |
| HP Omen 17-db0079ng | |
| CrossMark / Responsiveness | |
| Lenovo Legion 7 16 IRX G9 | |
| Acer Predator Helios Neo 16 (2024) | |
| Moyenne Intel Core i7-14700HX, NVIDIA GeForce RTX 4070 Laptop GPU (1960 - 2053, n=2) | |
| MSI Sword 16 HX B14VGKG | |
| Moyenne de la classe Gaming (1030 - 2330, n=114, 2 dernières années) | |
| Asus ROG Strix G17 G713PI | |
| Alienware m16 R2 | |
| HP Omen 17-db0079ng | |
| WebXPRT 3 / Overall | |
| Lenovo Legion 7 16 IRX G9 | |
| Acer Predator Helios Neo 16 (2024) | |
| Asus ROG Strix G17 G713PI | |
| Moyenne Intel Core i7-14700HX, NVIDIA GeForce RTX 4070 Laptop GPU (302 - 323, n=2) | |
| MSI Sword 16 HX B14VGKG | |
| Moyenne de la classe Gaming (215 - 480, n=127, 2 dernières années) | |
| Alienware m16 R2 | |
| HP Victus 16-r0077ng | |
| HP Victus 16-r0077ng | |
| HP Omen 17-db0079ng | |
| WebXPRT 4 / Overall | |
| Acer Predator Helios Neo 16 (2024) | |
| Lenovo Legion 7 16 IRX G9 | |
| Moyenne Intel Core i7-14700HX, NVIDIA GeForce RTX 4070 Laptop GPU (274 - 307, n=2) | |
| Asus ROG Strix G17 G713PI | |
| MSI Sword 16 HX B14VGKG | |
| Moyenne de la classe Gaming (176.4 - 335, n=115, 2 dernières années) | |
| Alienware m16 R2 | |
| HP Victus 16-r0077ng | |
| HP Victus 16-r0077ng | |
| Mozilla Kraken 1.1 / Total | |
| HP Omen 17-db0079ng | |
| Alienware m16 R2 | |
| HP Victus 16-r0077ng | |
| HP Victus 16-r0077ng | |
| Moyenne de la classe Gaming (409 - 674, n=139, 2 dernières années) | |
| Asus ROG Strix G17 G713PI | |
| MSI Sword 16 HX B14VGKG | |
| MSI Sword 16 HX B14VGKG | |
| Moyenne Intel Core i7-14700HX, NVIDIA GeForce RTX 4070 Laptop GPU (447 - 449, n=3) | |
| Acer Predator Helios Neo 16 (2024) | |
| Lenovo Legion 7 16 IRX G9 | |
* ... Moindre est la valeur, meilleures sont les performances
| PCMark 10 Score | 8512 points | |
Aide | ||
| AIDA64 / Memory Copy | |
| Lenovo Legion 7 16 IRX G9 | |
| Acer Predator Helios Neo 16 (2024) | |
| Moyenne Intel Core i7-14700HX (63949 - 78742, n=7) | |
| MSI Sword 16 HX B14VGKG | |
| HP Omen 17-db0079ng | |
| Moyenne de la classe Gaming (21750 - 97515, n=147, 2 dernières années) | |
| Alienware m16 R2 | |
| HP Victus 16-r0077ng | |
| Asus ROG Strix G17 G713PI | |
| AIDA64 / Memory Read | |
| Lenovo Legion 7 16 IRX G9 | |
| MSI Sword 16 HX B14VGKG | |
| Acer Predator Helios Neo 16 (2024) | |
| Moyenne Intel Core i7-14700HX (68593 - 86175, n=7) | |
| Alienware m16 R2 | |
| HP Victus 16-r0077ng | |
| Moyenne de la classe Gaming (22956 - 102937, n=147, 2 dernières années) | |
| HP Omen 17-db0079ng | |
| Asus ROG Strix G17 G713PI | |
| AIDA64 / Memory Write | |
| HP Omen 17-db0079ng | |
| Lenovo Legion 7 16 IRX G9 | |
| Acer Predator Helios Neo 16 (2024) | |
| Moyenne Intel Core i7-14700HX (64033 - 76689, n=7) | |
| Moyenne de la classe Gaming (22297 - 108954, n=147, 2 dernières années) | |
| Alienware m16 R2 | |
| MSI Sword 16 HX B14VGKG | |
| HP Victus 16-r0077ng | |
| Asus ROG Strix G17 G713PI | |
| AIDA64 / Memory Latency | |
| Alienware m16 R2 | |
| HP Omen 17-db0079ng | |
| Moyenne de la classe Gaming (59.5 - 259, n=147, 2 dernières années) | |
| HP Victus 16-r0077ng | |
| Acer Predator Helios Neo 16 (2024) | |
| Moyenne Intel Core i7-14700HX (82.7 - 96.4, n=7) | |
| Asus ROG Strix G17 G713PI | |
| Lenovo Legion 7 16 IRX G9 | |
| MSI Sword 16 HX B14VGKG | |
* ... Moindre est la valeur, meilleures sont les performances
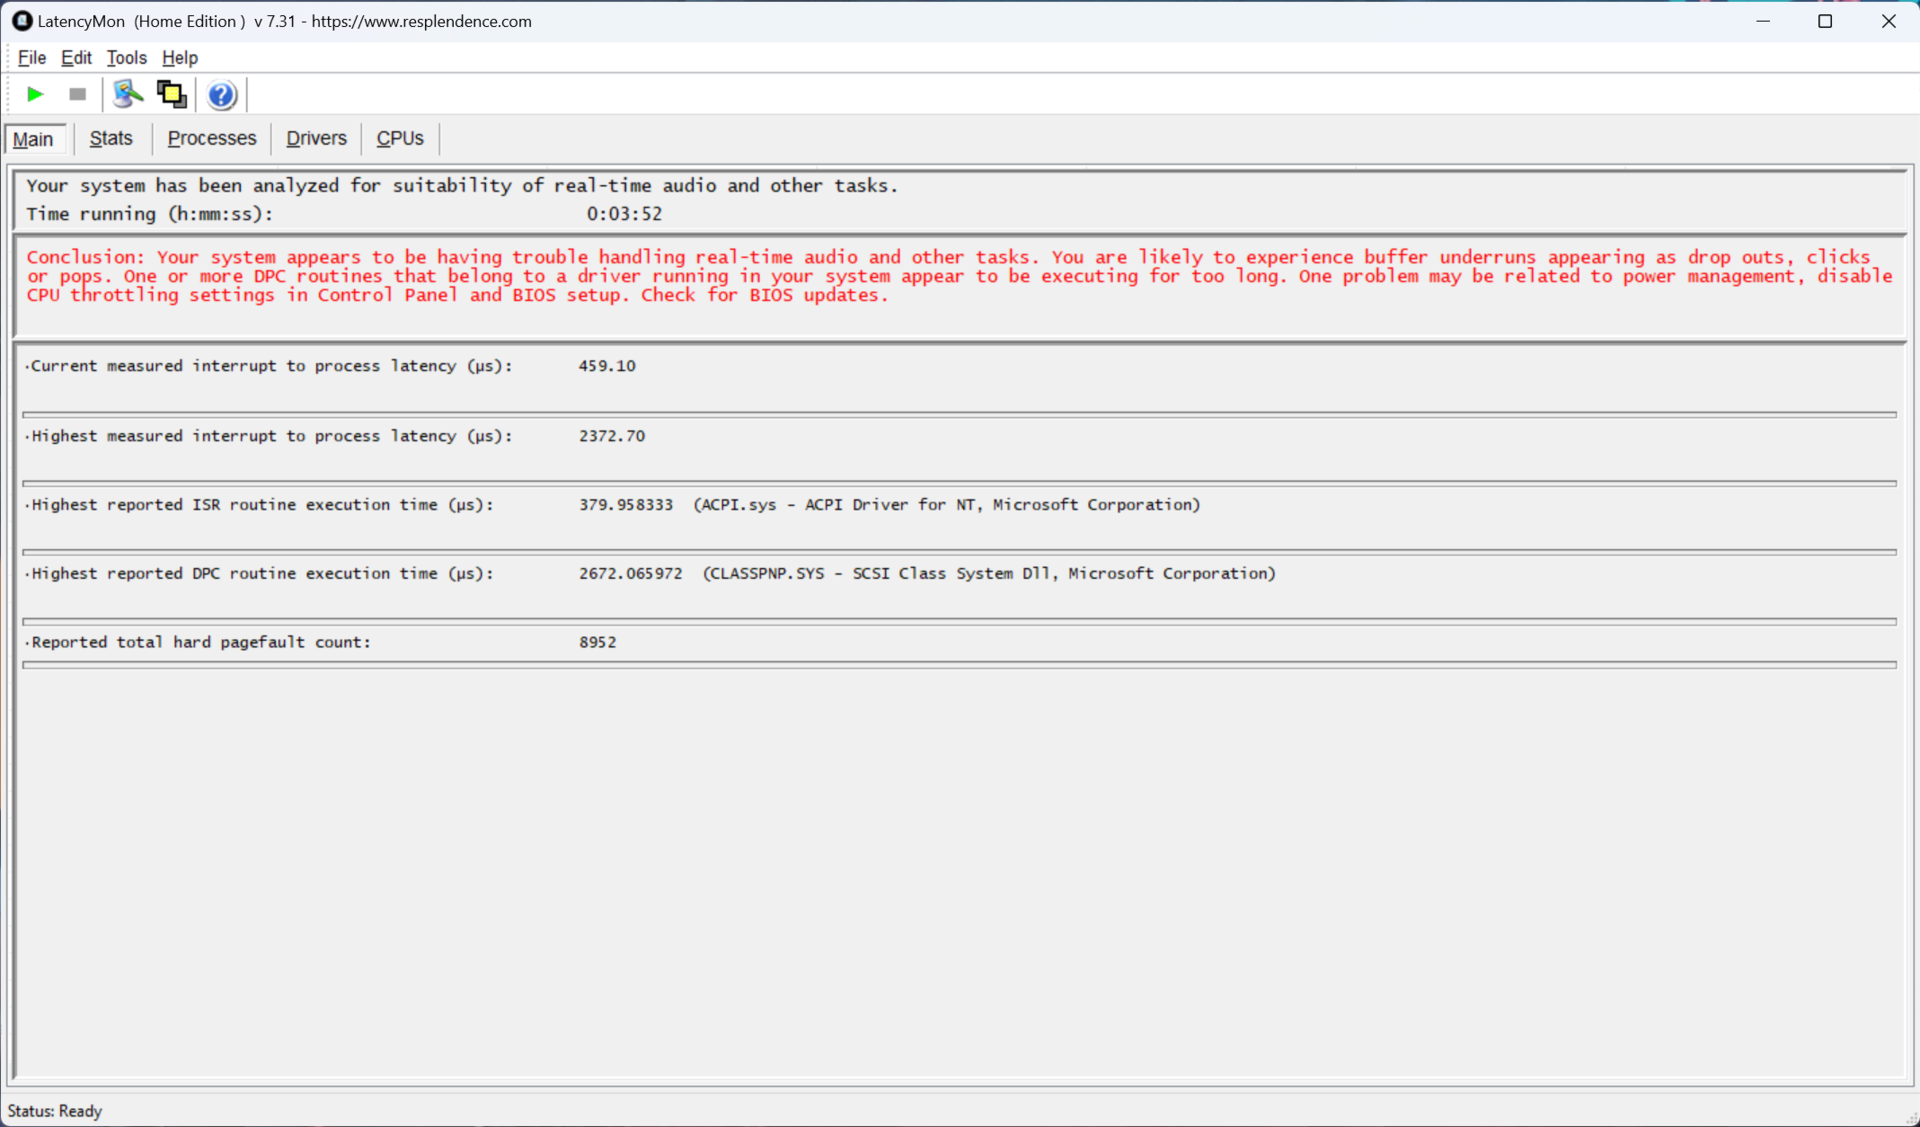
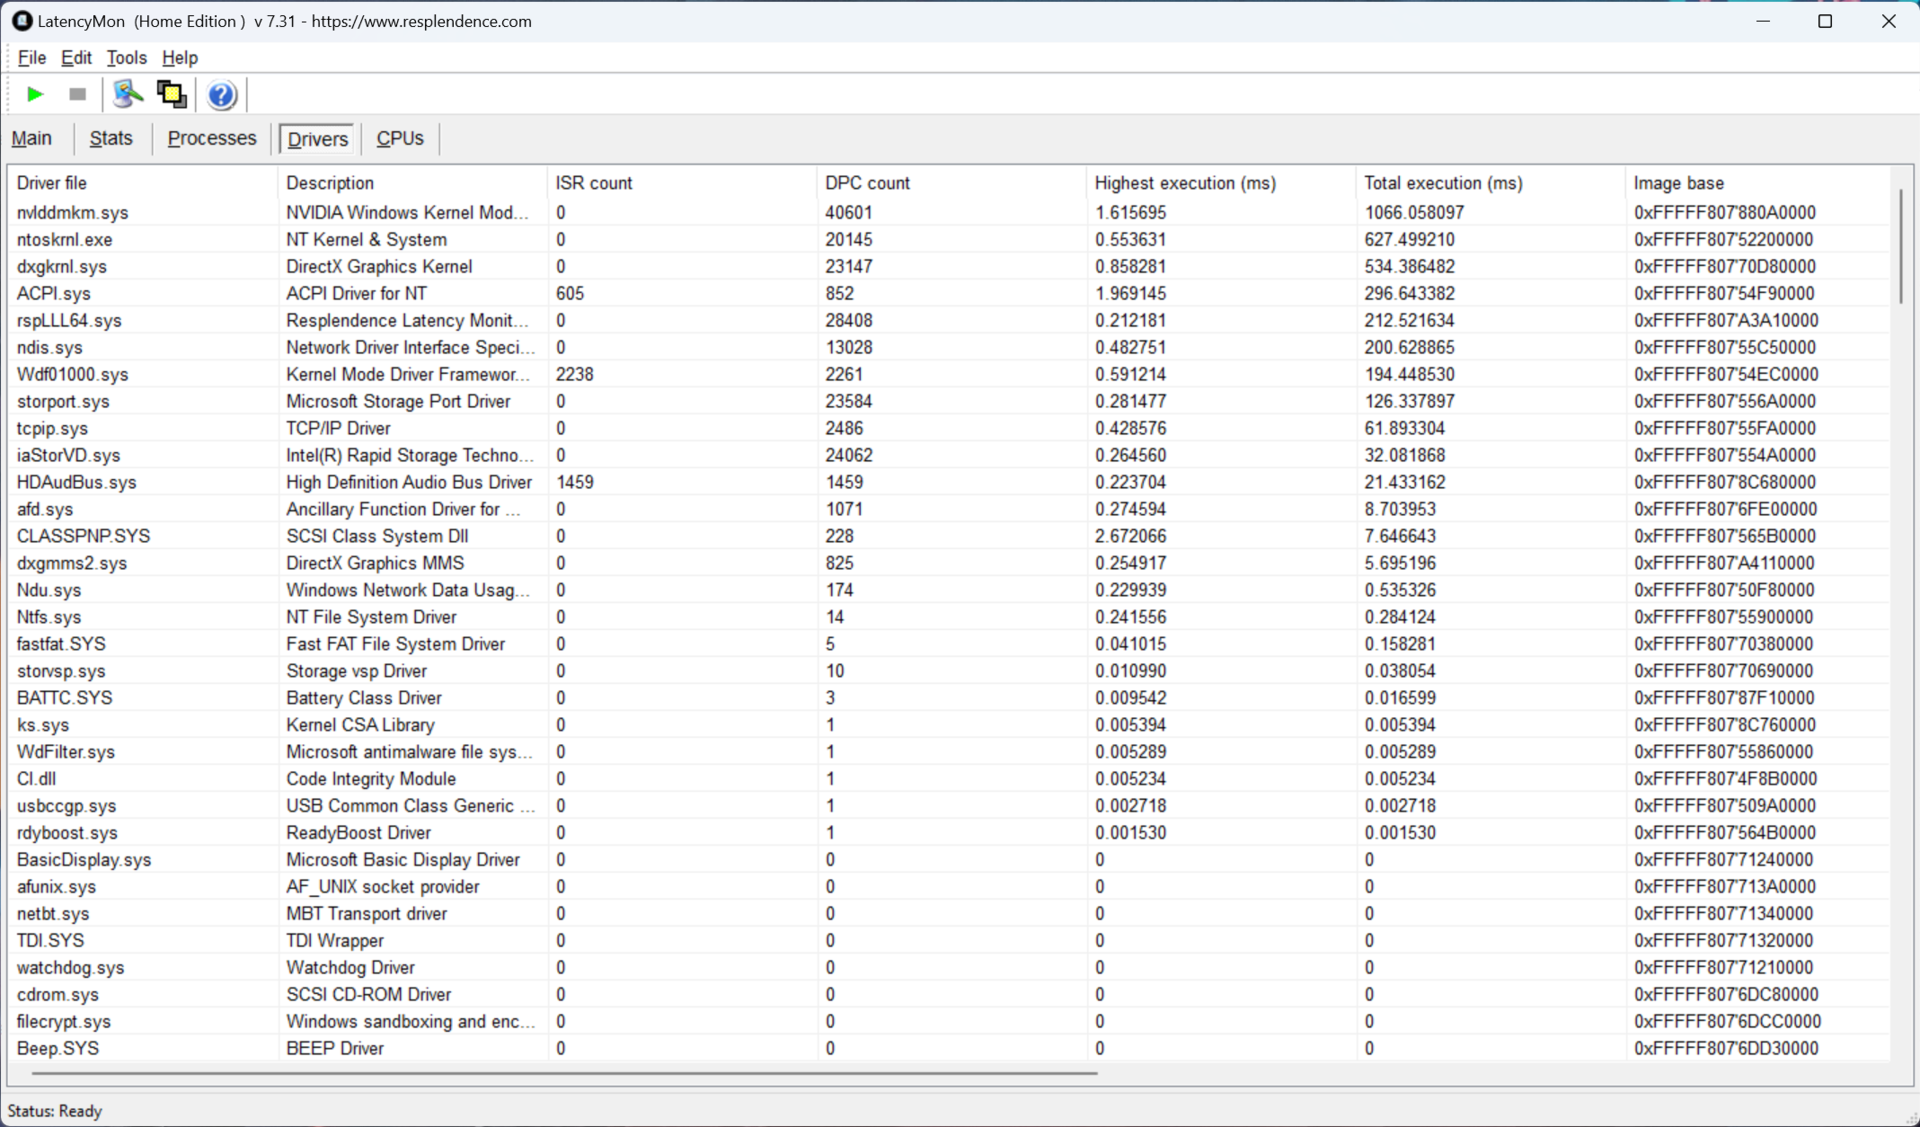
Latence DPC
Le MSI Sword 16 HX n'est malheureusement pas idéal pour les applications d'édition audio et vidéo en temps réel. Sa latence DPC est plus élevée en raison des pilotes de Nvidia. Une future mise à jour logicielle devrait résoudre ce problème.
| DPC Latencies / LatencyMon - interrupt to process latency (max), Web, Youtube, Prime95 | |
| MSI Sword 16 HX B14VGKG | |
| Alienware m16 R2 | |
| HP Omen 17-db0079ng | |
| HP Victus 16-r0077ng | |
| Lenovo Legion 7 16 IRX G9 | |
| Asus ROG Strix G17 G713PI | |
| Acer Predator Helios Neo 16 (2024) | |
* ... Moindre est la valeur, meilleures sont les performances
Dispositifs de stockage
Malheureusement, le SSD Western Digital PC SN560 NVMe du Sword 16 HX est l'un des disques les plus lents du marché. Il est largement surpassé par les offres concurrentes de Samsung, Kioxia et SK Hynix.
Comme nous n'avons pas pu regarder à l'intérieur, nous ne savons pas où le PC SN560 SSD est connecté, mais il est probablement inséré dans l'emplacement PCIe Gen5.

* ... Moindre est la valeur, meilleures sont les performances
Disk Throttling: DiskSpd Read Loop, Queue Depth 8
Performance du GPU
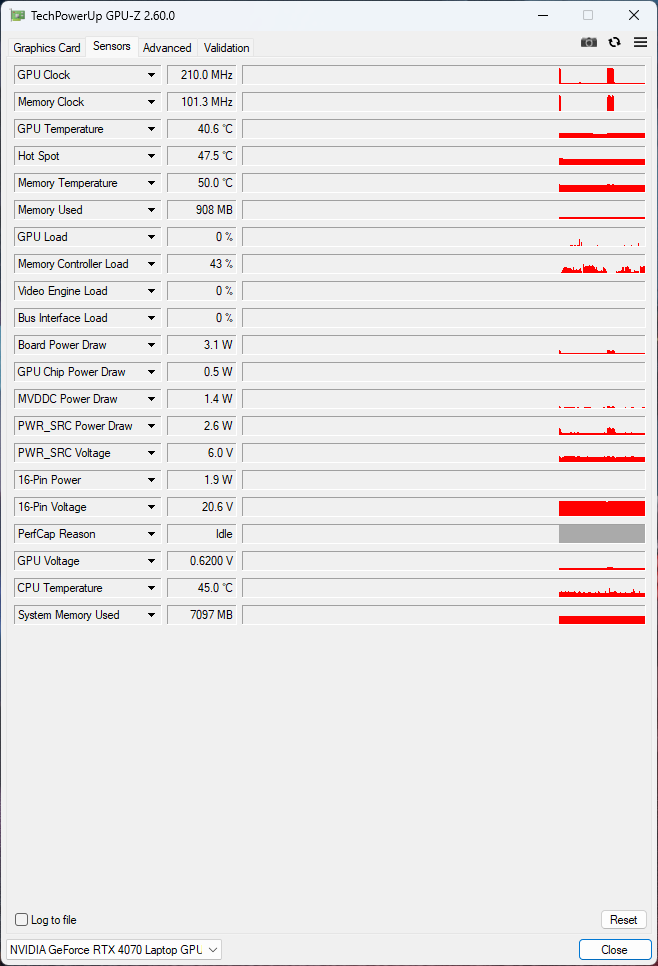
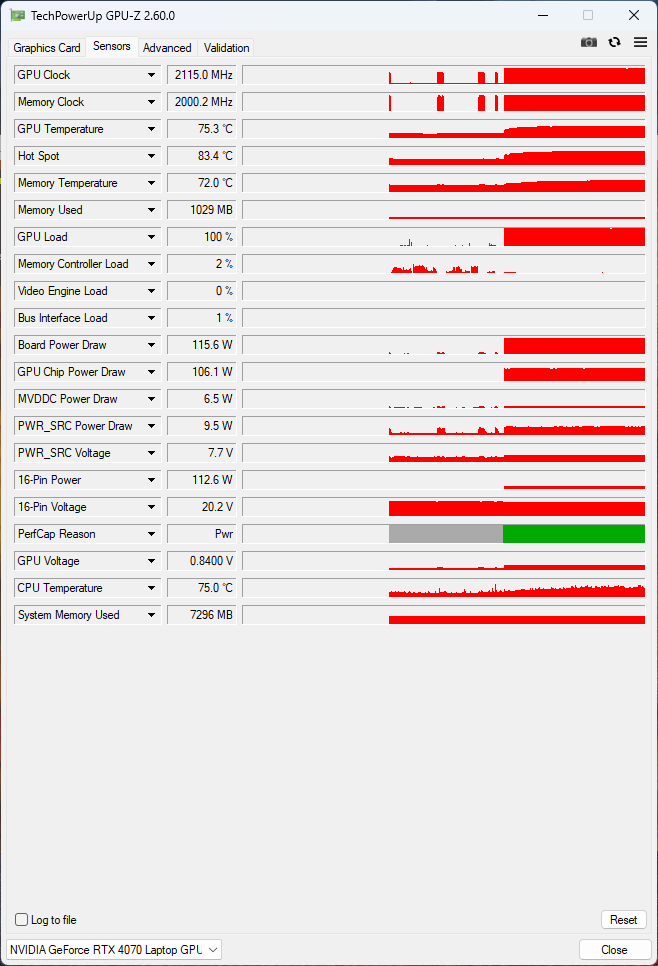
Les Nvidia GeForce RTX 4070 de la MSI Sword 16 HX n'est pas l'une des plus rapides que nous ayons testées, mais nous pouvons mettre cela sur le compte de son TDP de 115 watts contre 140 watts pour les autres. La décision de MSI d'utiliser une variante de 115 watts est logique, car le refroidissement de la variante de 150 watts serait un défi à ce niveau de prix.
Cela dit, la configuration actuelle de MSI donne la priorité au GPU par rapport au CPU. Dans une charge de travail mixte CPU et GPU, la GeForce RTX 4070 tourne constamment à 115 Watts, alors que le Core i7-14700HX reste stable à environ 86 Watts.
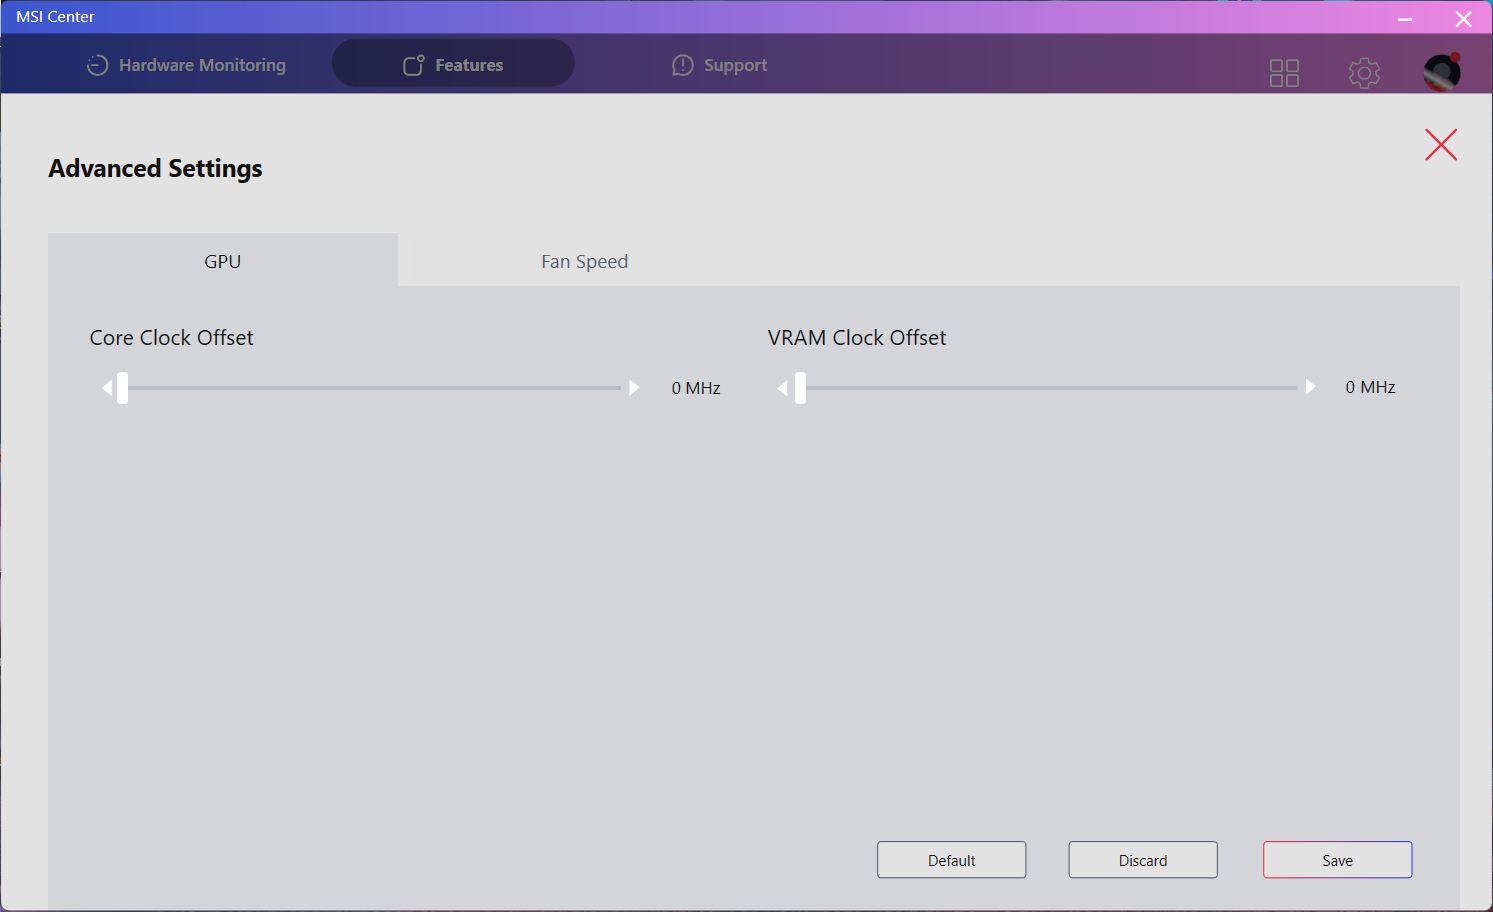
Dans l'ensemble, les performances de l'ordinateur portable dans les tests synthétiques sont acceptables et se situent dans la lignée des autres RTX 4070 de 115 watts. MSI vous permet de basculer entre le GPU et l'iGPU via le logiciel. Cependant, le passage d'un GPU à l'autre nécessite un redémarrage. Vous avez également la possibilité de laisser Windows basculer automatiquement entre le dGPU et l'iGPU.
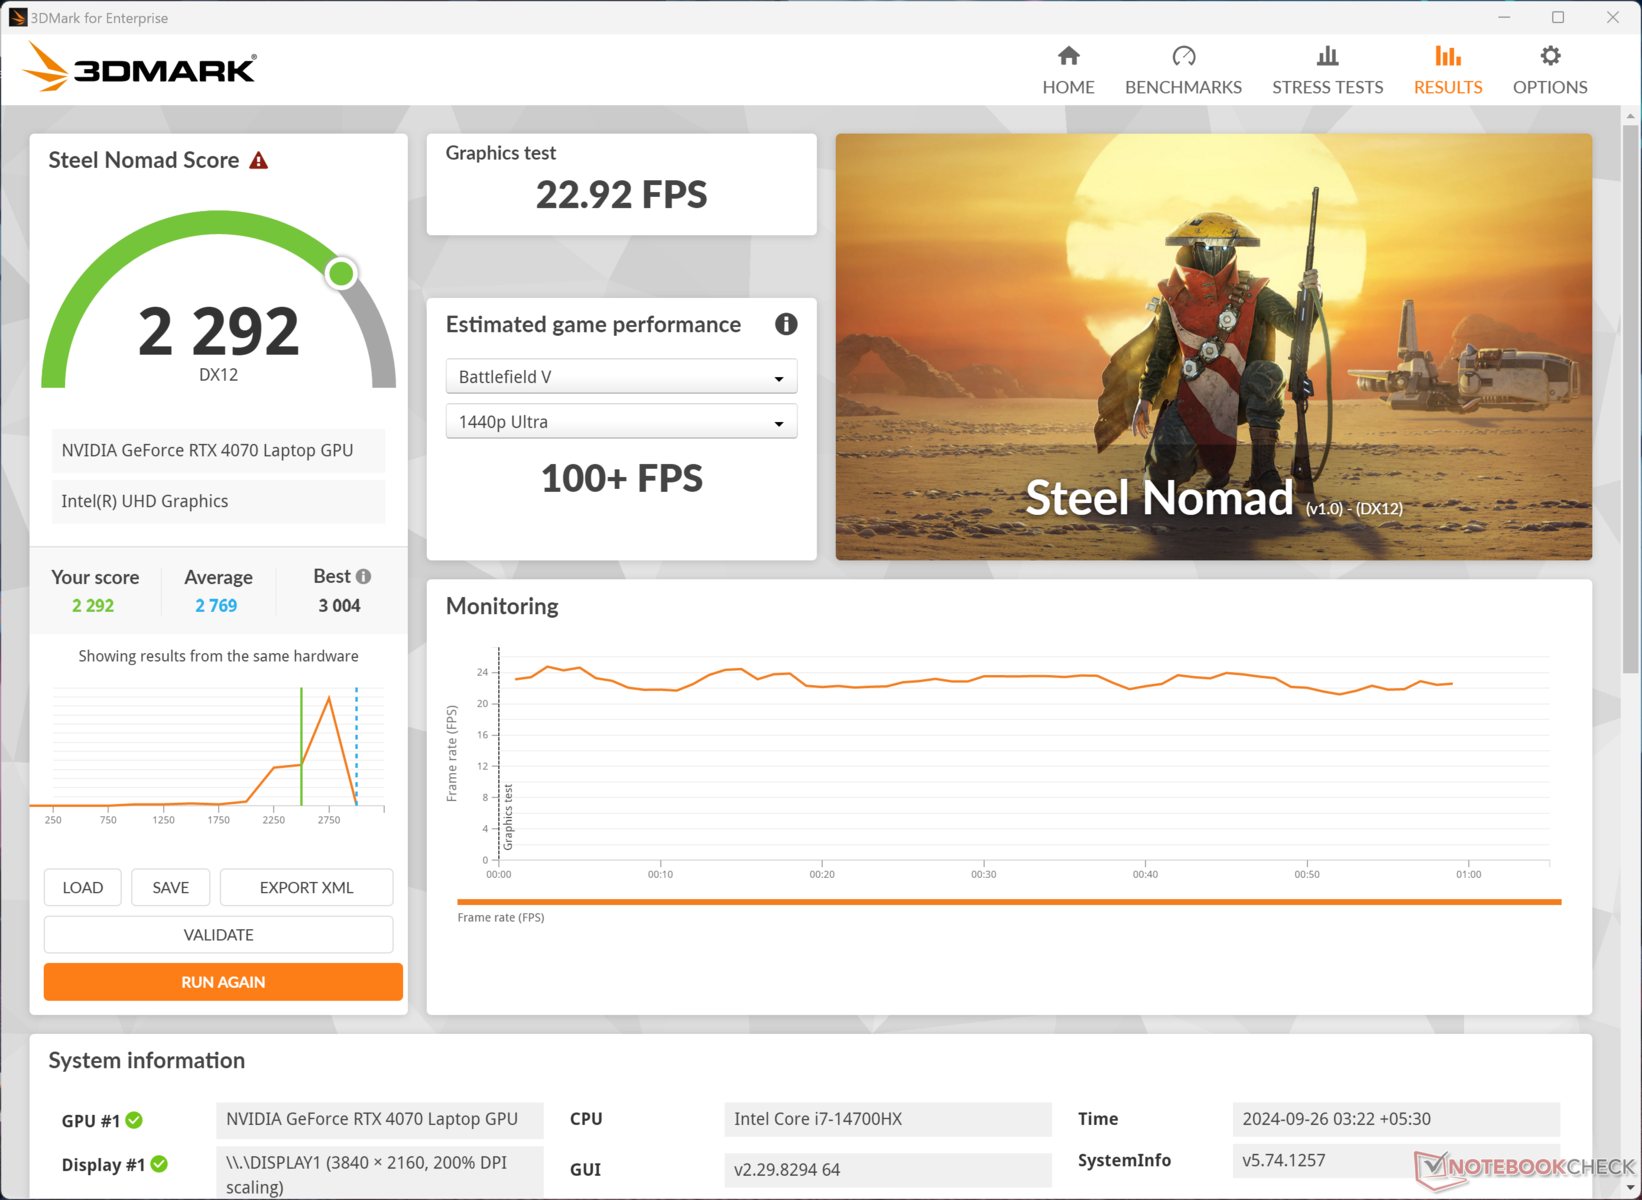
La perte de performances du GPU est perceptible lorsque vous passez d'un profil d'alimentation à l'autre. Dans 3DMark Steel Nomad, le Sword 16 obtient 2 643 points avec le profil Extreme Performance. Ce chiffre tombe à 2 140 (-19%) en mode silencieux.

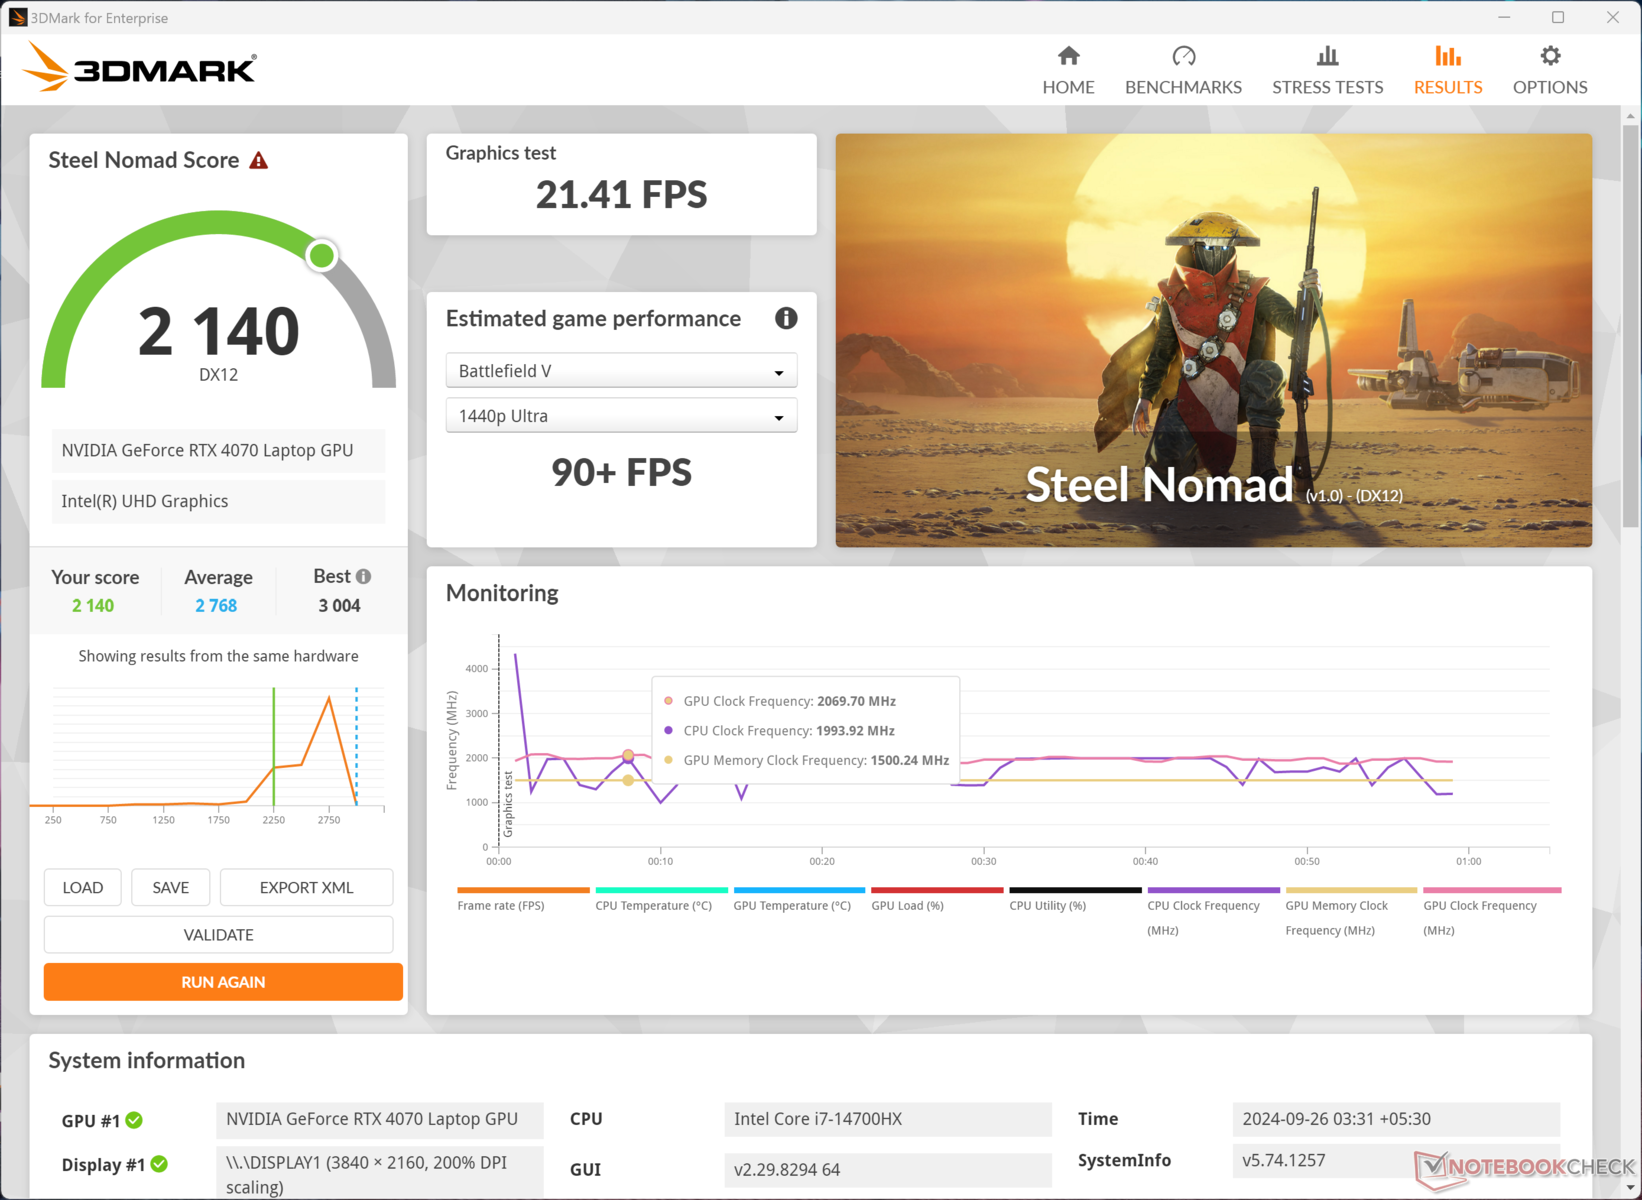
| 3DMark Cloud Gate Standard Score | 59887 points | |
| 3DMark Fire Strike Score | 28285 points | |
| 3DMark Fire Strike Extreme Score | 14311 points | |
| 3DMark Steel Nomad Score | 2991 points | |
Aide | ||
| Blender / v3.3 Classroom OPTIX/RTX | |
| HP Victus 16-r0077ng | |
| HP Omen 17-db0079ng | |
| Moyenne NVIDIA GeForce RTX 4070 Laptop GPU (18 - 30, n=67) | |
| Moyenne de la classe Gaming (10 - 95, n=143, 2 dernières années) | |
| MSI Sword 16 HX B14VGKG | |
| Asus ROG Strix G17 G713PI | |
| Alienware m16 R2 | |
| Lenovo Legion 7 16 IRX G9 | |
| Acer Predator Helios Neo 16 (2024) | |
| Blender / v3.3 Classroom CUDA | |
| Moyenne de la classe Gaming (16 - 175, n=145, 2 dernières années) | |
| HP Victus 16-r0077ng | |
| Moyenne NVIDIA GeForce RTX 4070 Laptop GPU (32 - 50, n=66) | |
| Asus ROG Strix G17 G713PI | |
| MSI Sword 16 HX B14VGKG | |
| Alienware m16 R2 | |
| Acer Predator Helios Neo 16 (2024) | |
| HP Omen 17-db0079ng | |
| Lenovo Legion 7 16 IRX G9 | |
| Blender / v3.3 Classroom CPU | |
| HP Victus 16-r0077ng | |
| HP Omen 17-db0079ng | |
| Moyenne de la classe Gaming (123 - 962, n=150, 2 dernières années) | |
| Alienware m16 R2 | |
| Moyenne NVIDIA GeForce RTX 4070 Laptop GPU (158 - 440, n=66) | |
| MSI Sword 16 HX B14VGKG | |
| Acer Predator Helios Neo 16 (2024) | |
| Lenovo Legion 7 16 IRX G9 | |
| Asus ROG Strix G17 G713PI | |
* ... Moindre est la valeur, meilleures sont les performances
Performances des jeux
En tant qu'ordinateur portable de jeu, le Sword 16 HX n'a qu'un seul but : jouer à des jeux. Sans surprise, il le fait plutôt bien. L'écran terne mis à part, le combo CPU/GPU peut facilement faire tourner les titres les plus exigeants à des taux d'images respectables.
Tous les titres que nous avons testés s'en sortent plutôt bien à 1440p. le jeu en 4K, en revanche, peut s'avérer difficile, en particulier pour les titres les plus récents. Si vous devez absolument jouer en 4K, vous devrez soit débourser un peu plus d'argent pour un ordinateur portable équipé d'une RTX 4080/4090, soit compter sur DLSS/FSR ou même XeSS.
| The Witcher 3 - 1920x1080 Ultra Graphics & Postprocessing (HBAO+) | |
| Acer Predator Helios Neo 16 (2024) | |
| MSI Sword 16 HX B14VGKG | |
| Moyenne de la classe Gaming (18.4 - 214, n=119, 2 dernières années) | |
| Alienware m16 R2 | |
| Asus ROG Strix G17 G713PI | |
| HP Victus 16-r0077ng | |
| Lenovo Legion 7 16 IRX G9 | |
| GTA V - 1920x1080 Highest Settings possible AA:4xMSAA + FX AF:16x | |
| Acer Predator Helios Neo 16 (2024) | |
| Lenovo Legion 7 16 IRX G9 | |
| Asus ROG Strix G17 G713PI | |
| HP Victus 16-r0077ng | |
| Moyenne de la classe Gaming (12.1 - 168.2, n=132, 2 dernières années) | |
| MSI Sword 16 HX B14VGKG | |
| HP Omen 17-db0079ng | |
| GTA V | |
| 1920x1080 Highest Settings possible AA:4xMSAA + FX AF:16x | |
| Acer Predator Helios Neo 16 (2024) | |
| Lenovo Legion 7 16 IRX G9 | |
| Asus ROG Strix G17 G713PI | |
| HP Victus 16-r0077ng | |
| Moyenne de la classe Gaming (12.1 - 168.2, n=132, 2 dernières années) | |
| Moyenne NVIDIA GeForce RTX 4070 Laptop GPU (48.3 - 141.6, n=62) | |
| MSI Sword 16 HX B14VGKG | |
| HP Omen 17-db0079ng | |
| 2560x1440 Highest Settings possible AA:4xMSAA + FX AF:16x | |
| Moyenne de la classe Gaming (36.9 - 163.3, n=82, 2 dernières années) | |
| Acer Predator Helios Neo 16 (2024) | |
| Lenovo Legion 7 16 IRX G9 | |
| HP Omen 17-db0079ng | |
| MSI Sword 16 HX B14VGKG | |
| Moyenne NVIDIA GeForce RTX 4070 Laptop GPU (36.9 - 102.2, n=50) | |
| 3840x2160 High/On (Advanced Graphics Off) AA:FX AF:8x | |
| Moyenne de la classe Gaming (68.8 - 183.2, n=31, 2 dernières années) | |
| MSI Sword 16 HX B14VGKG | |
| Moyenne NVIDIA GeForce RTX 4070 Laptop GPU (53 - 99.8, n=16) | |
Cyberpunk 2077 2.1 fonctionne sans problème pendant une boucle de 20 minutes. Bien qu'il y ait eu des chutes d'images entre les deux, elles étaient mineures et n'affecteront pas l'expérience de jeu de manière significative.
Cyberpunk 2077 1080p Ultra FPS Chart
| Bas | Moyen | Élevé | Ultra | QHD DLSS | QHD | 4K DLSS | 4K | |
|---|---|---|---|---|---|---|---|---|
| GTA V (2015) | 174.4 | 171.6 | 164.5 | 105.9 | 87.6 | 88.8 | ||
| The Witcher 3 (2015) | 428 | 328 | 239 | 125.4 | 91.1 | |||
| Dota 2 Reborn (2015) | 194.7 | 174.6 | 170.6 | 158.6 | 134.6 | |||
| Final Fantasy XV Benchmark (2018) | 215 | 151.9 | 110.6 | 45 | ||||
| X-Plane 11.11 (2018) | 187.5 | 164.7 | 128.4 | 112.8 | ||||
| Far Cry 5 (2018) | 173 | 153 | 145 | 138 | 113 | 61 | ||
| Strange Brigade (2018) | 420 | 282 | 233 | 195.7 | 133.9 | 66.7 | ||
| Far Cry 6 (2021) | 150.2 | 132.1 | 120.8 | 96.3 | 74.5 | 12.8 | ||
| Baldur's Gate 3 (2023) | 155.4 | 132.5 | 113.8 | 113.6 | 85.7 | 66.4 | 43.5 | |
| Cyberpunk 2077 2.2 Phantom Liberty (2023) | 116.3 | 110.2 | 94.1 | 83.6 | 51.8 | 21.9 | ||
| F1 24 (2024) | 249 | 212 | 193.9 | 68.9 | 44.8 | 35.4 | 21.8 | |
| Black Myth: Wukong (2024) | 89.8 | 68.5 | 54.1 | 34.7 | 39.2 | 25.7 | 26.2 | 12.6 |
Émissions : Rythme bruyant et chaud
Bruit du système
L'une des premières choses que nous avons remarquées à propos du Sword 16 est le niveau sonore de ses ventilateurs sous charge. Même à quelques mètres de distance, le bruit peut atteindre 55 dB(A) pendant le jeu. Ce n'est pas nécessairement une mauvaise chose, car l'ordinateur portable a besoin de tout le refroidissement possible pour garder les températures sous contrôle.
Degré de la nuisance sonore
| Au repos |
| 23.31 / 23.31 / 23.31 dB(A) |
| Fortement sollicité |
| 42.71 / 50.34 dB(A) |
 | ||
30 dB silencieux 40 dB(A) audible 50 dB(A) bruyant |
||
min: | ||
| Mode performance (PL1 / PL2) | Ralenti dB(A) | Charge moyenne dB(A) | Charge maximale dB(A) | Cyberpunk 2077 1080p Ultra dB(A) |
|---|---|---|---|---|
| Silencieux (45 / 60 W) | 23,31 | 30,35 | 36,74 | 36,72 / 44 fps |
| Équilibré (60 / 80 W) | 23.31 | 42.30 | 42.61 | 42.20 / 65 fps |
| Extreme (100 / 120 W) | 23.44 | 42.71 | 50.34 | 50.40 / 82 fps |
| CoolerBoost (100 / 120 W) | 55.02 | 55.02 | 55.02 | 55.02 / 82 fps |
| MSI Sword 16 HX B14VGKG i7-14700HX, NVIDIA GeForce RTX 4070 Laptop GPU | HP Omen 17-db0079ng R7 8845HS, NVIDIA GeForce RTX 4070 Laptop GPU | Lenovo Legion 7 16 IRX G9 i9-14900HX, NVIDIA GeForce RTX 4070 Laptop GPU | Acer Predator Helios Neo 16 (2024) i7-14700HX, NVIDIA GeForce RTX 4070 Laptop GPU | Alienware m16 R2 Ultra 7 155H, NVIDIA GeForce RTX 4070 Laptop GPU | Asus ROG Strix G17 G713PI R9 7945HX, NVIDIA GeForce RTX 4070 Laptop GPU | HP Victus 16-r0077ng i7-13700H, NVIDIA GeForce RTX 4070 Laptop GPU | |
|---|---|---|---|---|---|---|---|
| Noise | -12% | -1% | -18% | -5% | -12% | -13% | |
| arrêt / environnement * | 23.31 | 25 -7% | 24.5 -5% | 25.2 -8% | 24.7 -6% | 25 -7% | 25 -7% |
| Idle Minimum * | 23.31 | 25 -7% | 24.5 -5% | 27.8 -19% | 25.3 -9% | 26 -12% | 28 -20% |
| Idle Average * | 23.31 | 29 -24% | 24.5 -5% | 32 -37% | 25.3 -9% | 29 -24% | 29 -24% |
| Idle Maximum * | 23.31 | 33 -42% | 24.5 -5% | 29.6 -27% | 25.3 -9% | 30 -29% | 30 -29% |
| Load Average * | 42.71 | 45 -5% | 34.8 19% | 45.2 -6% | 31.7 26% | 46 -8% | 43 -1% |
| Cyberpunk 2077 ultra * | 50.4 | 48 5% | |||||
| Load Maximum * | 50.34 | 52 -3% | 54.1 -7% | 55.8 -11% | 62 -23% | 47 7% | 48 5% |
| Witcher 3 ultra * | 54.1 | 53.8 | 46 | 46 |
* ... Moindre est la valeur, meilleures sont les performances
Température
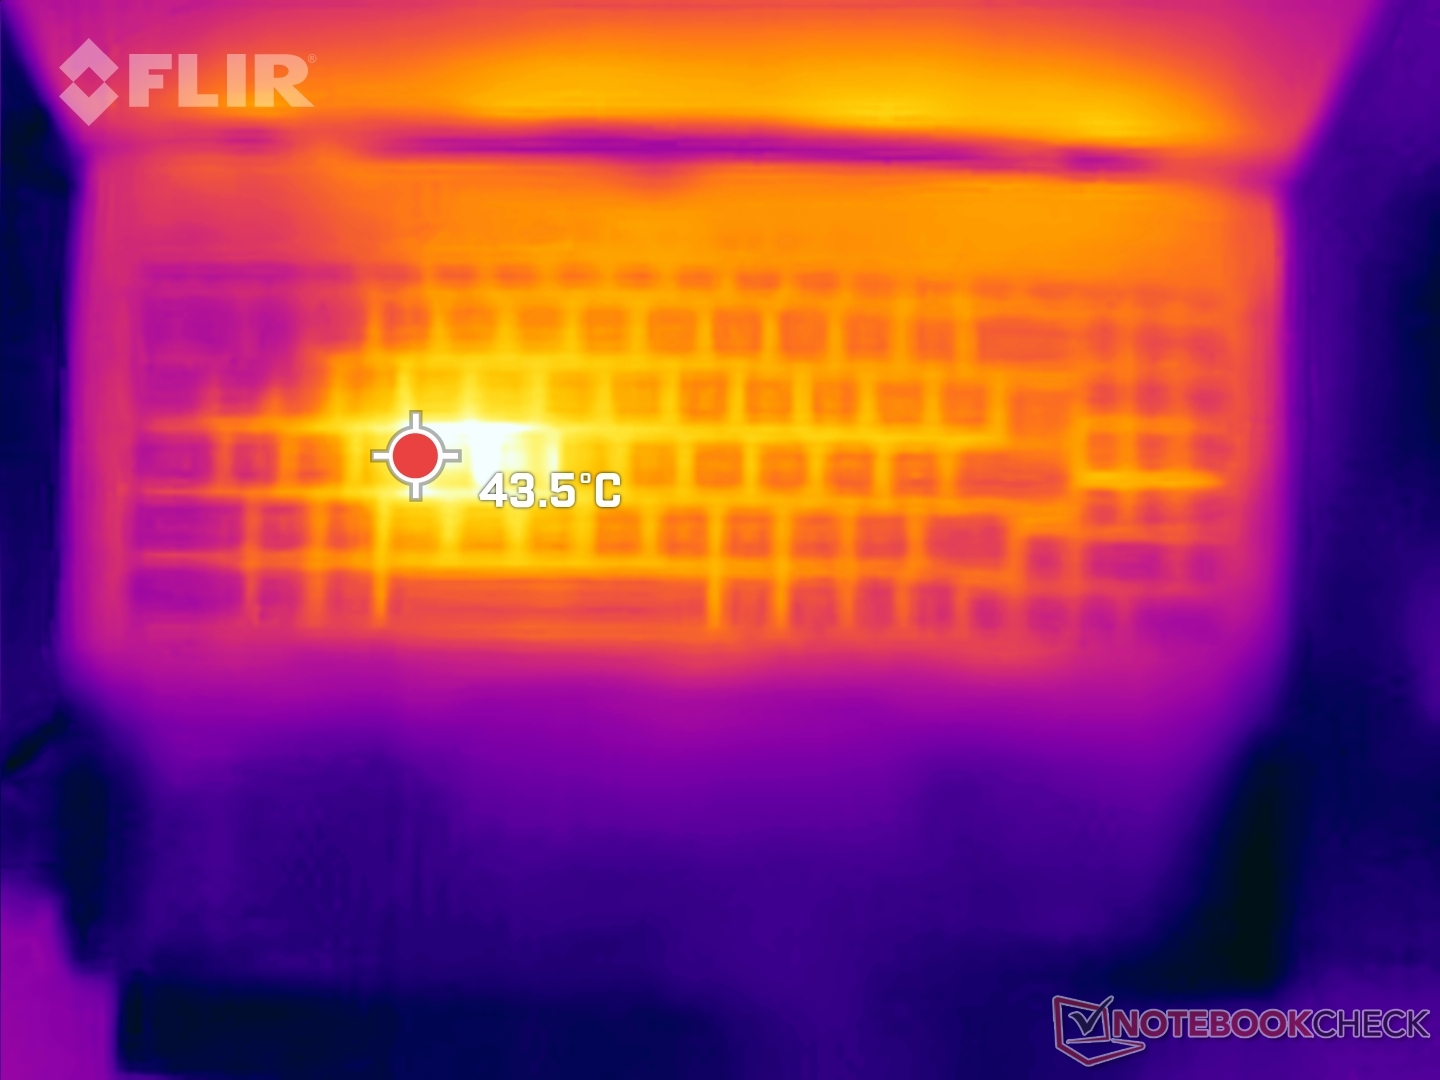
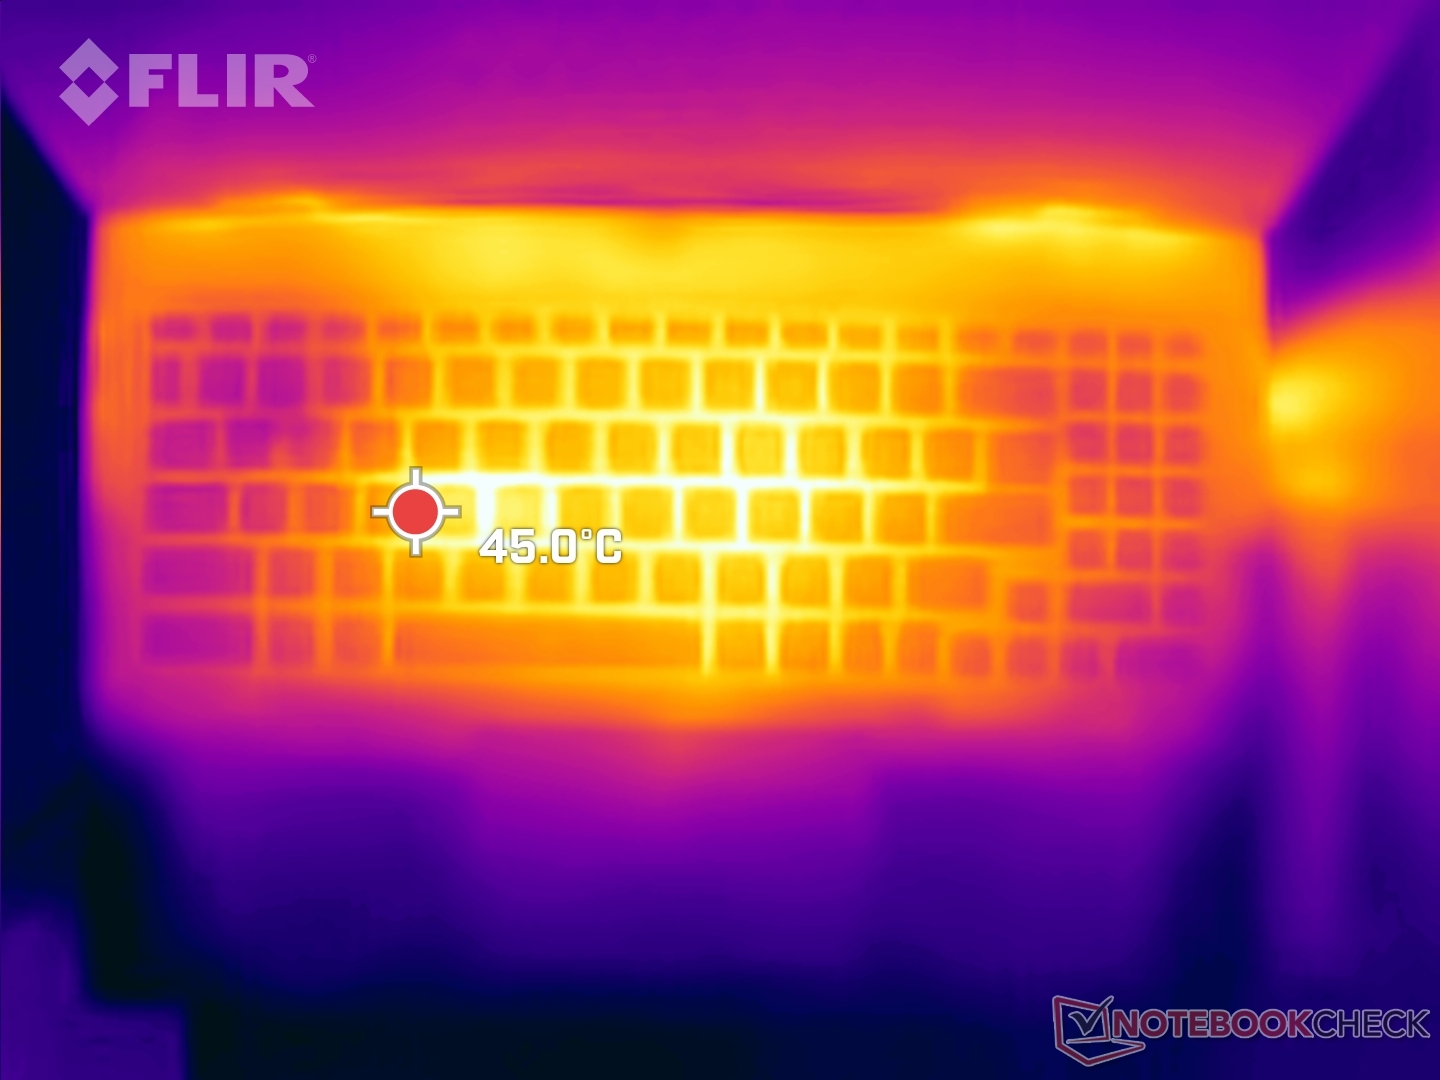
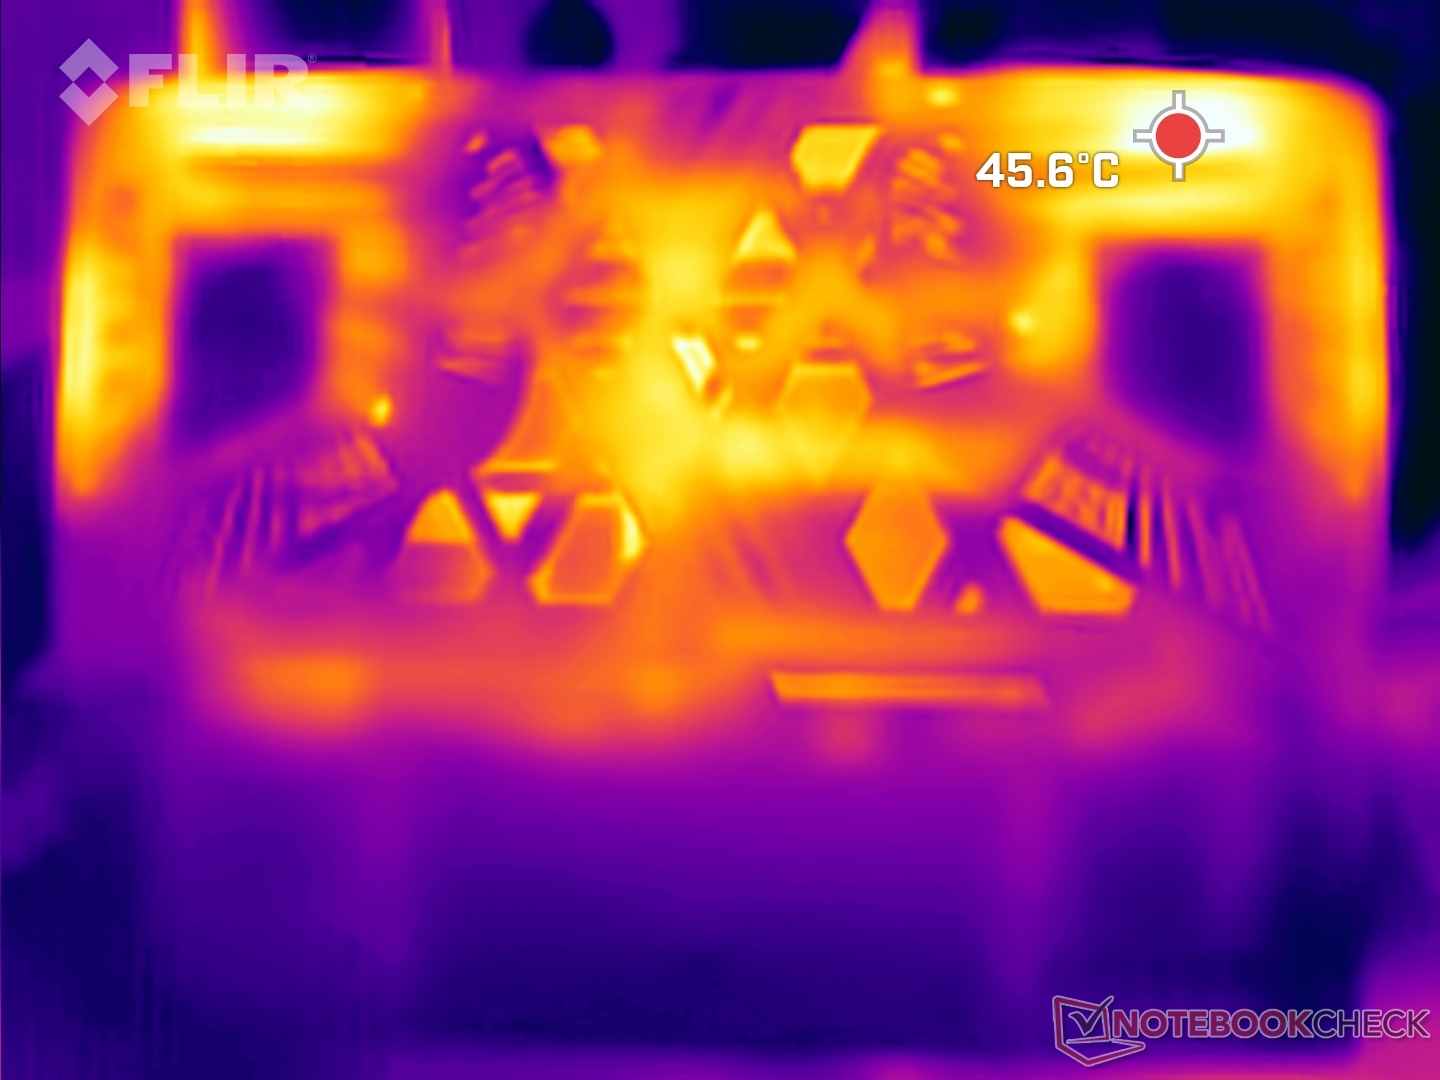
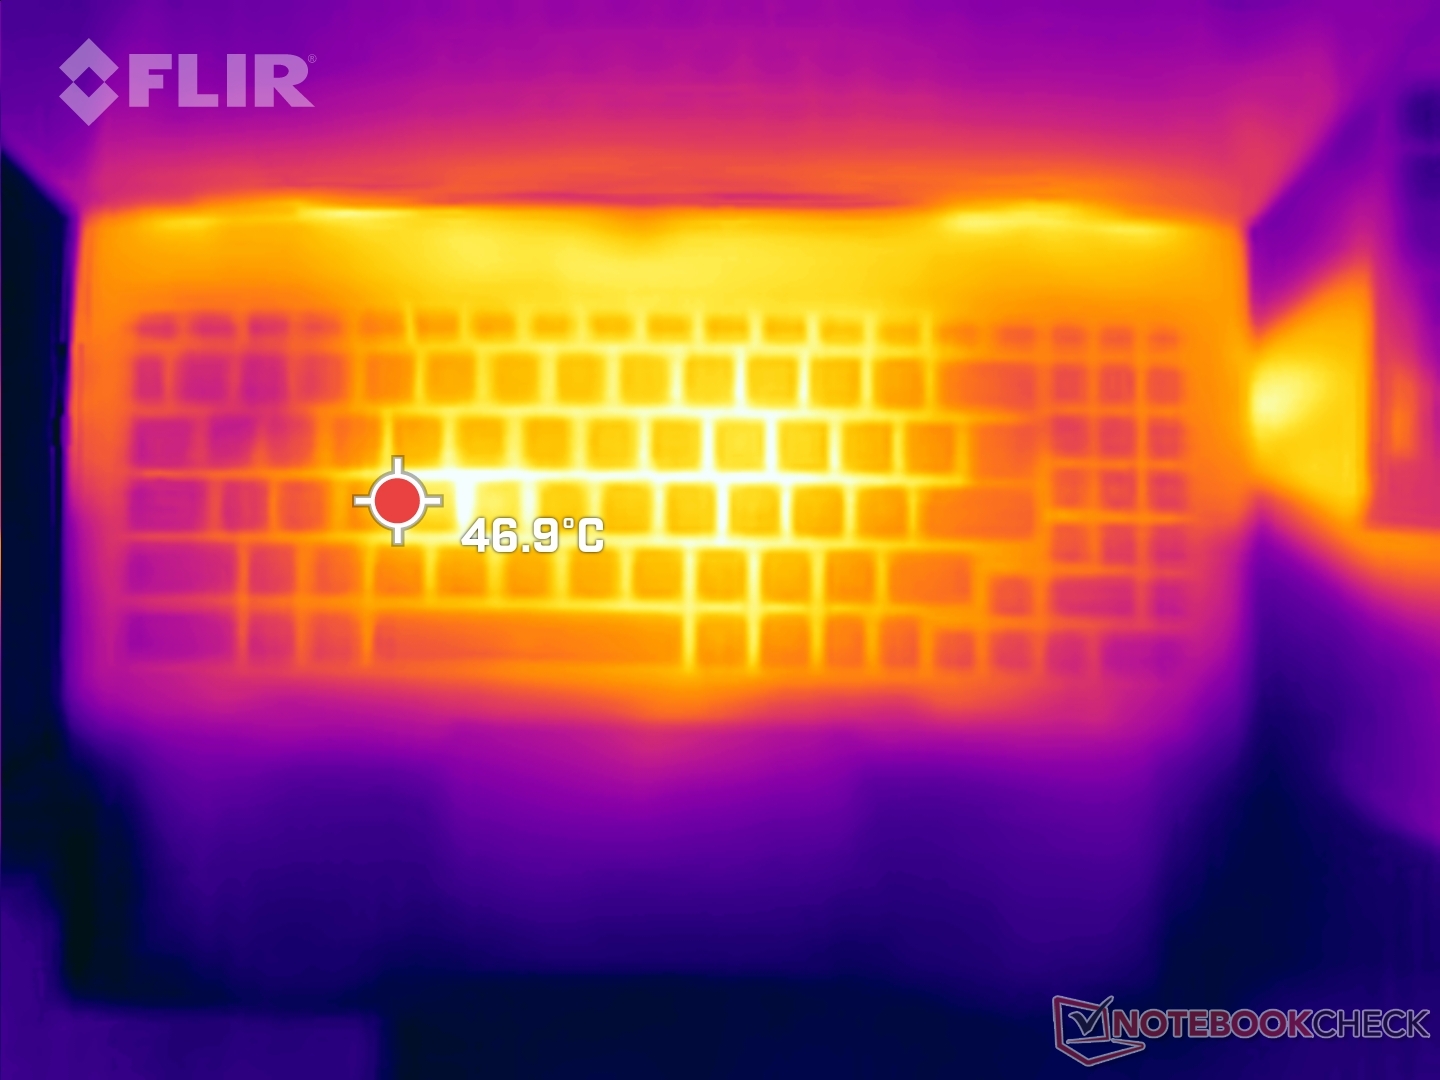
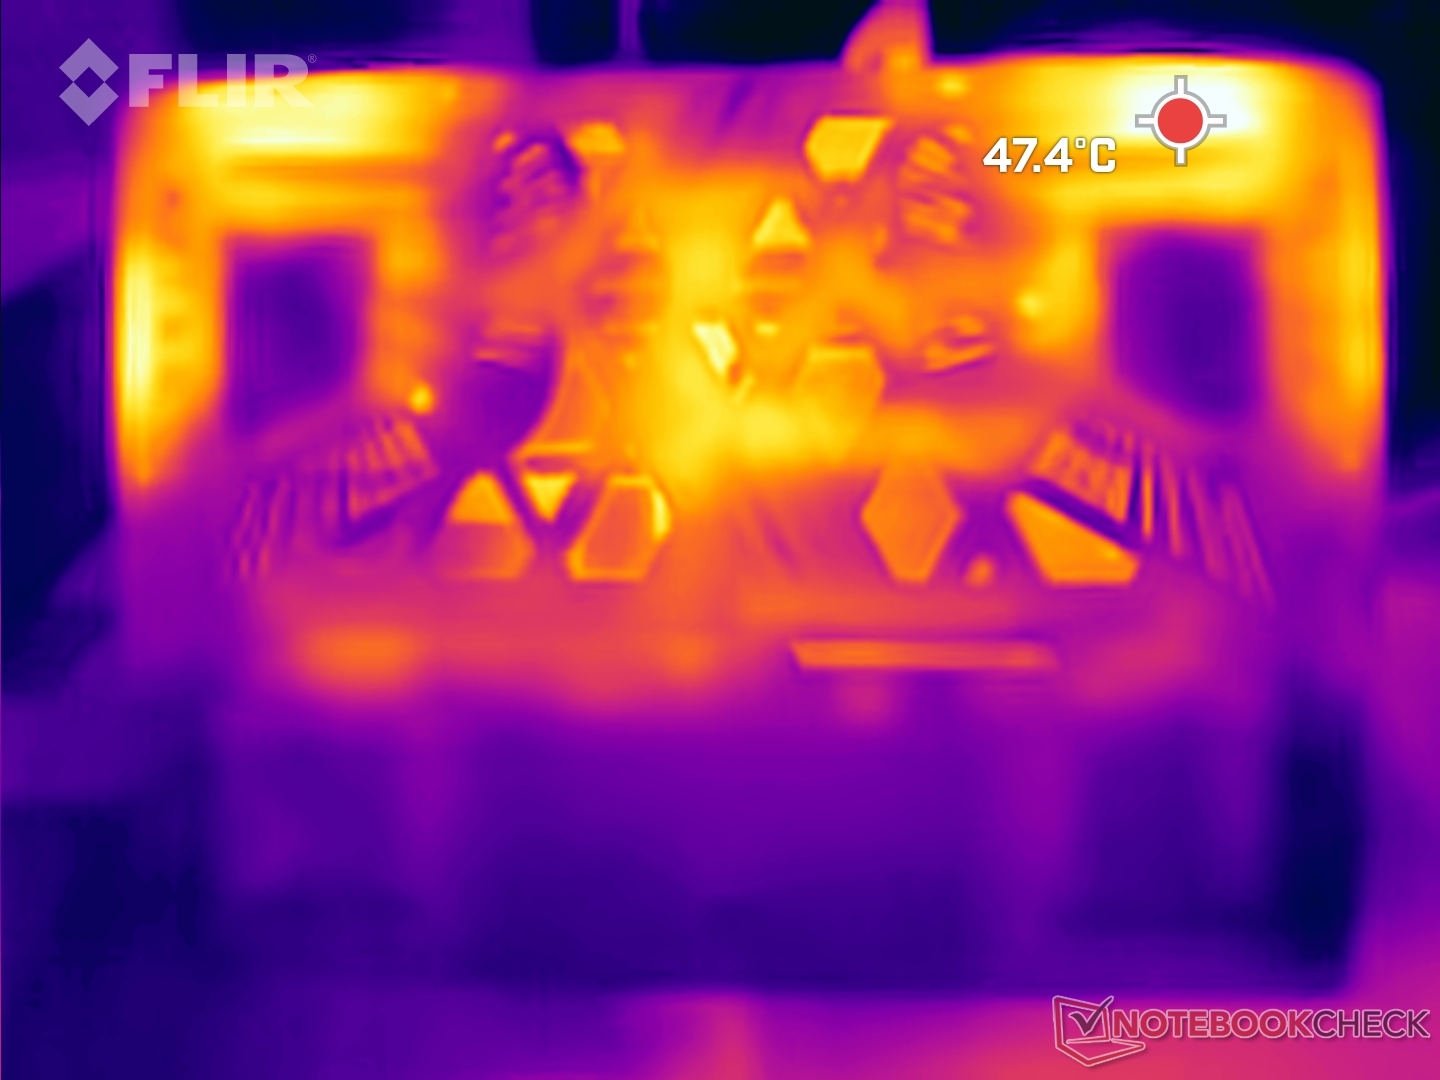
Tous les ventilateurs et les appareils de transfert de chaleur font que le Sword 16 devient chaud au toucher pendant le jeu. Dans Cyberpunk 2077 2.1, vous pouvez sentir le clavier chauffer davantage.
La température peut facilement atteindre 45 °C près de la zone du clavier et 48 °C dans la zone supérieure gauche, juste à côté du connecteur d'alimentation.
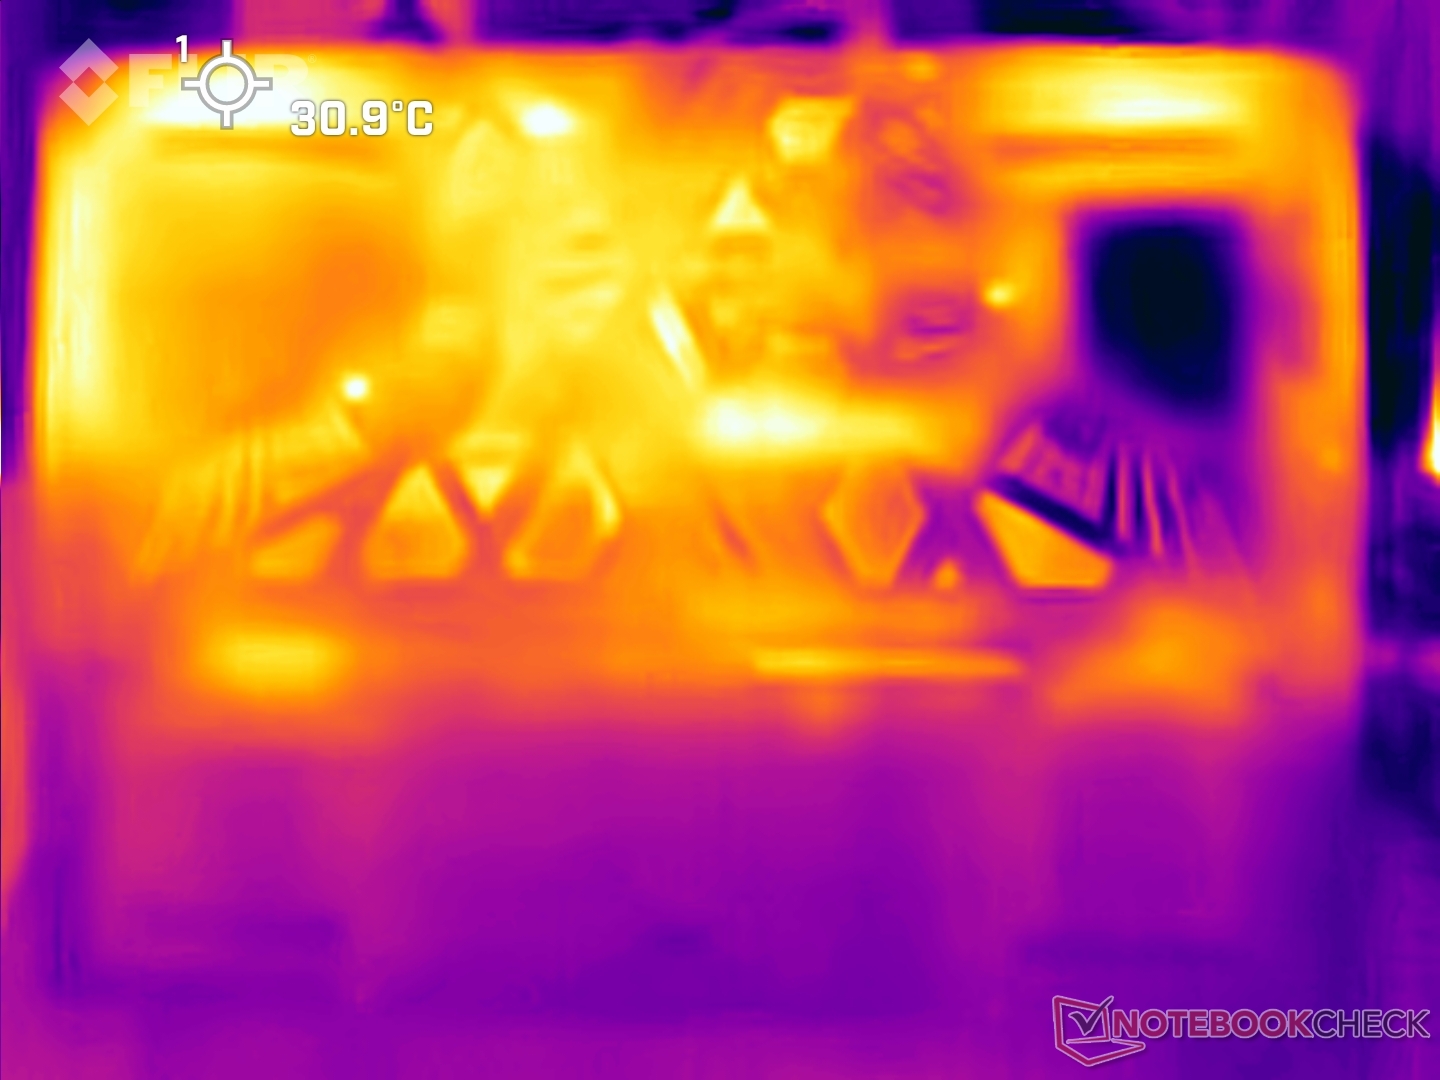
(-) La température maximale du côté supérieur est de 47.8 °C / 118 F, par rapport à la moyenne de 40.4 °C / 105 F, allant de 21.2 à 68.8 °C pour la classe Gaming.
(-) Le fond chauffe jusqu'à un maximum de 45.8 °C / 114 F, contre une moyenne de 43.2 °C / 110 F
(+) En utilisation inactive, la température moyenne du côté supérieur est de 31.2 °C / 88 F, par rapport à la moyenne du dispositif de 33.9 °C / 93 F.
(-) 3: The average temperature for the upper side is 40.4 °C / 105 F, compared to the average of 33.9 °C / 93 F for the class Gaming.
(+) Les repose-poignets et le pavé tactile sont plus froids que la température de la peau avec un maximum de 31.8 °C / 89.2 F et sont donc froids au toucher.
(-) La température moyenne de la zone de l'appui-paume de dispositifs similaires était de 28.9 °C / 84 F (-2.9 °C / #-5.2 F).
| MSI Sword 16 HX B14VGKG Intel Core i7-14700HX, NVIDIA GeForce RTX 4070 Laptop GPU | HP Omen 17-db0079ng AMD Ryzen 7 8845HS, NVIDIA GeForce RTX 4070 Laptop GPU | Lenovo Legion 7 16 IRX G9 Intel Core i9-14900HX, NVIDIA GeForce RTX 4070 Laptop GPU | Acer Predator Helios Neo 16 (2024) Intel Core i7-14700HX, NVIDIA GeForce RTX 4070 Laptop GPU | Alienware m16 R2 Intel Core Ultra 7 155H, NVIDIA GeForce RTX 4070 Laptop GPU | Asus ROG Strix G17 G713PI AMD Ryzen 9 7945HX, NVIDIA GeForce RTX 4070 Laptop GPU | HP Victus 16-r0077ng Intel Core i7-13700H, NVIDIA GeForce RTX 4070 Laptop GPU | |
|---|---|---|---|---|---|---|---|
| Heat | 13% | 9% | -7% | -9% | 6% | -5% | |
| Maximum Upper Side * | 47.8 | 44 8% | 43.7 9% | 58 -21% | 44.8 6% | 42 12% | 51 -7% |
| Maximum Bottom * | 45.8 | 45 2% | 42.9 6% | 45.2 1% | 48 -5% | 41 10% | 54 -18% |
| Idle Upper Side * | 38.6 | 26 33% | 29.1 25% | 31.1 19% | 37.2 4% | 33 15% | 37 4% |
| Idle Bottom * | 29.6 | 27 9% | 30.6 -3% | 37.2 -26% | 42 -42% | 34 -15% | 29 2% |
* ... Moindre est la valeur, meilleures sont les performances
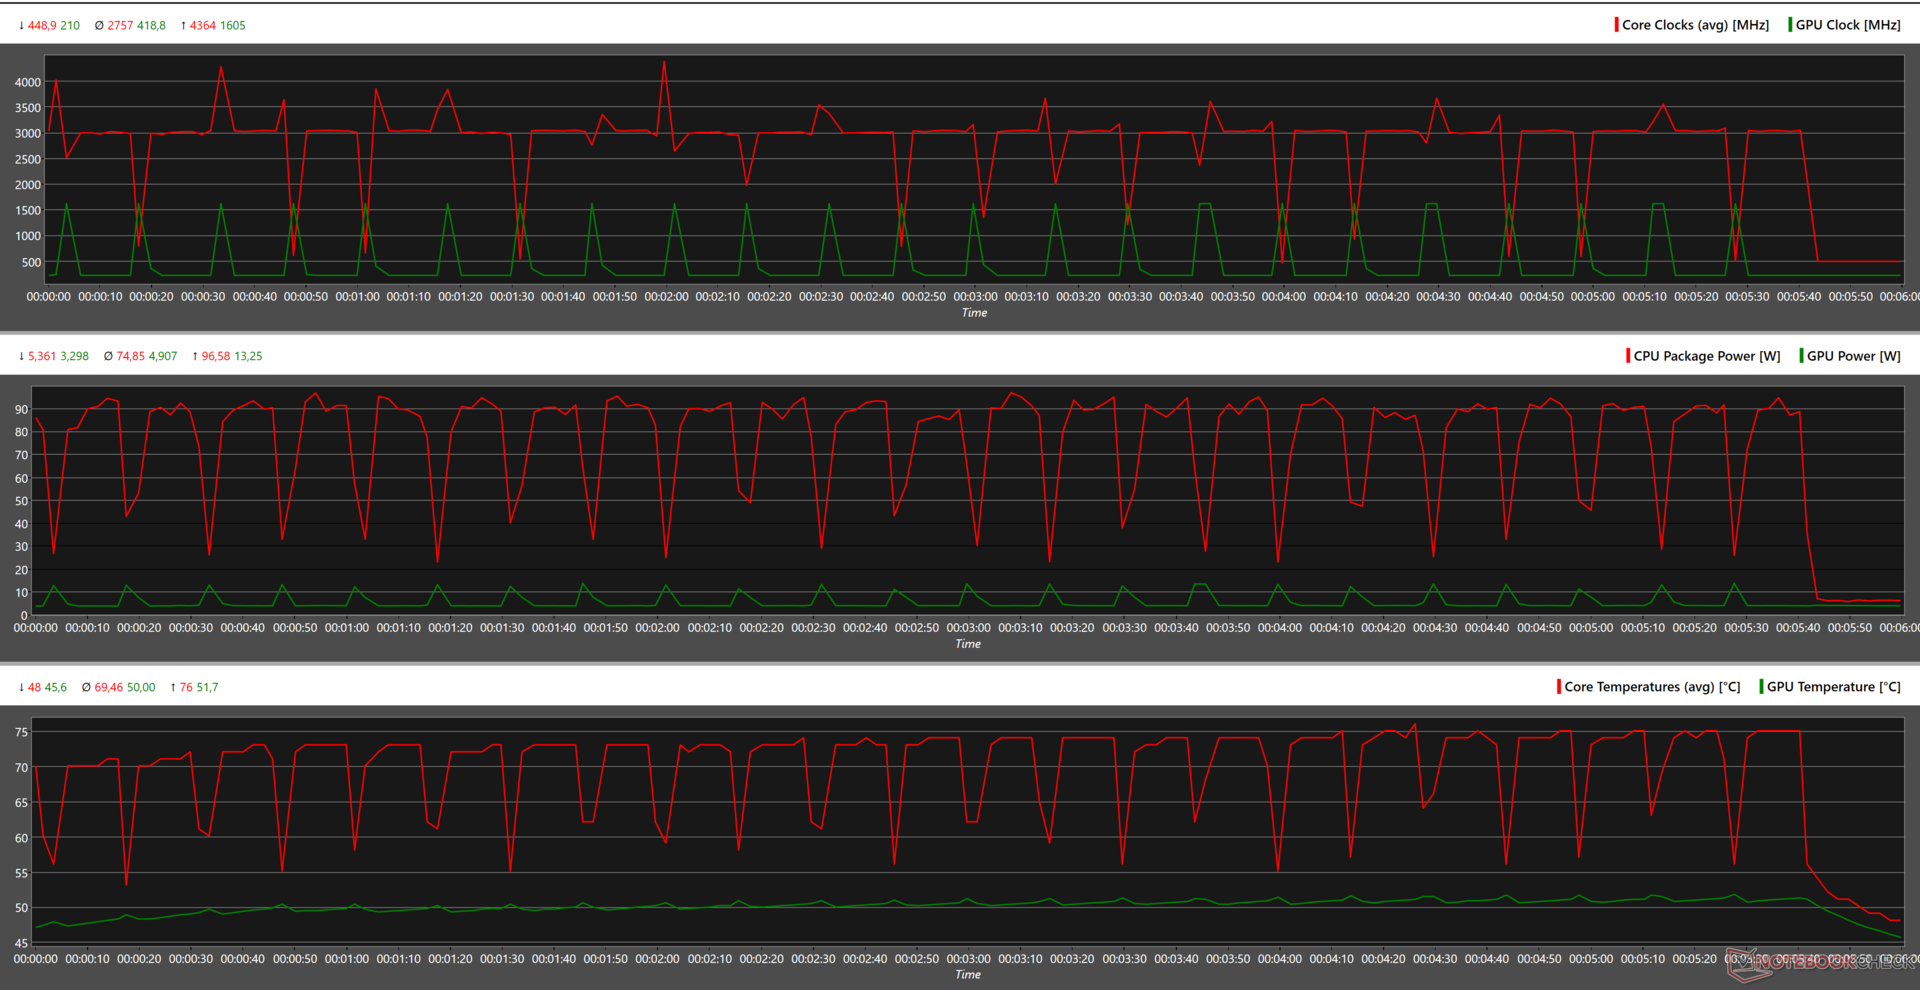
Test de stress
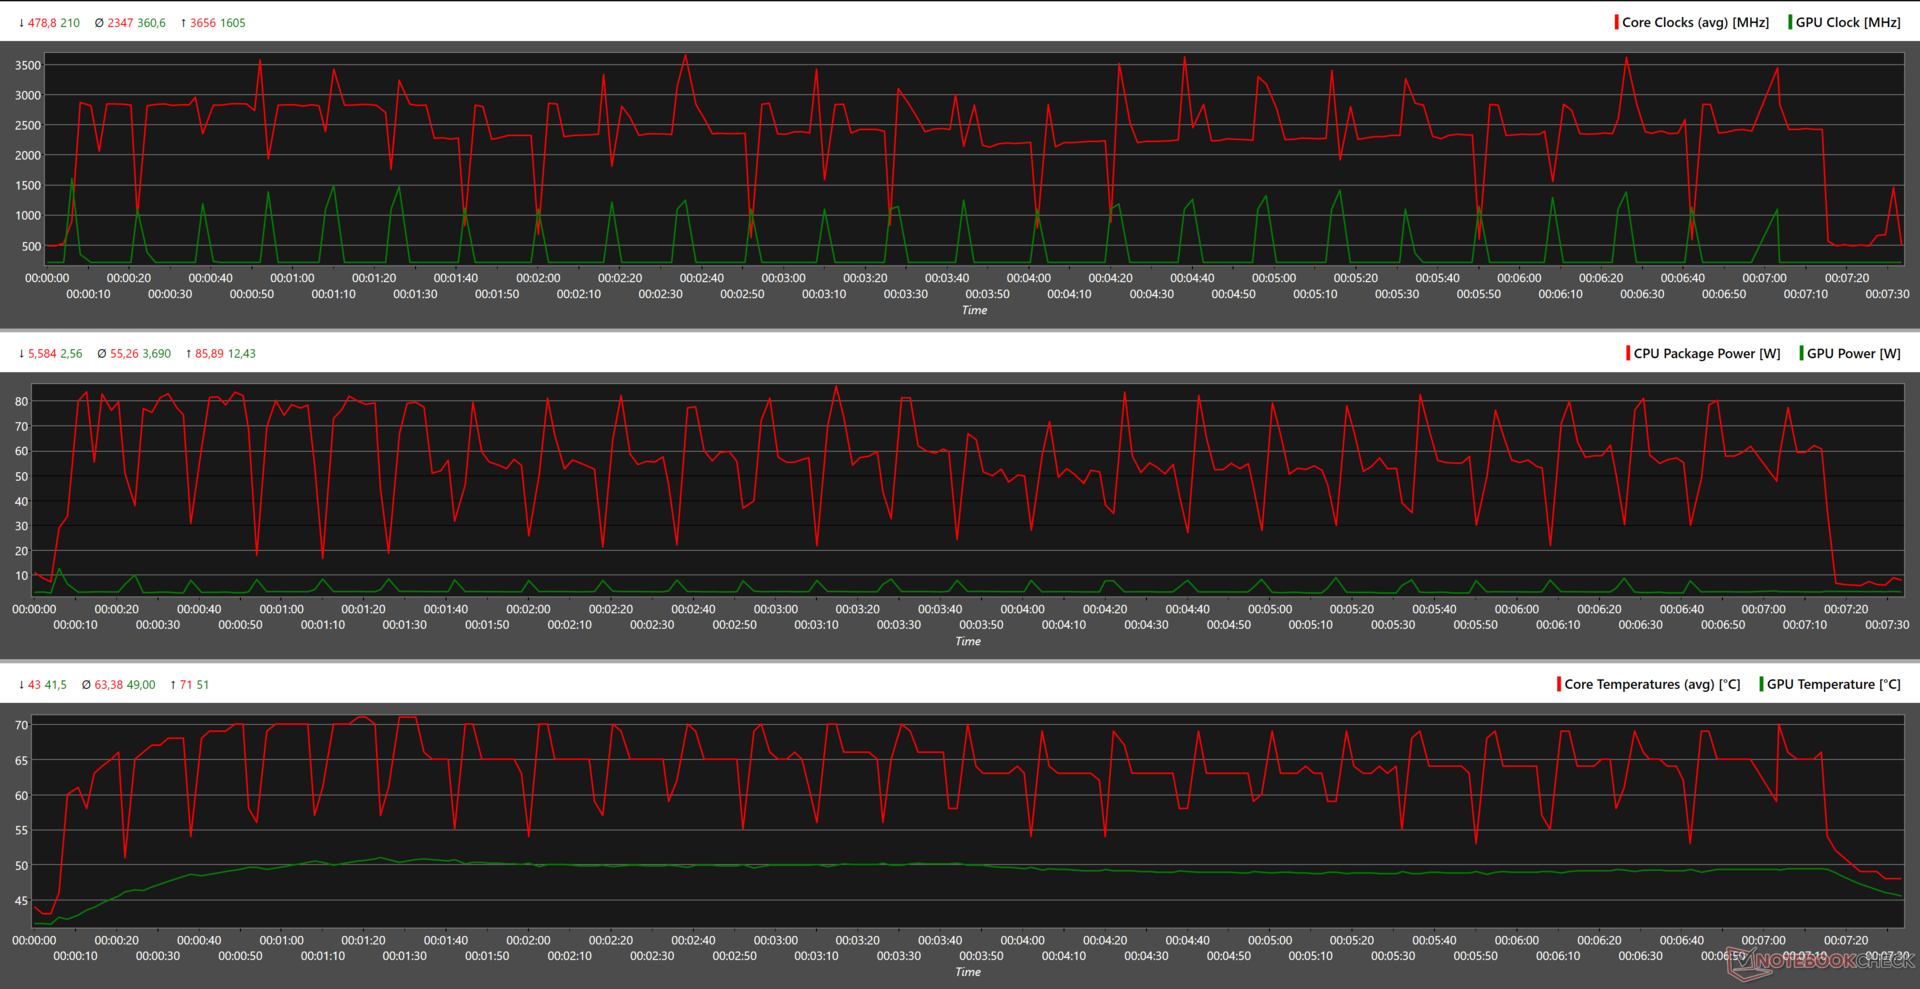
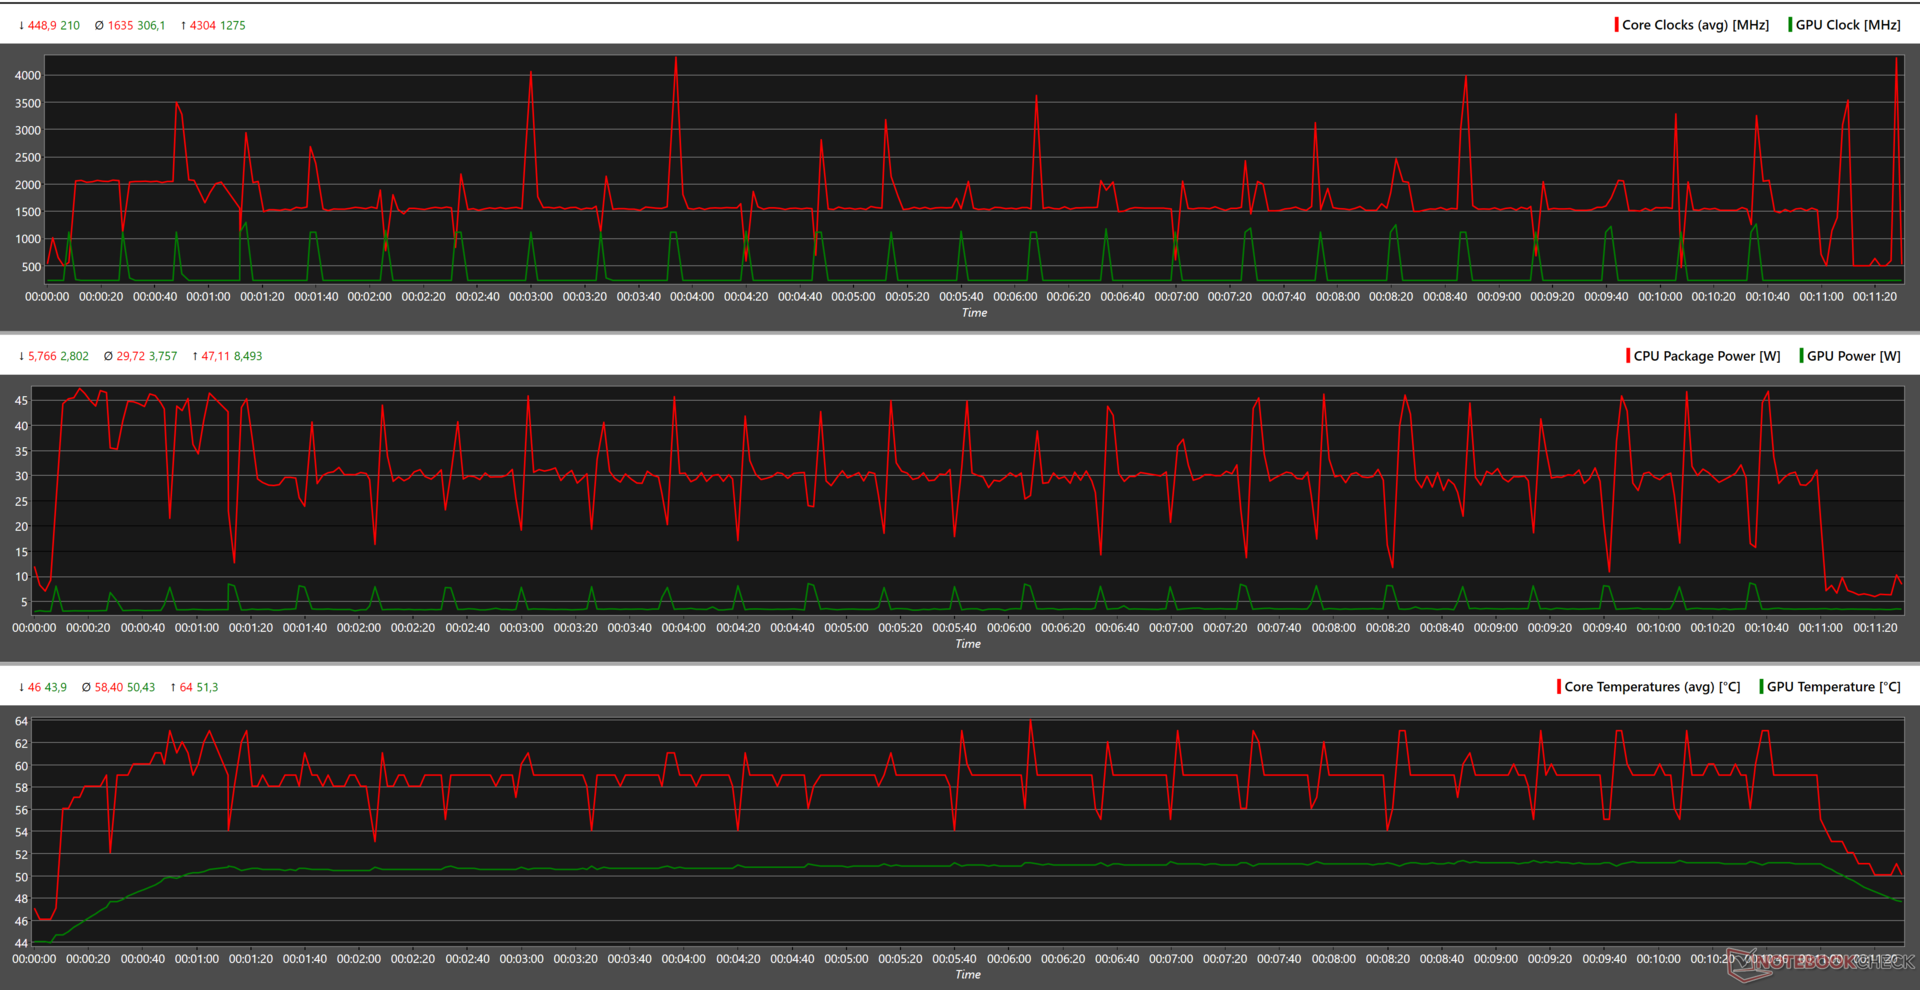
Le Sword 16 HX a été soumis à une charge combinée de Prime95 et Furmark, ce qui a poussé le CPU et le GPU à leurs limites. Le Core i7-14700HX démarre à 4,3 GHz avant de se stabiliser à 2,6 GHz. La Nvidia GeForce RTX 4070 maintient une fréquence stable de 2,0 GHz tout au long de la course.
Le CPU et le GPU se disputent la puissance, le premier consommant 62 watts et le second s'efforçant d'atteindre son pic de 115 watts.
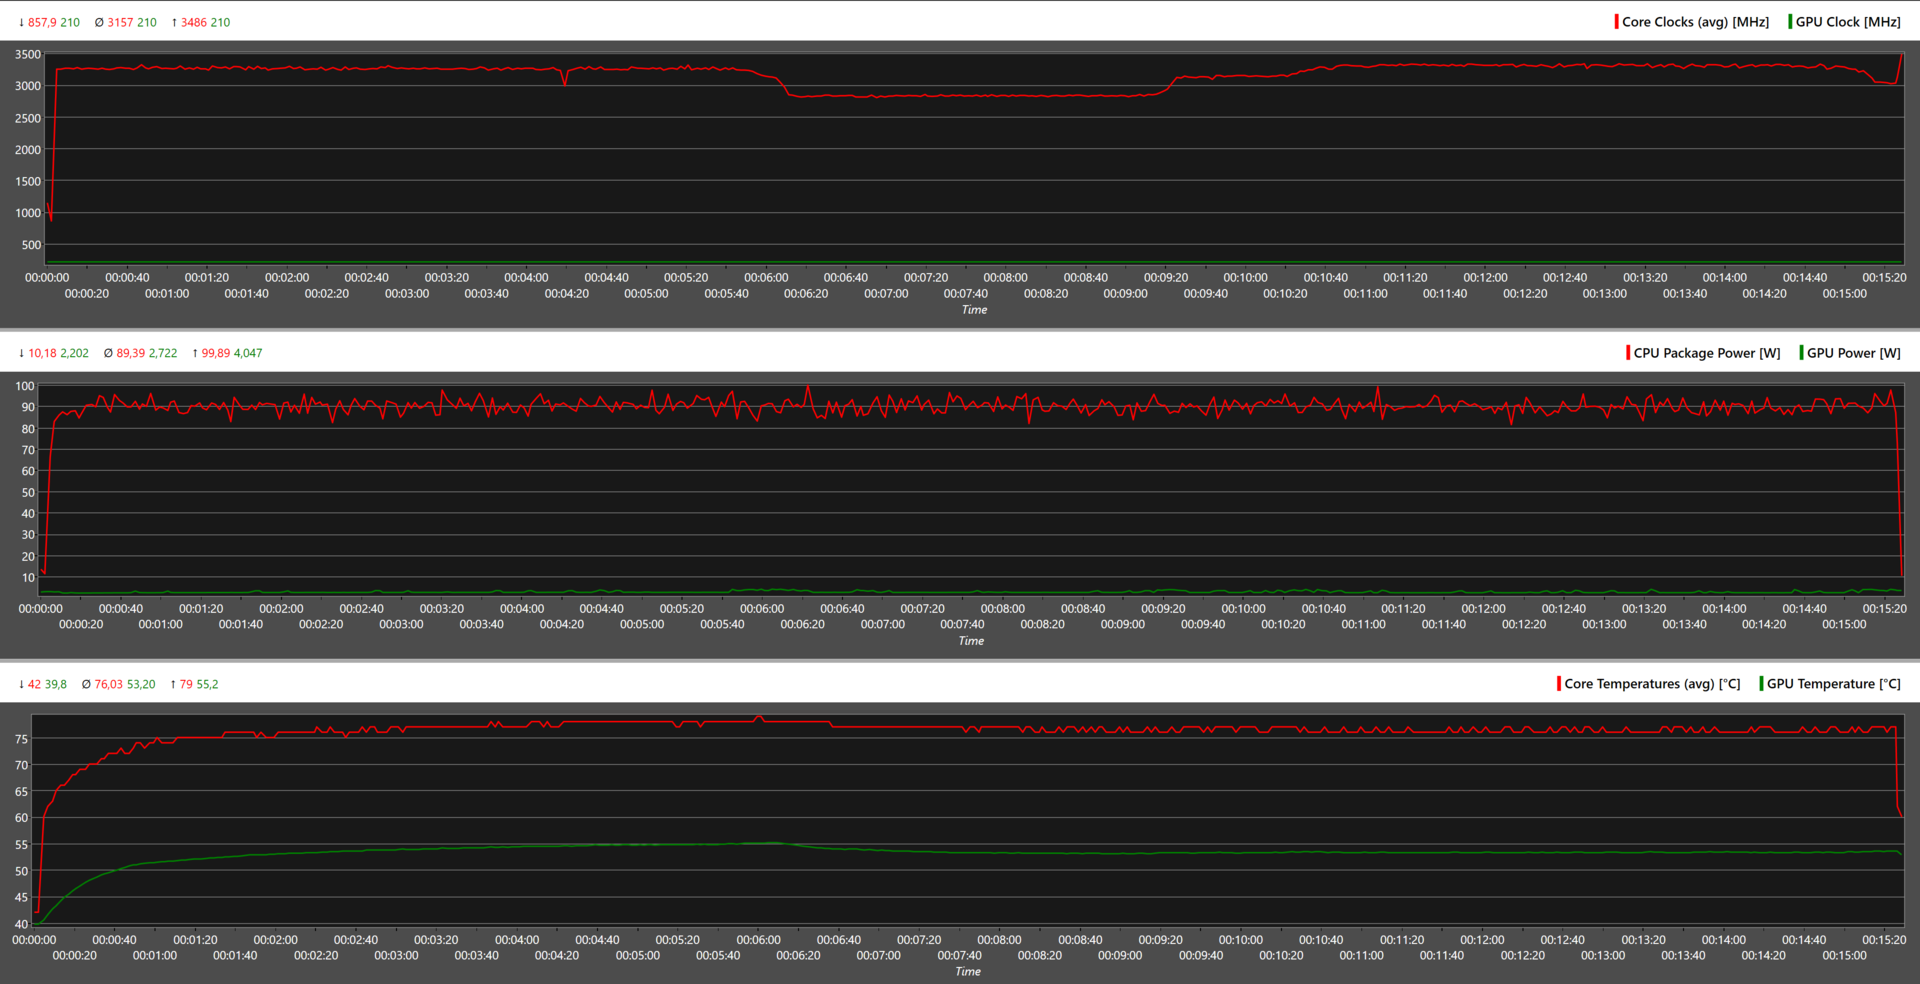
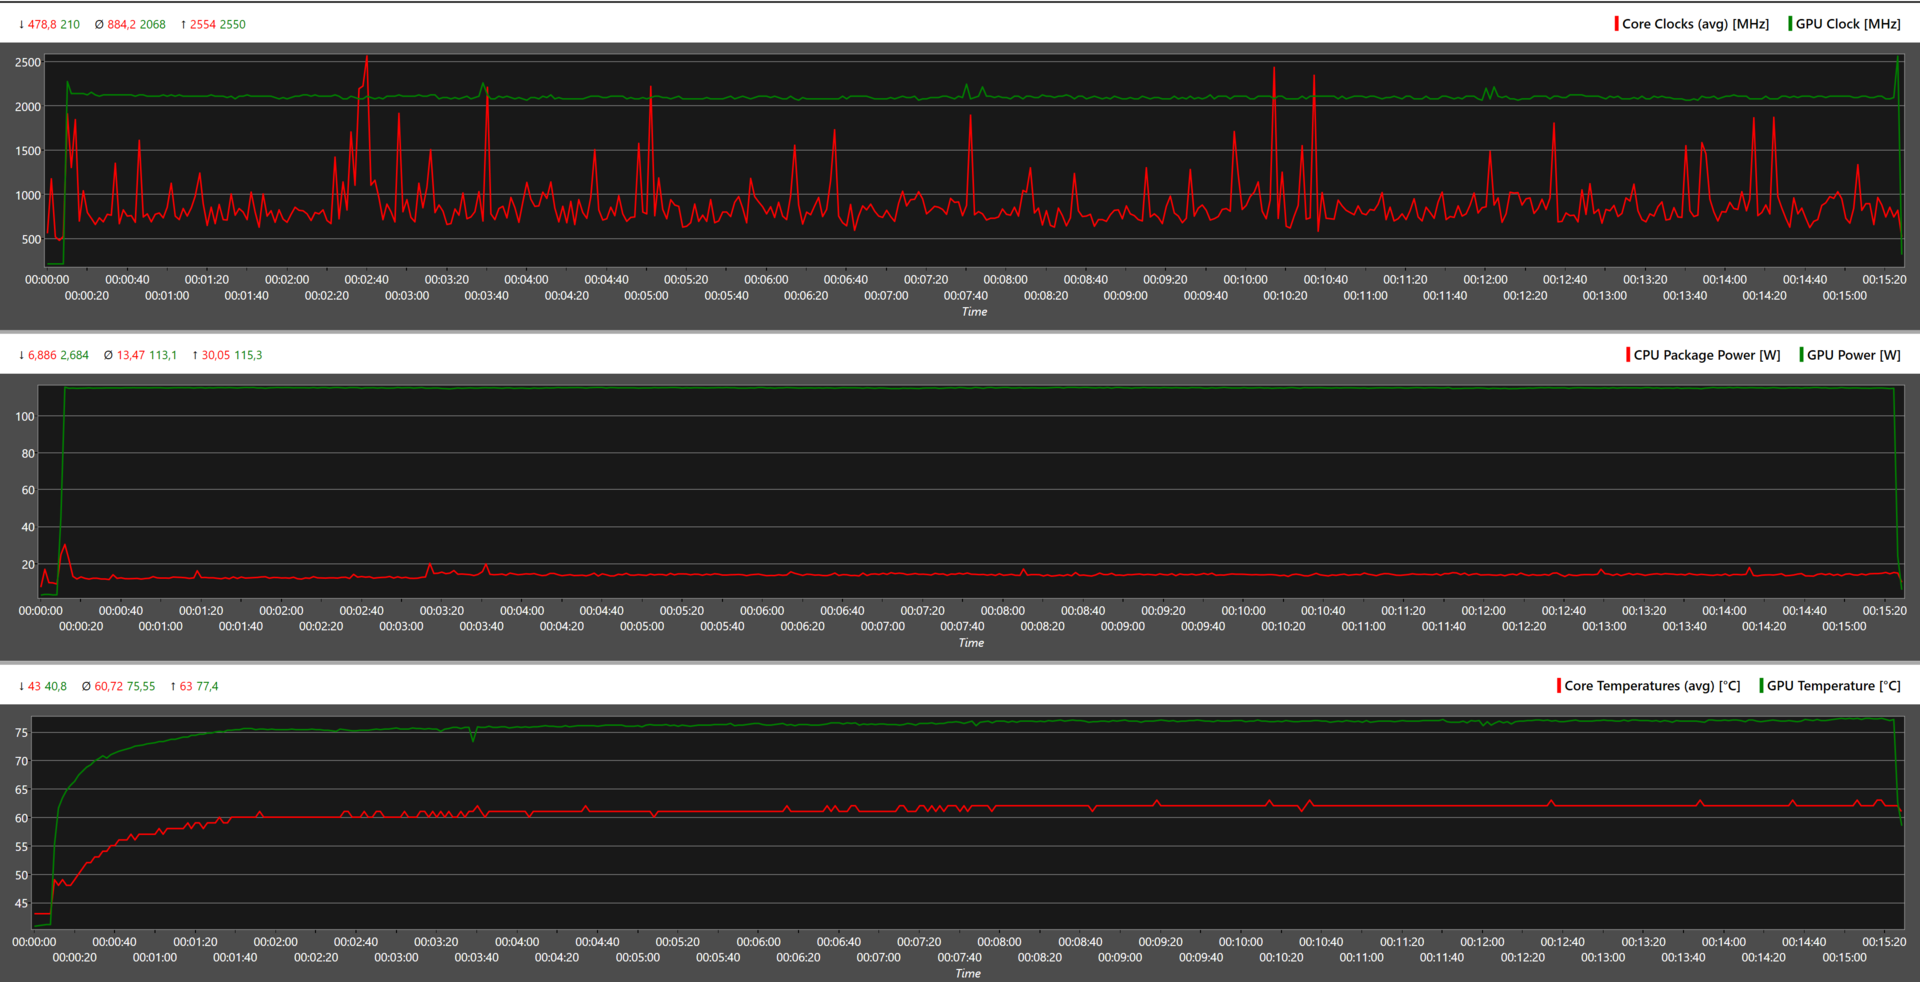
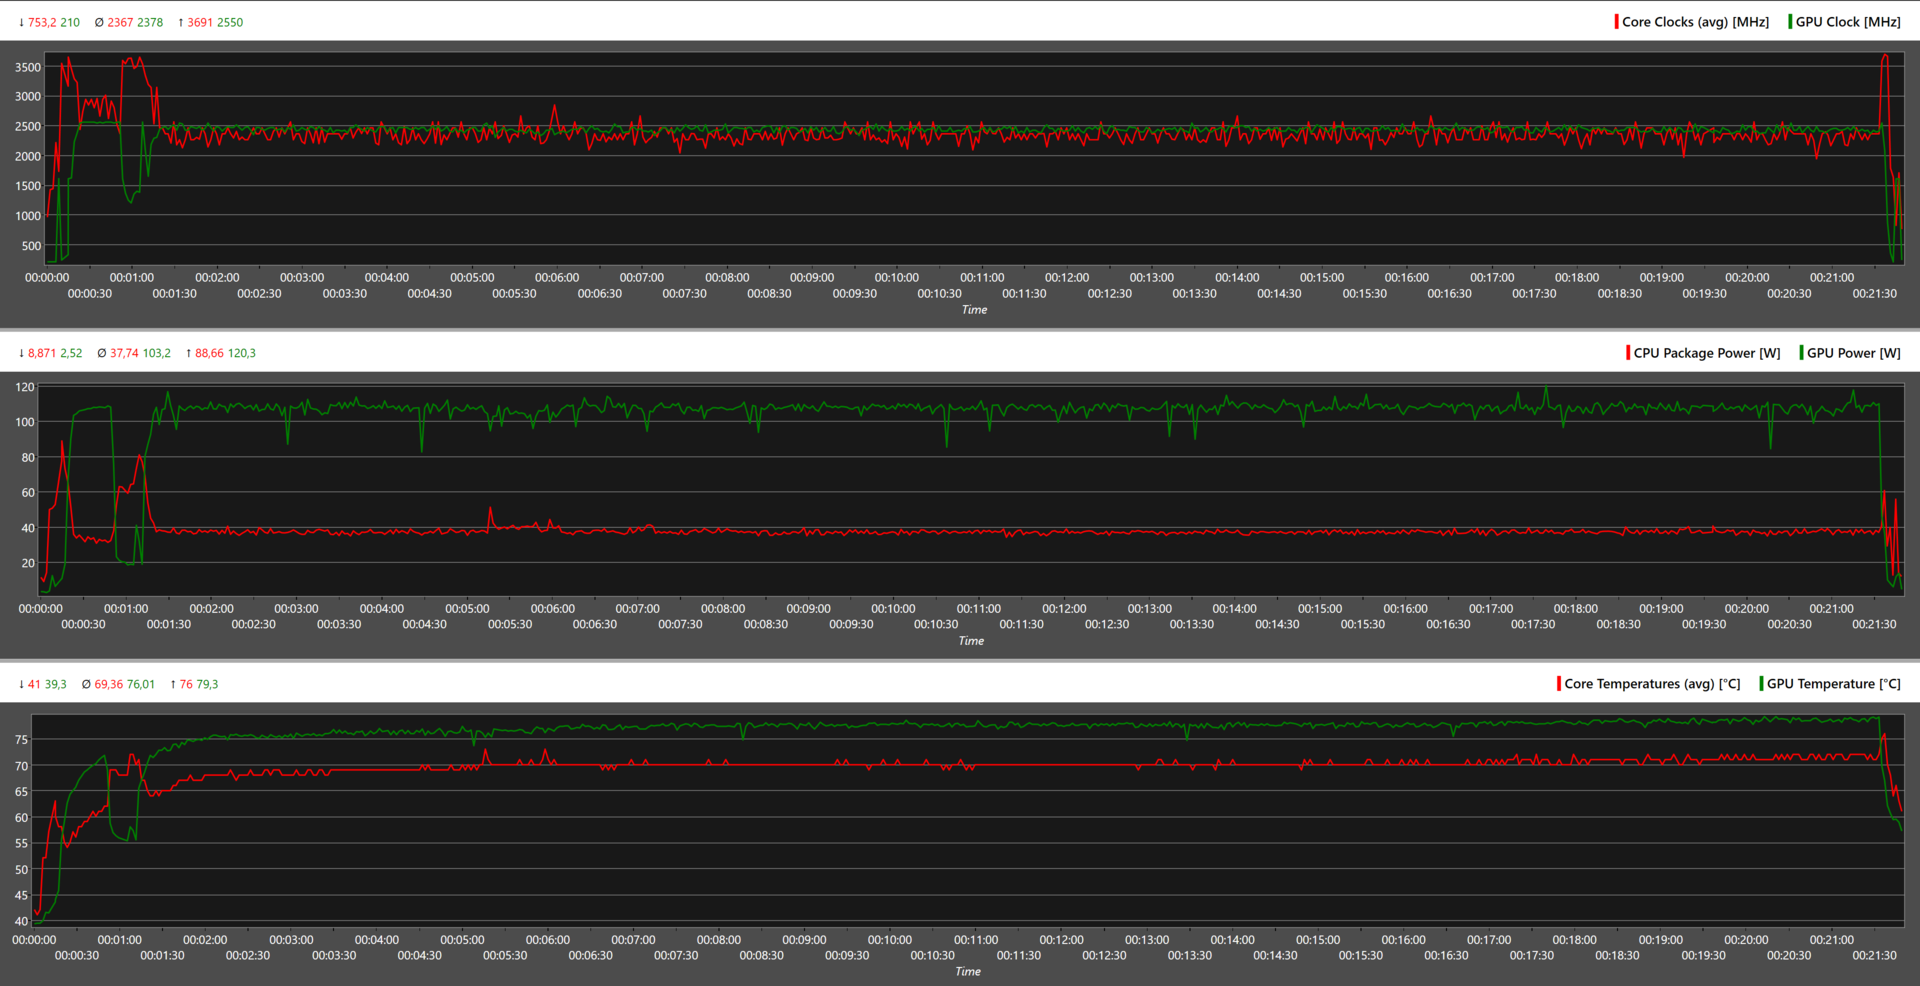
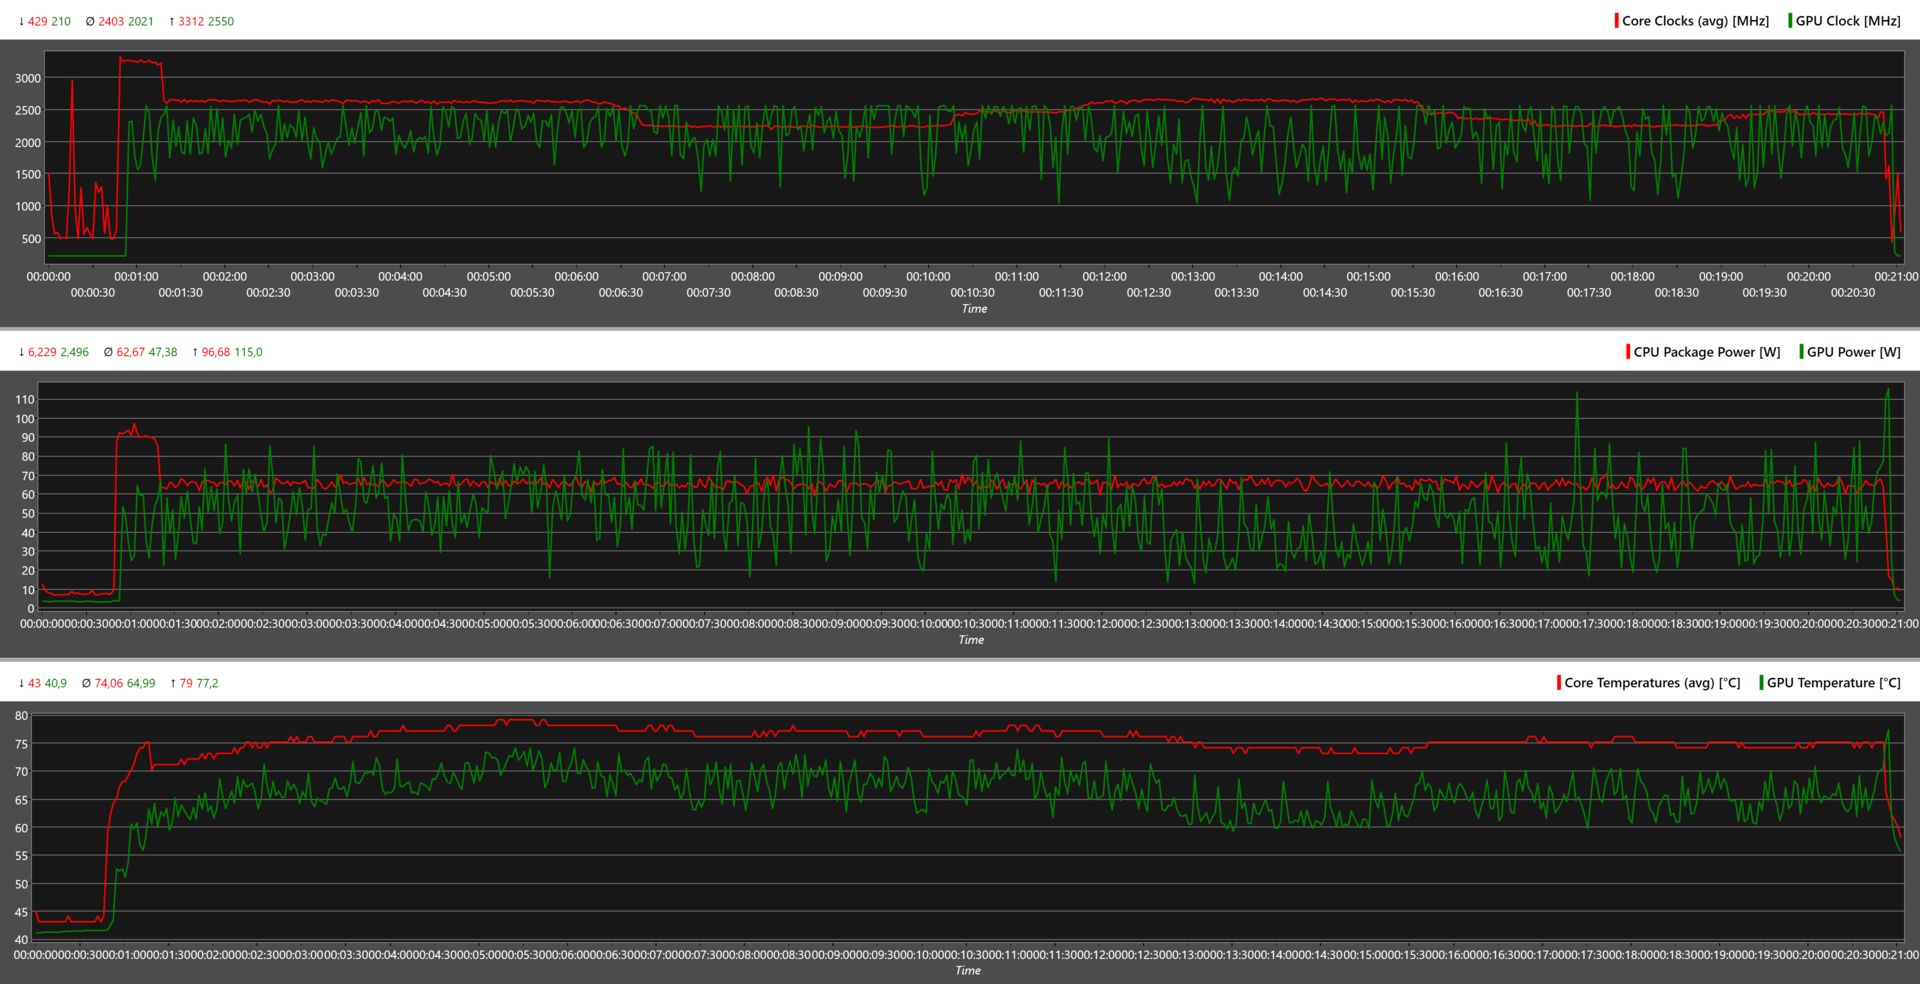
| Horloge du CPU (GHz) | Horloge du GPU (MHz) | Température moyenne du CPU (°C) | Température moyenne du GPU (°C) | |
| Système au repos | 0,726 | 769 | 43 | 41 |
| Prime95 Stress | 3.5 | 60.8 | 79 | 60 |
| Prime95 + FurMark Stress | 2.6 | 2,000 | 77 | 71 |
| Cyberpunk 2077 Stress | 2,6 | 2,300 | 73 | 83 |
Intervenants
En tant qu'ordinateur portable de milieu de gamme, le MSI Sword 16 fait des compromis sur la qualité des haut-parleurs. Les basses sont décevantes, les médiums et les aigus sont tout juste acceptables. Même si vous souhaitez utiliser les haut-parleurs intégrés, ils risquent d'être noyés dans le bruit du ventilateur. Heureusement, vous pouvez connecter vos propres appareils audio via la prise audio 3,5 mm incluse, le Bluetooth 5.3 ou même l'USB-C.
MSI Sword 16 HX B14VGKG analyse audio
(±) | le niveau sonore du haut-parleur est moyen mais bon (77.9# dB)
Basses 100 - 315 Hz
(-) | presque aucune basse - en moyenne 19.7% plus bas que la médiane
(±) | la linéarité des basses est moyenne (13.5% delta à la fréquence précédente)
Médiums 400 - 2000 Hz
(+) | médiane équilibrée - seulement 3.4% de la médiane
(+) | les médiums sont linéaires (6.3% delta à la fréquence précédente)
Aiguës 2 - 16 kHz
(+) | des sommets équilibrés - à seulement 2.3% de la médiane
(+) | les aigus sont linéaires (4.8% delta à la fréquence précédente)
Globalement 100 - 16 000 Hz
(±) | la linéarité du son global est moyenne (15.2% de différence avec la médiane)
Par rapport à la même classe
» 31% de tous les appareils testés de cette catégorie étaient meilleurs, 6% similaires, 63% pires
» Le meilleur avait un delta de 6%, la moyenne était de 18%, le pire était de 132%.
Par rapport à tous les appareils testés
» 20% de tous les appareils testés étaient meilleurs, 4% similaires, 77% pires
» Le meilleur avait un delta de 4%, la moyenne était de 24%, le pire était de 134%.
Apple MacBook Pro 16 2021 M1 Pro analyse audio
(+) | les haut-parleurs peuvent jouer relativement fort (84.7# dB)
Basses 100 - 315 Hz
(+) | bonne basse - seulement 3.8% loin de la médiane
(+) | les basses sont linéaires (5.2% delta à la fréquence précédente)
Médiums 400 - 2000 Hz
(+) | médiane équilibrée - seulement 1.3% de la médiane
(+) | les médiums sont linéaires (2.1% delta à la fréquence précédente)
Aiguës 2 - 16 kHz
(+) | des sommets équilibrés - à seulement 1.9% de la médiane
(+) | les aigus sont linéaires (2.7% delta à la fréquence précédente)
Globalement 100 - 16 000 Hz
(+) | le son global est linéaire (4.6% différence à la médiane)
Par rapport à la même classe
» 0% de tous les appareils testés de cette catégorie étaient meilleurs, 0% similaires, 100% pires
» Le meilleur avait un delta de 5%, la moyenne était de 18%, le pire était de 45%.
Par rapport à tous les appareils testés
» 0% de tous les appareils testés étaient meilleurs, 0% similaires, 100% pires
» Le meilleur avait un delta de 4%, la moyenne était de 24%, le pire était de 134%.
Gestion de l'énergie : Consommation élevée en mode veille avec des durées de lecture vidéo médiocres
Consommation électrique
Le MSI Sword 16 HX peut consommer jusqu'à 226 Watts en charge. Son adaptateur d'alimentation est conçu pour 250 watts et ne devrait pas avoir de mal à le maintenir à niveau pendant les sessions de jeu prolongées.
Raptor Lake-HX (et les processeurs HX d'Intel en général) n'ont pas été conçus pour des scénarios de faible consommation, comme le confirme la consommation d'énergie au repos de 22,39 Watts de l'ordinateur portable.
| Éteint/en veille | |
| Au repos | |
| Fortement sollicité |
|
Légende:
min: | |
| MSI Sword 16 HX B14VGKG i7-14700HX, NVIDIA GeForce RTX 4070 Laptop GPU, IPS, 1920x1200, 16" | HP Omen 17-db0079ng R7 8845HS, NVIDIA GeForce RTX 4070 Laptop GPU, IPS, 2560x1440, 17.3" | Lenovo Legion 7 16 IRX G9 i9-14900HX, NVIDIA GeForce RTX 4070 Laptop GPU, IPS, 3200x2000, 16" | Acer Predator Helios Neo 16 (2024) i7-14700HX, NVIDIA GeForce RTX 4070 Laptop GPU, LED, 2560x1600, 16" | Alienware m16 R2 Ultra 7 155H, NVIDIA GeForce RTX 4070 Laptop GPU, IPS, 2560x1600, 16" | Asus ROG Strix G17 G713PI R9 7945HX, NVIDIA GeForce RTX 4070 Laptop GPU, IPS, 2560x1440, 17.3" | HP Victus 16-r0077ng i7-13700H, NVIDIA GeForce RTX 4070 Laptop GPU, IPS, 1920x1080, 16.1" | Moyenne NVIDIA GeForce RTX 4070 Laptop GPU | Moyenne de la classe Gaming | |
|---|---|---|---|---|---|---|---|---|---|
| Power Consumption | 23% | 2% | -17% | 7% | -0% | 25% | 14% | 8% | |
| Idle Minimum * | 19.61 | 6 69% | 15.4 21% | 26.7 -36% | 8.1 59% | 15 24% | 8 59% | 12.8 ? 35% | 13.4 ? 32% |
| Idle Average * | 22.39 | 12 46% | 21.2 5% | 24.4 -9% | 13 42% | 20 11% | 13 42% | 17.8 ? 21% | 18.9 ? 16% |
| Idle Maximum * | 23.51 | 18 23% | 21.9 7% | 32.7 -39% | 40.3 -71% | 29 -23% | 22 6% | 24.3 ? -3% | 26.3 ? -12% |
| Load Average * | 114.8 | 71 38% | 128.5 -12% | 122.1 -6% | 79 31% | 121 -5% | 86 25% | 96.9 ? 16% | 102.7 ? 11% |
| Cyberpunk 2077 ultra * | 183.7 | 197 -7% | |||||||
| Cyberpunk 2077 ultra external monitor * | 181.1 | 191.8 -6% | |||||||
| Witcher 3 ultra * | 179.3 | 188.4 -5% | 190.6 -6% | 188.1 -5% | 179.8 -0% | 141.8 21% | |||
| Load Maximum * | 226 | 228 -1% | 239.1 -6% | 241 -7% | 254.9 -13% | 246 -9% | 233 -3% | 221 ? 2% | 244 ? -8% |
* ... Moindre est la valeur, meilleures sont les performances
Power consumption: Cyberpunk 2077 / Stress test
Power consumption: External monitor
Autonomie de la batterie
Le MSI Sword 16 étant un modèle de milieu de gamme, il doit se contenter d'une batterie de 65 Wh qui ne dure pas très longtemps lorsque le CPU/GPU est sollicité, même légèrement. Avec le mode " Super Battery " activé, nous avons obtenu jusqu'à 4 heures et 40 minutes d'autonomie avec l'écran réglé à 150 nits.
Il est intéressant de noter que l'autonomie de la batterie a chuté pendant la lecture de vidéos au format H.246, probablement parce que l'ordinateur portable n'a pas basculé automatiquement sur l'iGPU. Si vous devez utiliser l'ordinateur portable loin du secteur, nous vous recommandons de basculer en mode 'Silent' ou 'Super Battery' pour une autonomie optimale.
| MSI Sword 16 HX B14VGKG i7-14700HX, NVIDIA GeForce RTX 4070 Laptop GPU, 65 Wh | HP Omen 17-db0079ng R7 8845HS, NVIDIA GeForce RTX 4070 Laptop GPU, 83 Wh | Lenovo Legion 7 16 IRX G9 i9-14900HX, NVIDIA GeForce RTX 4070 Laptop GPU, 99.9 Wh | Acer Predator Helios Neo 16 (2024) i7-14700HX, NVIDIA GeForce RTX 4070 Laptop GPU, 90.61 Wh | Alienware m16 R2 Ultra 7 155H, NVIDIA GeForce RTX 4070 Laptop GPU, 90 Wh | Asus ROG Strix G17 G713PI R9 7945HX, NVIDIA GeForce RTX 4070 Laptop GPU, 90 Wh | HP Victus 16-r0077ng i7-13700H, NVIDIA GeForce RTX 4070 Laptop GPU, 83 Wh | Moyenne de la classe Gaming | |
|---|---|---|---|---|---|---|---|---|
| Autonomie de la batterie | 109% | 142% | 38% | 41% | 8% | 52% | 113% | |
| H.264 | 129 | 462 258% | 620 381% | 242 88% | 166 29% | 447 ? 247% | ||
| WiFi v1.3 | 280 | 544 94% | 433 55% | 227 -19% | 483 73% | 255 -9% | 426 52% | 387 ? 38% |
| Cyberpunk 2077 ultra 150cd | 80 | 59 -26% | ||||||
| Load | 55 | 49 -11% | 79 44% | 60 9% | 58 5% | 84.5 ? 54% | ||
| Reader / Idle | 356 | 758 | 585 ? | |||||
| Witcher 3 ultra | 64 | 74.7 ? |
Points positifs
Points négatifs
Verdict : Un ordinateur portable de jeu décent qui ne cherche pas à surpasser ses concurrents
Notre principal problème avec le MSI Sword 16 HX est son écran. Non seulement la précision des couleurs est médiocre, mais les temps de réponse sont élevés, ce qui n'est pas idéal pour les FPS rapides. Heureusement, ce problème est facilement compensé par la connexion d'un moniteur externe.
Le connecteur d'alimentation est mal positionné, le disque dur SSD est lent et le port HDMI pose problème. Veillez à vérifier la version de votre BIOS et à la mettre à jour. Cela dit, cet ordinateur est conçu pour jouer à des jeux et il s'en acquitte plutôt bien.
Le MSI Sword 16 HX réussit à combler le fossé entre le prix et la performance avec un mélange de matériel puissant et un prix raisonnable"
Pour l'instant, le combo Raptor Lake-HX et Ada Lovelace est à peu près le meilleur combo que l'on puisse trouver dans un ordinateur portable de jeu. L'engouement d'Intel et d'AMD pour l'IA signifie que nous n'aurons pas de nouvelles UGS à haute puissance avant l'année prochaine. Si l'on se base sur la trajectoire actuelleles nouveaux GPU Nvidia/AMD pour ordinateurs portables pourraient mettre encore plus de temps à arriver.
Avec la montée en flèche des coûts du matériel informatique, le MSI Sword 16 HX peut servir de substitut décent à un ordinateur de bureau. Si vous souhaitez disposer d'un meilleur écran et d'un meilleur espace de stockage, vous pouvez opter pour le Acer Predator Helios Neo 16 ou le Lenovo Legion 7 16 G9. Ces deux modèles coûtent plus ou moins le même prix et sont remarquablement meilleurs que le MSI Sword 16 à cet égard.
Prix et disponibilité
La variante MSI Sword 16 HX testée ci-dessus est actuellement vendue au prix de 1 38 990 euros sur Amazon India. Une version moins sophistiquée avec le même processeur et une GeForce RTX 4060 peut être obtenue pour ₹1,17,990.
Note : Nous avons récemment mis à jour notre système d'évaluation et les résultats de la version 8 ne sont pas comparables à ceux de la version 7. De plus amples informations sont disponibles ici .
MSI Sword 16 HX B14VGKG
- 10/08/2024 v8
Anil Ganti
 Total Sustainability Score:
 Transparency
La sélection des appareils à examiner est effectuée par notre équipe éditoriale. L'échantillon de test a été prêté à l'auteur par le fabricant ou le détaillant pour les besoins de cet examen. Le prêteur n'a pas eu d'influence sur cette évaluation et le fabricant n'a pas reçu de copie de cette évaluation avant sa publication. Il n'y avait aucune obligation de publier cet article. Nous n'acceptons jamais de compensation ou de paiement en échange de nos commentaires. En tant que média indépendant, Notebookcheck n'est pas soumis à l'autorité des fabricants, des détaillants ou des éditeurs.
Voici comment Notebookcheck teste
Chaque année, Notebookcheck examine de manière indépendante des centaines d'ordinateurs portables et de smartphones en utilisant des procédures standardisées afin de garantir que tous les résultats sont comparables. Nous avons continuellement développé nos méthodes de test depuis environ 20 ans et avons établi des normes industrielles dans le processus. Dans nos laboratoires de test, des équipements de mesure de haute qualité sont utilisés par des techniciens et des rédacteurs expérimentés. Ces tests impliquent un processus de validation en plusieurs étapes. Notre système d'évaluation complexe repose sur des centaines de mesures et de points de référence bien fondés, ce qui garantit l'objectivité.Price comparison

