

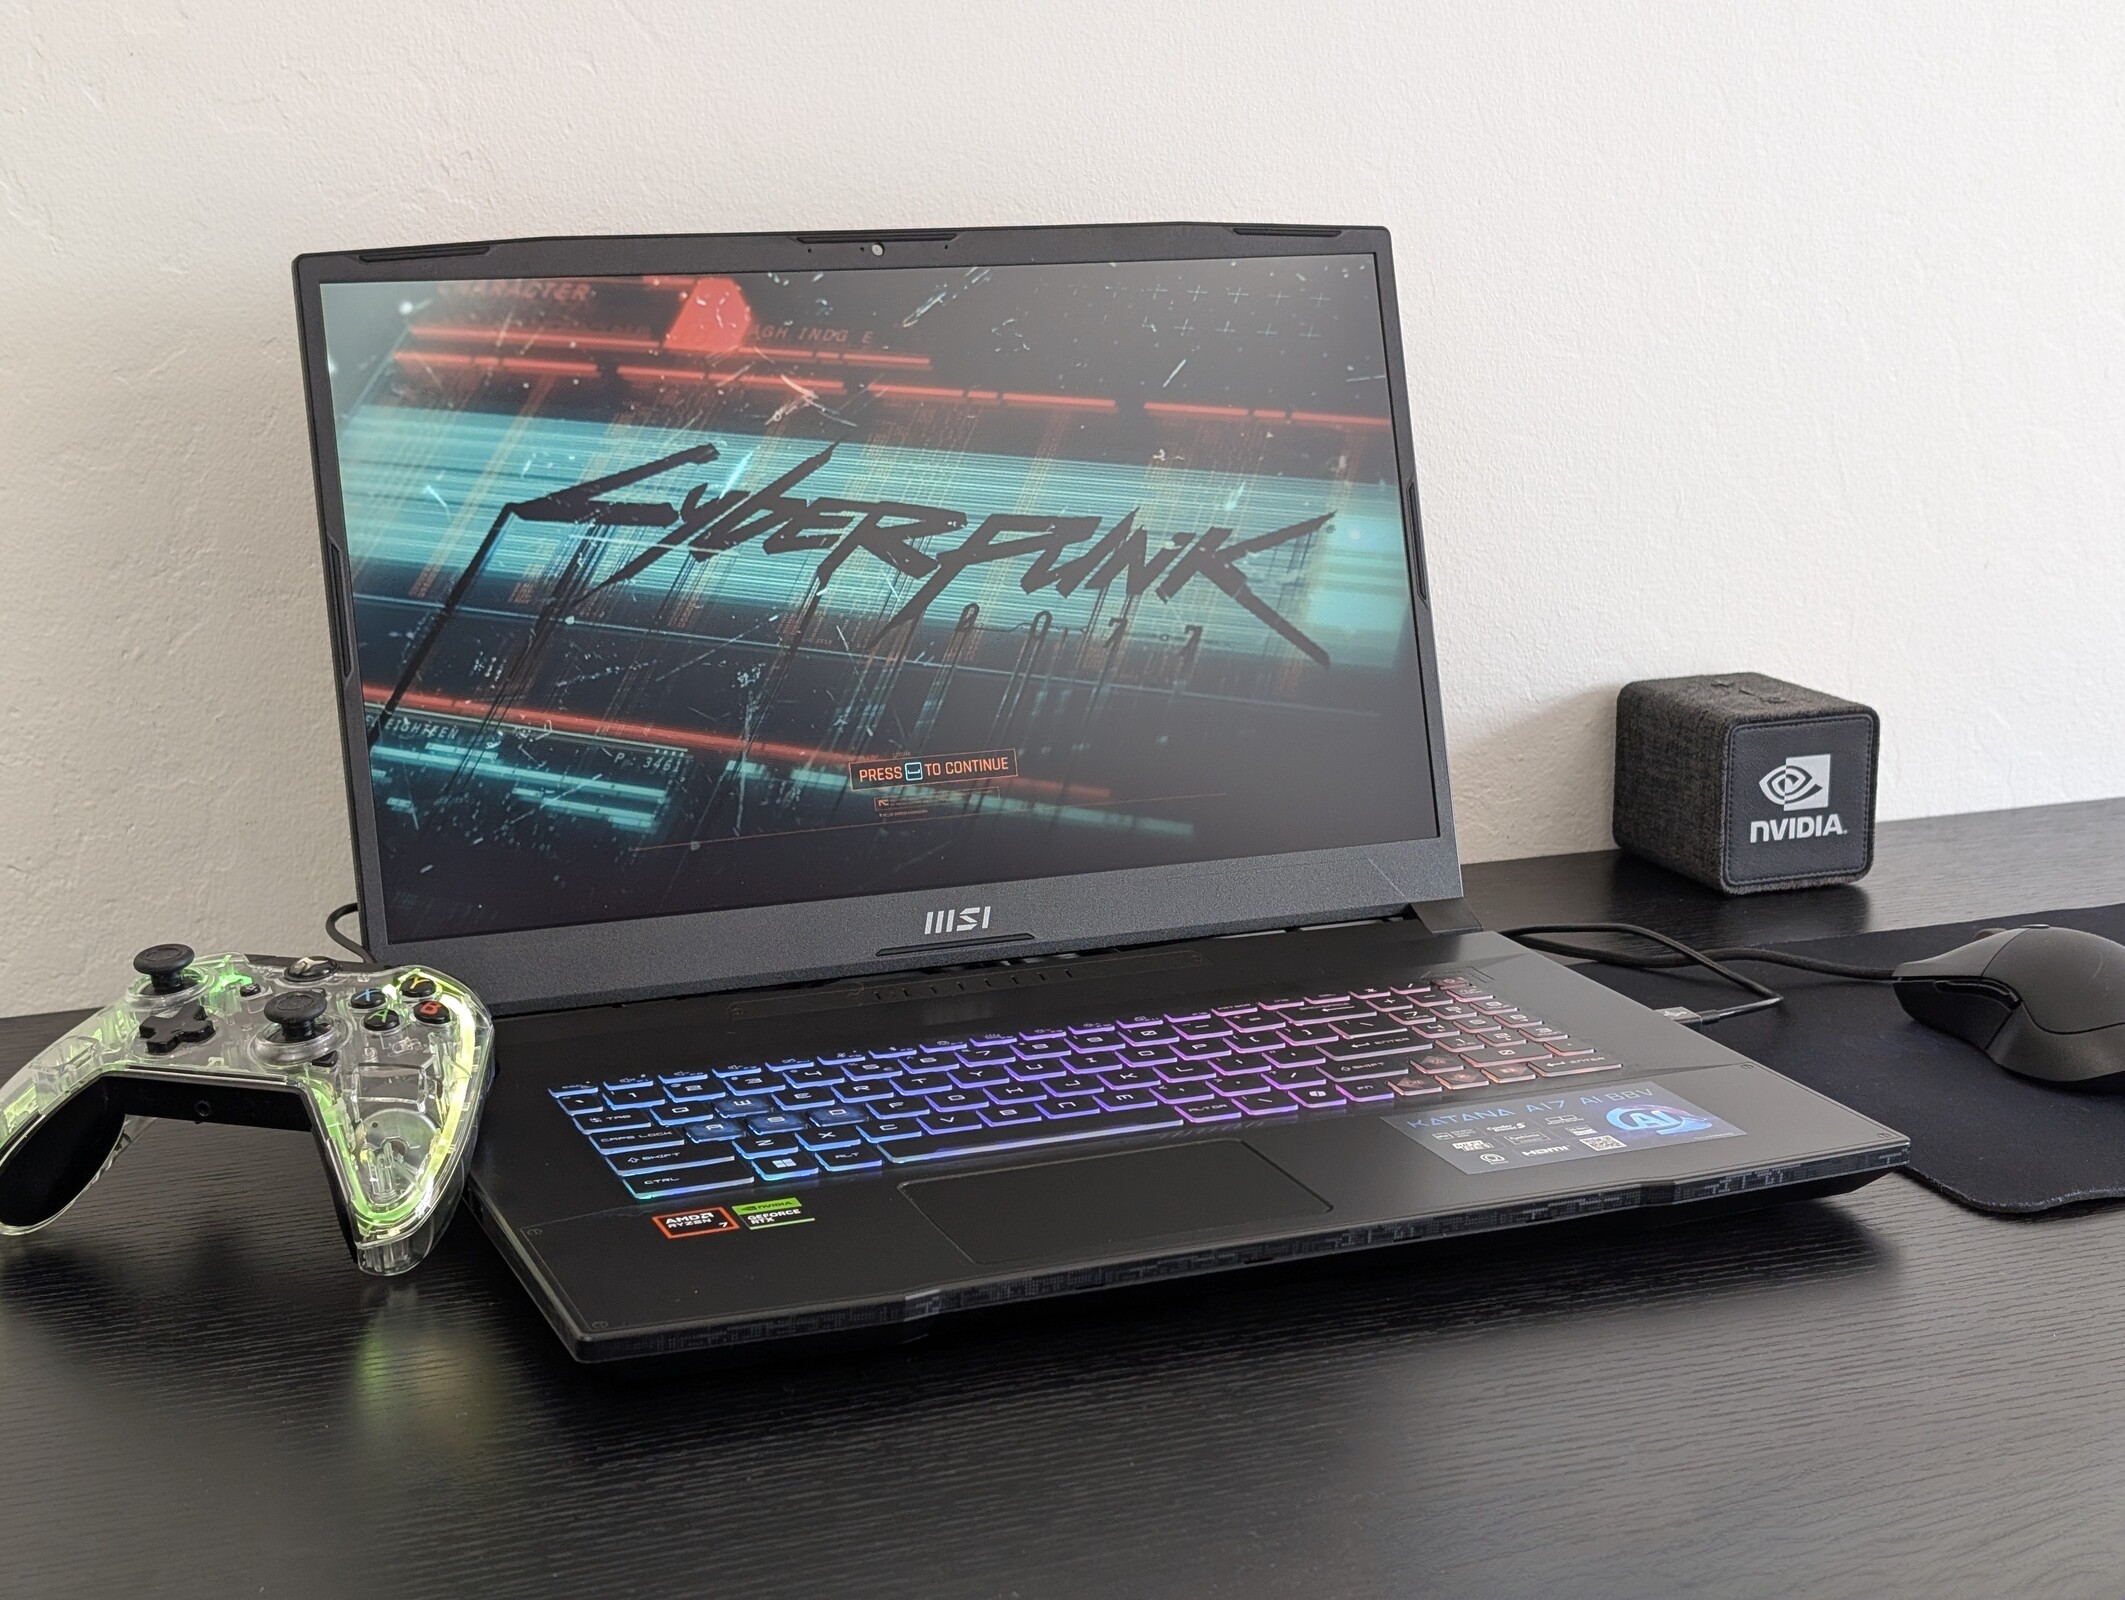
Test du MSI Katana A17 AI : des graphismes puissants, mais un écran insatisfaisant
L'écran 1080p de base laisse beaucoup à désirer.
Le Katana A17 est une alternative moins chère que les séries GE, GS ou GT, tout en offrant d'excellentes performances graphiques avec son GPU RTX 4070 de 105 W GeForce. Malheureusement, son écran 1080p manque de couleurs sRGB, de temps de réponse rapides et de support G-Sync.Allen Ngo, 👁 Allen Ngo (traduit par DeepL / Ninh Duy) Publié 🇺🇸 🇪🇸 ...
Verdict - Excellent pour les jeux si vous pouvez éviter l'option d'affichage la moins chère
En tant que l'un des ordinateurs portables de jeu les plus abordables de MSI, le Katana A17 fait l'impasse sur les LED fantaisistes et les matériaux métalliques pour un design plastique plus basique, tout en conservant des taux de rafraîchissement natifs élevés et des options de GPU comme la RTX 4070 sur le site GeForce. Pour les core gamers au budget plus serré, le GPU a probablement la priorité sur d'autres aspects et le Katana A17 est à la hauteur, tout en offrant des niveaux de bruit de ventilateur décents et un clavier confortable pour les tâches non liées au jeu.
Cependant, les coupes sombres peuvent être un peu profondes. L'autonomie de la batterie est faible et l'écran 1080p144 offre des couleurs et une luminosité médiocres pour une expérience visuelle qui n'a rien d'extraordinaire. L'option 1440p240 résout directement ce problème, mais elle n'est pas disponible avec la configuration Ryzen 7 car elle est liée au CPU Ryzen 9, ce qui signifie que les utilisateurs devront payer 400 $ de plus juste pour un meilleur écran. Lorsque vous prenez en compte le fait que le Ryzen 9 8945HS n'offre pratiquement aucun avantage par rapport au Ryzen 7 8845HS, la configuration QHD semble surévaluée, surtout si l'on tient compte du fait que la série GS de MSI est plus haut de gamme MSI GS series mSI GS, plus haut de gamme, peut être trouvé pour le même prix.
Points positifs
Points négatifs
Prix et disponibilité
Amazon ne propose pas notre configuration Ryzen 7 FHD pour le moment. A la place, la configuration Ryzen 9 QHD est disponible pour $1800 USD.
Comparaison des alternatives possibles
Image | Modèle | Prix | Poids | Épaisseur | Écran |
|---|---|---|---|---|---|
1. 78.6%  | MSI Katana A17 AI B8VG AMD Ryzen 7 8845HS ⎘ NVIDIA GeForce RTX 4070 Laptop GPU ⎘ 32 Go Mémoire, 1024 Go SSD | Amazon: $1,219.00 Prix de liste: 1400 USD | 2.7 kg | 25.2 mm | 17.30" 1920x1080 127 PPI IPS |
2. 80.4%  | HP Omen 17-db0079ng AMD Ryzen 7 8845HS ⎘ NVIDIA GeForce RTX 4070 Laptop GPU ⎘ 32 Go Mémoire, 1024 Go SSD | Amazon: 1. $69.88 230W AC Charger fit for HP O... 2. $1,699.00 HP Omen 17 Gaming Laptop 17.... 3. $1,999.00 OMEN by HP 2019 17-Inch Gami... Prix de liste: 1900€ | 2.8 kg | 30.1 mm | 17.30" 2560x1440 170 PPI IPS |
3. 85.6% v7 (old)  | Asus TUF Gaming A17 FA707XI-NS94 AMD Ryzen 9 7940HS ⎘ NVIDIA GeForce RTX 4070 Laptop GPU ⎘ 16 Go Mémoire, 1024 Go SSD | Amazon: $1,983.68 Prix de liste: 1400 USD | 2.5 kg | 25.4 mm | 17.30" 1920x1080 127 PPI IPS |
4. 87.2% v7 (old)  | Acer Nitro 17 AN17-51-71ER Intel Core i7-13700H ⎘ NVIDIA GeForce RTX 4060 Laptop GPU ⎘ 16 Go Mémoire, 1024 Go SSD | Amazon: 1. $96.99 LCDOLED Compatible with Acer... 2. $128.88 POBRIDA Replacement for Acer... 3. $15.98 Deal4GO CPU Cooling Fan 23.Q... Prix de liste: 1900€ | 3 kg | 30.3 mm | 17.30" 2560x1440 170 PPI |
5. 86.3% v7 (old)  | MSI Pulse 17 B13VGK Intel Core i7-13700H ⎘ NVIDIA GeForce RTX 4070 Laptop GPU ⎘ 16 Go Mémoire, 1024 Go SSD | Amazon: 1. $64.99 240W 20V 12A AC Adapter for ... 2. $2,053.04 Msi Pulse15B13VGK-287US Gami... 3. $17.99 HSSDTECH DC Power Jack Charg... Prix de liste: 2500€ | 2.7 kg | 27.2 mm | 17.30" 1920x1080 127 PPI IPS |
6. 85.2% v7 (old) 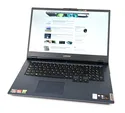 | Lenovo Legion 5 17ACH6H-82JY0003GE AMD Ryzen 5 5600H ⎘ NVIDIA GeForce RTX 3060 Laptop GPU ⎘ 16 Go Mémoire, 512 Go SSD | Amazon: 1. $91.50 EM EMAJOR TECH New Screen Re... 2. $95.11 EM EMAJOR TECH New Screen Re... 3. $91.50 EM EMAJOR TECH New Screen Re... Prix de liste: 1810 EUR | 3.1 kg | 24.3 mm | 17.30" 1920x1080 127 PPI IPS |
Table des matières
- Verdict - Excellent pour les jeux si vous pouvez éviter l'option d'affichage la moins chère
- Spécifications
- Étui - plastique polyvalent
- Connectivité
- Affichage - Taux de rafraîchissement décent mais couleurs médiocres
- Performance - Plus de performance par watt avec AMD Zen 4
- Émissions
- Gestion de l'énergie - D'excellentes performances par watt mais une faible autonomie de la batterie
- Notebookcheck Rating
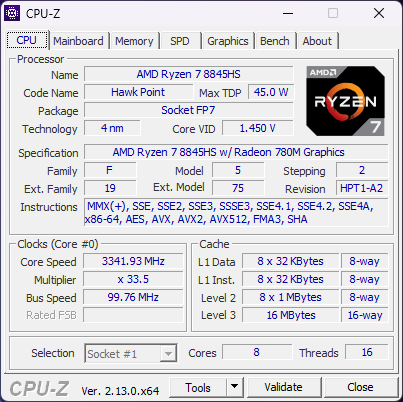
Le Katana A17 est la version AMD la plus récente du Katana 17 de l'année dernière, équipé d'un processeur Intel. Pour contenir les prix, il utilise des processeurs de la série Zen 4 au lieu des derniers Zen 5.
Notre unité de test est une configuration de milieu de gamme avec le CPU Ryzen 7 8845HS, le GPU GeForce RTX 4070 et un écran 17,3 pouces 1080p144 pour environ 1400 $. Les SKUs inférieurs peuvent être livrés avec la RTX 4060 ou 4050 à la place, tandis que les SKUs plus haut de gamme sont livrés avec le Ryzen 9 8945HS et un écran 1440p240 Hz. Une version 15 pouces de ce modèle est disponible sous le nom de Katana A15.
Les alternatives au Katana A17 comprennent d'autres ordinateurs portables de jeu orientés vers le budget comme le Asus TUF Gaming A17, Acer Nitro 17, ou Lenovo Legion 5.
Plus d'avis sur MSI :
Spécifications
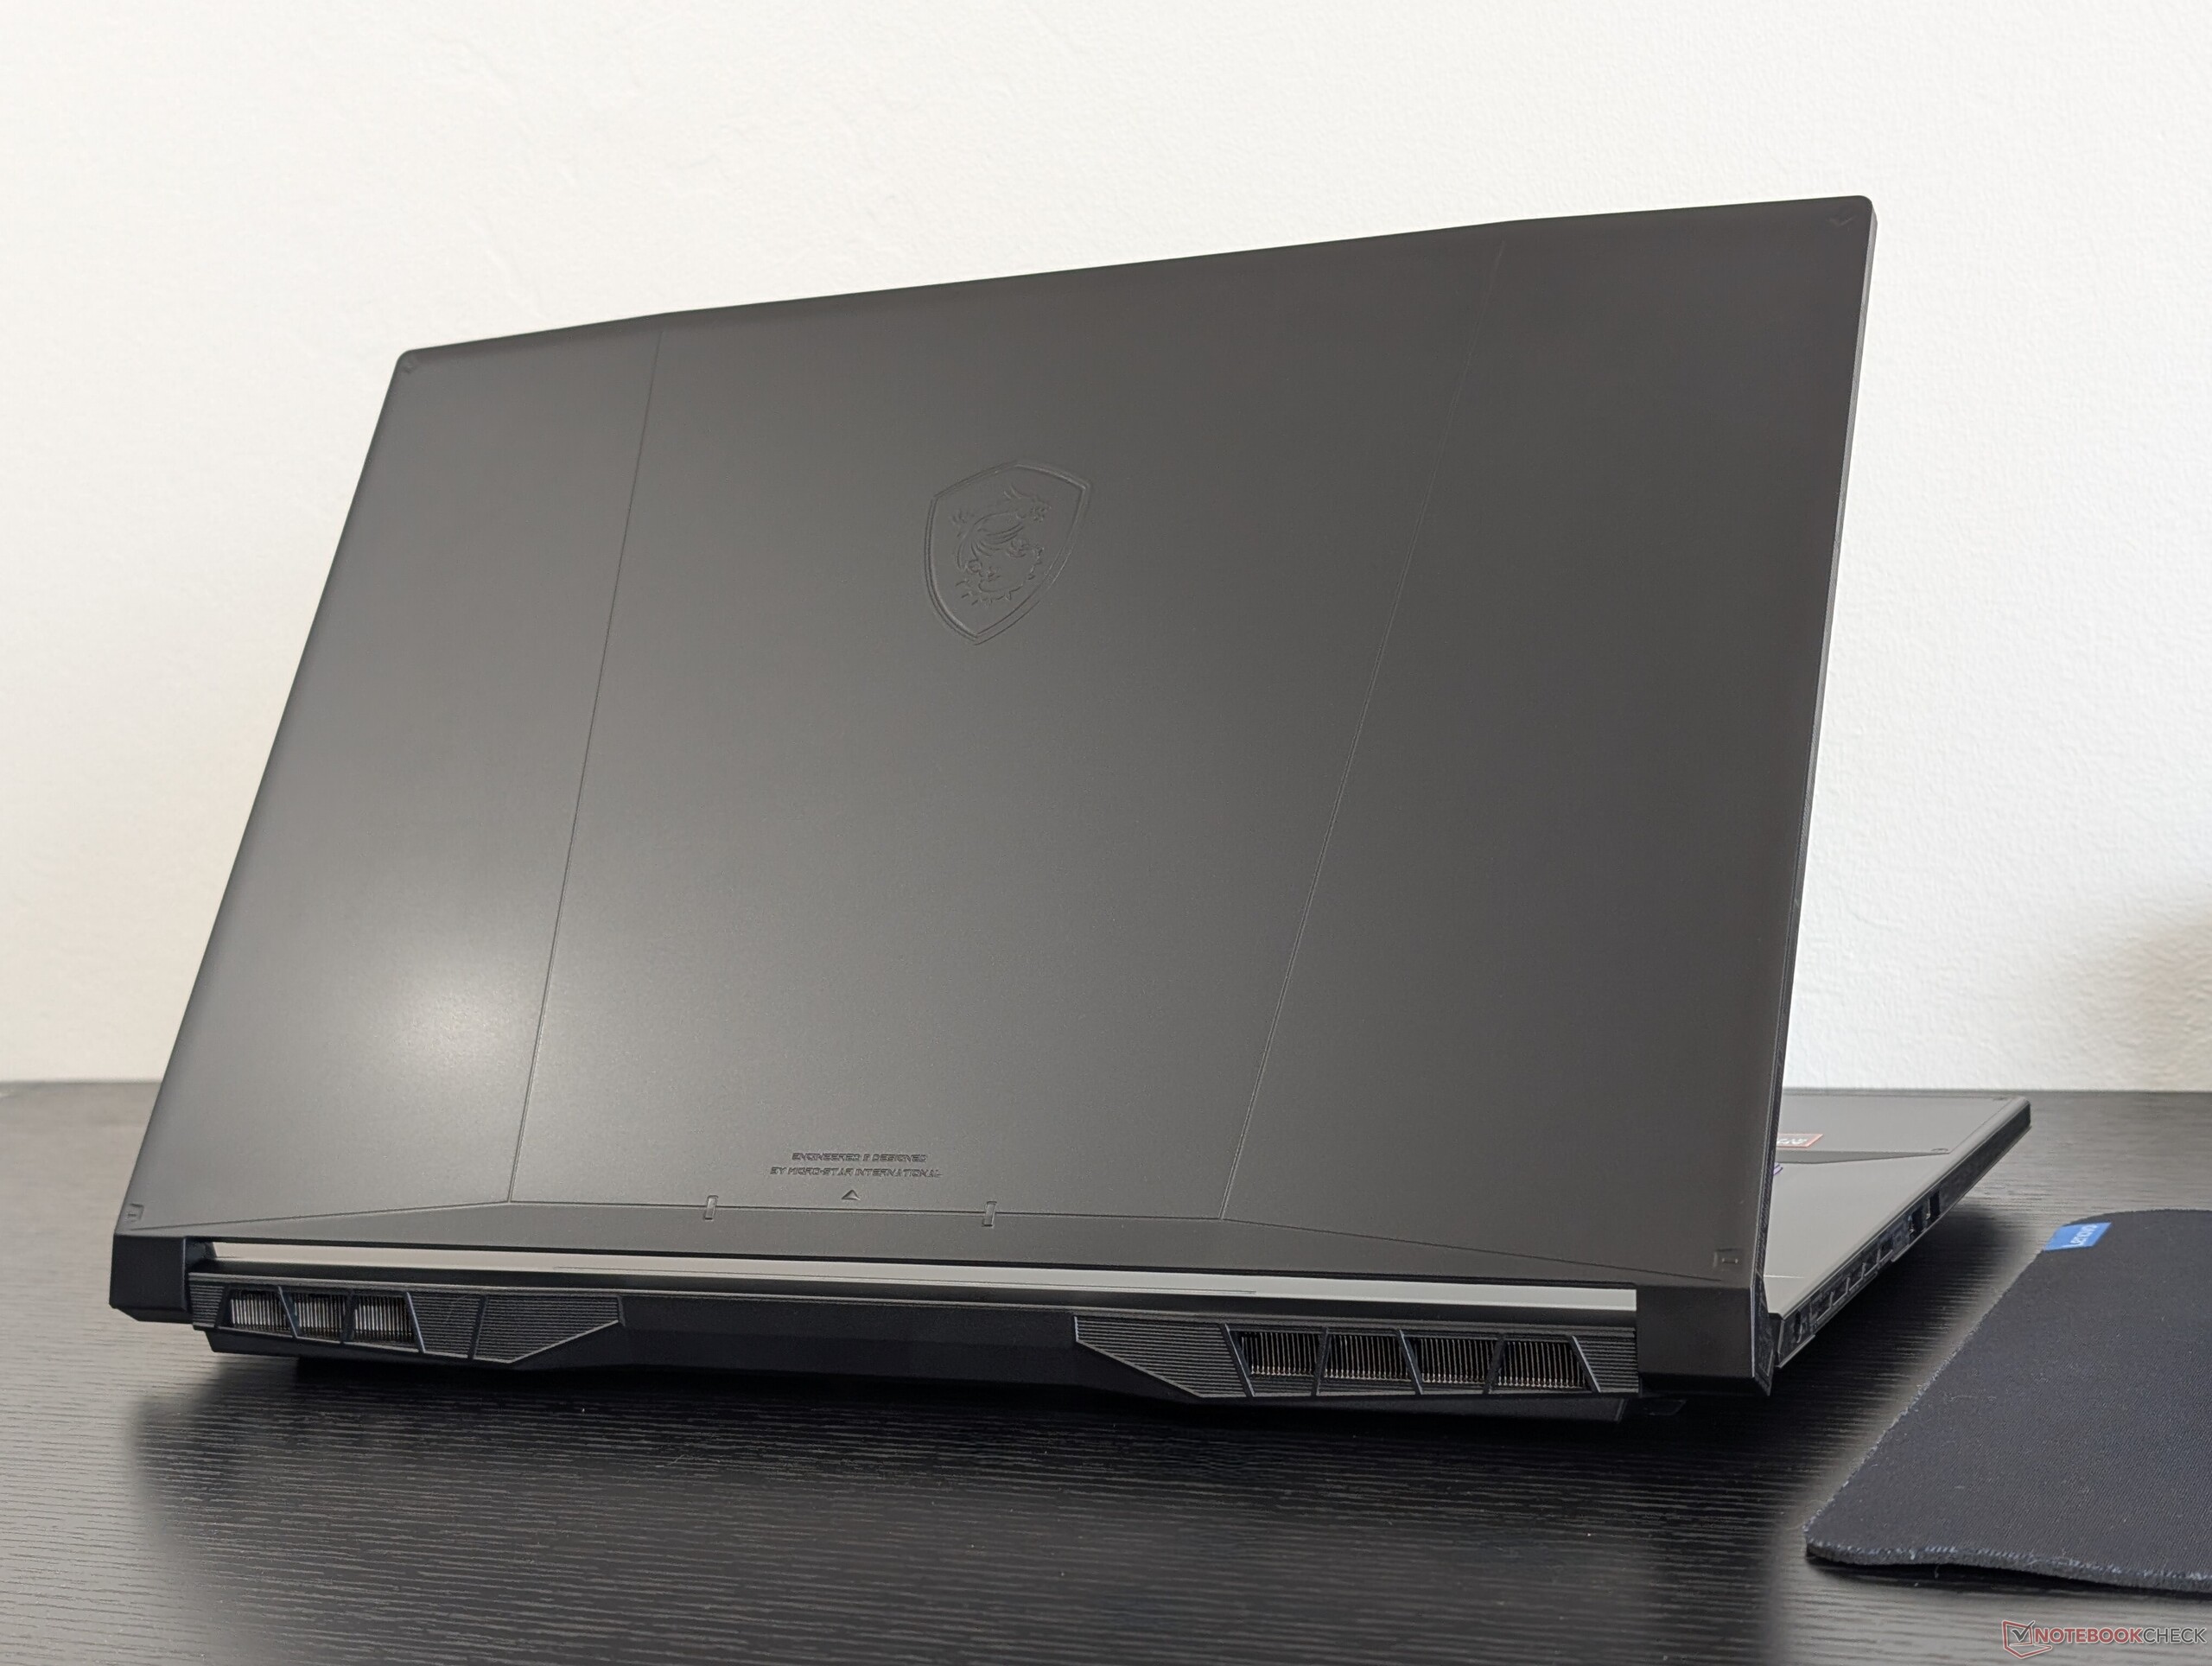
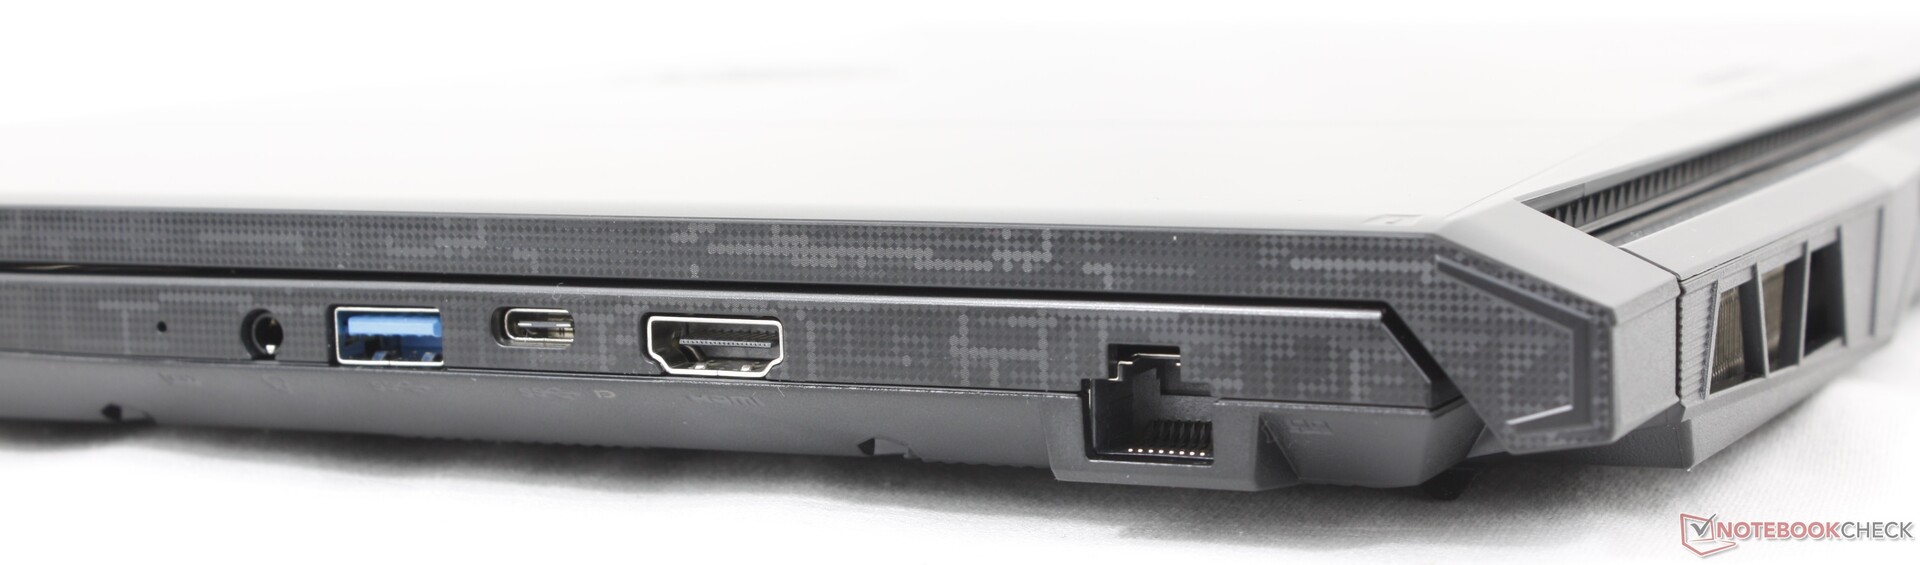
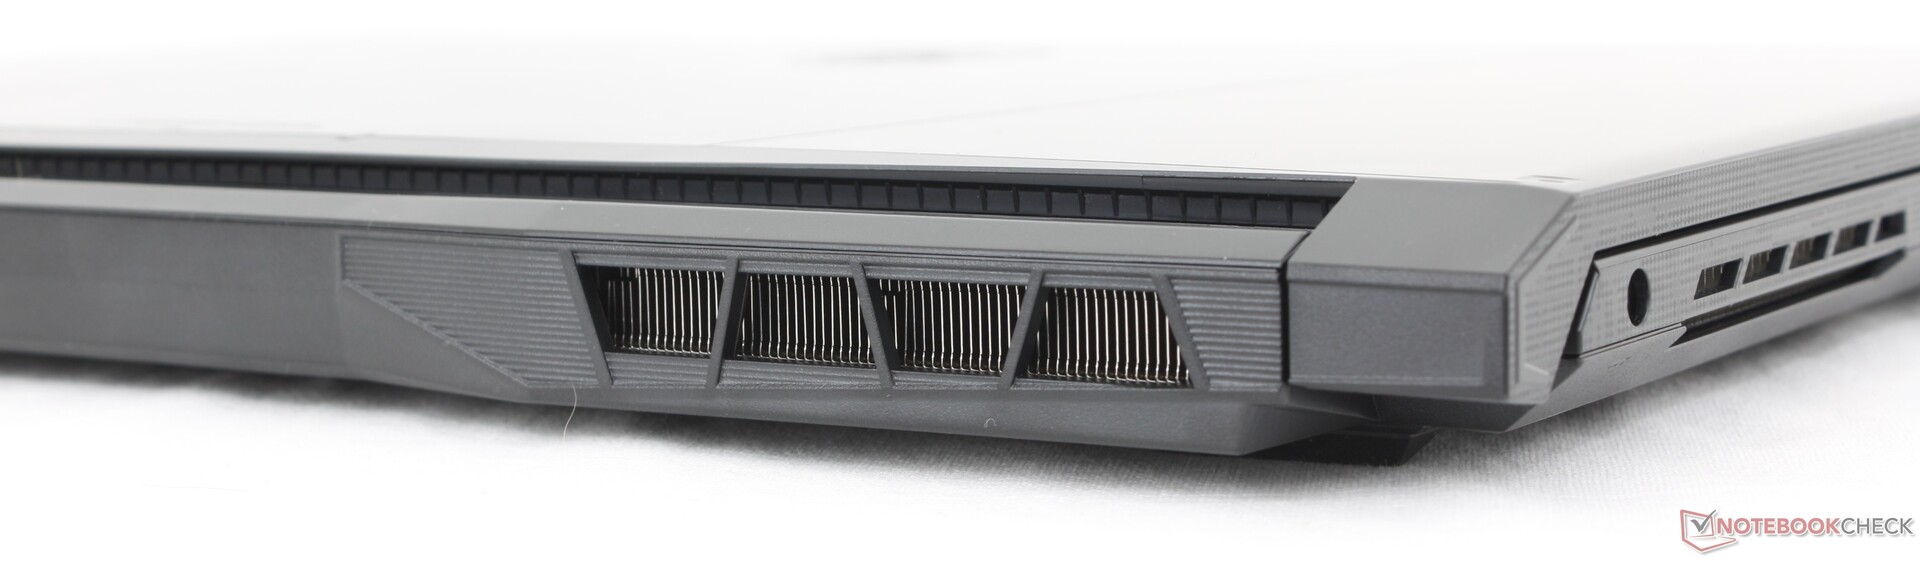
Étui - plastique polyvalent
Le châssis n'a pas changé par rapport au modèle 2023 Katana 17 et il comporte donc le même squelette en plastique ABS, le même clavier et les mêmes options de connectivité qu'auparavant. En comparaison, les modèles plus haut de gamme des séries GT ou GS utilisent plus d'alliages métalliques pour un look plus luxueux. Les charnières pourraient certainement être plus rigides pour les futures itérations de la Katana A17.
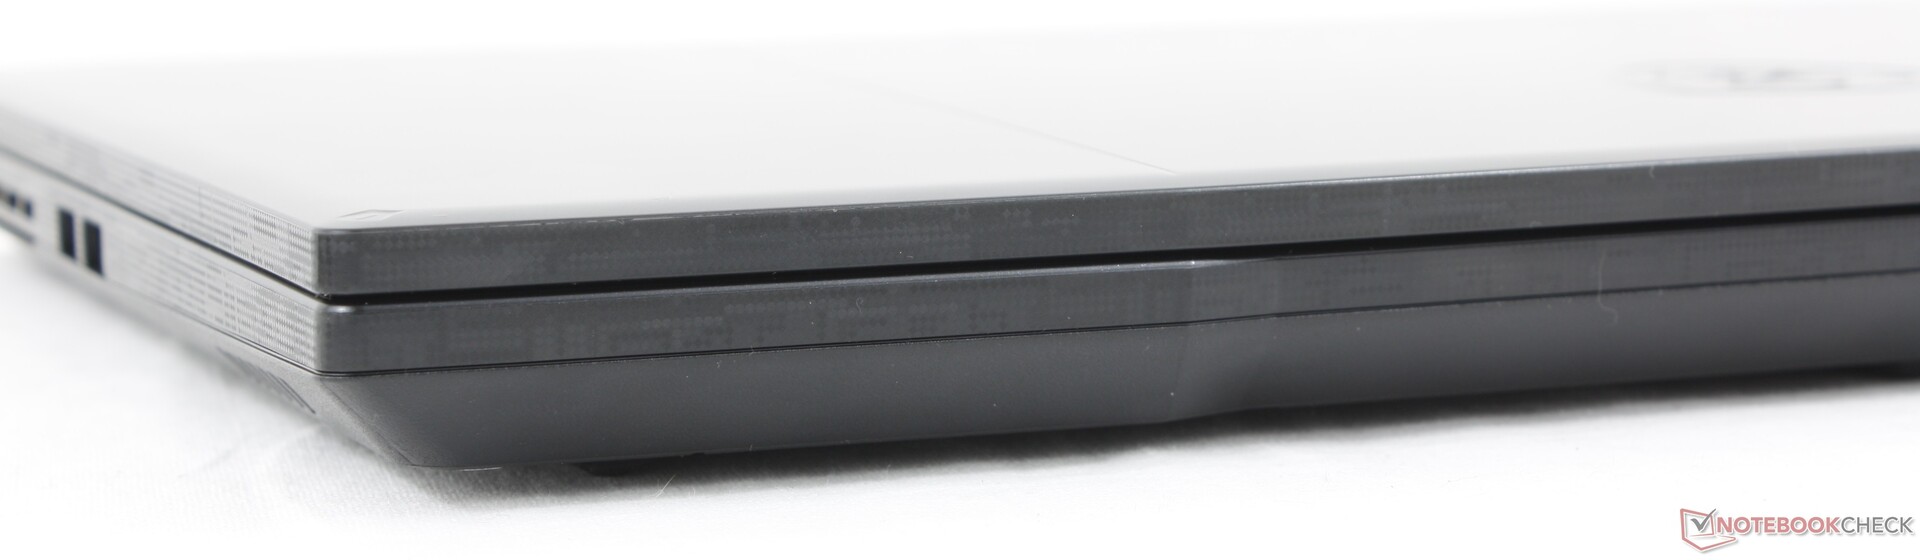
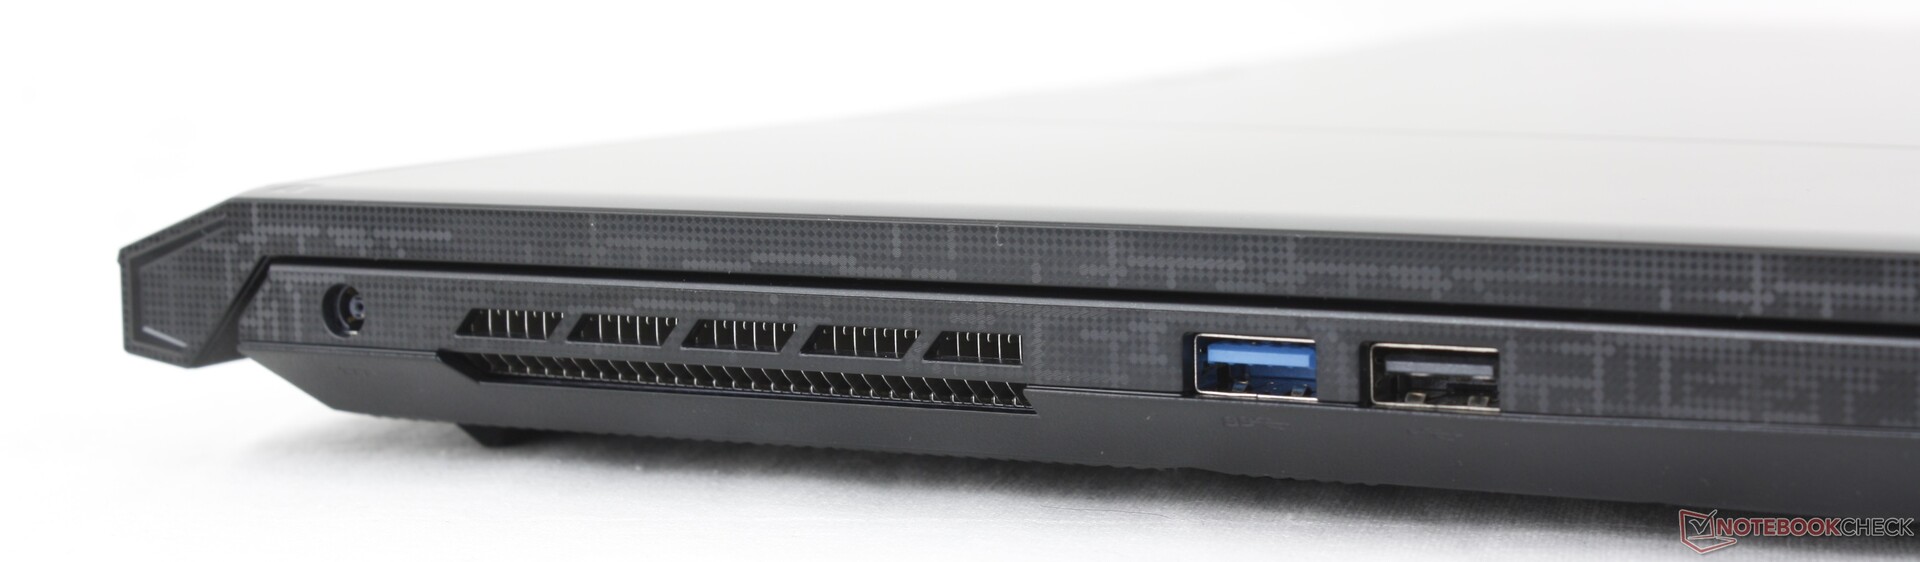
Connectivité
Communication
| Networking | |
| iperf3 transmit AX12 | |
| Lenovo Legion 5 17ACH6H-82JY0003GE | |
| iperf3 receive AX12 | |
| Lenovo Legion 5 17ACH6H-82JY0003GE | |
| iperf3 transmit AXE11000 | |
| Acer Nitro 17 AN17-51-71ER | |
| MSI Pulse 17 B13VGK | |
| MSI Katana A17 AI B8VG | |
| Asus TUF Gaming A17 FA707XI-NS94 | |
| HP Omen 17-db0079ng | |
| iperf3 receive AXE11000 | |
| MSI Pulse 17 B13VGK | |
| Acer Nitro 17 AN17-51-71ER | |
| MSI Katana A17 AI B8VG | |
| HP Omen 17-db0079ng | |
| Asus TUF Gaming A17 FA707XI-NS94 | |
| iperf3 transmit AXE11000 6GHz | |
| MSI Katana A17 AI B8VG | |
| iperf3 receive AXE11000 6GHz | |
| MSI Katana A17 AI B8VG | |
Webcam
Le modèle intègre une webcam 720p ou 1 MP de faible qualité, sans obturateur de confidentialité ni IR. La caméra peut être désactivée électroniquement à l'aide d'un raccourci clavier.


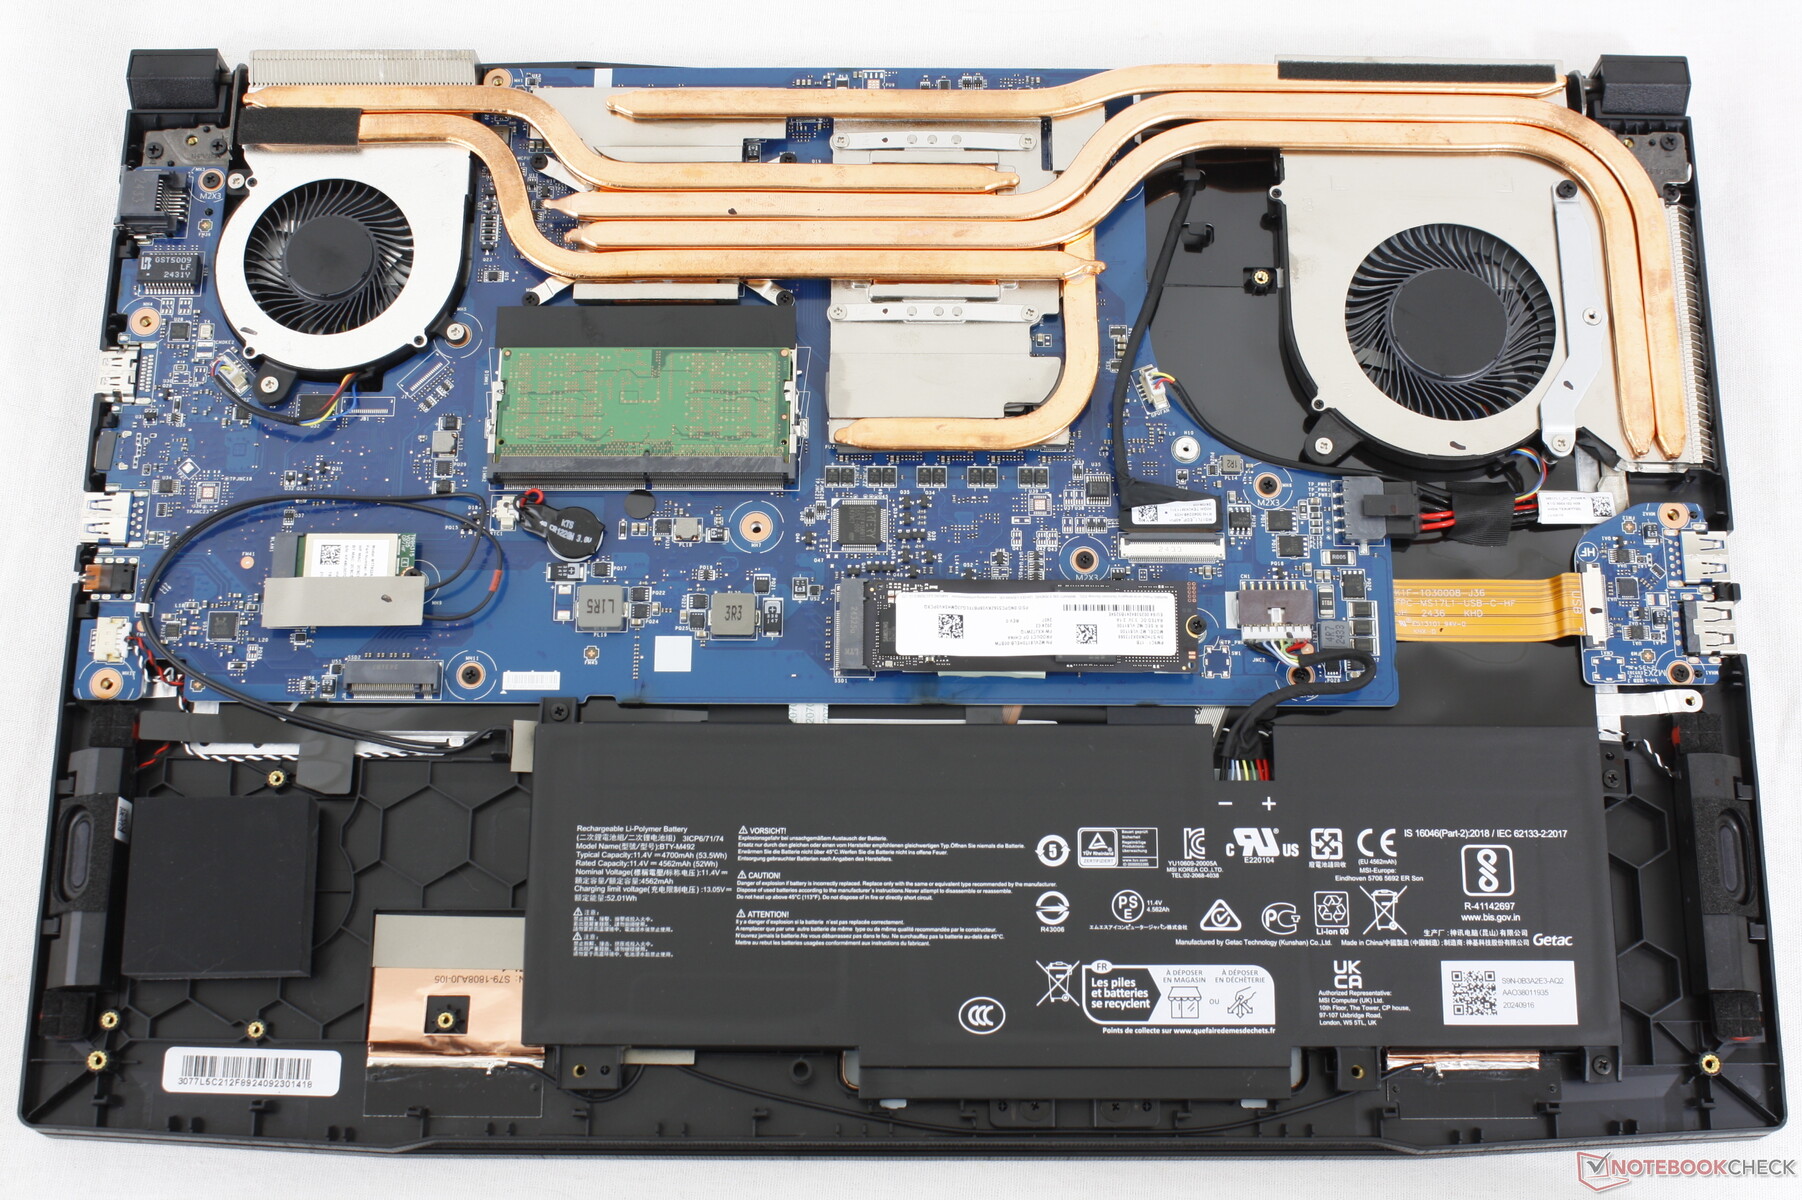
Maintenance
Le panneau inférieur est fixé par 13 vis Phillips pour faciliter l'entretien. Notez qu'un autocollant anti-sabotage doit être brisé pour accéder à la carte mère. Une fois à l'intérieur, les utilisateurs disposent de deux emplacements M.2 2280, de deux emplacements SODIMM et d'un module WLAN amovible.
Durabilité
MSI ne fait aucune déclaration de durabilité pour la série Katana A17. Pour le reste, l'emballage est essentiellement en carton, avec quelques protections en plastique.
Accessoires et garantie
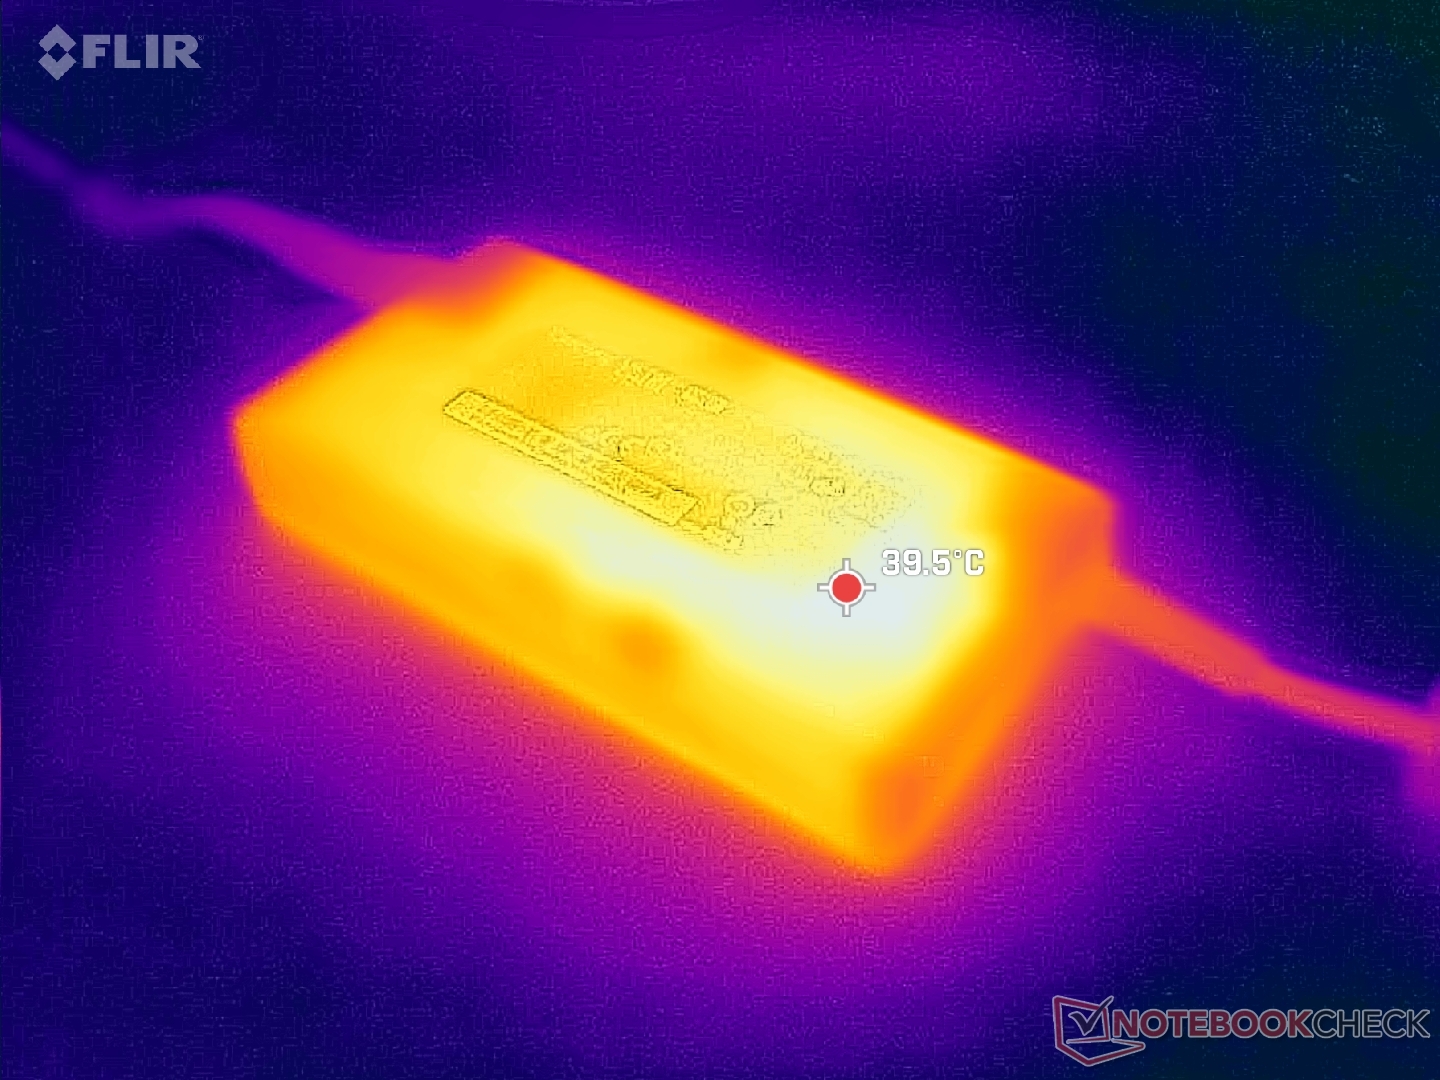
La boîte ne contient pas d'autres éléments que l'adaptateur secteur de 200 W et la documentation. La garantie limitée habituelle d'un an du fabricant s'applique.
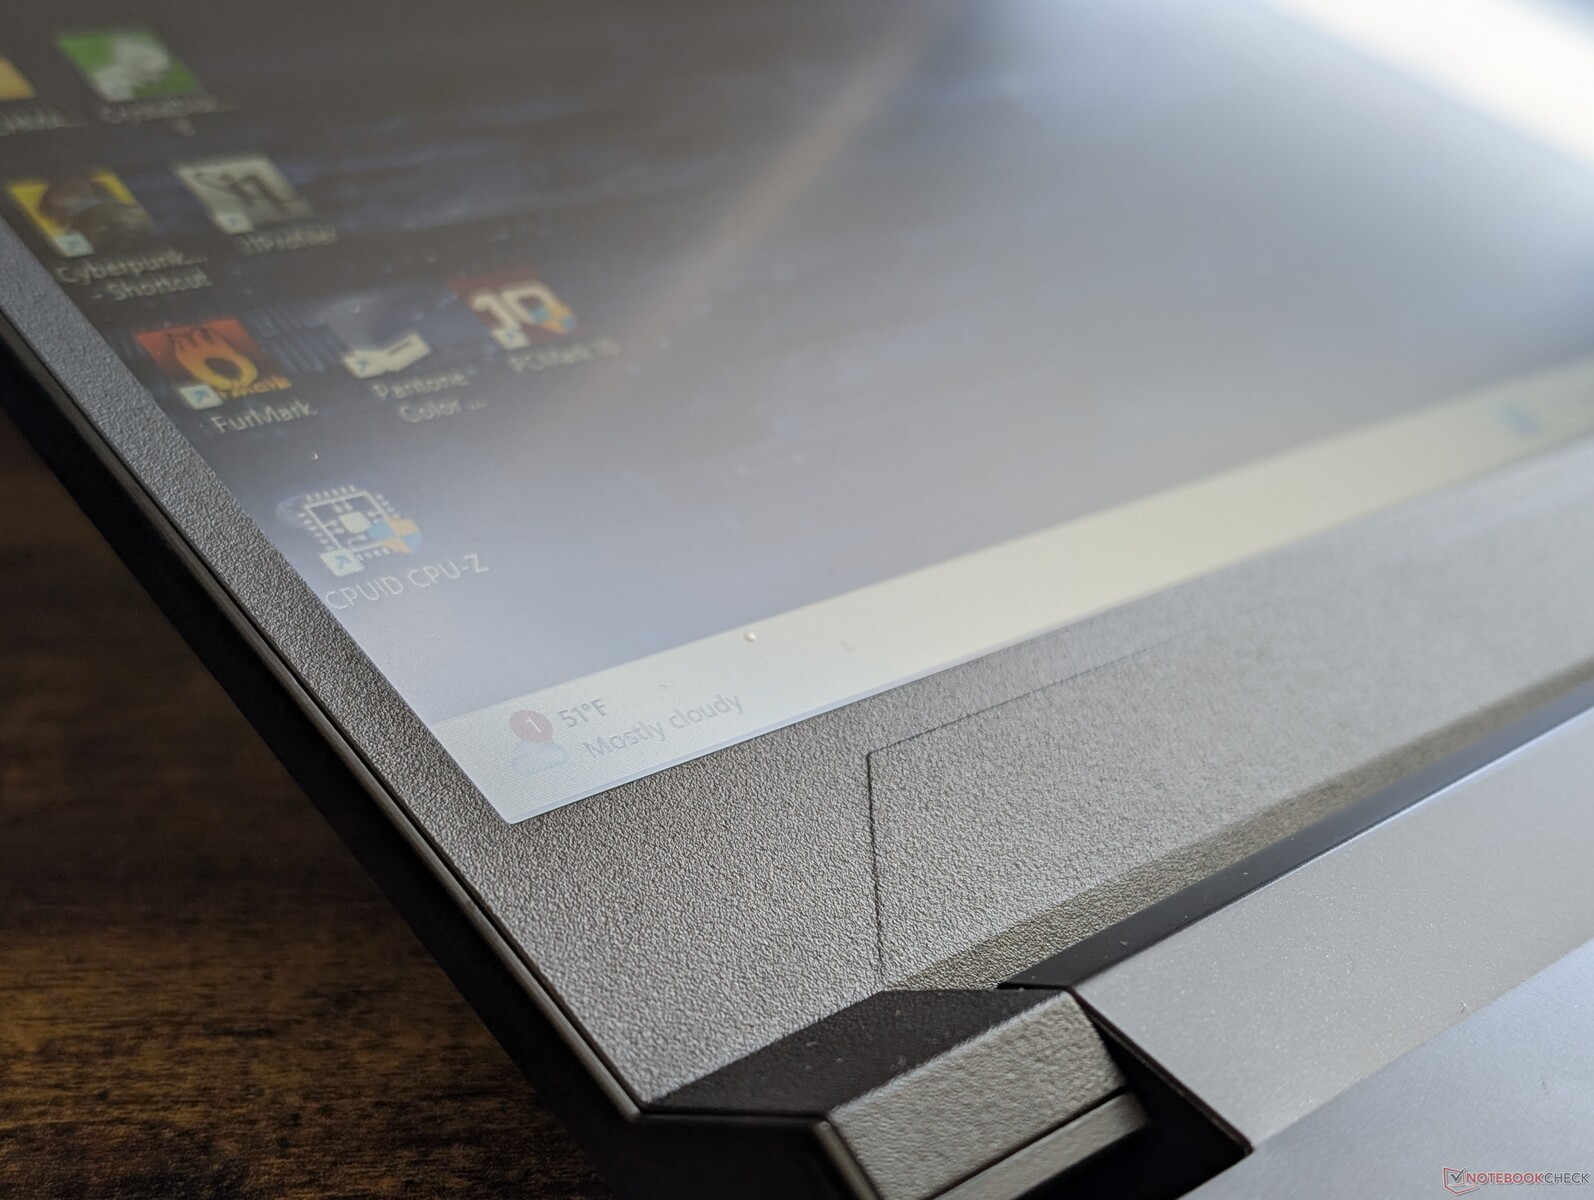
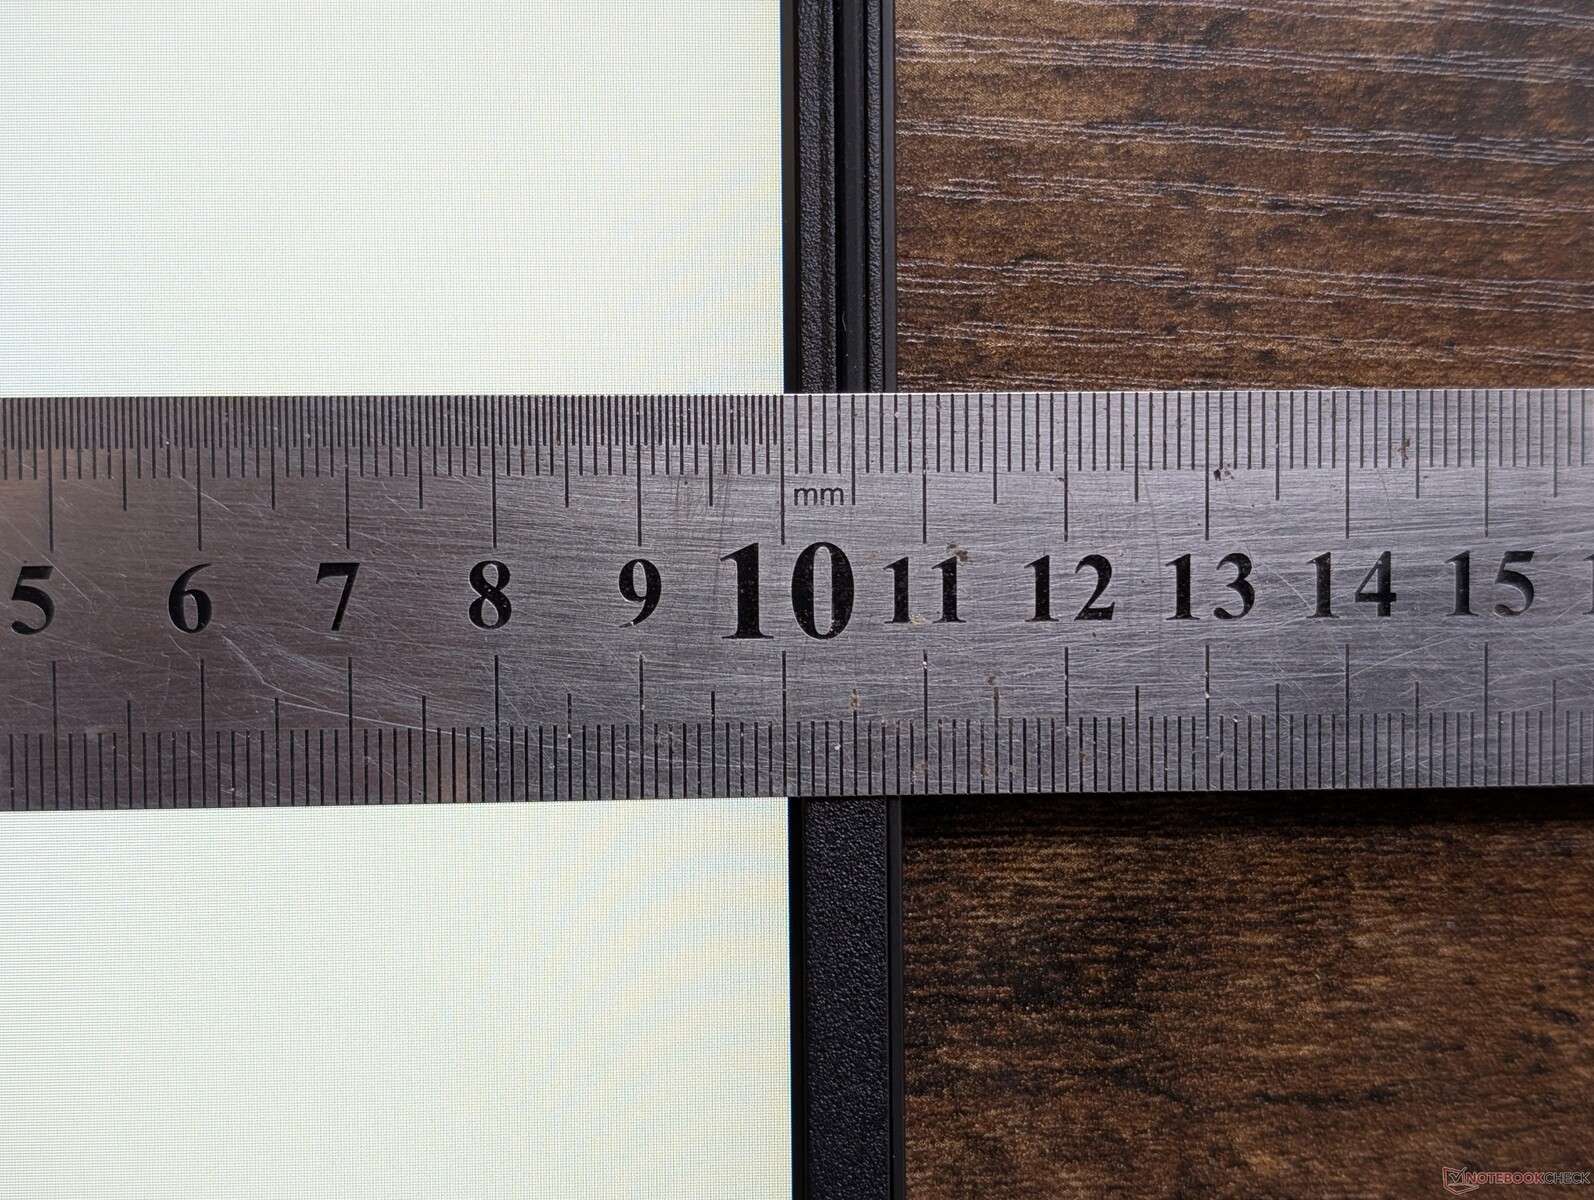
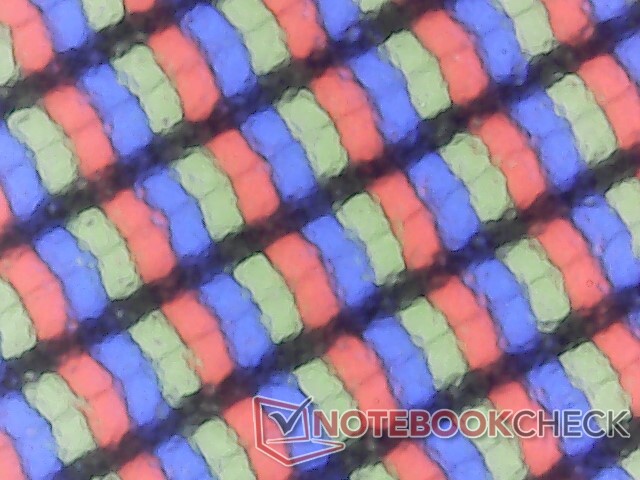
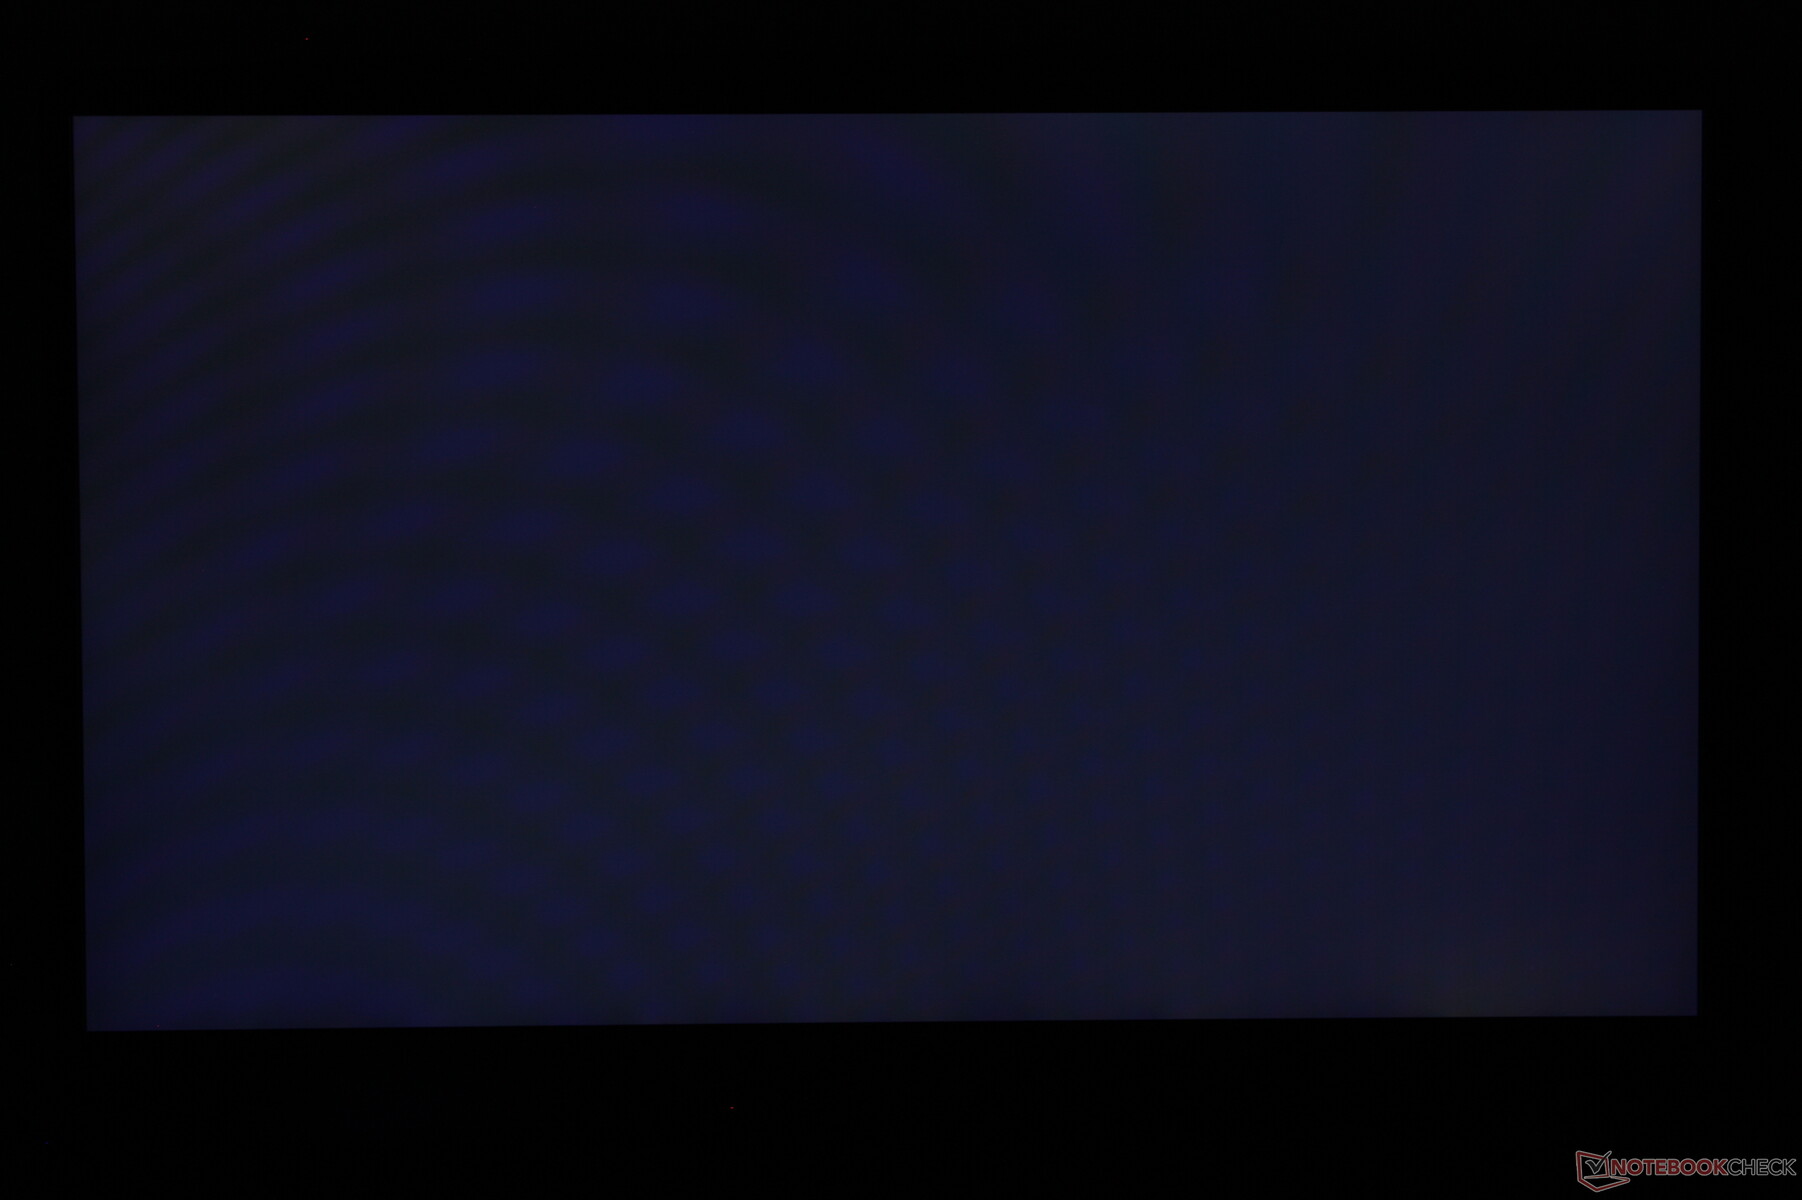
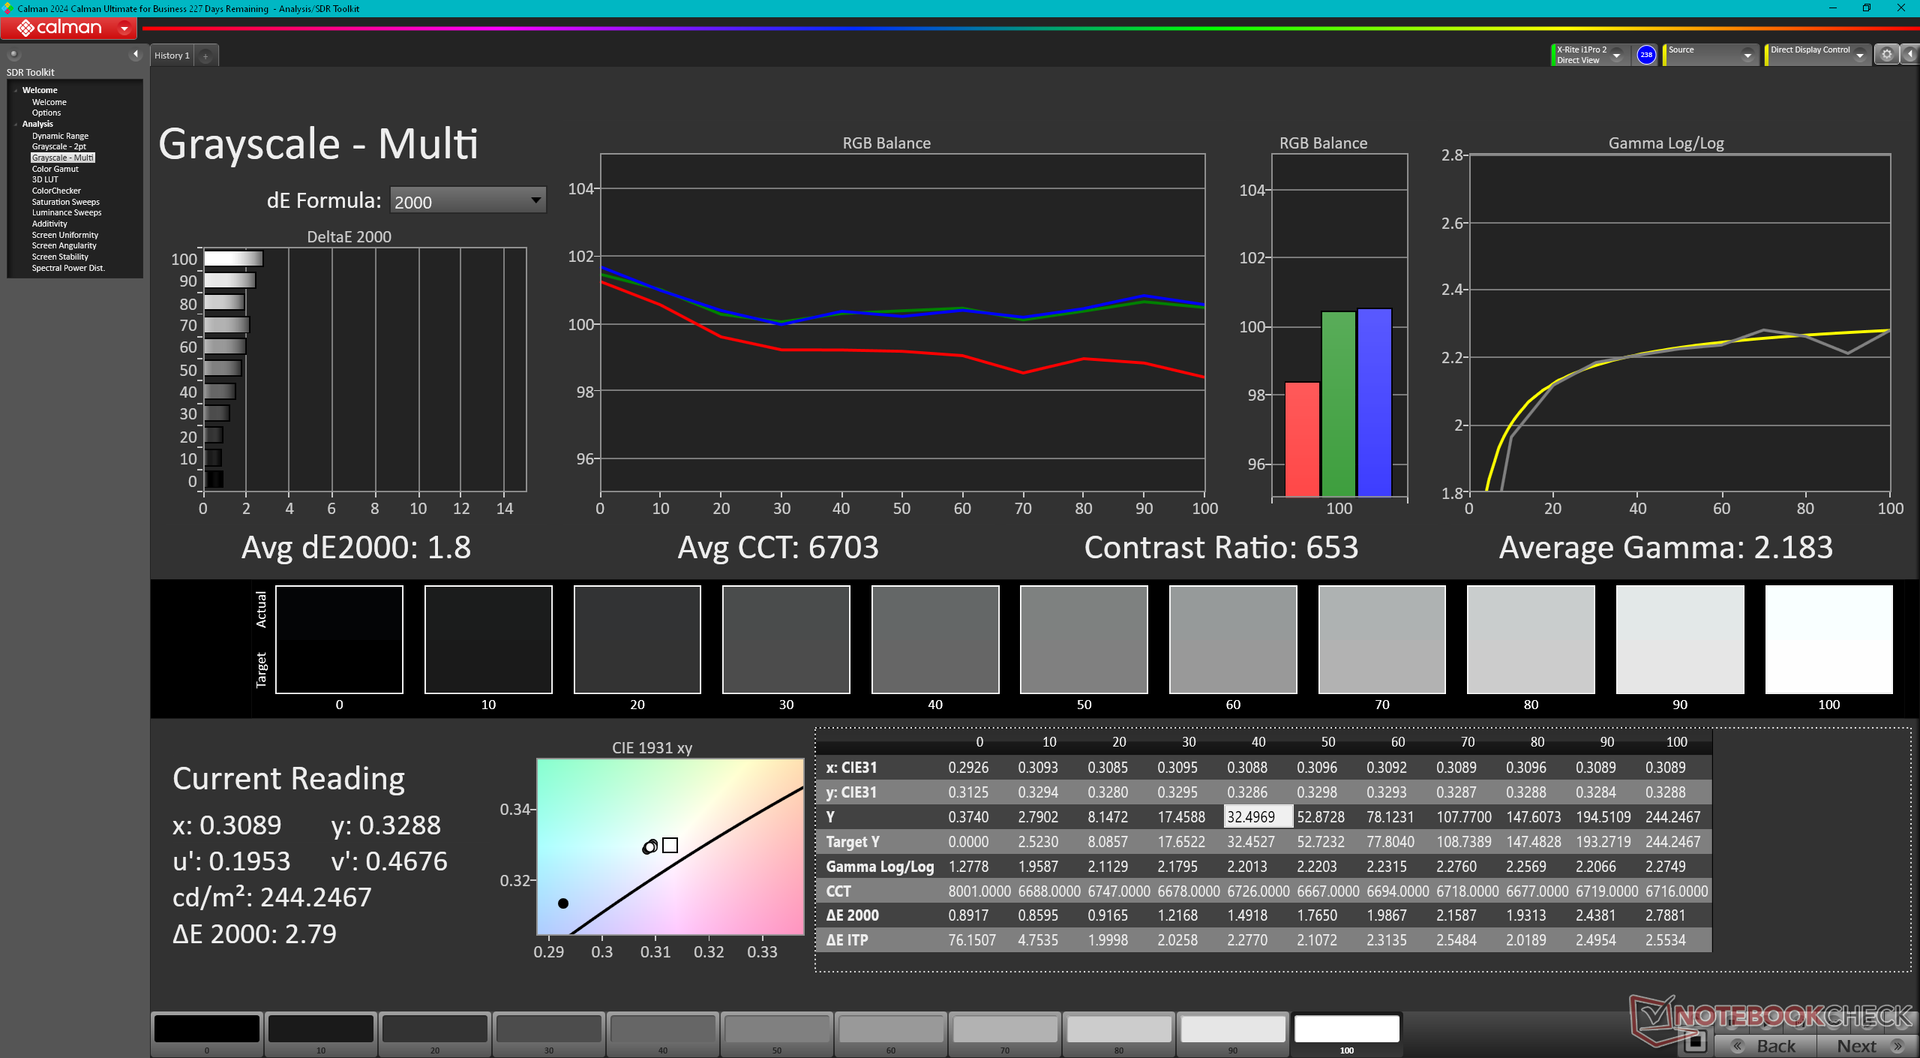
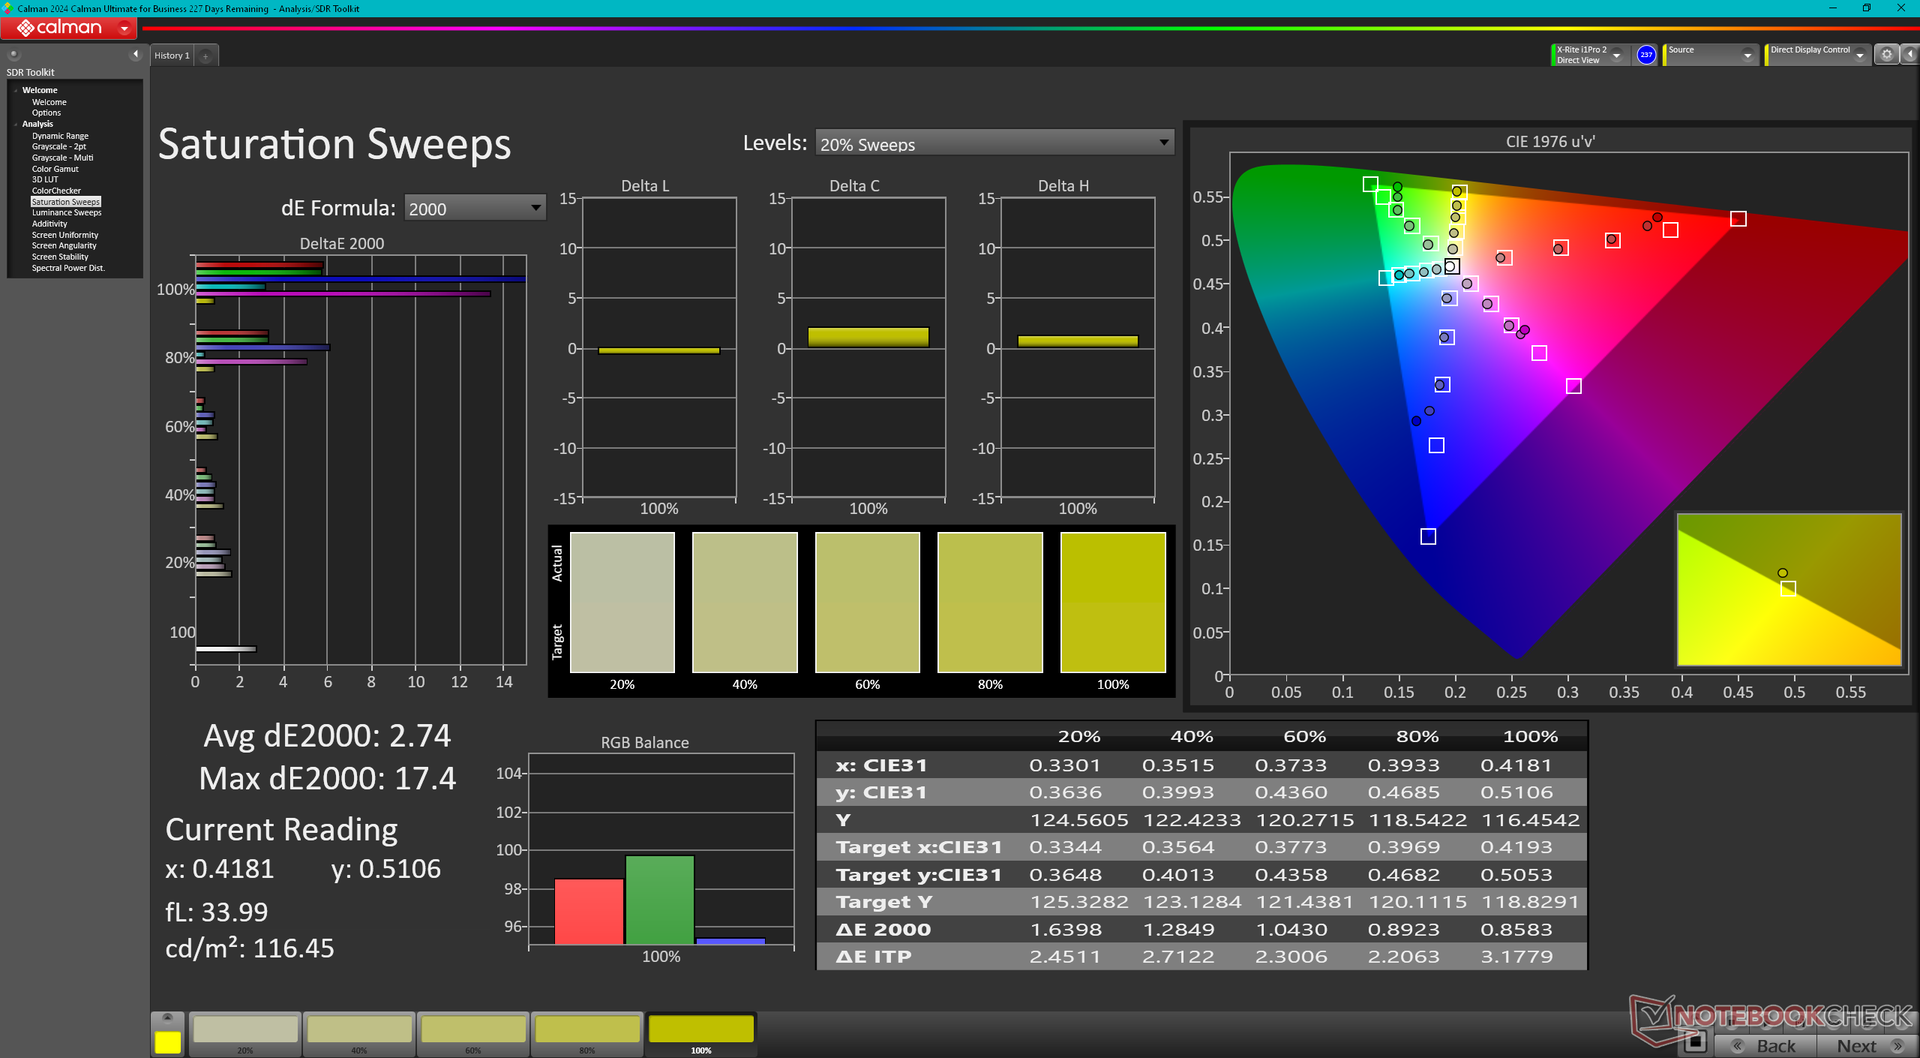
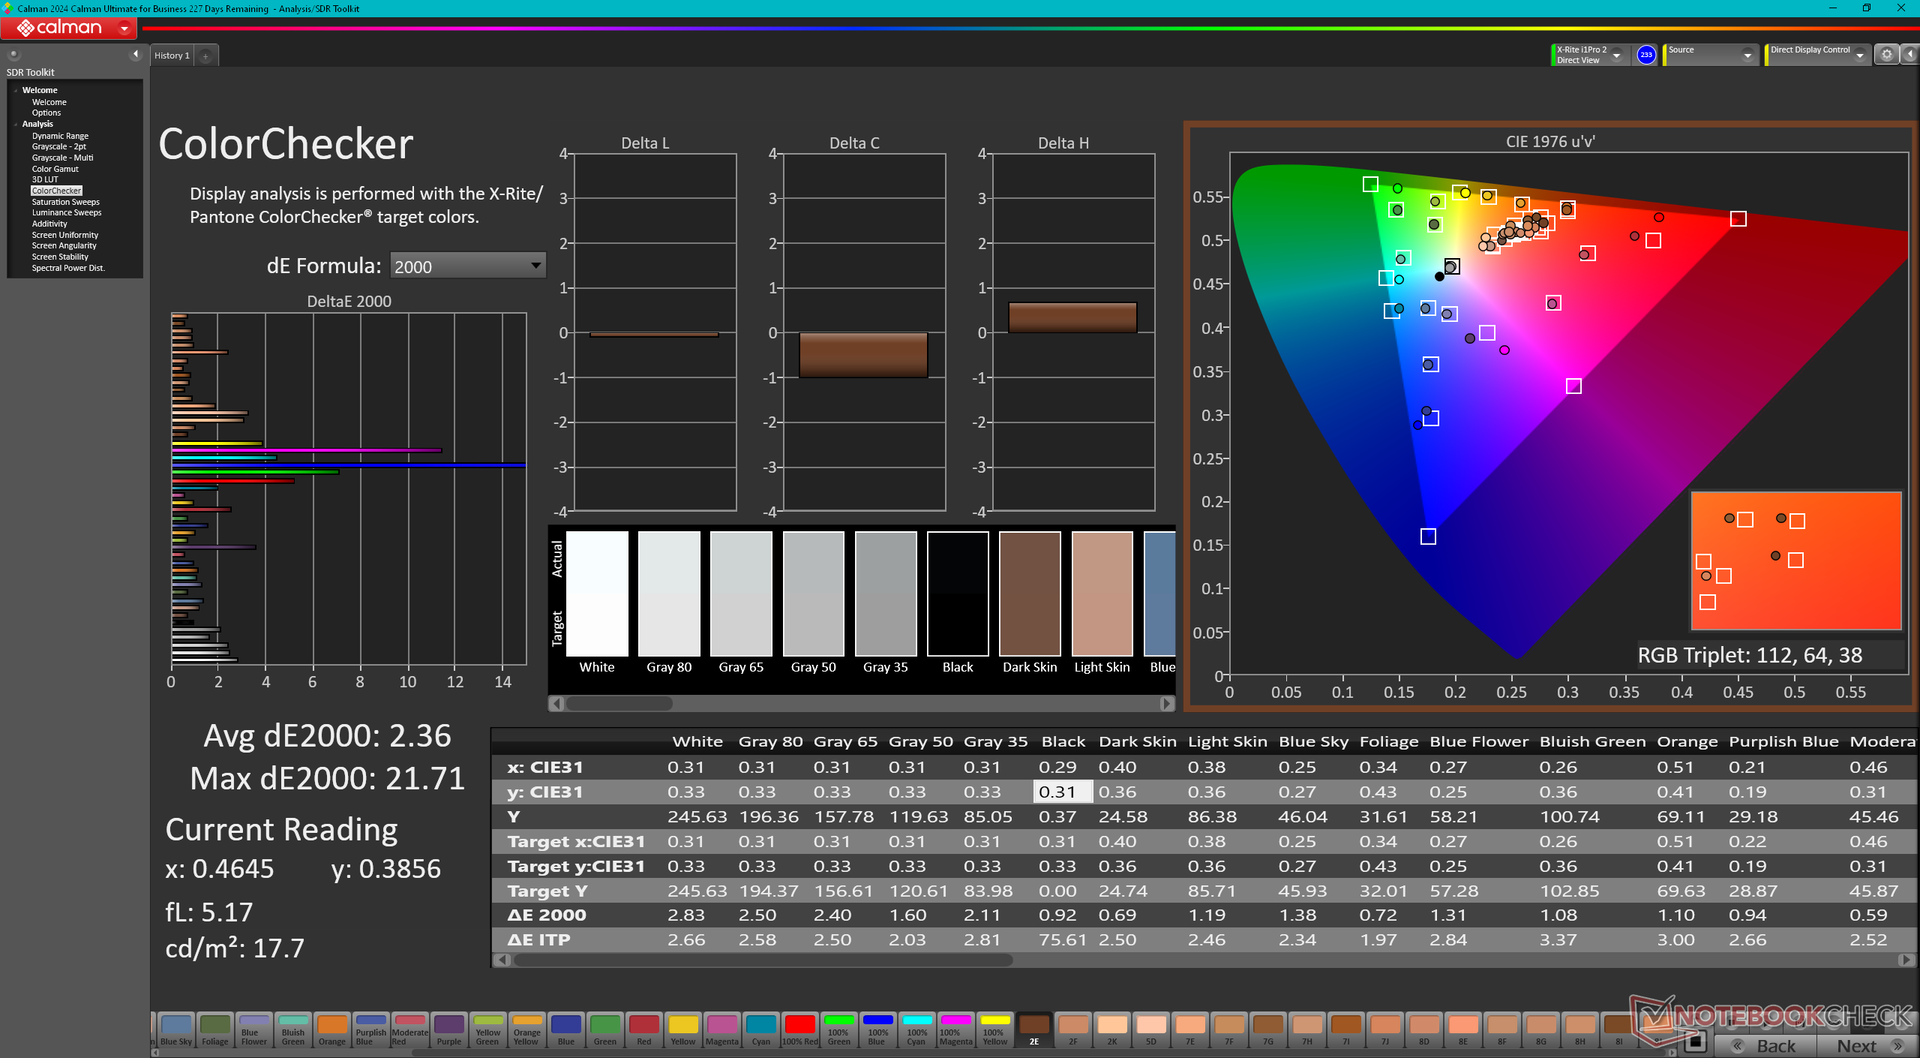
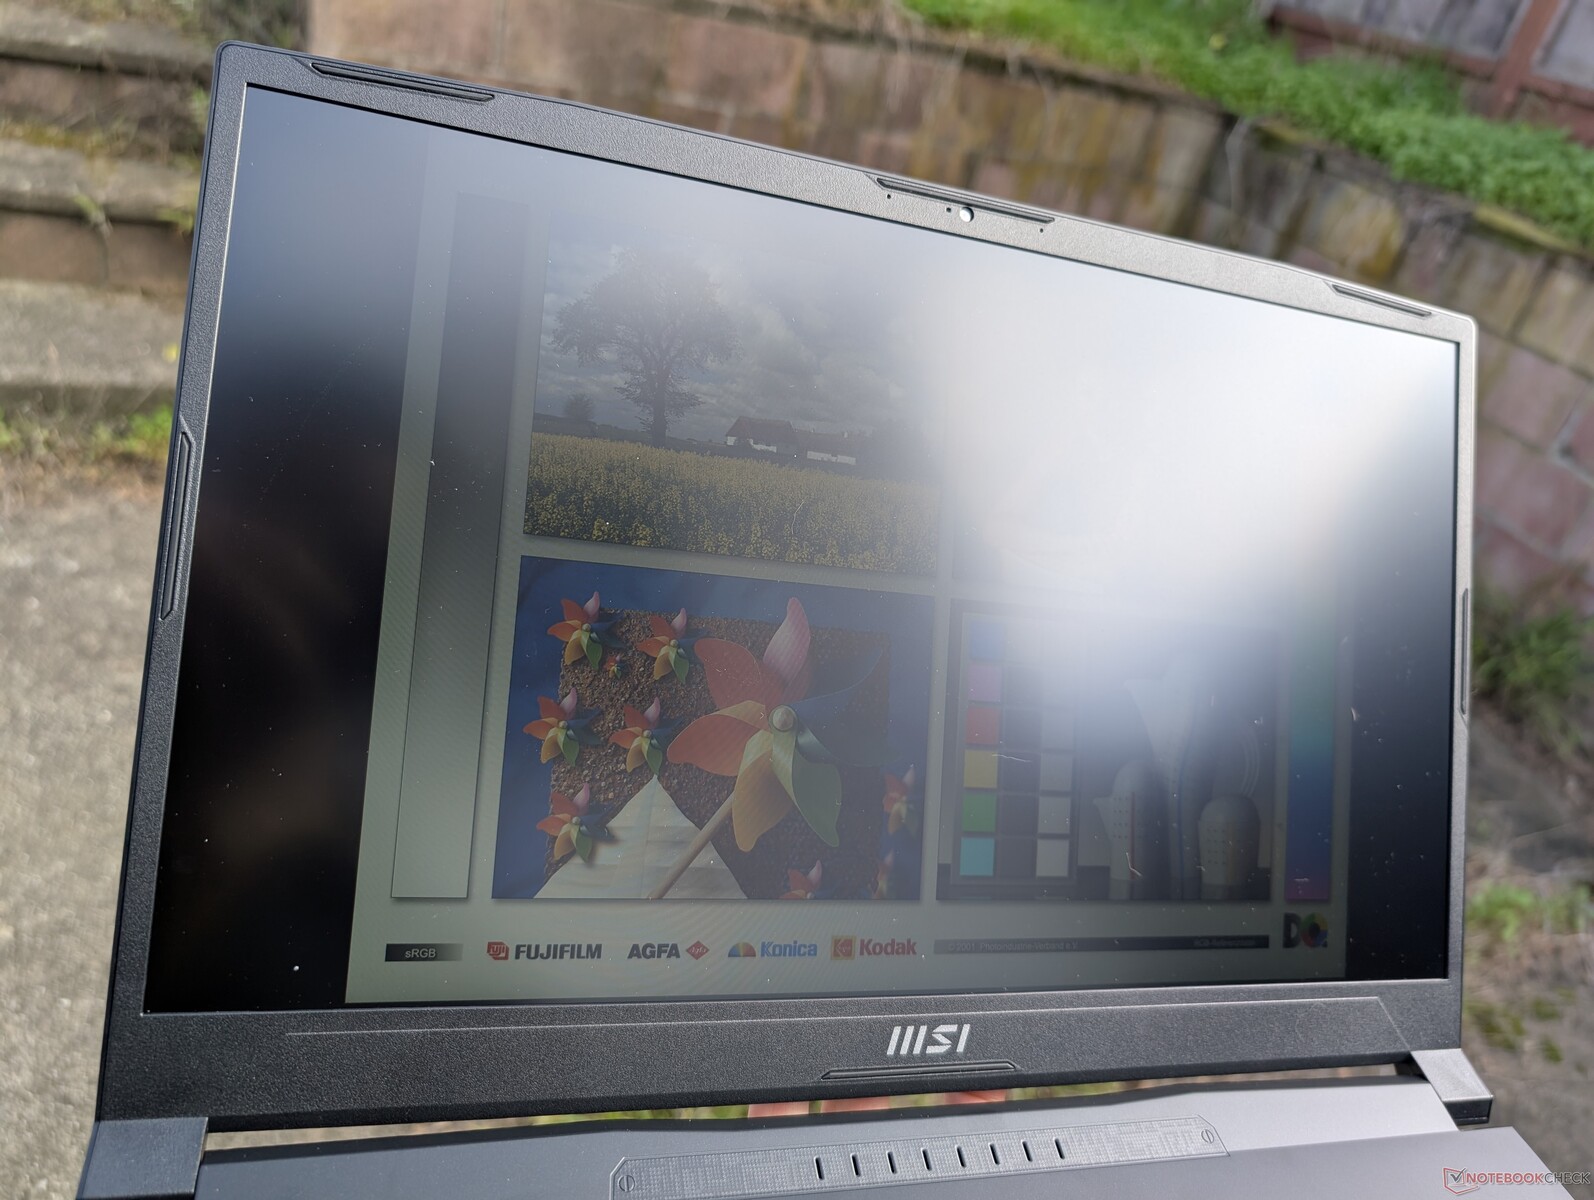
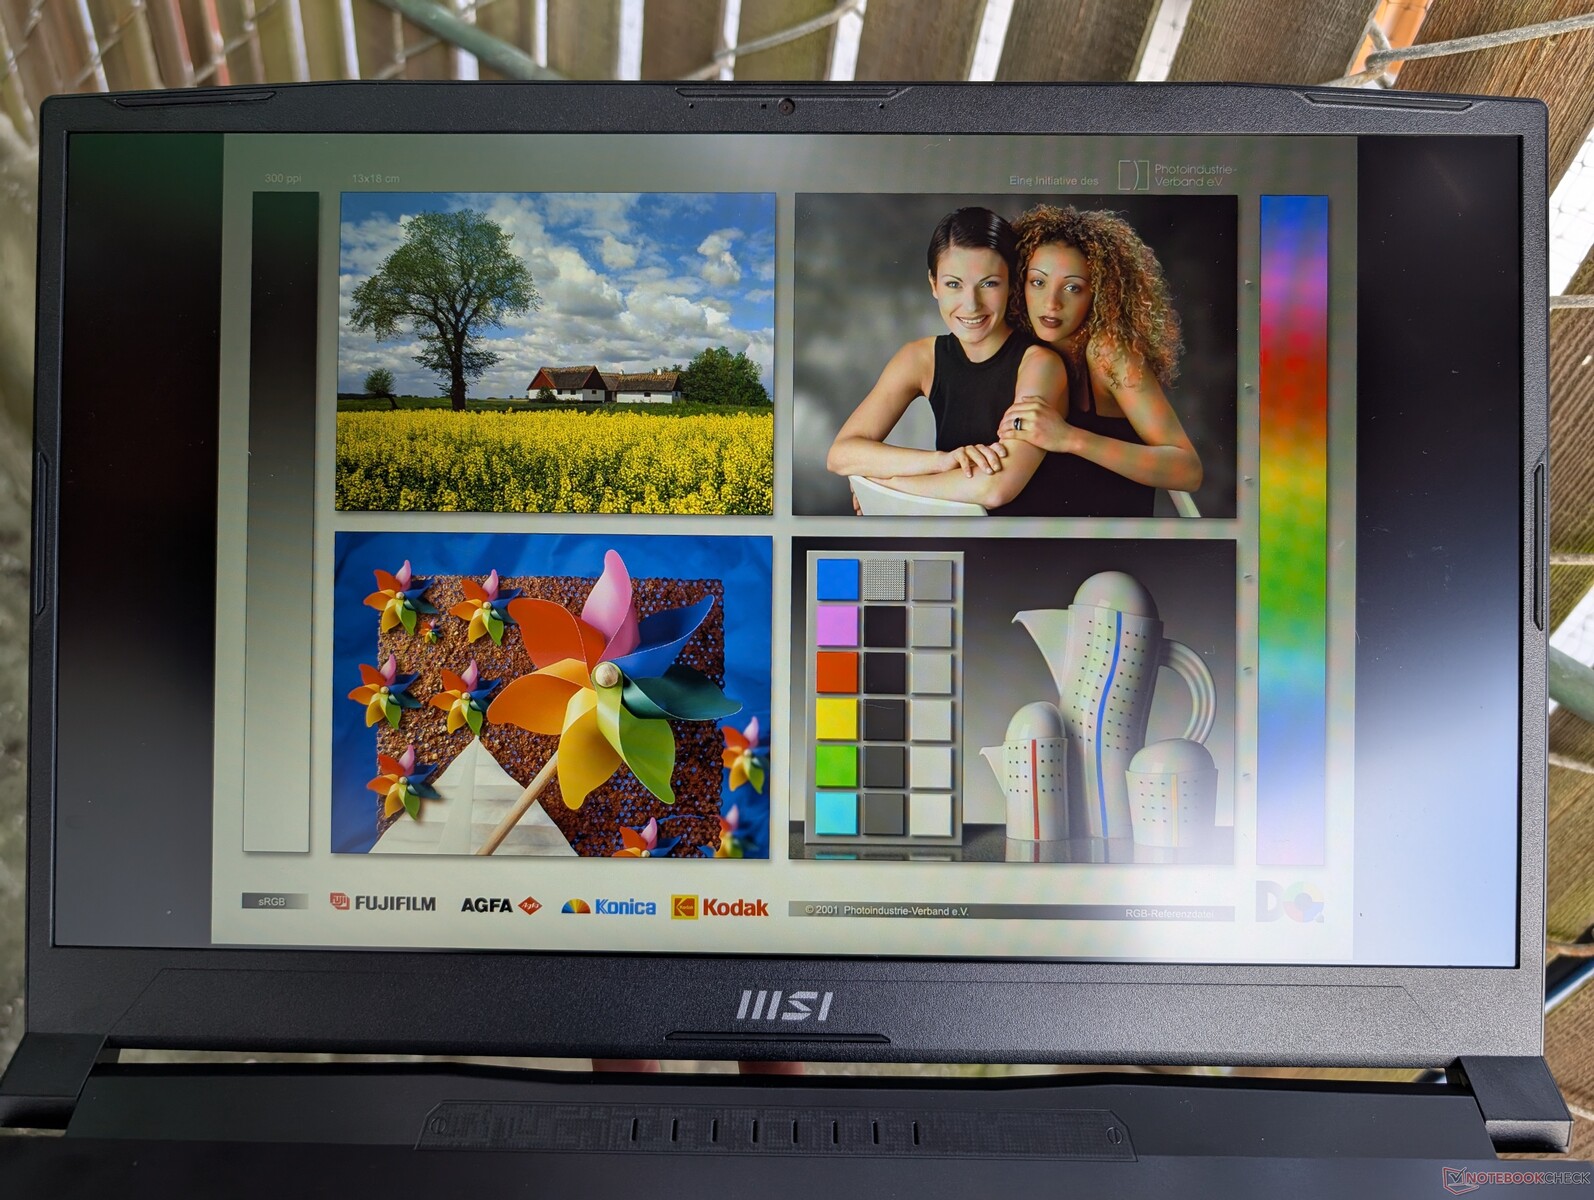
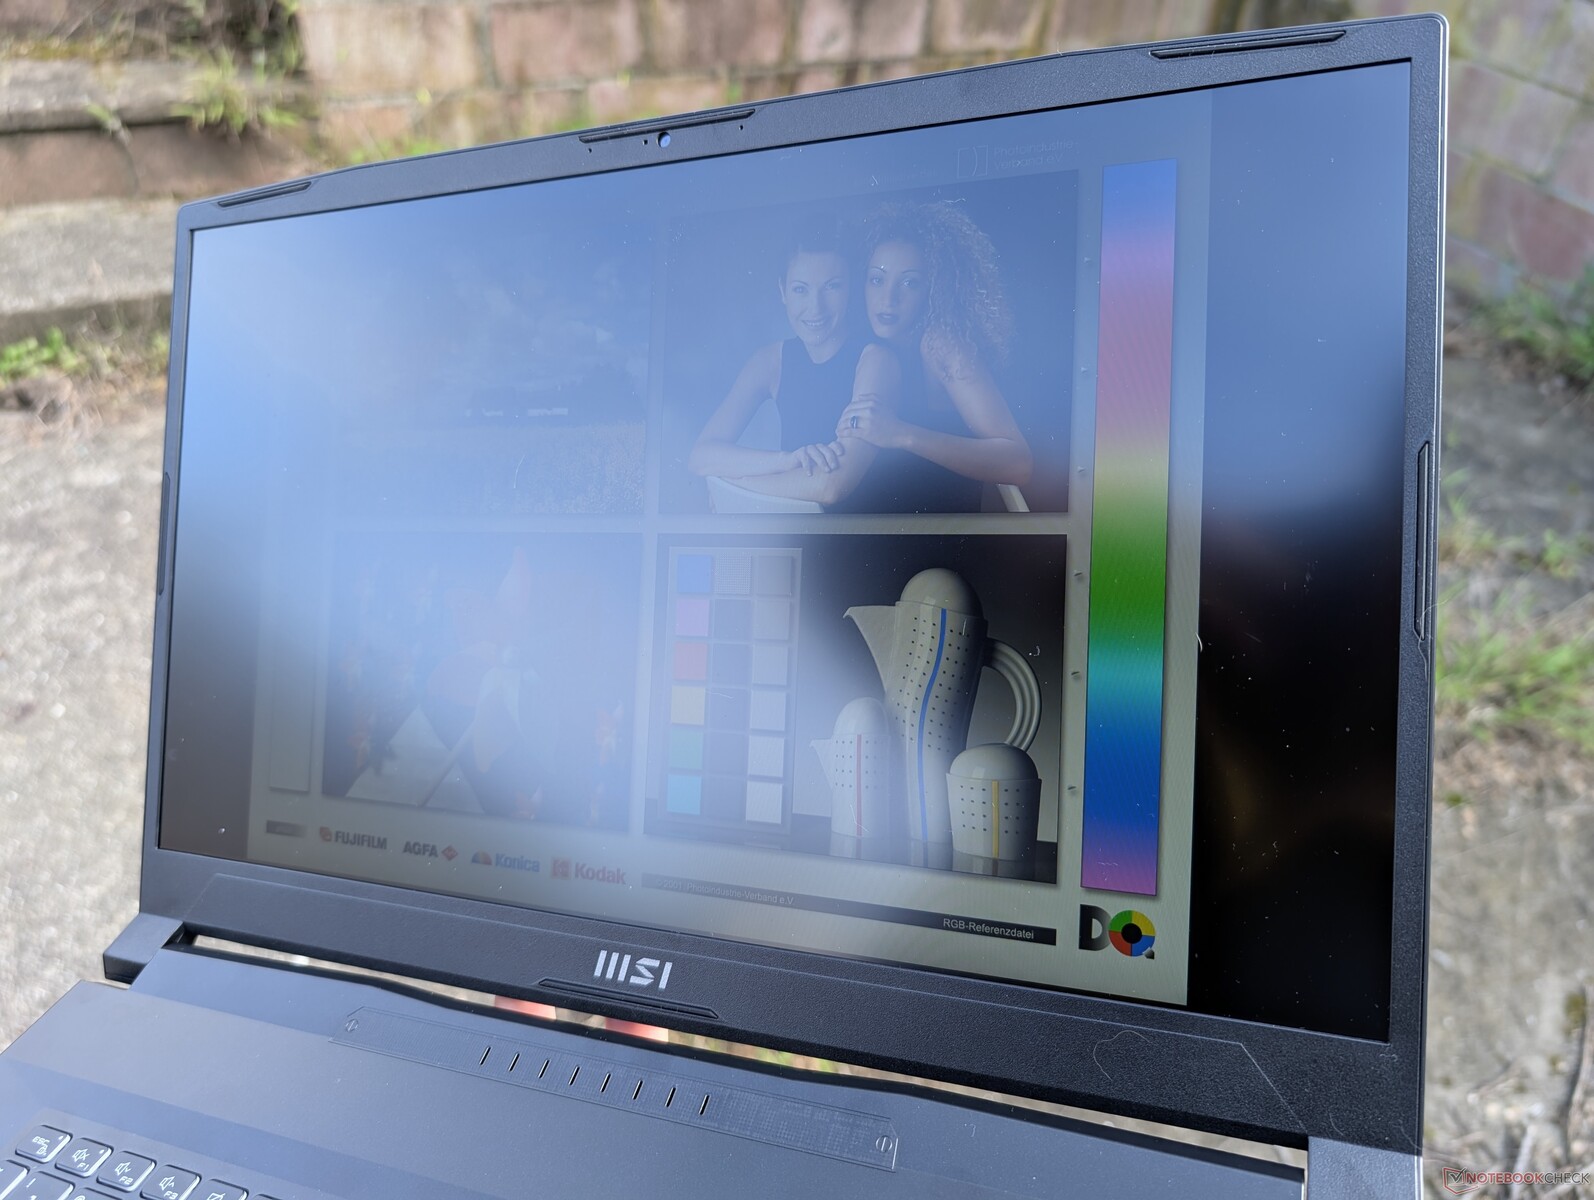
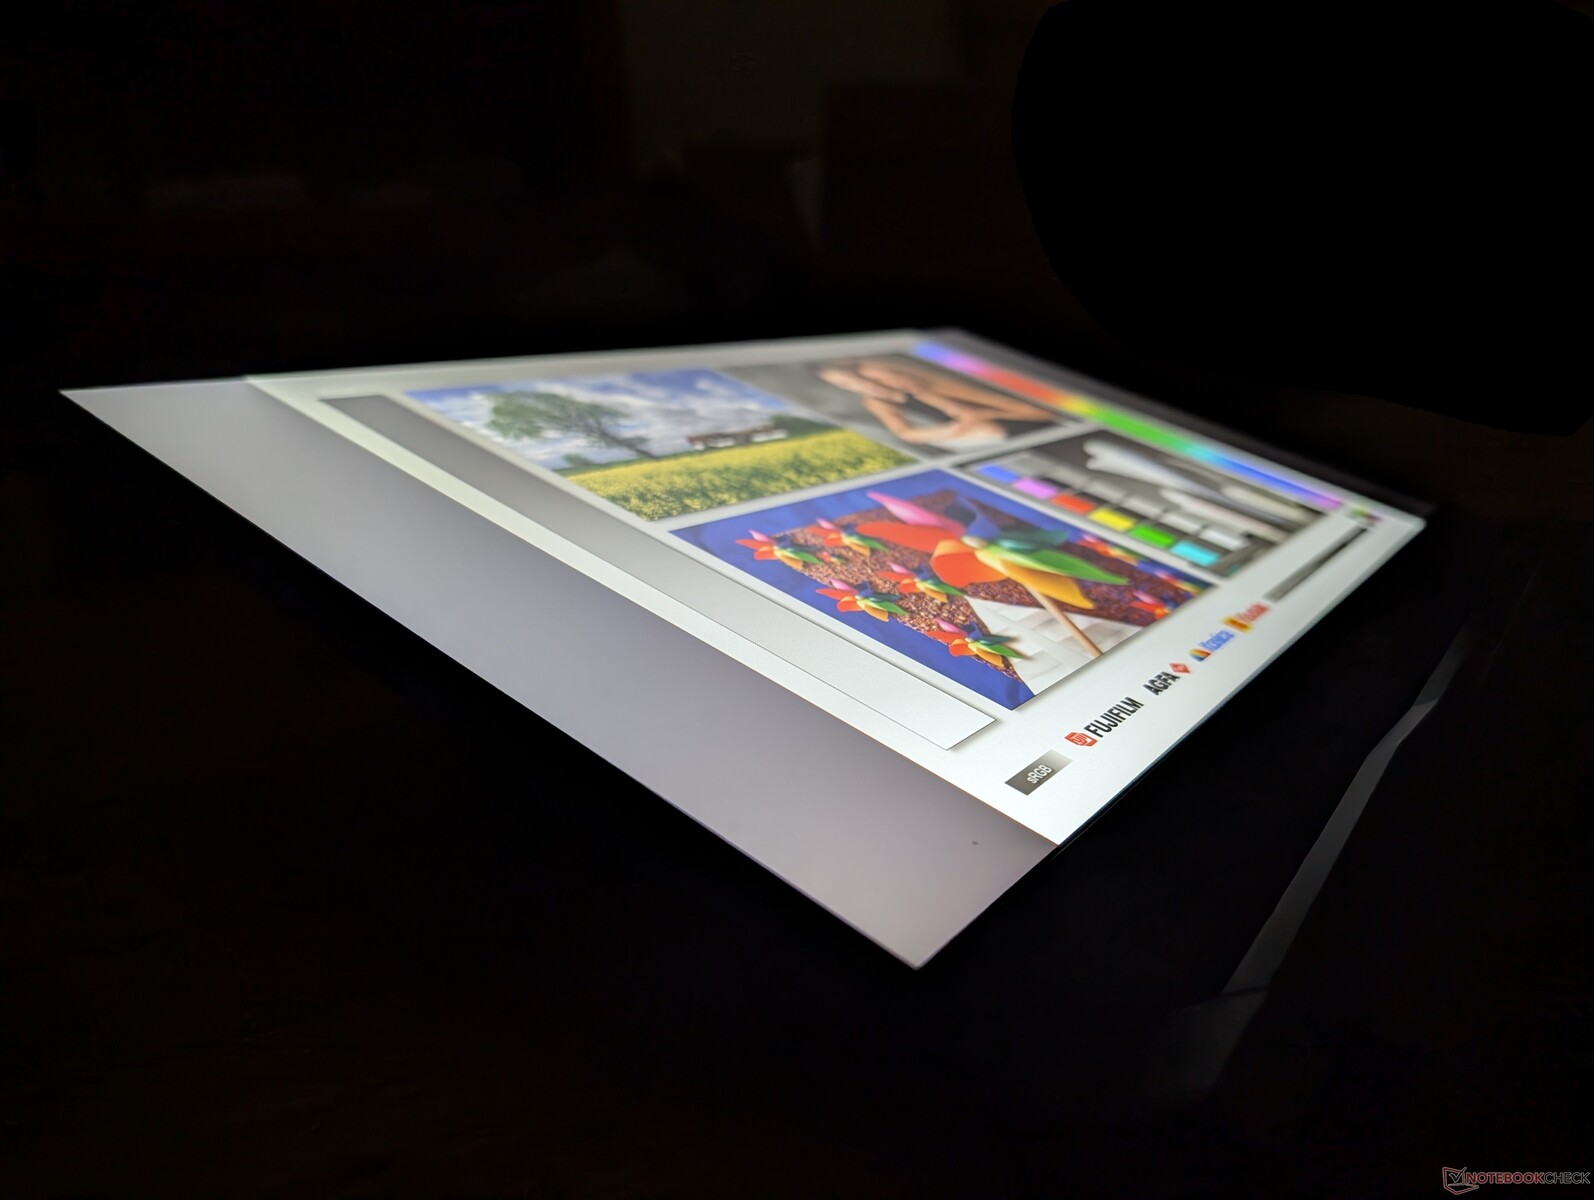
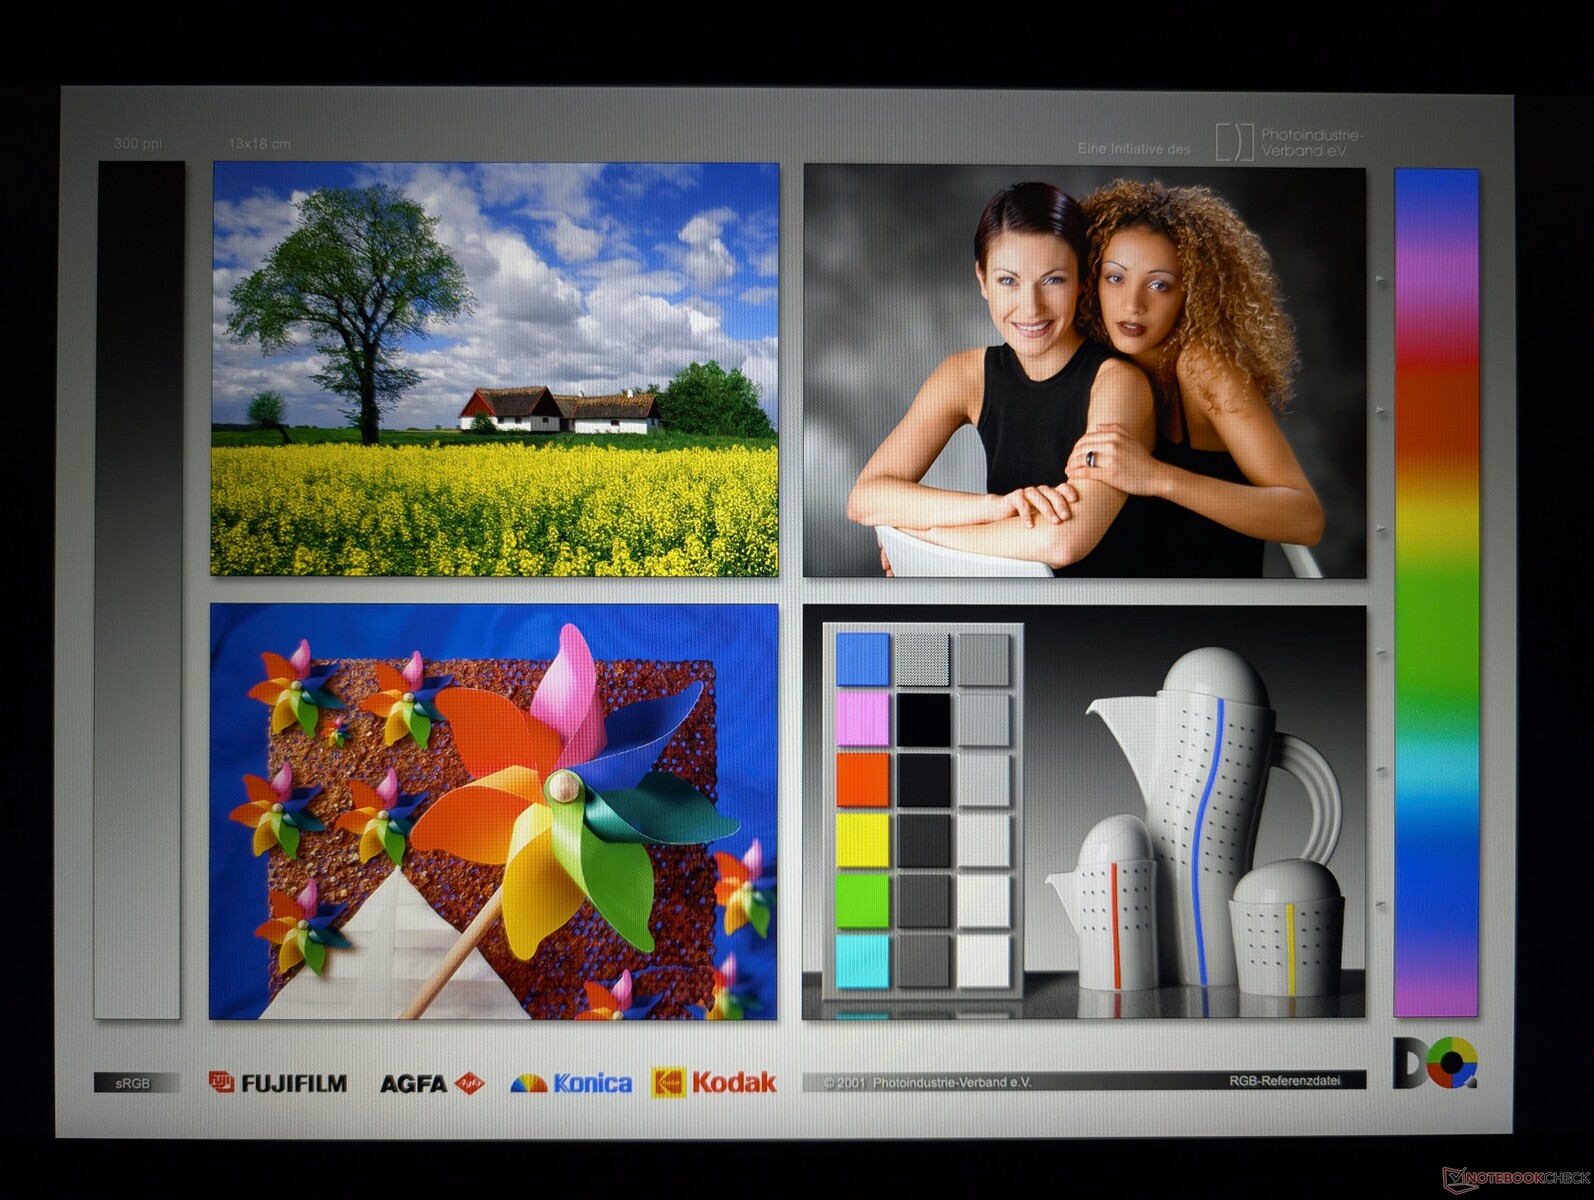
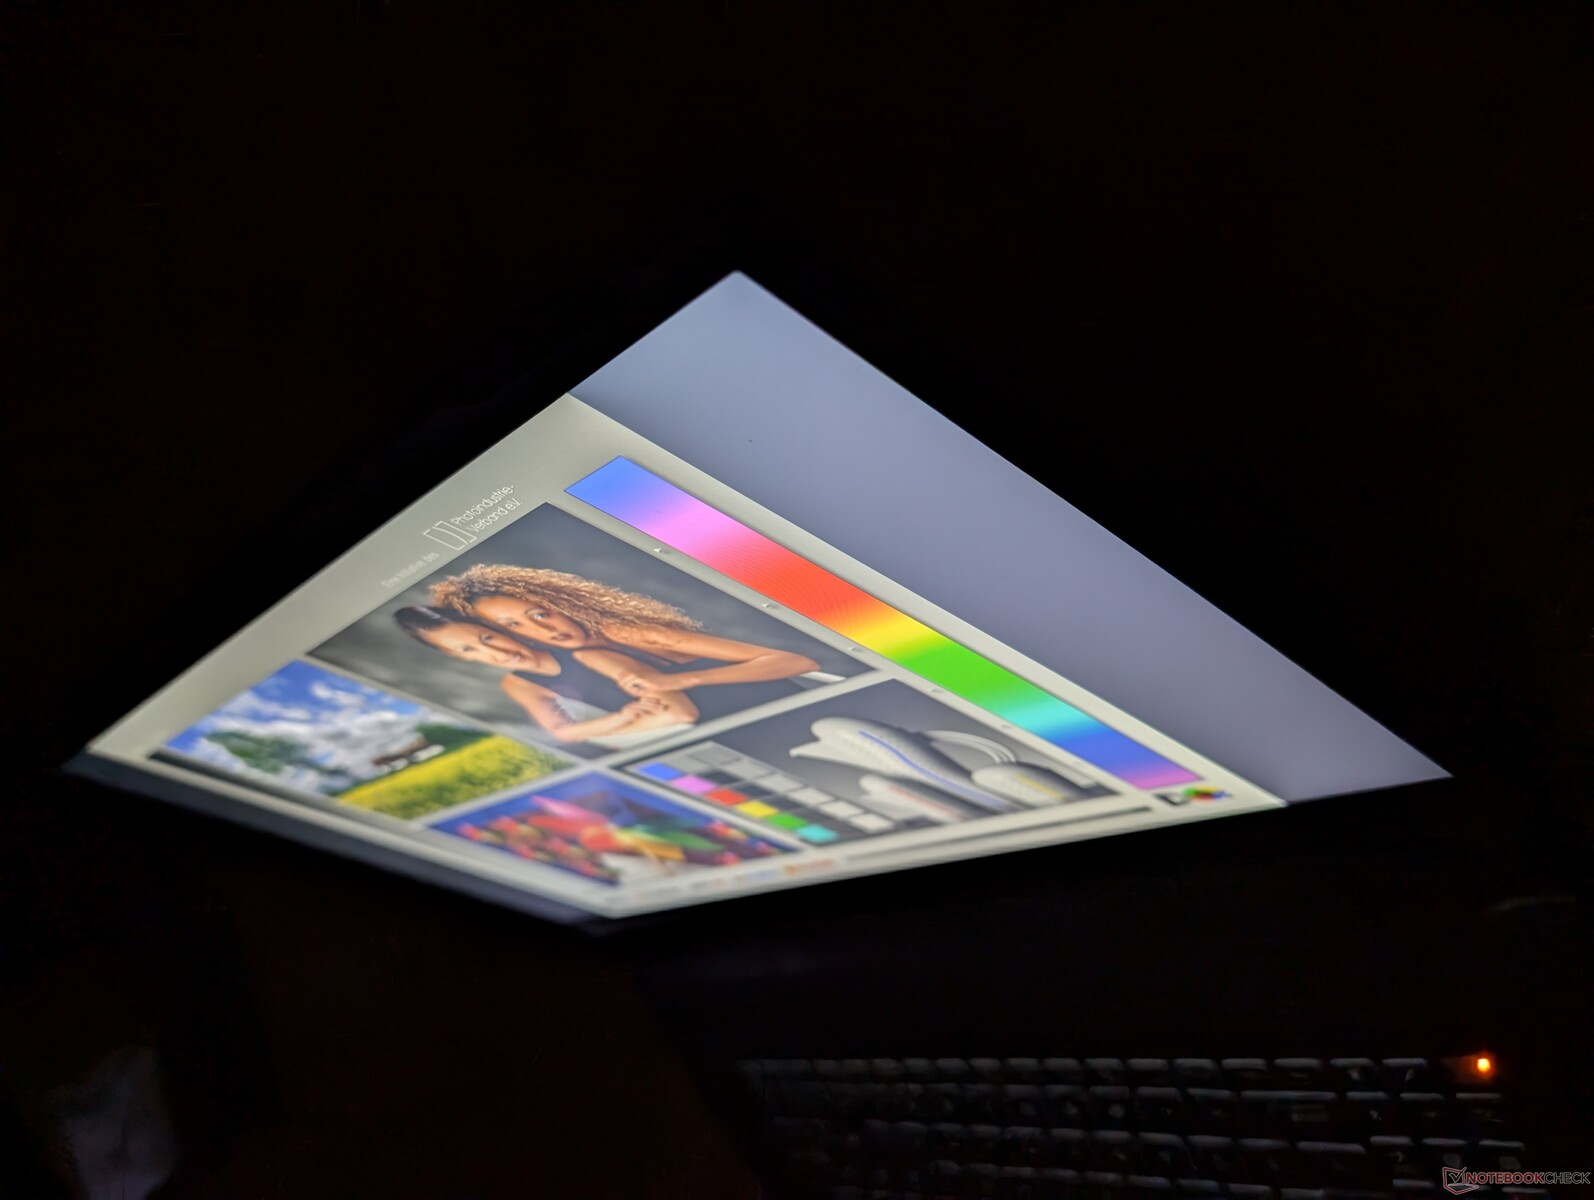
Affichage - Taux de rafraîchissement décent mais couleurs médiocres
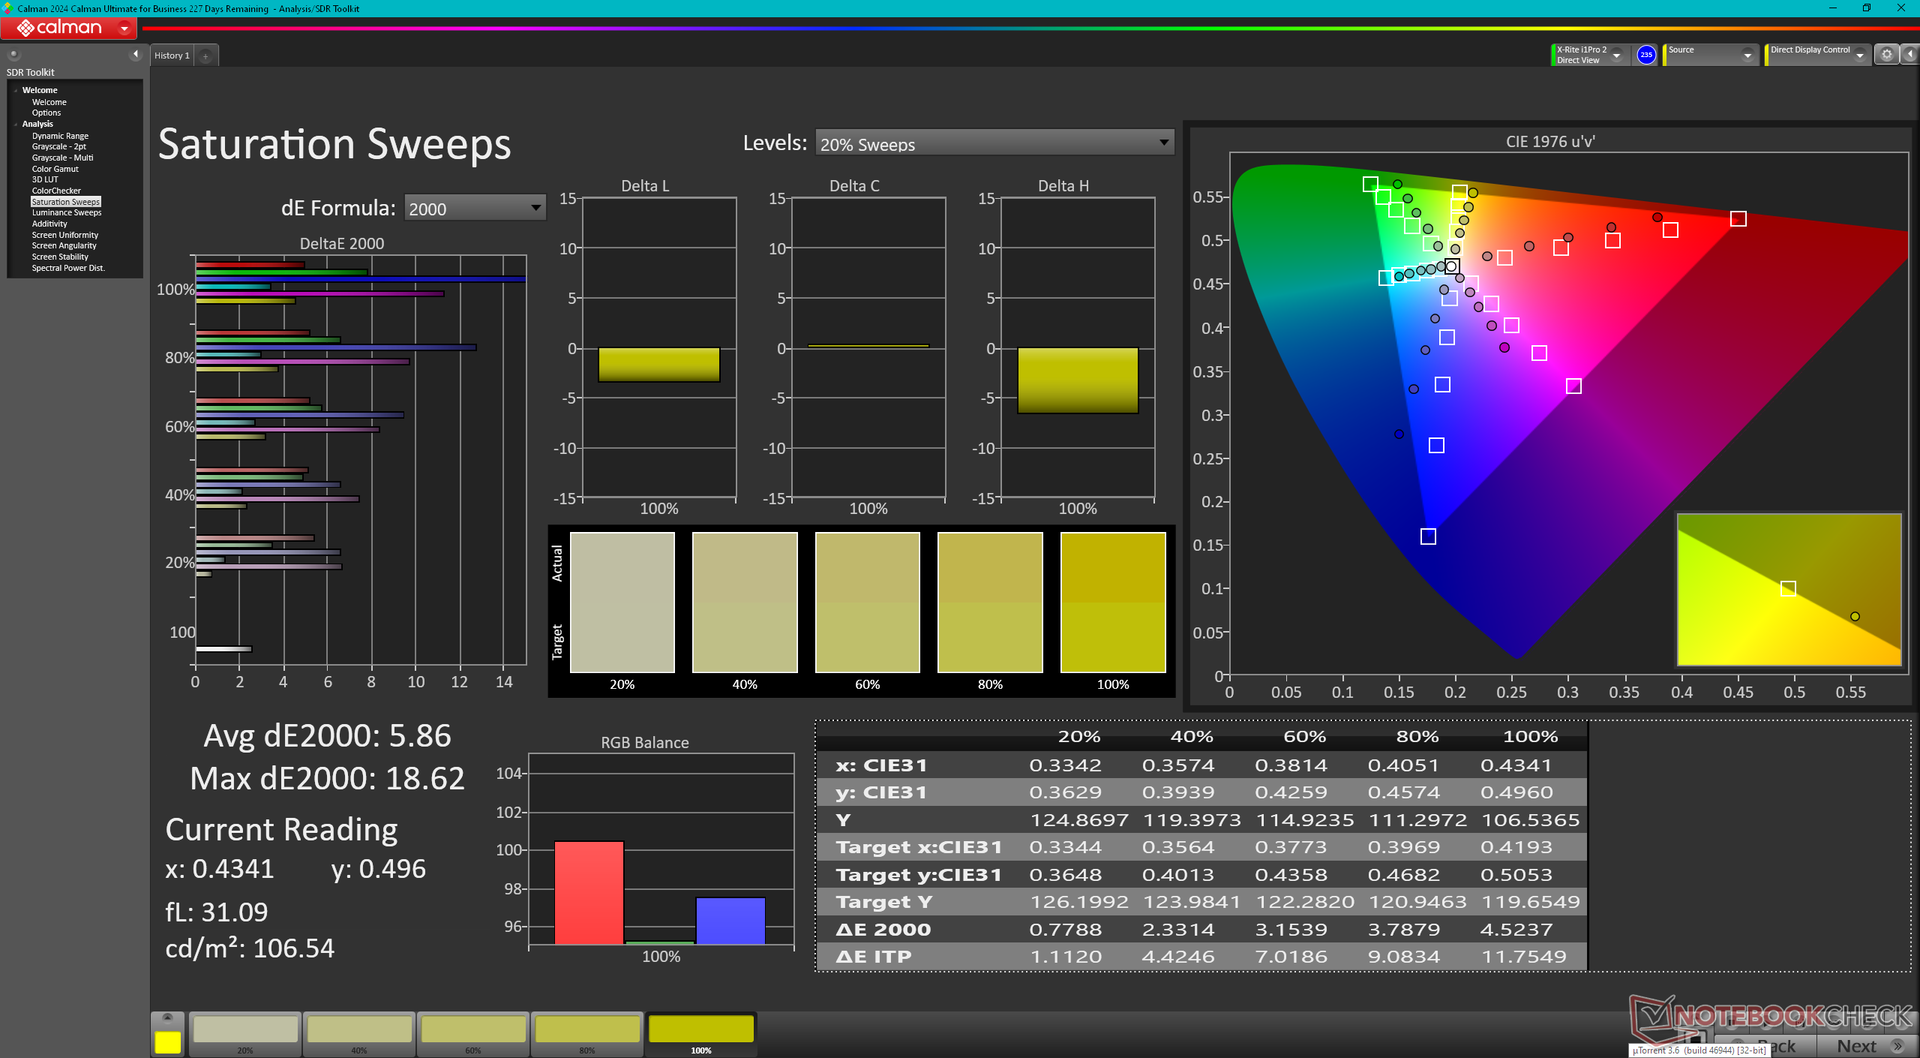
Ne vous laissez pas tromper par le taux de rafraîchissement de 144 Hz, car l'écran est par ailleurs peu impressionnant. La luminosité, les temps de réponse et la couverture des couleurs sont respectivement faibles, moyens et étroits, pour représenter un écran de budget. Même subjectivement, les couleurs et les images fantômes sont nettement inférieures aux écrans plus fluides des modèles plus chers comme le Lenovo Legion 5 17 ou le MSI GT series MSI GT series. Au moins, la qualité de l'image est propre et il n'y a pas de problèmes majeurs d'effets de rétroéclairage ou de grain.
Notez que cette même dalle AU Optronics B173HAN04.9 est également présente sur le modèle concurrent Asus TUF Gaming A17. La configuration 1440p240Hz, plus onéreuse, devrait offrir des couleurs et des caractéristiques bien meilleures.
| |||||||||||||||||||||||||
Homogénéité de la luminosité: 83 %
Valeur mesurée au centre, sur batterie: 244.5 cd/m²
Contraste: 1111:1 (Valeurs des noirs: 0.22 cd/m²)
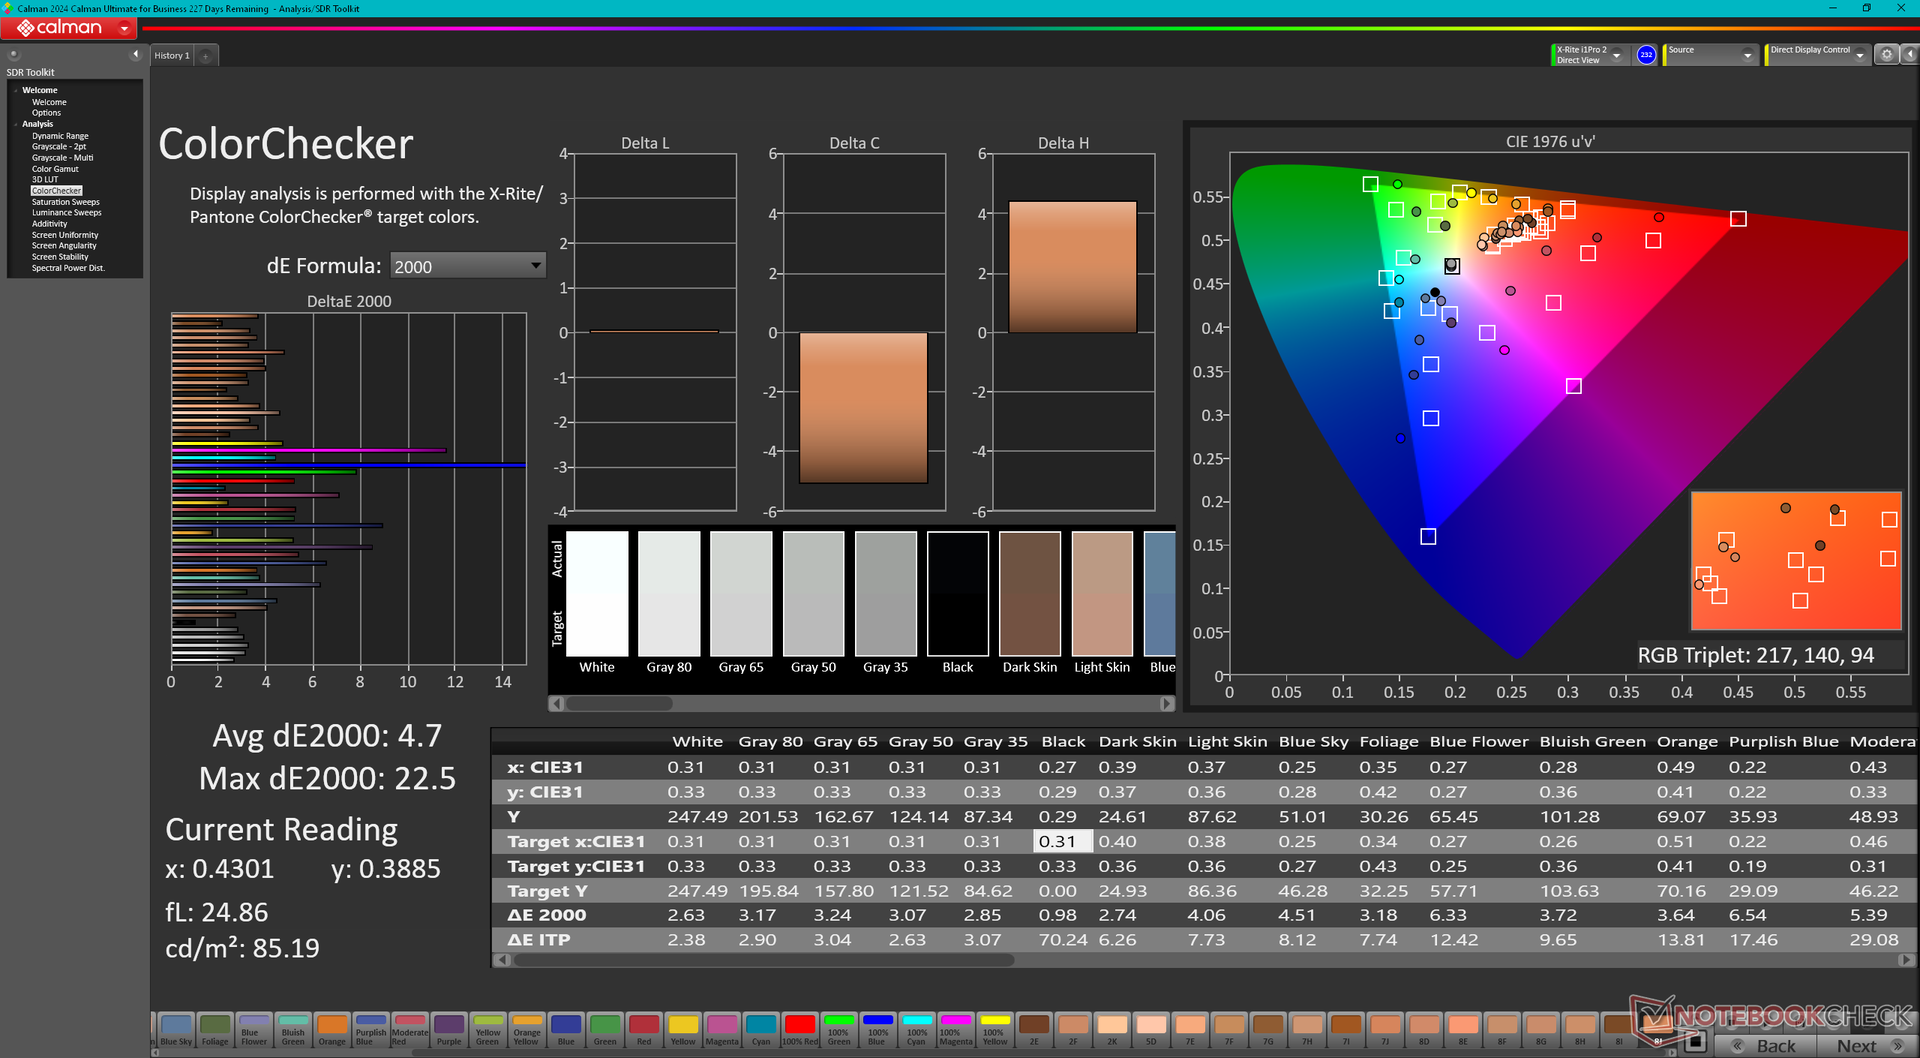
ΔE Color 4.7 | 0.5-29.43 Ø4.87, calibrated: 2.36
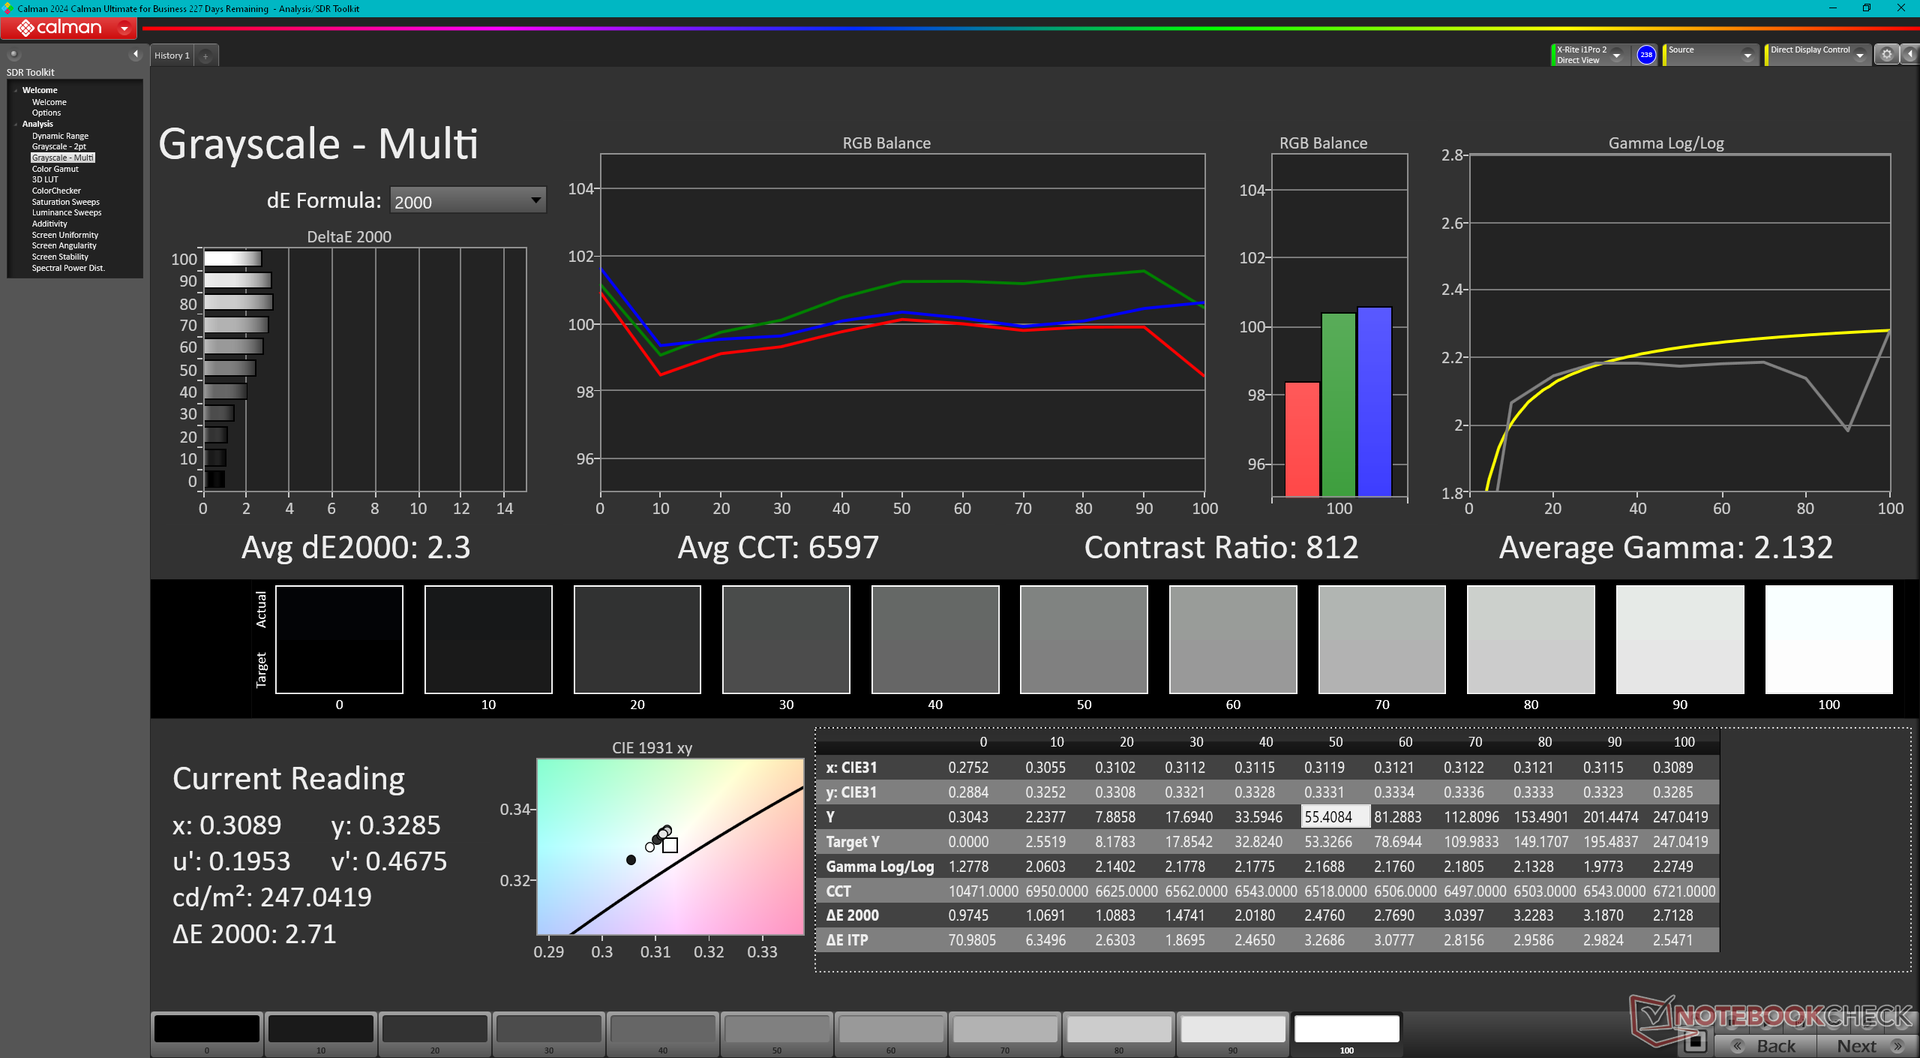
ΔE Greyscale 2.3 | 0.5-98 Ø5.1
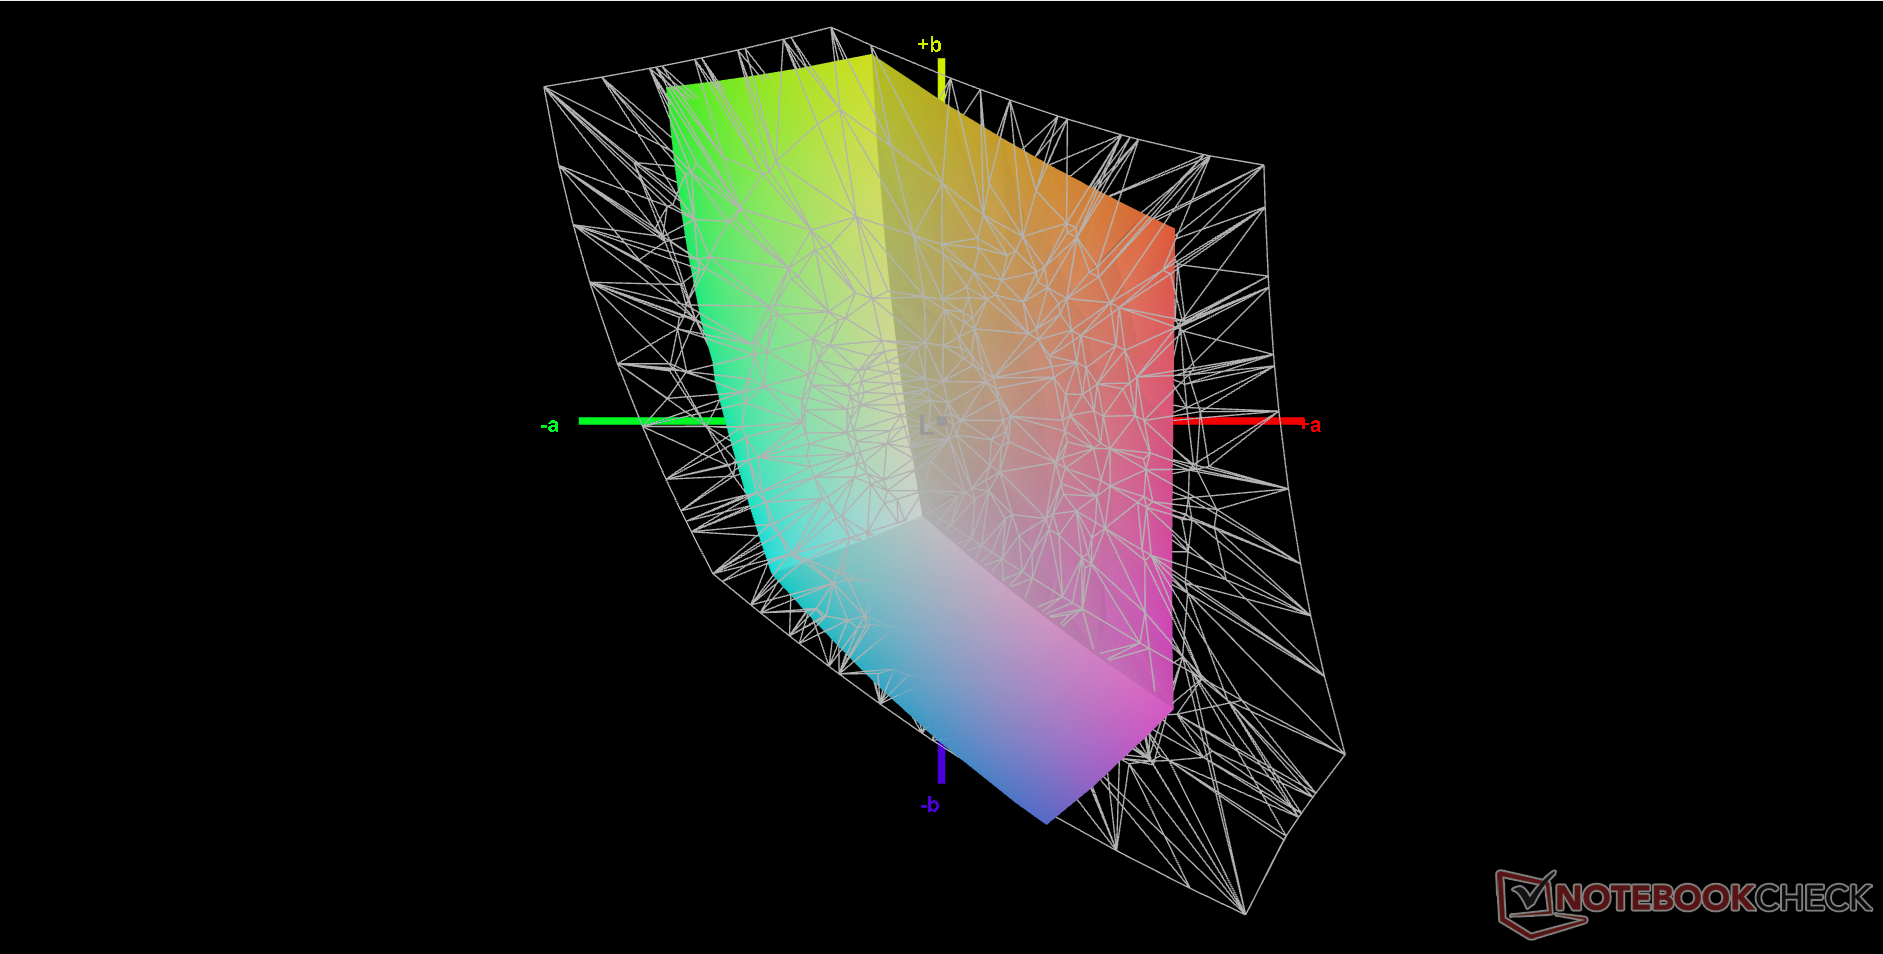
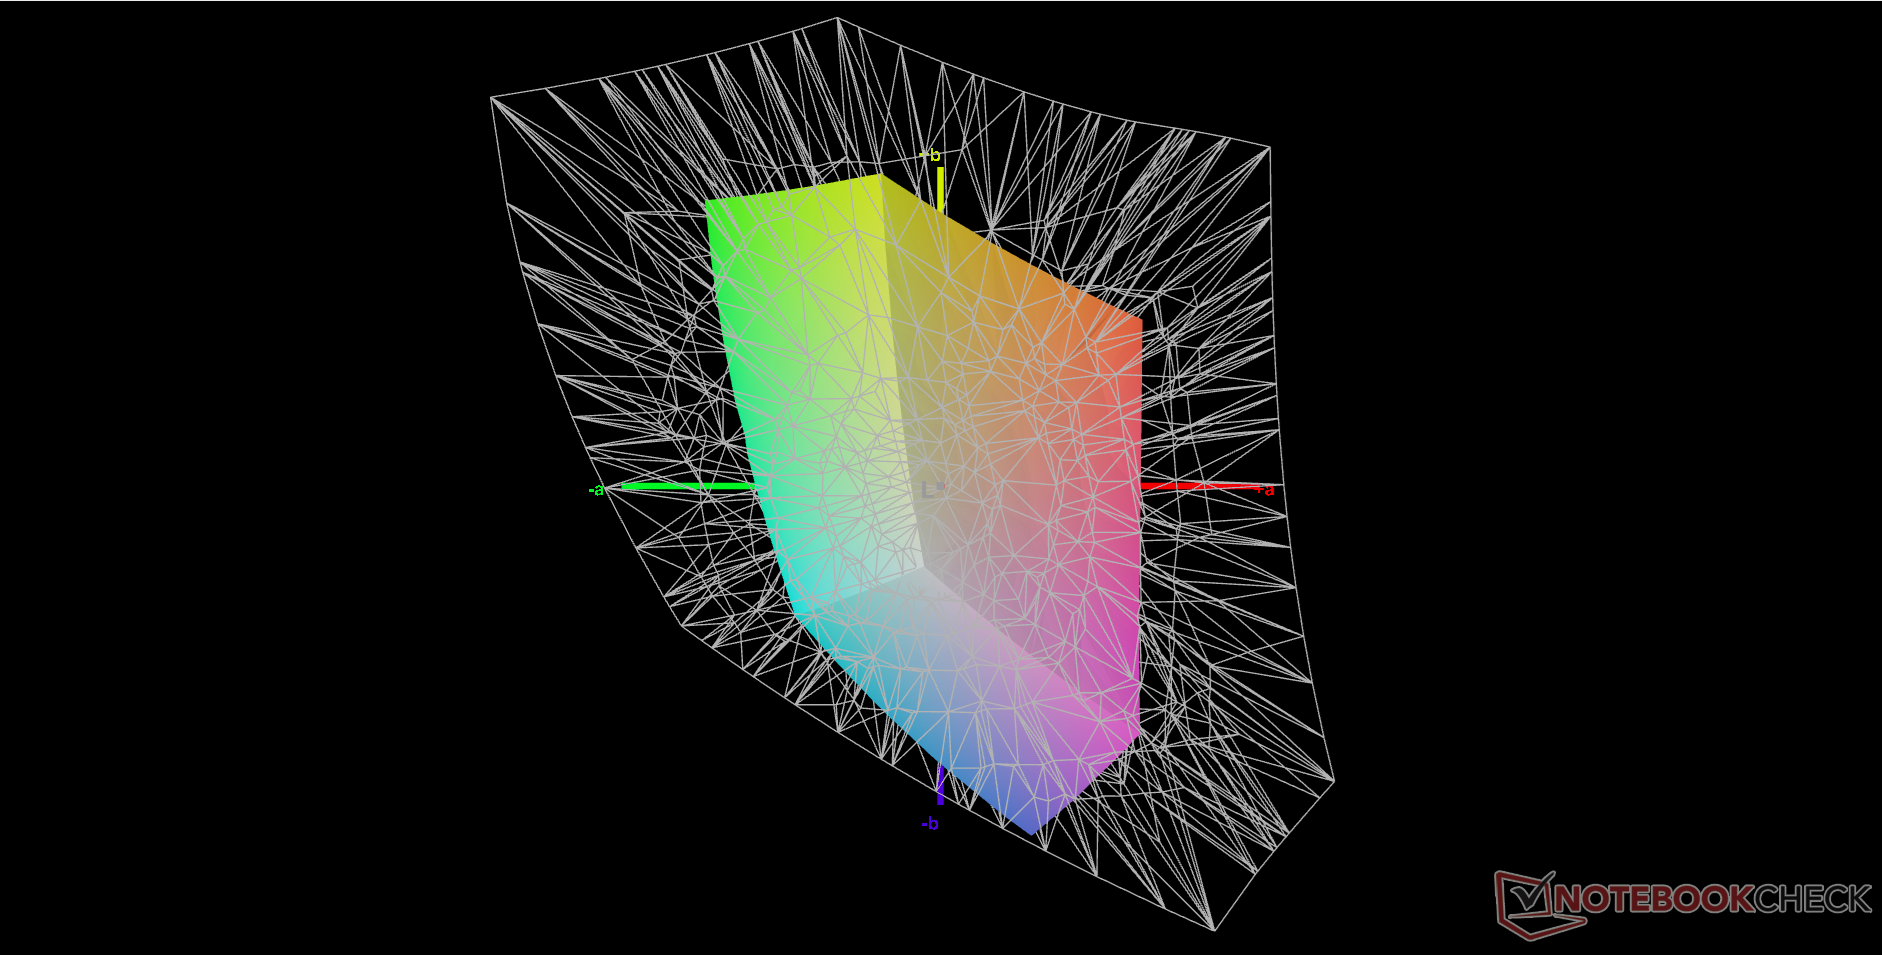
41.1% AdobeRGB 1998 (Argyll 2.2.0 3D)
59.3% sRGB (Argyll 2.2.0 3D)
39.8% Display P3 (Argyll 2.2.0 3D)
Gamma: 2.13
| MSI Katana A17 AI B8VG AU Optronics B173HAN04.9, IPS, 1920x1080, 17.3", 144 Hz | HP Omen 17-db0079ng BOE0B67, IPS, 2560x1440, 17.3", 240 Hz | Asus TUF Gaming A17 FA707XI-NS94 AU Optronics B173HAN04.9, IPS, 1920x1080, 17.3", 144 Hz | Acer Nitro 17 AN17-51-71ER BOE0B7C NE173QHM-NY6, , 2560x1440, 17.3", 165 Hz | MSI Pulse 17 B13VGK AU Optronics B173HAN04.9, IPS, 1920x1080, 17.3", 144 Hz | Lenovo Legion 5 17ACH6H-82JY0003GE LEN173FHD, IPS, 1920x1080, 17.3", 144 Hz | |
|---|---|---|---|---|---|---|
| Display | 64% | 0% | 108% | -3% | 63% | |
| Display P3 Coverage | 39.8 | 66.2 66% | 39.7 0% | 98.3 147% | 38.4 -4% | 64.8 63% |
| sRGB Coverage | 59.3 | 95.5 61% | 59.1 0% | 100 69% | 57.5 -3% | 97.2 64% |
| AdobeRGB 1998 Coverage | 41.1 | 68.1 66% | 41 0% | 85.7 109% | 39.7 -3% | 66.7 62% |
| Response Times | 60% | -18% | 60% | 2% | 57% | |
| Response Time Grey 50% / Grey 80% * | 30.8 ? | 14.4 ? 53% | 39 ? -27% | 14.8 ? 52% | 31.2 ? -1% | 15 ? 51% |
| Response Time Black / White * | 24.6 ? | 8.3 ? 66% | 26.9 ? -9% | 8 ? 67% | 23.6 ? 4% | 9 ? 63% |
| PWM Frequency | ||||||
| Screen | 25% | 4% | -14% | 11% | 29% | |
| Brightness middle | 244.5 | 363 48% | 255.9 5% | 361 48% | 254 4% | 323 32% |
| Brightness | 234 | 341 46% | 248 6% | 326 39% | 250 7% | 305 30% |
| Brightness Distribution | 83 | 84 1% | 91 10% | 87 5% | 91 10% | 89 7% |
| Black Level * | 0.22 | 0.38 -73% | 0.21 5% | 0.6 -173% | 0.14 36% | 0.25 -14% |
| Contrast | 1111 | 955 -14% | 1219 10% | 602 -46% | 1814 63% | 1292 16% |
| Colorchecker dE 2000 * | 4.7 | 1.74 63% | 4.51 4% | 3.83 19% | 4.52 4% | 1.87 60% |
| Colorchecker dE 2000 max. * | 22.5 | 5.39 76% | 20.77 8% | 5.71 75% | 21.22 6% | 4.84 78% |
| Colorchecker dE 2000 calibrated * | 2.36 | 1.43 39% | 1.82 23% | 3.48 -47% | 4.52 -92% | 0.92 61% |
| Greyscale dE 2000 * | 2.3 | 1.3 43% | 3.2 -39% | 3.29 -43% | 1 57% | 2.57 -12% |
| Gamma | 2.13 103% | 2.235 98% | 2.08 106% | 2.29 96% | 2.44 90% | 2.42 91% |
| CCT | 6597 99% | 6346 102% | 6054 107% | 6679 97% | 6502 100% | 7012 93% |
| Moyenne finale (programmes/paramètres) | 50% /
39% | -5% /
-0% | 51% /
23% | 3% /
6% | 50% /
40% |
* ... Moindre est la valeur, meilleures sont les performances
Les niveaux de gris sont satisfaisants dès la sortie de la boîte, tandis que la précision des couleurs pourrait être améliorée. En calibrant nous-mêmes le panneau, nous améliorerions les valeurs moyennes de niveaux de gris et de deltaE des couleurs de 2,3 à 1,8 et de 4,7 à 2,36, respectivement. Notre profil ICM calibré peut être téléchargé gratuitement ci-dessus.
Temps de réponse de l'écran
| ↔ Temps de réponse noir à blanc | ||
|---|---|---|
| 24.6 ms ... hausse ↗ et chute ↘ combinées | ↗ 12.7 ms hausse | 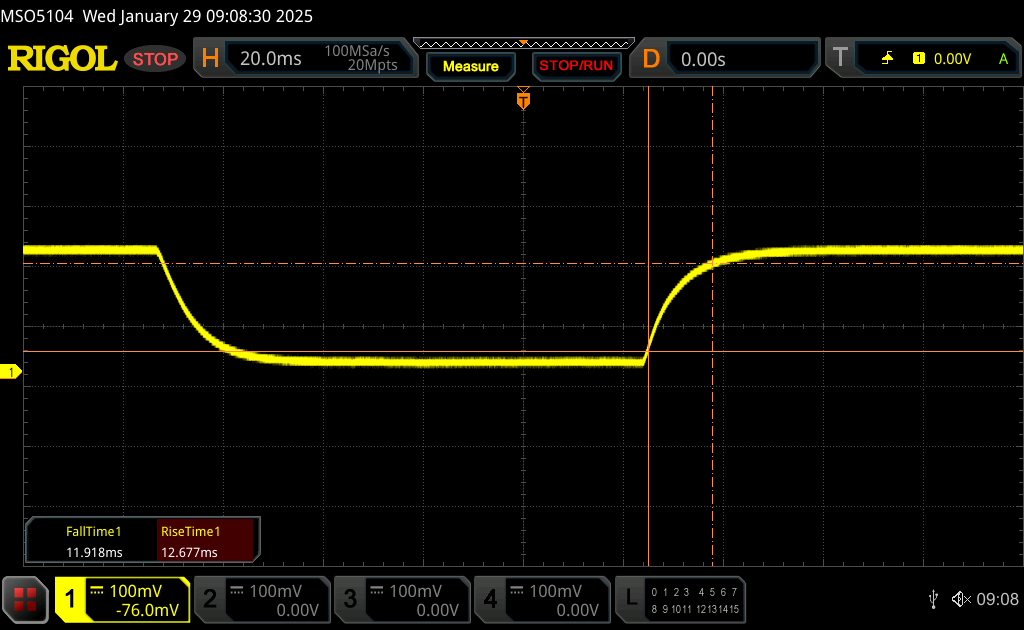 |
| ↘ 11.9 ms chute | ||
| L'écran montre de bons temps de réponse, mais insuffisant pour du jeu compétitif. En comparaison, tous les appareils testés affichent entre 0.1 (minimum) et 240 (maximum) ms. » 55 % des appareils testés affichent de meilleures performances. Cela signifie que les latences relevées sont moins bonnes que la moyenne (20.8 ms) de tous les appareils testés. | ||
| ↔ Temps de réponse gris 50% à gris 80% | ||
| 30.8 ms ... hausse ↗ et chute ↘ combinées | ↗ 14.4 ms hausse | 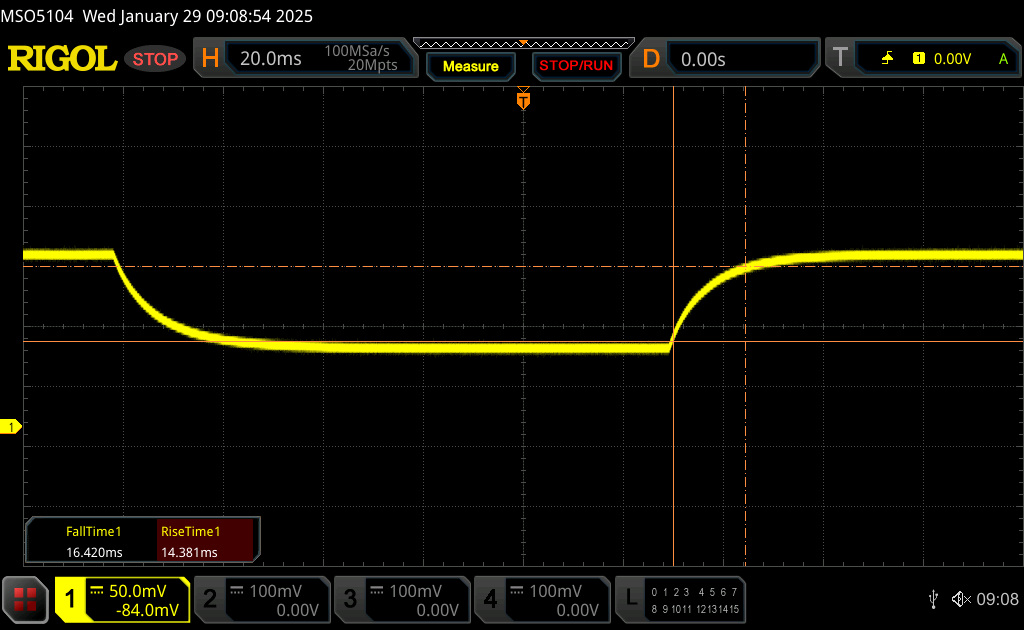 |
| ↘ 16.4 ms chute | ||
| L'écran souffre de latences très élevées, à éviter pour le jeu. En comparaison, tous les appareils testés affichent entre 0.165 (minimum) et 636 (maximum) ms. » 38 % des appareils testés affichent de meilleures performances. Cela signifie que les latences relevées sont similaires à la moyenne (32.5 ms) de tous les appareils testés. | ||
Scintillement / MLI (Modulation de largeur d'impulsion)
| Scintillement / MLI (Modulation de largeur d'impulsion) non décelé | 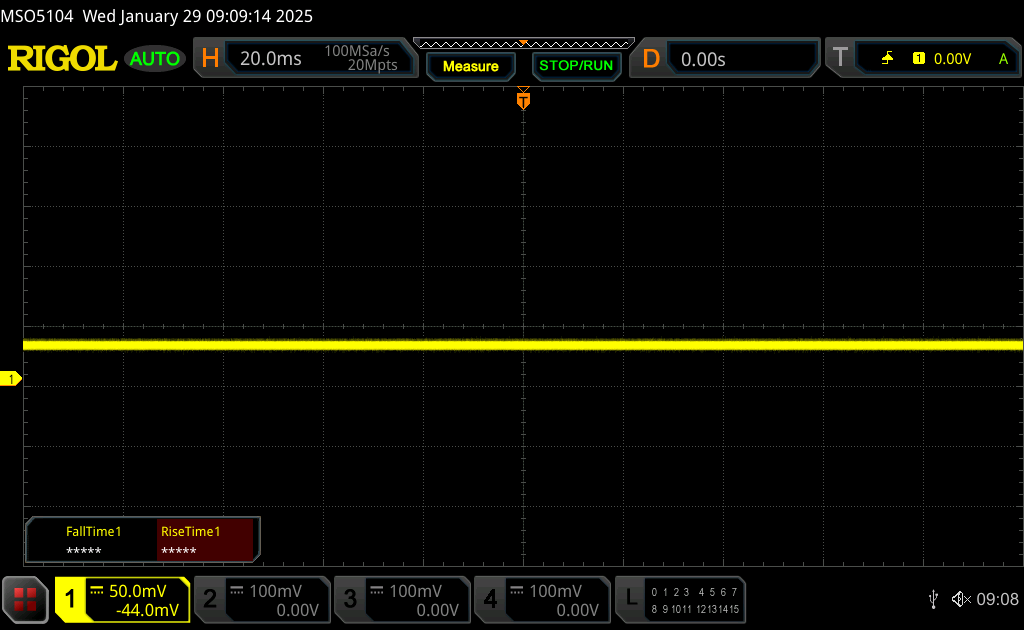 | ||
En comparaison, 53 % des appareils testés n'emploient pas MDI pour assombrir leur écran. Nous avons relevé une moyenne à 8519 (minimum : 5 - maximum : 343500) Hz dans le cas où une MDI était active. | |||
Performance - Plus de performance par watt avec AMD Zen 4
Conditions d'essai
Nous avons réglé Windows et MSI Center sur le mode Performance avant d'effectuer les tests ci-dessous. Nous avons également réglé le système en mode GPU discret au lieu de MSHybrid. Les propriétaires doivent se familiariser avec le MSI Center, car de nombreux paramètres clés y sont activés.
Processeur
Le Ryzen 7 8845HS est le plus comparable au Core i7-12700H qui s'accordent tous deux très bien avec la RTX 4070 mobile. La mise à niveau vers le Ryzen 9 8945HS ne devrait apporter que des gains très marginaux, de l'ordre de 5 %, d'après notre expérience avec la Katana A15.
Cinebench R15 Multi Loop
Cinebench R23: Multi Core | Single Core
Cinebench R20: CPU (Multi Core) | CPU (Single Core)
Cinebench R15: CPU Multi 64Bit | CPU Single 64Bit
Blender: v2.79 BMW27 CPU
7-Zip 18.03: 7z b 4 | 7z b 4 -mmt1
Geekbench 6.4: Multi-Core | Single-Core
Geekbench 5.5: Multi-Core | Single-Core
HWBOT x265 Benchmark v2.2: 4k Preset
LibreOffice : 20 Documents To PDF
R Benchmark 2.5: Overall mean
| Geekbench 6.4 / Multi-Core | |
| Eurocom Raptor X17 Core i9-14900HX | |
| MSI Katana A17 AI B8VG | |
| Moyenne AMD Ryzen 7 8845HS (11073 - 14014, n=16) | |
| HP Omen 17-db0079ng | |
| Asus TUF Gaming A17 FA707XI-NS94 | |
| Acer Nitro 17 AN17-41-R9LN | |
| Geekbench 6.4 / Single-Core | |
| Eurocom Raptor X17 Core i9-14900HX | |
| Asus TUF Gaming A17 FA707XI-NS94 | |
| MSI Katana A17 AI B8VG | |
| Moyenne AMD Ryzen 7 8845HS (2510 - 2698, n=14) | |
| HP Omen 17-db0079ng | |
| Acer Nitro 17 AN17-41-R9LN | |
Cinebench R23: Multi Core | Single Core
Cinebench R20: CPU (Multi Core) | CPU (Single Core)
Cinebench R15: CPU Multi 64Bit | CPU Single 64Bit
Blender: v2.79 BMW27 CPU
7-Zip 18.03: 7z b 4 | 7z b 4 -mmt1
Geekbench 6.4: Multi-Core | Single-Core
Geekbench 5.5: Multi-Core | Single-Core
HWBOT x265 Benchmark v2.2: 4k Preset
LibreOffice : 20 Documents To PDF
R Benchmark 2.5: Overall mean
* ... Moindre est la valeur, meilleures sont les performances
AIDA64: FP32 Ray-Trace | FPU Julia | CPU SHA3 | CPU Queen | FPU SinJulia | FPU Mandel | CPU AES | CPU ZLib | FP64 Ray-Trace | CPU PhotoWorxx
| Performance Rating | |
| Asus TUF Gaming A17 FA707XI-NS94 | |
| HP Omen 17-db0079ng | |
| MSI Katana A17 AI B8VG | |
| Moyenne AMD Ryzen 7 8845HS | |
| Acer Nitro 17 AN17-51-71ER | |
| MSI Pulse 17 B13VGK | |
| Lenovo Legion 5 17ACH6H-82JY0003GE | |
| AIDA64 / FP32 Ray-Trace | |
| Asus TUF Gaming A17 FA707XI-NS94 | |
| HP Omen 17-db0079ng | |
| MSI Katana A17 AI B8VG | |
| Moyenne AMD Ryzen 7 8845HS (23708 - 29544, n=12) | |
| MSI Pulse 17 B13VGK | |
| Acer Nitro 17 AN17-51-71ER | |
| Lenovo Legion 5 17ACH6H-82JY0003GE | |
| AIDA64 / FPU Julia | |
| Asus TUF Gaming A17 FA707XI-NS94 | |
| HP Omen 17-db0079ng | |
| MSI Katana A17 AI B8VG | |
| Moyenne AMD Ryzen 7 8845HS (99659 - 125873, n=12) | |
| MSI Pulse 17 B13VGK | |
| Acer Nitro 17 AN17-51-71ER | |
| Lenovo Legion 5 17ACH6H-82JY0003GE | |
| AIDA64 / CPU SHA3 | |
| Asus TUF Gaming A17 FA707XI-NS94 | |
| HP Omen 17-db0079ng | |
| MSI Katana A17 AI B8VG | |
| Moyenne AMD Ryzen 7 8845HS (4332 - 5180, n=12) | |
| Acer Nitro 17 AN17-51-71ER | |
| MSI Pulse 17 B13VGK | |
| Lenovo Legion 5 17ACH6H-82JY0003GE | |
| AIDA64 / CPU Queen | |
| Asus TUF Gaming A17 FA707XI-NS94 | |
| MSI Katana A17 AI B8VG | |
| Moyenne AMD Ryzen 7 8845HS (109458 - 124695, n=12) | |
| HP Omen 17-db0079ng | |
| Acer Nitro 17 AN17-51-71ER | |
| MSI Pulse 17 B13VGK | |
| Lenovo Legion 5 17ACH6H-82JY0003GE | |
| AIDA64 / FPU SinJulia | |
| Asus TUF Gaming A17 FA707XI-NS94 | |
| MSI Katana A17 AI B8VG | |
| HP Omen 17-db0079ng | |
| Moyenne AMD Ryzen 7 8845HS (14062 - 15519, n=12) | |
| MSI Pulse 17 B13VGK | |
| Acer Nitro 17 AN17-51-71ER | |
| Lenovo Legion 5 17ACH6H-82JY0003GE | |
| AIDA64 / FPU Mandel | |
| Asus TUF Gaming A17 FA707XI-NS94 | |
| HP Omen 17-db0079ng | |
| MSI Katana A17 AI B8VG | |
| Moyenne AMD Ryzen 7 8845HS (53436 - 67367, n=12) | |
| MSI Pulse 17 B13VGK | |
| Acer Nitro 17 AN17-51-71ER | |
| Lenovo Legion 5 17ACH6H-82JY0003GE | |
| AIDA64 / CPU AES | |
| Acer Nitro 17 AN17-51-71ER | |
| Lenovo Legion 5 17ACH6H-82JY0003GE | |
| Moyenne AMD Ryzen 7 8845HS (64515 - 172642, n=12) | |
| Asus TUF Gaming A17 FA707XI-NS94 | |
| HP Omen 17-db0079ng | |
| MSI Katana A17 AI B8VG | |
| MSI Pulse 17 B13VGK | |
| AIDA64 / CPU ZLib | |
| Acer Nitro 17 AN17-51-71ER | |
| MSI Pulse 17 B13VGK | |
| Asus TUF Gaming A17 FA707XI-NS94 | |
| HP Omen 17-db0079ng | |
| MSI Katana A17 AI B8VG | |
| Moyenne AMD Ryzen 7 8845HS (627 - 1080, n=12) | |
| Lenovo Legion 5 17ACH6H-82JY0003GE | |
| AIDA64 / FP64 Ray-Trace | |
| Asus TUF Gaming A17 FA707XI-NS94 | |
| HP Omen 17-db0079ng | |
| MSI Katana A17 AI B8VG | |
| Moyenne AMD Ryzen 7 8845HS (12361 - 15911, n=12) | |
| MSI Pulse 17 B13VGK | |
| Acer Nitro 17 AN17-51-71ER | |
| Lenovo Legion 5 17ACH6H-82JY0003GE | |
| AIDA64 / CPU PhotoWorxx | |
| HP Omen 17-db0079ng | |
| MSI Katana A17 AI B8VG | |
| Moyenne AMD Ryzen 7 8845HS (33192 - 41668, n=12) | |
| MSI Pulse 17 B13VGK | |
| Acer Nitro 17 AN17-51-71ER | |
| Asus TUF Gaming A17 FA707XI-NS94 | |
| Lenovo Legion 5 17ACH6H-82JY0003GE | |
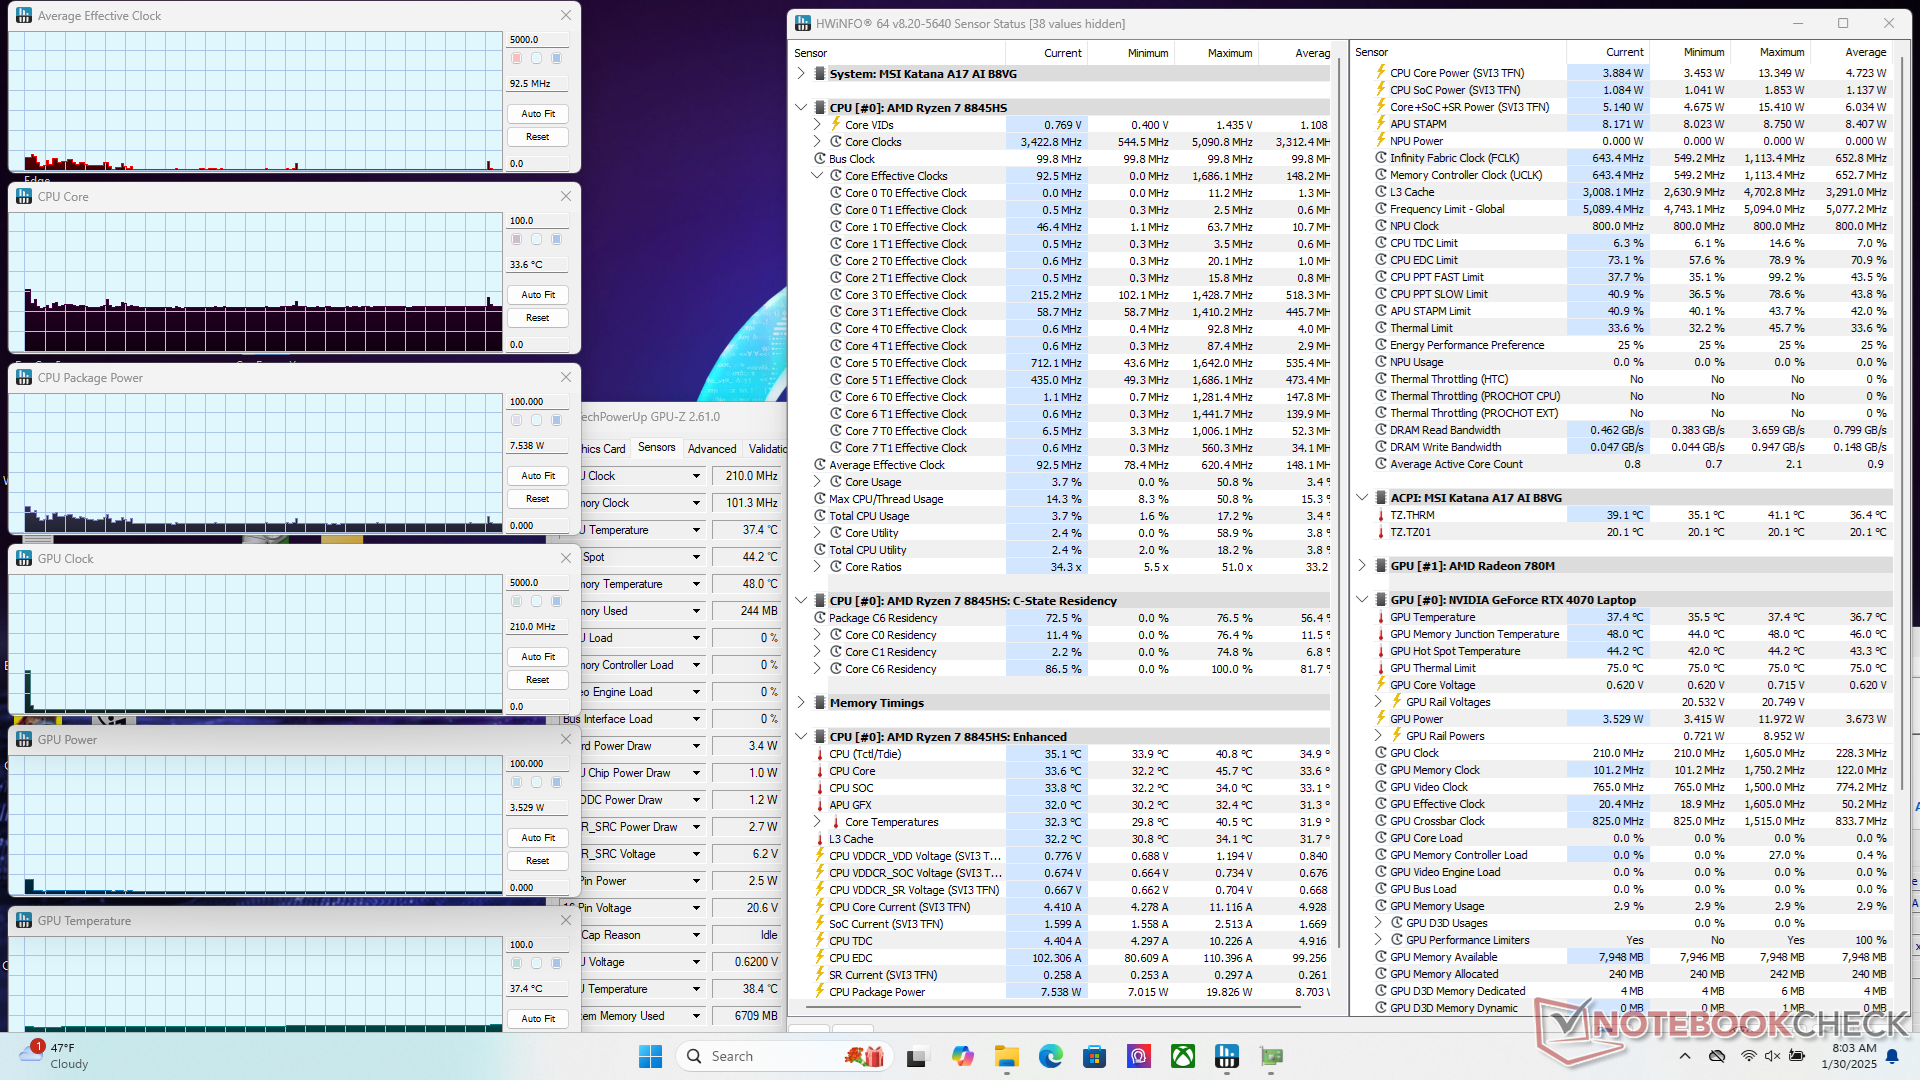
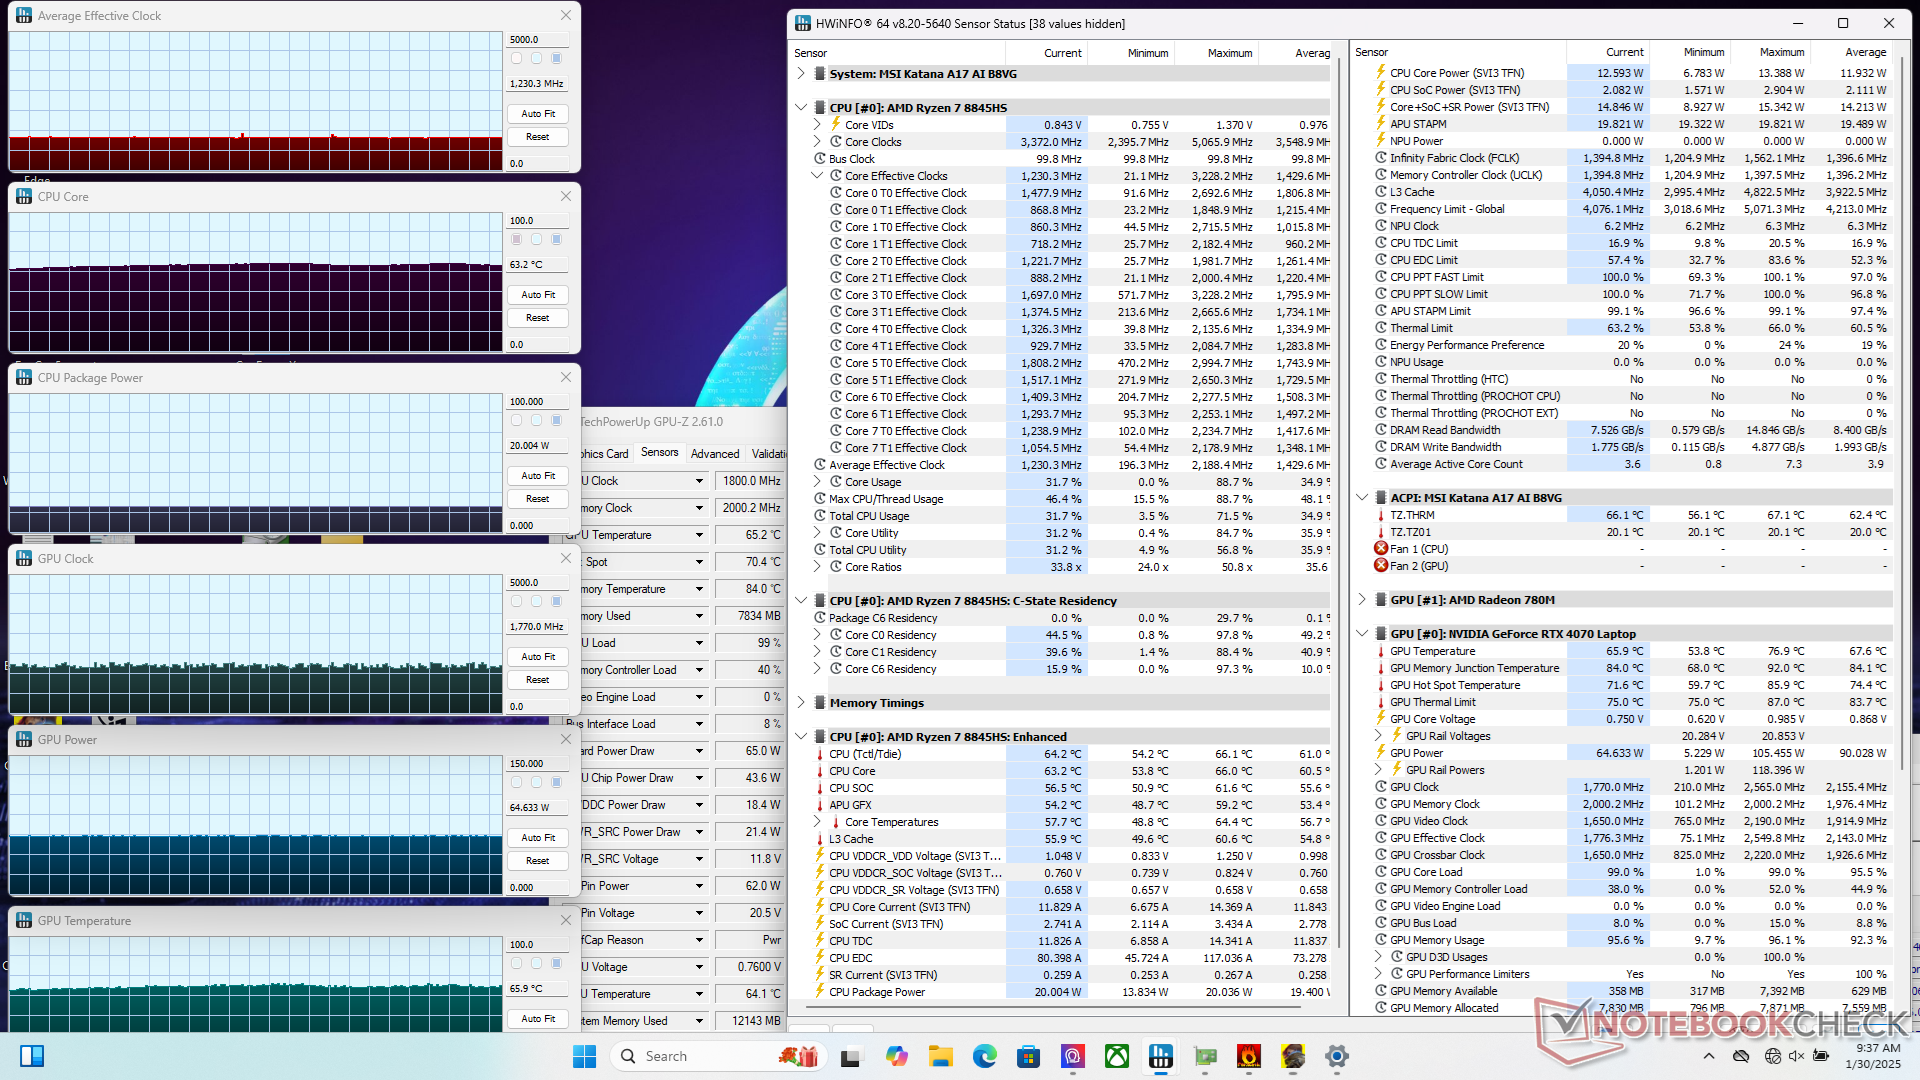
Test de stress
Le processeur maintient une fréquence d'horloge et une consommation d'énergie de 2,0 GHz et 20 W, respectivement, lors de l'exécution du test Prime95. Les températures du CPU et du GPU resteraient également relativement basses pour un ordinateur portable de jeu, à seulement ~65 C chacune lors de l'exécution de charges exigeantes telles que les jeux. En comparaison, le CPU et le GPU du Maingear ML-16 se stabiliseraient à des températures beaucoup plus chaudes de ~100 C et 85 C, respectivement, dans des conditions similaires.
Notez que le mode Cooler Boost (c'est-à-dire le mode de ventilation maximale) n'a pas d'impact majeur sur les performances de jeu, comme le montrent les captures d'écran ci-dessous. En revanche, le passage en mode Balanced permet de réduire la fréquence d'horloge du GPU. Ces résultats correspondent à ce que nous avons observé sur d'autres ordinateurs portables de jeu MSI.
La consommation du GPU passe de 100 W à 65 W en passant du mode Performance au mode Équilibré.
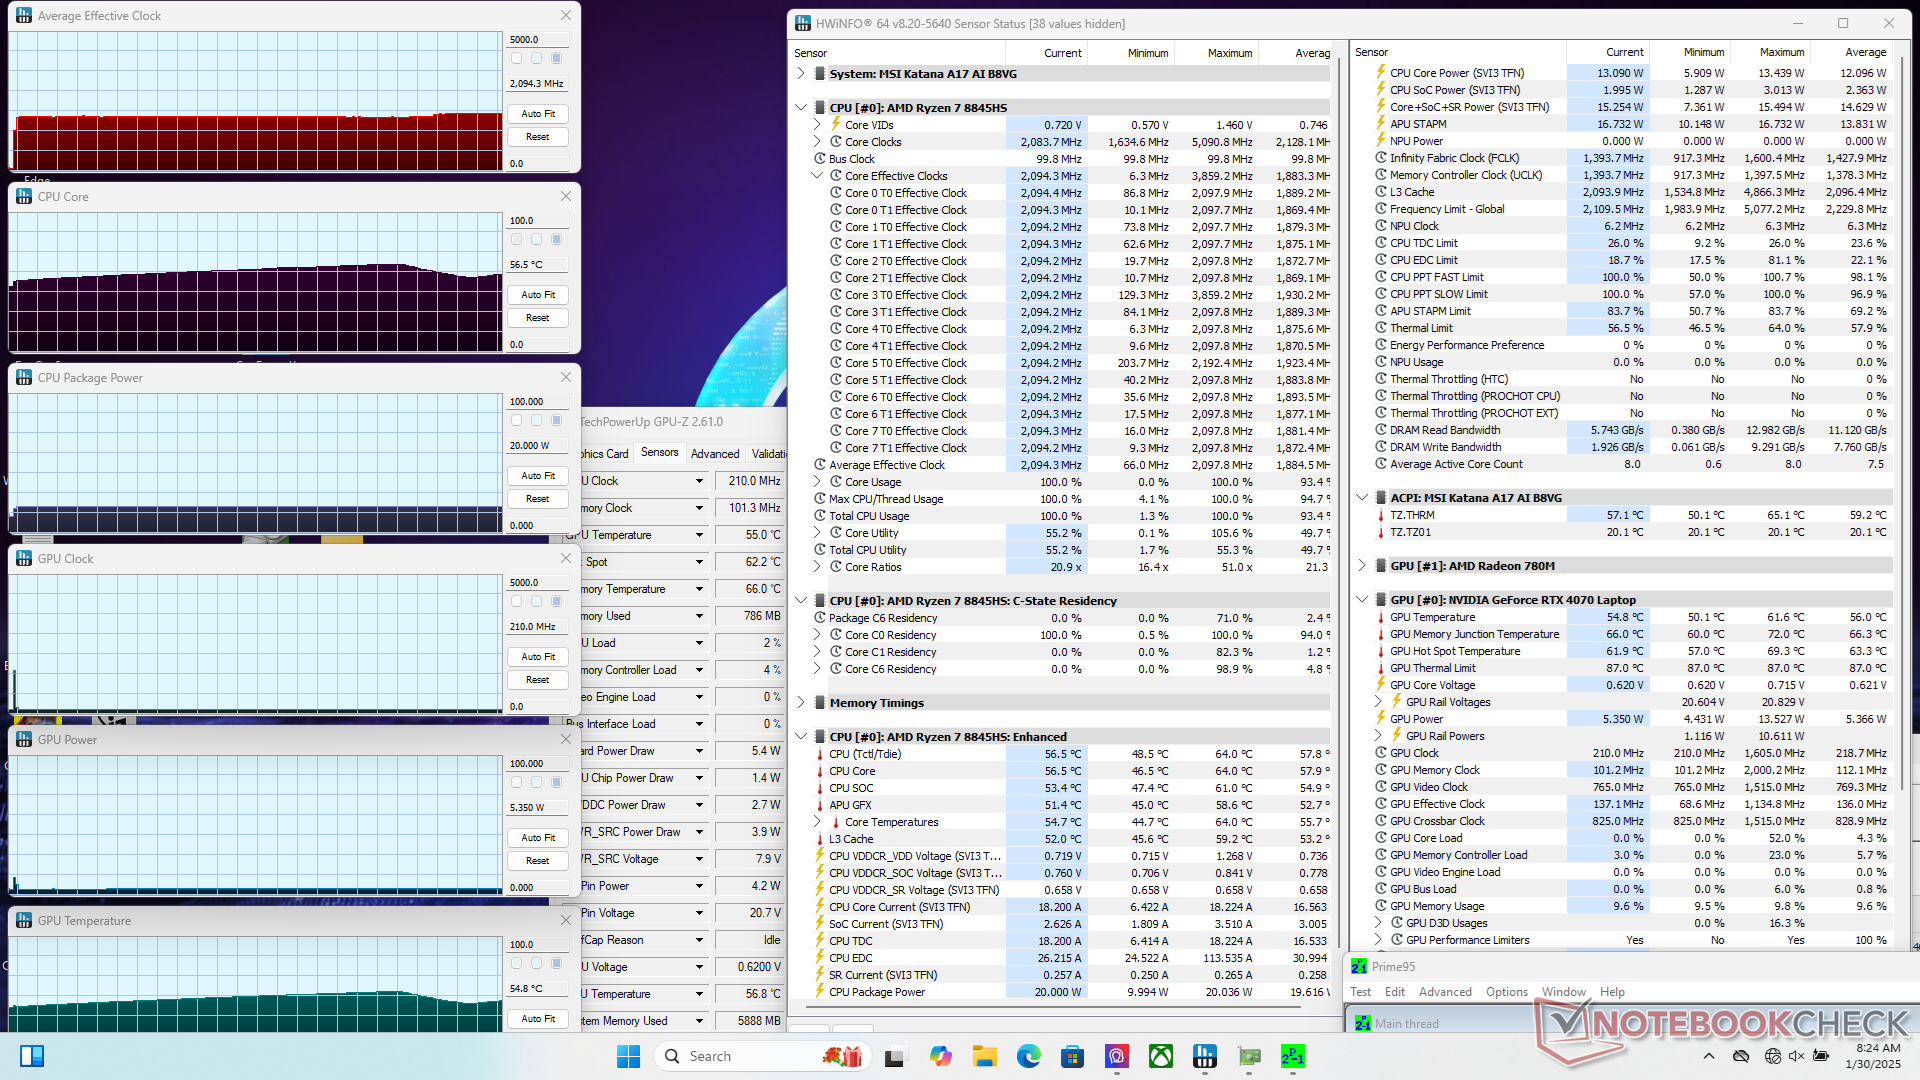
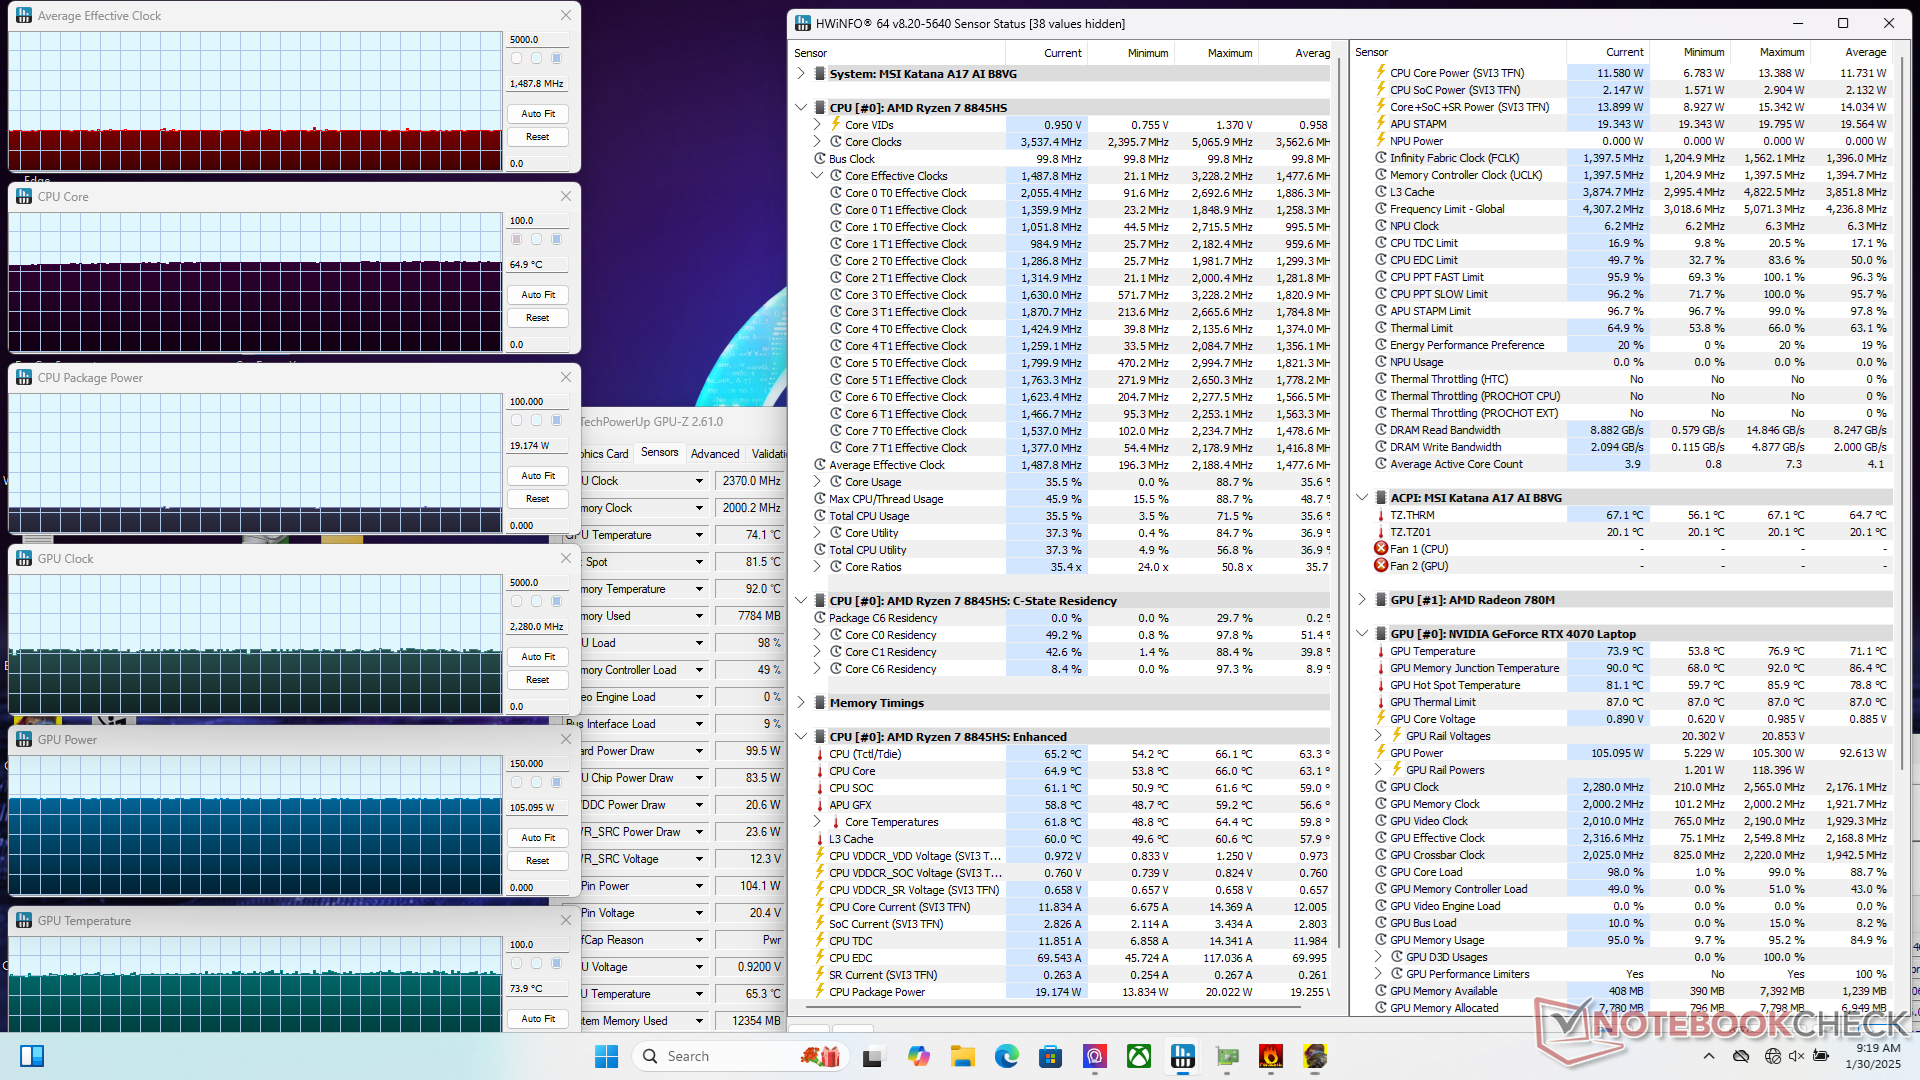
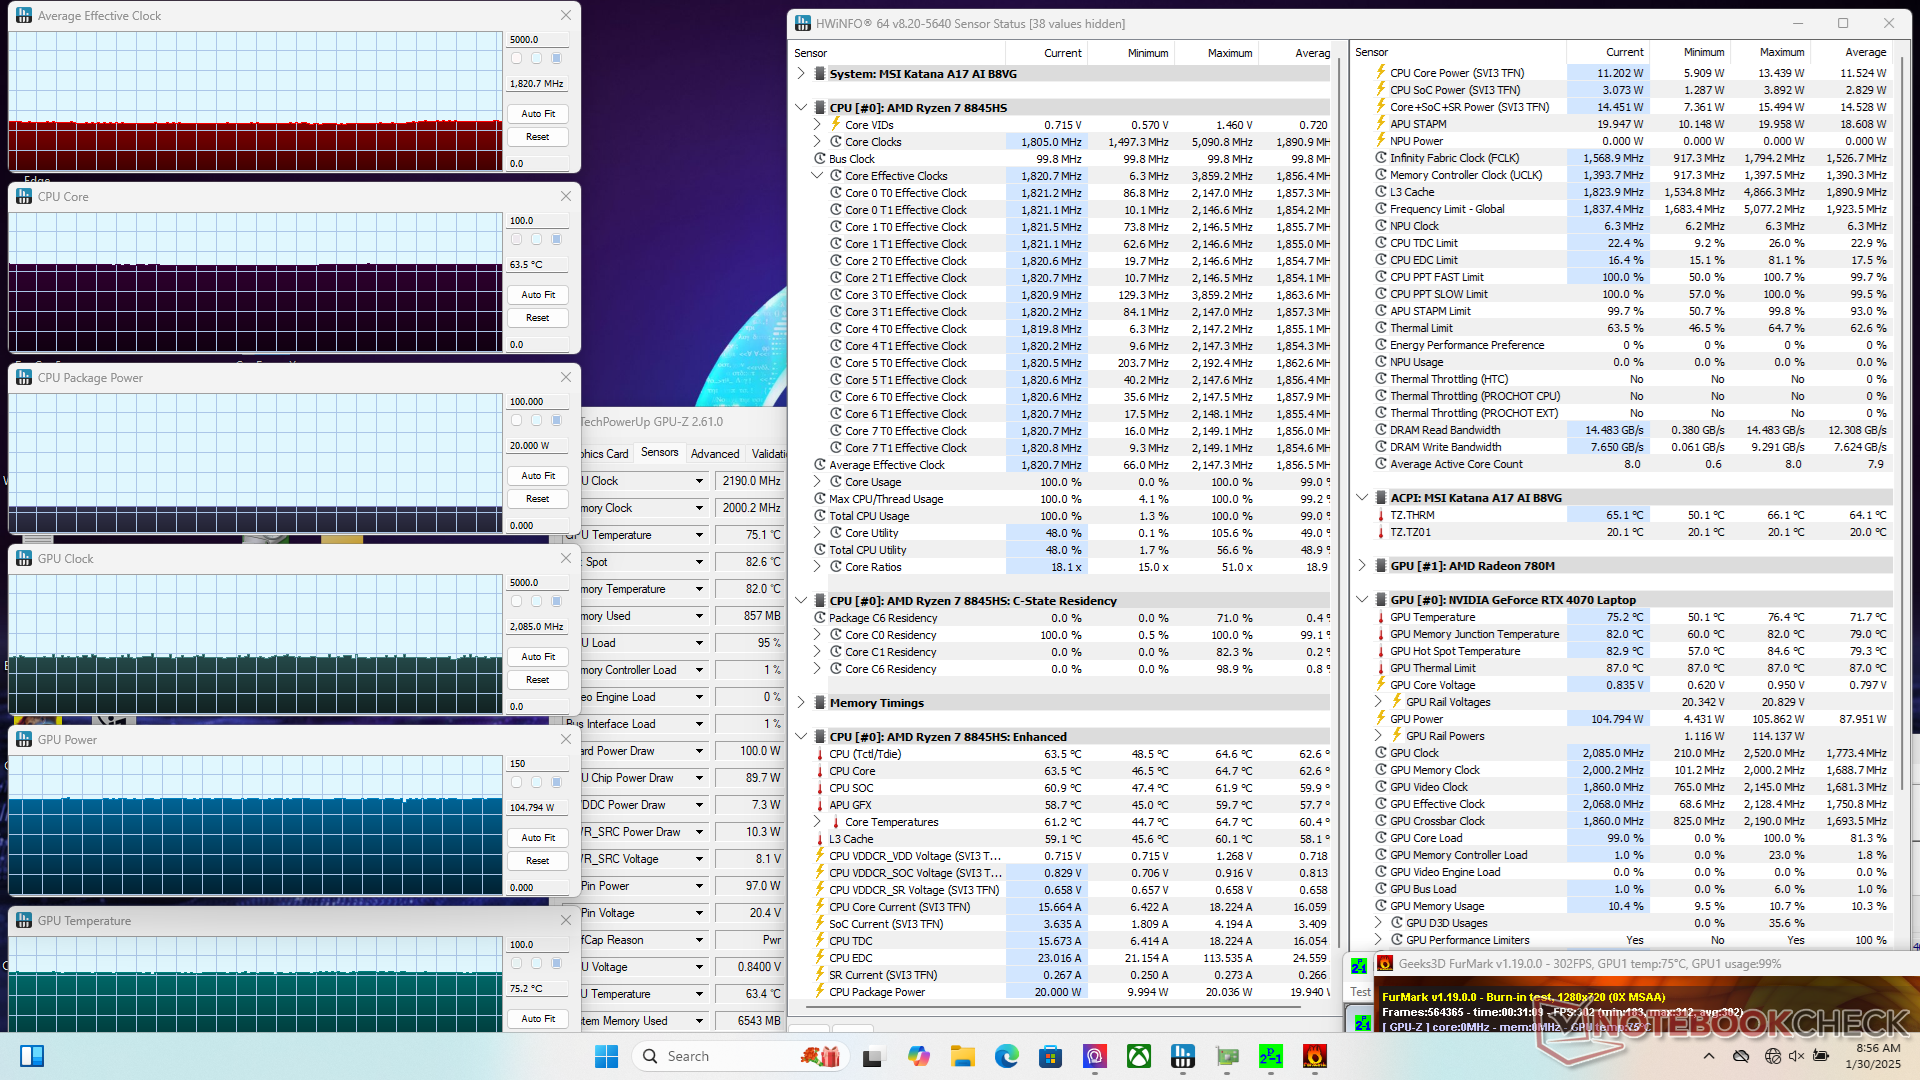
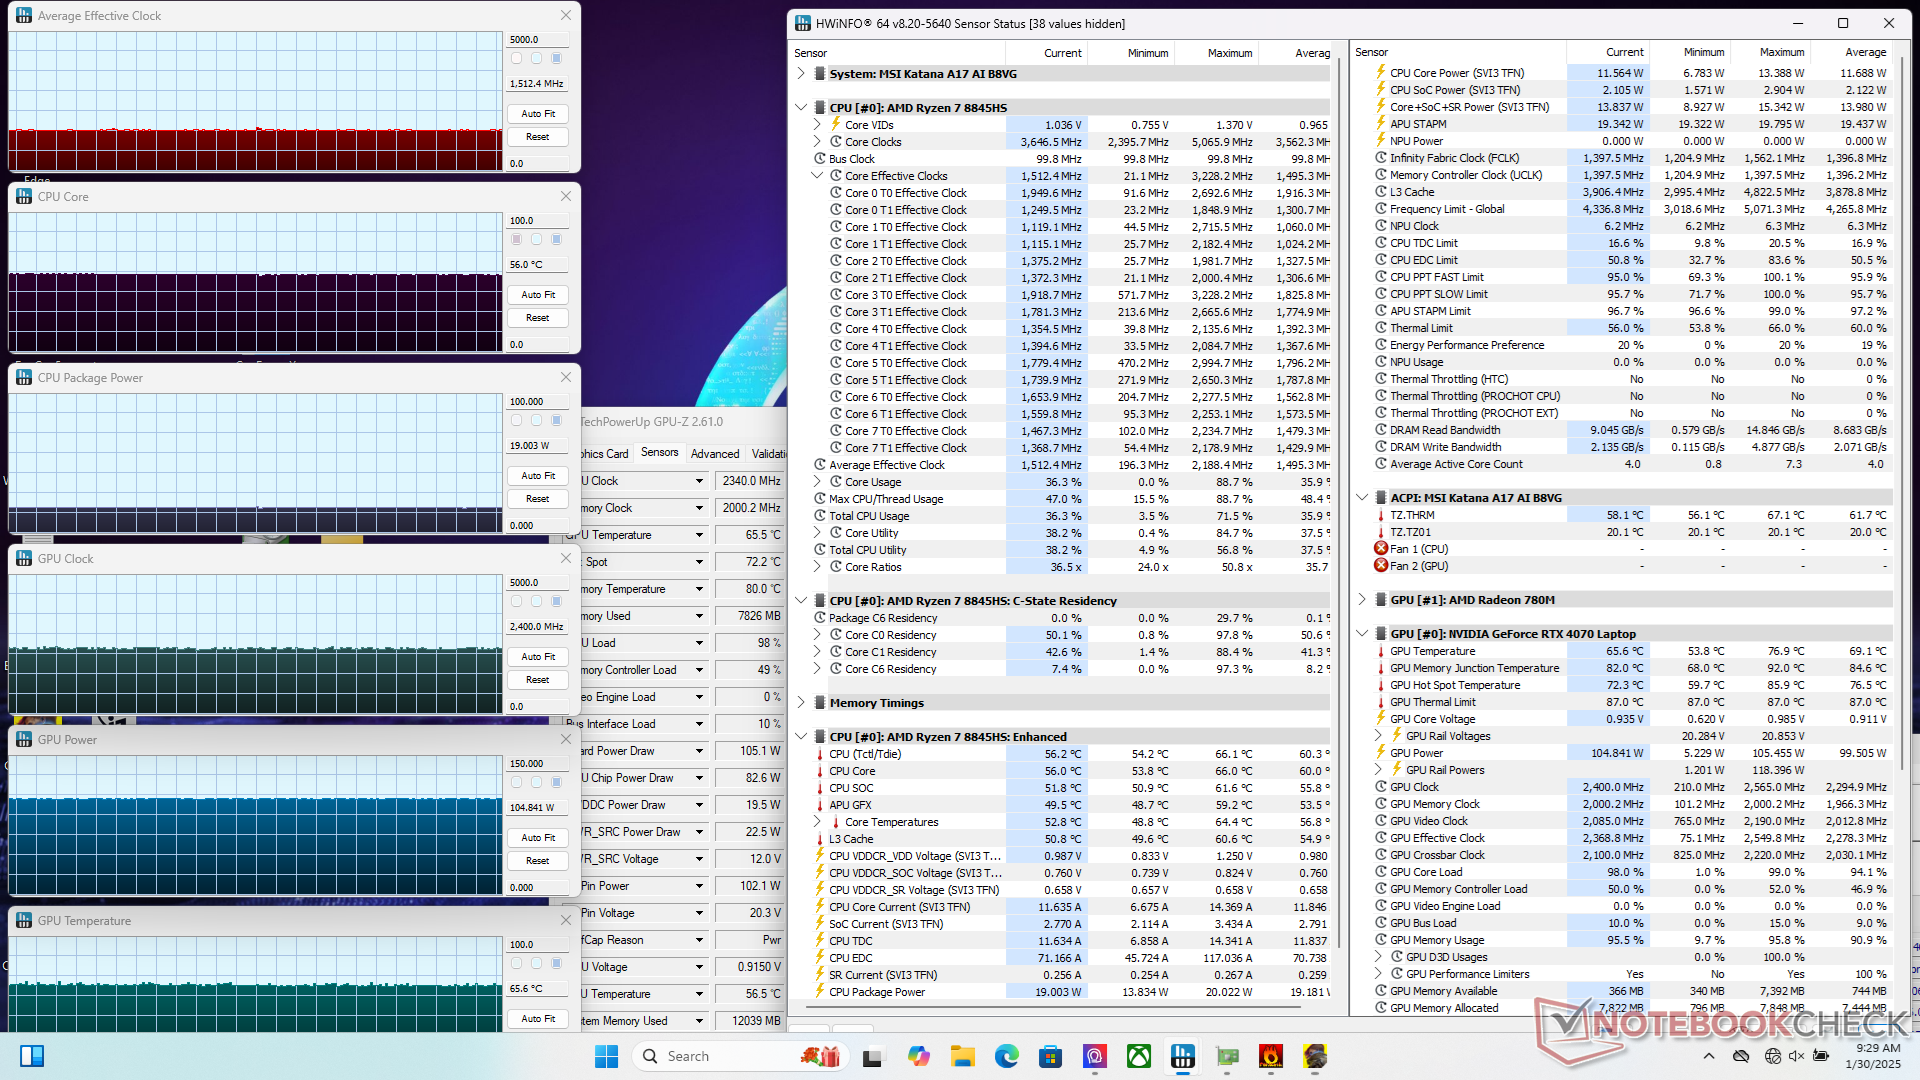
| Horloge moyenne du CPU (GHz) | Horloge du GPU (MHz) | Température moyenne du CPU (°C) | Température moyenne du GPU (°C) | |
| Système au repos | -- | -- | 34 | 37 |
| Prime95 Stress | 2.0 | -- | 57 | 55 |
| Prime95 + FurMark Stress | 1.8 | 2190 | 64 | 75 |
| Cyberpunk 2077 Stress (profil équilibré) | 1.2 | 1800 | 63 | 66 |
| Cyberpunk 2077 Stress (Cooler Boost off) | 1.5 | 2370 | 65 | 74 |
| Cyberpunk 2077 Stress (Cooler Boost on) | 1.5 | 2340 | 56 | 66 |
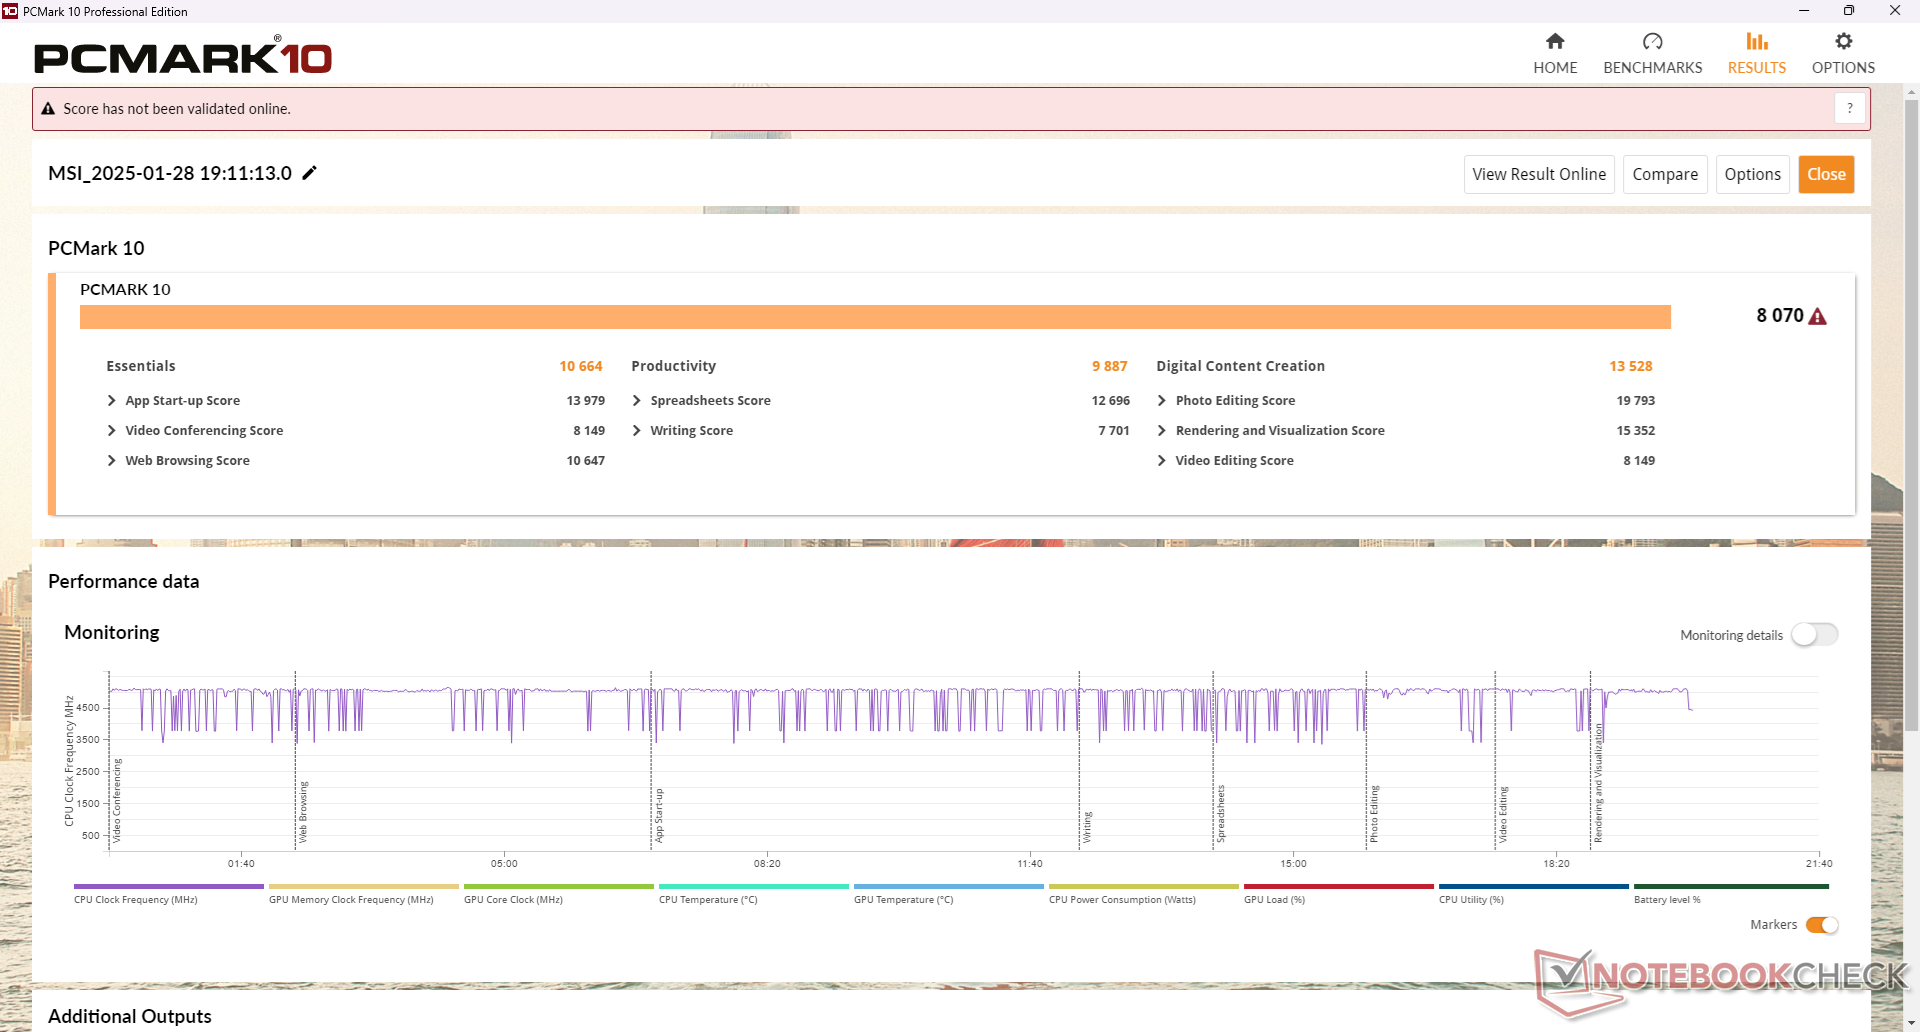
Performance du système
Les scores PCMark sont plus élevés que ceux de l'ancienne Katana 17, en particulier dans le sous-test de création de contenu numérique, grâce à notre GPU beaucoup plus rapide. En revanche, notre score dans le sous-test Productivité, qui fait appel au processeur, n'est que légèrement supérieur. Les résultats correspondent à ce que nous avons observé dans nos benchmarks CPU et GPU. Les performances de la mémoire vive sont également bien meilleures cette fois-ci.
CrossMark: Overall | Productivity | Creativity | Responsiveness
WebXPRT 3: Overall
WebXPRT 4: Overall
Mozilla Kraken 1.1: Total
| PCMark 10 / Score | |
| Asus TUF Gaming A17 FA707XI-NS94 | |
| MSI Katana A17 AI B8VG | |
| Moyenne AMD Ryzen 7 8845HS, NVIDIA GeForce RTX 4070 Laptop GPU (7800 - 8070, n=2) | |
| HP Omen 17-db0079ng | |
| MSI Pulse 17 B13VGK | |
| Acer Nitro 17 AN17-51-71ER | |
| Lenovo Legion 5 17ACH6H-82JY0003GE | |
| PCMark 10 / Essentials | |
| Asus TUF Gaming A17 FA707XI-NS94 | |
| MSI Katana A17 AI B8VG | |
| Moyenne AMD Ryzen 7 8845HS, NVIDIA GeForce RTX 4070 Laptop GPU (10499 - 10664, n=2) | |
| HP Omen 17-db0079ng | |
| MSI Pulse 17 B13VGK | |
| Acer Nitro 17 AN17-51-71ER | |
| Lenovo Legion 5 17ACH6H-82JY0003GE | |
| PCMark 10 / Productivity | |
| MSI Pulse 17 B13VGK | |
| HP Omen 17-db0079ng | |
| Moyenne AMD Ryzen 7 8845HS, NVIDIA GeForce RTX 4070 Laptop GPU (9887 - 10202, n=2) | |
| MSI Katana A17 AI B8VG | |
| Asus TUF Gaming A17 FA707XI-NS94 | |
| Lenovo Legion 5 17ACH6H-82JY0003GE | |
| Acer Nitro 17 AN17-51-71ER | |
| PCMark 10 / Digital Content Creation | |
| Asus TUF Gaming A17 FA707XI-NS94 | |
| MSI Katana A17 AI B8VG | |
| Moyenne AMD Ryzen 7 8845HS, NVIDIA GeForce RTX 4070 Laptop GPU (12023 - 13528, n=2) | |
| HP Omen 17-db0079ng | |
| Acer Nitro 17 AN17-51-71ER | |
| MSI Pulse 17 B13VGK | |
| Lenovo Legion 5 17ACH6H-82JY0003GE | |
| CrossMark / Overall | |
| MSI Pulse 17 B13VGK | |
| Asus TUF Gaming A17 FA707XI-NS94 | |
| MSI Katana A17 AI B8VG | |
| Moyenne AMD Ryzen 7 8845HS, NVIDIA GeForce RTX 4070 Laptop GPU (1531 - 1790, n=2) | |
| Acer Nitro 17 AN17-51-71ER | |
| HP Omen 17-db0079ng | |
| Lenovo Legion 5 17ACH6H-82JY0003GE | |
| CrossMark / Productivity | |
| MSI Pulse 17 B13VGK | |
| Asus TUF Gaming A17 FA707XI-NS94 | |
| MSI Katana A17 AI B8VG | |
| Moyenne AMD Ryzen 7 8845HS, NVIDIA GeForce RTX 4070 Laptop GPU (1488 - 1720, n=2) | |
| Acer Nitro 17 AN17-51-71ER | |
| HP Omen 17-db0079ng | |
| Lenovo Legion 5 17ACH6H-82JY0003GE | |
| CrossMark / Creativity | |
| MSI Pulse 17 B13VGK | |
| Asus TUF Gaming A17 FA707XI-NS94 | |
| MSI Katana A17 AI B8VG | |
| Moyenne AMD Ryzen 7 8845HS, NVIDIA GeForce RTX 4070 Laptop GPU (1683 - 1932, n=2) | |
| Acer Nitro 17 AN17-51-71ER | |
| HP Omen 17-db0079ng | |
| Lenovo Legion 5 17ACH6H-82JY0003GE | |
| CrossMark / Responsiveness | |
| MSI Pulse 17 B13VGK | |
| Acer Nitro 17 AN17-51-71ER | |
| MSI Katana A17 AI B8VG | |
| Asus TUF Gaming A17 FA707XI-NS94 | |
| Moyenne AMD Ryzen 7 8845HS, NVIDIA GeForce RTX 4070 Laptop GPU (1255 - 1603, n=2) | |
| HP Omen 17-db0079ng | |
| Lenovo Legion 5 17ACH6H-82JY0003GE | |
| WebXPRT 3 / Overall | |
| Asus TUF Gaming A17 FA707XI-NS94 | |
| MSI Katana A17 AI B8VG | |
| Moyenne AMD Ryzen 7 8845HS, NVIDIA GeForce RTX 4070 Laptop GPU (275 - 312, n=2) | |
| HP Omen 17-db0079ng | |
| MSI Pulse 17 B13VGK | |
| Lenovo Legion 5 17ACH6H-82JY0003GE | |
| Acer Nitro 17 AN17-51-71ER | |
| WebXPRT 4 / Overall | |
| Asus TUF Gaming A17 FA707XI-NS94 | |
| MSI Katana A17 AI B8VG | |
| Moyenne AMD Ryzen 7 8845HS, NVIDIA GeForce RTX 4070 Laptop GPU (n=1) | |
| MSI Pulse 17 B13VGK | |
| Acer Nitro 17 AN17-51-71ER | |
| Mozilla Kraken 1.1 / Total | |
| Lenovo Legion 5 17ACH6H-82JY0003GE | |
| Acer Nitro 17 AN17-51-71ER | |
| HP Omen 17-db0079ng | |
| MSI Pulse 17 B13VGK | |
| Moyenne AMD Ryzen 7 8845HS, NVIDIA GeForce RTX 4070 Laptop GPU (500 - 564, n=2) | |
| MSI Katana A17 AI B8VG | |
| Asus TUF Gaming A17 FA707XI-NS94 | |
* ... Moindre est la valeur, meilleures sont les performances
| PCMark 10 Score | 8070 points | |
Aide | ||
| AIDA64 / Memory Copy | |
| MSI Katana A17 AI B8VG | |
| HP Omen 17-db0079ng | |
| Moyenne AMD Ryzen 7 8845HS (61459 - 71873, n=12) | |
| MSI Pulse 17 B13VGK | |
| Asus TUF Gaming A17 FA707XI-NS94 | |
| Acer Nitro 17 AN17-51-71ER | |
| Lenovo Legion 5 17ACH6H-82JY0003GE | |
| AIDA64 / Memory Read | |
| MSI Pulse 17 B13VGK | |
| Acer Nitro 17 AN17-51-71ER | |
| Asus TUF Gaming A17 FA707XI-NS94 | |
| MSI Katana A17 AI B8VG | |
| HP Omen 17-db0079ng | |
| Moyenne AMD Ryzen 7 8845HS (49866 - 61976, n=12) | |
| Lenovo Legion 5 17ACH6H-82JY0003GE | |
| AIDA64 / Memory Write | |
| MSI Katana A17 AI B8VG | |
| HP Omen 17-db0079ng | |
| Moyenne AMD Ryzen 7 8845HS (68425 - 93239, n=12) | |
| Asus TUF Gaming A17 FA707XI-NS94 | |
| Acer Nitro 17 AN17-51-71ER | |
| MSI Pulse 17 B13VGK | |
| Lenovo Legion 5 17ACH6H-82JY0003GE | |
| AIDA64 / Memory Latency | |
| Acer Nitro 17 AN17-51-71ER | |
| HP Omen 17-db0079ng | |
| MSI Katana A17 AI B8VG | |
| Moyenne AMD Ryzen 7 8845HS (82.5 - 117, n=12) | |
| MSI Pulse 17 B13VGK | |
| Asus TUF Gaming A17 FA707XI-NS94 | |
| Lenovo Legion 5 17ACH6H-82JY0003GE | |
* ... Moindre est la valeur, meilleures sont les performances
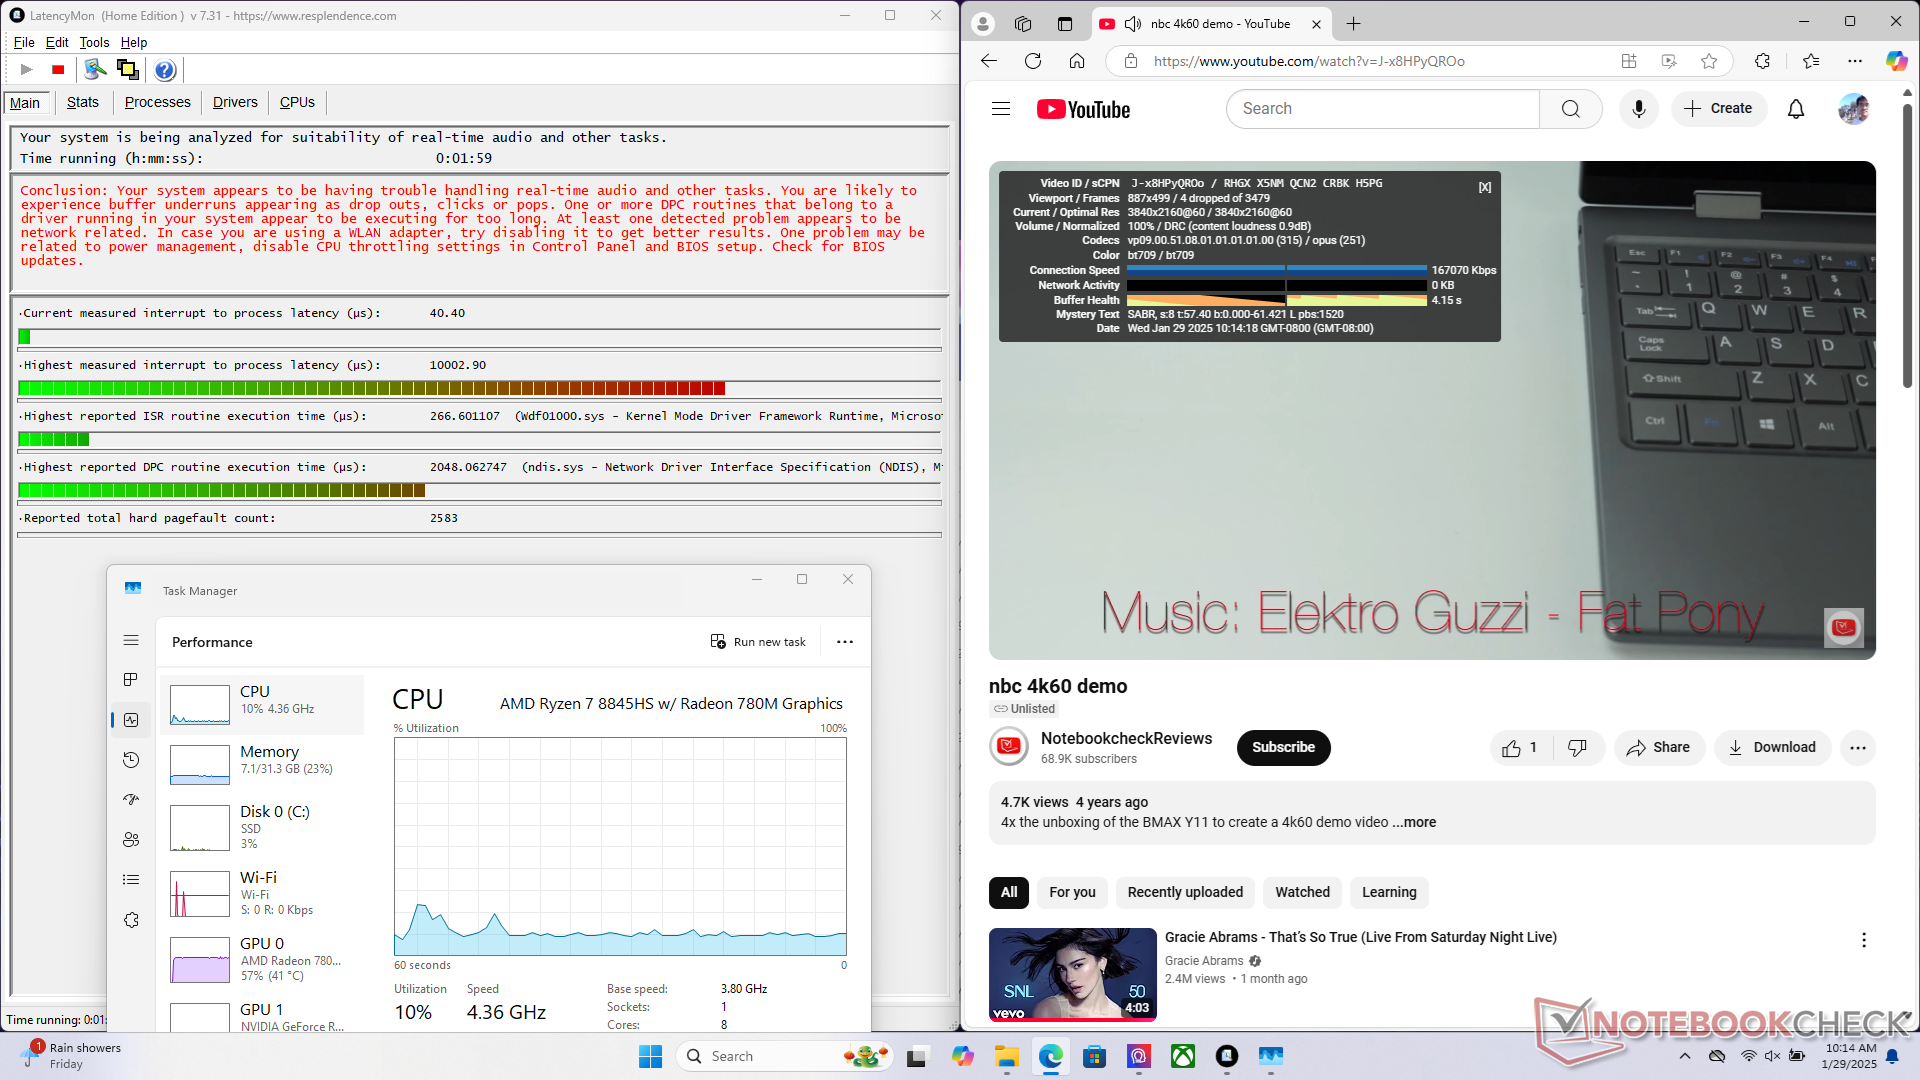
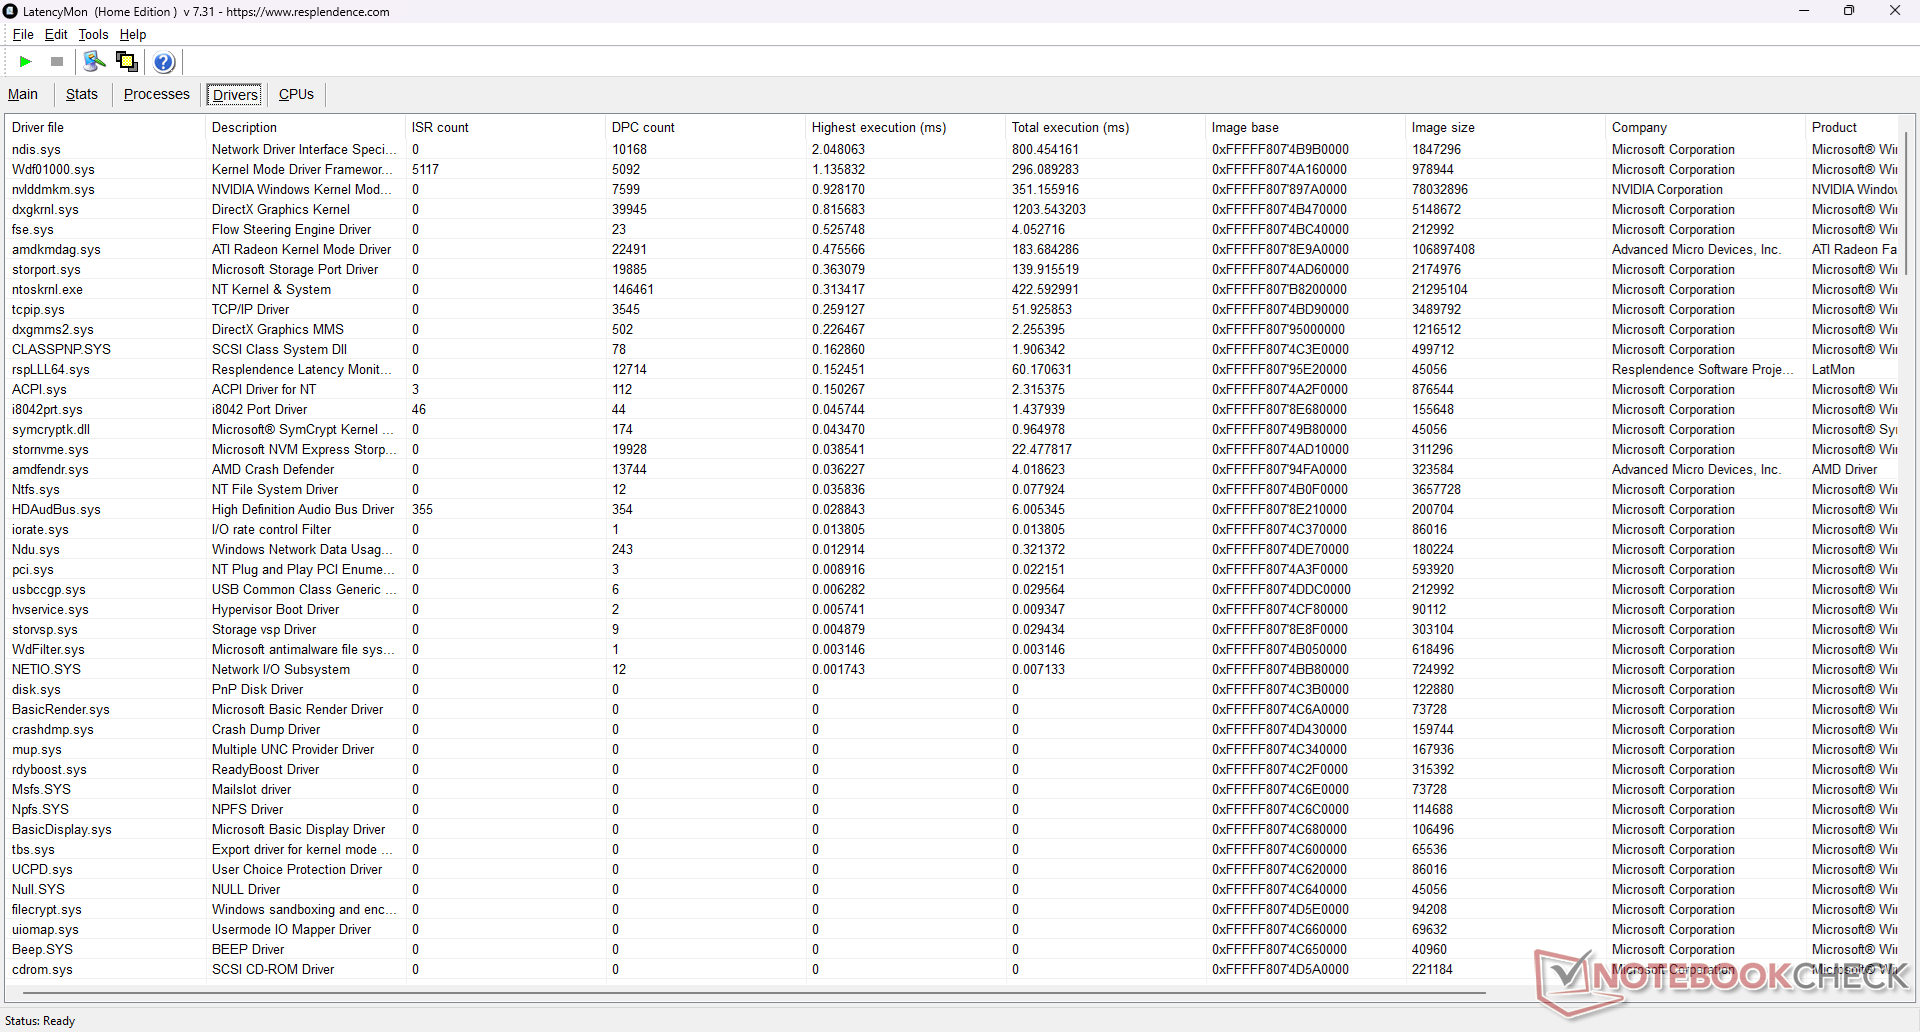
Latence DPC
LatencyMon révèle des problèmes de latence DPC lors de l'ouverture de plusieurs onglets de notre page d'accueil. De plus, la lecture vidéo 4K60 est imparfaite avec 4 images perdues enregistrées sur une période de 60 secondes, même en mode iGPU.
| DPC Latencies / LatencyMon - interrupt to process latency (max), Web, Youtube, Prime95 | |
| MSI Katana A17 AI B8VG | |
| HP Omen 17-db0079ng | |
| Asus TUF Gaming A17 FA707XI-NS94 | |
| Lenovo Legion 5 17ACH6H-82JY0003GE | |
| Acer Nitro 17 AN17-51-71ER | |
| MSI Pulse 17 B13VGK | |
* ... Moindre est la valeur, meilleures sont les performances
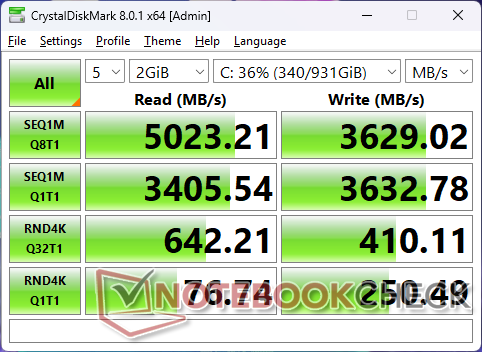
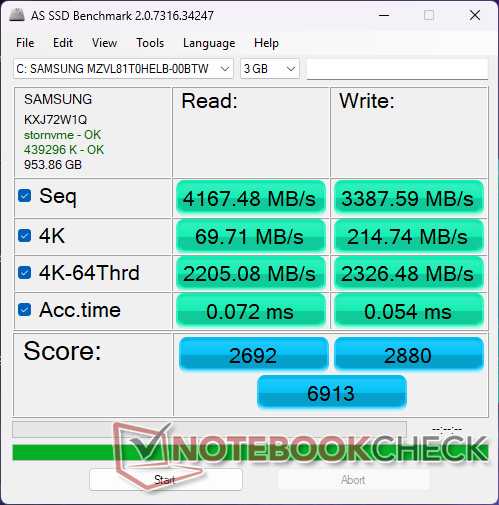
Dispositifs de stockage
Le Samsung PM9C1 est un SSD NVMe PCIe4 x4 de milieu de gamme offrant des taux de transfert allant jusqu'à 5000 Mo/s. Malheureusement, ce taux maximal n'est viable que pendant une minute environ, avant de retomber régulièrement dans la fourchette basse des 3000 Mo/s.

| Drive Performance Rating - Percent | |
| Acer Nitro 17 AN17-51-71ER -1! | |
| MSI Katana A17 AI B8VG | |
| MSI Pulse 17 B13VGK | |
| HP Omen 17-db0079ng | |
| Asus TUF Gaming A17 FA707XI-NS94 | |
| Lenovo Legion 5 17ACH6H-82JY0003GE | |
* ... Moindre est la valeur, meilleures sont les performances
Disk Throttling: DiskSpd Read Loop, Queue Depth 8
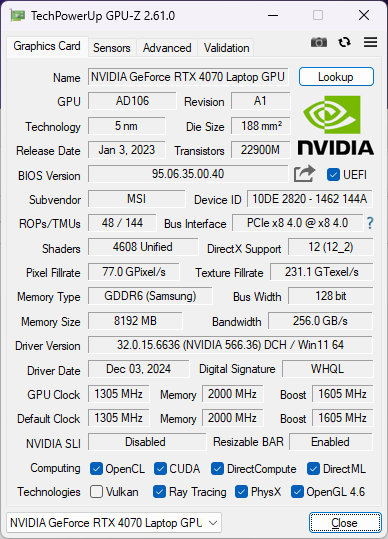
Performance du GPU - 105 W GeForce RTX 4070
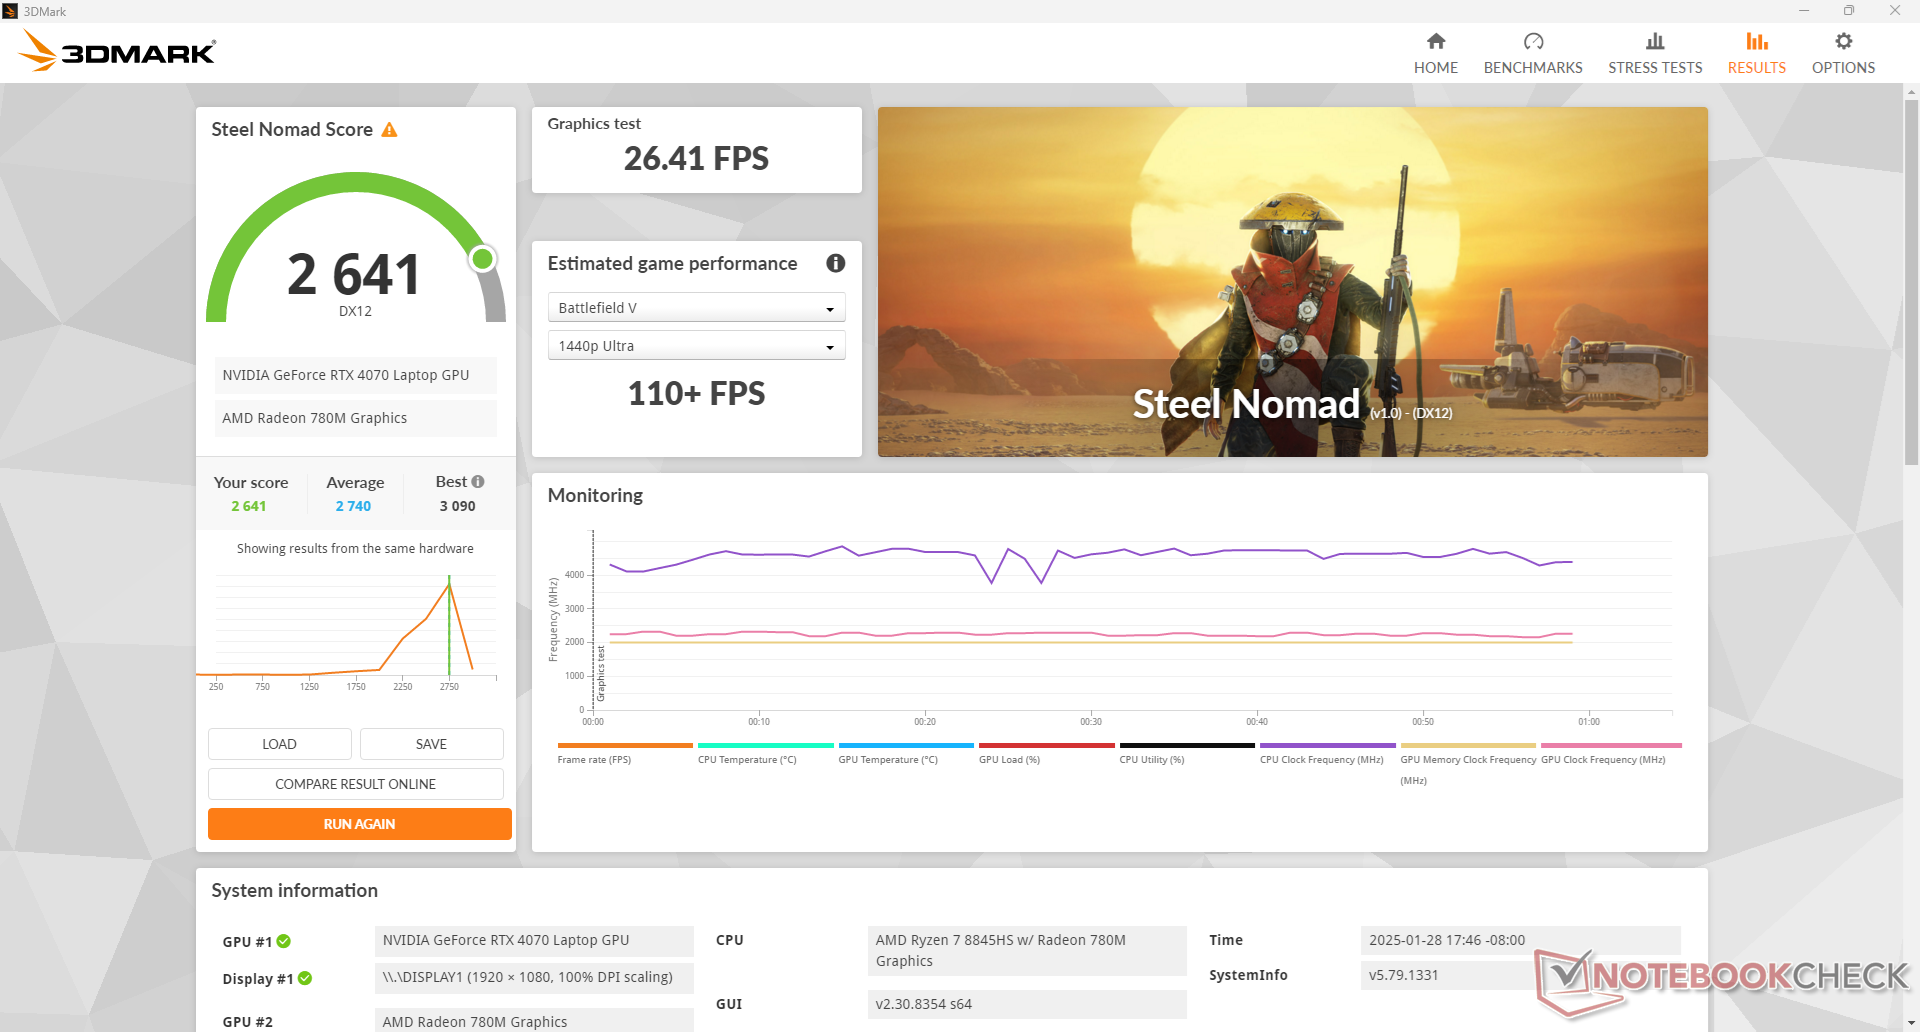
Les performances graphiques sont entre 5 et 15 % plus rapides que celles d'un ordinateur portable moyen de notre base de données équipé de la même technologie GeForce RTX 4070 Ce qui est très appréciable pour un modèle économique comme le Katana A17. Cependant, gardez à l'esprit que la RTX 4070 mobile dispose de beaucoup moins de VRAM que la rTX 4070 de bureau ce qui peut avoir un impact sur les performances avec des paramètres de texture ou des résolutions plus élevés.
| Profil de puissance | Score graphique | Score physique | Score combiné |
| Mode Performance | 32669 | 27799 | 14107 |
| Mode équilibré | 27310 (-16%) | 28029 (-1%) | 11927 (-15%) |
| Alimentation par batterie | 16481 (-50%) | 20600 (-26%) | 4877 (-65%) |
L'utilisation du mode équilibré a un impact sur les performances graphiques d'un peu plus de 15 % et le déficit est encore plus important si vous utilisez la batterie, comme le montre notre tableau de résultats Fire Strike ci-dessus.
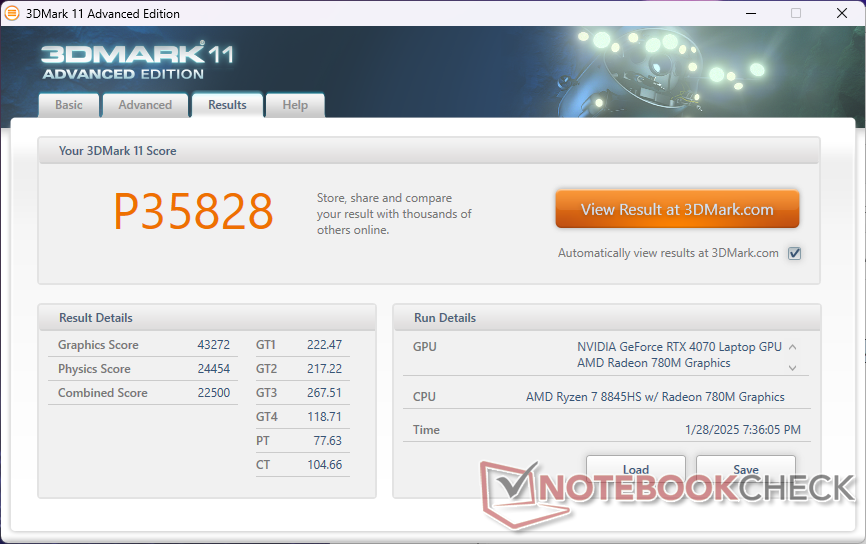

| 3DMark 11 Performance | 35828 points | |
| 3DMark Cloud Gate Standard Score | 63840 points | |
| 3DMark Fire Strike Score | 28215 points | |
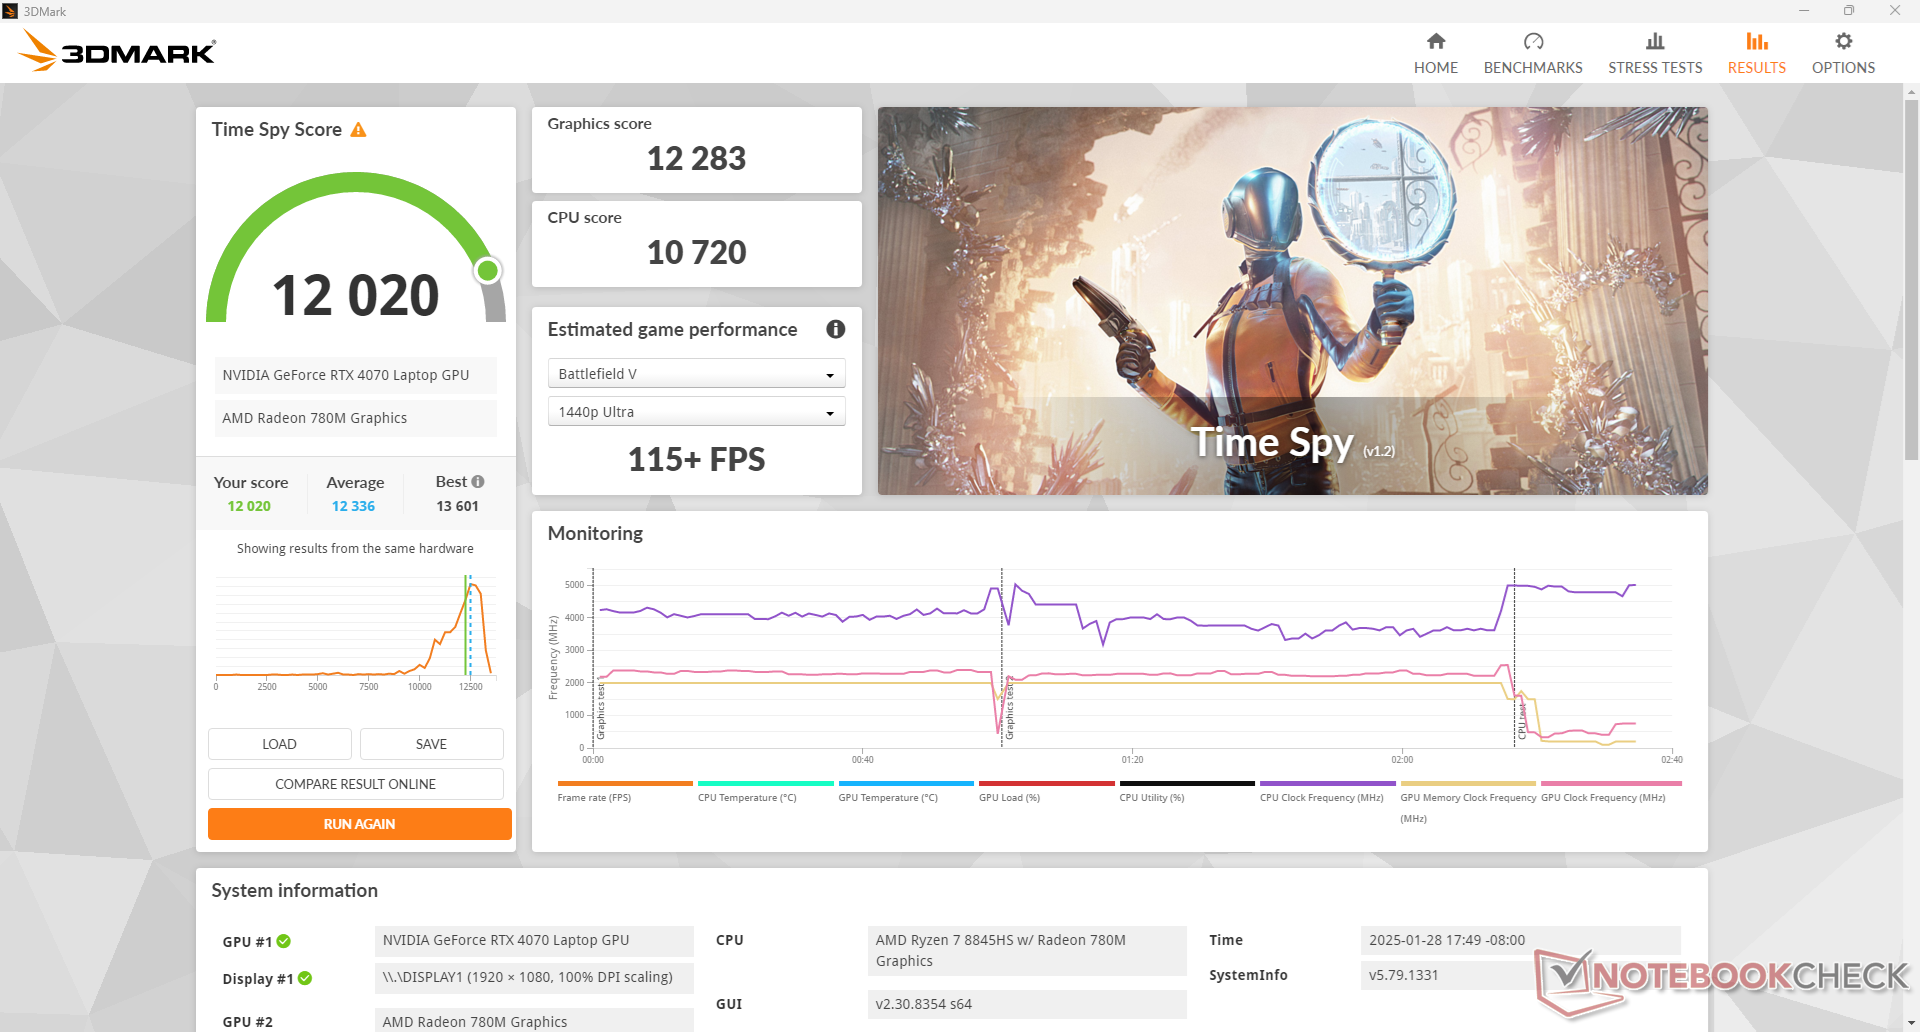
| 3DMark Time Spy Score | 12020 points | |
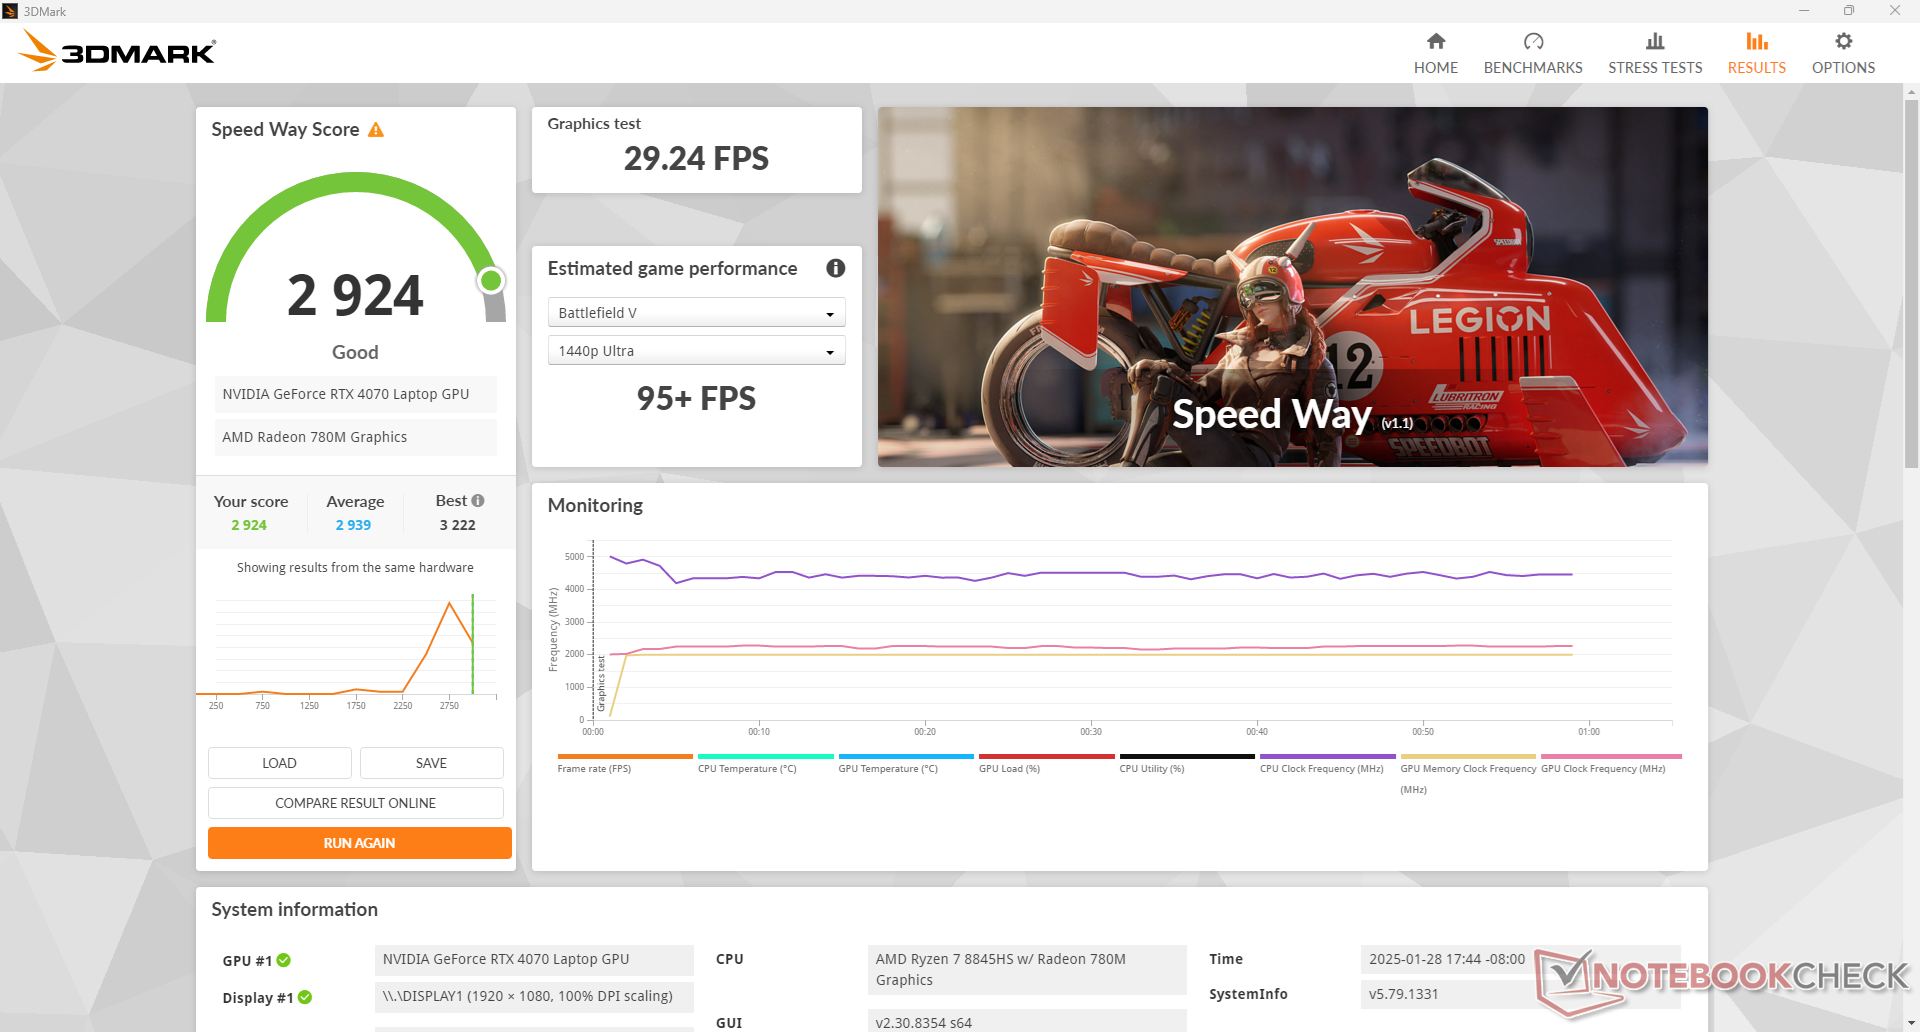
| 3DMark Steel Nomad Score | 2641 points | |
Aide | ||
* ... Moindre est la valeur, meilleures sont les performances
Performances des jeux
La RTX 4070 mobile est suffisante pour jouer avec des paramètres élevés à maximum avec l'écran interne 1080p ou 1440p. L'activation de DLSS est recommandée si vous essayez d'atteindre un taux de rafraîchissement stable de 144 FPS pour exploiter pleinement le taux de rafraîchissement de 144 Hz de l'écran 1080p. Curieusement, Strange Brigade ne se lance pas, même après une réinstallation et plusieurs tentatives.
| Cyberpunk 2077 2.2 Phantom Liberty | |
| 1280x720 Low Preset (FSR off) | |
| Eurocom Raptor X17 Core i9-14900HX | |
| Asus TUF Gaming A17 FA707XI-NS94 | |
| Moyenne NVIDIA GeForce RTX 4070 Laptop GPU (119.8 - 175.5, n=17) | |
| MSI Katana A17 AI B8VG | |
| 1920x1080 Low Preset (FSR off) | |
| Eurocom Raptor X17 Core i9-14900HX | |
| Asus TUF Gaming A17 FA707XI-NS94 | |
| MSI Katana A17 AI B8VG | |
| Moyenne NVIDIA GeForce RTX 4070 Laptop GPU (43.1 - 156.6, n=27) | |
| 1920x1080 Medium Preset (FSR off) | |
| Eurocom Raptor X17 Core i9-14900HX | |
| MSI Katana A17 AI B8VG | |
| Asus TUF Gaming A17 FA707XI-NS94 | |
| Moyenne NVIDIA GeForce RTX 4070 Laptop GPU (81.6 - 124.5, n=29) | |
| 1920x1080 High Preset (FSR off) | |
| Eurocom Raptor X17 Core i9-14900HX | |
| MSI Katana A17 AI B8VG | |
| Asus TUF Gaming A17 FA707XI-NS94 | |
| Moyenne NVIDIA GeForce RTX 4070 Laptop GPU (74.7 - 103.6, n=30) | |
| 1920x1080 Ultra Preset (FSR off) | |
| Eurocom Raptor X17 Core i9-14900HX | |
| Asus TUF Gaming A17 FA707XI-NS94 | |
| MSI Katana A17 AI B8VG | |
| Moyenne NVIDIA GeForce RTX 4070 Laptop GPU (30.7 - 90.7, n=38) | |
| Tiny Tina's Wonderlands | |
| 1280x720 Lowest Preset (DX12) | |
| KFA2 GeForce RTX 4070 EX Gamer | |
| Moyenne NVIDIA GeForce RTX 4070 Laptop GPU (277 - 345, n=4) | |
| MSI Katana A17 AI B8VG | |
| 1920x1080 Low Preset (DX12) | |
| KFA2 GeForce RTX 4070 EX Gamer | |
| MSI Katana A17 AI B8VG | |
| Moyenne NVIDIA GeForce RTX 4070 Laptop GPU (98.1 - 283, n=14) | |
| MSI Katana 17 B13VFK | |
| 1920x1080 Medium Preset (DX12) | |
| KFA2 GeForce RTX 4070 EX Gamer | |
| MSI Katana A17 AI B8VG | |
| Moyenne NVIDIA GeForce RTX 4070 Laptop GPU (92.5 - 231, n=14) | |
| MSI Katana 17 B13VFK | |
| 1920x1080 High Preset (DX12) | |
| KFA2 GeForce RTX 4070 EX Gamer | |
| MSI Katana A17 AI B8VG | |
| Moyenne NVIDIA GeForce RTX 4070 Laptop GPU (74.3 - 151.4, n=14) | |
| MSI Katana 17 B13VFK | |
| 1920x1080 Badass Preset (DX12) | |
| KFA2 GeForce RTX 4070 EX Gamer | |
| Asus TUF Gaming A17 FA707XI-NS94 | |
| MSI Katana A17 AI B8VG | |
| Moyenne NVIDIA GeForce RTX 4070 Laptop GPU (58.6 - 115.9, n=17) | |
| MSI Katana 17 B13VFK | |
Cyberpunk 2077 ultra FPS Chart
| Bas | Moyen | Élevé | Ultra | |
|---|---|---|---|---|
| GTA V (2015) | 184 | 179.8 | 171.1 | 120 |
| Dota 2 Reborn (2015) | 168.4 | 154 | 149.1 | 143.1 |
| Final Fantasy XV Benchmark (2018) | 218 | 162.2 | 120.1 | |
| X-Plane 11.11 (2018) | 88.9 | 82 | 66.2 | |
| Far Cry 5 (2018) | 158 | 139 | 133 | 124 |
| Tiny Tina's Wonderlands (2022) | 245.9 | 199.6 | 138.7 | 107.7 |
| F1 22 (2022) | 256 | 252 | 216 | 81.9 |
| Baldur's Gate 3 (2023) | 162.6 | 139.3 | 122.4 | 121.4 |
| Cyberpunk 2077 2.2 Phantom Liberty (2023) | 135.1 | 119.1 | 101 | 85.5 |
Émissions
Bruit du système
Le bruit du ventilateur est généralement plus silencieux que celui que nous avons enregistré sur l'ancienne Katana 17. Plus précisément, notre Katana A17 est capable de rester plus longtemps silencieux avant de plafonner à des niveaux de bruit similaires à ceux d'avant.
Notez qu'il y a une différence significative de niveau sonore lorsque vous jouez avec Cooler Boost désactivé au lieu d'activé (51 dB(A) contre 60 dB(A)) même si les différences de performance sont extrêmement mineures. Il est donc recommandé de jouer avec Cooler Boost désactivé dans la plupart des cas.

Degré de la nuisance sonore
| Au repos |
| 23.9 / 24.1 / 24.2 dB(A) |
| Fortement sollicité |
| 24 / 59.8 dB(A) |
 | ||
30 dB silencieux 40 dB(A) audible 50 dB(A) bruyant |
||
min: | ||
| MSI Katana A17 AI B8VG NVIDIA GeForce RTX 4070 Laptop GPU, R7 8845HS, Samsung PM9C1 MZVL81T0HELB-00BTW | HP Omen 17-db0079ng NVIDIA GeForce RTX 4070 Laptop GPU, R7 8845HS, WD PC SN560 SDDPNQE-1T00 | Asus TUF Gaming A17 FA707XI-NS94 NVIDIA GeForce RTX 4070 Laptop GPU, R9 7940HS, WD PC SN560 SDDPNQE-1T00 | Acer Nitro 17 AN17-51-71ER NVIDIA GeForce RTX 4060 Laptop GPU, i7-13700H, Samsung PM9A1 MZVL21T0HCLR | MSI Pulse 17 B13VGK NVIDIA GeForce RTX 4070 Laptop GPU, i7-13700H, Micron 2400 MTFDKBA1T0QFM | Lenovo Legion 5 17ACH6H-82JY0003GE GeForce RTX 3060 Laptop GPU, R5 5600H, Samsung PM991a MZALQ512HBLU | |
|---|---|---|---|---|---|---|
| Noise | -19% | -21% | -13% | -2% | -14% | |
| arrêt / environnement * | 23.5 | 25 -6% | 27.9 -19% | 24 -2% | 24 -2% | 25 -6% |
| Idle Minimum * | 23.9 | 25 -5% | 28.5 -19% | 24 -0% | 24 -0% | 25 -5% |
| Idle Average * | 24.1 | 29 -20% | 29.8 -24% | 24 -0% | 24 -0% | 25 -4% |
| Idle Maximum * | 24.2 | 33 -36% | 29.8 -23% | 32.32 -34% | 24 1% | 30.5 -26% |
| Load Average * | 24 | 45 -88% | 34.8 -45% | 35.18 -47% | 32.49 -35% | 37.5 -56% |
| Cyberpunk 2077 ultra * | 51.2 | 48 6% | ||||
| Load Maximum * | 59.8 | 52 13% | 57.3 4% | 54.78 8% | 46.51 22% | 51 15% |
| Witcher 3 ultra * | 57.1 | 54.78 | 46.51 |
* ... Moindre est la valeur, meilleures sont les performances
Température
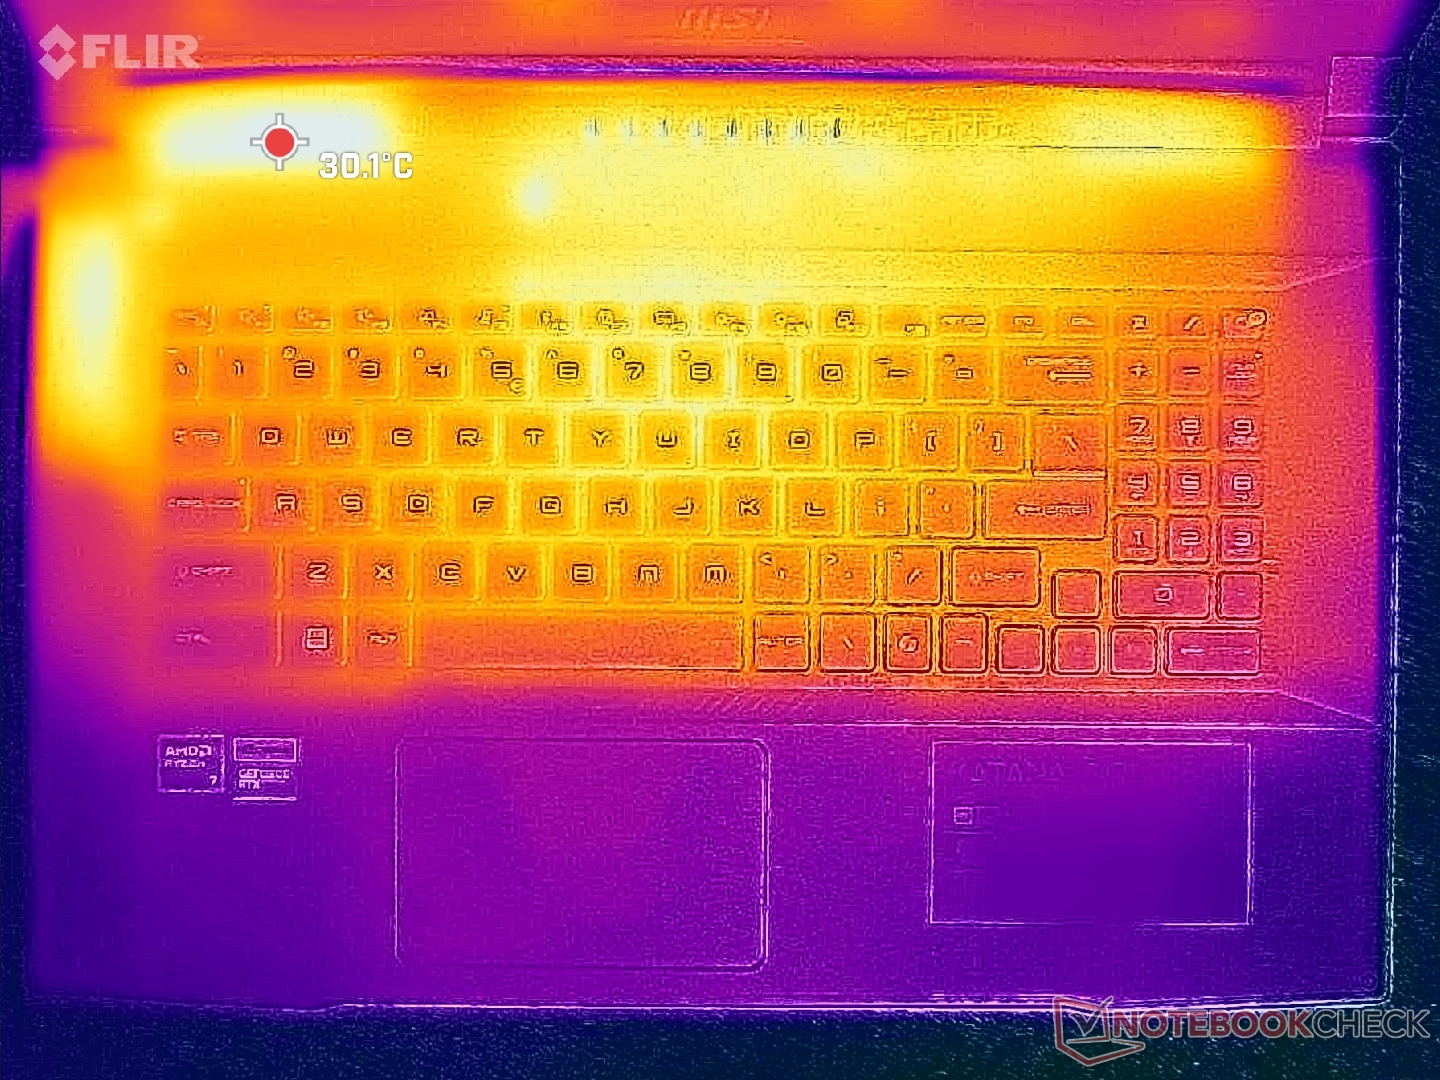
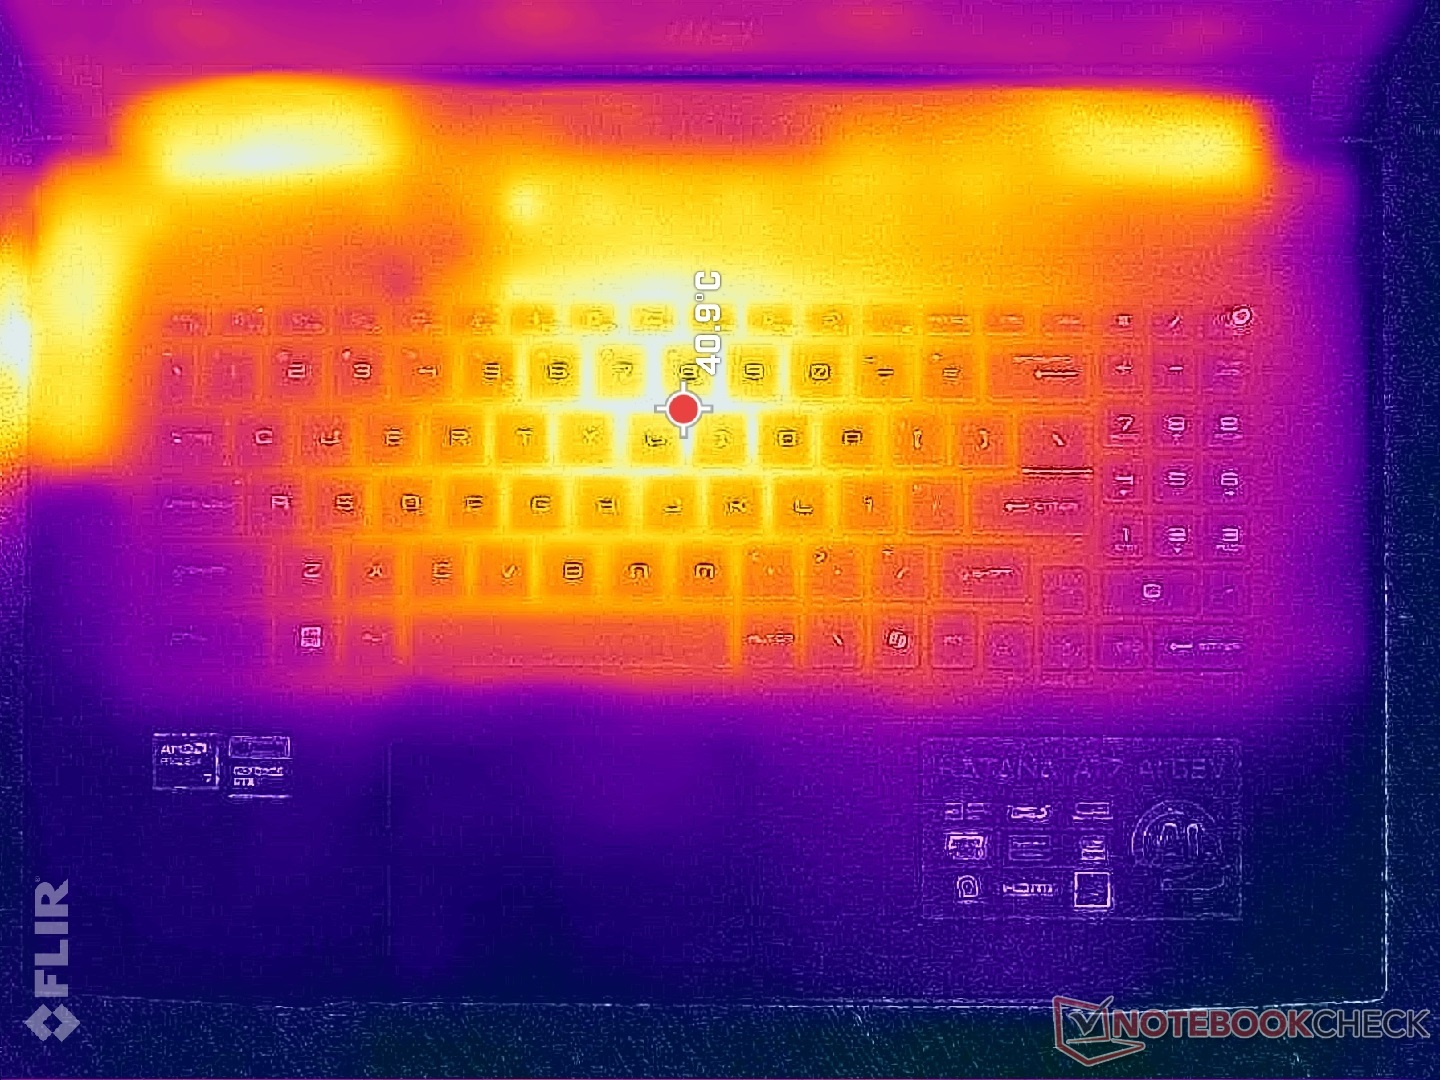
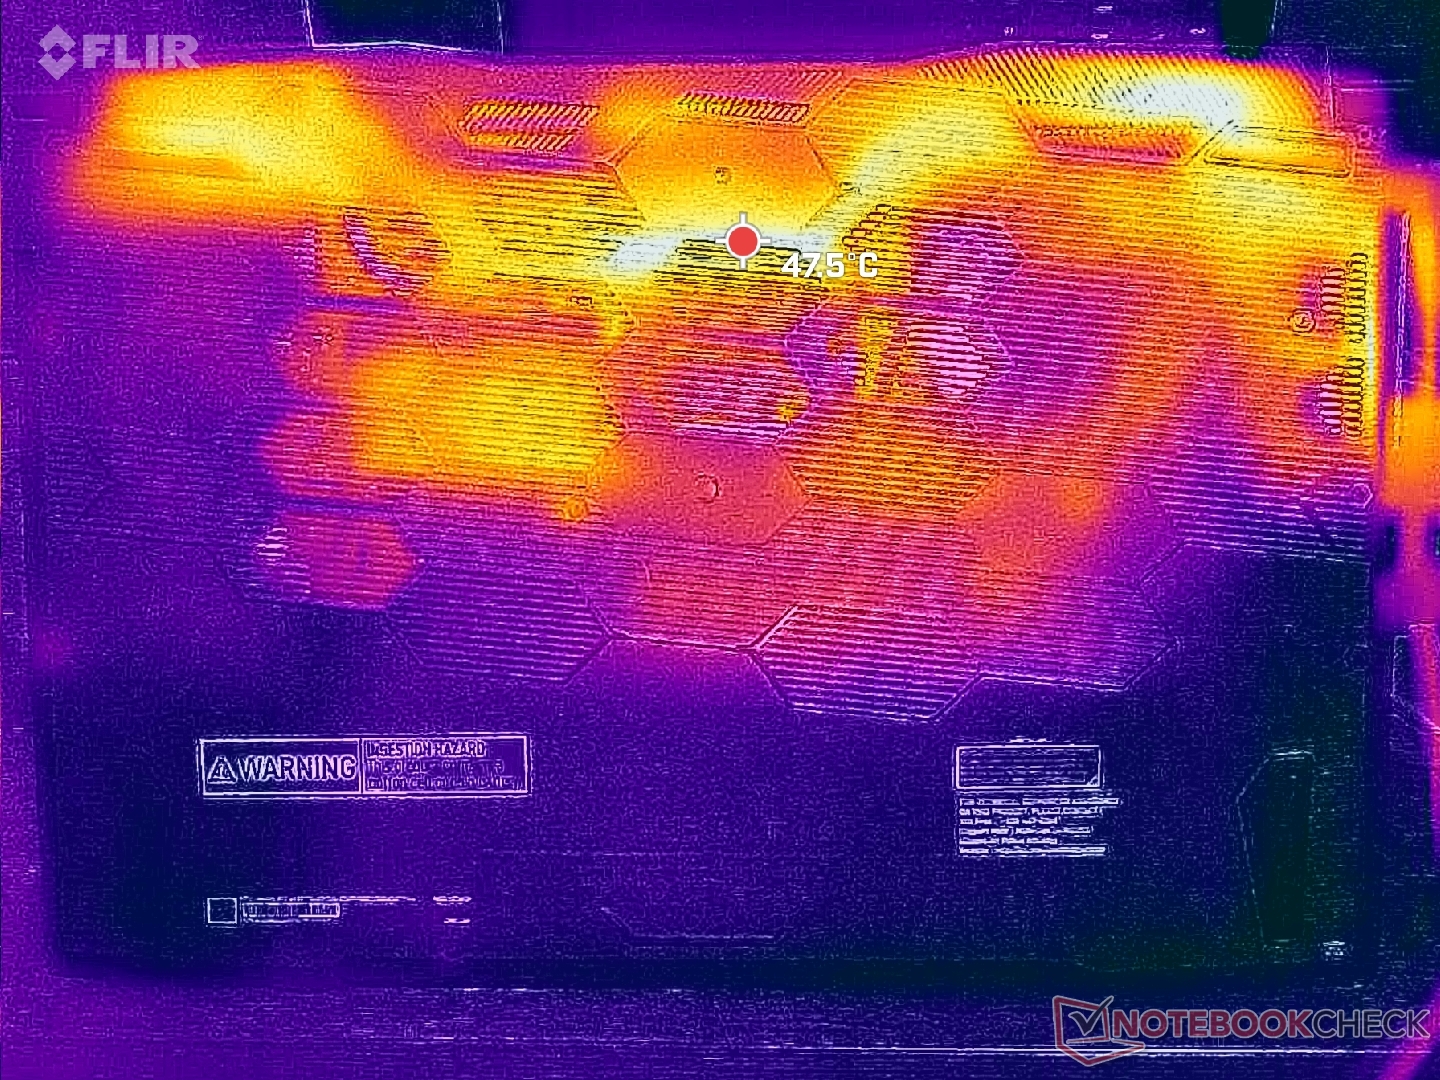
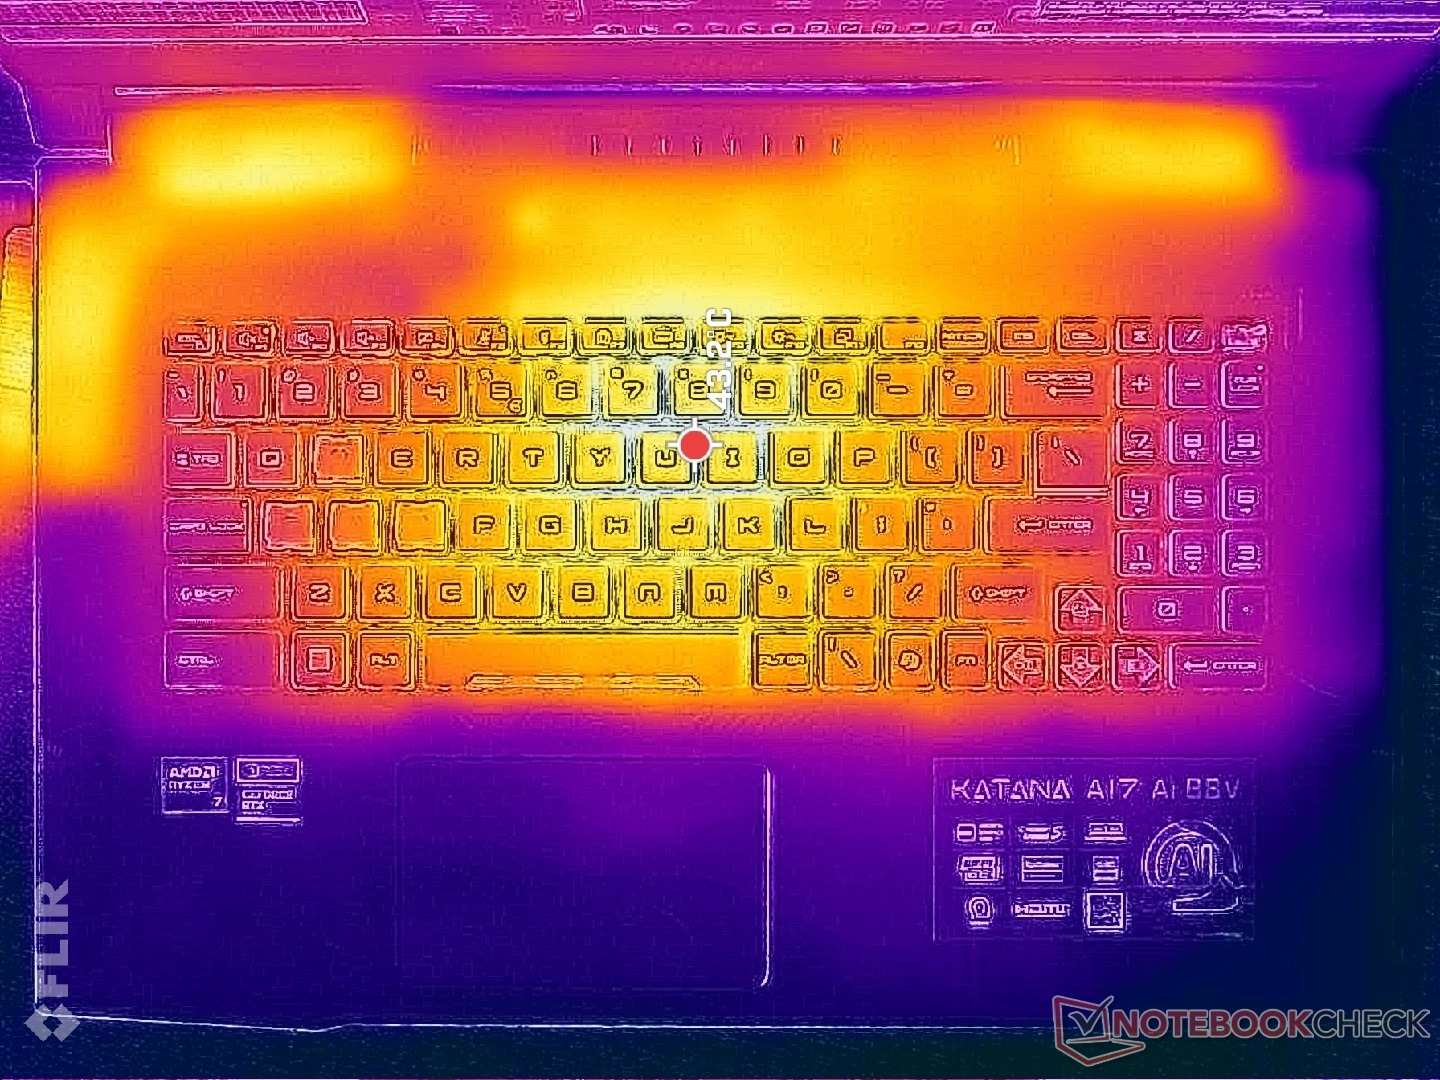
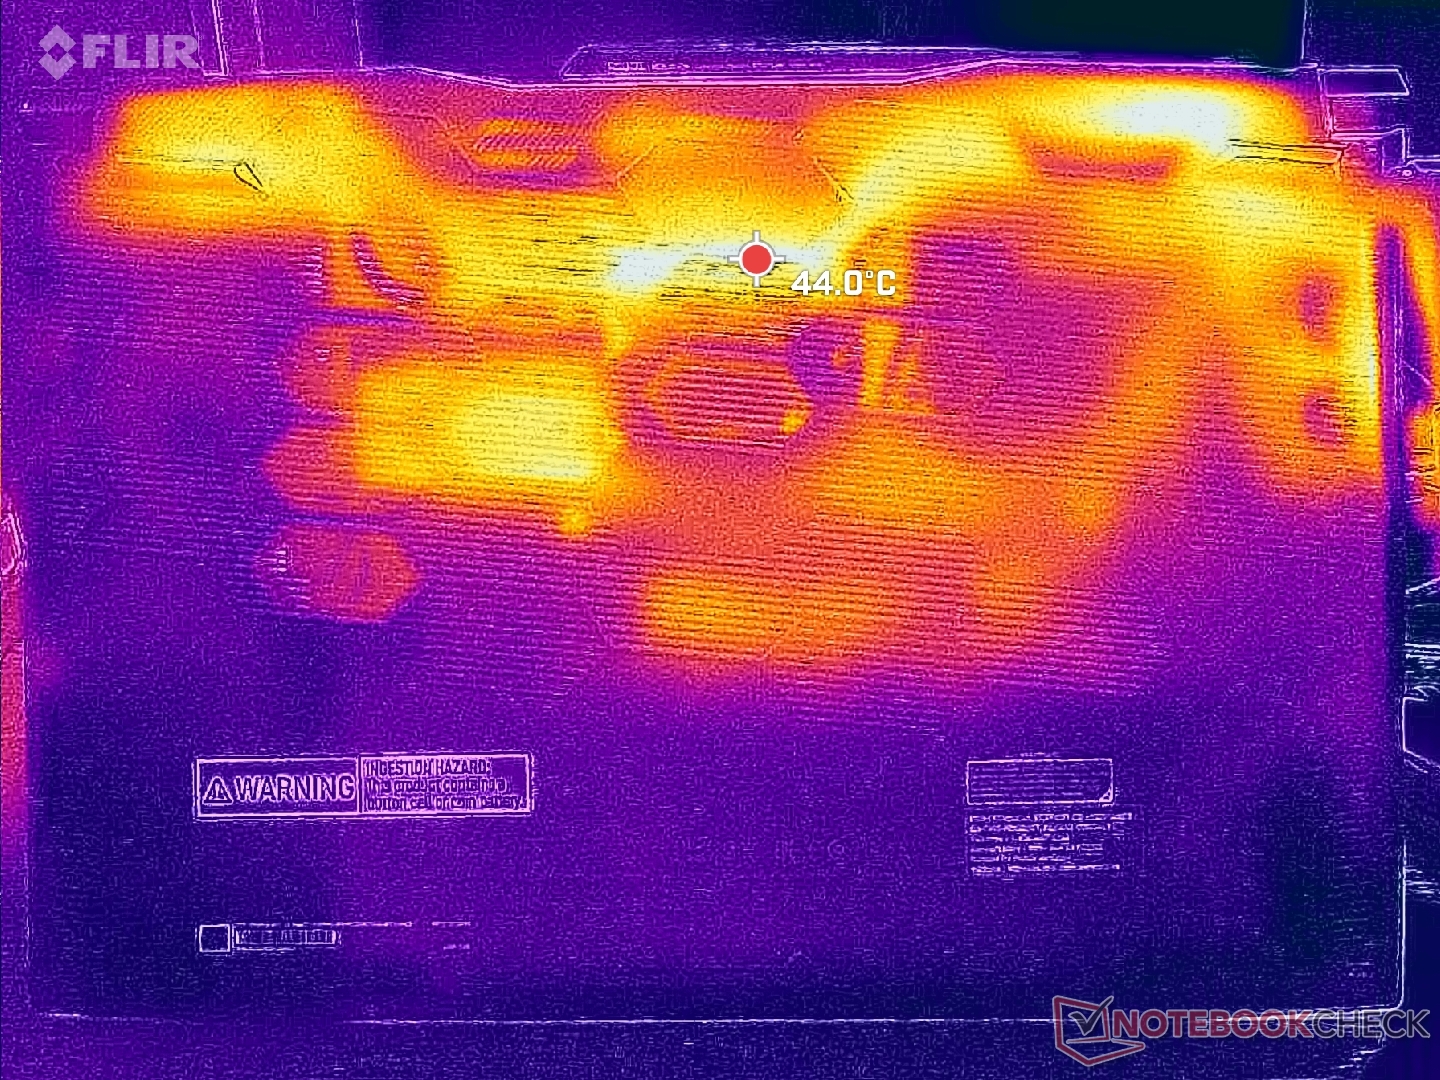
Les températures de surface sont les plus élevées au centre du clavier, où le contact avec les paumes et les doigts est minimisé lors des jeux. Les résultats sont comparables à ceux du Asus TUF Gaming A17 qui est livré avec des options de CPU et de GPU similaires.

(±) La température maximale du côté supérieur est de 42 °C / 108 F, par rapport à la moyenne de 40.4 °C / 105 F, allant de 21.2 à 68.8 °C pour la classe Gaming.
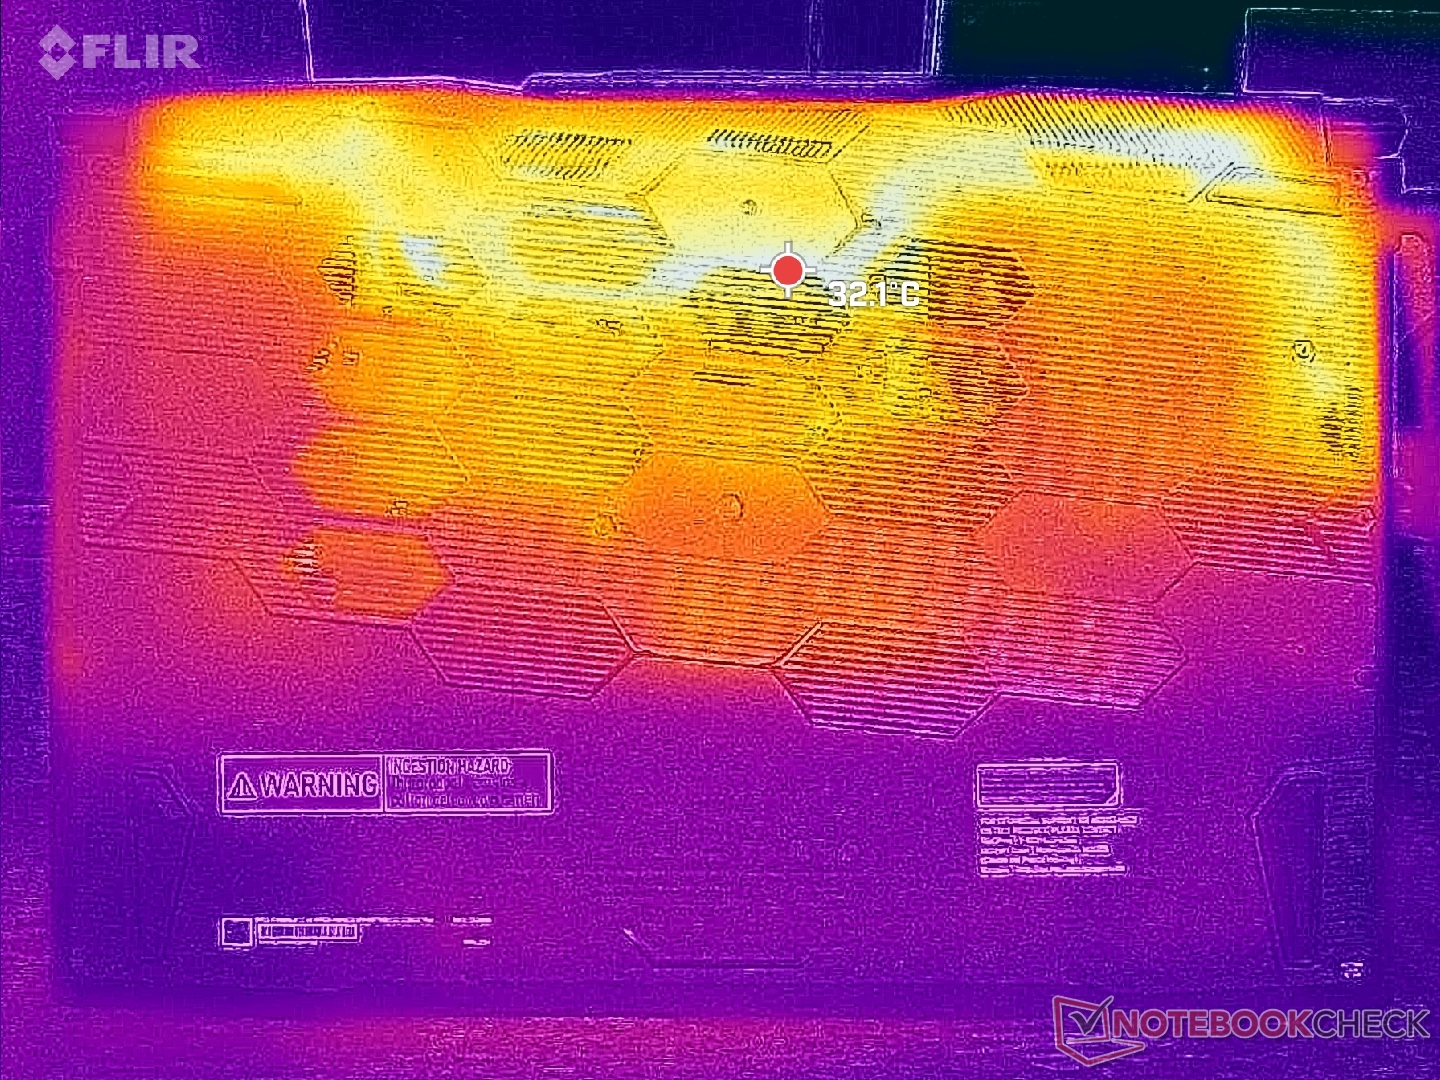
(±) Le fond chauffe jusqu'à un maximum de 41.4 °C / 107 F, contre une moyenne de 43.2 °C / 110 F
(+) En utilisation inactive, la température moyenne du côté supérieur est de 26.5 °C / 80 F, par rapport à la moyenne du dispositif de 33.9 °C / 93 F.
(+) 3: The average temperature for the upper side is 30.3 °C / 87 F, compared to the average of 33.9 °C / 93 F for the class Gaming.
(+) Les repose-poignets et le pavé tactile sont plus froids que la température de la peau avec un maximum de 22.4 °C / 72.3 F et sont donc froids au toucher.
(+) La température moyenne de la zone de l'appui-paume de dispositifs similaires était de 28.9 °C / 84 F (+6.5 °C / #11.7 F).
| MSI Katana A17 AI B8VG AMD Ryzen 7 8845HS, NVIDIA GeForce RTX 4070 Laptop GPU | HP Omen 17-db0079ng AMD Ryzen 7 8845HS, NVIDIA GeForce RTX 4070 Laptop GPU | Asus TUF Gaming A17 FA707XI-NS94 AMD Ryzen 9 7940HS, NVIDIA GeForce RTX 4070 Laptop GPU | Acer Nitro 17 AN17-51-71ER Intel Core i7-13700H, NVIDIA GeForce RTX 4060 Laptop GPU | MSI Pulse 17 B13VGK Intel Core i7-13700H, NVIDIA GeForce RTX 4070 Laptop GPU | Lenovo Legion 5 17ACH6H-82JY0003GE AMD Ryzen 5 5600H, NVIDIA GeForce RTX 3060 Laptop GPU | |
|---|---|---|---|---|---|---|
| Heat | 9% | 20% | -6% | -3% | -3% | |
| Maximum Upper Side * | 42 | 44 -5% | 40 5% | 46 -10% | 48 -14% | 42.2 -0% |
| Maximum Bottom * | 41.4 | 45 -9% | 33.6 19% | 51 -23% | 50 -21% | 50.9 -23% |
| Idle Upper Side * | 32.6 | 26 20% | 26.6 18% | 34 -4% | 30 8% | 34.3 -5% |
| Idle Bottom * | 38.2 | 27 29% | 24.4 36% | 33 14% | 33 14% | 32 16% |
* ... Moindre est la valeur, meilleures sont les performances
Intervenants
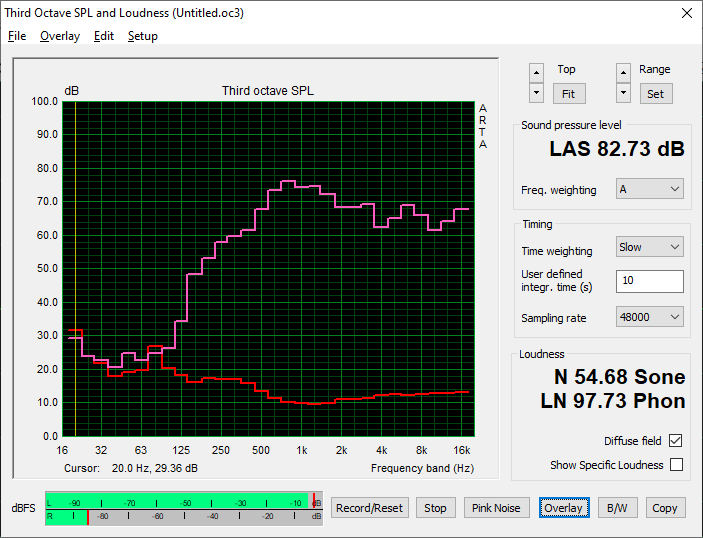
MSI Katana A17 AI B8VG analyse audio
(+) | les haut-parleurs peuvent jouer relativement fort (82.7# dB)
Basses 100 - 315 Hz
(-) | presque aucune basse - en moyenne 19.3% plus bas que la médiane
(±) | la linéarité des basses est moyenne (10.9% delta à la fréquence précédente)
Médiums 400 - 2000 Hz
(±) | médiane supérieure - en moyenne 6.3% supérieure à la médiane
(+) | les médiums sont linéaires (5.8% delta à la fréquence précédente)
Aiguës 2 - 16 kHz
(+) | des sommets équilibrés - à seulement 2.5% de la médiane
(+) | les aigus sont linéaires (5.9% delta à la fréquence précédente)
Globalement 100 - 16 000 Hz
(±) | la linéarité du son global est moyenne (16.2% de différence avec la médiane)
Par rapport à la même classe
» 38% de tous les appareils testés de cette catégorie étaient meilleurs, 7% similaires, 55% pires
» Le meilleur avait un delta de 6%, la moyenne était de 18%, le pire était de 132%.
Par rapport à tous les appareils testés
» 24% de tous les appareils testés étaient meilleurs, 5% similaires, 71% pires
» Le meilleur avait un delta de 4%, la moyenne était de 24%, le pire était de 134%.
Apple MacBook Pro 16 2021 M1 Pro analyse audio
(+) | les haut-parleurs peuvent jouer relativement fort (84.7# dB)
Basses 100 - 315 Hz
(+) | bonne basse - seulement 3.8% loin de la médiane
(+) | les basses sont linéaires (5.2% delta à la fréquence précédente)
Médiums 400 - 2000 Hz
(+) | médiane équilibrée - seulement 1.3% de la médiane
(+) | les médiums sont linéaires (2.1% delta à la fréquence précédente)
Aiguës 2 - 16 kHz
(+) | des sommets équilibrés - à seulement 1.9% de la médiane
(+) | les aigus sont linéaires (2.7% delta à la fréquence précédente)
Globalement 100 - 16 000 Hz
(+) | le son global est linéaire (4.6% différence à la médiane)
Par rapport à la même classe
» 0% de tous les appareils testés de cette catégorie étaient meilleurs, 0% similaires, 100% pires
» Le meilleur avait un delta de 5%, la moyenne était de 18%, le pire était de 45%.
Par rapport à tous les appareils testés
» 0% de tous les appareils testés étaient meilleurs, 0% similaires, 100% pires
» Le meilleur avait un delta de 4%, la moyenne était de 24%, le pire était de 134%.
Gestion de l'énergie - D'excellentes performances par watt mais une faible autonomie de la batterie
Consommation électrique
La consommation globale est très proche de celle que nous avons enregistrée sur la Katana 17 malgré le fait que notre Katana A17 offre à peu près les mêmes performances de CPU mais avec des performances graphiques jusqu'à 20 % plus élevées. La performance par watt est donc plus élevée, surtout lorsqu'il s'agit du Ryzen 7 7 8845HS par rapport au Core i7-13620H.
| Éteint/en veille | |
| Au repos | |
| Fortement sollicité |
|
Légende:
min: | |
| MSI Katana A17 AI B8VG R7 8845HS, NVIDIA GeForce RTX 4070 Laptop GPU, Samsung PM9C1 MZVL81T0HELB-00BTW, IPS, 1920x1080, 17.3" | HP Omen 17-db0079ng R7 8845HS, NVIDIA GeForce RTX 4070 Laptop GPU, WD PC SN560 SDDPNQE-1T00, IPS, 2560x1440, 17.3" | Asus TUF Gaming A17 FA707XI-NS94 R9 7940HS, NVIDIA GeForce RTX 4070 Laptop GPU, WD PC SN560 SDDPNQE-1T00, IPS, 1920x1080, 17.3" | Acer Nitro 17 AN17-51-71ER i7-13700H, NVIDIA GeForce RTX 4060 Laptop GPU, Samsung PM9A1 MZVL21T0HCLR, , 2560x1440, 17.3" | MSI Pulse 17 B13VGK i7-13700H, NVIDIA GeForce RTX 4070 Laptop GPU, Micron 2400 MTFDKBA1T0QFM, IPS, 1920x1080, 17.3" | Lenovo Legion 5 17ACH6H-82JY0003GE R5 5600H, GeForce RTX 3060 Laptop GPU, Samsung PM991a MZALQ512HBLU, IPS, 1920x1080, 17.3" | |
|---|---|---|---|---|---|---|
| Power Consumption | -6% | -11% | -3% | 12% | -38% | |
| Idle Minimum * | 15.4 | 6 61% | 6.2 60% | 8.3 46% | 9 42% | 15.6 -1% |
| Idle Average * | 16.8 | 12 29% | 21.8 -30% | 13.5 20% | 10.2 39% | 20.7 -23% |
| Idle Maximum * | 17.1 | 18 -5% | 22 -29% | 14.8 13% | 10.8 37% | 22.9 -34% |
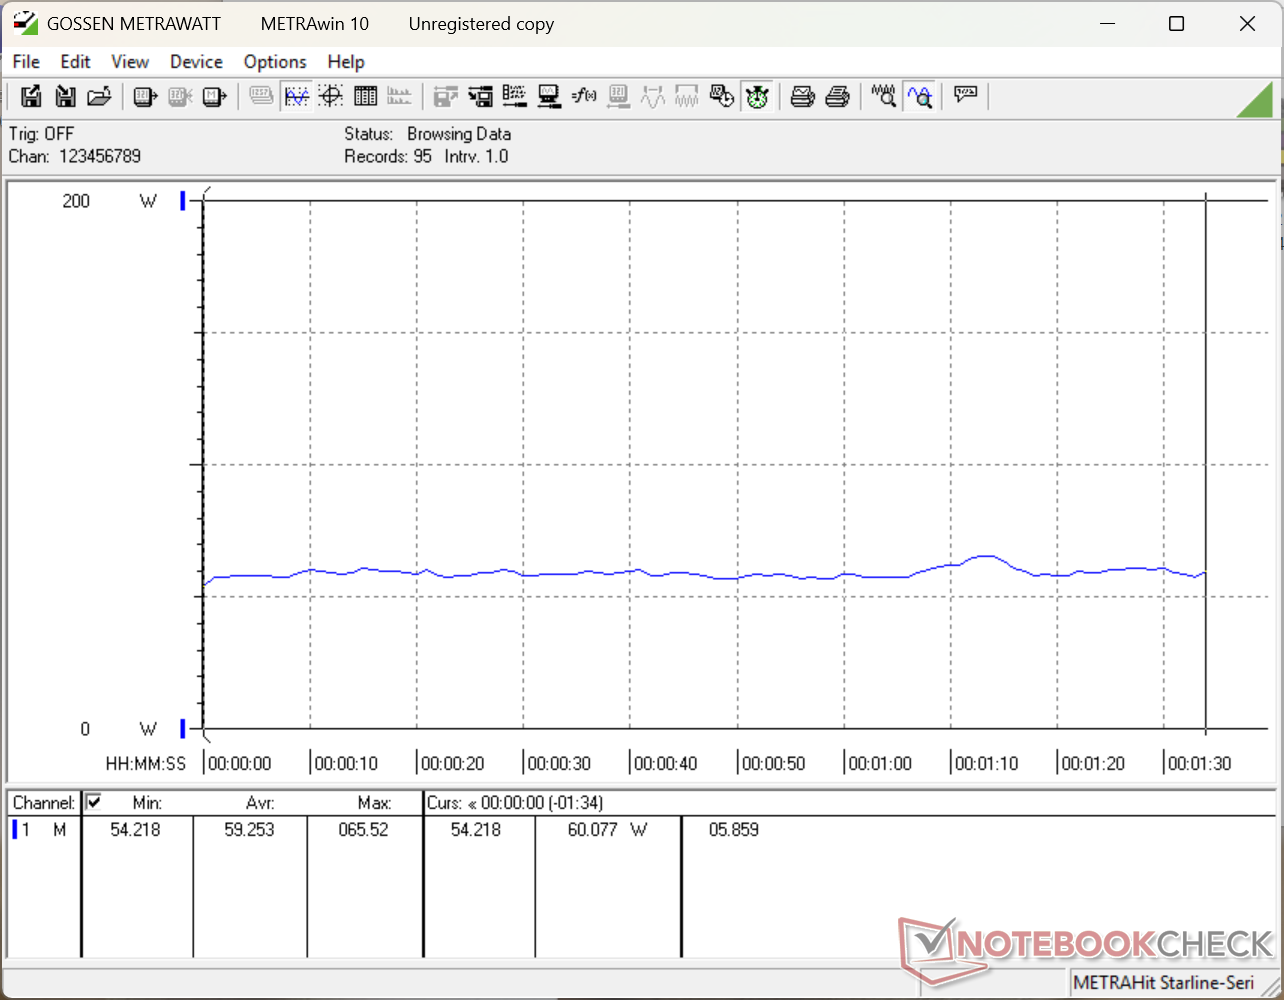
| Load Average * | 59.3 | 71 -20% | 59.2 -0% | 77 -30% | 72 -21% | 134 -126% |
| Cyberpunk 2077 ultra external monitor * | 147.4 | 191.8 -30% | ||||
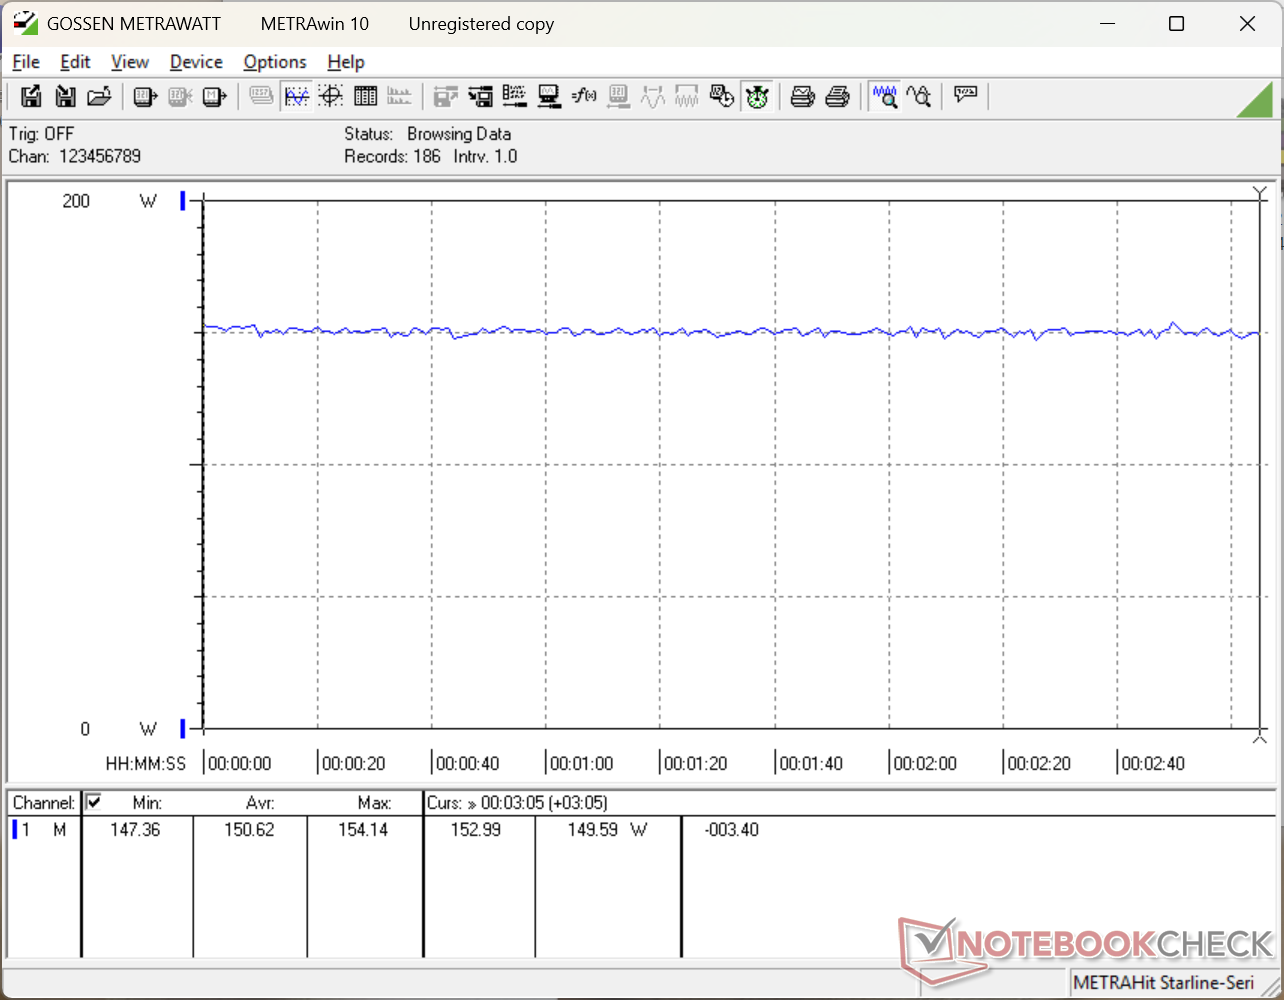
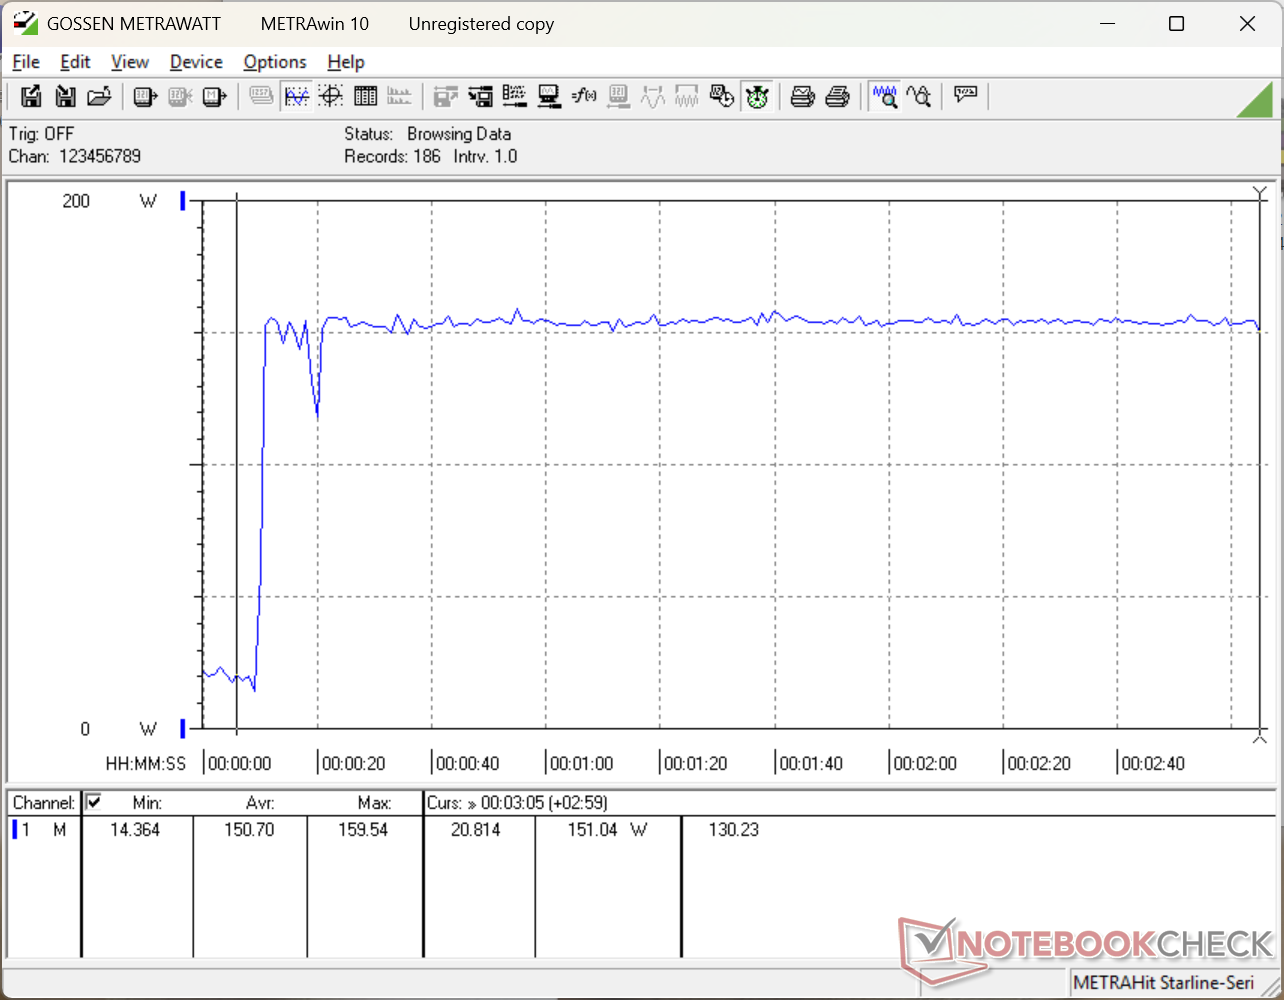
| Cyberpunk 2077 ultra * | 150.6 | 197 -31% | ||||
| Load Maximum * | 160 | 228 -43% | 247.8 -55% | 263 -64% | 221 -38% | 170 -6% |
| Witcher 3 ultra * | 189.7 | 154 | 130 | 135 |
* ... Moindre est la valeur, meilleures sont les performances
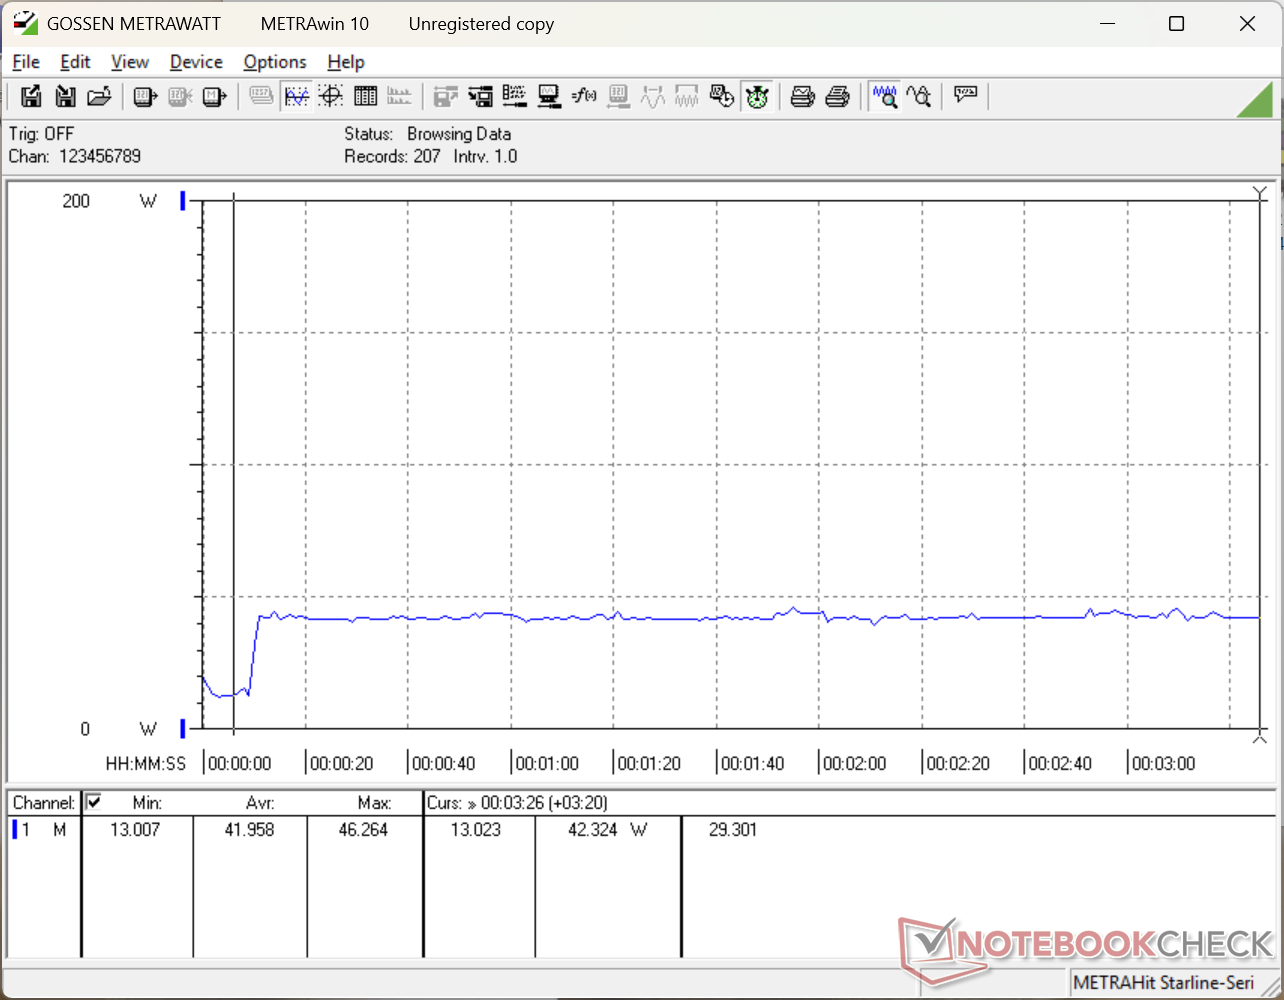
Power Consumption Cyberpunk / Stress Test
Power Consumption external Monitor
Autonomie de la batterie
La capacité de la batterie est faible (53 Wh) et l'autonomie est généralement inférieure à celle de la plupart des autres ordinateurs portables de jeu, même en mode iGPU.
| MSI Katana A17 AI B8VG R7 8845HS, NVIDIA GeForce RTX 4070 Laptop GPU, 53.5 Wh | HP Omen 17-db0079ng R7 8845HS, NVIDIA GeForce RTX 4070 Laptop GPU, 83 Wh | Asus TUF Gaming A17 FA707XI-NS94 R9 7940HS, NVIDIA GeForce RTX 4070 Laptop GPU, 90 Wh | Acer Nitro 17 AN17-51-71ER i7-13700H, NVIDIA GeForce RTX 4060 Laptop GPU, 90 Wh | MSI Pulse 17 B13VGK i7-13700H, NVIDIA GeForce RTX 4070 Laptop GPU, 90 Wh | Lenovo Legion 5 17ACH6H-82JY0003GE R5 5600H, GeForce RTX 3060 Laptop GPU, 80 Wh | |
|---|---|---|---|---|---|---|
| Autonomie de la batterie | 131% | 132% | 109% | 128% | 11% | |
| WiFi v1.3 | 236 | 544 131% | 548 132% | 494 109% | 537 128% | 263 11% |
| H.264 | 462 | 413 | 212 | |||
| Cyberpunk 2077 ultra 150cd | 59 | |||||
| Reader / Idle | 1180 | 331 | ||||
| Load | 103 | 131 | 111 | |||
| Witcher 3 ultra | 151 |
Notebookcheck Rating
MSI Katana A17 AI B8VG
- 02/03/2025 v8
Allen Ngo
 Total Sustainability Score:
 Transparency
La sélection des appareils à examiner est effectuée par notre équipe éditoriale. L'échantillon de test a été prêté à l'auteur par le fabricant ou le détaillant pour les besoins de cet examen. Le prêteur n'a pas eu d'influence sur cette évaluation et le fabricant n'a pas reçu de copie de cette évaluation avant sa publication. Il n'y avait aucune obligation de publier cet article. Nous n'acceptons jamais de compensation ou de paiement en échange de nos commentaires. En tant que média indépendant, Notebookcheck n'est pas soumis à l'autorité des fabricants, des détaillants ou des éditeurs.
Voici comment Notebookcheck teste
Chaque année, Notebookcheck examine de manière indépendante des centaines d'ordinateurs portables et de smartphones en utilisant des procédures standardisées afin de garantir que tous les résultats sont comparables. Nous avons continuellement développé nos méthodes de test depuis environ 20 ans et avons établi des normes industrielles dans le processus. Dans nos laboratoires de test, des équipements de mesure de haute qualité sont utilisés par des techniciens et des rédacteurs expérimentés. Ces tests impliquent un processus de validation en plusieurs étapes. Notre système d'évaluation complexe repose sur des centaines de mesures et de points de référence bien fondés, ce qui garantit l'objectivité.
