Notebookcheck Logo
Teaser

Test de l'Asus NUC 14 Pro+ : mini PC tueur potentiel des PC de bureau avec seulement 622 g

Une centrale polyvalente avec des capacités exceptionnelles.

L'Asus NUC 14 Pro+ promet d'offrir des performances impressionnantes dans un format compact, avec les derniers processeurs et une puissance massive. Mais comment se comporte-t-il au quotidien ? Dans cet article, nous mettons le NUC 14 Pro+ à l'épreuve pour voir s'il tient ses promesses et s'il peut réellement remplacer un ordinateur de bureau.
Sebastian Bade, 👁 Sebastian Bade (traduit par DeepL / Ninh Duy) Published 🇺🇸 🇩🇪 ...
Mini PC Desktop Intel Meteor Lake Thunderbolt

Verdict - Les performances élevées ont un coût

L'Asus NUC 14 Pro+ avec Intel Core Ultra 9 185H se distingue à bien des égards en tant que mini-PC compact. Doté d'un processeur de nouvelle génération, il offre d'excellentes performances pour les tâches exigeantes, du multitâche aux applications créatives telles que l'édition d'images et de vidéos. Visuellement, l'Asus NUC 14 Pro+ semble plus petit que beaucoup d'autres mini PC, grâce à ses couleurs argentées et blanches. Une caractéristique particulièrement impressionnante est le large éventail d'options de connectivité, y compris deux ports Thunderbolt 4 à l'épreuve du temps. Le démontage sans outil de la face inférieure est un choix de conception astucieux, qui permet de mettre à niveau rapidement et facilement le SSD ou la RAM.

L'inconvénient est le niveau de bruit en cas de charge élevée ou moyenne, qui peut être clairement perceptible selon le scénario d'utilisation. Il serait logique d'avoir un meilleur réglage de la courbe du ventilateur dès la sortie de la boîte, surtout si l'on considère le prix d'achat. Après tout, le BIOS offre une variété de réglages qui peuvent aider à améliorer ce problème. Néanmoins, le NUC 14 Pro+ reste un choix solide pour tous ceux qui recherchent un PC puissant et peu encombrant, que ce soit pour les tâches quotidiennes, le multimédia ou les applications créatives.

Points positifs

+ étui robuste et de qualité supérieure
+ fabrication impeccable
+ deux ports Thunderbolt 4
+ Intel Core Ultra 9 185H avec des performances illimitées
+ puissant GPU intégré
+ rAM généreuse de 32 Go
+ performance stable et constante du SSD
+ nombreuses options de configuration du BIOS
+ garantie de 36 mois

Points négatifs

- l'unité de refroidissement fonctionne efficacement sous des charges extrêmes
- bruit perceptible à charge partielle et à pleine charge
- absence d'interface OCuLink
- le prix élevé

Prix et disponibilité

Amazon vend le modèle Asus NUC 14 Pro+ que nous avons testé au prix de 1 050 $. Le modèle barebone est également disponible sur Amazon à partir de 882 $. Pour une option plus abordable, considérez l'Asus NUC 14 Pro+ avec l'Intel Core Ultra 5 125H, au prix d'environ 765 $, et équipé d'un SSD de 512 Go et de 16 Go de RAM.

Amazon Logo
$1,000.89
ASUS NUC 14 Pro+ Full System Mini PC with Intel 14th Gen Core Ultra 9 185H, 32GB DDR5 RAM, 1TB PCIe G4x4 NVMe SSD, Thunderbolt 4, Win 11 Home, Silver Aluminum Chassis, VESA Mount Included
  • $599.99
    ASUS NUC 14 Pro Slim Barebone with Intel 14th Gen Core Ultra 7 155H (NPU Support), Up to 96GB DDR5 RAM, Dual Storage Design, Thunderbolt 4, Wi-Fi 6E & Bluetooth 5.3, with VESA Mount
  • $1,099.00
    ASUS NUC 14 Pro AI Mini Pc, Ultra 7 155H (16C/22T, Up to 4.8GHz) Mini Desktop, 32GB DDR5 RAM 1TB PCIe 4 SSD Mini Computer, Intel Arc Gpu/AI GC/AI Boost/AI Ready/Type C 3.2/8K/HDR/My ASUS/BT5.3/WiFi 6E

Comparaison des alternatives possibles

Image
Modèle
Geizhals
Poids
Épaisseur
Display
1.
75.3%
Asus NUC 14 Pro+
Asus NUC 14 Pro+
Intel Core Ultra 9 185H ⎘
Intel Arc 8-Core iGPU ⎘
32 Go Mémoire, 1024 Go SSD
Bestpreis 1299€ galaxus
2. 1299€ computeruniverse.net
3. 1299€ Cyberport.de
622 g41 mmx
2.
80.8%
Aoostar GEM12
Aoostar GEM12
AMD Ryzen 7 8845HS ⎘
AMD Radeon 780M ⎘
32 Go Mémoire, 1024 Go SSD
Listenpreis 649 US-Dollar653 g60 mmx
3.
78.8%
Geekom GT1 Mega
Geekom GT1 Mega
Intel Core Ultra 9 185H ⎘
Intel Arc 8-Core iGPU ⎘
32 Go Mémoire, 2048 Go SSD
Listenpreis 1149 EUR
Geizhals Suche
693 g46.9 mmx
4.
78.4%
Geekom AX8 Pro
Geekom AX8 Pro
AMD Ryzen 9 8945H ⎘
AMD Radeon 780M ⎘
32 Go Mémoire, 2048 Go SSD
Listenpreis 999 EUR548 g37 mmx
5.
87.5% v7 (old)
Minisforum AtomMan X7 Ti
Intel Core Ultra 9 185H ⎘
Intel Arc 8-Core iGPU ⎘
32 Go Mémoire, 1024 Go SSD
Bestpreis 1159€ pclike
2. 1159€ pclike
863 g48.6 mmx
6.
83.4% v7 (old)
Acemagic F2A
Acemagic F2A
Intel Core Ultra 7 155H ⎘
Intel Arc 8-Core iGPU ⎘
32 Go Mémoire, 1024 Go SSD
Listenpreis 1199 EUR768 g57 mmx

Le NUC 14 Pro+ d'Asus se distingue clairement de la série NUC (Next Unit of Computing), initialement introduite par Intel. Cette petite centrale est légèrement plus grande, mais reste très compacte. Dans cet article, nous nous concentrerons sur la meilleure configuration avec le processeur Intel Core Ultra 9 185H. Avec 32 Go de RAM et un SSD de 1 To, le système est prêt à être utilisé immédiatement, même si le prix de 1 050 $ est un peu élevé. Si vous choisissez d'équiper l'appareil avec votre propre RAM et SSD, vous paierez moins cher. De plus, l'Asus NUC 14 Pro+ est disponible avec un processeur Intel Core Ultra 5 125H ou Intel Core Ultra 7 155H comme options alternatives. Ces modèles légèrement moins puissants restent suffisamment rapides pour les tâches quotidiennes.

Sur le marché très concurrentiel des mini-PC, Asus doit faire face à une forte concurrence de la part de marques d'Extrême-Orient. Des sociétés comme Minisforum, Geekom et Aoostar proposent des appareils similaires à des prix plus compétitifs. Regardons de plus près comment Asus se situe par rapport à ces rivaux.

Spécifications

Asus NUC 14 Pro+
Processeur
Intel Core Ultra 9 185H 16 x 3.8 - 5.1 GHz, 115 W PL2 / Short Burst, 115 W PL1 / Sustained, Meteor Lake-H
Carte graphique
Intel Arc 8-Core iGPU, Processeur: 2350 MHz
Mémoire
32 Go 
, 5600 MT/s, max 96 GB
Carte mère
Intel Meteor Lake-U/P/H PCH
Disque dur
Samsung PM9A1a MZVL21T0HDLU, 1024 Go 
, 875 Go libres
Carte son
Intel Meteor Lake-U/P/H PCH - cAVS (Audio, Voice, Speech)
Connexions
1 USB 2.0, 4 USB 3.1 Gen2, 2 USB 4.0 40 Gbps, 2 Thunderbolt, 2 HDMI, 2 DisplayPort, 1 Encoche de Sécurité Kensington, 1 Port pour Station d'accueil
Réseau
Intel Ethernet Controller I226-V (10/2500MBit/s), Intel Wi-Fi 6E AX211 (a/b/g/h/n = Wi-Fi 4/ac = Wi-Fi 5/ax = Wi-Fi 6/ Wi-Fi 6E 6 GHz), Bluetooth 5.3
Taille
Hauteur x Largeur x Profondeur (en mm): 41 x 144 x 112
Système d'exploitation
Microsoft Windows 11 Pro
Fonctionnalités additionnelles
150W Power Adapter, 36 Mois Garantie
Poids
622 g, Alimentation: 303 g
Prix
1250 EUR
Remarque : le fabricant peut utiliser des composants provenant de différents fournisseurs, notamment des panneaux d'affichage, des lecteurs ou des clés USB ayant des spécifications similaires.


Boîtier - Un solide mélange de métal et de plastique

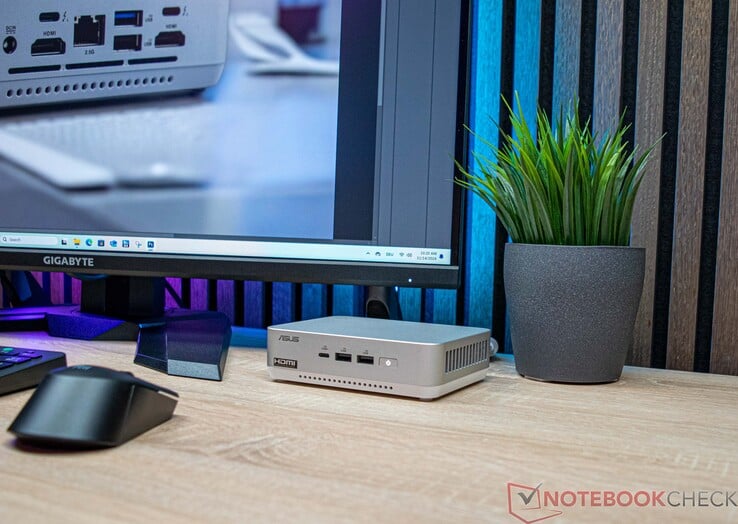
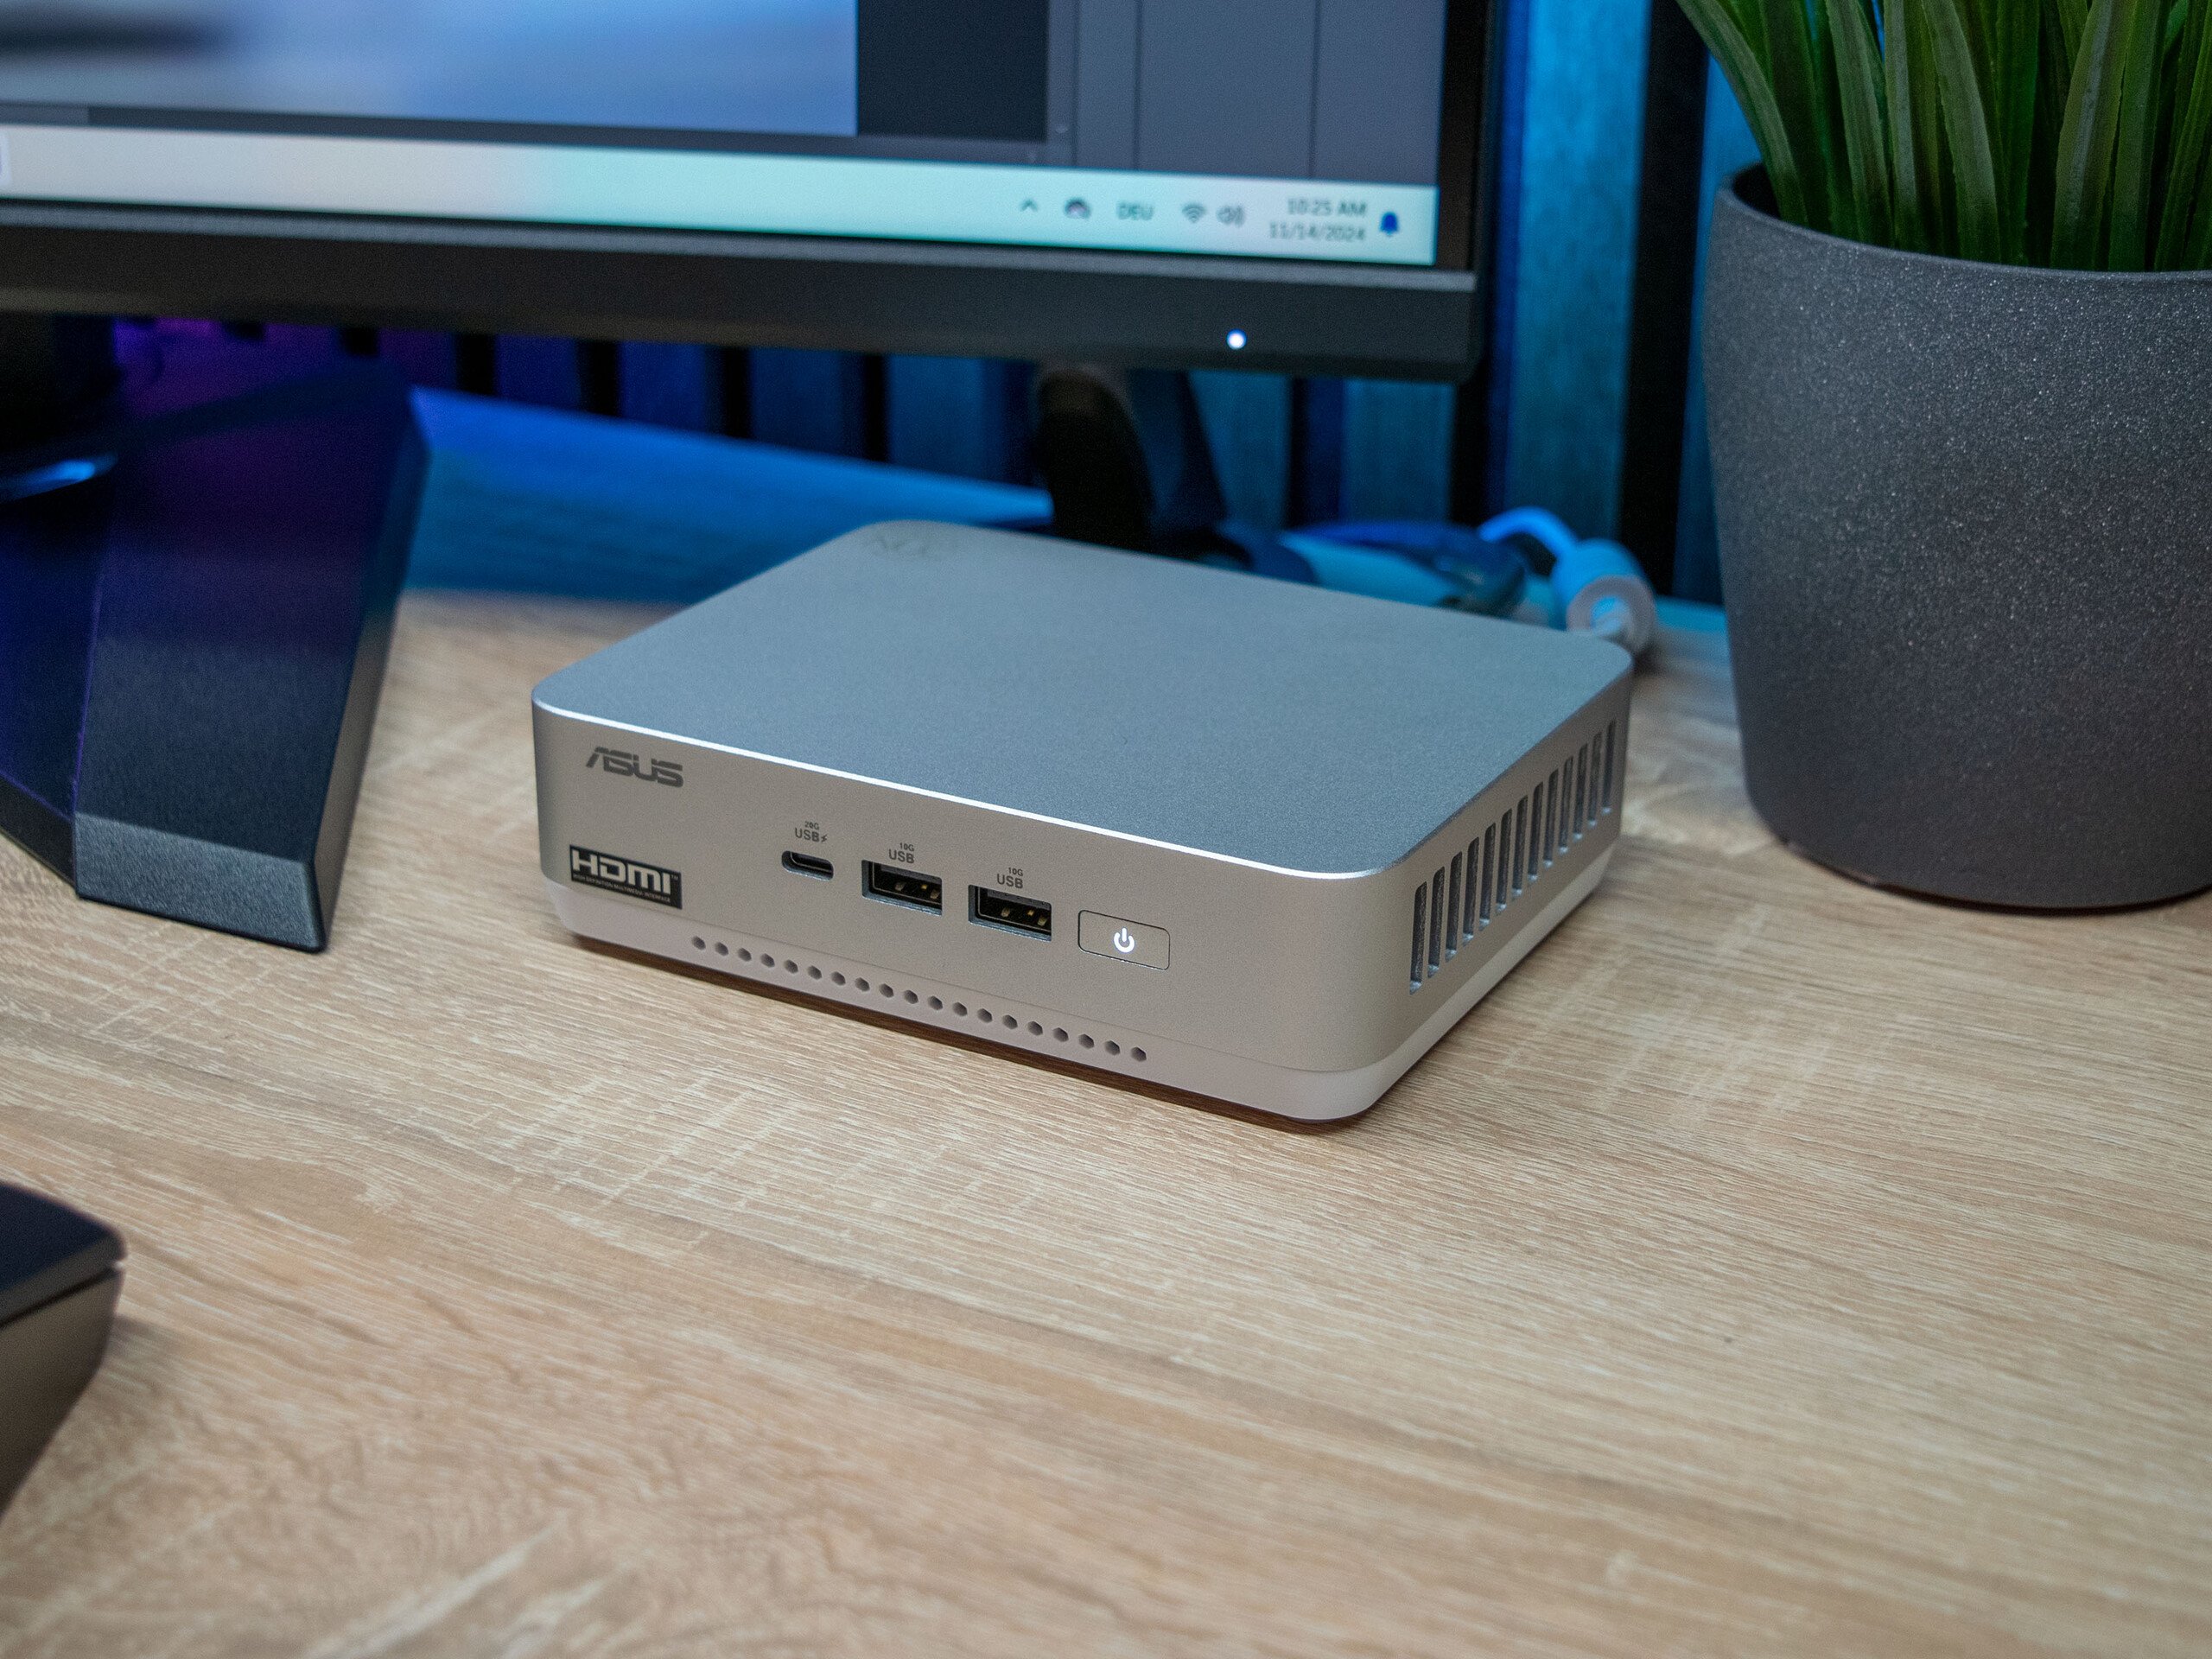
Visuellement, l'Asus NUC 14 Pro+ se distingue des mini PC NUC vendus par Asus. L'entreprise a opté pour une combinaison d'aluminium et de plastique pour les matériaux. Le dessous, qui sert également de volet de maintenance, est en plastique, tandis que le dessus est en aluminium. Dans l'ensemble, le traitement du petit PC est impeccable. Visuellement et tactiquement, il n'y a rien à redire sur l'Asus NUC 14 Pro+. En termes d'encombrement, l'Asus NUC 14 Pro+ prend un peu plus de place que certains de ses concurrents. Cependant, avec un encombrement de 14,4 x 11,2 centimètres, sa taille reste raisonnable et devrait s'adapter confortablement à la plupart des bureaux. De plus, grâce à la fixation VESA incluse, l'Asus NUC 14 Pro+ peut être fixé directement sur un moniteur.

Comparaison des tailles

146 mm 146 mm 57 mm 768 g145 mm 145 mm 48.6 mm 863 g130 mm 130 mm 60 mm 653 g144 mm 112 mm 41 mm 622 g135 mm 132 mm 46.9 mm 693 g117 mm 112 mm 37 mm 548 g210 mm 148 mm 1 mm 2.9 g

Connectivité - Tous les éléments essentiels sont inclus

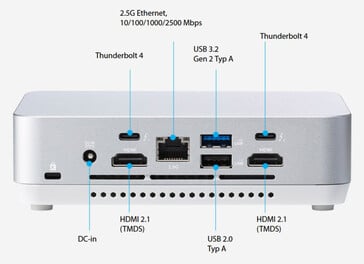
Le mini-PC offre une solide sélection de ports externes, bien qu'il ne soit pas à la hauteur du Geekom GT1 Mega en termes de connexions totales. Asus a inclus un total de sept ports USB, dont quatre prises standard de type A et trois ports de type C. Notamment, deux des ports USB-C sont compatibles avec Thunderbolt 4, ce qui élargit considérablement le potentiel du mini-PC pour la connexion d'accessoires compatibles. En outre, le NUC 14 Pro+ est équipé de deux ports HDMI et d'une connexion réseau 2,5G. Dans l'ensemble, la répartition des connexions est bien pensée, offrant un bon équilibre entre polyvalence et accessibilité pour une variété de cas d'utilisation.

Les connexions externes de l'Asus NUC 14 Pro+ - face avant (source : Asus)
Les connexions externes de l'Asus NUC 14 Pro+ - arrière (source : Asus)
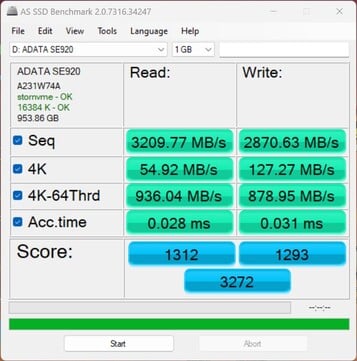
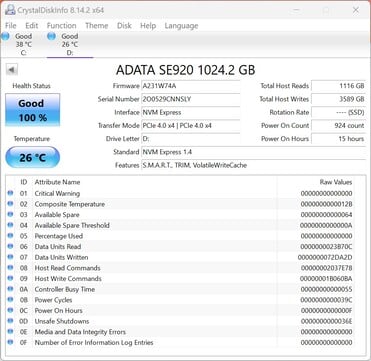
Vérification des performances avec l'ADATA SE920 via USB4
ADATA SE920 fonctionne avec PCIe 4.0 x4
Connectivity - USB 3.x / USB4 / TB - AS SSD Seq Read Test (1GB)
Minisforum MS-A1
Radeon 780M, Ryzen 7 8700G, Kingston OM8PGP41024Q-A0
3245.45 MB/s
Asus NUC 14 Pro+
Arc 8-Core, Ultra 9 185H, Samsung PM9A1a MZVL21T0HDLU
3209.77 MB/s
Khadas Mind 2
Arc 8-Core, Ultra 7 155H, WD PC SN740 SDDPTQD-1T00
3165.4 MB/s
Moyenne de la classe Mini PC
  (1611 - 3245, n=6, 2 dernières années)
2831 MB/s
Geekom GT1 Mega
Arc 8-Core, Ultra 9 185H, Crucial P3 Plus CT2000P3PSSD8
1611.37 MB/s

Communication

Le module WLAN est intégré

Le module Intel Wi-Fi 6E AX211 fourni avec l'Asus NUC 14 Pro+ donne de bons résultats lors des tests. Cependant, ses performances sont légèrement inférieures à celles de ses concurrents. Pour des performances optimales, il est recommandé d'utiliser principalement la bande de fréquence 6 GHz pour les communications sans fil. Les tests WLAN ont été réalisés avec le routeur Asus ROG Capture GT AXE11000.

Networking
iperf3 receive AXE11000 6GHz
Acemagic F2A
Intel Wi-Fi 7 BE200 320MHz
1770 (1584min - 1790max) MBit/s +22%
Minisforum AtomMan X7 Ti
Intel Wi-Fi 7 BE200 320MHz
1761 (1734min - 1774max) MBit/s +22%
Geekom AX8 Pro
MediaTek Wi-Fi 6E MT7922 160MHz Wireless LAN Card
1657 (1619min - 1670max) MBit/s +15%
Moyenne Intel Wi-Fi 6E AX211
  (700 - 1857, n=213)
1493 MBit/s +3%
Asus NUC 14 Pro+
Intel Wi-Fi 6E AX211
1446 (1321min - 1486max) MBit/s
Moyenne de la classe Mini PC
  (684 - 1771, n=55, 2 dernières années)
1380 MBit/s -5%
Geekom GT1 Mega
Intel Wi-Fi 7 BE200 320MHz
1149 (666min - 1346max) MBit/s -21%
iperf3 transmit AXE11000 6GHz
Geekom AX8 Pro
MediaTek Wi-Fi 6E MT7922 160MHz Wireless LAN Card
1800 (1737min - 1904max) MBit/s +47%
Acemagic F2A
Intel Wi-Fi 7 BE200 320MHz
1615 (767min - 1670max) MBit/s +32%
Minisforum AtomMan X7 Ti
Intel Wi-Fi 7 BE200 320MHz
1562 (1198min - 1713max) MBit/s +28%
Moyenne Intel Wi-Fi 6E AX211
  (385 - 1851, n=214)
1368 MBit/s +12%
Moyenne de la classe Mini PC
  (394 - 1800, n=55, 2 dernières années)
1330 MBit/s +9%
Geekom GT1 Mega
Intel Wi-Fi 7 BE200 320MHz
1242 (1110min - 1348max) MBit/s +2%
Asus NUC 14 Pro+
Intel Wi-Fi 6E AX211
1223 (1160min - 1303max) MBit/s
iperf3 receive AXE11000
Minisforum AtomMan X7 Ti
Intel Wi-Fi 7 BE200 320MHz
1599 (802min - 1683max) MBit/s +68%
Moyenne Intel Wi-Fi 6E AX211
  (582 - 1890, n=242)
1382 MBit/s +45%
Geekom AX8 Pro
MediaTek Wi-Fi 6E MT7922 160MHz Wireless LAN Card
979 (962min - 989max) MBit/s +3%
Asus NUC 14 Pro+
Intel Wi-Fi 6E AX211
951 (926min - 965max) MBit/s
Moyenne de la classe Mini PC
  (320 - 1796, n=113, 2 dernières années)
945 MBit/s -1%
Geekom GT1 Mega
Intel Wi-Fi 7 BE200 320MHz
888 (825min - 926max) MBit/s -7%
Acemagic F2A
Intel Wi-Fi 7 BE200 320MHz
838 (728min - 926max) MBit/s -12%
Aoostar GEM12
Intel Wi-Fi 6 AX200
740 (676min - 758max) MBit/s -22%
iperf3 transmit AXE11000
Minisforum AtomMan X7 Ti
Intel Wi-Fi 7 BE200 320MHz
1566 (904min - 1695max) MBit/s +121%
Moyenne Intel Wi-Fi 6E AX211
  (64 - 1921, n=242)
1231 MBit/s +74%
Geekom AX8 Pro
MediaTek Wi-Fi 6E MT7922 160MHz Wireless LAN Card
966 (921min - 1008max) MBit/s +37%
Moyenne de la classe Mini PC
  (184.1 - 1776, n=113, 2 dernières années)
874 MBit/s +24%
Geekom GT1 Mega
Intel Wi-Fi 7 BE200 320MHz
741 (690min - 797max) MBit/s +5%
Aoostar GEM12
Intel Wi-Fi 6 AX200
736 (369min - 756max) MBit/s +4%
Acemagic F2A
Intel Wi-Fi 7 BE200 320MHz
709 (369min - 977max) MBit/s 0%
Asus NUC 14 Pro+
Intel Wi-Fi 6E AX211
707 (666min - 737max) MBit/s
0501001502002503003504004505005506006507007508008509009501000105011001150120012501300135014001450150015501600165017001750180018501900Tooltip
Asus NUC 14 Pro+ Intel Wi-Fi 6E AX211; iperf3 transmit AXE11000 6GHz; iperf 3.1.3: Ø1223 (1160-1303)
Geekom GT1 Mega Intel Wi-Fi 7 BE200 320MHz; iperf3 transmit AXE11000 6GHz; iperf 3.1.3: Ø1242 (1110-1348)
Geekom AX8 Pro MediaTek Wi-Fi 6E MT7922 160MHz Wireless LAN Card; iperf3 transmit AXE11000 6GHz; iperf 3.1.3: Ø1800 (1737-1904)
Asus NUC 14 Pro+ Intel Wi-Fi 6E AX211; iperf3 receive AXE11000 6GHz; iperf 3.1.3: Ø1445 (1321-1486)
Geekom GT1 Mega Intel Wi-Fi 7 BE200 320MHz; iperf3 receive AXE11000 6GHz; iperf 3.1.3: Ø1126 (666-1346)
Geekom AX8 Pro MediaTek Wi-Fi 6E MT7922 160MHz Wireless LAN Card; iperf3 receive AXE11000 6GHz; iperf 3.1.3: Ø1656 (1619-1670)
Asus NUC 14 Pro+ Intel Wi-Fi 6E AX211; iperf3 receive AXE11000; iperf 3.1.3: Ø950 (926-965)
Geekom GT1 Mega Intel Wi-Fi 7 BE200 320MHz; iperf3 receive AXE11000; iperf 3.1.3: Ø887 (825-926)
Geekom AX8 Pro MediaTek Wi-Fi 6E MT7922 160MHz Wireless LAN Card; iperf3 receive AXE11000; iperf 3.1.3: Ø978 (962-989)
Asus NUC 14 Pro+ Intel Wi-Fi 6E AX211; iperf3 transmit AXE11000; iperf 3.1.3: Ø707 (666-737)
Geekom GT1 Mega Intel Wi-Fi 7 BE200 320MHz; iperf3 transmit AXE11000; iperf 3.1.3: Ø741 (690-797)
Geekom AX8 Pro MediaTek Wi-Fi 6E MT7922 160MHz Wireless LAN Card; iperf3 transmit AXE11000; iperf 3.1.3: Ø966 (921-1008)

Accessoires

L'Asus NUC 14 Pro+ est livré avec un bloc d'alimentation de 150 watts, un support VESA et l'assemblage nécessaire. Aucun autre périphérique comme un clavier ou une souris n'est fourni.

Maintenance

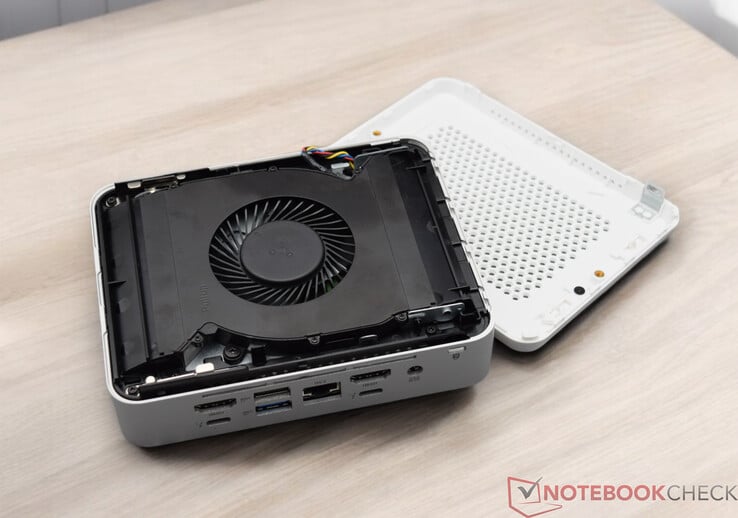
L'Asus NUC 14 Pro+ est également disponible en version barebone, ce qui signifie que vous devrez installer vous-même la RAM et le SSD. C'est très simple, car la face inférieure peut être retirée sans aucun outil. Notre échantillon de test comporte déjà un SSD et deux modules SO-DIMM. Il y a encore de la place pour ajouter un autre SSD, mais il faut tenir compte de la longueur totale de 42 millimètres.

Asus NUC 14 Pro+ avec le dessous enlevé
Asus NUC 14 Pro+ avec l'unité de refroidissement dépliée
Vue de l'intérieur de l'Asus NUC 14 Pro+

Durabilité

Comparé à un ordinateur de bureau traditionnel, l'Asus NUC 14 Pro+ est un PC compact qui offre des avantages significatifs en termes d'économie d'énergie. Il est livré dans une petite boîte de taille appropriée. Le mini-PC lui-même est principalement composé de métal et de plastique, bien qu'il ne soit pas clair si des matériaux spécialement recyclés ont été utilisés dans sa construction. Nous apprécions la période de garantie de trois ans, qui est une caractéristique remarquable.

Performance - Intel Core Ultra 9 185H sans aucune limitation

Le Intel Core Ultra 9 185H est le modèle phare d'Intel dans la série Meteor Lake H actuelle. Sa conception hybride offre des performances substantielles pour les tâches quotidiennes tout en restant économe en énergie lorsque la pleine puissance n'est pas nécessaire. L'Asus NUC 14 Pro+ avec le Intel Core Ultra 7 155Hqui dispose du même nombre de cœurs, est une option légèrement plus abordable. Plus bas sur l'échelle, l'Asus NUC 14 Pro+ avec le processeur Intel Core Ultra 5 125H Bénéficie également de la conception hybride et inclut un NPU. Ce modèle est un excellent choix pour ceux qui privilégient le rapport prix/performance.

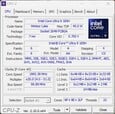
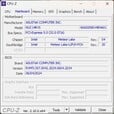
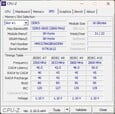
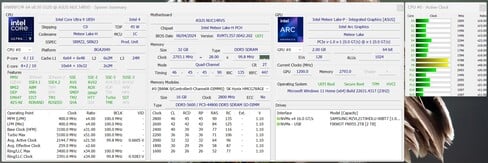
CPU-Z
CPU-Z
CPU-Z
CPU-Z
CPU-Z
CPU-Z
GPU-Z
GPU-Z
HWiNFO

Conditions d'essai

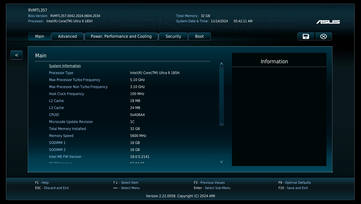
Nous avons effectué tous les tests de performance en utilisant le profil énergétique Balanced et n'avons pas modifié les performances du SoC, le laissant dans son état par défaut selon les paramètres du BIOS (Balanced). Les configurations étendues du BIOS sont excellentes. Par rapport aux mini PC de marques telles que Geekom, Minisforum ou Acemagic, Asus se distingue clairement à cet égard. Outre le réglage de la consommation d'énergie du processeur, les utilisateurs peuvent même désactiver certains ports USB en cas de besoin.

Processeur

Le modèle supérieur de l'Asus NUC 14 Pro+ est équipé d'un processeur Intel Core Ultra 9 185H Intel Core Ultra 9 185Hqui dispose de 16 cœurs et de 22 threads, offrant ainsi d'excellentes performances multithreads. Asus ne limite pas la consommation d'énergie maximale, ce qui signifie qu'il est théoriquement possible de consommer jusqu'à 115 watts. Lors des tests de stress, nous avons observé que le système peut supporter de courtes pointes de consommation d'énergie jusqu'à 100 watts. Bien qu'Asus n'exploite pas pleinement le potentiel dans ce domaine, le SoC de l'Asus NUC 14 Pro+ affiche une consommation d'énergie supérieure à celle d'autres mini-PC. Toutefois, les différences de performances entre les modèles concurrents sont minimes, de sorte qu'il n'y a pas de différence notable.

Le SoC Intel Core Ultra 5 125H a également été inclus dans la comparaison des performances. Par rapport à l'Intel Core Ultra 9 185H, l'Intel Core Ultra 5 125H est environ 10 à 15 % plus lent.

Pour plus de comparaisons et de benchmarks détaillés, veuillez vous référer à notre tableau de comparaison des CPU.

Cinebench R15
Cinebench R15
Cinebench R20
Cinebench R20
Cinebench R23
Cinebench R23
Cinebench 2024
Cinebench 2024
Performance Rating - Percent
Asus NUC 14 Pro+
Intel Core Ultra 9 185H
55.7 pt
Geekom AX8 Pro
AMD Ryzen 9 8945H
55.6 pt
Minisforum AtomMan X7 Ti
Intel Core Ultra 9 185H
55.6 pt
Aoostar GEM12
AMD Ryzen 7 8845HS
55.5 pt
Geekom GT1 Mega
Intel Core Ultra 9 185H
55.1 pt
Acemagic F2A
Intel Core Ultra 7 155H
54.2 pt
Moyenne Intel Core Ultra 5 125H
 
48.9 pt
Cinebench 2024
CPU Multi Core
Minisforum AtomMan X7 Ti
Intel Core Ultra 9 185H
1067 Points +8%
Acemagic F2A
Intel Core Ultra 7 155H
1022 Points +3%
Asus NUC 14 Pro+
Intel Core Ultra 9 185H
991 Points
Aoostar GEM12
AMD Ryzen 7 8845HS
933 Points -6%
Geekom GT1 Mega
Intel Core Ultra 9 185H
924 Points -7%
Geekom AX8 Pro
AMD Ryzen 9 8945H
852 Points -14%
Moyenne Intel Core Ultra 5 125H
  (331 - 815, n=5)
638 Points -36%
CPU Single Core
Minisforum AtomMan X7 Ti
Intel Core Ultra 9 185H
110 Points +3%
Aoostar GEM12
AMD Ryzen 7 8845HS
107 Points 0%
Geekom AX8 Pro
AMD Ryzen 9 8945H
107 Points 0%
Geekom GT1 Mega
Intel Core Ultra 9 185H
107 Points 0%
Asus NUC 14 Pro+
Intel Core Ultra 9 185H
107 Points
Acemagic F2A
Intel Core Ultra 7 155H
106 Points -1%
Moyenne Intel Core Ultra 5 125H
  (97 - 102.2, n=5)
100.2 Points -6%
Cinebench R23
Multi Core
Geekom GT1 Mega
Intel Core Ultra 9 185H
18608 Points +6%
Acemagic F2A
Intel Core Ultra 7 155H
18497 Points +5%
Minisforum AtomMan X7 Ti
Intel Core Ultra 9 185H
18016 Points +2%
Asus NUC 14 Pro+
Intel Core Ultra 9 185H
17615 Points
Aoostar GEM12
AMD Ryzen 7 8845HS
16130 Points -8%
Geekom AX8 Pro
AMD Ryzen 9 8945H
15516 Points -12%
Moyenne Intel Core Ultra 5 125H
  (9194 - 14564, n=6)
12308 Points -30%
Single Core
Minisforum AtomMan X7 Ti
Intel Core Ultra 9 185H
1851 Points +5%
Geekom AX8 Pro
AMD Ryzen 9 8945H
1808 Points +2%
Aoostar GEM12
AMD Ryzen 7 8845HS
1783 Points +1%
Geekom GT1 Mega
Intel Core Ultra 9 185H
1774 Points +1%
Acemagic F2A
Intel Core Ultra 7 155H
1771 Points 0%
Asus NUC 14 Pro+
Intel Core Ultra 9 185H
1764 Points
Moyenne Intel Core Ultra 5 125H
  (1549 - 1735, n=6)
1668 Points -5%
Cinebench R20
CPU (Single Core)
Minisforum AtomMan X7 Ti
Intel Core Ultra 9 185H
715 Points +2%
Geekom AX8 Pro
AMD Ryzen 9 8945H
703 Points 0%
Asus NUC 14 Pro+
Intel Core Ultra 9 185H
702 Points
Geekom GT1 Mega
Intel Core Ultra 9 185H
696 Points -1%
Aoostar GEM12
AMD Ryzen 7 8845HS
691 Points -2%
Acemagic F2A
Intel Core Ultra 7 155H
679 Points -3%
Moyenne Intel Core Ultra 5 125H
  (622 - 664, n=6)
643 Points -8%
CPU (Multi Core)
Minisforum AtomMan X7 Ti
Intel Core Ultra 9 185H
7196 Points +3%
Geekom GT1 Mega
Intel Core Ultra 9 185H
7192 Points +3%
Acemagic F2A
Intel Core Ultra 7 155H
7188 Points +3%
Asus NUC 14 Pro+
Intel Core Ultra 9 185H
6997 Points
Aoostar GEM12
AMD Ryzen 7 8845HS
6346 Points -9%
Geekom AX8 Pro
AMD Ryzen 9 8945H
6153 Points -12%
Moyenne Intel Core Ultra 5 125H
  (3673 - 5618, n=6)
4766 Points -32%
Cinebench R15
CPU Single 64Bit
Geekom AX8 Pro
AMD Ryzen 9 8945H
284 Points +8%
Aoostar GEM12
AMD Ryzen 7 8845HS
279 Points +6%
Minisforum AtomMan X7 Ti
Intel Core Ultra 9 185H
268 Points +2%
Geekom GT1 Mega
Intel Core Ultra 9 185H
262 Points 0%
Asus NUC 14 Pro+
Intel Core Ultra 9 185H
262 Points
Acemagic F2A
Intel Core Ultra 7 155H
258 Points -2%
Moyenne Intel Core Ultra 5 125H
  (235 - 251, n=6)
244 Points -7%
CPU Multi 64Bit
Asus NUC 14 Pro+
Intel Core Ultra 9 185H
2863 Points
Geekom GT1 Mega
Intel Core Ultra 9 185H
2794 Points -2%
Minisforum AtomMan X7 Ti
Intel Core Ultra 9 185H
2746 Points -4%
Acemagic F2A
Intel Core Ultra 7 155H
2738 Points -4%
Aoostar GEM12
AMD Ryzen 7 8845HS
2537 Points -11%
Geekom AX8 Pro
AMD Ryzen 9 8945H
2521 Points -12%
Moyenne Intel Core Ultra 5 125H
  (1700 - 2245, n=6)
1983 Points -31%
Cinebench R11.5
CPU Single 64Bit
Aoostar GEM12
AMD Ryzen 7 8845HS
3.32 Points +5%
Geekom AX8 Pro
AMD Ryzen 9 8945H
3.28 Points +4%
Minisforum AtomMan X7 Ti
Intel Core Ultra 9 185H
3.27 Points +4%
Asus NUC 14 Pro+
Intel Core Ultra 9 185H
3.15 Points
Acemagic F2A
Intel Core Ultra 7 155H
3.13 Points -1%
Geekom GT1 Mega
Intel Core Ultra 9 185H
3.13 Points -1%
Moyenne Intel Core Ultra 5 125H
  (2.86 - 3.03, n=4)
2.94 Points -7%
CPU Multi 64Bit
Asus NUC 14 Pro+
Intel Core Ultra 9 185H
34.81 Points
Geekom GT1 Mega
Intel Core Ultra 9 185H
34.34 Points -1%
Minisforum AtomMan X7 Ti
Intel Core Ultra 9 185H
33.95 Points -2%
Acemagic F2A
Intel Core Ultra 7 155H
33.49 Points -4%
Aoostar GEM12
AMD Ryzen 7 8845HS
29.76 Points -15%
Geekom AX8 Pro
AMD Ryzen 9 8945H
29.14 Points -16%
Moyenne Intel Core Ultra 5 125H
  (21.9 - 27, n=4)
25.6 Points -26%
Cinebench R10
Rendering Single CPUs 64Bit
Geekom AX8 Pro
AMD Ryzen 9 8945H
14451 Points +4%
Minisforum AtomMan X7 Ti
Intel Core Ultra 9 185H
14374 Points +3%
Aoostar GEM12
AMD Ryzen 7 8845HS
14163 Points +2%
Geekom GT1 Mega
Intel Core Ultra 9 185H
13997 Points +1%
Acemagic F2A
Intel Core Ultra 7 155H
13938 Points 0%
Asus NUC 14 Pro+
Intel Core Ultra 9 185H
13892 Points
Moyenne Intel Core Ultra 5 125H
  (12858 - 13281, n=2)
13070 Points -6%
Rendering Multiple CPUs 64Bit
Acemagic F2A
Intel Core Ultra 7 155H
95005 Points +3%
Asus NUC 14 Pro+
Intel Core Ultra 9 185H
92183 Points
Geekom GT1 Mega
Intel Core Ultra 9 185H
91553 Points -1%
Minisforum AtomMan X7 Ti
Intel Core Ultra 9 185H
88902 Points -4%
Aoostar GEM12
AMD Ryzen 7 8845HS
85872 Points -7%
Geekom AX8 Pro
AMD Ryzen 9 8945H
84253 Points -9%
Moyenne Intel Core Ultra 5 125H
  (78788 - 78817, n=2)
78803 Points -15%
Blender - v2.79 BMW27 CPU
Moyenne Intel Core Ultra 5 125H
  (228 - 364, n=6)
285 Seconds * -55%
Geekom AX8 Pro
AMD Ryzen 9 8945H
206 Seconds * -12%
Aoostar GEM12
AMD Ryzen 7 8845HS
197 Seconds * -7%
Geekom GT1 Mega
Intel Core Ultra 9 185H
191 Seconds * -4%
Asus NUC 14 Pro+
Intel Core Ultra 9 185H
184 Seconds *
Acemagic F2A
Intel Core Ultra 7 155H
178 Seconds * +3%
Minisforum AtomMan X7 Ti
Intel Core Ultra 9 185H
171 Seconds * +7%
wPrime 2.10
32m
Moyenne Intel Core Ultra 5 125H
  (4.11 - 9.5, n=3)
6.03 s * -77%
Acemagic F2A
Intel Core Ultra 7 155H
3.523 s * -3%
Asus NUC 14 Pro+
Intel Core Ultra 9 185H
3.411 s *
Geekom GT1 Mega
Intel Core Ultra 9 185H
3.271 s * +4%
Minisforum AtomMan X7 Ti
Intel Core Ultra 9 185H
3.254 s * +5%
Aoostar GEM12
AMD Ryzen 7 8845HS
2.703 s * +21%
Geekom AX8 Pro
AMD Ryzen 9 8945H
2.688 s * +21%
1024m
Minisforum AtomMan X7 Ti
Intel Core Ultra 9 185H
441.275 s * -405%
Moyenne Intel Core Ultra 5 125H
  (149 - 297, n=3)
231 s * -164%
Geekom GT1 Mega
Intel Core Ultra 9 185H
165.075 s * -89%
Acemagic F2A
Intel Core Ultra 7 155H
139.617 s * -60%
Aoostar GEM12
AMD Ryzen 7 8845HS
98.896 s * -13%
Asus NUC 14 Pro+
Intel Core Ultra 9 185H
87.408 s *
Geekom AX8 Pro
AMD Ryzen 9 8945H
74.917 s * +14%
X264 HD Benchmark 4.0
Pass 1
Geekom GT1 Mega
Intel Core Ultra 9 185H
336.5 (329min - 346max) fps +6%
Minisforum AtomMan X7 Ti
Intel Core Ultra 9 185H
335.5 (329min - 340max) fps +6%
Acemagic F2A
Intel Core Ultra 7 155H
325 (323min - 328max) fps +3%
Asus NUC 14 Pro+
Intel Core Ultra 9 185H
317 (310min - 328max) fps
Moyenne Intel Core Ultra 5 125H
  (305 - 309, n=3)
306 fps -3%
Geekom AX8 Pro
AMD Ryzen 9 8945H
300 (299min - 301max) fps -5%
Aoostar GEM12
AMD Ryzen 7 8845HS
289 (286min - 292max) fps -9%
Pass 2
Geekom GT1 Mega
Intel Core Ultra 9 185H
161.5 (159.8min - 163.8max) fps +5%
Minisforum AtomMan X7 Ti
Intel Core Ultra 9 185H
158.2 (157.4min - 158.8max) fps +3%
Acemagic F2A
Intel Core Ultra 7 155H
154.15 (153.8min - 154.3max) fps 0%
Asus NUC 14 Pro+
Intel Core Ultra 9 185H
153.6 (147.8min - 162.3max) fps
Aoostar GEM12
AMD Ryzen 7 8845HS
143.7 (143min - 145.2max) fps -6%
Geekom AX8 Pro
AMD Ryzen 9 8945H
141.2 (141min - 143.9max) fps -8%
Moyenne Intel Core Ultra 5 125H
  (129.6 - 134, n=3)
132 fps -14%
WinRAR - Result
Geekom GT1 Mega
Intel Core Ultra 9 185H
8563 KB/s +10%
Minisforum AtomMan X7 Ti
Intel Core Ultra 9 185H
7940 KB/s +2%
Moyenne Intel Core Ultra 5 125H
  (5594 - 13080, n=4)
7773 KB/s 0%
Asus NUC 14 Pro+
Intel Core Ultra 9 185H
7763 KB/s
Geekom AX8 Pro
AMD Ryzen 9 8945H
7744 KB/s 0%
Acemagic F2A
Intel Core Ultra 7 155H
7723 KB/s -1%
Aoostar GEM12
AMD Ryzen 7 8845HS
7327 KB/s -6%
TrueCrypt
AES Mean 100MB
Geekom AX8 Pro
AMD Ryzen 9 8945H
14.5 GB/s +20%
Aoostar GEM12
AMD Ryzen 7 8845HS
14.4 GB/s +19%
Asus NUC 14 Pro+
Intel Core Ultra 9 185H
12.1 GB/s
Minisforum AtomMan X7 Ti
Intel Core Ultra 9 185H
11.3 GB/s -7%
Geekom GT1 Mega
Intel Core Ultra 9 185H
11 GB/s -9%
Acemagic F2A
Intel Core Ultra 7 155H
10.6 GB/s -12%
Moyenne Intel Core Ultra 5 125H
  (8.8 - 9, n=4)
8.93 GB/s -26%
Twofish Mean 100MB
Asus NUC 14 Pro+
Intel Core Ultra 9 185H
2.3 GB/s
Geekom AX8 Pro
AMD Ryzen 9 8945H
2.1 GB/s -9%
Aoostar GEM12
AMD Ryzen 7 8845HS
2 GB/s -13%
Geekom GT1 Mega
Intel Core Ultra 9 185H
1.9 GB/s -17%
Minisforum AtomMan X7 Ti
Intel Core Ultra 9 185H
1.8 GB/s -22%
Acemagic F2A
Intel Core Ultra 7 155H
1.7 GB/s -26%
Moyenne Intel Core Ultra 5 125H
  (1.2 - 1.4, n=4)
1.35 GB/s -41%
Serpent Mean 100MB
Aoostar GEM12
AMD Ryzen 7 8845HS
1.3 GB/s 0%
Geekom AX8 Pro
AMD Ryzen 9 8945H
1.3 GB/s 0%
Asus NUC 14 Pro+
Intel Core Ultra 9 185H
1.3 GB/s
Minisforum AtomMan X7 Ti
Intel Core Ultra 9 185H
1.1 GB/s -15%
Geekom GT1 Mega
Intel Core Ultra 9 185H
1.1 GB/s -15%
Acemagic F2A
Intel Core Ultra 7 155H
1 GB/s -23%
Moyenne Intel Core Ultra 5 125H
  (0.817 - 0.869, n=4)
0.843 GB/s -35%
Geekbench 5.5
Multi-Core
Geekom GT1 Mega
Intel Core Ultra 9 185H
13763 Points +1%
Asus NUC 14 Pro+
Intel Core Ultra 9 185H
13566 Points
Minisforum AtomMan X7 Ti
Intel Core Ultra 9 185H
13392 Points -1%
Acemagic F2A
Intel Core Ultra 7 155H
12662 Points -7%
Aoostar GEM12
AMD Ryzen 7 8845HS
12143 Points -10%
Geekom AX8 Pro
AMD Ryzen 9 8945H
11980 Points -12%
Moyenne Intel Core Ultra 5 125H
  (9696 - 10856, n=6)
10408 Points -23%
Single-Core
Geekom AX8 Pro
AMD Ryzen 9 8945H
1994 Points +14%
Aoostar GEM12
AMD Ryzen 7 8845HS
1958 Points +12%
Minisforum AtomMan X7 Ti
Intel Core Ultra 9 185H
1856 Points +6%
Geekom GT1 Mega
Intel Core Ultra 9 185H
1852 Points +6%
Acemagic F2A
Intel Core Ultra 7 155H
1746 Points 0%
Asus NUC 14 Pro+
Intel Core Ultra 9 185H
1743 Points
Moyenne Intel Core Ultra 5 125H
  (1593 - 1699, n=6)
1660 Points -5%
Geekbench 5.0
5.0 Multi-Core
Geekom GT1 Mega
Intel Core Ultra 9 185H
13822 Points +1%
Asus NUC 14 Pro+
Intel Core Ultra 9 185H
13736 Points
Minisforum AtomMan X7 Ti
Intel Core Ultra 9 185H
13228 Points -4%
Acemagic F2A
Intel Core Ultra 7 155H
12438 Points -9%
Aoostar GEM12
AMD Ryzen 7 8845HS
12086 Points -12%
Geekom AX8 Pro
AMD Ryzen 9 8945H
11804 Points -14%
Moyenne Intel Core Ultra 5 125H
  (10676 - 10747, n=2)
10712 Points -22%
5.0 Single-Core
Geekom AX8 Pro
AMD Ryzen 9 8945H
1907 Points +13%
Aoostar GEM12
AMD Ryzen 7 8845HS
1900 Points +12%
Minisforum AtomMan X7 Ti
Intel Core Ultra 9 185H
1821 Points +7%
Geekom GT1 Mega
Intel Core Ultra 9 185H
1797 Points +6%
Acemagic F2A
Intel Core Ultra 7 155H
1708 Points +1%
Asus NUC 14 Pro+
Intel Core Ultra 9 185H
1695 Points
Moyenne Intel Core Ultra 5 125H
  (1596 - 1659, n=2)
1628 Points -4%
Geekbench 4.4
64 Bit Single-Core Score
Geekom AX8 Pro
AMD Ryzen 9 8945H
8140 Points +16%
Aoostar GEM12
AMD Ryzen 7 8845HS
8034 Points +14%
Minisforum AtomMan X7 Ti
Intel Core Ultra 9 185H
7602 Points +8%
Geekom GT1 Mega
Intel Core Ultra 9 185H
7516 Points +7%
Asus NUC 14 Pro+
Intel Core Ultra 9 185H
7040 Points
Acemagic F2A
Intel Core Ultra 7 155H
6927 Points -2%
Moyenne Intel Core Ultra 5 125H
  (6734 - 6964, n=3)
6816 Points -3%
64 Bit Multi-Core Score
Geekom GT1 Mega
Intel Core Ultra 9 185H
49924 Points 0%
Asus NUC 14 Pro+
Intel Core Ultra 9 185H
49826 Points
Minisforum AtomMan X7 Ti
Intel Core Ultra 9 185H
47960 Points -4%
Geekom AX8 Pro
AMD Ryzen 9 8945H
47917 Points -4%
Aoostar GEM12
AMD Ryzen 7 8845HS
47777 Points -4%
Acemagic F2A
Intel Core Ultra 7 155H
45250 Points -9%
Moyenne Intel Core Ultra 5 125H
  (38648 - 38793, n=3)
38726 Points -22%
3DMark 11 - 1280x720 Performance Physics
Asus NUC 14 Pro+
Intel Core Ultra 9 185H
22681 Points
Geekom AX8 Pro
AMD Ryzen 9 8945H
22340 Points -2%
Minisforum AtomMan X7 Ti
Intel Core Ultra 9 185H
21875 Points -4%
Aoostar GEM12
AMD Ryzen 7 8845HS
21762 Points -4%
Acemagic F2A
Intel Core Ultra 7 155H
20846 Points -8%
Geekom GT1 Mega
Intel Core Ultra 9 185H
18130 Points -20%
Moyenne Intel Core Ultra 5 125H
  (12766 - 17992, n=8)
16347 Points -28%
7-Zip 18.03
7z b 4
Minisforum AtomMan X7 Ti
Intel Core Ultra 9 185H
71934 MIPS +3%
Geekom GT1 Mega
Intel Core Ultra 9 185H
71050 MIPS +2%
Aoostar GEM12
AMD Ryzen 7 8845HS
70733 MIPS +1%
Asus NUC 14 Pro+
Intel Core Ultra 9 185H
69720 MIPS
Geekom AX8 Pro
AMD Ryzen 9 8945H
66557 MIPS -5%
Acemagic F2A
Intel Core Ultra 7 155H
66438 MIPS -5%
Moyenne Intel Core Ultra 5 125H
  (0 - 0, n=2)
0 MIPS -100%
7z b 4 -mmt1
Geekom AX8 Pro
AMD Ryzen 9 8945H
6691 MIPS +17%
Aoostar GEM12
AMD Ryzen 7 8845HS
6644 MIPS +16%
Asus NUC 14 Pro+
Intel Core Ultra 9 185H
5713 MIPS
Geekom GT1 Mega
Intel Core Ultra 9 185H
5657 MIPS -1%
Minisforum AtomMan X7 Ti
Intel Core Ultra 9 185H
5560 MIPS -3%
Acemagic F2A
Intel Core Ultra 7 155H
5485 MIPS -4%
Moyenne Intel Core Ultra 5 125H
  (4663 - 5136, n=6)
4948 MIPS -13%
HWBOT x265 Benchmark v2.2 - 4k Preset
Minisforum AtomMan X7 Ti
Intel Core Ultra 9 185H
20.9 fps +6%
Geekom AX8 Pro
AMD Ryzen 9 8945H
20.6 fps +5%
Aoostar GEM12
AMD Ryzen 7 8845HS
20.5 fps +4%
Geekom GT1 Mega
Intel Core Ultra 9 185H
20.2 fps +3%
Asus NUC 14 Pro+
Intel Core Ultra 9 185H
19.7 fps
Acemagic F2A
Intel Core Ultra 7 155H
19.6 fps -1%
Moyenne Intel Core Ultra 5 125H
  (9.7 - 16.7, n=6)
13.4 fps -32%
R Benchmark 2.5 - Overall mean
Moyenne Intel Core Ultra 5 125H
  (0.4898 - 0.53, n=6)
0.506 sec * -12%
Acemagic F2A
Intel Core Ultra 7 155H
0.4652 sec * -3%
Minisforum AtomMan X7 Ti
Intel Core Ultra 9 185H
0.4627 sec * -3%
Geekom AX8 Pro
AMD Ryzen 9 8945H
0.4576 sec * -2%
Geekom GT1 Mega
Intel Core Ultra 9 185H
0.4571 sec * -1%
Asus NUC 14 Pro+
Intel Core Ultra 9 185H
0.4504 sec *
Aoostar GEM12
AMD Ryzen 7 8845HS
0.4392 sec * +2%
LibreOffice - 20 Documents To PDF
Moyenne Intel Core Ultra 5 125H
  (42.7 - 70.9, n=6)
53.4 s * -3%
Geekom GT1 Mega
Intel Core Ultra 9 185H
52.1 s * -1%
Asus NUC 14 Pro+
Intel Core Ultra 9 185H
51.8 s *
Geekom AX8 Pro
AMD Ryzen 9 8945H
49.8 s * +4%
Minisforum AtomMan X7 Ti
Intel Core Ultra 9 185H
49.5 s * +4%
Aoostar GEM12
AMD Ryzen 7 8845HS
47.5 s * +8%
Acemagic F2A
Intel Core Ultra 7 155H
44.5 s * +14%
WebXPRT 3 - Overall
Geekom AX8 Pro
AMD Ryzen 9 8945H
309 Points +15%
Aoostar GEM12
AMD Ryzen 7 8845HS
300 Points +12%
Geekom GT1 Mega
Intel Core Ultra 9 185H
286 Points +7%
Acemagic F2A
Intel Core Ultra 7 155H
276 Points +3%
Asus NUC 14 Pro+
Intel Core Ultra 9 185H
268 Points
Minisforum AtomMan X7 Ti
Intel Core Ultra 9 185H
264 Points -1%
Moyenne Intel Core Ultra 5 125H
  (245 - 263, n=6)
255 Points -5%
Mozilla Kraken 1.1 - Total
Moyenne Intel Core Ultra 5 125H
  (560 - 595, n=6)
575 ms * -9%
Acemagic F2A
Intel Core Ultra 7 155H
535 ms * -1%
Minisforum AtomMan X7 Ti
Intel Core Ultra 9 185H
532 ms * -1%
Asus NUC 14 Pro+
Intel Core Ultra 9 185H
528 ms *
Geekom GT1 Mega
Intel Core Ultra 9 185H
518 ms * +2%
Aoostar GEM12
AMD Ryzen 7 8845HS
517 ms * +2%
Geekom AX8 Pro
AMD Ryzen 9 8945H
506 ms * +4%
3DMark
1920x1080 Fire Strike Physics
Asus NUC 14 Pro+
Intel Core Ultra 9 185H
30340 Points
Geekom AX8 Pro
AMD Ryzen 9 8945H
27363 Points -10%
Aoostar GEM12
AMD Ryzen 7 8845HS
26194 Points -14%
Minisforum AtomMan X7 Ti
Intel Core Ultra 9 185H
26038 Points -14%
Acemagic F2A
Intel Core Ultra 7 155H
25043 Points -17%
Geekom GT1 Mega
Intel Core Ultra 9 185H
24366 Points -20%
Moyenne Intel Core Ultra 5 125H
  (16291 - 22978, n=8)
20865 Points -31%
2560x1440 Time Spy CPU
Minisforum AtomMan X7 Ti
Intel Core Ultra 9 185H
11481 Points 0%
Asus NUC 14 Pro+
Intel Core Ultra 9 185H
11428 Points
Geekom AX8 Pro
AMD Ryzen 9 8945H
10844 Points -5%
Aoostar GEM12
AMD Ryzen 7 8845HS
10824 Points -5%
Acemagic F2A
Intel Core Ultra 7 155H
10014 Points -12%
Geekom GT1 Mega
Intel Core Ultra 9 185H
9687 Points -15%
Moyenne Intel Core Ultra 5 125H
  (6216 - 9182, n=8)
8210 Points -28%
Super Pi mod 1.5 XS 1M - 1M
Moyenne Intel Core Ultra 5 125H
  (7.4 - 7.74, n=4)
7.52 s * -10%
Aoostar GEM12
AMD Ryzen 7 8845HS
7.331 s * -7%
Acemagic F2A
Intel Core Ultra 7 155H
7.168 s * -5%
Geekom AX8 Pro
AMD Ryzen 9 8945H
6.962 s * -2%
Asus NUC 14 Pro+
Intel Core Ultra 9 185H
6.84 s *
Geekom GT1 Mega
Intel Core Ultra 9 185H
6.762 s * +1%
Minisforum AtomMan X7 Ti
Intel Core Ultra 9 185H
6.751 s * +1%
Super Pi mod 1.5 XS 2M - 2M
Aoostar GEM12
AMD Ryzen 7 8845HS
18.138 s * -23%
Geekom AX8 Pro
AMD Ryzen 9 8945H
17.404 s * -18%
Moyenne Intel Core Ultra 5 125H
  (16.4 - 17, n=4)
16.6 s * -12%
Acemagic F2A
Intel Core Ultra 7 155H
16.125 s * -9%
Geekom GT1 Mega
Intel Core Ultra 9 185H
14.928 s * -1%
Minisforum AtomMan X7 Ti
Intel Core Ultra 9 185H
14.879 s * -1%
Asus NUC 14 Pro+
Intel Core Ultra 9 185H
14.786 s *
Affinity Photo 2 - Combined (Multi CPU)
Minisforum AtomMan X7 Ti
Intel Core Ultra 9 185H
813 Points +6%
Geekom GT1 Mega
Intel Core Ultra 9 185H
792 Points +3%
Acemagic F2A
Intel Core Ultra 7 155H
770 Points 0%
Asus NUC 14 Pro+
Intel Core Ultra 9 185H
768 Points
Aoostar GEM12
AMD Ryzen 7 8845HS
633 Points -18%
Moyenne Intel Core Ultra 5 125H
  (594 - 615, n=2)
605 Points -21%
Geekom AX8 Pro
AMD Ryzen 9 8945H
603 Points -21%

* ... Moindre est la valeur, meilleures sont les performances

Cinebench R10 Rendering Single 32Bit
9767
Cinebench R10 Shading 64Bit
19713 Points
Cinebench R10 Rendering Multiple CPUs 64Bit
92183 Points
Cinebench R10 Rendering Single CPUs 64Bit
13892 Points
Cinebench R10 Shading 32Bit
18259
Cinebench R10 Rendering Multiple CPUs 32Bit
67204
Cinebench R11.5 CPU Single 32Bit
2.72 Points
Cinebench R11.5 CPU Multi 32Bit
30.69 Points
Cinebench R11.5 OpenGL 32Bit
111.95 fps
Cinebench R11.5 CPU Single 64Bit
3.15 Points
Cinebench R11.5 CPU Multi 64Bit
34.81 Points
Cinebench R11.5 OpenGL 64Bit
115.68 fps
Cinebench R15 CPU Single 64Bit
262 Points
Cinebench R15 CPU Multi 64Bit
2863 Points
Cinebench R15 Ref. Match 64Bit
97.8 %
Cinebench R15 OpenGL 64Bit
160.26 fps
Cinebench R20 CPU (Single Core)
702 Points
Cinebench R20 CPU (Multi Core)
6997 Points
Cinebench R23 Multi Core
17615 Points
Cinebench R23 Single Core
1764 Points
Cinebench 2024 CPU Single Core
107 Points
Cinebench 2024 CPU Multi Core
991 Points
Aide
Performance Rating
Geekom AX8 Pro
AMD Ryzen 9 8945H, Radeon 780M
94.8 pt
Aoostar GEM12
AMD Ryzen 7 8845HS, Radeon 780M
92.3 pt
Minisforum AtomMan X7 Ti
Intel Core Ultra 9 185H, Arc 8-Core
82.5 pt
Acemagic F2A
Intel Core Ultra 7 155H, Arc 8-Core
78.5 pt
Geekom GT1 Mega
Intel Core Ultra 9 185H, Arc 8-Core
75.8 pt
Asus NUC 14 Pro+
Intel Core Ultra 9 185H, Arc 8-Core
73.1 pt
Moyenne de la classe Mini PC
 
58 pt
AIDA64 / FP32 Ray-Trace
Aoostar GEM12
AMD Ryzen 7 8845HS, Radeon 780M
25916 KRay/s +66%
Geekom AX8 Pro
AMD Ryzen 9 8945H, Radeon 780M
24531 KRay/s +57%
Acemagic F2A
Intel Core Ultra 7 155H, Arc 8-Core
17544 KRay/s +13%
Minisforum AtomMan X7 Ti
Intel Core Ultra 9 185H, Arc 8-Core
17312 KRay/s +11%
Asus NUC 14 Pro+
Intel Core Ultra 9 185H, Arc 8-Core
15589 KRay/s
Geekom GT1 Mega
Intel Core Ultra 9 185H, Arc 8-Core
15184 KRay/s -3%
Moyenne de la classe Mini PC
  (646 - 51004, n=119, 2 dernières années)
12878 KRay/s -17%
AIDA64 / FPU Julia
Aoostar GEM12
AMD Ryzen 7 8845HS, Radeon 780M
109747 Points +36%
Geekom AX8 Pro
AMD Ryzen 9 8945H, Radeon 780M
106518 Points +32%
Minisforum AtomMan X7 Ti
Intel Core Ultra 9 185H, Arc 8-Core
91112 Points +13%
Acemagic F2A
Intel Core Ultra 7 155H, Arc 8-Core
88829 Points +10%
Asus NUC 14 Pro+
Intel Core Ultra 9 185H, Arc 8-Core
80501 Points
Geekom GT1 Mega
Intel Core Ultra 9 185H, Arc 8-Core
78346 Points -3%
Moyenne de la classe Mini PC
  (3857 - 214250, n=119, 2 dernières années)
64921 Points -19%
AIDA64 / CPU SHA3
Aoostar GEM12
AMD Ryzen 7 8845HS, Radeon 780M
4695 MB/s +20%
Geekom AX8 Pro
AMD Ryzen 9 8945H, Radeon 780M
4684 MB/s +20%
Minisforum AtomMan X7 Ti
Intel Core Ultra 9 185H, Arc 8-Core
4343 MB/s +11%
Acemagic F2A
Intel Core Ultra 7 155H, Arc 8-Core
4246 MB/s +9%
Asus NUC 14 Pro+
Intel Core Ultra 9 185H, Arc 8-Core
3909 MB/s
Geekom GT1 Mega
Intel Core Ultra 9 185H, Arc 8-Core
3753 MB/s -4%
Moyenne de la classe Mini PC
  (260 - 9399, n=119, 2 dernières années)
2856 MB/s -27%
AIDA64 / CPU Queen
Aoostar GEM12
AMD Ryzen 7 8845HS, Radeon 780M
116083 Points +23%
Geekom AX8 Pro
AMD Ryzen 9 8945H, Radeon 780M
114586 Points +21%
Asus NUC 14 Pro+
Intel Core Ultra 9 185H, Arc 8-Core
94503 Points
Acemagic F2A
Intel Core Ultra 7 155H, Arc 8-Core
89748 Points -5%
Minisforum AtomMan X7 Ti
Intel Core Ultra 9 185H, Arc 8-Core
87291 Points -8%
Geekom GT1 Mega
Intel Core Ultra 9 185H, Arc 8-Core
86969 Points -8%
Moyenne de la classe Mini PC
  (8172 - 184747, n=119, 2 dernières années)
80187 Points -15%
AIDA64 / FPU SinJulia
Aoostar GEM12
AMD Ryzen 7 8845HS, Radeon 780M
14876 Points +43%
Geekom AX8 Pro
AMD Ryzen 9 8945H, Radeon 780M
14631 Points +41%
Minisforum AtomMan X7 Ti
Intel Core Ultra 9 185H, Arc 8-Core
10759 Points +3%
Asus NUC 14 Pro+
Intel Core Ultra 9 185H, Arc 8-Core
10406 Points
Geekom GT1 Mega
Intel Core Ultra 9 185H, Arc 8-Core
10289 Points -1%
Acemagic F2A
Intel Core Ultra 7 155H, Arc 8-Core
10247 Points -2%
Moyenne de la classe Mini PC
  (408 - 29064, n=119, 2 dernières années)
8812 Points -15%
AIDA64 / FPU Mandel
Aoostar GEM12
AMD Ryzen 7 8845HS, Radeon 780M
58597 Points +48%
Geekom AX8 Pro
AMD Ryzen 9 8945H, Radeon 780M
56505 Points +43%
Acemagic F2A
Intel Core Ultra 7 155H, Arc 8-Core
45718 Points +16%
Minisforum AtomMan X7 Ti
Intel Core Ultra 9 185H, Arc 8-Core
44874 Points +14%
Asus NUC 14 Pro+
Intel Core Ultra 9 185H, Arc 8-Core
39506 Points
Geekom GT1 Mega
Intel Core Ultra 9 185H, Arc 8-Core
38945 Points -1%
Moyenne de la classe Mini PC
  (1987 - 113499, n=119, 2 dernières années)
33863 Points -14%
AIDA64 / CPU AES
Geekom AX8 Pro
AMD Ryzen 9 8945H, Radeon 780M
163032 MB/s +117%
Minisforum AtomMan X7 Ti
Intel Core Ultra 9 185H, Arc 8-Core
154066 MB/s +105%
Acemagic F2A
Intel Core Ultra 7 155H, Arc 8-Core
144741 MB/s +92%
Geekom GT1 Mega
Intel Core Ultra 9 185H, Arc 8-Core
138481 MB/s +84%
Moyenne de la classe Mini PC
  (3691 - 325960, n=119, 2 dernières années)
88382 MB/s +17%
Aoostar GEM12
AMD Ryzen 7 8845HS, Radeon 780M
85572 MB/s +14%
Asus NUC 14 Pro+
Intel Core Ultra 9 185H, Arc 8-Core
75293 MB/s
AIDA64 / CPU ZLib
Minisforum AtomMan X7 Ti
Intel Core Ultra 9 185H, Arc 8-Core
1233 MB/s +7%
Acemagic F2A
Intel Core Ultra 7 155H, Arc 8-Core
1183 MB/s +2%
Geekom GT1 Mega
Intel Core Ultra 9 185H, Arc 8-Core
1181 MB/s +2%
Asus NUC 14 Pro+
Intel Core Ultra 9 185H, Arc 8-Core
1155 MB/s
Aoostar GEM12
AMD Ryzen 7 8845HS, Radeon 780M
1048 MB/s -9%
Geekom AX8 Pro
AMD Ryzen 9 8945H, Radeon 780M
976 MB/s -15%
Moyenne de la classe Mini PC
  (74.9 - 2039, n=119, 2 dernières années)
740 MB/s -36%
AIDA64 / FP64 Ray-Trace
Aoostar GEM12
AMD Ryzen 7 8845HS, Radeon 780M
13875 KRay/s +68%
Geekom AX8 Pro
AMD Ryzen 9 8945H, Radeon 780M
13609 KRay/s +65%
Acemagic F2A
Intel Core Ultra 7 155H, Arc 8-Core
9284 KRay/s +12%
Minisforum AtomMan X7 Ti
Intel Core Ultra 9 185H, Arc 8-Core
9270 KRay/s +12%
Asus NUC 14 Pro+
Intel Core Ultra 9 185H, Arc 8-Core
8272 KRay/s
Geekom GT1 Mega
Intel Core Ultra 9 185H, Arc 8-Core
7925 KRay/s -4%
Moyenne de la classe Mini PC
  (350 - 26952, n=119, 2 dernières années)
6881 KRay/s -17%
AIDA64 / CPU PhotoWorxx
Geekom GT1 Mega
Intel Core Ultra 9 185H, Arc 8-Core
47032 MPixel/s +4%
Minisforum AtomMan X7 Ti
Intel Core Ultra 9 185H, Arc 8-Core
45560 MPixel/s +1%
Asus NUC 14 Pro+
Intel Core Ultra 9 185H, Arc 8-Core
45293 MPixel/s
Aoostar GEM12
AMD Ryzen 7 8845HS, Radeon 780M
40245 MPixel/s -11%
Geekom AX8 Pro
AMD Ryzen 9 8945H, Radeon 780M
40114 MPixel/s -11%
Acemagic F2A
Intel Core Ultra 7 155H, Arc 8-Core
33092 MPixel/s -27%
Moyenne de la classe Mini PC
  (4408 - 50500, n=119, 2 dernières années)
28301 MPixel/s -38%

Cinebench R15 Multi continuous test

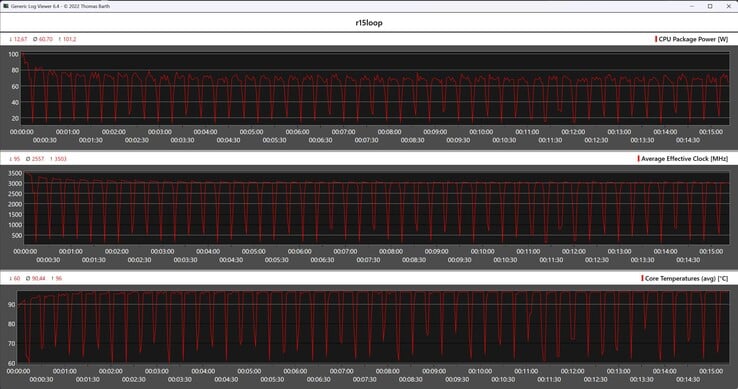
La limite de performance élevée de l'Asus NUC 14 Pro+ est surtout visible au début du test d'endurance Cinebench R15. Au cours de la deuxième exécution, les performances diminuent légèrement, mais cette perte se stabilise et l'appareil termine le test de charge avec un score moyen de 2 588 points. Cependant, Asus n'est pas à la hauteur de l'AtomManager de Minisforum AtomMan X7 Ti et à l Acemagic F2Ace qui signifie que notre échantillon de test obtient la troisième place dans ce comparatif.

Mesures du processeur pendant la boucle Cinebench R15
01503004506007509001050120013501500165018001950210022502400255027002850Tooltip
Asus NUC 14 Pro+ Intel Core Ultra 9 185H, Intel Core Ultra 9 185H: Ø2588 (2519.69-2910.57)
Aoostar GEM12 AMD Ryzen 7 8845HS, AMD Ryzen 7 8845HS: Ø2530 (2503.13-2552.81)
Geekom GT1 Mega Intel Core Ultra 9 185H, Intel Core Ultra 9 185H: Ø2442 (2286.63-2795.05)
Geekom AX8 Pro AMD Ryzen 9 8945H, AMD Ryzen 9 8945H: Ø2223 (2100.4-2438.43)
Minisforum AtomMan X7 Ti Intel Core Ultra 9 185H, Intel Core Ultra 9 185H: Ø2784 (2721.64-2831.86)
Acemagic F2A Intel Core Ultra 7 155H, Intel Core Ultra 7 155H: Ø2759 (2690.7-2800.92)

Performance du système

L'Asus NUC 14 Pro+ illustre clairement que si un bon résultat au benchmark du processeur est impressionnant, il ne se traduit pas toujours par des performances aussi élevées dans les tests système. Les écarts avec les concurrents plus rapides sont relativement faibles, ce qui correspond à notre impression subjective pendant la période de test. Équipé d'un Intel Core Ultra 9 185Hl'Asus NUC 14 Pro+ offre des performances exceptionnelles qui restent largement inexploitées au quotidien.

PCMark 10 / Score
Geekom AX8 Pro, AMD Ryzen 9 8945H
AMD Radeon 780M, Acer N7000
7553 Points +6%
Minisforum AtomMan X7 Ti, Intel Core Ultra 9 185H
Intel Arc 8-Core iGPU, Kingston OM8PGP41024Q-A0
7510 Points +6%
Aoostar GEM12, AMD Ryzen 7 8845HS
AMD Radeon 780M, Crucial P3 Plus CT1000P3PSSD8
7431 Points +5%
Geekom GT1 Mega, Intel Core Ultra 9 185H
Intel Arc 8-Core iGPU, Crucial P3 Plus CT2000P3PSSD8
7232 Points +2%
Acemagic F2A, Intel Core Ultra 7 155H
Intel Arc 8-Core iGPU, Kingston OM8SEP1024Q-A0
7120 Points 0%
Asus NUC 14 Pro+, Intel Core Ultra 9 185H
Intel Arc 8-Core iGPU, Samsung PM9A1a MZVL21T0HDLU
7103 Points
PCMark 10 / Essentials
Geekom AX8 Pro, AMD Ryzen 9 8945H
AMD Radeon 780M, Acer N7000
11227 Points +11%
Acemagic F2A, Intel Core Ultra 7 155H
Intel Arc 8-Core iGPU, Kingston OM8SEP1024Q-A0
11125 Points +10%
Minisforum AtomMan X7 Ti, Intel Core Ultra 9 185H
Intel Arc 8-Core iGPU, Kingston OM8PGP41024Q-A0
11030 Points +9%
Geekom GT1 Mega, Intel Core Ultra 9 185H
Intel Arc 8-Core iGPU, Crucial P3 Plus CT2000P3PSSD8
10824 Points +7%
Aoostar GEM12, AMD Ryzen 7 8845HS
AMD Radeon 780M, Crucial P3 Plus CT1000P3PSSD8
10822 Points +7%
Asus NUC 14 Pro+, Intel Core Ultra 9 185H
Intel Arc 8-Core iGPU, Samsung PM9A1a MZVL21T0HDLU
10135 Points
PCMark 10 / Productivity
Geekom AX8 Pro, AMD Ryzen 9 8945H
AMD Radeon 780M, Acer N7000
10774 Points +19%
Minisforum AtomMan X7 Ti, Intel Core Ultra 9 185H
Intel Arc 8-Core iGPU, Kingston OM8PGP41024Q-A0
10484 Points +16%
Aoostar GEM12, AMD Ryzen 7 8845HS
AMD Radeon 780M, Crucial P3 Plus CT1000P3PSSD8
10482 Points +16%
Asus NUC 14 Pro+, Intel Core Ultra 9 185H
Intel Arc 8-Core iGPU, Samsung PM9A1a MZVL21T0HDLU
9058 Points
Acemagic F2A, Intel Core Ultra 7 155H
Intel Arc 8-Core iGPU, Kingston OM8SEP1024Q-A0
8901 Points -2%
Geekom GT1 Mega, Intel Core Ultra 9 185H
Intel Arc 8-Core iGPU, Crucial P3 Plus CT2000P3PSSD8
8797 Points -3%
CrossMark / Overall
Aoostar GEM12, AMD Ryzen 7 8845HS
AMD Radeon 780M, Crucial P3 Plus CT1000P3PSSD8
1939 Points +13%
Geekom GT1 Mega, Intel Core Ultra 9 185H
Intel Arc 8-Core iGPU, Crucial P3 Plus CT2000P3PSSD8
1888 Points +10%
Geekom AX8 Pro, AMD Ryzen 9 8945H
AMD Radeon 780M, Acer N7000
1865 Points +9%
Acemagic F2A, Intel Core Ultra 7 155H
Intel Arc 8-Core iGPU, Kingston OM8SEP1024Q-A0
1802 Points +5%
Asus NUC 14 Pro+, Intel Core Ultra 9 185H
Intel Arc 8-Core iGPU, Samsung PM9A1a MZVL21T0HDLU
1713 Points
Minisforum AtomMan X7 Ti, Intel Core Ultra 9 185H
Intel Arc 8-Core iGPU, Kingston OM8PGP41024Q-A0
1675 Points -2%
CrossMark / Responsiveness
Geekom GT1 Mega, Intel Core Ultra 9 185H
Intel Arc 8-Core iGPU, Crucial P3 Plus CT2000P3PSSD8
1864 Points +35%
Aoostar GEM12, AMD Ryzen 7 8845HS
AMD Radeon 780M, Crucial P3 Plus CT1000P3PSSD8
1849 Points +34%
Acemagic F2A, Intel Core Ultra 7 155H
Intel Arc 8-Core iGPU, Kingston OM8SEP1024Q-A0
1700 Points +23%
Geekom AX8 Pro, AMD Ryzen 9 8945H
AMD Radeon 780M, Acer N7000
1583 Points +15%
Minisforum AtomMan X7 Ti, Intel Core Ultra 9 185H
Intel Arc 8-Core iGPU, Kingston OM8PGP41024Q-A0
1378 Points 0%
Asus NUC 14 Pro+, Intel Core Ultra 9 185H
Intel Arc 8-Core iGPU, Samsung PM9A1a MZVL21T0HDLU
1378 Points
CrossMark / Creativity
Geekom AX8 Pro, AMD Ryzen 9 8945H
AMD Radeon 780M, Acer N7000
2057 Points +4%
Aoostar GEM12, AMD Ryzen 7 8845HS
AMD Radeon 780M, Crucial P3 Plus CT1000P3PSSD8
2040 Points +3%
Asus NUC 14 Pro+, Intel Core Ultra 9 185H
Intel Arc 8-Core iGPU, Samsung PM9A1a MZVL21T0HDLU
1984 Points
Geekom GT1 Mega, Intel Core Ultra 9 185H
Intel Arc 8-Core iGPU, Crucial P3 Plus CT2000P3PSSD8
1959 Points -1%
Acemagic F2A, Intel Core Ultra 7 155H
Intel Arc 8-Core iGPU, Kingston OM8SEP1024Q-A0
1929 Points -3%
Minisforum AtomMan X7 Ti, Intel Core Ultra 9 185H
Intel Arc 8-Core iGPU, Kingston OM8PGP41024Q-A0
1883 Points -5%
CrossMark / Productivity
Aoostar GEM12, AMD Ryzen 7 8845HS
AMD Radeon 780M, Crucial P3 Plus CT1000P3PSSD8
1872 Points +18%
Geekom GT1 Mega, Intel Core Ultra 9 185H
Intel Arc 8-Core iGPU, Crucial P3 Plus CT2000P3PSSD8
1827 Points +15%
Geekom AX8 Pro, AMD Ryzen 9 8945H
AMD Radeon 780M, Acer N7000
1786 Points +12%
Acemagic F2A, Intel Core Ultra 7 155H
Intel Arc 8-Core iGPU, Kingston OM8SEP1024Q-A0
1717 Points +8%
Asus NUC 14 Pro+, Intel Core Ultra 9 185H
Intel Arc 8-Core iGPU, Samsung PM9A1a MZVL21T0HDLU
1591 Points
Minisforum AtomMan X7 Ti, Intel Core Ultra 9 185H
Intel Arc 8-Core iGPU, Kingston OM8PGP41024Q-A0
1589 Points 0%
AIDA64 / Memory Copy
Geekom GT1 Mega
Intel Core Ultra 9 185H, Arc 8-Core
73624 MB/s +5%
Minisforum AtomMan X7 Ti
Intel Core Ultra 9 185H, Arc 8-Core
71990 MB/s +3%
Asus NUC 14 Pro+
Intel Core Ultra 9 185H, Arc 8-Core
69929 MB/s
Geekom AX8 Pro
AMD Ryzen 9 8945H, Radeon 780M
68924 MB/s -1%
Aoostar GEM12
AMD Ryzen 7 8845HS, Radeon 780M
67777 MB/s -3%
Acemagic F2A
Intel Core Ultra 7 155H, Arc 8-Core
62397 MB/s -11%
Moyenne de la classe Mini PC
  (6481 - 89287, n=119, 2 dernières années)
48357 MB/s -31%
AIDA64 / Memory Read
Geekom GT1 Mega
Intel Core Ultra 9 185H, Arc 8-Core
79371 MB/s +4%
Asus NUC 14 Pro+
Intel Core Ultra 9 185H, Arc 8-Core
76074 MB/s
Minisforum AtomMan X7 Ti
Intel Core Ultra 9 185H, Arc 8-Core
75449 MB/s -1%
Acemagic F2A
Intel Core Ultra 7 155H, Arc 8-Core
64323 MB/s -15%
Geekom AX8 Pro
AMD Ryzen 9 8945H, Radeon 780M
61624 MB/s -19%
Aoostar GEM12
AMD Ryzen 7 8845HS, Radeon 780M
61006 MB/s -20%
Moyenne de la classe Mini PC
  (6914 - 99171, n=119, 2 dernières années)
49177 MB/s -35%
AIDA64 / Memory Write
Geekom AX8 Pro
AMD Ryzen 9 8945H, Radeon 780M
87138 MB/s +21%
Aoostar GEM12
AMD Ryzen 7 8845HS, Radeon 780M
86677 MB/s +20%
Asus NUC 14 Pro+
Intel Core Ultra 9 185H, Arc 8-Core
72287 MB/s
Geekom GT1 Mega
Intel Core Ultra 9 185H, Arc 8-Core
72187 MB/s 0%
Minisforum AtomMan X7 Ti
Intel Core Ultra 9 185H, Arc 8-Core
70596 MB/s -2%
Acemagic F2A
Intel Core Ultra 7 155H, Arc 8-Core
65057 MB/s -10%
Moyenne de la classe Mini PC
  (6862 - 98583, n=119, 2 dernières années)
52856 MB/s -27%
AIDA64 / Memory Latency
Acemagic F2A
Intel Core Ultra 7 155H, Arc 8-Core
149 ns * -23%
Minisforum AtomMan X7 Ti
Intel Core Ultra 9 185H, Arc 8-Core
146.1 ns * -20%
Geekom GT1 Mega
Intel Core Ultra 9 185H, Arc 8-Core
136.7 ns * -13%
Asus NUC 14 Pro+
Intel Core Ultra 9 185H, Arc 8-Core
121.4 ns *
Moyenne de la classe Mini PC
  (44.9 - 184.8, n=119, 2 dernières années)
92.1 ns * +24%
Geekom AX8 Pro
AMD Ryzen 9 8945H, Radeon 780M
91.4 ns * +25%
Aoostar GEM12
AMD Ryzen 7 8845HS, Radeon 780M
88.6 ns * +27%

* ... Moindre est la valeur, meilleures sont les performances

Performances de la NPU

Le NPU (Neural Processing Unit) est une caractéristique clé de l'Intel Core Ultra 9 185H, qui permet au SoC de traiter les tâches d'intelligence artificielle avec une efficacité exceptionnelle. La puissance non plafonnée du processeur permet au NPU de donner le meilleur de lui-même. Pour comparer les performances, nous avons utilisé le test UL Procyon AI Interface Benchmark. Cependant, une fois de plus, le Geekom GT1 Mega reste un concurrent de taille à cet égard.

UL Procyon for Windows / Overall Score Integer NPU
Geekom GT1 Mega
Intel Core Ultra 9 185H, Arc 8-Core
529 Points +2%
Asus NUC 14 Pro+
Intel Core Ultra 9 185H, Arc 8-Core
519 Points
Khadas Mind 2
Intel Core Ultra 7 155H, Arc 8-Core
504 Points -3%
Minisforum UH125 Pro
Intel Core Ultra 5 125H, Arc 7-Core
501 Points -3%
Acemagic F2A
Intel Core Ultra 7 155H, Arc 8-Core
499 Points -4%
UL Procyon for Windows / Overall Score Integer GPU
Acer Predator BiFrost Arc A770 OC, 16GB GDDR6
AMD Ryzen 9 7950X, Arc A770
1500 Points +79%
Acer Predator BiFrost Arc A750 OC
AMD Ryzen 9 7950X, Arc A750
1433 Points +71%
Asus NUC 14 Pro+
Intel Core Ultra 9 185H, Arc 8-Core
836 Points
Geekom GT1 Mega
Intel Core Ultra 9 185H, Arc 8-Core
801 Points -4%
Khadas Mind 2
Intel Core Ultra 7 155H, Arc 8-Core
687 Points -18%
Acemagic F2A
Intel Core Ultra 7 155H, Arc 8-Core
684 Points -18%
Minisforum UH125 Pro
Intel Core Ultra 5 125H, Arc 7-Core
547 Points -35%

Latences DPC

Les résultats de latence DPC de l'Asus NUC 14 Pro+ sont meilleurs que ceux d'autres mini PC. Cependant, il n'est pas encore tout à fait convaincant. Des latences accrues sont déjà perceptibles lors de la navigation sur Internet avec le navigateur Edge, bien qu'elles ne s'aggravent pas lors de la lecture d'une vidéo de test 4K. Ce n'est que lors du court test de stress avec Prime 95 que les latences augmentent à nouveau.

La latence maximale se produit lors de l'ouverture de plusieurs onglets du navigateur
Latence maximale lors de la lecture de séquences vidéo 4K
Latence maximale après dix secondes de Prime95
Pilote classé par temps d'exécution le plus long
DPC Latencies / LatencyMon - interrupt to process latency (max), Web, Youtube, Prime95
Acemagic F2A
Arc 8-Core, Ultra 7 155H, Kingston OM8SEP1024Q-A0
2724 μs * -49%
Minisforum AtomMan X7 Ti
Arc 8-Core, Ultra 9 185H, Kingston OM8PGP41024Q-A0
2069.2 μs * -13%
Geekom AX8 Pro
Radeon 780M, R9 8945H, Acer N7000
1856 μs * -1%
Asus NUC 14 Pro+
Arc 8-Core, Ultra 9 185H, Samsung PM9A1a MZVL21T0HDLU
1831 μs *
Geekom GT1 Mega
Arc 8-Core, Ultra 9 185H, Crucial P3 Plus CT2000P3PSSD8
1145.7 μs * +37%
Aoostar GEM12
Radeon 780M, R7 8845HS, Crucial P3 Plus CT1000P3PSSD8
1001.9 μs * +45%

* ... Moindre est la valeur, meilleures sont les performances

Dispositifs de stockage

1 TB SSD
1 TB SSD

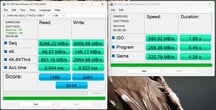
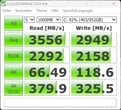
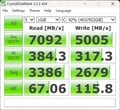
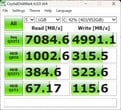
Asus équipe le NUC 14 Pro+ d'un SSD Samsung de 1 To qui exploite pleinement l'interface M.2 avec PCIe 4.0 x4 pour des performances optimales. Cela garantit d'excellentes performances, comparables à celles de l'Acer N7000 utilisé dans le NUC 14 Pro+ Geekom AX8. En plus du SSD de 80 mm préinstallé, il y a un emplacement supplémentaire pour les SSD de 42 mm. Les deux SSD sont activement refroidis par une unité située sur la base. Le SSD Samsung se comporte bien pendant les tests de stress, en maintenant des performances constantes sans baisse notable. La comparaison avec l'Acer N7000 reste serrée.

Pour plus de comparaisons et de benchmarks, veuillez vous référer à notre tableau de comparaison.

AS SSD
AS SSD
MDP 3
MDP 3
MDP 5
MDP 5
MDP 6
MDP 6
CDI
CDI
Samsung PM9A1a MZVL21T0HDLU
Sequential Read: 3556 MB/s
Sequential Write: 2949 MB/s
512K Read: 2292 MB/s
512K Write: 2158 MB/s
4K Read: 66.49 MB/s
4K Write: 118.6 MB/s
4K QD32 Read: 379.9 MB/s
4K QD32 Write: 325.5 MB/s
Drive Performance Rating - Percent
Aoostar GEM12
Crucial P3 Plus CT1000P3PSSD8
88.1 pt
Geekom GT1 Mega
Crucial P3 Plus CT2000P3PSSD8
82.6 pt
Geekom AX8 Pro
Acer N7000
63.6 pt
Asus NUC 14 Pro+
Samsung PM9A1a MZVL21T0HDLU
62.8 pt
Minisforum AtomMan X7 Ti
Kingston OM8PGP41024Q-A0
57 pt
Moyenne de la classe Mini PC
 
46.3 pt
Acemagic F2A
Kingston OM8SEP1024Q-A0
45.1 pt
DiskSpd
seq read
Geekom AX8 Pro
Acer N7000
3921 (3897.31min - 3920.75max) MB/s +13%
Asus NUC 14 Pro+
Samsung PM9A1a MZVL21T0HDLU
3463 (3381.92min - 3463.03max) MB/s
Aoostar GEM12
Crucial P3 Plus CT1000P3PSSD8
3108 (3065.99min - 3107.56max) MB/s -10%
Geekom GT1 Mega
Crucial P3 Plus CT2000P3PSSD8
2734 (2730.27min - 2734.25max) MB/s -21%
Moyenne de la classe Mini PC
  (277 - 4357, n=119, 2 dernières années)
2333 MB/s -33%
Minisforum AtomMan X7 Ti
Kingston OM8PGP41024Q-A0
2315 (2293.84min - 2315.26max) MB/s -33%
Acemagic F2A
Kingston OM8SEP1024Q-A0
1674 (1242.56min - 1673.54max) MB/s -52%
seq write
Aoostar GEM12
Crucial P3 Plus CT1000P3PSSD8
4619 (4584.79min - 4619.39max) MB/s +55%
Geekom GT1 Mega
Crucial P3 Plus CT2000P3PSSD8
3976 (425.08min - 3975.57max) MB/s +33%
Geekom AX8 Pro
Acer N7000
3791 (3695.18min - 3790.57max) MB/s +27%
Minisforum AtomMan X7 Ti
Kingston OM8PGP41024Q-A0
3386 (3076.94min - 3385.64max) MB/s +14%
Asus NUC 14 Pro+
Samsung PM9A1a MZVL21T0HDLU
2979 (2849.65min - 2979.21max) MB/s
Moyenne de la classe Mini PC
  (229 - 5595, n=119, 2 dernières années)
2509 MB/s -16%
Acemagic F2A
Kingston OM8SEP1024Q-A0
1348 (1117.85min - 1347.87max) MB/s -55%
seq q8 t1 read
Geekom AX8 Pro
Acer N7000
7012 (5624.01min - 7012.25max) MB/s +1%
Asus NUC 14 Pro+
Samsung PM9A1a MZVL21T0HDLU
6962 (5614.59min - 6961.5max) MB/s
Aoostar GEM12
Crucial P3 Plus CT1000P3PSSD8
5213 (4500.71min - 5212.95max) MB/s -25%
Geekom GT1 Mega
Crucial P3 Plus CT2000P3PSSD8
5060 (4781.3min - 5060.16max) MB/s -27%
Minisforum AtomMan X7 Ti
Kingston OM8PGP41024Q-A0
4676 (4310.07min - 4675.81max) MB/s -33%
Moyenne de la classe Mini PC
  (236 - 8430, n=119, 2 dernières années)
3790 MB/s -46%
Acemagic F2A
Kingston OM8SEP1024Q-A0
3194 (2810.81min - 3194.17max) MB/s -54%
seq q8 t1 write
Geekom AX8 Pro
Acer N7000
5685 (5389.6min - 5684.54max) MB/s +14%
Asus NUC 14 Pro+
Samsung PM9A1a MZVL21T0HDLU
4971 (4934.6min - 4970.75max) MB/s
Aoostar GEM12
Crucial P3 Plus CT1000P3PSSD8
4754 (4738.27min - 4754.03max) MB/s -4%
Geekom GT1 Mega
Crucial P3 Plus CT2000P3PSSD8
3985 (52.74min - 3985.01max) MB/s -20%
Minisforum AtomMan X7 Ti
Kingston OM8PGP41024Q-A0
3729 (3700.15min - 3728.95max) MB/s -25%
Moyenne de la classe Mini PC
  (239 - 6669, n=119, 2 dernières années)
2810 MB/s -43%
Acemagic F2A
Kingston OM8SEP1024Q-A0
2212 (1222.43min - 2212.27max) MB/s -56%
4k q1 t1 read
Aoostar GEM12
Crucial P3 Plus CT1000P3PSSD8
78.7 (78.09min - 78.69max) MB/s +20%
Asus NUC 14 Pro+
Samsung PM9A1a MZVL21T0HDLU
65.8 (64.95min - 65.84max) MB/s
Minisforum AtomMan X7 Ti
Kingston OM8PGP41024Q-A0
63.5 (59.81min - 63.5max) MB/s -3%
Geekom GT1 Mega
Crucial P3 Plus CT2000P3PSSD8
62.5 (62.22min - 62.52max) MB/s -5%
Geekom AX8 Pro
Acer N7000
62.2 (61.55min - 62.23max) MB/s -5%
Moyenne de la classe Mini PC
  (6.85 - 86.6, n=119, 2 dernières années)
55.3 MB/s -16%
Acemagic F2A
Kingston OM8SEP1024Q-A0
47.3 (47.07min - 47.31max) MB/s -28%
4k q1 t1 write
Geekom GT1 Mega
Crucial P3 Plus CT2000P3PSSD8
353 (348.24min - 353.16max) MB/s +195%
Aoostar GEM12
Crucial P3 Plus CT1000P3PSSD8
274 (271.38min - 273.89max) MB/s +129%
Moyenne de la classe Mini PC
  (30.4 - 435, n=119, 2 dernières années)
196.9 MB/s +65%
Acemagic F2A
Kingston OM8SEP1024Q-A0
187.2 (181.54min - 187.2max) MB/s +57%
Geekom AX8 Pro
Acer N7000
187 (185.73min - 187.04max) MB/s +56%
Minisforum AtomMan X7 Ti
Kingston OM8PGP41024Q-A0
184.4 (177.6min - 184.36max) MB/s +54%
Asus NUC 14 Pro+
Samsung PM9A1a MZVL21T0HDLU
119.6 (116.09min - 119.59max) MB/s
4k q32 t16 read
Aoostar GEM12
Crucial P3 Plus CT1000P3PSSD8
3197 (3174.44min - 3196.85max) MB/s +266%
Geekom GT1 Mega
Crucial P3 Plus CT2000P3PSSD8
2876 (2861.34min - 2875.92max) MB/s +229%
Acemagic F2A
Kingston OM8SEP1024Q-A0
1824 (1239.47min - 1824.09max) MB/s +109%
Geekom AX8 Pro
Acer N7000
1644 (1568.76min - 1643.51max) MB/s +88%
Moyenne de la classe Mini PC
  (26.1 - 4158, n=119, 2 dernières années)
1411 MB/s +62%
Minisforum AtomMan X7 Ti
Kingston OM8PGP41024Q-A0
1143 (1091.01min - 1142.98max) MB/s +31%
Asus NUC 14 Pro+
Samsung PM9A1a MZVL21T0HDLU
873 (810.06min - 872.85max) MB/s
4k q32 t16 write
Aoostar GEM12
Crucial P3 Plus CT1000P3PSSD8
3639 (3534.46min - 3639.09max) MB/s +943%
Geekom GT1 Mega
Crucial P3 Plus CT2000P3PSSD8
2822 (709.76min - 2821.52max) MB/s +709%
Acemagic F2A
Kingston OM8SEP1024Q-A0
1434 (1410.26min - 1433.71max) MB/s +311%
Moyenne de la classe Mini PC
  (32.6 - 4288, n=119, 2 dernières années)
1332 MB/s +282%
Geekom AX8 Pro
Acer N7000
647 (598.22min - 647.4max) MB/s +85%
Minisforum AtomMan X7 Ti
Kingston OM8PGP41024Q-A0
497 (467.49min - 497.28max) MB/s +42%
Asus NUC 14 Pro+
Samsung PM9A1a MZVL21T0HDLU
349 (343.71min - 348.99max) MB/s
AS SSD
Score Total
Aoostar GEM12
Crucial P3 Plus CT1000P3PSSD8
10021 Points +85%
Geekom GT1 Mega
Crucial P3 Plus CT2000P3PSSD8
8215 Points +52%
Geekom AX8 Pro
Acer N7000
5512 Points +2%
Asus NUC 14 Pro+
Samsung PM9A1a MZVL21T0HDLU
5414 Points
Minisforum AtomMan X7 Ti
Kingston OM8PGP41024Q-A0
4987 Points -8%
Acemagic F2A
Kingston OM8SEP1024Q-A0
4412 Points -19%
Moyenne de la classe Mini PC
  (211 - 10021, n=117, 2 dernières années)
4244 Points -22%
Score Read
Aoostar GEM12
Crucial P3 Plus CT1000P3PSSD8
3741 Points +168%
Geekom GT1 Mega
Crucial P3 Plus CT2000P3PSSD8
2779 Points +99%
Geekom AX8 Pro
Acer N7000
1793 Points +29%
Moyenne de la classe Mini PC
  (76 - 3741, n=117, 2 dernières années)
1578 Points +13%
Acemagic F2A
Kingston OM8SEP1024Q-A0
1561 Points +12%
Minisforum AtomMan X7 Ti
Kingston OM8PGP41024Q-A0
1482 Points +6%
Asus NUC 14 Pro+
Samsung PM9A1a MZVL21T0HDLU
1395 Points
Score Write
Aoostar GEM12
Crucial P3 Plus CT1000P3PSSD8
4371 Points +29%
Geekom GT1 Mega
Crucial P3 Plus CT2000P3PSSD8
3987 Points +17%
Asus NUC 14 Pro+
Samsung PM9A1a MZVL21T0HDLU
3401 Points
Geekom AX8 Pro
Acer N7000
2896 Points -15%
Minisforum AtomMan X7 Ti
Kingston OM8PGP41024Q-A0
2807 Points -17%
Acemagic F2A
Kingston OM8SEP1024Q-A0
2082 Points -39%
Moyenne de la classe Mini PC
  (88 - 4371, n=117, 2 dernières années)
1902 Points -44%
Seq Read
Asus NUC 14 Pro+
Samsung PM9A1a MZVL21T0HDLU
5266 MB/s
Geekom AX8 Pro
Acer N7000
4902 MB/s -7%
Aoostar GEM12
Crucial P3 Plus CT1000P3PSSD8
4317 MB/s -18%
Minisforum AtomMan X7 Ti
Kingston OM8PGP41024Q-A0
3779 MB/s -28%
Geekom GT1 Mega
Crucial P3 Plus CT2000P3PSSD8
3587 MB/s -32%
Moyenne de la classe Mini PC
  (291 - 6620, n=117, 2 dernières années)
3231 MB/s -39%
Acemagic F2A
Kingston OM8SEP1024Q-A0
3010 MB/s -43%
Seq Write
Aoostar GEM12
Crucial P3 Plus CT1000P3PSSD8
4188 MB/s +39%
Geekom GT1 Mega
Crucial P3 Plus CT2000P3PSSD8
3938 MB/s +31%
Asus NUC 14 Pro+
Samsung PM9A1a MZVL21T0HDLU
3006 MB/s
Geekom AX8 Pro
Acer N7000
2835 MB/s -6%
Acemagic F2A
Kingston OM8SEP1024Q-A0
2369 MB/s -21%
Moyenne de la classe Mini PC
  (242 - 5783, n=117, 2 dernières années)
2292 MB/s -24%
Minisforum AtomMan X7 Ti
Kingston OM8PGP41024Q-A0
2285 MB/s -24%
4K Read
Aoostar GEM12
Crucial P3 Plus CT1000P3PSSD8
89.3 MB/s +33%
Geekom GT1 Mega
Crucial P3 Plus CT2000P3PSSD8
83.6 MB/s +25%
Asus NUC 14 Pro+
Samsung PM9A1a MZVL21T0HDLU
66.9 MB/s
Minisforum AtomMan X7 Ti
Kingston OM8PGP41024Q-A0
63.3 MB/s -5%
Moyenne de la classe Mini PC
  (21.4 - 104.3, n=117, 2 dernières années)
59.7 MB/s -11%
Geekom AX8 Pro
Acer N7000
59.1 MB/s -12%
Acemagic F2A
Kingston OM8SEP1024Q-A0
41.8 MB/s -38%
4K Write
Geekom GT1 Mega
Crucial P3 Plus CT2000P3PSSD8
314 MB/s +115%
Minisforum AtomMan X7 Ti
Kingston OM8PGP41024Q-A0
238 MB/s +63%
Aoostar GEM12
Crucial P3 Plus CT1000P3PSSD8
221 MB/s +51%
Acemagic F2A
Kingston OM8SEP1024Q-A0
196.9 MB/s +35%
Geekom AX8 Pro
Acer N7000
181.4 MB/s +24%
Moyenne de la classe Mini PC
  (30.9 - 366, n=117, 2 dernières années)
177.5 MB/s +21%
Asus NUC 14 Pro+
Samsung PM9A1a MZVL21T0HDLU
146.2 MB/s
4K-64 Read
Aoostar GEM12
Crucial P3 Plus CT1000P3PSSD8
3220 MB/s +302%
Geekom GT1 Mega
Crucial P3 Plus CT2000P3PSSD8
2336 MB/s +192%
Geekom AX8 Pro
Acer N7000
1244 MB/s +55%
Acemagic F2A
Kingston OM8SEP1024Q-A0
1218 MB/s +52%
Moyenne de la classe Mini PC
  (23.4 - 3220, n=117, 2 dernières années)
1195 MB/s +49%
Minisforum AtomMan X7 Ti
Kingston OM8PGP41024Q-A0
1041 MB/s +30%
Asus NUC 14 Pro+
Samsung PM9A1a MZVL21T0HDLU
801 MB/s
4K-64 Write
Aoostar GEM12
Crucial P3 Plus CT1000P3PSSD8
3731 MB/s +26%
Geekom GT1 Mega
Crucial P3 Plus CT2000P3PSSD8
3279 MB/s +11%
Asus NUC 14 Pro+
Samsung PM9A1a MZVL21T0HDLU
2955 MB/s
Geekom AX8 Pro
Acer N7000
2431 MB/s -18%
Minisforum AtomMan X7 Ti
Kingston OM8PGP41024Q-A0
2340 MB/s -21%
Acemagic F2A
Kingston OM8SEP1024Q-A0
1649 MB/s -44%
Moyenne de la classe Mini PC
  (32.8 - 3731, n=117, 2 dernières années)
1495 MB/s -49%
Access Time Read
Moyenne de la classe Mini PC
  (0.022 - 0.489, n=117, 2 dernières années)
0.09579 ms * -118%
Geekom AX8 Pro
Acer N7000
0.079 ms * -80%
Aoostar GEM12
Crucial P3 Plus CT1000P3PSSD8
0.076 ms * -73%
Minisforum AtomMan X7 Ti
Kingston OM8PGP41024Q-A0
0.067 ms * -52%
Acemagic F2A
Kingston OM8SEP1024Q-A0
0.046 ms * -5%
Asus NUC 14 Pro+
Samsung PM9A1a MZVL21T0HDLU
0.044 ms *
Geekom GT1 Mega
Crucial P3 Plus CT2000P3PSSD8
0.027 ms * +39%
Access Time Write
Acemagic F2A
Kingston OM8SEP1024Q-A0
0.126 ms * -367%
Moyenne de la classe Mini PC
  (0.014 - 0.765, n=117, 2 dernières années)
0.1133 ms * -320%
Geekom AX8 Pro
Acer N7000
0.064 ms * -137%
Asus NUC 14 Pro+
Samsung PM9A1a MZVL21T0HDLU
0.027 ms *
Minisforum AtomMan X7 Ti
Kingston OM8PGP41024Q-A0
0.02 ms * +26%
Aoostar GEM12
Crucial P3 Plus CT1000P3PSSD8
0.017 ms * +37%
Geekom GT1 Mega
Crucial P3 Plus CT2000P3PSSD8
0.014 ms * +48%

* ... Moindre est la valeur, meilleures sont les performances

Reading continuous performance:/Disk Throttling: DiskSpd Read Loop, Queue Depth 8

035571010651420177521302485284031953550390542604615497053255680603563906745Tooltip
Asus NUC 14 Pro+ Samsung PM9A1a MZVL21T0HDLU; diskspd 2.0.17 f: Ø6962 (5660.63-7000.13)
Aoostar GEM12 Crucial P3 Plus CT1000P3PSSD8; diskspd 2.0.17 f: Ø5121 (4152.57-5218.34)
Geekom GT1 Mega Crucial P3 Plus CT2000P3PSSD8 ; diskspd 2.0.17 f: Ø5055 (4738.1-5067.7)
Geekom AX8 Pro Acer N7000; diskspd 2.0.17 f: Ø6996 (5972.7-7027.76)
Minisforum AtomMan X7 Ti Kingston OM8PGP41024Q-A0; diskspd 2.0.17 f: Ø4683 (3872.18-4767.25)
Acemagic F2A Kingston OM8SEP1024Q-A0; diskspd 2.0.17 f: Ø1320 (771.89-3141.95)

Carte graphique

L'iGPU de l'Asus NUC 14 Pro+ est basé sur l'architecture Intel Arc, désormais appelée Intel Arc 8-Corel'iGPU Intel Arc 8-Core offre beaucoup plus de puissance que son prédécesseur, l'Intel Iris Xe G7 avec 96 EUs. L'iGPU Intel Arc 8-Core est nettement plus compétitif et capable de rivaliser avec l'AMD Radeon 780M. Cependant, il n'atteint pas encore le niveau de performance du Geekom GT1 Mega. Dans des tâches telles que l'exécution d'Affinity Photo 2, l'iGPU d'Intel offre des performances exceptionnelles, surpassant les solutions iGPU d'AMD. Il est important de tempérer les attentes, car ses performances sont inférieures à celles du GPU pour ordinateur portable Nvidia GeForce RTX 4050.

Pour des comparaisons et des benchmarks plus détaillés, reportez-vous à notre Tableau de comparaison des GPU.

3DMark Performance Rating - Percent
Moyenne NVIDIA GeForce RTX 4050 Laptop GPU
 
100 pt
Geekom GT1 Mega
Intel Arc 8-Core iGPU, Intel Core Ultra 9 185H
44.6 pt
Asus NUC 14 Pro+
Intel Arc 8-Core iGPU, Intel Core Ultra 9 185H
43.4 pt
Aoostar GEM12
AMD Radeon 780M, AMD Ryzen 7 8845HS
40.4 pt
Geekom AX8 Pro
AMD Radeon 780M, AMD Ryzen 9 8945H
40.4 pt
Acemagic F2A
Intel Arc 8-Core iGPU, Intel Core Ultra 7 155H
39.9 pt
Minisforum AtomMan X7 Ti
Intel Arc 8-Core iGPU, Intel Core Ultra 9 185H
39.2 pt
3DMark 11 - 1280x720 Performance GPU
Moyenne NVIDIA GeForce RTX 4050 Laptop GPU
  (13339 - 32642, n=38)
28641 Points +118%
Aoostar GEM12
AMD Radeon 780M, AMD Ryzen 7 8845HS
13410 Points +2%
Geekom GT1 Mega
Intel Arc 8-Core iGPU, Intel Core Ultra 9 185H
13309 Points +1%
Geekom AX8 Pro
AMD Radeon 780M, AMD Ryzen 9 8945H
13281 Points +1%
Asus NUC 14 Pro+
Intel Arc 8-Core iGPU, Intel Core Ultra 9 185H
13163 Points
Acemagic F2A
Intel Arc 8-Core iGPU, Intel Core Ultra 7 155H
12085 Points -8%
Minisforum AtomMan X7 Ti
Intel Arc 8-Core iGPU, Intel Core Ultra 9 185H
11691 Points -11%
3DMark
2560x1440 Time Spy Graphics
Moyenne NVIDIA GeForce RTX 4050 Laptop GPU
  (5107 - 9040, n=36)
7812 Points +125%
Geekom GT1 Mega
Intel Arc 8-Core iGPU, Intel Core Ultra 9 185H
3610 Points +4%
Asus NUC 14 Pro+
Intel Arc 8-Core iGPU, Intel Core Ultra 9 185H
3476 Points
Acemagic F2A
Intel Arc 8-Core iGPU, Intel Core Ultra 7 155H
3205 Points -8%
Minisforum AtomMan X7 Ti
Intel Arc 8-Core iGPU, Intel Core Ultra 9 185H
3193 Points -8%
Geekom AX8 Pro
AMD Radeon 780M, AMD Ryzen 9 8945H
2852 Points -18%
Aoostar GEM12
AMD Radeon 780M, AMD Ryzen 7 8845HS
2846 Points -18%
1920x1080 Fire Strike Graphics
Moyenne NVIDIA GeForce RTX 4050 Laptop GPU
  (13591 - 24007, n=36)
21155 Points +152%
Geekom GT1 Mega
Intel Arc 8-Core iGPU, Intel Core Ultra 9 185H
8726 Points +4%
Asus NUC 14 Pro+
Intel Arc 8-Core iGPU, Intel Core Ultra 9 185H
8396 Points
Geekom AX8 Pro
AMD Radeon 780M, AMD Ryzen 9 8945H
8117 Points -3%
Aoostar GEM12
AMD Radeon 780M, AMD Ryzen 7 8845HS
8007 Points -5%
Acemagic F2A
Intel Arc 8-Core iGPU, Intel Core Ultra 7 155H
7710 Points -8%
Minisforum AtomMan X7 Ti
Intel Arc 8-Core iGPU, Intel Core Ultra 9 185H
7599 Points -9%
Unigine Heaven 4.0
Extreme Preset OpenGL
Moyenne NVIDIA GeForce RTX 4050 Laptop GPU
  ()
118.1 fps +235%
Geekom GT1 Mega
Intel Arc 8-Core iGPU, Intel Core Ultra 9 185H
36.4 fps +3%
Asus NUC 14 Pro+
Intel Arc 8-Core iGPU, Intel Core Ultra 9 185H
35.3 fps
Aoostar GEM12
AMD Radeon 780M, AMD Ryzen 7 8845HS
34.6 fps -2%
Acemagic F2A
Intel Arc 8-Core iGPU, Intel Core Ultra 7 155H
31.6 fps -10%
Geekom AX8 Pro
AMD Radeon 780M, AMD Ryzen 9 8945H
30 fps -15%
Minisforum AtomMan X7 Ti
Intel Arc 8-Core iGPU, Intel Core Ultra 9 185H
29.7 fps -16%
Extreme Preset DX11
Moyenne NVIDIA GeForce RTX 4050 Laptop GPU
  ()
114.6 fps +216%
Geekom GT1 Mega
Intel Arc 8-Core iGPU, Intel Core Ultra 9 185H
37.5 fps +3%
Geekom AX8 Pro
AMD Radeon 780M, AMD Ryzen 9 8945H
36.4 fps 0%
Aoostar GEM12
AMD Radeon 780M, AMD Ryzen 7 8845HS
36.3 fps 0%
Asus NUC 14 Pro+
Intel Arc 8-Core iGPU, Intel Core Ultra 9 185H
36.3 fps
Minisforum AtomMan X7 Ti
Intel Arc 8-Core iGPU, Intel Core Ultra 9 185H
33.2 fps -9%
Acemagic F2A
Intel Arc 8-Core iGPU, Intel Core Ultra 7 155H
32.7 fps -10%
Unigine Valley 1.0
1920x1080 Extreme HD DirectX AA:x8
Aoostar GEM12
AMD Radeon 780M, AMD Ryzen 7 8845HS
24.5 fps +26%
Geekom AX8 Pro
AMD Radeon 780M, AMD Ryzen 9 8945H
23.1 fps +18%
Geekom GT1 Mega
Intel Arc 8-Core iGPU, Intel Core Ultra 9 185H
20.1 fps +3%
Asus NUC 14 Pro+
Intel Arc 8-Core iGPU, Intel Core Ultra 9 185H
19.5 fps
Minisforum AtomMan X7 Ti
Intel Arc 8-Core iGPU, Intel Core Ultra 9 185H
18.5 fps -5%
Acemagic F2A
Intel Arc 8-Core iGPU, Intel Core Ultra 7 155H
17.1 fps -12%
1920x1080 Extreme HD Preset OpenGL AA:x8
Minisforum AtomMan X7 Ti
Intel Arc 8-Core iGPU, Intel Core Ultra 9 185H
32.4 fps +53%
Geekom GT1 Mega
Intel Arc 8-Core iGPU, Intel Core Ultra 9 185H
21.9 fps +3%
Asus NUC 14 Pro+
Intel Arc 8-Core iGPU, Intel Core Ultra 9 185H
21.2 fps
Aoostar GEM12
AMD Radeon 780M, AMD Ryzen 7 8845HS
21 fps -1%
Geekom AX8 Pro
AMD Radeon 780M, AMD Ryzen 9 8945H
20.6 fps -3%
Acemagic F2A
Intel Arc 8-Core iGPU, Intel Core Ultra 7 155H
18.3 fps -14%
Unigine Superposition
1280x720 720p Low
Geekom GT1 Mega
Intel Arc 8-Core iGPU, Intel Core Ultra 9 185H
12451 Points +5%
Geekom AX8 Pro
AMD Radeon 780M, AMD Ryzen 9 8945H
12232 Points +3%
Aoostar GEM12
AMD Radeon 780M, AMD Ryzen 7 8845HS
12174 Points +2%
Asus NUC 14 Pro+
Intel Arc 8-Core iGPU, Intel Core Ultra 9 185H
11902 Points
Acemagic F2A
Intel Arc 8-Core iGPU, Intel Core Ultra 7 155H
10491 Points -12%
Minisforum AtomMan X7 Ti
Intel Arc 8-Core iGPU, Intel Core Ultra 9 185H
10102 Points -15%
1920x1080 1080p High
Geekom GT1 Mega
Intel Arc 8-Core iGPU, Intel Core Ultra 9 185H
3948 Points +3%
Asus NUC 14 Pro+
Intel Arc 8-Core iGPU, Intel Core Ultra 9 185H
3836 Points
Aoostar GEM12
AMD Radeon 780M, AMD Ryzen 7 8845HS
3592 Points -6%
Geekom AX8 Pro
AMD Radeon 780M, AMD Ryzen 9 8945H
3559 Points -7%
Acemagic F2A
Intel Arc 8-Core iGPU, Intel Core Ultra 7 155H
3391 Points -12%
Minisforum AtomMan X7 Ti
Intel Arc 8-Core iGPU, Intel Core Ultra 9 185H
3341 Points -13%
1920x1080 1080p Extreme
Geekom GT1 Mega
Intel Arc 8-Core iGPU, Intel Core Ultra 9 185H
2119 Points 0%
Asus NUC 14 Pro+
Intel Arc 8-Core iGPU, Intel Core Ultra 9 185H
2114 Points
Acemagic F2A
Intel Arc 8-Core iGPU, Intel Core Ultra 7 155H
1920 Points -9%
Minisforum AtomMan X7 Ti
Intel Arc 8-Core iGPU, Intel Core Ultra 9 185H
1812 Points -14%
Aoostar GEM12
AMD Radeon 780M, AMD Ryzen 7 8845HS
1737 Points -18%
Geekom AX8 Pro
AMD Radeon 780M, AMD Ryzen 9 8945H
1649 Points -22%
ComputeMark v2.1
1024x600 Normal, Score
Moyenne NVIDIA GeForce RTX 4050 Laptop GPU
  ()
16302 Points +115%
Aoostar GEM12
AMD Radeon 780M, AMD Ryzen 7 8845HS
9494 Points +25%
Geekom AX8 Pro
AMD Radeon 780M, AMD Ryzen 9 8945H
8595 Points +13%
Geekom GT1 Mega
Intel Arc 8-Core iGPU, Intel Core Ultra 9 185H
7963 Points +5%
Asus NUC 14 Pro+
Intel Arc 8-Core iGPU, Intel Core Ultra 9 185H
7594 Points
Acemagic F2A
Intel Arc 8-Core iGPU, Intel Core Ultra 7 155H
7480 Points -2%
Minisforum AtomMan X7 Ti
Intel Arc 8-Core iGPU, Intel Core Ultra 9 185H
6270 Points -17%
1024x600 Normal, Fluid 3DTex
Moyenne NVIDIA GeForce RTX 4050 Laptop GPU
  ()
1319 Points +182%
Geekom GT1 Mega
Intel Arc 8-Core iGPU, Intel Core Ultra 9 185H
492 Points +5%
Geekom AX8 Pro
AMD Radeon 780M, AMD Ryzen 9 8945H
488 Points +4%
Aoostar GEM12
AMD Radeon 780M, AMD Ryzen 7 8845HS
483 Points +3%
Minisforum AtomMan X7 Ti
Intel Arc 8-Core iGPU, Intel Core Ultra 9 185H
469 Points 0%
Asus NUC 14 Pro+
Intel Arc 8-Core iGPU, Intel Core Ultra 9 185H
468 Points
Acemagic F2A
Intel Arc 8-Core iGPU, Intel Core Ultra 7 155H
427 Points -9%
1024x600 Normal, Fluid 2DTexArr
Moyenne NVIDIA GeForce RTX 4050 Laptop GPU
  ()
1284 Points +177%
Geekom GT1 Mega
Intel Arc 8-Core iGPU, Intel Core Ultra 9 185H
487 Points +5%
Aoostar GEM12
AMD Radeon 780M, AMD Ryzen 7 8845HS
481 Points +4%
Asus NUC 14 Pro+
Intel Arc 8-Core iGPU, Intel Core Ultra 9 185H
464 Points
Minisforum AtomMan X7 Ti
Intel Arc 8-Core iGPU, Intel Core Ultra 9 185H
462 Points 0%
Geekom AX8 Pro
AMD Radeon 780M, AMD Ryzen 9 8945H
427 Points -8%
Acemagic F2A
Intel Arc 8-Core iGPU, Intel Core Ultra 7 155H
422 Points -9%
1024x600 Normal, Mandel Vector
Moyenne NVIDIA GeForce RTX 4050 Laptop GPU
  ()
3456 Points +82%
Aoostar GEM12
AMD Radeon 780M, AMD Ryzen 7 8845HS
2477 Points +30%
Geekom AX8 Pro
AMD Radeon 780M, AMD Ryzen 9 8945H
2362 Points +24%
Geekom GT1 Mega
Intel Arc 8-Core iGPU, Intel Core Ultra 9 185H
2039 Points +7%
Acemagic F2A
Intel Arc 8-Core iGPU, Intel Core Ultra 7 155H
1961 Points +3%
Asus NUC 14 Pro+
Intel Arc 8-Core iGPU, Intel Core Ultra 9 185H
1899 Points
Minisforum AtomMan X7 Ti
Intel Arc 8-Core iGPU, Intel Core Ultra 9 185H
1620 Points -15%
1024x600 Normal, Mandel Scalar
Moyenne NVIDIA GeForce RTX 4050 Laptop GPU
  ()
3578 Points +118%
Aoostar GEM12
AMD Radeon 780M, AMD Ryzen 7 8845HS
2519 Points +53%
Geekom AX8 Pro
AMD Radeon 780M, AMD Ryzen 9 8945H
2449 Points +49%
Geekom GT1 Mega
Intel Arc 8-Core iGPU, Intel Core Ultra 9 185H
1701 Points +4%
Asus NUC 14 Pro+
Intel Arc 8-Core iGPU, Intel Core Ultra 9 185H
1643 Points
Acemagic F2A
Intel Arc 8-Core iGPU, Intel Core Ultra 7 155H
1594 Points -3%
Minisforum AtomMan X7 Ti
Intel Arc 8-Core iGPU, Intel Core Ultra 9 185H
1274 Points -22%
1024x600 Normal, QJuliaRayTrace
Moyenne NVIDIA GeForce RTX 4050 Laptop GPU
  ()
6665 Points +114%
Aoostar GEM12
AMD Radeon 780M, AMD Ryzen 7 8845HS
3535 Points +13%
Geekom GT1 Mega
Intel Arc 8-Core iGPU, Intel Core Ultra 9 185H
3244 Points +4%
Asus NUC 14 Pro+
Intel Arc 8-Core iGPU, Intel Core Ultra 9 185H
3121 Points
Acemagic F2A
Intel Arc 8-Core iGPU, Intel Core Ultra 7 155H
3076 Points -1%
Geekom AX8 Pro
AMD Radeon 780M, AMD Ryzen 9 8945H
2868 Points -8%
Minisforum AtomMan X7 Ti
Intel Arc 8-Core iGPU, Intel Core Ultra 9 185H
2444 Points -22%
LuxMark v2.0 64Bit
Room GPUs-only
Moyenne NVIDIA GeForce RTX 4050 Laptop GPU
  ()
2967 Samples/s +297%
Geekom AX8 Pro
AMD Radeon 780M, AMD Ryzen 9 8945H
1068 Samples/s +43%
Aoostar GEM12
AMD Radeon 780M, AMD Ryzen 7 8845HS
801 Samples/s +7%
Asus NUC 14 Pro+
Intel Arc 8-Core iGPU, Intel Core Ultra 9 185H
747 Samples/s
Geekom GT1 Mega
Intel Arc 8-Core iGPU, Intel Core Ultra 9 185H
656 Samples/s -12%
Minisforum AtomMan X7 Ti
Intel Arc 8-Core iGPU, Intel Core Ultra 9 185H
640 Samples/s -14%
Acemagic F2A
Intel Arc 8-Core iGPU, Intel Core Ultra 7 155H
549 Samples/s -27%
Sala GPUs-only
Moyenne NVIDIA GeForce RTX 4050 Laptop GPU
  ()
8036 Samples/s +175%
Asus NUC 14 Pro+
Intel Arc 8-Core iGPU, Intel Core Ultra 9 185H
2927 Samples/s
Geekom GT1 Mega
Intel Arc 8-Core iGPU, Intel Core Ultra 9 185H
2888 Samples/s -1%
Minisforum AtomMan X7 Ti
Intel Arc 8-Core iGPU, Intel Core Ultra 9 185H
2732 Samples/s -7%
Acemagic F2A
Intel Arc 8-Core iGPU, Intel Core Ultra 7 155H
2319 Samples/s -21%
Geekom AX8 Pro
AMD Radeon 780M, AMD Ryzen 9 8945H
2218 Samples/s -24%
Aoostar GEM12
AMD Radeon 780M, AMD Ryzen 7 8845HS
1496 Samples/s -49%
Affinity Photo 2 - Combined (Single / Multi GPU)
Geekom GT1 Mega
Intel Arc 8-Core iGPU, Intel Core Ultra 9 185H
6468 Points +6%
Asus NUC 14 Pro+
Intel Arc 8-Core iGPU, Intel Core Ultra 9 185H
6081 Points
Minisforum AtomMan X7 Ti
Intel Arc 8-Core iGPU, Intel Core Ultra 9 185H
5308 Points -13%
Acemagic F2A
Intel Arc 8-Core iGPU, Intel Core Ultra 7 155H
4928 Points -19%
Geekom AX8 Pro
AMD Radeon 780M, AMD Ryzen 9 8945H
1831 Points -70%
Aoostar GEM12
AMD Radeon 780M, AMD Ryzen 7 8845HS
1709 Points -72%
Asus NUC 14 Pro+, Intel Arc 8-Core iGPU
Ultra 9 185H
Aoostar GEM12, AMD Radeon 780M
R7 8845HS
Geekom GT1 Mega, Intel Arc 8-Core iGPU
Ultra 9 185H
Geekom AX8 Pro, AMD Radeon 780M
R9 8945H
Minisforum AtomMan X7 Ti, Intel Arc 8-Core iGPU
Ultra 9 185H
Acemagic F2A, Intel Arc 8-Core iGPU
Ultra 7 155H
Moyenne de la classe Mini PC
 
SPECviewperf 2020
244%
4%
237%
-0%
-9%
139%
3840x2160 Medical (medical-03)
6.99
11.2
60%
7.07
1%
12.8
83%
4.23
-39%
5.05
-28%
3840x2160 Energy (energy-03)
4.94
19.9
303%
5
1%
13.3
169%
6.03
22%
4.61
-7%
3840x2160 Creo (creo-03)
18.9
33.4
77%
19.8
5%
35.3
87%
18.5
-2%
17.9
-5%
3840x2160 CATIA (catia-06)
11.2
23.2
107%
11.7
4%
25.1
124%
11.1
-1%
10
-11%
3840x2160 3ds Max (3dsmax-07)
14.8
20.4
38%
15.5
5%
21.1
43%
14.9
1%
12.9
-13%
3840x2160 Siemens NX (snx-04)
5.37
64.1
1094%
5.68
6%
65.7
1123%
6.24
16%
5.7
6%
3840x2160 Maya (maya-06)
37.2
47.7
28%
38.8
4%
49.6
33%
37.7
1%
35.4
-5%
3DMark 05 Standard
50932 points
3DMark 06 Standard Score
36407 points
3DMark Vantage P Result
42630 points
3DMark 11 Performance
13441 points
3DMark Ice Storm Standard Score
148268 points
3DMark Cloud Gate Standard Score
36112 points
3DMark Fire Strike Score
7757 points
3DMark Fire Strike Extreme Score
4006 points
3DMark Time Spy Score
3881 points
3DMark Steel Nomad Score
714 points
3DMark Steel Nomad Light Score
3026 points
Aide

Performances des jeux

Les performances de jeu de l'Asus NUC 14 Pro+ en comparaison avec des appareils équipés de cartes graphiques dédiées. Cependant, le jeu est toujours possible si vous êtes prêt à baisser les paramètres graphiques. Même en réduisant les détails, ce mini PC est capable de faire tourner plusieurs jeux. Par rapport à ses concurrents, le Geekom GT1 Mega surpasse notre échantillon de test, mais l'intégration d'une Radeon 780M d'AMD améliore les performances. Pour obtenir une augmentation significative des performances de jeu, une carte graphique externe serait la solution la plus efficace.

Pour une comparaison détaillée des performances iGPU de différentes cartes graphiques, veuillez consulter notre Liste de jeux GPU.

GTA V
1024x768 Lowest Settings possible
Moyenne NVIDIA GeForce RTX 4050 Laptop GPU
  (163.6 - 186.7, n=14)
181.9 fps +12%
Geekom AX8 Pro
Radeon 780M, R9 8945H, Acer N7000
169.4 (3.69min, 125P1) fps +4%
Geekom GT1 Mega
Arc 8-Core, Ultra 9 185H, Crucial P3 Plus CT2000P3PSSD8
165.2 (3.77min, 100P1) fps +1%
Aoostar GEM12
Radeon 780M, R7 8845HS, Crucial P3 Plus CT1000P3PSSD8
165.1 (4.83min, 125P1) fps +1%
Minisforum AtomMan X7 Ti
Arc 8-Core, Ultra 9 185H, Kingston OM8PGP41024Q-A0
163.6 (4.63min, 111.1P1) fps 0%
Asus NUC 14 Pro+
Arc 8-Core, Ultra 9 185H, Samsung PM9A1a MZVL21T0HDLU
162.9 (3.78min, 111.1P1) fps
Acemagic F2A
Arc 8-Core, Ultra 7 155H, Kingston OM8SEP1024Q-A0
161 (4.76min, 100P1) fps -1%
1920x1080 High/On (Advanced Graphics Off) AA:2xMSAA + FX AF:8x
Moyenne NVIDIA GeForce RTX 4050 Laptop GPU
  (106 - 177.3, n=26)
158.4 fps +290%
Geekom AX8 Pro
Radeon 780M, R9 8945H, Acer N7000
65.9 (2.44min, 41.7P1) fps +62%
Aoostar GEM12
Radeon 780M, R7 8845HS, Crucial P3 Plus CT1000P3PSSD8
65.3 (4.57min, 45.5P1) fps +61%
Geekom GT1 Mega
Arc 8-Core, Ultra 9 185H, Crucial P3 Plus CT2000P3PSSD8
43.5 (3.49min, 32.3P1) fps +7%
Minisforum AtomMan X7 Ti
Arc 8-Core, Ultra 9 185H, Kingston OM8PGP41024Q-A0
41.2 (3.12min, 30.3P1) fps +1%
Asus NUC 14 Pro+
Arc 8-Core, Ultra 9 185H, Samsung PM9A1a MZVL21T0HDLU
40.6 (3.3min, 30.3P1) fps
Acemagic F2A
Arc 8-Core, Ultra 7 155H, Kingston OM8SEP1024Q-A0
31.3 (2.94min, 22.7P1) fps -23%
Dota 2 Reborn
1280x720 min (0/3) fastest
Moyenne NVIDIA GeForce RTX 4050 Laptop GPU
  (113.7 - 196.3, n=34)
164.4 fps +57%
Geekom AX8 Pro
Radeon 780M, R9 8945H, Acer N7000
157.5 (136min) fps +50%
Aoostar GEM12
Radeon 780M, R7 8845HS, Crucial P3 Plus CT1000P3PSSD8
152.7 (134.2min) fps +46%
Geekom GT1 Mega
Arc 8-Core, Ultra 9 185H, Crucial P3 Plus CT2000P3PSSD8
110.5 (63min) fps +6%
Minisforum AtomMan X7 Ti
Arc 8-Core, Ultra 9 185H, Kingston OM8PGP41024Q-A0
106.5 (61min) fps +2%
Asus NUC 14 Pro+
Arc 8-Core, Ultra 9 185H, Samsung PM9A1a MZVL21T0HDLU
104.7 (61.7min) fps
Acemagic F2A
Arc 8-Core, Ultra 7 155H, Kingston OM8SEP1024Q-A0
103.2 (59.8min) fps -1%
1920x1080 high (2/3)
Moyenne NVIDIA GeForce RTX 4050 Laptop GPU
  (79.2 - 191.8, n=35)
141.6 fps +158%
Geekom AX8 Pro
Radeon 780M, R9 8945H, Acer N7000
88 (69.2min) fps +61%
Geekom GT1 Mega
Arc 8-Core, Ultra 9 185H, Crucial P3 Plus CT2000P3PSSD8
87.8 (28.3min) fps +60%
Aoostar GEM12
Radeon 780M, R7 8845HS, Crucial P3 Plus CT1000P3PSSD8
86.6 (72.2min) fps +58%
Minisforum AtomMan X7 Ti
Arc 8-Core, Ultra 9 185H, Kingston OM8PGP41024Q-A0
79 (48.2min) fps +44%
Acemagic F2A
Arc 8-Core, Ultra 7 155H, Kingston OM8SEP1024Q-A0
77.3 (52.5min) fps +41%
Asus NUC 14 Pro+
Arc 8-Core, Ultra 9 185H, Samsung PM9A1a MZVL21T0HDLU
54.8 (35.3min) fps
Cyberpunk 2077 2.1 Phantom Liberty
1920x1080 Low Preset (FSR off)
Moyenne NVIDIA GeForce RTX 4050 Laptop GPU
  (67.2 - 103.1, n=5)
85.1 fps +145%
Aoostar GEM12
Radeon 780M, R7 8845HS, Crucial P3 Plus CT1000P3PSSD8
42.4 (35.7min) fps +22%
Geekom AX8 Pro
Radeon 780M, R9 8945H, Acer N7000
41.3 (34.5min) fps +19%
Geekom GT1 Mega
Arc 8-Core, Ultra 9 185H, Crucial P3 Plus CT2000P3PSSD8
38 (33.3min) fps +10%
Asus NUC 14 Pro+
Arc 8-Core, Ultra 9 185H, Samsung PM9A1a MZVL21T0HDLU
34.7 (30.4min) fps
Minisforum AtomMan X7 Ti
Arc 8-Core, Ultra 9 185H, Kingston OM8PGP41024Q-A0
34.3 (29.1min) fps -1%
Acemagic F2A
Arc 8-Core, Ultra 7 155H, Kingston OM8SEP1024Q-A0
29.5 (24.1min) fps -15%
1920x1080 High Preset (FSR off)
Moyenne NVIDIA GeForce RTX 4050 Laptop GPU
  (42.4 - 75, n=6)
59 fps +145%
Aoostar GEM12
Radeon 780M, R7 8845HS, Crucial P3 Plus CT1000P3PSSD8
26.3 (22.2min) fps +9%
Geekom GT1 Mega
Arc 8-Core, Ultra 9 185H, Crucial P3 Plus CT2000P3PSSD8
26 (22.6min) fps +8%
Geekom AX8 Pro
Radeon 780M, R9 8945H, Acer N7000
25.8 (21.7min) fps +7%
Asus NUC 14 Pro+
Arc 8-Core, Ultra 9 185H, Samsung PM9A1a MZVL21T0HDLU
24.1 (21.1min) fps
Minisforum AtomMan X7 Ti
Arc 8-Core, Ultra 9 185H, Kingston OM8PGP41024Q-A0
24 (20.6min) fps 0%
Acemagic F2A
Arc 8-Core, Ultra 7 155H, Kingston OM8SEP1024Q-A0
20.4 (13.8min) fps -15%
Baldur's Gate 3
1280x720 Low Preset
Moyenne NVIDIA GeForce RTX 4050 Laptop GPU
  ()
148.9 fps +164%
Geekom AX8 Pro
Radeon 780M, R9 8945H, Acer N7000
60.8 (21.6min, 28.1P0.1, 35.6P1) fps +8%
Aoostar GEM12
Radeon 780M, R7 8845HS, Crucial P3 Plus CT1000P3PSSD8
60.3 (21.3min, 36P0.1, 46.1P1) fps +7%
Geekom GT1 Mega
Arc 8-Core, Ultra 9 185H, Crucial P3 Plus CT2000P3PSSD8
57.6 (31.7min, 33.6P0.1, 37.9P1) fps +2%
Asus NUC 14 Pro+
Arc 8-Core, Ultra 9 185H, Samsung PM9A1a MZVL21T0HDLU
56.4 (29min, 30.5P0.1, 37.9P1) fps
1920x1080 High Preset
Moyenne NVIDIA GeForce RTX 4050 Laptop GPU
  (49.8 - 83.5, n=7)
69.8 fps +177%
Geekom GT1 Mega
Arc 8-Core, Ultra 9 185H, Crucial P3 Plus CT2000P3PSSD8
25.4 (13.9min, 14.3P0.1, 16.3P1) fps +1%
Asus NUC 14 Pro+
Arc 8-Core, Ultra 9 185H, Samsung PM9A1a MZVL21T0HDLU
25.2 (14.5min, 14.6P0.1, 16.2P1) fps
Aoostar GEM12
Radeon 780M, R7 8845HS, Crucial P3 Plus CT1000P3PSSD8
24.7 (16.6min, 17.1P0.1, 19.4P1) fps -2%
Geekom AX8 Pro
Radeon 780M, R9 8945H, Acer N7000
24.5 (17.7min, 17.7P0.1, 19.8P1) fps -3%
F1 24
1920x1080 Low Preset AA:T AF:16x
Geekom GT1 Mega
Arc 8-Core, Ultra 9 185H, Crucial P3 Plus CT2000P3PSSD8
84.3 (70min, 66P1) fps +17%
Geekom AX8 Pro
Radeon 780M, R9 8945H, Acer N7000
83.4 (28min, 33P1) fps +16%
Asus NUC 14 Pro+
Arc 8-Core, Ultra 9 185H, Samsung PM9A1a MZVL21T0HDLU
71.8 (59min, 46P1) fps
1920x1080 High Preset AA:T AF:16x
Moyenne NVIDIA GeForce RTX 4050 Laptop GPU
  ()
146 fps +202%
Geekom GT1 Mega
Arc 8-Core, Ultra 9 185H, Crucial P3 Plus CT2000P3PSSD8
54.8 (43min, 45P1) fps +13%
Geekom AX8 Pro
Radeon 780M, R9 8945H, Acer N7000
51.3 (23min, 15P1) fps +6%
Asus NUC 14 Pro+
Arc 8-Core, Ultra 9 185H, Samsung PM9A1a MZVL21T0HDLU
48.4 (40min, 36P1) fps

FPS chart - 30 min Cyberpunk 2077 1920 x 1080 Ultra Preset (FSR off)

05101520Tooltip
Asus NUC 14 Pro+ Ultra 9 185H, Arc 8-Core: Ø20.3 (18.2-21.9)
Aoostar GEM12 R7 8845HS, Radeon 780M: Ø21.7 (20.1-23.3)
Geekom GT1 Mega Ultra 9 185H, Arc 8-Core: Ø22.1 (18.6-24)
Geekom AX8 Pro R9 8945H, Radeon 780M: Ø19.2 (17.9-20.3)
BasMoyenÉlevéUltra
GTA V (2015) 162.9 154.1 40.6 15.8
Dota 2 Reborn (2015) 104.7 78 54.8 76
Final Fantasy XV Benchmark (2018) 75.3 40.2 28.6
X-Plane 11.11 (2018) 65.5 49.8 42.2
Baldur's Gate 3 (2023) 37.9 29.7 25.2 24.4
Cyberpunk 2077 2.1 Phantom Liberty (2023) 34.7 28.9 24.1 22
F1 24 (2024) 71.8 64.7 48.4

Test de performance du NUC 14 Pro+ d'Asus avec une Nvidia GeForce RTX 4090

Asus NUC 14 Pro+ et Nvidia GeForce RTX 4090
GPU-Z
GPU-Z

Équipé de deux ports Thunderbolt, l'Asus NUC 14 Pro+ prend en charge les connexions de cartes graphiques externes. Cependant, il est important de noter la limitation de la bande passante, car un GPU externe ne peut fonctionner qu'à des vitesses PCIe 3.0 x4 via une connexion USB4. Nous avons testé les performances avec une carte graphique Nvidia GeForce RTX 4090 pour voir quel type d'augmentation des performances peut être attendu avec la carte graphique grand public la plus rapide actuellement disponible.

Pendant le test, les performances 3D peuvent être améliorées de manière significative dans certains scénarios. Les benchmarks synthétiques et de jeu démontrent les gains potentiels. Il y a une baisse notable des performances par rapport à l'utilisation de la carte graphique dans un PC de bureau classique. À titre de référence, nous avons comparé ces résultats avec ceux de la carte AMD Ryzen 5 9600X associée à la carte Nvidia GeForce RTX 4090. Une solution potentielle pour minimiser la perte de performance pourrait être une connexion OCuLink, bien que cela reste une option rare. Le Minisforum MS-A1 montre ce qu'il est possible de faire avec cette configuration.

Performance Rating - Percent
AMD Ryzen 5 9600X
AMD Ryzen 5 9600X
100 pt
Minisforum MS-A1 (Nvidia GeForce RTX 4090 @OCuLink)
AMD Ryzen 7 8700G
89.4 pt
Geekom GT1 Mega (Nvidia GeForce RTX 4090 @USB4)
Intel Core Ultra 9 185H
79.6 pt
Asus NUC 14 Pro+ (Nvidia GeForce RTX 4090 @USB4)
Intel Core Ultra 9 185H
78.2 pt
Khadas Mind 2 (Nvidia GeForce RTX 4090 @USB4)
Intel Core Ultra 7 155H
75.9 pt
3DMark 11 - 1280x720 Performance GPU
AMD Ryzen 5 9600X
AMD Ryzen 5 9600X
104516 Points +694%
Minisforum MS-A1 (Nvidia GeForce RTX 4090 @OCuLink)
AMD Ryzen 7 8700G
98454 Points +648%
Geekom GT1 Mega (Nvidia GeForce RTX 4090 @USB4)
Intel Core Ultra 9 185H
64648 Points +391%
Khadas Mind 2 (Nvidia GeForce RTX 4090 @USB4)
Intel Core Ultra 7 155H
62498 Points +375%
Asus NUC 14 Pro+ (Nvidia GeForce RTX 4090 @USB4)
Intel Core Ultra 9 185H
61826 Points +370%

13163 Points
3DMark
2560x1440 Time Spy Graphics
AMD Ryzen 5 9600X
AMD Ryzen 5 9600X
37161 Points +969%
Minisforum MS-A1 (Nvidia GeForce RTX 4090 @OCuLink)
AMD Ryzen 7 8700G
34984 Points +906%
Geekom GT1 Mega (Nvidia GeForce RTX 4090 @USB4)
Intel Core Ultra 9 185H
28844 Points +730%
Asus NUC 14 Pro+ (Nvidia GeForce RTX 4090 @USB4)
Intel Core Ultra 9 185H
28592 Points +723%
Khadas Mind 2 (Nvidia GeForce RTX 4090 @USB4)
Intel Core Ultra 7 155H
23140 Points +566%

3476 Points
1920x1080 Fire Strike Graphics
AMD Ryzen 5 9600X
AMD Ryzen 5 9600X
78579 Points +836%
Minisforum MS-A1 (Nvidia GeForce RTX 4090 @OCuLink)
AMD Ryzen 7 8700G
76191 Points +807%
Geekom GT1 Mega (Nvidia GeForce RTX 4090 @USB4)
Intel Core Ultra 9 185H
53367 Points +536%
Asus NUC 14 Pro+ (Nvidia GeForce RTX 4090 @USB4)
Intel Core Ultra 9 185H
50990 Points +507%
Khadas Mind 2 (Nvidia GeForce RTX 4090 @USB4)
Intel Core Ultra 7 155H
40417 Points +381%

8396 Points
3840x2160 Fire Strike Ultra Graphics
AMD Ryzen 5 9600X
AMD Ryzen 5 9600X
24915 Points +1148%
Minisforum MS-A1 (Nvidia GeForce RTX 4090 @OCuLink)
AMD Ryzen 7 8700G
23565 Points +1081%
Geekom GT1 Mega (Nvidia GeForce RTX 4090 @USB4)
Intel Core Ultra 9 185H
21506 Points +977%
Asus NUC 14 Pro+ (Nvidia GeForce RTX 4090 @USB4)
Intel Core Ultra 9 185H
21410 Points +973%
Khadas Mind 2 (Nvidia GeForce RTX 4090 @USB4)
Intel Core Ultra 7 155H
17047 Points +754%

1996 Points
Unigine Superposition
1280x720 720p Low
AMD Ryzen 5 9600X
AMD Ryzen 5 9600X
63603 Points +434%
Minisforum MS-A1 (Nvidia GeForce RTX 4090 @OCuLink)
AMD Ryzen 7 8700G
35453 Points +198%
Geekom GT1 Mega (Nvidia GeForce RTX 4090 @USB4)
Intel Core Ultra 9 185H
33318 Points +180%
Asus NUC 14 Pro+ (Nvidia GeForce RTX 4090 @USB4)
Intel Core Ultra 9 185H
30513 Points +156%
Khadas Mind 2 (Nvidia GeForce RTX 4090 @USB4)
Intel Core Ultra 7 155H
28104 Points +136%

11902 Points
1920x1080 1080p High
AMD Ryzen 5 9600X
AMD Ryzen 5 9600X
50230 Points +1209%
Minisforum MS-A1 (Nvidia GeForce RTX 4090 @OCuLink)
AMD Ryzen 7 8700G
32728 Points +753%
Geekom GT1 Mega (Nvidia GeForce RTX 4090 @USB4)
Intel Core Ultra 9 185H
30115 Points +685%
Asus NUC 14 Pro+ (Nvidia GeForce RTX 4090 @USB4)
Intel Core Ultra 9 185H
27938 Points +628%
Khadas Mind 2 (Nvidia GeForce RTX 4090 @USB4)
Intel Core Ultra 7 155H
26890 Points +601%

3836 Points
1920x1080 1080p Extreme
AMD Ryzen 5 9600X
AMD Ryzen 5 9600X
21586 Points +921%
Minisforum MS-A1 (Nvidia GeForce RTX 4090 @OCuLink)
AMD Ryzen 7 8700G
20934 Points +890%
Asus NUC 14 Pro+ (Nvidia GeForce RTX 4090 @USB4)
Intel Core Ultra 9 185H
20260 Points +858%
Geekom GT1 Mega (Nvidia GeForce RTX 4090 @USB4)
Intel Core Ultra 9 185H
19915 Points +842%
Khadas Mind 2 (Nvidia GeForce RTX 4090 @USB4)
Intel Core Ultra 7 155H
19877 Points +840%

2114 Points
3840x2160 4k Optimized
AMD Ryzen 5 9600X
AMD Ryzen 5 9600X
33095 Points
Minisforum MS-A1 (Nvidia GeForce RTX 4090 @OCuLink)
AMD Ryzen 7 8700G
30190 Points
Geekom GT1 Mega (Nvidia GeForce RTX 4090 @USB4)
Intel Core Ultra 9 185H
27686 Points
Asus NUC 14 Pro+ (Nvidia GeForce RTX 4090 @USB4)
Intel Core Ultra 9 185H
27334 Points
Khadas Mind 2 (Nvidia GeForce RTX 4090 @USB4)
Intel Core Ultra 7 155H
25802 Points
7680x4320 8k Optimized
AMD Ryzen 5 9600X
AMD Ryzen 5 9600X
12498 Points
Minisforum MS-A1 (Nvidia GeForce RTX 4090 @OCuLink)
AMD Ryzen 7 8700G
12251 Points
Geekom GT1 Mega (Nvidia GeForce RTX 4090 @USB4)
Intel Core Ultra 9 185H
12132 Points
Khadas Mind 2 (Nvidia GeForce RTX 4090 @USB4)
Intel Core Ultra 7 155H
12050 Points
Asus NUC 14 Pro+ (Nvidia GeForce RTX 4090 @USB4)
Intel Core Ultra 9 185H
12045 Points
Unigine Valley 1.0
1920x1080 Extreme HD DirectX AA:x8
AMD Ryzen 5 9600X
AMD Ryzen 5 9600X
324 fps +1562%
Minisforum MS-A1 (Nvidia GeForce RTX 4090 @OCuLink)
AMD Ryzen 7 8700G
216.1 fps +1008%
Geekom GT1 Mega (Nvidia GeForce RTX 4090 @USB4)
Intel Core Ultra 9 185H
208.7 fps +970%
Asus NUC 14 Pro+ (Nvidia GeForce RTX 4090 @USB4)
Intel Core Ultra 9 185H
196.3 fps +907%
Khadas Mind 2 (Nvidia GeForce RTX 4090 @USB4)
Intel Core Ultra 7 155H
187.1 fps +859%

19.5 fps
1920x1080 Extreme HD Preset OpenGL AA:x8
AMD Ryzen 5 9600X
AMD Ryzen 5 9600X
331.8 fps +1465%
Minisforum MS-A1 (Nvidia GeForce RTX 4090 @OCuLink)
AMD Ryzen 7 8700G
231.7 fps +993%
Asus NUC 14 Pro+ (Nvidia GeForce RTX 4090 @USB4)
Intel Core Ultra 9 185H
224.8 fps +960%
Geekom GT1 Mega (Nvidia GeForce RTX 4090 @USB4)
Intel Core Ultra 9 185H
224.4 fps +958%
Khadas Mind 2 (Nvidia GeForce RTX 4090 @USB4)
Intel Core Ultra 7 155H
200.5 fps +846%

21.2 fps
Unigine Heaven 4.0
Extreme Preset OpenGL
AMD Ryzen 5 9600X
AMD Ryzen 5 9600X
472.4 fps +1238%
Minisforum MS-A1 (Nvidia GeForce RTX 4090 @OCuLink)
AMD Ryzen 7 8700G
441.5 fps +1151%
Geekom GT1 Mega (Nvidia GeForce RTX 4090 @USB4)
Intel Core Ultra 9 185H
386.5 fps +995%
Asus NUC 14 Pro+ (Nvidia GeForce RTX 4090 @USB4)
Intel Core Ultra 9 185H
376.3 fps +966%
Khadas Mind 2 (Nvidia GeForce RTX 4090 @USB4)
Intel Core Ultra 7 155H
372.8 fps +956%

35.3 fps
Extreme Preset DX11
AMD Ryzen 5 9600X
AMD Ryzen 5 9600X
473.9 fps +1206%
Minisforum MS-A1 (Nvidia GeForce RTX 4090 @OCuLink)
AMD Ryzen 7 8700G
422.3 fps +1063%
Khadas Mind 2 (Nvidia GeForce RTX 4090 @USB4)
Intel Core Ultra 7 155H
344.6 fps +849%
Geekom GT1 Mega (Nvidia GeForce RTX 4090 @USB4)
Intel Core Ultra 9 185H
343 fps +845%
Asus NUC 14 Pro+ (Nvidia GeForce RTX 4090 @USB4)
Intel Core Ultra 9 185H
337.2 fps +829%

36.3 fps
ComputeMark v2.1
1024x600 Normal, Score
AMD Ryzen 5 9600X
AMD Ryzen 5 9600X
92222 Points +1114%
Minisforum MS-A1 (Nvidia GeForce RTX 4090 @OCuLink)
AMD Ryzen 7 8700G
90882 Points +1097%
Khadas Mind 2 (Nvidia GeForce RTX 4090 @USB4)
Intel Core Ultra 7 155H
86314 Points +1037%
Geekom GT1 Mega (Nvidia GeForce RTX 4090 @USB4)
Intel Core Ultra 9 185H
83349 Points +998%
Asus NUC 14 Pro+ (Nvidia GeForce RTX 4090 @USB4)
Intel Core Ultra 9 185H
82718 Points +989%

7594 Points
1024x600 Normal, Fluid 3DTex
AMD Ryzen 5 9600X
AMD Ryzen 5 9600X
10756 Points +2198%
Minisforum MS-A1 (Nvidia GeForce RTX 4090 @OCuLink)
AMD Ryzen 7 8700G
10664 Points +2179%
Khadas Mind 2 (Nvidia GeForce RTX 4090 @USB4)
Intel Core Ultra 7 155H
10373 Points +2116%
Geekom GT1 Mega (Nvidia GeForce RTX 4090 @USB4)
Intel Core Ultra 9 185H
9972 Points +2031%
Asus NUC 14 Pro+ (Nvidia GeForce RTX 4090 @USB4)
Intel Core Ultra 9 185H
9947 Points +2025%

468 Points
1024x600 Normal, Fluid 2DTexArr
AMD Ryzen 5 9600X
AMD Ryzen 5 9600X
6948 Points +1397%
Minisforum MS-A1 (Nvidia GeForce RTX 4090 @OCuLink)
AMD Ryzen 7 8700G
6907 Points +1389%
Khadas Mind 2 (Nvidia GeForce RTX 4090 @USB4)
Intel Core Ultra 7 155H
6771 Points +1359%
Geekom GT1 Mega (Nvidia GeForce RTX 4090 @USB4)
Intel Core Ultra 9 185H
6566 Points +1315%
Asus NUC 14 Pro+ (Nvidia GeForce RTX 4090 @USB4)
Intel Core Ultra 9 185H
6478 Points +1296%

464 Points
1024x600 Normal, Mandel Vector
AMD Ryzen 5 9600X
AMD Ryzen 5 9600X
17307 Points +811%
Minisforum MS-A1 (Nvidia GeForce RTX 4090 @OCuLink)
AMD Ryzen 7 8700G
17088 Points +800%
Khadas Mind 2 (Nvidia GeForce RTX 4090 @USB4)
Intel Core Ultra 7 155H
16044 Points +745%
Geekom GT1 Mega (Nvidia GeForce RTX 4090 @USB4)
Intel Core Ultra 9 185H
15583 Points +721%
Asus NUC 14 Pro+ (Nvidia GeForce RTX 4090 @USB4)
Intel Core Ultra 9 185H
15358 Points +709%

1899 Points
1024x600 Normal, Mandel Scalar
AMD Ryzen 5 9600X
AMD Ryzen 5 9600X
22843 Points +1290%
Minisforum MS-A1 (Nvidia GeForce RTX 4090 @OCuLink)
AMD Ryzen 7 8700G
22633 Points +1278%
Khadas Mind 2 (Nvidia GeForce RTX 4090 @USB4)
Intel Core Ultra 7 155H
21302 Points +1197%
Geekom GT1 Mega (Nvidia GeForce RTX 4090 @USB4)
Intel Core Ultra 9 185H
20574 Points +1152%
Asus NUC 14 Pro+ (Nvidia GeForce RTX 4090 @USB4)
Intel Core Ultra 9 185H
20445 Points +1144%

1643 Points
1024x600 Normal, QJuliaRayTrace
AMD Ryzen 5 9600X
AMD Ryzen 5 9600X
34367 Points +1001%
Minisforum MS-A1 (Nvidia GeForce RTX 4090 @OCuLink)
AMD Ryzen 7 8700G
33589 Points +976%
Khadas Mind 2 (Nvidia GeForce RTX 4090 @USB4)
Intel Core Ultra 7 155H
31824 Points +920%
Geekom GT1 Mega (Nvidia GeForce RTX 4090 @USB4)
Intel Core Ultra 9 185H
30654 Points +882%
Asus NUC 14 Pro+ (Nvidia GeForce RTX 4090 @USB4)
Intel Core Ultra 9 185H
30490 Points +877%

3121 Points
Performance Rating - Percent
AMD Ryzen 5 9600X
AMD Ryzen 5 9600X
100 pt
Minisforum MS-A1 (Nvidia GeForce RTX 4090 @OCuLink)
AMD Ryzen 7 8700G
75.5 pt
Geekom GT1 Mega (Nvidia GeForce RTX 4090 @USB4)
Intel Core Ultra 9 185H
42 pt
Asus NUC 14 Pro+ (Nvidia GeForce RTX 4090 @USB4)
Intel Core Ultra 9 185H
38.2 pt
Khadas Mind 2 (Nvidia GeForce RTX 4090 @USB4)
Intel Core Ultra 7 155H
33.7 pt
Cyberpunk 2077 2.1 Phantom Liberty
1280x720 Low Preset (FSR off)
AMD Ryzen 5 9600X
AMD Ryzen 5 9600X
256 (183.7min - 319max) fps +428%
Minisforum MS-A1 (Nvidia GeForce RTX 4090 @OCuLink)
AMD Ryzen 7 8700G
187.3 (143.6min - 225max) fps +286%
Geekom GT1 Mega (Nvidia GeForce RTX 4090 @USB4)
Intel Core Ultra 9 185H
88.9 (67.9min - 123.3max) fps +83%
Khadas Mind 2 (Nvidia GeForce RTX 4090 @USB4)
Intel Core Ultra 7 155H
79.7 (62.5min - 101.2max) fps +64%
Asus NUC 14 Pro+ (Nvidia GeForce RTX 4090 @USB4)
Intel Core Ultra 9 185H
74.1 (55.6min - 105.1max) fps +53%

48.5 (39.4min - 57.8max) fps
1920x1080 Medium Preset (FSR off)
AMD Ryzen 5 9600X
AMD Ryzen 5 9600X
252 (174.7min - 318max) fps +772%
Minisforum MS-A1 (Nvidia GeForce RTX 4090 @OCuLink)
AMD Ryzen 7 8700G
184.9 (141min - 225max) fps +540%
Geekom GT1 Mega (Nvidia GeForce RTX 4090 @USB4)
Intel Core Ultra 9 185H
87.8 (65.1min - 123max) fps +204%
Khadas Mind 2 (Nvidia GeForce RTX 4090 @USB4)
Intel Core Ultra 7 155H
77.5 (58.3min - 109.1max) fps +168%
Asus NUC 14 Pro+ (Nvidia GeForce RTX 4090 @USB4)
Intel Core Ultra 9 185H
71.7 (52.9min - 102.7max) fps +148%

28.9 (25.6min - 33.1max) fps
1920x1080 Ultra Preset (FSR off)
AMD Ryzen 5 9600X
AMD Ryzen 5 9600X
204 (126.1min - 264max) fps +827%
Minisforum MS-A1 (Nvidia GeForce RTX 4090 @OCuLink)
AMD Ryzen 7 8700G
161.8 (107min - 205max) fps +635%
Geekom GT1 Mega (Nvidia GeForce RTX 4090 @USB4)
Intel Core Ultra 9 185H
75 (50.3min - 110.2max) fps +241%
Khadas Mind 2 (Nvidia GeForce RTX 4090 @USB4)
Intel Core Ultra 7 155H
68.8 (46.7min - 98.6max) fps +213%
Asus NUC 14 Pro+ (Nvidia GeForce RTX 4090 @USB4)
Intel Core Ultra 9 185H
61.4 (39.5min - 89max) fps +179%

22 (18.9min - 26max) fps
Baldur's Gate 3
1920x1080 Low Preset
AMD Ryzen 5 9600X
AMD Ryzen 5 9600X
253 (30.2min, 76.7P0.1, 155.7P1 - 431max) fps +568%
Minisforum MS-A1 (Nvidia GeForce RTX 4090 @OCuLink)
AMD Ryzen 7 8700G
200 (109.4min, 129.1P0.1, 154.1P1 - 278max) fps +428%
Geekom GT1 Mega (Nvidia GeForce RTX 4090 @USB4)
Intel Core Ultra 9 185H
189.1 (95.1min, 108.7P0.1, 136.8P1 - 323max) fps +399%
Asus NUC 14 Pro+ (Nvidia GeForce RTX 4090 @USB4)
Intel Core Ultra 9 185H
171.8 (77.1min, 96.4P0.1, 118.1P1 - 312max) fps +353%
Khadas Mind 2 (Nvidia GeForce RTX 4090 @USB4)
Intel Core Ultra 7 155H
142.8 (70.4min, 75.8P0.1, 97.6P1 - 236max) fps +277%

37.9 (22.7min, 23.2P0.1, 26.9P1 - 91.7max) fps
1920x1080 Medium Preset
AMD Ryzen 5 9600X
AMD Ryzen 5 9600X
231 (52.4min, 123P0.1, 150.8P1 - 382max) fps +678%
Minisforum MS-A1 (Nvidia GeForce RTX 4090 @OCuLink)
AMD Ryzen 7 8700G
194.4 (102.5min, 120P0.1, 151.2P1 - 274max) fps +555%
Geekom GT1 Mega (Nvidia GeForce RTX 4090 @USB4)
Intel Core Ultra 9 185H
168.3 (71.8min, 94P0.1, 117.8P1 - 266max) fps +467%
Asus NUC 14 Pro+ (Nvidia GeForce RTX 4090 @USB4)
Intel Core Ultra 9 185H
157.9 (75.9min, 89.1P0.1, 105.9P1 - 265max) fps +432%
Khadas Mind 2 (Nvidia GeForce RTX 4090 @USB4)
Intel Core Ultra 7 155H
114 (35.5min, 44P0.1, 57.3P1 - 219max) fps +284%

29.7 (17.5min, 18.4P0.1, 19.7P1 - 65.1max) fps
1920x1080 Ultra Preset
AMD Ryzen 5 9600X
AMD Ryzen 5 9600X
212 (16.9min, 120.1P0.1, 151.8P1 - 372max) fps +769%
Minisforum MS-A1 (Nvidia GeForce RTX 4090 @OCuLink)
AMD Ryzen 7 8700G
190.9 (107.5min, 129.1P0.1, 148.8P1 - 259max) fps +682%
Geekom GT1 Mega (Nvidia GeForce RTX 4090 @USB4)
Intel Core Ultra 9 185H
151.8 (67.2min, 82P0.1, 101.9P1 - 254max) fps +522%
Asus NUC 14 Pro+ (Nvidia GeForce RTX 4090 @USB4)
Intel Core Ultra 9 185H
146.9 (66.9min, 80.1P0.1, 101.3P1 - 245max) fps +502%
Khadas Mind 2 (Nvidia GeForce RTX 4090 @USB4)
Intel Core Ultra 7 155H
109.2 (29.8min, 38.6P0.1, 55.9P1 - 199max) fps +348%

24.4 (8.14min, 11.8P0.1, 15.7P1 - 98.9max) fps
F1 24
1920x1080 Low Preset AA:T AF:16x
AMD Ryzen 5 9600X
AMD Ryzen 5 9600X
405 (297min, 246P1 - 476max) fps +464%
Minisforum MS-A1 (Nvidia GeForce RTX 4090 @OCuLink)
AMD Ryzen 7 8700G
269 (203min, 181P1 - 313max) fps +275%
Geekom GT1 Mega (Nvidia GeForce RTX 4090 @USB4)
Intel Core Ultra 9 185H
78.1 (43min, 45P1 - 98max) fps +9%
Asus NUC 14 Pro+ (Nvidia GeForce RTX 4090 @USB4)
Intel Core Ultra 9 185H
75.7 (42min, 44P1 - 92max) fps +5%
Khadas Mind 2 (Nvidia GeForce RTX 4090 @USB4)
Intel Core Ultra 7 155H
74.6 (42min, 44P1 - 94max) fps +4%

71.8 (59min, 46P1 - 83max) fps
1920x1080 Medium Preset AA:T AF:16x
AMD Ryzen 5 9600X
AMD Ryzen 5 9600X
421 (328min, 262P1 - 470max) fps +551%
Minisforum MS-A1 (Nvidia GeForce RTX 4090 @OCuLink)
AMD Ryzen 7 8700G
285 (216min, 190P1 - 313max) fps +340%
Geekom GT1 Mega (Nvidia GeForce RTX 4090 @USB4)
Intel Core Ultra 9 185H
74.4 (42min, 44P1 - 86max) fps +15%
Khadas Mind 2 (Nvidia GeForce RTX 4090 @USB4)
Intel Core Ultra 7 155H
72.1 (41min, 43P1 - 85max) fps +11%
Asus NUC 14 Pro+ (Nvidia GeForce RTX 4090 @USB4)
Intel Core Ultra 9 185H
70.5 (41min, 43P1 - 82max) fps +9%

64.7 (52min, 41P1 - 75max) fps
1920x1080 High Preset AA:T AF:16x
AMD Ryzen 5 9600X
AMD Ryzen 5 9600X
401 (305min, 241P1 - 449max) fps +729%
Minisforum MS-A1 (Nvidia GeForce RTX 4090 @OCuLink)
AMD Ryzen 7 8700G
267 (203min, 176P1 - 297max) fps +452%
Geekom GT1 Mega (Nvidia GeForce RTX 4090 @USB4)
Intel Core Ultra 9 185H
61.7 (35min, 37P1 - 75max) fps +27%
Khadas Mind 2 (Nvidia GeForce RTX 4090 @USB4)
Intel Core Ultra 7 155H
60.1 (35min, 36P1 - 74max) fps +24%
Asus NUC 14 Pro+ (Nvidia GeForce RTX 4090 @USB4)
Intel Core Ultra 9 185H
59.7 (35min, 35P1 - 73max) fps +23%

48.4 (40min, 36P1 - 56max) fps
BasMoyenÉlevéUltraQHD4K
Dota 2 Reborn (2015) 167.9 154.7 150.5 140 135
Final Fantasy XV Benchmark (2018) 195.5 184.4 158.2 150.6 118.7
X-Plane 11.11 (2018) 92.4 91.9 77.1 67.5
Baldur's Gate 3 (2023) 171.8 157.9 147.5 146.9 133.8 93.8
Cyberpunk 2077 2.1 Phantom Liberty (2023) 73.8 71.7 65.3 61.4 62.8 52.8
F1 24 (2024) 75.7 70.5 59.7 41.7 40.8 39.8

Émissions - Une arme à double tranchant

Bruit du système

Asus utilise un système de refroidissement actif dans le NUC 14 Pro+, avec un ventilateur situé sur le dessous de l'appareil. Cependant, nous avons observé que la solution de refroidissement atteint rapidement ses limites lors du test de stress Cinebench R15. Les émissions sonores indiquent clairement que l'unique ventilateur doit travailler dur pour faire circuler suffisamment d'air frais dans le boîtier. Avec un niveau de bruit moyen de 45,7 dB(A), l'Asus NUC 14 Pro+ est clairement audible. Lors du test de stress, nous avons enregistré un pic de 47,4 dB(A). En mode veille, l'appareil fonctionne silencieusement, bien que le ventilateur continue de tourner.

Le profil du ventilateur est réglable dans le BIOS. Pour comparer, nous avons testé le système en mode silencieux et en mode performance. En mode chuchotement, le niveau sonore maximal tombe à environ 43 dB(A), ce qui le rend plus tolérable pour une utilisation à long terme. En revanche, le mode performance entraîne une augmentation significative du bruit, le niveau de pression acoustique atteignant près de 58 dB(A), ce qui n'est pas recommandé pour une utilisation quotidienne.

Degré de la nuisance sonore

Au repos
24.7 / 29.6 / 29.8 dB(A)
Fortement sollicité
45.7 / 47.4 dB(A)
  red to green bar
 
 
30 dB
silencieux
40 dB(A)
audible
50 dB(A)
bruyant
 
min: dark, med: mid, max: light   Earthworks M23R (à 15 cm de distance)   bruit ambiant: 24.6 dB(A)
dB(A) 0102030405060708090Deep BassMiddle BassHigh BassLower RangeMidsHigher MidsLower HighsMid HighsUpper HighsSuper Highs2042.648.63743.23839.942.62542.145.245.344.144.13642.13142.743.237.938.639.139.742.74036.346.128.229.127.434.136.35043.63531.330.230.331.243.66333.635.428.428.424.625.533.68027.333.827.325.721.321.827.310025.527.725.123.120.821.625.512525.325.716.814.611.112.725.316021.121.61813913.221.120024.222.516.815.49.210.324.225023.62314.514.58.89.623.63152523.51515.19.192540027.825.81918.98.6827.850030.328.820.619.78.88.330.363031.53118.618.78.9931.580036.134.122.421.89.69.536.1100035.734.420.220.49.69.835.712503634.617.317.410.411.1361600403819.419.411.210.840200039.337.518.518.61211.339.325003634.315.91612.612.136315037.235.315.7161312.837.2400034.332.114.614.613.613.634.3500028.726.414.514.2141428.763002623.514.514.514.414.526800022.320.514.814.614.614.522.31000019.318.41514.914.814.719.31250016.216.614.614.614.514.516.21600014.915.614.113.914.213.914.9SPL47.445.729.829.624.724.647.4N5.24.61.21.20.50.55.2median 27.8median 26.4median 16.8median 15.4median 11.2median 12.1median 27.8Delta6.96.52.42.42.52.56.9hearing rangehide median Fan NoiseAsus NUC 14 Pro+
Asus NUC 14 Pro+
Ultra 9 185H, Arc 8-Core
Aoostar GEM12
R7 8845HS, Radeon 780M
Geekom GT1 Mega
Ultra 9 185H, Arc 8-Core
Geekom AX8 Pro
R9 8945H, Radeon 780M
Minisforum AtomMan X7 Ti
Ultra 9 185H, Arc 8-Core
Acemagic F2A
Ultra 7 155H, Arc 8-Core
Noise
10%
-2%
1%
1%
3%
off / environment *
24.6
24.3
1%
24.8
-1%
24.9
-1%
24.1
2%
24.9
-1%
Idle Minimum *
24.7
27.5
-11%
25.4
-3%
24.9
-1%
29.8
-21%
25.4
-3%
Idle Average *
29.6
27.6
7%
27.2
8%
24.9
16%
29.9
-1%
25.7
13%
Idle Maximum *
29.8
27.6
7%
27.5
8%
24.9
16%
30
-1%
25.7
14%
Load Average *
45.7
36
21%
50.9
-11%
50.1
-10%
37.3
18%
47.8
-5%
Cyberpunk 2077 ultra *
47.7
35.4
26%
50.8
-6%
50
-5%
Load Maximum *
47.4
38.2
19%
50.9
-7%
50.2
-6%
43.5
8%
49
-3%
Witcher 3 ultra *
35.4
40.2
45.23

* ... Moindre est la valeur, meilleures sont les performances

Température

Les températures de surface de l'Asus NUC 14 Pro+ varient considérablement entre les conditions d'utilisation et de charge. La surface métallique répartit efficacement la chaleur, évitant ainsi les points chauds localisés. Pendant le test de stress, le processeur Intel Core Ultra 9 185H peut facilement atteindre des températures de 212 °F. Le SoC est conçu pour supporter jusqu'à 239 watts en charge continue, bien que ce pic ne soit pas pleinement utilisé. À court terme, la consommation d'énergie atteint un pic légèrement supérieur à 212 watts, mais en charge continue, le système ne dissipe généralement qu'environ 147 watts. Malgré cela, le SoC fonctionne constamment au-dessus de 212 °F, ce que l'Intel Core Ultra 9 185H supporte bien. Selon les spécifications techniques, le processeur est conçu pour fonctionner à des températures allant jusqu'à 230 °F.

Épreuve d'effort Prime95, en solo
Test de stress FurMark, solo
Test de stress Prime95 et FurMark
Asus NUC 14 Pro+ pendant le test de stress (haut)
Asus NUC 14 Pro+ stress test (dessous)
Bloc d'alimentation pendant le test de résistance
 46.2 °C45.1 °C45.6 °C 
 46.2 °C45.8 °C45.7 °C 
 45.7 °C44.9 °C45.7 °C 
Maximum: 46.2 °C
Moyenne: 45.7 °C
31.6 °C30.3 °C31.4 °C
30.9 °C28.8 °C32.1 °C
30.9 °C33.2 °C33.5 °C
Maximum: 33.5 °C
Moyenne: 31.4 °C
Alimentation (valeur maximale)  51.6 °C | Température ambiante de la pièce 21.9 °C | Fluke t3000FC (calibrated)
(-) La température moyenne de la face supérieure sous charge maximale est de 45.7 °C / 114 F, par rapport à la moyenne de 32.3 °C / 90 F pour les appareils de la classe Mini PC.
(-) La température maximale du côté supérieur est de 46.2 °C / 115 F, par rapport à la moyenne de 35.8 °C / 96 F, allant de 24 à 69.5 °C pour la classe Mini PC.
(+) Le fond chauffe jusqu'à un maximum de 33.5 °C / 92 F, contre une moyenne de 36.1 °C / 97 F
(±) En utilisation inactive, la température moyenne du côté supérieur est de 32 °C / 90 F, par rapport à la moyenne du dispositif de 32.3 °C / 90 F.
(-) 3: The average temperature for the upper side is 39.2 °C / 103 F, compared to the average of 32.3 °C / 90 F for the class Mini PC.

Gestion de l'énergie

L'Asus NUC 14 Pro+ est essentiellement un mini-PC abordable dont les performances sont optimales en mode veille et sous une charge modérée. En raison de la puissance maximale du processeur, la consommation d'énergie à court terme augmente considérablement par rapport à d'autres mini-PC. Avec un peu moins de 145 watts, notre échantillon de test enregistre la valeur la plus élevée de cette comparaison. Il convient de noter que cette valeur n'est atteinte que pendant une courte période. Le bloc d'alimentation, capable de fournir jusqu'à 150 watts, est bien dimensionné pour le système.

Consommation énergétique
Éteint/en veilledarklight 0.78 / 1 Watts
Au reposdarkmidlight 4.2 / 7.2 / 13 Watts
Fortement sollicité midlight 68.5 / 144.9 Watts
 color bar
Légende: min: dark, med: mid, max: light        Metrahit Energy
Asus NUC 14 Pro+
Ultra 9 185H, Arc 8-Core
Aoostar GEM12
R7 8845HS, Radeon 780M
Geekom GT1 Mega
Ultra 9 185H, Arc 8-Core
Geekom AX8 Pro
R9 8945H, Radeon 780M
Minisforum AtomMan X7 Ti
Ultra 9 185H, Arc 8-Core
Acemagic F2A
Ultra 7 155H, Arc 8-Core
Moyenne Intel Arc 8-Core iGPU
 
Moyenne de la classe Mini PC
 
Power Consumption
-21%
10%
-60%
-24%
-25%
4%
-34%
Idle Minimum *
4.2
8.2
-95%
4.1
2%
14
-233%
8.2
-95%
9.1
-117%
5.41 ?(1.8 - 10.3, n=37)
-29%
Idle Average *
7.2
10
-39%
6.6
8%
15.9
-121%
12.1
-68%
10.3
-43%
8.64 ?(4.2 - 16, n=37)
-20%
Idle Maximum *
13
14.6
-12%
11.3
13%
19.5
-50%
14
-8%
14.4
-11%
12.1 ?(4.5 - 49, n=37)
7%
Load Average *
68.5
73.9
-8%
65.8
4%
76.4
-12%
53.1
22%
54.9
20%
Cyberpunk 2077 ultra external monitor *
74.1
79.9
-8%
69.4
6%
54.3
27%
Load Maximum *
144.9
95.3
34%
104.8
28%
99.1
32%
100.4
31%
110.4
24%

* ... Moindre est la valeur, meilleures sont les performances

Efficiency overview

Performance Rating - Percent
Geekom AX8 Pro
AMD Ryzen 9 8945H, Radeon 780M
100 pt
Minisforum AtomMan X7 Ti
Intel Core Ultra 9 185H, Arc 8-Core
92 pt
Geekom GT1 Mega
Intel Core Ultra 9 185H, Arc 8-Core
89.2 pt
Acemagic F2A
Intel Core Ultra 7 155H, Arc 8-Core
83.6 pt
Asus NUC 14 Pro+
Intel Core Ultra 9 185H, Arc 8-Core
79.6 pt
Power Consumption
Cinebench R23 Multi Power Efficiency - external Monitor
Geekom AX8 Pro
AMD Ryzen 9 8945H, Radeon 780M
219 Points per Watt +17%
Minisforum AtomMan X7 Ti
Intel Core Ultra 9 185H, Arc 8-Core
205 Points per Watt +9%
Geekom GT1 Mega
Intel Core Ultra 9 185H, Arc 8-Core
194.8 Points per Watt +4%
Asus NUC 14 Pro+
Intel Core Ultra 9 185H, Arc 8-Core
187.8 Points per Watt
Acemagic F2A
Intel Core Ultra 7 155H, Arc 8-Core
183.7 Points per Watt -2%
Cinebench R23 Single Power Efficiency - external Monitor
Geekom AX8 Pro
AMD Ryzen 9 8945H, Radeon 780M
58.3 Points per Watt +17%
Geekom GT1 Mega
Intel Core Ultra 9 185H, Arc 8-Core
56.7 Points per Watt +13%
Minisforum AtomMan X7 Ti
Intel Core Ultra 9 185H, Arc 8-Core
55.6 Points per Watt +11%
Acemagic F2A
Intel Core Ultra 7 155H, Arc 8-Core
54.2 Points per Watt +8%
Asus NUC 14 Pro+
Intel Core Ultra 9 185H, Arc 8-Core
50 Points per Watt
Cinebench R15 Multi Efficiency (external Monitor)
Geekom AX8 Pro
AMD Ryzen 9 8945H, Radeon 780M
35.9 Points per Watt +48%
Minisforum AtomMan X7 Ti
Intel Core Ultra 9 185H, Arc 8-Core
31.2 Points per Watt +29%
Geekom GT1 Mega
Intel Core Ultra 9 185H, Arc 8-Core
29.2 Points per Watt +21%
Acemagic F2A
Intel Core Ultra 7 155H, Arc 8-Core
26.6 Points per Watt +10%
Asus NUC 14 Pro+
Intel Core Ultra 9 185H, Arc 8-Core
24.2 Points per Watt

Power consumption with external monitor

0102030405060708090100110120130140Tooltip
Asus NUC 14 Pro+ Ultra 9 185H, Arc 8-Core; Idle 1min (external Monitor): Ø7.26 (4.91-13.1)
Geekom GT1 Mega Ultra 9 185H, Arc 8-Core; Idle 1min (external Monitor): Ø6.65 (4.54-11.3)
Geekom AX8 Pro R9 8945H, Radeon 780M; Idle 1min (external Monitor): Ø15.9 (14.3-19.4)
Asus NUC 14 Pro+ Ultra 9 185H, Arc 8-Core; 1280x720 Prime95 28.10 and Furmark 1.25: Ø114.7 (100.9-144.9)
Geekom GT1 Mega Ultra 9 185H, Arc 8-Core; 1280x720 Prime95 28.10 and Furmark 1.25: Ø75.4 (64.2-104.8)
Geekom AX8 Pro R9 8945H, Radeon 780M; 1280x720 Prime95 28.10 and Furmark 1.25: Ø89.4 (87.8-94.6)
Asus NUC 14 Pro+ Ultra 9 185H, Arc 8-Core; Cyberpunk 2077 FHD ultra no FSR (external Monitor): Ø74.1 (62.4-78.7)
Geekom GT1 Mega Ultra 9 185H, Arc 8-Core; Cyberpunk 2077 FHD ultra no FSR (external Monitor): Ø69.4 (66.7-76.7)
Geekom AX8 Pro R9 8945H, Radeon 780M; Cyberpunk 2077 FHD ultra no FSR (external Monitor): Ø54.3 (43.7-67.1)
Asus NUC 14 Pro+ Ultra 9 185H, Arc 8-Core; 3DMark06 Return To Proxycon: Ø68.5 (60-97.6)
Geekom GT1 Mega Ultra 9 185H, Arc 8-Core; 3DMark06 Return To Proxycon: Ø65.8 (59-72.8)
Geekom AX8 Pro R9 8945H, Radeon 780M; 3DMark06 Return To Proxycon: Ø76.5 (55.7-96.2)

Power consumption with external monitor

0102030405060708090100110120130140Tooltip
Asus NUC 14 Pro+ Ultra 9 185H, Arc 8-Core; Prime95 V2810 Stress (external Monitor): Ø104.2 (91.4-142.7)
Geekom GT1 Mega Ultra 9 185H, Arc 8-Core; Prime95 V2810 Stress (external Monitor): Ø75.6 (62.9-104.6)
Geekom AX8 Pro R9 8945H, Radeon 780M; Prime95 V2810 Stress (external Monitor): Ø75.9 (72.6-96)
Asus NUC 14 Pro+ Ultra 9 185H, Arc 8-Core; Cinebench R15 Multi (external Monitor): Ø118.5 (109.4-137.5)
Geekom GT1 Mega Ultra 9 185H, Arc 8-Core; Cinebench R15 Multi (external Monitor): Ø95.8 (95-96.5)
Geekom AX8 Pro R9 8945H, Radeon 780M; Cinebench R15 Multi (external Monitor): Ø70.3 (63.2-83)
Asus NUC 14 Pro+ Ultra 9 185H, Arc 8-Core; Cinebench R23 Single (external Monitor): Ø35.3 (25.6-81.6)
Geekom GT1 Mega Ultra 9 185H, Arc 8-Core; Cinebench R23 Single (external Monitor): Ø31.3 (15.7-81.3)
Geekom AX8 Pro R9 8945H, Radeon 780M; Cinebench R23 Single (external Monitor): Ø31 (25.6-51.4)
Asus NUC 14 Pro+ Ultra 9 185H, Arc 8-Core; Cinebench R23 Multi (external Monitor): Ø93.8 (87.6-109.2)
Geekom GT1 Mega Ultra 9 185H, Arc 8-Core; Cinebench R23 Multi (external Monitor): Ø95.5 (94-96.6)
Geekom AX8 Pro R9 8945H, Radeon 780M; Cinebench R23 Multi (external Monitor): Ø70.9 (66.8-89.8)
Asus NUC 14 Pro+ Ultra 9 185H, Arc 8-Core; 1280x720 FurMark 1.19 GPU Stress Test (external Monitor): Ø56.6 (55.1-70.1)
Geekom GT1 Mega Ultra 9 185H, Arc 8-Core; 1280x720 FurMark 1.19 GPU Stress Test (external Monitor): Ø58.2 (56.2-74.2)
Geekom AX8 Pro R9 8945H, Radeon 780M; 1280x720 FurMark 1.19 GPU Stress Test (external Monitor): Ø85.7 (73.1-99.9)

Notebookcheck

Les performances de l'Asus NUC 14 Pro+ sont remarquables, avec une technologie de pointe et une large gamme d'options de connectivité. L'Intel Core Ultra 9 185H offre d'excellentes performances pour les applications bureautiques et une grande facilité à gérer les tâches multimédias gourmandes en énergie. Le seul inconvénient est le système de refroidissement parfois bruyant, qui est perceptible même sous une charge modérée.
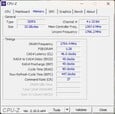
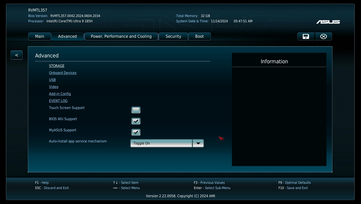
Asus NUC 14 Pro+ - 11/14/2024 v8
Sebastian Bade

Châssis
84 / 98 → 85%
Connectivité
62 / 81 → 77%
Poids
81%
Performances en jeu
49 / 80 → 62%
Performances dans les applications
82 / 92 → 90%
Workstation
32%
AI Performance
83%
Chauffe
86%
Nuisance sonore
73%
Moyenne
55%
75%
Mini PC - Moyenne compensée
CO2 Emissions
No Data
Materials
25%
Packaging
25%
Power Use
74.9%
Repairability
30%
Software Updates
50%
Recycle Logo Total Sustainability Score: 34.2%

Transparency

The selection of devices to be reviewed is made by our editorial team. The test sample was provided to the author as a loan by the manufacturer or retailer for the purpose of this review. The lender had no influence on this review, nor did the manufacturer receive a copy of this review before publication. There was no obligation to publish this review. We never accept compensation or payment in return for our reviews. As an independent media company, Notebookcheck is not subjected to the authority of manufacturers, retailers or publishers.

This is how Notebookcheck is testing

Every year, Notebookcheck independently reviews hundreds of laptops and smartphones using standardized procedures to ensure that all results are comparable. We have continuously developed our test methods for around 20 years and set industry standards in the process. In our test labs, high-quality measuring equipment is utilized by experienced technicians and editors. These tests involve a multi-stage validation process. Our complex rating system is based on hundreds of well-founded measurements and benchmarks, which maintains objectivity. Further information on our test methods can be found here.

Please share our article, every link counts!
Mail Logo
> Revues et rapports de ordinateurs portatifs et smartphones, ordiphones > Critiques > Test de l'Asus NUC 14 Pro+ : mini PC tueur potentiel des PC de bureau avec seulement 622 g
Sebastian Bade, 2024-11-17 (Update: 2024-11-19)