Notebookcheck Logo
Teaser

Test du MSI Thin GF63 12VE : GeForce RTX 4050 avec 8 Go de RAM

Il va un peu trop loin dans la réduction des coûts.

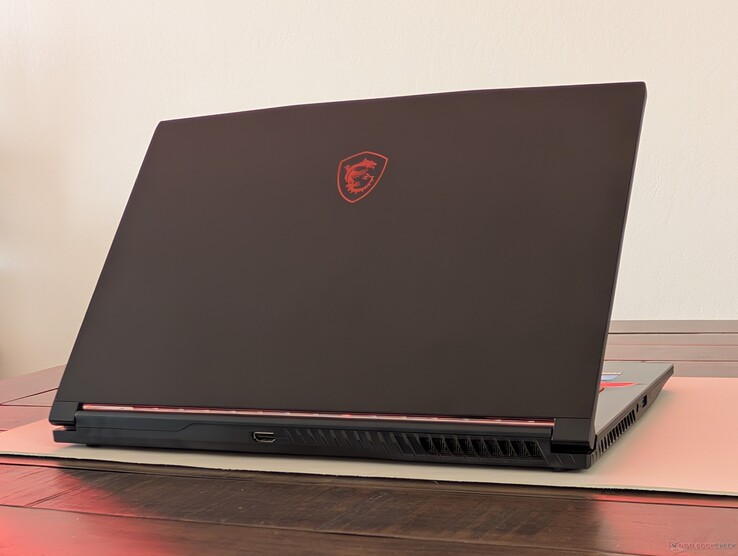
L'ordinateur portable de jeu de 15,6 pouces le moins cher de MSI présente des caractéristiques modernes telles qu'un écran IPS de 144 Hz, une carte graphique RTX 4050 ( GeForce ) et un processeur de la série Core-H. Vous devrez toutefois éviter certains modèles, notamment ceux qui ne disposent que de 8 Go de RAM. Cependant, vous devrez éviter certains modèles, en particulier ceux qui ne disposent que de 8 Go de mémoire vive.
Allen Ngo, 👁 Allen Ngo (traduit par DeepL / Ninh Duy) Publié 🇺🇸 🇪🇸 ...
Alder Lake Gaming Geforce Laptop / Notebook

Verdict - Optez pour la configuration 16 Go

Le prix inférieur à 900 $ est suffisant pour que tout joueur à petit budget s'intéresse au MSI GF63. Ses spécifications sont nombreuses : taux de rafraîchissement rapide de 144 Hz, GPU GeForce RTX 4050, processeur Core i5 ou i7 de la série H relativement récent de la 12ème génération et 512 Go de stockage. Il ne s'agit pas d'une machine lente à la base et son prix ne fera qu'augmenter maintenant que les ordinateurs portables GeForce RTX 50 arrivent sur le marché. Le système de MSI est également plus léger que de nombreuses autres solutions, notamment le Acer Nitro V 15 ou le Lenovo LOQ 15.

Malheureusement, l'expérience utilisateur reste inchangée par rapport au modèle 2020 le châssis semble toujours aussi bon marché et toute réparation par l'utilisateur final nécessite de briser l'autocollant d'usine anti-sabotage. Les modèles dotés de 8 Go de RAM sont donc à éviter, car la mémoire limitée a un impact sur les performances globales, tandis que l'autocollant d'usine dissuade toute forme de mise à niveau.

Points positifs

+ taux de rafraîchissement rapide de 144 Hz avec des temps de réponse corrects
+ prend en charge un disque secondaire SATA III de 2,5 pouces
+ températures de cœur décentes pour les jeux
+ relativement bon marché

Points négatifs

- l'ajout de RAM ou de SSD nécessite de briser un autocollant anti-tamper
- seulement 8 Go de RAM pour la configuration de base
- couverture sRGB limitée
- châssis essentiellement en plastique
- faible autonomie de la batterie

Prix et disponibilité

La version Core i7 du MSI Thin GF63 est désormais disponible sur Amazon au prix de 860 $.

Amazon Logo
$863.00
MSI Thin GF63 15.6" 144Hz Gaming Laptop: 12th Gen Intel Core i7, NVIDIA GeForce RTX 4050, 16GB DDR4, 512GB NVMe SSD, Type-C, Cooler Boost 5, Win11 Home: Black 12VE-066US

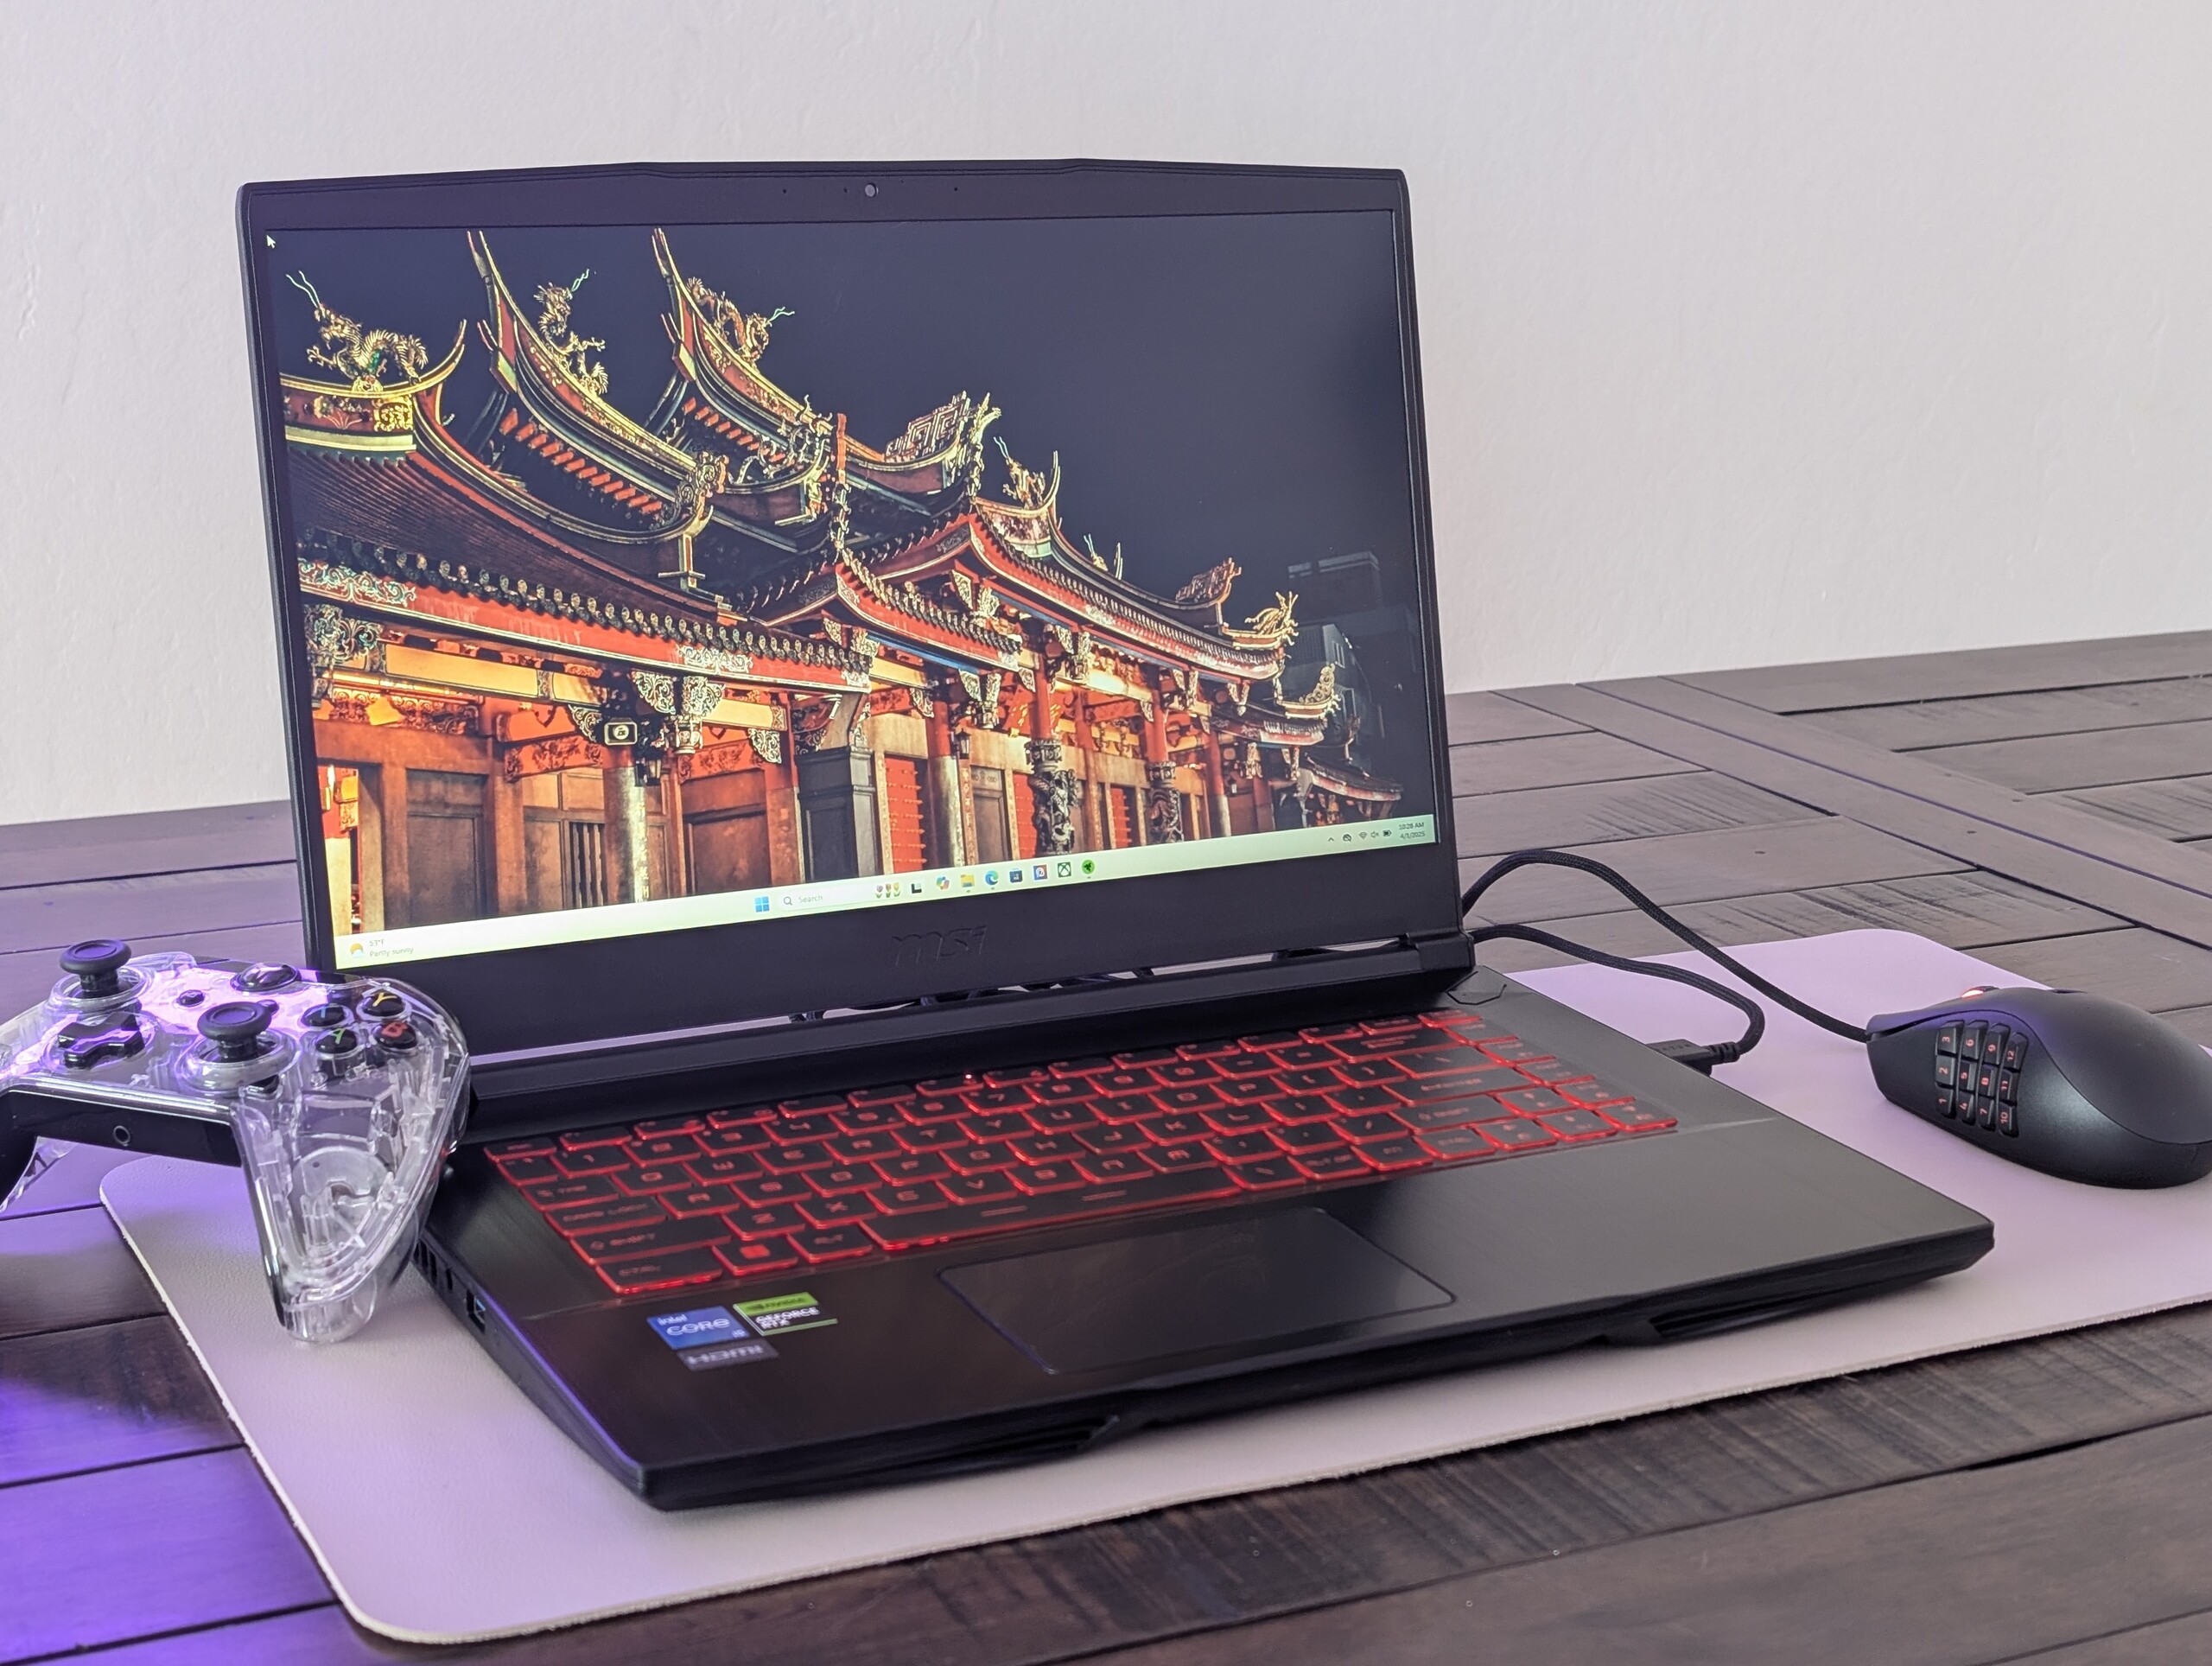
Le GF63 est la gamme d'ordinateurs portables de jeu la moins chère de MSI, conçue pour les joueurs soucieux de leur budget qui veulent des graphiques RTX sur GeForce sans toutes les cloches et les sifflets. Cela fait 5 ans que nous avons testé le dernier GF63 et ce dernier modèle est équipé d'un processeur Intel Alder Lake et d'un GPU Ada Lovelace.

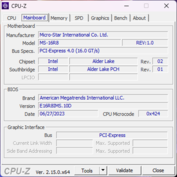
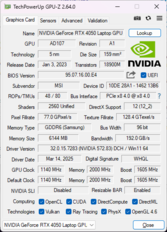
Notre unité de test est une configuration bas de gamme largement disponible chez des détaillants comme Target et Amazon. Elle est livrée avec le Core i5-12450H, 6 Go de RTX 4050, 8 Go de RAM et un écran IPS 1080p à 144 Hz pour environ 850 à 900 $. Des modèles équipés du Core i7-12650H, de la RTX 4060 et de deux fois plus de RAM sont également disponibles.

Les concurrents comprennent d'autres ordinateurs portables de jeu d'entrée de gamme comme le Lenovo LOQ 15, l'Asus TUF A15, ou l'Acer Nitro V 15.

Plus d'avis sur MSI :

Spécifications

MSI Thin GF63 12VE (GF63 Gamme)
Processeur
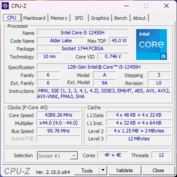
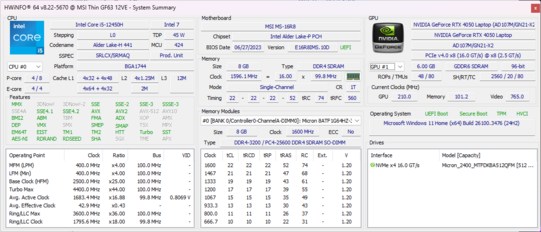
Intel Core i5-12450H 8 x 1.5 - 4.4 GHz, 62 W PL2 / Short Burst, 53 W PL1 / Sustained, Alder Lake-H
Carte graphique
NVIDIA GeForce RTX 4050 Laptop GPU - 6 Go VRAM, Processeur: 1605 MHz, RAM: 2000 MHz, 45 W TDP, GDDR6, 572.83, Optimus
Mémoire
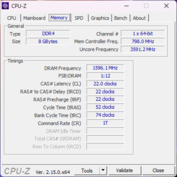
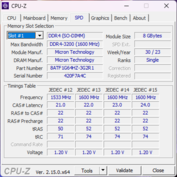
8 Go 
, DDR4-3200, Micron, 22-22-22-52, Single-Channel
Écran
15.60 pouces 16:9, 1920 x 1080 pixel 141 PPP, AU Optronics B156HAN08.4, IPS, brillant: non, 144 Hz
Carte mère
Intel Alder Lake-P PCH
Disque dur
Micron 2400 MTFDKBA512QFM, 512 Go 
Carte son
Intel Alder Lake-P PCH - cAVS (Audio, Voice, Speech)
Connexions
4 USB 3.0 / 3.1 Gen1, 1 HDMI, 1 DisplayPort, Connectique audio: 3.5 mm combo
Réseau
Realtek Semiconductor RTL8168/8111 PCI-E Gigabit Ethernet NIC (10/100/1000MBit/s), Intel Wi-Fi 6 AX201 (a/b/g/h/n = Wi-Fi 4/ac = Wi-Fi 5/ax = Wi-Fi 6/), Bluetooth 5.2
Taille
Hauteur x Largeur x Profondeur (en mm): 21.7 x 359 x 254
Batterie
52.4 Wh Lithium-Polymère
Système d'exploitation
Microsoft Windows 11 Home
Appareil photo
Webcam: 720p30
Appareil photo primaire: 1 MPix
Fonctionnalités additionnelles
Haut-parleurs: 2x 2 W, Clavier: Chiclet, Rétroéclairage du clavier: oui, MSI Center, 12 Mois Garantie
Poids
1.82 kg, Alimentation: 496 g
Prix
900 USD
Amazon
Remarque : le fabricant peut utiliser des composants provenant de différents fournisseurs, notamment des panneaux d'affichage, des lecteurs ou des clés USB ayant des spécifications similaires.


Cas

Comparaison des tailles

362 mm 240 mm 23.5 mm 2.1 kg359.86 mm 258.7 mm 23.9 mm 2.4 kg358 mm 255 mm 24 mm 2.3 kg359 mm 254 mm 22 mm 1.8 kg359 mm 254 mm 21.7 mm 1.8 kg354 mm 251 mm 24.9 mm 2.2 kg297 mm 210 mm 1 mm 5.7 g

Connectivité

Avant : Pas de ports
Droite : casque 3,5 mm, microphone 3,5 mm, 2x USB-A 3.2 Gen. 1, USB-C 3.2 Gen. 1 avec DisplayPort, RJ-45 (1 Gbps), verrou Kensington
Arrière : HDMI 1.4 (jusqu'à 4K30)
À gauche : Adaptateur secteur, USB-A 3.2 Gen. 1

Communication

Networking
iperf3 transmit AX12
MSI GF63 Thin 9SC
Intel Wireless-AC 9560
1150 MBit/s
iperf3 receive AX12
MSI GF63 Thin 9SC
Intel Wireless-AC 9560
1290 MBit/s
iperf3 transmit AXE11000
Asus TUF A15 FA507
MediaTek MT7921
985 (902min - 1065max) MBit/s +3%
MSI Thin GF63 12VE
Intel Wi-Fi 6 AX201
960 (893min - 1035max) MBit/s
Lenovo LOQ 15IRX9
Realtek RTL8852BE
830 (747min - 873max) MBit/s -14%
Acer Nitro V 15 ANV15-51-582S
Intel Wi-Fi 6 AX203
743 (638min - 782max) MBit/s -23%
HP Victus 15-fa1057ng
MediaTek MT7921
713 (682min - 751max) MBit/s -26%
iperf3 receive AXE11000
Lenovo LOQ 15IRX9
Realtek RTL8852BE
975 (950min - 986max) MBit/s +12%
Acer Nitro V 15 ANV15-51-582S
Intel Wi-Fi 6 AX203
931 (912min - 945max) MBit/s +7%
Asus TUF A15 FA507
MediaTek MT7921
917 (797min - 933max) MBit/s +6%
MSI Thin GF63 12VE
Intel Wi-Fi 6 AX201
868 (728min - 973max) MBit/s
HP Victus 15-fa1057ng
MediaTek MT7921
730 (716min - 738max) MBit/s -16%
0501001502002503003504004505005506006507007508008509009501000Tooltip
MSI Thin GF63 12VE; iperf3 transmit AXE11000; iperf 3.1.3: Ø960 (893-1035)
MSI Thin GF63 12VE; iperf3 receive AXE11000; iperf 3.1.3: Ø868 (728-973)

Webcam

Il n'y a pas de capteur IR ni de curseur physique pour la caméra. Au lieu de cela, la caméra peut s'éteindre électroniquement via une touche de raccourci.
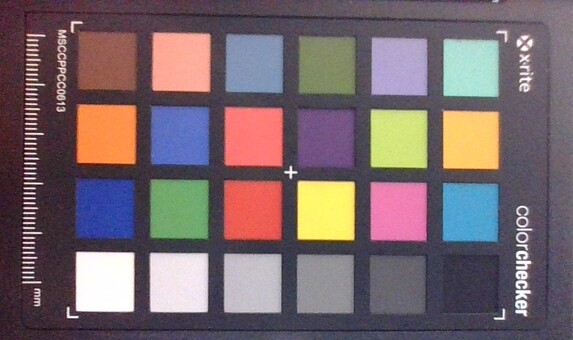
ColorChecker
9.1 ∆E
12 ∆E
10.4 ∆E
13.6 ∆E
13.1 ∆E
12.7 ∆E
9.4 ∆E
8.9 ∆E
15.1 ∆E
8.4 ∆E
11.5 ∆E
11 ∆E
2.5 ∆E
9.5 ∆E
18.5 ∆E
11.7 ∆E
15.6 ∆E
13.5 ∆E
2.5 ∆E
10.9 ∆E
11.1 ∆E
10.7 ∆E
9.1 ∆E
10.9 ∆E
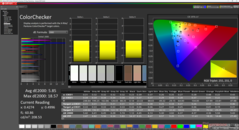
ColorChecker MSI Thin GF63 12VE: 10.9 ∆E min: 2.53 - max: 18.49 ∆E

Maintenance

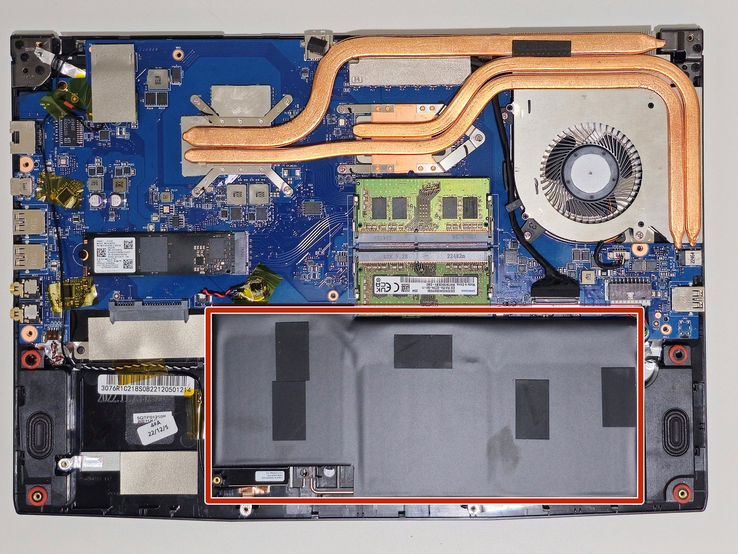
Pour retirer le panneau inférieur, il faut déchirer un autocollant anti-sabotage. Sinon, il devrait se détacher facilement à l'aide d'un simple tournevis cruciforme.

Carte mère MSI GF63 12VE (Source : iFixit)

Durabilité

MSI n'annonce aucune mesure de développement durable pour la série GF63. L'emballage, cependant, est principalement composé de papier et de carton.

Accessoires et garantie

Il n'y a pas de supplément dans la boîte. La garantie limitée standard d'un an du fabricant s'applique.

Périphériques d'entrée

Clavier et pavé tactile

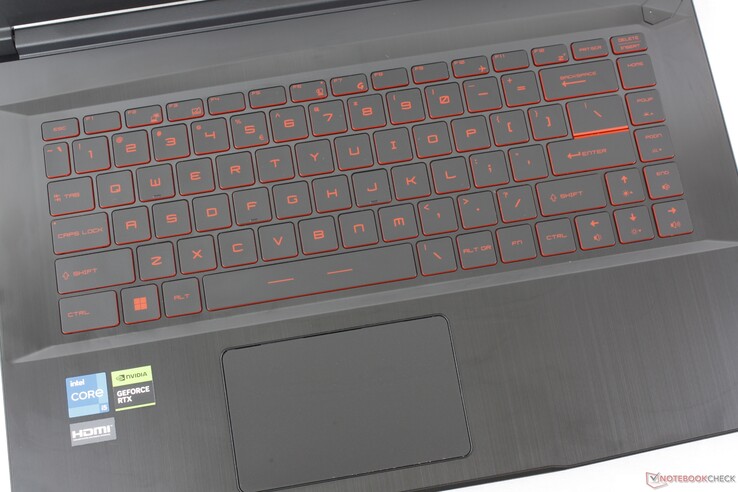
Il n'y a pas de changement au niveau du pavé tactile ou du clavier à rétroéclairage rouge par rapport au modèle 2020. Même la taille du pavé tactile reste inchangée.

La police rouge foncé contraste mal avec les touches noires lorsque le rétroéclairage est éteint

Affichage

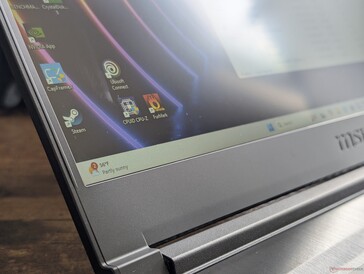
Notre écran IPS AU Optronics B156HAN08.4 est une amélioration par rapport à l'écran AU Optronics B156HAN02.1 du 2020 GF63 en termes de taux de rafraîchissement natif et de temps de réponse. Cependant, la couverture sRGB et la luminosité restent faibles.

Pas de verre bord à bord ni d'options brillantes
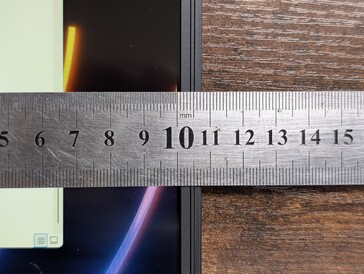
Encadrements latéraux étroits
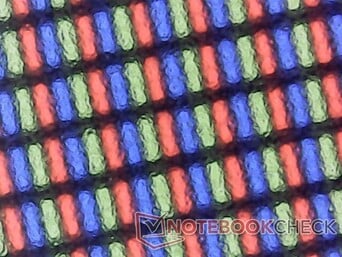
Recouvrement mat légèrement granuleux
Légère décoloration inégale du rétroéclairage en bas à gauche
257.2
cd/m²
255.6
cd/m²
253.7
cd/m²
258
cd/m²
248.6
cd/m²
260
cd/m²
259
cd/m²
257.2
cd/m²
260
cd/m²
Homogénéité de la luminosité
AU Optronics B156HAN08.4 testé avec X-Rite i1Pro 2
Maximum: 260 cd/m² (Nits) Moyenne: 256.6 cd/m² Minimum: 13.2 cd/m²
Homogénéité de la luminosité: 96 %
Valeur mesurée au centre, sur batterie: 248.6 cd/m²
Contraste: 1381:1 (Valeurs des noirs: 0.18 cd/m²)
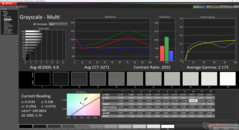
ΔE Color 5.85 | 0.5-29.43 Ø4.88, calibrated: 2.52
ΔE Greyscale 4.8 | 0.5-98 Ø5.1
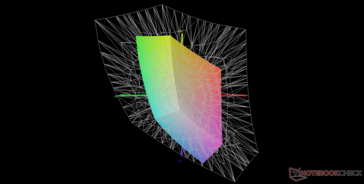
40.5% AdobeRGB 1998 (Argyll 2.2.0 3D)
58.4% sRGB (Argyll 2.2.0 3D)
39.2% Display P3 (Argyll 2.2.0 3D)
Gamma: 2.17
MSI Thin GF63 12VE
AU Optronics B156HAN08.4, IPS, 1920x1080, 15.6", 144 Hz
MSI GF63 Thin 9SC
AU Optronics B156HAN02.1 (AUO21ED), IPS, 1920x1080, 15.6",  Hz
Lenovo LOQ 15IRX9
BOE NJ NE156FHM-NX9, IPS, 1920x1080, 15.6", 144 Hz
HP Victus 15-fa1057ng
BOE094D, IPS, 1920x1080, 15.6", 144 Hz
Acer Nitro V 15 ANV15-51-582S
LG LP156WFJ-SPB4 (LGD0742), IPS, 1920x1080, 15.6", 144 Hz
Asus TUF A15 FA507
N156HMA-GA1, IPS, 1920x1080, 15.6", 144 Hz
Display
-4%
79%
-0%
2%
65%
Display P3 Coverage
39.2
37.76
-4%
73.7
88%
39.2
0%
40
2%
64.9
66%
sRGB Coverage
58.4
56.5
-3%
99.1
70%
57.9
-1%
60
3%
96.5
65%
AdobeRGB 1998 Coverage
40.5
39.01
-4%
72.6
79%
40.5
0%
41.4
2%
66.6
64%
Response Times
-60%
-35%
16%
-26%
-7%
Response Time Grey 50% / Grey 80% *
25.6 ?(12.2, 13.4)
44.8 ?(22, 22.8)
-75%
42.2 ?(19.1, 23.1)
-65%
23.8 ?(11.1, 12.7)
7%
34.2 ?(15.8, 18.4)
-34%
30.4 ?(14.8, 15.6)
-19%
Response Time Black / White *
21.8 ?(11.2, 10.6)
31.6 ?(17.2, 14.4)
-45%
22.6 ?(11.2, 11.4)
-4%
16.3 ?(7.6, 8.7)
25%
25.8 ?(13.8, 12)
-18%
20.8 ?(11.7, 9.1)
5%
PWM Frequency
Screen
4%
27%
-12%
-14%
34%
Brightness middle
248.6
260
5%
306
23%
273
10%
292
17%
288
16%
Brightness
257
249
-3%
287
12%
249
-3%
263
2%
271
5%
Brightness Distribution
96
92
-4%
88
-8%
84
-12%
80
-17%
91
-5%
Black Level *
0.18
0.23
-28%
0.21
-17%
0.28
-56%
0.25
-39%
0.17
6%
Contrast
1381
1130
-18%
1457
6%
975
-29%
1168
-15%
1694
23%
Colorchecker dE 2000 *
5.85
4.1
30%
2.25
62%
5.19
11%
7.15
-22%
1.9
68%
Colorchecker dE 2000 max. *
18.57
7.93
57%
4.84
74%
21.16
-14%
15.51
16%
3.3
82%
Colorchecker dE 2000 calibrated *
2.52
3.56
-41%
1.45
42%
4.54
-80%
4.13
-64%
0.9
64%
Greyscale dE 2000 *
4.8
2.83
41%
2.4
50%
1.7
65%
4.9
-2%
2.7
44%
Gamma
2.17 101%
2.53 87%
2.259 97%
2.148 102%
2.014 109%
2.32 95%
CCT
6271 104%
6158 106%
6790 96%
6819 95%
7178 91%
6535 99%
Color Space (Percent of AdobeRGB 1998)
36
Color Space (Percent of sRGB)
56
Moyenne finale (programmes/paramètres)
-20% / -7%
24% / 29%
1% / -6%
-13% / -12%
31% / 35%

* ... Moindre est la valeur, meilleures sont les performances

vs. sRGB
vs. sRGB
vs. P3
vs. P3
Niveaux de gris avant étalonnage
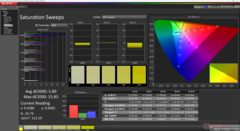
Balayages de saturation avant étalonnage
ColorChecker avant étalonnage
Niveaux de gris après étalonnage
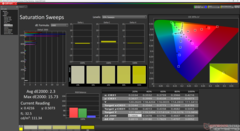
Balayages de saturation après étalonnage
ColorChecker après étalonnage

Temps de réponse de l'écran

Le temps de réponse d'un écran mesure la rapidité à laquelle l'écran est capable de changer une couleur pour une autre. Un temps de réponse élevé se traduit par une image floutée pour les objets en mouvement. Les joueurs bénéficieront de faibles latences d'affichage en jeu.
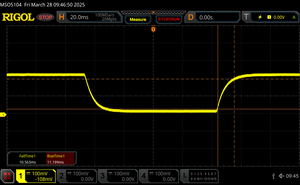
       Temps de réponse noir à blanc
21.8 ms ... hausse ↗ et chute ↘ combinées↗ 11.2 ms hausse
↘ 10.6 ms chute
L'écran montre de bons temps de réponse, mais insuffisant pour du jeu compétitif.
En comparaison, tous les appareils testés affichent entre 0.1 (minimum) et 240 (maximum) ms. » 45 % des appareils testés affichent de meilleures performances.
Cela signifie que les latences relevées sont similaires à la moyenne (20.8 ms) de tous les appareils testés.
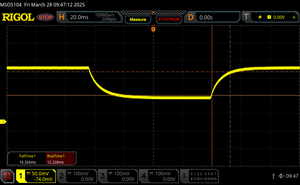
       Temps de réponse gris 50% à gris 80%
25.6 ms ... hausse ↗ et chute ↘ combinées↗ 12.2 ms hausse
↘ 13.4 ms chute
L'écran souffre de latences relativement élevées, insuffisant pour le jeu.
En comparaison, tous les appareils testés affichent entre 0.165 (minimum) et 636 (maximum) ms. » 33 % des appareils testés affichent de meilleures performances.
Cela signifie que les latences relevées sont meilleures que la moyenne (32.5 ms) de tous les appareils testés.

Scintillement / MLI (Modulation de largeur d'impulsion)

Afin d'abaisser la luminosité de l'écran, certains ordinateurs portables font varier très rapidement le rétroéclairage entre éteint et allumé. La fréquence à laquelle le rétroéclairage s'éteint et se rallume est normalement fixée à une valeur qui permet de rendre la variation indétectable à l'œil nu? Si la fréquence est trop basse, certaines personnes peuvent être sujettes à une fatigue oculaire, des maux de tête ou même percevoir les variations.
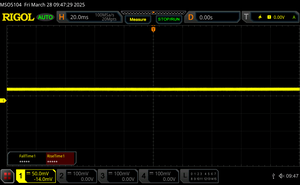
Scintillement / MLI (Modulation de largeur d'impulsion) non décelé

En comparaison, 53 % des appareils testés n'emploient pas MDI pour assombrir leur écran. Nous avons relevé une moyenne à 8527 (minimum : 5 - maximum : 343500) Hz dans le cas où une MDI était active.

Angles de vision IPS étendus
A l'extérieur, sous la lumière du soleil
A l'extérieur, à l'ombre
A l'extérieur, sous la lumière du soleil

Performance


Conditions d'essai

Nous avons réglé MSI Center sur le mode Performance extrême avant d'effectuer les tests ci-dessous.

Processeur

Cinebench R15 Multi Loop

0130260390520650780910104011701300143015601690182019502080221023402470Tooltip
MSI Thin GF63 12VE Intel Core i5-12450H: Ø1460 (1226.92-1577.97)
MSI GF63 Thin 9SC Intel Core i5-9300H: Ø737 (729.39-797)
Lenovo LOQ 15IRX9 Intel Core i5-13450HX: Ø2170 (2104.93-2503.76)
HP Victus 15-fa1057ng Intel Core i5-13500H: Ø1859 (1813.15-2238.76)
Acer Nitro V 15 ANV15-51-582S Intel Core i5-13420H: Ø1640 (1557.09-1815.38)
Asus TUF A15 FA507 AMD Ryzen 7 7735HS: Ø2219 (2188.66-2273.89)
CPU Performance Rating: Percent
Cinebench R23: Multi Core | Single Core
Cinebench R20: CPU (Multi Core) | CPU (Single Core)
Cinebench R15: CPU Multi 64Bit | CPU Single 64Bit
Blender: v2.79 BMW27 CPU
7-Zip 18.03: 7z b 4 | 7z b 4 -mmt1
Geekbench 6.4: Multi-Core | Single-Core
Geekbench 5.5: Multi-Core | Single-Core
HWBOT x265 Benchmark v2.2: 4k Preset
LibreOffice : 20 Documents To PDF
R Benchmark 2.5: Overall mean
CPU Performance Rating
Asus TUF Gaming A15 FA507UV
AMD Ryzen 9 8945H
86.8 pt
Gigabyte G5 KF5 2024
Intel Core i7-13620H
78.9 pt
Lenovo LOQ 15IRH8 Core i7
Intel Core i7-13620H
78.5 pt
Lenovo LOQ 15IRX9
Intel Core i5-13450HX
76.4 pt
HP Victus 15 fa0020nr -2!
Intel Core i7-12700H
73.6 pt
Gigabyte G5 KE -2!
Intel Core i5-12500H
67.7 pt
HP Victus 15-fa1057ng -4!
Intel Core i5-13500H
63.7 pt
Acer Nitro V 15 ANV15-51-582S
Intel Core i5-13420H
63.6 pt
Moyenne Intel Core i5-12450H
 
56.5 pt
MSI Thin GF63 12VE
Intel Core i5-12450H
55.5 pt
Lenovo IdeaPad Gaming 3 15ARH7 -2!
AMD Ryzen 5 6600H
54.3 pt
Cinebench R23 / Multi Core
Asus TUF Gaming A15 FA507UV
AMD Ryzen 9 8945H
17423 Points +64%
Lenovo LOQ 15IRX9
Intel Core i5-13450HX
16797 Points +58%
HP Victus 15 fa0020nr
Intel Core i7-12700H
15271 (12272min - 15271.4max) Points +44%
Lenovo LOQ 15IRH8 Core i7
Intel Core i7-13620H
15176 Points +43%
Gigabyte G5 KF5 2024
Intel Core i7-13620H
14686 Points +38%
HP Victus 15-fa1057ng
Intel Core i5-13500H
14081 Points +32%
Gigabyte G5 KE
Intel Core i5-12500H
13155 Points +24%
Acer Nitro V 15 ANV15-51-582S
Intel Core i5-13420H
11871 Points +12%
MSI Thin GF63 12VE
Intel Core i5-12450H
10633 (8110.88min - 10633.5max) Points
Lenovo IdeaPad Gaming 3 15ARH7
AMD Ryzen 5 6600H
10226 (10089.9min - 10226.3max) Points -4%
Moyenne Intel Core i5-12450H
  (7662 - 10633, n=6)
9113 Points -14%
Cinebench R23 / Single Core
Gigabyte G5 KF5 2024
Intel Core i7-13620H
1862 Points +16%
Lenovo LOQ 15IRH8 Core i7
Intel Core i7-13620H
1860 Points +16%
Asus TUF Gaming A15 FA507UV
AMD Ryzen 9 8945H
1814 Points +13%
HP Victus 15 fa0020nr
Intel Core i7-12700H
1756 Points +10%
Lenovo LOQ 15IRX9
Intel Core i5-13450HX
1710 Points +7%
HP Victus 15-fa1057ng
Intel Core i5-13500H
1704 Points +6%
Acer Nitro V 15 ANV15-51-582S
Intel Core i5-13420H
1697 Points +6%
Moyenne Intel Core i5-12450H
  (1601 - 1688, n=6)
1655 Points +3%
Gigabyte G5 KE
Intel Core i5-12500H
1629 Points +2%
MSI Thin GF63 12VE
Intel Core i5-12450H
1601 Points
Lenovo IdeaPad Gaming 3 15ARH7
AMD Ryzen 5 6600H
1458 Points -9%
Cinebench R20 / CPU (Multi Core)
Asus TUF Gaming A15 FA507UV
AMD Ryzen 9 8945H
6859 Points +70%
Lenovo LOQ 15IRX9
Intel Core i5-13450HX
6532 Points +62%
HP Victus 15 fa0020nr
Intel Core i7-12700H
5921 Points +47%
Lenovo LOQ 15IRH8 Core i7
Intel Core i7-13620H
5828 Points +45%
Gigabyte G5 KF5 2024
Intel Core i7-13620H
5558 Points +38%
HP Victus 15-fa1057ng
Intel Core i5-13500H
5345 Points +33%
Gigabyte G5 KE
Intel Core i5-12500H
5066 Points +26%
Acer Nitro V 15 ANV15-51-582S
Intel Core i5-13420H
4524 Points +12%
MSI Thin GF63 12VE
Intel Core i5-12450H
4029 Points
Lenovo IdeaPad Gaming 3 15ARH7
AMD Ryzen 5 6600H
3965 Points -2%
Moyenne Intel Core i5-12450H
  (2952 - 4105, n=6)
3517 Points -13%
Cinebench R20 / CPU (Single Core)
Lenovo LOQ 15IRH8 Core i7
Intel Core i7-13620H
719 Points +16%
Gigabyte G5 KF5 2024
Intel Core i7-13620H
697 Points +12%
HP Victus 15 fa0020nr
Intel Core i7-12700H
681 Points +9%
Asus TUF Gaming A15 FA507UV
AMD Ryzen 9 8945H
670 Points +8%
HP Victus 15-fa1057ng
Intel Core i5-13500H
655 Points +5%
Acer Nitro V 15 ANV15-51-582S
Intel Core i5-13420H
652 Points +5%
Lenovo LOQ 15IRX9
Intel Core i5-13450HX
652 Points +5%
Moyenne Intel Core i5-12450H
  (622 - 646, n=6)
638 Points +3%
Gigabyte G5 KE
Intel Core i5-12500H
627 Points +1%
MSI Thin GF63 12VE
Intel Core i5-12450H
622 Points
Lenovo IdeaPad Gaming 3 15ARH7
AMD Ryzen 5 6600H
564 Points -9%
Cinebench R15 / CPU Multi 64Bit
Asus TUF Gaming A15 FA507UV
AMD Ryzen 9 8945H
2777 Points +76%
HP Victus 15 fa0020nr
Intel Core i7-12700H
2696 (1935.64min - 2695.78max) Points +71%
Lenovo LOQ 15IRX9
Intel Core i5-13450HX
2503 Points +59%
Gigabyte G5 KF5 2024
Intel Core i7-13620H
2396 (2113.38min - 2395.78max) Points +52%
Lenovo LOQ 15IRH8 Core i7
Intel Core i7-13620H
2278 (1668.89min - 2278.03max) Points +44%
HP Victus 15-fa1057ng
Intel Core i5-13500H
2239 (1813.15min - 2238.76max) Points +42%
Gigabyte G5 KE
Intel Core i5-12500H
2112 (1956.47min - 2112.49max) Points +34%
Acer Nitro V 15 ANV15-51-582S
Intel Core i5-13420H
1815 (1557.09min - 1815.38max) Points +15%
Lenovo IdeaPad Gaming 3 15ARH7
AMD Ryzen 5 6600H
1626 (1594.77min - 1626.41max) Points +3%
MSI Thin GF63 12VE
Intel Core i5-12450H
1578 (1226.92min - 1577.97max) Points
Moyenne Intel Core i5-12450H
  (1150 - 1591, n=6)
1372 Points -13%
Cinebench R15 / CPU Single 64Bit
Asus TUF Gaming A15 FA507UV
AMD Ryzen 9 8945H
284 Points +26%
Gigabyte G5 KF5 2024
Intel Core i7-13620H
269 Points +20%
Lenovo LOQ 15IRH8 Core i7
Intel Core i7-13620H
263 Points +17%
HP Victus 15 fa0020nr
Intel Core i7-12700H
256 Points +14%
Gigabyte G5 KE
Intel Core i5-12500H
245 Points +9%
HP Victus 15-fa1057ng
Intel Core i5-13500H
243 Points +8%
Acer Nitro V 15 ANV15-51-582S
Intel Core i5-13420H
242 Points +8%
Lenovo LOQ 15IRX9
Intel Core i5-13450HX
239 Points +6%
Moyenne Intel Core i5-12450H
  (225 - 239, n=6)
234 Points +4%
Lenovo IdeaPad Gaming 3 15ARH7
AMD Ryzen 5 6600H
231 Points +3%
MSI Thin GF63 12VE
Intel Core i5-12450H
225 Points
Blender / v2.79 BMW27 CPU
Moyenne Intel Core i5-12450H
  (330 - 429, n=7)
379 Seconds * -15%
MSI Thin GF63 12VE
Intel Core i5-12450H
330 Seconds *
Lenovo IdeaPad Gaming 3 15ARH7
AMD Ryzen 5 6600H
306 Seconds * +7%
Acer Nitro V 15 ANV15-51-582S
Intel Core i5-13420H
289 Seconds * +12%
HP Victus 15-fa1057ng
Intel Core i5-13500H
260 Seconds * +21%
Lenovo LOQ 15IRH8 Core i7
Intel Core i7-13620H
243 Seconds * +26%
HP Victus 15 fa0020nr
Intel Core i7-12700H
234 Seconds * +29%
Gigabyte G5 KE
Intel Core i5-12500H
230 Seconds * +30%
Lenovo LOQ 15IRX9
Intel Core i5-13450HX
229 Seconds * +31%
Gigabyte G5 KF5 2024
Intel Core i7-13620H
218 Seconds * +34%
Asus TUF Gaming A15 FA507UV
AMD Ryzen 9 8945H
182 Seconds * +45%
7-Zip 18.03 / 7z b 4
Asus TUF Gaming A15 FA507UV
AMD Ryzen 9 8945H
73222 MIPS +119%
Gigabyte G5 KF5 2024
Intel Core i7-13620H
60545 MIPS +81%
Lenovo LOQ 15IRX9
Intel Core i5-13450HX
59026 MIPS +76%
Lenovo LOQ 15IRH8 Core i7
Intel Core i7-13620H
55381 MIPS +65%
Gigabyte G5 KE
Intel Core i5-12500H
54380 MIPS +62%
HP Victus 15-fa1057ng
Intel Core i5-13500H
52066 MIPS +55%
HP Victus 15 fa0020nr
Intel Core i7-12700H
50905 MIPS +52%
Acer Nitro V 15 ANV15-51-582S
Intel Core i5-13420H
44970 MIPS +34%
Lenovo IdeaPad Gaming 3 15ARH7
AMD Ryzen 5 6600H
39886 MIPS +19%
Moyenne Intel Core i5-12450H
  (31119 - 38415, n=7)
33971 MIPS +1%
MSI Thin GF63 12VE
Intel Core i5-12450H
33491 MIPS
7-Zip 18.03 / 7z b 4 -mmt1
Asus TUF Gaming A15 FA507UV
AMD Ryzen 9 8945H
6615 MIPS +37%
Gigabyte G5 KF5 2024
Intel Core i7-13620H
6096 MIPS +26%
Lenovo LOQ 15IRH8 Core i7
Intel Core i7-13620H
5915 MIPS +23%
HP Victus 15 fa0020nr
Intel Core i7-12700H
5826 MIPS +21%
HP Victus 15-fa1057ng
Intel Core i5-13500H
5519 MIPS +14%
Lenovo IdeaPad Gaming 3 15ARH7
AMD Ryzen 5 6600H
5466 MIPS +13%
Gigabyte G5 KE
Intel Core i5-12500H
5383 MIPS +12%
Lenovo LOQ 15IRX9
Intel Core i5-13450HX
5370 MIPS +11%
Acer Nitro V 15 ANV15-51-582S
Intel Core i5-13420H
5331 MIPS +11%
Moyenne Intel Core i5-12450H
  (4824 - 5386, n=7)
5109 MIPS +6%
MSI Thin GF63 12VE
Intel Core i5-12450H
4824 MIPS
Geekbench 6.4 / Multi-Core
Gigabyte G5 KF5 2024
Intel Core i7-13620H
12779 Points +80%
Lenovo LOQ 15IRX9
Intel Core i5-13450HX
12684 Points +79%
Asus TUF Gaming A15 FA507UV
AMD Ryzen 9 8945H
12662 Points +79%
Lenovo LOQ 15IRH8 Core i7
Intel Core i7-13620H
12557 Points +77%
Acer Nitro V 15 ANV15-51-582S
Intel Core i5-13420H
9241 Points +31%
Moyenne Intel Core i5-12450H
  (7081 - 9109, n=7)
8200 Points +16%
MSI Thin GF63 12VE
Intel Core i5-12450H
7081 Points
Geekbench 6.4 / Single-Core
Asus TUF Gaming A15 FA507UV
AMD Ryzen 9 8945H
2711 Points +26%
Lenovo LOQ 15IRH8 Core i7
Intel Core i7-13620H
2592 Points +20%
Gigabyte G5 KF5 2024
Intel Core i7-13620H
2544 Points +18%
Lenovo LOQ 15IRX9
Intel Core i5-13450HX
2381 Points +10%
Acer Nitro V 15 ANV15-51-582S
Intel Core i5-13420H
2318 Points +8%
Moyenne Intel Core i5-12450H
  (2155 - 2293, n=7)
2226 Points +3%
MSI Thin GF63 12VE
Intel Core i5-12450H
2155 Points
Geekbench 5.5 / Multi-Core
Lenovo LOQ 15IRX9
Intel Core i5-13450HX
12005 Points +77%
Asus TUF Gaming A15 FA507UV
AMD Ryzen 9 8945H
11949 Points +76%
Gigabyte G5 KF5 2024
Intel Core i7-13620H
11699 Points +73%
Lenovo LOQ 15IRH8 Core i7
Intel Core i7-13620H
11430 Points +69%
HP Victus 15 fa0020nr
Intel Core i7-12700H
10348 Points +53%
Gigabyte G5 KE
Intel Core i5-12500H
10260 Points +51%
Acer Nitro V 15 ANV15-51-582S
Intel Core i5-13420H
8336 Points +23%
Moyenne Intel Core i5-12450H
  (6777 - 8330, n=7)
7342 Points +8%
MSI Thin GF63 12VE
Intel Core i5-12450H
6777 Points
Lenovo IdeaPad Gaming 3 15ARH7
AMD Ryzen 5 6600H
6403 Points -6%
Geekbench 5.5 / Single-Core
Asus TUF Gaming A15 FA507UV
AMD Ryzen 9 8945H
1991 Points +30%
Lenovo LOQ 15IRH8 Core i7
Intel Core i7-13620H
1865 Points +22%
Gigabyte G5 KF5 2024
Intel Core i7-13620H
1799 Points +18%
HP Victus 15 fa0020nr
Intel Core i7-12700H
1782 Points +17%
Lenovo LOQ 15IRX9
Intel Core i5-13450HX
1696 Points +11%
Acer Nitro V 15 ANV15-51-582S
Intel Core i5-13420H
1664 Points +9%
Gigabyte G5 KE
Intel Core i5-12500H
1647 Points +8%
Moyenne Intel Core i5-12450H
  (1527 - 1665, n=7)
1614 Points +6%
MSI Thin GF63 12VE
Intel Core i5-12450H
1527 Points
Lenovo IdeaPad Gaming 3 15ARH7
AMD Ryzen 5 6600H
1446 Points -5%
HWBOT x265 Benchmark v2.2 / 4k Preset
Asus TUF Gaming A15 FA507UV
AMD Ryzen 9 8945H
21.9 fps +90%
Gigabyte G5 KF5 2024
Intel Core i7-13620H
17.7 fps +54%
Lenovo LOQ 15IRX9
Intel Core i5-13450HX
17.5 fps +52%
Gigabyte G5 KE
Intel Core i5-12500H
16.6 fps +44%
Lenovo LOQ 15IRH8 Core i7
Intel Core i7-13620H
16.6 fps +44%
HP Victus 15 fa0020nr
Intel Core i7-12700H
15.7 fps +37%
HP Victus 15-fa1057ng
Intel Core i5-13500H
14.4 fps +25%
Acer Nitro V 15 ANV15-51-582S
Intel Core i5-13420H
13.3 fps +16%
Lenovo IdeaPad Gaming 3 15ARH7
AMD Ryzen 5 6600H
11.5 fps 0%
MSI Thin GF63 12VE
Intel Core i5-12450H
11.5 fps
Moyenne Intel Core i5-12450H
  (8.78 - 12.3, n=6)
10.5 fps -9%
LibreOffice / 20 Documents To PDF
HP Victus 15-fa1057ng
Intel Core i5-13500H
65.5 s * -9%
MSI Thin GF63 12VE
Intel Core i5-12450H
60.3 s *
Acer Nitro V 15 ANV15-51-582S
Intel Core i5-13420H
59.5 s * +1%
Lenovo LOQ 15IRX9
Intel Core i5-13450HX
59.3 s * +2%
Lenovo IdeaPad Gaming 3 15ARH7
AMD Ryzen 5 6600H
58.4 s * +3%
Gigabyte G5 KE
Intel Core i5-12500H
57.7 s * +4%
Gigabyte G5 KF5 2024
Intel Core i7-13620H
51.4 s * +15%
HP Victus 15 fa0020nr
Intel Core i7-12700H
49.3 s * +18%
Moyenne Intel Core i5-12450H
  (41.1 - 60.3, n=7)
48.2 s * +20%
Asus TUF Gaming A15 FA507UV
AMD Ryzen 9 8945H
47.5 s * +21%
Lenovo LOQ 15IRH8 Core i7
Intel Core i7-13620H
43.8 s * +27%
R Benchmark 2.5 / Overall mean
MSI Thin GF63 12VE
Intel Core i5-12450H
0.54 sec *
Lenovo IdeaPad Gaming 3 15ARH7
AMD Ryzen 5 6600H
0.532 sec * +1%
Moyenne Intel Core i5-12450H
  (0.4949 - 0.54, n=7)
0.517 sec * +4%
Acer Nitro V 15 ANV15-51-582S
Intel Core i5-13420H
0.516 sec * +4%
HP Victus 15-fa1057ng
Intel Core i5-13500H
0.51 sec * +6%
Gigabyte G5 KE
Intel Core i5-12500H
0.4865 sec * +10%
Lenovo LOQ 15IRX9
Intel Core i5-13450HX
0.4838 sec * +10%
HP Victus 15 fa0020nr
Intel Core i7-12700H
0.4715 sec * +13%
Lenovo LOQ 15IRH8 Core i7
Intel Core i7-13620H
0.4509 sec * +16%
Gigabyte G5 KF5 2024
Intel Core i7-13620H
0.446 sec * +17%
Asus TUF Gaming A15 FA507UV
AMD Ryzen 9 8945H
0.4298 sec * +20%

* ... Moindre est la valeur, meilleures sont les performances

Cinebench R15 CPU Multi 64Bit
1578 Points
Cinebench R15 OpenGL 64Bit
135.1 fps
Cinebench R15 Ref. Match 64Bit
99.6 %
Cinebench R15 CPU Single 64Bit
225 Points
Cinebench R20 CPU (Multi Core)
4029 Points
Cinebench R20 CPU (Single Core)
622 Points
Cinebench R23 Single Core
1601 Points
Cinebench R23 Multi Core
10633 Points
Aide
Performance Rating
Asus TUF A15 FA507
AMD Ryzen 7 7735HS, NVIDIA GeForce RTX 4050 Laptop GPU
91 pt
Lenovo LOQ 15IRX9
Intel Core i5-13450HX, NVIDIA GeForce RTX 4060 Laptop GPU
83.7 pt
HP Victus 15-fa1057ng
Intel Core i5-13500H, NVIDIA GeForce RTX 4050 Laptop GPU
69.4 pt
Acer Nitro V 15 ANV15-51-582S
Intel Core i5-13420H, NVIDIA GeForce RTX 4050 Laptop GPU
67.8 pt
MSI Thin GF63 12VE
Intel Core i5-12450H, NVIDIA GeForce RTX 4050 Laptop GPU
55.9 pt
Moyenne Intel Core i5-12450H
 
55.3 pt
AIDA64 / FP32 Ray-Trace
Asus TUF A15 FA507
AMD Ryzen 7 7735HS, NVIDIA GeForce RTX 4050 Laptop GPU
16315 KRay/s +56%
Lenovo LOQ 15IRX9
Intel Core i5-13450HX, NVIDIA GeForce RTX 4060 Laptop GPU
13747 KRay/s +31%
HP Victus 15-fa1057ng
Intel Core i5-13500H, NVIDIA GeForce RTX 4050 Laptop GPU
11489 KRay/s +10%
Acer Nitro V 15 ANV15-51-582S
Intel Core i5-13420H, NVIDIA GeForce RTX 4050 Laptop GPU
11106 KRay/s +6%
MSI Thin GF63 12VE
Intel Core i5-12450H, NVIDIA GeForce RTX 4050 Laptop GPU
10474 KRay/s
Moyenne Intel Core i5-12450H
  (7229 - 10474, n=6)
8823 KRay/s -16%
AIDA64 / FPU Julia
Asus TUF A15 FA507
AMD Ryzen 7 7735HS, NVIDIA GeForce RTX 4050 Laptop GPU
102221 Points +98%
Lenovo LOQ 15IRX9
Intel Core i5-13450HX, NVIDIA GeForce RTX 4060 Laptop GPU
71834 Points +39%
Acer Nitro V 15 ANV15-51-582S
Intel Core i5-13420H, NVIDIA GeForce RTX 4050 Laptop GPU
59715 Points +16%
HP Victus 15-fa1057ng
Intel Core i5-13500H, NVIDIA GeForce RTX 4050 Laptop GPU
57595 Points +12%
MSI Thin GF63 12VE
Intel Core i5-12450H, NVIDIA GeForce RTX 4050 Laptop GPU
51636 Points
Moyenne Intel Core i5-12450H
  (37583 - 51636, n=6)
44726 Points -13%
AIDA64 / CPU SHA3
Lenovo LOQ 15IRX9
Intel Core i5-13450HX, NVIDIA GeForce RTX 4060 Laptop GPU
3530 MB/s +50%
Asus TUF A15 FA507
AMD Ryzen 7 7735HS, NVIDIA GeForce RTX 4050 Laptop GPU
3421 MB/s +45%
Acer Nitro V 15 ANV15-51-582S
Intel Core i5-13420H, NVIDIA GeForce RTX 4050 Laptop GPU
2634 MB/s +12%
HP Victus 15-fa1057ng
Intel Core i5-13500H, NVIDIA GeForce RTX 4050 Laptop GPU
2621 MB/s +11%
MSI Thin GF63 12VE
Intel Core i5-12450H, NVIDIA GeForce RTX 4050 Laptop GPU
2359 MB/s
Moyenne Intel Core i5-12450H
  (1724 - 2359, n=6)
2042 MB/s -13%
AIDA64 / CPU Queen
Asus TUF A15 FA507
AMD Ryzen 7 7735HS, NVIDIA GeForce RTX 4050 Laptop GPU
103991 Points +53%
Lenovo LOQ 15IRX9
Intel Core i5-13450HX, NVIDIA GeForce RTX 4060 Laptop GPU
86148 Points +27%
HP Victus 15-fa1057ng
Intel Core i5-13500H, NVIDIA GeForce RTX 4050 Laptop GPU
77835 Points +15%
Acer Nitro V 15 ANV15-51-582S
Intel Core i5-13420H, NVIDIA GeForce RTX 4050 Laptop GPU
71286 Points +5%
MSI Thin GF63 12VE
Intel Core i5-12450H, NVIDIA GeForce RTX 4050 Laptop GPU
67959 Points
Moyenne Intel Core i5-12450H
  (59539 - 68897, n=6)
64206 Points -6%
AIDA64 / FPU SinJulia
Asus TUF A15 FA507
AMD Ryzen 7 7735HS, NVIDIA GeForce RTX 4050 Laptop GPU
12579 Points +105%
Lenovo LOQ 15IRX9
Intel Core i5-13450HX, NVIDIA GeForce RTX 4060 Laptop GPU
9344 Points +53%
HP Victus 15-fa1057ng
Intel Core i5-13500H, NVIDIA GeForce RTX 4050 Laptop GPU
7538 Points +23%
Acer Nitro V 15 ANV15-51-582S
Intel Core i5-13420H, NVIDIA GeForce RTX 4050 Laptop GPU
6622 Points +8%
MSI Thin GF63 12VE
Intel Core i5-12450H, NVIDIA GeForce RTX 4050 Laptop GPU
6124 Points
Moyenne Intel Core i5-12450H
  (5007 - 6147, n=6)
5667 Points -7%
AIDA64 / FPU Mandel
Asus TUF A15 FA507
AMD Ryzen 7 7735HS, NVIDIA GeForce RTX 4050 Laptop GPU
55524 Points +121%
Lenovo LOQ 15IRX9
Intel Core i5-13450HX, NVIDIA GeForce RTX 4060 Laptop GPU
34956 Points +39%
HP Victus 15-fa1057ng
Intel Core i5-13500H, NVIDIA GeForce RTX 4050 Laptop GPU
28657 Points +14%
Acer Nitro V 15 ANV15-51-582S
Intel Core i5-13420H, NVIDIA GeForce RTX 4050 Laptop GPU
27607 Points +10%
MSI Thin GF63 12VE
Intel Core i5-12450H, NVIDIA GeForce RTX 4050 Laptop GPU
25115 Points
Moyenne Intel Core i5-12450H
  (18516 - 25115, n=6)
21639 Points -14%
AIDA64 / CPU AES
Acer Nitro V 15 ANV15-51-582S
Intel Core i5-13420H, NVIDIA GeForce RTX 4050 Laptop GPU
93100 MB/s +99%
Lenovo LOQ 15IRX9
Intel Core i5-13450HX, NVIDIA GeForce RTX 4060 Laptop GPU
70330 MB/s +50%
Asus TUF A15 FA507
AMD Ryzen 7 7735HS, NVIDIA GeForce RTX 4050 Laptop GPU
66447 MB/s +42%
Moyenne Intel Core i5-12450H
  (46835 - 78537, n=6)
63661 MB/s +36%
HP Victus 15-fa1057ng
Intel Core i5-13500H, NVIDIA GeForce RTX 4050 Laptop GPU
62657 MB/s +34%
MSI Thin GF63 12VE
Intel Core i5-12450H, NVIDIA GeForce RTX 4050 Laptop GPU
46835 MB/s
AIDA64 / CPU ZLib
Lenovo LOQ 15IRX9
Intel Core i5-13450HX, NVIDIA GeForce RTX 4060 Laptop GPU
1002 MB/s +46%
HP Victus 15-fa1057ng
Intel Core i5-13500H, NVIDIA GeForce RTX 4050 Laptop GPU
947 MB/s +38%
Acer Nitro V 15 ANV15-51-582S
Intel Core i5-13420H, NVIDIA GeForce RTX 4050 Laptop GPU
744 MB/s +8%
MSI Thin GF63 12VE
Intel Core i5-12450H, NVIDIA GeForce RTX 4050 Laptop GPU
687 MB/s
Asus TUF A15 FA507
AMD Ryzen 7 7735HS, NVIDIA GeForce RTX 4050 Laptop GPU
651 MB/s -5%
Moyenne Intel Core i5-12450H
  (490 - 708, n=6)
596 MB/s -13%
AIDA64 / FP64 Ray-Trace
Asus TUF A15 FA507
AMD Ryzen 7 7735HS, NVIDIA GeForce RTX 4050 Laptop GPU
8556 KRay/s +52%
Lenovo LOQ 15IRX9
Intel Core i5-13450HX, NVIDIA GeForce RTX 4060 Laptop GPU
7428 KRay/s +32%
HP Victus 15-fa1057ng
Intel Core i5-13500H, NVIDIA GeForce RTX 4050 Laptop GPU
6106 KRay/s +9%
Acer Nitro V 15 ANV15-51-582S
Intel Core i5-13420H, NVIDIA GeForce RTX 4050 Laptop GPU
5831 KRay/s +4%
MSI Thin GF63 12VE
Intel Core i5-12450H, NVIDIA GeForce RTX 4050 Laptop GPU
5614 KRay/s
Moyenne Intel Core i5-12450H
  (4025 - 5614, n=6)
4797 KRay/s -15%
AIDA64 / CPU PhotoWorxx
Lenovo LOQ 15IRX9
Intel Core i5-13450HX, NVIDIA GeForce RTX 4060 Laptop GPU
36764 MPixel/s +200%
Asus TUF A15 FA507
AMD Ryzen 7 7735HS, NVIDIA GeForce RTX 4050 Laptop GPU
28318 MPixel/s +131%
HP Victus 15-fa1057ng
Intel Core i5-13500H, NVIDIA GeForce RTX 4050 Laptop GPU
26998 MPixel/s +120%
Moyenne Intel Core i5-12450H
  (12271 - 28682, n=6)
24704 MPixel/s +101%
Acer Nitro V 15 ANV15-51-582S
Intel Core i5-13420H, NVIDIA GeForce RTX 4050 Laptop GPU
23374 MPixel/s +90%
MSI Thin GF63 12VE
Intel Core i5-12450H, NVIDIA GeForce RTX 4050 Laptop GPU
12271 MPixel/s

Performance du système

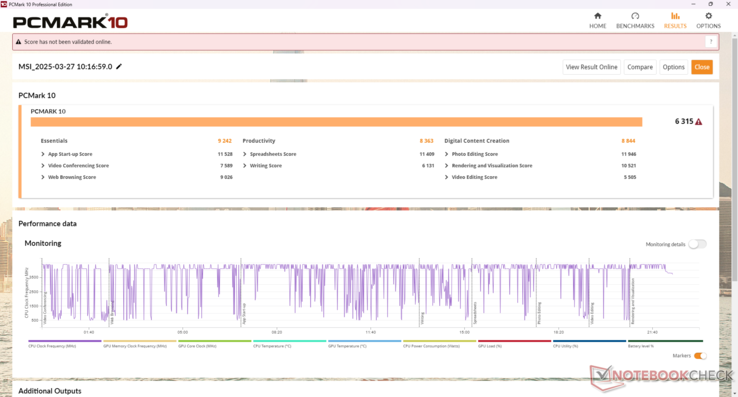
Les scores PCMark sont légèrement inférieurs à ceux de nombreux Core i5 concurrents, en partie à cause des 8 Go de RAM monocanal limités sur notre unité de test.

PCMark 10 Standard
PCMark 10 Standard
PCMark 10 / Score
Asus TUF A15 FA507
NVIDIA GeForce RTX 4050 Laptop GPU, R7 7735HS, Micron 2400 MTFDKBA512QFM
7210 Points +14%
Lenovo LOQ 15IRX9
NVIDIA GeForce RTX 4060 Laptop GPU, i5-13450HX, Micron 2400 MTFDKCD1T0QFM
6929 Points +10%
HP Victus 15-fa1057ng
NVIDIA GeForce RTX 4050 Laptop GPU, i5-13500H, Kioxia XG8 KXG80ZNV512G
6812 Points +8%
Acer Nitro V 15 ANV15-51-582S
NVIDIA GeForce RTX 4050 Laptop GPU, i5-13420H, SK hynix PC801 HFS512GEJ9X115N
6569 Points +4%
MSI Thin GF63 12VE
NVIDIA GeForce RTX 4050 Laptop GPU, i5-12450H, Micron 2400 MTFDKBA512QFM
6315 Points
Moyenne Intel Core i5-12450H, NVIDIA GeForce RTX 4050 Laptop GPU
  (n=1)
6315 Points 0%
MSI GF63 Thin 9SC
GeForce GTX 1650 Max-Q, i5-9300H, Toshiba KBG30ZMV512G
4889 Points -23%
PCMark 10 / Essentials
Asus TUF A15 FA507
NVIDIA GeForce RTX 4050 Laptop GPU, R7 7735HS, Micron 2400 MTFDKBA512QFM
10573 Points +14%
HP Victus 15-fa1057ng
NVIDIA GeForce RTX 4050 Laptop GPU, i5-13500H, Kioxia XG8 KXG80ZNV512G
9521 Points +3%
Acer Nitro V 15 ANV15-51-582S
NVIDIA GeForce RTX 4050 Laptop GPU, i5-13420H, SK hynix PC801 HFS512GEJ9X115N
9460 Points +2%
Lenovo LOQ 15IRX9
NVIDIA GeForce RTX 4060 Laptop GPU, i5-13450HX, Micron 2400 MTFDKCD1T0QFM
9379 Points +1%
MSI Thin GF63 12VE
NVIDIA GeForce RTX 4050 Laptop GPU, i5-12450H, Micron 2400 MTFDKBA512QFM
9242 Points
Moyenne Intel Core i5-12450H, NVIDIA GeForce RTX 4050 Laptop GPU
  (n=1)
9242 Points 0%
MSI GF63 Thin 9SC
GeForce GTX 1650 Max-Q, i5-9300H, Toshiba KBG30ZMV512G
8586 Points -7%
PCMark 10 / Productivity
Asus TUF A15 FA507
NVIDIA GeForce RTX 4050 Laptop GPU, R7 7735HS, Micron 2400 MTFDKBA512QFM
9313 Points +11%
HP Victus 15-fa1057ng
NVIDIA GeForce RTX 4050 Laptop GPU, i5-13500H, Kioxia XG8 KXG80ZNV512G
8890 Points +6%
Lenovo LOQ 15IRX9
NVIDIA GeForce RTX 4060 Laptop GPU, i5-13450HX, Micron 2400 MTFDKCD1T0QFM
8800 Points +5%
Acer Nitro V 15 ANV15-51-582S
NVIDIA GeForce RTX 4050 Laptop GPU, i5-13420H, SK hynix PC801 HFS512GEJ9X115N
8661 Points +4%
MSI Thin GF63 12VE
NVIDIA GeForce RTX 4050 Laptop GPU, i5-12450H, Micron 2400 MTFDKBA512QFM
8363 Points
Moyenne Intel Core i5-12450H, NVIDIA GeForce RTX 4050 Laptop GPU
  (n=1)
8363 Points 0%
MSI GF63 Thin 9SC
GeForce GTX 1650 Max-Q, i5-9300H, Toshiba KBG30ZMV512G
6768 Points -19%
PCMark 10 / Digital Content Creation
Lenovo LOQ 15IRX9
NVIDIA GeForce RTX 4060 Laptop GPU, i5-13450HX, Micron 2400 MTFDKCD1T0QFM
10937 Points +24%
Asus TUF A15 FA507
NVIDIA GeForce RTX 4050 Laptop GPU, R7 7735HS, Micron 2400 MTFDKBA512QFM
10333 Points +17%
HP Victus 15-fa1057ng
NVIDIA GeForce RTX 4050 Laptop GPU, i5-13500H, Kioxia XG8 KXG80ZNV512G
10134 Points +15%
Acer Nitro V 15 ANV15-51-582S
NVIDIA GeForce RTX 4050 Laptop GPU, i5-13420H, SK hynix PC801 HFS512GEJ9X115N
9388 Points +6%
MSI Thin GF63 12VE
NVIDIA GeForce RTX 4050 Laptop GPU, i5-12450H, Micron 2400 MTFDKBA512QFM
8844 Points
Moyenne Intel Core i5-12450H, NVIDIA GeForce RTX 4050 Laptop GPU
  (n=1)
8844 Points 0%
MSI GF63 Thin 9SC
GeForce GTX 1650 Max-Q, i5-9300H, Toshiba KBG30ZMV512G
5461 Points -38%
CrossMark / Overall
Lenovo LOQ 15IRX9
NVIDIA GeForce RTX 4060 Laptop GPU, i5-13450HX, Micron 2400 MTFDKCD1T0QFM
1804 Points +23%
Asus TUF A15 FA507
NVIDIA GeForce RTX 4050 Laptop GPU, R7 7735HS, Micron 2400 MTFDKBA512QFM
1550 Points +6%
MSI Thin GF63 12VE
NVIDIA GeForce RTX 4050 Laptop GPU, i5-12450H, Micron 2400 MTFDKBA512QFM
1463 Points
Moyenne Intel Core i5-12450H, NVIDIA GeForce RTX 4050 Laptop GPU
  (n=1)
1463 Points 0%
CrossMark / Productivity
Lenovo LOQ 15IRX9
NVIDIA GeForce RTX 4060 Laptop GPU, i5-13450HX, Micron 2400 MTFDKCD1T0QFM
1728 Points +13%
MSI Thin GF63 12VE
NVIDIA GeForce RTX 4050 Laptop GPU, i5-12450H, Micron 2400 MTFDKBA512QFM
1526 Points
Moyenne Intel Core i5-12450H, NVIDIA GeForce RTX 4050 Laptop GPU
  (n=1)
1526 Points 0%
Asus TUF A15 FA507
NVIDIA GeForce RTX 4050 Laptop GPU, R7 7735HS, Micron 2400 MTFDKBA512QFM
1517 Points -1%
CrossMark / Creativity
Lenovo LOQ 15IRX9
NVIDIA GeForce RTX 4060 Laptop GPU, i5-13450HX, Micron 2400 MTFDKCD1T0QFM
1904 Points +37%
Asus TUF A15 FA507
NVIDIA GeForce RTX 4050 Laptop GPU, R7 7735HS, Micron 2400 MTFDKBA512QFM
1709 Points +23%
MSI Thin GF63 12VE
NVIDIA GeForce RTX 4050 Laptop GPU, i5-12450H, Micron 2400 MTFDKBA512QFM
1389 Points
Moyenne Intel Core i5-12450H, NVIDIA GeForce RTX 4050 Laptop GPU
  (n=1)
1389 Points 0%
CrossMark / Responsiveness
Lenovo LOQ 15IRX9
NVIDIA GeForce RTX 4060 Laptop GPU, i5-13450HX, Micron 2400 MTFDKCD1T0QFM
1748 Points +16%
MSI Thin GF63 12VE
NVIDIA GeForce RTX 4050 Laptop GPU, i5-12450H, Micron 2400 MTFDKBA512QFM
1505 Points
Moyenne Intel Core i5-12450H, NVIDIA GeForce RTX 4050 Laptop GPU
  (n=1)
1505 Points 0%
Asus TUF A15 FA507
NVIDIA GeForce RTX 4050 Laptop GPU, R7 7735HS, Micron 2400 MTFDKBA512QFM
1231 Points -18%
WebXPRT 3 / Overall
Asus TUF A15 FA507
NVIDIA GeForce RTX 4050 Laptop GPU, R7 7735HS, Micron 2400 MTFDKBA512QFM
290 Points +15%
HP Victus 15-fa1057ng
NVIDIA GeForce RTX 4050 Laptop GPU, i5-13500H, Kioxia XG8 KXG80ZNV512G
267 Points +6%
Acer Nitro V 15 ANV15-51-582S
NVIDIA GeForce RTX 4050 Laptop GPU, i5-13420H, SK hynix PC801 HFS512GEJ9X115N
263 Points +4%
Lenovo LOQ 15IRX9
NVIDIA GeForce RTX 4060 Laptop GPU, i5-13450HX, Micron 2400 MTFDKCD1T0QFM
262 Points +4%
MSI Thin GF63 12VE
NVIDIA GeForce RTX 4050 Laptop GPU, i5-12450H, Micron 2400 MTFDKBA512QFM
253 Points
Moyenne Intel Core i5-12450H, NVIDIA GeForce RTX 4050 Laptop GPU
  (n=1)
253 Points 0%
WebXPRT 4 / Overall
Lenovo LOQ 15IRX9
NVIDIA GeForce RTX 4060 Laptop GPU, i5-13450HX, Micron 2400 MTFDKCD1T0QFM
243 Points +6%
Acer Nitro V 15 ANV15-51-582S
NVIDIA GeForce RTX 4050 Laptop GPU, i5-13420H, SK hynix PC801 HFS512GEJ9X115N
238 Points +4%
MSI Thin GF63 12VE
NVIDIA GeForce RTX 4050 Laptop GPU, i5-12450H, Micron 2400 MTFDKBA512QFM
229 Points
Moyenne Intel Core i5-12450H, NVIDIA GeForce RTX 4050 Laptop GPU
  (n=1)
229 Points 0%
Asus TUF A15 FA507
NVIDIA GeForce RTX 4050 Laptop GPU, R7 7735HS, Micron 2400 MTFDKBA512QFM
227 Points -1%
Mozilla Kraken 1.1 / Total
Asus TUF A15 FA507
NVIDIA GeForce RTX 4050 Laptop GPU, R7 7735HS, Micron 2400 MTFDKBA512QFM
594 ms * -1%
MSI Thin GF63 12VE
NVIDIA GeForce RTX 4050 Laptop GPU, i5-12450H, Micron 2400 MTFDKBA512QFM
590 ms *
Moyenne Intel Core i5-12450H, NVIDIA GeForce RTX 4050 Laptop GPU
  (n=1)
590 ms * -0%
Acer Nitro V 15 ANV15-51-582S
NVIDIA GeForce RTX 4050 Laptop GPU, i5-13420H, SK hynix PC801 HFS512GEJ9X115N
576 ms * +2%
Lenovo LOQ 15IRX9
NVIDIA GeForce RTX 4060 Laptop GPU, i5-13450HX, Micron 2400 MTFDKCD1T0QFM
550 ms * +7%
HP Victus 15-fa1057ng
NVIDIA GeForce RTX 4050 Laptop GPU, i5-13500H, Kioxia XG8 KXG80ZNV512G
545 ms * +8%

* ... Moindre est la valeur, meilleures sont les performances

PCMark 10 Score
6315 points
Aide
AIDA64 / Memory Copy
Lenovo LOQ 15IRX9
Intel Core i5-13450HX, NVIDIA GeForce RTX 4060 Laptop GPU
58673 MB/s +170%
Asus TUF A15 FA507
AMD Ryzen 7 7735HS, NVIDIA GeForce RTX 4050 Laptop GPU
48432 MB/s +123%
HP Victus 15-fa1057ng
Intel Core i5-13500H, NVIDIA GeForce RTX 4050 Laptop GPU
44253 MB/s +103%
Moyenne Intel Core i5-12450H
  (21750 - 43918, n=6)
39769 MB/s +83%
Acer Nitro V 15 ANV15-51-582S
Intel Core i5-13420H, NVIDIA GeForce RTX 4050 Laptop GPU
35890 MB/s +65%
MSI Thin GF63 12VE
Intel Core i5-12450H, NVIDIA GeForce RTX 4050 Laptop GPU
21750 MB/s
AIDA64 / Memory Read
Lenovo LOQ 15IRX9
Intel Core i5-13450HX, NVIDIA GeForce RTX 4060 Laptop GPU
68109 MB/s +197%
Asus TUF A15 FA507
AMD Ryzen 7 7735HS, NVIDIA GeForce RTX 4050 Laptop GPU
49994 MB/s +118%
HP Victus 15-fa1057ng
Intel Core i5-13500H, NVIDIA GeForce RTX 4050 Laptop GPU
46858 MB/s +104%
Moyenne Intel Core i5-12450H
  (22956 - 47555, n=6)
42429 MB/s +85%
Acer Nitro V 15 ANV15-51-582S
Intel Core i5-13420H, NVIDIA GeForce RTX 4050 Laptop GPU
39797 MB/s +73%
MSI Thin GF63 12VE
Intel Core i5-12450H, NVIDIA GeForce RTX 4050 Laptop GPU
22956 MB/s
AIDA64 / Memory Write
Lenovo LOQ 15IRX9
Intel Core i5-13450HX, NVIDIA GeForce RTX 4060 Laptop GPU
59981 MB/s +169%
Asus TUF A15 FA507
AMD Ryzen 7 7735HS, NVIDIA GeForce RTX 4050 Laptop GPU
54997 MB/s +147%
HP Victus 15-fa1057ng
Intel Core i5-13500H, NVIDIA GeForce RTX 4050 Laptop GPU
46904 MB/s +110%
Moyenne Intel Core i5-12450H
  (22297 - 46963, n=6)
42160 MB/s +89%
Acer Nitro V 15 ANV15-51-582S
Intel Core i5-13420H, NVIDIA GeForce RTX 4050 Laptop GPU
36463 MB/s +64%
MSI Thin GF63 12VE
Intel Core i5-12450H, NVIDIA GeForce RTX 4050 Laptop GPU
22297 MB/s
AIDA64 / Memory Latency
MSI Thin GF63 12VE
Intel Core i5-12450H, NVIDIA GeForce RTX 4050 Laptop GPU
98.4 ns *
Lenovo LOQ 15IRX9
Intel Core i5-13450HX, NVIDIA GeForce RTX 4060 Laptop GPU
94.2 ns * +4%
Acer Nitro V 15 ANV15-51-582S
Intel Core i5-13420H, NVIDIA GeForce RTX 4050 Laptop GPU
90.2 ns * +8%
HP Victus 15-fa1057ng
Intel Core i5-13500H, NVIDIA GeForce RTX 4050 Laptop GPU
87.5 ns * +11%
Moyenne Intel Core i5-12450H
  (76.5 - 100.9, n=6)
84.7 ns * +14%
Asus TUF A15 FA507
AMD Ryzen 7 7735HS, NVIDIA GeForce RTX 4050 Laptop GPU
82.2 ns * +16%

* ... Moindre est la valeur, meilleures sont les performances

Latence DPC

LatencyMon
LatencyMon
Liste des conducteurs
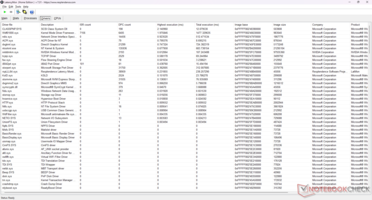
DPC Latencies / LatencyMon - interrupt to process latency (max), Web, Youtube, Prime95
MSI Thin GF63 12VE
NVIDIA GeForce RTX 4050 Laptop GPU, i5-12450H, Micron 2400 MTFDKBA512QFM
5984.2 μs *
HP Victus 15-fa1057ng
NVIDIA GeForce RTX 4050 Laptop GPU, i5-13500H, Kioxia XG8 KXG80ZNV512G
3622 μs * +39%
Lenovo LOQ 15IRX9
NVIDIA GeForce RTX 4060 Laptop GPU, i5-13450HX, Micron 2400 MTFDKCD1T0QFM
1689.3 μs * +72%
Acer Nitro V 15 ANV15-51-582S
NVIDIA GeForce RTX 4050 Laptop GPU, i5-13420H, SK hynix PC801 HFS512GEJ9X115N
1066 μs * +82%

* ... Moindre est la valeur, meilleures sont les performances

Dispositifs de stockage

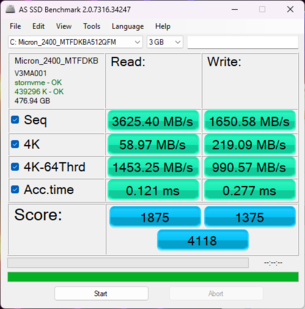
AS SSD
AS SSD
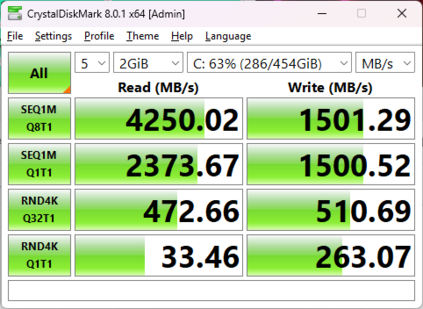
CDM 8
CDM 8
Micron 2400 MTFDKBA512QFM
CDM 5/6 Read Seq Q32T1: 4291 MB/s
CDM 5/6 Write Seq Q32T1: 1511 MB/s
CDM 5/6 Read 4K Q32T1: 719.1 MB/s
CDM 5/6 Write 4K Q32T1: 516.9 MB/s
CDM 5 Read Seq: 2373 MB/s
CDM 5 Write Seq: 1494 MB/s
CDM 5/6 Read 4K: 36.05 MB/s
CDM 5/6 Write 4K: 251.1 MB/s
Drive Performance Rating - Percent
Acer Nitro V 15 ANV15-51-582S
SK hynix PC801 HFS512GEJ9X115N
88.3 pt
Lenovo LOQ 15IRX9
Micron 2400 MTFDKCD1T0QFM
83 pt
HP Victus 15-fa1057ng
Kioxia XG8 KXG80ZNV512G
75.4 pt
MSI Thin GF63 12VE
Micron 2400 MTFDKBA512QFM
55.8 pt
Asus TUF A15 FA507
Micron 2400 MTFDKBA512QFM
47.9 pt
MSI GF63 Thin 9SC -8!
Toshiba KBG30ZMV512G
29.5 pt
DiskSpd
seq read
HP Victus 15-fa1057ng
Kioxia XG8 KXG80ZNV512G
2866 (2793.62min - 2866.04max) MB/s +40%
Acer Nitro V 15 ANV15-51-582S
SK hynix PC801 HFS512GEJ9X115N
2805 (2758.32min - 2804.94max) MB/s +37%
Lenovo LOQ 15IRX9
Micron 2400 MTFDKCD1T0QFM
2364 (2348.18min - 2364.12max) MB/s +16%
MSI Thin GF63 12VE
Micron 2400 MTFDKBA512QFM
2041 (2033.82min - 2041.27max) MB/s
Asus TUF A15 FA507
Micron 2400 MTFDKBA512QFM
1759 (1754.48min - 1759.3max) MB/s -14%
Asus TUF A15 FA507
Micron 2400 MTFDKBA512QFM
1759 (1754.48min - 1759.3max) MB/s -14%
seq write
Acer Nitro V 15 ANV15-51-582S
SK hynix PC801 HFS512GEJ9X115N
3634 (3531.46min - 3633.74max) MB/s +150%
HP Victus 15-fa1057ng
Kioxia XG8 KXG80ZNV512G
3526 (3357.33min - 3526.44max) MB/s +143%
Lenovo LOQ 15IRX9
Micron 2400 MTFDKCD1T0QFM
3103 (3061.84min - 3102.82max) MB/s +113%
Asus TUF A15 FA507
Micron 2400 MTFDKBA512QFM
1554 (1534.35min - 1553.61max) MB/s +7%
Asus TUF A15 FA507
Micron 2400 MTFDKBA512QFM
1554 (1534.35min - 1553.61max) MB/s +7%
MSI Thin GF63 12VE
Micron 2400 MTFDKBA512QFM
1454 (1284.03min - 1454.17max) MB/s
seq q8 t1 read
HP Victus 15-fa1057ng
Kioxia XG8 KXG80ZNV512G
6270 (5201.78min - 6270.02max) MB/s +53%
Lenovo LOQ 15IRX9
Micron 2400 MTFDKCD1T0QFM
4611 (4173.71min - 4610.79max) MB/s +13%
Acer Nitro V 15 ANV15-51-582S
SK hynix PC801 HFS512GEJ9X115N
4407 (3618.43min - 4407.38max) MB/s +8%
MSI Thin GF63 12VE
Micron 2400 MTFDKBA512QFM
4085 (3607.02min - 4085.26max) MB/s
Asus TUF A15 FA507
Micron 2400 MTFDKBA512QFM
3886 (3200.77min - 3885.81max) MB/s -5%
Asus TUF A15 FA507
Micron 2400 MTFDKBA512QFM
3886 (3200.77min - 3885.81max) MB/s -5%
seq q8 t1 write
HP Victus 15-fa1057ng
Kioxia XG8 KXG80ZNV512G
5013 (4747.47min - 5013.45max) MB/s +195%
Acer Nitro V 15 ANV15-51-582S
SK hynix PC801 HFS512GEJ9X115N
4510 (4458.34min - 4509.93max) MB/s +165%
Lenovo LOQ 15IRX9
Micron 2400 MTFDKCD1T0QFM
3612 (3558.24min - 3612.04max) MB/s +113%
MSI Thin GF63 12VE
Micron 2400 MTFDKBA512QFM
1699 (1615.56min - 1698.65max) MB/s
Asus TUF A15 FA507
Micron 2400 MTFDKBA512QFM
1640 (1630.54min - 1639.84max) MB/s -3%
Asus TUF A15 FA507
Micron 2400 MTFDKBA512QFM
1640 (1630.54min - 1639.84max) MB/s -3%
4k q1 t1 read
HP Victus 15-fa1057ng
Kioxia XG8 KXG80ZNV512G
58 (56.64min - 57.95max) MB/s +56%
Acer Nitro V 15 ANV15-51-582S
SK hynix PC801 HFS512GEJ9X115N
54.6 (53.33min - 54.58max) MB/s +47%
Lenovo LOQ 15IRX9
Micron 2400 MTFDKCD1T0QFM
54.4 (52.28min - 54.35max) MB/s +47%
MSI Thin GF63 12VE
Micron 2400 MTFDKBA512QFM
37.1 (36.78min - 37.05max) MB/s
Asus TUF A15 FA507
Micron 2400 MTFDKBA512QFM
32.6 (32.27min - 32.56max) MB/s -12%
Asus TUF A15 FA507
Micron 2400 MTFDKBA512QFM
32.6 (32.27min - 32.56max) MB/s -12%
4k q1 t1 write
Acer Nitro V 15 ANV15-51-582S
SK hynix PC801 HFS512GEJ9X115N
313 (306.58min - 313.25max) MB/s +18%
Lenovo LOQ 15IRX9
Micron 2400 MTFDKCD1T0QFM
266 (259.13min - 265.64max) MB/s 0%
MSI Thin GF63 12VE
Micron 2400 MTFDKBA512QFM
266 (260.28min - 265.97max) MB/s
HP Victus 15-fa1057ng
Kioxia XG8 KXG80ZNV512G
137.8 (136.03min - 137.79max) MB/s -48%
Asus TUF A15 FA507
Micron 2400 MTFDKBA512QFM
129.5 (125.88min - 129.52max) MB/s -51%
Asus TUF A15 FA507
Micron 2400 MTFDKBA512QFM
129.5 (125.88min - 129.52max) MB/s -51%
4k q32 t16 read
Acer Nitro V 15 ANV15-51-582S
SK hynix PC801 HFS512GEJ9X115N
3321 (3296.83min - 3320.83max) MB/s +321%
Lenovo LOQ 15IRX9
Micron 2400 MTFDKCD1T0QFM
2852 (1702.21min - 2851.88max) MB/s +261%
HP Victus 15-fa1057ng
Kioxia XG8 KXG80ZNV512G
864 (769.87min - 864.23max) MB/s +10%
Asus TUF A15 FA507
Micron 2400 MTFDKBA512QFM
789 (769.77min - 789.25max) MB/s 0%
Asus TUF A15 FA507
Micron 2400 MTFDKBA512QFM
789 (769.77min - 789.25max) MB/s 0%
MSI Thin GF63 12VE
Micron 2400 MTFDKBA512QFM
789 (727.22min - 788.89max) MB/s
4k q32 t16 write
Acer Nitro V 15 ANV15-51-582S
SK hynix PC801 HFS512GEJ9X115N
2826 (2756.6min - 2826.42max) MB/s +161%
Lenovo LOQ 15IRX9
Micron 2400 MTFDKCD1T0QFM
2535 (2457.97min - 2535.38max) MB/s +134%
MSI Thin GF63 12VE
Micron 2400 MTFDKBA512QFM
1083 (1052.84min - 1082.71max) MB/s
HP Victus 15-fa1057ng
Kioxia XG8 KXG80ZNV512G
452 (444.25min - 452.18max) MB/s -58%
Asus TUF A15 FA507
Micron 2400 MTFDKBA512QFM
314 (293.25min - 314.3max) MB/s -71%
Asus TUF A15 FA507
Micron 2400 MTFDKBA512QFM
314 (293.25min - 314.3max) MB/s -71%
AS SSD
Score Total
Acer Nitro V 15 ANV15-51-582S
SK hynix PC801 HFS512GEJ9X115N
6452 Points +57%
Lenovo LOQ 15IRX9
Micron 2400 MTFDKCD1T0QFM
5947 Points +44%
HP Victus 15-fa1057ng
Kioxia XG8 KXG80ZNV512G
4745 Points +15%
MSI Thin GF63 12VE
Micron 2400 MTFDKBA512QFM
4118 Points
Asus TUF A15 FA507
Micron 2400 MTFDKBA512QFM
3315 Points -19%
MSI GF63 Thin 9SC
Toshiba KBG30ZMV512G
2025 Points -51%
Score Read
Acer Nitro V 15 ANV15-51-582S
SK hynix PC801 HFS512GEJ9X115N
2812 Points +50%
Lenovo LOQ 15IRX9
Micron 2400 MTFDKCD1T0QFM
2363 Points +26%
MSI Thin GF63 12VE
Micron 2400 MTFDKBA512QFM
1875 Points
HP Victus 15-fa1057ng
Kioxia XG8 KXG80ZNV512G
1331 Points -29%
Asus TUF A15 FA507
Micron 2400 MTFDKBA512QFM
1116 Points -40%
MSI GF63 Thin 9SC
Toshiba KBG30ZMV512G
1087 Points -42%
Score Write
HP Victus 15-fa1057ng
Kioxia XG8 KXG80ZNV512G
2843 Points +107%
Lenovo LOQ 15IRX9
Micron 2400 MTFDKCD1T0QFM
2414 Points +76%
Acer Nitro V 15 ANV15-51-582S
SK hynix PC801 HFS512GEJ9X115N
2271 Points +65%
Asus TUF A15 FA507
Micron 2400 MTFDKBA512QFM
1735 Points +26%
MSI Thin GF63 12VE
Micron 2400 MTFDKBA512QFM
1375 Points
MSI GF63 Thin 9SC
Toshiba KBG30ZMV512G
408 Points -70%
Seq Read
HP Victus 15-fa1057ng
Kioxia XG8 KXG80ZNV512G
5161.69 MB/s +42%
Acer Nitro V 15 ANV15-51-582S
SK hynix PC801 HFS512GEJ9X115N
4076.28 MB/s +12%
Lenovo LOQ 15IRX9
Micron 2400 MTFDKCD1T0QFM
3796.49 MB/s +5%
MSI Thin GF63 12VE
Micron 2400 MTFDKBA512QFM
3625.4 MB/s
Asus TUF A15 FA507
Micron 2400 MTFDKBA512QFM
3466 MB/s -4%
MSI GF63 Thin 9SC
Toshiba KBG30ZMV512G
1342 MB/s -63%
Seq Write
Lenovo LOQ 15IRX9
Micron 2400 MTFDKCD1T0QFM
3051.23 MB/s +15%
Acer Nitro V 15 ANV15-51-582S
SK hynix PC801 HFS512GEJ9X115N
2781.86 MB/s +5%
HP Victus 15-fa1057ng
Kioxia XG8 KXG80ZNV512G
2706.08 MB/s +2%
MSI Thin GF63 12VE
Micron 2400 MTFDKBA512QFM
2650.58 MB/s
Asus TUF A15 FA507
Micron 2400 MTFDKBA512QFM
1295 MB/s -51%
MSI GF63 Thin 9SC
Toshiba KBG30ZMV512G
640 MB/s -76%
4K Read
MSI Thin GF63 12VE
Micron 2400 MTFDKBA512QFM
58.97 MB/s
HP Victus 15-fa1057ng
Kioxia XG8 KXG80ZNV512G
56.57 MB/s -4%
Acer Nitro V 15 ANV15-51-582S
SK hynix PC801 HFS512GEJ9X115N
56.08 MB/s -5%
Lenovo LOQ 15IRX9
Micron 2400 MTFDKCD1T0QFM
53.84 MB/s -9%
MSI GF63 Thin 9SC
Toshiba KBG30ZMV512G
43.19 MB/s -27%
Asus TUF A15 FA507
Micron 2400 MTFDKBA512QFM
30.4 MB/s -48%
4K Write
Acer Nitro V 15 ANV15-51-582S
SK hynix PC801 HFS512GEJ9X115N
291.16 MB/s +33%
Lenovo LOQ 15IRX9
Micron 2400 MTFDKCD1T0QFM
226.41 MB/s +3%
MSI Thin GF63 12VE
Micron 2400 MTFDKBA512QFM
219.09 MB/s
HP Victus 15-fa1057ng
Kioxia XG8 KXG80ZNV512G
180.28 MB/s -18%
Asus TUF A15 FA507
Micron 2400 MTFDKBA512QFM
137.5 MB/s -37%
MSI GF63 Thin 9SC
Toshiba KBG30ZMV512G
89.2 MB/s -59%
4K-64 Read
Acer Nitro V 15 ANV15-51-582S
SK hynix PC801 HFS512GEJ9X115N
2347.96 MB/s +62%
Lenovo LOQ 15IRX9
Micron 2400 MTFDKCD1T0QFM
1929.3 MB/s +33%
MSI Thin GF63 12VE
Micron 2400 MTFDKBA512QFM
1453.25 MB/s
MSI GF63 Thin 9SC
Toshiba KBG30ZMV512G
910 MB/s -37%
HP Victus 15-fa1057ng
Kioxia XG8 KXG80ZNV512G
758.5 MB/s -48%
Asus TUF A15 FA507
Micron 2400 MTFDKBA512QFM
739 MB/s -49%
4K-64 Write
HP Victus 15-fa1057ng
Kioxia XG8 KXG80ZNV512G
2392.18 MB/s +141%
Lenovo LOQ 15IRX9
Micron 2400 MTFDKCD1T0QFM
1882 MB/s +90%
Acer Nitro V 15 ANV15-51-582S
SK hynix PC801 HFS512GEJ9X115N
1701.44 MB/s +72%
Asus TUF A15 FA507
Micron 2400 MTFDKBA512QFM
1468 MB/s +48%
MSI Thin GF63 12VE
Micron 2400 MTFDKBA512QFM
990.57 MB/s
MSI GF63 Thin 9SC
Toshiba KBG30ZMV512G
254.3 MB/s -74%
Access Time Read
MSI GF63 Thin 9SC
Toshiba KBG30ZMV512G
0.162 ms * -34%
MSI Thin GF63 12VE
Micron 2400 MTFDKBA512QFM
0.121 ms *
Acer Nitro V 15 ANV15-51-582S
SK hynix PC801 HFS512GEJ9X115N
0.089 ms * +26%
HP Victus 15-fa1057ng
Kioxia XG8 KXG80ZNV512G
0.069 ms * +43%
Asus TUF A15 FA507
Micron 2400 MTFDKBA512QFM
0.039 ms * +68%
Lenovo LOQ 15IRX9
Micron 2400 MTFDKCD1T0QFM
0.033 ms * +73%
Access Time Write
MSI Thin GF63 12VE
Micron 2400 MTFDKBA512QFM
0.277 ms *
MSI GF63 Thin 9SC
Toshiba KBG30ZMV512G
0.166 ms * +40%
Asus TUF A15 FA507
Micron 2400 MTFDKBA512QFM
0.139 ms * +50%
Acer Nitro V 15 ANV15-51-582S
SK hynix PC801 HFS512GEJ9X115N
0.098 ms * +65%
Lenovo LOQ 15IRX9
Micron 2400 MTFDKCD1T0QFM
0.097 ms * +65%
HP Victus 15-fa1057ng
Kioxia XG8 KXG80ZNV512G
0.021 ms * +92%

* ... Moindre est la valeur, meilleures sont les performances

Disk Throttling: DiskSpd Read Loop, Queue Depth 8

0210420630840105012601470168018902100231025202730294031503360357037803990Tooltip
MSI Thin GF63 12VE; diskspd 2.0.17 f: Ø4088 (3599.69-4112.89)

Performance du GPU

Les performances graphiques sont inférieures à la moyenne par rapport à d'autres ordinateurs portables dotés du même GPU RTX 4050 le même GPU RTX 4050 en grande partie à cause de notre mémoire vive limitée à 8 Go.

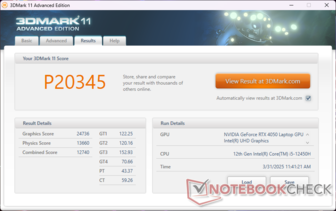
3DMark 11
3DMark 11
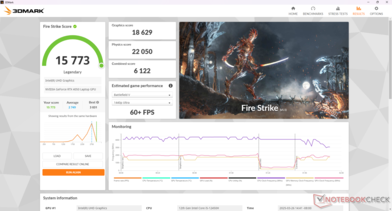
Fire Strike
Fire Strike
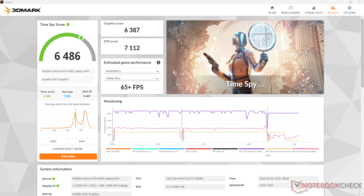
Time Spy
Time Spy
Voie rapide
Voie rapide
3DMark Performance Rating - Percent
Asus TUF Gaming A15 FA507UV -1!
NVIDIA GeForce RTX 4060 Laptop GPU, AMD Ryzen 9 8945H
100 pt
Lenovo LOQ 15IRX9 -1!
NVIDIA GeForce RTX 4060 Laptop GPU, Intel Core i5-13450HX
96.8 pt
Gigabyte G5 KF5 2024 -1!
NVIDIA GeForce RTX 4060 Laptop GPU, Intel Core i7-13620H
90.5 pt
Gigabyte G5 KE
NVIDIA GeForce RTX 3060 Laptop GPU, Intel Core i5-12500H
86.8 pt
Lenovo LOQ 15IRH8 Core i7
NVIDIA GeForce RTX 4050 Laptop GPU, Intel Core i7-13620H
84.5 pt
Moyenne NVIDIA GeForce RTX 4050 Laptop GPU
 
78.4 pt
HP Victus 15-fa1057ng -1!
NVIDIA GeForce RTX 4050 Laptop GPU, Intel Core i5-13500H
78 pt
Acer Nitro V 15 ANV15-51-582S -1!
NVIDIA GeForce RTX 4050 Laptop GPU, Intel Core i5-13420H
77 pt
MSI Thin GF63 12VE
NVIDIA GeForce RTX 4050 Laptop GPU, Intel Core i5-12450H
67.3 pt
Lenovo IdeaPad Gaming 3 15ARH7 -1!
NVIDIA GeForce RTX 3050 4GB Laptop GPU, AMD Ryzen 5 6600H
51.1 pt
HP Victus 15 fa0020nr
NVIDIA GeForce RTX 3050 Ti Laptop GPU, Intel Core i7-12700H
43.6 pt
3DMark 11 - 1280x720 Performance GPU
Asus TUF Gaming A15 FA507UV
NVIDIA GeForce RTX 4060 Laptop GPU, AMD Ryzen 9 8945H
36493 Points +48%
Lenovo LOQ 15IRX9
NVIDIA GeForce RTX 4060 Laptop GPU, Intel Core i5-13450HX
35608 Points +44%
Gigabyte G5 KF5 2024
NVIDIA GeForce RTX 4060 Laptop GPU, Intel Core i7-13620H
32903 Points +33%
Lenovo LOQ 15IRH8 Core i7
NVIDIA GeForce RTX 4050 Laptop GPU, Intel Core i7-13620H
30943 Points +25%
Gigabyte G5 KE
NVIDIA GeForce RTX 3060 Laptop GPU, Intel Core i5-12500H
29569 Points +20%
HP Victus 15-fa1057ng
NVIDIA GeForce RTX 4050 Laptop GPU, Intel Core i5-13500H
28713 Points +16%
Acer Nitro V 15 ANV15-51-582S
NVIDIA GeForce RTX 4050 Laptop GPU, Intel Core i5-13420H
28643 Points +16%
Moyenne NVIDIA GeForce RTX 4050 Laptop GPU
  (13339 - 32642, n=41)
28461 Points +15%
MSI Thin GF63 12VE
NVIDIA GeForce RTX 4050 Laptop GPU, Intel Core i5-12450H
24736 Points
HP Victus 15 fa0020nr
NVIDIA GeForce RTX 3050 Ti Laptop GPU, Intel Core i7-12700H
19416 Points -22%
Lenovo IdeaPad Gaming 3 15ARH7
NVIDIA GeForce RTX 3050 4GB Laptop GPU, AMD Ryzen 5 6600H
18557 Points -25%
3DMark
1920x1080 Fire Strike Graphics
Asus TUF Gaming A15 FA507UV
NVIDIA GeForce RTX 4060 Laptop GPU, AMD Ryzen 9 8945H
28015 Points +50%
Lenovo LOQ 15IRX9
NVIDIA GeForce RTX 4060 Laptop GPU, Intel Core i5-13450HX
27026 Points +45%
Gigabyte G5 KF5 2024
NVIDIA GeForce RTX 4060 Laptop GPU, Intel Core i7-13620H
25556 Points +37%
Gigabyte G5 KE
NVIDIA GeForce RTX 3060 Laptop GPU, Intel Core i5-12500H
22625 Points +21%
Lenovo LOQ 15IRH8 Core i7
NVIDIA GeForce RTX 4050 Laptop GPU, Intel Core i7-13620H
22068 Points +18%
HP Victus 15-fa1057ng
NVIDIA GeForce RTX 4050 Laptop GPU, Intel Core i5-13500H
21949 Points +18%
Acer Nitro V 15 ANV15-51-582S
NVIDIA GeForce RTX 4050 Laptop GPU, Intel Core i5-13420H
21198 Points +14%
Moyenne NVIDIA GeForce RTX 4050 Laptop GPU
  (13591 - 24007, n=39)
21010 Points +13%
MSI Thin GF63 12VE
NVIDIA GeForce RTX 4050 Laptop GPU, Intel Core i5-12450H
18629 Points
HP Victus 15 fa0020nr
NVIDIA GeForce RTX 3050 Ti Laptop GPU, Intel Core i7-12700H
14628 Points -21%
Lenovo IdeaPad Gaming 3 15ARH7
NVIDIA GeForce RTX 3050 4GB Laptop GPU, AMD Ryzen 5 6600H
14157 Points -24%
2560x1440 Time Spy Graphics
Asus TUF Gaming A15 FA507UV
NVIDIA GeForce RTX 4060 Laptop GPU, AMD Ryzen 9 8945H
10189 Points +60%
Lenovo LOQ 15IRX9
NVIDIA GeForce RTX 4060 Laptop GPU, Intel Core i5-13450HX
9830 Points +54%
Gigabyte G5 KF5 2024
NVIDIA GeForce RTX 4060 Laptop GPU, Intel Core i7-13620H
9183 Points +44%
Gigabyte G5 KE
NVIDIA GeForce RTX 3060 Laptop GPU, Intel Core i5-12500H
8686 Points +36%
Lenovo LOQ 15IRH8 Core i7
NVIDIA GeForce RTX 4050 Laptop GPU, Intel Core i7-13620H
8589 Points +34%
HP Victus 15-fa1057ng
NVIDIA GeForce RTX 4050 Laptop GPU, Intel Core i5-13500H
7843 Points +23%
Acer Nitro V 15 ANV15-51-582S
NVIDIA GeForce RTX 4050 Laptop GPU, Intel Core i5-13420H
7818 Points +22%
Moyenne NVIDIA GeForce RTX 4050 Laptop GPU
  (5107 - 9040, n=39)
7751 Points +21%
MSI Thin GF63 12VE
NVIDIA GeForce RTX 4050 Laptop GPU, Intel Core i5-12450H
6387 Points
HP Victus 15 fa0020nr
NVIDIA GeForce RTX 3050 Ti Laptop GPU, Intel Core i7-12700H
5481 Points -14%
Lenovo IdeaPad Gaming 3 15ARH7
NVIDIA GeForce RTX 3050 4GB Laptop GPU, AMD Ryzen 5 6600H
5295 Points -17%
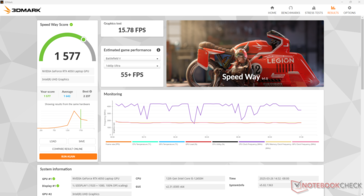
2560x1440 Speed Way Score
Gigabyte G5 KE
NVIDIA GeForce RTX 3060 Laptop GPU, Intel Core i5-12500H
2189 Points +39%
Lenovo LOQ 15IRH8 Core i7
NVIDIA GeForce RTX 4050 Laptop GPU, Intel Core i7-13620H
1974 Points +25%
Moyenne NVIDIA GeForce RTX 4050 Laptop GPU
  (1475 - 2078, n=16)
1854 Points +18%
MSI Thin GF63 12VE
NVIDIA GeForce RTX 4050 Laptop GPU, Intel Core i5-12450H
1577 Points
HP Victus 15 fa0020nr
NVIDIA GeForce RTX 3050 Ti Laptop GPU, Intel Core i7-12700H
334 Points -79%
3DMark 11 Performance
20345 points
3DMark Fire Strike Score
15773 points
3DMark Time Spy Score
6486 points
Aide
Blender
v3.3 Classroom HIP/AMD
Lenovo IdeaPad Gaming 3 15ARH7
NVIDIA GeForce RTX 3050 4GB Laptop GPU, AMD Ryzen 5 6600H
668 Seconds *
Moyenne NVIDIA GeForce RTX 4050 Laptop GPU
  (345 - 345, n=2)
345 Seconds *
v3.3 Classroom OPTIX/RTX
Lenovo IdeaPad Gaming 3 15ARH7
NVIDIA GeForce RTX 3050 4GB Laptop GPU, AMD Ryzen 5 6600H
53 Seconds * -66%
HP Victus 15 fa0020nr
NVIDIA GeForce RTX 3050 Ti Laptop GPU, Intel Core i7-12700H
48 Seconds * -50%
MSI Thin GF63 12VE
NVIDIA GeForce RTX 4050 Laptop GPU, Intel Core i5-12450H
32 Seconds *
Gigabyte G5 KE
NVIDIA GeForce RTX 3060 Laptop GPU, Intel Core i5-12500H
30 Seconds * +6%
Acer Nitro V 15 ANV15-51-582S
NVIDIA GeForce RTX 4050 Laptop GPU, Intel Core i5-13420H
30 Seconds * +6%
HP Victus 15-fa1057ng
NVIDIA GeForce RTX 4050 Laptop GPU, Intel Core i5-13500H
30 Seconds * +6%
Moyenne NVIDIA GeForce RTX 4050 Laptop GPU
  (25 - 37, n=39)
29 Seconds * +9%
Lenovo LOQ 15IRH8 Core i7
NVIDIA GeForce RTX 4050 Laptop GPU, Intel Core i7-13620H
27 Seconds * +16%
Lenovo LOQ 15IRX9
NVIDIA GeForce RTX 4060 Laptop GPU, Intel Core i5-13450HX
25 Seconds * +22%
Gigabyte G5 KF5 2024
NVIDIA GeForce RTX 4060 Laptop GPU, Intel Core i7-13620H
25 Seconds * +22%
Asus TUF Gaming A15 FA507UV
NVIDIA GeForce RTX 4060 Laptop GPU, AMD Ryzen 9 8945H
21 Seconds * +34%
v3.3 Classroom CUDA
Lenovo IdeaPad Gaming 3 15ARH7
NVIDIA GeForce RTX 3050 4GB Laptop GPU, AMD Ryzen 5 6600H
97 Seconds * -70%
HP Victus 15 fa0020nr
NVIDIA GeForce RTX 3050 Ti Laptop GPU, Intel Core i7-12700H
83 Seconds * -46%
MSI Thin GF63 12VE
NVIDIA GeForce RTX 4050 Laptop GPU, Intel Core i5-12450H
57 Seconds *
Moyenne NVIDIA GeForce RTX 4050 Laptop GPU
  (47 - 175, n=40)
56.1 Seconds * +2%
Gigabyte G5 KE
NVIDIA GeForce RTX 3060 Laptop GPU, Intel Core i5-12500H
52 Seconds * +9%
Acer Nitro V 15 ANV15-51-582S
NVIDIA GeForce RTX 4050 Laptop GPU, Intel Core i5-13420H
52 Seconds * +9%
HP Victus 15-fa1057ng
NVIDIA GeForce RTX 4050 Laptop GPU, Intel Core i5-13500H
52 Seconds * +9%
Lenovo LOQ 15IRH8 Core i7
NVIDIA GeForce RTX 4050 Laptop GPU, Intel Core i7-13620H
50 Seconds * +12%
Lenovo LOQ 15IRX9
NVIDIA GeForce RTX 4060 Laptop GPU, Intel Core i5-13450HX
44 Seconds * +23%
Gigabyte G5 KF5 2024
NVIDIA GeForce RTX 4060 Laptop GPU, Intel Core i7-13620H
43 Seconds * +25%
Asus TUF Gaming A15 FA507UV
NVIDIA GeForce RTX 4060 Laptop GPU, AMD Ryzen 9 8945H
41 Seconds * +28%
v3.3 Classroom CPU
MSI Thin GF63 12VE
NVIDIA GeForce RTX 4050 Laptop GPU, Intel Core i5-12450H
565 Seconds *
Lenovo IdeaPad Gaming 3 15ARH7
NVIDIA GeForce RTX 3050 4GB Laptop GPU, AMD Ryzen 5 6600H
532 Seconds * +6%
Acer Nitro V 15 ANV15-51-582S
NVIDIA GeForce RTX 4050 Laptop GPU, Intel Core i5-13420H
502 Seconds * +11%
HP Victus 15-fa1057ng
NVIDIA GeForce RTX 4050 Laptop GPU, Intel Core i5-13500H
460 Seconds * +19%
Lenovo LOQ 15IRH8 Core i7
NVIDIA GeForce RTX 4050 Laptop GPU, Intel Core i7-13620H
435 Seconds * +23%
Gigabyte G5 KE
NVIDIA GeForce RTX 3060 Laptop GPU, Intel Core i5-12500H
423 Seconds * +25%
HP Victus 15 fa0020nr
NVIDIA GeForce RTX 3050 Ti Laptop GPU, Intel Core i7-12700H
416 Seconds * +26%
Lenovo LOQ 15IRX9
NVIDIA GeForce RTX 4060 Laptop GPU, Intel Core i5-13450HX
397 Seconds * +30%
Moyenne NVIDIA GeForce RTX 4050 Laptop GPU
  (243 - 907, n=40)
396 Seconds * +30%
Gigabyte G5 KF5 2024
NVIDIA GeForce RTX 4060 Laptop GPU, Intel Core i7-13620H
378 Seconds * +33%
Asus TUF Gaming A15 FA507UV
NVIDIA GeForce RTX 4060 Laptop GPU, AMD Ryzen 9 8945H
293 Seconds * +48%

* ... Moindre est la valeur, meilleures sont les performances

Final Fantasy XV Benchmark
1280x720 Lite Quality
Asus TUF Gaming A15 FA507UV
AMD Ryzen 9 8945H, NVIDIA GeForce RTX 4060 Laptop GPU
210 fps +70%
Lenovo LOQ 15IRX9
Intel Core i5-13450HX, NVIDIA GeForce RTX 4060 Laptop GPU
198.9 fps +61%
Lenovo LOQ 15IRH8 Core i7
Intel Core i7-13620H, NVIDIA GeForce RTX 4050 Laptop GPU
192.9 fps +57%
Gigabyte G5 KF5 2024
Intel Core i7-13620H, NVIDIA GeForce RTX 4060 Laptop GPU
187.2 fps +52%
Gigabyte G5 KE
Intel Core i5-12500H, NVIDIA GeForce RTX 3060 Laptop GPU
179.3 fps +46%
Moyenne NVIDIA GeForce RTX 4050 Laptop GPU
  (47.8 - 215, n=27)
163.1 fps +32%
HP Victus 15 fa0020nr
Intel Core i7-12700H, NVIDIA GeForce RTX 3050 Ti Laptop GPU
138.1 fps +12%
MSI Thin GF63 12VE
Intel Core i5-12450H, NVIDIA GeForce RTX 4050 Laptop GPU
123.2 fps
Lenovo IdeaPad Gaming 3 15ARH7
AMD Ryzen 5 6600H, NVIDIA GeForce RTX 3050 4GB Laptop GPU
116.4 fps -6%
1920x1080 Standard Quality
Asus TUF Gaming A15 FA507UV
AMD Ryzen 9 8945H, NVIDIA GeForce RTX 4060 Laptop GPU
138.8 fps +62%
Lenovo LOQ 15IRX9
Intel Core i5-13450HX, NVIDIA GeForce RTX 4060 Laptop GPU
138.5 fps +62%
Gigabyte G5 KF5 2024
Intel Core i7-13620H, NVIDIA GeForce RTX 4060 Laptop GPU
129.6 fps +51%
Lenovo LOQ 15IRH8 Core i7
Intel Core i7-13620H, NVIDIA GeForce RTX 4050 Laptop GPU
121.2 fps +41%
Gigabyte G5 KE
Intel Core i5-12500H, NVIDIA GeForce RTX 3060 Laptop GPU
118.9 fps +39%
HP Victus 15-fa1057ng
Intel Core i5-13500H, NVIDIA GeForce RTX 4050 Laptop GPU
105.1 fps +23%
Moyenne NVIDIA GeForce RTX 4050 Laptop GPU
  (20 - 123.3, n=33)
104.4 fps +22%
Acer Nitro V 15 ANV15-51-582S
Intel Core i5-13420H, NVIDIA GeForce RTX 4050 Laptop GPU
104.3 fps +22%
MSI Thin GF63 12VE
Intel Core i5-12450H, NVIDIA GeForce RTX 4050 Laptop GPU
85.7 fps
HP Victus 15 fa0020nr
Intel Core i7-12700H, NVIDIA GeForce RTX 3050 Ti Laptop GPU
81.7 fps -5%
Lenovo IdeaPad Gaming 3 15ARH7
AMD Ryzen 5 6600H, NVIDIA GeForce RTX 3050 4GB Laptop GPU
73.6 fps -14%
1920x1080 High Quality
Asus TUF Gaming A15 FA507UV
AMD Ryzen 9 8945H, NVIDIA GeForce RTX 4060 Laptop GPU
100.7 fps +57%
Lenovo LOQ 15IRX9
Intel Core i5-13450HX, NVIDIA GeForce RTX 4060 Laptop GPU
99.9 fps +56%
Gigabyte G5 KF5 2024
Intel Core i7-13620H, NVIDIA GeForce RTX 4060 Laptop GPU
93.2 fps +45%
Gigabyte G5 KE
Intel Core i5-12500H, NVIDIA GeForce RTX 3060 Laptop GPU
90.3 fps +41%
Lenovo LOQ 15IRH8 Core i7
Intel Core i7-13620H, NVIDIA GeForce RTX 4050 Laptop GPU
84 fps +31%
HP Victus 15-fa1057ng
Intel Core i5-13500H, NVIDIA GeForce RTX 4050 Laptop GPU
80.3 fps +25%
Acer Nitro V 15 ANV15-51-582S
Intel Core i5-13420H, NVIDIA GeForce RTX 4050 Laptop GPU
76.5 fps +19%
Moyenne NVIDIA GeForce RTX 4050 Laptop GPU
  (15.5 - 122.3, n=39)
75.9 fps +18%
MSI Thin GF63 12VE
Intel Core i5-12450H, NVIDIA GeForce RTX 4050 Laptop GPU
64.2 fps
HP Victus 15 fa0020nr
Intel Core i7-12700H, NVIDIA GeForce RTX 3050 Ti Laptop GPU
54.7 fps -15%
Lenovo IdeaPad Gaming 3 15ARH7
AMD Ryzen 5 6600H, NVIDIA GeForce RTX 3050 4GB Laptop GPU
53.5 fps -17%
Dota 2 Reborn
1280x720 min (0/3) fastest
Lenovo LOQ 15IRH8 Core i7
Intel Core i7-13620H, NVIDIA GeForce RTX 4050 Laptop GPU
196.3 (171.6min) fps +60%
Gigabyte G5 KF5 2024
Intel Core i7-13620H, NVIDIA GeForce RTX 4060 Laptop GPU
188.7 (165min) fps +54%
Asus TUF Gaming A15 FA507UV
AMD Ryzen 9 8945H, NVIDIA GeForce RTX 4060 Laptop GPU
171.5 (151.7min) fps +40%
Lenovo LOQ 15IRX9
Intel Core i5-13450HX, NVIDIA GeForce RTX 4060 Laptop GPU
171.2 (147.9min) fps +40%
Gigabyte G5 KE
Intel Core i5-12500H, NVIDIA GeForce RTX 3060 Laptop GPU
168.5 (150.2min) fps +37%
Moyenne NVIDIA GeForce RTX 4050 Laptop GPU
  (113.7 - 196.3, n=37)
162.8 fps +33%
HP Victus 15 fa0020nr
Intel Core i7-12700H, NVIDIA GeForce RTX 3050 Ti Laptop GPU
161.7 (142.9min) fps +32%
HP Victus 15-fa1057ng
Intel Core i5-13500H, NVIDIA GeForce RTX 4050 Laptop GPU
159.7 (139.7min) fps +30%
Acer Nitro V 15 ANV15-51-582S
Intel Core i5-13420H, NVIDIA GeForce RTX 4050 Laptop GPU
153.7 (130.7min) fps +25%
MSI Thin GF63 12VE
Intel Core i5-12450H, NVIDIA GeForce RTX 4050 Laptop GPU
122.7 (105.4min) fps
Lenovo IdeaPad Gaming 3 15ARH7
AMD Ryzen 5 6600H, NVIDIA GeForce RTX 3050 4GB Laptop GPU
117.2 (104.9min) fps -4%
1366x768 med (1/3)
Lenovo LOQ 15IRH8 Core i7
Intel Core i7-13620H, NVIDIA GeForce RTX 4050 Laptop GPU
178.3 (157.3min) fps +64%
Gigabyte G5 KF5 2024
Intel Core i7-13620H, NVIDIA GeForce RTX 4060 Laptop GPU
172.3 (151min) fps +59%
Lenovo LOQ 15IRX9
Intel Core i5-13450HX, NVIDIA GeForce RTX 4060 Laptop GPU
156.8 (137.5min) fps +44%
Asus TUF Gaming A15 FA507UV
AMD Ryzen 9 8945H, NVIDIA GeForce RTX 4060 Laptop GPU
154.9 (137.1min) fps +43%
Gigabyte G5 KE
Intel Core i5-12500H, NVIDIA GeForce RTX 3060 Laptop GPU
153.1 (136.1min) fps +41%
Moyenne NVIDIA GeForce RTX 4050 Laptop GPU
  (100.1 - 181.6, n=37)
147.4 fps +36%
Acer Nitro V 15 ANV15-51-582S
Intel Core i5-13420H, NVIDIA GeForce RTX 4050 Laptop GPU
143.6 (122.1min) fps +32%
HP Victus 15-fa1057ng
Intel Core i5-13500H, NVIDIA GeForce RTX 4050 Laptop GPU
141.1 (121.2min) fps +30%
HP Victus 15 fa0020nr
Intel Core i7-12700H, NVIDIA GeForce RTX 3050 Ti Laptop GPU
140.3 (124.9min) fps +29%
MSI Thin GF63 12VE
Intel Core i5-12450H, NVIDIA GeForce RTX 4050 Laptop GPU
108.6 (93.6min) fps
Lenovo IdeaPad Gaming 3 15ARH7
AMD Ryzen 5 6600H, NVIDIA GeForce RTX 3050 4GB Laptop GPU
106.4 (95.7min) fps -2%
1920x1080 high (2/3)
Lenovo LOQ 15IRH8 Core i7
Intel Core i7-13620H, NVIDIA GeForce RTX 4050 Laptop GPU
171.1 (150.5min) fps +78%
Gigabyte G5 KF5 2024
Intel Core i7-13620H, NVIDIA GeForce RTX 4060 Laptop GPU
164.9 (143.7min) fps +72%
Lenovo LOQ 15IRX9
Intel Core i5-13450HX, NVIDIA GeForce RTX 4060 Laptop GPU
149.4 (130.5min) fps +56%
Asus TUF Gaming A15 FA507UV
AMD Ryzen 9 8945H, NVIDIA GeForce RTX 4060 Laptop GPU
149.3 (131.2min) fps +56%
Gigabyte G5 KE
Intel Core i5-12500H, NVIDIA GeForce RTX 3060 Laptop GPU
144.8 (128.5min) fps +51%
Moyenne NVIDIA GeForce RTX 4050 Laptop GPU
  (79.2 - 191.8, n=38)
140.1 fps +46%
Acer Nitro V 15 ANV15-51-582S
Intel Core i5-13420H, NVIDIA GeForce RTX 4050 Laptop GPU
136.5 (106min) fps +42%
HP Victus 15 fa0020nr
Intel Core i7-12700H, NVIDIA GeForce RTX 3050 Ti Laptop GPU
132.2 (115.8min) fps +38%
HP Victus 15-fa1057ng
Intel Core i5-13500H, NVIDIA GeForce RTX 4050 Laptop GPU
130.7 (114.5min) fps +36%
Lenovo IdeaPad Gaming 3 15ARH7
AMD Ryzen 5 6600H, NVIDIA GeForce RTX 3050 4GB Laptop GPU
100.6 (89.9min) fps +5%
MSI Thin GF63 12VE
Intel Core i5-12450H, NVIDIA GeForce RTX 4050 Laptop GPU
95.9 (82.8min) fps
1920x1080 ultra (3/3) best looking
Lenovo LOQ 15IRH8 Core i7
Intel Core i7-13620H, NVIDIA GeForce RTX 4050 Laptop GPU
162.2 (134min) fps +79%
Gigabyte G5 KF5 2024
Intel Core i7-13620H, NVIDIA GeForce RTX 4060 Laptop GPU
154.5 (133.1min) fps +71%
Lenovo LOQ 15IRX9
Intel Core i5-13450HX, NVIDIA GeForce RTX 4060 Laptop GPU
141 (122.7min) fps +56%
Asus TUF Gaming A15 FA507UV
AMD Ryzen 9 8945H, NVIDIA GeForce RTX 4060 Laptop GPU
139.5 (122.4min) fps +54%
Gigabyte G5 KE
Intel Core i5-12500H, NVIDIA GeForce RTX 3060 Laptop GPU
137.5 (121.2min) fps +52%
Moyenne NVIDIA GeForce RTX 4050 Laptop GPU
  (73.5 - 175.6, n=39)
130.7 fps +44%
HP Victus 15 fa0020nr
Intel Core i7-12700H, NVIDIA GeForce RTX 3050 Ti Laptop GPU
123.8 (108.4min) fps +37%
HP Victus 15-fa1057ng
Intel Core i5-13500H, NVIDIA GeForce RTX 4050 Laptop GPU
122.5 (106.9min) fps +35%
Acer Nitro V 15 ANV15-51-582S
Intel Core i5-13420H, NVIDIA GeForce RTX 4050 Laptop GPU
120.3 (103.3min) fps +33%
Lenovo IdeaPad Gaming 3 15ARH7
AMD Ryzen 5 6600H, NVIDIA GeForce RTX 3050 4GB Laptop GPU
95.2 (85.1min) fps +5%
MSI Thin GF63 12VE
Intel Core i5-12450H, NVIDIA GeForce RTX 4050 Laptop GPU
90.5 (80.9min) fps
GTA V
1024x768 Lowest Settings possible
Gigabyte G5 KF5 2024
Intel Core i7-13620H, NVIDIA GeForce RTX 4060 Laptop GPU
186.4 (1.849min, 142.9P1) fps +24%
Lenovo LOQ 15IRH8 Core i7
Intel Core i7-13620H, NVIDIA GeForce RTX 4050 Laptop GPU
185.9 (2.97min, 166.7P1) fps +23%
Lenovo LOQ 15IRX9
Intel Core i5-13450HX, NVIDIA GeForce RTX 4060 Laptop GPU
184.4 (2.08min, 125P1) fps +22%
Gigabyte G5 KE
Intel Core i5-12500H, NVIDIA GeForce RTX 3060 Laptop GPU
183.4 (2.85min, 142.9P1) fps +22%
Asus TUF Gaming A15 FA507UV
AMD Ryzen 9 8945H, NVIDIA GeForce RTX 4060 Laptop GPU
182.6 (2.28min, 142.9P1) fps +21%
HP Victus 15 fa0020nr
Intel Core i7-12700H, NVIDIA GeForce RTX 3050 Ti Laptop GPU
179.5 (4.1min, 125P1) fps +19%
Moyenne NVIDIA GeForce RTX 4050 Laptop GPU
  (150.9 - 186.7, n=16)
179.5 fps +19%
MSI Thin GF63 12VE
Intel Core i5-12450H, NVIDIA GeForce RTX 4050 Laptop GPU
150.9 (4.56min, 83.3P1) fps
Lenovo IdeaPad Gaming 3 15ARH7
AMD Ryzen 5 6600H, NVIDIA GeForce RTX 3050 4GB Laptop GPU
144 (4.48min, 71.4P1) fps -5%
1920x1080 Lowest Settings possible
Gigabyte G5 KF5 2024
Intel Core i7-13620H, NVIDIA GeForce RTX 4060 Laptop GPU
185.4 (2.28min, 125P1) fps +26%
Lenovo LOQ 15IRX9
Intel Core i5-13450HX, NVIDIA GeForce RTX 4060 Laptop GPU
185.3 (1.709min, 125P1) fps +26%
Gigabyte G5 KE
Intel Core i5-12500H, NVIDIA GeForce RTX 3060 Laptop GPU
185 (3.03min, 142.9P1) fps +25%
Lenovo LOQ 15IRH8 Core i7
Intel Core i7-13620H, NVIDIA GeForce RTX 4050 Laptop GPU
181.3 (2.4min, 125P1) fps +23%
HP Victus 15 fa0020nr
Intel Core i7-12700H, NVIDIA GeForce RTX 3050 Ti Laptop GPU
176.7 (4.32min, 125P1) fps +20%
Moyenne NVIDIA GeForce RTX 4050 Laptop GPU
  (147.5 - 186.3, n=17)
176.6 fps +20%
MSI Thin GF63 12VE
Intel Core i5-12450H, NVIDIA GeForce RTX 4050 Laptop GPU
147.5 (4.44min, 83.3P1) fps
Lenovo IdeaPad Gaming 3 15ARH7
AMD Ryzen 5 6600H, NVIDIA GeForce RTX 3050 4GB Laptop GPU
133.5 (5.33min, 71.4P1) fps -9%
1366x768 Normal/Off AF:4x
Lenovo LOQ 15IRX9
Intel Core i5-13450HX, NVIDIA GeForce RTX 4060 Laptop GPU
181.5 (1.59min, 125P1) fps +28%
Gigabyte G5 KF5 2024
Intel Core i7-13620H, NVIDIA GeForce RTX 4060 Laptop GPU
181.2 (2.24min, 125P1) fps +27%
Gigabyte G5 KE
Intel Core i5-12500H, NVIDIA GeForce RTX 3060 Laptop GPU
179.9 (2.96min, 142.9P1) fps +27%
Lenovo LOQ 15IRH8 Core i7
Intel Core i7-13620H, NVIDIA GeForce RTX 4050 Laptop GPU
179.7 (2.91min, 142.9P1) fps +26%
Acer Nitro V 15 ANV15-51-582S
Intel Core i5-13420H, NVIDIA GeForce RTX 4050 Laptop GPU
177.3 (3.63min, 125P1) fps +25%
Asus TUF Gaming A15 FA507UV
AMD Ryzen 9 8945H, NVIDIA GeForce RTX 4060 Laptop GPU
177 (3.38min, 142.9P1) fps +24%
HP Victus 15 fa0020nr
Intel Core i7-12700H, NVIDIA GeForce RTX 3050 Ti Laptop GPU
173 (3.33min, 111.1P1) fps +22%
HP Victus 15-fa1057ng
Intel Core i5-13500H, NVIDIA GeForce RTX 4050 Laptop GPU
172.4 (3.94min, 111.1P1) fps +21%
Moyenne NVIDIA GeForce RTX 4050 Laptop GPU
  (119.9 - 185.1, n=24)
170.7 fps +20%
MSI Thin GF63 12VE
Intel Core i5-12450H, NVIDIA GeForce RTX 4050 Laptop GPU
142.2 (4.75min, 71.4P1) fps
Lenovo IdeaPad Gaming 3 15ARH7
AMD Ryzen 5 6600H, NVIDIA GeForce RTX 3050 4GB Laptop GPU
133.3 (6.58min, 66.7P1) fps -6%
1920x1080 Normal/Off AF:4x
Gigabyte G5 KF5 2024
Intel Core i7-13620H, NVIDIA GeForce RTX 4060 Laptop GPU
182 (2.93min, 125P1) fps +50%
Gigabyte G5 KE
Intel Core i5-12500H, NVIDIA GeForce RTX 3060 Laptop GPU
179.8 (3.99min, 142.9P1) fps +48%
Lenovo LOQ 15IRH8 Core i7
Intel Core i7-13620H, NVIDIA GeForce RTX 4050 Laptop GPU
179.2 (3.17min, 125P1) fps +48%
Acer Nitro V 15 ANV15-51-582S
Intel Core i5-13420H, NVIDIA GeForce RTX 4050 Laptop GPU
174.3 (3.29min, 125P1) fps +44%
Moyenne NVIDIA GeForce RTX 4050 Laptop GPU
  (121.4 - 185.2, n=19)
170.9 fps +41%
HP Victus 15-fa1057ng
Intel Core i5-13500H, NVIDIA GeForce RTX 4050 Laptop GPU
170.2 (3.51min, 100P1) fps +40%
HP Victus 15 fa0020nr
Intel Core i7-12700H, NVIDIA GeForce RTX 3050 Ti Laptop GPU
169.5 (3.95min, 90.9P1) fps +40%
Lenovo IdeaPad Gaming 3 15ARH7
AMD Ryzen 5 6600H, NVIDIA GeForce RTX 3050 4GB Laptop GPU
128.6 (15.3min, 66.7P1) fps +6%
MSI Thin GF63 12VE
Intel Core i5-12450H, NVIDIA GeForce RTX 4050 Laptop GPU
121.4 (5.95min, 62.5P1) fps
1920x1080 High/On (Advanced Graphics Off) AA:2xMSAA + FX AF:8x
Lenovo LOQ 15IRX9
Intel Core i5-13450HX, NVIDIA GeForce RTX 4060 Laptop GPU
175.5 (3.33min, 125P1) fps +59%
Gigabyte G5 KE
Intel Core i5-12500H, NVIDIA GeForce RTX 3060 Laptop GPU
172.8 (3.64min, 125P1) fps +56%
Gigabyte G5 KF5 2024
Intel Core i7-13620H, NVIDIA GeForce RTX 4060 Laptop GPU
170.6 (3.7min, 111.1P1) fps +54%
Lenovo LOQ 15IRH8 Core i7
Intel Core i7-13620H, NVIDIA GeForce RTX 4050 Laptop GPU
168.9 (4.03min, 111.1P1) fps +53%
Asus TUF Gaming A15 FA507UV
AMD Ryzen 9 8945H, NVIDIA GeForce RTX 4060 Laptop GPU
168 (6.25min, 111.1P1) fps +52%
HP Victus 15-fa1057ng
Intel Core i5-13500H, NVIDIA GeForce RTX 4050 Laptop GPU
160.7 (3.77min, 100P1) fps +45%
Acer Nitro V 15 ANV15-51-582S
Intel Core i5-13420H, NVIDIA GeForce RTX 4050 Laptop GPU
158.2 (4.06min, 83.3P1) fps +43%
Moyenne NVIDIA GeForce RTX 4050 Laptop GPU
  (106 - 177.3, n=29)
155.7 fps +41%
HP Victus 15 fa0020nr
Intel Core i7-12700H, NVIDIA GeForce RTX 3050 Ti Laptop GPU
144.7 (4.22min, 90.9P1) fps +31%
MSI Thin GF63 12VE
Intel Core i5-12450H, NVIDIA GeForce RTX 4050 Laptop GPU
110.7 (5.2min, 58.8P1) fps
Lenovo IdeaPad Gaming 3 15ARH7
AMD Ryzen 5 6600H, NVIDIA GeForce RTX 3050 4GB Laptop GPU
103.5 (13.5min, 62.5P1) fps -7%
1920x1080 Highest Settings possible AA:4xMSAA + FX AF:16x
Lenovo LOQ 15IRX9
Intel Core i5-13450HX, NVIDIA GeForce RTX 4060 Laptop GPU
112.6 (5.45min, 76.9P1) fps +68%
Asus TUF Gaming A15 FA507UV
AMD Ryzen 9 8945H, NVIDIA GeForce RTX 4060 Laptop GPU
107.2 (4.45min, 76.9P1) fps +60%
Gigabyte G5 KE
Intel Core i5-12500H, NVIDIA GeForce RTX 3060 Laptop GPU
103 (7.98min, 71.4P1) fps +54%
Gigabyte G5 KF5 2024
Intel Core i7-13620H, NVIDIA GeForce RTX 4060 Laptop GPU
102.4 (8.53min, 71.4P1) fps +53%
Lenovo LOQ 15IRH8 Core i7
Intel Core i7-13620H, NVIDIA GeForce RTX 4050 Laptop GPU
93.2 (4.57min, 62.5P1) fps +39%
HP Victus 15-fa1057ng
Intel Core i5-13500H, NVIDIA GeForce RTX 4050 Laptop GPU
89.1 (6.81min, 55.6P1) fps +33%
Acer Nitro V 15 ANV15-51-582S
Intel Core i5-13420H, NVIDIA GeForce RTX 4050 Laptop GPU
86.9 (26min, 55.6P1) fps +30%
Moyenne NVIDIA GeForce RTX 4050 Laptop GPU
  (14.9 - 101.7, n=34)
81.2 fps +21%
HP Victus 15 fa0020nr
Intel Core i7-12700H, NVIDIA GeForce RTX 3050 Ti Laptop GPU
73.1 (6.87min, 47.6P1) fps +9%
MSI Thin GF63 12VE
Intel Core i5-12450H, NVIDIA GeForce RTX 4050 Laptop GPU
67.1 (3.43min, 37P1) fps
Lenovo IdeaPad Gaming 3 15ARH7
AMD Ryzen 5 6600H, NVIDIA GeForce RTX 3050 4GB Laptop GPU
60.3 (7.33min, 37P1) fps -10%
X-Plane 11.11
1280x720 low (fps_test=1)
Lenovo LOQ 15IRH8 Core i7
Intel Core i7-13620H, NVIDIA GeForce RTX 4050 Laptop GPU
159.9 fps +128%
Gigabyte G5 KF5 2024
Intel Core i7-13620H, NVIDIA GeForce RTX 4060 Laptop GPU
159.3 fps +127%
Lenovo LOQ 15IRX9
Intel Core i5-13450HX, NVIDIA GeForce RTX 4060 Laptop GPU
139.6 fps +99%
Asus TUF Gaming A15 FA507UV
AMD Ryzen 9 8945H, NVIDIA GeForce RTX 4060 Laptop GPU
135.3 fps +93%
Moyenne NVIDIA GeForce RTX 4050 Laptop GPU
  (70.1 - 165.2, n=38)
131.2 fps +87%
HP Victus 15 fa0020nr
Intel Core i7-12700H, NVIDIA GeForce RTX 3050 Ti Laptop GPU
127.1 fps +81%
Gigabyte G5 KE
Intel Core i5-12500H, NVIDIA GeForce RTX 3060 Laptop GPU
118.4 fps +69%
Acer Nitro V 15 ANV15-51-582S
Intel Core i5-13420H, NVIDIA GeForce RTX 4050 Laptop GPU
114.3 fps +63%
HP Victus 15-fa1057ng
Intel Core i5-13500H, NVIDIA GeForce RTX 4050 Laptop GPU
113 fps +61%
Lenovo IdeaPad Gaming 3 15ARH7
AMD Ryzen 5 6600H, NVIDIA GeForce RTX 3050 4GB Laptop GPU
84.4 fps +20%
MSI Thin GF63 12VE
Intel Core i5-12450H, NVIDIA GeForce RTX 4050 Laptop GPU
70.1 fps
1920x1080 med (fps_test=2)
Lenovo LOQ 15IRH8 Core i7
Intel Core i7-13620H, NVIDIA GeForce RTX 4050 Laptop GPU
139.8 fps +119%
Gigabyte G5 KF5 2024
Intel Core i7-13620H, NVIDIA GeForce RTX 4060 Laptop GPU
131.1 fps +105%
Lenovo LOQ 15IRX9
Intel Core i5-13450HX, NVIDIA GeForce RTX 4060 Laptop GPU
118.4 fps +86%
Asus TUF Gaming A15 FA507UV
AMD Ryzen 9 8945H, NVIDIA GeForce RTX 4060 Laptop GPU
117.5 fps +84%
HP Victus 15 fa0020nr
Intel Core i7-12700H, NVIDIA GeForce RTX 3050 Ti Laptop GPU
115.6 fps +81%
Moyenne NVIDIA GeForce RTX 4050 Laptop GPU
  (63.8 - 147.6, n=38)
113.9 fps +79%
Gigabyte G5 KE
Intel Core i5-12500H, NVIDIA GeForce RTX 3060 Laptop GPU
105.6 fps +66%
HP Victus 15-fa1057ng
Intel Core i5-13500H, NVIDIA GeForce RTX 4050 Laptop GPU
101.1 fps +58%
Acer Nitro V 15 ANV15-51-582S
Intel Core i5-13420H, NVIDIA GeForce RTX 4050 Laptop GPU
94.5 fps +48%
Lenovo IdeaPad Gaming 3 15ARH7
AMD Ryzen 5 6600H, NVIDIA GeForce RTX 3050 4GB Laptop GPU
77.1 fps +21%
MSI Thin GF63 12VE
Intel Core i5-12450H, NVIDIA GeForce RTX 4050 Laptop GPU
63.8 fps
1920x1080 high (fps_test=3)
Lenovo LOQ 15IRH8 Core i7
Intel Core i7-13620H, NVIDIA GeForce RTX 4050 Laptop GPU
110.2 fps +99%
Gigabyte G5 KF5 2024
Intel Core i7-13620H, NVIDIA GeForce RTX 4060 Laptop GPU
102 fps +84%
HP Victus 15 fa0020nr
Intel Core i7-12700H, NVIDIA GeForce RTX 3050 Ti Laptop GPU
92.9 fps +67%
Lenovo LOQ 15IRX9
Intel Core i5-13450HX, NVIDIA GeForce RTX 4060 Laptop GPU
92.2 fps +66%
Asus TUF Gaming A15 FA507UV
AMD Ryzen 9 8945H, NVIDIA GeForce RTX 4060 Laptop GPU
91.7 fps +65%
Moyenne NVIDIA GeForce RTX 4050 Laptop GPU
  (55.5 - 117, n=40)
91.1 fps +64%
Gigabyte G5 KE
Intel Core i5-12500H, NVIDIA GeForce RTX 3060 Laptop GPU
86.7 fps +56%
HP Victus 15-fa1057ng
Intel Core i5-13500H, NVIDIA GeForce RTX 4050 Laptop GPU
81.5 fps +47%
Acer Nitro V 15 ANV15-51-582S
Intel Core i5-13420H, NVIDIA GeForce RTX 4050 Laptop GPU
77 fps +39%
Lenovo IdeaPad Gaming 3 15ARH7
AMD Ryzen 5 6600H, NVIDIA GeForce RTX 3050 4GB Laptop GPU
63.6 fps +15%
MSI Thin GF63 12VE
Intel Core i5-12450H, NVIDIA GeForce RTX 4050 Laptop GPU
55.5 fps
Strange Brigade
1280x720 lowest AF:1
Lenovo LOQ 15IRH8 Core i7
Intel Core i7-13620H, NVIDIA GeForce RTX 4050 Laptop GPU
475 (160min, 360P1) fps +59%
Gigabyte G5 KF5 2024
Intel Core i7-13620H, NVIDIA GeForce RTX 4060 Laptop GPU
441 (191.8min, 340P1) fps +47%
Lenovo LOQ 15IRX9
Intel Core i5-13450HX, NVIDIA GeForce RTX 4060 Laptop GPU
425 (99.5min, 299P1) fps +42%
Gigabyte G5 KE
Intel Core i5-12500H, NVIDIA GeForce RTX 3060 Laptop GPU
385 (106.8min, 293P1) fps +29%
Moyenne NVIDIA GeForce RTX 4050 Laptop GPU
  (239 - 481, n=26)
382 fps +28%
Asus TUF Gaming A15 FA507UV
AMD Ryzen 9 8945H, NVIDIA GeForce RTX 4060 Laptop GPU
360 (196.7min, 274P1) fps +20%
MSI Thin GF63 12VE
Intel Core i5-12450H, NVIDIA GeForce RTX 4050 Laptop GPU
299 (158.1min, 228P1) fps
HP Victus 15 fa0020nr
Intel Core i7-12700H, NVIDIA GeForce RTX 3050 Ti Laptop GPU
297 (67min, 220P1) fps -1%
Lenovo IdeaPad Gaming 3 15ARH7
AMD Ryzen 5 6600H, NVIDIA GeForce RTX 3050 4GB Laptop GPU
248 (105.4min, 186.2P1) fps -17%
1920x1080 medium AA:medium AF:4
Asus TUF Gaming A15 FA507UV
AMD Ryzen 9 8945H, NVIDIA GeForce RTX 4060 Laptop GPU
263 (144.9min, 209P1) fps +63%
Lenovo LOQ 15IRX9
Intel Core i5-13450HX, NVIDIA GeForce RTX 4060 Laptop GPU
260 (89min, 197.8P1) fps +62%
Gigabyte G5 KF5 2024
Intel Core i7-13620H, NVIDIA GeForce RTX 4060 Laptop GPU
253 (105.2min, 207P1) fps +57%
Gigabyte G5 KE
Intel Core i5-12500H, NVIDIA GeForce RTX 3060 Laptop GPU
216 (27.5min, 173P1) fps +34%
Lenovo LOQ 15IRH8 Core i7
Intel Core i7-13620H, NVIDIA GeForce RTX 4050 Laptop GPU
211 (27.5min, 185.5P1) fps +31%
HP Victus 15-fa1057ng
Intel Core i5-13500H, NVIDIA GeForce RTX 4050 Laptop GPU
197.1 (72.3min, 158.1P1) fps +22%
Moyenne NVIDIA GeForce RTX 4050 Laptop GPU
  (130 - 221, n=31)
192.6 fps +20%
Acer Nitro V 15 ANV15-51-582S
Intel Core i5-13420H, NVIDIA GeForce RTX 4050 Laptop GPU
189.5 (34min, 157P1) fps +18%
MSI Thin GF63 12VE
Intel Core i5-12450H, NVIDIA GeForce RTX 4050 Laptop GPU
160.9 (36.1min, 134.3P1) fps
HP Victus 15 fa0020nr
Intel Core i7-12700H, NVIDIA GeForce RTX 3050 Ti Laptop GPU
138.8 (35.4min, 114.6P1) fps -14%
Lenovo IdeaPad Gaming 3 15ARH7
AMD Ryzen 5 6600H, NVIDIA GeForce RTX 3050 4GB Laptop GPU
134.7 (72.4min, 113.6P1) fps -16%
1920x1080 high AA:high AF:8
Asus TUF Gaming A15 FA507UV
AMD Ryzen 9 8945H, NVIDIA GeForce RTX 4060 Laptop GPU
213 (113.9min, 157.4P1) fps +64%
Lenovo LOQ 15IRX9
Intel Core i5-13450HX, NVIDIA GeForce RTX 4060 Laptop GPU
209 (86.5min, 149.5P1) fps +61%
Gigabyte G5 KF5 2024
Intel Core i7-13620H, NVIDIA GeForce RTX 4060 Laptop GPU
192.3 (62.2min, 140.9P1) fps +48%
Gigabyte G5 KE
Intel Core i5-12500H, NVIDIA GeForce RTX 3060 Laptop GPU
175.3 (19.6min, 128P1) fps +35%
Lenovo LOQ 15IRH8 Core i7
Intel Core i7-13620H, NVIDIA GeForce RTX 4050 Laptop GPU
171.8 (94.1min, 130.1P1) fps +33%
HP Victus 15-fa1057ng
Intel Core i5-13500H, NVIDIA GeForce RTX 4050 Laptop GPU
159 (75.6min, 117.8P1) fps +23%
Moyenne NVIDIA GeForce RTX 4050 Laptop GPU
  (105 - 178, n=33)
156.4 fps +21%
Acer Nitro V 15 ANV15-51-582S
Intel Core i5-13420H, NVIDIA GeForce RTX 4050 Laptop GPU
155.2 (92.3min, 118.7P1) fps +20%
MSI Thin GF63 12VE
Intel Core i5-12450H, NVIDIA GeForce RTX 4050 Laptop GPU
129.5 (32.4min, 93.8P1) fps
HP Victus 15 fa0020nr
Intel Core i7-12700H, NVIDIA GeForce RTX 3050 Ti Laptop GPU
112.2 (38.3min, 86.1P1) fps -13%
Lenovo IdeaPad Gaming 3 15ARH7
AMD Ryzen 5 6600H, NVIDIA GeForce RTX 3050 4GB Laptop GPU
109.1 (46.1min, 74.1P1) fps -16%
1920x1080 ultra AA:ultra AF:16
Asus TUF Gaming A15 FA507UV
AMD Ryzen 9 8945H, NVIDIA GeForce RTX 4060 Laptop GPU
184.2 (41min, 136.6P1) fps +62%
Lenovo LOQ 15IRX9
Intel Core i5-13450HX, NVIDIA GeForce RTX 4060 Laptop GPU
182.7 (43.5min, 133.1P1) fps +61%
Gigabyte G5 KF5 2024
Intel Core i7-13620H, NVIDIA GeForce RTX 4060 Laptop GPU
170.8 (53.4min, 126.3P1) fps +50%
Gigabyte G5 KE
Intel Core i5-12500H, NVIDIA GeForce RTX 3060 Laptop GPU
153.3 (32.3min, 117.2P1) fps +35%
Lenovo LOQ 15IRH8 Core i7
Intel Core i7-13620H, NVIDIA GeForce RTX 4050 Laptop GPU
149.2 (34.2min, 113.8P1) fps +31%
HP Victus 15-fa1057ng
Intel Core i5-13500H, NVIDIA GeForce RTX 4050 Laptop GPU
139.1 (69.3min, 102.8P1) fps +22%
Acer Nitro V 15 ANV15-51-582S
Intel Core i5-13420H, NVIDIA GeForce RTX 4050 Laptop GPU
135.2 (11.5min, 103.8P1) fps +19%
Moyenne NVIDIA GeForce RTX 4050 Laptop GPU
  (21.2 - 156.6, n=38)
133.4 fps +17%
MSI Thin GF63 12VE
Intel Core i5-12450H, NVIDIA GeForce RTX 4050 Laptop GPU
113.6 (49.5min, 87.6P1) fps
HP Victus 15 fa0020nr
Intel Core i7-12700H, NVIDIA GeForce RTX 3050 Ti Laptop GPU
97.4 (34.3min, 73.6P1) fps -14%
Lenovo IdeaPad Gaming 3 15ARH7
AMD Ryzen 5 6600H, NVIDIA GeForce RTX 3050 4GB Laptop GPU
95.1 (59min, 71.2P1) fps -16%
Tiny Tina's Wonderlands
1280x720 Lowest Preset (DX12)
Moyenne NVIDIA GeForce RTX 4050 Laptop GPU
  (109.3 - 250, n=4)
186.3 fps +21%
MSI Thin GF63 12VE
Intel Core i5-12450H, NVIDIA GeForce RTX 4050 Laptop GPU
154 fps
1920x1080 Low Preset (DX12)
Moyenne NVIDIA GeForce RTX 4050 Laptop GPU
  (104.5 - 183.3, n=7)
152.5 fps +35%
MSI Thin GF63 12VE
Intel Core i5-12450H, NVIDIA GeForce RTX 4050 Laptop GPU
113 fps
1920x1080 Medium Preset (DX12)
Moyenne NVIDIA GeForce RTX 4050 Laptop GPU
  (93.4 - 149.2, n=7)
126.4 fps +32%
MSI Thin GF63 12VE
Intel Core i5-12450H, NVIDIA GeForce RTX 4050 Laptop GPU
95.6 fps
1920x1080 High Preset (DX12)
Moyenne NVIDIA GeForce RTX 4050 Laptop GPU
  (63.3 - 99.5, n=7)
84.4 fps +17%
MSI Thin GF63 12VE
Intel Core i5-12450H, NVIDIA GeForce RTX 4050 Laptop GPU
72.1 fps
1920x1080 Badass Preset (DX12)
Moyenne NVIDIA GeForce RTX 4050 Laptop GPU
  (49.8 - 77.3, n=7)
65.4 fps +19%
MSI Thin GF63 12VE
Intel Core i5-12450H, NVIDIA GeForce RTX 4050 Laptop GPU
55 fps
F1 22
1280x720 Ultra Low Preset AA:T AF:16x
Lenovo LOQ 15IRH8 Core i7
Intel Core i7-13620H, NVIDIA GeForce RTX 4050 Laptop GPU
308 (233min, 184P1) fps +71%
Moyenne NVIDIA GeForce RTX 4050 Laptop GPU
  (175.1 - 364, n=16)
259 fps +44%
Gigabyte G5 KE
Intel Core i5-12500H, NVIDIA GeForce RTX 3060 Laptop GPU
256 (198min, 165P1) fps +42%
MSI Thin GF63 12VE
Intel Core i5-12450H, NVIDIA GeForce RTX 4050 Laptop GPU
179.7 (128min, 110P1) fps
1920x1080 Low Preset AA:T AF:16x
Lenovo LOQ 15IRH8 Core i7
Intel Core i7-13620H, NVIDIA GeForce RTX 4050 Laptop GPU
233 (168min, 127P1) fps +80%
Gigabyte G5 KE
Intel Core i5-12500H, NVIDIA GeForce RTX 3060 Laptop GPU
197 (165min, 130P1) fps +52%
Moyenne NVIDIA GeForce RTX 4050 Laptop GPU
  (100.9 - 244, n=22)
192.3 fps +49%
MSI Thin GF63 12VE
Intel Core i5-12450H, NVIDIA GeForce RTX 4050 Laptop GPU
129.2 (101min, 80P1) fps
1920x1080 Medium Preset AA:T AF:16x
Lenovo LOQ 15IRH8 Core i7
Intel Core i7-13620H, NVIDIA GeForce RTX 4050 Laptop GPU
224 (190min, 126P1) fps +77%
Gigabyte G5 KE
Intel Core i5-12500H, NVIDIA GeForce RTX 3060 Laptop GPU
189.4 (162min, 115P1) fps +50%
Moyenne NVIDIA GeForce RTX 4050 Laptop GPU
  (101.8 - 234, n=21)
182.5 fps +44%
MSI Thin GF63 12VE
Intel Core i5-12450H, NVIDIA GeForce RTX 4050 Laptop GPU
126.3 (88min, 76P1) fps
1920x1080 High Preset AA:T AF:16x
Lenovo LOQ 15IRH8 Core i7
Intel Core i7-13620H, NVIDIA GeForce RTX 4050 Laptop GPU
172.3 (130min, 99P1) fps +74%
Gigabyte G5 KE
Intel Core i5-12500H, NVIDIA GeForce RTX 3060 Laptop GPU
153.3 (137min, 102P1) fps +54%
Moyenne NVIDIA GeForce RTX 4050 Laptop GPU
  (94.4 - 174.7, n=22)
143.5 fps +45%
MSI Thin GF63 12VE
Intel Core i5-12450H, NVIDIA GeForce RTX 4050 Laptop GPU
99.3 (88min, 63P1) fps
1920x1080 Ultra High Preset AA:T AF:16x
Gigabyte G5 KE
Intel Core i5-12500H, NVIDIA GeForce RTX 3060 Laptop GPU
55.9 (48min, 46P1) fps +39%
Lenovo LOQ 15IRH8 Core i7
Intel Core i7-13620H, NVIDIA GeForce RTX 4050 Laptop GPU
55 (44min, 40P1) fps +37%
Moyenne NVIDIA GeForce RTX 4050 Laptop GPU
  (10.9 - 56.4, n=24)
47.3 fps +18%
MSI Thin GF63 12VE
Intel Core i5-12450H, NVIDIA GeForce RTX 4050 Laptop GPU
40.1 (32min, 31P1) fps
Baldur's Gate 3
1280x720 Low Preset
Gigabyte G5 KF5 2024
Intel Core i7-13620H, NVIDIA GeForce RTX 4060 Laptop GPU
162 fps +49%
Moyenne NVIDIA GeForce RTX 4050 Laptop GPU
  (108.6 - 148.9, n=3)
130.7 fps +20%
MSI Thin GF63 12VE
Intel Core i5-12450H, NVIDIA GeForce RTX 4050 Laptop GPU
108.6 fps
1920x1080 Low Preset
Asus TUF Gaming A15 FA507UV
AMD Ryzen 9 8945H, NVIDIA GeForce RTX 4060 Laptop GPU
135 (59.6min, 79.1P0.1, 106.6P1) fps +64%
Gigabyte G5 KF5 2024
Intel Core i7-13620H, NVIDIA GeForce RTX 4060 Laptop GPU
125 fps +52%
Moyenne NVIDIA GeForce RTX 4050 Laptop GPU
  (73.4 - 112.3, n=8)
93.3 fps +14%
MSI Thin GF63 12VE
Intel Core i5-12450H, NVIDIA GeForce RTX 4050 Laptop GPU
82.1 fps
1920x1080 Medium Preset
Asus TUF Gaming A15 FA507UV
AMD Ryzen 9 8945H, NVIDIA GeForce RTX 4060 Laptop GPU
107.8 (60.2min, 78.3P0.1, 89.2P1) fps +51%
Gigabyte G5 KF5 2024
Intel Core i7-13620H, NVIDIA GeForce RTX 4060 Laptop GPU
98 fps +37%
Moyenne NVIDIA GeForce RTX 4050 Laptop GPU
  (56 - 91.9, n=10)
76.7 fps +8%
MSI Thin GF63 12VE
Intel Core i5-12450H, NVIDIA GeForce RTX 4050 Laptop GPU
71.3 fps
1920x1080 High Preset
Asus TUF Gaming A15 FA507UV
AMD Ryzen 9 8945H, NVIDIA GeForce RTX 4060 Laptop GPU
95.9 (61.4min, 73.9P0.1, 80.4P1) fps +50%
Gigabyte G5 KF5 2024
Intel Core i7-13620H, NVIDIA GeForce RTX 4060 Laptop GPU
86 fps +34%
Moyenne NVIDIA GeForce RTX 4050 Laptop GPU
  (49.8 - 83.5, n=10)
65.9 fps +3%
MSI Thin GF63 12VE
Intel Core i5-12450H, NVIDIA GeForce RTX 4050 Laptop GPU
64 fps
1920x1080 Ultra Preset
Asus TUF Gaming A15 FA507UV
AMD Ryzen 9 8945H, NVIDIA GeForce RTX 4060 Laptop GPU
93.9 (67.7min, 75.2P0.1, 79P1) fps +47%
Gigabyte G5 KF5 2024
Intel Core i7-13620H, NVIDIA GeForce RTX 4060 Laptop GPU
84 fps +32%
Moyenne NVIDIA GeForce RTX 4050 Laptop GPU
  (48.3 - 81.3, n=10)
64.2 fps +1%
MSI Thin GF63 12VE
Intel Core i5-12450H, NVIDIA GeForce RTX 4050 Laptop GPU
63.8 fps
Cyberpunk 2077 2.2 Phantom Liberty
1280x720 Low Preset (FSR off)
Lenovo LOQ 15IRX9
Intel Core i5-13450HX, NVIDIA GeForce RTX 4060 Laptop GPU
150.4 (70.6min) fps +77%
Asus TUF Gaming A15 FA507UV
AMD Ryzen 9 8945H, NVIDIA GeForce RTX 4060 Laptop GPU
144.1 (113.7min) fps +70%
Gigabyte G5 KF5 2024
Intel Core i7-13620H, NVIDIA GeForce RTX 4060 Laptop GPU
138.7 (112.2min) fps +63%
Moyenne NVIDIA GeForce RTX 4050 Laptop GPU
  (83.1 - 122, n=5)
104.1 fps +23%
MSI Thin GF63 12VE
Intel Core i5-12450H, NVIDIA GeForce RTX 4050 Laptop GPU
84.9 (65.3min, 55.6P1) fps
1920x1080 Low Preset (FSR off)
Asus TUF Gaming A15 FA507UV
AMD Ryzen 9 8945H, NVIDIA GeForce RTX 4060 Laptop GPU
122.2 (101.4min) fps +60%
Lenovo LOQ 15IRX9
Intel Core i5-13450HX, NVIDIA GeForce RTX 4060 Laptop GPU
118.9 (63min) fps +56%
Gigabyte G5 KF5 2024
Intel Core i7-13620H, NVIDIA GeForce RTX 4060 Laptop GPU
114 (93.4min) fps +49%
Moyenne NVIDIA GeForce RTX 4050 Laptop GPU
  (67.2 - 103.1, n=8)
85.7 fps +12%
MSI Thin GF63 12VE
Intel Core i5-12450H, NVIDIA GeForce RTX 4050 Laptop GPU
76.4 (57.5min, 49.7P1) fps
1920x1080 Medium Preset (FSR off)
Asus TUF Gaming A15 FA507UV
AMD Ryzen 9 8945H, NVIDIA GeForce RTX 4060 Laptop GPU
96.6 (83min) fps +48%
Lenovo LOQ 15IRX9
Intel Core i5-13450HX, NVIDIA GeForce RTX 4060 Laptop GPU
94.3 (50.4min) fps +45%
Gigabyte G5 KF5 2024
Intel Core i7-13620H, NVIDIA GeForce RTX 4060 Laptop GPU
91 (78.1min) fps +40%
Moyenne NVIDIA GeForce RTX 4050 Laptop GPU
  (50.1 - 88.6, n=9)
69.8 fps +7%
MSI Thin GF63 12VE
Intel Core i5-12450H, NVIDIA GeForce RTX 4050 Laptop GPU
65.1 (51.9min, 45.1P1) fps
1920x1080 High Preset (FSR off)
Asus TUF Gaming A15 FA507UV
AMD Ryzen 9 8945H, NVIDIA GeForce RTX 4060 Laptop GPU
82.7 (70.8min) fps +48%
Lenovo LOQ 15IRX9
Intel Core i5-13450HX, NVIDIA GeForce RTX 4060 Laptop GPU
80.1 (47.7min) fps +44%
Gigabyte G5 KF5 2024
Intel Core i7-13620H, NVIDIA GeForce RTX 4060 Laptop GPU
77.2 (66.2min) fps +39%
Moyenne NVIDIA GeForce RTX 4050 Laptop GPU
  (42.4 - 75, n=9)
59.1 fps +6%
MSI Thin GF63 12VE
Intel Core i5-12450H, NVIDIA GeForce RTX 4050 Laptop GPU
55.7 (43.5min, 38.1P1) fps
1920x1080 Ultra Preset (FSR off)
Asus TUF Gaming A15 FA507UV
AMD Ryzen 9 8945H, NVIDIA GeForce RTX 4060 Laptop GPU
76.2 (63.3min) fps +61%
Lenovo LOQ 15IRX9
Intel Core i5-13450HX, NVIDIA GeForce RTX 4060 Laptop GPU
71.4 (40.1min) fps +51%
Gigabyte G5 KF5 2024
Intel Core i7-13620H, NVIDIA GeForce RTX 4060 Laptop GPU
68.2 (57.4min) fps +44%
Moyenne NVIDIA GeForce RTX 4050 Laptop GPU
  (35.8 - 67.3, n=9)
51 fps +8%
MSI Thin GF63 12VE
Intel Core i5-12450H, NVIDIA GeForce RTX 4050 Laptop GPU
47.3 (37.3min, 32.6P1) fps
Far Cry 5
1280x720 Low Preset AA:T
Gigabyte G5 KE
Intel Core i5-12500H, NVIDIA GeForce RTX 3060 Laptop GPU
159 (128min) fps +64%
Lenovo LOQ 15IRH8 Core i7
Intel Core i7-13620H, NVIDIA GeForce RTX 4050 Laptop GPU
156 (119min) fps +61%
Moyenne NVIDIA GeForce RTX 4050 Laptop GPU
  (97 - 197, n=18)
147.4 fps +52%
MSI Thin GF63 12VE
Intel Core i5-12450H, NVIDIA GeForce RTX 4050 Laptop GPU
97 (70min) fps
1920x1080 Medium Preset AA:T
Lenovo LOQ 15IRH8 Core i7
Intel Core i7-13620H, NVIDIA GeForce RTX 4050 Laptop GPU
135 (112min) fps +61%
Gigabyte G5 KE
Intel Core i5-12500H, NVIDIA GeForce RTX 3060 Laptop GPU
134 (115min) fps +60%
Acer Nitro V 15 ANV15-51-582S
Intel Core i5-13420H, NVIDIA GeForce RTX 4050 Laptop GPU
128 (105min) fps +52%
Moyenne NVIDIA GeForce RTX 4050 Laptop GPU
  (73 - 146, n=22)
115.5 fps +38%
MSI Thin GF63 12VE
Intel Core i5-12450H, NVIDIA GeForce RTX 4050 Laptop GPU
84 (65min) fps
1920x1080 High Preset AA:T
Gigabyte G5 KE
Intel Core i5-12500H, NVIDIA GeForce RTX 3060 Laptop GPU
129 (115min) fps +57%
Lenovo LOQ 15IRH8 Core i7
Intel Core i7-13620H, NVIDIA GeForce RTX 4050 Laptop GPU
128 (109min) fps +56%
Acer Nitro V 15 ANV15-51-582S
Intel Core i5-13420H, NVIDIA GeForce RTX 4050 Laptop GPU
118 (108min) fps +44%
Moyenne NVIDIA GeForce RTX 4050 Laptop GPU
  (51 - 135, n=24)
108.3 fps +32%
MSI Thin GF63 12VE
Intel Core i5-12450H, NVIDIA GeForce RTX 4050 Laptop GPU
82 (68min) fps
1920x1080 Ultra Preset AA:T
Lenovo LOQ 15IRH8 Core i7
Intel Core i7-13620H, NVIDIA GeForce RTX 4050 Laptop GPU
121 (98min) fps +73%
Gigabyte G5 KE
Intel Core i5-12500H, NVIDIA GeForce RTX 3060 Laptop GPU
118 (90min) fps +69%
Acer Nitro V 15 ANV15-51-582S
Intel Core i5-13420H, NVIDIA GeForce RTX 4050 Laptop GPU
102 (63min) fps +46%
Moyenne NVIDIA GeForce RTX 4050 Laptop GPU
  (50 - 127, n=24)
101.1 fps +44%
MSI Thin GF63 12VE
Intel Core i5-12450H, NVIDIA GeForce RTX 4050 Laptop GPU
70 (60min) fps

Cyberpunk 2077 ultra FPS Chart

0510152025303540Tooltip
MSI Thin GF63 12VE i5-12450H, NVIDIA GeForce RTX 4050 Laptop GPU: Ø44.2 (40.9-44.8)
BasMoyenÉlevéUltra
GTA V (2015) 150.9 142.2 110.7 67.1
Dota 2 Reborn (2015) 122.7 108.6 95.9 90.5
Final Fantasy XV Benchmark (2018) 123.2 85.7 64.2
X-Plane 11.11 (2018) 70.1 63.8 55.5
Far Cry 5 (2018) 97 84 82 70
Strange Brigade (2018) 299 160.9 129.5 113.6
Tiny Tina's Wonderlands (2022) 113 95.6 72.1 55
F1 22 (2022) 129.2 126.3 99.3 40.1
Baldur's Gate 3 (2023) 82.1 71.3 64 63.8
Cyberpunk 2077 2.2 Phantom Liberty (2023) 76.4 65.1 55.7 47.3

Émissions

Bruit du système

Notez que le bruit du ventilateur en mode équilibré est le même qu'en mode performance (47,7 dB(A)). Il est donc recommandé de jouer en mode Performance car il n'y a pas d'augmentation significative du bruit du ventilateur.

Profil de bruit du ventilateur (Blanc : Arrière-plan, Rouge : Système au ralenti, Bleu : 3DMark 06, Orange : Cyberpunk 2077, Vert : Cooler Boost activé)

Degré de la nuisance sonore

Au repos
24.3 / 24.3 / 24.3 dB(A)
Fortement sollicité
36.2 / 59.3 dB(A)
  red to green bar
 
 
30 dB
silencieux
40 dB(A)
audible
50 dB(A)
bruyant
 
min: dark, med: mid, max: light   Earthworks M23R, Arta (à 15 cm de distance)   bruit ambiant: 24.3 dB(A)
dB(A) 0102030405060708090Deep BassMiddle BassHigh BassLower RangeMidsHigher MidsLower HighsMid HighsUpper HighsSuper Highs2046.439.639.843.737.52539.634.530.938.129.83134.431.630.93329.44027.626.823.424.525.6503230.827.829.430.76330.73026.927.830.38029.930.426.928.431.21003126.32526.935.912532.231.53232.135.416027.822.419.221.337.62002620.91818.534.325028.421.115.316.135.431528.921.717.117.237.140030.721.716.31638.750030.722.613.413.539.763029.221.812.11138.380031.52310.21039.9100035.827.39.59.243.9125035.927.39.29.344.6160037.928.19.69.746.6200037.526.810.31046.7250038.223.810.510.348.4315038.6231110.850.1400036.322.511.311.150.9500036.619.611.711.551630032.515.811.711.447.7800026.413.511.811.543.71000022.413.612.111.540.91250019.613.512.111.6391600017.915.11310.736.8SPL47.736.224.324.359.3N5.82.20.60.612.6median 31median 22.4median 12.1median 11.5median 39.9Delta4.94.33.13.35.1hearing rangehide median Fan NoiseMSI Thin GF63 12VE
MSI Thin GF63 12VE
NVIDIA GeForce RTX 4050 Laptop GPU, i5-12450H, Micron 2400 MTFDKBA512QFM
MSI GF63 Thin 9SC
GeForce GTX 1650 Max-Q, i5-9300H, Toshiba KBG30ZMV512G
Lenovo LOQ 15IRX9
NVIDIA GeForce RTX 4060 Laptop GPU, i5-13450HX, Micron 2400 MTFDKCD1T0QFM
HP Victus 15-fa1057ng
NVIDIA GeForce RTX 4050 Laptop GPU, i5-13500H, Kioxia XG8 KXG80ZNV512G
Acer Nitro V 15 ANV15-51-582S
NVIDIA GeForce RTX 4050 Laptop GPU, i5-13420H, SK hynix PC801 HFS512GEJ9X115N
Asus TUF A15 FA507
NVIDIA GeForce RTX 4050 Laptop GPU, R7 7735HS, Micron 2400 MTFDKBA512QFM
Noise
-27%
-17%
-11%
-12%
10%
arrêt / environnement *
24.3
30
-23%
25
-3%
25
-3%
25
-3%
23.3
4%
Idle Minimum *
24.3
35
-44%
26
-7%
29
-19%
25
-3%
23.3
4%
Idle Average *
24.3
36
-48%
34
-40%
30
-23%
29
-19%
23.3
4%
Idle Maximum *
24.3
37
-52%
36
-48%
31
-28%
30
-23%
23.3
4%
Load Average *
36.2
44
-22%
48
-33%
40
-10%
49
-35%
29.6
18%
Cyberpunk 2077 ultra *
47.7
48
-1%
Load Maximum *
59.3
43
27%
50
16%
48
19%
51
14%
43
27%
Witcher 3 ultra *
41
42
49
43

* ... Moindre est la valeur, meilleures sont les performances

Température

Échappement à l'arrière et sur le côté gauche
L'adaptateur CA atteint plus de 48°C lorsque les charges sont élevées
 39.8 °C38.8 °C35.4 °C 
 32.6 °C35.8 °C35.4 °C 
 23.8 °C22.8 °C24.4 °C 
Maximum: 39.8 °C
Moyenne: 32.1 °C
33.8 °C37.6 °C32.6 °C
29.4 °C30.4 °C29 °C
24.4 °C26.8 °C24.6 °C
Maximum: 37.6 °C
Moyenne: 29.8 °C
Alimentation (valeur maximale)  48 °C | Température ambiante de la pièce 20 °C | Fluke 62 Mini IR Thermometer
(±) La température moyenne de la face supérieure sous charge maximale est de 32.1 °C / 90 F, par rapport à la moyenne de 33.9 °C / 93 F pour les appareils de la classe Gaming.
(+) La température maximale du côté supérieur est de 39.8 °C / 104 F, par rapport à la moyenne de 40.4 °C / 105 F, allant de 21.2 à 68.8 °C pour la classe Gaming.
(+) Le fond chauffe jusqu'à un maximum de 37.6 °C / 100 F, contre une moyenne de 43.2 °C / 110 F
(+) En utilisation inactive, la température moyenne du côté supérieur est de 28.5 °C / 83 F, par rapport à la moyenne du dispositif de 33.9 °C / 93 F.
(+) Les repose-poignets et le pavé tactile sont plus froids que la température de la peau avec un maximum de 24.6 °C / 76.3 F et sont donc froids au toucher.
(+) La température moyenne de la zone de l'appui-paume de dispositifs similaires était de 28.9 °C / 84 F (+4.3 °C / #7.7 F).
Système à l'arrêt (couvercle C)
Système à l'arrêt (couvercle D)
Prime95+FurMark stress (couverture C)
Prime95+FurMark stress (couverture D)
MSI Thin GF63 12VE
Intel Core i5-12450H, NVIDIA GeForce RTX 4050 Laptop GPU
MSI GF63 Thin 9SC
Intel Core i5-9300H, NVIDIA GeForce GTX 1650 Max-Q
Lenovo LOQ 15IRX9
Intel Core i5-13450HX, NVIDIA GeForce RTX 4060 Laptop GPU
HP Victus 15-fa1057ng
Intel Core i5-13500H, NVIDIA GeForce RTX 4050 Laptop GPU
Acer Nitro V 15 ANV15-51-582S
Intel Core i5-13420H, NVIDIA GeForce RTX 4050 Laptop GPU
Asus TUF A15 FA507
AMD Ryzen 7 7735HS, NVIDIA GeForce RTX 4050 Laptop GPU
Heat
2%
-17%
11%
0%
1%
Maximum Upper Side *
39.8
47
-18%
47
-18%
42
-6%
46
-16%
48.9
-23%
Maximum Bottom *
37.6
47
-25%
58
-54%
42
-12%
48
-28%
44.6
-19%
Idle Upper Side *
32.8
26
21%
32
2%
24
27%
27
18%
27.1
17%
Idle Bottom *
37.6
26
31%
36
4%
24
36%
28
26%
27.5
27%

* ... Moindre est la valeur, meilleures sont les performances

Test de stress

Stress oisif
Stress oisif

Le processeur monte à 62 W, 88 C et 3,9 GHz lors du lancement de Prime95 avant de redescendre à 2,8 GHz et 53 W quelques instants plus tard. Les températures du CPU et du GPU sont correctes pour un ordinateur portable de jeu, à <80 C, même en mode équilibré.

Cyberpunk 2077 stress (Mode équilibré)
Prime95 stress
Prime95 stress
Cyberpunk 2077 stress (mode Performance)
Prime95+FurMark stress
Horloge moyenne du CPU (GHz) Horloge du GPU (MHz) Température moyenne du CPU (°C) Température moyenne du GPU (°C)
Système au repos -- -- 46 45
Prime95 Stress 2.9 -- 88 54
Prime95 + FurMark Stress 3.2 1440 86 70
Cyberpunk 2077 Stress (mode équilibré) 2.4 1740 72 68
Cyberpunk 2077 Stress (mode Performance) 2.4 1755 79 64

Intervenants

Le bruit rose montre un bon volume maximum et un bon équilibre pour un ordinateur portable de jeu à petit budget
dB(A) 0102030405060708090Deep BassMiddle BassHigh BassLower RangeMidsHigher MidsLower HighsMid HighsUpper HighsSuper Highs2044.639.844.62537.130.937.1313130.9314027.323.427.35031.527.831.56330.926.930.98029.726.929.710026.52526.512531.23231.216042.819.242.820057.31857.325067.815.367.83156617.16640062.816.362.850062.713.462.763066.612.166.68007210.272100071.69.571.6125070.19.270.1160067.89.667.8200065.910.365.9250065.210.565.2315067.11167.1400066.311.366.3500067.711.767.7630074.411.774.4800072.211.872.21000070.212.170.21250067.712.167.71600061.61361.6SPL81.524.381.5N53.90.653.9median 66.6median 12.1median 66.6Delta4.83.14.826.325.821.422.12624.925.127.622.532.523.448.72655.818.860.922.167.2267019.372.317.674.217.774.319.575.31571.711.871.311.27410.574.21072.710.17210.67210.97511.374.811.671.71269.71269.612.371.112.669.61270.111.269.824.784.70.666.6median 12median 71.73.42.2hearing rangehide median Pink NoiseMSI Thin GF63 12VEApple MacBook Pro 16 2021 M1 Pro
Diagramme de fréquence (les cases peuvent être cochées et décochées pour comparer les appareils)
MSI Thin GF63 12VE analyse audio

(±) | le niveau sonore du haut-parleur est moyen mais bon (81.5# dB)
Basses 100 - 315 Hz
(-) | presque aucune basse - en moyenne 18.4% plus bas que la médiane
(±) | la linéarité des basses est moyenne (14.2% delta à la fréquence précédente)
Médiums 400 - 2000 Hz
(+) | médiane équilibrée - seulement 2.9% de la médiane
(+) | les médiums sont linéaires (4.3% delta à la fréquence précédente)
Aiguës 2 - 16 kHz
(+) | des sommets équilibrés - à seulement 2.9% de la médiane
(+) | les aigus sont linéaires (4% delta à la fréquence précédente)
Globalement 100 - 16 000 Hz
(+) | le son global est linéaire (13.8% différence à la médiane)
Par rapport à la même classe
» 20% de tous les appareils testés de cette catégorie étaient meilleurs, 6% similaires, 73% pires
» Le meilleur avait un delta de 6%, la moyenne était de 18%, le pire était de 132%.
Par rapport à tous les appareils testés
» 14% de tous les appareils testés étaient meilleurs, 4% similaires, 83% pires
» Le meilleur avait un delta de 4%, la moyenne était de 24%, le pire était de 134%.

Apple MacBook Pro 16 2021 M1 Pro analyse audio

(+) | les haut-parleurs peuvent jouer relativement fort (84.7# dB)
Basses 100 - 315 Hz
(+) | bonne basse - seulement 3.8% loin de la médiane
(+) | les basses sont linéaires (5.2% delta à la fréquence précédente)
Médiums 400 - 2000 Hz
(+) | médiane équilibrée - seulement 1.3% de la médiane
(+) | les médiums sont linéaires (2.1% delta à la fréquence précédente)
Aiguës 2 - 16 kHz
(+) | des sommets équilibrés - à seulement 1.9% de la médiane
(+) | les aigus sont linéaires (2.7% delta à la fréquence précédente)
Globalement 100 - 16 000 Hz
(+) | le son global est linéaire (4.6% différence à la médiane)
Par rapport à la même classe
» 0% de tous les appareils testés de cette catégorie étaient meilleurs, 0% similaires, 100% pires
» Le meilleur avait un delta de 5%, la moyenne était de 18%, le pire était de 45%.
Par rapport à tous les appareils testés
» 0% de tous les appareils testés étaient meilleurs, 0% similaires, 100% pires
» Le meilleur avait un delta de 4%, la moyenne était de 24%, le pire était de 134%.

Gestion de l'énergie

Consommation électrique

consommation de 3DMark 06
Cyberpunk 2077 1080p Ultra consommation
Prime95 stress initié au bout de 10s
Prime95+FurMark stress initié au bout de 10s
Consommation énergétique
Éteint/en veilledarklight 0.19 / 0.48 Watts
Au reposdarkmidlight 4.3 / 9.2 / 16.4 Watts
Fortement sollicité midlight 67 / 122 Watts
 color bar
Légende: min: dark, med: mid, max: light        Metrahit Energy
MSI Thin GF63 12VE
i5-12450H, NVIDIA GeForce RTX 4050 Laptop GPU, Micron 2400 MTFDKBA512QFM, IPS, 1920x1080, 15.6"
MSI GF63 Thin 9SC
i5-9300H, GeForce GTX 1650 Max-Q, Toshiba KBG30ZMV512G, IPS, 1920x1080, 15.6"
Lenovo LOQ 15IRX9
i5-13450HX, NVIDIA GeForce RTX 4060 Laptop GPU, Micron 2400 MTFDKCD1T0QFM, IPS, 1920x1080, 15.6"
HP Victus 15-fa1057ng
i5-13500H, NVIDIA GeForce RTX 4050 Laptop GPU, Kioxia XG8 KXG80ZNV512G, IPS, 1920x1080, 15.6"
Acer Nitro V 15 ANV15-51-582S
i5-13420H, NVIDIA GeForce RTX 4050 Laptop GPU, SK hynix PC801 HFS512GEJ9X115N, IPS, 1920x1080, 15.6"
Asus TUF A15 FA507
R7 7735HS, NVIDIA GeForce RTX 4050 Laptop GPU, Micron 2400 MTFDKBA512QFM, IPS, 1920x1080, 15.6"
Power Consumption
-18%
-83%
-20%
-8%
-32%
Idle Minimum *
4.3
7
-63%
13
-202%
5
-16%
7
-63%
8
-86%
Idle Average *
9.2
9
2%
18
-96%
9
2%
8
13%
12.1
-32%
Idle Maximum *
16.4
13
21%
24
-46%
22
-34%
11
33%
12.5
24%
Load Average *
67
79
-18%
85
-27%
72
-7%
76
-13%
74.9
-12%
Cyberpunk 2077 ultra external monitor *
94.2
150.9
-60%
Cyberpunk 2077 ultra *
98.2
155.7
-59%
Load Maximum *
122
164
-34%
232
-90%
176
-44%
136
-11%
185
-52%
Witcher 3 ultra *
73
113
98.2
136.6

* ... Moindre est la valeur, meilleures sont les performances

Power Consumption Cyberpunk / Stress Test

0102030405060708090100110120130140150Tooltip
MSI Thin GF63 12VE i5-12450H, NVIDIA GeForce RTX 4050 Laptop GPU; 1280x720 Prime95 28.10 and Furmark 1.25: Ø108.1 (105.2-122)
HP Victus 15-fa1057ng i5-13500H, NVIDIA GeForce RTX 4050 Laptop GPU; 1280x720 Prime95 28.10 and Furmark 1.25: Ø129 (115.4-155.2)
MSI Thin GF63 12VE i5-12450H, NVIDIA GeForce RTX 4050 Laptop GPU; Idle 150cd/m2: Ø7.22 (3.52-15.3)
HP Victus 15-fa1057ng i5-13500H, NVIDIA GeForce RTX 4050 Laptop GPU; Idle 150cd/m2: Ø9 (4.67-21.9)
MSI Thin GF63 12VE i5-12450H, NVIDIA GeForce RTX 4050 Laptop GPU; Cyberpunk 2077 FHD ultra no FSR 150cd: Ø98.2 (92.5-102.9)

Power Consumption external Monitor

0102030405060708090100110Tooltip
MSI Thin GF63 12VE i5-12450H, NVIDIA GeForce RTX 4050 Laptop GPU; Prime95 V2810 Stress (external Monitor): Ø90.4 (85.6-95.6)
HP Victus 15-fa1057ng i5-13500H, NVIDIA GeForce RTX 4050 Laptop GPU; Prime95 V2810 Stress (external Monitor): Ø73.2 (61.2-111.6)
MSI Thin GF63 12VE i5-12450H, NVIDIA GeForce RTX 4050 Laptop GPU; Cinebench R15 Multi (external Monitor): Ø102.2 (94.2-113.4)
MSI Thin GF63 12VE i5-12450H, NVIDIA GeForce RTX 4050 Laptop GPU; 1280x720 FurMark 1.19 GPU Stress Test (external Monitor): Ø69.7 (66.9-90.2)
HP Victus 15-fa1057ng i5-13500H, NVIDIA GeForce RTX 4050 Laptop GPU; 1280x720 FurMark 1.19 GPU Stress Test (external Monitor): Ø109.6 (105-118.1)
MSI Thin GF63 12VE i5-12450H, NVIDIA GeForce RTX 4050 Laptop GPU; Idle 1min (external Monitor): Ø4.6 (2.58-9.85)
HP Victus 15-fa1057ng i5-13500H, NVIDIA GeForce RTX 4050 Laptop GPU; Idle 1min (external Monitor): Ø13.7 (10.8-19.3)
MSI Thin GF63 12VE i5-12450H, NVIDIA GeForce RTX 4050 Laptop GPU; Cyberpunk 2077 FHD ultra no FSR (external Monitor): Ø94.2 (89.2-99.5)

Autonomie de la batterie

Autonomie
WiFi Websurfing
3h 33min
MSI Thin GF63 12VE
i5-12450H, NVIDIA GeForce RTX 4050 Laptop GPU, 52.4 Wh
MSI GF63 Thin 9SC
i5-9300H, GeForce GTX 1650 Max-Q, 51 Wh
Lenovo LOQ 15IRX9
i5-13450HX, NVIDIA GeForce RTX 4060 Laptop GPU, 60 Wh
HP Victus 15-fa1057ng
i5-13500H, NVIDIA GeForce RTX 4050 Laptop GPU, 70 Wh
Acer Nitro V 15 ANV15-51-582S
i5-13420H, NVIDIA GeForce RTX 4050 Laptop GPU, 57 Wh
Asus TUF A15 FA507
R7 7735HS, NVIDIA GeForce RTX 4050 Laptop GPU, 90 Wh
Autonomie de la batterie
23%
50%
110%
163%
229%
WiFi v1.3
213
262
23%
320
50%
448
110%
561
163%
701
229%
Reader / Idle
507
1290
Load
72
100
59
H.264
747

Notebookcheck Rating

MSI Thin GF63 12VE - 04/03/2025 v8
Allen Ngo

Châssis
74 / 98 → 76%
Clavier
79%
Dispositif de pointage
72%
Connectivité
53 / 80 → 66%
Poids
65 / 10-68 → 95%
Autonomie
55 / 95 → 58%
Écran
74%
Performances en jeu
69%
Performances dans les applications
77%
Chauffe
92 / 95 → 97%
Nuisance sonore
73 / 90 → 81%
Audio
77%
Appareil photo
29 / 75 → 38%
Moyenne
59%
74%
Gaming - Moyenne compensée
CO2 Emissions
No Data
Materials
50%
Packaging
50%
Power Use
86.4%
Repairability
40%
Software Updates
22.3%
Recycle Logo Total Sustainability Score: 41.5%

Potential Competitors in Comparison

Image
Modèle
Prix
Poids
Épaisseur
Écran
1.
74%
MSI Thin GF63 12VE
MSI Thin GF63 12VE
Intel Core i5-12450H ⎘
NVIDIA GeForce RTX 4050 Laptop GPU ⎘
8 Go Mémoire, 512 Go SSD
Amazon: $863.00
Prix de liste: 900 USD
1.8 kg21.7 mm15.60"
1920x1080
141 PPI
IPS
2.
77.6% v7 (old)
MSI GF63 Thin 9SC
MSI GF63 Thin 9SC
Intel Core i5-9300H ⎘
NVIDIA GeForce GTX 1650 Max-Q ⎘
8 Go Mémoire, 512 Go SSD
Amazon:
1. $585.00
MSI GF63 Thin 9SC-068 15.6" ...
2. $899.99
MSI GF63 Thin 9SC-066 15.6" ...
3. $28.49
TREE.NB BTY-M6K Laptop Batte...
Prix de liste: 975 EUR
1.8 kg22 mm15.60"
1920x1080
141 PPI
IPS
3.
79%
Lenovo LOQ 15IRX9
Lenovo LOQ 15IRX9
Intel Core i5-13450HX ⎘
NVIDIA GeForce RTX 4060 Laptop GPU ⎘
16 Go Mémoire, 1024 Go SSD
Amazon: $1,269.00
Prix de liste: 1149 Euro
2.4 kg23.9 mm15.60"
1920x1080
141 PPI
IPS
4.
84% v7 (old)
HP Victus 15-fa1057ng
Intel Core i5-13500H ⎘
NVIDIA GeForce RTX 4050 Laptop GPU ⎘
16 Go Mémoire, 512 Go SSD
Amazon:
1. $126.00
15.6" FHD 1920(RGB)*1080 LCD...
2. $125.99
15.6" FHD 1920(RGB)*1080 144...
3. $12.00
RAKSTORE Laptop CPU Cooling ...
Prix de liste: 1000 EUR
2.3 kg24 mm15.60"
1920x1080
141 PPI
IPS
5.
82.8% v7 (old)
Acer Nitro V 15 ANV15-51-582S
Intel Core i5-13420H ⎘
NVIDIA GeForce RTX 4050 Laptop GPU ⎘
16 Go Mémoire, 512 Go SSD
Amazon:
1. $22.99
Deal4GO CPU & GPU Graphics C...
Prix de liste: 900 EUR
2.1 kg23.5 mm15.60"
1920x1080
141 PPI
IPS
6.
86.3% v7 (old)
Asus TUF A15 FA507
Asus TUF A15 FA507
AMD Ryzen 7 7735HS ⎘
NVIDIA GeForce RTX 4050 Laptop GPU ⎘
16 Go Mémoire, 512 Go SSD
Amazon:
1. $36.98
90Wh C41N2013 C41N2013-1 Lap...
2. $36.99
Replacement Backlit Keyboard...
3. $729.00
ASUS TUF Gaming A15 Laptop |...
Prix de liste: 1199€
2.2 kg24.9 mm15.60"
1920x1080
141 PPI
IPS

Transparency

La sélection des appareils à examiner est effectuée par notre équipe éditoriale. L'échantillon de test a été acheté gratuitement par l'auteur, à ses propres frais. Le prêteur n'a eu aucune influence sur cette évaluation et le fabricant n'a pas reçu de copie de cette évaluation avant sa publication. Il n'y avait aucune obligation de publier cet article. Nous n'acceptons jamais de compensation ou de paiement en échange de nos commentaires. En tant que média indépendant, Notebookcheck n'est pas soumis à l'autorité des fabricants, des détaillants ou des éditeurs.

Voici comment Notebookcheck teste

Chaque année, Notebookcheck examine de manière indépendante des centaines d'ordinateurs portables et de smartphones en utilisant des procédures standardisées afin de garantir que tous les résultats sont comparables. Nous avons continuellement développé nos méthodes de test depuis environ 20 ans et avons établi des normes industrielles dans le processus. Dans nos laboratoires de test, des équipements de mesure de haute qualité sont utilisés par des techniciens et des rédacteurs expérimentés. Ces tests impliquent un processus de validation en plusieurs étapes. Notre système d'évaluation complexe repose sur des centaines de mesures et de points de référence bien fondés, ce qui garantit l'objectivité.
Please share our article, every link counts!
Mail Logo
> Revues et rapports de ordinateurs portatifs et smartphones, ordiphones > Critiques > Test du MSI Thin GF63 12VE : GeForce RTX 4050 avec 8 Go de RAM
Allen Ngo, 2025-04- 4 (Update: 2025-04- 4)