

Test du Maingear ML-16 MK2 : la puissance de la GeForce RTX 4070 à un prix correct

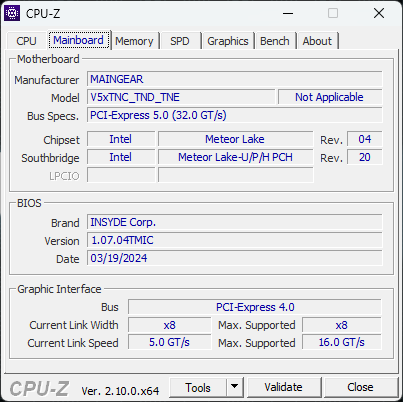
À l'instar de Schenker ou d'Eurocom, Maingear est un revendeur d'ordinateurs portables haute performance en marque blanche, conçus pour attirer les joueurs et les professionnels. Cette approche contraste avec les fabricants de PC plus connus comme Dell, Lenovo ou HP qui conçoivent leurs ordinateurs portables en interne. Le dernier modèle de Maingear est le ML-16 MK2 équipé du dernier processeur Intel Meteor Lake et d'un GPU Nvidia.
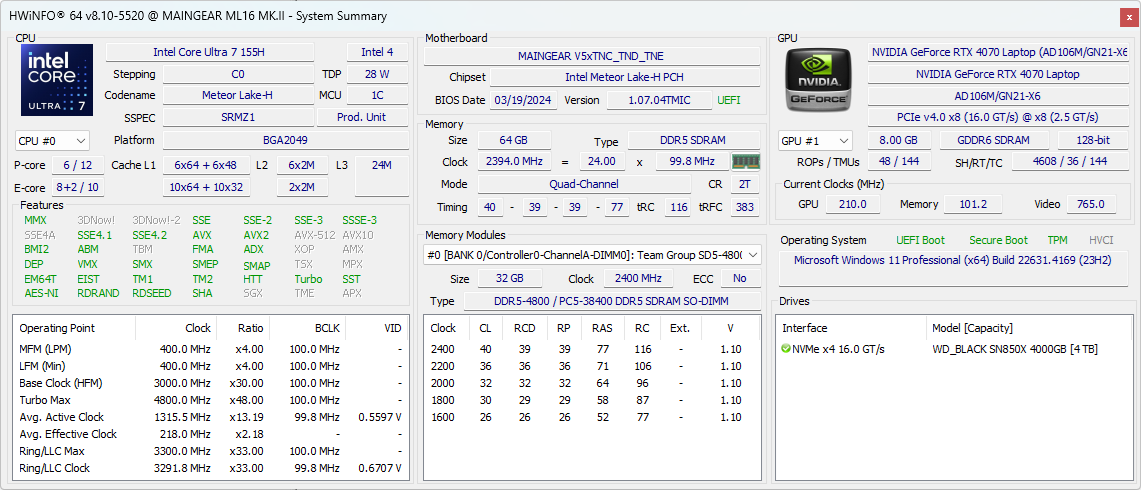
Notre unité de test a été entièrement configurée avec le Core Ultra 7 155H, 105 W GeForce RTX 4070, et 240 Hz 1600p IPS display pour environ 2000 $. Les SKUs inférieurs sont livrés avec la RTX 4060 à la place, mais le CPU et l'écran restent fixes.
Parmi les concurrents du ML-16 MK2, on trouve d'autres ordinateurs portables de jeu ultrafins de 16 pouces tels que le Razer Blade 16, Alienware x16 R2, Asus ROG Zephyrus G16ou le Lenovo Legion Pro 7 16.
Plus de commentaires sur Maingear :
Comparaison avec les concurrents potentiels
Note | Version | Date | Modèle | Poids | Épaisseur | Taille | Résolution | Prix |
|---|---|---|---|---|---|---|---|---|
| 80.9 % | v8 | 09/24 | Maingear ML-16 MK2 Ultra 7 155H, NVIDIA GeForce RTX 4070 Laptop GPU | 2.1 kg | 19.9 mm | 16.00" | 2560x1600 | |
| 85.9 % | v8 | 08/24 | Asus ROG Zephyrus G16 GA605WV Ryzen AI 9 HX 370, NVIDIA GeForce RTX 4060 Laptop GPU | 1.8 kg | 17.2 mm | 16.00" | 2560x1600 | |
| 84.3 % v7 (old) | v7 (old) | 05/24 | HP Victus 16 (2024) i7-14700HX, NVIDIA GeForce RTX 4060 Laptop GPU | 2.4 kg | 23.9 mm | 16.10" | 1920x1080 | |
| 88.4 % v7 (old) | v7 (old) | 05/24 | Alienware x16 R2 P120F Ultra 9 185H, NVIDIA GeForce RTX 4080 Laptop GPU | 2.7 kg | 18.57 mm | 16.00" | 2560x1600 | |
| 89.3 % v7 (old) | v7 (old) | 04/24 | Lenovo Legion Pro 5 16IRX9 i9-14900HX, NVIDIA GeForce RTX 4070 Laptop GPU | 2.5 kg | 26.95 mm | 16.00" | 2560x1600 | |
| 91.1 % v7 (old) | v7 (old) | 02/24 | Razer Blade 16 2024, RTX 4090 i9-14900HX, NVIDIA GeForce RTX 4090 Laptop GPU | 2.5 kg | 22 mm | 16.00" | 2560x1600 |
Note : Nous avons récemment mis à jour notre système d'évaluation et les résultats de la version 8 ne sont pas comparables à ceux de la version 7. Vous trouverez de plus amples informations ici .
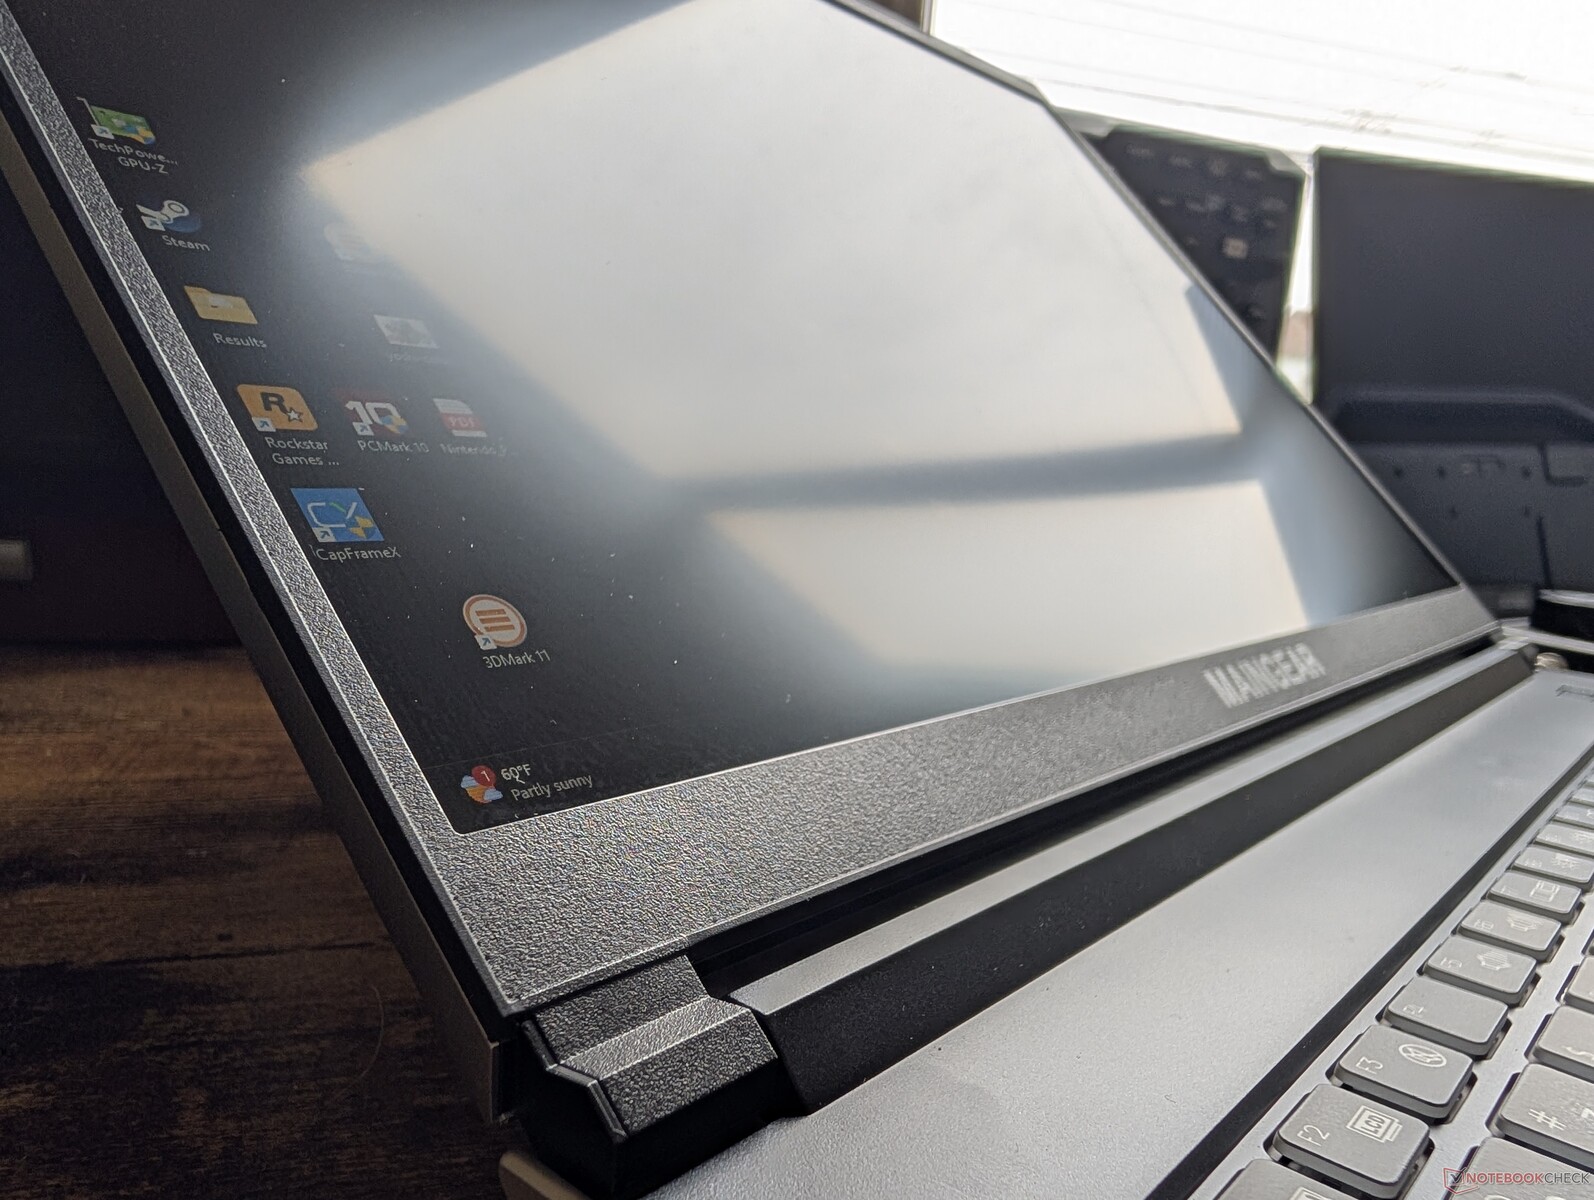
Boîtier - Fin et tranchant
Le châssis peut être attribué à Clevo (V560TNE-S) d'après le fabricant d'origine. Il se compose principalement d'aluminium pour le couvercle extérieur et le fond, tandis que le clavier noir est en plastique. Les deux couleurs contrastées fonctionnent bien ensemble pour aider à distinguer visuellement le modèle de l'habituel ordinateur portable de jeu tout noir ou blanc mat.
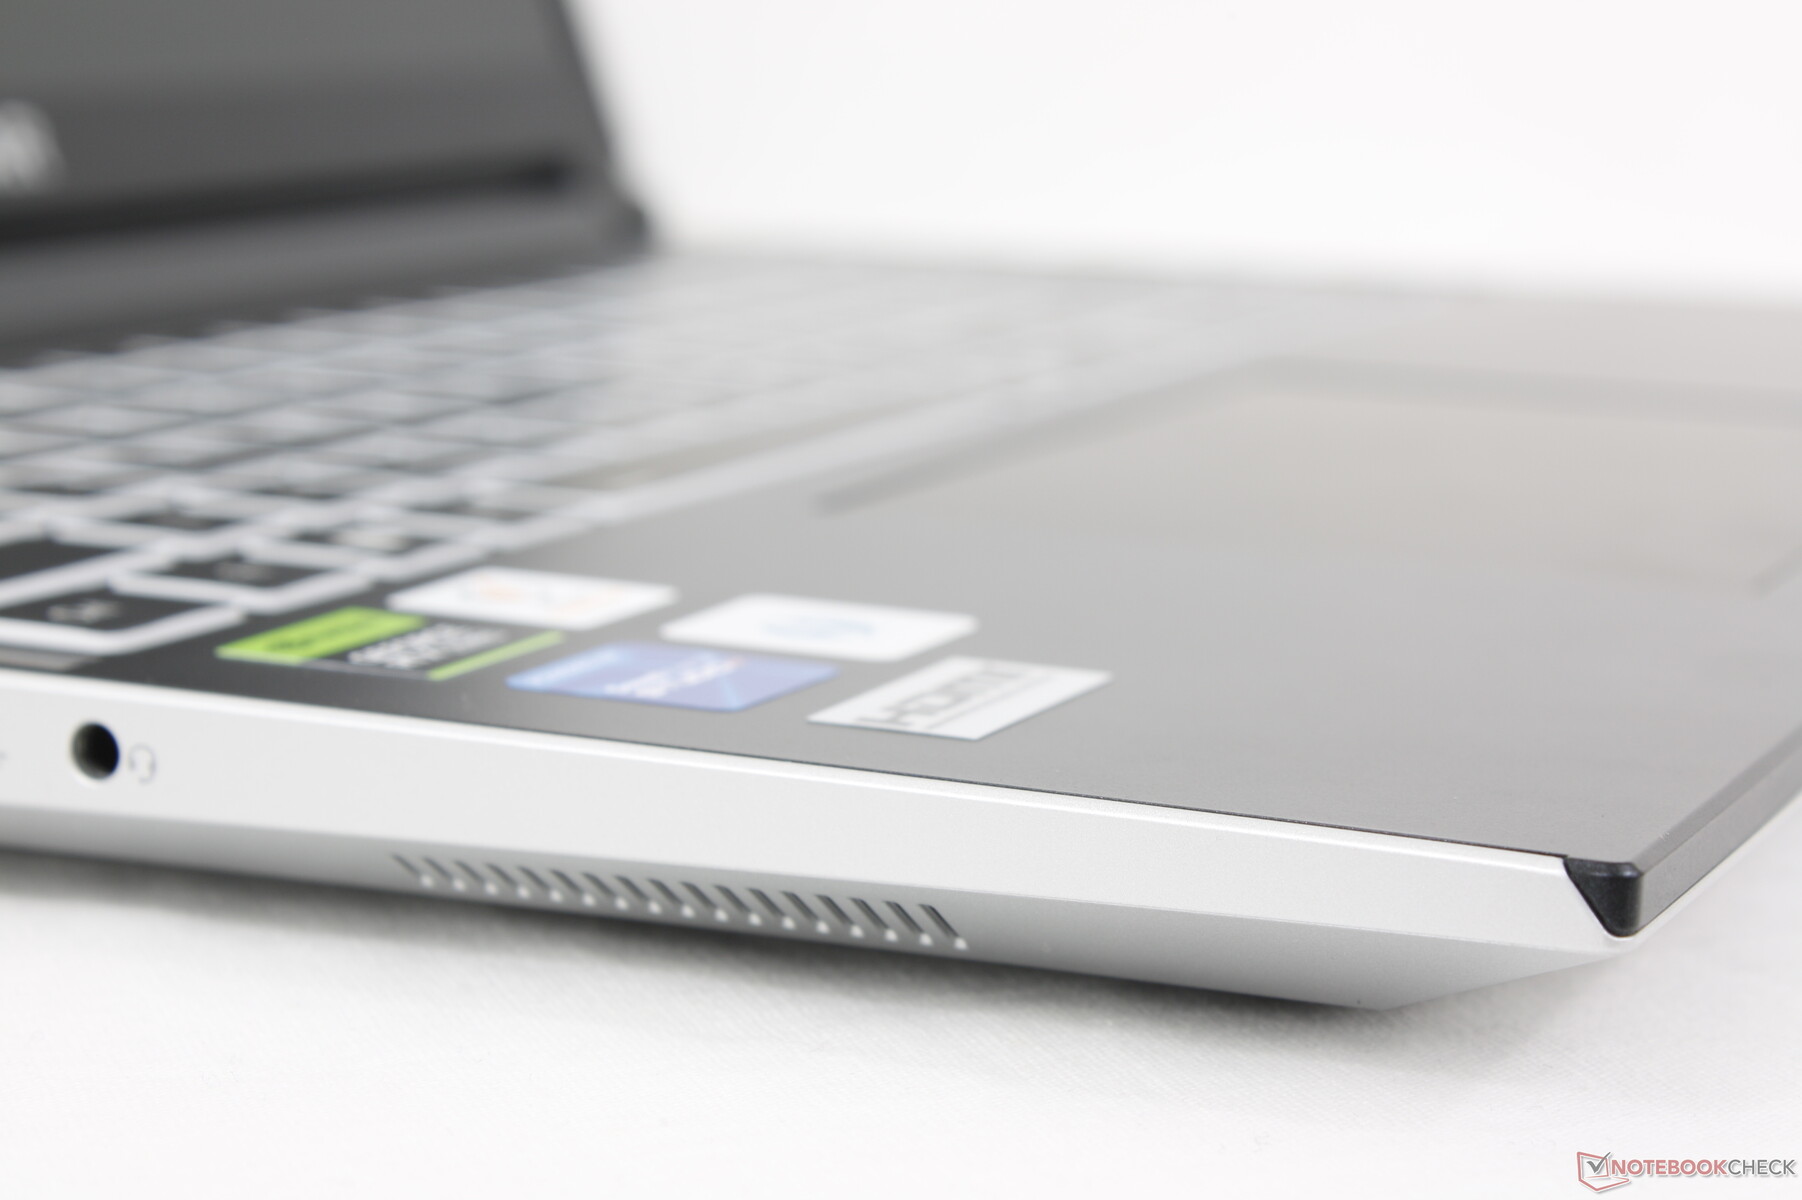
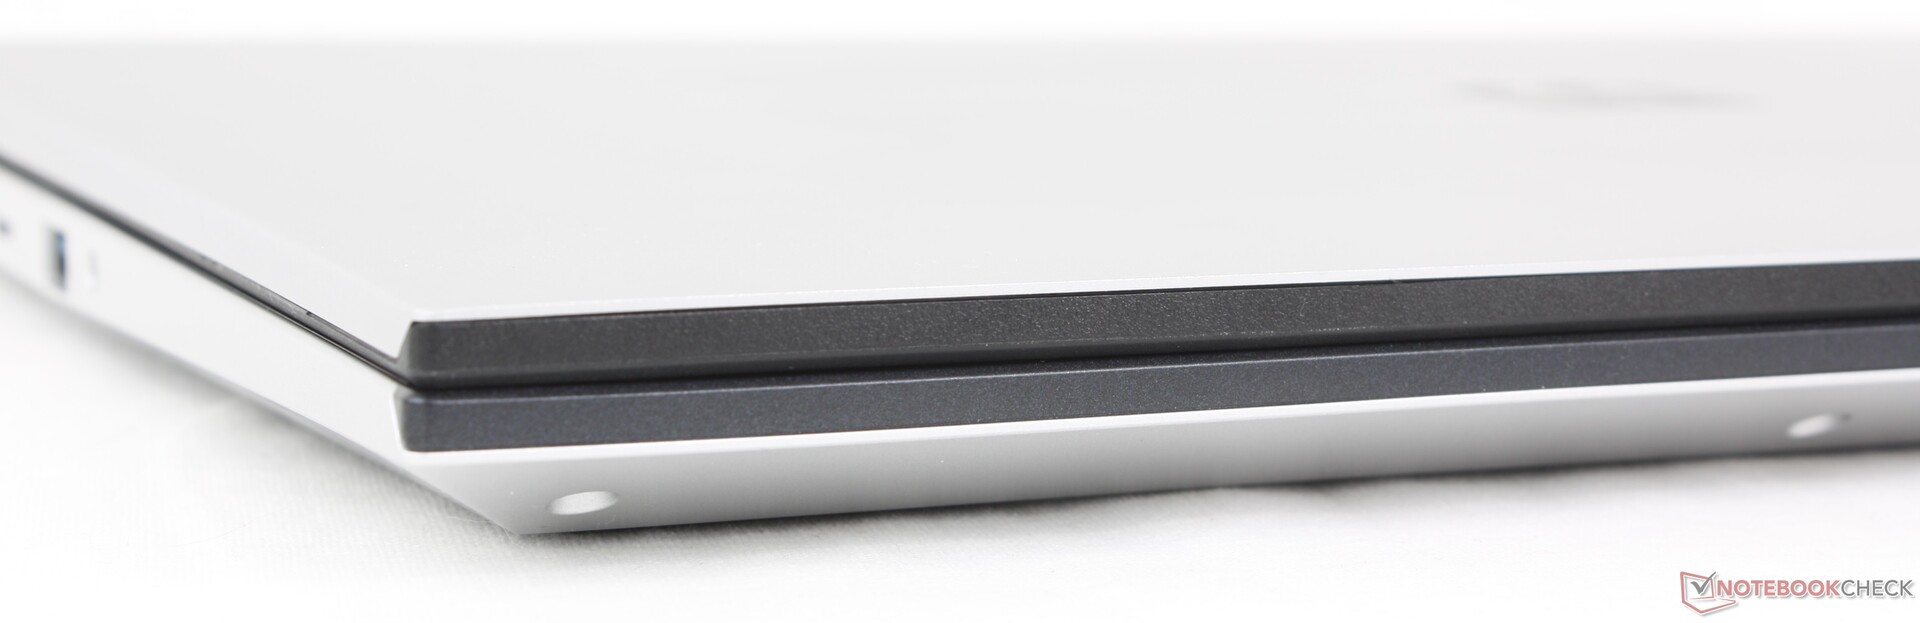
La qualité du châssis ne reflète cependant pas le prix élevé demandé. Les surfaces se déforment plus facilement et ne sont pas aussi rigides que celles de concurrents comme le Razer Blade 16 ou l'Alienware x16 R2. Par exemple, si vous appuyez avec un doigt sur le centre du clavier ou sur le couvercle extérieur, les surfaces s'enfoncent sensiblement. Le couvercle oscille plus facilement lorsque vous ajustez les angles. Vous devrez être plus prudent lorsque vous manipulerez le ML-16 MK2 ou vous risquerez d'endommager les petites charnières.
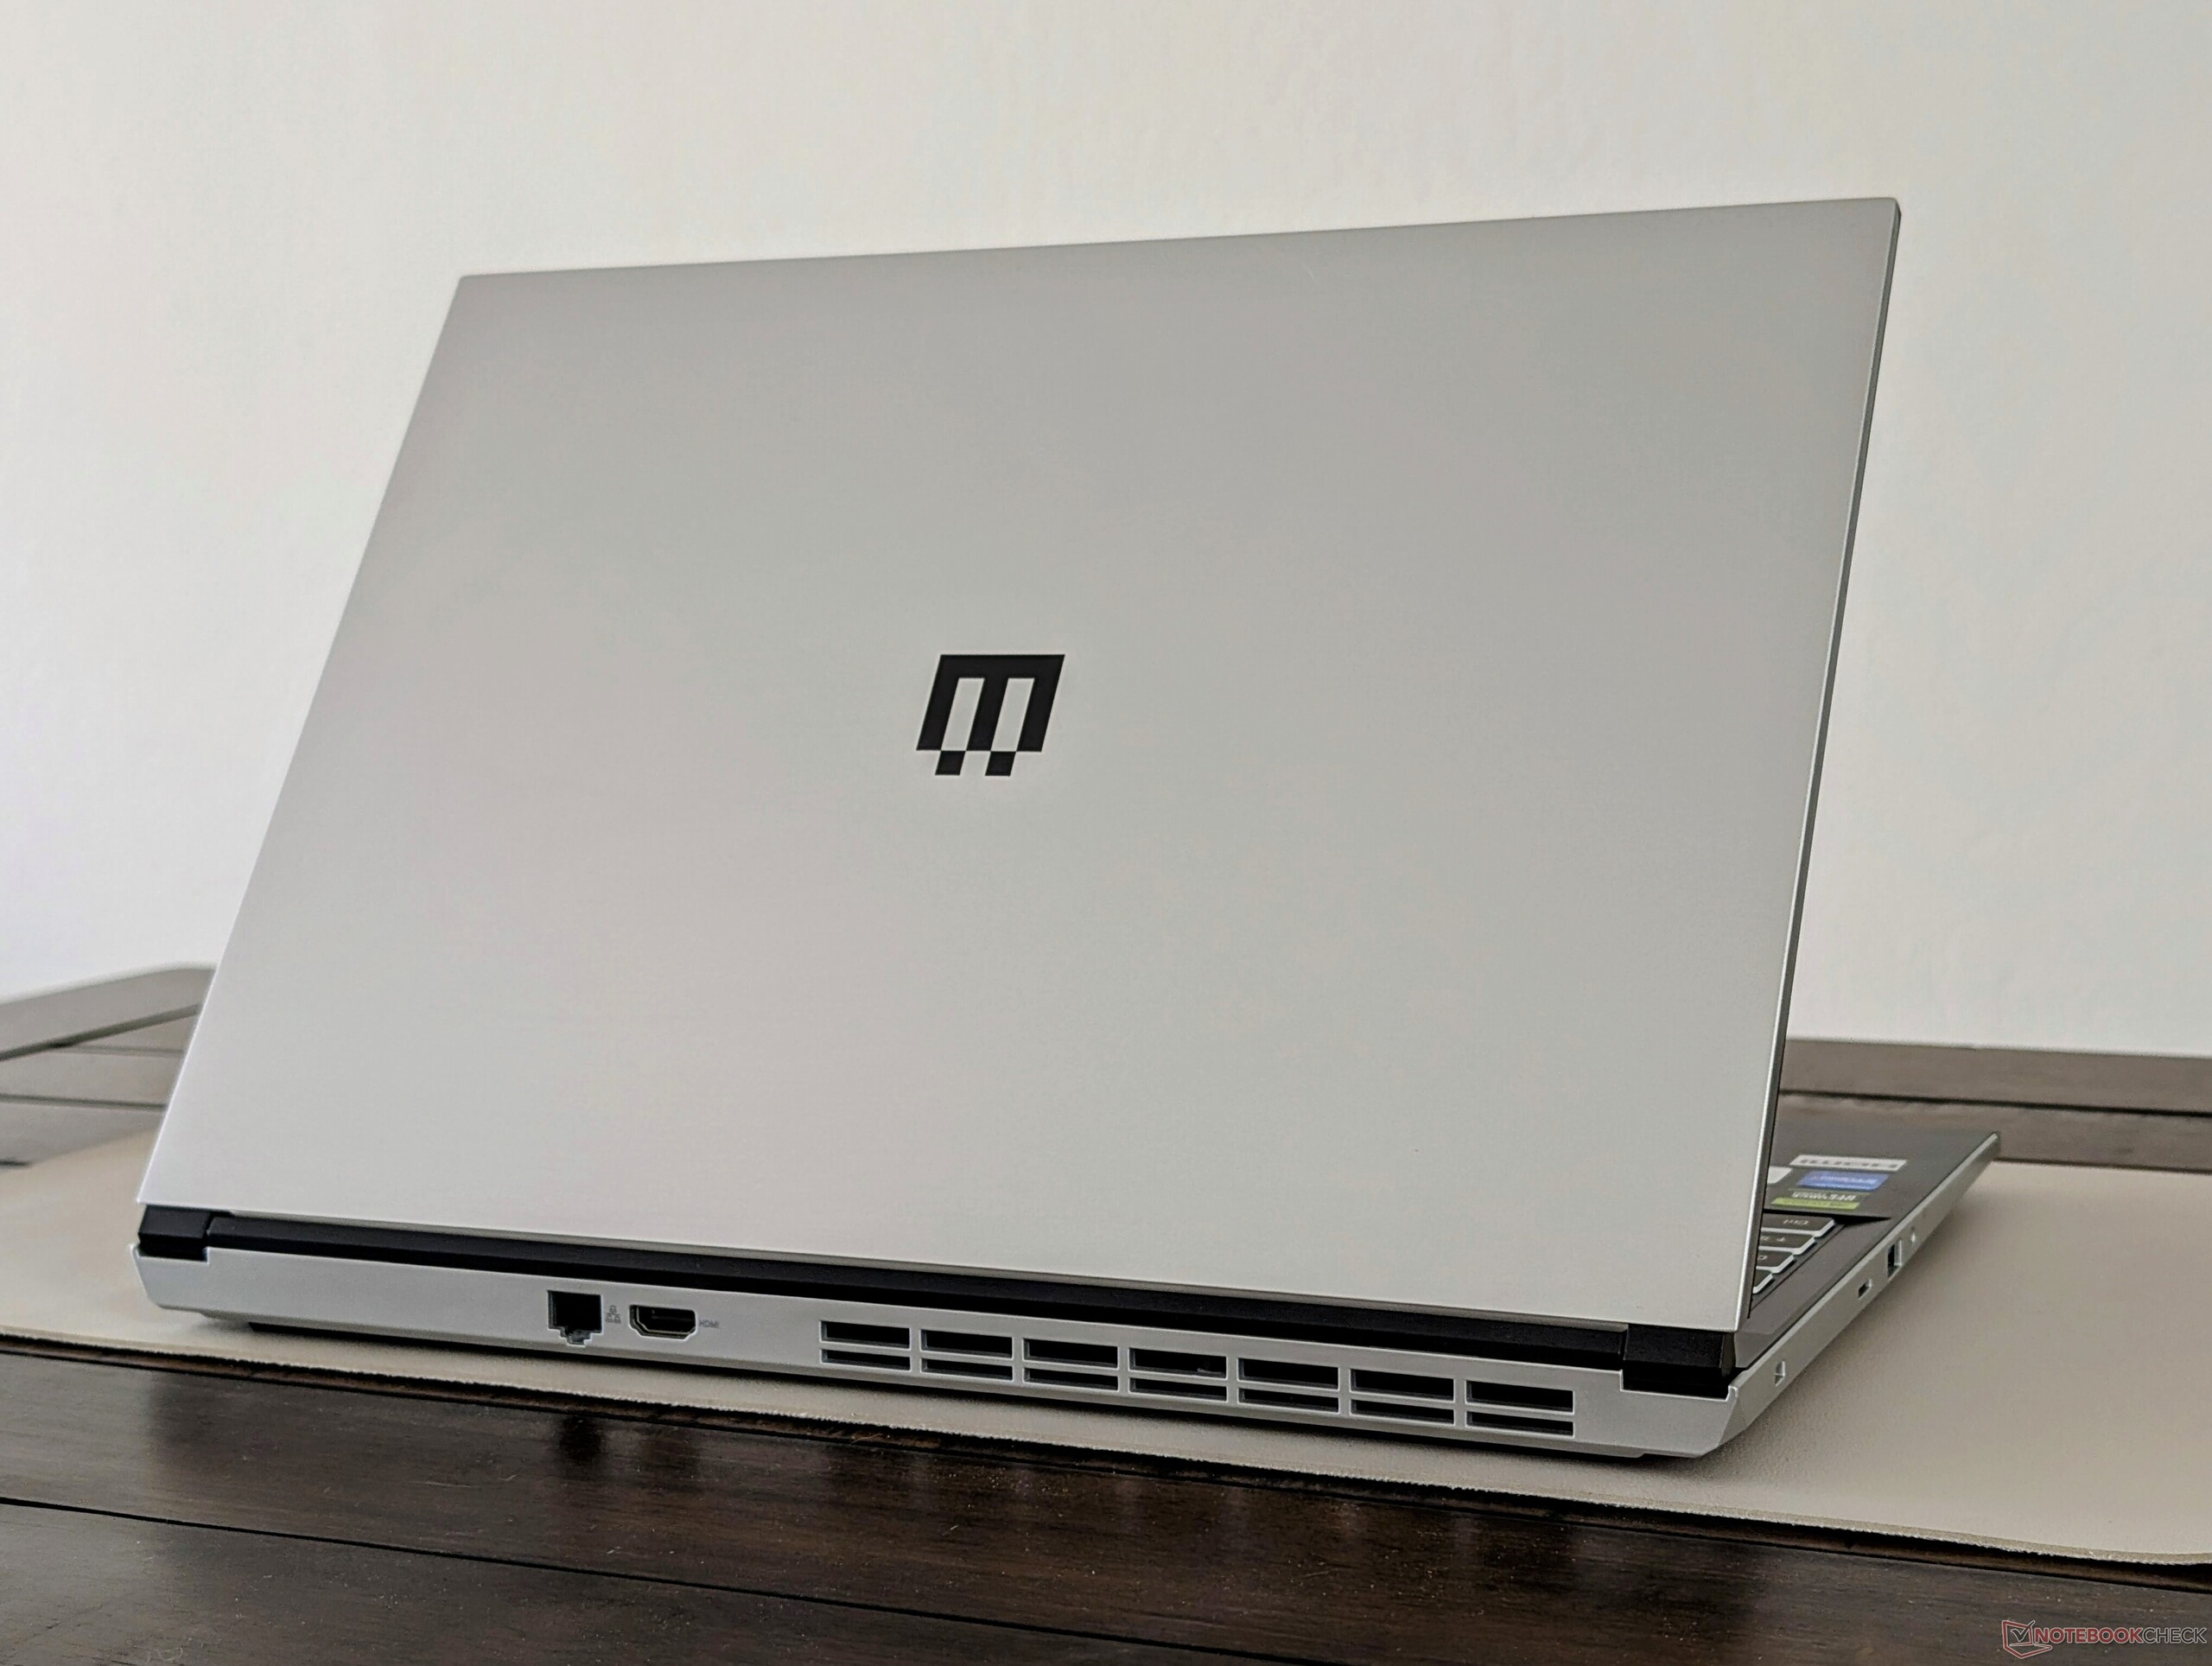
Le poids et l'épaisseur sont plus légers et plus minces que ceux des principaux concurrents, y compris le Blade 16 ou l'Epson Lenovo Legion Pro 5 16IRX9. L'Asus ROG Zephyrus G16 est encore plus fin et plus léger que notre Maingear, mais il se vend également plusieurs centaines d'euros de plus.
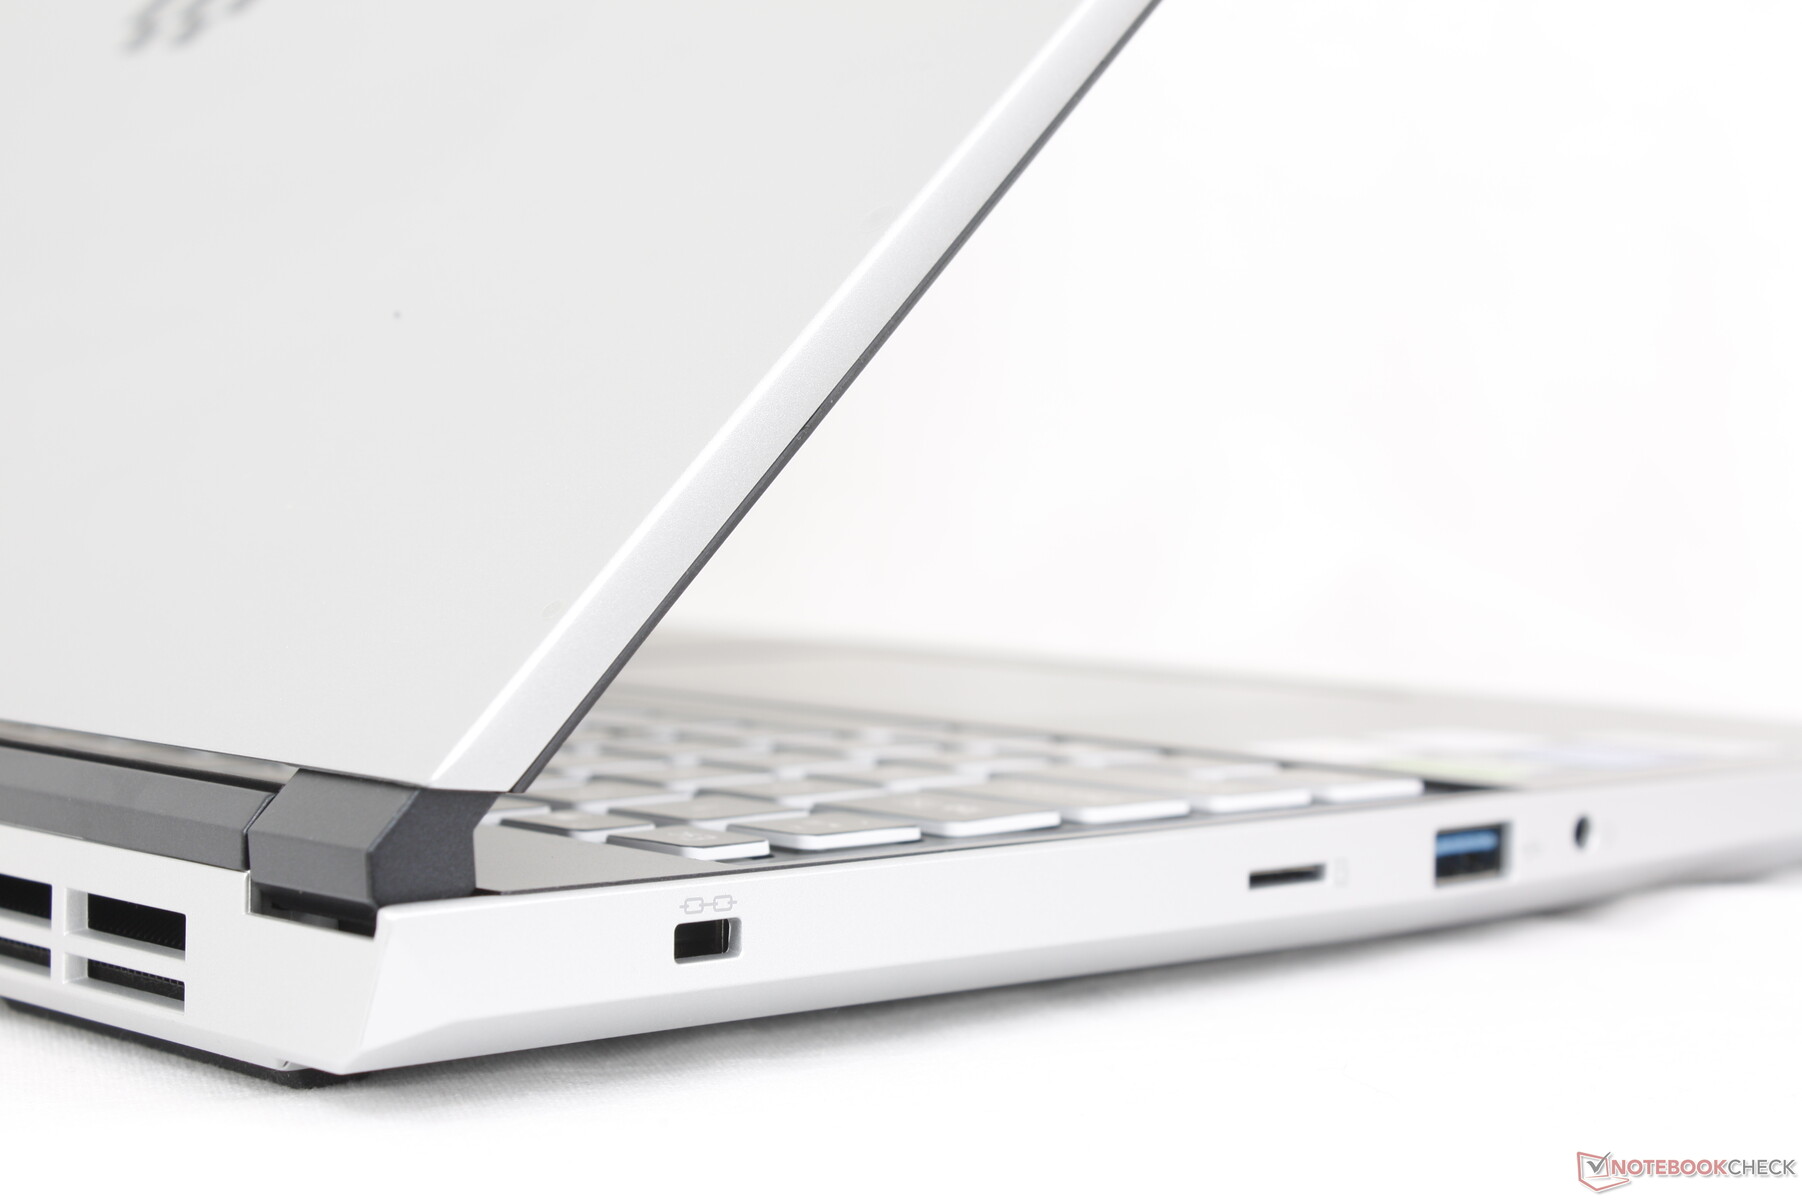
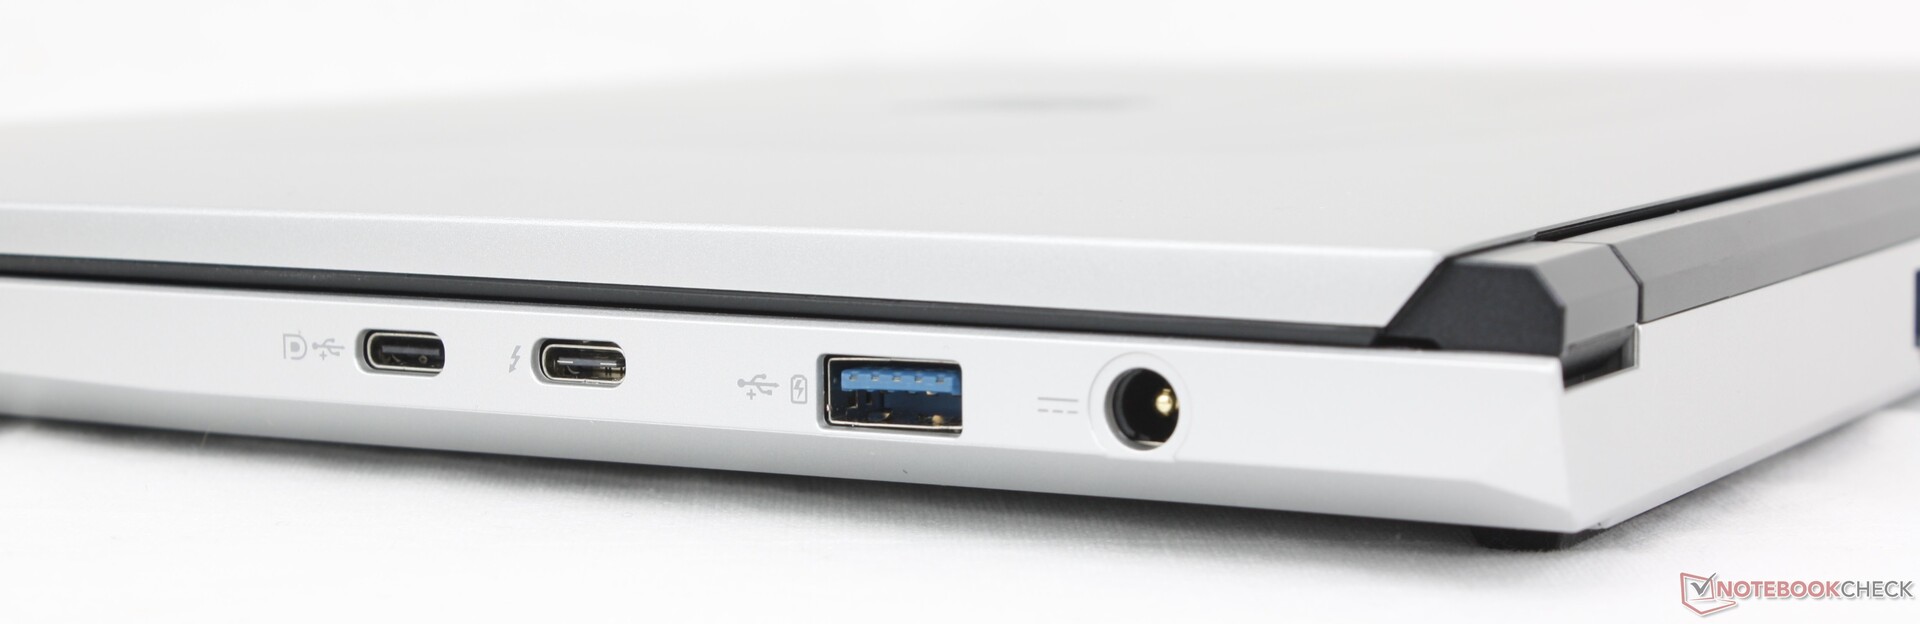
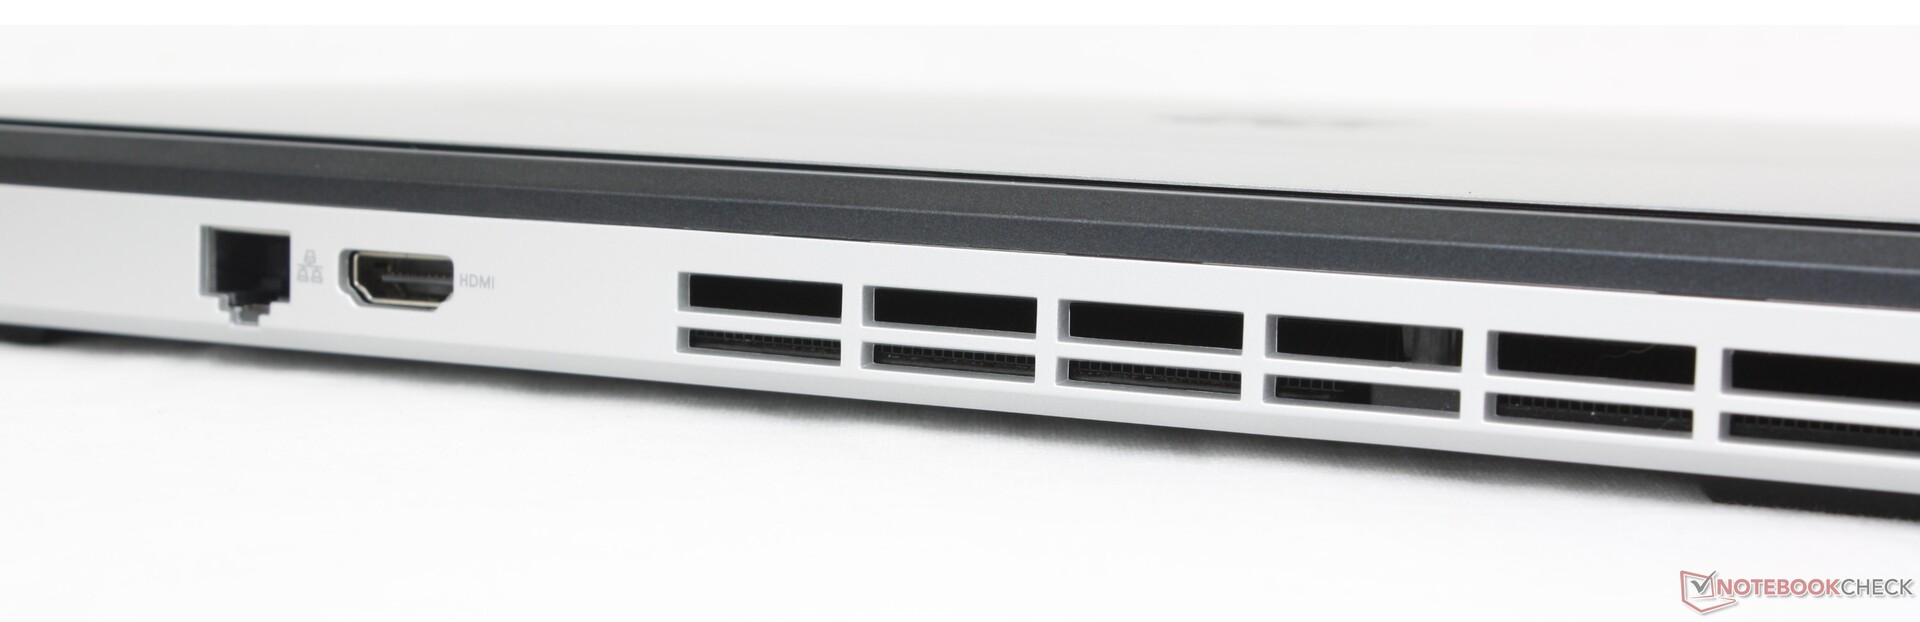
Connectivité
Les ports sont nombreux, même s'il en manque quelques-uns. Le Blade 16, par exemple, comprend plus de ports USB-A tandis que l'Alienware x16 R2 comprend un mini-DisplayPort. Les ports sont bien positionnés et ne sont pas trop encombrés, contrairement au système Alienware susmentionné.
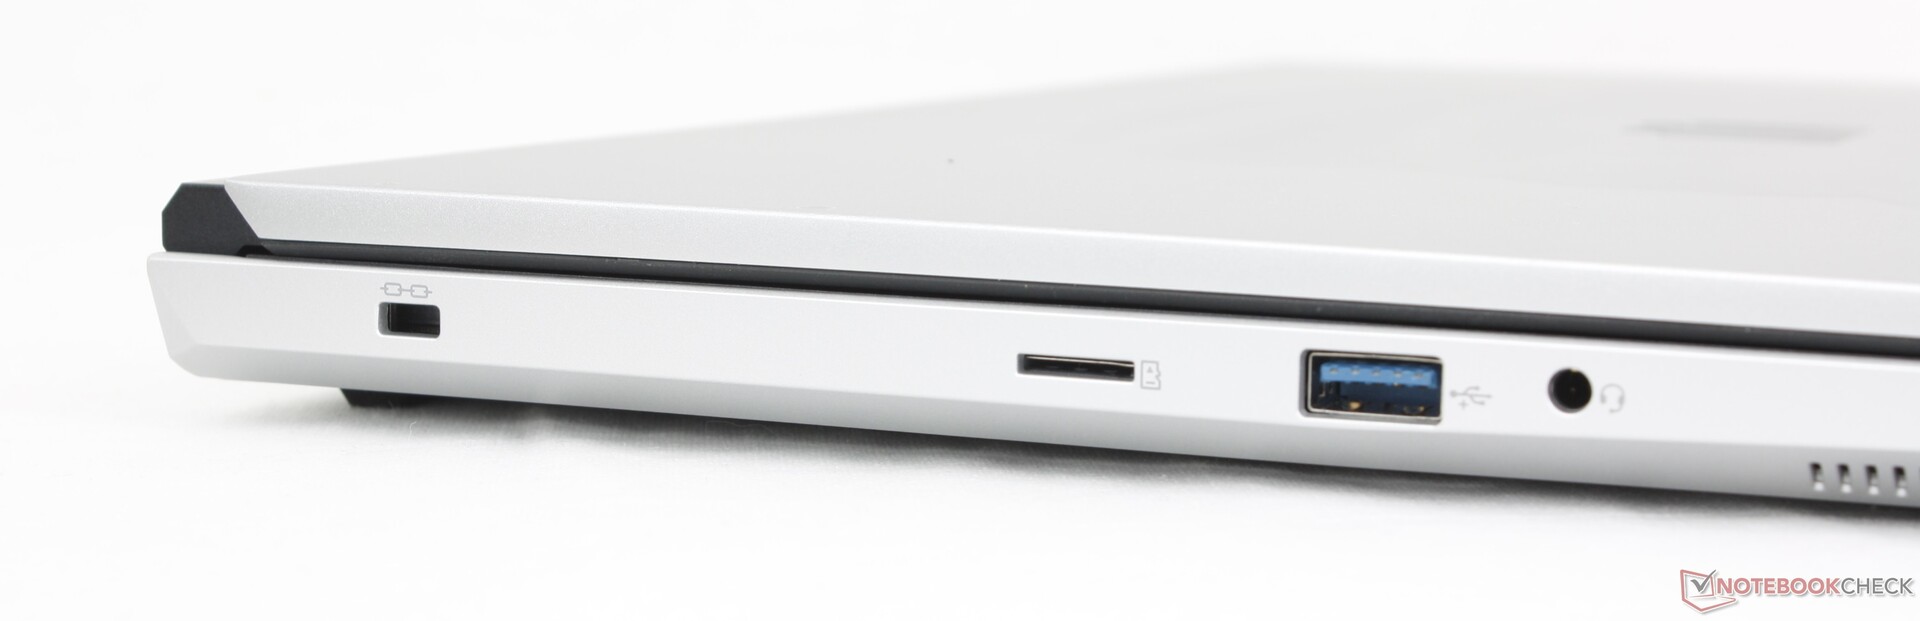
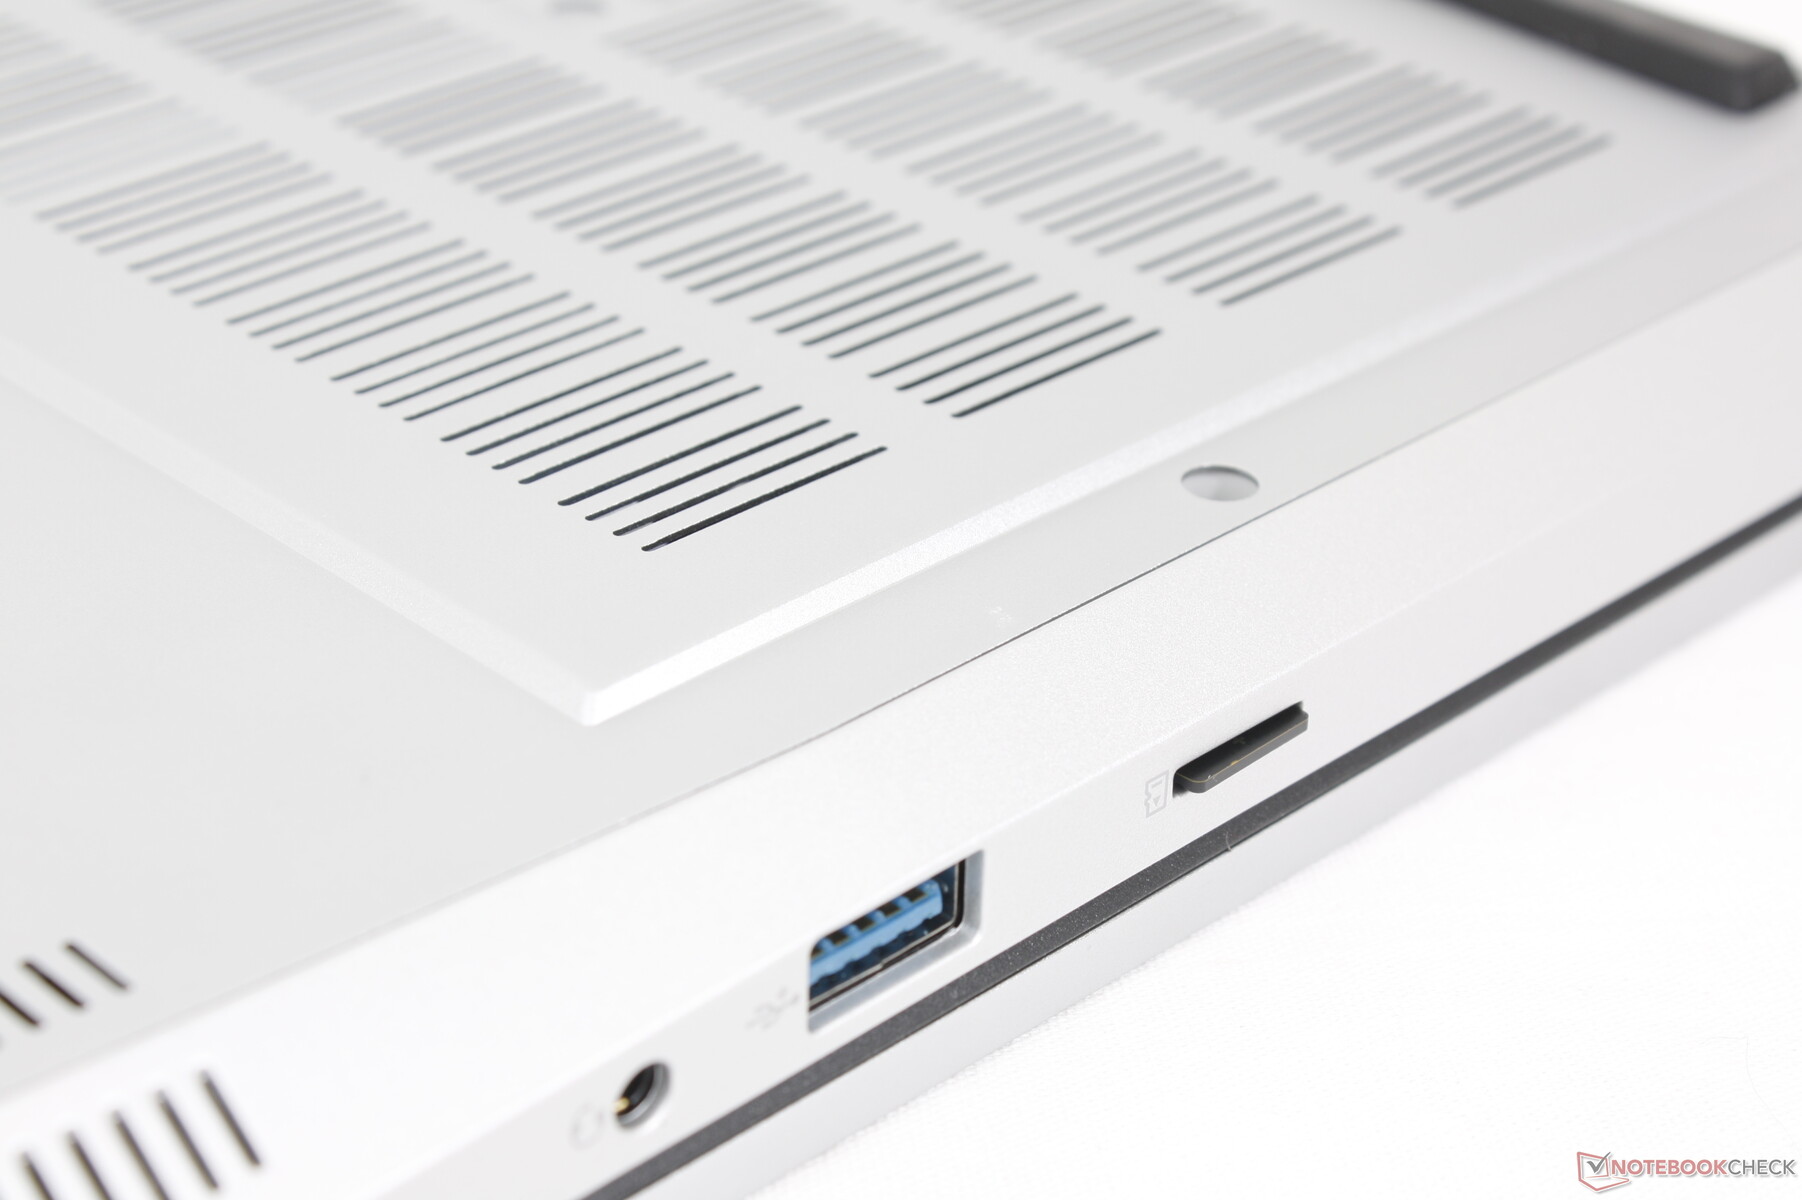
Lecteur de carte SD
Bien que nous apprécions d'avoir un petit lecteur MicroSD plutôt que de ne pas avoir de lecteur SD du tout, celui-ci est lent, surtout pour un ordinateur portable de jeu de 16 pouces. Le transfert de 1 Go de photos depuis notre carte de test UHS-II prend environ 25 secondes, contre seulement 6 secondes sur le Blade 16.
| SD Card Reader | |
| average JPG Copy Test (av. of 3 runs) | |
| Razer Blade 16 2024, RTX 4090 | |
| Alienware x16 R2 P120F (AV PRO microSD 128 GB V60) | |
| Maingear ML-16 MK2 (AV PRO microSD 128 GB V60) | |
| maximum AS SSD Seq Read Test (1GB) | |
| Alienware x16 R2 P120F (AV PRO microSD 128 GB V60) | |
| Razer Blade 16 2024, RTX 4090 | |
| Maingear ML-16 MK2 (AV PRO microSD 128 GB V60) | |
Communication
L'Intel AX211 est livré en standard avec une connectivité Wi-Fi 6E et Bluetooth 5.3. Nous avons constaté des taux de transfert réguliers et n'avons rencontré aucun problème lorsque nous l'avons couplé à notre routeur de test AXE11000.
Webcam
Une webcam de 2 mégapixels avec infrarouge et obturateur électronique est fournie en standard pour être comparable à ses concurrents.


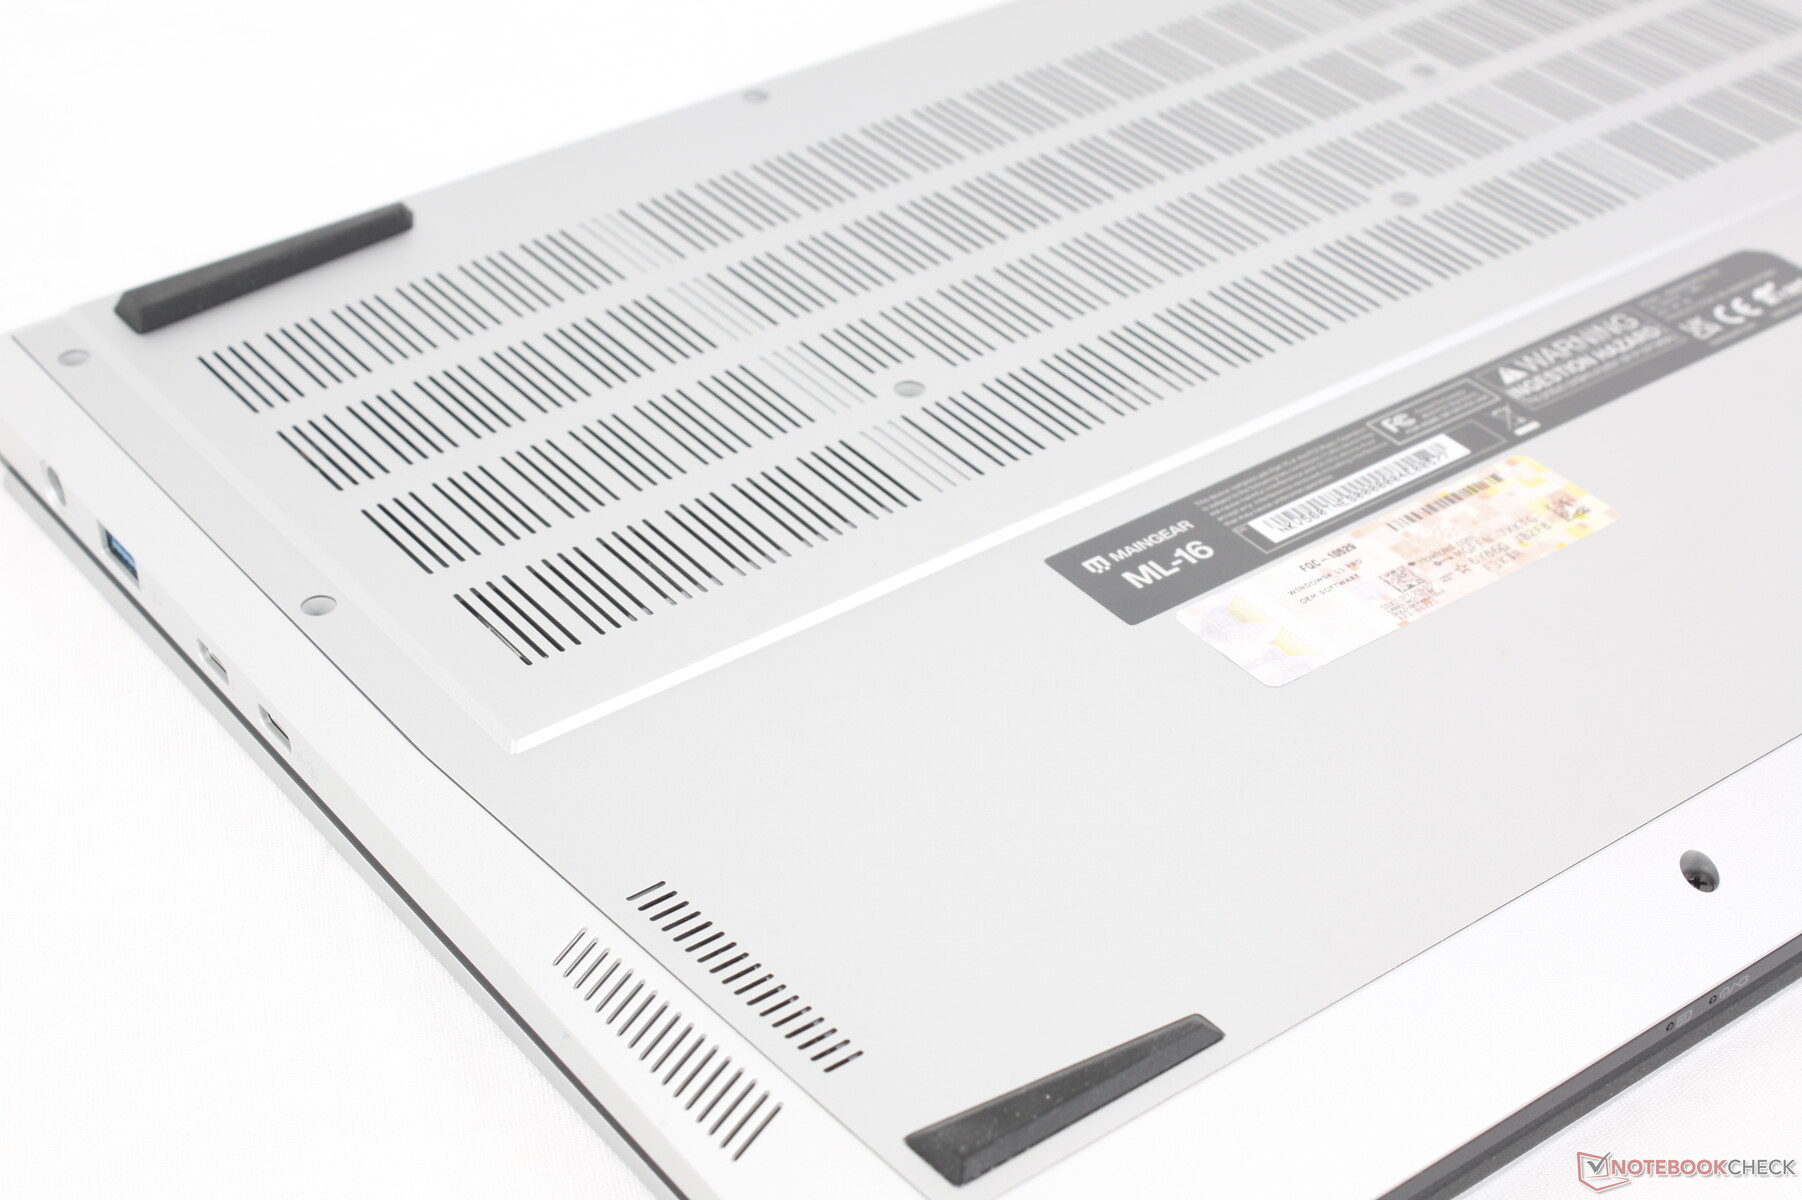
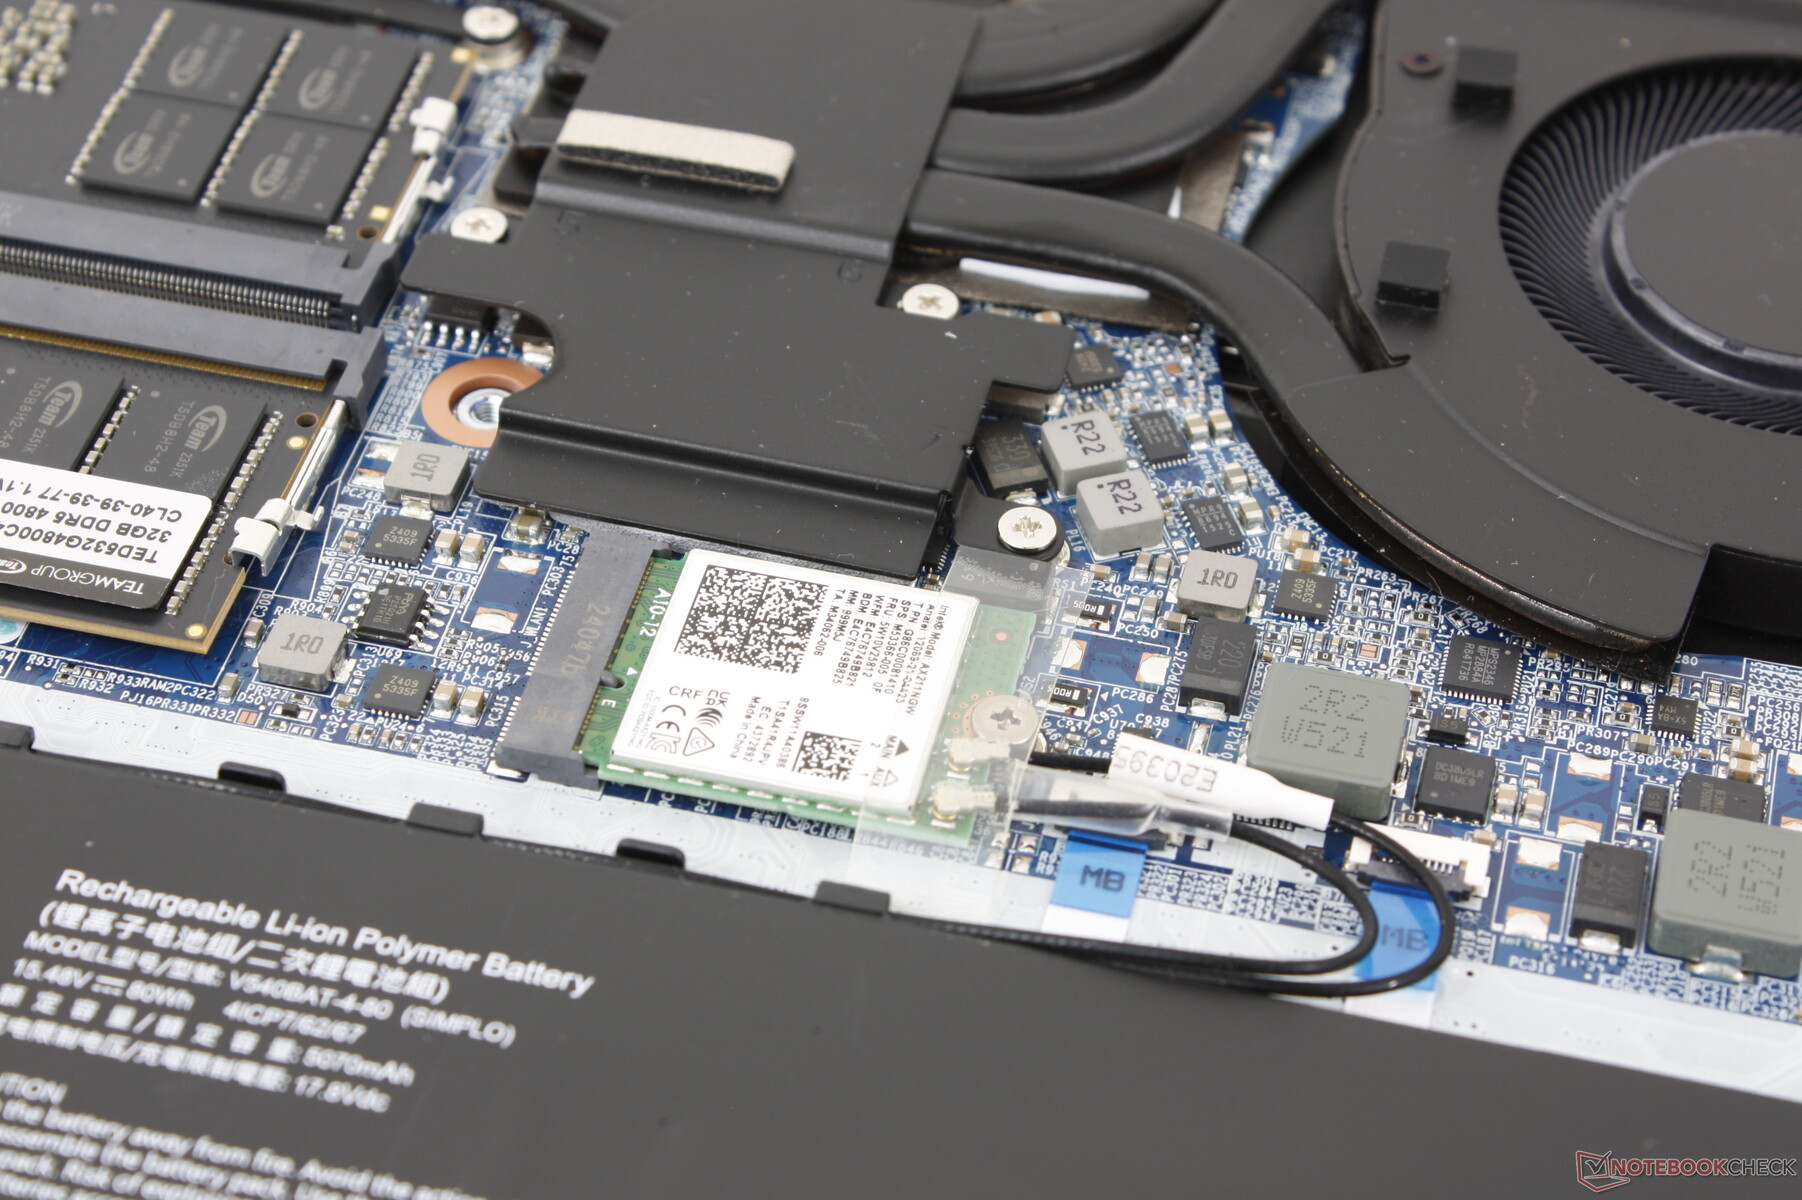
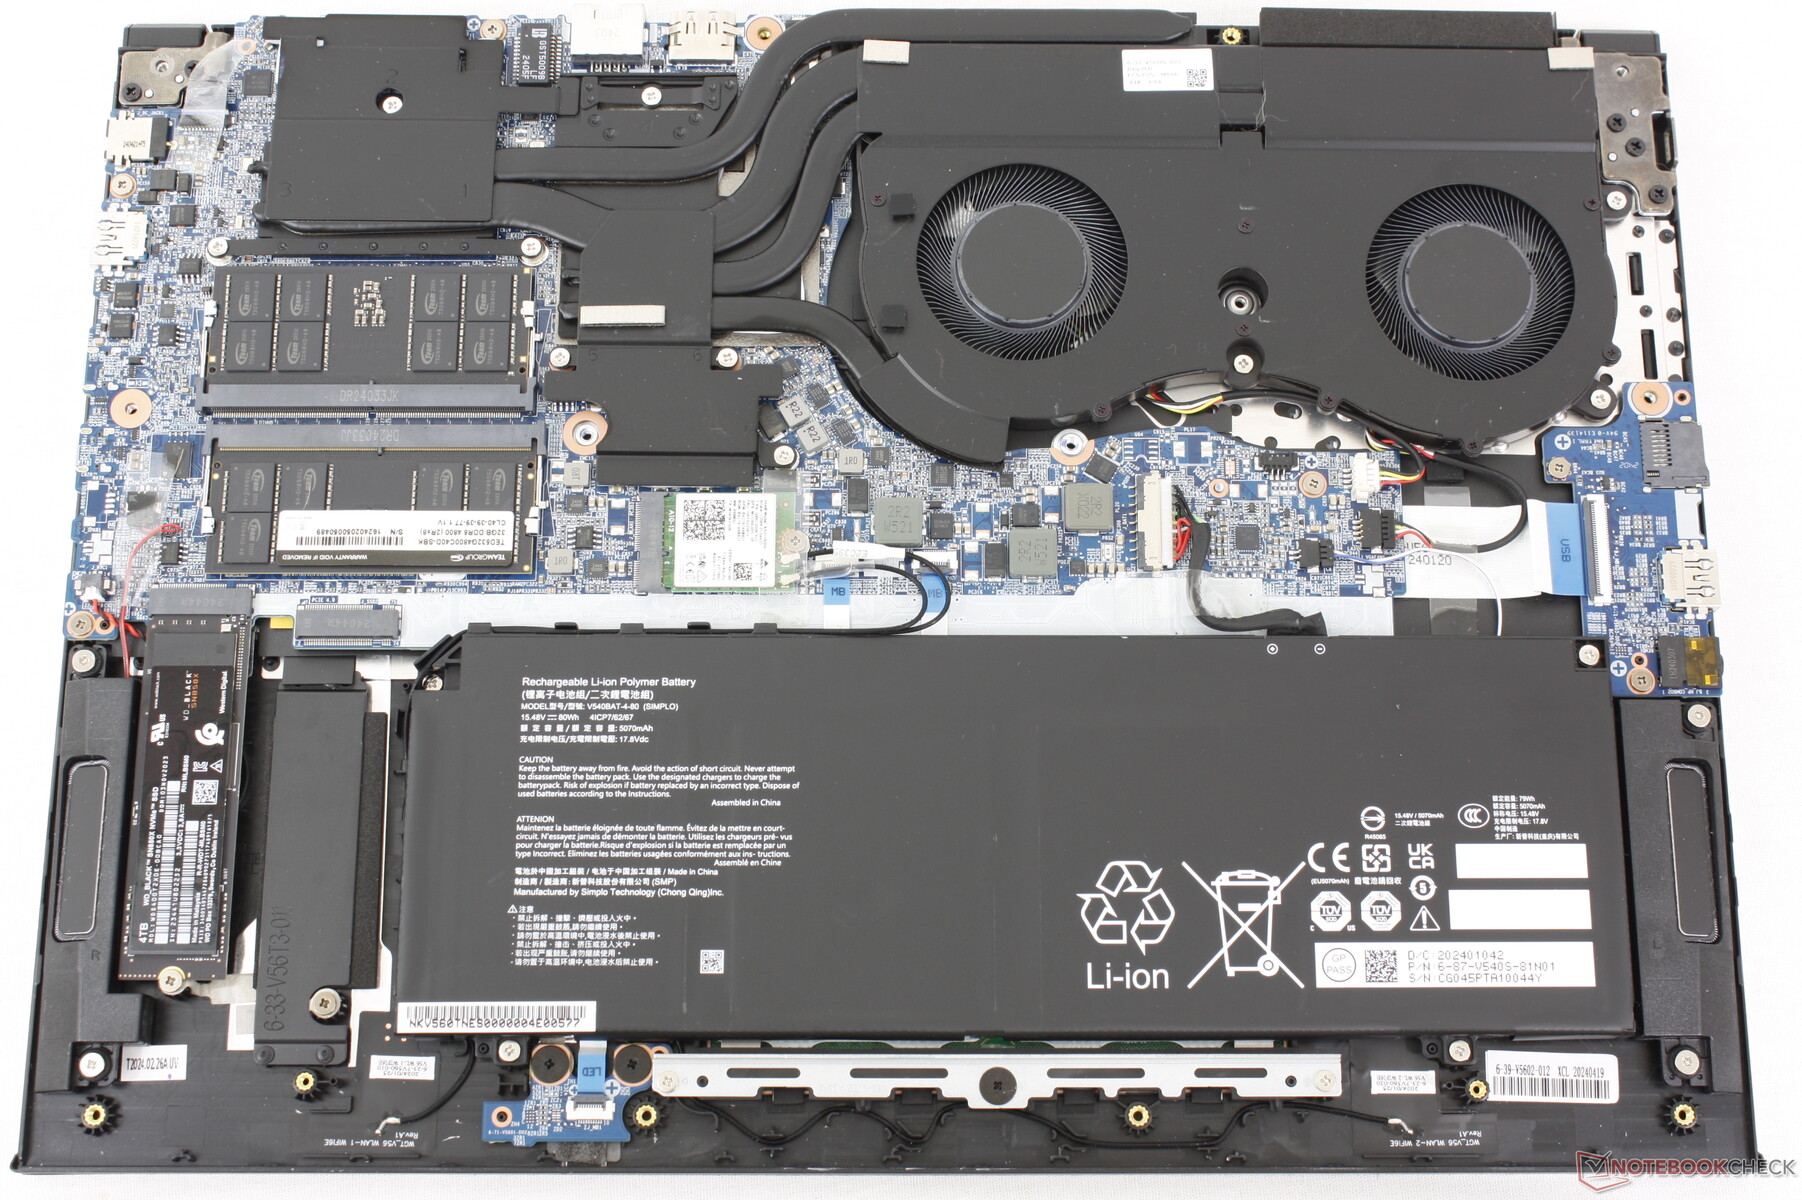
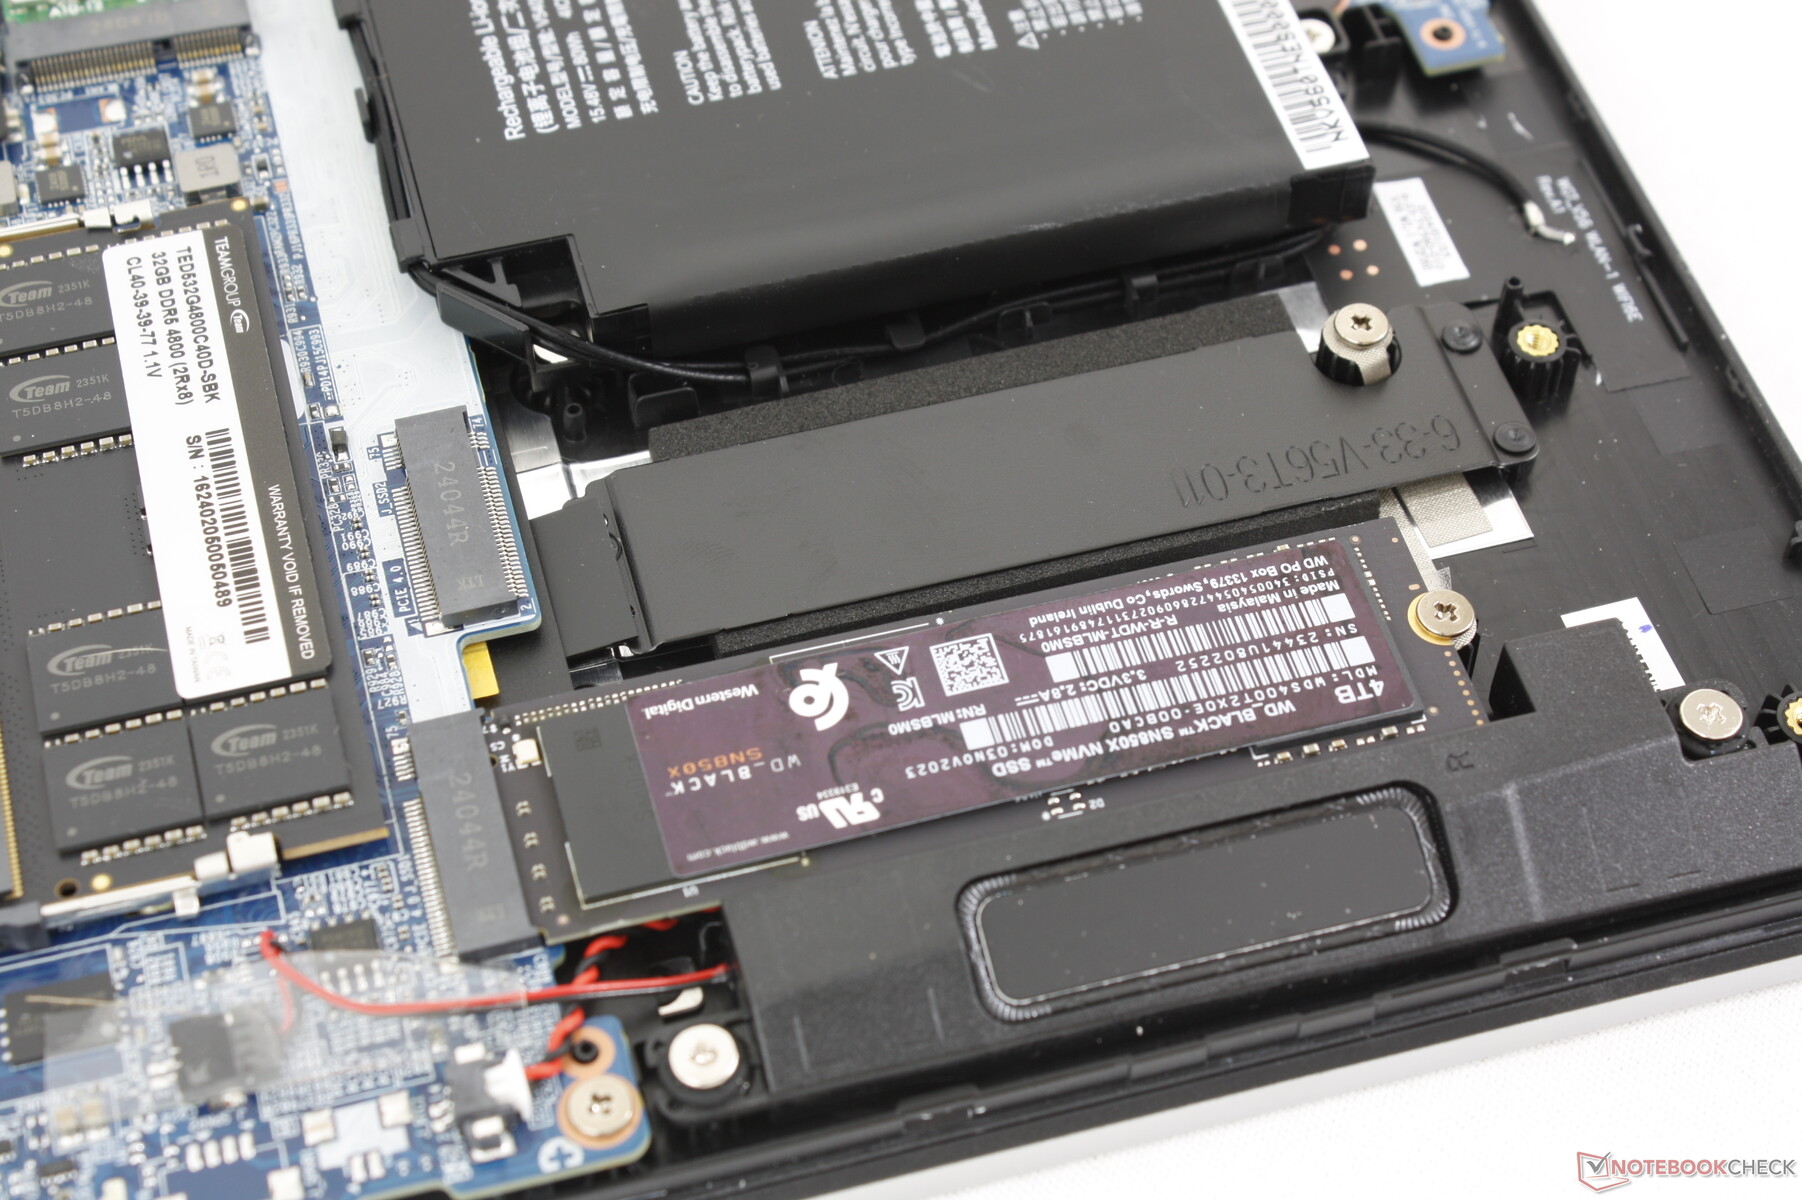
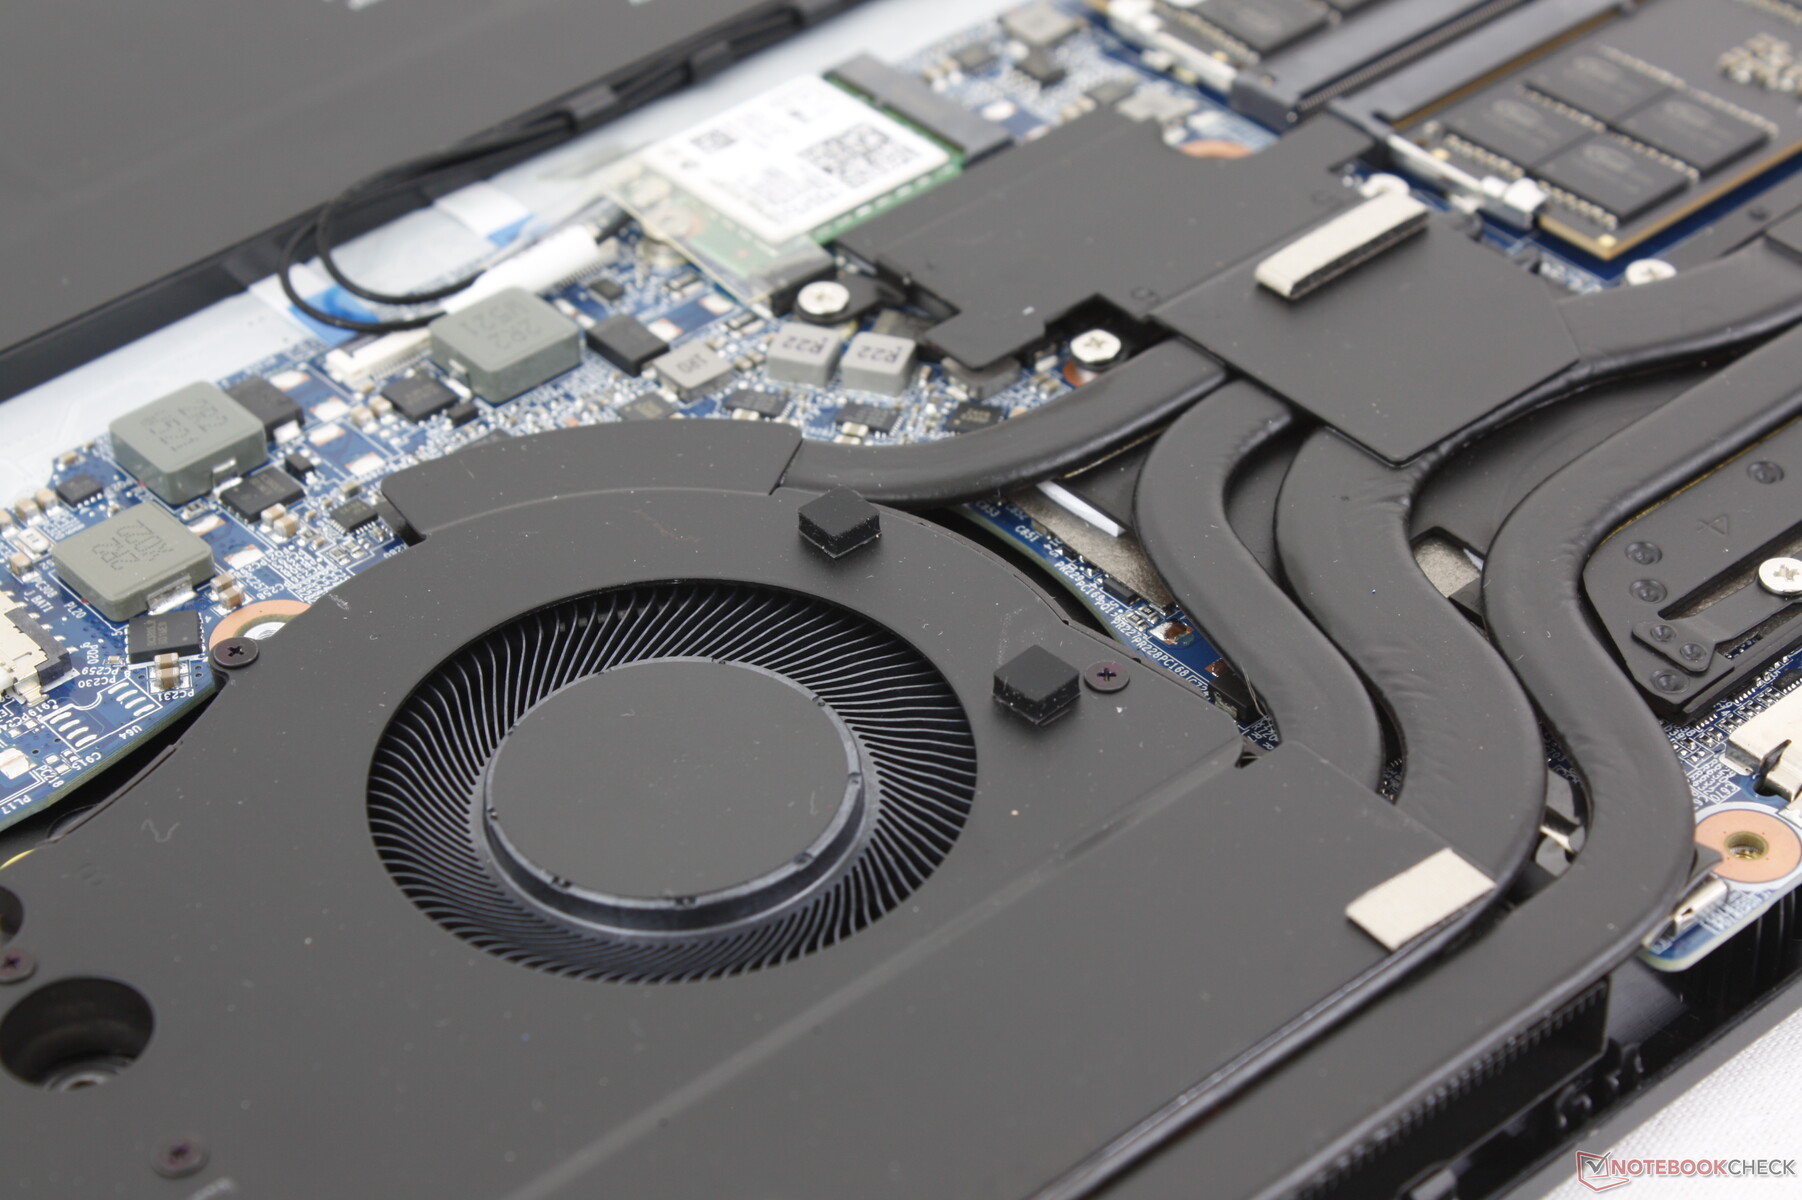
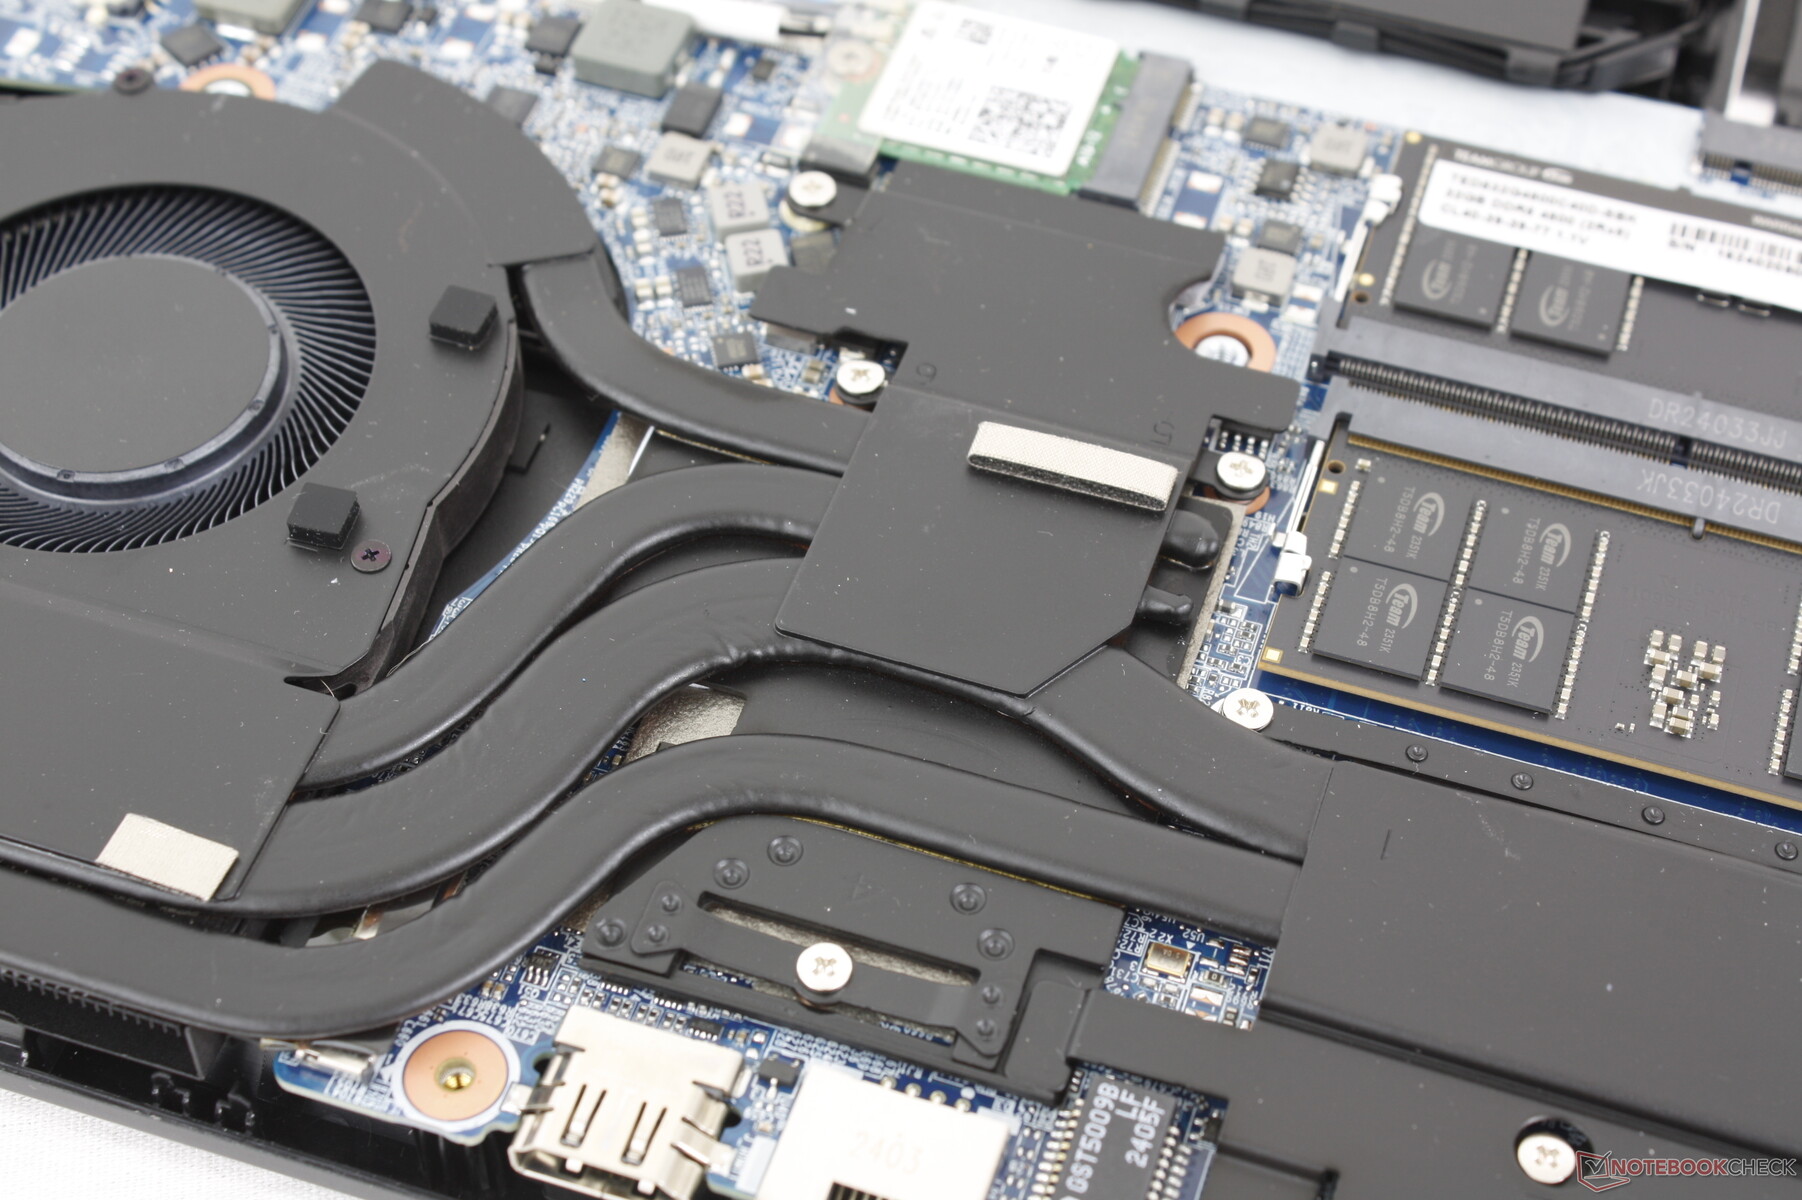
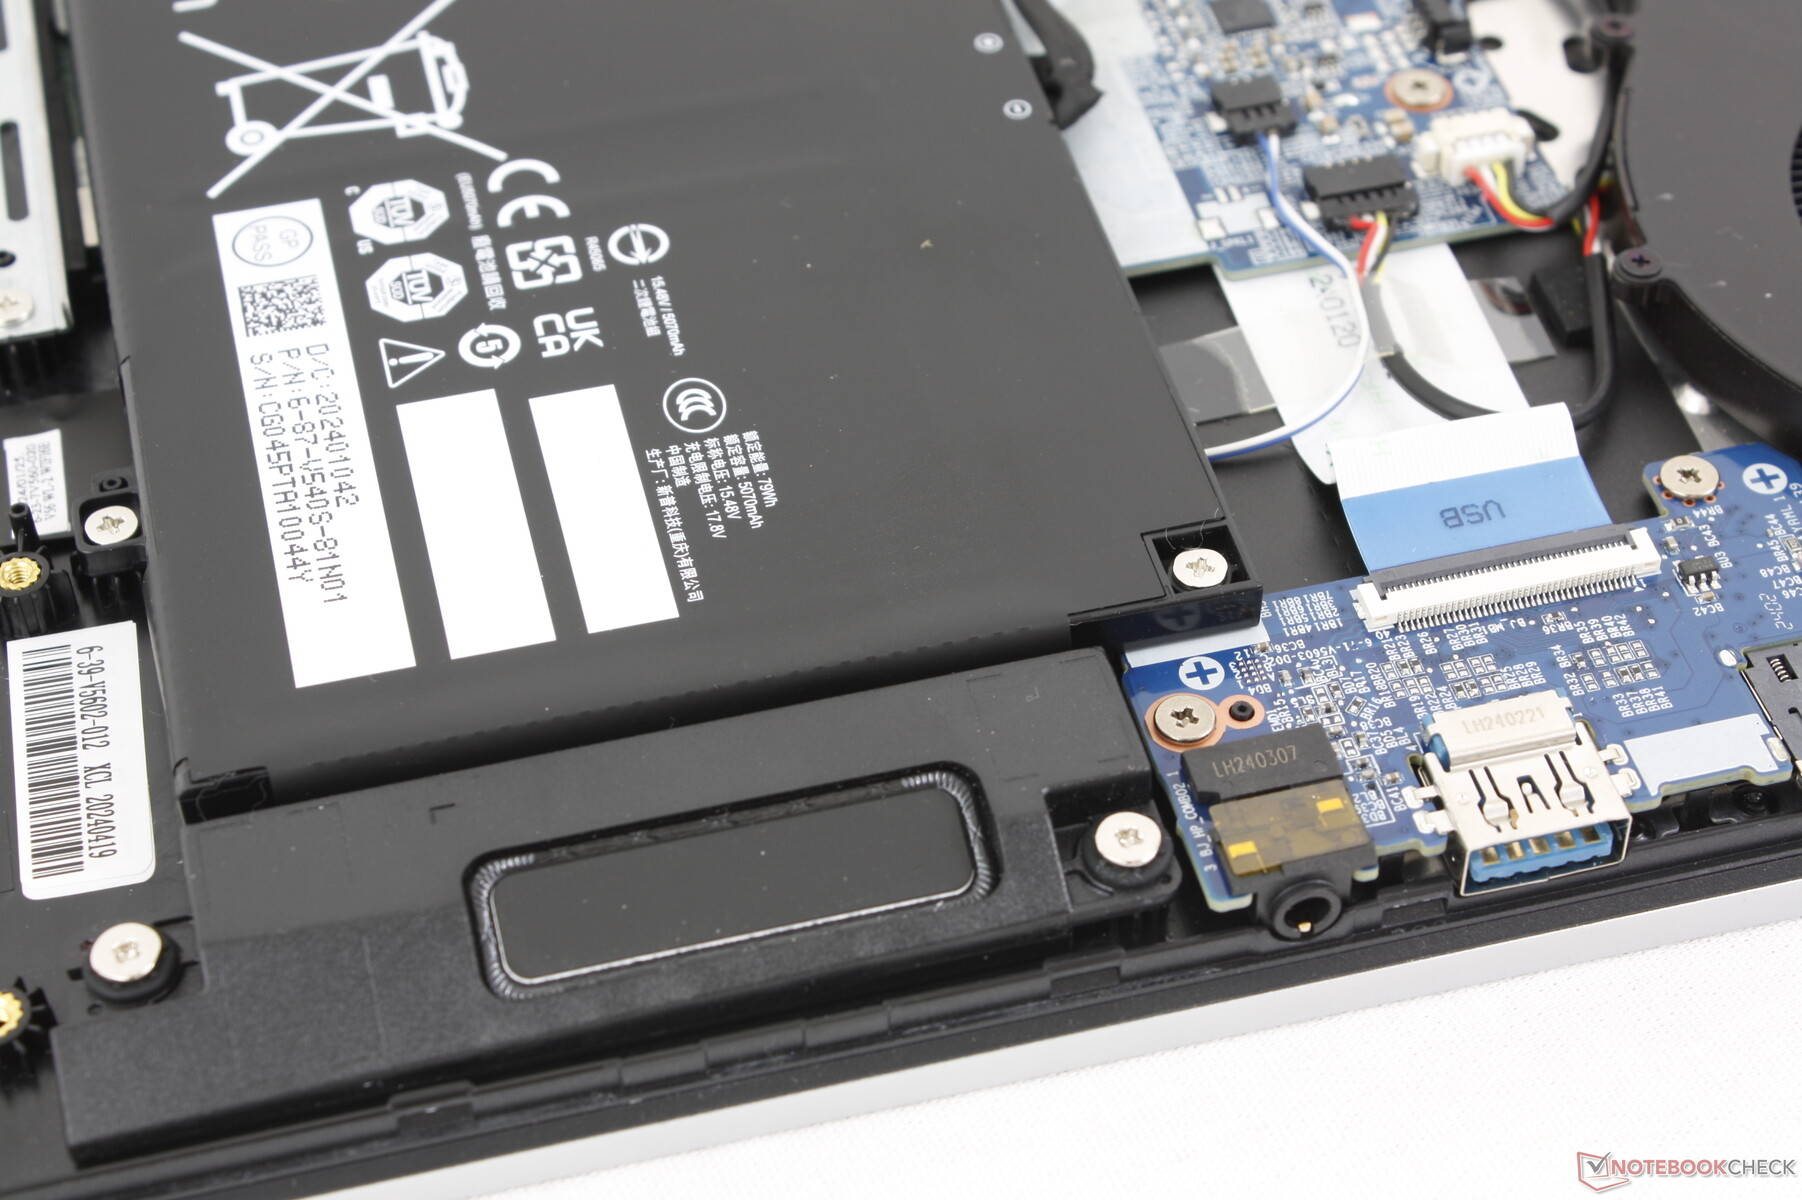
Maintenance
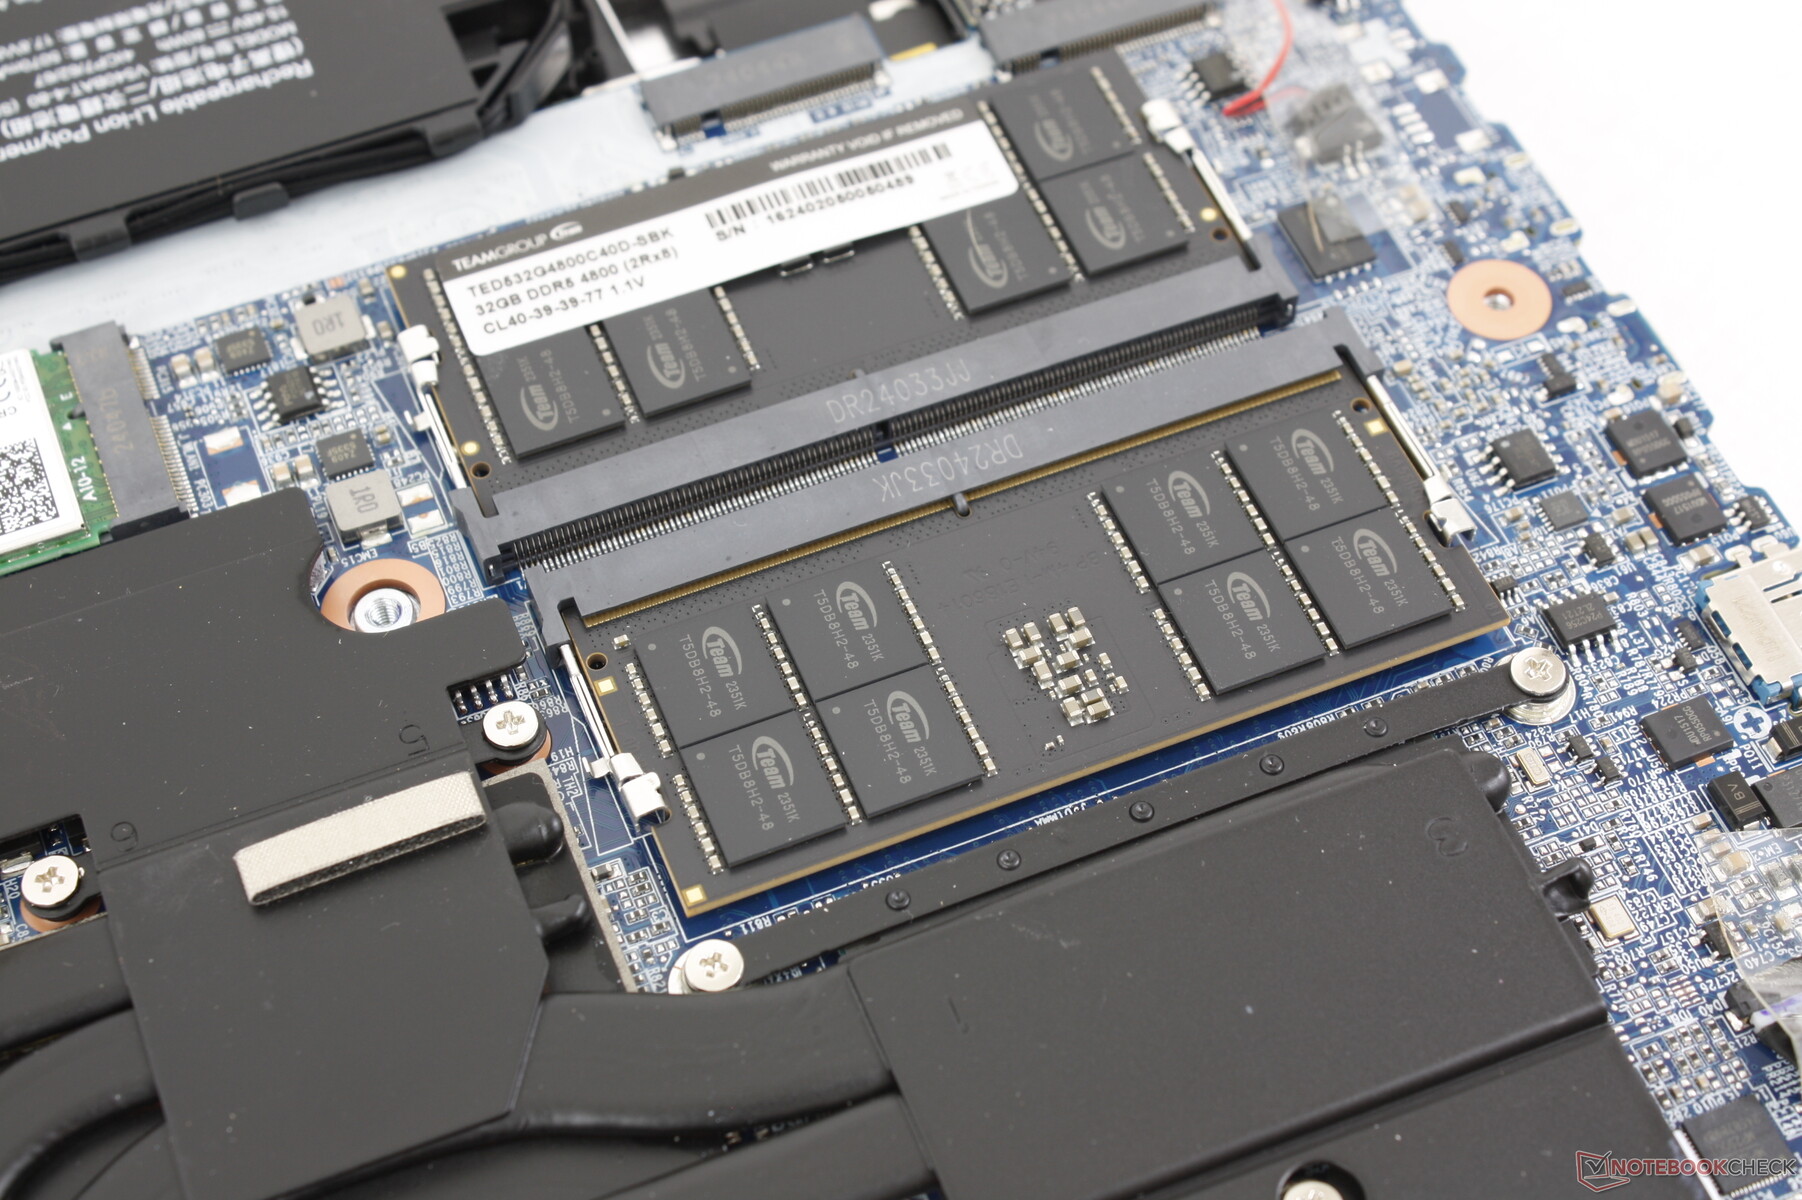
Le panneau inférieur nécessite un peu de patience pour être retiré, car il est fixé par 13 vis Phillips. Il s'enlève sans trop de résistance pour faciliter l'accès aux deux baies M.2 PCIe4 x4 2280, aux deux emplacements SODIMM, à la batterie et au module WLAN amovible. Ces options sont comparables à celles du Razer Blade 16 tout en étant meilleures que celles de l Alienware x16 R2 qui ne dispose d'aucune mémoire vive extensible par l'utilisateur.
Durabilité
Maingear indique qu'aucun matériau recyclé n'a été utilisé pour fabriquer l'ordinateur portable.
L'emballage se compose de carton, d'emballage plastique et de PEBD non recyclable.
Accessoires et garantie
La boîte ne contient pas d'autres éléments que l'adaptateur secteur et la documentation. La garantie limitée habituelle d'un an du fabricant s'applique si l'appareil est acheté aux États-Unis.
Périphériques d'entrée
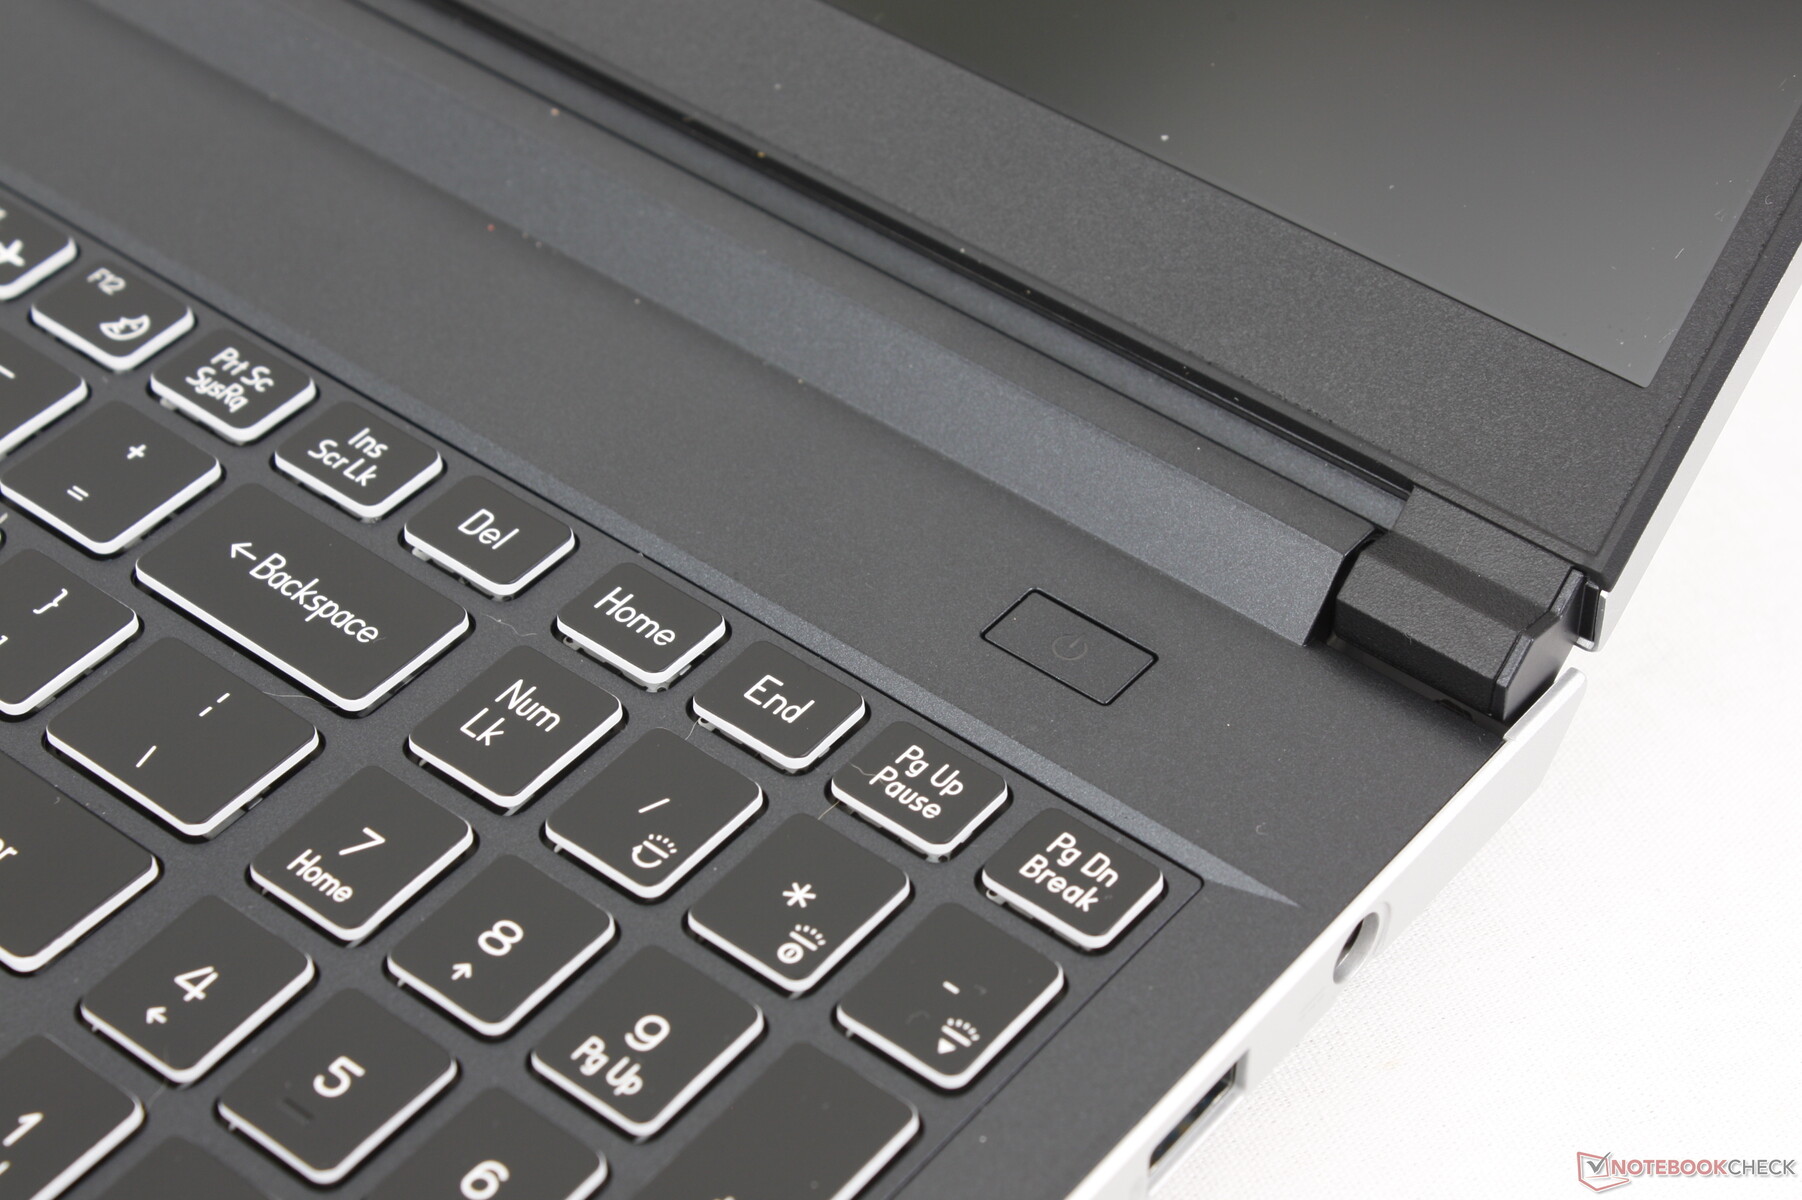
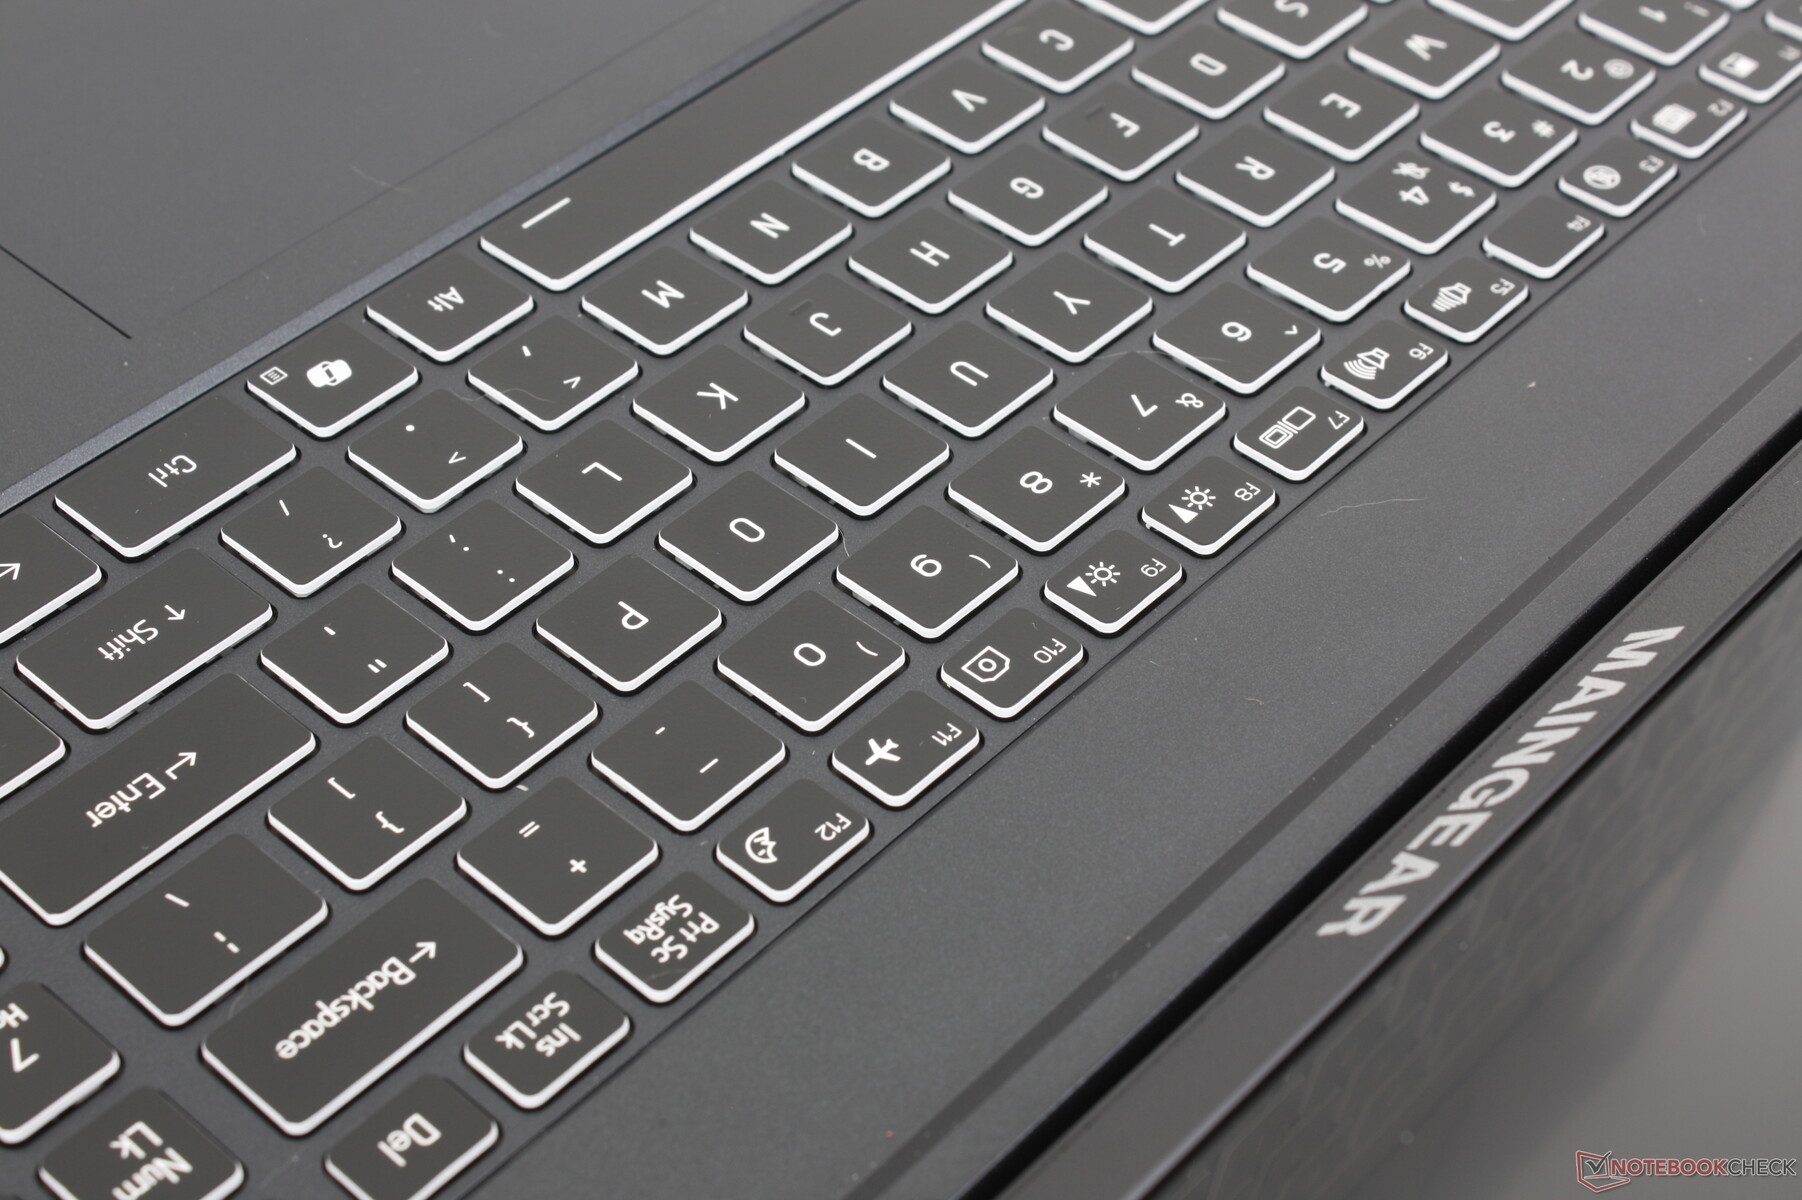
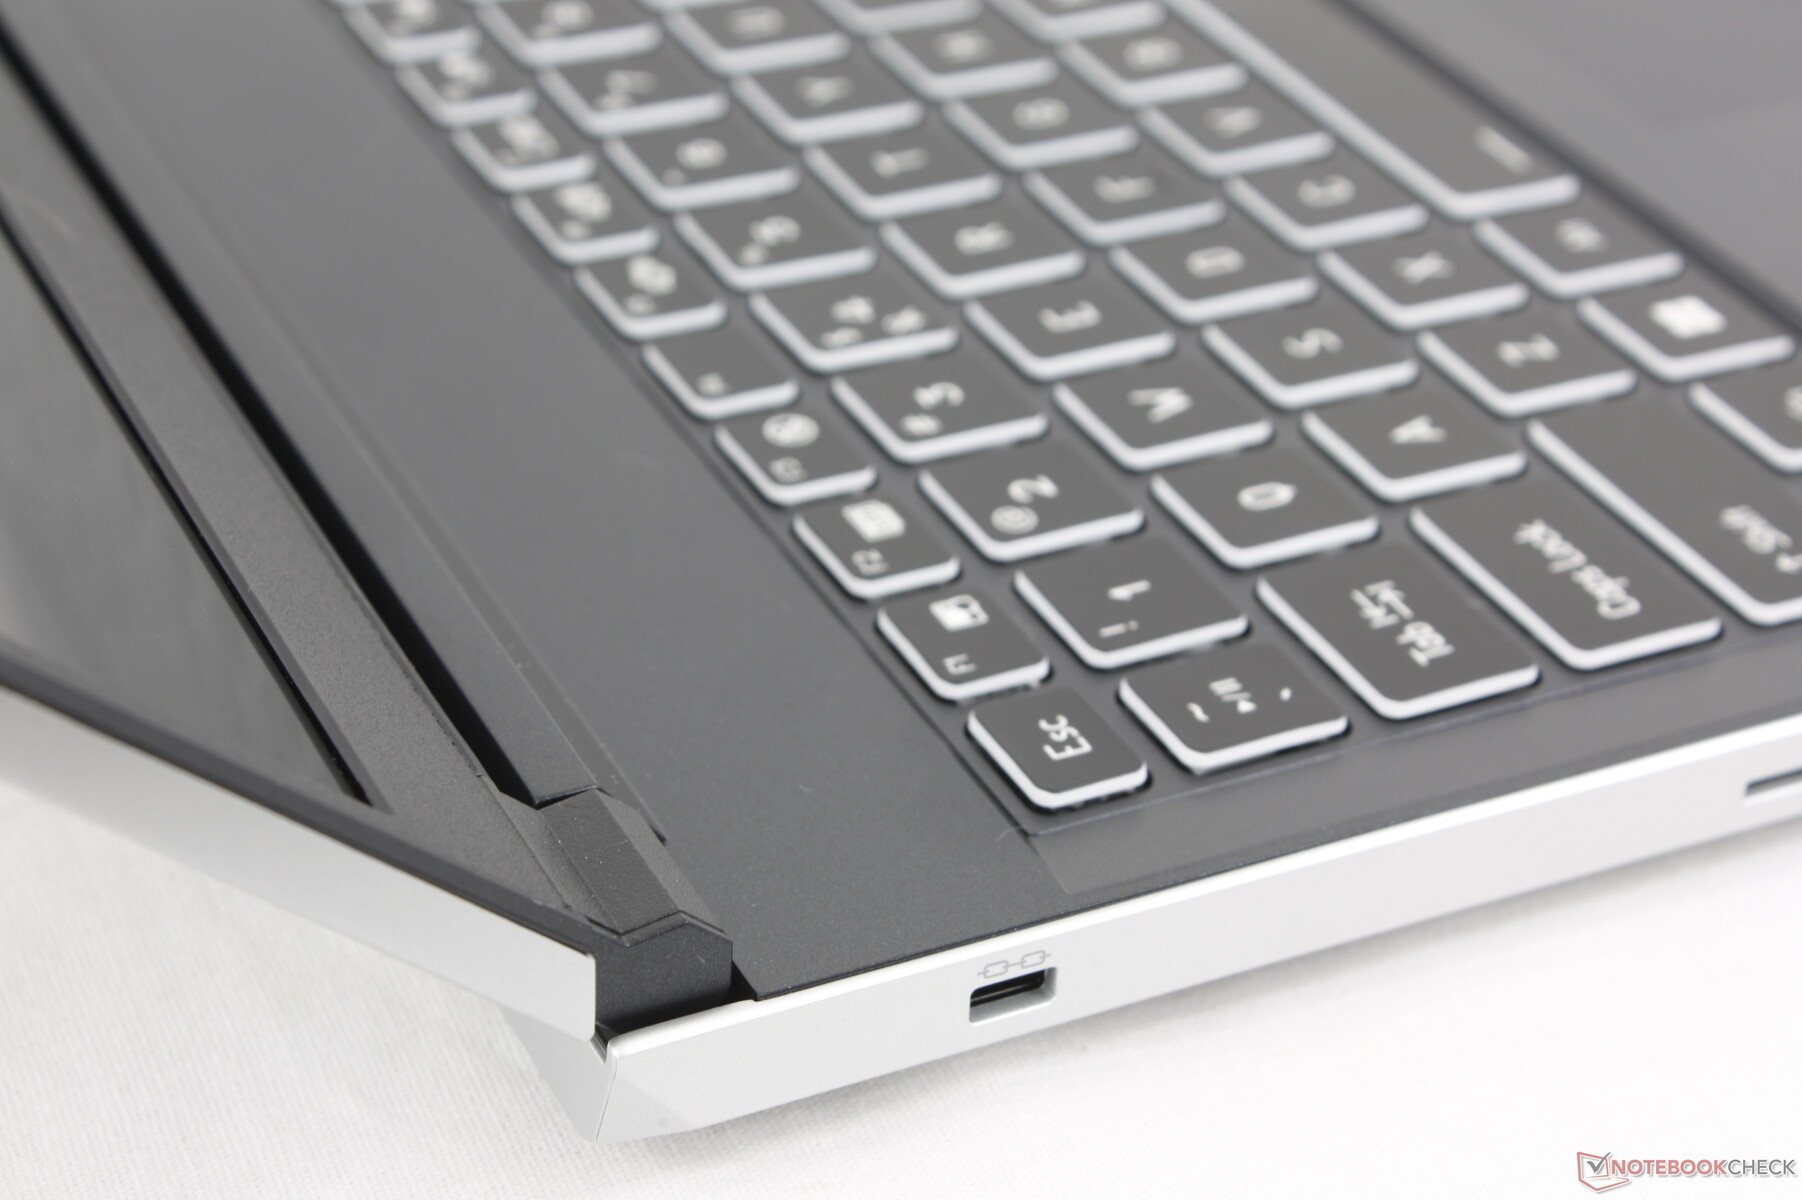
Clavier
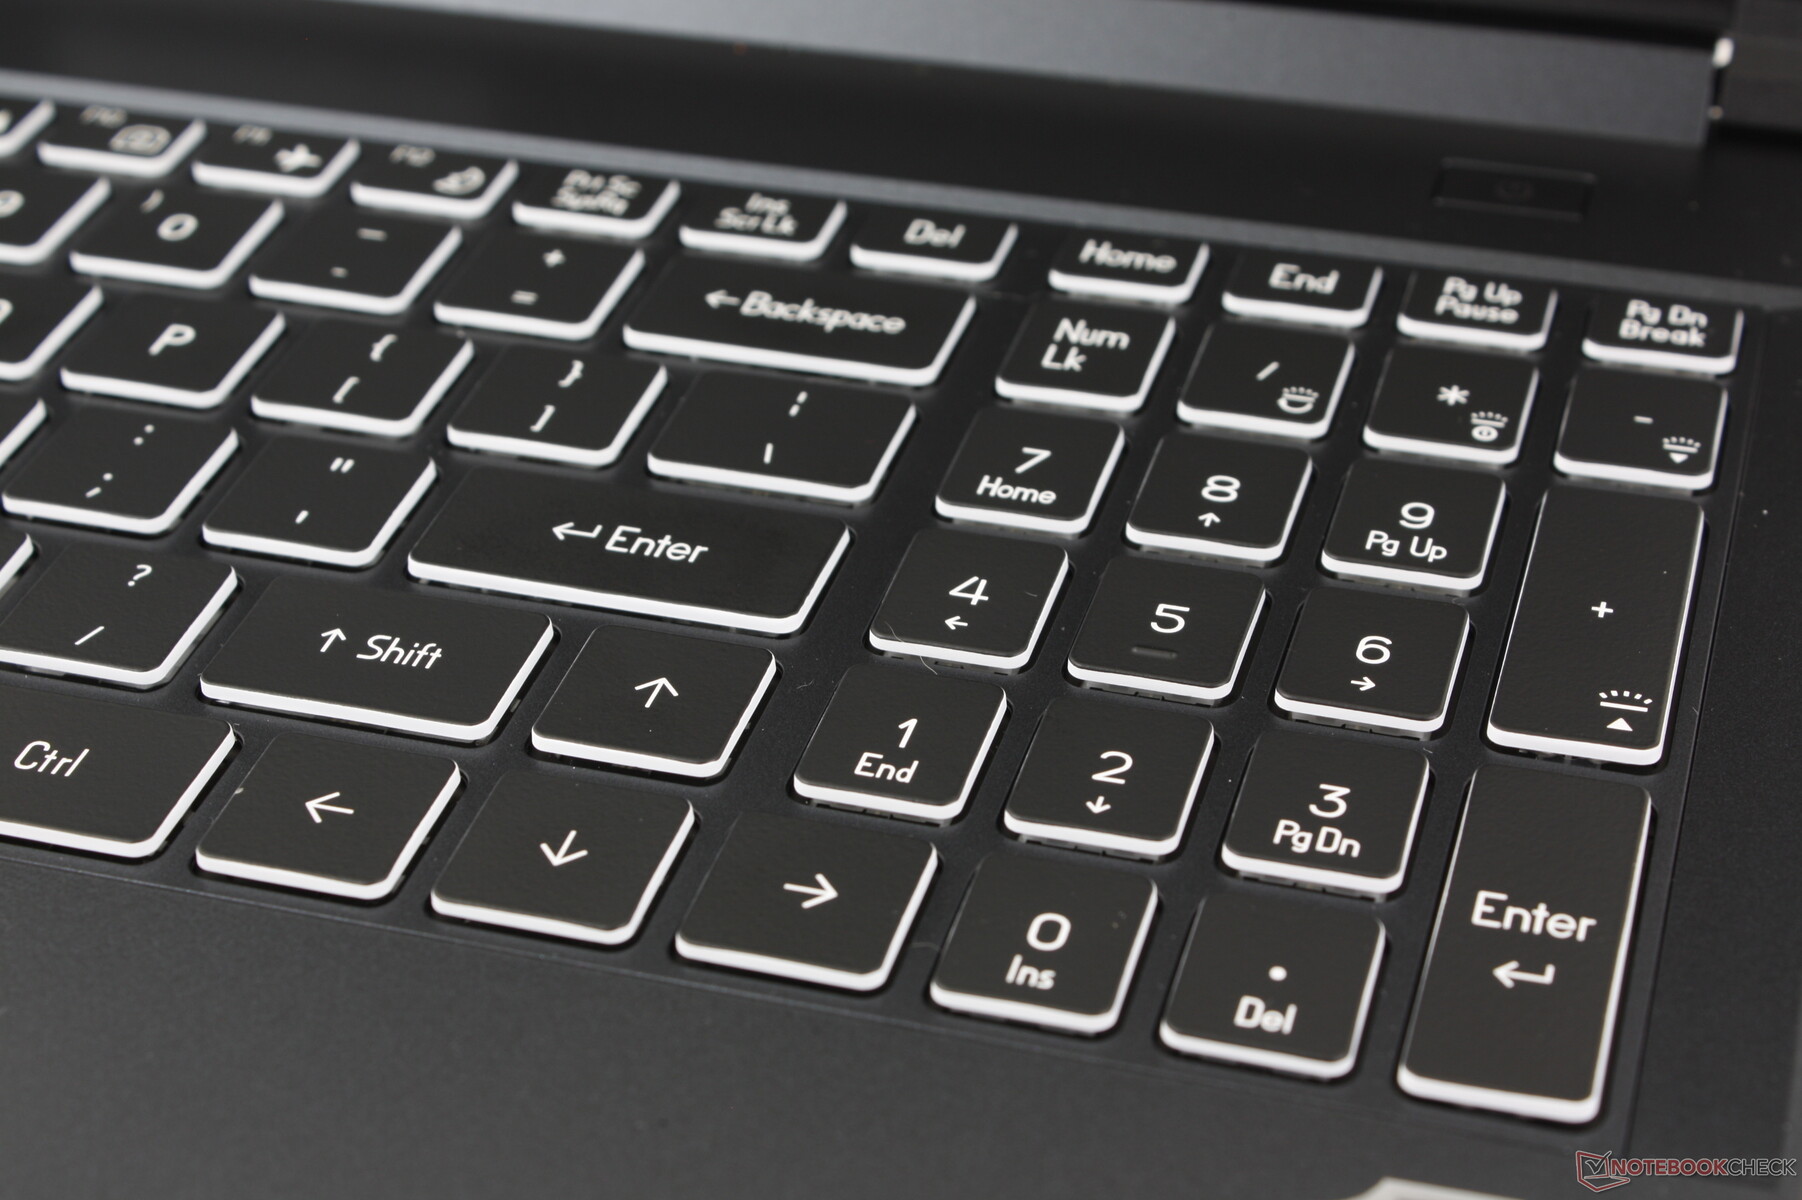
La frappe est plus bruyante que sur la plupart des autres ordinateurs portables en raison du bruit aigu des touches QWERTY principales. Un claquement fort signifie généralement un retour d'information plus ferme et plus satisfaisant, mais ce n'est pas le cas sur le ML-16 MK2, car la course reste faible et le retour d'information doux ne correspond pas tout à fait au niveau de bruit élevé. Les claviers du Legion Pro 5 16 ou du Victus 16 qui sont plus familiers en comparaison et auxquels il est plus facile de s'habituer.
Un rétroéclairage RGB à zone unique est fourni en standard, sans options RGB par touche ou même quadri-zone.
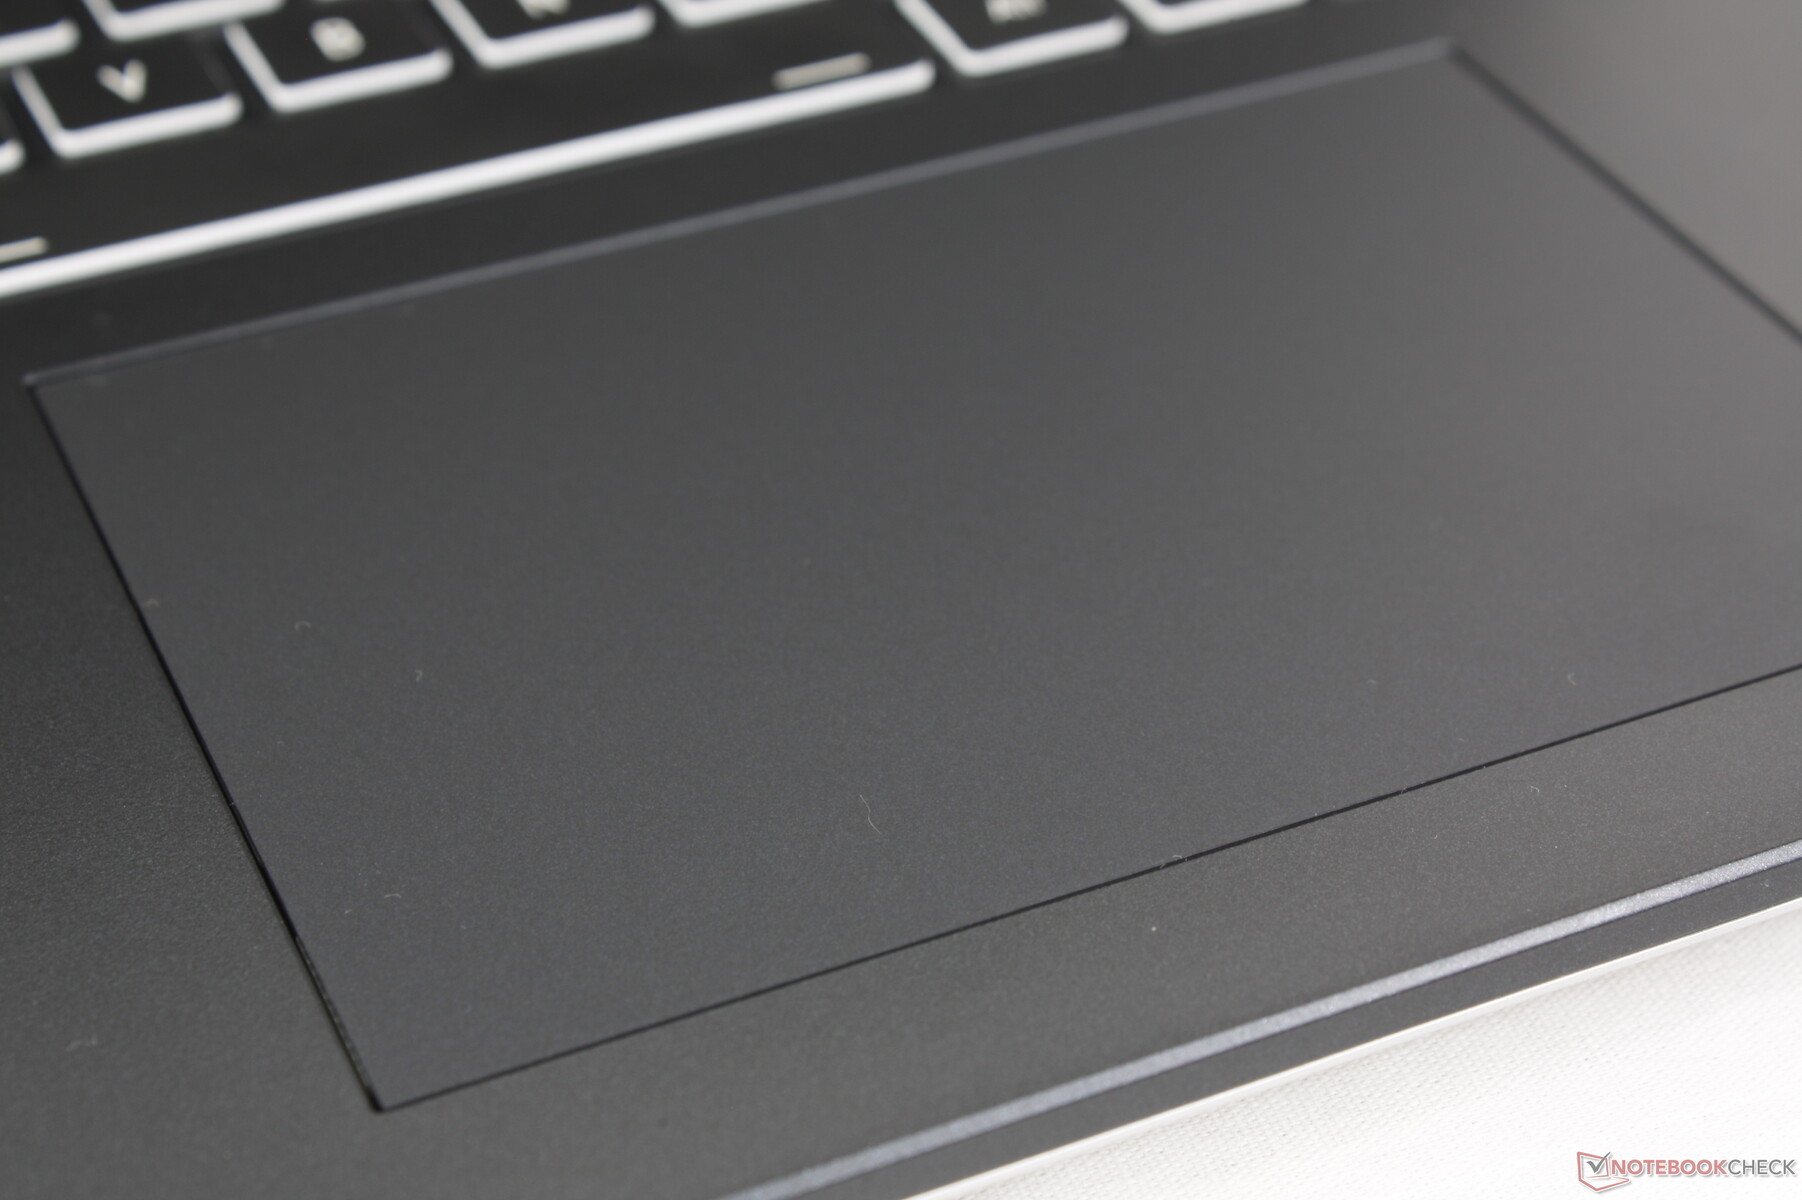
Pavé tactile
Le pavé tactile (12,2 x 8,3 cm) est plus petit que celui du Blade 16 (17 x 9,7 cm) mais plus grand que celui du Legion Pro 5 16IRX9 (12 x 7,5 cm). Elle est spacieuse et offre un retour d'information ferme et percutant lorsque vous appuyez dessus. Cependant, la glisse est presque trop fluide, surtout à faible vitesse, ce qui rend les clics de précision ou les actions de glisser-déposer plus difficiles. En comparaison, sur la plupart des autres ordinateurs portables, le doigt a tendance à rester collé lorsqu'il se déplace à des vitesses plus lentes, ce qui facilite la précision.


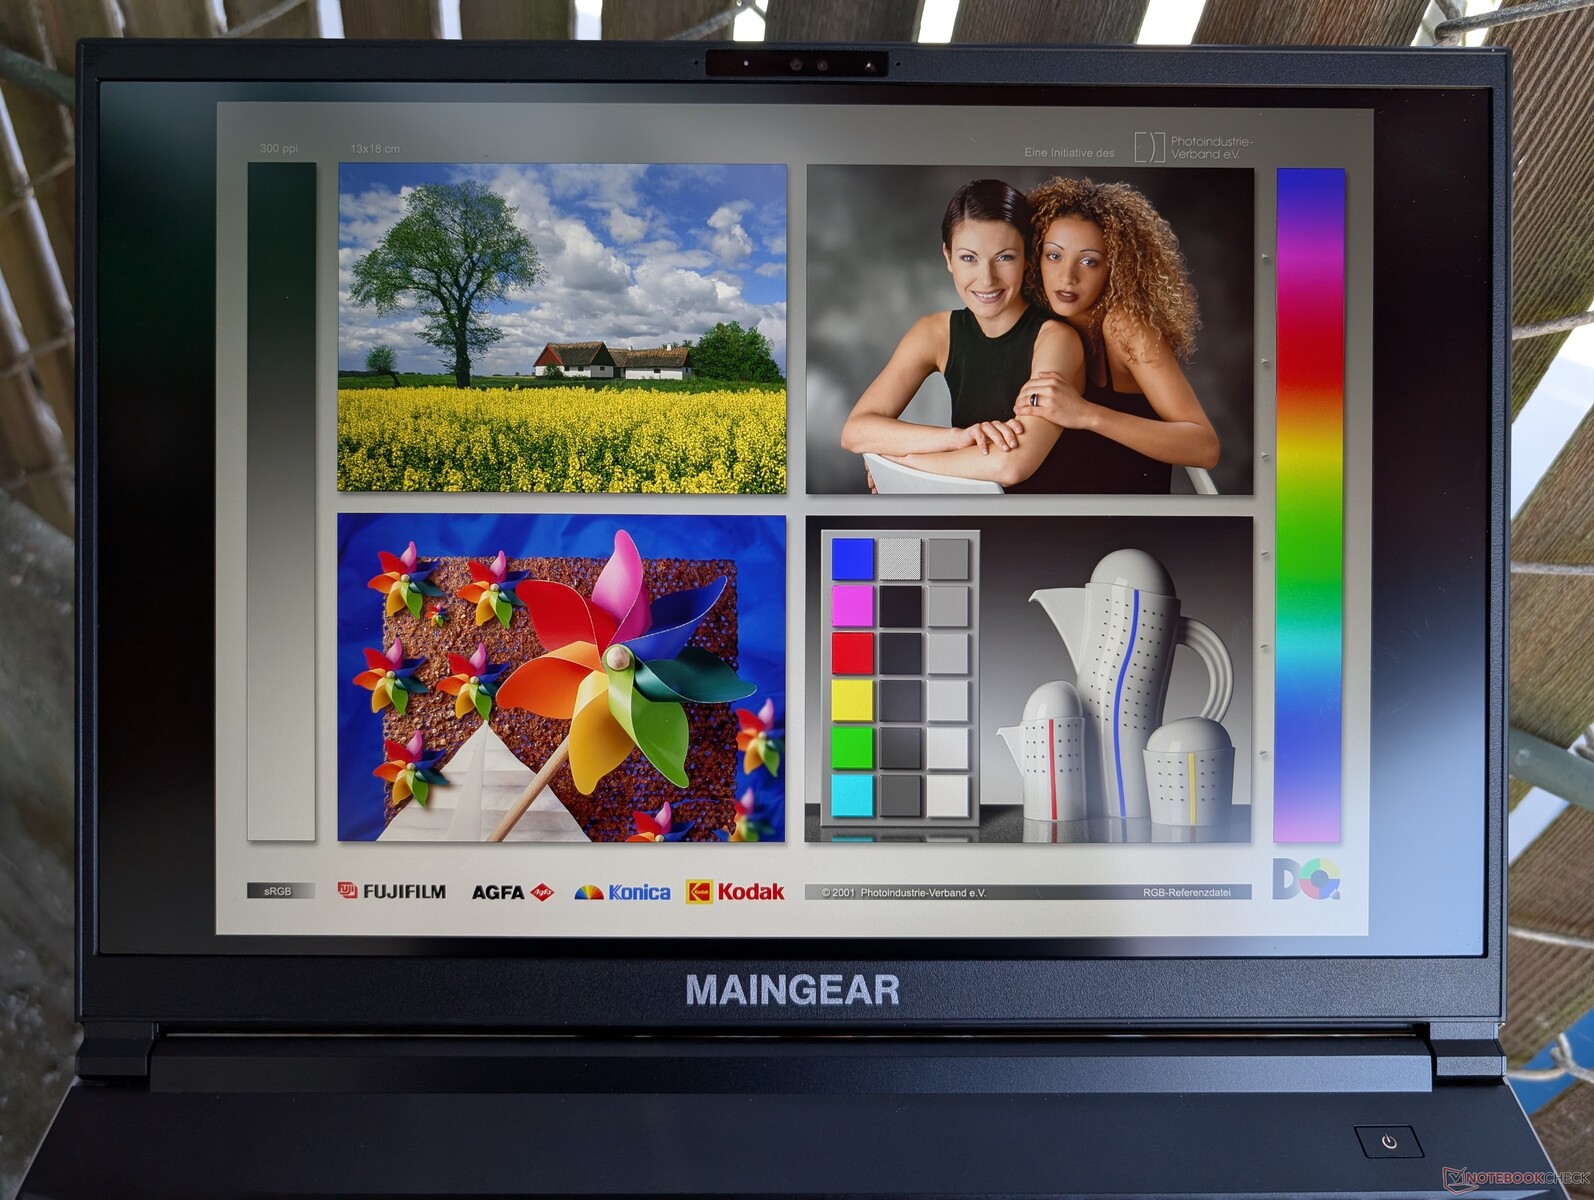
Affichage - Gaming IPS
Le ML-16 MK2 est le premier modèle de notre base de données à être livré avec la dalle IPS TL160ADMP11-0 240 Hz. Il est comparable à l'écran BOE B160QAN de l'Alienware x16 R2 en termes de taux de rafraîchissement, de rapport de contraste et de résolution, mais il n'arrive pas à égaler l'écran Dell en termes de reproduction des couleurs ou de temps de réponse. L'écran ML-16 MK2 peut donc être considéré comme un écran de milieu de gamme, mais il est tout de même très bien adapté aux jeux et à la plupart des montages graphiques amateurs.
Les fonctions plus avancées telles que G-Sync ou HDR ne sont pas prises en charge.


| |||||||||||||||||||||||||
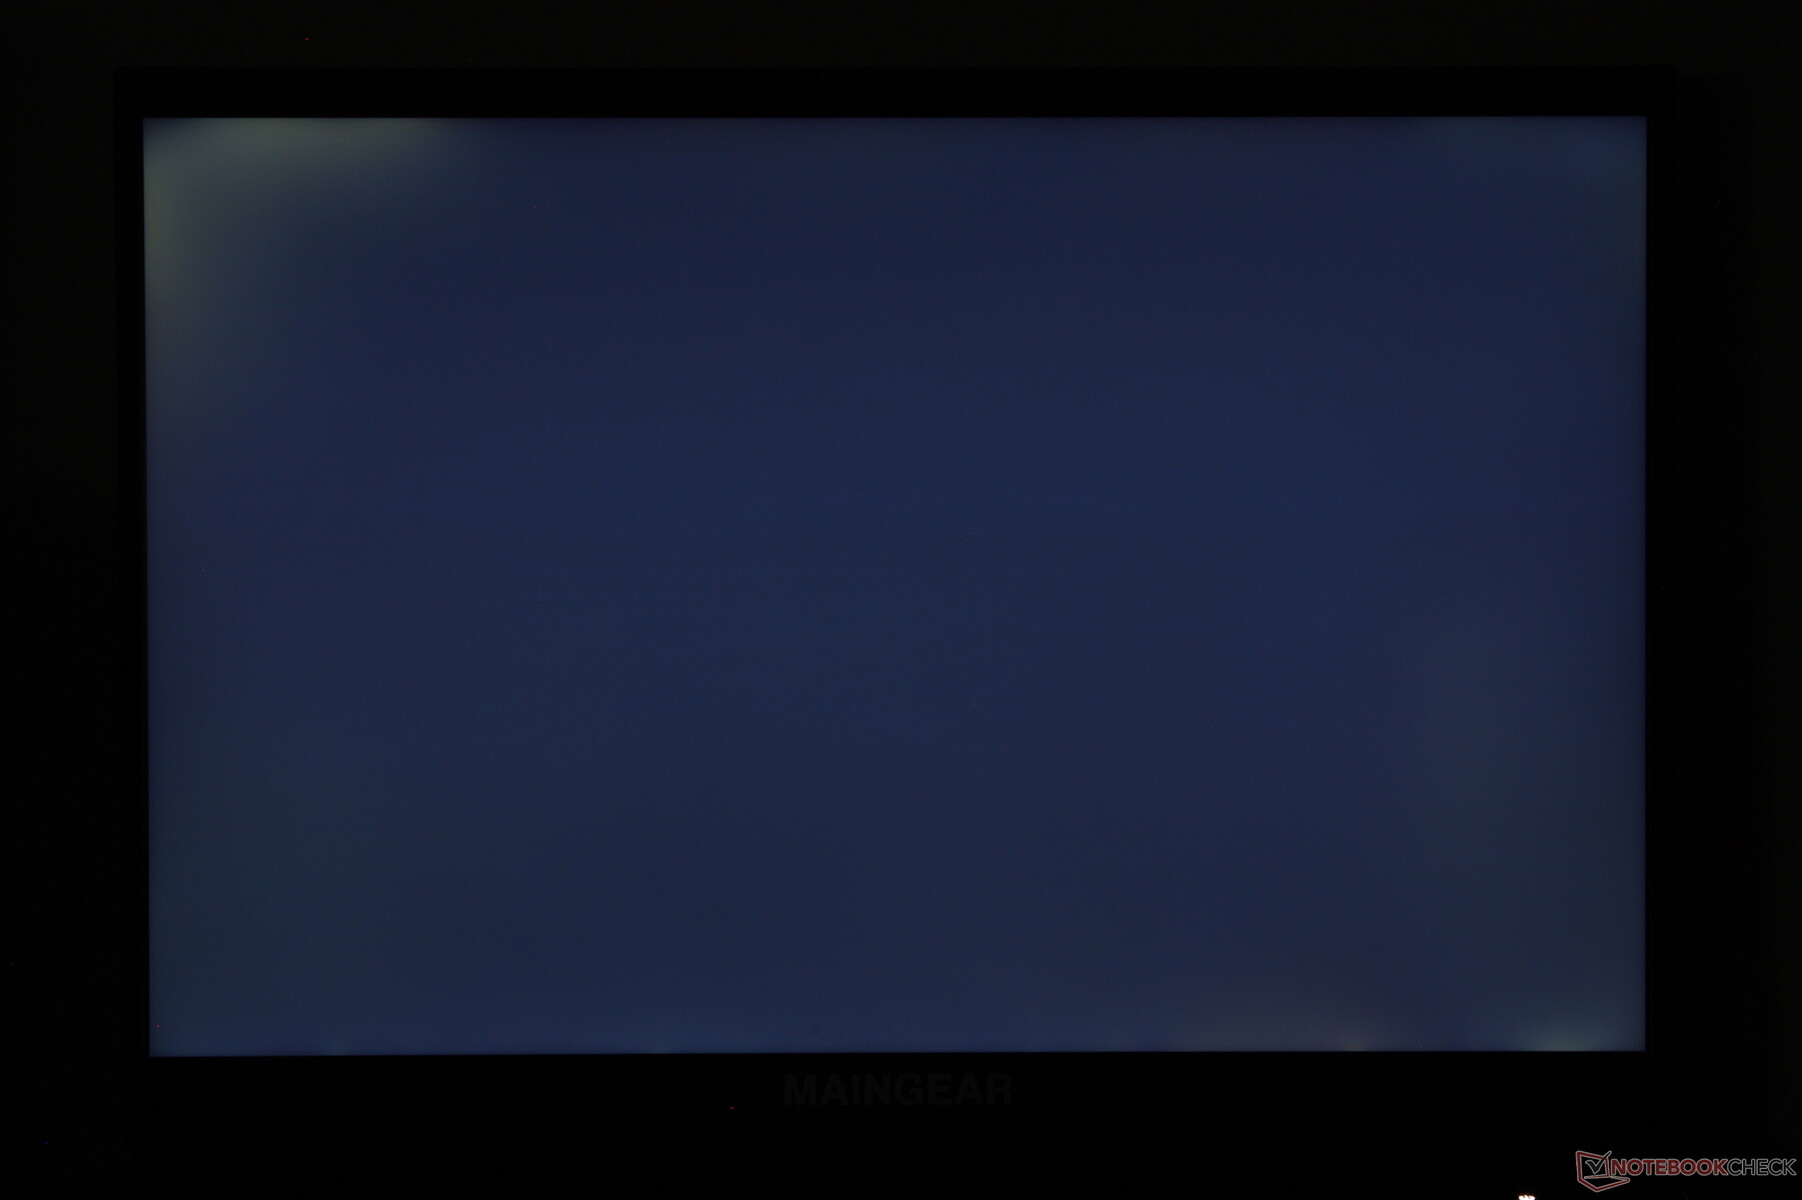
Homogénéité de la luminosité: 90 %
Valeur mesurée au centre, sur batterie: 518.2 cd/m²
Contraste: 1296:1 (Valeurs des noirs: 0.4 cd/m²)
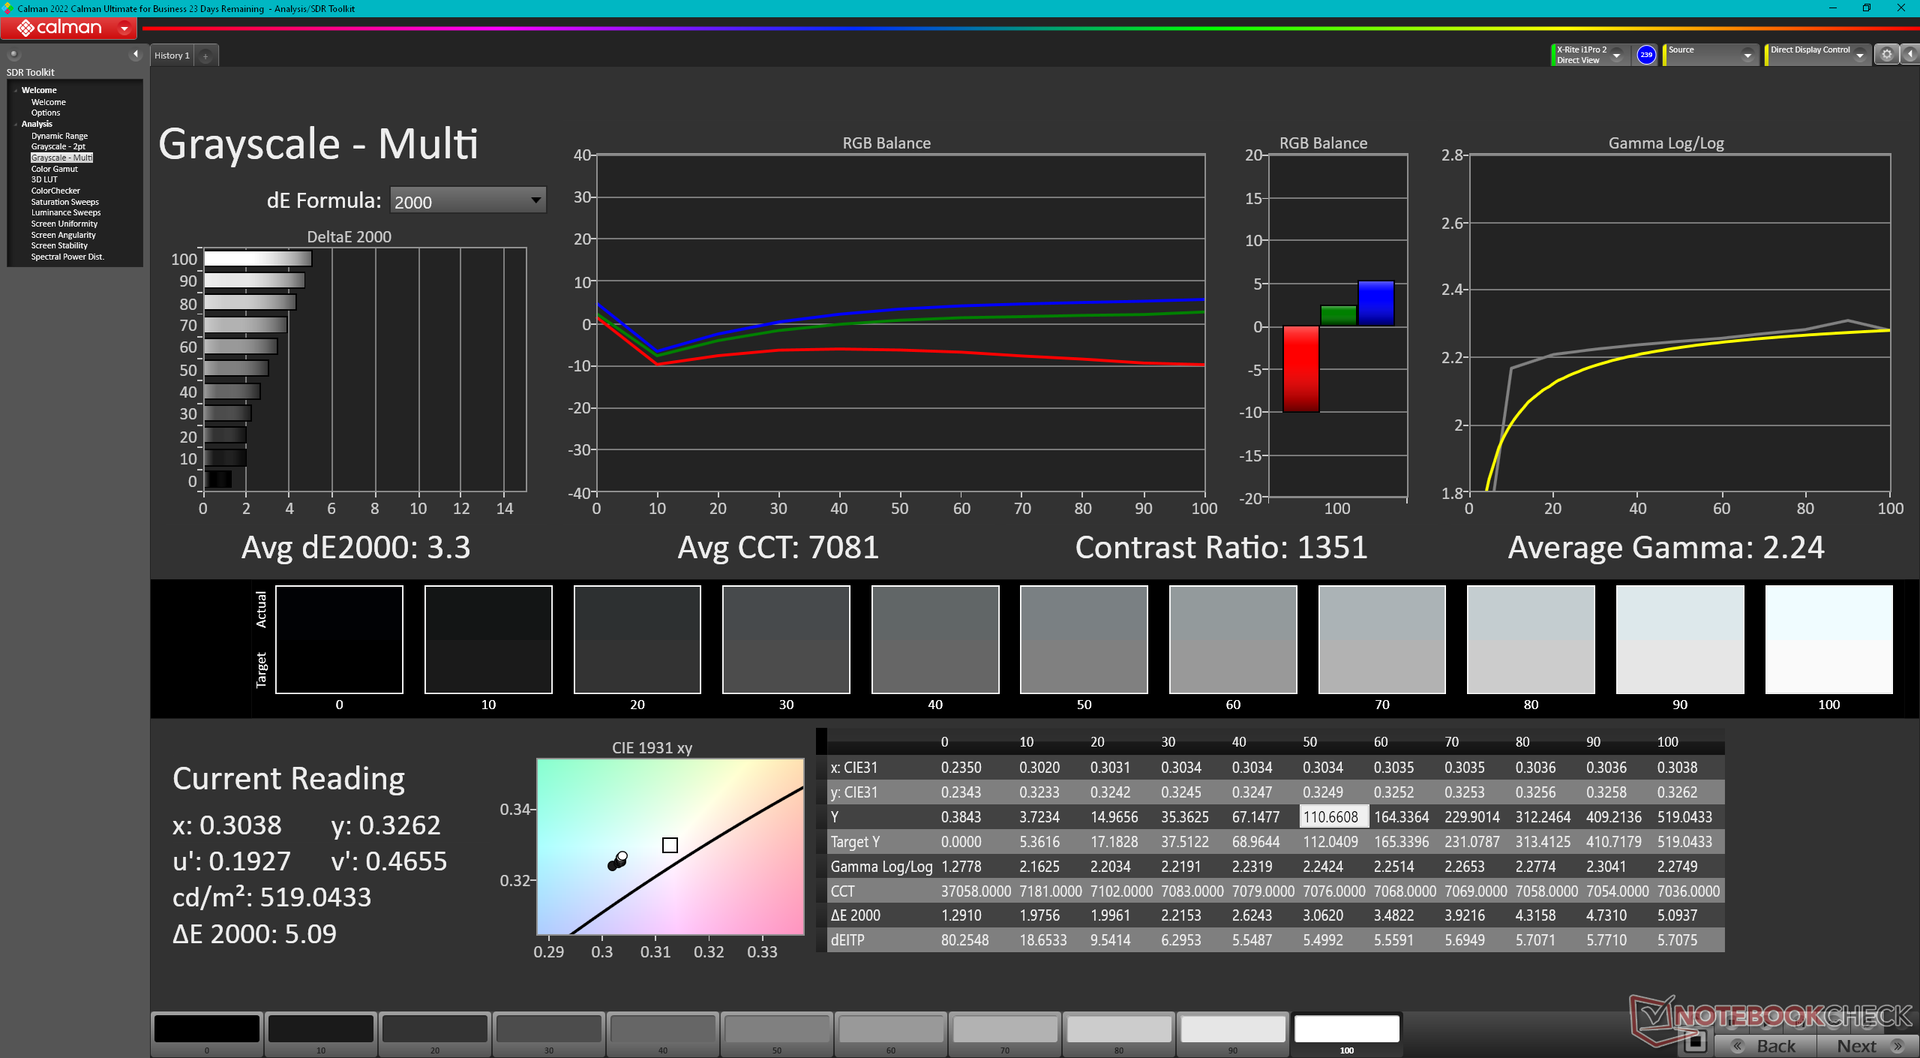
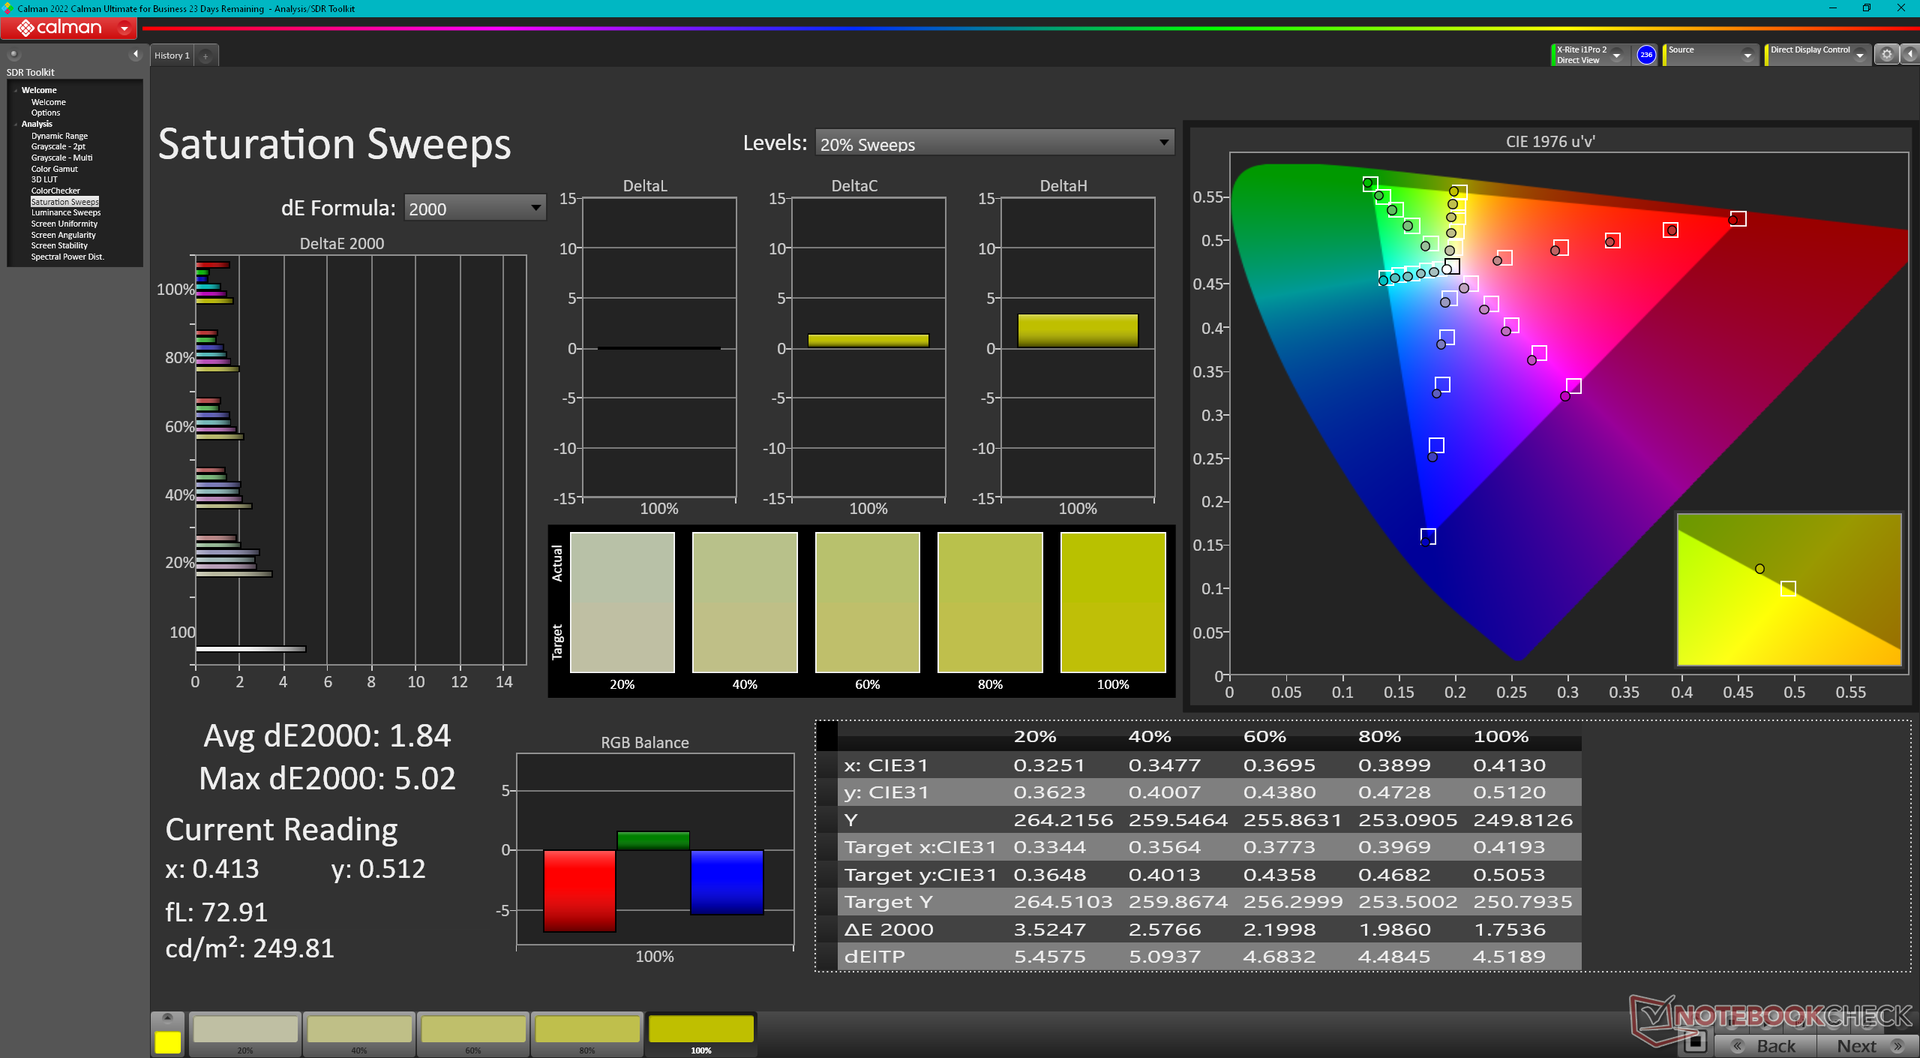
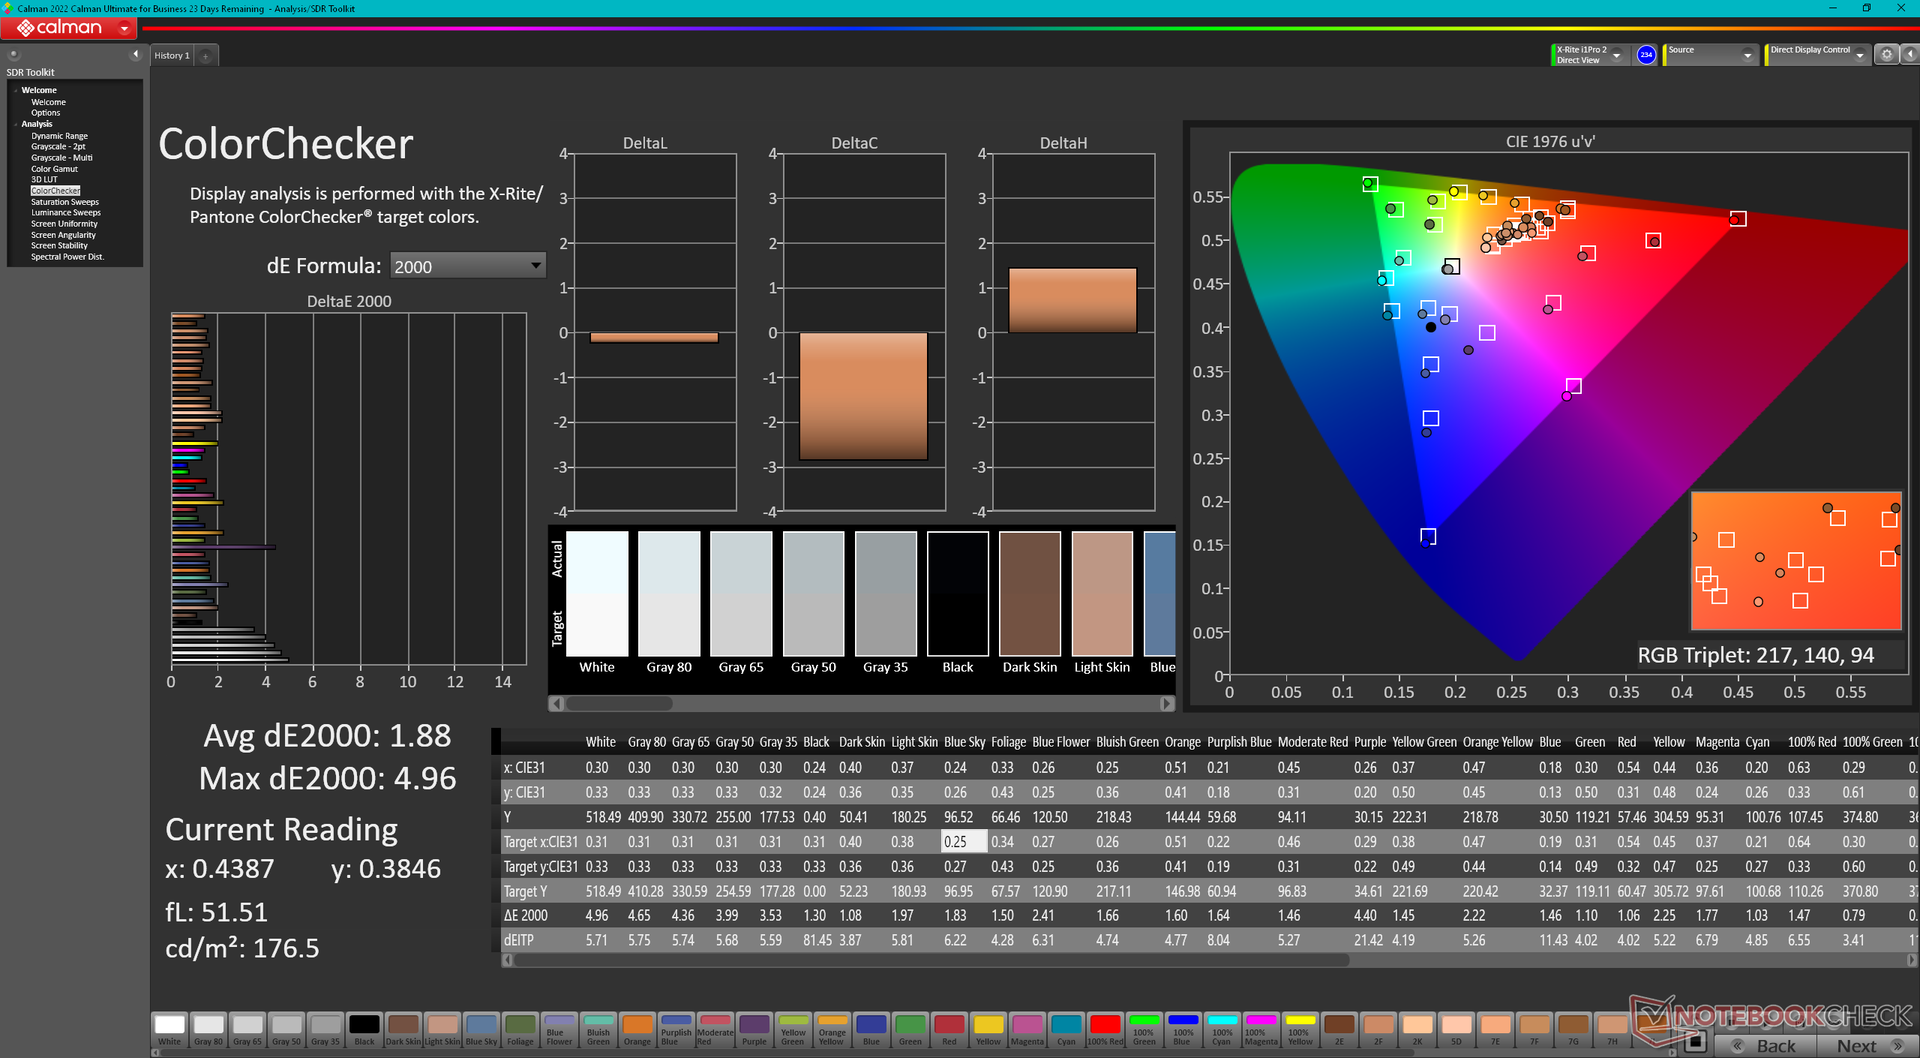
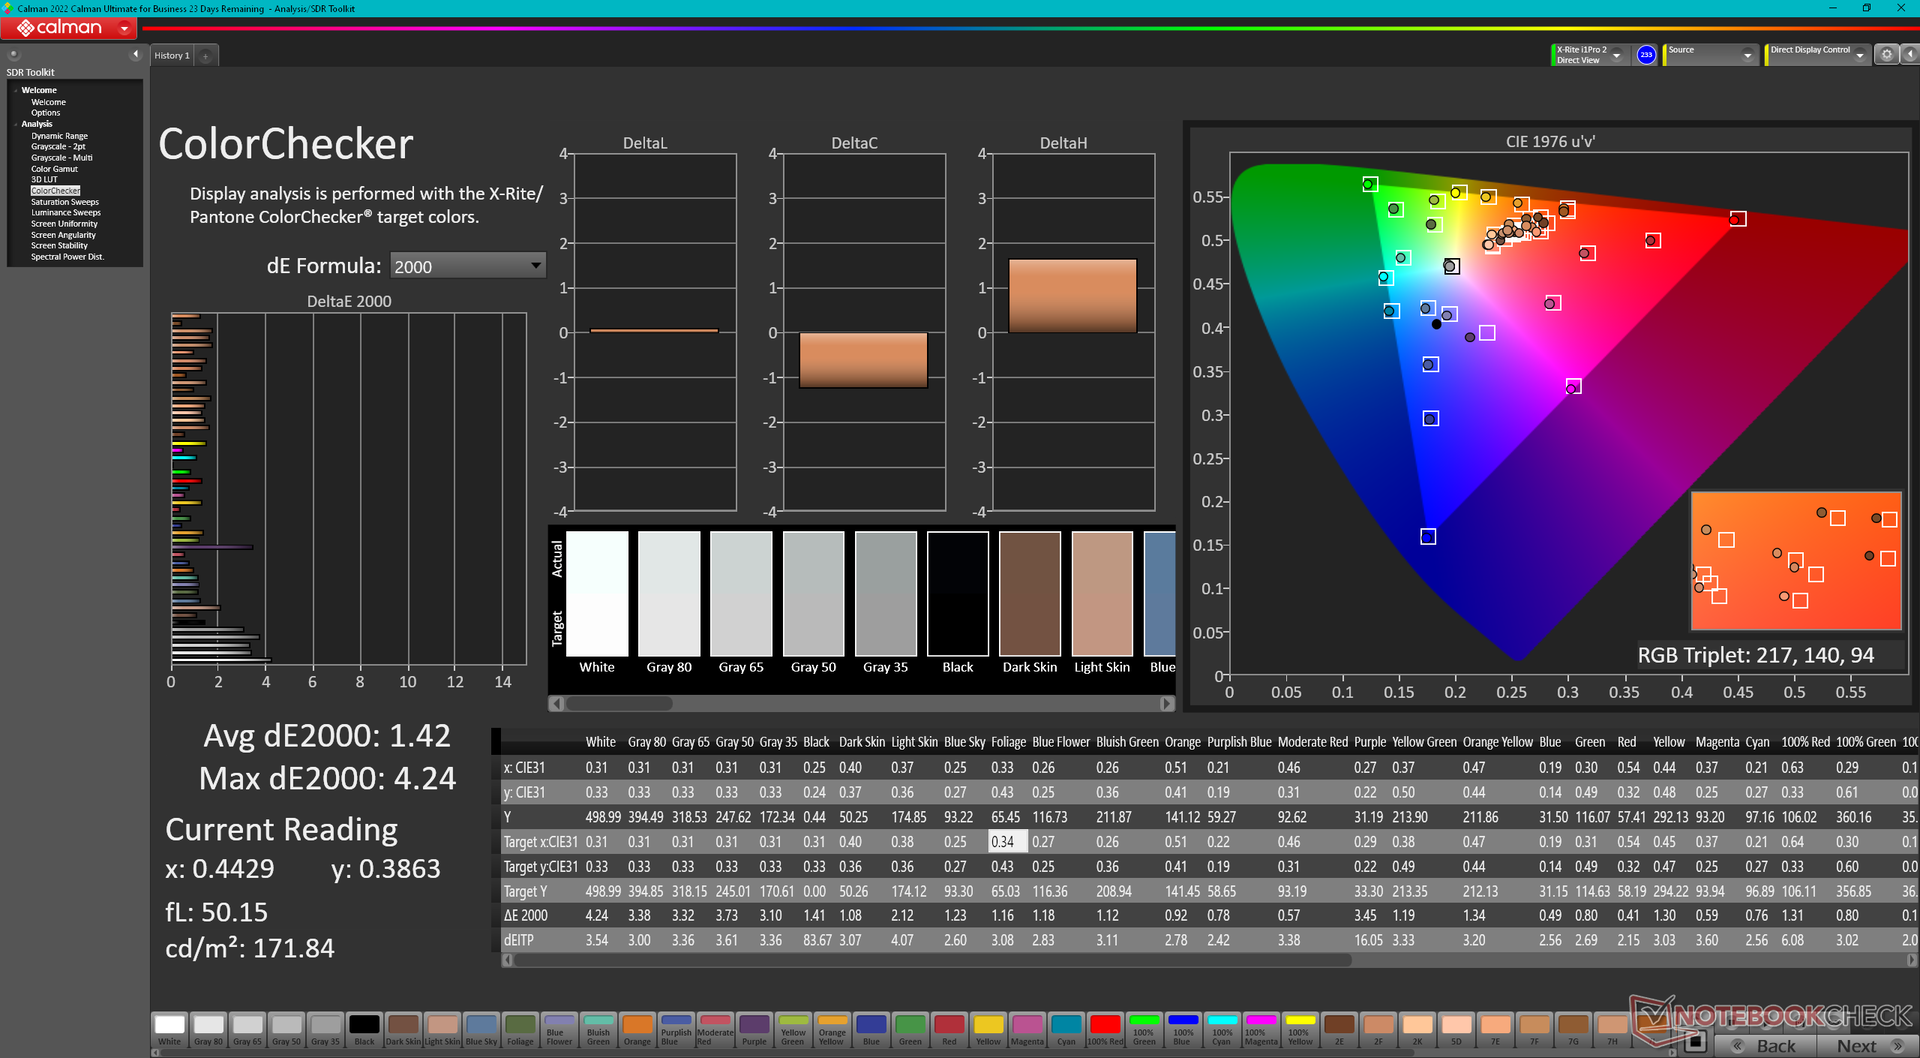
ΔE Color 1.88 | 0.5-29.43 Ø4.87, calibrated: 1.42
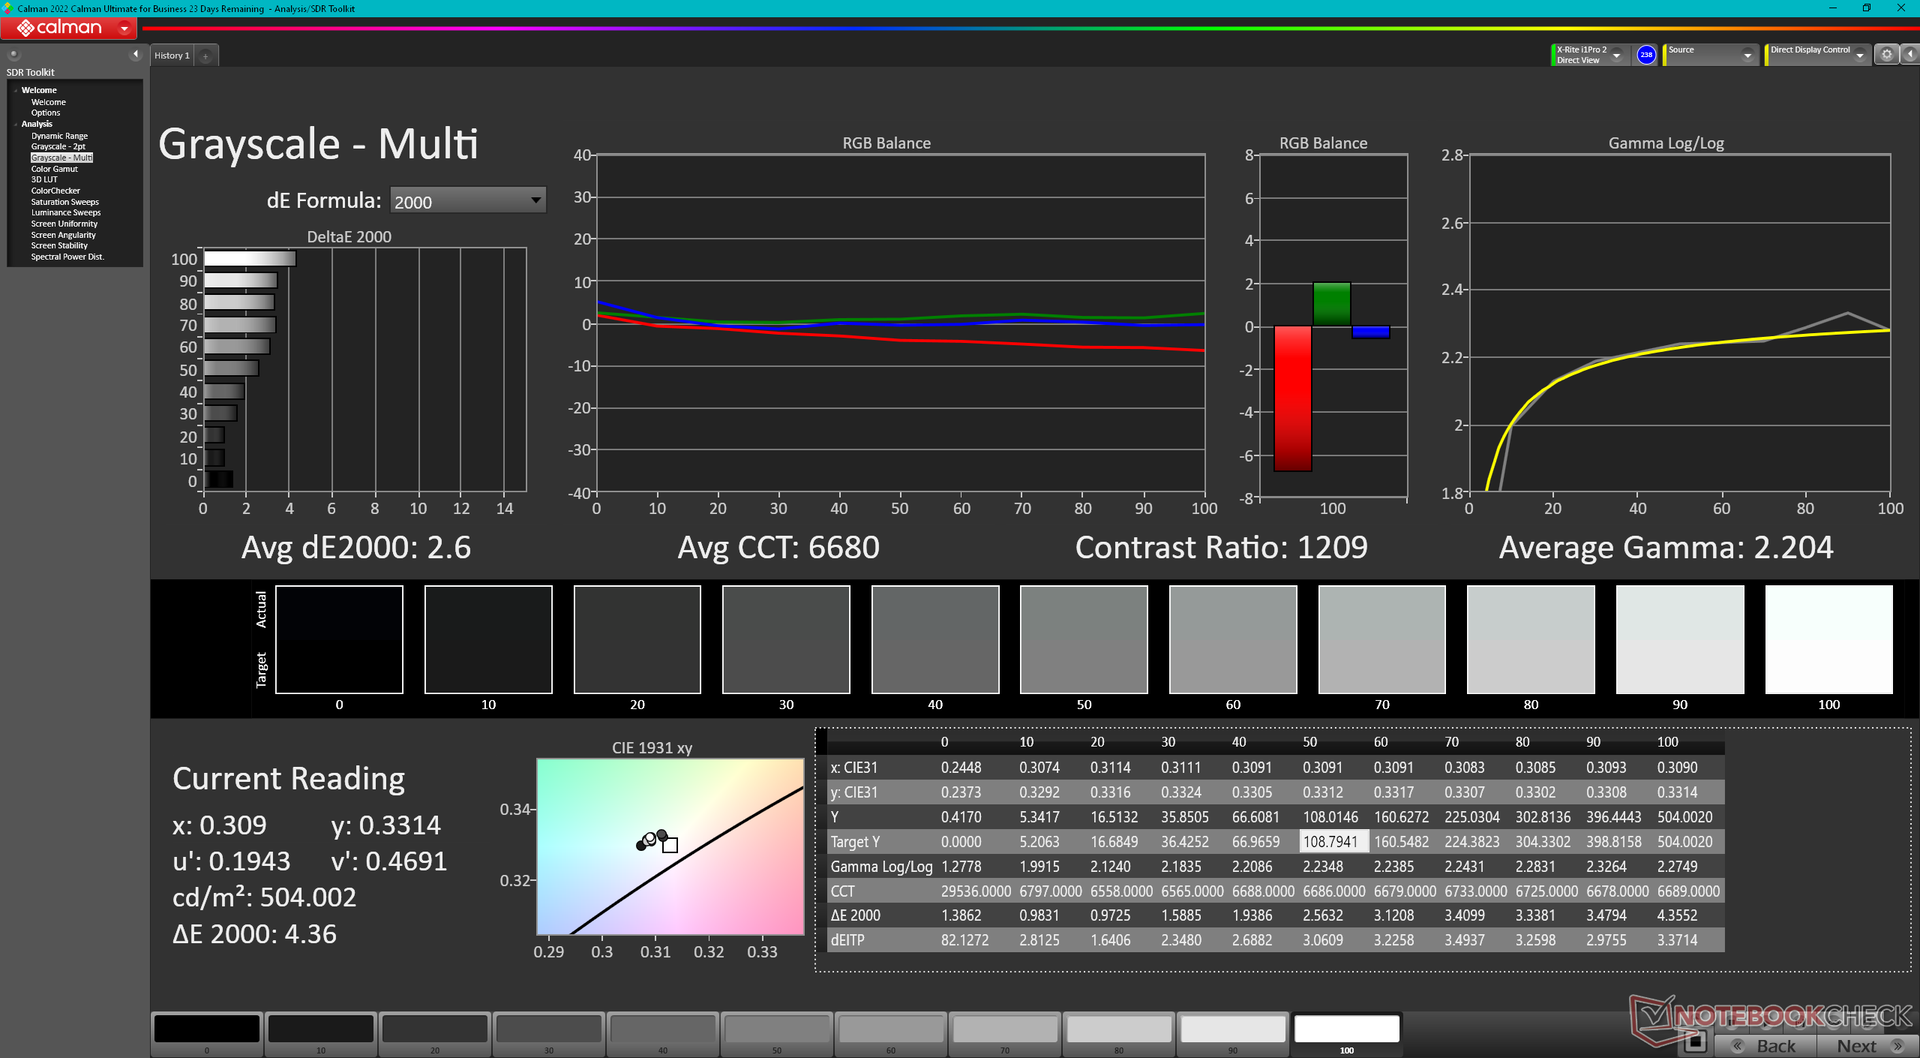
ΔE Greyscale 3.3 | 0.5-98 Ø5.1
69.2% AdobeRGB 1998 (Argyll 2.2.0 3D)
98.2% sRGB (Argyll 2.2.0 3D)
67.3% Display P3 (Argyll 2.2.0 3D)
Gamma: 2.24
| Maingear ML-16 MK2 TL160ADMP11-0, IPS, 2560x1600, 16", 240 Hz | Asus ROG Zephyrus G16 GA605WV ATNA60DL04-0, OLED, 2560x1600, 16", 240 Hz | HP Victus 16 (2024) Chi Mei CMN163E, IPS, 1920x1080, 16.1", 144 Hz | Alienware x16 R2 P120F BOE B160QAN, IPS, 2560x1600, 16", 240 Hz | Lenovo Legion Pro 5 16IRX9 BOE NE160QDM-NYC, IPS, 2560x1600, 16", 165 Hz | Razer Blade 16 2024, RTX 4090 Samsung SDC41AB (ATNA60DL03-0), OLED, 2560x1600, 16", 240 Hz | |
|---|---|---|---|---|---|---|
| Display | 30% | -38% | 25% | 2% | 29% | |
| Display P3 Coverage | 67.3 | 99.9 48% | 41.3 -39% | 98.3 46% | 69.3 3% | 99.1 47% |
| sRGB Coverage | 98.2 | 100 2% | 61.7 -37% | 100 2% | 99.4 1% | 99.9 2% |
| AdobeRGB 1998 Coverage | 69.2 | 96.9 40% | 42.7 -38% | 88.8 28% | 70.1 1% | 95.6 38% |
| Response Times | 98% | -117% | 42% | 4% | 97% | |
| Response Time Grey 50% / Grey 80% * | 12.5 ? | 0.22 ? 98% | 28.6 ? -129% | 3.9 ? 69% | 11.9 ? 5% | 0.24 ? 98% |
| Response Time Black / White * | 9.1 ? | 0.25 ? 97% | 18.7 ? -105% | 7.8 ? 14% | 8.9 ? 2% | 0.4 ? 96% |
| PWM Frequency | 960 | 960 | ||||
| Screen | 11% | -79% | -3% | 14% | 193% | |
| Brightness middle | 518.2 | 416 -20% | 287 -45% | 348.4 -33% | 384 -26% | 418 -19% |
| Brightness | 487 | 418 -14% | 288 -41% | 340 -30% | 366 -25% | 420 -14% |
| Brightness Distribution | 90 | 96 7% | 86 -4% | 90 0% | 91 1% | 98 9% |
| Black Level * | 0.4 | 0.19 52% | 0.33 17% | 0.35 12% | 0.02 95% | |
| Contrast | 1296 | 1511 17% | 1056 -19% | 1097 -15% | 20900 1513% | |
| Colorchecker dE 2000 * | 1.88 | 1.6 15% | 5.46 -190% | 2.68 -43% | 0.97 48% | 1.07 43% |
| Colorchecker dE 2000 max. * | 4.96 | 2.1 58% | 20.36 -310% | 4.14 17% | 3.57 28% | 4.04 19% |
| Colorchecker dE 2000 calibrated * | 1.42 | 3.52 -148% | 0.42 70% | 0.77 46% | 1.07 25% | |
| Greyscale dE 2000 * | 3.3 | 2.7 18% | 4.8 -45% | 3.4 -3% | 1.5 55% | 1.12 66% |
| Gamma | 2.24 98% | 2.16 102% | 2.108 104% | 2.41 91% | 2.24 98% | 2.29 96% |
| CCT | 7081 92% | 6331 103% | 6442 101% | 6083 107% | 6709 97% | 6417 101% |
| Moyenne finale (programmes/paramètres) | 46% /
32% | -78% /
-76% | 21% /
10% | 7% /
10% | 106% /
144% |
* ... Moindre est la valeur, meilleures sont les performances
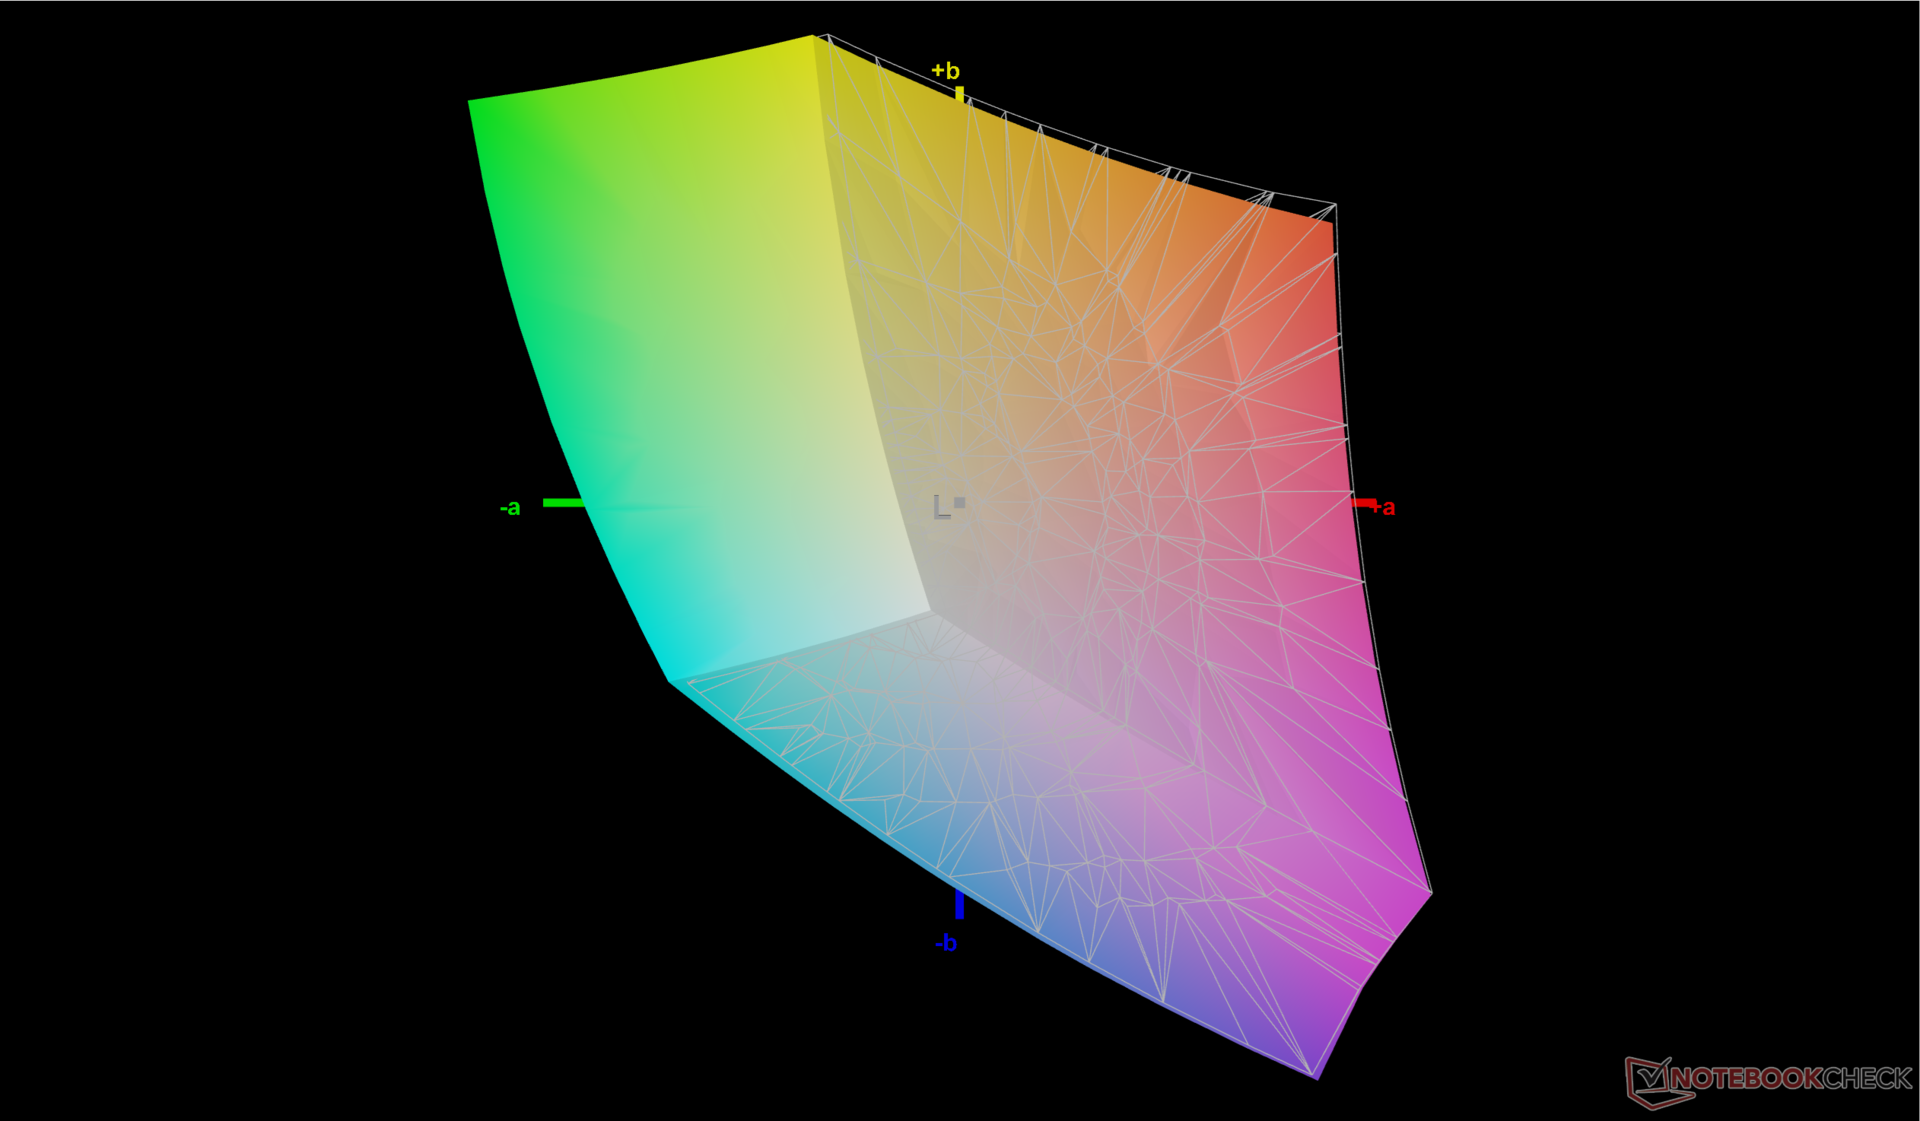
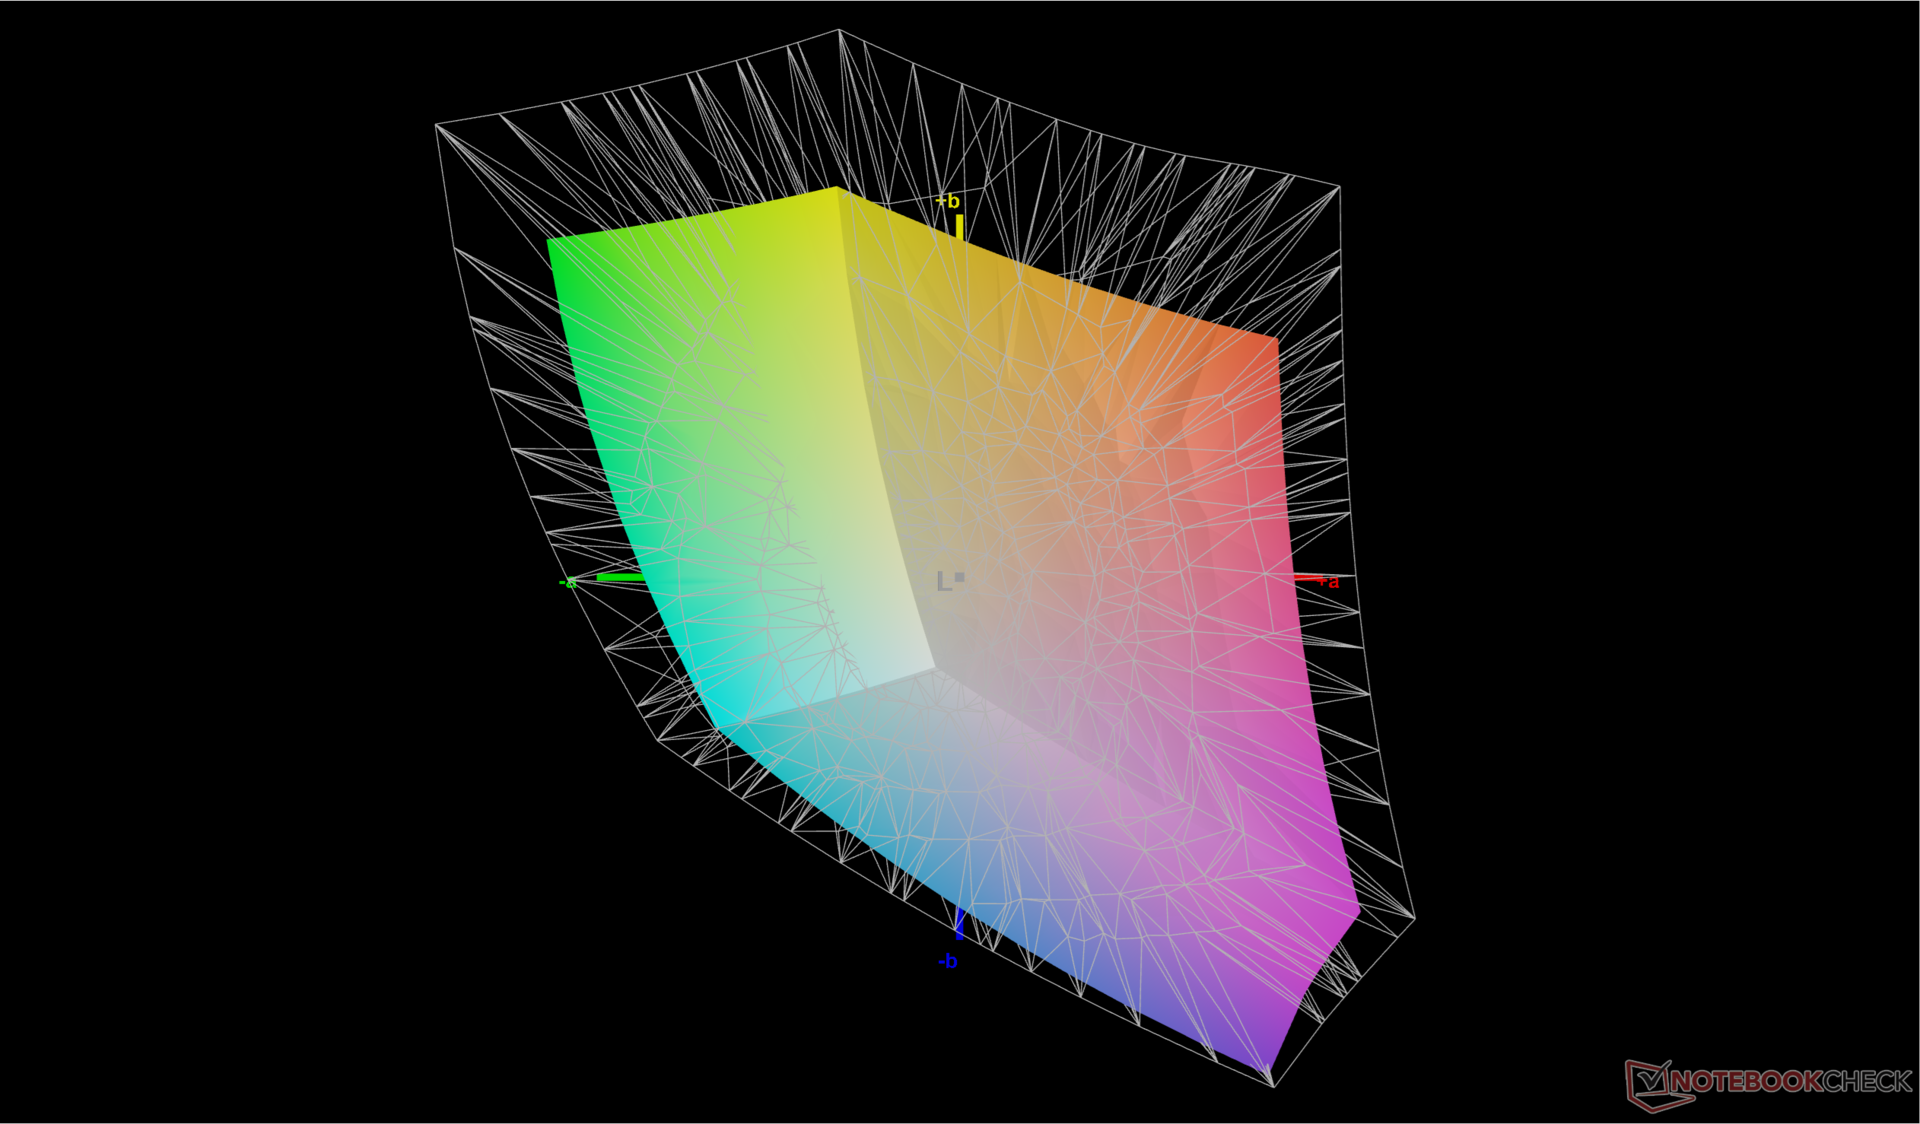
Bien que l'écran ne soit pas étalonné en usine, les valeurs DeltaE moyennes en niveaux de gris et en couleurs sont assez bonnes dès la sortie de l'emballage, avec respectivement 3,3 et 1,8. La température des couleurs est légèrement trop froide à près de 7100, mais l'étalonnage avec notre colorimètre X-Rite permet d'améliorer légèrement les valeurs deltaE moyennes. Les utilisateurs peuvent appliquer gratuitement notre profil ICM calibré ci-dessus.

Temps de réponse de l'écran
| ↔ Temps de réponse noir à blanc | ||
|---|---|---|
| 9.1 ms ... hausse ↗ et chute ↘ combinées | ↗ 5 ms hausse | 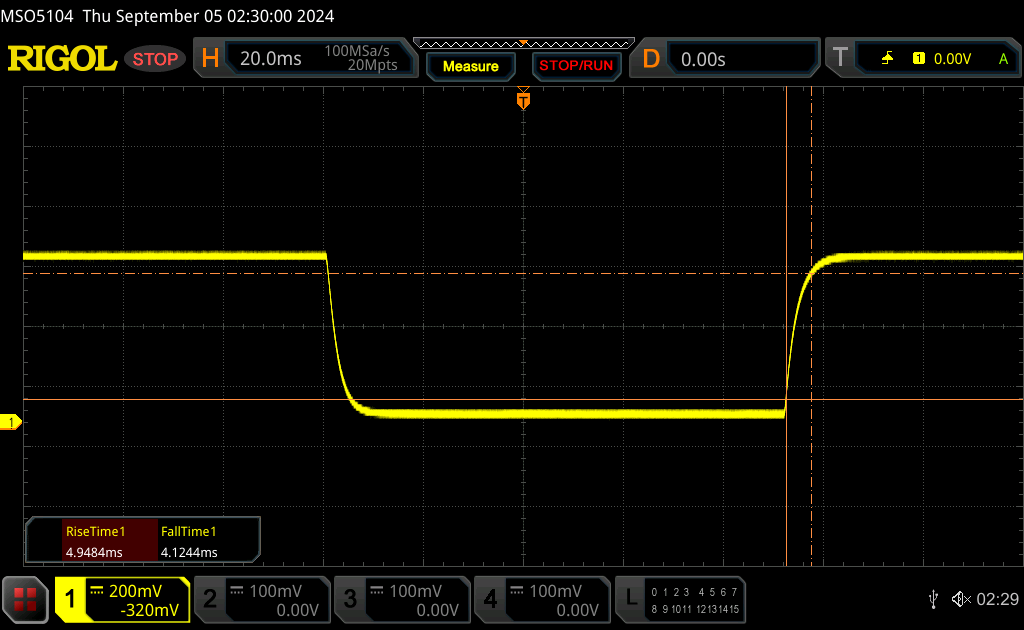 |
| ↘ 4.1 ms chute | ||
| L'écran montre de faibles temps de réponse, un bon écran pour jouer. En comparaison, tous les appareils testés affichent entre 0.1 (minimum) et 240 (maximum) ms. » 23 % des appareils testés affichent de meilleures performances. Cela signifie que les latences relevées sont meilleures que la moyenne (20.8 ms) de tous les appareils testés. | ||
| ↔ Temps de réponse gris 50% à gris 80% | ||
| 12.5 ms ... hausse ↗ et chute ↘ combinées | ↗ 5.6 ms hausse | 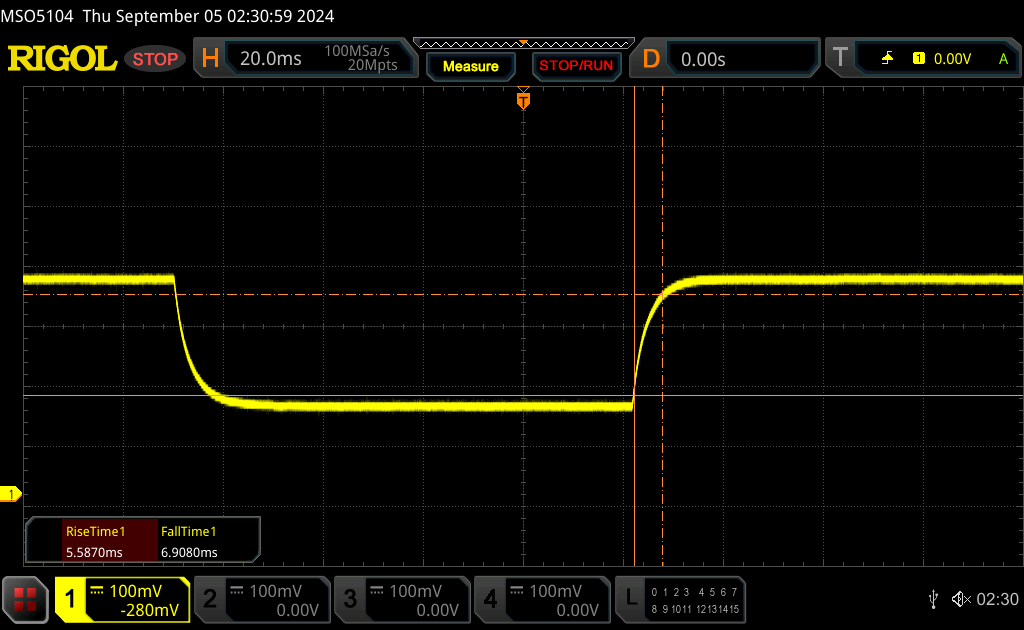 |
| ↘ 6.9 ms chute | ||
| L'écran montre de bons temps de réponse, mais insuffisant pour du jeu compétitif. En comparaison, tous les appareils testés affichent entre 0.165 (minimum) et 636 (maximum) ms. » 23 % des appareils testés affichent de meilleures performances. Cela signifie que les latences relevées sont meilleures que la moyenne (32.5 ms) de tous les appareils testés. | ||
Scintillement / MLI (Modulation de largeur d'impulsion)
| Scintillement / MLI (Modulation de largeur d'impulsion) non décelé | 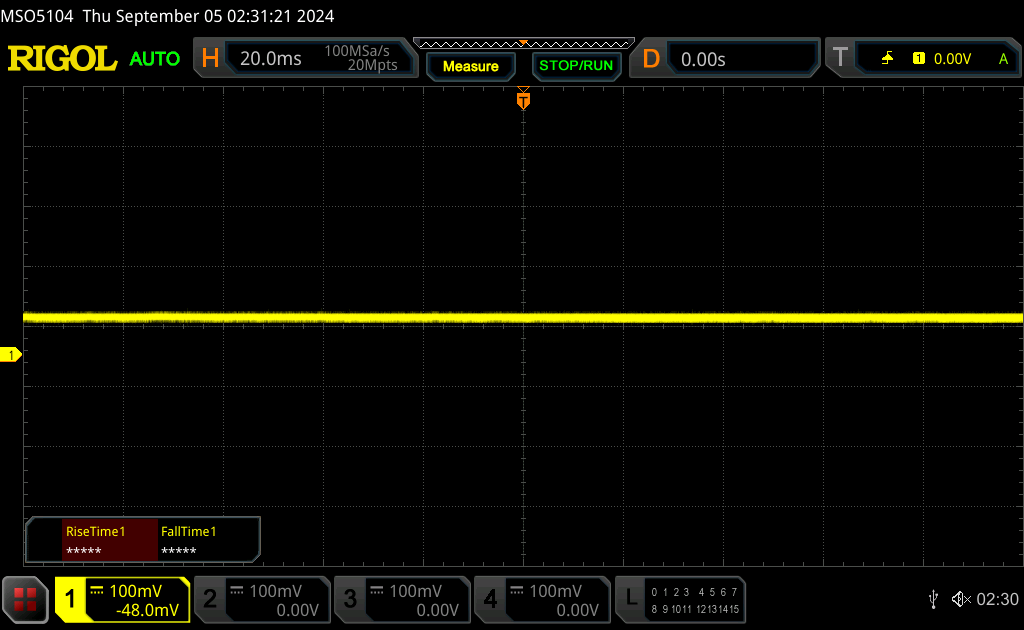 | ||
En comparaison, 53 % des appareils testés n'emploient pas MDI pour assombrir leur écran. Nous avons relevé une moyenne à 8516 (minimum : 5 - maximum : 343500) Hz dans le cas où une MDI était active. | |||
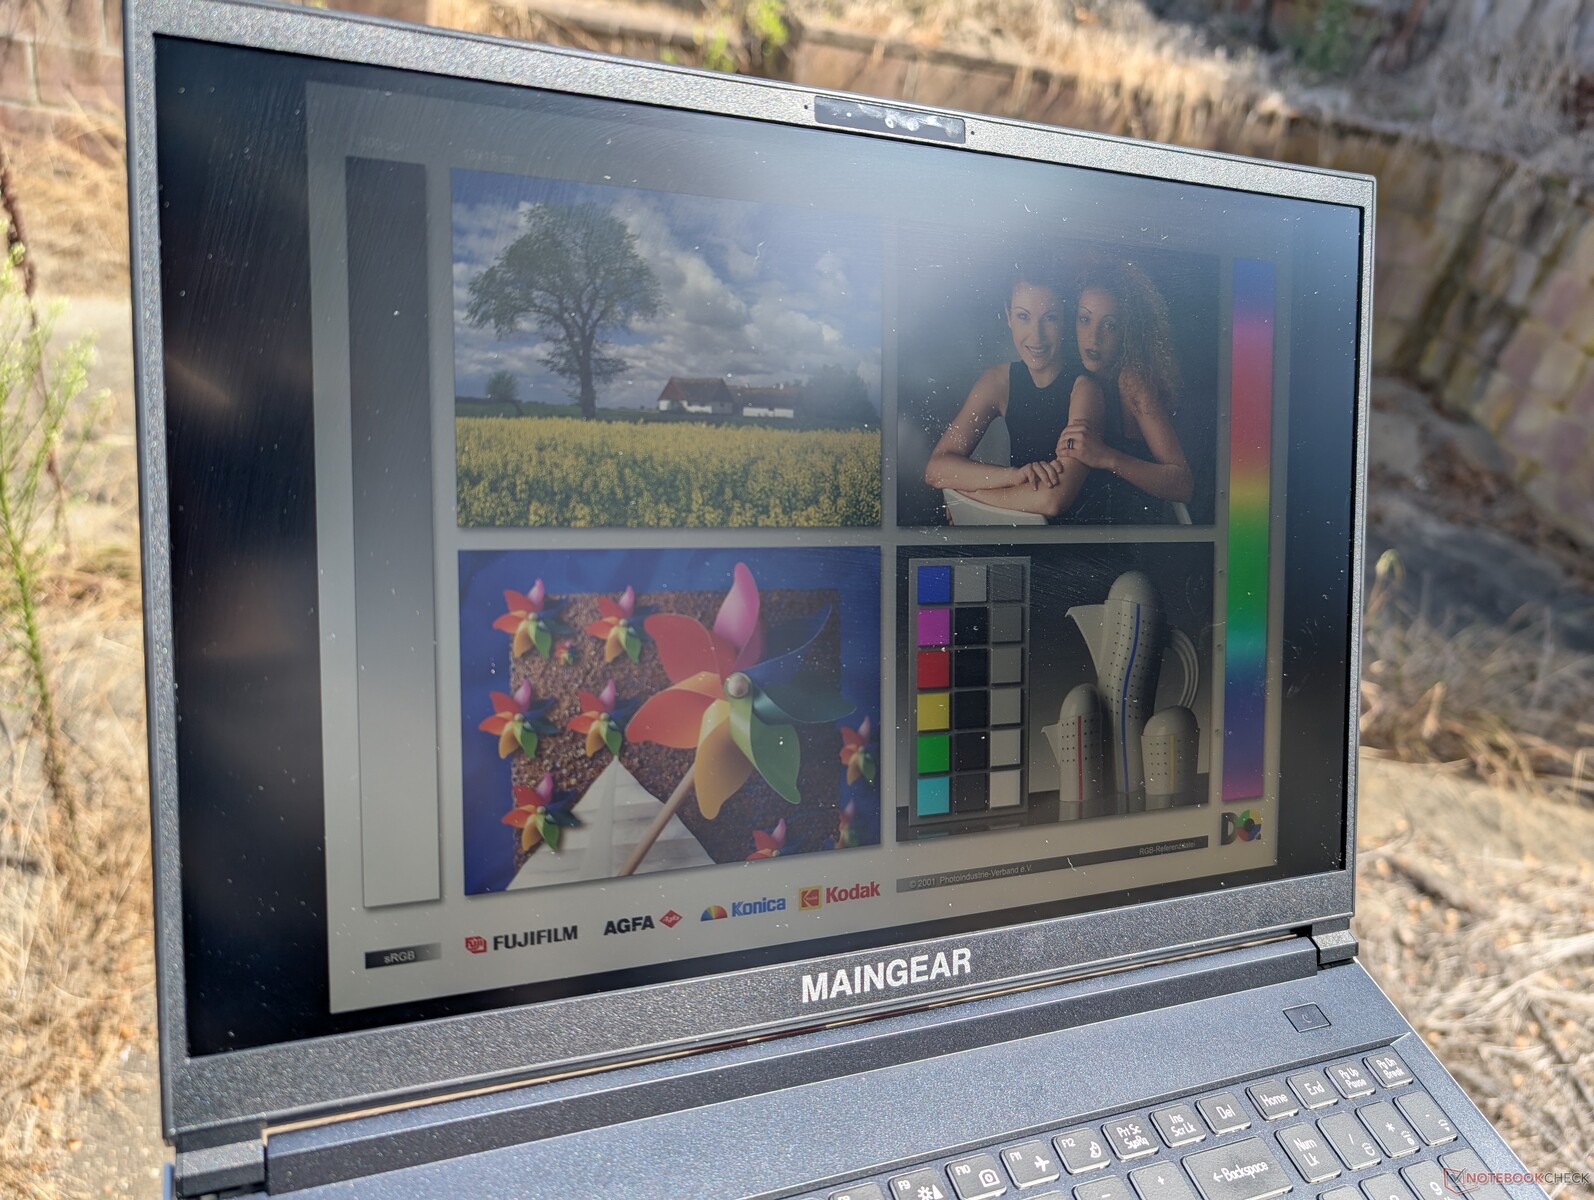
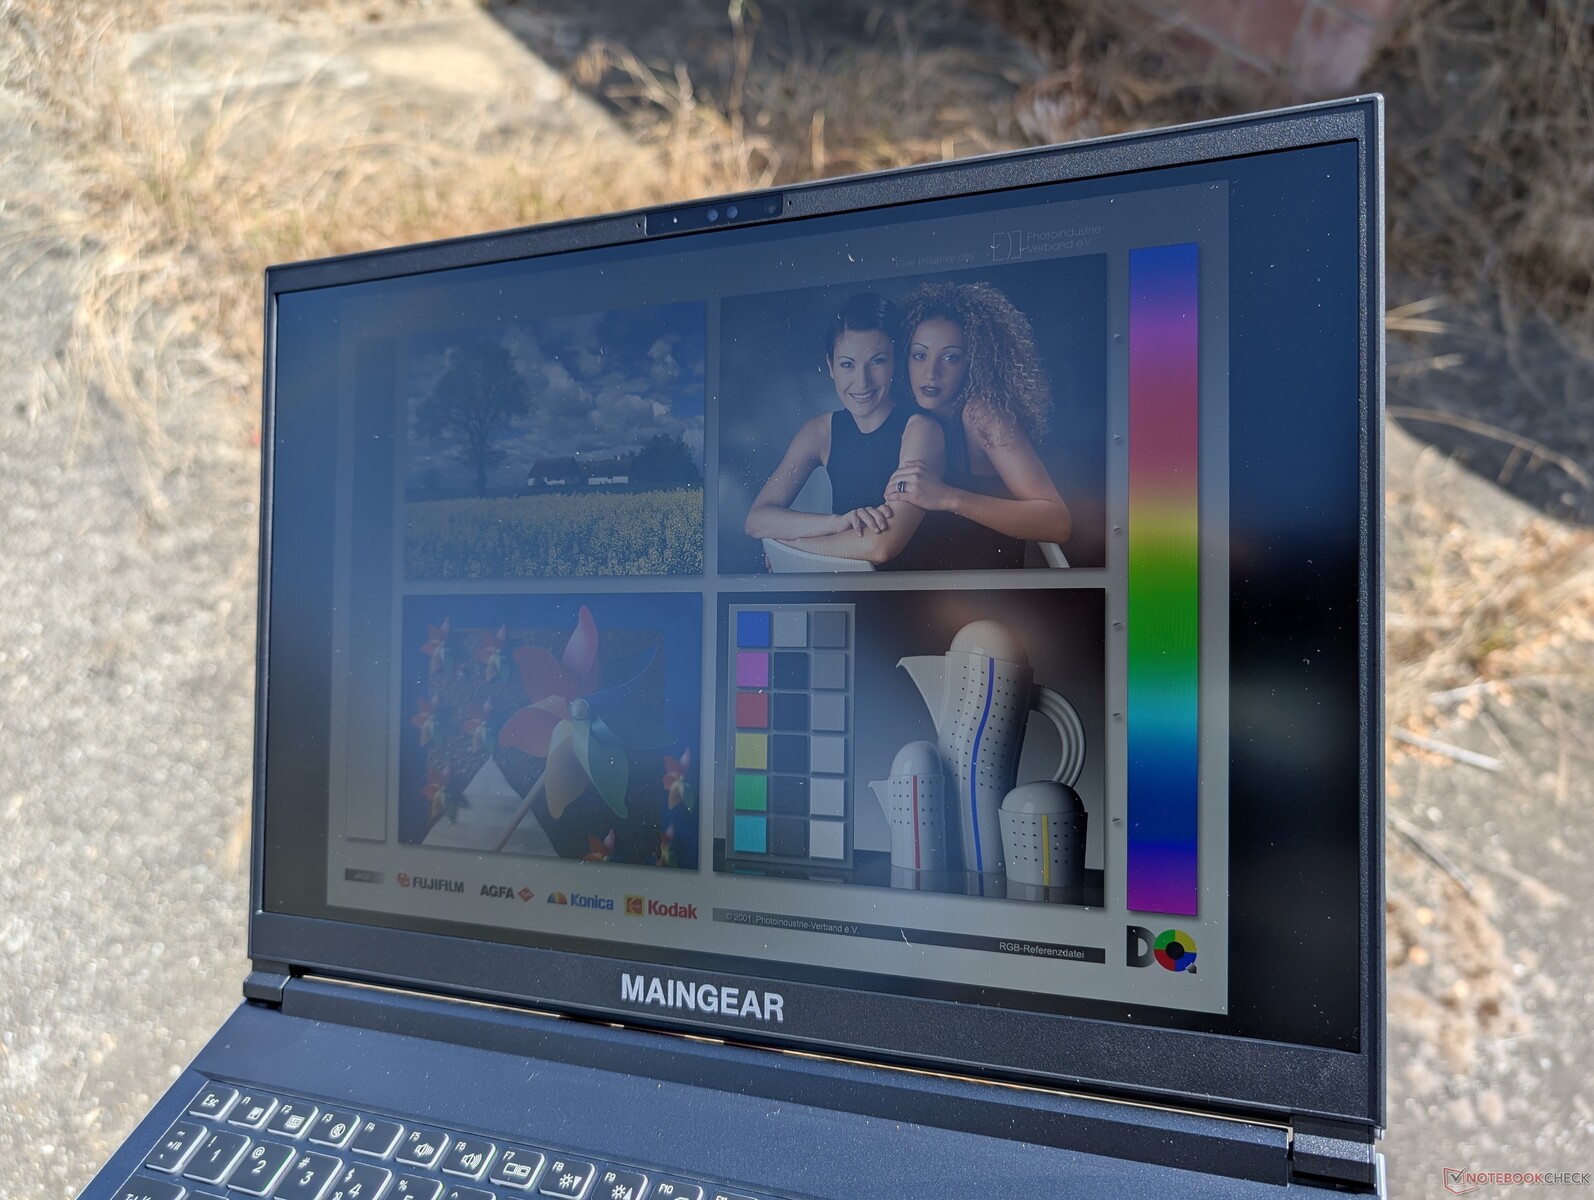
La visibilité en extérieur est meilleure que celle de la plupart des autres ordinateurs portables de jeu de 16 pouces grâce au rétroéclairage relativement lumineux de 500 nit. Le Victus 16alienware x16 R2 et Blade 16, par exemple, plafonnent à 400 nits ou même à 300 nits pour être nettement moins lumineux. Vous devrez toujours éviter la lumière directe du soleil pour préserver les couleurs autant que possible.

Performance - Meteor Lake au lieu de Raptor Lake Refresh
Conditions d'essai
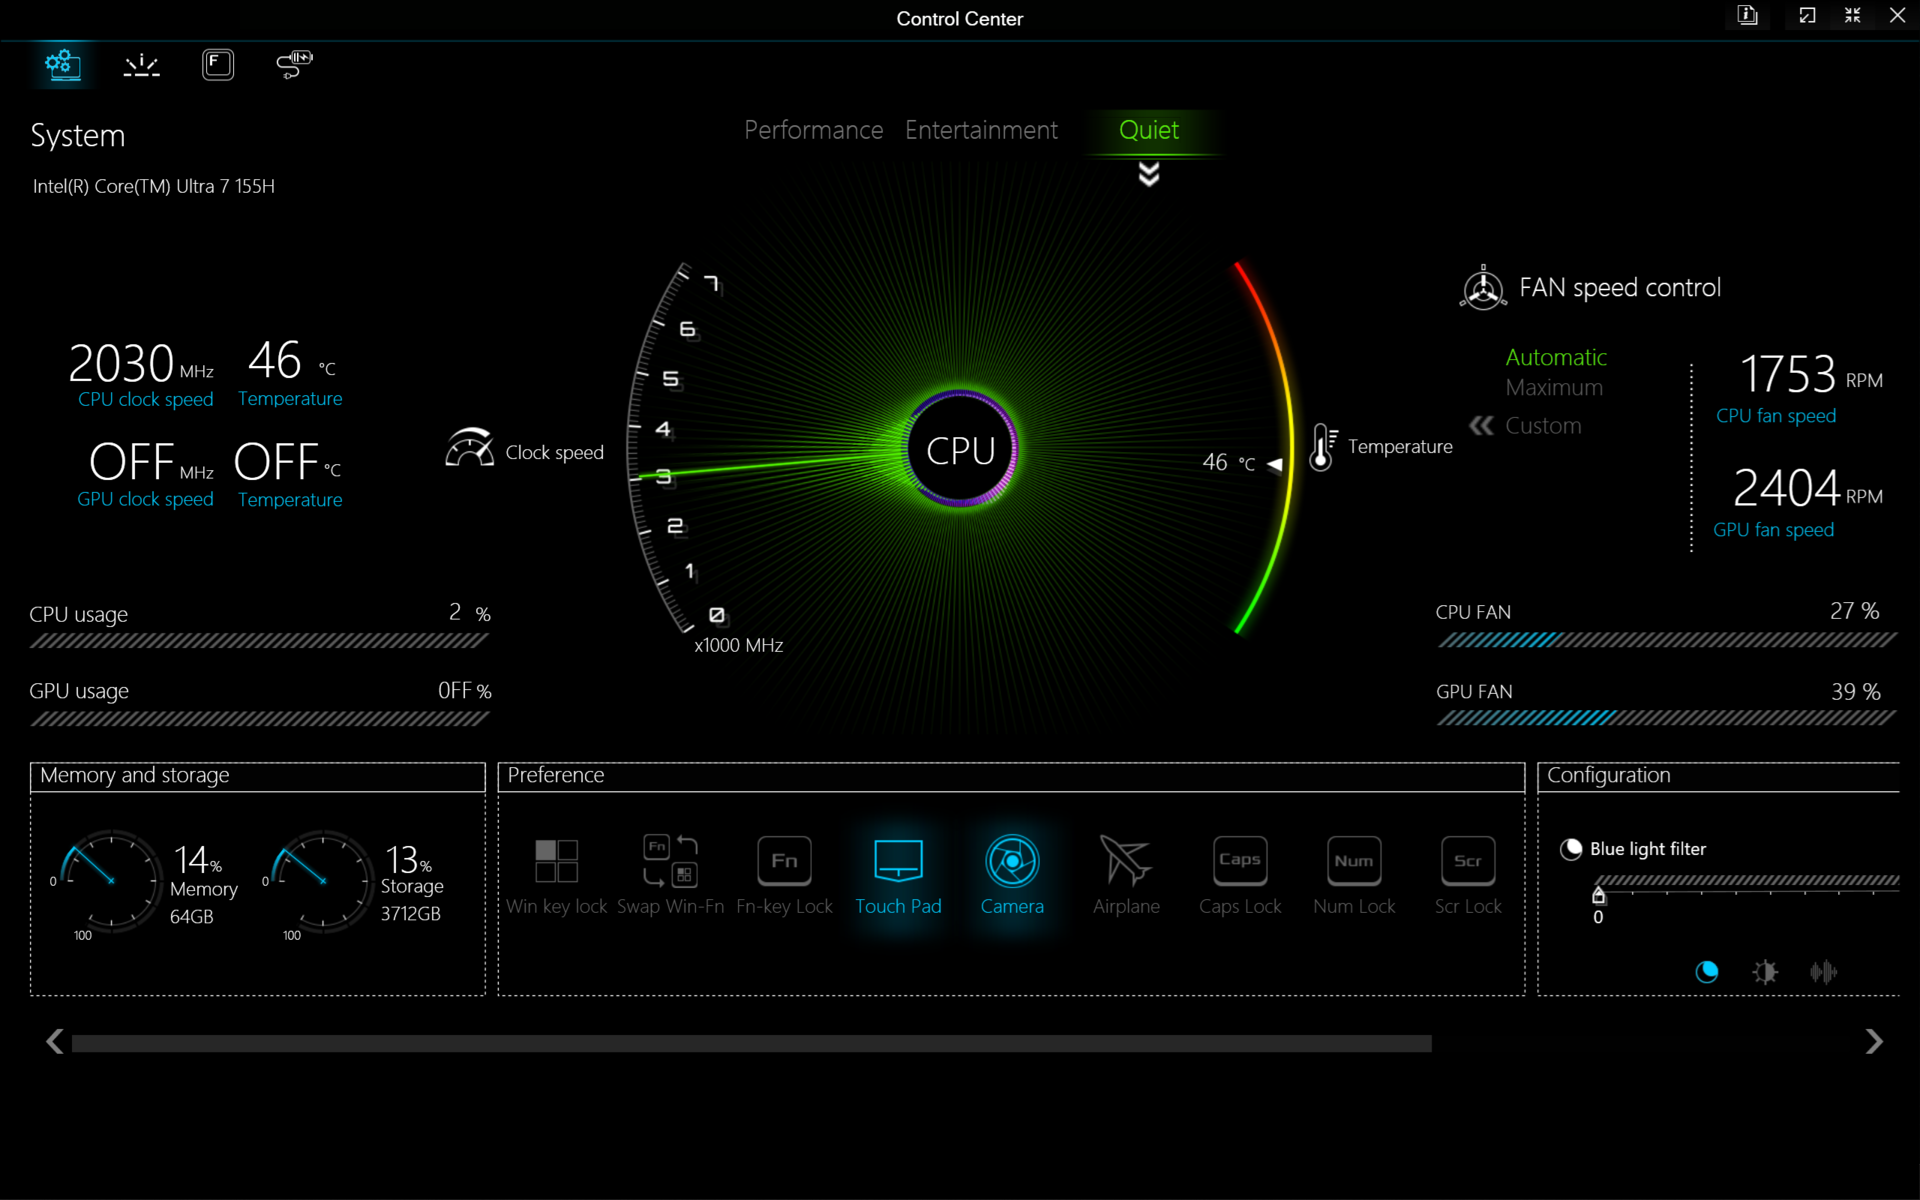
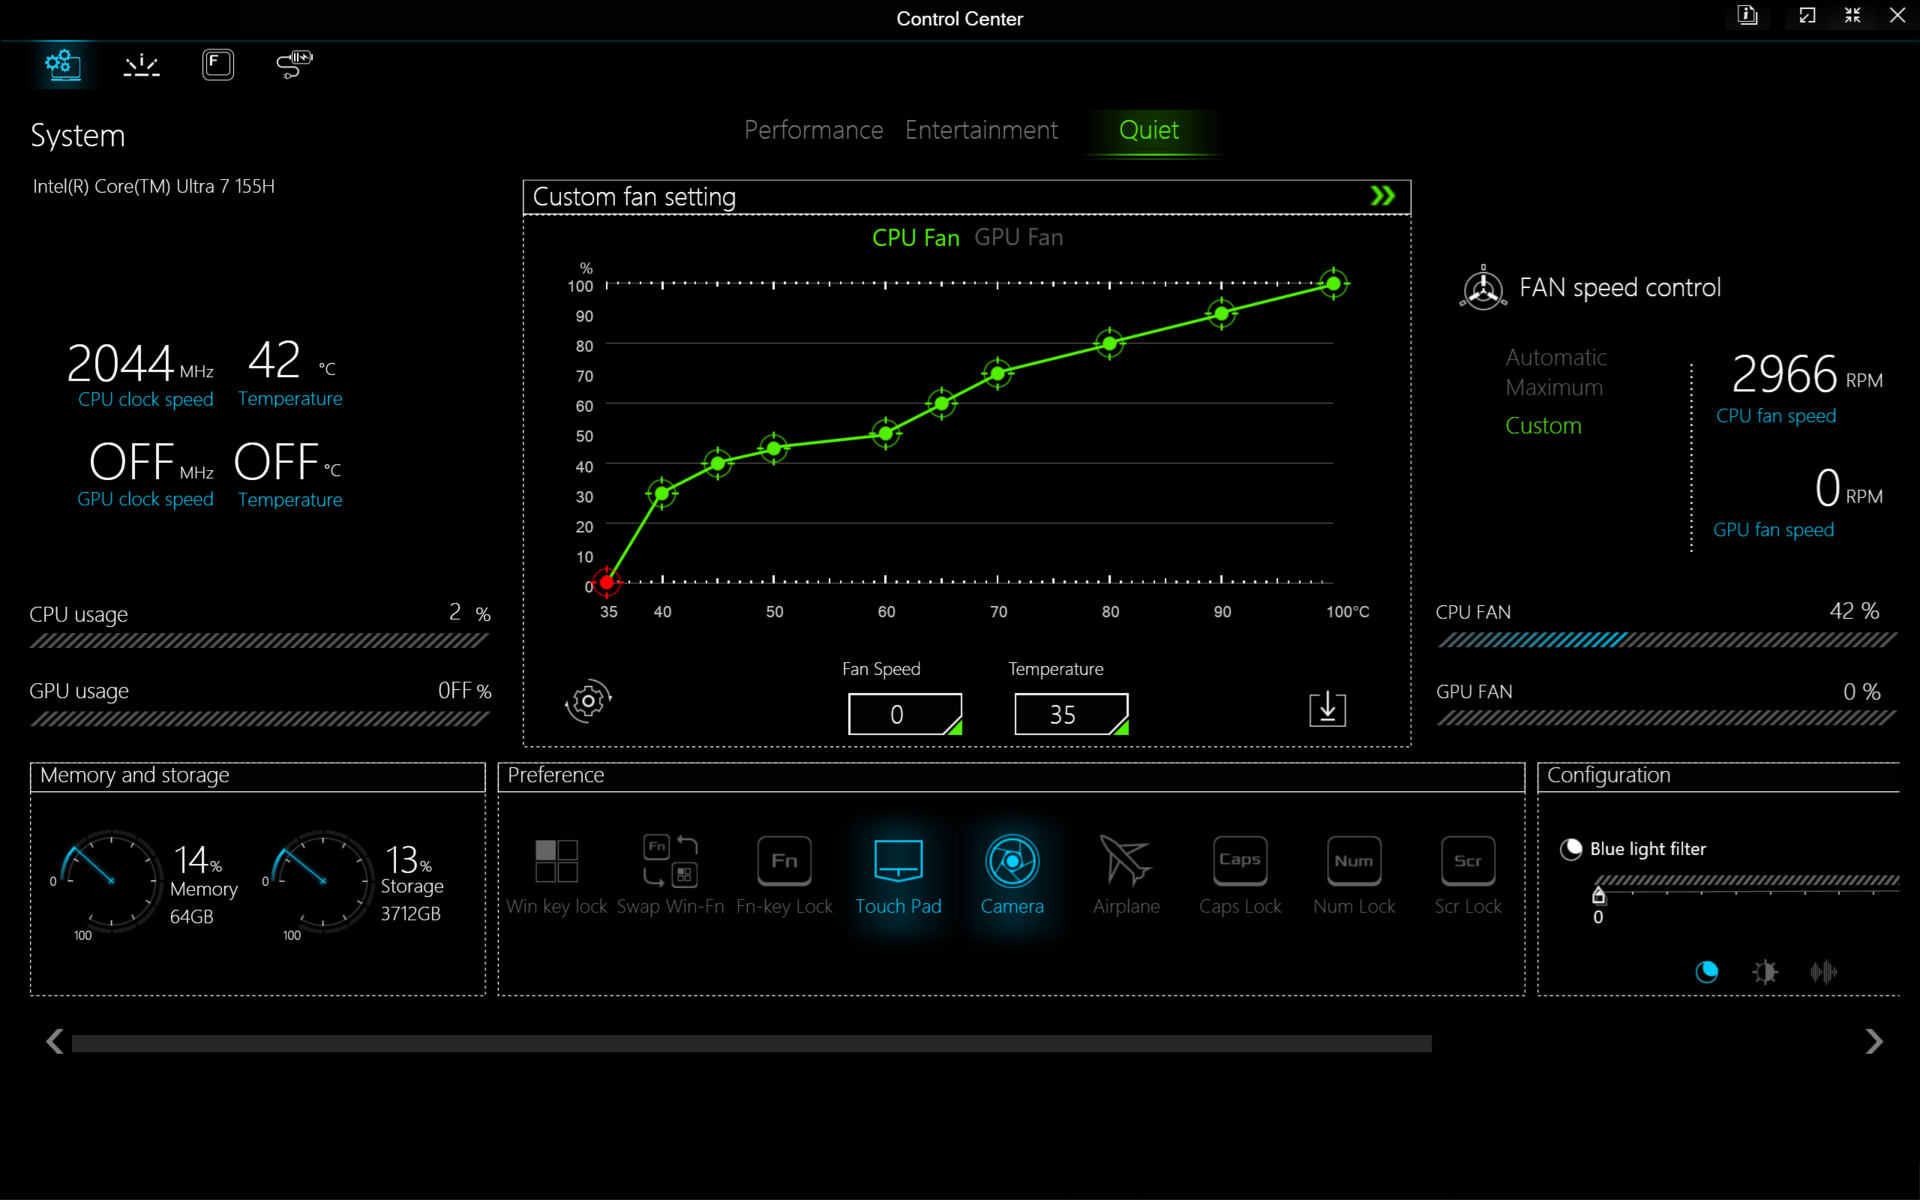
Nous avons réglé Windows et le centre de contrôle sur le mode Performance avant d'exécuter les tests de référence ci-dessous. Les propriétaires doivent se familiariser avec le logiciel Control Center préinstallé, car il permet d'ajuster des fonctions clés telles que le comportement des ventilateurs, l'obturateur électronique de la caméra, les touches RVB et le commutateur GPU MUX manuel. Notez que ce dernier est ennuyeusement caché dans un sous-menu qui nécessite des clics supplémentaires pour y accéder.
Seuls l'Optimus et le MUX standard sont pris en charge, sans l'Optimus avancé. Ainsi, un redémarrage est nécessaire pour passer du mode dGPU au mode MSHybrid.

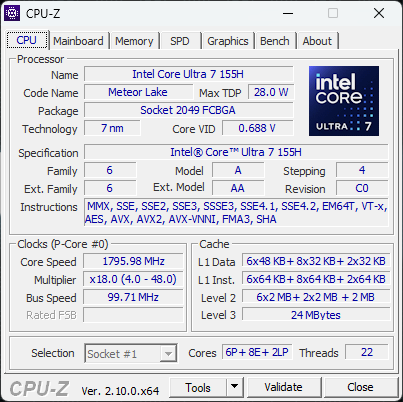
Processeur
Le Core Ultra 7 155H succède au Core i7-13700Hmais l'augmentation des performances est relativement marginale, de l'ordre de 5 à 15 %. Cela s'explique par le fait que la nouvelle plateforme Meteor Lake réserve une grande partie de son espace disque au nouveau NPU intégré et que les avantages en termes de performances brutes ont été relégués au second plan cette année. Le Core i7-14700HX aurait amélioré les performances brutes de manière bien plus significative que le Core Ultra 7 155H, mais il s'agit également d'un processeur plus gourmand en énergie.
Le NPU intégré est malheureusement d'une utilité très limitée car il n'est pas compatible avec Co-Pilot+ ; le service de Microsoft nécessite au moins un processeur Lunar Lake ou l'équivalent AMD/Qualcomm. La plupart des jeux n'utilisent pas encore le NPU non plus.
Cinebench R15 Multi Loop
Cinebench R23: Multi Core | Single Core
Cinebench R20: CPU (Multi Core) | CPU (Single Core)
Cinebench R15: CPU Multi 64Bit | CPU Single 64Bit
Blender: v2.79 BMW27 CPU
7-Zip 18.03: 7z b 4 | 7z b 4 -mmt1
Geekbench 6.4: Multi-Core | Single-Core
Geekbench 5.5: Multi-Core | Single-Core
HWBOT x265 Benchmark v2.2: 4k Preset
LibreOffice : 20 Documents To PDF
R Benchmark 2.5: Overall mean
| CPU Performance Rating | |
| Razer Blade 16 2024, RTX 4090 | |
| Asus ROG Zephyrus G16 GA605WV | |
| HP Victus 16 (2024) | |
| Asus TUF Gaming A16 FA617XS -2! | |
| MSI Stealth 16 Mercedes-AMG Motorsport A13VG | |
| Lenovo Legion Slim 7 16APH8 | |
| Dell Inspiron 16 Plus 7630 | |
| HP Victus 16-r0076TX -3! | |
| Alienware x16 R2 P120F | |
| Maingear ML-16 MK2 | |
| Moyenne Intel Core Ultra 7 155H | |
| HP Victus 16-r0077ng | |
| CSL GameStar Notebook VenomGamer G16 | |
| HP Omen 16-n0033dx -2! | |
| Acer Nitro 16 AN16-41-R7YE | |
| Cinebench R23 / Multi Core | |
| Razer Blade 16 2024, RTX 4090 | |
| HP Victus 16 (2024) | |
| Asus ROG Zephyrus G16 GA605WV | |
| MSI Stealth 16 Mercedes-AMG Motorsport A13VG | |
| Alienware x16 R2 P120F | |
| HP Victus 16-r0076TX | |
| Maingear ML-16 MK2 | |
| Asus TUF Gaming A16 FA617XS | |
| Lenovo Legion Slim 7 16APH8 | |
| Dell Inspiron 16 Plus 7630 | |
| HP Victus 16-r0077ng | |
| Moyenne Intel Core Ultra 7 155H (9769 - 19007, n=52) | |
| CSL GameStar Notebook VenomGamer G16 | |
| HP Omen 16-n0033dx | |
| Acer Nitro 16 AN16-41-R7YE | |
| Cinebench R23 / Single Core | |
| Razer Blade 16 2024, RTX 4090 | |
| MSI Stealth 16 Mercedes-AMG Motorsport A13VG | |
| Asus ROG Zephyrus G16 GA605WV | |
| Dell Inspiron 16 Plus 7630 | |
| Asus TUF Gaming A16 FA617XS | |
| Lenovo Legion Slim 7 16APH8 | |
| Moyenne Intel Core Ultra 7 155H (1496 - 1815, n=52) | |
| HP Victus 16 (2024) | |
| HP Victus 16-r0076TX | |
| HP Victus 16-r0077ng | |
| Maingear ML-16 MK2 | |
| Alienware x16 R2 P120F | |
| CSL GameStar Notebook VenomGamer G16 | |
| HP Omen 16-n0033dx | |
| Acer Nitro 16 AN16-41-R7YE | |
| Cinebench R20 / CPU (Multi Core) | |
| Razer Blade 16 2024, RTX 4090 | |
| HP Victus 16 (2024) | |
| Asus ROG Zephyrus G16 GA605WV | |
| MSI Stealth 16 Mercedes-AMG Motorsport A13VG | |
| Alienware x16 R2 P120F | |
| HP Victus 16-r0076TX | |
| Maingear ML-16 MK2 | |
| Asus TUF Gaming A16 FA617XS | |
| Lenovo Legion Slim 7 16APH8 | |
| Dell Inspiron 16 Plus 7630 | |
| HP Victus 16-r0077ng | |
| Moyenne Intel Core Ultra 7 155H (3798 - 7409, n=50) | |
| CSL GameStar Notebook VenomGamer G16 | |
| HP Omen 16-n0033dx | |
| Acer Nitro 16 AN16-41-R7YE | |
| Cinebench R20 / CPU (Single Core) | |
| Razer Blade 16 2024, RTX 4090 | |
| Asus ROG Zephyrus G16 GA605WV | |
| MSI Stealth 16 Mercedes-AMG Motorsport A13VG | |
| Dell Inspiron 16 Plus 7630 | |
| Asus TUF Gaming A16 FA617XS | |
| Lenovo Legion Slim 7 16APH8 | |
| Moyenne Intel Core Ultra 7 155H (601 - 696, n=50) | |
| HP Victus 16 (2024) | |
| HP Victus 16-r0077ng | |
| HP Victus 16-r0076TX | |
| Maingear ML-16 MK2 | |
| Alienware x16 R2 P120F | |
| HP Omen 16-n0033dx | |
| CSL GameStar Notebook VenomGamer G16 | |
| Acer Nitro 16 AN16-41-R7YE | |
| Cinebench R15 / CPU Multi 64Bit | |
| Razer Blade 16 2024, RTX 4090 | |
| HP Victus 16 (2024) | |
| Asus ROG Zephyrus G16 GA605WV | |
| MSI Stealth 16 Mercedes-AMG Motorsport A13VG | |
| HP Victus 16-r0076TX | |
| Alienware x16 R2 P120F | |
| Maingear ML-16 MK2 | |
| Asus TUF Gaming A16 FA617XS | |
| Lenovo Legion Slim 7 16APH8 | |
| Moyenne Intel Core Ultra 7 155H (1932 - 2880, n=56) | |
| Dell Inspiron 16 Plus 7630 | |
| HP Victus 16-r0077ng | |
| CSL GameStar Notebook VenomGamer G16 | |
| HP Omen 16-n0033dx | |
| Acer Nitro 16 AN16-41-R7YE | |
| Cinebench R15 / CPU Single 64Bit | |
| Razer Blade 16 2024, RTX 4090 | |
| Asus ROG Zephyrus G16 GA605WV | |
| Asus TUF Gaming A16 FA617XS | |
| MSI Stealth 16 Mercedes-AMG Motorsport A13VG | |
| Lenovo Legion Slim 7 16APH8 | |
| Dell Inspiron 16 Plus 7630 | |
| CSL GameStar Notebook VenomGamer G16 | |
| Moyenne Intel Core Ultra 7 155H (99.6 - 268, n=52) | |
| HP Victus 16-r0077ng | |
| HP Omen 16-n0033dx | |
| HP Victus 16-r0076TX | |
| Maingear ML-16 MK2 | |
| Acer Nitro 16 AN16-41-R7YE | |
| HP Victus 16 (2024) | |
| Alienware x16 R2 P120F | |
| Blender / v2.79 BMW27 CPU | |
| Acer Nitro 16 AN16-41-R7YE | |
| HP Omen 16-n0033dx | |
| Moyenne Intel Core Ultra 7 155H (175 - 381, n=47) | |
| MSI Stealth 16 Mercedes-AMG Motorsport A13VG | |
| Maingear ML-16 MK2 | |
| Dell Inspiron 16 Plus 7630 | |
| HP Victus 16-r0077ng | |
| CSL GameStar Notebook VenomGamer G16 | |
| Lenovo Legion Slim 7 16APH8 | |
| HP Victus 16-r0076TX | |
| Asus TUF Gaming A16 FA617XS | |
| Alienware x16 R2 P120F | |
| HP Victus 16 (2024) | |
| Asus ROG Zephyrus G16 GA605WV | |
| Razer Blade 16 2024, RTX 4090 | |
| 7-Zip 18.03 / 7z b 4 | |
| Razer Blade 16 2024, RTX 4090 | |
| HP Victus 16 (2024) | |
| Asus ROG Zephyrus G16 GA605WV | |
| HP Victus 16-r0076TX | |
| Lenovo Legion Slim 7 16APH8 | |
| Asus TUF Gaming A16 FA617XS | |
| Alienware x16 R2 P120F | |
| HP Victus 16-r0077ng | |
| Maingear ML-16 MK2 | |
| CSL GameStar Notebook VenomGamer G16 | |
| Dell Inspiron 16 Plus 7630 | |
| Moyenne Intel Core Ultra 7 155H (41739 - 70254, n=50) | |
| HP Omen 16-n0033dx | |
| MSI Stealth 16 Mercedes-AMG Motorsport A13VG | |
| Acer Nitro 16 AN16-41-R7YE | |
| 7-Zip 18.03 / 7z b 4 -mmt1 | |
| Razer Blade 16 2024, RTX 4090 | |
| Asus TUF Gaming A16 FA617XS | |
| Lenovo Legion Slim 7 16APH8 | |
| MSI Stealth 16 Mercedes-AMG Motorsport A13VG | |
| Asus ROG Zephyrus G16 GA605WV | |
| CSL GameStar Notebook VenomGamer G16 | |
| Dell Inspiron 16 Plus 7630 | |
| Acer Nitro 16 AN16-41-R7YE | |
| HP Omen 16-n0033dx | |
| HP Victus 16 (2024) | |
| HP Victus 16-r0077ng | |
| HP Victus 16-r0076TX | |
| Moyenne Intel Core Ultra 7 155H (4594 - 5621, n=50) | |
| Maingear ML-16 MK2 | |
| Alienware x16 R2 P120F | |
| Geekbench 6.4 / Multi-Core | |
| Razer Blade 16 2024, RTX 4090 | |
| Asus ROG Zephyrus G16 GA605WV | |
| HP Victus 16 (2024) | |
| Dell Inspiron 16 Plus 7630 | |
| Lenovo Legion Slim 7 16APH8 | |
| Alienware x16 R2 P120F | |
| Moyenne Intel Core Ultra 7 155H (7732 - 13656, n=55) | |
| MSI Stealth 16 Mercedes-AMG Motorsport A13VG | |
| Maingear ML-16 MK2 | |
| HP Victus 16-r0077ng | |
| CSL GameStar Notebook VenomGamer G16 | |
| Acer Nitro 16 AN16-41-R7YE | |
| Geekbench 6.4 / Single-Core | |
| Razer Blade 16 2024, RTX 4090 | |
| Asus ROG Zephyrus G16 GA605WV | |
| MSI Stealth 16 Mercedes-AMG Motorsport A13VG | |
| Dell Inspiron 16 Plus 7630 | |
| Lenovo Legion Slim 7 16APH8 | |
| HP Victus 16-r0077ng | |
| HP Victus 16 (2024) | |
| Moyenne Intel Core Ultra 7 155H (1901 - 2473, n=52) | |
| Maingear ML-16 MK2 | |
| Alienware x16 R2 P120F | |
| CSL GameStar Notebook VenomGamer G16 | |
| Acer Nitro 16 AN16-41-R7YE | |
| Geekbench 5.5 / Multi-Core | |
| Razer Blade 16 2024, RTX 4090 | |
| HP Victus 16 (2024) | |
| Asus ROG Zephyrus G16 GA605WV | |
| Dell Inspiron 16 Plus 7630 | |
| Alienware x16 R2 P120F | |
| HP Victus 16-r0076TX | |
| Maingear ML-16 MK2 | |
| Asus TUF Gaming A16 FA617XS | |
| Moyenne Intel Core Ultra 7 155H (10017 - 13556, n=52) | |
| Lenovo Legion Slim 7 16APH8 | |
| HP Victus 16-r0077ng | |
| MSI Stealth 16 Mercedes-AMG Motorsport A13VG | |
| CSL GameStar Notebook VenomGamer G16 | |
| HP Omen 16-n0033dx | |
| Acer Nitro 16 AN16-41-R7YE | |
| Geekbench 5.5 / Single-Core | |
| Razer Blade 16 2024, RTX 4090 | |
| Asus ROG Zephyrus G16 GA605WV | |
| Asus TUF Gaming A16 FA617XS | |
| MSI Stealth 16 Mercedes-AMG Motorsport A13VG | |
| Lenovo Legion Slim 7 16APH8 | |
| Dell Inspiron 16 Plus 7630 | |
| Moyenne Intel Core Ultra 7 155H (1462 - 1824, n=52) | |
| HP Victus 16 (2024) | |
| Alienware x16 R2 P120F | |
| HP Victus 16-r0076TX | |
| HP Victus 16-r0077ng | |
| Maingear ML-16 MK2 | |
| CSL GameStar Notebook VenomGamer G16 | |
| HP Omen 16-n0033dx | |
| Acer Nitro 16 AN16-41-R7YE | |
| HWBOT x265 Benchmark v2.2 / 4k Preset | |
| Razer Blade 16 2024, RTX 4090 | |
| Asus ROG Zephyrus G16 GA605WV | |
| HP Victus 16 (2024) | |
| Asus TUF Gaming A16 FA617XS | |
| Alienware x16 R2 P120F | |
| HP Victus 16-r0076TX | |
| Lenovo Legion Slim 7 16APH8 | |
| CSL GameStar Notebook VenomGamer G16 | |
| Maingear ML-16 MK2 | |
| HP Victus 16-r0077ng | |
| Moyenne Intel Core Ultra 7 155H (9.93 - 21.2, n=50) | |
| HP Omen 16-n0033dx | |
| Dell Inspiron 16 Plus 7630 | |
| MSI Stealth 16 Mercedes-AMG Motorsport A13VG | |
| Acer Nitro 16 AN16-41-R7YE | |
| LibreOffice / 20 Documents To PDF | |
| Lenovo Legion Slim 7 16APH8 | |
| CSL GameStar Notebook VenomGamer G16 | |
| HP Victus 16-r0077ng | |
| HP Omen 16-n0033dx | |
| MSI Stealth 16 Mercedes-AMG Motorsport A13VG | |
| HP Victus 16 (2024) | |
| Asus ROG Zephyrus G16 GA605WV | |
| Moyenne Intel Core Ultra 7 155H (37.5 - 79.2, n=49) | |
| Razer Blade 16 2024, RTX 4090 | |
| Acer Nitro 16 AN16-41-R7YE | |
| Alienware x16 R2 P120F | |
| Dell Inspiron 16 Plus 7630 | |
| Maingear ML-16 MK2 | |
| Asus TUF Gaming A16 FA617XS | |
| R Benchmark 2.5 / Overall mean | |
| Maingear ML-16 MK2 | |
| HP Victus 16-r0077ng | |
| Acer Nitro 16 AN16-41-R7YE | |
| Alienware x16 R2 P120F | |
| HP Omen 16-n0033dx | |
| HP Victus 16 (2024) | |
| HP Victus 16-r0076TX | |
| CSL GameStar Notebook VenomGamer G16 | |
| Moyenne Intel Core Ultra 7 155H (0.4457 - 0.53, n=49) | |
| Lenovo Legion Slim 7 16APH8 | |
| Dell Inspiron 16 Plus 7630 | |
| MSI Stealth 16 Mercedes-AMG Motorsport A13VG | |
| Asus TUF Gaming A16 FA617XS | |
| Asus ROG Zephyrus G16 GA605WV | |
| Razer Blade 16 2024, RTX 4090 | |
Cinebench R23: Multi Core | Single Core
Cinebench R20: CPU (Multi Core) | CPU (Single Core)
Cinebench R15: CPU Multi 64Bit | CPU Single 64Bit
Blender: v2.79 BMW27 CPU
7-Zip 18.03: 7z b 4 | 7z b 4 -mmt1
Geekbench 6.4: Multi-Core | Single-Core
Geekbench 5.5: Multi-Core | Single-Core
HWBOT x265 Benchmark v2.2: 4k Preset
LibreOffice : 20 Documents To PDF
R Benchmark 2.5: Overall mean
* ... Moindre est la valeur, meilleures sont les performances
AIDA64: FP32 Ray-Trace | FPU Julia | CPU SHA3 | CPU Queen | FPU SinJulia | FPU Mandel | CPU AES | CPU ZLib | FP64 Ray-Trace | CPU PhotoWorxx
| Performance Rating | |
| Asus ROG Zephyrus G16 GA605WV | |
| Razer Blade 16 2024, RTX 4090 | |
| Lenovo Legion Pro 5 16IRX9 | |
| Alienware x16 R2 P120F | |
| HP Victus 16 (2024) | |
| Maingear ML-16 MK2 | |
| Moyenne Intel Core Ultra 7 155H | |
| AIDA64 / FP32 Ray-Trace | |
| Asus ROG Zephyrus G16 GA605WV | |
| Razer Blade 16 2024, RTX 4090 | |
| Lenovo Legion Pro 5 16IRX9 | |
| Alienware x16 R2 P120F | |
| HP Victus 16 (2024) | |
| Maingear ML-16 MK2 | |
| Moyenne Intel Core Ultra 7 155H (6670 - 18470, n=50) | |
| AIDA64 / FPU Julia | |
| Asus ROG Zephyrus G16 GA605WV | |
| Lenovo Legion Pro 5 16IRX9 | |
| Razer Blade 16 2024, RTX 4090 | |
| Alienware x16 R2 P120F | |
| HP Victus 16 (2024) | |
| Maingear ML-16 MK2 | |
| Moyenne Intel Core Ultra 7 155H (40905 - 93181, n=50) | |
| AIDA64 / CPU SHA3 | |
| Lenovo Legion Pro 5 16IRX9 | |
| Razer Blade 16 2024, RTX 4090 | |
| Asus ROG Zephyrus G16 GA605WV | |
| Alienware x16 R2 P120F | |
| HP Victus 16 (2024) | |
| Maingear ML-16 MK2 | |
| Moyenne Intel Core Ultra 7 155H (1940 - 4436, n=50) | |
| AIDA64 / CPU Queen | |
| Lenovo Legion Pro 5 16IRX9 | |
| Razer Blade 16 2024, RTX 4090 | |
| HP Victus 16 (2024) | |
| Alienware x16 R2 P120F | |
| Asus ROG Zephyrus G16 GA605WV | |
| Maingear ML-16 MK2 | |
| Moyenne Intel Core Ultra 7 155H (64698 - 94181, n=50) | |
| AIDA64 / FPU SinJulia | |
| Asus ROG Zephyrus G16 GA605WV | |
| Razer Blade 16 2024, RTX 4090 | |
| Lenovo Legion Pro 5 16IRX9 | |
| HP Victus 16 (2024) | |
| Alienware x16 R2 P120F | |
| Maingear ML-16 MK2 | |
| Moyenne Intel Core Ultra 7 155H (5639 - 10647, n=50) | |
| AIDA64 / FPU Mandel | |
| Asus ROG Zephyrus G16 GA605WV | |
| Razer Blade 16 2024, RTX 4090 | |
| Lenovo Legion Pro 5 16IRX9 | |
| Alienware x16 R2 P120F | |
| HP Victus 16 (2024) | |
| Maingear ML-16 MK2 | |
| Moyenne Intel Core Ultra 7 155H (18236 - 47685, n=50) | |
| AIDA64 / CPU AES | |
| Maingear ML-16 MK2 | |
| Razer Blade 16 2024, RTX 4090 | |
| Lenovo Legion Pro 5 16IRX9 | |
| Alienware x16 R2 P120F | |
| HP Victus 16 (2024) | |
| Asus ROG Zephyrus G16 GA605WV | |
| Moyenne Intel Core Ultra 7 155H (45713 - 152179, n=50) | |
| AIDA64 / CPU ZLib | |
| Lenovo Legion Pro 5 16IRX9 | |
| Razer Blade 16 2024, RTX 4090 | |
| Asus ROG Zephyrus G16 GA605WV | |
| Alienware x16 R2 P120F | |
| Maingear ML-16 MK2 | |
| HP Victus 16 (2024) | |
| Moyenne Intel Core Ultra 7 155H (557 - 1250, n=50) | |
| AIDA64 / FP64 Ray-Trace | |
| Asus ROG Zephyrus G16 GA605WV | |
| Razer Blade 16 2024, RTX 4090 | |
| Lenovo Legion Pro 5 16IRX9 | |
| Alienware x16 R2 P120F | |
| HP Victus 16 (2024) | |
| Maingear ML-16 MK2 | |
| Moyenne Intel Core Ultra 7 155H (3569 - 9802, n=50) | |
| AIDA64 / CPU PhotoWorxx | |
| Alienware x16 R2 P120F | |
| Lenovo Legion Pro 5 16IRX9 | |
| Razer Blade 16 2024, RTX 4090 | |
| Asus ROG Zephyrus G16 GA605WV | |
| Moyenne Intel Core Ultra 7 155H (32719 - 54223, n=50) | |
| HP Victus 16 (2024) | |
| Maingear ML-16 MK2 | |
Test de stress
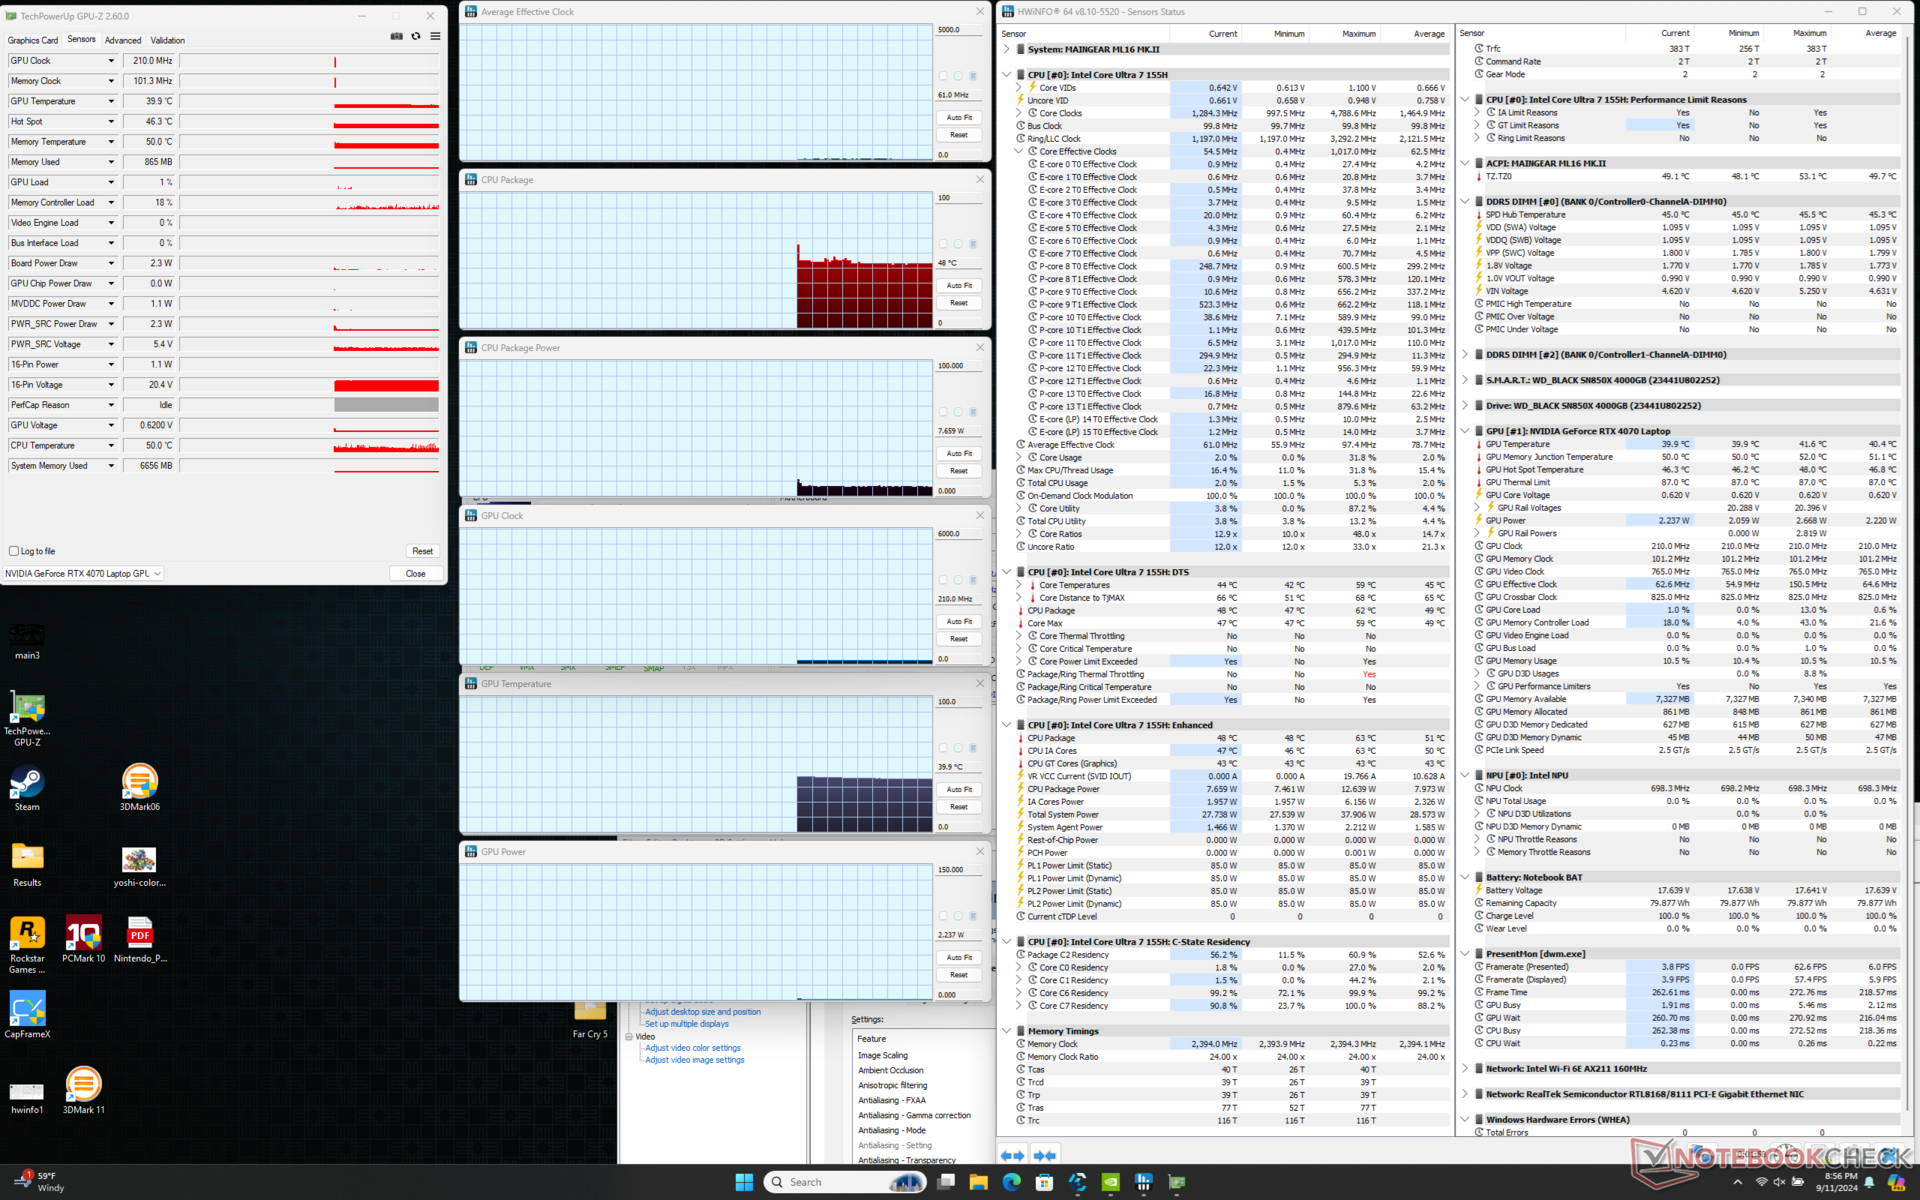
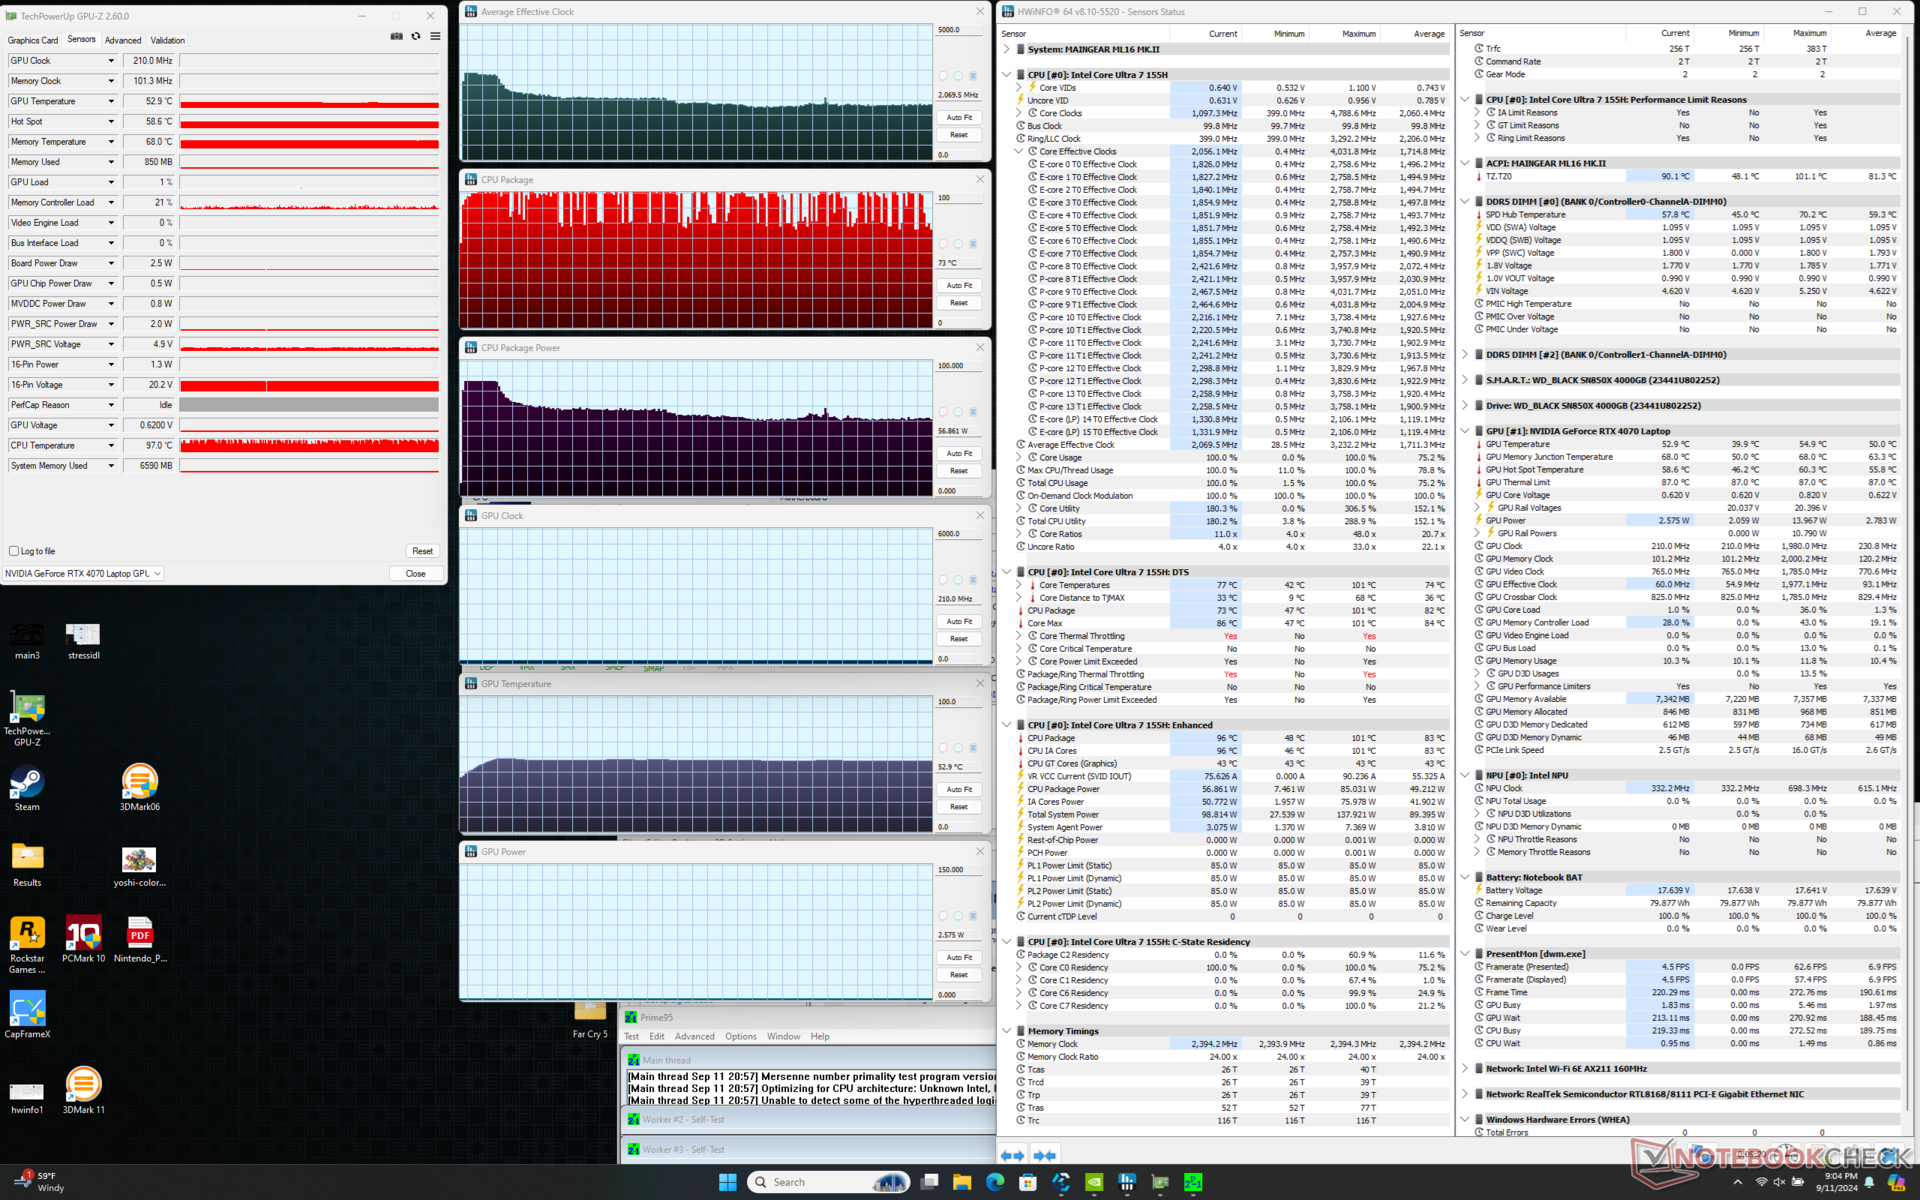
Le processeur atteignait 3,2 GHz, 100 C et 85 W lors de l'initialisation du stress Prime95. Cependant, après quelques secondes, le processeur descend à 2,6 GHz et 69 W, puis se stabilise à 2,1 GHz et 57 W. La température du cœur oscille entre 73 C et 100 C, avec un étranglement thermique détecté selon HWiNFO. Ces températures élevées du cœur sont plus chaudes que sur le Razer Blade 16 dans des conditions similaires et elles sont également responsables des températures de surface très chaudes.
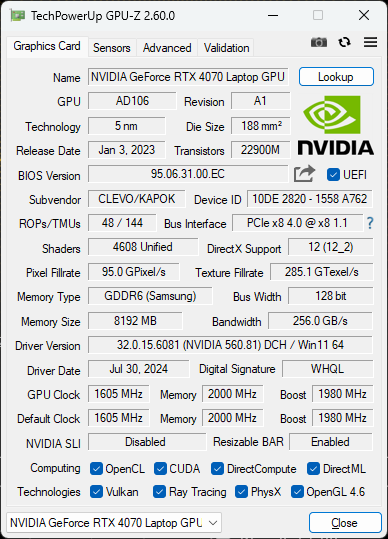
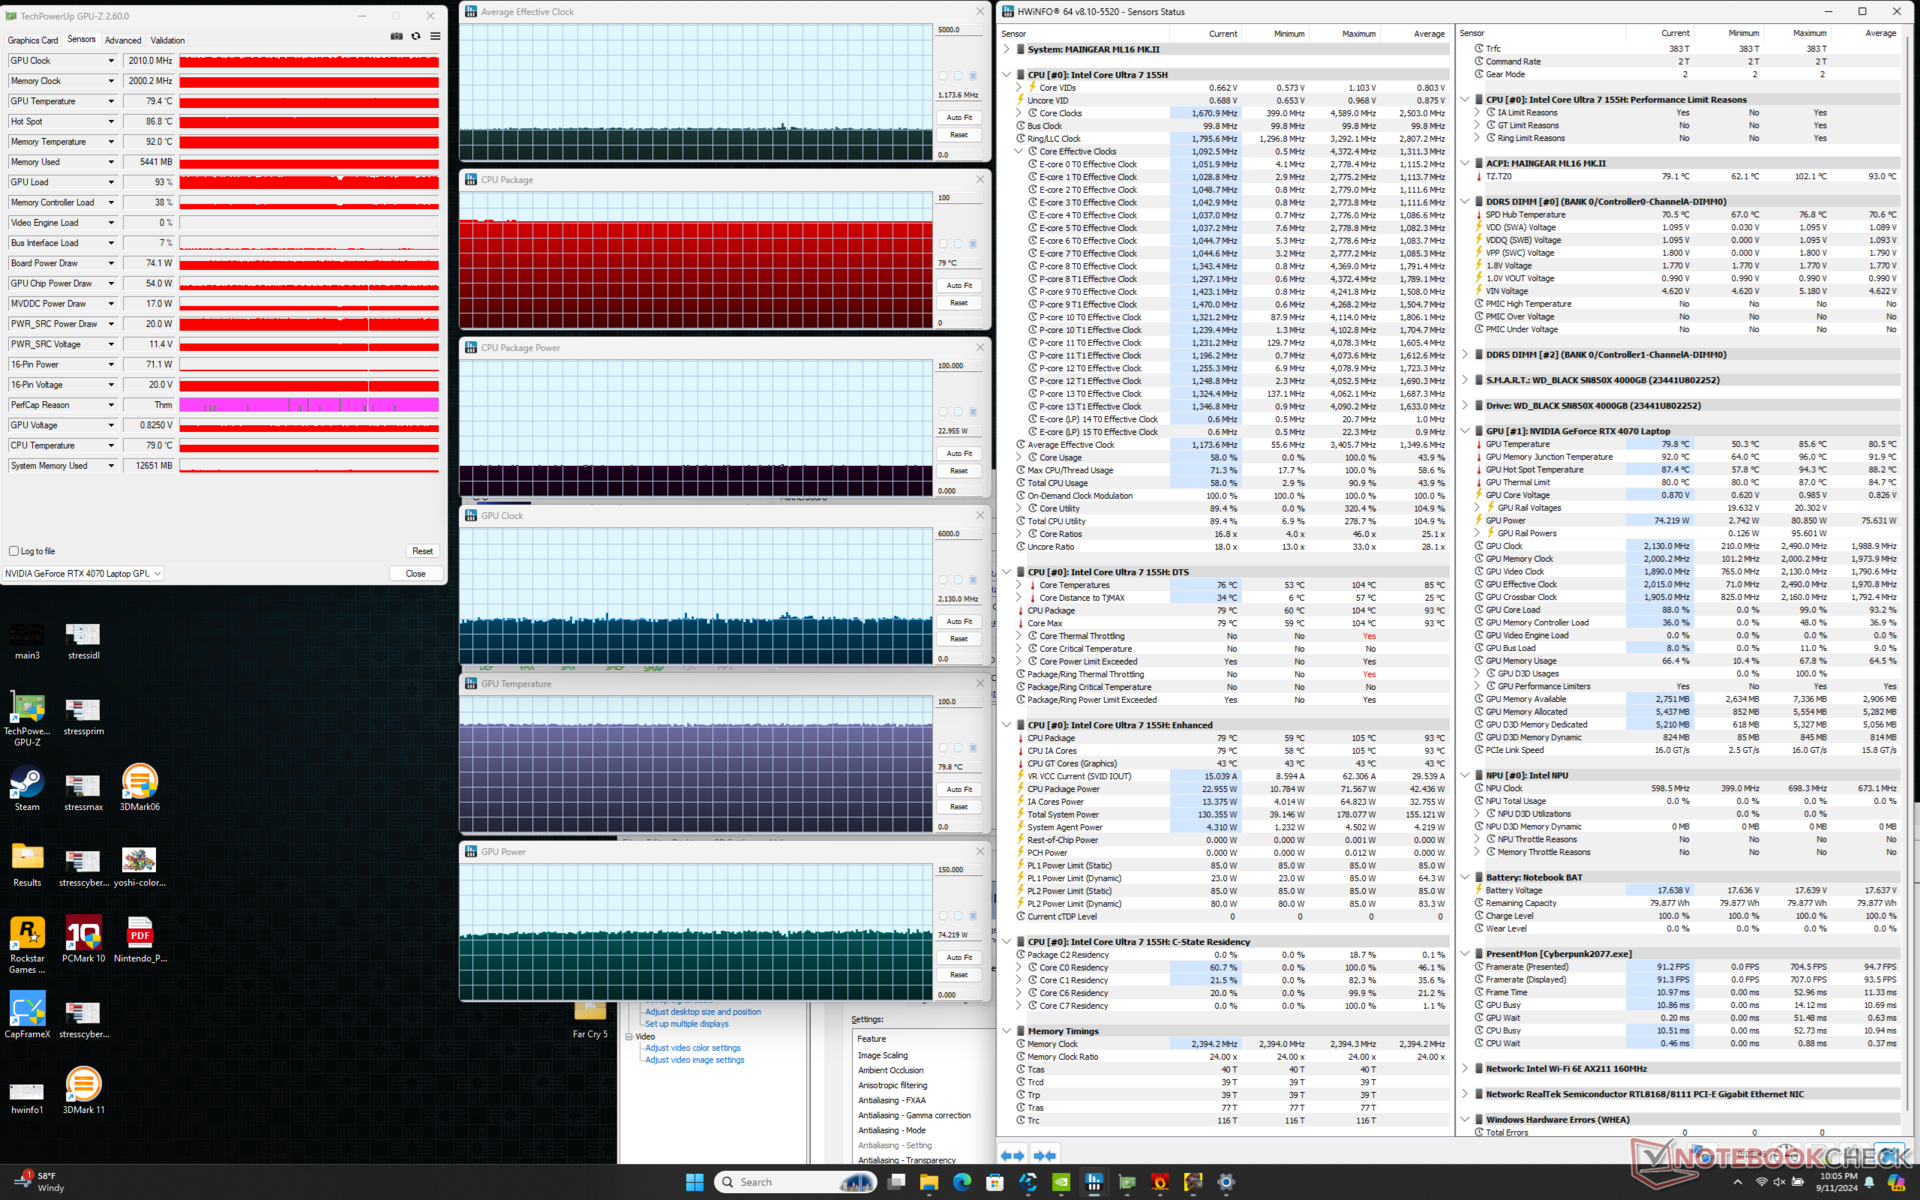
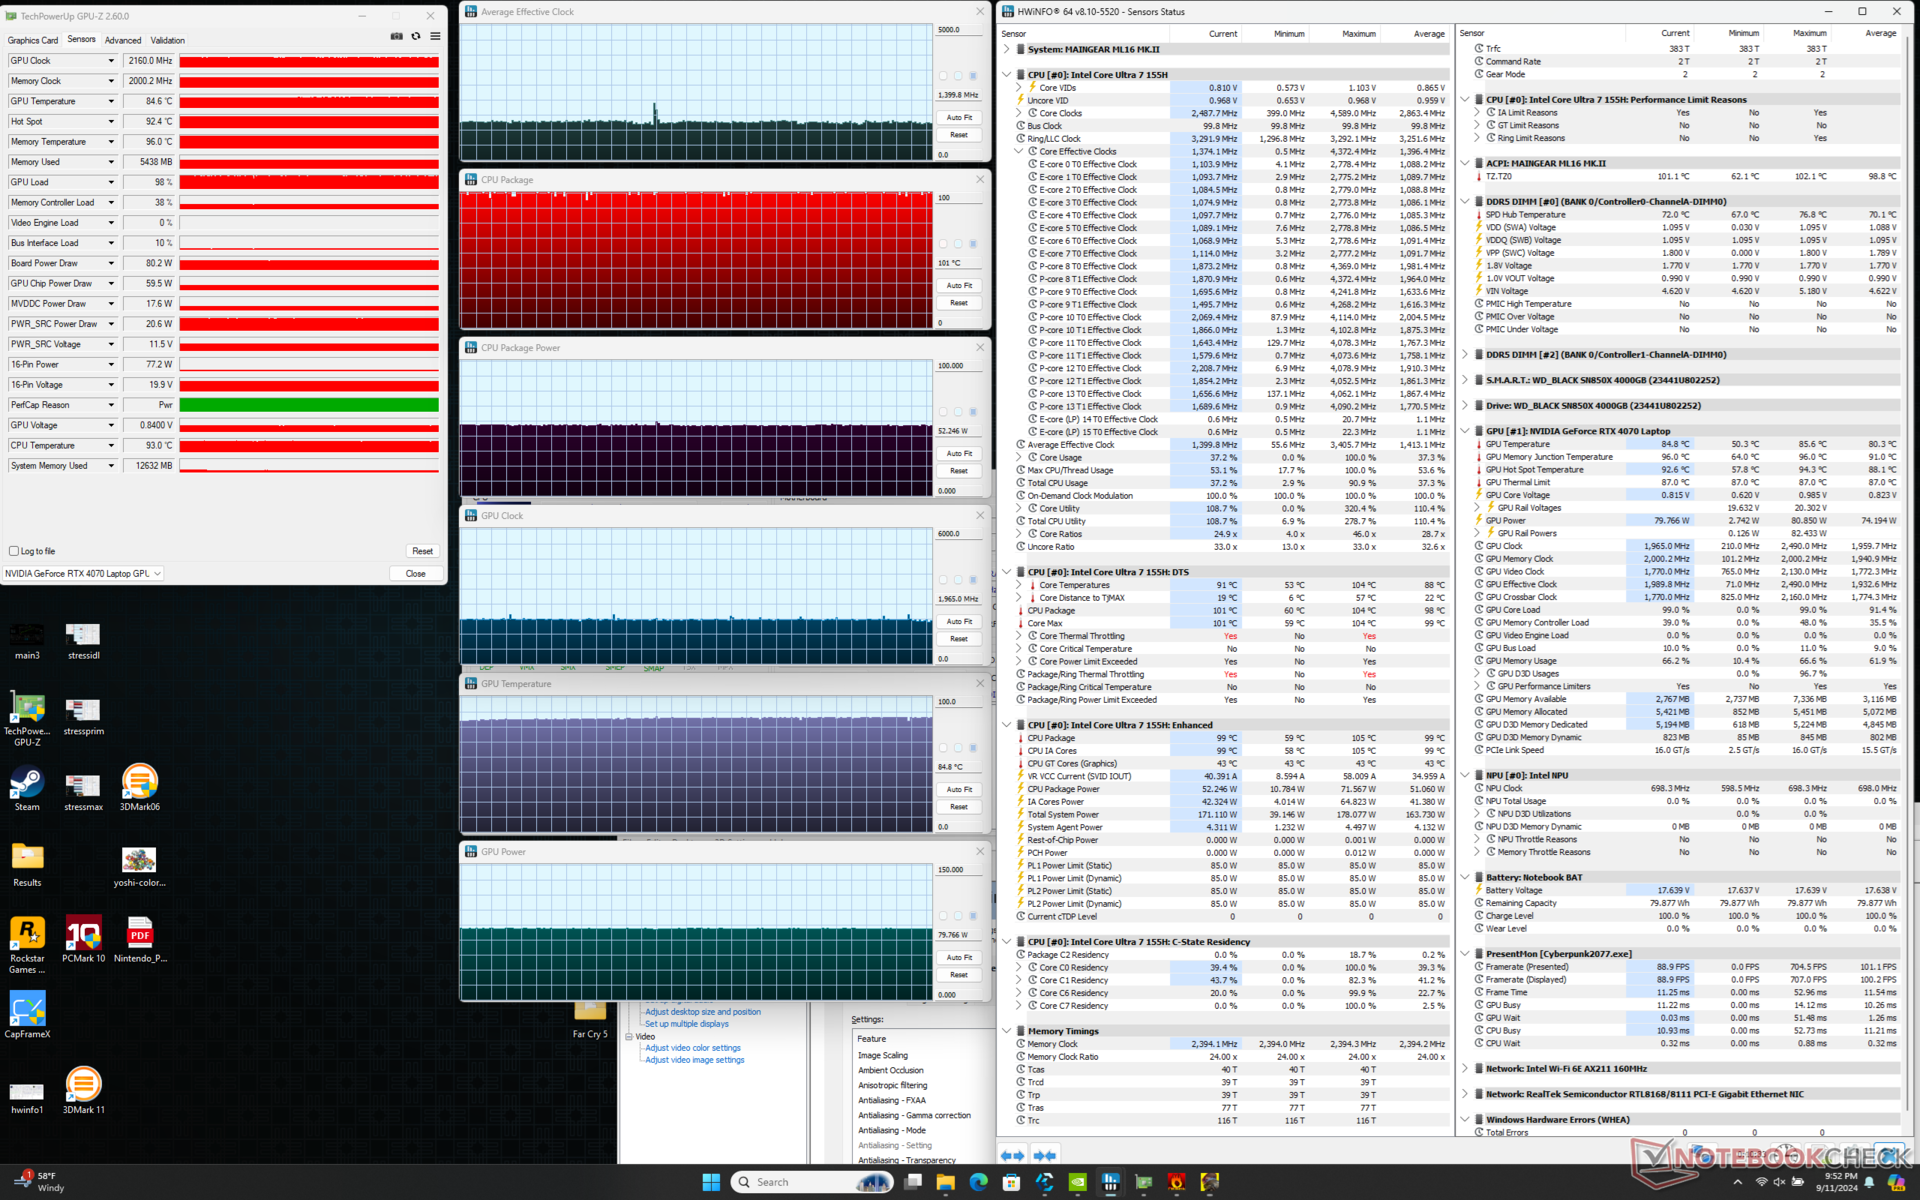
Lorsque vous exécutez Cyberpunk 2077 en mode Performance, le GPU se stabilise à 2160 MHz, 85 C, et 80 W comparé à 2010 MHz, 80 C, et 74 W lorsque vous êtes en mode Équilibré plus silencieux. Si votre jeu n'est pas très gourmand en ressources processeur, il est préférable d'utiliser le mode équilibré car le GPU n'est pas trop affecté. Notez que le panneau de contrôle Nvidia indique un TGP de 105 W, mais nous n'avons pu atteindre qu'un maximum de 80 W en jouant selon GPU-Z.
La température globale du processeur est bien plus élevée que celle d'un Blade 16. Notre CPU et notre GPU se stabilisent à 101°C et 85°C, respectivement, contre 78°C et 75°C sur le Razer. L'activation du mode ventilateur maximum ne réduirait la température du cœur que de quelques degrés C sans améliorer les performances.

| Horloge moyenne du CPU (GHz) | Horloge du GPU (MHz) | Température moyenne du CPU (°C) | Température moyenne du GPU (°C) | |
| Système au repos | -- | -- | 48 | 40 |
| Prime95 Stress | 2.1 | -- | 73 - 101 | 53 |
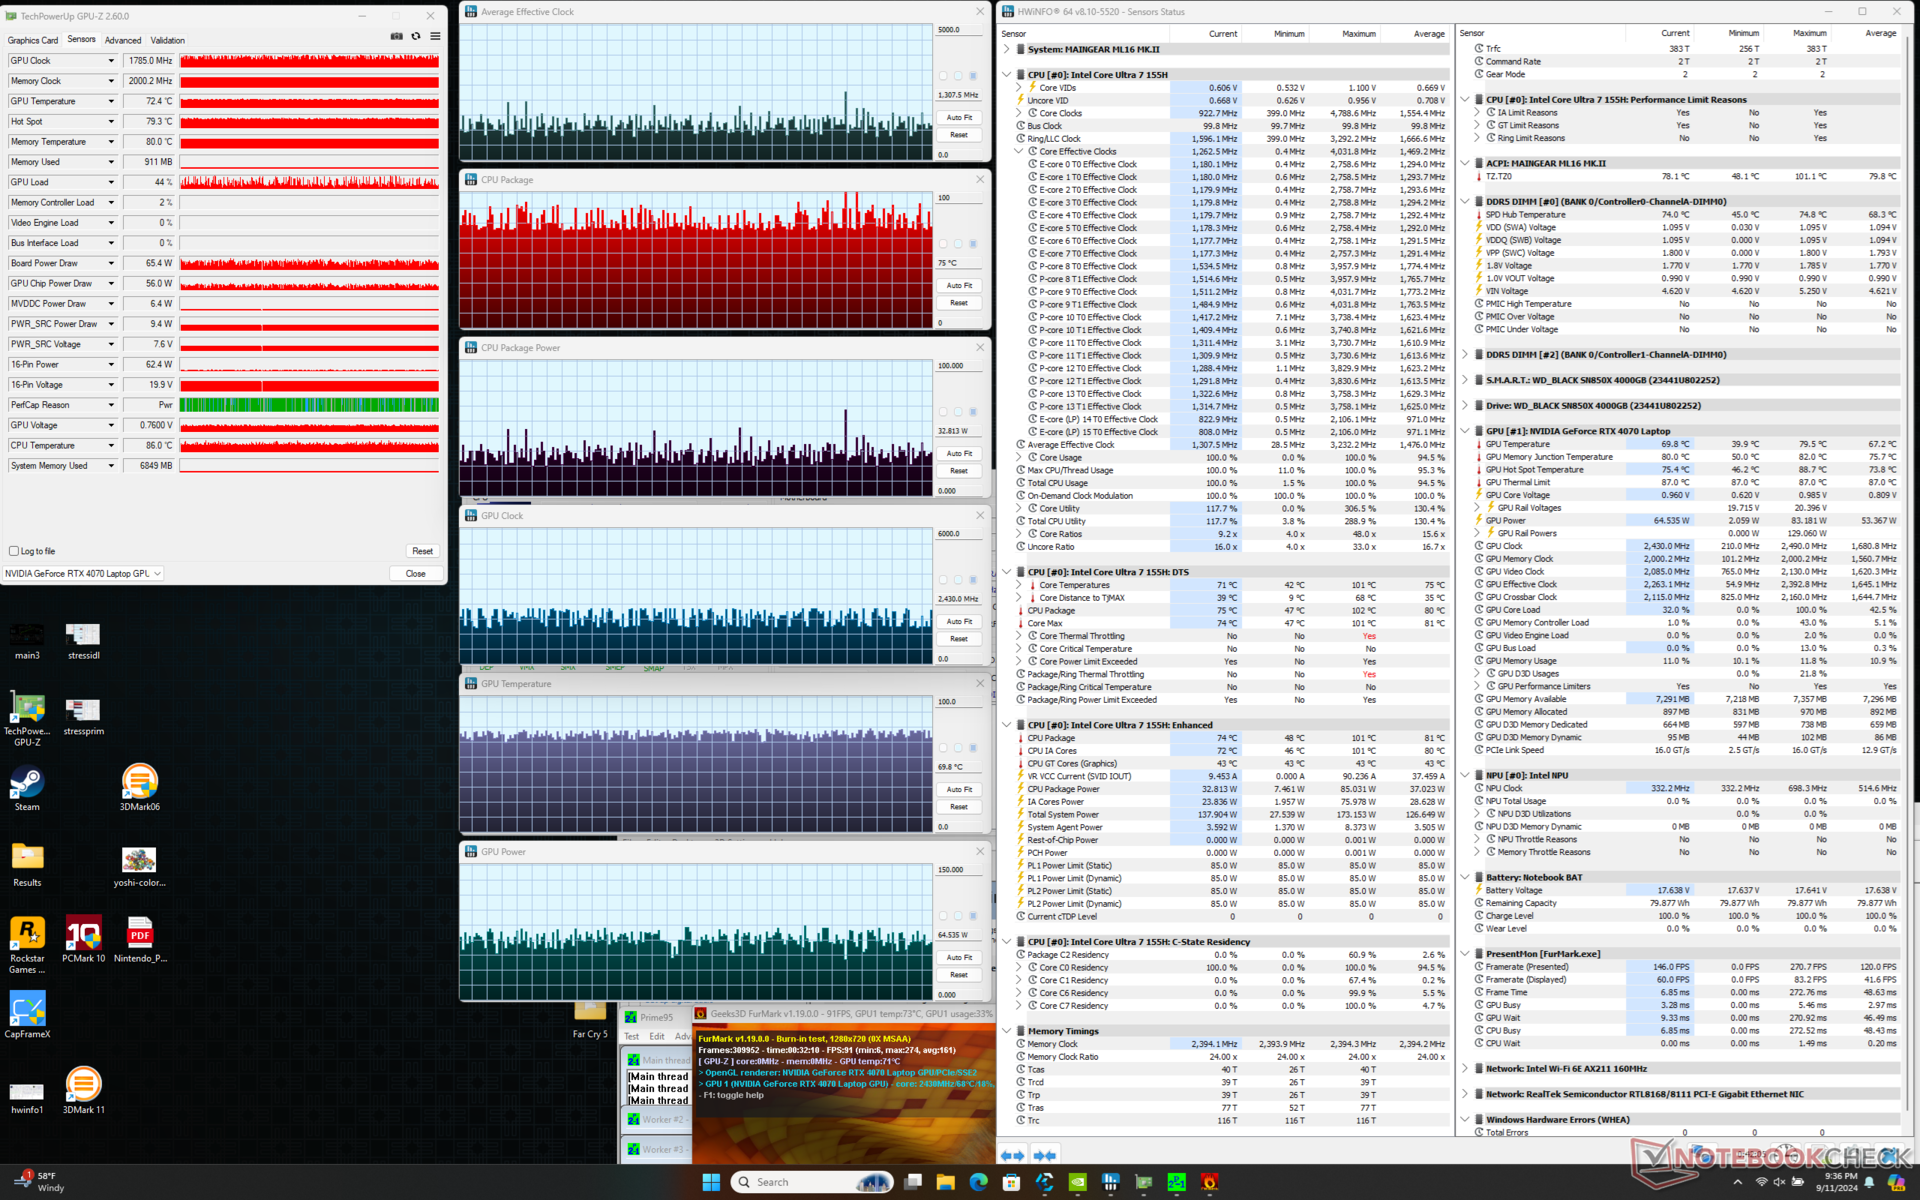
| Prime95 + FurMark Stress | 1.1 - 1.4 | ~1785 | 75 - 95 | ~70 |
| Cyberpunk 2077 Stress (mode équilibré) | 1.2 | 2010 | 79 | 80 |
| Cyberpunk 2077 Stress (mode Performance avec ventilateur Max désactivé) | 1.4 | 2160 | 101 | 85 |
| Cyberpunk 2077 Stress (mode performance avec ventilateur maximal activé) | 1.5 | 2055 | 98 | 82 |
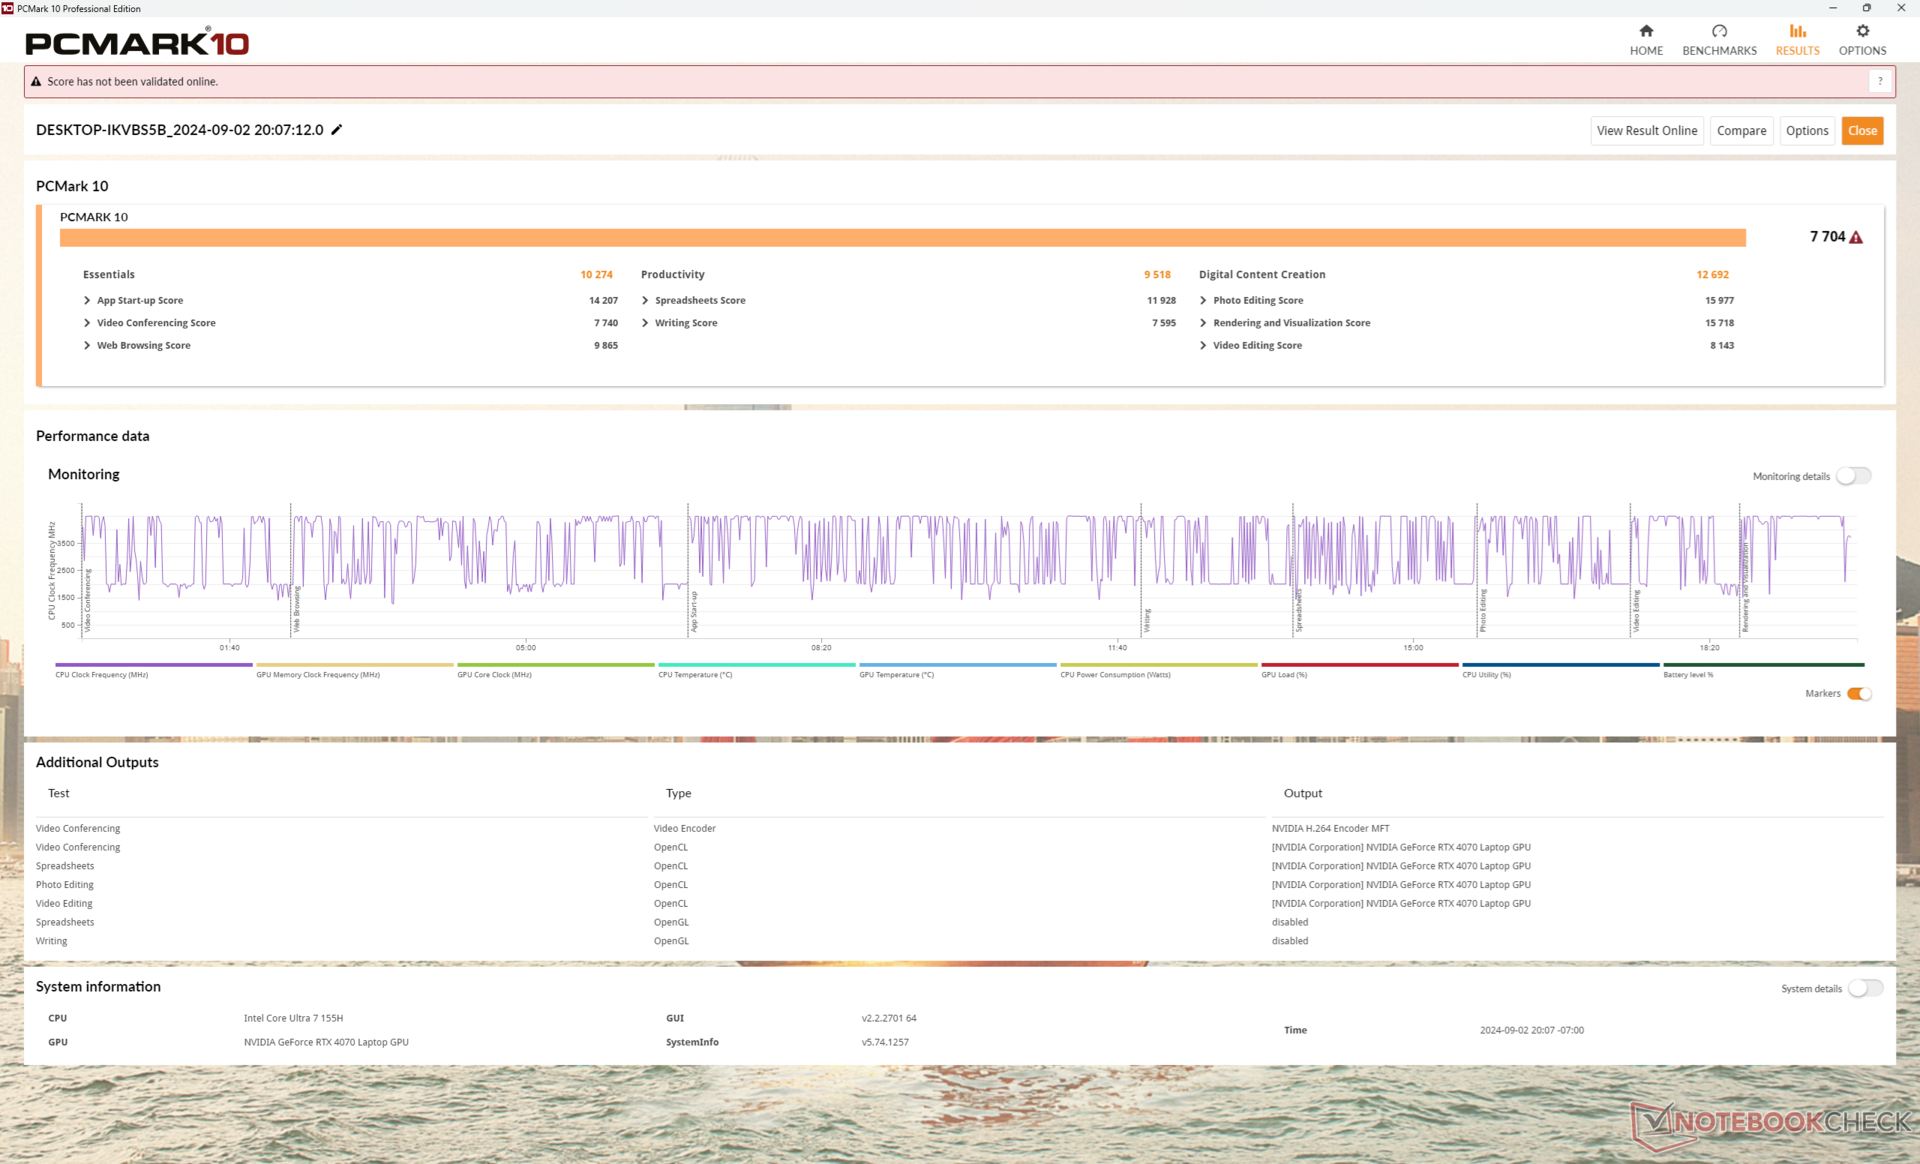
Performance du système
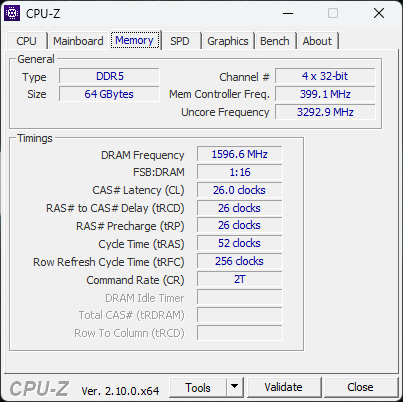
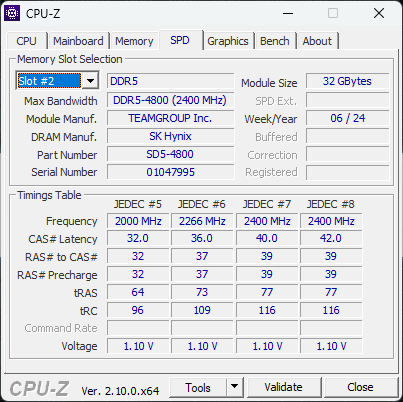
Les scores PCMark sont comparables à ceux de machines concurrentes telles que la HP Victus 16 ou l'Asus ROG Zephyrus G16 Asus ROG Zephyrus G16 ce qui montre que la plupart des tâches quotidiennes ne s'exécutent pas plus vite ou plus lentement sur le Maingear malgré les différences de spécifications. Cependant, les résultats CrossMark et AIDA64 pour la mémoire sont tous deux plus bas que prévu en raison des performances brutes comparativement plus faibles de notre CPU et de notre RAM DDR5-4800. Les concurrents comme le Blade 16 ou l'Alienware m16 R2 sont livrés avec de la DDR5-5600 ou de la LPDDR5-7467 plus rapide, respectivement.
CrossMark: Overall | Productivity | Creativity | Responsiveness
WebXPRT 3: Overall
WebXPRT 4: Overall
Mozilla Kraken 1.1: Total
| PCMark 10 / Score | |
| Lenovo Legion Pro 5 16IRX9 | |
| Razer Blade 16 2024, RTX 4090 | |
| Asus ROG Zephyrus G16 GA605WV | |
| Maingear ML-16 MK2 | |
| HP Victus 16 (2024) | |
| Moyenne Intel Core Ultra 7 155H, NVIDIA GeForce RTX 4070 Laptop GPU (7084 - 7761, n=4) | |
| Alienware x16 R2 P120F | |
| PCMark 10 / Essentials | |
| Lenovo Legion Pro 5 16IRX9 | |
| Razer Blade 16 2024, RTX 4090 | |
| HP Victus 16 (2024) | |
| Maingear ML-16 MK2 | |
| Moyenne Intel Core Ultra 7 155H, NVIDIA GeForce RTX 4070 Laptop GPU (10038 - 10393, n=4) | |
| Asus ROG Zephyrus G16 GA605WV | |
| Alienware x16 R2 P120F | |
| PCMark 10 / Productivity | |
| Razer Blade 16 2024, RTX 4090 | |
| Lenovo Legion Pro 5 16IRX9 | |
| Asus ROG Zephyrus G16 GA605WV | |
| HP Victus 16 (2024) | |
| Maingear ML-16 MK2 | |
| Moyenne Intel Core Ultra 7 155H, NVIDIA GeForce RTX 4070 Laptop GPU (9192 - 9518, n=4) | |
| Alienware x16 R2 P120F | |
| PCMark 10 / Digital Content Creation | |
| Lenovo Legion Pro 5 16IRX9 | |
| Asus ROG Zephyrus G16 GA605WV | |
| Razer Blade 16 2024, RTX 4090 | |
| Alienware x16 R2 P120F | |
| Maingear ML-16 MK2 | |
| Moyenne Intel Core Ultra 7 155H, NVIDIA GeForce RTX 4070 Laptop GPU (10100 - 13035, n=4) | |
| HP Victus 16 (2024) | |
| CrossMark / Overall | |
| Razer Blade 16 2024, RTX 4090 | |
| Lenovo Legion Pro 5 16IRX9 | |
| HP Victus 16 (2024) | |
| Asus ROG Zephyrus G16 GA605WV | |
| Moyenne Intel Core Ultra 7 155H, NVIDIA GeForce RTX 4070 Laptop GPU (1687 - 1848, n=4) | |
| Maingear ML-16 MK2 | |
| Alienware x16 R2 P120F | |
| CrossMark / Productivity | |
| Razer Blade 16 2024, RTX 4090 | |
| Lenovo Legion Pro 5 16IRX9 | |
| HP Victus 16 (2024) | |
| Moyenne Intel Core Ultra 7 155H, NVIDIA GeForce RTX 4070 Laptop GPU (1589 - 1750, n=4) | |
| Asus ROG Zephyrus G16 GA605WV | |
| Maingear ML-16 MK2 | |
| Alienware x16 R2 P120F | |
| CrossMark / Creativity | |
| Razer Blade 16 2024, RTX 4090 | |
| Lenovo Legion Pro 5 16IRX9 | |
| Asus ROG Zephyrus G16 GA605WV | |
| HP Victus 16 (2024) | |
| Moyenne Intel Core Ultra 7 155H, NVIDIA GeForce RTX 4070 Laptop GPU (1860 - 2014, n=4) | |
| Maingear ML-16 MK2 | |
| Alienware x16 R2 P120F | |
| CrossMark / Responsiveness | |
| Razer Blade 16 2024, RTX 4090 | |
| HP Victus 16 (2024) | |
| Lenovo Legion Pro 5 16IRX9 | |
| Alienware x16 R2 P120F | |
| Moyenne Intel Core Ultra 7 155H, NVIDIA GeForce RTX 4070 Laptop GPU (1424 - 1683, n=4) | |
| Maingear ML-16 MK2 | |
| Asus ROG Zephyrus G16 GA605WV | |
| WebXPRT 3 / Overall | |
| Razer Blade 16 2024, RTX 4090 | |
| Lenovo Legion Pro 5 16IRX9 | |
| Moyenne Intel Core Ultra 7 155H, NVIDIA GeForce RTX 4070 Laptop GPU (264 - 294, n=4) | |
| HP Victus 16 (2024) | |
| Maingear ML-16 MK2 | |
| Alienware x16 R2 P120F | |
| WebXPRT 4 / Overall | |
| Lenovo Legion Pro 5 16IRX9 | |
| Asus ROG Zephyrus G16 GA605WV | |
| Moyenne Intel Core Ultra 7 155H, NVIDIA GeForce RTX 4070 Laptop GPU (247 - 257, n=4) | |
| HP Victus 16 (2024) | |
| Maingear ML-16 MK2 | |
| Alienware x16 R2 P120F | |
| Mozilla Kraken 1.1 / Total | |
| Alienware x16 R2 P120F | |
| Maingear ML-16 MK2 | |
| Moyenne Intel Core Ultra 7 155H, NVIDIA GeForce RTX 4070 Laptop GPU (546 - 568, n=3) | |
| HP Victus 16 (2024) | |
| Razer Blade 16 2024, RTX 4090 | |
| Lenovo Legion Pro 5 16IRX9 | |
| Asus ROG Zephyrus G16 GA605WV | |
* ... Moindre est la valeur, meilleures sont les performances
| PCMark 10 Score | 7704 points | |
Aide | ||
| AIDA64 / Memory Copy | |
| Alienware x16 R2 P120F | |
| Asus ROG Zephyrus G16 GA605WV | |
| Moyenne Intel Core Ultra 7 155H (62397 - 96791, n=50) | |
| Lenovo Legion Pro 5 16IRX9 | |
| Razer Blade 16 2024, RTX 4090 | |
| HP Victus 16 (2024) | |
| Maingear ML-16 MK2 | |
| AIDA64 / Memory Read | |
| Asus ROG Zephyrus G16 GA605WV | |
| Razer Blade 16 2024, RTX 4090 | |
| Lenovo Legion Pro 5 16IRX9 | |
| Alienware x16 R2 P120F | |
| HP Victus 16 (2024) | |
| Moyenne Intel Core Ultra 7 155H (60544 - 90647, n=50) | |
| Maingear ML-16 MK2 | |
| AIDA64 / Memory Write | |
| Asus ROG Zephyrus G16 GA605WV | |
| Lenovo Legion Pro 5 16IRX9 | |
| Razer Blade 16 2024, RTX 4090 | |
| Alienware x16 R2 P120F | |
| Moyenne Intel Core Ultra 7 155H (58692 - 93451, n=50) | |
| HP Victus 16 (2024) | |
| Maingear ML-16 MK2 | |
| AIDA64 / Memory Latency | |
| Maingear ML-16 MK2 | |
| Moyenne Intel Core Ultra 7 155H (116.2 - 233, n=50) | |
| Alienware x16 R2 P120F | |
| Asus ROG Zephyrus G16 GA605WV | |
| HP Victus 16 (2024) | |
| Razer Blade 16 2024, RTX 4090 | |
| Lenovo Legion Pro 5 16IRX9 | |
* ... Moindre est la valeur, meilleures sont les performances
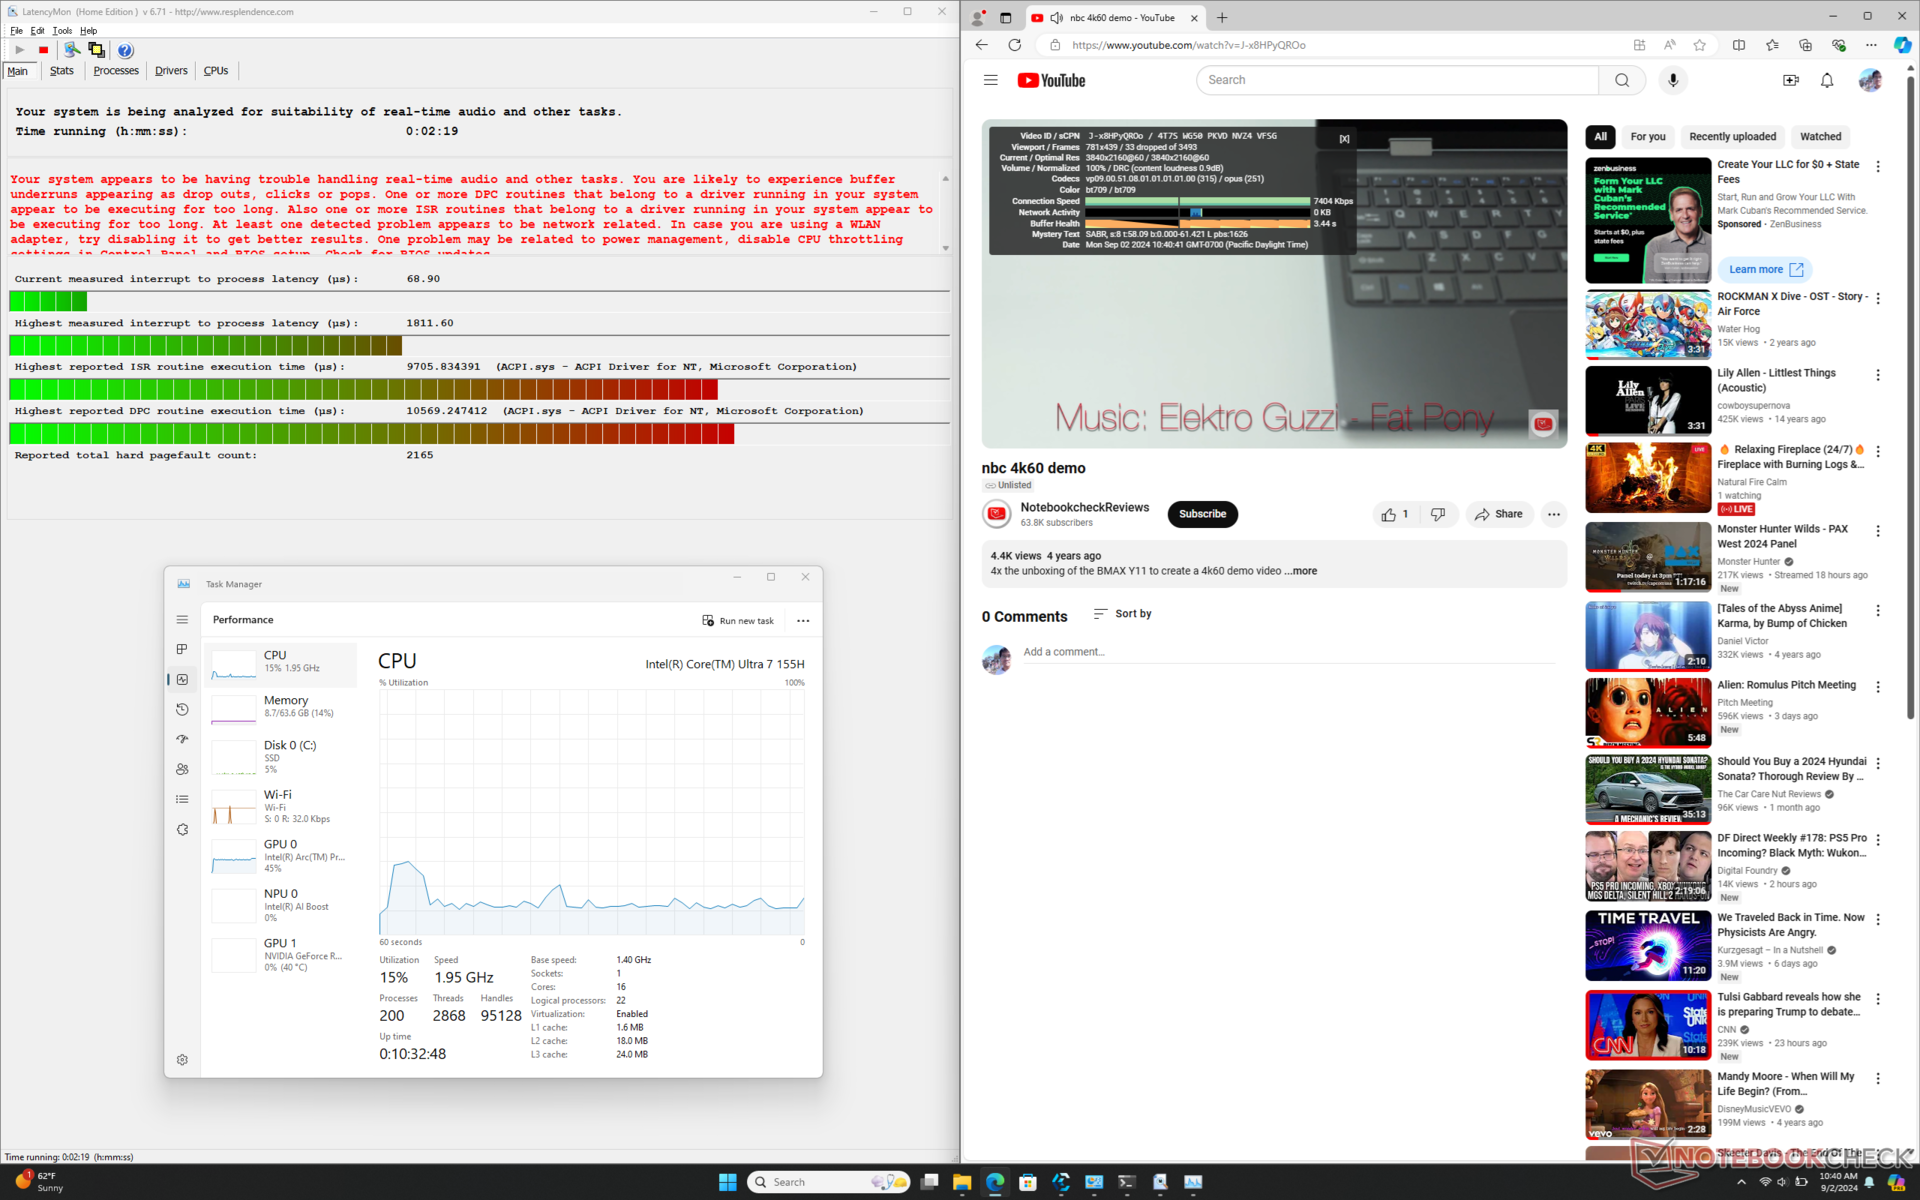
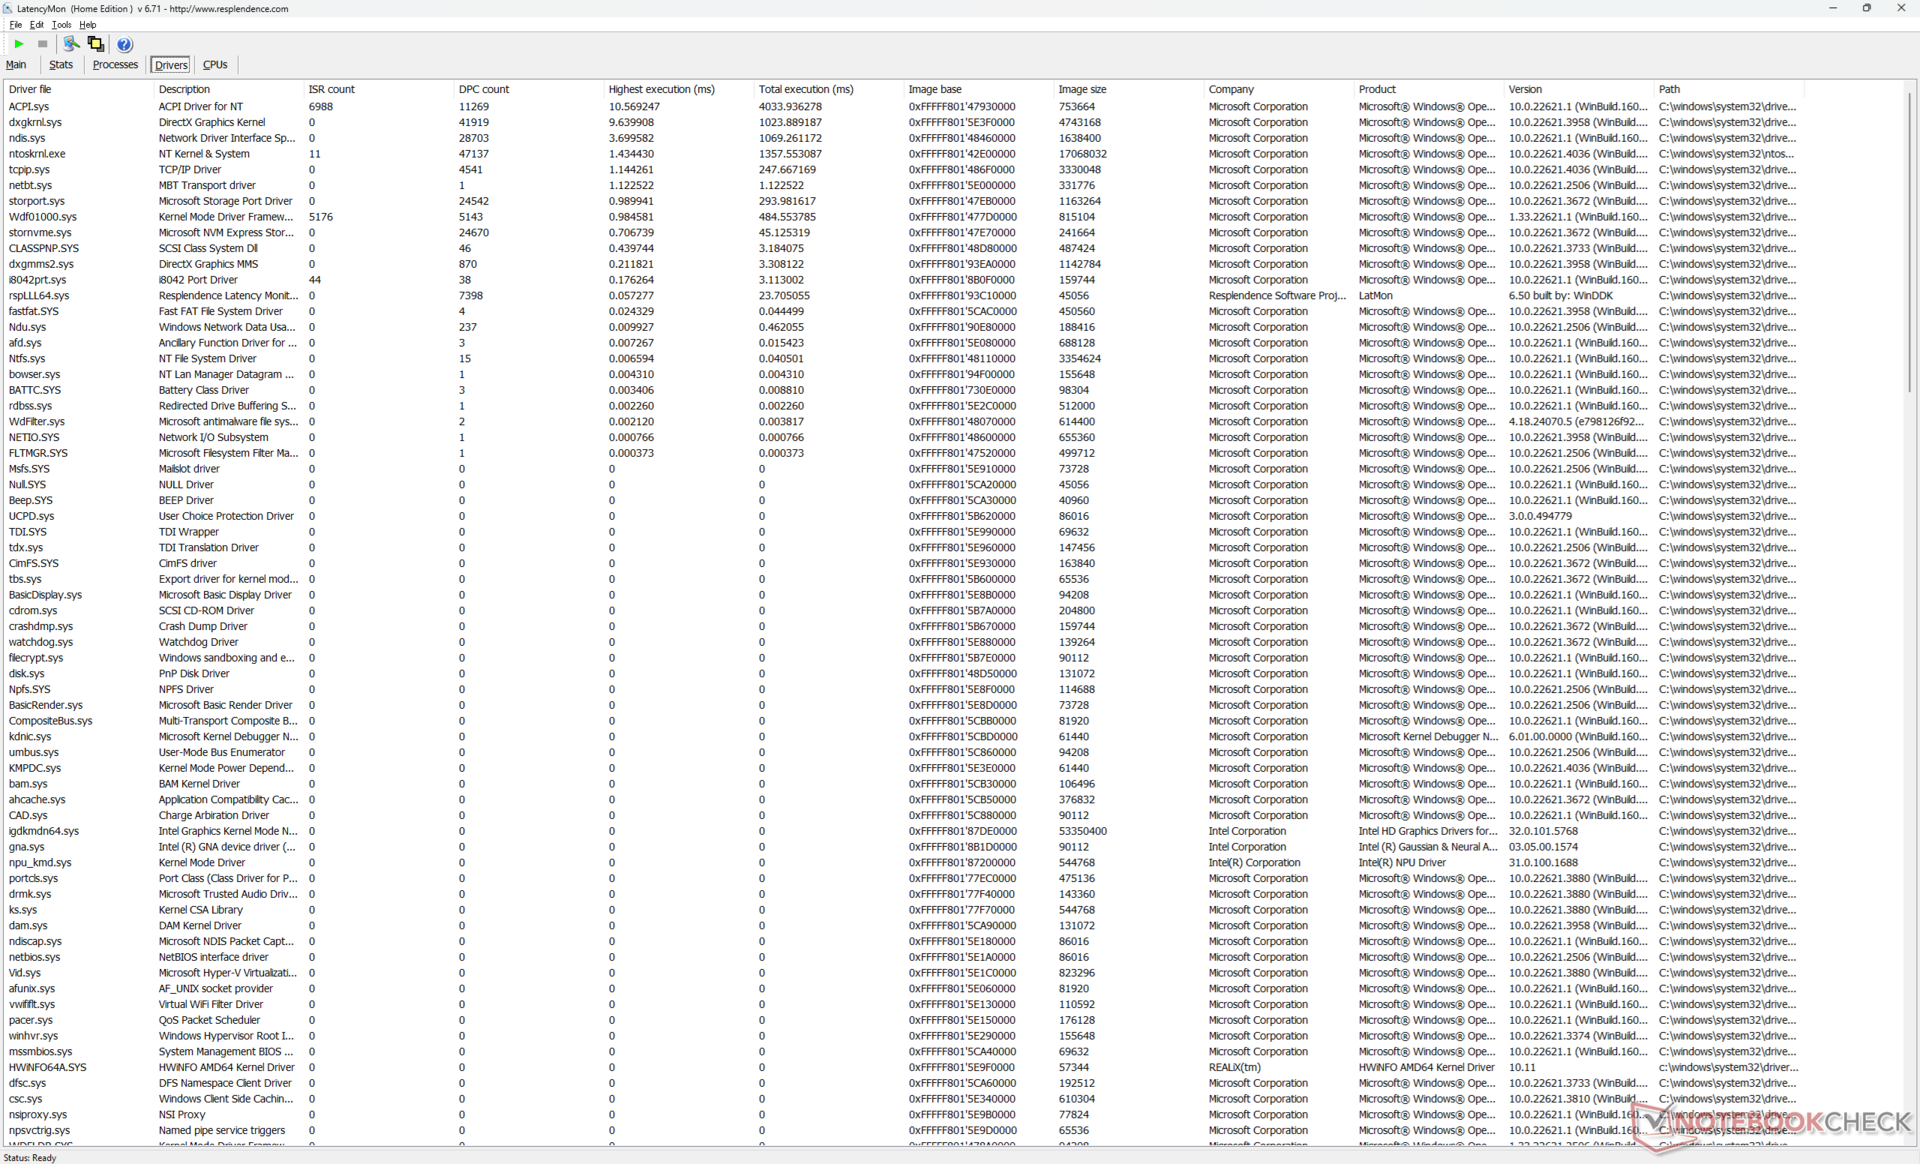
Latence DPC
LatencyMon révèle des problèmes de DPC plus importants que prévu liés aux pilotes ACPI, même en mode MSHybrid. De plus, nous avons pu enregistrer 33 images perdues pendant une vidéo de test 4K60 de 60 secondes, alors qu'il ne devrait y en avoir aucune, surtout si l'on considère le processeur Meteor Lake-H. Ces images perdues se manifestent sous la forme de bégaiements lors de la diffusion de vidéos 4K. Ces images perdues se manifestent par des bégaiements lors de la diffusion de vidéos 4K et suggèrent un problème de pilote sous-jacent ou une mauvaise gestion des activités d'arrière-plan qui peuvent interrompre la fenêtre principale.
| DPC Latencies / LatencyMon - interrupt to process latency (max), Web, Youtube, Prime95 | |
| Alienware x16 R2 P120F | |
| Maingear ML-16 MK2 | |
| Razer Blade 16 2024, RTX 4090 | |
| Lenovo Legion Pro 5 16IRX9 | |
| HP Victus 16 (2024) | |
| Asus ROG Zephyrus G16 GA605WV | |
* ... Moindre est la valeur, meilleures sont les performances
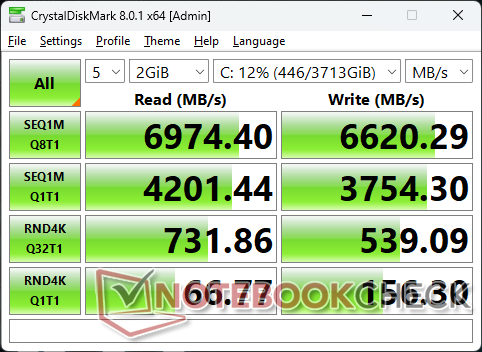
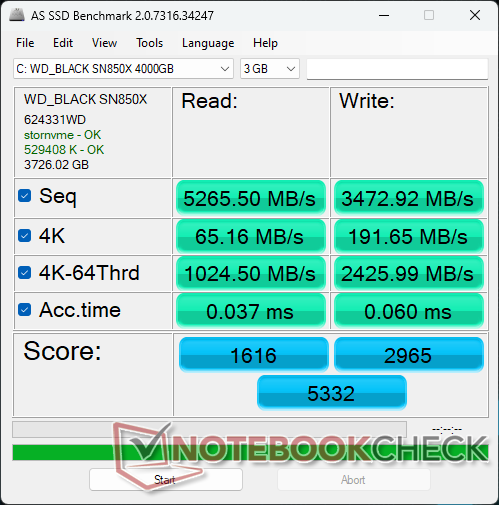
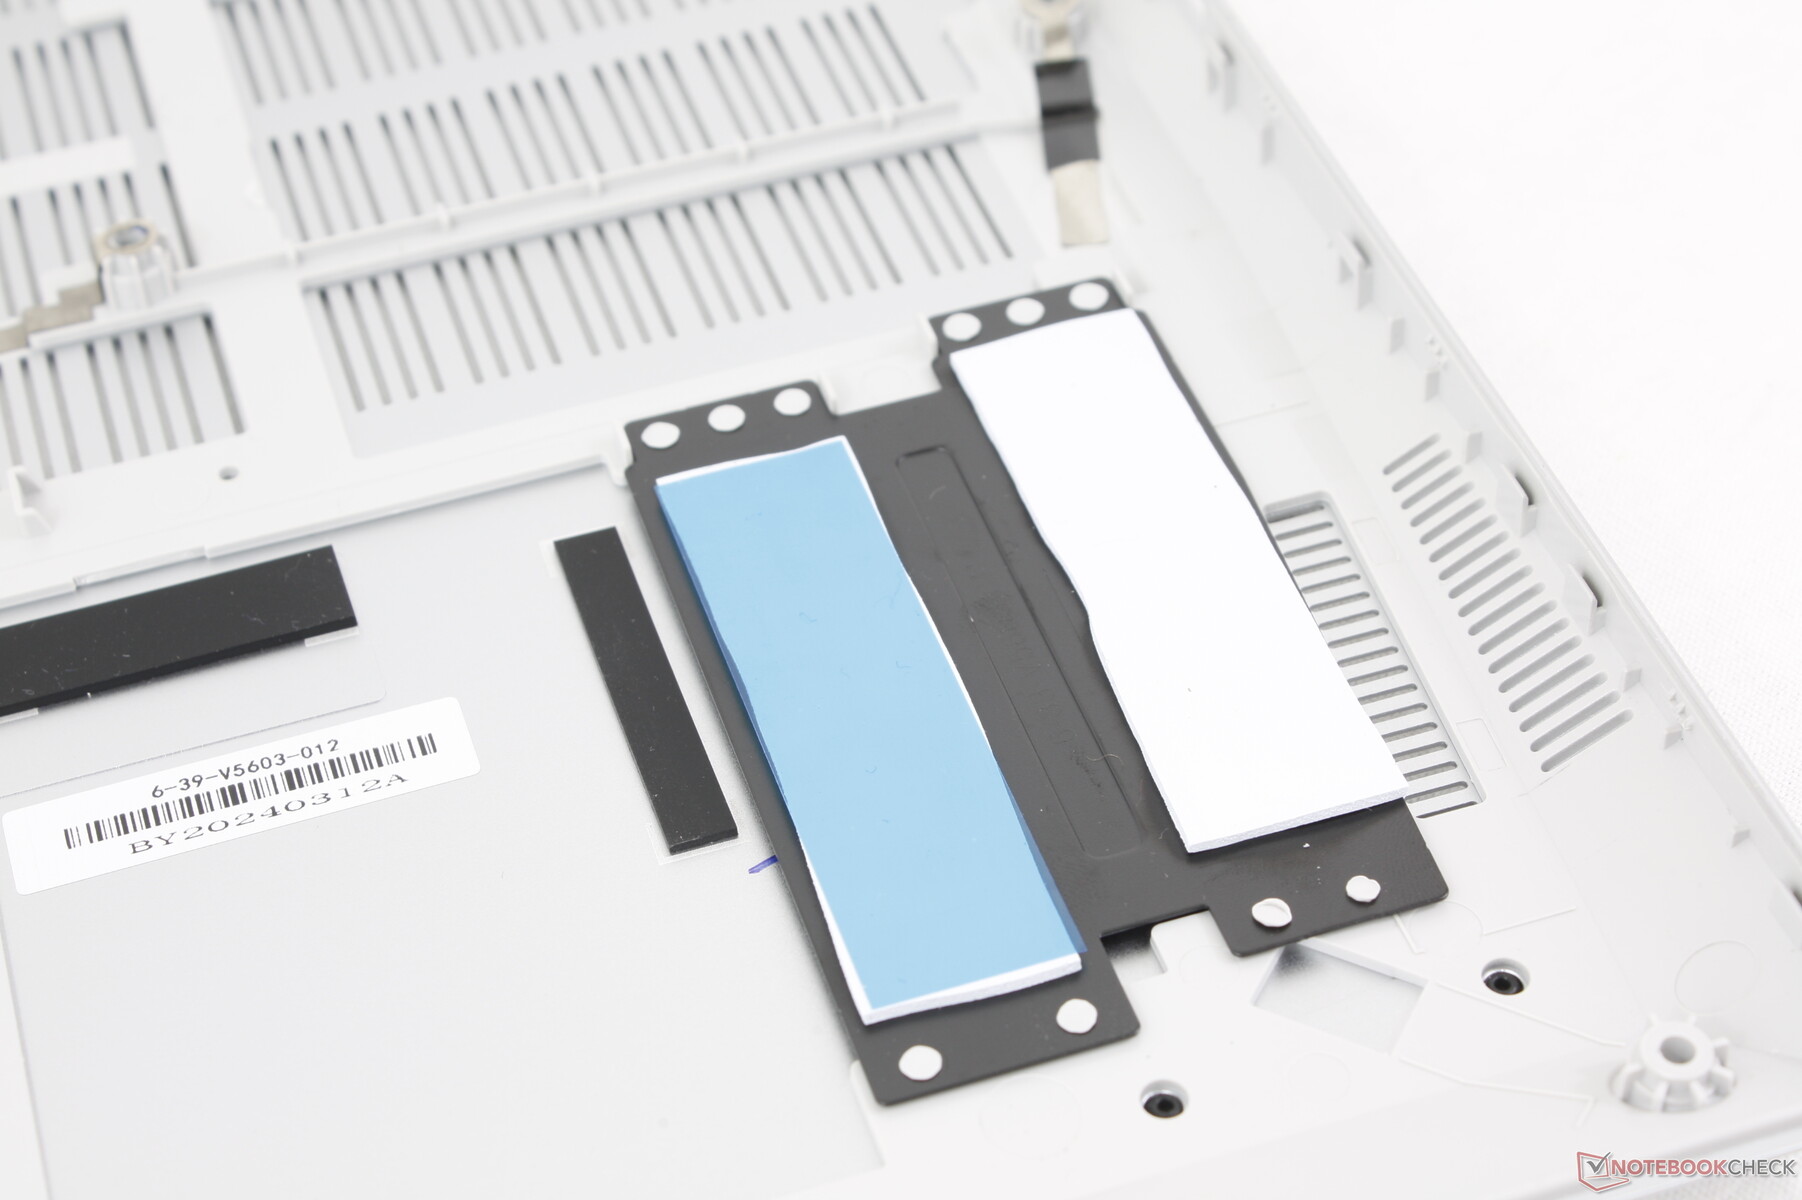
Dispositifs de stockage
Le Maingear est l'un des rares systèmes à être livré avec 4 To WD Black SN850X PCIe4 x4 NVMe. Les taux de transfert sont excellents, à près de 7000 Mo/s, et aucun ralentissement n'est détecté lorsqu'ils sont sollicités. Nous apprécions le fait que le dissipateur thermique et les coussinets thermiques soient fournis en standard pour aider à dissiper la chaleur.

| Drive Performance Rating - Percent | |
| Lenovo Legion Pro 5 16IRX9 | |
| Alienware x16 R2 P120F | |
| Razer Blade 16 2024, RTX 4090 | |
| HP Victus 16 (2024) | |
| Maingear ML-16 MK2 | |
| Asus ROG Zephyrus G16 GA605WV | |
* ... Moindre est la valeur, meilleures sont les performances
Disk Throttling: DiskSpd Read Loop, Queue Depth 8
Performance du GPU
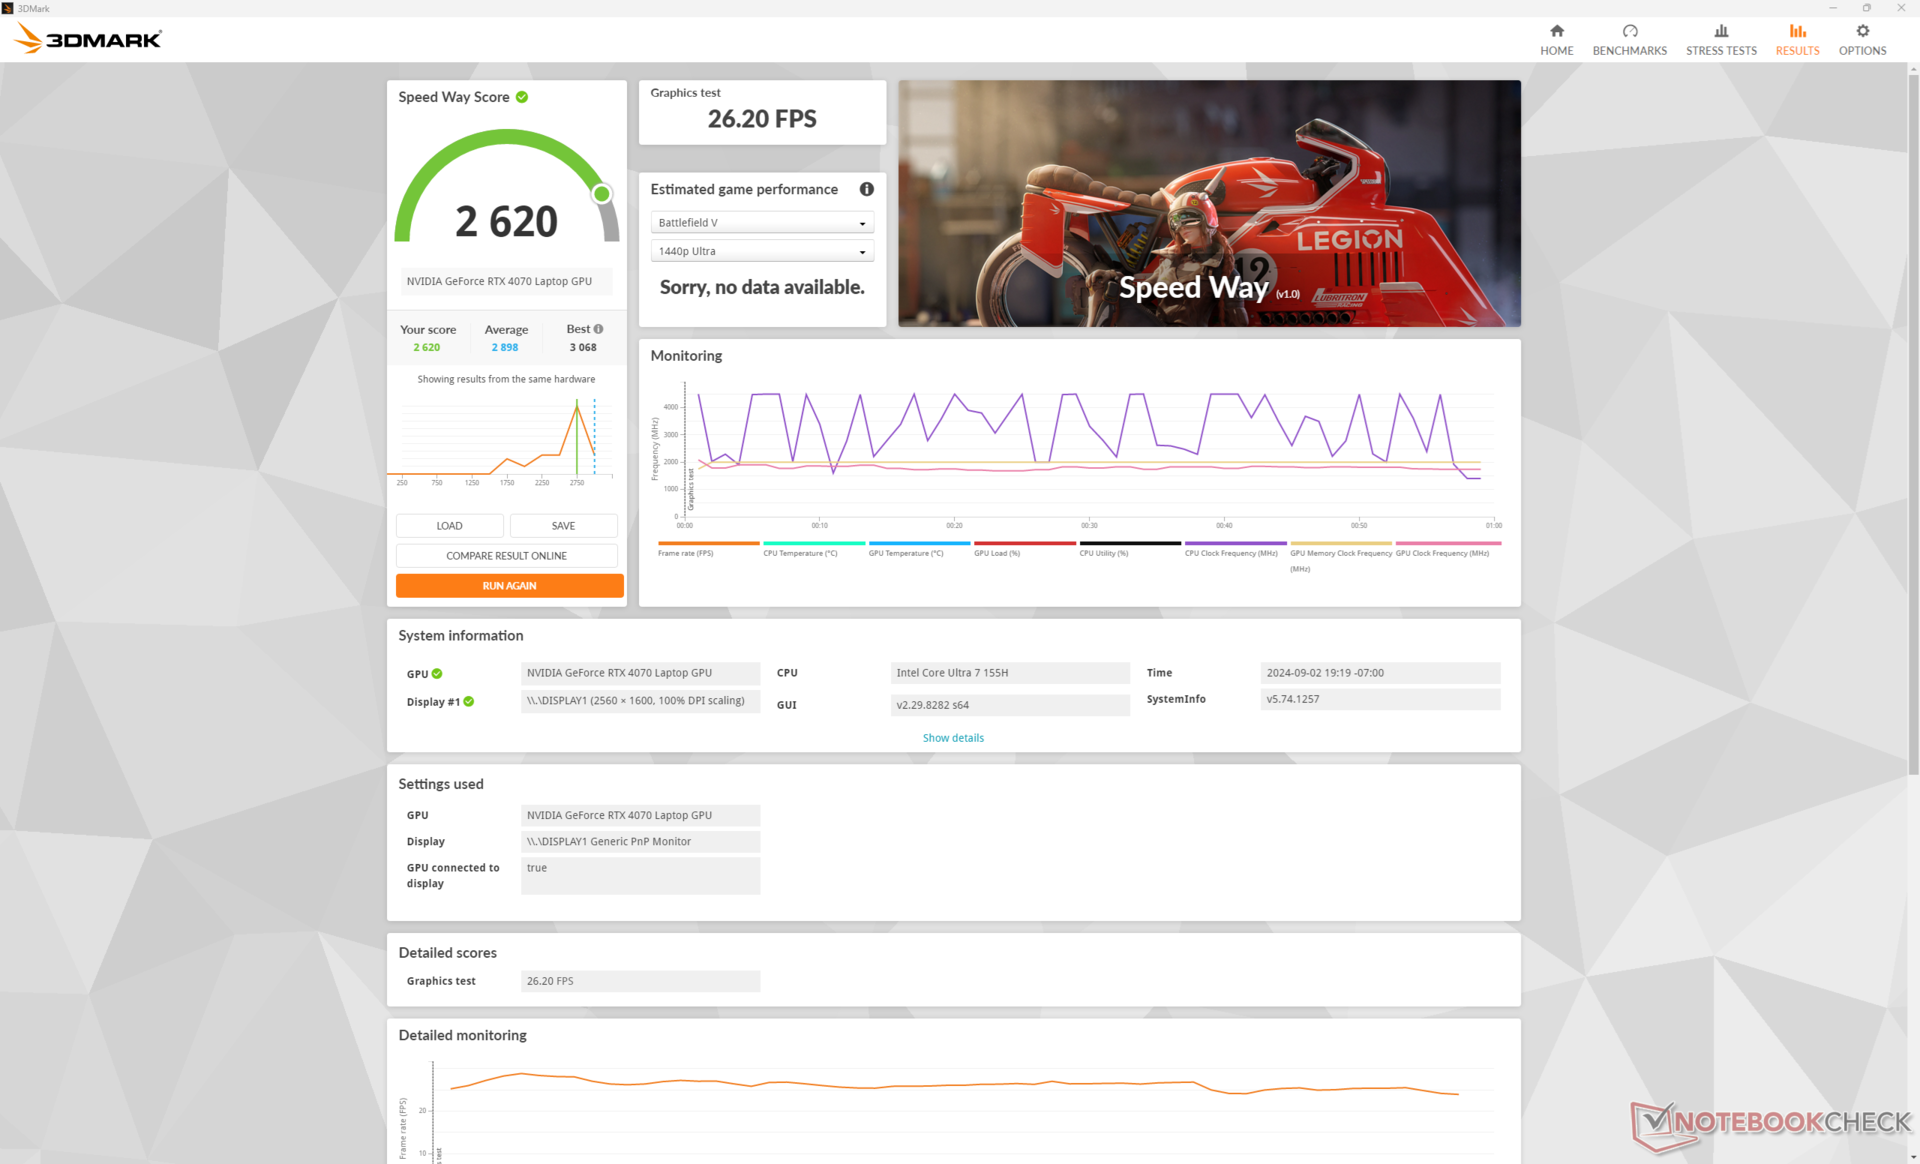
La carte mobile GeForce RTX 4070 est quelques points de pourcentage plus lente que la moyenne des ordinateurs portables de notre base de données ordinateur portable moyen de notre base de données avec la même option GPU. La performance globale n'est que de 5 à 15 % supérieure à celle du modèle de base RTX 4060 de base, ou environ 15 % de plus que l'ancienne RTX 3070 Ti. L'écart se creuse davantage lorsque l'on compare la RTX 4070 mobile à la rTX 4080 mobilemais cette dernière n'est pas configurable sur ce modèle.
Gardez à l'esprit que la RTX 4070 mobile est beaucoup plus lente que sa homologue de bureau d'environ 35 à 40 %.
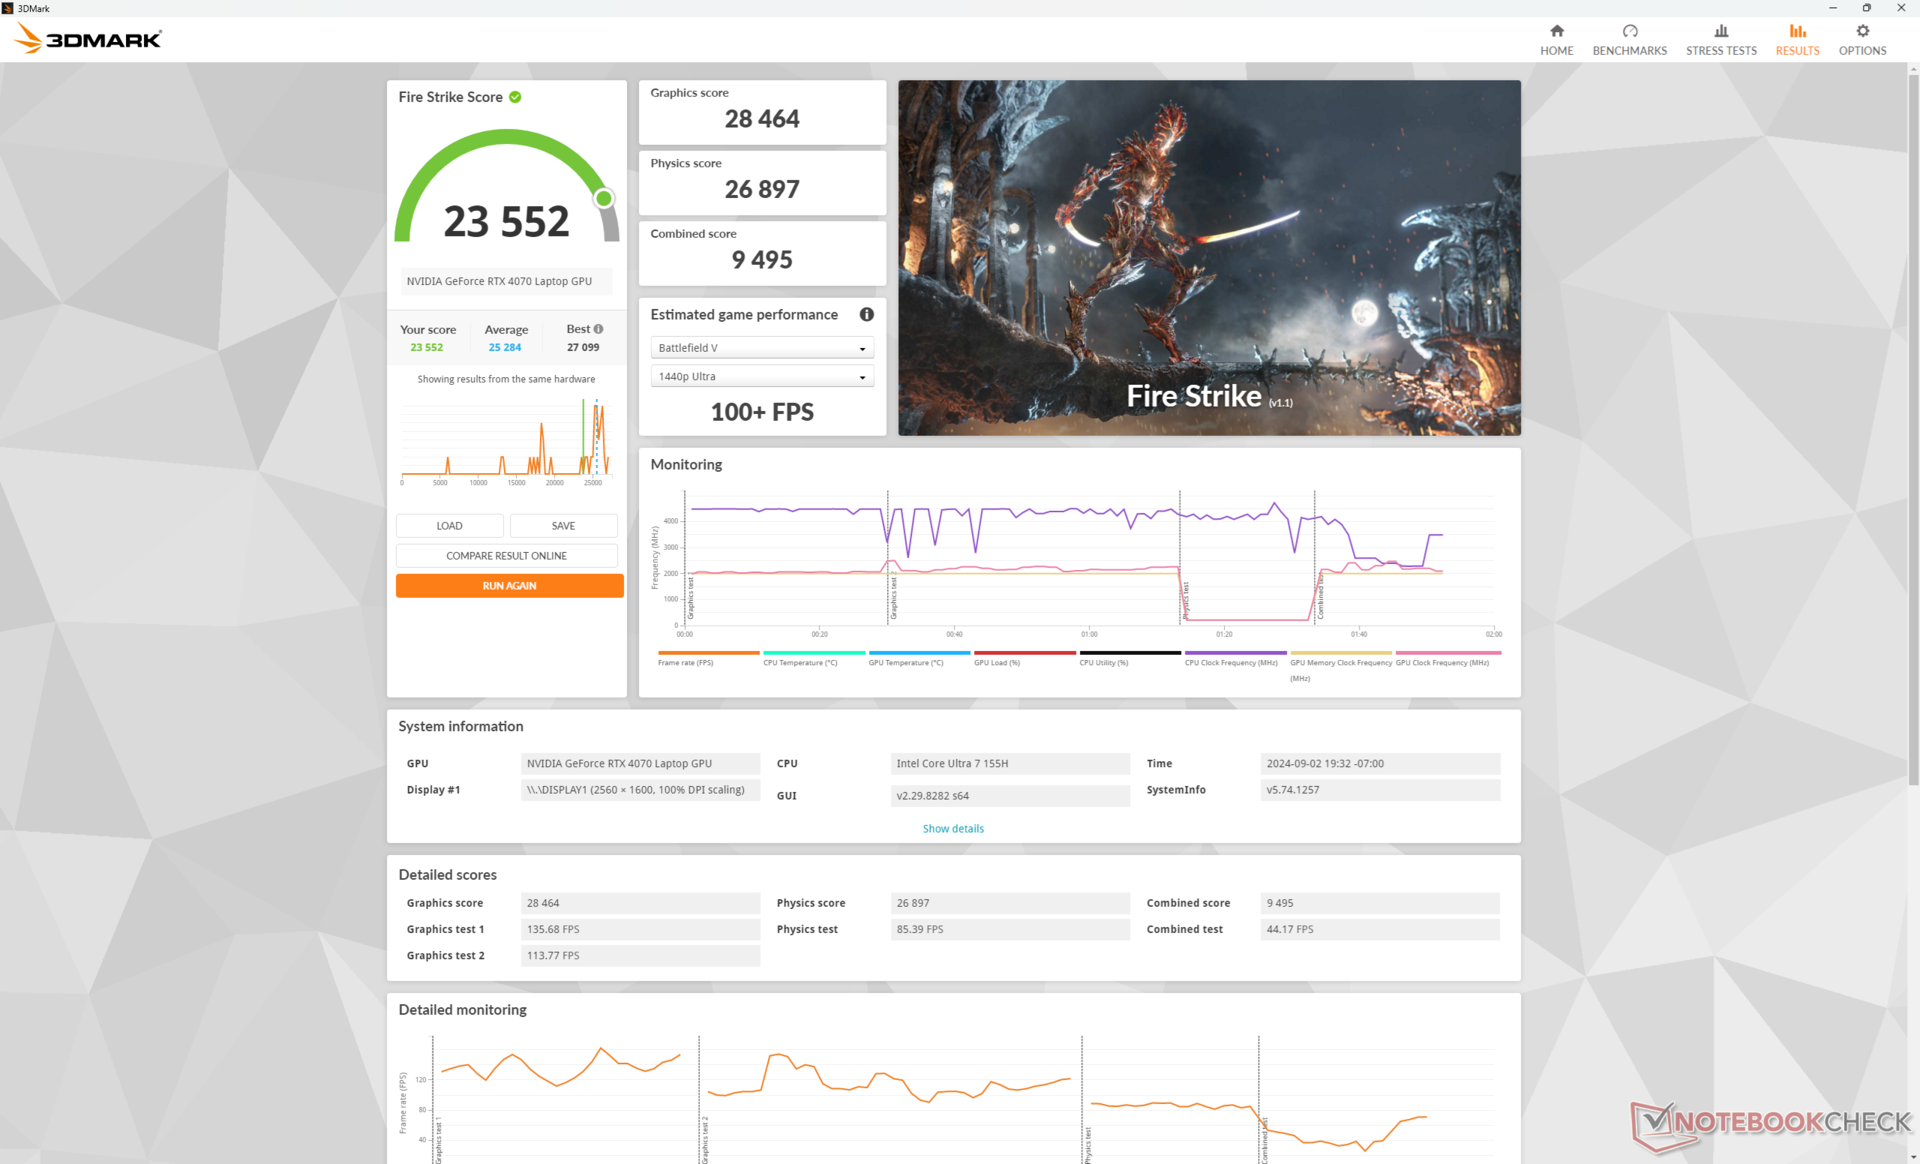
| Profil de puissance | Score graphique | Score physique | Score combiné |
| Mode performance | 28464 | 26897 | 9495 |
| Mode équilibré | 28238 (-0%) | 16060 (-40%) | 8049 (-15%) |
| Alimentation par batterie | 5539 (-81%) | 12186 (-55%) | 1715 (-82%) |
L'exécution en mode équilibré au lieu du mode performance a un impact significatif sur les performances du processeur, tandis que les performances graphiques ne sont pas affectées selon notre tableau de résultats Fire Strike ci-dessus. Cela correspond à nos observations dans la section Test de stress ci-dessus. L'utilisation de la batterie a un impact supplémentaire sur les performances globales, même en mode Performance.
| 3DMark Performance Rating - Percent | |
| Razer Blade 16 2024, RTX 4090 -1! | |
| KFA2 GeForce RTX 4070 EX Gamer | |
| Alienware x16 R2 P120F | |
| Lenovo Yoga Pro 9 16IMH9 -1! | |
| Moyenne NVIDIA GeForce RTX 4070 Laptop GPU | |
| Maingear ML-16 MK2 | |
| HP Victus 16 (2024) -1! | |
| HP Omen 16-b0085ng -1! | |
| CSL GameStar Notebook VenomGamer G16 -1! | |
| Asus ROG Zephyrus M16 GU603Z -1! | |
| Asus TUF Gaming A16 FA617XS | |
| HP Victus 16-r0076TX | |
| HP Omen 16-n0033dx | |
| Acer Nitro 16 AN16-41-R7YE | |
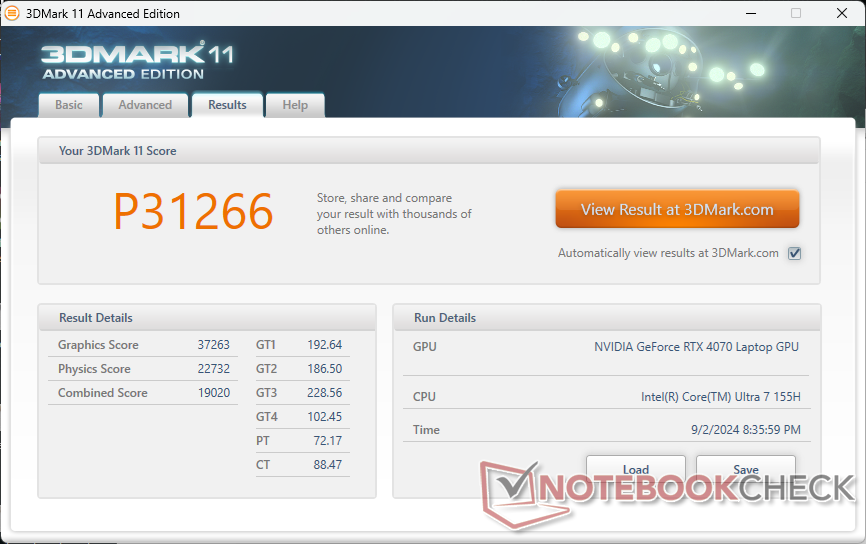
| Lenovo Legion C7 15IMH05 82EH0030GE -1! | |
| 3DMark 11 Performance | 31266 points | |
| 3DMark Cloud Gate Standard Score | 57717 points | |
| 3DMark Fire Strike Score | 23552 points | |
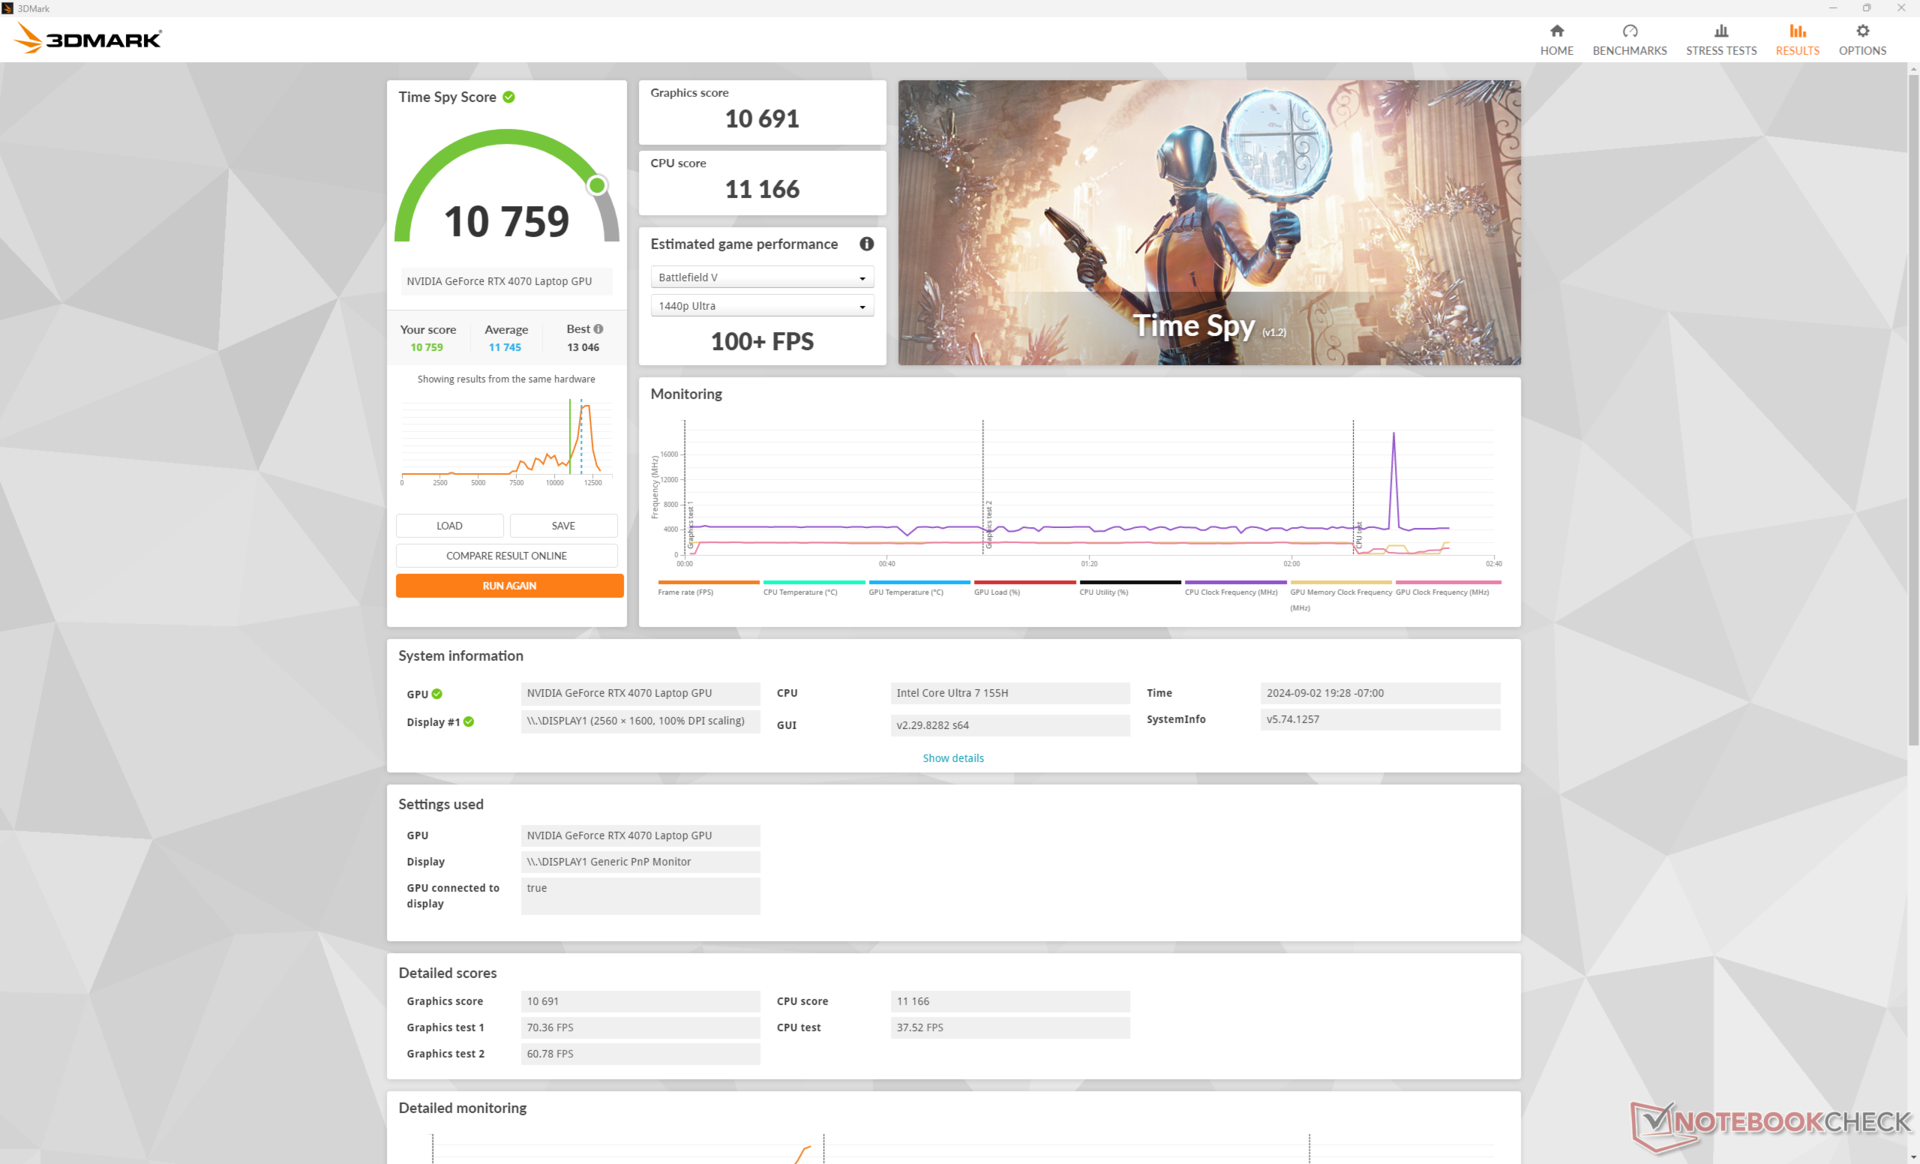
| 3DMark Time Spy Score | 10759 points | |
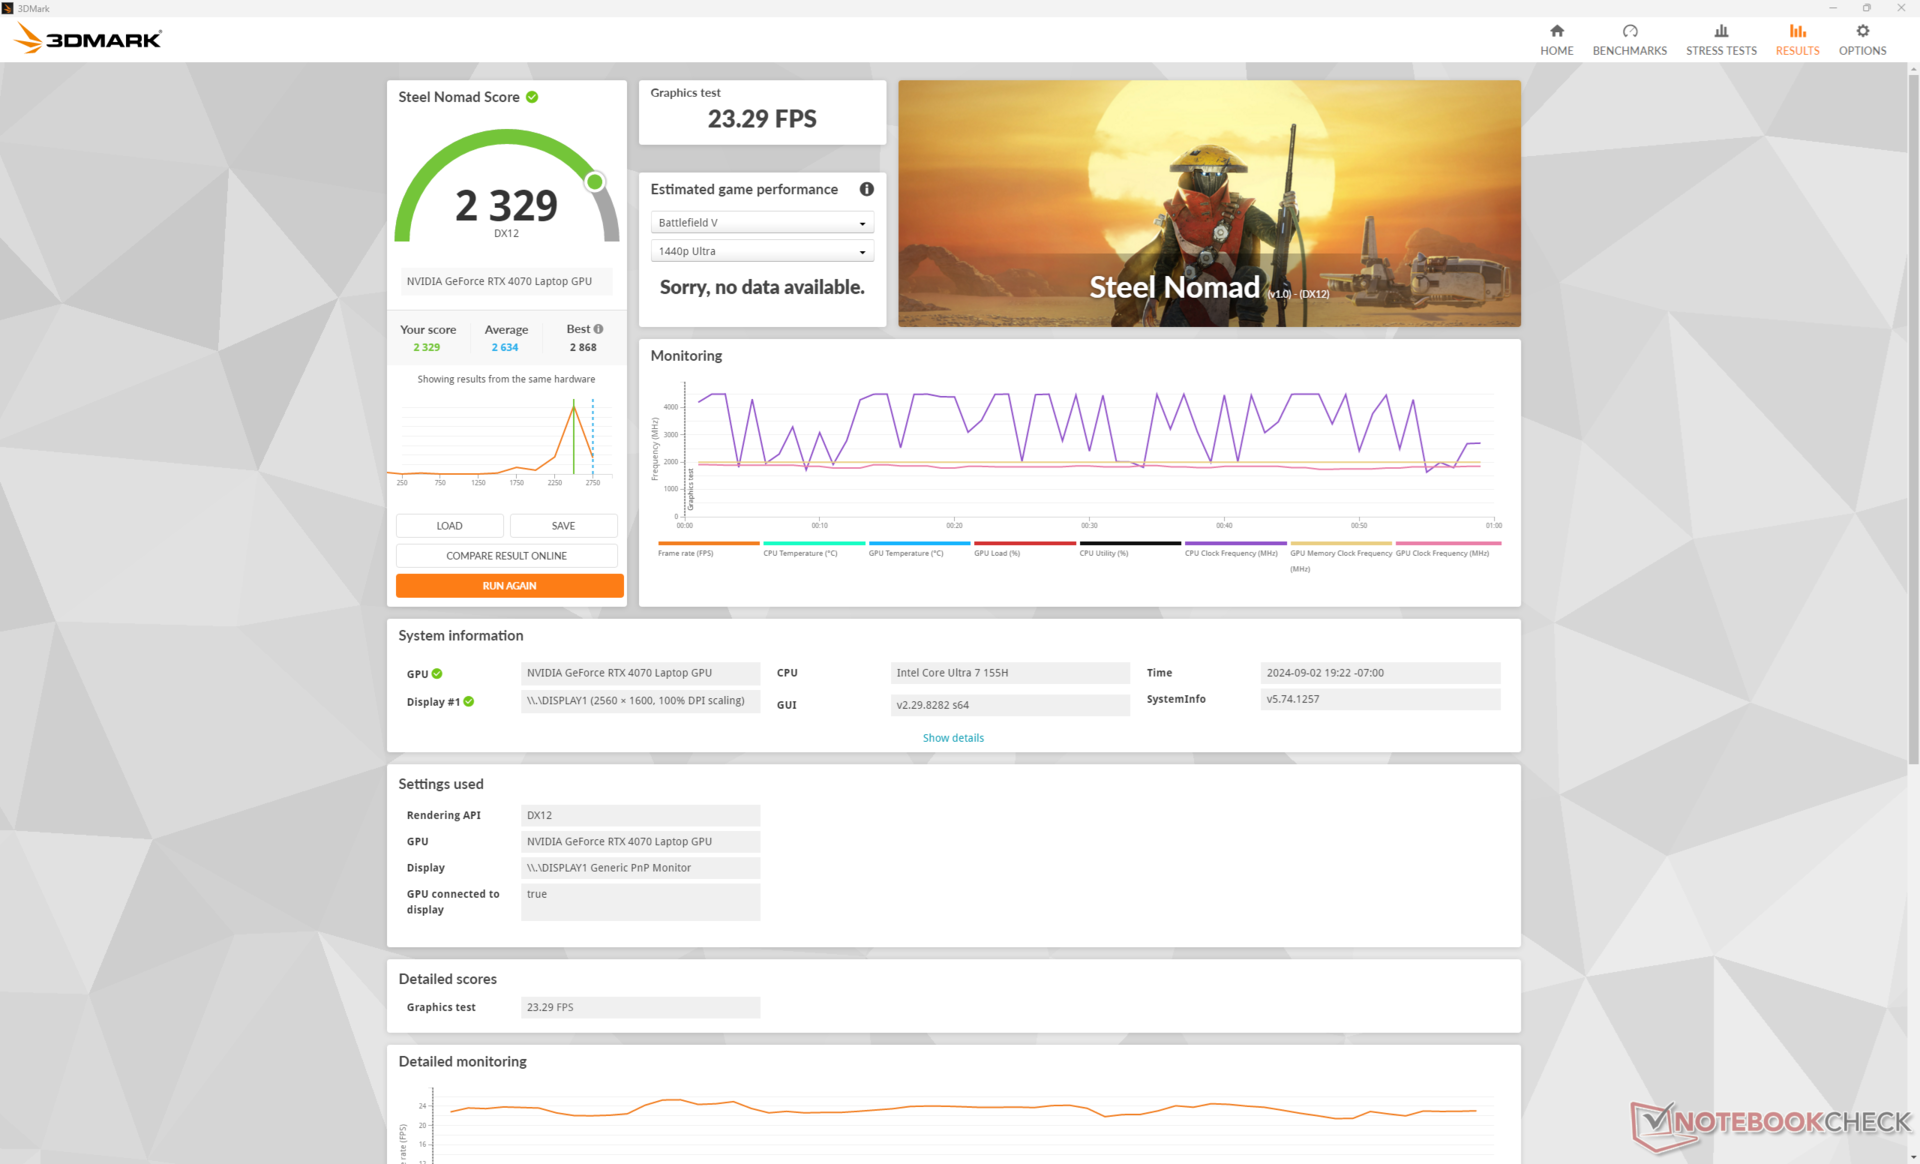
| 3DMark Steel Nomad Score | 2329 points | |
Aide | ||
* ... Moindre est la valeur, meilleures sont les performances
Performances des jeux
La RTX 4070 mobile est suffisamment puissante pour faire tourner des titres modernes avec les paramètres maximums à la résolution native QHD+. Des titres plus exigeants comme Cyberpunk 2077 sont également possibles, bien qu'il faille utiliser DLSS pour atteindre 60 FPS ou plus. L'exécution du benchmark du jeu avec les paramètres Ultra RT et la résolution native de 1600p, par exemple, donnerait un taux de rafraîchissement moyen de seulement 20,2 contre 63,1 avec DLSS 3 Balanced activé.
| Performance Rating - Percent | |
| Razer Blade 16 2024, RTX 4090 | |
| Lenovo Legion Pro 5 16IRX9 | |
| Alienware x16 R2 P120F -1! | |
| Maingear ML-16 MK2 | |
| HP Victus 16 (2024) -1! | |
| Asus ROG Zephyrus G16 GA605WV | |
| GTA V - 1920x1080 Highest Settings possible AA:4xMSAA + FX AF:16x | |
| Razer Blade 16 2024, RTX 4090 | |
| Lenovo Legion Pro 5 16IRX9 | |
| Maingear ML-16 MK2 | |
| HP Victus 16 (2024) | |
| Asus ROG Zephyrus G16 GA605WV | |
| Final Fantasy XV Benchmark - 1920x1080 High Quality | |
| Alienware x16 R2 P120F | |
| Razer Blade 16 2024, RTX 4090 | |
| Lenovo Legion Pro 5 16IRX9 | |
| Maingear ML-16 MK2 | |
| HP Victus 16 (2024) | |
| Asus ROG Zephyrus G16 GA605WV | |
| Strange Brigade - 1920x1080 ultra AA:ultra AF:16 | |
| Razer Blade 16 2024, RTX 4090 | |
| Alienware x16 R2 P120F | |
| Lenovo Legion Pro 5 16IRX9 | |
| Maingear ML-16 MK2 | |
| HP Victus 16 (2024) | |
| Asus ROG Zephyrus G16 GA605WV | |
| Dota 2 Reborn - 1920x1080 ultra (3/3) best looking | |
| Razer Blade 16 2024, RTX 4090 | |
| Lenovo Legion Pro 5 16IRX9 | |
| HP Victus 16 (2024) | |
| Asus ROG Zephyrus G16 GA605WV | |
| Maingear ML-16 MK2 | |
| Alienware x16 R2 P120F | |
| X-Plane 11.11 - 1920x1080 high (fps_test=3) | |
| Razer Blade 16 2024, RTX 4090 | |
| Lenovo Legion Pro 5 16IRX9 | |
| HP Victus 16 (2024) | |
| Maingear ML-16 MK2 | |
| Alienware x16 R2 P120F | |
| Asus ROG Zephyrus G16 GA605WV | |
| Far Cry 5 - 1920x1080 Ultra Preset AA:T | |
| Lenovo Legion Pro 5 16IRX9 | |
| Razer Blade 16 2024, RTX 4090 | |
| Alienware x16 R2 P120F | |
| Maingear ML-16 MK2 | |
| Asus ROG Zephyrus G16 GA605WV | |
| Baldur's Gate 3 | |
| 1920x1080 High Preset | |
| Alienware x16 R2 P120F | |
| Lenovo Yoga Pro 9 16IMH9 | |
| Maingear ML-16 MK2 | |
| Moyenne NVIDIA GeForce RTX 4070 Laptop GPU (72.7 - 129.3, n=26) | |
| CSL GameStar Notebook VenomGamer G16 | |
| 1920x1080 Ultra Preset | |
| Razer Blade 16 2024, RTX 4090 | |
| Alienware x16 R2 P120F | |
| Lenovo Yoga Pro 9 16IMH9 | |
| Maingear ML-16 MK2 | |
| Moyenne NVIDIA GeForce RTX 4070 Laptop GPU (66.7 - 128.5, n=28) | |
| CSL GameStar Notebook VenomGamer G16 | |
| 2560x1440 Ultra Preset | |
| Razer Blade 16 2024, RTX 4090 | |
| Alienware x16 R2 P120F | |
| Lenovo Yoga Pro 9 16IMH9 | |
| Moyenne NVIDIA GeForce RTX 4070 Laptop GPU (54.4 - 89.6, n=23) | |
| Maingear ML-16 MK2 | |
| CSL GameStar Notebook VenomGamer G16 | |
| Tiny Tina's Wonderlands | |
| 1920x1080 High Preset (DX12) | |
| KFA2 GeForce RTX 4070 EX Gamer | |
| Alienware x16 R2 P120F | |
| Moyenne NVIDIA GeForce RTX 4070 Laptop GPU (74.3 - 151.4, n=14) | |
| Maingear ML-16 MK2 | |
| Asus TUF Gaming A16 FA617XS | |
| 1920x1080 Badass Preset (DX12) | |
| KFA2 GeForce RTX 4070 EX Gamer | |
| Alienware x16 R2 P120F | |
| Moyenne NVIDIA GeForce RTX 4070 Laptop GPU (58.6 - 115.9, n=17) | |
| Maingear ML-16 MK2 | |
| Asus TUF Gaming A16 FA617XS | |
| 2560x1440 Badass Preset (DX12) | |
| KFA2 GeForce RTX 4070 EX Gamer | |
| Alienware x16 R2 P120F | |
| Moyenne NVIDIA GeForce RTX 4070 Laptop GPU (49.8 - 79.5, n=16) | |
| Maingear ML-16 MK2 | |
| Cyberpunk 2077 2.2 Phantom Liberty | |
| 1920x1080 Medium Preset (FSR off) | |
| Alienware x16 R2 P120F | |
| Moyenne NVIDIA GeForce RTX 4070 Laptop GPU (81.6 - 124.5, n=29) | |
| Lenovo Yoga Pro 9 16IMH9 | |
| Maingear ML-16 MK2 | |
| HP Victus 16 (2024) | |
| CSL GameStar Notebook VenomGamer G16 | |
| 1920x1080 High Preset (FSR off) | |
| Alienware x16 R2 P120F | |
| Moyenne NVIDIA GeForce RTX 4070 Laptop GPU (74.7 - 103.6, n=30) | |
| Lenovo Yoga Pro 9 16IMH9 | |
| Maingear ML-16 MK2 | |
| HP Victus 16 (2024) | |
| CSL GameStar Notebook VenomGamer G16 | |
| 1920x1080 Ultra Preset (FSR off) | |
| Alienware x16 R2 P120F | |
| Razer Blade 16 2024, RTX 4090 | |
| Moyenne NVIDIA GeForce RTX 4070 Laptop GPU (30.7 - 90.7, n=38) | |
| Lenovo Yoga Pro 9 16IMH9 | |
| Maingear ML-16 MK2 | |
| HP Victus 16 (2024) | |
| CSL GameStar Notebook VenomGamer G16 | |
| 2560x1440 Ultra Preset (FSR off) | |
| Razer Blade 16 2024, RTX 4090 | |
| Alienware x16 R2 P120F | |
| Moyenne NVIDIA GeForce RTX 4070 Laptop GPU (24.8 - 57.1, n=35) | |
| Lenovo Yoga Pro 9 16IMH9 | |
| Maingear ML-16 MK2 | |
| CSL GameStar Notebook VenomGamer G16 | |
Cyberpunk 2077 ultra FPS Chart
| Bas | Moyen | Élevé | Ultra | QHD | |
|---|---|---|---|---|---|
| GTA V (2015) | 183.3 | 180.4 | 175 | 115.1 | 90.6 |
| Dota 2 Reborn (2015) | 173.4 | 152.8 | 145.3 | 139.2 | |
| Final Fantasy XV Benchmark (2018) | 187.6 | 146.3 | 110.6 | 80 | |
| X-Plane 11.11 (2018) | 139.9 | 124.4 | 89.8 | ||
| Far Cry 5 (2018) | 125 | 125 | 114 | 101 | |
| Strange Brigade (2018) | 477 | 284 | 224 | 192.8 | 127.9 |
| Tiny Tina's Wonderlands (2022) | 218.7 | 180.9 | 119.4 | 92.9 | 62.7 |
| F1 22 (2022) | 252 | 250 | 206 | 69.2 | 42.9 |
| Baldur's Gate 3 (2023) | 152 | 125.9 | 108.2 | 106.8 | 70.6 |
| Cyberpunk 2077 2.2 Phantom Liberty (2023) | 130 | 106.1 | 88.1 | 76.4 | 44.3 |
Émissions - Chaudes et bruyantes
Bruit du système
Le bruit du ventilateur lors de la navigation ou du streaming vidéo atteint 27 dB(A) sur un fond silencieux de 23 dB(A), ce qui est perceptible mais tolérable en mode silencieux. Si vous jouez en mode Performance, le bruit du ventilateur devient très fort, avec un peu plus de 55 dB(A), ce qui est plus fort que des concurrents comme le Victus 16, Alienware x16 R2ou Legion Pro 5 16. L'activation du bruit maximal du ventilateur augmente encore le bruit du ventilateur à près de 58 dB(A).

Degré de la nuisance sonore
| Au repos |
| 24.1 / 24.1 / 25.6 dB(A) |
| Fortement sollicité |
| 44.3 / 57.8 dB(A) |
 | ||
30 dB silencieux 40 dB(A) audible 50 dB(A) bruyant |
||
min: | ||
| Maingear ML-16 MK2 NVIDIA GeForce RTX 4070 Laptop GPU, Ultra 7 155H | Asus ROG Zephyrus G16 GA605WV NVIDIA GeForce RTX 4060 Laptop GPU, Ryzen AI 9 HX 370, Micron 2400 MTFDKBA1T0QFM | HP Victus 16 (2024) NVIDIA GeForce RTX 4060 Laptop GPU, i7-14700HX, Kioxia XG8 KXG80ZNV512G | Alienware x16 R2 P120F NVIDIA GeForce RTX 4080 Laptop GPU, Ultra 9 185H, WDC PC SN810 1TB | Lenovo Legion Pro 5 16IRX9 NVIDIA GeForce RTX 4070 Laptop GPU, i9-14900HX, Samsung PM9A1 MZVL21T0HCLR | Razer Blade 16 2024, RTX 4090 NVIDIA GeForce RTX 4090 Laptop GPU, i9-14900HX, Samsung PM9A1 MZVL22T0HBLB | |
|---|---|---|---|---|---|---|
| Noise | -4% | -10% | 2% | -3% | 3% | |
| arrêt / environnement * | 23 | 24.6 -7% | 25 -9% | 23.4 -2% | 23.9 -4% | 23 -0% |
| Idle Minimum * | 24.1 | 28.6 -19% | 28 -16% | 23.8 1% | 24.3 -1% | 23 5% |
| Idle Average * | 24.1 | 28.6 -19% | 29 -20% | 28.5 -18% | 24.3 -1% | 23 5% |
| Idle Maximum * | 25.6 | 28.6 -12% | 33 -29% | 28.5 -11% | 28.9 -13% | 27.66 -8% |
| Load Average * | 44.3 | 42.8 3% | 45 -2% | 28.8 35% | 45.8 -3% | 43.76 1% |
| Cyberpunk 2077 ultra * | 55.4 | 48.3 13% | ||||
| Load Maximum * | 57.8 | 48.3 16% | 48 17% | 54.2 6% | 56.6 2% | 50.37 13% |
| Witcher 3 ultra * | 43 | 49.5 | 51 | 46.81 |
* ... Moindre est la valeur, meilleures sont les performances
Température
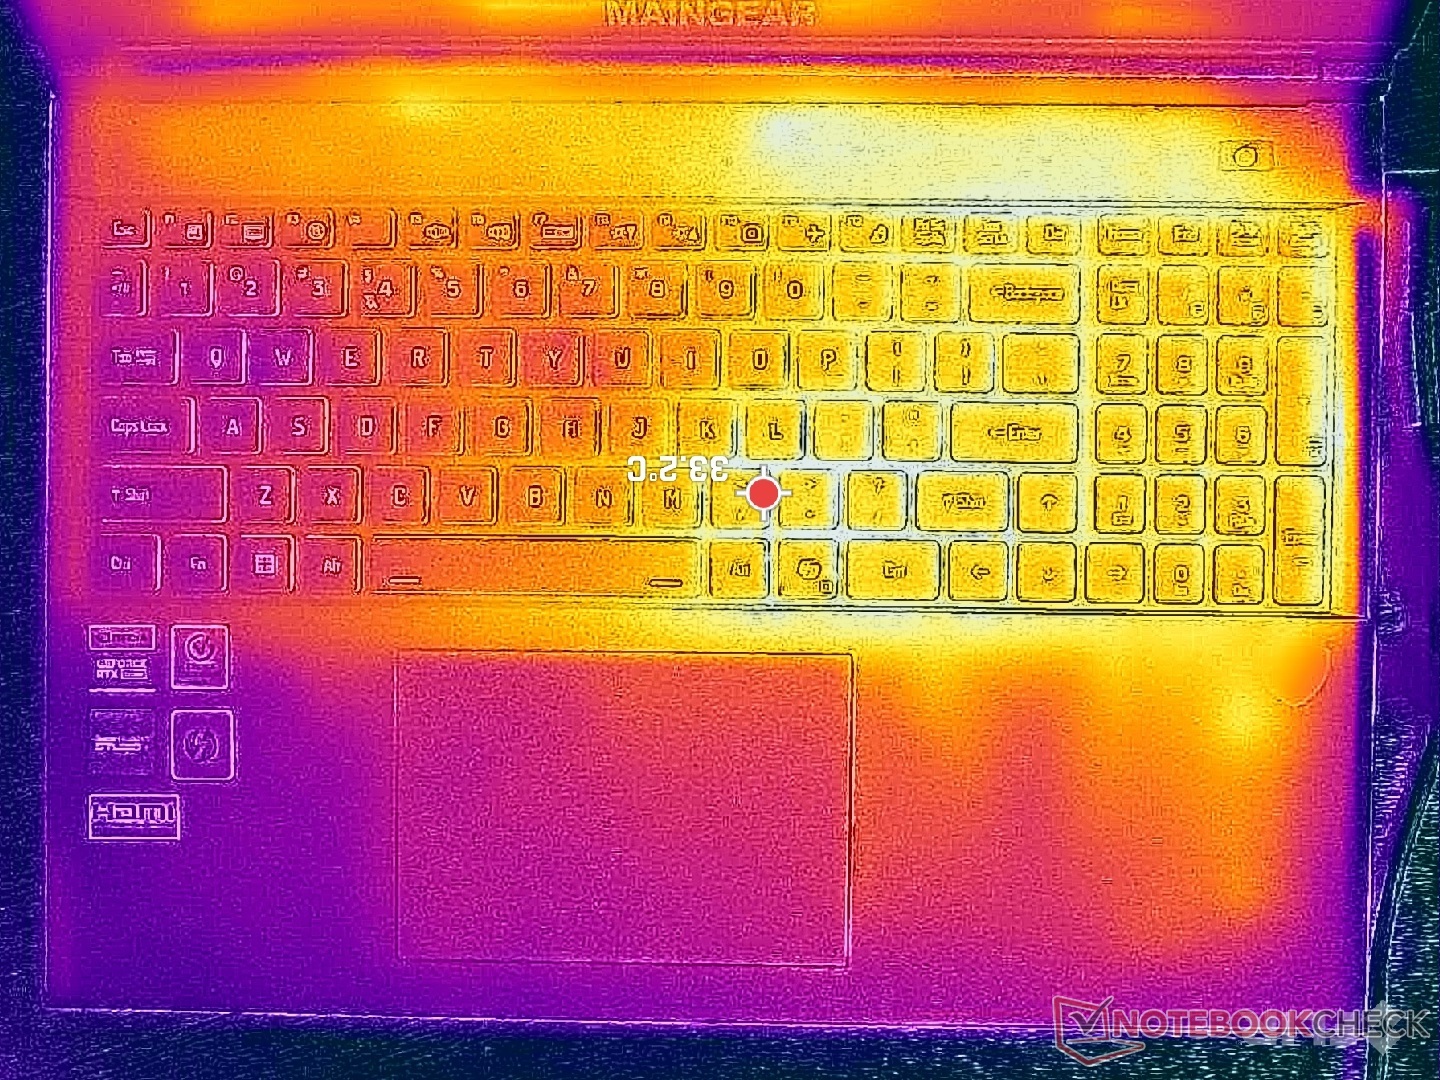
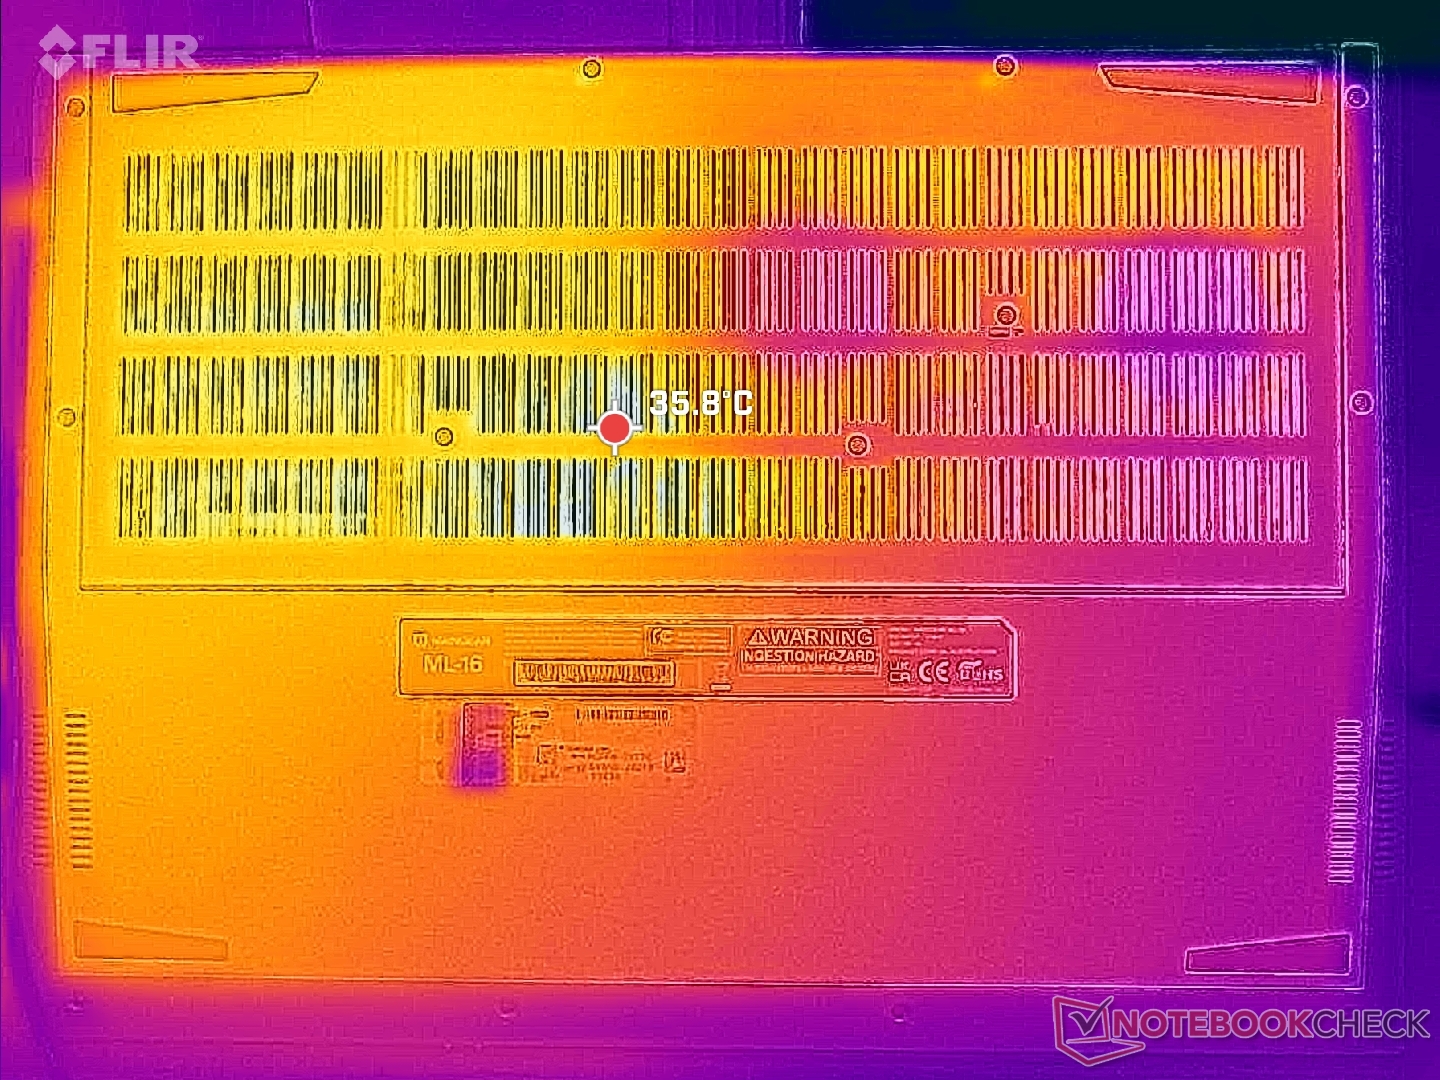
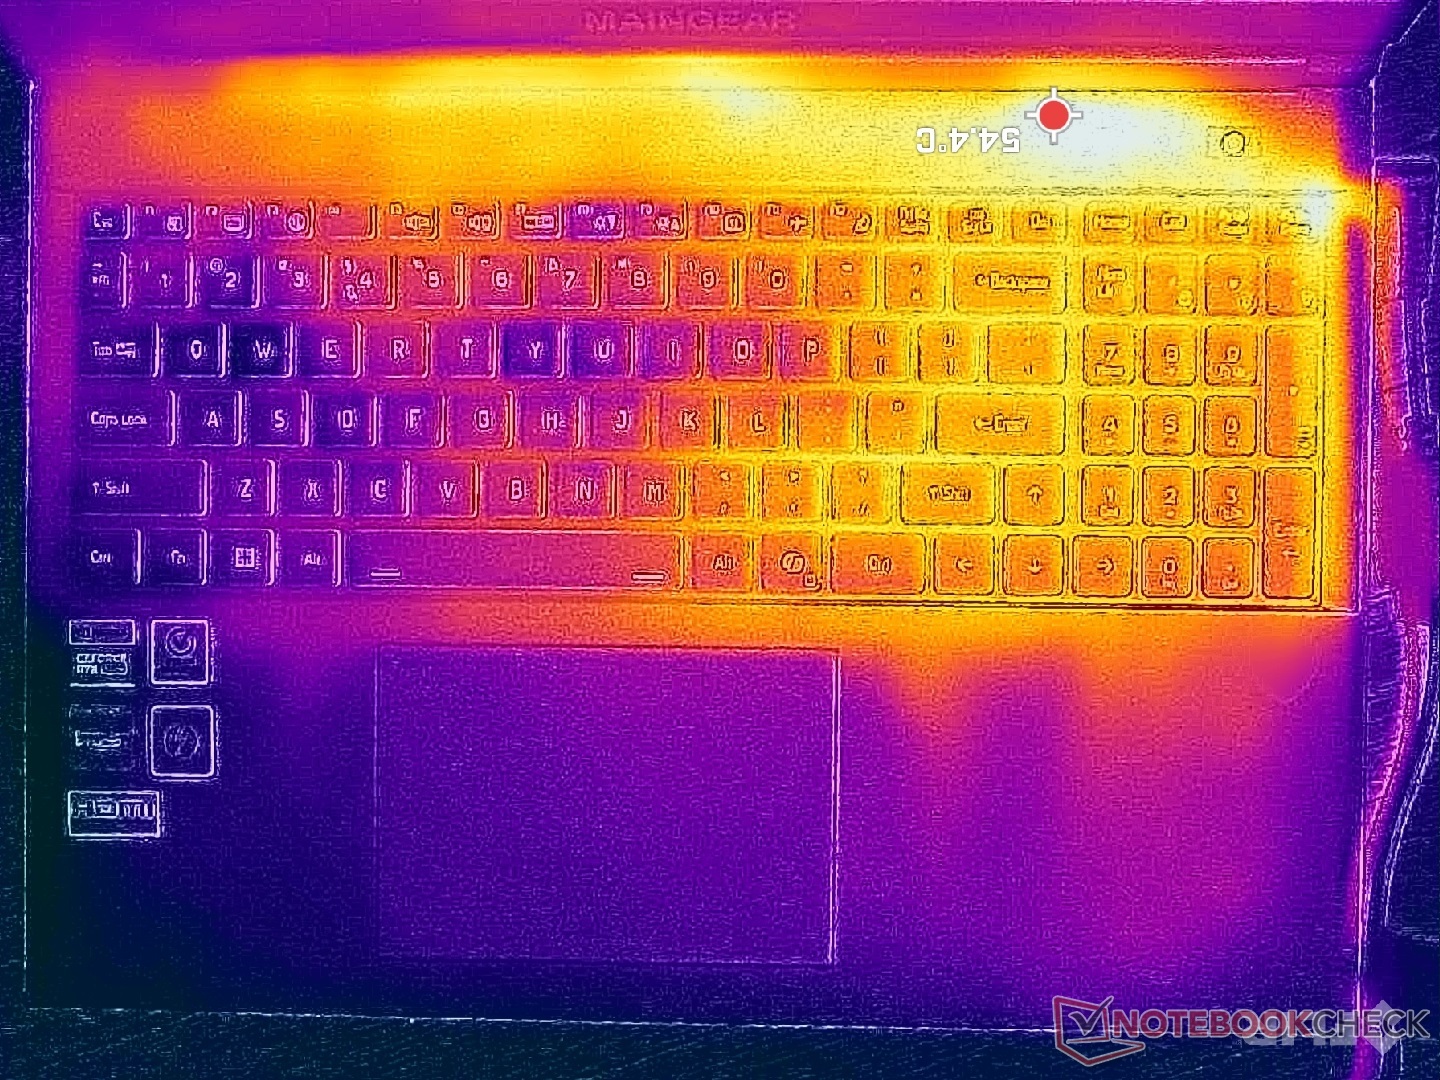
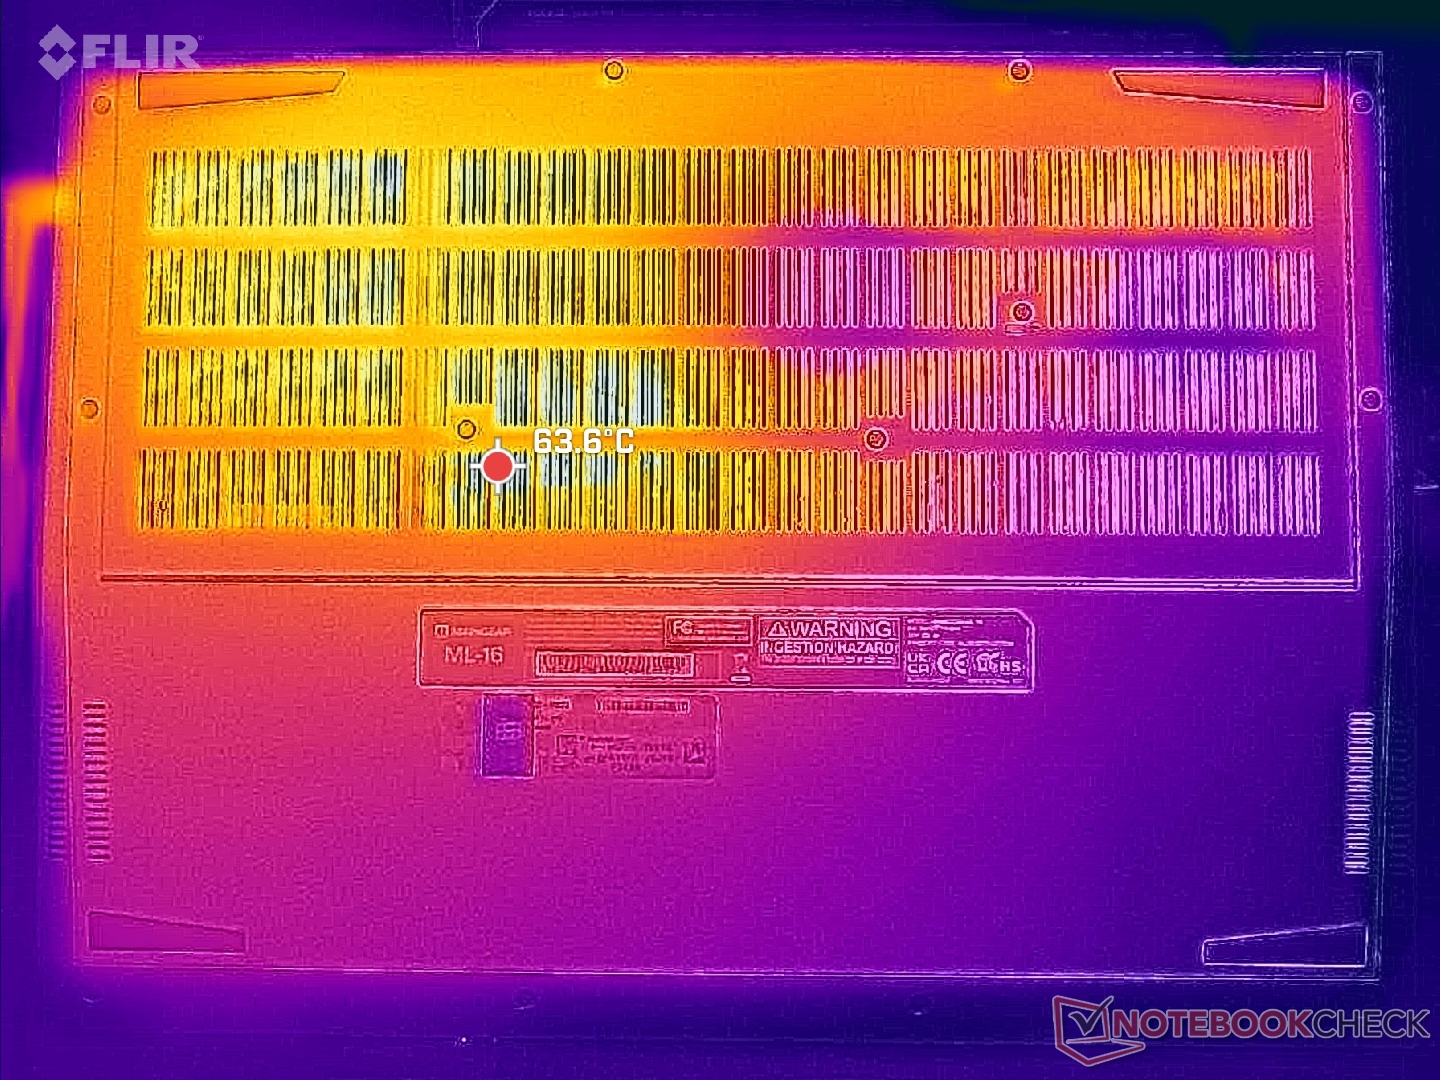
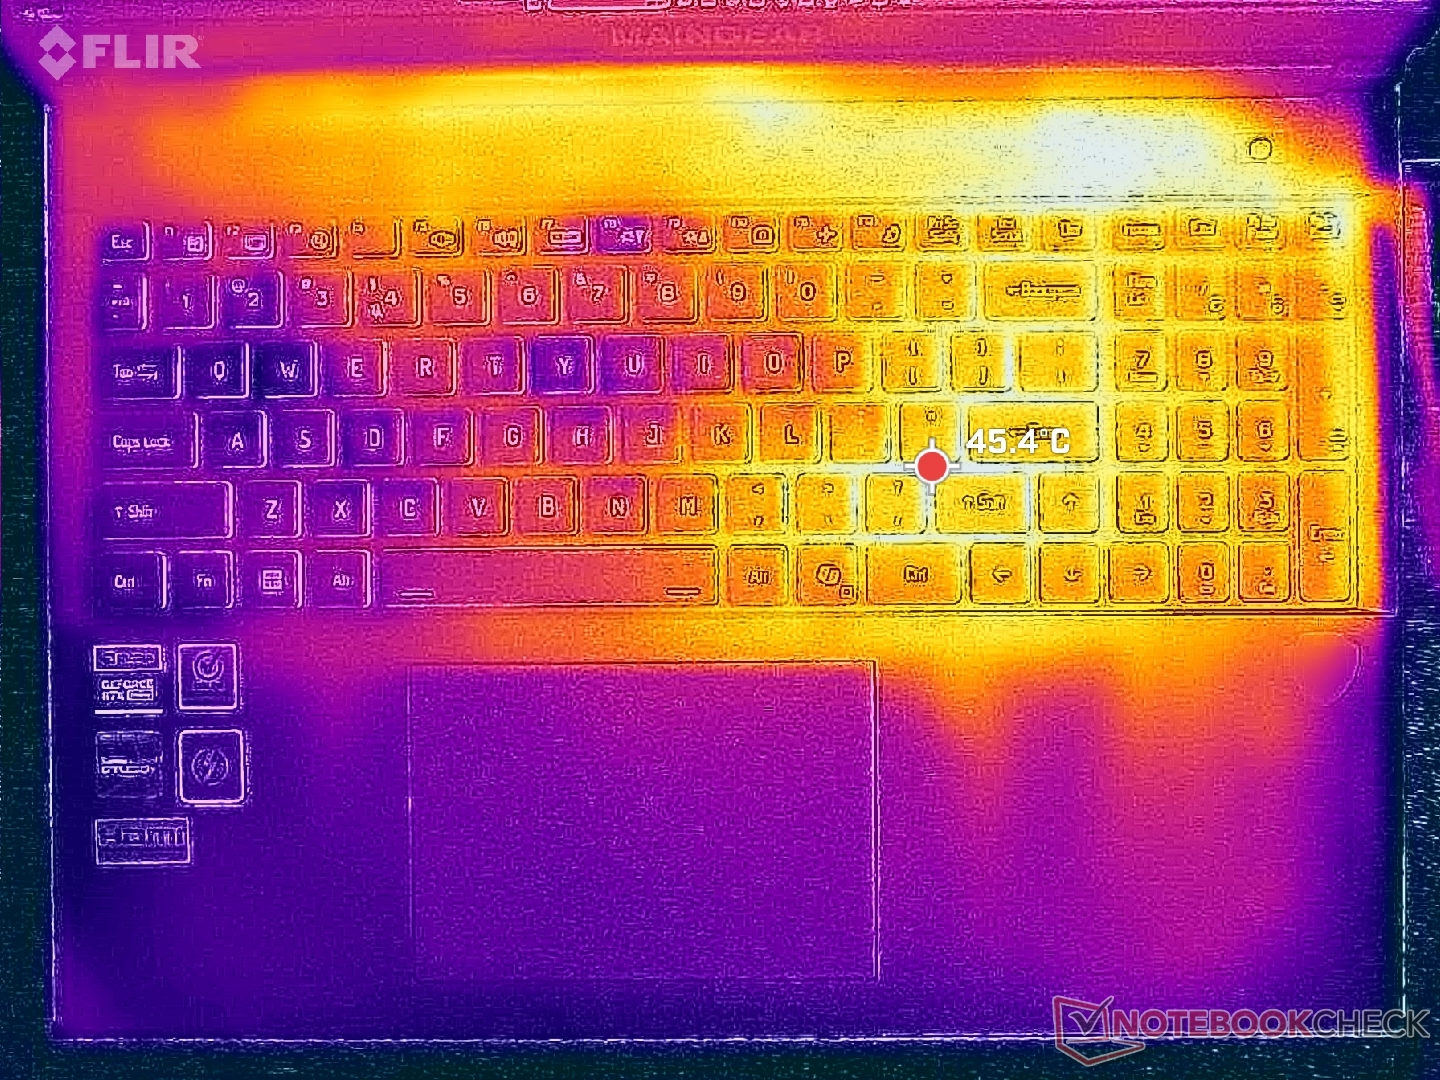
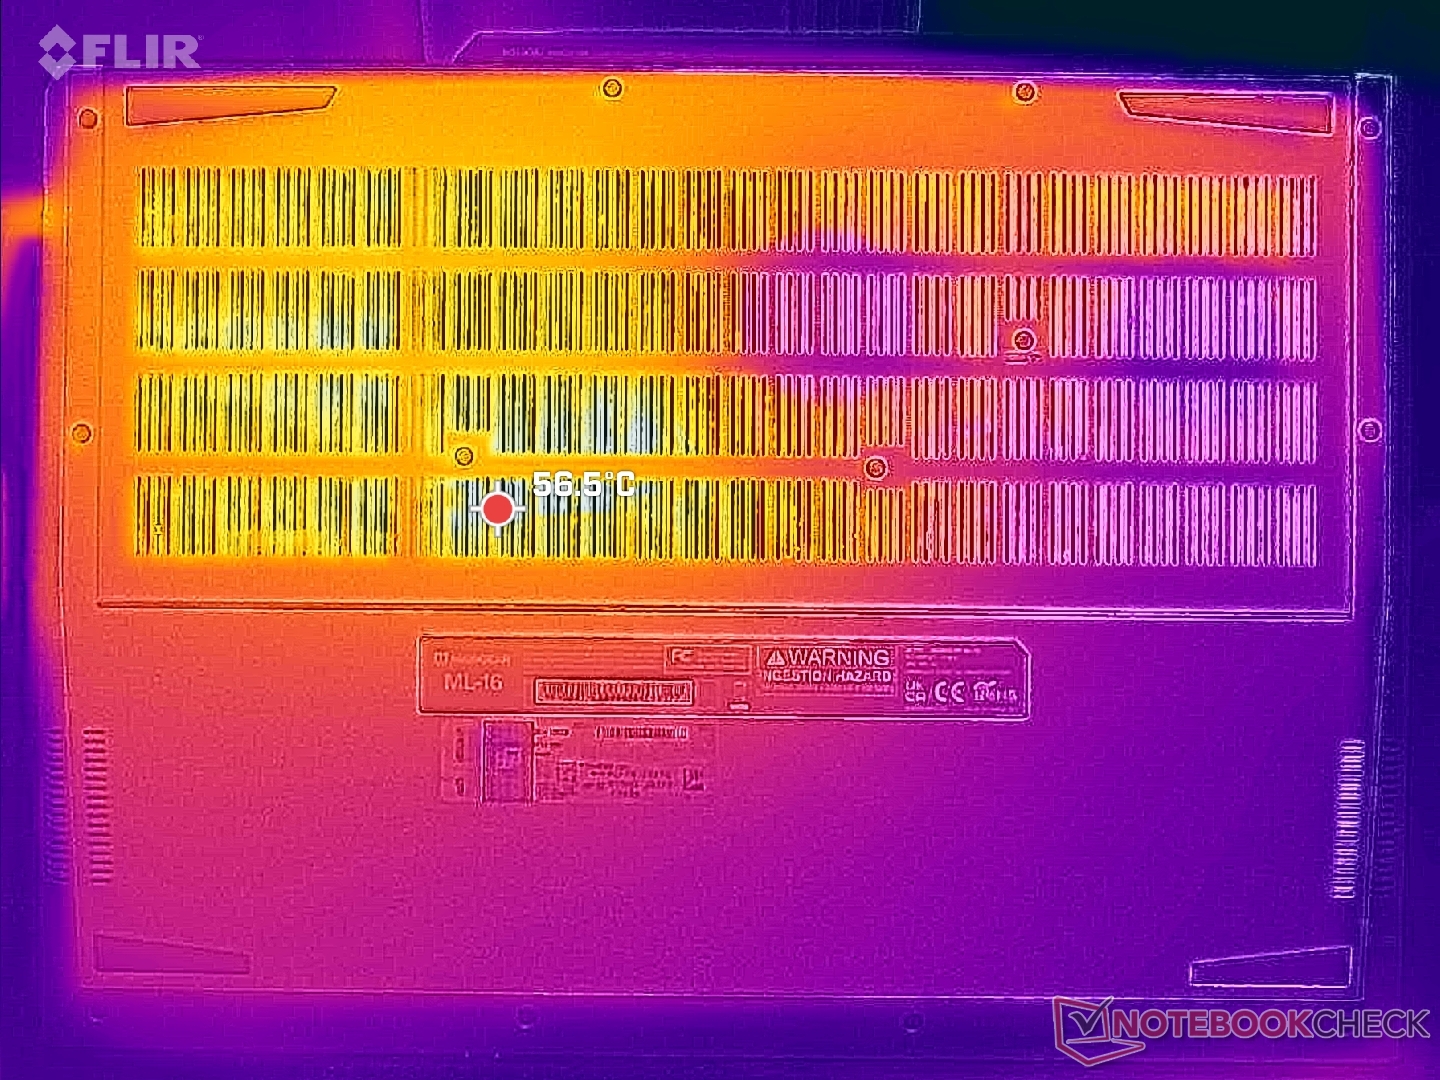
Les températures de fonctionnement très élevées mentionnées ci-dessus entraînent des températures de surface plus chaudes que la moyenne. Les points chauds pendant les jeux peuvent atteindre plus de 54°C et 56°C respectivement sur le dessus et le dessous, contre seulement 40°C sur la Blade 16 ou 47 C sur le Legion Pro 5 16IRX9.
De plus, la solution de refroidissement asymétrique signifie que la moitié droite du châssis ou du clavier sera beaucoup plus chaude que la moitié gauche. Cela contraste avec la plupart des autres ordinateurs portables de jeu où les solutions de refroidissement symétriques sont courantes. Ce n'est pas un gros problème car la plupart des jeux n'utilisent que les touches WASD sur la moitié gauche du clavier, mais vous pouvez vous attendre à avoir la paume en sueur si le jeu demande des entrées à partir du pavé numérique.
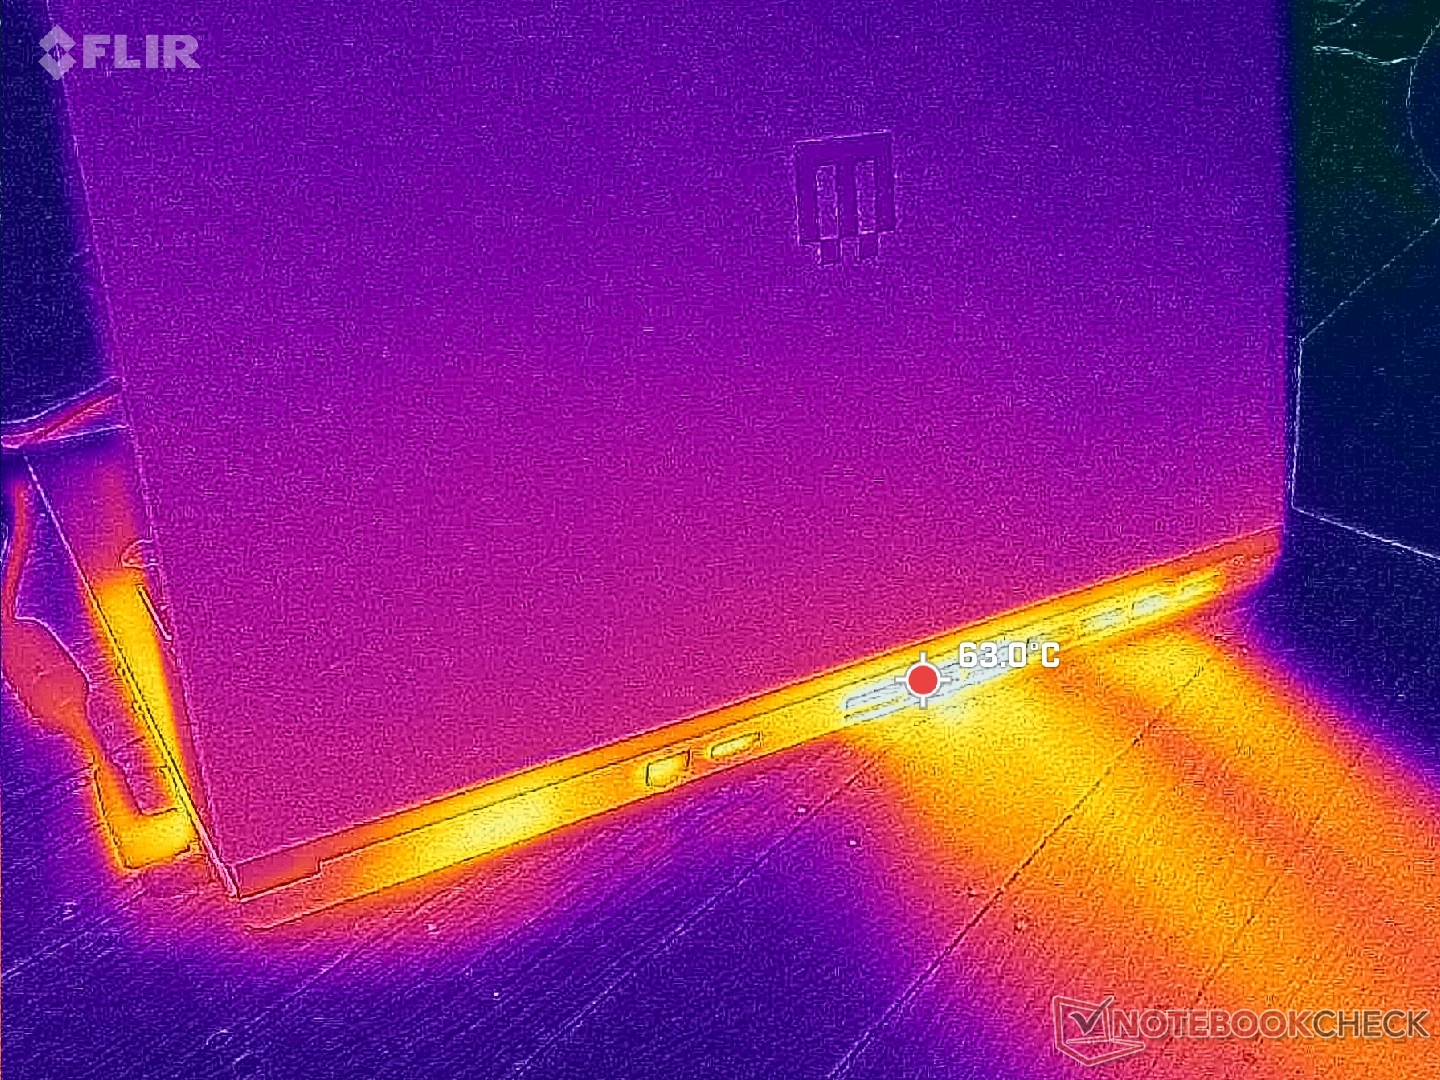
(-) La température maximale du côté supérieur est de 45.2 °C / 113 F, par rapport à la moyenne de 40.4 °C / 105 F, allant de 21.2 à 68.8 °C pour la classe Gaming.
(-) Le fond chauffe jusqu'à un maximum de 48.8 °C / 120 F, contre une moyenne de 43.2 °C / 110 F
(+) En utilisation inactive, la température moyenne du côté supérieur est de 31.9 °C / 89 F, par rapport à la moyenne du dispositif de 33.9 °C / 93 F.
(-) 3: The average temperature for the upper side is 40 °C / 104 F, compared to the average of 33.9 °C / 93 F for the class Gaming.
(+) Les repose-poignets et le pavé tactile atteignent la température maximale de la peau (34.6 °C / 94.3 F) et ne sont donc pas chauds.
(-) La température moyenne de la zone de l'appui-paume de dispositifs similaires était de 28.9 °C / 84 F (-5.7 °C / #-10.3 F).
| Maingear ML-16 MK2 Intel Core Ultra 7 155H, NVIDIA GeForce RTX 4070 Laptop GPU | Asus ROG Zephyrus G16 GA605WV AMD Ryzen AI 9 HX 370, NVIDIA GeForce RTX 4060 Laptop GPU | HP Victus 16 (2024) Intel Core i7-14700HX, NVIDIA GeForce RTX 4060 Laptop GPU | Alienware x16 R2 P120F Intel Core Ultra 9 185H, NVIDIA GeForce RTX 4080 Laptop GPU | Lenovo Legion Pro 5 16IRX9 Intel Core i9-14900HX, NVIDIA GeForce RTX 4070 Laptop GPU | Razer Blade 16 2024, RTX 4090 Intel Core i9-14900HX, NVIDIA GeForce RTX 4090 Laptop GPU | |
|---|---|---|---|---|---|---|
| Heat | 8% | 12% | -4% | 0% | 12% | |
| Maximum Upper Side * | 45.2 | 48.2 -7% | 50 -11% | 51 -13% | 43.8 3% | 45 -0% |
| Maximum Bottom * | 48.8 | 51.3 -5% | 50 -2% | 50.8 -4% | 55.4 -14% | 45 8% |
| Idle Upper Side * | 34.8 | 28 20% | 25 28% | 36.6 -5% | 32.8 6% | 29 17% |
| Idle Bottom * | 38.2 | 28.8 25% | 26 32% | 35.2 8% | 36 6% | 30 21% |
* ... Moindre est la valeur, meilleures sont les performances
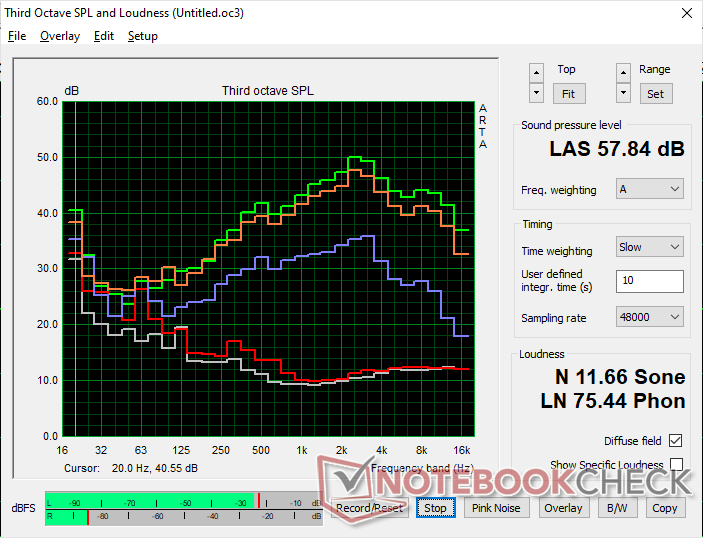
Intervenants
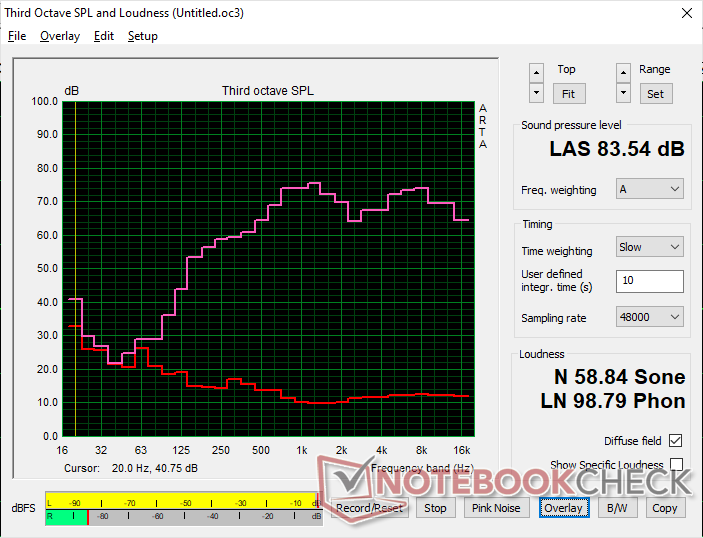
Maingear ML-16 MK2 analyse audio
(+) | les haut-parleurs peuvent jouer relativement fort (83.5# dB)
Basses 100 - 315 Hz
(-) | presque aucune basse - en moyenne 16.1% plus bas que la médiane
(±) | la linéarité des basses est moyenne (9.2% delta à la fréquence précédente)
Médiums 400 - 2000 Hz
(+) | médiane équilibrée - seulement 4.9% de la médiane
(+) | les médiums sont linéaires (4.9% delta à la fréquence précédente)
Aiguës 2 - 16 kHz
(+) | des sommets équilibrés - à seulement 3.3% de la médiane
(+) | les aigus sont linéaires (5.1% delta à la fréquence précédente)
Globalement 100 - 16 000 Hz
(+) | le son global est linéaire (13.7% différence à la médiane)
Par rapport à la même classe
» 20% de tous les appareils testés de cette catégorie étaient meilleurs, 6% similaires, 74% pires
» Le meilleur avait un delta de 6%, la moyenne était de 18%, le pire était de 132%.
Par rapport à tous les appareils testés
» 13% de tous les appareils testés étaient meilleurs, 4% similaires, 83% pires
» Le meilleur avait un delta de 4%, la moyenne était de 24%, le pire était de 134%.
Apple MacBook Pro 16 2021 M1 Pro analyse audio
(+) | les haut-parleurs peuvent jouer relativement fort (84.7# dB)
Basses 100 - 315 Hz
(+) | bonne basse - seulement 3.8% loin de la médiane
(+) | les basses sont linéaires (5.2% delta à la fréquence précédente)
Médiums 400 - 2000 Hz
(+) | médiane équilibrée - seulement 1.3% de la médiane
(+) | les médiums sont linéaires (2.1% delta à la fréquence précédente)
Aiguës 2 - 16 kHz
(+) | des sommets équilibrés - à seulement 1.9% de la médiane
(+) | les aigus sont linéaires (2.7% delta à la fréquence précédente)
Globalement 100 - 16 000 Hz
(+) | le son global est linéaire (4.6% différence à la médiane)
Par rapport à la même classe
» 0% de tous les appareils testés de cette catégorie étaient meilleurs, 0% similaires, 100% pires
» Le meilleur avait un delta de 5%, la moyenne était de 18%, le pire était de 45%.
Par rapport à tous les appareils testés
» 0% de tous les appareils testés étaient meilleurs, 0% similaires, 100% pires
» Le meilleur avait un delta de 4%, la moyenne était de 24%, le pire était de 134%.
Gestion de l'énergie
Consommation électrique
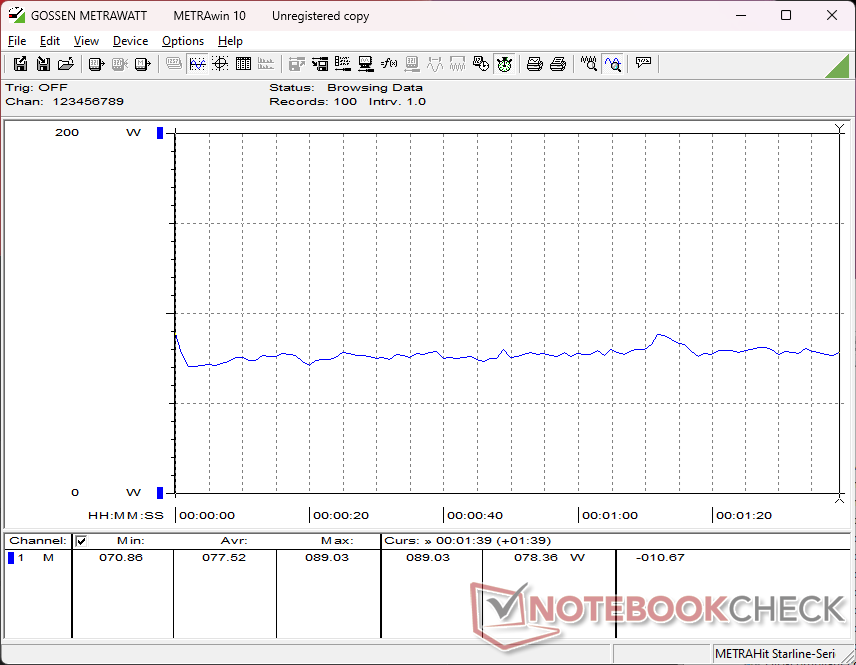
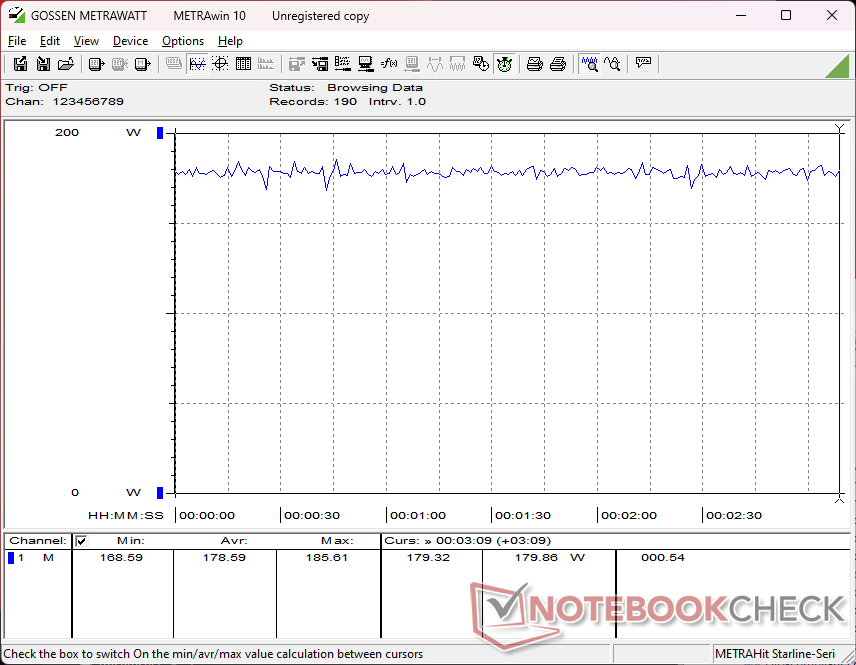
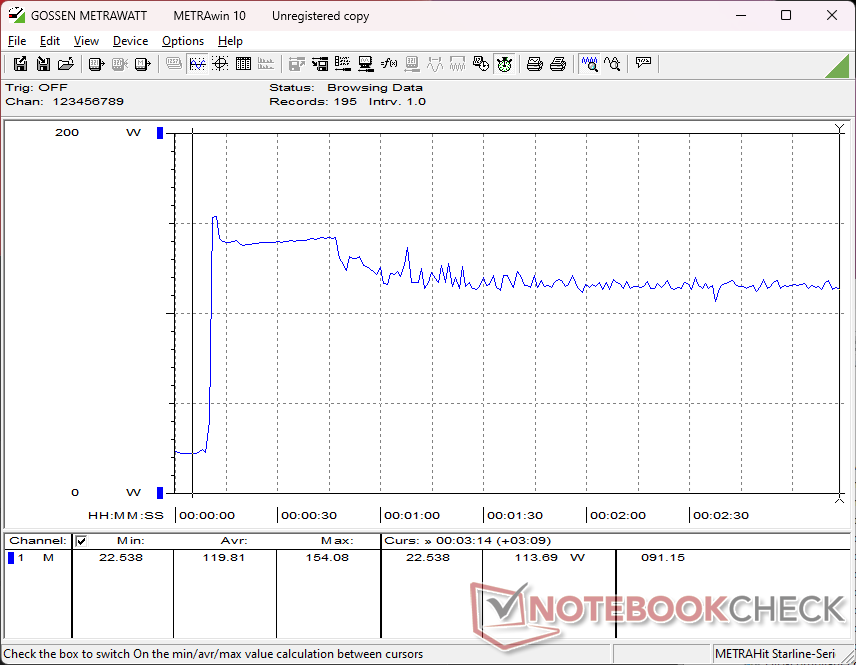
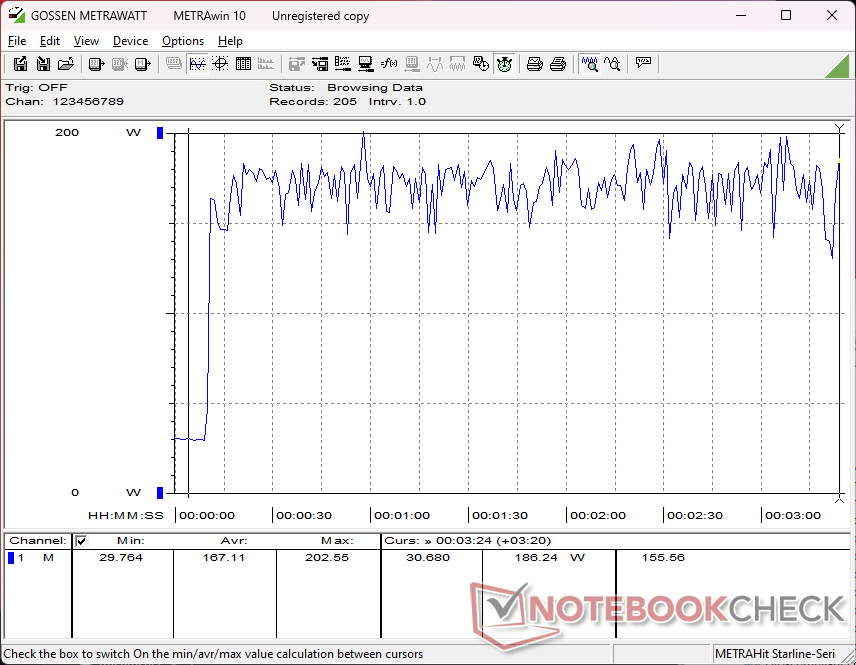
La consommation d'énergie au ralenti varie de 7 à 27 W en fonction du réglage du GPU et du niveau de luminosité, ce qui représente une fourchette plus large par rapport à la concurrence. Cela explique également la durée de vie relativement courte de la batterie dans la section suivante. Le simple fait d'activer le mode dGPU et la luminosité maximale de l'écran fait bondir la consommation de 7 à 23 W. Il est donc recommandé d'utiliser le mode MSHybrid si l'autonomie de la batterie est importante.
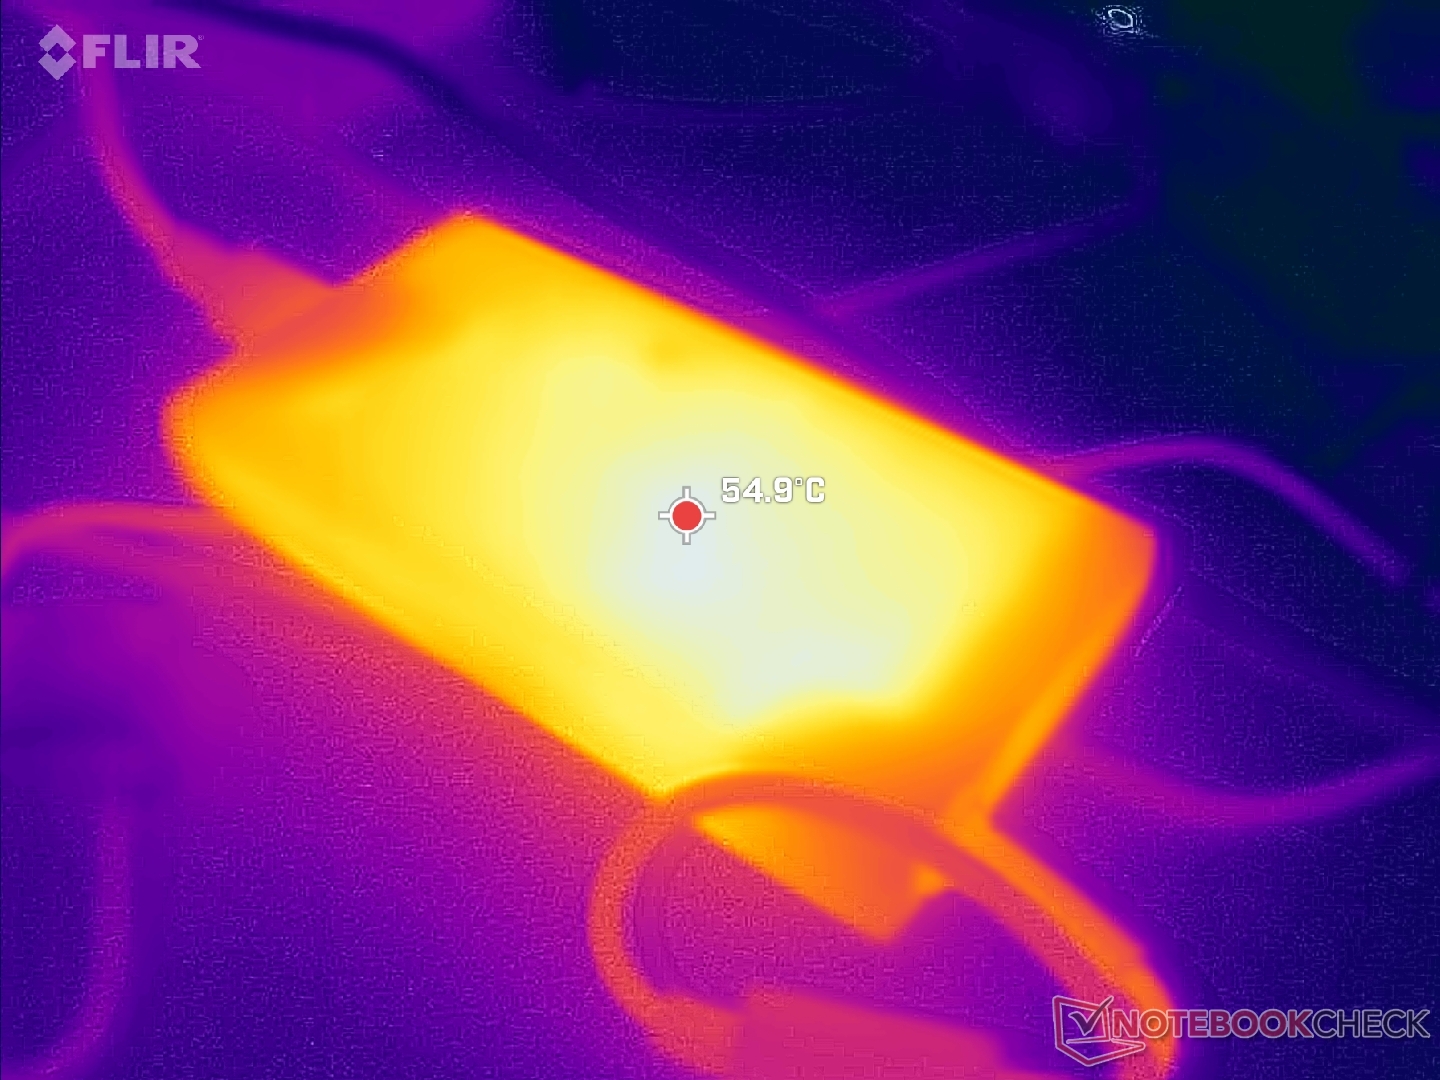
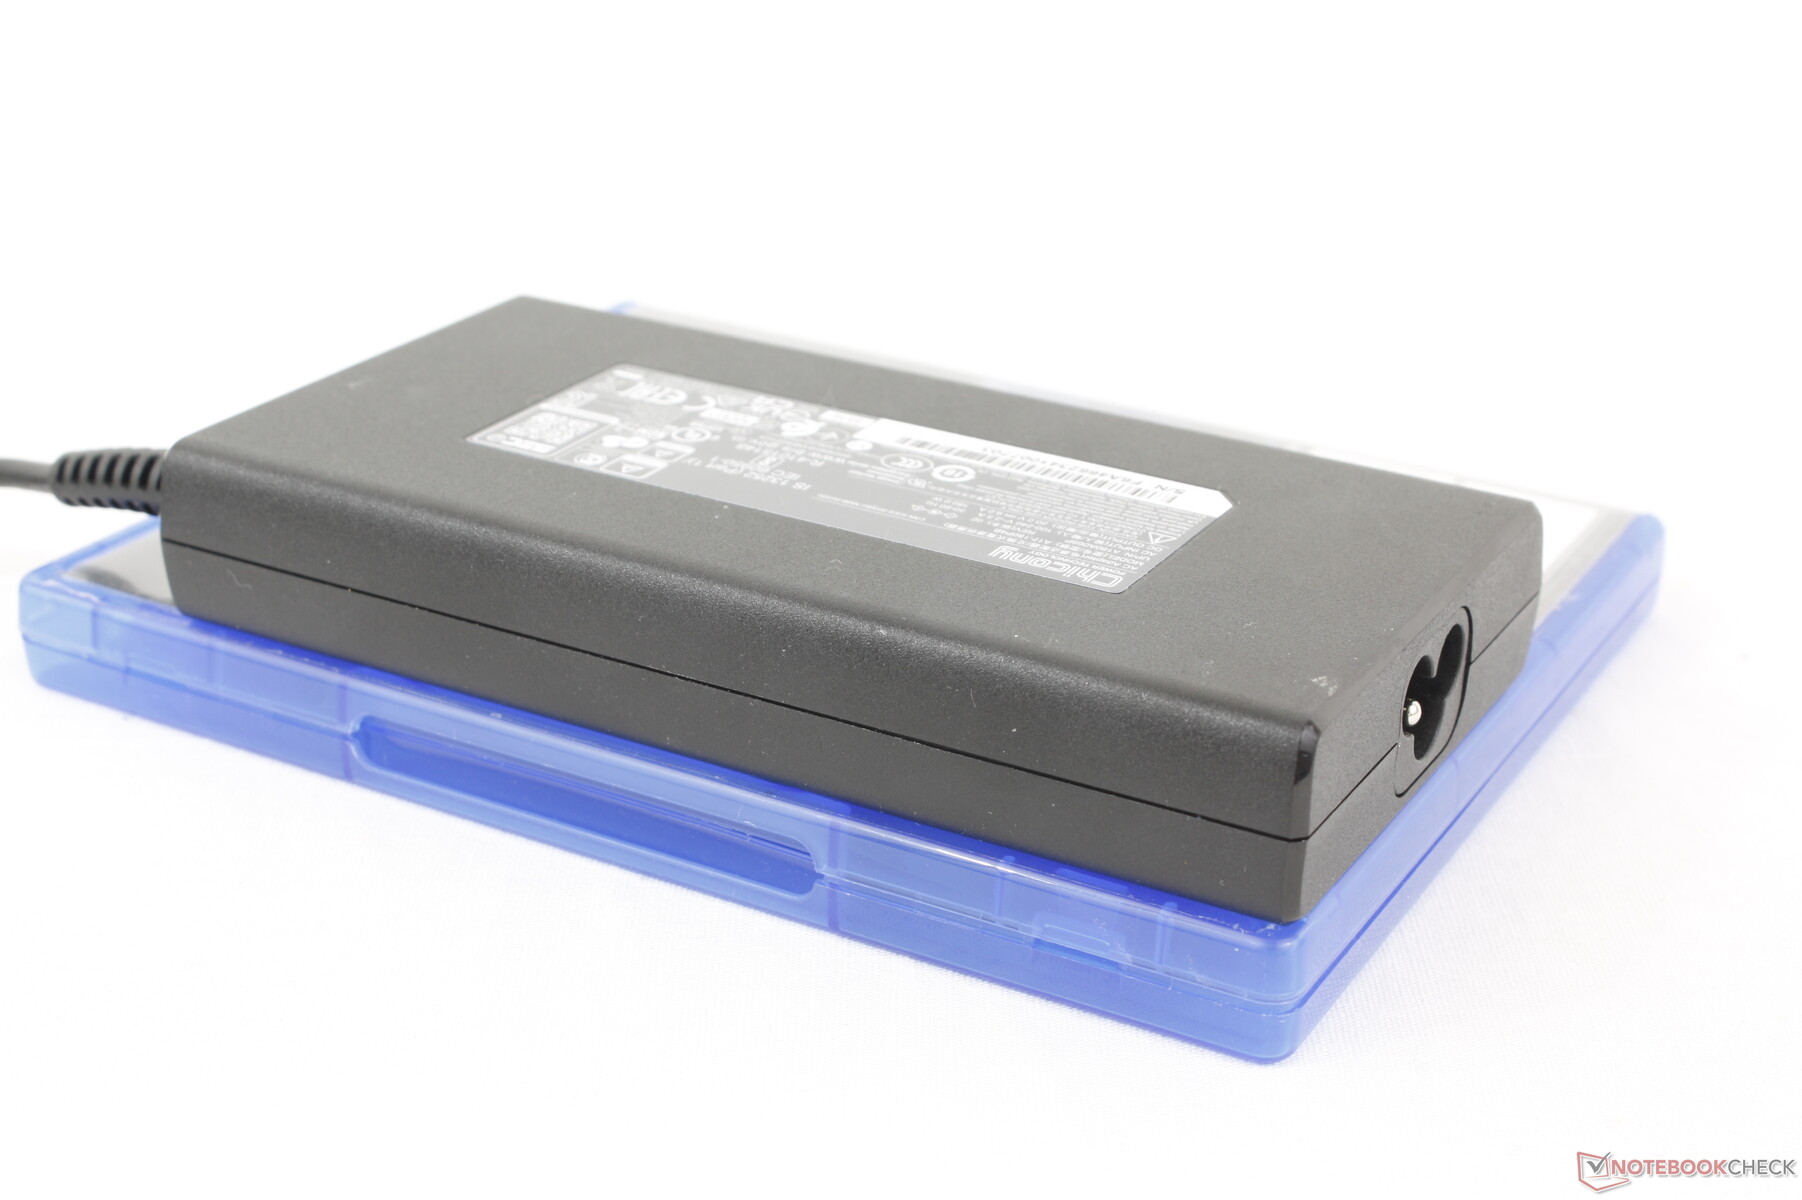
Les jeux demandent en moyenne 179 W à l'adaptateur secteur de taille moyenne (~14,4 x 7,5 x 2,3 cm) de 180 W. Cela signifie que le taux de charge ralentira. Cela signifie que le taux de charge ralentira si vous utilisez des jeux simultanément et cela suggère également que les performances auraient pu être plus rapides si le modèle avait été livré avec un adaptateur secteur plus grand de 230 watts. En fait, nous avons pu enregistrer une consommation maximale de 203 W lorsque le CPU et le GPU sont pleinement utilisés, ce qui prouve que le système peut demander plus que ce que l'adaptateur secteur peut fournir en toute sécurité. Ceci est similaire à ce que nous avons observé sur le Lenovo Yoga Pro 9i 16 G9 où nous avons trouvé que l'adaptateur secteur de 170 W était trop petit pour le CPU Core Ultra H et le GPU RTX 4070.
| Éteint/en veille | |
| Au repos | |
| Fortement sollicité |
|
Légende:
min: | |
| Maingear ML-16 MK2 Ultra 7 155H, NVIDIA GeForce RTX 4070 Laptop GPU, , IPS, 2560x1600, 16" | Asus ROG Zephyrus G16 GA605WV Ryzen AI 9 HX 370, NVIDIA GeForce RTX 4060 Laptop GPU, Micron 2400 MTFDKBA1T0QFM, OLED, 2560x1600, 16" | HP Victus 16 (2024) i7-14700HX, NVIDIA GeForce RTX 4060 Laptop GPU, Kioxia XG8 KXG80ZNV512G, IPS, 1920x1080, 16.1" | Alienware x16 R2 P120F Ultra 9 185H, NVIDIA GeForce RTX 4080 Laptop GPU, WDC PC SN810 1TB, IPS, 2560x1600, 16" | Lenovo Legion Pro 5 16IRX9 i9-14900HX, NVIDIA GeForce RTX 4070 Laptop GPU, Samsung PM9A1 MZVL21T0HCLR, IPS, 2560x1600, 16" | Razer Blade 16 2024, RTX 4090 i9-14900HX, NVIDIA GeForce RTX 4090 Laptop GPU, Samsung PM9A1 MZVL22T0HBLB, OLED, 2560x1600, 16" | |
|---|---|---|---|---|---|---|
| Power Consumption | 24% | -9% | -20% | -29% | -39% | |
| Idle Minimum * | 7.7 | 6.9 10% | 9 -17% | 9.9 -29% | 12.5 -62% | 16.9 -119% |
| Idle Average * | 22.9 | 12.6 45% | 15 34% | 14.5 37% | 24.6 -7% | 17.8 22% |
| Idle Maximum * | 26.7 | 13 51% | 23 14% | 33.5 -25% | 24.8 7% | 19.6 27% |
| Load Average * | 77.5 | 84.1 -9% | 123 -59% | 97.5 -26% | 109.6 -41% | 128 -65% |
| Cyberpunk 2077 ultra external monitor * | 178.9 | 124.5 30% | ||||
| Cyberpunk 2077 ultra * | 178.6 | 127.2 29% | ||||
| Load Maximum * | 202.6 | 177.6 12% | 241 -19% | 315.2 -56% | 284.9 -41% | 328 -62% |
| Witcher 3 ultra * | 143.7 | 230 | 218 | 243 |
* ... Moindre est la valeur, meilleures sont les performances
Power Consumption Cyberpunk / Stress Test
Power Consumption external Monitor
Autonomie de la batterie
La capacité de la batterie de 80 Wh est moyenne pour un écran de 16 pouces. En revanche, les durées d'utilisation sont inférieures à la moyenne pour un ordinateur portable de jeu. Nous n'avons pu enregistrer qu'un peu plus de 3,5 heures de navigation WLAN dans le monde réel, même en utilisant le profil d'alimentation équilibré avec MSHybrid actif, contre plus de deux fois plus sur l'Asus ROG Zephyrus G16 Asus ROG Zephyrus G16 ou HP Victus 16.
La charge de la batterie vide à la batterie pleine est relativement rapide (1 à 1,5 heure). Le système peut également être rechargé via des adaptateurs secteur USB-C tiers, bien qu'à un rythme plus lent. Gardez à l'esprit qu'un seul des deux ports USB-C prend en charge la recharge.
| Maingear ML-16 MK2 Ultra 7 155H, NVIDIA GeForce RTX 4070 Laptop GPU, 80 Wh | Asus ROG Zephyrus G16 GA605WV Ryzen AI 9 HX 370, NVIDIA GeForce RTX 4060 Laptop GPU, 90 Wh | HP Victus 16 (2024) i7-14700HX, NVIDIA GeForce RTX 4060 Laptop GPU, 83 Wh | Alienware x16 R2 P120F Ultra 9 185H, NVIDIA GeForce RTX 4080 Laptop GPU, 90 Wh | Lenovo Legion Pro 5 16IRX9 i9-14900HX, NVIDIA GeForce RTX 4070 Laptop GPU, 80 Wh | Razer Blade 16 2024, RTX 4090 i9-14900HX, NVIDIA GeForce RTX 4090 Laptop GPU, 95.2 Wh | |
|---|---|---|---|---|---|---|
| Autonomie de la batterie | 62% | 134% | -11% | -13% | 16% | |
| Reader / Idle | 651 | 403 -38% | ||||
| WiFi v1.3 | 218 | 478 119% | 511 134% | 193 -11% | 290 33% | 329 51% |
| Load | 98 | 103 5% | 65 -34% | 79 -19% | ||
| H.264 | 824 | 456 |
Points positifs
Points négatifs
Verdict - Étonnamment léger, mais un peu trop chaud
Le Maingear ML-16 MK2 présente quelques avantages par rapport à ses concurrents de renom. Les plus notables sont son poids léger et son écran relativement lumineux, qui aident les utilisateurs qui ne jouent pas toujours à la maison. Le pavé numérique intégré peut s'avérer utile pour certains types de jeux et de feuilles de calcul, tandis que la facilité d'entretien est toujours appréciée par les passionnés.
Malheureusement, le modèle souffre d'une longue liste d'inconvénients. Tout d'abord, sa solution de refroidissement est relativement petite et n'est pas aussi efficace que celle des ordinateurs portables de jeu de 16 pouces concurrents. Les températures du cœur, les températures de surface et le bruit des ventilateurs sont donc plus chauds et plus bruyants que ceux d'autres ordinateurs portables plus lourds comme le Razer Blade 16 ou le Lenovo Legion Pro. La rigidité du châssis est également plus faible que celle de ces concurrents, ce qui nuit à la première impression. Ces inconvénients peuvent être en partie attribués à la légèreté de l'appareil, car le châssis et la solution de refroidissement ont fait l'objet de coupes sombres. En d'autres termes, vous devrez faire quelques sacrifices importants pour obtenir un poids plus léger et plus facile à transporter.
La Maingear ML-16 MK2 est plus légère et plus lumineuse que prévu. Cependant, il lui manque plusieurs fonctions avancées, tandis que les températures et le bruit du ventilateur auraient pu être meilleurs.
D'autres fonctionnalités avancées comme Optimus 2.0, HDR, OLED, éclairage RGB par touche, refroidissement par chambre à vapeur et interface en métal liquide ne sont pas disponibles sur le ML-16 MK2. De telles omissions peuvent être acceptables dans la gamme des 1500$, mais nous nous attendions à un peu plus étant donné le prix de 2000$ demandé pour notre configuration RTX 4070.
Prix et disponibilité
Maingear est maintenant en train d'expédier la ML-16 Mark 2 pour $1800 avec la GeForce RTX 4060 ou $2000 avec la RTX 4070 telle que revue.
Note : Nous avons récemment mis à jour notre système d'évaluation et les résultats de la version 8 ne sont pas comparables à ceux de la version 7. De plus amples informations sont disponibles ici .
Maingear ML-16 MK2
- 09/17/2024 v8
Allen Ngo
 Total Sustainability Score:
 Transparency
La sélection des appareils à examiner est effectuée par notre équipe éditoriale. L'échantillon de test a été prêté à l'auteur par le fabricant ou le détaillant pour les besoins de cet examen. Le prêteur n'a pas eu d'influence sur cette évaluation et le fabricant n'a pas reçu de copie de cette évaluation avant sa publication. Il n'y avait aucune obligation de publier cet article. Nous n'acceptons jamais de compensation ou de paiement en échange de nos commentaires. En tant que média indépendant, Notebookcheck n'est pas soumis à l'autorité des fabricants, des détaillants ou des éditeurs.
Voici comment Notebookcheck teste
Chaque année, Notebookcheck examine de manière indépendante des centaines d'ordinateurs portables et de smartphones en utilisant des procédures standardisées afin de garantir que tous les résultats sont comparables. Nous avons continuellement développé nos méthodes de test depuis environ 20 ans et avons établi des normes industrielles dans le processus. Dans nos laboratoires de test, des équipements de mesure de haute qualité sont utilisés par des techniciens et des rédacteurs expérimentés. Ces tests impliquent un processus de validation en plusieurs étapes. Notre système d'évaluation complexe repose sur des centaines de mesures et de points de référence bien fondés, ce qui garantit l'objectivité.Price comparison

