Notebookcheck Logo
Teaser

Test du MSI Summit A16 AI Plus : un puissant convertible AMD Ryzen 9

L'augmentation des performances du Zen 5.

Le modèle MSI est désormais l'un des ordinateurs convertibles de 16 pouces les plus rapides du marché en termes de performances du processeur. Toutefois, l'absence d'options graphiques discrètes le retient face à d'autres grands concurrents comme le HP Spectre x360 16.
Allen Ngo, 👁 Allen Ngo (traduit par DeepL / Ninh Duy) Published 🇺🇸 🇩🇪 ...
AMD Zen 5 Laptop / Notebook

Verdict - Une puissance extrême du processeur, mais pas de possibilité de GPU dédié

Les points forts qui différencient le Summit A16 AI Plus des autres sont la rapidité du processeur et la luminosité de l'écran tactile à 165 Hz. Le processeur AMD Zen 5 est plusieurs fois supérieur au Core i7-1280P du modèle précédent, tandis que l'écran reste l'une des meilleures dalles IPS 16 pouces du marché.

Plusieurs inconvénients empêchent le MSI d'être le meilleur convertible 16 pouces du marché. La webcam de 2 MP, l'absence d'options d'affichage OLED 3K ou 4K et le manque de prise en charge des GPU discrets ou des disques SSD M.2 secondaires peuvent décourager les utilisateurs intensifs ou les joueurs les plus assidus. Les utilisateurs peuvent donc préférer le HP Spectre x360 16 pour ses performances graphiques supérieures ou le Samsung Galaxy Book5 Pro 360 16, beaucoup plus léger, et son écran tactile OLED à plus haute résolution.

Il convient de noter que nous avons rencontré des problèmes notables sur notre appareil, liés à un dysfonctionnement du pavé tactile et à des temps de démarrage parfois anormalement longs. Nous ne savons pas si ces problèmes sont généralisés, mais ils méritent d'être vérifiés dès l'achat.

Points positifs

+ performance du processeur rapide pour la catégorie
+ écran tactile IPS 1600p 165 Hz de haute qualité
+ performances graphiques respectables
+ meilleure autonomie de la batterie
+ lecteur MicroSD rapide

Points négatifs

- pas d'options graphiques discrètes
- pas d'options 4K, HDR ou VRR
- les haut-parleurs pourraient être plus puissants
- ventilateurs bruyants lors des jeux
- webcam de 2 mégapixels seulement

Prix et disponibilité

Cette configuration est actuellement disponible sur Amazon au prix de 1600 USD.

Amazon Logo
$1,499.00
MSI Summit A16 AI+ (2024) 16” QHD+ 165Hz 2-in-1 Touchscreen Laptop: AMD Ryzen AI 9-365, Radeon Graphics, 32GB LPDDR5x, 1TB NVMe SSD, 360 Flip, Pen, Win 11 Home: Ink Black A3HMTG-015US

Comparaison des alternatives possibles

Image
Modèle
Price
Poids
Épaisseur
Display
1.
81.9%
MSI Summit A16 AI Plus A3HMTG
AMD Ryzen AI 9 365 ⎘
AMD Radeon 880M ⎘
32 Go Mémoire
Amazon: $1,499.00
List Price: 1600 USD
2.1 kg16.85 mm16.00"
2560x1600
189 PPI
IPS
2.
84.2% v7 (old)
MSI Summit E16 Flip A12UDT-031
Intel Core i7-1280P ⎘
NVIDIA GeForce RTX 3050 Ti Laptop GPU ⎘
32 Go Mémoire, 2048 Go SSD
Amazon:
1. $49.91
Original New for MSI Summit ...
2. $131.00
Replacement Screen 16.0 inch...
3. $126.00
Generic 16.0"" WQXGA 2560(RG...
List Price: 2580 Euro
1.9 kg16.85 mm16.00"
2560x1600
189 PPI
IPS
3.
91.1% v7 (old)
HP Spectre x360 16 RTX 4050
Intel Core Ultra 7 155H ⎘
NVIDIA GeForce RTX 4050 Laptop GPU ⎘
16 Go Mémoire, 1024 Go SSD
Amazon: $2,699.00
List Price: 1600 USD
2 kg19.8 mm16.00"
2880x1800
212 PPI
OLED
4.
86.5% v7 (old)
Asus ExpertBook B5 Flip B5602FBN
Intel Core i7-1260P ⎘
Intel Arc A350M ⎘
16 Go Mémoire, 1024 Go SSD
Amazon:
1. $40.99
90W USB C Charger for Asus A...
2. $945.00
ASUS ExpertBook B5 Thin & Li...
3. $61.99
A-Tech 16GB RAM for ASUS Exp...
List Price: 2199 Euro
1.8 kg19.9 mm16.00"
3840x2400
283 PPI
OLED
5.
82.8%
LG gram Pro 2-in-1 16T90SP
Intel Core Ultra 7 155H ⎘
Intel Arc 8-Core iGPU ⎘
16 Go Mémoire, 1024 Go SSD
Amazon: $1,844.97
List Price: 1850€
1.4 kg12.9 mm16.00"
2880x1800
212 PPI
OLED
6.
86.7% v7 (old)
Lenovo Yoga 7 2-in-1 16IML9
Intel Core Ultra 5 125U ⎘
Intel Graphics 4-Core iGPU (Arc) ⎘
16 Go Mémoire, 512 Go SSD
Amazon: $629.00
List Price: 900 USD
2.1 kg16.99 mm16.00"
1920x1200
142 PPI
IPS

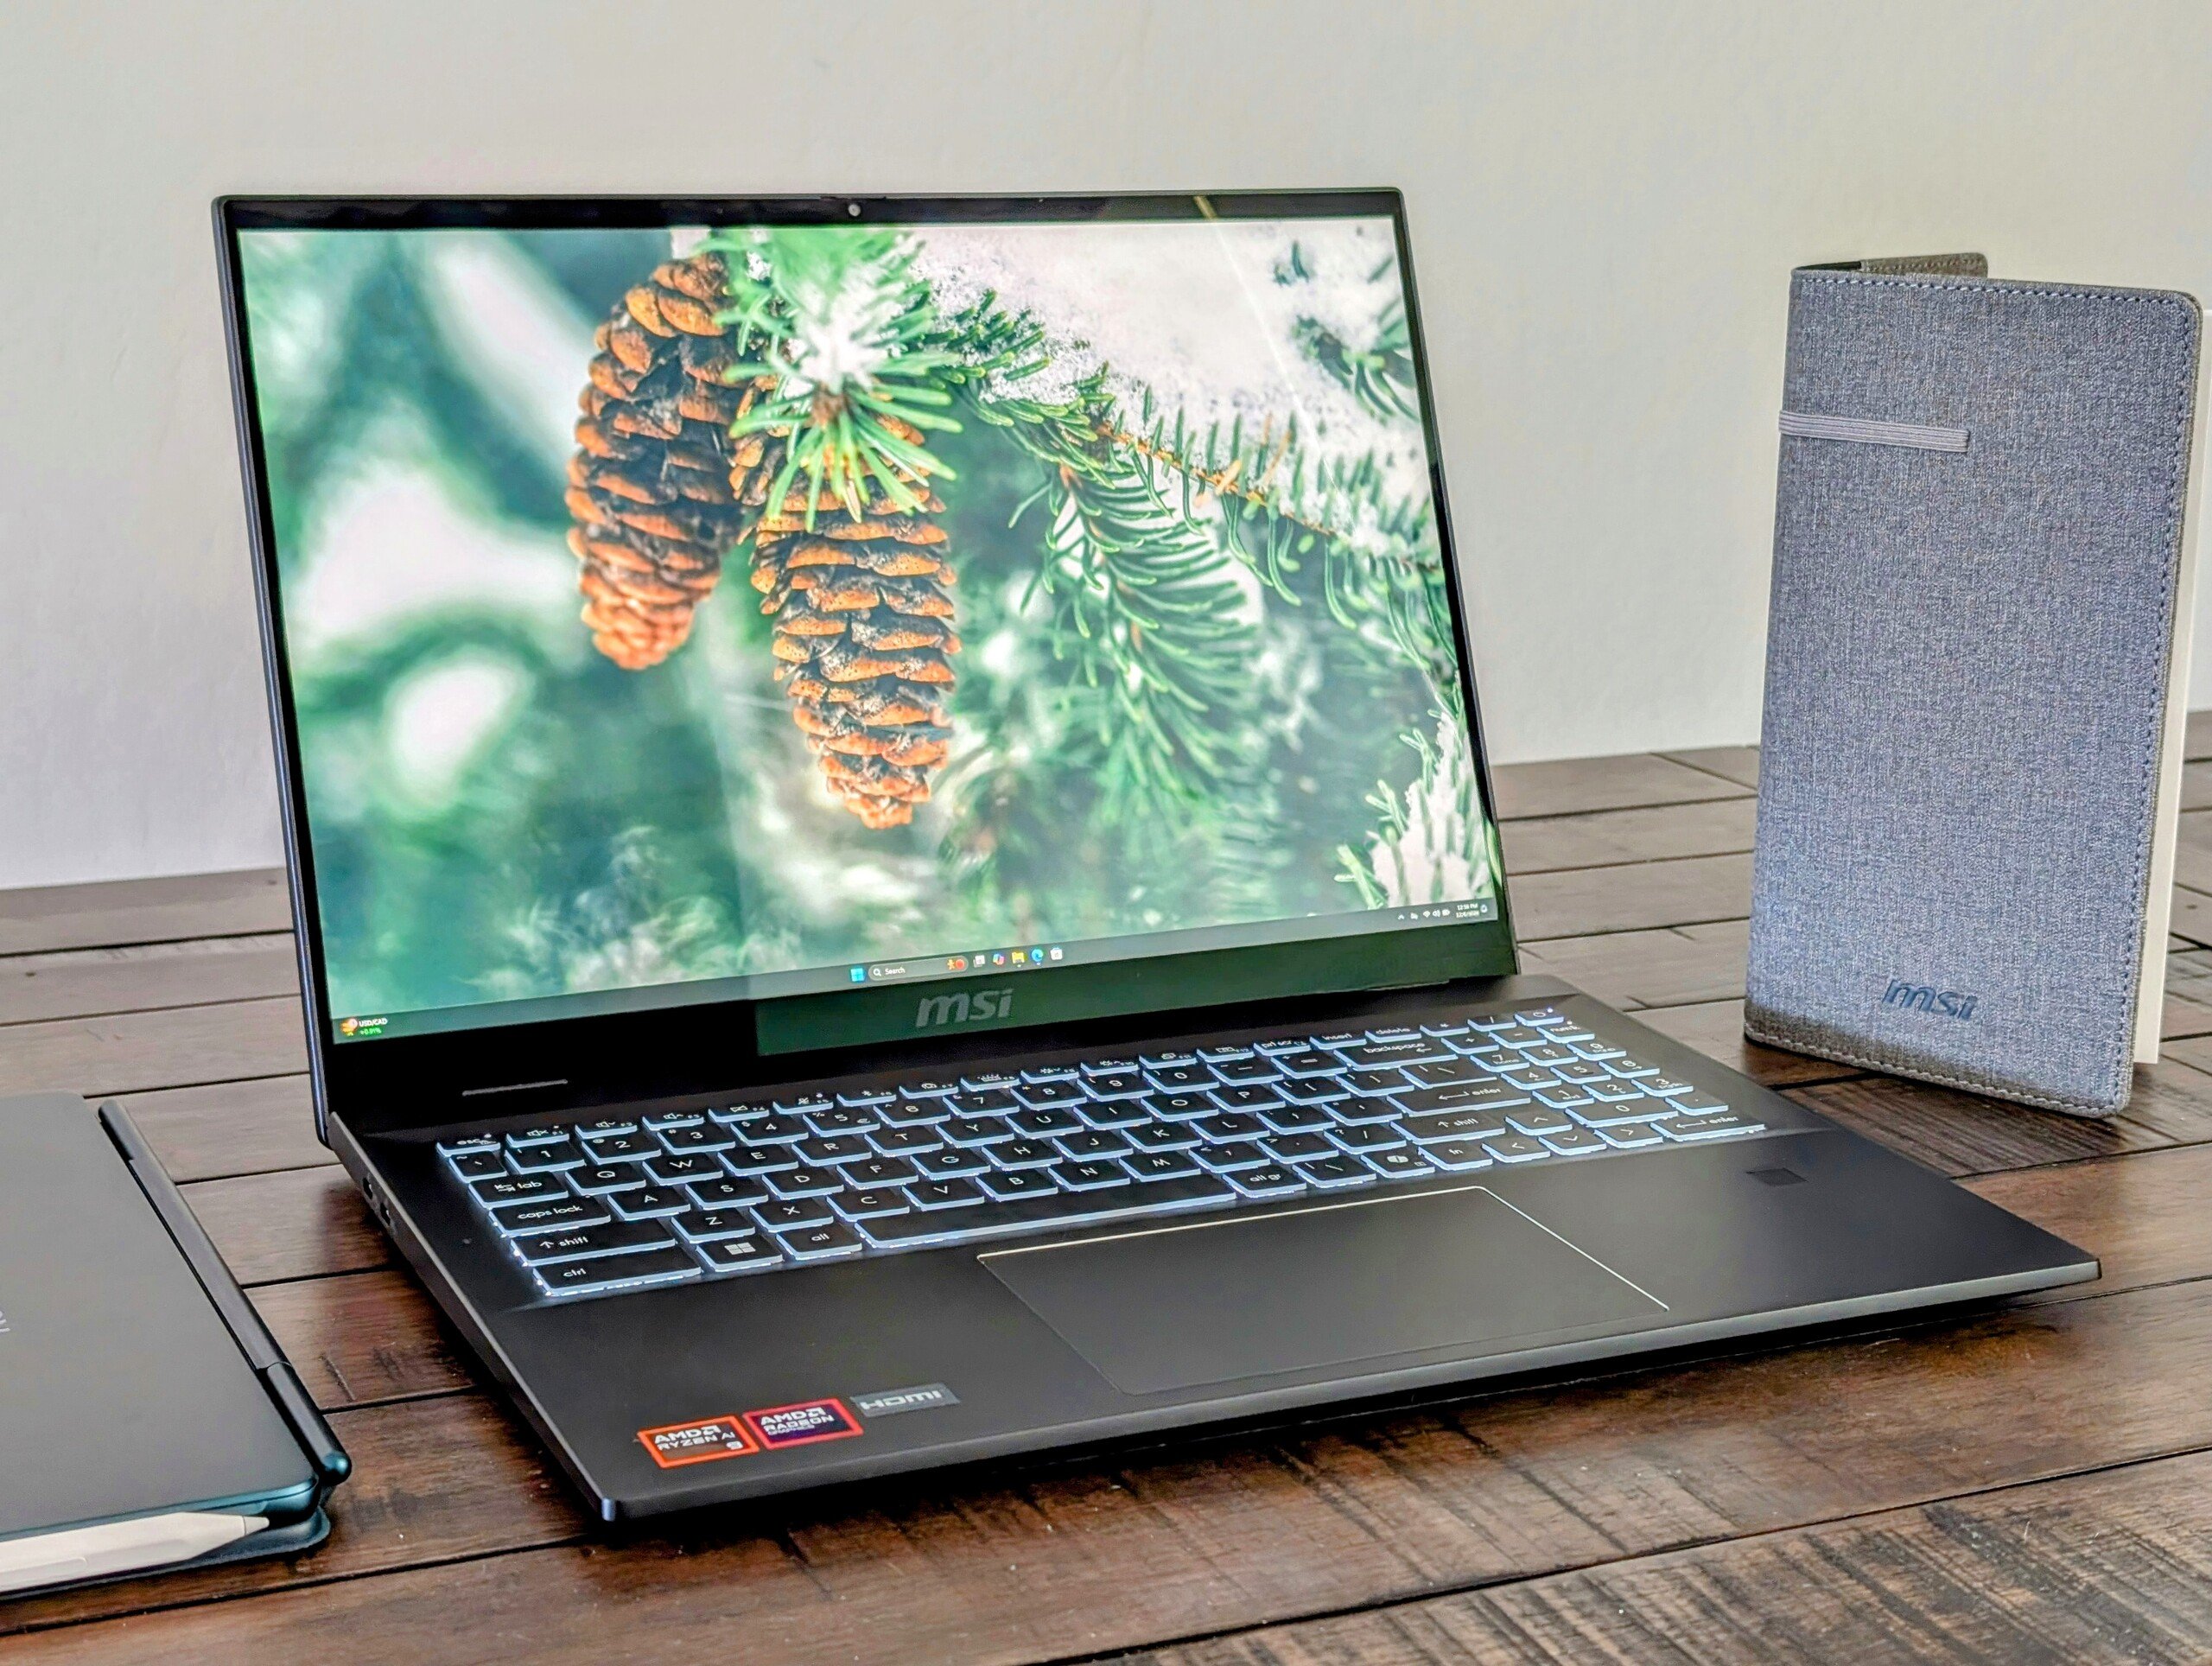
Le Summit A16 AI Plus 2024 succède au Summit E16 Flip 2022 sommet 2022 E16 Flip. Bien que leurs noms soient différents, ils utilisent le même design extérieur 2-en-1. En interne, cependant, le modèle 2024 a remplacé le CPU Intel et le GPU Nvidia par une seule solution AMD Zen 5.

Notre unité de test est configurée avec le CPU Ryzen AI 9 365, une carte graphique Radeon 880M intégrée et un écran tactile IPS 1600p 165 Hz pour environ 1600 $. Aucune autre référence majeure n'est disponible pour le moment et ces trois caractéristiques principales sont donc fixes.

Les alternatives au Summit A16 AI Plus incluent d'autres convertibles multimédia de 16 pouces comme le Lenovo Yoga 7 2-en-1, HP Spectre x360 16ou le LG Gram Pro 2-en-1.

Plus d'avis sur MSI :

Spécifications

MSI Summit A16 AI Plus A3HMTG
Processeur
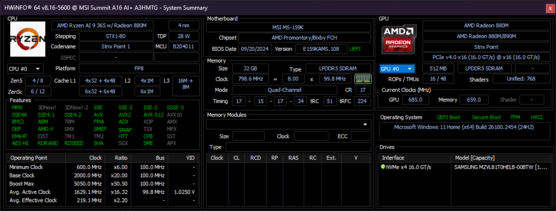
AMD Ryzen AI 9 365 10 x 2 - 5 GHz, 71 W PL2 / Short Burst, 50 W PL1 / Sustained, Strix Point (Zen 5)
Carte graphique
AMD Radeon 880M, Processeur: 2800 MHz, Mémoire: 937 MHz, LPDDR5, 32.0.12019.1028
Mémoire
32 Go 
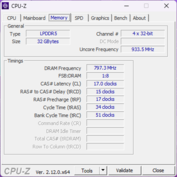
, LPDDR5x-7500, Dual-Channel, 23-17-20-40
Écran
16.00 pouces 16:10, 2560 x 1600 pixel 189 PPP, Capacitive, Prise en charge native d'une utilisation avec un stylet, AU Optronics B16QAN02.N, IPS, brillant: oui, 165 Hz
Carte mère
AMD Promontory/Bixby FCH
Carte son
AMD Zen - Audio Processor - HD Audio Controller
Connexions
1 USB 3.1 Gen2, 2 USB 4.0 40 Gbps, 2 Thunderbolt, USB-C Power Delivery (PD), 1 HDMI, 2 DisplayPort, Connectique audio: 3.5 mm combo, Lecteur de cartes mémoires: MicroSD, 1 Lecteur d'empreintes digitales, Capteurs: Acceleration, Gyroscope
Réseau
Qualcomm FastConnect 7800 (b/g/n = Wi-Fi 4/ac = Wi-Fi 5/ax = Wi-Fi 6/ Wi-Fi 6E 6 GHz be = Wi-Fi 7), Bluetooth 5.4
Taille
Hauteur x Largeur x Profondeur (en mm): 16.85 x 358 x 258.6
Batterie
82 Wh Lithium-Polymère, 4-cell
Système d'exploitation
Microsoft Windows 11 Home
Appareil photo
Webcam: FHD, IR
Appareil photo primaire: 2.1 MPix
Fonctionnalités additionnelles
Haut-parleurs: Stereo, Clavier: Chiclet, Active Stylus, MSI Center S, Pen, 12 Mois Garantie
Poids
2.118 kg, Alimentation: 422 g
Prix
1600 USD
Amazon
Remarque : le fabricant peut utiliser des composants provenant de différents fournisseurs, notamment des panneaux d'affichage, des lecteurs ou des clés USB ayant des spécifications similaires.


Cas

Le châssis reste identique à celui de 2022. Malgré cela, sa taille et son poids restent compétitifs par rapport aux alternatives actuelles de HP, Lenovo ou Asus.

Comparaison des tailles

362.2 mm 250.1 mm 16.99 mm 2.1 kg358.2 mm 261.2 mm 19.9 mm 1.8 kg356.8 mm 245.5 mm 19.8 mm 2 kg358 mm 258.6 mm 16.85 mm 2.1 kg358 mm 258.6 mm 16.85 mm 1.9 kg357.3 mm 253.8 mm 12.9 mm 1.4 kg297 mm 210 mm 1 mm 5.7 g

Connectivité

Les options de port sont légèrement différentes de celles de la version 2022. Le port HDMI, par exemple, se trouve désormais sur le bord droit du système et non plus sur le bord gauche. En outre, le nouveau modèle comporte un port USB-A de moins que l'ancien.

À droite : casque d'écoute 3,5 mm, lecteur MicroSD, USB-A 3.2 Gen. 2, HDMI 2.1
Gauche : 2x USB-C 4.0 Thunderbolt 4 avec DisplayPort 1.4 + Power Delivery 3.0

Lecteur de carte SD

SD Card Reader
average JPG Copy Test (av. of 3 runs)
MSI Summit E16 Flip A12UDT-031
Intel Core i7-1280P (AV Pro SD microSD 128 GB V60)
177.7 MB/s +75%
MSI Summit A16 AI Plus A3HMTG
AMD Ryzen AI 9 365 (AV Pro SD microSD 128 GB V60)
101.3 MB/s
Lenovo Yoga 7 2-in-1 16IML9
Intel Core Ultra 5 125U (AV Pro SD microSD 128 GB V60)
84.83 MB/s -16%
Asus ExpertBook B5 Flip B5602FBN
Intel Core i7-1260P (AV Pro SD microSD 128 GB V60)
17.7 MB/s -83%
maximum AS SSD Seq Read Test (1GB)
MSI Summit A16 AI Plus A3HMTG
AMD Ryzen AI 9 365 (AV Pro SD microSD 128 GB V60)
196.1 MB/s
MSI Summit E16 Flip A12UDT-031
Intel Core i7-1280P (AV Pro SD microSD 128 GB V60)
173.2 MB/s -12%
Lenovo Yoga 7 2-in-1 16IML9
Intel Core Ultra 5 125U (AV Pro SD microSD 128 GB V60)
90.22 MB/s -54%
Asus ExpertBook B5 Flip B5602FBN
Intel Core i7-1260P (AV Pro SD microSD 128 GB V60)
26.8 MB/s -86%

Communication

Un Qualcomm FastConnect 7800 est fourni en standard pour la prise en charge du Wi-Fi 7 et du Bluetooth 5.4. Les performances sont fiables, mais pas aussi rapides que nous l'espérions par rapport à l'Intel AX211, plus courant.

Networking
iperf3 transmit AXE11000
MSI Summit E16 Flip A12UDT-031
Killer Wi-Fi 6E AX1675i 160MHz Wireless Network Adapter
1347 (1110min - 1403max) MBit/s +187%
HP Spectre x360 16 RTX 4050
Intel Wi-Fi 6E AX211
1172 (756min - 1362max) MBit/s +149%
LG gram Pro 2-in-1 16T90SP
Intel Wi-Fi 6E AX211
944 (477min - 984max) MBit/s +101%
Lenovo Yoga 7 2-in-1 16IML9
Intel Wi-Fi 6E AX211
709 (595min - 781max) MBit/s +51%
MSI Summit A16 AI Plus A3HMTG
Qualcomm FastConnect 7800
470 (180min - 587max) MBit/s
iperf3 receive AXE11000
MSI Summit E16 Flip A12UDT-031
Killer Wi-Fi 6E AX1675i 160MHz Wireless Network Adapter
1526 (846min - 1719max) MBit/s +210%
HP Spectre x360 16 RTX 4050
Intel Wi-Fi 6E AX211
1429 (1235min - 1517max) MBit/s +190%
LG gram Pro 2-in-1 16T90SP
Intel Wi-Fi 6E AX211
956 (485min - 1007max) MBit/s +94%
Lenovo Yoga 7 2-in-1 16IML9
Intel Wi-Fi 6E AX211
814 (710min - 867max) MBit/s +65%
MSI Summit A16 AI Plus A3HMTG
Qualcomm FastConnect 7800
492 (335min - 605max) MBit/s
iperf3 transmit AXE11000 6GHz
LG gram Pro 2-in-1 16T90SP
Intel Wi-Fi 6E AX211
1648 (830min - 1744max) MBit/s +94%
Asus ExpertBook B5 Flip B5602FBN
Intel Wi-Fi 6E AX211
1548 (1461min - 1613max) MBit/s +83%
HP Spectre x360 16 RTX 4050
Intel Wi-Fi 6E AX211
1227 (1085min - 1274max) MBit/s +45%
Lenovo Yoga 7 2-in-1 16IML9
Intel Wi-Fi 6E AX211
1052 (678min - 1199max) MBit/s +24%
MSI Summit A16 AI Plus A3HMTG
Qualcomm FastConnect 7800
848 (442min - 893max) MBit/s
iperf3 receive AXE11000 6GHz
LG gram Pro 2-in-1 16T90SP
Intel Wi-Fi 6E AX211
1763 (880min - 1830max) MBit/s +90%
Asus ExpertBook B5 Flip B5602FBN
Intel Wi-Fi 6E AX211
1629 (1558min - 1653max) MBit/s +76%
HP Spectre x360 16 RTX 4050
Intel Wi-Fi 6E AX211
1320 (1256min - 1381max) MBit/s +42%
Lenovo Yoga 7 2-in-1 16IML9
Intel Wi-Fi 6E AX211
1300 (1261min - 1348max) MBit/s +40%
MSI Summit A16 AI Plus A3HMTG
Qualcomm FastConnect 7800
928 (716min - 992max) MBit/s
050100150200250300350400450500550600650700750800850900950Tooltip
MSI Summit A16 AI Plus A3HMTG; iperf3 transmit AXE11000 6GHz; iperf 3.1.3: Ø833 (442-893)
MSI Summit A16 AI Plus A3HMTG; iperf3 receive AXE11000 6GHz; iperf 3.1.3: Ø928 (716-992)

Webcam

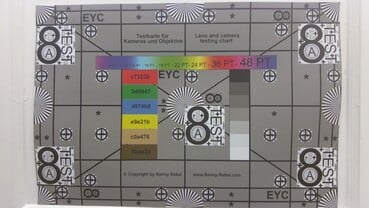
La webcam de 2 mégapixels avec infrarouge et obturateur physique reste inchangée.
ColorChecker
9.3 ∆E
8.5 ∆E
19.7 ∆E
20.7 ∆E
17.9 ∆E
10.5 ∆E
5.8 ∆E
17.4 ∆E
11.7 ∆E
18.5 ∆E
8 ∆E
8.9 ∆E
9 ∆E
14.5 ∆E
13.1 ∆E
4.4 ∆E
12.1 ∆E
16.9 ∆E
7.2 ∆E
3.6 ∆E
12 ∆E
17.3 ∆E
17.1 ∆E
9.4 ∆E
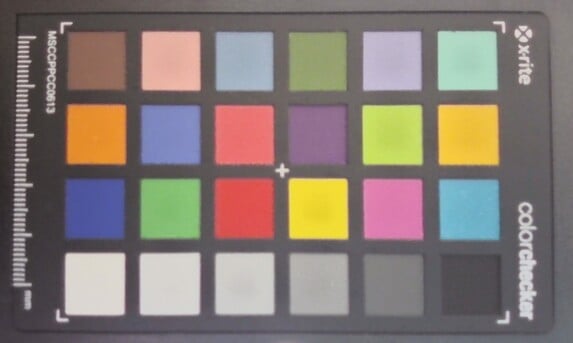
ColorChecker MSI Summit A16 AI Plus A3HMTG: 12.23 ∆E min: 3.58 - max: 20.74 ∆E

Maintenance

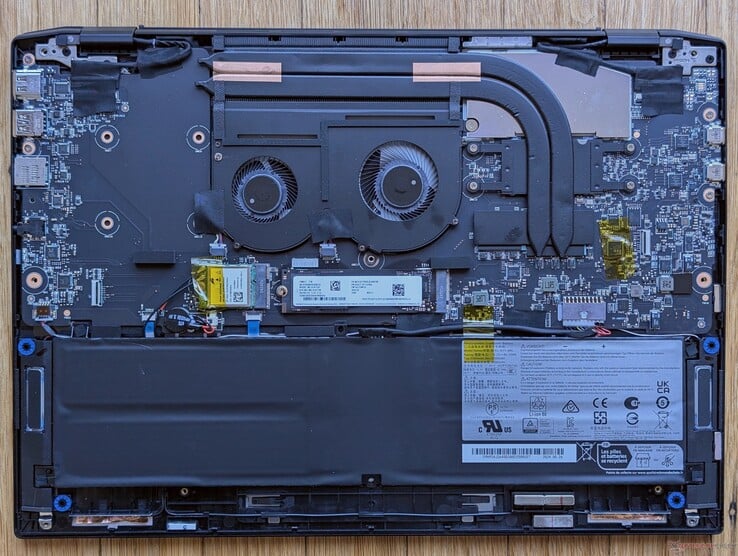
Un autocollant anti-sabotage doit être brisé pour pouvoir retirer le panneau inférieur. A l'intérieur, le modèle est similaire à l'ancien Summit E16 Flip, mais sans GPU dédié, comme le montre l'espace inoccupé à gauche des ventilateurs.

2024 Sommet A16 AI Plus
2022 Summit E16 Flip

Durabilité

MSI n'annonce aucune mesure de développement durable pour la fabrication du modèle. L'emballage est essentiellement composé de carton et de papier, avec quelques emballages en plastique pour les accessoires.

Accessoires et garantie

Le coffret comprend le stylet actif MSI Pen 2 qui prend en charge Microsoft MPP 2.6 et le retour haptique.

La garantie standard du fabricant, limitée à un an, s'applique.

Affichage

MSI n'a pas modifié l'écran tactile et notre modèle 2024 utilise la même dalle haut de gamme AU Optronics B16QAN02.N que celle du modèle 2022 pour une expérience visuelle identique. Ce n'est pas nécessairement une mauvaise chose car le panneau FreeSync permet des temps de réponse rapides, des couleurs P3 profondes et un taux de rafraîchissement élevé. Néanmoins, Windows HDR et le taux de rafraîchissement variable (VRR) auraient été des ajouts intéressants.
Notez que la luminosité maximale passe de 475 nits à 363 nits lorsque l'écran fonctionne sur batterie, à moins que la fonction AMD Vari-Bright ne soit désactivée.

Sous-pixels RVB nets et presque sans grain
Léger - modéré - saignement irrégulier du contre-jour dans les coins
447.3
cd/m²
440.2
cd/m²
447.4
cd/m²
431.8
cd/m²
475.4
cd/m²
430
cd/m²
422
cd/m²
437.2
cd/m²
427.2
cd/m²
Homogénéité de la luminosité
AU Optronics B16QAN02.N tested with X-Rite i1Pro 2
Maximum: 475.4 cd/m² (Nits) Moyenne: 439.8 cd/m² Minimum: 22.6 cd/m²
Homogénéité de la luminosité: 89 %
Valeur mesurée au centre, sur batterie: 475.4 cd/m²
Contraste: 1321:1 (Valeurs des noirs: 0.36 cd/m²)
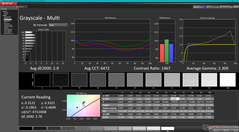
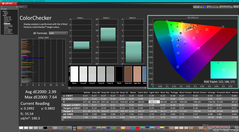
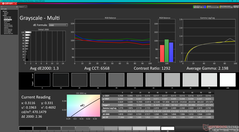
ΔE Color 2.99 | 0.5-29.43 Ø4.9, calibrated: 0.74
ΔE Greyscale 2.9 | 0.5-98 Ø5.2
84.7% AdobeRGB 1998 (Argyll 2.2.0 3D)
99.8% sRGB (Argyll 2.2.0 3D)
96.8% Display P3 (Argyll 2.2.0 3D)
Gamma: 2.31
MSI Summit A16 AI Plus A3HMTG
AU Optronics B16QAN02.N, IPS, 2560x1600, 16", 165 Hz
MSI Summit E16 Flip A12UDT-031
AU Optronics B16QAN02.N, IPS, 2560x1600, 16", 165 Hz
HP Spectre x360 16 RTX 4050
Samsung SDC41A6, OLED, 2880x1800, 16", 120 Hz
Asus ExpertBook B5 Flip B5602FBN
Samsung ATNA60YV02-0, OLED, 3840x2400, 16", 60 Hz
LG gram Pro 2-in-1 16T90SP
ATNA60CL06-0, OLED, 2880x1800, 16", 120 Hz
Lenovo Yoga 7 2-in-1 16IML9
LEN160FHD, IPS, 1920x1200, 16", 60 Hz
Display
1%
6%
-4%
4%
-49%
Display P3 Coverage
96.8
98.9
2%
99.6
3%
71.7
-26%
99.9
3%
40.9
-58%
sRGB Coverage
99.8
100
0%
100
0%
100
0%
100
0%
61.4
-38%
AdobeRGB 1998 Coverage
84.7
86.5
2%
96.7
14%
97.1
15%
92.7
9%
42.3
-50%
Response Times
-1%
92%
81%
18%
-147%
Response Time Grey 50% / Grey 80% *
12.9 ?(6.2, 6.7)
13 ?(6, 7)
-1%
0.78 ?(0.44, 0.34)
94%
2 ?(1, 1)
84%
14 ?(10.5, 3.5)
-9%
32.1 ?(15.3, 16.8)
-149%
Response Time Black / White *
8.9 ?(4.7, 4.2)
9 ?(5, 4)
-1%
0.86 ?(0.4, 0.46)
90%
2 ?(1, 1)
78%
5 ?(2.5, 2.5)
44%
21.8 ?(12.6, 9.2)
-145%
PWM Frequency
480 ?(100)
240 ?(50)
481
Screen
-10%
13%
297%
206%
-51%
Brightness middle
475.4
314
-34%
385.2
-19%
379
-20%
402
-15%
313.3
-34%
Brightness
440
294
-33%
387
-12%
382
-13%
403
-8%
294
-33%
Brightness Distribution
89
89
0%
99
11%
98
10%
99
11%
82
-8%
Black Level *
0.36
0.28
22%
0.01
97%
0.017
95%
0.35
3%
Contrast
1321
1121
-15%
37900
2769%
23647
1690%
895
-32%
Colorchecker dE 2000 *
2.99
3.08
-3%
1.73
42%
2.79
7%
1.67
44%
4.41
-47%
Colorchecker dE 2000 max. *
7.64
5.49
28%
3.95
48%
5.29
31%
2.87
62%
15.75
-106%
Colorchecker dE 2000 calibrated *
0.74
0.88
-19%
2.5
-238%
1.32
-78%
1.84
-149%
Greyscale dE 2000 *
2.9
3.99
-38%
2.6
10%
1.92
34%
1.27
56%
4.4
-52%
Gamma
2.31 95%
2.3 96%
2.17 101%
2.38 92%
2.25 98%
2.3 96%
CCT
6472 100%
6219 105%
6133 106%
6270 104%
6724 97%
7395 88%
Moyenne finale (programmes/paramètres)
-3% / -6%
37% / 26%
125% / 202%
76% / 136%
-82% / -64%

* ... Moindre est la valeur, meilleures sont les performances

vs. sRGB
vs. sRGB
vs. P3
vs. P3

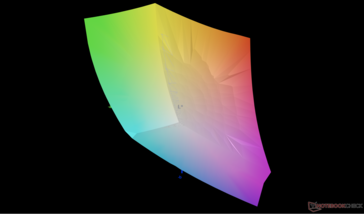
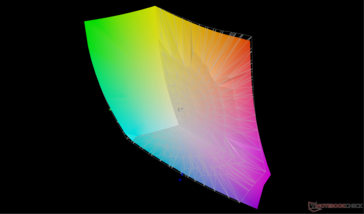
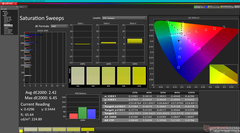
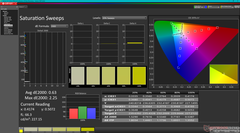
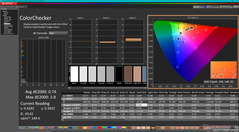
Le panneau est étalonné de manière satisfaisante par rapport à la norme P3, avec des valeurs moyennes de deltaE faibles.

Niveaux de gris avant étalonnage
Balayages de saturation avant étalonnage
ColorChecker avant étalonnage
Niveaux de gris après étalonnage
Balayages de saturation après étalonnage
ColorChecker après étalonnage

Temps de réponse de l'écran

Le temps de réponse d'un écran mesure la rapidité à laquelle l'écran est capable de changer une couleur pour une autre. Un temps de réponse élevé se traduit par une image floutée pour les objets en mouvement. Les joueurs bénéficieront de faibles latences d'affichage en jeu.
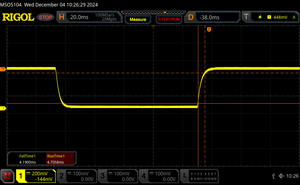
       Temps de réponse noir à blanc
8.9 ms ... hausse ↗ et chute ↘ combinées↗ 4.7 ms hausse
↘ 4.2 ms chute
L'écran montre de faibles temps de réponse, un bon écran pour jouer.
En comparaison, tous les appareils testés affichent entre 0.1 (minimum) et 240 (maximum) ms. » 21 % des appareils testés affichent de meilleures performances.
Cela signifie que les latences relevées sont meilleures que la moyenne (20.9 ms) de tous les appareils testés.
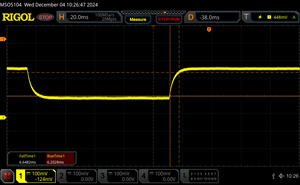
       Temps de réponse gris 50% à gris 80%
12.9 ms ... hausse ↗ et chute ↘ combinées↗ 6.2 ms hausse
↘ 6.7 ms chute
L'écran montre de bons temps de réponse, mais insuffisant pour du jeu compétitif.
En comparaison, tous les appareils testés affichent entre 0.165 (minimum) et 636 (maximum) ms. » 23 % des appareils testés affichent de meilleures performances.
Cela signifie que les latences relevées sont meilleures que la moyenne (32.8 ms) de tous les appareils testés.

Scintillement / MLI (Modulation de largeur d'impulsion)

Afin d'abaisser la luminosité de l'écran, certains ordinateurs portables font varier très rapidement le rétroéclairage entre éteint et allumé. La fréquence à laquelle le rétroéclairage s'éteint et se rallume est normalement fixée à une valeur qui permet de rendre la variation indétectable à l'œil nu? Si la fréquence est trop basse, certaines personnes peuvent être sujettes à une fatigue oculaire, des maux de tête ou même percevoir les variations.
Scintillement / MLI (Modulation de largeur d'impulsion) non décelé

En comparaison, 53 % des appareils testés n'emploient pas MDI pour assombrir leur écran. Nous avons relevé une moyenne à 8687 (minimum : 5 - maximum : 343500) Hz dans le cas où une MDI était active.

A l'extérieur, à l'ombre
A l'extérieur, sous la lumière du soleil
A l'extérieur, à l'ombre
Angles de vision IPS étendus

Performance


Conditions d'essai

Nous avons réglé Windows et le centre MSI sur le mode Performance avant d'effectuer les tests ci-dessous. Un mode séparé de ventilation maximale appelé mode Cooler Boost est également disponible.

Processeur

Performances brutes du processeur avec le Ryzen AI 9 365 est l'une des plus rapides de tous les ordinateurs portables 16 pouces non dédiés au jeu. Comparé au Summit E16 Flip 2022 et son Core i7-1280Pnotre processeur AMD est 20 à 25 % plus rapide. La durabilité des performances est également meilleure que prévu pour un convertible, sans baisse majeure au fil du temps lors de l'exécution en boucle de CineBench R15 xT.

Cinebench R15 Multi Loop

01452904355807258701015116013051450159517401885203021752320246526102755Tooltip
MSI Summit A16 AI Plus A3HMTG AMD Ryzen AI 9 365: Ø2784 (2638-2841.72)
MSI Summit E16 Flip A12UDT-031 Intel Core i7-1280P: Ø2059 (1955.03-2339.73)
HP Spectre x360 16 RTX 4050 Intel Core Ultra 7 155H: Ø1705 (1414.83-2302.95)
Asus ExpertBook B5 Flip B5602FBN Intel Core i7-1260P: Ø1613 (1568.63-2022.76)
LG gram Pro 2-in-1 16T90SP Intel Core Ultra 7 155H; Normal cooling mode: Ø1595 (1216.25-2200.1)
LG gram Pro 2-in-1 16T90SP Intel Core Ultra 7 155H; High cooling mode: Ø1742 (1692.19-2188.66)
Lenovo Yoga 7 2-in-1 16IML9 Intel Core Ultra 5 125U: Ø1351 (1250.47-1657.34)
CPU Performance Rating: Percent
Cinebench R23: Multi Core | Single Core
Cinebench R20: CPU (Multi Core) | CPU (Single Core)
Cinebench R15: CPU Multi 64Bit | CPU Single 64Bit
Blender: v2.79 BMW27 CPU
7-Zip 18.03: 7z b 4 | 7z b 4 -mmt1
Geekbench 6.3: Multi-Core | Single-Core
Geekbench 5.5: Multi-Core | Single-Core
HWBOT x265 Benchmark v2.2: 4k Preset
LibreOffice : 20 Documents To PDF
R Benchmark 2.5: Overall mean
CPU Performance Rating
MSI Summit A16 AI Plus A3HMTG
AMD Ryzen AI 9 365
86.1 pt
Asus Zenbook S 16 UM5606-RK333W
AMD Ryzen AI 9 HX 370
82.4 pt
Moyenne AMD Ryzen AI 9 365
 
81.7 pt
Framework Laptop 16
AMD Ryzen 9 7940HS
81.4 pt
Dell Inspiron 16 7640 2-in-1
Intel Core Ultra 7 155H
75.3 pt
Ninkear A16 Pro
AMD Ryzen 7 8845HS
74.9 pt
HP Spectre x360 16 RTX 4050 -1!
Intel Core Ultra 7 155H
73.2 pt
Asus Zenbook S 16 UM5606WA-RK052W
AMD Ryzen AI 9 365
72.5 pt
LG gram Pro 2-in-1 16T90SP -2!
Intel Core Ultra 7 155H
71.6 pt
Samsung Galaxy Book3 Ultra 16 -2!
Intel Core i7-13700H
70.8 pt
HP Envy x360 2-in-1 16-ad0097nr
AMD Ryzen 7 8840HS
69.3 pt
Acer Aspire 16 A16-51GM-77G2
Intel Core 7 150U
65.8 pt
Lenovo IdeaPad Slim 5 16IRU9
Intel Core 7 150U
62.6 pt
MSI Summit E16 Flip A12UDT-031 -2!
Intel Core i7-1280P
62.3 pt
Asus ExpertBook B5 Flip B5602FBN -2!
Intel Core i7-1260P
61.2 pt
Lenovo Yoga 7 2-in-1 16IML9
Intel Core Ultra 5 125U
55.4 pt
Lenovo ThinkPad E16 Gen 2 21M5002VGE
AMD Ryzen 5 7535HS
50.1 pt
Cinebench R23 / Multi Core
MSI Summit A16 AI Plus A3HMTG
AMD Ryzen AI 9 365
18698 (17017.2min - 18698.1max) Points
Moyenne AMD Ryzen AI 9 365
  (11462 - 18748, n=4)
16744 Points -10%
Asus Zenbook S 16 UM5606-RK333W
AMD Ryzen AI 9 HX 370
16522 Points -12%
Framework Laptop 16
AMD Ryzen 9 7940HS
16519 (16352.4min - 16518.9max) Points -12%
Dell Inspiron 16 7640 2-in-1
Intel Core Ultra 7 155H
15802 (14802min - 15802.2max) Points -15%
Samsung Galaxy Book3 Ultra 16
Intel Core i7-13700H
15306 Points -18%
HP Spectre x360 16 RTX 4050
Intel Core Ultra 7 155H
15154 (13865.9min - 15153.6max) Points -19%
Ninkear A16 Pro
AMD Ryzen 7 8845HS
15026 Points -20%
MSI Summit E16 Flip A12UDT-031
Intel Core i7-1280P
14803 Points -21%
HP Envy x360 2-in-1 16-ad0097nr
AMD Ryzen 7 8840HS
13082 (12624.7min - 13082.1max) Points -30%
LG gram Pro 2-in-1 16T90SP
Intel Core Ultra 7 155H
12282 Points -34%
Asus Zenbook S 16 UM5606WA-RK052W
AMD Ryzen AI 9 365
11462 Points -39%
Asus ExpertBook B5 Flip B5602FBN
Intel Core i7-1260P
11245 Points -40%
Lenovo IdeaPad Slim 5 16IRU9
Intel Core 7 150U
9895 (8061.94min - 9895.33max) Points -47%
Lenovo Yoga 7 2-in-1 16IML9
Intel Core Ultra 5 125U
9533 (8675.99min - 9532.96max) Points -49%
Acer Aspire 16 A16-51GM-77G2
Intel Core 7 150U
8692 Points -54%
Lenovo ThinkPad E16 Gen 2 21M5002VGE
AMD Ryzen 5 7535HS
8613 Points -54%
Cinebench R23 / Single Core
Acer Aspire 16 A16-51GM-77G2
Intel Core 7 150U
2032 Points +3%
MSI Summit A16 AI Plus A3HMTG
AMD Ryzen AI 9 365
1980 Points
Moyenne AMD Ryzen AI 9 365
  (1942 - 1992, n=4)
1977 Points 0%
Asus Zenbook S 16 UM5606-RK333W
AMD Ryzen AI 9 HX 370
1953 Points -1%
Asus Zenbook S 16 UM5606WA-RK052W
AMD Ryzen AI 9 365
1942 Points -2%
Lenovo IdeaPad Slim 5 16IRU9
Intel Core 7 150U
1873 Points -5%
Asus ExpertBook B5 Flip B5602FBN
Intel Core i7-1260P
1774 Points -10%
Dell Inspiron 16 7640 2-in-1
Intel Core Ultra 7 155H
1756 Points -11%
HP Envy x360 2-in-1 16-ad0097nr
AMD Ryzen 7 8840HS
1745 Points -12%
Ninkear A16 Pro
AMD Ryzen 7 8845HS
1737 Points -12%
Framework Laptop 16
AMD Ryzen 9 7940HS
1733 Points -12%
HP Spectre x360 16 RTX 4050
Intel Core Ultra 7 155H
1708 Points -14%
Samsung Galaxy Book3 Ultra 16
Intel Core i7-13700H
1698 Points -14%
LG gram Pro 2-in-1 16T90SP
Intel Core Ultra 7 155H
1692 Points -15%
MSI Summit E16 Flip A12UDT-031
Intel Core i7-1280P
1647 Points -17%
Lenovo Yoga 7 2-in-1 16IML9
Intel Core Ultra 5 125U
1548 Points -22%
Lenovo ThinkPad E16 Gen 2 21M5002VGE
AMD Ryzen 5 7535HS
1445 Points -27%
Cinebench R20 / CPU (Multi Core)
MSI Summit A16 AI Plus A3HMTG
AMD Ryzen AI 9 365
7303 Points
Moyenne AMD Ryzen AI 9 365
  (5247 - 7346, n=4)
6738 Points -8%
Asus Zenbook S 16 UM5606-RK333W
AMD Ryzen AI 9 HX 370
6469 Points -11%
Framework Laptop 16
AMD Ryzen 9 7940HS
6402 Points -12%
Dell Inspiron 16 7640 2-in-1
Intel Core Ultra 7 155H
6185 Points -15%
Samsung Galaxy Book3 Ultra 16
Intel Core i7-13700H
5926 Points -19%
Ninkear A16 Pro
AMD Ryzen 7 8845HS
5883 Points -19%
HP Spectre x360 16 RTX 4050
Intel Core Ultra 7 155H
5609 Points -23%
MSI Summit E16 Flip A12UDT-031
Intel Core i7-1280P
5415 Points -26%
Asus Zenbook S 16 UM5606WA-RK052W
AMD Ryzen AI 9 365
5247 Points -28%
HP Envy x360 2-in-1 16-ad0097nr
AMD Ryzen 7 8840HS
4994 Points -32%
LG gram Pro 2-in-1 16T90SP
Intel Core Ultra 7 155H
4687 Points -36%
Asus ExpertBook B5 Flip B5602FBN
Intel Core i7-1260P
4027 Points -45%
Lenovo IdeaPad Slim 5 16IRU9
Intel Core 7 150U
3790 Points -48%
Lenovo Yoga 7 2-in-1 16IML9
Intel Core Ultra 5 125U
3720 Points -49%
Acer Aspire 16 A16-51GM-77G2
Intel Core 7 150U
3370 Points -54%
Lenovo ThinkPad E16 Gen 2 21M5002VGE
AMD Ryzen 5 7535HS
3333 Points -54%
Cinebench R20 / CPU (Single Core)
Acer Aspire 16 A16-51GM-77G2
Intel Core 7 150U
782 Points 0%
MSI Summit A16 AI Plus A3HMTG
AMD Ryzen AI 9 365
781 Points
Moyenne AMD Ryzen AI 9 365
  (758 - 785, n=4)
777 Points -1%
Asus Zenbook S 16 UM5606-RK333W
AMD Ryzen AI 9 HX 370
772 Points -1%
Asus Zenbook S 16 UM5606WA-RK052W
AMD Ryzen AI 9 365
758 Points -3%
Lenovo IdeaPad Slim 5 16IRU9
Intel Core 7 150U
699 Points -10%
Framework Laptop 16
AMD Ryzen 9 7940HS
680 Points -13%
Asus ExpertBook B5 Flip B5602FBN
Intel Core i7-1260P
674 Points -14%
Ninkear A16 Pro
AMD Ryzen 7 8845HS
673 Points -14%
Dell Inspiron 16 7640 2-in-1
Intel Core Ultra 7 155H
667 Points -15%
HP Spectre x360 16 RTX 4050
Intel Core Ultra 7 155H
663 Points -15%
Samsung Galaxy Book3 Ultra 16
Intel Core i7-13700H
657 Points -16%
LG gram Pro 2-in-1 16T90SP
Intel Core Ultra 7 155H
651 Points -17%
HP Envy x360 2-in-1 16-ad0097nr
AMD Ryzen 7 8840HS
649 Points -17%
MSI Summit E16 Flip A12UDT-031
Intel Core i7-1280P
634 Points -19%
Lenovo Yoga 7 2-in-1 16IML9
Intel Core Ultra 5 125U
605 Points -23%
Lenovo ThinkPad E16 Gen 2 21M5002VGE
AMD Ryzen 5 7535HS
560 Points -28%
Cinebench R15 / CPU Multi 64Bit
MSI Summit A16 AI Plus A3HMTG
AMD Ryzen AI 9 365
2842 (2638min - 2841.72max) Points
Dell Inspiron 16 7640 2-in-1
Intel Core Ultra 7 155H
2680 (2205.8min - 2679.71max) Points -6%
Framework Laptop 16
AMD Ryzen 9 7940HS
2653 (2587.82min - 2652.52max) Points -7%
Moyenne AMD Ryzen AI 9 365
  (1950 - 2855, n=4)
2605 Points -8%
Samsung Galaxy Book3 Ultra 16
Intel Core i7-13700H
2515 Points -12%
Asus Zenbook S 16 UM5606-RK333W
AMD Ryzen AI 9 HX 370
2498.13 (2382.65min - 2498.13max) Points -12%
Ninkear A16 Pro
AMD Ryzen 7 8845HS
2342 (2329.51min - 2341.78max) Points -18%
MSI Summit E16 Flip A12UDT-031
Intel Core i7-1280P
2332 Points -18%
HP Spectre x360 16 RTX 4050
Intel Core Ultra 7 155H
2303 (1414.83min - 2302.95max) Points -19%
LG gram Pro 2-in-1 16T90SP
Intel Core Ultra 7 155H
2200 (1216.25min - 2200.1max) Points -23%
LG gram Pro 2-in-1 16T90SP
Intel Core Ultra 7 155H
2189 (1692.19min - 2188.66max) Points -23%
HP Envy x360 2-in-1 16-ad0097nr
AMD Ryzen 7 8840HS
2045 (1885.73min - 2044.68max) Points -28%
Asus ExpertBook B5 Flip B5602FBN
Intel Core i7-1260P
2034 Points -28%
Asus Zenbook S 16 UM5606WA-RK052W
AMD Ryzen AI 9 365
1950 (1686.84min - 1949.7max) Points -31%
Lenovo Yoga 7 2-in-1 16IML9
Intel Core Ultra 5 125U
1657 (1250.47min - 1657.34max) Points -42%
Acer Aspire 16 A16-51GM-77G2
Intel Core 7 150U
1549 (1306.93min - 1549.25max) Points -45%
Lenovo IdeaPad Slim 5 16IRU9
Intel Core 7 150U
1462 (1223.84min - 1461.77max) Points -49%
Lenovo ThinkPad E16 Gen 2 21M5002VGE
AMD Ryzen 5 7535HS
1457 (1361.47min - 1456.93max) Points -49%
Cinebench R15 / CPU Single 64Bit
MSI Summit A16 AI Plus A3HMTG
AMD Ryzen AI 9 365
302 Points
Moyenne AMD Ryzen AI 9 365
  (293 - 305, n=4)
301 Points 0%
Asus Zenbook S 16 UM5606-RK333W
AMD Ryzen AI 9 HX 370
298 Points -1%
Asus Zenbook S 16 UM5606WA-RK052W
AMD Ryzen AI 9 365
293 Points -3%
Acer Aspire 16 A16-51GM-77G2
Intel Core 7 150U
290 Points -4%
Framework Laptop 16
AMD Ryzen 9 7940HS
277 Points -8%
Ninkear A16 Pro
AMD Ryzen 7 8845HS
272 Points -10%
HP Envy x360 2-in-1 16-ad0097nr
AMD Ryzen 7 8840HS
261 Points -14%
Dell Inspiron 16 7640 2-in-1
Intel Core Ultra 7 155H
256 Points -15%
HP Spectre x360 16 RTX 4050
Intel Core Ultra 7 155H
255 Points -16%
Lenovo IdeaPad Slim 5 16IRU9
Intel Core 7 150U
250 Points -17%
Samsung Galaxy Book3 Ultra 16
Intel Core i7-13700H
246 Points -19%
Asus ExpertBook B5 Flip B5602FBN
Intel Core i7-1260P
241 Points -20%
LG gram Pro 2-in-1 16T90SP
Intel Core Ultra 7 155H
240 Points -21%
MSI Summit E16 Flip A12UDT-031
Intel Core i7-1280P
238 Points -21%
Lenovo ThinkPad E16 Gen 2 21M5002VGE
AMD Ryzen 5 7535HS
232 Points -23%
Lenovo Yoga 7 2-in-1 16IML9
Intel Core Ultra 5 125U
226 Points -25%
Blender / v2.79 BMW27 CPU
Lenovo ThinkPad E16 Gen 2 21M5002VGE
AMD Ryzen 5 7535HS
467 Seconds * -167%
Lenovo IdeaPad Slim 5 16IRU9
Intel Core 7 150U
360 Seconds * -106%
Lenovo Yoga 7 2-in-1 16IML9
Intel Core Ultra 5 125U
358 Seconds * -105%
Acer Aspire 16 A16-51GM-77G2
Intel Core 7 150U
356 Seconds * -103%
MSI Summit E16 Flip A12UDT-031
Intel Core i7-1280P
309 Seconds * -77%
Asus ExpertBook B5 Flip B5602FBN
Intel Core i7-1260P
291 Seconds * -66%
LG gram Pro 2-in-1 16T90SP
Intel Core Ultra 7 155H
276 Seconds * -58%
Asus Zenbook S 16 UM5606WA-RK052W
AMD Ryzen AI 9 365
270 Seconds * -54%
HP Envy x360 2-in-1 16-ad0097nr
AMD Ryzen 7 8840HS
246 Seconds * -41%
Samsung Galaxy Book3 Ultra 16
Intel Core i7-13700H
221 Seconds * -26%
Ninkear A16 Pro
AMD Ryzen 7 8845HS
216 Seconds * -23%
Moyenne AMD Ryzen AI 9 365
  (175 - 270, n=4)
211 Seconds * -21%
Dell Inspiron 16 7640 2-in-1
Intel Core Ultra 7 155H
209 Seconds * -19%
Framework Laptop 16
AMD Ryzen 9 7940HS
195 Seconds * -11%
Asus Zenbook S 16 UM5606-RK333W
AMD Ryzen AI 9 HX 370
192 Seconds * -10%
MSI Summit A16 AI Plus A3HMTG
AMD Ryzen AI 9 365
175 Seconds *
7-Zip 18.03 / 7z b 4
Framework Laptop 16
AMD Ryzen 9 7940HS
71464 MIPS +2%
MSI Summit A16 AI Plus A3HMTG
AMD Ryzen AI 9 365
69773 MIPS
Asus Zenbook S 16 UM5606-RK333W
AMD Ryzen AI 9 HX 370
67615 MIPS -3%
Ninkear A16 Pro
AMD Ryzen 7 8845HS
65460 MIPS -6%
Dell Inspiron 16 7640 2-in-1
Intel Core Ultra 7 155H
63597 MIPS -9%
Samsung Galaxy Book3 Ultra 16
Intel Core i7-13700H
60842 MIPS -13%
Moyenne AMD Ryzen AI 9 365
  (47754 - 69773, n=4)
60706 MIPS -13%
HP Spectre x360 16 RTX 4050
Intel Core Ultra 7 155H
60099 MIPS -14%
HP Envy x360 2-in-1 16-ad0097nr
AMD Ryzen 7 8840HS
54768 MIPS -22%
LG gram Pro 2-in-1 16T90SP
Intel Core Ultra 7 155H
51695 MIPS -26%
Asus Zenbook S 16 UM5606WA-RK052W
AMD Ryzen AI 9 365
47754 MIPS -32%
Asus ExpertBook B5 Flip B5602FBN
Intel Core i7-1260P
46214 MIPS -34%
MSI Summit E16 Flip A12UDT-031
Intel Core i7-1280P
45292 MIPS -35%
Lenovo ThinkPad E16 Gen 2 21M5002VGE
AMD Ryzen 5 7535HS
40996 MIPS -41%
Lenovo IdeaPad Slim 5 16IRU9
Intel Core 7 150U
39286 MIPS -44%
Lenovo Yoga 7 2-in-1 16IML9
Intel Core Ultra 5 125U
39065 MIPS -44%
Acer Aspire 16 A16-51GM-77G2
Intel Core 7 150U
37914 MIPS -46%
7-Zip 18.03 / 7z b 4 -mmt1
Framework Laptop 16
AMD Ryzen 9 7940HS
6599 MIPS +14%
Acer Aspire 16 A16-51GM-77G2
Intel Core 7 150U
6261 MIPS +8%
Asus Zenbook S 16 UM5606-RK333W
AMD Ryzen AI 9 HX 370
6063 MIPS +5%
Asus Zenbook S 16 UM5606WA-RK052W
AMD Ryzen AI 9 365
6012 MIPS +4%
Moyenne AMD Ryzen AI 9 365
  (5790 - 6062, n=4)
5948 MIPS +3%
HP Envy x360 2-in-1 16-ad0097nr
AMD Ryzen 7 8840HS
5912 MIPS +2%
MSI Summit A16 AI Plus A3HMTG
AMD Ryzen AI 9 365
5790 MIPS
Lenovo IdeaPad Slim 5 16IRU9
Intel Core 7 150U
5745 MIPS -1%
Ninkear A16 Pro
AMD Ryzen 7 8845HS
5662 MIPS -2%
Asus ExpertBook B5 Flip B5602FBN
Intel Core i7-1260P
5611 MIPS -3%
Samsung Galaxy Book3 Ultra 16
Intel Core i7-13700H
5510 MIPS -5%
Dell Inspiron 16 7640 2-in-1
Intel Core Ultra 7 155H
5374 MIPS -7%
LG gram Pro 2-in-1 16T90SP
Intel Core Ultra 7 155H
5219 MIPS -10%
Lenovo ThinkPad E16 Gen 2 21M5002VGE
AMD Ryzen 5 7535HS
5206 MIPS -10%
MSI Summit E16 Flip A12UDT-031
Intel Core i7-1280P
5190 MIPS -10%
HP Spectre x360 16 RTX 4050
Intel Core Ultra 7 155H
5125 MIPS -11%
Lenovo Yoga 7 2-in-1 16IML9
Intel Core Ultra 5 125U
4492 MIPS -22%
Geekbench 6.3 / Multi-Core
MSI Summit A16 AI Plus A3HMTG
AMD Ryzen AI 9 365
14513 Points
Moyenne AMD Ryzen AI 9 365
  (12627 - 14513, n=4)
13862 Points -4%
Asus Zenbook S 16 UM5606-RK333W
AMD Ryzen AI 9 HX 370
13648 Points -6%
Framework Laptop 16
AMD Ryzen 9 7940HS
13217 Points -9%
Ninkear A16 Pro
AMD Ryzen 7 8845HS
13056 Points -10%
Asus Zenbook S 16 UM5606WA-RK052W
AMD Ryzen AI 9 365
12627 Points -13%
Dell Inspiron 16 7640 2-in-1
Intel Core Ultra 7 155H
12243 Points -16%
HP Spectre x360 16 RTX 4050
Intel Core Ultra 7 155H
11962 Points -18%
HP Envy x360 2-in-1 16-ad0097nr
AMD Ryzen 7 8840HS
11081 Points -24%
LG gram Pro 2-in-1 16T90SP
Intel Core Ultra 7 155H
10921 Points -25%
Acer Aspire 16 A16-51GM-77G2
Intel Core 7 150U
10160 Points -30%
Lenovo Yoga 7 2-in-1 16IML9
Intel Core Ultra 5 125U
9601 Points -34%
Lenovo IdeaPad Slim 5 16IRU9
Intel Core 7 150U
9319 Points -36%
Lenovo ThinkPad E16 Gen 2 21M5002VGE
AMD Ryzen 5 7535HS
8094 Points -44%
Geekbench 6.3 / Single-Core
MSI Summit A16 AI Plus A3HMTG
AMD Ryzen AI 9 365
2814 Points
Moyenne AMD Ryzen AI 9 365
  (2778 - 2830, n=4)
2809 Points 0%
Asus Zenbook S 16 UM5606-RK333W
AMD Ryzen AI 9 HX 370
2785 Points -1%
Acer Aspire 16 A16-51GM-77G2
Intel Core 7 150U
2781 Points -1%
Asus Zenbook S 16 UM5606WA-RK052W
AMD Ryzen AI 9 365
2778 Points -1%
Lenovo IdeaPad Slim 5 16IRU9
Intel Core 7 150U
2665 Points -5%
Framework Laptop 16
AMD Ryzen 9 7940HS
2630 Points -7%
Ninkear A16 Pro
AMD Ryzen 7 8845HS
2618 Points -7%
HP Envy x360 2-in-1 16-ad0097nr
AMD Ryzen 7 8840HS
2525 Points -10%
Dell Inspiron 16 7640 2-in-1
Intel Core Ultra 7 155H
2356 Points -16%
HP Spectre x360 16 RTX 4050
Intel Core Ultra 7 155H
2288 Points -19%
Lenovo Yoga 7 2-in-1 16IML9
Intel Core Ultra 5 125U
2148 Points -24%
Lenovo ThinkPad E16 Gen 2 21M5002VGE
AMD Ryzen 5 7535HS
1988 Points -29%
LG gram Pro 2-in-1 16T90SP
Intel Core Ultra 7 155H
1901 Points -32%
Geekbench 5.5 / Multi-Core
MSI Summit A16 AI Plus A3HMTG
AMD Ryzen AI 9 365
13172 Points
Asus Zenbook S 16 UM5606-RK333W
AMD Ryzen AI 9 HX 370
12487 Points -5%
Framework Laptop 16
AMD Ryzen 9 7940HS
12379 Points -6%
Dell Inspiron 16 7640 2-in-1
Intel Core Ultra 7 155H
12331 Points -6%
Moyenne AMD Ryzen AI 9 365
  (9599 - 13172, n=4)
12110 Points -8%
HP Spectre x360 16 RTX 4050
Intel Core Ultra 7 155H
12053 Points -8%
Ninkear A16 Pro
AMD Ryzen 7 8845HS
11516 Points -13%
Samsung Galaxy Book3 Ultra 16
Intel Core i7-13700H
11497 Points -13%
LG gram Pro 2-in-1 16T90SP
Intel Core Ultra 7 155H
10548 Points -20%
HP Envy x360 2-in-1 16-ad0097nr
AMD Ryzen 7 8840HS
9949 Points -24%
MSI Summit E16 Flip A12UDT-031
Intel Core i7-1280P
9623 Points -27%
Asus Zenbook S 16 UM5606WA-RK052W
AMD Ryzen AI 9 365
9599 Points -27%
Asus ExpertBook B5 Flip B5602FBN
Intel Core i7-1260P
9571 Points -27%
Lenovo Yoga 7 2-in-1 16IML9
Intel Core Ultra 5 125U
8355 Points -37%
Acer Aspire 16 A16-51GM-77G2
Intel Core 7 150U
8354 Points -37%
Lenovo IdeaPad Slim 5 16IRU9
Intel Core 7 150U
8186 Points -38%
Lenovo ThinkPad E16 Gen 2 21M5002VGE
AMD Ryzen 5 7535HS
7189 Points -45%
Geekbench 5.5 / Single-Core
Asus Zenbook S 16 UM5606-RK333W
AMD Ryzen AI 9 HX 370
2078 Points +1%
Moyenne AMD Ryzen AI 9 365
  (2062 - 2095, n=4)
2072 Points 0%
Asus Zenbook S 16 UM5606WA-RK052W
AMD Ryzen AI 9 365
2065 Points 0%
MSI Summit A16 AI Plus A3HMTG
AMD Ryzen AI 9 365
2062 Points
Acer Aspire 16 A16-51GM-77G2
Intel Core 7 150U
1969 Points -5%
Framework Laptop 16
AMD Ryzen 9 7940HS
1963 Points -5%
Lenovo IdeaPad Slim 5 16IRU9
Intel Core 7 150U
1909 Points -7%
HP Envy x360 2-in-1 16-ad0097nr
AMD Ryzen 7 8840HS
1894 Points -8%
Ninkear A16 Pro
AMD Ryzen 7 8845HS
1816 Points -12%
Dell Inspiron 16 7640 2-in-1
Intel Core Ultra 7 155H
1760 Points -15%
LG gram Pro 2-in-1 16T90SP
Intel Core Ultra 7 155H
1738 Points -16%
HP Spectre x360 16 RTX 4050
Intel Core Ultra 7 155H
1731 Points -16%
Samsung Galaxy Book3 Ultra 16
Intel Core i7-13700H
1692 Points -18%
MSI Summit E16 Flip A12UDT-031
Intel Core i7-1280P
1631 Points -21%
Lenovo Yoga 7 2-in-1 16IML9
Intel Core Ultra 5 125U
1560 Points -24%
Asus ExpertBook B5 Flip B5602FBN
Intel Core i7-1260P
1528 Points -26%
Lenovo ThinkPad E16 Gen 2 21M5002VGE
AMD Ryzen 5 7535HS
1481 Points -28%
HWBOT x265 Benchmark v2.2 / 4k Preset
MSI Summit A16 AI Plus A3HMTG
AMD Ryzen AI 9 365
22.4 fps
Framework Laptop 16
AMD Ryzen 9 7940HS
21 fps -6%
Asus Zenbook S 16 UM5606-RK333W
AMD Ryzen AI 9 HX 370
20.3 fps -9%
Moyenne AMD Ryzen AI 9 365
  (18.6 - 22.4, n=4)
20.3 fps -9%
Ninkear A16 Pro
AMD Ryzen 7 8845HS
18.7 fps -17%
Asus Zenbook S 16 UM5606WA-RK052W
AMD Ryzen AI 9 365
18.6 fps -17%
Dell Inspiron 16 7640 2-in-1
Intel Core Ultra 7 155H
17.9 fps -20%
Samsung Galaxy Book3 Ultra 16
Intel Core i7-13700H
16.8 fps -25%
HP Spectre x360 16 RTX 4050
Intel Core Ultra 7 155H
16.4 fps -27%
HP Envy x360 2-in-1 16-ad0097nr
AMD Ryzen 7 8840HS
15.7 fps -30%
Asus ExpertBook B5 Flip B5602FBN
Intel Core i7-1260P
12.7 fps -43%
MSI Summit E16 Flip A12UDT-031
Intel Core i7-1280P
11.8 fps -47%
Lenovo ThinkPad E16 Gen 2 21M5002VGE
AMD Ryzen 5 7535HS
11.3 fps -50%
LG gram Pro 2-in-1 16T90SP
Intel Core Ultra 7 155H
11.2 fps -50%
Lenovo Yoga 7 2-in-1 16IML9
Intel Core Ultra 5 125U
11.1 fps -50%
Lenovo IdeaPad Slim 5 16IRU9
Intel Core 7 150U
11.1 fps -50%
Acer Aspire 16 A16-51GM-77G2
Intel Core 7 150U
9.17 fps -59%
LibreOffice / 20 Documents To PDF
Lenovo ThinkPad E16 Gen 2 21M5002VGE
AMD Ryzen 5 7535HS
57 s * -9%
Asus Zenbook S 16 UM5606WA-RK052W
AMD Ryzen AI 9 365
54.9 s * -5%
Moyenne AMD Ryzen AI 9 365
  (50.8 - 59.5, n=4)
54.3 s * -4%
MSI Summit E16 Flip A12UDT-031
Intel Core i7-1280P
52.5 s * -1%
MSI Summit A16 AI Plus A3HMTG
AMD Ryzen AI 9 365
52.1 s *
HP Envy x360 2-in-1 16-ad0097nr
AMD Ryzen 7 8840HS
51.7 s * +1%
Ninkear A16 Pro
AMD Ryzen 7 8845HS
51.7 s * +1%
Asus ExpertBook B5 Flip B5602FBN
Intel Core i7-1260P
49.8 s * +4%
Samsung Galaxy Book3 Ultra 16
Intel Core i7-13700H
49.6 s * +5%
Asus Zenbook S 16 UM5606-RK333W
AMD Ryzen AI 9 HX 370
49.6 s * +5%
Lenovo Yoga 7 2-in-1 16IML9
Intel Core Ultra 5 125U
47 s * +10%
Dell Inspiron 16 7640 2-in-1
Intel Core Ultra 7 155H
45.6 s * +12%
HP Spectre x360 16 RTX 4050
Intel Core Ultra 7 155H
45.3 s * +13%
Framework Laptop 16
AMD Ryzen 9 7940HS
43.6 s * +16%
Lenovo IdeaPad Slim 5 16IRU9
Intel Core 7 150U
38.2 s * +27%
Acer Aspire 16 A16-51GM-77G2
Intel Core 7 150U
29 s * +44%
R Benchmark 2.5 / Overall mean
Lenovo ThinkPad E16 Gen 2 21M5002VGE
AMD Ryzen 5 7535HS
0.557 sec * -32%
Lenovo Yoga 7 2-in-1 16IML9
Intel Core Ultra 5 125U
0.533 sec * -27%
MSI Summit E16 Flip A12UDT-031
Intel Core i7-1280P
0.512 sec * -22%
Ninkear A16 Pro
AMD Ryzen 7 8845HS
0.4908 sec * -17%
HP Spectre x360 16 RTX 4050
Intel Core Ultra 7 155H
0.4907 sec * -17%
Samsung Galaxy Book3 Ultra 16
Intel Core i7-13700H
0.489 sec * -16%
Asus ExpertBook B5 Flip B5602FBN
Intel Core i7-1260P
0.4839 sec * -15%
Dell Inspiron 16 7640 2-in-1
Intel Core Ultra 7 155H
0.4837 sec * -15%
HP Envy x360 2-in-1 16-ad0097nr
AMD Ryzen 7 8840HS
0.4638 sec * -10%
Framework Laptop 16
AMD Ryzen 9 7940HS
0.4467 sec * -6%
Lenovo IdeaPad Slim 5 16IRU9
Intel Core 7 150U
0.443 sec * -5%
Acer Aspire 16 A16-51GM-77G2
Intel Core 7 150U
0.4386 sec * -4%
Asus Zenbook S 16 UM5606WA-RK052W
AMD Ryzen AI 9 365
0.4272 sec * -1%
Asus Zenbook S 16 UM5606-RK333W
AMD Ryzen AI 9 HX 370
0.4257 sec * -1%
MSI Summit A16 AI Plus A3HMTG
AMD Ryzen AI 9 365
0.4209 sec *
Moyenne AMD Ryzen AI 9 365
  (0.4142 - 0.4272, n=4)
0.4206 sec * -0%
CPU Performance Rating: Percent
Cinebench R23: Multi Core | Single Core
Cinebench R20: CPU (Multi Core) | CPU (Single Core)
Cinebench R15: CPU Multi 64Bit | CPU Single 64Bit
Blender: v2.79 BMW27 CPU
7-Zip 18.03: 7z b 4 | 7z b 4 -mmt1
Geekbench 6.3: Multi-Core | Single-Core
Geekbench 5.5: Multi-Core | Single-Core
HWBOT x265 Benchmark v2.2: 4k Preset
LibreOffice : 20 Documents To PDF
R Benchmark 2.5: Overall mean

* ... Moindre est la valeur, meilleures sont les performances

Cinebench R15 CPU Multi 64Bit
2842 Points
Cinebench R15 OpenGL 64Bit
257 fps
Cinebench R15 Ref. Match 64Bit
97.9 %
Cinebench R15 CPU Single 64Bit
302 Points
Cinebench R20 CPU (Multi Core)
7303 Points
Cinebench R20 CPU (Single Core)
781 Points
Cinebench R23 Multi Core
18698 Points
Cinebench R23 Single Core
1980 Points
Cinebench 2024 CPU Single Core
112.4 Points
Cinebench 2024 CPU Multi Core
989 Points
Aide
Performance Rating
MSI Summit A16 AI Plus A3HMTG
AMD Ryzen AI 9 365, Radeon 880M
99.2 pt
Moyenne AMD Ryzen AI 9 365
 
89.7 pt
HP Spectre x360 16 RTX 4050
Intel Core Ultra 7 155H, NVIDIA GeForce RTX 4050 Laptop GPU
70 pt
MSI Summit E16 Flip A12UDT-031
Intel Core i7-1280P, GeForce RTX 3050 Ti Laptop GPU
66.1 pt
LG gram Pro 2-in-1 16T90SP
Intel Core Ultra 7 155H, Arc 8-Core
57.7 pt
Asus ExpertBook B5 Flip B5602FBN
Intel Core i7-1260P, A350M
51.9 pt
Lenovo Yoga 7 2-in-1 16IML9
Intel Core Ultra 5 125U, Graphics 4-Core
48 pt
AIDA64 / FP32 Ray-Trace
MSI Summit A16 AI Plus A3HMTG
AMD Ryzen AI 9 365, Radeon 880M
29594 KRay/s
Moyenne AMD Ryzen AI 9 365
  (17096 - 29902, n=4)
26302 KRay/s -11%
HP Spectre x360 16 RTX 4050
Intel Core Ultra 7 155H, NVIDIA GeForce RTX 4050 Laptop GPU
13917 KRay/s -53%
MSI Summit E16 Flip A12UDT-031
Intel Core i7-1280P, GeForce RTX 3050 Ti Laptop GPU
13068 KRay/s -56%
LG gram Pro 2-in-1 16T90SP
Intel Core Ultra 7 155H, Arc 8-Core
10362 KRay/s -65%
Asus ExpertBook B5 Flip B5602FBN
Intel Core i7-1260P, A350M
10010 KRay/s -66%
Lenovo Yoga 7 2-in-1 16IML9
Intel Core Ultra 5 125U, Graphics 4-Core
8556 KRay/s -71%
AIDA64 / FPU Julia
MSI Summit A16 AI Plus A3HMTG
AMD Ryzen AI 9 365, Radeon 880M
114033 Points
Moyenne AMD Ryzen AI 9 365
  (61976 - 114482, n=4)
99748 Points -13%
HP Spectre x360 16 RTX 4050
Intel Core Ultra 7 155H, NVIDIA GeForce RTX 4050 Laptop GPU
72948 Points -36%
MSI Summit E16 Flip A12UDT-031
Intel Core i7-1280P, GeForce RTX 3050 Ti Laptop GPU
66081 Points -42%
LG gram Pro 2-in-1 16T90SP
Intel Core Ultra 7 155H, Arc 8-Core
54824 Points -52%
Asus ExpertBook B5 Flip B5602FBN
Intel Core i7-1260P, A350M
50608 Points -56%
Lenovo Yoga 7 2-in-1 16IML9
Intel Core Ultra 5 125U, Graphics 4-Core
44602 Points -61%
AIDA64 / CPU SHA3
MSI Summit A16 AI Plus A3HMTG
AMD Ryzen AI 9 365, Radeon 880M
4841 MB/s
Moyenne AMD Ryzen AI 9 365
  (2951 - 4841, n=4)
4318 MB/s -11%
HP Spectre x360 16 RTX 4050
Intel Core Ultra 7 155H, NVIDIA GeForce RTX 4050 Laptop GPU
3360 MB/s -31%
MSI Summit E16 Flip A12UDT-031
Intel Core i7-1280P, GeForce RTX 3050 Ti Laptop GPU
2992 MB/s -38%
LG gram Pro 2-in-1 16T90SP
Intel Core Ultra 7 155H, Arc 8-Core
2552 MB/s -47%
Asus ExpertBook B5 Flip B5602FBN
Intel Core i7-1260P, A350M
2426 MB/s -50%
Lenovo Yoga 7 2-in-1 16IML9
Intel Core Ultra 5 125U, Graphics 4-Core
2312 MB/s -52%
AIDA64 / CPU Queen
MSI Summit E16 Flip A12UDT-031
Intel Core i7-1280P, GeForce RTX 3050 Ti Laptop GPU
100358 Points +9%
MSI Summit A16 AI Plus A3HMTG
AMD Ryzen AI 9 365, Radeon 880M
91947 Points
Moyenne AMD Ryzen AI 9 365
  (85333 - 93045, n=4)
89457 Points -3%
HP Spectre x360 16 RTX 4050
Intel Core Ultra 7 155H, NVIDIA GeForce RTX 4050 Laptop GPU
81755 Points -11%
Asus ExpertBook B5 Flip B5602FBN
Intel Core i7-1260P, A350M
80849 Points -12%
LG gram Pro 2-in-1 16T90SP
Intel Core Ultra 7 155H, Arc 8-Core
75626 Points -18%
Lenovo Yoga 7 2-in-1 16IML9
Intel Core Ultra 5 125U, Graphics 4-Core
47712 Points -48%
AIDA64 / FPU SinJulia
MSI Summit A16 AI Plus A3HMTG
AMD Ryzen AI 9 365, Radeon 880M
16315 Points
Moyenne AMD Ryzen AI 9 365
  (11586 - 16315, n=4)
14982 Points -8%
HP Spectre x360 16 RTX 4050
Intel Core Ultra 7 155H, NVIDIA GeForce RTX 4050 Laptop GPU
9622 Points -41%
MSI Summit E16 Flip A12UDT-031
Intel Core i7-1280P, GeForce RTX 3050 Ti Laptop GPU
8571 Points -47%
LG gram Pro 2-in-1 16T90SP
Intel Core Ultra 7 155H, Arc 8-Core
8086 Points -50%
Asus ExpertBook B5 Flip B5602FBN
Intel Core i7-1260P, A350M
6758 Points -59%
Lenovo Yoga 7 2-in-1 16IML9
Intel Core Ultra 5 125U, Graphics 4-Core
5507 Points -66%
AIDA64 / FPU Mandel
MSI Summit A16 AI Plus A3HMTG
AMD Ryzen AI 9 365, Radeon 880M
61249 Points
Moyenne AMD Ryzen AI 9 365
  (33409 - 61298, n=4)
53468 Points -13%
HP Spectre x360 16 RTX 4050
Intel Core Ultra 7 155H, NVIDIA GeForce RTX 4050 Laptop GPU
35607 Points -42%
MSI Summit E16 Flip A12UDT-031
Intel Core i7-1280P, GeForce RTX 3050 Ti Laptop GPU
32766 Points -47%
LG gram Pro 2-in-1 16T90SP
Intel Core Ultra 7 155H, Arc 8-Core
26864 Points -56%
Asus ExpertBook B5 Flip B5602FBN
Intel Core i7-1260P, A350M
25256 Points -59%
Lenovo Yoga 7 2-in-1 16IML9
Intel Core Ultra 5 125U, Graphics 4-Core
23731 Points -61%
AIDA64 / CPU AES
MSI Summit A16 AI Plus A3HMTG
AMD Ryzen AI 9 365, Radeon 880M
69801 MB/s
HP Spectre x360 16 RTX 4050
Intel Core Ultra 7 155H, NVIDIA GeForce RTX 4050 Laptop GPU
68741 MB/s -2%
MSI Summit E16 Flip A12UDT-031
Intel Core i7-1280P, GeForce RTX 3050 Ti Laptop GPU
63453 MB/s -9%
Moyenne AMD Ryzen AI 9 365
  (47468 - 69801, n=4)
62457 MB/s -11%
LG gram Pro 2-in-1 16T90SP
Intel Core Ultra 7 155H, Arc 8-Core
54754 MB/s -22%
Asus ExpertBook B5 Flip B5602FBN
Intel Core i7-1260P, A350M
49610 MB/s -29%
Lenovo Yoga 7 2-in-1 16IML9
Intel Core Ultra 5 125U, Graphics 4-Core
46209 MB/s -34%
AIDA64 / CPU ZLib
MSI Summit A16 AI Plus A3HMTG
AMD Ryzen AI 9 365, Radeon 880M
1243 MB/s
Moyenne AMD Ryzen AI 9 365
  (706 - 1243, n=4)
1084 MB/s -13%
HP Spectre x360 16 RTX 4050
Intel Core Ultra 7 155H, NVIDIA GeForce RTX 4050 Laptop GPU
996 MB/s -20%
MSI Summit E16 Flip A12UDT-031
Intel Core i7-1280P, GeForce RTX 3050 Ti Laptop GPU
879 MB/s -29%
LG gram Pro 2-in-1 16T90SP
Intel Core Ultra 7 155H, Arc 8-Core
774 MB/s -38%
Asus ExpertBook B5 Flip B5602FBN
Intel Core i7-1260P, A350M
714 MB/s -43%
Lenovo Yoga 7 2-in-1 16IML9
Intel Core Ultra 5 125U, Graphics 4-Core
709 MB/s -43%
AIDA64 / FP64 Ray-Trace
MSI Summit A16 AI Plus A3HMTG
AMD Ryzen AI 9 365, Radeon 880M
16065 KRay/s
Moyenne AMD Ryzen AI 9 365
  (9061 - 16159, n=4)
14157 KRay/s -12%
HP Spectre x360 16 RTX 4050
Intel Core Ultra 7 155H, NVIDIA GeForce RTX 4050 Laptop GPU
7241 KRay/s -55%
MSI Summit E16 Flip A12UDT-031
Intel Core i7-1280P, GeForce RTX 3050 Ti Laptop GPU
7184 KRay/s -55%
LG gram Pro 2-in-1 16T90SP
Intel Core Ultra 7 155H, Arc 8-Core
5498 KRay/s -66%
Asus ExpertBook B5 Flip B5602FBN
Intel Core i7-1260P, A350M
5430 KRay/s -66%
Lenovo Yoga 7 2-in-1 16IML9
Intel Core Ultra 5 125U, Graphics 4-Core
4297 KRay/s -73%
AIDA64 / CPU PhotoWorxx
MSI Summit A16 AI Plus A3HMTG
AMD Ryzen AI 9 365, Radeon 880M
50260 MPixel/s
Moyenne AMD Ryzen AI 9 365
  (47654 - 50517, n=4)
49569 MPixel/s -1%
LG gram Pro 2-in-1 16T90SP
Intel Core Ultra 7 155H, Arc 8-Core
48837 MPixel/s -3%
HP Spectre x360 16 RTX 4050
Intel Core Ultra 7 155H, NVIDIA GeForce RTX 4050 Laptop GPU
48831 MPixel/s -3%
Lenovo Yoga 7 2-in-1 16IML9
Intel Core Ultra 5 125U, Graphics 4-Core
47564 MPixel/s -5%
MSI Summit E16 Flip A12UDT-031
Intel Core i7-1280P, GeForce RTX 3050 Ti Laptop GPU
42750 MPixel/s -15%
Asus ExpertBook B5 Flip B5602FBN
Intel Core i7-1260P, A350M
32871 MPixel/s -35%

Test de stress

Système en veille
Système en veille

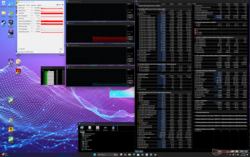
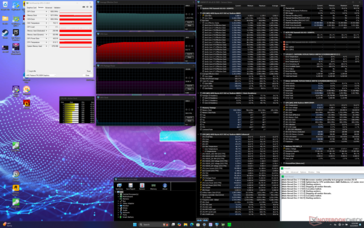
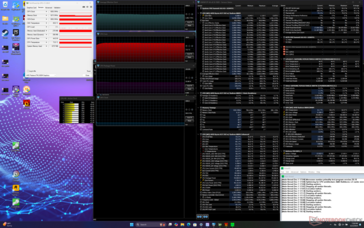
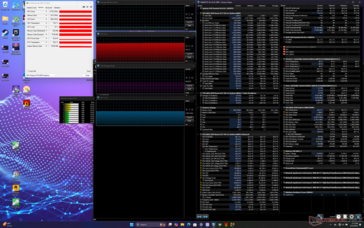
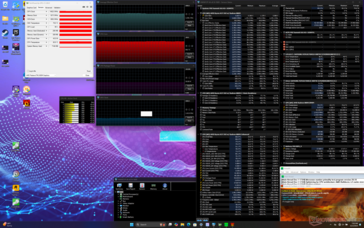
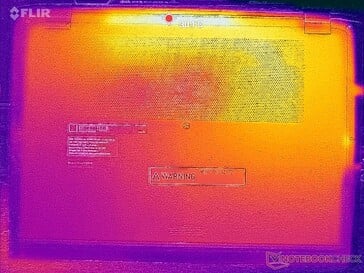
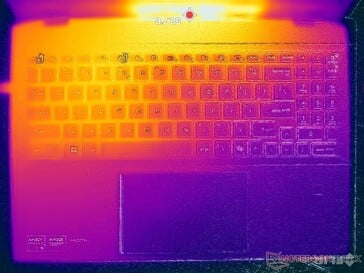
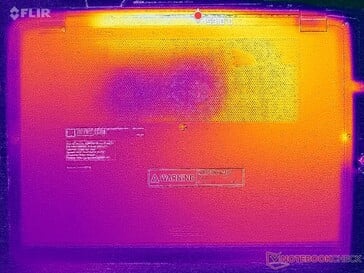
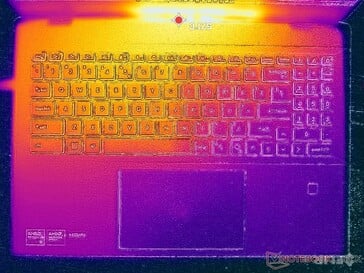
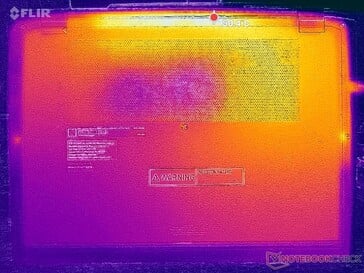
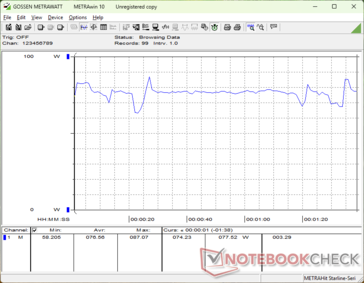
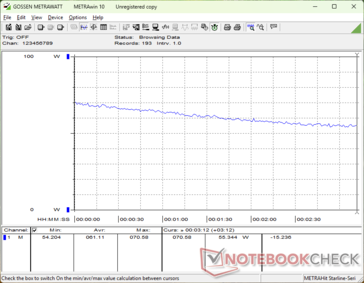
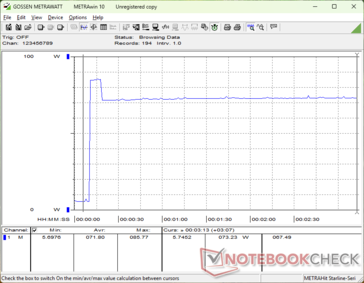
Lors du lancement du stress Prime95, le CPU atteint 3,8 GHz et 71 W pendant les premières secondes avant de redescendre à 3,2 GHz et 50 W. La température du cœur se stabilise à 82 °C si Cooler Boost est désactivé ou à 74 °C si Cooler Boost est activé. L'objectif principal de cette fonction est de réduire la température du cœur et non d'augmenter directement les performances.

Si vous jouez, la température du cœur se stabilisera à 75°C, contre 72°C sur le HP Spectre x360 16, qui est plus performant HP Spectre x360 16 doté d'une carte graphique RTX 4050 plus rapide.

Prime95 stress (Cooler Boost désactivé)
Prime95 stress (Cooler Boost activé)
Cyberpunk 2077 stress
Prime95+FurMark stress
Horloge moyenne du CPU (GHz) Horloge du GPU (MHz) Température moyenne du CPU (°C)
Système au repos -- -- 32
Prime95 Stress (Cooler Boost off) 3.2 -- 82
Prime95 Stress (Cooler Boost on) 3.1 -- 74
Prime95 + FurMark Stress 3.2 1412 81
Cyberpunk 2077 Stress 0.7 2787 75

Performance du système

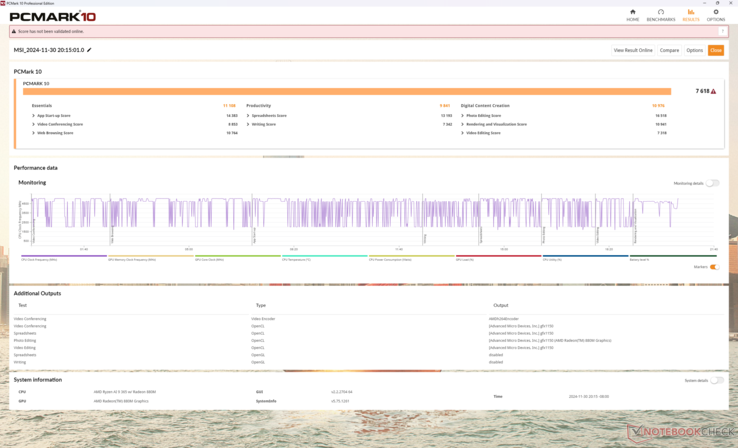
Les résultats de PCMark sont parmi les plus élevés dans la catégorie des ordinateurs convertibles de 16 pouces, grâce à la rapidité du processeur Zen 5 et du GPU intégré.

PCMark 10 Standard
PCMark 10 Standard
PCMark 10 / Score
MSI Summit A16 AI Plus A3HMTG
Radeon 880M, Ryzen AI 9 365
7618 Points
Moyenne AMD Ryzen AI 9 365, AMD Radeon 880M
  (7045 - 7641, n=4)
7475 Points -2%
HP Spectre x360 16 RTX 4050
NVIDIA GeForce RTX 4050 Laptop GPU, Ultra 7 155H, SK hynix PC801 HFS001TEJ9X101N
6720 Points -12%
LG gram Pro 2-in-1 16T90SP
Arc 8-Core, Ultra 7 155H, SK hynix PC801 HFS001TEJ9X101N
6339 Points -17%
MSI Summit E16 Flip A12UDT-031
GeForce RTX 3050 Ti Laptop GPU, i7-1280P, Samsung PM9A1 MZVL22T0HBLB
5984 Points -21%
Lenovo Yoga 7 2-in-1 16IML9
Graphics 4-Core, Ultra 5 125U, SK hynix HFS512GEJ4X112N
5895 Points -23%
Asus ExpertBook B5 Flip B5602FBN
A350M, i7-1260P, WD PC SN735 SDBPNHH-1T00
5609 Points -26%
PCMark 10 / Essentials
MSI Summit A16 AI Plus A3HMTG
Radeon 880M, Ryzen AI 9 365
11108 Points
Moyenne AMD Ryzen AI 9 365, AMD Radeon 880M
  (10421 - 11140, n=4)
10924 Points -2%
Lenovo Yoga 7 2-in-1 16IML9
Graphics 4-Core, Ultra 5 125U, SK hynix HFS512GEJ4X112N
10827 Points -3%
HP Spectre x360 16 RTX 4050
NVIDIA GeForce RTX 4050 Laptop GPU, Ultra 7 155H, SK hynix PC801 HFS001TEJ9X101N
10326 Points -7%
LG gram Pro 2-in-1 16T90SP
Arc 8-Core, Ultra 7 155H, SK hynix PC801 HFS001TEJ9X101N
10239 Points -8%
MSI Summit E16 Flip A12UDT-031
GeForce RTX 3050 Ti Laptop GPU, i7-1280P, Samsung PM9A1 MZVL22T0HBLB
9687 Points -13%
Asus ExpertBook B5 Flip B5602FBN
A350M, i7-1260P, WD PC SN735 SDBPNHH-1T00
9411 Points -15%
PCMark 10 / Productivity
Moyenne AMD Ryzen AI 9 365, AMD Radeon 880M
  (9841 - 10293, n=4)
10118 Points +3%
MSI Summit A16 AI Plus A3HMTG
Radeon 880M, Ryzen AI 9 365
9841 Points
HP Spectre x360 16 RTX 4050
NVIDIA GeForce RTX 4050 Laptop GPU, Ultra 7 155H, SK hynix PC801 HFS001TEJ9X101N
9272 Points -6%
LG gram Pro 2-in-1 16T90SP
Arc 8-Core, Ultra 7 155H, SK hynix PC801 HFS001TEJ9X101N
8517 Points -13%
Lenovo Yoga 7 2-in-1 16IML9
Graphics 4-Core, Ultra 5 125U, SK hynix HFS512GEJ4X112N
7712 Points -22%
MSI Summit E16 Flip A12UDT-031
GeForce RTX 3050 Ti Laptop GPU, i7-1280P, Samsung PM9A1 MZVL22T0HBLB
7521 Points -24%
Asus ExpertBook B5 Flip B5602FBN
A350M, i7-1260P, WD PC SN735 SDBPNHH-1T00
6728 Points -32%
PCMark 10 / Digital Content Creation
MSI Summit A16 AI Plus A3HMTG
Radeon 880M, Ryzen AI 9 365
10976 Points
Moyenne AMD Ryzen AI 9 365, AMD Radeon 880M
  (8973 - 10976, n=4)
10274 Points -6%
HP Spectre x360 16 RTX 4050
NVIDIA GeForce RTX 4050 Laptop GPU, Ultra 7 155H, SK hynix PC801 HFS001TEJ9X101N
8602 Points -22%
MSI Summit E16 Flip A12UDT-031
GeForce RTX 3050 Ti Laptop GPU, i7-1280P, Samsung PM9A1 MZVL22T0HBLB
7980 Points -27%
LG gram Pro 2-in-1 16T90SP
Arc 8-Core, Ultra 7 155H, SK hynix PC801 HFS001TEJ9X101N
7928 Points -28%
Asus ExpertBook B5 Flip B5602FBN
A350M, i7-1260P, WD PC SN735 SDBPNHH-1T00
7562 Points -31%
Lenovo Yoga 7 2-in-1 16IML9
Graphics 4-Core, Ultra 5 125U, SK hynix HFS512GEJ4X112N
6658 Points -39%
CrossMark / Overall
MSI Summit A16 AI Plus A3HMTG
Radeon 880M, Ryzen AI 9 365
1733 Points
Moyenne AMD Ryzen AI 9 365, AMD Radeon 880M
  (1658 - 1742, n=3)
1711 Points -1%
Asus ExpertBook B5 Flip B5602FBN
A350M, i7-1260P, WD PC SN735 SDBPNHH-1T00
1687 Points -3%
MSI Summit E16 Flip A12UDT-031
GeForce RTX 3050 Ti Laptop GPU, i7-1280P, Samsung PM9A1 MZVL22T0HBLB
1652 Points -5%
Lenovo Yoga 7 2-in-1 16IML9
Graphics 4-Core, Ultra 5 125U, SK hynix HFS512GEJ4X112N
1648 Points -5%
HP Spectre x360 16 RTX 4050
NVIDIA GeForce RTX 4050 Laptop GPU, Ultra 7 155H, SK hynix PC801 HFS001TEJ9X101N
1574 Points -9%
LG gram Pro 2-in-1 16T90SP
Arc 8-Core, Ultra 7 155H, SK hynix PC801 HFS001TEJ9X101N
1557 Points -10%
CrossMark / Productivity
Asus ExpertBook B5 Flip B5602FBN
A350M, i7-1260P, WD PC SN735 SDBPNHH-1T00
1663 Points +4%
MSI Summit A16 AI Plus A3HMTG
Radeon 880M, Ryzen AI 9 365
1593 Points
MSI Summit E16 Flip A12UDT-031
GeForce RTX 3050 Ti Laptop GPU, i7-1280P, Samsung PM9A1 MZVL22T0HBLB
1583 Points -1%
Moyenne AMD Ryzen AI 9 365, AMD Radeon 880M
  (1508 - 1596, n=3)
1566 Points -2%
LG gram Pro 2-in-1 16T90SP
Arc 8-Core, Ultra 7 155H, SK hynix PC801 HFS001TEJ9X101N
1506 Points -5%
HP Spectre x360 16 RTX 4050
NVIDIA GeForce RTX 4050 Laptop GPU, Ultra 7 155H, SK hynix PC801 HFS001TEJ9X101N
1496 Points -6%
Lenovo Yoga 7 2-in-1 16IML9
Graphics 4-Core, Ultra 5 125U, SK hynix HFS512GEJ4X112N
1310 Points -18%
CrossMark / Creativity
Moyenne AMD Ryzen AI 9 365, AMD Radeon 880M
  (2044 - 2074, n=3)
2064 Points +1%
MSI Summit A16 AI Plus A3HMTG
Radeon 880M, Ryzen AI 9 365
2044 Points
HP Spectre x360 16 RTX 4050
NVIDIA GeForce RTX 4050 Laptop GPU, Ultra 7 155H, SK hynix PC801 HFS001TEJ9X101N
1831 Points -10%
MSI Summit E16 Flip A12UDT-031
GeForce RTX 3050 Ti Laptop GPU, i7-1280P, Samsung PM9A1 MZVL22T0HBLB
1761 Points -14%
Asus ExpertBook B5 Flip B5602FBN
A350M, i7-1260P, WD PC SN735 SDBPNHH-1T00
1733 Points -15%
LG gram Pro 2-in-1 16T90SP
Arc 8-Core, Ultra 7 155H, SK hynix PC801 HFS001TEJ9X101N
1731 Points -15%
Lenovo Yoga 7 2-in-1 16IML9
Graphics 4-Core, Ultra 5 125U, SK hynix HFS512GEJ4X112N
1499 Points -27%
CrossMark / Responsiveness
Asus ExpertBook B5 Flip B5602FBN
A350M, i7-1260P, WD PC SN735 SDBPNHH-1T00
1625 Points +19%
MSI Summit E16 Flip A12UDT-031
GeForce RTX 3050 Ti Laptop GPU, i7-1280P, Samsung PM9A1 MZVL22T0HBLB
1550 Points +14%
MSI Summit A16 AI Plus A3HMTG
Radeon 880M, Ryzen AI 9 365
1360 Points
Moyenne AMD Ryzen AI 9 365, AMD Radeon 880M
  (1124 - 1360, n=3)
1276 Points -6%
LG gram Pro 2-in-1 16T90SP
Arc 8-Core, Ultra 7 155H, SK hynix PC801 HFS001TEJ9X101N
1251 Points -8%
HP Spectre x360 16 RTX 4050
NVIDIA GeForce RTX 4050 Laptop GPU, Ultra 7 155H, SK hynix PC801 HFS001TEJ9X101N
1167 Points -14%
Lenovo Yoga 7 2-in-1 16IML9
Graphics 4-Core, Ultra 5 125U, SK hynix HFS512GEJ4X112N
1066 Points -22%
WebXPRT 3 / Overall
MSI Summit A16 AI Plus A3HMTG
Radeon 880M, Ryzen AI 9 365
336 Points
Moyenne AMD Ryzen AI 9 365, AMD Radeon 880M
  (309 - 336, n=3)
322 Points -4%
Asus ExpertBook B5 Flip B5602FBN
A350M, i7-1260P, WD PC SN735 SDBPNHH-1T00
286 Points -15%
HP Spectre x360 16 RTX 4050
NVIDIA GeForce RTX 4050 Laptop GPU, Ultra 7 155H, SK hynix PC801 HFS001TEJ9X101N
278 Points -17%
LG gram Pro 2-in-1 16T90SP
Arc 8-Core, Ultra 7 155H, SK hynix PC801 HFS001TEJ9X101N
275 Points -18%
MSI Summit E16 Flip A12UDT-031
GeForce RTX 3050 Ti Laptop GPU, i7-1280P, Samsung PM9A1 MZVL22T0HBLB
261 Points -22%
Lenovo Yoga 7 2-in-1 16IML9
Graphics 4-Core, Ultra 5 125U, SK hynix HFS512GEJ4X112N
237 Points -29%
WebXPRT 4 / Overall
Moyenne AMD Ryzen AI 9 365, AMD Radeon 880M
  (255 - 330, n=5)
274 Points +3%
MSI Summit A16 AI Plus A3HMTG
Radeon 880M, Ryzen AI 9 365
267 Points
HP Spectre x360 16 RTX 4050
NVIDIA GeForce RTX 4050 Laptop GPU, Ultra 7 155H, SK hynix PC801 HFS001TEJ9X101N
255 Points -4%
LG gram Pro 2-in-1 16T90SP
Arc 8-Core, Ultra 7 155H, SK hynix PC801 HFS001TEJ9X101N
249 Points -7%
Asus ExpertBook B5 Flip B5602FBN
A350M, i7-1260P, WD PC SN735 SDBPNHH-1T00
237 Points -11%
MSI Summit E16 Flip A12UDT-031
GeForce RTX 3050 Ti Laptop GPU, i7-1280P, Samsung PM9A1 MZVL22T0HBLB
232 Points -13%
Lenovo Yoga 7 2-in-1 16IML9
Graphics 4-Core, Ultra 5 125U, SK hynix HFS512GEJ4X112N
227 Points -15%
Mozilla Kraken 1.1 / Total
Lenovo Yoga 7 2-in-1 16IML9
Graphics 4-Core, Ultra 5 125U, SK hynix HFS512GEJ4X112N
587 ms * -35%
MSI Summit E16 Flip A12UDT-031
GeForce RTX 3050 Ti Laptop GPU, i7-1280P, Samsung PM9A1 MZVL22T0HBLB
579 ms * -33%
LG gram Pro 2-in-1 16T90SP
Arc 8-Core, Ultra 7 155H, SK hynix PC801 HFS001TEJ9X101N
558 ms * -28%
Asus ExpertBook B5 Flip B5602FBN
A350M, i7-1260P, WD PC SN735 SDBPNHH-1T00
538 ms * -23%
HP Spectre x360 16 RTX 4050
NVIDIA GeForce RTX 4050 Laptop GPU, Ultra 7 155H, SK hynix PC801 HFS001TEJ9X101N
537 ms * -23%
Moyenne AMD Ryzen AI 9 365, AMD Radeon 880M
  (433 - 456, n=5)
445 ms * -2%
MSI Summit A16 AI Plus A3HMTG
Radeon 880M, Ryzen AI 9 365
436 ms *

* ... Moindre est la valeur, meilleures sont les performances

PCMark 10 Score
7618 points
Aide
AIDA64 / Memory Copy
Moyenne AMD Ryzen AI 9 365
  (88745 - 90113, n=4)
89247 MB/s 0%
MSI Summit A16 AI Plus A3HMTG
AMD Ryzen AI 9 365, Radeon 880M
89145 MB/s
LG gram Pro 2-in-1 16T90SP
Intel Core Ultra 7 155H, Arc 8-Core
85548 MB/s -4%
HP Spectre x360 16 RTX 4050
Intel Core Ultra 7 155H, NVIDIA GeForce RTX 4050 Laptop GPU
84352 MB/s -5%
Lenovo Yoga 7 2-in-1 16IML9
Intel Core Ultra 5 125U, Graphics 4-Core
82786 MB/s -7%
MSI Summit E16 Flip A12UDT-031
Intel Core i7-1280P, GeForce RTX 3050 Ti Laptop GPU
64695 MB/s -27%
Asus ExpertBook B5 Flip B5602FBN
Intel Core i7-1260P, A350M
48842 MB/s -45%
AIDA64 / Memory Read
MSI Summit A16 AI Plus A3HMTG
AMD Ryzen AI 9 365, Radeon 880M
98772 MB/s
Moyenne AMD Ryzen AI 9 365
  (89012 - 99376, n=4)
96095 MB/s -3%
HP Spectre x360 16 RTX 4050
Intel Core Ultra 7 155H, NVIDIA GeForce RTX 4050 Laptop GPU
86873 MB/s -12%
LG gram Pro 2-in-1 16T90SP
Intel Core Ultra 7 155H, Arc 8-Core
80994 MB/s -18%
MSI Summit E16 Flip A12UDT-031
Intel Core i7-1280P, GeForce RTX 3050 Ti Laptop GPU
65256 MB/s -34%
Lenovo Yoga 7 2-in-1 16IML9
Intel Core Ultra 5 125U, Graphics 4-Core
63131 MB/s -36%
Asus ExpertBook B5 Flip B5602FBN
Intel Core i7-1260P, A350M
52296 MB/s -47%
AIDA64 / Memory Write
Moyenne AMD Ryzen AI 9 365
  (93627 - 100507, n=4)
97121 MB/s +4%
MSI Summit A16 AI Plus A3HMTG
AMD Ryzen AI 9 365, Radeon 880M
93627 MB/s
HP Spectre x360 16 RTX 4050
Intel Core Ultra 7 155H, NVIDIA GeForce RTX 4050 Laptop GPU
93451 MB/s 0%
LG gram Pro 2-in-1 16T90SP
Intel Core Ultra 7 155H, Arc 8-Core
75922 MB/s -19%
Lenovo Yoga 7 2-in-1 16IML9
Intel Core Ultra 5 125U, Graphics 4-Core
62028 MB/s -34%
MSI Summit E16 Flip A12UDT-031
Intel Core i7-1280P, GeForce RTX 3050 Ti Laptop GPU
58868 MB/s -37%
Asus ExpertBook B5 Flip B5602FBN
Intel Core i7-1260P, A350M
50710 MB/s -46%
AIDA64 / Memory Latency
MSI Summit E16 Flip A12UDT-031
Intel Core i7-1280P, GeForce RTX 3050 Ti Laptop GPU
153.3 ns * -27%
Lenovo Yoga 7 2-in-1 16IML9
Intel Core Ultra 5 125U, Graphics 4-Core
149.8 ns * -24%
HP Spectre x360 16 RTX 4050
Intel Core Ultra 7 155H, NVIDIA GeForce RTX 4050 Laptop GPU
138.4 ns * -14%
LG gram Pro 2-in-1 16T90SP
Intel Core Ultra 7 155H, Arc 8-Core
136.9 ns * -13%
Moyenne AMD Ryzen AI 9 365
  (116.3 - 129.8, n=4)
121.7 ns * -0%
MSI Summit A16 AI Plus A3HMTG
AMD Ryzen AI 9 365, Radeon 880M
121.1 ns *
Asus ExpertBook B5 Flip B5602FBN
Intel Core i7-1260P, A350M
95.7 ns * +21%

* ... Moindre est la valeur, meilleures sont les performances

Latence DPC

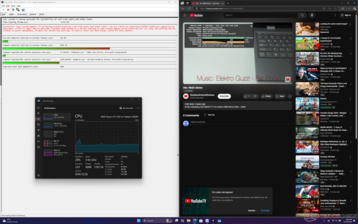
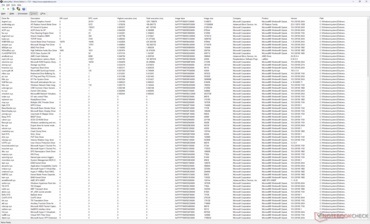
LatencyMon révèle des problèmes de DPC lors de l'ouverture de plusieurs onglets de notre page d'accueil. la lecture de vidéos 4K à 60 FPS est par ailleurs parfaite, sans aucune perte d'images.

LatencyMon
LatencyMon
Liste des conducteurs
DPC Latencies / LatencyMon - interrupt to process latency (max), Web, Youtube, Prime95
LG gram Pro 2-in-1 16T90SP
Arc 8-Core, Ultra 7 155H, SK hynix PC801 HFS001TEJ9X101N
6357.1 μs * -29%
HP Spectre x360 16 RTX 4050
NVIDIA GeForce RTX 4050 Laptop GPU, Ultra 7 155H, SK hynix PC801 HFS001TEJ9X101N
6156.4 μs * -25%
MSI Summit A16 AI Plus A3HMTG
Radeon 880M, Ryzen AI 9 365
4920.3 μs *
Asus ExpertBook B5 Flip B5602FBN
A350M, i7-1260P, WD PC SN735 SDBPNHH-1T00
1624 μs * +67%
MSI Summit E16 Flip A12UDT-031
GeForce RTX 3050 Ti Laptop GPU, i7-1280P, Samsung PM9A1 MZVL22T0HBLB
941.8 μs * +81%
Lenovo Yoga 7 2-in-1 16IML9
Graphics 4-Core, Ultra 5 125U, SK hynix HFS512GEJ4X112N
775.1 μs * +84%

* ... Moindre est la valeur, meilleures sont les performances

Dispositifs de stockage

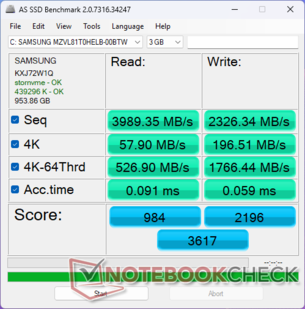
Notre appareil est livré avec le Samsung PM9C1 au lieu du PM9A1 que l'on trouve sur le modèle 2022. Malheureusement, le PM9C1 offre des taux de transfert plus lents de plus de 1500 MB/s comme le montre notre graphique de comparaison ci-dessous.

AS SSD
AS SSD
CDM 8
CDM 8
DiskSpd seq_q8t1_read: 5043MB/s
DiskSpd seq_q8t1_write: 3358MB/s
DiskSpd seq_read: 2400MB/s
DiskSpd seq_write: 2846MB/s
DiskSpd 4k_q32t16_read: 536MB/s
DiskSpd 4k_q32t16_write: 309MB/s
DiskSpd 4k_q1t1_read: 55.4MB/s
DiskSpd 4k_q1t1_write: 139.5MB/s
DiskSpd Loop seq_q8t1_read: 4828MB/s
Drive Performance Rating - Percent
MSI Summit E16 Flip A12UDT-031
Samsung PM9A1 MZVL22T0HBLB
93.7 pt
Asus ExpertBook B5 Flip B5602FBN
WD PC SN735 SDBPNHH-1T00
69.6 pt
LG gram Pro 2-in-1 16T90SP
SK hynix PC801 HFS001TEJ9X101N
69.1 pt
HP Spectre x360 16 RTX 4050
SK hynix PC801 HFS001TEJ9X101N
64.6 pt
MSI Summit A16 AI Plus A3HMTG -11!
 
50 pt
Lenovo Yoga 7 2-in-1 16IML9
SK hynix HFS512GEJ4X112N
36.7 pt
DiskSpd
seq read
LG gram Pro 2-in-1 16T90SP
SK hynix PC801 HFS001TEJ9X101N
4416 (4386.61min - 4415.53max) MB/s +84%
HP Spectre x360 16 RTX 4050
SK hynix PC801 HFS001TEJ9X101N
4195 (3890.22min - 4194.51max) MB/s +75%
MSI Summit E16 Flip A12UDT-031
Samsung PM9A1 MZVL22T0HBLB
3977 (3942.98min - 3977.02max) MB/s +66%
Lenovo Yoga 7 2-in-1 16IML9
SK hynix HFS512GEJ4X112N
2699 (2655.97min - 2699.09max) MB/s +12%
MSI Summit A16 AI Plus A3HMTG
 
2400 (2351.87min - 2400.42max) MB/s
Asus ExpertBook B5 Flip B5602FBN
WD PC SN735 SDBPNHH-1T00
1864 (1747.35min - 1863.53max) MB/s -22%
seq write
MSI Summit E16 Flip A12UDT-031
Samsung PM9A1 MZVL22T0HBLB
3790 (3739.64min - 3789.58max) MB/s +33%
MSI Summit A16 AI Plus A3HMTG
 
2846 (2762.16min - 2845.6max) MB/s
LG gram Pro 2-in-1 16T90SP
SK hynix PC801 HFS001TEJ9X101N
2828 (2746.39min - 2828.43max) MB/s -1%
Asus ExpertBook B5 Flip B5602FBN
WD PC SN735 SDBPNHH-1T00
2744 (2684.9min - 2744.3max) MB/s -4%
HP Spectre x360 16 RTX 4050
SK hynix PC801 HFS001TEJ9X101N
2569 (1593.04min - 2568.7max) MB/s -10%
Lenovo Yoga 7 2-in-1 16IML9
SK hynix HFS512GEJ4X112N
2007 (1120.16min - 2006.74max) MB/s -29%
seq q8 t1 read
HP Spectre x360 16 RTX 4050
SK hynix PC801 HFS001TEJ9X101N
7152 (6200.23min - 7151.67max) MB/s +42%
LG gram Pro 2-in-1 16T90SP
SK hynix PC801 HFS001TEJ9X101N
7145 (6269.27min - 7144.76max) MB/s +42%
MSI Summit E16 Flip A12UDT-031
Samsung PM9A1 MZVL22T0HBLB
6677 (6052.53min - 6677.33max) MB/s +32%
MSI Summit A16 AI Plus A3HMTG
 
5043 (4486.65min - 5043.21max) MB/s
Lenovo Yoga 7 2-in-1 16IML9
SK hynix HFS512GEJ4X112N
4319 (3684.49min - 4319.04max) MB/s -14%
Asus ExpertBook B5 Flip B5602FBN
WD PC SN735 SDBPNHH-1T00
3571 (2783.76min - 3571.04max) MB/s -29%
seq q8 t1 write
LG gram Pro 2-in-1 16T90SP
SK hynix PC801 HFS001TEJ9X101N
5136 (4892.73min - 5135.51max) MB/s +53%
MSI Summit E16 Flip A12UDT-031
Samsung PM9A1 MZVL22T0HBLB
4937 (4850.71min - 4936.71max) MB/s +47%
HP Spectre x360 16 RTX 4050
SK hynix PC801 HFS001TEJ9X101N
4542 (1615.35min - 4542.01max) MB/s +35%
MSI Summit A16 AI Plus A3HMTG
 
3358 (3235.73min - 3358.37max) MB/s
Asus ExpertBook B5 Flip B5602FBN
WD PC SN735 SDBPNHH-1T00
2829 (2776.84min - 2828.85max) MB/s -16%
Lenovo Yoga 7 2-in-1 16IML9
SK hynix HFS512GEJ4X112N
2692 (2518.05min - 2692.39max) MB/s -20%
4k q1 t1 read
MSI Summit E16 Flip A12UDT-031
Samsung PM9A1 MZVL22T0HBLB
86 (85.32min - 86.04max) MB/s +55%
LG gram Pro 2-in-1 16T90SP
SK hynix PC801 HFS001TEJ9X101N
62.4 (61.71min - 62.36max) MB/s +13%
HP Spectre x360 16 RTX 4050
SK hynix PC801 HFS001TEJ9X101N
59.7 (57.49min - 59.7max) MB/s +8%
MSI Summit A16 AI Plus A3HMTG
 
55.4 (54.56min - 55.37max) MB/s
Asus ExpertBook B5 Flip B5602FBN
WD PC SN735 SDBPNHH-1T00
49.1 (41.93min - 49.1max) MB/s -11%
Lenovo Yoga 7 2-in-1 16IML9
SK hynix HFS512GEJ4X112N
42.4 (41.92min - 42.35max) MB/s -23%
4k q1 t1 write
Asus ExpertBook B5 Flip B5602FBN
WD PC SN735 SDBPNHH-1T00
326 (294.1min - 325.52max) MB/s +134%
MSI Summit E16 Flip A12UDT-031
Samsung PM9A1 MZVL22T0HBLB
231 (225.55min - 230.61max) MB/s +66%
MSI Summit A16 AI Plus A3HMTG
 
139.5 (135.28min - 139.54max) MB/s
LG gram Pro 2-in-1 16T90SP
SK hynix PC801 HFS001TEJ9X101N
95.5 (84.49min - 95.49max) MB/s -32%
HP Spectre x360 16 RTX 4050
SK hynix PC801 HFS001TEJ9X101N
77.7 (70.39min - 77.73max) MB/s -44%
Lenovo Yoga 7 2-in-1 16IML9
SK hynix HFS512GEJ4X112N
65.6 (57.11min - 65.62max) MB/s -53%
4k q32 t16 read
MSI Summit E16 Flip A12UDT-031
Samsung PM9A1 MZVL22T0HBLB
3523 (3505.63min - 3522.62max) MB/s +557%
Asus ExpertBook B5 Flip B5602FBN
WD PC SN735 SDBPNHH-1T00
2150 (2141.61min - 2149.81max) MB/s +301%
Lenovo Yoga 7 2-in-1 16IML9
SK hynix HFS512GEJ4X112N
607 (582.45min - 607.33max) MB/s +13%
MSI Summit A16 AI Plus A3HMTG
 
536 (529.03min - 536.13max) MB/s
LG gram Pro 2-in-1 16T90SP
SK hynix PC801 HFS001TEJ9X101N
419 (407.72min - 418.51max) MB/s -22%
HP Spectre x360 16 RTX 4050
SK hynix PC801 HFS001TEJ9X101N
353 (326.84min - 352.62max) MB/s -34%
4k q32 t16 write
MSI Summit E16 Flip A12UDT-031
Samsung PM9A1 MZVL22T0HBLB
2551 (2458.41min - 2551.26max) MB/s +726%
Asus ExpertBook B5 Flip B5602FBN
WD PC SN735 SDBPNHH-1T00
2350 (2283.36min - 2349.91max) MB/s +661%
Lenovo Yoga 7 2-in-1 16IML9
SK hynix HFS512GEJ4X112N
316 (305.01min - 315.67max) MB/s +2%
MSI Summit A16 AI Plus A3HMTG
 
309 (297.57min - 309.12max) MB/s
LG gram Pro 2-in-1 16T90SP
SK hynix PC801 HFS001TEJ9X101N
168.9 (160.24min - 168.85max) MB/s -45%
HP Spectre x360 16 RTX 4050
SK hynix PC801 HFS001TEJ9X101N
148.5 (140.69min - 148.5max) MB/s -52%
AS SSD
Score Total
MSI Summit E16 Flip A12UDT-031
Samsung PM9A1 MZVL22T0HBLB
7382 Points
Asus ExpertBook B5 Flip B5602FBN
WD PC SN735 SDBPNHH-1T00
5832 Points
LG gram Pro 2-in-1 16T90SP
SK hynix PC801 HFS001TEJ9X101N
4784 Points
HP Spectre x360 16 RTX 4050
SK hynix PC801 HFS001TEJ9X101N
4395 Points
Lenovo Yoga 7 2-in-1 16IML9
SK hynix HFS512GEJ4X112N
2591 Points
Score Read
MSI Summit E16 Flip A12UDT-031
Samsung PM9A1 MZVL22T0HBLB
2807 Points
Asus ExpertBook B5 Flip B5602FBN
WD PC SN735 SDBPNHH-1T00
2411 Points
LG gram Pro 2-in-1 16T90SP
SK hynix PC801 HFS001TEJ9X101N
1176 Points
Lenovo Yoga 7 2-in-1 16IML9
SK hynix HFS512GEJ4X112N
1054 Points
HP Spectre x360 16 RTX 4050
SK hynix PC801 HFS001TEJ9X101N
953 Points
Score Write
MSI Summit E16 Flip A12UDT-031
Samsung PM9A1 MZVL22T0HBLB
3195 Points
LG gram Pro 2-in-1 16T90SP
SK hynix PC801 HFS001TEJ9X101N
3097 Points
HP Spectre x360 16 RTX 4050
SK hynix PC801 HFS001TEJ9X101N
3036 Points
Asus ExpertBook B5 Flip B5602FBN
WD PC SN735 SDBPNHH-1T00
2208 Points
Lenovo Yoga 7 2-in-1 16IML9
SK hynix HFS512GEJ4X112N
1131 Points
Seq Read
HP Spectre x360 16 RTX 4050
SK hynix PC801 HFS001TEJ9X101N
5353.82 MB/s
LG gram Pro 2-in-1 16T90SP
SK hynix PC801 HFS001TEJ9X101N
5297.48 MB/s
MSI Summit E16 Flip A12UDT-031
Samsung PM9A1 MZVL22T0HBLB
5009.86 MB/s
Lenovo Yoga 7 2-in-1 16IML9
SK hynix HFS512GEJ4X112N
3724.94 MB/s
Asus ExpertBook B5 Flip B5602FBN
WD PC SN735 SDBPNHH-1T00
3074.15 MB/s
Seq Write
MSI Summit E16 Flip A12UDT-031
Samsung PM9A1 MZVL22T0HBLB
3780.52 MB/s
HP Spectre x360 16 RTX 4050
SK hynix PC801 HFS001TEJ9X101N
3349.41 MB/s
LG gram Pro 2-in-1 16T90SP
SK hynix PC801 HFS001TEJ9X101N
3146.24 MB/s
Asus ExpertBook B5 Flip B5602FBN
WD PC SN735 SDBPNHH-1T00
2552.02 MB/s
Lenovo Yoga 7 2-in-1 16IML9
SK hynix HFS512GEJ4X112N
881.04 MB/s
4K Read
MSI Summit E16 Flip A12UDT-031
Samsung PM9A1 MZVL22T0HBLB
77.43 MB/s
Asus ExpertBook B5 Flip B5602FBN
WD PC SN735 SDBPNHH-1T00
67.43 MB/s
LG gram Pro 2-in-1 16T90SP
SK hynix PC801 HFS001TEJ9X101N
62.74 MB/s
HP Spectre x360 16 RTX 4050
SK hynix PC801 HFS001TEJ9X101N
58.84 MB/s
Lenovo Yoga 7 2-in-1 16IML9
SK hynix HFS512GEJ4X112N
42.06 MB/s
4K Write
Asus ExpertBook B5 Flip B5602FBN
WD PC SN735 SDBPNHH-1T00
278.34 MB/s
MSI Summit E16 Flip A12UDT-031
Samsung PM9A1 MZVL22T0HBLB
196.21 MB/s
LG gram Pro 2-in-1 16T90SP
SK hynix PC801 HFS001TEJ9X101N
168.02 MB/s
HP Spectre x360 16 RTX 4050
SK hynix PC801 HFS001TEJ9X101N
160.09 MB/s
Lenovo Yoga 7 2-in-1 16IML9
SK hynix HFS512GEJ4X112N
148.14 MB/s
4K-64 Read
MSI Summit E16 Flip A12UDT-031
Samsung PM9A1 MZVL22T0HBLB
2228.2 MB/s
Asus ExpertBook B5 Flip B5602FBN
WD PC SN735 SDBPNHH-1T00
2036.29 MB/s
Lenovo Yoga 7 2-in-1 16IML9
SK hynix HFS512GEJ4X112N
639.81 MB/s
LG gram Pro 2-in-1 16T90SP
SK hynix PC801 HFS001TEJ9X101N
583.18 MB/s
HP Spectre x360 16 RTX 4050
SK hynix PC801 HFS001TEJ9X101N
358.94 MB/s
4K-64 Write
MSI Summit E16 Flip A12UDT-031
Samsung PM9A1 MZVL22T0HBLB
2620.46 MB/s
LG gram Pro 2-in-1 16T90SP
SK hynix PC801 HFS001TEJ9X101N
2614.4 MB/s
HP Spectre x360 16 RTX 4050
SK hynix PC801 HFS001TEJ9X101N
2541 MB/s
Asus ExpertBook B5 Flip B5602FBN
WD PC SN735 SDBPNHH-1T00
1674.57 MB/s
Lenovo Yoga 7 2-in-1 16IML9
SK hynix HFS512GEJ4X112N
894.74 MB/s
Access Time Read
Lenovo Yoga 7 2-in-1 16IML9
SK hynix HFS512GEJ4X112N
0.126 ms *
Asus ExpertBook B5 Flip B5602FBN
WD PC SN735 SDBPNHH-1T00
0.103 ms *
HP Spectre x360 16 RTX 4050
SK hynix PC801 HFS001TEJ9X101N
0.05 ms *
LG gram Pro 2-in-1 16T90SP
SK hynix PC801 HFS001TEJ9X101N
0.038 ms *
MSI Summit E16 Flip A12UDT-031
Samsung PM9A1 MZVL22T0HBLB
0.036 ms *
Access Time Write
Lenovo Yoga 7 2-in-1 16IML9
SK hynix HFS512GEJ4X112N
0.393 ms *
Asus ExpertBook B5 Flip B5602FBN
WD PC SN735 SDBPNHH-1T00
0.106 ms *
HP Spectre x360 16 RTX 4050
SK hynix PC801 HFS001TEJ9X101N
0.069 ms *
MSI Summit E16 Flip A12UDT-031
Samsung PM9A1 MZVL22T0HBLB
0.021 ms *
LG gram Pro 2-in-1 16T90SP
SK hynix PC801 HFS001TEJ9X101N
0.021 ms *

* ... Moindre est la valeur, meilleures sont les performances

Disk Throttling: DiskSpd Read Loop, Queue Depth 8

033567010051340167520102345268030153350368540204355469050255360569560306365Tooltip
MSI Summit A16 AI Plus A3HMTG  ; diskspd 2.0.17 f: Ø4828 (3978.51-5043.21)
MSI Summit E16 Flip A12UDT-031 Samsung PM9A1 MZVL22T0HBLB: Ø6626 (6157.24-6654.79)

Performance du GPU

La carte intégrée Radeon 880M est une amélioration significative par rapport aux Iris Xe 96 EU que l'on trouve généralement sur la plupart des ordinateurs portables convertibles depuis 2020. Par rapport à la championne précédente, la Radeon 780Mla Radeon 880M est environ 15 à 25 % plus rapide. Elle est suffisamment rapide pour jouer à des titres modernes en 1080p avec des paramètres bas, y compris à des titres exigeants comme Cyberpunk 2077.

MSI ne propose pas de SKU avec la Radeon 890M qui aurait permis d'augmenter les performances graphiques de 10 à 15 % supplémentaires.

Profil de puissanceScore graphiqueScore physiqueScore combiné
Mode performance9203265593122
Mode équilibré8821 (-4%)25223 (-5%)2948 (-6%)
Alimentation par batterie8747 (-5%)20465 (-23%)3098 (-1%)

L'exécution en mode équilibré au lieu du mode performance réduit légèrement les performances, comme le montre notre tableau de résultats Fire Strike ci-dessus.

3DMark 11
3DMark 11
Fire Strike
Fire Strike
Time Spy
Time Spy
Steel Nomad
Steel Nomad
Voie rapide
Voie rapide
 
3DMark Performance Rating - Percent
HP Spectre x360 16 RTX 4050 -1!
NVIDIA GeForce RTX 4050 Laptop GPU, Intel Core Ultra 7 155H
100 pt
Samsung Galaxy Book3 Ultra 16
NVIDIA GeForce RTX 4050 Laptop GPU, Intel Core i7-13700H
88.4 pt
MSI Summit E16 Flip A12UDT-031
NVIDIA GeForce RTX 3050 Ti Laptop GPU, Intel Core i7-1280P
80 pt
Acer Aspire 16 A16-51GM-77G2
NVIDIA GeForce RTX 2050 Mobile, Intel Core 7 150U
62.7 pt
MSI Summit A16 AI Plus A3HMTG
AMD Radeon 880M, AMD Ryzen AI 9 365
56.8 pt
Moyenne AMD Radeon 880M
 
55.3 pt
Dell Inspiron 16 7640 2-in-1
Intel Arc 8-Core iGPU, Intel Core Ultra 7 155H
51.6 pt
Ninkear A16 Pro
AMD Radeon 780M, AMD Ryzen 7 8845HS
50.4 pt
Asus Zenbook S 16 UM5606-RK333W -1!
AMD Radeon 890M, AMD Ryzen AI 9 HX 370
49.8 pt
Asus Zenbook S 16 UM5606WA-RK052W
AMD Radeon 880M, AMD Ryzen AI 9 365
49.5 pt
HP Envy x360 2-in-1 16-ad0097nr
AMD Radeon 780M, AMD Ryzen 7 8840HS
47.3 pt
LG gram Pro 2-in-1 16T90SP -2!
Intel Arc 8-Core iGPU, Intel Core Ultra 7 155H
43.4 pt
Asus ExpertBook B5 Flip B5602FBN
Intel Arc A350M, Intel Core i7-1260P
41.6 pt
Lenovo ThinkPad E16 Gen 2 21M5002VGE
AMD Radeon 660M, AMD Ryzen 5 7535HS
30.8 pt
Lenovo IdeaPad Slim 5 16IRU9
Intel Iris Xe Graphics G7 96EUs, Intel Core 7 150U
30.6 pt
Lenovo Yoga 7 2-in-1 16IML9
Intel Graphics 4-Core iGPU (Arc), Intel Core Ultra 5 125U
28.8 pt
3DMark 11 - 1280x720 Performance GPU
HP Spectre x360 16 RTX 4050
NVIDIA GeForce RTX 4050 Laptop GPU, Intel Core Ultra 7 155H
24603 Points +60%
Samsung Galaxy Book3 Ultra 16
NVIDIA GeForce RTX 4050 Laptop GPU, Intel Core i7-13700H
22469 Points +46%
MSI Summit E16 Flip A12UDT-031
NVIDIA GeForce RTX 3050 Ti Laptop GPU, Intel Core i7-1280P
18102 Points +18%
MSI Summit A16 AI Plus A3HMTG
AMD Radeon 880M, AMD Ryzen AI 9 365
15345 Points
Moyenne AMD Radeon 880M
  (12321 - 15589, n=5)
14224 Points -7%
Acer Aspire 16 A16-51GM-77G2
NVIDIA GeForce RTX 2050 Mobile, Intel Core 7 150U
13694 Points -11%
Asus Zenbook S 16 UM5606-RK333W
AMD Radeon 890M, AMD Ryzen AI 9 HX 370
13345 Points -13%
Dell Inspiron 16 7640 2-in-1
Intel Arc 8-Core iGPU, Intel Core Ultra 7 155H
12670 Points -17%
Ninkear A16 Pro
AMD Radeon 780M, AMD Ryzen 7 8845HS
12550 Points -18%
Asus Zenbook S 16 UM5606WA-RK052W
AMD Radeon 880M, AMD Ryzen AI 9 365
12439 Points -19%
HP Envy x360 2-in-1 16-ad0097nr
AMD Radeon 780M, AMD Ryzen 7 8840HS
12413 Points -19%
Asus ExpertBook B5 Flip B5602FBN
Intel Arc A350M, Intel Core i7-1260P
10773 Points -30%
Lenovo ThinkPad E16 Gen 2 21M5002VGE
AMD Radeon 660M, AMD Ryzen 5 7535HS
7024 Points -54%
Lenovo Yoga 7 2-in-1 16IML9
Intel Graphics 4-Core iGPU (Arc), Intel Core Ultra 5 125U
6711 Points -56%
Lenovo IdeaPad Slim 5 16IRU9
Intel Iris Xe Graphics G7 96EUs, Intel Core 7 150U
6438 Points -58%
3DMark
1280x720 Cloud Gate Standard Graphics
MSI Summit E16 Flip A12UDT-031
NVIDIA GeForce RTX 3050 Ti Laptop GPU, Intel Core i7-1280P
74205 Points +44%
Samsung Galaxy Book3 Ultra 16
NVIDIA GeForce RTX 4050 Laptop GPU, Intel Core i7-13700H
65080 Points +26%
Acer Aspire 16 A16-51GM-77G2
NVIDIA GeForce RTX 2050 Mobile, Intel Core 7 150U
65047 Points +26%
Moyenne AMD Radeon 880M
  (46354 - 57533, n=4)
53127 Points +3%
MSI Summit A16 AI Plus A3HMTG
AMD Radeon 880M, AMD Ryzen AI 9 365
51652 Points
Ninkear A16 Pro
AMD Radeon 780M, AMD Ryzen 7 8845HS
49373 Points -4%
Dell Inspiron 16 7640 2-in-1
Intel Arc 8-Core iGPU, Intel Core Ultra 7 155H
47143 Points -9%
Asus Zenbook S 16 UM5606WA-RK052W
AMD Radeon 880M, AMD Ryzen AI 9 365
46354 Points -10%
HP Envy x360 2-in-1 16-ad0097nr
AMD Radeon 780M, AMD Ryzen 7 8840HS
44702 Points -13%
Lenovo IdeaPad Slim 5 16IRU9
Intel Iris Xe Graphics G7 96EUs, Intel Core 7 150U
33070 Points -36%
Lenovo ThinkPad E16 Gen 2 21M5002VGE
AMD Radeon 660M, AMD Ryzen 5 7535HS
33036 Points -36%
Asus ExpertBook B5 Flip B5602FBN
Intel Arc A350M, Intel Core i7-1260P
28623 Points -45%
Lenovo Yoga 7 2-in-1 16IML9
Intel Graphics 4-Core iGPU (Arc), Intel Core Ultra 5 125U
27316 Points -47%
1920x1080 Fire Strike Graphics
HP Spectre x360 16 RTX 4050
NVIDIA GeForce RTX 4050 Laptop GPU, Intel Core Ultra 7 155H
17908 Points +95%
Samsung Galaxy Book3 Ultra 16
NVIDIA GeForce RTX 4050 Laptop GPU, Intel Core i7-13700H
16174 Points +76%
MSI Summit E16 Flip A12UDT-031
NVIDIA GeForce RTX 3050 Ti Laptop GPU, Intel Core i7-1280P
13081 Points +42%
Acer Aspire 16 A16-51GM-77G2
NVIDIA GeForce RTX 2050 Mobile, Intel Core 7 150U
9886 Points +7%
MSI Summit A16 AI Plus A3HMTG
AMD Radeon 880M, AMD Ryzen AI 9 365
9203 Points
Moyenne AMD Radeon 880M
  (7404 - 9462, n=5)
8599 Points -7%
Dell Inspiron 16 7640 2-in-1
Intel Arc 8-Core iGPU, Intel Core Ultra 7 155H
8567 Points -7%
Asus Zenbook S 16 UM5606-RK333W
AMD Radeon 890M, AMD Ryzen AI 9 HX 370
8188 Points -11%
Ninkear A16 Pro
AMD Radeon 780M, AMD Ryzen 7 8845HS
7993 Points -13%
Asus Zenbook S 16 UM5606WA-RK052W
AMD Radeon 880M, AMD Ryzen AI 9 365
7538 Points -18%
LG gram Pro 2-in-1 16T90SP
Intel Arc 8-Core iGPU, Intel Core Ultra 7 155H
7492 Points -19%
HP Envy x360 2-in-1 16-ad0097nr
AMD Radeon 780M, AMD Ryzen 7 8840HS
7357 Points -20%
Asus ExpertBook B5 Flip B5602FBN
Intel Arc A350M, Intel Core i7-1260P
7147 Points -22%
Lenovo IdeaPad Slim 5 16IRU9
Intel Iris Xe Graphics G7 96EUs, Intel Core 7 150U
5237 Points -43%
Lenovo ThinkPad E16 Gen 2 21M5002VGE
AMD Radeon 660M, AMD Ryzen 5 7535HS
4881 Points -47%
Lenovo Yoga 7 2-in-1 16IML9
Intel Graphics 4-Core iGPU (Arc), Intel Core Ultra 5 125U
4786 Points -48%
2560x1440 Time Spy Graphics
HP Spectre x360 16 RTX 4050
NVIDIA GeForce RTX 4050 Laptop GPU, Intel Core Ultra 7 155H
6941 Points +128%
Samsung Galaxy Book3 Ultra 16
NVIDIA GeForce RTX 4050 Laptop GPU, Intel Core i7-13700H
5859 Points +93%
MSI Summit E16 Flip A12UDT-031
NVIDIA GeForce RTX 3050 Ti Laptop GPU, Intel Core i7-1280P
5081 Points +67%
Acer Aspire 16 A16-51GM-77G2
NVIDIA GeForce RTX 2050 Mobile, Intel Core 7 150U
3626 Points +19%
Asus Zenbook S 16 UM5606-RK333W
AMD Radeon 890M, AMD Ryzen AI 9 HX 370
3421 Points +12%
LG gram Pro 2-in-1 16T90SP
Intel Arc 8-Core iGPU, Intel Core Ultra 7 155H
3117 Points +2%
Asus ExpertBook B5 Flip B5602FBN
Intel Arc A350M, Intel Core i7-1260P
3050 Points 0%
MSI Summit A16 AI Plus A3HMTG
AMD Radeon 880M, AMD Ryzen AI 9 365
3041 Points
Moyenne AMD Radeon 880M
  (2300 - 3464, n=5)
3040 Points 0%
Dell Inspiron 16 7640 2-in-1
Intel Arc 8-Core iGPU, Intel Core Ultra 7 155H
3023 Points -1%
Asus Zenbook S 16 UM5606WA-RK052W
AMD Radeon 880M, AMD Ryzen AI 9 365
2970 Points -2%
Ninkear A16 Pro
AMD Radeon 780M, AMD Ryzen 7 8845HS
2732 Points -10%
HP Envy x360 2-in-1 16-ad0097nr
AMD Radeon 780M, AMD Ryzen 7 8840HS
2591 Points -15%
Lenovo Yoga 7 2-in-1 16IML9
Intel Graphics 4-Core iGPU (Arc), Intel Core Ultra 5 125U
1704 Points -44%
Lenovo ThinkPad E16 Gen 2 21M5002VGE
AMD Radeon 660M, AMD Ryzen 5 7535HS
1585 Points -48%
Lenovo IdeaPad Slim 5 16IRU9
Intel Iris Xe Graphics G7 96EUs, Intel Core 7 150U
1567 Points -48%
3DMark 11 Performance
14646 points
3DMark Cloud Gate Standard Score
36919 points
3DMark Fire Strike Score
8391 points
3DMark Time Spy Score
3399 points
3DMark Steel Nomad Score
550 points
Aide
Blender
v3.3 Classroom HIP/AMD
Lenovo ThinkPad E16 Gen 2 21M5002VGE
AMD Radeon 660M, AMD Ryzen 5 7535HS
438 Seconds *
v3.3 Classroom OPTIX/RTX
Acer Aspire 16 A16-51GM-77G2
NVIDIA GeForce RTX 2050 Mobile, Intel Core 7 150U
76 Seconds *
MSI Summit E16 Flip A12UDT-031
NVIDIA GeForce RTX 3050 Ti Laptop GPU, Intel Core i7-1280P
55 Seconds *
Samsung Galaxy Book3 Ultra 16
NVIDIA GeForce RTX 4050 Laptop GPU, Intel Core i7-13700H
34 Seconds *
HP Spectre x360 16 RTX 4050
NVIDIA GeForce RTX 4050 Laptop GPU, Intel Core Ultra 7 155H
31 Seconds *
v3.3 Classroom CUDA
Acer Aspire 16 A16-51GM-77G2
NVIDIA GeForce RTX 2050 Mobile, Intel Core 7 150U
126 Seconds *
MSI Summit E16 Flip A12UDT-031
NVIDIA GeForce RTX 3050 Ti Laptop GPU, Intel Core i7-1280P
92 Seconds *
Samsung Galaxy Book3 Ultra 16
NVIDIA GeForce RTX 4050 Laptop GPU, Intel Core i7-13700H
61 Seconds *
HP Spectre x360 16 RTX 4050
NVIDIA GeForce RTX 4050 Laptop GPU, Intel Core Ultra 7 155H
54 Seconds *
v3.3 Classroom CPU
Lenovo ThinkPad E16 Gen 2 21M5002VGE
AMD Radeon 660M, AMD Ryzen 5 7535HS
802 Seconds * -198%
Lenovo IdeaPad Slim 5 16IRU9
Intel Iris Xe Graphics G7 96EUs, Intel Core 7 150U
689 Seconds * -156%
Acer Aspire 16 A16-51GM-77G2
NVIDIA GeForce RTX 2050 Mobile, Intel Core 7 150U
659 Seconds * -145%
Lenovo Yoga 7 2-in-1 16IML9
Intel Graphics 4-Core iGPU (Arc), Intel Core Ultra 5 125U
648 Seconds * -141%
MSI Summit E16 Flip A12UDT-031
NVIDIA GeForce RTX 3050 Ti Laptop GPU, Intel Core i7-1280P
557 Seconds * -107%
LG gram Pro 2-in-1 16T90SP
Intel Arc 8-Core iGPU, Intel Core Ultra 7 155H
543 Seconds * -102%
Asus ExpertBook B5 Flip B5602FBN
Intel Arc A350M, Intel Core i7-1260P
526 Seconds * -96%
Asus Zenbook S 16 UM5606WA-RK052W
AMD Radeon 880M, AMD Ryzen AI 9 365
429 Seconds * -59%
HP Envy x360 2-in-1 16-ad0097nr
AMD Radeon 780M, AMD Ryzen 7 8840HS
405 Seconds * -51%
HP Spectre x360 16 RTX 4050
NVIDIA GeForce RTX 4050 Laptop GPU, Intel Core Ultra 7 155H
397 Seconds * -48%
Samsung Galaxy Book3 Ultra 16
NVIDIA GeForce RTX 4050 Laptop GPU, Intel Core i7-13700H
386 Seconds * -43%
Dell Inspiron 16 7640 2-in-1
Intel Arc 8-Core iGPU, Intel Core Ultra 7 155H
367 Seconds * -36%
Ninkear A16 Pro
AMD Radeon 780M, AMD Ryzen 7 8845HS
352 Seconds * -31%
Moyenne AMD Radeon 880M
  (269 - 429, n=5)
344 Seconds * -28%
Asus Zenbook S 16 UM5606-RK333W
AMD Radeon 890M, AMD Ryzen AI 9 HX 370
306 Seconds * -14%
MSI Summit A16 AI Plus A3HMTG
AMD Radeon 880M, AMD Ryzen AI 9 365
269 Seconds *
v3.3 Classroom oneAPI/Intel
LG gram Pro 2-in-1 16T90SP
Intel Arc 8-Core iGPU, Intel Core Ultra 7 155H
261 Seconds *
Dell Inspiron 16 7640 2-in-1
Intel Arc 8-Core iGPU, Intel Core Ultra 7 155H
219 Seconds *

* ... Moindre est la valeur, meilleures sont les performances

Tiny Tina's Wonderlands
1280x720 Lowest Preset (DX12)
MSI Summit A16 AI Plus A3HMTG
AMD Ryzen AI 9 365, AMD Radeon 880M
167.2 fps
Moyenne AMD Radeon 880M
  ()
167.2 fps 0%
Samsung Galaxy Book3 Ultra 16
Intel Core i7-13700H, NVIDIA GeForce RTX 4050 Laptop GPU
109.3 fps -35%
HP Envy x360 2-in-1 16-ad0097nr
AMD Ryzen 7 8840HS, AMD Radeon 780M
97.4 fps -42%
Dell Inspiron 16 7640 2-in-1
Intel Core Ultra 7 155H, Intel Arc 8-Core iGPU
86.6 fps -48%
Lenovo Yoga 7 2-in-1 16IML9
Intel Core Ultra 5 125U, Intel Graphics 4-Core iGPU (Arc)
54.8 fps -67%
Lenovo IdeaPad Slim 5 16IRU9
Intel Core 7 150U, Intel Iris Xe Graphics G7 96EUs
51.8 fps -69%
1920x1080 Low Preset (DX12)
HP Spectre x360 16 RTX 4050
Intel Core Ultra 7 155H, NVIDIA GeForce RTX 4050 Laptop GPU
135.1 fps +59%
Samsung Galaxy Book3 Ultra 16
Intel Core i7-13700H, NVIDIA GeForce RTX 4050 Laptop GPU
104.5 fps +23%
MSI Summit A16 AI Plus A3HMTG
AMD Ryzen AI 9 365, AMD Radeon 880M
84.9 fps
Moyenne AMD Radeon 880M
  ()
84.9 fps 0%
HP Envy x360 2-in-1 16-ad0097nr
AMD Ryzen 7 8840HS, AMD Radeon 780M
49.8 fps -41%
Dell Inspiron 16 7640 2-in-1
Intel Core Ultra 7 155H, Intel Arc 8-Core iGPU
49.2 fps -42%
Lenovo IdeaPad Slim 5 16IRU9
Intel Core 7 150U, Intel Iris Xe Graphics G7 96EUs
30.5 fps -64%
Lenovo Yoga 7 2-in-1 16IML9
Intel Core Ultra 5 125U, Intel Graphics 4-Core iGPU (Arc)
29.9 fps -65%
1920x1080 Medium Preset (DX12)
HP Spectre x360 16 RTX 4050
Intel Core Ultra 7 155H, NVIDIA GeForce RTX 4050 Laptop GPU
113.4 fps +85%
Samsung Galaxy Book3 Ultra 16
Intel Core i7-13700H, NVIDIA GeForce RTX 4050 Laptop GPU
93.4 fps +52%
MSI Summit A16 AI Plus A3HMTG
AMD Ryzen AI 9 365, AMD Radeon 880M
61.4 fps
Moyenne AMD Radeon 880M
  ()
61.4 fps 0%
HP Envy x360 2-in-1 16-ad0097nr
AMD Ryzen 7 8840HS, AMD Radeon 780M
38 fps -38%
Dell Inspiron 16 7640 2-in-1
Intel Core Ultra 7 155H, Intel Arc 8-Core iGPU
37.3 fps -39%
Lenovo Yoga 7 2-in-1 16IML9
Intel Core Ultra 5 125U, Intel Graphics 4-Core iGPU (Arc)
24 fps -61%
Lenovo IdeaPad Slim 5 16IRU9
Intel Core 7 150U, Intel Iris Xe Graphics G7 96EUs
23 fps -63%
1920x1080 High Preset (DX12)
HP Spectre x360 16 RTX 4050
Intel Core Ultra 7 155H, NVIDIA GeForce RTX 4050 Laptop GPU
75.4 fps +88%
Samsung Galaxy Book3 Ultra 16
Intel Core i7-13700H, NVIDIA GeForce RTX 4050 Laptop GPU
63.3 fps +57%
MSI Summit A16 AI Plus A3HMTG
AMD Ryzen AI 9 365, AMD Radeon 880M
40.2 fps
Moyenne AMD Radeon 880M
  ()
40.2 fps 0%
Dell Inspiron 16 7640 2-in-1
Intel Core Ultra 7 155H, Intel Arc 8-Core iGPU
26.4 fps -34%
HP Envy x360 2-in-1 16-ad0097nr
AMD Ryzen 7 8840HS, AMD Radeon 780M
24 fps -40%
Lenovo Yoga 7 2-in-1 16IML9
Intel Core Ultra 5 125U, Intel Graphics 4-Core iGPU (Arc)
16.1 fps -60%
Lenovo IdeaPad Slim 5 16IRU9
Intel Core 7 150U, Intel Iris Xe Graphics G7 96EUs
15 fps -63%
1920x1080 Badass Preset (DX12)
HP Spectre x360 16 RTX 4050
Intel Core Ultra 7 155H, NVIDIA GeForce RTX 4050 Laptop GPU
59.1 fps +85%
Samsung Galaxy Book3 Ultra 16
Intel Core i7-13700H, NVIDIA GeForce RTX 4050 Laptop GPU
49.8 fps +56%
MSI Summit A16 AI Plus A3HMTG
AMD Ryzen AI 9 365, AMD Radeon 880M
31.9 fps
Moyenne AMD Radeon 880M
  ()
31.9 fps 0%
Dell Inspiron 16 7640 2-in-1
Intel Core Ultra 7 155H, Intel Arc 8-Core iGPU
21.2 fps -34%
HP Envy x360 2-in-1 16-ad0097nr
AMD Ryzen 7 8840HS, AMD Radeon 780M
19.5 fps -39%
Lenovo Yoga 7 2-in-1 16IML9
Intel Core Ultra 5 125U, Intel Graphics 4-Core iGPU (Arc)
12.7 fps -60%
Lenovo IdeaPad Slim 5 16IRU9
Intel Core 7 150U, Intel Iris Xe Graphics G7 96EUs
11.6 fps -64%
GTA V
1024x768 Lowest Settings possible
Samsung Galaxy Book3 Ultra 16
Intel Core i7-13700H, NVIDIA GeForce RTX 4050 Laptop GPU
182.1 (2.44min, 111.1P1) fps +7%
MSI Summit E16 Flip A12UDT-031
Intel Core i7-1280P, NVIDIA GeForce RTX 3050 Ti Laptop GPU
179.7 (3.85min, 125P1) fps +5%
HP Spectre x360 16 RTX 4050
Intel Core Ultra 7 155H, NVIDIA GeForce RTX 4050 Laptop GPU
171.3 (5.58min, 111.1P1) fps 0%
Asus ExpertBook B5 Flip B5602FBN
Intel Core i7-1260P, Intel Arc A350M
170.7 (3.91min, 111.1P1) fps 0%
MSI Summit A16 AI Plus A3HMTG
AMD Ryzen AI 9 365, AMD Radeon 880M
170.6 (4.43min, 111.1P1) fps
Ninkear A16 Pro
AMD Ryzen 7 8845HS, AMD Radeon 780M
162.2 (3.25min, 111.1P1) fps -5%
Asus Zenbook S 16 UM5606-RK333W
AMD Ryzen AI 9 HX 370, AMD Radeon 890M
161.3 (4.39min, 83.3P1) fps -5%
Moyenne AMD Radeon 880M
  (142.9 - 173.3, n=6)
160.2 fps -6%
Acer Aspire 16 A16-51GM-77G2
Intel Core 7 150U, NVIDIA GeForce RTX 2050 Mobile
153.3 (4.8min, 83.3P1) fps -10%
Asus Zenbook S 16 UM5606WA-RK052W
AMD Ryzen AI 9 365, AMD Radeon 880M
148.5 (4.32min, 90.9P1) fps -13%
Lenovo ThinkPad E16 Gen 2 21M5002VGE
AMD Ryzen 5 7535HS, AMD Radeon 660M
128.9 (8min, 76.9P1) fps -24%
Lenovo IdeaPad Slim 5 16IRU9
Intel Core 7 150U, Intel Iris Xe Graphics G7 96EUs
113.9 (6.44min, 71.4P1) fps -33%
1920x1080 Lowest Settings possible
Samsung Galaxy Book3 Ultra 16
Intel Core i7-13700H, NVIDIA GeForce RTX 4050 Laptop GPU
178.1 fps +20%
HP Spectre x360 16 RTX 4050
Intel Core Ultra 7 155H, NVIDIA GeForce RTX 4050 Laptop GPU
162.7 (4.69min, 90.9P1) fps +9%
Acer Aspire 16 A16-51GM-77G2
Intel Core 7 150U, NVIDIA GeForce RTX 2050 Mobile
158.8 (4.99min, 90.9P1) fps +7%
MSI Summit A16 AI Plus A3HMTG
AMD Ryzen AI 9 365, AMD Radeon 880M
148.8 (4.34min, 100P1) fps
Asus ExpertBook B5 Flip B5602FBN
Intel Core i7-1260P, Intel Arc A350M
142.3 (6.43min, 100P1) fps -4%
Moyenne AMD Radeon 880M
  (116.8 - 148.8, n=4)
133 fps -11%
Asus Zenbook S 16 UM5606WA-RK052W
AMD Ryzen AI 9 365, AMD Radeon 880M
121.4 (12.6min, 71.4P1) fps -18%
Ninkear A16 Pro
AMD Ryzen 7 8845HS, AMD Radeon 780M
117.2 (3.38min, 76.9P1) fps -21%
Lenovo ThinkPad E16 Gen 2 21M5002VGE
AMD Ryzen 5 7535HS, AMD Radeon 660M
93.4 (7.23min, 62.5P1) fps -37%
Lenovo IdeaPad Slim 5 16IRU9
Intel Core 7 150U, Intel Iris Xe Graphics G7 96EUs
90.3 (18.2min, 58.8P1) fps -39%
1366x768 Normal/Off AF:4x
MSI Summit E16 Flip A12UDT-031
Intel Core i7-1280P, NVIDIA GeForce RTX 3050 Ti Laptop GPU
173.8 (4.13min, 125P1) fps
Samsung Galaxy Book3 Ultra 16
Intel Core i7-13700H, NVIDIA GeForce RTX 4050 Laptop GPU
166.5 (4.12min, 100P1) fps
HP Spectre x360 16 RTX 4050
Intel Core Ultra 7 155H, NVIDIA GeForce RTX 4050 Laptop GPU
162.2 (3.89min, 90.9P1) fps
Asus ExpertBook B5 Flip B5602FBN
Intel Core i7-1260P, Intel Arc A350M
156.3 (4.31min, 90.9P1) fps
Acer Aspire 16 A16-51GM-77G2
Intel Core 7 150U, NVIDIA GeForce RTX 2050 Mobile
153.3 (4.24min, 71.4P1) fps
Ninkear A16 Pro
AMD Ryzen 7 8845HS, AMD Radeon 780M
149.8 (7.19min, 100P1) fps
Moyenne AMD Radeon 880M
  (132 - 165, n=4)
144.4 fps
Asus Zenbook S 16 UM5606WA-RK052W
AMD Ryzen AI 9 365, AMD Radeon 880M
132.3 (5.99min, 76.9P1) fps
Asus Zenbook S 16 UM5606-RK333W
AMD Ryzen AI 9 HX 370, AMD Radeon 890M
129.6 (5.51min, 76.9P1) fps
Lenovo ThinkPad E16 Gen 2 21M5002VGE
AMD Ryzen 5 7535HS, AMD Radeon 660M
116.1 (7.45min, 71.4P1) fps
Lenovo IdeaPad Slim 5 16IRU9
Intel Core 7 150U, Intel Iris Xe Graphics G7 96EUs
98.4 (17.8min, 62.5P1) fps
1920x1080 Normal/Off AF:4x
Samsung Galaxy Book3 Ultra 16
Intel Core i7-13700H, NVIDIA GeForce RTX 4050 Laptop GPU
164.8 (4.75min, 83.3P1) fps +16%
MSI Summit E16 Flip A12UDT-031
Intel Core i7-1280P, NVIDIA GeForce RTX 3050 Ti Laptop GPU
158.6 (60.1min, 100P1) fps +12%
HP Spectre x360 16 RTX 4050
Intel Core Ultra 7 155H, NVIDIA GeForce RTX 4050 Laptop GPU
158.4 (4.52min, 83.3P1) fps +12%
MSI Summit A16 AI Plus A3HMTG
AMD Ryzen AI 9 365, AMD Radeon 880M
141.6 (4.19min, 90.9P1) fps
Acer Aspire 16 A16-51GM-77G2
Intel Core 7 150U, NVIDIA GeForce RTX 2050 Mobile
140.2 (4.56min, 58.8P1) fps -1%
Moyenne AMD Radeon 880M
  (116 - 150.9, n=4)
131.6 fps -7%
Ninkear A16 Pro
AMD Ryzen 7 8845HS, AMD Radeon 780M
123.7 (9.81min, 83.3P1) fps -13%
Asus ExpertBook B5 Flip B5602FBN
Intel Core i7-1260P, Intel Arc A350M
116.2 (8.19min, 83.3P1) fps -18%
Asus Zenbook S 16 UM5606WA-RK052W
AMD Ryzen AI 9 365, AMD Radeon 880M
116 (13.4min, 71.4P1) fps -18%
Lenovo ThinkPad E16 Gen 2 21M5002VGE
AMD Ryzen 5 7535HS, AMD Radeon 660M
92.8 (6.68min, 62.5P1) fps -34%
Lenovo IdeaPad Slim 5 16IRU9
Intel Core 7 150U, Intel Iris Xe Graphics G7 96EUs
78.4 (19min, 52.6P1) fps -45%
1920x1080 High/On (Advanced Graphics Off) AA:2xMSAA + FX AF:8x
HP Spectre x360 16 RTX 4050
Intel Core Ultra 7 155H, NVIDIA GeForce RTX 4050 Laptop GPU
135.3 (4.26min, 76.9P1) fps +68%
Samsung Galaxy Book3 Ultra 16
Intel Core i7-13700H, NVIDIA GeForce RTX 4050 Laptop GPU
133.2 (5.12min, 71.4P1) fps +65%
MSI Summit E16 Flip A12UDT-031
Intel Core i7-1280P, NVIDIA GeForce RTX 3050 Ti Laptop GPU
114.3 (32.5min, 76.9P1) fps +42%
Acer Aspire 16 A16-51GM-77G2
Intel Core 7 150U, NVIDIA GeForce RTX 2050 Mobile
97.1 (20.8min, 62.5P1) fps +21%
MSI Summit A16 AI Plus A3HMTG
AMD Ryzen AI 9 365, AMD Radeon 880M
80.5 (8.07min, 55.6P1) fps
Moyenne AMD Radeon 880M
  (54.9 - 81.6, n=6)
71.7 fps -11%
Asus Zenbook S 16 UM5606-RK333W
AMD Ryzen AI 9 HX 370, AMD Radeon 890M
68.4 (2.59min, 41.7P1) fps -15%
Asus Zenbook S 16 UM5606WA-RK052W
AMD Ryzen AI 9 365, AMD Radeon 880M
62.7 (2.31min, 40P1) fps -22%
Ninkear A16 Pro
AMD Ryzen 7 8845HS, AMD Radeon 780M
62.2 (3.1min, 38.5P1) fps -23%
Lenovo ThinkPad E16 Gen 2 21M5002VGE
AMD Ryzen 5 7535HS, AMD Radeon 660M
40.5 (2.37min, 27.8P1) fps -50%
Asus ExpertBook B5 Flip B5602FBN
Intel Core i7-1260P, Intel Arc A350M
38 (5.76min, 26.3P1) fps -53%
Lenovo IdeaPad Slim 5 16IRU9
Intel Core 7 150U, Intel Iris Xe Graphics G7 96EUs
24.8 (5.85min, 18.9P1) fps -69%
1920x1080 Highest Settings possible AA:4xMSAA + FX AF:16x
HP Spectre x360 16 RTX 4050
Intel Core Ultra 7 155H, NVIDIA GeForce RTX 4050 Laptop GPU
76.7 (12.6min, 52.6P1) fps +136%
Samsung Galaxy Book3 Ultra 16
Intel Core i7-13700H, NVIDIA GeForce RTX 4050 Laptop GPU
65.3 (21.8min, 35.7P1) fps +101%
MSI Summit E16 Flip A12UDT-031
Intel Core i7-1280P, NVIDIA GeForce RTX 3050 Ti Laptop GPU
57.1 (23min, 38.5P1) fps +76%
Acer Aspire 16 A16-51GM-77G2
Intel Core 7 150U, NVIDIA GeForce RTX 2050 Mobile
50.3 (12.4min, 32.3P1) fps +55%
MSI Summit A16 AI Plus A3HMTG
AMD Ryzen AI 9 365, AMD Radeon 880M
32.5 (5.09min, 23.3P1) fps
Asus Zenbook S 16 UM5606-RK333W
AMD Ryzen AI 9 HX 370, AMD Radeon 890M
30.4 (3.23min, 21.7P1) fps -6%
Moyenne AMD Radeon 880M
  (20.5 - 32.7, n=6)
29.2 fps -10%
Asus Zenbook S 16 UM5606WA-RK052W
AMD Ryzen AI 9 365, AMD Radeon 880M
27.5 (1.477min, 18.2P1) fps -15%
Ninkear A16 Pro
AMD Ryzen 7 8845HS, AMD Radeon 780M
25.1 (3.5min, 16.4P1) fps -23%
Lenovo ThinkPad E16 Gen 2 21M5002VGE
AMD Ryzen 5 7535HS, AMD Radeon 660M
18.9 (2.23min, 12.3P1) fps -42%
Asus ExpertBook B5 Flip B5602FBN
Intel Core i7-1260P, Intel Arc A350M
15.2 (2.43min, 10.5P1) fps -53%
Lenovo IdeaPad Slim 5 16IRU9
Intel Core 7 150U, Intel Iris Xe Graphics G7 96EUs
10.5 (4.93min, 6.67P1) fps -68%
Dota 2 Reborn
1280x720 min (0/3) fastest
Samsung Galaxy Book3 Ultra 16
Intel Core i7-13700H, NVIDIA GeForce RTX 4050 Laptop GPU
161.8 (140.9min) fps +3%
Asus Zenbook S 16 UM5606-RK333W
AMD Ryzen AI 9 HX 370, AMD Radeon 890M
161.1 (133min) fps +3%
Acer Aspire 16 A16-51GM-77G2
Intel Core 7 150U, NVIDIA GeForce RTX 2050 Mobile
159.1 (139.1min) fps +2%
MSI Summit A16 AI Plus A3HMTG
AMD Ryzen AI 9 365, AMD Radeon 880M
156.7 (135.7min) fps
Moyenne AMD Radeon 880M
  (131 - 168.3, n=6)
154.8 fps -1%
Ninkear A16 Pro
AMD Ryzen 7 8845HS, AMD Radeon 780M
148.4 (127.6min) fps -5%
Asus Zenbook S 16 UM5606WA-RK052W
AMD Ryzen AI 9 365, AMD Radeon 880M
147.1 (119.5min) fps -6%
HP Spectre x360 16 RTX 4050
Intel Core Ultra 7 155H, NVIDIA GeForce RTX 4050 Laptop GPU
142 (123.9min) fps -9%
MSI Summit E16 Flip A12UDT-031
Intel Core i7-1280P, NVIDIA GeForce RTX 3050 Ti Laptop GPU
134.8 (117.6min) fps -14%
HP Envy x360 2-in-1 16-ad0097nr
AMD Ryzen 7 8840HS, AMD Radeon 780M
123.7 (106.8min) fps -21%
Lenovo ThinkPad E16 Gen 2 21M5002VGE
AMD Ryzen 5 7535HS, AMD Radeon 660M
121.1 (98.6min) fps -23%
Lenovo IdeaPad Slim 5 16IRU9
Intel Core 7 150U, Intel Iris Xe Graphics G7 96EUs
110.1 (87.4min) fps -30%
Asus ExpertBook B5 Flip B5602FBN
Intel Core i7-1260P, Intel Arc A350M
102.1 (74.1min) fps -35%
Lenovo Yoga 7 2-in-1 16IML9
Intel Core Ultra 5 125U, Intel Graphics 4-Core iGPU (Arc)
101.9 (62min) fps -35%
Dell Inspiron 16 7640 2-in-1
Intel Core Ultra 7 155H, Intel Arc 8-Core iGPU
101.5 (58.8min) fps -35%
LG gram Pro 2-in-1 16T90SP
Intel Core Ultra 7 155H, Intel Arc 8-Core iGPU
92.1 (54.3min) fps -41%
1366x768 med (1/3)
Samsung Galaxy Book3 Ultra 16
Intel Core i7-13700H, NVIDIA GeForce RTX 4050 Laptop GPU
138.7 (119.8min) fps +4%
Acer Aspire 16 A16-51GM-77G2
Intel Core 7 150U, NVIDIA GeForce RTX 2050 Mobile
134.8 (112.1min) fps +1%
MSI Summit A16 AI Plus A3HMTG
AMD Ryzen AI 9 365, AMD Radeon 880M
133.6 (112.8min) fps
HP Spectre x360 16 RTX 4050
Intel Core Ultra 7 155H, NVIDIA GeForce RTX 4050 Laptop GPU
124.2 (106.7min) fps -7%
Moyenne AMD Radeon 880M
  (103.3 - 137.4, n=6)
123.5 fps -8%
Asus Zenbook S 16 UM5606-RK333W
AMD Ryzen AI 9 HX 370, AMD Radeon 890M
123.1 (103min) fps -8%
MSI Summit E16 Flip A12UDT-031
Intel Core i7-1280P, NVIDIA GeForce RTX 3050 Ti Laptop GPU
122.8 (106.1min) fps -8%
Ninkear A16 Pro
AMD Ryzen 7 8845HS, AMD Radeon 780M
117.9 (95.5min) fps -12%
Asus Zenbook S 16 UM5606WA-RK052W
AMD Ryzen AI 9 365, AMD Radeon 880M
109.3 (92.2min) fps -18%
HP Envy x360 2-in-1 16-ad0097nr
AMD Ryzen 7 8840HS, AMD Radeon 780M
103.7 (87.1min) fps -22%
Lenovo ThinkPad E16 Gen 2 21M5002VGE
AMD Ryzen 5 7535HS, AMD Radeon 660M
94.4 (79.3min) fps -29%
Dell Inspiron 16 7640 2-in-1
Intel Core Ultra 7 155H, Intel Arc 8-Core iGPU
93.3 (53.6min) fps -30%
Asus ExpertBook B5 Flip B5602FBN
Intel Core i7-1260P, Intel Arc A350M
85.8 (64.6min) fps -36%
Lenovo IdeaPad Slim 5 16IRU9
Intel Core 7 150U, Intel Iris Xe Graphics G7 96EUs
85.4 (68min) fps -36%
LG gram Pro 2-in-1 16T90SP
Intel Core Ultra 7 155H, Intel Arc 8-Core iGPU
83.2 (25.5min) fps -38%
Lenovo Yoga 7 2-in-1 16IML9
Intel Core Ultra 5 125U, Intel Graphics 4-Core iGPU (Arc)
60.7 (38.1min) fps -55%
1920x1080 high (2/3)
Acer Aspire 16 A16-51GM-77G2
Intel Core 7 150U, NVIDIA GeForce RTX 2050 Mobile
120.1 (93.6min) fps +154%
HP Spectre x360 16 RTX 4050
Intel Core Ultra 7 155H, NVIDIA GeForce RTX 4050 Laptop GPU
119.6 (101.8min) fps +153%
MSI Summit E16 Flip A12UDT-031
Intel Core i7-1280P, NVIDIA GeForce RTX 3050 Ti Laptop GPU
117.9 (101.7min) fps +150%
Samsung Galaxy Book3 Ultra 16
Intel Core i7-13700H, NVIDIA GeForce RTX 4050 Laptop GPU
79.2 (72.5min) fps +68%
Dell Inspiron 16 7640 2-in-1
Intel Core Ultra 7 155H, Intel Arc 8-Core iGPU
77.8 (54.2min) fps +65%
Ninkear A16 Pro
AMD Ryzen 7 8845HS, AMD Radeon 780M
76.4 (60min) fps +62%
HP Envy x360 2-in-1 16-ad0097nr
AMD Ryzen 7 8840HS, AMD Radeon 780M
73 (61.3min) fps +55%
Lenovo IdeaPad Slim 5 16IRU9
Intel Core 7 150U, Intel Iris Xe Graphics G7 96EUs
68.6 (57.4min) fps +45%
Lenovo ThinkPad E16 Gen 2 21M5002VGE
AMD Ryzen 5 7535HS, AMD Radeon 660M
63.1 (53.2min) fps +34%
LG gram Pro 2-in-1 16T90SP
Intel Core Ultra 7 155H, Intel Arc 8-Core iGPU
62.6 (31.3min) fps +33%
Lenovo Yoga 7 2-in-1 16IML9
Intel Core Ultra 5 125U, Intel Graphics 4-Core iGPU (Arc)
61.1 (37.9min) fps +29%
Asus ExpertBook B5 Flip B5602FBN
Intel Core i7-1260P, Intel Arc A350M
60.6 (34min) fps +28%
Moyenne AMD Radeon 880M
  (31.1 - 101.2, n=6)
59.5 fps +26%
MSI Summit A16 AI Plus A3HMTG
AMD Ryzen AI 9 365, AMD Radeon 880M
47.2 (34.7min) fps
Asus Zenbook S 16 UM5606-RK333W
AMD Ryzen AI 9 HX 370, AMD Radeon 890M
35.8 (19.8min) fps -24%
Asus Zenbook S 16 UM5606WA-RK052W
AMD Ryzen AI 9 365, AMD Radeon 880M
31.1 (17.1min) fps -34%
1920x1080 ultra (3/3) best looking
MSI Summit E16 Flip A12UDT-031
Intel Core i7-1280P, NVIDIA GeForce RTX 3050 Ti Laptop GPU
114.1 (98min) fps +147%
Acer Aspire 16 A16-51GM-77G2
Intel Core 7 150U, NVIDIA GeForce RTX 2050 Mobile
110.6 (92.5min) fps +139%
HP Spectre x360 16 RTX 4050
Intel Core Ultra 7 155H, NVIDIA GeForce RTX 4050 Laptop GPU
106.4 (89.8min) fps +130%
Dell Inspiron 16 7640 2-in-1
Intel Core Ultra 7 155H, Intel Arc 8-Core iGPU
78 (52.7min) fps +69%
Samsung Galaxy Book3 Ultra 16
Intel Core i7-13700H, NVIDIA GeForce RTX 4050 Laptop GPU
73.5 (63.9min) fps +59%
Ninkear A16 Pro
AMD Ryzen 7 8845HS, AMD Radeon 780M
70.6 (54.4min) fps +53%
HP Envy x360 2-in-1 16-ad0097nr
AMD Ryzen 7 8840HS, AMD Radeon 780M
65.4 (54.7min) fps +42%
Lenovo IdeaPad Slim 5 16IRU9
Intel Core 7 150U, Intel Iris Xe Graphics G7 96EUs
60.1 (51min) fps +30%
Lenovo Yoga 7 2-in-1 16IML9
Intel Core Ultra 5 125U, Intel Graphics 4-Core iGPU (Arc)
57.6 (37.5min) fps +25%
LG gram Pro 2-in-1 16T90SP
Intel Core Ultra 7 155H, Intel Arc 8-Core iGPU
56.8 (30.9min) fps +23%
Asus ExpertBook B5 Flip B5602FBN
Intel Core i7-1260P, Intel Arc A350M
56.1 (33.4min) fps +21%
Moyenne AMD Radeon 880M
  (29 - 90.5, n=6)
55.6 fps +20%
Lenovo ThinkPad E16 Gen 2 21M5002VGE
AMD Ryzen 5 7535HS, AMD Radeon 660M
53.9 (47.5min) fps +17%
MSI Summit A16 AI Plus A3HMTG
AMD Ryzen AI 9 365, AMD Radeon 880M
46.2 (33.5min) fps
Asus Zenbook S 16 UM5606-RK333W
AMD Ryzen AI 9 HX 370, AMD Radeon 890M
33.1 (18.7min) fps -28%
Asus Zenbook S 16 UM5606WA-RK052W
AMD Ryzen AI 9 365, AMD Radeon 880M
29 (15.8min) fps -37%
Final Fantasy XV Benchmark
1280x720 Lite Quality
HP Spectre x360 16 RTX 4050
Intel Core Ultra 7 155H, NVIDIA GeForce RTX 4050 Laptop GPU
132.7 fps +53%
Samsung Galaxy Book3 Ultra 16
Intel Core i7-13700H, NVIDIA GeForce RTX 4050 Laptop GPU
105 fps +21%
MSI Summit E16 Flip A12UDT-031
Intel Core i7-1280P, NVIDIA GeForce RTX 3050 Ti Laptop GPU
104.9 fps +21%
Acer Aspire 16 A16-51GM-77G2
Intel Core 7 150U, NVIDIA GeForce RTX 2050 Mobile
101.3 fps +16%
MSI Summit A16 AI Plus A3HMTG
AMD Ryzen AI 9 365, AMD Radeon 880M
87 fps
Moyenne AMD Radeon 880M
  (66.5 - 90.5, n=6)
80.8 fps -7%
Asus Zenbook S 16 UM5606-RK333W
AMD Ryzen AI 9 HX 370, AMD Radeon 890M
75.5 fps -13%
Ninkear A16 Pro
AMD Ryzen 7 8845HS, AMD Radeon 780M
74.3 fps -15%
Asus Zenbook S 16 UM5606WA-RK052W
AMD Ryzen AI 9 365, AMD Radeon 880M
66.5 fps -24%
Dell Inspiron 16 7640 2-in-1
Intel Core Ultra 7 155H, Intel Arc 8-Core iGPU
65 fps -25%
Asus ExpertBook B5 Flip B5602FBN
Intel Core i7-1260P, Intel Arc A350M
64.8 fps -26%
HP Envy x360 2-in-1 16-ad0097nr
AMD Ryzen 7 8840HS, AMD Radeon 780M
64.5 fps -26%
Lenovo IdeaPad Slim 5 16IRU9
Intel Core 7 150U, Intel Iris Xe Graphics G7 96EUs
45.9 fps -47%
LG gram Pro 2-in-1 16T90SP
Intel Core Ultra 7 155H, Intel Arc 8-Core iGPU
45.5 fps -48%
Lenovo ThinkPad E16 Gen 2 21M5002VGE
AMD Ryzen 5 7535HS, AMD Radeon 660M
44.9 fps -48%
Lenovo Yoga 7 2-in-1 16IML9
Intel Core Ultra 5 125U, Intel Graphics 4-Core iGPU (Arc)
37.6 fps -57%
1920x1080 Standard Quality
HP Spectre x360 16 RTX 4050
Intel Core Ultra 7 155H, NVIDIA GeForce RTX 4050 Laptop GPU
94.5 fps +116%
Samsung Galaxy Book3 Ultra 16
Intel Core i7-13700H, NVIDIA GeForce RTX 4050 Laptop GPU
77.2 fps +77%
MSI Summit E16 Flip A12UDT-031
Intel Core i7-1280P, NVIDIA GeForce RTX 3050 Ti Laptop GPU
59.2 fps +35%
Acer Aspire 16 A16-51GM-77G2
Intel Core 7 150U, NVIDIA GeForce RTX 2050 Mobile
55.3 fps +27%
MSI Summit A16 AI Plus A3HMTG
AMD Ryzen AI 9 365, AMD Radeon 880M
43.7 fps
Moyenne AMD Radeon 880M
  (33.3 - 46.4, n=6)
40 fps -8%
Asus Zenbook S 16 UM5606-RK333W
AMD Ryzen AI 9 HX 370, AMD Radeon 890M
38.3 fps -12%
Ninkear A16 Pro
AMD Ryzen 7 8845HS, AMD Radeon 780M
37.2 fps -15%
Dell Inspiron 16 7640 2-in-1
Intel Core Ultra 7 155H, Intel Arc 8-Core iGPU
36.5 fps -16%
Asus Zenbook S 16 UM5606WA-RK052W
AMD Ryzen AI 9 365, AMD Radeon 880M
34.6 fps -21%
HP Envy x360 2-in-1 16-ad0097nr
AMD Ryzen 7 8840HS, AMD Radeon 780M
34.1 fps -22%
Asus ExpertBook B5 Flip B5602FBN
Intel Core i7-1260P, Intel Arc A350M
33.2 fps -24%
LG gram Pro 2-in-1 16T90SP
Intel Core Ultra 7 155H, Intel Arc 8-Core iGPU
28.7 fps -34%
LG gram Pro 2-in-1 16T90SP
Intel Core Ultra 7 155H, Intel Arc 8-Core iGPU
28.2 fps -35%
Lenovo IdeaPad Slim 5 16IRU9
Intel Core 7 150U, Intel Iris Xe Graphics G7 96EUs
25.2 fps -42%
Lenovo ThinkPad E16 Gen 2 21M5002VGE
AMD Ryzen 5 7535HS, AMD Radeon 660M
23.7 fps -46%
Lenovo Yoga 7 2-in-1 16IML9
Intel Core Ultra 5 125U, Intel Graphics 4-Core iGPU (Arc)
23 fps -47%
1920x1080 High Quality
HP Spectre x360 16 RTX 4050
Intel Core Ultra 7 155H, NVIDIA GeForce RTX 4050 Laptop GPU
68.6 fps +118%
Samsung Galaxy Book3 Ultra 16
Intel Core i7-13700H, NVIDIA GeForce RTX 4050 Laptop GPU
56.9 fps +81%
MSI Summit E16 Flip A12UDT-031
Intel Core i7-1280P, NVIDIA GeForce RTX 3050 Ti Laptop GPU
44.9 fps +43%
Acer Aspire 16 A16-51GM-77G2
Intel Core 7 150U, NVIDIA GeForce RTX 2050 Mobile
39.3 fps +25%
MSI Summit A16 AI Plus A3HMTG
AMD Ryzen AI 9 365, AMD Radeon 880M
31.4 fps
Moyenne AMD Radeon 880M
  (25.1 - 32, n=6)
29.1 fps -7%
Asus Zenbook S 16 UM5606-RK333W
AMD Ryzen AI 9 HX 370, AMD Radeon 890M
28.6 fps -9%
Ninkear A16 Pro
AMD Ryzen 7 8845HS, AMD Radeon 780M
27 fps -14%
Dell Inspiron 16 7640 2-in-1
Intel Core Ultra 7 155H, Intel Arc 8-Core iGPU
26.8 fps -15%
HP Envy x360 2-in-1 16-ad0097nr
AMD Ryzen 7 8840HS, AMD Radeon 780M
25.2 fps -20%
Asus Zenbook S 16 UM5606WA-RK052W
AMD Ryzen AI 9 365, AMD Radeon 880M
25.1 fps -20%
LG gram Pro 2-in-1 16T90SP
Intel Core Ultra 7 155H, Intel Arc 8-Core iGPU
19.4 fps -38%
LG gram Pro 2-in-1 16T90SP
Intel Core Ultra 7 155H, Intel Arc 8-Core iGPU
19.2 fps -39%
Asus ExpertBook B5 Flip B5602FBN
Intel Core i7-1260P, Intel Arc A350M
18.2 fps -42%
Lenovo IdeaPad Slim 5 16IRU9
Intel Core 7 150U, Intel Iris Xe Graphics G7 96EUs
17.6 fps -44%
Lenovo ThinkPad E16 Gen 2 21M5002VGE
AMD Ryzen 5 7535HS, AMD Radeon 660M
17.2 fps -45%
Lenovo Yoga 7 2-in-1 16IML9
Intel Core Ultra 5 125U, Intel Graphics 4-Core iGPU (Arc)
16.3 fps -48%
X-Plane 11.11
1280x720 low (fps_test=1)
Samsung Galaxy Book3 Ultra 16
Intel Core i7-13700H, NVIDIA GeForce RTX 4050 Laptop GPU
143.6 fps +80%
MSI Summit E16 Flip A12UDT-031
Intel Core i7-1280P, NVIDIA GeForce RTX 3050 Ti Laptop GPU
125.7 fps +57%
Acer Aspire 16 A16-51GM-77G2
Intel Core 7 150U, NVIDIA GeForce RTX 2050 Mobile
104 fps +30%
HP Spectre x360 16 RTX 4050
Intel Core Ultra 7 155H, NVIDIA GeForce RTX 4050 Laptop GPU
100.6 fps +26%
MSI Summit A16 AI Plus A3HMTG
AMD Ryzen AI 9 365, AMD Radeon 880M
79.9 fps
Moyenne AMD Radeon 880M
  (59.1 - 82.5, n=6)
72 fps -10%
Asus Zenbook S 16 UM5606-RK333W
AMD Ryzen AI 9 HX 370, AMD Radeon 890M
66.5 fps -17%
Ninkear A16 Pro
AMD Ryzen 7 8845HS, AMD Radeon 780M
64.9 fps -19%
Asus Zenbook S 16 UM5606WA-RK052W
AMD Ryzen AI 9 365, AMD Radeon 880M
64.1 fps -20%
Dell Inspiron 16 7640 2-in-1
Intel Core Ultra 7 155H, Intel Arc 8-Core iGPU
50.8 fps -36%
LG gram Pro 2-in-1 16T90SP
Intel Core Ultra 7 155H, Intel Arc 8-Core iGPU
49.3 fps -38%
Lenovo ThinkPad E16 Gen 2 21M5002VGE
AMD Ryzen 5 7535HS, AMD Radeon 660M
48.2 fps -40%
HP Envy x360 2-in-1 16-ad0097nr
AMD Ryzen 7 8840HS, AMD Radeon 780M
47.8 fps -40%
Asus ExpertBook B5 Flip B5602FBN
Intel Core i7-1260P, Intel Arc A350M
43.9 fps -45%
Lenovo IdeaPad Slim 5 16IRU9
Intel Core 7 150U, Intel Iris Xe Graphics G7 96EUs
39.1 fps -51%
Lenovo Yoga 7 2-in-1 16IML9
Intel Core Ultra 5 125U, Intel Graphics 4-Core iGPU (Arc)
36.5 fps -54%
1920x1080 med (fps_test=2)
MSI Summit E16 Flip A12UDT-031
Intel Core i7-1280P, NVIDIA GeForce RTX 3050 Ti Laptop GPU
105.9 fps +68%
Acer Aspire 16 A16-51GM-77G2
Intel Core 7 150U, NVIDIA GeForce RTX 2050 Mobile
88.7 fps +41%
Samsung Galaxy Book3 Ultra 16
Intel Core i7-13700H, NVIDIA GeForce RTX 4050 Laptop GPU
88.2 fps +40%
HP Spectre x360 16 RTX 4050
Intel Core Ultra 7 155H, NVIDIA GeForce RTX 4050 Laptop GPU
86.7 fps +37%
MSI Summit A16 AI Plus A3HMTG
AMD Ryzen AI 9 365, AMD Radeon 880M
63.1 fps
Moyenne AMD Radeon 880M
  (47.2 - 65.9, n=6)
56.6 fps -10%
Asus Zenbook S 16 UM5606-RK333W
AMD Ryzen AI 9 HX 370, AMD Radeon 890M
54.4 fps -14%
Asus Zenbook S 16 UM5606WA-RK052W
AMD Ryzen AI 9 365, AMD Radeon 880M
51.2 fps -19%
Ninkear A16 Pro
AMD Ryzen 7 8845HS, AMD Radeon 780M
47.8 fps -24%
Dell Inspiron 16 7640 2-in-1
Intel Core Ultra 7 155H, Intel Arc 8-Core iGPU
40.8 fps -35%
Lenovo IdeaPad Slim 5 16IRU9
Intel Core 7 150U, Intel Iris Xe Graphics G7 96EUs
38.1 fps -40%
Lenovo ThinkPad E16 Gen 2 21M5002VGE
AMD Ryzen 5 7535HS, AMD Radeon 660M
35.6 fps -44%
HP Envy x360 2-in-1 16-ad0097nr
AMD Ryzen 7 8840HS, AMD Radeon 780M
33.9 fps -46%
Asus ExpertBook B5 Flip B5602FBN
Intel Core i7-1260P, Intel Arc A350M
32.2 fps -49%
LG gram Pro 2-in-1 16T90SP
Intel Core Ultra 7 155H, Intel Arc 8-Core iGPU
31.1 fps -51%
Lenovo Yoga 7 2-in-1 16IML9
Intel Core Ultra 5 125U, Intel Graphics 4-Core iGPU (Arc)
28 fps -56%
1920x1080 high (fps_test=3)
MSI Summit E16 Flip A12UDT-031
Intel Core i7-1280P, NVIDIA GeForce RTX 3050 Ti Laptop GPU
88.1 fps +81%
Samsung Galaxy Book3 Ultra 16
Intel Core i7-13700H, NVIDIA GeForce RTX 4050 Laptop GPU
79 fps +62%
Acer Aspire 16 A16-51GM-77G2
Intel Core 7 150U, NVIDIA GeForce RTX 2050 Mobile
75.5 fps +55%
HP Spectre x360 16 RTX 4050
Intel Core Ultra 7 155H, NVIDIA GeForce RTX 4050 Laptop GPU
69.7 fps +43%
MSI Summit A16 AI Plus A3HMTG
AMD Ryzen AI 9 365, AMD Radeon 880M
48.8 fps
Asus Zenbook S 16 UM5606-RK333W
AMD Ryzen AI 9 HX 370, AMD Radeon 890M
44.2 fps -9%
Moyenne AMD Radeon 880M
  (35.3 - 49.5, n=6)
43.2 fps -11%
Dell Inspiron 16 7640 2-in-1
Intel Core Ultra 7 155H, Intel Arc 8-Core iGPU
40.1 fps -18%
Ninkear A16 Pro
AMD Ryzen 7 8845HS, AMD Radeon 780M
40.1 fps -18%
Asus Zenbook S 16 UM5606WA-RK052W
AMD Ryzen AI 9 365, AMD Radeon 880M
39.8 fps -18%
Lenovo IdeaPad Slim 5 16IRU9
Intel Core 7 150U, Intel Iris Xe Graphics G7 96EUs
33 fps -32%
Lenovo ThinkPad E16 Gen 2 21M5002VGE
AMD Ryzen 5 7535HS, AMD Radeon 660M
30.8 fps -37%
LG gram Pro 2-in-1 16T90SP
Intel Core Ultra 7 155H, Intel Arc 8-Core iGPU
29.9 fps -39%
Asus ExpertBook B5 Flip B5602FBN
Intel Core i7-1260P, Intel Arc A350M
27.9 fps -43%
HP Envy x360 2-in-1 16-ad0097nr
AMD Ryzen 7 8840HS, AMD Radeon 780M
27.9 fps -43%
Lenovo Yoga 7 2-in-1 16IML9
Intel Core Ultra 5 125U, Intel Graphics 4-Core iGPU (Arc)
23.4 fps -52%
Far Cry 5
1280x720 Low Preset AA:T
Samsung Galaxy Book3 Ultra 16
Intel Core i7-13700H, NVIDIA GeForce RTX 4050 Laptop GPU
148 (100min) fps +45%
MSI Summit A16 AI Plus A3HMTG
AMD Ryzen AI 9 365, AMD Radeon 880M
102 (81min) fps
HP Spectre x360 16 RTX 4050
Intel Core Ultra 7 155H, NVIDIA GeForce RTX 4050 Laptop GPU
97 (3min) fps -5%
Asus ExpertBook B5 Flip B5602FBN
Intel Core i7-1260P, Intel Arc A350M
89 (74min) fps -13%
Moyenne AMD Radeon 880M
  (69 - 102, n=5)
86.4 fps -15%
Asus Zenbook S 16 UM5606-RK333W
AMD Ryzen AI 9 HX 370, AMD Radeon 890M
81 fps -21%
Asus Zenbook S 16 UM5606WA-RK052W
AMD Ryzen AI 9 365, AMD Radeon 880M
76 (65min) fps -25%
Dell Inspiron 16 7640 2-in-1
Intel Core Ultra 7 155H, Intel Arc 8-Core iGPU
68 (21min) fps -33%
HP Envy x360 2-in-1 16-ad0097nr
AMD Ryzen 7 8840HS, AMD Radeon 780M
63 (46min) fps -38%
Lenovo ThinkPad E16 Gen 2 21M5002VGE
AMD Ryzen 5 7535HS, AMD Radeon 660M
55 (34min) fps -46%
Lenovo Yoga 7 2-in-1 16IML9
Intel Core Ultra 5 125U, Intel Graphics 4-Core iGPU (Arc)
46 (39min) fps -55%
Lenovo IdeaPad Slim 5 16IRU9
Intel Core 7 150U, Intel Iris Xe Graphics G7 96EUs
45 (27min) fps -56%
1920x1080 Medium Preset AA:T
HP Spectre x360 16 RTX 4050
Intel Core Ultra 7 155H, NVIDIA GeForce RTX 4050 Laptop GPU
93 (13min) fps +60%
Samsung Galaxy Book3 Ultra 16
Intel Core i7-13700H, NVIDIA GeForce RTX 4050 Laptop GPU
87 (67min) fps +50%
MSI Summit A16 AI Plus A3HMTG
AMD Ryzen AI 9 365, AMD Radeon 880M
58 (50min) fps
Asus Zenbook S 16 UM5606-RK333W
AMD Ryzen AI 9 HX 370, AMD Radeon 890M
50 fps -14%
Moyenne AMD Radeon 880M
  (36 - 58, n=5)
49.8 fps -14%
Asus ExpertBook B5 Flip B5602FBN
Intel Core i7-1260P, Intel Arc A350M
44 (38min) fps -24%
Asus Zenbook S 16 UM5606WA-RK052W
AMD Ryzen AI 9 365, AMD Radeon 880M
43 (38min) fps -26%
Dell Inspiron 16 7640 2-in-1
Intel Core Ultra 7 155H, Intel Arc 8-Core iGPU
38 (12min) fps -34%
HP Envy x360 2-in-1 16-ad0097nr
AMD Ryzen 7 8840HS, AMD Radeon 780M
36 (6min) fps -38%
LG gram Pro 2-in-1 16T90SP
Intel Core Ultra 7 155H, Intel Arc 8-Core iGPU
30 (2min) fps -48%
Lenovo ThinkPad E16 Gen 2 21M5002VGE
AMD Ryzen 5 7535HS, AMD Radeon 660M
26 (4min) fps -55%
Lenovo Yoga 7 2-in-1 16IML9
Intel Core Ultra 5 125U, Intel Graphics 4-Core iGPU (Arc)
25 (17min) fps -57%
Lenovo IdeaPad Slim 5 16IRU9
Intel Core 7 150U, Intel Iris Xe Graphics G7 96EUs
24 (9min) fps -59%
1920x1080 High Preset AA:T
HP Spectre x360 16 RTX 4050
Intel Core Ultra 7 155H, NVIDIA GeForce RTX 4050 Laptop GPU
95 (75min) fps +79%
Samsung Galaxy Book3 Ultra 16
Intel Core i7-13700H, NVIDIA GeForce RTX 4050 Laptop GPU
74 (57min) fps +40%
MSI Summit A16 AI Plus A3HMTG
AMD Ryzen AI 9 365, AMD Radeon 880M
53 (46min) fps
Asus Zenbook S 16 UM5606-RK333W
AMD Ryzen AI 9 HX 370, AMD Radeon 890M
46 fps -13%
Moyenne AMD Radeon 880M
  (32 - 53, n=5)
45.4 fps -14%
Asus ExpertBook B5 Flip B5602FBN
Intel Core i7-1260P, Intel Arc A350M
41 (36min) fps -23%
Asus Zenbook S 16 UM5606WA-RK052W
AMD Ryzen AI 9 365, AMD Radeon 880M
40 (34min) fps -25%
Dell Inspiron 16 7640 2-in-1
Intel Core Ultra 7 155H, Intel Arc 8-Core iGPU
36 (24min) fps -32%
HP Envy x360 2-in-1 16-ad0097nr
AMD Ryzen 7 8840HS, AMD Radeon 780M
33 (20min) fps -38%
LG gram Pro 2-in-1 16T90SP
Intel Core Ultra 7 155H, Intel Arc 8-Core iGPU
28 (13min) fps -47%
Lenovo Yoga 7 2-in-1 16IML9
Intel Core Ultra 5 125U, Intel Graphics 4-Core iGPU (Arc)
25 (22min) fps -53%
Lenovo ThinkPad E16 Gen 2 21M5002VGE
AMD Ryzen 5 7535HS, AMD Radeon 660M
23 (11min) fps -57%
Lenovo IdeaPad Slim 5 16IRU9
Intel Core 7 150U, Intel Iris Xe Graphics G7 96EUs
22 (16min) fps -58%
1920x1080 Ultra Preset AA:T
HP Spectre x360 16 RTX 4050
Intel Core Ultra 7 155H, NVIDIA GeForce RTX 4050 Laptop GPU
87 (64min) fps +74%
Samsung Galaxy Book3 Ultra 16
Intel Core i7-13700H, NVIDIA GeForce RTX 4050 Laptop GPU
71 (47min) fps +42%
MSI Summit A16 AI Plus A3HMTG
AMD Ryzen AI 9 365, AMD Radeon 880M
50 (43min) fps
Moyenne AMD Radeon 880M
  (30 - 50, n=5)
42.6 fps -15%
Asus ExpertBook B5 Flip B5602FBN
Intel Core i7-1260P, Intel Arc A350M
38 (33min) fps -24%
Asus Zenbook S 16 UM5606WA-RK052W
AMD Ryzen AI 9 365, AMD Radeon 880M
37 (32min) fps -26%
Dell Inspiron 16 7640 2-in-1
Intel Core Ultra 7 155H, Intel Arc 8-Core iGPU
34 (28min) fps -32%
Asus Zenbook S 16 UM5606-RK333W
AMD Ryzen AI 9 HX 370, AMD Radeon 890M
33 fps -34%
HP Envy x360 2-in-1 16-ad0097nr
AMD Ryzen 7 8840HS, AMD Radeon 780M
31 (23min) fps -38%
LG gram Pro 2-in-1 16T90SP
Intel Core Ultra 7 155H, Intel Arc 8-Core iGPU
26 (12min) fps -48%
Lenovo Yoga 7 2-in-1 16IML9
Intel Core Ultra 5 125U, Intel Graphics 4-Core iGPU (Arc)
23 (20min) fps -54%
Lenovo ThinkPad E16 Gen 2 21M5002VGE
AMD Ryzen 5 7535HS, AMD Radeon 660M
22 (20min) fps -56%
Lenovo IdeaPad Slim 5 16IRU9
Intel Core 7 150U, Intel Iris Xe Graphics G7 96EUs
21 (19min) fps -58%
Strange Brigade
1280x720 lowest AF:1
Samsung Galaxy Book3 Ultra 16
Intel Core i7-13700H, NVIDIA GeForce RTX 4050 Laptop GPU
321 (54.9min, 240P1) fps +66%
HP Spectre x360 16 RTX 4050
Intel Core Ultra 7 155H, NVIDIA GeForce RTX 4050 Laptop GPU
299 (47.1min, 215P1) fps +55%
MSI Summit E16 Flip A12UDT-031
Intel Core i7-1280P, NVIDIA GeForce RTX 3050 Ti Laptop GPU
270 (142.9min, 172.6P1) fps +40%
Acer Aspire 16 A16-51GM-77G2
Intel Core 7 150U, NVIDIA GeForce RTX 2050 Mobile
197.9 (104.3min, 162.4P1) fps +3%
MSI Summit A16 AI Plus A3HMTG
AMD Ryzen AI 9 365, AMD Radeon 880M
192.9 (113.4min, 164.6P1) fps
Moyenne AMD Radeon 880M
  (156.1 - 192.9, n=5)
178.7 fps -7%
Asus Zenbook S 16 UM5606-RK333W
AMD Ryzen AI 9 HX 370, AMD Radeon 890M
165.1 (71.8min, 139.9P1) fps -14%
Asus ExpertBook B5 Flip B5602FBN
Intel Core i7-1260P, Intel Arc A350M
163.4 (57.2min, 64.4P1) fps -15%
Asus Zenbook S 16 UM5606WA-RK052W
AMD Ryzen AI 9 365, AMD Radeon 880M
156.1 (68.6min, 128.2P1) fps -19%
Ninkear A16 Pro
AMD Ryzen 7 8845HS, AMD Radeon 780M
149.3 (46.6min, 120.4P1) fps -23%
LG gram Pro 2-in-1 16T90SP
Intel Core Ultra 7 155H, Intel Arc 8-Core iGPU
146.1 (39.9min, 61.8P1) fps -24%
Dell Inspiron 16 7640 2-in-1
Intel Core Ultra 7 155H, Intel Arc 8-Core iGPU
145.6 (11.6min, 70.2P1) fps -25%
HP Envy x360 2-in-1 16-ad0097nr
AMD Ryzen 7 8840HS, AMD Radeon 780M
138.2 (14.6min, 108.4P1) fps -28%
Lenovo Yoga 7 2-in-1 16IML9
Intel Core Ultra 5 125U, Intel Graphics 4-Core iGPU (Arc)
120.4 (39.2min, 96.2P1) fps -38%
Lenovo ThinkPad E16 Gen 2 21M5002VGE
AMD Ryzen 5 7535HS, AMD Radeon 660M
117.4 (81.8min, 104.7P1) fps -39%
Lenovo IdeaPad Slim 5 16IRU9
Intel Core 7 150U, Intel Iris Xe Graphics G7 96EUs
91.2 (19.5min, 31.8P1) fps -53%
1920x1080 medium AA:medium AF:4
HP Spectre x360 16 RTX 4050
Intel Core Ultra 7 155H, NVIDIA GeForce RTX 4050 Laptop GPU
171.1 (14.5min, 135.8P1) fps +115%
Samsung Galaxy Book3 Ultra 16
Intel Core i7-13700H, NVIDIA GeForce RTX 4050 Laptop GPU
153.5 (31.8min, 110.3P1) fps +93%
MSI Summit E16 Flip A12UDT-031
Intel Core i7-1280P, NVIDIA GeForce RTX 3050 Ti Laptop GPU
114.8 (67.2min, 79.2P1) fps +44%
Acer Aspire 16 A16-51GM-77G2
Intel Core 7 150U, NVIDIA GeForce RTX 2050 Mobile
87.6 (56.3min, 75.4P1) fps +10%
MSI Summit A16 AI Plus A3HMTG
AMD Ryzen AI 9 365, AMD Radeon 880M
79.7 (58.9min, 66.7P1) fps
Moyenne AMD Radeon 880M
  (64.2 - 79.7, n=5)
73.6 fps -8%
Dell Inspiron 16 7640 2-in-1
Intel Core Ultra 7 155H, Intel Arc 8-Core iGPU
71.8 (6.8min, 59.5P1) fps -10%
Asus ExpertBook B5 Flip B5602FBN
Intel Core i7-1260P, Intel Arc A350M
71.6 (58min, 62P1) fps -10%
Asus Zenbook S 16 UM5606-RK333W
AMD Ryzen AI 9 HX 370, AMD Radeon 890M
71.1 (42.9min, 59.3P1) fps -11%
LG gram Pro 2-in-1 16T90SP
Intel Core Ultra 7 155H, Intel Arc 8-Core iGPU
67.7 (41.4min, 52.7P1) fps -15%
Asus Zenbook S 16 UM5606WA-RK052W
AMD Ryzen AI 9 365, AMD Radeon 880M
64.2 (41.7min, 56.2P1) fps -19%
Ninkear A16 Pro
AMD Ryzen 7 8845HS, AMD Radeon 780M
62.6 (30.5min, 53.5P1) fps -21%
HP Envy x360 2-in-1 16-ad0097nr
AMD Ryzen 7 8840HS, AMD Radeon 780M
60.3 (10.3min, 50.5P1) fps -24%
Lenovo Yoga 7 2-in-1 16IML9
Intel Core Ultra 5 125U, Intel Graphics 4-Core iGPU (Arc)
50 (24.3min, 41.3P1) fps -37%
Lenovo ThinkPad E16 Gen 2 21M5002VGE
AMD Ryzen 5 7535HS, AMD Radeon 660M
43.3 (36.5min, 39P1) fps -46%
Lenovo IdeaPad Slim 5 16IRU9
Intel Core 7 150U, Intel Iris Xe Graphics G7 96EUs
39.8 (15.4min, 22.7P1) fps -50%
1920x1080 high AA:high AF:8
HP Spectre x360 16 RTX 4050
Intel Core Ultra 7 155H, NVIDIA GeForce RTX 4050 Laptop GPU
137.4 (50.7min, 105.7P1) fps +105%
Samsung Galaxy Book3 Ultra 16
Intel Core i7-13700H, NVIDIA GeForce RTX 4050 Laptop GPU
120.1 (21.3min, 85.9P1) fps +79%
MSI Summit E16 Flip A12UDT-031
Intel Core i7-1280P, NVIDIA GeForce RTX 3050 Ti Laptop GPU
104.9 (62.6min, 78.1P1) fps +57%
Acer Aspire 16 A16-51GM-77G2
Intel Core 7 150U, NVIDIA GeForce RTX 2050 Mobile
72.1 (51.1min, 55.6P1) fps +8%
MSI Summit A16 AI Plus A3HMTG
AMD Ryzen AI 9 365, AMD Radeon 880M
67 (39.8min, 51.4P1) fps
Moyenne AMD Radeon 880M
  (53.7 - 67, n=5)
62 fps -7%
Asus Zenbook S 16 UM5606-RK333W
AMD Ryzen AI 9 HX 370, AMD Radeon 890M
60.2 (33min, 45.5P1) fps -10%
Asus ExpertBook B5 Flip B5602FBN
Intel Core i7-1260P, Intel Arc A350M
58.7 (11.3min, 46P1) fps -12%
Dell Inspiron 16 7640 2-in-1
Intel Core Ultra 7 155H, Intel Arc 8-Core iGPU
55.4 (6.8min, 15.4P1) fps -17%
LG gram Pro 2-in-1 16T90SP
Intel Core Ultra 7 155H, Intel Arc 8-Core iGPU
54.9 (17.3min, 29.3P1) fps -18%
Asus Zenbook S 16 UM5606WA-RK052W
AMD Ryzen AI 9 365, AMD Radeon 880M
53.7 (30.3min, 41.5P1) fps -20%
Ninkear A16 Pro
AMD Ryzen 7 8845HS, AMD Radeon 780M
53 (28.3min, 40.8P1) fps -21%
HP Envy x360 2-in-1 16-ad0097nr
AMD Ryzen 7 8840HS, AMD Radeon 780M
50.2 (8.3min, 15.8P1) fps -25%
Lenovo Yoga 7 2-in-1 16IML9
Intel Core Ultra 5 125U, Intel Graphics 4-Core iGPU (Arc)
39.2 (10min, 24P1) fps -41%
Lenovo ThinkPad E16 Gen 2 21M5002VGE
AMD Ryzen 5 7535HS, AMD Radeon 660M
35 (27.7min, 28.5P1) fps -48%
Lenovo IdeaPad Slim 5 16IRU9
Intel Core 7 150U, Intel Iris Xe Graphics G7 96EUs
31.1 (8.3min, 16.6P1) fps -54%
1920x1080 ultra AA:ultra AF:16
HP Spectre x360 16 RTX 4050
Intel Core Ultra 7 155H, NVIDIA GeForce RTX 4050 Laptop GPU
121.3 (49.1min, 95P1) fps +114%
Samsung Galaxy Book3 Ultra 16
Intel Core i7-13700H, NVIDIA GeForce RTX 4050 Laptop GPU
103.9 (65min, 77.7P1) fps +83%
MSI Summit E16 Flip A12UDT-031
Intel Core i7-1280P, NVIDIA GeForce RTX 3050 Ti Laptop GPU
88.2 (43.8min, 56.8P1) fps +56%
Acer Aspire 16 A16-51GM-77G2
Intel Core 7 150U, NVIDIA GeForce RTX 2050 Mobile
62.8 (46.5min, 48.8P1) fps +11%
MSI Summit A16 AI Plus A3HMTG
AMD Ryzen AI 9 365, AMD Radeon 880M
56.7 (38.9min, 43.7P1) fps
Moyenne AMD Radeon 880M
  (44.2 - 56.7, n=5)
51.9 fps -8%
Asus Zenbook S 16 UM5606-RK333W
AMD Ryzen AI 9 HX 370, AMD Radeon 890M
49.8 (31.1min, 37.7P1) fps -12%
Asus ExpertBook B5 Flip B5602FBN
Intel Core i7-1260P, Intel Arc A350M
49.1 (37.2min, 39.5P1) fps -13%
Ninkear A16 Pro
AMD Ryzen 7 8845HS, AMD Radeon 780M
45.6 (11.1min, 17.7P1) fps -20%
Dell Inspiron 16 7640 2-in-1
Intel Core Ultra 7 155H, Intel Arc 8-Core iGPU
45.4 (5min, 8.91P1) fps -20%
Asus Zenbook S 16 UM5606WA-RK052W
AMD Ryzen AI 9 365, AMD Radeon 880M
44.2 (7.8min, 23P1) fps -22%
HP Envy x360 2-in-1 16-ad0097nr
AMD Ryzen 7 8840HS, AMD Radeon 780M
42.2 (7.1min, 9.18P1) fps -26%
LG gram Pro 2-in-1 16T90SP
Intel Core Ultra 7 155H, Intel Arc 8-Core iGPU
40.7 (5min, 7.28P1) fps -28%
Lenovo Yoga 7 2-in-1 16IML9
Intel Core Ultra 5 125U, Intel Graphics 4-Core iGPU (Arc)
30.2 (7.6min, 10.6P1) fps -47%
Lenovo ThinkPad E16 Gen 2 21M5002VGE
AMD Ryzen 5 7535HS, AMD Radeon 660M
29 (22.6min, 23.6P1) fps -49%
Lenovo IdeaPad Slim 5 16IRU9
Intel Core 7 150U, Intel Iris Xe Graphics G7 96EUs
25.3 (5.1min, 6.9P1) fps -55%
F1 22
1280x720 Ultra Low Preset AA:T AF:16x
Samsung Galaxy Book3 Ultra 16
Intel Core i7-13700H, NVIDIA GeForce RTX 4050 Laptop GPU
225 (172min, 116P1) fps +39%
MSI Summit E16 Flip A12UDT-031
Intel Core i7-1280P, NVIDIA GeForce RTX 3050 Ti Laptop GPU
202 (141min, 116P1) fps +25%
HP Spectre x360 16 RTX 4050
Intel Core Ultra 7 155H, NVIDIA GeForce RTX 4050 Laptop GPU
175.1 (117min, 95P1) fps +8%
MSI Summit A16 AI Plus A3HMTG
AMD Ryzen AI 9 365, AMD Radeon 880M
162.1 (138min, 112P1) fps
Moyenne AMD Radeon 880M
  ()
162.1 fps 0%
HP Envy x360 2-in-1 16-ad0097nr
AMD Ryzen 7 8840HS, AMD Radeon 780M
126.9 (104min, 83P1) fps -22%
Dell Inspiron 16 7640 2-in-1
Intel Core Ultra 7 155H, Intel Arc 8-Core iGPU
120.1 (100min, 88P1) fps -26%
Asus ExpertBook B5 Flip B5602FBN
Intel Core i7-1260P, Intel Arc A350M
118.4 fps -27%
Lenovo IdeaPad Slim 5 16IRU9
Intel Core 7 150U, Intel Iris Xe Graphics G7 96EUs
79.5 (62min, 62P1) fps -51%
Lenovo Yoga 7 2-in-1 16IML9
Intel Core Ultra 5 125U, Intel Graphics 4-Core iGPU (Arc)
63.9 (54min, 53P1) fps -61%
1920x1080 Low Preset AA:T AF:16x
HP Spectre x360 16 RTX 4050
Intel Core Ultra 7 155H, NVIDIA GeForce RTX 4050 Laptop GPU
159.4 (117min, 92P1) fps +58%
Samsung Galaxy Book3 Ultra 16
Intel Core i7-13700H, NVIDIA GeForce RTX 4050 Laptop GPU
135.3 (97min, 78P1) fps +34%
MSI Summit E16 Flip A12UDT-031
Intel Core i7-1280P, NVIDIA GeForce RTX 3050 Ti Laptop GPU
122.2 (88min, 72P1) fps +21%
MSI Summit A16 AI Plus A3HMTG
AMD Ryzen AI 9 365, AMD Radeon 880M
101.1 (80min, 63P1) fps
Moyenne AMD Radeon 880M
  ()
101.1 fps 0%
Asus Zenbook S 16 UM5606-RK333W
AMD Ryzen AI 9 HX 370, AMD Radeon 890M
81 (59min, 35P1) fps -20%
HP Envy x360 2-in-1 16-ad0097nr
AMD Ryzen 7 8840HS, AMD Radeon 780M
70.2 (59min, 50P1) fps -31%
Dell Inspiron 16 7640 2-in-1
Intel Core Ultra 7 155H, Intel Arc 8-Core iGPU
68.8 (51min, 53P1) fps -32%
Asus ExpertBook B5 Flip B5602FBN
Intel Core i7-1260P, Intel Arc A350M
52.1 (45min, 39P1) fps -48%
Lenovo IdeaPad Slim 5 16IRU9
Intel Core 7 150U, Intel Iris Xe Graphics G7 96EUs
47.9 (40min, 38P1) fps -53%
Lenovo Yoga 7 2-in-1 16IML9
Intel Core Ultra 5 125U, Intel Graphics 4-Core iGPU (Arc)
41.7 (34min, 33P1) fps -59%
1920x1080 Medium Preset AA:T AF:16x
HP Spectre x360 16 RTX 4050
Intel Core Ultra 7 155H, NVIDIA GeForce RTX 4050 Laptop GPU
146.6 (46min, 79P1) fps +58%
Samsung Galaxy Book3 Ultra 16
Intel Core i7-13700H, NVIDIA GeForce RTX 4050 Laptop GPU
127.4 (98min, 73P1) fps +38%
MSI Summit E16 Flip A12UDT-031
Intel Core i7-1280P, NVIDIA GeForce RTX 3050 Ti Laptop GPU
107.9 (80min, 62P1) fps +17%
MSI Summit A16 AI Plus A3HMTG
AMD Ryzen AI 9 365, AMD Radeon 880M
92.5 (67min, 59P1) fps
Moyenne AMD Radeon 880M
  ()
92.5 fps 0%
Asus Zenbook S 16 UM5606-RK333W
AMD Ryzen AI 9 HX 370, AMD Radeon 890M
76.8 (42min, 42P1) fps -17%
Dell Inspiron 16 7640 2-in-1
Intel Core Ultra 7 155H, Intel Arc 8-Core iGPU
65.6 (54min, 52P1) fps -29%
HP Envy x360 2-in-1 16-ad0097nr
AMD Ryzen 7 8840HS, AMD Radeon 780M
60 (49min, 41P1) fps -35%
Asus ExpertBook B5 Flip B5602FBN
Intel Core i7-1260P, Intel Arc A350M
51.4 (40min, 36P1) fps -44%
Lenovo IdeaPad Slim 5 16IRU9
Intel Core 7 150U, Intel Iris Xe Graphics G7 96EUs
42.7 (36min, 34P1) fps -54%
Lenovo Yoga 7 2-in-1 16IML9
Intel Core Ultra 5 125U, Intel Graphics 4-Core iGPU (Arc)
39.7 (33min, 32P1) fps -57%
1920x1080 High Preset AA:T AF:16x
HP Spectre x360 16 RTX 4050
Intel Core Ultra 7 155H, NVIDIA GeForce RTX 4050 Laptop GPU
124.6 (100min, 75P1) fps +77%
Samsung Galaxy Book3 Ultra 16
Intel Core i7-13700H, NVIDIA GeForce RTX 4050 Laptop GPU
97.5 (82min, 52P1) fps +39%
MSI Summit E16 Flip A12UDT-031
Intel Core i7-1280P, NVIDIA GeForce RTX 3050 Ti Laptop GPU
79.2 (61min, 51P1) fps +13%
MSI Summit A16 AI Plus A3HMTG
AMD Ryzen AI 9 365, AMD Radeon 880M
70.3 (52min, 46P1) fps
Moyenne AMD Radeon 880M
  ()
70.3 fps 0%
Asus Zenbook S 16 UM5606-RK333W
AMD Ryzen AI 9 HX 370, AMD Radeon 890M
64.2 (44min, 27P1) fps -9%
HP Envy x360 2-in-1 16-ad0097nr
AMD Ryzen 7 8840HS, AMD Radeon 780M
46 (39min, 32P1) fps -35%
Asus ExpertBook B5 Flip B5602FBN
Intel Core i7-1260P, Intel Arc A350M
35.5 (28min, 25P1) fps -50%
Lenovo IdeaPad Slim 5 16IRU9
Intel Core 7 150U, Intel Iris Xe Graphics G7 96EUs
30.4 (26min, 25P1) fps -57%
1920x1080 Ultra High Preset AA:T AF:16x
HP Spectre x360 16 RTX 4050
Intel Core Ultra 7 155H, NVIDIA GeForce RTX 4050 Laptop GPU
42 (36min, 34P1) fps +130%
Samsung Galaxy Book3 Ultra 16
Intel Core i7-13700H, NVIDIA GeForce RTX 4050 Laptop GPU
36.2 (31min, 25P1) fps +98%
MSI Summit E16 Flip A12UDT-031
Intel Core i7-1280P, NVIDIA GeForce RTX 3050 Ti Laptop GPU
29.3 (23min, 20P1) fps +60%
MSI Summit A16 AI Plus A3HMTG
AMD Ryzen AI 9 365, AMD Radeon 880M
18.3 (11min, 12P1) fps
Moyenne AMD Radeon 880M
  ()
18.3 fps 0%
Asus Zenbook S 16 UM5606-RK333W
AMD Ryzen AI 9 HX 370, AMD Radeon 890M
16.7 (12min, 10P1) fps -9%
HP Envy x360 2-in-1 16-ad0097nr
AMD Ryzen 7 8840HS, AMD Radeon 780M
12 (8min, 7P1) fps -34%
Baldur's Gate 3
1280x720 Low Preset
Acer Aspire 16 A16-51GM-77G2
Intel Core 7 150U, NVIDIA GeForce RTX 2050 Mobile
82 fps +30%
Ninkear A16 Pro
AMD Ryzen 7 8845HS, AMD Radeon 780M
66.7 fps +6%
MSI Summit A16 AI Plus A3HMTG
AMD Ryzen AI 9 365, AMD Radeon 880M
63.2 fps
Moyenne AMD Radeon 880M
  (35.3 - 68.3, n=3)
55.6 fps -12%
HP Envy x360 2-in-1 16-ad0097nr
AMD Ryzen 7 8840HS, AMD Radeon 780M
51.3 fps -19%
Dell Inspiron 16 7640 2-in-1
Intel Core Ultra 7 155H, Intel Arc 8-Core iGPU
46.7 fps -26%
Lenovo Yoga 7 2-in-1 16IML9
Intel Core Ultra 5 125U, Intel Graphics 4-Core iGPU (Arc)
24.9 fps -61%
Lenovo IdeaPad Slim 5 16IRU9
Intel Core 7 150U, Intel Iris Xe Graphics G7 96EUs
23.5 fps -63%
1920x1080 Low Preset
HP Spectre x360 16 RTX 4050
Intel Core Ultra 7 155H, NVIDIA GeForce RTX 4050 Laptop GPU
84.9 fps +93%
Acer Aspire 16 A16-51GM-77G2
Intel Core 7 150U, NVIDIA GeForce RTX 2050 Mobile
55.5 fps +26%
Asus Zenbook S 16 UM5606-RK333W
AMD Ryzen AI 9 HX 370, AMD Radeon 890M
45.2 fps +2%
MSI Summit A16 AI Plus A3HMTG
AMD Ryzen AI 9 365, AMD Radeon 880M
44.1 fps
Ninkear A16 Pro
AMD Ryzen 7 8845HS, AMD Radeon 780M
42 fps -5%
Moyenne AMD Radeon 880M
  (31.1 - 45.9, n=6)
39.5 fps -10%
HP Envy x360 2-in-1 16-ad0097nr
AMD Ryzen 7 8840HS, AMD Radeon 780M
35 fps -21%
Asus Zenbook S 16 UM5606WA-RK052W
AMD Ryzen AI 9 365, AMD Radeon 880M
31.1 (23.6min, 24.2P0.1, 27.3P1) fps -29%
Dell Inspiron 16 7640 2-in-1
Intel Core Ultra 7 155H, Intel Arc 8-Core iGPU
30.8 fps -30%
Lenovo ThinkPad E16 Gen 2 21M5002VGE
AMD Ryzen 5 7535HS, AMD Radeon 660M
22 (12P0.1, 18P1) fps -50%
LG gram Pro 2-in-1 16T90SP
Intel Core Ultra 7 155H, Intel Arc 8-Core iGPU
21 (1.4P0.1, 5P1) fps -52%
Lenovo IdeaPad Slim 5 16IRU9
Intel Core 7 150U, Intel Iris Xe Graphics G7 96EUs
16 fps -64%
Lenovo Yoga 7 2-in-1 16IML9
Intel Core Ultra 5 125U, Intel Graphics 4-Core iGPU (Arc)
15.4 fps -65%
1920x1080 Medium Preset
HP Spectre x360 16 RTX 4050
Intel Core Ultra 7 155H, NVIDIA GeForce RTX 4050 Laptop GPU
71.4 fps +98%
Acer Aspire 16 A16-51GM-77G2
Intel Core 7 150U, NVIDIA GeForce RTX 2050 Mobile
43.7 fps +21%
MSI Summit A16 AI Plus A3HMTG
AMD Ryzen AI 9 365, AMD Radeon 880M
36.1 fps
Asus Zenbook S 16 UM5606-RK333W
AMD Ryzen AI 9 HX 370, AMD Radeon 890M
35.8 fps -1%
Ninkear A16 Pro
AMD Ryzen 7 8845HS, AMD Radeon 780M
33.3 fps -8%
Moyenne AMD Radeon 880M
  (23 - 36.1, n=6)
30.6 fps -15%
HP Envy x360 2-in-1 16-ad0097nr
AMD Ryzen 7 8840HS, AMD Radeon 780M
28.5 fps -21%
Dell Inspiron 16 7640 2-in-1
Intel Core Ultra 7 155H, Intel Arc 8-Core iGPU
27.4 fps -24%
Asus Zenbook S 16 UM5606WA-RK052W
AMD Ryzen AI 9 365, AMD Radeon 880M
24.4 (18.4min, 18.5P0.1, 20.4P1) fps -32%
LG gram Pro 2-in-1 16T90SP
Intel Core Ultra 7 155H, Intel Arc 8-Core iGPU
16.3 fps -55%
Lenovo ThinkPad E16 Gen 2 21M5002VGE
AMD Ryzen 5 7535HS, AMD Radeon 660M
14 (4P0.1, 11P1) fps -61%
Lenovo IdeaPad Slim 5 16IRU9
Intel Core 7 150U, Intel Iris Xe Graphics G7 96EUs
13 fps -64%
1920x1080 High Preset
HP Spectre x360 16 RTX 4050
Intel Core Ultra 7 155H, NVIDIA GeForce RTX 4050 Laptop GPU
64 fps +114%
Acer Aspire 16 A16-51GM-77G2
Intel Core 7 150U, NVIDIA GeForce RTX 2050 Mobile
37.8 fps +26%
MSI Summit A16 AI Plus A3HMTG
AMD Ryzen AI 9 365, AMD Radeon 880M
29.9 fps
Ninkear A16 Pro
AMD Ryzen 7 8845HS, AMD Radeon 780M
27.5 fps -8%
Asus Zenbook S 16 UM5606-RK333W
AMD Ryzen AI 9 HX 370, AMD Radeon 890M
25.6 fps -14%
Moyenne AMD Radeon 880M
  (19.6 - 29.9, n=6)
25.4 fps -15%
Dell Inspiron 16 7640 2-in-1
Intel Core Ultra 7 155H, Intel Arc 8-Core iGPU
23.7 fps -21%
HP Envy x360 2-in-1 16-ad0097nr
AMD Ryzen 7 8840HS, AMD Radeon 780M
22.6 fps -24%
Asus Zenbook S 16 UM5606WA-RK052W
AMD Ryzen AI 9 365, AMD Radeon 880M
19.6 (15.1min, 15.6P0.1, 16.6P1) fps -34%
LG gram Pro 2-in-1 16T90SP
Intel Core Ultra 7 155H, Intel Arc 8-Core iGPU
15.8 (5.4P0.1, 7.9P1) fps -47%
Lenovo ThinkPad E16 Gen 2 21M5002VGE
AMD Ryzen 5 7535HS, AMD Radeon 660M
13 (9P0.1, 11P1) fps -57%
Lenovo IdeaPad Slim 5 16IRU9
Intel Core 7 150U, Intel Iris Xe Graphics G7 96EUs
10.6 fps -65%
1920x1080 Ultra Preset
HP Spectre x360 16 RTX 4050
Intel Core Ultra 7 155H, NVIDIA GeForce RTX 4050 Laptop GPU
63.1 fps +118%
Acer Aspire 16 A16-51GM-77G2
Intel Core 7 150U, NVIDIA GeForce RTX 2050 Mobile
37 fps +28%
MSI Summit A16 AI Plus A3HMTG
AMD Ryzen AI 9 365, AMD Radeon 880M
28.9 fps
Ninkear A16 Pro
AMD Ryzen 7 8845HS, AMD Radeon 780M
27 fps -7%
Asus Zenbook S 16 UM5606-RK333W
AMD Ryzen AI 9 HX 370, AMD Radeon 890M
24.9 fps -14%
Moyenne AMD Radeon 880M
  (17.6 - 28.9, n=6)
24.5 fps -15%
HP Envy x360 2-in-1 16-ad0097nr
AMD Ryzen 7 8840HS, AMD Radeon 780M
22.2 fps -23%
Dell Inspiron 16 7640 2-in-1
Intel Core Ultra 7 155H, Intel Arc 8-Core iGPU
22 fps -24%
Asus Zenbook S 16 UM5606WA-RK052W
AMD Ryzen AI 9 365, AMD Radeon 880M
17.6 (7.48min, 8.78P0.1, 12.3P1) fps -39%
Lenovo ThinkPad E16 Gen 2 21M5002VGE
AMD Ryzen 5 7535HS, AMD Radeon 660M
12 (5P0.1, 9P1) fps -58%
Lenovo IdeaPad Slim 5 16IRU9
Intel Core 7 150U, Intel Iris Xe Graphics G7 96EUs
9.3 fps -68%
Cyberpunk 2077 2.1 Phantom Liberty
1280x720 Low Preset (FSR off)
HP Spectre x360 16 RTX 4050
Intel Core Ultra 7 155H, NVIDIA GeForce RTX 4050 Laptop GPU
83.1 (32.7min) fps +2%
MSI Summit A16 AI Plus A3HMTG
AMD Ryzen AI 9 365, AMD Radeon 880M
81.8 (67.1min) fps
Moyenne AMD Radeon 880M
  (79.9 - 81.8, n=2)
80.9 fps -1%
Acer Aspire 16 A16-51GM-77G2
Intel Core 7 150U, NVIDIA GeForce RTX 2050 Mobile
70.6 fps -14%
Ninkear A16 Pro
AMD Ryzen 7 8845HS, AMD Radeon 780M
65.2 (53.5min) fps -20%
HP Envy x360 2-in-1 16-ad0097nr
AMD Ryzen 7 8840HS, AMD Radeon 780M
58.5 (20.6min) fps -28%
Dell Inspiron 16 7640 2-in-1
Intel Core Ultra 7 155H, Intel Arc 8-Core iGPU
38 (27.9min) fps -54%
Lenovo Yoga 7 2-in-1 16IML9
Intel Core Ultra 5 125U, Intel Graphics 4-Core iGPU (Arc)
32.8 (7.65min) fps -60%
Lenovo IdeaPad Slim 5 16IRU9
Intel Core 7 150U, Intel Iris Xe Graphics G7 96EUs
31.1 (24.4min) fps -62%
1920x1080 Low Preset (FSR off)
HP Spectre x360 16 RTX 4050
Intel Core Ultra 7 155H, NVIDIA GeForce RTX 4050 Laptop GPU
79.3 (21.3min) fps +60%
MSI Summit A16 AI Plus A3HMTG
AMD Ryzen AI 9 365, AMD Radeon 880M
49.5 (41.5min) fps
Acer Aspire 16 A16-51GM-77G2
Intel Core 7 150U, NVIDIA GeForce RTX 2050 Mobile
47.8 (36.3min) fps -3%
Asus Zenbook S 16 UM5606-RK333W
AMD Ryzen AI 9 HX 370, AMD Radeon 890M
46 (38.3min) fps -7%
Moyenne AMD Radeon 880M
  (37.2 - 49.5, n=6)
43 fps -13%
Ninkear A16 Pro
AMD Ryzen 7 8845HS, AMD Radeon 780M
39.2 (33min) fps -21%
Asus Zenbook S 16 UM5606WA-RK052W
AMD Ryzen AI 9 365, AMD Radeon 880M
37.2 (28min) fps -25%
HP Envy x360 2-in-1 16-ad0097nr
AMD Ryzen 7 8840HS, AMD Radeon 780M
35.5 (19.3min) fps -28%
Dell Inspiron 16 7640 2-in-1
Intel Core Ultra 7 155H, Intel Arc 8-Core iGPU
31 (25.4min) fps -37%
LG gram Pro 2-in-1 16T90SP
Intel Core Ultra 7 155H, Intel Arc 8-Core iGPU
23.6 (16.6min) fps -52%
Lenovo ThinkPad E16 Gen 2 21M5002VGE
AMD Ryzen 5 7535HS, AMD Radeon 660M
22.9 (19.3min) fps -54%
Lenovo Yoga 7 2-in-1 16IML9
Intel Core Ultra 5 125U, Intel Graphics 4-Core iGPU (Arc)
20.9 (8.34min) fps -58%
Lenovo IdeaPad Slim 5 16IRU9
Intel Core 7 150U, Intel Iris Xe Graphics G7 96EUs
18.7 (14.5min) fps -62%
1920x1080 Medium Preset (FSR off)
HP Spectre x360 16 RTX 4050
Intel Core Ultra 7 155H, NVIDIA GeForce RTX 4050 Laptop GPU
63.3 (24.8min) fps +65%
MSI Summit A16 AI Plus A3HMTG
AMD Ryzen AI 9 365, AMD Radeon 880M
38.3 (33.2min) fps
Acer Aspire 16 A16-51GM-77G2
Intel Core 7 150U, NVIDIA GeForce RTX 2050 Mobile
36.4 fps -5%
Moyenne AMD Radeon 880M
  (29.1 - 38.3, n=6)
33.6 fps -12%
Asus Zenbook S 16 UM5606-RK333W
AMD Ryzen AI 9 HX 370, AMD Radeon 890M
31.3 (19.7min) fps -18%
Ninkear A16 Pro
AMD Ryzen 7 8845HS, AMD Radeon 780M
31 (26.7min) fps -19%
Asus Zenbook S 16 UM5606WA-RK052W
AMD Ryzen AI 9 365, AMD Radeon 880M
29.1 (24min) fps -24%
HP Envy x360 2-in-1 16-ad0097nr
AMD Ryzen 7 8840HS, AMD Radeon 780M
27.8 (15.3min) fps -27%
Dell Inspiron 16 7640 2-in-1
Intel Core Ultra 7 155H, Intel Arc 8-Core iGPU
26.3 (20.8min) fps -31%
Lenovo ThinkPad E16 Gen 2 21M5002VGE
AMD Ryzen 5 7535HS, AMD Radeon 660M
17.4 (15.2min) fps -55%
Lenovo Yoga 7 2-in-1 16IML9
Intel Core Ultra 5 125U, Intel Graphics 4-Core iGPU (Arc)
16.9 (7.96min) fps -56%
Lenovo IdeaPad Slim 5 16IRU9
Intel Core 7 150U, Intel Iris Xe Graphics G7 96EUs
14.7 (12.2min) fps -62%
1920x1080 High Preset (FSR off)
HP Spectre x360 16 RTX 4050
Intel Core Ultra 7 155H, NVIDIA GeForce RTX 4050 Laptop GPU
53.5 (36.3min) fps +76%
MSI Summit A16 AI Plus A3HMTG
AMD Ryzen AI 9 365, AMD Radeon 880M
30.4 (25.7min) fps
Acer Aspire 16 A16-51GM-77G2
Intel Core 7 150U, NVIDIA GeForce RTX 2050 Mobile
29.2 (19.5min) fps -4%
Moyenne AMD Radeon 880M
  (23.9 - 30.4, n=6)
26.5 fps -13%
Asus Zenbook S 16 UM5606-RK333W
AMD Ryzen AI 9 HX 370, AMD Radeon 890M
25.4 (15.6min) fps -16%
Ninkear A16 Pro
AMD Ryzen 7 8845HS, AMD Radeon 780M
24.9 (21.3min) fps -18%
Asus Zenbook S 16 UM5606WA-RK052W
AMD Ryzen AI 9 365, AMD Radeon 880M
23.9 (20min) fps -21%
HP Envy x360 2-in-1 16-ad0097nr
AMD Ryzen 7 8840HS, AMD Radeon 780M
22.1 (11min) fps -27%
Dell Inspiron 16 7640 2-in-1
Intel Core Ultra 7 155H, Intel Arc 8-Core iGPU
21.9 (16.8min) fps -28%
LG gram Pro 2-in-1 16T90SP
Intel Core Ultra 7 155H, Intel Arc 8-Core iGPU
14.8 (11.6min) fps -51%
Lenovo Yoga 7 2-in-1 16IML9
Intel Core Ultra 5 125U, Intel Graphics 4-Core iGPU (Arc)
14.3 (3.34min) fps -53%
Lenovo ThinkPad E16 Gen 2 21M5002VGE
AMD Ryzen 5 7535HS, AMD Radeon 660M
13.2 (11.5min) fps -57%
Lenovo ThinkPad E16 Gen 2 21M5002VGE
AMD Ryzen 5 7535HS, AMD Radeon 660M
11 (9.48min) fps -64%
Lenovo IdeaPad Slim 5 16IRU9
Intel Core 7 150U, Intel Iris Xe Graphics G7 96EUs
12.4 (10.3min) fps -59%
1920x1080 Ultra Preset (FSR off)
HP Spectre x360 16 RTX 4050
Intel Core Ultra 7 155H, NVIDIA GeForce RTX 4050 Laptop GPU
46 (29.2min) fps +75%
MSI Summit A16 AI Plus A3HMTG
AMD Ryzen AI 9 365, AMD Radeon 880M
26.3 (21.7min) fps
Acer Aspire 16 A16-51GM-77G2
Intel Core 7 150U, NVIDIA GeForce RTX 2050 Mobile
24.7 (13.5min, 18.1P0.1, 18.9P1) fps -6%
Asus Zenbook S 16 UM5606-RK333W
AMD Ryzen AI 9 HX 370, AMD Radeon 890M
23.1 (18.2min) fps -12%
Moyenne AMD Radeon 880M
  (19.4 - 26.3, n=6)
22.2 fps -16%
Ninkear A16 Pro
AMD Ryzen 7 8845HS, AMD Radeon 780M
21.8 (18.3min) fps -17%
Asus Zenbook S 16 UM5606WA-RK052W
AMD Ryzen AI 9 365, AMD Radeon 880M
20 (16min) fps -24%
HP Envy x360 2-in-1 16-ad0097nr
AMD Ryzen 7 8840HS, AMD Radeon 780M
19.1 (9.74min) fps -27%
Lenovo Yoga 7 2-in-1 16IML9
Intel Core Ultra 5 125U, Intel Graphics 4-Core iGPU (Arc)
12.5 (2.72min) fps -52%
Lenovo ThinkPad E16 Gen 2 21M5002VGE
AMD Ryzen 5 7535HS, AMD Radeon 660M
11.2 (9.6min) fps -57%
Lenovo IdeaPad Slim 5 16IRU9
Intel Core 7 150U, Intel Iris Xe Graphics G7 96EUs
10.9 (9.32min) fps -59%

Cyberpunk 2077 ultra FPS Chart

0510152025Tooltip
MSI Summit A16 AI Plus A3HMTG Ryzen AI 9 365, Radeon 880M: Ø24.8 (23-25.8)
BasMoyenÉlevéUltraQHD
GTA V (2015) 170.6 80.5 32.5 22.3
Dota 2 Reborn (2015) 156.7 133.6 47.2 46.2
Final Fantasy XV Benchmark (2018) 87 43.7 31.4 23.2
X-Plane 11.11 (2018) 79.9 63.1 48.8
Far Cry 5 (2018) 102 58 53 50
Strange Brigade (2018) 192.9 79.7 67 56.7 35.7
Tiny Tina's Wonderlands (2022) 84.9 61.4 40.2 31.9
F1 22 (2022) 101.1 92.5 70.3 18.3 11.2
Baldur's Gate 3 (2023) 44.1 36.1 29.9 28.9
Cyberpunk 2077 2.1 Phantom Liberty (2023) 49.5 38.3 30.4 26.3 19.1

Émissions

Bruit du système

Le bruit des ventilateurs n'est pas beaucoup plus silencieux qu'auparavant malgré l'absence d'un GPU discret. Les ventilateurs sont presque toujours actifs, quelle que soit la charge, et ils montent relativement vite en régime lorsque des charges plus élevées sont introduites. De plus, le bruit des ventilateurs est aigu et tout changement de régime est plus perceptible.

Avec plus de 46 dB(A) en jeu, le Summit A16 peut être aussi bruyant que beaucoup d'ordinateurs portables dédiés au jeu.

Profil de bruit du ventilateur (Blanc : Arrière-plan, Rouge : Système au ralenti, Bleu : 3DMark 06, Orange : Cyberpunk 2077, Vert : Cooler Boost activé)

Degré de la nuisance sonore

Au repos
25 / 25 / 29.5 dB(A)
Fortement sollicité
37.5 / 56.1 dB(A)
  red to green bar
 
 
30 dB
silencieux
40 dB(A)
audible
50 dB(A)
bruyant
 
min: dark, med: mid, max: light   Earthworks M23R, Arta (à 15 cm de distance)   bruit ambiant: 23.8 dB(A)
dB(A) 0102030405060708090Deep BassMiddle BassHigh BassLower RangeMidsHigher MidsLower HighsMid HighsUpper HighsSuper Highs2036.734.831.832.637.32526.42826.327.629.93120.622.722.424.222.74019.323.122.520.820.95021.33230.929.529.36327.929.32726.1258026.224.924.523.623.210029.925.726.42624.61252219.119.719.229.216026.822.221.522.522.720023.722.622.421.423.325020.917.715.916.624.931521.919.818.217.327.640023.319.616.816.230.550023.719.913.713.132.963027.221.112.811.134.680029.922.912.210.137.8100034.426.213.99.442.2125036.128.5149.443.2160037.129.612.89.545.2200035.427.310.99.943.9250035.127.410.710.443.3315035.526.71110.644.540003823.811.211.146.450003320.311.411.344.9630033.519.411.81248800029.616.511.811.644.51000026.215.11211.641.51250022.41412.111.538.81600019.112.711.410.736.8SPL46.537.52523.856.1N5.12.40.70.510median 29.6median 21.1median 12.8median 11.5median 38.8Delta6.14.22.73.17.5hearing rangehide median Fan NoiseMSI Summit A16 AI Plus A3HMTG
MSI Summit A16 AI Plus A3HMTG
Radeon 880M, Ryzen AI 9 365
MSI Summit E16 Flip A12UDT-031
GeForce RTX 3050 Ti Laptop GPU, i7-1280P, Samsung PM9A1 MZVL22T0HBLB
HP Spectre x360 16 RTX 4050
NVIDIA GeForce RTX 4050 Laptop GPU, Ultra 7 155H, SK hynix PC801 HFS001TEJ9X101N
Asus ExpertBook B5 Flip B5602FBN
A350M, i7-1260P, WD PC SN735 SDBPNHH-1T00
LG gram Pro 2-in-1 16T90SP
Arc 8-Core, Ultra 7 155H, SK hynix PC801 HFS001TEJ9X101N
Lenovo Yoga 7 2-in-1 16IML9
Graphics 4-Core, Ultra 5 125U, SK hynix HFS512GEJ4X112N
Noise
-3%
17%
-6%
5%
15%
off / environment *
23.8
25
-5%
23.3
2%
27.5
-16%
25.12
-6%
22.8
4%
Idle Minimum *
25
25
-0%
23.6
6%
27.5
-10%
25.12
-0%
22.8
9%
Idle Average *
25
25
-0%
23.6
6%
27.5
-10%
26.17
-5%
22.8
9%
Idle Maximum *
29.5
28.9
2%
23.6
20%
28.3
4%
26.17
11%
22.8
23%
Load Average *
37.5
49.3
-31%
29.2
22%
40.7
-9%
36.33
3%
30.8
18%
Cyberpunk 2077 ultra *
46.5
Load Maximum *
56.1
48.2
14%
32.1
43%
53.6
4%
41.61
26%
40.8
27%
Witcher 3 ultra *
32.1
31

* ... Moindre est la valeur, meilleures sont les performances

Température

Les points chauds peuvent être très élevés à l'arrière, dépassant largement les 45°C en cas d'utilisation intensive. Cependant, la température moyenne de surface est plus basse que sur le modèle 2022 car notre unité AMD n'a pas de GPU dédié. Cela est évident car la moitié droite de notre modèle 2024 serait beaucoup plus froide que la moitié droite du modèle 2022, où se trouve le dGPU.

La chaleur résiduelle s'échappe vers l'avant de l'écran au lieu de l'arrière ou des côtés
L'adaptateur CA atteint plus de 45°C lorsque vous utilisez des charges exigeantes
 48 °C52.8 °C45 °C 
 43.8 °C43.6 °C30.6 °C 
 30.4 °C27.6 °C25.8 °C 
Maximum: 52.8 °C
Moyenne: 38.6 °C
36.2 °C38.6 °C42 °C
29.2 °C32 °C36.8 °C
27.4 °C30.4 °C31.4 °C
Maximum: 42 °C
Moyenne: 33.8 °C
Alimentation (valeur maximale)  42 °C | Température ambiante de la pièce 20 °C | Fluke 62 Mini IR Thermometer
(-) La température moyenne de la face supérieure sous charge maximale est de 38.6 °C / 101 F, par rapport à la moyenne de 30.2 °C / 86 F pour les appareils de la classe Convertible.
(-) La température maximale du côté supérieur est de 52.8 °C / 127 F, par rapport à la moyenne de 35.3 °C / 96 F, allant de 19.6 à 60 °C pour la classe Convertible.
(±) Le fond chauffe jusqu'à un maximum de 42 °C / 108 F, contre une moyenne de 36.8 °C / 98 F
(+) En utilisation inactive, la température moyenne du côté supérieur est de 25.2 °C / 77 F, par rapport à la moyenne du dispositif de 30.2 °C / 86 F.
(±) 3: The average temperature for the upper side is 34.9 °C / 95 F, compared to the average of 30.2 °C / 86 F for the class Convertible.
(+) Les repose-poignets et le pavé tactile sont plus froids que la température de la peau avec un maximum de 30.4 °C / 86.7 F et sont donc froids au toucher.
(-) La température moyenne de la zone de l'appui-paume de dispositifs similaires était de 28 °C / 82.4 F (-2.4 °C / #-4.3 F).
Système à l'arrêt (couvercle C)
Système à l'arrêt (couvercle D)
Cyberpunk 2077 stress (couverture C)
Prime95+FurMark stress (couverture D)
Prime95+FurMark stress (couverture C)
Cyberpunk 2077 stress (couverture D)
MSI Summit A16 AI Plus A3HMTG
AMD Ryzen AI 9 365, AMD Radeon 880M
MSI Summit E16 Flip A12UDT-031
Intel Core i7-1280P, NVIDIA GeForce RTX 3050 Ti Laptop GPU
HP Spectre x360 16 RTX 4050
Intel Core Ultra 7 155H, NVIDIA GeForce RTX 4050 Laptop GPU
Asus ExpertBook B5 Flip B5602FBN
Intel Core i7-1260P, Intel Arc A350M
LG gram Pro 2-in-1 16T90SP
Intel Core Ultra 7 155H, Intel Arc 8-Core iGPU
Lenovo Yoga 7 2-in-1 16IML9
Intel Core Ultra 5 125U, Intel Graphics 4-Core iGPU (Arc)
Heat
-3%
8%
11%
3%
16%
Maximum Upper Side *
52.8
49.2
7%
39.6
25%
37.9
28%
34.5
35%
37.8
28%
Maximum Bottom *
42
50.2
-20%
39.2
7%
39.4
6%
55.4
-32%
38.8
8%
Idle Upper Side *
30.6
29.4
4%
29
5%
28.8
6%
28.7
6%
25.4
17%
Idle Bottom *
29.6
30
-1%
31.6
-7%
29.1
2%
28.7
3%
26.8
9%

* ... Moindre est la valeur, meilleures sont les performances

Intervenants

Le bruit rose montre un volume maximal faible et une qualité audio "faible"
dB(A) 0102030405060708090Deep BassMiddle BassHigh BassLower RangeMidsHigher MidsLower HighsMid HighsUpper HighsSuper Highs2039.331.839.32528.226.328.23124.722.424.74024.722.524.75035.930.935.96329.72729.78024.624.524.610023.626.423.612523.219.723.216035.921.535.920044.422.444.42504715.9473155418.2544006016.86050058.913.758.963065.412.865.480069.712.269.7100071.113.971.11250721472160065.112.865.1200066.110.966.1250065.210.765.2315064.31164.3400065.111.265.150006011.460630057.711.857.7800057.211.857.21000050.81250.81250049.112.149.11600048.611.448.6SPL78.22578.2N39.60.739.6median 58.9median 12.8median 58.9Delta9.12.79.126.325.821.422.12624.925.127.622.532.523.448.72655.818.860.922.167.2267019.372.317.674.217.774.319.575.31571.711.871.311.27410.574.21072.710.17210.67210.97511.374.811.671.71269.71269.612.371.112.669.61270.111.269.824.784.70.666.6median 12median 71.73.42.2hearing rangehide median Pink NoiseMSI Summit A16 AI Plus A3HMTGApple MacBook Pro 16 2021 M1 Pro
Diagramme de fréquence (les cases peuvent être cochées et décochées pour comparer les appareils)
MSI Summit A16 AI Plus A3HMTG analyse audio

(±) | le niveau sonore du haut-parleur est moyen mais bon (78.2# dB)
Bass 100 - 315 Hz
(-) | presque aucune basse - en moyenne 20.8% plus bas que la médiane
(±) | la linéarité des basses est moyenne (11.7% delta à la fréquence précédente)
Mids 400 - 2000 Hz
(±) | médiane supérieure - en moyenne 7.2% supérieure à la médiane
(±) | la linéarité des médiums est moyenne (7.7% delta à la fréquence précédente)
Aiguës 2 - 16 kHz
(+) | des sommets équilibrés - à seulement 4.3% de la médiane
(+) | les aigus sont linéaires (5.3% delta à la fréquence précédente)
Overall 100 - 16.000 Hz
(±) | la linéarité du son global est moyenne (23.5% de différence avec la médiane)
Par rapport à la même classe
» 69% de tous les appareils testés de cette catégorie étaient meilleurs, 5% similaires, 26% pires
» Le meilleur avait un delta de 6%, la moyenne était de 21%, le pire était de 57%.
Par rapport à tous les appareils testés
» 67% de tous les appareils testés étaient meilleurs, 7% similaires, 26% pires
» Le meilleur avait un delta de 4%, la moyenne était de 25%, le pire était de 134%.

Apple MacBook Pro 16 2021 M1 Pro analyse audio

(+) | les haut-parleurs peuvent jouer relativement fort (84.7# dB)
Bass 100 - 315 Hz
(+) | bonne basse - seulement 3.8% loin de la médiane
(+) | les basses sont linéaires (5.2% delta à la fréquence précédente)
Mids 400 - 2000 Hz
(+) | médiane équilibrée - seulement 1.3% de la médiane
(+) | les médiums sont linéaires (2.1% delta à la fréquence précédente)
Aiguës 2 - 16 kHz
(+) | des sommets équilibrés - à seulement 1.9% de la médiane
(+) | les aigus sont linéaires (2.7% delta à la fréquence précédente)
Overall 100 - 16.000 Hz
(+) | le son global est linéaire (4.6% différence à la médiane)
Par rapport à la même classe
» 0% de tous les appareils testés de cette catégorie étaient meilleurs, 0% similaires, 100% pires
» Le meilleur avait un delta de 5%, la moyenne était de 18%, le pire était de 45%.
Par rapport à tous les appareils testés
» 0% de tous les appareils testés étaient meilleurs, 0% similaires, 100% pires
» Le meilleur avait un delta de 4%, la moyenne était de 25%, le pire était de 134%.

Gestion de l'énergie

Consommation électrique

Notre système AMD est moins exigeant que le modèle Intel-Nvidia 2022 de plusieurs watts lorsqu'il tourne au ralenti sur le bureau, ce qui contribue à la durée de vie généralement plus longue de la batterie, comme indiqué dans la section suivante. La consommation peut être plus élevée de quelques watts lors de l'exécution du stress Prime95, mais cela est compensé par la performance plus rapide du processeur et donc la performance par watt est toujours en faveur de notre unité alimentée par AMD.

L'adaptateur secteur USB-C 100 W est assez petit avec seulement 7,5 x 7,5 x 2,9 cm.

consommation de 3DMark 06
Cyberpunk 2077 1080p Ultra consommation
La consommation atteignait 86 W lors du déclenchement du stress Prime95 avant de redescendre et de se stabiliser à 73 W quelques secondes plus tard
Prime95+FurMark stress initié au bout de 10s
Consommation énergétique
Éteint/en veilledarklight 0.56 / 0.63 Watts
Au reposdarkmidlight 5.4 / 11 / 11.2 Watts
Fortement sollicité midlight 76.6 / 91.8 Watts
 color bar
Légende: min: dark, med: mid, max: light        Metrahit Energy
MSI Summit A16 AI Plus A3HMTG
Ryzen AI 9 365, Radeon 880M, , IPS, 2560x1600, 16"
MSI Summit E16 Flip A12UDT-031
i7-1280P, GeForce RTX 3050 Ti Laptop GPU, Samsung PM9A1 MZVL22T0HBLB, IPS, 2560x1600, 16"
HP Spectre x360 16 RTX 4050
Ultra 7 155H, NVIDIA GeForce RTX 4050 Laptop GPU, SK hynix PC801 HFS001TEJ9X101N, OLED, 2880x1800, 16"
Asus ExpertBook B5 Flip B5602FBN
i7-1260P, A350M, WD PC SN735 SDBPNHH-1T00, OLED, 3840x2400, 16"
LG gram Pro 2-in-1 16T90SP
Ultra 7 155H, Arc 8-Core, SK hynix PC801 HFS001TEJ9X101N, OLED, 2880x1800, 16"
Lenovo Yoga 7 2-in-1 16IML9
Ultra 5 125U, Graphics 4-Core, SK hynix HFS512GEJ4X112N, IPS, 1920x1200, 16"
Power Consumption
-38%
-53%
3%
24%
33%
Idle Minimum *
5.4
9.8
-81%
5.8
-7%
6.5
-20%
6
-11%
3
44%
Idle Average *
11
15.3
-39%
12.3
-12%
7.6
31%
7.5
32%
8.5
23%
Idle Maximum *
11.2
16.3
-46%
33.9
-203%
9.8
12%
8.2
27%
8.9
21%
Load Average *
76.6
87
-14%
83.3
-9%
85
-11%
45.2
41%
41.1
46%
Cyberpunk 2077 ultra external monitor *
49.2
Cyberpunk 2077 ultra *
61.1
Load Maximum *
91.8
100
-9%
120.8
-32%
91
1%
61.4
33%
64.6
30%
Witcher 3 ultra *
86.1
89.1
85.6
38.9
30.7

* ... Moindre est la valeur, meilleures sont les performances

Power Consumption Cyberpunk / Stress Test

0102030405060708090100Tooltip
MSI Summit A16 AI Plus A3HMTG Ryzen AI 9 365, Radeon 880M; 1280x720 Prime95 28.10 and Furmark 1.25: Ø79.2 (73.7-91.7)
MSI Summit E16 Flip A12UDT-031 i7-1280P, GeForce RTX 3050 Ti Laptop GPU; 1280x720 Prime95 28.10 and Furmark 1.25: Ø92.5 (72.6-102.4)
MSI Summit A16 AI Plus A3HMTG Ryzen AI 9 365, Radeon 880M; Idle 150cd/m2: Ø6.86 (6.4-10)
MSI Summit E16 Flip A12UDT-031 i7-1280P, GeForce RTX 3050 Ti Laptop GPU; Idle 150cd/m2: Ø17.4 (16.6-19.1)
MSI Summit A16 AI Plus A3HMTG Ryzen AI 9 365, Radeon 880M; Cyberpunk 2077 FHD ultra no FSR 150cd: Ø61.1 (54.2-70.6)

Power Consumption external Monitor

05101520253035404550556065707580859095Tooltip
MSI Summit A16 AI Plus A3HMTG Ryzen AI 9 365, Radeon 880M; Prime95 V2810 Stress (external Monitor): Ø73.4 (71.7-85.8)
MSI Summit E16 Flip A12UDT-031 i7-1280P, GeForce RTX 3050 Ti Laptop GPU; Prime95 V2810 Stress (external Monitor): Ø73.4 (67.2-95.2)
MSI Summit A16 AI Plus A3HMTG Ryzen AI 9 365, Radeon 880M; Cinebench R15 Multi (external Monitor): Ø72.1 (68-80.6)
MSI Summit E16 Flip A12UDT-031 i7-1280P, GeForce RTX 3050 Ti Laptop GPU; Cinebench R15 Multi (external Monitor): Ø94.2 (86.3-96.2)
MSI Summit A16 AI Plus A3HMTG Ryzen AI 9 365, Radeon 880M; 1280x720 FurMark 1.19 GPU Stress Test (external Monitor): Ø69.8 (63.3-73)
MSI Summit E16 Flip A12UDT-031 i7-1280P, GeForce RTX 3050 Ti Laptop GPU; 1280x720 FurMark 1.19 GPU Stress Test (external Monitor): Ø75.6 (71.2-82.3)
MSI Summit A16 AI Plus A3HMTG Ryzen AI 9 365, Radeon 880M; Idle 1min (external Monitor): Ø5.96 (5.37-7.4)
MSI Summit E16 Flip A12UDT-031 i7-1280P, GeForce RTX 3050 Ti Laptop GPU; Idle 1min (external Monitor): Ø13.6 (13-15.1)
MSI Summit A16 AI Plus A3HMTG Ryzen AI 9 365, Radeon 880M; Cyberpunk 2077 FHD ultra no FSR (external Monitor): Ø49.2 (48.5-51.2)

Autonomie de la batterie

L'autonomie du réseau local sans fil est supérieure d'environ deux heures à celle de notre modèle 2022, ce qui s'explique en grande partie par l'absence de GPU dédié dans notre modèle 2024.

Autonomie
WiFi Websurfing
9h 07min
MSI Summit A16 AI Plus A3HMTG
Ryzen AI 9 365, Radeon 880M, 82 Wh
MSI Summit E16 Flip A12UDT-031
i7-1280P, GeForce RTX 3050 Ti Laptop GPU, 82 Wh
HP Spectre x360 16 RTX 4050
Ultra 7 155H, NVIDIA GeForce RTX 4050 Laptop GPU, 83 Wh
Asus ExpertBook B5 Flip B5602FBN
i7-1260P, A350M, 84 Wh
LG gram Pro 2-in-1 16T90SP
Ultra 7 155H, Arc 8-Core, 77 Wh
Lenovo Yoga 7 2-in-1 16IML9
Ultra 5 125U, Graphics 4-Core, 71 Wh
Autonomie de la batterie
-22%
21%
-11%
6%
35%
WiFi v1.3
547
428
-22%
660
21%
488
-11%
581
6%
738
35%
Load
101

Notebookcheck Rating

MSI Summit A16 AI Plus A3HMTG - 12/05/2024 v8
Allen Ngo

Châssis
83 / 98 → 84%
Clavier
82%
Dispositif de pointage
89%
Connectivité
70 / 74 → 95%
Poids
62 / 20-75 → 77%
Autonomie
86%
Écran
76%
Performances en jeu
55 / 65 → 85%
Performances dans les applications
86 / 92 → 93%
AI Performance
85%
Chauffe
88%
Nuisance sonore
72%
Audio
65 / 91 → 71%
Appareil photo
32 / 75 → 42%
Moyenne
60%
82%
Convertible - Moyenne compensée
CO2 Emissions
No Data
Materials
0%
Packaging
50%
Power Use
80.6%
Repairability
40%
Software Updates
22.3%
Recycle Logo Total Sustainability Score: 32.2%

Transparency

The selection of devices to be reviewed is made by our editorial team. The test sample was provided to the author as a loan by the manufacturer or retailer for the purpose of this review. The lender had no influence on this review, nor did the manufacturer receive a copy of this review before publication. There was no obligation to publish this review. We never accept compensation or payment in return for our reviews. As an independent media company, Notebookcheck is not subjected to the authority of manufacturers, retailers or publishers.

This is how Notebookcheck is testing

Every year, Notebookcheck independently reviews hundreds of laptops and smartphones using standardized procedures to ensure that all results are comparable. We have continuously developed our test methods for around 20 years and set industry standards in the process. In our test labs, high-quality measuring equipment is utilized by experienced technicians and editors. These tests involve a multi-stage validation process. Our complex rating system is based on hundreds of well-founded measurements and benchmarks, which maintains objectivity. Further information on our test methods can be found here.

Please share our article, every link counts!
Mail Logo
> Revues et rapports de ordinateurs portatifs et smartphones, ordiphones > Critiques > Test du MSI Summit A16 AI Plus : un puissant convertible AMD Ryzen 9
Allen Ngo, 2024-12-11 (Update: 2024-12-11)