

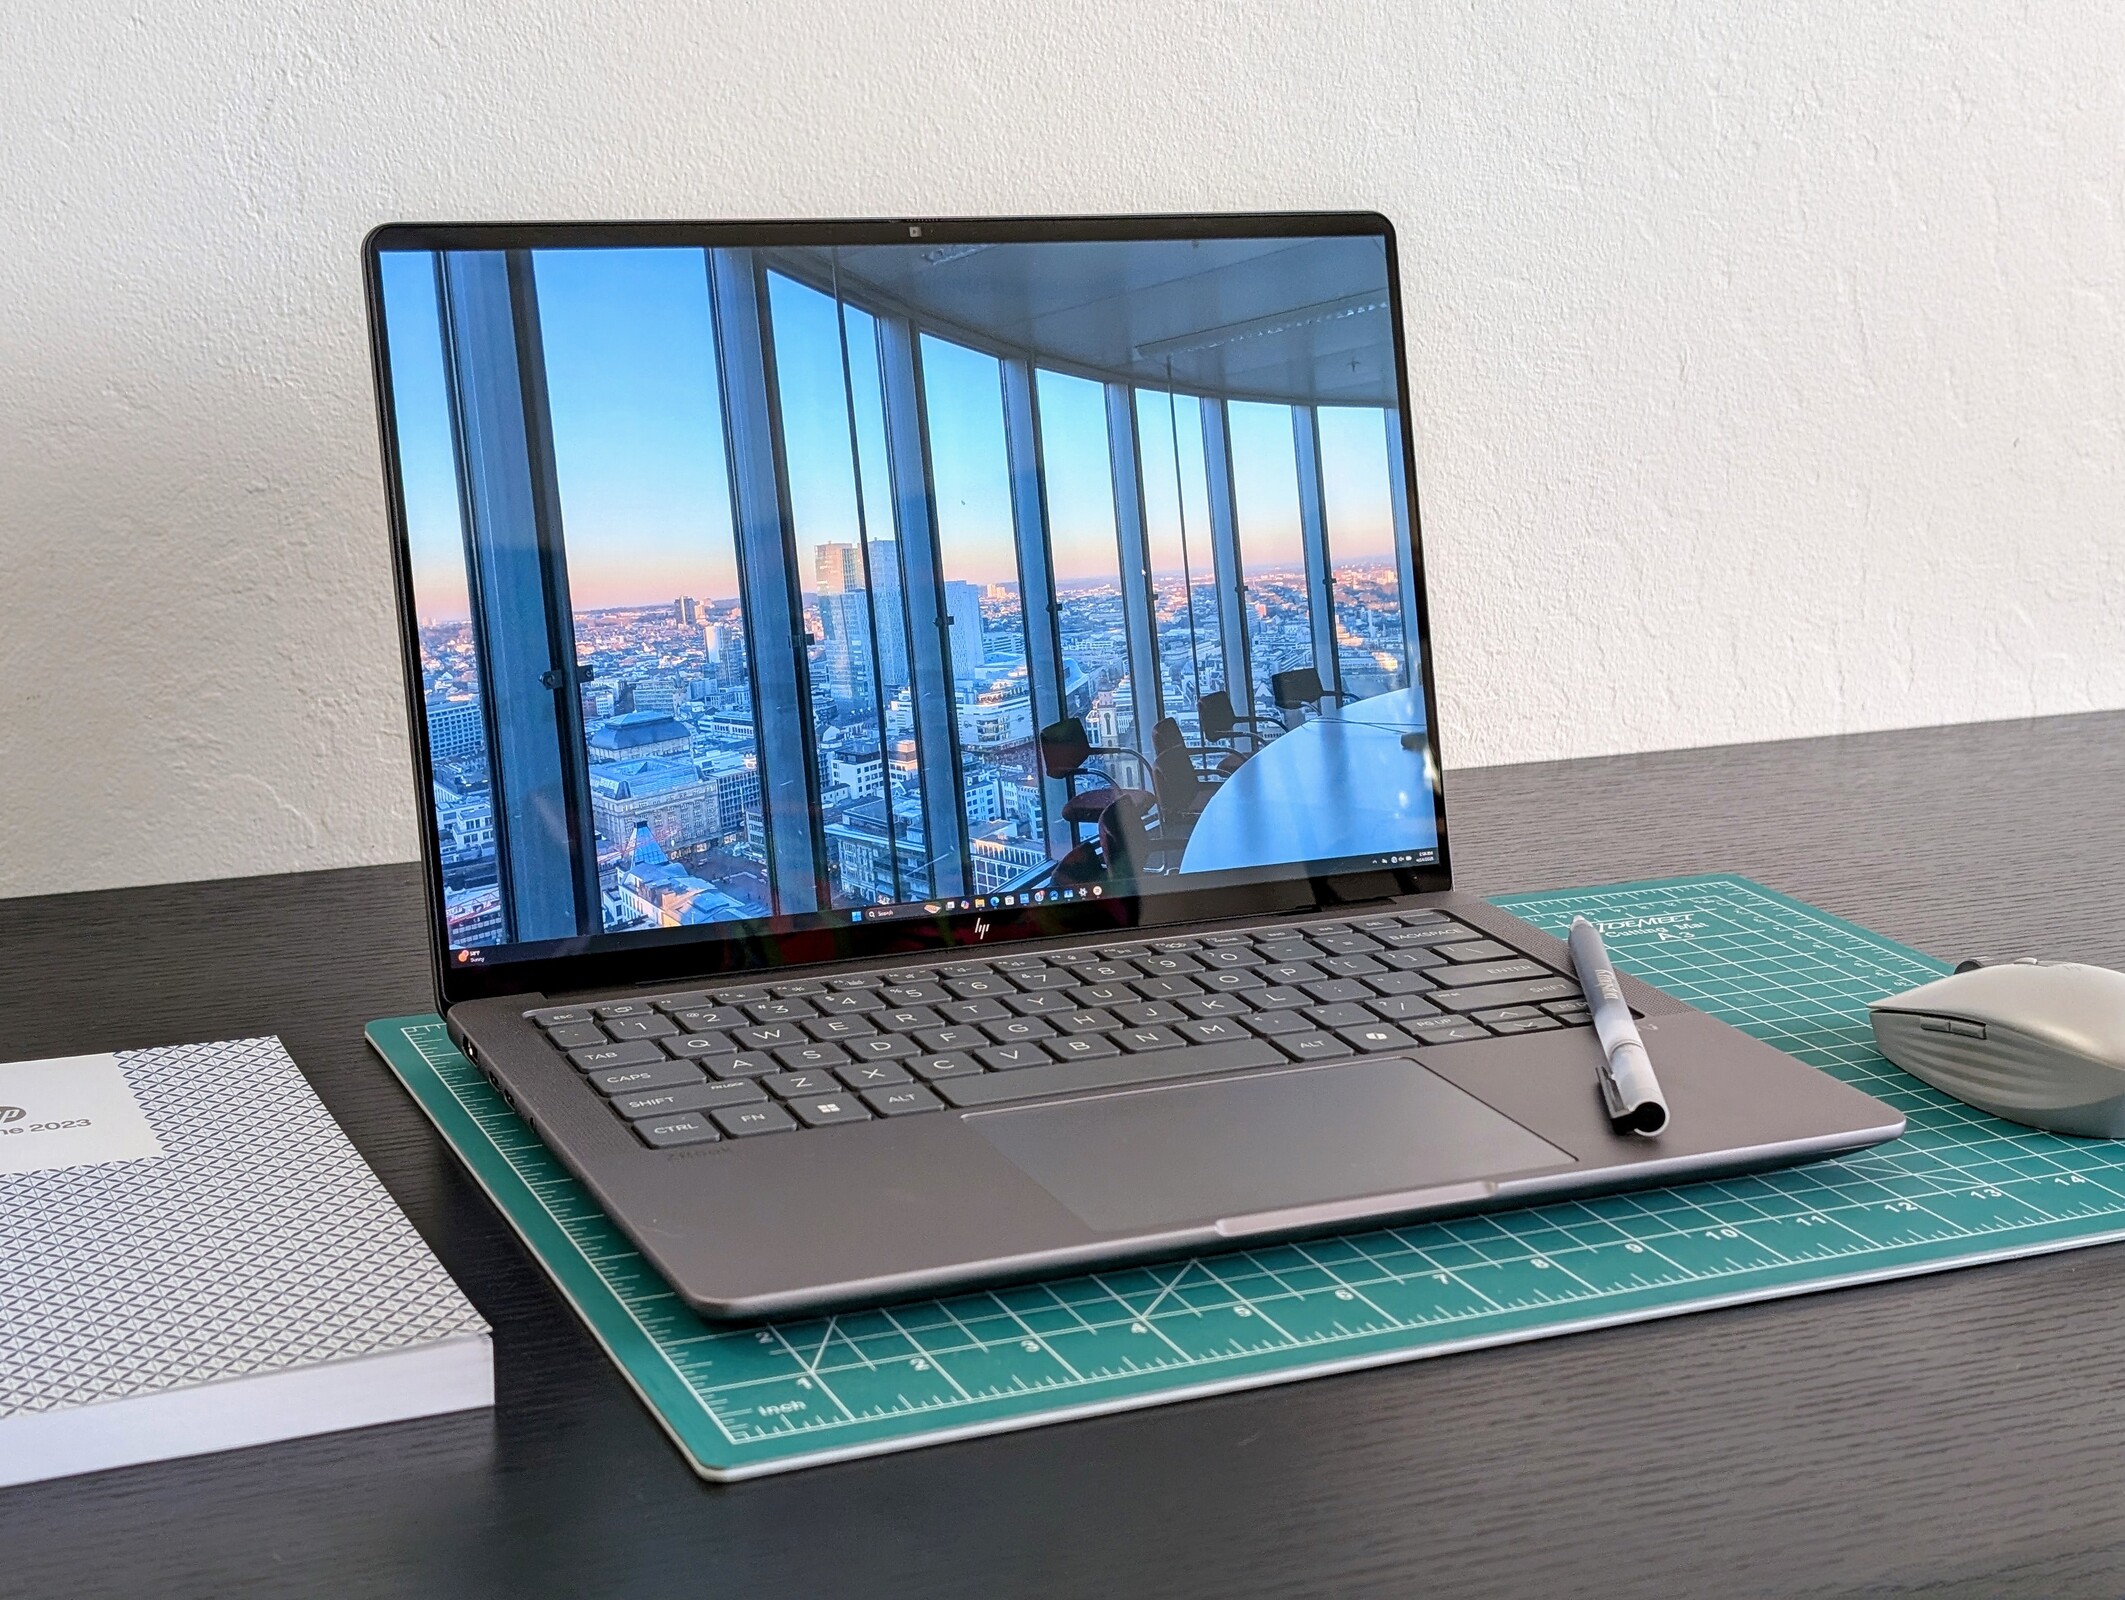
Test du HP ZBook Ultra G1a 14 : Une alternative puissante au MacBook Pro pour le travail et les jeux
AMD Ryzen AI Max n'est pas une blague.
HP n'a pas exagéré en déclarant que son dernier ZBook serait le "PC de station de travail de 14 pouces le plus rapide au monde". Le Ryzen AI Max+ 395 fonctionne bien sur les ordinateurs de bureau spécialisés et les mini-PC, mais il est encore plus impressionnant sur un format fin et léger de 14 pouces.Allen Ngo, 👁 Allen Ngo (traduit par DeepL / Ninh Duy) Publié 🇺🇸
Verdict - AMD tire son épingle du jeu
Le ZBook Ultra G1a 14 n'est possible que grâce à la série unique Ryzen AI Max. Le processeur spécialisé Zen 5 intègre des cartes graphiques Radeon 8060S et jusqu'à 128 Go de RAM pour un niveau de performance très élevé compte tenu du facteur de forme de 14 pouces. Les performances par volume sont denses et constituent facilement le plus grand avantage de ce modèle. L'impressionnant écran tactile OLED 120 Hz et le design professionnel du ZBook complètent bien l'ensemble.
Le fait de condenser autant de performances dans un si petit boîtier a ses inconvénients. La mémoire vive est fixe, sans support ECC, le stockage est limité à un seul disque et l'autonomie de la batterie est un peu courte pour cette catégorie de taille. Les performances globales sont réduites lorsque l'ordinateur fonctionne sur batterie, tandis que l'adaptateur secteur est plus volumineux que prévu en raison des exigences internes.
Les professionnels qui recherchent un ordinateur de 14 pouces facile à transporter sans sacrifier trop de performances trouveront dans le ZBook Ultra G1a 14 une excellente option. Pour plus de puissance, les utilisateurs devront se tourner vers des modèles de 15 pouces ou plus les modèles de 15 pouces ou plus avec des cartes graphiques RTX 4000 Ada ou plus.
Points positifs
Points négatifs
Prix et disponibilité
HP commercialise actuellement le ZBook Ultra G1a 14 au prix de 4 000 $, tel qu'il est configuré dans cet article.
- $1,049.00HP ZBook Firefly G11 14” AI-Ready Mobile Workstation IPS WUXGA (Intel Ultra 7 155U 12-Core, 64GB DDR5, 1TB SSD, Backlit KYB, Fingerprint, 2 Thunderbolt 4, WiFi 6E, 5MP Cam, Win 11 Pro) w/MAJ Deskpad
- $1,249.99HP ZBook Firefly G11 Mobile Workstation (14" FHD+, NVIDIA RTX 500, Intel Core Ultra 7 155H, 32GB DDR5 RAM, 1TB SSD) AI Copilot Laptop for Engineer, Designer, IST Hub, Backlit, Fingerprint, Win 11 Pro
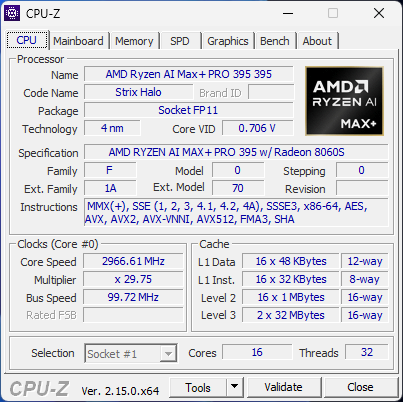
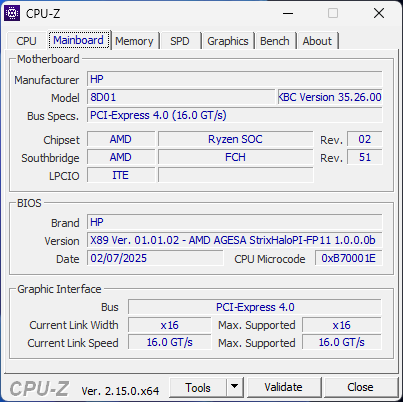
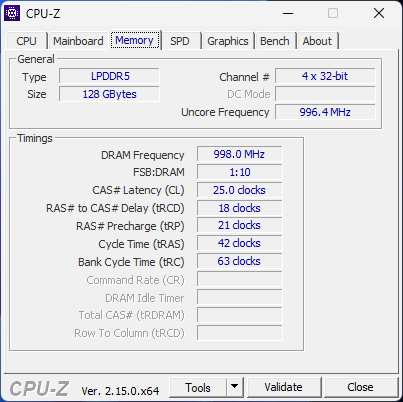
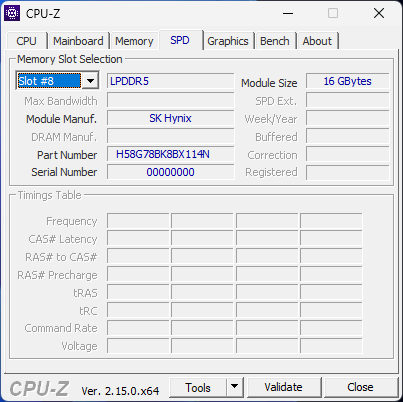
A ne pas confondre avec le modèle bureautique EliteBook X G1a 14le ZBook Ultra G1a 14 est l'un des premiers ordinateurs portables à être équipé du processeur Ryzen AI Max+ Pro 395 d'AMD et d'une carte graphique Radeon 8060S intégrée. Il se distingue également par la présence de 128 Go de mémoire vive LPDDR5X-8533, ce qui est inédit pour une station de travail de 14 pouces. Ce modèle diffère du ZBook Firefly 14 qui est légèrement plus grand et ne propose que des options Intel et Nvidia.
Notre unité de test est une configuration haut de gamme avec le processeur Ryzen AI Max+ Pro 395, le GPU Radeon 8060S et l'écran tactile 2.8K OLED 120 Hz pour un prix de détail d'environ 4000$. Les SKUs moins importants peuvent être livrés avec le processeur Ryzen AI Max 380 non Pro, la Radeon 8040S ou un écran 1200p IPS pour des prix de départ plus bas.
Parmi les alternatives au ZBook Ultra G1a 14, on trouve d'autres ordinateurs portables professionnels de 14 pouces tels que le Dell Precision 5490dell, la série ThinkPad P14 seriesou le MacBook Pro 14.
Plus d'avis sur HP :
Spécifications
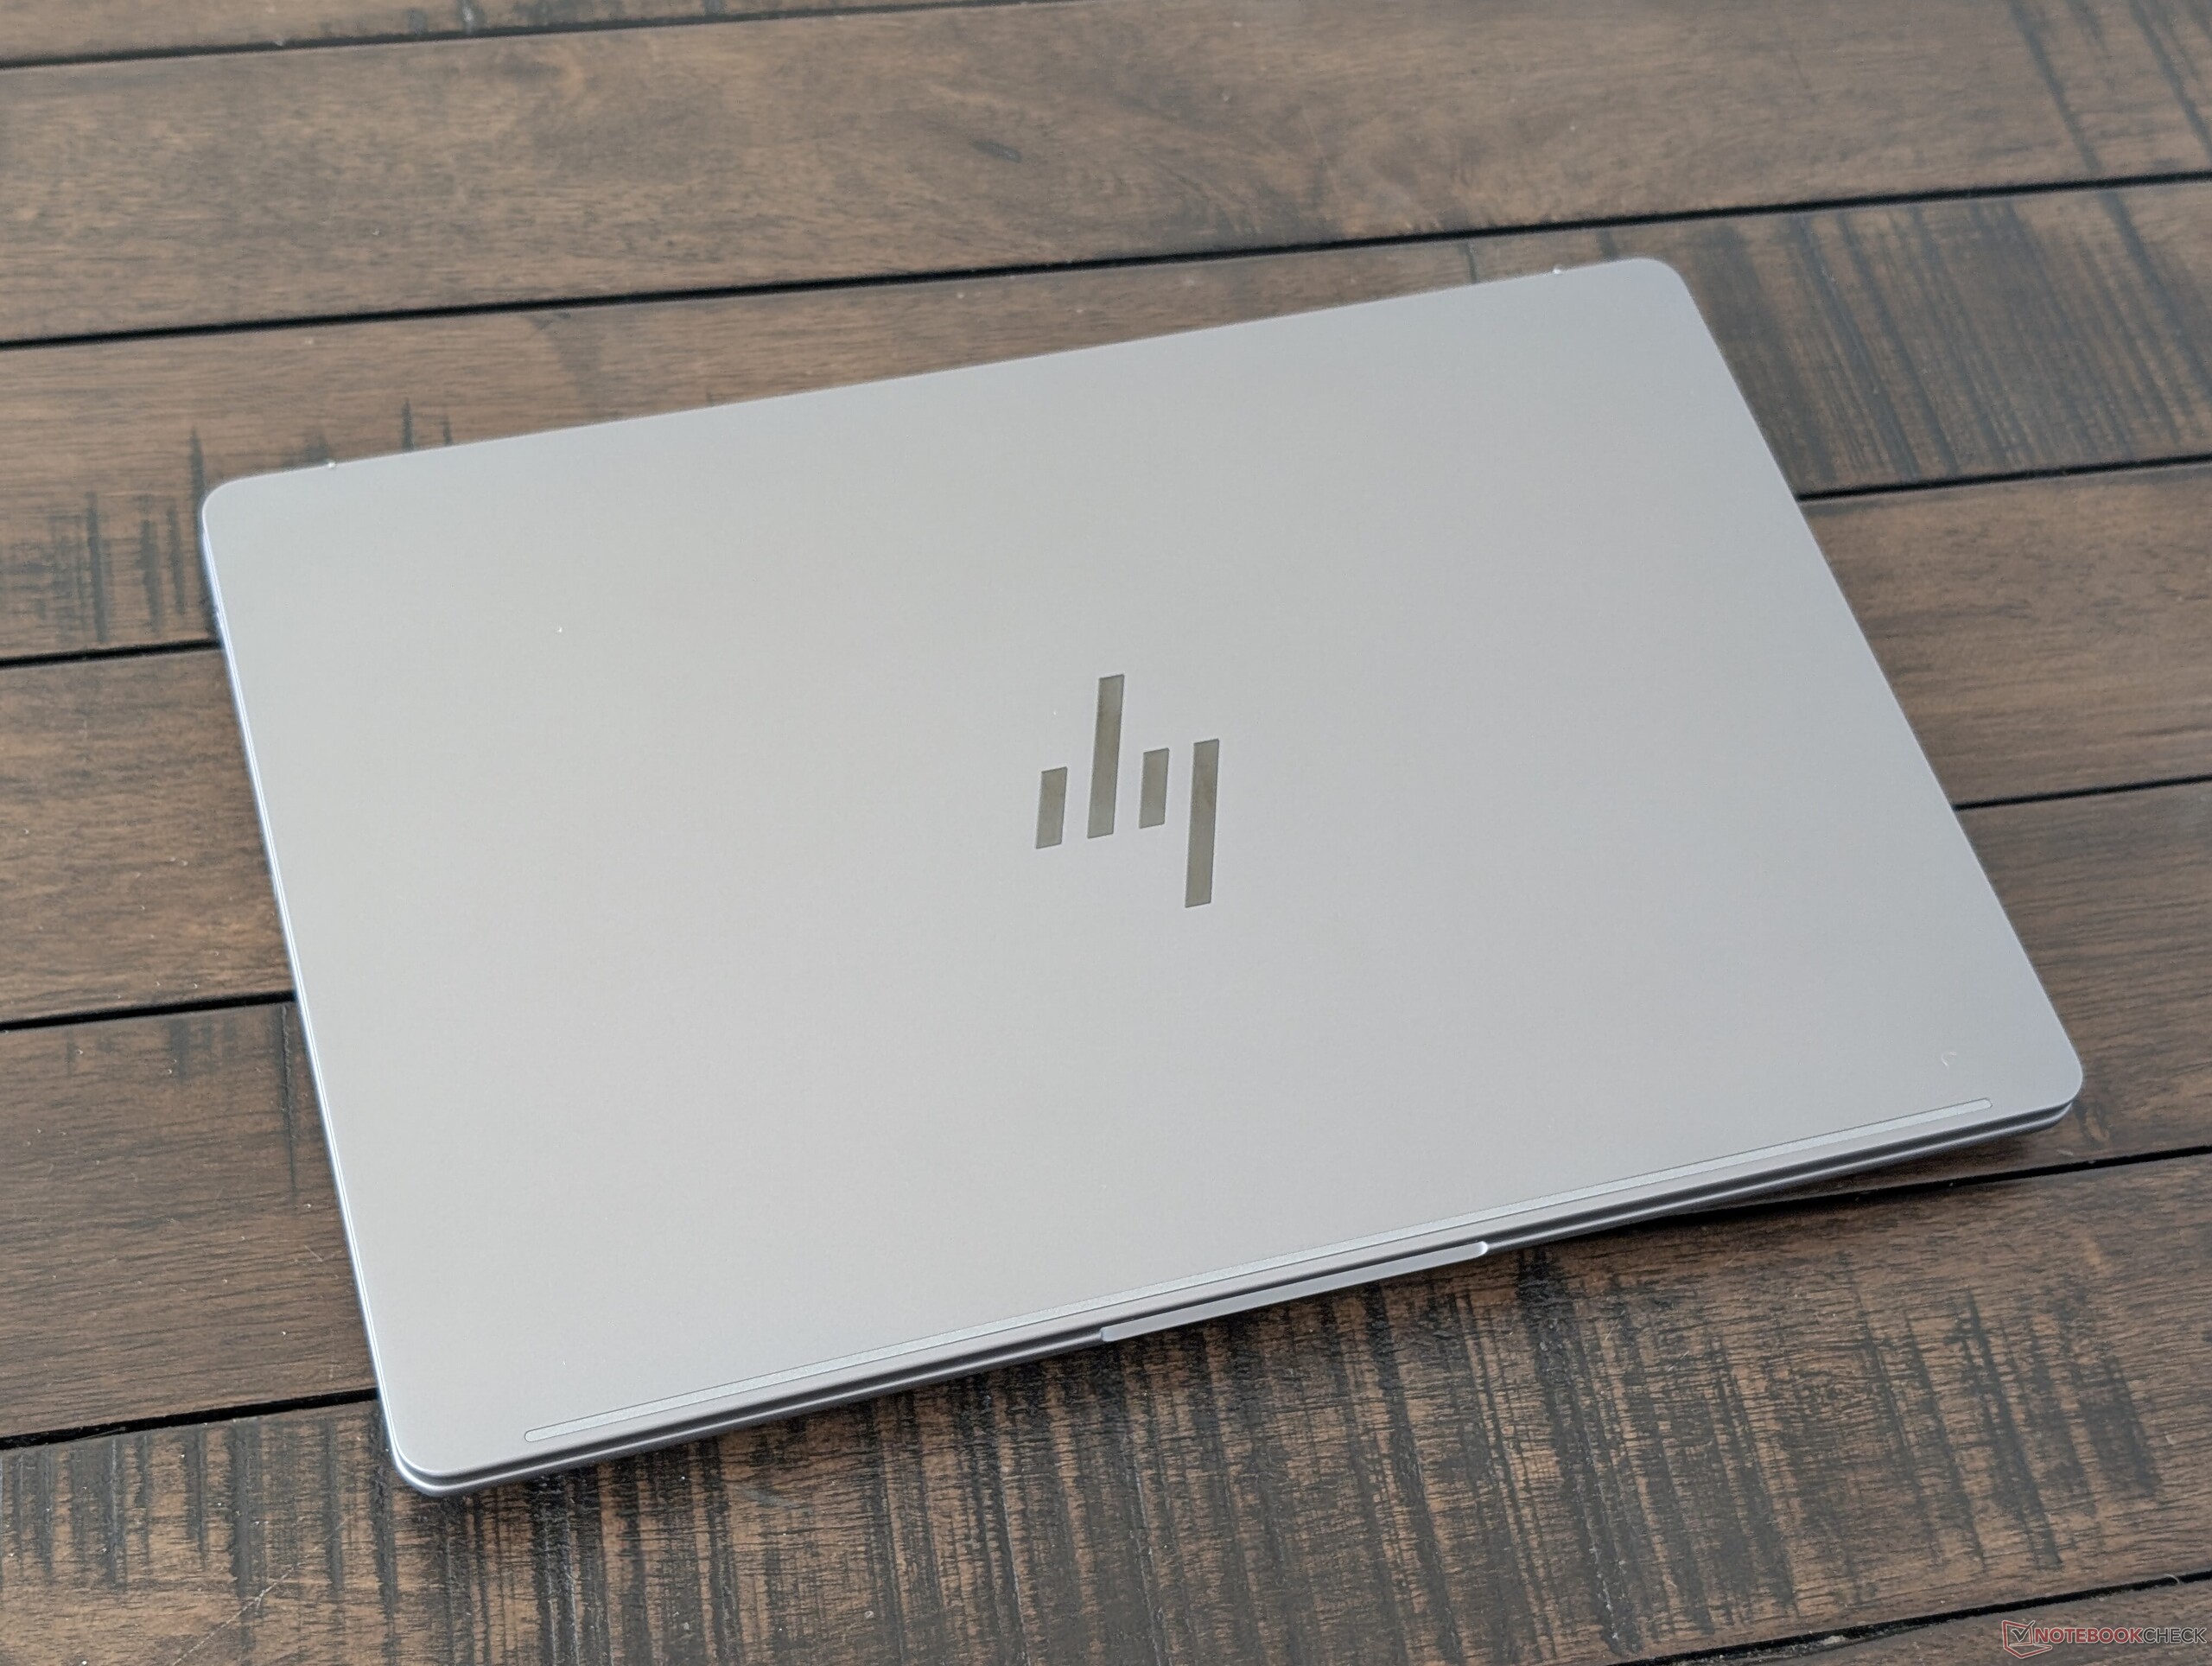
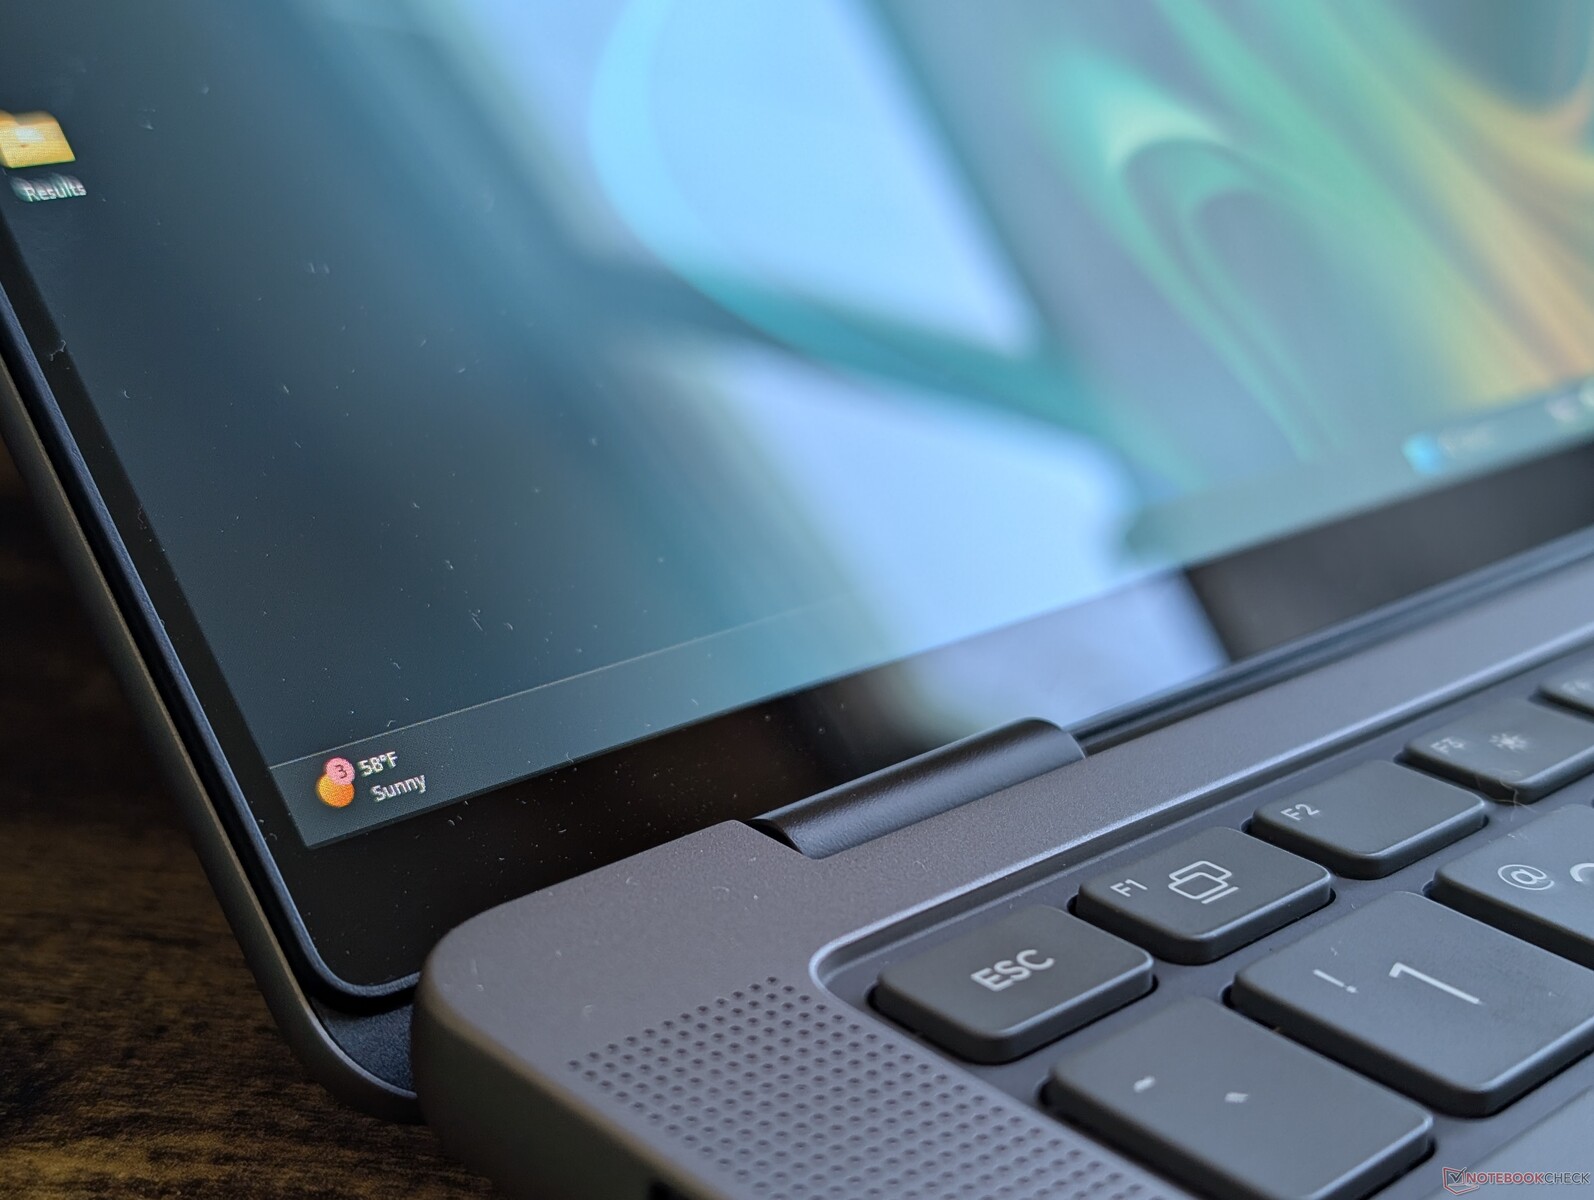
Cas
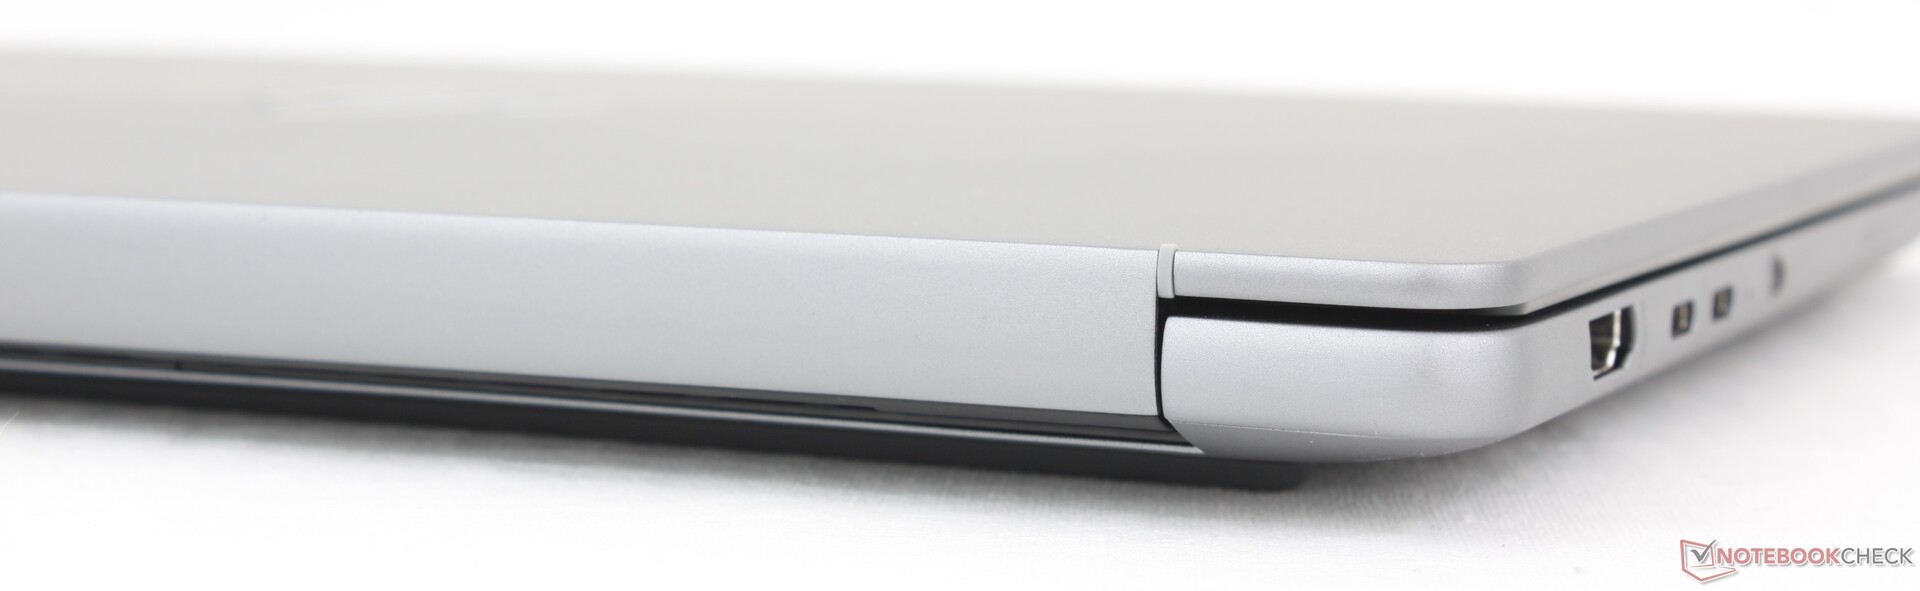
Les caractéristiques extérieures et les dimensions sont presque identiques à celles du EliteBook X G1a 14. Les deux modèles partagent même les mêmes ports, le même clavier, la même taille de clickpad et les mêmes haut-parleurs Poly Studio quad. La façon la plus simple de distinguer le modèle ZBook du modèle EliteBook est peut-être le ton gris plus foncé du ZBook.
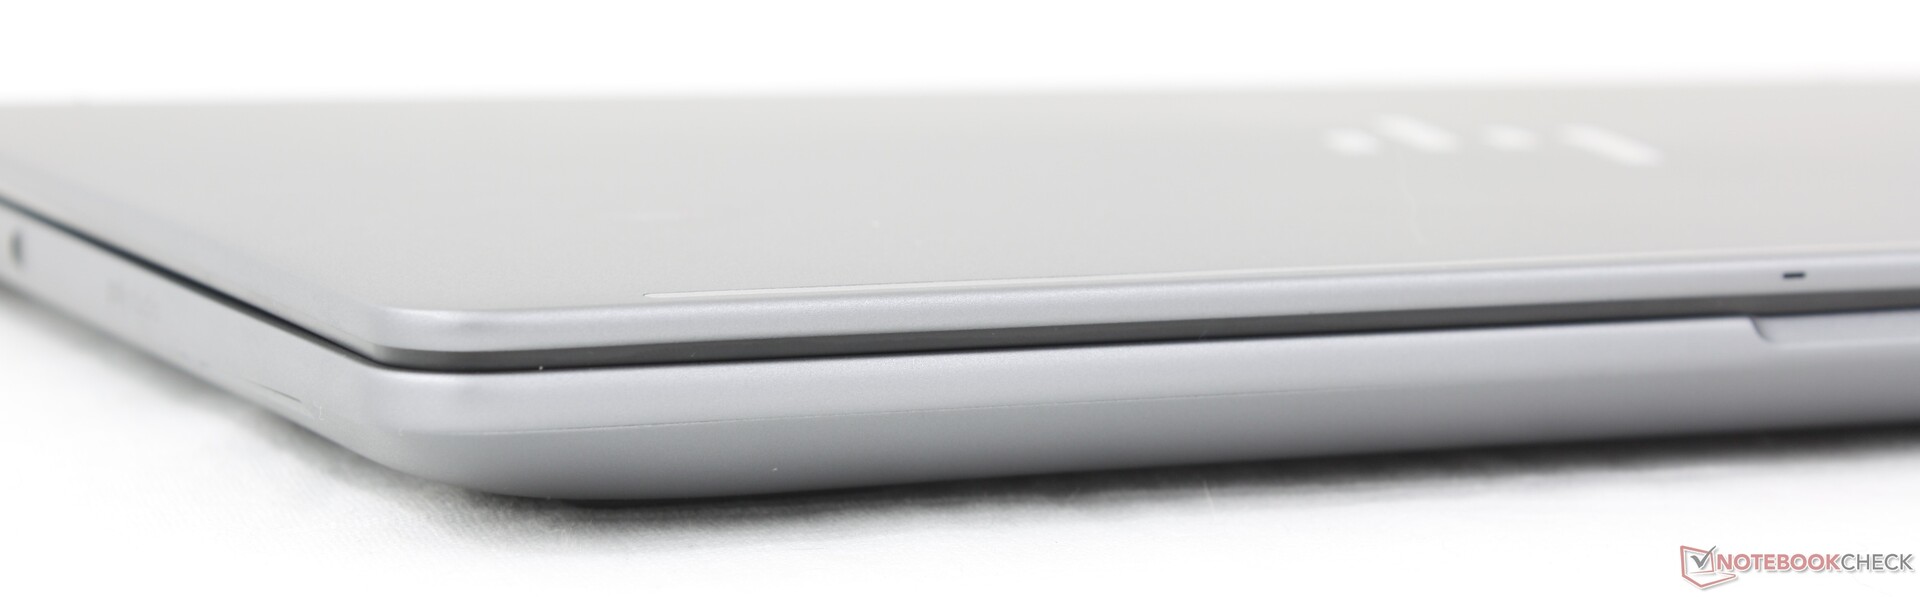
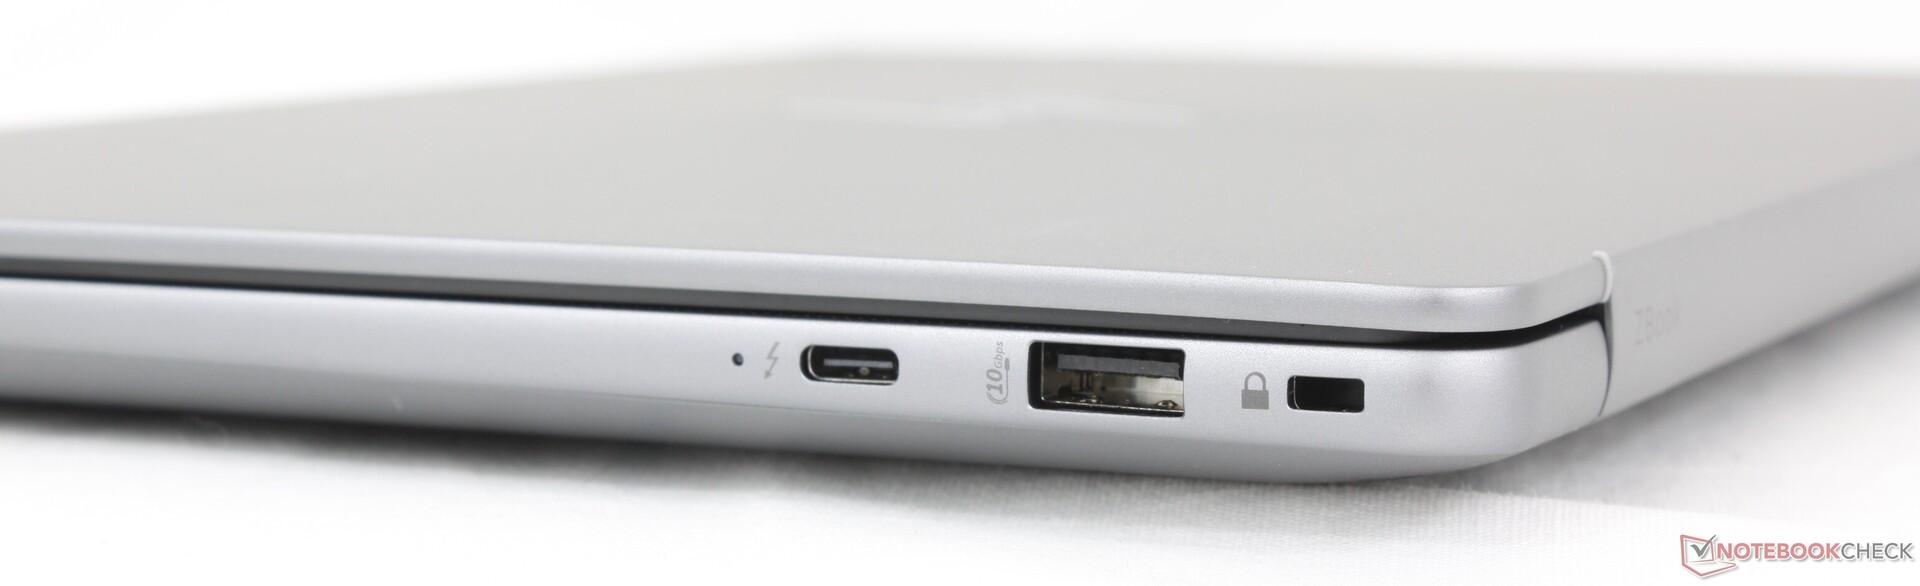
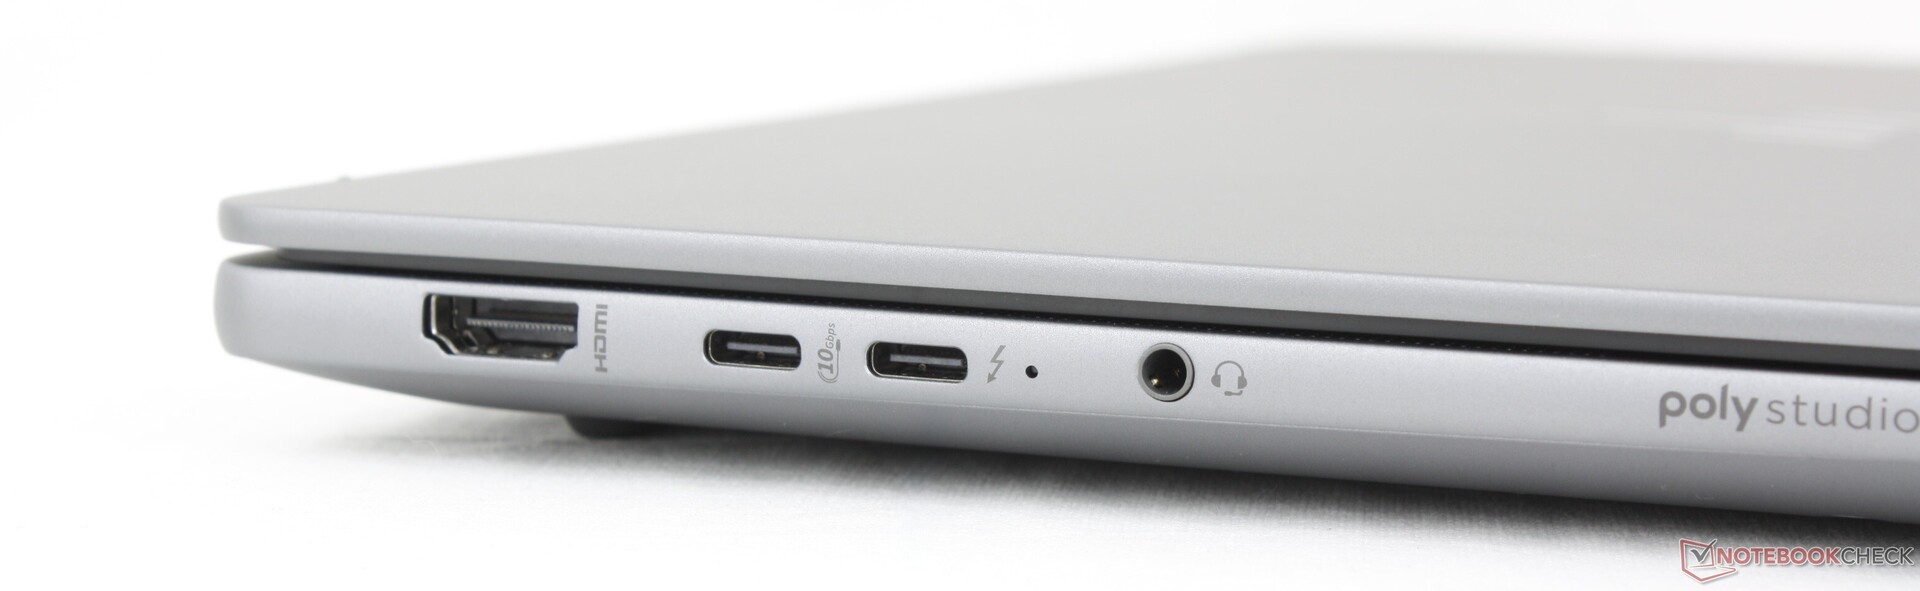
Connectivité
Communication
Webcam
Une webcam de 5 mégapixels avec infrarouge et obturateur physique est fournie en standard.


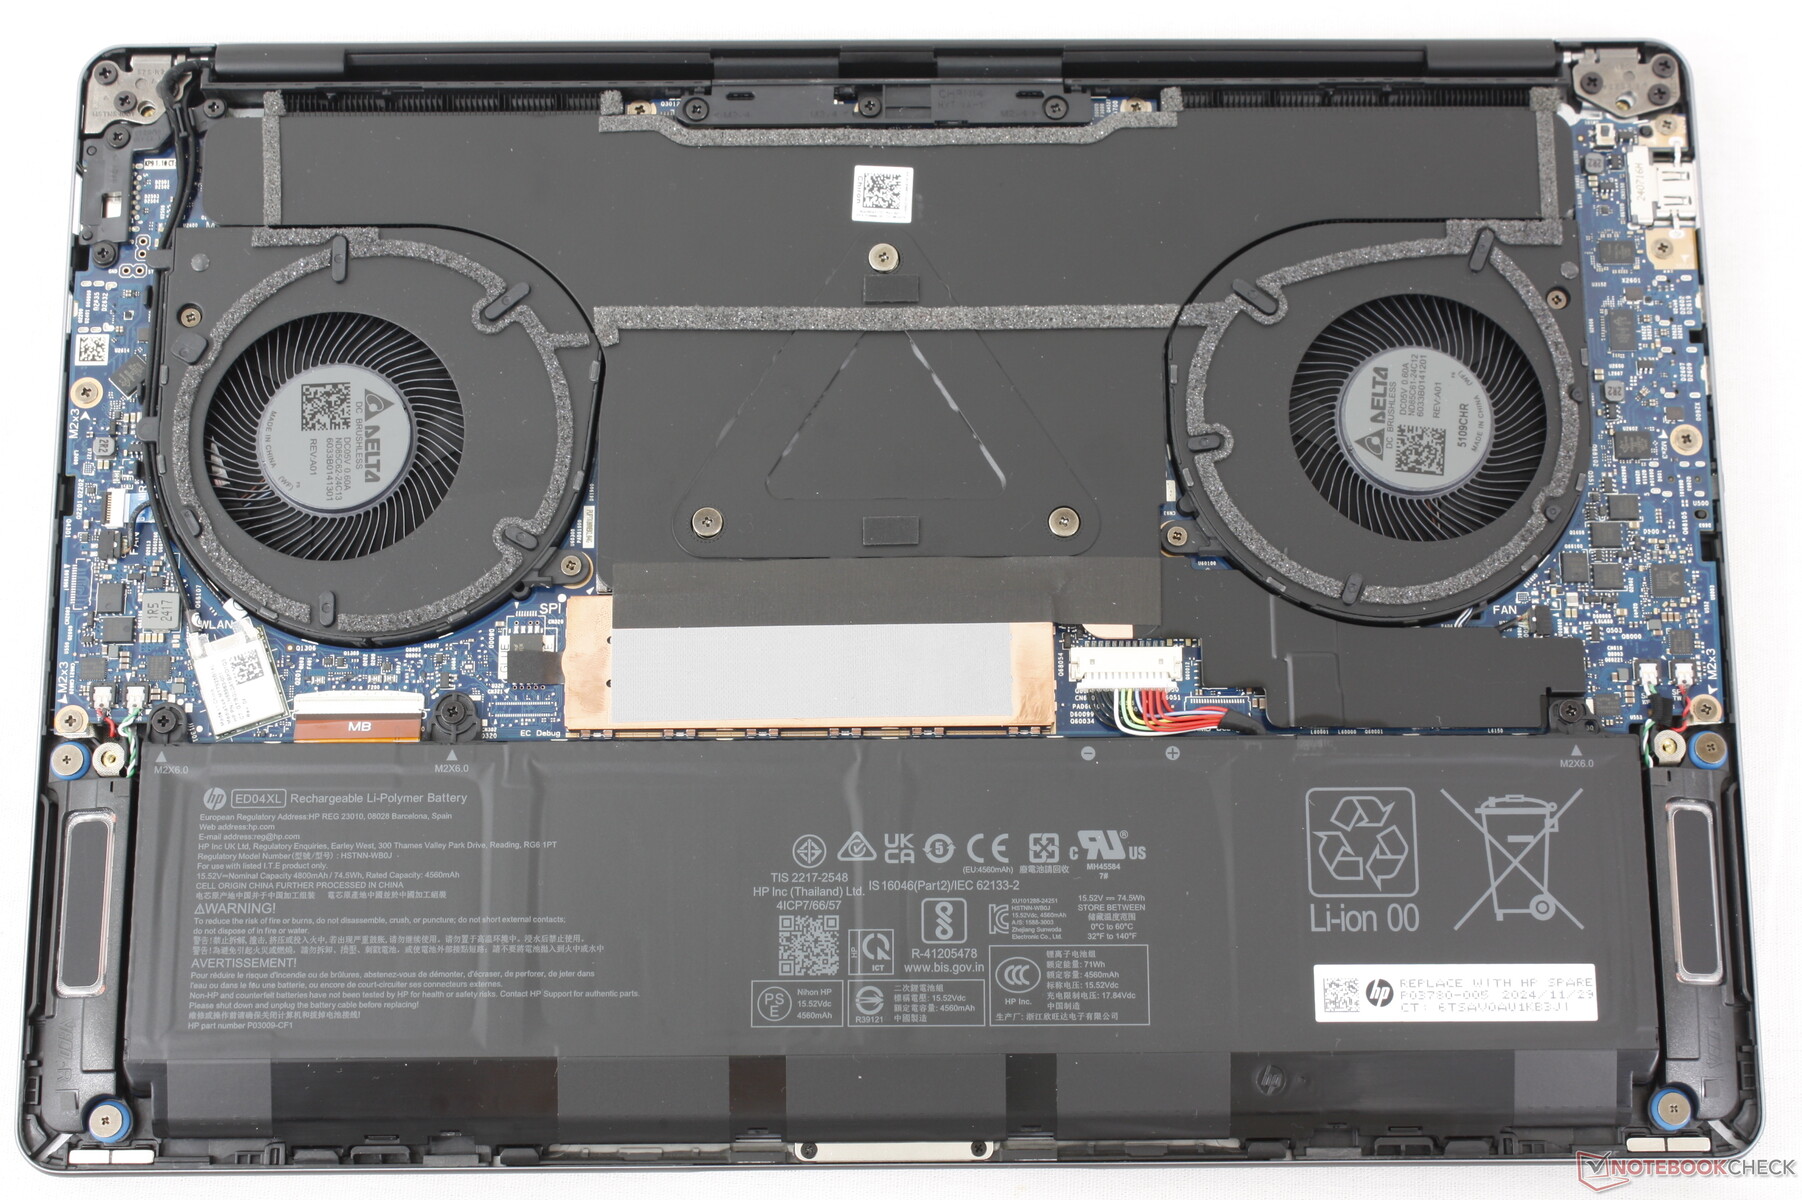
Maintenance
Pour l'entretien, il suffit de retirer quatre vis Phillips du panneau inférieur. Les mises à jour sont par ailleurs limitées car la RAM et le WLAN sont soudés. Il n'y a pas de place pour un second SSD.
Durabilité
HP intègre 80 % d'aluminium recyclé, 65 % de plastique recyclé, 30 % de plastique recyclé provenant des océans, 50 % de cuivre recyclé et 20 % d'huile de cuisson recyclée pour les différents composants du modèle au cours de la fabrication. L'emballage, quant à lui, est 100 % durable, avec seulement un peu de plastique autour de l'adaptateur secteur.
Accessoires et garantie
La boîte ne contient pas d'autres éléments que l'adaptateur secteur et la documentation. Une garantie constructeur de trois ans est fournie en standard, ce qui est normal pour un modèle ZBook haut de gamme.
Périphériques d'entrée
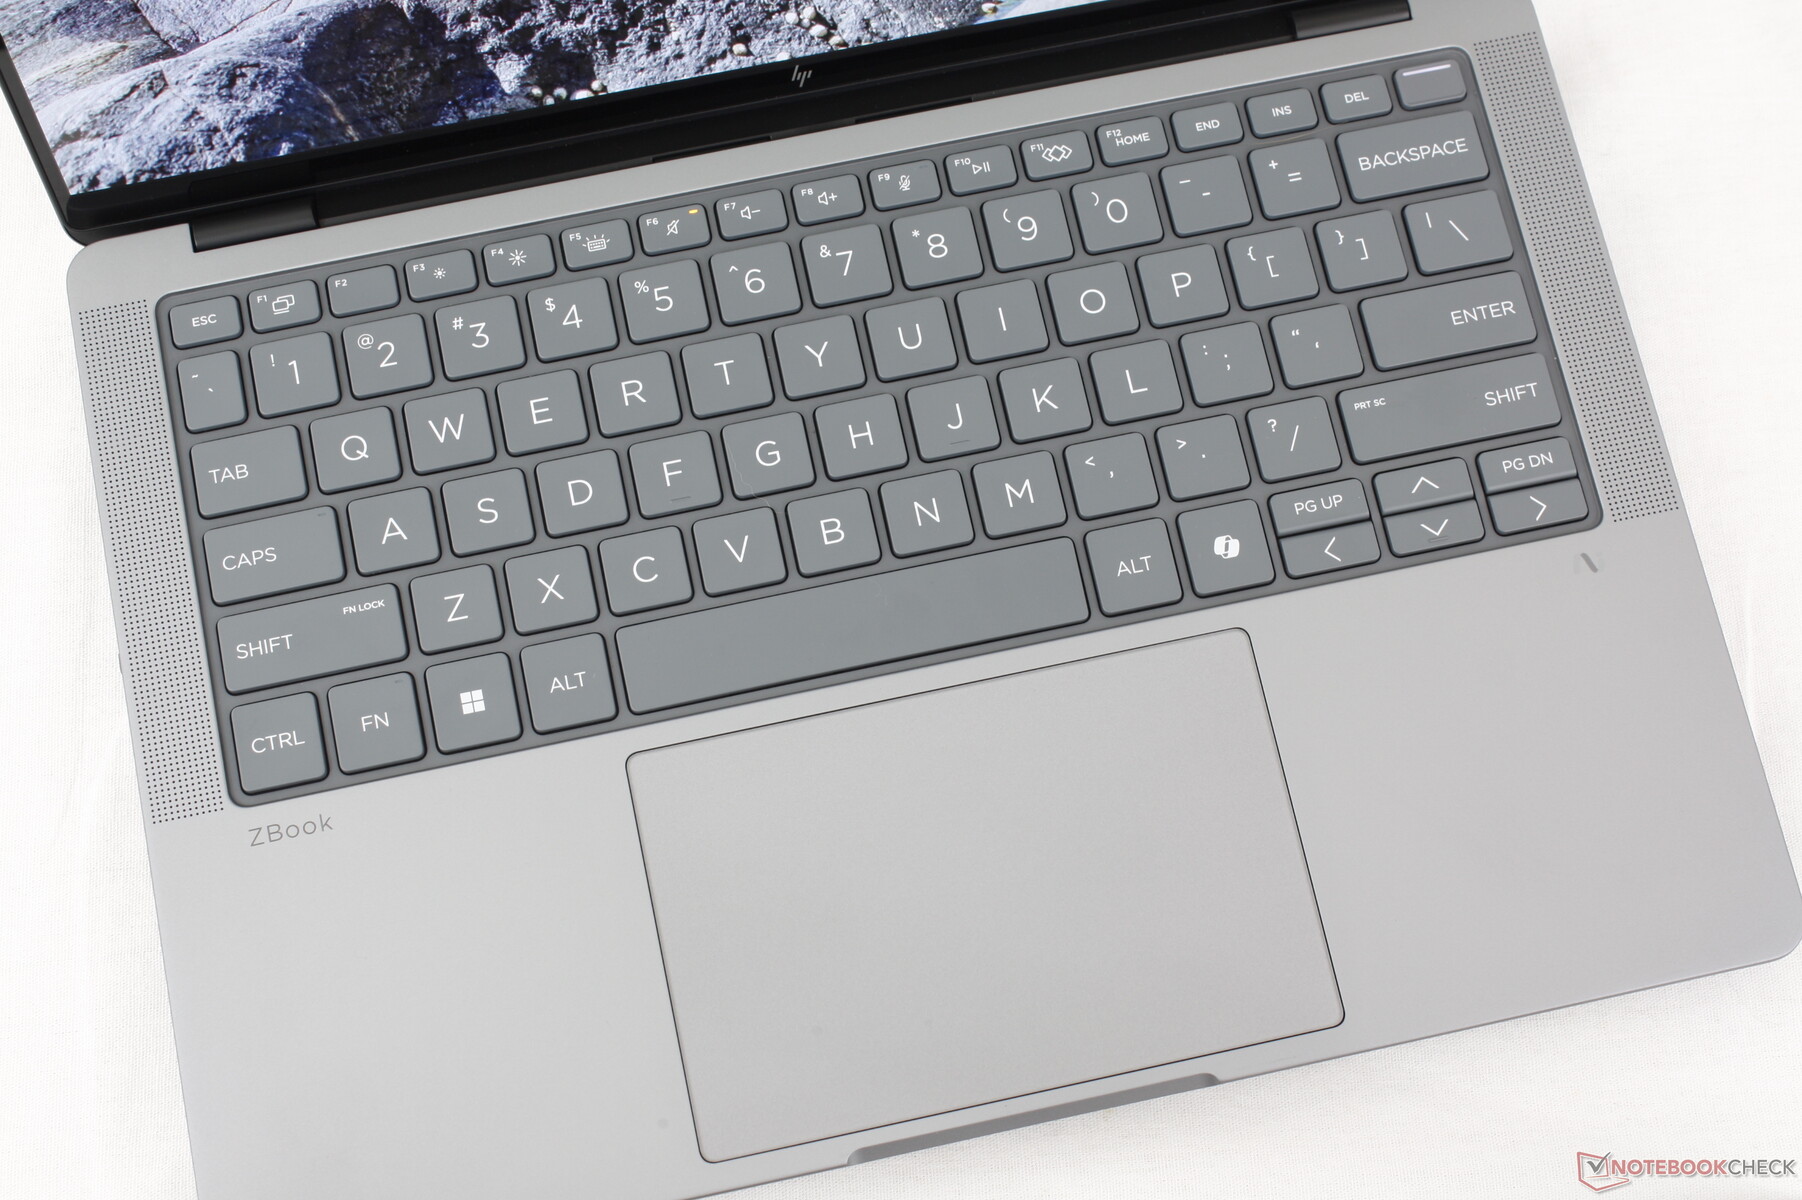
Clavier et pavé tactile
L'expérience de frappe est similaire à celle de l'EliteBook X G1a 14, ce qui n'est pas une mauvaise chose car nous trouvons généralement que les claviers des modèles HP Elite sont parmi les meilleurs de tous les ordinateurs portables professionnels. La touche Espace, cependant, semble étrangement plus douce et plus silencieuse que le reste du clavier, tandis que les touches fléchées sont toujours aussi exiguës. Ce sont de légers inconvénients sur une disposition par ailleurs confortable.
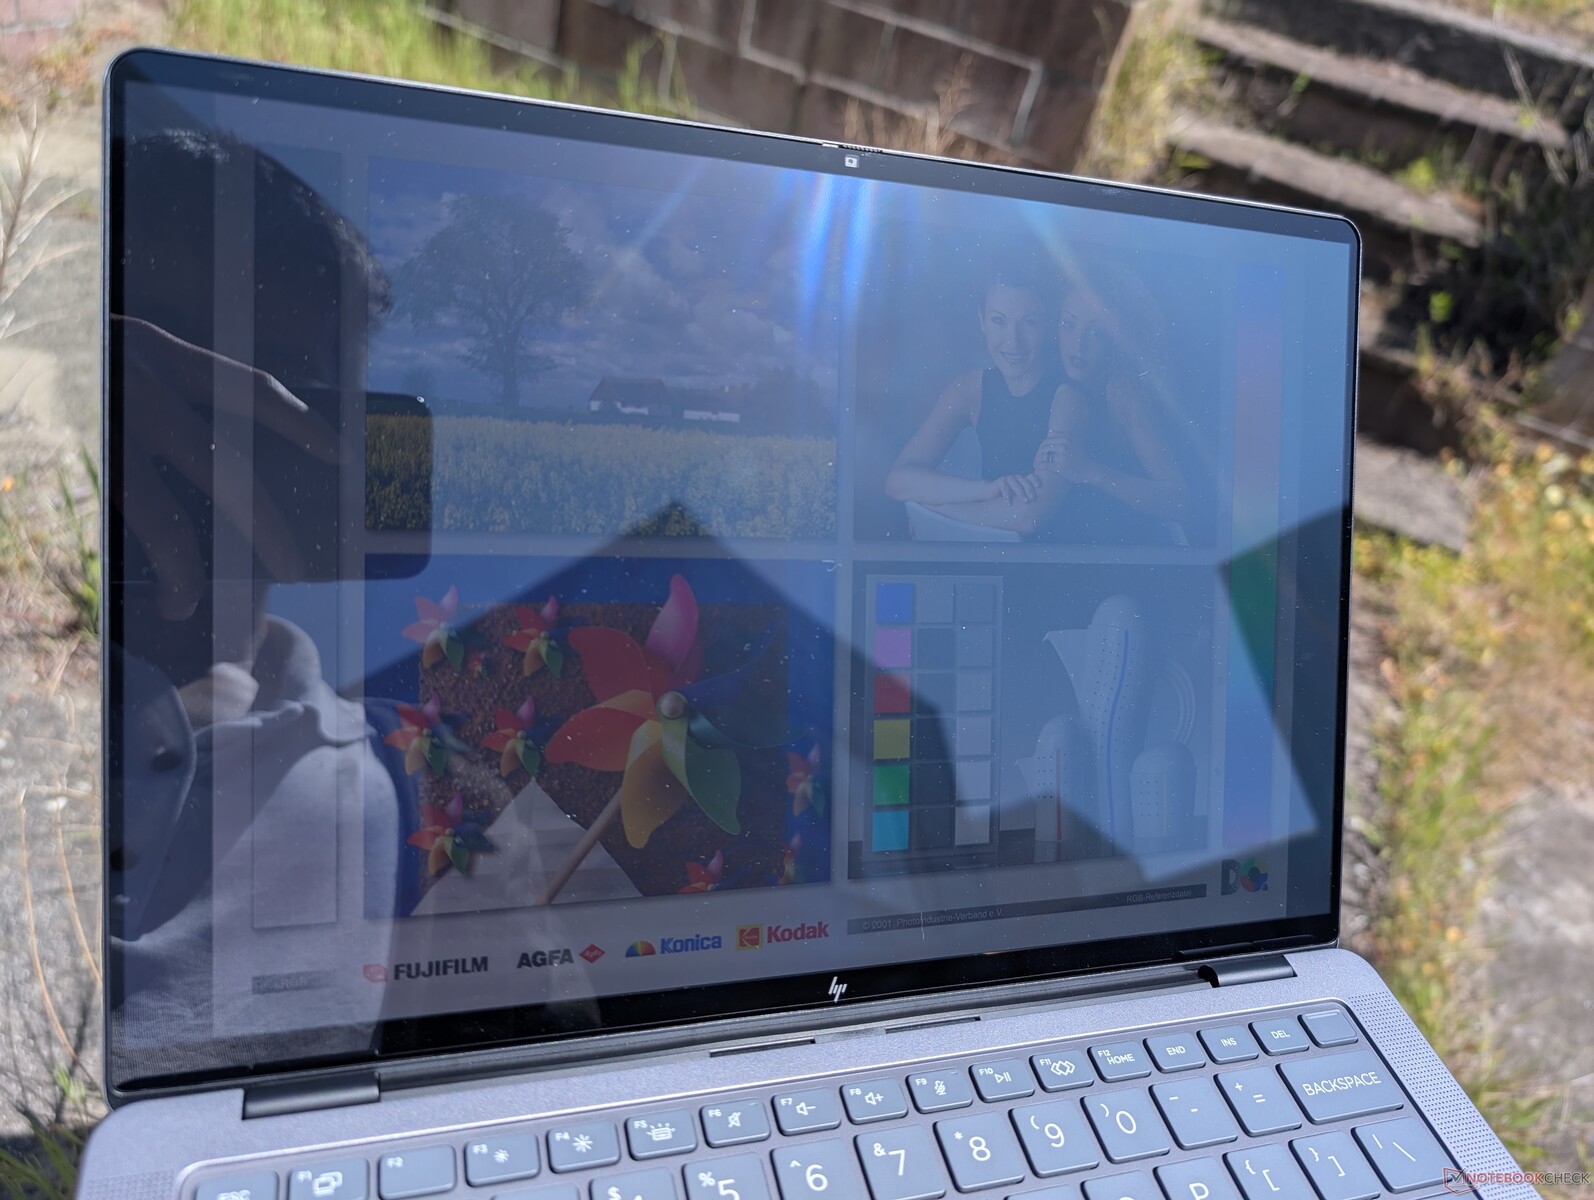
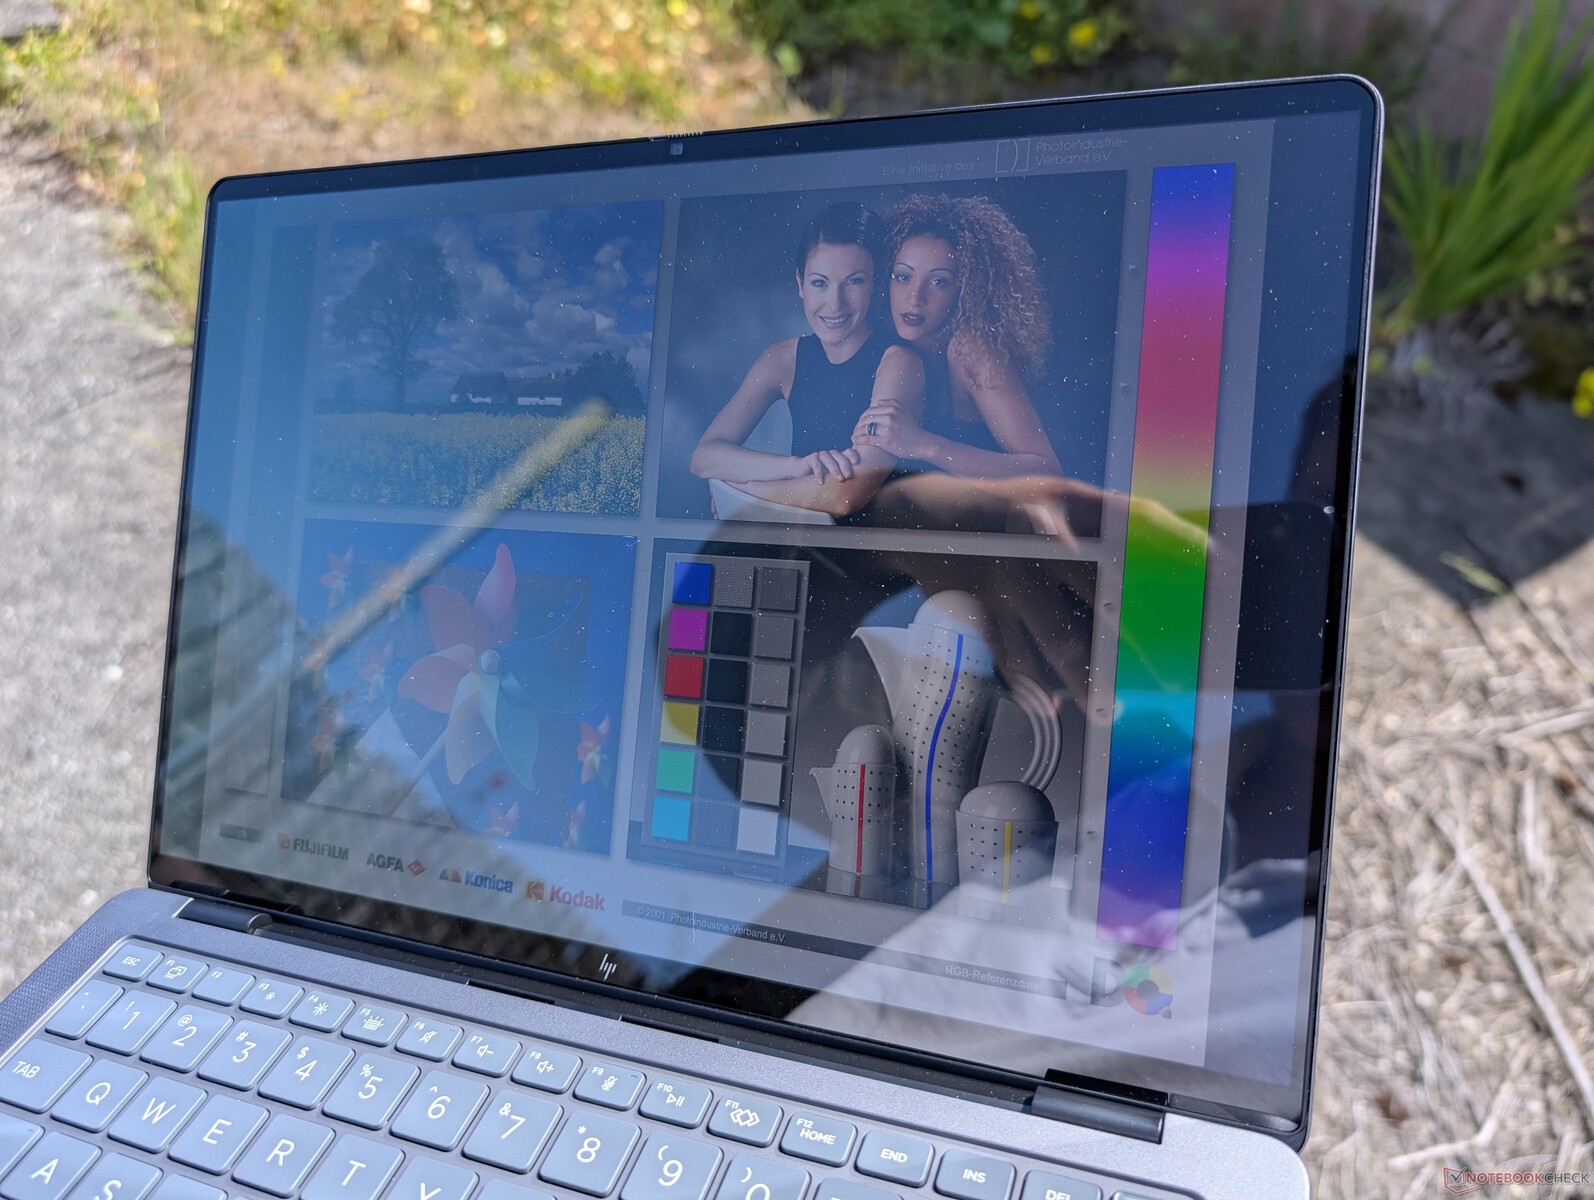
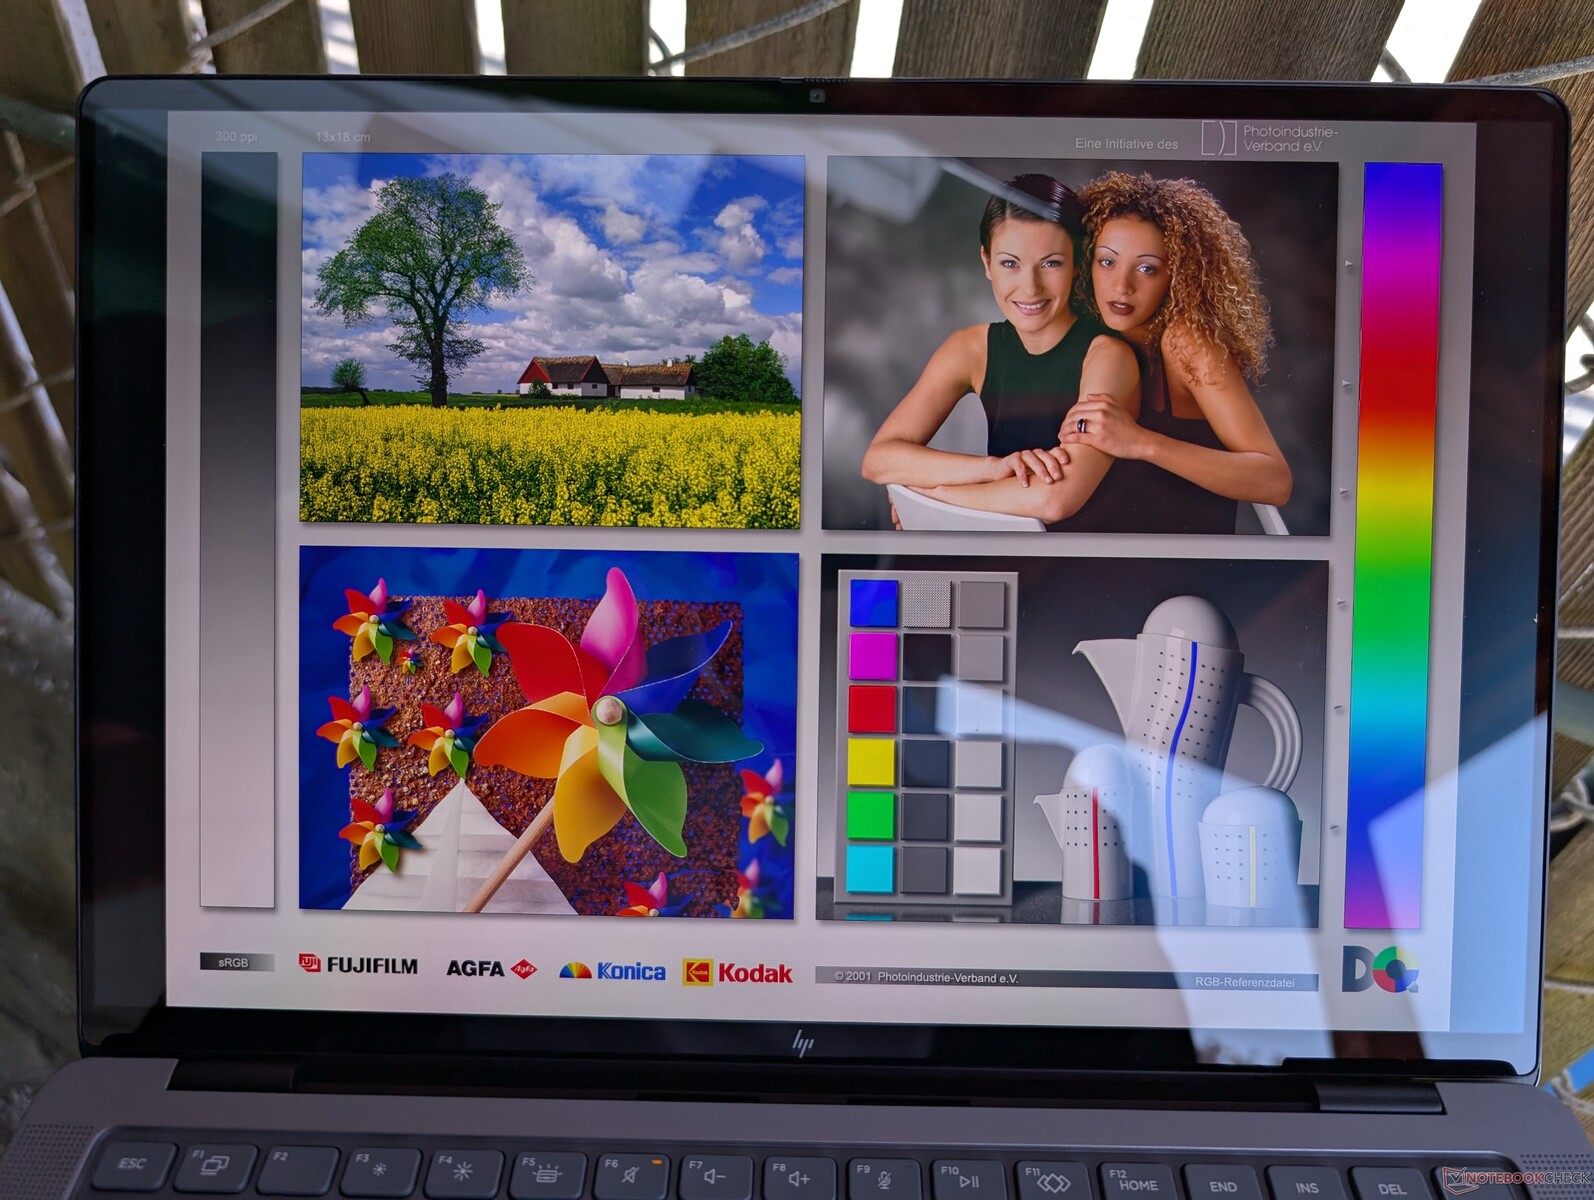
Affichage
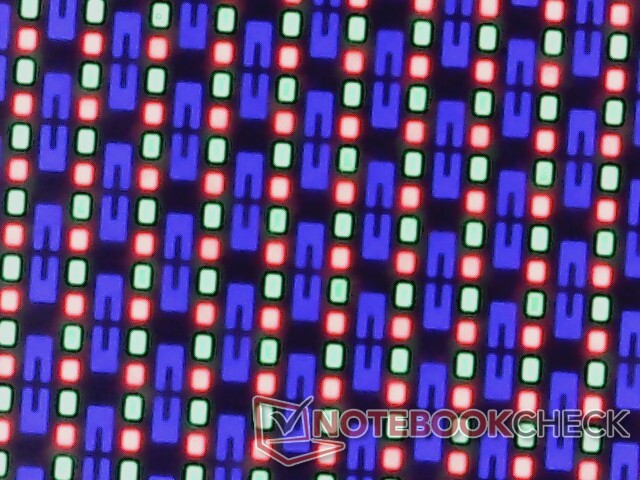
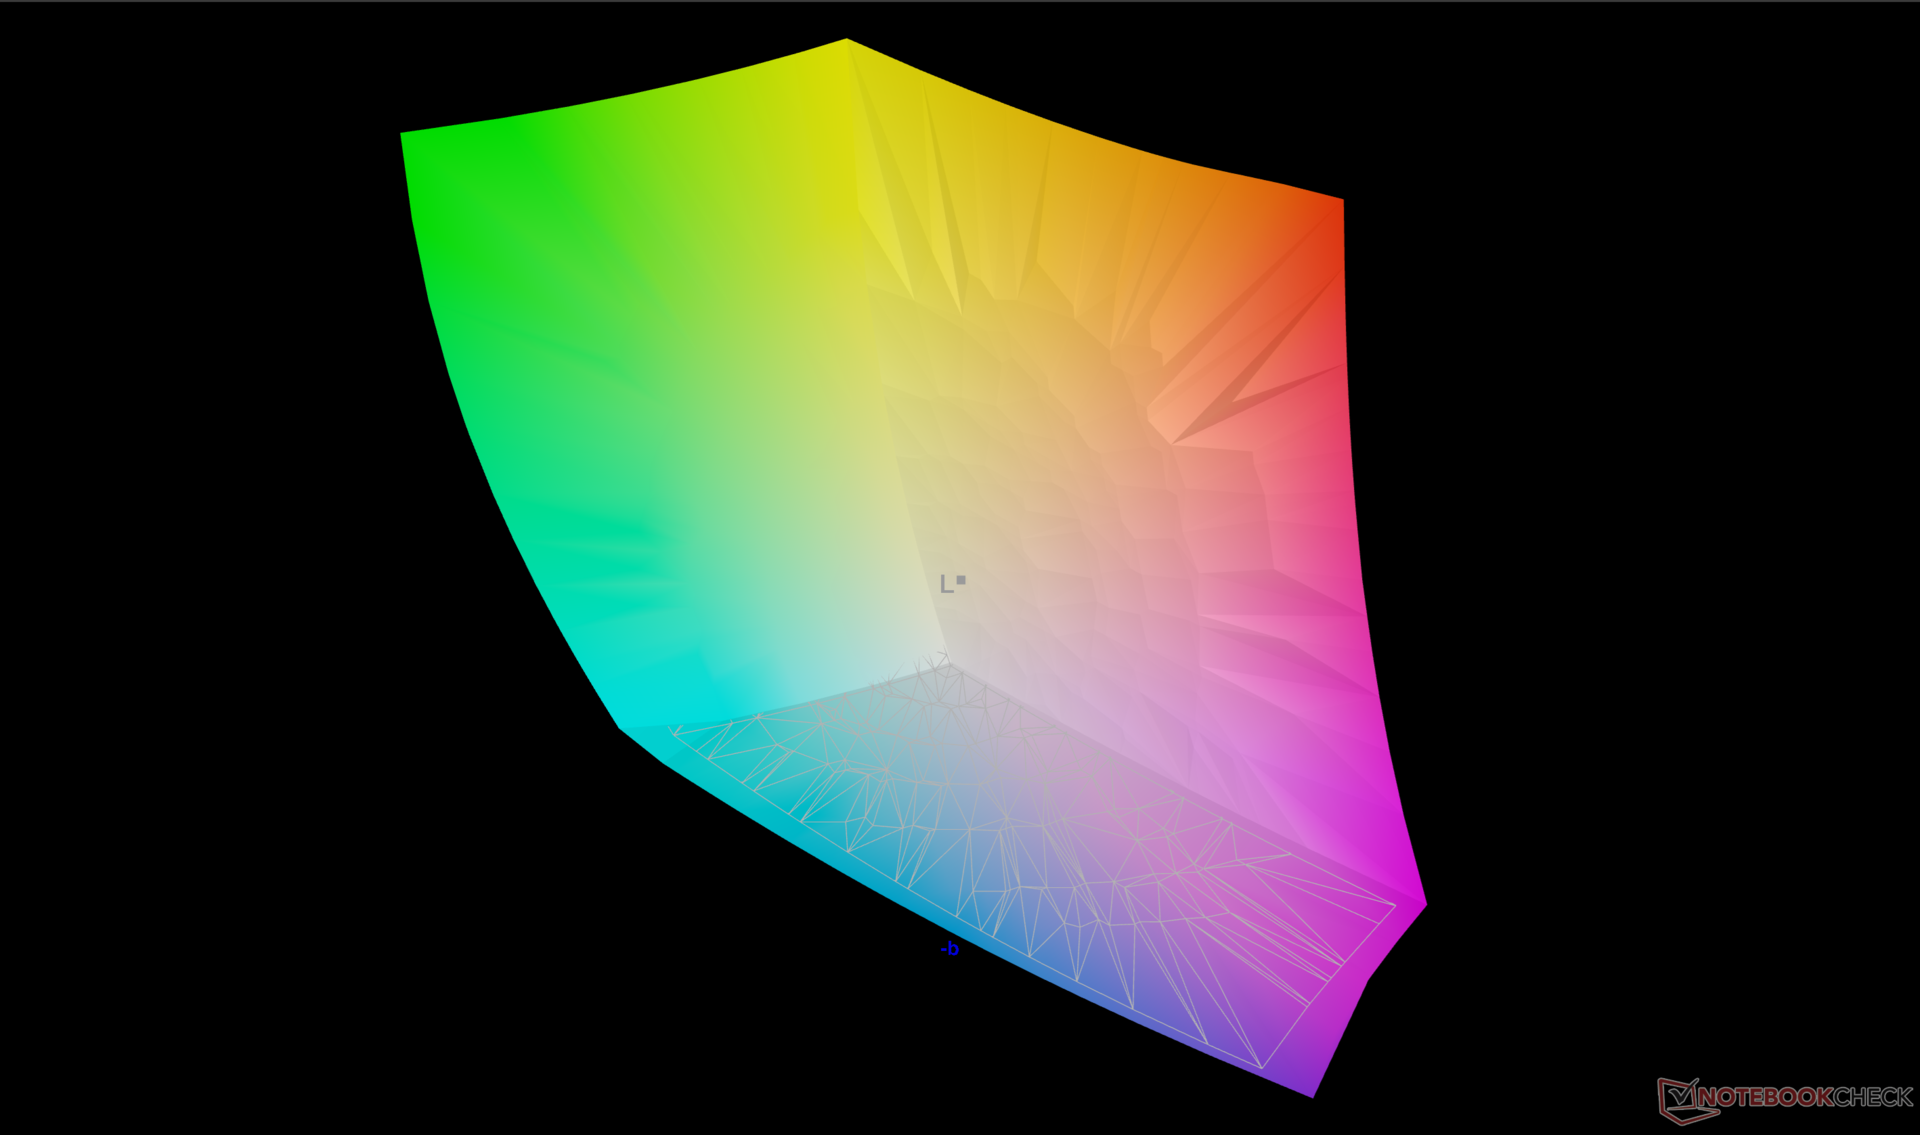
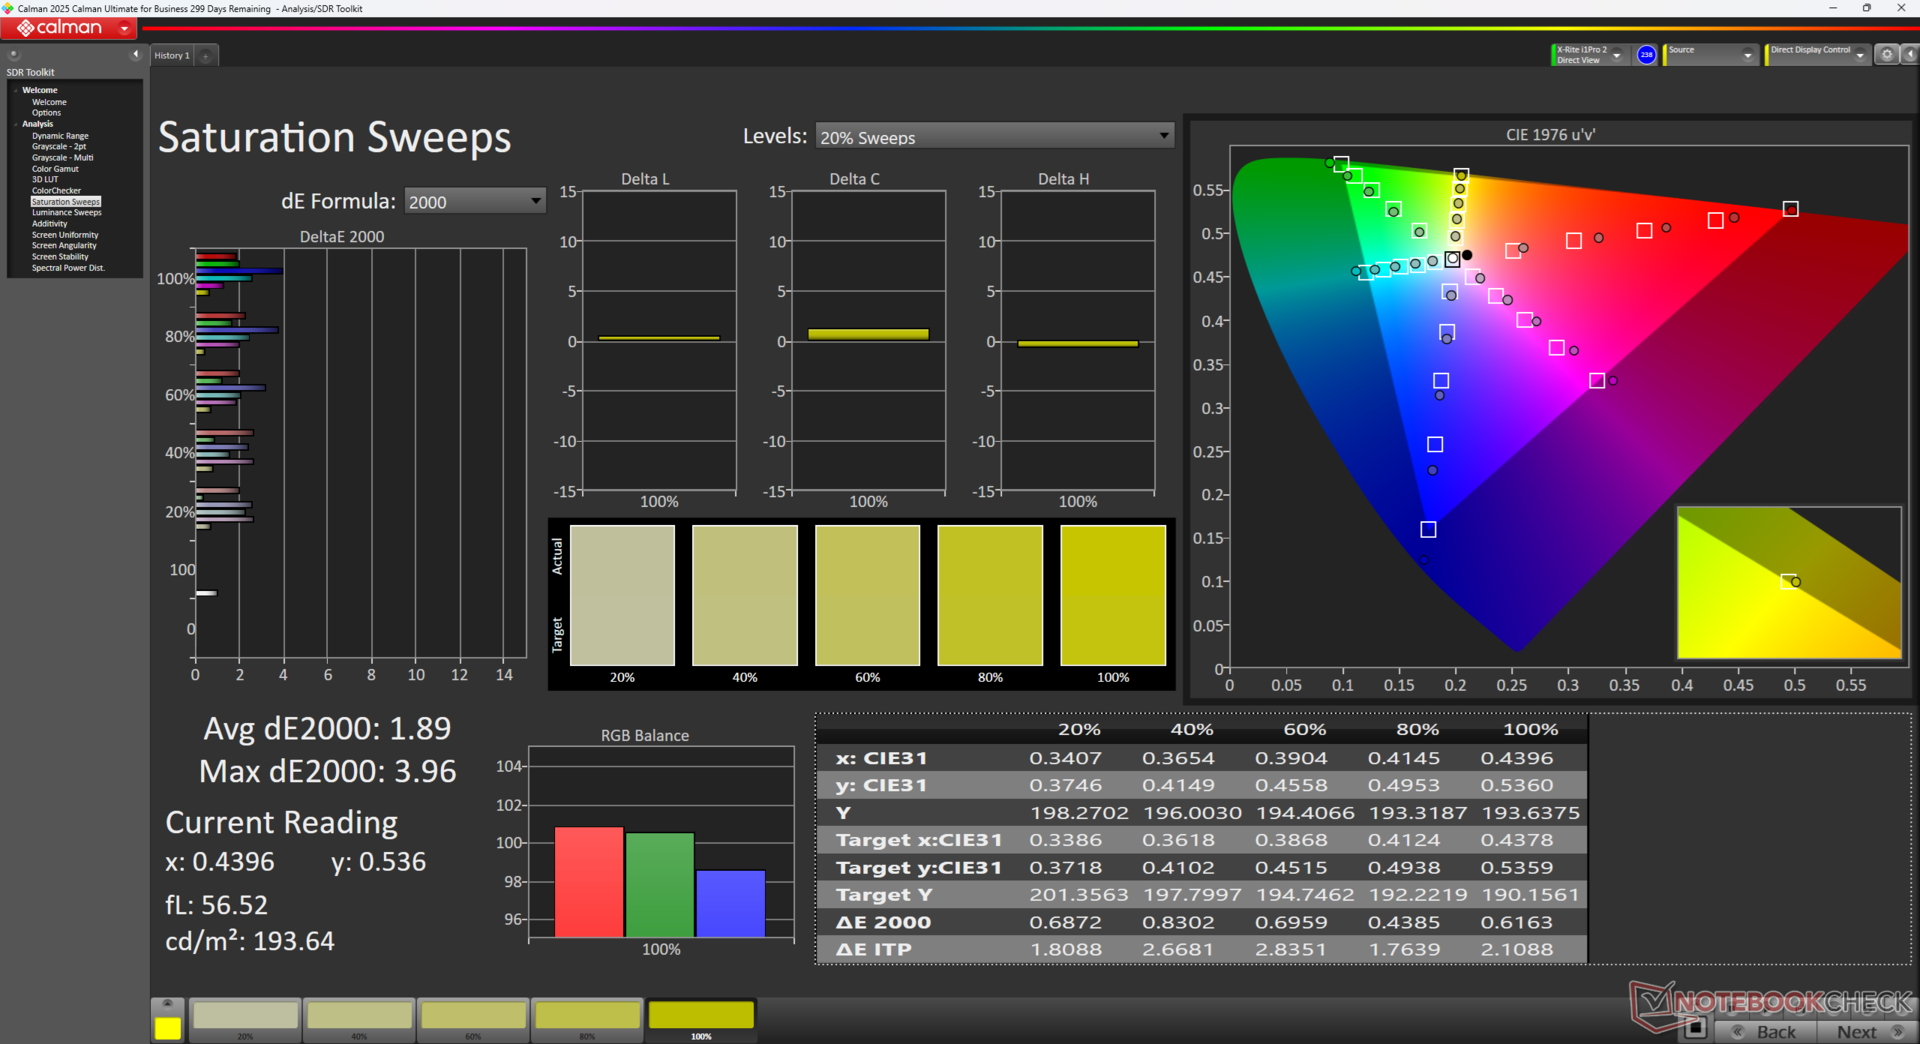
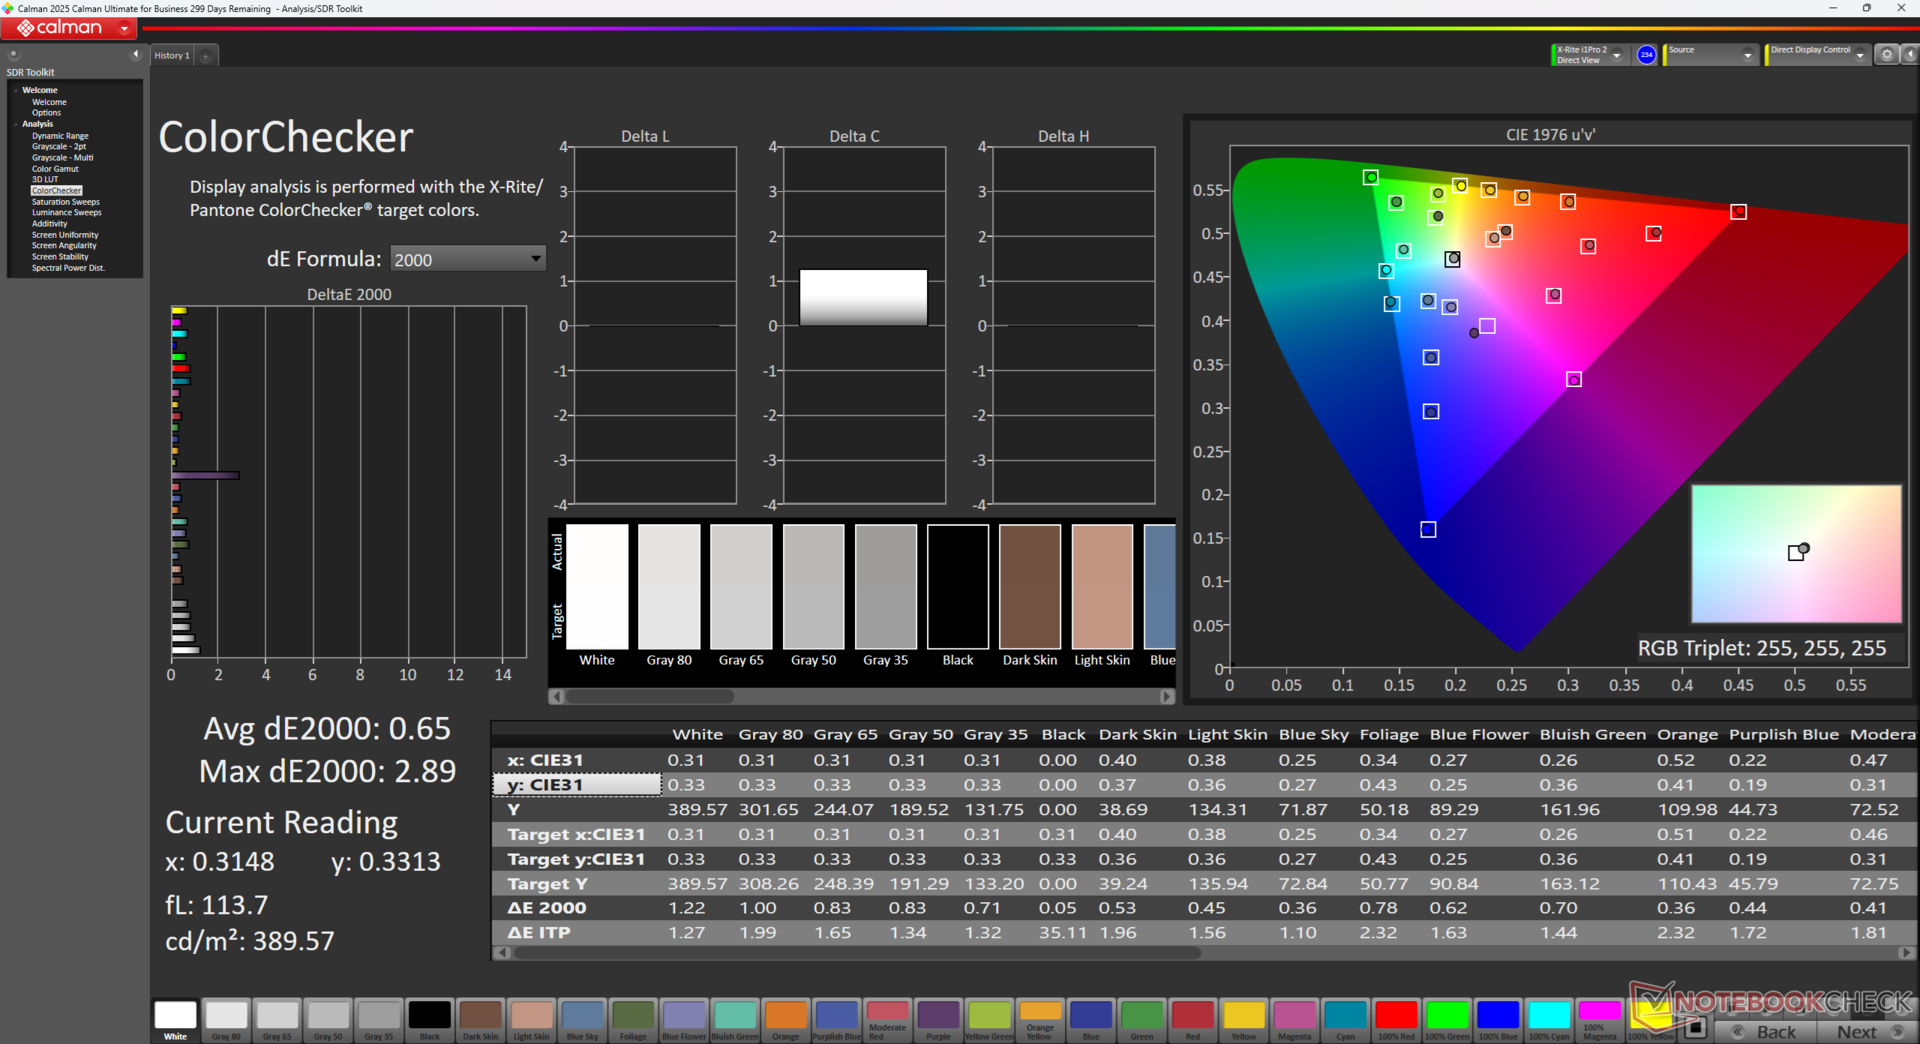
L'écran tactile OLED prend en charge 120 Hz et est bien calibré par rapport à la norme P3. Il n'est cependant pas très lumineux, avec un maximum de 400 nits seulement, contre plus de 600 nits ou 450 sur le MacBook Pro 14 ou le Book Firefly 14 G11, respectivement.
Le HDR et la synchronisation adaptative ne sont pas pris en charge.
| |||||||||||||||||||||||||
Homogénéité de la luminosité: 99 %
Valeur mesurée au centre, sur batterie: 384.7 cd/m²
Contraste: ∞:1 (Valeurs des noirs: 0 cd/m²)
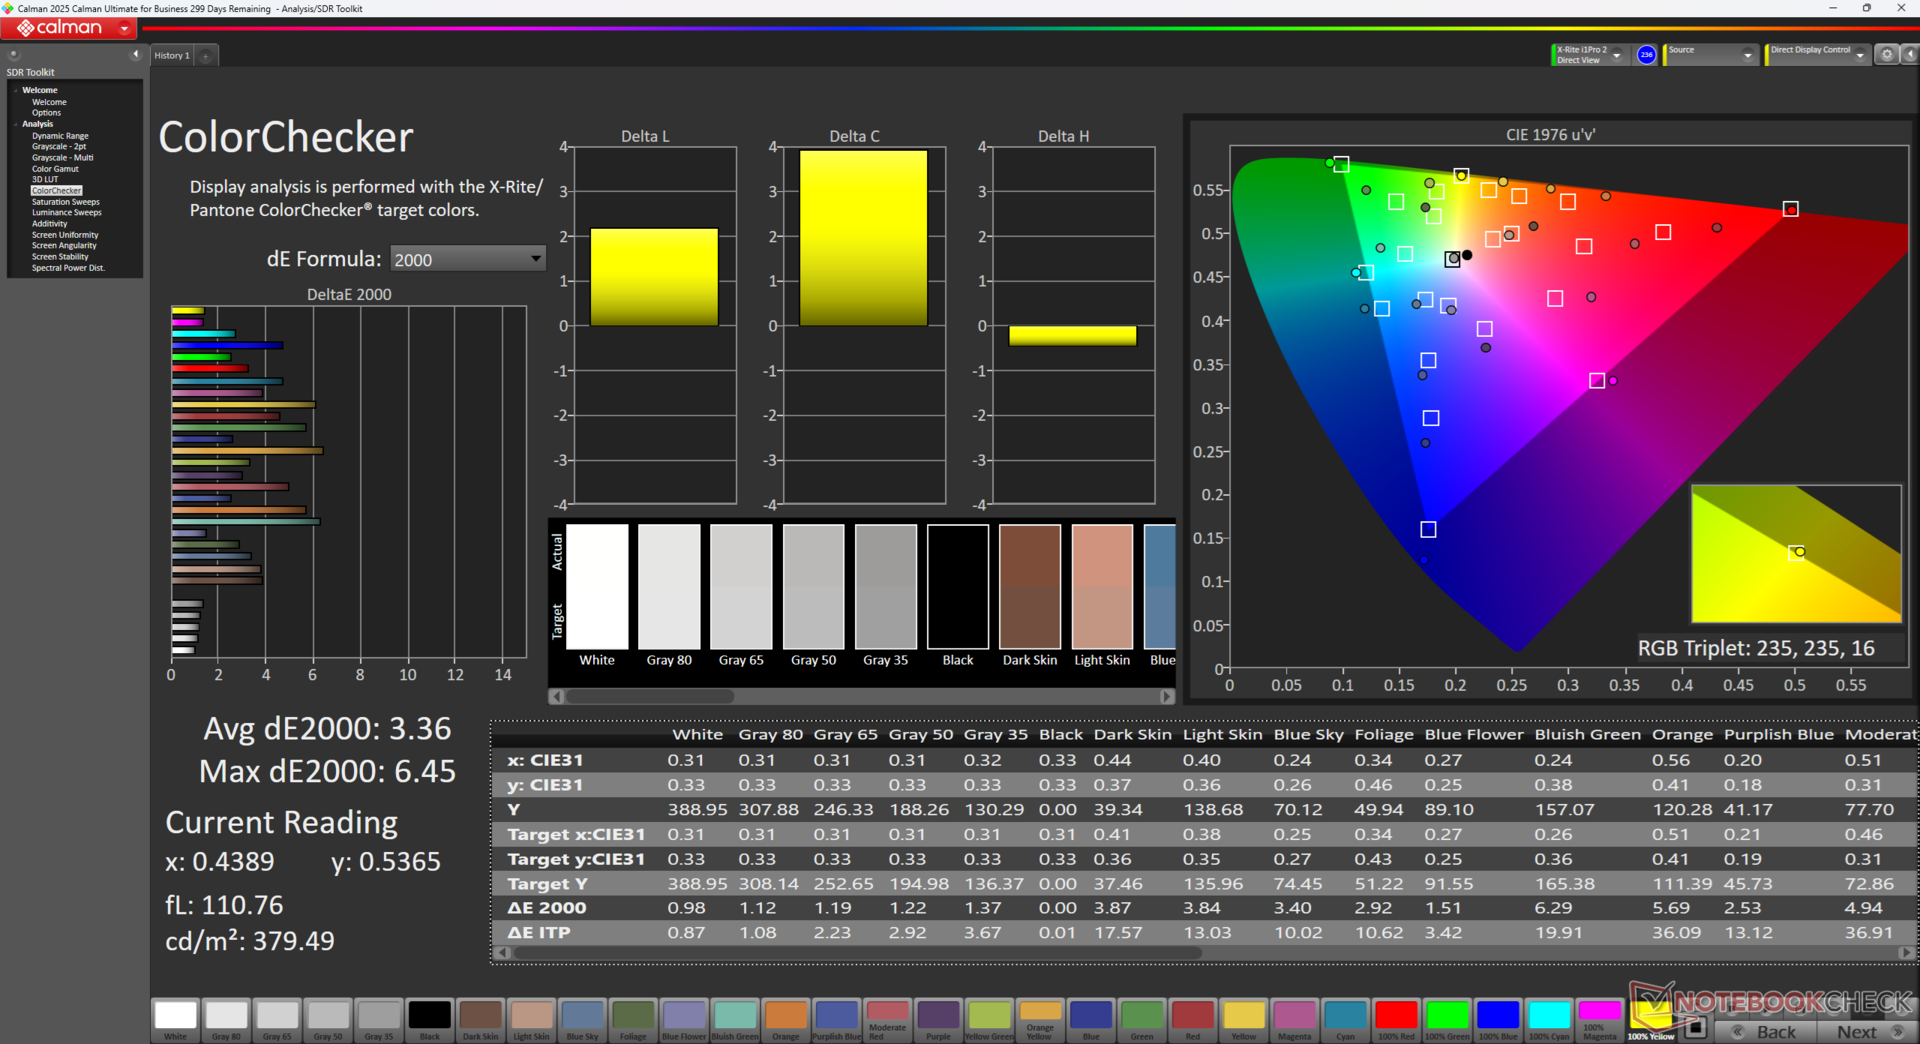
ΔE Color 3.36 | 0.5-29.43 Ø4.87, calibrated: 0.65
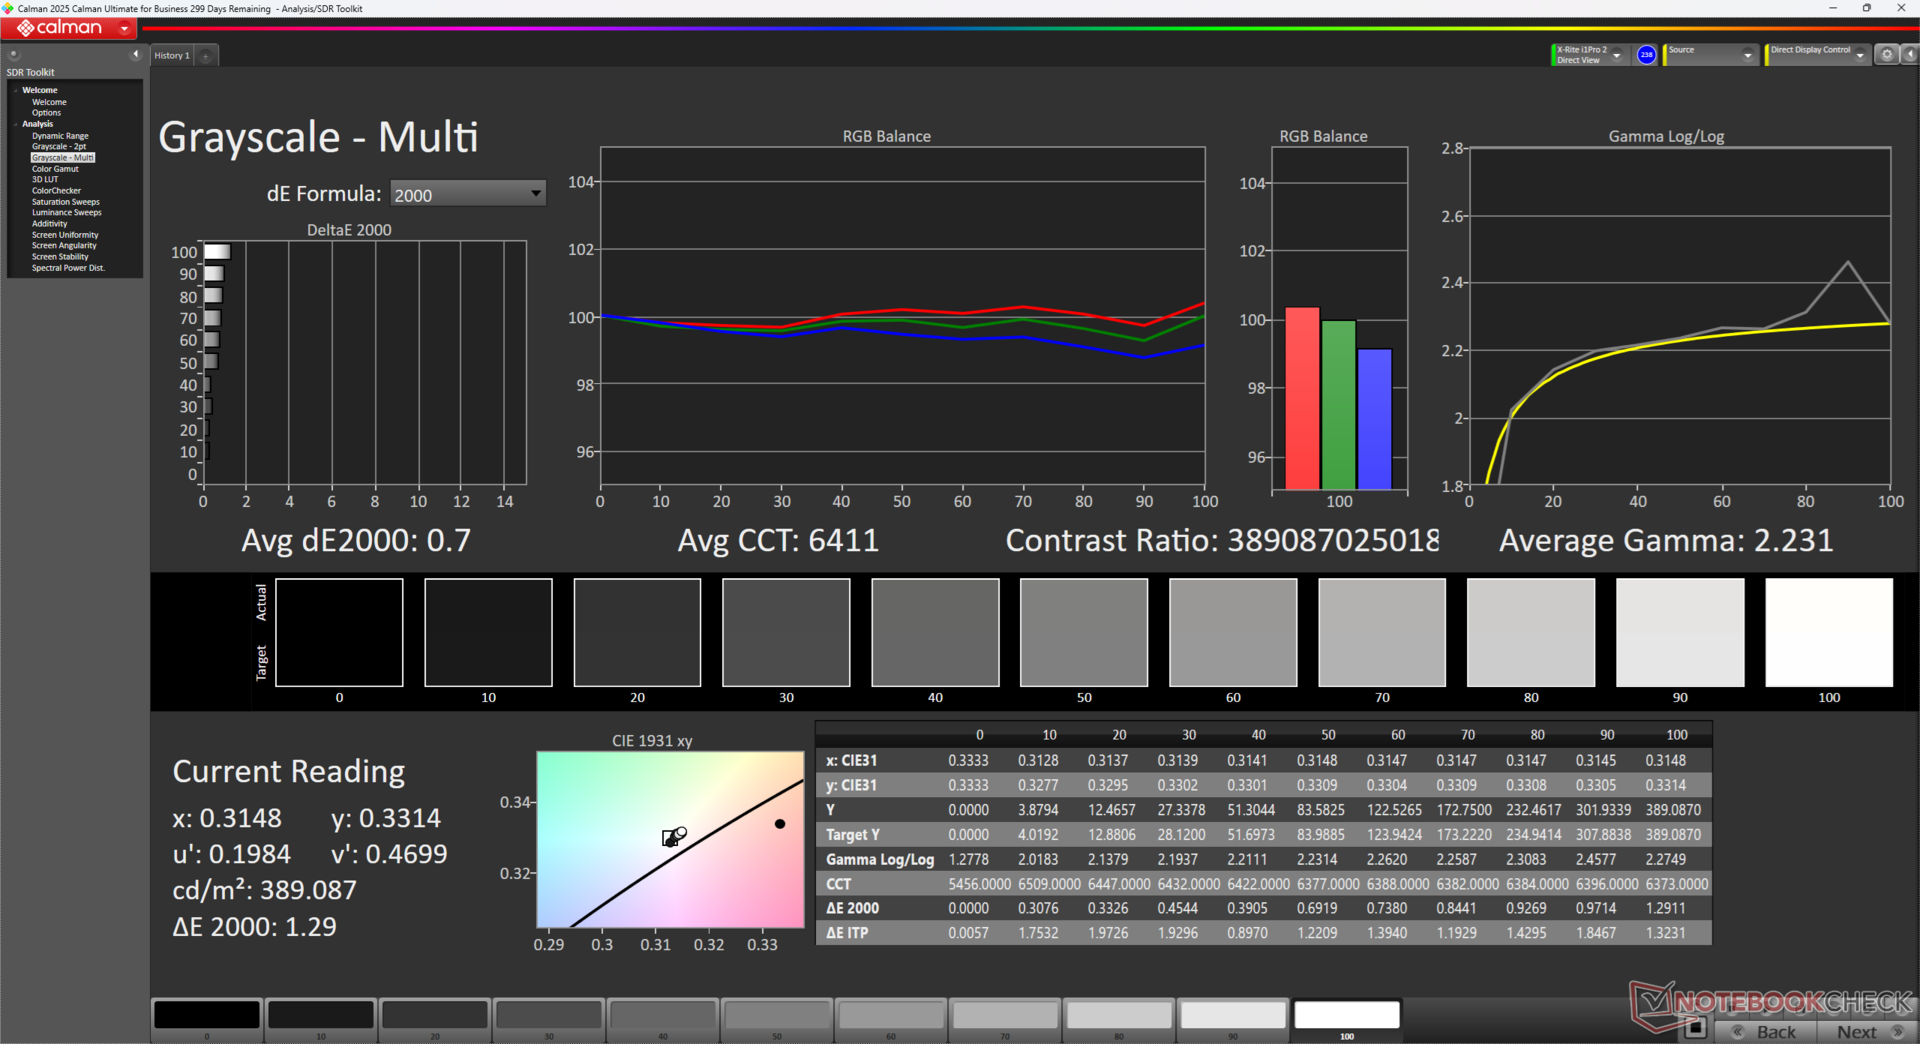
ΔE Greyscale 1 | 0.5-98 Ø5.1
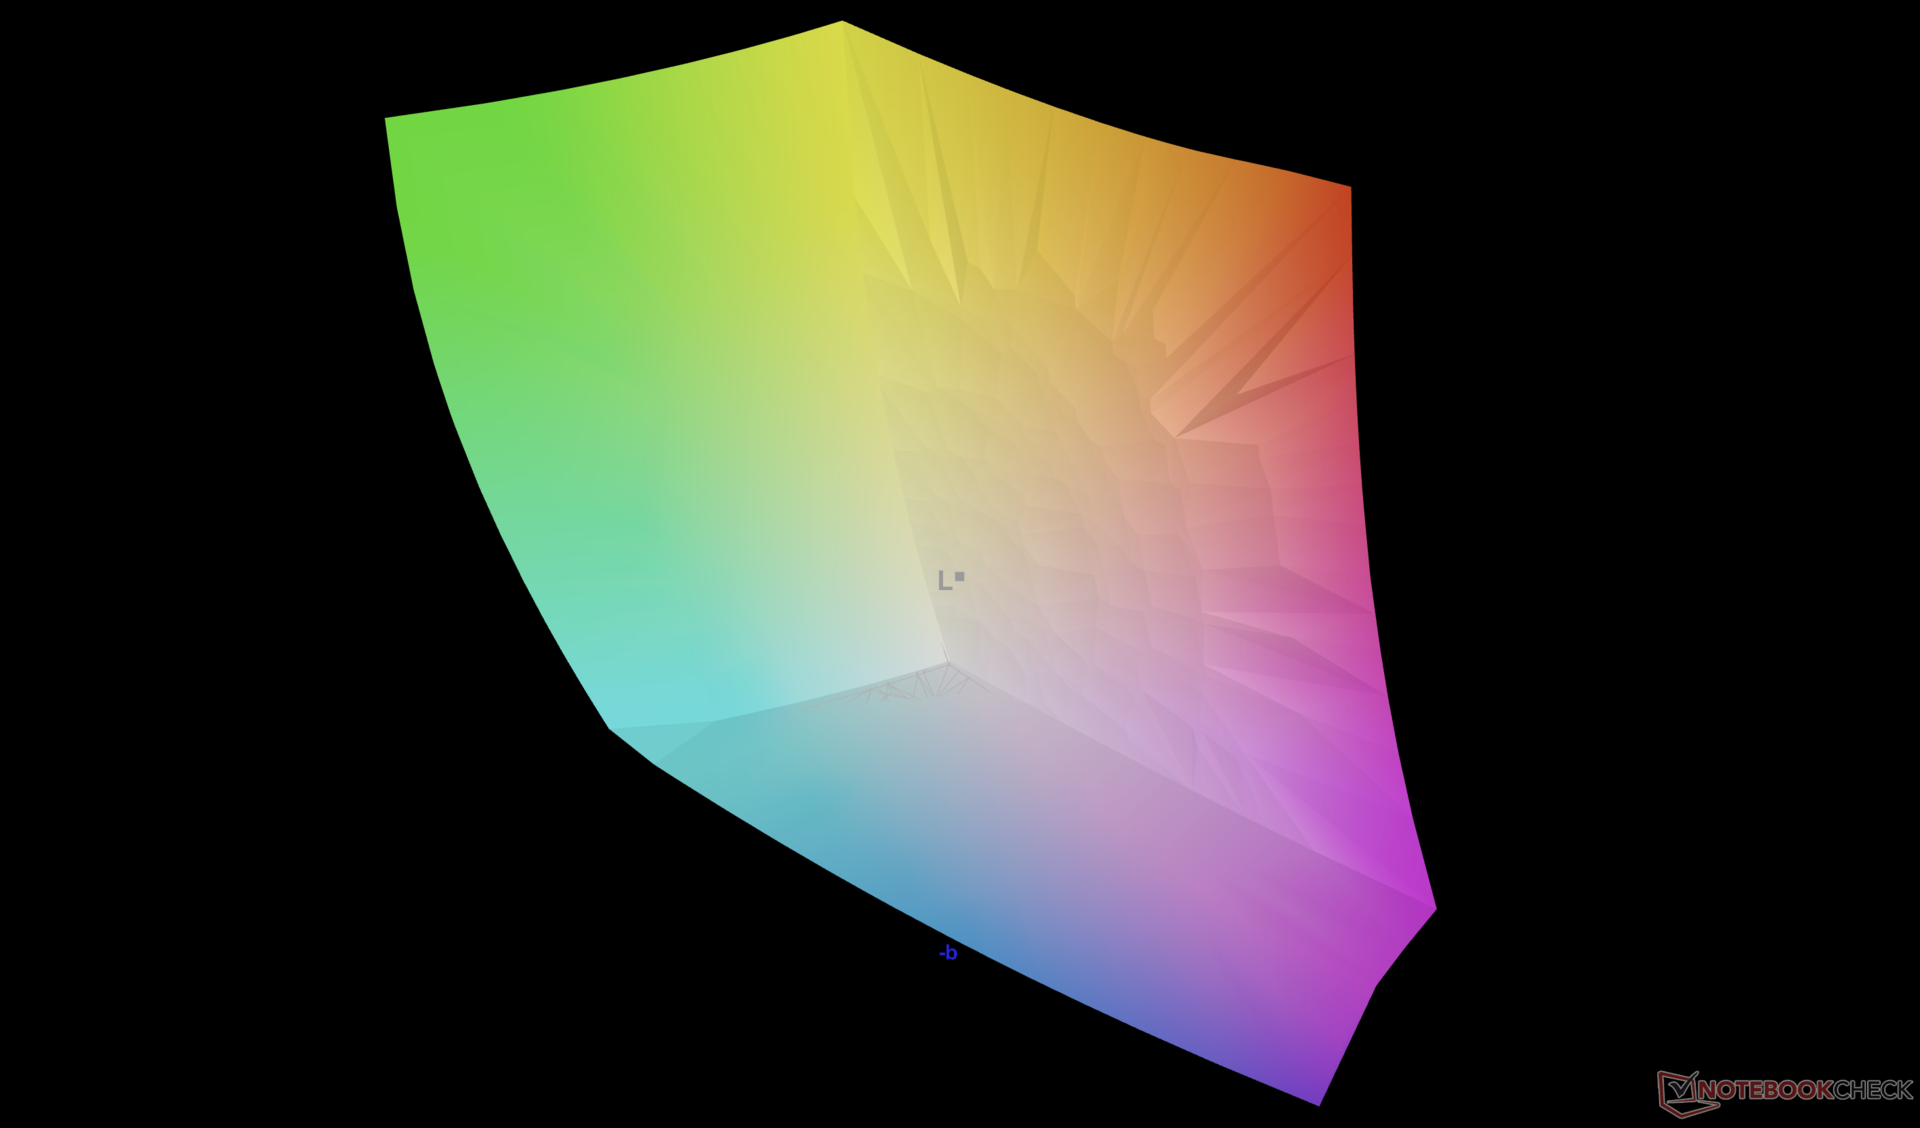
95.6% AdobeRGB 1998 (Argyll 2.2.0 3D)
100% sRGB (Argyll 2.2.0 3D)
99.7% Display P3 (Argyll 2.2.0 3D)
Gamma: 2.26
| HP ZBook Ultra G1a 14 Samsung SDC41B3, OLED, 2880x1800, 14", 120 Hz | HP ZBook Firefly 14 G11 AUO6DA8, IPS, 2560x1600, 14", 120 Hz | Lenovo ThinkPad X1 Carbon Gen 13 21NS0010GE ATNA40YK20-0, OLED, 2880x1800, 14", 120 Hz | Dell Precision 5000 5490 AU Optronics B140QAN, IPS, 2560x1600, 14", 60 Hz | Asus ExpertBook P5 P5405-NZ0102X NE140QDM-NX4, IPS LED, 2560x1600, 14", 144 Hz | Apple MacBook Pro 14 2024 M4 Pro MiniLED, 3024x1964, 14.2", 120 Hz | |
|---|---|---|---|---|---|---|
| Display | -3% | 1% | -12% | -19% | -2% | |
| Display P3 Coverage | 99.7 | 98.9 -1% | 99.5 0% | 79.7 -20% | 70.8 -29% | 99.6 0% |
| sRGB Coverage | 100 | 99.9 0% | 100 0% | 100 0% | 98 -2% | 100 0% |
| AdobeRGB 1998 Coverage | 95.6 | 86.6 -9% | 97.1 2% | 79.5 -17% | 71.6 -25% | 89 -7% |
| Response Times | -966% | -98% | -4331% | -2990% | -4060% | |
| Response Time Grey 50% / Grey 80% * | 0.94 ? | 12.3 ? -1209% | 2.4 ? -155% | 52.3 ? -5464% | 36.3 ? -3762% | 77.2 ? -8113% |
| Response Time Black / White * | 1.01 ? | 8.3 ? -722% | 1.9 ? -88% | 33.3 ? -3197% | 23.4 ? -2217% | 71.6 ? -6989% |
| PWM Frequency | 492.6 | 240 ? -51% | 14880 ? 2921% | |||
| Screen | 20% | -118% | -2% | -97% | 50% | |
| Brightness middle | 384.7 | 554.1 44% | 407 6% | 485.1 26% | 457 19% | 638 66% |
| Brightness | 387 | 540 40% | 410 6% | 471 22% | 457 18% | 621 60% |
| Brightness Distribution | 99 | 93 -6% | 99 0% | 90 -9% | 95 -4% | 95 -4% |
| Black Level * | 0.58 | 0.38 | 0.12 | |||
| Colorchecker dE 2000 * | 3.36 | 2.54 24% | 4.9 -46% | 2.15 36% | 4.9 -46% | 0.6 82% |
| Colorchecker dE 2000 max. * | 6.45 | 4.99 23% | 9.1 -41% | 5.39 16% | 8.5 -32% | 1.4 78% |
| Colorchecker dE 2000 calibrated * | 0.65 | 0.56 14% | 4.7 -623% | 0.67 -3% | 1.7 -162% | |
| Greyscale dE 2000 * | 1 | 1 -0% | 2.3 -130% | 2 -100% | 5.7 -470% | 0.8 20% |
| Gamma | 2.26 97% | 2.3 96% | 2.26 97% | 2.3 96% | 2.25 98% | 2.22 99% |
| CCT | 6380 102% | 6556 99% | 6310 103% | 6826 95% | 7647 85% | 6430 101% |
| Contrast | 955 | 1277 | 3808 | |||
| Moyenne finale (programmes/paramètres) | -316% /
-150% | -72% /
-86% | -1448% /
-726% | -1035% /
-559% | -1337% /
-991% |
* ... Moindre est la valeur, meilleures sont les performances


Temps de réponse de l'écran
| ↔ Temps de réponse noir à blanc | ||
|---|---|---|
| 1.01 ms ... hausse ↗ et chute ↘ combinées | ↗ 0.46 ms hausse | 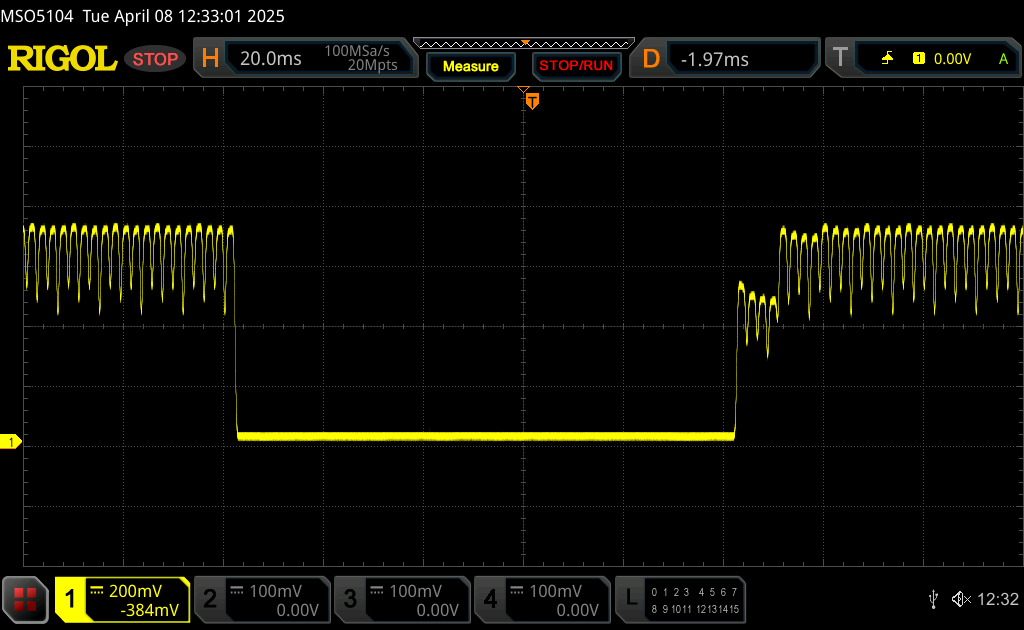 |
| ↘ 0.55 ms chute | ||
| L'écran montre de très faibles temps de réponse, parfait pour le jeu. En comparaison, tous les appareils testés affichent entre 0.1 (minimum) et 240 (maximum) ms. » 2 % des appareils testés affichent de meilleures performances. Cela signifie que les latences relevées sont meilleures que la moyenne (20.8 ms) de tous les appareils testés. | ||
| ↔ Temps de réponse gris 50% à gris 80% | ||
| 0.94 ms ... hausse ↗ et chute ↘ combinées | ↗ 0.53 ms hausse | 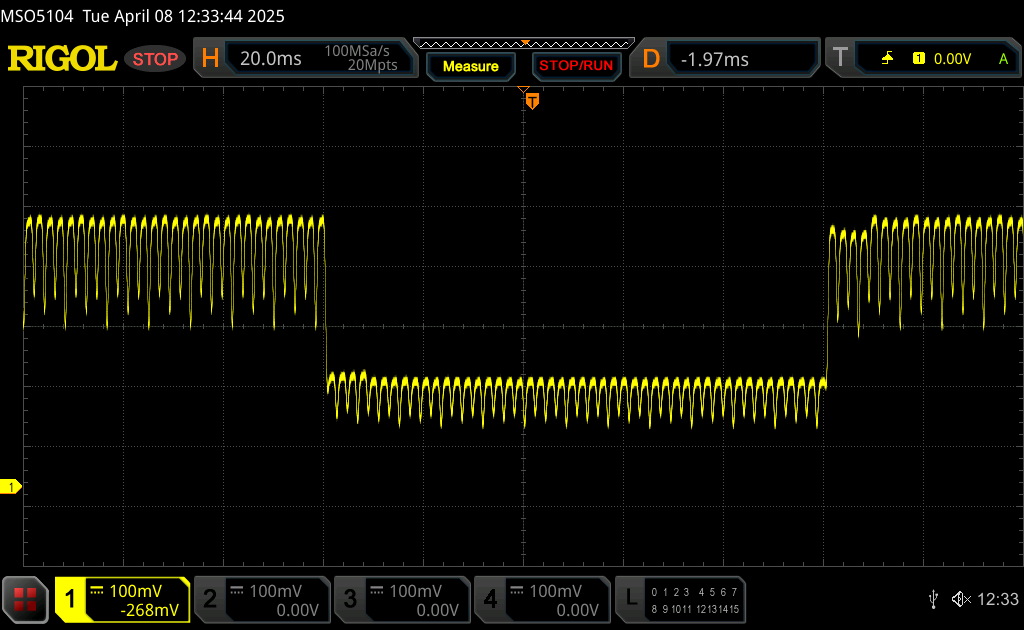 |
| ↘ 0.41 ms chute | ||
| L'écran montre de très faibles temps de réponse, parfait pour le jeu. En comparaison, tous les appareils testés affichent entre 0.165 (minimum) et 636 (maximum) ms. » 2 % des appareils testés affichent de meilleures performances. Cela signifie que les latences relevées sont meilleures que la moyenne (32.5 ms) de tous les appareils testés. | ||
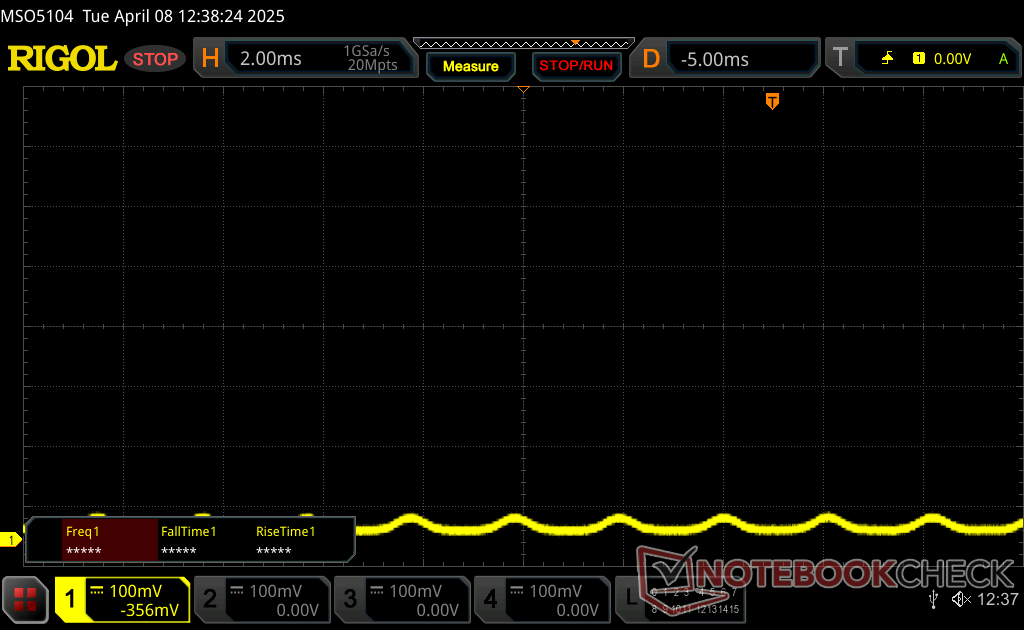
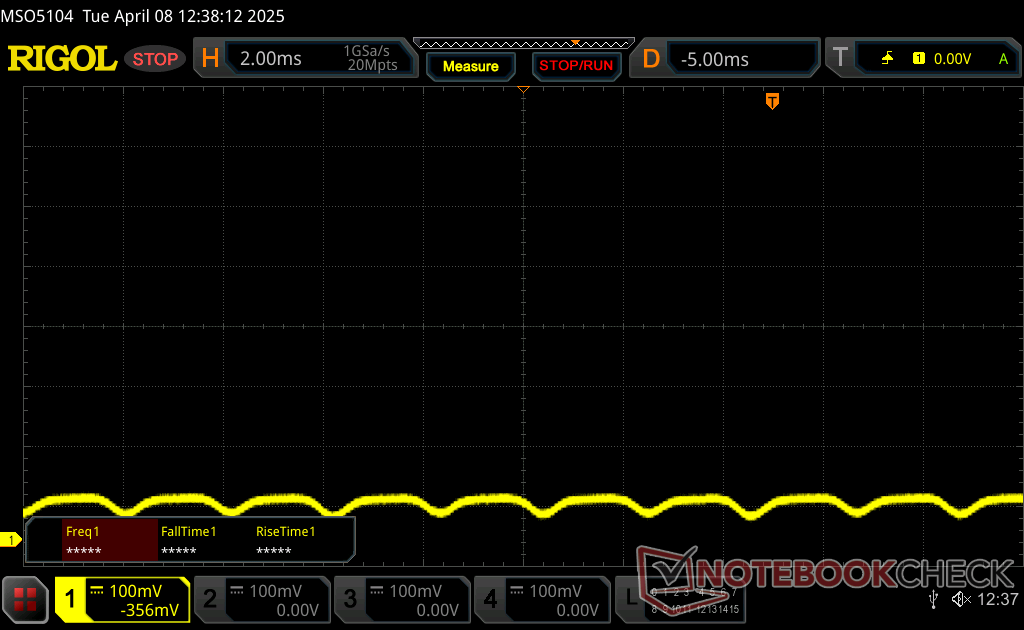
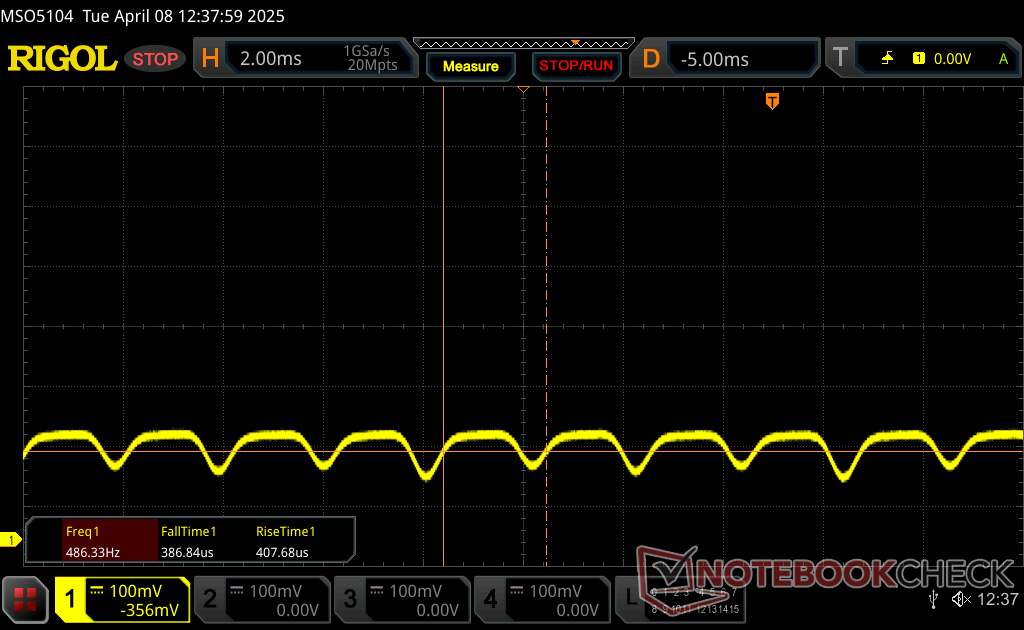
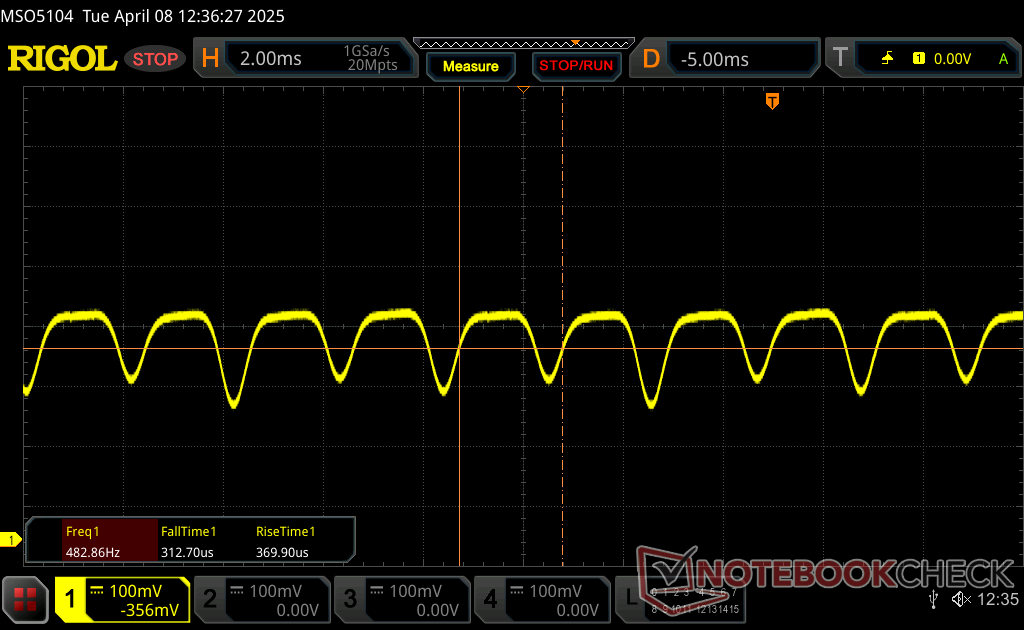
Scintillement / MLI (Modulation de largeur d'impulsion)
| Scintillement / MLI (Modulation de largeur d'impulsion) décelé | 492.6 Hz Amplitude: 43 % | 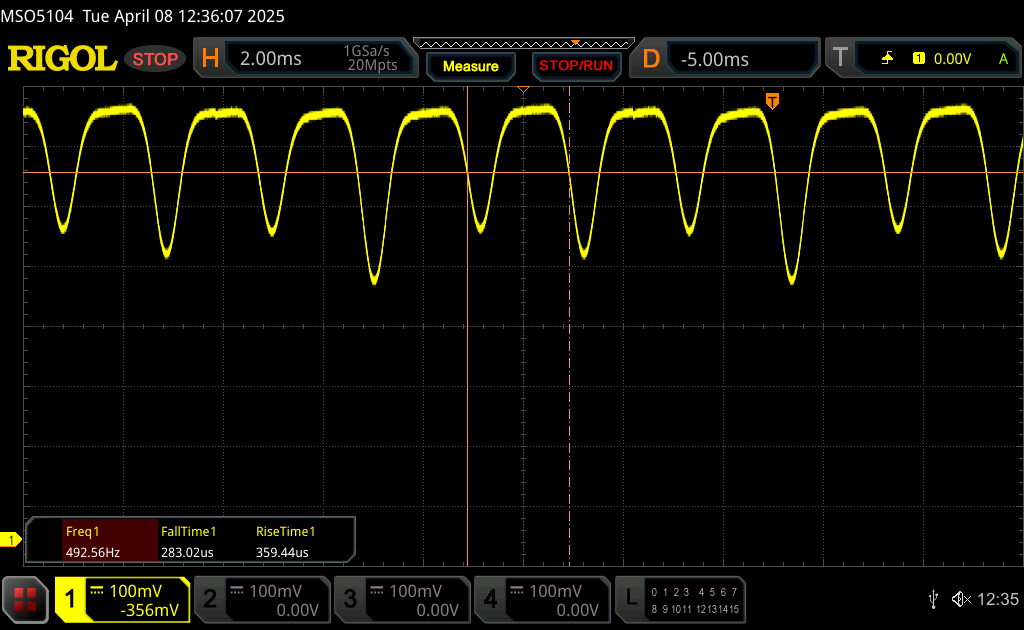 | |
Le rétroéclairage de l'écran scintille à la fréquence de 492.6 Hz (certainement du fait de l'utilisation d'une MDI - Modulation de largeur d'impulsion) . La fréquence de rafraîchissement de 492.6 Hz est relativement élevée, la grande majorité des utilisateurs ne devrait pas percevLa fréquence de rafraîchissement de 492.6 Hz est relativement élevée, la grande majorité des utilisateurs ne devrait pas percevoir de scintillements et être sujette à une fatigue oculaire accrue.oir de scintillements et être sujette à une fatigue oculaire accrue. Néanmoins certaines personnes pourront toujours percevoir un scintillement. En comparaison, 53 % des appareils testés n'emploient pas MDI pour assombrir leur écran. Nous avons relevé une moyenne à 8516 (minimum : 5 - maximum : 343500) Hz dans le cas où une MDI était active. | |||
!MODIFIER !
Angles de vue : décrivez les angles de vue dans la pratique (important pour l'utilisation mobile, utilisation sur les genoux ?!,...) Ajoutez une composition de photos pour la comparaison (image de référence NBC, luminosité maximale de l'écran, pièce sombre, même ouverture et vitesse d'obturation pour toutes les photos, pas de 45° dans toutes les directions)
Performance
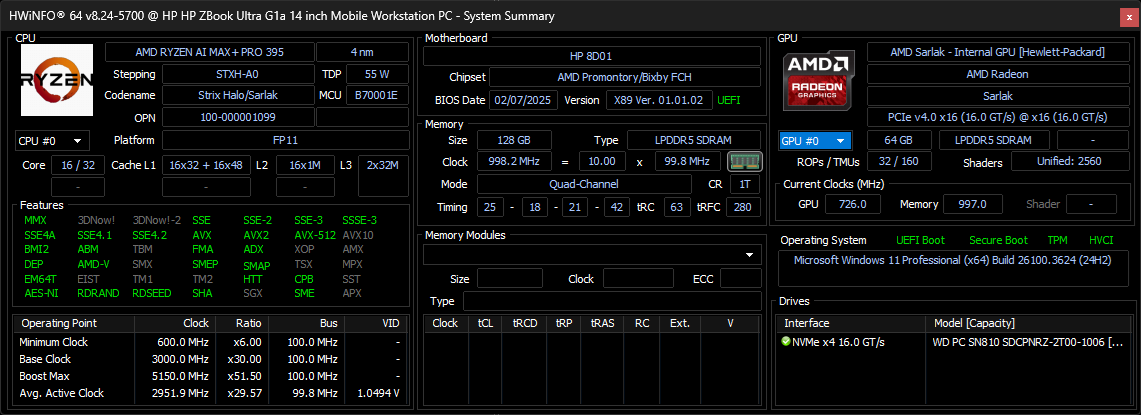
Conditions d'essai
Nous avons réglé Windows et MyHP en mode haute performance avant d'effectuer les tests ci-dessous.
La RAM soudée est configurable entre la RAM système et la RAM vidéo comme détaillé ici.
Processeur
Performances brutes du processeur avec le Ryzen AI Max+ PRO 395 est l'une des plus rapides de toutes les stations de travail de 14 pouces, si ce n'est *la* plus rapide. Il surpasse le Core Ultra 9 185H dans l'ordinateur concurrent Precision 5470 de ~80 % dans les charges de travail multithread, tout en étant au coude-à-coude avec le processeur 14 cœurs Apple M4 Pro. Les performances en mode mono-thread sont néanmoins moyennes, ce qui explique qu'il perde encore du terrain face au fleuron Apple dans certaines conditions.
La durabilité des performances sous charge est excellente et meilleure que ce que l'on attend d'un ordinateur de 14 pouces.
Cinebench R15 Multi Loop
Cinebench 2024: CPU Multi Core | CPU Single Core
Cinebench R23: Multi Core | Single Core
Cinebench R20: CPU (Multi Core) | CPU (Single Core)
Cinebench R15: CPU Multi 64Bit | CPU Single 64Bit
Blender: v2.79 BMW27 CPU
7-Zip 18.03: 7z b 4 | 7z b 4 -mmt1
Geekbench 6.4: Multi-Core | Single-Core
Geekbench 5.5: Multi-Core | Single-Core
HWBOT x265 Benchmark v2.2: 4k Preset
LibreOffice : 20 Documents To PDF
R Benchmark 2.5: Overall mean
| Cinebench 2024 / CPU Single Core | |
| Apple MacBook Pro 14 2024 M4 Pro | |
| Xiaomi RedmiBook Pro 14 2025 | |
| Lenovo ThinkPad X1 Carbon Gen 13 21NS0010GE | |
| Asus ROG Flow Z13 GZ302EA-RU073W | |
| Lenovo Yoga Pro 7 14ASP G9 | |
| HP ZBook Ultra G1a 14 | |
| Moyenne AMD Ryzen AI Max+ PRO 395 (n=1) | |
| Asus Zenbook 14 OLED UM3406HA | |
| Lenovo Yoga 7 2-in-1 14AHP9 Arctic Grey | |
Cinebench 2024: CPU Multi Core | CPU Single Core
Cinebench R23: Multi Core | Single Core
Cinebench R20: CPU (Multi Core) | CPU (Single Core)
Cinebench R15: CPU Multi 64Bit | CPU Single 64Bit
Blender: v2.79 BMW27 CPU
7-Zip 18.03: 7z b 4 | 7z b 4 -mmt1
Geekbench 6.4: Multi-Core | Single-Core
Geekbench 5.5: Multi-Core | Single-Core
HWBOT x265 Benchmark v2.2: 4k Preset
LibreOffice : 20 Documents To PDF
R Benchmark 2.5: Overall mean
* ... Moindre est la valeur, meilleures sont les performances
AIDA64: FP32 Ray-Trace | FPU Julia | CPU SHA3 | CPU Queen | FPU SinJulia | FPU Mandel | CPU AES | CPU ZLib | FP64 Ray-Trace | CPU PhotoWorxx
| Performance Rating | |
| HP ZBook Ultra G1a 14 | |
| Moyenne AMD Ryzen AI Max+ PRO 395 | |
| Dell Precision 5000 5490 | |
| HP ZBook Firefly 14 G11 | |
| Asus ExpertBook P5 P5405-NZ0102X | |
| Lenovo ThinkPad X1 Carbon Gen 13 21NS0010GE | |
| AIDA64 / FP32 Ray-Trace | |
| HP ZBook Ultra G1a 14 | |
| Moyenne AMD Ryzen AI Max+ PRO 395 (n=1) | |
| Dell Precision 5000 5490 | |
| Asus ExpertBook P5 P5405-NZ0102X | |
| HP ZBook Firefly 14 G11 | |
| Lenovo ThinkPad X1 Carbon Gen 13 21NS0010GE | |
| AIDA64 / FPU Julia | |
| HP ZBook Ultra G1a 14 | |
| Moyenne AMD Ryzen AI Max+ PRO 395 (n=1) | |
| Dell Precision 5000 5490 | |
| Asus ExpertBook P5 P5405-NZ0102X | |
| Lenovo ThinkPad X1 Carbon Gen 13 21NS0010GE | |
| HP ZBook Firefly 14 G11 | |
| AIDA64 / CPU SHA3 | |
| HP ZBook Ultra G1a 14 | |
| Moyenne AMD Ryzen AI Max+ PRO 395 (n=1) | |
| Dell Precision 5000 5490 | |
| Asus ExpertBook P5 P5405-NZ0102X | |
| Lenovo ThinkPad X1 Carbon Gen 13 21NS0010GE | |
| HP ZBook Firefly 14 G11 | |
| AIDA64 / CPU Queen | |
| HP ZBook Ultra G1a 14 | |
| Moyenne AMD Ryzen AI Max+ PRO 395 (n=1) | |
| Dell Precision 5000 5490 | |
| HP ZBook Firefly 14 G11 | |
| Asus ExpertBook P5 P5405-NZ0102X | |
| Lenovo ThinkPad X1 Carbon Gen 13 21NS0010GE | |
| AIDA64 / FPU SinJulia | |
| HP ZBook Ultra G1a 14 | |
| Moyenne AMD Ryzen AI Max+ PRO 395 (n=1) | |
| Dell Precision 5000 5490 | |
| HP ZBook Firefly 14 G11 | |
| Asus ExpertBook P5 P5405-NZ0102X | |
| Lenovo ThinkPad X1 Carbon Gen 13 21NS0010GE | |
| AIDA64 / FPU Mandel | |
| HP ZBook Ultra G1a 14 | |
| Moyenne AMD Ryzen AI Max+ PRO 395 (n=1) | |
| Dell Precision 5000 5490 | |
| Asus ExpertBook P5 P5405-NZ0102X | |
| Lenovo ThinkPad X1 Carbon Gen 13 21NS0010GE | |
| HP ZBook Firefly 14 G11 | |
| AIDA64 / CPU AES | |
| HP ZBook Ultra G1a 14 | |
| Moyenne AMD Ryzen AI Max+ PRO 395 (n=1) | |
| Dell Precision 5000 5490 | |
| HP ZBook Firefly 14 G11 | |
| Asus ExpertBook P5 P5405-NZ0102X | |
| Lenovo ThinkPad X1 Carbon Gen 13 21NS0010GE | |
| AIDA64 / CPU ZLib | |
| HP ZBook Ultra G1a 14 | |
| Moyenne AMD Ryzen AI Max+ PRO 395 (n=1) | |
| Dell Precision 5000 5490 | |
| HP ZBook Firefly 14 G11 | |
| Asus ExpertBook P5 P5405-NZ0102X | |
| Lenovo ThinkPad X1 Carbon Gen 13 21NS0010GE | |
| AIDA64 / FP64 Ray-Trace | |
| HP ZBook Ultra G1a 14 | |
| Moyenne AMD Ryzen AI Max+ PRO 395 (n=1) | |
| Dell Precision 5000 5490 | |
| Asus ExpertBook P5 P5405-NZ0102X | |
| HP ZBook Firefly 14 G11 | |
| Lenovo ThinkPad X1 Carbon Gen 13 21NS0010GE | |
| AIDA64 / CPU PhotoWorxx | |
| HP ZBook Ultra G1a 14 | |
| Moyenne AMD Ryzen AI Max+ PRO 395 (n=1) | |
| Asus ExpertBook P5 P5405-NZ0102X | |
| Lenovo ThinkPad X1 Carbon Gen 13 21NS0010GE | |
| Dell Precision 5000 5490 | |
| HP ZBook Firefly 14 G11 | |
Test de stress
Lors de l'initialisation du stress Prime95, le CPU atteignait 3,3 GHz et 81 W pendant quelques secondes avant de redescendre et de se stabiliser à 3,1 GHz, 66 W et 71 C. La température du cœur atteignait environ 70 C lors de l'exécution de charges exigeantes, ce qui est plus bas que prévu compte tenu de la consommation d'énergie relativement élevée et des performances rapides pour la taille de l'appareil.
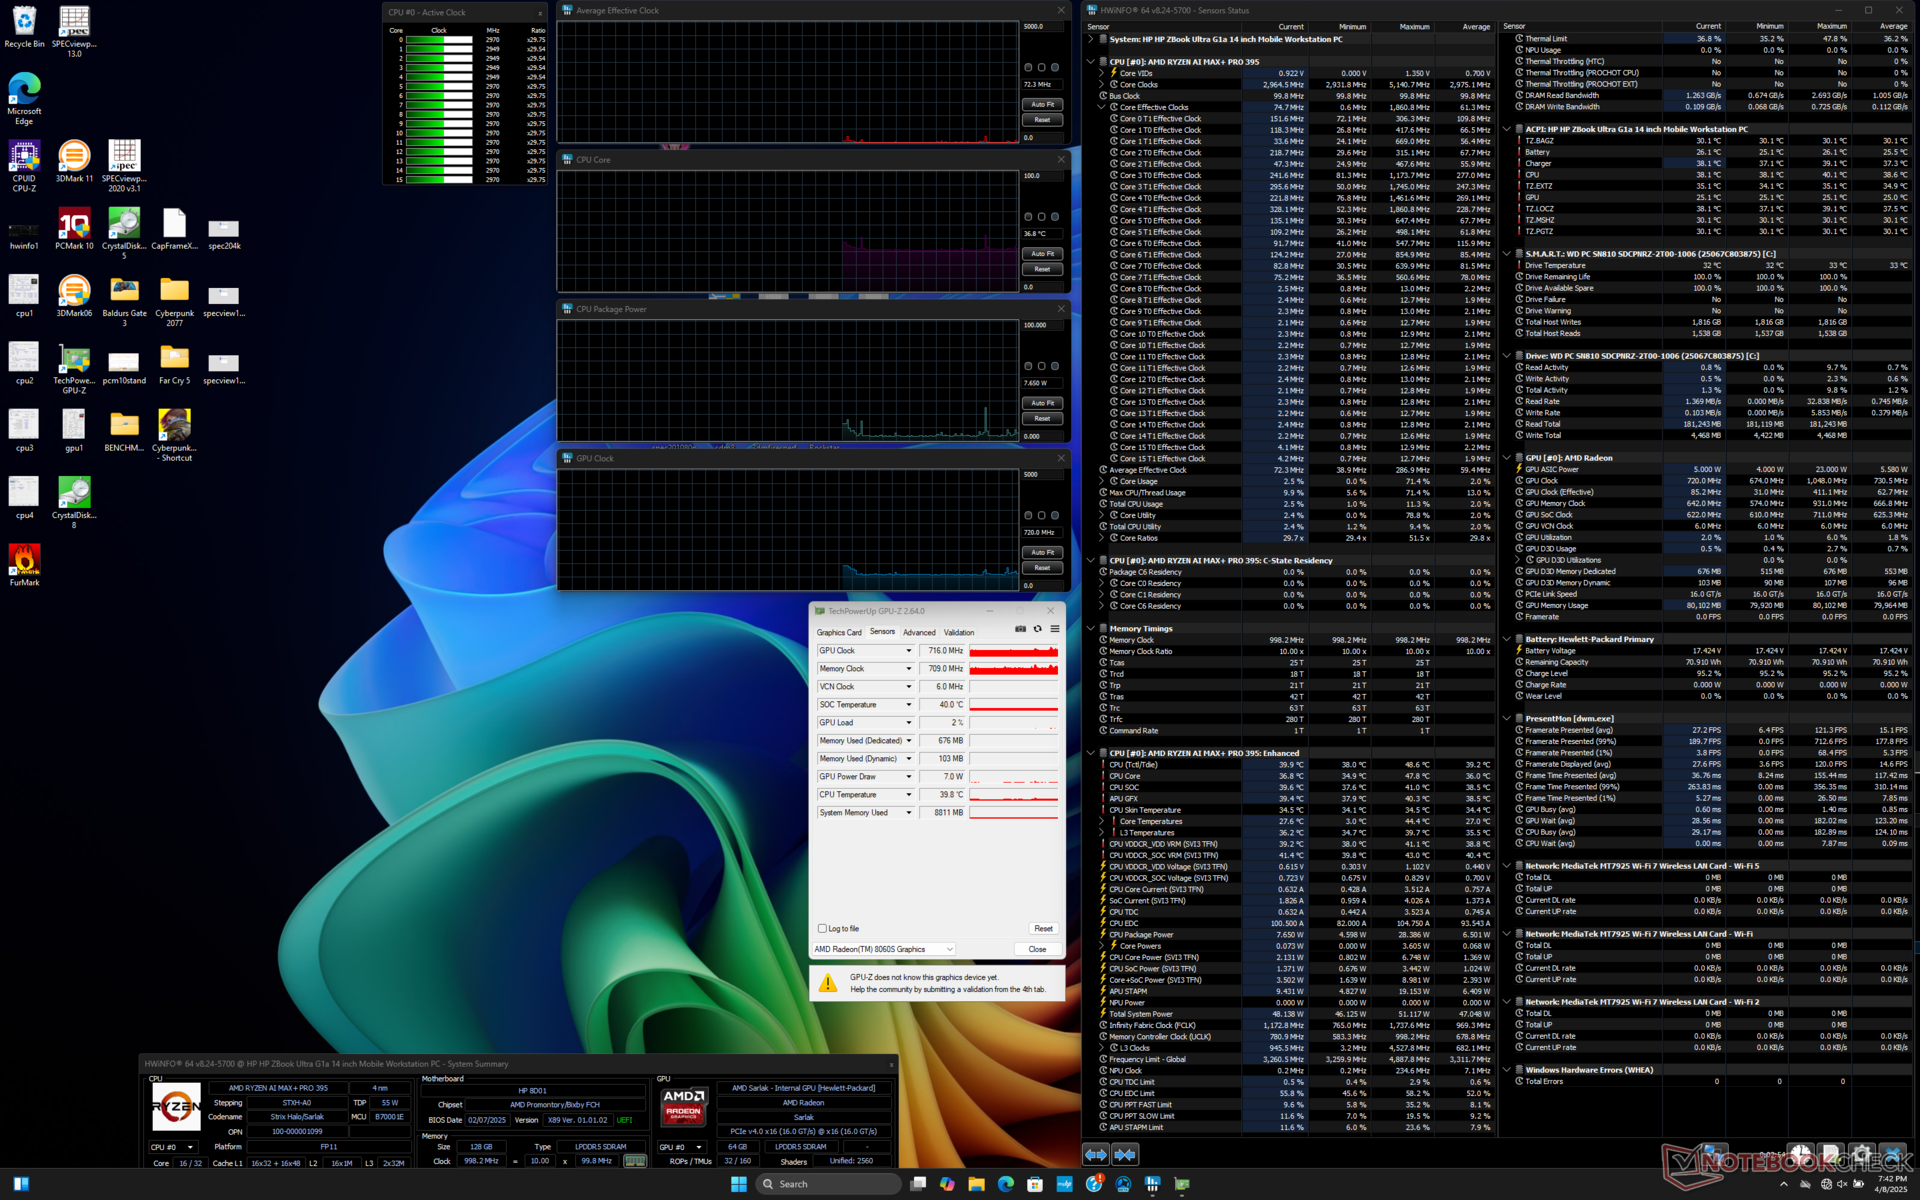

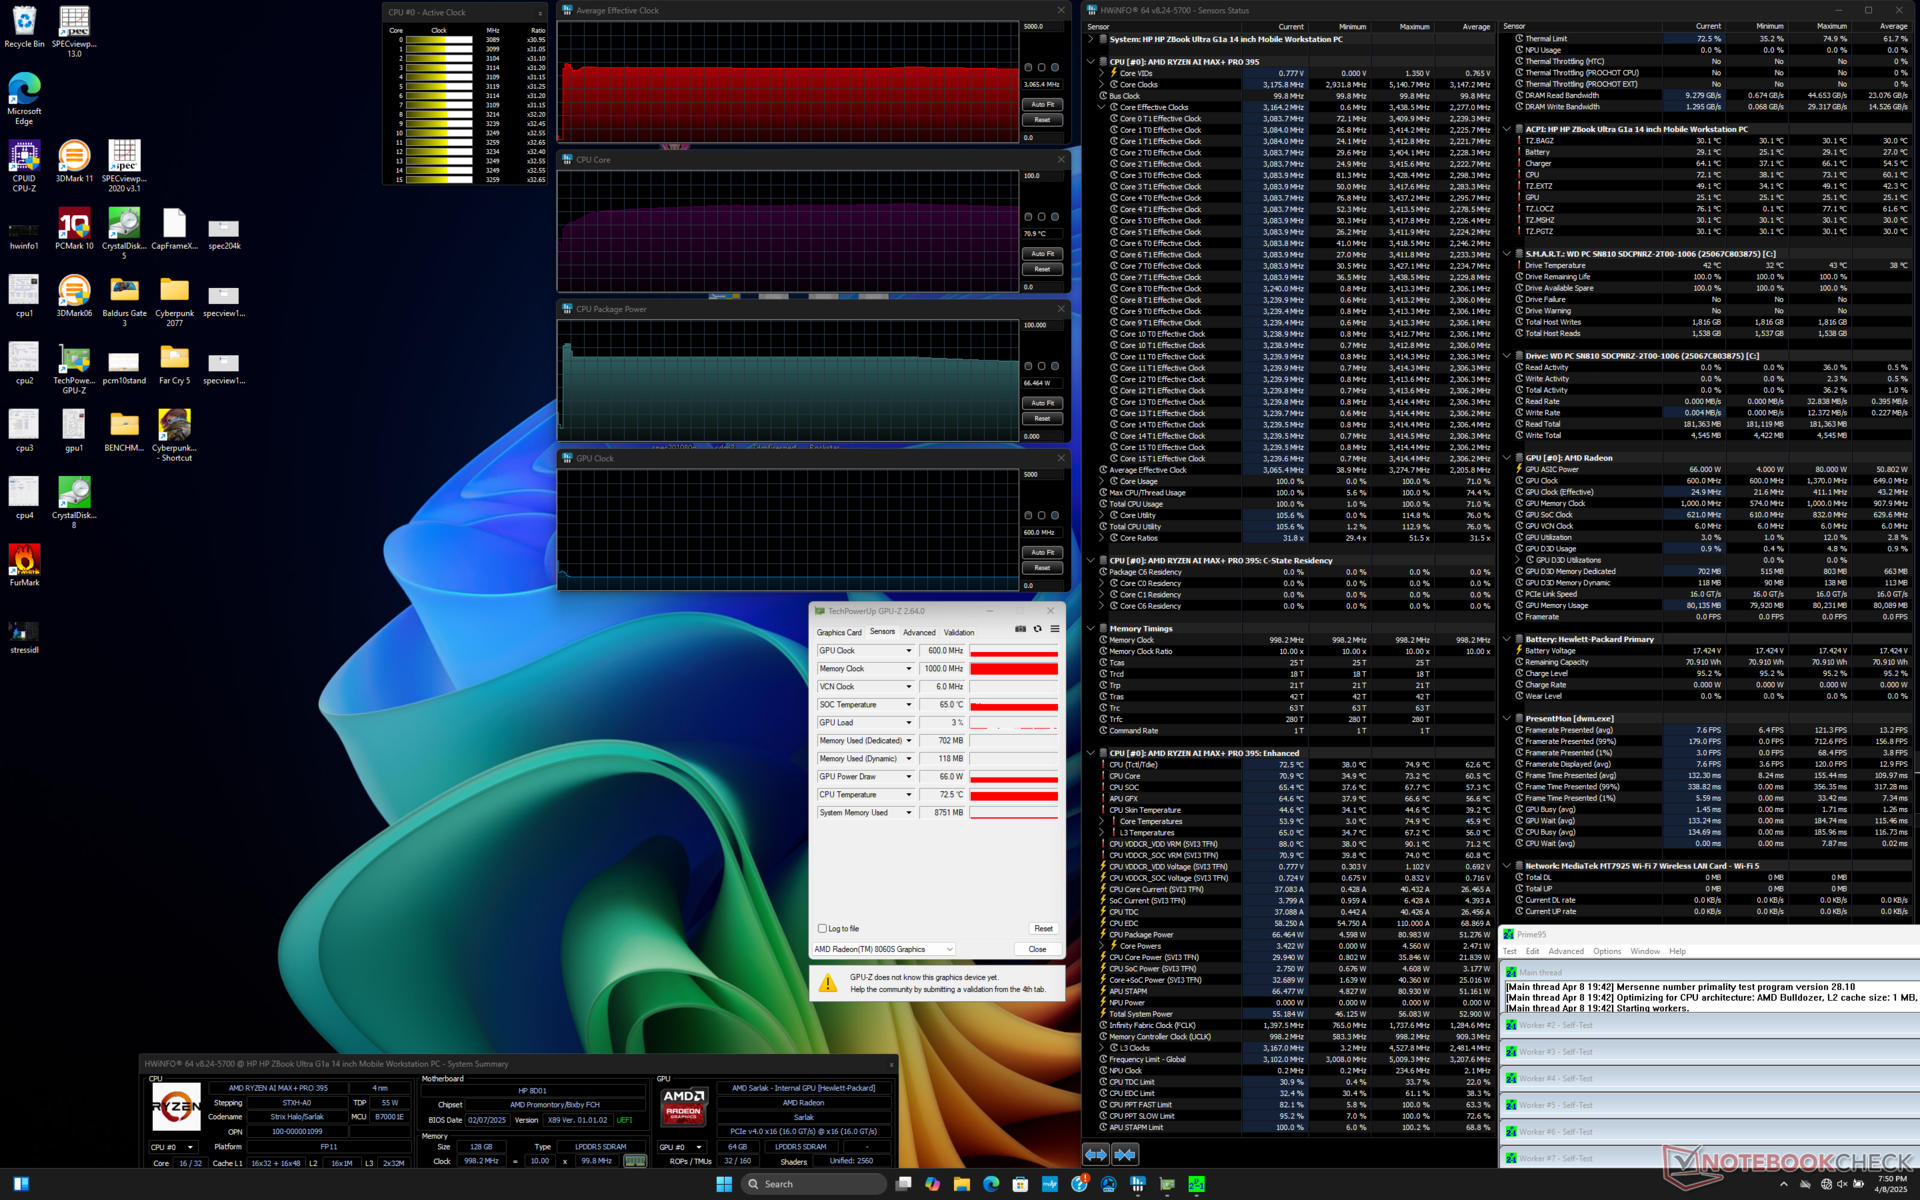
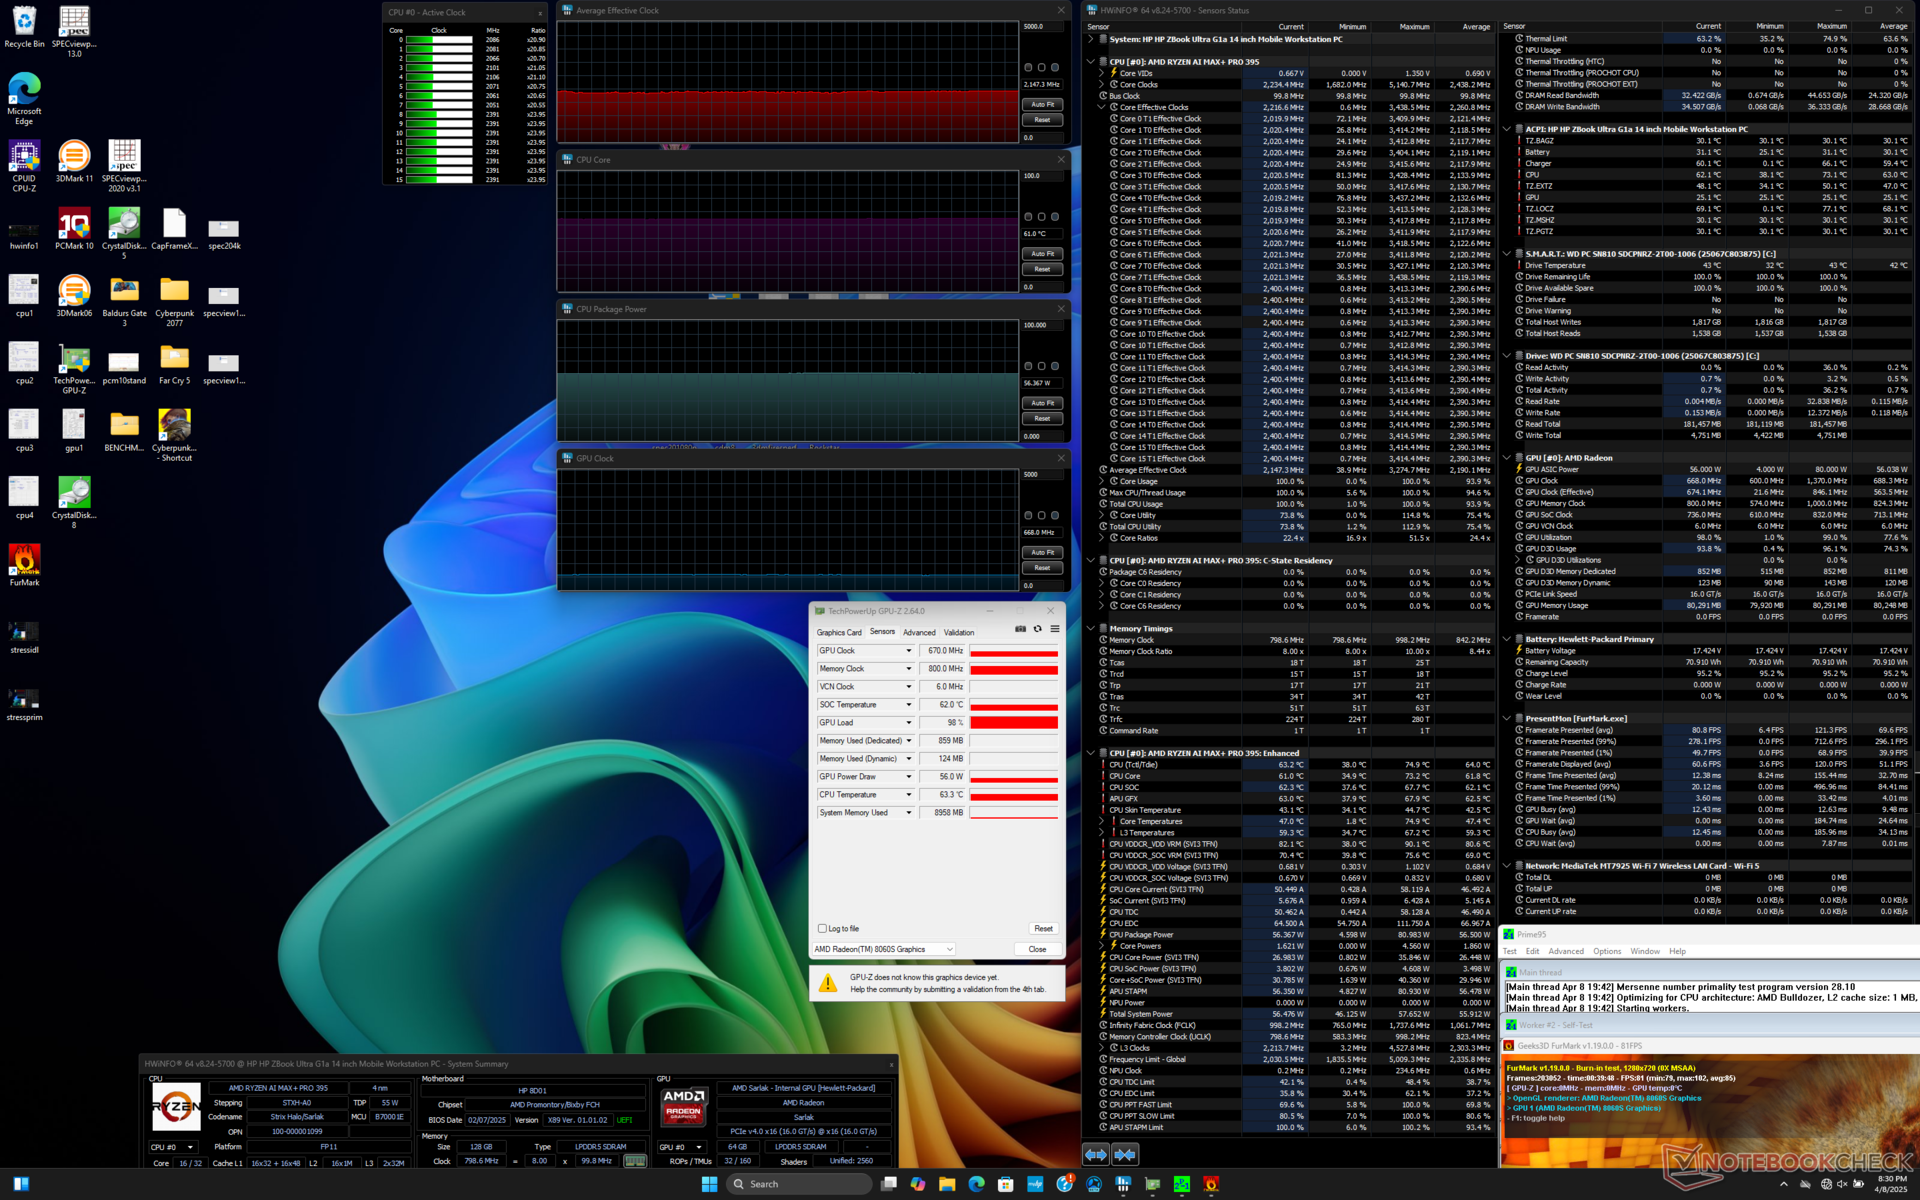
| Horloge moyenne du CPU (GHz) | Horloge du GPU (MHz) | Température moyenne du CPU (°C) | |
| Système au repos | -- | -- | 37 |
| Prime95 Stress | 3.1 | -- | 71 |
| Prime95 + FurMark Stress | 2.2 | 670 | 61 |
| Cyberpunk 2077 Stress | 0.9 | 2107 | 64 |
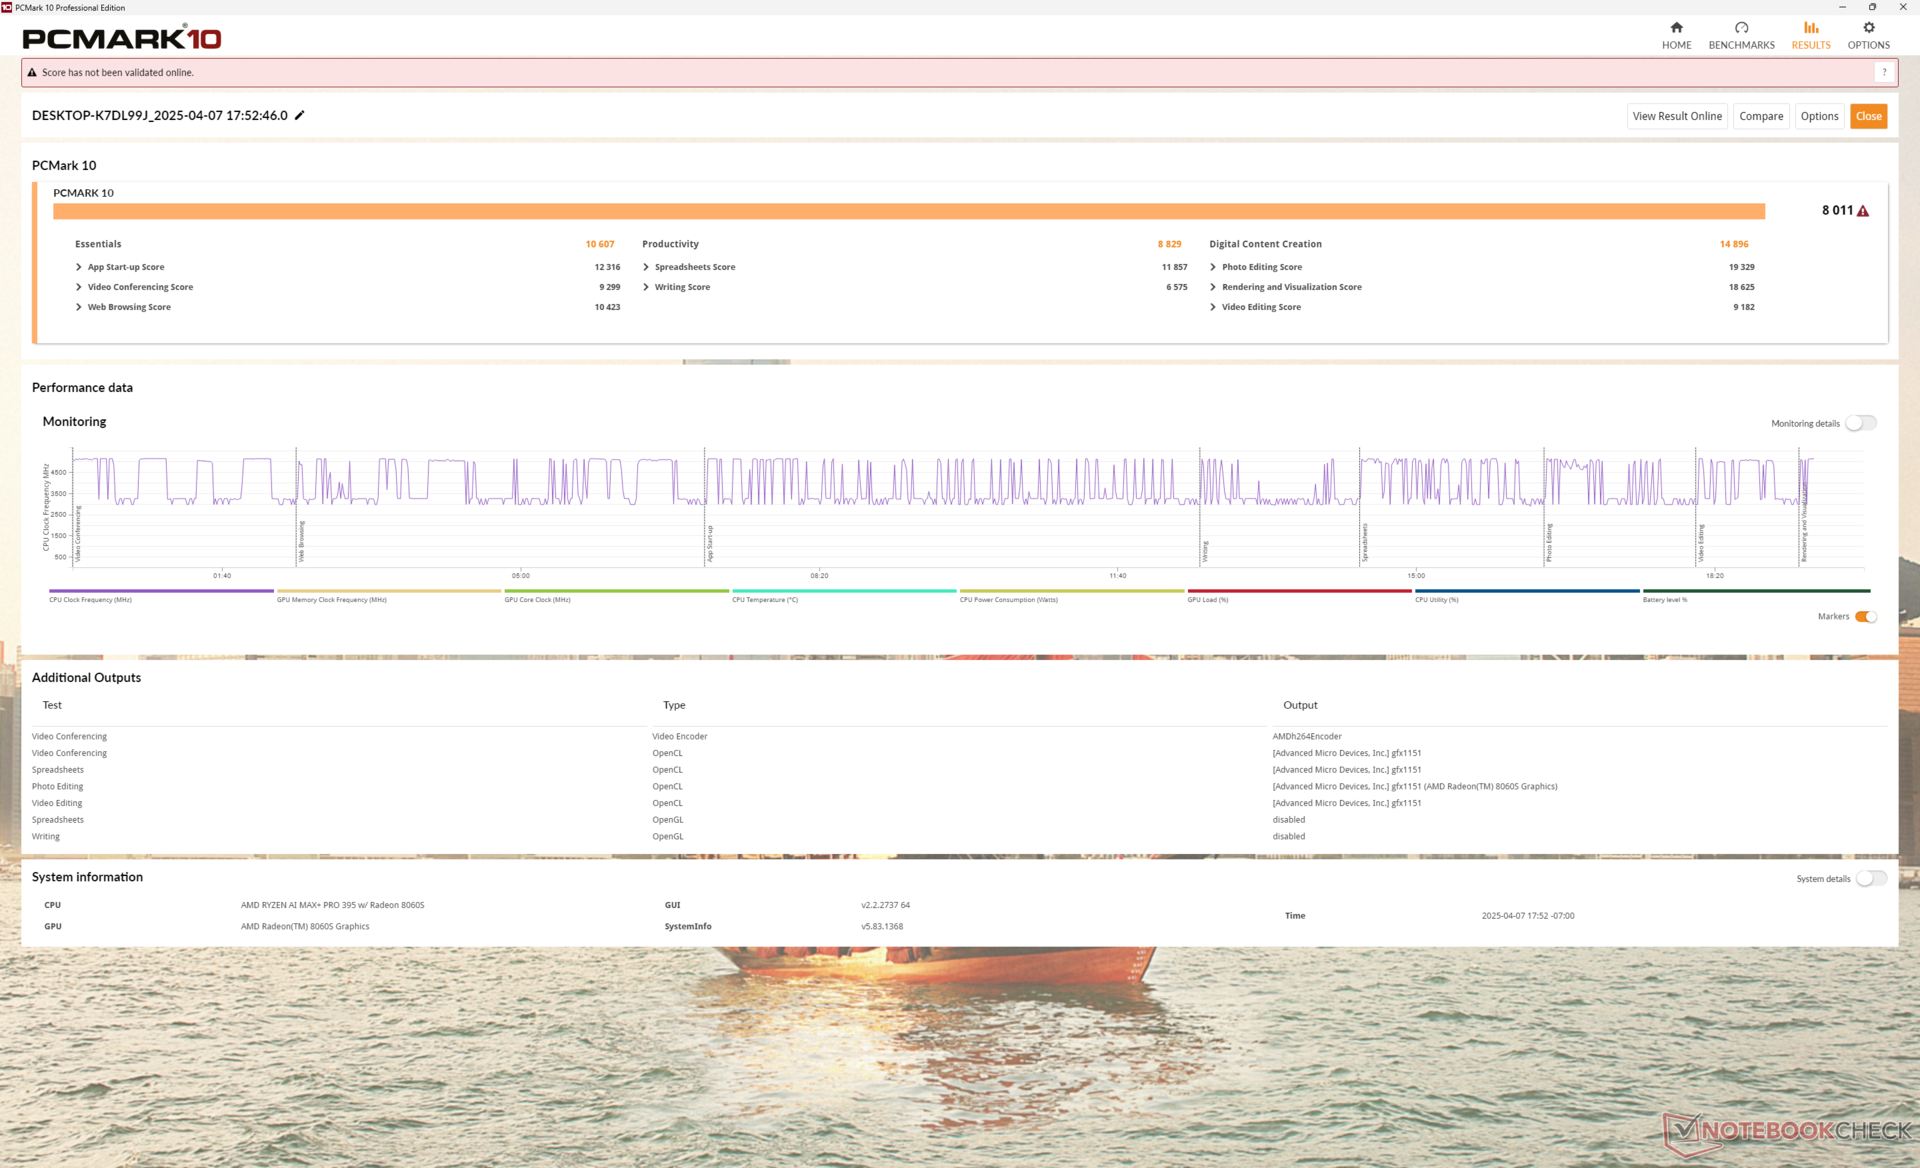
Performance du système
CrossMark: Overall | Productivity | Creativity | Responsiveness
WebXPRT 3: Overall
WebXPRT 4: Overall
Mozilla Kraken 1.1: Total
| PCMark 10 / Score | |
| HP ZBook Ultra G1a 14 | |
| Moyenne AMD Ryzen AI Max+ PRO 395, AMD Radeon RX 8060S (n=1) | |
| Dell Precision 5000 5490 | |
| Lenovo ThinkPad X1 Carbon Gen 13 21NS0010GE | |
| Asus ExpertBook P5 P5405-NZ0102X | |
| HP ZBook Firefly 14 G11 | |
| PCMark 10 / Essentials | |
| Dell Precision 5000 5490 | |
| HP ZBook Ultra G1a 14 | |
| Moyenne AMD Ryzen AI Max+ PRO 395, AMD Radeon RX 8060S (n=1) | |
| Lenovo ThinkPad X1 Carbon Gen 13 21NS0010GE | |
| HP ZBook Firefly 14 G11 | |
| Asus ExpertBook P5 P5405-NZ0102X | |
| PCMark 10 / Productivity | |
| HP ZBook Firefly 14 G11 | |
| Dell Precision 5000 5490 | |
| Lenovo ThinkPad X1 Carbon Gen 13 21NS0010GE | |
| Asus ExpertBook P5 P5405-NZ0102X | |
| HP ZBook Ultra G1a 14 | |
| Moyenne AMD Ryzen AI Max+ PRO 395, AMD Radeon RX 8060S (n=1) | |
| PCMark 10 / Digital Content Creation | |
| HP ZBook Ultra G1a 14 | |
| Moyenne AMD Ryzen AI Max+ PRO 395, AMD Radeon RX 8060S (n=1) | |
| Dell Precision 5000 5490 | |
| Lenovo ThinkPad X1 Carbon Gen 13 21NS0010GE | |
| Asus ExpertBook P5 P5405-NZ0102X | |
| HP ZBook Firefly 14 G11 | |
| CrossMark / Overall | |
| Apple MacBook Pro 14 2024 M4 Pro | |
| HP ZBook Ultra G1a 14 | |
| Moyenne AMD Ryzen AI Max+ PRO 395, AMD Radeon RX 8060S (n=1) | |
| Dell Precision 5000 5490 | |
| Lenovo ThinkPad X1 Carbon Gen 13 21NS0010GE | |
| HP ZBook Firefly 14 G11 | |
| Asus ExpertBook P5 P5405-NZ0102X | |
| CrossMark / Productivity | |
| Apple MacBook Pro 14 2024 M4 Pro | |
| Lenovo ThinkPad X1 Carbon Gen 13 21NS0010GE | |
| Dell Precision 5000 5490 | |
| HP ZBook Ultra G1a 14 | |
| Moyenne AMD Ryzen AI Max+ PRO 395, AMD Radeon RX 8060S (n=1) | |
| Asus ExpertBook P5 P5405-NZ0102X | |
| HP ZBook Firefly 14 G11 | |
| CrossMark / Creativity | |
| Apple MacBook Pro 14 2024 M4 Pro | |
| HP ZBook Ultra G1a 14 | |
| Moyenne AMD Ryzen AI Max+ PRO 395, AMD Radeon RX 8060S (n=1) | |
| Dell Precision 5000 5490 | |
| Lenovo ThinkPad X1 Carbon Gen 13 21NS0010GE | |
| HP ZBook Firefly 14 G11 | |
| Asus ExpertBook P5 P5405-NZ0102X | |
| CrossMark / Responsiveness | |
| Apple MacBook Pro 14 2024 M4 Pro | |
| HP ZBook Ultra G1a 14 | |
| Moyenne AMD Ryzen AI Max+ PRO 395, AMD Radeon RX 8060S (n=1) | |
| Dell Precision 5000 5490 | |
| HP ZBook Firefly 14 G11 | |
| Lenovo ThinkPad X1 Carbon Gen 13 21NS0010GE | |
| Asus ExpertBook P5 P5405-NZ0102X | |
| WebXPRT 3 / Overall | |
| Apple MacBook Pro 14 2024 M4 Pro | |
| HP ZBook Firefly 14 G11 | |
| Dell Precision 5000 5490 | |
| Asus ExpertBook P5 P5405-NZ0102X | |
| HP ZBook Ultra G1a 14 | |
| Moyenne AMD Ryzen AI Max+ PRO 395, AMD Radeon RX 8060S (n=1) | |
| WebXPRT 4 / Overall | |
| Apple MacBook Pro 14 2024 M4 Pro | |
| Lenovo ThinkPad X1 Carbon Gen 13 21NS0010GE | |
| Dell Precision 5000 5490 | |
| Asus ExpertBook P5 P5405-NZ0102X | |
| HP ZBook Firefly 14 G11 | |
| HP ZBook Ultra G1a 14 | |
| Moyenne AMD Ryzen AI Max+ PRO 395, AMD Radeon RX 8060S (n=1) | |
| Mozilla Kraken 1.1 / Total | |
| Dell Precision 5000 5490 | |
| HP ZBook Firefly 14 G11 | |
| Asus ExpertBook P5 P5405-NZ0102X | |
| Lenovo ThinkPad X1 Carbon Gen 13 21NS0010GE | |
| HP ZBook Ultra G1a 14 | |
| Moyenne AMD Ryzen AI Max+ PRO 395, AMD Radeon RX 8060S (n=1) | |
| Apple MacBook Pro 14 2024 M4 Pro | |
* ... Moindre est la valeur, meilleures sont les performances
| PCMark 10 Score | 8011 points | |
Aide | ||
| AIDA64 / Memory Copy | |
| HP ZBook Ultra G1a 14 | |
| Moyenne AMD Ryzen AI Max+ PRO 395 (n=1) | |
| Asus ExpertBook P5 P5405-NZ0102X | |
| Lenovo ThinkPad X1 Carbon Gen 13 21NS0010GE | |
| Dell Precision 5000 5490 | |
| HP ZBook Firefly 14 G11 | |
| AIDA64 / Memory Read | |
| HP ZBook Ultra G1a 14 | |
| Moyenne AMD Ryzen AI Max+ PRO 395 (n=1) | |
| Asus ExpertBook P5 P5405-NZ0102X | |
| Lenovo ThinkPad X1 Carbon Gen 13 21NS0010GE | |
| Dell Precision 5000 5490 | |
| HP ZBook Firefly 14 G11 | |
| AIDA64 / Memory Write | |
| HP ZBook Ultra G1a 14 | |
| Moyenne AMD Ryzen AI Max+ PRO 395 (n=1) | |
| Asus ExpertBook P5 P5405-NZ0102X | |
| Lenovo ThinkPad X1 Carbon Gen 13 21NS0010GE | |
| Dell Precision 5000 5490 | |
| HP ZBook Firefly 14 G11 | |
| AIDA64 / Memory Latency | |
| HP ZBook Ultra G1a 14 | |
| Moyenne AMD Ryzen AI Max+ PRO 395 (n=1) | |
| Dell Precision 5000 5490 | |
| HP ZBook Firefly 14 G11 | |
| Lenovo ThinkPad X1 Carbon Gen 13 21NS0010GE | |
| Asus ExpertBook P5 P5405-NZ0102X | |
* ... Moindre est la valeur, meilleures sont les performances
Latence DPC
LatencyMon ne montre que des problèmes mineurs de DPC lors de l'ouverture de plusieurs onglets de notre page d'accueil. la lecture de vidéos 4K à 60 FPS est par ailleurs fluide, sans aucune perte d'images.
Il est intéressant de noter qu'un problème survient lors de la lecture d'un contenu 4K60 alors que LatencyMon s'exécute simultanément. Les pertes d'images montent en flèche et le système devient paresseux sans raison apparente. L'arrêt de LatencyMon résout le problème. Le programme signale un problème potentiel lié au noyau DirectX lorsque les bégaiements commencent.
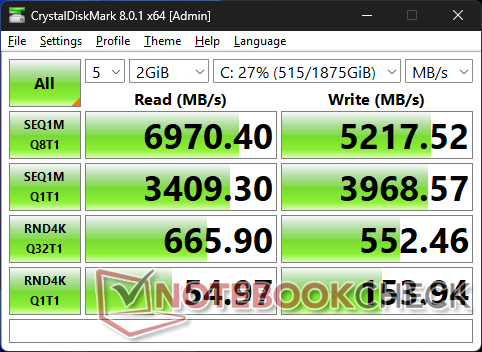
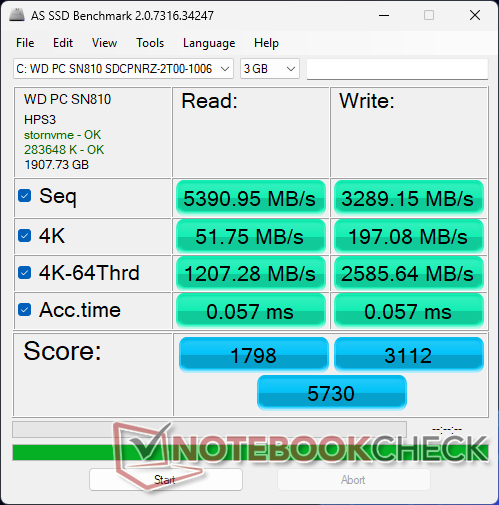
Dispositifs de stockage
Le WD SN810 PCIe4 NVMe SSD dans le ZBook Ultra G1a 14 ne souffre pas des mêmes problèmes d'étranglement des performances que nous avons observés sur le HP ZBook Firefly 14 G11.

| Drive Performance Rating - Percent | |
| HP ZBook Ultra G1a 14 | |
| Lenovo ThinkPad X1 Carbon Gen 13 21NS0010GE | |
| Dell Precision 5000 5490 | |
| HP ZBook Firefly 14 G11 | |
| Asus ExpertBook P5 P5405-NZ0102X | |
* ... Moindre est la valeur, meilleures sont les performances
Disk Throttling: DiskSpd Read Loop, Queue Depth 8
Performance du GPU
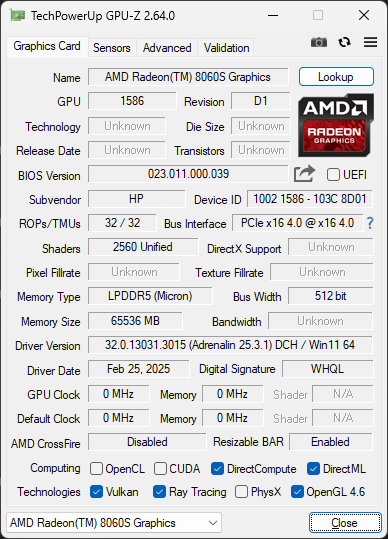
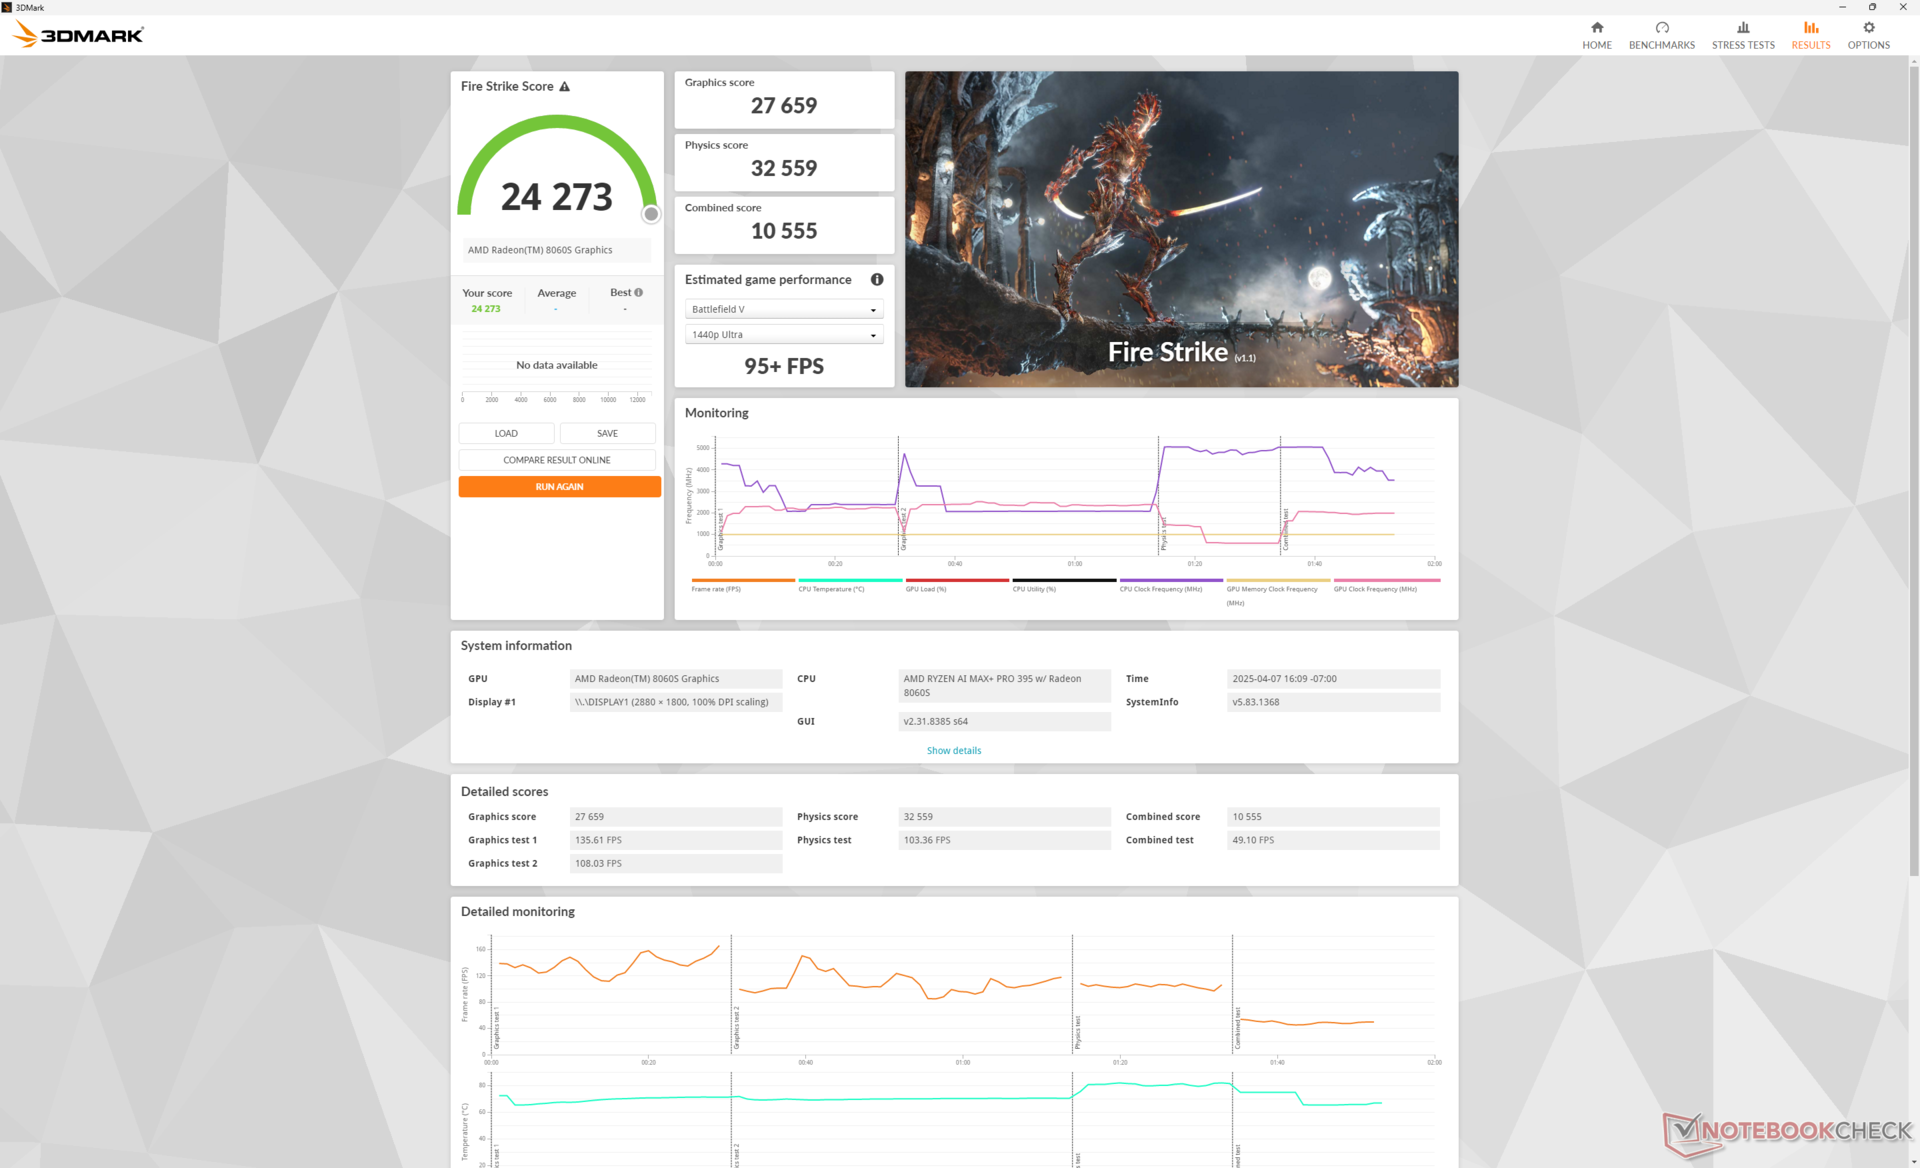
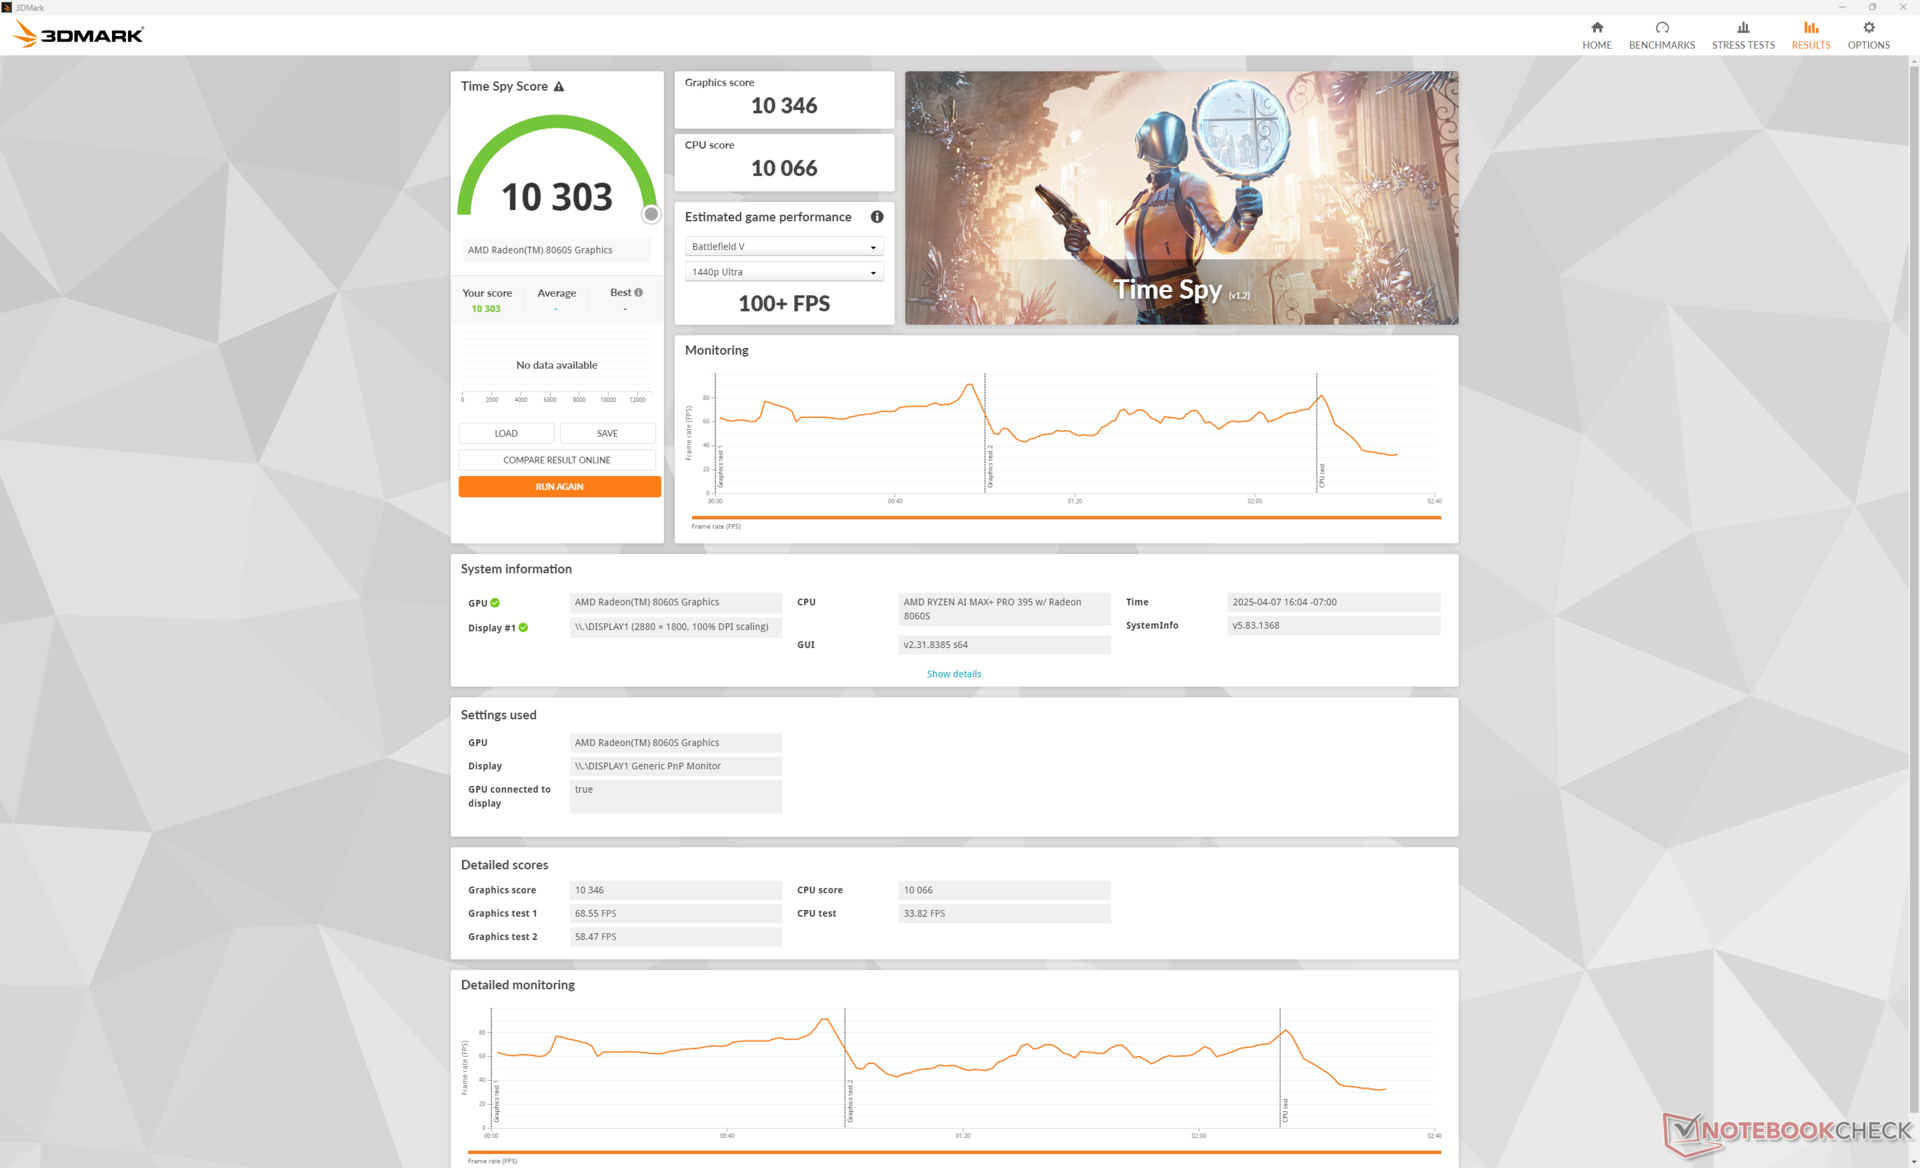
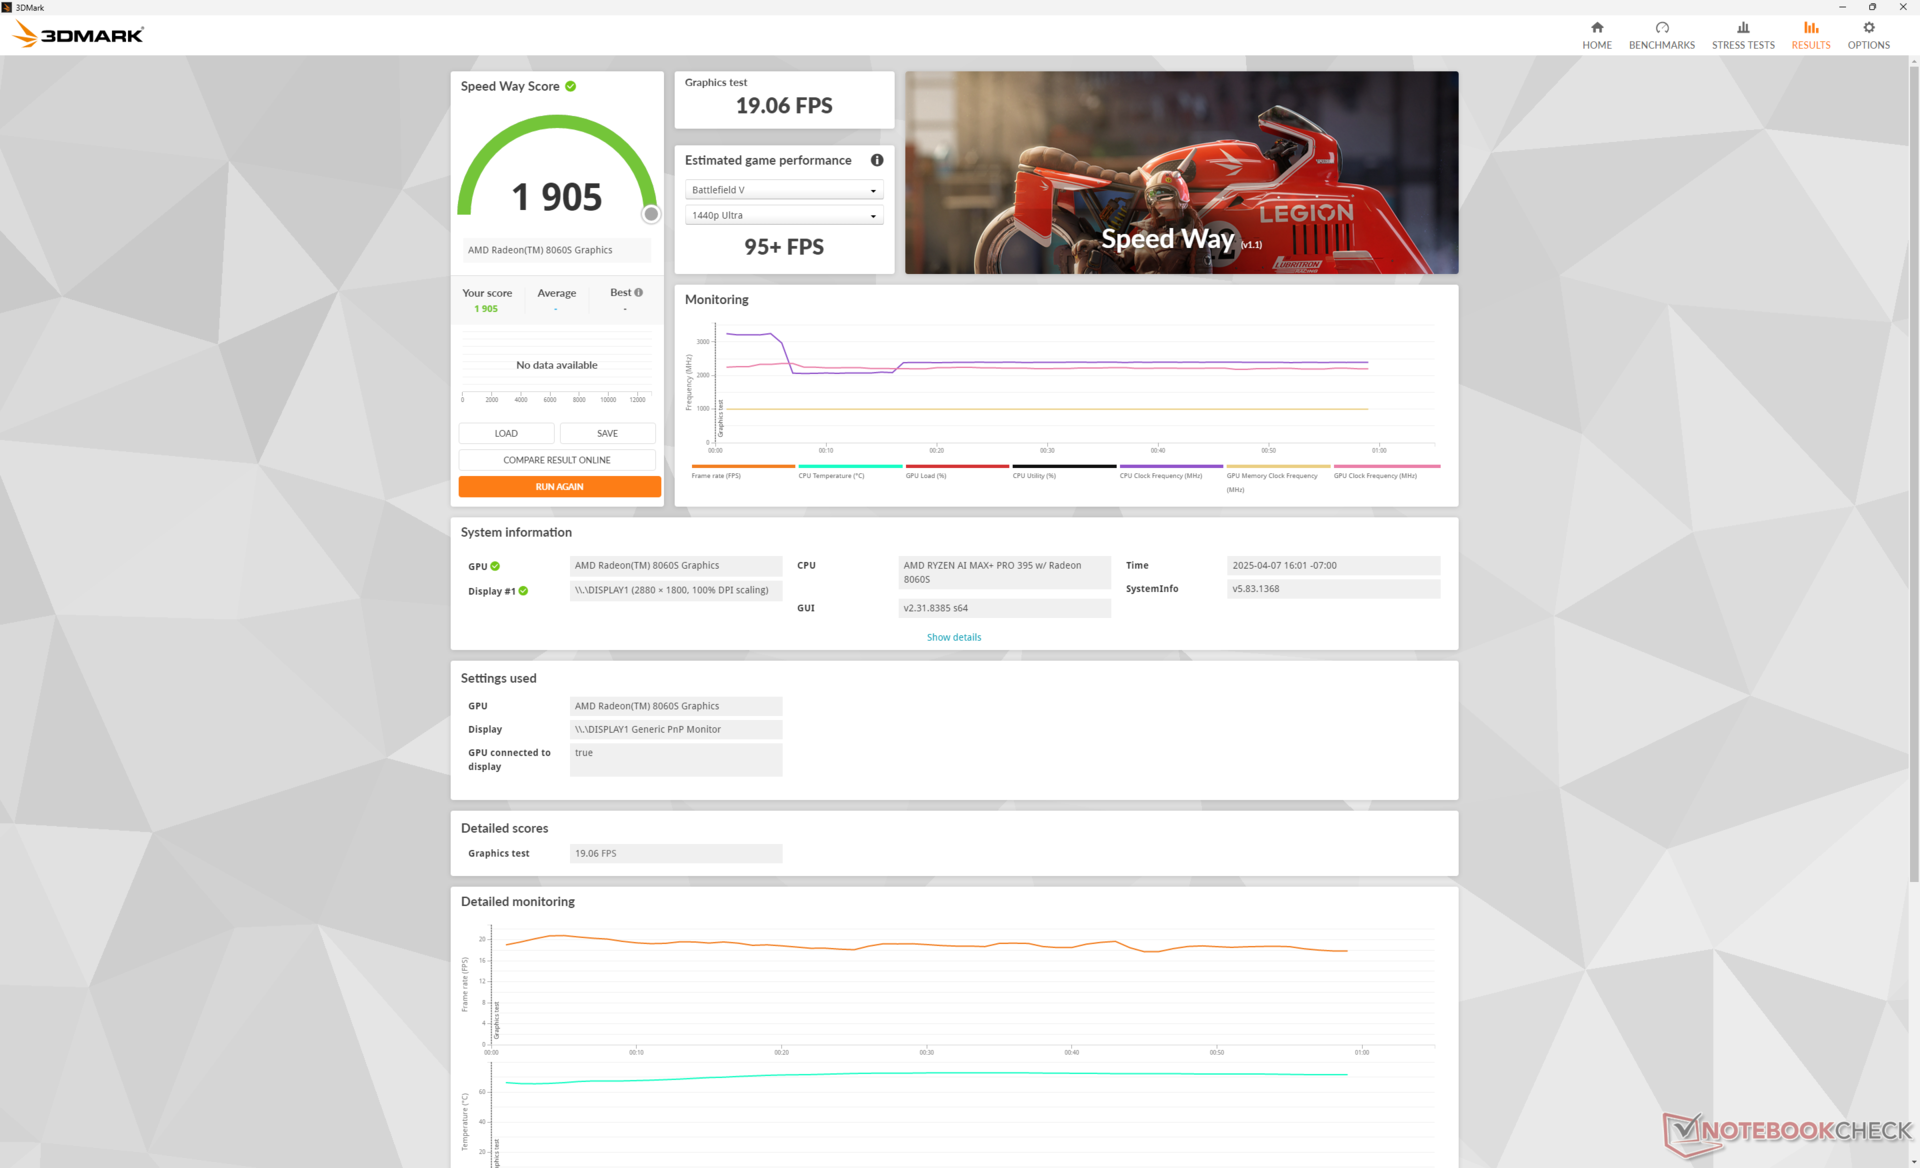
La Radeon RX 8060S se situe entre la RTX 3000 Ada et la RTX 4000 Ada en termes de potentiel graphique brut. Si l'on considère que la solution AMD est intégrée, il s'agit d'un véritable exploit, en particulier du point de vue des performances par volume ou par watt. À notre connaissance, il n'existe actuellement aucune station de travail de 14 pouces avec des options RTX 4000 Ada, ce qui conforte HP dans son affirmation de "station de travail de 14 pouces la plus rapide au monde".
| Profil de puissance | Score graphique | Score physique | Score combiné |
| Mode Performance | 27659 | 32559 | 10555 |
| Mode équilibré | 25972 (-6%) | 31510 (-3%) | 9739 (-8%) |
| Alimentation par batterie | 20915 (-24%) | 25705 (-21%) | 6915 (-35%) |
Malheureusement, les performances sont réduites de 25 à 35 % si l'ordinateur fonctionne sur batterie, même lorsqu'il est réglé en mode haute performance, selon les résultats de notre site Fire Strike figurant dans le tableau ci-dessus.
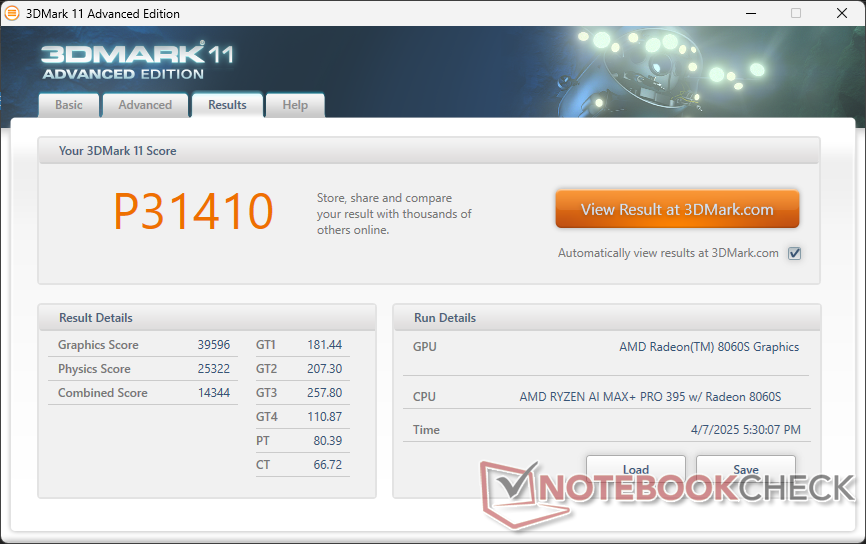
| 3DMark 11 Performance | 31410 points | |
| 3DMark Cloud Gate Standard Score | 66462 points | |
| 3DMark Fire Strike Score | 24273 points | |
| 3DMark Time Spy Score | 10303 points | |
Aide | ||
* ... Moindre est la valeur, meilleures sont les performances
Performances des jeux
La Radeon 8060S intégrée ressemble le plus à la discrète GeForce RTX 4050 lorsqu'il s'agit de faire tourner des jeux. Gardez à l'esprit que le jeu n'est pas la fonction première du ZBook.
| F1 22 | |
| 1280x720 Ultra Low Preset AA:T AF:16x | |
| HP ZBook Ultra G1a 14 | |
| Moyenne AMD Radeon RX 8060S (n=1) | |
| Dell Precision 5000 5490 | |
| HP ZBook Firefly 14 G11 | |
| HP EliteBook x360 1040 G11 | |
| 1920x1080 Low Preset AA:T AF:16x | |
| HP ZBook Ultra G1a 14 | |
| Moyenne AMD Radeon RX 8060S (n=1) | |
| Dell Precision 5000 5490 | |
| HP ZBook Firefly 14 G11 | |
| HP EliteBook x360 1040 G11 | |
| 1920x1080 Medium Preset AA:T AF:16x | |
| HP ZBook Ultra G1a 14 | |
| Moyenne AMD Radeon RX 8060S (n=1) | |
| Dell Precision 5000 5490 | |
| HP ZBook Firefly 14 G11 | |
| HP EliteBook x360 1040 G11 | |
| 1920x1080 High Preset AA:T AF:16x | |
| HP ZBook Ultra G1a 14 | |
| Moyenne AMD Radeon RX 8060S (n=1) | |
| Dell Precision 5000 5490 | |
| HP ZBook Firefly 14 G11 | |
| HP EliteBook x360 1040 G11 | |
| 1920x1080 Ultra High Preset AA:T AF:16x | |
| HP ZBook Ultra G1a 14 | |
| Moyenne AMD Radeon RX 8060S (n=1) | |
| Dell Precision 5000 5490 | |
| HP ZBook Firefly 14 G11 | |
| Tiny Tina's Wonderlands | |
| 1280x720 Lowest Preset (DX12) | |
| HP ZBook Ultra G1a 14 | |
| Moyenne AMD Radeon RX 8060S (n=1) | |
| HP ZBook Firefly 14 G11 | |
| HP EliteBook x360 1040 G11 | |
| 1920x1080 Low Preset (DX12) | |
| Moyenne AMD Radeon RX 8060S (n=1) | |
| HP ZBook Ultra G1a 14 | |
| Dell Precision 5000 5490 | |
| HP ZBook Firefly 14 G11 | |
| HP EliteBook x360 1040 G11 | |
| 1920x1080 Medium Preset (DX12) | |
| HP ZBook Ultra G1a 14 | |
| Moyenne AMD Radeon RX 8060S (n=1) | |
| Dell Precision 5000 5490 | |
| HP ZBook Firefly 14 G11 | |
| HP EliteBook x360 1040 G11 | |
| 1920x1080 High Preset (DX12) | |
| HP ZBook Ultra G1a 14 | |
| Moyenne AMD Radeon RX 8060S (n=1) | |
| Dell Precision 5000 5490 | |
| HP ZBook Firefly 14 G11 | |
| HP EliteBook x360 1040 G11 | |
| 1920x1080 Badass Preset (DX12) | |
| HP ZBook Ultra G1a 14 | |
| Moyenne AMD Radeon RX 8060S (n=1) | |
| Dell Precision 5000 5490 | |
| HP ZBook Firefly 14 G11 | |
| HP EliteBook x360 1040 G11 | |
Cyberpunk 2077 ultra FPS Chart
| Bas | Moyen | Élevé | Ultra | |
|---|---|---|---|---|
| GTA V (2015) | 184.4 | 177.7 | 164.3 | 86.6 |
| Dota 2 Reborn (2015) | 210 | 177.2 | 147.7 | 133.1 |
| Final Fantasy XV Benchmark (2018) | 192.9 | 122.6 | 84.8 | |
| X-Plane 11.11 (2018) | 109.5 | 66.4 | 57.2 | |
| Far Cry 5 (2018) | 116 | 96 | 95 | 92 |
| Strange Brigade (2018) | 491 | 218 | 188.6 | 171 |
| Tiny Tina's Wonderlands (2022) | 220.5 | 162.3 | 110.2 | 90 |
| F1 22 (2022) | 250 | 239 | 185.1 | 57.4 |
| Baldur's Gate 3 (2023) | 139.6 | 118.3 | 101.2 | 99.4 |
| Cyberpunk 2077 2.2 Phantom Liberty (2023) | 135.4 | 111.5 | 90.2 | 80.7 |
| Monster Hunter Wilds (2025) | 55.8 | 47 | 34.5 |
Émissions
Bruit du système
Les ventilateurs restent silencieux à environ 28 dB(A) contre un bruit de fond de 24 dB(A) lors de l'exécution de charges peu exigeantes comme Excel ou les navigateurs. Cependant, ils augmentent relativement rapidement dès que des charges plus élevées sont introduites pour être aussi bruyants que le Precision 5490 à près de 50 dB(A).
Degré de la nuisance sonore
| Au repos |
| 23.9 / 23.9 / 26.8 dB(A) |
| Fortement sollicité |
| 42.2 / 49.2 dB(A) |
 | ||
30 dB silencieux 40 dB(A) audible 50 dB(A) bruyant |
||
min: | ||
| HP ZBook Ultra G1a 14 Radeon RX 8060S, Ryzen AI Max+ PRO 395, WDC PC SN810 2TB | HP ZBook Firefly 14 G11 RTX A500 Laptop GPU, Ultra 7 165H, Kioxia XG8 KXG80ZNV512G | Lenovo ThinkPad X1 Carbon Gen 13 21NS0010GE Arc 140V, Core Ultra 7 258V, SK hynix PCB01 HFS001TFM9X179N GL | Dell Precision 5000 5490 NVIDIA RTX 3000 Ada Generation Laptop GPU, Ultra 9 185H, Kioxia XG8 KXG80ZNV1T02 | Asus ExpertBook P5 P5405-NZ0102X Arc 140V, Core Ultra 7 258V, Western Digital PC SN5000S SDEQNSJ-1T00 | Apple MacBook Pro 14 2024 M4 Pro M4 Pro 20-Core GPU, M4 Pro (14 cores), Apple SSD AP2048Z | |
|---|---|---|---|---|---|---|
| Noise | 3% | 12% | 3% | 15% | 8% | |
| arrêt / environnement * | 23.9 | 24.3 -2% | 23.2 3% | 22.8 5% | 24.1 -1% | 23.9 -0% |
| Idle Minimum * | 23.9 | 24.6 -3% | 23.2 3% | 23.8 -0% | 24.1 -1% | 23.9 -0% |
| Idle Average * | 23.9 | 25.2 -5% | 23.2 3% | 23.8 -0% | 24.1 -1% | 23.9 -0% |
| Idle Maximum * | 26.8 | 26.8 -0% | 23.2 13% | 24.7 8% | 24.1 10% | 23.9 11% |
| Load Average * | 42.2 | 38.9 8% | 29.9 29% | 38.9 8% | 31.2 26% | 30.2 28% |
| Cyberpunk 2077 ultra * | 49.1 | 41.8 15% | 43.3 12% | 31.7 35% | 44.5 9% | |
| Load Maximum * | 49.2 | 45.8 7% | 40.5 18% | 51.4 -4% | 31.2 37% | 44.5 10% |
| Witcher 3 ultra * | 49.9 |
* ... Moindre est la valeur, meilleures sont les performances
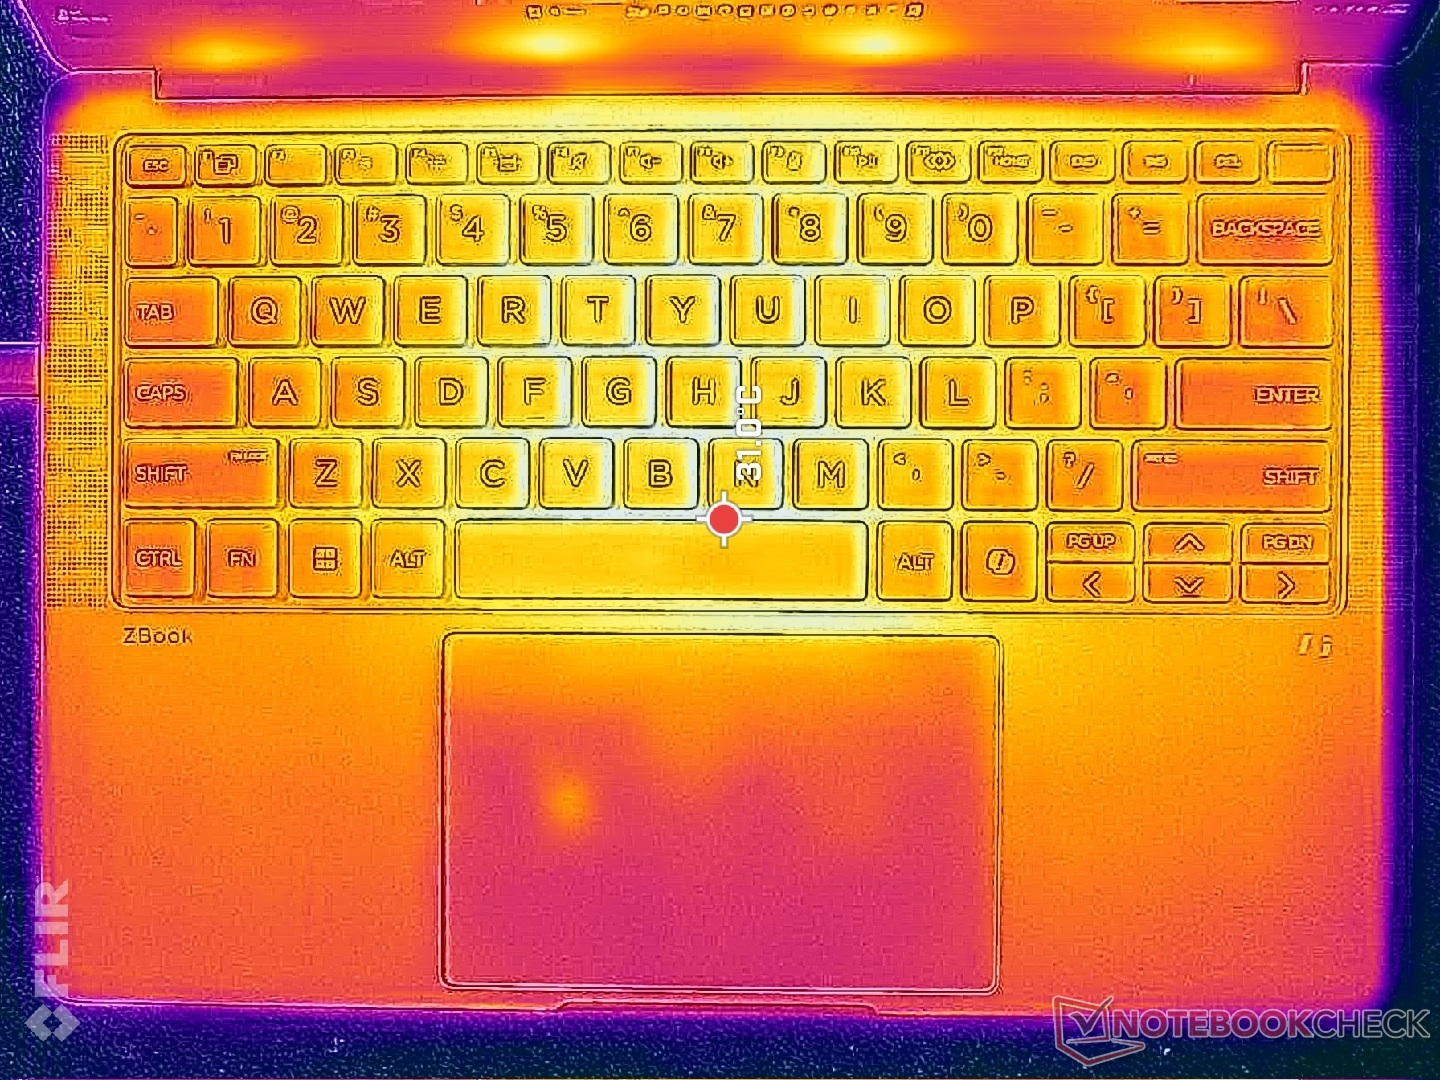
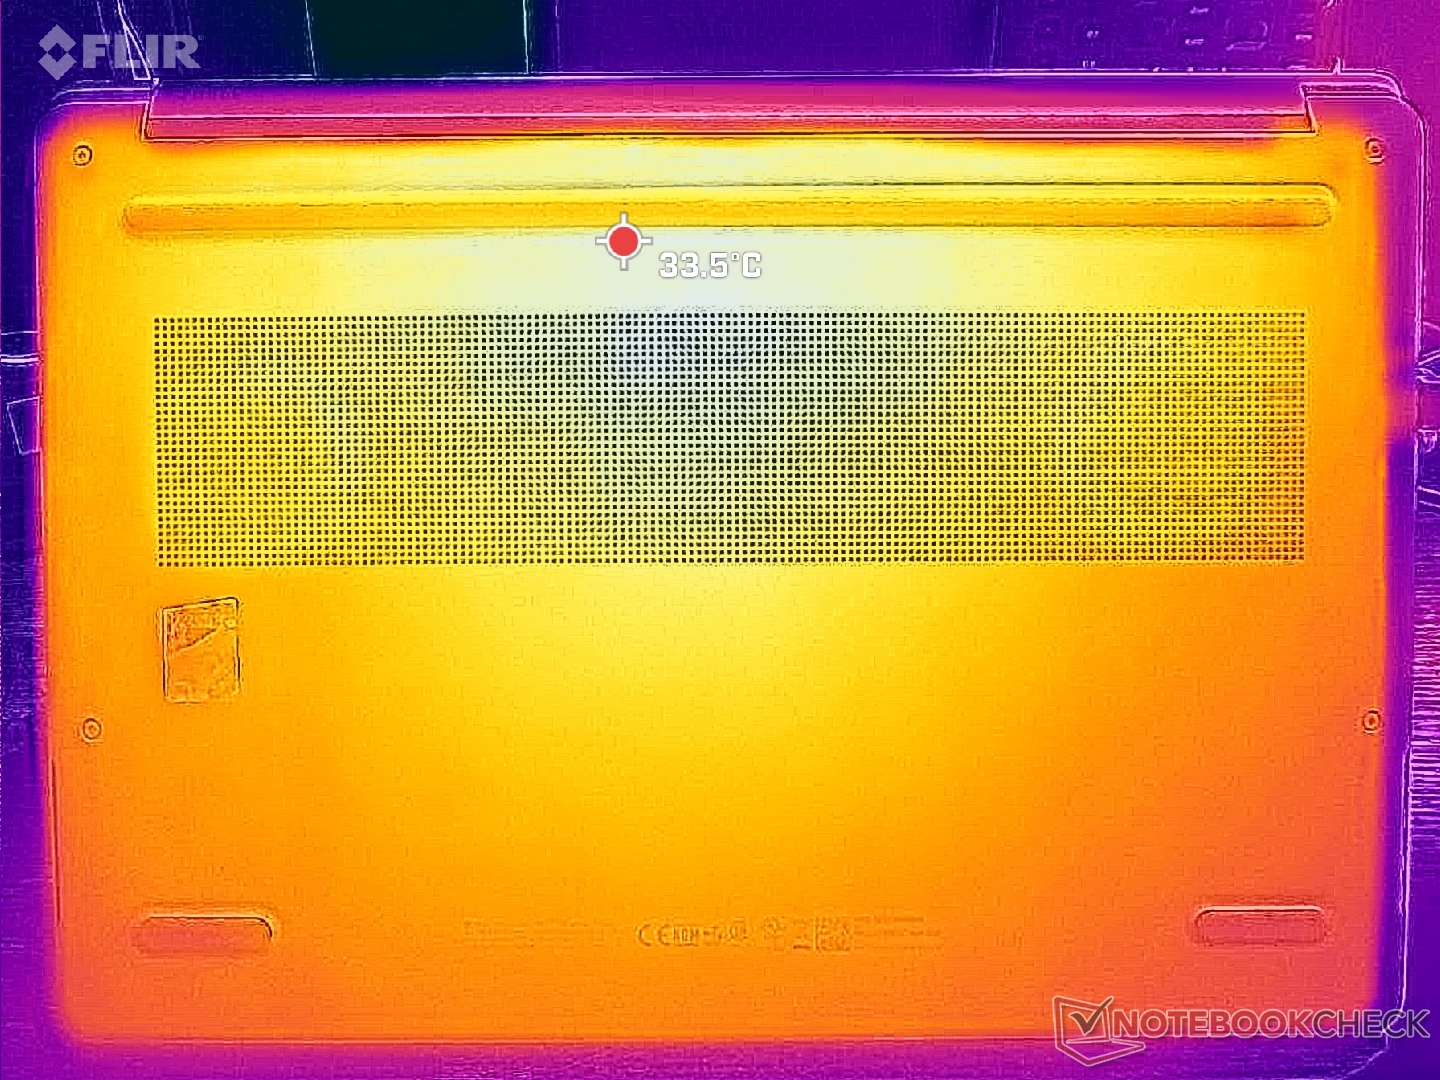
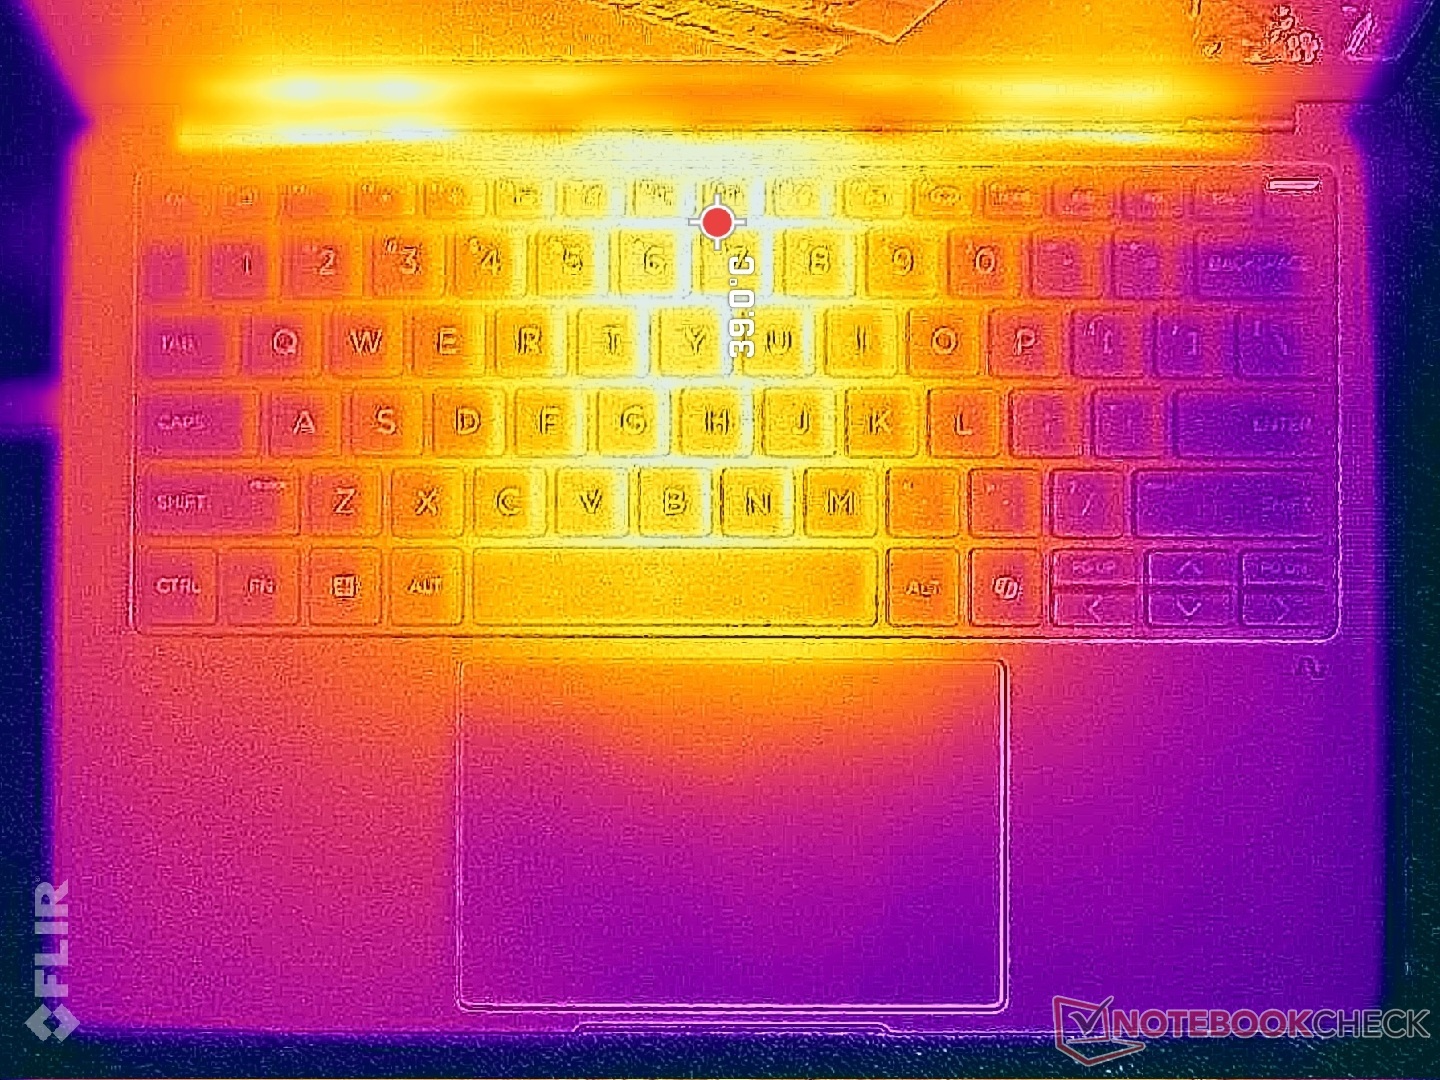
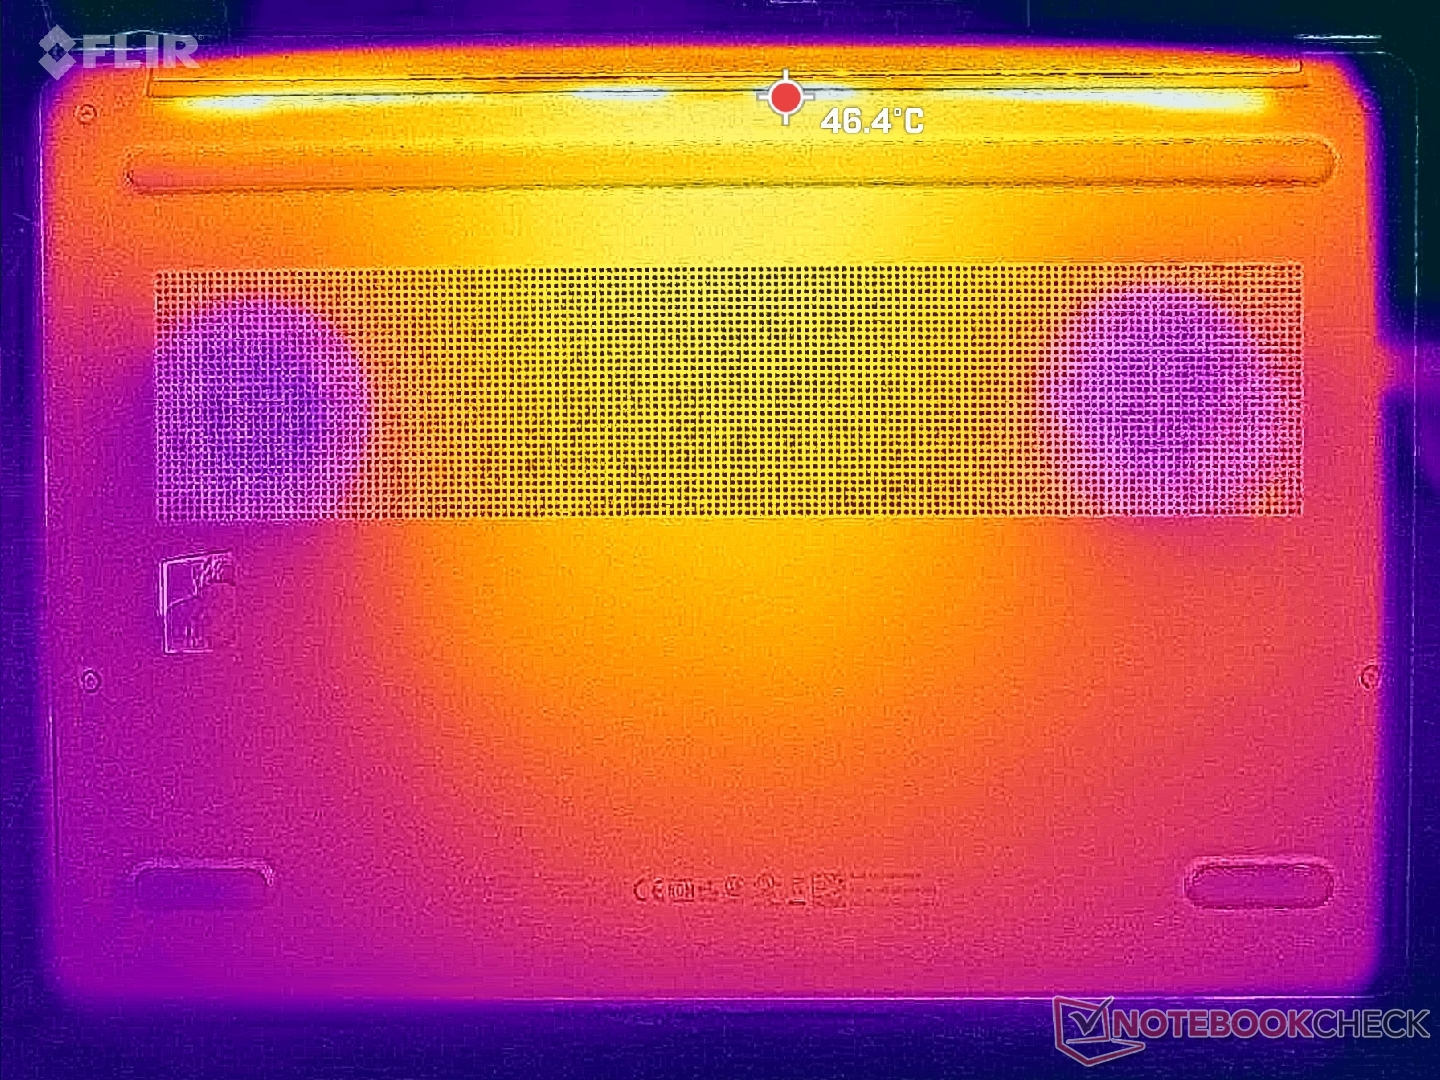
Température
Les températures moyennes de surface lors de l'exécution de charges exigeantes sont plus élevées que sur le site Web de l'entreprise Dell Precision 5490 mais plus froides que sur le MacBook Pro 14. Les points chauds se situent au centre du clavier, mais les repose-paumes peuvent également devenir sensiblement plus chauds en raison de la densité des composants internes et de la petite taille de l'appareil.
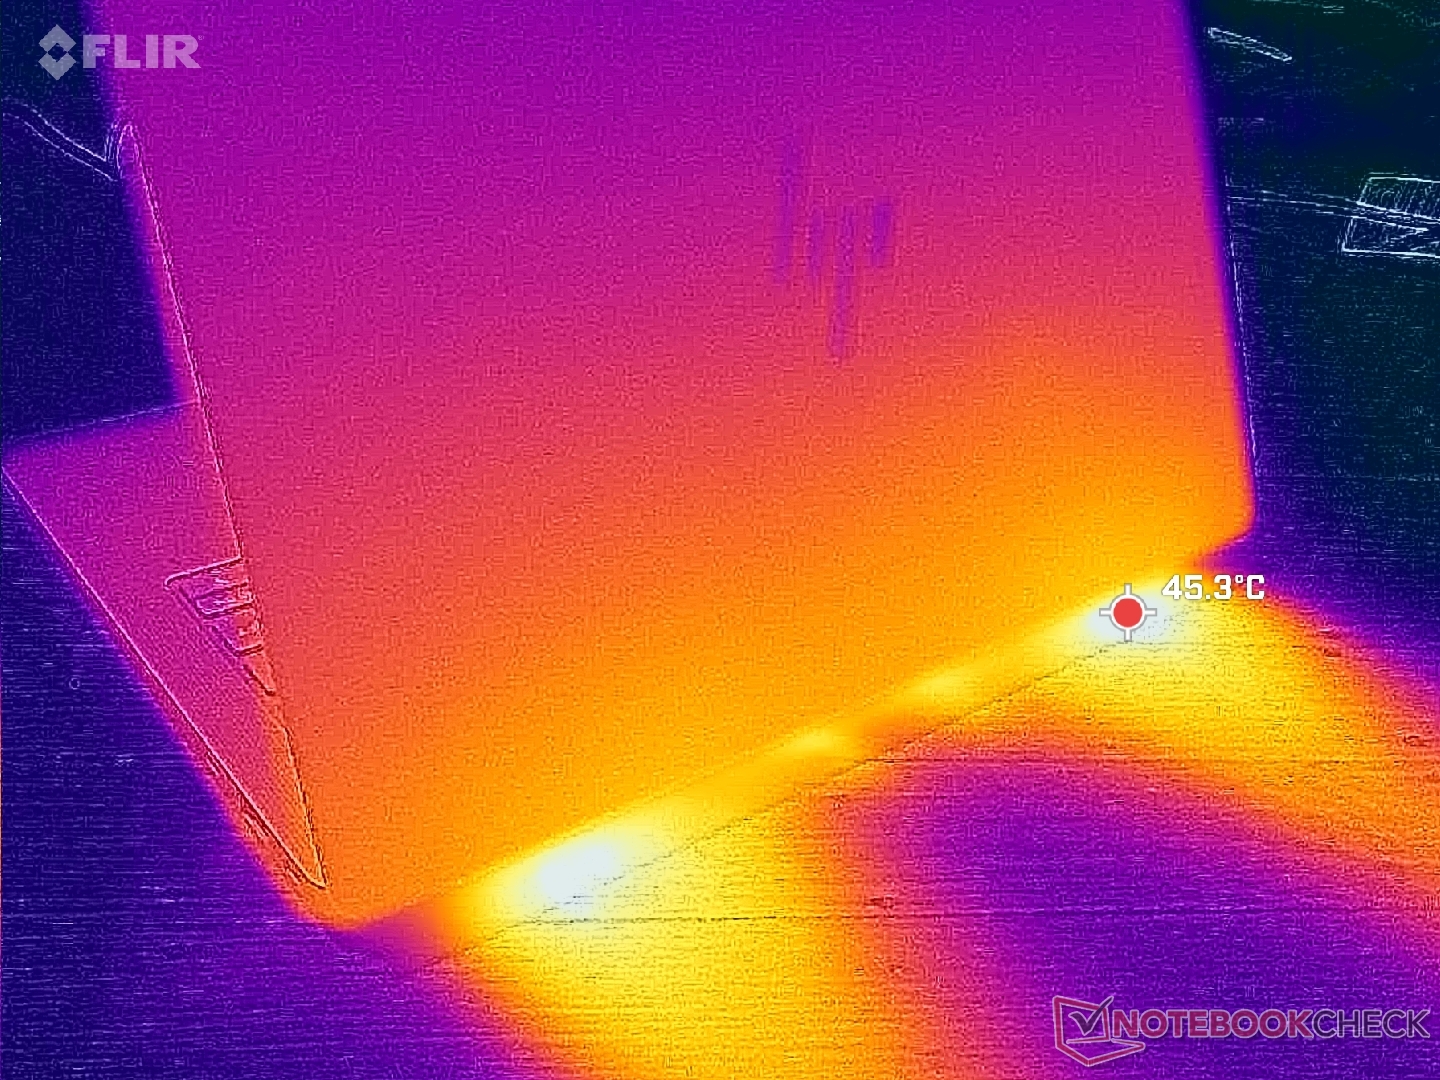
(±) La température maximale du côté supérieur est de 41.4 °C / 107 F, par rapport à la moyenne de 38.2 °C / 101 F, allant de 22.2 à 69.8 °C pour la classe Workstation.
(+) Le fond chauffe jusqu'à un maximum de 36.6 °C / 98 F, contre une moyenne de 41.2 °C / 106 F
(±) En utilisation inactive, la température moyenne du côté supérieur est de 32.5 °C / 91 F, par rapport à la moyenne du dispositif de 32 °C / 90 F.
(+) Les repose-poignets et le pavé tactile atteignent la température maximale de la peau (32 °C / 89.6 F) et ne sont donc pas chauds.
(-) La température moyenne de la zone de l'appui-paume de dispositifs similaires était de 27.8 °C / 82 F (-4.2 °C / #-7.6 F).
| HP ZBook Ultra G1a 14 AMD Ryzen AI Max+ PRO 395, AMD Radeon RX 8060S | HP ZBook Firefly 14 G11 Intel Core Ultra 7 165H, NVIDIA RTX A500 Laptop GPU | Lenovo ThinkPad X1 Carbon Gen 13 21NS0010GE Intel Core Ultra 7 258V, Intel Arc Graphics 140V | Dell Precision 5000 5490 Intel Core Ultra 9 185H, NVIDIA RTX 3000 Ada Generation Laptop GPU | Asus ExpertBook P5 P5405-NZ0102X Intel Core Ultra 7 258V, Intel Arc Graphics 140V | Apple MacBook Pro 14 2024 M4 Pro Apple M4 Pro (14 cores), Apple M4 Pro 20-Core GPU | |
|---|---|---|---|---|---|---|
| Heat | -2% | 6% | 2% | 8% | 9% | |
| Maximum Upper Side * | 41.4 | 42.8 -3% | 42.3 -2% | 43.2 -4% | 41.6 -0% | 47.3 -14% |
| Maximum Bottom * | 36.6 | 44 -20% | 40.1 -10% | 38.4 -5% | 43.2 -18% | 44.2 -21% |
| Idle Upper Side * | 34 | 30.6 10% | 27.3 20% | 31.6 7% | 25.7 24% | 22.1 35% |
| Idle Bottom * | 33.6 | 31.4 7% | 28.3 16% | 30.6 9% | 25.3 25% | 22.1 34% |
* ... Moindre est la valeur, meilleures sont les performances
Intervenants
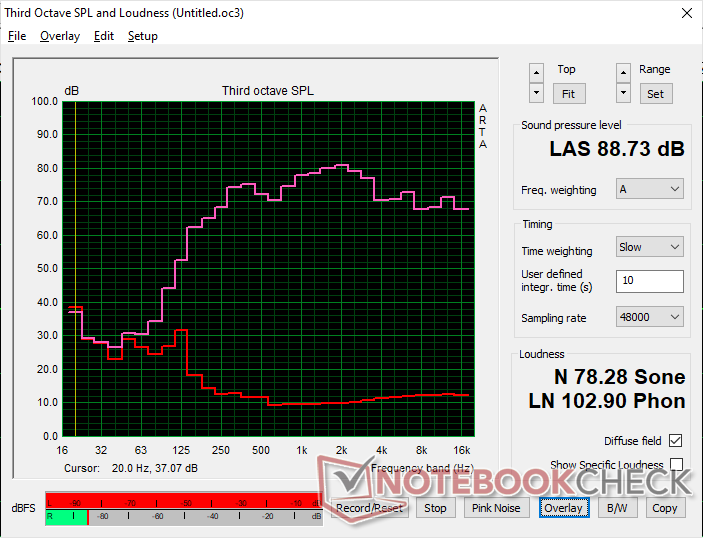
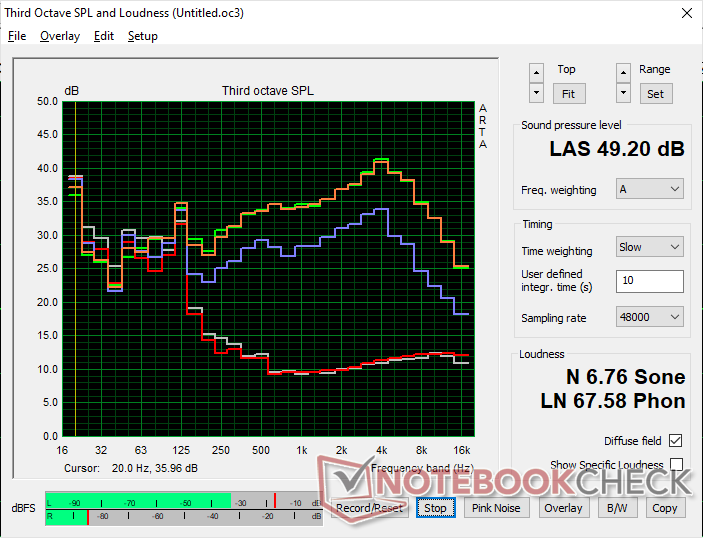
HP ZBook Ultra G1a 14 analyse audio
(+) | les haut-parleurs peuvent jouer relativement fort (88.7# dB)
Basses 100 - 315 Hz
(±) | basse réduite - en moyenne 11.8% inférieure à la médiane
(±) | la linéarité des basses est moyenne (11% delta à la fréquence précédente)
Médiums 400 - 2000 Hz
(+) | médiane équilibrée - seulement 4.5% de la médiane
(+) | les médiums sont linéaires (3.4% delta à la fréquence précédente)
Aiguës 2 - 16 kHz
(+) | des sommets équilibrés - à seulement 3.4% de la médiane
(+) | les aigus sont linéaires (4.3% delta à la fréquence précédente)
Globalement 100 - 16 000 Hz
(+) | le son global est linéaire (10.4% différence à la médiane)
Par rapport à la même classe
» 6% de tous les appareils testés de cette catégorie étaient meilleurs, 4% similaires, 90% pires
» Le meilleur avait un delta de 7%, la moyenne était de 18%, le pire était de 35%.
Par rapport à tous les appareils testés
» 4% de tous les appareils testés étaient meilleurs, 1% similaires, 94% pires
» Le meilleur avait un delta de 4%, la moyenne était de 24%, le pire était de 134%.
Apple MacBook Pro 16 2021 M1 Pro analyse audio
(+) | les haut-parleurs peuvent jouer relativement fort (84.7# dB)
Basses 100 - 315 Hz
(+) | bonne basse - seulement 3.8% loin de la médiane
(+) | les basses sont linéaires (5.2% delta à la fréquence précédente)
Médiums 400 - 2000 Hz
(+) | médiane équilibrée - seulement 1.3% de la médiane
(+) | les médiums sont linéaires (2.1% delta à la fréquence précédente)
Aiguës 2 - 16 kHz
(+) | des sommets équilibrés - à seulement 1.9% de la médiane
(+) | les aigus sont linéaires (2.7% delta à la fréquence précédente)
Globalement 100 - 16 000 Hz
(+) | le son global est linéaire (4.6% différence à la médiane)
Par rapport à la même classe
» 0% de tous les appareils testés de cette catégorie étaient meilleurs, 0% similaires, 100% pires
» Le meilleur avait un delta de 5%, la moyenne était de 18%, le pire était de 45%.
Par rapport à tous les appareils testés
» 0% de tous les appareils testés étaient meilleurs, 0% similaires, 100% pires
» Le meilleur avait un delta de 4%, la moyenne était de 24%, le pire était de 134%.
Gestion de l'énergie
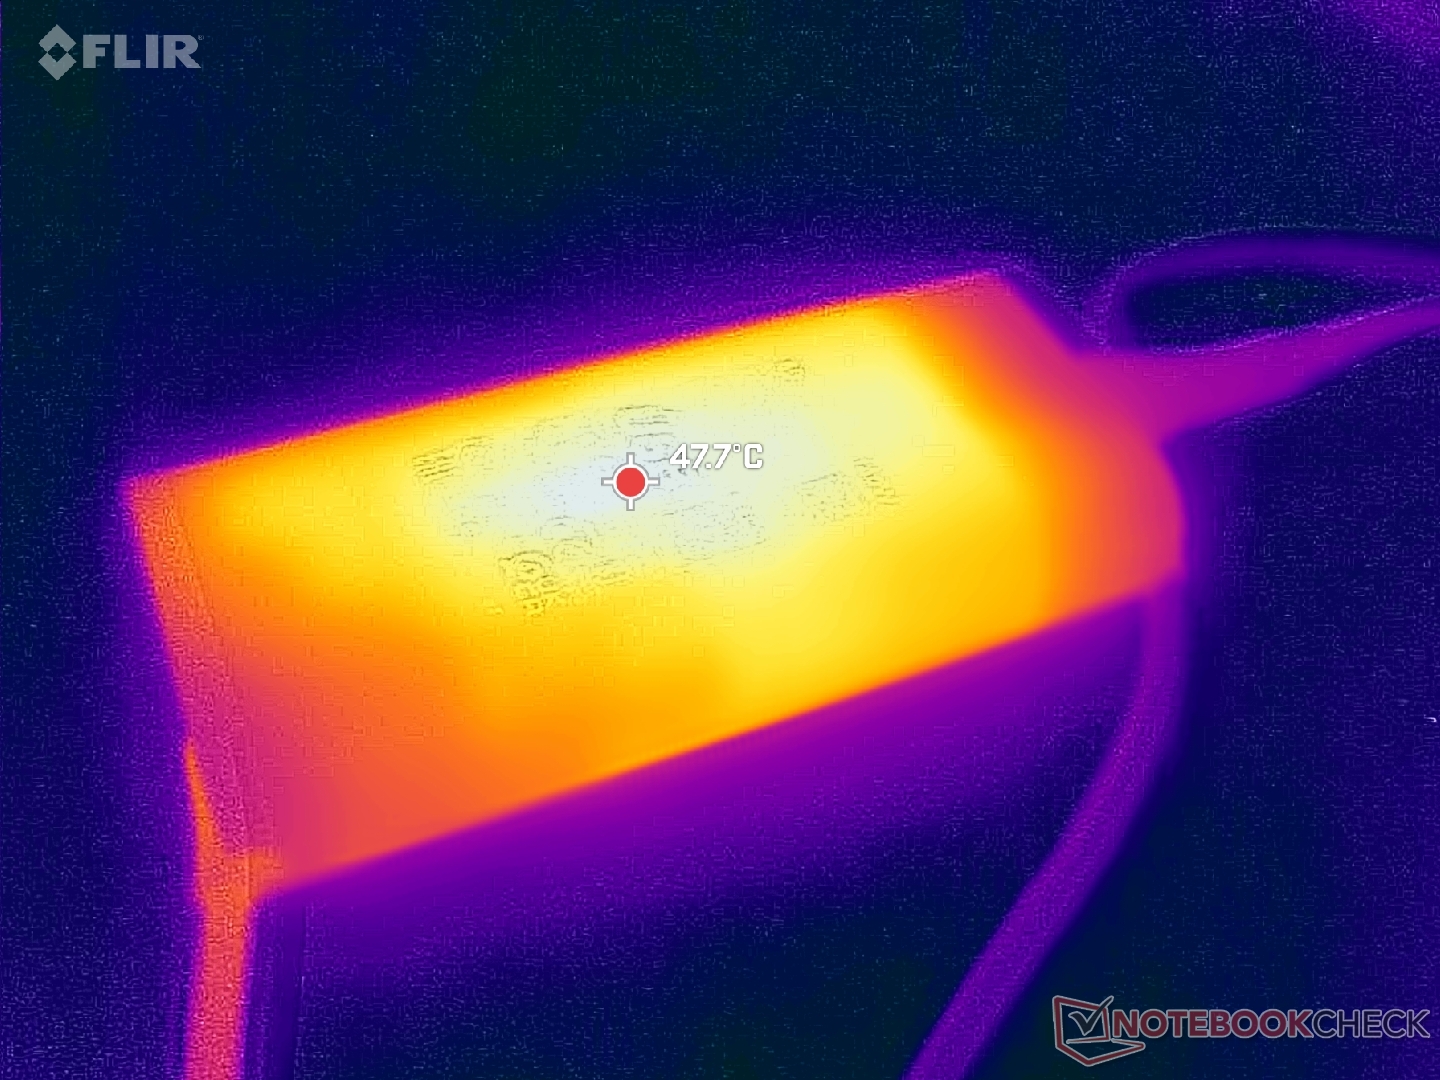
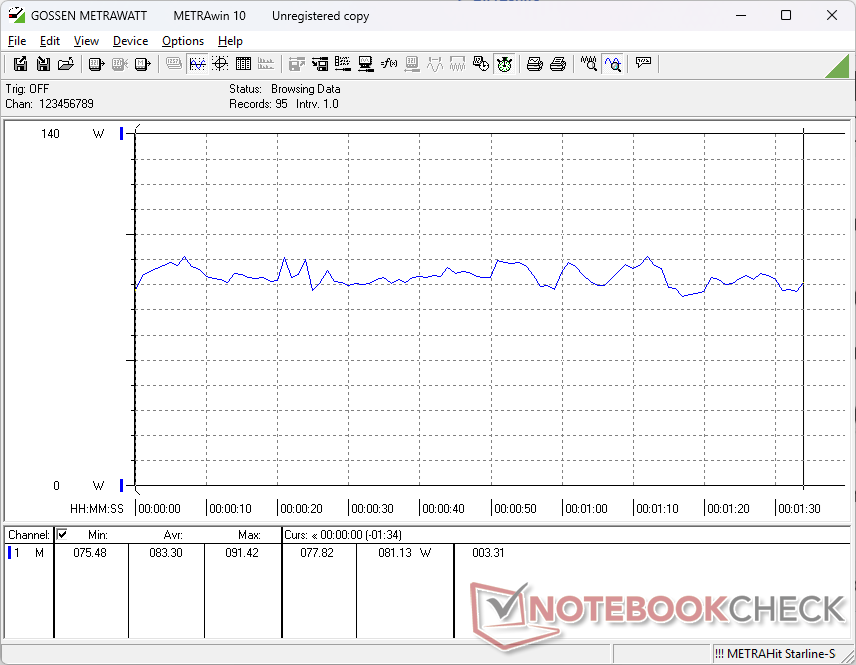
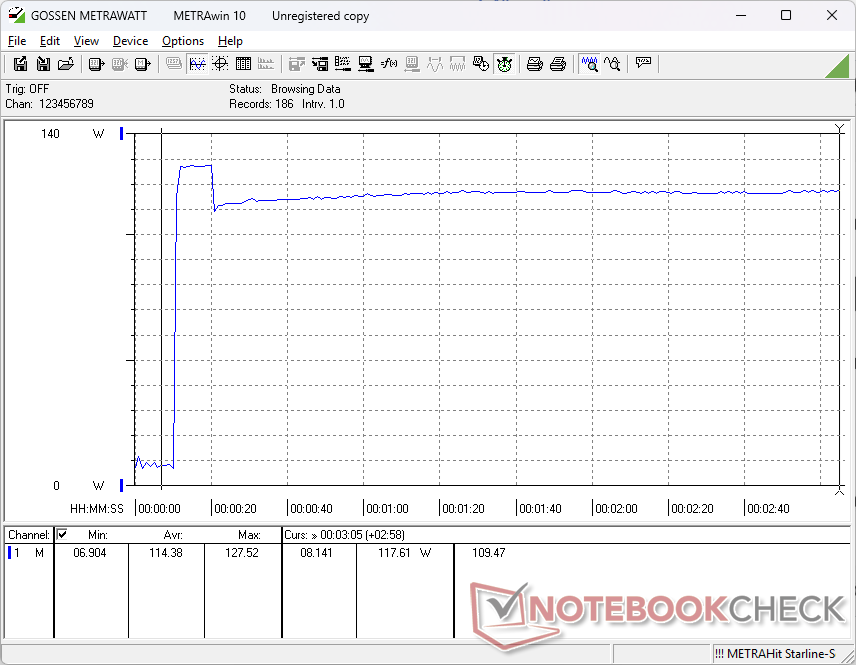
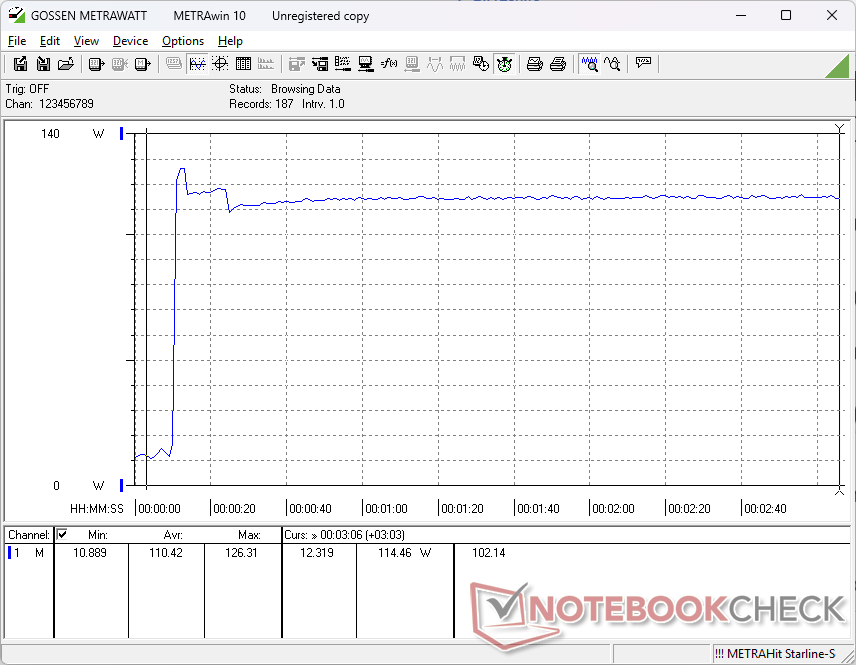
Consommation électrique
Les performances rapides ne sont pas gratuites, car le HP peut être assez exigeant pour un facteur de forme de 14 pouces, comme le montrent nos tableaux de comparaison ci-dessous. L'adaptateur secteur USB-C de 140 W (~14 x 6,5 x 2,8 cm) en est la preuve, alors que la plupart des ordinateurs portables de 14 pouces sont livrés avec des adaptateurs plus petits et plus légers.
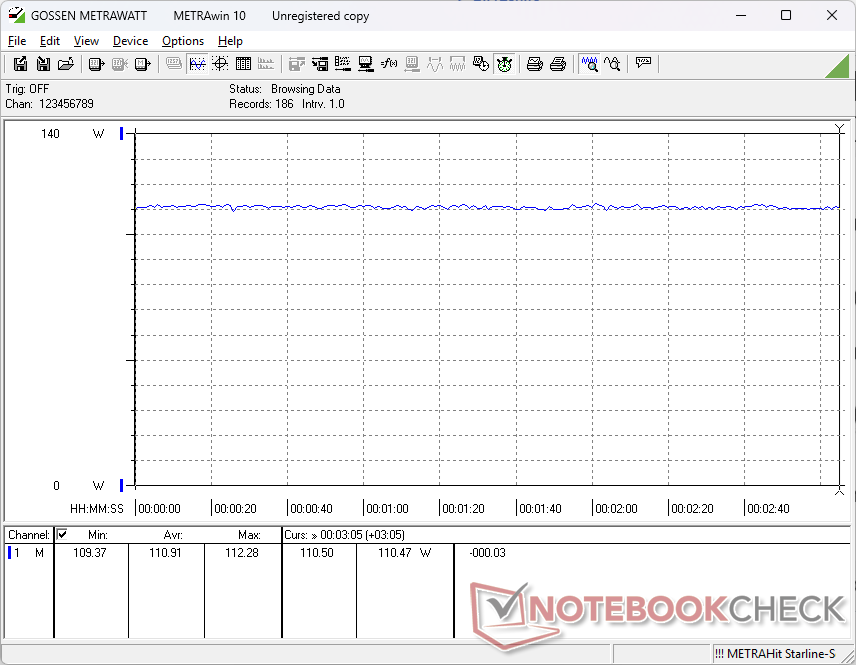
| Éteint/en veille | |
| Au repos | |
| Fortement sollicité |
|
Légende:
min: | |
| HP ZBook Ultra G1a 14 Ryzen AI Max+ PRO 395, Radeon RX 8060S, WDC PC SN810 2TB, OLED, 2880x1800, 14" | HP ZBook Firefly 14 G11 Ultra 7 165H, RTX A500 Laptop GPU, Kioxia XG8 KXG80ZNV512G, IPS, 2560x1600, 14" | Lenovo ThinkPad X1 Carbon Gen 13 21NS0010GE Core Ultra 7 258V, Arc 140V, SK hynix PCB01 HFS001TFM9X179N GL, OLED, 2880x1800, 14" | Dell Precision 5000 5490 Ultra 9 185H, NVIDIA RTX 3000 Ada Generation Laptop GPU, Kioxia XG8 KXG80ZNV1T02, IPS, 2560x1600, 14" | Asus ExpertBook P5 P5405-NZ0102X Core Ultra 7 258V, Arc 140V, Western Digital PC SN5000S SDEQNSJ-1T00, IPS LED, 2560x1600, 14" | Apple MacBook Pro 14 2024 M4 Pro M4 Pro (14 cores), M4 Pro 20-Core GPU, Apple SSD AP2048Z, MiniLED, 3024x1964, 14.2" | |
|---|---|---|---|---|---|---|
| Power Consumption | 12% | 53% | -32% | 40% | 19% | |
| Idle Minimum * | 6.9 | 6.6 4% | 4.7 32% | 11.1 -61% | 3.9 43% | 2.17 69% |
| Idle Average * | 7.7 | 12.7 -65% | 5.7 26% | 14.8 -92% | 8.9 -16% | 10.9 -42% |
| Idle Maximum * | 14.7 | 13.3 10% | 6.1 59% | 16.5 -12% | 9.6 35% | 11 25% |
| Load Average * | 83.3 | 67 20% | 29.8 64% | 70.1 16% | 43.4 48% | 74.3 11% |
| Cyberpunk 2077 ultra external monitor * | 110.5 | 58.1 47% | 34.1 69% | 41.8 62% | 80.5 27% | |
| Cyberpunk 2077 ultra * | 110.9 | 63.4 43% | 35.3 68% | 42.8 61% | ||
| Load Maximum * | 126.3 | 94.9 25% | 60.1 52% | 137.5 -9% | 64.1 49% | 98.1 22% |
| Witcher 3 ultra * | 93.1 |
* ... Moindre est la valeur, meilleures sont les performances
Power Consumption Cyberpunk / Stress Test
Power Consumption external Monitor
Autonomie de la batterie
Les durées d'exécution globales sont plus courtes que celles de nombreux ordinateurs portables de 14 pouces, en partie à cause des niveaux de consommation généralement plus élevés mentionnés ci-dessus.
| HP ZBook Ultra G1a 14 Ryzen AI Max+ PRO 395, Radeon RX 8060S, 74.5 Wh | HP ZBook Firefly 14 G11 Ultra 7 165H, RTX A500 Laptop GPU, 56 Wh | Lenovo ThinkPad X1 Carbon Gen 13 21NS0010GE Core Ultra 7 258V, Arc 140V, 57 Wh | Dell Precision 5000 5490 Ultra 9 185H, NVIDIA RTX 3000 Ada Generation Laptop GPU, 72 Wh | Asus ExpertBook P5 P5405-NZ0102X Core Ultra 7 258V, Arc 140V, 63 Wh | Apple MacBook Pro 14 2024 M4 Pro M4 Pro (14 cores), M4 Pro 20-Core GPU, 72.6 Wh | |
|---|---|---|---|---|---|---|
| Autonomie de la batterie | 23% | 56% | 56% | 131% | 125% | |
| WiFi v1.3 | 421 | 517 23% | 658 56% | 658 56% | 973 131% | 947 125% |
| Cyberpunk 2077 ultra 150cd | 94 | |||||
| Load | 86 | 173 | ||||
| H.264 | 1186 |
Notebookcheck Rating
HP ZBook Ultra G1a 14
- 04/11/2025 v8
Allen Ngo
 Total Sustainability Score:
 Potential Competitors in Comparison
Image | Modèle | Prix | Poids | Épaisseur | Écran |
|---|---|---|---|---|---|
1. 87.4%  | HP ZBook Ultra G1a 14 AMD Ryzen AI Max+ PRO 395 ⎘ AMD Radeon RX 8060S ⎘ 128 Go Mémoire, 2048 Go SSD | Amazon: 1. $1,099.00 HP ZBook 14 Firefly G11 (Lat... 2. $1,049.00 HP ZBook Firefly G11 14” A... 3. $1,249.99 HP ZBook Firefly G11 Mobile ... Prix de liste: 4000 USD | 1.6 kg | 18.5 mm | 14.00" 2880x1800 243 PPI OLED |
Transparency
La sélection des appareils à examiner est effectuée par notre équipe éditoriale. L'échantillon de test a été prêté à l'auteur par le fabricant ou le détaillant pour les besoins de cet examen. Le prêteur n'a pas eu d'influence sur cette évaluation et le fabricant n'a pas reçu de copie de cette évaluation avant sa publication. Il n'y avait aucune obligation de publier cet article. Nous n'acceptons jamais de compensation ou de paiement en échange de nos commentaires. En tant que média indépendant, Notebookcheck n'est pas soumis à l'autorité des fabricants, des détaillants ou des éditeurs.
Voici comment Notebookcheck teste
Chaque année, Notebookcheck examine de manière indépendante des centaines d'ordinateurs portables et de smartphones en utilisant des procédures standardisées afin de garantir que tous les résultats sont comparables. Nous avons continuellement développé nos méthodes de test depuis environ 20 ans et avons établi des normes industrielles dans le processus. Dans nos laboratoires de test, des équipements de mesure de haute qualité sont utilisés par des techniciens et des rédacteurs expérimentés. Ces tests impliquent un processus de validation en plusieurs étapes. Notre système d'évaluation complexe repose sur des centaines de mesures et de points de référence bien fondés, ce qui garantit l'objectivité.
