 Deutsch
 English
 Español
 Français
 Italiano
 Nederlands
 Polski
 Português
 Русский
 Türkçe
 Svenska
 Chinese
 Magyar
Revue de la station de travail Lenovo ThinkPad P16 Gen 2 : Une station de travail lourde avec des graphiques surchargés
Allen Ngo (traduit par DeepL / Ninh Duy) Published 🇺🇸
Verdict - Le pouvoir a un coût
Le ThinkPad P16 Gen 2 donne la priorité aux performances, même si cela signifie un système plus grand, plus lourd, plus bruyant et plus chaud. Si vous pouvez faire face à ces inconvénients, vous trouverez que son RTX 4000 Ada de 130 W est un monstre de station de travail mobile.
Le ThinkPad P16 Gen 2 se distingue de la plupart des autres stations de travail de 16 pouces par sa puissance graphique TGP de 130 W qui lui permet de faire face aux charges de travail les plus exigeantes.
L'inconvénient le plus notable est peut-être que le GPU peut s'essouffler d'environ 10 % après quelques minutes de stress, ce qui suggère que la solution de refroidissement ne peut pas supporter indéfiniment les exigences du GPU. L'autonomie de la batterie est également très courte, quelques heures tout au plus. Malgré cela, le ThinkPad P16 Gen 2 reste l'une des stations de travail les plus rapides dans sa catégorie de 16 pouces.
Points positifs
Points négatifs
Prix et disponibilité
Lenovo expédie maintenant le ThinkPad P16 Gen 2 directement à partir de sa boutique en ligne à partir de 1850 $ ou 3770 $US s'il est configuré avec la RTX 4000. Un petit nombre de SKU est également disponible sur Amazon.
Price comparison
Comparaison avec les concurrents potentiels
Image | Modèle | Geizhals | Poids | Épaisseur | Display |
|---|---|---|---|---|---|
1. 85.9%  | Lenovo ThinkPad P16 Gen 2 Intel Core i7-14700HX ⎘ NVIDIA RTX 4000 Ada Generation Laptop GPU ⎘ 32 Go Mémoire, 1024 Go SSD | Listenpreis 3500 USD | 3.1 kg | 30.23 mm | 16.00" 2560x1600 189 PPI IPS |
2. 90.2%  | Lenovo ThinkPad P16 G2 21FA000FGE Intel Core i7-13700HX ⎘ NVIDIA RTX 2000 Ada Generation Laptop GPU ⎘ 32 Go Mémoire, 1024 Go SSD | Listenpreis 2750 Euro | 3 kg | 30.23 mm | 16.00" 2560x1600 189 PPI IPS LED |
3. 88.6%  | Lenovo ThinkPad P16s G2 21K9000CGE AMD Ryzen 7 PRO 7840U ⎘ AMD Radeon 780M ⎘ 32 Go Mémoire, 1024 Go SSD | Listenpreis 2150€ | 1.8 kg | 24.4 mm | 16.00" 3840x2400 283 PPI OLED |
4. 91%  | Lenovo ThinkPad P16 G1 RTX A5500 Intel Core i9-12950HX ⎘ NVIDIA RTX A5500 Laptop GPU ⎘ 64 Go Mémoire, 2048 Go SSD | Listenpreis 9000 USD | 3 kg | 30.23 mm | 16.00" 3840x2400 283 PPI IPS |
5. 85.4%  | HP ZBook Power 16 G11 A AMD Ryzen 7 8845HS ⎘ NVIDIA RTX 2000 Ada Generation Laptop GPU ⎘ 64 Go Mémoire, 2048 Go SSD | Listenpreis 2100 USD | 2.2 kg | 22.9 mm | 16.00" 2560x1600 189 PPI IPS |
6. 88.3%  | Dell Precision 5690 Intel Core Ultra 9 185H ⎘ NVIDIA RTX 5000 Ada Generation Laptop GPU ⎘ 32 Go Mémoire, 2048 Go SSD | 2.3 kg | 22.17 mm | 16.00" 3840x2400 283 PPI OLED |
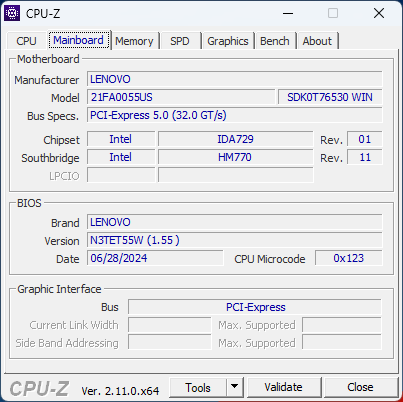
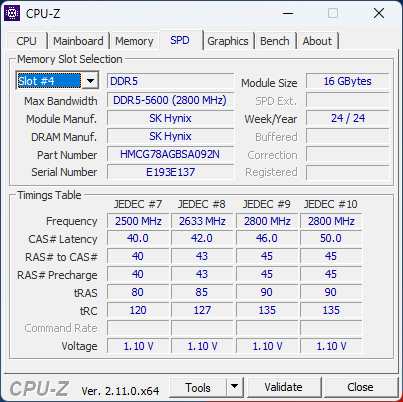
Lenovo met à jour sa gamme haut de gamme ThinkPad P16 Gen 2 avec de nouveaux processeurs Raptor Lake-HX Refresh pour le quatrième trimestre 2024 afin de remplacer les options Raptor Lake-HX originales publiées plus tôt cette année. La conception du châssis reste par ailleurs inchangée et toutes nos impressions sur le thinkPad P16 Gen 2, s'appliquent également ici, y compris en ce qui concerne les ports s'appliquent ici aussi, y compris les ports.
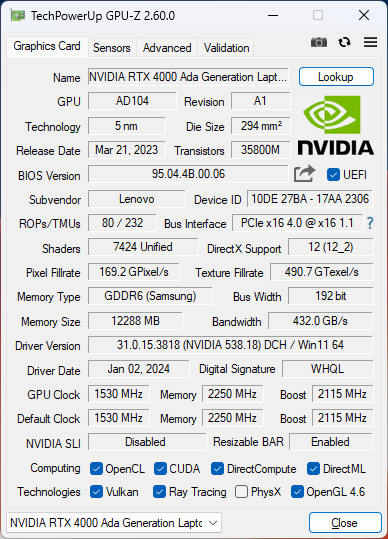
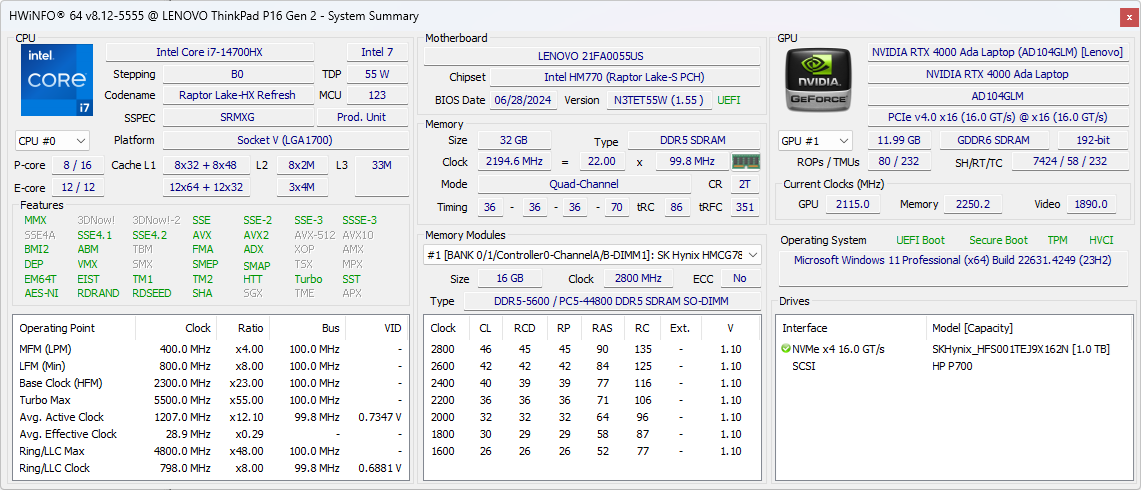
Notre unité de test est équipée d'un processeur Core i7-14700HX et d'un GPU Nvidia RTX 4000 Ada de 130 W, contre un Core i7-13700HX et une RTX 2000 de 80 W dans notre premier test du ThinkPad P16 Gen 2. L'amélioration des performances est significative, comme le montrent les données ci-dessous.
Parmi les concurrents du ThinkPad P16 Gen 2, on trouve d'autres stations de travail mobiles de 16 pouces très performantes, comme le HP ZBook Power 16 G11 A ou le Dell Precision 5690.
Plus de commentaires sur Lenovo :
Spécifications
Cas
Lecteur de carte SD
| SD Card Reader | |
| average JPG Copy Test (av. of 3 runs) | |
| HP ZBook Power 16 G11 A (Toshiba Exceria Pro SDXC 64 GB UHS-II) | |
| Lenovo ThinkPad P16 Gen 2 (Toshiba Exceria Pro SDXC 64 GB UHS-II) | |
| Lenovo ThinkPad P16 G1 RTX A5500 (Toshiba Exceria Pro SDXC 64 GB UHS-II) | |
| Lenovo ThinkPad P16 G2 21FA000FGE | |
| maximum AS SSD Seq Read Test (1GB) | |
| HP ZBook Power 16 G11 A (Toshiba Exceria Pro SDXC 64 GB UHS-II) | |
| Lenovo ThinkPad P16 Gen 2 (Toshiba Exceria Pro SDXC 64 GB UHS-II) | |
| Lenovo ThinkPad P16 G2 21FA000FGE | |
| Lenovo ThinkPad P16 G1 RTX A5500 (Toshiba Exceria Pro SDXC 64 GB UHS-II) | |
Communication
Webcam


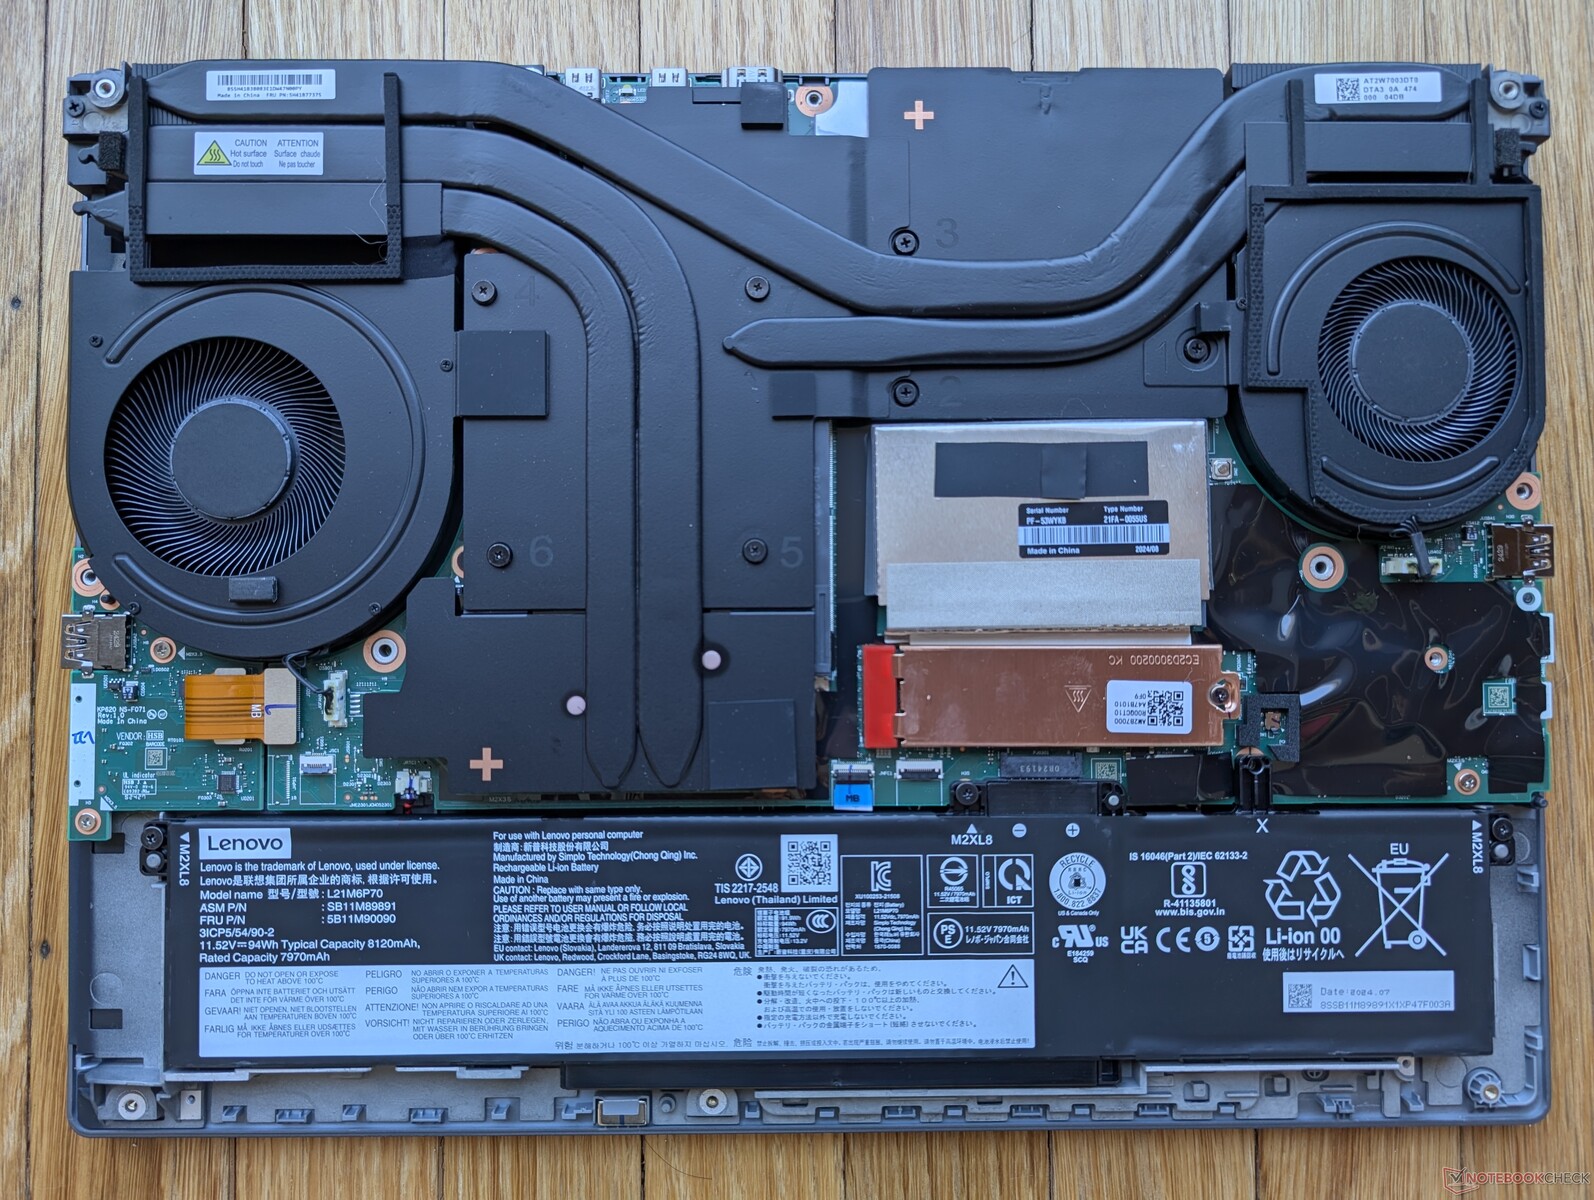
Maintenance
Durabilité
Lenovo incorpore une quantité importante de matériaux recyclés au cours de la production, notamment 50 % d'aluminium recyclé pour le couvercle extérieur (couvercle A), 90 % de magnésium pour le plateau du clavier (couvercle C) et >85 % de plastique post-consommation pour les capuchons des touches, le bloc-batterie et les haut-parleurs.
L'emballage ne contient pas de plastique et est entièrement recyclable.
Accessoires et garantie
Il n'y a rien de plus dans la boîte que l'adaptateur secteur et la documentation. Cependant, il convient de noter que notre unité est livrée avec un adaptateur secteur de 230 W au lieu de 170 W sur notre premier ThinkPad P16 Gen 2, en raison de notre GPU RTX 4000 Ada plus exigeant.
Une garantie constructeur de trois ans s'applique en standard.
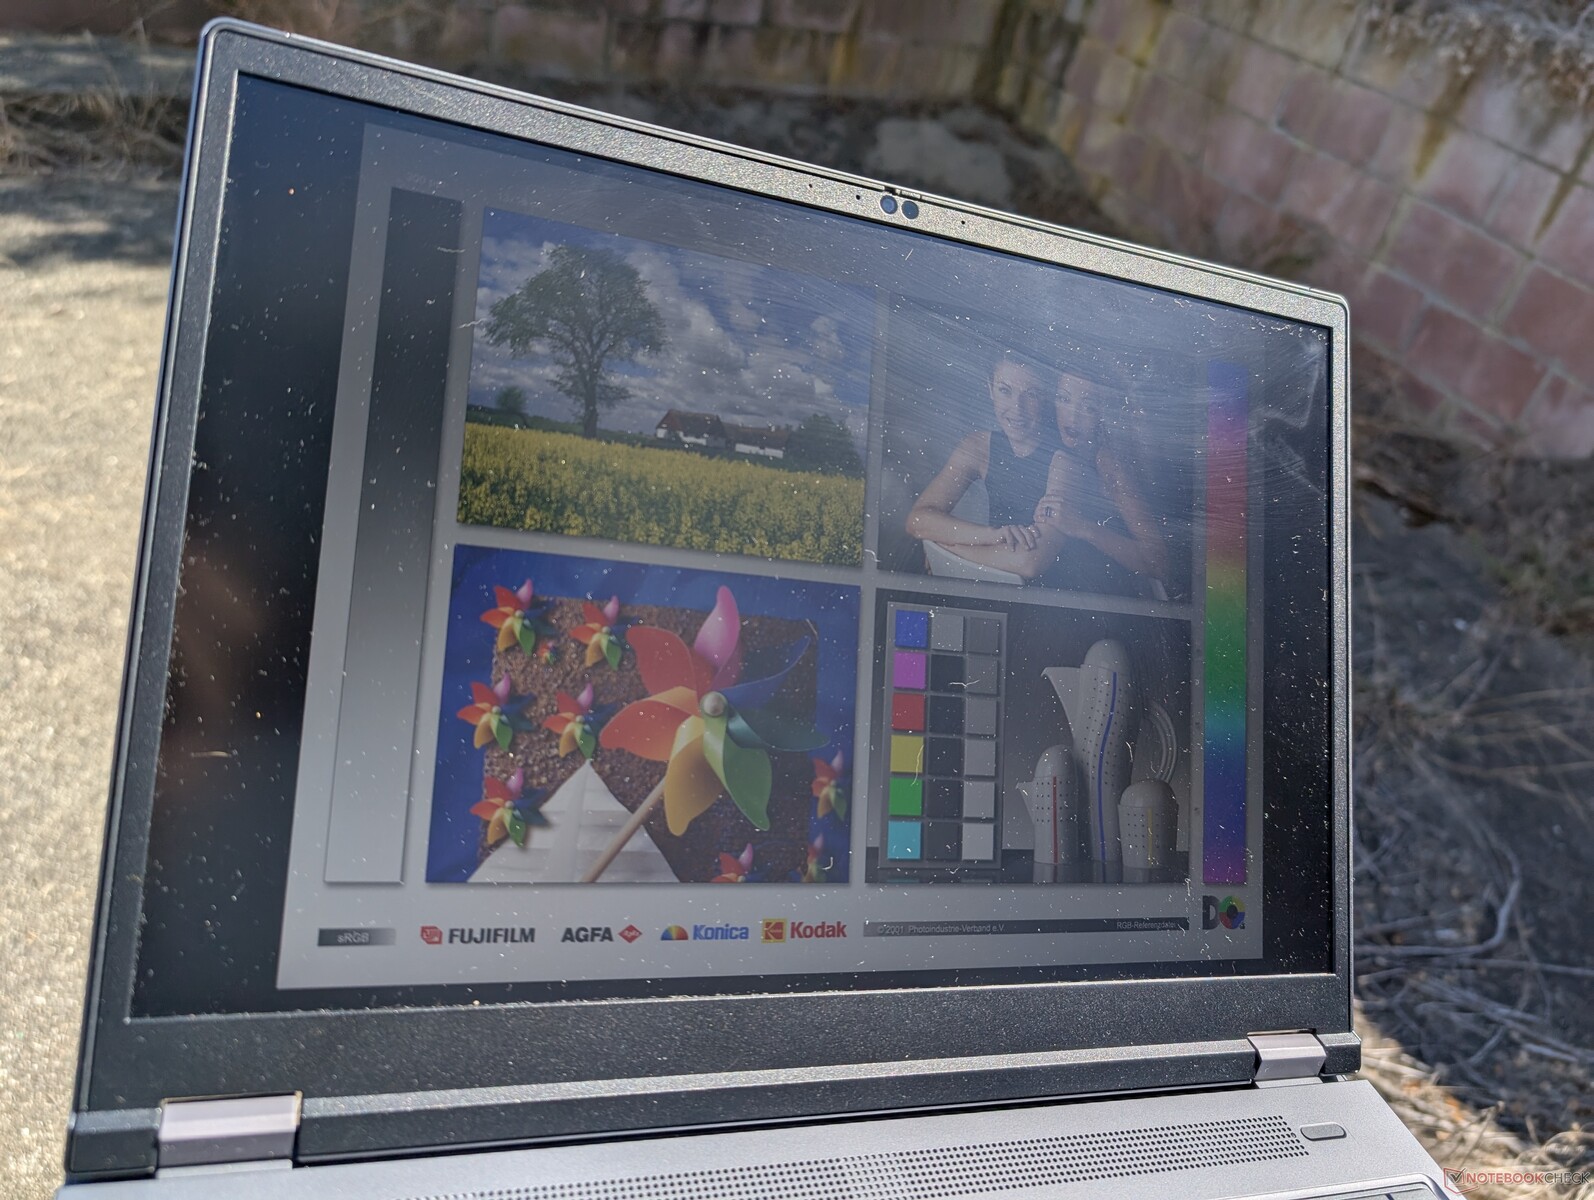
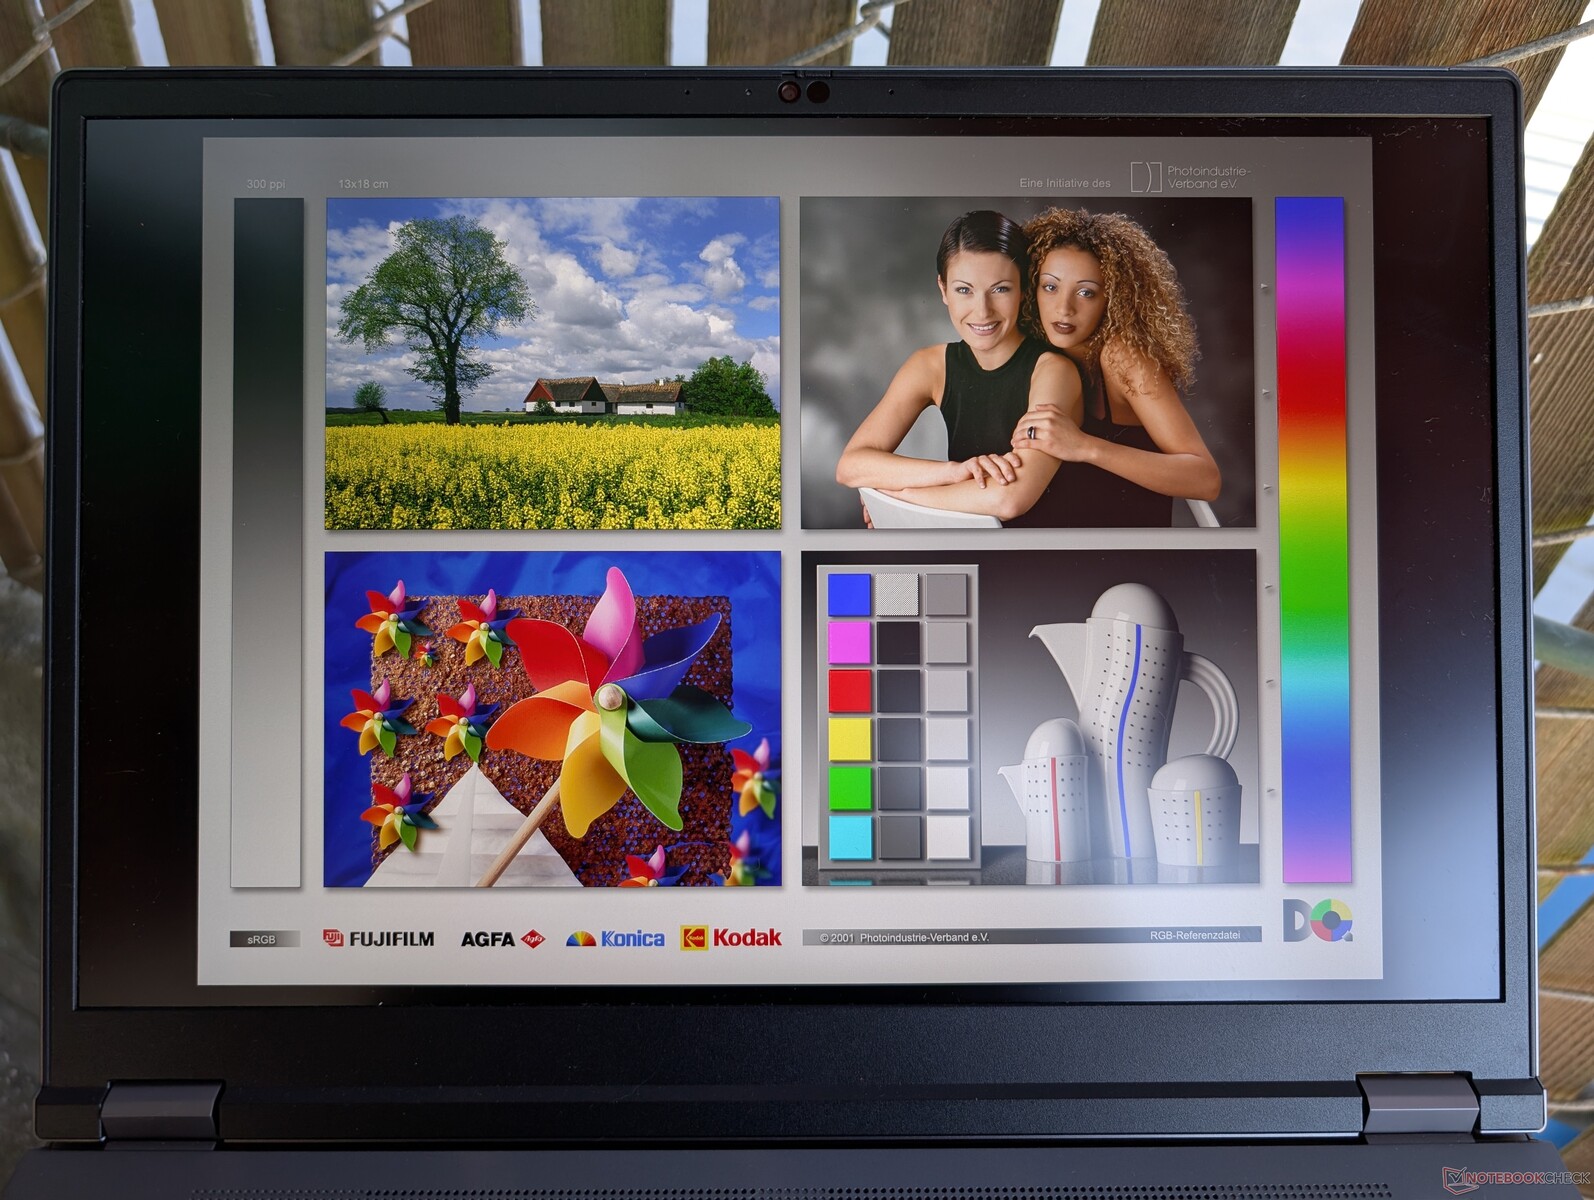
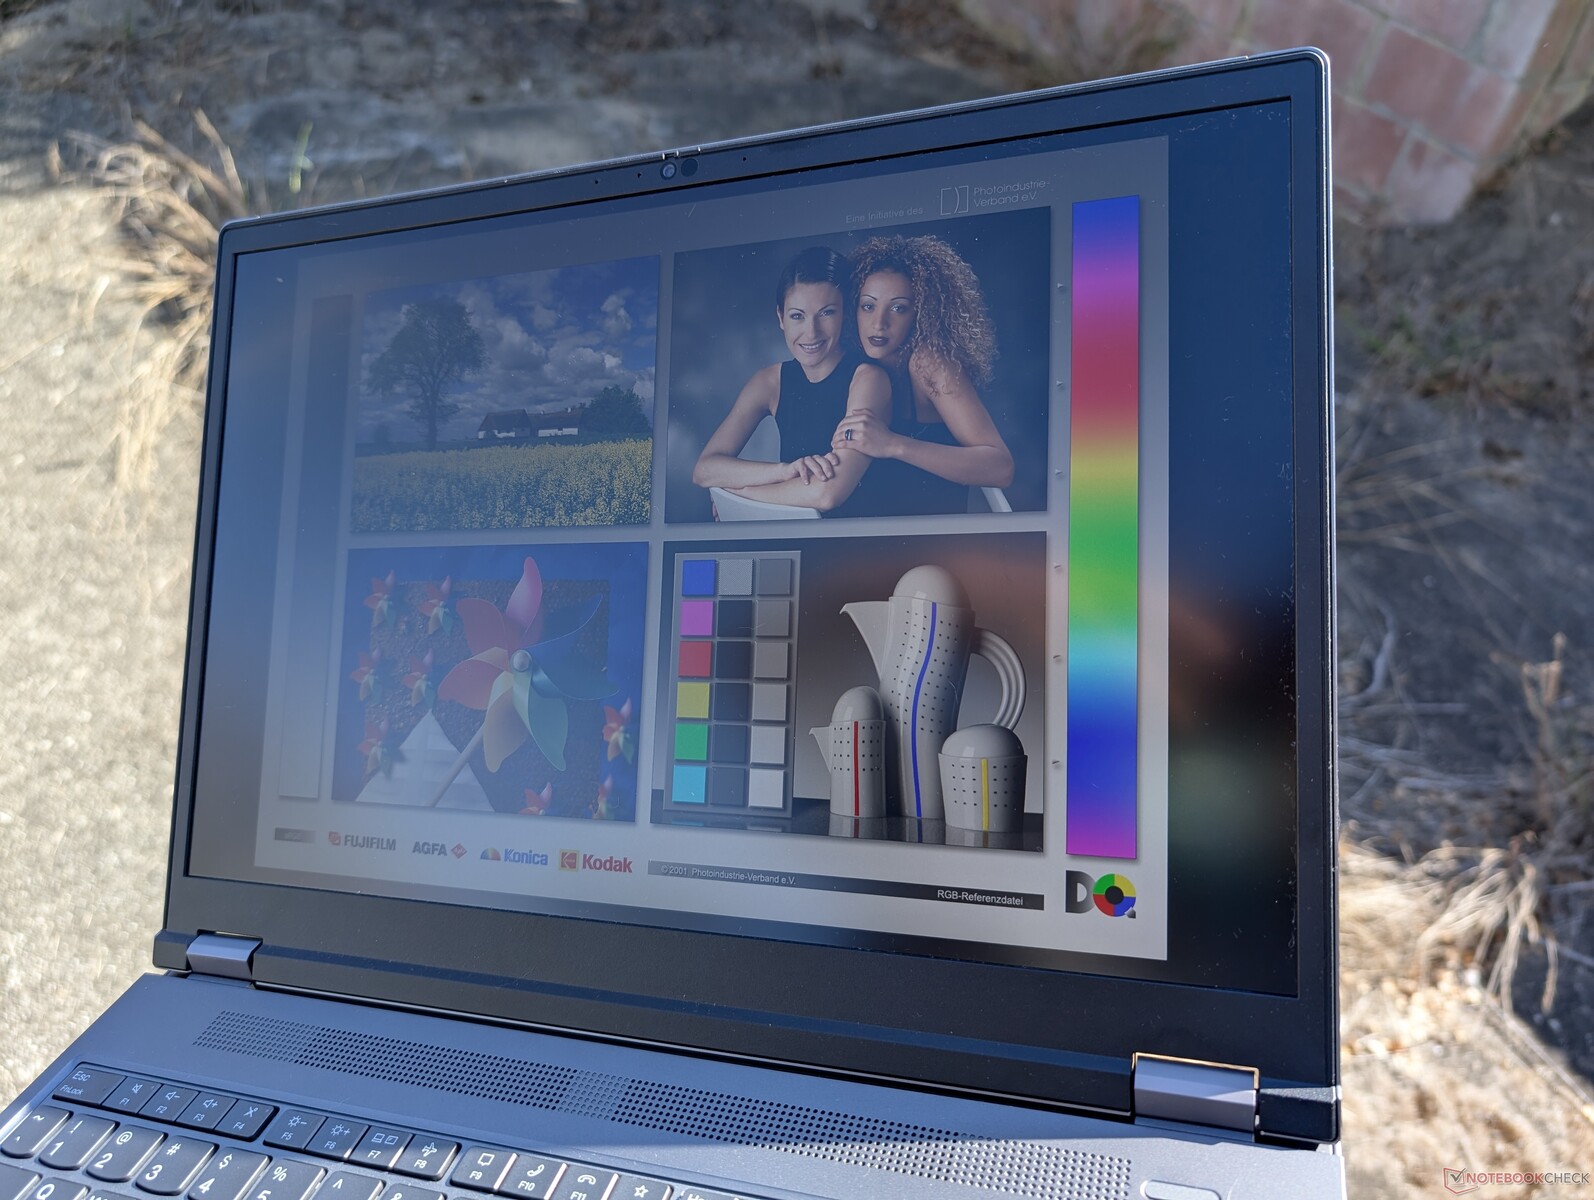
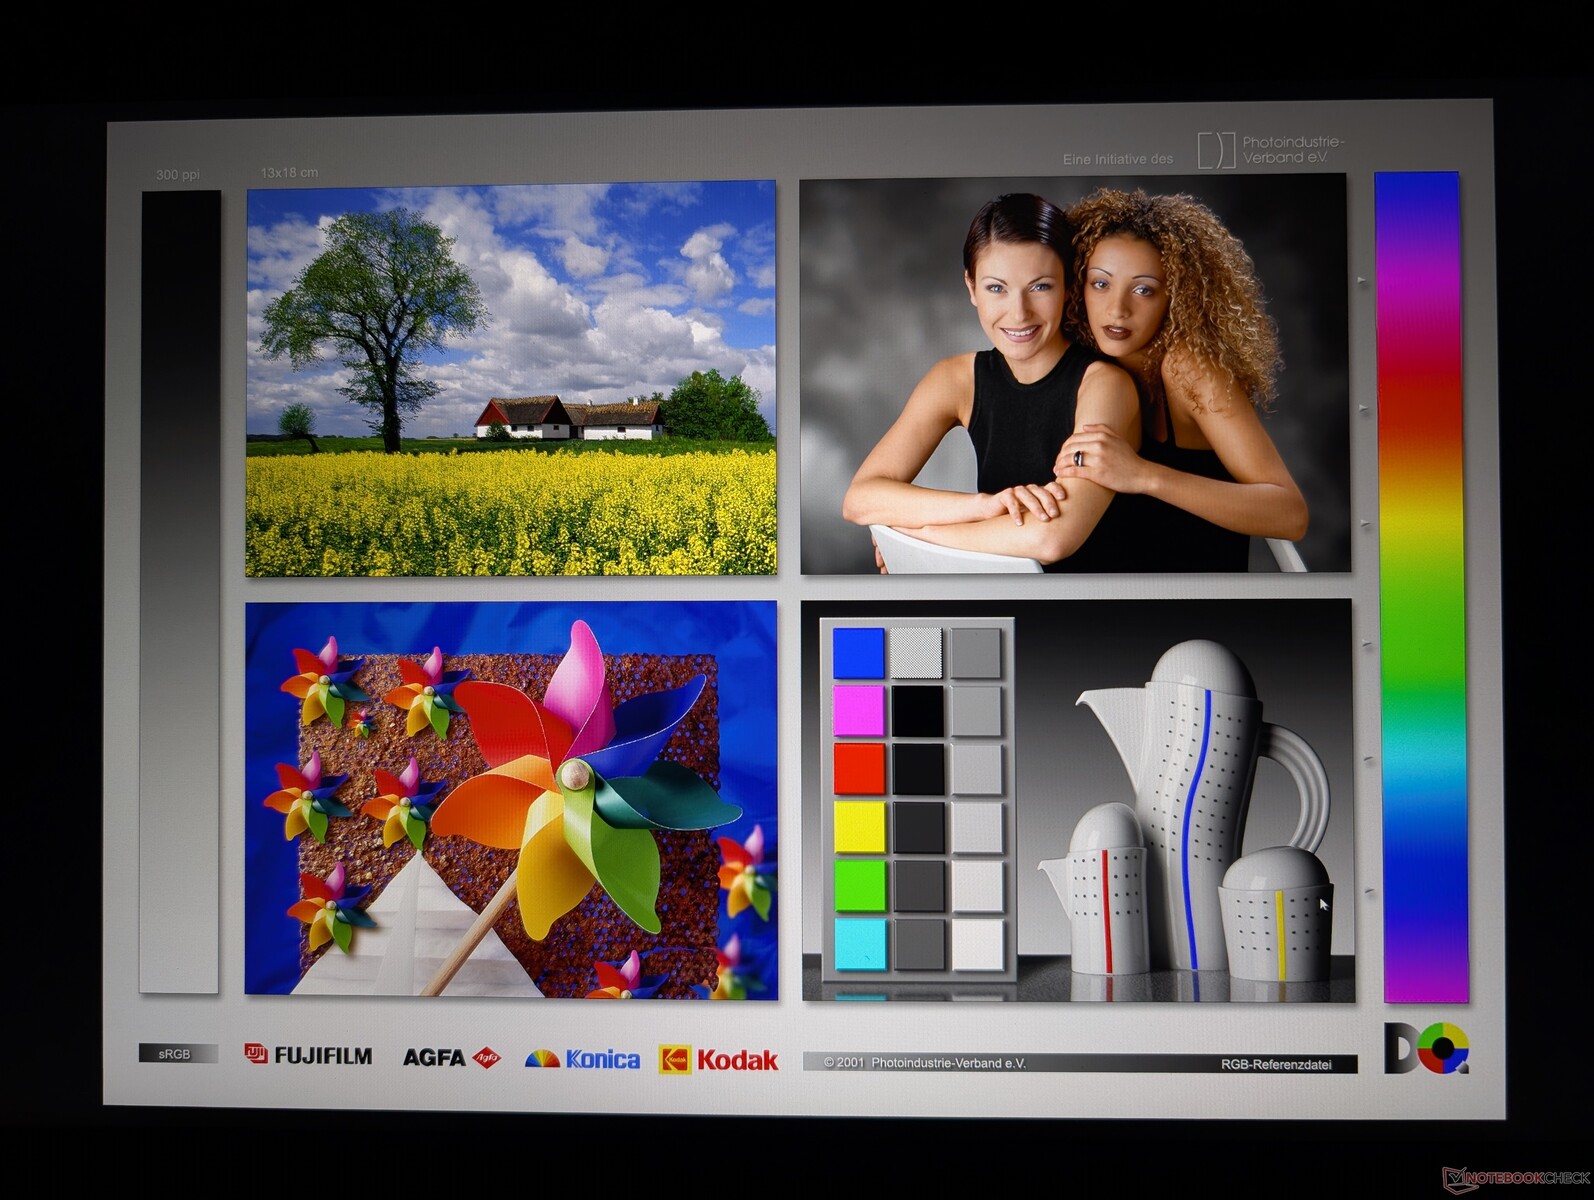
Affichage
Il est intéressant de noter que notre écran IPS 1600p165 provient d'un autre fabricant que celui de notre premier ThinkPad P16 Gen 2 (NE160QDM-NY1 vs. MNG007DA1-9). Les caractéristiques principales et la luminosité sont pratiquement identiques. D'autres options d'affichage sont disponibles, notamment l'OLED 2400p et l'IPS 1200p.


| |||||||||||||||||||||||||
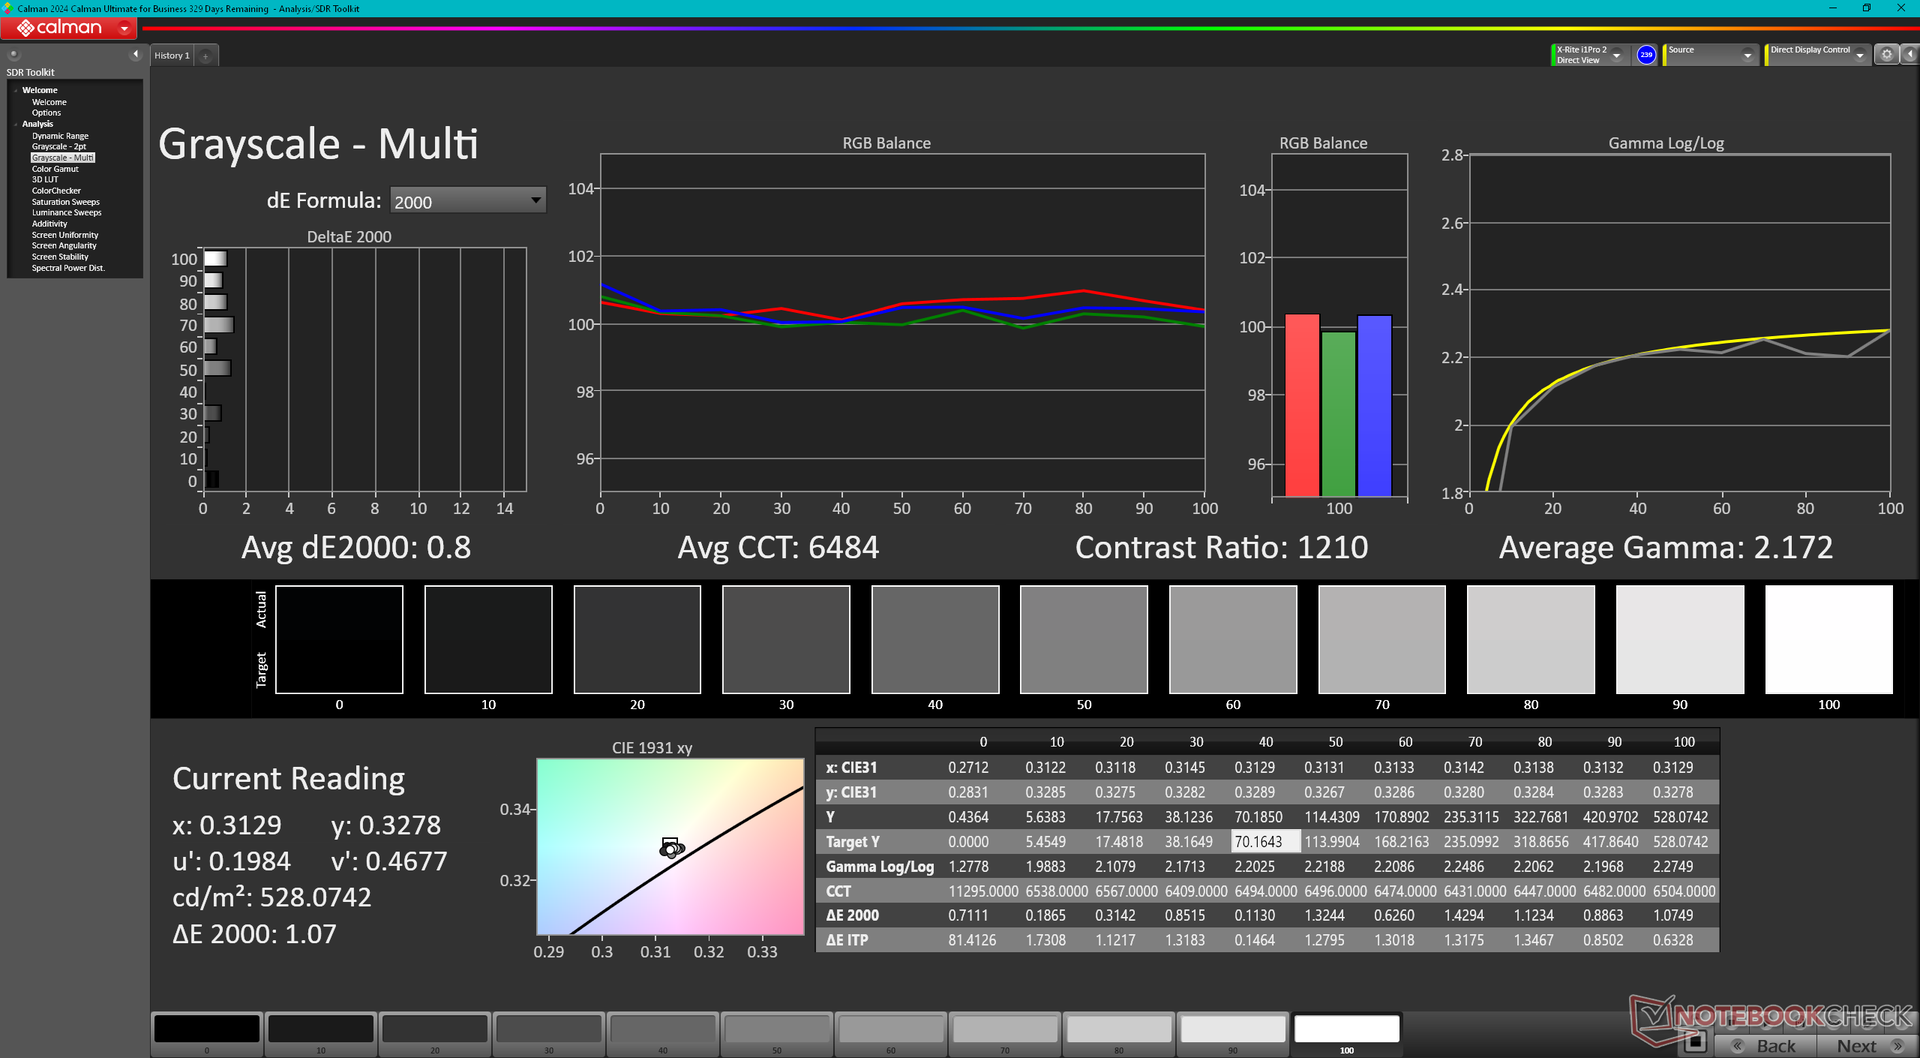
Homogénéité de la luminosité: 89 %
Valeur mesurée au centre, sur batterie: 531.5 cd/m²
Contraste: 1399:1 (Valeurs des noirs: 0.38 cd/m²)
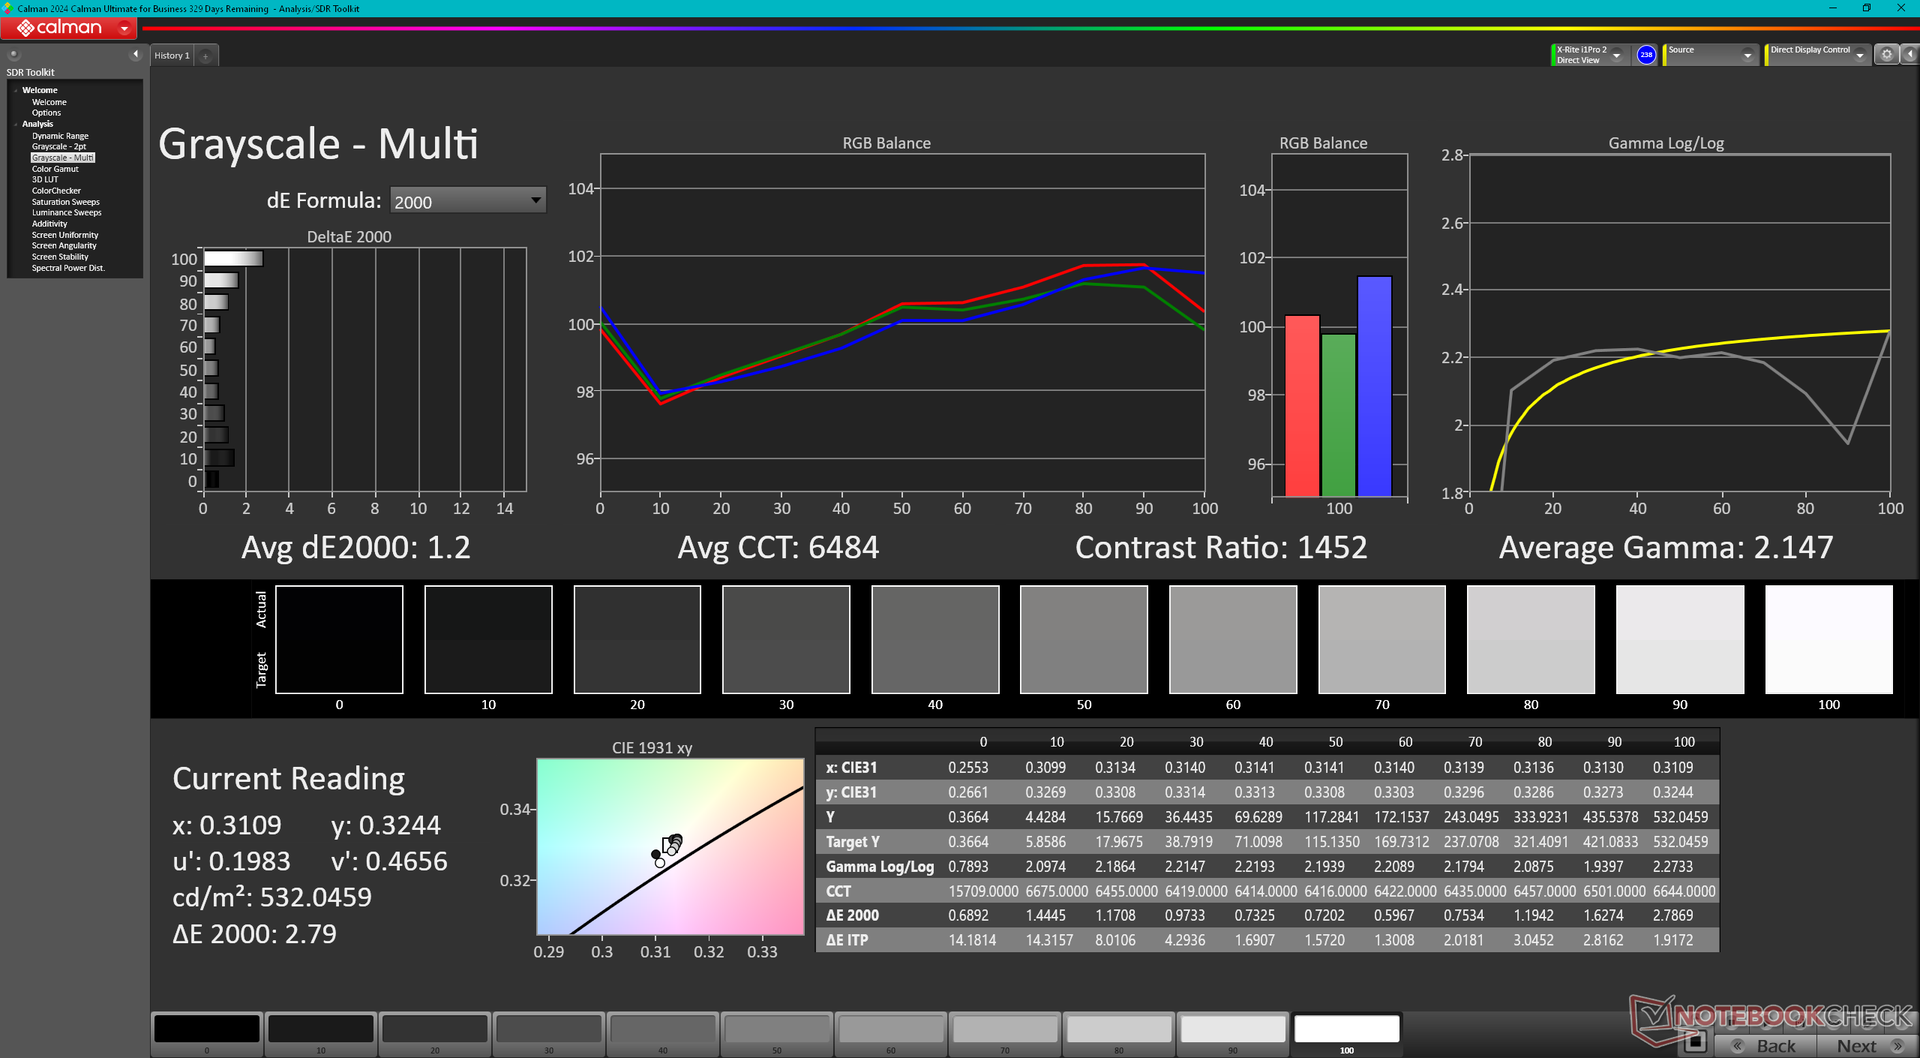
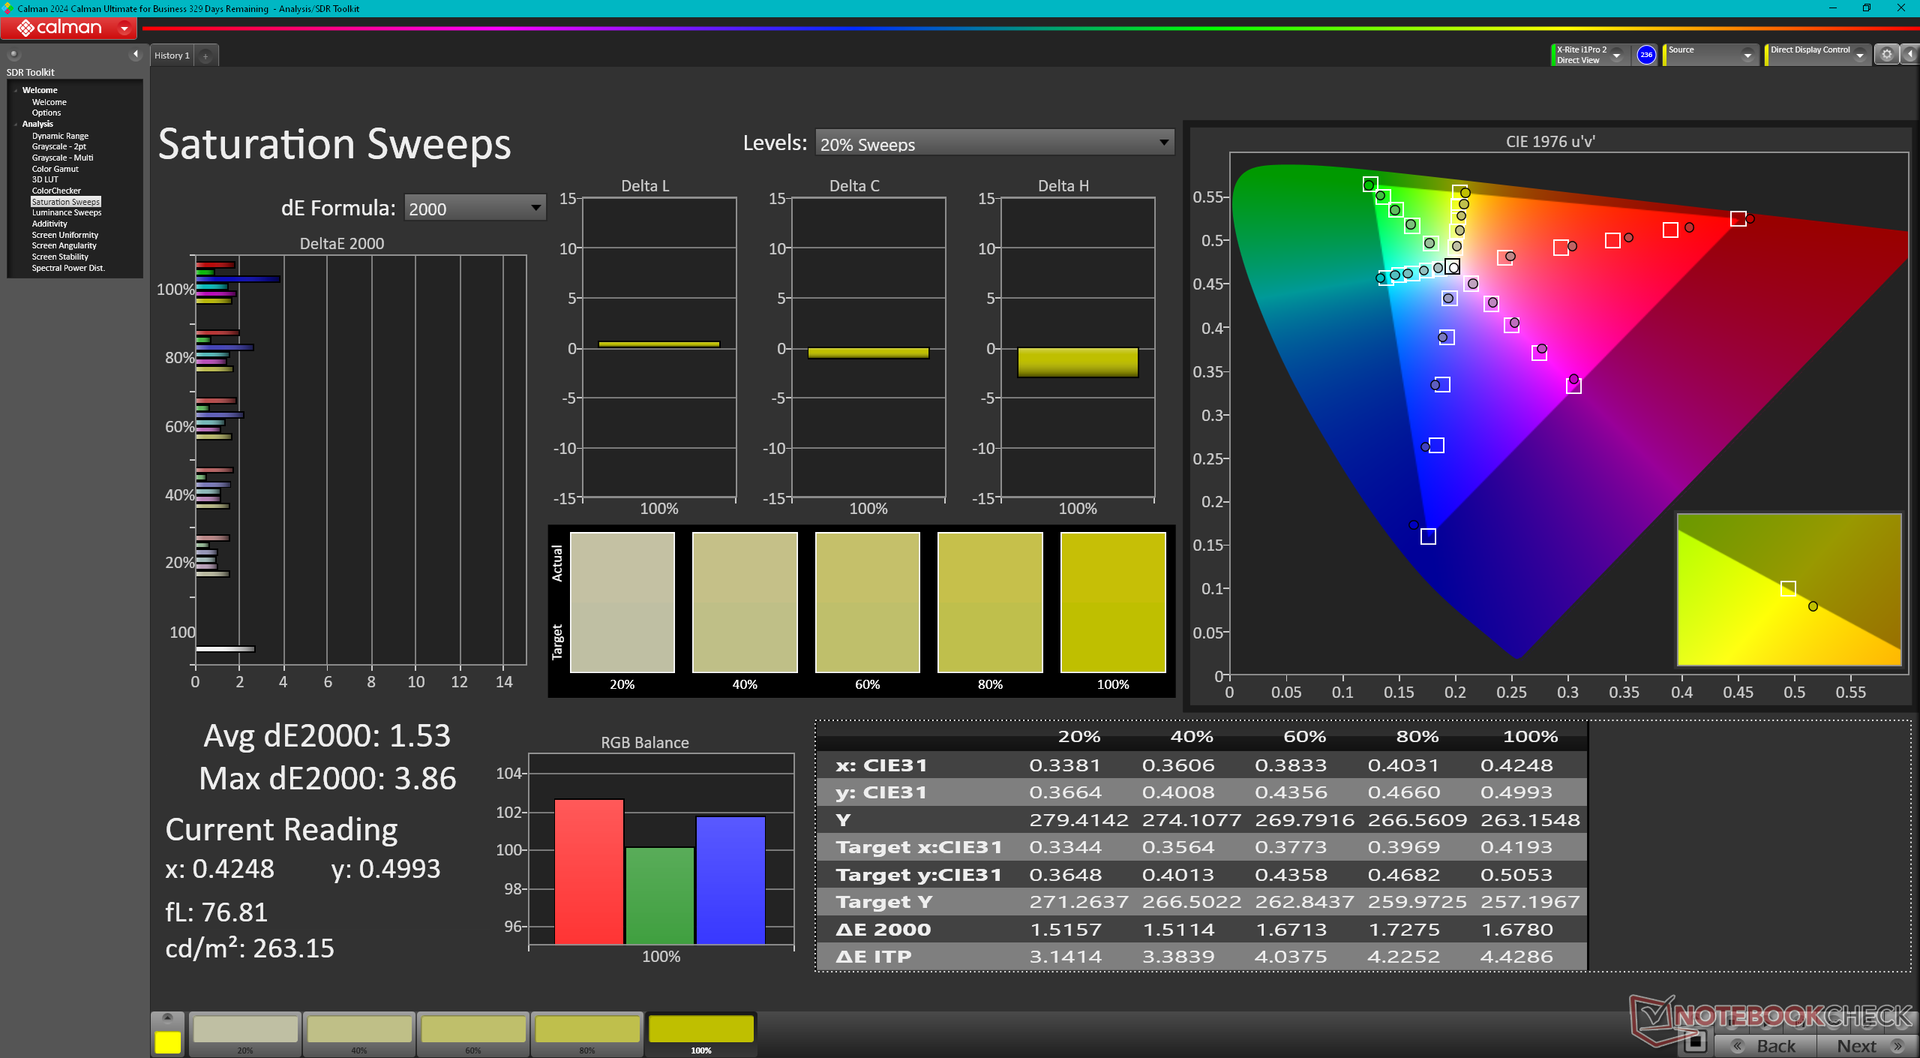
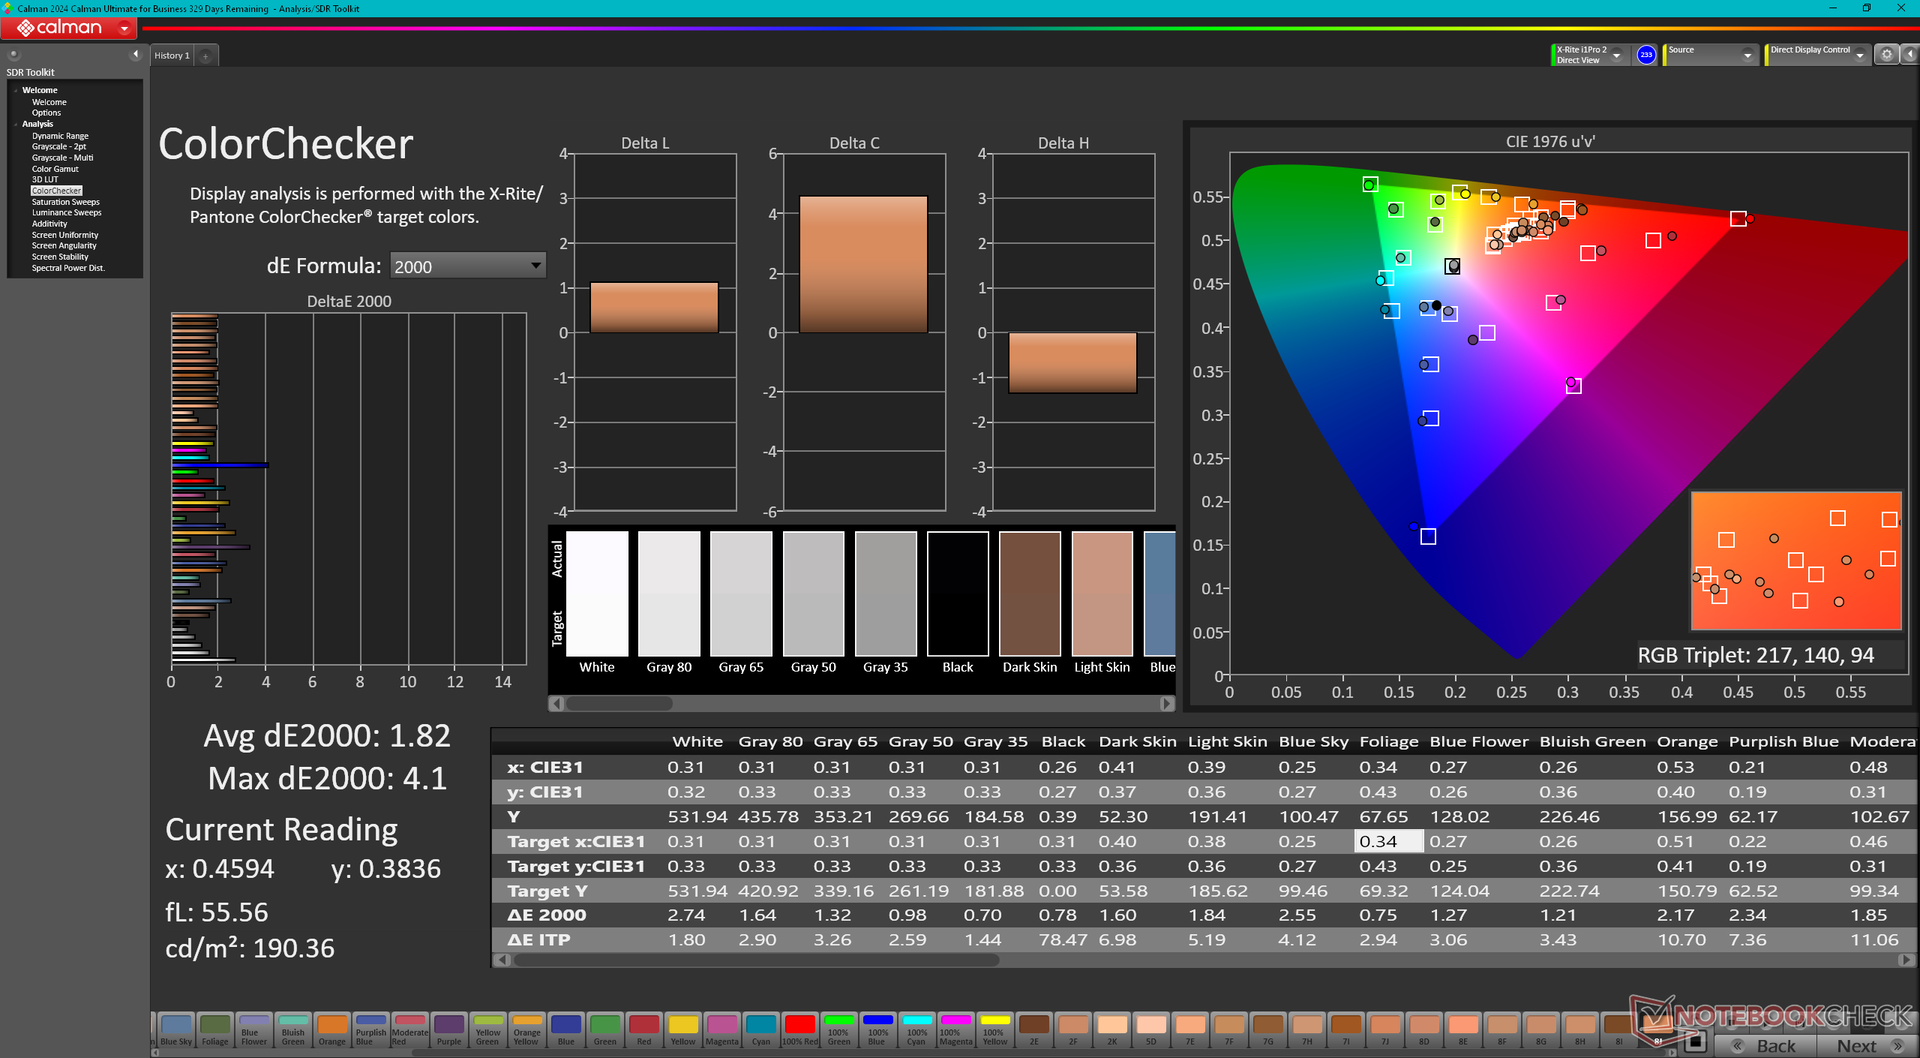
ΔE Color 1.82 | 0.5-29.43 Ø4.93, calibrated: 0.63
ΔE Greyscale 1.2 | 0.5-98 Ø5.2
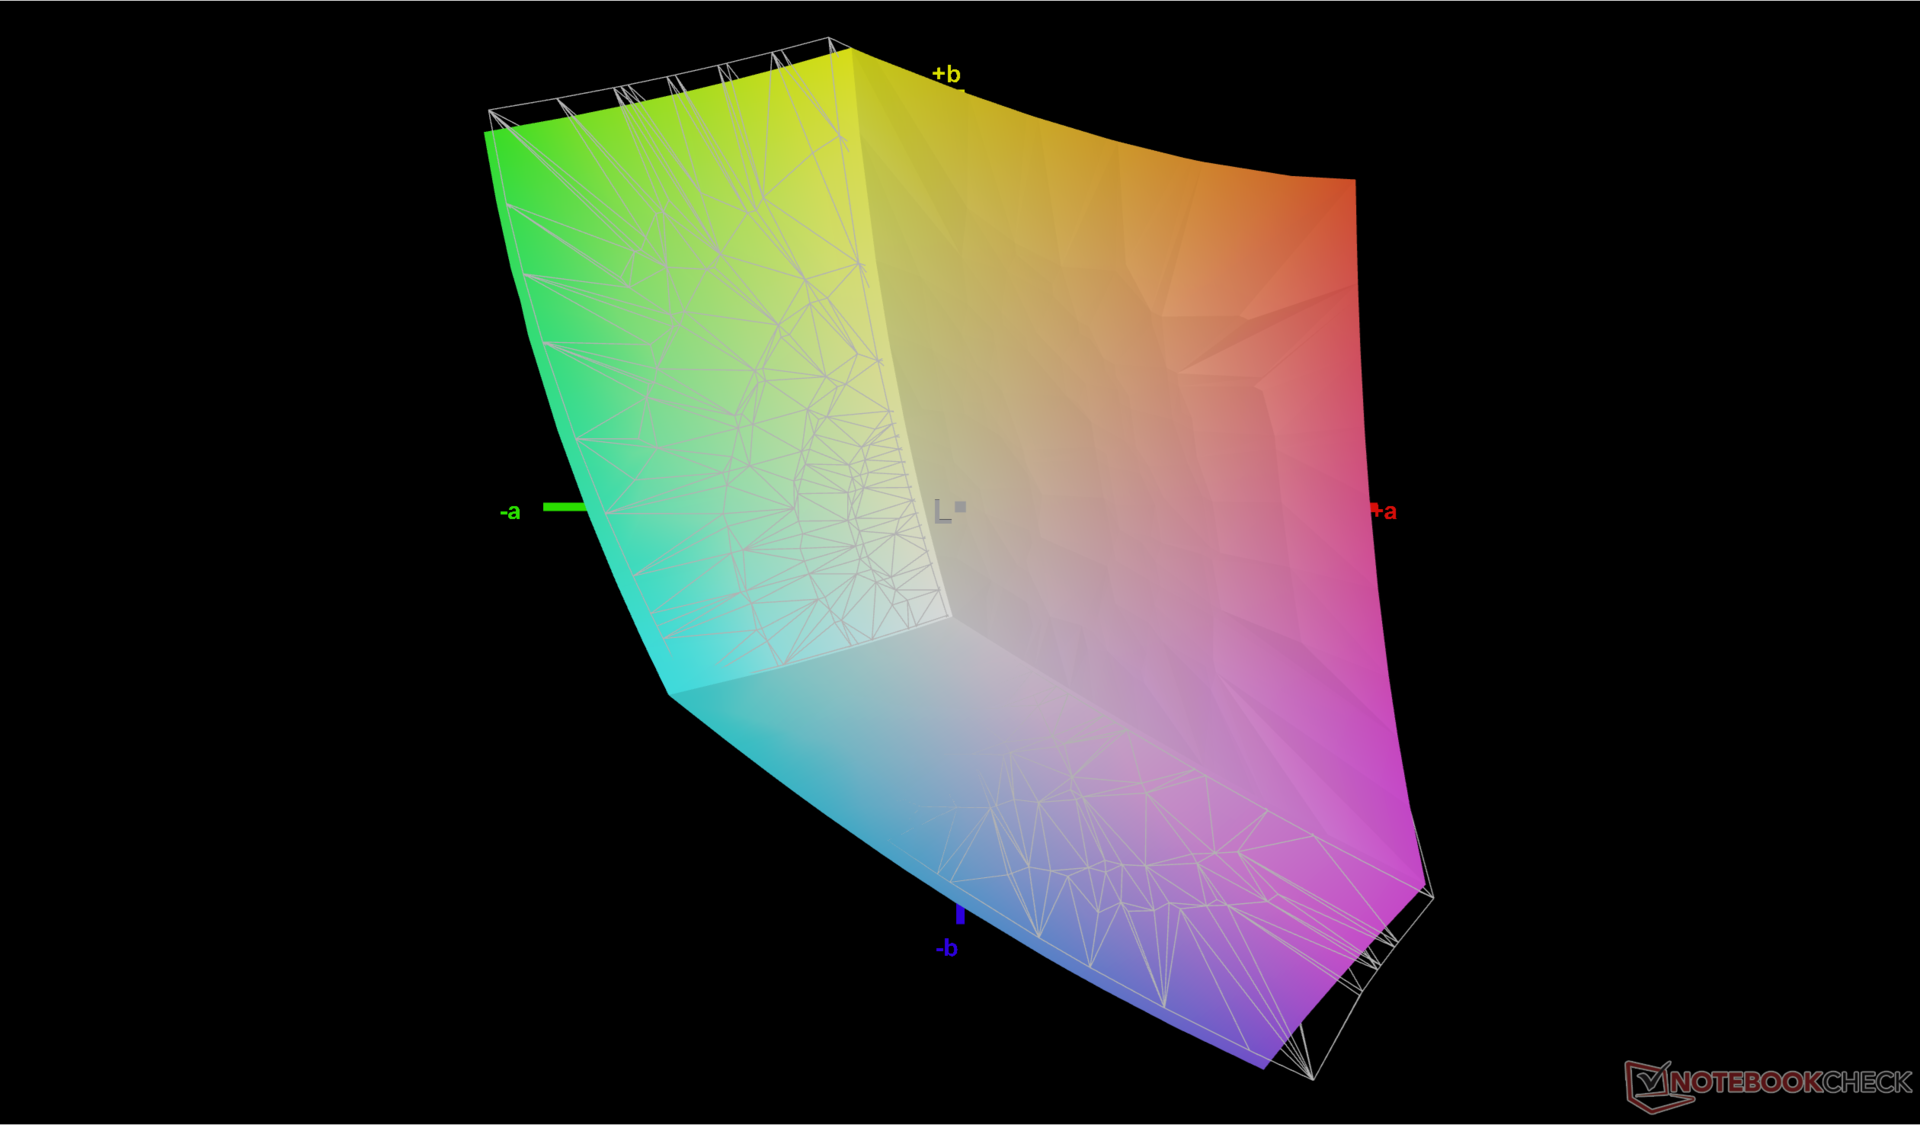
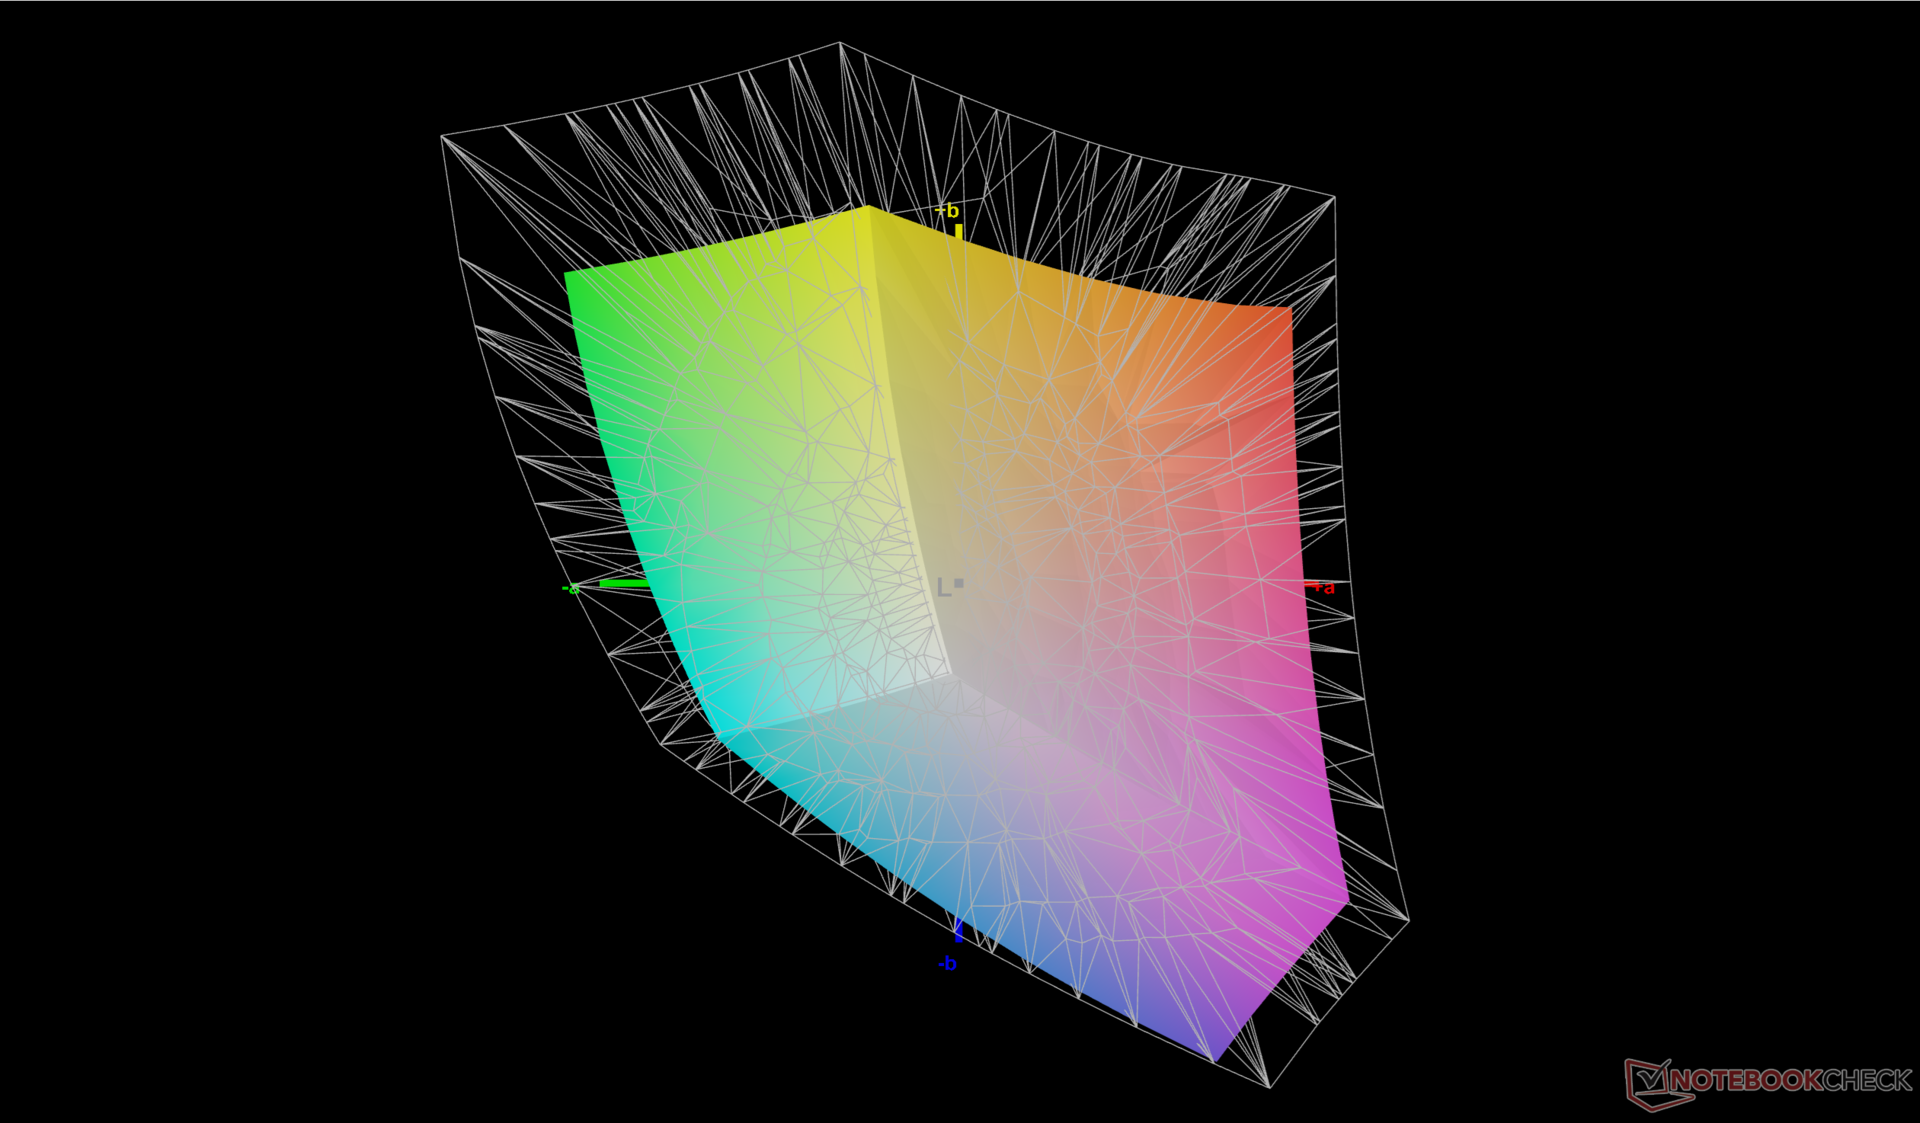
70.6% AdobeRGB 1998 (Argyll 2.2.0 3D)
96.9% sRGB (Argyll 2.2.0 3D)
68.4% Display P3 (Argyll 2.2.0 3D)
Gamma: 2.15
| Lenovo ThinkPad P16 Gen 2 NE160QDM-NY1, IPS, 2560x1600, 16", 165 Hz | Lenovo ThinkPad P16 G2 21FA000FGE MNG007DA1-9, IPS LED, 2560x1600, 16", 165 Hz | Lenovo ThinkPad P16s G2 21K9000CGE ATNA60YV04-0, OLED, 3840x2400, 16", 60 Hz | Lenovo ThinkPad P16 G1 RTX A5500 LP160UQ1-SPB1, IPS, 3840x2400, 16", 60 Hz | HP ZBook Power 16 G11 A AUOA0A9, IPS, 2560x1600, 16", 120 Hz | Dell Precision 5690 Samsung 160YV03, OLED, 3840x2400, 16", 60 Hz | |
|---|---|---|---|---|---|---|
| Display | 3% | 29% | 20% | 1% | 29% | |
| Display P3 Coverage | 68.4 | 71 4% | 99.9 46% | 82.9 21% | 69.1 1% | 99.8 46% |
| sRGB Coverage | 96.9 | 99.2 2% | 100 3% | 98.9 2% | 97.7 1% | 100 3% |
| AdobeRGB 1998 Coverage | 70.6 | 73.2 4% | 96.9 37% | 95.9 36% | 71 1% | 96.6 37% |
| Response Times | 4% | 88% | -248% | 10% | 86% | |
| Response Time Grey 50% / Grey 80% * | 14.1 ? | 12.8 ? 9% | 1.5 ? 89% | 45.6 ? -223% | 13.6 ? 4% | 1.7 ? 88% |
| Response Time Black / White * | 9.9 ? | 10.1 ? -2% | 1.3 ? 87% | 36.8 ? -272% | 8.4 ? 15% | 1.7 ? 83% |
| PWM Frequency | 60 | 60 ? | ||||
| Screen | -59% | -54% | -22% | -52% | -49% | |
| Brightness middle | 531.5 | 510 -4% | 416 -22% | 601.9 13% | 470.7 -11% | 348.1 -35% |
| Brightness | 499 | 517 4% | 421 -16% | 569 14% | 431 -14% | 351 -30% |
| Brightness Distribution | 89 | 89 0% | 98 10% | 77 -13% | 88 -1% | 97 9% |
| Black Level * | 0.38 | 0.37 3% | 0.47 -24% | 0.57 -50% | ||
| Contrast | 1399 | 1378 -2% | 1281 -8% | 826 -41% | ||
| Colorchecker dE 2000 * | 1.82 | 2.6 -43% | 1.3 29% | 2.45 -35% | 2.16 -19% | 4.18 -130% |
| Colorchecker dE 2000 max. * | 4.1 | 5.2 -27% | 2.8 32% | 4.46 -9% | 4.39 -7% | 6.68 -63% |
| Colorchecker dE 2000 calibrated * | 0.63 | 2.3 -265% | 2.9 -360% | 1.37 -117% | 0.97 -54% | |
| Greyscale dE 2000 * | 1.2 | 3.6 -200% | 1.8 -50% | 2.6 -117% | 3.7 -208% | 1.7 -42% |
| Gamma | 2.15 102% | 2.26 97% | 2.25 98% | 2.3 96% | 2.38 92% | 2.2 100% |
| CCT | 6484 100% | 5969 109% | 6574 99% | 6805 96% | 6765 96% | 6198 105% |
| Moyenne finale (programmes/paramètres) | -17% /
-37% | 21% /
-10% | -83% /
-47% | -14% /
-32% | 22% /
-7% |
* ... Moindre est la valeur, meilleures sont les performances
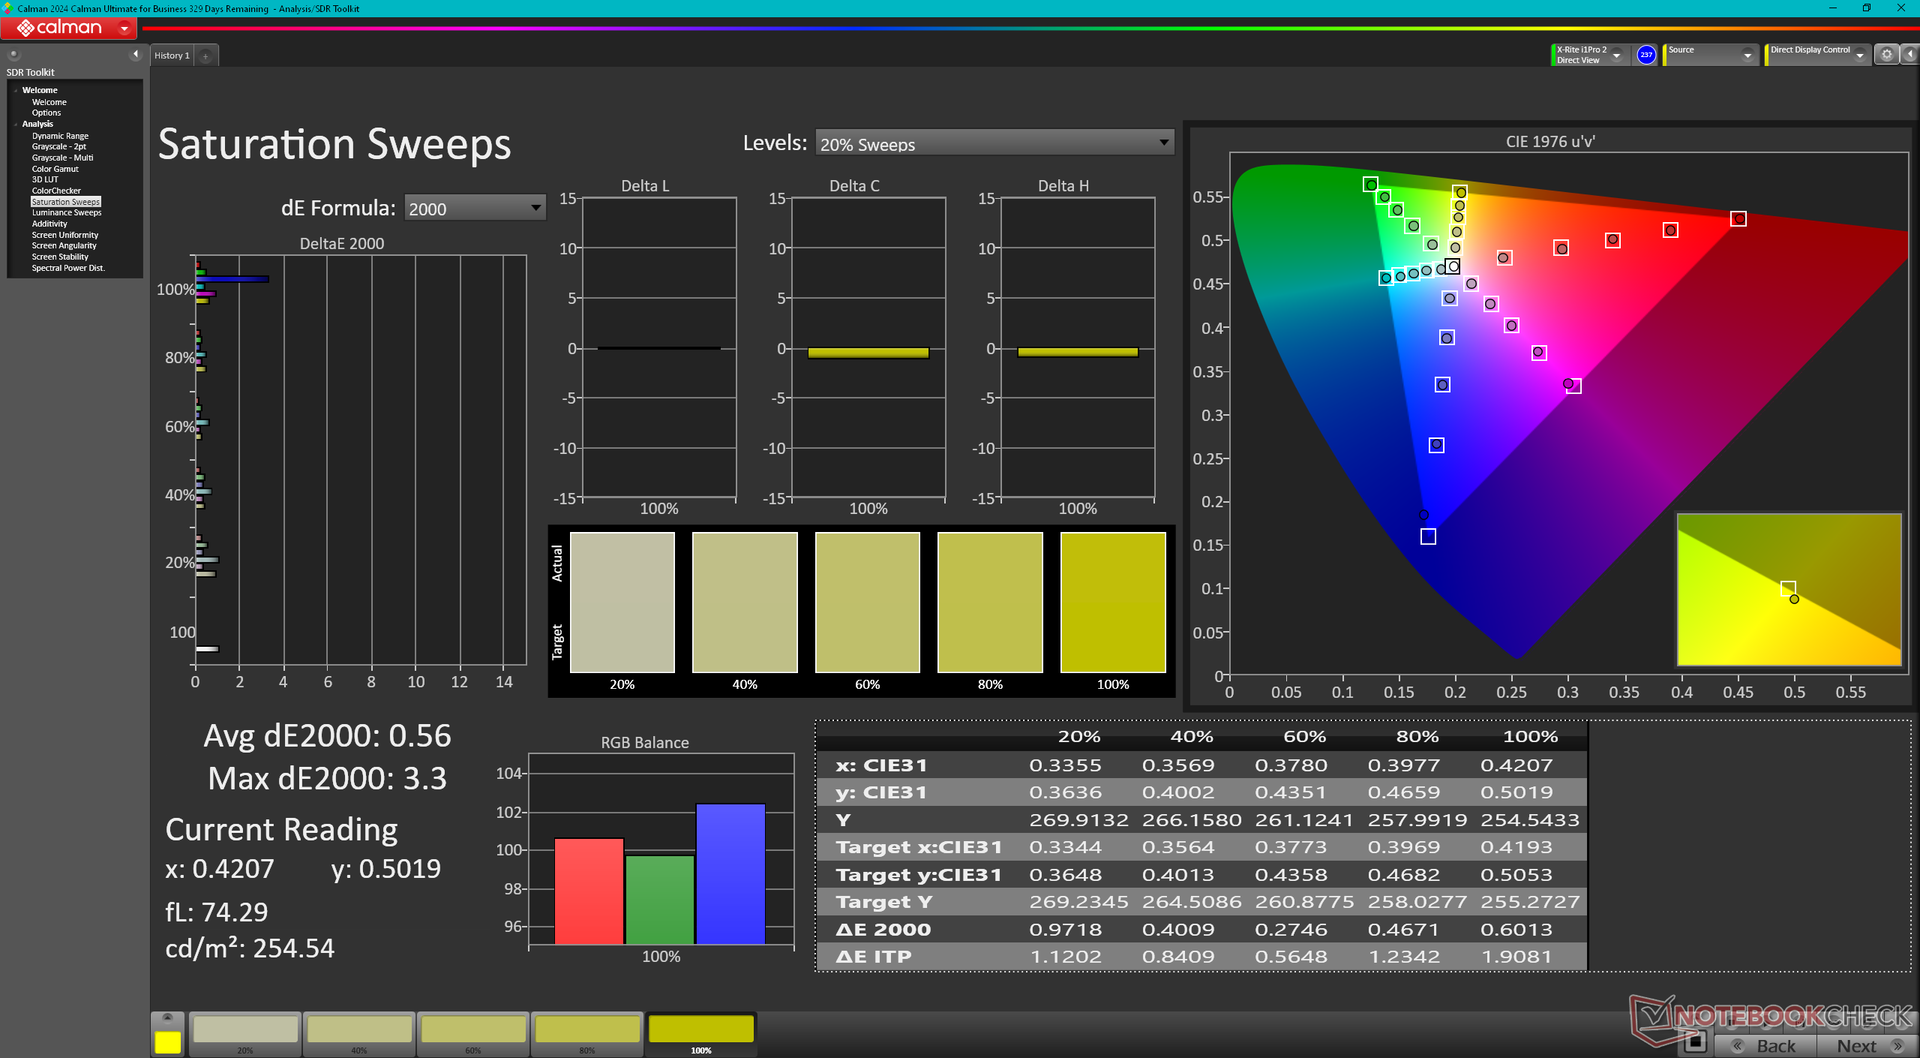
L'écran est préétalonné par rapport à la norme sRGB avec des valeurs moyennes de deltaE en niveaux de gris de seulement 1,2 et 1,82, respectivement. Un étalonnage par l'utilisateur final n'est donc pas nécessaire dans la plupart des cas.

Temps de réponse de l'écran
| ↔ Temps de réponse noir à blanc | ||
|---|---|---|
| 9.9 ms ... hausse ↗ et chute ↘ combinées | ↗ 5 ms hausse | 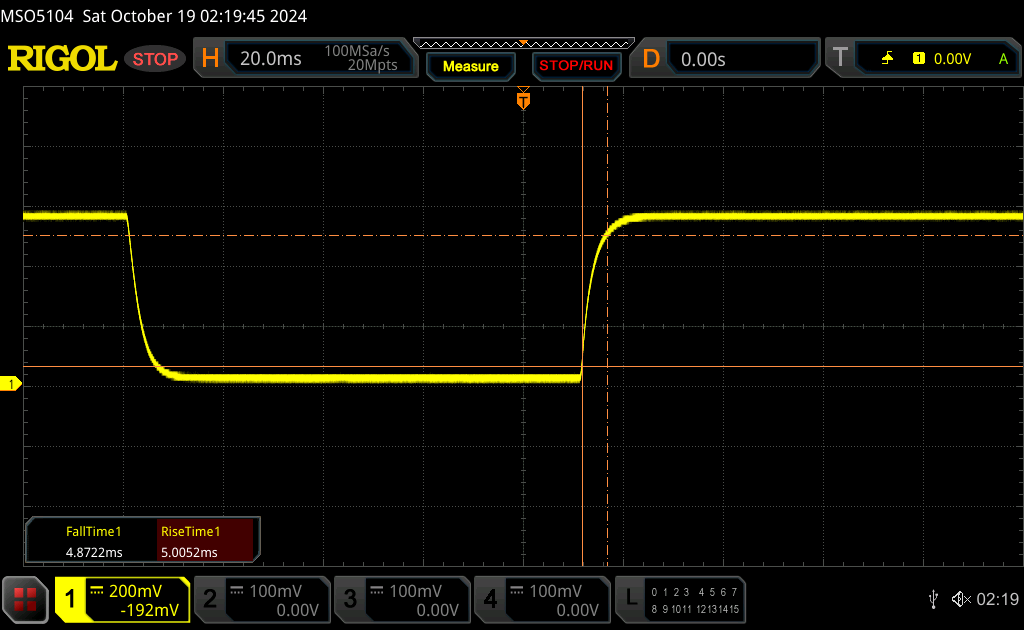 |
| ↘ 4.9 ms chute | ||
| L'écran montre de faibles temps de réponse, un bon écran pour jouer. En comparaison, tous les appareils testés affichent entre 0.1 (minimum) et 240 (maximum) ms. » 23 % des appareils testés affichent de meilleures performances. Cela signifie que les latences relevées sont meilleures que la moyenne (21 ms) de tous les appareils testés. | ||
| ↔ Temps de réponse gris 50% à gris 80% | ||
| 14.1 ms ... hausse ↗ et chute ↘ combinées | ↗ 6.7 ms hausse | 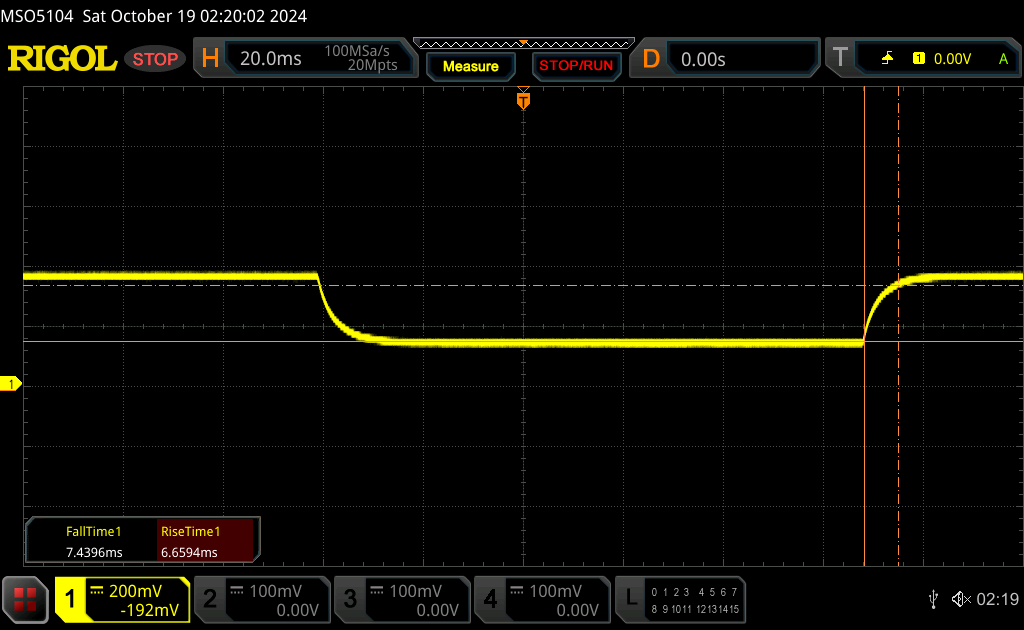 |
| ↘ 7.4 ms chute | ||
| L'écran montre de bons temps de réponse, mais insuffisant pour du jeu compétitif. En comparaison, tous les appareils testés affichent entre 0.165 (minimum) et 636 (maximum) ms. » 24 % des appareils testés affichent de meilleures performances. Cela signifie que les latences relevées sont meilleures que la moyenne (33 ms) de tous les appareils testés. | ||
Scintillement / MLI (Modulation de largeur d'impulsion)
| Scintillement / MLI (Modulation de largeur d'impulsion) non décelé |  | ||
En comparaison, 53 % des appareils testés n'emploient pas MDI pour assombrir leur écran. Nous avons relevé une moyenne à 8782 (minimum : 5 - maximum : 343500) Hz dans le cas où une MDI était active. | |||

Performance
Conditions d'essai
Nous avons réglé Windows sur le mode Performance et le GPU sur le mode discret avant d'effectuer les tests ci-dessous. Le système ne prend pas en charge Advanced Optimus selon le panneau de configuration Nvidia.
Processeur
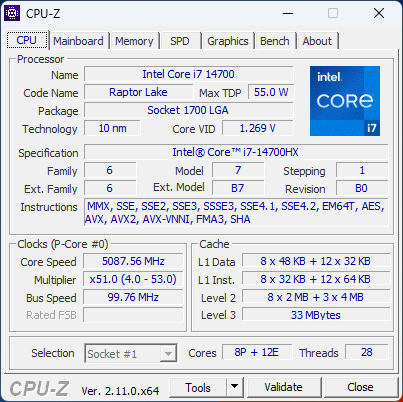
Le Core i7-14700HX est une amélioration notable par rapport au Core i7-13700HX avec une augmentation de 20 à 25 % des performances multithread. Les UGS dotées du Core i9-13980HX sont encore disponibles et peuvent offrir des performances encore plus rapides que notre Core I7-14700HX, bien qu'il s'agisse d'un processeur plus ancien.
La durabilité des performances est bonne, mais elle pourrait être meilleure. Lors de l'exécution en boucle de CineBench R15 xT, par exemple, notre score initial de 3930 points chutait de 10 % après seulement quelques boucles.
Cinebench R15 Multi Loop
Cinebench R23: Multi Core | Single Core
Cinebench R20: CPU (Multi Core) | CPU (Single Core)
Cinebench R15: CPU Multi 64Bit | CPU Single 64Bit
Blender: v2.79 BMW27 CPU
7-Zip 18.03: 7z b 4 | 7z b 4 -mmt1
Geekbench 6.3: Multi-Core | Single-Core
Geekbench 5.5: Multi-Core | Single-Core
HWBOT x265 Benchmark v2.2: 4k Preset
LibreOffice : 20 Documents To PDF
R Benchmark 2.5: Overall mean
| CPU Performance Rating | |
| HP ZBook Fury 16 G11 | |
| Lenovo ThinkPad P16 Gen 2 | |
| Moyenne Intel Core i7-14700HX | |
| Lenovo ThinkPad P16 G1 RTX A5500 -2! | |
| Lenovo ThinkPad P1 G6 21FV001KUS | |
| Lenovo ThinkPad P16 G2 21FA000FGE -2! | |
| Dell Precision 5690 | |
| Lenovo ThinkPad P1 G6-21FV000DGE | |
| Lenovo ThinkPad P1 Gen 7 21KV001SGE | |
| HP ZBook Fury 16 G9 -2! | |
| Moyenne de la classe Workstation | |
| HP ZBook Power 16 G11 A | |
| MSI CreatorPro Z16P B12UKST -2! | |
| Lenovo ThinkPad P16v G1 AMD | |
| Lenovo ThinkPad P16s G2 21K9000CGE | |
| HP ZBook Firefly 16 G9-6B897EA -2! | |
| Geekbench 6.3 / Multi-Core | |
| Lenovo ThinkPad P16 Gen 2 | |
| Moyenne Intel Core i7-14700HX (14807 - 17562, n=7) | |
| HP ZBook Fury 16 G11 | |
| Dell Precision 5690 | |
| Moyenne de la classe Workstation (10200 - 16326, n=19, 2 dernières années) | |
| Lenovo ThinkPad P1 Gen 7 21KV001SGE | |
| Lenovo ThinkPad P1 G6 21FV001KUS | |
| HP ZBook Power 16 G11 A | |
| Lenovo ThinkPad P1 G6-21FV000DGE | |
| Lenovo ThinkPad P16s G2 21K9000CGE | |
| Lenovo ThinkPad P16v G1 AMD | |
| Geekbench 6.3 / Single-Core | |
| HP ZBook Fury 16 G11 | |
| Lenovo ThinkPad P16 Gen 2 | |
| Lenovo ThinkPad P1 G6 21FV001KUS | |
| Moyenne Intel Core i7-14700HX (2378 - 2975, n=7) | |
| Lenovo ThinkPad P1 G6-21FV000DGE | |
| HP ZBook Power 16 G11 A | |
| Moyenne de la classe Workstation (2352 - 2949, n=19, 2 dernières années) | |
| Lenovo ThinkPad P16v G1 AMD | |
| Dell Precision 5690 | |
| Lenovo ThinkPad P16s G2 21K9000CGE | |
| Lenovo ThinkPad P1 Gen 7 21KV001SGE | |
Cinebench R23: Multi Core | Single Core
Cinebench R20: CPU (Multi Core) | CPU (Single Core)
Cinebench R15: CPU Multi 64Bit | CPU Single 64Bit
Blender: v2.79 BMW27 CPU
7-Zip 18.03: 7z b 4 | 7z b 4 -mmt1
Geekbench 6.3: Multi-Core | Single-Core
Geekbench 5.5: Multi-Core | Single-Core
HWBOT x265 Benchmark v2.2: 4k Preset
LibreOffice : 20 Documents To PDF
R Benchmark 2.5: Overall mean
* ... Moindre est la valeur, meilleures sont les performances
AIDA64: FP32 Ray-Trace | FPU Julia | CPU SHA3 | CPU Queen | FPU SinJulia | FPU Mandel | CPU AES | CPU ZLib | FP64 Ray-Trace | CPU PhotoWorxx
| Performance Rating | |
| Lenovo ThinkPad P16 Gen 2 | |
| Moyenne Intel Core i7-14700HX | |
| HP ZBook Power 16 G11 A | |
| Lenovo ThinkPad P16s G2 21K9000CGE | |
| Dell Precision 5690 | |
| Lenovo ThinkPad P16 G1 RTX A5500 | |
| Lenovo ThinkPad P16 G2 21FA000FGE | |
| AIDA64 / FP32 Ray-Trace | |
| HP ZBook Power 16 G11 A | |
| Lenovo ThinkPad P16s G2 21K9000CGE | |
| Moyenne Intel Core i7-14700HX (16932 - 23676, n=7) | |
| Lenovo ThinkPad P16 Gen 2 | |
| Dell Precision 5690 | |
| Lenovo ThinkPad P16 G2 21FA000FGE | |
| Lenovo ThinkPad P16 G1 RTX A5500 | |
| AIDA64 / FPU Julia | |
| HP ZBook Power 16 G11 A | |
| Lenovo ThinkPad P16 Gen 2 | |
| Moyenne Intel Core i7-14700HX (86338 - 116556, n=7) | |
| Lenovo ThinkPad P16s G2 21K9000CGE | |
| Dell Precision 5690 | |
| Lenovo ThinkPad P16 G2 21FA000FGE | |
| Lenovo ThinkPad P16 G1 RTX A5500 | |
| AIDA64 / CPU SHA3 | |
| Lenovo ThinkPad P16 Gen 2 | |
| Moyenne Intel Core i7-14700HX (4008 - 5567, n=7) | |
| HP ZBook Power 16 G11 A | |
| Lenovo ThinkPad P16s G2 21K9000CGE | |
| Dell Precision 5690 | |
| Lenovo ThinkPad P16 G2 21FA000FGE | |
| Lenovo ThinkPad P16 G1 RTX A5500 | |
| AIDA64 / CPU Queen | |
| Lenovo ThinkPad P16 Gen 2 | |
| Moyenne Intel Core i7-14700HX (129836 - 152200, n=7) | |
| HP ZBook Power 16 G11 A | |
| Lenovo ThinkPad P16 G2 21FA000FGE | |
| Lenovo ThinkPad P16 G1 RTX A5500 | |
| Lenovo ThinkPad P16s G2 21K9000CGE | |
| Dell Precision 5690 | |
| AIDA64 / FPU SinJulia | |
| HP ZBook Power 16 G11 A | |
| Lenovo ThinkPad P16s G2 21K9000CGE | |
| Lenovo ThinkPad P16 Gen 2 | |
| Moyenne Intel Core i7-14700HX (11704 - 14434, n=7) | |
| Lenovo ThinkPad P16 G1 RTX A5500 | |
| Lenovo ThinkPad P16 G2 21FA000FGE | |
| Dell Precision 5690 | |
| AIDA64 / FPU Mandel | |
| HP ZBook Power 16 G11 A | |
| Lenovo ThinkPad P16s G2 21K9000CGE | |
| Lenovo ThinkPad P16 Gen 2 | |
| Moyenne Intel Core i7-14700HX (42125 - 58380, n=7) | |
| Dell Precision 5690 | |
| Lenovo ThinkPad P16 G1 RTX A5500 | |
| Lenovo ThinkPad P16 G2 21FA000FGE | |
| AIDA64 / CPU AES | |
| Lenovo ThinkPad P16 Gen 2 | |
| Moyenne Intel Core i7-14700HX (82161 - 113157, n=7) | |
| Dell Precision 5690 | |
| Lenovo ThinkPad P16 G2 21FA000FGE | |
| Lenovo ThinkPad P16 G1 RTX A5500 | |
| HP ZBook Power 16 G11 A | |
| Lenovo ThinkPad P16s G2 21K9000CGE | |
| AIDA64 / CPU ZLib | |
| Lenovo ThinkPad P16 Gen 2 | |
| Moyenne Intel Core i7-14700HX (1177 - 1682, n=7) | |
| Dell Precision 5690 | |
| Lenovo ThinkPad P16 G1 RTX A5500 | |
| Lenovo ThinkPad P16 G2 21FA000FGE | |
| HP ZBook Power 16 G11 A | |
| Lenovo ThinkPad P16s G2 21K9000CGE | |
| AIDA64 / FP64 Ray-Trace | |
| HP ZBook Power 16 G11 A | |
| Lenovo ThinkPad P16s G2 21K9000CGE | |
| Moyenne Intel Core i7-14700HX (9029 - 12928, n=7) | |
| Lenovo ThinkPad P16 Gen 2 | |
| Lenovo ThinkPad P16 G1 RTX A5500 | |
| Lenovo ThinkPad P16 G2 21FA000FGE | |
| Dell Precision 5690 | |
| AIDA64 / CPU PhotoWorxx | |
| Dell Precision 5690 | |
| Moyenne Intel Core i7-14700HX (39151 - 49671, n=7) | |
| Lenovo ThinkPad P16 G1 RTX A5500 | |
| HP ZBook Power 16 G11 A | |
| Lenovo ThinkPad P16 Gen 2 | |
| Lenovo ThinkPad P16s G2 21K9000CGE | |
| Lenovo ThinkPad P16 G2 21FA000FGE | |
Test de stress
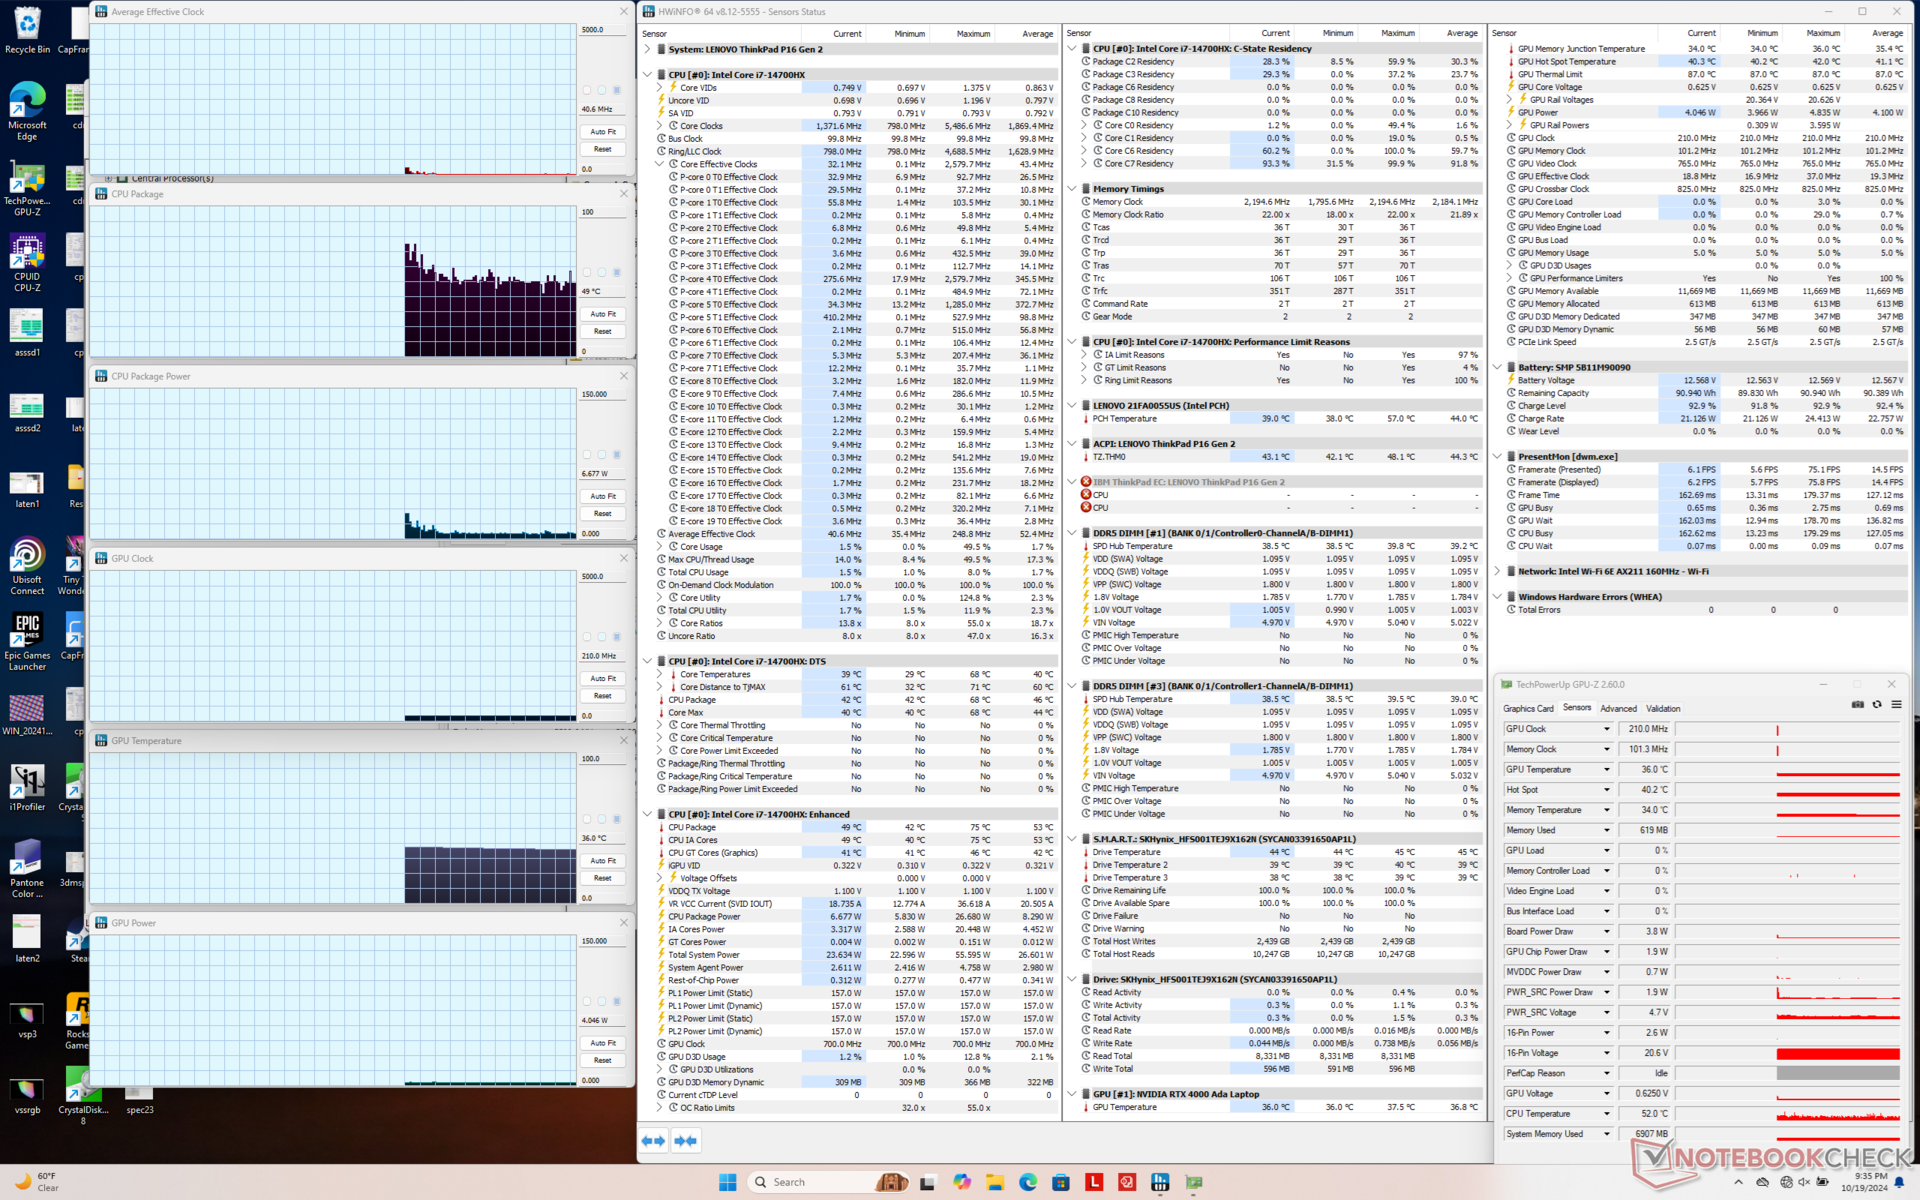
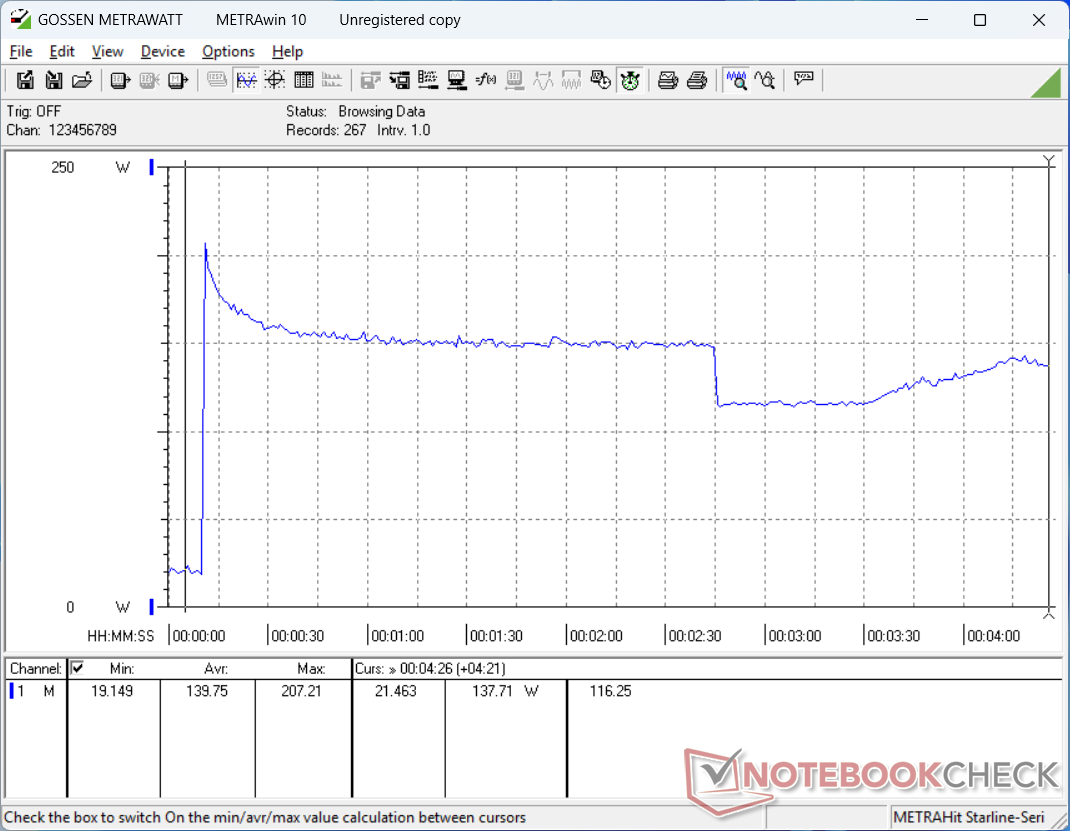
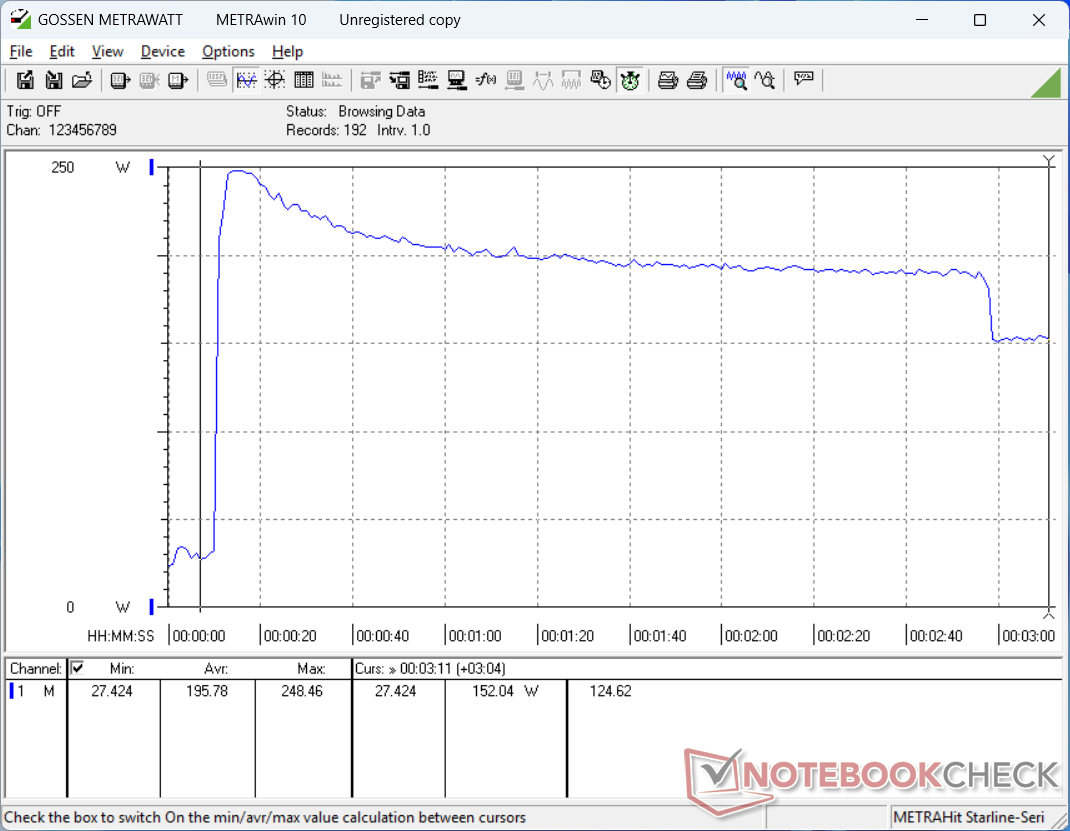
Les températures du cœur sont assez élevées lorsque le système est sollicité, ce qui entraîne des températures de surface très chaudes, comme indiqué dans la section Température ci-dessous. Lorsque vous utilisez Prime95 ou Cyberpunk 2077, par exemple, le CPU peut atteindre plus de 80°C et parfois même 100°C. La consommation d'énergie du processeur et donc la fréquence d'horloge fluctuent entre 66 et 90 W afin de maintenir les températures sous contrôle, comme le montrent les captures d'écran ci-dessous.
La consommation de la carte graphique peut atteindre les 130 W annoncés lorsque Cyberpunk 2077 fonctionne en mode Performance. Cependant, la température du GPU sera relativement élevée (plus de 85°C) et les taux de rafraîchissement diminueront en conséquence, comme nous l'avons mentionné dans la section sur les performances du GPU. L'horloge du cœur, l'horloge de la mémoire et la consommation d'énergie de la carte diminueront encore plus si vous jouez en mode équilibré.
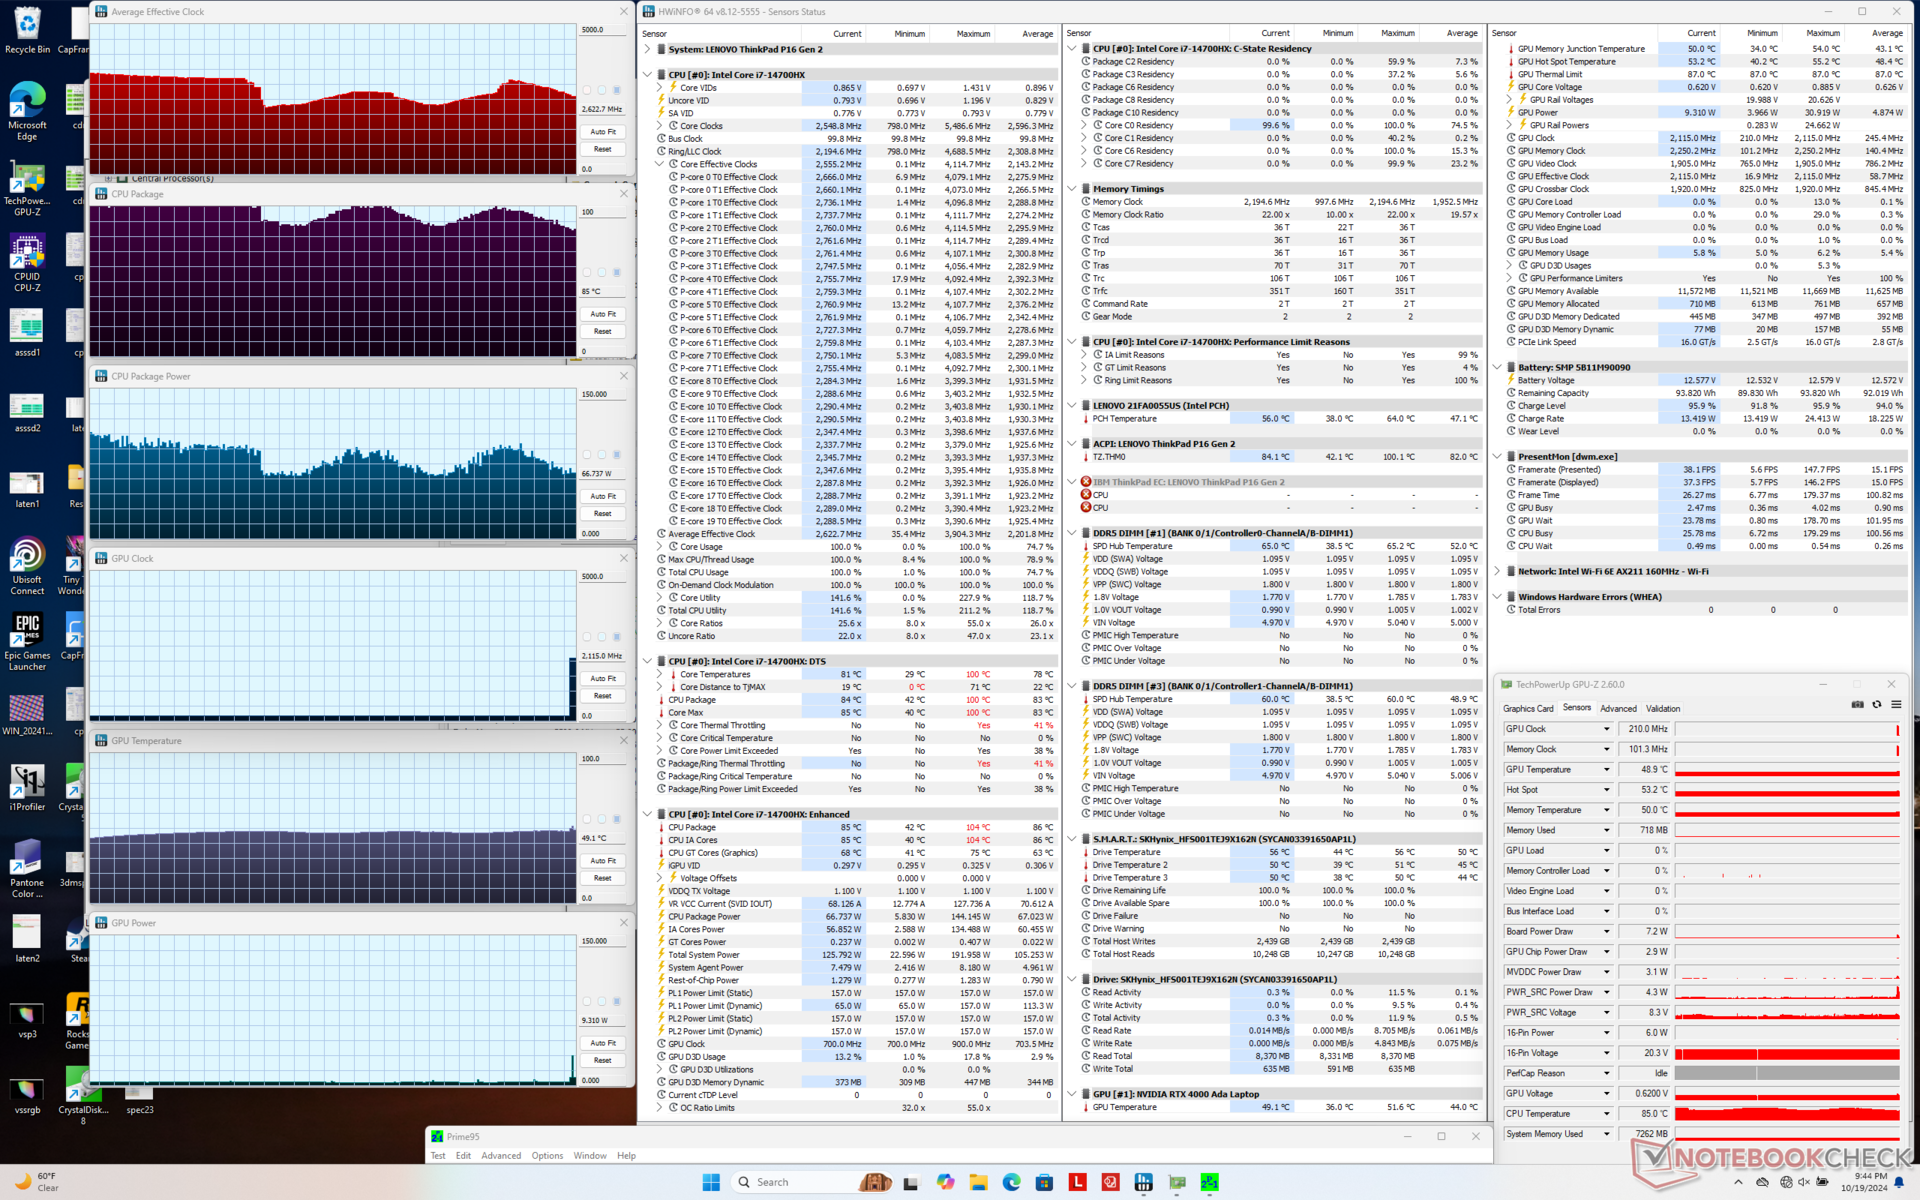
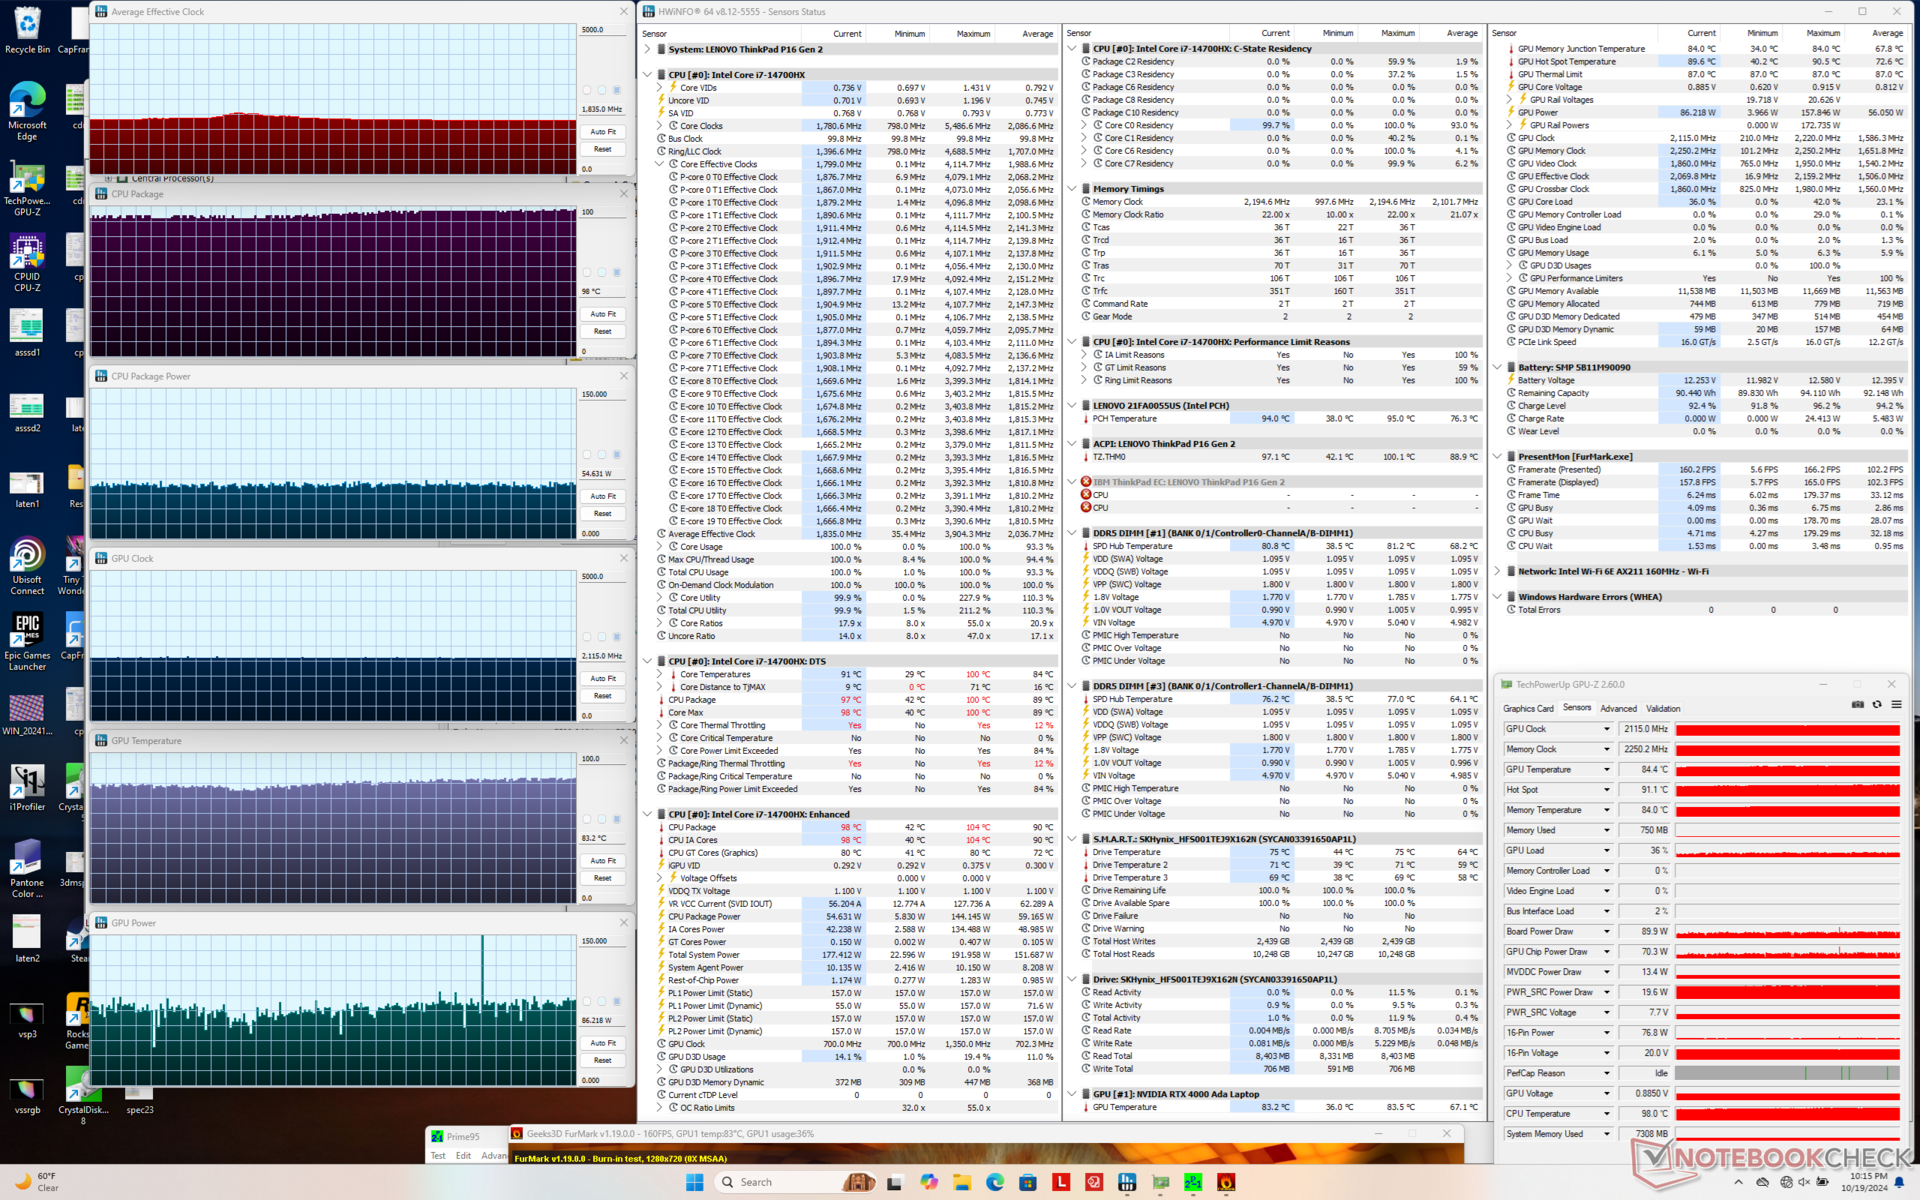
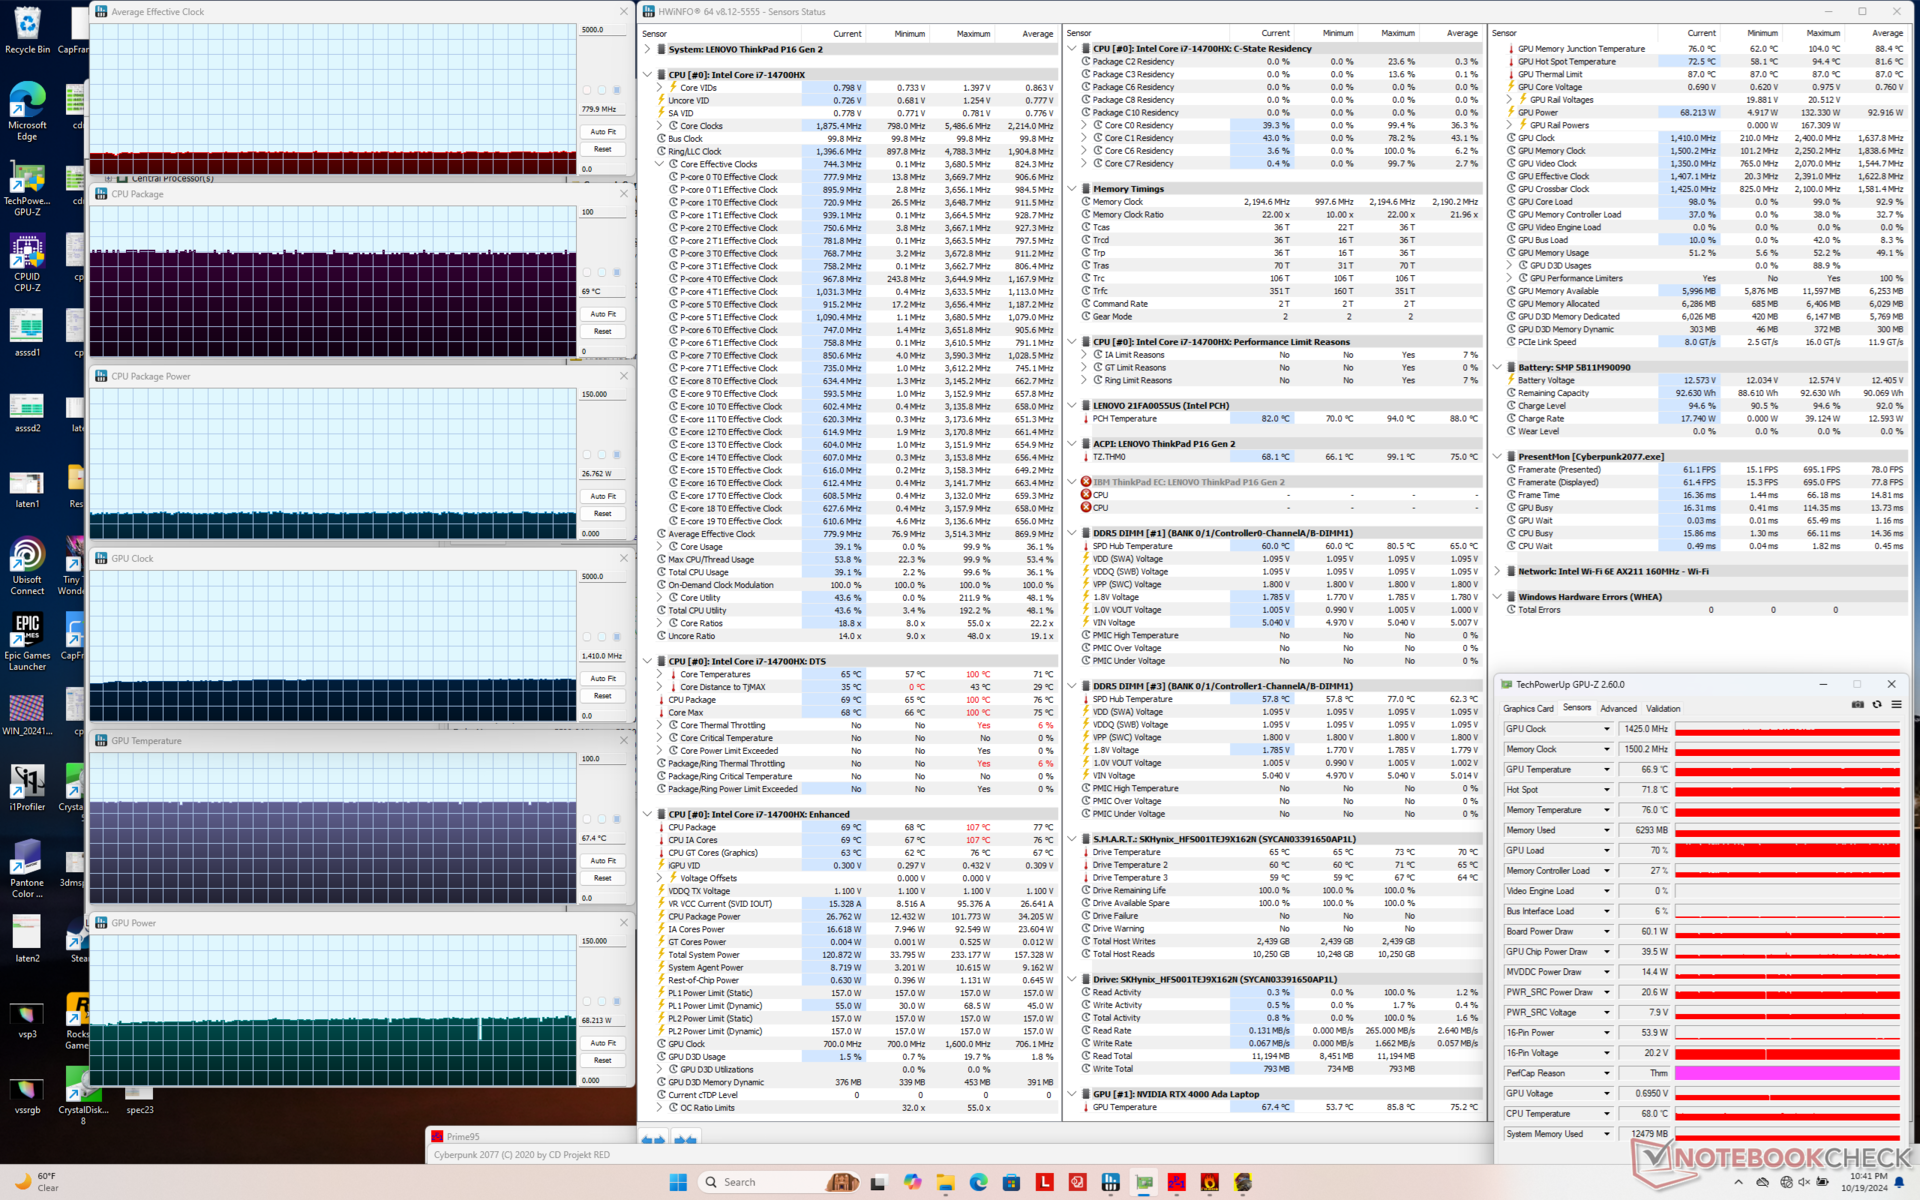
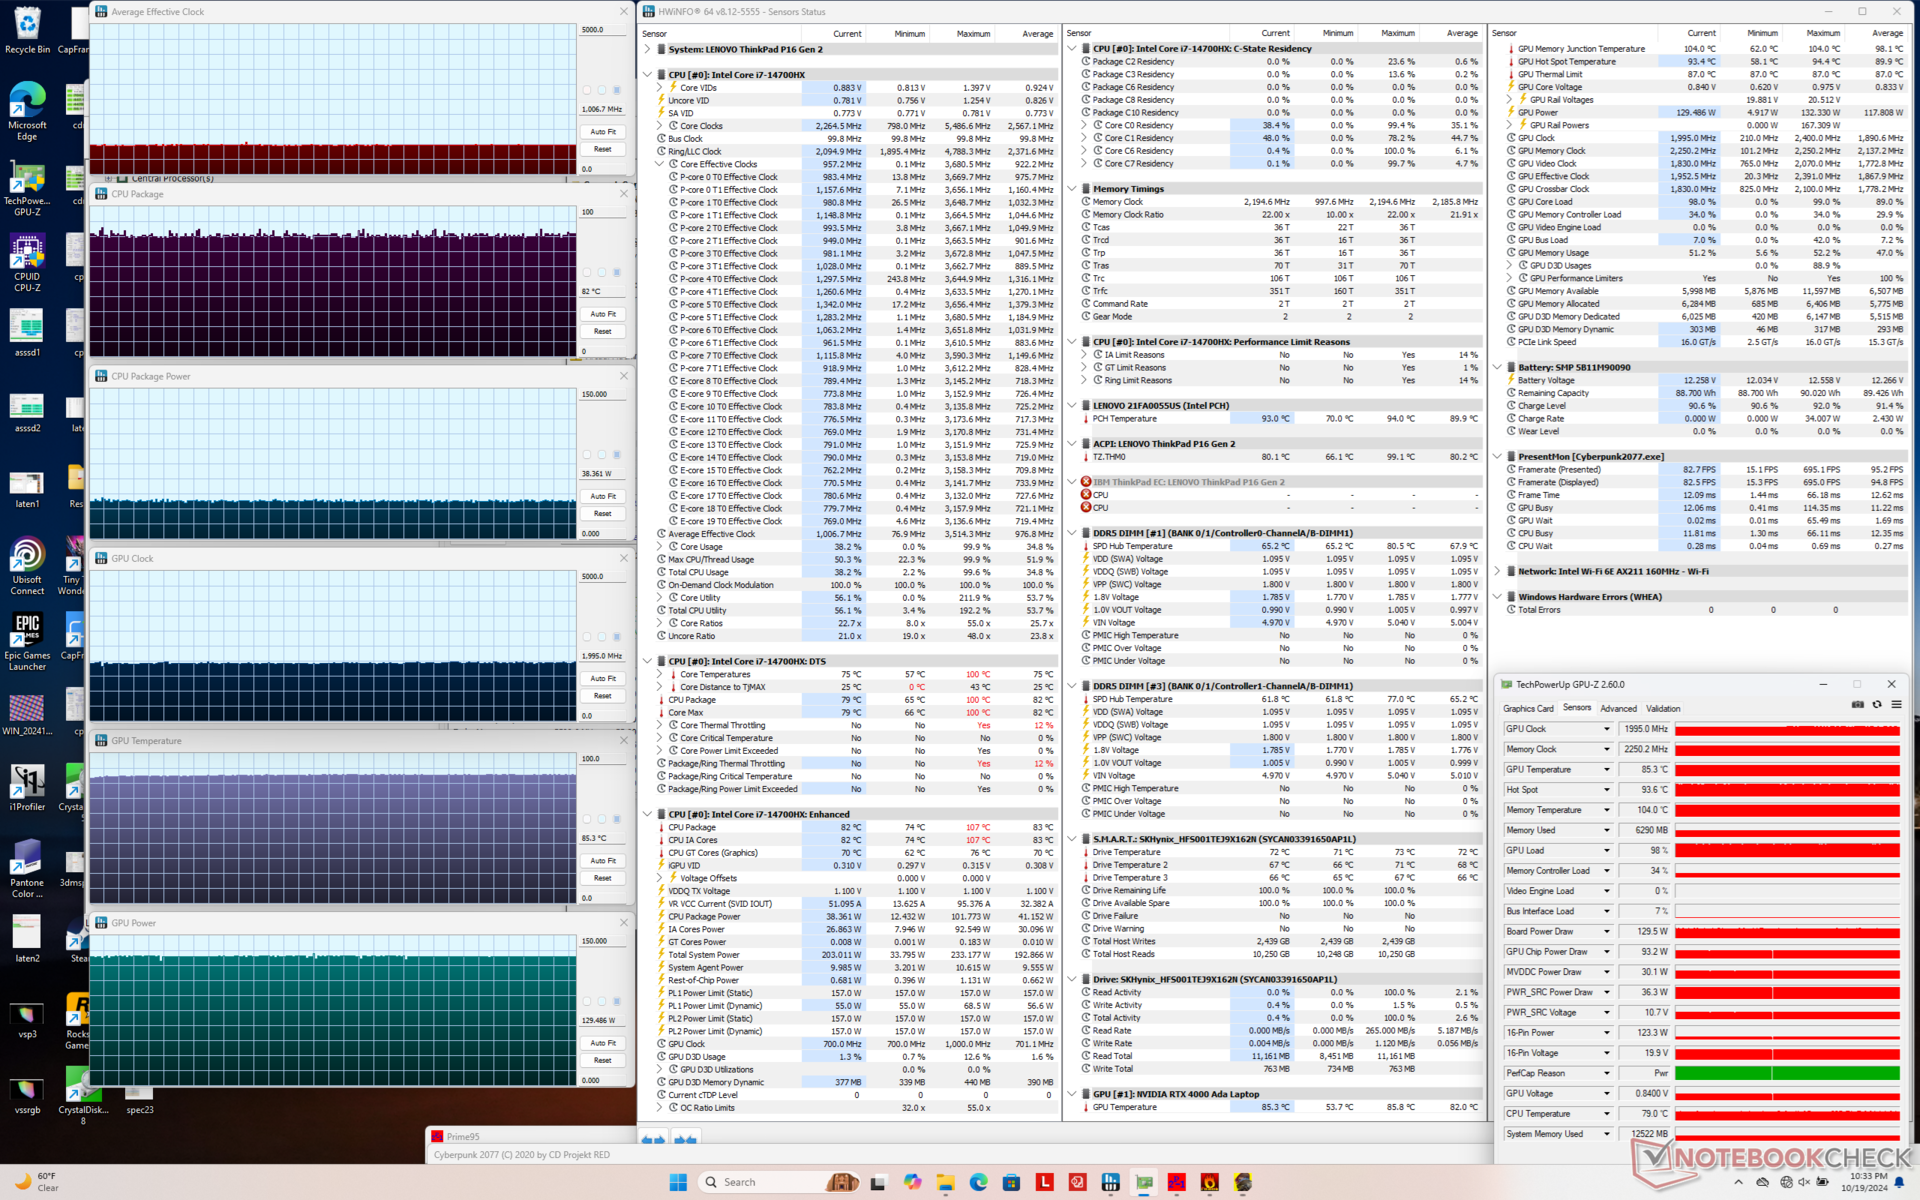
| Horloge du CPU (GHz) | Horloge du GPU (MHz) | Température moyenne du CPU (°C) | Température moyenne du GPU (°C) | |
| Système en veille | -- | -- | 49 | 36 |
| Prime95 Stress | 2.6 - 3.1 | -- | 85 - 100 | 49 |
| Prime95 + FurMark Stress | 1.8 | 2115 | 98 | 83 |
| Cyberpunk 2077 Stress (mode équilibré) | 0.8 | 1425 | 69 | 67 |
| Cyberpunk 2077 Stress (mode Performance) | 1.0 | 1995 | 82 | 85 |
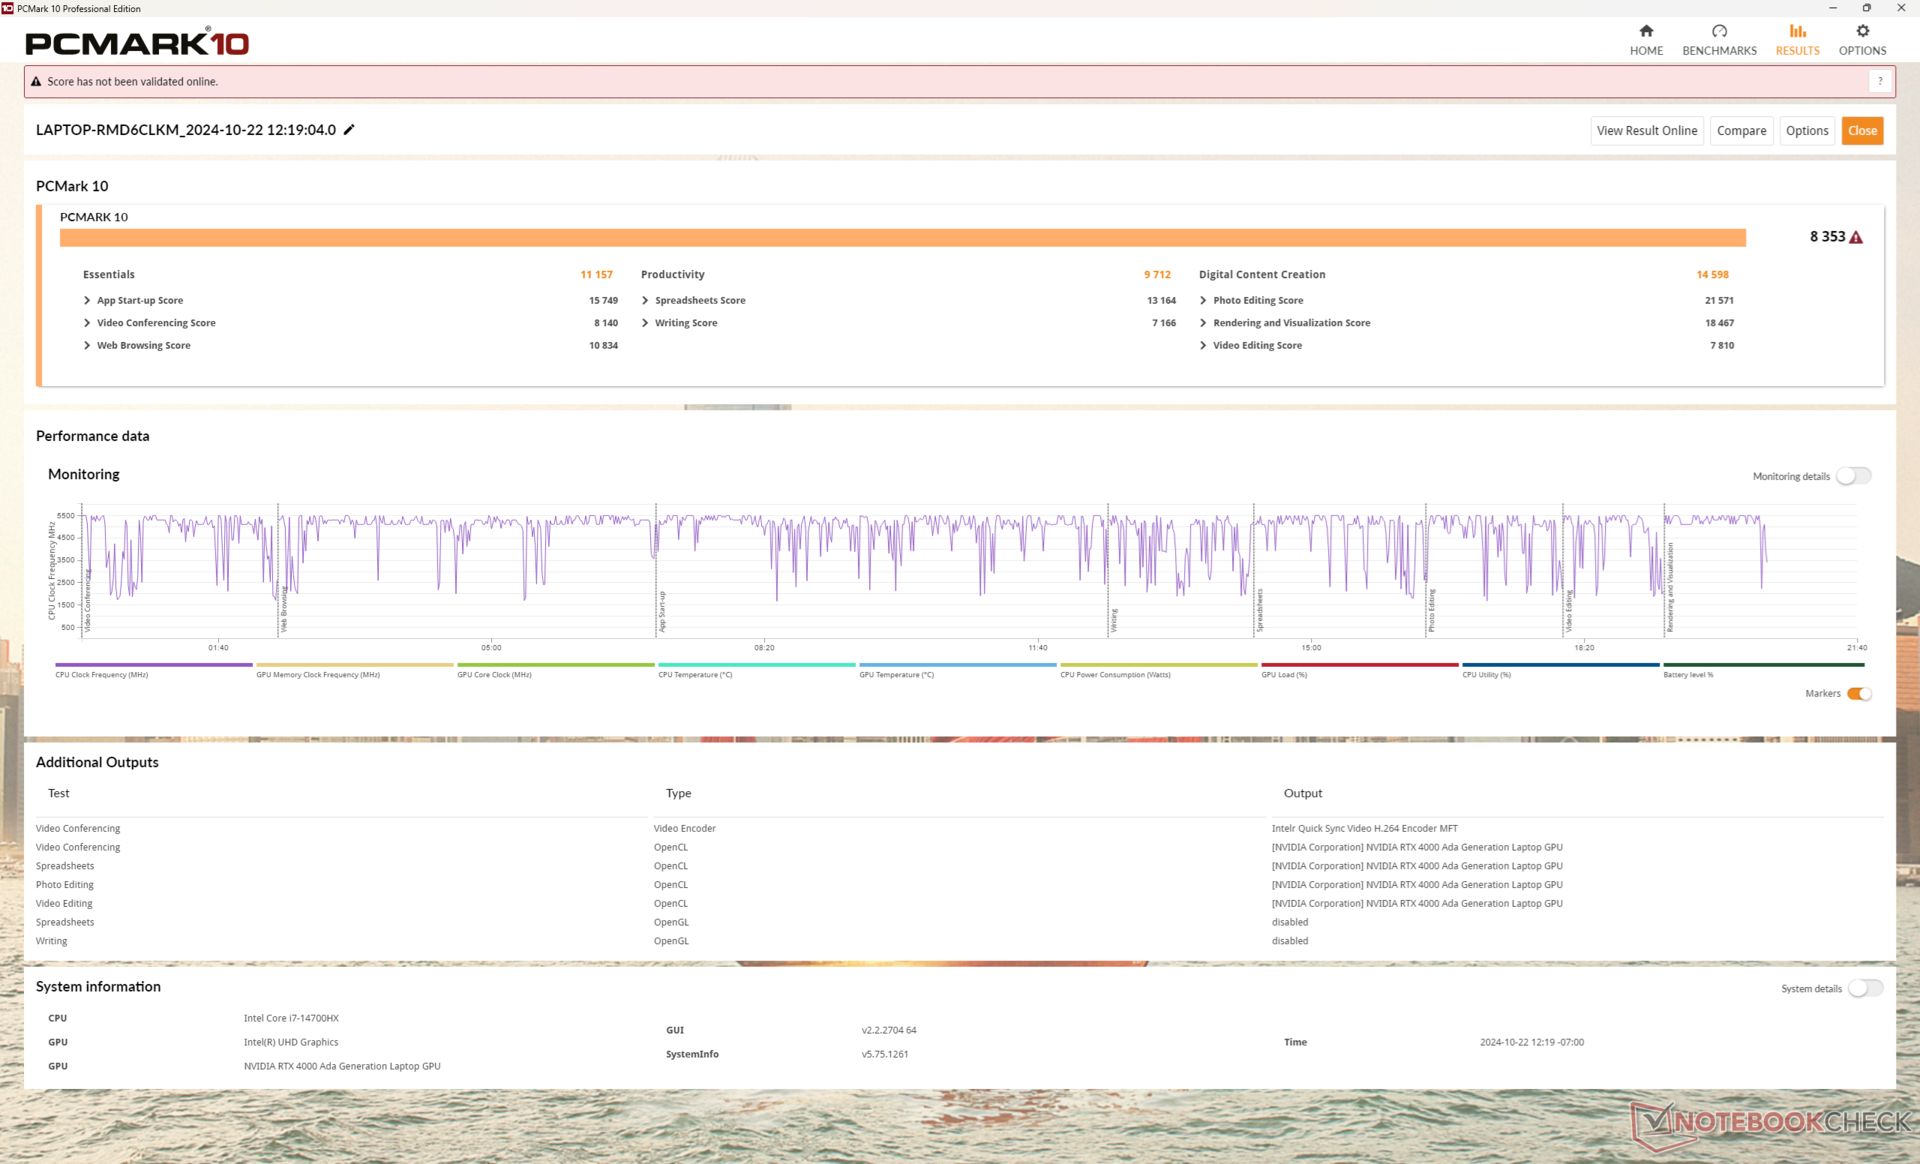
Performance du système
CrossMark: Overall | Productivity | Creativity | Responsiveness
WebXPRT 3: Overall
WebXPRT 4: Overall
Mozilla Kraken 1.1: Total
| PCMark 10 / Score | |
| Lenovo ThinkPad P16 Gen 2 | |
| Moyenne Intel Core i7-14700HX, NVIDIA RTX 4000 Ada Generation Laptop GPU () | |
| Dell Precision 5690 | |
| HP ZBook Power 16 G11 A | |
| Lenovo ThinkPad P16 G1 RTX A5500 | |
| Lenovo ThinkPad P16 G2 21FA000FGE | |
| Lenovo ThinkPad P16s G2 21K9000CGE | |
| PCMark 10 / Essentials | |
| Lenovo ThinkPad P16 Gen 2 | |
| Moyenne Intel Core i7-14700HX, NVIDIA RTX 4000 Ada Generation Laptop GPU () | |
| Dell Precision 5690 | |
| Lenovo ThinkPad P16 G2 21FA000FGE | |
| Lenovo ThinkPad P16 G1 RTX A5500 | |
| HP ZBook Power 16 G11 A | |
| Lenovo ThinkPad P16s G2 21K9000CGE | |
| PCMark 10 / Productivity | |
| Dell Precision 5690 | |
| Lenovo ThinkPad P16 Gen 2 | |
| Moyenne Intel Core i7-14700HX, NVIDIA RTX 4000 Ada Generation Laptop GPU () | |
| HP ZBook Power 16 G11 A | |
| Lenovo ThinkPad P16 G1 RTX A5500 | |
| Lenovo ThinkPad P16 G2 21FA000FGE | |
| Lenovo ThinkPad P16s G2 21K9000CGE | |
| PCMark 10 / Digital Content Creation | |
| Lenovo ThinkPad P16 Gen 2 | |
| Moyenne Intel Core i7-14700HX, NVIDIA RTX 4000 Ada Generation Laptop GPU () | |
| Dell Precision 5690 | |
| HP ZBook Power 16 G11 A | |
| Lenovo ThinkPad P16 G1 RTX A5500 | |
| Lenovo ThinkPad P16 G2 21FA000FGE | |
| Lenovo ThinkPad P16s G2 21K9000CGE | |
| CrossMark / Overall | |
| Lenovo ThinkPad P16 Gen 2 | |
| Moyenne Intel Core i7-14700HX, NVIDIA RTX 4000 Ada Generation Laptop GPU () | |
| Lenovo ThinkPad P16 G1 RTX A5500 | |
| Lenovo ThinkPad P16 G2 21FA000FGE | |
| Dell Precision 5690 | |
| HP ZBook Power 16 G11 A | |
| Lenovo ThinkPad P16s G2 21K9000CGE | |
| CrossMark / Productivity | |
| Lenovo ThinkPad P16 Gen 2 | |
| Moyenne Intel Core i7-14700HX, NVIDIA RTX 4000 Ada Generation Laptop GPU () | |
| Lenovo ThinkPad P16 G1 RTX A5500 | |
| Dell Precision 5690 | |
| Lenovo ThinkPad P16 G2 21FA000FGE | |
| HP ZBook Power 16 G11 A | |
| Lenovo ThinkPad P16s G2 21K9000CGE | |
| CrossMark / Creativity | |
| Lenovo ThinkPad P16 Gen 2 | |
| Moyenne Intel Core i7-14700HX, NVIDIA RTX 4000 Ada Generation Laptop GPU () | |
| Lenovo ThinkPad P16 G1 RTX A5500 | |
| Lenovo ThinkPad P16 G2 21FA000FGE | |
| HP ZBook Power 16 G11 A | |
| Dell Precision 5690 | |
| Lenovo ThinkPad P16s G2 21K9000CGE | |
| CrossMark / Responsiveness | |
| Lenovo ThinkPad P16 Gen 2 | |
| Moyenne Intel Core i7-14700HX, NVIDIA RTX 4000 Ada Generation Laptop GPU () | |
| Dell Precision 5690 | |
| Lenovo ThinkPad P16 G1 RTX A5500 | |
| Lenovo ThinkPad P16 G2 21FA000FGE | |
| HP ZBook Power 16 G11 A | |
| Lenovo ThinkPad P16s G2 21K9000CGE | |
| WebXPRT 3 / Overall | |
| Lenovo ThinkPad P16 Gen 2 | |
| Moyenne Intel Core i7-14700HX, NVIDIA RTX 4000 Ada Generation Laptop GPU () | |
| Lenovo ThinkPad P16 G2 21FA000FGE | |
| Lenovo ThinkPad P16 G1 RTX A5500 | |
| HP ZBook Power 16 G11 A | |
| Dell Precision 5690 | |
| Lenovo ThinkPad P16s G2 21K9000CGE | |
| WebXPRT 4 / Overall | |
| Lenovo ThinkPad P16 Gen 2 | |
| Moyenne Intel Core i7-14700HX, NVIDIA RTX 4000 Ada Generation Laptop GPU () | |
| Lenovo ThinkPad P16 G1 RTX A5500 | |
| Dell Precision 5690 | |
| HP ZBook Power 16 G11 A | |
| Mozilla Kraken 1.1 / Total | |
| Lenovo ThinkPad P16s G2 21K9000CGE | |
| HP ZBook Power 16 G11 A | |
| Dell Precision 5690 | |
| Lenovo ThinkPad P16 G1 RTX A5500 | |
| Lenovo ThinkPad P16 G2 21FA000FGE | |
| Lenovo ThinkPad P16 Gen 2 | |
| Moyenne Intel Core i7-14700HX, NVIDIA RTX 4000 Ada Generation Laptop GPU () | |
* ... Moindre est la valeur, meilleures sont les performances
| PCMark 10 Score | 8353 points | |
Aide | ||
| AIDA64 / Memory Copy | |
| Dell Precision 5690 | |
| Moyenne Intel Core i7-14700HX (63949 - 78742, n=7) | |
| Lenovo ThinkPad P16s G2 21K9000CGE | |
| Lenovo ThinkPad P16 Gen 2 | |
| Lenovo ThinkPad P16 G1 RTX A5500 | |
| HP ZBook Power 16 G11 A | |
| Lenovo ThinkPad P16 G2 21FA000FGE | |
| AIDA64 / Memory Read | |
| Dell Precision 5690 | |
| Moyenne Intel Core i7-14700HX (68593 - 86175, n=7) | |
| Lenovo ThinkPad P16 Gen 2 | |
| Lenovo ThinkPad P16 G1 RTX A5500 | |
| HP ZBook Power 16 G11 A | |
| Lenovo ThinkPad P16 G2 21FA000FGE | |
| Lenovo ThinkPad P16s G2 21K9000CGE | |
| AIDA64 / Memory Write | |
| Lenovo ThinkPad P16s G2 21K9000CGE | |
| HP ZBook Power 16 G11 A | |
| Dell Precision 5690 | |
| Moyenne Intel Core i7-14700HX (64033 - 76689, n=7) | |
| Lenovo ThinkPad P16 Gen 2 | |
| Lenovo ThinkPad P16 G1 RTX A5500 | |
| Lenovo ThinkPad P16 G2 21FA000FGE | |
| AIDA64 / Memory Latency | |
| Dell Precision 5690 | |
| Lenovo ThinkPad P16s G2 21K9000CGE | |
| Lenovo ThinkPad P16 G2 21FA000FGE | |
| HP ZBook Power 16 G11 A | |
| Lenovo ThinkPad P16 Gen 2 | |
| Lenovo ThinkPad P16 G1 RTX A5500 | |
| Moyenne Intel Core i7-14700HX (82.7 - 96.4, n=7) | |
* ... Moindre est la valeur, meilleures sont les performances
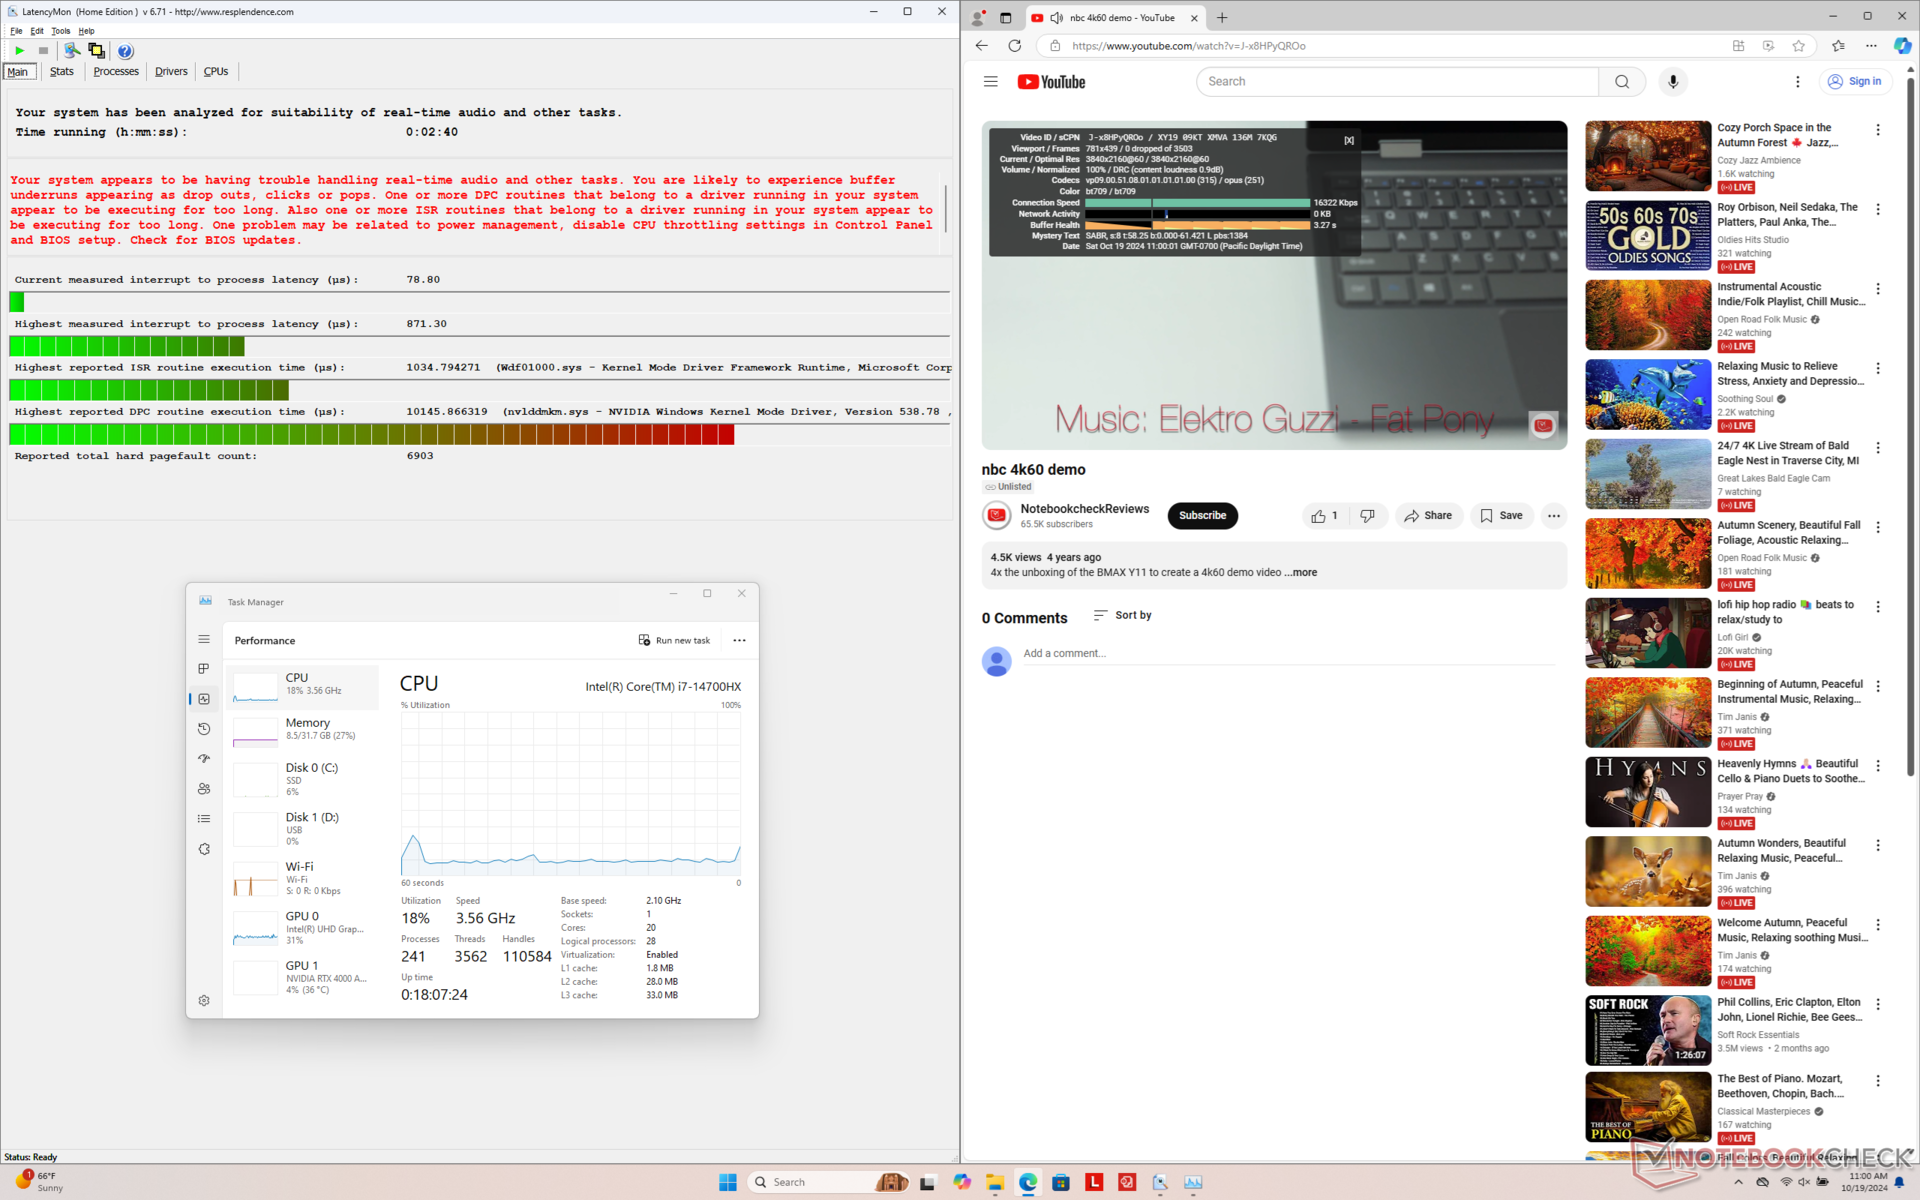
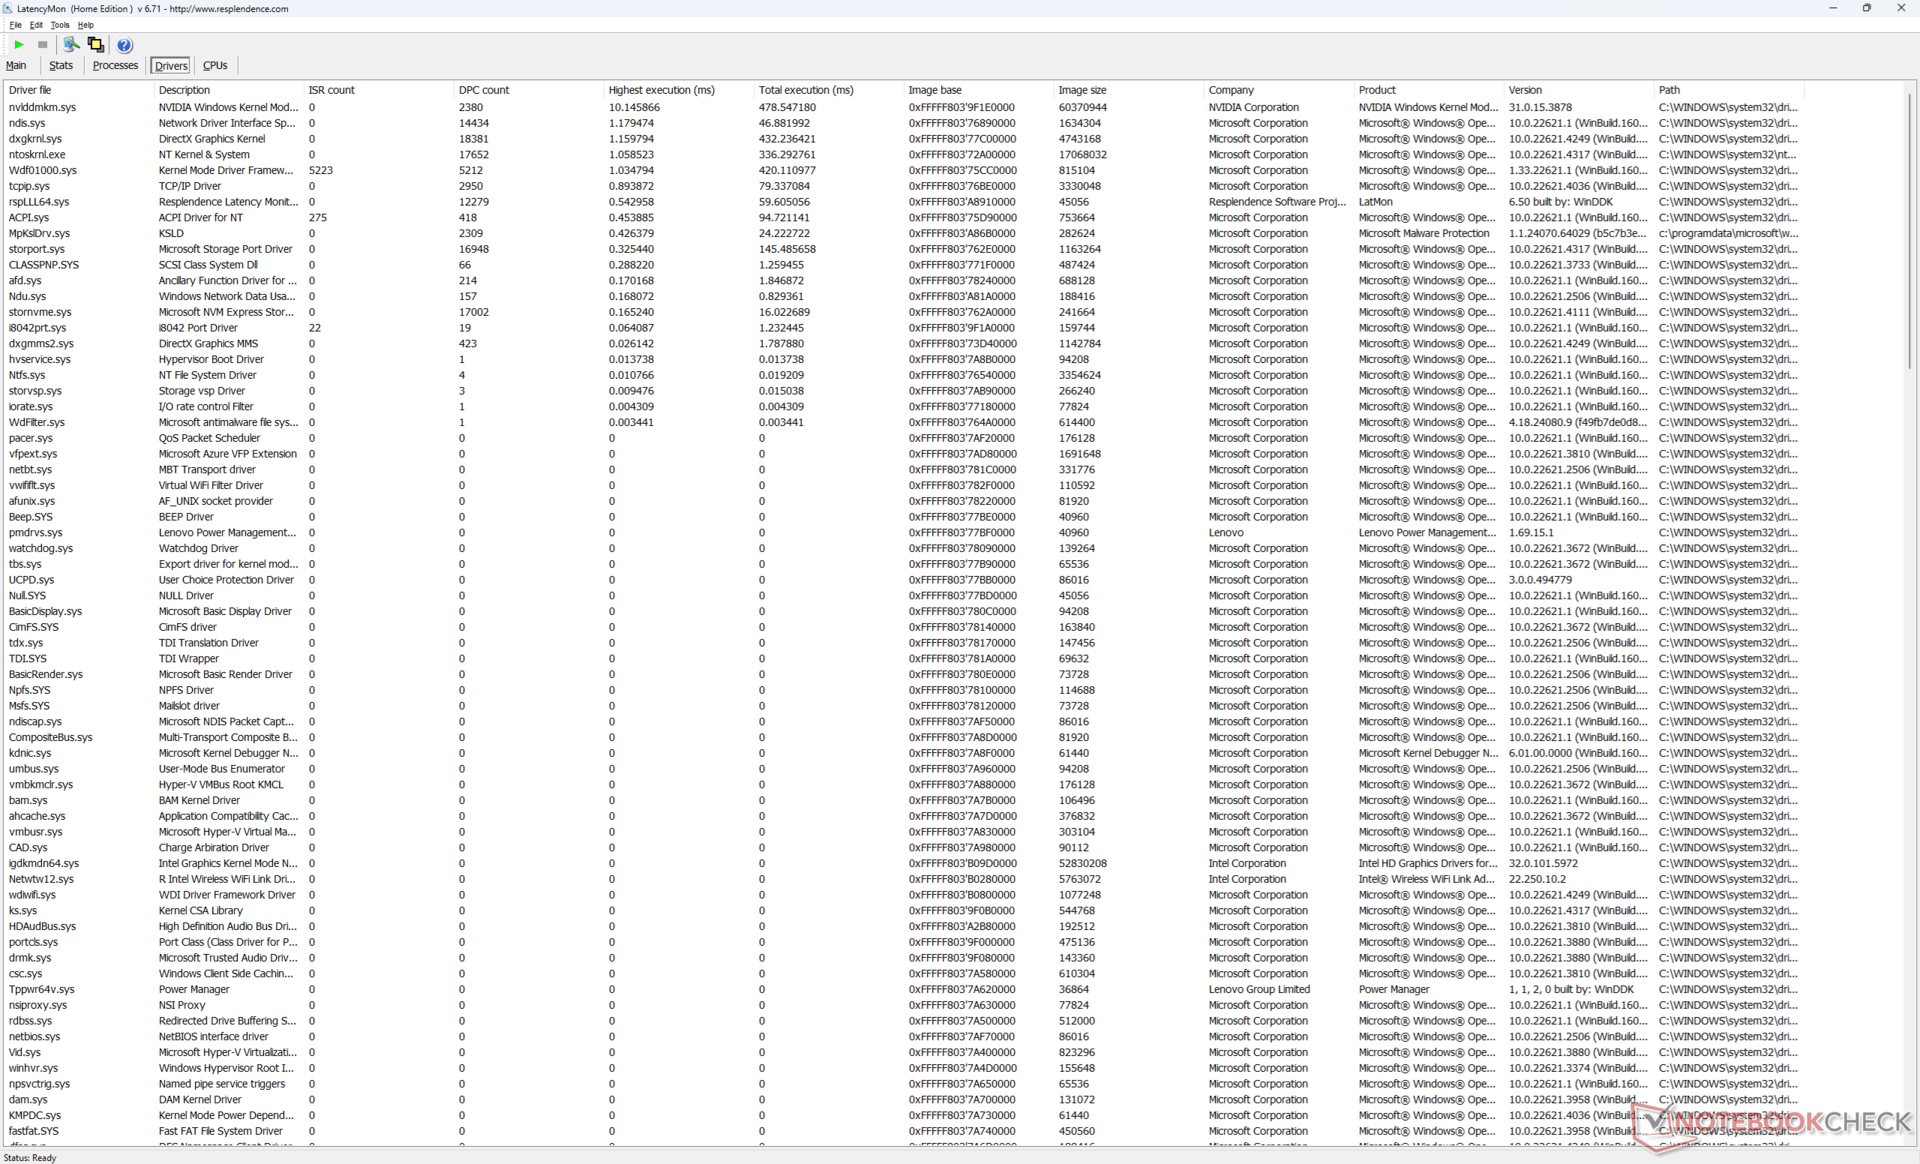
Latence DPC
LatencyMon révèle de légers problèmes de DPC lors de l'ouverture de plusieurs onglets de notre page d'accueil. la lecture de vidéos 4K à 60 FPS est par ailleurs parfaite, sans aucune perte d'images.
| DPC Latencies / LatencyMon - interrupt to process latency (max), Web, Youtube, Prime95 | |
| HP ZBook Power 16 G11 A | |
| Lenovo ThinkPad P16 G1 RTX A5500 | |
| Lenovo ThinkPad P16s G2 21K9000CGE | |
| Lenovo ThinkPad P16 G2 21FA000FGE | |
| Lenovo ThinkPad P16 Gen 2 | |
| Dell Precision 5690 | |
* ... Moindre est la valeur, meilleures sont les performances
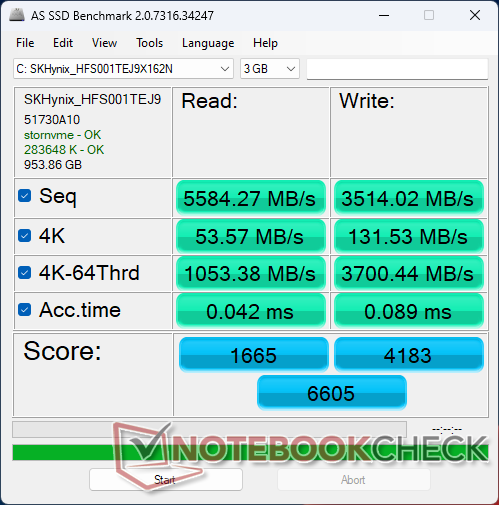
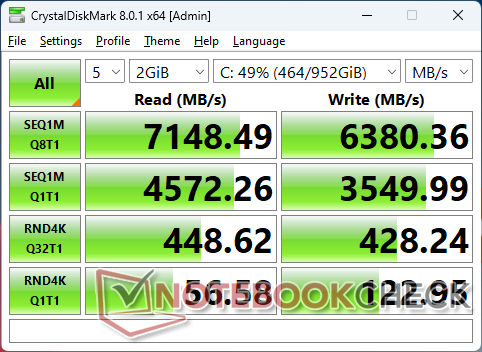
Dispositifs de stockage
Aucune modification des options de stockage ou des performances des disques SSD n'a été observée entre nos deux ThinkPad P16 Gen 2 de test.

* ... Moindre est la valeur, meilleures sont les performances
Disk Throttling: DiskSpd Read Loop, Queue Depth 8
Performance du GPU
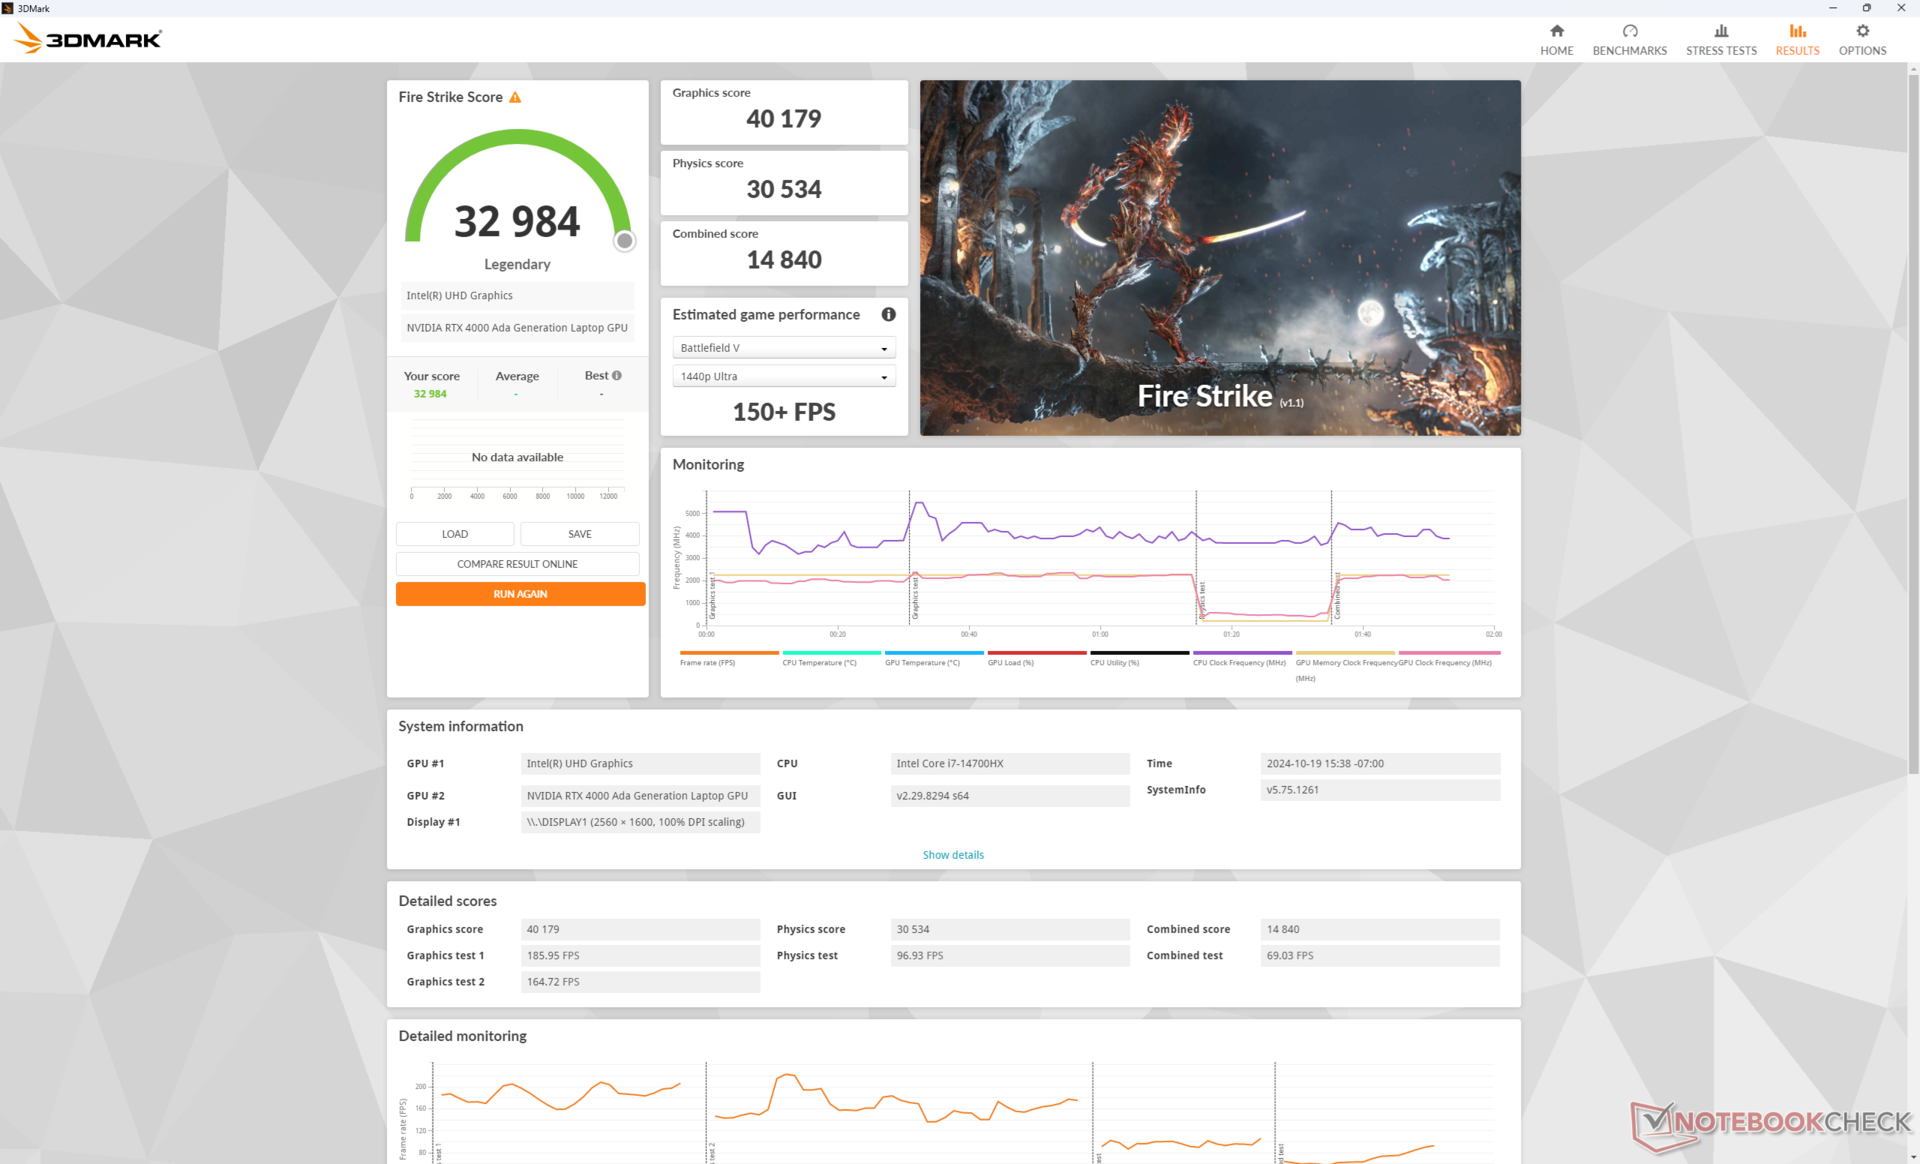
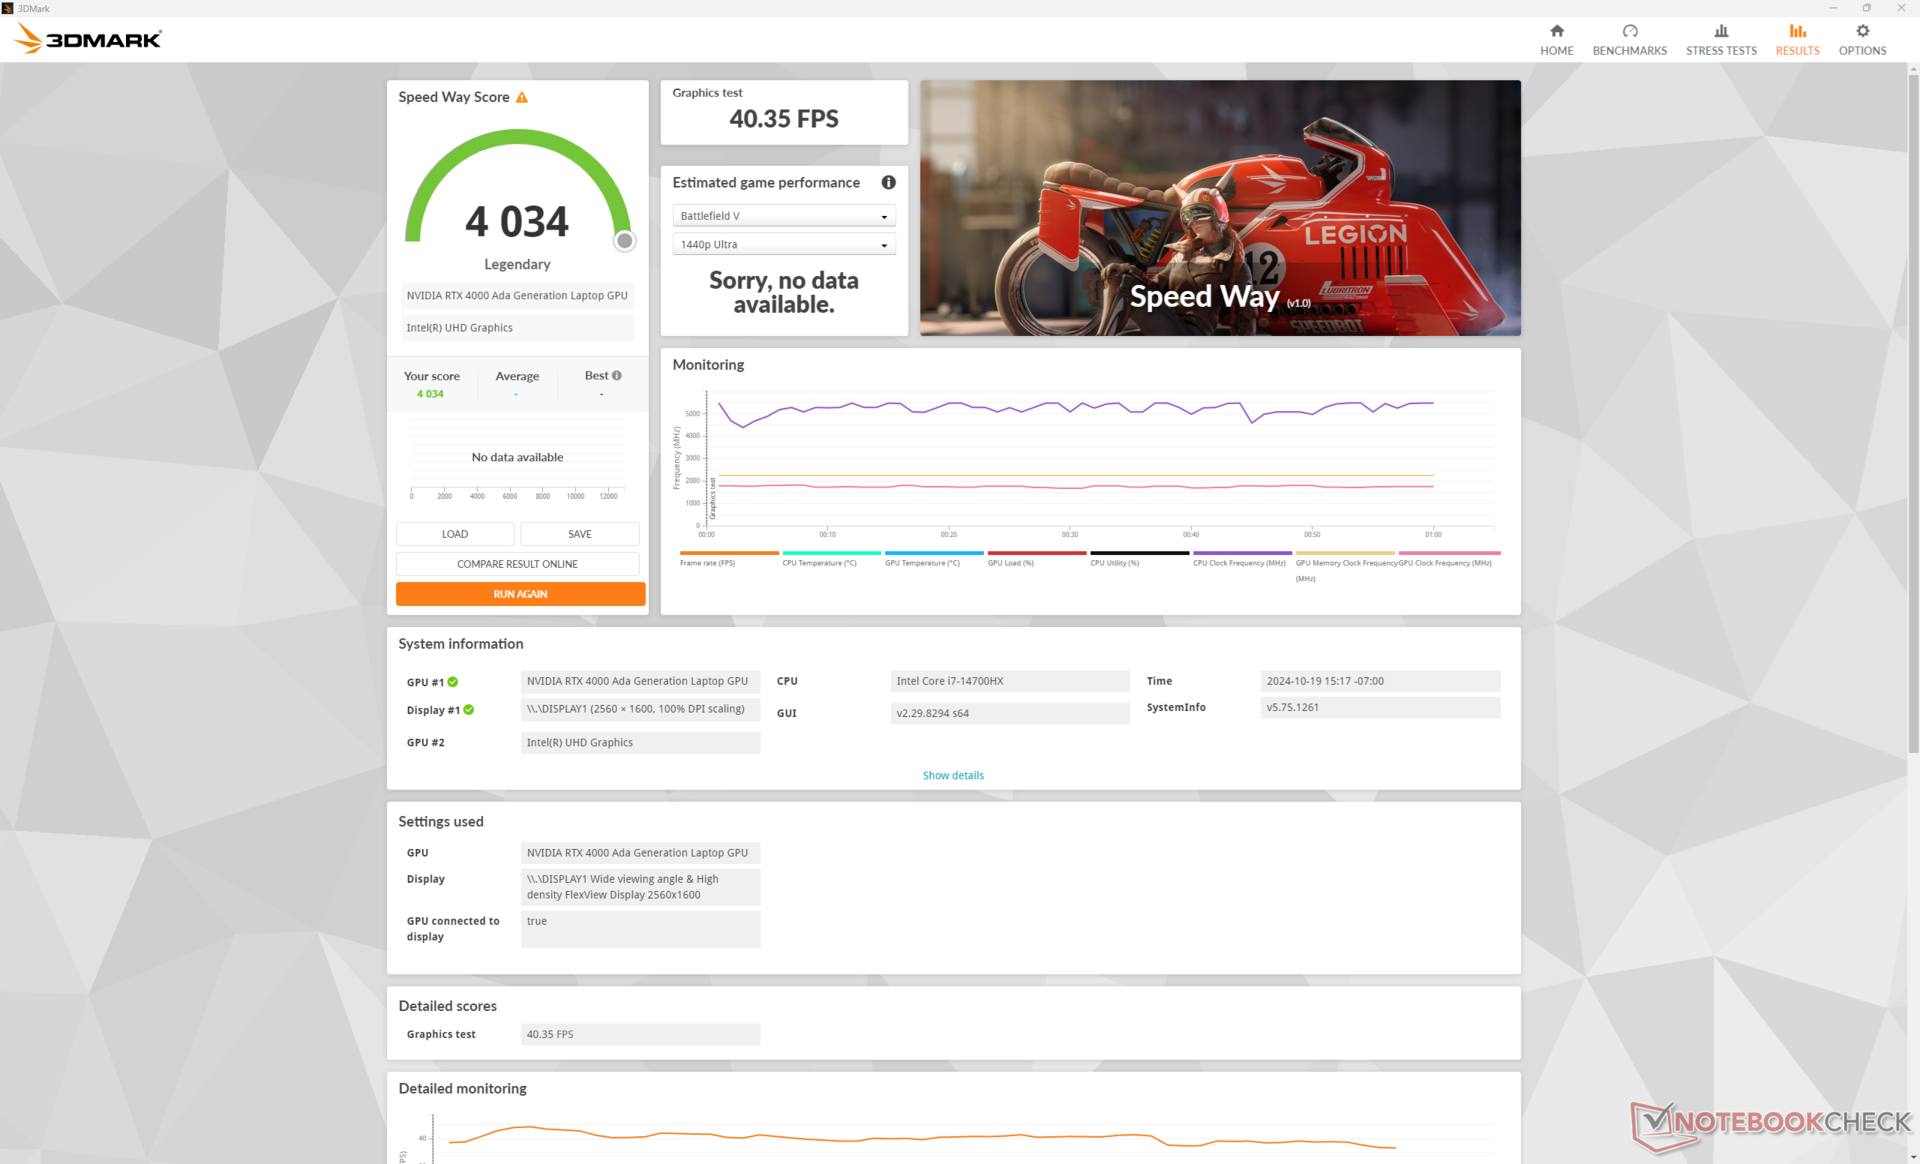
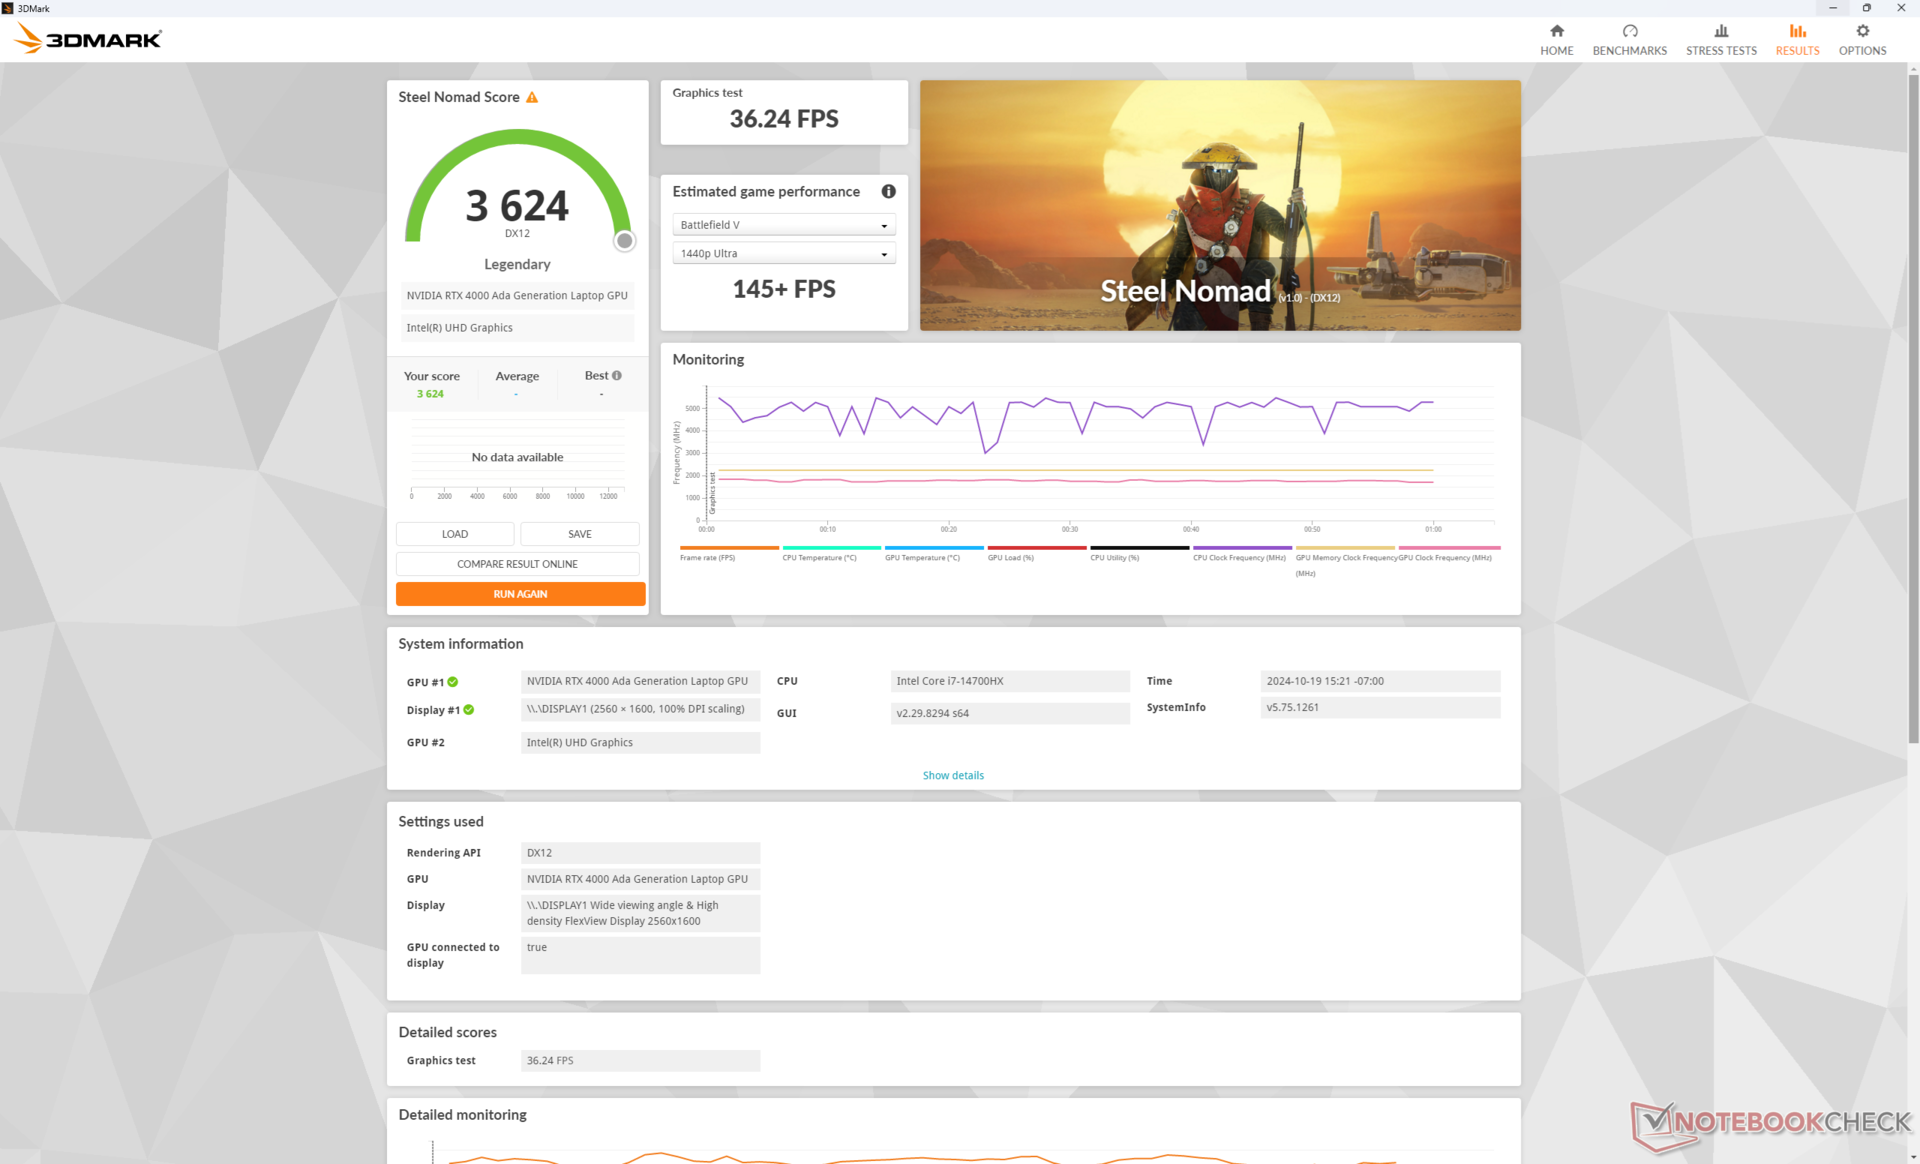
Les 130 W RTX 4000 Ada de notre Lenovo est très puissante pour un GPU mobile, surpassant même la puissance de 95 W de la RTX 5000 Ada de 95 W dans le Precision 5690. les résultats de 3DMark, par exemple, sont entre 10 et 40 % plus élevés et des résultats similaires peuvent être obtenus en exécutant SpecViewPerf.
| Profil de puissance | Score graphique | Score physique | Score combiné |
| Mode Performance | 40179 | 30534 | 14840 |
| Mode équilibré | 32889 (-18%) | 29923 (-2%) | 13007 (-12%) |
| Mode batterie | 23401 (-42%) | 27793 (-9%) | 8510 (-42%) |
Le passage du mode Performance au mode Équilibré a un impact assez important sur les performances graphiques, comme le montre notre tableau de résultats Fire Strike ci-dessus.
| 3DMark Performance Rating - Percent | |
| Lenovo ThinkPad P16 Gen 2 -3! | |
| Moyenne NVIDIA RTX 4000 Ada Generation Laptop GPU -3! | |
| Dell Precision 5690 -3! | |
| HP ZBook Fury 16 G11 | |
| HP ZBook Fury 16 G9 -3! | |
| Dell Precision 5000 5490 -3! | |
| MSI CreatorPro Z16P B12UKST -19! | |
| HP ZBook Power 15 G10 -11! | |
| Asus ExpertBook B6 Flip B6602FC2 -19! | |
| Lenovo ThinkPad P16v G1 AMD -18! | |
| Lenovo ThinkPad P1 G4-20Y4Z9DVUS -19! | |
| Lenovo ThinkPad P16s G2 21K9000CGE -19! | |
| HP ZBook Firefly 16 G9-6B897EA -19! | |
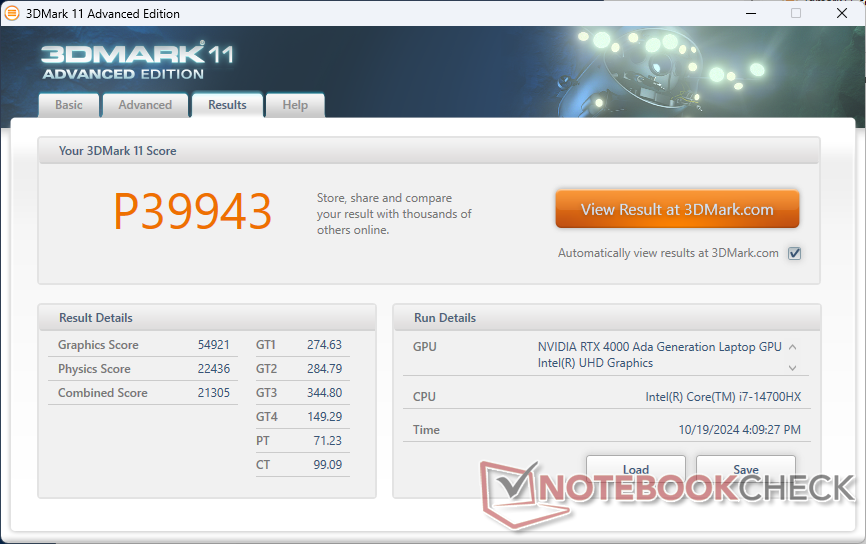
| 3DMark 11 Performance | 39943 points | |
| 3DMark Cloud Gate Standard Score | 61459 points | |
| 3DMark Fire Strike Score | 32984 points | |
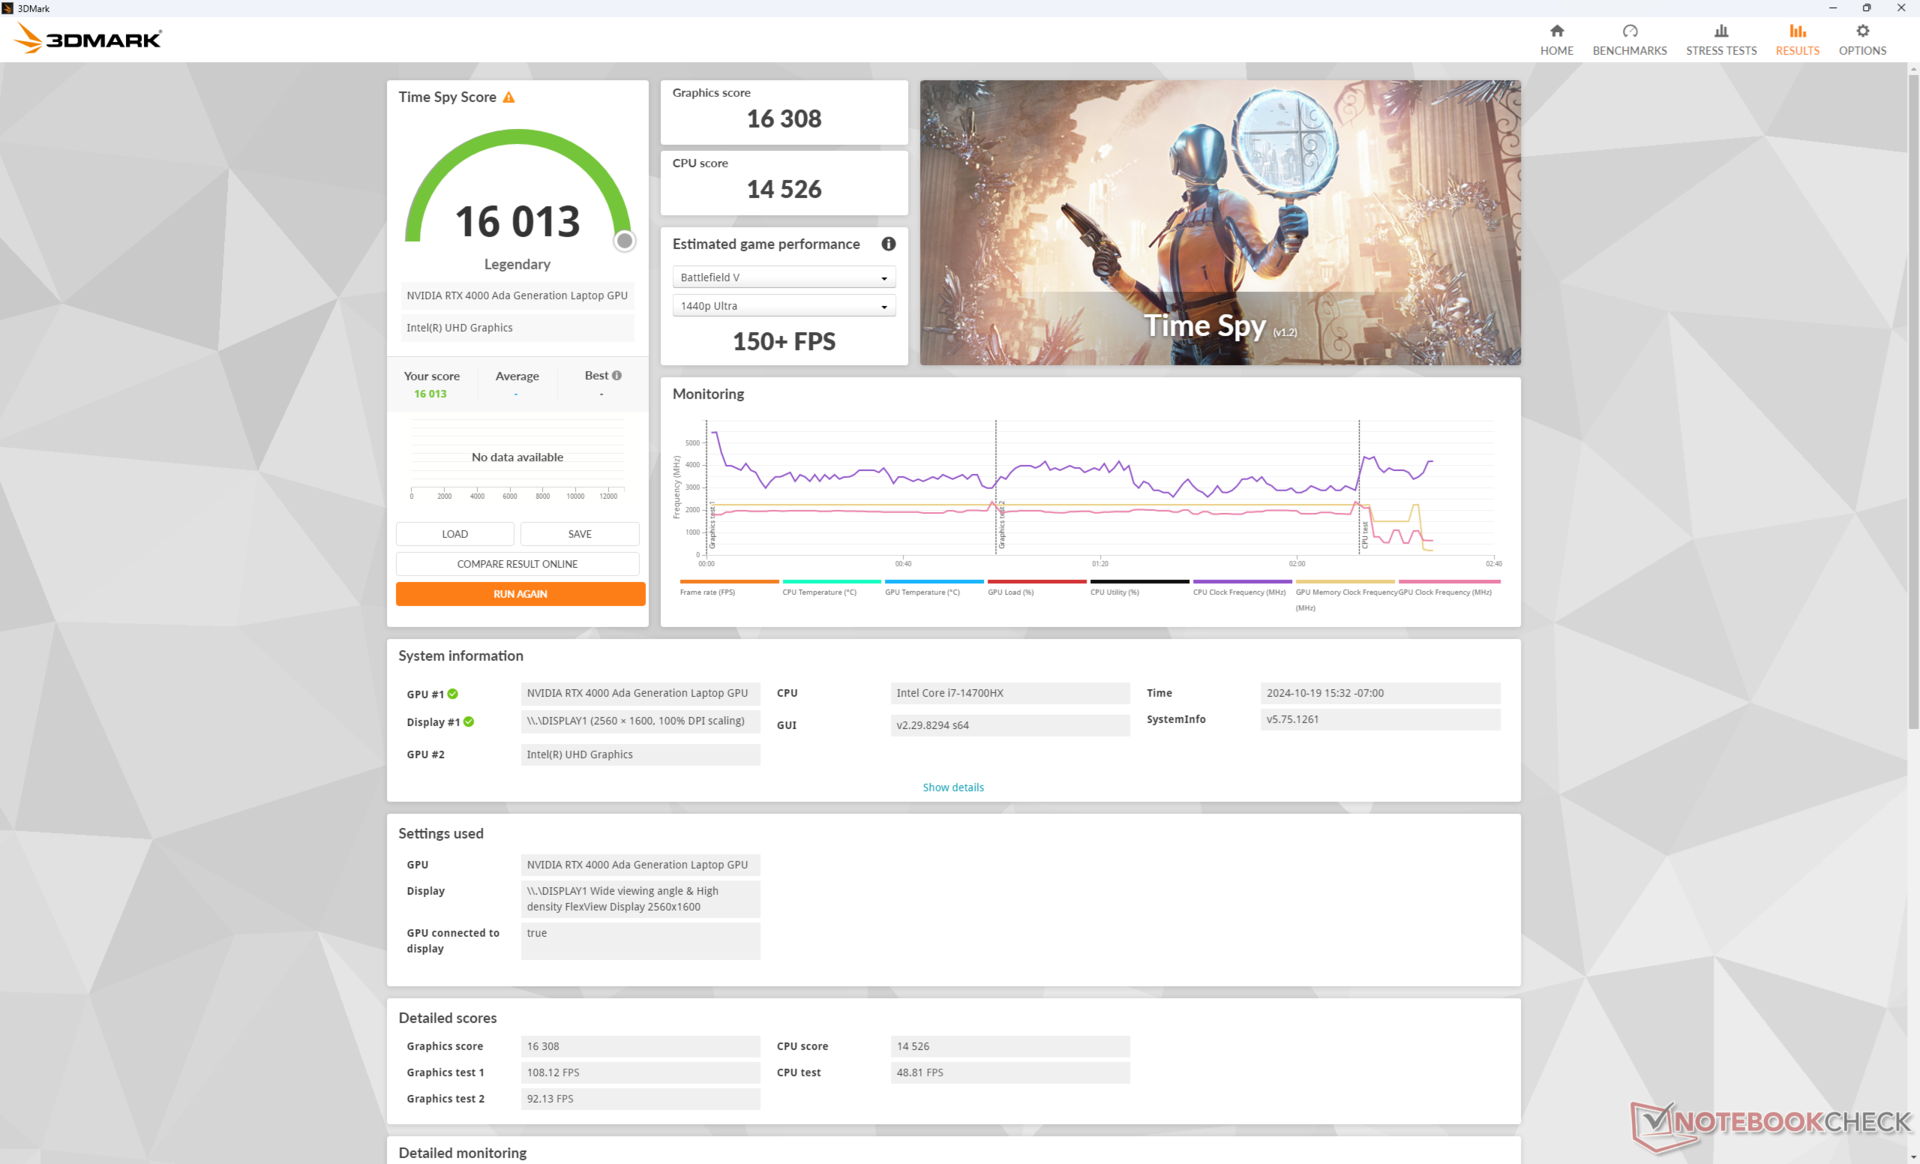
| 3DMark Time Spy Score | 16013 points | |
| 3DMark Steel Nomad Score | 3624 points | |
Aide | ||
* ... Moindre est la valeur, meilleures sont les performances
Performances des jeux
Bien qu'elle ne soit pas optimisée pour le jeu, la RTX 4000 Ada reste une machine puissante, surtout si l'on considère son plafond de 130 W TGP. Les performances de jeu sont très proches de celles d'un ordinateur portable de jeu haut de gamme fonctionnant avec la carte mobile GeForce RTX 4080.
| Performance Rating - Percent | |
| Lenovo ThinkPad P16 Gen 2 | |
| Dell Precision 5690 -1! | |
| Lenovo ThinkPad P16 G1 RTX A5500 -1! | |
| Lenovo ThinkPad P16 G2 21FA000FGE -1! | |
| HP ZBook Power 16 G11 A | |
| Lenovo ThinkPad P16s G2 21K9000CGE -1! | |
| Baldur's Gate 3 - 1920x1080 Ultra Preset | |
| Lenovo ThinkPad P16 Gen 2 | |
| Dell Precision 5690 | |
| HP ZBook Power 16 G11 A | |
| GTA V - 1920x1080 Highest Settings possible AA:4xMSAA + FX AF:16x | |
| Lenovo ThinkPad P16 Gen 2 | |
| Lenovo ThinkPad P16 G1 RTX A5500 | |
| Lenovo ThinkPad P16 G2 21FA000FGE | |
| HP ZBook Power 16 G11 A | |
| Lenovo ThinkPad P16s G2 21K9000CGE | |
| Final Fantasy XV Benchmark - 1920x1080 High Quality | |
| Lenovo ThinkPad P16 Gen 2 | |
| Dell Precision 5690 | |
| Lenovo ThinkPad P16 G1 RTX A5500 | |
| Lenovo ThinkPad P16 G2 21FA000FGE | |
| HP ZBook Power 16 G11 A | |
| Lenovo ThinkPad P16s G2 21K9000CGE | |
| Strange Brigade - 1920x1080 ultra AA:ultra AF:16 | |
| Lenovo ThinkPad P16 Gen 2 | |
| Dell Precision 5690 | |
| Lenovo ThinkPad P16 G1 RTX A5500 | |
| Lenovo ThinkPad P16 G2 21FA000FGE | |
| HP ZBook Power 16 G11 A | |
| Lenovo ThinkPad P16s G2 21K9000CGE | |
| Dota 2 Reborn - 1920x1080 ultra (3/3) best looking | |
| Lenovo ThinkPad P16 Gen 2 | |
| Lenovo ThinkPad P16 G1 RTX A5500 | |
| Lenovo ThinkPad P16 G2 21FA000FGE | |
| Dell Precision 5690 | |
| HP ZBook Power 16 G11 A | |
| Lenovo ThinkPad P16s G2 21K9000CGE | |
| Cyberpunk 2077 2.1 Phantom Liberty | |
| 1920x1080 High Preset (FSR off) | |
| Lenovo ThinkPad P16 Gen 2 | |
| Moyenne NVIDIA RTX 4000 Ada Generation Laptop GPU () | |
| HP ZBook Fury 16 G11 | |
| Dell Precision 5690 | |
| Dell Precision 5000 5490 | |
| HP ZBook Power 15 G10 | |
| Lenovo ThinkPad P16v G1 AMD | |
| 1920x1080 Ultra Preset (FSR off) | |
| Dell Precision 5690 | |
| Lenovo ThinkPad P16 Gen 2 | |
| Moyenne NVIDIA RTX 4000 Ada Generation Laptop GPU () | |
| HP ZBook Fury 16 G11 | |
| Dell Precision 5000 5490 | |
| HP ZBook Power 15 G10 | |
| Lenovo ThinkPad P16v G1 AMD | |
| 2560x1440 Ultra Preset (FSR off) | |
| Lenovo ThinkPad P16 Gen 2 | |
| Moyenne NVIDIA RTX 4000 Ada Generation Laptop GPU () | |
| Dell Precision 5690 | |
| HP ZBook Fury 16 G11 | |
| HP ZBook Power 15 G10 | |
Malheureusement, il y a une légère perte de performance lors de l'exécution de Cyberpunk 2077. Les taux de rafraîchissement passent de ~103 à ~96 après seulement quelques minutes d'inactivité dans le jeu et les résultats ne s'améliorent pas après plusieurs tests. Cela suggère que le GPU aurait pu bénéficier d'une solution de refroidissement plus performante.
Cyberpunk 2077 ultra FPS Chart
| Bas | Moyen | Élevé | Ultra | QHD | |
|---|---|---|---|---|---|
| GTA V (2015) | 185.8 | 183.9 | 179.4 | 125.6 | 118.7 |
| Dota 2 Reborn (2015) | 215.4 | 189.7 | 185.2 | 164.4 | |
| Final Fantasy XV Benchmark (2018) | 207 | 185.3 | 150 | 119.5 | |
| X-Plane 11.11 (2018) | 166.8 | 144 | 113.1 | ||
| Far Cry 5 (2018) | 168 | 148 | 138 | 128 | 125 |
| Strange Brigade (2018) | 452 | 372 | 323 | 292 | 210 |
| Tiny Tina's Wonderlands (2022) | 275.4 | 232.6 | 171.4 | 137.1 | 92 |
| F1 22 (2022) | 275 | 264 | 238 | 95.5 | 65.7 |
| Baldur's Gate 3 (2023) | 178.3 | 160.6 | 141.6 | 137 | 90.7 |
| Cyberpunk 2077 2.1 Phantom Liberty (2023) | 129.3 | 115.1 | 108.4 | 98.3 | 68.5 |
Émissions - Fortes et responsables
Bruit du système
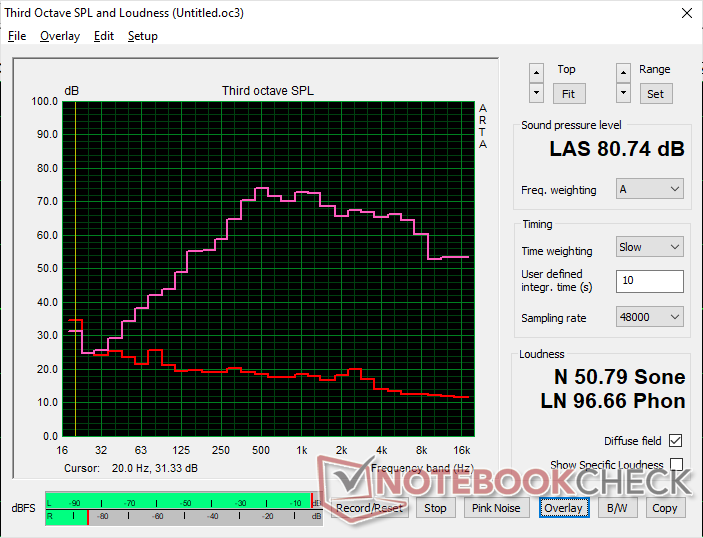
Les ventilateurs de notre unité ont tendance à augmenter le nombre de tours/minute et le bruit plus facilement par rapport à notre configuration RTX 2000 Ada inférieure. Ainsi, les propriétaires peuvent s'attendre à plus de pulsations de ventilateur et à des changements de bruit de ventilateur lors de l'exécution de différents types de charges. Les charges exigeantes comme les jeux induisent un bruit de ventilateur de 53 dB(A), ce qui en fait l'une des stations de travail de 16 pouces les plus bruyantes que nous ayons testées.
L'exécution de Cyberpunk 2077 en mode équilibré au lieu du mode performance réduit sensiblement le bruit du ventilateur de 52,8 dB(A) à 47,9 dB(A). Cependant, cela se fait au détriment des performances, comme indiqué dans la section Performances du GPU ci-dessus.
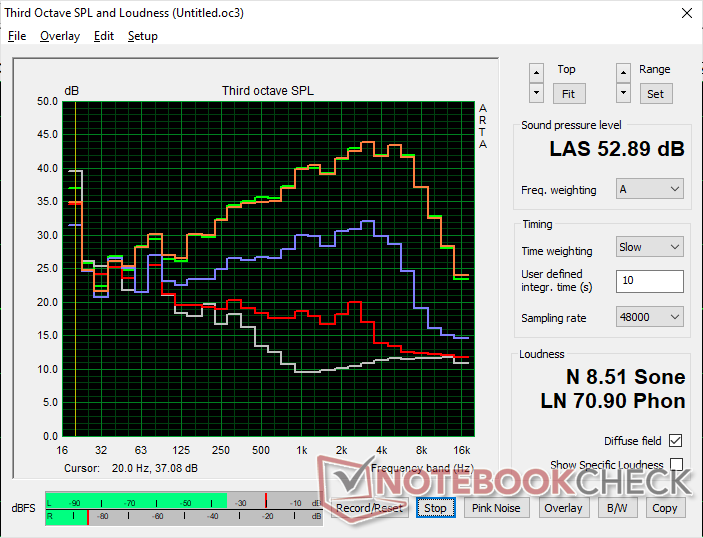
Degré de la nuisance sonore
| Au repos |
| 29.1 / 29.1 / 29.1 dB(A) |
| Fortement sollicité |
| 41 / 52.9 dB(A) |
 | ||
30 dB silencieux 40 dB(A) audible 50 dB(A) bruyant |
||
min: | ||
| Lenovo ThinkPad P16 Gen 2 NVIDIA RTX 4000 Ada Generation Laptop GPU, i7-14700HX, SK hynix PC801 HFS001TEJ9X162N | Lenovo ThinkPad P16 G2 21FA000FGE NVIDIA RTX 2000 Ada Generation Laptop GPU, i7-13700HX, SK hynix PC801 HFS001TEJ9X162N | Lenovo ThinkPad P16s G2 21K9000CGE Radeon 780M, R7 PRO 7840U, SK hynix PC801 HFS001TEJ9X162N | Lenovo ThinkPad P16 G1 RTX A5500 RTX A5500 Laptop GPU, i9-12950HX, WDC PC SN810 2TB | HP ZBook Power 16 G11 A NVIDIA RTX 2000 Ada Generation Laptop GPU, R7 8845HS, Samsung PM9A1 MZVL22T0HBLB | Dell Precision 5690 NVIDIA RTX 5000 Ada Generation Laptop GPU, Ultra 9 185H, 2x Samsung PM9A1 1TB (RAID 0) | |
|---|---|---|---|---|---|---|
| Noise | 6% | 17% | 17% | 18% | 5% | |
| off / environment * | 23.9 | 23.5 2% | 22.6 5% | 23.1 3% | 23.5 2% | 23.4 2% |
| Idle Minimum * | 29.1 | 23.5 19% | 22.6 22% | 23.1 21% | 23.8 18% | 23.6 19% |
| Idle Average * | 29.1 | 29.2 -0% | 22.6 22% | 23.1 21% | 24.2 17% | 24.9 14% |
| Idle Maximum * | 29.1 | 29.5 -1% | 22.6 22% | 23.1 21% | 24.2 17% | 30.9 -6% |
| Load Average * | 41 | 32.7 20% | 37.8 8% | 28.9 30% | 25.4 38% | 40.4 1% |
| Cyberpunk 2077 ultra * | 52.8 | 43 19% | ||||
| Load Maximum * | 52.9 | 56.6 -7% | 40.5 23% | 51.4 3% | 45 15% | 51.9 2% |
| Witcher 3 ultra * | 50.6 | 40.3 | 51.6 | 48.3 |
* ... Moindre est la valeur, meilleures sont les performances
Température
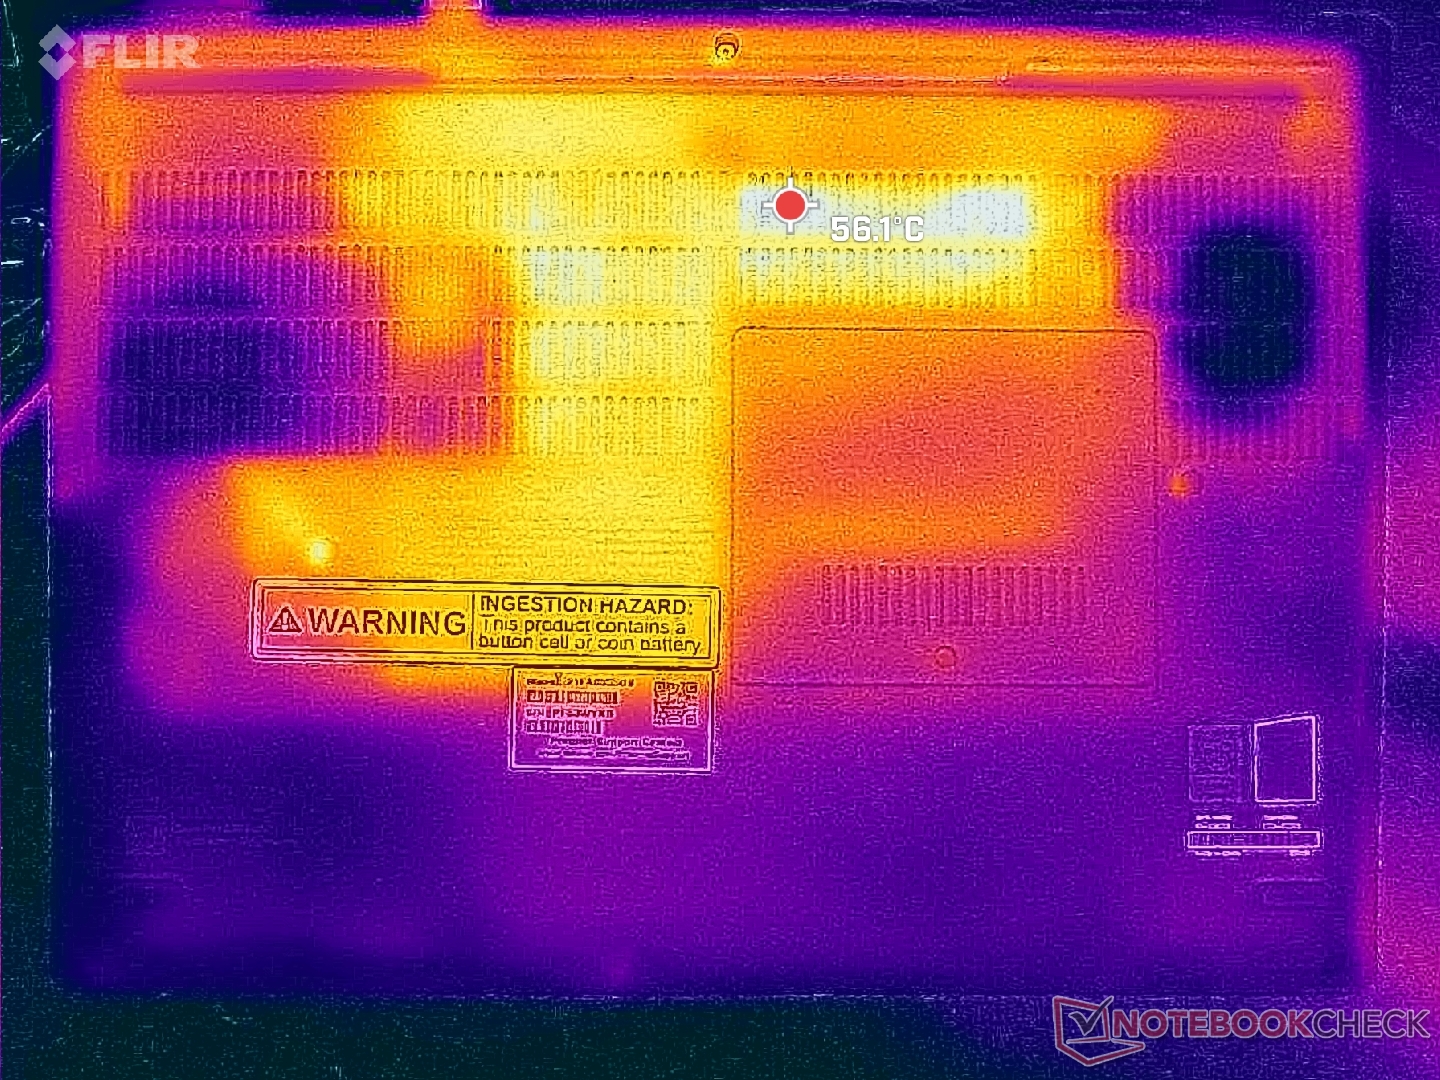
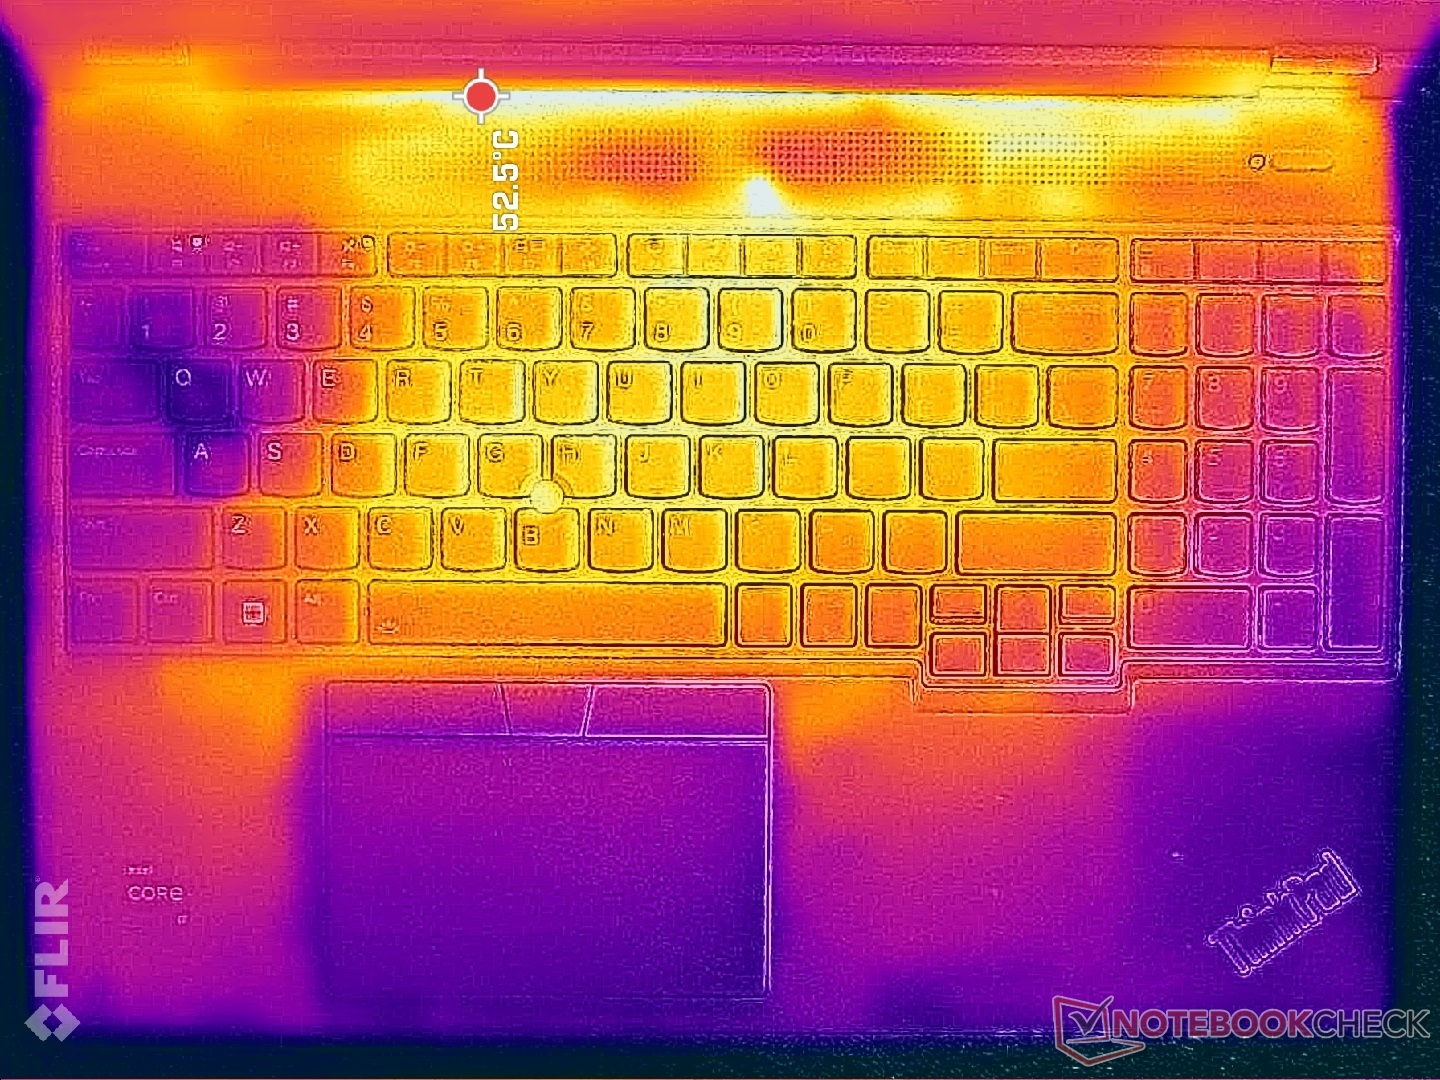
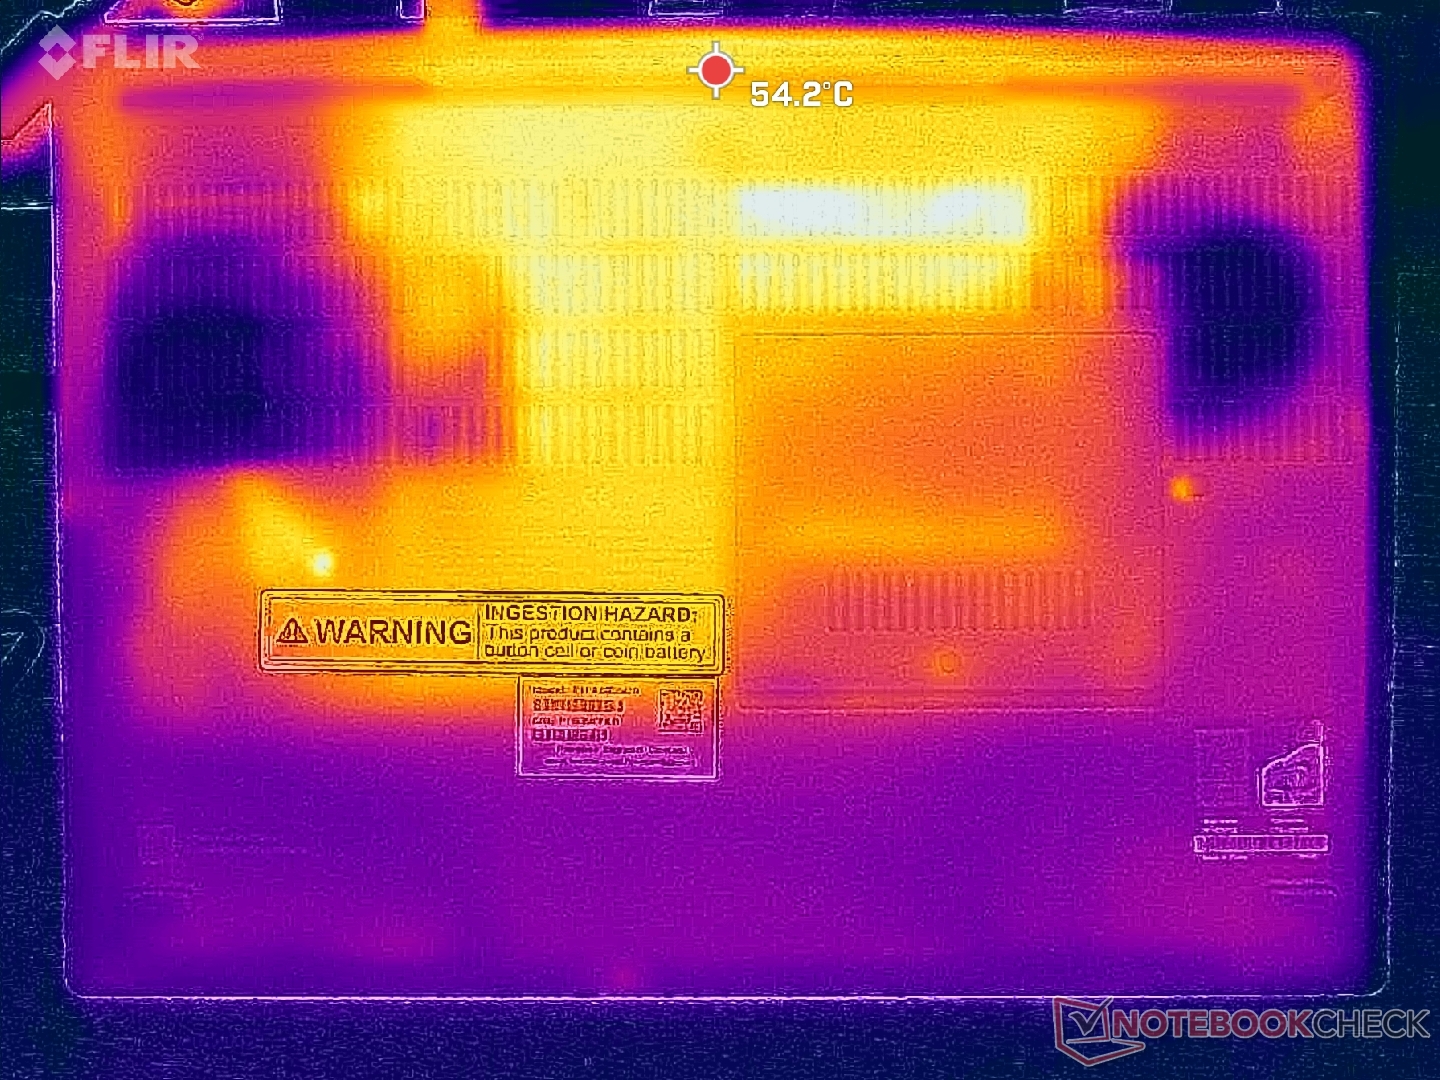
Les températures de surface sont plus élevées que sur notre premier ThinkPad P16 Gen 2 en raison de notre GPU RTX 4000 Ada de 130 W plus exigeant, mais la différence est plus importante que prévu. La température moyenne sur les couvercles C et D peut atteindre 43°C, contre seulement 32°C sur notre configuration moins équipée, lorsque nous exécutons des charges exigeantes.
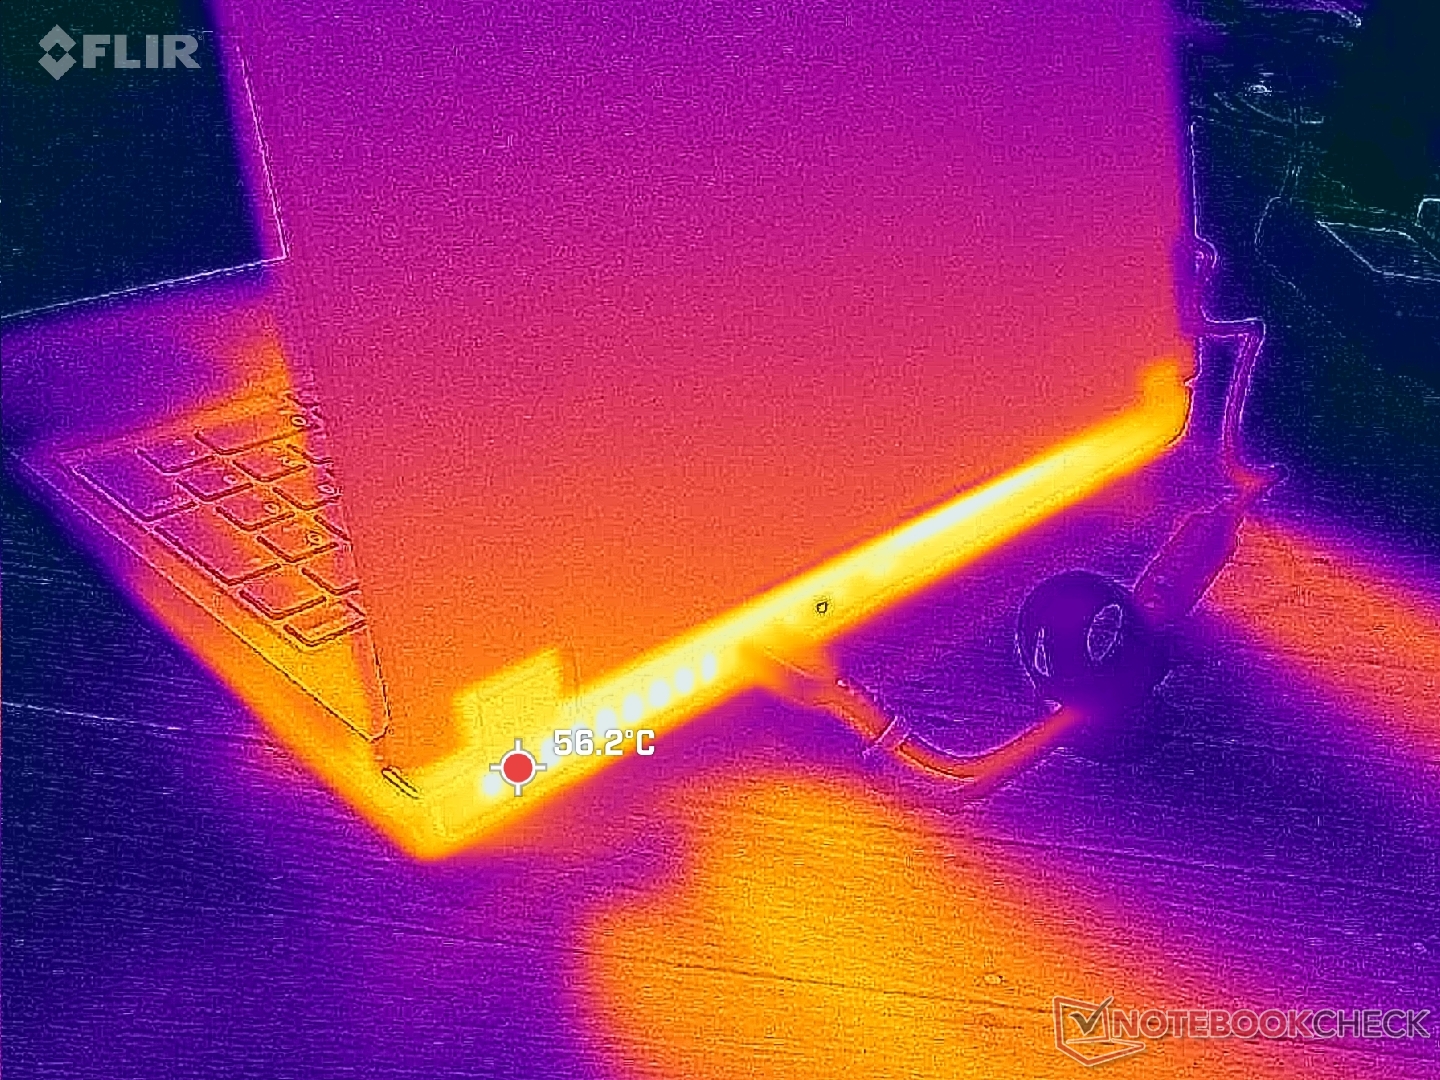
(-) La température maximale du côté supérieur est de 46.6 °C / 116 F, par rapport à la moyenne de 38.2 °C / 101 F, allant de 22.2 à 69.8 °C pour la classe Workstation.
(-) Le fond chauffe jusqu'à un maximum de 51 °C / 124 F, contre une moyenne de 41.2 °C / 106 F
(+) En utilisation inactive, la température moyenne du côté supérieur est de 23.9 °C / 75 F, par rapport à la moyenne du dispositif de 32 °C / 90 F.
(-) 3: The average temperature for the upper side is 39.6 °C / 103 F, compared to the average of 32 °C / 90 F for the class Workstation.
(+) Les repose-poignets et le pavé tactile atteignent la température maximale de la peau (35.6 °C / 96.1 F) et ne sont donc pas chauds.
(-) La température moyenne de la zone de l'appui-paume de dispositifs similaires était de 27.8 °C / 82 F (-7.8 °C / #-14.1 F).
| Lenovo ThinkPad P16 Gen 2 Intel Core i7-14700HX, NVIDIA RTX 4000 Ada Generation Laptop GPU | Lenovo ThinkPad P16 G2 21FA000FGE Intel Core i7-13700HX, NVIDIA RTX 2000 Ada Generation Laptop GPU | Lenovo ThinkPad P16s G2 21K9000CGE AMD Ryzen 7 PRO 7840U, AMD Radeon 780M | Lenovo ThinkPad P16 G1 RTX A5500 Intel Core i9-12950HX, NVIDIA RTX A5500 Laptop GPU | HP ZBook Power 16 G11 A AMD Ryzen 7 8845HS, NVIDIA RTX 2000 Ada Generation Laptop GPU | Dell Precision 5690 Intel Core Ultra 9 185H, NVIDIA RTX 5000 Ada Generation Laptop GPU | |
|---|---|---|---|---|---|---|
| Heat | 3% | -2% | -17% | 6% | -3% | |
| Maximum Upper Side * | 46.6 | 47.2 -1% | 42.7 8% | 44.8 4% | 40.6 13% | 46.6 -0% |
| Maximum Bottom * | 51 | 39.5 23% | 47.2 7% | 49.8 2% | 40.6 20% | 33 35% |
| Idle Upper Side * | 24.8 | 28.1 -13% | 27.8 -12% | 30.6 -23% | 26 -5% | 32.4 -31% |
| Idle Bottom * | 25.6 | 25.3 1% | 28.4 -11% | 38.6 -51% | 26.6 -4% | 29.4 -15% |
* ... Moindre est la valeur, meilleures sont les performances
Intervenants
Lenovo ThinkPad P16 Gen 2 analyse audio
(±) | le niveau sonore du haut-parleur est moyen mais bon (80.7# dB)
Bass 100 - 315 Hz
(±) | basse réduite - en moyenne 10.8% inférieure à la médiane
(±) | la linéarité des basses est moyenne (8% delta à la fréquence précédente)
Mids 400 - 2000 Hz
(±) | médiane supérieure - en moyenne 5.4% supérieure à la médiane
(+) | les médiums sont linéaires (6.2% delta à la fréquence précédente)
Aiguës 2 - 16 kHz
(+) | des sommets équilibrés - à seulement 3.3% de la médiane
(+) | les aigus sont linéaires (5.5% delta à la fréquence précédente)
Overall 100 - 16.000 Hz
(±) | la linéarité du son global est moyenne (15.6% de différence avec la médiane)
Par rapport à la même classe
» 31% de tous les appareils testés de cette catégorie étaient meilleurs, 9% similaires, 60% pires
» Le meilleur avait un delta de 7%, la moyenne était de 18%, le pire était de 35%.
Par rapport à tous les appareils testés
» 21% de tous les appareils testés étaient meilleurs, 4% similaires, 75% pires
» Le meilleur avait un delta de 4%, la moyenne était de 25%, le pire était de 134%.
Apple MacBook Pro 16 2021 M1 Pro analyse audio
(+) | les haut-parleurs peuvent jouer relativement fort (84.7# dB)
Bass 100 - 315 Hz
(+) | bonne basse - seulement 3.8% loin de la médiane
(+) | les basses sont linéaires (5.2% delta à la fréquence précédente)
Mids 400 - 2000 Hz
(+) | médiane équilibrée - seulement 1.3% de la médiane
(+) | les médiums sont linéaires (2.1% delta à la fréquence précédente)
Aiguës 2 - 16 kHz
(+) | des sommets équilibrés - à seulement 1.9% de la médiane
(+) | les aigus sont linéaires (2.7% delta à la fréquence précédente)
Overall 100 - 16.000 Hz
(+) | le son global est linéaire (4.6% différence à la médiane)
Par rapport à la même classe
» 0% de tous les appareils testés de cette catégorie étaient meilleurs, 0% similaires, 100% pires
» Le meilleur avait un delta de 5%, la moyenne était de 18%, le pire était de 45%.
Par rapport à tous les appareils testés
» 0% de tous les appareils testés étaient meilleurs, 0% similaires, 100% pires
» Le meilleur avait un delta de 4%, la moyenne était de 25%, le pire était de 134%.
Gestion de l'énergie
Consommation électrique
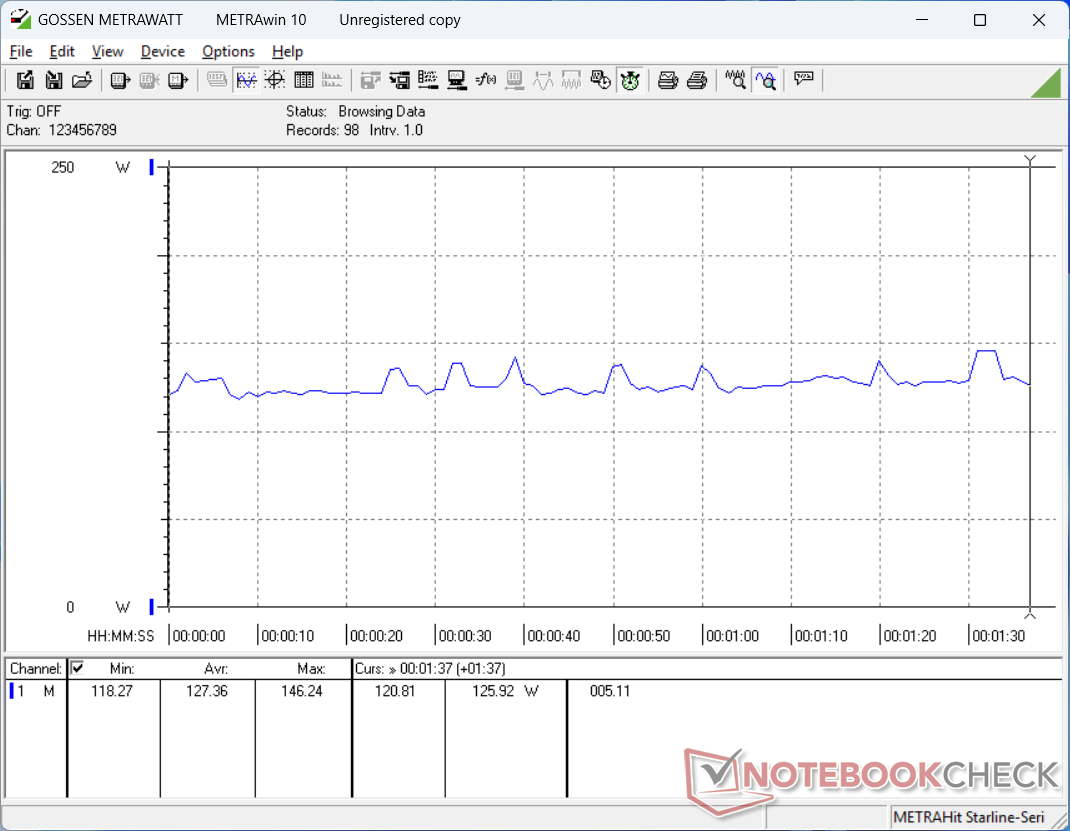
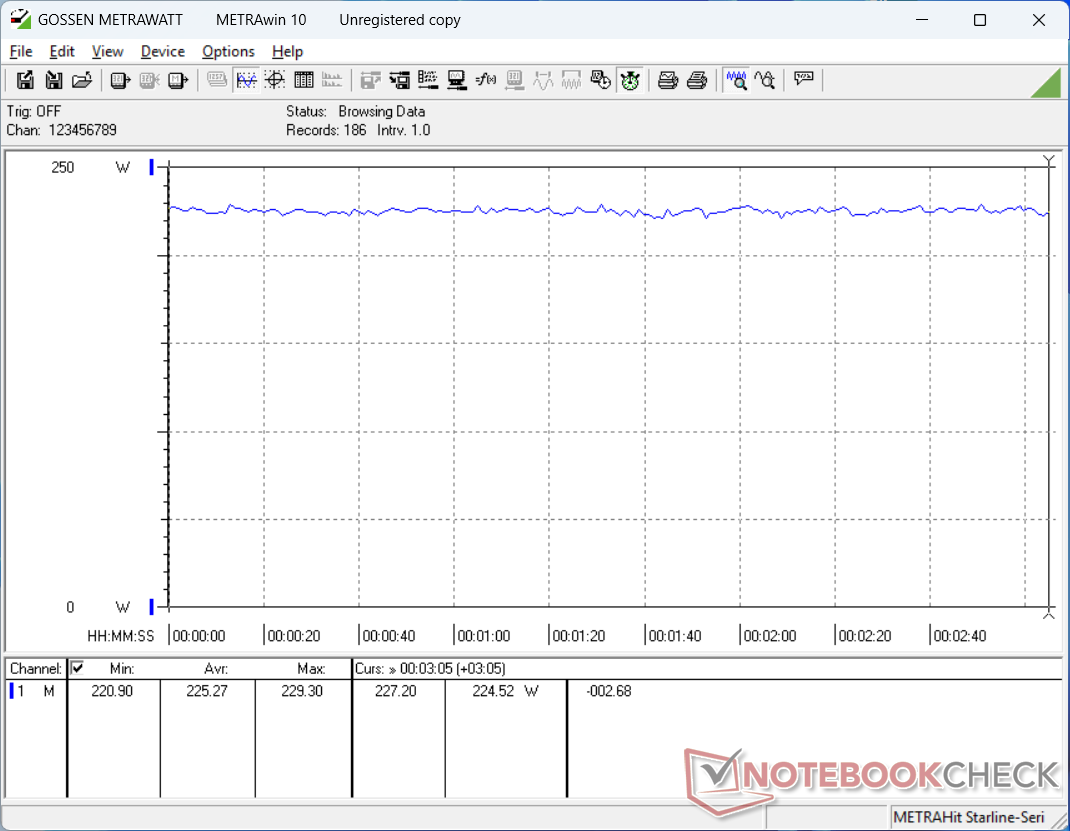
La marche au ralenti sur un ordinateur de bureau peut demander jusqu'à 25 W, contre seulement 16 W pour la configuration RTX 2000 moins bien équipée. Lors de l'exécution de charges exigeantes comme les jeux, le delta peut atteindre 80 W pour une augmentation de 55% de la consommation. Assurez-vous d'utiliser l'adaptateur secteur de 230 W pour tirer le meilleur parti de la configuration RTX 4000.
| Éteint/en veille | |
| Au repos | |
| Fortement sollicité |
|
Légende:
min: | |
| Lenovo ThinkPad P16 Gen 2 i7-14700HX, NVIDIA RTX 4000 Ada Generation Laptop GPU, SK hynix PC801 HFS001TEJ9X162N, IPS, 2560x1600, 16" | Lenovo ThinkPad P16 G2 21FA000FGE i7-13700HX, NVIDIA RTX 2000 Ada Generation Laptop GPU, SK hynix PC801 HFS001TEJ9X162N, IPS LED, 2560x1600, 16" | Lenovo ThinkPad P16s G2 21K9000CGE R7 PRO 7840U, Radeon 780M, SK hynix PC801 HFS001TEJ9X162N, OLED, 3840x2400, 16" | Lenovo ThinkPad P16 G1 RTX A5500 i9-12950HX, RTX A5500 Laptop GPU, WDC PC SN810 2TB, IPS, 3840x2400, 16" | HP ZBook Power 16 G11 A R7 8845HS, NVIDIA RTX 2000 Ada Generation Laptop GPU, Samsung PM9A1 MZVL22T0HBLB, IPS, 2560x1600, 16" | Dell Precision 5690 Ultra 9 185H, NVIDIA RTX 5000 Ada Generation Laptop GPU, 2x Samsung PM9A1 1TB (RAID 0), OLED, 3840x2400, 16" | |
|---|---|---|---|---|---|---|
| Power Consumption | 7% | 55% | -27% | 47% | 8% | |
| Idle Minimum * | 7.9 | 9.3 -18% | 6.1 23% | 7.5 5% | 4.6 42% | 7.9 -0% |
| Idle Average * | 13.1 | 14.1 -8% | 6.5 50% | 20.1 -53% | 10 24% | 12 8% |
| Idle Maximum * | 24.2 | 15.5 36% | 7 71% | 40 -65% | 10.6 56% | 28.6 -18% |
| Load Average * | 127.4 | 133.6 -5% | 56.6 56% | 137 -8% | 60.9 52% | 98.8 22% |
| Cyberpunk 2077 ultra external monitor * | 219 | 92.8 58% | ||||
| Cyberpunk 2077 ultra * | 225 | 96.8 57% | ||||
| Load Maximum * | 248.5 | 179.6 28% | 68.3 73% | 285.9 -15% | 154.8 38% | 174.8 30% |
| Witcher 3 ultra * | 144.9 | 61.2 | 208 | 144.5 |
* ... Moindre est la valeur, meilleures sont les performances
Power Consumption Cyberpunk / Stress Test
Power Consumption external Monitor
Autonomie de la batterie
Les durées d'exécution sont inférieures de plus de moitié à celles que nous avons enregistrées sur la configuration inférieure du ThinkPad P16 Gen 2, même en mode équilibré et avec une luminosité de 150 nit. La différence peut être attribuée à l'absence de support Advanced Optimus sur notre RTX 4000 Ada et donc le GPU discret n'est jamais complètement désactivé.
La charge de la batterie vide à la pleine capacité prend environ 130 minutes, même si la fonction Lenovo Quick Charge est activée.
| Lenovo ThinkPad P16 Gen 2 i7-14700HX, NVIDIA RTX 4000 Ada Generation Laptop GPU, 94 Wh | Lenovo ThinkPad P16 G2 21FA000FGE i7-13700HX, NVIDIA RTX 2000 Ada Generation Laptop GPU, 94 Wh | Lenovo ThinkPad P16s G2 21K9000CGE R7 PRO 7840U, Radeon 780M, 84 Wh | Lenovo ThinkPad P16 G1 RTX A5500 i9-12950HX, RTX A5500 Laptop GPU, 94 Wh | HP ZBook Power 16 G11 A R7 8845HS, NVIDIA RTX 2000 Ada Generation Laptop GPU, 83 Wh | Dell Precision 5690 Ultra 9 185H, NVIDIA RTX 5000 Ada Generation Laptop GPU, 98 Wh | |
|---|---|---|---|---|---|---|
| Autonomie de la batterie | 248% | 329% | 136% | 293% | 271% | |
| WiFi v1.3 | 148 | 515 248% | 635 329% | 350 136% | 582 293% | 549 271% |
| H.264 | 797 | |||||
| Load | 92 | 103 | ||||
| Reader / Idle | 1566 |
Notebookcheck Rating
Lenovo ThinkPad P16 Gen 2
-
10/25/2024 v8
Allen Ngo
 Total Sustainability Score:
Lenovo ThinkPad P16 Gen 2
-
10/25/2024 v8
Allen Ngo
Total Sustainability Score: Transparency
The selection of devices to be reviewed is made by our editorial team. The test sample was provided to the author as a loan by the manufacturer or retailer for the purpose of this review. The lender had no influence on this review, nor did the manufacturer receive a copy of this review before publication. There was no obligation to publish this review. We never accept compensation or payment in return for our reviews. As an independent media company, Notebookcheck is not subjected to the authority of manufacturers, retailers or publishers.
This is how Notebookcheck is testing
Every year, Notebookcheck independently reviews hundreds of laptops and smartphones using standardized procedures to ensure that all results are comparable. We have continuously developed our test methods for around 20 years and set industry standards in the process. In our test labs, high-quality measuring equipment is utilized by experienced technicians and editors. These tests involve a multi-stage validation process. Our complex rating system is based on hundreds of well-founded measurements and benchmarks, which maintains objectivity. Further information on our test methods can be found here.

