

Critique du mini-PC GMK NucBox K11 : Le Zen 4 d'AMD offre un excellent rapport performances/prix
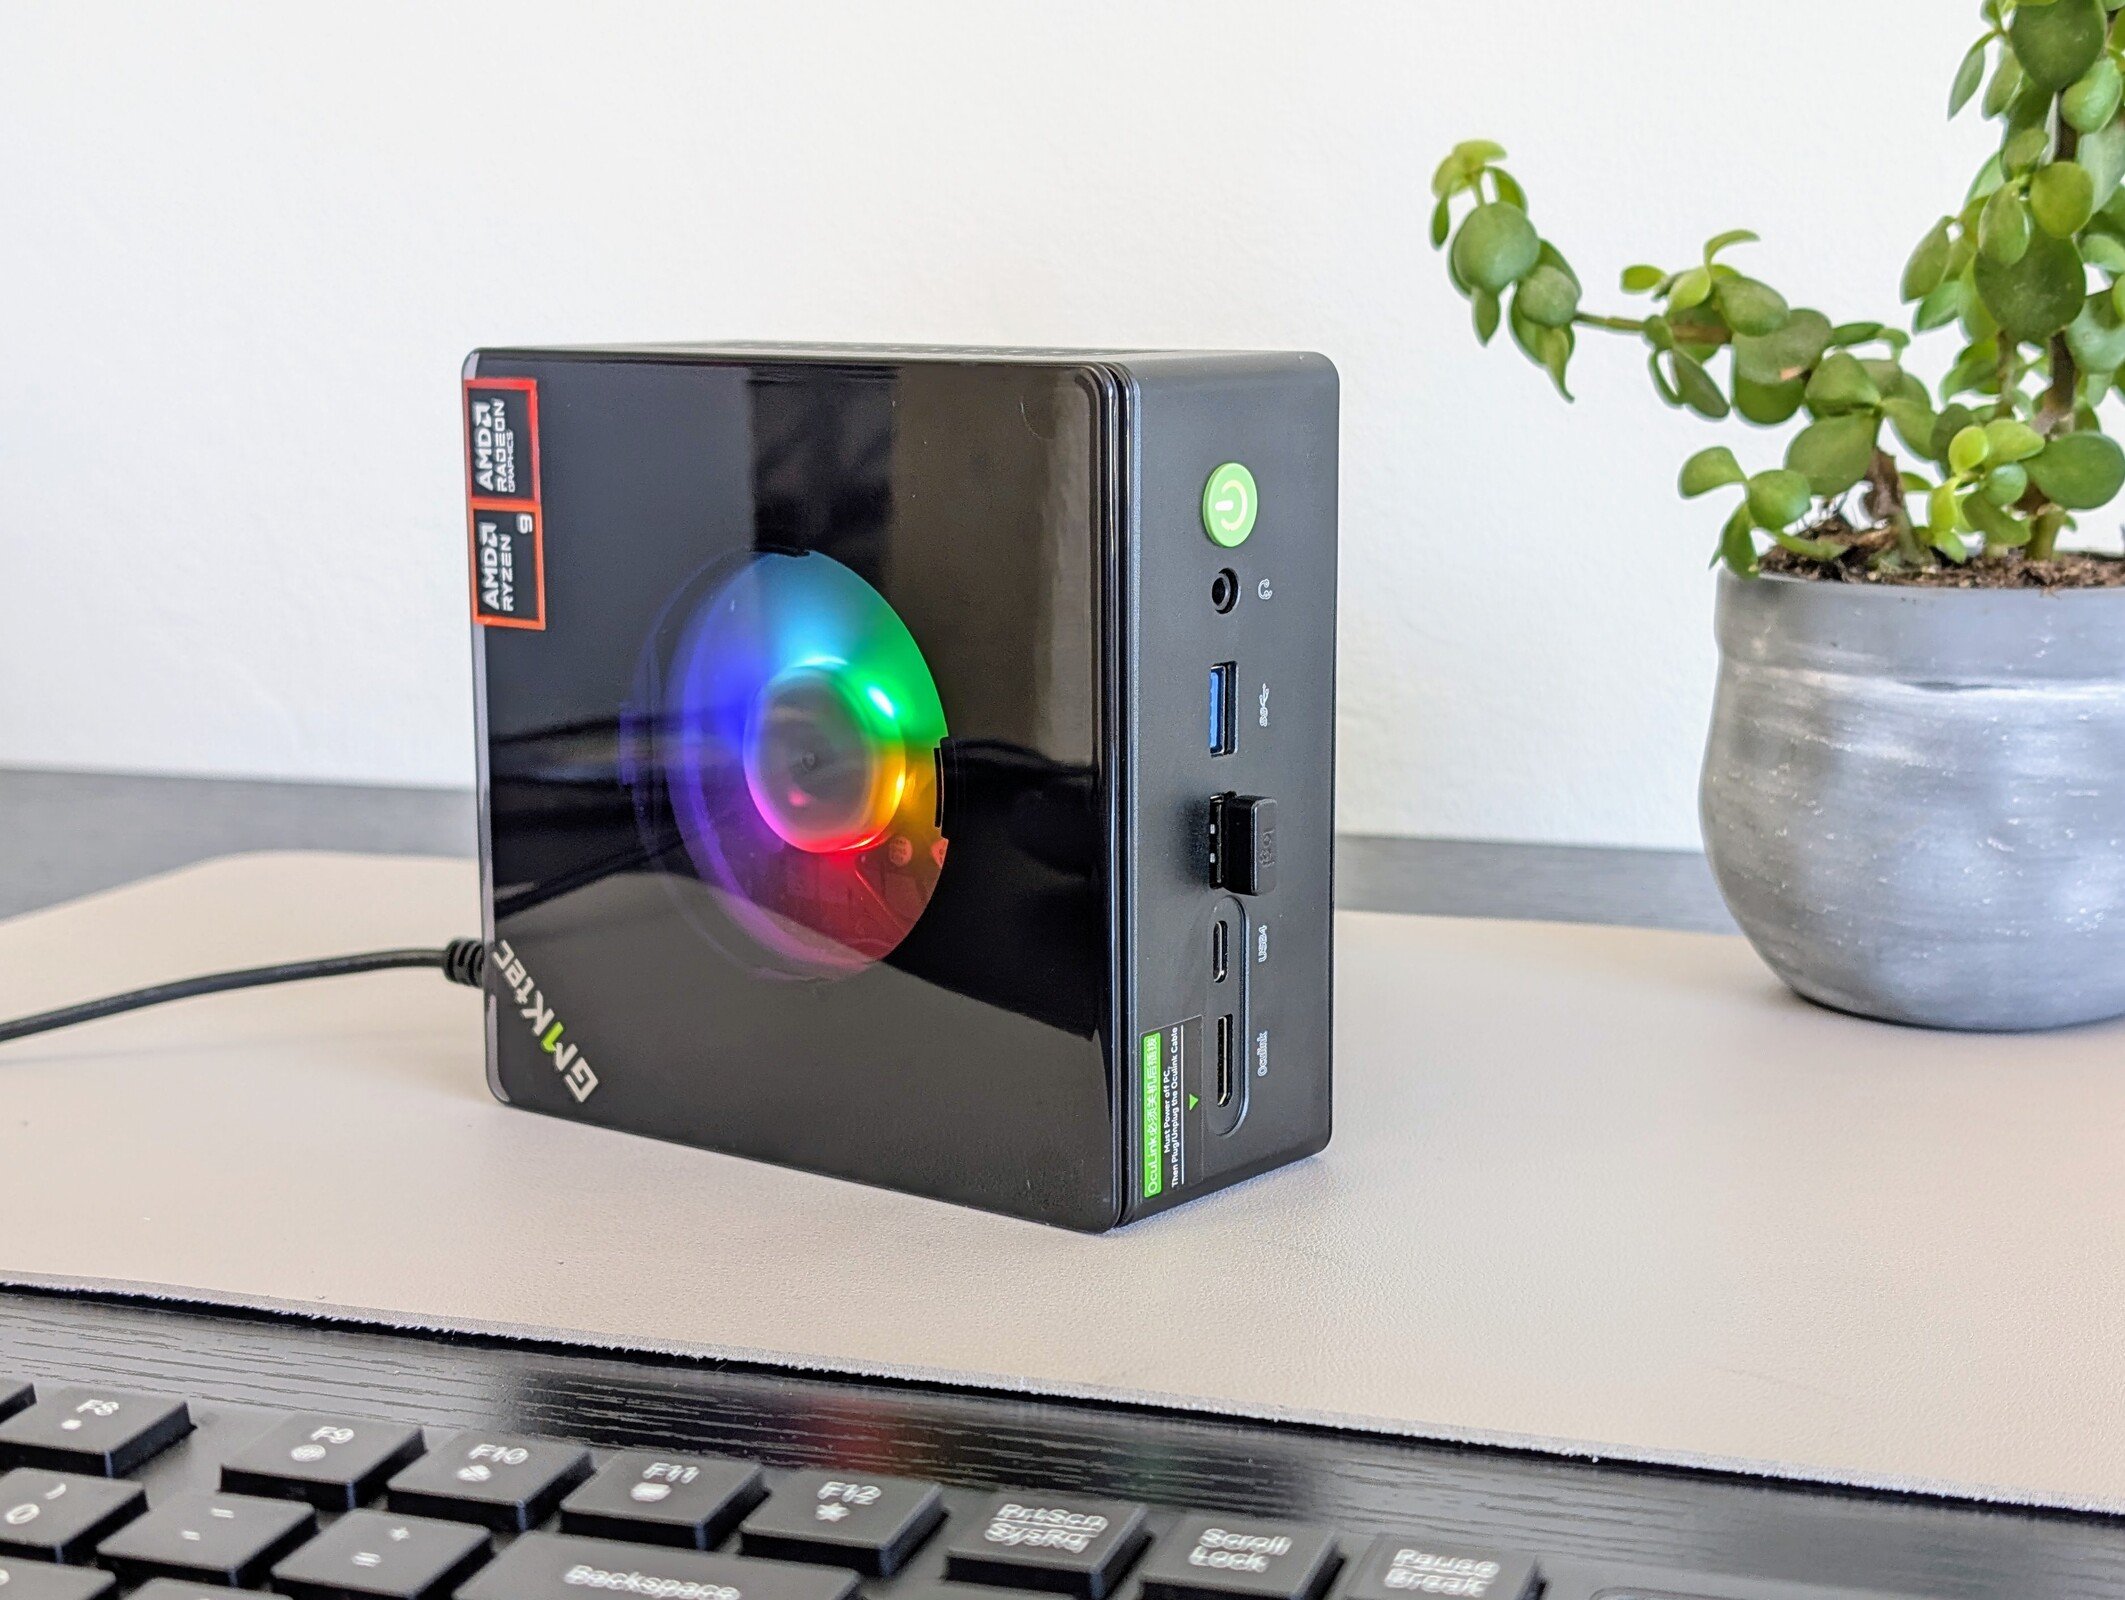
Des LED RVB à foison.
Les anciens processeurs Zen 4 deviennent une véritable aubaine, surtout lorsqu'ils sont comparés aux alternatives d'Intel. La NucBox K11 est l'un des mini PC AMD les moins chers et supporte également l'OcuLink.Allen Ngo, 👁 Allen Ngo (traduit par DeepL / Ninh Duy) Publié 🇺🇸
Verdict - Un bon équilibre entre prix et performances avec AMD
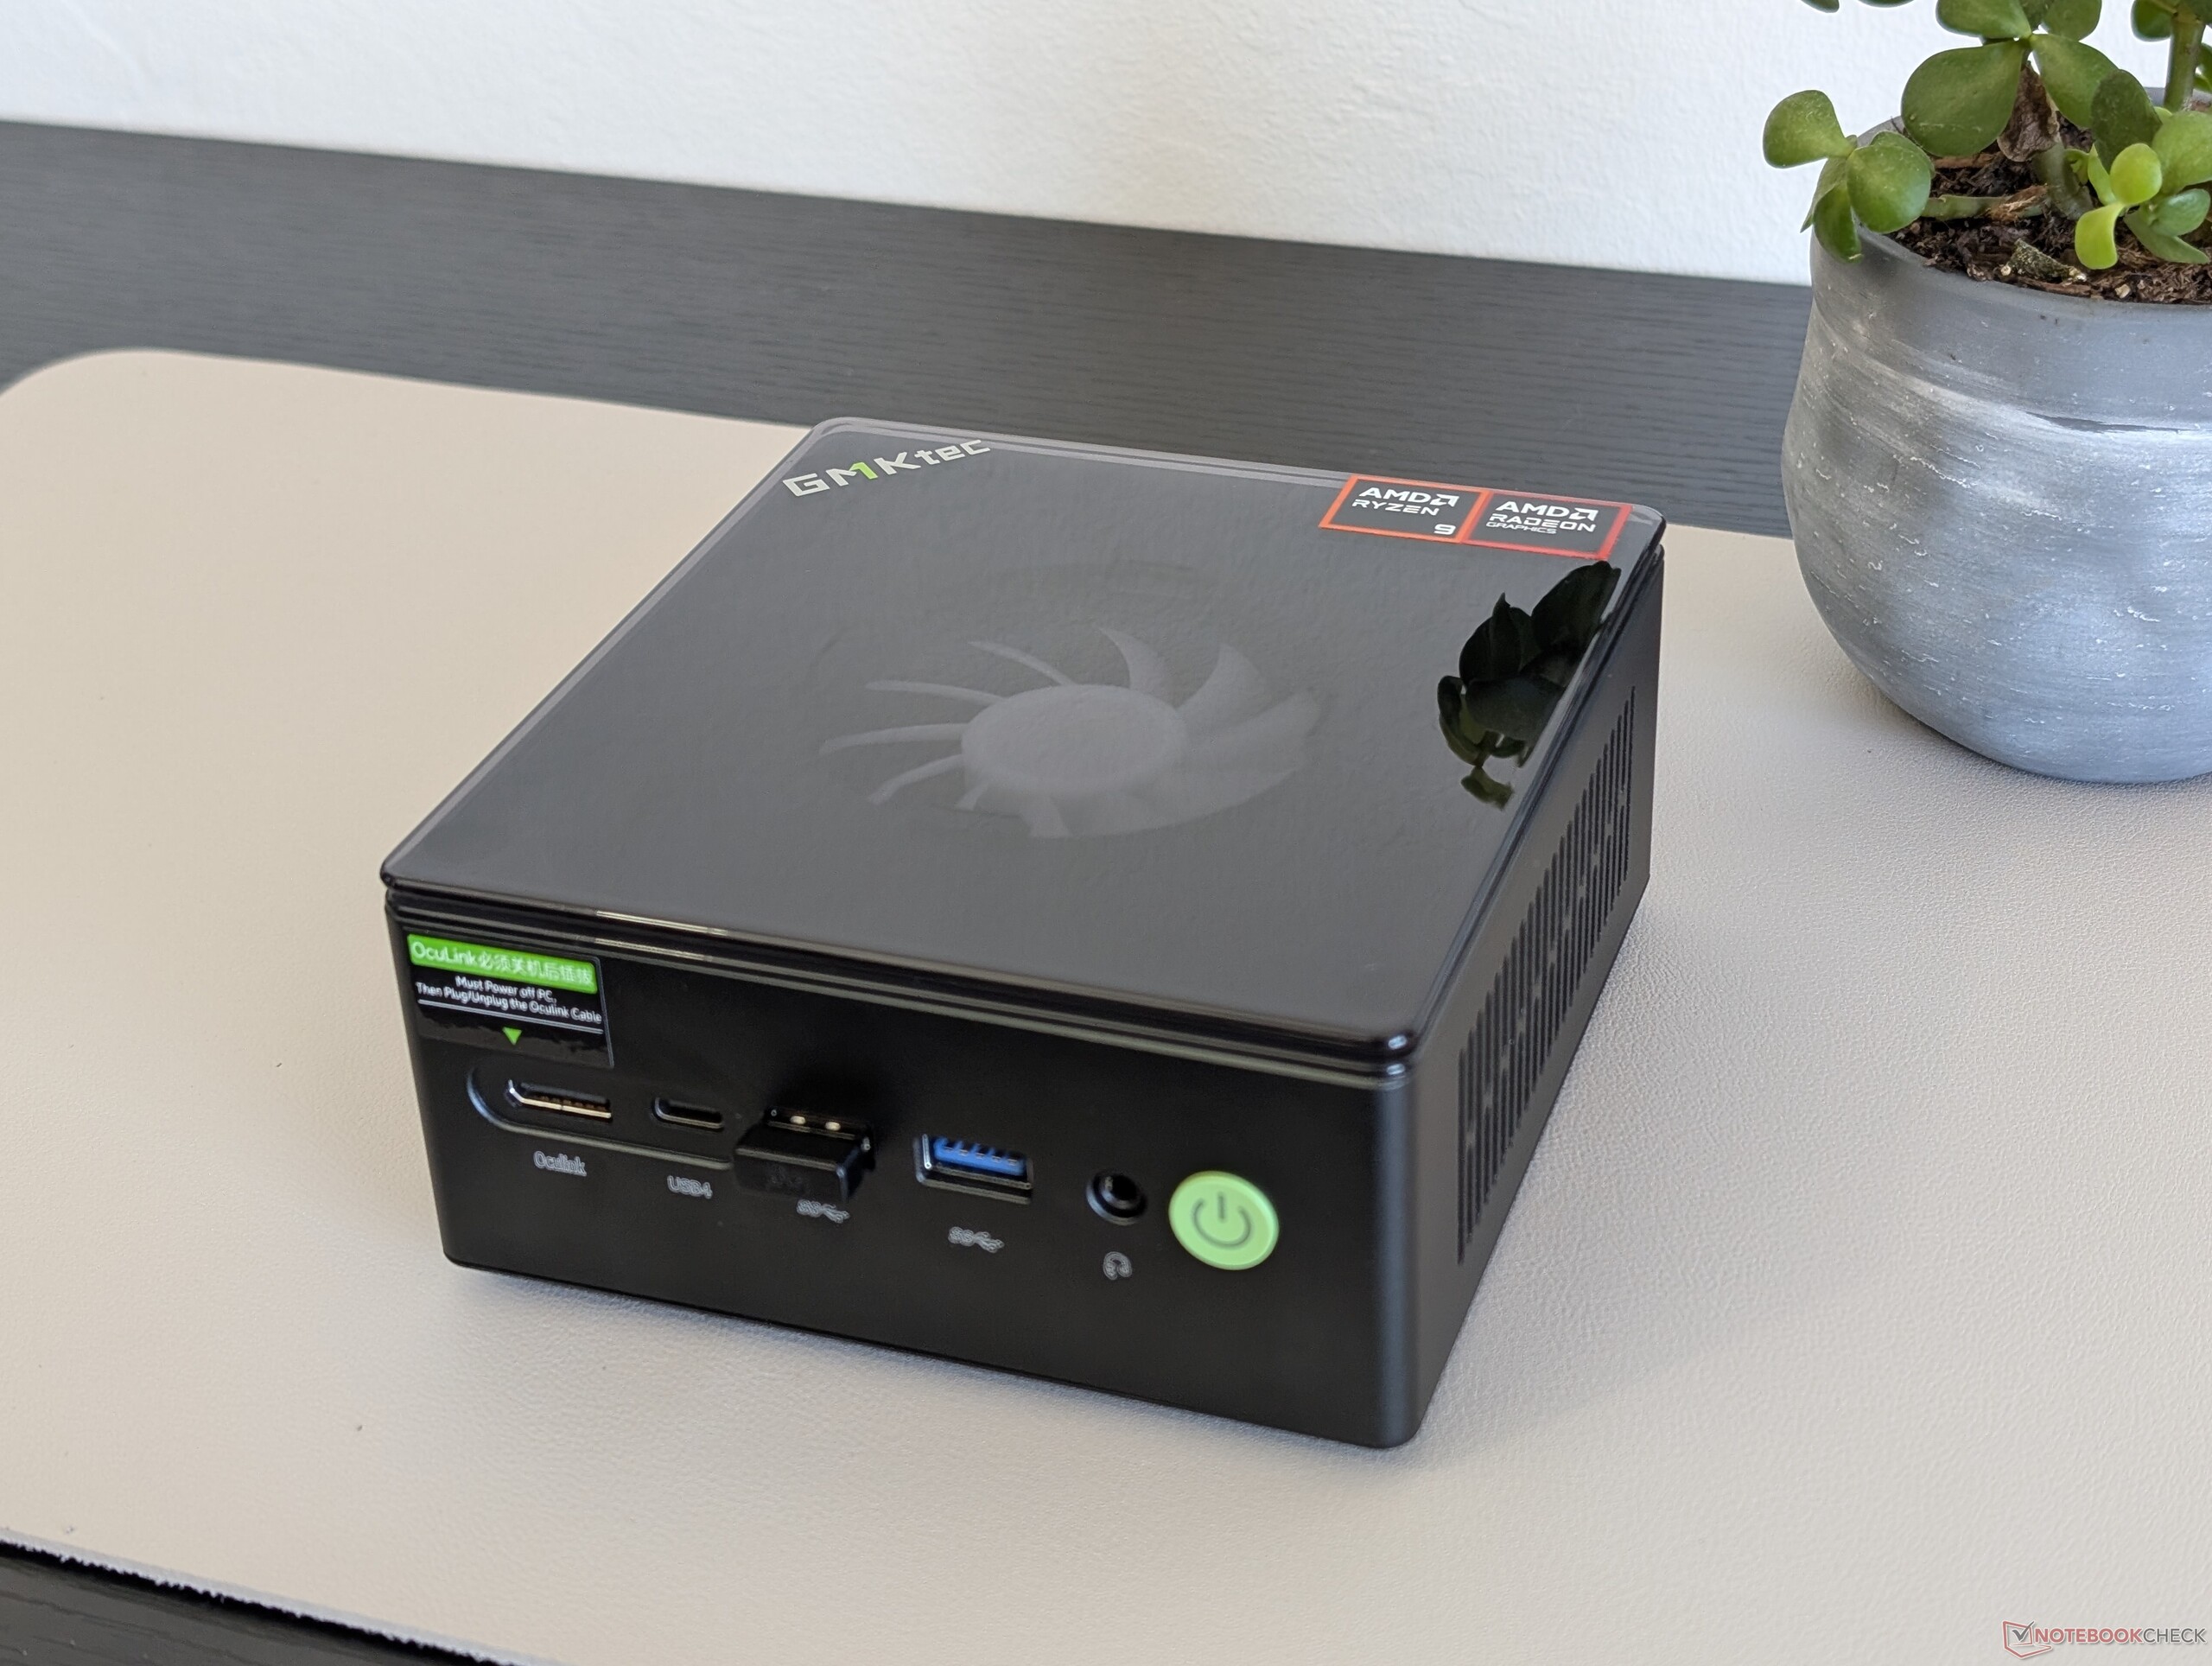
La NucBox K11 se distingue de la plupart des autres mini PC par son port OcuLink intégré et ses LED RGB excentriques. Les éléments de base d'un mini PC décent sont intacts, y compris la RAM extensible, le SSD extensible, le petit profil et la bonne sélection de ports intégrés. Son prix de 600 $ est raisonnable si l'on considère que le processeur Zen 4 Ryzen 9 peut encore rivaliser avec les offres Intel relativement plus récentes en termes de performances et d'efficacité.
Les utilisateurs qui pourraient être rebutés par les LED RVB superficielles n'ont aucun moyen facile de les éteindre au moment où nous écrivons ces lignes. Si GMK souhaite les intégrer à ses futurs produits, il faudrait au moins les personnaliser ou les utiliser comme des voyants lumineux. Des vis à oreilles auraient également facilité l'entretien du modèle. Des alternatives comme le Beelink SER9 ou le MSI Cubi ont une esthétique plus professionnelle et moins de pièces en plastique.
Points positifs
Points négatifs
Prix et disponibilité
La NucBox K11 est désormais disponible directement auprès du fabricant pour 600 $ avec 32 Go de RAM et 1 To de SSD, comme indiqué dans l'article. Amazon propose également le modèle en vente au prix de 650 $ avec 32 Go de RAM et 2 To de SSD.
Comparaison des alternatives possibles
Image | Modèle | Prix | Poids | Épaisseur | Écran |
|---|---|---|---|---|---|
1. 78.3%  | GMK NucBox K11 AMD Ryzen 9 8945HS ⎘ AMD Radeon 780M ⎘ 32 Go Mémoire, 1024 Go SSD | Amazon: $849.99 Prix de liste: 600 USD | 630 g | 58 mm | x |
2. 79.9%  | Beelink GTI13 Ultra Intel Core i9-13900HK ⎘ Intel Iris Xe Graphics G7 96EUs ⎘ 32 Go Mémoire, 1024 Go SSD | Amazon: $759.00 Prix de liste: 600 USD | 1.3 kg | 55.8 mm | x |
3. 72%  | GMK EVO-X1 AMD Ryzen AI 9 HX 370 ⎘ AMD Radeon 890M ⎘ 32 Go Mémoire, 1024 Go SSD | Amazon: $1,099.99 Prix de liste: 900 USD | 595 g | 63.2 mm | x |
4. 79%  | BOSGAME M2 AMD Ryzen 9 7940HS ⎘ AMD Radeon 780M ⎘ 32 Go Mémoire | Amazon: $699.00 Prix de liste: 600 USD | 819 g | 51 mm | x |
5. 66.1%  | MSI Cubi NUC 1M Intel Core 7 150U ⎘ Intel Iris Xe Graphics G7 96EUs ⎘ 16 Go Mémoire, 1024 Go SSD | Amazon: $599.00 Prix de liste: 950 USD | 660 g | 50.1 mm | x |
6. 78.8%  | Geekom GT1 Mega Intel Core Ultra 9 185H ⎘ Intel Arc 8-Core iGPU ⎘ 32 Go Mémoire, 2048 Go SSD | Amazon: 1. $989.00 GEEKOM GT1 Mega AI Mini PC,1... 2. $989.99 GEEKOM XT1 Mega AI Mini PC,1... 3. $979.00 GEEKOM IT1 Mega AI Mini PC,1... Prix de liste: 1149 EUR | 693 g | 46.9 mm | x |
La NucBox K11 est un mini PC de milieu de gamme supérieur qui a plus en commun avec la NucBox M7 Pro qu'avec la NucBox K9. Elle se distingue par l'intégration d'Oculink et de LED RVB overt, tout en fonctionnant sur du matériel Zen 4 moderne.
Notre unité de test est équipée du processeur Ryzen 9 8945HS, de 32 Go de RAM et d'un disque dur SSD de 1 To pour environ 600 $. L'option "barebones" peut être trouvée à partir de 480 $, mais le CPU Ryzen 9 reste constant.
Les alternatives à la NucBox K11 comprennent d'autres mini PC de la taille d'un NUC comme le BOSGAME M2, Geekom GT1 Mega, ou Beelink GTI13 Ultra.
Plus de commentaires sur la GMK :
Spécifications
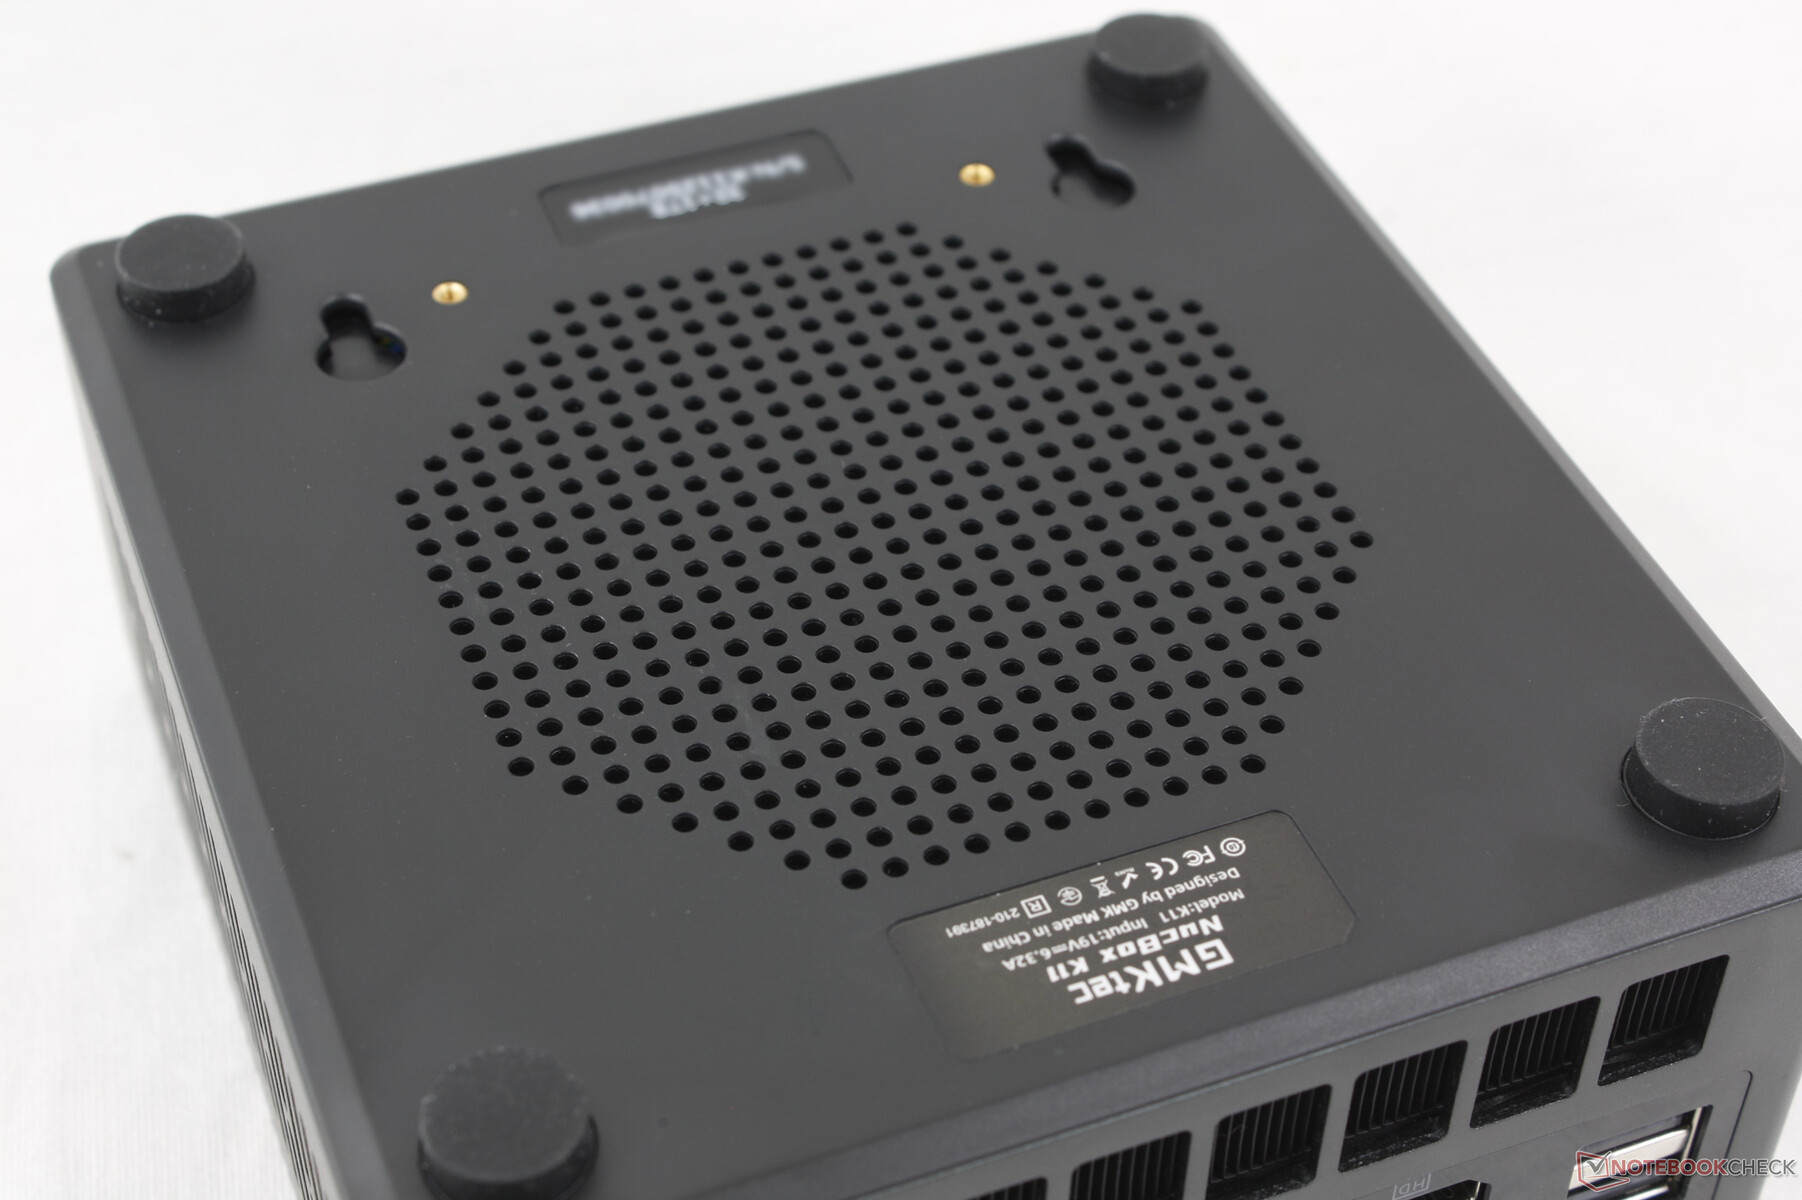
Cas
Le châssis est essentiellement identique à celui du GMK M7 Pro bien qu'il soit doté d'un éclairage LED RVB pour un meilleur rendu visuel. Malheureusement, les LED sont statiques et ne disposent d'aucune fonction de personnalisation, ni même d'un moyen pratique de les éteindre. Le récent EVO-X1 souffre du même problème.
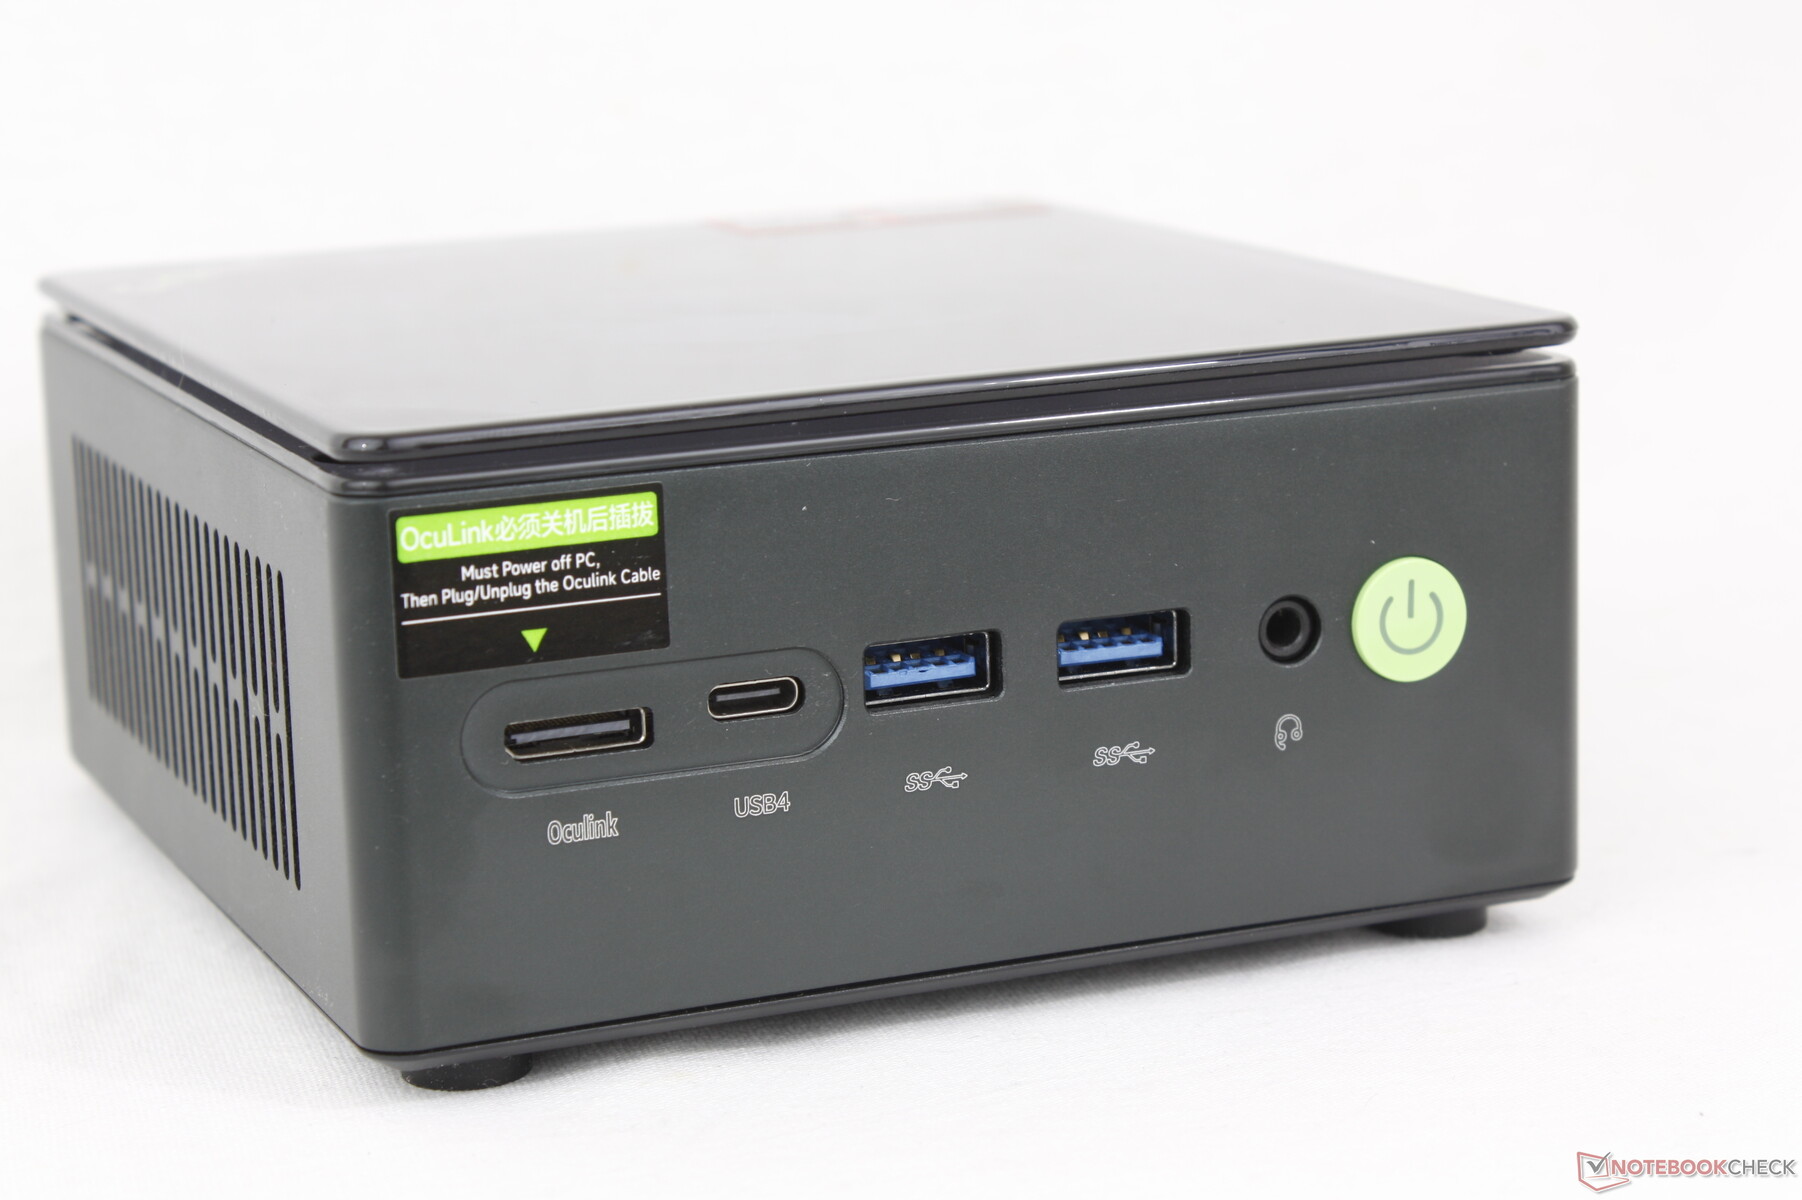
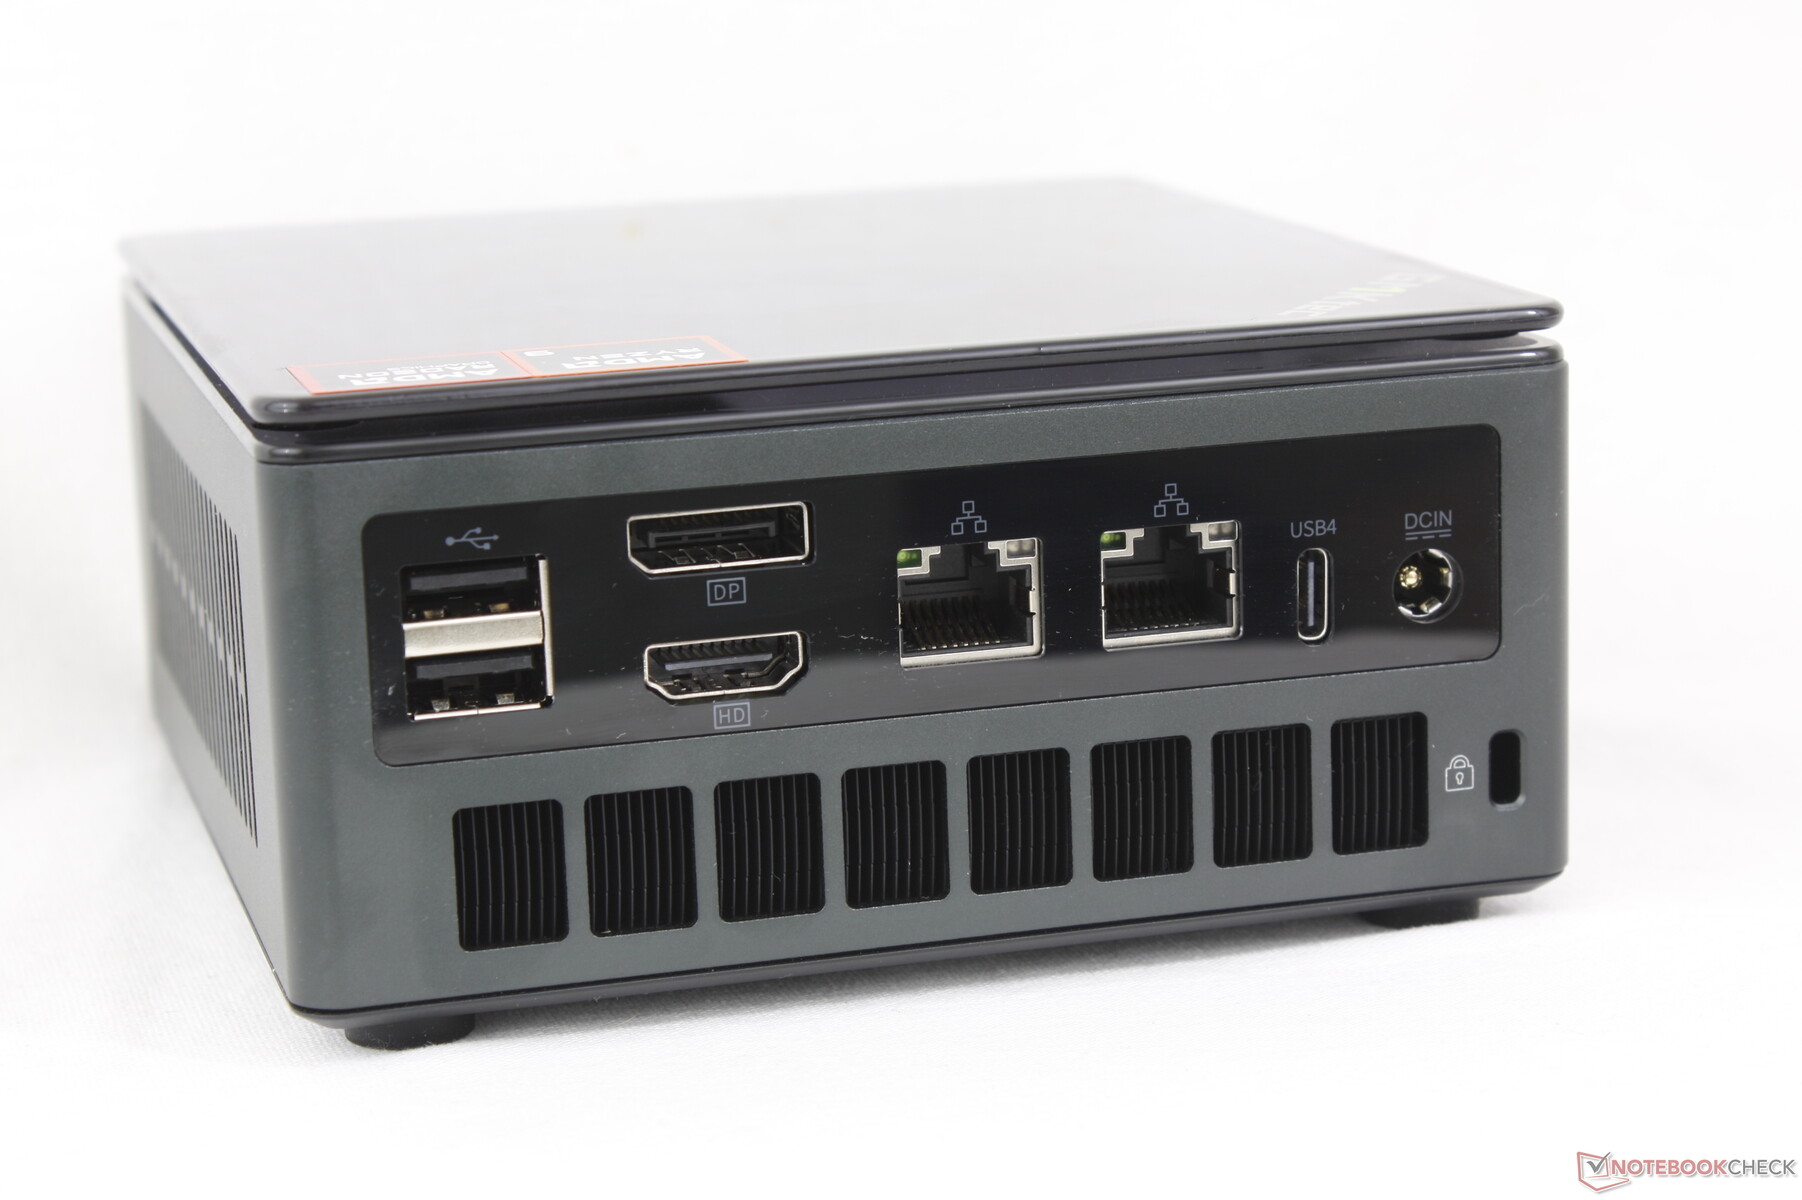
Connectivité
Le port Oculink est peut-être la caractéristique la plus remarquable de la NucBox K11. Sinon, la sélection des ports est saine à l'avant et à l'arrière du modèle.
Communication
| Networking | |
| iperf3 transmit AXE11000 | |
| BOSGAME M2 | |
| GMK EVO-X1 | |
| Geekom GT1 Mega | |
| Beelink GTI13 Ultra | |
| GMK NucBox K11 | |
| MSI Cubi NUC 1M | |
| iperf3 receive AXE11000 | |
| GMK EVO-X1 | |
| BOSGAME M2 | |
| Geekom GT1 Mega | |
| Beelink GTI13 Ultra | |
| MSI Cubi NUC 1M | |
| GMK NucBox K11 | |
| iperf3 transmit AXE11000 6GHz | |
| MSI Cubi NUC 1M | |
| Geekom GT1 Mega | |
| BOSGAME M2 | |
| iperf3 receive AXE11000 6GHz | |
| MSI Cubi NUC 1M | |
| Geekom GT1 Mega | |
| BOSGAME M2 | |
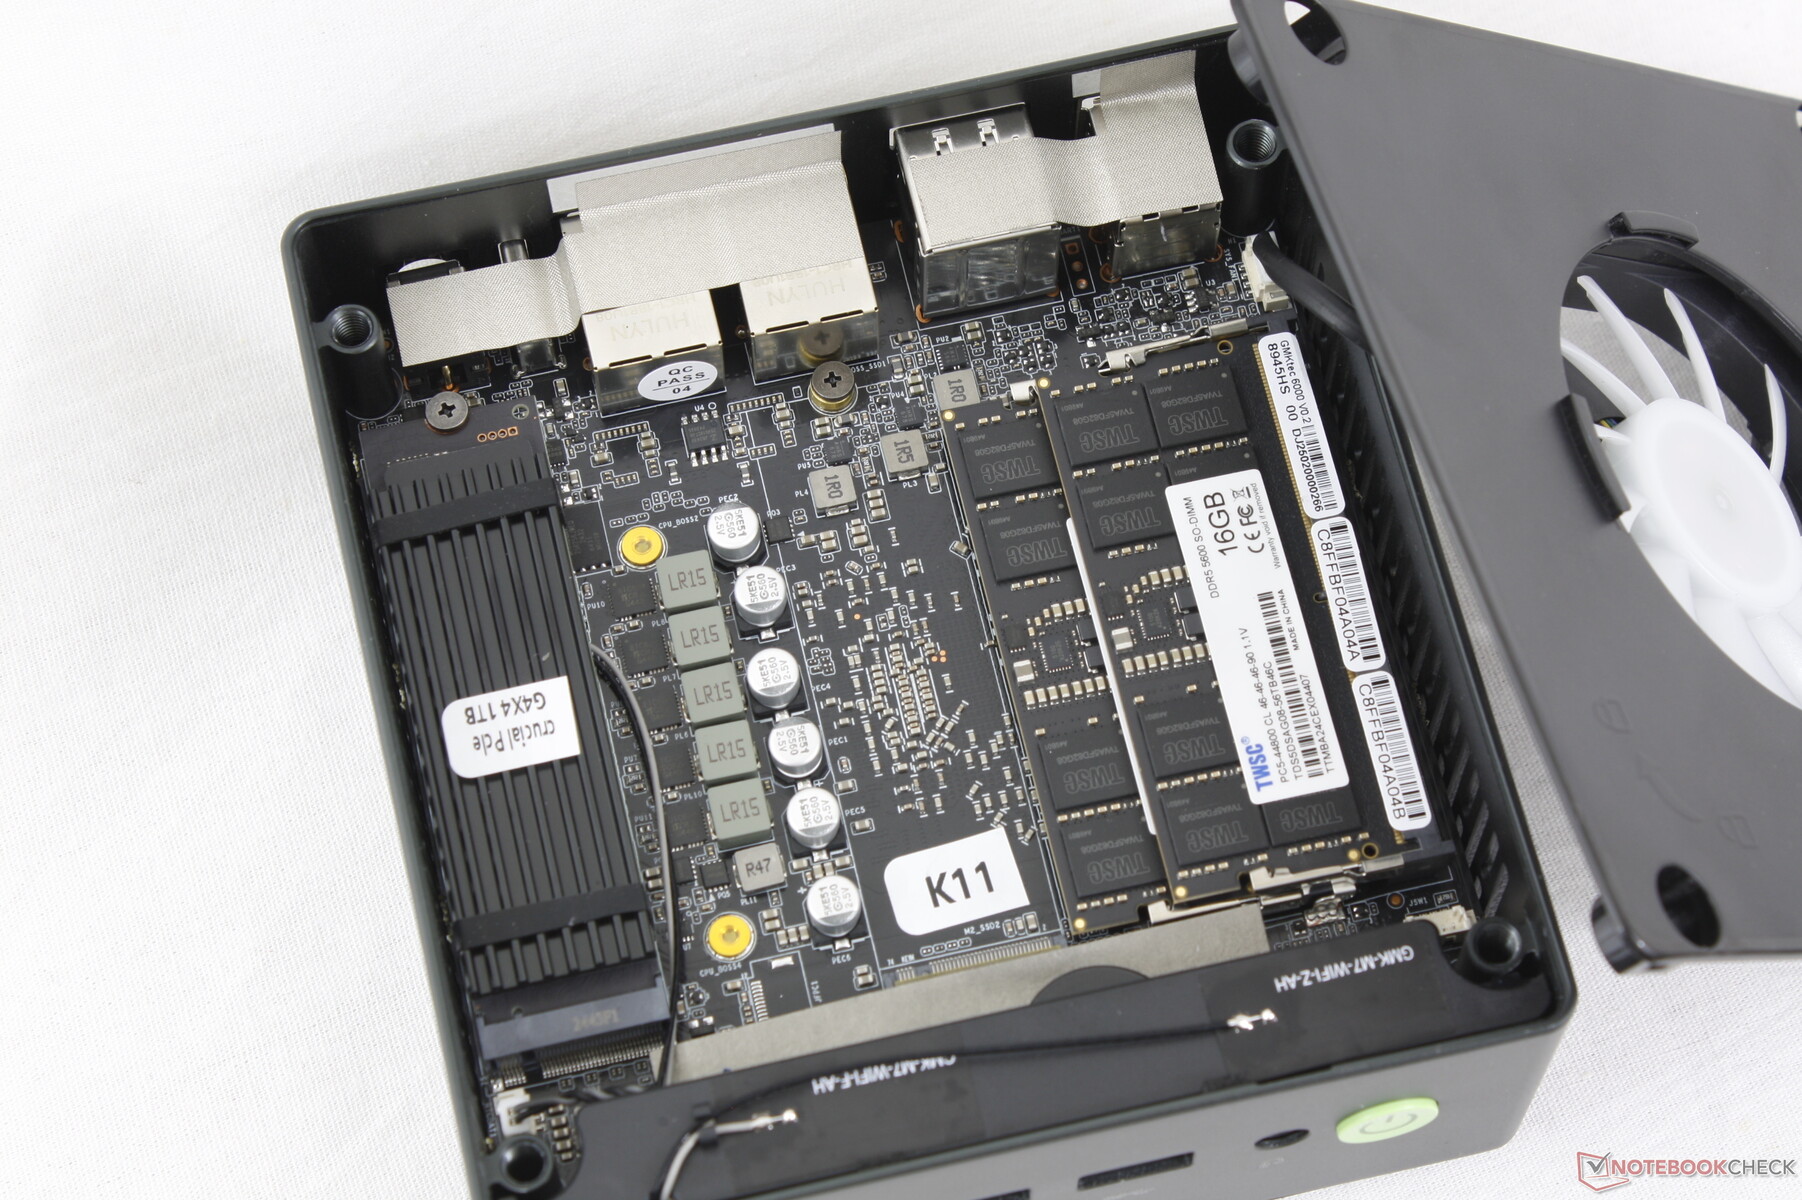
Maintenance
Le plastique transparent supérieur peut être retiré par torsion, comme sur le M7 Pro. Le ventilateur RGB peut ensuite être facilement retiré à l'aide d'un tournevis Phillips pour révéler deux emplacements SODIMM et deux emplacements M.2 2280 SSD.
Durabilité
GMK ne fait état d'aucune mesure de durabilité prise au cours de la fabrication. L'emballage lui-même est principalement composé de papier et de carton, avec un peu d'emballage plastique et de mousse de protection.
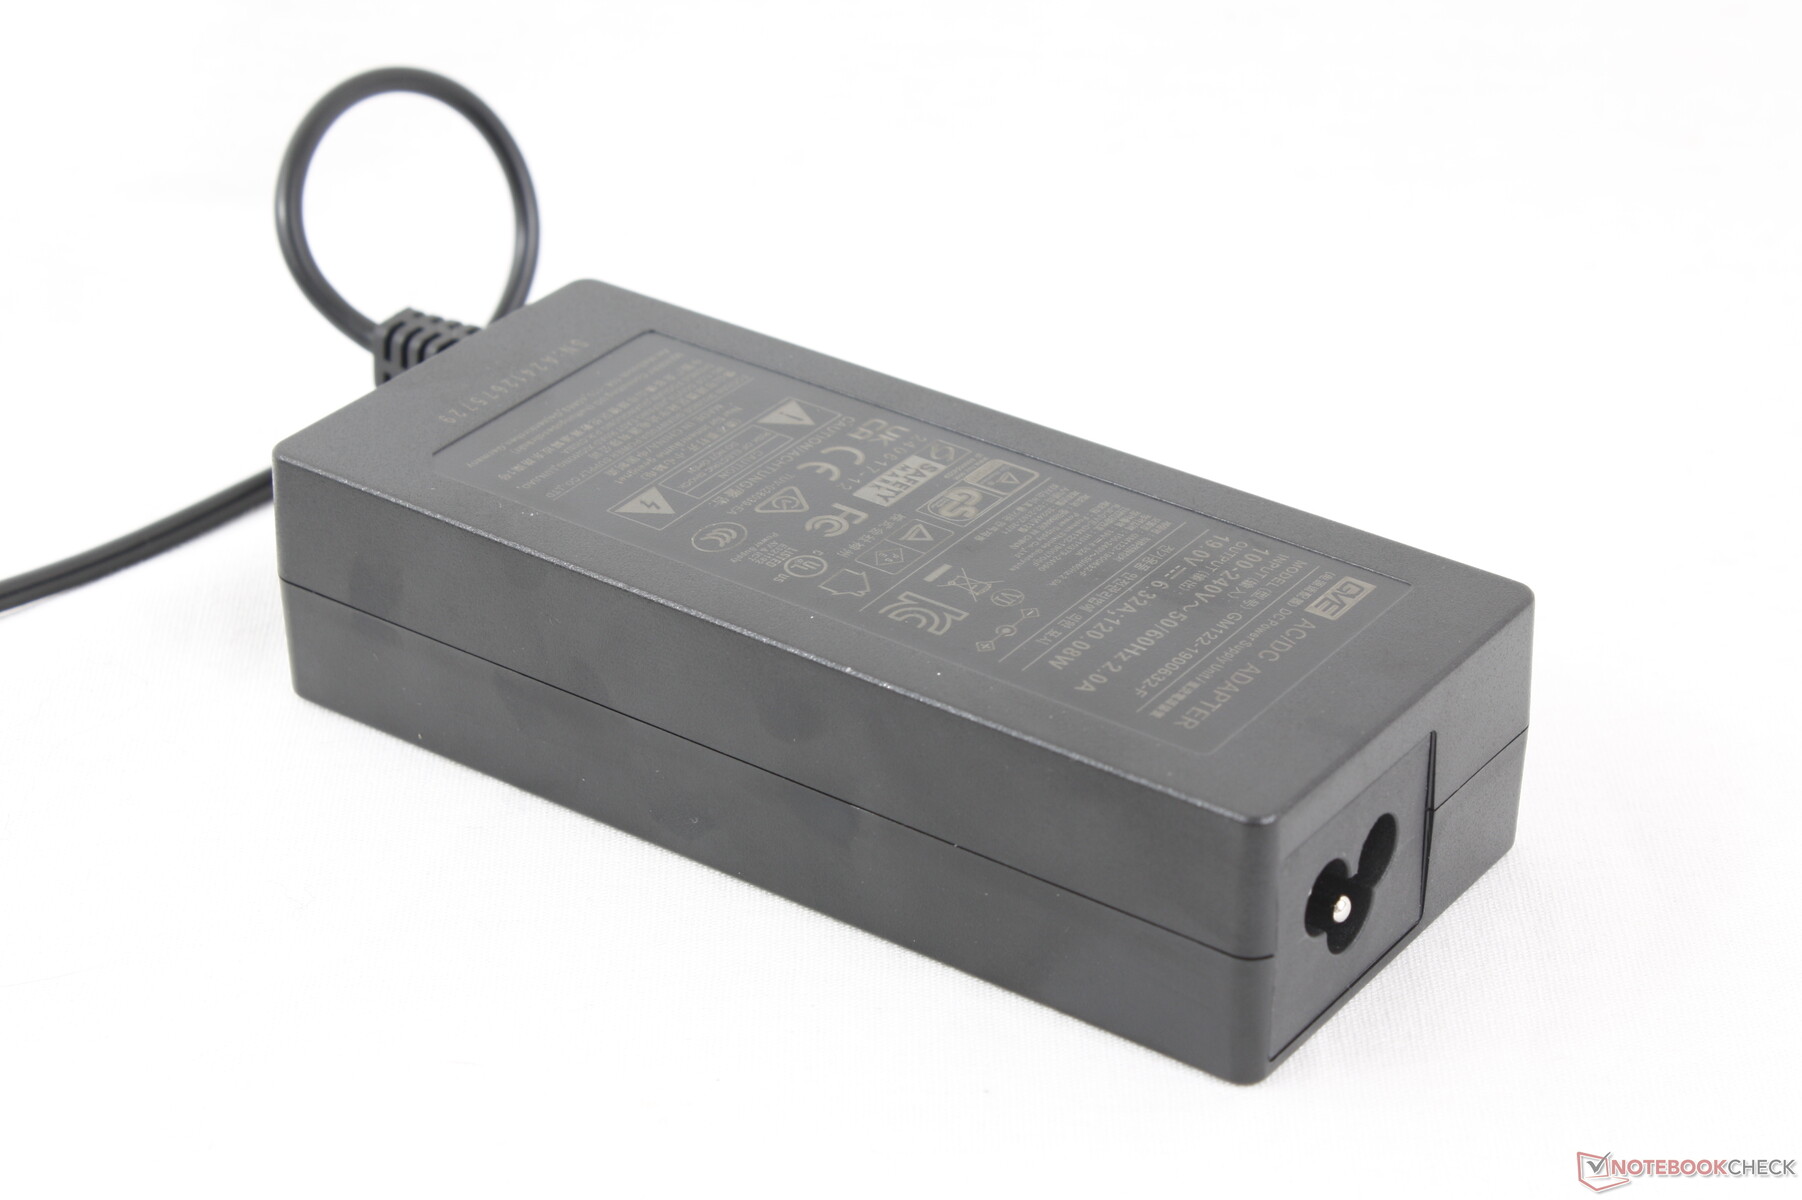
Accessoires et garantie
L'emballage comprend un support de montage VESA amovible et un câble HDMI, en plus de l'adaptateur secteur et de la documentation. La garantie limitée habituelle d'un an du fabricant s'applique si vous achetez l'appareil aux États-Unis.
Performance
Conditions d'essai
Nous avons réglé Windows sur le mode Performance avant d'effectuer les tests ci-dessous.
Processeur
Les performances sont régulières et ne présentent pas de problèmes d'étranglement notables. Le Ryzen 9 8945HS a beau avoir quelques années, il tient toujours la route face à des alternatives plus onéreuses comme le Core i9-13900HK ou même le plus récent Core Ultra 9 185H.
Cinebench R15 Multi Loop
Cinebench R23: Multi Core | Single Core
Cinebench R20: CPU (Multi Core) | CPU (Single Core)
Cinebench R15: CPU Multi 64Bit | CPU Single 64Bit
Blender: v2.79 BMW27 CPU
7-Zip 18.03: 7z b 4 | 7z b 4 -mmt1
Geekbench 6.4: Multi-Core | Single-Core
Geekbench 5.5: Multi-Core | Single-Core
HWBOT x265 Benchmark v2.2: 4k Preset
LibreOffice : 20 Documents To PDF
R Benchmark 2.5: Overall mean
| CPU Performance Rating | |
| GMK EVO-X1 | |
| Minisforum MS-A1 | |
| Beelink GTI13 Ultra | |
| GMK NucBox K11 | |
| Geekom GT1 Mega | |
| BOSGAME M2 | |
| Moyenne AMD Ryzen 9 8945HS | |
| Geekom Mini IT12 | |
| MSI Cubi NUC 1M | |
| Beelink SER5 | |
| Cinebench R23 / Multi Core | |
| GMK EVO-X1 | |
| Geekom GT1 Mega | |
| Minisforum MS-A1 | |
| Moyenne AMD Ryzen 9 8945HS (16463 - 17376, n=6) | |
| GMK NucBox K11 | |
| Beelink GTI13 Ultra | |
| BOSGAME M2 | |
| Geekom Mini IT12 | |
| Beelink SER5 | |
| MSI Cubi NUC 1M | |
| Cinebench R23 / Single Core | |
| Beelink GTI13 Ultra | |
| GMK EVO-X1 | |
| MSI Cubi NUC 1M | |
| Minisforum MS-A1 | |
| GMK NucBox K11 | |
| Moyenne AMD Ryzen 9 8945HS (1719 - 1825, n=6) | |
| Geekom GT1 Mega | |
| BOSGAME M2 | |
| Geekom Mini IT12 | |
| Beelink SER5 | |
| Cinebench R20 / CPU (Multi Core) | |
| GMK EVO-X1 | |
| Geekom GT1 Mega | |
| Minisforum MS-A1 | |
| Moyenne AMD Ryzen 9 8945HS (6404 - 6785, n=6) | |
| GMK NucBox K11 | |
| BOSGAME M2 | |
| Beelink GTI13 Ultra | |
| Geekom Mini IT12 | |
| Beelink SER5 | |
| MSI Cubi NUC 1M | |
| Cinebench R20 / CPU (Single Core) | |
| Beelink GTI13 Ultra | |
| GMK EVO-X1 | |
| MSI Cubi NUC 1M | |
| GMK NucBox K11 | |
| Minisforum MS-A1 | |
| Moyenne AMD Ryzen 9 8945HS (676 - 711, n=6) | |
| Geekom GT1 Mega | |
| BOSGAME M2 | |
| Geekom Mini IT12 | |
| Beelink SER5 | |
| Cinebench R15 / CPU Multi 64Bit | |
| GMK EVO-X1 | |
| Geekom GT1 Mega | |
| Minisforum MS-A1 | |
| Moyenne AMD Ryzen 9 8945HS (2615 - 2775, n=6) | |
| GMK NucBox K11 | |
| BOSGAME M2 | |
| Beelink GTI13 Ultra | |
| Geekom Mini IT12 | |
| Beelink SER5 | |
| MSI Cubi NUC 1M | |
| Cinebench R15 / CPU Single 64Bit | |
| GMK EVO-X1 | |
| Beelink GTI13 Ultra | |
| GMK NucBox K11 | |
| Minisforum MS-A1 | |
| Moyenne AMD Ryzen 9 8945HS (265 - 288, n=6) | |
| Geekom GT1 Mega | |
| MSI Cubi NUC 1M | |
| BOSGAME M2 | |
| Geekom Mini IT12 | |
| Beelink SER5 | |
| Blender / v2.79 BMW27 CPU | |
| MSI Cubi NUC 1M | |
| Beelink SER5 | |
| Geekom Mini IT12 | |
| BOSGAME M2 | |
| Beelink GTI13 Ultra | |
| GMK NucBox K11 | |
| Moyenne AMD Ryzen 9 8945HS (186 - 198, n=6) | |
| Geekom GT1 Mega | |
| Minisforum MS-A1 | |
| GMK EVO-X1 | |
| 7-Zip 18.03 / 7z b 4 | |
| GMK EVO-X1 | |
| Minisforum MS-A1 | |
| Moyenne AMD Ryzen 9 8945HS (68889 - 72821, n=6) | |
| GMK NucBox K11 | |
| Geekom GT1 Mega | |
| BOSGAME M2 | |
| Beelink GTI13 Ultra | |
| Beelink SER5 | |
| Geekom Mini IT12 | |
| MSI Cubi NUC 1M | |
| 7-Zip 18.03 / 7z b 4 -mmt1 | |
| GMK NucBox K11 | |
| Minisforum MS-A1 | |
| Beelink GTI13 Ultra | |
| Moyenne AMD Ryzen 9 8945HS (5994 - 6675, n=6) | |
| BOSGAME M2 | |
| GMK EVO-X1 | |
| MSI Cubi NUC 1M | |
| Geekom GT1 Mega | |
| Geekom Mini IT12 | |
| Beelink SER5 | |
| Geekbench 6.4 / Multi-Core | |
| Geekom GT1 Mega | |
| Minisforum MS-A1 | |
| BOSGAME M2 | |
| Beelink GTI13 Ultra | |
| GMK NucBox K11 | |
| Moyenne AMD Ryzen 9 8945HS (12015 - 13715, n=7) | |
| GMK EVO-X1 | |
| Geekom Mini IT12 | |
| MSI Cubi NUC 1M | |
| Beelink SER5 | |
| Geekbench 6.4 / Single-Core | |
| GMK EVO-X1 | |
| Beelink GTI13 Ultra | |
| GMK NucBox K11 | |
| BOSGAME M2 | |
| Minisforum MS-A1 | |
| MSI Cubi NUC 1M | |
| Moyenne AMD Ryzen 9 8945HS (2399 - 2745, n=7) | |
| Geekom GT1 Mega | |
| Geekom Mini IT12 | |
| Beelink SER5 | |
| Geekbench 5.5 / Multi-Core | |
| Geekom GT1 Mega | |
| Minisforum MS-A1 | |
| Beelink GTI13 Ultra | |
| GMK EVO-X1 | |
| BOSGAME M2 | |
| GMK NucBox K11 | |
| Moyenne AMD Ryzen 9 8945HS (10985 - 12481, n=7) | |
| Geekom Mini IT12 | |
| MSI Cubi NUC 1M | |
| Beelink SER5 | |
| Geekbench 5.5 / Single-Core | |
| GMK EVO-X1 | |
| Minisforum MS-A1 | |
| GMK NucBox K11 | |
| Beelink GTI13 Ultra | |
| BOSGAME M2 | |
| Moyenne AMD Ryzen 9 8945HS (1835 - 2039, n=7) | |
| MSI Cubi NUC 1M | |
| Geekom GT1 Mega | |
| Geekom Mini IT12 | |
| Beelink SER5 | |
| HWBOT x265 Benchmark v2.2 / 4k Preset | |
| GMK EVO-X1 | |
| Minisforum MS-A1 | |
| BOSGAME M2 | |
| Moyenne AMD Ryzen 9 8945HS (19.8 - 22.2, n=6) | |
| GMK NucBox K11 | |
| Geekom GT1 Mega | |
| Beelink GTI13 Ultra | |
| Geekom Mini IT12 | |
| Beelink SER5 | |
| MSI Cubi NUC 1M | |
| LibreOffice / 20 Documents To PDF | |
| Beelink SER5 | |
| GMK EVO-X1 | |
| Geekom GT1 Mega | |
| Moyenne AMD Ryzen 9 8945HS (48.4 - 54.9, n=5) | |
| GMK NucBox K11 | |
| Geekom Mini IT12 | |
| Minisforum MS-A1 | |
| BOSGAME M2 | |
| MSI Cubi NUC 1M | |
| Beelink GTI13 Ultra | |
| R Benchmark 2.5 / Overall mean | |
| Beelink SER5 | |
| Geekom Mini IT12 | |
| Geekom GT1 Mega | |
| MSI Cubi NUC 1M | |
| Moyenne AMD Ryzen 9 8945HS (0.4294 - 0.4452, n=5) | |
| GMK NucBox K11 | |
| BOSGAME M2 | |
| Minisforum MS-A1 | |
| Beelink GTI13 Ultra | |
| GMK EVO-X1 | |
* ... Moindre est la valeur, meilleures sont les performances
AIDA64: FP32 Ray-Trace | FPU Julia | CPU SHA3 | CPU Queen | FPU SinJulia | FPU Mandel | CPU AES | CPU ZLib | FP64 Ray-Trace | CPU PhotoWorxx
| Performance Rating | |
| BOSGAME M2 | |
| GMK EVO-X1 | |
| GMK NucBox K11 | |
| Moyenne AMD Ryzen 9 8945HS | |
| Geekom GT1 Mega | |
| Beelink GTI13 Ultra | |
| MSI Cubi NUC 1M | |
| AIDA64 / FP32 Ray-Trace | |
| GMK EVO-X1 | |
| Moyenne AMD Ryzen 9 8945HS (26205 - 28836, n=5) | |
| BOSGAME M2 | |
| GMK NucBox K11 | |
| Beelink GTI13 Ultra | |
| Geekom GT1 Mega | |
| MSI Cubi NUC 1M | |
| AIDA64 / FPU Julia | |
| GMK EVO-X1 | |
| Moyenne AMD Ryzen 9 8945HS (111404 - 122633, n=5) | |
| BOSGAME M2 | |
| GMK NucBox K11 | |
| Beelink GTI13 Ultra | |
| Geekom GT1 Mega | |
| MSI Cubi NUC 1M | |
| AIDA64 / CPU SHA3 | |
| GMK EVO-X1 | |
| BOSGAME M2 | |
| Moyenne AMD Ryzen 9 8945HS (4839 - 5077, n=5) | |
| GMK NucBox K11 | |
| Geekom GT1 Mega | |
| Beelink GTI13 Ultra | |
| MSI Cubi NUC 1M | |
| AIDA64 / CPU Queen | |
| Moyenne AMD Ryzen 9 8945HS (114610 - 125044, n=5) | |
| BOSGAME M2 | |
| GMK NucBox K11 | |
| Beelink GTI13 Ultra | |
| Geekom GT1 Mega | |
| MSI Cubi NUC 1M | |
| GMK EVO-X1 | |
| AIDA64 / FPU SinJulia | |
| GMK EVO-X1 | |
| Moyenne AMD Ryzen 9 8945HS (15026 - 15661, n=5) | |
| BOSGAME M2 | |
| GMK NucBox K11 | |
| Geekom GT1 Mega | |
| Beelink GTI13 Ultra | |
| MSI Cubi NUC 1M | |
| AIDA64 / FPU Mandel | |
| GMK EVO-X1 | |
| Moyenne AMD Ryzen 9 8945HS (59645 - 65746, n=5) | |
| BOSGAME M2 | |
| GMK NucBox K11 | |
| Geekom GT1 Mega | |
| Beelink GTI13 Ultra | |
| MSI Cubi NUC 1M | |
| AIDA64 / CPU AES | |
| BOSGAME M2 | |
| GMK NucBox K11 | |
| Geekom GT1 Mega | |
| Moyenne AMD Ryzen 9 8945HS (86495 - 169431, n=5) | |
| GMK EVO-X1 | |
| Beelink GTI13 Ultra | |
| MSI Cubi NUC 1M | |
| AIDA64 / CPU ZLib | |
| GMK EVO-X1 | |
| Geekom GT1 Mega | |
| Moyenne AMD Ryzen 9 8945HS (1029 - 1135, n=5) | |
| GMK NucBox K11 | |
| BOSGAME M2 | |
| Beelink GTI13 Ultra | |
| MSI Cubi NUC 1M | |
| AIDA64 / FP64 Ray-Trace | |
| GMK EVO-X1 | |
| Moyenne AMD Ryzen 9 8945HS (13962 - 15588, n=5) | |
| BOSGAME M2 | |
| GMK NucBox K11 | |
| Beelink GTI13 Ultra | |
| Geekom GT1 Mega | |
| MSI Cubi NUC 1M | |
| AIDA64 / CPU PhotoWorxx | |
| GMK EVO-X1 | |
| Geekom GT1 Mega | |
| Beelink GTI13 Ultra | |
| BOSGAME M2 | |
| GMK NucBox K11 | |
| Moyenne AMD Ryzen 9 8945HS (33371 - 40815, n=5) | |
| MSI Cubi NUC 1M | |
Performance du système
CrossMark: Overall | Productivity | Creativity | Responsiveness
WebXPRT 3: Overall
WebXPRT 4: Overall
Mozilla Kraken 1.1: Total
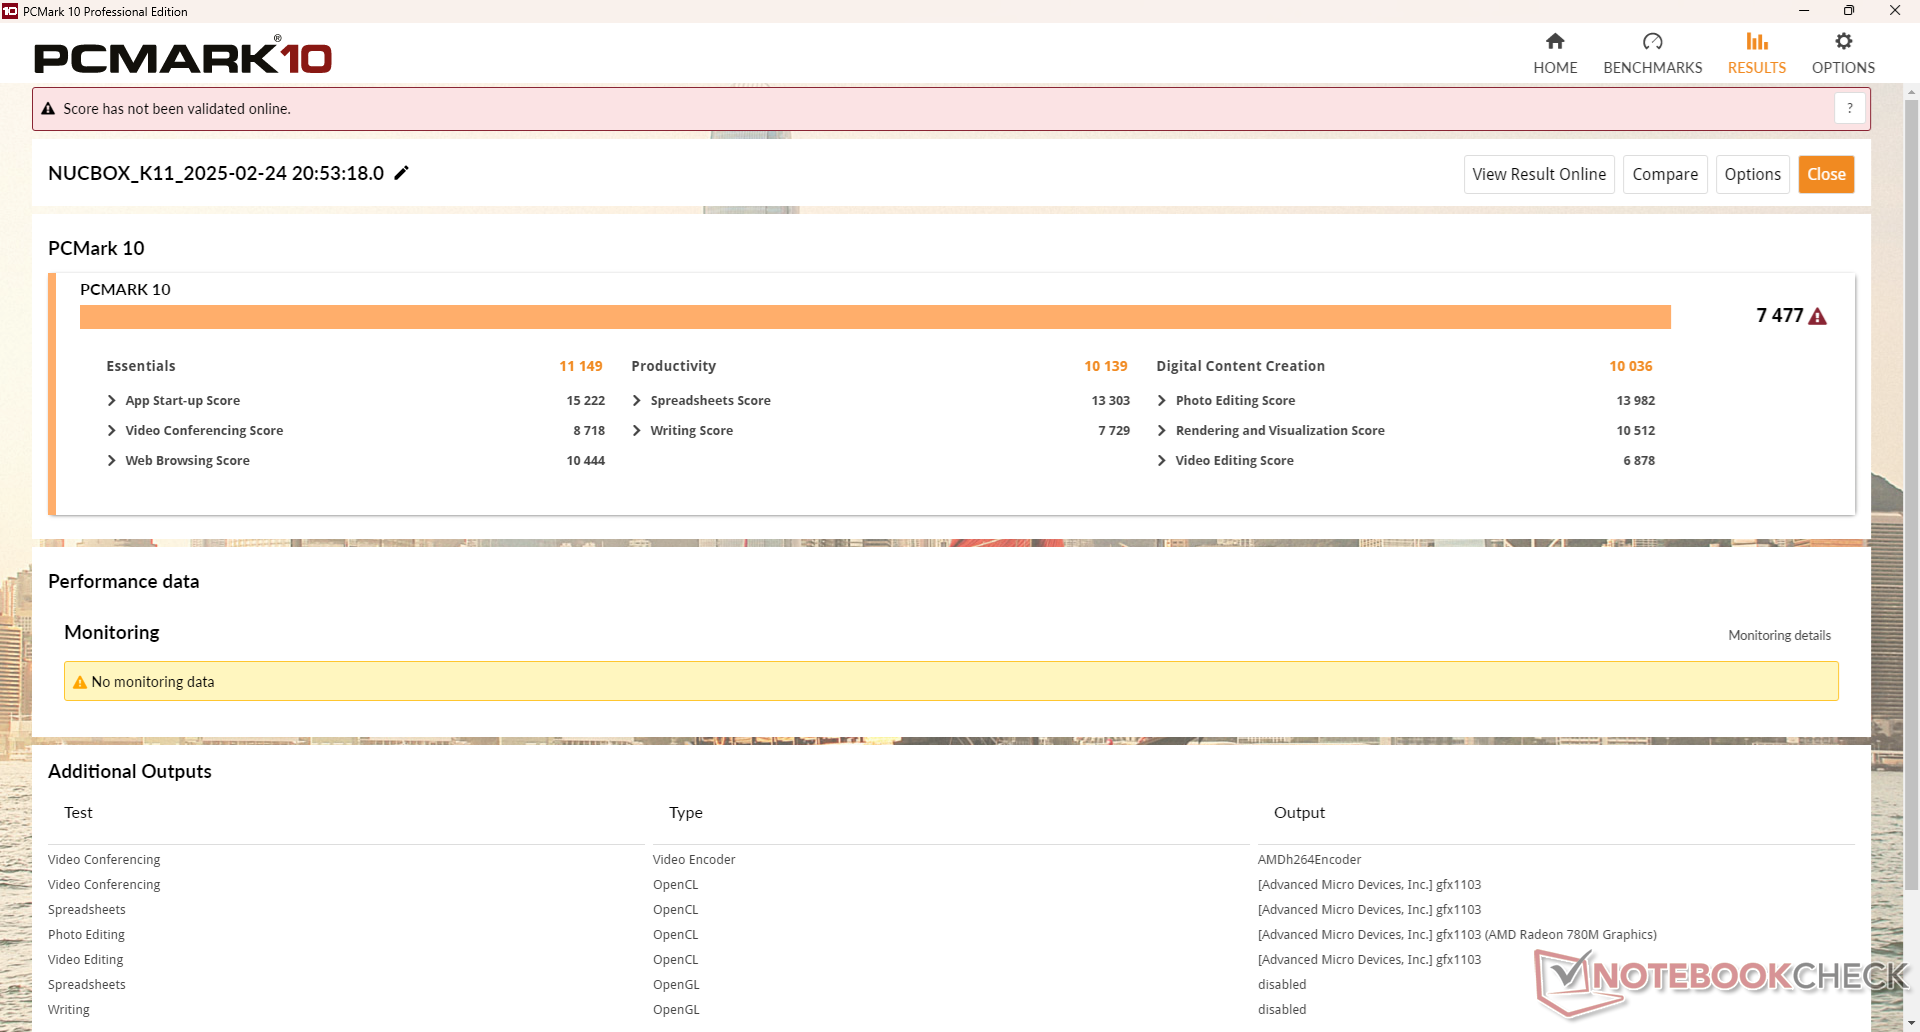
| PCMark 10 / Score | |
| Moyenne AMD Ryzen 9 8945HS, AMD Radeon 780M (7477 - 7705, n=2) | |
| GMK NucBox K11 | |
| BOSGAME M2 | |
| GMK EVO-X1 | |
| Geekom GT1 Mega | |
| Beelink GTI13 Ultra | |
| MSI Cubi NUC 1M | |
| PCMark 10 / Essentials | |
| Beelink GTI13 Ultra | |
| Moyenne AMD Ryzen 9 8945HS, AMD Radeon 780M (11149 - 11333, n=2) | |
| GMK NucBox K11 | |
| BOSGAME M2 | |
| GMK EVO-X1 | |
| MSI Cubi NUC 1M | |
| Geekom GT1 Mega | |
| PCMark 10 / Productivity | |
| Moyenne AMD Ryzen 9 8945HS, AMD Radeon 780M (10139 - 11082, n=2) | |
| GMK NucBox K11 | |
| BOSGAME M2 | |
| GMK EVO-X1 | |
| Geekom GT1 Mega | |
| MSI Cubi NUC 1M | |
| Beelink GTI13 Ultra | |
| PCMark 10 / Digital Content Creation | |
| Geekom GT1 Mega | |
| GMK EVO-X1 | |
| GMK NucBox K11 | |
| Moyenne AMD Ryzen 9 8945HS, AMD Radeon 780M (9884 - 10036, n=2) | |
| BOSGAME M2 | |
| Beelink GTI13 Ultra | |
| MSI Cubi NUC 1M | |
| CrossMark / Overall | |
| Beelink GTI13 Ultra | |
| Geekom GT1 Mega | |
| Moyenne AMD Ryzen 9 8945HS, AMD Radeon 780M (1774 - 1866, n=2) | |
| GMK NucBox K11 | |
| BOSGAME M2 | |
| MSI Cubi NUC 1M | |
| GMK EVO-X1 | |
| CrossMark / Productivity | |
| Beelink GTI13 Ultra | |
| Geekom GT1 Mega | |
| MSI Cubi NUC 1M | |
| Moyenne AMD Ryzen 9 8945HS, AMD Radeon 780M (1728 - 1764, n=2) | |
| GMK NucBox K11 | |
| BOSGAME M2 | |
| GMK EVO-X1 | |
| CrossMark / Creativity | |
| Beelink GTI13 Ultra | |
| Moyenne AMD Ryzen 9 8945HS, AMD Radeon 780M (1905 - 2127, n=2) | |
| Geekom GT1 Mega | |
| BOSGAME M2 | |
| GMK NucBox K11 | |
| GMK EVO-X1 | |
| MSI Cubi NUC 1M | |
| CrossMark / Responsiveness | |
| Beelink GTI13 Ultra | |
| Geekom GT1 Mega | |
| MSI Cubi NUC 1M | |
| BOSGAME M2 | |
| GMK NucBox K11 | |
| Moyenne AMD Ryzen 9 8945HS, AMD Radeon 780M (1494 - 1552, n=2) | |
| GMK EVO-X1 | |
| WebXPRT 3 / Overall | |
| Beelink GTI13 Ultra | |
| GMK NucBox K11 | |
| BOSGAME M2 | |
| GMK EVO-X1 | |
| Moyenne AMD Ryzen 9 8945HS, AMD Radeon 780M (316 - 344, n=2) | |
| MSI Cubi NUC 1M | |
| Geekom GT1 Mega | |
| WebXPRT 4 / Overall | |
| Beelink GTI13 Ultra | |
| GMK NucBox K11 | |
| BOSGAME M2 | |
| MSI Cubi NUC 1M | |
| Moyenne AMD Ryzen 9 8945HS, AMD Radeon 780M (260 - 275, n=2) | |
| GMK EVO-X1 | |
| Geekom GT1 Mega | |
| Mozilla Kraken 1.1 / Total | |
| Geekom GT1 Mega | |
| BOSGAME M2 | |
| Moyenne AMD Ryzen 9 8945HS, AMD Radeon 780M (490 - 505, n=2) | |
| GMK NucBox K11 | |
| MSI Cubi NUC 1M | |
| Beelink GTI13 Ultra | |
| GMK EVO-X1 | |
* ... Moindre est la valeur, meilleures sont les performances
| PCMark 10 Score | 7477 points | |
Aide | ||
| AIDA64 / Memory Copy | |
| GMK EVO-X1 | |
| Geekom GT1 Mega | |
| Beelink GTI13 Ultra | |
| BOSGAME M2 | |
| GMK NucBox K11 | |
| Moyenne AMD Ryzen 9 8945HS (62371 - 69218, n=5) | |
| MSI Cubi NUC 1M | |
| AIDA64 / Memory Read | |
| GMK EVO-X1 | |
| Geekom GT1 Mega | |
| Beelink GTI13 Ultra | |
| MSI Cubi NUC 1M | |
| BOSGAME M2 | |
| GMK NucBox K11 | |
| Moyenne AMD Ryzen 9 8945HS (49966 - 61710, n=5) | |
| AIDA64 / Memory Write | |
| GMK EVO-X1 | |
| BOSGAME M2 | |
| GMK NucBox K11 | |
| Moyenne AMD Ryzen 9 8945HS (78351 - 93153, n=5) | |
| Beelink GTI13 Ultra | |
| Geekom GT1 Mega | |
| MSI Cubi NUC 1M | |
| AIDA64 / Memory Latency | |
| Geekom GT1 Mega | |
| GMK EVO-X1 | |
| BOSGAME M2 | |
| Moyenne AMD Ryzen 9 8945HS (87.8 - 110.4, n=5) | |
| GMK NucBox K11 | |
| Beelink GTI13 Ultra | |
| MSI Cubi NUC 1M | |
* ... Moindre est la valeur, meilleures sont les performances
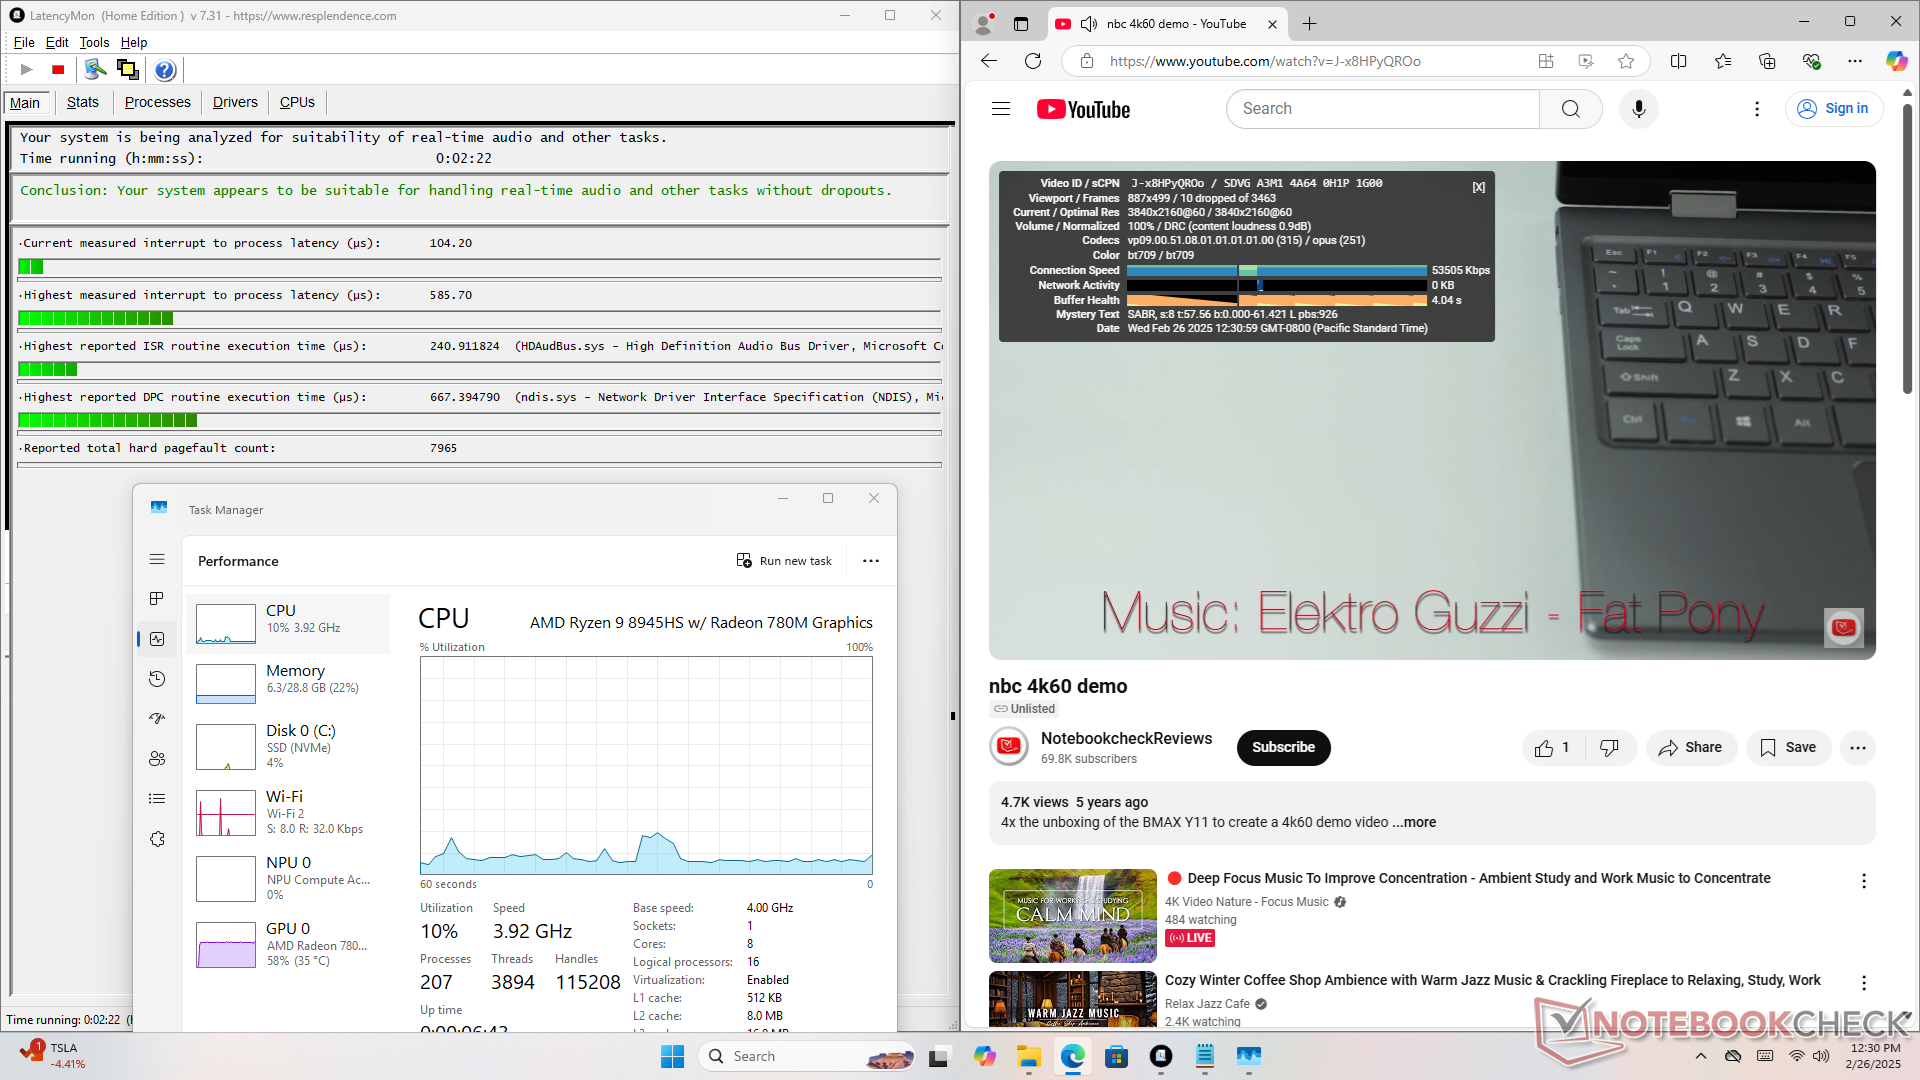
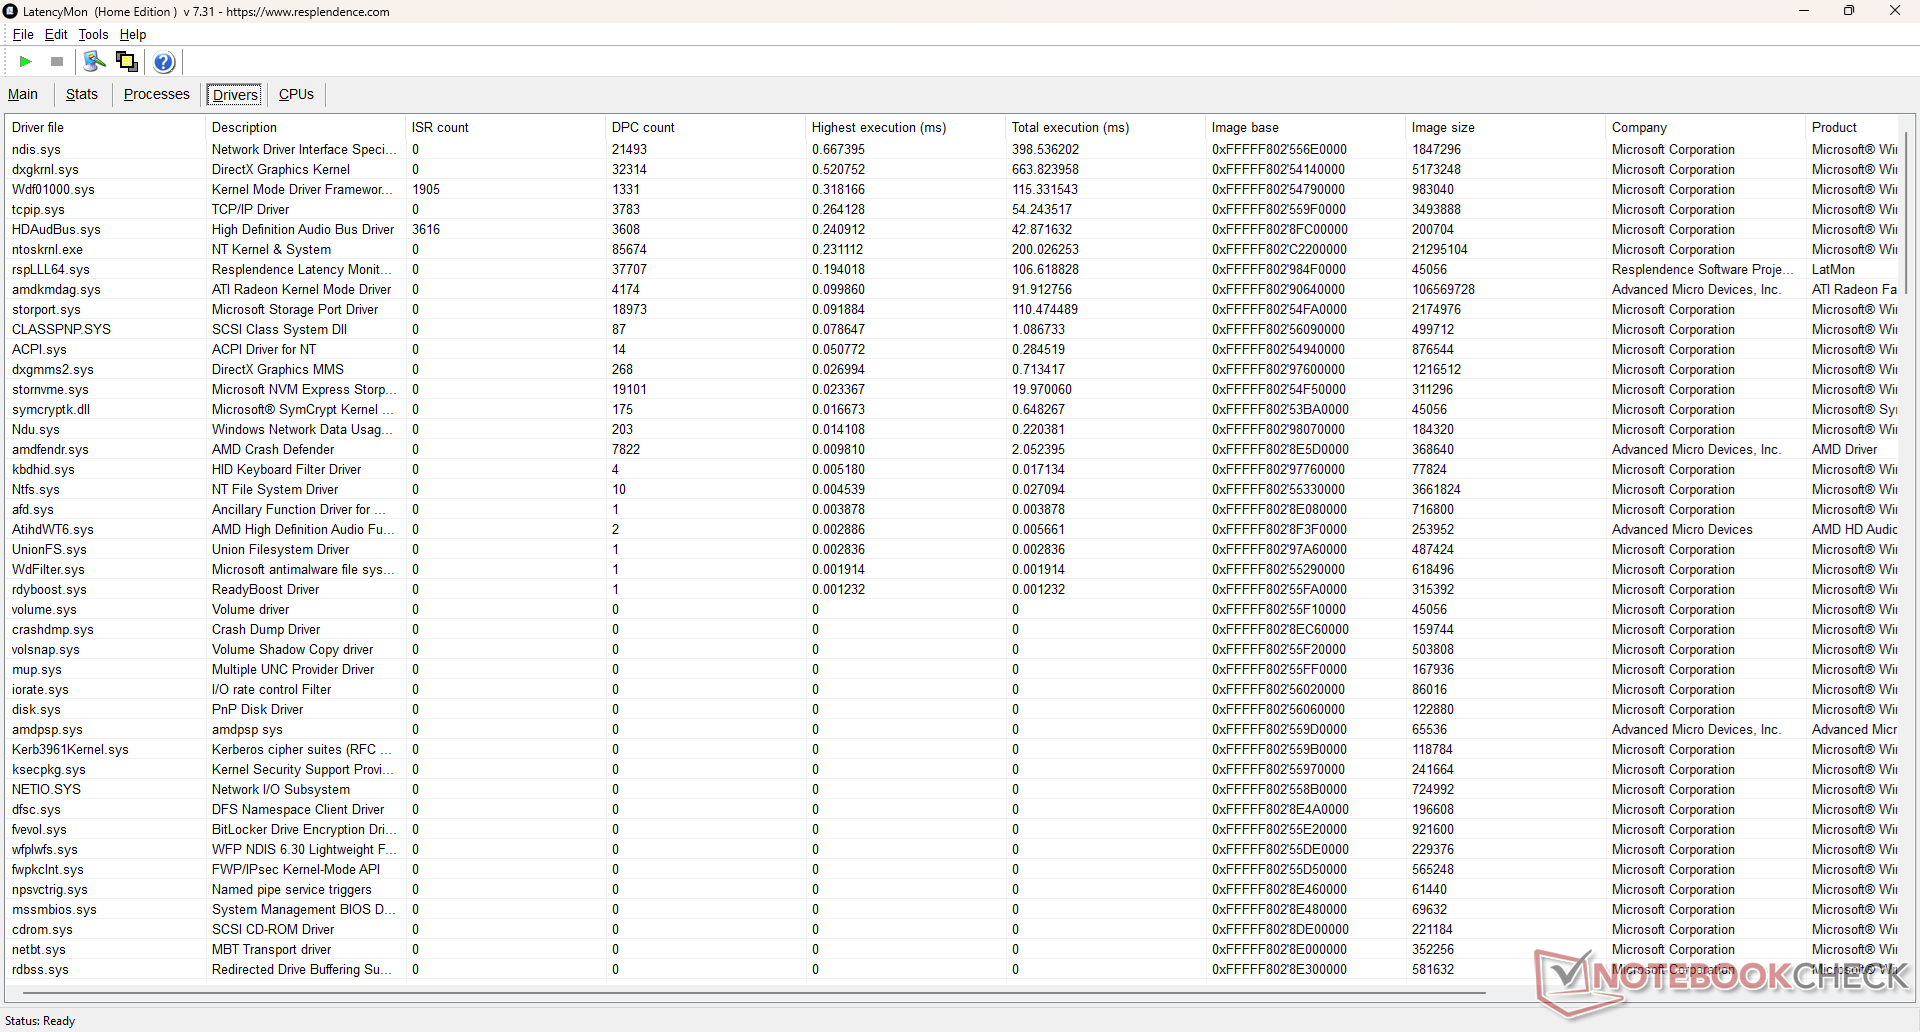
Latence DPC
LatencyMon n'indique aucun problème majeur de DPC lors de l'ouverture de plusieurs onglets de notre page d'accueil. Malheureusement, la perte d'images lors de la lecture de contenus vidéo 4K60 se produit encore beaucoup plus fréquemment que sur les mini-PC équipés de processeurs Intel.
| DPC Latencies / LatencyMon - interrupt to process latency (max), Web, Youtube, Prime95 | |
| MSI Cubi NUC 1M | |
| Geekom GT1 Mega | |
| Beelink GTI13 Ultra | |
| BOSGAME M2 | |
| GMK EVO-X1 | |
| GMK NucBox K11 | |
* ... Moindre est la valeur, meilleures sont les performances
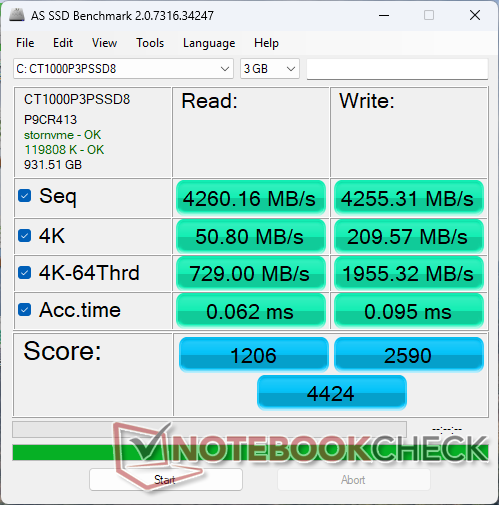
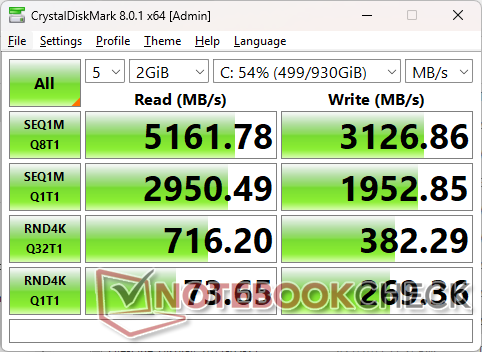
Dispositifs de stockage
Notre unité est livrée avec le même Crucial P3 Plus CT1000P3PSSD8 PCIe4 x4 NVMe SSD que l'on trouve sur les mini PC de GMK récemment sorti.

| Drive Performance Rating - Percent | |
| Geekom GT1 Mega | |
| Beelink GTI13 Ultra | |
| BOSGAME M2 | |
| GMK NucBox K11 | |
| MSI Cubi NUC 1M | |
| GMK EVO-X1 | |
* ... Moindre est la valeur, meilleures sont les performances
Disk Throttling: DiskSpd Read Loop, Queue Depth 8
Performance du GPU
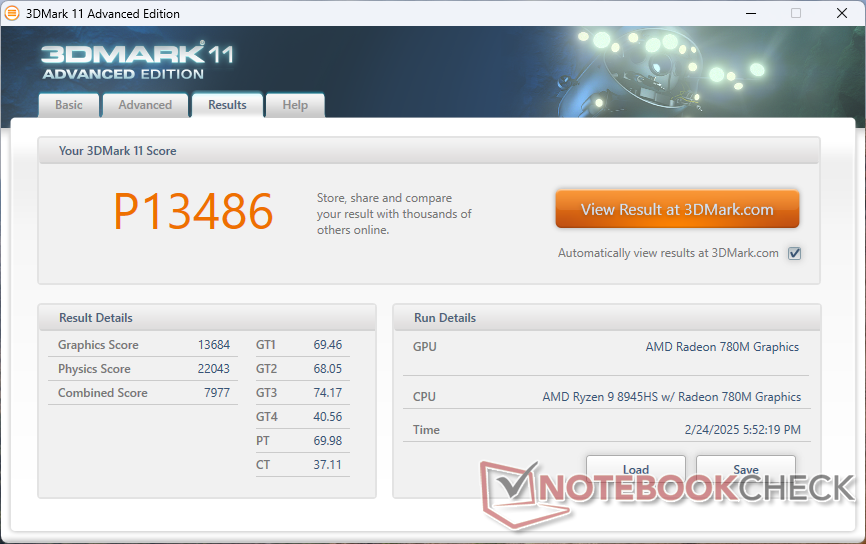
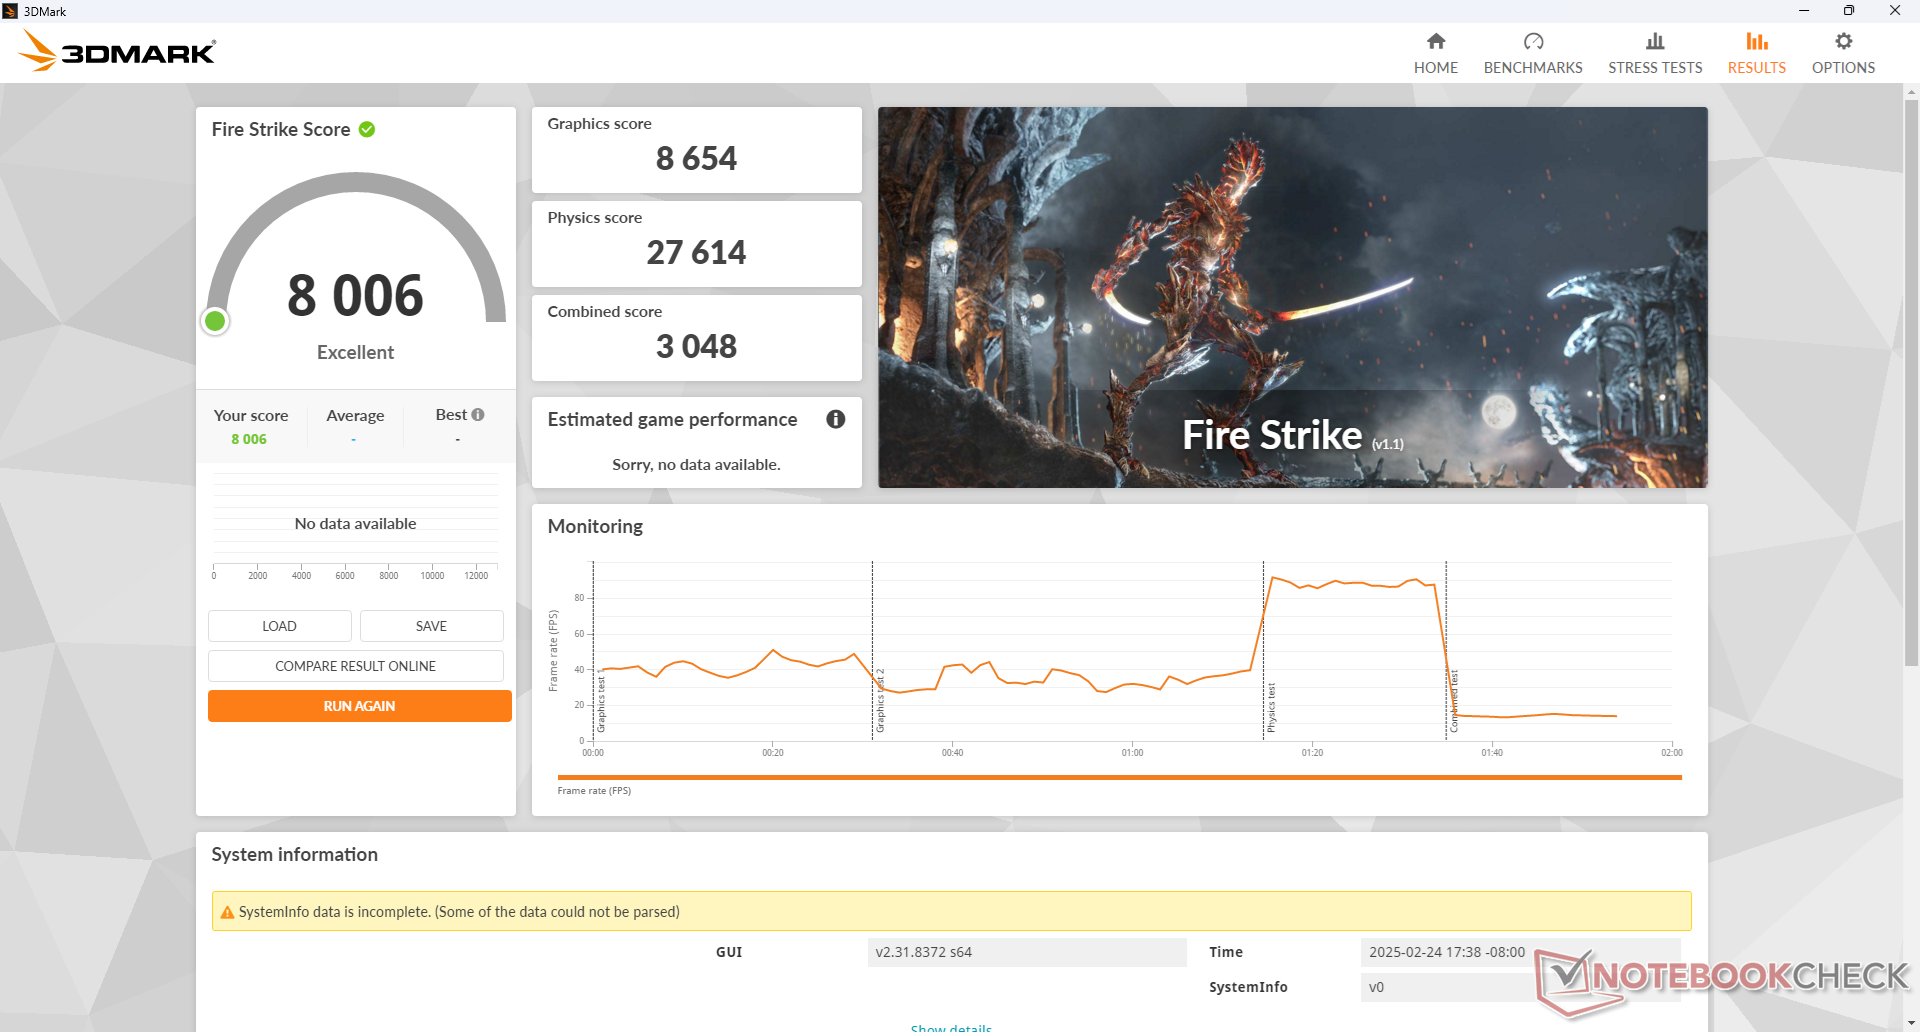
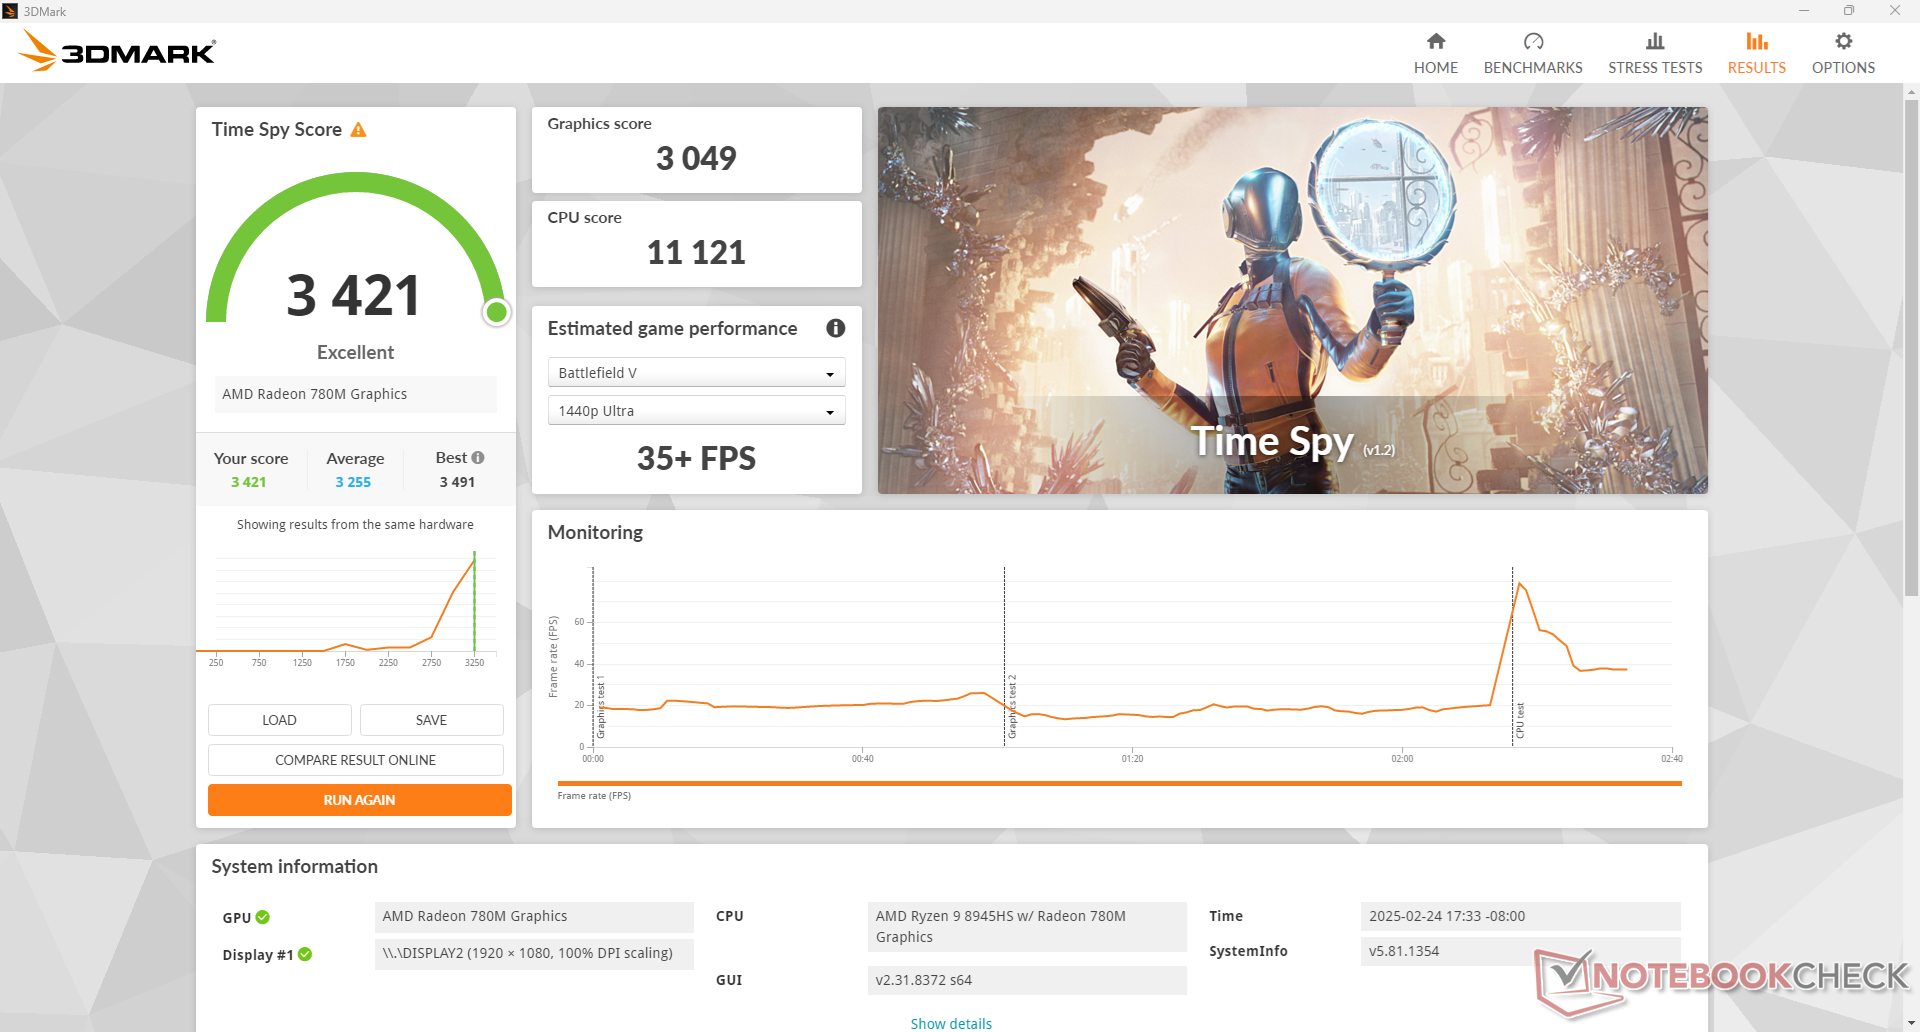
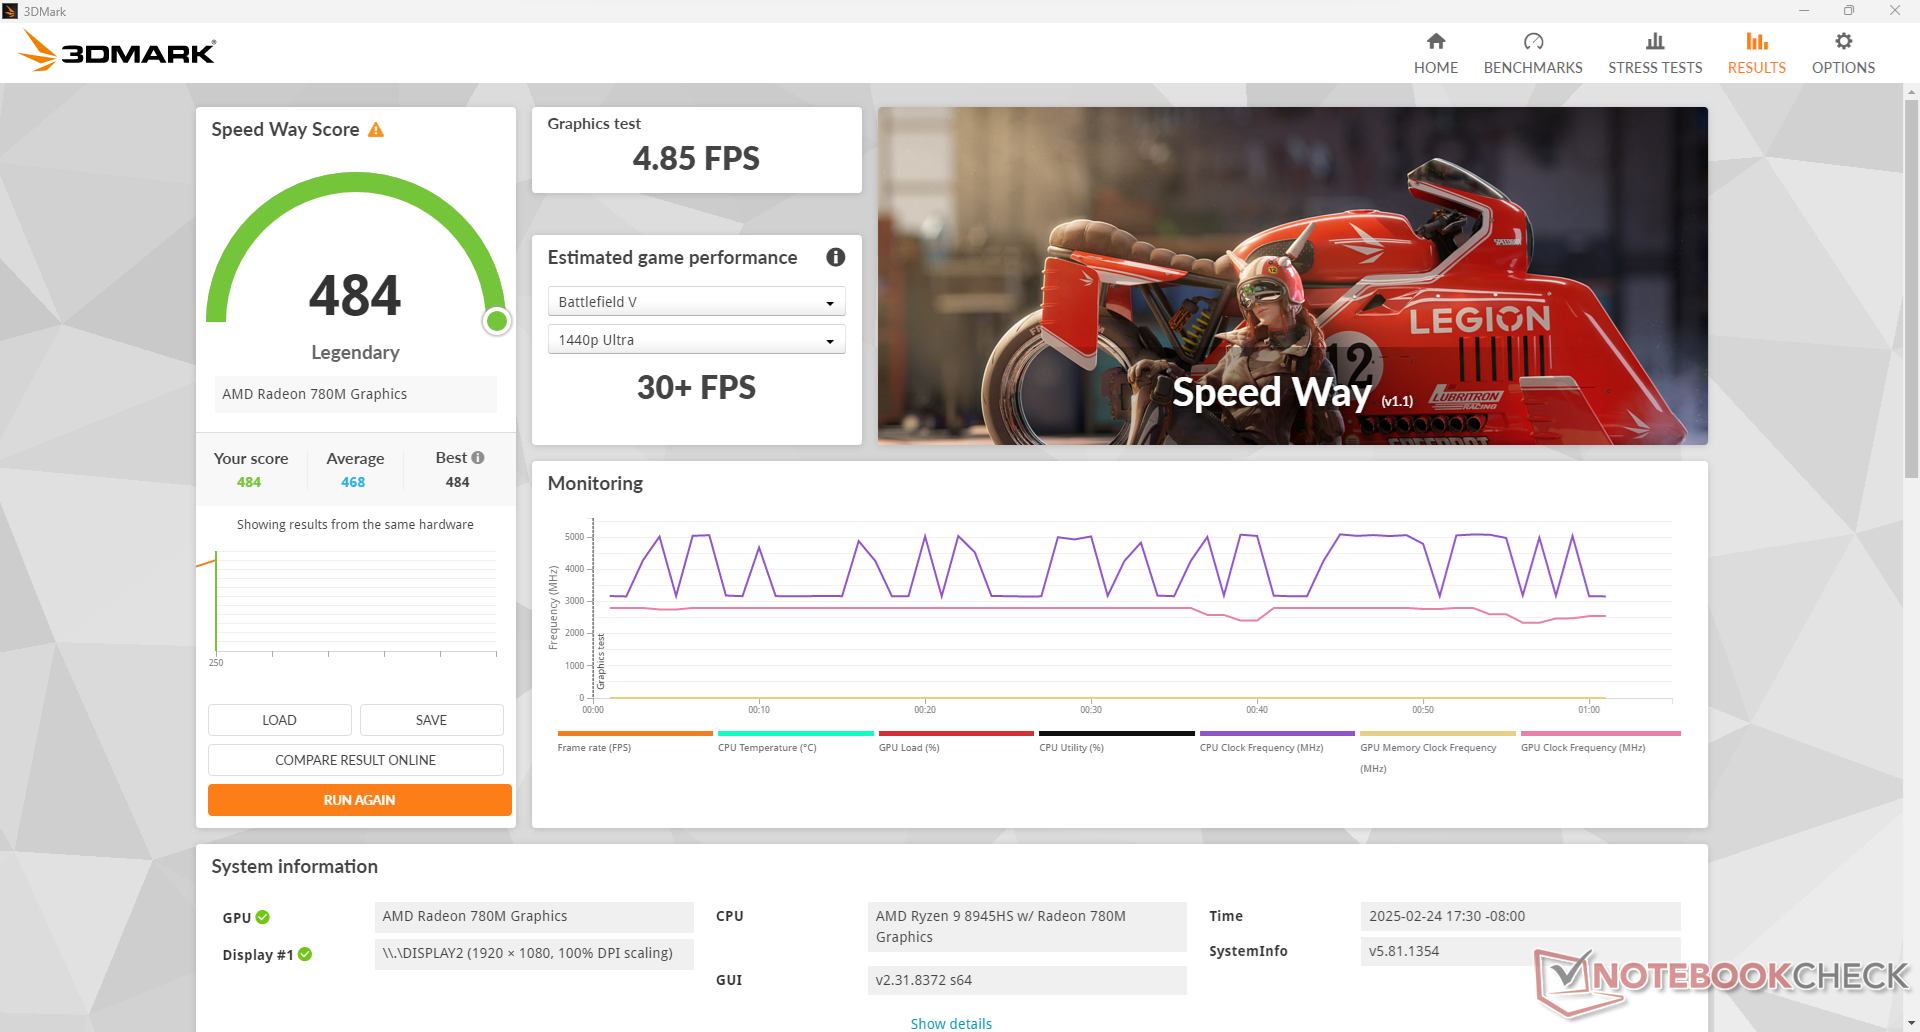
Notre Radeon 780M est très performante, jusqu'à 15 % plus rapide que les autres PC équipés du même GPU en moyenne. Les nouvelles cartes Arc 8 ou Radeon 890M sont encore plus rapides (jusqu'à 15 à 20 %), mais ces options sont plus coûteuses.
| 3DMark Performance Rating - Percent | |
| GMK EVO-X1 | |
| Geekom GT1 Mega | |
| BOSGAME M2 | |
| GMK NucBox K11 | |
| Minisforum MS-A1 | |
| Moyenne AMD Radeon 780M | |
| Beelink GTI13 Ultra | |
| Geekom Mini IT12 | |
| MSI Cubi NUC 1M | |
| Beelink SER5 | |
| 3DMark 11 Performance | 13486 points | |
| 3DMark Cloud Gate Standard Score | 39553 points | |
| 3DMark Fire Strike Score | 8006 points | |
| 3DMark Time Spy Score | 3421 points | |
Aide | ||
| Blender | |
| v3.3 Classroom HIP/AMD | |
| Beelink SER5 | |
| v3.3 Classroom CPU | |
| MSI Cubi NUC 1M | |
| Beelink SER5 | |
| Geekom Mini IT12 | |
| Moyenne AMD Radeon 780M (300 - 664, n=59) | |
| Beelink GTI13 Ultra | |
| Geekom GT1 Mega | |
| BOSGAME M2 | |
| GMK NucBox K11 | |
| Minisforum MS-A1 | |
| GMK EVO-X1 | |
| v3.3 Classroom oneAPI/Intel | |
| Geekom GT1 Mega | |
* ... Moindre est la valeur, meilleures sont les performances
| X-Plane 11.11 | |
| 1280x720 low (fps_test=1) | |
| GMK EVO-X1 | |
| Minisforum MS-A1 | |
| Geekom GT1 Mega | |
| BOSGAME M2 | |
| GMK NucBox K11 | |
| Geekom Mini IT12 | |
| Moyenne AMD Radeon 780M (39 - 69.6, n=65) | |
| Beelink SER5 | |
| 1920x1080 med (fps_test=2) | |
| GMK EVO-X1 | |
| Geekom GT1 Mega | |
| BOSGAME M2 | |
| Minisforum MS-A1 | |
| GMK NucBox K11 | |
| Geekom Mini IT12 | |
| Moyenne AMD Radeon 780M (26.2 - 49.1, n=65) | |
| Beelink SER5 | |
| 1920x1080 high (fps_test=3) | |
| GMK EVO-X1 | |
| Geekom GT1 Mega | |
| Minisforum MS-A1 | |
| BOSGAME M2 | |
| GMK NucBox K11 | |
| Geekom Mini IT12 | |
| Moyenne AMD Radeon 780M (24.5 - 41.5, n=64) | |
| Beelink SER5 | |
| Cyberpunk 2077 2.2 Phantom Liberty | |
| 1280x720 Low Preset (FSR off) | |
| BOSGAME M2 | |
| GMK EVO-X1 | |
| GMK NucBox K11 | |
| Minisforum MS-A1 | |
| Moyenne AMD Radeon 780M (53.6 - 80.6, n=23) | |
| Geekom GT1 Mega | |
| Beelink GTI13 Ultra | |
| MSI Cubi NUC 1M | |
| 1920x1080 Low Preset (FSR off) | |
| GMK EVO-X1 | |
| BOSGAME M2 | |
| GMK NucBox K11 | |
| Minisforum MS-A1 | |
| Moyenne AMD Radeon 780M (29.3 - 52.1, n=45) | |
| Geekom GT1 Mega | |
| Beelink GTI13 Ultra | |
| MSI Cubi NUC 1M | |
| 1920x1080 Medium Preset (FSR off) | |
| GMK EVO-X1 | |
| BOSGAME M2 | |
| GMK NucBox K11 | |
| Minisforum MS-A1 | |
| Geekom GT1 Mega | |
| Moyenne AMD Radeon 780M (16.3 - 37.5, n=41) | |
| Beelink GTI13 Ultra | |
| MSI Cubi NUC 1M | |
| 1920x1080 High Preset (FSR off) | |
| BOSGAME M2 | |
| GMK EVO-X1 | |
| GMK NucBox K11 | |
| Minisforum MS-A1 | |
| Geekom GT1 Mega | |
| Moyenne AMD Radeon 780M (13.8 - 29.6, n=42) | |
| Beelink GTI13 Ultra | |
| MSI Cubi NUC 1M | |
| 1920x1080 Ultra Preset (FSR off) | |
| BOSGAME M2 | |
| GMK EVO-X1 | |
| GMK NucBox K11 | |
| Minisforum MS-A1 | |
| Geekom GT1 Mega | |
| Moyenne AMD Radeon 780M (11.5 - 26.3, n=37) | |
| Beelink GTI13 Ultra | |
| MSI Cubi NUC 1M | |
| F1 22 | |
| 1280x720 Ultra Low Preset AA:T AF:16x | |
| BOSGAME M2 | |
| GMK EVO-X1 | |
| GMK NucBox K11 | |
| Moyenne AMD Radeon 780M (85.4 - 186.7, n=29) | |
| Beelink GTI13 Ultra | |
| MSI Cubi NUC 1M | |
| Geekom Mini IT12 | |
| Beelink SER5 | |
| 1920x1080 Low Preset AA:T AF:16x | |
| BOSGAME M2 | |
| GMK EVO-X1 | |
| GMK NucBox K11 | |
| Moyenne AMD Radeon 780M (47 - 109.9, n=35) | |
| Beelink GTI13 Ultra | |
| MSI Cubi NUC 1M | |
| Geekom Mini IT12 | |
| Beelink SER5 | |
| 1920x1080 Medium Preset AA:T AF:16x | |
| GMK EVO-X1 | |
| BOSGAME M2 | |
| GMK NucBox K11 | |
| Moyenne AMD Radeon 780M (41.5 - 95, n=35) | |
| Beelink GTI13 Ultra | |
| MSI Cubi NUC 1M | |
| Geekom Mini IT12 | |
| Beelink SER5 | |
| 1920x1080 High Preset AA:T AF:16x | |
| GMK EVO-X1 | |
| BOSGAME M2 | |
| GMK NucBox K11 | |
| Moyenne AMD Radeon 780M (31.7 - 70.6, n=35) | |
| Beelink GTI13 Ultra | |
| MSI Cubi NUC 1M | |
| Geekom Mini IT12 | |
| Beelink SER5 | |
| 1920x1080 Ultra High Preset AA:T AF:16x | |
| Beelink GTI13 Ultra | |
| Geekom Mini IT12 | |
| MSI Cubi NUC 1M | |
| GMK EVO-X1 | |
| BOSGAME M2 | |
| GMK NucBox K11 | |
| Moyenne AMD Radeon 780M (9.92 - 19.3, n=27) | |
| Beelink SER5 | |
| Tiny Tina's Wonderlands | |
| 1280x720 Lowest Preset (DX12) | |
| GMK EVO-X1 | |
| GMK NucBox K11 | |
| BOSGAME M2 | |
| Moyenne AMD Radeon 780M (62.6 - 152.7, n=25) | |
| Beelink GTI13 Ultra | |
| Beelink SER5 | |
| Geekom Mini IT12 | |
| MSI Cubi NUC 1M | |
| 1920x1080 Low Preset (DX12) | |
| GMK EVO-X1 | |
| BOSGAME M2 | |
| GMK NucBox K11 | |
| Moyenne AMD Radeon 780M (34.3 - 77.7, n=25) | |
| Beelink GTI13 Ultra | |
| Geekom Mini IT12 | |
| MSI Cubi NUC 1M | |
| Beelink SER5 | |
| 1920x1080 Medium Preset (DX12) | |
| GMK EVO-X1 | |
| BOSGAME M2 | |
| GMK NucBox K11 | |
| Moyenne AMD Radeon 780M (28.4 - 55.9, n=25) | |
| Beelink GTI13 Ultra | |
| Geekom Mini IT12 | |
| MSI Cubi NUC 1M | |
| Beelink SER5 | |
| 1920x1080 High Preset (DX12) | |
| GMK EVO-X1 | |
| BOSGAME M2 | |
| GMK NucBox K11 | |
| Moyenne AMD Radeon 780M (18.6 - 38.8, n=25) | |
| Beelink GTI13 Ultra | |
| Geekom Mini IT12 | |
| MSI Cubi NUC 1M | |
| Beelink SER5 | |
| 1920x1080 Badass Preset (DX12) | |
| GMK EVO-X1 | |
| BOSGAME M2 | |
| GMK NucBox K11 | |
| Moyenne AMD Radeon 780M (16.5 - 31.3, n=25) | |
| Beelink GTI13 Ultra | |
| Geekom Mini IT12 | |
| MSI Cubi NUC 1M | |
| Beelink SER5 | |
Cyberpunk 2077 ultra FPS Chart
| Bas | Moyen | Élevé | Ultra | |
|---|---|---|---|---|
| GTA V (2015) | 164.1 | 157.9 | 66.5 | 28.1 |
| Dota 2 Reborn (2015) | 151.3 | 121.1 | 96.7 | 87.5 |
| Final Fantasy XV Benchmark (2018) | 79.3 | 39.7 | 29 | |
| X-Plane 11.11 (2018) | 65.7 | 47.5 | 40.6 | |
| Far Cry 5 (2018) | 88 | 51 | 47 | 45 |
| Strange Brigade (2018) | 172.1 | 68 | 57.8 | 49.7 |
| Tiny Tina's Wonderlands (2022) | 73.8 | 54.7 | 37.4 | 30.2 |
| F1 22 (2022) | 98.9 | 85.1 | 65.4 | 18.5 |
| Baldur's Gate 3 (2023) | 43.3 | 36.1 | 29.7 | 28.7 |
| Cyberpunk 2077 2.2 Phantom Liberty (2023) | 44.5 | 34.9 | 27.4 | 24.1 |
Émissions
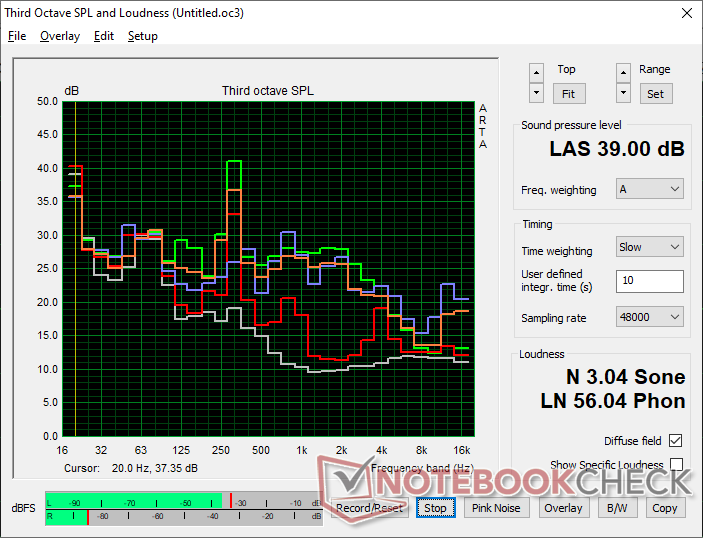
Bruit du système
Le bruit du ventilateur est généralement inférieur ou égal à 30 dB(A) lors de l'exécution de charges peu exigeantes telles que les navigateurs ou les flux vidéo, ce qui le rend pratiquement inaudible dans un bureau ou à la maison. Le bruit reste inférieur à 40 dB(A) lors de l'exécution de charges plus exigeantes, ce qui le rend plus silencieux que la plupart des autres mini PC AMD, y compris l'EVO-X1 de GMK.
Degré de la nuisance sonore
| Au repos |
| 25.2 / 30.2 / 30.2 dB(A) |
| Fortement sollicité |
| 36.4 / 39 dB(A) |
 | ||
30 dB silencieux 40 dB(A) audible 50 dB(A) bruyant |
||
min: | ||
| GMK NucBox K11 Radeon 780M, R9 8945HS, Crucial P3 Plus CT1000P3PSSD8 | Beelink GTI13 Ultra Iris Xe G7 96EUs, i9-13900HK, Crucial P5 Plus 1TB CT1000P5PSSD8 | GMK EVO-X1 Radeon 890M, Ryzen AI 9 HX 370, Crucial P3 Plus CT1000P3PSSD8 | BOSGAME M2 Radeon 780M, R9 7940HS | MSI Cubi NUC 1M Iris Xe G7 96EUs, Core 7 150U, WD PC SN560 SDDPNQE-1T00 | Geekom GT1 Mega Arc 8-Core, Ultra 9 185H, Crucial P3 Plus CT2000P3PSSD8 | |
|---|---|---|---|---|---|---|
| Noise | 9% | -10% | -10% | -4% | -14% | |
| arrêt / environnement * | 24 | 23.4 2% | 23.3 3% | 23 4% | 23.5 2% | 24.8 -3% |
| Idle Minimum * | 25.2 | 26.5 -5% | 27.8 -10% | 31.5 -25% | 29.9 -19% | 25.4 -1% |
| Idle Average * | 30.2 | 26.7 12% | 30.3 -0% | 32.3 -7% | 29.9 1% | 27.2 10% |
| Idle Maximum * | 30.2 | 28.5 6% | 30.4 -1% | 34.9 -16% | 32 -6% | 27.5 9% |
| Load Average * | 36.4 | 30.6 16% | 44.6 -23% | 39 -7% | 33.5 8% | 50.9 -40% |
| Cyberpunk 2077 ultra * | 36.6 | 32.5 11% | 44.2 -21% | 40.3 -10% | 39.1 -7% | 50.8 -39% |
| Load Maximum * | 39 | 30.8 21% | 46.1 -18% | 42.5 -9% | 40.5 -4% | 50.9 -31% |
* ... Moindre est la valeur, meilleures sont les performances
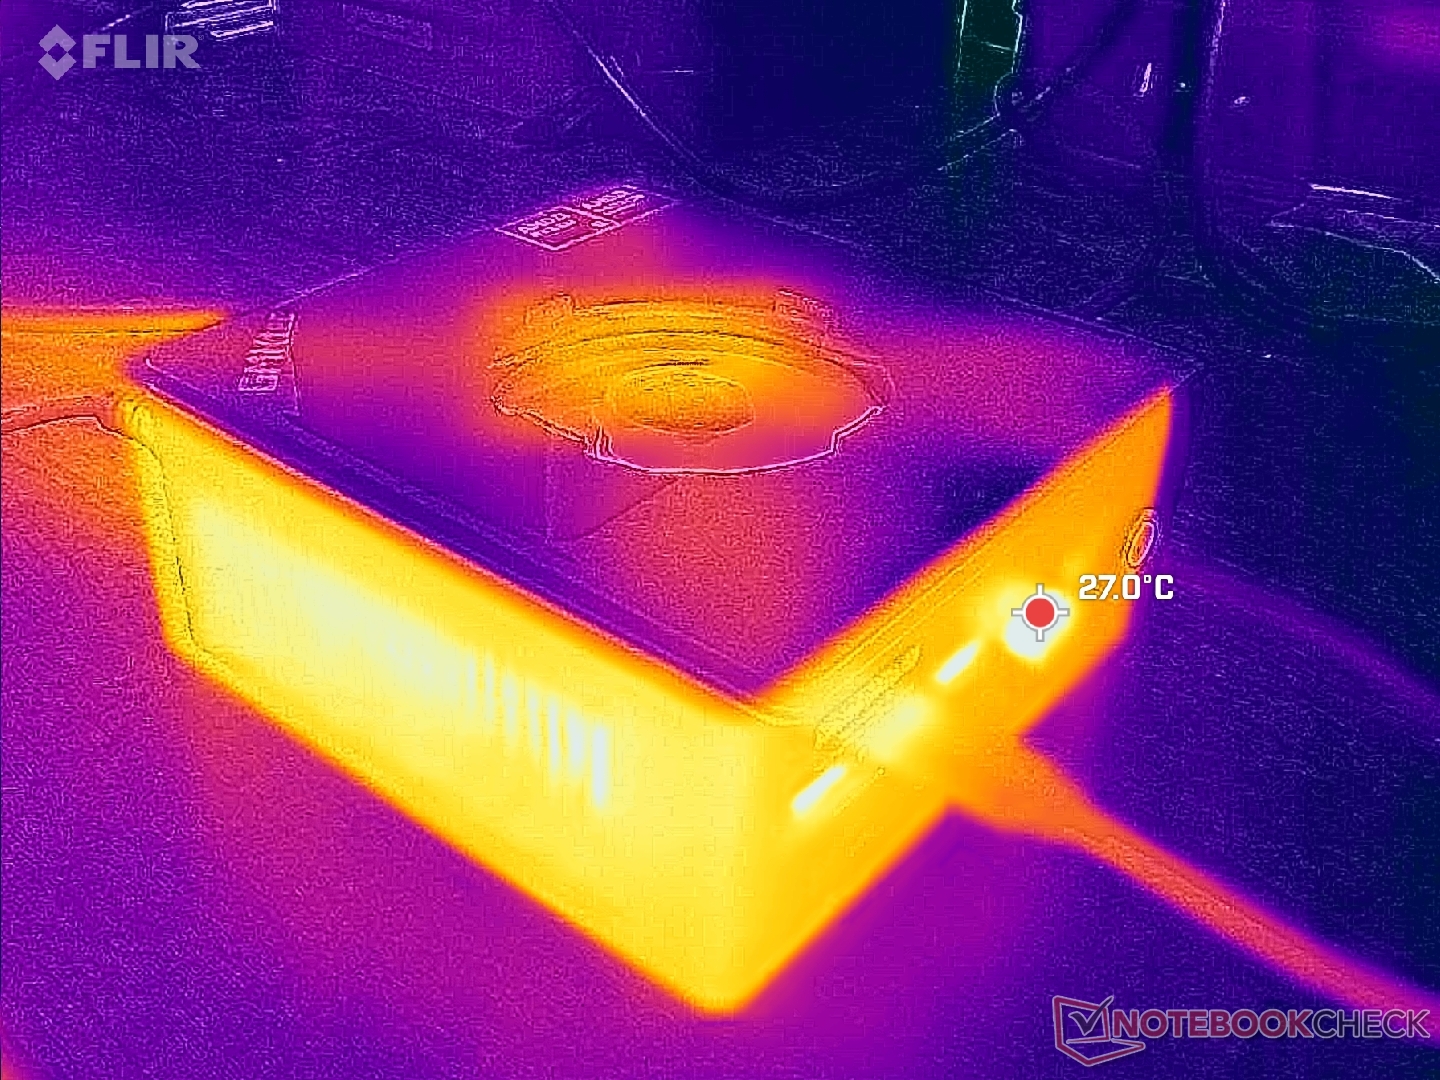
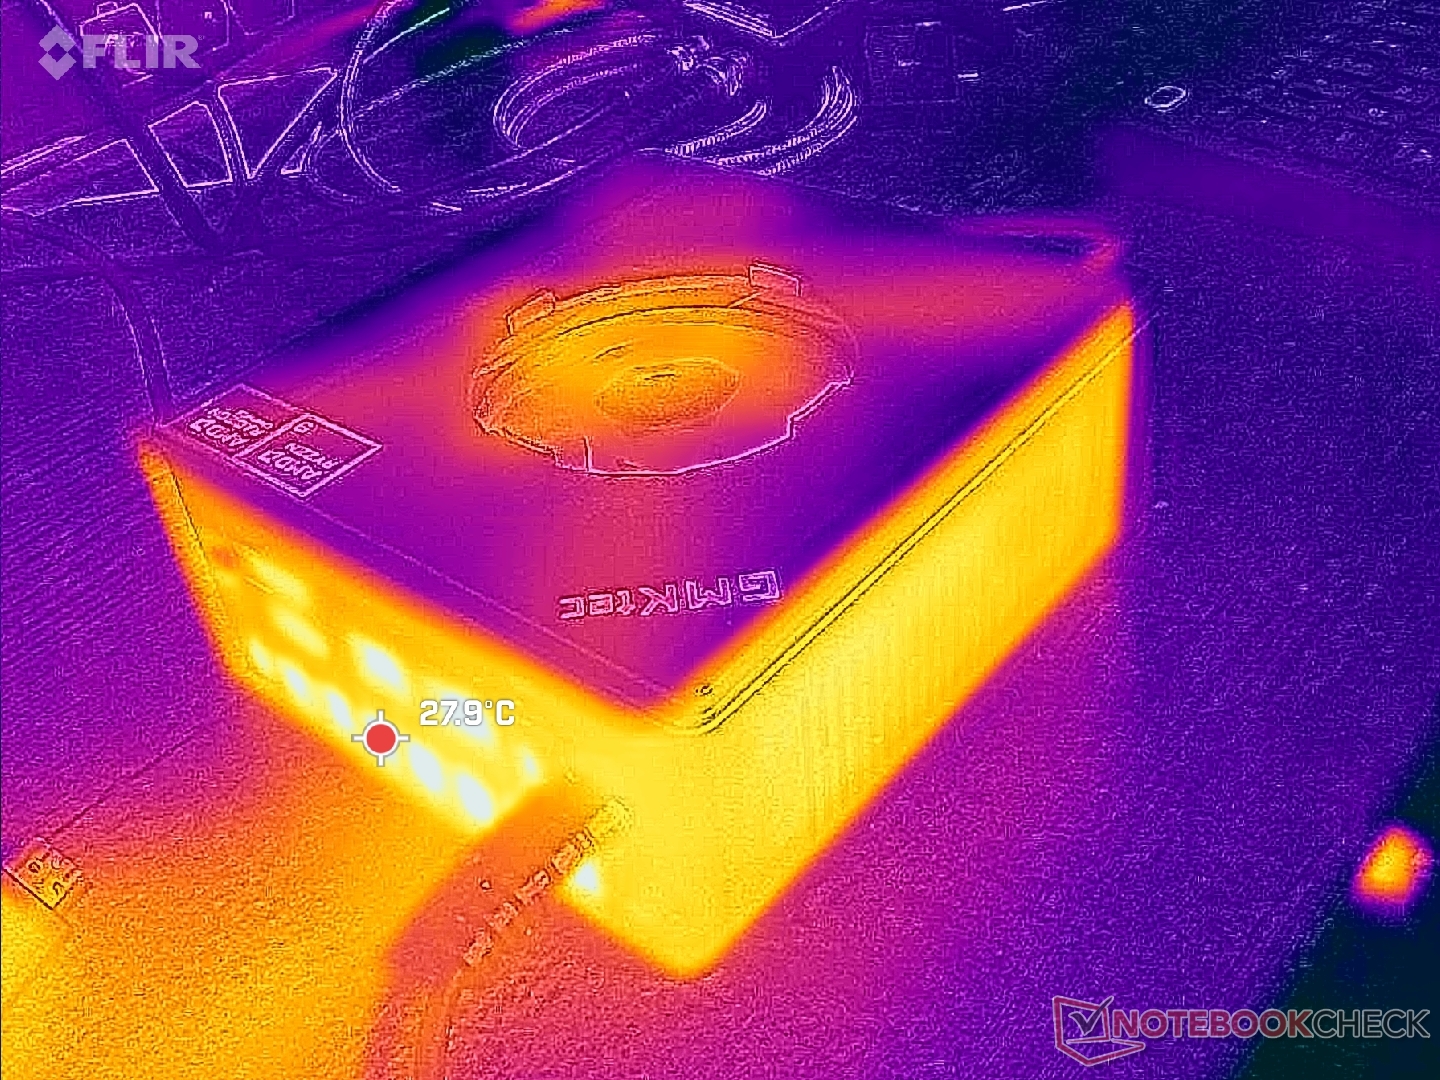
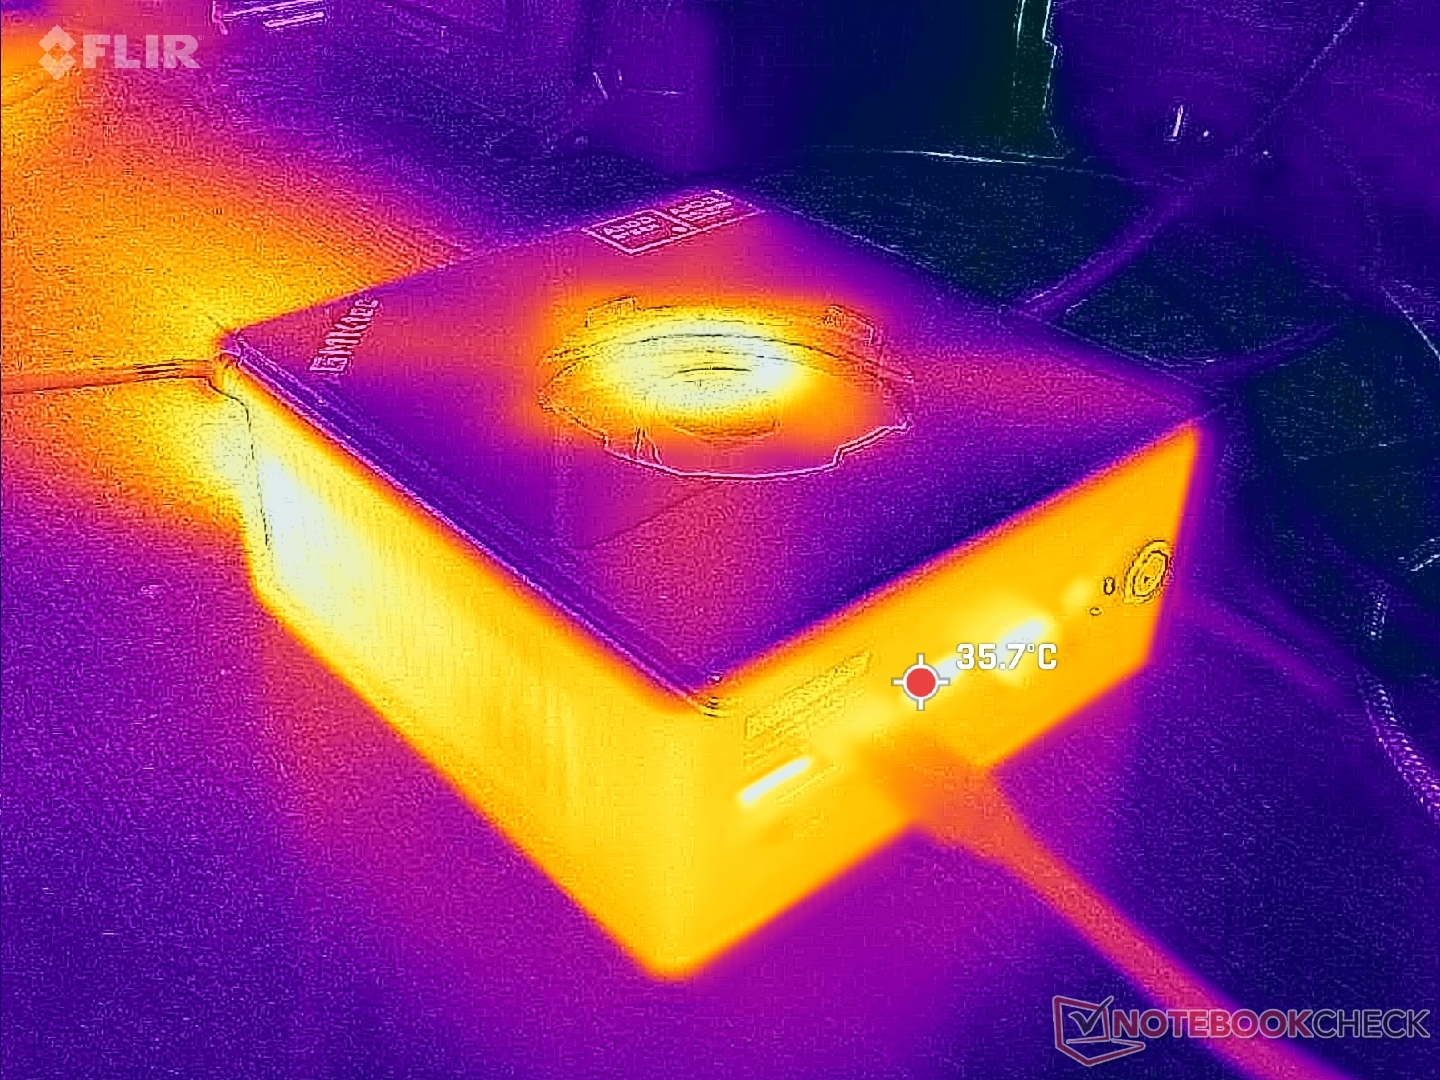
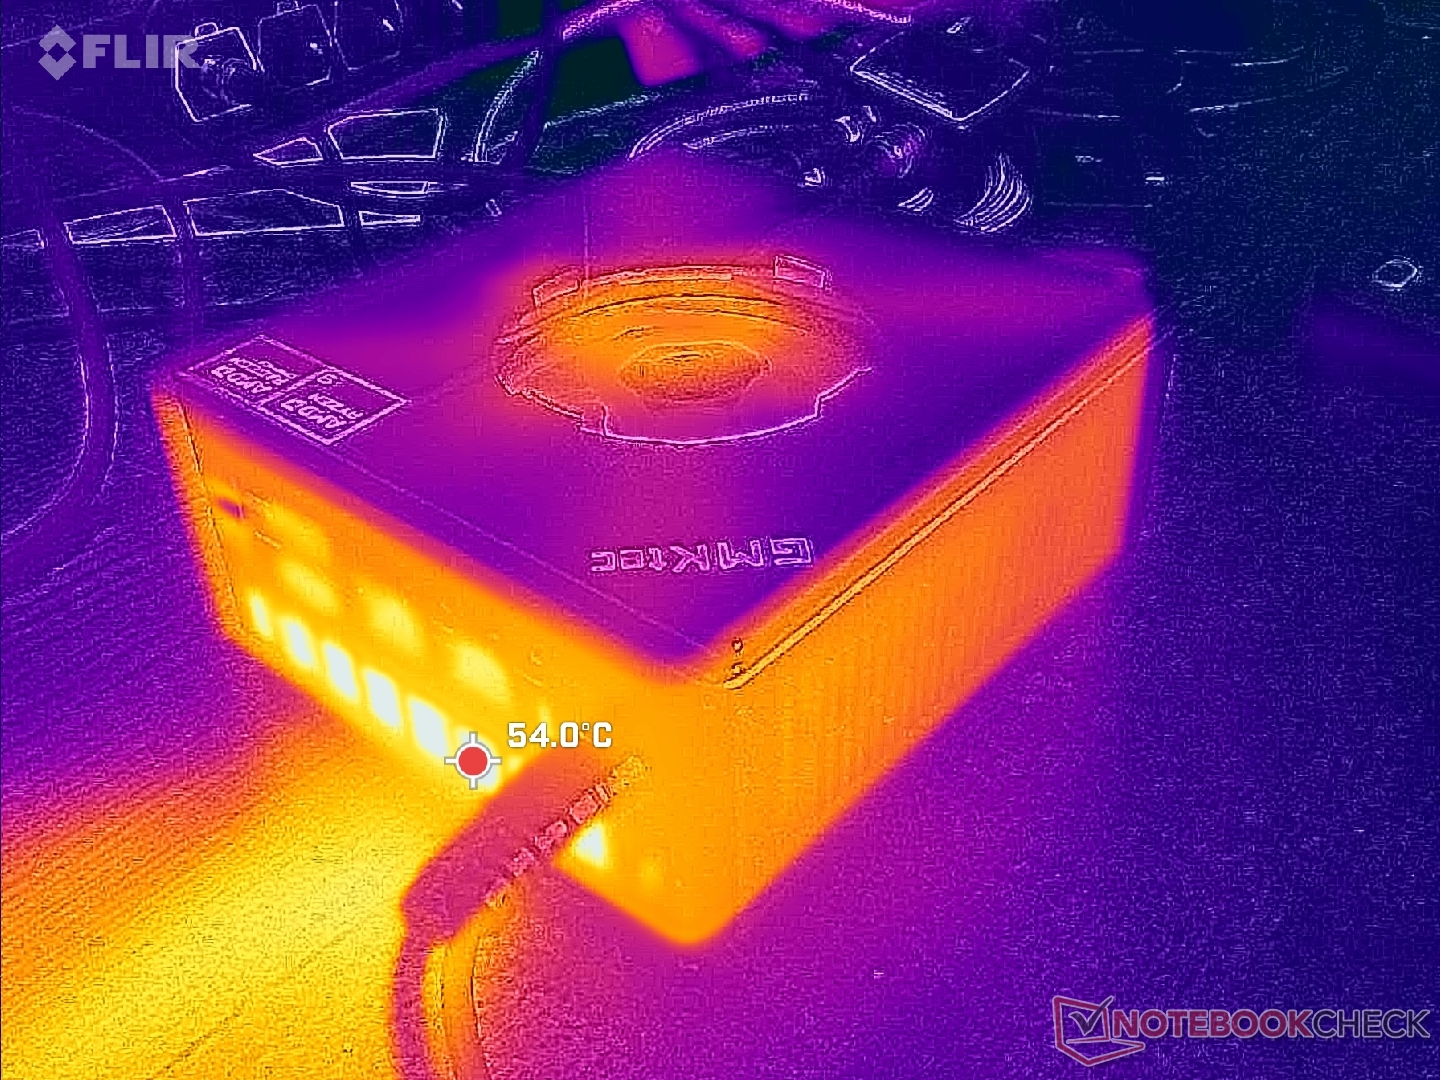
Température
L'air frais entre par le périmètre de la surface supérieure et sort par l'arrière. Si vous positionnez l'appareil à la verticale, certaines grilles d'aération seront obstruées, mais pas suffisamment pour que cela pose un problème.
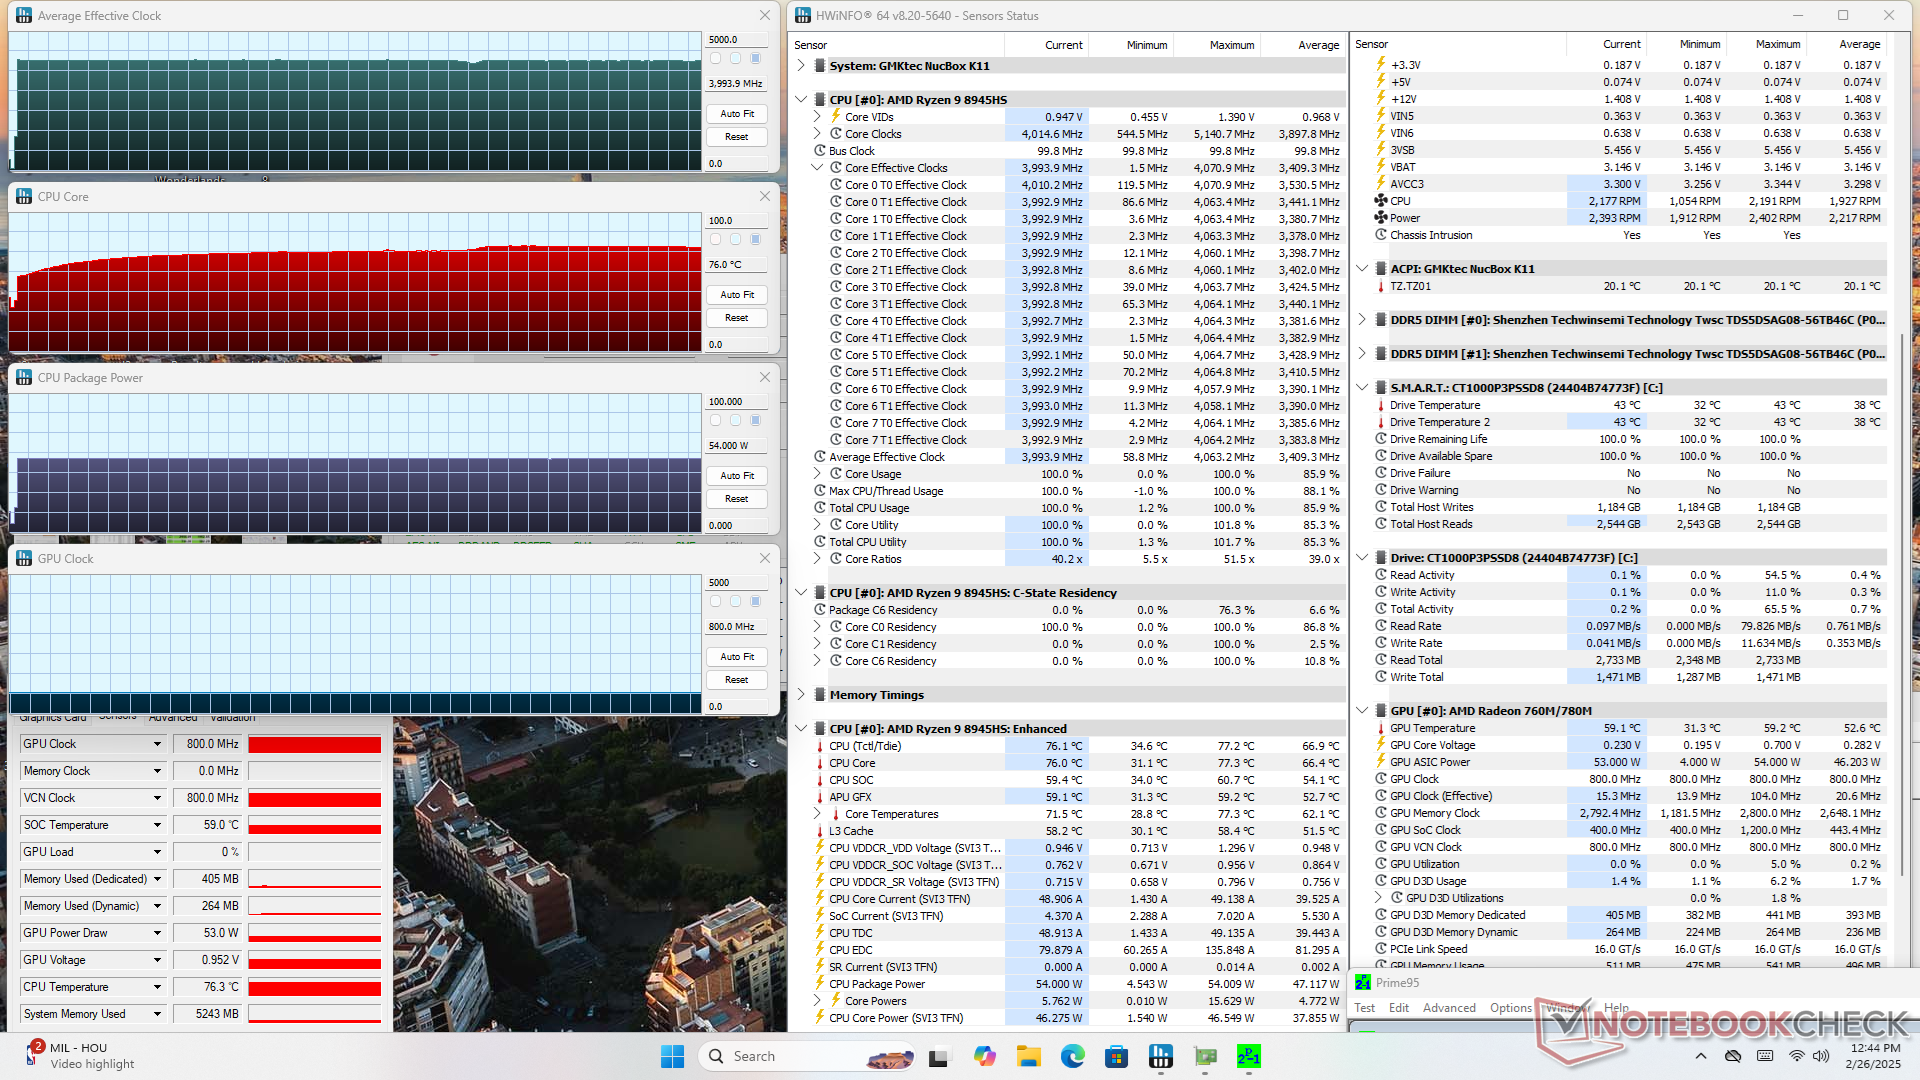
Test de stress
La température du cœur se situe entre 70 et 76 °C sous charge, contre 66 à 87 °C sur le Bosgame M2 fonctionnant sur un matériel Zen 4 similaire.
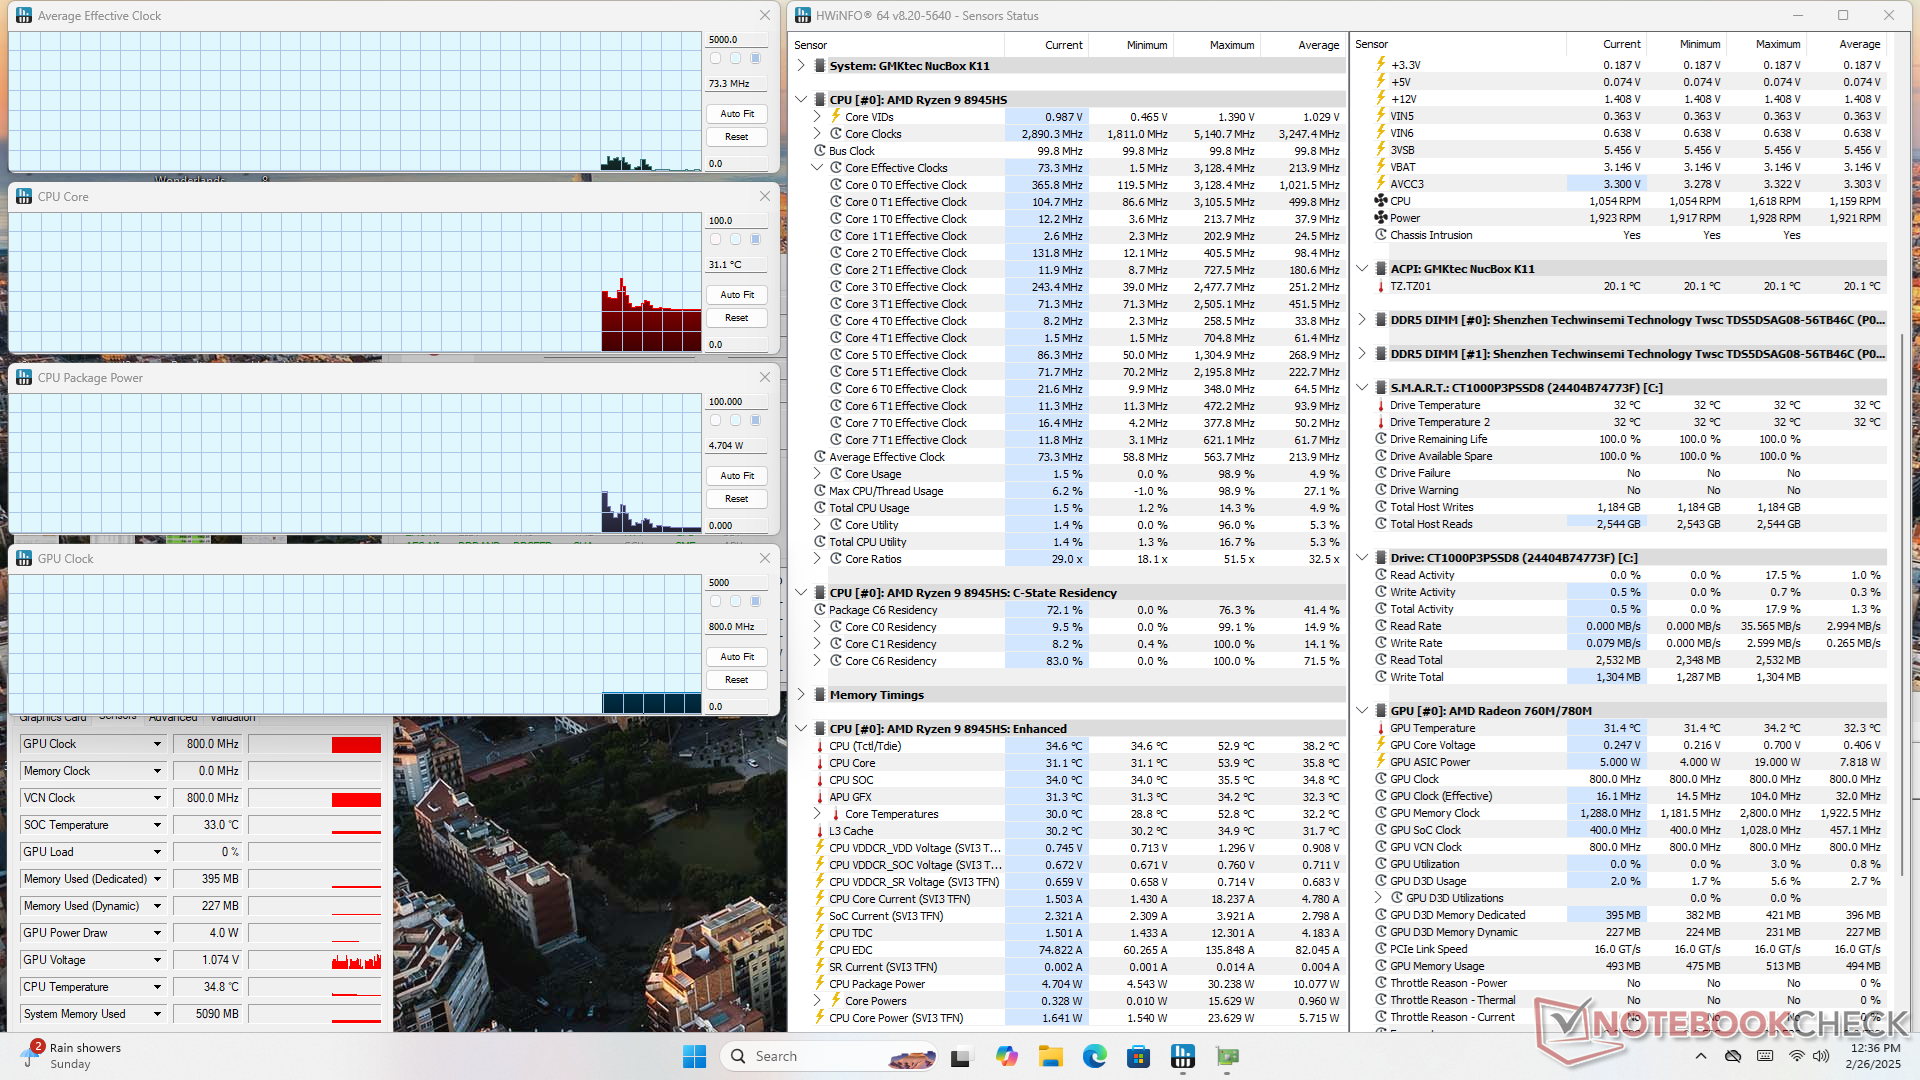
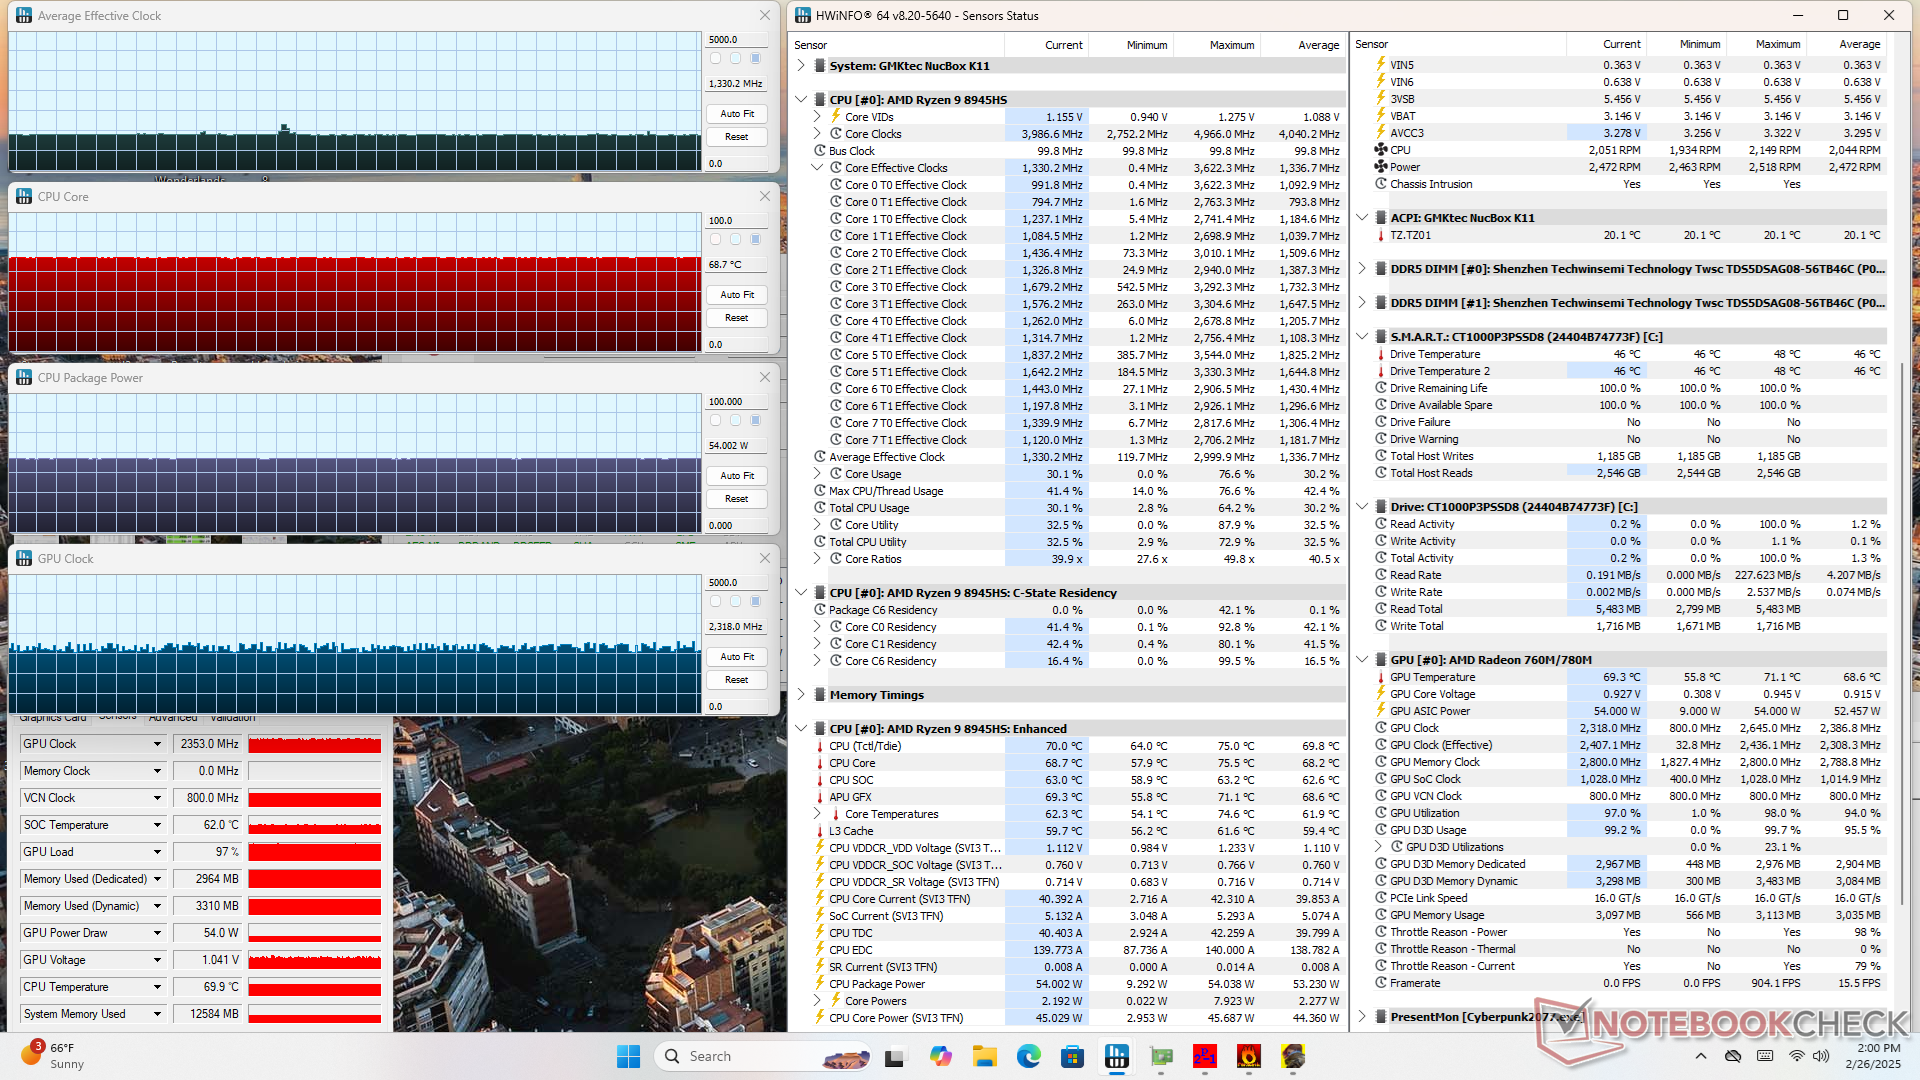
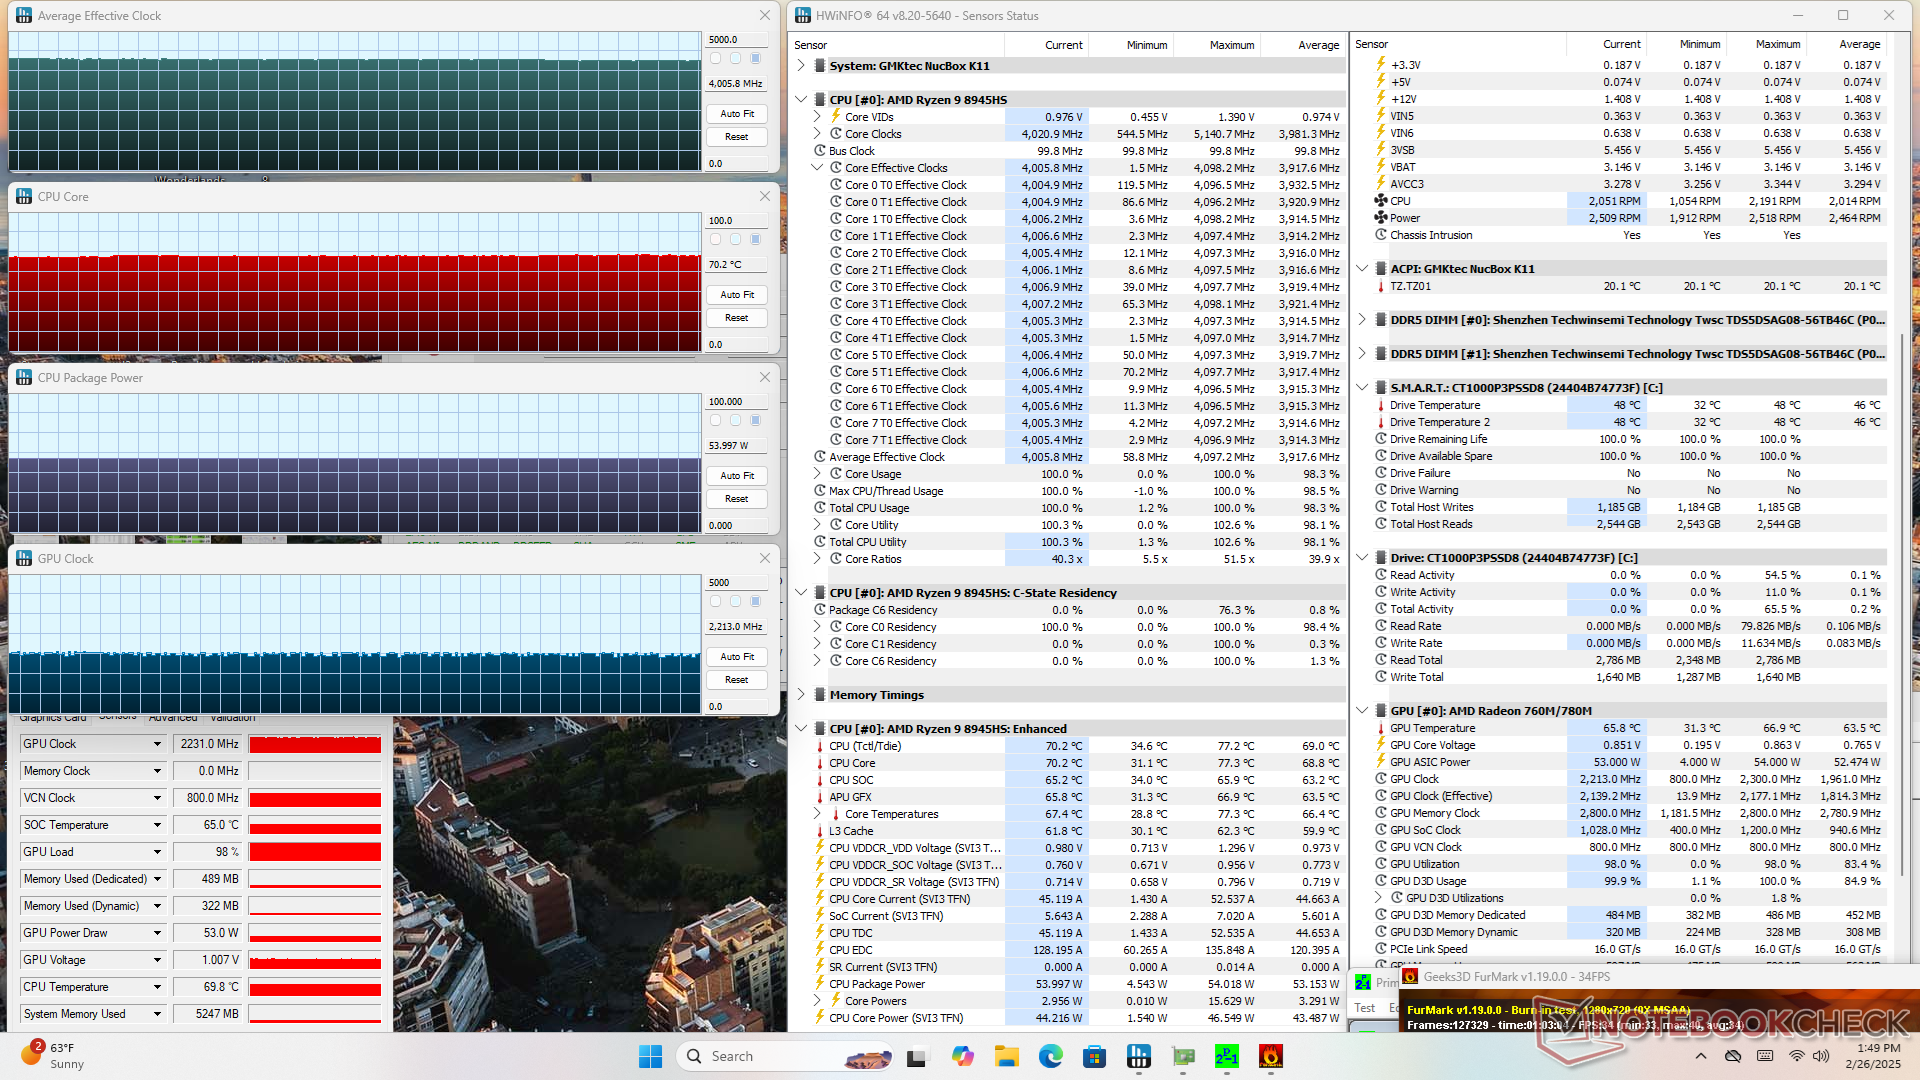
| Horloge du CPU (GHz) | Horloge du GPU (MHz) | Température moyenne du CPU (°C) | |
| Système au repos | -- | -- | 31 |
| Prime95 Stress | 4.0 | 800 | 76 |
| Prime95 + FurMark Stress | 4.0 | 2213 | 70 |
| Cyberpunk 2077 Stress | 1.3 | 2318 | 69 |
Gestion de l'énergie
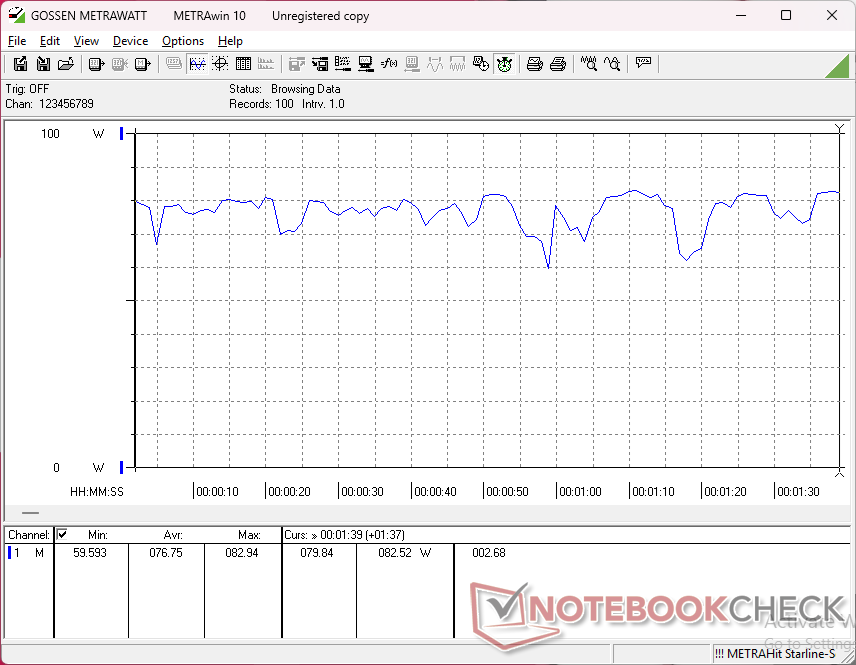
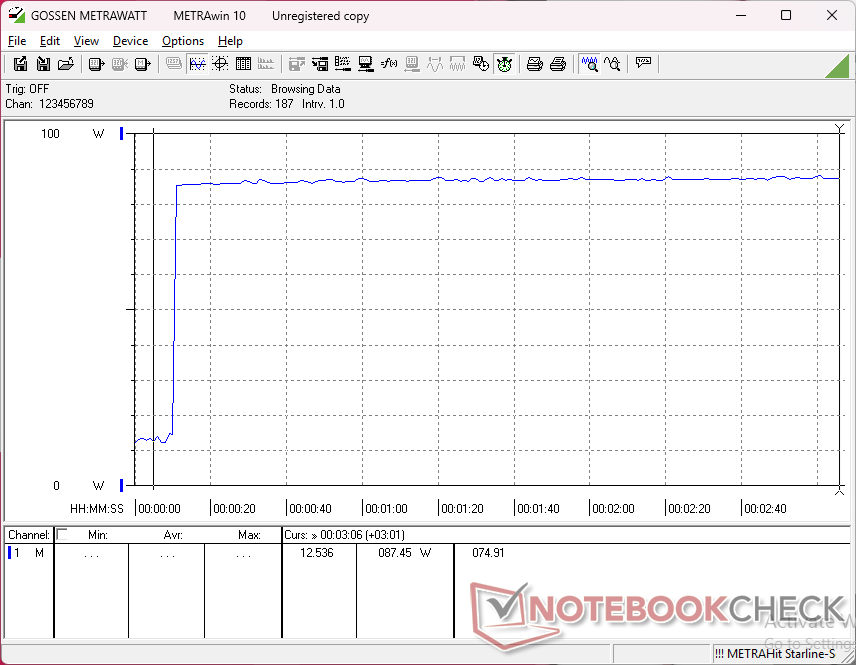
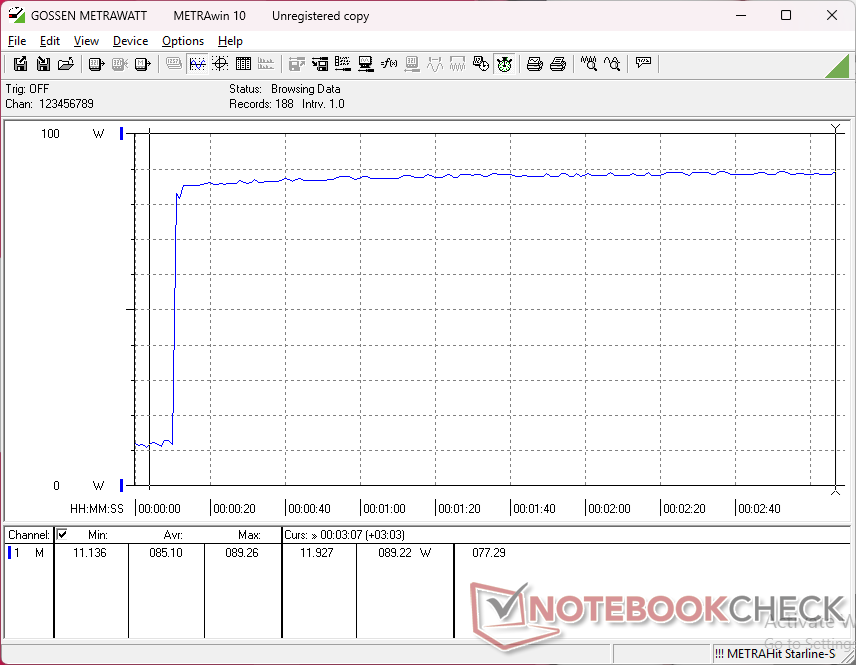
Consommation électrique
La consommation globale est comparable à celle de la machine Intel Beelink GTI13 Ultra tout en offrant des performances similaires au niveau du processeur et de meilleures performances graphiques pour une meilleure performance par watt.
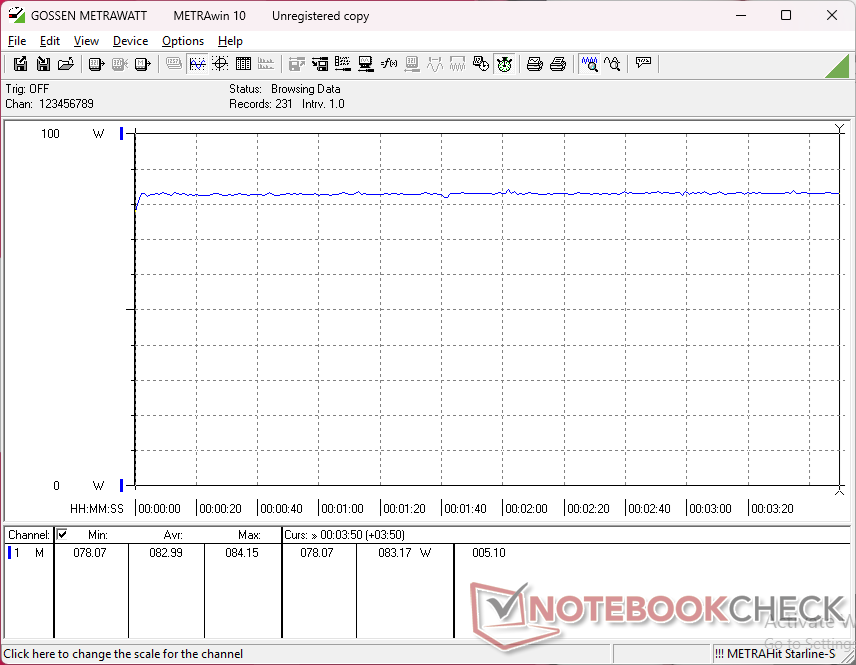
| Éteint/en veille | |
| Au repos | |
| Fortement sollicité |
|
Légende:
min: | |
| GMK NucBox K11 R9 8945HS, Radeon 780M, Crucial P3 Plus CT1000P3PSSD8, , x, | Beelink GTI13 Ultra i9-13900HK, Iris Xe G7 96EUs, Crucial P5 Plus 1TB CT1000P5PSSD8, , x, | GMK EVO-X1 Ryzen AI 9 HX 370, Radeon 890M, Crucial P3 Plus CT1000P3PSSD8, , x, | BOSGAME M2 R9 7940HS, Radeon 780M, , , x, | MSI Cubi NUC 1M Core 7 150U, Iris Xe G7 96EUs, WD PC SN560 SDDPNQE-1T00, , x, | Geekom GT1 Mega Ultra 9 185H, Arc 8-Core, Crucial P3 Plus CT2000P3PSSD8 , , x, | |
|---|---|---|---|---|---|---|
| Power Consumption | -50% | 23% | 8% | 28% | 13% | |
| Idle Minimum * | 6.6 | 15.7 -138% | 5.4 18% | 6.4 3% | 6.4 3% | 4.1 38% |
| Idle Average * | 9.1 | 16.5 -81% | 5.8 36% | 7.3 20% | 8.3 9% | 6.6 27% |
| Idle Maximum * | 11.3 | 16.5 -46% | 5.8 49% | 7.5 34% | 10.4 8% | 11.3 -0% |
| Load Average * | 76.8 | 77.3 -1% | 72.1 6% | 75 2% | 38.5 50% | 65.8 14% |
| Cyberpunk 2077 ultra external monitor * | 83 | 91.9 -11% | 72.5 13% | 83 -0% | 36.1 57% | 69.4 16% |
| Load Maximum * | 88 | 106 -20% | 76.1 14% | 99.9 -14% | 52.5 40% | 104.8 -19% |
* ... Moindre est la valeur, meilleures sont les performances
Power Consumption Cyberpunk / Stress Test
Power Consumption external Monitor
Notebookcheck Rating
GMK NucBox K11
- 03/03/2025 v8
Allen Ngo
 Total Sustainability Score:
 Transparency
La sélection des appareils à examiner est effectuée par notre équipe éditoriale. L'échantillon de test a été prêté à l'auteur par le fabricant ou le détaillant pour les besoins de cet examen. Le prêteur n'a pas eu d'influence sur cette évaluation et le fabricant n'a pas reçu de copie de cette évaluation avant sa publication. Il n'y avait aucune obligation de publier cet article. Nous n'acceptons jamais de compensation ou de paiement en échange de nos commentaires. En tant que média indépendant, Notebookcheck n'est pas soumis à l'autorité des fabricants, des détaillants ou des éditeurs.
Voici comment Notebookcheck teste
Chaque année, Notebookcheck examine de manière indépendante des centaines d'ordinateurs portables et de smartphones en utilisant des procédures standardisées afin de garantir que tous les résultats sont comparables. Nous avons continuellement développé nos méthodes de test depuis environ 20 ans et avons établi des normes industrielles dans le processus. Dans nos laboratoires de test, des équipements de mesure de haute qualité sont utilisés par des techniciens et des rédacteurs expérimentés. Ces tests impliquent un processus de validation en plusieurs étapes. Notre système d'évaluation complexe repose sur des centaines de mesures et de points de référence bien fondés, ce qui garantit l'objectivité.
