
Test du Lenovo Yoga Pro 7 14 : PC portable multimédia OLED 120 Hz et RTX 4050
Augmentation des performances du GPU.
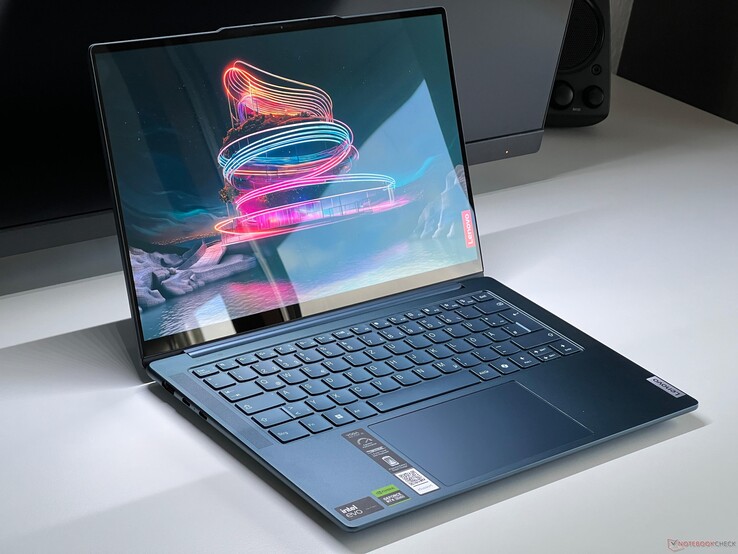
Le Yoga Pro 7 14 de Lenovo est un ordinateur portable multimédia rapide qui peut être équipé en option de GPU dédiés GeForce. Nous avons testé la version avec le Meteor Lake Core Ultra 7 155H, 32 Go de RAM, 120-Hz OLED et le Nvidia GeForce RTX 4050 Laptop.Andreas Osthoff, 👁 Andreas Osthoff (traduit par DeepL / Ninh Duy) Publié 🇺🇸 🇩🇪 ...
Verdict - Le Yoga Pro 7 14 bénéficie de meilleures performances GPU grâce à sa carte graphique RTX 4050
Le Lenovo Yoga Pro 7 14 est un bon ordinateur portable multimédia et son ordinateur portable dédié GeForce RTX 4050 double les performances graphiques des configurations iGPU. Le développement de ses performances avec un TGP maximum de 60 watts est décent et les performances du processeur Core Ultra 7 155H de l'ordinateur portable sont également bonnes (70 watts). Cependant, ses limites de puissance élevées conduisent à des ventilateurs bruyants et la comparaison avec la variante AMD montre que le Ryzen AI 9 365 offre légèrement plus de performance avec moins de puissance. Par conséquent, la combinaison AMD/Nvidia serait en fait le meilleur choix.
Le boîtier du Yoga, y compris ses ports, est impressionnant et son clavier est très confortable. De plus, il est doté de bons haut-parleurs. L'écran OLED 120-Hz en option offre une excellente qualité d'image et Lenovo fournit des profils précis pour P3 et sRGB. Cependant, l'écran est assez réfléchissant et nous avons noté un scintillement PWM constant à 240 Hz.
Outre les ventilateurs bruyants, les points faibles de l'ordinateur portable sont ses durées de fonctionnement, qui sont malheureusement médiocres au mieux. De plus, son bloc d'alimentation n'est pas assez volumineux. En cas de charge très élevée, la batterie doit être sollicitée pour couvrir la consommation d'énergie de l'appareil. Ce n'est pas nécessaire et ce n'est certainement pas bon pour la batterie. Lenovo aurait dû prévoir un bloc d'alimentation de 130 watts. Sans oublier que la RAM ne peut pas être mise à niveau et que vous ne pouvez installer qu'un SSD compact M.2-2242 en raison du GPU dédié.
Points positifs
Points négatifs
Prix et disponibilité
L'appareil que nous avons testé n'est actuellement pas disponible à l'achat en ligne aux États-Unis, mais vous pouvez consulter et acheter d'autres versions de l'ordinateur portable sur le site Web de Lenovo.
Comparaison des alternatives possibles
Image | Modèle | Prix | Poids | Épaisseur | Écran |
|---|---|---|---|---|---|
| Lenovo Yoga Pro 7 14IMH9, RTX 4050 Intel Core Ultra 7 155H ⎘ NVIDIA GeForce RTX 4050 Laptop GPU ⎘ 32 Go Mémoire, 1024 Go SSD | Amazon: 1. $1,149.00 Lenovo Yoga Pro 7 14AHP9 202... 2. $799.98 Lenovo Yoga 7 7i 2-in-1 Lapt... 3. $899.99 Lenovo - Yoga 7 2-in-1 14" 2... Prix de liste: 1699€ | 1.6 kg | 16.6 mm | 14.50" 2880x1800 234 PPI OLED | |
| SCHENKER Key 14 (M24) Intel Core Ultra 7 155H ⎘ NVIDIA GeForce RTX 4060 Laptop GPU ⎘ 32 Go Mémoire, 1024 Go SSD | Amazon: 1. $68.99 PowerHOOD 20V AC/DC Adapter ... Prix de liste: 1890€ | 1.7 kg | 19.9 mm | 14.00" 2880x1800 243 PPI IPS | |
| Dell XPS 14 2024 OLED Intel Core Ultra 7 155H ⎘ NVIDIA GeForce RTX 4050 Laptop GPU ⎘ 32 Go Mémoire, 1024 Go SSD | Amazon: $1,175.00 Prix de liste: 2949€ | 1.8 kg | 19 mm | 14.50" 3200x2000 260 PPI OLED | |
| HP OmniBook Ultra 14 AMD Ryzen AI 9 HX 375 ⎘ AMD Radeon 890M ⎘ 32 Go Mémoire, 2048 Go SSD | Amazon: Prix de liste: 1030 USD | 1.5 kg | 16.5 mm | 14.00" 2240x1400 189 PPI IPS | |
| SCHENKER Vision 14 M23 RTX 3050 Intel Core i7-13700H ⎘ NVIDIA GeForce RTX 3050 6GB Laptop GPU ⎘ 32 Go Mémoire, 1024 Go SSD | Amazon: 1. $125.00 14.0" 2880(RGB)*1800 LCD Scr... 2. $132.99 14.0" 2880(RGB)*1800 90Hz ED... 3. $45.99 19V 6.32A 120W Charger for M... Prix de liste: 1985€ | 1.3 kg | 16.6 mm | 14.00" 2880x1800 243 PPI IPS | |
| Lenovo Yoga Pro 7 14IMH9 Intel Core Ultra 7 155H ⎘ Intel Arc 8-Core iGPU ⎘ 32 Go Mémoire, 1024 Go SSD | Amazon: 1. $969.99 Lenovo Yoga Pro 7 14AHP9-202... 2. $1,749.00 Lenovo Yoga Pro 9i Laptop, I... 3. $2,049.00 Lenovo Yoga Pro 9i 16"" Lapt... Prix de liste: 1300 EUR | 1.6 kg | 16.6 mm | 14.50" 3072x1920 250 PPI IPS |
Table des matières
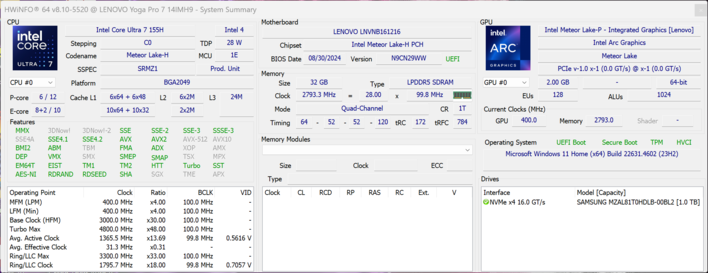
Lenovo propose son Yoga Pro 7 14 dans différentes configurations et nous avons déjà testé le AMD Zen5 et Intel (chacun avec une carte graphique intégrée), par exemple. Cependant, des variantes plus puissantes (notamment en ce qui concerne le GPU) jusqu'à la RTX 4060 Laptop sont également disponibles. Notre appareil de test actuel, pour un MRSP d'un peu plus de 1700 $, est équipé du processeur Meteor Lake Core Ultra 7 155H, de 32 Go de RAM, d'un écran OLED 2,8K à 120 Hz et de la carte graphique dédiée RTX 4060 de Nvidia Ordinateur portable Nvidia GeForce RTX 4050.
Top 10
» Le Top 10 des PC portables multimédia
» Le Top 10 des PC portables de jeu
» Le Top 10 des PC portables de jeu légers
» Le Top 10 des ordinateurs portables bureautiques
» Le Top 10 des PC portables bureautiques premium/professionnels
» Le Top 10 des Stations de travail mobiles
» Le Top 10 des Ultraportables
» Le Top 10 des Ultrabooks
» Le Top 10 des Convertibles
» Le Top 10 des Tablettes
» Le Top 10 des Tablettes Windows
» Le Top 10 des Smartphones
» Le Top 10 des PC Portables á moins de 300 euros
» Le Top 10 des PC Portables á moins de 500 euros
» Le Top 25 des meilleurs écrans d'ordinateurs
Spécifications
Boîtier et connectivité
En général, le design du boîtier de notre appareil de test est pratiquement le même que celui de la version AMD Zen5 ou Intel que nous avons déjà testée, mais au lieu de la variante de couleur Tidal Gray, il présente la variante de couleur Tidal Teal, c'est-à-dire un boîtier turquoise. La stabilité et la qualité de construction du boîtier métallique ne donnent pas lieu à des critiques et ses surfaces ne sont pas particulièrement sensibles aux traces de doigts. Par rapport à d'autres portables Lenovo, la bosse de l'appareil photo est très discrète et est même très utile si vous voulez ouvrir le couvercle, ce qui peut se faire facilement d'une seule main.
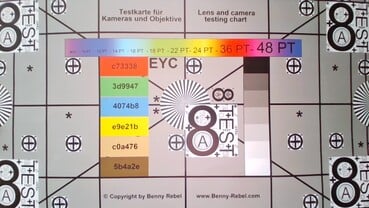
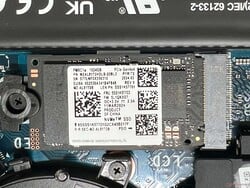
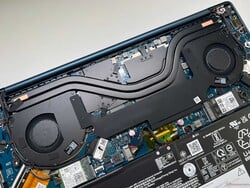
La RAM est soudée, ce qui explique que les options de maintenance se limitent au module WLAN, au SSD compact M.2-2242 (M.2-2280 pour les versions iGPU) et au nettoyage des ventilateurs. La batterie vissée peut également être remplacée si nécessaire. Tous les ports importants sont présents (y compris Thunderbolt 4) et la webcam 1080p (avec capteur IR et obturateur électronique) supporte Windows Studio Effects. Le module Wi-Fi est conforme à la norme Wi-Fi 6E et a atteint des taux de transfert élevés lors de notre test ; toutefois, l'ordinateur portable ne dispose pas d'un lecteur de cartes.
| Networking | |
| Lenovo Yoga Pro 7 14IMH9, RTX 4050 | |
| iperf3 transmit AXE11000 | |
| iperf3 receive AXE11000 | |
| SCHENKER Key 14 (M24) | |
| iperf3 transmit AXE11000 | |
| iperf3 receive AXE11000 | |
| Dell XPS 14 2024 OLED | |
| iperf3 transmit AXE11000 | |
| iperf3 receive AXE11000 | |
| HP OmniBook Ultra 14 | |
| iperf3 transmit AXE11000 | |
| iperf3 receive AXE11000 | |
| iperf3 transmit AXE11000 6GHz | |
| iperf3 receive AXE11000 6GHz | |
| Lenovo Yoga Pro 7 14IMH9 | |
| iperf3 transmit AXE11000 | |
| iperf3 receive AXE11000 | |

Durabilité
Lenovo n'a pas fourni d'informations sur l'empreinteCO2 de la production du Yoga Pro 7 14, mais l'appareil est au moins certifié EPEAT Gold et Energy Star. Son emballage ne contient aucun plastique et 50 % d'aluminium recyclé a été utilisé pour l'unité de base et le couvercle de l'écran.
Dispositifs d'entrée - course des touches de 1,5 mm
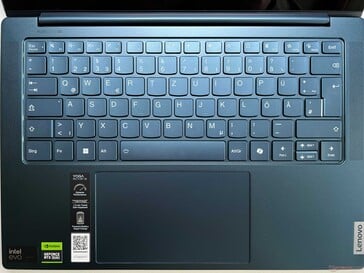
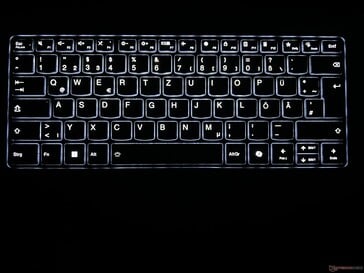
Le clavier de l'ordinateur portable est agréable à utiliser grâce à sa course de 1,5 mm et à son retour d'information précis. Cependant, les touches les plus larges sont assez bruyantes. Malgré sa couleur bleue, la visibilité des touches est bonne et le rétroéclairage blanc à deux niveaux - qui peut également être activé automatiquement par un capteur - est utile dans les environnements sombres. Le ClickPad fonctionne très bien en principe, mais les clics mécaniques dans la zone inférieure sont très bruyants, ce qui donne l'impression d'être bon marché.
Affichage - OLED 2,8K à 120 Hz
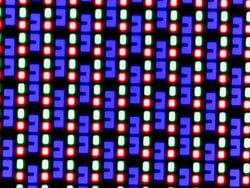
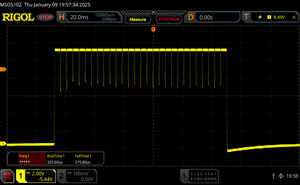
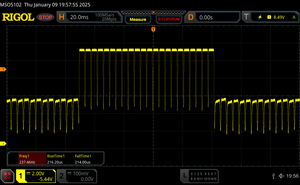
L'écran OLED de 14,5 pouces (2 880 x 1 800 pixels, 16:10) de notre appareil de test offre une très bonne qualité d'image subjective et ne présente plus les mêmes problèmes d'effet de trame que les précédents écrans OLED 2,8K de Lenovo. Son taux de rafraîchissement est de 120 Hz et les mouvements sont très fluides, et ses temps de réponse sont extrêmement rapides. Les panneaux OLED n'ont pas d'effet de rétroéclairage, mais ils utilisent un scintillement PWM constant à 240 Hz. Ni la luminosité ni la température de couleur ne peuvent être réglées automatiquement en fonction de la lumière ambiante. L'écran n'est pas tactile.
En mode SDR, sa luminosité est d'environ 400 cd/m² et, avec son faible niveau de noir, il en résulte un rapport de contraste extrêmement élevé. En mode HDR, nous avons mesuré une luminosité maximale de 650 cd/m² lors de l'affichage d'une petite section d'image et de 520 cd/m² lors de l'affichage d'une image presque entièrement blanche. Il convient toutefois de noter que le mode HDR doit être activé manuellement et que les profils de couleur ne fonctionnent alors plus.
| |||||||||||||||||||||||||
Homogénéité de la luminosité: 98 %
Valeur mesurée au centre, sur batterie: 398 cd/m²
Contraste: ∞:1 (Valeurs des noirs: 0 cd/m²)
ΔE Color 1.4 | 0.5-29.43 Ø4.87
ΔE Greyscale 1.8 | 0.5-98 Ø5.1
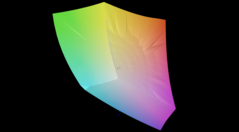
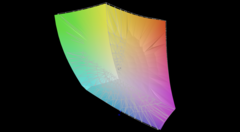
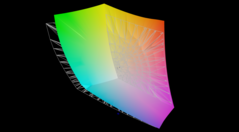
88.8% AdobeRGB 1998 (Argyll 2.2.0 3D)
99.9% sRGB (Argyll 2.2.0 3D)
98% Display P3 (Argyll 2.2.0 3D)
Gamma: 2.27
| Lenovo Yoga Pro 7 14IMH9, RTX 4050 LEN145WQ+, OLED, 2880x1800, 14.5", 120 Hz | SCHENKER Key 14 (M24) TL140ADXP24-0, IPS, 2880x1800, 14", 120 Hz | Dell XPS 14 2024 OLED SDC41A2, OLED, 3200x2000, 14.5", 120 Hz | HP OmniBook Ultra 14 BOE0C9E, IPS, 2240x1400, 14", 60 Hz | Lenovo Yoga Pro 7 14IMH9 Lenovo LEN145-3K (LEN8AAF), IPS, 3072x1920, 14.5", 120 Hz | SCHENKER Vision 14 2023 CSOT T3 MNE007ZA1-3, IPS, 2880x1800, 14", 90 Hz | |
|---|---|---|---|---|---|---|
| Display | -16% | -0% | -18% | -1% | -13% | |
| Display P3 Coverage | 98 | 70.3 -28% | 98.5 1% | 67.1 -32% | 98.4 0% | 74.7 -24% |
| sRGB Coverage | 99.9 | 97.4 -3% | 100 0% | 99 -1% | 100 0% | 99.6 0% |
| AdobeRGB 1998 Coverage | 88.8 | 72.4 -18% | 87.2 -2% | 68.9 -22% | 86.9 -2% | 75.8 -15% |
| Response Times | -6393% | 4% | -6370% | -5046% | -4907% | |
| Response Time Grey 50% / Grey 80% * | 0.43 ? | 38.5 ? -8853% | 0.7 ? -63% | 35.9 ? -8249% | 34.1 ? -7830% | 32.2 ? -7388% |
| Response Time Black / White * | 0.61 ? | 24.6 ? -3933% | 0.77 ? -26% | 28 ? -4490% | 14.4 ? -2261% | 15.4 ? -2425% |
| PWM Frequency | 240 ? | 480 100% | ||||
| Screen | -17% | -13% | -19% | 20% | -8% | |
| Brightness middle | 398 | 325 -18% | 351 -12% | 359.5 -10% | 464 17% | 402 1% |
| Brightness | 402 | 317 -21% | 353 -12% | 361 -10% | 456 13% | 371 -8% |
| Brightness Distribution | 98 | 94 -4% | 97 -1% | 92 -6% | 90 -8% | 86 -12% |
| Black Level * | 0.12 | 0.27 | 0.36 | 0.27 | ||
| Colorchecker dE 2000 * | 1.4 | 1.8 -29% | 1.7 -21% | 1.64 -17% | 0.9 36% | 1.8 -29% |
| Colorchecker dE 2000 max. * | 3.7 | 3.4 8% | 2.2 41% | 4.68 -26% | 2.32 37% | 3.6 3% |
| Greyscale dE 2000 * | 1.8 | 2.5 -39% | 3.1 -72% | 2.6 -44% | 1.4 22% | 1.8 -0% |
| Gamma | 2.27 97% | 2.15 102% | 2.12 104% | 2.22 99% | 2.218 99% | 2.27 97% |
| CCT | 6609 98% | 7017 93% | 6616 98% | 6388 102% | 6669 97% | 6695 97% |
| Contrast | 2708 | 1331 | 1289 | 1489 | ||
| Colorchecker dE 2000 calibrated * | 1.4 | 0.8 | 0.97 | 0.35 | 1.5 | |
| Moyenne finale (programmes/paramètres) | -2142% /
-1176% | -3% /
-6% | -2136% /
-1173% | -1676% /
-907% | -1643% /
-900% |
* ... Moindre est la valeur, meilleures sont les performances
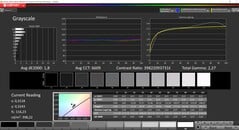
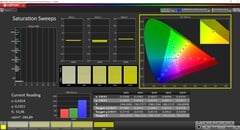
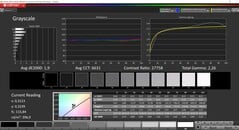
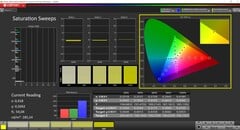
Nous avons analysé la dalle à l'aide du logiciel professionnel CalMAN. Lenovo propose différents profils dans l'application Vantage et l'écran est déjà assez impressionnant avec le profil P3 sélectionné. Nous n'avons relevé aucune valeur aberrante supérieure à l'écart important de 3, que ce soit dans les niveaux de gris ou dans les couleurs, et vous ne trouverez pas non plus de dominante de couleur. Les utilisateurs disposent également d'un profil sRGB précis. Les espaces colorimétriques P3 et sRGB sont entièrement couverts. Nous n'avons pas été en mesure d'améliorer davantage l'affichage grâce à notre propre étalonnage.
Temps de réponse de l'écran
| ↔ Temps de réponse noir à blanc | ||
|---|---|---|
| 0.61 ms ... hausse ↗ et chute ↘ combinées | ↗ 0.33 ms hausse | |
| ↘ 0.28 ms chute | ||
| L'écran montre de très faibles temps de réponse, parfait pour le jeu. En comparaison, tous les appareils testés affichent entre 0.1 (minimum) et 240 (maximum) ms. » 1 % des appareils testés affichent de meilleures performances. Cela signifie que les latences relevées sont meilleures que la moyenne (20.8 ms) de tous les appareils testés. | ||
| ↔ Temps de réponse gris 50% à gris 80% | ||
| 0.43 ms ... hausse ↗ et chute ↘ combinées | ↗ 0.22 ms hausse | |
| ↘ 0.21 ms chute | ||
| L'écran montre de très faibles temps de réponse, parfait pour le jeu. En comparaison, tous les appareils testés affichent entre 0.165 (minimum) et 636 (maximum) ms. » 0 % des appareils testés affichent de meilleures performances. Cela signifie que les latences relevées sont meilleures que la moyenne (32.5 ms) de tous les appareils testés. | ||
Scintillement / MLI (Modulation de largeur d'impulsion)
| Scintillement / MLI (Modulation de largeur d'impulsion) décelé | 240 Hz Amplitude: 50 % | ≤ 100 Niveau de luminosité | |
Le rétroéclairage de l'écran scintille à la fréquence de 240 Hz (certainement du fait de l'utilisation d'une MDI - Modulation de largeur d'impulsion) à un niveau de luminosité inférieur ou égal à 100 % . Aucun scintillement ne devrait être perceptible au-dessus de cette valeur. La fréquence de rafraîchissement de 240 Hz est relativement faible, les personnes les plus sensibles devraient percevoir un scintillement et être sujettes à une fatigue oculaire accrue (avec le niveau de luminosité indiqué) En comparaison, 53 % des appareils testés n'emploient pas MDI pour assombrir leur écran. Nous avons relevé une moyenne à 8516 (minimum : 5 - maximum : 343500) Hz dans le cas où une MDI était active. | |||
Performance - Meteor Lake-H
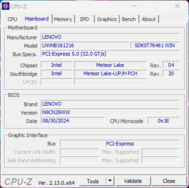
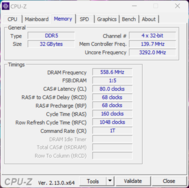
Notre appareil de test est équipé de 32 Go de mémoire vive LPDDR5x-7467, ce qui devrait suffire à la plupart des utilisateurs. Toutefois, il n'est pas possible de l'étendre.
Conditions d'essai
Lenovo propose différents profils énergétiques qui peuvent être modifiés via le logiciel Vantage ou la combinaison de touches Fn+Q. Nous avons effectué les tests et mesures suivants en utilisant le mode de performance maximale afin d'utiliser toutes les performances du CPU et du GPU.
| Mode énergie | CPU TDP | CB R23 Multi | GPU TGP | Time Spy Graphics | émissions sonores du ventilateur max |
|---|---|---|---|---|---|
| Mode économie de batterie | 50/15 watts | 12 648 points | 13 watts | 1 251 points | 29,8 dB(A) |
| Mode d'économie adaptative de la batterie (Auto) | 70/65 watts | 17,539 points | 50 watts | 6,461 points | 45 dB(A) |
| Performance | 75/70 watts | 18,184 points | 60 watts | 7,342 points | 49.1 dB(A) |
Processeur
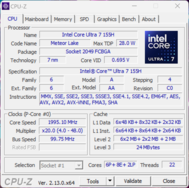
Le Intel Core Ultra 7 155H de la génération Meteor Lake est utilisé comme processeur de l'ordinateur portable. Il dispose d'un total de 16 cœurs (22 threads) et peut fonctionner dans une plage de 28 à 115 watts. Lors de notre test, le Yoga Pro 7 14 a consommé un maximum de 75 watts, qui s'est ensuite stabilisé à 70 watts. Par conséquent, ses performances multicœurs étaient bonnes et stables dans l'ensemble, bien que le processeur Ryzen AI 9 365 soit plus puissant Ryzen AI 9 365 a obtenu des résultats encore meilleurs avec une consommation légèrement inférieure (60/54 watts). Ses performances sont en outre restées stables en mode batterie. D'autres benchmarks CPU sont disponibles dans notre section technique.
Cinebench R15 Multi continuous test
Cinebench R23: Multi Core | Single Core
Cinebench R20: CPU (Multi Core) | CPU (Single Core)
Cinebench R15: CPU Multi 64Bit | CPU Single 64Bit
Blender: v2.79 BMW27 CPU
7-Zip 18.03: 7z b 4 | 7z b 4 -mmt1
Geekbench 6.4: Multi-Core | Single-Core
Geekbench 5.5: Multi-Core | Single-Core
HWBOT x265 Benchmark v2.2: 4k Preset
LibreOffice : 20 Documents To PDF
R Benchmark 2.5: Overall mean
| CPU Performance Rating | |
| HP OmniBook Ultra 14 | |
| Lenovo Yoga Pro 7 14ASP G9 | |
| Lenovo Yoga Pro 7 14IMH9, RTX 4050 | |
| Moyenne de la classe Multimedia | |
| SCHENKER Key 14 (M24) | |
| Lenovo Yoga Pro 7 14IMH9 | |
| Dell XPS 14 2024 OLED | |
| Moyenne Intel Core Ultra 7 155H | |
| SCHENKER Vision 14 M23 RTX 3050 | |
| Cinebench R23 / Multi Core | |
| HP OmniBook Ultra 14 | |
| Lenovo Yoga Pro 7 14ASP G9 | |
| Lenovo Yoga Pro 7 14IMH9, RTX 4050 | |
| Moyenne de la classe Multimedia (4861 - 30789, n=96, 2 dernières années) | |
| SCHENKER Key 14 (M24) | |
| Moyenne Intel Core Ultra 7 155H (9769 - 19007, n=52) | |
| Lenovo Yoga Pro 7 14IMH9 | |
| Dell XPS 14 2024 OLED | |
| SCHENKER Vision 14 M23 RTX 3050 | |
| Cinebench R23 / Single Core | |
| Lenovo Yoga Pro 7 14ASP G9 | |
| HP OmniBook Ultra 14 | |
| SCHENKER Vision 14 M23 RTX 3050 | |
| Moyenne de la classe Multimedia (878 - 2290, n=87, 2 dernières années) | |
| Lenovo Yoga Pro 7 14IMH9, RTX 4050 | |
| Dell XPS 14 2024 OLED | |
| Moyenne Intel Core Ultra 7 155H (1496 - 1815, n=52) | |
| SCHENKER Key 14 (M24) | |
| Lenovo Yoga Pro 7 14IMH9 | |
| Cinebench R20 / CPU (Multi Core) | |
| HP OmniBook Ultra 14 | |
| Lenovo Yoga Pro 7 14ASP G9 | |
| Lenovo Yoga Pro 7 14IMH9, RTX 4050 | |
| Dell XPS 14 2024 OLED | |
| SCHENKER Key 14 (M24) | |
| Moyenne de la classe Multimedia (1887 - 11924, n=80, 2 dernières années) | |
| Moyenne Intel Core Ultra 7 155H (3798 - 7409, n=50) | |
| Lenovo Yoga Pro 7 14IMH9 | |
| SCHENKER Vision 14 M23 RTX 3050 | |
| Cinebench R20 / CPU (Single Core) | |
| Lenovo Yoga Pro 7 14ASP G9 | |
| HP OmniBook Ultra 14 | |
| SCHENKER Vision 14 M23 RTX 3050 | |
| Lenovo Yoga Pro 7 14IMH9, RTX 4050 | |
| Moyenne de la classe Multimedia (341 - 853, n=80, 2 dernières années) | |
| Dell XPS 14 2024 OLED | |
| Lenovo Yoga Pro 7 14IMH9 | |
| Moyenne Intel Core Ultra 7 155H (601 - 696, n=50) | |
| SCHENKER Key 14 (M24) | |
| Cinebench R15 / CPU Multi 64Bit | |
| HP OmniBook Ultra 14 | |
| Lenovo Yoga Pro 7 14ASP G9 | |
| Lenovo Yoga Pro 7 14IMH9, RTX 4050 | |
| Dell XPS 14 2024 OLED | |
| Lenovo Yoga Pro 7 14IMH9 | |
| Moyenne de la classe Multimedia (856 - 5224, n=87, 2 dernières années) | |
| SCHENKER Key 14 (M24) | |
| Moyenne Intel Core Ultra 7 155H (1932 - 2880, n=56) | |
| SCHENKER Vision 14 M23 RTX 3050 | |
| Cinebench R15 / CPU Single 64Bit | |
| Lenovo Yoga Pro 7 14ASP G9 | |
| HP OmniBook Ultra 14 | |
| SCHENKER Vision 14 M23 RTX 3050 | |
| Lenovo Yoga Pro 7 14IMH9 | |
| Moyenne de la classe Multimedia (99.6 - 323, n=82, 2 dernières années) | |
| Lenovo Yoga Pro 7 14IMH9, RTX 4050 | |
| Dell XPS 14 2024 OLED | |
| Moyenne Intel Core Ultra 7 155H (99.6 - 268, n=52) | |
| SCHENKER Key 14 (M24) | |
| Blender / v2.79 BMW27 CPU | |
| Dell XPS 14 2024 OLED | |
| SCHENKER Vision 14 M23 RTX 3050 | |
| Moyenne de la classe Multimedia (100 - 557, n=80, 2 dernières années) | |
| Moyenne Intel Core Ultra 7 155H (175 - 381, n=47) | |
| SCHENKER Key 14 (M24) | |
| Lenovo Yoga Pro 7 14IMH9 | |
| Lenovo Yoga Pro 7 14ASP G9 | |
| Lenovo Yoga Pro 7 14IMH9, RTX 4050 | |
| HP OmniBook Ultra 14 | |
| 7-Zip 18.03 / 7z b 4 | |
| HP OmniBook Ultra 14 | |
| Lenovo Yoga Pro 7 14IMH9, RTX 4050 | |
| Lenovo Yoga Pro 7 14ASP G9 | |
| Lenovo Yoga Pro 7 14IMH9 | |
| SCHENKER Key 14 (M24) | |
| Moyenne de la classe Multimedia (29095 - 130368, n=75, 2 dernières années) | |
| Moyenne Intel Core Ultra 7 155H (41739 - 70254, n=50) | |
| SCHENKER Vision 14 M23 RTX 3050 | |
| Dell XPS 14 2024 OLED | |
| 7-Zip 18.03 / 7z b 4 -mmt1 | |
| SCHENKER Vision 14 M23 RTX 3050 | |
| Lenovo Yoga Pro 7 14ASP G9 | |
| HP OmniBook Ultra 14 | |
| Moyenne de la classe Multimedia (3398 - 7545, n=75, 2 dernières années) | |
| Lenovo Yoga Pro 7 14IMH9, RTX 4050 | |
| Lenovo Yoga Pro 7 14IMH9 | |
| SCHENKER Key 14 (M24) | |
| Dell XPS 14 2024 OLED | |
| Moyenne Intel Core Ultra 7 155H (4594 - 5621, n=50) | |
| Geekbench 6.4 / Multi-Core | |
| HP OmniBook Ultra 14 | |
| Lenovo Yoga Pro 7 14ASP G9 | |
| Moyenne de la classe Multimedia (4983 - 25760, n=77, 2 dernières années) | |
| Lenovo Yoga Pro 7 14IMH9, RTX 4050 | |
| Dell XPS 14 2024 OLED | |
| Lenovo Yoga Pro 7 14IMH9 | |
| SCHENKER Key 14 (M24) | |
| Moyenne Intel Core Ultra 7 155H (7732 - 13656, n=55) | |
| SCHENKER Vision 14 M23 RTX 3050 | |
| Geekbench 6.4 / Single-Core | |
| HP OmniBook Ultra 14 | |
| Lenovo Yoga Pro 7 14ASP G9 | |
| Moyenne de la classe Multimedia (1534 - 3927, n=73, 2 dernières années) | |
| SCHENKER Vision 14 M23 RTX 3050 | |
| Dell XPS 14 2024 OLED | |
| Lenovo Yoga Pro 7 14IMH9, RTX 4050 | |
| Lenovo Yoga Pro 7 14IMH9 | |
| Moyenne Intel Core Ultra 7 155H (1901 - 2473, n=52) | |
| SCHENKER Key 14 (M24) | |
| Geekbench 5.5 / Multi-Core | |
| HP OmniBook Ultra 14 | |
| Lenovo Yoga Pro 7 14IMH9, RTX 4050 | |
| Lenovo Yoga Pro 7 14ASP G9 | |
| Dell XPS 14 2024 OLED | |
| Lenovo Yoga Pro 7 14IMH9 | |
| SCHENKER Key 14 (M24) | |
| Moyenne de la classe Multimedia (4652 - 23059, n=79, 2 dernières années) | |
| Moyenne Intel Core Ultra 7 155H (10017 - 13556, n=52) | |
| SCHENKER Vision 14 M23 RTX 3050 | |
| Geekbench 5.5 / Single-Core | |
| HP OmniBook Ultra 14 | |
| Lenovo Yoga Pro 7 14ASP G9 | |
| SCHENKER Vision 14 M23 RTX 3050 | |
| Moyenne de la classe Multimedia (891 - 2555, n=79, 2 dernières années) | |
| Lenovo Yoga Pro 7 14IMH9 | |
| Lenovo Yoga Pro 7 14IMH9, RTX 4050 | |
| Dell XPS 14 2024 OLED | |
| Moyenne Intel Core Ultra 7 155H (1462 - 1824, n=52) | |
| SCHENKER Key 14 (M24) | |
| HWBOT x265 Benchmark v2.2 / 4k Preset | |
| HP OmniBook Ultra 14 | |
| Lenovo Yoga Pro 7 14IMH9, RTX 4050 | |
| Lenovo Yoga Pro 7 14ASP G9 | |
| Lenovo Yoga Pro 7 14IMH9 | |
| Moyenne de la classe Multimedia (5.26 - 34.3, n=74, 2 dernières années) | |
| Moyenne Intel Core Ultra 7 155H (9.93 - 21.2, n=50) | |
| Dell XPS 14 2024 OLED | |
| SCHENKER Key 14 (M24) | |
| SCHENKER Vision 14 M23 RTX 3050 | |
| LibreOffice / 20 Documents To PDF | |
| Lenovo Yoga Pro 7 14IMH9 | |
| SCHENKER Vision 14 M23 RTX 3050 | |
| Lenovo Yoga Pro 7 14ASP G9 | |
| Moyenne de la classe Multimedia (23.9 - 146.7, n=76, 2 dernières années) | |
| Dell XPS 14 2024 OLED | |
| Moyenne Intel Core Ultra 7 155H (37.5 - 79.2, n=49) | |
| Lenovo Yoga Pro 7 14IMH9, RTX 4050 | |
| HP OmniBook Ultra 14 | |
| SCHENKER Key 14 (M24) | |
| R Benchmark 2.5 / Overall mean | |
| Lenovo Yoga Pro 7 14IMH9 | |
| SCHENKER Key 14 (M24) | |
| Moyenne Intel Core Ultra 7 155H (0.4457 - 0.53, n=49) | |
| Moyenne de la classe Multimedia (0.3604 - 0.947, n=74, 2 dernières années) | |
| Dell XPS 14 2024 OLED | |
| Lenovo Yoga Pro 7 14IMH9, RTX 4050 | |
| SCHENKER Vision 14 M23 RTX 3050 | |
| HP OmniBook Ultra 14 | |
| Lenovo Yoga Pro 7 14ASP G9 | |
* ... Moindre est la valeur, meilleures sont les performances
AIDA64: FP32 Ray-Trace | FPU Julia | CPU SHA3 | CPU Queen | FPU SinJulia | FPU Mandel | CPU AES | CPU ZLib | FP64 Ray-Trace | CPU PhotoWorxx
| Performance Rating | |
| HP OmniBook Ultra 14 | |
| Lenovo Yoga Pro 7 14IMH9, RTX 4050 | |
| Lenovo Yoga Pro 7 14IMH9 | |
| Moyenne de la classe Multimedia | |
| SCHENKER Key 14 (M24) | |
| Moyenne Intel Core Ultra 7 155H | |
| Dell XPS 14 2024 OLED | |
| SCHENKER Vision 14 M23 RTX 3050 | |
| AIDA64 / FP32 Ray-Trace | |
| HP OmniBook Ultra 14 | |
| Lenovo Yoga Pro 7 14IMH9, RTX 4050 | |
| Lenovo Yoga Pro 7 14IMH9 | |
| Moyenne de la classe Multimedia (5121 - 50388, n=73, 2 dernières années) | |
| SCHENKER Key 14 (M24) | |
| Moyenne Intel Core Ultra 7 155H (6670 - 18470, n=50) | |
| SCHENKER Vision 14 M23 RTX 3050 | |
| Dell XPS 14 2024 OLED | |
| AIDA64 / FPU Julia | |
| HP OmniBook Ultra 14 | |
| Lenovo Yoga Pro 7 14IMH9, RTX 4050 | |
| Lenovo Yoga Pro 7 14IMH9 | |
| Moyenne de la classe Multimedia (14528 - 201874, n=74, 2 dernières années) | |
| SCHENKER Key 14 (M24) | |
| Moyenne Intel Core Ultra 7 155H (40905 - 93181, n=50) | |
| SCHENKER Vision 14 M23 RTX 3050 | |
| Dell XPS 14 2024 OLED | |
| AIDA64 / CPU SHA3 | |
| HP OmniBook Ultra 14 | |
| Lenovo Yoga Pro 7 14IMH9, RTX 4050 | |
| Lenovo Yoga Pro 7 14IMH9 | |
| Moyenne de la classe Multimedia (1188 - 8623, n=74, 2 dernières années) | |
| SCHENKER Key 14 (M24) | |
| Moyenne Intel Core Ultra 7 155H (1940 - 4436, n=50) | |
| Dell XPS 14 2024 OLED | |
| SCHENKER Vision 14 M23 RTX 3050 | |
| AIDA64 / CPU Queen | |
| HP OmniBook Ultra 14 | |
| Moyenne de la classe Multimedia (21547 - 181505, n=74, 2 dernières années) | |
| SCHENKER Vision 14 M23 RTX 3050 | |
| SCHENKER Key 14 (M24) | |
| Lenovo Yoga Pro 7 14IMH9 | |
| Lenovo Yoga Pro 7 14IMH9, RTX 4050 | |
| Dell XPS 14 2024 OLED | |
| Moyenne Intel Core Ultra 7 155H (64698 - 94181, n=50) | |
| AIDA64 / FPU SinJulia | |
| HP OmniBook Ultra 14 | |
| Lenovo Yoga Pro 7 14IMH9, RTX 4050 | |
| Lenovo Yoga Pro 7 14IMH9 | |
| Moyenne de la classe Multimedia (1240 - 28794, n=74, 2 dernières années) | |
| SCHENKER Key 14 (M24) | |
| Moyenne Intel Core Ultra 7 155H (5639 - 10647, n=50) | |
| Dell XPS 14 2024 OLED | |
| SCHENKER Vision 14 M23 RTX 3050 | |
| AIDA64 / FPU Mandel | |
| HP OmniBook Ultra 14 | |
| Lenovo Yoga Pro 7 14IMH9, RTX 4050 | |
| Lenovo Yoga Pro 7 14IMH9 | |
| Moyenne de la classe Multimedia (9903 - 105740, n=73, 2 dernières années) | |
| SCHENKER Key 14 (M24) | |
| Moyenne Intel Core Ultra 7 155H (18236 - 47685, n=50) | |
| SCHENKER Vision 14 M23 RTX 3050 | |
| Dell XPS 14 2024 OLED | |
| AIDA64 / CPU AES | |
| Lenovo Yoga Pro 7 14IMH9, RTX 4050 | |
| Moyenne Intel Core Ultra 7 155H (45713 - 152179, n=50) | |
| HP OmniBook Ultra 14 | |
| Lenovo Yoga Pro 7 14IMH9 | |
| Moyenne de la classe Multimedia (26066 - 169946, n=74, 2 dernières années) | |
| SCHENKER Key 14 (M24) | |
| Dell XPS 14 2024 OLED | |
| SCHENKER Vision 14 M23 RTX 3050 | |
| AIDA64 / CPU ZLib | |
| HP OmniBook Ultra 14 | |
| Lenovo Yoga Pro 7 14IMH9, RTX 4050 | |
| Lenovo Yoga Pro 7 14IMH9 | |
| SCHENKER Key 14 (M24) | |
| Moyenne de la classe Multimedia (440 - 2022, n=74, 2 dernières années) | |
| Moyenne Intel Core Ultra 7 155H (557 - 1250, n=50) | |
| Dell XPS 14 2024 OLED | |
| SCHENKER Vision 14 M23 RTX 3050 | |
| AIDA64 / FP64 Ray-Trace | |
| HP OmniBook Ultra 14 | |
| Lenovo Yoga Pro 7 14IMH9, RTX 4050 | |
| Moyenne de la classe Multimedia (2759 - 26875, n=74, 2 dernières années) | |
| Lenovo Yoga Pro 7 14IMH9 | |
| SCHENKER Key 14 (M24) | |
| SCHENKER Vision 14 M23 RTX 3050 | |
| Moyenne Intel Core Ultra 7 155H (3569 - 9802, n=50) | |
| Dell XPS 14 2024 OLED | |
| AIDA64 / CPU PhotoWorxx | |
| Lenovo Yoga Pro 7 14IMH9, RTX 4050 | |
| Lenovo Yoga Pro 7 14IMH9 | |
| Dell XPS 14 2024 OLED | |
| HP OmniBook Ultra 14 | |
| SCHENKER Key 14 (M24) | |
| Moyenne Intel Core Ultra 7 155H (32719 - 54223, n=50) | |
| SCHENKER Vision 14 M23 RTX 3050 | |
| Moyenne de la classe Multimedia (12860 - 58844, n=74, 2 dernières années) | |
Performance du système
Le Yoga s'est très bien comporté lors des tests de référence du système et est un appareil réactif lors d'une utilisation quotidienne. Nous n'avons rencontré aucun problème de stabilité du système sur notre appareil de test.
CrossMark: Overall | Productivity | Creativity | Responsiveness
WebXPRT 3: Overall
WebXPRT 4: Overall
Mozilla Kraken 1.1: Total
| PCMark 10 / Score | |
| HP OmniBook Ultra 14 | |
| Lenovo Yoga Pro 7 14IMH9, RTX 4050 | |
| Lenovo Yoga Pro 7 14IMH9 | |
| Moyenne de la classe Multimedia (4325 - 8670, n=70, 2 dernières années) | |
| Moyenne Intel Core Ultra 7 155H, NVIDIA GeForce RTX 4050 Laptop GPU (6537 - 6973, n=5) | |
| SCHENKER Key 14 (M24) | |
| Dell XPS 14 2024 OLED | |
| SCHENKER Vision 14 M23 RTX 3050 | |
| PCMark 10 / Essentials | |
| HP OmniBook Ultra 14 | |
| Lenovo Yoga Pro 7 14IMH9 | |
| Moyenne de la classe Multimedia (8025 - 12420, n=70, 2 dernières années) | |
| Lenovo Yoga Pro 7 14IMH9, RTX 4050 | |
| Moyenne Intel Core Ultra 7 155H, NVIDIA GeForce RTX 4050 Laptop GPU (9463 - 10446, n=5) | |
| SCHENKER Key 14 (M24) | |
| Dell XPS 14 2024 OLED | |
| SCHENKER Vision 14 M23 RTX 3050 | |
| PCMark 10 / Productivity | |
| HP OmniBook Ultra 14 | |
| Lenovo Yoga Pro 7 14IMH9, RTX 4050 | |
| Moyenne Intel Core Ultra 7 155H, NVIDIA GeForce RTX 4050 Laptop GPU (8769 - 9272, n=5) | |
| Moyenne de la classe Multimedia (6089 - 10615, n=70, 2 dernières années) | |
| SCHENKER Vision 14 M23 RTX 3050 | |
| Dell XPS 14 2024 OLED | |
| Lenovo Yoga Pro 7 14IMH9 | |
| SCHENKER Key 14 (M24) | |
| PCMark 10 / Digital Content Creation | |
| HP OmniBook Ultra 14 | |
| SCHENKER Key 14 (M24) | |
| Lenovo Yoga Pro 7 14IMH9 | |
| Lenovo Yoga Pro 7 14IMH9, RTX 4050 | |
| Moyenne Intel Core Ultra 7 155H, NVIDIA GeForce RTX 4050 Laptop GPU (8602 - 10622, n=5) | |
| Moyenne de la classe Multimedia (3651 - 13548, n=70, 2 dernières années) | |
| Dell XPS 14 2024 OLED | |
| SCHENKER Vision 14 M23 RTX 3050 | |
| CrossMark / Overall | |
| SCHENKER Key 14 (M24) | |
| Moyenne de la classe Multimedia (866 - 2255, n=81, 2 dernières années) | |
| HP OmniBook Ultra 14 | |
| Dell XPS 14 2024 OLED | |
| Moyenne Intel Core Ultra 7 155H, NVIDIA GeForce RTX 4050 Laptop GPU (1552 - 1740, n=5) | |
| Lenovo Yoga Pro 7 14IMH9, RTX 4050 | |
| SCHENKER Vision 14 M23 RTX 3050 | |
| CrossMark / Productivity | |
| SCHENKER Key 14 (M24) | |
| Moyenne de la classe Multimedia (913 - 2050, n=81, 2 dernières années) | |
| HP OmniBook Ultra 14 | |
| Dell XPS 14 2024 OLED | |
| Moyenne Intel Core Ultra 7 155H, NVIDIA GeForce RTX 4050 Laptop GPU (1459 - 1659, n=5) | |
| Lenovo Yoga Pro 7 14IMH9, RTX 4050 | |
| SCHENKER Vision 14 M23 RTX 3050 | |
| CrossMark / Creativity | |
| Moyenne de la classe Multimedia (907 - 2795, n=81, 2 dernières années) | |
| HP OmniBook Ultra 14 | |
| Dell XPS 14 2024 OLED | |
| Moyenne Intel Core Ultra 7 155H, NVIDIA GeForce RTX 4050 Laptop GPU (1811 - 1943, n=5) | |
| SCHENKER Key 14 (M24) | |
| Lenovo Yoga Pro 7 14IMH9, RTX 4050 | |
| SCHENKER Vision 14 M23 RTX 3050 | |
| CrossMark / Responsiveness | |
| SCHENKER Key 14 (M24) | |
| HP OmniBook Ultra 14 | |
| Moyenne de la classe Multimedia (605 - 2094, n=81, 2 dernières années) | |
| Dell XPS 14 2024 OLED | |
| Moyenne Intel Core Ultra 7 155H, NVIDIA GeForce RTX 4050 Laptop GPU (1167 - 1467, n=5) | |
| SCHENKER Vision 14 M23 RTX 3050 | |
| Lenovo Yoga Pro 7 14IMH9, RTX 4050 | |
| WebXPRT 3 / Overall | |
| HP OmniBook Ultra 14 | |
| Moyenne de la classe Multimedia (136.4 - 545, n=81, 2 dernières années) | |
| SCHENKER Vision 14 M23 RTX 3050 | |
| Lenovo Yoga Pro 7 14IMH9, RTX 4050 | |
| Dell XPS 14 2024 OLED | |
| SCHENKER Key 14 (M24) | |
| Lenovo Yoga Pro 7 14IMH9 | |
| Moyenne Intel Core Ultra 7 155H, NVIDIA GeForce RTX 4050 Laptop GPU (262 - 285, n=5) | |
| WebXPRT 4 / Overall | |
| SCHENKER Vision 14 M23 RTX 3050 | |
| HP OmniBook Ultra 14 | |
| Moyenne de la classe Multimedia (133.2 - 353, n=75, 2 dernières années) | |
| Lenovo Yoga Pro 7 14IMH9, RTX 4050 | |
| Dell XPS 14 2024 OLED | |
| Moyenne Intel Core Ultra 7 155H, NVIDIA GeForce RTX 4050 Laptop GPU (247 - 260, n=5) | |
| SCHENKER Key 14 (M24) | |
| Mozilla Kraken 1.1 / Total | |
| SCHENKER Key 14 (M24) | |
| Lenovo Yoga Pro 7 14IMH9 | |
| Lenovo Yoga Pro 7 14IMH9, RTX 4050 | |
| Dell XPS 14 2024 OLED | |
| Moyenne Intel Core Ultra 7 155H, NVIDIA GeForce RTX 4050 Laptop GPU (416 - 561, n=5) | |
| SCHENKER Vision 14 M23 RTX 3050 | |
| Moyenne de la classe Multimedia (254 - 1016, n=86, 2 dernières années) | |
| HP OmniBook Ultra 14 | |
* ... Moindre est la valeur, meilleures sont les performances
| PCMark 10 Score | 6941 points | |
Aide | ||
| AIDA64 / Memory Copy | |
| Lenovo Yoga Pro 7 14IMH9, RTX 4050 | |
| Lenovo Yoga Pro 7 14IMH9 | |
| Dell XPS 14 2024 OLED | |
| HP OmniBook Ultra 14 | |
| Moyenne Intel Core Ultra 7 155H (62397 - 96791, n=50) | |
| SCHENKER Key 14 (M24) | |
| Moyenne de la classe Multimedia (21158 - 104459, n=74, 2 dernières années) | |
| SCHENKER Vision 14 M23 RTX 3050 | |
| AIDA64 / Memory Read | |
| HP OmniBook Ultra 14 | |
| Lenovo Yoga Pro 7 14IMH9, RTX 4050 | |
| Dell XPS 14 2024 OLED | |
| Lenovo Yoga Pro 7 14IMH9 | |
| SCHENKER Key 14 (M24) | |
| Moyenne Intel Core Ultra 7 155H (60544 - 90647, n=50) | |
| Moyenne de la classe Multimedia (24312 - 125604, n=74, 2 dernières années) | |
| SCHENKER Vision 14 M23 RTX 3050 | |
| AIDA64 / Memory Write | |
| HP OmniBook Ultra 14 | |
| SCHENKER Key 14 (M24) | |
| Dell XPS 14 2024 OLED | |
| Lenovo Yoga Pro 7 14IMH9, RTX 4050 | |
| Lenovo Yoga Pro 7 14IMH9 | |
| Moyenne Intel Core Ultra 7 155H (58692 - 93451, n=50) | |
| Moyenne de la classe Multimedia (23679 - 117933, n=74, 2 dernières années) | |
| SCHENKER Vision 14 M23 RTX 3050 | |
| AIDA64 / Memory Latency | |
| Lenovo Yoga Pro 7 14IMH9 | |
| Moyenne Intel Core Ultra 7 155H (116.2 - 233, n=50) | |
| Dell XPS 14 2024 OLED | |
| Lenovo Yoga Pro 7 14IMH9, RTX 4050 | |
| HP OmniBook Ultra 14 | |
| SCHENKER Key 14 (M24) | |
| Moyenne de la classe Multimedia (7 - 346, n=74, 2 dernières années) | |
| SCHENKER Vision 14 M23 RTX 3050 | |
* ... Moindre est la valeur, meilleures sont les performances
Latences DPC
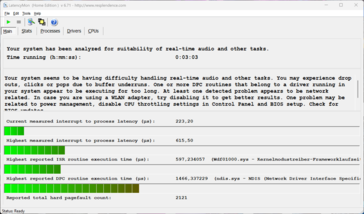
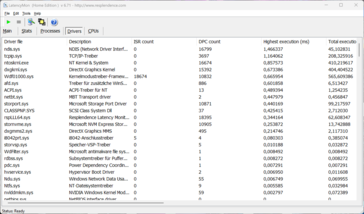
Lors de notre test de latence standardisé (surf sur le web, lecture YouTube 4K, charge du CPU), notre appareil de test avec la version actuelle du BIOS n'a montré aucun problème. L'un des pilotes a légèrement échoué, mais la valeur importante "interrupt-to-process-latency" était faible.
| DPC Latencies / LatencyMon - interrupt to process latency (max), Web, Youtube, Prime95 | |
| Dell XPS 14 2024 OLED | |
| SCHENKER Vision 14 M23 RTX 3050 | |
| Lenovo Yoga Pro 7 14IMH9 | |
| Lenovo Yoga Pro 7 14IMH9, RTX 4050 | |
| SCHENKER Key 14 (M24) | |
* ... Moindre est la valeur, meilleures sont les performances
Dispositif de stockage
Comme décrit ci-dessus, les configurations du Yoga Pro 7 14 avec un GPU dédié sont limitées à un SSD compact M.2-2242. Une version de 1 To du Samsung PM9C1a est installée dans notre appareil de test, et les taux de transfert du SSD PCIe 4.0 que nous avons mesurés étaient corrects. Ses performances ont légèrement fluctué en cas de charge constante, mais cela n'a pas posé de problème. Vous trouverez d'autres tests de performance pour les SSD ici.
* ... Moindre est la valeur, meilleures sont les performances
Reading continuous performance: DiskSpd Read Loop, Queue Depth 8
Carte graphique
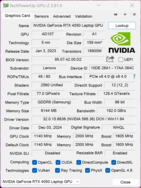
En plus de la carte graphique Intel Arc intégrée au processeur, notre appareil de test utilise la carte graphique Nvidia RTX 4050 dédiée Ordinateur portable Nvidia GeForce RTX 4050 avec 6 Go de VRAM, avec commutation graphique via la technologie Optimus. Le TGP maximal du portable 4050 est de 60 watts (45 watts + 15 watts Dynamic Boost), de sorte qu'il n'est pas possible de tirer pleinement parti des performances du portable 4050. Lors des benchmarks graphiques synthétiques, les performances des deux modèles iGPU du Yoga Pro 7 14 ont été doublées. L'ordinateur portable RTX 4050 dans le Dell XPS 14 (30 watts TGP) était significativement plus lent, tandis que l'ordinateur portable RTX 4060 dans le Dell XPS 14 (30 watts TGP) était significativement plus lent RTX 4060 Laptop dans le Schenker Key 14 (100 watts TGP) était plus rapide.
Ces résultats ont été confirmés lors des tests de jeu réels et le Yoga Pro 7 14 a fait face aux jeux actuels avec des détails élevés et en résolution Full HD. En résolution QHD, cependant, les choses sont devenues un peu plus serrées. Dans l'ensemble, cependant, il a obtenu des résultats solides. Les performances de son GPU et de ses jeux restent constantes sous charge permanente. En mode batterie, la consommation d'énergie du GPU est limitée à 45 watts, ce qui entraîne une réduction des performances d'environ 12 %. D'autres tests de performance du GPU sont disponibles ici.
| 3DMark 11 Performance | 24470 points | |
| 3DMark Fire Strike Score | 17998 points | |
| 3DMark Time Spy Score | 7757 points | |
| 3DMark Steel Nomad Score | 1561 points | |
| 3DMark Steel Nomad Light Score | 7254 points | |
Aide | ||
| Blender / v3.3 Classroom OPTIX/RTX | |
| SCHENKER Vision 14 M23 RTX 3050 | |
| Moyenne de la classe Multimedia (19 - 105, n=39, 2 dernières années) | |
| Dell XPS 14 2024 OLED | |
| Lenovo Yoga Pro 7 14IMH9, RTX 4050 | |
| Moyenne NVIDIA GeForce RTX 4050 Laptop GPU (25 - 37, n=39) | |
| SCHENKER Key 14 (M24) | |
| Blender / v3.3 Classroom CUDA | |
| SCHENKER Vision 14 M23 RTX 3050 | |
| Dell XPS 14 2024 OLED | |
| Moyenne de la classe Multimedia (32 - 164, n=39, 2 dernières années) | |
| Moyenne NVIDIA GeForce RTX 4050 Laptop GPU (47 - 175, n=40) | |
| Lenovo Yoga Pro 7 14IMH9, RTX 4050 | |
| SCHENKER Key 14 (M24) | |
| Blender / v3.3 Classroom CPU | |
| Dell XPS 14 2024 OLED | |
| SCHENKER Vision 14 M23 RTX 3050 | |
| Moyenne de la classe Multimedia (160 - 1042, n=80, 2 dernières années) | |
| Moyenne NVIDIA GeForce RTX 4050 Laptop GPU (243 - 907, n=40) | |
| SCHENKER Key 14 (M24) | |
| Lenovo Yoga Pro 7 14IMH9 | |
| Lenovo Yoga Pro 7 14IMH9, RTX 4050 | |
| HP OmniBook Ultra 14 | |
* ... Moindre est la valeur, meilleures sont les performances
| Cyberpunk 2077 2.2 Phantom Liberty - 1920x1080 Ultra Preset (FSR off) | |
| SCHENKER Key 14 (M24) | |
| Lenovo Yoga Pro 7 14IMH9, RTX 4050 | |
| Dell XPS 14 2024 OLED | |
| Moyenne de la classe Multimedia (8.26 - 86, n=63, 2 dernières années) | |
| SCHENKER Vision 14 M23 RTX 3050 | |
| HP OmniBook Ultra 14 | |
| Lenovo Yoga Pro 7 14ASP G9 | |
| GTA V - 1920x1080 Highest Settings possible AA:4xMSAA + FX AF:16x | |
| Lenovo Yoga Pro 7 14IMH9, RTX 4050 | |
| SCHENKER Key 14 (M24) | |
| Dell XPS 14 2024 OLED | |
| Moyenne de la classe Multimedia (9.38 - 141.6, n=77, 2 dernières années) | |
| SCHENKER Vision 14 M23 RTX 3050 | |
| Lenovo Yoga Pro 7 14ASP G9 | |
| HP OmniBook Ultra 14 | |
| Lenovo Yoga Pro 7 14IMH9 | |
Cyberpunk 2077 ultra FPS diagram
| Bas | Moyen | Élevé | Ultra | QHD | |
|---|---|---|---|---|---|
| GTA V (2015) | 133.5 | 84.9 | 63.7 | ||
| Dota 2 Reborn (2015) | 163.1 | 148.7 | 143.9 | 133.8 | |
| Final Fantasy XV Benchmark (2018) | 156 | 99 | 71.9 | 52.6 | |
| X-Plane 11.11 (2018) | 127.9 | 113.6 | 89.9 | ||
| Strange Brigade (2018) | 385 | 178 | 146 | 129 | 86 |
| Baldur's Gate 3 (2023) | 95.9 | 74.4 | 53.3 | 49.8 | 35.7 |
| Cyberpunk 2077 2.2 Phantom Liberty (2023) | 88.9 | 70.5 | 59.3 | 50.8 | 31.4 |
Émissions et énergie
Émissions sonores
Les deux ventilateurs de l'unité de refroidissement restent généralement silencieux ou émettent un faible bruit (~30 dB(A)) au ralenti et en cas de faible charge. Cependant, dès que le processeur ou la carte graphique sont sollicités, le bruit devient rapidement audible en raison des limites de puissance élevées. Nous avons mesuré 49,1 dB(A) en jouant et pendant notre test de stress, ce qui peut devenir gênant à la longue. En mode adaptatif(Auto), nous avons noté 45 dB(A), ce qui reste très audible. Nous aurions souhaité un écart un peu plus important et un résultat d'environ 40 dB(A). Ce n'est qu'en mode d'économie de batterie qu'il devient nettement plus silencieux, avec un maximum de 29,8 dB(A) - mais les performances de l'ordinateur portable sont alors également réduites de manière significative et il n'est plus possible de jouer, par exemple. Aucun autre bruit électronique n'a été émis par notre appareil de test.
Degré de la nuisance sonore
| Au repos |
| 25.4 / 25.4 / 29.8 dB(A) |
| Fortement sollicité |
| 39.3 / 49.1 dB(A) |
 | ||
30 dB silencieux 40 dB(A) audible 50 dB(A) bruyant |
||
min: | ||
| Lenovo Yoga Pro 7 14IMH9, RTX 4050 NVIDIA GeForce RTX 4050 Laptop GPU, Ultra 7 155H, Samsung PM9C1a MZAL81T0HDLB | SCHENKER Key 14 (M24) NVIDIA GeForce RTX 4060 Laptop GPU, Ultra 7 155H, Samsung 990 Pro 1 TB | Dell XPS 14 2024 OLED NVIDIA GeForce RTX 4050 Laptop GPU, Ultra 7 155H, Samsung PM9A1 MZVL21T0HCLR | HP OmniBook Ultra 14 Radeon 890M, Ryzen AI 9 HX 375, SK hynix PC801 HFS002TEJ9X101N | SCHENKER Vision 14 M23 RTX 3050 GeForce RTX 3050 6GB Laptop GPU, i7-13700H, Samsung 990 Pro 1 TB | Lenovo Yoga Pro 7 14IMH9 Arc 8-Core, Ultra 7 155H, SK Hynix HFS001TEJ9X115N | Lenovo Yoga Pro 7 14ASP G9 Radeon 880M, Ryzen AI 9 365, Micron 2550 1TB MTFDKCD1T0TGE | |
|---|---|---|---|---|---|---|---|
| Noise | -10% | 4% | 10% | 4% | 5% | 9% | |
| arrêt / environnement * | 25.4 | 25.5 -0% | 24.3 4% | 23.8 6% | 23.5 7% | 24 6% | 23.8 6% |
| Idle Minimum * | 25.4 | 25.5 -0% | 24.3 4% | 24.9 2% | 23.5 7% | 25 2% | 23.8 6% |
| Idle Average * | 25.4 | 26.5 -4% | 26.5 -4% | 24.9 2% | 23.5 7% | 27 -6% | 23.8 6% |
| Idle Maximum * | 29.8 | 30.3 -2% | 28.5 4% | 24.9 16% | 26 13% | 30 -1% | 23.8 20% |
| Load Average * | 39.3 | 49.3 -25% | 37 6% | 32.9 16% | 43.6 -11% | 36 8% | 44.6 -13% |
| Cyberpunk 2077 ultra * | 49.1 | 57.8 -18% | 40.9 17% | 35.9 27% | |||
| Load Maximum * | 49.1 | 57.8 -18% | 43.3 12% | 43 12% | 49.1 -0% | 38 23% | 44.6 9% |
| Witcher 3 ultra * | 39.1 | 48.7 | 38 |
* ... Moindre est la valeur, meilleures sont les performances
Température
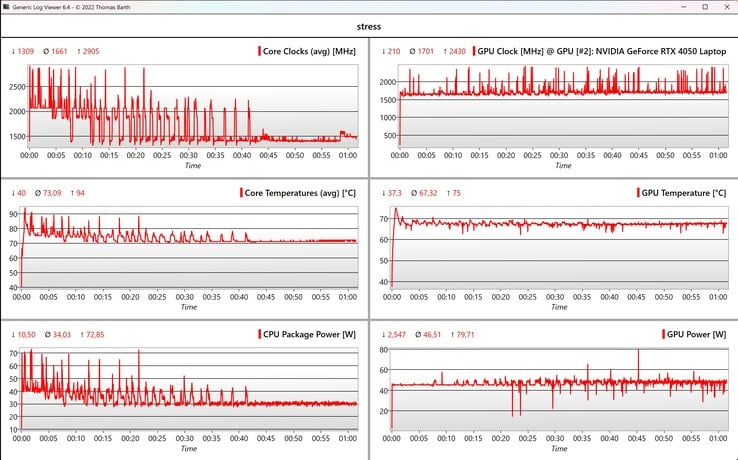
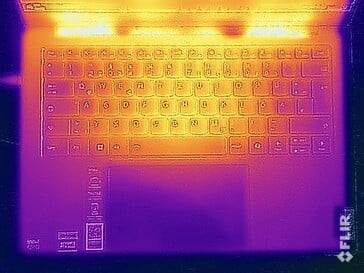
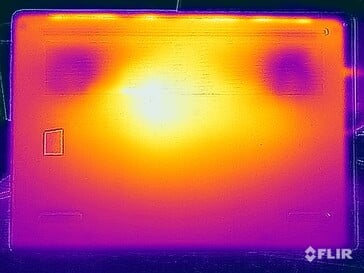
Lenovo a bien maîtrisé les températures de surface de l'ordinateur portable, puisque nous avons mesuré un maximum de 43 °C même à pleine charge. Par conséquent, vous pouvez placer le Yoga sur vos cuisses dans ces sacoches. L'ensemble du boîtier reste frais et agréable à faible charge. Pendant le test de stress, le GPU a fonctionné à 45 watts, tandis que le processeur a d'abord fluctué quelque peu pour finalement se stabiliser à 30 watts au cours du test de stress.
(±) La température maximale du côté supérieur est de 42.4 °C / 108 F, par rapport à la moyenne de 36.9 °C / 98 F, allant de 21.1 à 71 °C pour la classe Multimedia.
(±) Le fond chauffe jusqu'à un maximum de 43.3 °C / 110 F, contre une moyenne de 39.2 °C / 103 F
(+) En utilisation inactive, la température moyenne du côté supérieur est de 26.9 °C / 80 F, par rapport à la moyenne du dispositif de 31.3 °C / 88 F.
(-) 3: The average temperature for the upper side is 38.2 °C / 101 F, compared to the average of 31.3 °C / 88 F for the class Multimedia.
(+) Les repose-poignets et le pavé tactile sont plus froids que la température de la peau avec un maximum de 30.5 °C / 86.9 F et sont donc froids au toucher.
(±) La température moyenne de la zone de l'appui-paume de dispositifs similaires était de 28.8 °C / 83.8 F (-1.7 °C / #-3.1 F).
| Lenovo Yoga Pro 7 14IMH9, RTX 4050 Intel Core Ultra 7 155H, NVIDIA GeForce RTX 4050 Laptop GPU | SCHENKER Key 14 (M24) Intel Core Ultra 7 155H, NVIDIA GeForce RTX 4060 Laptop GPU | Dell XPS 14 2024 OLED Intel Core Ultra 7 155H, NVIDIA GeForce RTX 4050 Laptop GPU | HP OmniBook Ultra 14 AMD Ryzen AI 9 HX 375, AMD Radeon 890M | SCHENKER Vision 14 M23 RTX 3050 Intel Core i7-13700H, NVIDIA GeForce RTX 3050 6GB Laptop GPU | Lenovo Yoga Pro 7 14IMH9 Intel Core Ultra 7 155H, Intel Arc 8-Core iGPU | |
|---|---|---|---|---|---|---|
| Heat | -20% | 2% | -7% | -9% | 4% | |
| Maximum Upper Side * | 42.4 | 43.1 -2% | 40.5 4% | 40.4 5% | 48.5 -14% | 43 -1% |
| Maximum Bottom * | 43.3 | 51.3 -18% | 42.6 2% | 43.6 -1% | 52.8 -22% | 42 3% |
| Idle Upper Side * | 27.5 | 33.2 -21% | 26.9 2% | 31 -13% | 27.6 -0% | 25 9% |
| Idle Bottom * | 27.6 | 38.3 -39% | 27.8 -1% | 32.2 -17% | 27 2% | 26 6% |
* ... Moindre est la valeur, meilleures sont les performances
Intervenants
Lenovo Yoga Pro 7 14IMH9, RTX 4050 analyse audio
(+) | les haut-parleurs peuvent jouer relativement fort (83.1# dB)
Basses 100 - 315 Hz
(±) | basse réduite - en moyenne 12.1% inférieure à la médiane
(±) | la linéarité des basses est moyenne (12.1% delta à la fréquence précédente)
Médiums 400 - 2000 Hz
(+) | médiane équilibrée - seulement 3.2% de la médiane
(+) | les médiums sont linéaires (5.7% delta à la fréquence précédente)
Aiguës 2 - 16 kHz
(+) | des sommets équilibrés - à seulement 3% de la médiane
(+) | les aigus sont linéaires (3.8% delta à la fréquence précédente)
Globalement 100 - 16 000 Hz
(+) | le son global est linéaire (10.8% différence à la médiane)
Par rapport à la même classe
» 11% de tous les appareils testés de cette catégorie étaient meilleurs, 2% similaires, 87% pires
» Le meilleur avait un delta de 5%, la moyenne était de 18%, le pire était de 45%.
Par rapport à tous les appareils testés
» 5% de tous les appareils testés étaient meilleurs, 1% similaires, 94% pires
» Le meilleur avait un delta de 4%, la moyenne était de 24%, le pire était de 134%.
SCHENKER Key 14 (M24) analyse audio
(±) | le niveau sonore du haut-parleur est moyen mais bon (81.5# dB)
Basses 100 - 315 Hz
(-) | presque aucune basse - en moyenne 29.9% plus bas que la médiane
(±) | la linéarité des basses est moyenne (7.9% delta à la fréquence précédente)
Médiums 400 - 2000 Hz
(±) | médiane supérieure - en moyenne 5.3% supérieure à la médiane
(+) | les médiums sont linéaires (5.9% delta à la fréquence précédente)
Aiguës 2 - 16 kHz
(+) | des sommets équilibrés - à seulement 2.1% de la médiane
(+) | les aigus sont linéaires (2.8% delta à la fréquence précédente)
Globalement 100 - 16 000 Hz
(±) | la linéarité du son global est moyenne (20.9% de différence avec la médiane)
Par rapport à la même classe
» 70% de tous les appareils testés de cette catégorie étaient meilleurs, 8% similaires, 22% pires
» Le meilleur avait un delta de 5%, la moyenne était de 18%, le pire était de 45%.
Par rapport à tous les appareils testés
» 54% de tous les appareils testés étaient meilleurs, 8% similaires, 38% pires
» Le meilleur avait un delta de 4%, la moyenne était de 24%, le pire était de 134%.
Dell XPS 14 2024 OLED analyse audio
(+) | les haut-parleurs peuvent jouer relativement fort (82.8# dB)
Basses 100 - 315 Hz
(±) | basse réduite - en moyenne 9.9% inférieure à la médiane
(±) | la linéarité des basses est moyenne (10.1% delta à la fréquence précédente)
Médiums 400 - 2000 Hz
(+) | médiane équilibrée - seulement 4.4% de la médiane
(+) | les médiums sont linéaires (3.8% delta à la fréquence précédente)
Aiguës 2 - 16 kHz
(+) | des sommets équilibrés - à seulement 2.3% de la médiane
(±) | la linéarité des aigus est moyenne (7% delta à la fréquence précédente)
Globalement 100 - 16 000 Hz
(+) | le son global est linéaire (11% différence à la médiane)
Par rapport à la même classe
» 12% de tous les appareils testés de cette catégorie étaient meilleurs, 3% similaires, 85% pires
» Le meilleur avait un delta de 5%, la moyenne était de 18%, le pire était de 45%.
Par rapport à tous les appareils testés
» 5% de tous les appareils testés étaient meilleurs, 2% similaires, 93% pires
» Le meilleur avait un delta de 4%, la moyenne était de 24%, le pire était de 134%.
HP OmniBook Ultra 14 analyse audio
(+) | les haut-parleurs peuvent jouer relativement fort (88.8# dB)
Basses 100 - 315 Hz
(±) | basse réduite - en moyenne 9.9% inférieure à la médiane
(±) | la linéarité des basses est moyenne (9.5% delta à la fréquence précédente)
Médiums 400 - 2000 Hz
(+) | médiane équilibrée - seulement 4% de la médiane
(+) | les médiums sont linéaires (4.3% delta à la fréquence précédente)
Aiguës 2 - 16 kHz
(+) | des sommets équilibrés - à seulement 2.7% de la médiane
(+) | les aigus sont linéaires (3.6% delta à la fréquence précédente)
Globalement 100 - 16 000 Hz
(+) | le son global est linéaire (9.2% différence à la médiane)
Par rapport à la même classe
» 3% de tous les appareils testés de cette catégorie étaient meilleurs, 1% similaires, 96% pires
» Le meilleur avait un delta de 5%, la moyenne était de 19%, le pire était de 53%.
Par rapport à tous les appareils testés
» 3% de tous les appareils testés étaient meilleurs, 1% similaires, 97% pires
» Le meilleur avait un delta de 4%, la moyenne était de 24%, le pire était de 134%.
Consommation électrique
Ses valeurs de consommation en mode veille sont assez faibles, mais un problème apparaît rapidement en charge. Le bloc d'alimentation de 100 watts fourni n'est pas suffisant pour couvrir la consommation de l'ordinateur portable à pleine charge. Nous avons mesuré un peu moins de 111 watts pendant le test de stress et environ 105 watts pendant le reste du test. En conséquence, la batterie s'est déchargée pendant le test de stress, d'environ 9 % par heure. Même lors de courtes pointes de charge, la batterie doit toujours être brièvement sollicitée. Il s'agit d'une mesure d'économie inutile et Lenovo aurait dû livrer la version dGPU avec une alimentation de 130 watts.
| Éteint/en veille | |
| Au repos | |
| Fortement sollicité |
|
Légende:
min: | |
| Lenovo Yoga Pro 7 14IMH9, RTX 4050 NVIDIA GeForce RTX 4050 Laptop GPU, Ultra 7 155H, Samsung PM9C1a MZAL81T0HDLB | SCHENKER Key 14 (M24) NVIDIA GeForce RTX 4060 Laptop GPU, Ultra 7 155H, Samsung 990 Pro 1 TB | Dell XPS 14 2024 OLED NVIDIA GeForce RTX 4050 Laptop GPU, Ultra 7 155H, Samsung PM9A1 MZVL21T0HCLR | HP OmniBook Ultra 14 Radeon 890M, Ryzen AI 9 HX 375, SK hynix PC801 HFS002TEJ9X101N | SCHENKER Vision 14 M23 RTX 3050 GeForce RTX 3050 6GB Laptop GPU, i7-13700H, Samsung 990 Pro 1 TB | Lenovo Yoga Pro 7 14IMH9 Arc 8-Core, Ultra 7 155H, SK Hynix HFS001TEJ9X115N | |
|---|---|---|---|---|---|---|
| Power Consumption | -46% | -22% | 31% | -5% | 8% | |
| Idle Minimum * | 4.9 | 5.8 -18% | 8.1 -65% | 2.7 45% | 5.2 -6% | 4 18% |
| Idle Average * | 6.9 | 10.8 -57% | 9.9 -43% | 5.4 22% | 7.8 -13% | 5.5 20% |
| Idle Maximum * | 9.3 | 11.1 -19% | 10.4 -12% | 5.5 41% | 9 3% | 11.8 -27% |
| Load Average * | 79.7 | 87.4 -10% | 75.6 5% | 67.4 15% | 78.6 1% | 66 17% |
| Cyberpunk 2077 ultra * | 97.5 | 175.3 -80% | 67.9 30% | |||
| Cyberpunk 2077 ultra external monitor * | 96.1 | 169.1 -76% | 67.8 29% | |||
| Load Maximum * | 110.9 | 183 -65% | 107.1 3% | 68.3 38% | 121.2 -9% | 100 10% |
| Witcher 3 ultra * | 65.6 | 86.8 | 55 |
* ... Moindre est la valeur, meilleures sont les performances
Power consumption Cyberpunk / stress test
Power consumption with external monitor
Délais d'exécution
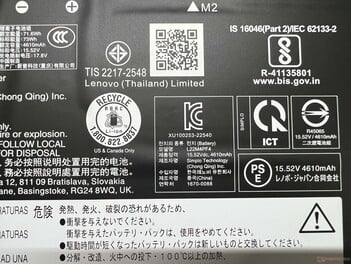
Sa batterie de 73 Wh ne permet qu'une autonomie moyenne. Lors du test WLAN à 150 cd/m² (ce qui correspond à 69 % de la luminosité SDR maximale de notre appareil de test) et à 60 Hz, il a duré environ 8 heures (ou 7 heures à 120 Hz) et 6:17 heures à pleine luminosité SDR (ou 5:40 heures à 120 Hz). Lors du test vidéo à 150 cd/m², le résultat était meilleur, l'appareil tenant plus de 13 heures.
| Lenovo Yoga Pro 7 14IMH9, RTX 4050 Ultra 7 155H, NVIDIA GeForce RTX 4050 Laptop GPU, 73 Wh | SCHENKER Key 14 (M24) Ultra 7 155H, NVIDIA GeForce RTX 4060 Laptop GPU, 80 Wh | Dell XPS 14 2024 OLED Ultra 7 155H, NVIDIA GeForce RTX 4050 Laptop GPU, 69.5 Wh | HP OmniBook Ultra 14 Ryzen AI 9 HX 375, Radeon 890M, 68 Wh | SCHENKER Vision 14 M23 RTX 3050 i7-13700H, GeForce RTX 3050 6GB Laptop GPU, 99 Wh | Lenovo Yoga Pro 7 14IMH9 Ultra 7 155H, Arc 8-Core, 73 Wh | Lenovo Yoga Pro 7 14ASP G9 Ryzen AI 9 365, Radeon 880M, 73 Wh | Moyenne de la classe Multimedia | |
|---|---|---|---|---|---|---|---|---|
| Autonomie de la batterie | -5% | -12% | 18% | 52% | 43% | -2% | 18% | |
| H.264 | 794 | 635 -20% | 649 -18% | 864 ? 9% | ||||
| WiFi v1.3 | 477 | 454 -5% | 465 -3% | 661 39% | 723 52% | 680 43% | 527 10% | 645 ? 35% |
| Load | 91 | 79 -13% | 88 -3% | 93 2% | 99 ? 9% |
Notebookcheck évaluation totale
Lenovo Yoga Pro 7 14IMH9, RTX 4050
- 01/10/2025 v8
Andreas Osthoff
Transparency
La sélection des appareils à examiner est effectuée par notre équipe éditoriale. L'échantillon de test a été prêté à l'auteur par le fabricant ou le détaillant pour les besoins de cet examen. Le prêteur n'a pas eu d'influence sur cette évaluation et le fabricant n'a pas reçu de copie de cette évaluation avant sa publication. Il n'y avait aucune obligation de publier cet article. Nous n'acceptons jamais de compensation ou de paiement en échange de nos commentaires. En tant que média indépendant, Notebookcheck n'est pas soumis à l'autorité des fabricants, des détaillants ou des éditeurs.
Voici comment Notebookcheck teste
Chaque année, Notebookcheck examine de manière indépendante des centaines d'ordinateurs portables et de smartphones en utilisant des procédures standardisées afin de garantir que tous les résultats sont comparables. Nous avons continuellement développé nos méthodes de test depuis environ 20 ans et avons établi des normes industrielles dans le processus. Dans nos laboratoires de test, des équipements de mesure de haute qualité sont utilisés par des techniciens et des rédacteurs expérimentés. Ces tests impliquent un processus de validation en plusieurs étapes. Notre système d'évaluation complexe repose sur des centaines de mesures et de points de référence bien fondés, ce qui garantit l'objectivité.












 Total Sustainability Score:


