Notebookcheck Logo

Test du Lenovo LOQ 15 Core i7 : alternative abordable au Legion mais au cœur du conflit Intel - AMD
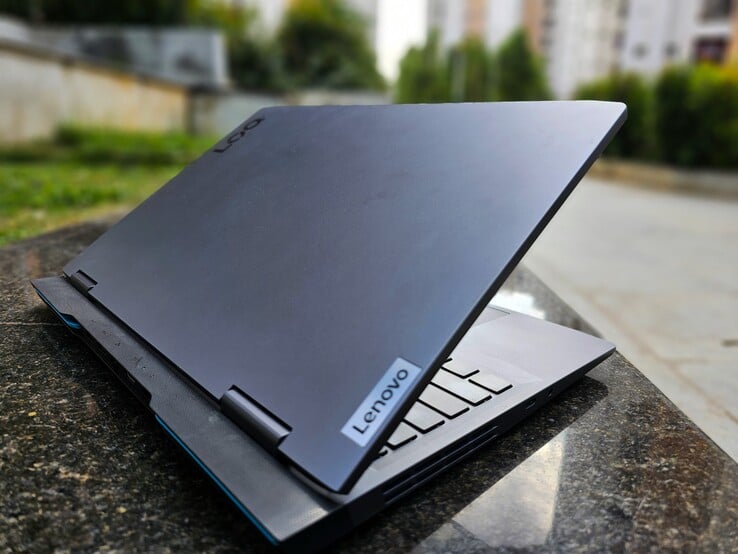
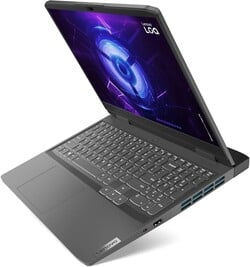
Legion pour le commun des mortels.

Avec le LOQ 15IRH8, Lenovo entend proposer un ordinateur portable de jeu original et performant, qui ne pèse pas lourd dans le portefeuille et qui n'a pas les inconvénients de ses autres gammes à bas prix. Ce modèle en plastique réussit-il à s'imposer ? Comment ce modèle Core i7-13620H se comporte-t-il par rapport à son cousin AMD Zen 4 au prix similaire ? Nos tests révèlent des résultats mitigés.
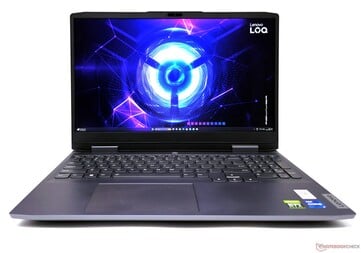
Lenovo LOQ 15 Core i7 en revue

La série LOQ de Lenovo s'adresse aux joueurs d'entrée de gamme à petit budget, à l'instar des gammes Dell G Series, HP Victus, Asus TUF, MSI Katana et Acer Nitro. Nous avons récemment testé le LOQ 15APH8 avec un processeurAMD Ryzen 7 7840HSetGPU Nvidia RTX 4050 pour ordinateur portable. Le LOQ 16IRH8 LOQ 16IRH8 combine également des composants Intel et Nvidia, en associant un processeur Core i7-13620H avec une RTX 4060 .

Le LOQ 15IRH8 de 15 pouces, équipé d'un Core i7-13620H et d'une RTX 4050, est désormais dans nos laboratoires. Notre modèle de test était également équipé de 16 Go de mémoire DDR5-5200, d'un SSD NVMe PCIe Gen4 de 512 Go et d'un écran QHD G-Sync de 165 Hz.

Cette configuration de milieu de gamme supérieur fait sonner les caisses à ₹1 01 988 (1 224 $ US) en Inde, tandis que la variante 1080p 144Hz peut être obtenue pour ₹97 790 (1 050 $ US).

Lenovo LOQ 15IRH8 Core i7 (LOQ 15 Gamme)
Processeur
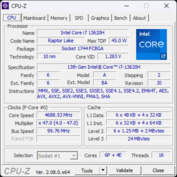
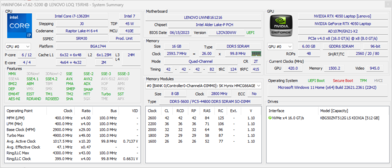
Intel Core i7-13620H 10 x 1.8 - 4.9 GHz, 135 W PL2 / Short Burst, 70 W PL1 / Sustained, Raptor Lake-H
Carte graphique
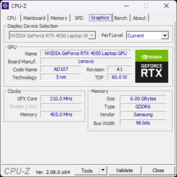
NVIDIA GeForce RTX 4050 Laptop GPU - 6 Go VRAM, 95 W TDP, GDDR6, Game Ready Driver 537.13, Advanced Optimus, MUX
Mémoire
16 Go 
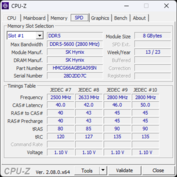
, DDR5-5600 Quad-Channel, Timings: 42-42-42-82
Écran
15.60 pouces 16:9, 2560 x 1440 pixel 188 PPP, BOE CQ NE156QHM-NY4, IPS, brillant: non, 165 Hz
Carte mère
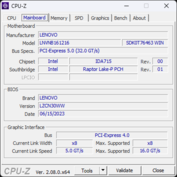
Intel Alder Lake-P PCH
Disque dur
Kioxia BG5 KBG50ZNT512G, 512 Go 
, M.2 2230 PCIe Gen4, 415 Go libres
Carte son
Intel Raptor Lake-P/U/H PCH - cAVS
Connexions
1 USB 3.0 / 3.1 Gen1, 3 USB 3.1 Gen2, USB-C Power Delivery (PD), 1 HDMI, 1 DisplayPort, Connectique audio: 3.5 mm combo audio jack
Réseau
Realtek Semiconductor RTL8168/8111 PCI-E Gigabit Ethernet NIC (10/100/1000MBit/s), Realtek RTL8852BE (b/g/n = Wi-Fi 4/ac = Wi-Fi 5/ax = Wi-Fi 6/), Bluetooth 5.2
Taille
Hauteur x Largeur x Profondeur (en mm): 25.2 x 359.6 x 264.8
Batterie
60 Wh Lithium-Polymère
Charge
charge rapide / Quickcharge
Système d'exploitation
Microsoft Windows 11 Home
Appareil photo
Webcam: 1080p webcam with electronic shutter
Appareil photo primaire: 2.1 MPix
Fonctionnalités additionnelles
Haut-parleurs: 2x 2 W Stereo speakers, Clavier: Chiclet, Rétroéclairage du clavier: oui, Lenovo Vantage, Xbox Game Pass (3-month trial), Microsoft Office 365 trial, 12 Mois Garantie
Poids
2.4 kg
Prix
1161 EUR
Remarque : le fabricant peut utiliser des composants provenant de différents fournisseurs, notamment des panneaux d'affichage, des lecteurs ou des clés USB ayant des spécifications similaires.


Comparaison avec les concurrents potentiels

Note
Date
Modèle
Poids
Épaisseur
Taille
Résolution
Meilleur prix
85.9 %
v7 (old)
10/23
Lenovo LOQ 15IRH8 Core i7
i7-13620H, NVIDIA GeForce RTX 4050 Laptop GPU
2.4 kg25.2 mm15.60"2560x1440
87.3 %
v7 (old)
09/23
Lenovo LOQ 16IRH8
i7-13620H, NVIDIA GeForce RTX 4060 Laptop GPU
2.7 kg25.9 mm16.00"2560x1600
85.7 %
v7 (old)
07/23
Lenovo LOQ 15APH8
R7 7840HS, NVIDIA GeForce RTX 4050 Laptop GPU
2.5 kg25.2 mm15.60"1920x1080
82.1 %
v7 (old)
02/23
MSI Katana 17 B13VFK
i7-13620H, NVIDIA GeForce RTX 4060 Laptop GPU
2.8 kg25.2 mm17.30"1920x1080
89 %
v7 (old)
08/23
Lenovo Legion Pro 5 16ARX8 (R5 7645HX, RTX 4050)
R5 7645HX, NVIDIA GeForce RTX 4050 Laptop GPU
2.5 kg27.3 mm16.00"2560x1600
85.1 %
v7 (old)
09/23
HP Victus 16-r0077ng
i7-13700H, NVIDIA GeForce RTX 4070 Laptop GPU
2.4 kg24 mm16.10"1920x1080
84.2 %
v7 (old)
06/23
Dell G15 5530
i7-13650HX, NVIDIA GeForce RTX 4060 Laptop GPU
3 kg26.95 mm15.60"1920x1080
86.9 %
v7 (old)
06/23
Asus TUF Gaming A16 FA617XS
R9 7940HS, Radeon RX 7600S
2.2 kg22.1 mm16.00"1920x1200

Châssis et périphériques d'entrée : Même construction en plastique que la variante AMD

Pour plus de détails sur le châssis, la maintenance et les périphériques d'entrée du Lenovo LOQ 15IRH8, veuillez consulter notre LOQ 15APH8- ces aspects sont identiques entre les ordinateurs portables LOQ de Lenovo basés sur Intel et AMD.

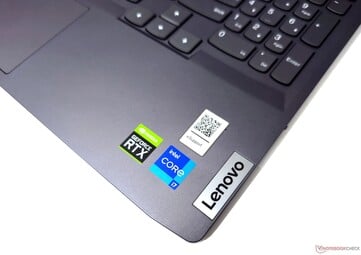
Lenovo LOQ 15 Intel
Lenovo LOQ 15 Intel
Lenovo LOQ 15 Intel
Lenovo LOQ 15 Intel
Lenovo LOQ 15 Intel : Clavier et pavé tactile
Lenovo LOQ 15 Intel
Lenovo LOQ 15 Intel : Intérieur

Comparaison des tailles

398 mm 273 mm 25.2 mm 2.8 kg369 mm 259 mm 24 mm 2.4 kg364 mm 260 mm 27.3 mm 2.5 kg359.6 mm 277.6 mm 25.9 mm 2.7 kg359.6 mm 264.8 mm 25.2 mm 2.4 kg359.6 mm 264.8 mm 25.2 mm 2.5 kg357.26 mm 274.52 mm 26.95 mm 3 kg355 mm 252 mm 22.1 mm 2.2 kg297 mm 210 mm 1 mm 5.7 g

Connectivité : alimentation USB-C de 140 W, mais pas de Thunderbolt 4

La sélection et l'emplacement des ports sont exactement les mêmes que pour le LOQ 16 basé sur Intel. Contrairement au LOQ 15APH8, qui utilise un port USB 2.0 parmi d'autres ports USB 3.2, les variantes Intel utilisent entièrement la connectivité USB 3.2.

Selon Lenovo, le seul port USB 3.2 Gen2 Type-C est capable de délivrer une puissance de 140 W. Il n'y a pas d'option USB4 ou Thunderbolt 4 fournie.

À gauche : USB 3.2 Gen2 Type-C avec sortie DisplayPort 1.4 et Power Delivery 140 W, prise audio combo 3,5 mm
A droite : Obturateur de confidentialité de la webcam, USB 3.2 Gen1 Type-A
Arrière : 2x USB 3.2 Gen2 Type-A, RJ-45 Ethernet, HDMI 2.1-out, DC-in

Communication

Les performances sans fil sont conformes aux attentes pour un module Realtek Wi-Fi 6. Les tests d'émission et de réception ont montré un débit stable lorsqu'ils ont été effectués avec notre routeur de référence Asus ROG Rapture GT-AXE11000.

Networking / iperf3 transmit AXE11000
Lenovo Legion Pro 5 16ARX8 (R5 7645HX, RTX 4050)
MediaTek Wi-Fi 6E MT7922 160MHz Wireless LAN Card
1611 (854min - 1699max) MBit/s +74%
Dell G15 5530
Intel Wi-Fi 6 AX201
1588 (1500min - 1697max) MBit/s +72%
MSI Katana 17 B13VFK
Intel Wi-Fi 6 AX201
1569 (1259min - 1667max) MBit/s +70%
Moyenne de la classe Gaming
  (469 - 1843, n=149, 2 dernières années)
1238 MBit/s +34%
Lenovo LOQ 15IRH8 Core i7
Realtek RTL8852BE
925 (899min - 969max) MBit/s
Lenovo LOQ 15APH8
Realtek RTL8852BE
896 (844min - 959max) MBit/s -3%
Moyenne Realtek RTL8852BE
  (536 - 925, n=42)
792 MBit/s -14%
Asus TUF Gaming A16 FA617XS
Realtek RTL8852BE
776 (392min - 802max) MBit/s -16%
Lenovo LOQ 16IRH8
Realtek RTL8852BE
768 (712min - 807max) MBit/s -17%
HP Victus 16-r0077ng
MediaTek MT7921
714 (679min - 745max) MBit/s -23%
Networking / iperf3 receive AXE11000
MSI Katana 17 B13VFK
Intel Wi-Fi 6 AX201
1675 (1509min - 1726max) MBit/s +70%
Lenovo Legion Pro 5 16ARX8 (R5 7645HX, RTX 4050)
MediaTek Wi-Fi 6E MT7922 160MHz Wireless LAN Card
1562 (1285min - 1684max) MBit/s +59%
Dell G15 5530
Intel Wi-Fi 6 AX201
1540 (1454min - 1570max) MBit/s +57%
Moyenne de la classe Gaming
  (680 - 1890, n=149, 2 dernières années)
1387 MBit/s +41%
Lenovo LOQ 15IRH8 Core i7
Realtek RTL8852BE
984 (966min - 995max) MBit/s
Asus TUF Gaming A16 FA617XS
Realtek RTL8852BE
905 (765min - 969max) MBit/s -8%
Moyenne Realtek RTL8852BE
  (455 - 984, n=43)
847 MBit/s -14%
Lenovo LOQ 16IRH8
Realtek RTL8852BE
843 (426min - 854max) MBit/s -14%
Lenovo LOQ 15APH8
Realtek RTL8852BE
800 (740min - 893max) MBit/s -19%
HP Victus 16-r0077ng
MediaTek MT7921
726 (714min - 732max) MBit/s -26%
05010015020025030035040045050055060065070075080085090095010001050110011501200125013001350140014501500155016001650Tooltip
Lenovo LOQ 15IRH8 Core i7 Realtek RTL8852BE; iperf3 transmit AXE11000; iperf 3.1.3: Ø926 (899-969)
Lenovo Legion Pro 5 16ARX8 (R5 7645HX, RTX 4050) MediaTek Wi-Fi 6E MT7922 160MHz Wireless LAN Card; iperf3 transmit AXE11000; iperf 3.1.3: Ø1583 (854-1699)
Lenovo LOQ 15IRH8 Core i7 Realtek RTL8852BE; iperf3 receive AXE11000; iperf 3.1.3: Ø984 (966-995)
Lenovo Legion Pro 5 16ARX8 (R5 7645HX, RTX 4050) MediaTek Wi-Fi 6E MT7922 160MHz Wireless LAN Card; iperf3 receive AXE11000; iperf 3.1.3: Ø1562 (1285-1684)

Webcam

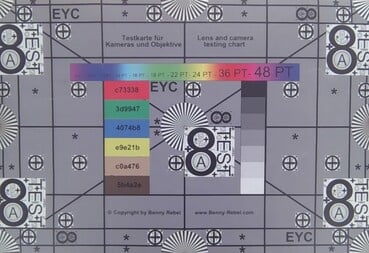
La webcam 1080p présente des écarts importants dans toutes les couleurs, à l'exception du blanc. La qualité de l'image reste acceptable pour les appels vidéo lorsque la lumière ambiante est bonne. Un bouton d'obturation électronique de la caméra se trouve sur le côté droit de l'appareil.
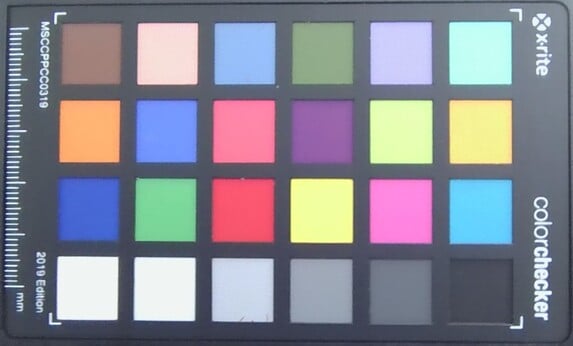
ColorChecker
19.1 ∆E
19 ∆E
22.1 ∆E
23.7 ∆E
21.8 ∆E
17.8 ∆E
14.6 ∆E
24.4 ∆E
18 ∆E
17.5 ∆E
18.2 ∆E
23.2 ∆E
16 ∆E
19.8 ∆E
19.9 ∆E
17.7 ∆E
18.7 ∆E
24.6 ∆E
2.8 ∆E
9.9 ∆E
16.9 ∆E
18 ∆E
16.7 ∆E
10.9 ∆E
ColorChecker Lenovo LOQ 15IRH8 Core i7: 17.98 ∆E min: 2.81 - max: 24.57 ∆E

Garantie

En Inde, Lenovo offre une garantie standard d'un an sur site pour le LOQ 15. Les acheteurs peuvent en outre opter pour plusieurs options de mise à niveau de la garantie et de protection contre les dommages accidentels directement auprès de Lenovo.

Écran : l'écran QHD G-Sync de 165 Hz constitue une option de mise à niveau importante

Notre LOQ 15 était équipé d'un écran BOE QHD avec un taux de rafraîchissement de 165 Hz. Lenovo évalue la luminosité à 350 nits, mais nous avons enregistré jusqu'à 383 nits au point le plus lumineux de l'écran.

Il y a des sautes de rétroéclairage dans les coins, mais l'uniformité globale de la luminosité est bonne (90 %). Les niveaux de noir et le rapport de contraste sont supérieurs à ceux de la dalle QHD+ du LOQ 16IRH8, fabriquée par AUO.

Matrice sous-pixel
Matrice sous-pixel
Baisse de luminosité dans les coins en cas d'exposition prolongée
372
cd/m²
349
cd/m²
373
cd/m²
375
cd/m²
373
cd/m²
383
cd/m²
356
cd/m²
346
cd/m²
358
cd/m²
Homogénéité de la luminosité
BOE CQ NE156QHM-NY4 tested with X-Rite i1Basic Pro 3
Maximum: 383 cd/m² (Nits) Moyenne: 365 cd/m² Minimum: 0.72 cd/m²
Homogénéité de la luminosité: 90 %
Valeur mesurée au centre, sur batterie: 372 cd/m²
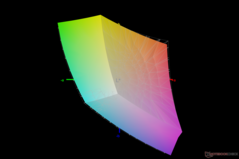
Contraste: 1130:1 (Valeurs des noirs: 0.33 cd/m²)
ΔE Color 4.19 | 0.5-29.43 Ø4.92, calibrated: 1.07
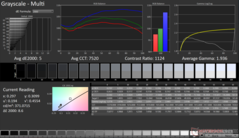
ΔE Greyscale 5 | 0.5-98 Ø5.2
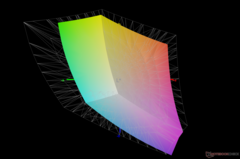
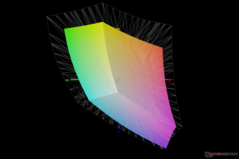
67.7% AdobeRGB 1998 (Argyll 2.2.0 3D)
96.6% sRGB (Argyll 2.2.0 3D)
66.3% Display P3 (Argyll 2.2.0 3D)
Gamma: 1.93
Lenovo LOQ 15IRH8 Core i7
BOE CQ NE156QHM-NY4, IPS, 2560x1440, 15.6"
Lenovo LOQ 16IRH8
AUOC1A5 (B160QAN03.L), IPS, 2560x1600, 16"
Lenovo LOQ 15APH8
BOE NJ NE156FHM-NX3, IPS, 1920x1080, 15.6"
MSI Katana 17 B13VFK
B173HAN04.9, IPS LED, 1920x1080, 17.3"
Lenovo Legion Pro 5 16ARX8 (R5 7645HX, RTX 4050)
CSOT T3 MNG007DA2-2, IPS, 2560x1600, 16"
HP Victus 16-r0077ng
CMN162D, IPS, 1920x1080, 16.1"
Dell G15 5530
AUO B156HAN, IPS, 1920x1080, 15.6"
Asus TUF Gaming A16 FA617XS
BOE NE160WUM-NX2, IPS, 1920x1200, 16"
Display
5%
-39%
-38%
6%
1%
7%
3%
Display P3 Coverage
66.3
70.5
6%
40.2
-39%
40.8
-38%
71.6
8%
66.7
1%
73.1
10%
69.3
5%
sRGB Coverage
96.6
98.9
2%
60.2
-38%
61
-37%
99.8
3%
98
1%
98.4
2%
97.3
1%
AdobeRGB 1998 Coverage
67.7
72.6
7%
41.5
-39%
42.2
-38%
72.9
8%
69
2%
74.4
10%
70.7
4%
Response Times
-16%
-473%
-385%
-51%
-82%
34%
-116%
Response Time Grey 50% / Grey 80% *
5 ?(2.16, 2.84)
7.2 ?(4, 3.2)
-44%
42.7 ?(19.2, 23.5)
-754%
33 ?(16, 17)
-560%
12 ?(5.4, 6.6)
-140%
13.3 ?(6, 7.3)
-166%
3.39 ?(1.4, 1.99)
32%
15.6 ?(7.3, 8.3)
-212%
Response Time Black / White *
8.41 ?(3.96, 4.45)
7.4 ?(3, 4.4)
12%
24.5 ?(12.2, 12.3)
-191%
26 ?(13, 13)
-209%
5.2 ?(1.8, 3.4)
38%
8.2 ?(4.5, 3.7)
2%
5.35 ?(2.34, 3.01)
36%
10 ?(5.7, 4.3)
-19%
PWM Frequency
21620 ?(100)
Screen
17%
-17%
-46%
20%
23%
-5%
20%
Brightness middle
373
407
9%
346.2
-7%
267
-28%
543
46%
308
-17%
320
-14%
301
-19%
Brightness
365
369
1%
329
-10%
256
-30%
516
41%
285
-22%
316
-13%
294
-19%
Brightness Distribution
90
85
-6%
81
-10%
93
3%
87
-3%
85
-6%
94
4%
94
4%
Black Level *
0.33
0.45
-36%
0.31
6%
0.21
36%
0.58
-76%
0.25
24%
0.21
36%
0.21
36%
Contrast
1130
904
-20%
1117
-1%
1271
12%
936
-17%
1232
9%
1524
35%
1433
27%
Colorchecker dE 2000 *
4.19
1.43
66%
4.19
-0%
4.7
-12%
1.35
68%
1.3
69%
4.55
-9%
1.79
57%
Colorchecker dE 2000 max. *
8.47
3.58
58%
19.19
-127%
20.4
-141%
3.22
62%
2.76
67%
9.83
-16%
3.48
59%
Colorchecker dE 2000 calibrated *
1.07
1.07
-0%
1.66
-55%
4.5
-321%
1.31
-22%
0.92
14%
1.51
-41%
1.2
-12%
Greyscale dE 2000 *
5
1.13
77%
2.6
48%
1.5
70%
1.03
79%
1.7
66%
6.2
-24%
2.5
50%
Gamma
1.93 114%
2.5 88%
2.19 100%
2.12 104%
2.38 92%
2.167 102%
2.07 106%
2.265 97%
CCT
7520 86%
6526 100%
6749 96%
6552 99%
6452 101%
6767 96%
6479 100%
6157 106%
Moyenne finale (programmes/paramètres)
2% / 9%
-176% / -87%
-156% / -92%
-8% / 7%
-19% / 3%
12% / 3%
-31% / -3%

* ... Moindre est la valeur, meilleures sont les performances

L'écran couvre près de 97 % de la gamme de couleurs sRGB, ce qui devrait être suffisant pour la plupart des jeux et des contenus web. Cependant, la couverture Adobe RGB et Display P3 n'est que médiocre.

Cela dit, la dalle QHD du LOQ 15IRH8 présente de bien meilleures caractéristiques chromatiques que la dalle 1080p 144 Hz du LOQ 15APH8 alimenté par AMD.

vs. sRGB : 96,6 % de couverture
vs. Adobe RGB : 67,7% de couverture
vs. Display P3 : 66,3% de couverture

Les couleurs prêtes à l'emploi présentent des écarts importants, mais notre routine d'étalonnage utilisant le spectrophotomètre X-Rite i1Basic Pro 3 et le logiciel Calman Ultimate de Portrait Displays montre des améliorations significatives dans les niveaux de gris et les valeurs Delta E de ColorChecker.

Le panneau a encore du mal à reproduire avec précision la partie 100% bleue du spectre.

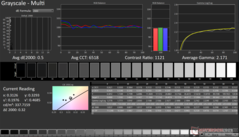
Niveaux de gris avant étalonnage
ColorChecker avant étalonnage
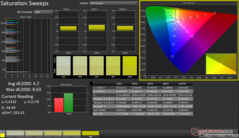
Balayages de saturation avant étalonnage
Niveaux de gris après étalonnage
ColorChecker après étalonnage
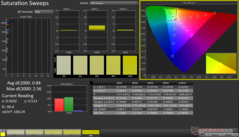
Balayages de saturation après étalonnage

Notre fichier ICC calibré peut être téléchargé à partir du lien ci-dessus.

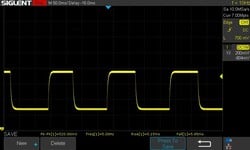
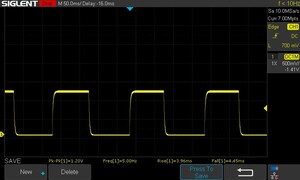
Temps de réponse de l'écran

Le temps de réponse d'un écran mesure la rapidité à laquelle l'écran est capable de changer une couleur pour une autre. Un temps de réponse élevé se traduit par une image floutée pour les objets en mouvement. Les joueurs bénéficieront de faibles latences d'affichage en jeu.
       Temps de réponse noir à blanc
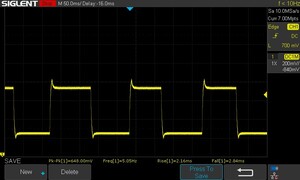
8.41 ms ... hausse ↗ et chute ↘ combinées↗ 3.96 ms hausse
↘ 4.45 ms chute
L'écran montre de faibles temps de réponse, un bon écran pour jouer.
En comparaison, tous les appareils testés affichent entre 0.1 (minimum) et 240 (maximum) ms. » 20 % des appareils testés affichent de meilleures performances.
Cela signifie que les latences relevées sont meilleures que la moyenne (21 ms) de tous les appareils testés.
       Temps de réponse gris 50% à gris 80%
5 ms ... hausse ↗ et chute ↘ combinées↗ 2.16 ms hausse
↘ 2.84 ms chute
L'écran montre de très faibles temps de réponse, parfait pour le jeu.
En comparaison, tous les appareils testés affichent entre 0.165 (minimum) et 636 (maximum) ms. » 13 % des appareils testés affichent de meilleures performances.
Cela signifie que les latences relevées sont meilleures que la moyenne (32.9 ms) de tous les appareils testés.
les temps de réponse de 50 % de gris à 80 % de gris augmentent à 11 ms lorsque l'overdrive est désactivé

Les temps de réponse sont nettement meilleurs que ceux de l'écran 1080p du LOQ 15APH8. Le panneau utilise l'overdrive par défaut, ce qui permet des transitions rapides de 50 % de gris à 80 % de gris en 5 ms. La désactivation de l'overdrive à partir de l'application Lenovo Vantage fait passer le temps de réponse combiné de 50 % de gris à 80 % de gris à 11 ms.

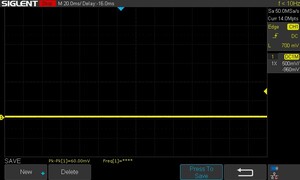
L'écran ne présente pas de scintillement PWM à tous les niveaux de luminosité testés. Pour plus d'informations, consultez notre article "Pourquoi le PWM est un tel casse-tête"ainsi que notre Tableau de classement PWM pour une comparaison des PWM mesurés sur l'ensemble des appareils examinés.

Scintillement / MLI (Modulation de largeur d'impulsion)

Afin d'abaisser la luminosité de l'écran, certains ordinateurs portables font varier très rapidement le rétroéclairage entre éteint et allumé. La fréquence à laquelle le rétroéclairage s'éteint et se rallume est normalement fixée à une valeur qui permet de rendre la variation indétectable à l'œil nu? Si la fréquence est trop basse, certaines personnes peuvent être sujettes à une fatigue oculaire, des maux de tête ou même percevoir les variations.
Scintillement / MLI (Modulation de largeur d'impulsion) non décelé ≤ 100 Niveau de luminosité

En comparaison, 53 % des appareils testés n'emploient pas MDI pour assombrir leur écran. Nous avons relevé une moyenne à 8743 (minimum : 5 - maximum : 343500) Hz dans le cas où une MDI était active.

La visibilité extérieure est bonne pour une utilisation générale, bien que les journées ensoleillées particulièrement lumineuses puissent être accablantes pour l'écran de 350 nits. Les angles de vision sont relativement stables, avec une perte minimale de luminosité et de couleur aux extrêmes.

Visualisation à l'extérieur sous la lumière du soleil
Visionnage en plein air à l'ombre
Bonne stabilité de l'angle de vision

Performances : Le Core i7-13620H a du mal à maintenir un niveau de performance élevé

En Inde, Lenovo propose plusieurs options de configuration du LOQ 15 avec des processeurs Intel et AMD. Les modèles basés sur Intel offrent le choix entre le Core i5-12450H et le Core i7-13620H Tandis que les variantes AMD sont dotées des processeurs Ryzen 5 7640HS ou Ryzen 7 7840HS. En ce qui concerne les cartes graphiques, les clients peuvent choisir des versions portables de la RTX 2050, RTX 3050, RTX 4050ou RTX 4060 GPU.

Pour le marché américain, Lenovo configure le LOQ 15 avec soit le Core i7-13700H associé à la RTX 4050, soit le Core i5-13420H associé à la RTX 2050.


Conditions d'essai

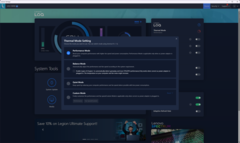
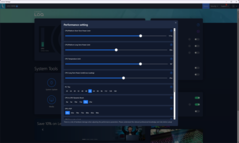
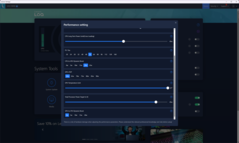
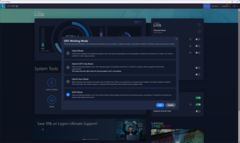
Lenovo Vantage permet de modifier facilement les profils de puissance, les effets RGB et d'autres propriétés du LOQ 15. L'application permet également aux utilisateurs expérimentés de définir leurs propres limites de puissance du CPU, la durée, le TDP du GPU, le Dynamic Boost du GPU vers le CPU et les limites de température.

Paramètres du Lenovo Vantage

Le tableau ci-dessous montre comment les profils d'alimentation par défaut affectent les PL1 et PL2 du processeur. Pour nos tests, nous avons utilisé le profil Performance et activé le mode dGPU pour permettre au Core i7-13620H et à la RTX 4050 de déployer pleinement leurs muscles. Les tests de batterie ont été effectués en profil silencieux avec le GPU en mode hybride.

Mode performance PL1 (PBP) / Tau PL2 (MTP) / Tau PL4 Cinebench R15 Multi score Cinebench R15 Multi score (30 boucles)
Silence 45 W / 56 s 55 W / 2,44 ms 210 W 1 879 (-17,98%) 1 412 (-26,34%)
Équilibre 60 W / 56 s 117 W / 2,44 ms 210 W 2 178 (-4,93%) 1 657 (-13,56%)
Performance 70 W / 56 s 135 W / 2.44 ms 210 W 2,291 (100%) 1,917 (100%)

Processeur

Le Core i7-13620H du LOQ 15 peine à offrir des performances soutenues

Le Core i7-13620H du LOQ 15IRH8 accuse un retard de 16 % sur le LOQ 15APH8 équipé du Ryzen 7 7840HS dans les tests multicœurs Cinebench, malgré le même nombre de threads, probablement en raison de l'horloge plus élevée de ce dernier. Cependant, nous constatons une inversion des rôles dans Geekbench multi-core. La puce Intel fait également bonne figure dans la plupart des benchmarks à cœur unique.

Le châssis et le refroidissement du LOQ 15IRH8 semblent avoir des difficultés à soutenir correctement un test en boucle multicœur Cinebench R15. Le Core i7-13620H trouve une meilleure place dans le LOQ 16IRH8 où les performances du processeur sont très stables.

Cinebench R15 Multi Loop

01603204806408009601120128014401600176019202080224024002560272028803040Tooltip
Lenovo LOQ 15IRH8 Core i7 Intel Core i7-13620H: Ø1890 (1668.89-2278.03)
Lenovo LOQ 16IRH8 Intel Core i7-13620H: Ø2126 (2053.7-2491.59)
Lenovo LOQ 15APH8 AMD Ryzen 7 7840HS: Ø2656 (2625.71-2710.39)
MSI Katana 17 B13VFK Intel Core i7-13620H: Ø2295 (2246.31-2349.07)
Lenovo Legion Pro 5 16ARX8 (R5 7645HX, RTX 4050) AMD Ryzen 5 7645HX: Ø2240 (2217.05-2275.83)
HP Victus 16-r0077ng Intel Core i7-13700H: Ø2242 (2203.13-2316.56)
Dell G15 5530 Intel Core i7-13650HX: Ø2985 (2897.29-3146.63)
Asus TUF Gaming A16 FA617XS AMD Ryzen 9 7940HS: Ø2646 (2596.9-2666.67)
CPU Performance Rating: Percent
Cinebench R23: Multi Core | Single Core
Cinebench R20: CPU (Multi Core) | CPU (Single Core)
Cinebench R15: CPU Multi 64Bit | CPU Single 64Bit
Blender: v2.79 BMW27 CPU
7-Zip 18.03: 7z b 4 | 7z b 4 -mmt1
Geekbench 5.5: Multi-Core | Single-Core
HWBOT x265 Benchmark v2.2: 4k Preset
LibreOffice : 20 Documents To PDF
R Benchmark 2.5: Overall mean
CPU Performance Rating
Moyenne de la classe Gaming
 
81.5 pt
Dell G15 5530
Intel Core i7-13650HX
78.9 pt
Asus TUF Gaming A16 FA617XS
AMD Ryzen 9 7940HS
74.4 pt
Lenovo LOQ 15APH8
AMD Ryzen 7 7840HS
69.6 pt
Lenovo LOQ 16IRH8
Intel Core i7-13620H
67.3 pt
Lenovo Legion Pro 5 16ARX8 (R5 7645HX, RTX 4050)
AMD Ryzen 5 7645HX
66.9 pt
Lenovo LOQ 15IRH8 Core i7
Intel Core i7-13620H
66 pt
MSI Katana 17 B13VFK
Intel Core i7-13620H
65.4 pt
Moyenne Intel Core i7-13620H
 
64.5 pt
HP Victus 16-r0077ng
Intel Core i7-13700H
62.3 pt
Cinebench R23 / Multi Core
Moyenne de la classe Gaming
  (5668 - 36249, n=191, 2 dernières années)
21701 Points +43%
Dell G15 5530
Intel Core i7-13650HX
20992 Points +38%
Lenovo LOQ 15APH8
AMD Ryzen 7 7840HS
17014 (16380.8min - 17014.2max) Points +12%
Asus TUF Gaming A16 FA617XS
AMD Ryzen 9 7940HS
16907 Points +11%
MSI Katana 17 B13VFK
Intel Core i7-13620H
15496 Points +2%
HP Victus 16-r0077ng
Intel Core i7-13700H
15410 Points +2%
Lenovo LOQ 16IRH8
Intel Core i7-13620H
15339 Points +1%
Lenovo LOQ 15IRH8 Core i7
Intel Core i7-13620H
15176 Points
Moyenne Intel Core i7-13620H
  (10819 - 15496, n=5)
14303 Points -6%
Lenovo Legion Pro 5 16ARX8 (R5 7645HX, RTX 4050)
AMD Ryzen 5 7645HX
13985 Points -8%
Cinebench R23 / Single Core
Moyenne de la classe Gaming
  (1088 - 2235, n=189, 2 dernières années)
1880 Points +1%
Lenovo LOQ 16IRH8
Intel Core i7-13620H
1871 Points +1%
Lenovo LOQ 15IRH8 Core i7
Intel Core i7-13620H
1860 Points
Moyenne Intel Core i7-13620H
  (1805 - 1871, n=5)
1843 Points -1%
Dell G15 5530
Intel Core i7-13650HX
1834 Points -1%
Lenovo Legion Pro 5 16ARX8 (R5 7645HX, RTX 4050)
AMD Ryzen 5 7645HX
1809 Points -3%
MSI Katana 17 B13VFK
Intel Core i7-13620H
1805 Points -3%
Asus TUF Gaming A16 FA617XS
AMD Ryzen 9 7940HS
1791 Points -4%
Lenovo LOQ 15APH8
AMD Ryzen 7 7840HS
1783 Points -4%
HP Victus 16-r0077ng
Intel Core i7-13700H
1687 Points -9%
Cinebench R20 / CPU (Multi Core)
Moyenne de la classe Gaming
  (2179 - 13832, n=189, 2 dernières années)
8258 Points +42%
Dell G15 5530
Intel Core i7-13650HX
8021 Points +38%
Lenovo LOQ 15APH8
AMD Ryzen 7 7840HS
6627 Points +14%
Asus TUF Gaming A16 FA617XS
AMD Ryzen 9 7940HS
6571 Points +13%
MSI Katana 17 B13VFK
Intel Core i7-13620H
5905 Points +1%
HP Victus 16-r0077ng
Intel Core i7-13700H
5895 Points +1%
Lenovo LOQ 15IRH8 Core i7
Intel Core i7-13620H
5828 Points
Lenovo LOQ 16IRH8
Intel Core i7-13620H
5626 Points -3%
Lenovo Legion Pro 5 16ARX8 (R5 7645HX, RTX 4050)
AMD Ryzen 5 7645HX
5467 Points -6%
Moyenne Intel Core i7-13620H
  (4214 - 5905, n=5)
5426 Points -7%
Cinebench R20 / CPU (Single Core)
Moyenne de la classe Gaming
  (427 - 856, n=189, 2 dernières années)
722 Points 0%
Lenovo LOQ 15IRH8 Core i7
Intel Core i7-13620H
719 Points
Dell G15 5530
Intel Core i7-13650HX
711 Points -1%
Lenovo LOQ 16IRH8
Intel Core i7-13620H
711 Points -1%
Moyenne Intel Core i7-13620H
  (693 - 719, n=5)
704 Points -2%
Asus TUF Gaming A16 FA617XS
AMD Ryzen 9 7940HS
702 Points -2%
Lenovo Legion Pro 5 16ARX8 (R5 7645HX, RTX 4050)
AMD Ryzen 5 7645HX
699 Points -3%
Lenovo LOQ 15APH8
AMD Ryzen 7 7840HS
695 Points -3%
MSI Katana 17 B13VFK
Intel Core i7-13620H
693 Points -4%
HP Victus 16-r0077ng
Intel Core i7-13700H
649 Points -10%
Cinebench R15 / CPU Multi 64Bit
Moyenne de la classe Gaming
  (905 - 5663, n=196, 2 dernières années)
3402 Points +49%
Dell G15 5530
Intel Core i7-13650HX
3147 (2897.29min - 3146.63max) Points +38%
Lenovo LOQ 15APH8
AMD Ryzen 7 7840HS
2710 (2625.71min - 2710.39max) Points +19%
Asus TUF Gaming A16 FA617XS
AMD Ryzen 9 7940HS
2666.7 Points +17%
Lenovo LOQ 16IRH8
Intel Core i7-13620H
2492 (2053.7min - 2491.59max) Points +9%
MSI Katana 17 B13VFK
Intel Core i7-13620H
2349 (2246.31min - 2349.07max) Points +3%
HP Victus 16-r0077ng
Intel Core i7-13700H
2317 (2203.13min - 2316.56max) Points +2%
Lenovo LOQ 15IRH8 Core i7
Intel Core i7-13620H
2278 (1668.89min - 2278.03max) Points
Lenovo Legion Pro 5 16ARX8 (R5 7645HX, RTX 4050)
AMD Ryzen 5 7645HX
2276 (2217.05min - 2275.83max) Points 0%
Moyenne Intel Core i7-13620H
  (1681 - 2492, n=5)
2239 Points -2%
Cinebench R15 / CPU Single 64Bit
Lenovo Legion Pro 5 16ARX8 (R5 7645HX, RTX 4050)
AMD Ryzen 5 7645HX
289 Points +10%
Asus TUF Gaming A16 FA617XS
AMD Ryzen 9 7940HS
283 Points +8%
Lenovo LOQ 15APH8
AMD Ryzen 7 7840HS
278 Points +6%
Moyenne de la classe Gaming
  (176.6 - 318, n=193, 2 dernières années)
277 Points +5%
Dell G15 5530
Intel Core i7-13650HX
273 Points +4%
Lenovo LOQ 16IRH8
Intel Core i7-13620H
264 Points 0%
Lenovo LOQ 15IRH8 Core i7
Intel Core i7-13620H
263 Points
Moyenne Intel Core i7-13620H
  (258 - 269, n=5)
263 Points 0%
MSI Katana 17 B13VFK
Intel Core i7-13620H
258 Points -2%
HP Victus 16-r0077ng
Intel Core i7-13700H
245 Points -7%
Blender / v2.79 BMW27 CPU
Lenovo LOQ 15IRH8 Core i7
Intel Core i7-13620H
243 Seconds *
Moyenne Intel Core i7-13620H
  (215 - 289, n=5)
238 Seconds * +2%
Lenovo Legion Pro 5 16ARX8 (R5 7645HX, RTX 4050)
AMD Ryzen 5 7645HX
224 Seconds * +8%
Lenovo LOQ 16IRH8
Intel Core i7-13620H
223 Seconds * +8%
MSI Katana 17 B13VFK
Intel Core i7-13620H
215 Seconds * +12%
HP Victus 16-r0077ng
Intel Core i7-13700H
215 Seconds * +12%
Asus TUF Gaming A16 FA617XS
AMD Ryzen 9 7940HS
189 Seconds * +22%
Lenovo LOQ 15APH8
AMD Ryzen 7 7840HS
189 Seconds * +22%
Moyenne de la classe Gaming
  (87 - 555, n=184, 2 dernières années)
171.9 Seconds * +29%
Dell G15 5530
Intel Core i7-13650HX
165 Seconds * +32%
7-Zip 18.03 / 7z b 4
Moyenne de la classe Gaming
  (23795 - 140932, n=188, 2 dernières années)
84837 MIPS +53%
Dell G15 5530
Intel Core i7-13650HX
77712 MIPS +40%
Asus TUF Gaming A16 FA617XS
AMD Ryzen 9 7940HS
70081 MIPS +27%
HP Victus 16-r0077ng
Intel Core i7-13700H
65405 MIPS +18%
MSI Katana 17 B13VFK
Intel Core i7-13620H
62324 MIPS +13%
Lenovo Legion Pro 5 16ARX8 (R5 7645HX, RTX 4050)
AMD Ryzen 5 7645HX
60373 MIPS +9%
Lenovo LOQ 15APH8
AMD Ryzen 7 7840HS
59538 MIPS +8%
Lenovo LOQ 16IRH8
Intel Core i7-13620H
59430 MIPS +7%
Moyenne Intel Core i7-13620H
  (45983 - 62324, n=5)
56733 MIPS +2%
Lenovo LOQ 15IRH8 Core i7
Intel Core i7-13620H
55381 MIPS
7-Zip 18.03 / 7z b 4 -mmt1
Lenovo Legion Pro 5 16ARX8 (R5 7645HX, RTX 4050)
AMD Ryzen 5 7645HX
7124 MIPS +20%
Asus TUF Gaming A16 FA617XS
AMD Ryzen 9 7940HS
6621 MIPS +12%
Lenovo LOQ 15APH8
AMD Ryzen 7 7840HS
6343 MIPS +7%
Moyenne de la classe Gaming
  (4168 - 7581, n=188, 2 dernières années)
6286 MIPS +6%
Moyenne Intel Core i7-13620H
  (5742 - 6326, n=5)
5994 MIPS +1%
Lenovo LOQ 15IRH8 Core i7
Intel Core i7-13620H
5915 MIPS
Lenovo LOQ 16IRH8
Intel Core i7-13620H
5890 MIPS 0%
Dell G15 5530
Intel Core i7-13650HX
5838 MIPS -1%
MSI Katana 17 B13VFK
Intel Core i7-13620H
5742 MIPS -3%
HP Victus 16-r0077ng
Intel Core i7-13700H
5559 MIPS -6%
Geekbench 5.5 / Multi-Core
Moyenne de la classe Gaming
  (4557 - 23194, n=189, 2 dernières années)
14925 Points +31%
Dell G15 5530
Intel Core i7-13650HX
14025 Points +23%
Lenovo LOQ 16IRH8
Intel Core i7-13620H
12223 Points +7%
Asus TUF Gaming A16 FA617XS
AMD Ryzen 9 7940HS
12111 Points +6%
HP Victus 16-r0077ng
Intel Core i7-13700H
11504 Points +1%
Lenovo LOQ 15IRH8 Core i7
Intel Core i7-13620H
11430 Points
MSI Katana 17 B13VFK
Intel Core i7-13620H
11289 Points -1%
Moyenne Intel Core i7-13620H
  (8357 - 12223, n=5)
11000 Points -4%
Lenovo Legion Pro 5 16ARX8 (R5 7645HX, RTX 4050)
AMD Ryzen 5 7645HX
10145 Points -11%
Lenovo LOQ 15APH8
AMD Ryzen 7 7840HS
8446 Points -26%
Geekbench 5.5 / Single-Core
Asus TUF Gaming A16 FA617XS
AMD Ryzen 9 7940HS
2032 Points +9%
Lenovo Legion Pro 5 16ARX8 (R5 7645HX, RTX 4050)
AMD Ryzen 5 7645HX
1971 Points +6%
Moyenne de la classe Gaming
  (986 - 2210, n=189, 2 dernières années)
1885 Points +1%
Lenovo LOQ 15IRH8 Core i7
Intel Core i7-13620H
1865 Points
Dell G15 5530
Intel Core i7-13650HX
1852 Points -1%
Lenovo LOQ 15APH8
AMD Ryzen 7 7840HS
1837 Points -2%
Lenovo LOQ 16IRH8
Intel Core i7-13620H
1831 Points -2%
Moyenne Intel Core i7-13620H
  (1793 - 1865, n=5)
1823 Points -2%
MSI Katana 17 B13VFK
Intel Core i7-13620H
1793 Points -4%
HP Victus 16-r0077ng
Intel Core i7-13700H
1685 Points -10%
HWBOT x265 Benchmark v2.2 / 4k Preset
Moyenne de la classe Gaming
  (6.72 - 38.9, n=188, 2 dernières années)
23.4 fps +41%
Dell G15 5530
Intel Core i7-13650HX
22.7 fps +37%
Asus TUF Gaming A16 FA617XS
AMD Ryzen 9 7940HS
20.8 fps +25%
Lenovo Legion Pro 5 16ARX8 (R5 7645HX, RTX 4050)
AMD Ryzen 5 7645HX
18.6 fps +12%
Lenovo LOQ 15APH8
AMD Ryzen 7 7840HS
17.4 fps +5%
MSI Katana 17 B13VFK
Intel Core i7-13620H
17.1 fps +3%
Lenovo LOQ 16IRH8
Intel Core i7-13620H
16.6 fps 0%
Lenovo LOQ 15IRH8 Core i7
Intel Core i7-13620H
16.6 fps
HP Victus 16-r0077ng
Intel Core i7-13700H
16.6 fps 0%
Moyenne Intel Core i7-13620H
  (12.9 - 17.7, n=5)
16.2 fps -2%
LibreOffice / 20 Documents To PDF
HP Victus 16-r0077ng
Intel Core i7-13700H
61.5 s * -40%
MSI Katana 17 B13VFK
Intel Core i7-13620H
56.8 s * -30%
Lenovo Legion Pro 5 16ARX8 (R5 7645HX, RTX 4050)
AMD Ryzen 5 7645HX
56.2 s * -28%
Moyenne Intel Core i7-13620H
  (41.5 - 56.8, n=5)
47.8 s * -9%
Moyenne de la classe Gaming
  (31.4 - 96.6, n=185, 2 dernières années)
47.5 s * -8%
Dell G15 5530
Intel Core i7-13650HX
46.4 s * -6%
Lenovo LOQ 16IRH8
Intel Core i7-13620H
45.5 s * -4%
Lenovo LOQ 15IRH8 Core i7
Intel Core i7-13620H
43.8 s *
Asus TUF Gaming A16 FA617XS
AMD Ryzen 9 7940HS
41.7 s * +5%
Lenovo LOQ 15APH8
AMD Ryzen 7 7840HS
40 s * +9%
R Benchmark 2.5 / Overall mean
HP Victus 16-r0077ng
Intel Core i7-13700H
0.504 sec * -12%
Lenovo LOQ 15IRH8 Core i7
Intel Core i7-13620H
0.4509 sec *
Lenovo LOQ 15APH8
AMD Ryzen 7 7840HS
0.4502 sec * -0%
Moyenne Intel Core i7-13620H
  (0.4438 - 0.4509, n=5)
0.4471 sec * +1%
Lenovo LOQ 16IRH8
Intel Core i7-13620H
0.447 sec * +1%
MSI Katana 17 B13VFK
Intel Core i7-13620H
0.4438 sec * +2%
Moyenne de la classe Gaming
  (0.3609 - 0.759, n=189, 2 dernières années)
0.4399 sec * +2%
Lenovo Legion Pro 5 16ARX8 (R5 7645HX, RTX 4050)
AMD Ryzen 5 7645HX
0.4302 sec * +5%
Dell G15 5530
Intel Core i7-13650HX
0.4273 sec * +5%
Asus TUF Gaming A16 FA617XS
AMD Ryzen 9 7940HS
0.4253 sec * +6%

* ... Moindre est la valeur, meilleures sont les performances

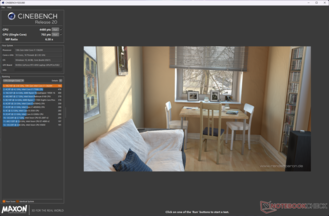
Cinebench R15 OpenGL 64Bit
218 fps
Cinebench R15 CPU Single 64Bit
263 Points
Cinebench R15 CPU Multi 64Bit
2278 Points
Cinebench R15 Ref. Match 64Bit
99.6 %
Cinebench R20 CPU (Multi Core)
5828 Points
Cinebench R20 CPU (Single Core)
719 Points
Cinebench R23 Single Core
1860 Points
Cinebench R23 Multi Core
15176 Points
Cinebench 2024 CPU Single Core
110 Points
Cinebench 2024 CPU Multi Core
691 Points
Aide

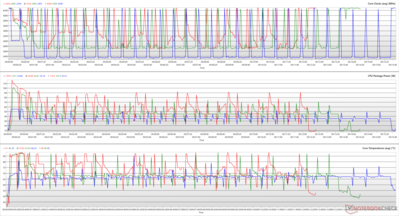
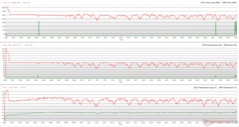
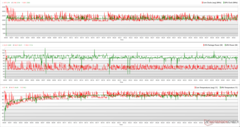
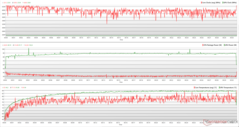
Une analyse du test en boucle multi-cœur Cinebench R15 montre comment les profils d'alimentation intégrés influencent les différents paramètres du processeur.

Alors que le mode Performance est censé permettre au processeur d'utiliser jusqu'à 135 W PL2, nous constatons qu'il ne plafonne qu'à 116,5 W. Le mode Balance semble également se contenter d'une puissance inférieure (101 W contre 117 W), mais nous constatons ici un fonctionnement plus stable par rapport au mode Performance.

Il est possible que le système de refroidissement du LOQ 15IRH8 éprouve des difficultés dès que la limite de puissance dépasse 116 W, ce qui explique les performances médiocres de ce benchmark.

Les scores multicœurs de Cinebench R20 chutent de 23 % sur batterie, alors que les performances monocœurs ne sont que légèrement affectées.

Horloges du processeur, puissances des boîtiers et températures des cœurs pendant une boucle de Cinebench R15. (Rouge : Performance, Vert : Equilibre, Bleu : Silence)
Les performances multicœur pèsent sur l'autonomie de la batterie
Performance Rating
Asus TUF Gaming A16 FA617XS
AMD Ryzen 9 7940HS, Radeon RX 7600S
91.8 pt
Moyenne de la classe Gaming
 
89.6 pt
Lenovo LOQ 15APH8
AMD Ryzen 7 7840HS, NVIDIA GeForce RTX 4050 Laptop GPU
88.5 pt
Dell G15 5530
Intel Core i7-13650HX, NVIDIA GeForce RTX 4060 Laptop GPU
78.1 pt
Lenovo Legion Pro 5 16ARX8 (R5 7645HX, RTX 4050)
AMD Ryzen 5 7645HX, NVIDIA GeForce RTX 4050 Laptop GPU
73.3 pt
HP Victus 16-r0077ng
Intel Core i7-13700H, NVIDIA GeForce RTX 4070 Laptop GPU
64 pt
MSI Katana 17 B13VFK
Intel Core i7-13620H, NVIDIA GeForce RTX 4060 Laptop GPU
57.4 pt
Lenovo LOQ 16IRH8
Intel Core i7-13620H, NVIDIA GeForce RTX 4060 Laptop GPU
55.9 pt
Moyenne Intel Core i7-13620H
 
54 pt
Lenovo LOQ 15IRH8 Core i7
Intel Core i7-13620H, NVIDIA GeForce RTX 4050 Laptop GPU
52.9 pt
AIDA64 / FP32 Ray-Trace
Lenovo LOQ 15APH8
AMD Ryzen 7 7840HS, NVIDIA GeForce RTX 4050 Laptop GPU
28537 KRay/s +165%
Asus TUF Gaming A16 FA617XS
AMD Ryzen 9 7940HS, Radeon RX 7600S
28033 KRay/s +160%
Lenovo Legion Pro 5 16ARX8 (R5 7645HX, RTX 4050)
AMD Ryzen 5 7645HX, NVIDIA GeForce RTX 4050 Laptop GPU
23070 KRay/s +114%
Moyenne de la classe Gaming
  (4986 - 60169, n=185, 2 dernières années)
21686 KRay/s +101%
Dell G15 5530
Intel Core i7-13650HX, NVIDIA GeForce RTX 4060 Laptop GPU
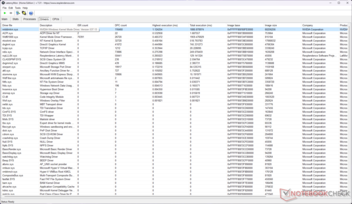
18208 KRay/s +69%
HP Victus 16-r0077ng
Intel Core i7-13700H, NVIDIA GeForce RTX 4070 Laptop GPU
14470 KRay/s +34%
MSI Katana 17 B13VFK
Intel Core i7-13620H, NVIDIA GeForce RTX 4060 Laptop GPU
13601 KRay/s +26%
Lenovo LOQ 16IRH8
Intel Core i7-13620H, NVIDIA GeForce RTX 4060 Laptop GPU
12788 KRay/s +19%
Moyenne Intel Core i7-13620H
  (10779 - 13601, n=5)
12202 KRay/s +13%
Lenovo LOQ 15IRH8 Core i7
Intel Core i7-13620H, NVIDIA GeForce RTX 4050 Laptop GPU
10779 KRay/s
AIDA64 / FPU Julia
Lenovo LOQ 15APH8
AMD Ryzen 7 7840HS, NVIDIA GeForce RTX 4050 Laptop GPU
123167 Points +95%
Asus TUF Gaming A16 FA617XS
AMD Ryzen 9 7940HS, Radeon RX 7600S
122098 Points +93%
Moyenne de la classe Gaming
  (25360 - 252486, n=185, 2 dernières années)
106189 Points +68%
Lenovo Legion Pro 5 16ARX8 (R5 7645HX, RTX 4050)
AMD Ryzen 5 7645HX, NVIDIA GeForce RTX 4050 Laptop GPU
94527 Points +50%
Dell G15 5530
Intel Core i7-13650HX, NVIDIA GeForce RTX 4060 Laptop GPU
91226 Points +44%
HP Victus 16-r0077ng
Intel Core i7-13700H, NVIDIA GeForce RTX 4070 Laptop GPU
72193 Points +14%
MSI Katana 17 B13VFK
Intel Core i7-13620H, NVIDIA GeForce RTX 4060 Laptop GPU
67187 Points +6%
Lenovo LOQ 16IRH8
Intel Core i7-13620H, NVIDIA GeForce RTX 4060 Laptop GPU
64478 Points +2%
Lenovo LOQ 15IRH8 Core i7
Intel Core i7-13620H, NVIDIA GeForce RTX 4050 Laptop GPU
63195 Points
Moyenne Intel Core i7-13620H
  (54287 - 67187, n=5)
62844 Points -1%
AIDA64 / CPU SHA3
Lenovo LOQ 15APH8
AMD Ryzen 7 7840HS, NVIDIA GeForce RTX 4050 Laptop GPU
4927 MB/s +91%
Moyenne de la classe Gaming
  (1339 - 10389, n=185, 2 dernières années)
4862 MB/s +89%
Asus TUF Gaming A16 FA617XS
AMD Ryzen 9 7940HS, Radeon RX 7600S
4566 MB/s +77%
Dell G15 5530
Intel Core i7-13650HX, NVIDIA GeForce RTX 4060 Laptop GPU
4343 MB/s +69%
Lenovo Legion Pro 5 16ARX8 (R5 7645HX, RTX 4050)
AMD Ryzen 5 7645HX, NVIDIA GeForce RTX 4050 Laptop GPU
3822 MB/s +48%
HP Victus 16-r0077ng
Intel Core i7-13700H, NVIDIA GeForce RTX 4070 Laptop GPU
3326 MB/s +29%
MSI Katana 17 B13VFK
Intel Core i7-13620H, NVIDIA GeForce RTX 4060 Laptop GPU
2773 MB/s +8%
Lenovo LOQ 16IRH8
Intel Core i7-13620H, NVIDIA GeForce RTX 4060 Laptop GPU
2661 MB/s +3%
Moyenne Intel Core i7-13620H
  (2357 - 2773, n=5)
2605 MB/s +1%
Lenovo LOQ 15IRH8 Core i7
Intel Core i7-13620H, NVIDIA GeForce RTX 4050 Laptop GPU
2576 MB/s
AIDA64 / CPU Queen
Asus TUF Gaming A16 FA617XS
AMD Ryzen 9 7940HS, Radeon RX 7600S
124433 Points +58%
Lenovo LOQ 15APH8
AMD Ryzen 7 7840HS, NVIDIA GeForce RTX 4050 Laptop GPU
121513 Points +54%
Moyenne de la classe Gaming
  (50699 - 200651, n=185, 2 dernières années)
116446 Points +48%
Dell G15 5530
Intel Core i7-13650HX, NVIDIA GeForce RTX 4060 Laptop GPU
108627 Points +38%
Lenovo Legion Pro 5 16ARX8 (R5 7645HX, RTX 4050)
AMD Ryzen 5 7645HX, NVIDIA GeForce RTX 4050 Laptop GPU
99232 Points +26%
HP Victus 16-r0077ng
Intel Core i7-13700H, NVIDIA GeForce RTX 4070 Laptop GPU
91638 Points +16%
Lenovo LOQ 15IRH8 Core i7
Intel Core i7-13620H, NVIDIA GeForce RTX 4050 Laptop GPU
78867 Points
Lenovo LOQ 16IRH8
Intel Core i7-13620H, NVIDIA GeForce RTX 4060 Laptop GPU
78667 Points 0%
MSI Katana 17 B13VFK
Intel Core i7-13620H, NVIDIA GeForce RTX 4060 Laptop GPU
78352 Points -1%
Moyenne Intel Core i7-13620H
  (66885 - 78867, n=5)
76259 Points -3%
AIDA64 / FPU SinJulia
Asus TUF Gaming A16 FA617XS
AMD Ryzen 9 7940HS, Radeon RX 7600S
15380 Points +114%
Lenovo LOQ 15APH8
AMD Ryzen 7 7840HS, NVIDIA GeForce RTX 4050 Laptop GPU
15026 Points +109%
Moyenne de la classe Gaming
  (4800 - 32988, n=185, 2 dernières années)
13194 Points +83%
Lenovo Legion Pro 5 16ARX8 (R5 7645HX, RTX 4050)
AMD Ryzen 5 7645HX, NVIDIA GeForce RTX 4050 Laptop GPU
11867 Points +65%
Dell G15 5530
Intel Core i7-13650HX, NVIDIA GeForce RTX 4060 Laptop GPU
10764 Points +50%
HP Victus 16-r0077ng
Intel Core i7-13700H, NVIDIA GeForce RTX 4070 Laptop GPU
8677 Points +21%
MSI Katana 17 B13VFK
Intel Core i7-13620H, NVIDIA GeForce RTX 4060 Laptop GPU
8421 Points +17%
Lenovo LOQ 16IRH8
Intel Core i7-13620H, NVIDIA GeForce RTX 4060 Laptop GPU
8402 Points +17%
Moyenne Intel Core i7-13620H
  (6737 - 8421, n=5)
7775 Points +8%
Lenovo LOQ 15IRH8 Core i7
Intel Core i7-13620H, NVIDIA GeForce RTX 4050 Laptop GPU
7192 Points
AIDA64 / FPU Mandel
Lenovo LOQ 15APH8
AMD Ryzen 7 7840HS, NVIDIA GeForce RTX 4050 Laptop GPU
65812 Points +112%
Asus TUF Gaming A16 FA617XS
AMD Ryzen 9 7940HS, Radeon RX 7600S
63432 Points +104%
Moyenne de la classe Gaming
  (12321 - 134044, n=185, 2 dernières années)
53500 Points +72%
Lenovo Legion Pro 5 16ARX8 (R5 7645HX, RTX 4050)
AMD Ryzen 5 7645HX, NVIDIA GeForce RTX 4050 Laptop GPU
49915 Points +61%
Dell G15 5530
Intel Core i7-13650HX, NVIDIA GeForce RTX 4060 Laptop GPU
44567 Points +44%
HP Victus 16-r0077ng
Intel Core i7-13700H, NVIDIA GeForce RTX 4070 Laptop GPU
36179 Points +16%
MSI Katana 17 B13VFK
Intel Core i7-13620H, NVIDIA GeForce RTX 4060 Laptop GPU
32787 Points +6%
Lenovo LOQ 16IRH8
Intel Core i7-13620H, NVIDIA GeForce RTX 4060 Laptop GPU
31583 Points +2%
Lenovo LOQ 15IRH8 Core i7
Intel Core i7-13620H, NVIDIA GeForce RTX 4050 Laptop GPU
31055 Points
Moyenne Intel Core i7-13620H
  (27242 - 32787, n=5)
30835 Points -1%
AIDA64 / CPU AES
Moyenne de la classe Gaming
  (19065 - 328679, n=185, 2 dernières années)
109209 MB/s +107%
Asus TUF Gaming A16 FA617XS
AMD Ryzen 9 7940HS, Radeon RX 7600S
86309 MB/s +64%
Dell G15 5530
Intel Core i7-13650HX, NVIDIA GeForce RTX 4060 Laptop GPU
85343 MB/s +62%
Lenovo LOQ 15APH8
AMD Ryzen 7 7840HS, NVIDIA GeForce RTX 4050 Laptop GPU
68345 MB/s +30%
HP Victus 16-r0077ng
Intel Core i7-13700H, NVIDIA GeForce RTX 4070 Laptop GPU
66484 MB/s +26%
Moyenne Intel Core i7-13620H
  (52697 - 85895, n=5)
61535 MB/s +17%
MSI Katana 17 B13VFK
Intel Core i7-13620H, NVIDIA GeForce RTX 4060 Laptop GPU
58525 MB/s +11%
Lenovo LOQ 16IRH8
Intel Core i7-13620H, NVIDIA GeForce RTX 4060 Laptop GPU
56461 MB/s +7%
Lenovo Legion Pro 5 16ARX8 (R5 7645HX, RTX 4050)
AMD Ryzen 5 7645HX, NVIDIA GeForce RTX 4050 Laptop GPU
54106 MB/s +3%
Lenovo LOQ 15IRH8 Core i7
Intel Core i7-13620H, NVIDIA GeForce RTX 4050 Laptop GPU
52697 MB/s
AIDA64 / CPU ZLib
Moyenne de la classe Gaming
  (373 - 2409, n=185, 2 dernières années)
1352 MB/s +78%
Dell G15 5530
Intel Core i7-13650HX, NVIDIA GeForce RTX 4060 Laptop GPU
1262 MB/s +66%
Lenovo LOQ 15APH8
AMD Ryzen 7 7840HS, NVIDIA GeForce RTX 4050 Laptop GPU
1123 MB/s +48%
Asus TUF Gaming A16 FA617XS
AMD Ryzen 9 7940HS, Radeon RX 7600S
1089 MB/s +43%
HP Victus 16-r0077ng
Intel Core i7-13700H, NVIDIA GeForce RTX 4070 Laptop GPU
950 MB/s +25%
Lenovo Legion Pro 5 16ARX8 (R5 7645HX, RTX 4050)
AMD Ryzen 5 7645HX, NVIDIA GeForce RTX 4050 Laptop GPU
875 MB/s +15%
Lenovo LOQ 16IRH8
Intel Core i7-13620H, NVIDIA GeForce RTX 4060 Laptop GPU
835 MB/s +10%
MSI Katana 17 B13VFK
Intel Core i7-13620H, NVIDIA GeForce RTX 4060 Laptop GPU
818 MB/s +8%
Moyenne Intel Core i7-13620H
  (697 - 835, n=5)
778 MB/s +2%
Lenovo LOQ 15IRH8 Core i7
Intel Core i7-13620H, NVIDIA GeForce RTX 4050 Laptop GPU
760 MB/s
AIDA64 / FP64 Ray-Trace
Lenovo LOQ 15APH8
AMD Ryzen 7 7840HS, NVIDIA GeForce RTX 4050 Laptop GPU
15599 KRay/s +144%
Asus TUF Gaming A16 FA617XS
AMD Ryzen 9 7940HS, Radeon RX 7600S
15209 KRay/s +138%
Lenovo Legion Pro 5 16ARX8 (R5 7645HX, RTX 4050)
AMD Ryzen 5 7645HX, NVIDIA GeForce RTX 4050 Laptop GPU
12421 KRay/s +94%
Moyenne de la classe Gaming
  (2540 - 31796, n=185, 2 dernières années)
11679 KRay/s +83%
Dell G15 5530
Intel Core i7-13650HX, NVIDIA GeForce RTX 4060 Laptop GPU
9886 KRay/s +55%
HP Victus 16-r0077ng
Intel Core i7-13700H, NVIDIA GeForce RTX 4070 Laptop GPU
7770 KRay/s +21%
MSI Katana 17 B13VFK
Intel Core i7-13620H, NVIDIA GeForce RTX 4060 Laptop GPU
7364 KRay/s +15%
Lenovo LOQ 16IRH8
Intel Core i7-13620H, NVIDIA GeForce RTX 4060 Laptop GPU
6904 KRay/s +8%
Moyenne Intel Core i7-13620H
  (6077 - 7364, n=5)
6709 KRay/s +5%
Lenovo LOQ 15IRH8 Core i7
Intel Core i7-13620H, NVIDIA GeForce RTX 4050 Laptop GPU
6398 KRay/s
AIDA64 / CPU PhotoWorxx
Moyenne de la classe Gaming
  (10805 - 60161, n=186, 2 dernières années)
39997 MPixel/s +18%
HP Victus 16-r0077ng
Intel Core i7-13700H, NVIDIA GeForce RTX 4070 Laptop GPU
39045 MPixel/s +15%
Dell G15 5530
Intel Core i7-13650HX, NVIDIA GeForce RTX 4060 Laptop GPU
37953 MPixel/s +12%
MSI Katana 17 B13VFK
Intel Core i7-13620H, NVIDIA GeForce RTX 4060 Laptop GPU
34544 MPixel/s +2%
Lenovo LOQ 15IRH8 Core i7
Intel Core i7-13620H, NVIDIA GeForce RTX 4050 Laptop GPU
33965 MPixel/s
Lenovo LOQ 16IRH8
Intel Core i7-13620H, NVIDIA GeForce RTX 4060 Laptop GPU
33601 MPixel/s -1%
Moyenne Intel Core i7-13620H
  (22766 - 34544, n=5)
31208 MPixel/s -8%
Asus TUF Gaming A16 FA617XS
AMD Ryzen 9 7940HS, Radeon RX 7600S
29922 MPixel/s -12%
Lenovo Legion Pro 5 16ARX8 (R5 7645HX, RTX 4050)
AMD Ryzen 5 7645HX, NVIDIA GeForce RTX 4050 Laptop GPU
28391 MPixel/s -16%
Lenovo LOQ 15APH8
AMD Ryzen 7 7840HS, NVIDIA GeForce RTX 4050 Laptop GPU
17615 MPixel/s -48%

Consultez notre site dédié Intel Core i7-13620H pour plus d'informations et des comparaisons de performances.

Performance du système

Le LOQ 15IRH8 devance son cousin LOQ 15APH8 basé sur AMD de 19% dans le classement général CrossMark, mais ces deux appareils sont pratiquement à égalité dans PCMark. Nous n'avons observé aucun problème dans les performances quotidiennes du système pendant les tâches de productivité ou les jeux.

PCMark 10 / Score
Lenovo Legion Pro 5 16ARX8 (R5 7645HX, RTX 4050)
NVIDIA GeForce RTX 4050 Laptop GPU, R5 7645HX, SK hynix PC801 HFS512GEJ9X115N
8105 Points +6%
Asus TUF Gaming A16 FA617XS
Radeon RX 7600S, R9 7940HS, Micron 2400 MTFDKBA512QFM
7927 Points +4%
Moyenne de la classe Gaming
  (5776 - 9852, n=166, 2 dernières années)
7775 Points +2%
Lenovo LOQ 15APH8
NVIDIA GeForce RTX 4050 Laptop GPU, R7 7840HS, Micron 2450 512GB MTFDKCD512TFK
7709 Points +1%
Lenovo LOQ 15IRH8 Core i7
NVIDIA GeForce RTX 4050 Laptop GPU, i7-13620H, Kioxia BG5 KBG50ZNT512G
7656 Points
Moyenne Intel Core i7-13620H, NVIDIA GeForce RTX 4050 Laptop GPU
  ()
7656 Points 0%
MSI Katana 17 B13VFK
NVIDIA GeForce RTX 4060 Laptop GPU, i7-13620H, Micron 2400 MTFDKBA1T0QFM
7160 Points -6%
HP Victus 16-r0077ng
NVIDIA GeForce RTX 4070 Laptop GPU, i7-13700H, Kioxia XG8 KXG80ZNV1T02
7158 Points -7%
Dell G15 5530
NVIDIA GeForce RTX 4060 Laptop GPU, i7-13650HX, SSTC CL4-3D512-Q11
6984 Points -9%
Lenovo LOQ 16IRH8
NVIDIA GeForce RTX 4060 Laptop GPU, i7-13620H, Solidigm SSDPFINW512GZL
6678 Points -13%
PCMark 10 / Essentials
Lenovo Legion Pro 5 16ARX8 (R5 7645HX, RTX 4050)
NVIDIA GeForce RTX 4050 Laptop GPU, R5 7645HX, SK hynix PC801 HFS512GEJ9X115N
11866 Points +9%
Dell G15 5530
NVIDIA GeForce RTX 4060 Laptop GPU, i7-13650HX, SSTC CL4-3D512-Q11
11151 Points +2%
Lenovo LOQ 15IRH8 Core i7
NVIDIA GeForce RTX 4050 Laptop GPU, i7-13620H, Kioxia BG5 KBG50ZNT512G
10923 Points
Moyenne Intel Core i7-13620H, NVIDIA GeForce RTX 4050 Laptop GPU
  ()
10923 Points 0%
Asus TUF Gaming A16 FA617XS
Radeon RX 7600S, R9 7940HS, Micron 2400 MTFDKBA512QFM
10844 Points -1%
Moyenne de la classe Gaming
  (9057 - 12334, n=165, 2 dernières années)
10833 Points -1%
MSI Katana 17 B13VFK
NVIDIA GeForce RTX 4060 Laptop GPU, i7-13620H, Micron 2400 MTFDKBA1T0QFM
10809 Points -1%
HP Victus 16-r0077ng
NVIDIA GeForce RTX 4070 Laptop GPU, i7-13700H, Kioxia XG8 KXG80ZNV1T02
10707 Points -2%
Lenovo LOQ 15APH8
NVIDIA GeForce RTX 4050 Laptop GPU, R7 7840HS, Micron 2450 512GB MTFDKCD512TFK
10621 Points -3%
Lenovo LOQ 16IRH8
NVIDIA GeForce RTX 4060 Laptop GPU, i7-13620H, Solidigm SSDPFINW512GZL
9909 Points -9%
PCMark 10 / Productivity
Lenovo Legion Pro 5 16ARX8 (R5 7645HX, RTX 4050)
NVIDIA GeForce RTX 4050 Laptop GPU, R5 7645HX, SK hynix PC801 HFS512GEJ9X115N
11127 Points +15%
Asus TUF Gaming A16 FA617XS
Radeon RX 7600S, R9 7940HS, Micron 2400 MTFDKBA512QFM
10505 Points +8%
Dell G15 5530
NVIDIA GeForce RTX 4060 Laptop GPU, i7-13650HX, SSTC CL4-3D512-Q11
9961 Points +3%
Lenovo LOQ 15APH8
NVIDIA GeForce RTX 4050 Laptop GPU, R7 7840HS, Micron 2450 512GB MTFDKCD512TFK
9932 Points +2%
Moyenne de la classe Gaming
  (6662 - 14612, n=165, 2 dernières années)
9877 Points +2%
Lenovo LOQ 15IRH8 Core i7
NVIDIA GeForce RTX 4050 Laptop GPU, i7-13620H, Kioxia BG5 KBG50ZNT512G
9707 Points
Moyenne Intel Core i7-13620H, NVIDIA GeForce RTX 4050 Laptop GPU
  ()
9707 Points 0%
MSI Katana 17 B13VFK
NVIDIA GeForce RTX 4060 Laptop GPU, i7-13620H, Micron 2400 MTFDKBA1T0QFM
9308 Points -4%
HP Victus 16-r0077ng
NVIDIA GeForce RTX 4070 Laptop GPU, i7-13700H, Kioxia XG8 KXG80ZNV1T02
8974 Points -8%
Lenovo LOQ 16IRH8
NVIDIA GeForce RTX 4060 Laptop GPU, i7-13620H, Solidigm SSDPFINW512GZL
8642 Points -11%
PCMark 10 / Digital Content Creation
Moyenne de la classe Gaming
  (6703 - 18475, n=165, 2 dernières années)
12039 Points +5%
Asus TUF Gaming A16 FA617XS
Radeon RX 7600S, R9 7940HS, Micron 2400 MTFDKBA512QFM
11868 Points +3%
Lenovo LOQ 15APH8
NVIDIA GeForce RTX 4050 Laptop GPU, R7 7840HS, Micron 2450 512GB MTFDKCD512TFK
11785 Points +3%
Lenovo LOQ 15IRH8 Core i7
NVIDIA GeForce RTX 4050 Laptop GPU, i7-13620H, Kioxia BG5 KBG50ZNT512G
11486 Points
Moyenne Intel Core i7-13620H, NVIDIA GeForce RTX 4050 Laptop GPU
  ()
11486 Points 0%
Lenovo Legion Pro 5 16ARX8 (R5 7645HX, RTX 4050)
NVIDIA GeForce RTX 4050 Laptop GPU, R5 7645HX, SK hynix PC801 HFS512GEJ9X115N
10943 Points -5%
HP Victus 16-r0077ng
NVIDIA GeForce RTX 4070 Laptop GPU, i7-13700H, Kioxia XG8 KXG80ZNV1T02
10358 Points -10%
MSI Katana 17 B13VFK
NVIDIA GeForce RTX 4060 Laptop GPU, i7-13620H, Micron 2400 MTFDKBA1T0QFM
9903 Points -14%
Lenovo LOQ 16IRH8
NVIDIA GeForce RTX 4060 Laptop GPU, i7-13620H, Solidigm SSDPFINW512GZL
9437 Points -18%
Dell G15 5530
NVIDIA GeForce RTX 4060 Laptop GPU, i7-13650HX, SSTC CL4-3D512-Q11
8323 Points -28%
CrossMark / Overall
Lenovo LOQ 16IRH8
NVIDIA GeForce RTX 4060 Laptop GPU, i7-13620H, Solidigm SSDPFINW512GZL
1944 Points +3%
Lenovo Legion Pro 5 16ARX8 (R5 7645HX, RTX 4050)
NVIDIA GeForce RTX 4050 Laptop GPU, R5 7645HX, SK hynix PC801 HFS512GEJ9X115N
1939 Points +3%
Moyenne de la classe Gaming
  (1247 - 2344, n=149, 2 dernières années)
1900 Points +1%
Lenovo LOQ 15IRH8 Core i7
NVIDIA GeForce RTX 4050 Laptop GPU, i7-13620H, Kioxia BG5 KBG50ZNT512G
1881 Points
Moyenne Intel Core i7-13620H, NVIDIA GeForce RTX 4050 Laptop GPU
  ()
1881 Points 0%
MSI Katana 17 B13VFK
NVIDIA GeForce RTX 4060 Laptop GPU, i7-13620H, Micron 2400 MTFDKBA1T0QFM
1857 Points -1%
Dell G15 5530
NVIDIA GeForce RTX 4060 Laptop GPU, i7-13650HX, SSTC CL4-3D512-Q11
1839 Points -2%
Asus TUF Gaming A16 FA617XS
Radeon RX 7600S, R9 7940HS, Micron 2400 MTFDKBA512QFM
1774 Points -6%
Lenovo LOQ 15APH8
NVIDIA GeForce RTX 4050 Laptop GPU, R7 7840HS, Micron 2450 512GB MTFDKCD512TFK
1586 Points -16%
CrossMark / Productivity
Lenovo Legion Pro 5 16ARX8 (R5 7645HX, RTX 4050)
NVIDIA GeForce RTX 4050 Laptop GPU, R5 7645HX, SK hynix PC801 HFS512GEJ9X115N
1908 Points +6%
Lenovo LOQ 16IRH8
NVIDIA GeForce RTX 4060 Laptop GPU, i7-13620H, Solidigm SSDPFINW512GZL
1869 Points +4%
Moyenne de la classe Gaming
  (1299 - 2204, n=149, 2 dernières années)
1802 Points 0%
Lenovo LOQ 15IRH8 Core i7
NVIDIA GeForce RTX 4050 Laptop GPU, i7-13620H, Kioxia BG5 KBG50ZNT512G
1799 Points
Moyenne Intel Core i7-13620H, NVIDIA GeForce RTX 4050 Laptop GPU
  ()
1799 Points 0%
MSI Katana 17 B13VFK
NVIDIA GeForce RTX 4060 Laptop GPU, i7-13620H, Micron 2400 MTFDKBA1T0QFM
1765 Points -2%
Dell G15 5530
NVIDIA GeForce RTX 4060 Laptop GPU, i7-13650HX, SSTC CL4-3D512-Q11
1738 Points -3%
Asus TUF Gaming A16 FA617XS
Radeon RX 7600S, R9 7940HS, Micron 2400 MTFDKBA512QFM
1715 Points -5%
Lenovo LOQ 15APH8
NVIDIA GeForce RTX 4050 Laptop GPU, R7 7840HS, Micron 2450 512GB MTFDKCD512TFK
1625 Points -10%
CrossMark / Creativity
Moyenne de la classe Gaming
  (1275 - 2660, n=149, 2 dernières années)
2085 Points +4%
Dell G15 5530
NVIDIA GeForce RTX 4060 Laptop GPU, i7-13650HX, SSTC CL4-3D512-Q11
2063 Points +3%
Lenovo LOQ 16IRH8
NVIDIA GeForce RTX 4060 Laptop GPU, i7-13620H, Solidigm SSDPFINW512GZL
2046 Points +2%
Lenovo Legion Pro 5 16ARX8 (R5 7645HX, RTX 4050)
NVIDIA GeForce RTX 4050 Laptop GPU, R5 7645HX, SK hynix PC801 HFS512GEJ9X115N
2029 Points +1%
MSI Katana 17 B13VFK
NVIDIA GeForce RTX 4060 Laptop GPU, i7-13620H, Micron 2400 MTFDKBA1T0QFM
2013 Points 0%
Lenovo LOQ 15IRH8 Core i7
NVIDIA GeForce RTX 4050 Laptop GPU, i7-13620H, Kioxia BG5 KBG50ZNT512G
2005 Points
Moyenne Intel Core i7-13620H, NVIDIA GeForce RTX 4050 Laptop GPU
  ()
2005 Points 0%
Asus TUF Gaming A16 FA617XS
Radeon RX 7600S, R9 7940HS, Micron 2400 MTFDKBA512QFM
1990 Points -1%
Lenovo LOQ 15APH8
NVIDIA GeForce RTX 4050 Laptop GPU, R7 7840HS, Micron 2450 512GB MTFDKCD512TFK
1628 Points -19%
CrossMark / Responsiveness
Lenovo LOQ 16IRH8
NVIDIA GeForce RTX 4060 Laptop GPU, i7-13620H, Solidigm SSDPFINW512GZL
1874 Points +5%
Lenovo Legion Pro 5 16ARX8 (R5 7645HX, RTX 4050)
NVIDIA GeForce RTX 4050 Laptop GPU, R5 7645HX, SK hynix PC801 HFS512GEJ9X115N
1779 Points 0%
Lenovo LOQ 15IRH8 Core i7
NVIDIA GeForce RTX 4050 Laptop GPU, i7-13620H, Kioxia BG5 KBG50ZNT512G
1778 Points
Moyenne Intel Core i7-13620H, NVIDIA GeForce RTX 4050 Laptop GPU
  ()
1778 Points 0%
MSI Katana 17 B13VFK
NVIDIA GeForce RTX 4060 Laptop GPU, i7-13620H, Micron 2400 MTFDKBA1T0QFM
1734 Points -2%
Moyenne de la classe Gaming
  (1030 - 2330, n=149, 2 dernières années)
1698 Points -4%
Dell G15 5530
NVIDIA GeForce RTX 4060 Laptop GPU, i7-13650HX, SSTC CL4-3D512-Q11
1544 Points -13%
Asus TUF Gaming A16 FA617XS
Radeon RX 7600S, R9 7940HS, Micron 2400 MTFDKBA512QFM
1388 Points -22%
Lenovo LOQ 15APH8
NVIDIA GeForce RTX 4050 Laptop GPU, R7 7840HS, Micron 2450 512GB MTFDKCD512TFK
1364 Points -23%
AIDA64 / Memory Copy
Moyenne de la classe Gaming
  (21842 - 94222, n=185, 2 dernières années)
65054 MB/s +21%
HP Victus 16-r0077ng
NVIDIA GeForce RTX 4070 Laptop GPU, i7-13700H, Kioxia XG8 KXG80ZNV1T02
60917 MB/s +13%
Asus TUF Gaming A16 FA617XS
Radeon RX 7600S, R9 7940HS, Micron 2400 MTFDKBA512QFM
59712 MB/s +11%
Dell G15 5530
NVIDIA GeForce RTX 4060 Laptop GPU, i7-13650HX, SSTC CL4-3D512-Q11
59347 MB/s +10%
Lenovo LOQ 15IRH8 Core i7
NVIDIA GeForce RTX 4050 Laptop GPU, i7-13620H, Kioxia BG5 KBG50ZNT512G
53927 MB/s
Moyenne Intel Core i7-13620H, NVIDIA GeForce RTX 4050 Laptop GPU
  ()
53927 MB/s 0%
Lenovo LOQ 16IRH8
NVIDIA GeForce RTX 4060 Laptop GPU, i7-13620H, Solidigm SSDPFINW512GZL
53485 MB/s -1%
MSI Katana 17 B13VFK
NVIDIA GeForce RTX 4060 Laptop GPU, i7-13620H, Micron 2400 MTFDKBA1T0QFM
53391 MB/s -1%
Lenovo Legion Pro 5 16ARX8 (R5 7645HX, RTX 4050)
NVIDIA GeForce RTX 4050 Laptop GPU, R5 7645HX, SK hynix PC801 HFS512GEJ9X115N
48052 MB/s -11%
Lenovo LOQ 15APH8
NVIDIA GeForce RTX 4050 Laptop GPU, R7 7840HS, Micron 2450 512GB MTFDKCD512TFK
30937 MB/s -43%
AIDA64 / Memory Read
HP Victus 16-r0077ng
NVIDIA GeForce RTX 4070 Laptop GPU, i7-13700H, Kioxia XG8 KXG80ZNV1T02
70121 MB/s +14%
Moyenne de la classe Gaming
  (23681 - 99713, n=185, 2 dernières années)
68795 MB/s +11%
Dell G15 5530
NVIDIA GeForce RTX 4060 Laptop GPU, i7-13650HX, SSTC CL4-3D512-Q11
67903 MB/s +10%
Lenovo LOQ 16IRH8
NVIDIA GeForce RTX 4060 Laptop GPU, i7-13620H, Solidigm SSDPFINW512GZL
61853 MB/s 0%
Lenovo LOQ 15IRH8 Core i7
NVIDIA GeForce RTX 4050 Laptop GPU, i7-13620H, Kioxia BG5 KBG50ZNT512G
61738 MB/s
Moyenne Intel Core i7-13620H, NVIDIA GeForce RTX 4050 Laptop GPU
  ()
61738 MB/s 0%
MSI Katana 17 B13VFK
NVIDIA GeForce RTX 4060 Laptop GPU, i7-13620H, Micron 2400 MTFDKBA1T0QFM
61613 MB/s 0%
Asus TUF Gaming A16 FA617XS
Radeon RX 7600S, R9 7940HS, Micron 2400 MTFDKBA512QFM
61609 MB/s 0%
Lenovo Legion Pro 5 16ARX8 (R5 7645HX, RTX 4050)
NVIDIA GeForce RTX 4050 Laptop GPU, R5 7645HX, SK hynix PC801 HFS512GEJ9X115N
50185 MB/s -19%
Lenovo LOQ 15APH8
NVIDIA GeForce RTX 4050 Laptop GPU, R7 7840HS, Micron 2450 512GB MTFDKCD512TFK
30497 MB/s -51%
AIDA64 / Memory Write
Asus TUF Gaming A16 FA617XS
Radeon RX 7600S, R9 7940HS, Micron 2400 MTFDKBA512QFM
72541 MB/s +34%
Moyenne de la classe Gaming
  (22986 - 108954, n=185, 2 dernières années)
66829 MB/s +24%
HP Victus 16-r0077ng
NVIDIA GeForce RTX 4070 Laptop GPU, i7-13700H, Kioxia XG8 KXG80ZNV1T02
61520 MB/s +14%
Dell G15 5530
NVIDIA GeForce RTX 4060 Laptop GPU, i7-13650HX, SSTC CL4-3D512-Q11
60052 MB/s +11%
Lenovo LOQ 15IRH8 Core i7
NVIDIA GeForce RTX 4050 Laptop GPU, i7-13620H, Kioxia BG5 KBG50ZNT512G
54111 MB/s
Moyenne Intel Core i7-13620H, NVIDIA GeForce RTX 4050 Laptop GPU
  ()
54111 MB/s 0%
Lenovo LOQ 16IRH8
NVIDIA GeForce RTX 4060 Laptop GPU, i7-13620H, Solidigm SSDPFINW512GZL
53955 MB/s 0%
Lenovo Legion Pro 5 16ARX8 (R5 7645HX, RTX 4050)
NVIDIA GeForce RTX 4050 Laptop GPU, R5 7645HX, SK hynix PC801 HFS512GEJ9X115N
53914 MB/s 0%
MSI Katana 17 B13VFK
NVIDIA GeForce RTX 4060 Laptop GPU, i7-13620H, Micron 2400 MTFDKBA1T0QFM
50700 MB/s -6%
Lenovo LOQ 15APH8
NVIDIA GeForce RTX 4050 Laptop GPU, R7 7840HS, Micron 2450 512GB MTFDKCD512TFK
34590 MB/s -36%
AIDA64 / Memory Latency
Lenovo LOQ 15IRH8 Core i7
NVIDIA GeForce RTX 4050 Laptop GPU, i7-13620H, Kioxia BG5 KBG50ZNT512G
108.2 ns *
Moyenne Intel Core i7-13620H, NVIDIA GeForce RTX 4050 Laptop GPU
  ()
108.2 ns * -0%
Lenovo LOQ 16IRH8
NVIDIA GeForce RTX 4060 Laptop GPU, i7-13620H, Solidigm SSDPFINW512GZL
107.6 ns * +1%
MSI Katana 17 B13VFK
NVIDIA GeForce RTX 4060 Laptop GPU, i7-13620H, Micron 2400 MTFDKBA1T0QFM
101.7 ns * +6%
Lenovo LOQ 15APH8
NVIDIA GeForce RTX 4050 Laptop GPU, R7 7840HS, Micron 2450 512GB MTFDKCD512TFK
94.6 ns * +13%
Moyenne de la classe Gaming
  (59.5 - 259, n=185, 2 dernières années)
94.2 ns * +13%
HP Victus 16-r0077ng
NVIDIA GeForce RTX 4070 Laptop GPU, i7-13700H, Kioxia XG8 KXG80ZNV1T02
94.1 ns * +13%
Dell G15 5530
NVIDIA GeForce RTX 4060 Laptop GPU, i7-13650HX, SSTC CL4-3D512-Q11
90.7 ns * +16%
Asus TUF Gaming A16 FA617XS
Radeon RX 7600S, R9 7940HS, Micron 2400 MTFDKBA512QFM
90.4 ns * +16%
Lenovo Legion Pro 5 16ARX8 (R5 7645HX, RTX 4050)
NVIDIA GeForce RTX 4050 Laptop GPU, R5 7645HX, SK hynix PC801 HFS512GEJ9X115N
84.2 ns * +22%

* ... Moindre est la valeur, meilleures sont les performances

PCMark 8 Home Score Accelerated v2
5795 points
PCMark 8 Work Score Accelerated v2
6177 points
PCMark 10 Score
7656 points
Aide

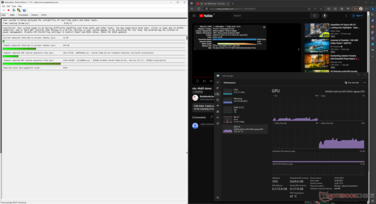
Latence DPC

La latence DPC est un peu plus élevée, mais le LOQ 15 Core i7 s'en sort beaucoup mieux que ses concurrents dans le test.

La latence DPC mesurée est un peu plus élevée
Le pilote Nvidia est celui qui a le temps d'exécution le plus élevé
DPC Latencies / LatencyMon - interrupt to process latency (max), Web, Youtube, Prime95
Dell G15 5530
NVIDIA GeForce RTX 4060 Laptop GPU, i7-13650HX, SSTC CL4-3D512-Q11
3585.6 μs * -469%
MSI Katana 17 B13VFK
NVIDIA GeForce RTX 4060 Laptop GPU, i7-13620H, Micron 2400 MTFDKBA1T0QFM
2396.6 μs * -281%
HP Victus 16-r0077ng
NVIDIA GeForce RTX 4070 Laptop GPU, i7-13700H, Kioxia XG8 KXG80ZNV1T02
1697 μs * -169%
Lenovo LOQ 15APH8
NVIDIA GeForce RTX 4050 Laptop GPU, R7 7840HS, Micron 2450 512GB MTFDKCD512TFK
1541.7 μs * -145%
Lenovo LOQ 16IRH8
NVIDIA GeForce RTX 4060 Laptop GPU, i7-13620H, Solidigm SSDPFINW512GZL
1397.1 μs * -122%
Asus TUF Gaming A16 FA617XS
Radeon RX 7600S, R9 7940HS, Micron 2400 MTFDKBA512QFM
1128.7 μs * -79%
Lenovo Legion Pro 5 16ARX8 (R5 7645HX, RTX 4050)
NVIDIA GeForce RTX 4050 Laptop GPU, R5 7645HX, SK hynix PC801 HFS512GEJ9X115N
666 μs * -6%
Lenovo LOQ 15IRH8 Core i7
NVIDIA GeForce RTX 4050 Laptop GPU, i7-13620H, Kioxia BG5 KBG50ZNT512G
629.8 μs *

* ... Moindre est la valeur, meilleures sont les performances

Notre Classement de la latence DPC offre une vue d'ensemble de la latence mesurée sur les appareils examinés.

Dispositifs de stockage

Le SSD Kioxia a des problèmes avec les lectures soutenues

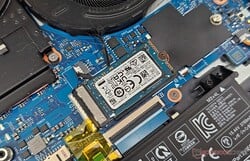
Notre unité LOQ 15IRH8 était équipée d'un disque SSD Kioxia M.2 2230 PCIe Gen4 NVMe de 512 Go. Vous pouvez le remplacer par un disque M.2280 de plus grande capacité si nécessaire. Un emplacement M.2 2280 libre est également disponible pour l'extension du stockage.

Les performances globales du disque sont inférieures à celles du disque Kioxia de 1 To équipant le modèle HP Victus 16. Le SSD a également du mal à maintenir une vitesse de lecture constante, car nous constatons des baisses de performances après le 25e essai de notre test de lecture en boucle DiskSpd avec une profondeur de file d'attente de 8.

Kioxia BG5 KBG50ZNT512G
CDM 5/6 Read Seq Q32T1: 2668 MB/s
CDM 5/6 Write Seq Q32T1: 2242 MB/s
CDM 5/6 Read 4K Q32T1: 675.4 MB/s
CDM 5/6 Write 4K Q32T1: 387.5 MB/s
CDM 5 Read Seq: 2196 MB/s
CDM 5 Write Seq: 2294 MB/s
CDM 5/6 Read 4K: 72.7 MB/s
CDM 5/6 Write 4K: 227.3 MB/s
CDM 6 Write 4K Q8T8: 369.9 MB/s
CDM 6 Read 4K Q8T8: 1529.9 MB/s
Drive Performance Rating - Percent
Lenovo Legion Pro 5 16ARX8 (R5 7645HX, RTX 4050)
SK hynix PC801 HFS512GEJ9X115N
97.4 pt
Moyenne de la classe Gaming
 
80.7 pt
MSI Katana 17 B13VFK
Micron 2400 MTFDKBA1T0QFM
72.4 pt
HP Victus 16-r0077ng
Kioxia XG8 KXG80ZNV1T02
66.8 pt
Lenovo LOQ 15IRH8 Core i7
Kioxia BG5 KBG50ZNT512G
54.6 pt
Moyenne Kioxia BG5 KBG50ZNT512G
 
54.6 pt
Lenovo LOQ 16IRH8
Solidigm SSDPFINW512GZL
53.3 pt
Asus TUF Gaming A16 FA617XS
Micron 2400 MTFDKBA512QFM
51 pt
Dell G15 5530
SSTC CL4-3D512-Q11
36.2 pt
Lenovo LOQ 15APH8
Micron 2450 512GB MTFDKCD512TFK
35.1 pt
DiskSpd
seq read
Lenovo Legion Pro 5 16ARX8 (R5 7645HX, RTX 4050)
SK hynix PC801 HFS512GEJ9X115N
4770 (4758.02min - 4770.39max) MB/s +76%
Moyenne de la classe Gaming
  (1319 - 7045, n=166, 2 dernières années)
3477 MB/s +28%
HP Victus 16-r0077ng
Kioxia XG8 KXG80ZNV1T02
2735 (2694.63min - 2735.3max) MB/s +1%
Dell G15 5530
SSTC CL4-3D512-Q11
2726 (2058.49min - 2725.67max) MB/s +1%
Lenovo LOQ 15IRH8 Core i7
Kioxia BG5 KBG50ZNT512G
2706 (2645.56min - 2705.91max) MB/s
Moyenne Kioxia BG5 KBG50ZNT512G
  ()
2706 MB/s 0%
MSI Katana 17 B13VFK
Micron 2400 MTFDKBA1T0QFM
2578 (2552.79min - 2578.03max) MB/s -5%
Asus TUF Gaming A16 FA617XS
Micron 2400 MTFDKBA512QFM
2253 (2206.83min - 2252.55max) MB/s -17%
Lenovo LOQ 16IRH8
Solidigm SSDPFINW512GZL
2171 (2026.48min - 2171.33max) MB/s -20%
Lenovo LOQ 15APH8
Micron 2450 512GB MTFDKCD512TFK
1773 (1758.83min - 1773.33max) MB/s -34%
seq write
Lenovo Legion Pro 5 16ARX8 (R5 7645HX, RTX 4050)
SK hynix PC801 HFS512GEJ9X115N
4938 (864.6min - 4938.37max) MB/s +103%
Moyenne de la classe Gaming
  (535 - 9307, n=166, 2 dernières années)
3794 MB/s +56%
HP Victus 16-r0077ng
Kioxia XG8 KXG80ZNV1T02
3641 (3537min - 3640.66max) MB/s +49%
MSI Katana 17 B13VFK
Micron 2400 MTFDKBA1T0QFM
3115 (2904.62min - 3115.38max) MB/s +28%
Lenovo LOQ 15IRH8 Core i7
Kioxia BG5 KBG50ZNT512G
2437 (2333.71min - 2436.52max) MB/s
Moyenne Kioxia BG5 KBG50ZNT512G
  ()
2437 MB/s 0%
Lenovo LOQ 15APH8
Micron 2450 512GB MTFDKCD512TFK
2177 (2040.95min - 2176.84max) MB/s -11%
Asus TUF Gaming A16 FA617XS
Micron 2400 MTFDKBA512QFM
1671 (1641.02min - 1670.59max) MB/s -31%
Lenovo LOQ 16IRH8
Solidigm SSDPFINW512GZL
1640 (1629.39min - 1639.55max) MB/s -33%
Dell G15 5530
SSTC CL4-3D512-Q11
535 (364.49min - 535.22max) MB/s -78%
seq q8 t1 read
Lenovo Legion Pro 5 16ARX8 (R5 7645HX, RTX 4050)
SK hynix PC801 HFS512GEJ9X115N
7328 (6805.28min - 7327.89max) MB/s +181%
Moyenne de la classe Gaming
  (2594 - 16089, n=166, 2 dernières années)
6320 MB/s +143%
HP Victus 16-r0077ng
Kioxia XG8 KXG80ZNV1T02
6169 (5196.32min - 6168.56max) MB/s +137%
MSI Katana 17 B13VFK
Micron 2400 MTFDKBA1T0QFM
4719 (4052.12min - 4719.01max) MB/s +81%
Asus TUF Gaming A16 FA617XS
Micron 2400 MTFDKBA512QFM
4294 (3669.6min - 4293.91max) MB/s +65%
Lenovo LOQ 16IRH8
Solidigm SSDPFINW512GZL
3507 (3153.28min - 3506.65max) MB/s +35%
Dell G15 5530
SSTC CL4-3D512-Q11
2985 (2124.05min - 2985.09max) MB/s +15%
Lenovo LOQ 15IRH8 Core i7
Kioxia BG5 KBG50ZNT512G
2605 (2370.7min - 2605.47max) MB/s
Moyenne Kioxia BG5 KBG50ZNT512G
  ()
2605 MB/s 0%
Lenovo LOQ 15APH8
Micron 2450 512GB MTFDKCD512TFK
2594 (2430.98min - 2593.81max) MB/s 0%
seq q8 t1 write
HP Victus 16-r0077ng
Kioxia XG8 KXG80ZNV1T02
5355 (5315.44min - 5354.87max) MB/s +95%
Lenovo Legion Pro 5 16ARX8 (R5 7645HX, RTX 4050)
SK hynix PC801 HFS512GEJ9X115N
4936 (877.32min - 4936.28max) MB/s +80%
Moyenne de la classe Gaming
  (539 - 14571, n=166, 2 dernières années)
4842 MB/s +77%
MSI Katana 17 B13VFK
Micron 2400 MTFDKBA1T0QFM
3629 MB/s +32%
Lenovo LOQ 15IRH8 Core i7
Kioxia BG5 KBG50ZNT512G
2741 (2725.88min - 2740.8max) MB/s
Moyenne Kioxia BG5 KBG50ZNT512G
  ()
2741 MB/s 0%
Lenovo LOQ 15APH8
Micron 2450 512GB MTFDKCD512TFK
2404 (653.05min - 2403.95max) MB/s -12%
Asus TUF Gaming A16 FA617XS
Micron 2400 MTFDKBA512QFM
1773 (1734.23min - 1773.16max) MB/s -35%
Lenovo LOQ 16IRH8
Solidigm SSDPFINW512GZL
1645 (1638.71min - 1645.22max) MB/s -40%
Dell G15 5530
SSTC CL4-3D512-Q11
539 (518.84min - 539max) MB/s -80%
4k q1 t1 read
Lenovo LOQ 16IRH8
Solidigm SSDPFINW512GZL
82.1 (81.04min - 82.14max) MB/s +13%
Lenovo Legion Pro 5 16ARX8 (R5 7645HX, RTX 4050)
SK hynix PC801 HFS512GEJ9X115N
75.5 (74.6min - 75.45max) MB/s +4%
Lenovo LOQ 15IRH8 Core i7
Kioxia BG5 KBG50ZNT512G
72.9 (72.39min - 72.89max) MB/s
Moyenne Kioxia BG5 KBG50ZNT512G
  ()
72.9 MB/s 0%
Moyenne de la classe Gaming
  (30.6 - 95.9, n=166, 2 dernières années)
65.8 MB/s -10%
HP Victus 16-r0077ng
Kioxia XG8 KXG80ZNV1T02
56.6 (54min - 56.56max) MB/s -22%
Lenovo LOQ 15APH8
Micron 2450 512GB MTFDKCD512TFK
42.6 (42.32min - 42.63max) MB/s -42%
MSI Katana 17 B13VFK
Micron 2400 MTFDKBA1T0QFM
37.7 (37.23min - 37.65max) MB/s -48%
Dell G15 5530
SSTC CL4-3D512-Q11
34 (32.67min - 33.95max) MB/s -53%
Asus TUF Gaming A16 FA617XS
Micron 2400 MTFDKBA512QFM
32.8 (32.61min - 32.76max) MB/s -55%
4k q1 t1 write
Lenovo Legion Pro 5 16ARX8 (R5 7645HX, RTX 4050)
SK hynix PC801 HFS512GEJ9X115N
296 (293.22min - 295.97max) MB/s +15%
Lenovo LOQ 16IRH8
Solidigm SSDPFINW512GZL
288 (280.44min - 288.2max) MB/s +12%
MSI Katana 17 B13VFK
Micron 2400 MTFDKBA1T0QFM
286 (269.48min - 285.84max) MB/s +11%
Lenovo LOQ 15IRH8 Core i7
Kioxia BG5 KBG50ZNT512G
258 (254.71min - 258.21max) MB/s
Moyenne Kioxia BG5 KBG50ZNT512G
  ()
258 MB/s 0%
Dell G15 5530
SSTC CL4-3D512-Q11
224 (206.15min - 223.94max) MB/s -13%
Moyenne de la classe Gaming
  (66.6 - 397, n=166, 2 dernières années)
221 MB/s -14%
Lenovo LOQ 15APH8
Micron 2450 512GB MTFDKCD512TFK
166.4 (154.44min - 166.37max) MB/s -36%
HP Victus 16-r0077ng
Kioxia XG8 KXG80ZNV1T02
142.3 (140.08min - 142.3max) MB/s -45%
Asus TUF Gaming A16 FA617XS
Micron 2400 MTFDKBA512QFM
132 (125.41min - 131.99max) MB/s -49%
4k q32 t16 read
Lenovo Legion Pro 5 16ARX8 (R5 7645HX, RTX 4050)
SK hynix PC801 HFS512GEJ9X115N
3794 (3727.63min - 3793.69max) MB/s +117%
MSI Katana 17 B13VFK
Micron 2400 MTFDKBA1T0QFM
2769 MB/s +58%
Moyenne de la classe Gaming
  (417 - 6172, n=166, 2 dernières années)
2553 MB/s +46%
Lenovo LOQ 15IRH8 Core i7
Kioxia BG5 KBG50ZNT512G
1751 (1733.17min - 1751.15max) MB/s
Moyenne Kioxia BG5 KBG50ZNT512G
  ()
1751 MB/s 0%
Asus TUF Gaming A16 FA617XS
Micron 2400 MTFDKBA512QFM
1705 (1701.1min - 1704.63max) MB/s -3%
Dell G15 5530
SSTC CL4-3D512-Q11
1054 (829.37min - 1053.72max) MB/s -40%
HP Victus 16-r0077ng
Kioxia XG8 KXG80ZNV1T02
1004 (933.19min - 1004.48max) MB/s -43%
Lenovo LOQ 15APH8
Micron 2450 512GB MTFDKCD512TFK
705 (694.52min - 705.09max) MB/s -60%
Lenovo LOQ 16IRH8
Solidigm SSDPFINW512GZL
478 (473.67min - 477.66max) MB/s -73%
4k q32 t16 write
Lenovo Legion Pro 5 16ARX8 (R5 7645HX, RTX 4050)
SK hynix PC801 HFS512GEJ9X115N
2679 (789.09min - 2678.78max) MB/s +220%
MSI Katana 17 B13VFK
Micron 2400 MTFDKBA1T0QFM
2635 (2459.5min - 2634.95max) MB/s +214%
Moyenne de la classe Gaming
  (162.3 - 4869, n=166, 2 dernières années)
2112 MB/s +152%
Lenovo LOQ 16IRH8
Solidigm SSDPFINW512GZL
1631 (1609.28min - 1630.54max) MB/s +95%
Asus TUF Gaming A16 FA617XS
Micron 2400 MTFDKBA512QFM
1585 (1554.44min - 1585.47max) MB/s +89%
Lenovo LOQ 15IRH8 Core i7
Kioxia BG5 KBG50ZNT512G
838 (789.23min - 837.94max) MB/s
Moyenne Kioxia BG5 KBG50ZNT512G
  ()
838 MB/s 0%
Dell G15 5530
SSTC CL4-3D512-Q11
507 (419.46min - 506.66max) MB/s -39%
HP Victus 16-r0077ng
Kioxia XG8 KXG80ZNV1T02
488 (476.91min - 488.32max) MB/s -42%
Lenovo LOQ 15APH8
Micron 2450 512GB MTFDKCD512TFK
414 (109.85min - 414.12max) MB/s -51%
AS SSD
Score Total
Lenovo Legion Pro 5 16ARX8 (R5 7645HX, RTX 4050)
SK hynix PC801 HFS512GEJ9X115N
8397 Points +127%
Moyenne de la classe Gaming
  (2271 - 13854, n=157, 2 dernières années)
6729 Points +82%
MSI Katana 17 B13VFK
Micron 2400 MTFDKBA1T0QFM
6311 Points +71%
HP Victus 16-r0077ng
Kioxia XG8 KXG80ZNV1T02
4988 Points +35%
Asus TUF Gaming A16 FA617XS
Micron 2400 MTFDKBA512QFM
4261 Points +15%
Lenovo LOQ 15IRH8 Core i7
Kioxia BG5 KBG50ZNT512G
3697 Points
Moyenne Kioxia BG5 KBG50ZNT512G
  ()
3697 Points 0%
Lenovo LOQ 16IRH8
Solidigm SSDPFINW512GZL
2782 Points -25%
Lenovo LOQ 15APH8
Micron 2450 512GB MTFDKCD512TFK
2319 Points -37%
Dell G15 5530
SSTC CL4-3D512-Q11
2271 Points -39%
Score Read
Lenovo Legion Pro 5 16ARX8 (R5 7645HX, RTX 4050)
SK hynix PC801 HFS512GEJ9X115N
3413 Points +90%
MSI Katana 17 B13VFK
Micron 2400 MTFDKBA1T0QFM
2446 Points +36%
Moyenne de la classe Gaming
  (776 - 4721, n=157, 2 dernières années)
2440 Points +36%
Asus TUF Gaming A16 FA617XS
Micron 2400 MTFDKBA512QFM
1830 Points +2%
Lenovo LOQ 15IRH8 Core i7
Kioxia BG5 KBG50ZNT512G
1800 Points
Moyenne Kioxia BG5 KBG50ZNT512G
  ()
1800 Points 0%
HP Victus 16-r0077ng
Kioxia XG8 KXG80ZNV1T02
1480 Points -18%
Dell G15 5530
SSTC CL4-3D512-Q11
1229 Points -32%
Lenovo LOQ 15APH8
Micron 2450 512GB MTFDKCD512TFK
882 Points -51%
Lenovo LOQ 16IRH8
Solidigm SSDPFINW512GZL
776 Points -57%
Score Write
Lenovo Legion Pro 5 16ARX8 (R5 7645HX, RTX 4050)
SK hynix PC801 HFS512GEJ9X115N
3324 Points +236%
Moyenne de la classe Gaming
  (515 - 7208, n=157, 2 dernières années)
3106 Points +214%
HP Victus 16-r0077ng
Kioxia XG8 KXG80ZNV1T02
2858 Points +189%
MSI Katana 17 B13VFK
Micron 2400 MTFDKBA1T0QFM
2658 Points +169%
Lenovo LOQ 16IRH8
Solidigm SSDPFINW512GZL
1645 Points +66%
Asus TUF Gaming A16 FA617XS
Micron 2400 MTFDKBA512QFM
1604 Points +62%
Lenovo LOQ 15APH8
Micron 2450 512GB MTFDKCD512TFK
1064 Points +8%
Lenovo LOQ 15IRH8 Core i7
Kioxia BG5 KBG50ZNT512G
989 Points
Moyenne Kioxia BG5 KBG50ZNT512G
  ()
989 Points 0%
Dell G15 5530
SSTC CL4-3D512-Q11
515 Points -48%
Seq Read
Lenovo Legion Pro 5 16ARX8 (R5 7645HX, RTX 4050)
SK hynix PC801 HFS512GEJ9X115N
5872 MB/s +95%
HP Victus 16-r0077ng
Kioxia XG8 KXG80ZNV1T02
5265.97 MB/s +75%
Moyenne de la classe Gaming
  (2260 - 12763, n=157, 2 dernières années)
4939 MB/s +64%
MSI Katana 17 B13VFK
Micron 2400 MTFDKBA1T0QFM
3920 MB/s +30%
Asus TUF Gaming A16 FA617XS
Micron 2400 MTFDKBA512QFM
3690.93 MB/s +23%
Lenovo LOQ 15IRH8 Core i7
Kioxia BG5 KBG50ZNT512G
3007.06 MB/s
Moyenne Kioxia BG5 KBG50ZNT512G
  ()
3007 MB/s 0%
Dell G15 5530
SSTC CL4-3D512-Q11
2603.73 MB/s -13%
Lenovo LOQ 16IRH8
Solidigm SSDPFINW512GZL
2603 MB/s -13%
Lenovo LOQ 15APH8
Micron 2450 512GB MTFDKCD512TFK
2460.42 MB/s -18%
Seq Write
Lenovo Legion Pro 5 16ARX8 (R5 7645HX, RTX 4050)
SK hynix PC801 HFS512GEJ9X115N
4253 MB/s +73%
Moyenne de la classe Gaming
  (495 - 11316, n=157, 2 dernières années)
3737 MB/s +52%
MSI Katana 17 B13VFK
Micron 2400 MTFDKBA1T0QFM
3007 MB/s +23%
HP Victus 16-r0077ng
Kioxia XG8 KXG80ZNV1T02
2831.66 MB/s +15%
Lenovo LOQ 15IRH8 Core i7
Kioxia BG5 KBG50ZNT512G
2454.13 MB/s
Moyenne Kioxia BG5 KBG50ZNT512G
  ()
2454 MB/s 0%
Asus TUF Gaming A16 FA617XS
Micron 2400 MTFDKBA512QFM
1633.49 MB/s -33%
Lenovo LOQ 16IRH8
Solidigm SSDPFINW512GZL
1427 MB/s -42%
Lenovo LOQ 15APH8
Micron 2450 512GB MTFDKCD512TFK
721.73 MB/s -71%
Dell G15 5530
SSTC CL4-3D512-Q11
494.63 MB/s -80%
4K Read
Moyenne Kioxia BG5 KBG50ZNT512G
  ()
71.5 MB/s 0%
Lenovo LOQ 15IRH8 Core i7
Kioxia BG5 KBG50ZNT512G
71.45 MB/s
Lenovo Legion Pro 5 16ARX8 (R5 7645HX, RTX 4050)
SK hynix PC801 HFS512GEJ9X115N
70.52 MB/s -1%
Moyenne de la classe Gaming
  (27.8 - 112.1, n=157, 2 dernières années)
65 MB/s -9%
Lenovo LOQ 16IRH8
Solidigm SSDPFINW512GZL
64.4 MB/s -10%
HP Victus 16-r0077ng
Kioxia XG8 KXG80ZNV1T02
61.43 MB/s -14%
MSI Katana 17 B13VFK
Micron 2400 MTFDKBA1T0QFM
58.8 MB/s -18%
Asus TUF Gaming A16 FA617XS
Micron 2400 MTFDKBA512QFM
42.75 MB/s -40%
Lenovo LOQ 15APH8
Micron 2450 512GB MTFDKCD512TFK
38.16 MB/s -47%
Dell G15 5530
SSTC CL4-3D512-Q11
36.37 MB/s -49%
4K Write
Lenovo Legion Pro 5 16ARX8 (R5 7645HX, RTX 4050)
SK hynix PC801 HFS512GEJ9X115N
251.8 MB/s +13%
MSI Katana 17 B13VFK
Micron 2400 MTFDKBA1T0QFM
249 MB/s +12%
Lenovo LOQ 16IRH8
Solidigm SSDPFINW512GZL
237 MB/s +6%
Moyenne Kioxia BG5 KBG50ZNT512G
  ()
223 MB/s 0%
Lenovo LOQ 15IRH8 Core i7
Kioxia BG5 KBG50ZNT512G
222.59 MB/s
Moyenne de la classe Gaming
  (108.8 - 512, n=157, 2 dernières années)
211 MB/s -5%
HP Victus 16-r0077ng
Kioxia XG8 KXG80ZNV1T02
209.28 MB/s -6%
Lenovo LOQ 15APH8
Micron 2450 512GB MTFDKCD512TFK
203.12 MB/s -9%
Dell G15 5530
SSTC CL4-3D512-Q11
188.64 MB/s -15%
Asus TUF Gaming A16 FA617XS
Micron 2400 MTFDKBA512QFM
118.17 MB/s -47%
4K-64 Read
Lenovo Legion Pro 5 16ARX8 (R5 7645HX, RTX 4050)
SK hynix PC801 HFS512GEJ9X115N
2755 MB/s +93%
MSI Katana 17 B13VFK
Micron 2400 MTFDKBA1T0QFM
1995 MB/s +40%
Moyenne de la classe Gaming
  (451 - 3475, n=157, 2 dernières années)
1875 MB/s +31%
Asus TUF Gaming A16 FA617XS
Micron 2400 MTFDKBA512QFM
1429.83 MB/s 0%
Moyenne Kioxia BG5 KBG50ZNT512G
  ()
1428 MB/s 0%
Lenovo LOQ 15IRH8 Core i7
Kioxia BG5 KBG50ZNT512G
1427.62 MB/s
Dell G15 5530
SSTC CL4-3D512-Q11
932.26 MB/s -35%
HP Victus 16-r0077ng
Kioxia XG8 KXG80ZNV1T02
892.37 MB/s -37%
Lenovo LOQ 15APH8
Micron 2450 512GB MTFDKCD512TFK
597.83 MB/s -58%
Lenovo LOQ 16IRH8
Solidigm SSDPFINW512GZL
451 MB/s -68%
4K-64 Write
Lenovo Legion Pro 5 16ARX8 (R5 7645HX, RTX 4050)
SK hynix PC801 HFS512GEJ9X115N
2647 MB/s +408%
Moyenne de la classe Gaming
  (277 - 5909, n=157, 2 dernières années)
2524 MB/s +384%
HP Victus 16-r0077ng
Kioxia XG8 KXG80ZNV1T02
2365.53 MB/s +354%
MSI Katana 17 B13VFK
Micron 2400 MTFDKBA1T0QFM
2108 MB/s +305%
Asus TUF Gaming A16 FA617XS
Micron 2400 MTFDKBA512QFM
1411.25 MB/s +171%
Lenovo LOQ 16IRH8
Solidigm SSDPFINW512GZL
1265 MB/s +143%
Lenovo LOQ 15APH8
Micron 2450 512GB MTFDKCD512TFK
788.8 MB/s +51%
Moyenne Kioxia BG5 KBG50ZNT512G
  ()
521 MB/s 0%
Lenovo LOQ 15IRH8 Core i7
Kioxia BG5 KBG50ZNT512G
520.95 MB/s
Dell G15 5530
SSTC CL4-3D512-Q11
276.64 MB/s -47%
Access Time Read
Lenovo LOQ 15IRH8 Core i7
Kioxia BG5 KBG50ZNT512G
0.125 ms *
Moyenne Kioxia BG5 KBG50ZNT512G
  ()
0.125 ms * -0%
Dell G15 5530
SSTC CL4-3D512-Q11
0.103 ms * +18%
MSI Katana 17 B13VFK
Micron 2400 MTFDKBA1T0QFM
0.094 ms * +25%
Lenovo LOQ 15APH8
Micron 2450 512GB MTFDKCD512TFK
0.083 ms * +34%
Asus TUF Gaming A16 FA617XS
Micron 2400 MTFDKBA512QFM
0.058 ms * +54%
Moyenne de la classe Gaming
  (0.016 - 0.379, n=156, 2 dernières années)
0.05537 ms * +56%
Lenovo LOQ 16IRH8
Solidigm SSDPFINW512GZL
0.055 ms * +56%
HP Victus 16-r0077ng
Kioxia XG8 KXG80ZNV1T02
0.052 ms * +58%
Lenovo Legion Pro 5 16ARX8 (R5 7645HX, RTX 4050)
SK hynix PC801 HFS512GEJ9X115N
0.039 ms * +69%
Access Time Write
Lenovo LOQ 15APH8
Micron 2450 512GB MTFDKCD512TFK
1.028 ms * -2756%
Dell G15 5530
SSTC CL4-3D512-Q11
0.182 ms * -406%
Asus TUF Gaming A16 FA617XS
Micron 2400 MTFDKBA512QFM
0.118 ms * -228%
MSI Katana 17 B13VFK
Micron 2400 MTFDKBA1T0QFM
0.096 ms * -167%
Moyenne de la classe Gaming
  (0.011 - 1.028, n=157, 2 dernières années)
0.04852 ms * -35%
Lenovo LOQ 16IRH8
Solidigm SSDPFINW512GZL
0.036 ms * -0%
Lenovo LOQ 15IRH8 Core i7
Kioxia BG5 KBG50ZNT512G
0.036 ms *
Moyenne Kioxia BG5 KBG50ZNT512G
  ()
0.036 ms * -0%
HP Victus 16-r0077ng
Kioxia XG8 KXG80ZNV1T02
0.02 ms * +44%
Lenovo Legion Pro 5 16ARX8 (R5 7645HX, RTX 4050)
SK hynix PC801 HFS512GEJ9X115N
0.017 ms * +53%

* ... Moindre est la valeur, meilleures sont les performances

Disk Throttling: DiskSpd Read Loop, Queue Depth 8

01553104656207759301085124013951550170518602015217023252480263527902945Tooltip
Lenovo LOQ 15IRH8 Core i7: Ø2663 (1671.84-3047.17)

Pour plus d'informations et de comparaisons de performances, consultez nos Benchmarks HDD et SSD page.

Performance du GPU

Le GPU RTX 4050 Laptop du LOQ 15IRH8 est évalué à 95 W TGP, mais il dispose d'une marge de manœuvre pour utiliser plus d'énergie en cas de stress. Nous constatons que le même GPU dans le LOQ 15APH8 est environ 6% plus rapide dans les tests 3DMark cumulés.

Il est intéressant de noter que cette RTX 4050 de 95 W n'est qu'à un cheveu de la variante de 140 W dans le modèle Lenovo Legion Pro 5. Cependant, ce dernier compense ce déficit dans le benchmark Blender CUDA.

3DMark Performance Rating - Percent
Moyenne de la classe Gaming
 
100 pt
HP Victus 16-r0077ng
NVIDIA GeForce RTX 4070 Laptop GPU, Intel Core i7-13700H
91.1 pt
Dell G15 5530
NVIDIA GeForce RTX 4060 Laptop GPU, Intel Core i7-13650HX
83.5 pt
MSI Katana 17 B13VFK
NVIDIA GeForce RTX 4060 Laptop GPU, Intel Core i7-13620H
83.4 pt
Lenovo LOQ 16IRH8
NVIDIA GeForce RTX 4060 Laptop GPU, Intel Core i7-13620H
81.3 pt
Asus TUF Gaming A16 FA617XS
AMD Radeon RX 7600S, AMD Ryzen 9 7940HS
76.5 pt
Lenovo LOQ 15APH8
NVIDIA GeForce RTX 4050 Laptop GPU, AMD Ryzen 7 7840HS
72.8 pt
Lenovo Legion Pro 5 16ARX8 (R5 7645HX, RTX 4050)
NVIDIA GeForce RTX 4050 Laptop GPU, AMD Ryzen 5 7645HX
72.1 pt
Lenovo LOQ 15IRH8 Core i7
NVIDIA GeForce RTX 4050 Laptop GPU, Intel Core i7-13620H
69 pt
Moyenne NVIDIA GeForce RTX 4050 Laptop GPU
 
64.3 pt
3DMark 11 - 1280x720 Performance GPU
Moyenne de la classe Gaming
  (1029 - 72178, n=184, 2 dernières années)
43666 Points +41%
HP Victus 16-r0077ng
NVIDIA GeForce RTX 4070 Laptop GPU, Intel Core i7-13700H
39951 Points +29%
Dell G15 5530
NVIDIA GeForce RTX 4060 Laptop GPU, Intel Core i7-13650HX
37187 Points +20%
MSI Katana 17 B13VFK
NVIDIA GeForce RTX 4060 Laptop GPU, Intel Core i7-13620H
36323 Points +17%
Lenovo LOQ 16IRH8
NVIDIA GeForce RTX 4060 Laptop GPU, Intel Core i7-13620H
35530 Points +15%
Asus TUF Gaming A16 FA617XS
AMD Radeon RX 7600S, AMD Ryzen 9 7940HS
33037 Points +7%
Lenovo LOQ 15APH8
NVIDIA GeForce RTX 4050 Laptop GPU, AMD Ryzen 7 7840HS
32642 Points +5%
Lenovo Legion Pro 5 16ARX8 (R5 7645HX, RTX 4050)
NVIDIA GeForce RTX 4050 Laptop GPU, AMD Ryzen 5 7645HX
31530 Points +2%
Lenovo LOQ 15IRH8 Core i7
NVIDIA GeForce RTX 4050 Laptop GPU, Intel Core i7-13620H
30943 Points
Moyenne NVIDIA GeForce RTX 4050 Laptop GPU
  (13339 - 32642, n=38)
28641 Points -7%
3DMark
1920x1080 Fire Strike Graphics
Moyenne de la classe Gaming
  (781 - 53059, n=194, 2 dernières années)
31337 Points +42%
HP Victus 16-r0077ng
NVIDIA GeForce RTX 4070 Laptop GPU, Intel Core i7-13700H
30239 Points +37%
MSI Katana 17 B13VFK
NVIDIA GeForce RTX 4060 Laptop GPU, Intel Core i7-13620H
27681 Points +25%
Dell G15 5530
NVIDIA GeForce RTX 4060 Laptop GPU, Intel Core i7-13650HX
26441 Points +20%
Asus TUF Gaming A16 FA617XS
AMD Radeon RX 7600S, AMD Ryzen 9 7940HS
26154 Points +19%
Lenovo LOQ 16IRH8
NVIDIA GeForce RTX 4060 Laptop GPU, Intel Core i7-13620H
26079 Points +18%
Lenovo Legion Pro 5 16ARX8 (R5 7645HX, RTX 4050)
NVIDIA GeForce RTX 4050 Laptop GPU, AMD Ryzen 5 7645HX
23721 Points +7%
Lenovo LOQ 15APH8
NVIDIA GeForce RTX 4050 Laptop GPU, AMD Ryzen 7 7840HS
23345 Points +6%
Lenovo LOQ 15IRH8 Core i7
NVIDIA GeForce RTX 4050 Laptop GPU, Intel Core i7-13620H
22068 Points
Moyenne NVIDIA GeForce RTX 4050 Laptop GPU
  (13591 - 24007, n=36)
21155 Points -4%
2560x1440 Time Spy Graphics
Moyenne de la classe Gaming
  (224 - 22717, n=189, 2 dernières années)
13077 Points +52%
HP Victus 16-r0077ng
NVIDIA GeForce RTX 4070 Laptop GPU, Intel Core i7-13700H
11168 Points +30%
Dell G15 5530
NVIDIA GeForce RTX 4060 Laptop GPU, Intel Core i7-13650HX
10604 Points +23%
Lenovo LOQ 16IRH8
NVIDIA GeForce RTX 4060 Laptop GPU, Intel Core i7-13620H
10366 Points +21%
MSI Katana 17 B13VFK
NVIDIA GeForce RTX 4060 Laptop GPU, Intel Core i7-13620H
10299 Points +20%
Asus TUF Gaming A16 FA617XS
AMD Radeon RX 7600S, AMD Ryzen 9 7940HS
9203 Points +7%
Lenovo LOQ 15APH8
NVIDIA GeForce RTX 4050 Laptop GPU, AMD Ryzen 7 7840HS
9040 Points +5%
Lenovo Legion Pro 5 16ARX8 (R5 7645HX, RTX 4050)
NVIDIA GeForce RTX 4050 Laptop GPU, AMD Ryzen 5 7645HX
8954 Points +4%
Lenovo LOQ 15IRH8 Core i7
NVIDIA GeForce RTX 4050 Laptop GPU, Intel Core i7-13620H
8589 Points
Moyenne NVIDIA GeForce RTX 4050 Laptop GPU
  (5107 - 9040, n=36)
7812 Points -9%
3DMark 11 Performance
27474 points
3DMark Ice Storm Standard Score
229274 points
3DMark Cloud Gate Standard Score
49040 points
3DMark Fire Strike Score
19230 points
3DMark Fire Strike Extreme Score
9873 points
3DMark Time Spy Score
8701 points
Aide
Blender / v3.3 Classroom OPTIX/RTX
Moyenne NVIDIA GeForce RTX 4050 Laptop GPU
  (25 - 37, n=37)
28.8 Seconds * -7%
Lenovo Legion Pro 5 16ARX8 (R5 7645HX, RTX 4050)
NVIDIA GeForce RTX 4050 Laptop GPU, AMD Ryzen 5 7645HX
28 Seconds * -4%
Lenovo LOQ 15IRH8 Core i7
NVIDIA GeForce RTX 4050 Laptop GPU, Intel Core i7-13620H
27 Seconds *
MSI Katana 17 B13VFK
NVIDIA GeForce RTX 4060 Laptop GPU, Intel Core i7-13620H
25 Seconds * +7%
Lenovo LOQ 15APH8
NVIDIA GeForce RTX 4050 Laptop GPU, AMD Ryzen 7 7840HS
25 Seconds * +7%
HP Victus 16-r0077ng
NVIDIA GeForce RTX 4070 Laptop GPU, Intel Core i7-13700H
23 Seconds * +15%
Lenovo LOQ 16IRH8
NVIDIA GeForce RTX 4060 Laptop GPU, Intel Core i7-13620H
22 Seconds * +19%
Dell G15 5530
NVIDIA GeForce RTX 4060 Laptop GPU, Intel Core i7-13650HX
21 Seconds * +22%
Moyenne de la classe Gaming
  (9 - 95, n=175, 2 dernières années)
20.9 Seconds * +23%
Blender / v3.3 Classroom CUDA
Moyenne NVIDIA GeForce RTX 4050 Laptop GPU
  (47 - 175, n=37)
56.2 Seconds * -12%
Lenovo LOQ 15IRH8 Core i7
NVIDIA GeForce RTX 4050 Laptop GPU, Intel Core i7-13620H
50 Seconds *
Lenovo LOQ 15APH8
NVIDIA GeForce RTX 4050 Laptop GPU, AMD Ryzen 7 7840HS
48 Seconds * +4%
Lenovo Legion Pro 5 16ARX8 (R5 7645HX, RTX 4050)
NVIDIA GeForce RTX 4050 Laptop GPU, AMD Ryzen 5 7645HX
47 Seconds * +6%
MSI Katana 17 B13VFK
NVIDIA GeForce RTX 4060 Laptop GPU, Intel Core i7-13620H
44 Seconds * +12%
Lenovo LOQ 16IRH8
NVIDIA GeForce RTX 4060 Laptop GPU, Intel Core i7-13620H
42 Seconds * +16%
Dell G15 5530
NVIDIA GeForce RTX 4060 Laptop GPU, Intel Core i7-13650HX
41 Seconds * +18%
Moyenne de la classe Gaming
  (16 - 175, n=181, 2 dernières années)
36.5 Seconds * +27%
HP Victus 16-r0077ng
NVIDIA GeForce RTX 4070 Laptop GPU, Intel Core i7-13700H
36 Seconds * +28%
Blender / v3.3 Classroom CPU
Lenovo LOQ 15IRH8 Core i7
NVIDIA GeForce RTX 4050 Laptop GPU, Intel Core i7-13620H
435 Seconds *
Moyenne NVIDIA GeForce RTX 4050 Laptop GPU
  (243 - 907, n=37)
395 Seconds * +9%
Lenovo LOQ 16IRH8
NVIDIA GeForce RTX 4060 Laptop GPU, Intel Core i7-13620H
391 Seconds * +10%
HP Victus 16-r0077ng
NVIDIA GeForce RTX 4070 Laptop GPU, Intel Core i7-13700H
379 Seconds * +13%
Lenovo Legion Pro 5 16ARX8 (R5 7645HX, RTX 4050)
NVIDIA GeForce RTX 4050 Laptop GPU, AMD Ryzen 5 7645HX
360 Seconds * +17%
MSI Katana 17 B13VFK
NVIDIA GeForce RTX 4060 Laptop GPU, Intel Core i7-13620H
353 Seconds * +19%
Asus TUF Gaming A16 FA617XS
AMD Radeon RX 7600S, AMD Ryzen 9 7940HS
301 Seconds * +31%
Lenovo LOQ 15APH8
NVIDIA GeForce RTX 4050 Laptop GPU, AMD Ryzen 7 7840HS
299 Seconds * +31%
Moyenne de la classe Gaming
  (138 - 962, n=189, 2 dernières années)
297 Seconds * +32%
Dell G15 5530
NVIDIA GeForce RTX 4060 Laptop GPU, Intel Core i7-13650HX
288 Seconds * +34%

* ... Moindre est la valeur, meilleures sont les performances

Performances des jeux

Des tendances similaires sont également observées dans les tests de jeu. La RTX 4050 de 95 W du LOQ 15 et la RTX 4050 de 140 W de la Legion Pro 5 sont presque identiques dans les tests de jeu cumulés en 1080p Ultra, mais la puissance plus élevée de cette dernière permet d'obtenir des résultats supérieurs en QHD Ultra.

Le LOQ 15IRH8 est essentiellement une machine de jeu 1080p Ultra. Il est possible d'obtenir des taux de rafraîchissement acceptables en QHD Ultra avec des titres un peu plus anciens. Les joueurs qui souhaitent obtenir plus d'images en QHD ou 4K devront inévitablement utiliser des technologies d'upscaling telles que AMD FSR, Nvidia DLSS ou Intel XeSS, selon le titre.

Performance Rating - Percent
Moyenne de la classe Gaming
 
95.7 pt
MSI Katana 17 B13VFK
Intel Core i7-13620H, NVIDIA GeForce RTX 4060 Laptop GPU
88.5 pt
Lenovo LOQ 16IRH8
Intel Core i7-13620H, NVIDIA GeForce RTX 4060 Laptop GPU
87.9 pt
Dell G15 5530
Intel Core i7-13650HX, NVIDIA GeForce RTX 4060 Laptop GPU
87.7 pt
HP Victus 16-r0077ng
Intel Core i7-13700H, NVIDIA GeForce RTX 4070 Laptop GPU
86.5 pt
Lenovo Legion Pro 5 16ARX8 (R5 7645HX, RTX 4050)
AMD Ryzen 5 7645HX, NVIDIA GeForce RTX 4050 Laptop GPU
81.8 pt
Lenovo LOQ 15IRH8 Core i7
Intel Core i7-13620H, NVIDIA GeForce RTX 4050 Laptop GPU
78.2 pt
Asus TUF Gaming A16 FA617XS
AMD Ryzen 9 7940HS, AMD Radeon RX 7600S
69.8 pt
Lenovo LOQ 15APH8
AMD Ryzen 7 7840HS, NVIDIA GeForce RTX 4050 Laptop GPU
69 pt
The Witcher 3 - 1920x1080 Ultra Graphics & Postprocessing (HBAO+)
Moyenne de la classe Gaming
  (18.4 - 216, n=166, 2 dernières années)
127.4 fps +49%
HP Victus 16-r0077ng
Intel Core i7-13700H, NVIDIA GeForce RTX 4070 Laptop GPU
114 fps +33%
MSI Katana 17 B13VFK
Intel Core i7-13620H, NVIDIA GeForce RTX 4060 Laptop GPU
104.7 (88min) fps +22%
Dell G15 5530
Intel Core i7-13650HX, NVIDIA GeForce RTX 4060 Laptop GPU
104.6 (93min, 93P1) fps +22%
Lenovo LOQ 16IRH8
Intel Core i7-13620H, NVIDIA GeForce RTX 4060 Laptop GPU
103.7 fps +21%
Asus TUF Gaming A16 FA617XS
AMD Ryzen 9 7940HS, AMD Radeon RX 7600S
98.1 (84min) fps +15%
Lenovo Legion Pro 5 16ARX8 (R5 7645HX, RTX 4050)
AMD Ryzen 5 7645HX, NVIDIA GeForce RTX 4050 Laptop GPU
89 fps +4%
Lenovo LOQ 15IRH8 Core i7
Intel Core i7-13620H, NVIDIA GeForce RTX 4050 Laptop GPU
85.6 (76min, 76.31P1) fps
Lenovo LOQ 15APH8
AMD Ryzen 7 7840HS, NVIDIA GeForce RTX 4050 Laptop GPU
83.8 (78min) fps -2%
GTA V - 1920x1080 Highest Settings possible AA:4xMSAA + FX AF:16x
Lenovo LOQ 16IRH8
Intel Core i7-13620H, NVIDIA GeForce RTX 4060 Laptop GPU
114.5 (8.64min, 76.9P1) fps +23%
Moyenne de la classe Gaming
  (12.1 - 167.7, n=169, 2 dernières années)
113.1 fps +21%
HP Victus 16-r0077ng
Intel Core i7-13700H, NVIDIA GeForce RTX 4070 Laptop GPU
112.8 (4.13min, 66.7P1) fps +21%
MSI Katana 17 B13VFK
Intel Core i7-13620H, NVIDIA GeForce RTX 4060 Laptop GPU
112.1 (8min, 62.5P1) fps +20%
Dell G15 5530
Intel Core i7-13650HX, NVIDIA GeForce RTX 4060 Laptop GPU
111.8 (4.01min, 76.9P1) fps +20%
Lenovo Legion Pro 5 16ARX8 (R5 7645HX, RTX 4050)
AMD Ryzen 5 7645HX, NVIDIA GeForce RTX 4050 Laptop GPU
101.7 (6.72min, 62.5P1) fps +9%
Lenovo LOQ 15IRH8 Core i7
Intel Core i7-13620H, NVIDIA GeForce RTX 4050 Laptop GPU
93.2 (4.57min, 62.5P1) fps
Asus TUF Gaming A16 FA617XS
AMD Ryzen 9 7940HS, AMD Radeon RX 7600S
92.9 (26.7min, 62.5P1) fps 0%
Lenovo LOQ 15APH8
AMD Ryzen 7 7840HS, NVIDIA GeForce RTX 4050 Laptop GPU
78.4 (1.015min, 40P1) fps -16%
Final Fantasy XV Benchmark - 1920x1080 High Quality
Moyenne de la classe Gaming
  (19.2 - 201, n=182, 2 dernières années)
119.3 fps +42%
HP Victus 16-r0077ng
Intel Core i7-13700H, NVIDIA GeForce RTX 4070 Laptop GPU
109.3 fps +30%
Lenovo LOQ 16IRH8
Intel Core i7-13620H, NVIDIA GeForce RTX 4060 Laptop GPU
101.4 fps +21%
Dell G15 5530
Intel Core i7-13650HX, NVIDIA GeForce RTX 4060 Laptop GPU
100.1 fps +19%
MSI Katana 17 B13VFK
Intel Core i7-13620H, NVIDIA GeForce RTX 4060 Laptop GPU
96.1 fps +14%
Lenovo Legion Pro 5 16ARX8 (R5 7645HX, RTX 4050)
AMD Ryzen 5 7645HX, NVIDIA GeForce RTX 4050 Laptop GPU
86.3 fps +3%
Lenovo LOQ 15APH8
AMD Ryzen 7 7840HS, NVIDIA GeForce RTX 4050 Laptop GPU
86.1 fps +3%
Asus TUF Gaming A16 FA617XS
AMD Ryzen 9 7940HS, AMD Radeon RX 7600S
85.2 fps +1%
Lenovo LOQ 15IRH8 Core i7
Intel Core i7-13620H, NVIDIA GeForce RTX 4050 Laptop GPU
84 fps
Strange Brigade - 1920x1080 ultra AA:ultra AF:16
Moyenne de la classe Gaming
  (38.9 - 421, n=180, 2 dernières années)
228 fps +53%
HP Victus 16-r0077ng
Intel Core i7-13700H, NVIDIA GeForce RTX 4070 Laptop GPU
192 (24.8min, 138.8P1) fps +29%
Dell G15 5530
Intel Core i7-13650HX, NVIDIA GeForce RTX 4060 Laptop GPU
189.6 (28.6min, 138.5P1) fps +27%
Lenovo LOQ 16IRH8
Intel Core i7-13620H, NVIDIA GeForce RTX 4060 Laptop GPU
186.9 (46.3min, 136.1P1) fps +25%
MSI Katana 17 B13VFK
Intel Core i7-13620H, NVIDIA GeForce RTX 4060 Laptop GPU
185.1 (15.5min, 136.7P1) fps +24%
Asus TUF Gaming A16 FA617XS
AMD Ryzen 9 7940HS, AMD Radeon RX 7600S
163.3 (16.3min, 119.3P1) fps +9%
Lenovo LOQ 15APH8
AMD Ryzen 7 7840HS, NVIDIA GeForce RTX 4050 Laptop GPU
156.6 (34.4min, 121.4P1) fps +5%
Lenovo Legion Pro 5 16ARX8 (R5 7645HX, RTX 4050)
AMD Ryzen 5 7645HX, NVIDIA GeForce RTX 4050 Laptop GPU
152.8 (57.9min, 118.1P1) fps +2%
Lenovo LOQ 15IRH8 Core i7
Intel Core i7-13620H, NVIDIA GeForce RTX 4050 Laptop GPU
149.2 (34.2min, 113.8P1) fps
Dota 2 Reborn - 1920x1080 ultra (3/3) best looking
Lenovo Legion Pro 5 16ARX8 (R5 7645HX, RTX 4050)
AMD Ryzen 5 7645HX, NVIDIA GeForce RTX 4050 Laptop GPU
175.6 (149.7min) fps +8%
Lenovo LOQ 15IRH8 Core i7
Intel Core i7-13620H, NVIDIA GeForce RTX 4050 Laptop GPU
162.2 (134min) fps
MSI Katana 17 B13VFK
Intel Core i7-13620H, NVIDIA GeForce RTX 4060 Laptop GPU
156.3 (132.3min) fps -4%
Lenovo LOQ 16IRH8
Intel Core i7-13620H, NVIDIA GeForce RTX 4060 Laptop GPU
153.1 (133.9min) fps -6%
Moyenne de la classe Gaming
  (30.8 - 220, n=188, 2 dernières années)
149.4 fps -8%
Dell G15 5530
Intel Core i7-13650HX, NVIDIA GeForce RTX 4060 Laptop GPU
144.8 (126.1min) fps -11%
HP Victus 16-r0077ng
Intel Core i7-13700H, NVIDIA GeForce RTX 4070 Laptop GPU
131.6 (112.7min) fps -19%
Lenovo LOQ 15APH8
AMD Ryzen 7 7840HS, NVIDIA GeForce RTX 4050 Laptop GPU
123.9 (110.9min) fps -24%
Asus TUF Gaming A16 FA617XS
AMD Ryzen 9 7940HS, AMD Radeon RX 7600S
121.6 (100.8min) fps -25%
X-Plane 11.11 - 1920x1080 high (fps_test=3)
MSI Katana 17 B13VFK
Intel Core i7-13620H, NVIDIA GeForce RTX 4060 Laptop GPU
118.9 fps +8%
Dell G15 5530
Intel Core i7-13650HX, NVIDIA GeForce RTX 4060 Laptop GPU
115.6 fps +5%
Lenovo LOQ 15IRH8 Core i7
Intel Core i7-13620H, NVIDIA GeForce RTX 4050 Laptop GPU
110.2 fps
Lenovo Legion Pro 5 16ARX8 (R5 7645HX, RTX 4050)
AMD Ryzen 5 7645HX, NVIDIA GeForce RTX 4050 Laptop GPU
110 fps 0%
Lenovo LOQ 16IRH8
Intel Core i7-13620H, NVIDIA GeForce RTX 4060 Laptop GPU
109.2 fps -1%
Moyenne de la classe Gaming
  (31.5 - 166.2, n=194, 2 dernières années)
107.3 fps -3%
HP Victus 16-r0077ng
Intel Core i7-13700H, NVIDIA GeForce RTX 4070 Laptop GPU
95.4 fps -13%
Lenovo LOQ 15APH8
AMD Ryzen 7 7840HS, NVIDIA GeForce RTX 4050 Laptop GPU
81.3 fps -26%
Asus TUF Gaming A16 FA617XS
AMD Ryzen 9 7940HS, AMD Radeon RX 7600S
57.3 fps -48%
The Witcher 3 - 2560x1440 Ultra Graphics & Postprocessing (HBAO+)
Moyenne de la classe Gaming
  (42.4 - 169.4, n=37, 2 dernières années)
106.6 fps +74%
Lenovo LOQ 16IRH8
Intel Core i7-13620H, NVIDIA GeForce RTX 4060 Laptop GPU
78.3 fps +28%
Lenovo LOQ 15IRH8 Core i7
Intel Core i7-13620H, NVIDIA GeForce RTX 4050 Laptop GPU
61.3 (55min, 55.31P1) fps
Moyenne NVIDIA GeForce RTX 4050 Laptop GPU
  (39 - 61.3, n=7)
54.7 fps -11%
Far Cry 5
1920x1080 Ultra Preset AA:T
Dell G15 5530
Intel Core i7-13650HX, NVIDIA GeForce RTX 4060 Laptop GPU
139 (90min) fps +15%
MSI Katana 17 B13VFK
Intel Core i7-13620H, NVIDIA GeForce RTX 4060 Laptop GPU
134 (109min) fps +11%
Lenovo LOQ 16IRH8
Intel Core i7-13620H, NVIDIA GeForce RTX 4060 Laptop GPU
133 fps +10%
Moyenne de la classe Gaming
  (34 - 218, n=102, 2 dernières années)
130.7 fps +8%
Lenovo LOQ 15IRH8 Core i7
Intel Core i7-13620H, NVIDIA GeForce RTX 4050 Laptop GPU
121 (98min) fps
Lenovo Legion Pro 5 16ARX8 (R5 7645HX, RTX 4050)
AMD Ryzen 5 7645HX, NVIDIA GeForce RTX 4050 Laptop GPU
119 (92min) fps -2%
Asus TUF Gaming A16 FA617XS
AMD Ryzen 9 7940HS, AMD Radeon RX 7600S
108 (77min) fps -11%
Moyenne NVIDIA GeForce RTX 4050 Laptop GPU
  (50 - 127, n=23)
102.5 fps -15%
2560x1440 Ultra Preset AA:T
Moyenne de la classe Gaming
  (71 - 194, n=81, 2 dernières années)
119.3 fps +44%
Lenovo LOQ 16IRH8
Intel Core i7-13620H, NVIDIA GeForce RTX 4060 Laptop GPU
104 fps +25%
MSI Katana 17 B13VFK
Intel Core i7-13620H, NVIDIA GeForce RTX 4060 Laptop GPU
99 (84min) fps +19%
Lenovo Legion Pro 5 16ARX8 (R5 7645HX, RTX 4050)
AMD Ryzen 5 7645HX, NVIDIA GeForce RTX 4050 Laptop GPU
88 (79min) fps +6%
Lenovo LOQ 15IRH8 Core i7
Intel Core i7-13620H, NVIDIA GeForce RTX 4050 Laptop GPU
83 (72min) fps
Moyenne NVIDIA GeForce RTX 4050 Laptop GPU
  (47 - 88, n=14)
69.6 fps -16%
Cyberpunk 2077 1.6
1920x1080 Ultra Preset
Moyenne de la classe Gaming
  (16.7 - 159.7, n=70, 2 dernières années)
92.6 fps +37%
Dell G15 5530
Intel Core i7-13650HX, NVIDIA GeForce RTX 4060 Laptop GPU
80 (40.7min) fps +18%
MSI Katana 17 B13VFK
Intel Core i7-13620H, NVIDIA GeForce RTX 4060 Laptop GPU
73.81 (36.7min) fps +9%
Lenovo LOQ 15APH8
AMD Ryzen 7 7840HS, NVIDIA GeForce RTX 4050 Laptop GPU
70.1 (15.3min) fps +3%
Lenovo LOQ 15IRH8 Core i7
Intel Core i7-13620H, NVIDIA GeForce RTX 4050 Laptop GPU
67.8 (43.7min) fps
Moyenne NVIDIA GeForce RTX 4050 Laptop GPU
  (44.4 - 79.4, n=14)
62.1 fps -8%
2560x1440 Ultra Preset
Moyenne de la classe Gaming
  (37.7 - 116, n=57, 2 dernières années)
69.4 fps +69%
MSI Katana 17 B13VFK
Intel Core i7-13620H, NVIDIA GeForce RTX 4060 Laptop GPU
45.9 (34.7min) fps +12%
Lenovo LOQ 15IRH8 Core i7
Intel Core i7-13620H, NVIDIA GeForce RTX 4050 Laptop GPU
41 (34.6min) fps
Moyenne NVIDIA GeForce RTX 4050 Laptop GPU
  (27.2 - 43.1, n=10)
35.7 fps -13%
1920x1080 Ray Tracing Ultra Preset (DLSS off)
Moyenne de la classe Gaming
  (19.1 - 74, n=26, 2 dernières années)
48.1 fps +99%
Dell G15 5530
Intel Core i7-13650HX, NVIDIA GeForce RTX 4060 Laptop GPU
34.3 (27.4min) fps +42%
Moyenne NVIDIA GeForce RTX 4050 Laptop GPU
  (15.8 - 65.6, n=5)
31.3 fps +29%
MSI Katana 17 B13VFK
Intel Core i7-13620H, NVIDIA GeForce RTX 4060 Laptop GPU
28 (20.9min) fps +16%
Lenovo LOQ 15IRH8 Core i7
Intel Core i7-13620H, NVIDIA GeForce RTX 4050 Laptop GPU
24.2 (4.17min) fps
F1 22
1920x1080 Ultra High Preset AA:T AF:16x
Moyenne de la classe Gaming
  (13 - 144.7, n=97, 2 dernières années)
84.5 fps +54%
Dell G15 5530
Intel Core i7-13650HX, NVIDIA GeForce RTX 4060 Laptop GPU
66.1 (53min, 40P1) fps +20%
MSI Katana 17 B13VFK
Intel Core i7-13620H, NVIDIA GeForce RTX 4060 Laptop GPU
65.4 (52min, 44P1) fps +19%
Lenovo LOQ 15IRH8 Core i7
Intel Core i7-13620H, NVIDIA GeForce RTX 4050 Laptop GPU
55 (44min, 40P1) fps
Asus TUF Gaming A16 FA617XS
AMD Ryzen 9 7940HS, AMD Radeon RX 7600S
50.5 (36min, 36P1) fps -8%
Moyenne NVIDIA GeForce RTX 4050 Laptop GPU
  (10.9 - 56.4, n=23)
47.6 fps -13%
2560x1440 Ultra High Preset AA:T AF:16x
Moyenne de la classe Gaming
  (29.9 - 92.2, n=76, 2 dernières années)
61.9 fps +83%
MSI Katana 17 B13VFK
Intel Core i7-13620H, NVIDIA GeForce RTX 4060 Laptop GPU
41 (35min, 33P1) fps +21%
Lenovo LOQ 15IRH8 Core i7
Intel Core i7-13620H, NVIDIA GeForce RTX 4050 Laptop GPU
33.9 (29min, 26P1) fps
Moyenne NVIDIA GeForce RTX 4050 Laptop GPU
  (6.58 - 34, n=14)
27.9 fps -18%
F1 23
1920x1080 Ultra High Preset AA:T AF:16x
Moyenne de la classe Gaming
  (12.9 - 149.2, n=40, 2 dernières années)
70.8 fps +61%
Lenovo Legion Pro 5 16ARX8 (R5 7645HX, RTX 4050)
AMD Ryzen 5 7645HX, NVIDIA GeForce RTX 4050 Laptop GPU
50.5 (40min, 40P1) fps +15%
Lenovo LOQ 15IRH8 Core i7
Intel Core i7-13620H, NVIDIA GeForce RTX 4050 Laptop GPU
44.1 (19min, 34P1) fps
Moyenne NVIDIA GeForce RTX 4050 Laptop GPU
  (25.7 - 60.8, n=14)
43.2 fps -2%
2560x1440 Ultra High Preset AA:T AF:16x
Moyenne de la classe Gaming
  (17 - 144.6, n=31, 2 dernières années)
50.5 fps +48%
Lenovo Legion Pro 5 16ARX8 (R5 7645HX, RTX 4050)
AMD Ryzen 5 7645HX, NVIDIA GeForce RTX 4050 Laptop GPU
40.8 (30min, 32P1) fps +20%
Lenovo LOQ 15IRH8 Core i7
Intel Core i7-13620H, NVIDIA GeForce RTX 4050 Laptop GPU
34.1 (20min, 25P1) fps
Moyenne NVIDIA GeForce RTX 4050 Laptop GPU
  (16.7 - 40.8, n=11)
31.2 fps -9%

Le tableau des FPS de Witcher 3

Bien que les performances soutenues du CPU du LOQ 15 (ou leur absence) fassent sourciller, le refroidissement de l'ordinateur portable semble adéquat pour le GPU RTX 4050 Laptop, comme en témoignent les taux de rafraîchissement relativement stables dans The Witcher 3 à 1080p Ultra.

0510152025303540455055606570758085Tooltip
Lenovo LOQ 15IRH8 Core i7 i7-13620H, NVIDIA GeForce RTX 4050 Laptop GPU: Ø84.7 (79-87)
BasMoyenÉlevéUltraQHD
GTA V (2015) 185.9 179.7 168.9 93.2 66
The Witcher 3 (2015) 390 286 167.6 85.6 61.3
Dota 2 Reborn (2015) 196.3 178.3 171.1 162.2
Final Fantasy XV Benchmark (2018) 192.9 121.2 84 60.9
X-Plane 11.11 (2018) 159.9 139.8 110.2
Far Cry 5 (2018) 156 135 128 121 83
Strange Brigade (2018) 475 211 171.8 149.2 95.5
Cyberpunk 2077 1.6 (2022) 103.3 85.5 72.9 67.8 41
F1 22 (2022) 233 224 172.3 55 33.9
F1 23 (2023) 228 222 158.4 44.1 34.1

Émissions : Températures de surface élevées sous charge

Bruit du système

Le bruit des ventilateurs du LOQ 15IRH8 au repos est similaire à celui du LOQ 15 AMD, mais les ventilateurs de ce dernier sont environ 7% plus bruyants à pleine charge. Lenovo a plafonné les niveaux de bruit des ventilateurs sous certains seuils en fonction du profil d'alimentation sélectionné, comme vous pouvez le voir dans le tableau ci-dessous.

Le mode Performance n'atteint pas la barre des 50 dB(A) en charge. Alors que le mode silencieux entraîne une baisse significative des performances du processeur, les jeux devraient être relativement faciles à réaliser avec le profil Performance.

Degré de la nuisance sonore

Au repos
29.03 / 29.03 / 29.03 dB(A)
Fortement sollicité
48.7 / 48.7 dB(A)
  red to green bar
 
 
30 dB
silencieux
40 dB(A)
audible
50 dB(A)
bruyant
 
min: dark, med: mid, max: light   Earthworks M23R, Arta (à 15 cm de distance)   bruit ambiant: 23.69 dB(A)
dB(A) 0102030405060708090Deep BassMiddle BassHigh BassLower RangeMidsHigher MidsLower HighsMid HighsUpper HighsSuper Highs2018.822.72523.822.23123.122.74017.121.35018.330.36320.528.58020.825.61002225.812522.628.416025.825.220025.729.325020.128.631522.932.540016.532.950015.132.563014.932.68008.235.51000735.412506.836.116006.437.820006.937.525006.837.131507.337.840008.239.65000839.263007.83680007.631.4100007.728.7125007.724.7160006.720.7SPL23.748.7N0.56.5median 8median 32.6Delta6.14.1hearing rangehide median Fan NoiseLenovo LOQ 15IRH8 Core i7
Ambient: 23.69 dB(A)
Mode de performance Ralenti dB(A) Charge moyenne dB(A) Charge maximale dB(A) Le Witcher 3 1080p Ultra dB(A)
Silence 25.28 33.09 36.07 36.69 / 78 fps
Équilibre 25.28 40.40 45.15 45.42 / 83 fps
Performance 29.03 48.72 48.71 48.52 / 85 fps
Lenovo LOQ 15IRH8 Core i7
i7-13620H, NVIDIA GeForce RTX 4050 Laptop GPU
Lenovo LOQ 16IRH8
i7-13620H, NVIDIA GeForce RTX 4060 Laptop GPU
Lenovo LOQ 15APH8
R7 7840HS, NVIDIA GeForce RTX 4050 Laptop GPU
MSI Katana 17 B13VFK
i7-13620H, NVIDIA GeForce RTX 4060 Laptop GPU
Lenovo Legion Pro 5 16ARX8 (R5 7645HX, RTX 4050)
R5 7645HX, NVIDIA GeForce RTX 4050 Laptop GPU
HP Victus 16-r0077ng
i7-13700H, NVIDIA GeForce RTX 4070 Laptop GPU
Dell G15 5530
i7-13650HX, NVIDIA GeForce RTX 4060 Laptop GPU
Asus TUF Gaming A16 FA617XS
R9 7940HS, Radeon RX 7600S
Noise
3%
9%
-6%
14%
2%
12%
3%
off / environment *
23.69
23
3%
23.1
2%
24.5
-3%
23
3%
25
-6%
20.41
14%
25
-6%
Idle Minimum *
29.03
23
21%
23.1
20%
24.5
16%
23
21%
28
4%
26.85
8%
25
14%
Idle Average *
29.03
23
21%
23.1
20%
24.5
16%
23
21%
29
-0%
26.85
8%
26
10%
Idle Maximum *
29.03
27.66
5%
25.2
13%
40
-38%
24.42
16%
30
-3%
26.85
8%
28
4%
Load Average *
48.7
53.62
-10%
44.3
9%
48.3
1%
34.94
28%
43
12%
27.65
43%
43
12%
Witcher 3 ultra *
48.5
53.5
-10%
45.8
6%
56
-15%
43.79
10%
46
5%
47.9
1%
51
-5%
Load Maximum *
48.7
53.5
-10%
52
-7%
59.1
-21%
50
-3%
48
1%
47.86
2%
53
-9%

* ... Moindre est la valeur, meilleures sont les performances

Température

Les températures de surface pendant les tests de stress dans le profil de performance peuvent devenir assez chaudes, en particulier sur le côté inférieur du châssis. Bien que nos tests de stress représentent des scénarios extrêmes, nous ne recommandons pas d'utiliser cet appareil sur vos genoux pour un usage autre que léger.

 45.4 °C46.4 °C45.2 °C 
 41.4 °C43.8 °C39.8 °C 
 34 °C30.8 °C31.2 °C 
Maximum: 46.4 °C
Moyenne: 39.8 °C
53.6 °C58 °C47.2 °C
46.8 °C59.2 °C55.2 °C
31.6 °C37.6 °C33.4 °C
Maximum: 59.2 °C
Moyenne: 47 °C
Alimentation (valeur maximale)  48.4 °C | Température ambiante de la pièce 22 °C | Amprobe TMD-50 // Fluke 62 Mini IR Thermometer
(-) La température moyenne de la face supérieure sous charge maximale est de 39.8 °C / 104 F, par rapport à la moyenne de 33.9 °C / 93 F pour les appareils de la classe Gaming.
(-) La température maximale du côté supérieur est de 46.4 °C / 116 F, par rapport à la moyenne de 40.5 °C / 105 F, allant de 21.2 à 68.8 °C pour la classe Gaming.
(-) Le fond chauffe jusqu'à un maximum de 59.2 °C / 139 F, contre une moyenne de 43.2 °C / 110 F
(±) En utilisation inactive, la température moyenne du côté supérieur est de 32.7 °C / 91 F, par rapport à la moyenne du dispositif de 33.9 °C / 93 F.
(-) En jouant à The Witcher 3, la température moyenne du côté supérieur est de 39.4 °C / 103 F, alors que la moyenne de l'appareil est de 33.9 °C / 93 F.
(+) Les repose-poignets et le pavé tactile atteignent la température maximale de la peau (34 °C / 93.2 F) et ne sont donc pas chauds.
(-) La température moyenne de la zone de l'appui-paume de dispositifs similaires était de 28.9 °C / 84 F (-5.1 °C / #-9.2 F).
Système à l'arrêt - Haut
Système à l'arrêt - Bas
Prime95 + FurMark stress - Top
Prime95 + FurMark stress - Bas
Le stress Witcher 3 - Haut de page
Le stress Witcher 3 - Bas
Lenovo LOQ 15IRH8 Core i7
Intel Core i7-13620H, NVIDIA GeForce RTX 4050 Laptop GPU
Lenovo LOQ 16IRH8
Intel Core i7-13620H, NVIDIA GeForce RTX 4060 Laptop GPU
Lenovo LOQ 15APH8
AMD Ryzen 7 7840HS, NVIDIA GeForce RTX 4050 Laptop GPU
MSI Katana 17 B13VFK
Intel Core i7-13620H, NVIDIA GeForce RTX 4060 Laptop GPU
Lenovo Legion Pro 5 16ARX8 (R5 7645HX, RTX 4050)
AMD Ryzen 5 7645HX, NVIDIA GeForce RTX 4050 Laptop GPU
HP Victus 16-r0077ng
Intel Core i7-13700H, NVIDIA GeForce RTX 4070 Laptop GPU
Dell G15 5530
Intel Core i7-13650HX, NVIDIA GeForce RTX 4060 Laptop GPU
Asus TUF Gaming A16 FA617XS
AMD Ryzen 9 7940HS, AMD Radeon RX 7600S
Heat
10%
13%
11%
1%
3%
-3%
9%
Maximum Upper Side *
46.4
48
-3%
44.4
4%
41.6
10%
45
3%
51
-10%
54
-16%
53
-14%
Maximum Bottom *
59.2
59
-0%
52
12%
43.1
27%
54
9%
54
9%
62.2
-5%
48
19%
Idle Upper Side *
34.4
28
19%
28
19%
32
7%
36
-5%
37
-8%
33.4
3%
30
13%
Idle Bottom *
36.2
28
23%
29.6
18%
35.8
1%
38
-5%
29
20%
33.4
8%
30
17%

* ... Moindre est la valeur, meilleures sont les performances

Test de stress

Contrairement à ce que nous avons vu avec le test de boucle multi-cœur Cinebench R15, en stressant le LOQ 15 avec Prime95 in-place large FFTs, le Core i7-13620H peut finalement atteindre 133 W avec une horloge maximale de 4.27 GHz. Cependant, ce n'est que de courte durée puisque le processeur se stabilise à une puissance moyenne de 65 W.

Un test combiné Prime95 et FurMark indique que la RTX 4050 peut utiliser jusqu'à 117 W avec une horloge maximale de 2 565 MHz. Le Core i7-13620H doit faire face à un pic de 3,6 GHz car il doit partager la marge thermique et énergétique avec la RTX 4050.

Test de stress Horloge du CPU (GHz) Horloge du GPU (MHz) Température moyenne du CPU (°C) Température moyenne du GPU (°C)
Système au repos 4.3 210 37 38.4
Prime95 4.8 210 75 54.2
Prime95 + FurMark 3.2 2,220 77 79.7
The Witcher 3 1080p Ultra 4.8 2,535 76 80.5

Dans le test de stress Witcher 3 1080p Ultra, la RTX 4050 est capable d'atteindre la même fréquence de 2 565 MHz mais avec un TGP maximum beaucoup plus bas de 103 W. Cela laisse un peu d'espace au Core i7-13620H pour utiliser jusqu'à 42 W pour un boost maximum de 4,26 GHz.

Horloges, températures et variations de puissance du CPU/GPU pendant le stress Prime95
Horloges, températures et variations de puissance du CPU/GPU pendant le stress Prime95 + FurMark
Horloges, températures et variations de puissance du CPU/GPU pendant le stress de The Witcher 3

Intervenants

Les haut-parleurs du LOQ 15IRH8 ont un niveau sonore correct. Les basses ne sont pas très profondes, mais les médiums et les aigus sont correctement reproduits. Les utilisateurs peuvent obtenir une meilleure sortie audio via des haut-parleurs filaires ou Bluetooth 5.2.

Les haut-parleurs embarqués du LOQ 15 ont une puissance sonore décente
Diagramme de bruit rose
dB(A) 0102030405060708090Deep BassMiddle BassHigh BassLower RangeMidsHigher MidsLower HighsMid HighsUpper HighsSuper Highs2018.818.32523.817.23123.1224017.119.35018.320.96320.526.48020.824.41002228.912522.633.116025.839.820025.748.225020.15431522.957.740016.559.950015.159.963014.962.88008.265.31000766.512506.866.716006.463.120006.962.225006.86231507.36140008.264.15000859.863007.864.880007.666.7100007.765.4125007.763.4160006.764.1SPL23.775.9N0.538.6median 8median 62.2Delta6.16.126.325.821.422.12624.925.127.622.532.523.448.72655.818.860.922.167.2267019.372.317.674.217.774.319.575.31571.711.871.311.27410.574.21072.710.17210.67210.97511.374.811.671.71269.71269.612.371.112.669.61270.111.269.824.784.70.666.6median 12median 71.73.42.2hearing rangehide median Pink NoiseLenovo LOQ 15IRH8 Core i7Apple MacBook Pro 16 2021 M1 Pro
Diagramme de fréquence (les cases peuvent être cochées et décochées pour comparer les appareils)
Lenovo LOQ 15IRH8 Core i7 analyse audio

(±) | le niveau sonore du haut-parleur est moyen mais bon (75.9# dB)
Bass 100 - 315 Hz
(-) | presque aucune basse - en moyenne 18.6% plus bas que la médiane
(±) | la linéarité des basses est moyenne (10.2% delta à la fréquence précédente)
Mids 400 - 2000 Hz
(+) | médiane équilibrée - seulement 2.2% de la médiane
(+) | les médiums sont linéaires (3.1% delta à la fréquence précédente)
Aiguës 2 - 16 kHz
(+) | des sommets équilibrés - à seulement 2.3% de la médiane
(+) | les aigus sont linéaires (4.4% delta à la fréquence précédente)
Overall 100 - 16.000 Hz
(+) | le son global est linéaire (13.7% différence à la médiane)
Par rapport à la même classe
» 20% de tous les appareils testés de cette catégorie étaient meilleurs, 6% similaires, 74% pires
» Le meilleur avait un delta de 6%, la moyenne était de 18%, le pire était de 132%.
Par rapport à tous les appareils testés
» 13% de tous les appareils testés étaient meilleurs, 3% similaires, 84% pires
» Le meilleur avait un delta de 4%, la moyenne était de 25%, le pire était de 134%.

Apple MacBook Pro 16 2021 M1 Pro analyse audio

(+) | les haut-parleurs peuvent jouer relativement fort (84.7# dB)
Bass 100 - 315 Hz
(+) | bonne basse - seulement 3.8% loin de la médiane
(+) | les basses sont linéaires (5.2% delta à la fréquence précédente)
Mids 400 - 2000 Hz
(+) | médiane équilibrée - seulement 1.3% de la médiane
(+) | les médiums sont linéaires (2.1% delta à la fréquence précédente)
Aiguës 2 - 16 kHz
(+) | des sommets équilibrés - à seulement 1.9% de la médiane
(+) | les aigus sont linéaires (2.7% delta à la fréquence précédente)
Overall 100 - 16.000 Hz
(+) | le son global est linéaire (4.6% différence à la médiane)
Par rapport à la même classe
» 0% de tous les appareils testés de cette catégorie étaient meilleurs, 0% similaires, 100% pires
» Le meilleur avait un delta de 5%, la moyenne était de 18%, le pire était de 45%.
Par rapport à tous les appareils testés
» 0% de tous les appareils testés étaient meilleurs, 0% similaires, 100% pires
» Le meilleur avait un delta de 4%, la moyenne était de 25%, le pire était de 134%.

Gestion de l'énergie : La variante AMD semble plus économique

Consommation électrique

Malgré les différences d'affichage, le LOQ 15APH8 équipé de Ryzen 7 7840HS est environ 18% plus économe en énergie que notre LOQ 15IRH8 basé sur Intel.

Le modèle tout AMD Asus TUF Gaming A16 est le plus économe, mais sa consommation en charge est comparable à celle du LOQ 15IRH8. La consommation d'énergie en charge maximale dépasse les 170 W du chargeur fourni.

Consommation énergétique
Éteint/en veilledarklight 0.39 / 0.77 Watts
Au reposdarkmidlight 18.52 / 22.54 / 29.79 Watts
Fortement sollicité midlight 94.5 / 190.4 Watts
 color bar
Légende: min: dark, med: mid, max: light        Metrahit Energy
Lenovo LOQ 15IRH8 Core i7
i7-13620H, NVIDIA GeForce RTX 4050 Laptop GPU, IPS, 2560x1440, 15.6"
Lenovo LOQ 16IRH8
i7-13620H, NVIDIA GeForce RTX 4060 Laptop GPU, IPS, 2560x1600, 16"
Lenovo LOQ 15APH8
R7 7840HS, NVIDIA GeForce RTX 4050 Laptop GPU, IPS, 1920x1080, 15.6"
MSI Katana 17 B13VFK
i7-13620H, NVIDIA GeForce RTX 4060 Laptop GPU, IPS LED, 1920x1080, 17.3"
Lenovo Legion Pro 5 16ARX8 (R5 7645HX, RTX 4050)
R5 7645HX, NVIDIA GeForce RTX 4050 Laptop GPU, IPS, 2560x1600, 16"
HP Victus 16-r0077ng
i7-13700H, NVIDIA GeForce RTX 4070 Laptop GPU, IPS, 1920x1080, 16.1"
Dell G15 5530
i7-13650HX, NVIDIA GeForce RTX 4060 Laptop GPU, IPS, 1920x1080, 15.6"
Asus TUF Gaming A16 FA617XS
R9 7940HS, Radeon RX 7600S, IPS, 1920x1200, 16"
Moyenne NVIDIA GeForce RTX 4050 Laptop GPU
 
Moyenne de la classe Gaming
 
Power Consumption
6%
18%
19%
15%
20%
12%
31%
26%
2%
Idle Minimum *
18.52
17.2
7%
15
19%
12.2
34%
13
30%
8
57%
8.4
55%
7
62%
9.84 ?(2 - 21.1, n=30)
47%
Idle Average *
22.54
19.3
14%
17.7
21%
14.9
34%
17.4
23%
13
42%
14.98
34%
10
56%
14.8 ?(5 - 32, n=30)
34%
Idle Maximum *
29.79
21.2
29%
21.5
28%
15.8
47%
21.8
27%
22
26%
15.56
48%
15
50%
Load Average *
94.5
90
5%
73.5
22%
85.22
10%
96.4
-2%
86
9%
96.8
-2%
86
9%
Witcher 3 ultra *
154.4
168
-9%
138.6
10%
151.1
2%
125
19%
141.8
8%
186
-20%
160.6
-4%
Load Maximum *
190.4
211
-11%
176.5
7%
212.8
-12%
204
-7%
233
-22%
271.42
-43%
172
10%

* ... Moindre est la valeur, meilleures sont les performances

Power Consumption: The Witcher 3 / Stress test

0102030405060708090100110120130140150160170180190Tooltip
Lenovo LOQ 15IRH8 Core i7; 3DMark06 Return To Proxycon: Ø94.5 (73.3-111.3)
Lenovo LOQ 15IRH8 Core i7; 1280x720 Prime95 28.10 and Furmark 1.25: Ø169.2 (161.6-190.4)
Lenovo LOQ 15IRH8 Core i7; Witcher 3 ultra: Ø154.4 (145.5-162.3)

Power Consumption: External Monitor

0102030405060708090100110120130140150160170180Tooltip
Lenovo LOQ 15IRH8 Core i7; Prime95 V2810 Stress (external Monitor): Ø121 (112.1-185.3)
Lenovo LOQ 15IRH8 Core i7; Cinebench R15 Multi (external Monitor): Ø132.6 (126.9-142.3)
Lenovo LOQ 15IRH8 Core i7; Cinebench R20 Single (external Monitor): Ø53.7 (51.5-101.2)
Lenovo LOQ 15IRH8 Core i7; Cinebench R20 Multi (external Monitor): Ø128.6 (107.5-150.2)
Lenovo LOQ 15IRH8 Core i7; Cinebench R23 Single (external Monitor): Ø53.5 (51-122.5)
Lenovo LOQ 15IRH8 Core i7; Cinebench R23 Multi (external Monitor): Ø133.4 (106.9-168.3)
Lenovo LOQ 15IRH8 Core i7; 1280x720 FurMark 1.19 GPU Stress Test (external Monitor): Ø145.7 (139.6-151.8)
Lenovo LOQ 15IRH8 Core i7; 1920x1080 The Witcher 3 ultra (external Monitor): Ø147.5 (133.2-158.5)
Lenovo LOQ 15IRH8 Core i7; Idle 1min (external Monitor): Ø21.4 (20.2-25.4)

Autonomie de la batterie

Les durées de vie des batteries sont similaires à celles que nous avons observées avec le LOQ 16IRH8. Les gains de consommation d'énergie du LOQ 15APH8 se traduisent par une durée de vie de la batterie supérieure de 25 % à celle du LOQ 15IRH8.

L'adaptateur électrique de 170 W fourni prend en charge la charge rapide Rapid Charge, qui peut être activée dans l'application Lenovo Vantage. Cela permet de charger l'appareil de zéro à 100 % en 45 minutes environ.

Autonomie
WiFi Websurfing
5h 53min
WiFi Websurfing max. Brightness
4h 46min
En lecture de Big Buck Bunny encodé en H.264 1080p
6h 06min
Lenovo LOQ 15IRH8 Core i7
i7-13620H, NVIDIA GeForce RTX 4050 Laptop GPU, 60 Wh
Lenovo LOQ 16IRH8
i7-13620H, NVIDIA GeForce RTX 4060 Laptop GPU, 80 Wh
Lenovo LOQ 15APH8
R7 7840HS, NVIDIA GeForce RTX 4050 Laptop GPU, 60 Wh
MSI Katana 17 B13VFK
i7-13620H, NVIDIA GeForce RTX 4060 Laptop GPU, 53.5 Wh
Lenovo Legion Pro 5 16ARX8 (R5 7645HX, RTX 4050)
R5 7645HX, NVIDIA GeForce RTX 4050 Laptop GPU, 80 Wh
HP Victus 16-r0077ng
i7-13700H, NVIDIA GeForce RTX 4070 Laptop GPU, 83 Wh
Dell G15 5530
i7-13650HX, NVIDIA GeForce RTX 4060 Laptop GPU, 86 Wh
Asus TUF Gaming A16 FA617XS
R9 7940HS, Radeon RX 7600S, 90 Wh
Moyenne de la classe Gaming
 
Autonomie de la batterie
6%
25%
-50%
-9%
21%
11%
108%
9%
H.264
366
385
5%
325
-11%
405
11%
746
104%
WiFi v1.3
353
376
7%
441
25%
176
-50%
333
-6%
426
21%
391
11%
745
111%
Load
88
65
58
50
52
Reader / Idle
587
1217
Witcher 3 ultra
47
47

Points positifs

+ 140 W de puissance délivrée par l'USB-C
+ Panneau QHD 165 Hz G-Sync avec temps de réponse réduits et sans PWM
+ Meilleure performance dans les jeux que la variante Ryzen 7 7840HS
+ Niveaux de bruit relativement faibles sous charge
+ La RTX 4050 peut utiliser plus que sa puissance nominale de 95 W TGP

Points négatifs

- Construction en plastique
- Pas de prise en charge du Wi-Fi 6
- Le Core i7-13620H ne tient pas bien la route
- Températures de surface élevées sous charge
- La consommation d'énergie et l'autonomie de la batterie ne sont pas aussi bonnes que celles de la variante Ryzen 7

Verdict : des jeux en 1080p Ultra qui ne coûtent pas les yeux de la tête

Lenovo LOQ 15IRH8. L'unité d'évaluation a été gracieusement fournie par Lenovo India.

Le LOQ 15 Core i7 est doté d'un écran QHD G-Sync de 165 Hz et d'une webcam 1080p malgré son faible coût. L'écran QHD est particulièrement impressionnant, avec des couleurs et des temps de réponse nettement améliorés par rapport à l'option FHD 144 Hz.

La qualité de fabrication souffre naturellement de l'abondance de plastique. Plus inquiétant, le Core i7-13620H du LOQ 15IRH8 a du mal à maintenir ses performances, contrairement à ce que nous avons pu voir avec le Core i7-13620H basé sur le AMD Ryzen 7 7840HS LOQ 15APH8 ou même le LOQ 16IRH8.

Cependant, les performances sont suffisantes pour un jeu fluide en 1080p, grâce au processeur Intel i7-13620H et à la carte graphique RTX 4050 qui peut utiliser plus que son TGP nominal.

Le Lenovo LOQ 15 Core i7 remplit la plupart des conditions et mérite d'être considéré si vous êtes à la recherche d'un ordinateur portable capable de jouer en 1080p aux alentours de 1 200 dollars ou 1 00 00 euros. Cependant, les attentes doivent être tempérées en ce qui concerne la qualité de construction et les émissions de chaleur."

Un autre domaine dans lequel le LOQ 15 basé sur Intel déçoit est celui des émissions de chaleur. En revanche, les niveaux de bruit des ventilateurs sont gérables, et il est possible de jouer convenablement à 1080p même avec des profils de puissance inférieurs.

Le choix entre le LOQ 15 à base d'Intel et celui à base d'AMD se résume à une question de priorités. La version Intel offre une meilleure puissance de jeu en 1080p et un bruit de ventilateur plus faible en charge. Mais la variante AMD est plus performante au niveau du processeur, elle est plus froide, plus économe en énergie et a une meilleure autonomie de batterie.

Cela dit, les deux variantes du LOQ 15 présentent un excellent rapport qualité-prix par rapport au Legion Pro 5 16. Des ordinateurs portables tels que le HP Victus 16 et le MSI Katana 17 sont nettement mieux classés, mais leur prix ne semble pas correspondre au matériel proposé par rapport au LOQ 15.

Prix et disponibilité

Le LOQ 15 Core i7 est proposé à partir de 97 790 euros pour la variante FHD 144 Hz et peut être acheté directement sur le site Lenovo India. Le site web ne mentionne pas actuellement la disponibilité de la variante QHD testée.

Amazon India n'a pas la plupart des variantes du LOQ 15 en stock actuellement, à l'exception du LOQ 16IRH8 avec un Core i7-13700H et RTX 4060 qui est listé à ₹2,25,766.

Lenovo US propose également une multitude de LOQ 15 Intel 13e génération avec plusieurs options de GPU Nvidia. Best Buy propose un LOQ 15 équipé d'un Core i5-13420H et d'une carte graphique RTX 3050 pour 650 dollars. Amazon US propose une variante avec une RTX 4050 pour 1 227 dollars. Une option Ryzen 7 7840HS avec RTX 4050 est également disponible chez Best Buy pour 1 240 dollars.

Lenovo LOQ 15IRH8 Core i7 - 10/13/2023 v7 (old)
Vaidyanathan Subramaniam

Châssis
75 / 98 → 76%
Clavier
85%
Dispositif de pointage
86%
Connectivité
61 / 80 → 77%
Poids
60 / 10-66 → 90%
Autonomie
67 / 95 → 70%
Écran
88%
Performances en jeu
99%
Performances dans les applications
96%
Chauffe
79 / 95 → 83%
Nuisance sonore
74 / 90 → 83%
Audio
74%
Appareil photo
40 / 85 → 46%
Moyenne
76%
86%
Gaming - Moyenne compensée

Transparency

The selection of devices to be reviewed is made by our editorial team. The test sample was provided to the author as a loan by the manufacturer or retailer for the purpose of this review. The lender had no influence on this review, nor did the manufacturer receive a copy of this review before publication. There was no obligation to publish this review. We never accept compensation or payment in return for our reviews. As an independent media company, Notebookcheck is not subjected to the authority of manufacturers, retailers or publishers.

This is how Notebookcheck is testing

Every year, Notebookcheck independently reviews hundreds of laptops and smartphones using standardized procedures to ensure that all results are comparable. We have continuously developed our test methods for around 20 years and set industry standards in the process. In our test labs, high-quality measuring equipment is utilized by experienced technicians and editors. These tests involve a multi-stage validation process. Our complex rating system is based on hundreds of well-founded measurements and benchmarks, which maintains objectivity. Further information on our test methods can be found here.

Price comparison

Please share our article, every link counts!
Mail Logo
> Revues et rapports de ordinateurs portatifs et smartphones, ordiphones > Critiques > Test du Lenovo LOQ 15 Core i7 : alternative abordable au Legion mais au cœur du conflit Intel - AMD
Vaidyanathan Subramaniam, 2023-10-14 (Update: 2023-10-16)