Notebookcheck Logo

Test de l'Asus ROG Strix Scar 15 G533zm : PC portable de jeu RTX 3060 moderne aux nombreuses qualités

Personnalisez votre Scar grâce à l'impression 3D.

Après avoir testé le Scar 15 G533zw avec une RTX 3070 Ti, nous venons de mettre la main sur le G533zm avec une RTX 3060. L'ordinateur portable Scar est personnalisable et offre de nombreuses fonctionnalités modernes, telles que le Wi-Fi 6E, la RAM DDR5 et le Thunderbolt 4. Dans notre test, nous verrons si ces fonctionnalités sont suffisantes pour justifier le prix assez élevé de 1 999 € (2 166 $) pour un ordinateur portable de jeu RTX 3060.

Nous disposons actuellement de deux modèles de l'Asus ROG Strix Scar 15 à tester. Cet article se concentre sur la RTX 3060 tandis qu'une revue de la RTX 3070 Ti sera publiée en parallèle. Outre la RTX 3060, notre SKU est équipée d'un puissant processeur Alder Lake i9-12900H D'un puissant processeur Alder Lake, de 16 Go de RAM et d'un écran QHD de 240 Hz.

L'année dernière, nous avons passé en revue le précédent Scar 15 avec une RTX 3080il est donc plus logique de comparer notre modèle avec sa sœur RTX 3070 Ti. De plus, nous avons choisi d'inclure dans notre comparaison d'autres ordinateurs portables de jeu de 15 pouces dotés du même GPU, tels que le Asus TUF Gaming F15le MSI Pulse GL66 et l Alienware m15 R5. Bien que la comparaison porte également sur le Lenovo Legion 5 avec une Radeon RX6600Mce portable n'est pas dans la même tranche de prix que le Strix Scar, étant donné que notre configuration d'évaluation est vendue à environ 2 000 € (2 170 $ US) alors que le Legion coûte un peu plus de 1 000 € (1 085 $ US).

Pour plus d'informations sur le châssis, la maintenance, les périphériques d'entrée et plus encore, veuillez vous référer à notre principale de l'Asus ROG Strix Scar avec RTX 3070 Ti.

Asus ROG Strix Scar 15 G533zm (ROG Strix Scar 15 Gamme)
Processeur
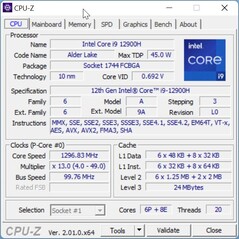
Intel Core i9-12900H 14 x 1.8 - 5 GHz, 135 W PL2 / Short Burst, 135 W PL1 / Sustained, Alder Lake-H
Carte graphique
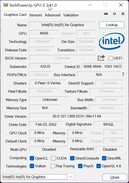
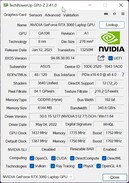
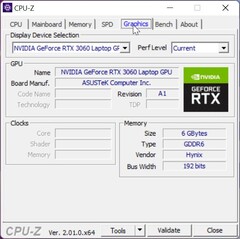
NVIDIA GeForce RTX 3060 Laptop GPU - 6 Go VRAM, 140 W TDP ( y compris 25 W Dynamic Boost), Geforce 512.77, MUX Switch + Optimus
Mémoire
16 Go 
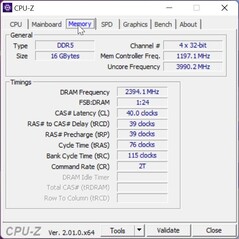
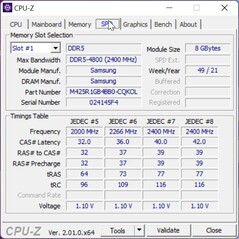
, 2x 8 GB Samsung DDR5-4800
Écran
15.60 pouces 16:9, 2560 x 1440 pixel 188 PPP, BOE CQ NE156QHM-NZ2 (BOE0A55), IPS, brillant: oui, 240 Hz
Carte mère
Intel Alder Lake-P PCH
Carte son
Intel Alder Lake-P PCH - cAVS (Audio, Voice, Speech)
Connexions
2 USB 3.0 / 3.1 Gen1, 2 USB 3.2 Gen 2x2 20Gbps, 1 Thunderbolt, USB-C Power Delivery (PD), 1 HDMI, 2 DisplayPort, Connectique audio: Headset jack port
Réseau
Realtek RTL8125 2.5GBe Family Ethernet Controller (10/100/1000/2500MBit/s), Intel Wi-Fi 6E AX211 (a/b/g/h/n = Wi-Fi 4/ac = Wi-Fi 5/ax = Wi-Fi 6/ Wi-Fi 6E 6 GHz), Bluetooth Bluetooth 5.2
Taille
Hauteur x Largeur x Profondeur (en mm): 27.2 x 354 x 259
Batterie
90 Wh Lithium-Ion
Système d'exploitation
Microsoft Windows 11 Home
Fonctionnalités additionnelles
Haut-parleurs: 4-speaker system with Smart Amplifier Technology, Clavier: chiclet with RGB per key, Rétroéclairage du clavier: oui, 24 Mois Garantie
Poids
2.328 kg, Alimentation: 734 g
Prix
1999 Euro
Remarque : le fabricant peut utiliser des composants provenant de différents fournisseurs, notamment des panneaux d'affichage, des lecteurs ou des clés USB ayant des spécifications similaires.


Comparaison des alternatives possibles

Note
Date
Modèle
Poids
Épaisseur
Taille
Résolution
Meilleur prix
89.2 %
v7 (old)
11/24
Asus ROG Strix Scar 15 G533zm
i9-12900H, GeForce RTX 3060 Laptop GPU
2.3 kg27.2 mm15.60"2560x1440
86.3 %
v7 (old)
06/22
Asus ROG Strix Scar 15 G533ZW-LN106WS
i9-12900H, GeForce RTX 3070 Ti Laptop GPU
2.3 kg27.2 mm15.60"2560x1440
87.2 %
v7 (old)
03/22
Asus TUF Gaming F15 FX507ZM
i7-12700H, GeForce RTX 3060 Laptop GPU
2.1 kg24.95 mm15.60"1920x1080
80.7 %
v7 (old)
04/22
MSI Pulse GL66 12UEK
i9-12900H, GeForce RTX 3060 Laptop GPU
2.3 kg25 mm15.60"1920x1080
84.7 %
v7 (old)
06/21
Alienware m15 R5 Ryzen Edition
R7 5800H, GeForce RTX 3060 Laptop GPU
2.5 kg22.85 mm15.60"1920x1080
82.6 %
v7 (old)
05/22
Lenovo Legion 5 15ACH6A-82NW0010GE
R5 5600H, Radeon RX 6600M
2.5 kg25.75 mm15.60"1920x1080

Boîtier - Design attrayant pour un ordinateur portable de jeu

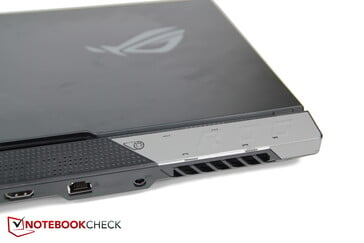
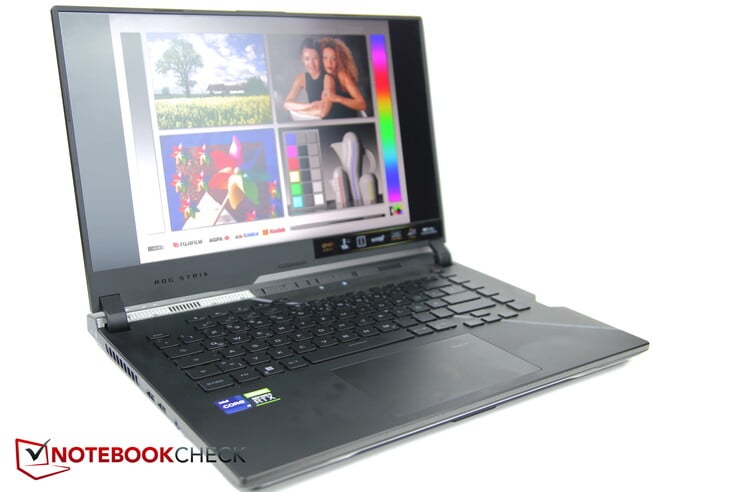
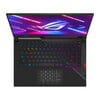
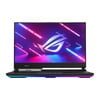
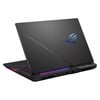
Une philosophie de conception assez unique imprègne l'ensemble du ROG Scar, ce qui en fait un ordinateur portable attrayant pour les joueurs. Avec des lignes diagonales, une plaque remplaçable sur le couvercle arrière, des accents de couleur subtils et des éléments RGB, le fabricant a créé un style de jeu distinct sans un éclairage trop voyant qui clignote et brille.

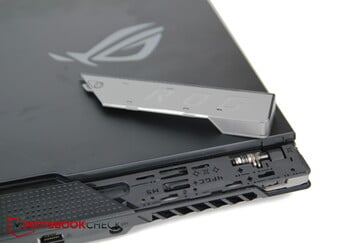
Plaque ROG interchangeable
Asus a inclus deux plaques de remplacement
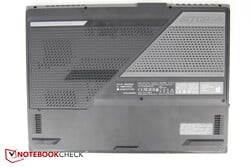
Pieds en caoutchouc brillant, lignes diagonales

Par exemple, une bande lumineuse traverse toute la face avant, mais elle est légèrement en retrait, ce qui la rend moins proéminente. Cette bande lumineuse peut également être synchronisée avec le clavier et le logo ROG sur la face supérieure.

Sur le dessous, de larges pieds en caoutchouc de couleur vive ajoutent du contraste au châssis à dominante noire.

Malgré sa construction presque entièrement en plastique, le Strix Scar 15 semble plutôt robuste. L'écran ne fait aucun bruit lorsqu'on le tourne, tandis que la partie inférieure ne grince que légèrement.

L'écran est solidement maintenu en place par deux charnières et n'oscille pratiquement pas lorsqu'il est déplacé.

Comparaison des tailles

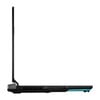
Dans l'ensemble, le Scar 15 est légèrement plus épais mais un peu plus petit que certains de ses concurrents. Il est également relativement léger ; par exemple, les modèles Alienware et Legion sont plus lourds, et seul le TUF Gaming F15 est légèrement plus léger.

Benchmark Comparison Plugin: ERROR, Layout "0" not supported!

Spécifications - Thunderbolt 4, Keystone, mais pas de webcam

Le Strix est équipé de deux ports USB-C, dont l'un prend en charge Thunderbolt 4 et l'autre est capable de vitesses USB 3.2 Gen 2. Les deux offrent une fonctionnalité DisplayPort. Cela montre que l'ordinateur portable dispose de caractéristiques assez modernes. Les E/S sont bien réparties sur le côté gauche et à l'arrière de l'appareil.

Le côté droit ne comporte qu'un emplacement Keystone. Le Keystone est en quelque sorte un petit périphérique de stockage et un commutateur en un. Par exemple, il peut être utilisé pour stocker des paramètres et les transférer vers des ordinateurs portables qui prennent en charge cette fonction (une liste de modèles compatibles est fournie par Asus). Il peut également servir de clé de sécurité sur le Strix Scar : une fois configuré, l'ordinateur portable ne s'allumera que si le Keystone est inséré. Une autre application consiste à permettre un accès rapide aux programmes. Les utilisateurs peuvent demander à l'ordinateur portable d'ouvrir automatiquement un certain programme, tel qu'un jeu, lorsque la Keystone est branchée. L'ordinateur portable peut également être programmé pour effectuer une combinaison d'actions, comme passer en mode ventilateur haute performance et lancer Cyberpunk simultanément. Le choix est entre les mains de l'utilisateur.

L'appareil d'Asus est toutefois dépourvu d'une webcam. Le Scar Strix est donc l'un des rares ordinateurs portables (de jeu) dépourvus de webcam.

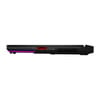
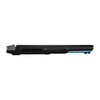
Gauche : 2x USB-A 3.0 (3.2 Gen1), prise audio combo
Droit : Keystone
Droit : Keystone
Arrière : USB-C Thunderbolt 4 avec DP, USB-C 3.2 Gen2 avec DP et PD, HDMI 2.1, LAN, port d'alimentation

Connectivité

Networking
iperf3 transmit AX12
Alienware m15 R5 Ryzen Edition
Killer Wi-Fi 6 AX1650x Wireless Network Adapter (200NGW)
1371 (925min - 1499max) MBit/s
Moyenne Intel Wi-Fi 6E AX211
  (1003 - 1501, n=4)
1320 MBit/s
Asus TUF Gaming F15 FX507ZM
Intel Wi-Fi 6 AX201
1045 (936min - 1115max) MBit/s
Lenovo Legion 5 15ACH6A-82NW0010GE
Realtek RTL8852AE
865 (767min - 911max) MBit/s
MSI Pulse GL66 12UEK
Intel Wi-Fi 6 AX201
690 (352min - 713max) MBit/s
iperf3 receive AX12
Asus TUF Gaming F15 FX507ZM
Intel Wi-Fi 6 AX201
1445 (1383min - 1538max) MBit/s
Moyenne Intel Wi-Fi 6E AX211
  (1178 - 1623, n=4)
1409 MBit/s
Alienware m15 R5 Ryzen Edition
Killer Wi-Fi 6 AX1650x Wireless Network Adapter (200NGW)
1330 (711min - 1563max) MBit/s
Lenovo Legion 5 15ACH6A-82NW0010GE
Realtek RTL8852AE
708 (665min - 735max) MBit/s
MSI Pulse GL66 12UEK
Intel Wi-Fi 6 AX201
702 (588min - 717max) MBit/s
iperf3 receive AXE11000 6GHz
Asus ROG Strix Scar 15 G533ZW-LN106WS
Intel Wi-Fi 6E AX211
1857 (831min - 1948max) MBit/s +16%
Asus ROG Strix Scar 15 G533zm
Intel Wi-Fi 6E AX211
1601 (639min - 1624max) MBit/s
Moyenne Intel Wi-Fi 6E AX211
  (700 - 1857, n=213)
1493 MBit/s -7%
Moyenne de la classe Gaming
  (853 - 1788, n=69, 2 dernières années)
1491 MBit/s -7%
iperf3 transmit AXE11000 6GHz
Asus ROG Strix Scar 15 G533ZW-LN106WS
Intel Wi-Fi 6E AX211
1481 (1314min - 1543max) MBit/s +5%
Moyenne de la classe Gaming
  (648 - 1878, n=69, 2 dernières années)
1432 MBit/s +2%
Asus ROG Strix Scar 15 G533zm
Intel Wi-Fi 6E AX211
1404 (693min - 1451max) MBit/s
Moyenne Intel Wi-Fi 6E AX211
  (385 - 1851, n=214)
1368 MBit/s -3%
0501001502002503003504004505005506006507007508008509009501000105011001150120012501300135014001450150015501600Tooltip
Asus ROG Strix Scar 15 G533zm; iperf3 transmit AXE11000 6GHz; iperf 3.1.3: Ø1381 (693-1451)
Asus ROG Strix Scar 15 G533zm; iperf3 receive AXE11000 6GHz; iperf 3.1.3: Ø1532 (639-1624)

Périphériques d'entrée - Le bouton du pavé tactile peut se bloquer légèrement

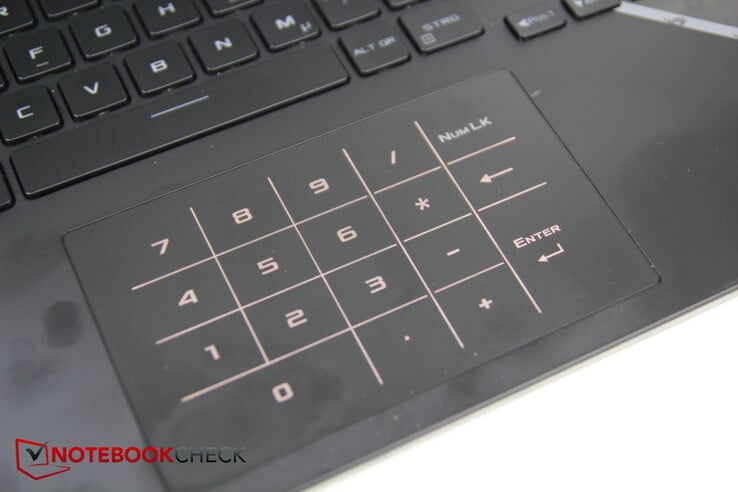
Pavé tactile

L'énorme pavé tactile a un petit truc en plus : il peut afficher un pavé numérique. Cela dit, les boutons intégrés de notre modèle d'essai peuvent parfois se bloquer légèrement, en particulier le bouton gauche, ce que nous avons trouvé très ennuyeux.

Écran - QHD avec 240 Hz et Dolby Vision Atmos

L'écran QHD IPS (2 560 x 1 440 pixels) fabriqué par BOE offre des temps de réponse assez rapides, un taux de rafraîchissement élevé de 240 Hz et une excellente couverture des couleurs, capable de reproduire la quasi-totalité des gammes sRGB et AdobeRGB.

L'écran a une luminosité moyenne de 300 nits et une distribution de la luminosité de 89%. Cependant, le niveau de noir et le contraste sont plutôt moyens.

L'ordinateur portable n'utilise pas de PWM pour ajuster la luminosité, et il n'y a qu'une infime quantité de saignement d'écran.

314
cd/m²
354
cd/m²
346
cd/m²
330
cd/m²
349
cd/m²
349
cd/m²
320
cd/m²
321
cd/m²
317
cd/m²
Homogénéité de la luminosité
BOE CQ NE156QHM-NZ2 (BOE0A55) tested with X-Rite i1Pro 3
Maximum: 354 cd/m² (Nits) Moyenne: 333.3 cd/m² Minimum: 4.3 cd/m²
Homogénéité de la luminosité: 89 %
Valeur mesurée au centre, sur batterie: 357 cd/m²
Contraste: 1026:1 (Valeurs des noirs: 0.34 cd/m²)
ΔE Color 3.44 | 0.5-29.43 Ø4.91, calibrated: 2.43
ΔE Greyscale 3.34 | 0.5-98 Ø5.2
84.1% AdobeRGB 1998 (Argyll 2.2.0 3D)
99.6% sRGB (Argyll 2.2.0 3D)
95% Display P3 (Argyll 2.2.0 3D)
Gamma: 2.5
Asus ROG Strix Scar 15 G533zm
BOE CQ NE156QHM-NZ2 (BOE0A55), IPS, 2560x1440, 15.6"
Asus ROG Strix Scar 15 G533ZW-LN106WS
BOE CQ NE156QHM-NZ2, IPS-level, 2560x1440, 15.6"
Asus TUF Gaming F15 FX507ZM
TL156VDXP0101, IPS, 1920x1080, 15.6"
MSI Pulse GL66 12UEK
AU Optronics B156HAN08.4 (AUOAF90), IPS, 1920x1080, 15.6"
Alienware m15 R5 Ryzen Edition
B156HAN, IPS, 1920x1080, 15.6"
Lenovo Legion 5 15ACH6A-82NW0010GE
LGD06A5, IPS, 1920x1080, 15.6"
Display
0%
-17%
-51%
-13%
Display P3 Coverage
95
96.2
1%
66.4
-30%
39
-59%
71.1
-25%
sRGB Coverage
99.6
99.9
0%
97
-3%
58.4
-41%
99.1
-1%
AdobeRGB 1998 Coverage
84.1
84.5
0%
68.5
-19%
40.3
-52%
72.3
-14%
Response Times
14%
-4%
-333%
30%
-45%
Response Time Grey 50% / Grey 80% *
6.4 ?(3, 3.4)
7.86 ?(4.02, 3.84)
-23%

4.21 ?(1.98, 2.23)
34%

5.6 ?(3.2, 2.4)
12%
38.8 ?(18.2, 20.6)
-506%
4 ?(1.2, 2.8)
37%
15 ?(7, 8)
-134%
Response Time Black / White *
10.8 ?(5.7, 5.1)
7.5 ?(3.89, 3.61)
31%
12.8 ?(6.8, 6)
-19%
28 ?(14.6, 13.4)
-159%
8.4 ?(4.4, 4)
22%
6 ?(2, 4)
44%
PWM Frequency
Screen
-14%
23%
15%
14%
2%
Brightness middle
349
346
-1%
353.7
1%
248
-29%
329
-6%
371
6%
Brightness
333
329
-1%
340
2%
245
-26%
321
-4%
328
-2%
Brightness Distribution
89
91
2%
89
0%
86
-3%
92
3%
85
-4%
Black Level *
0.34
0.59
-74%
0.34
-0%
0.13
62%
0.27
21%
0.32
6%
Contrast
1026
586
-43%
1040
1%
1908
86%
1219
19%
1159
13%
Colorchecker dE 2000 *
3.44
3.06
11%
1.74
49%
3.14
9%
2.78
19%
3.25
6%
Colorchecker dE 2000 max. *
5.78
5.81
-1%
3.63
37%
5.82
-1%
4.88
16%
6.33
-10%
Colorchecker dE 2000 calibrated *
2.43
2.57
-6%
0.5
79%
3.14
-29%
1.63
33%
1.11
54%
Greyscale dE 2000 *
3.34
2.1
37%
1.2
64%
2.5
25%
4.94
-48%
Gamma
2.5 88%
2.12 104%
2.3 96%
2.49 88%
2.106 104%
2.45 90%
CCT
6641 98%
7021 93%
6257 104%
6468 100%
6201 105%
6064 107%
Color Space (Percent of AdobeRGB 1998)
76
Color Space (Percent of sRGB)
99
Moyenne finale (programmes/paramètres)
0% / -5%
1% / 11%
-123% / -49%
22% / 17%
-19% / -8%

* ... Moindre est la valeur, meilleures sont les performances

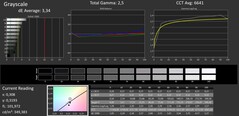
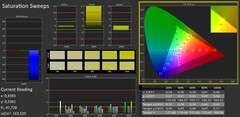
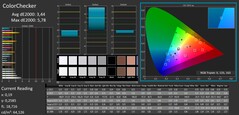
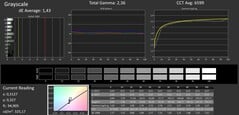
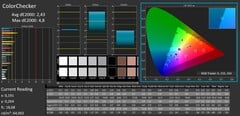
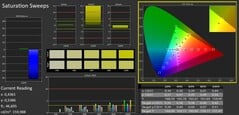
En utilisant l'outil d'étalonnage des couleurs Calman de Portrait Displays, nous avons mesuré des différences de couleurs normales à modérées dès la sortie de l'emballage, l'écran ayant une teinte plus orangée. Grâce à notre étalonnage, nous avons réussi à réduire considérablement les différences de couleur.

Échelle de gris
Échelle de gris
Saturation
Saturation
Contrôleur de couleurs
Niveaux de gris calibrés
ColorChecker calibré
Saturation calibrée
Saturation calibrée

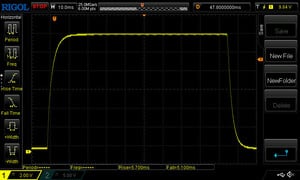
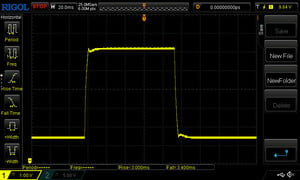
Temps de réponse de l'écran

Le temps de réponse d'un écran mesure la rapidité à laquelle l'écran est capable de changer une couleur pour une autre. Un temps de réponse élevé se traduit par une image floutée pour les objets en mouvement. Les joueurs bénéficieront de faibles latences d'affichage en jeu.
       Temps de réponse noir à blanc
10.8 ms ... hausse ↗ et chute ↘ combinées↗ 5.7 ms hausse
↘ 5.1 ms chute
L'écran montre de bons temps de réponse, mais insuffisant pour du jeu compétitif.
En comparaison, tous les appareils testés affichent entre 0.1 (minimum) et 240 (maximum) ms. » 26 % des appareils testés affichent de meilleures performances.
Cela signifie que les latences relevées sont meilleures que la moyenne (20.9 ms) de tous les appareils testés.
       Temps de réponse gris 50% à gris 80%
6.4 ms ... hausse ↗ et chute ↘ combinées↗ 3 ms hausse
↘ 3.4 ms chute
L'écran montre de très faibles temps de réponse, parfait pour le jeu.
En comparaison, tous les appareils testés affichent entre 0.165 (minimum) et 636 (maximum) ms. » 16 % des appareils testés affichent de meilleures performances.
Cela signifie que les latences relevées sont meilleures que la moyenne (32.8 ms) de tous les appareils testés.

Scintillement / MLI (Modulation de largeur d'impulsion)

Afin d'abaisser la luminosité de l'écran, certains ordinateurs portables font varier très rapidement le rétroéclairage entre éteint et allumé. La fréquence à laquelle le rétroéclairage s'éteint et se rallume est normalement fixée à une valeur qui permet de rendre la variation indétectable à l'œil nu? Si la fréquence est trop basse, certaines personnes peuvent être sujettes à une fatigue oculaire, des maux de tête ou même percevoir les variations.
Scintillement / MLI (Modulation de largeur d'impulsion) non décelé

En comparaison, 53 % des appareils testés n'emploient pas MDI pour assombrir leur écran. Nous avons relevé une moyenne à 8715 (minimum : 5 - maximum : 343500) Hz dans le cas où une MDI était active.

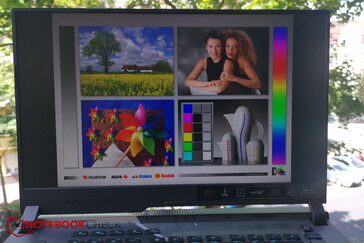
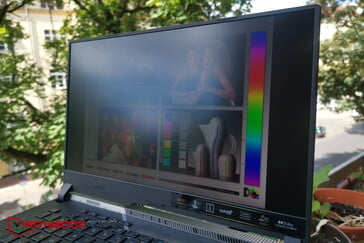
Grâce à la surface mate de l'écran et aux niveaux de luminosité élevés, le contenu de l'écran reste lisible à l'extérieur, à l'ombre. Toutefois, il est préférable d'éviter la lumière directe du soleil et d'essayer de regarder l'écran de face.

En plein air, à l'ombre
Reflets lorsque l'écran est regardé de biais

L'angle de vision est assez bon, ce qui est typique d'un écran IPS. La distorsion des couleurs et l'affaiblissement de la luminosité ne deviennent perceptibles que lorsque l'écran est regardé sous un angle extrême.

Performances - Bonnes performances de jeu avec une RTX 3060 de 140W

Le Core i9-12900H est l'un des meilleurs de sa catégorie. Bien que la RTX 3060 devrait être capable de gérer tous les jeux en FHD, elle pourrait avoir du mal avec des jeux très exigeants à la résolution native QHD de l'écran. Asus a également inclus de la RAM DDR5 à haute vitesse. Dans l'ensemble, le Strix Scar est un ordinateur portable de jeu de milieu de gamme supérieur que certains éditeurs de photos et de vidéos pourraient trouver attrayant.

Conditions d'essai

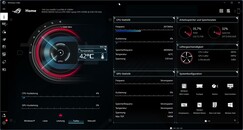
À notre avis, Asus est allé trop loin avec ses logiciels. Les ordinateurs portables de jeu Asus sont livrés avec le logiciel Armoury Crate en plus du programme MyASUS, qui est également préinstallé sur les ordinateurs portables ordinaires. Armoury Crate vous permet d'ajuster les ventilateurs et les profils de performance, et nous avons utilisé le mode Turbo pour obtenir les meilleurs résultats possibles lors de nos tests. D'autre part, MyASUS comprend des paramètres pour le comportement de charge de la batterie, des options Wi-Fi et des moyens de contacter le support client. Asus pourrait envisager de combiner les deux programmes afin d'éviter à ses clients de se retrouver avec des logiciels inutilement gonflés.

Aperçu de la caisse de l'armurerie
Paramètres de la caisse de l'armurerie
MyASUS
MyASUS

Processeur

Asus a choisi d'équiper la plupart des modèles avec le processeur haut de gamme Intel Core i9-12900Hqui comprend 6 cœurs de performance (P) et 8 cœurs d'efficacité (E), capables de gérer 20 threads simultanément. Chaque cœur P peut fonctionner jusqu'à 5 GHz. Les Strix G533zm et G533zw sont disponibles avec le processeur légèrement moins puissant i7-12700H.

Dans notre test en boucle Cinebench R15, le processeur a délivré d'excellentes performances comme prévu, surpassant à la fois le i7-12700H de l'Asus TUF Gaming F15 et les puces Ryzen de la génération précédente. Il ne s'est laissé distancer que de manière reproductible dans le test Cinebench R20.

Le passage à l'alimentation par batterie a fait chuter le score de Cinebench R15 à 1 752.

Cinebench R15 Multi sustained load

01553104656207759301085124013951550170518602015217023252480263527902945Tooltip
Asus ROG Strix Scar 15 G533zm Intel Core i9-12900H: Ø3056 (3039.05-3076.92)
Asus TUF Gaming F15 FX507ZM Intel Core i7-12700H: Ø2656 (2614.89-2735.42)
Alienware m15 R5 Ryzen Edition AMD Ryzen 7 5800H: Ø1977 (1921.88-2004.51)
Lenovo Legion 5 15ACH6A-82NW0010GE AMD Ryzen 5 5600H: Ø1622 (1447.86-1653.64)
CPU Performance Rating: Percent
Cinebench R23: Multi Core | Single Core
Cinebench R20: CPU (Multi Core) | CPU (Single Core)
Cinebench R15: CPU Multi 64Bit | CPU Single 64Bit
Blender: v2.79 BMW27 CPU
7-Zip 18.03: 7z b 4 | 7z b 4 -mmt1
Geekbench 5.5: Multi-Core | Single-Core
HWBOT x265 Benchmark v2.2: 4k Preset
LibreOffice : 20 Documents To PDF
R Benchmark 2.5: Overall mean
CPU Performance Rating
Moyenne de la classe Gaming
 
84 pt
Asus ROG Strix Scar 15 G533ZW-LN106WS
Intel Core i9-12900H
78.9 pt
Asus ROG Strix Scar 15 G533zm
Intel Core i9-12900H
77 pt
MSI Pulse GL66 12UEK
Intel Core i9-12900H
75.5 pt
Asus TUF Gaming F15 FX507ZM
Intel Core i7-12700H
72.1 pt
Moyenne Intel Core i9-12900H
 
69.4 pt
Alienware m15 R5 Ryzen Edition
AMD Ryzen 7 5800H
54.8 pt
Lenovo Legion 5 15ACH6A-82NW0010GE
AMD Ryzen 5 5600H
48.9 pt
Cinebench R23 / Multi Core
Moyenne de la classe Gaming
  (5668 - 36249, n=191, 2 dernières années)
21908 Points +30%
Asus ROG Strix Scar 15 G533ZW-LN106WS
Intel Core i9-12900H
19064 Points +13%
Asus TUF Gaming F15 FX507ZM
Intel Core i7-12700H
17713 (16651.9min - 17712.9max) Points +5%
MSI Pulse GL66 12UEK
Intel Core i9-12900H
17667 Points +4%
Asus ROG Strix Scar 15 G533zm
Intel Core i9-12900H
16917 Points
Moyenne Intel Core i9-12900H
  (7359 - 19648, n=28)
15133 Points -11%
Alienware m15 R5 Ryzen Edition
AMD Ryzen 7 5800H
12195 Points -28%
Lenovo Legion 5 15ACH6A-82NW0010GE
AMD Ryzen 5 5600H
10416 Points -38%
Cinebench R23 / Single Core
Asus ROG Strix Scar 15 G533ZW-LN106WS
Intel Core i9-12900H
1918 Points +6%
MSI Pulse GL66 12UEK
Intel Core i9-12900H
1914 Points +6%
Moyenne de la classe Gaming
  (1136 - 2235, n=190, 2 dernières années)
1892 Points +5%
Moyenne Intel Core i9-12900H
  (1634 - 1930, n=28)
1829 Points +1%
Asus ROG Strix Scar 15 G533zm
Intel Core i9-12900H
1805 Points
Asus TUF Gaming F15 FX507ZM
Intel Core i7-12700H
1771 Points -2%
Alienware m15 R5 Ryzen Edition
AMD Ryzen 7 5800H
1430 Points -21%
Lenovo Legion 5 15ACH6A-82NW0010GE
AMD Ryzen 5 5600H
1366 Points -24%
Cinebench R20 / CPU (Multi Core)
Moyenne de la classe Gaming
  (2179 - 13832, n=188, 2 dernières années)
8319 Points +56%
Asus ROG Strix Scar 15 G533ZW-LN106WS
Intel Core i9-12900H
7109 Points +33%
Asus TUF Gaming F15 FX507ZM
Intel Core i7-12700H
6754 Points +27%
MSI Pulse GL66 12UEK
Intel Core i9-12900H
6675 Points +25%
Moyenne Intel Core i9-12900H
  (2681 - 7471, n=28)
5717 Points +7%
Asus ROG Strix Scar 15 G533zm
Intel Core i9-12900H
5329 Points
Alienware m15 R5 Ryzen Edition
AMD Ryzen 7 5800H
4711 Points -12%
Lenovo Legion 5 15ACH6A-82NW0010GE
AMD Ryzen 5 5600H
4059 Points -24%
Cinebench R20 / CPU (Single Core)
MSI Pulse GL66 12UEK
Intel Core i9-12900H
735 Points +1%
Asus ROG Strix Scar 15 G533zm
Intel Core i9-12900H
730 Points
Asus ROG Strix Scar 15 G533ZW-LN106WS
Intel Core i9-12900H
728 Points 0%
Moyenne de la classe Gaming
  (439 - 856, n=188, 2 dernières années)
726 Points -1%
Moyenne Intel Core i9-12900H
  (624 - 738, n=28)
706 Points -3%
Asus TUF Gaming F15 FX507ZM
Intel Core i7-12700H
680 Points -7%
Alienware m15 R5 Ryzen Edition
AMD Ryzen 7 5800H
559 Points -23%
Lenovo Legion 5 15ACH6A-82NW0010GE
AMD Ryzen 5 5600H
535 Points -27%
Cinebench R15 / CPU Multi 64Bit
Moyenne de la classe Gaming
  (905 - 5663, n=195, 2 dernières années)
3427 Points +11%
Asus ROG Strix Scar 15 G533zm
Intel Core i9-12900H
3077 (3039.05min - 3076.92max) Points
Asus ROG Strix Scar 15 G533ZW-LN106WS
Intel Core i9-12900H
2978 (2732.8min - 2978.18max) Points -3%
Asus TUF Gaming F15 FX507ZM
Intel Core i7-12700H
2735 (2614.89min - 2735.42max) Points -11%
MSI Pulse GL66 12UEK
Intel Core i9-12900H
2729 (2493.77min - 2729.26max) Points -11%
Moyenne Intel Core i9-12900H
  (1395 - 3077, n=28)
2454 Points -20%
Alienware m15 R5 Ryzen Edition
AMD Ryzen 7 5800H
2005 (1921.88min - 2004.51max) Points -35%
Lenovo Legion 5 15ACH6A-82NW0010GE
AMD Ryzen 5 5600H
1723 Points -44%
Cinebench R15 / CPU Single 64Bit
Moyenne de la classe Gaming
  (191.9 - 318, n=192, 2 dernières années)
278 Points +1%
MSI Pulse GL66 12UEK
Intel Core i9-12900H
277 Points 0%
Asus ROG Strix Scar 15 G533zm
Intel Core i9-12900H
276 Points
Asus ROG Strix Scar 15 G533ZW-LN106WS
Intel Core i9-12900H
275 Points 0%
Moyenne Intel Core i9-12900H
  (235 - 277, n=29)
262 Points -5%
Asus TUF Gaming F15 FX507ZM
Intel Core i7-12700H
253 Points -8%
Alienware m15 R5 Ryzen Edition
AMD Ryzen 7 5800H
232 Points -16%
Lenovo Legion 5 15ACH6A-82NW0010GE
AMD Ryzen 5 5600H
223 Points -19%
Blender / v2.79 BMW27 CPU
Lenovo Legion 5 15ACH6A-82NW0010GE
AMD Ryzen 5 5600H
305.2 Seconds * -76%
Alienware m15 R5 Ryzen Edition
AMD Ryzen 7 5800H
253 Seconds * -46%
Moyenne Intel Core i9-12900H
  (160 - 451, n=28)
231 Seconds * -33%
MSI Pulse GL66 12UEK
Intel Core i9-12900H
187 Seconds * -8%
Asus TUF Gaming F15 FX507ZM
Intel Core i7-12700H
182 Seconds * -5%
Asus ROG Strix Scar 15 G533ZW-LN106WS
Intel Core i9-12900H
175.4 Seconds * -1%
Asus ROG Strix Scar 15 G533zm
Intel Core i9-12900H
173.7 Seconds *
Moyenne de la classe Gaming
  (87 - 555, n=183, 2 dernières années)
170.1 Seconds * +2%
7-Zip 18.03 / 7z b 4
Moyenne de la classe Gaming
  (23795 - 140932, n=187, 2 dernières années)
85423 MIPS +16%
Asus ROG Strix Scar 15 G533zm
Intel Core i9-12900H
73489 MIPS
Asus ROG Strix Scar 15 G533ZW-LN106WS
Intel Core i9-12900H
67680 MIPS -8%
Asus TUF Gaming F15 FX507ZM
Intel Core i7-12700H
67160 MIPS -9%
MSI Pulse GL66 12UEK
Intel Core i9-12900H
64918 MIPS -12%
Moyenne Intel Core i9-12900H
  (34684 - 76677, n=28)
60849 MIPS -17%
Alienware m15 R5 Ryzen Edition
AMD Ryzen 7 5800H
53902 MIPS -27%
Lenovo Legion 5 15ACH6A-82NW0010GE
AMD Ryzen 5 5600H
44503 MIPS -39%
7-Zip 18.03 / 7z b 4 -mmt1
Moyenne de la classe Gaming
  (4199 - 7581, n=187, 2 dernières années)
6315 MIPS +5%
MSI Pulse GL66 12UEK
Intel Core i9-12900H
6033 MIPS 0%
Asus ROG Strix Scar 15 G533zm
Intel Core i9-12900H
6028 MIPS
Asus ROG Strix Scar 15 G533ZW-LN106WS
Intel Core i9-12900H
5881 MIPS -2%
Moyenne Intel Core i9-12900H
  (5302 - 6289, n=28)
5843 MIPS -3%
Alienware m15 R5 Ryzen Edition
AMD Ryzen 7 5800H
5591 MIPS -7%
Asus TUF Gaming F15 FX507ZM
Intel Core i7-12700H
5381 MIPS -11%
Lenovo Legion 5 15ACH6A-82NW0010GE
AMD Ryzen 5 5600H
5330 MIPS -12%
Geekbench 5.5 / Multi-Core
Moyenne de la classe Gaming
  (4557 - 23194, n=188, 2 dernières années)
15043 Points +13%
Asus ROG Strix Scar 15 G533ZW-LN106WS
Intel Core i9-12900H
14140 Points +6%
Asus ROG Strix Scar 15 G533zm
Intel Core i9-12900H
13319 Points
Asus TUF Gaming F15 FX507ZM
Intel Core i7-12700H
12358 Points -7%
Moyenne Intel Core i9-12900H
  (8519 - 14376, n=31)
11913 Points -11%
MSI Pulse GL66 12UEK
Intel Core i9-12900H
11794 Points -11%
Alienware m15 R5 Ryzen Edition
AMD Ryzen 7 5800H
7522 Points -44%
Lenovo Legion 5 15ACH6A-82NW0010GE
AMD Ryzen 5 5600H
6567 Points -51%
Geekbench 5.5 / Single-Core
Moyenne de la classe Gaming
  (986 - 2210, n=188, 2 dernières années)
1895 Points +3%
Asus ROG Strix Scar 15 G533ZW-LN106WS
Intel Core i9-12900H
1849 Points 0%
MSI Pulse GL66 12UEK
Intel Core i9-12900H
1847 Points 0%
Asus ROG Strix Scar 15 G533zm
Intel Core i9-12900H
1843 Points
Moyenne Intel Core i9-12900H
  (1631 - 1897, n=31)
1800 Points -2%
Asus TUF Gaming F15 FX507ZM
Intel Core i7-12700H
1751 Points -5%
Alienware m15 R5 Ryzen Edition
AMD Ryzen 7 5800H
1481 Points -20%
Lenovo Legion 5 15ACH6A-82NW0010GE
AMD Ryzen 5 5600H
1414 Points -23%
HWBOT x265 Benchmark v2.2 / 4k Preset
Moyenne de la classe Gaming
  (6.72 - 38.9, n=187, 2 dernières années)
23.5 fps +4%
Asus ROG Strix Scar 15 G533zm
Intel Core i9-12900H
22.5 fps
Asus ROG Strix Scar 15 G533ZW-LN106WS
Intel Core i9-12900H
21.1 fps -6%
Asus TUF Gaming F15 FX507ZM
Intel Core i7-12700H
20.5 fps -9%
MSI Pulse GL66 12UEK
Intel Core i9-12900H
19.3 fps -14%
Moyenne Intel Core i9-12900H
  (8.05 - 22.5, n=28)
17.1 fps -24%
Alienware m15 R5 Ryzen Edition
AMD Ryzen 7 5800H
14.7 fps -35%
Lenovo Legion 5 15ACH6A-82NW0010GE
AMD Ryzen 5 5600H
12.8 fps -43%
LibreOffice / 20 Documents To PDF
Alienware m15 R5 Ryzen Edition
AMD Ryzen 7 5800H
57.4 s * -44%
Lenovo Legion 5 15ACH6A-82NW0010GE
AMD Ryzen 5 5600H
55.1 s * -38%
Asus TUF Gaming F15 FX507ZM
Intel Core i7-12700H
49.9 s * -25%
Moyenne de la classe Gaming
  (31.4 - 199, n=184, 2 dernières années)
48.2 s * -21%
Moyenne Intel Core i9-12900H
  (36.8 - 59.8, n=28)
42.4 s * -6%
MSI Pulse GL66 12UEK
Intel Core i9-12900H
41.3 s * -3%
Asus ROG Strix Scar 15 G533zm
Intel Core i9-12900H
40 s *
Asus ROG Strix Scar 15 G533ZW-LN106WS
Intel Core i9-12900H
39.7 s * +1%
R Benchmark 2.5 / Overall mean
Lenovo Legion 5 15ACH6A-82NW0010GE
AMD Ryzen 5 5600H
0.537 sec * -23%
Alienware m15 R5 Ryzen Edition
AMD Ryzen 7 5800H
0.524 sec * -20%
Asus TUF Gaming F15 FX507ZM
Intel Core i7-12700H
0.4655 sec * -6%
Moyenne Intel Core i9-12900H
  (0.4218 - 0.506, n=28)
0.454 sec * -4%
Asus ROG Strix Scar 15 G533zm
Intel Core i9-12900H
0.4377 sec *
Moyenne de la classe Gaming
  (0.3609 - 0.759, n=188, 2 dernières années)
0.4371 sec * -0%
Asus ROG Strix Scar 15 G533ZW-LN106WS
Intel Core i9-12900H
0.4316 sec * +1%
MSI Pulse GL66 12UEK
Intel Core i9-12900H
0.424 sec * +3%

* ... Moindre est la valeur, meilleures sont les performances

Cinebench R15 CPU Multi 64Bit
3077 Points
Cinebench R15 OpenGL 64Bit
200 fps
Cinebench R15 Ref. Match 64Bit
99.6 %
Cinebench R15 CPU Single 64Bit
276 Points
Cinebench R20 CPU (Multi Core)
5329 Points
Cinebench R20 CPU (Single Core)
730 Points
Cinebench R23 Single Core
1805 Points
Cinebench R23 Multi Core
16917 Points
Aide
Performance Rating
Moyenne de la classe Gaming
 
99.1 pt
Alienware m15 R5 Ryzen Edition
AMD Ryzen 7 5800H, GeForce RTX 3060 Laptop GPU
72.4 pt
Asus ROG Strix Scar 15 G533zm
Intel Core i9-12900H, GeForce RTX 3060 Laptop GPU
69.4 pt
Asus ROG Strix Scar 15 G533ZW-LN106WS
Intel Core i9-12900H, GeForce RTX 3070 Ti Laptop GPU
68.9 pt
Moyenne Intel Core i9-12900H
 
65.6 pt
MSI Pulse GL66 12UEK
Intel Core i9-12900H, GeForce RTX 3060 Laptop GPU
62.9 pt
Asus TUF Gaming F15 FX507ZM
Intel Core i7-12700H, GeForce RTX 3060 Laptop GPU
62.8 pt
Lenovo Legion 5 15ACH6A-82NW0010GE
AMD Ryzen 5 5600H, Radeon RX 6600M
61.3 pt
AIDA64 / FP32 Ray-Trace
Moyenne de la classe Gaming
  (4986 - 60169, n=184, 2 dernières années)
21878 KRay/s +117%
Alienware m15 R5 Ryzen Edition
AMD Ryzen 7 5800H, GeForce RTX 3060 Laptop GPU
14245 KRay/s +41%
Lenovo Legion 5 15ACH6A-82NW0010GE
AMD Ryzen 5 5600H, Radeon RX 6600M
12360 KRay/s +23%
Moyenne Intel Core i9-12900H
  (4074 - 18289, n=28)
11191 KRay/s +11%
Asus ROG Strix Scar 15 G533zm
Intel Core i9-12900H, GeForce RTX 3060 Laptop GPU
10077 KRay/s
Asus ROG Strix Scar 15 G533ZW-LN106WS
Intel Core i9-12900H, GeForce RTX 3070 Ti Laptop GPU
9592 KRay/s -5%
Asus TUF Gaming F15 FX507ZM
Intel Core i7-12700H, GeForce RTX 3060 Laptop GPU
9486 KRay/s -6%
MSI Pulse GL66 12UEK
Intel Core i9-12900H, GeForce RTX 3060 Laptop GPU
8965 KRay/s -11%
AIDA64 / FPU Julia
Moyenne de la classe Gaming
  (25360 - 252486, n=184, 2 dernières années)
106653 Points +144%
Alienware m15 R5 Ryzen Edition
AMD Ryzen 7 5800H, GeForce RTX 3060 Laptop GPU
88952 Points +103%
Lenovo Legion 5 15ACH6A-82NW0010GE
AMD Ryzen 5 5600H, Radeon RX 6600M
76011 Points +74%
Moyenne Intel Core i9-12900H
  (22307 - 93236, n=28)
55458 Points +27%
Asus ROG Strix Scar 15 G533zm
Intel Core i9-12900H, GeForce RTX 3060 Laptop GPU
43760 Points
Asus ROG Strix Scar 15 G533ZW-LN106WS
Intel Core i9-12900H, GeForce RTX 3070 Ti Laptop GPU
42697 Points -2%
Asus TUF Gaming F15 FX507ZM
Intel Core i7-12700H, GeForce RTX 3060 Laptop GPU
41434 Points -5%
MSI Pulse GL66 12UEK
Intel Core i9-12900H, GeForce RTX 3060 Laptop GPU
40863 Points -7%
AIDA64 / CPU SHA3
Moyenne de la classe Gaming
  (1339 - 10389, n=184, 2 dernières années)
4901 MB/s +37%
Asus ROG Strix Scar 15 G533zm
Intel Core i9-12900H, GeForce RTX 3060 Laptop GPU
3570 MB/s
Asus ROG Strix Scar 15 G533ZW-LN106WS
Intel Core i9-12900H, GeForce RTX 3070 Ti Laptop GPU
3471 MB/s -3%
Asus TUF Gaming F15 FX507ZM
Intel Core i7-12700H, GeForce RTX 3060 Laptop GPU
3288 MB/s -8%
MSI Pulse GL66 12UEK
Intel Core i9-12900H, GeForce RTX 3060 Laptop GPU
3213 MB/s -10%
Alienware m15 R5 Ryzen Edition
AMD Ryzen 7 5800H, GeForce RTX 3060 Laptop GPU
3055 MB/s -14%
Moyenne Intel Core i9-12900H
  (1378 - 4215, n=28)
3048 MB/s -15%
Lenovo Legion 5 15ACH6A-82NW0010GE
AMD Ryzen 5 5600H, Radeon RX 6600M
2607 MB/s -27%
AIDA64 / CPU Queen
Moyenne de la classe Gaming
  (50699 - 200651, n=184, 2 dernières années)
117058 Points +9%
Asus ROG Strix Scar 15 G533zm
Intel Core i9-12900H, GeForce RTX 3060 Laptop GPU
107003 Points
MSI Pulse GL66 12UEK
Intel Core i9-12900H, GeForce RTX 3060 Laptop GPU
105616 Points -1%
Asus ROG Strix Scar 15 G533ZW-LN106WS
Intel Core i9-12900H, GeForce RTX 3070 Ti Laptop GPU
104784 Points -2%
Moyenne Intel Core i9-12900H
  (78172 - 111241, n=28)
100462 Points -6%
Asus TUF Gaming F15 FX507ZM
Intel Core i7-12700H, GeForce RTX 3060 Laptop GPU
99267 Points -7%
Alienware m15 R5 Ryzen Edition
AMD Ryzen 7 5800H, GeForce RTX 3060 Laptop GPU
95789 Points -10%
Lenovo Legion 5 15ACH6A-82NW0010GE
AMD Ryzen 5 5600H, Radeon RX 6600M
76998 Points -28%
AIDA64 / FPU SinJulia
Moyenne de la classe Gaming
  (4800 - 32988, n=184, 2 dernières années)
13255 Points +28%
Alienware m15 R5 Ryzen Edition
AMD Ryzen 7 5800H, GeForce RTX 3060 Laptop GPU
11665 Points +12%
Asus ROG Strix Scar 15 G533zm
Intel Core i9-12900H, GeForce RTX 3060 Laptop GPU
10383 Points
Asus ROG Strix Scar 15 G533ZW-LN106WS
Intel Core i9-12900H, GeForce RTX 3070 Ti Laptop GPU
10220 Points -2%
MSI Pulse GL66 12UEK
Intel Core i9-12900H, GeForce RTX 3060 Laptop GPU
9889 Points -5%
Asus TUF Gaming F15 FX507ZM
Intel Core i7-12700H, GeForce RTX 3060 Laptop GPU
9852 Points -5%
Moyenne Intel Core i9-12900H
  (5709 - 10410, n=28)
9016 Points -13%
Lenovo Legion 5 15ACH6A-82NW0010GE
AMD Ryzen 5 5600H, Radeon RX 6600M
8894 Points -14%
AIDA64 / FPU Mandel
Moyenne de la classe Gaming
  (12321 - 134044, n=184, 2 dernières années)
53685 Points +88%
Alienware m15 R5 Ryzen Edition
AMD Ryzen 7 5800H, GeForce RTX 3060 Laptop GPU
45972 Points +61%
Lenovo Legion 5 15ACH6A-82NW0010GE
AMD Ryzen 5 5600H, Radeon RX 6600M
41691 Points +46%
Moyenne Intel Core i9-12900H
  (11257 - 45581, n=28)
28667 Points 0%
Asus ROG Strix Scar 15 G533zm
Intel Core i9-12900H, GeForce RTX 3060 Laptop GPU
28598 Points
Asus TUF Gaming F15 FX507ZM
Intel Core i7-12700H, GeForce RTX 3060 Laptop GPU
26379 Points -8%
Asus ROG Strix Scar 15 G533ZW-LN106WS
Intel Core i9-12900H, GeForce RTX 3070 Ti Laptop GPU
25718 Points -10%
MSI Pulse GL66 12UEK
Intel Core i9-12900H, GeForce RTX 3060 Laptop GPU
24991 Points -13%
AIDA64 / CPU AES
Alienware m15 R5 Ryzen Edition
AMD Ryzen 7 5800H, GeForce RTX 3060 Laptop GPU
119968 MB/s +12%
Moyenne de la classe Gaming
  (19065 - 328679, n=184, 2 dernières années)
109335 MB/s +2%
Asus ROG Strix Scar 15 G533zm
Intel Core i9-12900H, GeForce RTX 3060 Laptop GPU
107508 MB/s
Asus ROG Strix Scar 15 G533ZW-LN106WS
Intel Core i9-12900H, GeForce RTX 3070 Ti Laptop GPU
104589 MB/s -3%
MSI Pulse GL66 12UEK
Intel Core i9-12900H, GeForce RTX 3060 Laptop GPU
97298 MB/s -9%
Lenovo Legion 5 15ACH6A-82NW0010GE
AMD Ryzen 5 5600H, Radeon RX 6600M
96790 MB/s -10%
Moyenne Intel Core i9-12900H
  (31935 - 151546, n=28)
85711 MB/s -20%
Asus TUF Gaming F15 FX507ZM
Intel Core i7-12700H, GeForce RTX 3060 Laptop GPU
66712 MB/s -38%
AIDA64 / CPU ZLib
Moyenne de la classe Gaming
  (373 - 2409, n=184, 2 dernières années)
1364 MB/s +15%
Asus ROG Strix Scar 15 G533ZW-LN106WS
Intel Core i9-12900H, GeForce RTX 3070 Ti Laptop GPU
1188 MB/s 0%
Asus ROG Strix Scar 15 G533zm
Intel Core i9-12900H, GeForce RTX 3060 Laptop GPU
1183 MB/s
Asus TUF Gaming F15 FX507ZM
Intel Core i7-12700H, GeForce RTX 3060 Laptop GPU
1164 MB/s -2%
MSI Pulse GL66 12UEK
Intel Core i9-12900H, GeForce RTX 3060 Laptop GPU
1084 MB/s -8%
Moyenne Intel Core i9-12900H
  (449 - 1193, n=28)
932 MB/s -21%
Alienware m15 R5 Ryzen Edition
AMD Ryzen 7 5800H, GeForce RTX 3060 Laptop GPU
782 MB/s -34%
Lenovo Legion 5 15ACH6A-82NW0010GE
AMD Ryzen 5 5600H, Radeon RX 6600M
632 MB/s -47%
AIDA64 / FP64 Ray-Trace
Moyenne de la classe Gaming
  (2540 - 31796, n=184, 2 dernières années)
11782 KRay/s +94%
Alienware m15 R5 Ryzen Edition
AMD Ryzen 7 5800H, GeForce RTX 3060 Laptop GPU
7532 KRay/s +24%
Lenovo Legion 5 15ACH6A-82NW0010GE
AMD Ryzen 5 5600H, Radeon RX 6600M
6652 KRay/s +10%
Moyenne Intel Core i9-12900H
  (2235 - 10511, n=28)
6205 KRay/s +2%
Asus ROG Strix Scar 15 G533zm
Intel Core i9-12900H, GeForce RTX 3060 Laptop GPU
6068 KRay/s
Asus ROG Strix Scar 15 G533ZW-LN106WS
Intel Core i9-12900H, GeForce RTX 3070 Ti Laptop GPU
5498 KRay/s -9%
Asus TUF Gaming F15 FX507ZM
Intel Core i7-12700H, GeForce RTX 3060 Laptop GPU
5486 KRay/s -10%
MSI Pulse GL66 12UEK
Intel Core i9-12900H, GeForce RTX 3060 Laptop GPU
5184 KRay/s -15%
AIDA64 / CPU PhotoWorxx
Moyenne de la classe Gaming
  (10805 - 60161, n=185, 2 dernières années)
40175 MPixel/s +20%
Asus ROG Strix Scar 15 G533ZW-LN106WS
Intel Core i9-12900H, GeForce RTX 3070 Ti Laptop GPU
39856 MPixel/s +19%
Moyenne Intel Core i9-12900H
  (20960 - 48269, n=29)
36660 MPixel/s +9%
Asus ROG Strix Scar 15 G533zm
Intel Core i9-12900H, GeForce RTX 3060 Laptop GPU
33519 MPixel/s
Asus TUF Gaming F15 FX507ZM
Intel Core i7-12700H, GeForce RTX 3060 Laptop GPU
33509 MPixel/s 0%
MSI Pulse GL66 12UEK
Intel Core i9-12900H, GeForce RTX 3060 Laptop GPU
27374 MPixel/s -18%
Lenovo Legion 5 15ACH6A-82NW0010GE
AMD Ryzen 5 5600H, Radeon RX 6600M
15135 MPixel/s -55%
Alienware m15 R5 Ryzen Edition
AMD Ryzen 7 5800H, GeForce RTX 3060 Laptop GPU
14784 MPixel/s -56%

Performance du système

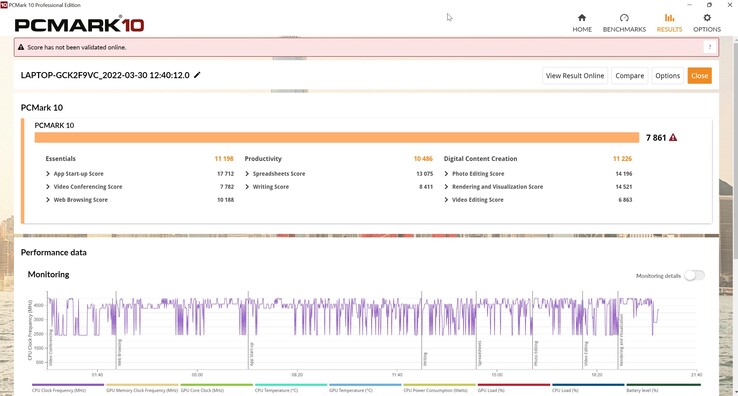
L'Asus Strix a surtout pris la première place dans PCMark 10 et a fourni des performances légèrement supérieures à ce que la même combinaison CPU/GPU offre en moyenne, d'après notre base de données.

PCMark 10
PCMark 10
PCMark 10 / Score
Asus ROG Strix Scar 15 G533ZW-LN106WS
GeForce RTX 3070 Ti Laptop GPU, i9-12900H, Samsung PM9A1 MZVL22T0HBLB
7904 Points +1%
Asus ROG Strix Scar 15 G533zm
GeForce RTX 3060 Laptop GPU, i9-12900H
7861 Points
Moyenne de la classe Gaming
  (5776 - 9852, n=165, 2 dernières années)
7799 Points -1%
Moyenne Intel Core i9-12900H, NVIDIA GeForce RTX 3060 Laptop GPU
  (7135 - 7861, n=4)
7518 Points -4%
Asus TUF Gaming F15 FX507ZM
GeForce RTX 3060 Laptop GPU, i7-12700H, SK Hynix HFM001TD3JX013N
7426 Points -6%
MSI Pulse GL66 12UEK
GeForce RTX 3060 Laptop GPU, i9-12900H, Micron 2450 512GB MTFDKBA512TFK
7135 Points -9%
Lenovo Legion 5 15ACH6A-82NW0010GE
Radeon RX 6600M, R5 5600H, Micron 2210 MTFDHBA512QFD
7091 Points -10%
Alienware m15 R5 Ryzen Edition
GeForce RTX 3060 Laptop GPU, R7 5800H, Toshiba KBG40ZNS512G NVMe
6465 Points -18%
PCMark 10 / Essentials
Asus ROG Strix Scar 15 G533zm
GeForce RTX 3060 Laptop GPU, i9-12900H
11198 Points
Moyenne Intel Core i9-12900H, NVIDIA GeForce RTX 3060 Laptop GPU
  (10380 - 11198, n=4)
10931 Points -2%
Moyenne de la classe Gaming
  (9057 - 12334, n=164, 2 dernières années)
10832 Points -3%
Asus ROG Strix Scar 15 G533ZW-LN106WS
GeForce RTX 3070 Ti Laptop GPU, i9-12900H, Samsung PM9A1 MZVL22T0HBLB
10708 Points -4%
Lenovo Legion 5 15ACH6A-82NW0010GE
Radeon RX 6600M, R5 5600H, Micron 2210 MTFDHBA512QFD
10506 Points -6%
Asus TUF Gaming F15 FX507ZM
GeForce RTX 3060 Laptop GPU, i7-12700H, SK Hynix HFM001TD3JX013N
10499 Points -6%
MSI Pulse GL66 12UEK
GeForce RTX 3060 Laptop GPU, i9-12900H, Micron 2450 512GB MTFDKBA512TFK
10380 Points -7%
Alienware m15 R5 Ryzen Edition
GeForce RTX 3060 Laptop GPU, R7 5800H, Toshiba KBG40ZNS512G NVMe
9589 Points -14%
PCMark 10 / Productivity
Asus ROG Strix Scar 15 G533zm
GeForce RTX 3060 Laptop GPU, i9-12900H
10486 Points
Asus ROG Strix Scar 15 G533ZW-LN106WS
GeForce RTX 3070 Ti Laptop GPU, i9-12900H, Samsung PM9A1 MZVL22T0HBLB
10424 Points -1%
Moyenne Intel Core i9-12900H, NVIDIA GeForce RTX 3060 Laptop GPU
  (9751 - 10486, n=4)
10103 Points -4%
Moyenne de la classe Gaming
  (6662 - 14612, n=164, 2 dernières années)
9904 Points -6%
MSI Pulse GL66 12UEK
GeForce RTX 3060 Laptop GPU, i9-12900H, Micron 2450 512GB MTFDKBA512TFK
9751 Points -7%
Lenovo Legion 5 15ACH6A-82NW0010GE
Radeon RX 6600M, R5 5600H, Micron 2210 MTFDHBA512QFD
9299 Points -11%
Asus TUF Gaming F15 FX507ZM
GeForce RTX 3060 Laptop GPU, i7-12700H, SK Hynix HFM001TD3JX013N
9070 Points -14%
Alienware m15 R5 Ryzen Edition
GeForce RTX 3060 Laptop GPU, R7 5800H, Toshiba KBG40ZNS512G NVMe
8913 Points -15%
PCMark 10 / Digital Content Creation
Moyenne de la classe Gaming
  (6703 - 18475, n=164, 2 dernières années)
12117 Points +8%
Asus ROG Strix Scar 15 G533ZW-LN106WS
GeForce RTX 3070 Ti Laptop GPU, i9-12900H, Samsung PM9A1 MZVL22T0HBLB
12007 Points +7%
Asus TUF Gaming F15 FX507ZM
GeForce RTX 3060 Laptop GPU, i7-12700H, SK Hynix HFM001TD3JX013N
11672 Points +4%
Asus ROG Strix Scar 15 G533zm
GeForce RTX 3060 Laptop GPU, i9-12900H
11226 Points
Moyenne Intel Core i9-12900H, NVIDIA GeForce RTX 3060 Laptop GPU
  (9741 - 11226, n=4)
10445 Points -7%
Lenovo Legion 5 15ACH6A-82NW0010GE
Radeon RX 6600M, R5 5600H, Micron 2210 MTFDHBA512QFD
9907 Points -12%
MSI Pulse GL66 12UEK
GeForce RTX 3060 Laptop GPU, i9-12900H, Micron 2450 512GB MTFDKBA512TFK
9741 Points -13%
Alienware m15 R5 Ryzen Edition
GeForce RTX 3060 Laptop GPU, R7 5800H, Toshiba KBG40ZNS512G NVMe
8582 Points -24%
CrossMark / Overall
MSI Pulse GL66 12UEK
GeForce RTX 3060 Laptop GPU, i9-12900H, Micron 2450 512GB MTFDKBA512TFK
2096 Points +3%
Asus ROG Strix Scar 15 G533ZW-LN106WS
GeForce RTX 3070 Ti Laptop GPU, i9-12900H, Samsung PM9A1 MZVL22T0HBLB
2044 Points +1%
Asus ROG Strix Scar 15 G533zm
GeForce RTX 3060 Laptop GPU, i9-12900H
2026 Points
Moyenne Intel Core i9-12900H, NVIDIA GeForce RTX 3060 Laptop GPU
  (1789 - 2096, n=4)
1971 Points -3%
Moyenne de la classe Gaming
  (1247 - 2344, n=146, 2 dernières années)
1908 Points -6%
CrossMark / Productivity
MSI Pulse GL66 12UEK
GeForce RTX 3060 Laptop GPU, i9-12900H, Micron 2450 512GB MTFDKBA512TFK
2062 Points +6%
Asus ROG Strix Scar 15 G533ZW-LN106WS
GeForce RTX 3070 Ti Laptop GPU, i9-12900H, Samsung PM9A1 MZVL22T0HBLB
1968 Points +1%
Asus ROG Strix Scar 15 G533zm
GeForce RTX 3060 Laptop GPU, i9-12900H
1951 Points
Moyenne Intel Core i9-12900H, NVIDIA GeForce RTX 3060 Laptop GPU
  (1677 - 2062, n=4)
1892 Points -3%
Moyenne de la classe Gaming
  (1299 - 2204, n=146, 2 dernières années)
1808 Points -7%
CrossMark / Creativity
Asus ROG Strix Scar 15 G533zm
GeForce RTX 3060 Laptop GPU, i9-12900H
2125 Points
Asus ROG Strix Scar 15 G533ZW-LN106WS
GeForce RTX 3070 Ti Laptop GPU, i9-12900H, Samsung PM9A1 MZVL22T0HBLB
2115 Points 0%
Moyenne de la classe Gaming
  (1275 - 2660, n=146, 2 dernières années)
2095 Points -1%
Moyenne Intel Core i9-12900H, NVIDIA GeForce RTX 3060 Laptop GPU
  (2032 - 2125, n=4)
2088 Points -2%
MSI Pulse GL66 12UEK
GeForce RTX 3060 Laptop GPU, i9-12900H, Micron 2450 512GB MTFDKBA512TFK
2086 Points -2%
CrossMark / Responsiveness
MSI Pulse GL66 12UEK
GeForce RTX 3060 Laptop GPU, i9-12900H, Micron 2450 512GB MTFDKBA512TFK
2230 Points +14%
Asus ROG Strix Scar 15 G533ZW-LN106WS
GeForce RTX 3070 Ti Laptop GPU, i9-12900H, Samsung PM9A1 MZVL22T0HBLB
2069 Points +5%
Asus ROG Strix Scar 15 G533zm
GeForce RTX 3060 Laptop GPU, i9-12900H
1964 Points
Moyenne Intel Core i9-12900H, NVIDIA GeForce RTX 3060 Laptop GPU
  (1486 - 2230, n=4)
1887 Points -4%
Moyenne de la classe Gaming
  (1030 - 2330, n=146, 2 dernières années)
1708 Points -13%
PCMark 10 Score
7861 points
Aide
AIDA64 / Memory Copy
Moyenne de la classe Gaming
  (21842 - 94222, n=184, 2 dernières années)
65340 MB/s +29%
Asus ROG Strix Scar 15 G533ZW-LN106WS
Intel Core i9-12900H, GeForce RTX 3070 Ti Laptop GPU
61561 MB/s +21%
Moyenne Intel Core i9-12900H
  (34438 - 74264, n=28)
58945 MB/s +16%
Asus TUF Gaming F15 FX507ZM
Intel Core i7-12700H, GeForce RTX 3060 Laptop GPU
53661 MB/s +6%
Asus ROG Strix Scar 15 G533zm
Intel Core i9-12900H, GeForce RTX 3060 Laptop GPU
50769 MB/s
MSI Pulse GL66 12UEK
Intel Core i9-12900H, GeForce RTX 3060 Laptop GPU
45624 MB/s -10%
Alienware m15 R5 Ryzen Edition
AMD Ryzen 7 5800H, GeForce RTX 3060 Laptop GPU
37687 MB/s -26%
Lenovo Legion 5 15ACH6A-82NW0010GE
AMD Ryzen 5 5600H, Radeon RX 6600M
37007 MB/s -27%
AIDA64 / Memory Read
Moyenne de la classe Gaming
  (23681 - 99713, n=184, 2 dernières années)
69264 MB/s +22%
Asus ROG Strix Scar 15 G533ZW-LN106WS
Intel Core i9-12900H, GeForce RTX 3070 Ti Laptop GPU
65018 MB/s +14%
Moyenne Intel Core i9-12900H
  (36365 - 74642, n=28)
61718 MB/s +8%
Asus TUF Gaming F15 FX507ZM
Intel Core i7-12700H, GeForce RTX 3060 Laptop GPU
59205 MB/s +4%
Asus ROG Strix Scar 15 G533zm
Intel Core i9-12900H, GeForce RTX 3060 Laptop GPU
56905 MB/s
MSI Pulse GL66 12UEK
Intel Core i9-12900H, GeForce RTX 3060 Laptop GPU
48866 MB/s -14%
Alienware m15 R5 Ryzen Edition
AMD Ryzen 7 5800H, GeForce RTX 3060 Laptop GPU
44146 MB/s -22%
Lenovo Legion 5 15ACH6A-82NW0010GE
AMD Ryzen 5 5600H, Radeon RX 6600M
42375 MB/s -26%
AIDA64 / Memory Write
Moyenne de la classe Gaming
  (22986 - 108954, n=184, 2 dernières années)
67131 MB/s +14%
Asus ROG Strix Scar 15 G533ZW-LN106WS
Intel Core i9-12900H, GeForce RTX 3070 Ti Laptop GPU
64873 MB/s +10%
Moyenne Intel Core i9-12900H
  (32276 - 67858, n=28)
59318 MB/s +1%
Asus ROG Strix Scar 15 G533zm
Intel Core i9-12900H, GeForce RTX 3060 Laptop GPU
58908 MB/s
Asus TUF Gaming F15 FX507ZM
Intel Core i7-12700H, GeForce RTX 3060 Laptop GPU
58758 MB/s 0%
MSI Pulse GL66 12UEK
Intel Core i9-12900H, GeForce RTX 3060 Laptop GPU
47016 MB/s -20%
Alienware m15 R5 Ryzen Edition
AMD Ryzen 7 5800H, GeForce RTX 3060 Laptop GPU
35891 MB/s -39%
Lenovo Legion 5 15ACH6A-82NW0010GE
AMD Ryzen 5 5600H, Radeon RX 6600M
30785 MB/s -48%
AIDA64 / Memory Latency
Asus ROG Strix Scar 15 G533zm
Intel Core i9-12900H, GeForce RTX 3060 Laptop GPU
98.3 ns *
Asus ROG Strix Scar 15 G533ZW-LN106WS
Intel Core i9-12900H, GeForce RTX 3070 Ti Laptop GPU
97.6 ns * +1%
Moyenne de la classe Gaming
  (59.5 - 259, n=184, 2 dernières années)
93.7 ns * +5%
MSI Pulse GL66 12UEK
Intel Core i9-12900H, GeForce RTX 3060 Laptop GPU
91.9 ns * +7%
Lenovo Legion 5 15ACH6A-82NW0010GE
AMD Ryzen 5 5600H, Radeon RX 6600M
87.9 ns * +11%
Moyenne Intel Core i9-12900H
  (74.7 - 118.1, n=27)
85.7 ns * +13%
Alienware m15 R5 Ryzen Edition
AMD Ryzen 7 5800H, GeForce RTX 3060 Laptop GPU
78.2 ns * +20%
Asus TUF Gaming F15 FX507ZM
Intel Core i7-12700H, GeForce RTX 3060 Laptop GPU
0 ns * +100%

* ... Moindre est la valeur, meilleures sont les performances

Latence DPC

LatencyMon a immédiatement signalé des problèmes dès qu'un navigateur était lancé. L'ouverture de plusieurs onglets a aggravé les problèmes. Les valeurs de latence ont encore augmenté lors de la lecture de notre vidéo de test YouTube en 4K et à 60 fps. Cependant, la vidéo s'est déroulée sans aucune perte d'images.

DPC Latencies / LatencyMon - interrupt to process latency (max), Web, Youtube, Prime95
Asus ROG Strix Scar 15 G533zm
GeForce RTX 3060 Laptop GPU, i9-12900H
1005.8 μs *
MSI Pulse GL66 12UEK
GeForce RTX 3060 Laptop GPU, i9-12900H, Micron 2450 512GB MTFDKBA512TFK
911 μs * +9%
Asus ROG Strix Scar 15 G533ZW-LN106WS
GeForce RTX 3070 Ti Laptop GPU, i9-12900H, Samsung PM9A1 MZVL22T0HBLB
892.1 μs * +11%
Lenovo Legion 5 15ACH6A-82NW0010GE
Radeon RX 6600M, R5 5600H, Micron 2210 MTFDHBA512QFD
833 μs * +17%
Asus TUF Gaming F15 FX507ZM
GeForce RTX 3060 Laptop GPU, i7-12700H, SK Hynix HFM001TD3JX013N
719 μs * +29%
Alienware m15 R5 Ryzen Edition
GeForce RTX 3060 Laptop GPU, R7 5800H, Toshiba KBG40ZNS512G NVMe
428.6 μs * +57%

* ... Moindre est la valeur, meilleures sont les performances

Mémoire de masse

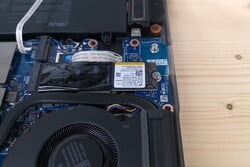
Le SSD de Micron
Le SSD de Micron

Asus a installé un SSD NVMe PCIe 4.0 assez récent de 1 To fabriqué par Micron. Malgré d'excellents taux de transfert, le disque n'a pas pleinement exploité les vitesses offertes par la norme relativement nouvelle. Cela dit, il a surtout offert les meilleures performances par rapport aux disques de stockage des ordinateurs portables concurrents. Ses performances sont également superbes en charge soutenue.

CDM 5/6 Read Seq Q32T1: 6489.8 MB/s
CDM 5/6 Write Seq Q32T1: 4988 MB/s
CDM 5/6 Read 4K Q32T1: 818.11 MB/s
CDM 5/6 Write 4K Q32T1: 760.89 MB/s
CDM 5/6 Read 4K: 71.35 MB/s
CDM 5/6 Write 4K: 271.37 MB/s
CDM 6 Write 4K Q8T8: 2509.59 MB/s
CDM 6 Read 4K Q8T8: 2298.39 MB/s
Drive Performance Rating - Percent
Asus ROG Strix Scar 15 G533ZW-LN106WS
Samsung PM9A1 MZVL22T0HBLB
93.5 pt
Asus ROG Strix Scar 15 G533zm
 
80.8 pt
Moyenne de la classe Gaming
 
77.6 pt
MSI Pulse GL66 12UEK
Micron 2450 512GB MTFDKBA512TFK
67.8 pt
Asus TUF Gaming F15 FX507ZM
SK Hynix HFM001TD3JX013N
65.6 pt
Lenovo Legion 5 15ACH6A-82NW0010GE
Micron 2210 MTFDHBA512QFD
40.3 pt
Alienware m15 R5 Ryzen Edition
Toshiba KBG40ZNS512G NVMe
38 pt
Global Average -3
 
37 pt
DiskSpd
seq read
Moyenne de la classe Gaming
  (1319 - 7045, n=165, 2 dernières années)
3475 MB/s +5%
Asus ROG Strix Scar 15 G533zm
 
3321 (3197.01min - 3321.47max) MB/s
Asus ROG Strix Scar 15 G533ZW-LN106WS
Samsung PM9A1 MZVL22T0HBLB
2397 (2152.62min - 2396.66max) MB/s -28%
Asus TUF Gaming F15 FX507ZM
SK Hynix HFM001TD3JX013N
2383 (2361.29min - 2382.94max) MB/s -28%
Global Average -3
  (38.2 - 7045, n=1730)
2351 MB/s -29%
MSI Pulse GL66 12UEK
Micron 2450 512GB MTFDKBA512TFK
2038 (1650.93min - 2038.34max) MB/s -39%
Lenovo Legion 5 15ACH6A-82NW0010GE
Micron 2210 MTFDHBA512QFD
1935 (1931.9min - 1934.83max) MB/s -42%
Alienware m15 R5 Ryzen Edition
Toshiba KBG40ZNS512G NVMe
1726 (1693.24min - 1725.96max) MB/s -48%
seq write
Asus ROG Strix Scar 15 G533zm
 
4889 (4577.32min - 4888.96max) MB/s
Asus ROG Strix Scar 15 G533ZW-LN106WS
Samsung PM9A1 MZVL22T0HBLB
4488 (4442.32min - 4488.16max) MB/s -8%
Moyenne de la classe Gaming
  (535 - 9307, n=165, 2 dernières années)
3812 MB/s -22%
MSI Pulse GL66 12UEK
Micron 2450 512GB MTFDKBA512TFK
3275 (3243.25min - 3275.12max) MB/s -33%
Asus TUF Gaming F15 FX507ZM
SK Hynix HFM001TD3JX013N
2894 (2651.7min - 2893.78max) MB/s -41%
Global Average -3
  (38.2 - 9307, n=1730)
2393 MB/s -51%
Alienware m15 R5 Ryzen Edition
Toshiba KBG40ZNS512G NVMe
1520 (983.77min - 1519.6max) MB/s -69%
Lenovo Legion 5 15ACH6A-82NW0010GE
Micron 2210 MTFDHBA512QFD
1146 (903.24min - 1146.3max) MB/s -77%
seq q8 t1 read
Asus ROG Strix Scar 15 G533ZW-LN106WS
Samsung PM9A1 MZVL22T0HBLB
7006 (6563.67min - 7005.79max) MB/s +10%
Asus ROG Strix Scar 15 G533zm
 
6379 (5807.98min - 6378.73max) MB/s
Moyenne de la classe Gaming
  (2594 - 16089, n=165, 2 dernières années)
6323 MB/s -1%
Global Average -3
  (38.5 - 16089, n=1730)
3968 MB/s -38%
MSI Pulse GL66 12UEK
Micron 2450 512GB MTFDKBA512TFK
3613 (3227.14min - 3613.09max) MB/s -43%
Asus TUF Gaming F15 FX507ZM
SK Hynix HFM001TD3JX013N
3554 (3284.35min - 3554.02max) MB/s -44%
Alienware m15 R5 Ryzen Edition
Toshiba KBG40ZNS512G NVMe
2314 (1882.82min - 2314max) MB/s -64%
Lenovo Legion 5 15ACH6A-82NW0010GE
Micron 2210 MTFDHBA512QFD
2213 (2018.77min - 2212.5max) MB/s -65%
seq q8 t1 write
Asus ROG Strix Scar 15 G533ZW-LN106WS
Samsung PM9A1 MZVL22T0HBLB
5263 (5104.74min - 5263.39max) MB/s +5%
Asus ROG Strix Scar 15 G533zm
 
4992 (4753.75min - 4992.35max) MB/s
Moyenne de la classe Gaming
  (539 - 14571, n=165, 2 dernières années)
4851 MB/s -3%
MSI Pulse GL66 12UEK
Micron 2450 512GB MTFDKBA512TFK
3351 (3295.17min - 3351.25max) MB/s -33%
Global Average -3
  (38.2 - 14571, n=1730)
2994 MB/s -40%
Asus TUF Gaming F15 FX507ZM
SK Hynix HFM001TD3JX013N
2869 (2667.88min - 2869.19max) MB/s -43%
Alienware m15 R5 Ryzen Edition
Toshiba KBG40ZNS512G NVMe
1449 (1364.2min - 1448.71max) MB/s -71%
Lenovo Legion 5 15ACH6A-82NW0010GE
Micron 2210 MTFDHBA512QFD
1145 (65.64min - 1144.64max) MB/s -77%
4k q1 t1 read
Asus ROG Strix Scar 15 G533ZW-LN106WS
Samsung PM9A1 MZVL22T0HBLB
86.8 (82.52min - 86.79max) MB/s +30%
MSI Pulse GL66 12UEK
Micron 2450 512GB MTFDKBA512TFK
71.5 (69.67min - 71.5max) MB/s +7%
Asus TUF Gaming F15 FX507ZM
SK Hynix HFM001TD3JX013N
69.4 (68.09min - 69.4max) MB/s +4%
Asus ROG Strix Scar 15 G533zm
 
66.7 (65.36min - 66.73max) MB/s
Moyenne de la classe Gaming
  (30.6 - 95.9, n=165, 2 dernières années)
66 MB/s -1%
Lenovo Legion 5 15ACH6A-82NW0010GE
Micron 2210 MTFDHBA512QFD
60.5 (60.38min - 60.5max) MB/s -9%
Global Average -3
  (0.67 - 361, n=1730)
58.3 MB/s -13%
Alienware m15 R5 Ryzen Edition
Toshiba KBG40ZNS512G NVMe
48.3 (47.05min - 48.34max) MB/s -28%
4k q1 t1 write
MSI Pulse GL66 12UEK
Micron 2450 512GB MTFDKBA512TFK
421 (225.22min - 421.18max) MB/s +61%
Asus ROG Strix Scar 15 G533ZW-LN106WS
Samsung PM9A1 MZVL22T0HBLB
294 (279.47min - 294.26max) MB/s +12%
Asus ROG Strix Scar 15 G533zm
 
262 (260.4min - 261.85max) MB/s
Moyenne de la classe Gaming
  (78 - 397, n=165, 2 dernières années)
224 MB/s -15%
Asus TUF Gaming F15 FX507ZM
SK Hynix HFM001TD3JX013N
211 (210.13min - 210.73max) MB/s -19%
Global Average -3
  (1.23 - 435, n=1729)
166 MB/s -37%
Lenovo Legion 5 15ACH6A-82NW0010GE
Micron 2210 MTFDHBA512QFD
153 (151.1min - 152.72max) MB/s -42%
Alienware m15 R5 Ryzen Edition
Toshiba KBG40ZNS512G NVMe
121 (117.79min - 121.25max) MB/s -54%
4k q32 t16 read
Asus ROG Strix Scar 15 G533ZW-LN106WS
Samsung PM9A1 MZVL22T0HBLB
3975 (3854.22min - 3974.57max) MB/s +40%
Asus ROG Strix Scar 15 G533zm
 
2835 (2764.71min - 2834.6max) MB/s
Moyenne de la classe Gaming
  (417 - 6172, n=165, 2 dernières années)
2571 MB/s -9%
Asus TUF Gaming F15 FX507ZM
SK Hynix HFM001TD3JX013N
2217 (2210.73min - 2217.07max) MB/s -22%
MSI Pulse GL66 12UEK
Micron 2450 512GB MTFDKBA512TFK
1550 (1546.75min - 1549.91max) MB/s -45%
Global Average -3
  (1.03 - 6172, n=1729)
1415 MB/s -50%
Alienware m15 R5 Ryzen Edition
Toshiba KBG40ZNS512G NVMe
1301 (981.55min - 1301max) MB/s -54%
Lenovo Legion 5 15ACH6A-82NW0010GE
Micron 2210 MTFDHBA512QFD
646 (644.91min - 645.74max) MB/s -77%
4k q32 t16 write
Asus ROG Strix Scar 15 G533ZW-LN106WS
Samsung PM9A1 MZVL22T0HBLB
3509 (3396.26min - 3509.01max) MB/s +29%
MSI Pulse GL66 12UEK
Micron 2450 512GB MTFDKBA512TFK
3249 (265.37min - 3249.37max) MB/s +20%
Asus ROG Strix Scar 15 G533zm
 
2717 (2628.09min - 2717.29max) MB/s
Asus TUF Gaming F15 FX507ZM
SK Hynix HFM001TD3JX013N
2314 (2299.73min - 2313.93max) MB/s -15%
Moyenne de la classe Gaming
  (162.3 - 4869, n=165, 2 dernières années)
2137 MB/s -21%
Global Average -3
  (1.5 - 5171, n=1729)
1213 MB/s -55%
Lenovo Legion 5 15ACH6A-82NW0010GE
Micron 2210 MTFDHBA512QFD
1061 (62.92min - 1061.17max) MB/s -61%
Alienware m15 R5 Ryzen Edition
Toshiba KBG40ZNS512G NVMe
497 (490.94min - 497.29max) MB/s -82%
AS SSD
Score Total
Asus ROG Strix Scar 15 G533ZW-LN106WS
Samsung PM9A1 MZVL22T0HBLB
9031 Points +28%
Asus ROG Strix Scar 15 G533zm
 
7076 Points
Moyenne de la classe Gaming
  (2271 - 13854, n=156, 2 dernières années)
6746 Points -5%
Asus TUF Gaming F15 FX507ZM
SK Hynix HFM001TD3JX013N
6117 Points -14%
MSI Pulse GL66 12UEK
Micron 2450 512GB MTFDKBA512TFK
4693 Points -34%
Alienware m15 R5 Ryzen Edition
Toshiba KBG40ZNS512G NVMe
3136 Points -56%
Global Average -3
  (19 - 13854, n=3398)
2886 Points -59%
Lenovo Legion 5 15ACH6A-82NW0010GE
Micron 2210 MTFDHBA512QFD
2499 Points -65%
Score Read
Asus ROG Strix Scar 15 G533ZW-LN106WS
Samsung PM9A1 MZVL22T0HBLB
3378 Points +21%
Asus ROG Strix Scar 15 G533zm
 
2784 Points
Moyenne de la classe Gaming
  (776 - 4721, n=156, 2 dernières années)
2446 Points -12%
Asus TUF Gaming F15 FX507ZM
SK Hynix HFM001TD3JX013N
2291 Points -18%
MSI Pulse GL66 12UEK
Micron 2450 512GB MTFDKBA512TFK
1878 Points -33%
Alienware m15 R5 Ryzen Edition
Toshiba KBG40ZNS512G NVMe
1506 Points -46%
Global Average -3
  (6 - 4721, n=3399)
1108 Points -60%
Lenovo Legion 5 15ACH6A-82NW0010GE
Micron 2210 MTFDHBA512QFD
841 Points -70%
Score Write
Asus ROG Strix Scar 15 G533ZW-LN106WS
Samsung PM9A1 MZVL22T0HBLB
3999 Points +35%
Moyenne de la classe Gaming
  (515 - 7208, n=156, 2 dernières années)
3112 Points +5%
Asus ROG Strix Scar 15 G533zm
 
2969 Points
Asus TUF Gaming F15 FX507ZM
SK Hynix HFM001TD3JX013N
2660 Points -10%
MSI Pulse GL66 12UEK
Micron 2450 512GB MTFDKBA512TFK
1837 Points -38%
Lenovo Legion 5 15ACH6A-82NW0010GE
Micron 2210 MTFDHBA512QFD
1251 Points -58%
Global Average -3
  (4 - 7208, n=3399)
1240 Points -58%
Alienware m15 R5 Ryzen Edition
Toshiba KBG40ZNS512G NVMe
918 Points -69%
Seq Read
Asus ROG Strix Scar 15 G533ZW-LN106WS
Samsung PM9A1 MZVL22T0HBLB
5563.48 MB/s +21%
Moyenne de la classe Gaming
  (2260 - 12763, n=156, 2 dernières années)
4945 MB/s +8%
Asus ROG Strix Scar 15 G533zm
 
4599 MB/s
MSI Pulse GL66 12UEK
Micron 2450 512GB MTFDKBA512TFK
3127 MB/s -32%
Asus TUF Gaming F15 FX507ZM
SK Hynix HFM001TD3JX013N
3013 MB/s -34%
Alienware m15 R5 Ryzen Edition
Toshiba KBG40ZNS512G NVMe
2082 MB/s -55%
Global Average -3
  (193.2 - 12763, n=3616)
1959 MB/s -57%
Lenovo Legion 5 15ACH6A-82NW0010GE
Micron 2210 MTFDHBA512QFD
1948 MB/s -58%
Seq Write
Asus ROG Strix Scar 15 G533ZW-LN106WS
Samsung PM9A1 MZVL22T0HBLB
4045.87 MB/s +57%
Moyenne de la classe Gaming
  (495 - 11316, n=156, 2 dernières années)
3760 MB/s +46%
MSI Pulse GL66 12UEK
Micron 2450 512GB MTFDKBA512TFK
2977 MB/s +16%
Asus TUF Gaming F15 FX507ZM
SK Hynix HFM001TD3JX013N
2768 MB/s +8%
Asus ROG Strix Scar 15 G533zm
 
2570 MB/s
Global Average -3
  (52.2 - 11316, n=3619)
1322 MB/s -49%
Lenovo Legion 5 15ACH6A-82NW0010GE
Micron 2210 MTFDHBA512QFD
1094 MB/s -57%
Alienware m15 R5 Ryzen Edition
Toshiba KBG40ZNS512G NVMe
825 MB/s -68%
4K Read
MSI Pulse GL66 12UEK
Micron 2450 512GB MTFDKBA512TFK
95.9 MB/s +46%
Asus ROG Strix Scar 15 G533ZW-LN106WS
Samsung PM9A1 MZVL22T0HBLB
81.3 MB/s +24%
Asus TUF Gaming F15 FX507ZM
SK Hynix HFM001TD3JX013N
66.9 MB/s +2%
Asus ROG Strix Scar 15 G533zm
 
65.68 MB/s
Moyenne de la classe Gaming
  (27.8 - 112.1, n=156, 2 dernières années)
65.2 MB/s -1%
Lenovo Legion 5 15ACH6A-82NW0010GE
Micron 2210 MTFDHBA512QFD
60.58 MB/s -8%
Alienware m15 R5 Ryzen Edition
Toshiba KBG40ZNS512G NVMe
42.41 MB/s -35%
Global Average -3
  (6.08 - 314, n=3608)
42.1 MB/s -36%
4K Write
MSI Pulse GL66 12UEK
Micron 2450 512GB MTFDKBA512TFK
363.5 MB/s +50%
Asus ROG Strix Scar 15 G533ZW-LN106WS
Samsung PM9A1 MZVL22T0HBLB
248.96 MB/s +3%
Asus ROG Strix Scar 15 G533zm
 
242.84 MB/s
Moyenne de la classe Gaming
  (108.8 - 512, n=156, 2 dernières années)
213 MB/s -12%
Asus TUF Gaming F15 FX507ZM
SK Hynix HFM001TD3JX013N
184.8 MB/s -24%
Lenovo Legion 5 15ACH6A-82NW0010GE
Micron 2210 MTFDHBA512QFD
145.7 MB/s -40%
Global Average -3
  (13.3 - 512, n=3608)
112.4 MB/s -54%
Alienware m15 R5 Ryzen Edition
Toshiba KBG40ZNS512G NVMe
98.3 MB/s -60%
4K-64 Read
Asus ROG Strix Scar 15 G533ZW-LN106WS
Samsung PM9A1 MZVL22T0HBLB
2740.24 MB/s +21%
Asus ROG Strix Scar 15 G533zm
 
2257.92 MB/s
Asus TUF Gaming F15 FX507ZM
SK Hynix HFM001TD3JX013N
1923 MB/s -15%
Moyenne de la classe Gaming
  (451 - 3475, n=156, 2 dernières années)
1881 MB/s -17%
MSI Pulse GL66 12UEK
Micron 2450 512GB MTFDKBA512TFK
1469 MB/s -35%
Alienware m15 R5 Ryzen Edition
Toshiba KBG40ZNS512G NVMe
1255 MB/s -44%
Global Average -3
  (13.1 - 3600, n=3607)
817 MB/s -64%
Lenovo Legion 5 15ACH6A-82NW0010GE
Micron 2210 MTFDHBA512QFD
585.23 MB/s -74%
4K-64 Write
Asus ROG Strix Scar 15 G533ZW-LN106WS
Samsung PM9A1 MZVL22T0HBLB
3345.62 MB/s +35%
Moyenne de la classe Gaming
  (277 - 5909, n=156, 2 dernières années)
2527 MB/s +2%
Asus ROG Strix Scar 15 G533zm
 
2469.12 MB/s
Asus TUF Gaming F15 FX507ZM
SK Hynix HFM001TD3JX013N
2198 MB/s -11%
MSI Pulse GL66 12UEK
Micron 2450 512GB MTFDKBA512TFK
1175 MB/s -52%
Lenovo Legion 5 15ACH6A-82NW0010GE
Micron 2210 MTFDHBA512QFD
995.52 MB/s -60%
Global Average -3
  (13.7 - 5909, n=3605)
933 MB/s -62%
Alienware m15 R5 Ryzen Edition
Toshiba KBG40ZNS512G NVMe
738 MB/s -70%
Access Time Read
Global Average -3
  (0.012 - 33, n=3539)
0.626 ms * -2622%
Alienware m15 R5 Ryzen Edition
Toshiba KBG40ZNS512G NVMe
0.109 ms * -374%
Lenovo Legion 5 15ACH6A-82NW0010GE
Micron 2210 MTFDHBA512QFD
0.077 ms * -235%
Moyenne de la classe Gaming
  (0.016 - 0.379, n=155, 2 dernières années)
0.05576 ms * -142%
MSI Pulse GL66 12UEK
Micron 2450 512GB MTFDKBA512TFK
0.051 ms * -122%
Asus TUF Gaming F15 FX507ZM
SK Hynix HFM001TD3JX013N
0.03 ms * -30%
Asus ROG Strix Scar 15 G533zm
 
0.023 ms *
Asus ROG Strix Scar 15 G533ZW-LN106WS
Samsung PM9A1 MZVL22T0HBLB
0.022 ms * +4%
Access Time Write
Global Average -3
  (0.011 - 60.7, n=3581)
0.535 ms * -2716%
Alienware m15 R5 Ryzen Edition
Toshiba KBG40ZNS512G NVMe
0.17 ms * -795%
MSI Pulse GL66 12UEK
Micron 2450 512GB MTFDKBA512TFK
0.167 ms * -779%
Asus TUF Gaming F15 FX507ZM
SK Hynix HFM001TD3JX013N
0.081 ms * -326%
Moyenne de la classe Gaming
  (0.011 - 1.028, n=156, 2 dernières années)
0.04728 ms * -149%
Lenovo Legion 5 15ACH6A-82NW0010GE
Micron 2210 MTFDHBA512QFD
0.039 ms * -105%
Asus ROG Strix Scar 15 G533zm
 
0.019 ms *
Asus ROG Strix Scar 15 G533ZW-LN106WS
Samsung PM9A1 MZVL22T0HBLB
0.017 ms * +11%

* ... Moindre est la valeur, meilleures sont les performances

Sustained load Read: DiskSpd Read Loop, Queue Depth 8

02605207801040130015601820208023402600286031203380364039004160442046804940Tooltip
Asus ROG Strix Scar 15 G533zm: Ø5140 (3821.01-5186.89)

Carte graphique

La Nividia GeForce RTX 3060 se situe entre le milieu et le haut de gamme. Son TGP peut varier de 60 à 115 watts, et la configuration de l'alimentation a un impact durable sur les performances 3D de la carte. La RTX 3060 de la Strix Scar a accès à la totalité des 115 watts et peut aller jusqu'à 140 watts avec un Dynamic Boost de 25 watts.

Dans les benchmarks 3D synthétiques, le GPU est légèrement plus performant qu'une RTX 3060 moyenne de notre base de données, mais la Lenovo Legion 5 et l'Asus TUF Gaming F15 sont marginalement plus rapides que la Strix Scar. La RTX 3070 Ti de la Scar 15 G533zw est environ 35% plus puissante.

Sur batterie, les performances 3D de l'ordinateur portable ont chuté d'environ 67 % lors d'un nouveau test sur Fire Strike, avec un score graphique de seulement 7 168 au lieu des 21 671 habituels.

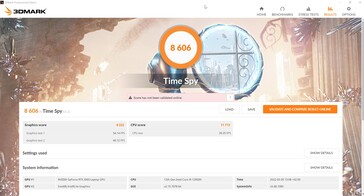
Time Spy
Time Spy
Fire Strike
Fire Strike
3DMark Performance Rating - Percent
Moyenne de la classe Gaming
 
100 pt
Asus ROG Strix Scar 15 G533ZW-LN106WS
NVIDIA GeForce RTX 3070 Ti Laptop GPU, Intel Core i9-12900H
89.7 pt
Lenovo Legion 5 15ACH6A-82NW0010GE
AMD Radeon RX 6600M, AMD Ryzen 5 5600H
71.3 pt
Asus TUF Gaming F15 FX507ZM
NVIDIA GeForce RTX 3060 Laptop GPU, Intel Core i7-12700H
71 pt
Asus ROG Strix Scar 15 G533zm
NVIDIA GeForce RTX 3060 Laptop GPU, Intel Core i9-12900H
65.8 pt
Alienware m15 R5 Ryzen Edition
NVIDIA GeForce RTX 3060 Laptop GPU, AMD Ryzen 7 5800H
63.1 pt
Moyenne NVIDIA GeForce RTX 3060 Laptop GPU
 
62.6 pt
MSI Pulse GL66 12UEK
NVIDIA GeForce RTX 3060 Laptop GPU, Intel Core i9-12900H
51.8 pt
3DMark 11 - 1280x720 Performance GPU
Moyenne de la classe Gaming
  (1029 - 72178, n=183, 2 dernières années)
43810 Points +52%
Asus ROG Strix Scar 15 G533ZW-LN106WS
NVIDIA GeForce RTX 3070 Ti Laptop GPU, Intel Core i9-12900H
39673 Points +38%
Lenovo Legion 5 15ACH6A-82NW0010GE
AMD Radeon RX 6600M, AMD Ryzen 5 5600H
31702 Points +10%
Asus TUF Gaming F15 FX507ZM
NVIDIA GeForce RTX 3060 Laptop GPU, Intel Core i7-12700H
30772 Points +7%
Asus ROG Strix Scar 15 G533zm
NVIDIA GeForce RTX 3060 Laptop GPU, Intel Core i9-12900H
28848 Points
Alienware m15 R5 Ryzen Edition
NVIDIA GeForce RTX 3060 Laptop GPU, AMD Ryzen 7 5800H
26881 Points -7%
Moyenne NVIDIA GeForce RTX 3060 Laptop GPU
  (13799 - 30772, n=43)
26816 Points -7%
MSI Pulse GL66 12UEK
NVIDIA GeForce RTX 3060 Laptop GPU, Intel Core i9-12900H
13799 Points -52%
3DMark
1920x1080 Fire Strike Graphics
Moyenne de la classe Gaming
  (781 - 53059, n=194, 2 dernières années)
31415 Points +45%
Asus ROG Strix Scar 15 G533ZW-LN106WS
NVIDIA GeForce RTX 3070 Ti Laptop GPU, Intel Core i9-12900H
29292 Points +35%
Lenovo Legion 5 15ACH6A-82NW0010GE
AMD Radeon RX 6600M, AMD Ryzen 5 5600H
24788 Points +14%
Asus TUF Gaming F15 FX507ZM
NVIDIA GeForce RTX 3060 Laptop GPU, Intel Core i7-12700H
22915 Points +6%
Asus ROG Strix Scar 15 G533zm
NVIDIA GeForce RTX 3060 Laptop GPU, Intel Core i9-12900H
21671 Points
Moyenne NVIDIA GeForce RTX 3060 Laptop GPU
  (16354 - 23109, n=49)
20436 Points -6%
Alienware m15 R5 Ryzen Edition
NVIDIA GeForce RTX 3060 Laptop GPU, AMD Ryzen 7 5800H
20312 Points -6%
MSI Pulse GL66 12UEK
NVIDIA GeForce RTX 3060 Laptop GPU, Intel Core i9-12900H
20286 Points -6%
2560x1440 Time Spy Graphics
Moyenne de la classe Gaming
  (224 - 22717, n=189, 2 dernières années)
13118 Points +60%
Asus ROG Strix Scar 15 G533ZW-LN106WS
NVIDIA GeForce RTX 3070 Ti Laptop GPU, Intel Core i9-12900H
11197 Points +36%
Asus TUF Gaming F15 FX507ZM
NVIDIA GeForce RTX 3060 Laptop GPU, Intel Core i7-12700H
9174 Points +12%
Alienware m15 R5 Ryzen Edition
NVIDIA GeForce RTX 3060 Laptop GPU, AMD Ryzen 7 5800H
8295 Points +1%
Lenovo Legion 5 15ACH6A-82NW0010GE
AMD Radeon RX 6600M, AMD Ryzen 5 5600H
8234 Points 0%
Asus ROG Strix Scar 15 G533zm
NVIDIA GeForce RTX 3060 Laptop GPU, Intel Core i9-12900H
8222 Points
Moyenne NVIDIA GeForce RTX 3060 Laptop GPU
  (6285 - 9235, n=49)
8057 Points -2%
MSI Pulse GL66 12UEK
NVIDIA GeForce RTX 3060 Laptop GPU, Intel Core i9-12900H
7780 Points -5%
3DMark 11 Performance
27156 points
3DMark Fire Strike Score
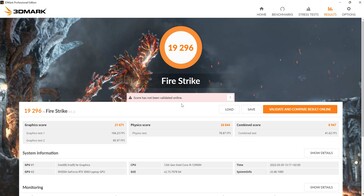
19296 points
3DMark Time Spy Score
8606 points
Aide

Performances des jeux

Malheureusement, Optimus limite la Strix à l'exécution des jeux DirectX 11 à seulement 60 images par seconde. Il s'agit d'un problème général affectant certains ordinateurs portables équipés d'Optimus. Outre le fait de jouer à ces jeux sur un moniteur externe, la seule solution consiste à activer le commutateur MUX et à utiliser directement le dGPU.

Le Strix 15 offre la plupart du temps les meilleures performances parmi les appareils de notre comparatif. Seul le TUF Gaming F15 est légèrement plus rapide dans certains jeux.

En débranchant le Strix, les taux d'images se sont stabilisés à 30 fps en mode Ultra, et les ventilateurs sont restés stables Witcher 3 en mode Ultra, et les ventilateurs sont restés agréablement silencieux pendant toute la durée du jeu.

The Witcher 3
1366x768 Medium Graphics & Postprocessing
Moyenne de la classe Gaming
  (168.5 - 617, n=98, 2 dernières années)
365 fps +26%
Asus ROG Strix Scar 15 G533ZW-LN106WS
Intel Core i9-12900H, NVIDIA GeForce RTX 3070 Ti Laptop GPU
326 (275min, 280.6P1) fps +12%
Asus ROG Strix Scar 15 G533ZW-LN106WS
Intel Core i9-12900H, NVIDIA GeForce RTX 3070 Ti Laptop GPU
251 (213min, 216.92P1) fps -13%
Asus TUF Gaming F15 FX507ZM
Intel Core i7-12700H, NVIDIA GeForce RTX 3060 Laptop GPU
291.8 (268min) fps +1%
Asus ROG Strix Scar 15 G533zm
Intel Core i9-12900H, NVIDIA GeForce RTX 3060 Laptop GPU
290 fps
MSI Pulse GL66 12UEK
Intel Core i9-12900H, NVIDIA GeForce RTX 3060 Laptop GPU
247.2 fps -15%
Moyenne NVIDIA GeForce RTX 3060 Laptop GPU
  (204 - 296, n=33)
237 fps -18%
Lenovo Legion 5 15ACH6A-82NW0010GE
AMD Ryzen 5 5600H, AMD Radeon RX 6600M
194 (8.99min, 82.6P0.1, 156P1) fps -33%
1920x1080 High Graphics & Postprocessing (Nvidia HairWorks Off)
Moyenne de la classe Gaming
  (40.1 - 449, n=120, 2 dernières années)
242 fps +47%
Asus ROG Strix Scar 15 G533ZW-LN106WS
Intel Core i9-12900H, NVIDIA GeForce RTX 3070 Ti Laptop GPU
209 (173min, 174.1P1) fps +27%
Asus TUF Gaming F15 FX507ZM
Intel Core i7-12700H, NVIDIA GeForce RTX 3060 Laptop GPU
186.8 (175min) fps +13%
Asus ROG Strix Scar 15 G533zm
Intel Core i9-12900H, NVIDIA GeForce RTX 3060 Laptop GPU
165 fps
Moyenne NVIDIA GeForce RTX 3060 Laptop GPU
  (81 - 186.8, n=41)
144.8 fps -12%
Alienware m15 R5 Ryzen Edition
AMD Ryzen 7 5800H, NVIDIA GeForce RTX 3060 Laptop GPU
142 fps -14%
Lenovo Legion 5 15ACH6A-82NW0010GE
AMD Ryzen 5 5600H, AMD Radeon RX 6600M
141 (8.84min, 64.6P0.1, 114P1) fps -15%
MSI Pulse GL66 12UEK
Intel Core i9-12900H, NVIDIA GeForce RTX 3060 Laptop GPU
139.6 fps -15%
1920x1080 Ultra Graphics & Postprocessing (HBAO+)
Moyenne de la classe Gaming
  (18.4 - 216, n=163, 2 dernières années)
128.3 fps +45%
Asus ROG Strix Scar 15 G533ZW-LN106WS
Intel Core i9-12900H, NVIDIA GeForce RTX 3070 Ti Laptop GPU
111 (95min, 95P1) fps +25%
Asus TUF Gaming F15 FX507ZM
Intel Core i7-12700H, NVIDIA GeForce RTX 3060 Laptop GPU
91.5 (87min) fps +3%
Asus ROG Strix Scar 15 G533zm
Intel Core i9-12900H, NVIDIA GeForce RTX 3060 Laptop GPU
88.7 fps
Lenovo Legion 5 15ACH6A-82NW0010GE
AMD Ryzen 5 5600H, AMD Radeon RX 6600M
81.3 (9.27min, 52.3P0.1, 66.2P1) fps -8%
MSI Pulse GL66 12UEK
Intel Core i9-12900H, NVIDIA GeForce RTX 3060 Laptop GPU
78 fps -12%
Moyenne NVIDIA GeForce RTX 3060 Laptop GPU
  (58.2 - 91.5, n=48)
76.9 fps -13%
Alienware m15 R5 Ryzen Edition
AMD Ryzen 7 5800H, NVIDIA GeForce RTX 3060 Laptop GPU
75.6 (64min) fps -15%
Far Cry 5
1920x1080 Medium Preset AA:T
Moyenne de la classe Gaming
  (38 - 248, n=85, 2 dernières années)
146 fps +13%
Asus ROG Strix Scar 15 G533ZW-LN106WS
Intel Core i9-12900H, NVIDIA GeForce RTX 3070 Ti Laptop GPU
143 (121min) fps +11%
Asus ROG Strix Scar 15 G533zm
Intel Core i9-12900H, NVIDIA GeForce RTX 3060 Laptop GPU
129 fps
MSI Pulse GL66 12UEK
Intel Core i9-12900H, NVIDIA GeForce RTX 3060 Laptop GPU
128 fps -1%
Asus TUF Gaming F15 FX507ZM
Intel Core i7-12700H, NVIDIA GeForce RTX 3060 Laptop GPU
123 (89min) fps -5%
Moyenne NVIDIA GeForce RTX 3060 Laptop GPU
  (88 - 135, n=25)
114.2 fps -11%
Alienware m15 R5 Ryzen Edition
AMD Ryzen 7 5800H, NVIDIA GeForce RTX 3060 Laptop GPU
105 fps -19%
Lenovo Legion 5 15ACH6A-82NW0010GE
AMD Ryzen 5 5600H, AMD Radeon RX 6600M
97 (79min) fps -25%
1920x1080 High Preset AA:T
Moyenne de la classe Gaming
  (35 - 232, n=98, 2 dernières années)
140 fps +14%
Asus ROG Strix Scar 15 G533ZW-LN106WS
Intel Core i9-12900H, NVIDIA GeForce RTX 3070 Ti Laptop GPU
138 (117min) fps +12%
Asus ROG Strix Scar 15 G533zm
Intel Core i9-12900H, NVIDIA GeForce RTX 3060 Laptop GPU
123 fps
MSI Pulse GL66 12UEK
Intel Core i9-12900H, NVIDIA GeForce RTX 3060 Laptop GPU
120 fps -2%
Asus TUF Gaming F15 FX507ZM
Intel Core i7-12700H, NVIDIA GeForce RTX 3060 Laptop GPU
114 (82min) fps -7%
Moyenne NVIDIA GeForce RTX 3060 Laptop GPU
  (85 - 129, n=29)
107.7 fps -12%
Alienware m15 R5 Ryzen Edition
AMD Ryzen 7 5800H, NVIDIA GeForce RTX 3060 Laptop GPU
100 fps -19%
Lenovo Legion 5 15ACH6A-82NW0010GE
AMD Ryzen 5 5600H, AMD Radeon RX 6600M
93 (74min) fps -24%
1920x1080 Ultra Preset AA:T
Moyenne de la classe Gaming
  (34 - 218, n=101, 2 dernières années)
131 fps +12%
Asus ROG Strix Scar 15 G533ZW-LN106WS
Intel Core i9-12900H, NVIDIA GeForce RTX 3070 Ti Laptop GPU
130 (102min) fps +11%
Asus ROG Strix Scar 15 G533zm
Intel Core i9-12900H, NVIDIA GeForce RTX 3060 Laptop GPU
117 fps
Asus TUF Gaming F15 FX507ZM
Intel Core i7-12700H, NVIDIA GeForce RTX 3060 Laptop GPU
114 (86min) fps -3%
MSI Pulse GL66 12UEK
Intel Core i9-12900H, NVIDIA GeForce RTX 3060 Laptop GPU
112 fps -4%
Moyenne NVIDIA GeForce RTX 3060 Laptop GPU
  (80 - 120, n=31)
101.6 fps -13%
Alienware m15 R5 Ryzen Edition
AMD Ryzen 7 5800H, NVIDIA GeForce RTX 3060 Laptop GPU
96 fps -18%
Lenovo Legion 5 15ACH6A-82NW0010GE
AMD Ryzen 5 5600H, AMD Radeon RX 6600M
86 (64min) fps -26%
Cyberpunk 2077 1.6
1920x1080 Medium Preset
Asus ROG Strix Scar 15 G533zm
Intel Core i9-12900H, NVIDIA GeForce RTX 3060 Laptop GPU
118 fps
Asus ROG Strix Scar 15 G533ZW-LN106WS
Intel Core i9-12900H, NVIDIA GeForce RTX 3070 Ti Laptop GPU
114.6 (27min) fps -3%
Moyenne de la classe Gaming
  (15 - 178.6, n=45, 2 dernières années)
109 fps -8%
Lenovo Legion 5 15ACH6A-82NW0010GE
AMD Ryzen 5 5600H, AMD Radeon RX 6600M
98.1 fps -17%
Moyenne NVIDIA GeForce RTX 3060 Laptop GPU
  (68 - 118, n=14)
89.3 fps -24%
MSI Pulse GL66 12UEK
Intel Core i9-12900H, NVIDIA GeForce RTX 3060 Laptop GPU
87.1 fps -26%
1920x1080 High Preset
Moyenne de la classe Gaming
  (12.2 - 205, n=58, 2 dernières années)
98.5 fps +56%
Asus ROG Strix Scar 15 G533ZW-LN106WS
Intel Core i9-12900H, NVIDIA GeForce RTX 3070 Ti Laptop GPU
89.5 (60.3min) fps +42%
Lenovo Legion 5 15ACH6A-82NW0010GE
AMD Ryzen 5 5600H, AMD Radeon RX 6600M
75.1 fps +19%
Moyenne NVIDIA GeForce RTX 3060 Laptop GPU
  (42.2 - 87.7, n=14)
68 fps +8%
Asus ROG Strix Scar 15 G533zm
Intel Core i9-12900H, NVIDIA GeForce RTX 3060 Laptop GPU
63 fps
MSI Pulse GL66 12UEK
Intel Core i9-12900H, NVIDIA GeForce RTX 3060 Laptop GPU
42.2 fps -33%
1920x1080 Ultra Preset
Moyenne de la classe Gaming
  (16.7 - 159.7, n=69, 2 dernières années)
93 fps +48%
Asus ROG Strix Scar 15 G533ZW-LN106WS
Intel Core i9-12900H, NVIDIA GeForce RTX 3070 Ti Laptop GPU
76 (31min) fps +21%
Asus ROG Strix Scar 15 G533zm
Intel Core i9-12900H, NVIDIA GeForce RTX 3060 Laptop GPU
63 fps
Moyenne NVIDIA GeForce RTX 3060 Laptop GPU
  (40 - 78.8, n=16)
61.1 fps -3%
Lenovo Legion 5 15ACH6A-82NW0010GE
AMD Ryzen 5 5600H, AMD Radeon RX 6600M
60.7 fps -4%
MSI Pulse GL66 12UEK
Intel Core i9-12900H, NVIDIA GeForce RTX 3060 Laptop GPU
40.7 fps -35%
2560x1440 Ultra Preset
Moyenne de la classe Gaming
  (37.7 - 116, n=56, 2 dernières années)
69.6 fps
Asus ROG Strix Scar 15 G533ZW-LN106WS
Intel Core i9-12900H, NVIDIA GeForce RTX 3070 Ti Laptop GPU
46 (29.7min) fps
Moyenne NVIDIA GeForce RTX 3060 Laptop GPU
  (23 - 45.8, n=9)
36.5 fps
1920x1080 Ray Tracing Ultra Preset (DLSS off)
Moyenne de la classe Gaming
  (19.1 - 74, n=26, 2 dernières années)
48.1 fps +84%
Asus ROG Strix Scar 15 G533ZW-LN106WS
Intel Core i9-12900H, NVIDIA GeForce RTX 3070 Ti Laptop GPU
34.7 (23.7min) fps +33%
Asus ROG Strix Scar 15 G533zm
Intel Core i9-12900H, NVIDIA GeForce RTX 3060 Laptop GPU
26.1 fps
Moyenne NVIDIA GeForce RTX 3060 Laptop GPU
  (12.6 - 28.9, n=7)
23.9 fps -8%
MSI Pulse GL66 12UEK
Intel Core i9-12900H, NVIDIA GeForce RTX 3060 Laptop GPU
23.8 fps -9%
Lenovo Legion 5 15ACH6A-82NW0010GE
AMD Ryzen 5 5600H, AMD Radeon RX 6600M
15.6 fps -40%
GTA V
1920x1080 Normal/Off AF:4x
Asus TUF Gaming F15 FX507ZM
Intel Core i7-12700H, NVIDIA GeForce RTX 3060 Laptop GPU
183 (3.66min, 143P1) fps +1%
Asus ROG Strix Scar 15 G533zm
Intel Core i9-12900H, NVIDIA GeForce RTX 3060 Laptop GPU
180.5 fps
Asus ROG Strix Scar 15 G533ZW-LN106WS
Intel Core i9-12900H, NVIDIA GeForce RTX 3070 Ti Laptop GPU
179.8 (4.84min, 18.5P1) fps 0%
Moyenne de la classe Gaming
  (101.7 - 187.7, n=121, 2 dernières années)
179.4 fps -1%
Moyenne NVIDIA GeForce RTX 3060 Laptop GPU
  (146 - 183.7, n=33)
170.2 fps -6%
Alienware m15 R5 Ryzen Edition
AMD Ryzen 7 5800H, NVIDIA GeForce RTX 3060 Laptop GPU
158 (4.71min, 100P1) fps -12%
Lenovo Legion 5 15ACH6A-82NW0010GE
AMD Ryzen 5 5600H, AMD Radeon RX 6600M
157 (4.98min, 90.9P1) fps -13%
1920x1080 High/On (Advanced Graphics Off) AA:2xMSAA + FX AF:8x
Asus ROG Strix Scar 15 G533ZW-LN106WS
Intel Core i9-12900H, NVIDIA GeForce RTX 3070 Ti Laptop GPU
172.2 (3.94min, 111.1P1) fps +3%
Moyenne de la classe Gaming
  (24.2 - 187.1, n=145, 2 dernières années)
169.6 fps +2%
Asus ROG Strix Scar 15 G533zm
Intel Core i9-12900H, NVIDIA GeForce RTX 3060 Laptop GPU
166.9 (4.78min, 125P1) fps
Asus TUF Gaming F15 FX507ZM
Intel Core i7-12700H, NVIDIA GeForce RTX 3060 Laptop GPU
162 (4.65min, 100P1) fps -3%
Moyenne NVIDIA GeForce RTX 3060 Laptop GPU
  (120 - 179.4, n=42)
154 fps -8%
Alienware m15 R5 Ryzen Edition
AMD Ryzen 7 5800H, NVIDIA GeForce RTX 3060 Laptop GPU
133 (17.8min, 90.9P1) fps -20%
Lenovo Legion 5 15ACH6A-82NW0010GE
AMD Ryzen 5 5600H, AMD Radeon RX 6600M
130.2 (19.1min, 83.3P1) fps -22%
1920x1080 Highest Settings possible AA:4xMSAA + FX AF:16x
Asus ROG Strix Scar 15 G533ZW-LN106WS
Intel Core i9-12900H, NVIDIA GeForce RTX 3070 Ti Laptop GPU
123.9 (6.53min, 76.9P1) fps +18%
Moyenne de la classe Gaming
  (12.1 - 167.7, n=170, 2 dernières années)
113.7 fps +8%
Asus ROG Strix Scar 15 G533zm
Intel Core i9-12900H, NVIDIA GeForce RTX 3060 Laptop GPU
105 fps
Asus TUF Gaming F15 FX507ZM
Intel Core i7-12700H, NVIDIA GeForce RTX 3060 Laptop GPU
97.9 (4.48min, 62.5P1) fps -7%
Moyenne NVIDIA GeForce RTX 3060 Laptop GPU
  (69.2 - 109.8, n=46)
89.7 fps -15%
Alienware m15 R5 Ryzen Edition
AMD Ryzen 7 5800H, NVIDIA GeForce RTX 3060 Laptop GPU
81.5 (9.89min, 58.8P1) fps -22%
Lenovo Legion 5 15ACH6A-82NW0010GE
AMD Ryzen 5 5600H, AMD Radeon RX 6600M
73.8 (17.6min, 52.6P1) fps -30%
Final Fantasy XV Benchmark
1920x1080 Standard Quality
Moyenne de la classe Gaming
  (33.5 - 230, n=145, 2 dernières années)
154.8 fps +32%
Asus ROG Strix Scar 15 G533ZW-LN106WS
Intel Core i9-12900H, NVIDIA GeForce RTX 3070 Ti Laptop GPU
129.7 fps +11%
Asus TUF Gaming F15 FX507ZM
Intel Core i7-12700H, NVIDIA GeForce RTX 3060 Laptop GPU
122 fps +4%
Asus ROG Strix Scar 15 G533zm
Intel Core i9-12900H, NVIDIA GeForce RTX 3060 Laptop GPU
117.2 fps
Moyenne NVIDIA GeForce RTX 3060 Laptop GPU
  (70.4 - 133.5, n=37)
105.6 fps -10%
Lenovo Legion 5 15ACH6A-82NW0010GE
AMD Ryzen 5 5600H, AMD Radeon RX 6600M
104.5 fps -11%
Alienware m15 R5 Ryzen Edition
AMD Ryzen 7 5800H, NVIDIA GeForce RTX 3060 Laptop GPU
102 fps -13%
1920x1080 High Quality
Moyenne de la classe Gaming
  (19.2 - 201, n=182, 2 dernières années)
119.9 fps +37%
Asus ROG Strix Scar 15 G533ZW-LN106WS
Intel Core i9-12900H, NVIDIA GeForce RTX 3070 Ti Laptop GPU
95.7 fps +9%
Asus TUF Gaming F15 FX507ZM
Intel Core i7-12700H, NVIDIA GeForce RTX 3060 Laptop GPU
91.9 fps +5%
Asus ROG Strix Scar 15 G533zm
Intel Core i9-12900H, NVIDIA GeForce RTX 3060 Laptop GPU
87.5 fps
Moyenne NVIDIA GeForce RTX 3060 Laptop GPU
  (55 - 100.9, n=42)
79.4 fps -9%
Lenovo Legion 5 15ACH6A-82NW0010GE
AMD Ryzen 5 5600H, AMD Radeon RX 6600M
78.4 fps -10%
Alienware m15 R5 Ryzen Edition
AMD Ryzen 7 5800H, NVIDIA GeForce RTX 3060 Laptop GPU
78.1 fps -11%
2560x1440 High Quality
Moyenne de la classe Gaming
  (32.5 - 169.2, n=132, 2 dernières années)
104.7 fps +61%
Asus ROG Strix Scar 15 G533ZW-LN106WS
Intel Core i9-12900H, NVIDIA GeForce RTX 3070 Ti Laptop GPU
72.2 fps +11%
Asus ROG Strix Scar 15 G533zm
Intel Core i9-12900H, NVIDIA GeForce RTX 3060 Laptop GPU
65.1 fps
Moyenne NVIDIA GeForce RTX 3060 Laptop GPU
  (41.1 - 73.7, n=25)
59.5 fps -9%
Strange Brigade
1920x1080 medium AA:medium AF:4
Moyenne de la classe Gaming
  (58.5 - 508, n=138, 2 dernières années)
295 fps +37%
Asus ROG Strix Scar 15 G533ZW-LN106WS
Intel Core i9-12900H, NVIDIA GeForce RTX 3070 Ti Laptop GPU
274 (64.3min, 228P1) fps +27%
Asus TUF Gaming F15 FX507ZM
Intel Core i7-12700H, NVIDIA GeForce RTX 3060 Laptop GPU
232 (74.6min, 191P1) fps +7%
Asus ROG Strix Scar 15 G533zm
Intel Core i9-12900H, NVIDIA GeForce RTX 3060 Laptop GPU
216 (71.2min, 170.2P1) fps
Moyenne NVIDIA GeForce RTX 3060 Laptop GPU
  (154.9 - 242, n=38)
193.8 fps -10%
Lenovo Legion 5 15ACH6A-82NW0010GE
AMD Ryzen 5 5600H, AMD Radeon RX 6600M
188.1 (133.1min, 138.4P1) fps -13%
Alienware m15 R5 Ryzen Edition
AMD Ryzen 7 5800H, NVIDIA GeForce RTX 3060 Laptop GPU
160 (82.3min, 124P1) fps -26%
1920x1080 high AA:high AF:8
Moyenne de la classe Gaming
  (49.4 - 465, n=152, 2 dernières années)
256 fps +45%
Asus ROG Strix Scar 15 G533ZW-LN106WS
Intel Core i9-12900H, NVIDIA GeForce RTX 3070 Ti Laptop GPU
235 (5min, 176P1) fps +33%
Asus TUF Gaming F15 FX507ZM
Intel Core i7-12700H, NVIDIA GeForce RTX 3060 Laptop GPU
185 (121min, 137P1) fps +5%
Asus ROG Strix Scar 15 G533zm
Intel Core i9-12900H, NVIDIA GeForce RTX 3060 Laptop GPU
176.4 (40.6min, 128.3P1) fps
Lenovo Legion 5 15ACH6A-82NW0010GE
AMD Ryzen 5 5600H, AMD Radeon RX 6600M
170 (120min, 126P1) fps -4%
Moyenne NVIDIA GeForce RTX 3060 Laptop GPU
  (115.6 - 192.1, n=41)
157 fps -11%
Alienware m15 R5 Ryzen Edition
AMD Ryzen 7 5800H, NVIDIA GeForce RTX 3060 Laptop GPU
146 (5min, 109P1) fps -17%
1920x1080 ultra AA:ultra AF:16
Moyenne de la classe Gaming
  (38.9 - 421, n=179, 2 dernières années)
229 fps +50%
Asus ROG Strix Scar 15 G533ZW-LN106WS
Intel Core i9-12900H, NVIDIA GeForce RTX 3070 Ti Laptop GPU
196.2 (70.2min, 148.7P1) fps +28%
Asus TUF Gaming F15 FX507ZM
Intel Core i7-12700H, NVIDIA GeForce RTX 3060 Laptop GPU
160 (75.9min, 121P1) fps +5%
Asus ROG Strix Scar 15 G533zm
Intel Core i9-12900H, NVIDIA GeForce RTX 3060 Laptop GPU
153 (44min, 114.2P1) fps
Lenovo Legion 5 15ACH6A-82NW0010GE
AMD Ryzen 5 5600H, AMD Radeon RX 6600M
151 (104min, 109P1) fps -1%
Moyenne NVIDIA GeForce RTX 3060 Laptop GPU
  (102.2 - 166.3, n=43)
137.6 fps -10%
Alienware m15 R5 Ryzen Edition
AMD Ryzen 7 5800H, NVIDIA GeForce RTX 3060 Laptop GPU
134 (92.7min, 100P1) fps -12%
2560x1440 ultra AA:ultra AF:16
Moyenne de la classe Gaming
  (52.8 - 322, n=122, 2 dernières années)
190.7 fps
Asus ROG Strix Scar 15 G533ZW-LN106WS
Intel Core i9-12900H, NVIDIA GeForce RTX 3070 Ti Laptop GPU
148.5 (30.1min, 117.7P1) fps
Moyenne NVIDIA GeForce RTX 3060 Laptop GPU
  (75.4 - 118.4, n=17)
99.7 fps
X-Plane 11.11
1280x720 low (fps_test=1)
Moyenne de la classe Gaming
  (39 - 221, n=184, 2 dernières années)
157.7 fps +8%
Asus TUF Gaming F15 FX507ZM
Intel Core i7-12700H, NVIDIA GeForce RTX 3060 Laptop GPU
153 fps +5%
Asus ROG Strix Scar 15 G533zm
Intel Core i9-12900H, NVIDIA GeForce RTX 3060 Laptop GPU
145.8 fps
MSI Pulse GL66 12UEK
Intel Core i9-12900H, NVIDIA GeForce RTX 3060 Laptop GPU
142 fps -3%
Moyenne NVIDIA GeForce RTX 3060 Laptop GPU
  (83.6 - 157.1, n=48)
115.1 fps -21%
Alienware m15 R5 Ryzen Edition
AMD Ryzen 7 5800H, NVIDIA GeForce RTX 3060 Laptop GPU
94.6 fps -35%
Lenovo Legion 5 15ACH6A-82NW0010GE
AMD Ryzen 5 5600H, AMD Radeon RX 6600M
64.7 fps -56%
1920x1080 med (fps_test=2)
Moyenne de la classe Gaming
  (38.9 - 193.1, n=187, 2 dernières années)
138.3 fps +12%
Asus TUF Gaming F15 FX507ZM
Intel Core i7-12700H, NVIDIA GeForce RTX 3060 Laptop GPU
136 fps +10%
Asus ROG Strix Scar 15 G533zm
Intel Core i9-12900H, NVIDIA GeForce RTX 3060 Laptop GPU
123.9 fps
MSI Pulse GL66 12UEK
Intel Core i9-12900H, NVIDIA GeForce RTX 3060 Laptop GPU
123 fps -1%
Moyenne NVIDIA GeForce RTX 3060 Laptop GPU
  (73 - 138.3, n=48)
100.9 fps -19%
Alienware m15 R5 Ryzen Edition
AMD Ryzen 7 5800H, NVIDIA GeForce RTX 3060 Laptop GPU
82.4 fps -33%
Lenovo Legion 5 15ACH6A-82NW0010GE
AMD Ryzen 5 5600H, AMD Radeon RX 6600M
50.7 fps -59%
1920x1080 high (fps_test=3)
Moyenne de la classe Gaming
  (32.8 - 166.2, n=194, 2 dernières années)
108.4 fps +9%
Asus TUF Gaming F15 FX507ZM
Intel Core i7-12700H, NVIDIA GeForce RTX 3060 Laptop GPU
107 fps +7%
MSI Pulse GL66 12UEK
Intel Core i9-12900H, NVIDIA GeForce RTX 3060 Laptop GPU
100 fps 0%
Asus ROG Strix Scar 15 G533zm
Intel Core i9-12900H, NVIDIA GeForce RTX 3060 Laptop GPU
99.8 fps
Moyenne NVIDIA GeForce RTX 3060 Laptop GPU
  (61.9 - 109.3, n=48)
82 fps -18%
Alienware m15 R5 Ryzen Edition
AMD Ryzen 7 5800H, NVIDIA GeForce RTX 3060 Laptop GPU
70 fps -30%
Lenovo Legion 5 15ACH6A-82NW0010GE
AMD Ryzen 5 5600H, AMD Radeon RX 6600M
45.1 fps -55%

Witcher 3 a fonctionné de manière assez stable pendant toute la durée du test d'une heure, avec seulement une légère baisse du taux de rafraîchissement.

Witcher 3 FPS chart

0510152025303540455055606570758085Tooltip
Asus ROG Strix Scar 15 G533zm i9-12900H, GeForce RTX 3060 Laptop GPU: Ø80.8 (76-86)
BasMoyenÉlevéUltraQHD
GTA V (2015) 186.2 181.6 166.9 105 80.5
The Witcher 3 (2015) 400 290 165 88.7
Dota 2 Reborn (2015) 182.6 167.7 159.1 151.4
Final Fantasy XV Benchmark (2018) 178.9 117.2 87.5 65.1
X-Plane 11.11 (2018) 145.8 123.9 99.8
Far Cry 5 (2018) 160 129 123 117 92
Strange Brigade (2018) 398 216 176.4 153
Cyberpunk 2077 1.6 (2022) 120 118 63 63

Émissions - Cool, mais pas forcément silencieuses

Émissions sonores

En mode Turbo, les ventilateurs internes tournent régulièrement très fort pendant quelques secondes avant de revenir au ralenti. Asus pourrait envisager de rendre le système de refroidissement moins agressif dans une prochaine mise à jour. Cela dit, les ventilateurs ne tournent généralement pas en mode silencieux.

L'Asus Strix Scar n'est pas forcément silencieux en charge. Pendant les jeux et le test de stress, l'Asus TUF et le MSI Pulse étaient aussi bruyants, tandis que le Lenovo Legion et l'Alienware restaient plus silencieux.

Lors du démarrage de certaines charges (par ex. Witcher 3), nous avons également remarqué de légers bips électroniques provenant de l'appareil, mais ils n'étaient présents que temporairement.

Degré de la nuisance sonore

Au repos
23 / 23 / 37.75 dB(A)
Fortement sollicité
45.35 / 56.22 dB(A)
  red to green bar
 
 
30 dB
silencieux
40 dB(A)
audible
50 dB(A)
bruyant
 
min: dark, med: mid, max: light   Earthworks M23R, Arta (à 15 cm de distance)   bruit ambiant: 23 dB(A)
dB(A) 0102030405060708090Deep BassMiddle BassHigh BassLower RangeMidsHigher MidsLower HighsMid HighsUpper HighsSuper Highs2038.832.538.82541.538.241.53143.841.743.84031.931.731.95033.733.333.76337.131.537.18033.324.433.31004125.14112532.321.132.316031.71931.720035.423.235.425035.519.635.531536.213.636.240039.212.339.250038.71038.763040.610.540.680042.38.842.3100044.47.844.4125047.48.647.4160048948200044.39.244.3250043.91043.9315044.110.544.1400044.210.644.2500040.310.840.3630042.110.942.1800045.311.145.31000041.211.241.21250038.61138.61600031.51031.5SPL56.223.356.2N110.511median 41median 10.8median 41Delta4.234.234.436.434.835.530.525.225.828.228.327.424.224.224.225.323.624.523.322.922.625.223.122.622.123.624.723.223.527.628.123.326.72321.321.526.727.522.619.120.127.427.221.518.120.826.827.722.412.713.129.731.121.914.413.332.834.924.215.114.334.835.92616.515.940.837.526.814.312.838.737.427.412.912.740.938.426.810.91141.441.428.19.89.64340.626.89.99.343.34328.7109.34644.128.310.49.546.34326.810.710.14643.425.111.110.646.54325.111.410.746.241.525.811.5114542.625.411.411.245.942.719.411.711.745.942.618.512.211.945.838.619.612.212.243.934.819.512.11240.53117.911.311.53654.23823.623.257.29.62.90.50.511.7median 38.6median 25.1median 11.7median 11.7median 435.72.81.91.35.9hearing rangehide median Fan NoiseAsus ROG Strix Scar 15 G533zmAsus TUF Gaming F15 FX507ZM
Asus ROG Strix Scar 15 G533zm
GeForce RTX 3060 Laptop GPU, i9-12900H
Asus ROG Strix Scar 15 G533ZW-LN106WS
GeForce RTX 3070 Ti Laptop GPU, i9-12900H, Samsung PM9A1 MZVL22T0HBLB
Asus TUF Gaming F15 FX507ZM
GeForce RTX 3060 Laptop GPU, i7-12700H, SK Hynix HFM001TD3JX013N
MSI Pulse GL66 12UEK
GeForce RTX 3060 Laptop GPU, i9-12900H, Micron 2450 512GB MTFDKBA512TFK
Alienware m15 R5 Ryzen Edition
GeForce RTX 3060 Laptop GPU, R7 5800H, Toshiba KBG40ZNS512G NVMe
Lenovo Legion 5 15ACH6A-82NW0010GE
Radeon RX 6600M, R5 5600H, Micron 2210 MTFDHBA512QFD
Noise
-26%
6%
0%
2%
-4%
off / environment *
23
26.86
-17%
23.2
-1%
23
-0%
24
-4%
25
-9%
Idle Minimum *
23
39.07
-70%
23.6
-3%
23
-0%
24
-4%
25
-9%
Idle Average *
23
39.07
-70%
23.6
-3%
27
-17%
25
-9%
25
-9%
Idle Maximum *
37.75
39.07
-3%
25.4
33%
27
28%
35
7%
34.5
9%
Load Average *
45.35
53.34
-18%
38
16%
48.2
-6%
44
3%
51.1
-13%
Witcher 3 ultra *
55.48
56.6
-2%
54.1
2%
56.9
-3%
48
13%
Load Maximum *
56.22
56.6
-1%
57.2
-2%
56.94
-1%
50
11%
51.3
9%

* ... Moindre est la valeur, meilleures sont les performances

Température

L'ordinateur portable de jeu Asus est capable de rester relativement froid à la fois au repos et en charge. L'Alienware, par exemple, est beaucoup plus chaud malgré son système de refroidissement proéminent. Le Strix Scar a une courbe de ventilateur plus agressive, ce qui permet de maintenir les températures de surface à un niveau raisonnable.

 43 °C43 °C38 °C 
 39 °C40 °C39 °C 
 20 °C21 °C20 °C 
Maximum: 43 °C
Moyenne: 33.7 °C
41 °C47 °C43 °C
33 °C41 °C35 °C
22 °C33 °C26 °C
Maximum: 47 °C
Moyenne: 35.7 °C
Alimentation (valeur maximale)  53 °C | Température ambiante de la pièce 22.5 °C | Fluke t3000FC (calibrated), Fluke 62 Mini
(±) La température moyenne de la face supérieure sous charge maximale est de 33.7 °C / 93 F, par rapport à la moyenne de 33.9 °C / 93 F pour les appareils de la classe Gaming.
(±) La température maximale du côté supérieur est de 43 °C / 109 F, par rapport à la moyenne de 40.5 °C / 105 F, allant de 21.2 à 68.8 °C pour la classe Gaming.
(-) Le fond chauffe jusqu'à un maximum de 47 °C / 117 F, contre une moyenne de 43.2 °C / 110 F
(+) En utilisation inactive, la température moyenne du côté supérieur est de 29.2 °C / 85 F, par rapport à la moyenne du dispositif de 33.9 °C / 93 F.
(±) En jouant à The Witcher 3, la température moyenne du côté supérieur est de 32.9 °C / 91 F, alors que la moyenne de l'appareil est de 33.9 °C / 93 F.
(+) Les repose-poignets et le pavé tactile sont plus froids que la température de la peau avec un maximum de 25 °C / 77 F et sont donc froids au toucher.
(+) La température moyenne de la zone de l'appui-paume de dispositifs similaires était de 28.9 °C / 84 F (+3.9 °C / #7 F).
Clavier pendant le test de résistance
Couvercle inférieur pendant le test de résistance
Adaptateur électrique
Asus ROG Strix Scar 15 G533zm
Intel Core i9-12900H, NVIDIA GeForce RTX 3060 Laptop GPU
Asus ROG Strix Scar 15 G533ZW-LN106WS
Intel Core i9-12900H, NVIDIA GeForce RTX 3070 Ti Laptop GPU
Asus TUF Gaming F15 FX507ZM
Intel Core i7-12700H, NVIDIA GeForce RTX 3060 Laptop GPU
MSI Pulse GL66 12UEK
Intel Core i9-12900H, NVIDIA GeForce RTX 3060 Laptop GPU
Alienware m15 R5 Ryzen Edition
AMD Ryzen 7 5800H, NVIDIA GeForce RTX 3060 Laptop GPU
Lenovo Legion 5 15ACH6A-82NW0010GE
AMD Ryzen 5 5600H, AMD Radeon RX 6600M
Heat
-10%
-11%
-11%
-22%
3%
Maximum Upper Side *
43
42.6
1%
44.4
-3%
50
-16%
62
-44%
39.9
7%
Maximum Bottom *
47
50.2
-7%
48.8
-4%
47
-0%
61
-30%
43.8
7%
Idle Upper Side *
32
36.2
-13%
37.8
-18%
36
-13%
36
-13%
34.1
-7%
Idle Bottom *
33
40.2
-22%
39.6
-20%
38
-15%
33
-0%
31.7
4%

* ... Moindre est la valeur, meilleures sont les performances

Épreuve d'effort

Pendant le test de stress, le TDP a atteint environ 95 watts pendant quelques secondes avant de redescendre à la valeur nominale de 45 watts. Dans le même temps, la vitesse d'horloge du CPU a chuté à environ 2,3 GHz en moyenne, avec des températures de cœur avoisinant les 76°C.

L'horloge du GPU tournait à environ 1,6 GHz, avec quelques fluctuations mineures. L'horloge de la mémoire tourne à une fréquence absolument constante de 1 750 MHz. Cependant, les températures du GPU étaient relativement élevées, à environ 81°C, ce qui reste néanmoins dans une fourchette de sécurité et indique que la marge de manœuvre a été bien utilisée. L'ensemble de la carte a consommé en moyenne 109 watts.

Début du test de résistance
Après 30 secondes d'épreuve d'effort
Fin du test de résistance
Vitesse d'horloge de l'unité centrale
Vitesse d'horloge du GPU
Puissance de l'unité centrale
Consommation d'énergie du GPU
Températures de l'unité centrale
Températures du GPU
Températures du GPU
Horloge CPU (GHz) Horloge GPU (MHz) Température moyenne du CPU (°C) Température moyenne du GPU (°C)
Prime95 + FurMark Stress 2.3 1.600 76 81

Intervenants

Les haut-parleurs ne sont pas assez puissants, même au volume maximum. Cela dit, ils sont au moins capables de produire des basses décentes pour des haut-parleurs d'ordinateur portable. En revanche, les aigus ne sont pas aussi impressionnants que sur les appareils concurrents.

Une prise audio combinée permet aux utilisateurs de brancher des appareils audio analogiques externes.

dB(A) 0102030405060708090Deep BassMiddle BassHigh BassLower RangeMidsHigher MidsLower HighsMid HighsUpper HighsSuper Highs2044.532.544.52540.738.240.73144.441.744.44039.731.739.75039.833.339.86342.531.542.58049.324.449.310053.125.153.112558.321.158.316059.61959.620062.323.262.325063.519.663.531563.713.663.740066.612.366.650064.61064.663069.810.569.880070.58.870.5100072.27.872.2125072.68.672.6160070.9970.9200065.19.265.1250065.21065.2315065.810.565.8400056.810.656.850005410.854630054.410.954.4800060.111.160.11000048.611.248.61250039.81139.816000411041SPL79.523.379.5N45.10.545.1median 63.5median 10.8median 63.5Delta6.636.636.634.836.627.928.227.923.924.223.923.222.923.222.522.122.525.927.625.930.521.330.535.619.135.638.318.138.34312.74347.114.447.154.715.154.759.716.559.762.414.362.466.512.966.568.210.968.268.89.868.863.89.963.862.41062.465.110.465.165.710.765.760.111.160.16511.46569.111.569.160.711.460.756.311.756.355.312.255.354.812.254.858.312.158.359.311.359.376.723.676.739.30.539.3median 60.1median 11.7median 60.171.97hearing rangehide median Pink NoiseAsus ROG Strix Scar 15 G533zmAsus TUF Gaming F15 FX507ZM
Diagramme de fréquence (les cases peuvent être cochées et décochées pour comparer les appareils)
Asus ROG Strix Scar 15 G533zm analyse audio

(±) | le niveau sonore du haut-parleur est moyen mais bon (79.48# dB)
Bass 100 - 315 Hz
(+) | bonne basse - seulement 3.5% loin de la médiane
(+) | les basses sont linéaires (4.6% delta à la fréquence précédente)
Mids 400 - 2000 Hz
(±) | médiane supérieure - en moyenne 5.6% supérieure à la médiane
(+) | les médiums sont linéaires (4.8% delta à la fréquence précédente)
Aiguës 2 - 16 kHz
(±) | sommets réduits - en moyenne 6.8% plus bas que la médiane
(±) | la linéarité des aigus est moyenne (8.2% delta à la fréquence précédente)
Overall 100 - 16.000 Hz
(+) | le son global est linéaire (14.7% différence à la médiane)
Par rapport à la même classe
» 27% de tous les appareils testés de cette catégorie étaient meilleurs, 7% similaires, 66% pires
» Le meilleur avait un delta de 6%, la moyenne était de 18%, le pire était de 132%.
Par rapport à tous les appareils testés
» 17% de tous les appareils testés étaient meilleurs, 4% similaires, 79% pires
» Le meilleur avait un delta de 4%, la moyenne était de 25%, le pire était de 134%.

Asus TUF Gaming F15 FX507ZM analyse audio

(±) | le niveau sonore du haut-parleur est moyen mais bon (76.7# dB)
Bass 100 - 315 Hz
(±) | basse réduite - en moyenne 13.7% inférieure à la médiane
(±) | la linéarité des basses est moyenne (10.1% delta à la fréquence précédente)
Mids 400 - 2000 Hz
(±) | médiane supérieure - en moyenne 5.2% supérieure à la médiane
(+) | les médiums sont linéaires (4.9% delta à la fréquence précédente)
Aiguës 2 - 16 kHz
(+) | des sommets équilibrés - à seulement 4.1% de la médiane
(±) | la linéarité des aigus est moyenne (8.6% delta à la fréquence précédente)
Overall 100 - 16.000 Hz
(±) | la linéarité du son global est moyenne (15.9% de différence avec la médiane)
Par rapport à la même classe
» 36% de tous les appareils testés de cette catégorie étaient meilleurs, 7% similaires, 58% pires
» Le meilleur avait un delta de 6%, la moyenne était de 18%, le pire était de 132%.
Par rapport à tous les appareils testés
» 22% de tous les appareils testés étaient meilleurs, 5% similaires, 73% pires
» Le meilleur avait un delta de 4%, la moyenne était de 25%, le pire était de 134%.

Gestion de l'énergie - Autonomie décente

Consommation électrique

Dans l'ensemble, bien qu'il ne soit pas particulièrement économe en énergie, l'Asus Strix Scar 15 n'est pas non plus trop problématique à cet égard. Il consomme un peu plus d'énergie que ses concurrents en mode veille et pendant les jeux. Néanmoins, sa consommation de pointe transitoire de 221 watts n'est pas plus élevée que celle de ses rivaux et est tout à fait dans les moyens du chargeur de 240 watts.

Consommation énergétique
Au reposdarkmidlight 13 / 17 / 17 Watts
Fortement sollicité midlight 135 / 221 Watts
 color bar
Légende: min: dark, med: mid, max: light        Metrahit Energy
Asus ROG Strix Scar 15 G533zm
i9-12900H, GeForce RTX 3060 Laptop GPU, , IPS, 2560x1440, 15.6"
Asus ROG Strix Scar 15 G533ZW-LN106WS
i9-12900H, GeForce RTX 3070 Ti Laptop GPU, Samsung PM9A1 MZVL22T0HBLB, IPS-level, 2560x1440, 15.6"
Asus TUF Gaming F15 FX507ZM
i7-12700H, GeForce RTX 3060 Laptop GPU, SK Hynix HFM001TD3JX013N, IPS, 1920x1080, 15.6"
MSI Pulse GL66 12UEK
i9-12900H, GeForce RTX 3060 Laptop GPU, Micron 2450 512GB MTFDKBA512TFK, IPS, 1920x1080, 15.6"
Alienware m15 R5 Ryzen Edition
R7 5800H, GeForce RTX 3060 Laptop GPU, Toshiba KBG40ZNS512G NVMe, IPS, 1920x1080, 15.6"
Lenovo Legion 5 15ACH6A-82NW0010GE
R5 5600H, Radeon RX 6600M, Micron 2210 MTFDHBA512QFD, IPS, 1920x1080, 15.6"
Moyenne NVIDIA GeForce RTX 3060 Laptop GPU
 
Moyenne de la classe Gaming
 
Power Consumption
7%
9%
28%
1%
8%
7%
-13%
Idle Minimum *
13
7.56
42%
6.3
52%
7
46%
11
15%
10
23%
10.4 ?(5 - 22.8, n=41)
20%
Idle Average *
17
13.5
21%
9.8
42%
13
24%
14
18%
13.2
22%
Idle Maximum *
17
16.87
1%
26.5
-56%
13.7
19%
25
-47%
15.6
8%
21.4 ?(11.8 - 48.2, n=41)
-26%
Load Average *
135
128.9
5%
103.8
23%
48.4
64%
123
9%
178
-32%
109.3 ?(48.4 - 191, n=41)
19%
Witcher 3 ultra *
195
196.2
-1%
189
3%
148
24%
176
10%
181
7%
Load Maximum *
221
274.86
-24%
241.9
-9%
244
-10%
226
-2%
180
19%

* ... Moindre est la valeur, meilleures sont les performances

Power consumption Witcher 3 / stress test

0153045607590105120135150165180195210Tooltip
Asus ROG Strix Scar 15 G533zm; Witcher 3 ultra: Ø194.8 (84.81-220.53)
Asus ROG Strix Scar 15 G533zm; 1280x720 Prime95 28.10 and Furmark 1.25: Ø189.8 (87.8-205.65)

Power consumption with external monitor

0153045607590105120135150165180195Tooltip
Asus ROG Strix Scar 15 G533zm; Prime95 V2810 Stress (external Monitor): Ø92 (71.11-116.55)
Asus ROG Strix Scar 15 G533zm; Cinebench R15 Multi (external Monitor): Ø112.2 (111.46-113.47)
Asus ROG Strix Scar 15 G533zm; 1280x720 FurMark 1.19 GPU Stress Test (external Monitor): Ø202 (189.93-207.29)
Asus ROG Strix Scar 15 G533zm; 1920x1080 The Witcher 3 ultra (external Monitor): Ø185.3 (175.52-208.09)

Durée de vie de la batterie

Asus a équipé l'ordinateur portable d'une grande batterie de 90Wh capable d'offrir 8,5 heures de lecture vidéo et 9 heures de navigation Internet lors de nos tests, qui ont été effectués avec une luminosité d'écran réduite.

Autonomie
Witcher 3 ultra 150cd
1h 20min
WiFi Websurfing
9h 11min
En lecture de Big Buck Bunny encodé en H.264 1080p
8h 38min
En jeu
0h 00min
Fortement sollicité (luminosité au maximum)
1h 35min
Asus ROG Strix Scar 15 G533zm
i9-12900H, GeForce RTX 3060 Laptop GPU, 90 Wh
Asus ROG Strix Scar 15 G533ZW-LN106WS
i9-12900H, GeForce RTX 3070 Ti Laptop GPU, 90 Wh
Asus TUF Gaming F15 FX507ZM
i7-12700H, GeForce RTX 3060 Laptop GPU, 90 Wh
MSI Pulse GL66 12UEK
i9-12900H, GeForce RTX 3060 Laptop GPU, 53.5 Wh
Alienware m15 R5 Ryzen Edition
R7 5800H, GeForce RTX 3060 Laptop GPU, 86 Wh
Lenovo Legion 5 15ACH6A-82NW0010GE
R5 5600H, Radeon RX 6600M, 80 Wh
Moyenne de la classe Gaming
 
Autonomie de la batterie
-17%
-40%
-16%
-16%
12%
-16%
H.264
518
510
-2%
237
-54%
525
1%
WiFi v1.3
551
501.4
-9%
285
-48%
306
-44%
552
0%
Witcher 3 ultra
80
70
-12%
96
20%
Load
95
52
-45%
66
-31%
116
22%
55
-42%
118
24%
Reader / Idle
947
881
770

Points positifs

+ une grande qualité de construction
+ options de personnalisation
+ design gaming cohérent
+ 2x ports USB-C (1x Thunderbolt 4, PD)
+ pavé tactile avec pavé numérique
+ Écran QHD avec une couverture des couleurs impressionnante
+ reste relativement froid
+ wi-Fi 6E rapide
+ RAM DDR5
+ bonne autonomie de la batterie

Points négatifs

- pas de webcam
- le bouton gauche du pavé tactile se bloque parfois
- deux applications Asus
- valeurs de latence assez élevées

Verdict - Un ordinateur portable de jeu impressionnant pour 1 999 €

Le Asus ROG Strix Scar 15 G533zm a été gracieusement fourni par Cyberport

Doté d'une RTX 3060, le modèle G533zm de l'Asus ROG Strix Scar 15 est également un ordinateur portable de jeu très compétent et de grande qualité. Il offre des E/S modernes, une expérience de frappe fantastique, un matériel puissant et des options de personnalisation. De plus, son écran se distingue par un temps de réponse élevé, une excellente couverture des couleurs, ainsi qu'un contraste et une luminosité solides. Comparé au modèle RTX 3070 Ti (G533zw) et à ses concurrents directs, le G533zm fonctionne relativement bien.

Nous n'avons pas de réel reproche à faire à cet ordinateur portable. Son niveau de bruit pourrait être optimisé, mais il est tout à fait raisonnable. A ce propos, vous pouvez vous demander s'il est nécessaire d'associer une RTX 3060 avec le rapide mais chaud i9-12900H, alors qu'un i7-12700H ferait très bien l'affaire. Sur notre modèle, le bouton gauche du touchpad s'est parfois bloqué, alors que l'autre modèle Scar n'a pas eu ce problème.

Pour environ 2 000 € (2 170 $ US), les joueurs disposent d'un excellent ordinateur portable avec d'excellentes performances, de nombreux atouts et peu d'inconvénients.

Bien qu'il ne s'agisse pas d'une véritable aubaine pour un ordinateur portable RTX 3060, le prix de 2 000 € (2 170 $) est plutôt raisonnable compte tenu des nombreux aspects positifs et des inconvénients presque inexistants. Ceux qui souhaitent investir moins d'argent peuvent également envisager l'Asus TUF Gaming F15. Cet ordinateur portable dispose de moins de fonctionnalités mais offre d'excellentes performances pour un prix d'environ 400 euros (2 170 euros)

Prix et disponibilité

La configuration examinée est actuellement disponible sur le site Cyberport au prix de 1 999 euros (2 166 dollars). Vous pouvez également trouver un modèle moins sophistiqué avec moins de mémoire et un écran FHD sur Amazon pour environ 1 600 euros.

Asus ROG Strix Scar 15 G533zm - 04/30/2024 v7 (old)
Christian Hintze

Châssis
88 / 98 → 90%
Clavier
94%
Dispositif de pointage
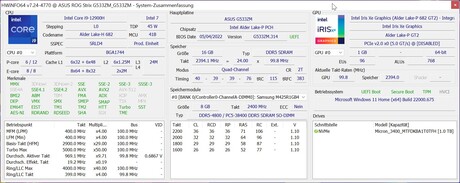
84%
Connectivité
68 / 80 → 84%
Poids
61 / 10-66 → 91%
Autonomie
82 / 95 → 86%
Écran
89%
Performances en jeu
99%
Performances dans les applications
97%
Chauffe
89 / 95 → 93%
Nuisance sonore
70 / 90 → 77%
Audio
80%
Appareil photo
28 / 85 → 33%
Moyenne
79%
89%
Gaming - Moyenne compensée

Price comparison

Please share our article, every link counts!
Mail Logo
> Revues et rapports de ordinateurs portatifs et smartphones, ordiphones > Critiques > Test de l'Asus ROG Strix Scar 15 G533zm : PC portable de jeu RTX 3060 moderne aux nombreuses qualités
Christian Hintze, 2024-11- 2 (Update: 2024-11- 6)