

Test du Minisforum BD795i SE : carte mère Mini-ITX et AMD Ryzen 9 pour bricoler des mini-PC de jeu
Beaucoup de performances, peu de connectivité.
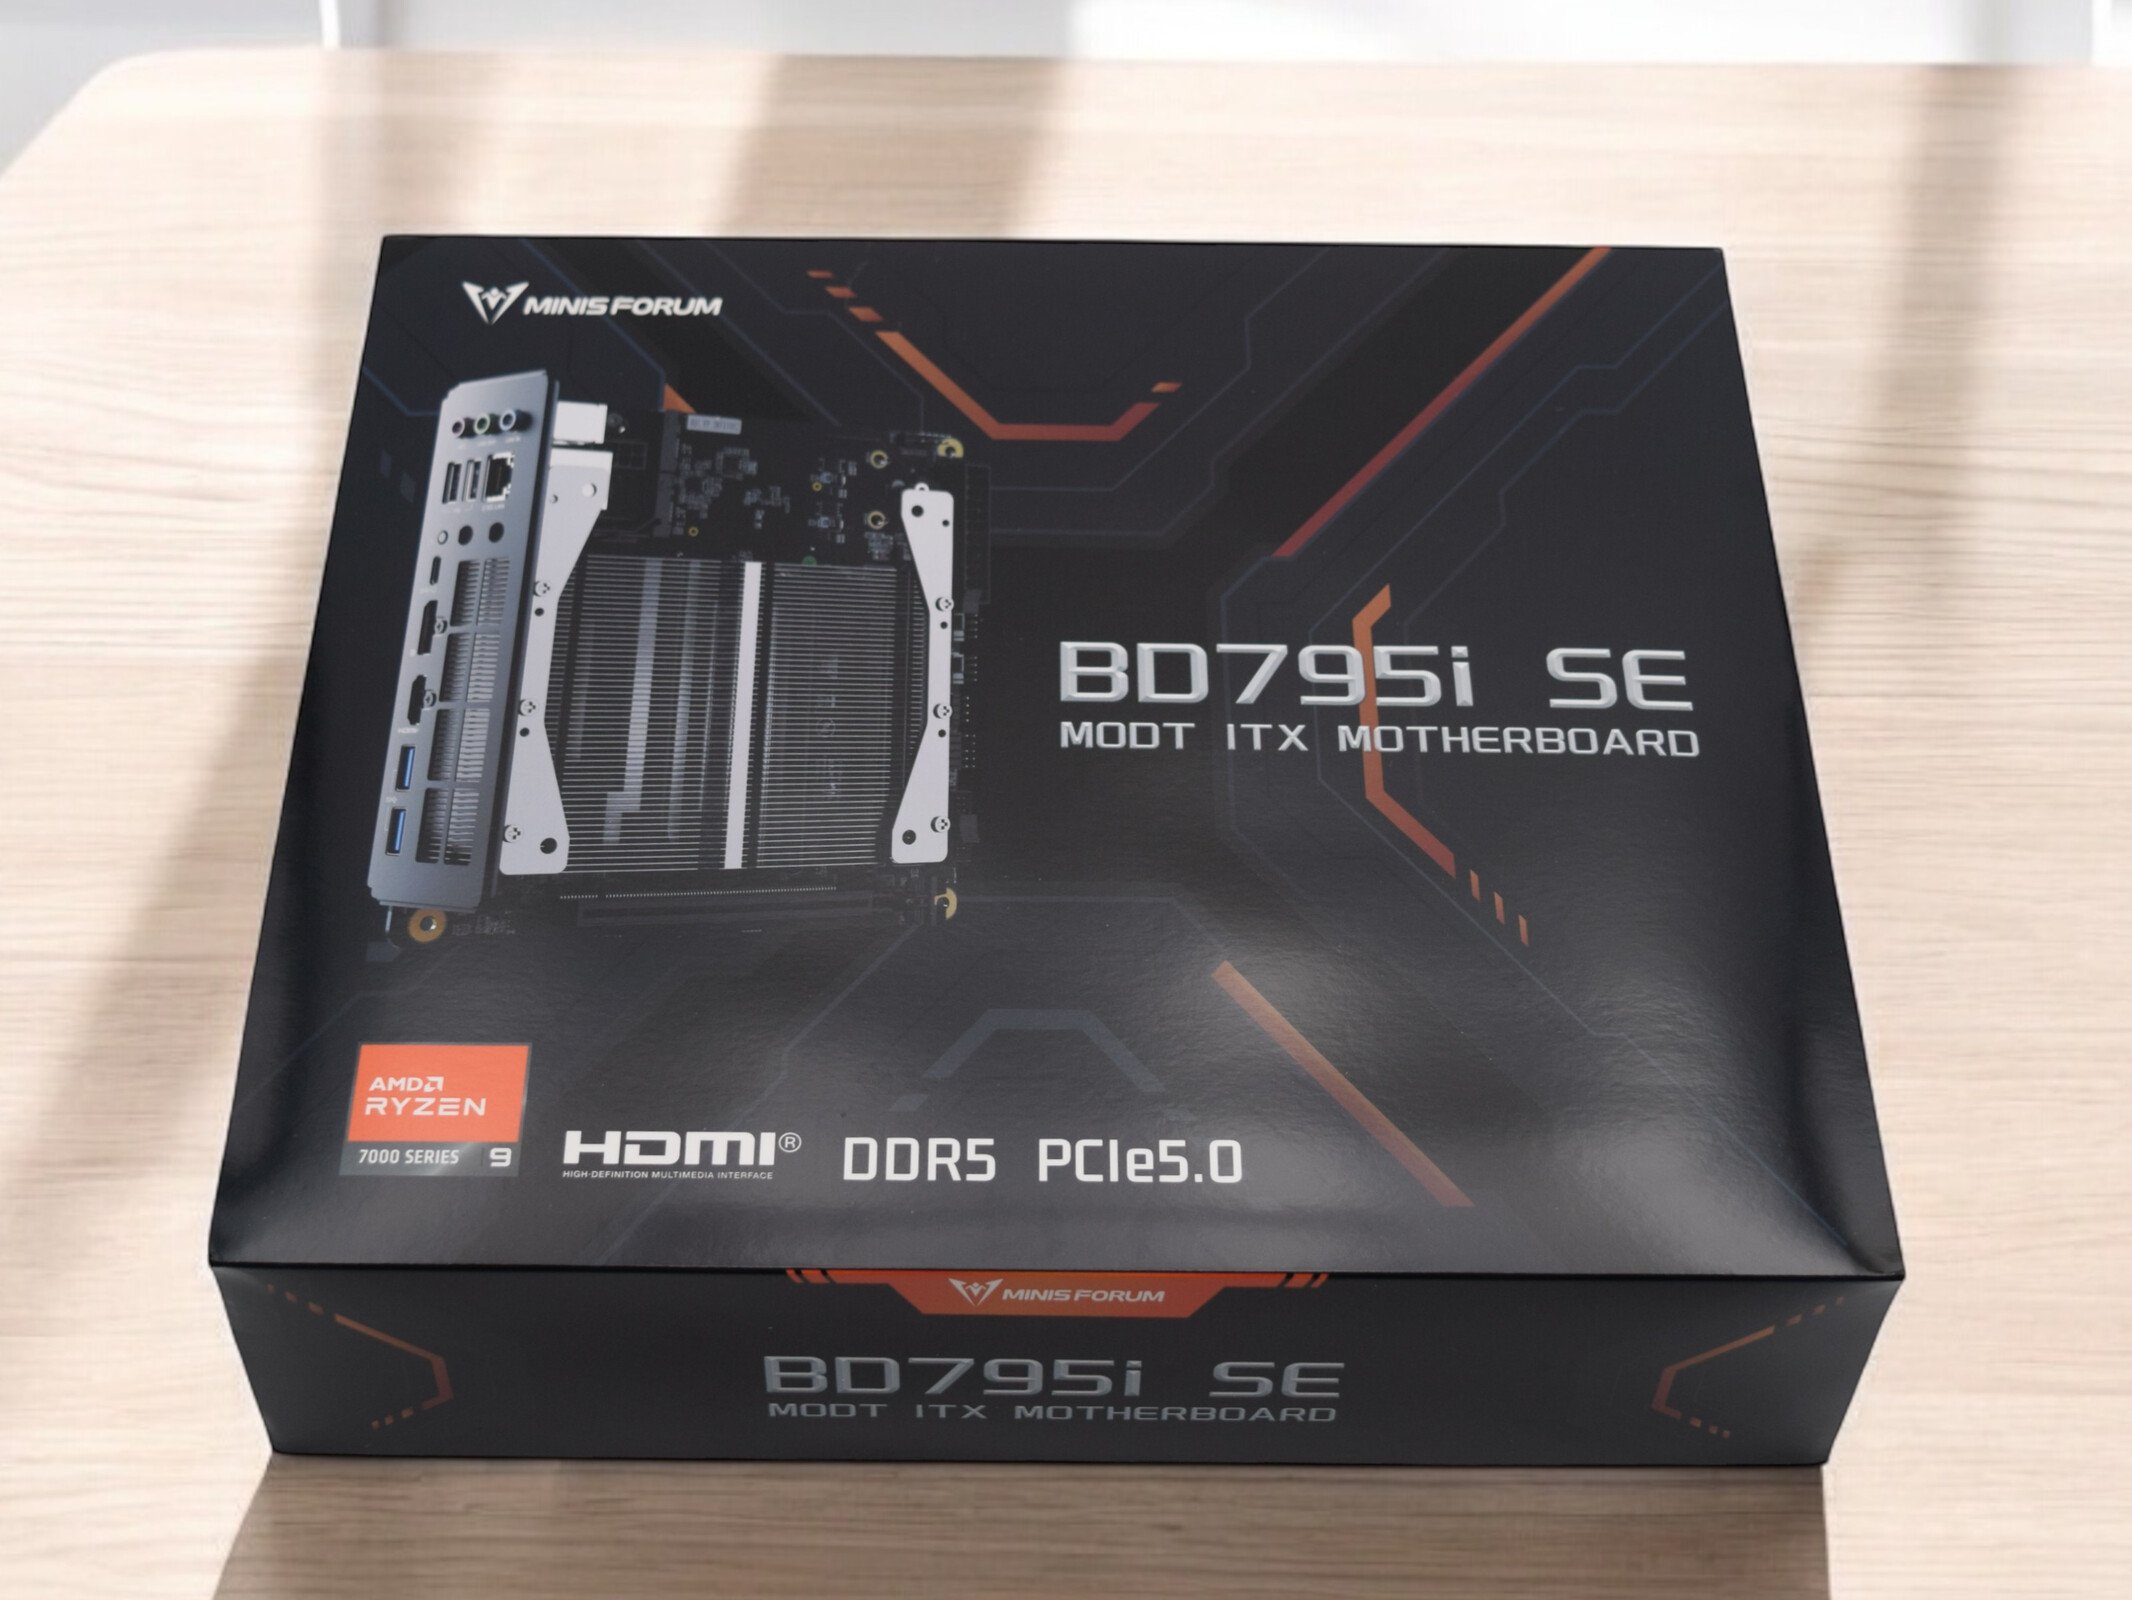
Le Minisforum BD795i SE promet de hautes performances et est idéal pour construire des PC Mini-ITX compacts. Avec son AMD Ryzen 9 7945HX installé en usine, il s'adresse aux utilisateurs exigeants. Nous avons testé ses performances lors de tâches intensives et analysé ses performances de jeu avec une Nvidia GeForce RTX 4090.Sebastian Bade, 👁 Sebastian Bade (traduit par DeepL / Ninh Duy) Publié 🇺🇸 🇩🇪 ...
Verdict - Une base puissante pour des systèmes performants
La Minisforum BD795i SE est une puissante carte mère Mini-ITX avec un AMD Ryzen 9 7945HX installé en permanence. Techniquement, elle est similaire à la Minisforum BD790i, mais elle est dépourvue de WLAN et d'un refroidisseur SSD actif. En termes de prix, le Minisforum BD795i SE est très attractif à 399,92 $ (Amazon) et offre beaucoup de performances pour relativement peu d'argent. Dans cette gamme de prix, d'autres configurations d'ordinateurs de bureau conventionnelles ne peuvent pas tenir la dragée haute au puissant AMD Ryzen 9 7945HX.
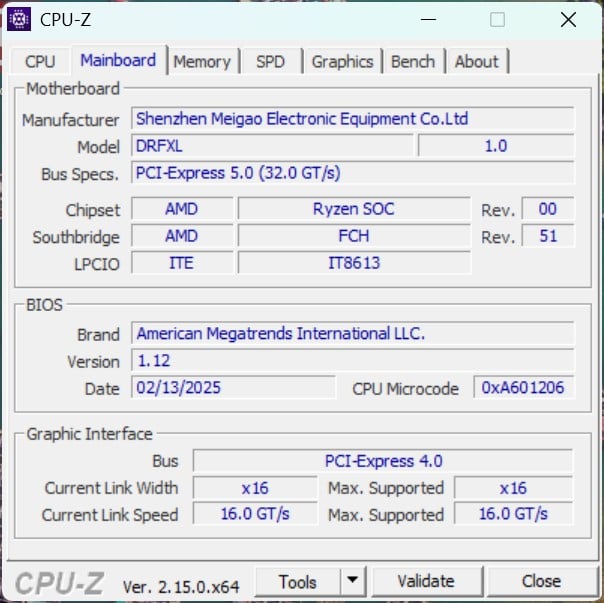
Le refroidissement est limité, car le dissipateur thermique installé en usine ne peut pas être remplacé. Le processeur est également installé de manière permanente, mais avec ses 16 cœurs et 32 threads, il est sûr d'offrir suffisamment de performances pour une longue période. Côté connectique, la BD795i SE ne peut rivaliser avec les cartes mères Mini-ITX classiques, car elle ne dispose que des ports les plus essentiels. Cependant, tout ce qui est nécessaire pour les systèmes compacts et performants est disponible - en particulier, le support PCIe 5.0 complet pour les disques durs SSD et les cartes graphiques est un atout indéniable.
Points positifs
Points négatifs
Prix et disponibilité
Actuellement, vous pouvez acheter le Minisforum BD795i SE sur Amazon au prix de 399,92 $.
Table des matières
- Verdict - Une base puissante pour des systèmes performants
- Le Minisforum BD795i SE en détail
- Portée de la livraison et connectivité
- Benchmark des processeurs
- Résultats Cinebench AMD Ryzen 9 7945HX
- Performance du système
- Latences DPC
- Dispositif de stockage
- Carte graphique - L'AMD Radeon 610M comme iGPU
- Le Minisforum BD795i SE avec la Nvidia GeForce RTX 4090
- Besoins en énergie et températures
- Notebookcheck évaluation totale
Minisforum est principalement connu pour ses mini-PC dans différentes catégories de performances. Depuis quelque temps, le fabricant s'aventure également dans le secteur des ordinateurs de bureau sous la forme de diverses cartes mères. Il reprend les processeurs puissants du secteur des ordinateurs portables, ce qui rend ce concept fondamentalement différent des grandes masses du segment des ordinateurs de bureau. La BD770i avec son Ryzen 7 7745HX ainsi que la BD790I ont déjà fait leurs preuves lors de nos tests.
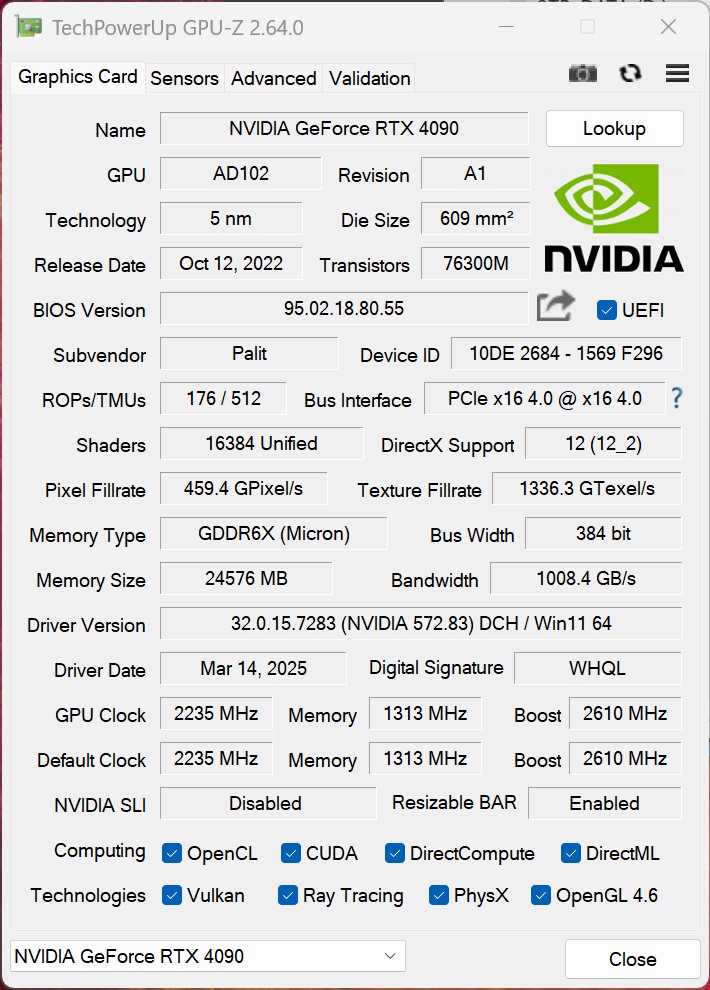
La Minisforum BD795i SE est une carte mère Mini-ITX puissante, idéale pour les systèmes compacts. Par rapport à la BD790i, elle offre des fonctionnalités légèrement réduites, mais elle est moins chère et reste puissante. Le processeur AMD Ryzen 9 7945HX est un SoC extrêmement puissant doté de 16 cœurs Zen4 et l'un des processeurs mobiles les plus rapides d'AMD. Pour évaluer ses performances de jeu, nous avons testé le système avec une Nvidia GeForce RTX 4090, qui peut être connectée sans restriction grâce à un slot PCIe x16 complet.
Comparaison des cartes mères du Minisforum
| Nom | BD795i SE | BD790i X3D | BD790i SE | BD770i | AR900i |
| CPU | AMD Ryzen 9 7945HX | AMD Ryzen 9 7945HX3D | AMD Ryzen 9 7940HX | AMD Ryzen 7 7745HX | Processeur Intel Core i9-13900HX |
| Cœurs / threads | 16 / 32 | 16 / 32 | 16/32 | 8/16 | 24/32 |
| GPU | AMD Radeon 610M | AMD Radeon 610M | AMD Radeon 610M | AMD Radeon 610M | Intel UHD Graphics |
| Types de mémoire | DDR5-5200SODIMM | DDR5-5200 SODIMM | DDR5-5200 SODIMM | DDR5-5200 SODIMM | DDR5-5600 SODIMM |
| Taille maximale de la mémoire | 96 GB | 96 GB | 64 GB | 64 GB | 64 GB |
Le Minisforum BD795i SE en détail
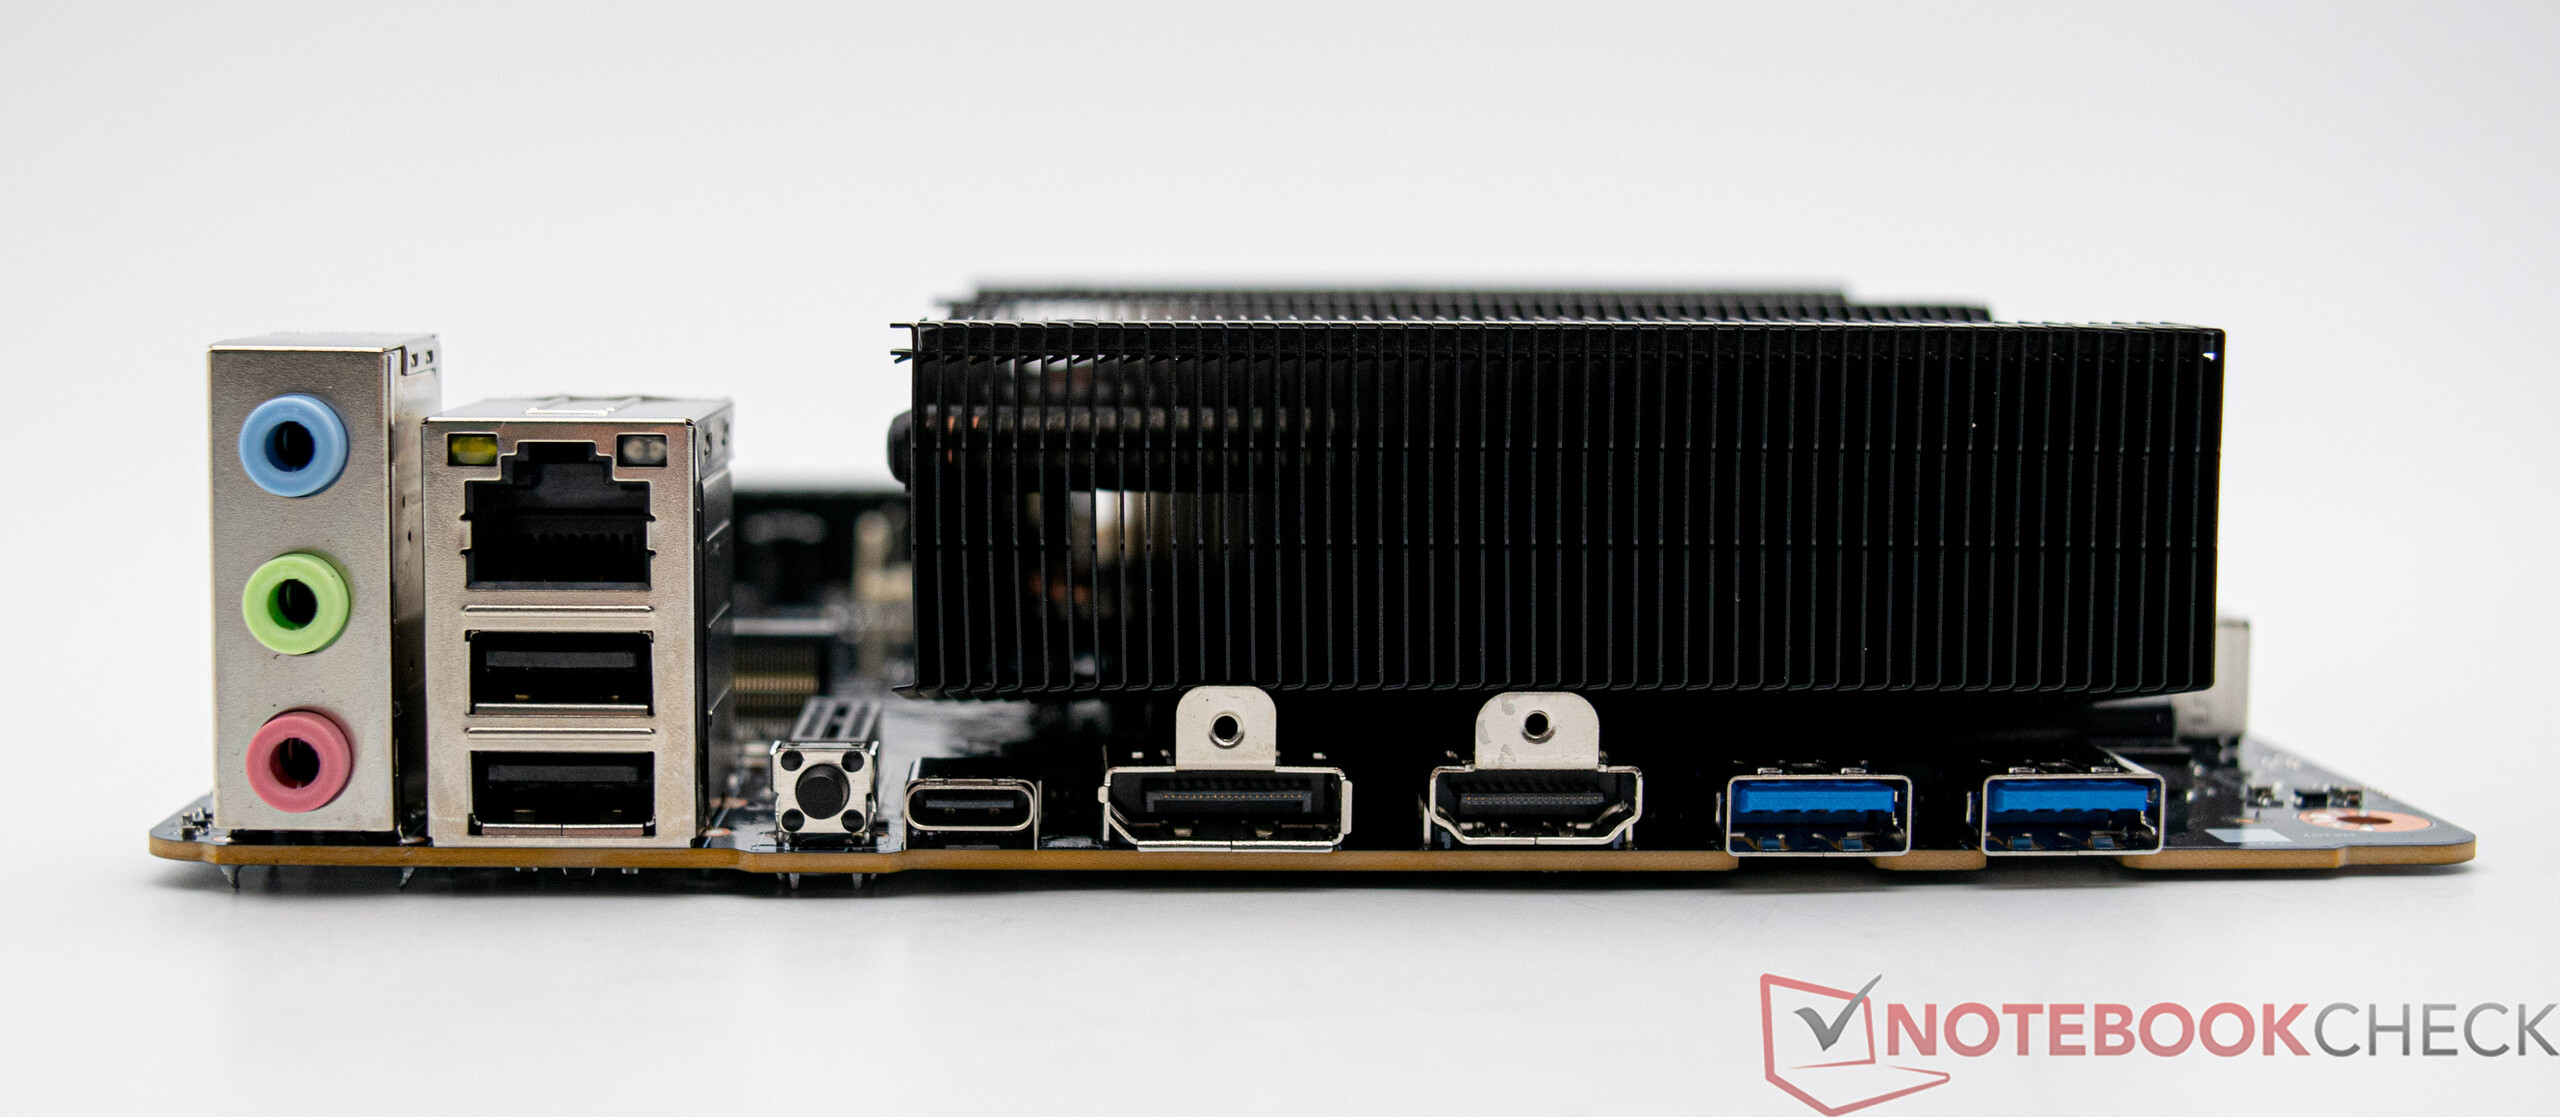
Portée de la livraison et connectivité
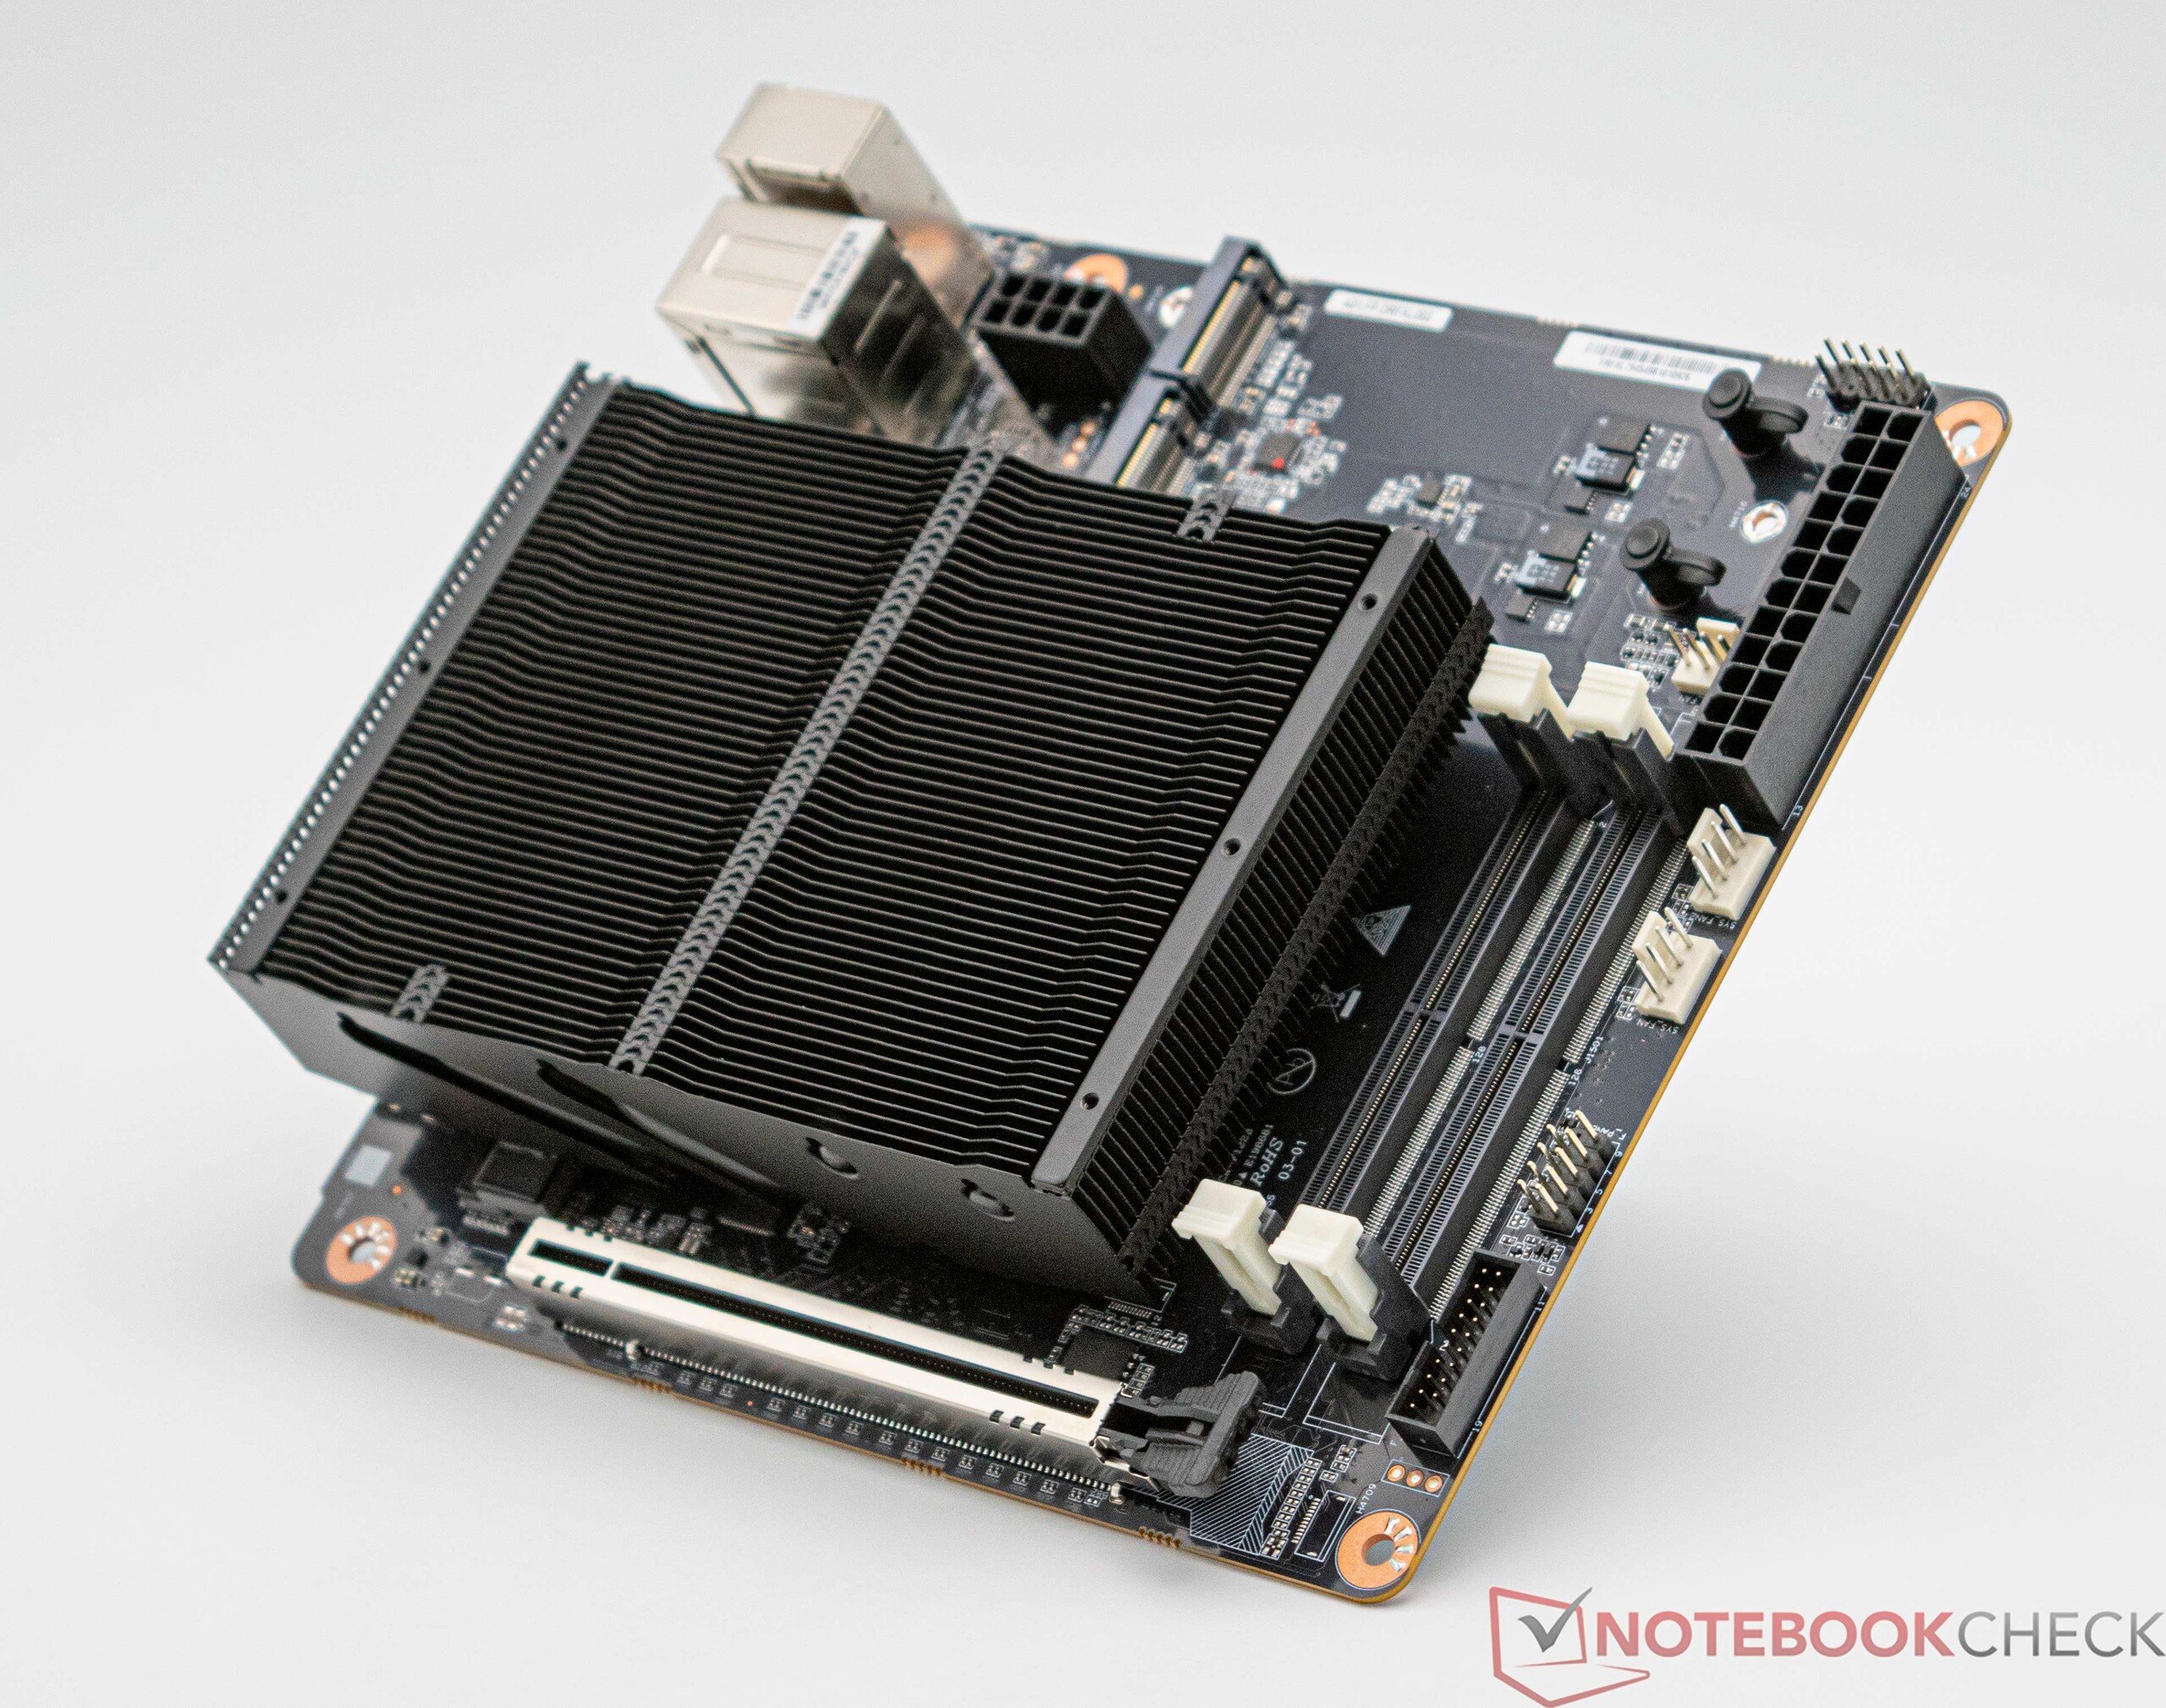
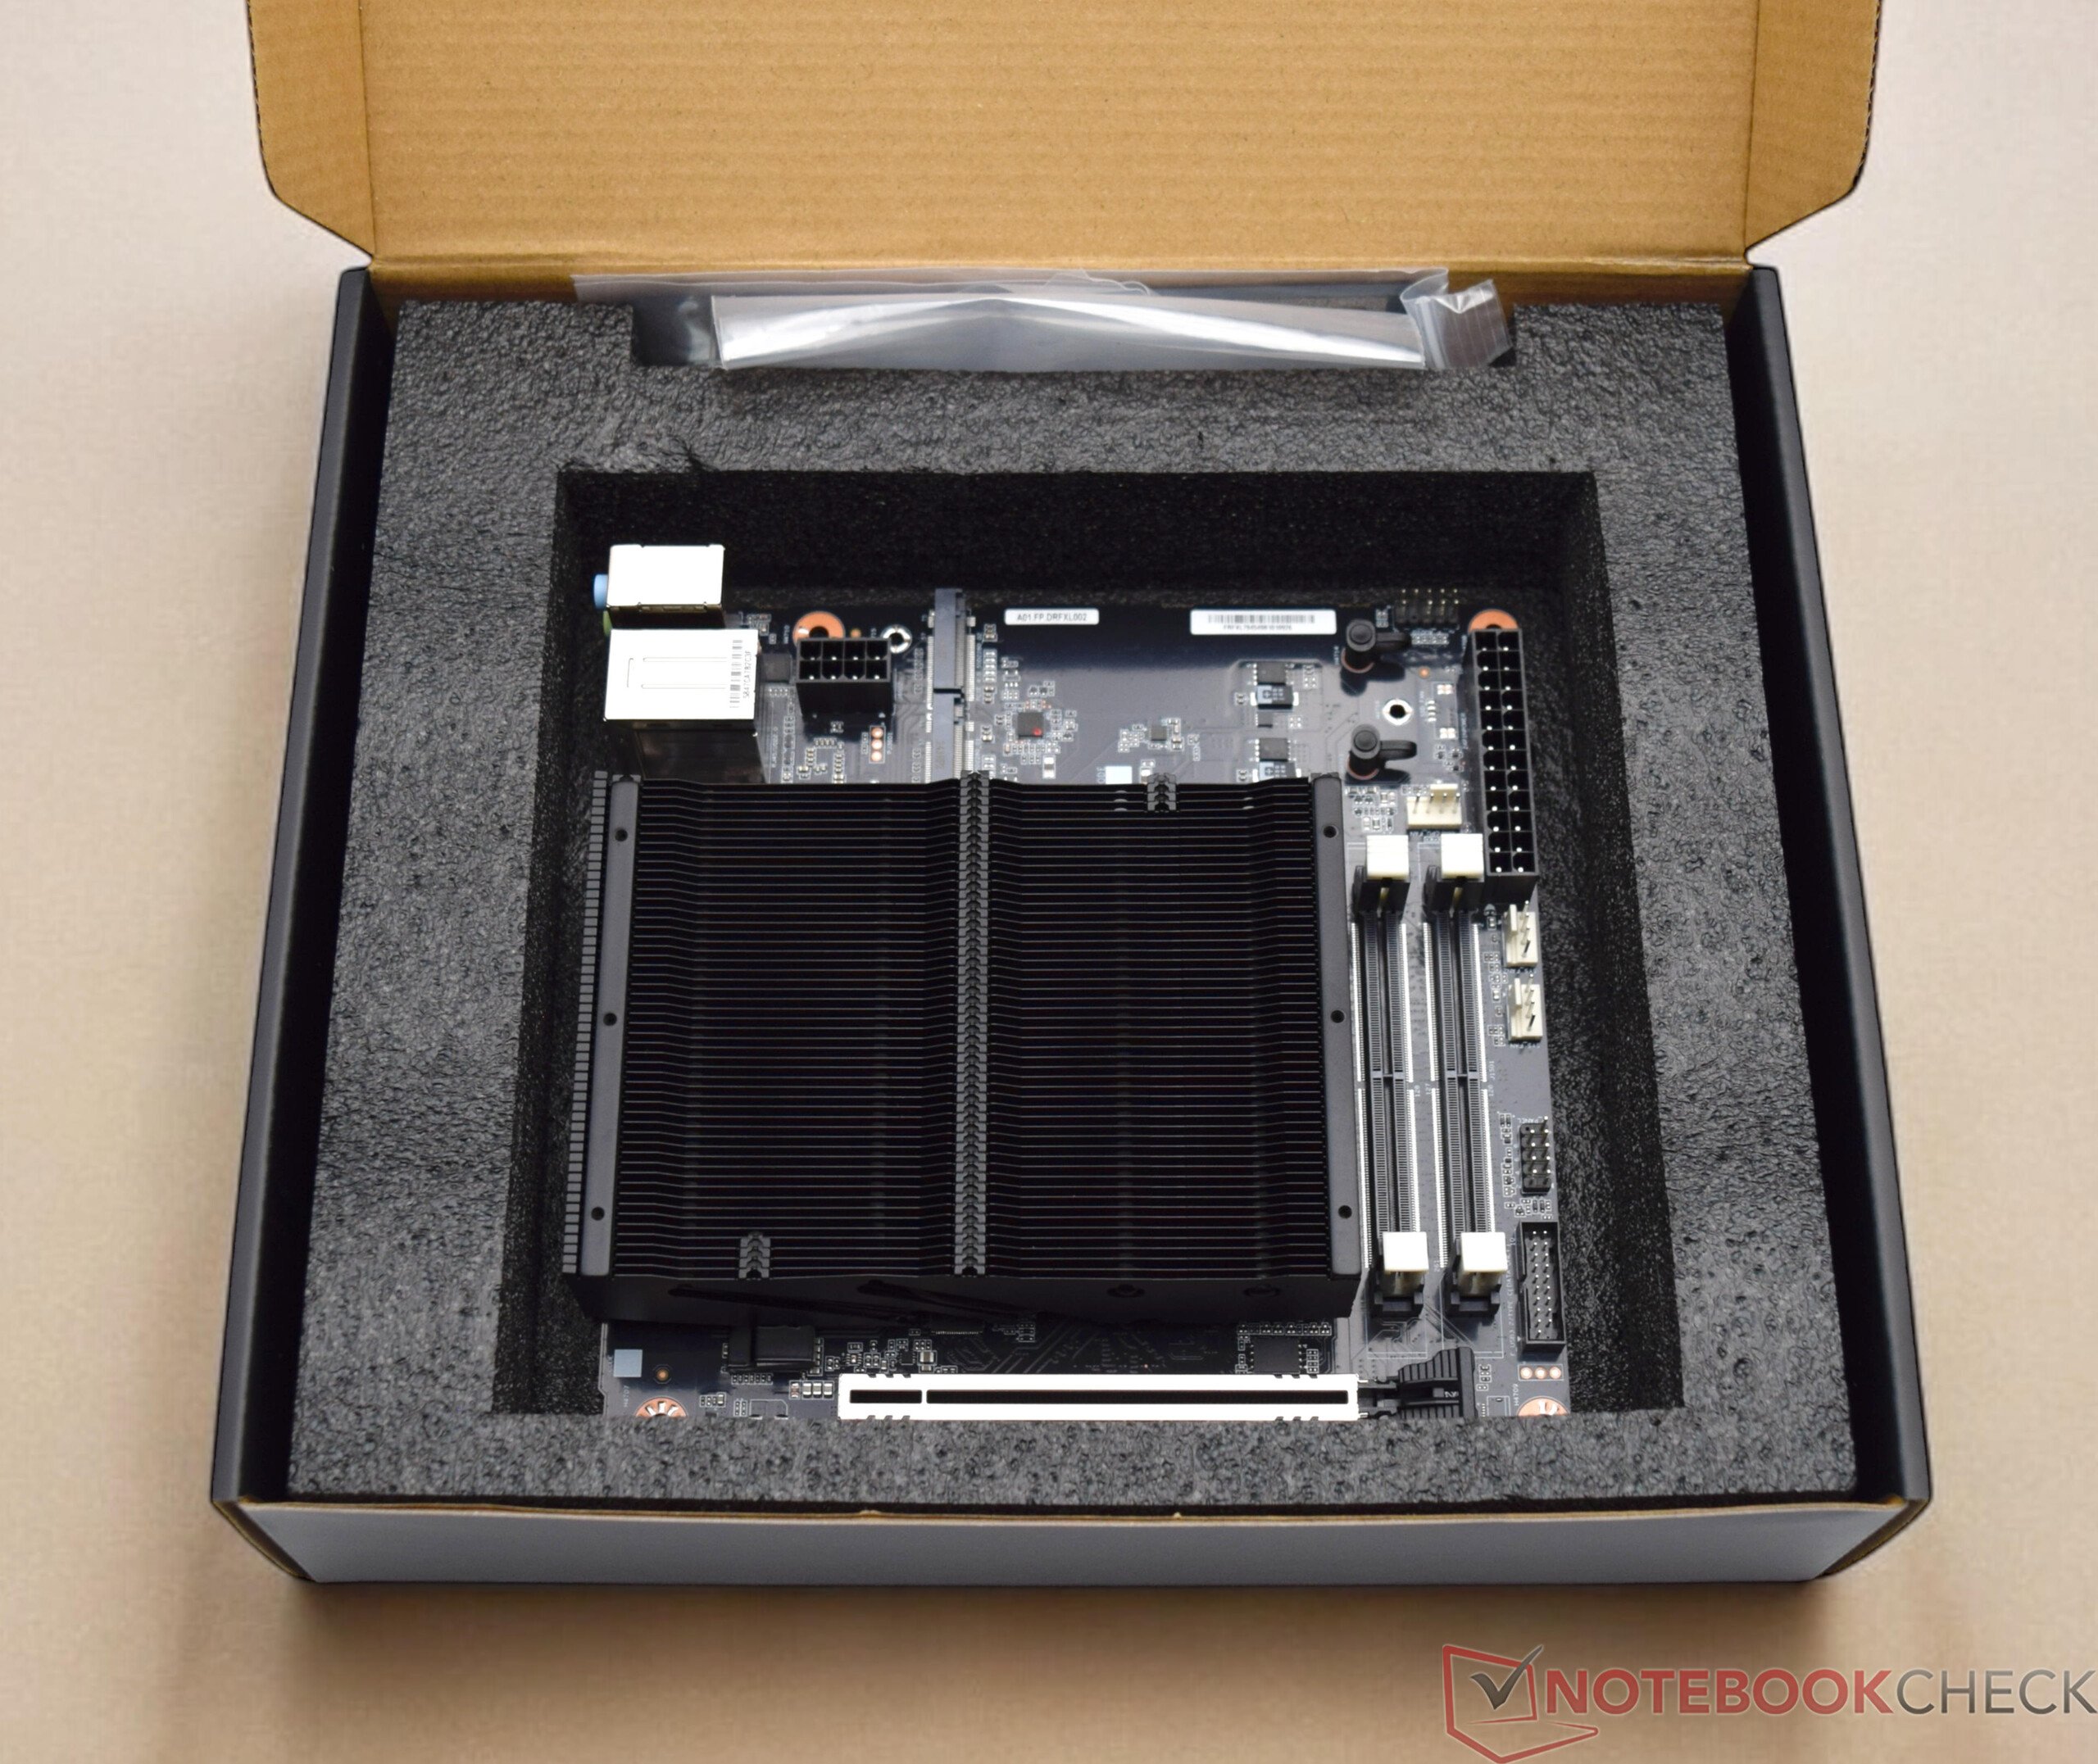
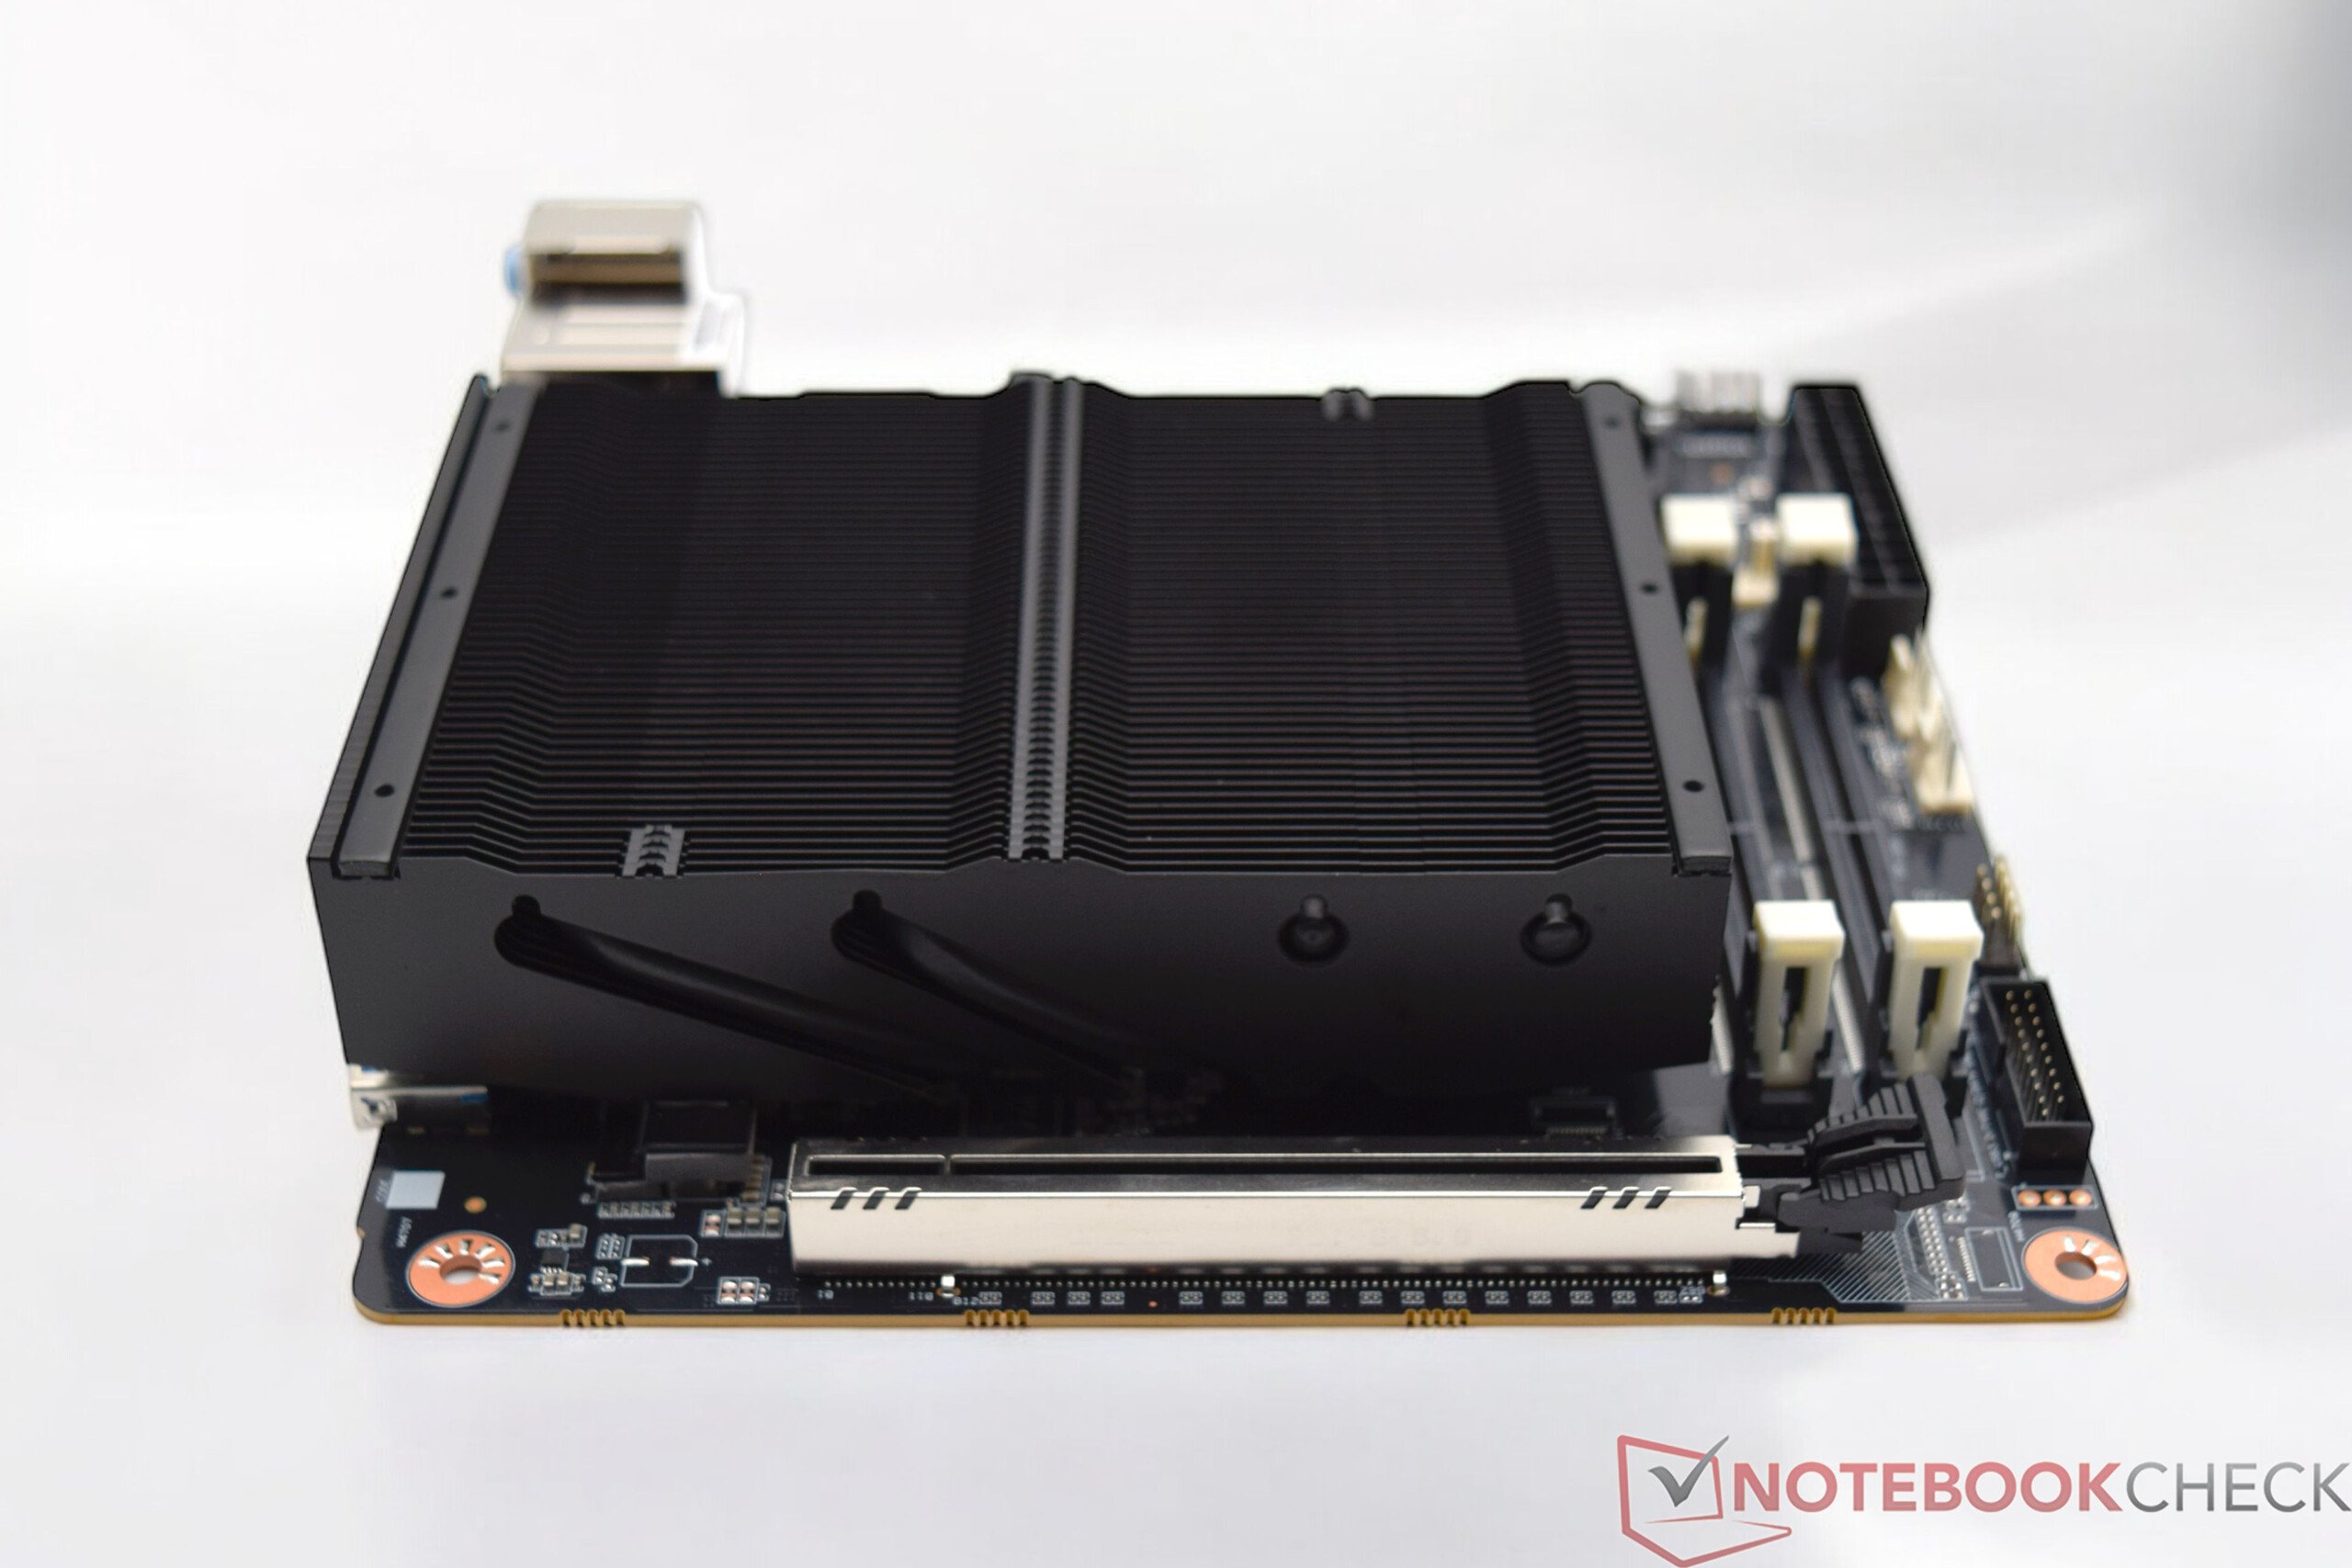
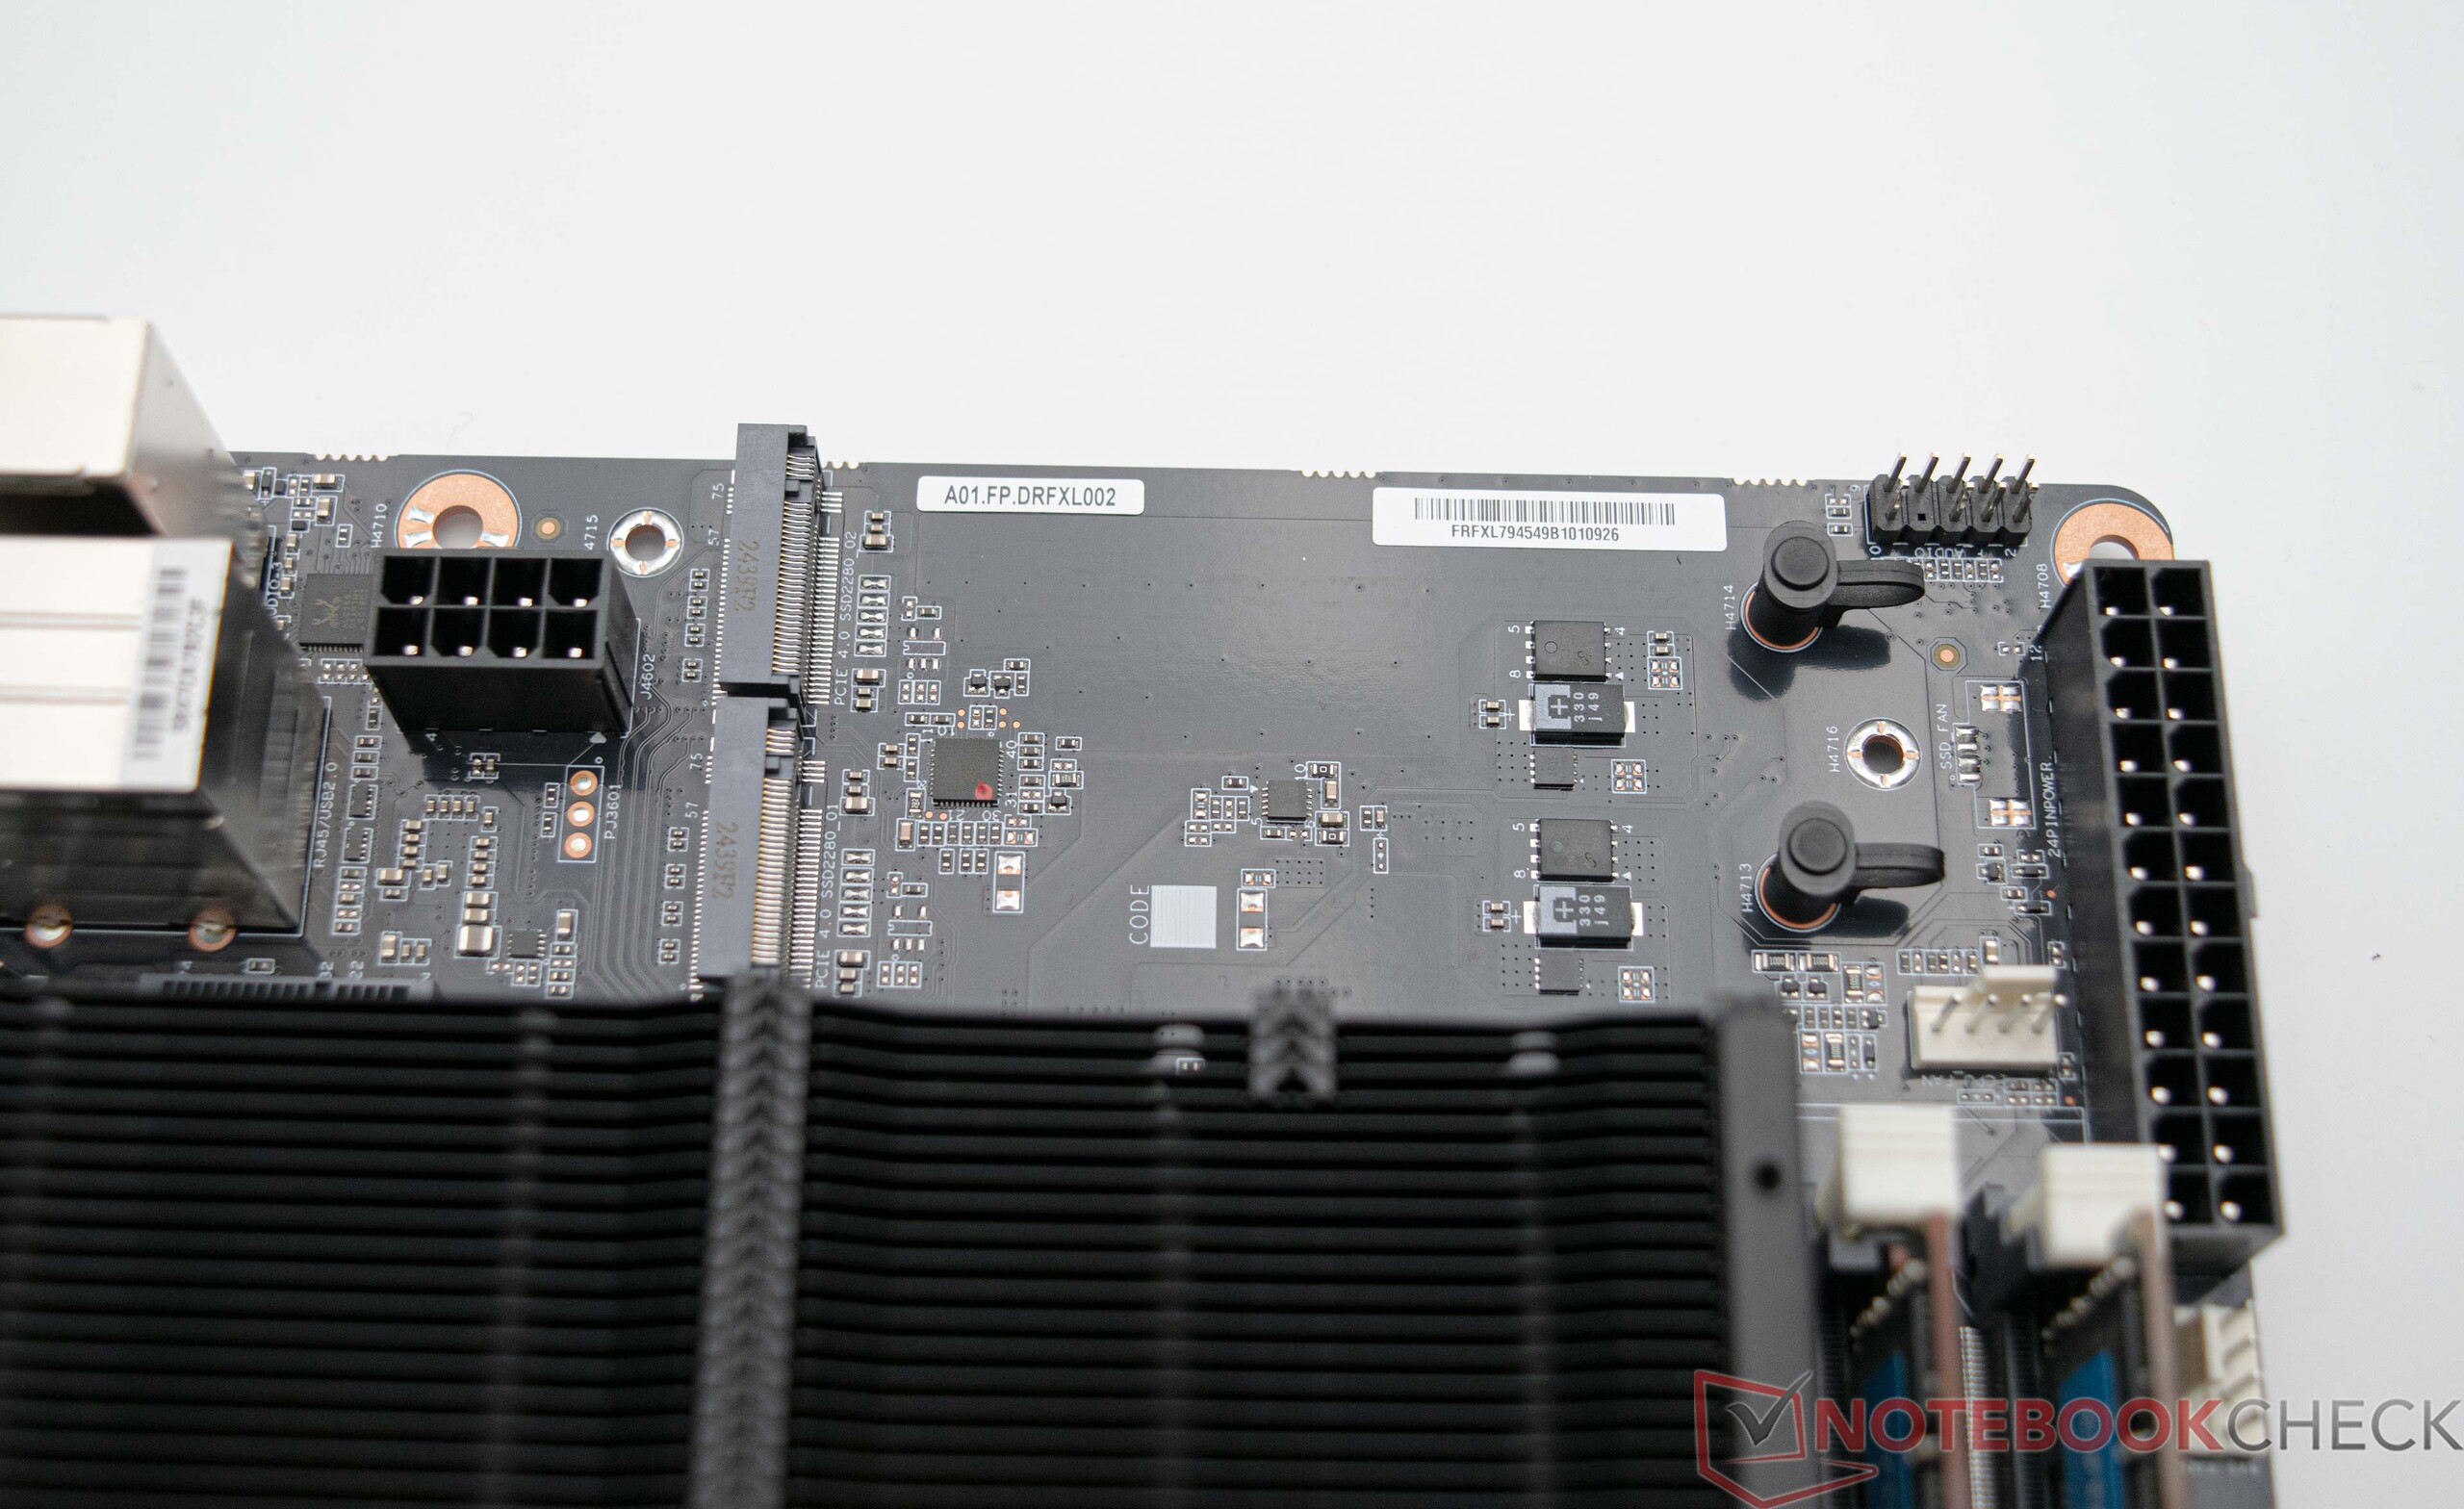
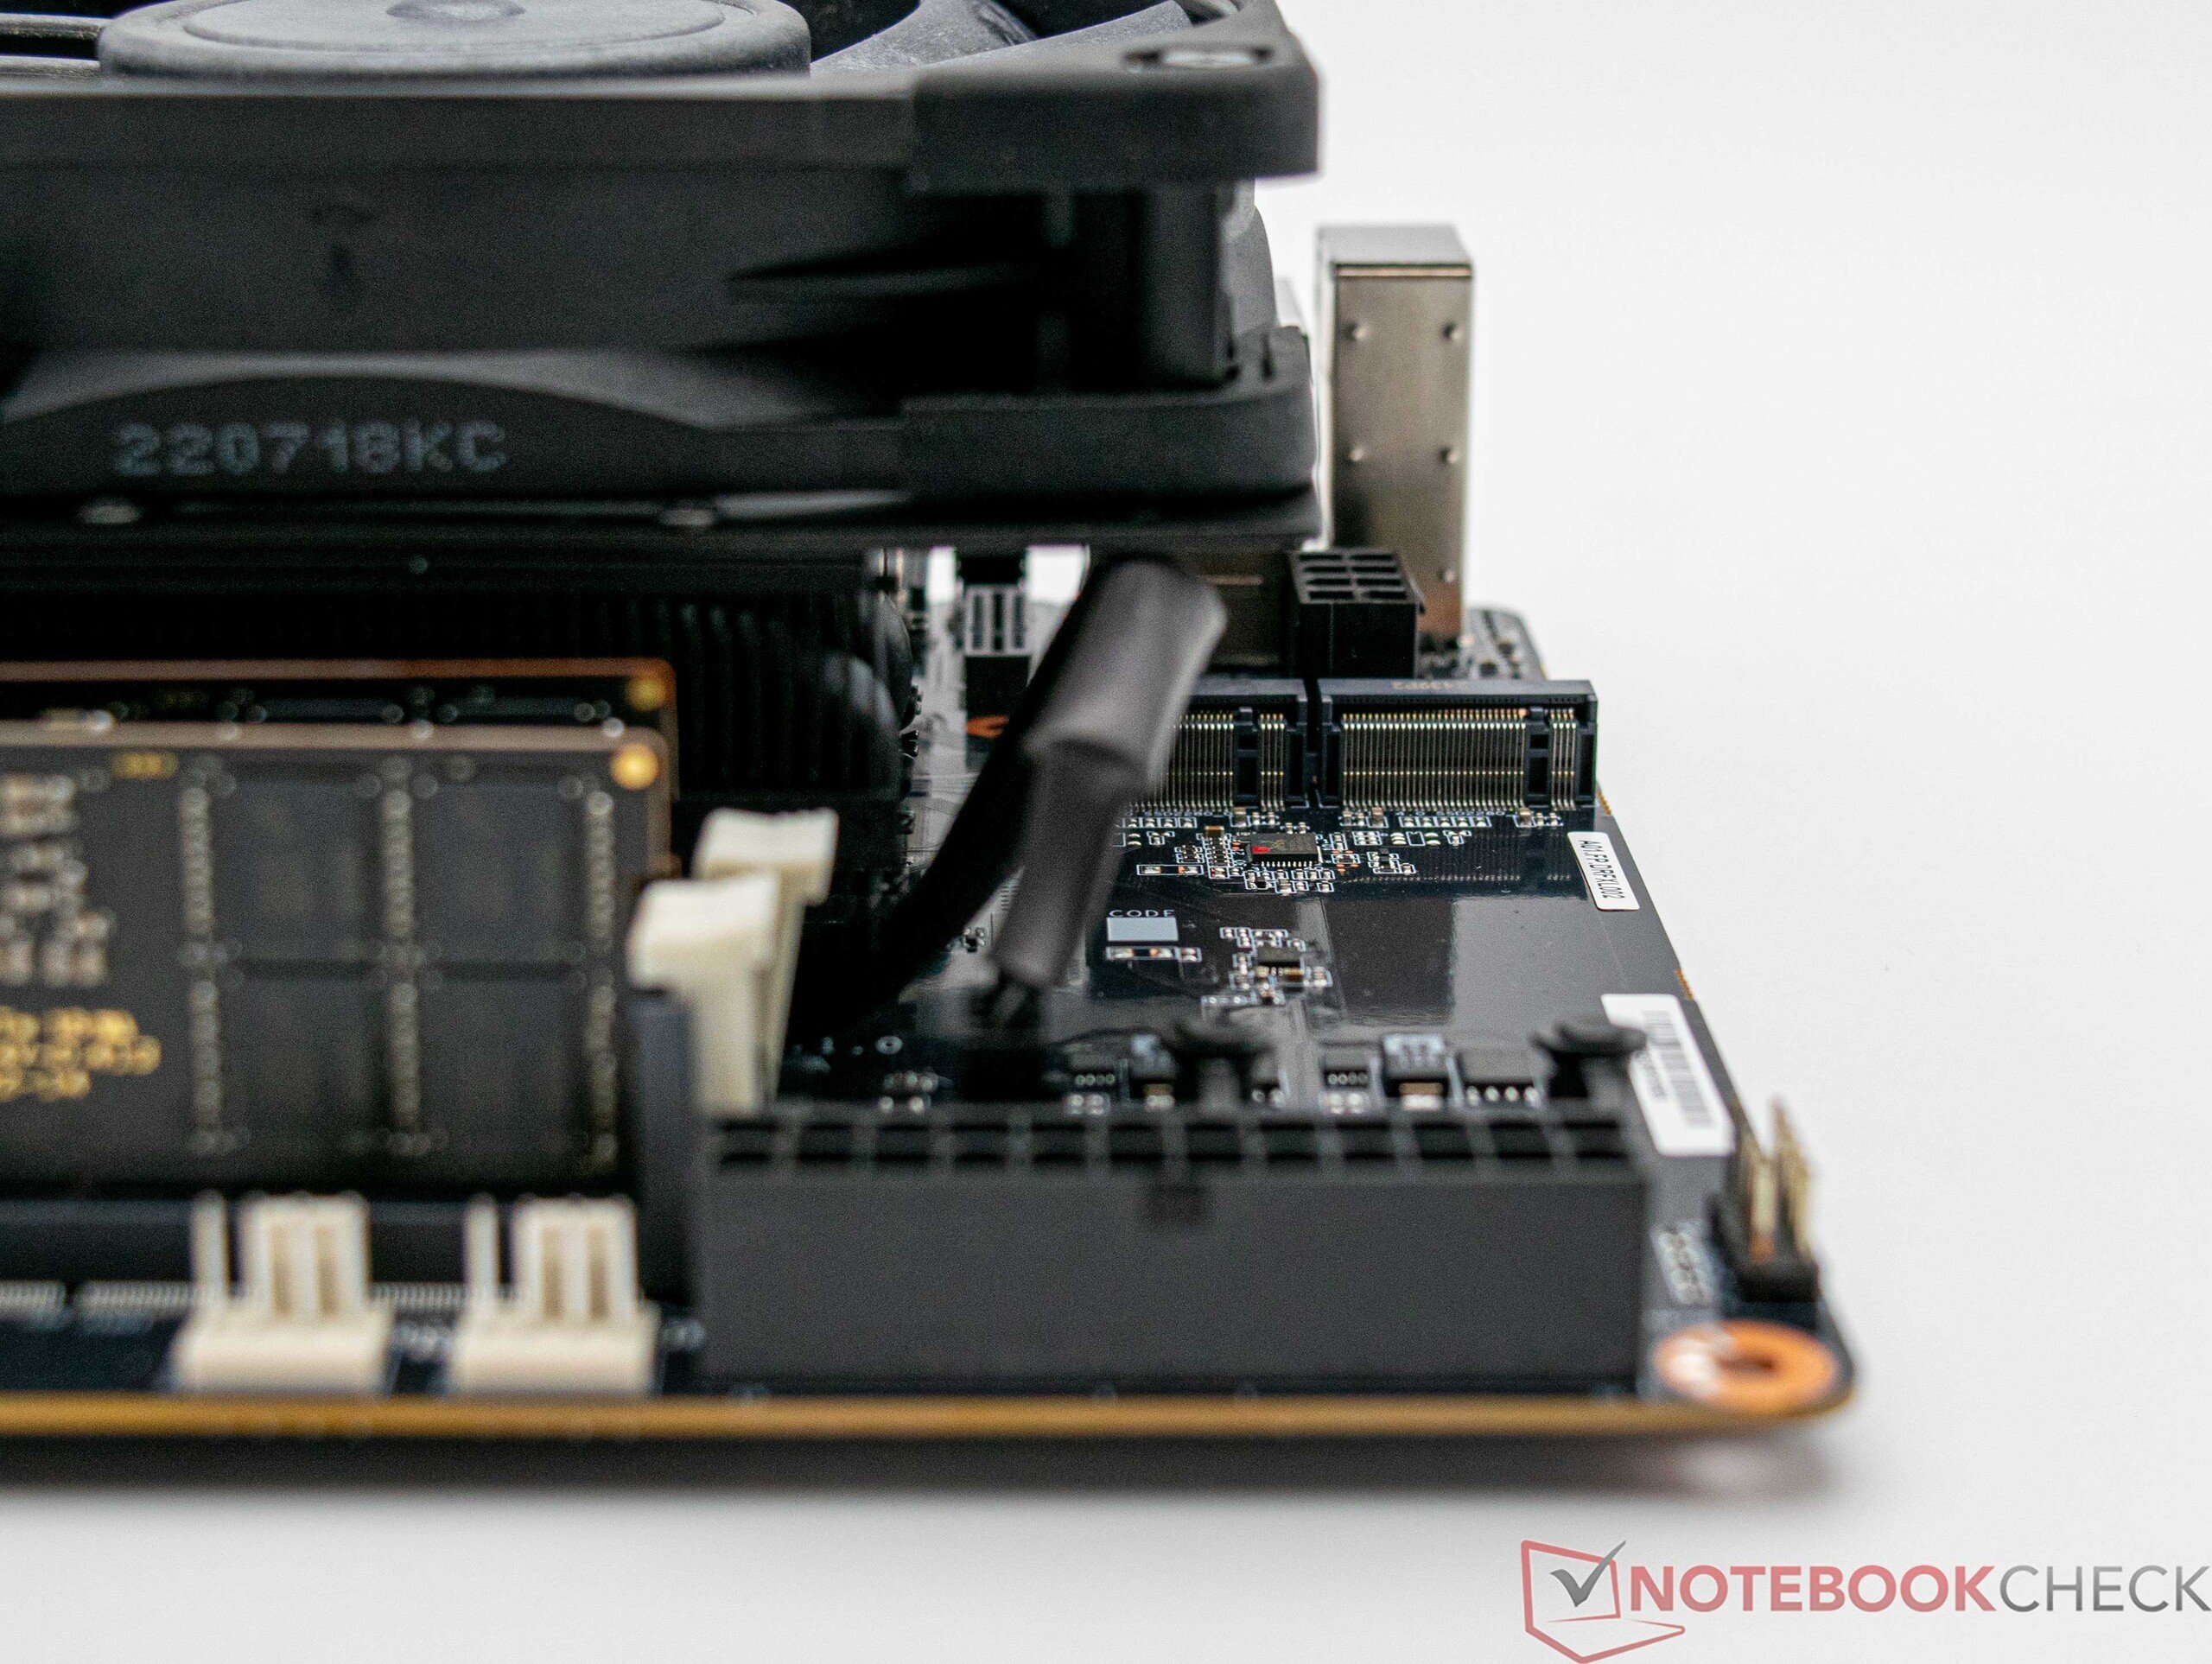
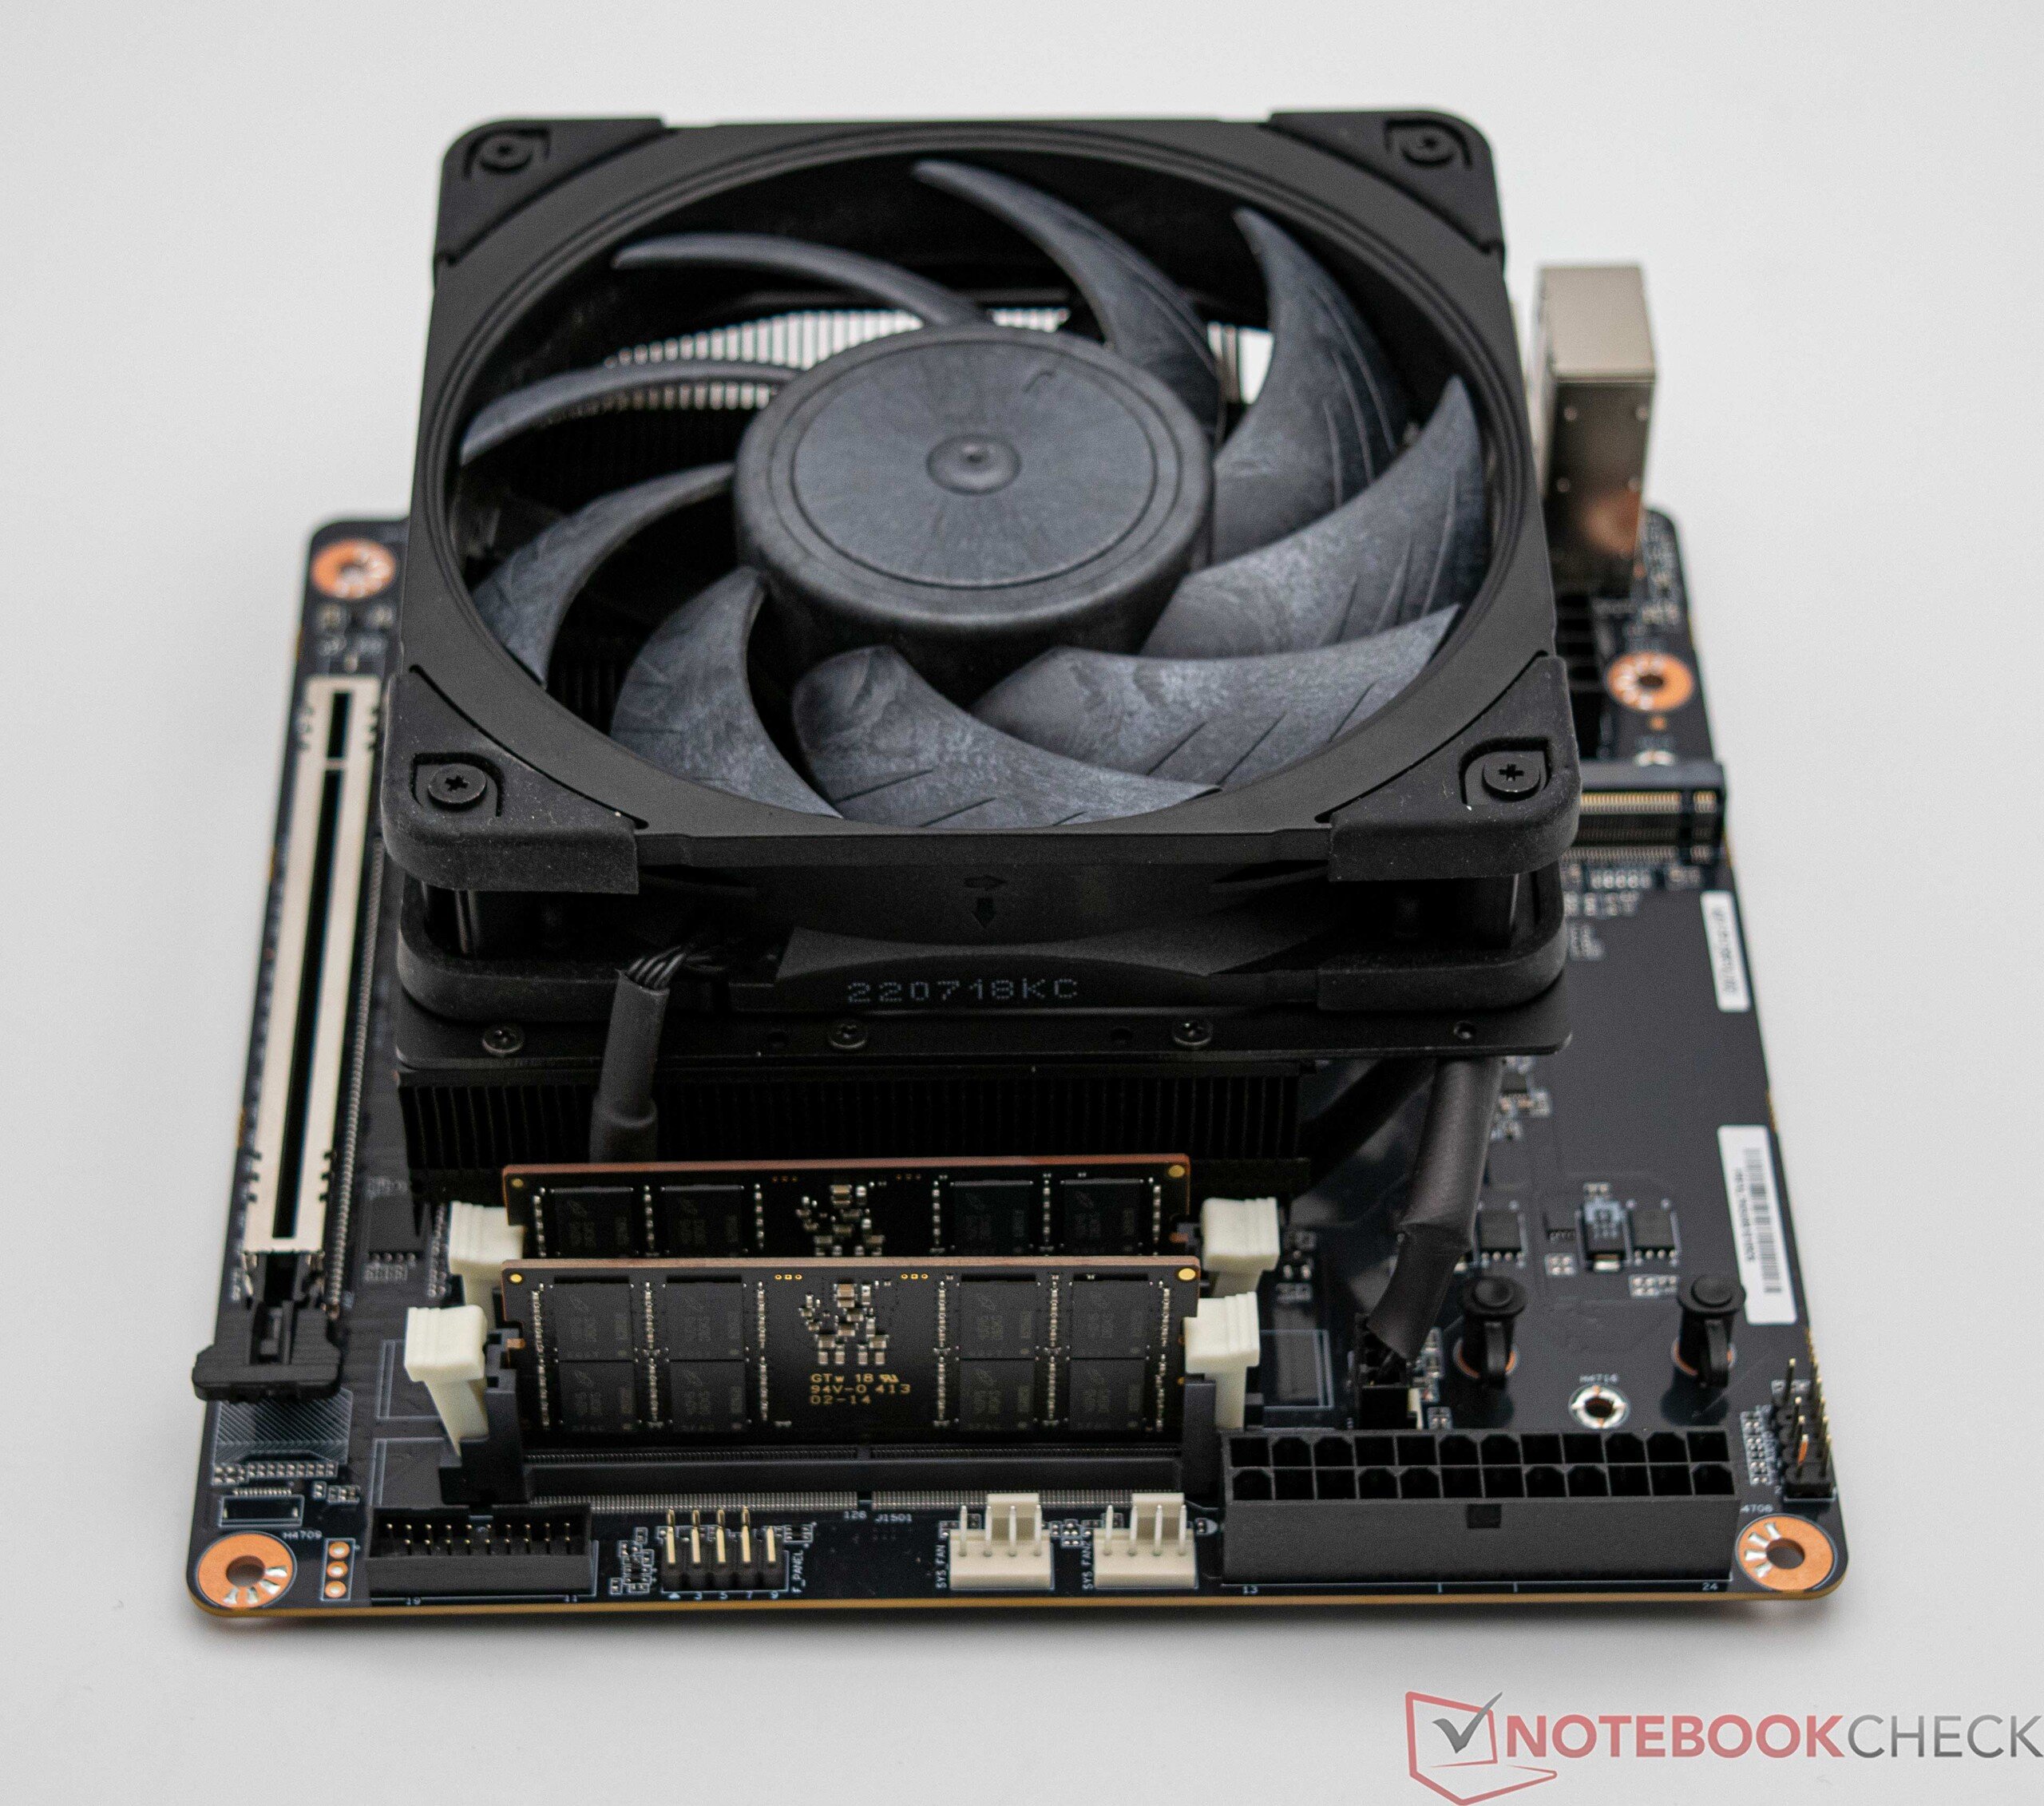
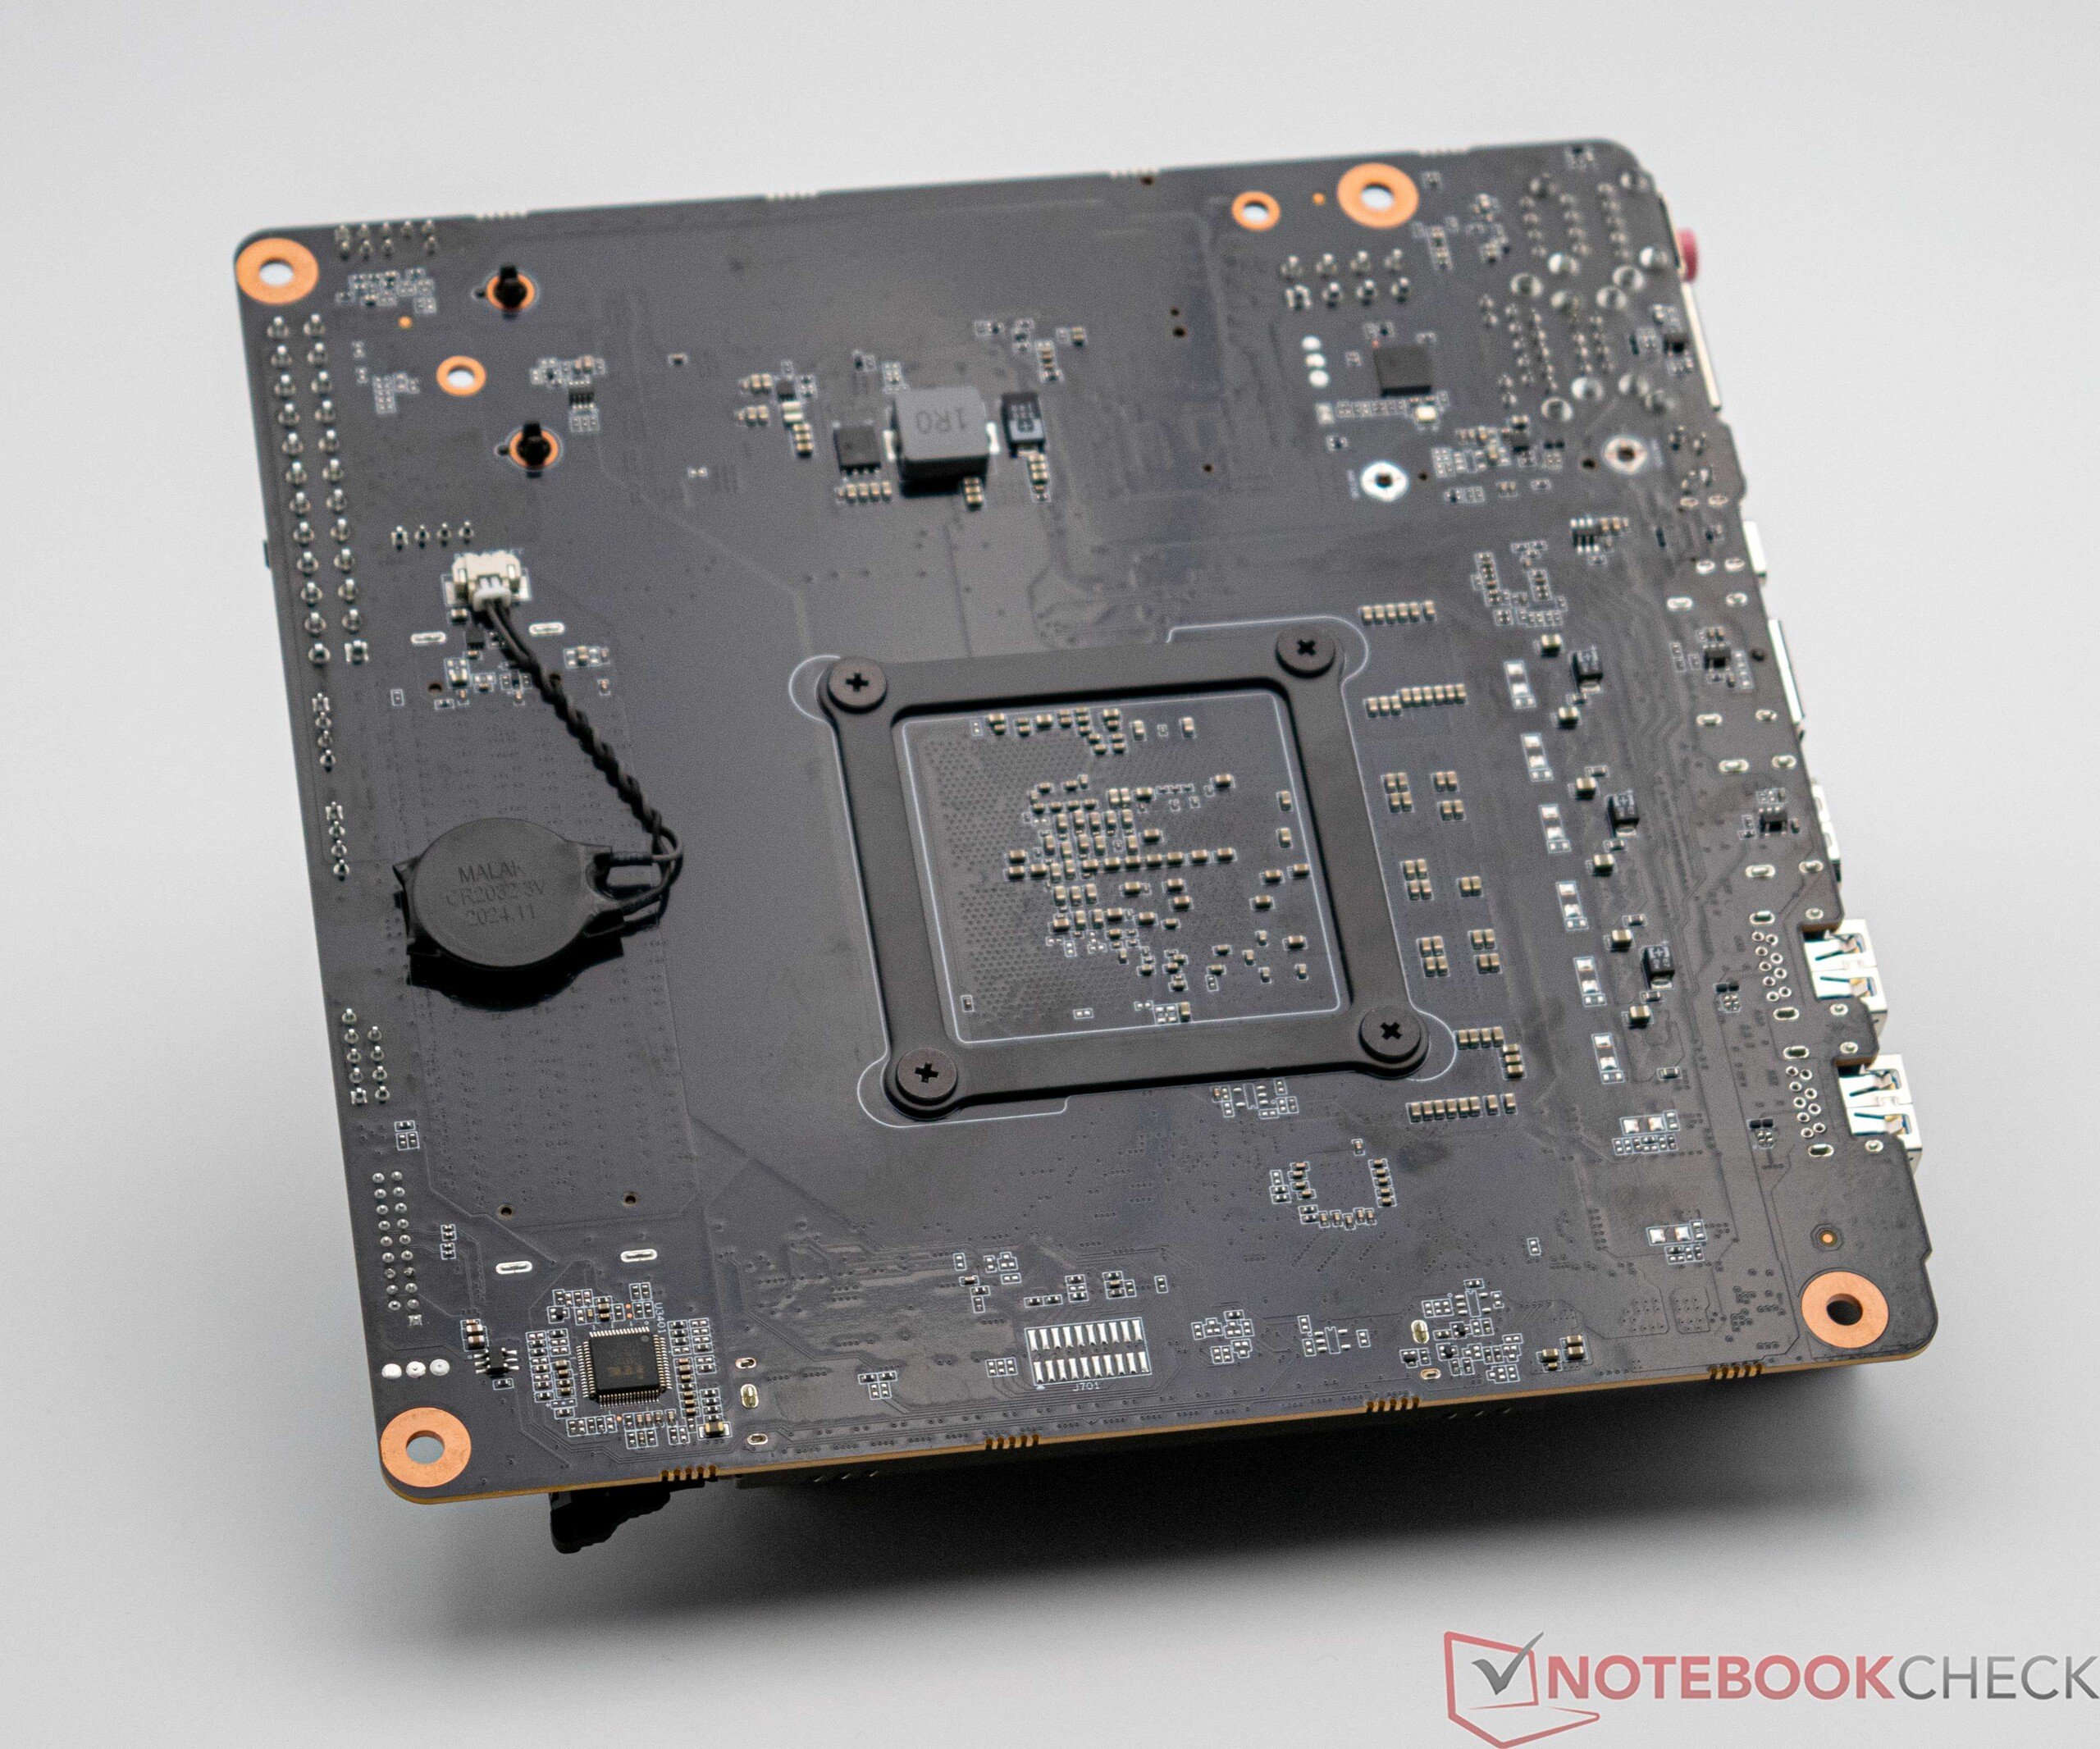
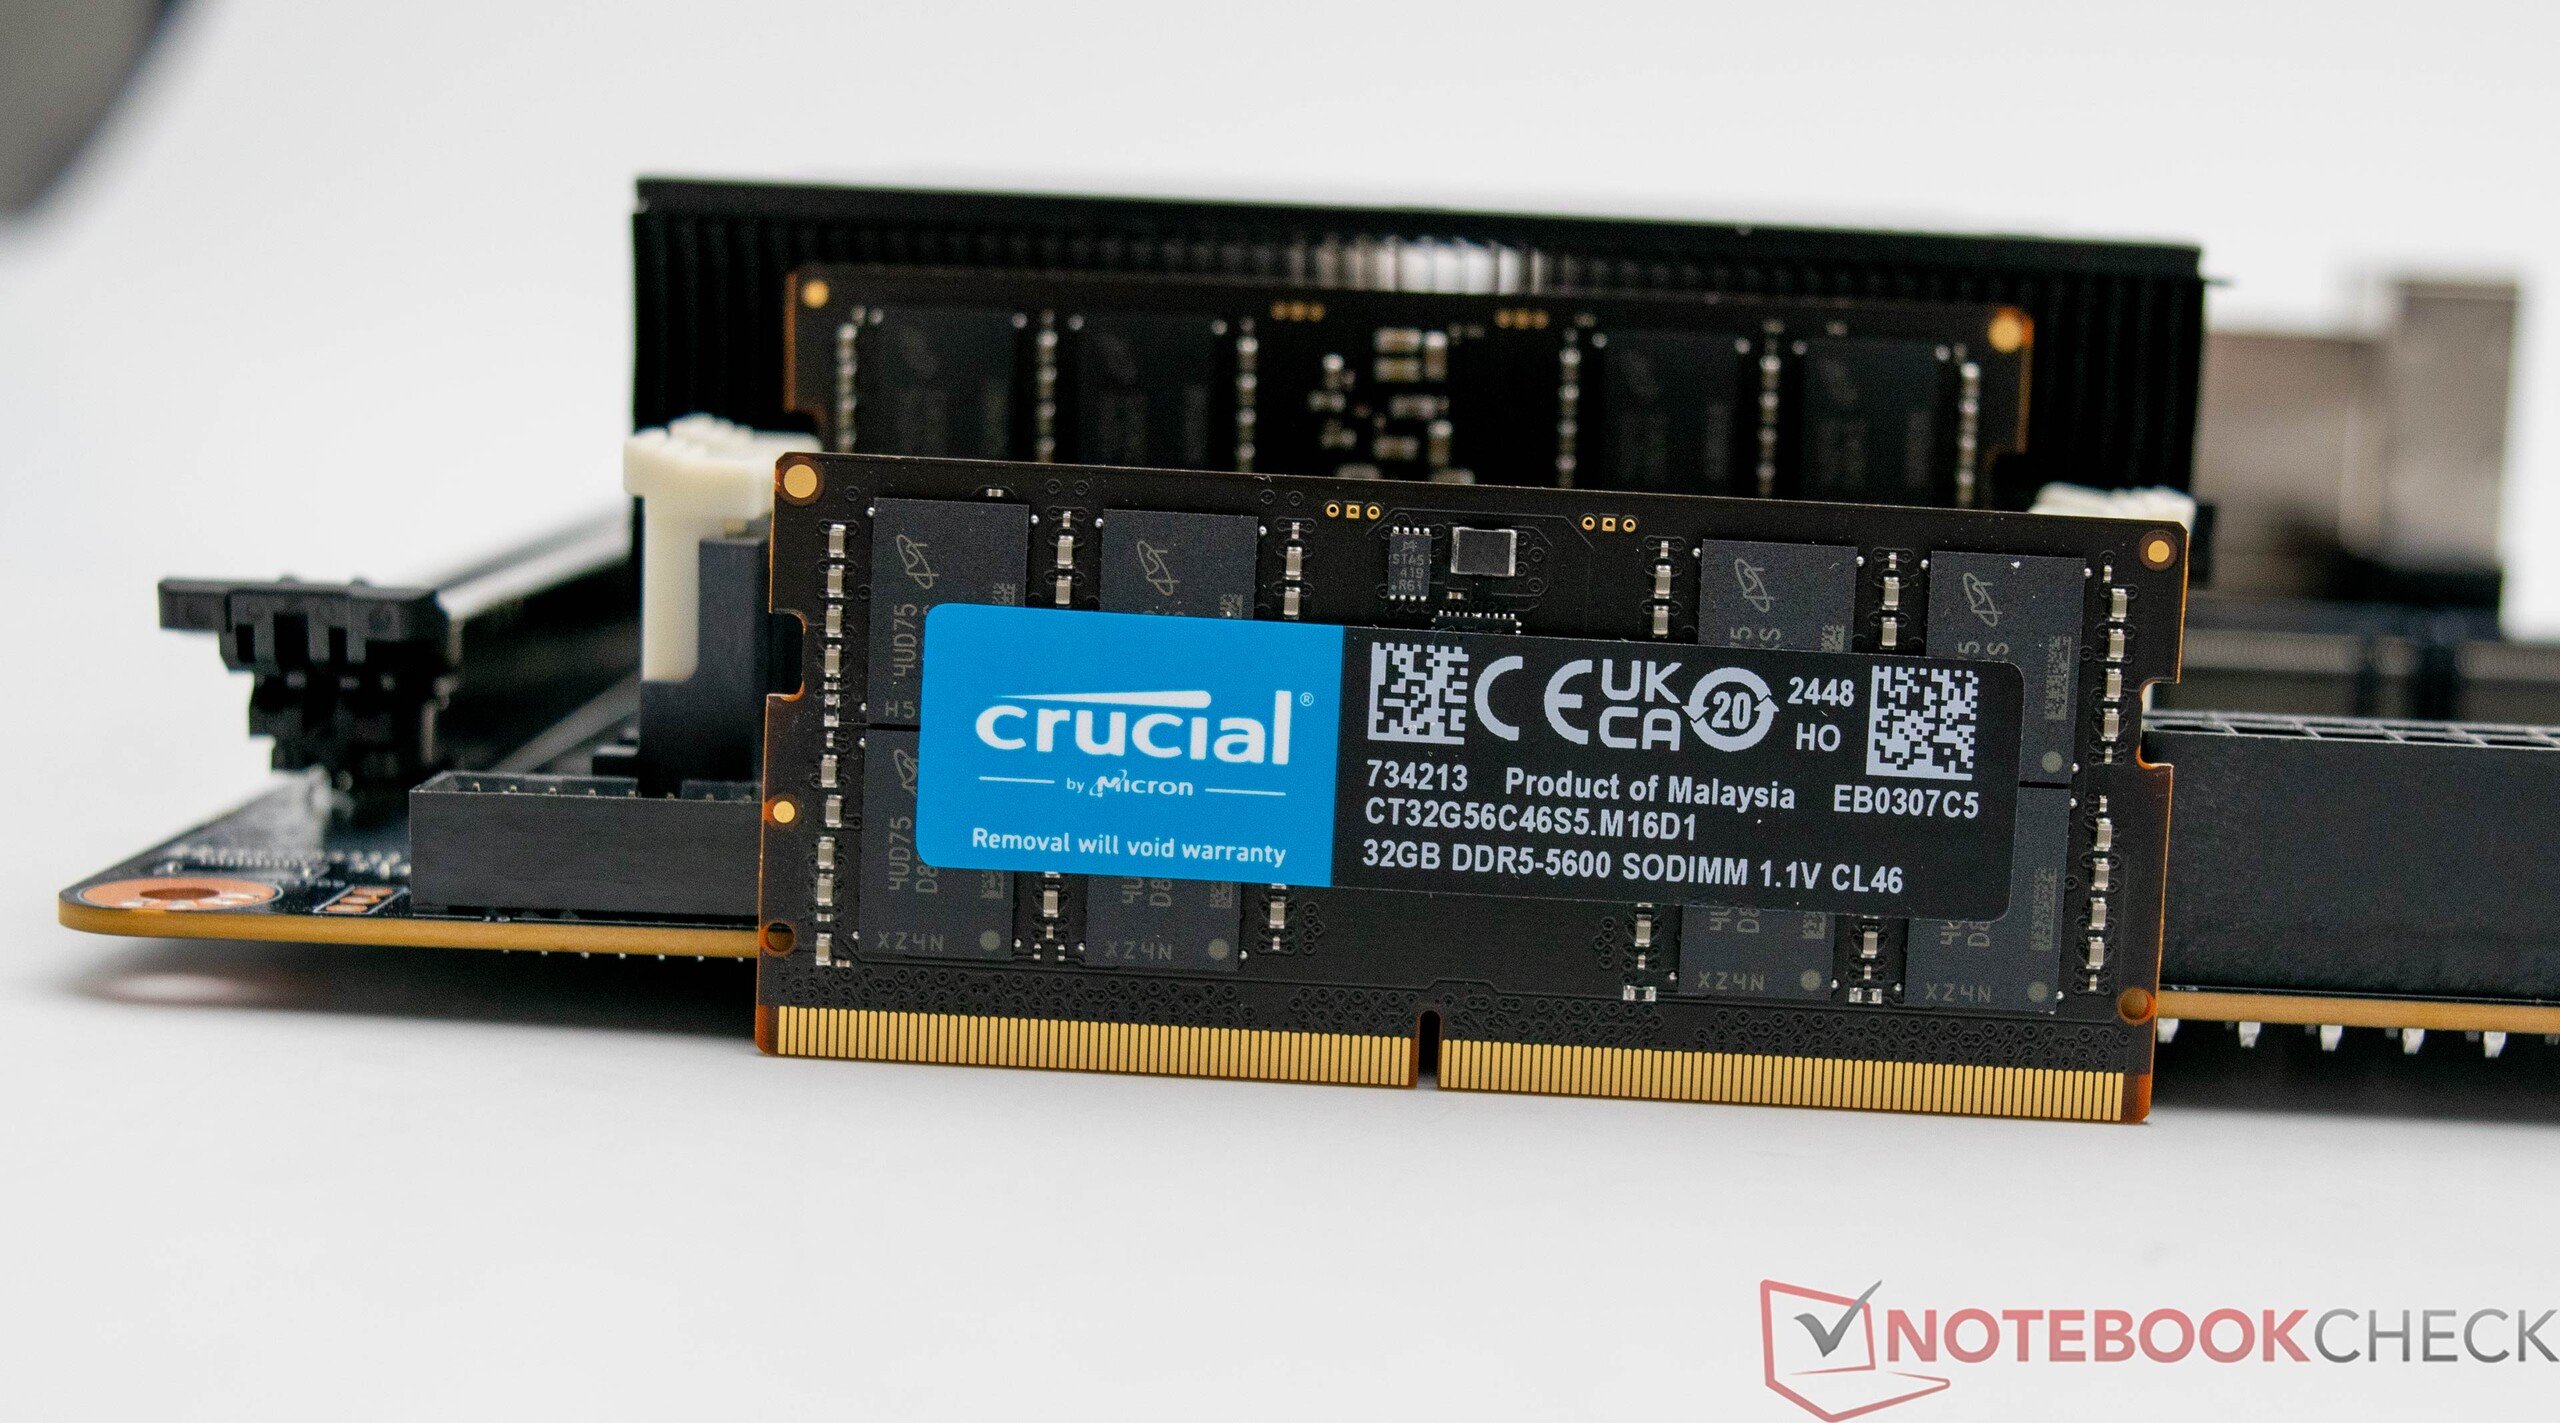
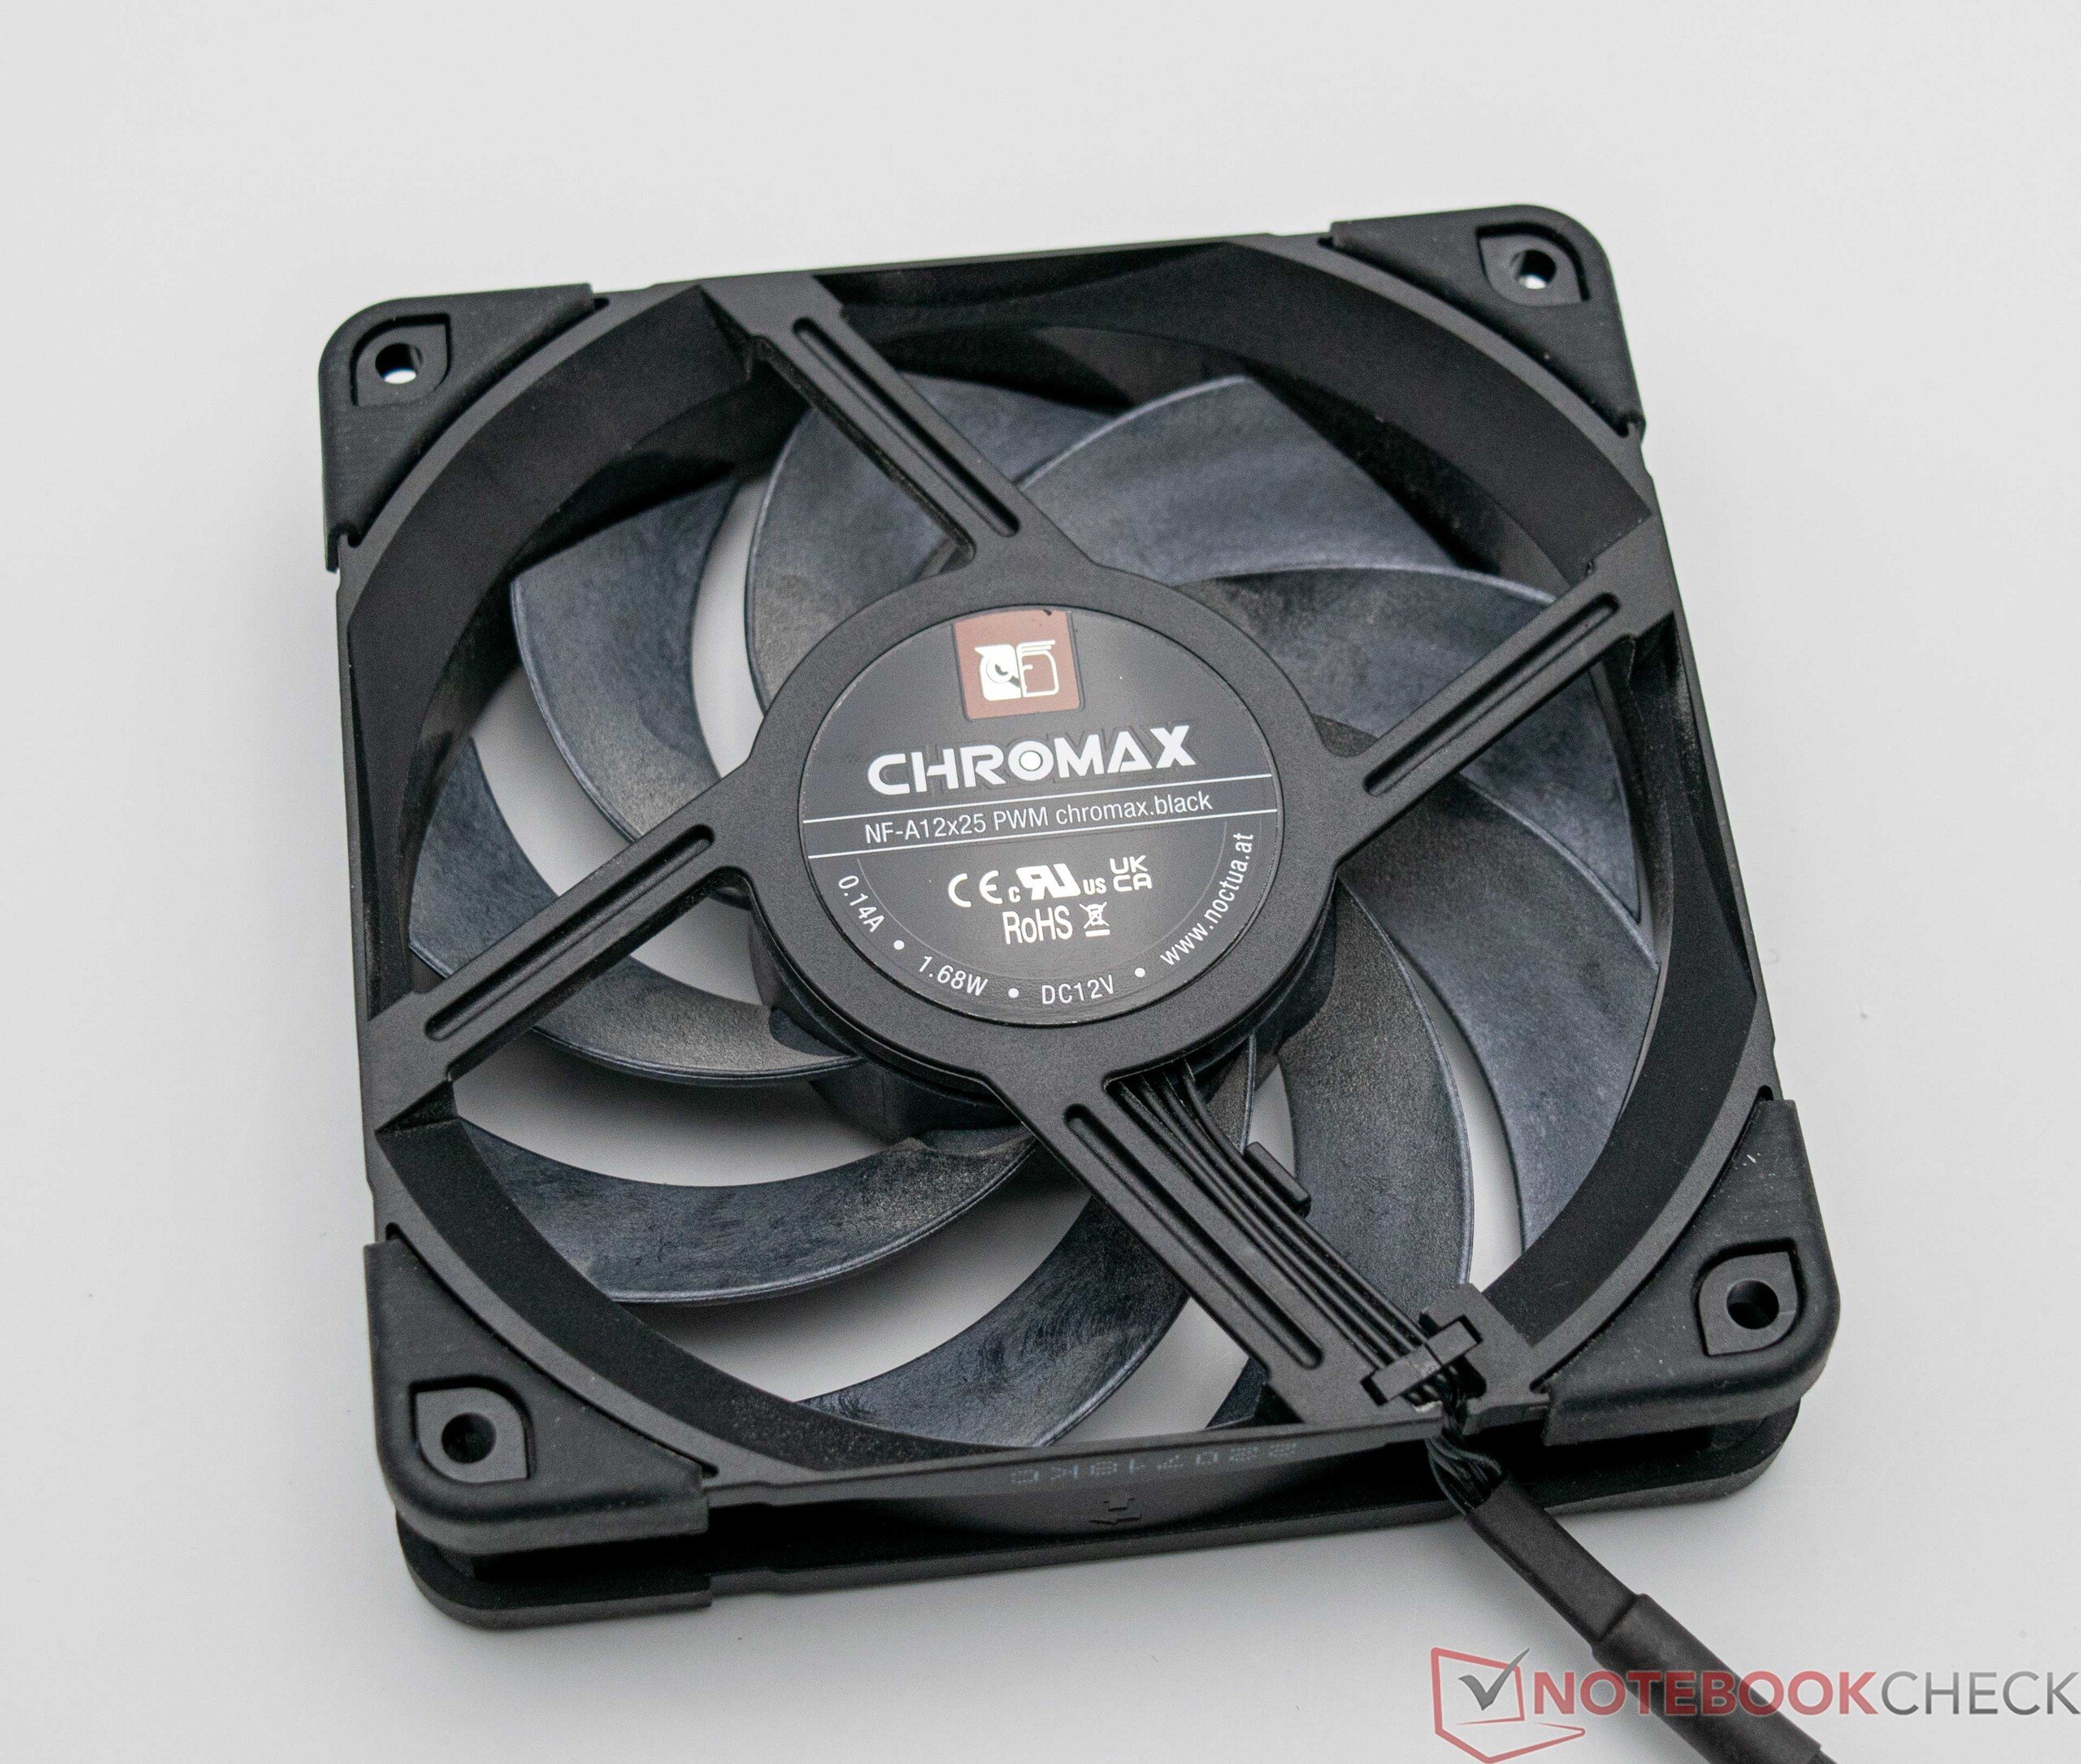
La livraison du Minisforum BD795i SE est presque identique à celle du BD790i. Elle est livrée avec un refroidisseur préinstallé qui couvre le CPU et les convertisseurs de tension. Un bouclier IO (non préinstallé) est également fourni avec la carte mère. Minisforum a renoncé à l'antenne WLAN relativement grande incluse dans la BD790ice qui rend son boîtier un peu plus petit. Toutefois, un support permettant d'installer ultérieurement un module WLAN est inclus. Comme pour les systèmes barebone, vous devez vous occuper vous-même du SSD, de la RAM, de l'alimentation, du boîtier et d'un ventilateur de 120 mm lorsque vous achetez le Minisforum BD795i SE.
Sa connectique est assez basique. Il n'y a que quelques connexions à l'arrière, mais tous les ports importants sont présents. La carte dispose également d'un connecteur USB 3.2 interne, ce qui signifie qu'un total de six ports USB A peuvent être utilisés. D'autres connexions telles que les connecteurs ARGB ou un connecteur USB-C supplémentaire manquent. Il n'y a pas d'alternative au refroidisseur préinstallé, car il n'y a pas d'option de montage pour des refroidisseurs plus puissants - un refroidissement séparé des convertisseurs de tension serait bénéfique dans ce cas.


Conditions d'essai
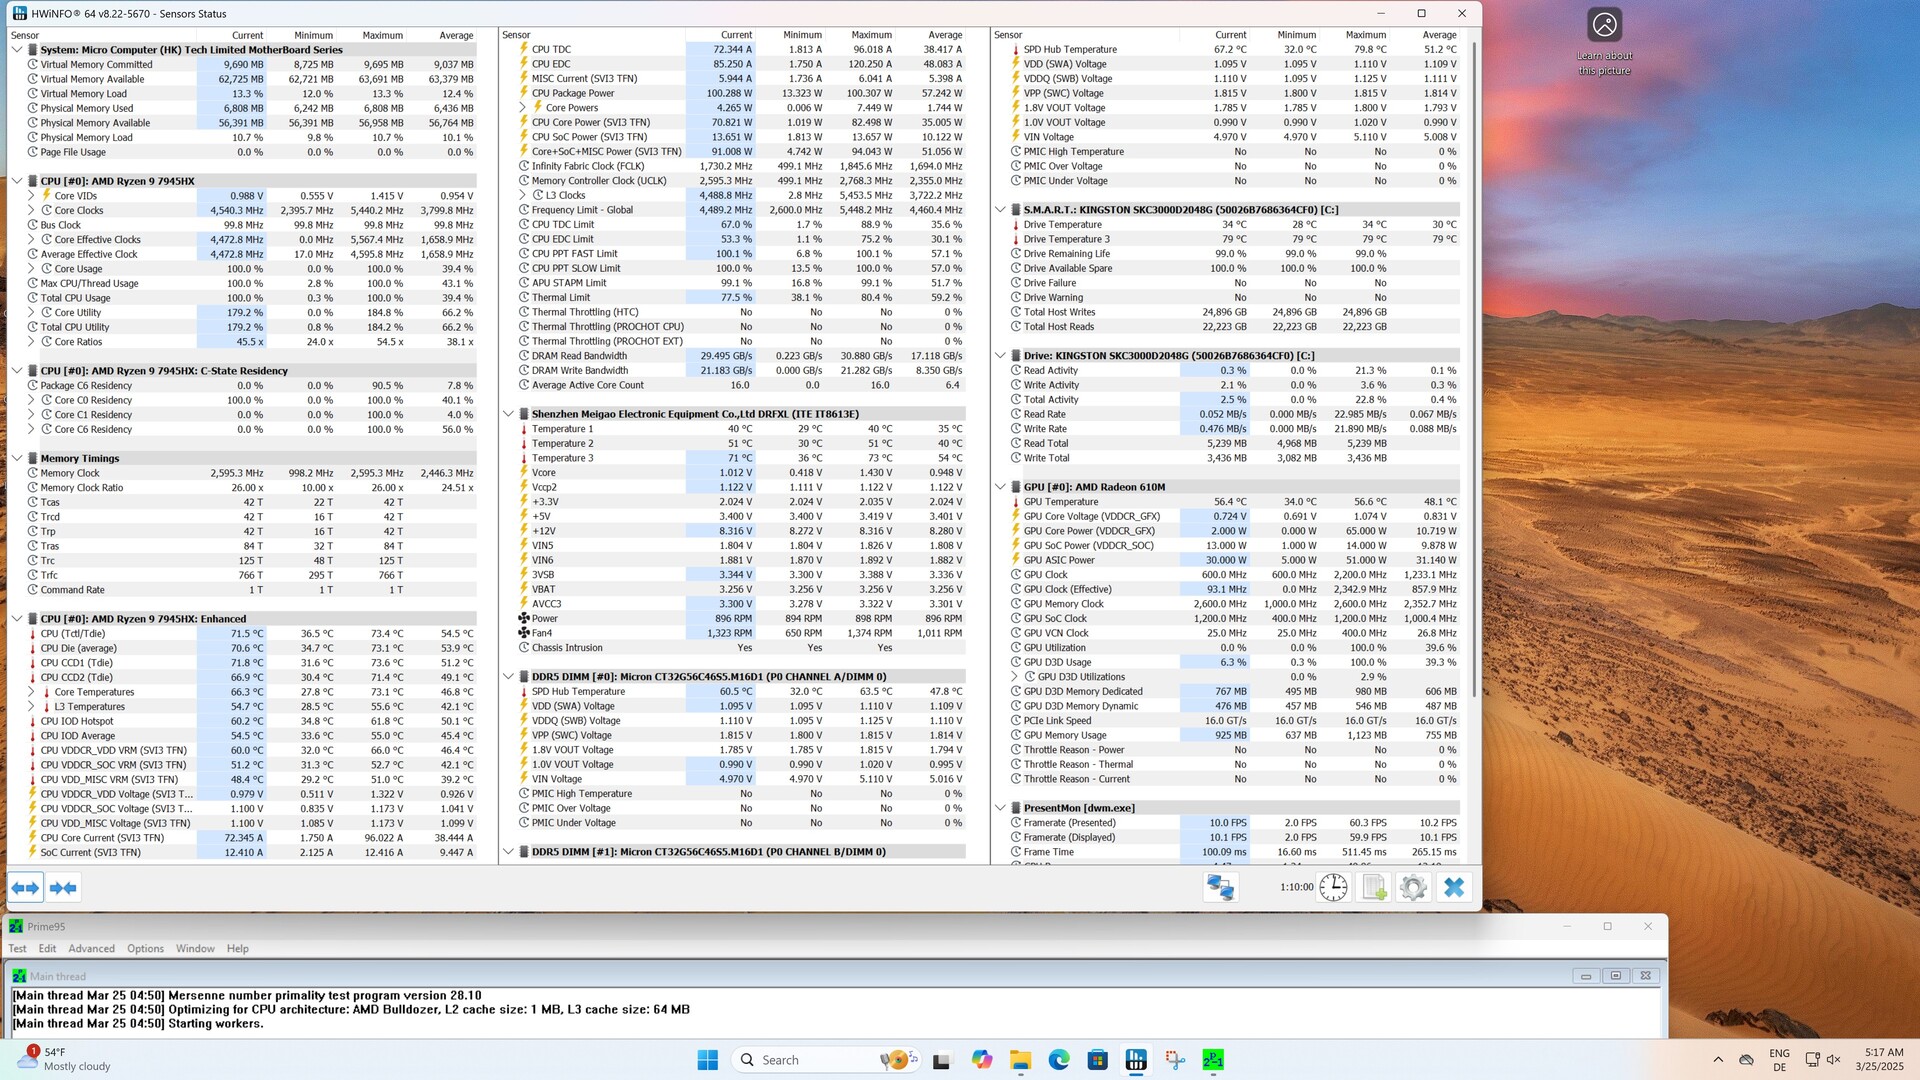
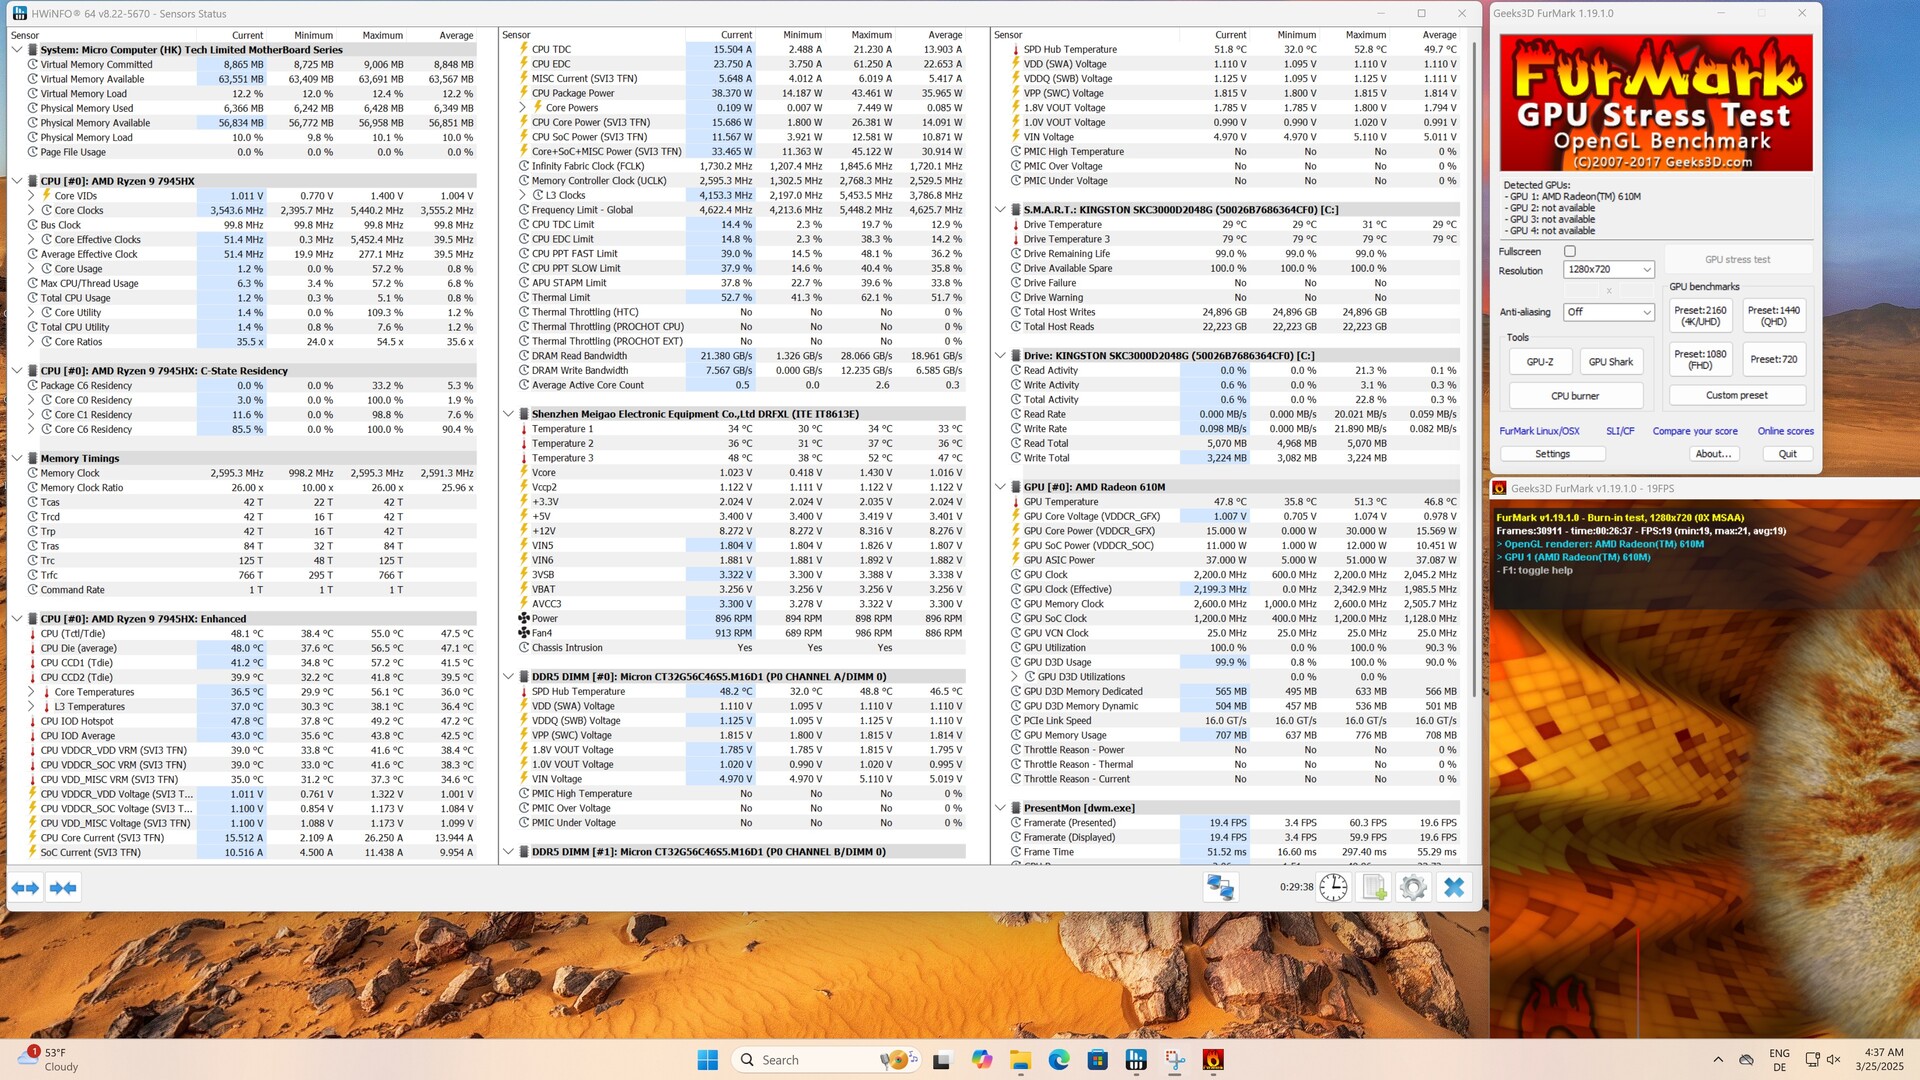
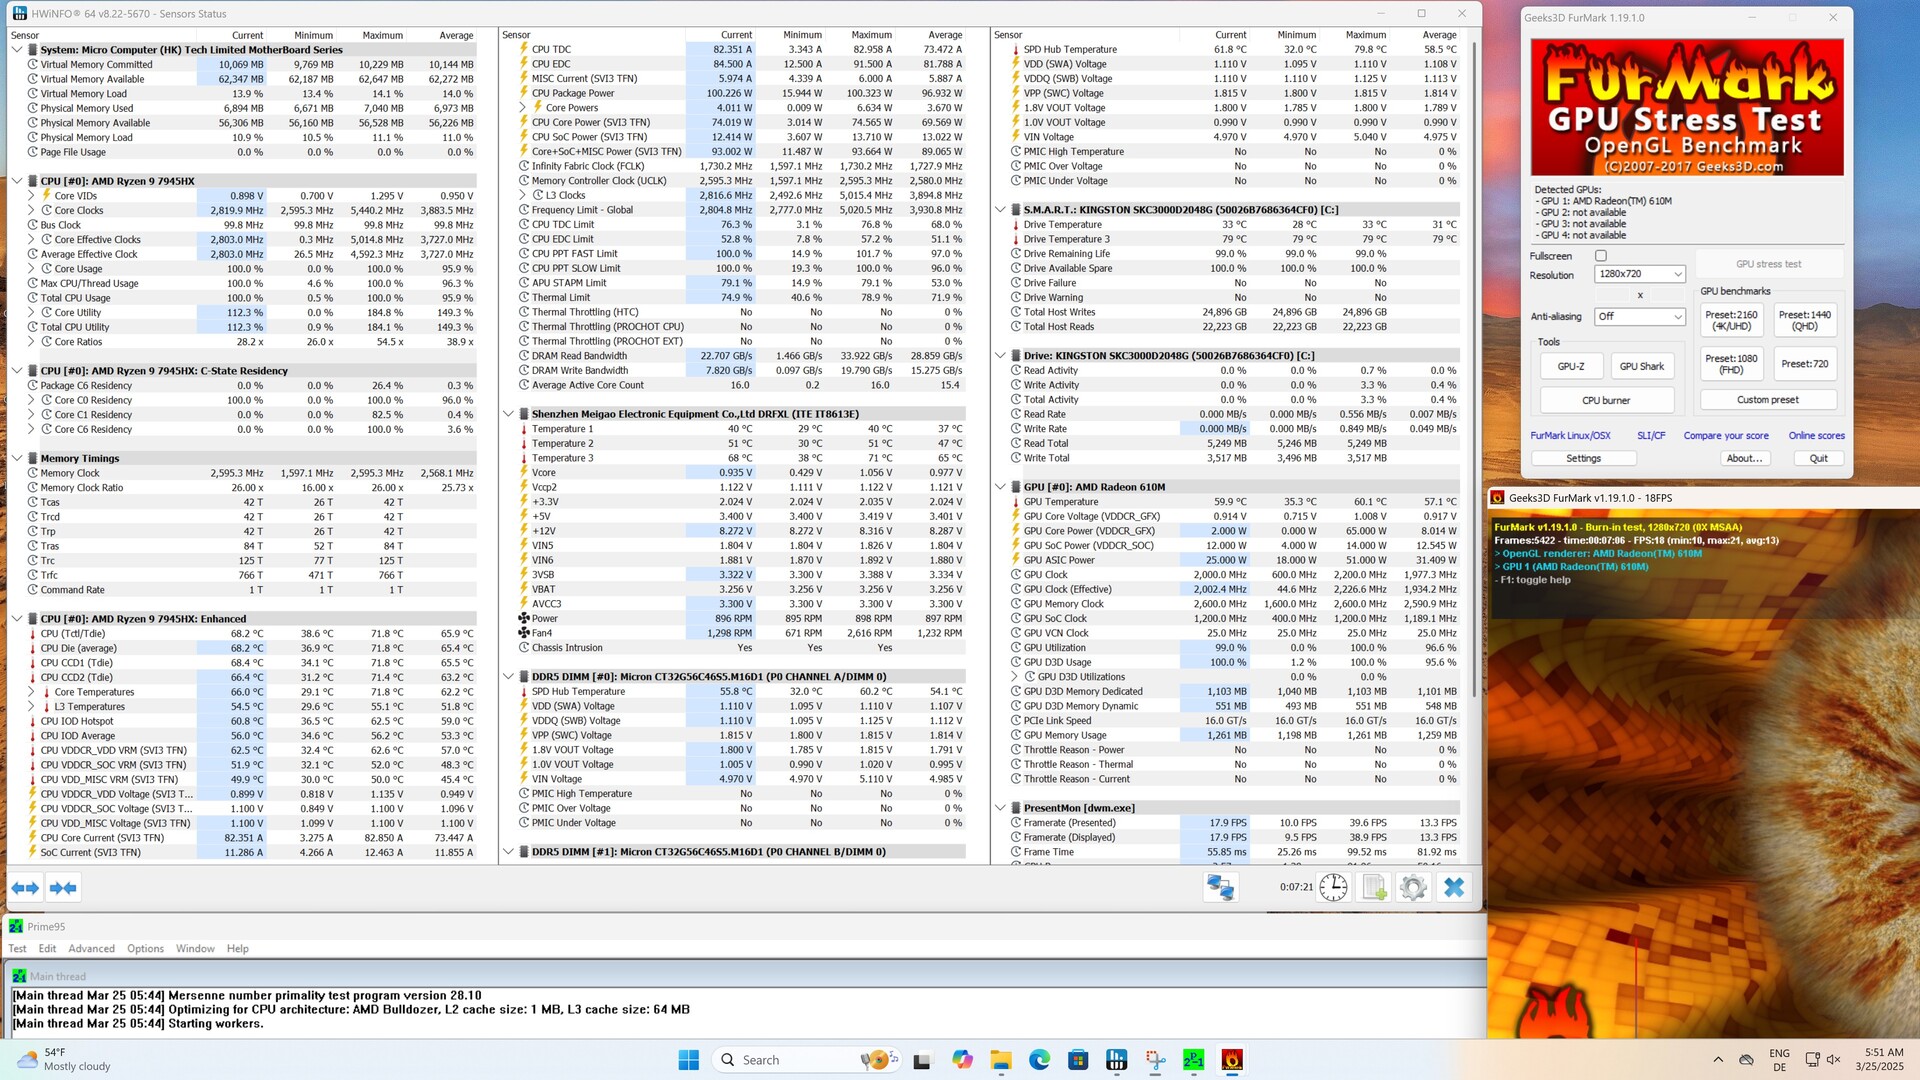
Nous avons effectué tous les tests de performance dans une configuration ouverte sur une table Streacom BC1 V2. Nous avons utilisé un Noctua NF-A12x25 comme ventilateur, et nous avons utilisé notre Palit GeForce RTX 4090 Gamerock OC pour les tests de jeu en combinaison avec une carte graphique dédiée.
Benchmark des processeurs
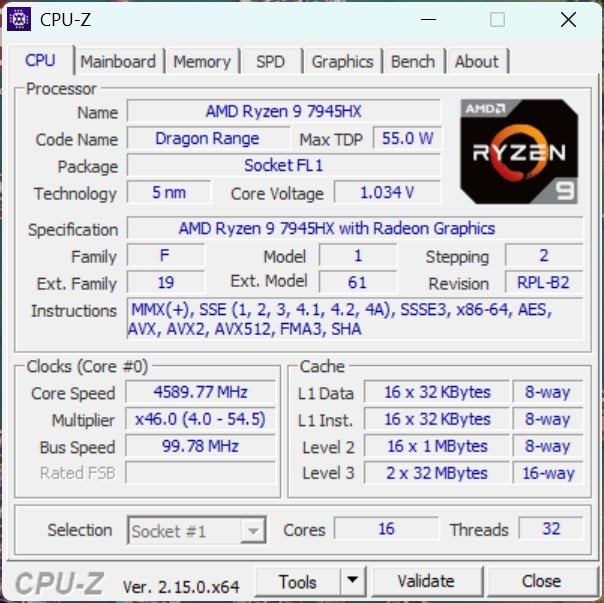
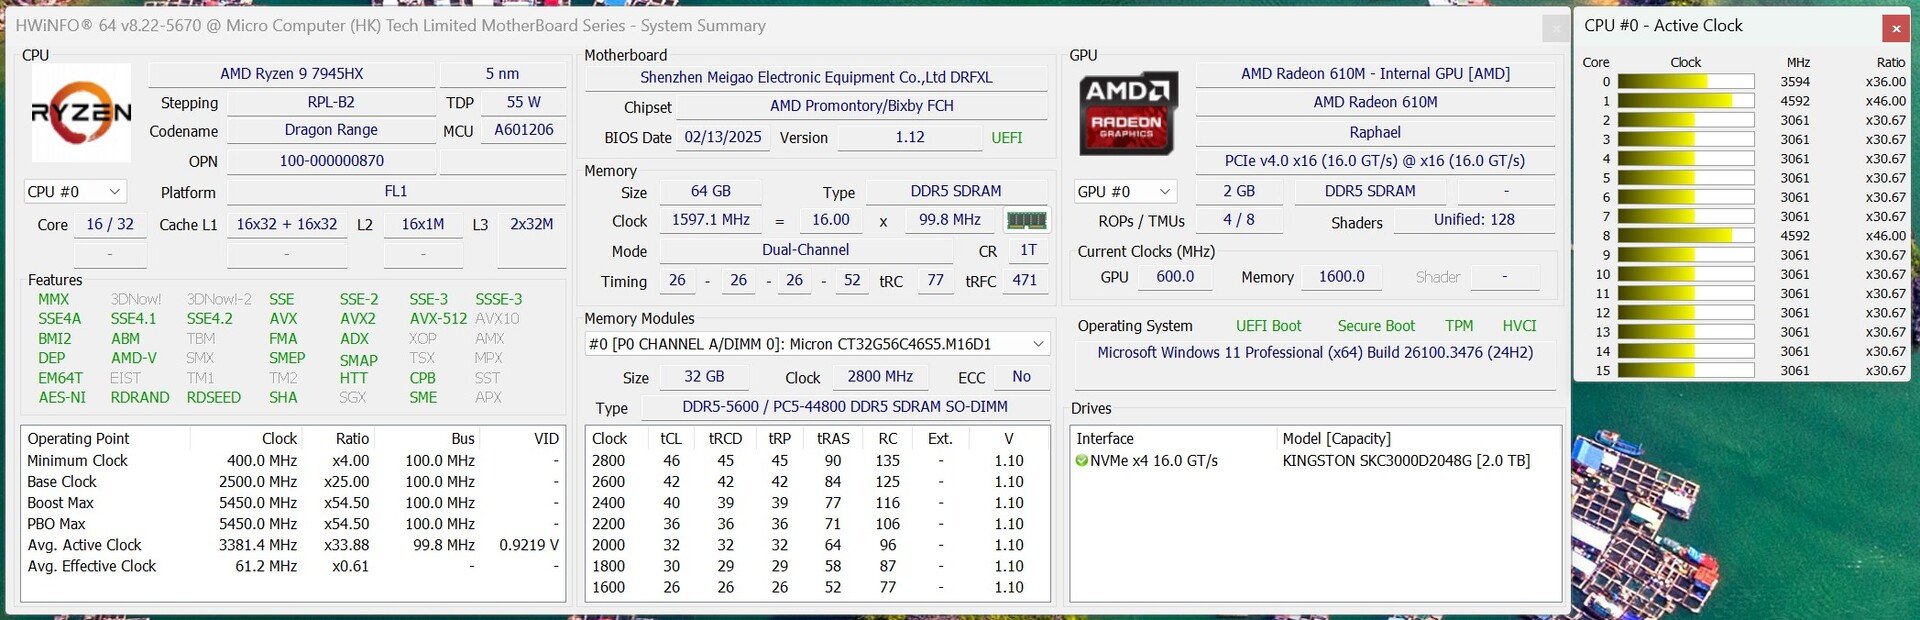
Le Minisforum BD795i SE est équipé du puissant processeur AMD Ryzen 9 7945HXun processeur pour ordinateur portable avec 16 cœurs Zen4 et 32 threads. Lors de nos tests, ses performances se situaient entre celles des processeurs AMD Ryzen 9 7900X et le AMD Ryzen 9 7950X et étaient comparables à celles du Intel Core i7-14700K. L'un de ses principaux avantages par rapport aux CPU de bureau est son efficacité : avec seulement 100 watts, il est plus économe et beaucoup plus facile à refroidir.
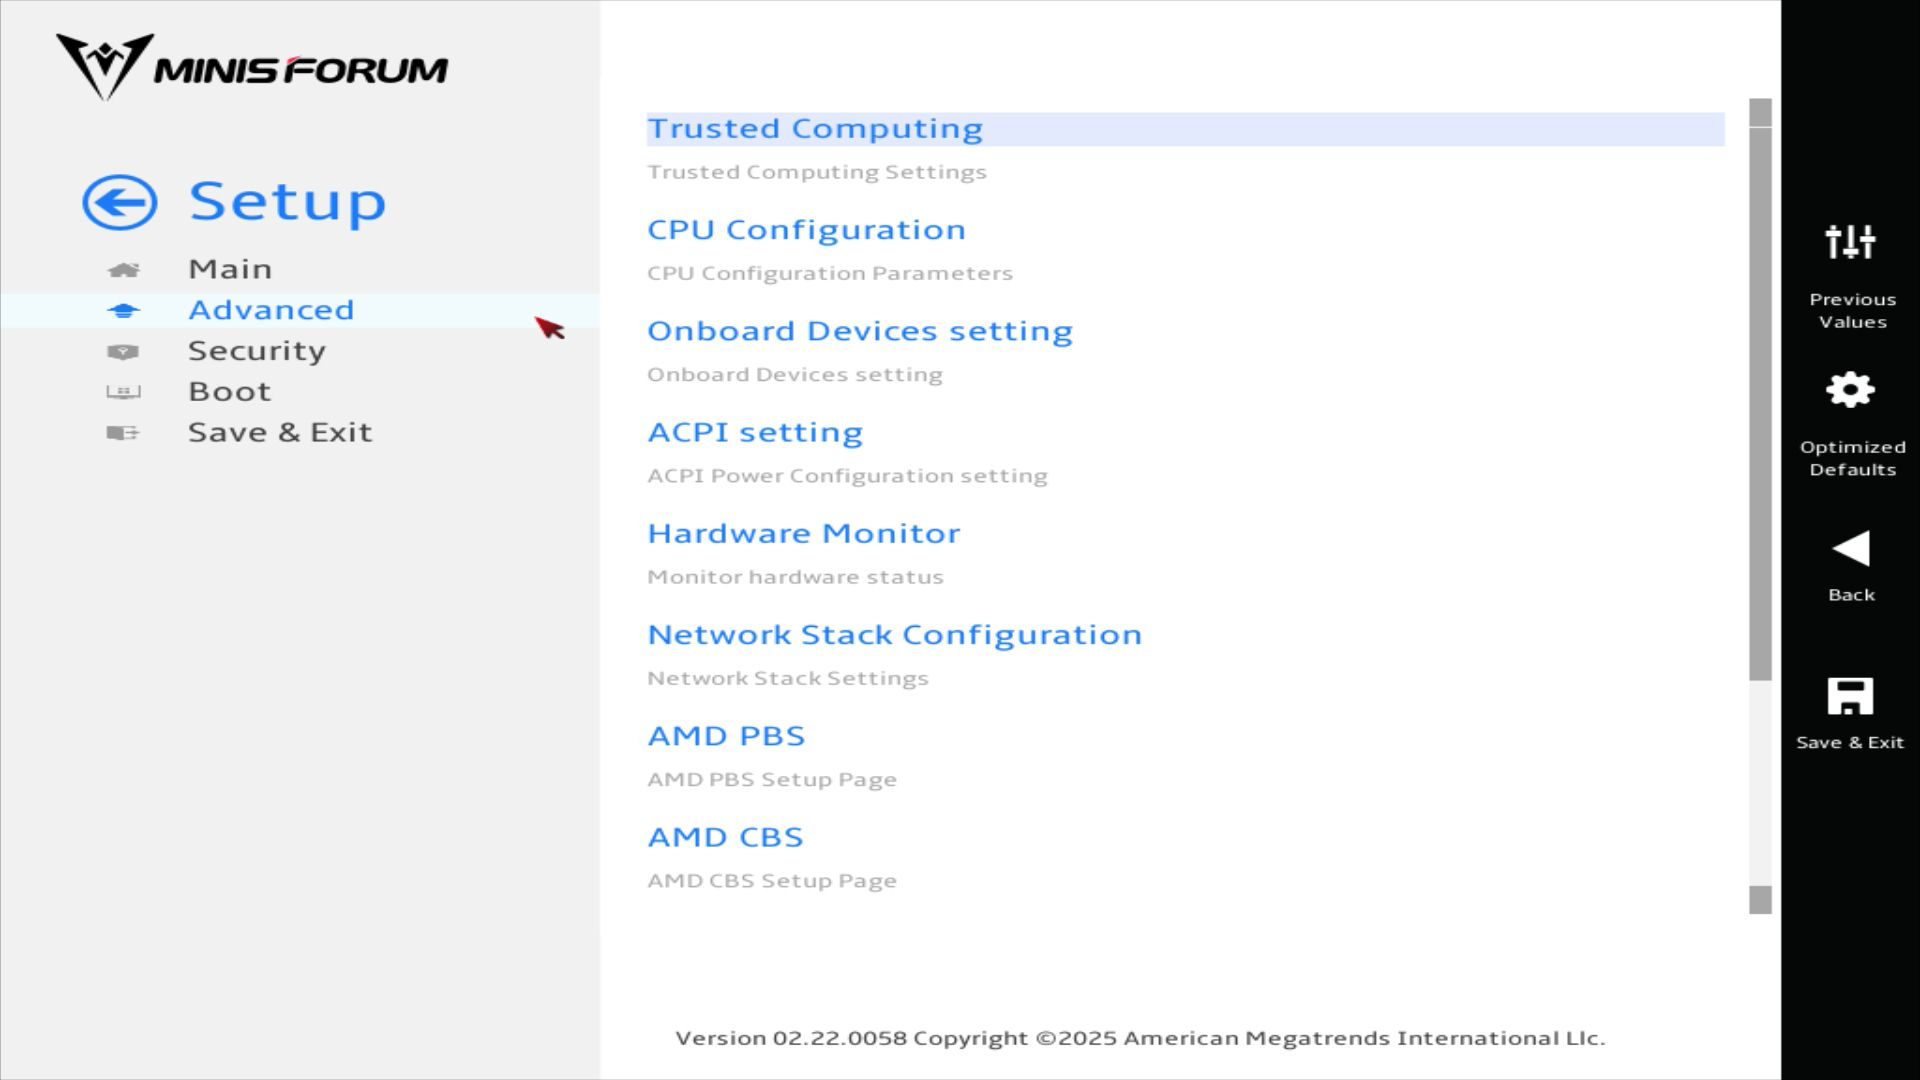
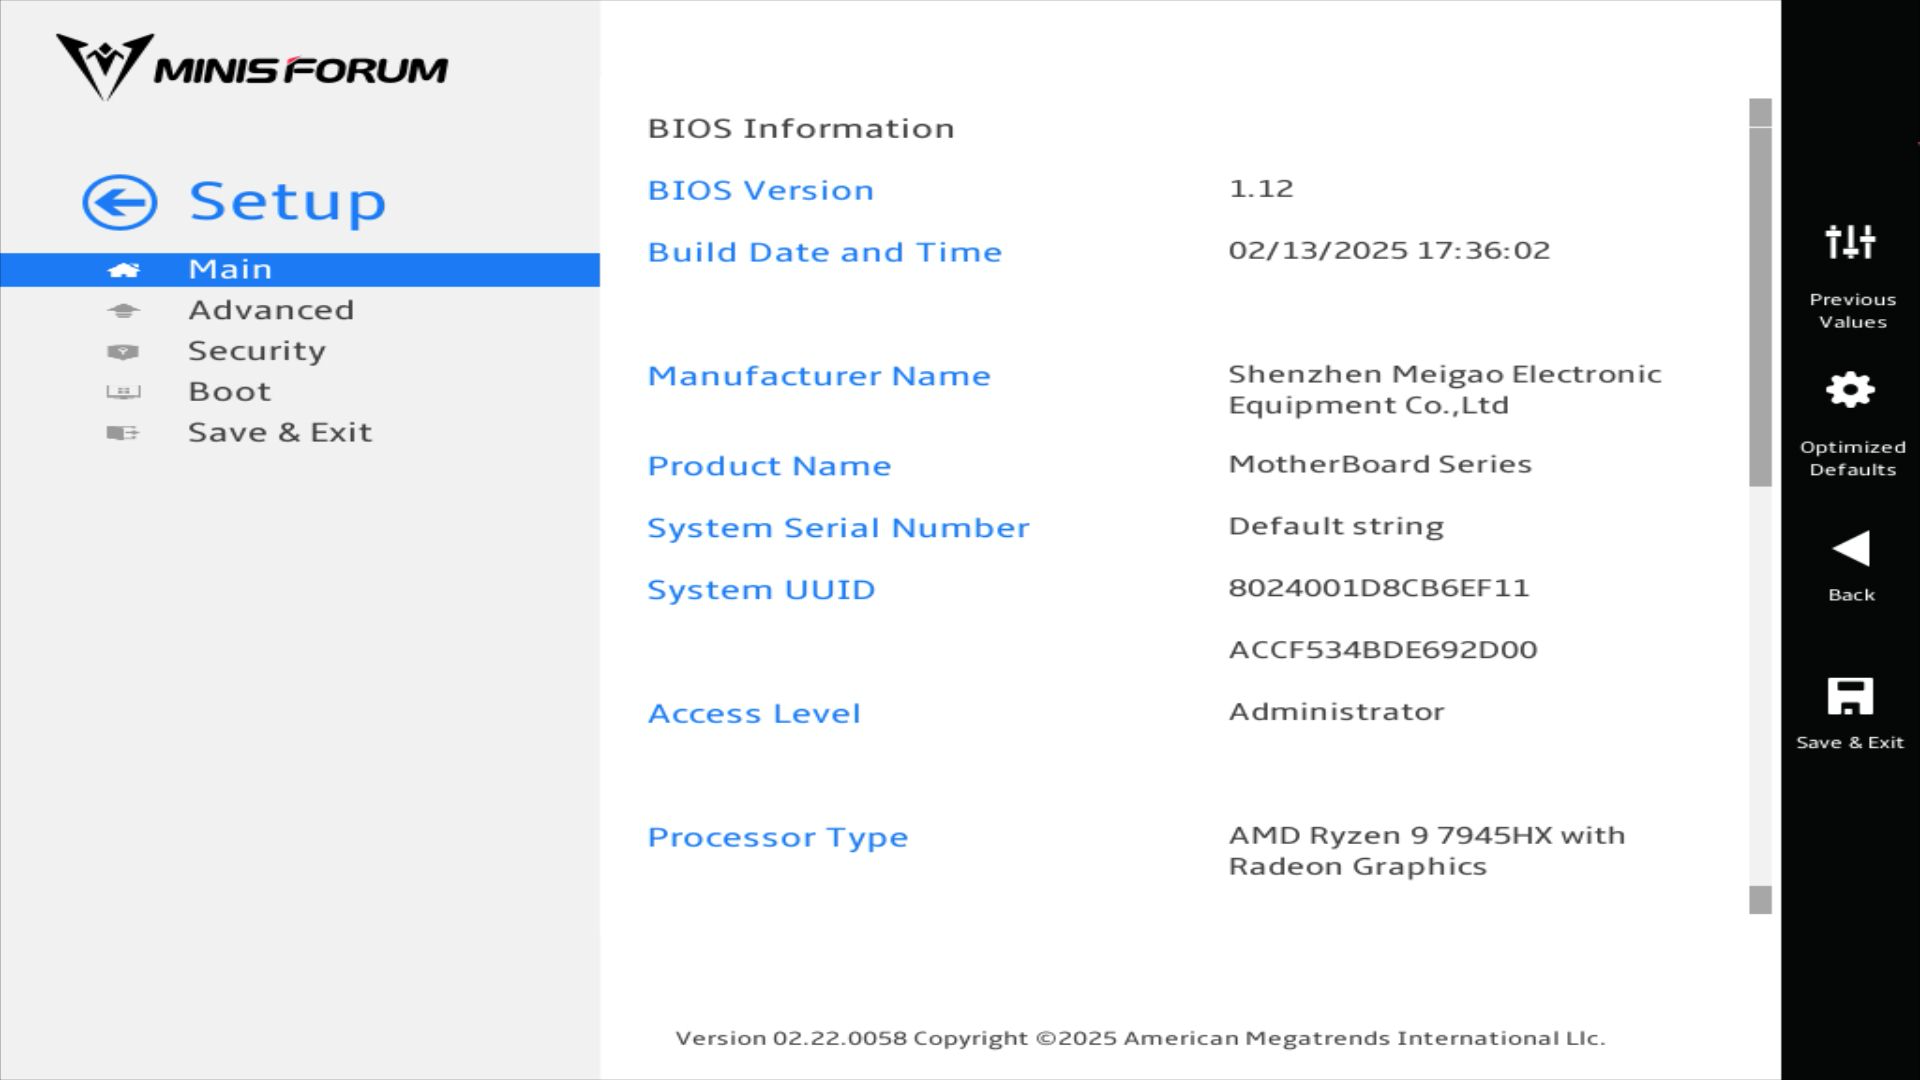
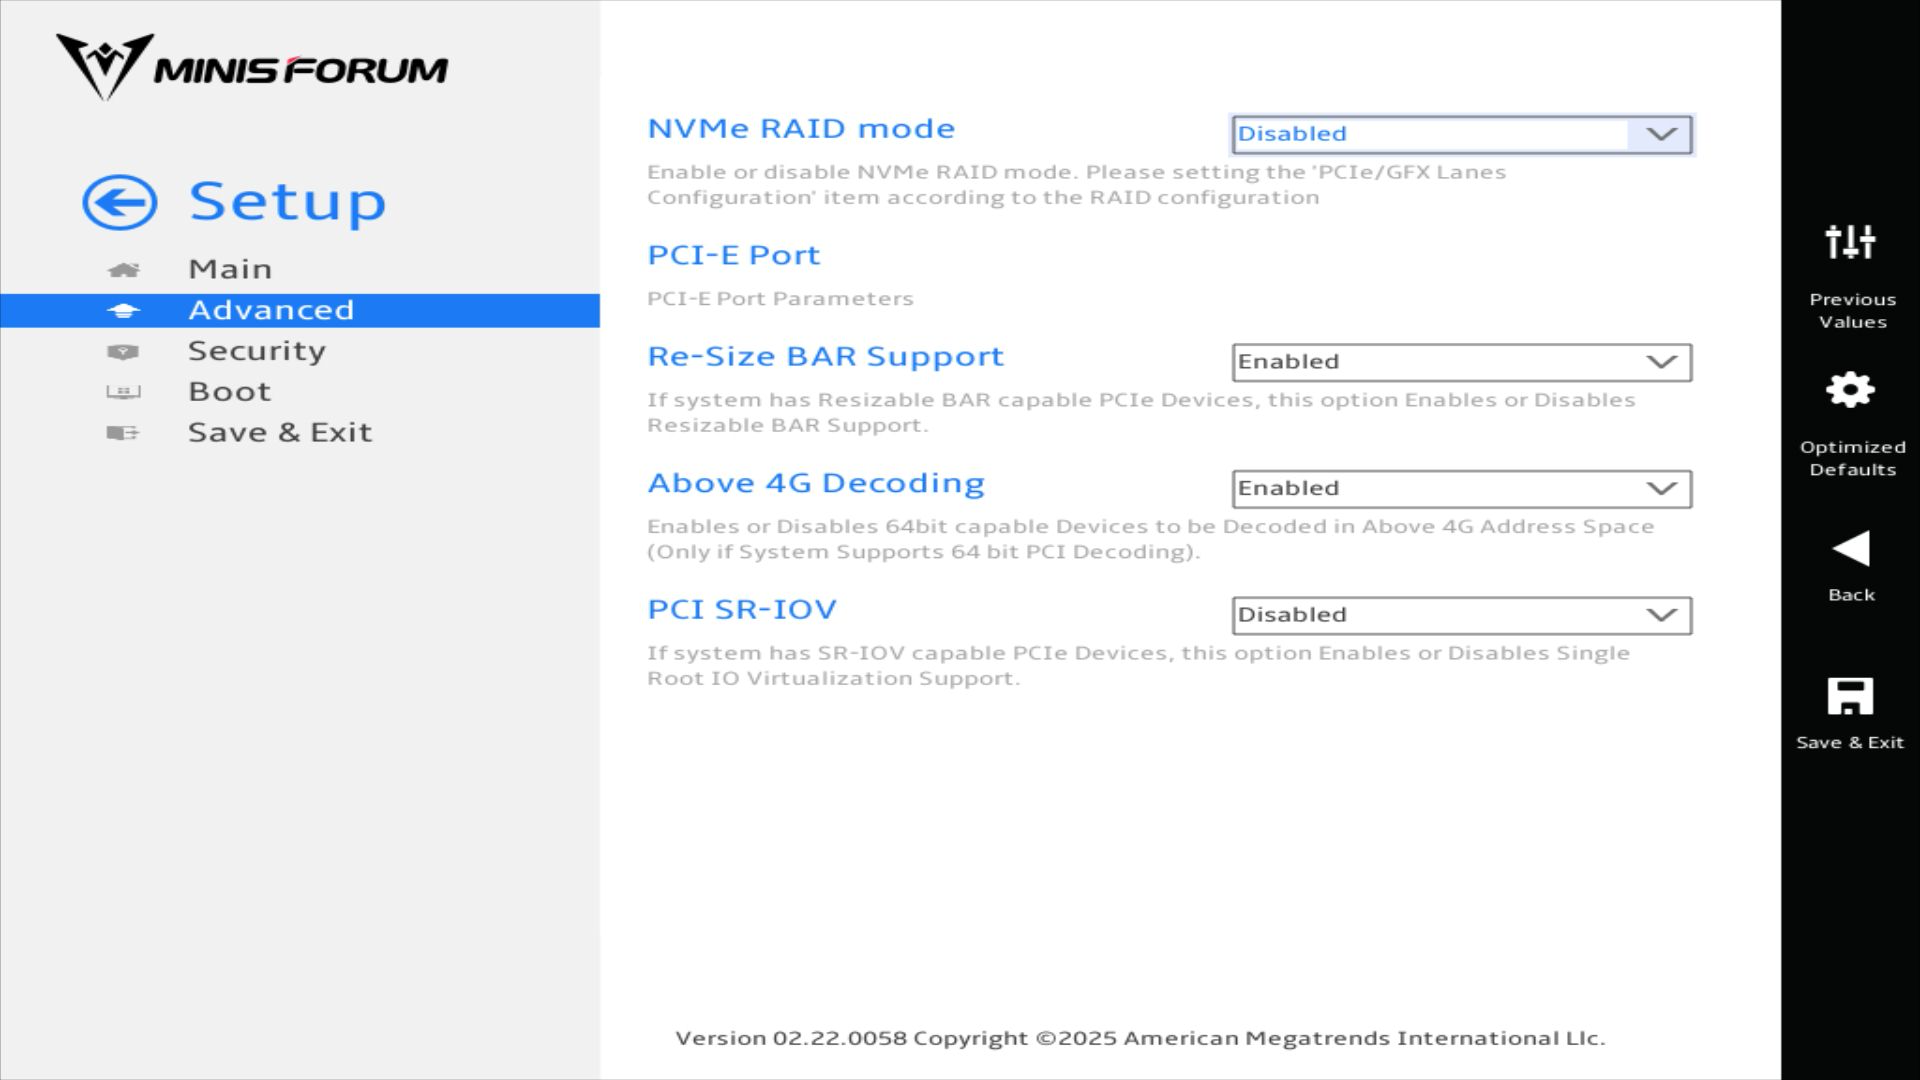
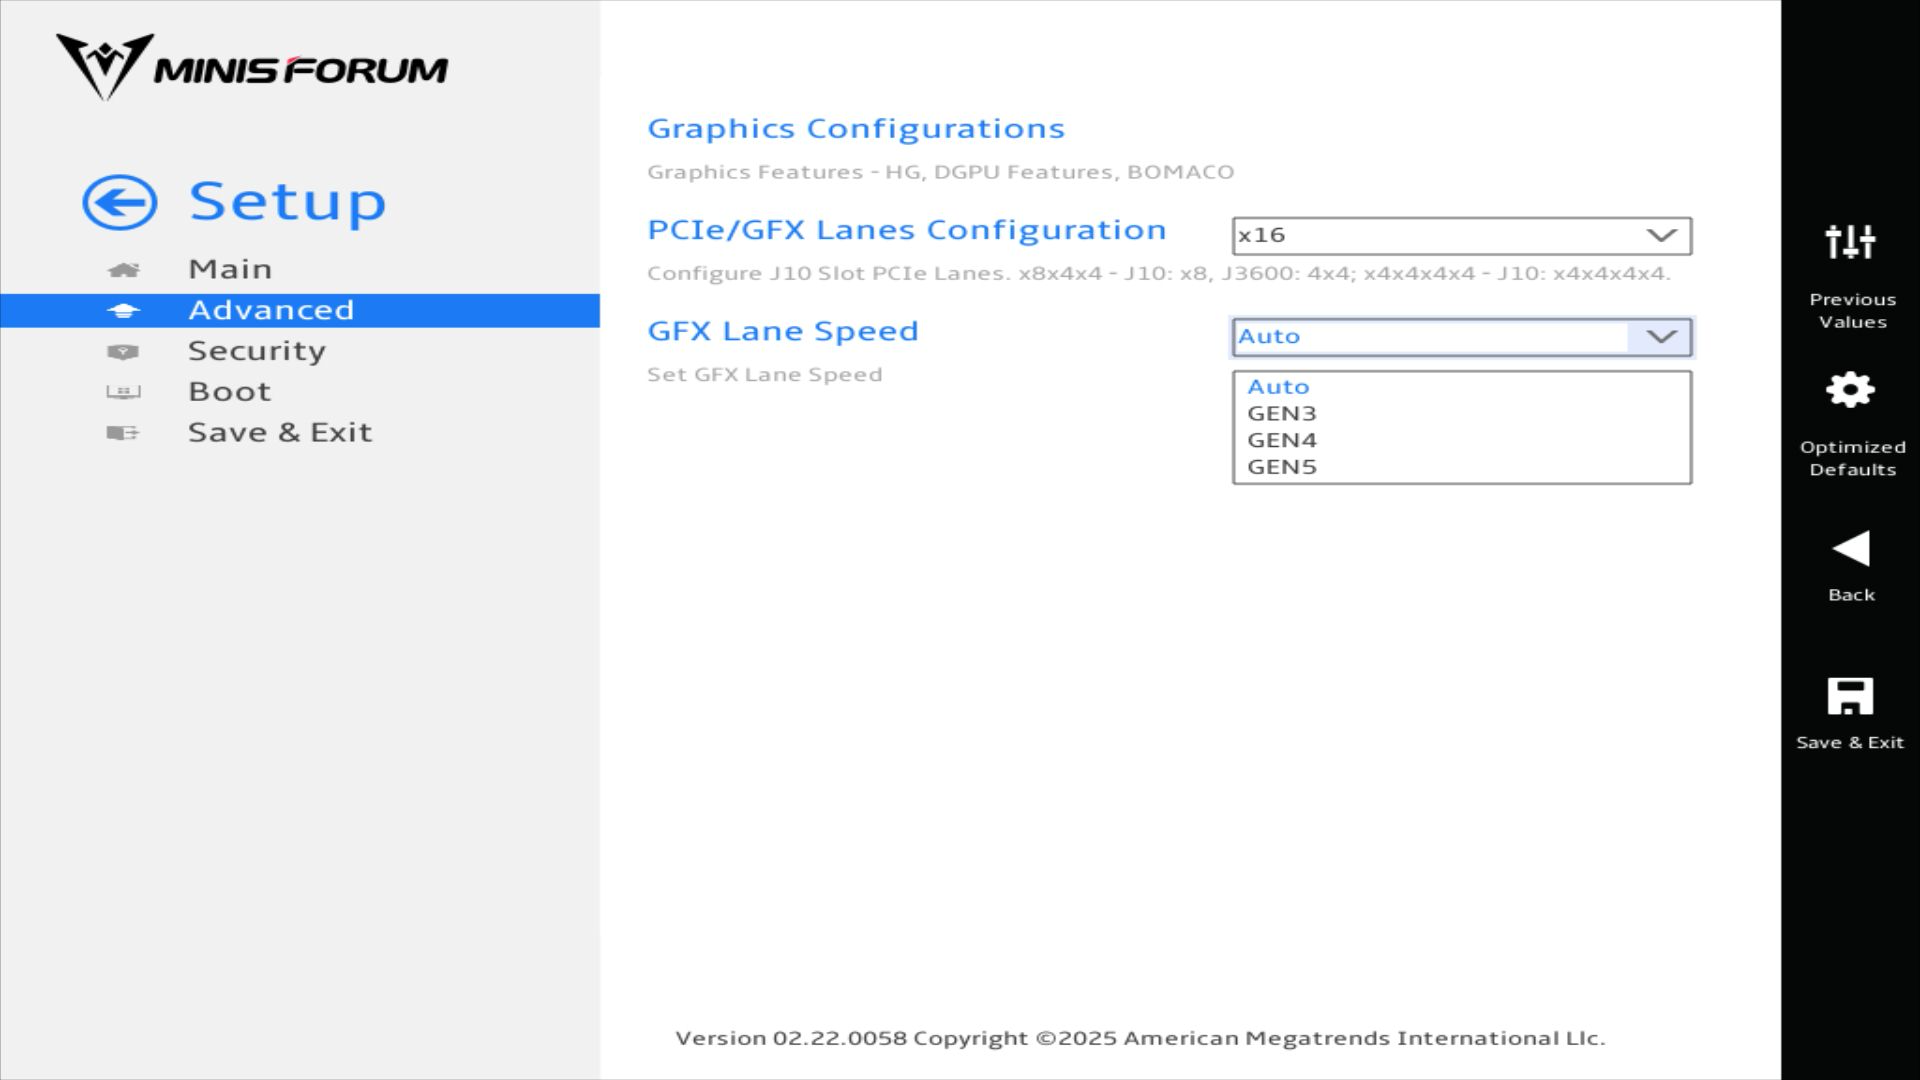
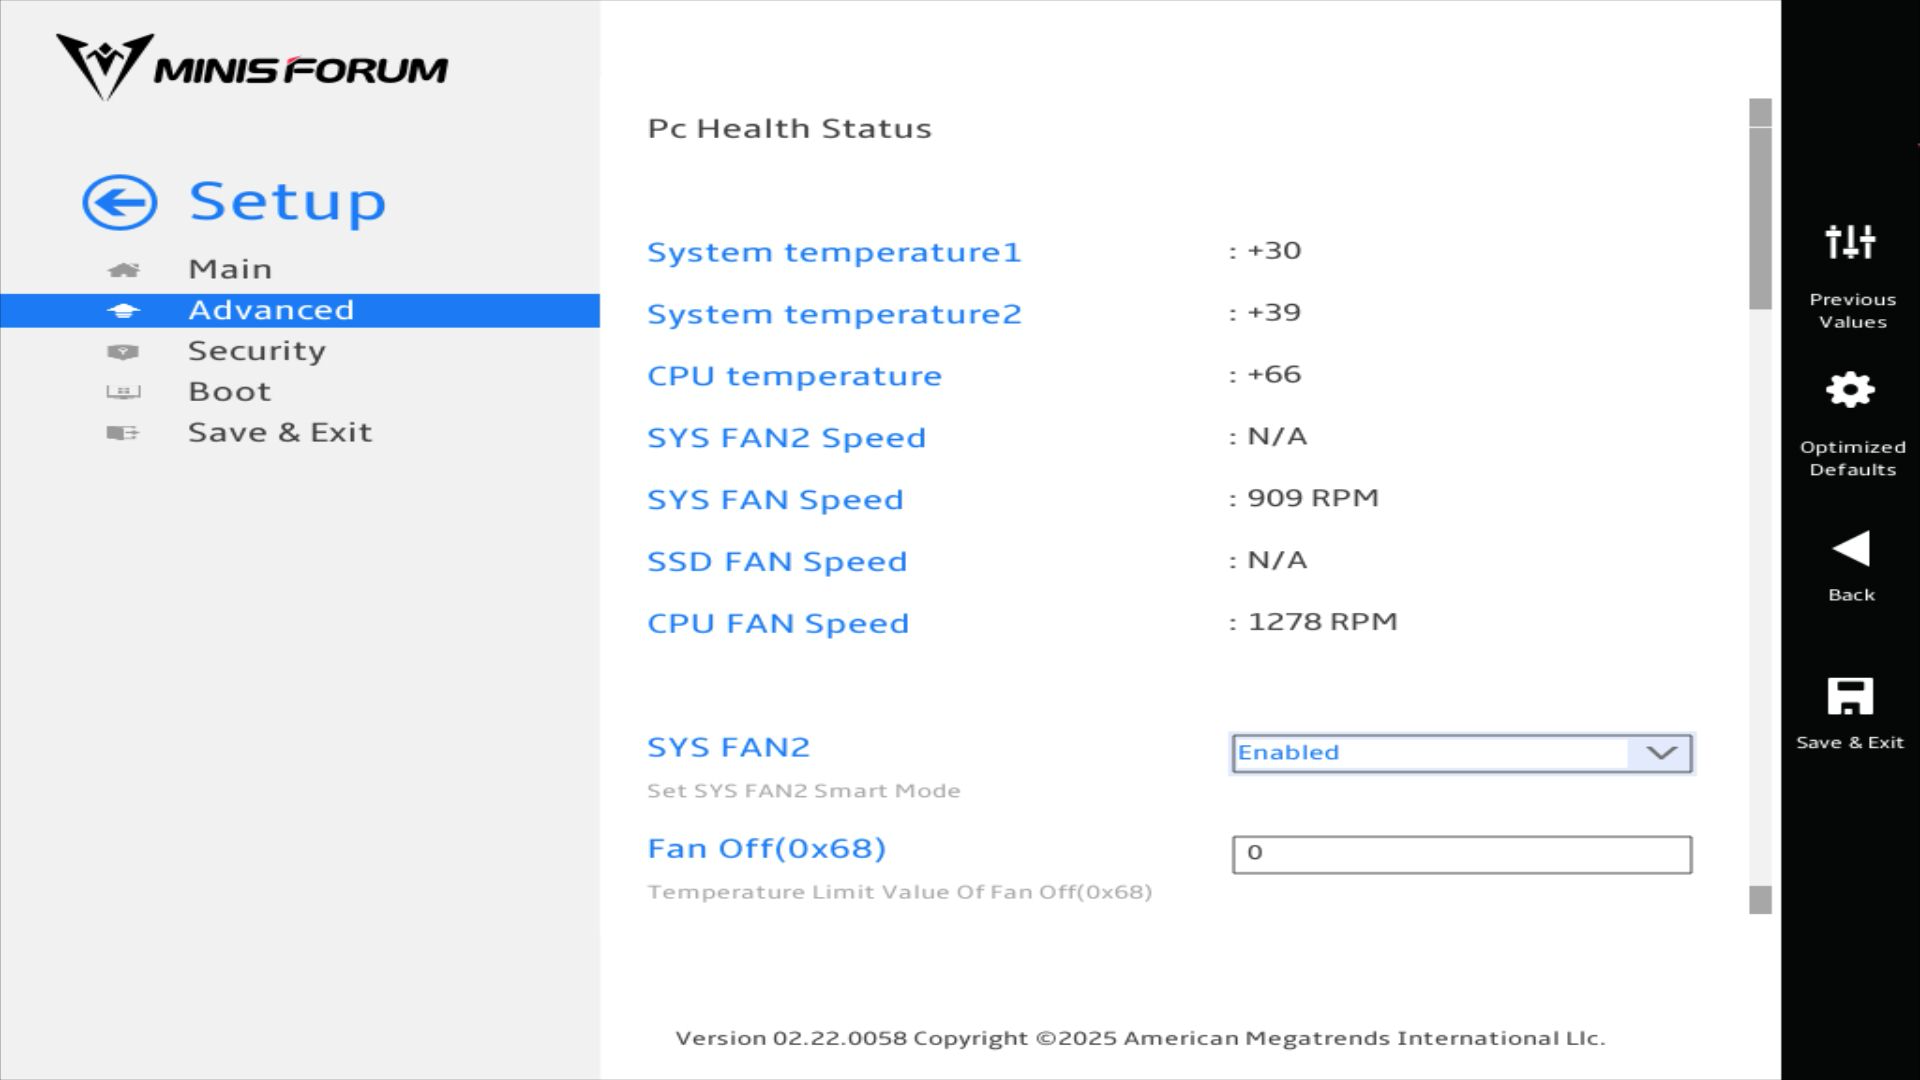
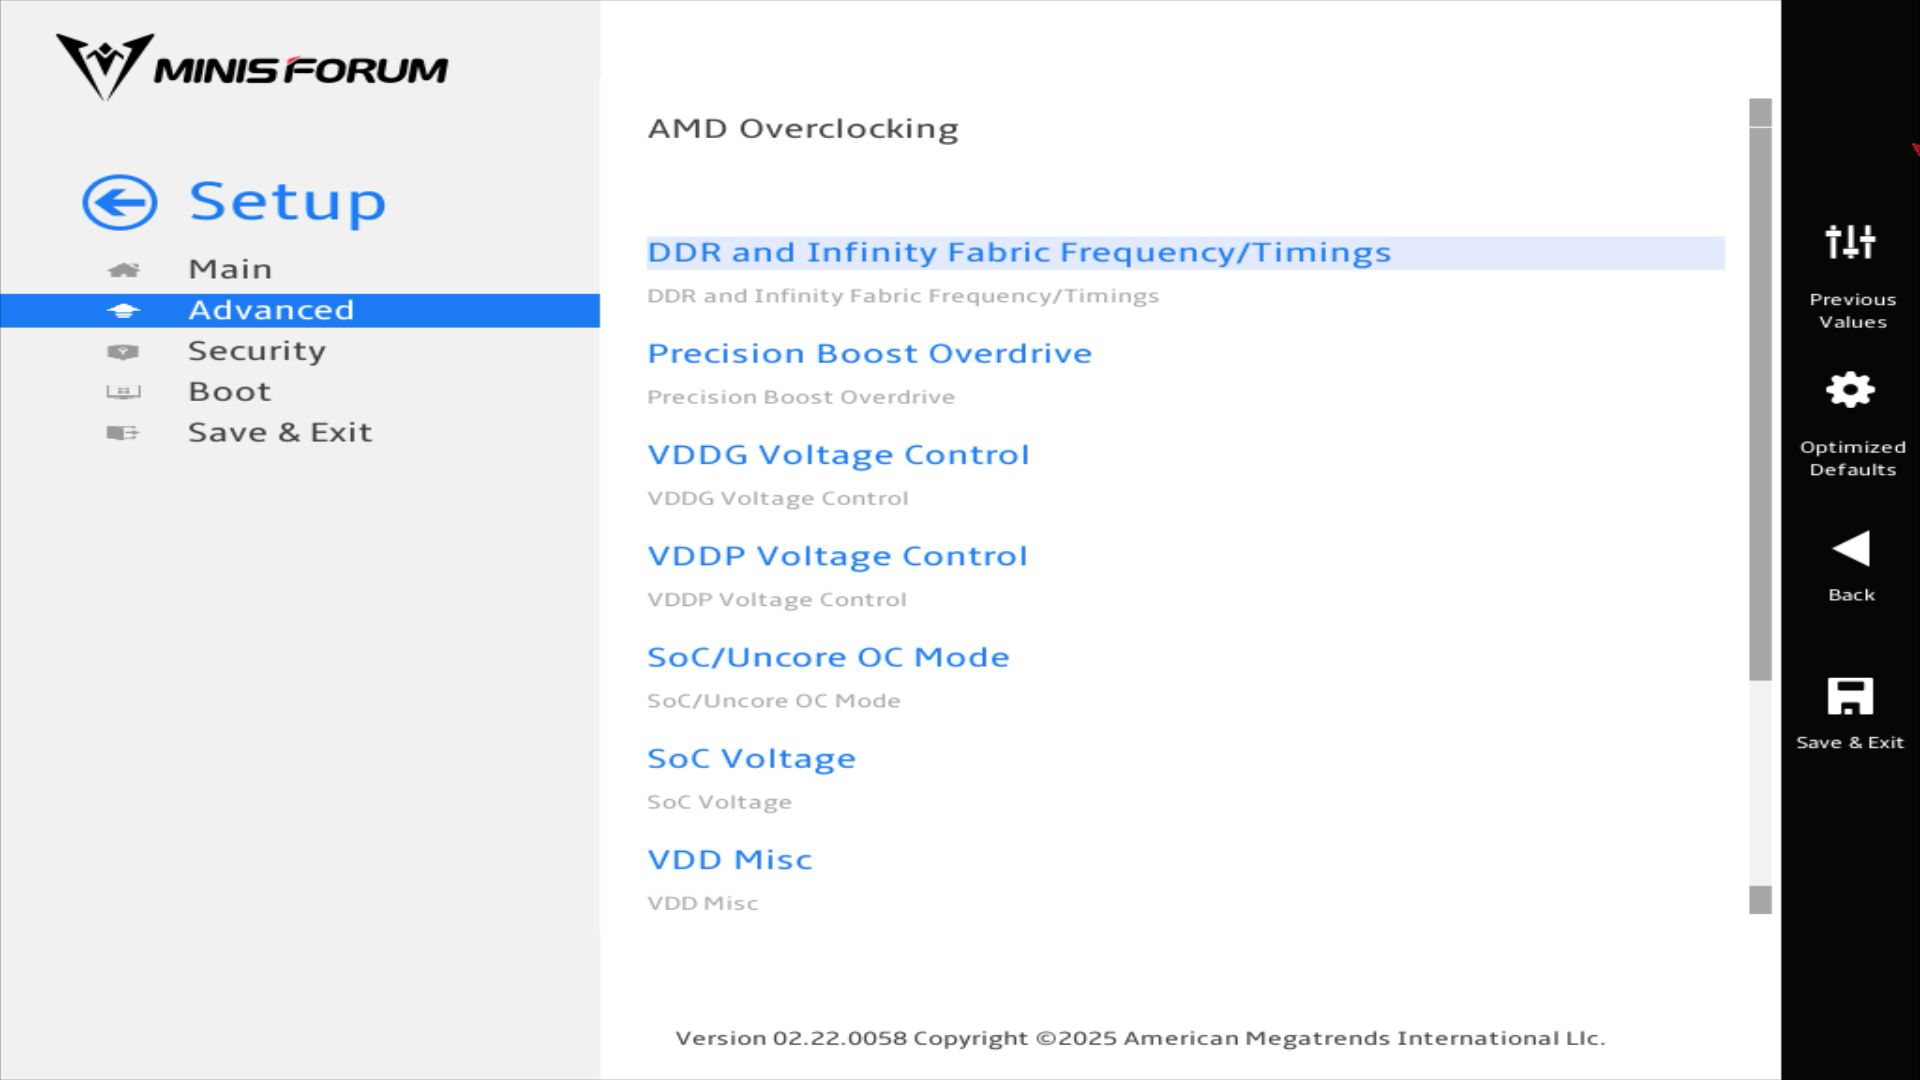
Options UEFI
* ... Moindre est la valeur, meilleures sont les performances
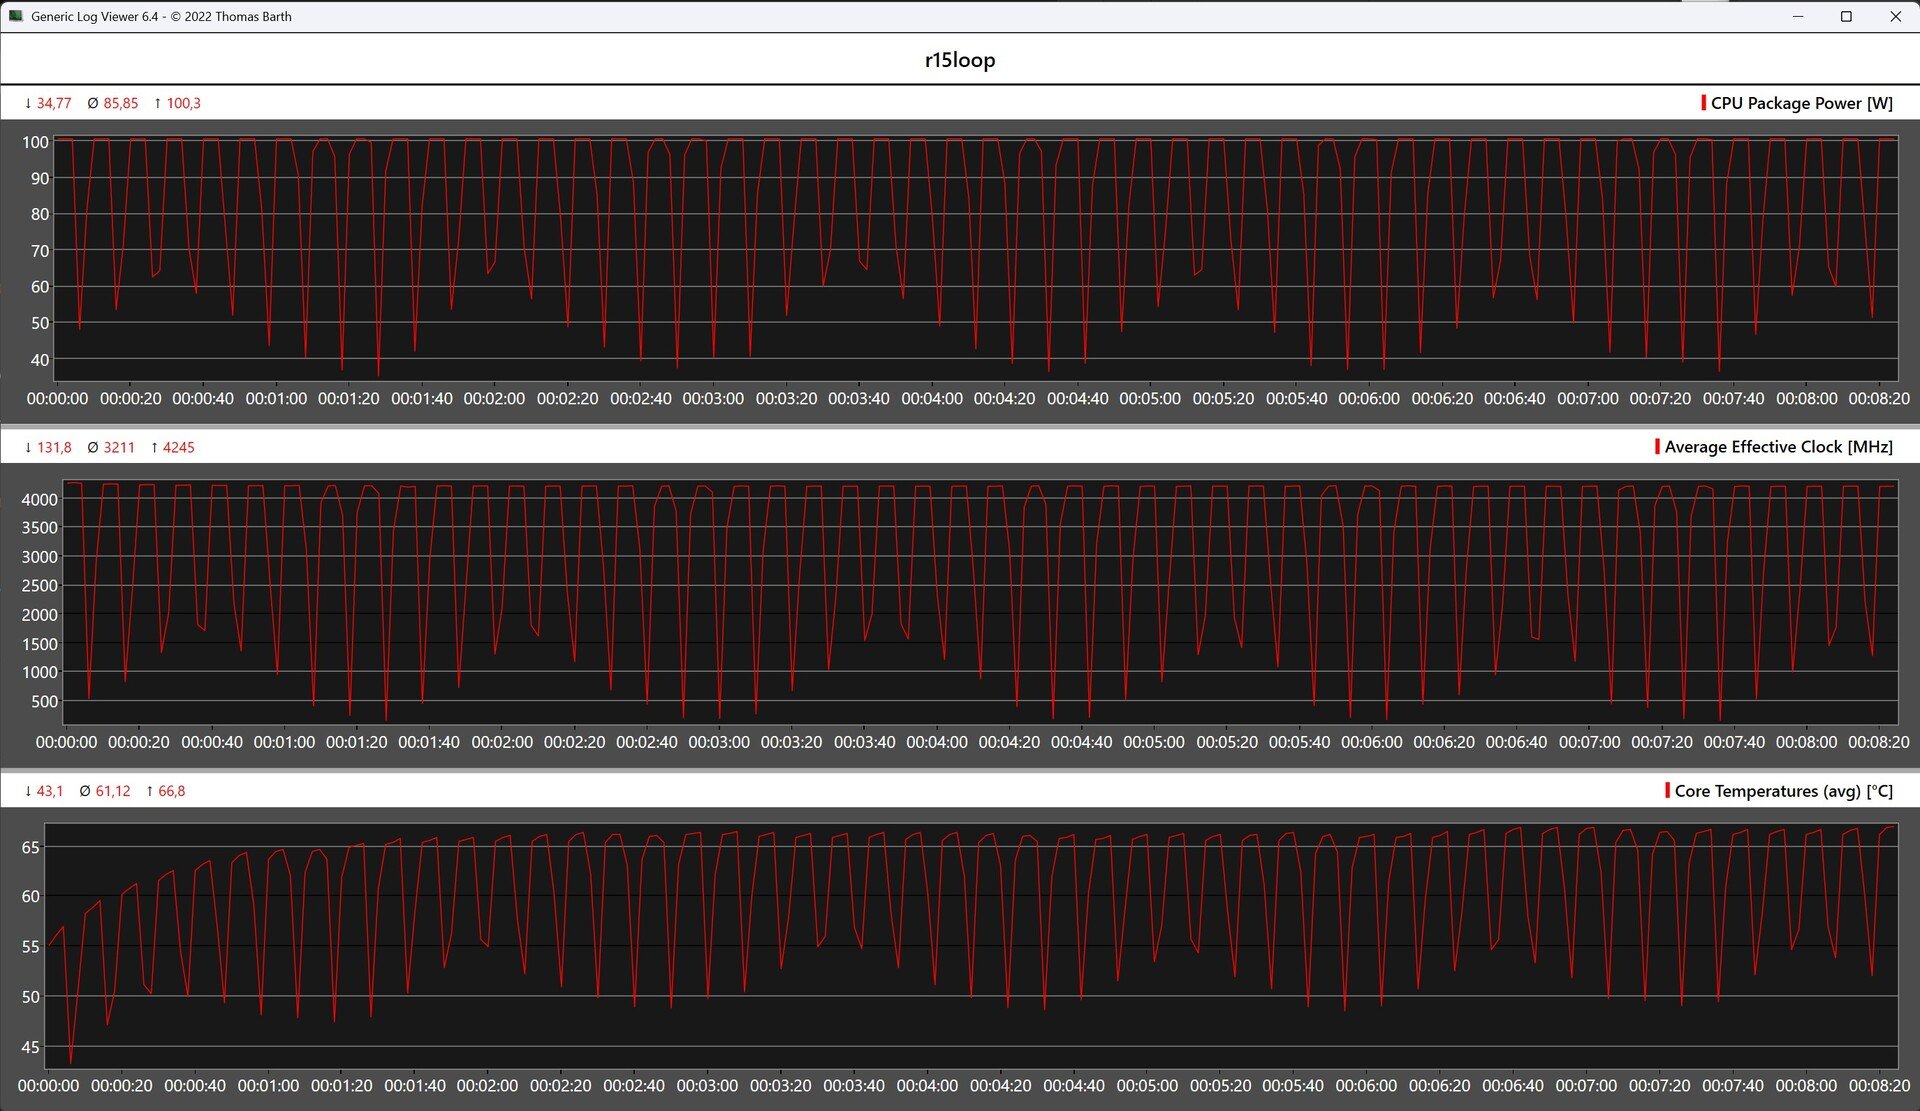
Résultats Cinebench AMD Ryzen 9 7945HX
Associé à son AMD Ryzen 9 7945HX, le Minisforum BD795i SE a maîtrisé la boucle continue Cinebench R15 sans aucun problème. Les performances du processeur 16 cœurs sont restées stables sur 50 exécutions, sans aucune baisse de régime en charge continue. Le refroidisseur installé en usine, combiné au ventilateur de 120 millimètres de Noctua, a assuré un refroidissement efficace.
Performance du système
Lors des benchmarks de performance système, notre système de test avec le Minisforum BD795i SE n'a pas pu suivre la concurrence tout le temps, mais est resté à un niveau élevé dans l'ensemble. L'efficace AMD Ryzen 9 7945HX ne montre aucune faiblesse lors de l'utilisation quotidienne, et grâce à son SSD NVMe rapide et à sa RAM DDR5, il peut même prendre en charge des tâches exigeantes sans aucun problème.
* ... Moindre est la valeur, meilleures sont les performances
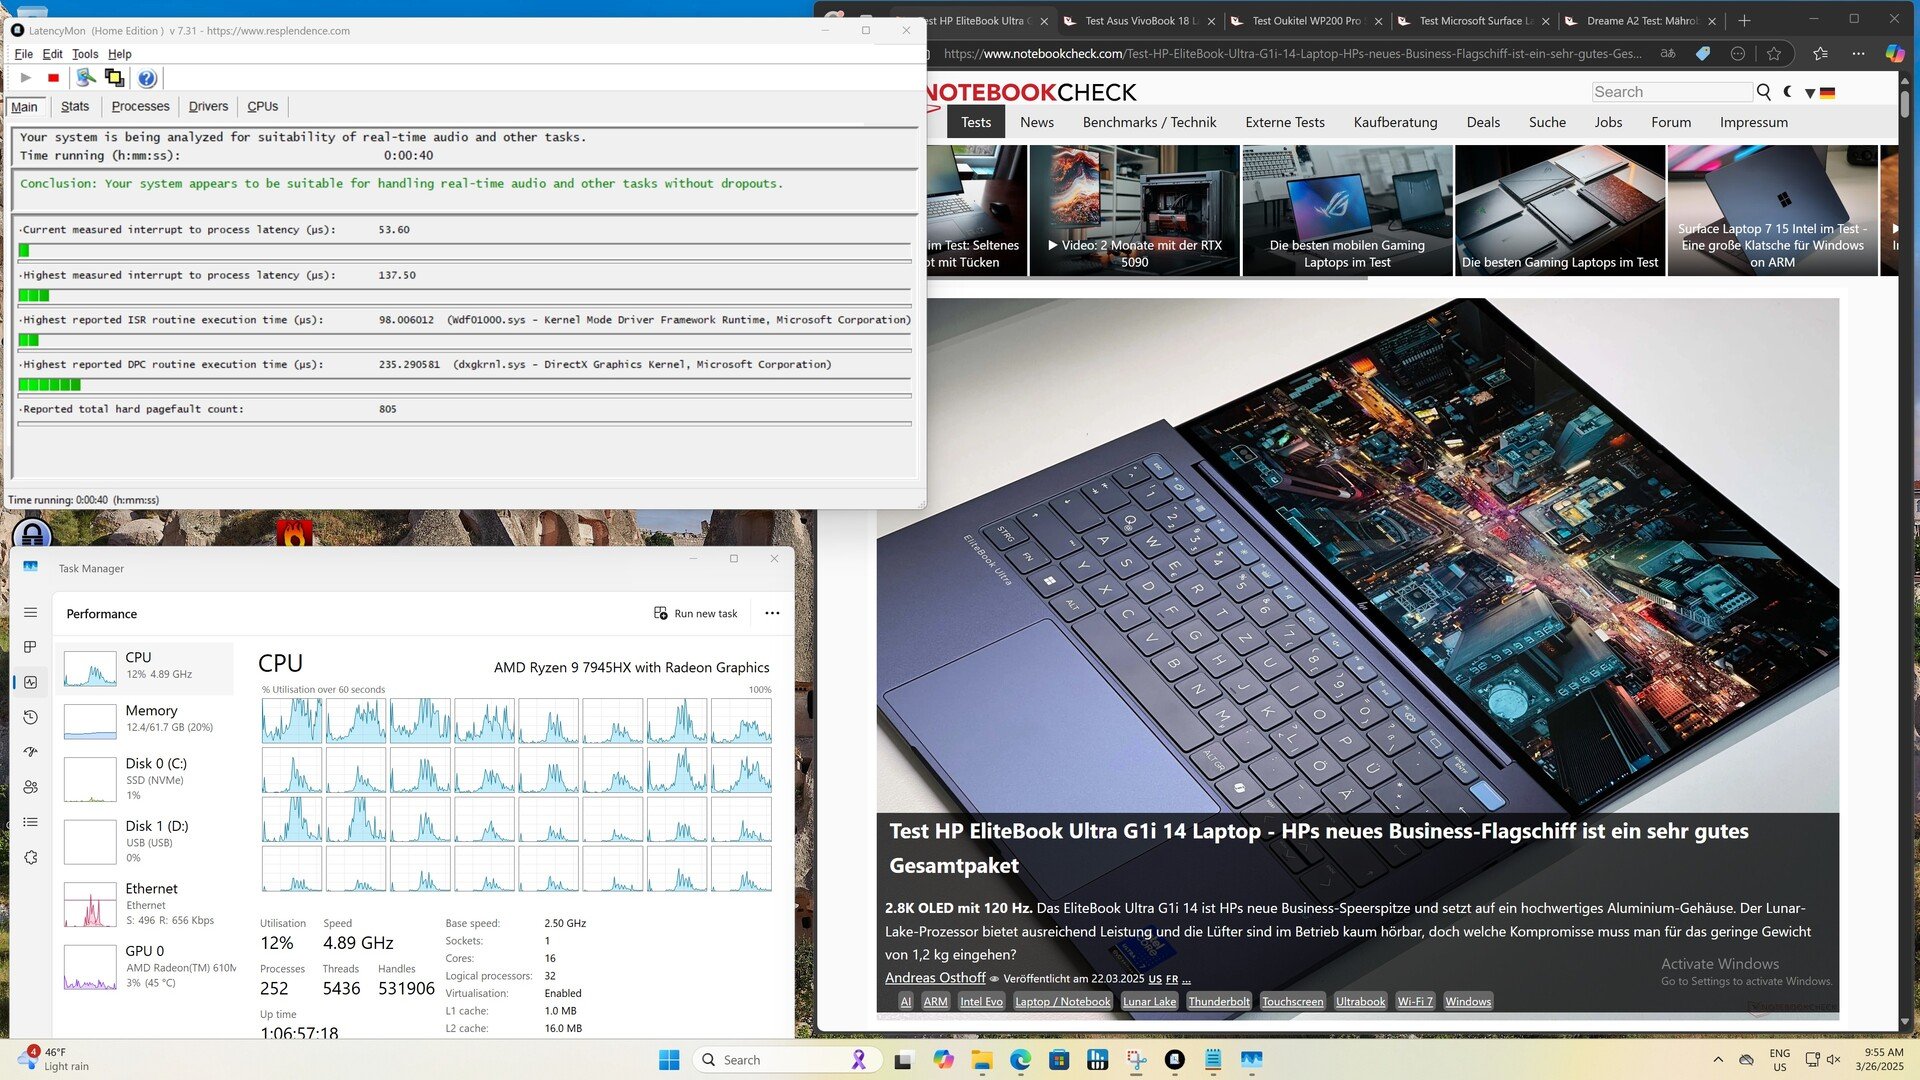
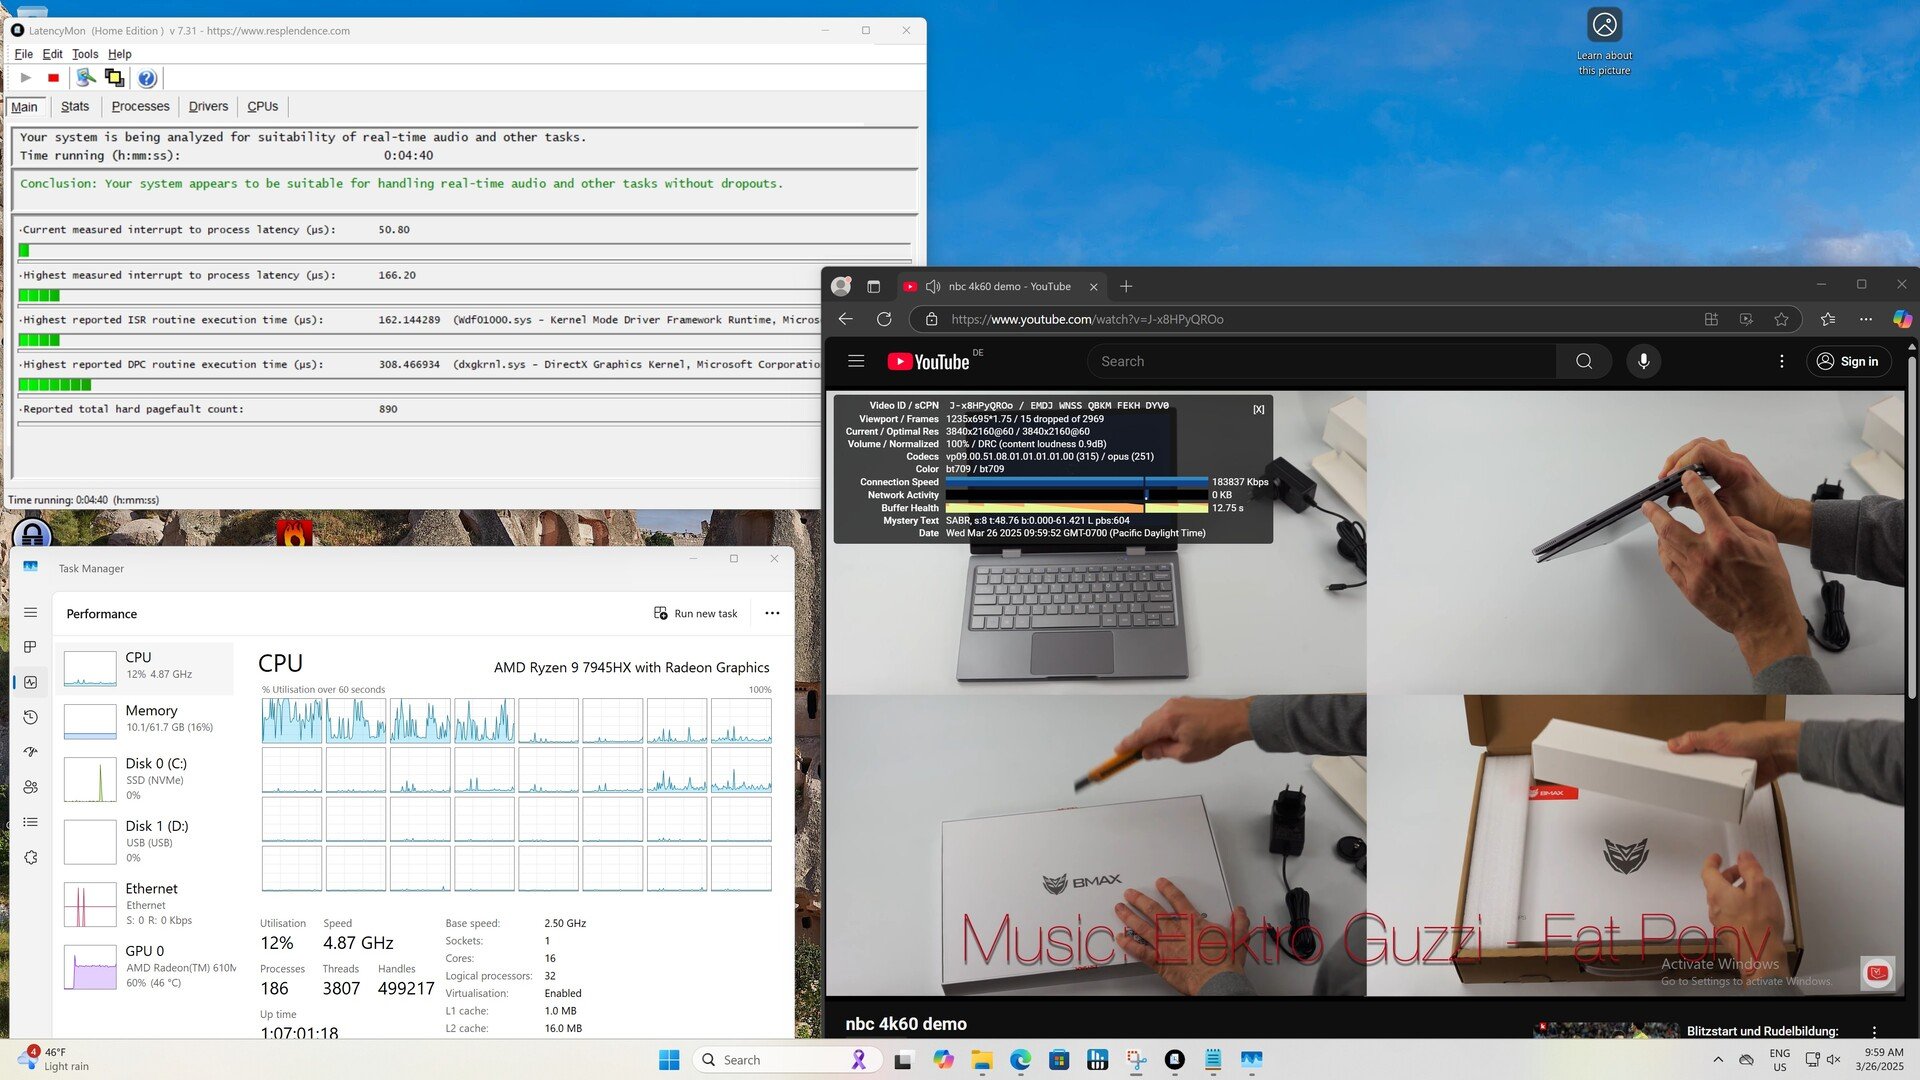
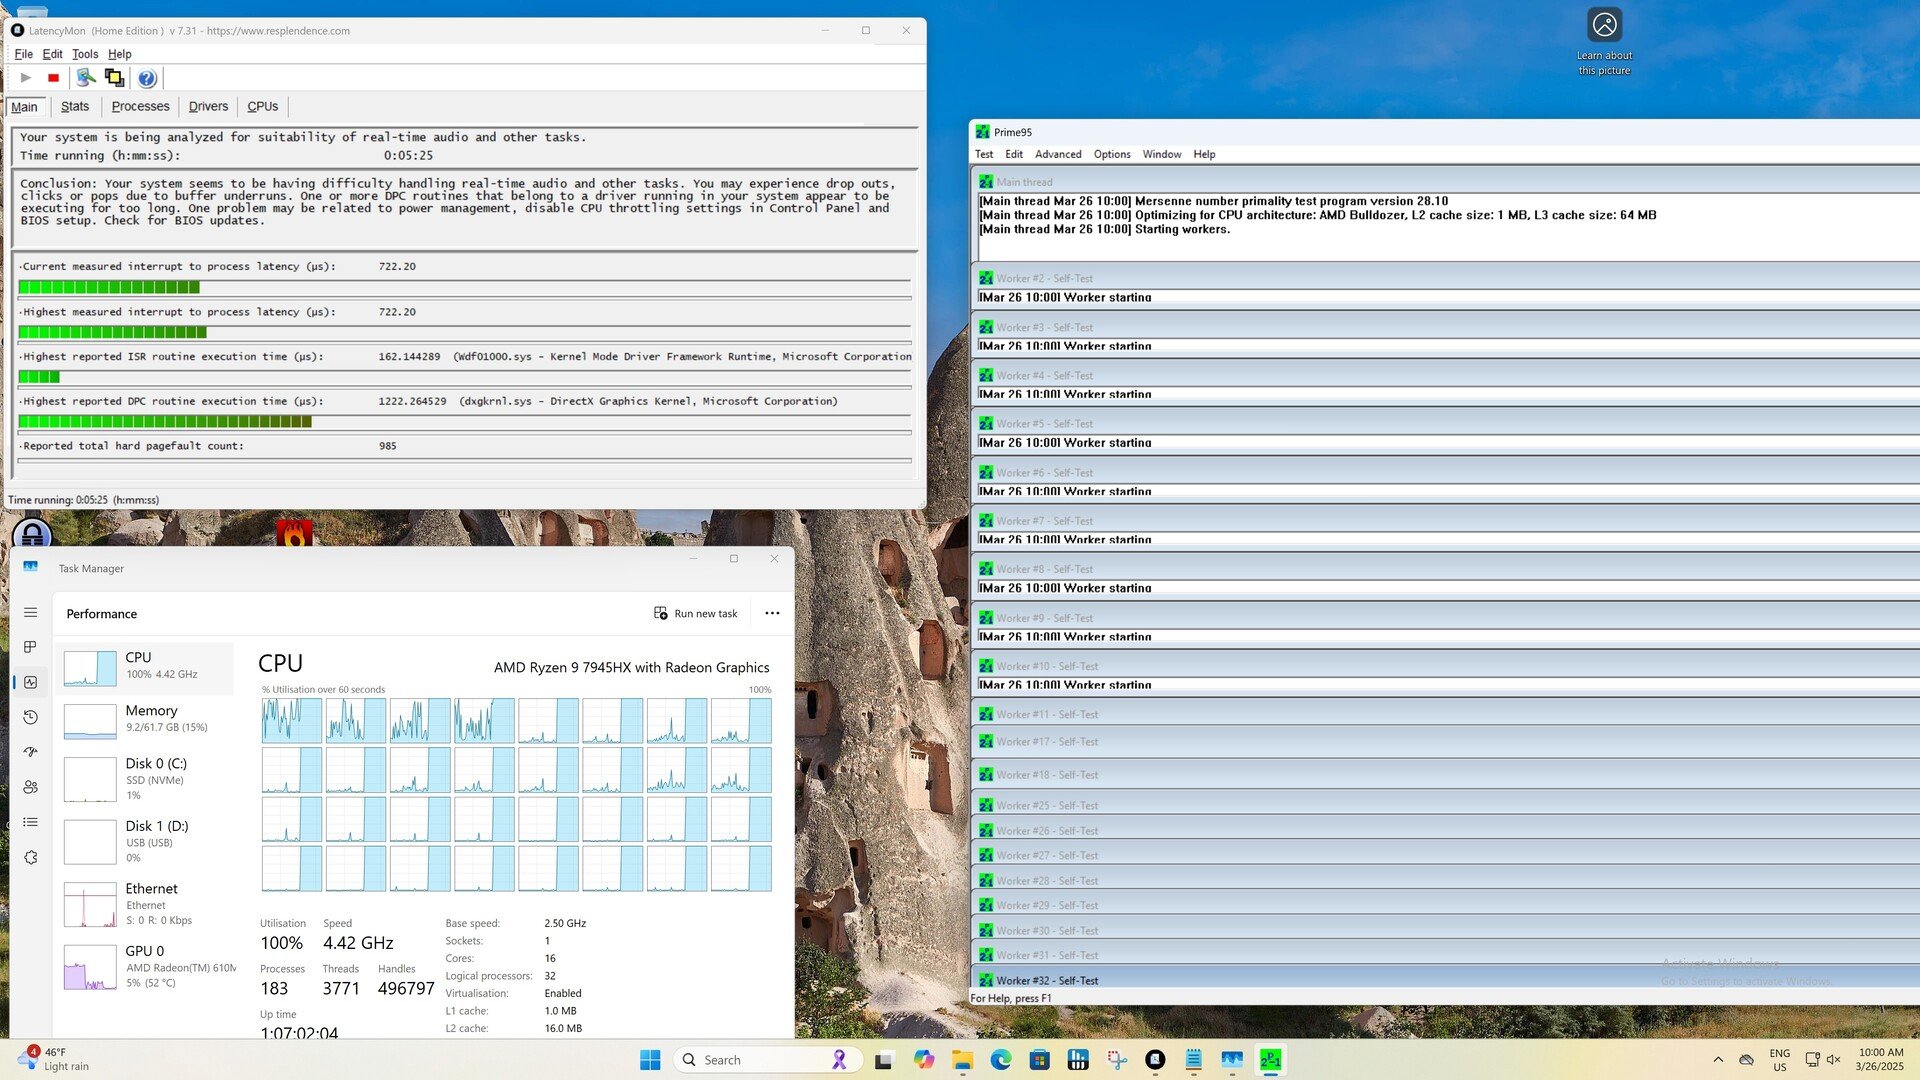
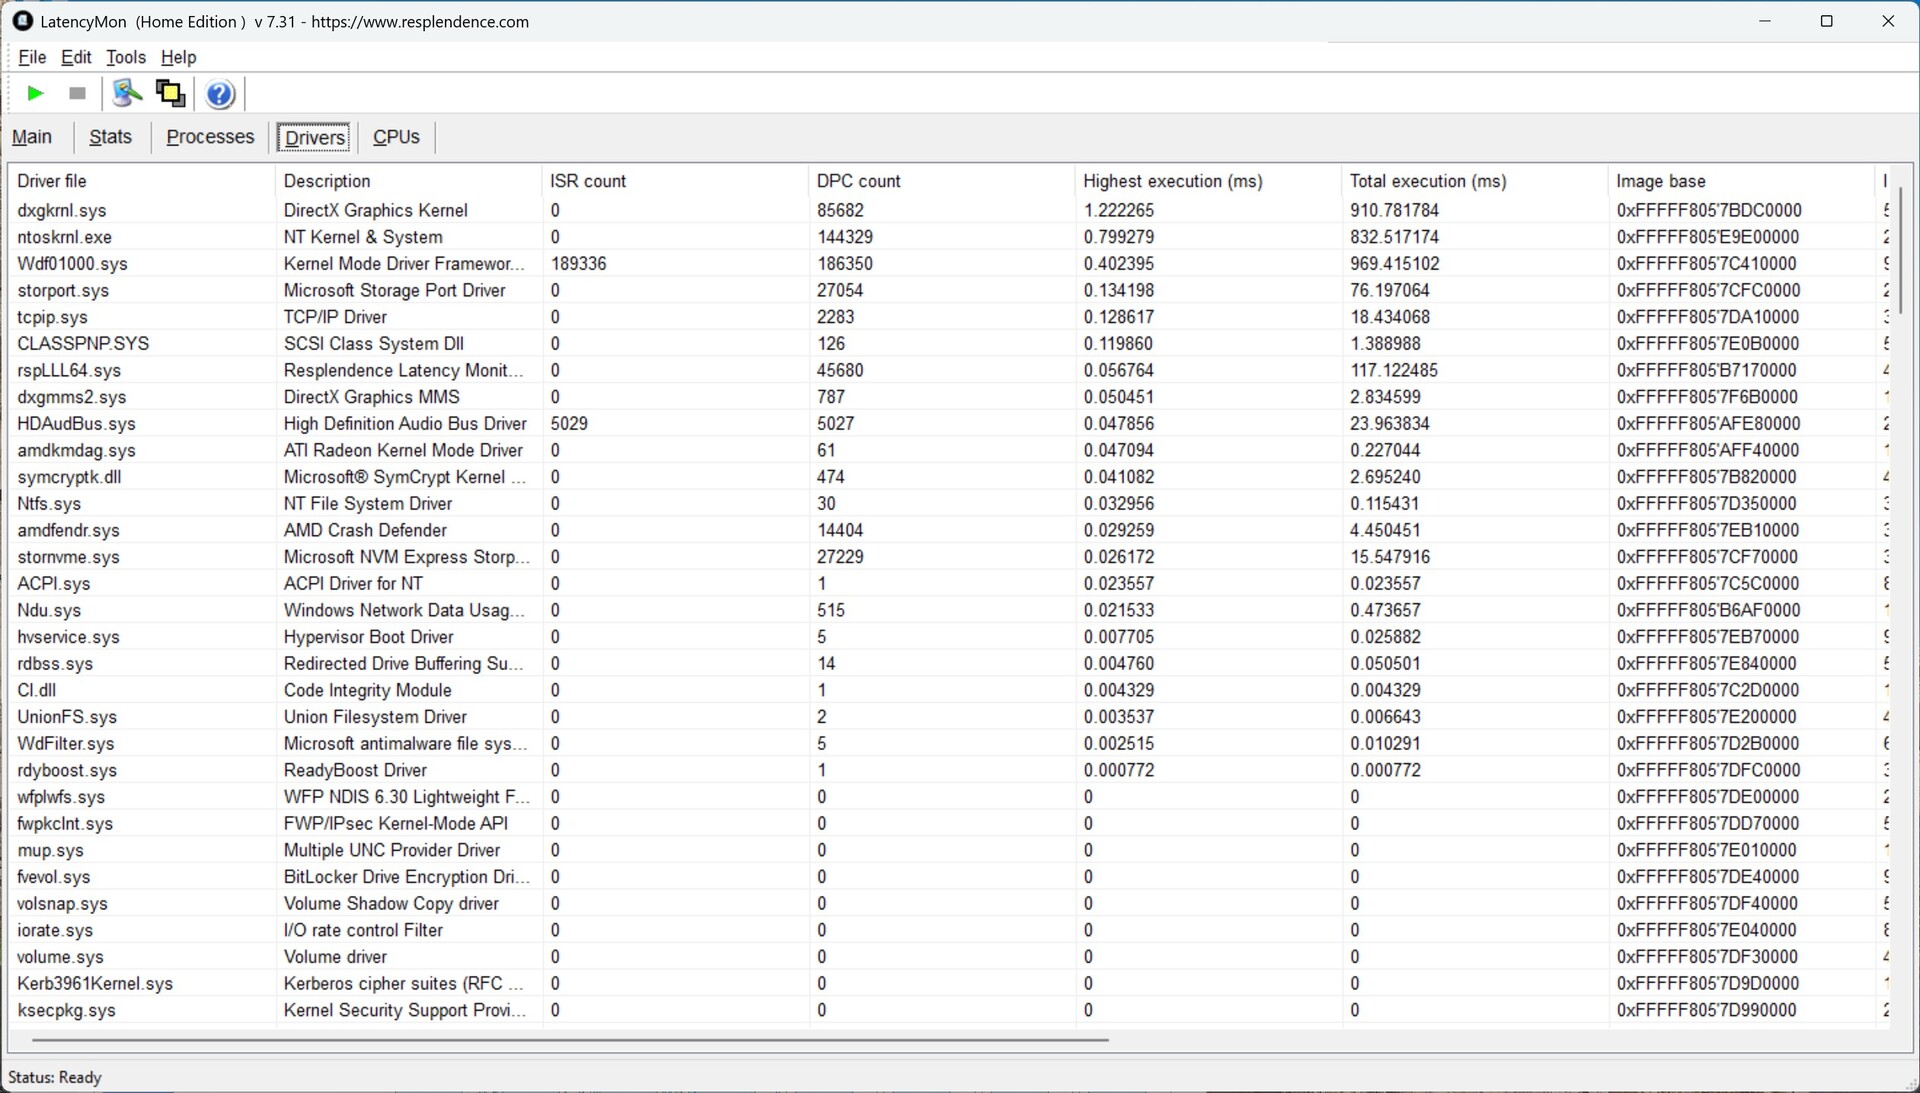
Latences DPC
Notre système de test avec le Minisforum BD795i SE a révélé des latences modérées. Tout s'est déroulé sans problème lors de la navigation sur le web et de la lecture d'une vidéo de test 4K, tandis que les latences n'ont fait qu'augmenter lors de l'exécution de Prime95.
| DPC Latencies / LatencyMon - interrupt to process latency (max), Web, Youtube, Prime95 | |
| Minisforum BD790i | |
| Minisforum BD795i SE | |
| Minisforum EliteMini UM780 XTX | |
| Minisforum Venus Series UM790 Pro | |
| Minisforum BD770i | |
* ... Moindre est la valeur, meilleures sont les performances
Dispositif de stockage
Minisforum ne fournit que la carte mère BD795 SE, de sorte que les composants manquants tels que la RAM, le SSD, le bloc d'alimentation et le ventilateur du processeur doivent être ajoutés par vous-même. Nous avons choisi le Kingston KC3000 (2 TB, PCIe 4.0 x4), qui ne peut pas utiliser pleinement le potentiel de la carte avec ses deux slots PCIe 5.0. Les deux emplacements M.2 sont situés sur le dessus et sont alimentés en air frais par le ventilateur du processeur. Les disques durs SSD avec un refroidisseur préinstallé en usine (hauteur maximale d'environ 27 millimètres) peuvent également être installés.

Reading continuous performance: DiskSpd Read Loop, Queue Depth 8
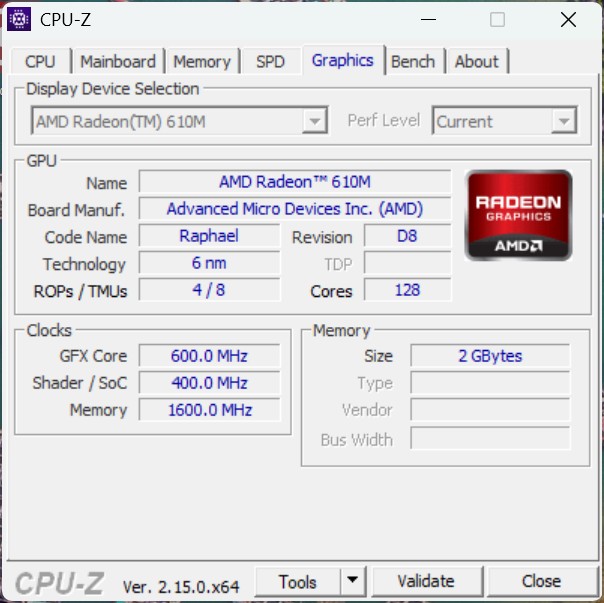
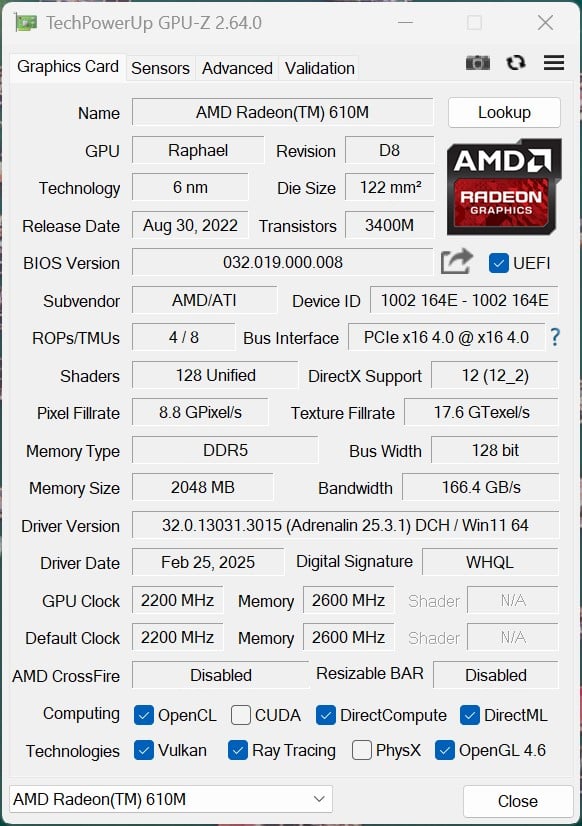
Carte graphique - L'AMD Radeon 610M comme iGPU
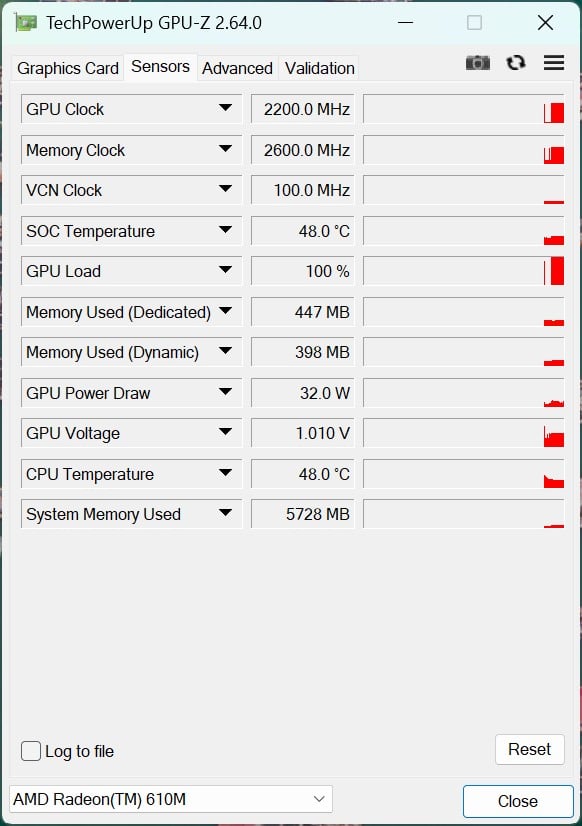
Le AMD Ryzen 9 7945HX dispose d'un iGPU RDNA2 simple avec 2 CU et 128 unités de shaders, à savoir la AMD Radeon 610M. Elle n'offre pas de meilleures performances 3D que l'iGPU de la Ryzen 7 7745HX, ce qui signifie que les résultats sont presque identiques. Elle s'est avérée nettement inférieure à la AMD Radeon 780M et ne convient qu'à la production d'images simples.
| Unigine Valley 1.0 | |
| 1920x1080 Extreme HD DirectX AA:x8 | |
| Minisforum EliteMini UM780 XTX | |
| Minisforum Venus Series UM790 Pro | |
| Minisforum Mars Series MC560 | |
| NiPoGi AD08 | |
| Minisforum BD770i | |
| Moyenne AMD Radeon 610M (9.8 - 10, n=3) | |
| Minisforum BD795i SE | |
| Acemagic AD15 | |
| 1920x1080 Extreme HD Preset OpenGL AA:x8 | |
| Minisforum EliteMini UM780 XTX | |
| Minisforum Venus Series UM790 Pro | |
| NiPoGi AD08 | |
| Minisforum Mars Series MC560 | |
| Acemagic AD15 | |
| Minisforum BD770i | |
| Moyenne AMD Radeon 610M (9.1 - 9.6, n=3) | |
| Minisforum BD795i SE | |
| Affinity Photo 2 - Combined (Single / Multi GPU) | |
| NiPoGi AD08 | |
| Moyenne AMD Radeon 610M (889 - 5750, n=3) | |
| Acemagic AD15 | |
| Minisforum EliteMini UM780 XTX | |
| Minisforum Mars Series MC560 | |
| Minisforum Venus Series UM790 Pro | |
| Minisforum BD795i SE | |
| Minisforum BD770i | |
| 3DMark 06 Standard Score | 20555 points | |
| 3DMark Vantage P Result | 12092 points | |
| 3DMark 11 Performance | 3873 points | |
| 3DMark Ice Storm Standard Score | 41556 points | |
| 3DMark Cloud Gate Standard Score | 14629 points | |
| 3DMark Fire Strike Score | 2156 points | |
| 3DMark Fire Strike Extreme Score | 530 points | |
| 3DMark Time Spy Score | 740 points | |
Aide | ||
| Bas | Moyen | Élevé | Ultra | |
|---|---|---|---|---|
| The Witcher 3 (2015) | 39.3 | 23.6 | 12.8 | |
| Dota 2 Reborn (2015) | 195.8 | 76.9 | 34.9 | 31.3 |
| Final Fantasy XV Benchmark (2018) | 23.4 | 10.9 | 7.05 | |
| X-Plane 11.11 (2018) | 37.1 | 23.7 | 19.5 | |
| Baldur's Gate 3 (2023) | 9.31 | 7.03 |
Le Minisforum BD795i SE avec la Nvidia GeForce RTX 4090
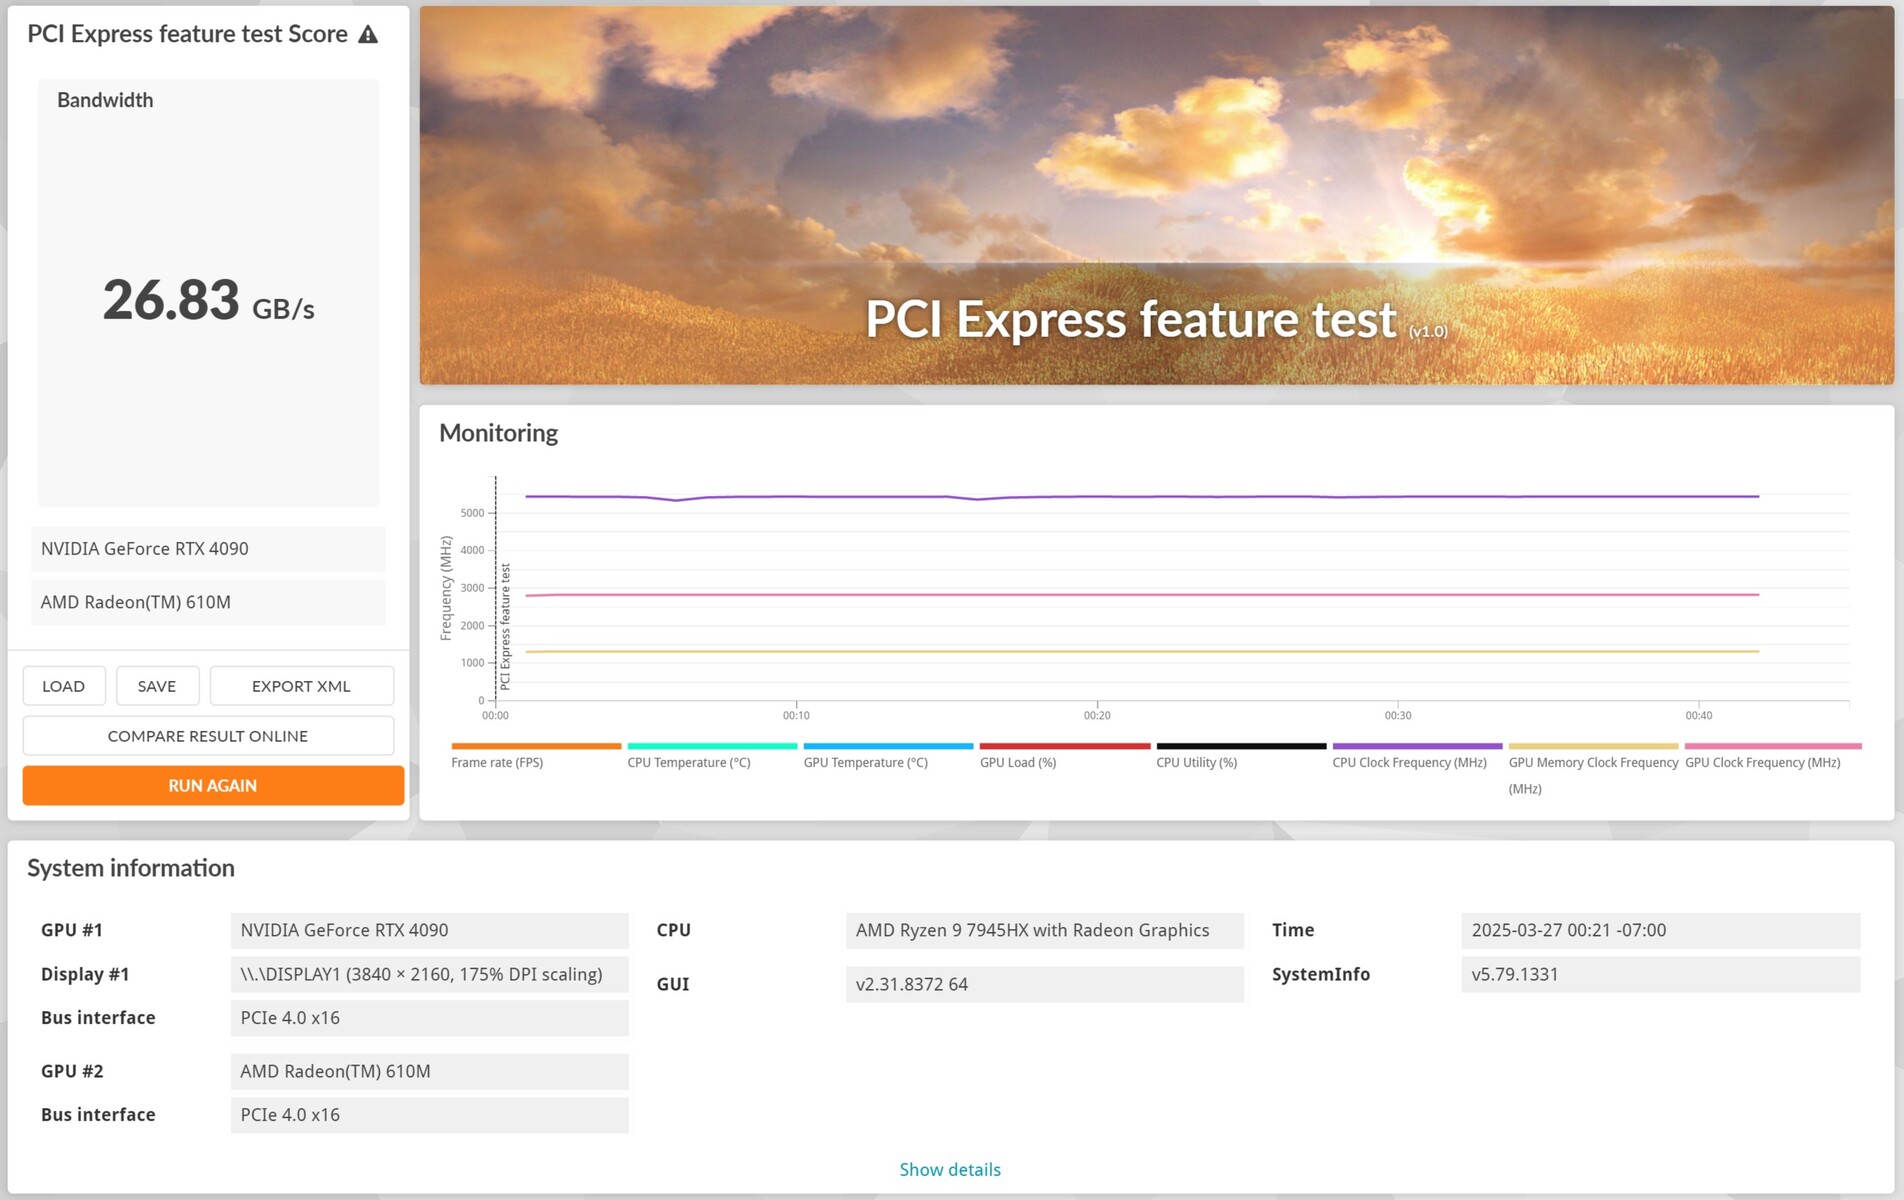
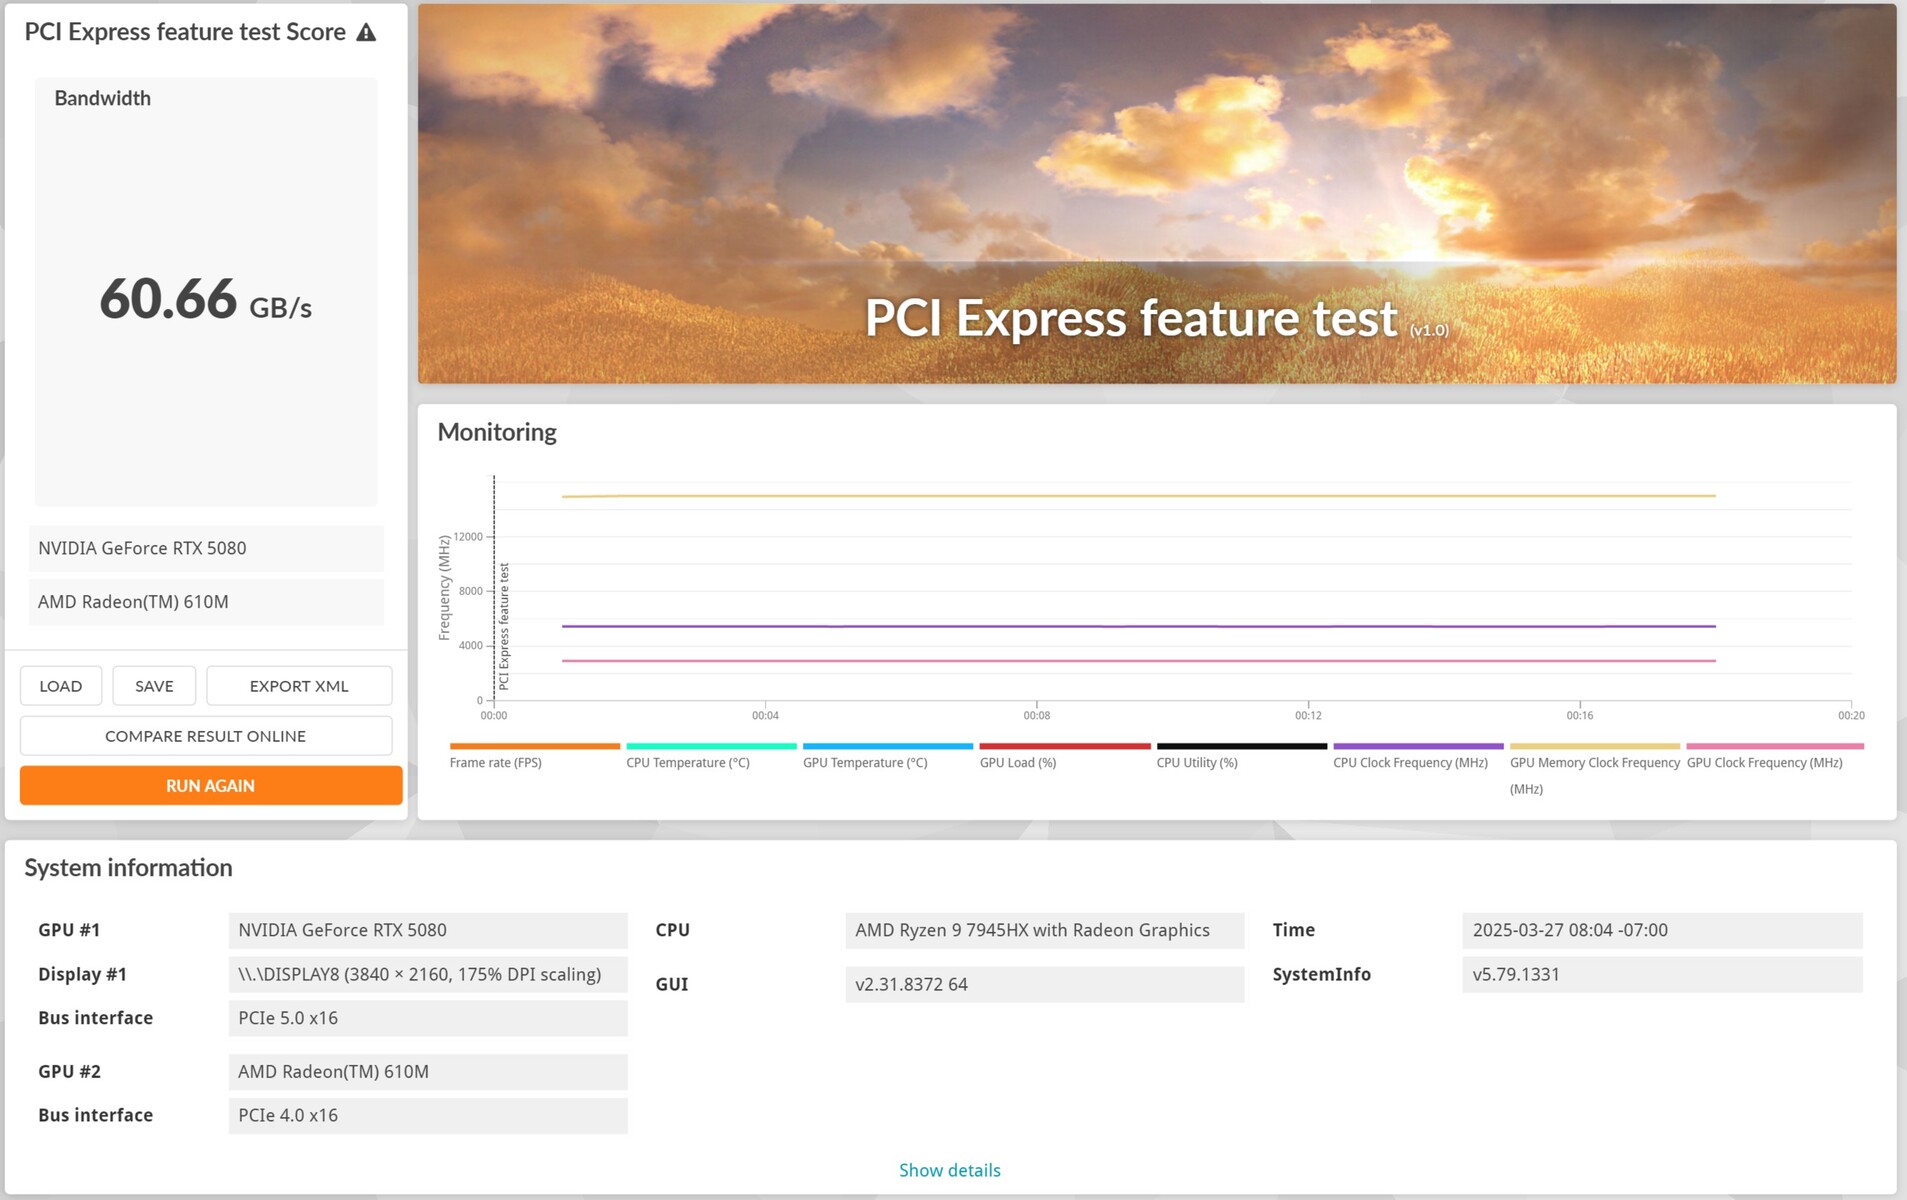
Lors de notre test, le Minisforum BD795i SE a délivré des performances impressionnantes en combinaison avec la carte Nvidia RTX 4090 Nvidia GeForce RTX 4090. Grâce à son emplacement PCIe 5.0 x16 complet, la carte graphique a pu libérer tout son potentiel. Lors de l'exécution de jeux courants, le système a géré des taux d'images par seconde élevés et s'est affiché de manière fluide en 4K avec un maximum de détails. Le test de bande passante en conjonction avec une carte Nvidia GeForce RTX 5080 a confirmé la pleine utilisation de l'interface PCIe 5.0 x16.
Performance comparison at CPU limit at 720p / 1,080p
| Performance Rating - Percent | |
| AMD Ryzen 7 9800X3D | |
| Intel Core Ultra 9 285K | |
| Intel Core Ultra 5 245K | |
| Minisforum BD795i SE, RTX 4090 | |
| Minisforum UM890 Pro (Nvidia GeForce RTX 4090 @OCuLink) | |
| 3DMark 11 - 1280x720 Performance GPU | |
| AMD Ryzen 7 9800X3D | |
| Intel Core Ultra 5 245K | |
| Minisforum UM890 Pro (Nvidia GeForce RTX 4090 @OCuLink) | |
| Intel Core Ultra 9 285K | |
| Minisforum BD795i SE, RTX 4090 | |
| 3DMark | |
| 2560x1440 Time Spy Graphics | |
| AMD Ryzen 7 9800X3D | |
| Intel Core Ultra 5 245K | |
| Intel Core Ultra 9 285K | |
| Minisforum UM890 Pro (Nvidia GeForce RTX 4090 @OCuLink) | |
| Minisforum BD795i SE, RTX 4090 | |
| 1920x1080 Fire Strike Graphics | |
| AMD Ryzen 7 9800X3D | |
| Intel Core Ultra 5 245K | |
| Minisforum UM890 Pro (Nvidia GeForce RTX 4090 @OCuLink) | |
| Minisforum BD795i SE, RTX 4090 | |
| Intel Core Ultra 9 285K | |
| 3840x2160 Fire Strike Ultra Graphics | |
| Minisforum BD795i SE, RTX 4090 | |
| Intel Core Ultra 5 245K | |
| AMD Ryzen 7 9800X3D | |
| Intel Core Ultra 9 285K | |
| Minisforum UM890 Pro (Nvidia GeForce RTX 4090 @OCuLink) | |
| Unigine Superposition | |
| 1280x720 720p Low | |
| AMD Ryzen 7 9800X3D | |
| Intel Core Ultra 9 285K | |
| Minisforum BD795i SE, RTX 4090 | |
| Intel Core Ultra 5 245K | |
| Minisforum UM890 Pro (Nvidia GeForce RTX 4090 @OCuLink) | |
| 1920x1080 1080p High | |
| AMD Ryzen 7 9800X3D | |
| Minisforum BD795i SE, RTX 4090 | |
| Intel Core Ultra 9 285K | |
| Intel Core Ultra 5 245K | |
| Minisforum UM890 Pro (Nvidia GeForce RTX 4090 @OCuLink) | |
| 1920x1080 1080p Extreme | |
| Intel Core Ultra 9 285K | |
| Minisforum BD795i SE, RTX 4090 | |
| AMD Ryzen 7 9800X3D | |
| Intel Core Ultra 5 245K | |
| Minisforum UM890 Pro (Nvidia GeForce RTX 4090 @OCuLink) | |
| 3840x2160 4k Optimized | |
| AMD Ryzen 7 9800X3D | |
| Intel Core Ultra 9 285K | |
| Minisforum BD795i SE, RTX 4090 | |
| Intel Core Ultra 5 245K | |
| Minisforum UM890 Pro (Nvidia GeForce RTX 4090 @OCuLink) | |
| 7680x4320 8k Optimized | |
| AMD Ryzen 7 9800X3D | |
| Intel Core Ultra 5 245K | |
| Intel Core Ultra 9 285K | |
| Minisforum BD795i SE, RTX 4090 | |
| Minisforum UM890 Pro (Nvidia GeForce RTX 4090 @OCuLink) | |
| Unigine Valley 1.0 | |
| 1920x1080 Extreme HD DirectX AA:x8 | |
| AMD Ryzen 7 9800X3D | |
| Intel Core Ultra 9 285K | |
| Minisforum BD795i SE, RTX 4090 | |
| Intel Core Ultra 5 245K | |
| Minisforum UM890 Pro (Nvidia GeForce RTX 4090 @OCuLink) | |
| 1920x1080 Extreme HD Preset OpenGL AA:x8 | |
| AMD Ryzen 7 9800X3D | |
| Intel Core Ultra 9 285K | |
| Intel Core Ultra 5 245K | |
| Minisforum BD795i SE, RTX 4090 | |
| Minisforum UM890 Pro (Nvidia GeForce RTX 4090 @OCuLink) | |
| Unigine Heaven 4.0 | |
| Extreme Preset OpenGL | |
| AMD Ryzen 7 9800X3D | |
| Intel Core Ultra 9 285K | |
| Minisforum BD795i SE, RTX 4090 | |
| Intel Core Ultra 5 245K | |
| Minisforum UM890 Pro (Nvidia GeForce RTX 4090 @OCuLink) | |
| Extreme Preset DX11 | |
| AMD Ryzen 7 9800X3D | |
| Intel Core Ultra 9 285K | |
| Minisforum BD795i SE, RTX 4090 | |
| Intel Core Ultra 5 245K | |
| Minisforum UM890 Pro (Nvidia GeForce RTX 4090 @OCuLink) | |
| ComputeMark v2.1 | |
| 1024x600 Normal, Score | |
| AMD Ryzen 7 9800X3D | |
| Minisforum BD795i SE, RTX 4090 | |
| Intel Core Ultra 9 285K | |
| Intel Core Ultra 5 245K | |
| Minisforum UM890 Pro (Nvidia GeForce RTX 4090 @OCuLink) | |
| 1024x600 Normal, Fluid 3DTex | |
| Minisforum BD795i SE, RTX 4090 | |
| AMD Ryzen 7 9800X3D | |
| Intel Core Ultra 9 285K | |
| Minisforum UM890 Pro (Nvidia GeForce RTX 4090 @OCuLink) | |
| Intel Core Ultra 5 245K | |
| 1024x600 Normal, Fluid 2DTexArr | |
| AMD Ryzen 7 9800X3D | |
| Minisforum BD795i SE, RTX 4090 | |
| Intel Core Ultra 9 285K | |
| Intel Core Ultra 5 245K | |
| Minisforum UM890 Pro (Nvidia GeForce RTX 4090 @OCuLink) | |
| 1024x600 Normal, Mandel Vector | |
| AMD Ryzen 7 9800X3D | |
| Intel Core Ultra 9 285K | |
| Minisforum BD795i SE, RTX 4090 | |
| Intel Core Ultra 5 245K | |
| Minisforum UM890 Pro (Nvidia GeForce RTX 4090 @OCuLink) | |
| 1024x600 Normal, Mandel Scalar | |
| AMD Ryzen 7 9800X3D | |
| Minisforum BD795i SE, RTX 4090 | |
| Intel Core Ultra 5 245K | |
| Intel Core Ultra 9 285K | |
| Minisforum UM890 Pro (Nvidia GeForce RTX 4090 @OCuLink) | |
| 1024x600 Normal, QJuliaRayTrace | |
| AMD Ryzen 7 9800X3D | |
| Minisforum BD795i SE, RTX 4090 | |
| Intel Core Ultra 5 245K | |
| Intel Core Ultra 9 285K | |
| Minisforum UM890 Pro (Nvidia GeForce RTX 4090 @OCuLink) | |
Performance comparison at CPU limit at 720p / 1,080p
| Performance Rating - Percent | |
| AMD Ryzen 7 9800X3D | |
| Minisforum BD795i SE, RTX 4090 | |
| F1 24 - 1920x1080 Low Preset AA:T AF:16x | |
| AMD Ryzen 7 9800X3D | |
| Minisforum BD795i SE, RTX 4090 | |
| Indiana Jones and the Great Circle - 1920x1080 Low Preset | |
| AMD Ryzen 7 9800X3D | |
| Minisforum BD795i SE, RTX 4090 | |
| Black Myth: Wukong - 1280x720 low TSR 100 | |
| AMD Ryzen 7 9800X3D | |
| Minisforum BD795i SE, RTX 4090 | |
| Baldur's Gate 3 - 1280x720 Low Preset | |
| AMD Ryzen 7 9800X3D | |
| Minisforum BD795i SE, RTX 4090 | |
| The Witcher 3 - 1024x768 Low Graphics & Postprocessing | |
| AMD Ryzen 7 9800X3D | |
| Minisforum BD795i SE, RTX 4090 | |
| Final Fantasy XV Benchmark - 1280x720 Lite Quality | |
| AMD Ryzen 7 9800X3D | |
| Minisforum BD795i SE, RTX 4090 | |
Performance comparison at GPU limit at 2,160p
| Performance Rating - Percent | |
| AMD Ryzen 7 9800X3D | |
| Minisforum BD795i SE, RTX 4090 | |
| F1 24 - 3840x2160 Ultra High Preset AA:T AF:16x | |
| Minisforum BD795i SE, RTX 4090 | |
| AMD Ryzen 7 9800X3D | |
| Indiana Jones and the Great Circle - 3840x2160 Very Ultra Preset | |
| AMD Ryzen 7 9800X3D | |
| Minisforum BD795i SE, RTX 4090 | |
| Black Myth: Wukong - 3840x2160 cinematic TSR 100 | |
| AMD Ryzen 7 9800X3D | |
| Minisforum BD795i SE, RTX 4090 | |
| Baldur's Gate 3 - 3840x2160 Ultra Preset | |
| AMD Ryzen 7 9800X3D | |
| Minisforum BD795i SE, RTX 4090 | |
| The Witcher 3 - 3840x2160 Ultra Graphics & Postprocessing (HBAO+) | |
| AMD Ryzen 7 9800X3D | |
| Minisforum BD795i SE, RTX 4090 | |
| Final Fantasy XV Benchmark - 3840x2160 High Quality | |
| AMD Ryzen 7 9800X3D | |
| Minisforum BD795i SE, RTX 4090 | |
| Bas | Moyen | Élevé | Ultra | QHD | 4K | |
|---|---|---|---|---|---|---|
| The Witcher 3 (2015) | 670 | 579 | 531 | 288 | 251 | 273 |
| Dota 2 Reborn (2015) | 252 | 219 | 204 | 197.2 | 192.1 | |
| Final Fantasy XV Benchmark (2018) | 233 | 231 | 210 | 204 | 160.1 | |
| X-Plane 11.11 (2018) | 128 | 121 | 97.4 | 90.8 | ||
| Strange Brigade (2018) | 593 | 472 | 465 | 478 | 467 | 290 |
| Baldur's Gate 3 (2023) | 282 | 252 | 232 | 228 | 204 | 128.1 |
| Cyberpunk 2077 2.2 Phantom Liberty (2023) | 185.3 | 184.3 | 175.3 | 166.2 | 155.7 | 78.1 |
| F1 24 (2024) | 351 | 370 | 357 | 184.5 | 168.4 | 93.4 |
| Black Myth: Wukong (2024) | 201 | 172 | 137 | 88 | 69 | 44 |
| Indiana Jones and the Great Circle (2024) | 246 | 210 | 194 | 163.8 | 107.5 | |
| Monster Hunter Wilds (2025) | 104.2 | 101.1 | 93.7 | 92.7 | 70.6 |
Besoins en énergie et températures
Minisforum fournit le BD795i SE avec des tuyaux de refroidissement préinstallés pour le CPU et le convertisseur de tension. L'utilisateur doit installer un ventilateur de 120 mm, mais le matériel de montage nécessaire est déjà inclus. Nous avons utilisé le Noctua NF-A12x25, qui a déjà fait ses preuves lors de notre examen des BD770i et BD790i. L'un des principaux avantages du BD795i SE est sa grande efficacité : Lors du multi-test Cinebench R15, nous n'avons mesuré qu'environ 140 watts, ce qui est impressionnant pour les performances proposées.
En ce qui concerne les émissions sonores : La carte mère elle-même n'a pas produit de bruit pendant notre test, car elle ne comporte pas d'éléments de refroidissement actifs. Le refroidissement a fonctionné efficacement et aucune température critique n'est apparue. Néanmoins, il serait judicieux de prévoir un refroidissement séparé pour le CPU et les VRM, surtout si vous utilisez un système de refroidissement par eau AiO. La BD795M de Minisforum, par exemple, est une carte mère mATX du même fabricant qui permet l'utilisation de ses propres solutions de refroidissement. Pourquoi pas aussi pour les modèles Mini-ITX ?
Par rapport aux fabricants de cartes mères établis, le BIOS n'offre que peu d'options. Vous pouvez certes régler la consommation d'énergie du processeur, mais pas la courbe du ventilateur. Si Minisforum continue à servir le marché, une optimisation plus conviviale du BIOS serait souhaitable. Un outil de surveillance basé sur Windows serait certainement un complément utile.
Efficiency overview
| Performance Rating - Percent | |
| Minisforum BD790i | |
| Minisforum BD795i SE | |
| Minisforum BD770i | |
| Intel Core Ultra 9 285K | |
| Intel Core Ultra 5 245K | |
| AMD Ryzen 7 9800X3D | |
| Power Consumption | |
| Cinebench R23 Multi Power Efficiency - external Monitor | |
| Minisforum BD790i | |
| Minisforum BD795i SE | |
| Minisforum BD770i | |
| Intel Core Ultra 9 285K | |
| Intel Core Ultra 5 245K | |
| AMD Ryzen 7 9800X3D | |
| Cinebench R23 Single Power Efficiency - external Monitor | |
| Minisforum BD770i | |
| Minisforum BD790i | |
| Minisforum BD795i SE | |
| Intel Core Ultra 9 285K | |
| Intel Core Ultra 5 245K | |
| AMD Ryzen 7 9800X3D | |
| Cinebench R15 Multi Efficiency (external Monitor) | |
| Minisforum BD790i | |
| Minisforum BD795i SE | |
| Minisforum BD770i | |
| Intel Core Ultra 9 285K | |
| Intel Core Ultra 5 245K | |
| AMD Ryzen 7 9800X3D | |
Power consumption without dedicated graphics card
Power consumption with Nvidia GeForce RTX 4090
Notebookcheck évaluation totale
La Minisforum BD795i SE est une puissante carte mère mini-ITX équipée de l'AMD Ryzen 9 7945HX. Grâce à son design compact et à son refroidissement efficace, elle est idéale pour les petits PC performants. Cependant, son BIOS n'offre que des options limitées et son refroidissement pourrait être plus flexible.
Transparency
La sélection des appareils à examiner est effectuée par notre équipe éditoriale. L'échantillon d'essai a été remis gratuitement à l'auteur par le fabricant à des fins d'évaluation. Cet examen n'a pas été influencé par des tiers et le fabricant n'a pas reçu de copie de cet examen avant sa publication. Il n'y avait aucune obligation de publier cet article. Nous n'acceptons jamais de compensation ou de paiement en échange de nos commentaires. En tant que média indépendant, Notebookcheck n'est pas soumis à l'autorité des fabricants, des détaillants ou des éditeurs.
Voici comment Notebookcheck teste
Chaque année, Notebookcheck examine de manière indépendante des centaines d'ordinateurs portables et de smartphones en utilisant des procédures standardisées afin de garantir que tous les résultats sont comparables. Nous avons continuellement développé nos méthodes de test depuis environ 20 ans et avons établi des normes industrielles dans le processus. Dans nos laboratoires de test, des équipements de mesure de haute qualité sont utilisés par des techniciens et des rédacteurs expérimentés. Ces tests impliquent un processus de validation en plusieurs étapes. Notre système d'évaluation complexe repose sur des centaines de mesures et de points de référence bien fondés, ce qui garantit l'objectivité.
