Notebookcheck Logo
Teaser

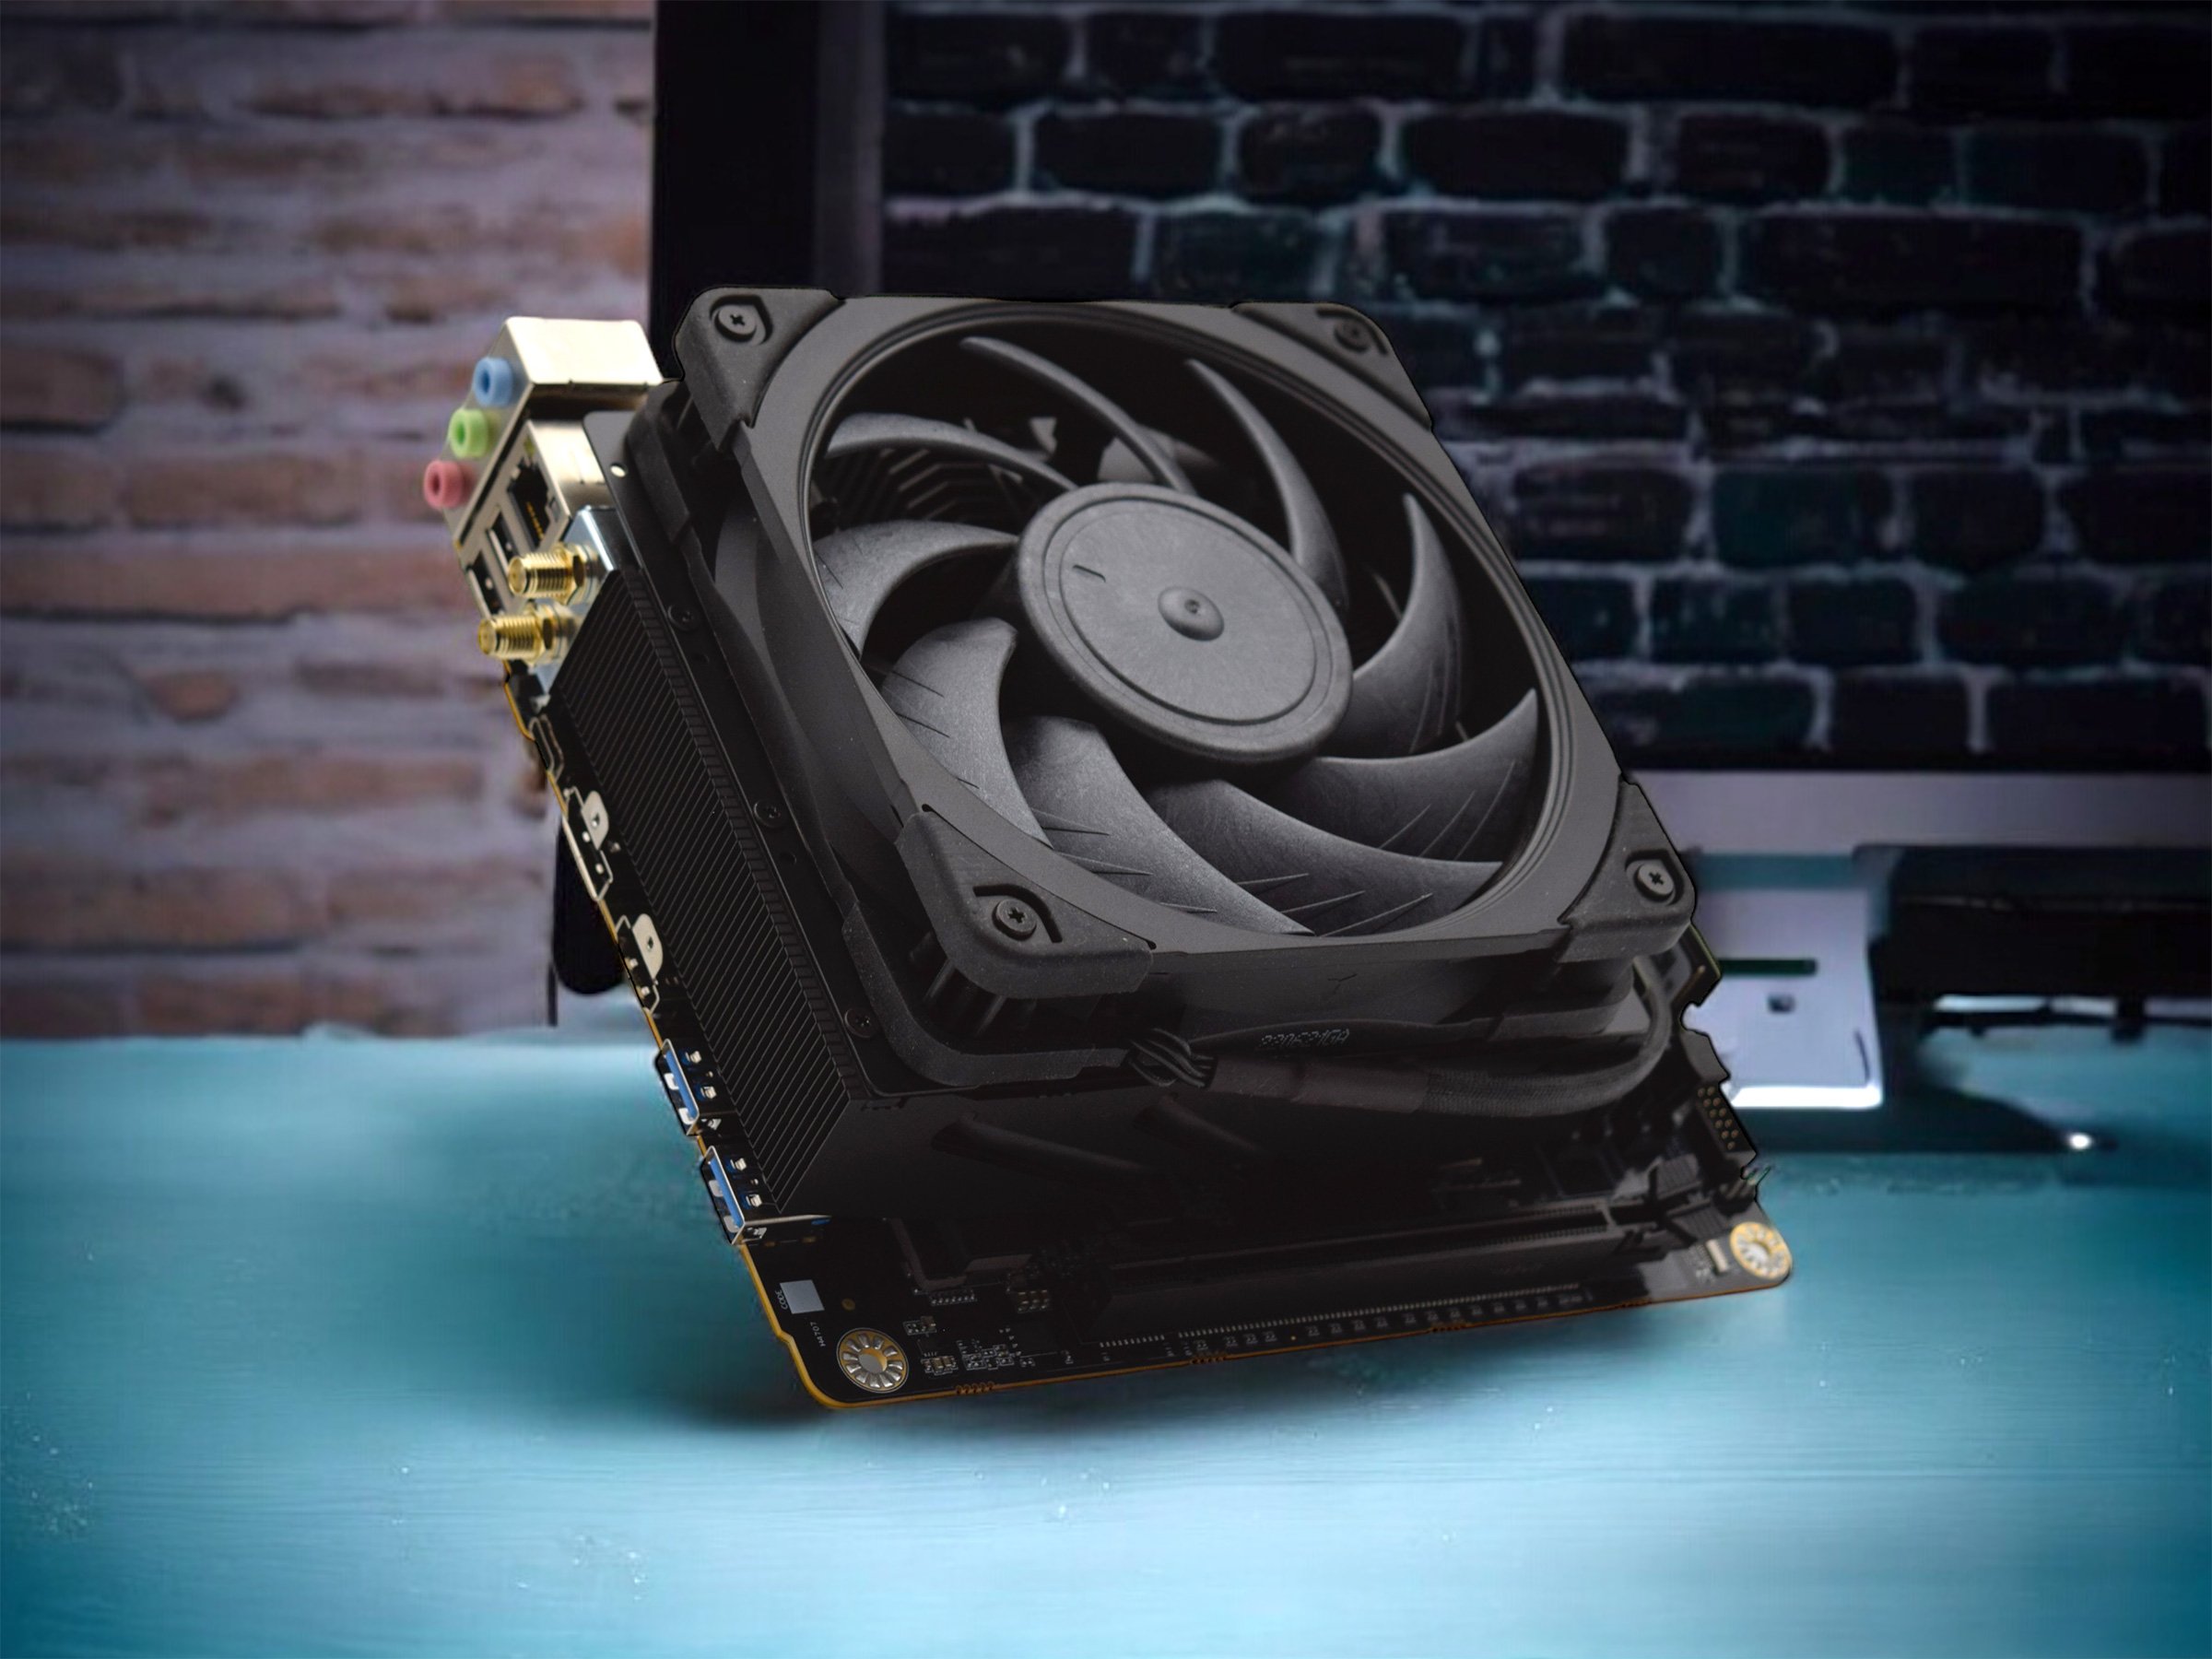
Test du Minisforum BD790i : carte mère Mini-ITX avec Ryzen 9 7945HX et PCIe 5.0 pour petits PC de jeu

Le SoC mobile rencontre la carte mère de l'ordinateur de bureau.

La carte mère Minisforum BD790i promet de belles performances et pourrait donc constituer une excellente base pour les PC Mini-ITX compacts. Nous avons examiné la carte mère, qui est équipée d'un processeur AMD Ryzen 9 7945HX et qui s'adresse tout particulièrement aux utilisateurs exigeants. Dans notre test, nous avons analysé les performances du système lors de tâches intensives et, en combinaison avec une Nvidia GeForce RTX 4090, nous avons également jeté un coup d'œil à ses performances de jeu.
Sebastian Bade, 👁 Sebastian Bade (traduit par DeepL / Ninh Duy) Publié 🇺🇸 🇩🇪 ...
Desktop AMD Gaming Mini PC

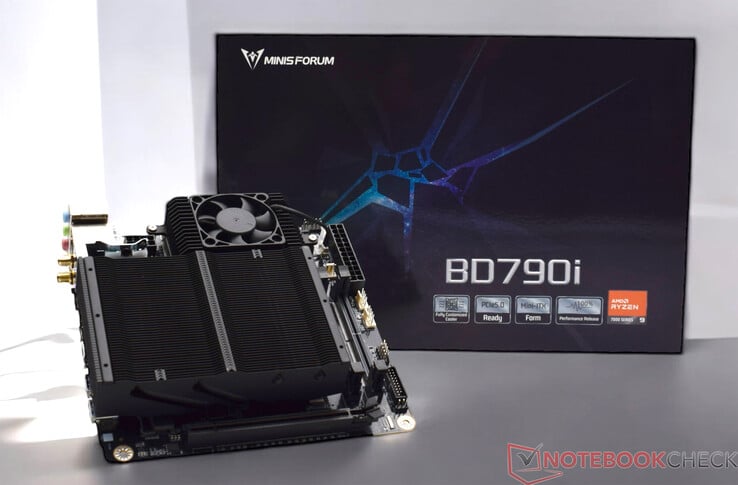
Minisforum est principalement connu pour son offre de mini-PC dans toutes les catégories de performances. La plupart des fabricants de mini-PC ont tendance à rester à l'écart du marché des ordinateurs de bureau classiques, mais il s'avère que Minisforum ose s'implanter dans ce domaine également. Il y a quelques temps, nous avons pu découvrir les bonnes performances du Minisforum BD770i basé sur le AMD Ryzen 7 7745HX. En tant que modèle haut de gamme avec un APU AMD Ryzen, la carte mère BD790i de Minisforum est un modèle encore plus puissant dans le portefeuille du fabricant, que nous allons examiner en détail dans cette revue.

Minisforum a installé une carte mère AMD Ryzen 9 7945HX dans le BD790i, qui est équipé de 16 cœurs Zen4. Cela signifie que le SoC, qui provient du secteur mobile, est actuellement l'un des plus rapides qu'AMD ait à offrir. Afin d'évaluer ses performances en matière de jeu, nous l'avons examiné en combinaison avec un processeur Nvidia RTX95 Nvidia GeForce RTX 4090. Grâce à son emplacement PCIe x16 complet, la carte graphique a pu être connectée avec ses pleines performances.

Comparaison des cartes mères du Minisforum

Nom BD790i BD790i SE BD770i AR900i
CPU AMD Ryzen 9 7945HX AMD Ryzen 9 7940HX AMD Ryzen 7 7745HX Intel Core i9-13900HX Processeur
Cœurs / threads 16 / 32 16/32 8/16 24/32
GPU AMD Radeon 610M AMD Radeon 610M AMD Radeon 610M Intel UHD Graphics
Types de mémoire DDR5-5200SODIMM DDR5-5200 SODIMM DDR5-5200 SODIMM DDR5-5600 SODIMM
Taille maximale de la mémoire 96 GB 64 GB 64 GB 64 GB
Minisforum BD790i
Processeur
AMD Ryzen 9 7945HX 16 x 2.5 - 5.4 GHz, Dragon Range-HX (Zen 4)
Carte graphique
AMD Radeon 610M
Mémoire
64 Go 
, DDR5-5200 SODIMM
Carte mère
AMD Promontory/Bixby FCH
Disque dur
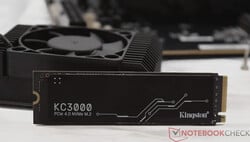
Kingston KC3000 2048G SKC3000D2048G, 2048 Go 
Carte son
AMD Zen - Audio Processor - HD Audio Controller
Connexions
2 USB 2.0, 3 USB 3.0 / 3.1 Gen1, 1 USB 3.1 Gen2, 1 HDMI, 2 DisplayPort, Connectique audio: 3,5mm Klinke, Line Out, Front Panel Audio header
Réseau
Realtek RTL8125 2.5GBe Family Ethernet Controller (10/100/1000/2500MBit/s), Intel Killer Wi-Fi 6E AX1675x (210NGW) (b/g/n = Wi-Fi 4/ac = Wi-Fi 5/ax = Wi-Fi 6/ Wi-Fi 6E 6 GHz), Bluetooth 5.2
Prix
551 euros
Remarque : le fabricant peut utiliser des composants provenant de différents fournisseurs, notamment des panneaux d'affichage, des lecteurs ou des clés USB ayant des spécifications similaires.


Le Minisforum BD790i et le système de test en détail

Minisforum BD790i
Minisforum BD790i
Minisforum BD790i
Minisforum BD790i
Minisforum BD790i
Minisforum BD790i
Minisforum BD790i
Minisforum BD790i
Minisforum BD790i
Minisforum BD790i
Minisforum BD790i
Minisforum BD790i
Minisforum BD790i
Kingston KC3000 (SSD de test)
Kingston FURY Impact SO-DIMM Kit 64 GB
Refroidisseur Noctua NF-A12x25
Minisforum BD790i avec refroidisseur Noctua NF-A12x25 installé
Phanteks Enthoo Evolv Shift XT
Phanteks Enthoo Evolv Shift XT avec Minisforum BD790i installé
Alimentation SilverStone SFX 650 watts

Cas et configuration de l'essai

Pour assurer la meilleure comparaison possible avec le Minisforum BD770i que nous avons déjà testé, nous avons respecté exactement les mêmes conditions. Plus précisément, cela signifie que nous avons effectué tous les tests du processeur dans son état installé. Nous avons utilisé le boîtier Phanteks Enthoo Evolv Shift XT, qui offre une bonne base grâce à sa compacité.

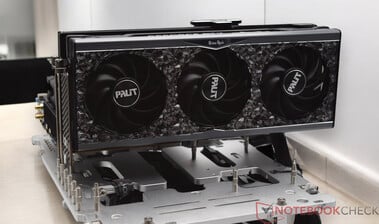
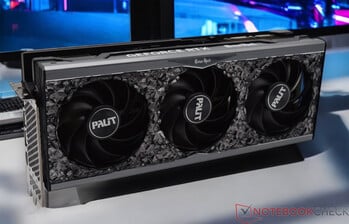
Pour notre comparaison des performances avec une carte graphique dédiée, nous avons testé le Minisforum BD790i avec les cartes suivantes Palit GeForce RTX 4090 GameRock OC dans une configuration ouverte. En raison de la taille de la carte graphique, il n'a pas été possible de l'installer dans le Phanteks Enthoo Evolv Shift XT. Les cartes graphiques qui ne dépassent pas une longueur de 32,4 centimètres peuvent être installées dans le Phanteks Enthoo Evolv Shift XT.

Portée de la livraison et connectivité

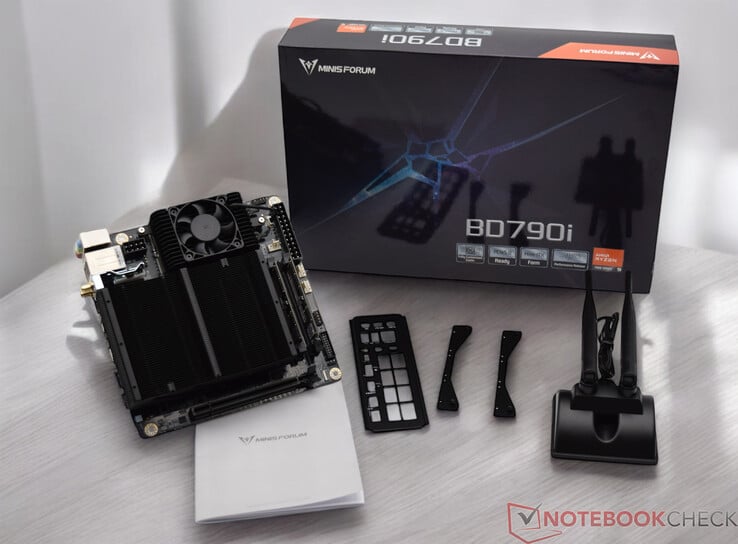
La livraison de la carte mère Minisforum BD790i est similaire à celle de la Minisforum BD770i. Le fabricant livre la carte mère avec un refroidisseur préinstallé qui couvre à la fois le processeur et les convertisseurs de tension. Un bouclier IO correspondant à la carte mère n'est malheureusement pas préinstallé. Une antenne WLAN relativement grande est également incluse dans la livraison. Il n'y a pas d'options entièrement préconfigurées, mais ce n'est pas un problème. Un ventilateur de 120 millimètres doit être acheté en tant que ventilateur de CPU, qui est rapidement installé à l'aide du matériel de montage. Un SSD et de la RAM ainsi qu'un bloc d'alimentation pour PC sont ensuite nécessaires pour le fonctionnement. Le Minisforum BD790i est une bonne base pour un PC de bricolage puissant et compact en format miniature.

La connectique du Minisforum BD790i est assez limitée. Il n'y a que quelques connexions à l'arrière par rapport aux cartes mères conventionnelles, bien que les ports les plus importants soient à bord. Il y a également un connecteur USB 3.2 sur la carte elle-même, ce qui signifie qu'un total de 6 ports USB-A peut être utilisé. Malheureusement, il n'y a pas d'autres connexions, telles qu'un en-tête ARGB ou un port USB-C supplémentaire. En ce qui concerne le choix du ventilateur, vous êtes limité au refroidisseur préinstallé. Il n'y a pas d'option alternative pour installer un refroidisseur plus puissant. Il serait préférable de refroidir les convertisseurs de tension séparément afin de donner à l'utilisateur la possibilité d'installer sa propre solution de refroidissement.

L'étendue de la livraison du Minisforum BD790i

Benchmark des processeurs

La carte mère Minisforum BD790i est équipée de l'un des processeurs les plus puissants actuellement disponibles dans le secteur des ordinateurs portables. Le processeur AMD Ryzen 9 7945HX dispose de 16 cœurs Zen4, qui peuvent traiter un total de 32 threads. En termes de performances, cela semble très prometteur, comme l'ont prouvé nos tests. Dans la comparaison des performances, l'AMD Ryzen 9 7945HX s'est classé entre l'AMD Ryzen 9 7900X et l'AMD Ryzen 9 7900X AMD Ryzen 9 7900X et un AMD Ryzen 9 7950X. Si l'on compare avec les processeurs Intel, les performances de l'AMD Ryzen 9 7945HX peuvent être comparées à celles de l'Intel Core i7-14700K et de l'AMD Ryzen 9 7945HX Intel Core i7-14700K. Par rapport aux processeurs de bureau classiques, la consommation d'énergie est le principal avantage de l'AMD Ryzen 9 7945HX. Avec seulement 100 watts, le processeur est nettement plus économe et plus facile à refroidir.

Pour d'autres comparaisons et benchmarks, consultez notre Tableau comparatif des processeurs.

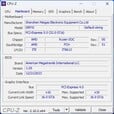
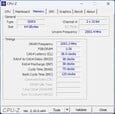
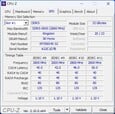
CPU-Z
CPU-Z
CPU-Z
CPU-Z
CPU-Z
CPU-Z
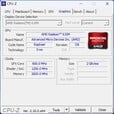
GPU-Z
GPU-Z
HWiNFO
Performance Rating - Percent
Intel Core i9-14900K
i9-14900K, 3200 MHz
79.5 pt
Intel Core i9-13900K
i9-13900K, 3000 MHz
77 pt
AMD Ryzen 9 7950X
R9 7950X, 4500 MHz
75.5 pt
AMD Ryzen 9 7950X3D
R9 7950X3D, 4200 MHz
74 pt
Intel Core i7-14700K
i7-14700K, 2500 MHz
73.8 pt
AMD Ryzen 9 7945HX
R9 7945HX, 2500 MHz
70.2 pt
AMD Ryzen 9 7900X
R9 7900X, 4700 MHz
68.5 pt
Intel Core i5-14600K
i5-14600K, 3500 MHz
65.4 pt
Intel Core i9-12900K
i9-12900K, 3200 MHz
64.7 pt
Intel Core i5-13600K
i5-13600K, 3500 MHz
63.3 pt
AMD Ryzen 9 5950X
R9 5950X, 3400 MHz
63.3 pt
AMD Ryzen 5 9600X
Ryzen 5 9600X, 3900 MHz
60.9 pt
AMD Ryzen 7 7800X3D
R7 7800X3D, 4200 MHz
60.3 pt
AMD Ryzen 7 7745HX
R7 7745HX, 3600 MHz
58.5 pt
AMD Ryzen 5 7600X
R5 7600X, 4700 MHz
58 pt
Intel Core i5-12600K
i5-12600K, 2800 MHz
55.9 pt
AMD Ryzen 7 7840HS
R7 7840HS, 3800 MHz
55.2 pt
AMD Ryzen 9 7940HS
R9 7940HS, 4000 MHz
55.2 pt
Intel Core i5-13400
i5-13400, 2500 MHz
53.1 pt
Intel Core i5-12400F
i5-12400F, 2500 MHz
48.2 pt
Cinebench R23
Single Core
Intel Core i9-14900K
i9-14900K, 3200 MHz
2351 Points +21%
Intel Core i9-13900K
i9-13900K, 3000 MHz
2267 Points +17%
AMD Ryzen 5 9600X
Ryzen 5 9600X, 3900 MHz
2180 Points +12%
Intel Core i7-14700K
i7-14700K, 2500 MHz
2153 Points +11%
Intel Core i5-14600K
i5-14600K, 3500 MHz
2064 Points +6%
AMD Ryzen 9 7950X3D
R9 7950X3D, 4200 MHz
2053 Points +6%
AMD Ryzen 9 7950X
R9 7950X, 4500 MHz
2045 Points +5%
AMD Ryzen 9 7900X
R9 7900X, 4700 MHz
2039 Points +5%
Intel Core i5-13600K
i5-13600K, 3500 MHz
2010 Points +4%
Intel Core i9-12900K
i9-12900K, 3200 MHz
1998 Points +3%
AMD Ryzen 5 7600X
R5 7600X, 4700 MHz
1967 Points +1%
AMD Ryzen 9 7945HX
R9 7945HX, 2500 MHz
1942 Points
Intel Core i5-12600K
i5-12600K, 2800 MHz
1907 Points -2%
AMD Ryzen 7 7745HX
R7 7745HX, 3600 MHz
1854 Points -5%
AMD Ryzen 7 7800X3D
R7 7800X3D, 4200 MHz
1820 Points -6%
AMD Ryzen 9 7940HS
R9 7940HS, 4000 MHz
1813 Points -7%
Intel Core i5-13400
i5-13400, 2500 MHz
1786 Points -8%
AMD Ryzen 7 7840HS
R7 7840HS, 3800 MHz
1779 Points -8%
Intel Core i5-12400F
i5-12400F, 2500 MHz
1680 Points -13%
AMD Ryzen 9 5950X
R9 5950X, 3400 MHz
1649 Points -15%
Multi Core
Intel Core i9-14900K
i9-14900K, 3200 MHz
41193 Points +23%
Intel Core i9-13900K
i9-13900K, 3000 MHz
40103 Points +20%
AMD Ryzen 9 7950X
R9 7950X, 4500 MHz
37792 Points +13%
AMD Ryzen 9 7950X3D
R9 7950X3D, 4200 MHz
36291 Points +8%
Intel Core i7-14700K
i7-14700K, 2500 MHz
35892 Points +7%
AMD Ryzen 9 7945HX
R9 7945HX, 2500 MHz
33459 Points
AMD Ryzen 9 7900X
R9 7900X, 4700 MHz
29480 Points -12%
AMD Ryzen 9 5950X
R9 5950X, 3400 MHz
27062 Points -19%
Intel Core i9-12900K
i9-12900K, 3200 MHz
27005 Points -19%
Intel Core i5-14600K
i5-14600K, 3500 MHz
24491 Points -27%
Intel Core i5-13600K
i5-13600K, 3500 MHz
24268 Points -27%
AMD Ryzen 7 7745HX
R7 7745HX, 3600 MHz
18845 Points -44%
AMD Ryzen 7 7800X3D
R7 7800X3D, 4200 MHz
18086 Points -46%
Intel Core i5-12600K
i5-12600K, 2800 MHz
17491 Points -48%
AMD Ryzen 5 9600X
Ryzen 5 9600X, 3900 MHz
17176 Points -49%
AMD Ryzen 9 7940HS
R9 7940HS, 4000 MHz
16985 Points -49%
AMD Ryzen 7 7840HS
R7 7840HS, 3800 MHz
16706 Points -50%
Intel Core i5-13400
i5-13400, 2500 MHz
15953 Points -52%
AMD Ryzen 5 7600X
R5 7600X, 4700 MHz
15322 Points -54%
Intel Core i5-12400F
i5-12400F, 2500 MHz
12380 Points -63%
Cinebench R20
CPU (Single Core)
Intel Core i9-14900K
i9-14900K, 3200 MHz
900 Points +18%
AMD Ryzen 5 9600X
Ryzen 5 9600X, 3900 MHz
858 Points +13%
Intel Core i7-14700K
i7-14700K, 2500 MHz
832 Points +9%
Intel Core i9-13900K
i9-13900K, 3000 MHz
828 Points +9%
AMD Ryzen 9 7950X
R9 7950X, 4500 MHz
795 Points +5%
AMD Ryzen 9 7950X3D
R9 7950X3D, 4200 MHz
795 Points +5%
Intel Core i5-14600K
i5-14600K, 3500 MHz
790 Points +4%
AMD Ryzen 9 7900X
R9 7900X, 4700 MHz
786 Points +3%
Intel Core i5-13600K
i5-13600K, 3500 MHz
775 Points +2%
Intel Core i9-12900K
i9-12900K, 3200 MHz
766 Points +1%
AMD Ryzen 5 7600X
R5 7600X, 4700 MHz
761 Points 0%
AMD Ryzen 9 7945HX
R9 7945HX, 2500 MHz
760 Points
Intel Core i5-12600K
i5-12600K, 2800 MHz
734 Points -3%
AMD Ryzen 7 7745HX
R7 7745HX, 3600 MHz
719 Points -5%
AMD Ryzen 9 7940HS
R9 7940HS, 4000 MHz
711 Points -6%
AMD Ryzen 7 7800X3D
R7 7800X3D, 4200 MHz
709 Points -7%
AMD Ryzen 7 7840HS
R7 7840HS, 3800 MHz
690 Points -9%
Intel Core i5-13400
i5-13400, 2500 MHz
688 Points -9%
Intel Core i5-12400F
i5-12400F, 2500 MHz
653 Points -14%
AMD Ryzen 9 5950X
R9 5950X, 3400 MHz
641 Points -16%
CPU (Multi Core)
Intel Core i9-14900K
i9-14900K, 3200 MHz
15466 Points +18%
Intel Core i9-13900K
i9-13900K, 3000 MHz
15181 Points +16%
AMD Ryzen 9 7950X
R9 7950X, 4500 MHz
14786 Points +13%
AMD Ryzen 9 7950X3D
R9 7950X3D, 4200 MHz
14188 Points +9%
Intel Core i7-14700K
i7-14700K, 2500 MHz
13672 Points +5%
AMD Ryzen 9 7945HX
R9 7945HX, 2500 MHz
13057 Points
AMD Ryzen 9 7900X
R9 7900X, 4700 MHz
11563 Points -11%
AMD Ryzen 9 5950X
R9 5950X, 3400 MHz
10482 Points -20%
Intel Core i9-12900K
i9-12900K, 3200 MHz
10240 Points -22%
Intel Core i5-14600K
i5-14600K, 3500 MHz
9371 Points -28%
Intel Core i5-13600K
i5-13600K, 3500 MHz
9265 Points -29%
AMD Ryzen 7 7745HX
R7 7745HX, 3600 MHz
7399 Points -43%
AMD Ryzen 7 7800X3D
R7 7800X3D, 4200 MHz
7121 Points -45%
AMD Ryzen 5 9600X
Ryzen 5 9600X, 3900 MHz
6719 Points -49%
Intel Core i5-12600K
i5-12600K, 2800 MHz
6692 Points -49%
AMD Ryzen 9 7940HS
R9 7940HS, 4000 MHz
6640 Points -49%
AMD Ryzen 7 7840HS
R7 7840HS, 3800 MHz
6509 Points -50%
Intel Core i5-13400
i5-13400, 2500 MHz
6135 Points -53%
AMD Ryzen 5 7600X
R5 7600X, 4700 MHz
5985 Points -54%
Intel Core i5-12400F
i5-12400F, 2500 MHz
4740 Points -64%
Cinebench R15
CPU Single 64Bit
AMD Ryzen 5 9600X
Ryzen 5 9600X, 3900 MHz
341 Points +10%
Intel Core i9-14900K
i9-14900K, 3200 MHz
332 Points +7%
AMD Ryzen 9 7950X
R9 7950X, 4500 MHz
328 Points +5%
Intel Core i9-13900K
i9-13900K, 3000 MHz
327 Points +5%
AMD Ryzen 9 7950X3D
R9 7950X3D, 4200 MHz
326 Points +5%
AMD Ryzen 9 7900X
R9 7900X, 4700 MHz
324 Points +4%
AMD Ryzen 5 7600X
R5 7600X, 4700 MHz
315 Points +1%
Intel Core i7-14700K
i7-14700K, 2500 MHz
314 Points +1%
AMD Ryzen 9 7945HX
R9 7945HX, 2500 MHz
311 Points
Intel Core i5-14600K
i5-14600K, 3500 MHz
297 Points -5%
AMD Ryzen 7 7745HX
R7 7745HX, 3600 MHz
295 Points -5%
AMD Ryzen 7 7800X3D
R7 7800X3D, 4200 MHz
291 Points -6%
Intel Core i5-13600K
i5-13600K, 3500 MHz
289 Points -7%
Intel Core i9-12900K
i9-12900K, 3200 MHz
286 Points -8%
AMD Ryzen 9 7940HS
R9 7940HS, 4000 MHz
284 Points -9%
AMD Ryzen 7 7840HS
R7 7840HS, 3800 MHz
279 Points -10%
Intel Core i5-12600K
i5-12600K, 2800 MHz
275 Points -12%
AMD Ryzen 9 5950X
R9 5950X, 3400 MHz
272 Points -13%
Intel Core i5-13400
i5-13400, 2500 MHz
257 Points -17%
Intel Core i5-12400F
i5-12400F, 2500 MHz
244 Points -22%
CPU Multi 64Bit
Intel Core i9-14900K
i9-14900K, 3200 MHz
6282 Points +19%
AMD Ryzen 9 7950X
R9 7950X, 4500 MHz
6209 Points +17%
Intel Core i9-13900K
i9-13900K, 3000 MHz
6191 Points +17%
AMD Ryzen 9 7950X3D
R9 7950X3D, 4200 MHz
5974 Points +13%
Intel Core i7-14700K
i7-14700K, 2500 MHz
5459 (5323.4min - 5459.26max) Points +3%
AMD Ryzen 9 7945HX
R9 7945HX, 2500 MHz
5289 Points
AMD Ryzen 9 7900X
R9 7900X, 4700 MHz
4856 Points -8%
AMD Ryzen 9 5950X
R9 5950X, 3400 MHz
4492 Points -15%
Intel Core i9-12900K
i9-12900K, 3200 MHz
4057 Points -23%
Intel Core i5-13600K
i5-13600K, 3500 MHz
3643 Points -31%
Intel Core i5-14600K
i5-14600K, 3500 MHz
3640 Points -31%
AMD Ryzen 7 7745HX
R7 7745HX, 3600 MHz
2994 Points -43%
AMD Ryzen 7 7800X3D
R7 7800X3D, 4200 MHz
2974 Points -44%
AMD Ryzen 9 7940HS
R9 7940HS, 4000 MHz
2663 Points -50%
AMD Ryzen 5 9600X
Ryzen 5 9600X, 3900 MHz
2630 Points -50%
AMD Ryzen 7 7840HS
R7 7840HS, 3800 MHz
2608 Points -51%
Intel Core i5-12600K
i5-12600K, 2800 MHz
2555 Points -52%
AMD Ryzen 5 7600X
R5 7600X, 4700 MHz
2507 Points -53%
Intel Core i5-13400
i5-13400, 2500 MHz
2358 Points -55%
Intel Core i5-12400F
i5-12400F, 2500 MHz
1759 Points -67%
Cinebench R11.5
CPU Single 64Bit
Intel Core i9-14900K
i9-14900K, 3200 MHz
4.02 Points +10%
AMD Ryzen 5 9600X
Ryzen 5 9600X, 3900 MHz
4 Points +9%
Intel Core i9-13900K
i9-13900K, 3000 MHz
3.92 Points +7%
AMD Ryzen 9 7950X
R9 7950X, 4500 MHz
3.86 Points +5%
AMD Ryzen 9 7950X3D
R9 7950X3D, 4200 MHz
3.86 Points +5%
AMD Ryzen 9 7900X
R9 7900X, 4700 MHz
3.83 Points +4%
AMD Ryzen 5 7600X
R5 7600X, 4700 MHz
3.72 Points +1%
Intel Core i7-14700K
i7-14700K, 2500 MHz
3.7 Points +1%
AMD Ryzen 9 7945HX
R9 7945HX, 2500 MHz
3.67 Points
Intel Core i5-14600K
i5-14600K, 3500 MHz
3.58 Points -2%
AMD Ryzen 7 7745HX
R7 7745HX, 3600 MHz
3.5 Points -5%
Intel Core i9-12900K
i9-12900K, 3200 MHz
3.49 Points -5%
Intel Core i5-13600K
i5-13600K, 3500 MHz
3.48 Points -5%
AMD Ryzen 9 7940HS
R9 7940HS, 4000 MHz
3.46 Points -6%
AMD Ryzen 7 7800X3D
R7 7800X3D, 4200 MHz
3.43 Points -7%
AMD Ryzen 7 7840HS
R7 7840HS, 3800 MHz
3.33 Points -9%
Intel Core i5-12600K
i5-12600K, 2800 MHz
3.31 Points -10%
AMD Ryzen 9 5950X
R9 5950X, 3400 MHz
3.14 Points -14%
Intel Core i5-13400
i5-13400, 2500 MHz
3.1 Points -16%
Intel Core i5-12400F
i5-12400F, 2500 MHz
2.95 Points -20%
CPU Multi 64Bit
Intel Core i9-14900K
i9-14900K, 3200 MHz
72.24 Points +17%
Intel Core i9-13900K
i9-13900K, 3000 MHz
70.78 Points +15%
AMD Ryzen 9 7950X
R9 7950X, 4500 MHz
68.61 Points +11%
AMD Ryzen 9 7950X3D
R9 7950X3D, 4200 MHz
64.59 Points +5%
AMD Ryzen 9 7945HX
R9 7945HX, 2500 MHz
61.54 Points
Intel Core i7-14700K
i7-14700K, 2500 MHz
61.44 Points 0%
AMD Ryzen 9 7900X
R9 7900X, 4700 MHz
54.51 Points -11%
AMD Ryzen 9 5950X
R9 5950X, 3400 MHz
49.6 Points -19%
Intel Core i9-12900K
i9-12900K, 3200 MHz
47.06 Points -24%
Intel Core i5-13600K
i5-13600K, 3500 MHz
42.38 Points -31%
Intel Core i5-14600K
i5-14600K, 3500 MHz
40.96 Points -33%
AMD Ryzen 7 7745HX
R7 7745HX, 3600 MHz
35.06 Points -43%
AMD Ryzen 7 7800X3D
R7 7800X3D, 4200 MHz
33.48 Points -46%
AMD Ryzen 9 7940HS
R9 7940HS, 4000 MHz
30.88 Points -50%
AMD Ryzen 5 9600X
Ryzen 5 9600X, 3900 MHz
30.86 Points -50%
AMD Ryzen 7 7840HS
R7 7840HS, 3800 MHz
30.25 Points -51%
Intel Core i5-12600K
i5-12600K, 2800 MHz
30.01 Points -51%
AMD Ryzen 5 7600X
R5 7600X, 4700 MHz
28.41 Points -54%
Intel Core i5-13400
i5-13400, 2500 MHz
27.36 Points -56%
Intel Core i5-12400F
i5-12400F, 2500 MHz
20.39 Points -67%
Cinebench R10
Rendering Single CPUs 64Bit
Intel Core i9-14900K
i9-14900K, 3200 MHz
18511 Points +17%
Intel Core i9-13900K
i9-13900K, 3000 MHz
18236 Points +15%
AMD Ryzen 5 9600X
Ryzen 5 9600X, 3900 MHz
17541 Points +10%
Intel Core i7-14700K
i7-14700K, 2500 MHz
17458 Points +10%
Intel Core i5-14600K
i5-14600K, 3500 MHz
16643 Points +5%
AMD Ryzen 9 7900X
R9 7900X, 4700 MHz
16338 Points +3%
AMD Ryzen 9 7950X
R9 7950X, 4500 MHz
16260 Points +2%
Intel Core i5-13600K
i5-13600K, 3500 MHz
16235 Points +2%
Intel Core i9-12900K
i9-12900K, 3200 MHz
16144 Points +2%
AMD Ryzen 5 7600X
R5 7600X, 4700 MHz
16010 Points +1%
AMD Ryzen 9 7945HX
R9 7945HX, 2500 MHz
15889 Points
Intel Core i5-12600K
i5-12600K, 2800 MHz
15180 Points -4%
AMD Ryzen 7 7745HX
R7 7745HX, 3600 MHz
15010 Points -6%
AMD Ryzen 9 7940HS
R9 7940HS, 4000 MHz
14731 Points -7%
AMD Ryzen 7 7800X3D
R7 7800X3D, 4200 MHz
14485 Points -9%
AMD Ryzen 7 7840HS
R7 7840HS, 3800 MHz
14177 Points -11%
Intel Core i5-13400
i5-13400, 2500 MHz
14142 Points -11%
Intel Core i5-12400F
i5-12400F, 2500 MHz
13664 Points -14%
AMD Ryzen 9 5950X
R9 5950X, 3400 MHz
13279 Points -16%
AMD Ryzen 9 7950X3D
R9 7950X3D, 4200 MHz
8853 Points -44%
Rendering Multiple CPUs 64Bit
Intel Core i9-14900K
i9-14900K, 3200 MHz
144156 Points +10%
Intel Core i7-14700K
i7-14700K, 2500 MHz
136062 Points +4%
Intel Core i9-13900K
i9-13900K, 3000 MHz
132000 Points +1%
AMD Ryzen 9 7945HX
R9 7945HX, 2500 MHz
131256 Points
AMD Ryzen 9 7950X
R9 7950X, 4500 MHz
130289 Points -1%
AMD Ryzen 9 7900X
R9 7900X, 4700 MHz
121250 Points -8%
Intel Core i5-14600K
i5-14600K, 3500 MHz
115171 Points -12%
Intel Core i9-12900K
i9-12900K, 3200 MHz
112749 Points -14%
Intel Core i5-13600K
i5-13600K, 3500 MHz
110412 Points -16%
AMD Ryzen 9 5950X
R9 5950X, 3400 MHz
104638 Points -20%
AMD Ryzen 5 9600X
Ryzen 5 9600X, 3900 MHz
100227 Points -24%
AMD Ryzen 7 7745HX
R7 7745HX, 3600 MHz
99215 Points -24%
AMD Ryzen 7 7800X3D
R7 7800X3D, 4200 MHz
94035 Points -28%
AMD Ryzen 5 7600X
R5 7600X, 4700 MHz
89641 Points -32%
Intel Core i5-12600K
i5-12600K, 2800 MHz
89478 Points -32%
AMD Ryzen 9 7940HS
R9 7940HS, 4000 MHz
88529 Points -33%
AMD Ryzen 7 7840HS
R7 7840HS, 3800 MHz
87064 Points -34%
Intel Core i5-13400
i5-13400, 2500 MHz
83214 Points -37%
AMD Ryzen 9 7950X3D
R9 7950X3D, 4200 MHz
72361 Points -45%
Intel Core i5-12400F
i5-12400F, 2500 MHz
69819 Points -47%
Blender - v2.79 BMW27 CPU
Intel Core i5-12400F
i5-12400F, 2500 MHz
269 Seconds * -186%
Intel Core i5-13400
i5-13400, 2500 MHz
206 Seconds * -119%
AMD Ryzen 5 7600X
R5 7600X, 4700 MHz
203 Seconds * -116%
AMD Ryzen 7 7840HS
R7 7840HS, 3800 MHz
192 Seconds * -104%
Intel Core i5-12600K
i5-12600K, 2800 MHz
189.5 Seconds * -102%
AMD Ryzen 9 7940HS
R9 7940HS, 4000 MHz
188 Seconds * -100%
AMD Ryzen 5 9600X
Ryzen 5 9600X, 3900 MHz
184 Seconds * -96%
AMD Ryzen 7 7800X3D
R7 7800X3D, 4200 MHz
169 Seconds * -80%
AMD Ryzen 7 7745HX
R7 7745HX, 3600 MHz
169 Seconds * -80%
Intel Core i5-13600K
i5-13600K, 3500 MHz
135 Seconds * -44%
Intel Core i5-14600K
i5-14600K, 3500 MHz
134 Seconds * -43%
Intel Core i9-12900K
i9-12900K, 3200 MHz
121.1 Seconds * -29%
AMD Ryzen 9 5950X
R9 5950X, 3400 MHz
112.8 Seconds * -20%
AMD Ryzen 9 7900X
R9 7900X, 4700 MHz
106 Seconds * -13%
AMD Ryzen 9 7945HX
R9 7945HX, 2500 MHz
94 Seconds *
Intel Core i7-14700K
i7-14700K, 2500 MHz
91 Seconds * +3%
AMD Ryzen 9 7950X3D
R9 7950X3D, 4200 MHz
86 Seconds * +9%
AMD Ryzen 9 7950X
R9 7950X, 4500 MHz
85 Seconds * +10%
Intel Core i9-13900K
i9-13900K, 3000 MHz
80 Seconds * +15%
Intel Core i9-14900K
i9-14900K, 3200 MHz
80 Seconds * +15%
wPrime 2.10
32m
Intel Core i9-12900K
i9-12900K, 3200 MHz
4.924 s * -157%
Intel Core i5-12600K
i5-12600K, 2800 MHz
4.725 s * -146%
Intel Core i5-12400F
i5-12400F, 2500 MHz
4.078 s * -113%
Intel Core i5-13400
i5-13400, 2500 MHz
3.474 s * -81%
AMD Ryzen 5 7600X
R5 7600X, 4700 MHz
2.78 s * -45%
AMD Ryzen 9 7940HS
R9 7940HS, 4000 MHz
2.698 s * -41%
AMD Ryzen 7 7840HS
R7 7840HS, 3800 MHz
2.626 s * -37%
AMD Ryzen 5 9600X
Ryzen 5 9600X, 3900 MHz
2.617 s * -37%
AMD Ryzen 9 5950X
R9 5950X, 3400 MHz
2.538 s * -32%
Intel Core i5-13600K
i5-13600K, 3500 MHz
2.527 s * -32%
AMD Ryzen 7 7800X3D
R7 7800X3D, 4200 MHz
2.435 s * -27%
Intel Core i5-14600K
i5-14600K, 3500 MHz
2.39 s * -25%
AMD Ryzen 7 7745HX
R7 7745HX, 3600 MHz
2.275 s * -19%
Intel Core i7-14700K
i7-14700K, 2500 MHz
2.147 s * -12%
Intel Core i9-14900K
i9-14900K, 3200 MHz
2.07 s * -8%
AMD Ryzen 9 7950X3D
R9 7950X3D, 4200 MHz
2.007 s * -5%
AMD Ryzen 9 7945HX
R9 7945HX, 2500 MHz
1.917 s *
Intel Core i9-13900K
i9-13900K, 3000 MHz
1.818 s * +5%
AMD Ryzen 9 7900X
R9 7900X, 4700 MHz
1.781 s * +7%
AMD Ryzen 9 7950X
R9 7950X, 4500 MHz
1.669 s * +13%
1024m
Intel Core i5-13400
i5-13400, 2500 MHz
452.309 s * -1209%
Intel Core i5-12600K
i5-12600K, 2800 MHz
202.7 s * -486%
Intel Core i9-12900K
i9-12900K, 3200 MHz
190.6 s * -451%
Intel Core i5-13600K
i5-13600K, 3500 MHz
177.592 s * -414%
Intel Core i5-14600K
i5-14600K, 3500 MHz
158.77 s * -359%
Intel Core i5-12400F
i5-12400F, 2500 MHz
112.849 s * -227%
Intel Core i7-14700K
i7-14700K, 2500 MHz
109.801 s * -218%
Intel Core i9-13900K
i9-13900K, 3000 MHz
79.738 s * -131%
AMD Ryzen 5 7600X
R5 7600X, 4700 MHz
74.491 s * -116%
Intel Core i9-14900K
i9-14900K, 3200 MHz
74.47 s * -115%
AMD Ryzen 7 7840HS
R7 7840HS, 3800 MHz
72.819 s * -111%
AMD Ryzen 5 9600X
Ryzen 5 9600X, 3900 MHz
72.546 s * -110%
AMD Ryzen 9 7940HS
R9 7940HS, 4000 MHz
66.801 s * -93%
AMD Ryzen 9 5950X
R9 5950X, 3400 MHz
64.9 s * -88%
AMD Ryzen 7 7800X3D
R7 7800X3D, 4200 MHz
62.733 s * -82%
AMD Ryzen 7 7745HX
R7 7745HX, 3600 MHz
60.675 s * -76%
AMD Ryzen 9 7900X
R9 7900X, 4700 MHz
39.954 s * -16%
AMD Ryzen 9 7945HX
R9 7945HX, 2500 MHz
34.561 s *
AMD Ryzen 9 7950X3D
R9 7950X3D, 4200 MHz
33.879 s * +2%
AMD Ryzen 9 7950X
R9 7950X, 4500 MHz
30.811 s * +11%
X264 HD Benchmark 4.0
Pass 1
Intel Core i9-14900K
i9-14900K, 3200 MHz
433.5 (424min - 434max) fps +15%
Intel Core i7-14700K
i7-14700K, 2500 MHz
419 (415min - 420max) fps +11%
Intel Core i9-13900K
i9-13900K, 3000 MHz
412 (410min - 417max) fps +9%
Intel Core i5-14600K
i5-14600K, 3500 MHz
411 (410min - 412max) fps +9%
AMD Ryzen 9 7950X3D
R9 7950X3D, 4200 MHz
392.5 (391min - 397max) fps +4%
Intel Core i5-13600K
i5-13600K, 3500 MHz
388 (386min - 388max) fps +3%
AMD Ryzen 9 7950X
R9 7950X, 4500 MHz
379.5 (378min - 385max) fps +1%
AMD Ryzen 9 7945HX
R9 7945HX, 2500 MHz
377 (375min - 380max) fps
AMD Ryzen 9 7900X
R9 7900X, 4700 MHz
376 (369min - 378max) fps 0%
Intel Core i9-12900K
i9-12900K, 3200 MHz
368.5 (366min - 369max) fps -2%
AMD Ryzen 5 7600X
R5 7600X, 4700 MHz
367 (363min - 371max) fps -3%
AMD Ryzen 5 9600X
Ryzen 5 9600X, 3900 MHz
364 (361min - 367max) fps -3%
AMD Ryzen 7 7745HX
R7 7745HX, 3600 MHz
358.5 (356min - 366max) fps -5%
AMD Ryzen 7 7800X3D
R7 7800X3D, 4200 MHz
344 (339min - 346max) fps -9%
AMD Ryzen 9 5950X
R9 5950X, 3400 MHz
338.5 (337min - 340max) fps -10%
Intel Core i5-12600K
i5-12600K, 2800 MHz
333.5 (332min - 336max) fps -12%
Intel Core i5-13400
i5-13400, 2500 MHz
311 (310min - 312max) fps -18%
AMD Ryzen 9 7940HS
R9 7940HS, 4000 MHz
304.5 (304min - 306max) fps -19%
AMD Ryzen 7 7840HS
R7 7840HS, 3800 MHz
298 (288min - 300max) fps -21%
Intel Core i5-12400F
i5-12400F, 2500 MHz
252.5 (249min - 256max) fps -33%
Pass 2
Intel Core i9-14900K
i9-14900K, 3200 MHz
286.5 (285min - 287max) fps +18%
Intel Core i9-13900K
i9-13900K, 3000 MHz
267 (266min - 271max) fps +10%
AMD Ryzen 9 7950X
R9 7950X, 4500 MHz
266.5 (263min - 267max) fps +10%
AMD Ryzen 9 7950X3D
R9 7950X3D, 4200 MHz
265.5 (263min - 266max) fps +9%
Intel Core i7-14700K
i7-14700K, 2500 MHz
261 (259min - 262max) fps +7%
AMD Ryzen 9 7945HX
R9 7945HX, 2500 MHz
243 (242min - 244max) fps
AMD Ryzen 9 7900X
R9 7900X, 4700 MHz
241 (240min - 242max) fps -1%
AMD Ryzen 9 5950X
R9 5950X, 3400 MHz
221 (220min - 221max) fps -9%
Intel Core i5-14600K
i5-14600K, 3500 MHz
209 (208min - 209max) fps -14%
Intel Core i9-12900K
i9-12900K, 3200 MHz
206 (206min - 206max) fps -15%
Intel Core i5-13600K
i5-13600K, 3500 MHz
199 (198.5min - 199.4max) fps -18%
AMD Ryzen 7 7745HX
R7 7745HX, 3600 MHz
173.25 (172.2min - 174.1max) fps -29%
AMD Ryzen 7 7800X3D
R7 7800X3D, 4200 MHz
169.25 (169.1min - 170max) fps -30%
AMD Ryzen 5 9600X
Ryzen 5 9600X, 3900 MHz
154 (153.4min - 154.3max) fps -37%
AMD Ryzen 9 7940HS
R9 7940HS, 4000 MHz
150.8 (150.7min - 152.5max) fps -38%
AMD Ryzen 7 7840HS
R7 7840HS, 3800 MHz
149.3 (148.8min - 149.8max) fps -39%
Intel Core i5-12600K
i5-12600K, 2800 MHz
148 (147min - 148max) fps -39%
AMD Ryzen 5 7600X
R5 7600X, 4700 MHz
147.8 (147.7min - 147.9max) fps -39%
Intel Core i5-13400
i5-13400, 2500 MHz
135.8 (135.7min - 135.9max) fps -44%
Intel Core i5-12400F
i5-12400F, 2500 MHz
101.35 (101.1min - 101.5max) fps -58%
WinRAR - Result
AMD Ryzen 9 7900X
R9 7900X, 4700 MHz
17225 KB/s +13%
AMD Ryzen 7 7800X3D
R7 7800X3D, 4200 MHz
16585 KB/s +9%
AMD Ryzen 9 7950X
R9 7950X, 4500 MHz
16351 KB/s +7%
AMD Ryzen 5 7600X
R5 7600X, 4700 MHz
16178 KB/s +6%
Intel Core i9-14900K
i9-14900K, 3200 MHz
16108 KB/s +6%
AMD Ryzen 9 7950X3D
R9 7950X3D, 4200 MHz
15779 KB/s +4%
AMD Ryzen 9 7945HX
R9 7945HX, 2500 MHz
15242 KB/s
Intel Core i9-13900K
i9-13900K, 3000 MHz
14836 KB/s -3%
AMD Ryzen 5 9600X
Ryzen 5 9600X, 3900 MHz
14819 KB/s -3%
AMD Ryzen 7 7745HX
R7 7745HX, 3600 MHz
14476 KB/s -5%
Intel Core i7-14700K
i7-14700K, 2500 MHz
12800 KB/s -16%
AMD Ryzen 9 5950X
R9 5950X, 3400 MHz
12503 KB/s -18%
Intel Core i5-14600K
i5-14600K, 3500 MHz
11491 KB/s -25%
Intel Core i5-13600K
i5-13600K, 3500 MHz
10937 KB/s -28%
Intel Core i9-12900K
i9-12900K, 3200 MHz
10792 KB/s -29%
Intel Core i5-13400
i5-13400, 2500 MHz
7979 KB/s -48%
Intel Core i5-12400F
i5-12400F, 2500 MHz
7816 KB/s -49%
AMD Ryzen 7 7840HS
R7 7840HS, 3800 MHz
7699 KB/s -49%
AMD Ryzen 9 7940HS
R9 7940HS, 4000 MHz
7439 KB/s -51%
Intel Core i5-12600K
i5-12600K, 2800 MHz
6239 KB/s -59%
TrueCrypt
AES Mean 100MB
AMD Ryzen 9 7950X
R9 7950X, 4500 MHz
30.7 GB/s +11%
AMD Ryzen 9 7945HX
R9 7945HX, 2500 MHz
27.7 GB/s
Intel Core i9-13900K
i9-13900K, 3000 MHz
27 GB/s -3%
AMD Ryzen 9 5950X
R9 5950X, 3400 MHz
26.9 GB/s -3%
AMD Ryzen 9 7950X3D
R9 7950X3D, 4200 MHz
26.9 GB/s -3%
Intel Core i9-14900K
i9-14900K, 3200 MHz
26.7 GB/s -4%
Intel Core i7-14700K
i7-14700K, 2500 MHz
25.6 GB/s -8%
Intel Core i5-14600K
i5-14600K, 3500 MHz
19.5 GB/s -30%
Intel Core i5-13600K
i5-13600K, 3500 MHz
18.8 GB/s -32%
Intel Core i9-12900K
i9-12900K, 3200 MHz
18.5 GB/s -33%
AMD Ryzen 7 7745HX
R7 7745HX, 3600 MHz
16.4 GB/s -41%
AMD Ryzen 7 7800X3D
R7 7800X3D, 4200 MHz
15.3 GB/s -45%
AMD Ryzen 7 7840HS
R7 7840HS, 3800 MHz
14.9 GB/s -46%
AMD Ryzen 9 7900X
R9 7900X, 4700 MHz
14.8 GB/s -47%
AMD Ryzen 9 7940HS
R9 7940HS, 4000 MHz
14.8 GB/s -47%
AMD Ryzen 5 9600X
Ryzen 5 9600X, 3900 MHz
13.4 GB/s -52%
AMD Ryzen 5 7600X
R5 7600X, 4700 MHz
13.2 GB/s -52%
Intel Core i5-12600K
i5-12600K, 2800 MHz
12.8 GB/s -54%
Intel Core i5-13400
i5-13400, 2500 MHz
11.8 GB/s -57%
Intel Core i5-12400F
i5-12400F, 2500 MHz
9.3 GB/s -66%
Twofish Mean 100MB
Intel Core i9-14900K
i9-14900K, 3200 MHz
5.8 GB/s +41%
Intel Core i9-13900K
i9-13900K, 3000 MHz
5.4 GB/s +32%
Intel Core i7-14700K
i7-14700K, 2500 MHz
4.6 GB/s +12%
AMD Ryzen 9 7950X
R9 7950X, 4500 MHz
4.5 GB/s +10%
AMD Ryzen 9 7950X3D
R9 7950X3D, 4200 MHz
4.2 GB/s +2%
AMD Ryzen 9 7945HX
R9 7945HX, 2500 MHz
4.1 GB/s
AMD Ryzen 9 5950X
R9 5950X, 3400 MHz
3.7 GB/s -10%
Intel Core i9-12900K
i9-12900K, 3200 MHz
3.7 GB/s -10%
Intel Core i5-14600K
i5-14600K, 3500 MHz
3.4 GB/s -17%
Intel Core i5-13600K
i5-13600K, 3500 MHz
3.1 GB/s -24%
AMD Ryzen 9 7900X
R9 7900X, 4700 MHz
2.8 GB/s -32%
Intel Core i5-12600K
i5-12600K, 2800 MHz
2.2 GB/s -46%
AMD Ryzen 7 7745HX
R7 7745HX, 3600 MHz
2.2 GB/s -46%
AMD Ryzen 5 9600X
Ryzen 5 9600X, 3900 MHz
2.2 GB/s -46%
AMD Ryzen 7 7800X3D
R7 7800X3D, 4200 MHz
2.1 GB/s -49%
AMD Ryzen 9 7940HS
R9 7940HS, 4000 MHz
2.1 GB/s -49%
AMD Ryzen 7 7840HS
R7 7840HS, 3800 MHz
2.1 GB/s -49%
Intel Core i5-13400
i5-13400, 2500 MHz
2 GB/s -51%
AMD Ryzen 5 7600X
R5 7600X, 4700 MHz
1.8 GB/s -56%
Intel Core i5-12400F
i5-12400F, 2500 MHz
1.4 GB/s -66%
Serpent Mean 100MB
Intel Core i9-13900K
i9-13900K, 3000 MHz
3 GB/s +15%
AMD Ryzen 9 7950X
R9 7950X, 4500 MHz
2.8 GB/s +8%
AMD Ryzen 9 7950X3D
R9 7950X3D, 4200 MHz
2.8 GB/s +8%
Intel Core i9-14900K
i9-14900K, 3200 MHz
2.8 GB/s +8%
Intel Core i7-14700K
i7-14700K, 2500 MHz
2.6 GB/s 0%
AMD Ryzen 9 7945HX
R9 7945HX, 2500 MHz
2.6 GB/s
AMD Ryzen 9 5950X
R9 5950X, 3400 MHz
2.4 GB/s -8%
Intel Core i9-12900K
i9-12900K, 3200 MHz
1.9 GB/s -27%
Intel Core i5-14600K
i5-14600K, 3500 MHz
1.8 GB/s -31%
Intel Core i5-13600K
i5-13600K, 3500 MHz
1.7 GB/s -35%
AMD Ryzen 9 7900X
R9 7900X, 4700 MHz
1.5 GB/s -42%
AMD Ryzen 9 7940HS
R9 7940HS, 4000 MHz
1.4 GB/s -46%
AMD Ryzen 7 7745HX
R7 7745HX, 3600 MHz
1.4 GB/s -46%
AMD Ryzen 5 9600X
Ryzen 5 9600X, 3900 MHz
1.4 GB/s -46%
Intel Core i5-12600K
i5-12600K, 2800 MHz
1.3 GB/s -50%
AMD Ryzen 7 7800X3D
R7 7800X3D, 4200 MHz
1.3 GB/s -50%
AMD Ryzen 7 7840HS
R7 7840HS, 3800 MHz
1.3 GB/s -50%
Intel Core i5-13400
i5-13400, 2500 MHz
1.2 GB/s -54%
AMD Ryzen 5 7600X
R5 7600X, 4700 MHz
1.1 GB/s -58%
Intel Core i5-12400F
i5-12400F, 2500 MHz
0.884 GB/s -66%
Geekbench 5.5
Multi-Core
Intel Core i9-14900K
i9-14900K, 3200 MHz
25867 Points +27%
AMD Ryzen 9 7950X
R9 7950X, 4500 MHz
24625 Points +21%
AMD Ryzen 9 7950X3D
R9 7950X3D, 4200 MHz
24343 Points +19%
Intel Core i9-13900K
i9-13900K, 3000 MHz
24157 Points +18%
Intel Core i7-14700K
i7-14700K, 2500 MHz
23159 Points +14%
AMD Ryzen 9 7945HX
R9 7945HX, 2500 MHz
20394 Points
AMD Ryzen 9 7900X
R9 7900X, 4700 MHz
19987 Points -2%
Intel Core i9-12900K
i9-12900K, 3200 MHz
17854 Points -12%
Intel Core i5-14600K
i5-14600K, 3500 MHz
17516 Points -14%
AMD Ryzen 9 5950X
R9 5950X, 3400 MHz
16891 Points -17%
Intel Core i5-13600K
i5-13600K, 3500 MHz
16651 Points -18%
AMD Ryzen 7 7800X3D
R7 7800X3D, 4200 MHz
14252 Points -30%
AMD Ryzen 7 7745HX
R7 7745HX, 3600 MHz
13462 Points -34%
Intel Core i5-12600K
i5-12600K, 2800 MHz
12797 Points -37%
AMD Ryzen 5 9600X
Ryzen 5 9600X, 3900 MHz
12751 Points -37%
AMD Ryzen 7 7840HS
R7 7840HS, 3800 MHz
12177 Points -40%
Intel Core i5-13400
i5-13400, 2500 MHz
12107 Points -41%
AMD Ryzen 5 7600X
R5 7600X, 4700 MHz
11917 Points -42%
AMD Ryzen 9 7940HS
R9 7940HS, 4000 MHz
11564 Points -43%
Intel Core i5-12400F
i5-12400F, 2500 MHz
9517 Points -53%
Single-Core
AMD Ryzen 5 9600X
Ryzen 5 9600X, 3900 MHz
2523 Points +17%
AMD Ryzen 9 7950X
R9 7950X, 4500 MHz
2311 Points +7%
AMD Ryzen 9 7950X3D
R9 7950X3D, 4200 MHz
2311 Points +7%
Intel Core i9-13900K
i9-13900K, 3000 MHz
2290 Points +6%
AMD Ryzen 9 7900X
R9 7900X, 4700 MHz
2274 Points +5%
Intel Core i9-14900K
i9-14900K, 3200 MHz
2243 Points +4%
AMD Ryzen 5 7600X
R5 7600X, 4700 MHz
2205 Points +2%
AMD Ryzen 9 7945HX
R9 7945HX, 2500 MHz
2158 Points
Intel Core i7-14700K
i7-14700K, 2500 MHz
2121 Points -2%
AMD Ryzen 7 7745HX
R7 7745HX, 3600 MHz
2067 Points -4%
Intel Core i9-12900K
i9-12900K, 3200 MHz
2042 Points -5%
AMD Ryzen 7 7800X3D
R7 7800X3D, 4200 MHz
2027 Points -6%
Intel Core i5-14600K
i5-14600K, 3500 MHz
2017 Points -7%
AMD Ryzen 9 7940HS
R9 7940HS, 4000 MHz
1975 Points -8%
Intel Core i5-13600K
i5-13600K, 3500 MHz
1967 Points -9%
AMD Ryzen 7 7840HS
R7 7840HS, 3800 MHz
1943 Points -10%
Intel Core i5-12600K
i5-12600K, 2800 MHz
1904 Points -12%
Intel Core i5-13400
i5-13400, 2500 MHz
1795 Points -17%
Intel Core i5-12400F
i5-12400F, 2500 MHz
1742 Points -19%
AMD Ryzen 9 5950X
R9 5950X, 3400 MHz
1682 Points -22%
Geekbench 5.0
5.0 Multi-Core
Intel Core i9-14900K
i9-14900K, 3200 MHz
25459 Points +24%
AMD Ryzen 9 7950X
R9 7950X, 4500 MHz
24479 Points +19%
Intel Core i9-13900K
i9-13900K, 3000 MHz
24021 Points +17%
AMD Ryzen 9 7950X3D
R9 7950X3D, 4200 MHz
23720 Points +15%
Intel Core i7-14700K
i7-14700K, 2500 MHz
22756 Points +11%
AMD Ryzen 9 7945HX
R9 7945HX, 2500 MHz
20593 Points
AMD Ryzen 9 7900X
R9 7900X, 4700 MHz
19975 Points -3%
Intel Core i9-12900K
i9-12900K, 3200 MHz
17959 Points -13%
Intel Core i5-14600K
i5-14600K, 3500 MHz
17374 Points -16%
Intel Core i5-13600K
i5-13600K, 3500 MHz
16635 Points -19%
AMD Ryzen 9 5950X
R9 5950X, 3400 MHz
16570 Points -20%
AMD Ryzen 7 7800X3D
R7 7800X3D, 4200 MHz
13888 Points -33%
AMD Ryzen 7 7745HX
R7 7745HX, 3600 MHz
13342 Points -35%
Intel Core i5-12600K
i5-12600K, 2800 MHz
12746 Points -38%
AMD Ryzen 5 9600X
Ryzen 5 9600X, 3900 MHz
12556 Points -39%
AMD Ryzen 7 7840HS
R7 7840HS, 3800 MHz
11933 Points -42%
AMD Ryzen 5 7600X
R5 7600X, 4700 MHz
11880 Points -42%
Intel Core i5-13400
i5-13400, 2500 MHz
11801 Points -43%
AMD Ryzen 9 7940HS
R9 7940HS, 4000 MHz
11232 Points -45%
Intel Core i5-12400F
i5-12400F, 2500 MHz
9368 Points -55%
5.0 Single-Core
AMD Ryzen 5 9600X
Ryzen 5 9600X, 3900 MHz
2397 Points +14%
Intel Core i9-14900K
i9-14900K, 3200 MHz
2272 Points +8%
AMD Ryzen 9 7950X
R9 7950X, 4500 MHz
2222 Points +6%
Intel Core i9-13900K
i9-13900K, 3000 MHz
2214 Points +6%
AMD Ryzen 9 7900X
R9 7900X, 4700 MHz
2194 Points +5%
AMD Ryzen 9 7950X3D
R9 7950X3D, 4200 MHz
2183 Points +4%
AMD Ryzen 5 7600X
R5 7600X, 4700 MHz
2126 Points +1%
AMD Ryzen 9 7945HX
R9 7945HX, 2500 MHz
2095 Points
Intel Core i7-14700K
i7-14700K, 2500 MHz
2045 Points -2%
Intel Core i5-14600K
i5-14600K, 3500 MHz
2004 Points -4%
AMD Ryzen 7 7745HX
R7 7745HX, 3600 MHz
1989 Points -5%
Intel Core i9-12900K
i9-12900K, 3200 MHz
1968 Points -6%
AMD Ryzen 7 7800X3D
R7 7800X3D, 4200 MHz
1938 Points -7%
Intel Core i5-13600K
i5-13600K, 3500 MHz
1931 Points -8%
AMD Ryzen 7 7840HS
R7 7840HS, 3800 MHz
1900 Points -9%
AMD Ryzen 9 7940HS
R9 7940HS, 4000 MHz
1898 Points -9%
Intel Core i5-12600K
i5-12600K, 2800 MHz
1821 Points -13%
Intel Core i5-13400
i5-13400, 2500 MHz
1706 Points -19%
AMD Ryzen 9 5950X
R9 5950X, 3400 MHz
1683 Points -20%
Intel Core i5-12400F
i5-12400F, 2500 MHz
1673 Points -20%
Geekbench 4.4
64 Bit Single-Core Score
Intel Core i9-14900K
i9-14900K, 3200 MHz
9890 Points +15%
AMD Ryzen 5 9600X
Ryzen 5 9600X, 3900 MHz
9757 Points +13%
Intel Core i9-13900K
i9-13900K, 3000 MHz
9598 Points +11%
AMD Ryzen 9 7950X
R9 7950X, 4500 MHz
9322 Points +8%
Intel Core i7-14700K
i7-14700K, 2500 MHz
9304 Points +8%
AMD Ryzen 9 7950X3D
R9 7950X3D, 4200 MHz
9240 Points +7%
AMD Ryzen 9 7900X
R9 7900X, 4700 MHz
9193 Points +7%
AMD Ryzen 7 7800X3D
R7 7800X3D, 4200 MHz
9097 Points +6%
AMD Ryzen 5 7600X
R5 7600X, 4700 MHz
8926 Points +4%
Intel Core i5-14600K
i5-14600K, 3500 MHz
8904 Points +3%
Intel Core i9-12900K
i9-12900K, 3200 MHz
8665 Points +1%
Intel Core i5-13600K
i5-13600K, 3500 MHz
8618 Points 0%
AMD Ryzen 9 7945HX
R9 7945HX, 2500 MHz
8613 Points
AMD Ryzen 7 7745HX
R7 7745HX, 3600 MHz
8243 Points -4%
Intel Core i5-12600K
i5-12600K, 2800 MHz
8223 Points -5%
AMD Ryzen 7 7840HS
R7 7840HS, 3800 MHz
8048 Points -7%
AMD Ryzen 9 7940HS
R9 7940HS, 4000 MHz
7904 Points -8%
Intel Core i5-13400
i5-13400, 2500 MHz
7683 Points -11%
Intel Core i5-12400F
i5-12400F, 2500 MHz
7548 Points -12%
AMD Ryzen 9 5950X
R9 5950X, 3400 MHz
7216 Points -16%
64 Bit Multi-Core Score
AMD Ryzen 9 7950X
R9 7950X, 4500 MHz
89678 Points +18%
Intel Core i9-14900K
i9-14900K, 3200 MHz
89177 Points +17%
AMD Ryzen 9 7950X3D
R9 7950X3D, 4200 MHz
87922 Points +15%
Intel Core i9-13900K
i9-13900K, 3000 MHz
86695 Points +14%
Intel Core i7-14700K
i7-14700K, 2500 MHz
79501 Points +4%
AMD Ryzen 9 7945HX
R9 7945HX, 2500 MHz
76265 Points
AMD Ryzen 9 7900X
R9 7900X, 4700 MHz
74731 Points -2%
Intel Core i5-14600K
i5-14600K, 3500 MHz
64035 Points -16%
Intel Core i9-12900K
i9-12900K, 3200 MHz
63583 Points -17%
AMD Ryzen 9 5950X
R9 5950X, 3400 MHz
63233 Points -17%
Intel Core i5-13600K
i5-13600K, 3500 MHz
60407 Points -21%
AMD Ryzen 7 7800X3D
R7 7800X3D, 4200 MHz
54840 Points -28%
AMD Ryzen 7 7745HX
R7 7745HX, 3600 MHz
54665 Points -28%
AMD Ryzen 5 9600X
Ryzen 5 9600X, 3900 MHz
51644 Points -32%
AMD Ryzen 7 7840HS
R7 7840HS, 3800 MHz
48743 Points -36%
AMD Ryzen 5 7600X
R5 7600X, 4700 MHz
47407 Points -38%
Intel Core i5-12600K
i5-12600K, 2800 MHz
46557 Points -39%
AMD Ryzen 9 7940HS
R9 7940HS, 4000 MHz
46270 Points -39%
Intel Core i5-13400
i5-13400, 2500 MHz
42509 Points -44%
Intel Core i5-12400F
i5-12400F, 2500 MHz
35098 Points -54%
3DMark 11 - 1280x720 Performance Physics
AMD Ryzen 9 7950X3D
R9 7950X3D, 4200 MHz
36991 Points +36%
AMD Ryzen 7 7800X3D
R7 7800X3D, 4200 MHz
35127 Points +30%
Intel Core i7-14700K
i7-14700K, 2500 MHz
32336 Points +19%
Intel Core i9-13900K
i9-13900K, 3000 MHz
32273 Points +19%
Intel Core i9-14900K
i9-14900K, 3200 MHz
32188 Points +19%
Intel Core i5-14600K
i5-14600K, 3500 MHz
31641 Points +17%
Intel Core i5-13600K
i5-13600K, 3500 MHz
30480 Points +12%
AMD Ryzen 9 7900X
R9 7900X, 4700 MHz
28618 Points +6%
AMD Ryzen 9 7950X
R9 7950X, 4500 MHz
28618 Points +6%
Intel Core i9-12900K
i9-12900K, 3200 MHz
28211 Points +4%
AMD Ryzen 9 7945HX
R9 7945HX, 2500 MHz
27102 Points
AMD Ryzen 7 7745HX
R7 7745HX, 3600 MHz
26321 Points -3%
AMD Ryzen 5 9600X
Ryzen 5 9600X, 3900 MHz
25717 Points -5%
AMD Ryzen 5 7600X
R5 7600X, 4700 MHz
25396 Points -6%
AMD Ryzen 9 5950X
R9 5950X, 3400 MHz
25367 Points -6%
Intel Core i5-12600K
i5-12600K, 2800 MHz
25017 Points -8%
Intel Core i5-13400
i5-13400, 2500 MHz
23120 Points -15%
AMD Ryzen 7 7840HS
R7 7840HS, 3800 MHz
22960 Points -15%
AMD Ryzen 9 7940HS
R9 7940HS, 4000 MHz
21848 Points -19%
Intel Core i5-12400F
i5-12400F, 2500 MHz
19436 Points -28%
7-Zip 18.03
7z b 4
AMD Ryzen 9 7950X
R9 7950X, 4500 MHz
161724 MIPS +15%
AMD Ryzen 9 7950X3D
R9 7950X3D, 4200 MHz
159341 MIPS +13%
Intel Core i9-14900K
i9-14900K, 3200 MHz
149570 MIPS +6%
Intel Core i9-13900K
i9-13900K, 3000 MHz
147068 MIPS +5%
AMD Ryzen 9 7945HX
R9 7945HX, 2500 MHz
140613 MIPS
Intel Core i7-14700K
i7-14700K, 2500 MHz
135648 MIPS -4%
AMD Ryzen 9 5950X
R9 5950X, 3400 MHz
127792 MIPS -9%
AMD Ryzen 9 7900X
R9 7900X, 4700 MHz
124975 MIPS -11%
Intel Core i9-12900K
i9-12900K, 3200 MHz
97671 MIPS -31%
Intel Core i5-14600K
i5-14600K, 3500 MHz
93235 MIPS -34%
Intel Core i5-13600K
i5-13600K, 3500 MHz
89647 MIPS -36%
AMD Ryzen 7 7800X3D
R7 7800X3D, 4200 MHz
85067 MIPS -40%
AMD Ryzen 7 7745HX
R7 7745HX, 3600 MHz
83268 MIPS -41%
AMD Ryzen 7 7840HS
R7 7840HS, 3800 MHz
72684 MIPS -48%
AMD Ryzen 9 7940HS
R9 7940HS, 4000 MHz
70019 MIPS -50%
AMD Ryzen 5 7600X
R5 7600X, 4700 MHz
69291 MIPS -51%
AMD Ryzen 5 9600X
Ryzen 5 9600X, 3900 MHz
68220 MIPS -51%
Intel Core i5-12600K
i5-12600K, 2800 MHz
64260 MIPS -54%
Intel Core i5-13400
i5-13400, 2500 MHz
59510 MIPS -58%
Intel Core i5-12400F
i5-12400F, 2500 MHz
45043 MIPS -68%
7z b 4 -mmt1
AMD Ryzen 9 7950X
R9 7950X, 4500 MHz
8365 MIPS +8%
AMD Ryzen 9 7950X3D
R9 7950X3D, 4200 MHz
8321 MIPS +8%
AMD Ryzen 9 7900X
R9 7900X, 4700 MHz
8282 MIPS +7%
AMD Ryzen 7 7800X3D
R7 7800X3D, 4200 MHz
8235 MIPS +7%
AMD Ryzen 5 7600X
R5 7600X, 4700 MHz
8063 MIPS +5%
AMD Ryzen 5 9600X
Ryzen 5 9600X, 3900 MHz
7796 MIPS +1%
Intel Core i9-14900K
i9-14900K, 3200 MHz
7772 MIPS +1%
AMD Ryzen 9 7945HX
R9 7945HX, 2500 MHz
7711 MIPS
Intel Core i7-14700K
i7-14700K, 2500 MHz
7351 MIPS -5%
AMD Ryzen 7 7745HX
R7 7745HX, 3600 MHz
7275 MIPS -6%
Intel Core i9-13900K
i9-13900K, 3000 MHz
7272 MIPS -6%
AMD Ryzen 9 5950X
R9 5950X, 3400 MHz
6974 MIPS -10%
Intel Core i5-14600K
i5-14600K, 3500 MHz
6910 MIPS -10%
AMD Ryzen 9 7940HS
R9 7940HS, 4000 MHz
6683 MIPS -13%
Intel Core i9-12900K
i9-12900K, 3200 MHz
6571 MIPS -15%
AMD Ryzen 7 7840HS
R7 7840HS, 3800 MHz
6563 MIPS -15%
Intel Core i5-13600K
i5-13600K, 3500 MHz
6502 MIPS -16%
Intel Core i5-12600K
i5-12600K, 2800 MHz
5944 MIPS -23%
Intel Core i5-13400
i5-13400, 2500 MHz
5829 MIPS -24%
Intel Core i5-12400F
i5-12400F, 2500 MHz
5476 MIPS -29%
HWBOT x265 Benchmark v2.2 - 4k Preset
AMD Ryzen 9 7950X
R9 7950X, 4500 MHz
44.4 fps +18%
Intel Core i9-14900K
i9-14900K, 3200 MHz
42.8 fps +14%
Intel Core i9-13900K
i9-13900K, 3000 MHz
42.6 fps +13%
AMD Ryzen 9 7950X3D
R9 7950X3D, 4200 MHz
42.4 fps +13%
AMD Ryzen 9 7945HX
R9 7945HX, 2500 MHz
37.6 fps
Intel Core i7-14700K
i7-14700K, 2500 MHz
36.8 fps -2%
AMD Ryzen 9 7900X
R9 7900X, 4700 MHz
36.2 fps -4%
AMD Ryzen 9 5950X
R9 5950X, 3400 MHz
31.8 fps -15%
Intel Core i5-12600K
i5-12600K, 2800 MHz
30.1 fps -20%
Intel Core i9-12900K
i9-12900K, 3200 MHz
30 fps -20%
Intel Core i5-14600K
i5-14600K, 3500 MHz
28.6 fps -24%
Intel Core i5-13600K
i5-13600K, 3500 MHz
27.6 fps -27%
AMD Ryzen 7 7800X3D
R7 7800X3D, 4200 MHz
24.4 fps -35%
AMD Ryzen 7 7745HX
R7 7745HX, 3600 MHz
24.1 fps -36%
AMD Ryzen 5 9600X
Ryzen 5 9600X, 3900 MHz
23.2 fps -38%
AMD Ryzen 5 7600X
R5 7600X, 4700 MHz
21.1 fps -44%
AMD Ryzen 7 7840HS
R7 7840HS, 3800 MHz
20.9 fps -44%
AMD Ryzen 9 7940HS
R9 7940HS, 4000 MHz
20.7 fps -45%
Intel Core i5-13400
i5-13400, 2500 MHz
19.1 fps -49%
Intel Core i5-12400F
i5-12400F, 2500 MHz
15.2 fps -60%
R Benchmark 2.5 - Overall mean
Intel Core i5-12400F
i5-12400F, 2500 MHz
0.4837 sec * -25%
Intel Core i5-13400
i5-13400, 2500 MHz
0.4654 sec * -20%
AMD Ryzen 9 5950X
R9 5950X, 3400 MHz
0.4556 sec * -17%
Intel Core i5-12600K
i5-12600K, 2800 MHz
0.4456 sec * -15%
AMD Ryzen 7 7840HS
R7 7840HS, 3800 MHz
0.4354 sec * -12%
Intel Core i9-12900K
i9-12900K, 3200 MHz
0.4216 sec * -9%
AMD Ryzen 9 7940HS
R9 7940HS, 4000 MHz
0.4192 sec * -8%
AMD Ryzen 7 7800X3D
R7 7800X3D, 4200 MHz
0.4152 sec * -7%
AMD Ryzen 7 7745HX
R7 7745HX, 3600 MHz
0.4141 sec * -7%
Intel Core i5-13600K
i5-13600K, 3500 MHz
0.405 sec * -4%
Intel Core i5-14600K
i5-14600K, 3500 MHz
0.3937 sec * -1%
AMD Ryzen 9 7945HX
R9 7945HX, 2500 MHz
0.3884 sec *
Intel Core i7-14700K
i7-14700K, 2500 MHz
0.3826 sec * +1%
AMD Ryzen 5 7600X
R5 7600X, 4700 MHz
0.3749 sec * +3%
AMD Ryzen 9 7900X
R9 7900X, 4700 MHz
0.3736 sec * +4%
AMD Ryzen 9 7950X3D
R9 7950X3D, 4200 MHz
0.372 sec * +4%
AMD Ryzen 9 7950X
R9 7950X, 4500 MHz
0.3682 sec * +5%
Intel Core i9-13900K
i9-13900K, 3000 MHz
0.3539 sec * +9%
Intel Core i9-14900K
i9-14900K, 3200 MHz
0.345 sec * +11%
AMD Ryzen 5 9600X
Ryzen 5 9600X, 3900 MHz
0.3389 sec * +13%
LibreOffice - 20 Documents To PDF
Intel Core i5-12600K
i5-12600K, 2800 MHz
71.8 s * -102%
AMD Ryzen 7 7840HS
R7 7840HS, 3800 MHz
53.9 s * -52%
Intel Core i5-12400F
i5-12400F, 2500 MHz
46.5 s * -31%
AMD Ryzen 5 9600X
Ryzen 5 9600X, 3900 MHz
46.4 s * -31%
AMD Ryzen 9 7940HS
R9 7940HS, 4000 MHz
46.3 s * -30%
AMD Ryzen 9 5950X
R9 5950X, 3400 MHz
45.97 s * -29%
AMD Ryzen 7 7745HX
R7 7745HX, 3600 MHz
41.4 s * -17%
AMD Ryzen 7 7800X3D
R7 7800X3D, 4200 MHz
40.7 s * -15%
Intel Core i9-12900K
i9-12900K, 3200 MHz
40.6 s * -14%
Intel Core i7-14700K
i7-14700K, 2500 MHz
39.8 s * -12%
Intel Core i5-13400
i5-13400, 2500 MHz
38.7 s * -9%
AMD Ryzen 9 7950X3D
R9 7950X3D, 4200 MHz
38.6 s * -9%
AMD Ryzen 5 7600X
R5 7600X, 4700 MHz
36.8 s * -4%
Intel Core i9-13900K
i9-13900K, 3000 MHz
36.6 s * -3%
AMD Ryzen 9 7950X
R9 7950X, 4500 MHz
35.5 s * -0%
AMD Ryzen 9 7945HX
R9 7945HX, 2500 MHz
35.5 s *
Intel Core i5-13600K
i5-13600K, 3500 MHz
35 s * +1%
AMD Ryzen 9 7900X
R9 7900X, 4700 MHz
34.9 s * +2%
Intel Core i9-14900K
i9-14900K, 3200 MHz
32.5 s * +8%
Intel Core i5-14600K
i5-14600K, 3500 MHz
31.9 s * +10%
WebXPRT 3 - Overall
AMD Ryzen 9 7950X3D
R9 7950X3D, 4200 MHz
383 Points +6%
Intel Core i9-14900K
i9-14900K, 3200 MHz
382 Points +6%
AMD Ryzen 9 7900X
R9 7900X, 4700 MHz
371 Points +3%
AMD Ryzen 9 7950X
R9 7950X, 4500 MHz
366 Points +1%
AMD Ryzen 5 9600X
Ryzen 5 9600X, 3900 MHz
364 Points +1%
AMD Ryzen 5 7600X
R5 7600X, 4700 MHz
362 Points 0%
Intel Core i9-13900K
i9-13900K, 3000 MHz
361 Points 0%
AMD Ryzen 9 7945HX
R9 7945HX, 2500 MHz
361 Points
Intel Core i5-14600K
i5-14600K, 3500 MHz
354 Points -2%
AMD Ryzen 7 7800X3D
R7 7800X3D, 4200 MHz
353 Points -2%
AMD Ryzen 7 7745HX
R7 7745HX, 3600 MHz
349 Points -3%
Intel Core i7-14700K
i7-14700K, 2500 MHz
339 Points -6%
Intel Core i5-13600K
i5-13600K, 3500 MHz
333 Points -8%
AMD Ryzen 7 7840HS
R7 7840HS, 3800 MHz
324 Points -10%
Intel Core i9-12900K
i9-12900K, 3200 MHz
320 Points -11%
Intel Core i5-13400
i5-13400, 2500 MHz
306 Points -15%
AMD Ryzen 9 7940HS
R9 7940HS, 4000 MHz
302 Points -16%
Intel Core i5-12600K
i5-12600K, 2800 MHz
293 Points -19%
AMD Ryzen 9 5950X
R9 5950X, 3400 MHz
291 Points -19%
Intel Core i5-12400F
i5-12400F, 2500 MHz
272 Points -25%
Mozilla Kraken 1.1 - Total
Intel Core i5-12400F
i5-12400F, 2500 MHz
573 ms * -28%
AMD Ryzen 9 5950X
R9 5950X, 3400 MHz
558 ms * -25%
Intel Core i5-13400
i5-13400, 2500 MHz
535 ms * -20%
AMD Ryzen 7 7840HS
R7 7840HS, 3800 MHz
517 ms * -16%
Intel Core i5-12600K
i5-12600K, 2800 MHz
511 ms * -15%
AMD Ryzen 7 7800X3D
R7 7800X3D, 4200 MHz
487 ms * -9%
AMD Ryzen 9 7940HS
R9 7940HS, 4000 MHz
487 ms * -9%
Intel Core i9-12900K
i9-12900K, 3200 MHz
481 ms * -8%
AMD Ryzen 7 7745HX
R7 7745HX, 3600 MHz
481 ms * -8%
Intel Core i5-13600K
i5-13600K, 3500 MHz
469 ms * -5%
Intel Core i5-14600K
i5-14600K, 3500 MHz
450 ms * -1%
AMD Ryzen 9 7945HX
R9 7945HX, 2500 MHz
446 ms *
AMD Ryzen 5 7600X
R5 7600X, 4700 MHz
441 ms * +1%
Intel Core i7-14700K
i7-14700K, 2500 MHz
439 ms * +2%
AMD Ryzen 9 7950X3D
R9 7950X3D, 4200 MHz
437 ms * +2%
AMD Ryzen 9 7950X
R9 7950X, 4500 MHz
433 ms * +3%
Intel Core i9-13900K
i9-13900K, 3000 MHz
432 ms * +3%
AMD Ryzen 9 7900X
R9 7900X, 4700 MHz
431 ms * +3%
Intel Core i9-14900K
i9-14900K, 3200 MHz
418 ms * +6%
AMD Ryzen 5 9600X
Ryzen 5 9600X, 3900 MHz
389 ms * +13%
3DMark
1920x1080 Fire Strike Physics
Intel Core i9-14900K
i9-14900K, 3200 MHz
56087 Points +43%
Intel Core i9-13900K
i9-13900K, 3000 MHz
53853 Points +38%
Intel Core i7-14700K
i7-14700K, 2500 MHz
49142 Points +26%
AMD Ryzen 9 7950X3D
R9 7950X3D, 4200 MHz
44787 Points +15%
AMD Ryzen 9 7900X
R9 7900X, 4700 MHz
42682 Points +9%
AMD Ryzen 9 7950X
R9 7950X, 4500 MHz
42682 Points +9%
Intel Core i5-14600K
i5-14600K, 3500 MHz
40164 Points +3%
AMD Ryzen 9 5950X
R9 5950X, 3400 MHz
39600 Points +1%
Intel Core i9-12900K
i9-12900K, 3200 MHz
39112 Points 0%
AMD Ryzen 9 7945HX
R9 7945HX, 2500 MHz
39095 Points
Intel Core i5-13600K
i5-13600K, 3500 MHz
35386 Points -9%
AMD Ryzen 5 9600X
Ryzen 5 9600X, 3900 MHz
33462 Points -14%
AMD Ryzen 7 7800X3D
R7 7800X3D, 4200 MHz
33345 Points -15%
AMD Ryzen 5 7600X
R5 7600X, 4700 MHz
30691 Points -21%
Intel Core i5-12600K
i5-12600K, 2800 MHz
29671 Points -24%
AMD Ryzen 7 7840HS
R7 7840HS, 3800 MHz
28906 Points -26%
AMD Ryzen 9 7940HS
R9 7940HS, 4000 MHz
28247 Points -28%
Intel Core i5-13400
i5-13400, 2500 MHz
27135 Points -31%
Intel Core i5-12400F
i5-12400F, 2500 MHz
24023 Points -39%
AMD Ryzen 7 7745HX
R7 7745HX, 3600 MHz
19932 Points -49%
2560x1440 Time Spy CPU
Intel Core i9-14900K
i9-14900K, 3200 MHz
23721 Points +107%
Intel Core i7-14700K
i7-14700K, 2500 MHz
21541 Points +88%
Intel Core i9-13900K
i9-13900K, 3000 MHz
19392 Points +69%
Intel Core i5-14600K
i5-14600K, 3500 MHz
18768 Points +64%
Intel Core i9-12900K
i9-12900K, 3200 MHz
18431 Points +61%
AMD Ryzen 9 7950X3D
R9 7950X3D, 4200 MHz
17206 Points +50%
Intel Core i5-13600K
i5-13600K, 3500 MHz
17124 Points +49%
AMD Ryzen 9 7900X
R9 7900X, 4700 MHz
16616 Points +45%
AMD Ryzen 9 7950X
R9 7950X, 4500 MHz
16616 Points +45%
AMD Ryzen 7 7800X3D
R7 7800X3D, 4200 MHz
14098 Points +23%
Intel Core i5-12600K
i5-12600K, 2800 MHz
13869 Points +21%
AMD Ryzen 9 5950X
R9 5950X, 3400 MHz
13650 Points +19%
Intel Core i5-13400
i5-13400, 2500 MHz
12948 Points +13%
AMD Ryzen 9 7945HX
R9 7945HX, 2500 MHz
11466 Points
AMD Ryzen 7 7840HS
R7 7840HS, 3800 MHz
11159 Points -3%
AMD Ryzen 7 7745HX
R7 7745HX, 3600 MHz
11051 Points -4%
AMD Ryzen 5 9600X
Ryzen 5 9600X, 3900 MHz
10821 Points -6%
AMD Ryzen 9 7940HS
R9 7940HS, 4000 MHz
10563 Points -8%
AMD Ryzen 5 7600X
R5 7600X, 4700 MHz
10458 Points -9%
Intel Core i5-12400F
i5-12400F, 2500 MHz
9745 Points -15%

* ... Moindre est la valeur, meilleures sont les performances

Résultats Cinebench AMD Ryzen 9 7945HX

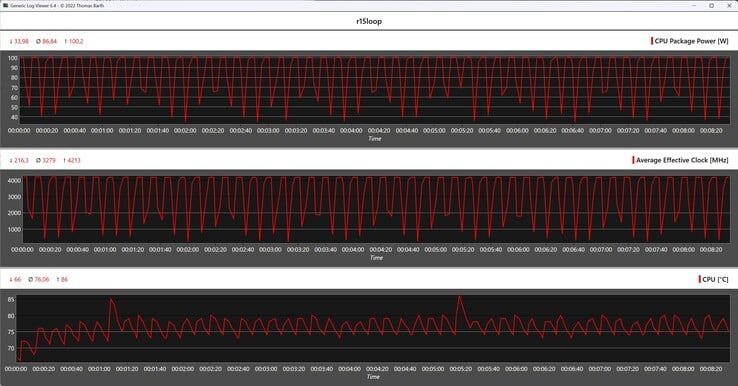
Associée à la carte AMD Ryzen 9 7945HX, la carte mère Minisforum BD790i a parfaitement maîtrisé la boucle continue Cinebench R15. Les performances de ses 16 cœurs sont restées stables au cours des 50 exécutions, ce qui signifie qu'aucune perte de performance n'est à prévoir en cas de charge continue. Le refroidisseur installé en usine a bien fonctionné lors de ce test.

Mesures du processeur pendant la boucle Cinebench R15
2440.22740.23040.23340.23640.23940.24240.24540.24840.25140.25440.25740.26040.2Tooltip
AMD Ryzen 9 7945HX Radeon 610M, R9 7945HX, Kingston KC3000 2048G SKC3000D2048G: Ø5075 (4988.15-5158.63)
Intel Core i9-12900K NVIDIA Titan RTX, i9-12900K, Intel Optane 905P 480GB 2.5: Ø3987 (3920.42-4037.55)
Intel Core i5-12600K NVIDIA Titan RTX, i5-12600K, Intel Optane 905P 480GB 2.5: Ø2545 (2497.35-2570.36)
AMD Ryzen 5 7600X NVIDIA GeForce RTX 3090, R5 7600X: Ø2468 (2440.21-2487.56)
AMD Ryzen 9 7900X NVIDIA GeForce RTX 3090, R9 7900X: Ø4785 (4739.9-4829.17)
AMD Ryzen 9 7950X NVIDIA GeForce RTX 3090, R9 7950X, Corsair MP600: Ø6154 (6136.85-6189.08)
Intel Core i9-13900K NVIDIA GeForce RTX 3090, i9-13900K, Corsair MP600: Ø6182 (6045.95-6213.11)
Intel Core i5-13600K NVIDIA GeForce RTX 3090, i5-13600K, Corsair MP600: Ø3620 (3607.83-3632.07)
AMD Ryzen 7 7840HS Radeon 780M, R7 7840HS, Kingston OM8PGP41024Q-A0: Ø2605 (2564.1-2649.53)
AMD Ryzen 5 9600X NVIDIA GeForce RTX 4090, Ryzen 5 9600X: Ø2623 (2586.99-2654.28)
AMD Ryzen 7 7745HX Radeon 610M, R7 7745HX, Fikwot FN955: Ø2867 (2818.49-2955.3)

Performance du système

Le système de test basé sur le Minisforum BD790i n'a pas toujours été à la hauteur de ses concurrents lors des tests de performance. Néanmoins, les performances du système étaient généralement assez élevées. Le puissant et en même temps relativement frugal AMD Ryzen 9 7945HX ne montre aucune faiblesse dans l'utilisation quotidienne. La combinaison de son SSD NVMe rapide et de sa RAM DDR5 lui laisse une marge de manœuvre suffisante pour maîtriser même les tâches gourmandes en énergie.

Performance Rating - Percent
AMD Ryzen 9 7950X3D, NVIDIA GeForce RTX 4090 -1!
NVIDIA GeForce RTX 4090, R9 7950X3D
97 pt
AMD Ryzen 9 7950X, NVIDIA GeForce RTX 3090
NVIDIA GeForce RTX 3090, R9 7950X, Corsair MP600
96.8 pt
AMD Ryzen 9 7900X, NVIDIA GeForce RTX 3090
NVIDIA GeForce RTX 3090, R9 7900X
96.8 pt
Intel Core i9-14900K, NVIDIA GeForce RTX 4090
NVIDIA GeForce RTX 4090, i9-14900K, WDC PC SN720 SDAQNTW-512G
96.5 pt
AMD Ryzen 5 7600X, NVIDIA GeForce RTX 3090
NVIDIA GeForce RTX 3090, R5 7600X
96.3 pt
Intel Core i9-13900K, NVIDIA GeForce RTX 3090
NVIDIA GeForce RTX 3090, i9-13900K, Corsair MP600
95.7 pt
Intel Core i5-13600K, NVIDIA GeForce RTX 3090
NVIDIA GeForce RTX 3090, i5-13600K, Corsair MP600
93.5 pt
Intel Core i5-14600K, NVIDIA GeForce RTX 4090
NVIDIA GeForce RTX 4090, i5-14600K, WDC PC SN720 SDAQNTW-512G
93.4 pt
AMD Ryzen 7 7800X3D, NVIDIA GeForce RTX 4090
NVIDIA GeForce RTX 4090, R7 7800X3D, Corsair MP600
92.7 pt
AMD Ryzen 9 5950X, NVIDIA Titan RTX
NVIDIA Titan RTX, R9 5950X, Intel Optane 905P 480GB 2.5
87.6 pt
Intel Core i9-12900K, NVIDIA Titan RTX
NVIDIA Titan RTX, i9-12900K, Intel Optane 905P 480GB 2.5
85.4 pt
Intel Core i5-13400, NVIDIA GeForce RTX 4090
NVIDIA GeForce RTX 4090, i5-13400, Intel Optane 905P 480GB 2.5
84.8 pt
AMD Ryzen 9 7945HX, AMD Radeon 610M
Radeon 610M, R9 7945HX, Kingston KC3000 2048G SKC3000D2048G
84.6 pt
Intel Core i5-12600K, NVIDIA Titan RTX
NVIDIA Titan RTX, i5-12600K, Intel Optane 905P 480GB 2.5
83.9 pt
AMD Ryzen 7 7745HX, AMD Radeon 610M
Radeon 610M, R7 7745HX, Fikwot FN955
82.7 pt
AMD Ryzen 7 7840HS, AMD Radeon 780M
Radeon 780M, R7 7840HS, Kingston OM8PGP41024Q-A0
82 pt
AMD Ryzen 9 7940HS, AMD Radeon 780M
Radeon 780M, R9 7940HS, 2x Kingston OM8PGP4256Q-A0 (RAID 0)
76.7 pt
Intel Core i5-12400F, NVIDIA GeForce RTX 4090
NVIDIA GeForce RTX 4090, i5-12400F, Intel Optane 905P 480GB 2.5
75.5 pt
PCMark 10
Score
Intel Core i9-14900K, NVIDIA GeForce RTX 4090
NVIDIA GeForce RTX 4090, i9-14900K, WDC PC SN720 SDAQNTW-512G
10101 Points +44%
AMD Ryzen 9 7900X, NVIDIA GeForce RTX 3090
NVIDIA GeForce RTX 3090, R9 7900X
9911 Points +41%
AMD Ryzen 9 7950X, NVIDIA GeForce RTX 3090
NVIDIA GeForce RTX 3090, R9 7950X, Corsair MP600
9911 Points +41%
Intel Core i9-13900K, NVIDIA GeForce RTX 3090
NVIDIA GeForce RTX 3090, i9-13900K, Corsair MP600
9788 Points +39%
Intel Core i5-14600K, NVIDIA GeForce RTX 4090
NVIDIA GeForce RTX 4090, i5-14600K, WDC PC SN720 SDAQNTW-512G
9587 Points +37%
AMD Ryzen 7 7800X3D, NVIDIA GeForce RTX 4090
NVIDIA GeForce RTX 4090, R7 7800X3D, Corsair MP600
9500 Points +35%
AMD Ryzen 5 7600X, NVIDIA GeForce RTX 3090
NVIDIA GeForce RTX 3090, R5 7600X
9470 Points +35%
Intel Core i5-13600K, NVIDIA GeForce RTX 3090
NVIDIA GeForce RTX 3090, i5-13600K, Corsair MP600
9362 Points +33%
AMD Ryzen 9 5950X, NVIDIA Titan RTX
NVIDIA Titan RTX, R9 5950X, Intel Optane 905P 480GB 2.5
8778 Points +25%
Intel Core i5-13400, NVIDIA GeForce RTX 4090
NVIDIA GeForce RTX 4090, i5-13400, Intel Optane 905P 480GB 2.5
8614 Points +23%
Intel Core i9-12900K, NVIDIA Titan RTX
NVIDIA Titan RTX, i9-12900K, Intel Optane 905P 480GB 2.5
8604 Points +23%
Intel Core i5-12600K, NVIDIA Titan RTX
NVIDIA Titan RTX, i5-12600K, Intel Optane 905P 480GB 2.5
8259 Points +18%
Intel Core i5-12400F, NVIDIA GeForce RTX 4090
NVIDIA GeForce RTX 4090, i5-12400F, Intel Optane 905P 480GB 2.5
7756 Points +10%
AMD Ryzen 7 7840HS, AMD Radeon 780M
Radeon 780M, R7 7840HS, Kingston OM8PGP41024Q-A0
7526 Points +7%
AMD Ryzen 9 7940HS, AMD Radeon 780M
Radeon 780M, R9 7940HS, 2x Kingston OM8PGP4256Q-A0 (RAID 0)
7048 Points 0%
AMD Ryzen 9 7945HX, AMD Radeon 610M
Radeon 610M, R9 7945HX, Kingston KC3000 2048G SKC3000D2048G
7020 Points
AMD Ryzen 7 7745HX, AMD Radeon 610M
Radeon 610M, R7 7745HX, Fikwot FN955
6751 Points -4%
Essentials
Intel Core i9-13900K, NVIDIA GeForce RTX 3090
NVIDIA GeForce RTX 3090, i9-13900K, Corsair MP600
12868 Points +4%
AMD Ryzen 9 7900X, NVIDIA GeForce RTX 3090
NVIDIA GeForce RTX 3090, R9 7900X
12651 Points +2%
AMD Ryzen 9 7950X, NVIDIA GeForce RTX 3090
NVIDIA GeForce RTX 3090, R9 7950X, Corsair MP600
12651 Points +2%
AMD Ryzen 9 7945HX, AMD Radeon 610M
Radeon 610M, R9 7945HX, Kingston KC3000 2048G SKC3000D2048G
12354 Points
Intel Core i9-14900K, NVIDIA GeForce RTX 4090
NVIDIA GeForce RTX 4090, i9-14900K, WDC PC SN720 SDAQNTW-512G
12352 Points 0%
Intel Core i5-13600K, NVIDIA GeForce RTX 3090
NVIDIA GeForce RTX 3090, i5-13600K, Corsair MP600
12306 Points 0%
AMD Ryzen 5 7600X, NVIDIA GeForce RTX 3090
NVIDIA GeForce RTX 3090, R5 7600X
12259 Points -1%
AMD Ryzen 9 7950X3D, NVIDIA GeForce RTX 4090
NVIDIA GeForce RTX 4090, R9 7950X3D
12130 Points -2%
AMD Ryzen 7 7745HX, AMD Radeon 610M
Radeon 610M, R7 7745HX, Fikwot FN955
12059 Points -2%
Intel Core i5-14600K, NVIDIA GeForce RTX 4090
NVIDIA GeForce RTX 4090, i5-14600K, WDC PC SN720 SDAQNTW-512G
11532 Points -7%
AMD Ryzen 7 7800X3D, NVIDIA GeForce RTX 4090
NVIDIA GeForce RTX 4090, R7 7800X3D, Corsair MP600
11337 Points -8%
AMD Ryzen 9 5950X, NVIDIA Titan RTX
NVIDIA Titan RTX, R9 5950X, Intel Optane 905P 480GB 2.5
11255 Points -9%
Intel Core i9-12900K, NVIDIA Titan RTX
NVIDIA Titan RTX, i9-12900K, Intel Optane 905P 480GB 2.5
11086 Points -10%
AMD Ryzen 7 7840HS, AMD Radeon 780M
Radeon 780M, R7 7840HS, Kingston OM8PGP41024Q-A0
11011 Points -11%
Intel Core i5-12600K, NVIDIA Titan RTX
NVIDIA Titan RTX, i5-12600K, Intel Optane 905P 480GB 2.5
10650 Points -14%
Intel Core i5-13400, NVIDIA GeForce RTX 4090
NVIDIA GeForce RTX 4090, i5-13400, Intel Optane 905P 480GB 2.5
10635 Points -14%
Intel Core i5-12400F, NVIDIA GeForce RTX 4090
NVIDIA GeForce RTX 4090, i5-12400F, Intel Optane 905P 480GB 2.5
10511 Points -15%
AMD Ryzen 9 7940HS, AMD Radeon 780M
Radeon 780M, R9 7940HS, 2x Kingston OM8PGP4256Q-A0 (RAID 0)
10448 Points -15%
Productivity
AMD Ryzen 5 7600X, NVIDIA GeForce RTX 3090
NVIDIA GeForce RTX 3090, R5 7600X
12608 Points +13%
AMD Ryzen 9 7950X3D, NVIDIA GeForce RTX 4090
NVIDIA GeForce RTX 4090, R9 7950X3D
12576 Points +13%
AMD Ryzen 7 7800X3D, NVIDIA GeForce RTX 4090
NVIDIA GeForce RTX 4090, R7 7800X3D, Corsair MP600
12108 Points +9%
Intel Core i5-14600K, NVIDIA GeForce RTX 4090
NVIDIA GeForce RTX 4090, i5-14600K, WDC PC SN720 SDAQNTW-512G
12075 Points +9%
AMD Ryzen 9 7900X, NVIDIA GeForce RTX 3090
NVIDIA GeForce RTX 3090, R9 7900X
11853 Points +7%
AMD Ryzen 9 7950X, NVIDIA GeForce RTX 3090
NVIDIA GeForce RTX 3090, R9 7950X, Corsair MP600
11853 Points +7%
Intel Core i9-14900K, NVIDIA GeForce RTX 4090
NVIDIA GeForce RTX 4090, i9-14900K, WDC PC SN720 SDAQNTW-512G
11784 Points +6%
Intel Core i5-13600K, NVIDIA GeForce RTX 3090
NVIDIA GeForce RTX 3090, i5-13600K, Corsair MP600
11630 Points +5%
Intel Core i9-13900K, NVIDIA GeForce RTX 3090
NVIDIA GeForce RTX 3090, i9-13900K, Corsair MP600
11370 Points +2%
AMD Ryzen 9 5950X, NVIDIA Titan RTX
NVIDIA Titan RTX, R9 5950X, Intel Optane 905P 480GB 2.5
11163 Points 0%
AMD Ryzen 9 7945HX, AMD Radeon 610M
Radeon 610M, R9 7945HX, Kingston KC3000 2048G SKC3000D2048G
11117 Points
AMD Ryzen 7 7745HX, AMD Radeon 610M
Radeon 610M, R7 7745HX, Fikwot FN955
11048 Points -1%
Intel Core i5-12600K, NVIDIA Titan RTX
NVIDIA Titan RTX, i5-12600K, Intel Optane 905P 480GB 2.5
11001 Points -1%
Intel Core i5-13400, NVIDIA GeForce RTX 4090
NVIDIA GeForce RTX 4090, i5-13400, Intel Optane 905P 480GB 2.5
10893 Points -2%
AMD Ryzen 7 7840HS, AMD Radeon 780M
Radeon 780M, R7 7840HS, Kingston OM8PGP41024Q-A0
10832 Points -3%
Intel Core i9-12900K, NVIDIA Titan RTX
NVIDIA Titan RTX, i9-12900K, Intel Optane 905P 480GB 2.5
10699 Points -4%
AMD Ryzen 9 7940HS, AMD Radeon 780M
Radeon 780M, R9 7940HS, 2x Kingston OM8PGP4256Q-A0 (RAID 0)
9971 Points -10%
Intel Core i5-12400F, NVIDIA GeForce RTX 4090
NVIDIA GeForce RTX 4090, i5-12400F, Intel Optane 905P 480GB 2.5
8577 Points -23%
CrossMark / Overall
Intel Core i9-14900K, NVIDIA GeForce RTX 4090
NVIDIA GeForce RTX 4090, i9-14900K, WDC PC SN720 SDAQNTW-512G
2611 Points +17%
Intel Core i9-13900K, NVIDIA GeForce RTX 3090
NVIDIA GeForce RTX 3090, i9-13900K, Corsair MP600
2589 Points +16%
AMD Ryzen 9 7950X, NVIDIA GeForce RTX 3090
NVIDIA GeForce RTX 3090, R9 7950X, Corsair MP600
2512 Points +12%
AMD Ryzen 9 7900X, NVIDIA GeForce RTX 3090
NVIDIA GeForce RTX 3090, R9 7900X
2405 Points +7%
Intel Core i5-14600K, NVIDIA GeForce RTX 4090
NVIDIA GeForce RTX 4090, i5-14600K, WDC PC SN720 SDAQNTW-512G
2310 Points +3%
Intel Core i5-13600K, NVIDIA GeForce RTX 3090
NVIDIA GeForce RTX 3090, i5-13600K, Corsair MP600
2271 Points +1%
AMD Ryzen 9 7945HX, AMD Radeon 610M
Radeon 610M, R9 7945HX, Kingston KC3000 2048G SKC3000D2048G
2240 Points
AMD Ryzen 5 7600X, NVIDIA GeForce RTX 3090
NVIDIA GeForce RTX 3090, R5 7600X
2236 Points 0%
AMD Ryzen 7 7800X3D, NVIDIA GeForce RTX 4090
NVIDIA GeForce RTX 4090, R7 7800X3D, Corsair MP600
2216 Points -1%
AMD Ryzen 9 7950X3D, NVIDIA GeForce RTX 4090
NVIDIA GeForce RTX 4090, R9 7950X3D
2193 Points -2%
AMD Ryzen 7 7745HX, AMD Radeon 610M
Radeon 610M, R7 7745HX, Fikwot FN955
2179 Points -3%
Intel Core i5-13400, NVIDIA GeForce RTX 4090
NVIDIA GeForce RTX 4090, i5-13400, Intel Optane 905P 480GB 2.5
1877 Points -16%
Intel Core i5-12400F, NVIDIA GeForce RTX 4090
NVIDIA GeForce RTX 4090, i5-12400F, Intel Optane 905P 480GB 2.5
1762 Points -21%
AMD Ryzen 7 7840HS, AMD Radeon 780M
Radeon 780M, R7 7840HS, Kingston OM8PGP41024Q-A0
1761 Points -21%
AMD Ryzen 9 7940HS, AMD Radeon 780M
Radeon 780M, R9 7940HS, 2x Kingston OM8PGP4256Q-A0 (RAID 0)
1726 Points -23%
AMD Ryzen 9 5950X, NVIDIA Titan RTX
NVIDIA Titan RTX, R9 5950X, Intel Optane 905P 480GB 2.5
1495 Points -33%
CrossMark / Productivity
Intel Core i9-14900K, NVIDIA GeForce RTX 4090
NVIDIA GeForce RTX 4090, i9-14900K, WDC PC SN720 SDAQNTW-512G
2421 Points +16%
Intel Core i9-13900K, NVIDIA GeForce RTX 3090
NVIDIA GeForce RTX 3090, i9-13900K, Corsair MP600
2388 Points +15%
AMD Ryzen 9 7950X, NVIDIA GeForce RTX 3090
NVIDIA GeForce RTX 3090, R9 7950X, Corsair MP600
2336 Points +12%
AMD Ryzen 9 7900X, NVIDIA GeForce RTX 3090
NVIDIA GeForce RTX 3090, R9 7900X
2211 Points +6%
Intel Core i5-14600K, NVIDIA GeForce RTX 4090
NVIDIA GeForce RTX 4090, i5-14600K, WDC PC SN720 SDAQNTW-512G
2142 Points +3%
Intel Core i5-13600K, NVIDIA GeForce RTX 3090
NVIDIA GeForce RTX 3090, i5-13600K, Corsair MP600
2115 Points +1%
AMD Ryzen 5 7600X, NVIDIA GeForce RTX 3090
NVIDIA GeForce RTX 3090, R5 7600X
2101 Points +1%
AMD Ryzen 9 7945HX, AMD Radeon 610M
Radeon 610M, R9 7945HX, Kingston KC3000 2048G SKC3000D2048G
2085 Points
AMD Ryzen 7 7800X3D, NVIDIA GeForce RTX 4090
NVIDIA GeForce RTX 4090, R7 7800X3D, Corsair MP600
2074 Points -1%
AMD Ryzen 7 7745HX, AMD Radeon 610M
Radeon 610M, R7 7745HX, Fikwot FN955
2061 Points -1%
AMD Ryzen 9 7950X3D, NVIDIA GeForce RTX 4090
NVIDIA GeForce RTX 4090, R9 7950X3D
2014 Points -3%
Intel Core i5-13400, NVIDIA GeForce RTX 4090
NVIDIA GeForce RTX 4090, i5-13400, Intel Optane 905P 480GB 2.5
1741 Points -16%
AMD Ryzen 9 7940HS, AMD Radeon 780M
Radeon 780M, R9 7940HS, 2x Kingston OM8PGP4256Q-A0 (RAID 0)
1675 Points -20%
Intel Core i5-12400F, NVIDIA GeForce RTX 4090
NVIDIA GeForce RTX 4090, i5-12400F, Intel Optane 905P 480GB 2.5
1667 Points -20%
AMD Ryzen 7 7840HS, AMD Radeon 780M
Radeon 780M, R7 7840HS, Kingston OM8PGP41024Q-A0
1656 Points -21%
AMD Ryzen 9 5950X, NVIDIA Titan RTX
NVIDIA Titan RTX, R9 5950X, Intel Optane 905P 480GB 2.5
1359 Points -35%
CrossMark / Creativity
Intel Core i9-14900K, NVIDIA GeForce RTX 4090
NVIDIA GeForce RTX 4090, i9-14900K, WDC PC SN720 SDAQNTW-512G
2891 Points +16%
AMD Ryzen 9 7950X, NVIDIA GeForce RTX 3090
NVIDIA GeForce RTX 3090, R9 7950X, Corsair MP600
2786 Points +12%
Intel Core i9-13900K, NVIDIA GeForce RTX 3090
NVIDIA GeForce RTX 3090, i9-13900K, Corsair MP600
2784 Points +12%
AMD Ryzen 9 7900X, NVIDIA GeForce RTX 3090
NVIDIA GeForce RTX 3090, R9 7900X
2673 Points +7%
Intel Core i5-14600K, NVIDIA GeForce RTX 4090
NVIDIA GeForce RTX 4090, i5-14600K, WDC PC SN720 SDAQNTW-512G
2575 Points +3%
AMD Ryzen 9 7950X3D, NVIDIA GeForce RTX 4090
NVIDIA GeForce RTX 4090, R9 7950X3D
2552 Points +3%
AMD Ryzen 9 7945HX, AMD Radeon 610M
Radeon 610M, R9 7945HX, Kingston KC3000 2048G SKC3000D2048G
2488 Points
AMD Ryzen 7 7800X3D, NVIDIA GeForce RTX 4090
NVIDIA GeForce RTX 4090, R7 7800X3D, Corsair MP600
2434 Points -2%
AMD Ryzen 5 7600X, NVIDIA GeForce RTX 3090
NVIDIA GeForce RTX 3090, R5 7600X
2414 Points -3%
Intel Core i5-13600K, NVIDIA GeForce RTX 3090
NVIDIA GeForce RTX 3090, i5-13600K, Corsair MP600
2412 Points -3%
AMD Ryzen 7 7745HX, AMD Radeon 610M
Radeon 610M, R7 7745HX, Fikwot FN955
2384 Points -4%
AMD Ryzen 7 7840HS, AMD Radeon 780M
Radeon 780M, R7 7840HS, Kingston OM8PGP41024Q-A0
2040 Points -18%
Intel Core i5-13400, NVIDIA GeForce RTX 4090
NVIDIA GeForce RTX 4090, i5-13400, Intel Optane 905P 480GB 2.5
2039 Points -18%
AMD Ryzen 9 7940HS, AMD Radeon 780M
Radeon 780M, R9 7940HS, 2x Kingston OM8PGP4256Q-A0 (RAID 0)
1914 Points -23%
Intel Core i5-12400F, NVIDIA GeForce RTX 4090
NVIDIA GeForce RTX 4090, i5-12400F, Intel Optane 905P 480GB 2.5
1849 Points -26%
AMD Ryzen 9 5950X, NVIDIA Titan RTX
NVIDIA Titan RTX, R9 5950X, Intel Optane 905P 480GB 2.5
1710 Points -31%
CrossMark / Responsiveness
Intel Core i9-13900K, NVIDIA GeForce RTX 3090
NVIDIA GeForce RTX 3090, i9-13900K, Corsair MP600
2653 Points +31%
Intel Core i9-14900K, NVIDIA GeForce RTX 4090
NVIDIA GeForce RTX 4090, i9-14900K, WDC PC SN720 SDAQNTW-512G
2413 Points +19%
Intel Core i5-13600K, NVIDIA GeForce RTX 3090
NVIDIA GeForce RTX 3090, i5-13600K, Corsair MP600
2350 Points +16%
AMD Ryzen 9 7950X, NVIDIA GeForce RTX 3090
NVIDIA GeForce RTX 3090, R9 7950X, Corsair MP600
2288 Points +13%
AMD Ryzen 9 7900X, NVIDIA GeForce RTX 3090
NVIDIA GeForce RTX 3090, R9 7900X
2251 Points +11%
AMD Ryzen 5 7600X, NVIDIA GeForce RTX 3090
NVIDIA GeForce RTX 3090, R5 7600X
2145 Points +6%
Intel Core i5-14600K, NVIDIA GeForce RTX 4090
NVIDIA GeForce RTX 4090, i5-14600K, WDC PC SN720 SDAQNTW-512G
2090 Points +3%
AMD Ryzen 7 7800X3D, NVIDIA GeForce RTX 4090
NVIDIA GeForce RTX 4090, R7 7800X3D, Corsair MP600
2039 Points +1%
AMD Ryzen 9 7945HX, AMD Radeon 610M
Radeon 610M, R9 7945HX, Kingston KC3000 2048G SKC3000D2048G
2026 Points
AMD Ryzen 7 7745HX, AMD Radeon 610M
Radeon 610M, R7 7745HX, Fikwot FN955
1965 Points -3%
Intel Core i5-13400, NVIDIA GeForce RTX 4090
NVIDIA GeForce RTX 4090, i5-13400, Intel Optane 905P 480GB 2.5
1831 Points -10%
Intel Core i5-12400F, NVIDIA GeForce RTX 4090
NVIDIA GeForce RTX 4090, i5-12400F, Intel Optane 905P 480GB 2.5
1799 Points -11%
AMD Ryzen 9 7950X3D, NVIDIA GeForce RTX 4090
NVIDIA GeForce RTX 4090, R9 7950X3D
1795 Points -11%
AMD Ryzen 9 7940HS, AMD Radeon 780M
Radeon 780M, R9 7940HS, 2x Kingston OM8PGP4256Q-A0 (RAID 0)
1382 Points -32%
AMD Ryzen 7 7840HS, AMD Radeon 780M
Radeon 780M, R7 7840HS, Kingston OM8PGP41024Q-A0
1361 Points -33%
AMD Ryzen 9 5950X, NVIDIA Titan RTX
NVIDIA Titan RTX, R9 5950X, Intel Optane 905P 480GB 2.5
1332 Points -34%
AIDA64 / Memory Copy
Intel Core i9-14900K, NVIDIA GeForce RTX 4090
NVIDIA GeForce RTX 4090, i9-14900K, WDC PC SN720 SDAQNTW-512G
85662 MB/s +48%
Intel Core i5-14600K, NVIDIA GeForce RTX 4090
NVIDIA GeForce RTX 4090, i5-14600K, WDC PC SN720 SDAQNTW-512G
82790 MB/s +43%
Intel Core i9-13900K, NVIDIA GeForce RTX 3090
NVIDIA GeForce RTX 3090, i9-13900K, Corsair MP600
74937 MB/s +29%
AMD Ryzen 9 7950X3D, NVIDIA GeForce RTX 4090
NVIDIA GeForce RTX 4090, R9 7950X3D
73868 MB/s +27%
Intel Core i9-12900K, NVIDIA Titan RTX
NVIDIA Titan RTX, i9-12900K, Intel Optane 905P 480GB 2.5
73146 MB/s +26%
AMD Ryzen 9 7950X, NVIDIA GeForce RTX 3090
NVIDIA GeForce RTX 3090, R9 7950X, Corsair MP600
73104 MB/s +26%
Intel Core i5-13400, NVIDIA GeForce RTX 4090
NVIDIA GeForce RTX 4090, i5-13400, Intel Optane 905P 480GB 2.5
71766 MB/s +24%
Intel Core i5-13600K, NVIDIA GeForce RTX 3090
NVIDIA GeForce RTX 3090, i5-13600K, Corsair MP600
71725 MB/s +24%
Intel Core i5-12400F, NVIDIA GeForce RTX 4090
NVIDIA GeForce RTX 4090, i5-12400F, Intel Optane 905P 480GB 2.5
71074 MB/s +23%
Intel Core i5-12600K, NVIDIA Titan RTX
NVIDIA Titan RTX, i5-12600K, Intel Optane 905P 480GB 2.5
70749 MB/s +22%
AMD Ryzen 9 7900X, NVIDIA GeForce RTX 3090
NVIDIA GeForce RTX 3090, R9 7900X
69140 MB/s +19%
Moyenne de la classe Desktop
  (43747 - 88386, n=11, 2 dernières années)
67123 MB/s +16%
AMD Ryzen 7 7840HS, AMD Radeon 780M
Radeon 780M, R7 7840HS, Kingston OM8PGP41024Q-A0
67039 MB/s +16%
AMD Ryzen 7 7800X3D, NVIDIA GeForce RTX 4090
NVIDIA GeForce RTX 4090, R7 7800X3D, Corsair MP600
63242 MB/s +9%
AMD Ryzen 9 7940HS, AMD Radeon 780M
Radeon 780M, R9 7940HS, 2x Kingston OM8PGP4256Q-A0 (RAID 0)
62093 MB/s +7%
AMD Ryzen 5 7600X, NVIDIA GeForce RTX 3090
NVIDIA GeForce RTX 3090, R5 7600X
59949 MB/s +3%
AMD Ryzen 9 5950X, NVIDIA Titan RTX
NVIDIA Titan RTX, R9 5950X, Intel Optane 905P 480GB 2.5
59171 MB/s +2%
AMD Ryzen 9 7945HX, AMD Radeon 610M
Radeon 610M, R9 7945HX, Kingston KC3000 2048G SKC3000D2048G
57953 MB/s
AMD Ryzen 7 7745HX, AMD Radeon 610M
Radeon 610M, R7 7745HX, Fikwot FN955
53867 MB/s -7%
Moyenne AMD Ryzen 9 7945HX
  (48948 - 57953, n=6)
51654 MB/s -11%
AIDA64 / Memory Read
Intel Core i9-14900K, NVIDIA GeForce RTX 4090
NVIDIA GeForce RTX 4090, i9-14900K, WDC PC SN720 SDAQNTW-512G
95232 MB/s +41%
Intel Core i5-14600K, NVIDIA GeForce RTX 4090
NVIDIA GeForce RTX 4090, i5-14600K, WDC PC SN720 SDAQNTW-512G
88793 MB/s +31%
Intel Core i9-13900K, NVIDIA GeForce RTX 3090
NVIDIA GeForce RTX 3090, i9-13900K, Corsair MP600
83883 MB/s +24%
Intel Core i9-12900K, NVIDIA Titan RTX
NVIDIA Titan RTX, i9-12900K, Intel Optane 905P 480GB 2.5
81059 MB/s +20%
AMD Ryzen 9 7950X3D, NVIDIA GeForce RTX 4090
NVIDIA GeForce RTX 4090, R9 7950X3D
80946 MB/s +19%
AMD Ryzen 9 7950X, NVIDIA GeForce RTX 3090
NVIDIA GeForce RTX 3090, R9 7950X, Corsair MP600
78282 MB/s +16%
Intel Core i5-13400, NVIDIA GeForce RTX 4090
NVIDIA GeForce RTX 4090, i5-13400, Intel Optane 905P 480GB 2.5
77867 MB/s +15%
Intel Core i5-12600K, NVIDIA Titan RTX
NVIDIA Titan RTX, i5-12600K, Intel Optane 905P 480GB 2.5
76864 MB/s +13%
Intel Core i5-13600K, NVIDIA GeForce RTX 3090
NVIDIA GeForce RTX 3090, i5-13600K, Corsair MP600
75757 MB/s +12%
AMD Ryzen 9 7900X, NVIDIA GeForce RTX 3090
NVIDIA GeForce RTX 3090, R9 7900X
75338 MB/s +11%
Intel Core i5-12400F, NVIDIA GeForce RTX 4090
NVIDIA GeForce RTX 4090, i5-12400F, Intel Optane 905P 480GB 2.5
74338 MB/s +10%
Moyenne de la classe Desktop
  (47347 - 94830, n=11, 2 dernières années)
72850 MB/s +8%
AMD Ryzen 9 7945HX, AMD Radeon 610M
Radeon 610M, R9 7945HX, Kingston KC3000 2048G SKC3000D2048G
67753 MB/s
AMD Ryzen 9 5950X, NVIDIA Titan RTX
NVIDIA Titan RTX, R9 5950X, Intel Optane 905P 480GB 2.5
62991 MB/s -7%
AMD Ryzen 7 7800X3D, NVIDIA GeForce RTX 4090
NVIDIA GeForce RTX 4090, R7 7800X3D, Corsair MP600
62528 MB/s -8%
AMD Ryzen 7 7840HS, AMD Radeon 780M
Radeon 780M, R7 7840HS, Kingston OM8PGP41024Q-A0
61867 MB/s -9%
AMD Ryzen 9 7940HS, AMD Radeon 780M
Radeon 780M, R9 7940HS, 2x Kingston OM8PGP4256Q-A0 (RAID 0)
61458 MB/s -9%
Moyenne AMD Ryzen 9 7945HX
  (56910 - 67753, n=6)
61316 MB/s -10%
AMD Ryzen 5 7600X, NVIDIA GeForce RTX 3090
NVIDIA GeForce RTX 3090, R5 7600X
59007 MB/s -13%
AMD Ryzen 7 7745HX, AMD Radeon 610M
Radeon 610M, R7 7745HX, Fikwot FN955
54278 MB/s -20%
AIDA64 / Memory Write
AMD Ryzen 7 7800X3D, NVIDIA GeForce RTX 4090
NVIDIA GeForce RTX 4090, R7 7800X3D, Corsair MP600
87412 MB/s +25%
AMD Ryzen 7 7840HS, AMD Radeon 780M
Radeon 780M, R7 7840HS, Kingston OM8PGP41024Q-A0
86693 MB/s +24%
AMD Ryzen 9 7950X3D, NVIDIA GeForce RTX 4090
NVIDIA GeForce RTX 4090, R9 7950X3D
85951 MB/s +23%
Intel Core i5-14600K, NVIDIA GeForce RTX 4090
NVIDIA GeForce RTX 4090, i5-14600K, WDC PC SN720 SDAQNTW-512G
84101 MB/s +20%
Intel Core i9-14900K, NVIDIA GeForce RTX 4090
NVIDIA GeForce RTX 4090, i9-14900K, WDC PC SN720 SDAQNTW-512G
83670 MB/s +19%
AMD Ryzen 5 7600X, NVIDIA GeForce RTX 3090
NVIDIA GeForce RTX 3090, R5 7600X
81320 MB/s +16%
AMD Ryzen 9 7950X, NVIDIA GeForce RTX 3090
NVIDIA GeForce RTX 3090, R9 7950X, Corsair MP600
79843 MB/s +14%
AMD Ryzen 9 7940HS, AMD Radeon 780M
Radeon 780M, R9 7940HS, 2x Kingston OM8PGP4256Q-A0 (RAID 0)
79298 MB/s +13%
AMD Ryzen 9 7900X, NVIDIA GeForce RTX 3090
NVIDIA GeForce RTX 3090, R9 7900X
76967 MB/s +10%
Moyenne de la classe Desktop
  (46768 - 84869, n=11, 2 dernières années)
75743 MB/s +8%
Intel Core i9-13900K, NVIDIA GeForce RTX 3090
NVIDIA GeForce RTX 3090, i9-13900K, Corsair MP600
74140 MB/s +6%
Intel Core i5-13400, NVIDIA GeForce RTX 4090
NVIDIA GeForce RTX 4090, i5-13400, Intel Optane 905P 480GB 2.5
74029 MB/s +6%
Intel Core i5-12600K, NVIDIA Titan RTX
NVIDIA Titan RTX, i5-12600K, Intel Optane 905P 480GB 2.5
73824 MB/s +5%
Intel Core i5-12400F, NVIDIA GeForce RTX 4090
NVIDIA GeForce RTX 4090, i5-12400F, Intel Optane 905P 480GB 2.5
73805 MB/s +5%
Intel Core i9-12900K, NVIDIA Titan RTX
NVIDIA Titan RTX, i9-12900K, Intel Optane 905P 480GB 2.5
73707 MB/s +5%
Intel Core i5-13600K, NVIDIA GeForce RTX 3090
NVIDIA GeForce RTX 3090, i5-13600K, Corsair MP600
73484 MB/s +5%
AMD Ryzen 7 7745HX, AMD Radeon 610M
Radeon 610M, R7 7745HX, Fikwot FN955
70803 MB/s +1%
AMD Ryzen 9 7945HX, AMD Radeon 610M
Radeon 610M, R9 7945HX, Kingston KC3000 2048G SKC3000D2048G
70063 MB/s
Moyenne AMD Ryzen 9 7945HX
  (58602 - 70063, n=6)
61965 MB/s -12%
AMD Ryzen 9 5950X, NVIDIA Titan RTX
NVIDIA Titan RTX, R9 5950X, Intel Optane 905P 480GB 2.5
48748 MB/s -30%
AIDA64 / Memory Latency
AMD Ryzen 7 7840HS, AMD Radeon 780M
Radeon 780M, R7 7840HS, Kingston OM8PGP41024Q-A0
92 ns * -19%
AMD Ryzen 9 7940HS, AMD Radeon 780M
Radeon 780M, R9 7940HS, 2x Kingston OM8PGP4256Q-A0 (RAID 0)
87.6 ns * -14%
Moyenne AMD Ryzen 9 7945HX
  (77.1 - 91.3, n=6)
84.2 ns * -9%
Intel Core i5-13600K, NVIDIA GeForce RTX 3090
NVIDIA GeForce RTX 3090, i5-13600K, Corsair MP600
81.1 ns * -5%
AMD Ryzen 7 7745HX, AMD Radeon 610M
Radeon 610M, R7 7745HX, Fikwot FN955
80.7 ns * -5%
Intel Core i5-12400F, NVIDIA GeForce RTX 4090
NVIDIA GeForce RTX 4090, i5-12400F, Intel Optane 905P 480GB 2.5
79.2 ns * -3%
Intel Core i5-13400, NVIDIA GeForce RTX 4090
NVIDIA GeForce RTX 4090, i5-13400, Intel Optane 905P 480GB 2.5
77.2 ns * -0%
AMD Ryzen 9 7945HX, AMD Radeon 610M
Radeon 610M, R9 7945HX, Kingston KC3000 2048G SKC3000D2048G
77.1 ns *
Intel Core i9-13900K, NVIDIA GeForce RTX 3090
NVIDIA GeForce RTX 3090, i9-13900K, Corsair MP600
76.5 ns * +1%
Moyenne de la classe Desktop
  (68.3 - 90.3, n=11, 2 dernières années)
75 ns * +3%
Intel Core i9-14900K, NVIDIA GeForce RTX 4090
NVIDIA GeForce RTX 4090, i9-14900K, WDC PC SN720 SDAQNTW-512G
70.3 ns * +9%
Intel Core i5-14600K, NVIDIA GeForce RTX 4090
NVIDIA GeForce RTX 4090, i5-14600K, WDC PC SN720 SDAQNTW-512G
69.7 ns * +10%
AMD Ryzen 7 7800X3D, NVIDIA GeForce RTX 4090
NVIDIA GeForce RTX 4090, R7 7800X3D, Corsair MP600
68 ns * +12%
AMD Ryzen 9 5950X, NVIDIA Titan RTX
NVIDIA Titan RTX, R9 5950X, Intel Optane 905P 480GB 2.5
67.7 ns * +12%
AMD Ryzen 9 7950X3D, NVIDIA GeForce RTX 4090
NVIDIA GeForce RTX 4090, R9 7950X3D
65.6 ns * +15%
AMD Ryzen 5 7600X, NVIDIA GeForce RTX 3090
NVIDIA GeForce RTX 3090, R5 7600X
63.8 ns * +17%
AMD Ryzen 9 7900X, NVIDIA GeForce RTX 3090
NVIDIA GeForce RTX 3090, R9 7900X
63.3 ns * +18%
AMD Ryzen 9 7950X, NVIDIA GeForce RTX 3090
NVIDIA GeForce RTX 3090, R9 7950X, Corsair MP600
61.7 ns * +20%

* ... Moindre est la valeur, meilleures sont les performances

Latences DPC

Nous avons enregistré des latences relativement élevées dans notre système de test basé sur le Minisforum BD790i. Nous avons enregistré des valeurs élevées même en surfant simplement sur le web. Ces valeurs ont encore augmenté lors de la lecture de la vidéo de test 4K, ce qui signifie que le système ne semble pas adapté au traitement de matériel vidéo et audio en temps réel dans cette configuration.

Latence maximale lors de l'ouverture de plusieurs onglets de navigateur
Latence maximale lors de la lecture de matériel vidéo 4K
Latence maximale après dix secondes de Prime95
Classement des conducteurs par durée d'exécution la plus longue
DPC Latencies / LatencyMon - interrupt to process latency (max), Web, Youtube, Prime95
Minisforum BD790i
Radeon 610M, R9 7945HX, Kingston KC3000 2048G SKC3000D2048G
3954 μs *
Minisforum EliteMini UM780 XTX
Radeon 780M, R7 7840HS, Kingston OM8PGP41024Q-A0
1178.9 μs * +70%
Minisforum Venus Series UM790 Pro
Radeon 780M, R9 7940HS, 2x Kingston OM8PGP4256Q-A0 (RAID 0)
1063 μs * +73%
Minisforum BD770i
Radeon 610M, R7 7745HX, Fikwot FN955
422.4 μs * +89%

* ... Moindre est la valeur, meilleures sont les performances

Dispositifs de stockage

Kingston KC3000
Kingston KC3000

Comme mentionné au début de cet article, Minisforum ne fournit que la carte mère BD790i elle-même. Pour pouvoir mettre en service un système complet, vous devez vous occuper vous-même des composants manquants tels que la RAM, le SSD, l'alimentation et le ventilateur du processeur. Pour le SSD, nous avons opté pour un Kingston KC3000 avec 2 To d'espace de stockage. Le modèle est connecté via PCIe 4.0 x4 et ne profite pas pleinement de l'interface, car le Minisforum BD790i supporte techniquement deux SSD PCIe 5.0. Les deux interfaces M.2 sont situées sur le dessus de la carte mère. Recouvert d'un petit dissipateur thermique, également équipé d'un petit ventilateur, notre SSD n'a eu aucun mal à délivrer des performances stables. Nous pouvons rassurer ceux qui pensent que ce petit ventilateur leur fera mal aux oreilles, car il est très silencieux et ne s'entend pas à côté du ventilateur du processeur.

Pour d'autres comparaisons et benchmarks, veuillez vous référer à notre tableau de comparaison.

AS SSD
AS SSD
MDP 3
MDP 3
MDP 5
MDP 5
MDP 6
MDP 6
CDI
CDI
Kingston KC3000 2048G SKC3000D2048G
Sequential Read: 4718 MB/s
Sequential Write: 6075 MB/s
512K Read: 3179 MB/s
512K Write: 5375 MB/s
4K Read: 81.57 MB/s
4K Write: 275.6 MB/s
4K QD32 Read: 800.2 MB/s
4K QD32 Write: 648.4 MB/s

Reading continuous performance: DiskSpd Read Loop, Queue Depth 8

037074011101480185022202590296033303700407044404810518055505920629066607030Tooltip
Minisforum BD790i Kingston KC3000 2048G SKC3000D2048G; diskspd 2.0.17 f: Ø7357 (6532.21-7378.41)
Minisforum EliteMini UM780 XTX Kingston OM8PGP41024Q-A0; diskspd 2.0.17 f: Ø4795 (3366.33-4823.24)
Minisforum Venus Series UM790 Pro 2x Kingston OM8PGP4256Q-A0 (RAID 0): Ø6430 (5686.85-6828.93)
Minisforum BD770i Fikwot FN955; diskspd 2.0.17 f: Ø7151 (6786.02-7165.06)

Carte graphique - L'AMD Radeon 610M comme iGPU

Le AMD Ryzen 9 7945HX ne dispose que d'une solution graphique simple en tant qu'iGPU, qui porte le nom de AMD Radeon 610M. Elle est toujours basée sur l'architecture RDNA2 et n'offre que 2 CU, ce qui signifie qu'il n'y a que 128 unités de shaders au total disponibles pour les calculs 3D. Par rapport à la AMD Ryzen 7 7745HXinstallé sur le Minisforum BD770iil n'y a pas plus de performance 3D. De ce fait, les résultats sont presque identiques. Par rapport à une AMD Radeon 780Ml'AMD Radeon 610M n'a aucune chance. À notre avis, cette solution graphique faible ne devrait pas être capable de faire plus qu'une simple sortie d'images.

Vous trouverez d'autres comparaisons et benchmarks dans notre Tableau de comparaison des GPU.

Performance Rating - Percent
AMD Radeon 780M, AMD Ryzen 7 7840HS
Radeon 780M, R7 7840HS, Kingston OM8PGP41024Q-A0
100 pt
AMD Radeon 780M, AMD Ryzen 9 7940HS
Radeon 780M, R9 7940HS, 2x Kingston OM8PGP4256Q-A0 (RAID 0)
90.5 pt
AMD Radeon RX Vega 7, AMD Ryzen 5 5600U
Vega 7, R5 5600U, ESO512GYLCT
44.5 pt
Intel UHD Graphics 64EUs (Alder Lake 12th Gen), Intel Core i7-12650H
UHD Graphics 64EUs, i7-12650H, Netac NS512GSSD530
42.3 pt
Intel UHD Graphics Xe 32EUs (Tiger Lake-H), Intel Core i7-11800H
UHD Graphics Xe 32EUs (Tiger Lake-H), i7-11800H, Netac NS512GSSD340
26.9 pt
AMD Radeon 610M, AMD Ryzen 9 7945HX
Radeon 610M, R9 7945HX, Kingston KC3000 2048G SKC3000D2048G
25.8 pt
AMD Radeon 610M, AMD Ryzen 7 7745HX
Radeon 610M, R7 7745HX, Fikwot FN955
23.1 pt
Moyenne AMD Radeon 610M
 
20.8 pt
3DMark 11 - 1280x720 Performance GPU
AMD Radeon 780M, AMD Ryzen 7 7840HS
Radeon 780M, R7 7840HS, Kingston OM8PGP41024Q-A0
13347 Points +293%
AMD Radeon 780M, AMD Ryzen 9 7940HS
Radeon 780M, R9 7940HS, 2x Kingston OM8PGP4256Q-A0 (RAID 0)
12384 Points +264%
AMD Radeon RX Vega 7, AMD Ryzen 5 5600U
Vega 7, R5 5600U, ESO512GYLCT
5923 Points +74%
Intel UHD Graphics 64EUs (Alder Lake 12th Gen), Intel Core i7-12650H
UHD Graphics 64EUs, i7-12650H, Netac NS512GSSD530
5047 Points +48%
AMD Radeon 610M, AMD Ryzen 9 7945HX
Radeon 610M, R9 7945HX, Kingston KC3000 2048G SKC3000D2048G
3399 Points
AMD Radeon 610M, AMD Ryzen 7 7745HX
Radeon 610M, R7 7745HX, Fikwot FN955
3347 Points -2%
Intel UHD Graphics Xe 32EUs (Tiger Lake-H), Intel Core i7-11800H
UHD Graphics Xe 32EUs (Tiger Lake-H), i7-11800H, Netac NS512GSSD340
3168 Points -7%
Moyenne AMD Radeon 610M
  (1029 - 3399, n=4)
2539 Points -25%
3DMark
2560x1440 Time Spy Graphics
AMD Radeon 780M, AMD Ryzen 7 7840HS
Radeon 780M, R7 7840HS, Kingston OM8PGP41024Q-A0
2832 Points +323%
AMD Radeon 780M, AMD Ryzen 9 7940HS
Radeon 780M, R9 7940HS, 2x Kingston OM8PGP4256Q-A0 (RAID 0)
2632 Points +293%
AMD Radeon RX Vega 7, AMD Ryzen 5 5600U
Vega 7, R5 5600U, ESO512GYLCT
1153 Points +72%
Intel UHD Graphics 64EUs (Alder Lake 12th Gen), Intel Core i7-12650H
UHD Graphics 64EUs, i7-12650H, Netac NS512GSSD530
1114 Points +67%
AMD Radeon 610M, AMD Ryzen 9 7945HX
Radeon 610M, R9 7945HX, Kingston KC3000 2048G SKC3000D2048G
669 Points
Intel UHD Graphics Xe 32EUs (Tiger Lake-H), Intel Core i7-11800H
UHD Graphics Xe 32EUs (Tiger Lake-H), i7-11800H, Netac NS512GSSD340
658 Points -2%
AMD Radeon 610M, AMD Ryzen 7 7745HX
Radeon 610M, R7 7745HX, Fikwot FN955
636 Points -5%
Moyenne AMD Radeon 610M
  (224 - 669, n=4)
511 Points -24%
1920x1080 Fire Strike Graphics
AMD Radeon 780M, AMD Ryzen 7 7840HS
Radeon 780M, R7 7840HS, Kingston OM8PGP41024Q-A0
8348 Points +267%
AMD Radeon 780M, AMD Ryzen 9 7940HS
Radeon 780M, R9 7940HS, 2x Kingston OM8PGP4256Q-A0 (RAID 0)
7284 Points +220%
Intel UHD Graphics 64EUs (Alder Lake 12th Gen), Intel Core i7-12650H
UHD Graphics 64EUs, i7-12650H, Netac NS512GSSD530
3905 Points +71%
AMD Radeon RX Vega 7, AMD Ryzen 5 5600U
Vega 7, R5 5600U, ESO512GYLCT
3819 Points +68%
Intel UHD Graphics Xe 32EUs (Tiger Lake-H), Intel Core i7-11800H
UHD Graphics Xe 32EUs (Tiger Lake-H), i7-11800H, Netac NS512GSSD340
2495 Points +10%
AMD Radeon 610M, AMD Ryzen 7 7745HX
Radeon 610M, R7 7745HX, Fikwot FN955
2305 Points +1%
AMD Radeon 610M, AMD Ryzen 9 7945HX
Radeon 610M, R9 7945HX, Kingston KC3000 2048G SKC3000D2048G
2277 Points
Moyenne AMD Radeon 610M
  (781 - 2305, n=4)
1754 Points -23%
Fire Strike Extreme Score
AMD Radeon 780M, AMD Ryzen 7 7840HS
Radeon 780M, R7 7840HS, Kingston OM8PGP41024Q-A0
4120 Points +296%
AMD Radeon 780M, AMD Ryzen 9 7940HS
Radeon 780M, R9 7940HS, 2x Kingston OM8PGP4256Q-A0 (RAID 0)
3506 Points +237%
Intel UHD Graphics 64EUs (Alder Lake 12th Gen), Intel Core i7-12650H
UHD Graphics 64EUs, i7-12650H, Netac NS512GSSD530
1733 Points +66%
AMD Radeon RX Vega 7, AMD Ryzen 5 5600U
Vega 7, R5 5600U, ESO512GYLCT
1560 Points +50%
Intel UHD Graphics Xe 32EUs (Tiger Lake-H), Intel Core i7-11800H
UHD Graphics Xe 32EUs (Tiger Lake-H), i7-11800H, Netac NS512GSSD340
1104 Points +6%
AMD Radeon 610M, AMD Ryzen 9 7945HX
Radeon 610M, R9 7945HX, Kingston KC3000 2048G SKC3000D2048G
1041 Points
Moyenne AMD Radeon 610M
  (530 - 1041, n=2)
786 Points -24%
AMD Radeon 610M, AMD Ryzen 7 7745HX
Radeon 610M, R7 7745HX, Fikwot FN955
530 Points -49%
1280x720 Cloud Gate Standard Graphics
AMD Radeon 780M, AMD Ryzen 7 7840HS
Radeon 780M, R7 7840HS, Kingston OM8PGP41024Q-A0
50924 Points +269%
AMD Radeon 780M, AMD Ryzen 9 7940HS
Radeon 780M, R9 7940HS, 2x Kingston OM8PGP4256Q-A0 (RAID 0)
47968 Points +247%
AMD Radeon RX Vega 7, AMD Ryzen 5 5600U
Vega 7, R5 5600U, ESO512GYLCT
27497 Points +99%
Intel UHD Graphics 64EUs (Alder Lake 12th Gen), Intel Core i7-12650H
UHD Graphics 64EUs, i7-12650H, Netac NS512GSSD530
23061 Points +67%
Intel UHD Graphics Xe 32EUs (Tiger Lake-H), Intel Core i7-11800H
UHD Graphics Xe 32EUs (Tiger Lake-H), i7-11800H, Netac NS512GSSD340
15662 Points +13%
AMD Radeon 610M, AMD Ryzen 7 7745HX
Radeon 610M, R7 7745HX, Fikwot FN955
13981 Points +1%
AMD Radeon 610M, AMD Ryzen 9 7945HX
Radeon 610M, R9 7945HX, Kingston KC3000 2048G SKC3000D2048G
13814 Points
Moyenne AMD Radeon 610M
  (11389 - 15902, n=4)
13772 Points 0%
Performance Rating - Percent
Minisforum EliteMini UM780 XTX
Radeon 780M, R7 7840HS, Kingston OM8PGP41024Q-A0
91.3 pt
Minisforum Venus Series UM790 Pro
Radeon 780M, R9 7940HS, 2x Kingston OM8PGP4256Q-A0 (RAID 0)
86 pt
NiPoGi AD08
UHD Graphics 64EUs, i7-12650H, Netac NS512GSSD530
42.7 pt
Minisforum Mars Series MC560
Vega 7, R5 5600U, ESO512GYLCT
40.6 pt
Minisforum BD790i
Radeon 610M, R9 7945HX, Kingston KC3000 2048G SKC3000D2048G
36.5 pt
Moyenne AMD Radeon 610M
 
30 pt
Acemagic AD15
UHD Graphics Xe 32EUs (Tiger Lake-H), i7-11800H, Netac NS512GSSD340
29.2 pt
Minisforum BD770i
Radeon 610M, R7 7745HX, Fikwot FN955
29.1 pt
Unigine Heaven 4.0
Extreme Preset OpenGL
Minisforum EliteMini UM780 XTX
Radeon 780M, R7 7840HS, Kingston OM8PGP41024Q-A0
34.5 fps +165%
Minisforum Venus Series UM790 Pro
Radeon 780M, R9 7940HS, 2x Kingston OM8PGP4256Q-A0 (RAID 0)
29.7 fps +128%
NiPoGi AD08
UHD Graphics 64EUs, i7-12650H, Netac NS512GSSD530
25 fps +92%
Minisforum Mars Series MC560
Vega 7, R5 5600U, ESO512GYLCT
18.6 fps +43%
Minisforum BD770i
Radeon 610M, R7 7745HX, Fikwot FN955
13.6 fps +5%
Acemagic AD15
UHD Graphics Xe 32EUs (Tiger Lake-H), i7-11800H, Netac NS512GSSD340
13.3 fps +2%
Minisforum BD790i
Radeon 610M, R9 7945HX, Kingston KC3000 2048G SKC3000D2048G
13 fps
Moyenne AMD Radeon 610M
  (12.3 - 13.6, n=3)
13 fps 0%
Extreme Preset DX11
Minisforum EliteMini UM780 XTX
Radeon 780M, R7 7840HS, Kingston OM8PGP41024Q-A0
35.5 fps +191%
Minisforum Venus Series UM790 Pro
Radeon 780M, R9 7940HS, 2x Kingston OM8PGP4256Q-A0 (RAID 0)
31.1 fps +155%
NiPoGi AD08
UHD Graphics 64EUs, i7-12650H, Netac NS512GSSD530
19.1 fps +57%
Minisforum Mars Series MC560
Vega 7, R5 5600U, ESO512GYLCT
18.2 fps +49%
Acemagic AD15
UHD Graphics Xe 32EUs (Tiger Lake-H), i7-11800H, Netac NS512GSSD340
14 fps +15%
Minisforum BD770i
Radeon 610M, R7 7745HX, Fikwot FN955
12.3 fps +1%
Minisforum BD790i
Radeon 610M, R9 7945HX, Kingston KC3000 2048G SKC3000D2048G
12.2 fps
Moyenne AMD Radeon 610M
  (11 - 12.3, n=3)
11.8 fps -3%
Unigine Valley 1.0
1920x1080 Extreme HD DirectX AA:x8
Minisforum EliteMini UM780 XTX
Radeon 780M, R7 7840HS, Kingston OM8PGP41024Q-A0
24 fps +140%
Minisforum Venus Series UM790 Pro
Radeon 780M, R9 7940HS, 2x Kingston OM8PGP4256Q-A0 (RAID 0)
20.4 fps +104%
Minisforum Mars Series MC560
Vega 7, R5 5600U, ESO512GYLCT
12.3 fps +23%
NiPoGi AD08
UHD Graphics 64EUs, i7-12650H, Netac NS512GSSD530
11.8 fps +18%
Minisforum BD770i
Radeon 610M, R7 7745HX, Fikwot FN955
10 fps 0%
Minisforum BD790i
Radeon 610M, R9 7945HX, Kingston KC3000 2048G SKC3000D2048G
10 fps
Moyenne AMD Radeon 610M
  (10 - 10, n=2)
10 fps 0%
Acemagic AD15
UHD Graphics Xe 32EUs (Tiger Lake-H), i7-11800H, Netac NS512GSSD340
8.8 fps -12%
1920x1080 Extreme HD Preset OpenGL AA:x8
Minisforum EliteMini UM780 XTX
Radeon 780M, R7 7840HS, Kingston OM8PGP41024Q-A0
20.8 fps +119%
Minisforum Venus Series UM790 Pro
Radeon 780M, R9 7940HS, 2x Kingston OM8PGP4256Q-A0 (RAID 0)
17.7 fps +86%
NiPoGi AD08
UHD Graphics 64EUs, i7-12650H, Netac NS512GSSD530
13 fps +37%
Minisforum Mars Series MC560
Vega 7, R5 5600U, ESO512GYLCT
12.2 fps +28%
Acemagic AD15
UHD Graphics Xe 32EUs (Tiger Lake-H), i7-11800H, Netac NS512GSSD340
10.1 fps +6%
Minisforum BD770i
Radeon 610M, R7 7745HX, Fikwot FN955
9.6 fps +1%
Moyenne AMD Radeon 610M
  (9.5 - 9.6, n=2)
9.55 fps +1%
Minisforum BD790i
Radeon 610M, R9 7945HX, Kingston KC3000 2048G SKC3000D2048G
9.5 fps
ComputeMark v2.1
1024x600 Normal, Score
Minisforum Venus Series UM790 Pro
Radeon 780M, R9 7940HS, 2x Kingston OM8PGP4256Q-A0 (RAID 0)
10495 Points +544%
Minisforum EliteMini UM780 XTX
Radeon 780M, R7 7840HS, Kingston OM8PGP41024Q-A0
10102 Points +520%
Minisforum Mars Series MC560
Vega 7, R5 5600U, ESO512GYLCT
2999 Points +84%
NiPoGi AD08
UHD Graphics 64EUs, i7-12650H, Netac NS512GSSD530
2370 Points +45%
Minisforum BD770i
Radeon 610M, R7 7745HX, Fikwot FN955
1632 Points 0%
Minisforum BD790i
Radeon 610M, R9 7945HX, Kingston KC3000 2048G SKC3000D2048G
1629 Points
Acemagic AD15
UHD Graphics Xe 32EUs (Tiger Lake-H), i7-11800H, Netac NS512GSSD340
1422 Points -13%
Moyenne AMD Radeon 610M
  (517 - 1632, n=3)
1259 Points -23%
1024x600 Normal, Fluid 3DTex
Minisforum EliteMini UM780 XTX
Radeon 780M, R7 7840HS, Kingston OM8PGP41024Q-A0
468 Points +107%
Minisforum Venus Series UM790 Pro
Radeon 780M, R9 7940HS, 2x Kingston OM8PGP4256Q-A0 (RAID 0)
427 Points +89%
Minisforum Mars Series MC560
Vega 7, R5 5600U, ESO512GYLCT
243 Points +8%
Minisforum BD770i
Radeon 610M, R7 7745HX, Fikwot FN955
227 Points 0%
Minisforum BD790i
Radeon 610M, R9 7945HX, Kingston KC3000 2048G SKC3000D2048G
226 Points
NiPoGi AD08
UHD Graphics 64EUs, i7-12650H, Netac NS512GSSD530
207 Points -8%
Moyenne AMD Radeon 610M
  (109 - 227, n=3)
187.3 Points -17%
Acemagic AD15
UHD Graphics Xe 32EUs (Tiger Lake-H), i7-11800H, Netac NS512GSSD340
182 Points -19%
1024x600 Normal, Fluid 2DTexArr
Minisforum EliteMini UM780 XTX
Radeon 780M, R7 7840HS, Kingston OM8PGP41024Q-A0
488 Points +153%
Minisforum Venus Series UM790 Pro
Radeon 780M, R9 7940HS, 2x Kingston OM8PGP4256Q-A0 (RAID 0)
427 Points +121%
Minisforum Mars Series MC560
Vega 7, R5 5600U, ESO512GYLCT
231 Points +20%
NiPoGi AD08
UHD Graphics 64EUs, i7-12650H, Netac NS512GSSD530
212 Points +10%
Minisforum BD770i
Radeon 610M, R7 7745HX, Fikwot FN955
194 Points +1%
Minisforum BD790i
Radeon 610M, R9 7945HX, Kingston KC3000 2048G SKC3000D2048G
193 Points
Acemagic AD15
UHD Graphics Xe 32EUs (Tiger Lake-H), i7-11800H, Netac NS512GSSD340
170 Points -12%
Moyenne AMD Radeon 610M
  (84 - 194, n=3)
157 Points -19%
1024x600 Normal, Mandel Vector
Minisforum Venus Series UM790 Pro
Radeon 780M, R9 7940HS, 2x Kingston OM8PGP4256Q-A0 (RAID 0)
2984 Points +838%
Minisforum EliteMini UM780 XTX
Radeon 780M, R7 7840HS, Kingston OM8PGP41024Q-A0
2637 Points +729%
Minisforum Mars Series MC560
Vega 7, R5 5600U, ESO512GYLCT
790 Points +148%
NiPoGi AD08
UHD Graphics 64EUs, i7-12650H, Netac NS512GSSD530
450 Points +42%
Minisforum BD770i
Radeon 610M, R7 7745HX, Fikwot FN955
321 Points +1%
Minisforum BD790i
Radeon 610M, R9 7945HX, Kingston KC3000 2048G SKC3000D2048G
318 Points
Acemagic AD15
UHD Graphics Xe 32EUs (Tiger Lake-H), i7-11800H, Netac NS512GSSD340
254 Points -20%
Moyenne AMD Radeon 610M
  (109 - 321, n=3)
249 Points -22%
1024x600 Normal, Mandel Scalar
Minisforum Venus Series UM790 Pro
Radeon 780M, R9 7940HS, 2x Kingston OM8PGP4256Q-A0 (RAID 0)
2808 Points +473%
Minisforum EliteMini UM780 XTX
Radeon 780M, R7 7840HS, Kingston OM8PGP41024Q-A0
2757 Points +463%
Minisforum Mars Series MC560
Vega 7, R5 5600U, ESO512GYLCT
877 Points +79%
NiPoGi AD08
UHD Graphics 64EUs, i7-12650H, Netac NS512GSSD530
743 Points +52%
Minisforum BD790i
Radeon 610M, R9 7945HX, Kingston KC3000 2048G SKC3000D2048G
490 Points
Minisforum BD770i
Radeon 610M, R7 7745HX, Fikwot FN955
487 Points -1%
Acemagic AD15
UHD Graphics Xe 32EUs (Tiger Lake-H), i7-11800H, Netac NS512GSSD340
378 Points -23%
Moyenne AMD Radeon 610M
  (87 - 490, n=3)
355 Points -28%
1024x600 Normal, QJuliaRayTrace
Minisforum Venus Series UM790 Pro
Radeon 780M, R9 7940HS, 2x Kingston OM8PGP4256Q-A0 (RAID 0)
3849 Points +855%
Minisforum EliteMini UM780 XTX
Radeon 780M, R7 7840HS, Kingston OM8PGP41024Q-A0
3752 Points +831%
Minisforum Mars Series MC560
Vega 7, R5 5600U, ESO512GYLCT
857 Points +113%
NiPoGi AD08
UHD Graphics 64EUs, i7-12650H, Netac NS512GSSD530
759 Points +88%
Acemagic AD15
UHD Graphics Xe 32EUs (Tiger Lake-H), i7-11800H, Netac NS512GSSD340
457 Points +13%
Minisforum BD770i
Radeon 610M, R7 7745HX, Fikwot FN955
403 Points 0%
Minisforum BD790i
Radeon 610M, R9 7945HX, Kingston KC3000 2048G SKC3000D2048G
403 Points
Moyenne AMD Radeon 610M
  (128 - 403, n=3)
311 Points -23%
Affinity Photo 2 - Combined (Single / Multi GPU)
Minisforum BD790i
Radeon 610M, R9 7945HX, Kingston KC3000 2048G SKC3000D2048G
5750 Points
NiPoGi AD08
UHD Graphics 64EUs, i7-12650H, Netac NS512GSSD530
3442 Points -40%
Moyenne AMD Radeon 610M
  (889 - 5750, n=2)
3320 Points -42%
Acemagic AD15
UHD Graphics Xe 32EUs (Tiger Lake-H), i7-11800H, Netac NS512GSSD340
2123 Points -63%
Minisforum EliteMini UM780 XTX
Radeon 780M, R7 7840HS, Kingston OM8PGP41024Q-A0
1399 Points -76%
Minisforum Mars Series MC560
Vega 7, R5 5600U, ESO512GYLCT
1360 Points -76%
Minisforum Venus Series UM790 Pro
Radeon 780M, R9 7940HS, 2x Kingston OM8PGP4256Q-A0 (RAID 0)
1331 Points -77%
Minisforum BD770i
Radeon 610M, R7 7745HX, Fikwot FN955
889 Points -85%
3DMark 06 Standard Score
20555 points
3DMark Vantage P Result
12092 points
3DMark 11 Performance
3873 points
3DMark Ice Storm Standard Score
41556 points
3DMark Cloud Gate Standard Score
14629 points
3DMark Fire Strike Score
2156 points
3DMark Fire Strike Extreme Score
530 points
3DMark Time Spy Score
740 points
Aide

Performances de jeu - AMD Radeon 610M

Afin de mieux évaluer la AMD Radeon 610Mnous l'avons soumise à quelques tests de jeu. Malheureusement, l'iGPU peu performant n'a pas pu afficher de bons taux de rafraîchissement. Même en jouant à des jeux plus anciens, l'AMD Radeon 610M a eu du mal à afficher des taux de rafraîchissement adéquats à l'écran. Les modèles équipés d'une AMD Radeon 780M offraient des performances nettement supérieures. Néanmoins, les limites d'une AMD Radeon 780M ont également été rapidement atteintes, ne laissant que l'option d'utiliser une carte graphique dédiée si vous souhaitez profiter des jeux les plus récents.

Pour avoir un aperçu des performances de l'iGPU par rapport à d'autres cartes graphiques, consultez notre Liste des jeux GPU.

The Witcher 3
1024x768 Low Graphics & Postprocessing
Minisforum EliteMini UM780 XTX
Radeon 780M, R7 7840HS, Kingston OM8PGP41024Q-A0
153.5 (20.1min, 43.1P0.1, 107.8P1 - 370max) fps +245%
Minisforum Venus Series UM790 Pro
Radeon 780M, R9 7940HS, 2x Kingston OM8PGP4256Q-A0 (RAID 0)
135.1 fps +204%
NiPoGi AD08
UHD Graphics 64EUs, i7-12650H, Netac NS512GSSD530
74 (26min, 29.9P0.1, 42.4P1 - 267max) fps +66%
Minisforum Mars Series MC560
Vega 7, R5 5600U, ESO512GYLCT
63.6 fps +43%
Acemagic AD15
UHD Graphics Xe 32EUs (Tiger Lake-H), i7-11800H, Netac NS512GSSD340
47.3 (4.78min, 19.9P0.1, 25.3P1 - 232max) fps +6%
Minisforum BD790i
Radeon 610M, R9 7945HX, Kingston KC3000 2048G SKC3000D2048G
44.5 (8.12min, 22.4P0.1, 30.4P1 - 506max) fps
Minisforum BD770i
Radeon 610M, R7 7745HX, Fikwot FN955
44 (17.6min, 23.6P0.1, 29.2P1 - 484max) fps -1%
1920x1080 High Graphics & Postprocessing (Nvidia HairWorks Off)
Minisforum EliteMini UM780 XTX
Radeon 780M, R7 7840HS, Kingston OM8PGP41024Q-A0
49.1 (23.1min, 38.4P0.1, 40.8P1 - 125.3max) fps +253%
Minisforum Venus Series UM790 Pro
Radeon 780M, R9 7940HS, 2x Kingston OM8PGP4256Q-A0 (RAID 0)
43.3 fps +212%
NiPoGi AD08
UHD Graphics 64EUs, i7-12650H, Netac NS512GSSD530
30.2 (5.17min, 14.7P0.1, 16.3P1 - 162.3max) fps +117%
Minisforum Mars Series MC560
Vega 7, R5 5600U, ESO512GYLCT
20.7 fps +49%
Acemagic AD15
UHD Graphics Xe 32EUs (Tiger Lake-H), i7-11800H, Netac NS512GSSD340
16.1 (8.34min, 8.6P0.1, 8.83P1 - 61max) fps +16%
Minisforum BD790i
Radeon 610M, R9 7945HX, Kingston KC3000 2048G SKC3000D2048G
13.9 (7.02min, 10.1P0.1, 12.1P1 - 16.8max) fps
Minisforum BD770i
Radeon 610M, R7 7745HX, Fikwot FN955
13.5 (6.61min, 9.9P0.1, 11.5P1 - 16.8max) fps -3%
Borderlands 3
1280x720 Very Low Overall Quality (DX11)
Minisforum EliteMini UM780 XTX
Radeon 780M, R7 7840HS, Kingston OM8PGP41024Q-A0
97.3 fps +155%
Minisforum Venus Series UM790 Pro
Radeon 780M, R9 7940HS, 2x Kingston OM8PGP4256Q-A0 (RAID 0)
90.4 fps +137%
Minisforum Mars Series MC560
Vega 7, R5 5600U, ESO512GYLCT
54.3 fps +43%
NiPoGi AD08
UHD Graphics 64EUs, i7-12650H, Netac NS512GSSD530
42.2 fps +11%
Minisforum BD770i
Radeon 610M, R7 7745HX, Fikwot FN955
40.3 fps +6%
Minisforum BD790i
Radeon 610M, R9 7945HX, Kingston KC3000 2048G SKC3000D2048G
38.1 fps
Acemagic AD15
UHD Graphics Xe 32EUs (Tiger Lake-H), i7-11800H, Netac NS512GSSD340
24.5 fps -36%
1920x1080 High Overall Quality (DX11)
Minisforum EliteMini UM780 XTX
Radeon 780M, R7 7840HS, Kingston OM8PGP41024Q-A0
33.3 fps +295%
Minisforum Venus Series UM790 Pro
Radeon 780M, R9 7940HS, 2x Kingston OM8PGP4256Q-A0 (RAID 0)
29 fps +244%
Minisforum Mars Series MC560
Vega 7, R5 5600U, ESO512GYLCT
13.2 fps +57%
NiPoGi AD08
UHD Graphics 64EUs, i7-12650H, Netac NS512GSSD530
11.2 fps +33%
Minisforum BD770i
Radeon 610M, R7 7745HX, Fikwot FN955
9.04 fps +7%
Minisforum BD790i
Radeon 610M, R9 7945HX, Kingston KC3000 2048G SKC3000D2048G
8.43 fps
Acemagic AD15
UHD Graphics Xe 32EUs (Tiger Lake-H), i7-11800H, Netac NS512GSSD340
6.23 fps -26%
GTA V
1024x768 Lowest Settings possible
Minisforum EliteMini UM780 XTX
Radeon 780M, R7 7840HS, Kingston OM8PGP41024Q-A0
164.4 (4.9min, 111.1P1 - 324max) fps +25%
Minisforum Venus Series UM790 Pro
Radeon 780M, R9 7940HS, 2x Kingston OM8PGP4256Q-A0 (RAID 0)
157.8 (4.54min, 111.1P1 - 295max) fps +20%
Minisforum BD770i
Radeon 610M, R7 7745HX, Fikwot FN955
134.5 (7.24min, 90.9P1 - 367max) fps +3%
Minisforum BD790i
Radeon 610M, R9 7945HX, Kingston KC3000 2048G SKC3000D2048G
131.2 (7.24min, 90.9P1 - 448max) fps
Minisforum Mars Series MC560
Vega 7, R5 5600U, ESO512GYLCT
121.3 (9.08min, 83.3P1 - 273max) fps -8%
NiPoGi AD08
UHD Graphics 64EUs, i7-12650H, Netac NS512GSSD530
118.3 (10.2min, 76.9P1 - 249max) fps -10%
Acemagic AD15
UHD Graphics Xe 32EUs (Tiger Lake-H), i7-11800H, Netac NS512GSSD340
100.8 (23.7min, 71.4P1 - 196.9max) fps -23%
1920x1080 High/On (Advanced Graphics Off) AA:2xMSAA + FX AF:8x
Minisforum EliteMini UM780 XTX
Radeon 780M, R7 7840HS, Kingston OM8PGP41024Q-A0
66.9 (3.09min, 45.5P1 - 259max) fps +210%
Minisforum Venus Series UM790 Pro
Radeon 780M, R9 7940HS, 2x Kingston OM8PGP4256Q-A0 (RAID 0)
59.7 (4.52min, 40P1 - 219max) fps +176%
Minisforum Mars Series MC560
Vega 7, R5 5600U, ESO512GYLCT
28.5 (10.1min, 21.3P1 - 207max) fps +32%
Minisforum BD770i
Radeon 610M, R7 7745HX, Fikwot FN955
23.1 (9.37min, 16.4P1 - 192max) fps +7%
Minisforum BD790i
Radeon 610M, R9 7945HX, Kingston KC3000 2048G SKC3000D2048G
21.6 (6.51min, 16.1P1 - 189.5max) fps
NiPoGi AD08
UHD Graphics 64EUs, i7-12650H, Netac NS512GSSD530
16.9 (5.82min, 13P1 - 41.6max) fps -22%
Acemagic AD15
UHD Graphics Xe 32EUs (Tiger Lake-H), i7-11800H, Netac NS512GSSD340
13.7 (7.54min, 9.71P1 - 58.8max) fps -37%
Far Cry 5
1280x720 Low Preset AA:T
Minisforum EliteMini UM780 XTX
Radeon 780M, R7 7840HS, Kingston OM8PGP41024Q-A0
87 (75min - 104max) fps +248%
Minisforum Venus Series UM790 Pro
Radeon 780M, R9 7940HS, 2x Kingston OM8PGP4256Q-A0 (RAID 0)
80 (69min - 98max) fps +220%
Minisforum Mars Series MC560
Vega 7, R5 5600U, ESO512GYLCT
49 (42min - 63max) fps +96%
NiPoGi AD08
UHD Graphics 64EUs, i7-12650H, Netac NS512GSSD530
46 (38min - 52max) fps +84%
Minisforum BD770i
Radeon 610M, R7 7745HX, Fikwot FN955
34 (29min - 43max) fps +36%
Acemagic AD15
UHD Graphics Xe 32EUs (Tiger Lake-H), i7-11800H, Netac NS512GSSD340
30 (26min - 36max) fps +20%
Minisforum BD790i
Radeon 610M, R9 7945HX, Kingston KC3000 2048G SKC3000D2048G
25 (21min - 33max) fps
1920x1080 High Preset AA:T
Minisforum EliteMini UM780 XTX
Radeon 780M, R7 7840HS, Kingston OM8PGP41024Q-A0
47 (42min - 56max) fps +292%
Minisforum Venus Series UM790 Pro
Radeon 780M, R9 7940HS, 2x Kingston OM8PGP4256Q-A0 (RAID 0)
41 (36min - 49max) fps +242%
NiPoGi AD08
UHD Graphics 64EUs, i7-12650H, Netac NS512GSSD530
21 (18min - 25max) fps +75%
Minisforum Mars Series MC560
Vega 7, R5 5600U, ESO512GYLCT
20 (17min - 25max) fps +67%
Minisforum BD770i
Radeon 610M, R7 7745HX, Fikwot FN955
14 (12min - 19max) fps +17%
Acemagic AD15
UHD Graphics Xe 32EUs (Tiger Lake-H), i7-11800H, Netac NS512GSSD340
12 (10min - 16max) fps 0%
Minisforum BD790i
Radeon 610M, R9 7945HX, Kingston KC3000 2048G SKC3000D2048G
12 (10min - 16max) fps
Far Cry New Dawn
1280x720 Low Preset
Minisforum EliteMini UM780 XTX
Radeon 780M, R7 7840HS, Kingston OM8PGP41024Q-A0
75 (58min - 97max) fps +134%
Minisforum Venus Series UM790 Pro
Radeon 780M, R9 7940HS, 2x Kingston OM8PGP4256Q-A0 (RAID 0)
70 (50min - 89max) fps +119%
NiPoGi AD08
UHD Graphics 64EUs, i7-12650H, Netac NS512GSSD530
45 (29min - 56max) fps +41%
Minisforum Mars Series MC560
Vega 7, R5 5600U, ESO512GYLCT
43 (33min - 55max) fps +34%
Minisforum BD770i
Radeon 610M, R7 7745HX, Fikwot FN955
35 (27min - 43max) fps +9%
Minisforum BD790i
Radeon 610M, R9 7945HX, Kingston KC3000 2048G SKC3000D2048G
32 (26min - 40max) fps
Acemagic AD15
UHD Graphics Xe 32EUs (Tiger Lake-H), i7-11800H, Netac NS512GSSD340
27 (17min - 35max) fps -16%
1920x1080 High Preset
Minisforum EliteMini UM780 XTX
Radeon 780M, R7 7840HS, Kingston OM8PGP41024Q-A0
45 (37min - 53max) fps +221%
Minisforum Venus Series UM790 Pro
Radeon 780M, R9 7940HS, 2x Kingston OM8PGP4256Q-A0 (RAID 0)
40 (32min - 47max) fps +186%
NiPoGi AD08
UHD Graphics 64EUs, i7-12650H, Netac NS512GSSD530
22 (16min - 27max) fps +57%
Minisforum Mars Series MC560
Vega 7, R5 5600U, ESO512GYLCT
20 (12min - 24max) fps +43%
Minisforum BD770i
Radeon 610M, R7 7745HX, Fikwot FN955
16 (12min - 19max) fps +14%
Minisforum BD790i
Radeon 610M, R9 7945HX, Kingston KC3000 2048G SKC3000D2048G
14 (11min - 17max) fps
Acemagic AD15
UHD Graphics Xe 32EUs (Tiger Lake-H), i7-11800H, Netac NS512GSSD340
13 (9min - 16max) fps -7%
Tiny Tina's Wonderlands
1280x720 Lowest Preset (DX12)
Minisforum EliteMini UM780 XTX
Radeon 780M, R7 7840HS, Kingston OM8PGP41024Q-A0
151.2 fps +311%
Minisforum Venus Series UM790 Pro
Radeon 780M, R9 7940HS, 2x Kingston OM8PGP4256Q-A0 (RAID 0)
131.4 fps +257%
Minisforum Mars Series MC560
Vega 7, R5 5600U, ESO512GYLCT
56.9 fps +55%
Minisforum BD770i
Radeon 610M, R7 7745HX, Fikwot FN955
40.9 fps +11%
Minisforum BD790i
Radeon 610M, R9 7945HX, Kingston KC3000 2048G SKC3000D2048G
36.8 fps
Acemagic AD15
UHD Graphics Xe 32EUs (Tiger Lake-H), i7-11800H, Netac NS512GSSD340
25.7 fps -30%
1920x1080 High Preset (DX12)
Minisforum EliteMini UM780 XTX
Radeon 780M, R7 7840HS, Kingston OM8PGP41024Q-A0
38.8 fps +361%
Minisforum Venus Series UM790 Pro
Radeon 780M, R9 7940HS, 2x Kingston OM8PGP4256Q-A0 (RAID 0)
33.3 fps +296%
Minisforum Mars Series MC560
Vega 7, R5 5600U, ESO512GYLCT
13.5 fps +61%
Minisforum BD770i
Radeon 610M, R7 7745HX, Fikwot FN955
9.24 fps +10%
Minisforum BD790i
Radeon 610M, R9 7945HX, Kingston KC3000 2048G SKC3000D2048G
8.41 fps
Acemagic AD15
UHD Graphics Xe 32EUs (Tiger Lake-H), i7-11800H, Netac NS512GSSD340
6.35 fps -24%
Metro Exodus
1280x720 Low Quality AF:4x
Minisforum EliteMini UM780 XTX
Radeon 780M, R7 7840HS, Kingston OM8PGP41024Q-A0
92.5 (56.63min - 130.99max) fps +269%
Minisforum Venus Series UM790 Pro
Radeon 780M, R9 7940HS, 2x Kingston OM8PGP4256Q-A0 (RAID 0)
81.1 (49.18min - 114.94max) fps +223%
NiPoGi AD08
UHD Graphics 64EUs, i7-12650H, Netac NS512GSSD530
33.1 (19.24min - 49.3max) fps +32%
Minisforum BD770i
Radeon 610M, R7 7745HX, Fikwot FN955
28.4 (18.34min - 40.02max) fps +13%
Minisforum BD790i
Radeon 610M, R9 7945HX, Kingston KC3000 2048G SKC3000D2048G
25.1 (15.39min - 37.85max) fps
1920x1080 High Quality AF:16x
Minisforum EliteMini UM780 XTX
Radeon 780M, R7 7840HS, Kingston OM8PGP41024Q-A0
28.7 (14.33min - 42.03max) fps +271%
Minisforum Venus Series UM790 Pro
Radeon 780M, R9 7940HS, 2x Kingston OM8PGP4256Q-A0 (RAID 0)
25 (12.18min - 37.05max) fps +223%
NiPoGi AD08
UHD Graphics 64EUs, i7-12650H, Netac NS512GSSD530
11.7 (6.1min - 17.86max) fps +51%
Minisforum BD770i
Radeon 610M, R7 7745HX, Fikwot FN955
8.4 (4.14min - 13.6max) fps +9%
Minisforum BD790i
Radeon 610M, R9 7945HX, Kingston KC3000 2048G SKC3000D2048G
7.73 (3.74min - 13.13max) fps
Shadow of the Tomb Raider
1280x720 Lowest Preset
Minisforum EliteMini UM780 XTX
Radeon 780M, R7 7840HS, Kingston OM8PGP41024Q-A0
109.2 fps +206%
Minisforum Venus Series UM790 Pro
Radeon 780M, R9 7940HS, 2x Kingston OM8PGP4256Q-A0 (RAID 0)
94.1 fps +164%
NiPoGi AD08
UHD Graphics 64EUs, i7-12650H, Netac NS512GSSD530
40.5 fps +13%
Minisforum BD770i
Radeon 610M, R7 7745HX, Fikwot FN955
40 fps +12%
Minisforum BD790i
Radeon 610M, R9 7945HX, Kingston KC3000 2048G SKC3000D2048G
35.7 fps
Acemagic AD15
UHD Graphics Xe 32EUs (Tiger Lake-H), i7-11800H, Netac NS512GSSD340
33.2 fps -7%
1920x1080 High Preset AA:SM
Minisforum EliteMini UM780 XTX
Radeon 780M, R7 7840HS, Kingston OM8PGP41024Q-A0
41.2 fps +258%
Minisforum Venus Series UM790 Pro
Radeon 780M, R9 7940HS, 2x Kingston OM8PGP4256Q-A0 (RAID 0)
36.3 fps +216%
NiPoGi AD08
UHD Graphics 64EUs, i7-12650H, Netac NS512GSSD530
17.6 fps +53%
Minisforum BD770i
Radeon 610M, R7 7745HX, Fikwot FN955
12.6 fps +10%
Acemagic AD15
UHD Graphics Xe 32EUs (Tiger Lake-H), i7-11800H, Netac NS512GSSD340
12.1 fps +5%
Minisforum BD790i
Radeon 610M, R9 7945HX, Kingston KC3000 2048G SKC3000D2048G
11.5 fps
Strange Brigade
1280x720 lowest AF:1
Minisforum EliteMini UM780 XTX
Radeon 780M, R7 7840HS, Kingston OM8PGP41024Q-A0
168.8 (121.6min, 142.3P1 - 233max) fps +708%
Minisforum Venus Series UM790 Pro
Radeon 780M, R9 7940HS, 2x Kingston OM8PGP4256Q-A0 (RAID 0)
148.8 (53.7min, 130P1 - 285max) fps +612%
Minisforum Mars Series MC560
Vega 7, R5 5600U, ESO512GYLCT
86.3 (51.6min, 72P1 - 163.3max) fps +313%
NiPoGi AD08
UHD Graphics 64EUs, i7-12650H, Netac NS512GSSD530
78.1 (17.5min, 24P1 - 419max) fps +274%
Minisforum BD770i
Radeon 610M, R7 7745HX, Fikwot FN955
67.7 (53.7min, 60.2P1 - 86.8max) fps +224%
Acemagic AD15
UHD Graphics Xe 32EUs (Tiger Lake-H), i7-11800H, Netac NS512GSSD340
55.6 (12.4min, 18P1 - 448max) fps +166%
Minisforum BD790i
Radeon 610M, R9 7945HX, Kingston KC3000 2048G SKC3000D2048G
20.9 (18.4min, 19.1P1 - 24.8max) fps
1920x1080 high AA:high AF:8
Minisforum EliteMini UM780 XTX
Radeon 780M, R7 7840HS, Kingston OM8PGP41024Q-A0
56.5 (37.2min, 44.1P1 - 77.4max) fps +295%
Minisforum Venus Series UM790 Pro
Radeon 780M, R9 7940HS, 2x Kingston OM8PGP4256Q-A0 (RAID 0)
50.7 (14.7min, 38.5P1 - 320max) fps +255%
Minisforum Mars Series MC560
Vega 7, R5 5600U, ESO512GYLCT
26 (19.1min, 20.7P1 - 45.9max) fps +82%
NiPoGi AD08
UHD Graphics 64EUs, i7-12650H, Netac NS512GSSD530
25.6 (5min, 9.18P1 - 212max) fps +79%
Minisforum BD770i
Radeon 610M, R7 7745HX, Fikwot FN955
17 (13.4min, 13.9P1 - 22.4max) fps +19%
Acemagic AD15
UHD Graphics Xe 32EUs (Tiger Lake-H), i7-11800H, Netac NS512GSSD340
16.6 (5min, 5.93P1 - 306max) fps +16%
Minisforum BD790i
Radeon 610M, R9 7945HX, Kingston KC3000 2048G SKC3000D2048G
14.3 (10.6min, 11P1 - 20max) fps
BasMoyenÉlevéUltra
GTA V (2015) 131.2 99.5 21.6 9.61
The Witcher 3 (2015) 44.5 27 13.9 7.8
Final Fantasy XV Benchmark (2018) 25.9 11.4 7.97
X-Plane 11.11 (2018) 39.8 23.5 20.8
Far Cry 5 (2018) 25 13 12 11
Strange Brigade (2018) 20.9 18.8 14.3 12
Shadow of the Tomb Raider (2018) 35.7 12.5 11.5 9.4
Far Cry New Dawn (2019) 32 15 14 12
Metro Exodus (2019) 25.1 10.6 7.73 6.41
Borderlands 3 (2019) 38.1 14.3 8.43 6.4
Tiny Tina's Wonderlands (2022) 16.3 12.8 8.41

Le Minisforum BD790i avec une Nvidia GeForce RTX 4090

La carte mère Minisforum BD790i est idéale comme base d'un système de jeu compact. L'AMD Ryzen 9 7945HX offre de bonnes performances, et même les jeux exigeants en termes de CPU ne surchargent pas le composant à 16 cœurs. Les benchmarks synthétiques ne révèlent que des différences mineures entre les différents systèmes. La carte mère Minisforum BD790i dispose d'une interface PCIe x16 complète qui supporte déjà le standard 5.0. Cela signifie que les futures cartes graphiques, qui sortiront probablement dans les mois à venir, pourront également être exploitées avec leur pleine largeur de bande, ce qui renforce encore les qualités d'avenir de ce composant. Nous avons utilisé notre Palit GeForce RTX 4090 Gamerock OC pour les tests de jeu. En raison de la taille de la carte graphique, nous avons dû utiliser le Minisforum BD790i dans une configuration ouverte pour ces tests. La carte graphique est tout simplement trop grande pour le boîtier Phanteks Enthoo Evolv Shift XT.

Pour analyser les benchmarks de jeu, regardons d'abord les performances à la limite du CPU. C'est là que les différences entre les différents processeurs sont les plus importantes. Notre système de test a fourni à peu près le niveau de performance que l'on peut attendre d'un AMD Ryzen 5 9600X. Un Intel Core i9-14900K était à portée de main et n'offrait que des performances légèrement supérieures. Lorsque nous avons augmenté la résolution et le niveau de détail, les performances du processeur sont passées au second plan. À la limite du GPU, tous les appareils de comparaison étaient beaucoup plus proches les uns des autres, ce qui signifie qu'une différence réelle était à peine perceptible. La combinaison d'un AMD Ryzen 9 7945HX et du Palit GeForce RTX 4090 Gamerock OC a toujours assuré des performances de jeu impressionnantes, qui ne sont en rien inférieures à celles des PC de bureau conventionnels.

Tous les systèmes présentés dans ce comparatif ont été testés avec la même carte graphique, une Palit GeForce RTX 4090 Gamerock OC.

Minisforum BD790i en combinaison avec la Nvidia GeForce RTX 4090
Nvidia GeForce RTX 4090
Performance Rating - Percent
AMD Ryzen 5 9600X, NVIDIA GeForce RTX 4090
97.8 pt
Intel Core i9-14900K, NVIDIA GeForce RTX 4090
96.3 pt
Intel Core i5-14600K, NVIDIA GeForce RTX 4090
96 pt
AMD Ryzen 7 7745HX, NVIDIA GeForce RTX 4090
95.5 pt
AMD Ryzen 9 7950X, NVIDIA GeForce RTX 4090
94.9 pt
AMD Ryzen 7 7800X3D, NVIDIA GeForce RTX 4090
94.9 pt
Intel Core i7-13700, NVIDIA GeForce RTX 4090
94.6 pt
AMD Ryzen 9 7945HX, NVIDIA GeForce RTX 4090
91.7 pt
Intel Core i7-12700, NVIDIA GeForce RTX 4090
90.8 pt
Intel Core i5-13400, NVIDIA GeForce RTX 4090
88.5 pt
3DMark 11 - 1280x720 Performance GPU
AMD Ryzen 7 7745HX, NVIDIA GeForce RTX 4090
115253 Points +3291%
AMD Ryzen 7 7800X3D, NVIDIA GeForce RTX 4090
114641 Points +3273%
Intel Core i5-14600K, NVIDIA GeForce RTX 4090
110994 Points +3165%
AMD Ryzen 9 7950X, NVIDIA GeForce RTX 4090
107723 Points +3069%
Intel Core i7-13700, NVIDIA GeForce RTX 4090
105473 Points +3003%
Intel Core i7-12700, NVIDIA GeForce RTX 4090
104876 Points +2985%
Intel Core i5-13400, NVIDIA GeForce RTX 4090
104598 Points +2977%
AMD Ryzen 5 9600X, NVIDIA GeForce RTX 4090
104516 Points +2975%
Intel Core i9-14900K, NVIDIA GeForce RTX 4090
103741 Points +2952%
AMD Ryzen 9 7945HX, NVIDIA GeForce RTX 4090
99614 Points +2831%
3399 Points
3DMark
2560x1440 Time Spy Graphics
AMD Ryzen 7 7745HX, NVIDIA GeForce RTX 4090
37809 Points +5552%
Intel Core i5-14600K, NVIDIA GeForce RTX 4090
37769 Points +5546%
Intel Core i9-14900K, NVIDIA GeForce RTX 4090
37714 Points +5537%
AMD Ryzen 7 7800X3D, NVIDIA GeForce RTX 4090
37664 Points +5530%
AMD Ryzen 5 9600X, NVIDIA GeForce RTX 4090
37161 Points +5455%
Intel Core i7-13700, NVIDIA GeForce RTX 4090
37106 Points +5446%
AMD Ryzen 9 7950X, NVIDIA GeForce RTX 4090
36836 Points +5406%
Intel Core i7-12700, NVIDIA GeForce RTX 4090
34580 Points +5069%
Intel Core i5-13400, NVIDIA GeForce RTX 4090
33624 Points +4926%
AMD Ryzen 9 7945HX, NVIDIA GeForce RTX 4090
32488 Points +4756%
669 Points
1920x1080 Fire Strike Graphics
AMD Ryzen 7 7745HX, NVIDIA GeForce RTX 4090
87786 Points +3755%
Intel Core i5-14600K, NVIDIA GeForce RTX 4090
86031 Points +3678%
Intel Core i7-12700, NVIDIA GeForce RTX 4090
79398 Points +3387%
Intel Core i7-13700, NVIDIA GeForce RTX 4090
78878 Points +3364%
AMD Ryzen 5 9600X, NVIDIA GeForce RTX 4090
78579 Points +3351%
Intel Core i5-13400, NVIDIA GeForce RTX 4090
77224 Points +3291%
AMD Ryzen 7 7800X3D, NVIDIA GeForce RTX 4090
73447 Points +3126%
AMD Ryzen 9 7950X, NVIDIA GeForce RTX 4090
72678 Points +3092%
AMD Ryzen 9 7945HX, NVIDIA GeForce RTX 4090
72177 Points +3070%
Intel Core i9-14900K, NVIDIA GeForce RTX 4090
66973 Points +2841%
2277 Points
3840x2160 Fire Strike Ultra Graphics
AMD Ryzen 7 7800X3D, NVIDIA GeForce RTX 4090
25571 Points +5306%
AMD Ryzen 7 7745HX, NVIDIA GeForce RTX 4090
25435 Points +5277%
Intel Core i5-14600K, NVIDIA GeForce RTX 4090
25342 Points +5258%
Intel Core i7-13700, NVIDIA GeForce RTX 4090
25254 Points +5239%
Intel Core i5-13400, NVIDIA GeForce RTX 4090
25052 Points +5196%
AMD Ryzen 9 7950X, NVIDIA GeForce RTX 4090
25018 Points +5189%
Intel Core i9-14900K, NVIDIA GeForce RTX 4090
24968 Points +5179%
AMD Ryzen 5 9600X, NVIDIA GeForce RTX 4090
24915 Points +5167%
AMD Ryzen 9 7945HX, NVIDIA GeForce RTX 4090
24906 Points +5166%
Intel Core i7-12700, NVIDIA GeForce RTX 4090
24669 Points +5115%
473 Points
Unigine Superposition
1280x720 720p Low
AMD Ryzen 5 9600X, NVIDIA GeForce RTX 4090
63603 Points +1278%
Intel Core i9-14900K, NVIDIA GeForce RTX 4090
57833 Points +1153%
AMD Ryzen 7 7800X3D, NVIDIA GeForce RTX 4090
56805 Points +1131%
AMD Ryzen 9 7950X, NVIDIA GeForce RTX 4090
51741 Points +1021%
AMD Ryzen 7 7745HX, NVIDIA GeForce RTX 4090
50617 Points +997%
Intel Core i7-13700, NVIDIA GeForce RTX 4090
50107 Points +986%
Intel Core i5-14600K, NVIDIA GeForce RTX 4090
49203 Points +966%
AMD Ryzen 9 7945HX, NVIDIA GeForce RTX 4090
45591 Points +888%
Intel Core i7-12700, NVIDIA GeForce RTX 4090
40758 Points +783%
Intel Core i5-13400, NVIDIA GeForce RTX 4090
35207 Points +663%
4614 Points
1920x1080 1080p High
Intel Core i9-14900K, NVIDIA GeForce RTX 4090
50390 Points +5353%
AMD Ryzen 5 9600X, NVIDIA GeForce RTX 4090
50230 Points +5336%
AMD Ryzen 7 7800X3D, NVIDIA GeForce RTX 4090
49328 Points +5239%
AMD Ryzen 9 7950X, NVIDIA GeForce RTX 4090
46814 Points +4966%
AMD Ryzen 7 7745HX, NVIDIA GeForce RTX 4090
45532 Points +4828%
Intel Core i7-13700, NVIDIA GeForce RTX 4090
45368 Points +4810%
Intel Core i5-14600K, NVIDIA GeForce RTX 4090
45162 Points +4788%
AMD Ryzen 9 7945HX, NVIDIA GeForce RTX 4090
41353 Points +4375%
Intel Core i7-12700, NVIDIA GeForce RTX 4090
37819 Points +3993%
Intel Core i5-13400, NVIDIA GeForce RTX 4090
32711 Points +3440%
924 Points
1920x1080 1080p Extreme
AMD Ryzen 7 7800X3D, NVIDIA GeForce RTX 4090
22618 Points +7978%
AMD Ryzen 7 7745HX, NVIDIA GeForce RTX 4090
22416 Points +7906%
Intel Core i5-14600K, NVIDIA GeForce RTX 4090
21954 Points +7741%
Intel Core i9-14900K, NVIDIA GeForce RTX 4090
21917 Points +7728%
AMD Ryzen 9 7950X, NVIDIA GeForce RTX 4090
21824 Points +7694%
Intel Core i7-13700, NVIDIA GeForce RTX 4090
21808 Points +7689%
Intel Core i5-13400, NVIDIA GeForce RTX 4090
21646 Points +7631%
Intel Core i7-12700, NVIDIA GeForce RTX 4090
21615 Points +7620%
AMD Ryzen 9 7945HX, NVIDIA GeForce RTX 4090
21604 Points +7616%
AMD Ryzen 5 9600X, NVIDIA GeForce RTX 4090
21586 Points +7609%
280 Points
3840x2160 4k Optimized
AMD Ryzen 9 7950X, NVIDIA GeForce RTX 4090
33943 Points
Intel Core i7-13700, NVIDIA GeForce RTX 4090
33765 Points
Intel Core i9-14900K, NVIDIA GeForce RTX 4090
33737 Points
Intel Core i5-14600K, NVIDIA GeForce RTX 4090
33700 Points
AMD Ryzen 7 7800X3D, NVIDIA GeForce RTX 4090
33601 Points
AMD Ryzen 7 7745HX, NVIDIA GeForce RTX 4090
33540 Points
AMD Ryzen 5 9600X, NVIDIA GeForce RTX 4090
33095 Points
AMD Ryzen 9 7945HX, NVIDIA GeForce RTX 4090
32629 Points
Intel Core i7-12700, NVIDIA GeForce RTX 4090
32608 Points
Intel Core i5-13400, NVIDIA GeForce RTX 4090
30877 Points
7680x4320 8k Optimized
AMD Ryzen 9 7950X, NVIDIA GeForce RTX 4090
13082 Points
Intel Core i7-13700, NVIDIA GeForce RTX 4090
13081 Points
Intel Core i7-12700, NVIDIA GeForce RTX 4090
13070 Points
Intel Core i5-13400, NVIDIA GeForce RTX 4090
13011 Points
Intel Core i9-14900K, NVIDIA GeForce RTX 4090
12801 Points
Intel Core i5-14600K, NVIDIA GeForce RTX 4090
12791 Points
AMD Ryzen 7 7800X3D, NVIDIA GeForce RTX 4090
12770 Points
AMD Ryzen 7 7745HX, NVIDIA GeForce RTX 4090
12752 Points
AMD Ryzen 9 7945HX, NVIDIA GeForce RTX 4090
12526 Points
AMD Ryzen 5 9600X, NVIDIA GeForce RTX 4090
12498 Points
Unigine Valley 1.0
1920x1080 Extreme HD DirectX AA:x8
AMD Ryzen 5 9600X, NVIDIA GeForce RTX 4090
324 fps +3140%
Intel Core i9-14900K, NVIDIA GeForce RTX 4090
304.6 fps +2946%
Intel Core i5-14600K, NVIDIA GeForce RTX 4090
283.4 fps +2734%
AMD Ryzen 9 7950X, NVIDIA GeForce RTX 4090
270.7 fps +2607%
Intel Core i7-13700, NVIDIA GeForce RTX 4090
266.6 fps +2566%
AMD Ryzen 9 7945HX, NVIDIA GeForce RTX 4090
257.5 fps +2475%
AMD Ryzen 7 7745HX, NVIDIA GeForce RTX 4090
249.8 fps +2398%
AMD Ryzen 7 7800X3D, NVIDIA GeForce RTX 4090
246.7 fps +2367%
Intel Core i7-12700, NVIDIA GeForce RTX 4090
238.4 fps +2284%
Intel Core i5-13400, NVIDIA GeForce RTX 4090
226.2 fps +2162%
10 fps
1920x1080 Extreme HD Preset OpenGL AA:x8
AMD Ryzen 5 9600X, NVIDIA GeForce RTX 4090
331.8 fps +3393%
Intel Core i9-14900K, NVIDIA GeForce RTX 4090
320.9 fps +3278%
Intel Core i5-14600K, NVIDIA GeForce RTX 4090
303.2 fps +3092%
Intel Core i7-13700, NVIDIA GeForce RTX 4090
293.1 fps +2985%
AMD Ryzen 9 7950X, NVIDIA GeForce RTX 4090
288 fps +2932%
AMD Ryzen 7 7745HX, NVIDIA GeForce RTX 4090
270 fps +2742%
AMD Ryzen 7 7800X3D, NVIDIA GeForce RTX 4090
260.9 fps +2646%
AMD Ryzen 9 7945HX, NVIDIA GeForce RTX 4090
260.9 fps +2646%
Intel Core i7-12700, NVIDIA GeForce RTX 4090
258.5 fps +2621%
Intel Core i5-13400, NVIDIA GeForce RTX 4090
242.8 fps +2456%
9.5 fps
Unigine Heaven 4.0
Extreme Preset OpenGL
AMD Ryzen 5 9600X, NVIDIA GeForce RTX 4090
472.4 fps +3534%
Intel Core i9-14900K, NVIDIA GeForce RTX 4090
463.3 fps +3464%
AMD Ryzen 7 7745HX, NVIDIA GeForce RTX 4090
461 fps +3446%
AMD Ryzen 9 7945HX, NVIDIA GeForce RTX 4090
458 fps +3423%
Intel Core i5-14600K, NVIDIA GeForce RTX 4090
456.3 fps +3410%
AMD Ryzen 9 7950X, NVIDIA GeForce RTX 4090
450.4 fps +3365%
Intel Core i7-13700, NVIDIA GeForce RTX 4090
450.4 fps +3365%
AMD Ryzen 7 7800X3D, NVIDIA GeForce RTX 4090
442.4 fps +3303%
Intel Core i7-12700, NVIDIA GeForce RTX 4090
433.8 fps +3237%
Intel Core i5-13400, NVIDIA GeForce RTX 4090
420 fps +3131%
13 fps
Extreme Preset DX11
AMD Ryzen 9 7950X, NVIDIA GeForce RTX 4090
491.5 fps +3929%
Intel Core i9-14900K, NVIDIA GeForce RTX 4090
484.4 fps +3870%
AMD Ryzen 9 7945HX, NVIDIA GeForce RTX 4090
476.3 fps +3804%
AMD Ryzen 5 9600X, NVIDIA GeForce RTX 4090
473.9 fps +3784%
AMD Ryzen 7 7745HX, NVIDIA GeForce RTX 4090
473.1 fps +3778%
Intel Core i5-14600K, NVIDIA GeForce RTX 4090
473 fps +3777%
AMD Ryzen 7 7800X3D, NVIDIA GeForce RTX 4090
463.8 fps +3702%
Intel Core i7-13700, NVIDIA GeForce RTX 4090
462.5 fps +3691%
Intel Core i7-12700, NVIDIA GeForce RTX 4090
435.2 fps +3467%
Intel Core i5-13400, NVIDIA GeForce RTX 4090
416.6 fps +3315%
12.2 fps
ComputeMark v2.1
1024x600 Normal, Score
AMD Ryzen 7 7745HX, NVIDIA GeForce RTX 4090
92521 Points +5580%
Intel Core i5-14600K, NVIDIA GeForce RTX 4090
92397 Points +5572%
AMD Ryzen 9 7945HX, NVIDIA GeForce RTX 4090
92292 Points +5566%
AMD Ryzen 5 9600X, NVIDIA GeForce RTX 4090
92222 Points +5561%
AMD Ryzen 9 7950X, NVIDIA GeForce RTX 4090
92171 Points +5558%
Intel Core i9-14900K, NVIDIA GeForce RTX 4090
91722 Points +5531%
Intel Core i7-12700, NVIDIA GeForce RTX 4090
91703 Points +5529%
AMD Ryzen 7 7800X3D, NVIDIA GeForce RTX 4090
91665 Points +5527%
Intel Core i5-13400, NVIDIA GeForce RTX 4090
91659 Points +5527%
Intel Core i7-13700, NVIDIA GeForce RTX 4090
91616 Points +5524%
1629 Points
1024x600 Normal, Fluid 3DTex
AMD Ryzen 7 7800X3D, NVIDIA GeForce RTX 4090
10875 Points +4712%
Intel Core i5-14600K, NVIDIA GeForce RTX 4090
10797 Points +4677%
Intel Core i7-13700, NVIDIA GeForce RTX 4090
10759 Points +4661%
AMD Ryzen 9 7945HX, NVIDIA GeForce RTX 4090
10758 Points +4660%
Intel Core i5-13400, NVIDIA GeForce RTX 4090
10756 Points +4659%
AMD Ryzen 5 9600X, NVIDIA GeForce RTX 4090
10756 Points +4659%
Intel Core i7-12700, NVIDIA GeForce RTX 4090
10749 Points +4656%
AMD Ryzen 9 7950X, NVIDIA GeForce RTX 4090
10724 Points +4645%
AMD Ryzen 7 7745HX, NVIDIA GeForce RTX 4090
10707 Points +4638%
Intel Core i9-14900K, NVIDIA GeForce RTX 4090
10498 Points +4545%
226 Points
1024x600 Normal, Fluid 2DTexArr
AMD Ryzen 9 7945HX, NVIDIA GeForce RTX 4090
6960 Points +3506%
AMD Ryzen 5 9600X, NVIDIA GeForce RTX 4090
6948 Points +3500%
AMD Ryzen 7 7745HX, NVIDIA GeForce RTX 4090
6924 Points +3488%
Intel Core i5-14600K, NVIDIA GeForce RTX 4090
6920 Points +3485%
Intel Core i9-14900K, NVIDIA GeForce RTX 4090
6901 Points +3476%
AMD Ryzen 9 7950X, NVIDIA GeForce RTX 4090
6891 Points +3470%
Intel Core i7-12700, NVIDIA GeForce RTX 4090
6891 Points +3470%
Intel Core i7-13700, NVIDIA GeForce RTX 4090
6891 Points +3470%
AMD Ryzen 7 7800X3D, NVIDIA GeForce RTX 4090
6887 Points +3468%
Intel Core i5-13400, NVIDIA GeForce RTX 4090
6879 Points +3464%
193 Points
1024x600 Normal, Mandel Vector
AMD Ryzen 7 7745HX, NVIDIA GeForce RTX 4090
17390 Points +5369%
AMD Ryzen 9 7945HX, NVIDIA GeForce RTX 4090
17369 Points +5362%
Intel Core i5-14600K, NVIDIA GeForce RTX 4090
17355 Points +5358%
AMD Ryzen 9 7950X, NVIDIA GeForce RTX 4090
17336 Points +5352%
AMD Ryzen 5 9600X, NVIDIA GeForce RTX 4090
17307 Points +5342%
Intel Core i9-14900K, NVIDIA GeForce RTX 4090
17246 Points +5323%
Intel Core i7-13700, NVIDIA GeForce RTX 4090
17207 Points +5311%
Intel Core i7-12700, NVIDIA GeForce RTX 4090
17196 Points +5308%
AMD Ryzen 7 7800X3D, NVIDIA GeForce RTX 4090
17156 Points +5295%
Intel Core i5-13400, NVIDIA GeForce RTX 4090
17154 Points +5294%
318 Points
1024x600 Normal, Mandel Scalar
AMD Ryzen 7 7745HX, NVIDIA GeForce RTX 4090
23006 Points +4595%
Intel Core i5-14600K, NVIDIA GeForce RTX 4090
22992 Points +4592%
Intel Core i9-14900K, NVIDIA GeForce RTX 4090
22970 Points +4588%
AMD Ryzen 9 7945HX, NVIDIA GeForce RTX 4090
22936 Points +4581%
AMD Ryzen 7 7800X3D, NVIDIA GeForce RTX 4090
22926 Points +4579%
AMD Ryzen 9 7950X, NVIDIA GeForce RTX 4090
22889 Points +4571%
AMD Ryzen 5 9600X, NVIDIA GeForce RTX 4090
22843 Points +4562%
Intel Core i7-12700, NVIDIA GeForce RTX 4090
22834 Points +4560%
Intel Core i7-13700, NVIDIA GeForce RTX 4090
22825 Points +4558%
Intel Core i5-13400, NVIDIA GeForce RTX 4090
22813 Points +4556%
490 Points
1024x600 Normal, QJuliaRayTrace
AMD Ryzen 7 7745HX, NVIDIA GeForce RTX 4090
34494 Points +8459%
AMD Ryzen 5 9600X, NVIDIA GeForce RTX 4090
34367 Points +8428%
Intel Core i5-14600K, NVIDIA GeForce RTX 4090
34333 Points +8419%
AMD Ryzen 9 7950X, NVIDIA GeForce RTX 4090
34332 Points +8419%
AMD Ryzen 9 7945HX, NVIDIA GeForce RTX 4090
34269 Points +8403%
Intel Core i9-14900K, NVIDIA GeForce RTX 4090
34107 Points +8363%
Intel Core i5-13400, NVIDIA GeForce RTX 4090
34057 Points +8351%
Intel Core i7-12700, NVIDIA GeForce RTX 4090
34033 Points +8345%
Intel Core i7-13700, NVIDIA GeForce RTX 4090
33935 Points +8321%
AMD Ryzen 7 7800X3D, NVIDIA GeForce RTX 4090
33822 Points +8293%
403 Points

Performance comparison at CPU limit at 720p

Performance Rating - Percent
AMD Ryzen 7 7800X3D, NVIDIA GeForce RTX 4090
98.8 pt
Intel Core i9-14900K, NVIDIA GeForce RTX 4090
90.2 pt
AMD Ryzen 5 9600X, NVIDIA GeForce RTX 4090
86.7 pt
AMD Ryzen 9 7950X, NVIDIA GeForce RTX 4090
85.2 pt
Intel Core i5-14600K, NVIDIA GeForce RTX 4090
79.4 pt
Intel Core i7-13700, NVIDIA GeForce RTX 4090
76.5 pt
AMD Ryzen 7 7745HX, NVIDIA GeForce RTX 4090
76.4 pt
AMD Ryzen 9 7945HX, NVIDIA GeForce RTX 4090
74.1 pt
Intel Core i7-12700, NVIDIA GeForce RTX 4090
65.9 pt
Intel Core i5-13400, NVIDIA GeForce RTX 4090
57.3 pt
F1 22 - 1280x720 Ultra Low Preset AA:T AF:16x
AMD Ryzen 7 7800X3D, NVIDIA GeForce RTX 4090
629 (477min, 404P1 - 691max) fps
Intel Core i9-14900K, NVIDIA GeForce RTX 4090
575 (428min, 366P1 - 631max) fps
AMD Ryzen 9 7950X, NVIDIA GeForce RTX 4090
533 (379min, 335P1 - 591max) fps
AMD Ryzen 5 9600X, NVIDIA GeForce RTX 4090
507 (370min, 322P1 - 562max) fps
Intel Core i5-14600K, NVIDIA GeForce RTX 4090
463 (344min, 290P1 - 519max) fps
AMD Ryzen 7 7745HX, NVIDIA GeForce RTX 4090
461 (332min, 291P1 - 514max) fps
Intel Core i7-13700, NVIDIA GeForce RTX 4090
447 (342min, 277P1 - 503max) fps
AMD Ryzen 9 7945HX, NVIDIA GeForce RTX 4090
436 (316min, 273P1 - 499max) fps
Intel Core i7-12700, NVIDIA GeForce RTX 4090
370 (291min, 235P1 - 403max) fps
Intel Core i5-13400, NVIDIA GeForce RTX 4090
276 (223min, 175P1 - 302max) fps
Far Cry 5 - 1280x720 Low Preset AA:T
AMD Ryzen 7 7800X3D, NVIDIA GeForce RTX 4090
344 (220min - 464max) fps +1276%
AMD Ryzen 5 9600X, NVIDIA GeForce RTX 4090
263 (201min - 342max) fps +952%
Intel Core i9-14900K, NVIDIA GeForce RTX 4090
256 (194min - 336max) fps +924%
Intel Core i5-14600K, NVIDIA GeForce RTX 4090
255 (199min - 343max) fps +920%
AMD Ryzen 9 7950X, NVIDIA GeForce RTX 4090
238 (182min - 313max) fps +852%
Intel Core i7-13700, NVIDIA GeForce RTX 4090
232 (161min - 306max) fps +828%
AMD Ryzen 7 7745HX, NVIDIA GeForce RTX 4090
205 (155min - 280max) fps +720%
Intel Core i7-12700, NVIDIA GeForce RTX 4090
204 (156min - 270max) fps +716%
AMD Ryzen 9 7945HX, NVIDIA GeForce RTX 4090
191 (154min - 245max) fps +664%
Intel Core i5-13400, NVIDIA GeForce RTX 4090
185 (144min - 241max) fps +640%
25 (21min - 33max) fps
X-Plane 11.11 - 1280x720 low (fps_test=1)
Intel Core i9-14900K, NVIDIA GeForce RTX 4090
263 fps +561%
AMD Ryzen 5 9600X, NVIDIA GeForce RTX 4090
245 fps +516%
Intel Core i5-14600K, NVIDIA GeForce RTX 4090
228 fps +473%
AMD Ryzen 9 7950X, NVIDIA GeForce RTX 4090
223 fps +460%
AMD Ryzen 7 7800X3D, NVIDIA GeForce RTX 4090
219 fps +450%
Intel Core i7-13700, NVIDIA GeForce RTX 4090
218 fps +448%
AMD Ryzen 9 7945HX, NVIDIA GeForce RTX 4090
196.4 fps +393%
AMD Ryzen 7 7745HX, NVIDIA GeForce RTX 4090
195.9 fps +392%
Intel Core i7-12700, NVIDIA GeForce RTX 4090
181.4 fps +356%
Intel Core i5-13400, NVIDIA GeForce RTX 4090
155.7 fps +291%
39.8 fps
Final Fantasy XV Benchmark - 1280x720 Lite Quality
AMD Ryzen 7 7745HX, NVIDIA GeForce RTX 4090
237 fps +815%
AMD Ryzen 5 9600X, NVIDIA GeForce RTX 4090
237 fps +815%
AMD Ryzen 9 7950X, NVIDIA GeForce RTX 4090
236 fps +811%
Intel Core i7-13700, NVIDIA GeForce RTX 4090
236 fps +811%
AMD Ryzen 7 7800X3D, NVIDIA GeForce RTX 4090
236 fps +811%
Intel Core i5-14600K, NVIDIA GeForce RTX 4090
236 fps +811%
Intel Core i9-14900K, NVIDIA GeForce RTX 4090
236 fps +811%
AMD Ryzen 9 7945HX, NVIDIA GeForce RTX 4090
234 fps +803%
Intel Core i7-12700, NVIDIA GeForce RTX 4090
232 fps +796%
Intel Core i5-13400, NVIDIA GeForce RTX 4090
217 fps +738%
25.9 fps
Dota 2 Reborn - 1280x720 min (0/3) fastest
AMD Ryzen 7 7800X3D, NVIDIA GeForce RTX 4090
322.9 (268min) fps
AMD Ryzen 9 7950X, NVIDIA GeForce RTX 4090
310.6 (261.3min) fps
Intel Core i9-14900K, NVIDIA GeForce RTX 4090
292.5 (254min) fps
AMD Ryzen 5 9600X, NVIDIA GeForce RTX 4090
291 (244.2min) fps
AMD Ryzen 9 7945HX, NVIDIA GeForce RTX 4090
268.7 (228.5min) fps
Intel Core i5-14600K, NVIDIA GeForce RTX 4090
261.5 (226.3min) fps
AMD Ryzen 7 7745HX, NVIDIA GeForce RTX 4090
252 (207.9min) fps
Intel Core i7-13700, NVIDIA GeForce RTX 4090
245 (213.8min) fps
Intel Core i7-12700, NVIDIA GeForce RTX 4090
202.4 (178min) fps
Intel Core i5-13400, NVIDIA GeForce RTX 4090
182.1 (160.5min) fps
The Witcher 3 - 1024x768 Low Graphics & Postprocessing
AMD Ryzen 7 7800X3D, NVIDIA GeForce RTX 4090
858.4 fps +1829%
AMD Ryzen 9 7950X, NVIDIA GeForce RTX 4090
826 (23.6min, 360P0.1, 574P1 - 1357max) fps +1756%
Intel Core i9-14900K, NVIDIA GeForce RTX 4090
826 (25.6min, 359P0.1, 581P1 - 1348max) fps +1756%
AMD Ryzen 5 9600X, NVIDIA GeForce RTX 4090
762 (66min, 266P0.1, 520P1 - 1355max) fps +1612%
AMD Ryzen 9 7945HX, NVIDIA GeForce RTX 4090
709 (68min, 283P0.1, 492P1 - 1116max) fps +1493%
AMD Ryzen 7 7745HX, NVIDIA GeForce RTX 4090
692 (27.9min, 218P0.1, 476P1 - 1085max) fps +1455%
Intel Core i7-13700, NVIDIA GeForce RTX 4090
670.4 fps +1407%
Intel Core i5-14600K, NVIDIA GeForce RTX 4090
632 (29.4min, 209P0.1, 471P1 - 1028max) fps +1320%
Intel Core i7-12700, NVIDIA GeForce RTX 4090
522 fps +1073%
Intel Core i5-13400, NVIDIA GeForce RTX 4090
451.7 fps +915%
44.5 (8.12min, 22.4P0.1, 30.4P1 - 506max) fps
GTA V - 1024x768 Lowest Settings possible
AMD Ryzen 7 7800X3D, NVIDIA GeForce RTX 4090
188.5 fps +44%
AMD Ryzen 9 7950X, NVIDIA GeForce RTX 4090
188.2 (5.44min, 200P1 - 724max) fps +43%
AMD Ryzen 5 9600X, NVIDIA GeForce RTX 4090
188.1 (3min, 200P1 - 713max) fps +43%
Intel Core i9-14900K, NVIDIA GeForce RTX 4090
188 (2.39min, 200P1 - 739max) fps +43%
Intel Core i7-13700, NVIDIA GeForce RTX 4090
187.7 (5.01min, 200P1 - 613max) fps +43%
Intel Core i5-14600K, NVIDIA GeForce RTX 4090
187.7 (4.67min, 200P1 - 640max) fps +43%
AMD Ryzen 7 7745HX, NVIDIA GeForce RTX 4090
187.6 (6.27min, 200P1 - 666max) fps +43%
AMD Ryzen 9 7945HX, NVIDIA GeForce RTX 4090
187.6 (6.33min, 200P1 - 591max) fps +43%
Intel Core i7-12700, NVIDIA GeForce RTX 4090
187.1 (2.4min, 200P1 - 499max) fps +43%
Intel Core i5-13400, NVIDIA GeForce RTX 4090
186.8 (1.87min, 166.7P1 - 445max) fps +42%
131.2 (7.24min, 90.9P1 - 448max) fps
Borderlands 3 - 1280x720 Very Low Overall Quality (DX11)
AMD Ryzen 7 7800X3D, NVIDIA GeForce RTX 4090
310 fps +714%
Intel Core i9-14900K, NVIDIA GeForce RTX 4090
258 fps +577%
AMD Ryzen 9 7950X, NVIDIA GeForce RTX 4090
242 fps +535%
Intel Core i5-14600K, NVIDIA GeForce RTX 4090
237 fps +522%
AMD Ryzen 5 9600X, NVIDIA GeForce RTX 4090
228 fps +498%
Intel Core i7-13700, NVIDIA GeForce RTX 4090
222 fps +483%
AMD Ryzen 9 7945HX, NVIDIA GeForce RTX 4090
213 fps +459%
AMD Ryzen 7 7745HX, NVIDIA GeForce RTX 4090
203 fps +433%
Intel Core i7-12700, NVIDIA GeForce RTX 4090
185.6 fps +387%
Intel Core i5-13400, NVIDIA GeForce RTX 4090
169 fps +344%
38.1 fps
Far Cry New Dawn - 1280x720 Low Preset
AMD Ryzen 7 7800X3D, NVIDIA GeForce RTX 4090
291 (218min - 442max) fps +809%
Intel Core i9-14900K, NVIDIA GeForce RTX 4090
231 (150min - 345max) fps +622%
AMD Ryzen 5 9600X, NVIDIA GeForce RTX 4090
226 (163min - 362max) fps +606%
Intel Core i5-14600K, NVIDIA GeForce RTX 4090
216 (168min - 312max) fps +575%
Intel Core i7-13700, NVIDIA GeForce RTX 4090
203 (144min - 297max) fps +534%
AMD Ryzen 9 7950X, NVIDIA GeForce RTX 4090
200 (140min - 302max) fps +525%
Intel Core i7-12700, NVIDIA GeForce RTX 4090
174 (103min - 253max) fps +444%
AMD Ryzen 7 7745HX, NVIDIA GeForce RTX 4090
170 (123min - 265max) fps +431%
AMD Ryzen 9 7945HX, NVIDIA GeForce RTX 4090
165 (119min - 255max) fps +416%
Intel Core i5-13400, NVIDIA GeForce RTX 4090
159 (110min - 233max) fps +397%
32 (26min - 40max) fps
Shadow of the Tomb Raider - 1280x720 Lowest Preset
AMD Ryzen 7 7800X3D, NVIDIA GeForce RTX 4090
407 fps +1040%
Intel Core i9-14900K, NVIDIA GeForce RTX 4090
337 fps +844%
AMD Ryzen 9 7950X, NVIDIA GeForce RTX 4090
332 fps +830%
AMD Ryzen 5 9600X, NVIDIA GeForce RTX 4090
319 fps +794%
Intel Core i5-14600K, NVIDIA GeForce RTX 4090
281 fps +687%
AMD Ryzen 7 7745HX, NVIDIA GeForce RTX 4090
275 fps +670%
AMD Ryzen 9 7945HX, NVIDIA GeForce RTX 4090
273 fps +665%
Intel Core i7-13700, NVIDIA GeForce RTX 4090
272 fps +662%
Intel Core i7-12700, NVIDIA GeForce RTX 4090
231 fps +547%
Intel Core i5-13400, NVIDIA GeForce RTX 4090
204 fps +471%
35.7 fps
Tiny Tina's Wonderlands - 1280x720 Lowest Preset (DX12)
AMD Ryzen 7 7800X3D, NVIDIA GeForce RTX 4090
548 fps +1389%
Intel Core i9-14900K, NVIDIA GeForce RTX 4090
536 fps +1357%
AMD Ryzen 9 7950X, NVIDIA GeForce RTX 4090
459 fps +1147%
Intel Core i5-14600K, NVIDIA GeForce RTX 4090
457 fps +1142%
AMD Ryzen 5 9600X, NVIDIA GeForce RTX 4090
438 fps +1090%
AMD Ryzen 7 7745HX, NVIDIA GeForce RTX 4090
414 fps +1025%
Intel Core i7-13700, NVIDIA GeForce RTX 4090
410 fps +1014%
AMD Ryzen 9 7945HX, NVIDIA GeForce RTX 4090
382 fps +938%
Intel Core i7-12700, NVIDIA GeForce RTX 4090
342 fps +829%
Intel Core i5-13400, NVIDIA GeForce RTX 4090
299 fps +713%
36.8 fps
Strange Brigade - 1280x720 lowest AF:1
Intel Core i9-14900K, NVIDIA GeForce RTX 4090
766 (267min, 595P1 - 1030max) fps +3565%
AMD Ryzen 7 7800X3D, NVIDIA GeForce RTX 4090
760 (257min, 602P1 - 1084max) fps +3536%
AMD Ryzen 5 9600X, NVIDIA GeForce RTX 4090
735 (154.9min, 595P1 - 998max) fps +3417%
Intel Core i5-14600K, NVIDIA GeForce RTX 4090
717 (186min, 554P1 - 1036max) fps +3331%
AMD Ryzen 9 7950X, NVIDIA GeForce RTX 4090
698 (182.7min, 569P1 - 937max) fps +3240%
AMD Ryzen 7 7745HX, NVIDIA GeForce RTX 4090
676 (174.6min, 524P1 - 975max) fps +3134%
Intel Core i7-13700, NVIDIA GeForce RTX 4090
626 (284min, 497P1 - 830max) fps +2895%
AMD Ryzen 9 7945HX, NVIDIA GeForce RTX 4090
592 (145.4min, 461P1 - 800max) fps +2733%
Intel Core i7-12700, NVIDIA GeForce RTX 4090
523 (243min, 410P1 - 698max) fps +2402%
Intel Core i5-13400, NVIDIA GeForce RTX 4090
408 (153.5min, 319P1 - 565max) fps +1852%
20.9 (18.4min, 19.1P1 - 24.8max) fps
Metro Exodus - 1280x720 Low Quality AF:4x
AMD Ryzen 7 7800X3D, NVIDIA GeForce RTX 4090
374 (214.41min - 571.76max) fps +1390%
AMD Ryzen 5 9600X, NVIDIA GeForce RTX 4090
349 (182.25min - 551.57max) fps +1290%
Intel Core i9-14900K, NVIDIA GeForce RTX 4090
318 (165.98min - 520.02max) fps +1167%
AMD Ryzen 9 7950X, NVIDIA GeForce RTX 4090
300 (162.95min - 476.42max) fps +1095%
Intel Core i5-14600K, NVIDIA GeForce RTX 4090
296 (170.68min - 455.17max) fps +1079%
AMD Ryzen 7 7745HX, NVIDIA GeForce RTX 4090
287 (154.34min - 426.99max) fps +1043%
AMD Ryzen 9 7945HX, NVIDIA GeForce RTX 4090
270 (148.35min - 431.03max) fps +976%
Intel Core i7-13700, NVIDIA GeForce RTX 4090
268 (127.73min - 445.04max) fps +968%
Intel Core i7-12700, NVIDIA GeForce RTX 4090
233 (124.52min - 364.56max) fps +828%
Intel Core i5-13400, NVIDIA GeForce RTX 4090
196.9 (110.05min - 286.04max) fps +684%
25.1 (15.39min - 37.85max) fps
F1 2020 - 1280x720 Ultra Low Preset
AMD Ryzen 7 7800X3D, NVIDIA GeForce RTX 4090
681 (531min - 769max) fps
AMD Ryzen 5 9600X, NVIDIA GeForce RTX 4090
630 (468min - 710max) fps
Intel Core i9-14900K, NVIDIA GeForce RTX 4090
584 (467min - 677max) fps
AMD Ryzen 9 7950X, NVIDIA GeForce RTX 4090
563 (437min - 628max) fps
AMD Ryzen 7 7745HX, NVIDIA GeForce RTX 4090
529 (400min - 599max) fps
AMD Ryzen 9 7945HX, NVIDIA GeForce RTX 4090
470 (364min - 522max) fps
Intel Core i7-13700, NVIDIA GeForce RTX 4090
461 (323min - 528max) fps
Intel Core i5-14600K, NVIDIA GeForce RTX 4090
403 (333min - 436max) fps
Intel Core i7-12700, NVIDIA GeForce RTX 4090
388 (314min - 434max) fps
Intel Core i5-13400, NVIDIA GeForce RTX 4090
292 (253min - 317max) fps
F1 2021 - 1280x720 Ultra Low Preset
AMD Ryzen 7 7800X3D, NVIDIA GeForce RTX 4090
830 (632min, 515P1 - 919max) fps
Intel Core i9-14900K, NVIDIA GeForce RTX 4090
720 (552min, 445P1 - 791max) fps
AMD Ryzen 9 7950X, NVIDIA GeForce RTX 4090
677 (504min, 418P1 - 754max) fps
AMD Ryzen 5 9600X, NVIDIA GeForce RTX 4090
669 (451min, 412P1 - 741max) fps
AMD Ryzen 7 7745HX, NVIDIA GeForce RTX 4090
589 (432min, 369P1 - 647max) fps
Intel Core i7-13700, NVIDIA GeForce RTX 4090
572 (447min, 359P1 - 620max) fps
Intel Core i5-14600K, NVIDIA GeForce RTX 4090
562 (468min, 364P1 - 618max) fps
AMD Ryzen 9 7945HX, NVIDIA GeForce RTX 4090
562 (420min, 351P1 - 627max) fps
Intel Core i7-12700, NVIDIA GeForce RTX 4090
448 (363min, 297P1 - 477max) fps
Intel Core i5-13400, NVIDIA GeForce RTX 4090
337 (277min, 237P1 - 358max) fps

Performance comparison at GPU limit at 2,160p

Performance Rating - Percent
AMD Ryzen 7 7800X3D, NVIDIA GeForce RTX 4090
99.2 pt
Intel Core i9-14900K, NVIDIA GeForce RTX 4090 -1!
97.5 pt
Intel Core i5-14600K, NVIDIA GeForce RTX 4090
96.5 pt
AMD Ryzen 9 7950X, NVIDIA GeForce RTX 4090
95.6 pt
AMD Ryzen 5 9600X, NVIDIA GeForce RTX 4090
95.2 pt
Intel Core i7-13700, NVIDIA GeForce RTX 4090
93.6 pt
AMD Ryzen 7 7745HX, NVIDIA GeForce RTX 4090
92.4 pt
AMD Ryzen 9 7945HX, NVIDIA GeForce RTX 4090
92.1 pt
Intel Core i7-12700, NVIDIA GeForce RTX 4090
89.7 pt
Intel Core i5-13400, NVIDIA GeForce RTX 4090
85.3 pt
F1 22 - 3840x2160 Ultra High Preset AA:T AF:16x
AMD Ryzen 5 9600X, NVIDIA GeForce RTX 4090
85 (73min, 72P1 - 99max) fps
AMD Ryzen 9 7945HX, NVIDIA GeForce RTX 4090
85 (60min, 65P1 - 98max) fps
AMD Ryzen 7 7745HX, NVIDIA GeForce RTX 4090
84.9 (73min, 72P1 - 98max) fps
AMD Ryzen 7 7800X3D, NVIDIA GeForce RTX 4090
84.5 (72min, 71P1 - 97max) fps
Intel Core i9-14900K, NVIDIA GeForce RTX 4090
83.8 (73min, 72P1 - 96max) fps
Intel Core i5-14600K, NVIDIA GeForce RTX 4090
83.5 (72min, 71P1 - 96max) fps
AMD Ryzen 9 7950X, NVIDIA GeForce RTX 4090
82.5 (72min, 71P1 - 96max) fps
Intel Core i7-13700, NVIDIA GeForce RTX 4090
81.6 (71min, 70P1 - 93max) fps
Intel Core i7-12700, NVIDIA GeForce RTX 4090
81.3 (71min, 68P1 - 93max) fps
Intel Core i5-13400, NVIDIA GeForce RTX 4090
81.2 (72min, 67P1 - 93max) fps
Far Cry 5 - 3840x2160 Ultra Preset AA:T
AMD Ryzen 7 7800X3D, NVIDIA GeForce RTX 4090
187 (166min - 215max) fps
Intel Core i5-14600K, NVIDIA GeForce RTX 4090
181 (151min - 215max) fps
Intel Core i9-14900K, NVIDIA GeForce RTX 4090
181 (150min - 215max) fps
AMD Ryzen 9 7950X, NVIDIA GeForce RTX 4090
175 (140min - 212max) fps
Intel Core i7-13700, NVIDIA GeForce RTX 4090
171 (140min - 207max) fps
AMD Ryzen 5 9600X, NVIDIA GeForce RTX 4090
170 (136min - 198max) fps
Intel Core i7-12700, NVIDIA GeForce RTX 4090
153 (117min - 203max) fps
AMD Ryzen 7 7745HX, NVIDIA GeForce RTX 4090
152 (115min - 207max) fps
AMD Ryzen 9 7945HX, NVIDIA GeForce RTX 4090
146 (112min - 198max) fps
Intel Core i5-13400, NVIDIA GeForce RTX 4090
142 (108min - 190max) fps
Final Fantasy XV Benchmark - 3840x2160 High Quality
Intel Core i9-14900K, NVIDIA GeForce RTX 4090
161.9 fps
Intel Core i5-14600K, NVIDIA GeForce RTX 4090
161.5 fps
AMD Ryzen 9 7950X, NVIDIA GeForce RTX 4090
161.1 fps
AMD Ryzen 7 7745HX, NVIDIA GeForce RTX 4090
160.2 fps
AMD Ryzen 7 7800X3D, NVIDIA GeForce RTX 4090
158.2 fps
Intel Core i7-13700, NVIDIA GeForce RTX 4090
157.9 fps
Intel Core i7-12700, NVIDIA GeForce RTX 4090
153.4 fps
AMD Ryzen 9 7945HX, NVIDIA GeForce RTX 4090
152 fps
AMD Ryzen 5 9600X, NVIDIA GeForce RTX 4090
150.9 fps
Intel Core i5-13400, NVIDIA GeForce RTX 4090
149.8 fps
Dota 2 Reborn - 3840x2160 ultra (3/3) best looking
AMD Ryzen 7 7800X3D, NVIDIA GeForce RTX 4090
258.2 (201.3min) fps
AMD Ryzen 9 7950X, NVIDIA GeForce RTX 4090
234.4 (192.2min) fps
Intel Core i9-14900K, NVIDIA GeForce RTX 4090
228.7 (190.7min) fps
AMD Ryzen 5 9600X, NVIDIA GeForce RTX 4090
225 (189.1min) fps
Intel Core i5-14600K, NVIDIA GeForce RTX 4090
211.5 (179.5min) fps
Intel Core i7-13700, NVIDIA GeForce RTX 4090
196.8 (166.7min) fps
AMD Ryzen 9 7945HX, NVIDIA GeForce RTX 4090
196.7 (164.3min) fps
AMD Ryzen 7 7745HX, NVIDIA GeForce RTX 4090
192.8 (156.7min) fps
Intel Core i7-12700, NVIDIA GeForce RTX 4090
163.7 (141.2min) fps
Intel Core i5-13400, NVIDIA GeForce RTX 4090
149.8 (129.3min) fps
The Witcher 3 - 3840x2160 High Graphics & Postprocessing (Nvidia HairWorks Off)
AMD Ryzen 9 7945HX, NVIDIA GeForce RTX 4090
292 (41.8min, 168.4P0.1, 232P1 - 689max) fps
Intel Core i5-14600K, NVIDIA GeForce RTX 4090
288 (85.6min, 166.1P0.1, 233P1 - 721max) fps
AMD Ryzen 9 7950X, NVIDIA GeForce RTX 4090
284 (88.3min, 166.6P0.1, 240P1 - 831max) fps
Intel Core i5-13400, NVIDIA GeForce RTX 4090
282.2 fps
Intel Core i7-13700, NVIDIA GeForce RTX 4090
282.1 fps
Intel Core i7-12700, NVIDIA GeForce RTX 4090
282 fps
AMD Ryzen 7 7800X3D, NVIDIA GeForce RTX 4090
281 fps
AMD Ryzen 7 7745HX, NVIDIA GeForce RTX 4090
277 (60.5min, 160.4P0.1, 218P1 - 675max) fps
AMD Ryzen 5 9600X, NVIDIA GeForce RTX 4090
277 (20.2min, 154.7P0.1, 219P1 - 925max) fps
GTA V - 3840x2160 Highest Settings possible AA:4xMSAA + FX AF:16x
AMD Ryzen 7 7800X3D, NVIDIA GeForce RTX 4090
146.2 (8.5min, 90.9P1 - 331max) fps
Intel Core i9-14900K, NVIDIA GeForce RTX 4090
145 (6.06min, 100P1 - 295max) fps
Intel Core i5-14600K, NVIDIA GeForce RTX 4090
141.9 (11.7min, 100P1 - 301max) fps
AMD Ryzen 5 9600X, NVIDIA GeForce RTX 4090
140.8 (8.91min, 90.9P1 - 270max) fps
AMD Ryzen 9 7950X, NVIDIA GeForce RTX 4090
138 (8.49min, 90.9P1 - 306max) fps
Intel Core i7-13700, NVIDIA GeForce RTX 4090
133.3 (8.35min, 90.9P1 - 273max) fps
AMD Ryzen 7 7745HX, NVIDIA GeForce RTX 4090
133 (6.57min, 90.9P1 - 255max) fps
AMD Ryzen 9 7945HX, NVIDIA GeForce RTX 4090
130.6 (8.29min, 90.9P1 - 245max) fps
Intel Core i7-12700, NVIDIA GeForce RTX 4090
126.9 (5min, 90.9P1 - 249max) fps
Intel Core i5-13400, NVIDIA GeForce RTX 4090
122.2 (8.01min, 90.9P1 - 227max) fps
Borderlands 3 - 3840x2160 Badass Overall Quality (DX11)
Intel Core i9-14900K, NVIDIA GeForce RTX 4090
137.9 fps
AMD Ryzen 7 7800X3D, NVIDIA GeForce RTX 4090
137.4 fps
Intel Core i5-14600K, NVIDIA GeForce RTX 4090
136.1 fps
AMD Ryzen 9 7950X, NVIDIA GeForce RTX 4090
135 fps
AMD Ryzen 9 7945HX, NVIDIA GeForce RTX 4090
134.1 fps
Intel Core i7-13700, NVIDIA GeForce RTX 4090
132.4 fps
AMD Ryzen 5 9600X, NVIDIA GeForce RTX 4090
131.8 fps
AMD Ryzen 7 7745HX, NVIDIA GeForce RTX 4090
127.9 fps
Intel Core i7-12700, NVIDIA GeForce RTX 4090
125.5 fps
Intel Core i5-13400, NVIDIA GeForce RTX 4090
120.5 fps
Far Cry New Dawn - 3840x2160 Ultra Preset
AMD Ryzen 7 7800X3D, NVIDIA GeForce RTX 4090
180 (147min - 219max) fps
Intel Core i9-14900K, NVIDIA GeForce RTX 4090
159 (120min - 220max) fps
Intel Core i5-14600K, NVIDIA GeForce RTX 4090
153 (115min - 219max) fps
AMD Ryzen 5 9600X, NVIDIA GeForce RTX 4090
148 (110min - 200max) fps
AMD Ryzen 9 7950X, NVIDIA GeForce RTX 4090
145 (104min - 215max) fps
Intel Core i7-13700, NVIDIA GeForce RTX 4090
145 (106min - 212max) fps
Intel Core i7-12700, NVIDIA GeForce RTX 4090
127 (92min - 198max) fps
AMD Ryzen 7 7745HX, NVIDIA GeForce RTX 4090
124 (84min - 203max) fps
AMD Ryzen 9 7945HX, NVIDIA GeForce RTX 4090
123 (85min - 195max) fps
Intel Core i5-13400, NVIDIA GeForce RTX 4090
119 (88min - 182max) fps
Shadow of the Tomb Raider - 3840x2160 Highest Preset AA:T
Intel Core i5-14600K, NVIDIA GeForce RTX 4090
188.8 fps
Intel Core i9-14900K, NVIDIA GeForce RTX 4090
188.2 fps
AMD Ryzen 5 9600X, NVIDIA GeForce RTX 4090
188.1 fps
AMD Ryzen 7 7800X3D, NVIDIA GeForce RTX 4090
187.7 fps
Intel Core i7-13700, NVIDIA GeForce RTX 4090
187.6 fps
AMD Ryzen 9 7945HX, NVIDIA GeForce RTX 4090
186.8 fps
AMD Ryzen 7 7745HX, NVIDIA GeForce RTX 4090
186.4 fps
AMD Ryzen 9 7950X, NVIDIA GeForce RTX 4090
186 fps
Intel Core i7-12700, NVIDIA GeForce RTX 4090
184.5 fps
Intel Core i5-13400, NVIDIA GeForce RTX 4090
173.1 fps
Tiny Tina's Wonderlands - 3840x2160 Badass Preset (DX12)
Intel Core i9-14900K, NVIDIA GeForce RTX 4090
131.6 fps
AMD Ryzen 7 7745HX, NVIDIA GeForce RTX 4090
130.8 fps
Intel Core i5-14600K, NVIDIA GeForce RTX 4090
130.4 fps
AMD Ryzen 9 7950X, NVIDIA GeForce RTX 4090
130.3 fps
Intel Core i7-13700, NVIDIA GeForce RTX 4090
130.2 fps
AMD Ryzen 5 9600X, NVIDIA GeForce RTX 4090
130 fps
AMD Ryzen 7 7800X3D, NVIDIA GeForce RTX 4090
129.8 fps
AMD Ryzen 9 7945HX, NVIDIA GeForce RTX 4090
129.8 fps
Intel Core i7-12700, NVIDIA GeForce RTX 4090
129.7 fps
Intel Core i5-13400, NVIDIA GeForce RTX 4090
129.7 fps
Strange Brigade - 3840x2160 ultra AA:ultra AF:16
Intel Core i9-14900K, NVIDIA GeForce RTX 4090
291 (43.8min, 249P1 - 489max) fps
AMD Ryzen 7 7800X3D, NVIDIA GeForce RTX 4090
289 (119.3min, 246P1 - 463max) fps
Intel Core i5-14600K, NVIDIA GeForce RTX 4090
289 (243min, 249P1 - 426max) fps
AMD Ryzen 9 7945HX, NVIDIA GeForce RTX 4090
289 (68.9min, 245P1 - 450max) fps
AMD Ryzen 7 7745HX, NVIDIA GeForce RTX 4090
287 (131.6min, 246P1 - 435max) fps
AMD Ryzen 5 9600X, NVIDIA GeForce RTX 4090
286 (37.1min, 244P1 - 520max) fps
Intel Core i7-12700, NVIDIA GeForce RTX 4090
284 (44.1min, 236P1 - 407max) fps
Intel Core i7-13700, NVIDIA GeForce RTX 4090
282 (28.1min, 238P1 - 533max) fps
AMD Ryzen 9 7950X, NVIDIA GeForce RTX 4090
281 (31.7min, 239P1 - 482max) fps
Intel Core i5-13400, NVIDIA GeForce RTX 4090
278 (59.8min, 227P1 - 408max) fps
Metro Exodus - 3840x2160 Ultra Quality AF:16x
Intel Core i9-14900K, NVIDIA GeForce RTX 4090
142.9 (82.83min - 229.52max) fps
Intel Core i5-14600K, NVIDIA GeForce RTX 4090
142.1 (81.45min - 230.73max) fps
AMD Ryzen 7 7800X3D, NVIDIA GeForce RTX 4090
141.6 (85.41min - 213.31max) fps
AMD Ryzen 9 7950X, NVIDIA GeForce RTX 4090
139.7 (76.95min - 229.15max) fps
AMD Ryzen 5 9600X, NVIDIA GeForce RTX 4090
138 (71.03min - 235.4max) fps
Intel Core i7-13700, NVIDIA GeForce RTX 4090
136.9 (71.43min - 234.36max) fps
AMD Ryzen 7 7745HX, NVIDIA GeForce RTX 4090
135.8 (71.78min - 226.91max) fps
AMD Ryzen 9 7945HX, NVIDIA GeForce RTX 4090
133.7 (72.8min - 223.61max) fps
Intel Core i7-12700, NVIDIA GeForce RTX 4090
132.4 (68.05min - 211.86max) fps
Intel Core i5-13400, NVIDIA GeForce RTX 4090
126.7 (68.66min - 196.97max) fps
F1 2020 - 3840x2160 Ultra High Preset AA:T AF:16x
AMD Ryzen 7 7800X3D, NVIDIA GeForce RTX 4090
288 (242min - 333max) fps
Intel Core i5-14600K, NVIDIA GeForce RTX 4090
288 (242min - 338max) fps
AMD Ryzen 7 7745HX, NVIDIA GeForce RTX 4090
287 (245min - 337max) fps
AMD Ryzen 5 9600X, NVIDIA GeForce RTX 4090
287 (243min - 337max) fps
AMD Ryzen 9 7950X, NVIDIA GeForce RTX 4090
286 (245min - 335max) fps
Intel Core i9-14900K, NVIDIA GeForce RTX 4090
286 (243min - 338max) fps
Intel Core i7-13700, NVIDIA GeForce RTX 4090
283 (240min - 332max) fps
AMD Ryzen 9 7945HX, NVIDIA GeForce RTX 4090
283 (239min - 331max) fps
Intel Core i7-12700, NVIDIA GeForce RTX 4090
275 (197min - 319max) fps
Intel Core i5-13400, NVIDIA GeForce RTX 4090
229 (184min - 265max) fps
F1 2021 - 3840x2160 Ultra High Preset + Raytracing AA:T AF:16x
AMD Ryzen 7 7800X3D, NVIDIA GeForce RTX 4090
207 (179min, 176P1 - 230max) fps
AMD Ryzen 7 7745HX, NVIDIA GeForce RTX 4090
207 (175min, 170P1 - 231max) fps
AMD Ryzen 5 9600X, NVIDIA GeForce RTX 4090
205 (176min, 168P1 - 232max) fps
AMD Ryzen 9 7945HX, NVIDIA GeForce RTX 4090
203 (170min, 156P1 - 223max) fps
Intel Core i5-14600K, NVIDIA GeForce RTX 4090
201 (173min, 153P1 - 227max) fps
Intel Core i9-14900K, NVIDIA GeForce RTX 4090
201 (173min, 158P1 - 226max) fps
AMD Ryzen 9 7950X, NVIDIA GeForce RTX 4090
199.1 (168min, 166P1 - 223max) fps
Intel Core i7-13700, NVIDIA GeForce RTX 4090
196.8 (166min, 156P1 - 217max) fps
Intel Core i7-12700, NVIDIA GeForce RTX 4090
193.1 (162min, 137P1 - 211max) fps
Intel Core i5-13400, NVIDIA GeForce RTX 4090
176.2 (144min, 127P1 - 189max) fps
BasMoyenÉlevéUltraQHD4K
GTA V (2015) 187.6 187.3 183 141 140.5 183.6
The Witcher 3 (2015) 709 618 563 310 272 292
Dota 2 Reborn (2015) 268.7 234.8 221.4 202.6 196.7
Final Fantasy XV Benchmark (2018) 234 234 213 208 152
X-Plane 11.11 (2018) 196.4 169.4 127.6 105.9
Far Cry 5 (2018) 191 168 163 151 151 146
Strange Brigade (2018) 592 470 465 463 461 289
Shadow of the Tomb Raider (2018) 273 266 264 263 252 186.8
Far Cry New Dawn (2019) 165 142 139 124 129 123
Metro Exodus (2019) 270 243 210 183.2 167.7 133.7
Borderlands 3 (2019) 213 189.6 175.5 165.6 163.2 134.1
F1 2020 (2020) 470 390 379 359 354 283
F1 2021 (2021) 562 533 455 220 222 203
Tiny Tina's Wonderlands (2022) 365 308 269 258 222 129.8
F1 22 (2022) 382 366 339 170 159.4 85
F1 23 (2023) 368 390 373 164.3 147.9 80.9
Cyberpunk 2077 2.1 Phantom Liberty (2023) 186 183.2 177.4 163.9 151.4 75.3
Assassin's Creed Mirage (2023) 250 244 236 167 163 128
Avatar Frontiers of Pandora (2023) 232 212 202 170 126 70
F1 24 (2024) 350 371 345 176.7 146.3 80

Consommation électrique et températures

Minisforum livre la carte mère BD790i avec une unité de refroidissement heatpipe préinstallée, qui refroidit le processeur et les convertisseurs de tension sur la carte mère. Le choix du ventilateur est laissé à l'utilisateur et doit être installé par ses soins. Le matériel de montage correspondant à l'installation d'un ventilateur de 120 millimètres est inclus. Nous avons choisi un ventilateur Noctua NF-A12x25, qui avait déjà été utilisé lors de notre test du Minisforum BD770i. Le plus grand avantage du Minisforum BD790i par rapport aux PC de bureau conventionnels est sa faible consommation d'énergie. Nous n'avons mesuré qu'environ 140 watts pendant le test multiple Cinebench R15, ce qui est très efficace par rapport aux performances qu'il offre.

En ce qui concerne le fonctionnement général et le niveau de bruit pendant le fonctionnement, nous pouvons seulement dire que le bloc d'alimentation intégré est audible dans notre configuration de test. Que ce soit en mode veille ou en charge, nous n'avons pas pu prendre de mesures qui auraient pu être influencées par le bloc d'alimentation installé. Le ventilateur du processeur et le ventilateur pré-installé pour refroidir le SSD ne sont pas audibles depuis le boîtier fermé. Le refroidissement fonctionne très efficacement et nous n'avons pas relevé de valeurs critiques sous charge. Néanmoins, nous sommes d'avis qu'il serait judicieux de séparer le refroidisseur du CPU et du VRM afin de pouvoir installer une solution de refroidissement pour le processeur lui-même. Le SoC pourrait certainement être refroidi encore plus efficacement avec une solution AiO.

Par rapport aux fabricants de cartes mères connus, les options de réglage dans le BIOS de la carte mère Minisforum BD790i sont très limitées. La consommation d'énergie du processeur peut être modifiée, mais la courbe du ventilateur ne peut pas être réglée séparément. Si Minisforum continue à couvrir ce marché, nous serions très heureux de disposer d'une option plus conviviale.

Épreuve d'effort Prime95, en solo
Test de stress FurMark, solo
Test d'effort Prime95 + FurMark

Efficiency overview

Performance Rating - Percent
Minisforum BD790i
AMD Ryzen 9 7945HX, Radeon 610M
93.8 pt
Minisforum BD770i
AMD Ryzen 7 7745HX, Radeon 610M
85.5 pt
Power Consumption
Cinebench R23 Multi Power Efficiency - external Monitor
Minisforum BD790i
AMD Ryzen 9 7945HX, Radeon 610M
237 Points per Watt
Minisforum BD770i
AMD Ryzen 7 7745HX, Radeon 610M
224 Points per Watt -5%
Cinebench R23 Single Power Efficiency - external Monitor
Minisforum BD770i
AMD Ryzen 7 7745HX, Radeon 610M
41.8 Points per Watt +23%
Minisforum BD790i
AMD Ryzen 9 7945HX, Radeon 610M
34 Points per Watt
Cinebench R15 Multi Efficiency (external Monitor)
Minisforum BD790i
AMD Ryzen 9 7945HX, Radeon 610M
38 Points per Watt
Minisforum BD770i
AMD Ryzen 7 7745HX, Radeon 610M
23.5 Points per Watt -38%
Power Consumption / Cinebench R15 Multi (external Monitor)
Intel Core i9-14900K
548 (545min, 545P1 - 551max) Watt * -294%
Intel Core i9-13900K
480 (263min, 277P1 - 553max) Watt * -245%
AMD Ryzen 9 7950X (Idle: 95.2 W)
364 (357min, 357P1 - 373max) Watt * -162%
Intel Core i7-13700K
357 (356min, 356P1 - 362max) Watt * -157%
Intel Core i5-14600K
329 (323min, 324P1 - 331max) Watt * -137%
Intel Core i5-13600K
286 (232min, 235P1 - 343max) Watt * -106%
Intel Core i7-12700
284 (282min, 282P1 - 287max) Watt * -104%
AMD Ryzen 9 7950X3D
273 (264min, 264P1 - 304max) Watt * -96%
AMD Ryzen 7 7800X3D
207 (203min, 203P1 - 216max) Watt * -49%
Intel Core i5-13400
196.6 (194.6min, 194.6P1 - 207max) Watt * -41%
Intel Core i5-12400F
194.4 (192.3min, 192.3P1 - 200max) Watt * -40%
AMD Ryzen 9 7945HX
139.1 (131.4min, 132P1 - 140.9max) Watt *
AMD Ryzen 7 7745HX
127.5 (126.9min, 126.9P1 - 127.9max) Watt * +8%
Power Consumption / Prime95 V2810 Stress (external Monitor)
Intel Core i9-14900K
537 (508min, 510P1 - 606max) Watt * -270%
Intel Core i9-13900K
471 (414min, 427P1 - 561max) Watt * -224%
Intel Core i5-14600K
370 (349min, 349P1 - 422max) Watt * -155%
Intel Core i7-13700K
357 (341min, 342P1 - 458max) Watt * -146%
Intel Core i5-13600K
348 (283min, 288P1 - 496max) Watt * -140%
AMD Ryzen 9 7950X (Idle: 95.2 W)
335 (311min, 312P1 - 364max) Watt * -131%
Intel Core i7-12700
327 (304min, 305P1 - 394max) Watt * -125%
AMD Ryzen 9 7950X3D
276 (267min, 267P1 - 329max) Watt * -90%
Intel Core i5-12400F
239 (225min, 226P1 - 252max) Watt * -65%
Intel Core i5-13400
229 (224min, 224P1 - 247max) Watt * -58%
AMD Ryzen 7 7800X3D
218 (214min, 215P1 - 223max) Watt * -50%
AMD Ryzen 9 7945HX
145.2 (140.8min, 141.7P1 - 151.2max) Watt *
AMD Ryzen 7 7745HX
130.1 (125.2min, 125.3P1 - 132.3max) Watt * +10%
Power Consumption / Cinebench R23 Multi (external Monitor)
Intel Core i9-14900K
531 (470min, 479P1 - 573max) Watt * -277%
AMD Ryzen 9 7950X (95.2)
353 (346min, 347P1 - 362max) Watt * -150%
Intel Core i5-14600K
332 (329min, 329P1 - 336max) Watt * -135%
AMD Ryzen 9 7950X3D
289 (287min, 287P1 - 290max) Watt * -105%
AMD Ryzen 7 7800X3D
203 (202min, 202P1 - 204max) Watt * -44%
AMD Ryzen 9 7945HX
141 (140.6min, 140.6P1 - 141.7max) Watt *
AMD Ryzen 7 7745HX
84.1 (81.1min, 81.5P1 - 88.8max) Watt * +40%
Power Consumption / Cinebench R23 Single (external Monitor)
AMD Ryzen 7 7800X3D
190.8 (180min, 184.6P1 - 261max) Watt * -234%
AMD Ryzen 9 7950X (95.2)
153.9 (148.8min, 149.8P1 - 179.2max) Watt * -169%
Intel Core i9-14900K
151.5 (145.4min, 146.4P1 - 205max) Watt * -165%
Intel Core i5-14600K
149.7 (143.8min, 144.7P1 - 227max) Watt * -162%
AMD Ryzen 9 7945HX
57.2 (50.9min, 52.3P1 - 68max) Watt *
AMD Ryzen 7 7745HX
44.4 (42.7min, 43P1 - 64max) Watt * +22%
Power Consumption / Cinebench R15 Multi Efficiency (external Monitor)
AMD Ryzen 9 7945HX
38 Points per Watt
AMD Ryzen 7 7745HX
23.5 Points per Watt -38%
AMD Ryzen 9 7950X3D
21.9 Points per Watt -42%
AMD Ryzen 9 7950X
17.1 Points per Watt -55%
AMD Ryzen 7 7800X3D
14.4 Points per Watt -62%
Intel Core i9-13900K
12.9 Points per Watt -66%
Intel Core i5-13600K
12.7 Points per Watt -67%
Intel Core i9-14900K
11.5 Points per Watt -70%
Intel Core i5-14600K
11.1 Points per Watt -71%

* ... Moindre est la valeur, meilleures sont les performances

Power consumption with and without dedicated graphics card

0102030405060708090100110120130140150Tooltip
Minisforum BD790i; Prime95 V2810 Stress (external Monitor): Ø145.2 (140.8-151.2)
Minisforum BD790i; Cinebench R15 Multi (external Monitor): Ø139.1 (131.4-140.9)
Minisforum BD790i; 1280x720 FurMark 1.19 GPU Stress Test (external Monitor): Ø79.9 (72.2-98.6)
Minisforum BD790i; 1920x1080 The Witcher 3 ultra (external Monitor): Ø69 (64.1-104.3)
Minisforum BD790i; Idle 1min (external Monitor): Ø28.9 (27.2-32.8)
Minisforum BD790i; Cinebench R23 Multi (external Monitor): Ø141 (140.6-141.7)
Minisforum BD790i; Cinebench R23 Single (external Monitor): Ø57.2 (50.9-68)
Minisforum BD790i; 3DMark06 Return To Proxycon: Ø76.6 (73.3-90.5)
Minisforum BD790i; Cyberpunk 2077 FHD ultra no FSR (external Monitor): Ø81.2 (71.4-107.1)

Power consumption with Nvidia GeForce RTX 4090

0306090120150180210240270300330360390420450480510540Tooltip
Minisforum BD790i, RTX 4090; 1280x720 FurMark 1.19 GPU Stress Test (external Monitor): Ø534 (520-560)
Minisforum BD790i, RTX 4090; 1920x1080 The Witcher 3 ultra (external Monitor): Ø487 (475-502)
Minisforum BD790i, RTX 4090; Idle 1min (external Monitor): Ø68.7 (67.5-72.1)
Minisforum BD790i, RTX 4090; 3DMark06 Return To Proxycon: Ø147.6 (134.1-200)
Minisforum BD790i, RTX 4090; Cyberpunk 2077 FHD ultra no FSR (external Monitor): Ø457 (446-468)

Points positifs

+ AMD Ryzen 9 7945HX (16 cœurs, 32 threads)
+ Support PCIe 5.0 pour SSD et GPU
+ le processeur est relativement facile à refroidir
+ Le SoC est très efficace
+ format Mini-ITX standard
+ refroidisseur SSD actif et silencieux

Points négatifs

- le processeur est fixé en place
- iGPU faible
- pas de ventilateur inclus dans la livraison
- absence de support pour les unités de refroidissement alternatives
- options BIOS limitées
- Pas de logiciel du fabricant pour le contrôle du ventilateur
- seulement deux SSD peuvent être installés, pas de connexions SATA

Verdict - La puissante AMD Ryzen 9 7945HX

Le Minisforum BD790i examiné : échantillon de test fourni par Minisforum

La Minisforum BD790i est une carte mère très puissante incluant un SoC, qui, en tant que carte mère Mini-ITX, offre une base parfaite pour la construction de petits systèmes. Comme il ne s'agit que d'une carte mère, le fabricant vise les clients désireux de construire eux-mêmes leur système. Contrairement aux mini-PC prêts à l'emploi, vous devez vous occuper des composants supplémentaires. Il va sans dire que cela entraîne des coûts supplémentaires.

En combinaison avec l'AMD Ryzen 9 7945HX, le Minisforum BD790i offre des performances impressionnantes, une grande efficacité et, grâce à son support PCIe-5.0, de bonnes qualités d'avenir pour les cartes graphiques et les disques durs SSD.

Sur la base de nos tests du Minisforum BD790i lui-même, nous pouvons dire que l'AMD Ryzen 9 7945HX est un processeur extrêmement puissant qui peut actuellement gérer toutes les tâches avec facilité. Comparé à un Intel Core i9-14900K ou à un AMD Ryzen 9 7950X, l'AMD Ryzen 9 7945HX doit s'avouer vaincu, même si la différence de performance n'est que très légère. En ce qui concerne la consommation d'énergie, les processeurs d'ordinateur de bureau classiques ne peuvent plus suivre. La décision d'intégrer la technologie des ordinateurs portables dans une carte mère classique est judicieuse en termes d'efficacité. Cependant, le principal inconvénient est que le SoC ne peut pas être simplement remplacé. En outre, vous êtes limité à une unité de refroidissement fixe, ce qui signifie que vous ne pouvez pas utiliser d'autres unités de refroidissement.

À première vue, le prix actuel d'un peu moins de 500 dollars US semble très élevé. Cependant, si l'on compare les performances, l'AMD Ryzen 9 7945HX n'a certainement pas besoin de se cacher derrière les processeurs de bureau les plus rapides. Nous considérons donc que son prix actuel est justifié, et si vous ne souhaitez pas mettre à niveau le CPU ultérieurement, vous pouvez l'acheter sans hésiter.

Prix et disponibilité

Au moment où nous écrivons ces lignes, vous pouvez acheter le Minisforum BD790i sur Amazon au prix de 479,99 dollars US.

Transparency

La sélection des appareils à examiner est effectuée par notre équipe éditoriale. L'échantillon d'essai a été remis gratuitement à l'auteur par le fabricant à des fins d'évaluation. Cet examen n'a pas été influencé par des tiers et le fabricant n'a pas reçu de copie de cet examen avant sa publication. Il n'y avait aucune obligation de publier cet article. Nous n'acceptons jamais de compensation ou de paiement en échange de nos commentaires. En tant que média indépendant, Notebookcheck n'est pas soumis à l'autorité des fabricants, des détaillants ou des éditeurs.

Voici comment Notebookcheck teste

Chaque année, Notebookcheck examine de manière indépendante des centaines d'ordinateurs portables et de smartphones en utilisant des procédures standardisées afin de garantir que tous les résultats sont comparables. Nous avons continuellement développé nos méthodes de test depuis environ 20 ans et avons établi des normes industrielles dans le processus. Dans nos laboratoires de test, des équipements de mesure de haute qualité sont utilisés par des techniciens et des rédacteurs expérimentés. Ces tests impliquent un processus de validation en plusieurs étapes. Notre système d'évaluation complexe repose sur des centaines de mesures et de points de référence bien fondés, ce qui garantit l'objectivité.
Please share our article, every link counts!
Mail Logo
> Revues et rapports de ordinateurs portatifs et smartphones, ordiphones > Critiques > Test du Minisforum BD790i : carte mère Mini-ITX avec Ryzen 9 7945HX et PCIe 5.0 pour petits PC de jeu
Sebastian Bade, 2024-10- 5 (Update: 2024-10- 7)