Notebookcheck Logo

Intel Core i7-14700K

Intel i7-14700K

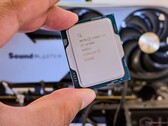
L'Intel Core i5-14700K est un processeur de bureau basé sur l'architecture Raptor Lake, qui hérite de la 13e génération de processeurs Intel Core avec des améliorations mineures. Le processeur offre une horloge de base de 2,5 GHz ou 3,4 GHz et atteint jusqu'à 5,6 GHz en Turbo. La structure de base du processeur reste inchangée. Cela signifie que l'Intel Core i5-14700K dispose également de 8 P-cores et de 12 E-cores, ce qui permet de traiter jusqu'à 28 threads en parallèle. L'Intel Core i5-14700K offre toujours un multiplicateur librement sélectionnable, ce qui facilite grandement l'overclocking. Il est également basé sur le socket LGA 1700, qui a déjà été introduit avec Alder Lake.

Performances

Par rapport à l'Intel Core i5-13600K , l'IPC du nouveau Core i5-14600K n'a été que légèrement augmenté. Cela signifie que la différence de performance est également minime. L'architecture hybride s'appuie sur l'Intel Thread Director, qui est responsable de la répartition correcte des tâches. Autre innovation, le fabricant mise de plus en plus sur l'IA, qui est également utilisée pour l'overclocking. En un clic, l'outil Intel Extreme Utility vérifie l'ensemble du système et effectue les réglages nécessaires.

Unité graphique

Comme l'Intel Core i5-13700K, l'Intel Core i5-14700K dispose d'une unité graphique intégrée. L'architecture Intel Iris Xe continue de servir de base. En termes de performances, rien n'a changé avec l'Intel UHD Graphics 770.

Consommation d'énergie

Le TDP de l'Intel Core i5-14700K est de 125 watts, avec la possibilité de consommer jusqu'à 253 watts en mode Turbo.

GammeIntel Raptor Lake-R
Nom de codeRaptor Lake

Gamme: Raptor Lake-R Raptor Lake

Intel Core i9-14900K3.2 - 6 GHz24 / 32 cores36 MB L3
Intel Core i7-14700K « 2.5 - 5.6 GHz20 / 28 cores33 MB L3
Intel Core i9-149002 - 5.8 GHz24 / 32 cores36 MB L3
Intel Core i5-14600K3.5 - 5.3 GHz14 / 20 cores24 MB L3
Intel Core i5-145002.6 - 5 GHz14 / 20 cores24 MB L3
Intel Core i5-14500T1.7 - 4.8 GHz14 / 20 cores24 MB L3
Fréquence2500 - 5600 MHz
Cache de Niveau 2 (L2)28 MB
Cache de Niveau 3 (L3)33 MB
Nombres de cœurs/threads simultanés supportés20 / 28
8 x 5.6 GHz Intel Raptor Cove P-Core
12 x 3.4 GHz Intel Gracemont E-Core
Consommation énergétique maximale (TDP)125 Watt(s)
Lithographie (procédé de fabrication)10 nm
Température maximale100 °C
SocketLGA 1700
FonctionnalitésIntel UHD Graphics 770, DDR5 5600 MT/s, DDR4 3200 MT/s
Carte graphiqueIntel UHD Graphics 770 (300 - 1600 MHz)
64 BitPrend en charge les instructions 64 Bit
Architecturex86
Prix de départ$319 U.S.
Date de présentation10/17/2023
Lien redirigeant vers une page externe du produitark.intel.com

Benchmarks

Performance Rating - CB R15 + R20 + 7-Zip + X265 + Blender + 3DM11 CPU
47.6 pt (79%)
Cinebench 2024 - Cinebench 2024 CPU Single Core
min: 126     moyenne: 127     médian: 127 (71%)     maximum: 127.9 Points
Cinebench 2024 - Cinebench 2024 CPU Multi Core
min: 1559     moyenne: 1771     médian: 1770.5 (33%)     maximum: 1982 Points
Cinebench R23 - Cinebench R23 Multi Core
min: 30989     moyenne: 33441     médian: 33440.5 (31%)     maximum: 35892 Points
Cinebench R23 - Cinebench R23 Single Core
min: 2153     moyenne: 2160     médian: 2160 (92%)     maximum: 2167 Points
74.4 -97%
...
2044 -5%
2053 -5%
2064 -4%
2067 -4%
AMD Ryzen 7 9800X3D
2080 -4%
2081 -4%
2116 -2%
Intel Core Ultra 5 245K
2132 -1%
2159 0%
Intel Core i7-14700K
2160
2184 1%
2202 2%
2211 2%
2212 2%
2238 4%
2253 4%
2263 5%
2269 5%
2270 5%
...
Intel Core Ultra 9 285K
2348 9%
0%
100%
Cinebench R20 - Cinebench R20 CPU (Single Core)
min: 832     moyenne: 836     médian: 836 (93%)     maximum: 840 Points
Cinebench R20 - Cinebench R20 CPU (Multi Core)
min: 11814     moyenne: 12743     médian: 12743 (31%)     maximum: 13672 Points
Cinebench R15 - Cinebench R15 CPU Multi 64 Bit
min: 4611     moyenne: 5035     médian: 5035 (32%)     maximum: 5459 Points
31 -99%
...
AMD Ryzen Threadripper 2970WX
4376 -13%
4475 -11%
4508 -10%
4522 -10%
4565 -9%
4724 -6%
4793 -5%
4818 -4%
5008 -1%
Intel Core i7-14700K
5035
5396 7%
5563 10%
5600 11%
5798 15%
5974 19%
6103 21%
6335 26%
Intel Core Ultra 9 285K
6492 29%
7053 40%
...
15842 215%
0%
100%
02755508251100137516501925220024752750302533003575385041254400467549505225Tooltip
Cinebench R15 - Cinebench R15 CPU Single 64 Bit
min: 313     moyenne: 313.5     médian: 313.5 (88%)     maximum: 314 Points
19 -94%
...
301 -4%
303 -3%
303.6 -3%
304 -3%
305.6 -3%
305.9 -2%
306.2 -2%
308 -2%
311 -1%
Intel Core i7-14700K
313.5
313.7 0%
314.1 0%
315 0%
315 0%
315 0%
316 1%
Intel Core Ultra 5 245K
322 3%
322.2 3%
324.5 4%
...
Intel Core Ultra 9 285K
355.5 13%
0%
100%
Cinebench R11.5 - Cinebench R11.5 CPU Multi 64 Bit
min: 54.22     moyenne: 57.8     médian: 57.8 (75%)     maximum: 61.44 Points
Cinebench R11.5 - Cinebench R11.5 CPU Single 64 Bit
min: 3.7     moyenne: 3.7     médian: 3.7 (89%)     maximum: 3.77 Points
Cinebench R10 - Cinebench R10 Rend. Single (32bit)
min: 11745     moyenne: 11886     médian: 11886 (72%)     maximum: 12027 points
Cinebench R10 - Cinebench R10 Rend. Multi (32bit)
min: 91081     moyenne: 91124     médian: 91123.5 (66%)     maximum: 91166 points
Cinebench R10 - Cinebench R10 Rend. Multi (64bit)
min: 124651     moyenne: 130357     médian: 130356 (83%)     maximum: 136062 Points
Cinebench R10 - Cinebench R10 Rend. Single (64bit)
min: 17400     moyenne: 17429     médian: 17429 (21%)     maximum: 17458 Points
wPrime 2.10 - wPrime 2.0 1024m *
min: 50.891     moyenne: 80.3     médian: 80.3 (1%)     maximum: 109.801 s
wPrime 2.10 - wPrime 2.0 32m *
min: 2.147     moyenne: 2.2     médian: 2.2 (0%)     maximum: 2.252 s
WinRAR - WinRAR 4.0
min: 12800     moyenne: 12813     médian: 12812.5 (20%)     maximum: 12825 points
7-Zip 18.03 - 7-Zip 18.03 Multi Thread 4 runs
min: 117224     moyenne: 126436     médian: 126436 (73%)     maximum: 135648 MIPS
7-Zip 18.03 - 7-Zip 18.03 Single Thread 4 runs
min: 7040     moyenne: 7196     médian: 7195.5 (85%)     maximum: 7351 MIPS
X264 HD Benchmark 4.0 - x264 Pass 2
min: 225.5     moyenne: 243.3     médian: 243.3 (81%)     maximum: 261 fps
X264 HD Benchmark 4.0 - x264 Pass 1
min: 393.5     moyenne: 406.3     médian: 406.3 (94%)     maximum: 419 fps
HWBOT x265 Benchmark v2.2 - HWBOT x265 4k Preset
min: 32.3     moyenne: 34.6     médian: 34.6 (61%)     maximum: 36.8 fps
051015202530354045Tooltip
TrueCrypt - TrueCrypt Serpent
min: 2.2     moyenne: 2.4     médian: 2.4 (71%)     maximum: 2.6 GB/s
TrueCrypt - TrueCrypt Twofish
min: 4.4     moyenne: 4.5     médian: 4.5 (78%)     maximum: 4.6 GB/s
TrueCrypt - TrueCrypt AES
min: 18     moyenne: 21.8     médian: 21.8 (57%)     maximum: 25.6 GB/s
Blender - Blender 3.3 Classroom CPU *
min: 155     moyenne: 181.5     médian: 181.5 (2%)     maximum: 208 Seconds
Blender - Blender 2.79 BMW27 CPU *
min: 91     moyenne: 100     médian: 100 (1%)     maximum: 109 Seconds
R Benchmark 2.5 - R Benchmark 2.5 *
min: 0.3788     moyenne: 0.4     médian: 0.4 (8%)     maximum: 0.3826 sec
3DMark 06 - CPU - 3DMark 06 - CPU
min: 11741     moyenne: 16203     médian: 16203 (34%)     maximum: 20665 Points
Super Pi mod 1.5 XS 1M - Super Pi mod 1.5 XS 1M *
min: 5.953     moyenne: 6     médian: 6 (1%)     maximum: 5.98 s
Super Pi mod 1.5 XS 2M - Super Pi mod 1.5 XS 2M *
min: 12.844     moyenne: 12.9     médian: 12.9 (1%)     maximum: 12.894 s
Super Pi Mod 1.5 XS 32M - Super Pi mod 1.5 XS 32M *
min: 305.942     moyenne: 311     médian: 311 (1%)     maximum: 316.148 s
3DMark Vantage - 3DM Vant. Perf. CPU no Physx
96298 Points (74%)
3DMark 11 - 3DM11 Performance Physics
min: 28739     moyenne: 30538     médian: 30537.5 (77%)     maximum: 32336 Points
3DMark - 3DMark Ice Storm Physics
82048 Points (67%)
3DMark - 3DMark Ice Storm Extreme Physics
81495 Points (66%)
3DMark - 3DMark Ice Storm Unlimited Physics
85692 Points (71%)
3DMark - 3DMark Cloud Gate Physics
23358 Points (59%)
3DMark - 3DMark Fire Strike Standard Physics
min: 40312     moyenne: 44727     médian: 44727 (80%)     maximum: 49142 Points
3DMark - 3DMark Time Spy CPU
min: 15951     moyenne: 18746     médian: 18746 (79%)     maximum: 21541 Points
Geekbench 6.3 - Geekbench 6.3 Single-Core
min: 2902     moyenne: 2922     médian: 2922 (74%)     maximum: 2942 points
Geekbench 6.3 - Geekbench 6.3 Multi-Core
min: 18504     moyenne: 19147     médian: 19147 (75%)     maximum: 19790 points
491 -97%
...
16817 -12%
16928 -12%
16957 -11%
16991 -11%
17409 -9%
17457 -9%
17564 -8%
Intel Core Ultra 5 245K
17575 -8%
AMD Ryzen 7 9800X3D
18074 -6%
Intel Core i7-14700K
19147
19249 1%
19688 3%
20380 6%
21254 11%
21326 11%
21383 12%
Intel Core Ultra 9 285K
21598 13%
22527 18%
25365 32%
0%
100%
Geekbench 5.5 - Geekbench 5.1 - 5.5 64 Bit Single-Core
min: 2092     moyenne: 2107     médian: 2106.5 (82%)     maximum: 2121 points
Geekbench 5.5 - Geekbench 5.1 - 5.5 64 Bit Multi-Core
min: 19971     moyenne: 21565     médian: 21565 (39%)     maximum: 23159 points
Geekbench 5.0 - Geekbench 5.0 64 Bit Single-Core
min: 2039     moyenne: 2042     médian: 2042 (9%)     maximum: 2045 points
Geekbench 5.0 - Geekbench 5.0 64 Bit Multi-Core
min: 19766     moyenne: 21261     médian: 21261 (67%)     maximum: 22756 points
Geekbench 4.4 - Geekbench 4.1 - 4.4 64 Bit Single-Core
min: 8874     moyenne: 9089     médian: 9089 (91%)     maximum: 9304 points
Geekbench 4.4 - Geekbench 4.1 - 4.4 64 Bit Multi-Core
min: 72062     moyenne: 75782     médian: 75781.5 (76%)     maximum: 79501 points
Mozilla Kraken 1.1 - Kraken 1.1 Total Score *
min: 439     moyenne: 439.5     médian: 439.5 (1%)     maximum: 440 ms
WebXPRT 4 - WebXPRT 4 Score
min: 303     moyenne: 308.5     médian: 308.5 (86%)     maximum: 314 Points
WebXPRT 3 - WebXPRT 3 Score
min: 311     moyenne: 325     médian: 325 (60%)     maximum: 339 Points
CrossMark - CrossMark Overall
min: 2194     moyenne: 2241     médian: 2241 (86%)     maximum: 2288 Points
Power Consumption - Prime95 Power Consumption - external Monitor *
min: 191.9     moyenne: 296     médian: 296 (51%)     maximum: 400 Watt
0255075100125150175200225250275300325350375400425Tooltip
Power Consumption - Cinebench R15 Multi Power Consumption - external Monitor *
min: 287     moyenne: 357.5     médian: 357.5 (65%)     maximum: 428 Watt
0255075100125150175200225250275300325350375400425Tooltip
Power Consumption - Idle Power Consumption - external Monitor *
min: 22.4     moyenne: 63.6     médian: 63.6 (42%)     maximum: 104.8 Watt
0102030405060708090100110Tooltip
Power Consumption - Cinebench R15 Multi Power Efficiency - external Monitor
min: 12.8     moyenne: 14.5     médian: 14.5 (11%)     maximum: 16.1 Points per Watt
- Amplitude des valeurs obtenues dans le benchmark avec cette carte graphique
red legend - Valeur moyenne obtenue dans le benchmark avec cette carte graphique
* Plus les chiffres sont petits, plus les performances sont élevées

v1.28
log 20. 09:24:54

#0 ran 0s before starting gpusingle class +0s ... 0s

#1 no ids found in url (should be separated by "_") +0s ... 0s

#2 not redirecting to Ajax server +0s ... 0s

#3 did not recreate cache, as it is less than 5 days old! Created at Tue, 19 Nov 2024 05:31:10 +0100 +0.001s ... 0.001s

#4 no comparison url found in template nbc.compare_page_2 needed +0.009s ... 0.01s

#5 no comparison url found in template nbc.compare_page_2 needed +0s ... 0.01s

#6 no comparison url found in template nbc.compare_page_2 needed +0s ... 0.01s

#7 no comparison url found in template nbc.compare_page_2 needed +0s ... 0.01s

#8 no comparison url found in template nbc.compare_page_2 needed +0s ... 0.011s

#9 composed specs +0.001s ... 0.011s

#10 did output specs +0s ... 0.011s

#11 getting avg benchmarks for device 16391 +0.016s ... 0.028s

#12 got single benchmarks 16391 +0.012s ... 0.04s

#13 got avg benchmarks for devices +0s ... 0.04s

#14 min, max, avg, median took s +1.059s ... 1.099s

#15 no comparison url found in template nbc.compare_page_2 needed +0s ... 1.099s

#16 return log +0s ... 1.099s

Please share our article, every link counts!
Mail Logo

» Comparaison des processeurs pour ordinateur portable
Comparaison de tout les processeurs mobiles


» Processeurs mobiles - liste des benchmarks
Liste des benchmarks de l'intégralité des processeurs pour portables


Les autres processeurs de la gamme Raptor Lake-R

» Intel Core i9-14900K
   24x 3.2 GHz - 6 GHz
» Intel Core i7-14700K
   20x 2.5 GHz - 5.6 GHz
» Intel Core i9-14900
   24x 2 GHz - 5.8 GHz
» Intel Core i5-14600K
   14x 3.5 GHz - 5.3 GHz
» Intel Core i5-14500
   14x 2.6 GHz - 5 GHz
» Intel Core i5-14500T
   14x 1.7 GHz - 4.8 GHz

Processeurs similaires

+ Intel Core i9-14900K
   24x 3.2 GHz - 6 GHz
+ AMD Ryzen 9 7950X
   16x 4.5 GHz - 5.7 GHz
+ Intel Core i9-13900K
   24x 3 GHz - 5.8 GHz
+ AMD Ryzen 9 7950X3D
   16x 4.2 GHz - 5.7 GHz
+ AMD Ryzen 9 9900X
   12x 4.4 GHz - 5.6 GHz
» Intel Core i7-14700K
   20x 2.5 GHz - 5.6 GHz
- AMD Ryzen 9 7900X
   12x 4.7 GHz - 5.6 GHz
- Intel Core i7-13700K
   16x 3.4 GHz - 5.4 GHz
- AMD Ryzen Threadripper PRO 3975WX
   32x 3.5 GHz - 4.2 GHz
- Intel Core i9-14900
   24x 2 GHz - 5.8 GHz
- AMD Ryzen 7 9700X
   8x 3.8 GHz - 5.5 GHz
> Revues et rapports de ordinateurs portatifs et smartphones, ordiphones > FAQ > Processeurs mobiles - indice de référence > Intel Raptor Lake-R i7-14700K Notebook Processor
Klaus Hinum (Update: 2024-01- 9)