 Deutsch
 English
 Español
 Français
 Italiano
 Nederlands
 Polski
 Português
 Русский
 Türkçe
 Svenska
 Chinese
 Magyar
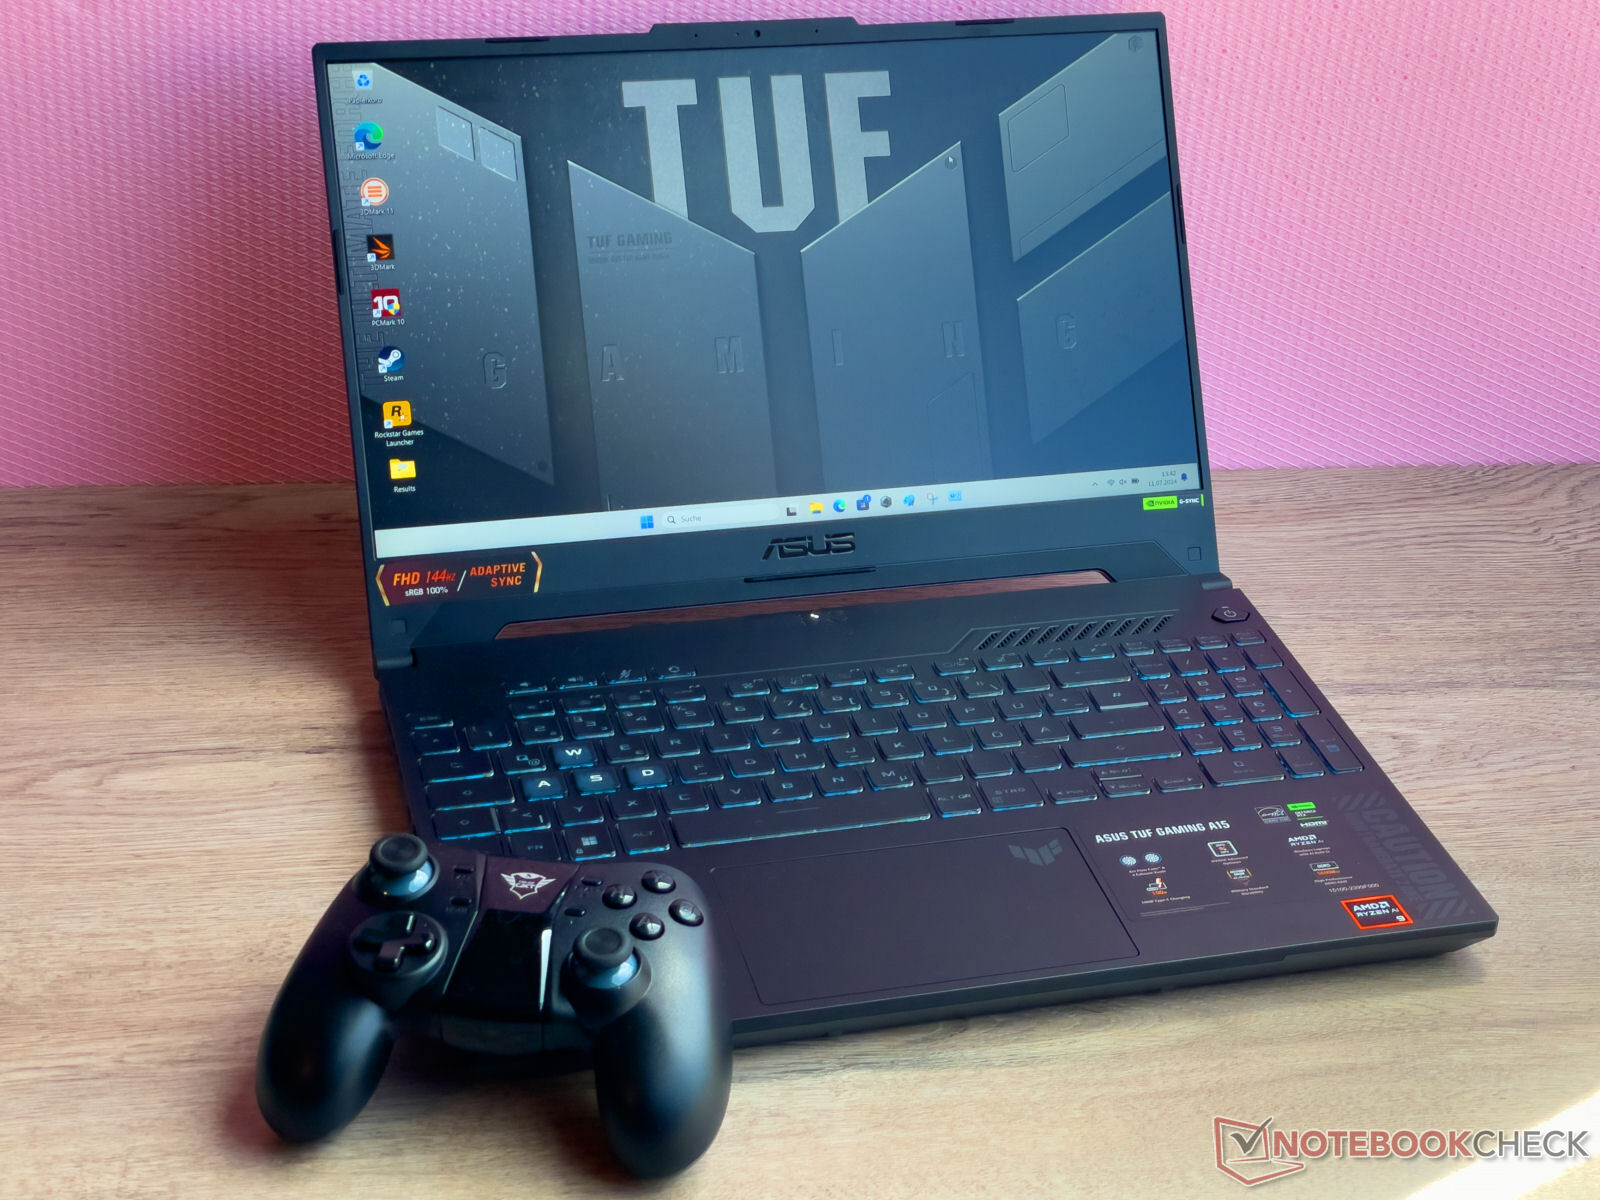
Test de l'Asus TUF Gaming A15 (2024) : puissance RTX 4060, prix modéré, grosse autonomie

"TUF Gaming" est synonyme d'ordinateurs portables de jeu au bas de l'échelle des prix : Ryzen 9 8945H, GeForce RTX 4060, 16 Go de RAM, un SSD de 512 Go et un prix d'environ 1 399 $ constituent un ordinateur portable de jeu de milieu de gamme abordable. La concurrence peut être trouvée sous la forme d'appareils tels que le Lenovo LOQ 15IRX9le Gigabyte G6X 9KG (2024)le Dell G16dell G16 XMG Core 15 (M24) et le HP Victus 16 (2024).
Ce modèle est identique au modèle frère de l'année précédente, le A15 que nous avons examiné l'année dernière. La principale différence est le passage de Ryzen 7000 à Ryzen 8000.
Comparaison avec les concurrents potentiels
Note | Version | Date | Modèle | Poids | Épaisseur | Taille | Résolution | Meilleur prix |
|---|---|---|---|---|---|---|---|---|
| 80.3 % | v8 | 07/24 | Asus TUF Gaming A15 FA507UV R9 8945H, NVIDIA GeForce RTX 4060 Laptop GPU | 2.1 kg | 22.4 mm | 15.60" | 1920x1080 | |
| 79 % | v8 | 07/24 | Lenovo LOQ 15IRX9 i5-13450HX, NVIDIA GeForce RTX 4060 Laptop GPU | 2.4 kg | 23.9 mm | 15.60" | 1920x1080 | |
| 84.3 % | v7 (old) | 05/24 | HP Victus 16 (2024) i7-14700HX, NVIDIA GeForce RTX 4060 Laptop GPU | 2.4 kg | 23.9 mm | 16.10" | 1920x1080 | |
| 83.2 % | v7 (old) | 03/24 | Gigabyte G6X 9KG (2024) i7-13650HX, NVIDIA GeForce RTX 4060 Laptop GPU | 2.6 kg | 25.1 mm | 16.00" | 1920x1200 | |
| 83.7 % | v8 | 06/24 | SCHENKER XMG Core 15 (M24) R7 8845HS, NVIDIA GeForce RTX 4060 Laptop GPU | 2.1 kg | 21.9 mm | 15.30" | 2560x1600 | |
| 85.5 % | v7 (old) | 02/24 | Dell G16, i7-13650HX, RTX 4060 i7-13650HX, NVIDIA GeForce RTX 4060 Laptop GPU | 2.8 kg | 25.65 mm | 16.00" | 2560x1600 |
Note : Nous avons récemment mis à jour notre système d'évaluation et les résultats de la version 8 ne sont pas comparables à ceux de la version 7. De plus amples informations sont disponibles ici.
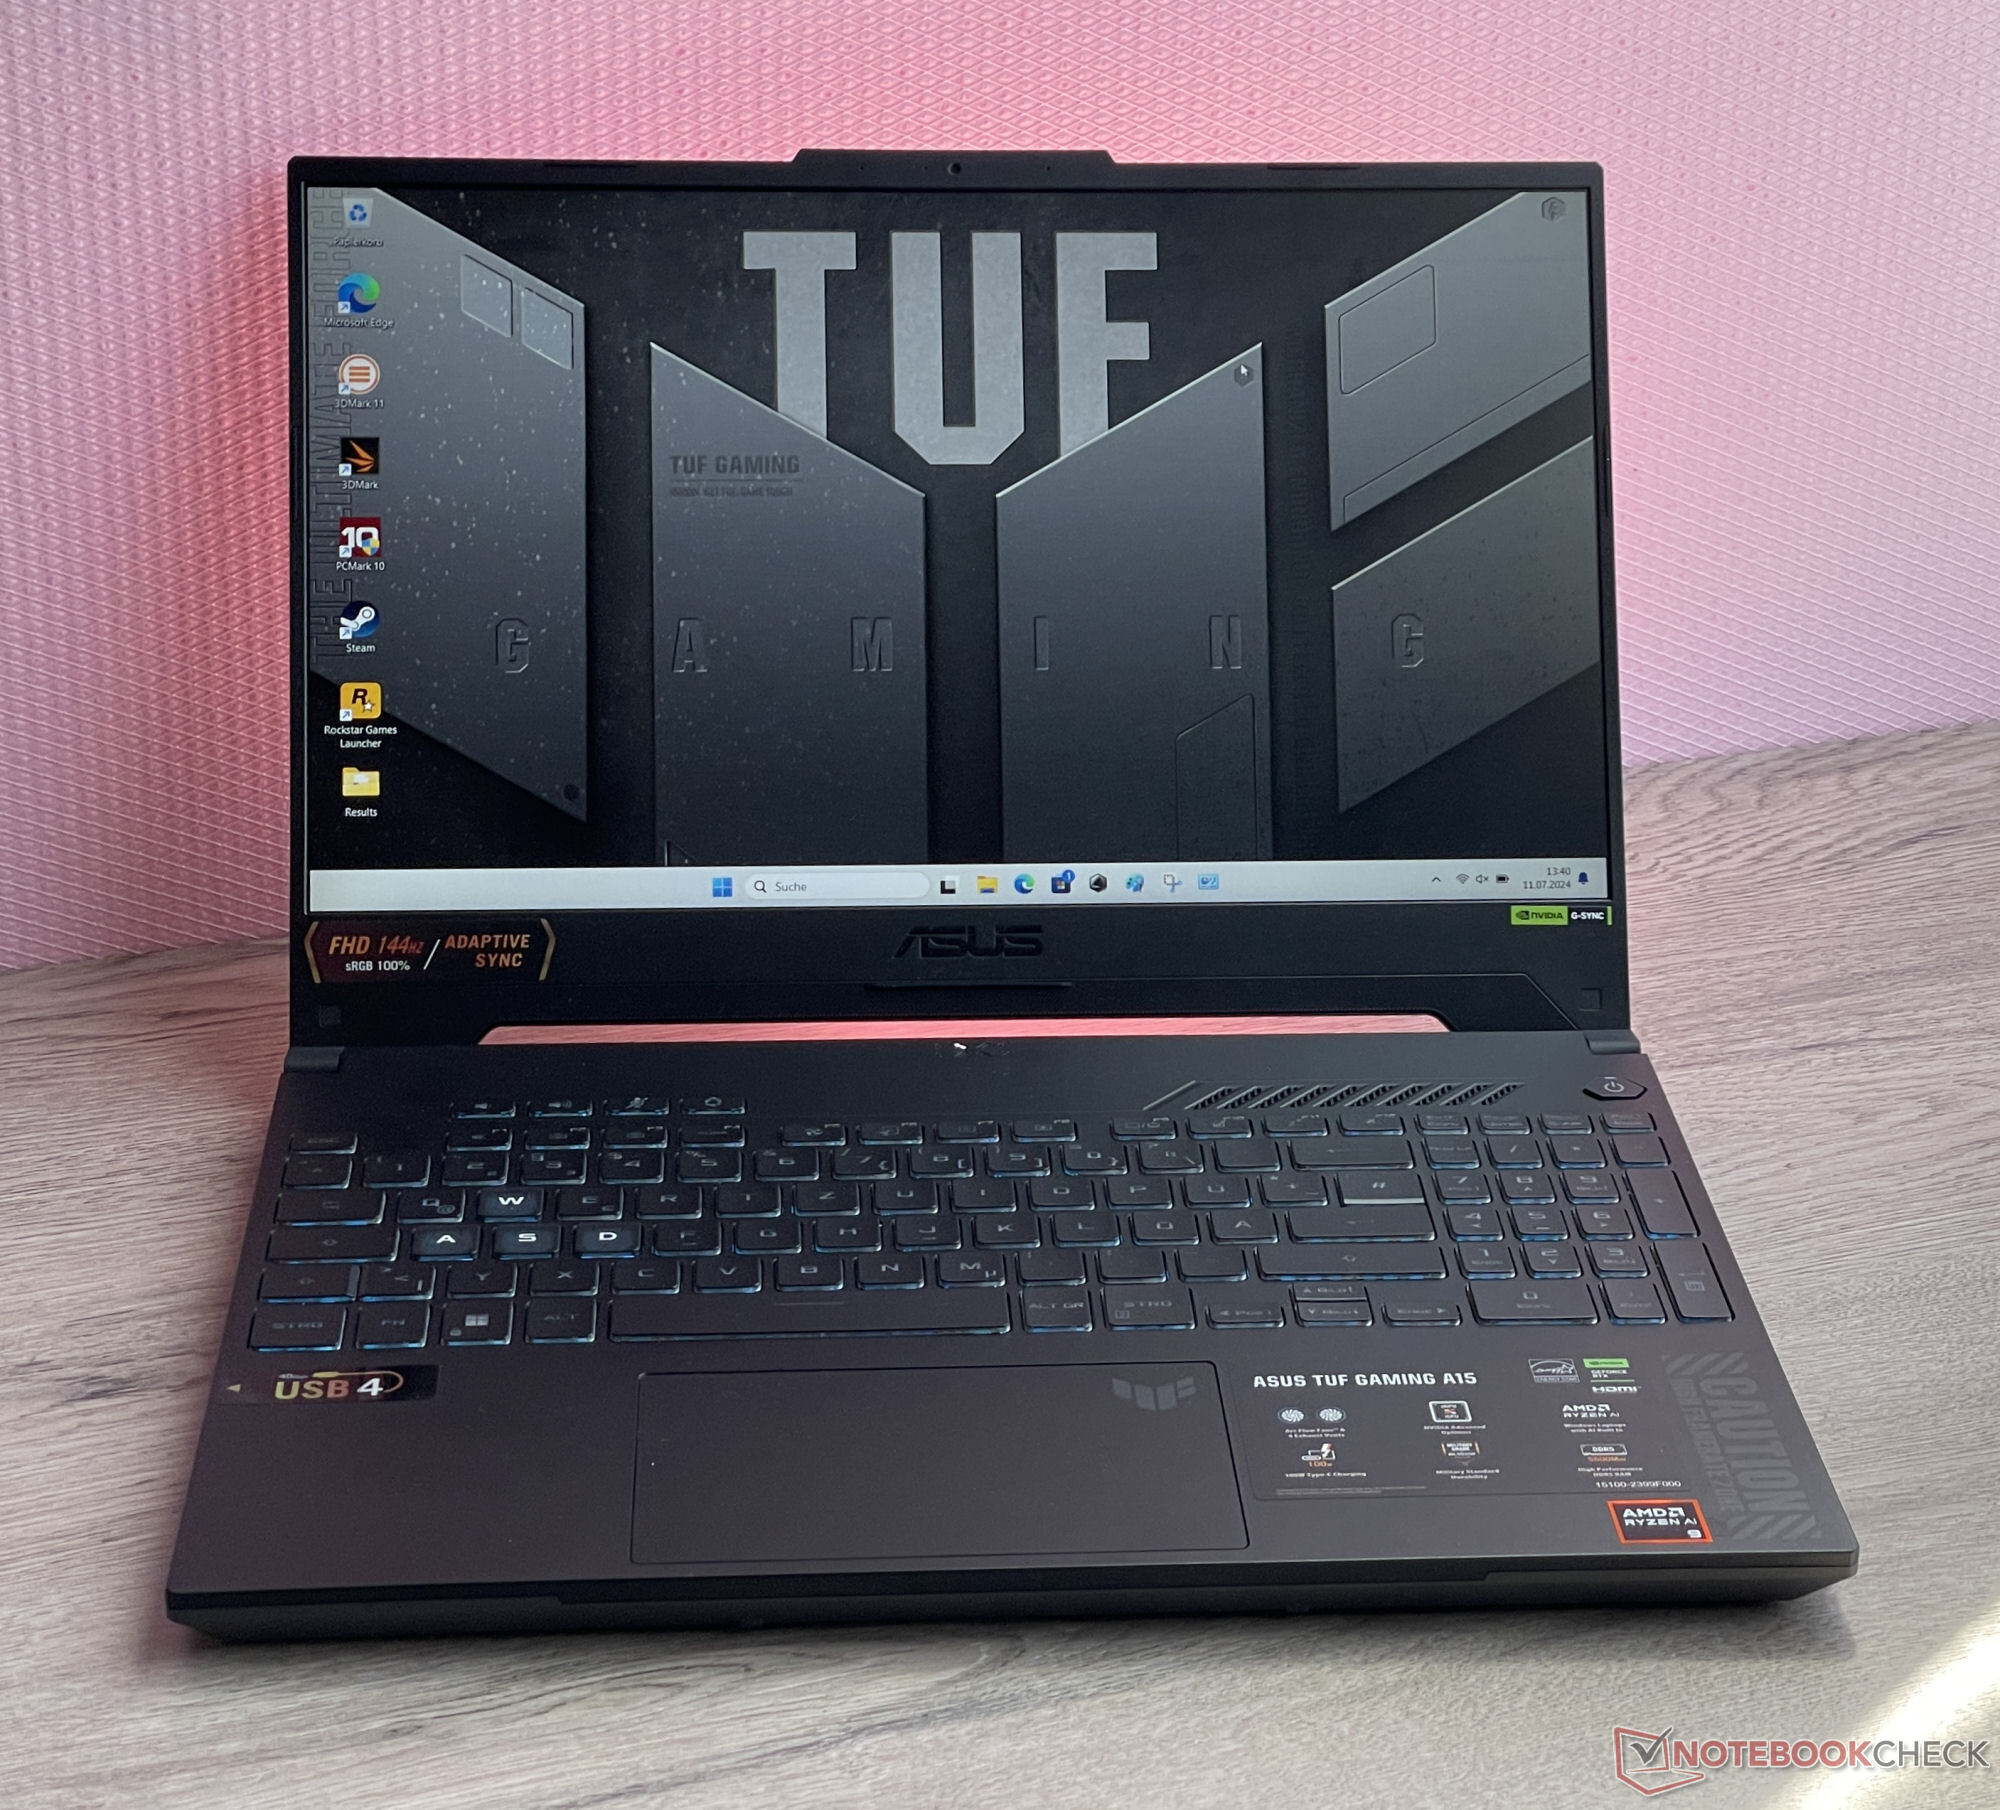
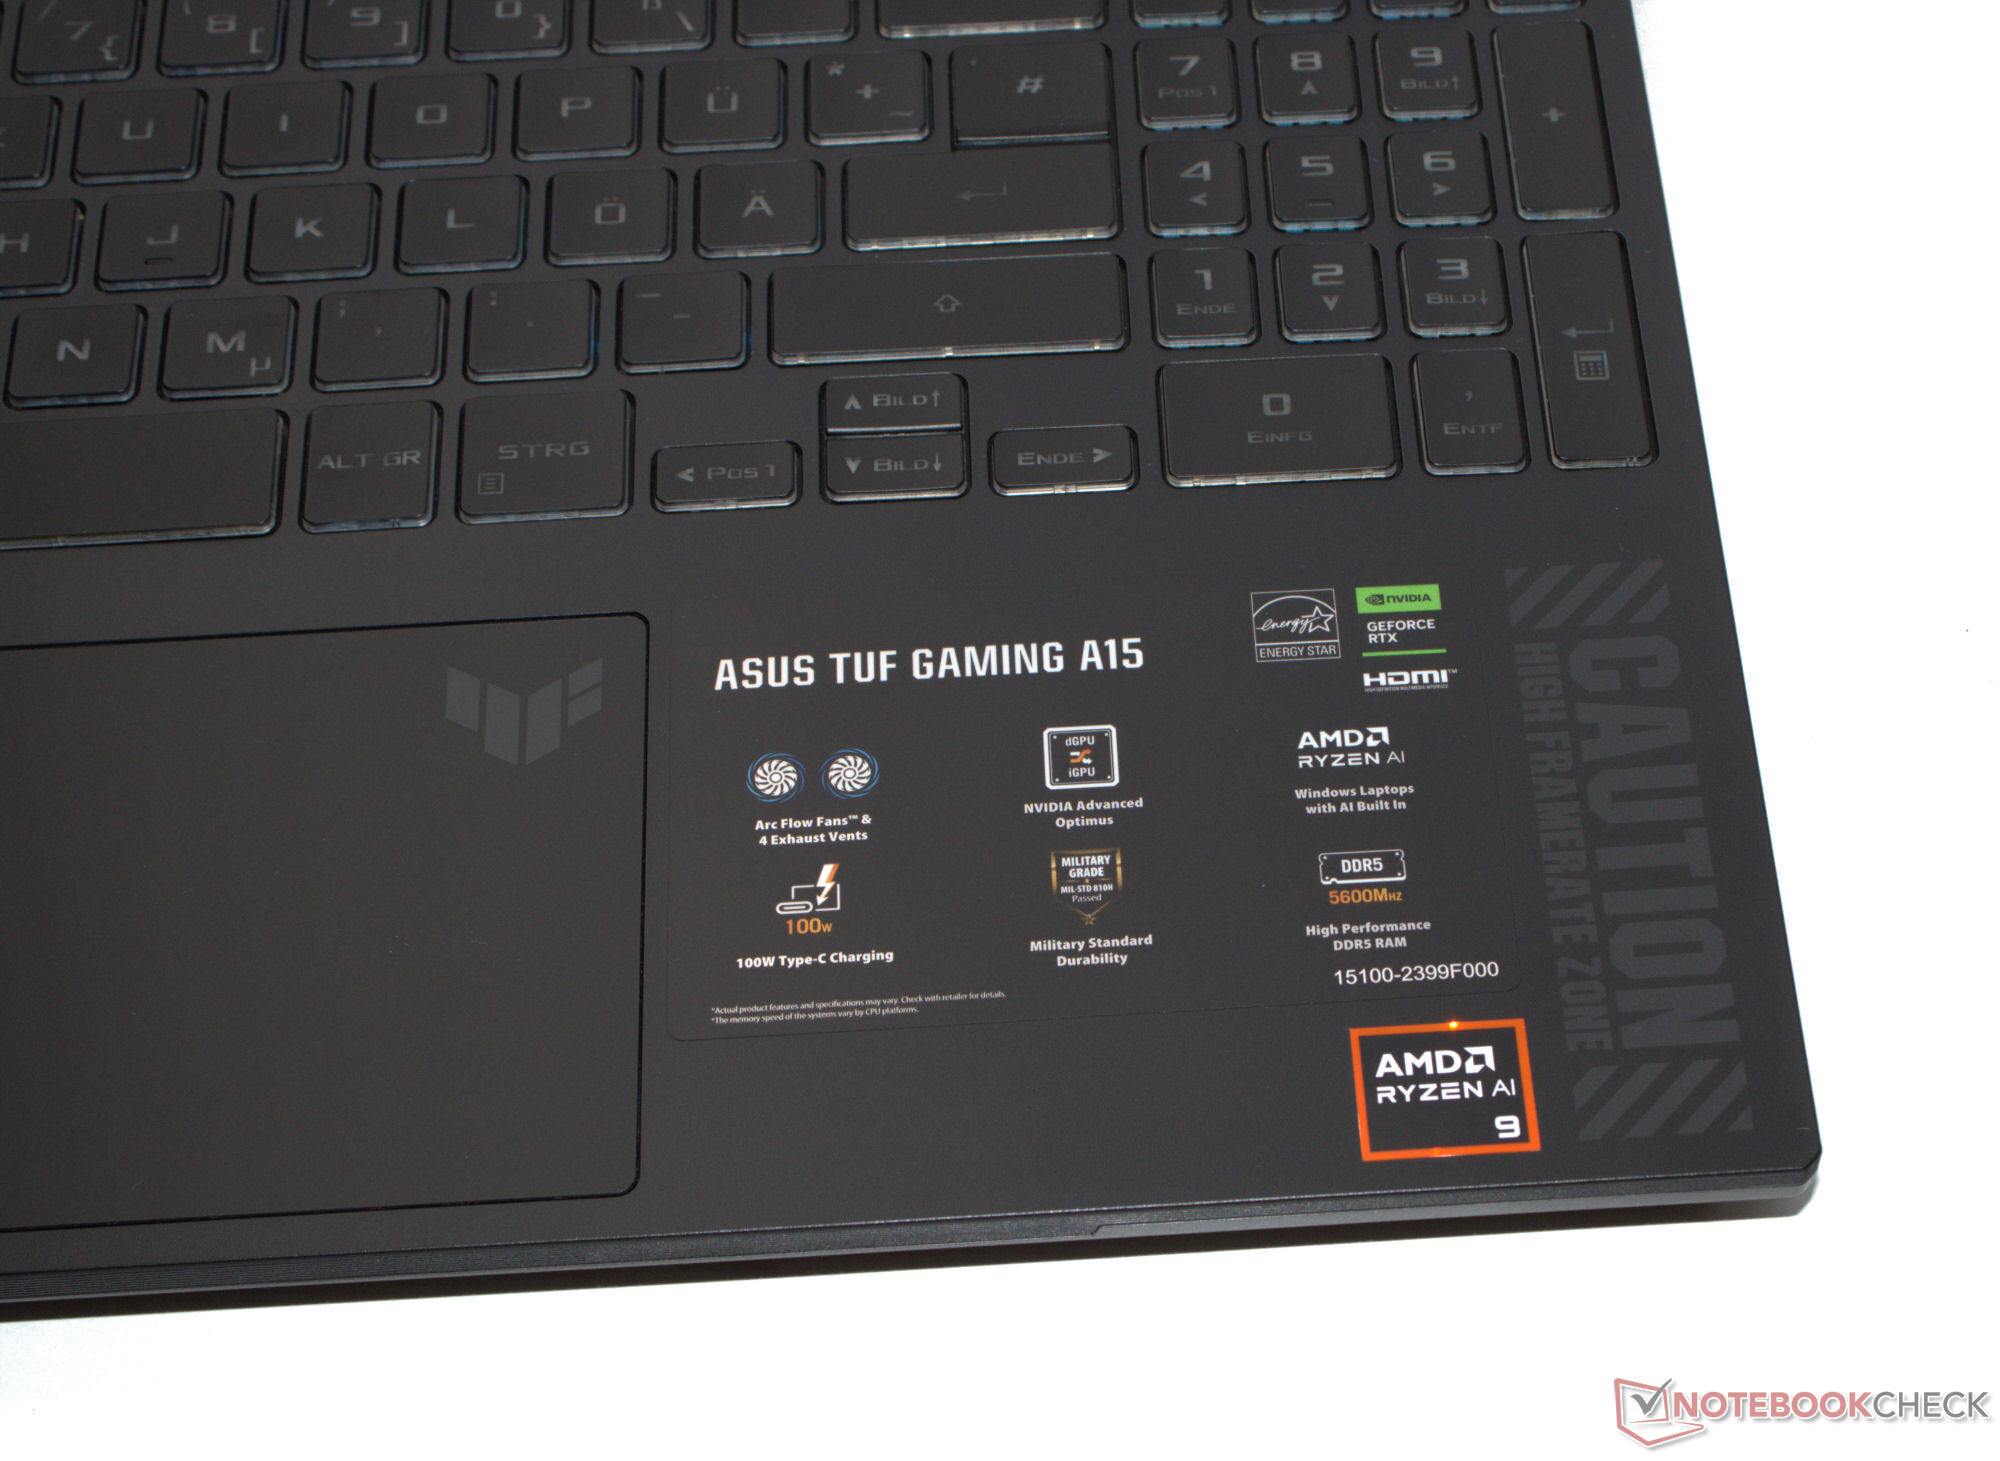
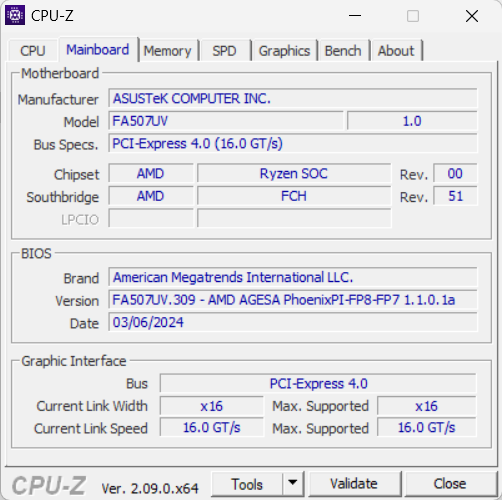
Boîtier et caractéristiques - Asus TUF et USB 4
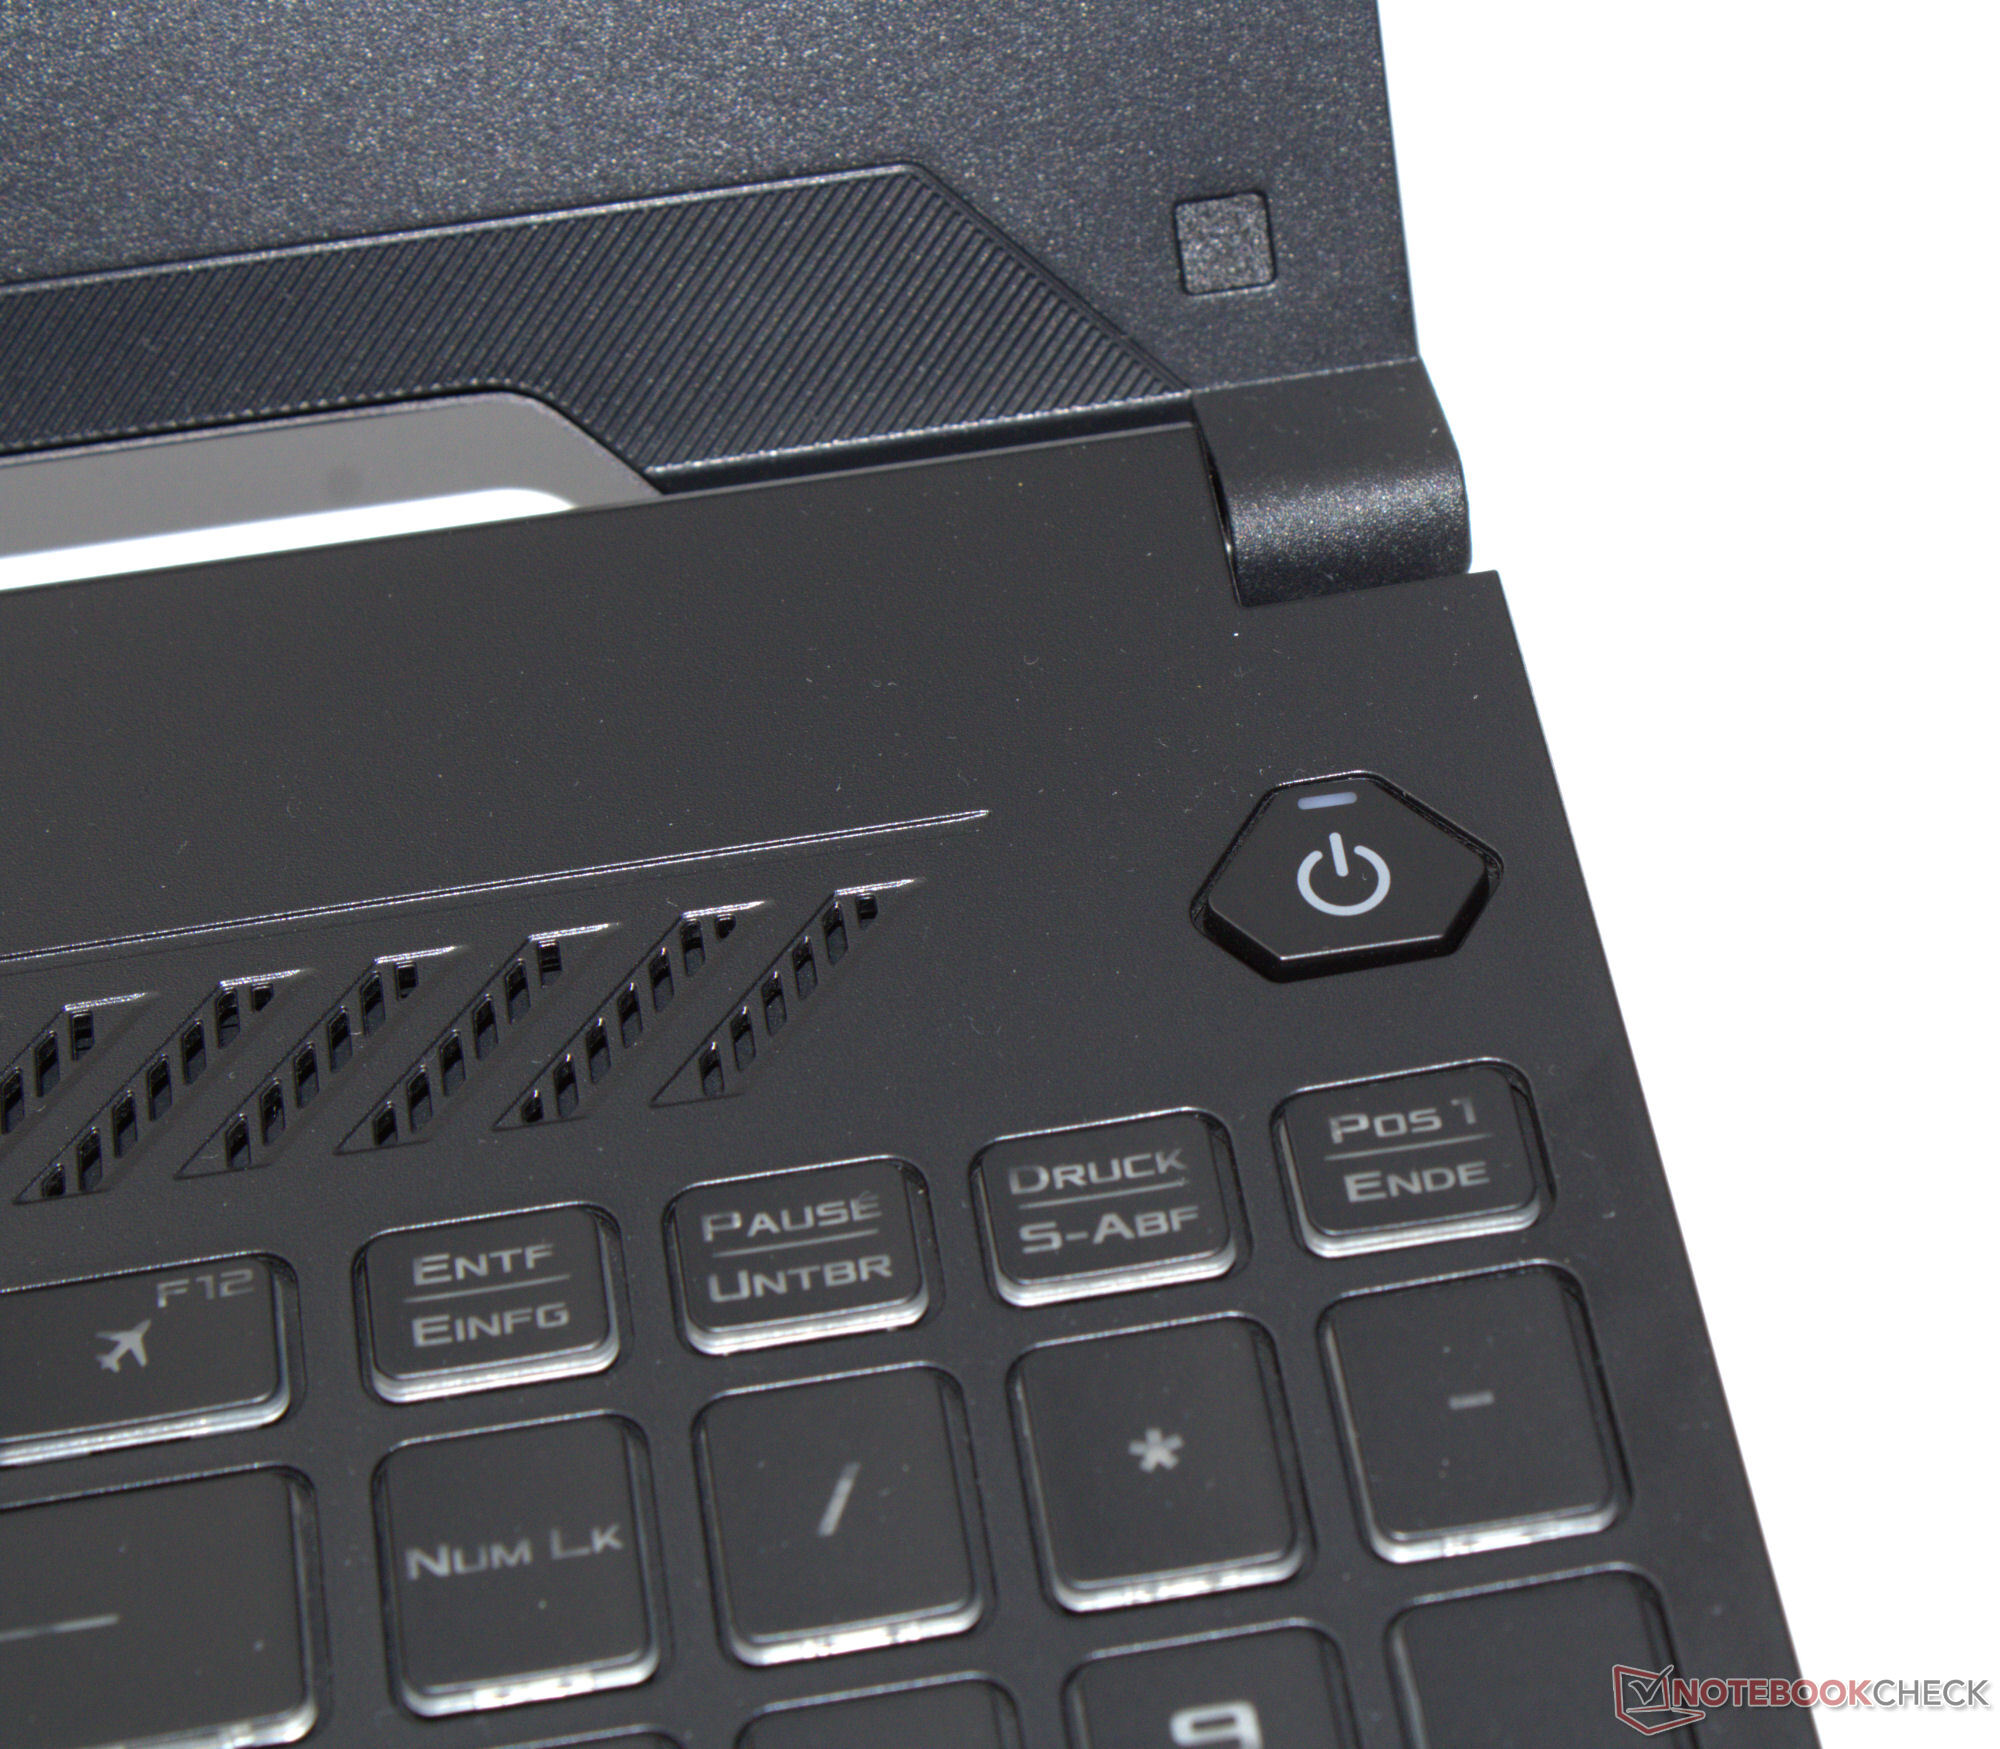
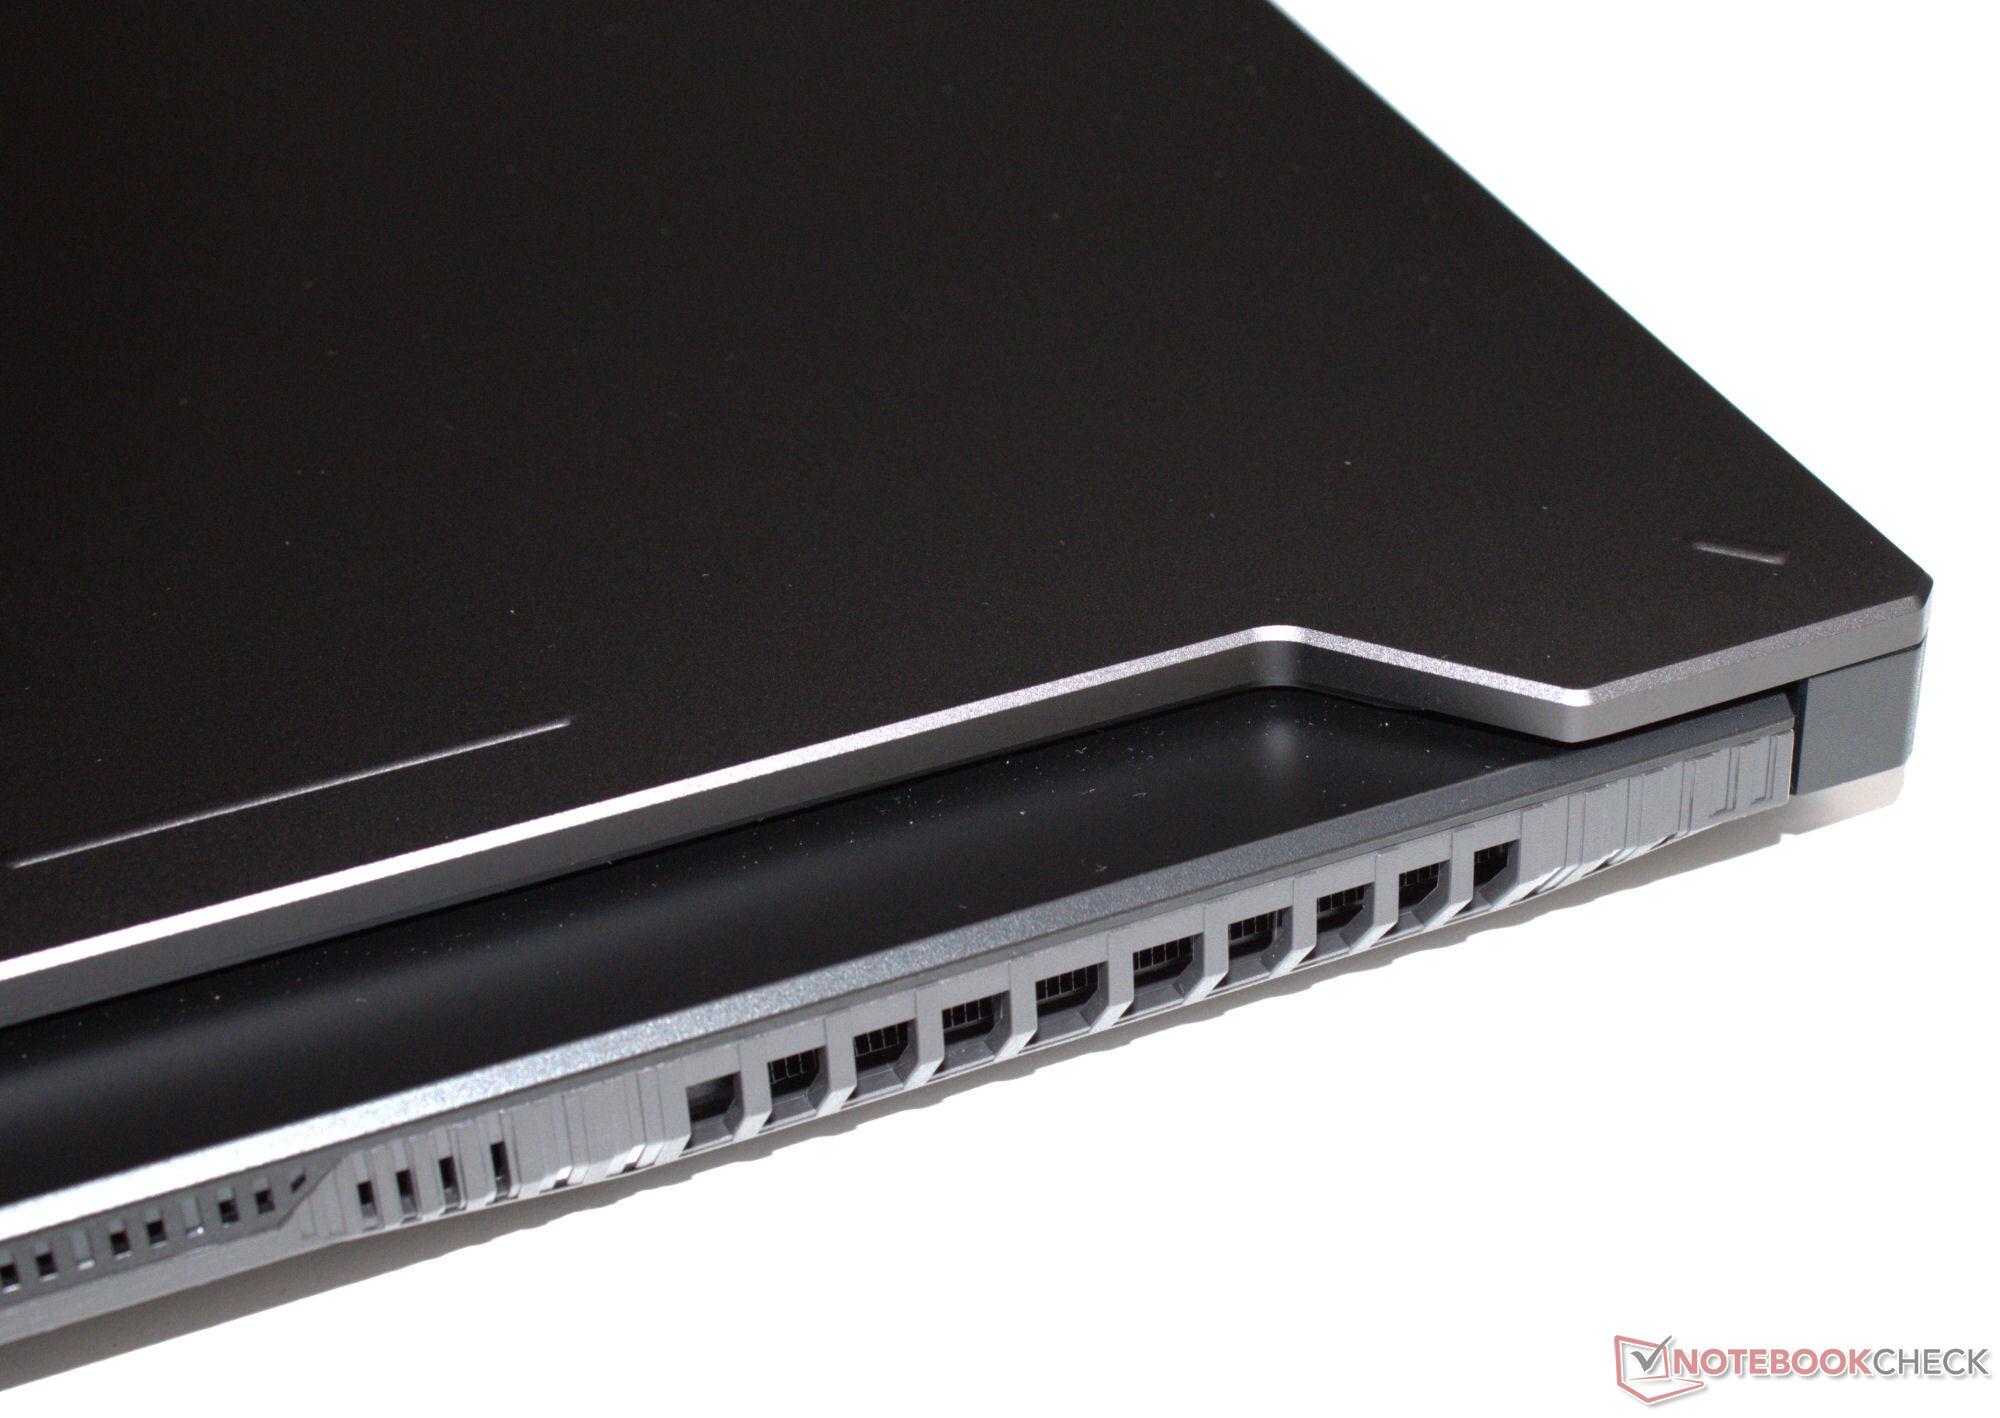
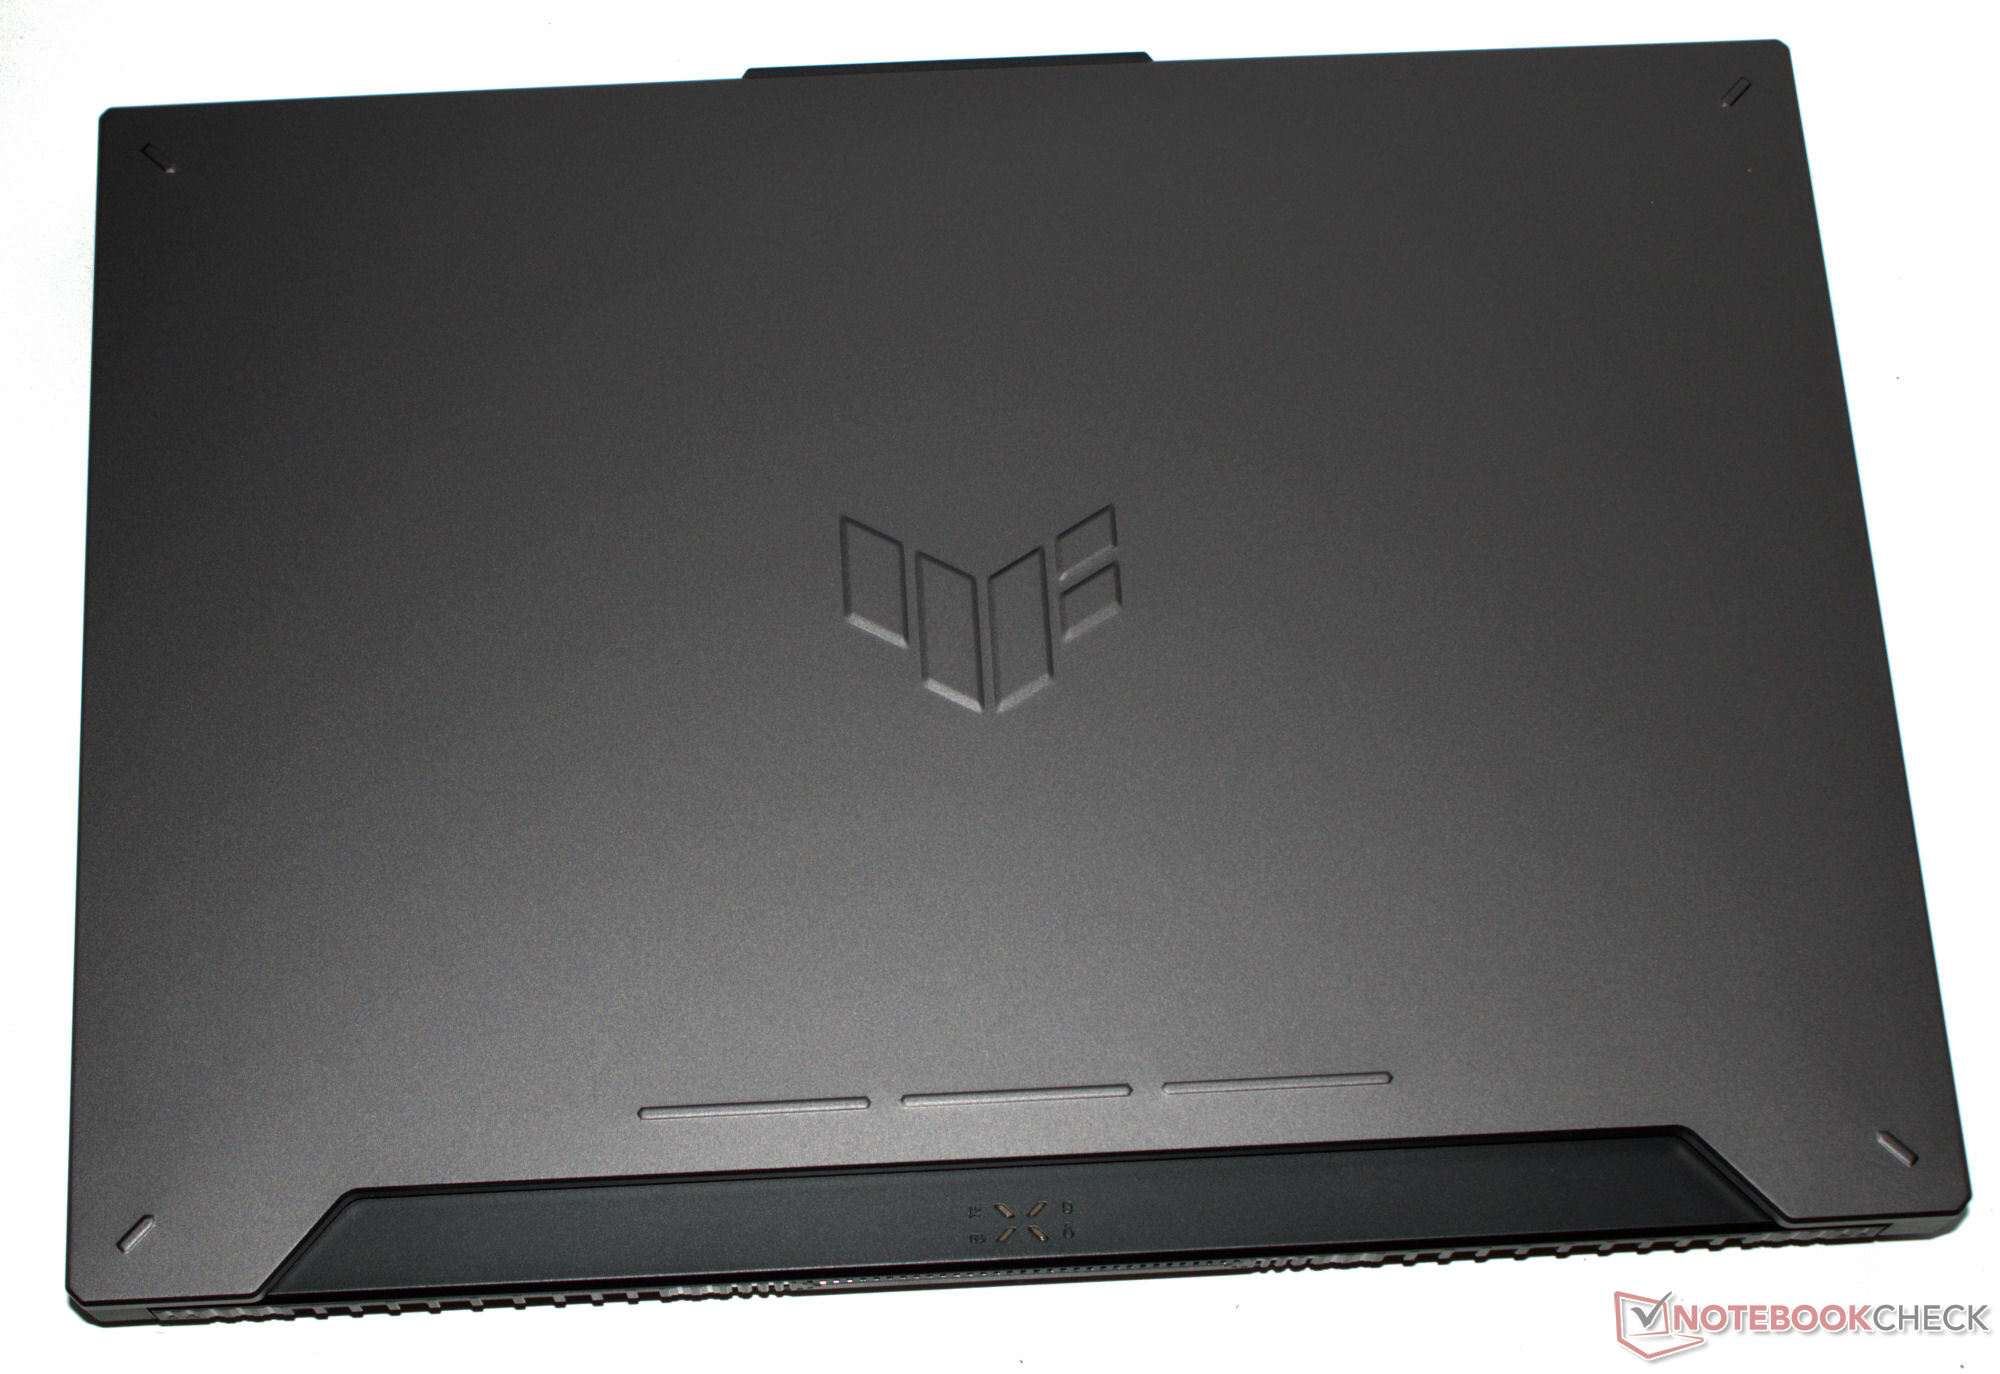
Le châssis gris (Mecha Gray), mat et à surface lisse est déjà bien connu grâce au A15 de l'année dernière l'A15 de l'année dernière. Il n'y a pas de problème de stabilité et l'unité de base (plastique) et le couvercle (métal à l'arrière) peuvent être tordus dans des limites acceptables. Le couvercle a un angle d'ouverture maximal d'environ 130 degrés.
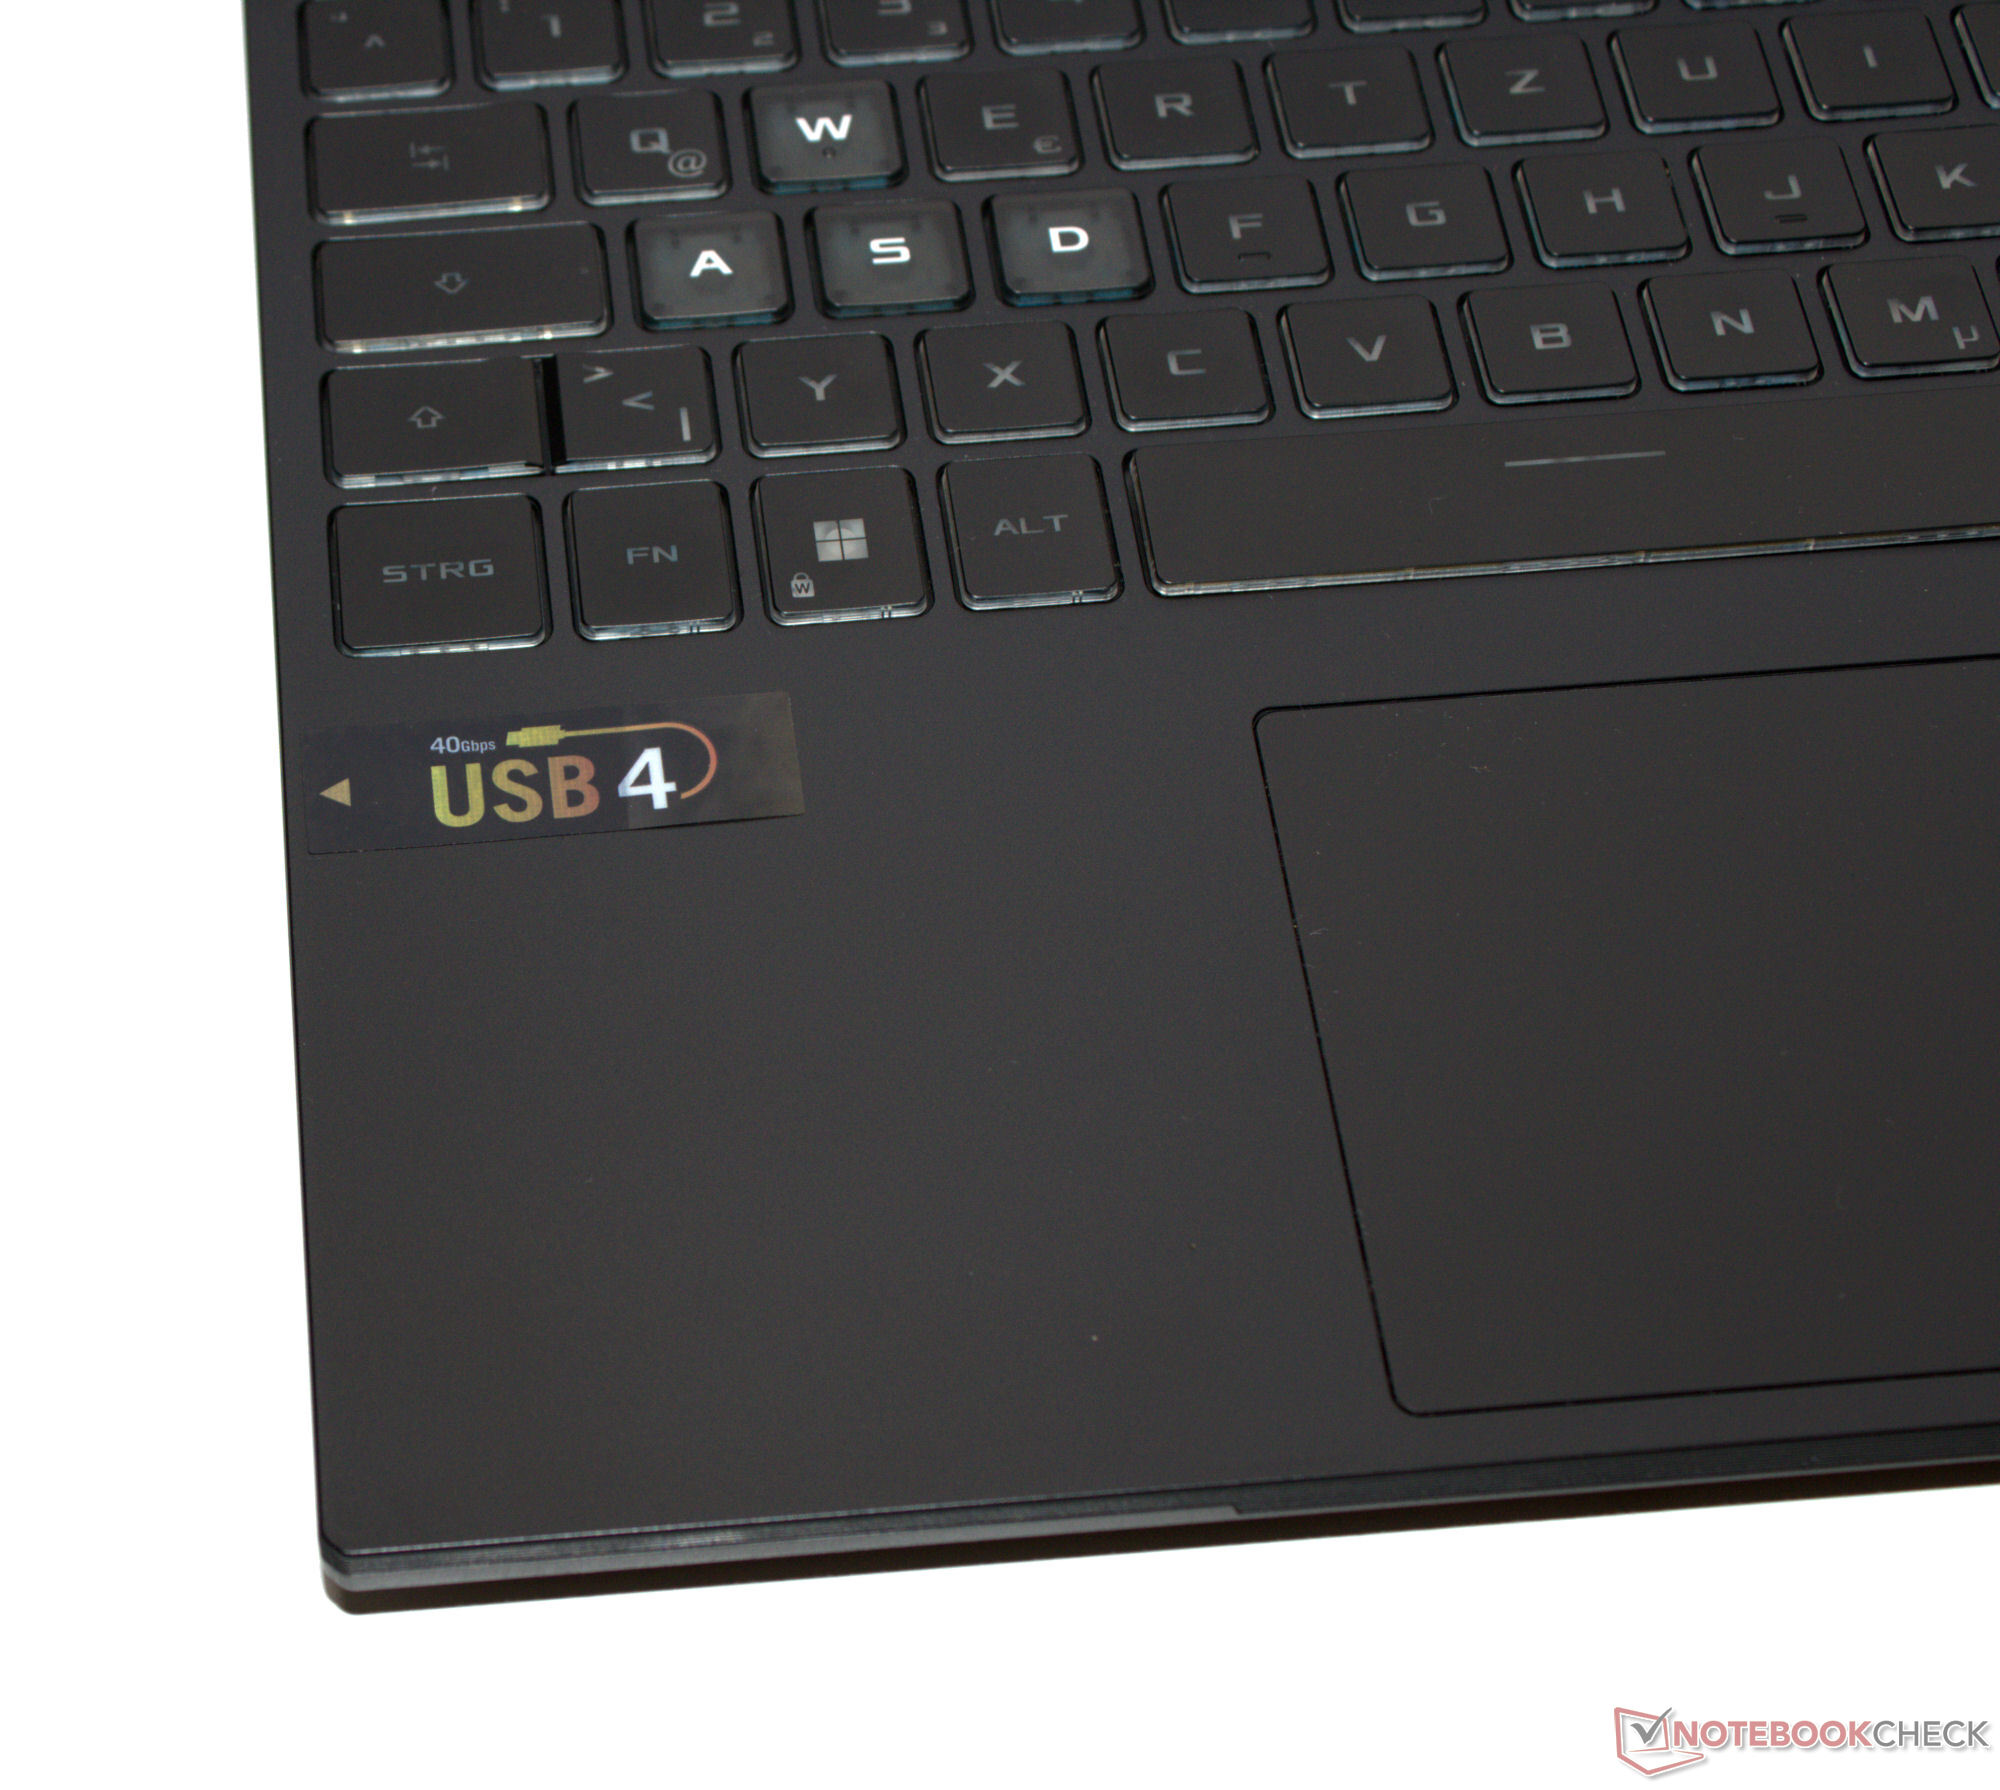
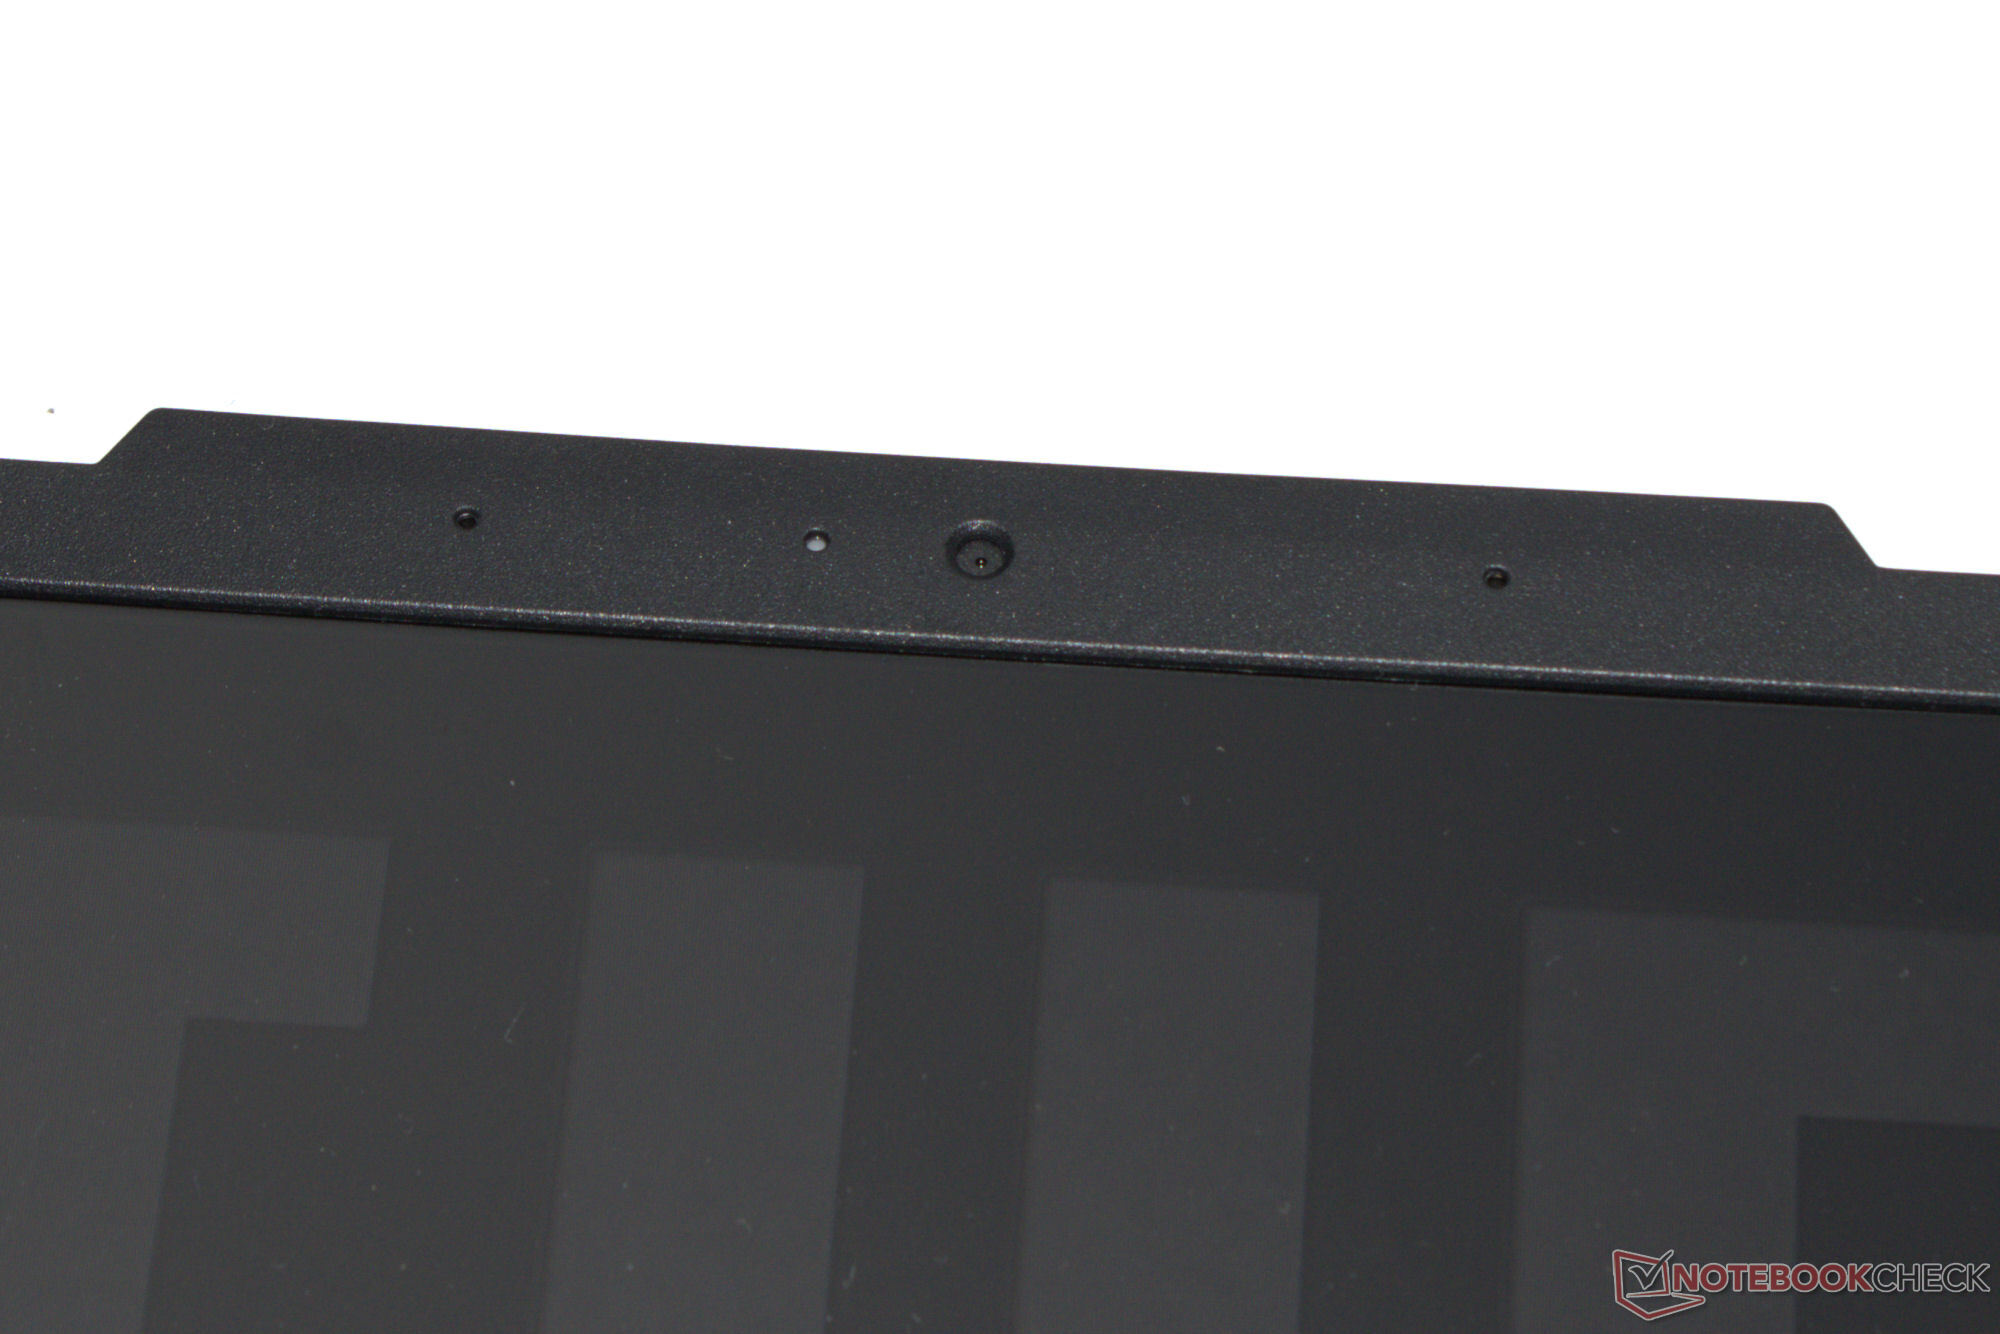
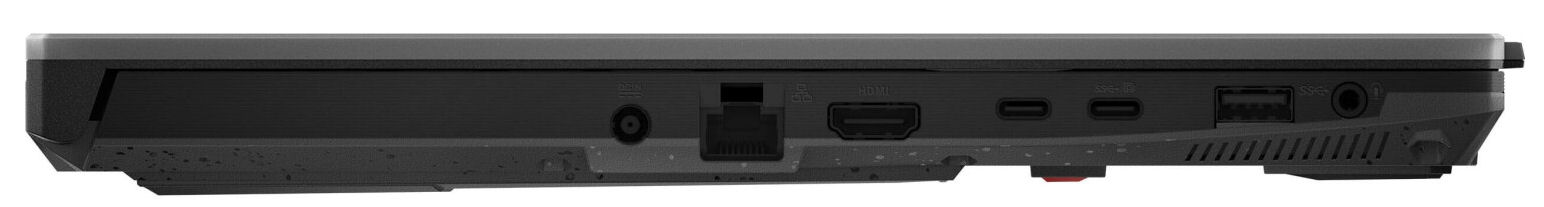
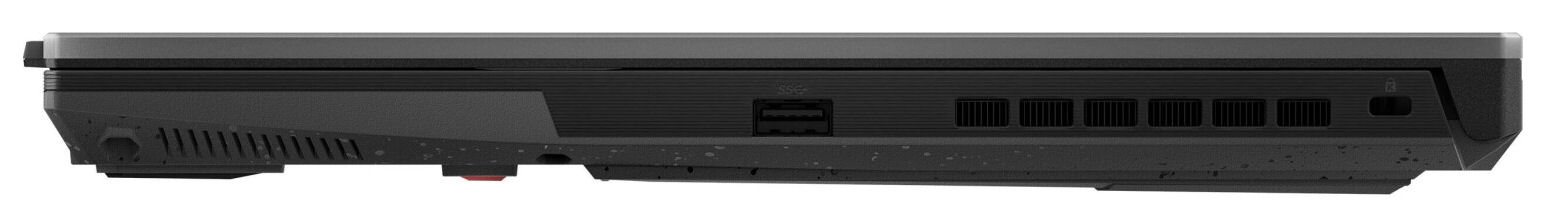
La plupart des ports ont été placés sur le côté gauche de l'ordinateur. Parmi ceux-ci, on trouve deux ports USB-A (USB 3.2 Gen 1) et deux connecteurs USB-C (1x USB 3.2 Gen 2, 1x USB 4). Ce dernier prend en charge le mode DisplayPort Alt et, en outre, le port USB 3.2 offre Power Delivery. Le TUF dispose donc de trois sorties vidéo (1x HDMI, 2x DP). Les images produites par la webcam (0,9 MP, pas d'obturateur) ne remporteront pas de prix. Le A15 n'est pas équipé d'un lecteur de carte mémoire.
L'ordinateur d'Asus rejoint les rangs des ordinateurs portables d'entrée de gamme qui utilisent la puce RTL8852BE de Realtek (WiFi 6). Cette puce sans fil offre des vitesses de transfert correctes, mais n'atteint pas son potentiel et ne parvient pas à atteindre les vitesses observées dans le module concurrent d'Intel. Un contrôleur Gigabit Ethernet (Realtek RTL8168/8111) est responsable des connexions filaires.

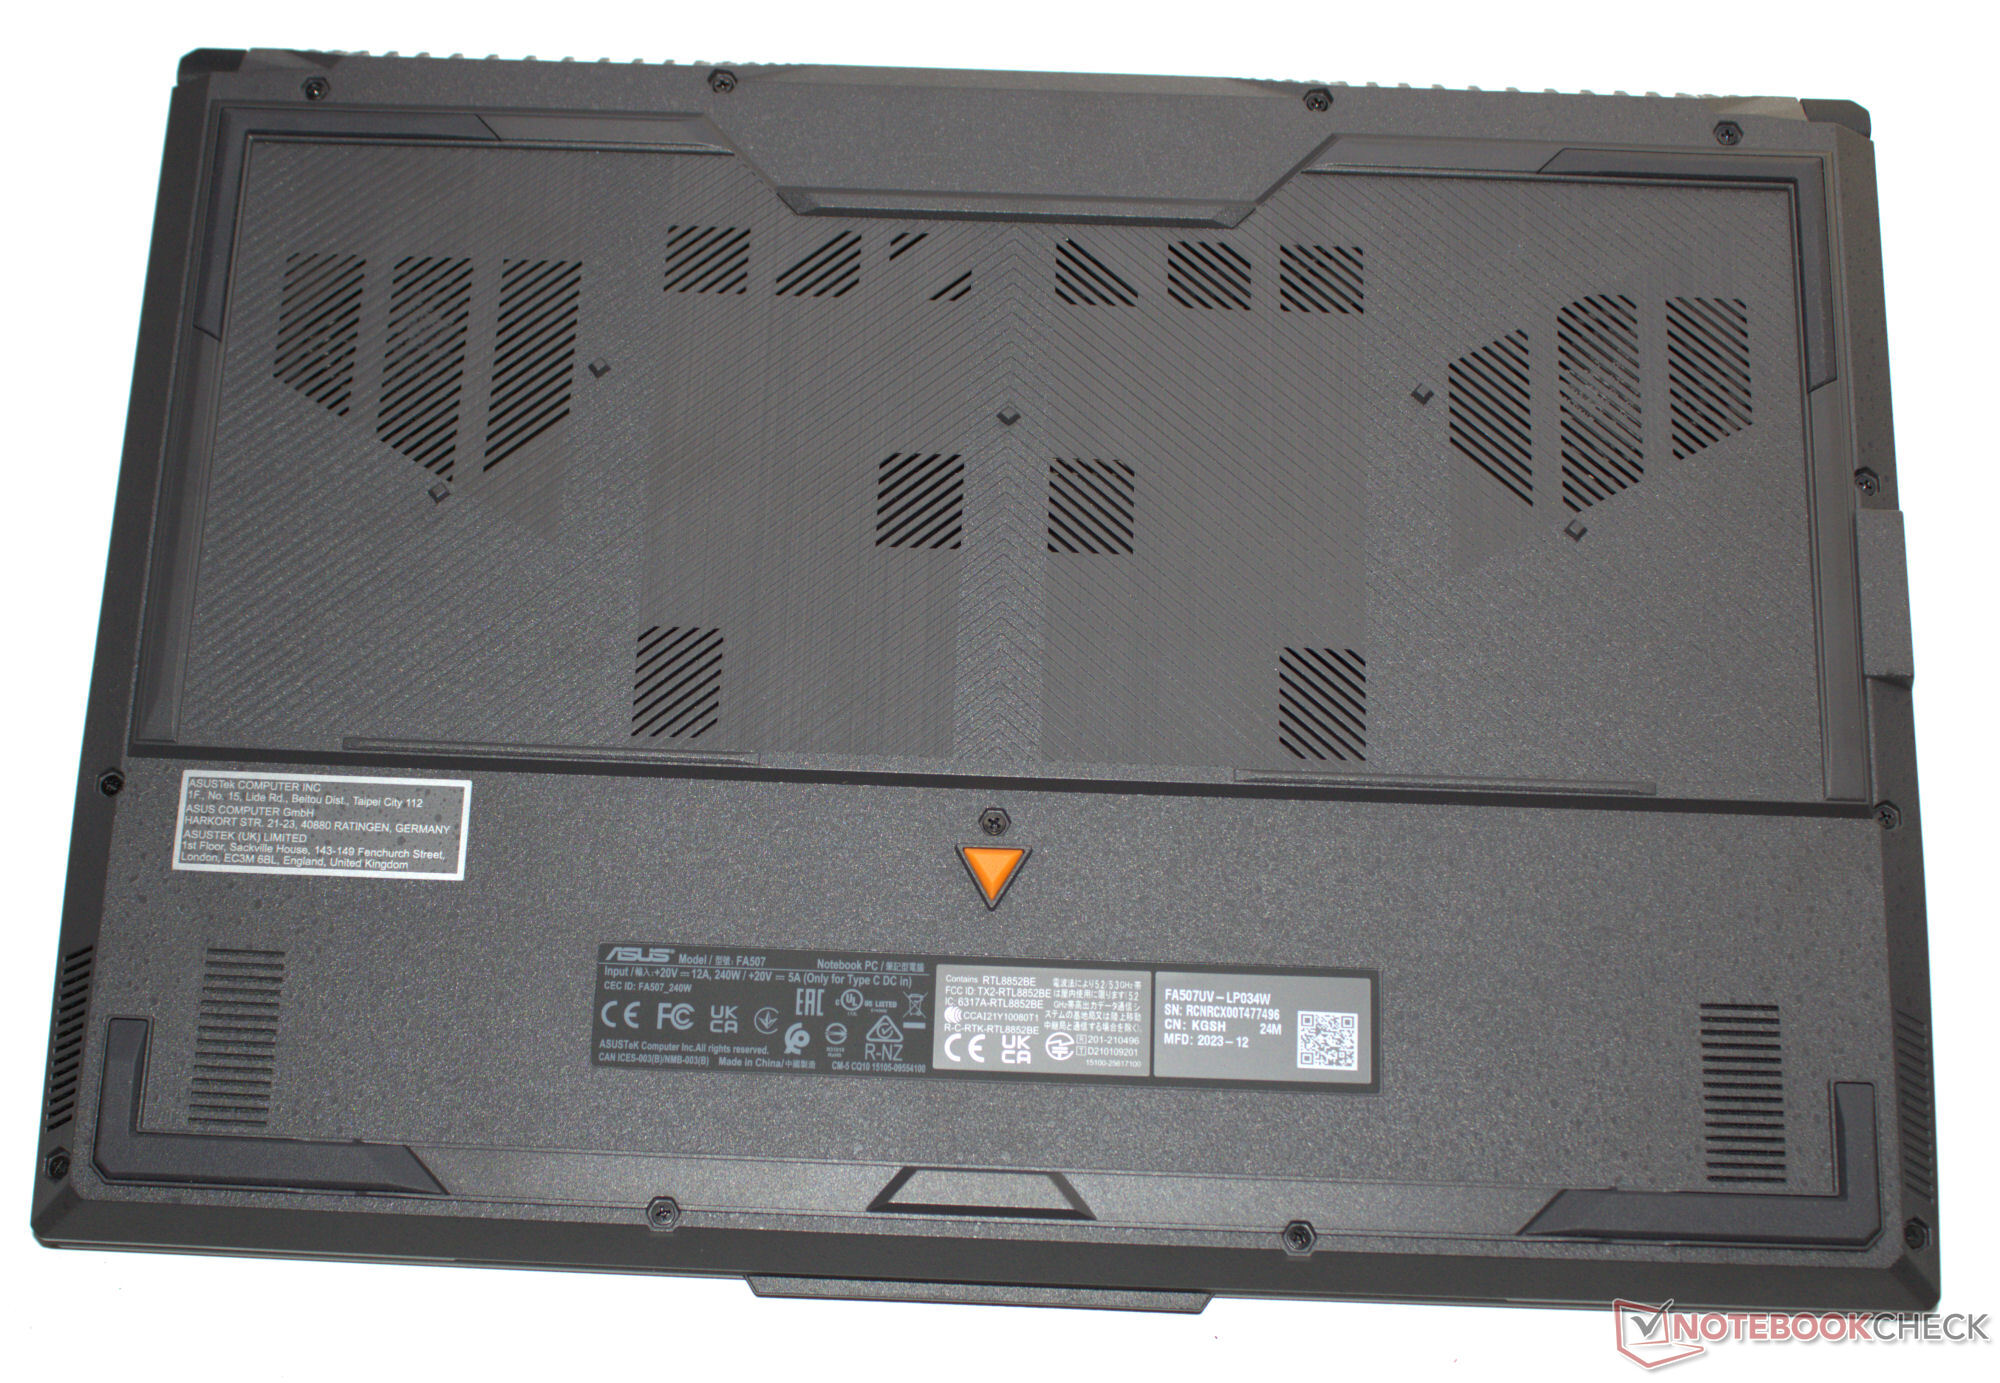


Durabilité
À l'intérieur de la boîte de l'ordinateur portable, vous trouverez essentiellement du carton et peu de plastique. L'ordinateur portable est logé dans un sac en fibre plastique avec un boîtier transparent protégeant le bloc d'alimentation des rayures. Enfin, un insert protège l'écran des rayures. Dans les trois cas, les plastiques utilisés sont spécifiés.
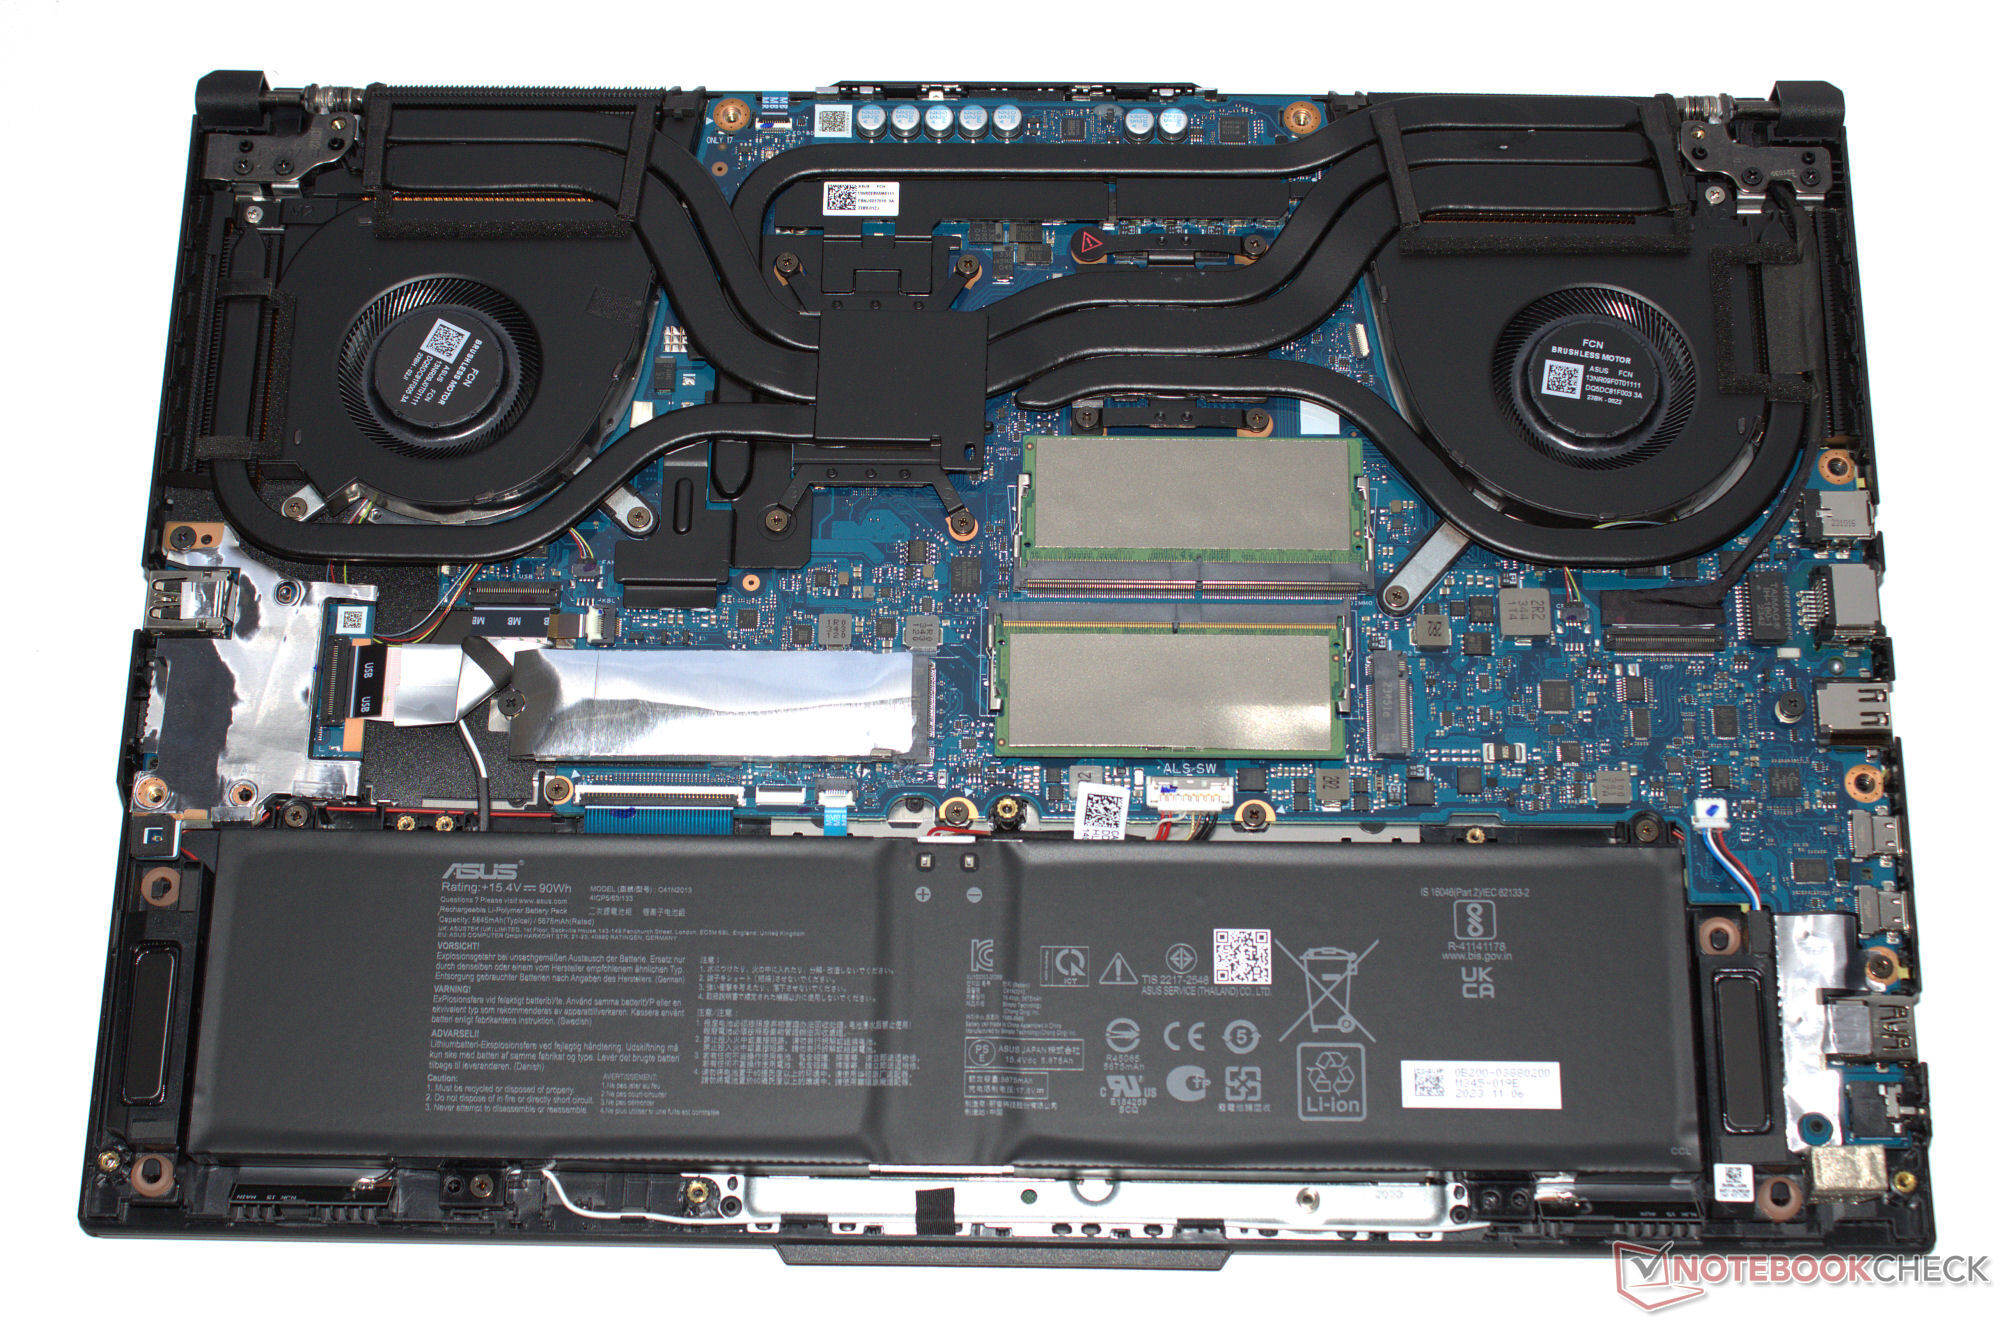
Les réparations devraient être faciles à effectuer grâce à la plaque de base amovible - l'ensemble du matériel est accessible. Nous n'avons pas été confrontés à des pâtes collées à l'intérieur de l'appareil. Les mises à jour logicielles ne devraient pas poser de problème dans les années à venir. L'ordinateur portable lui-même porte le label EPEAT bronze ( ).
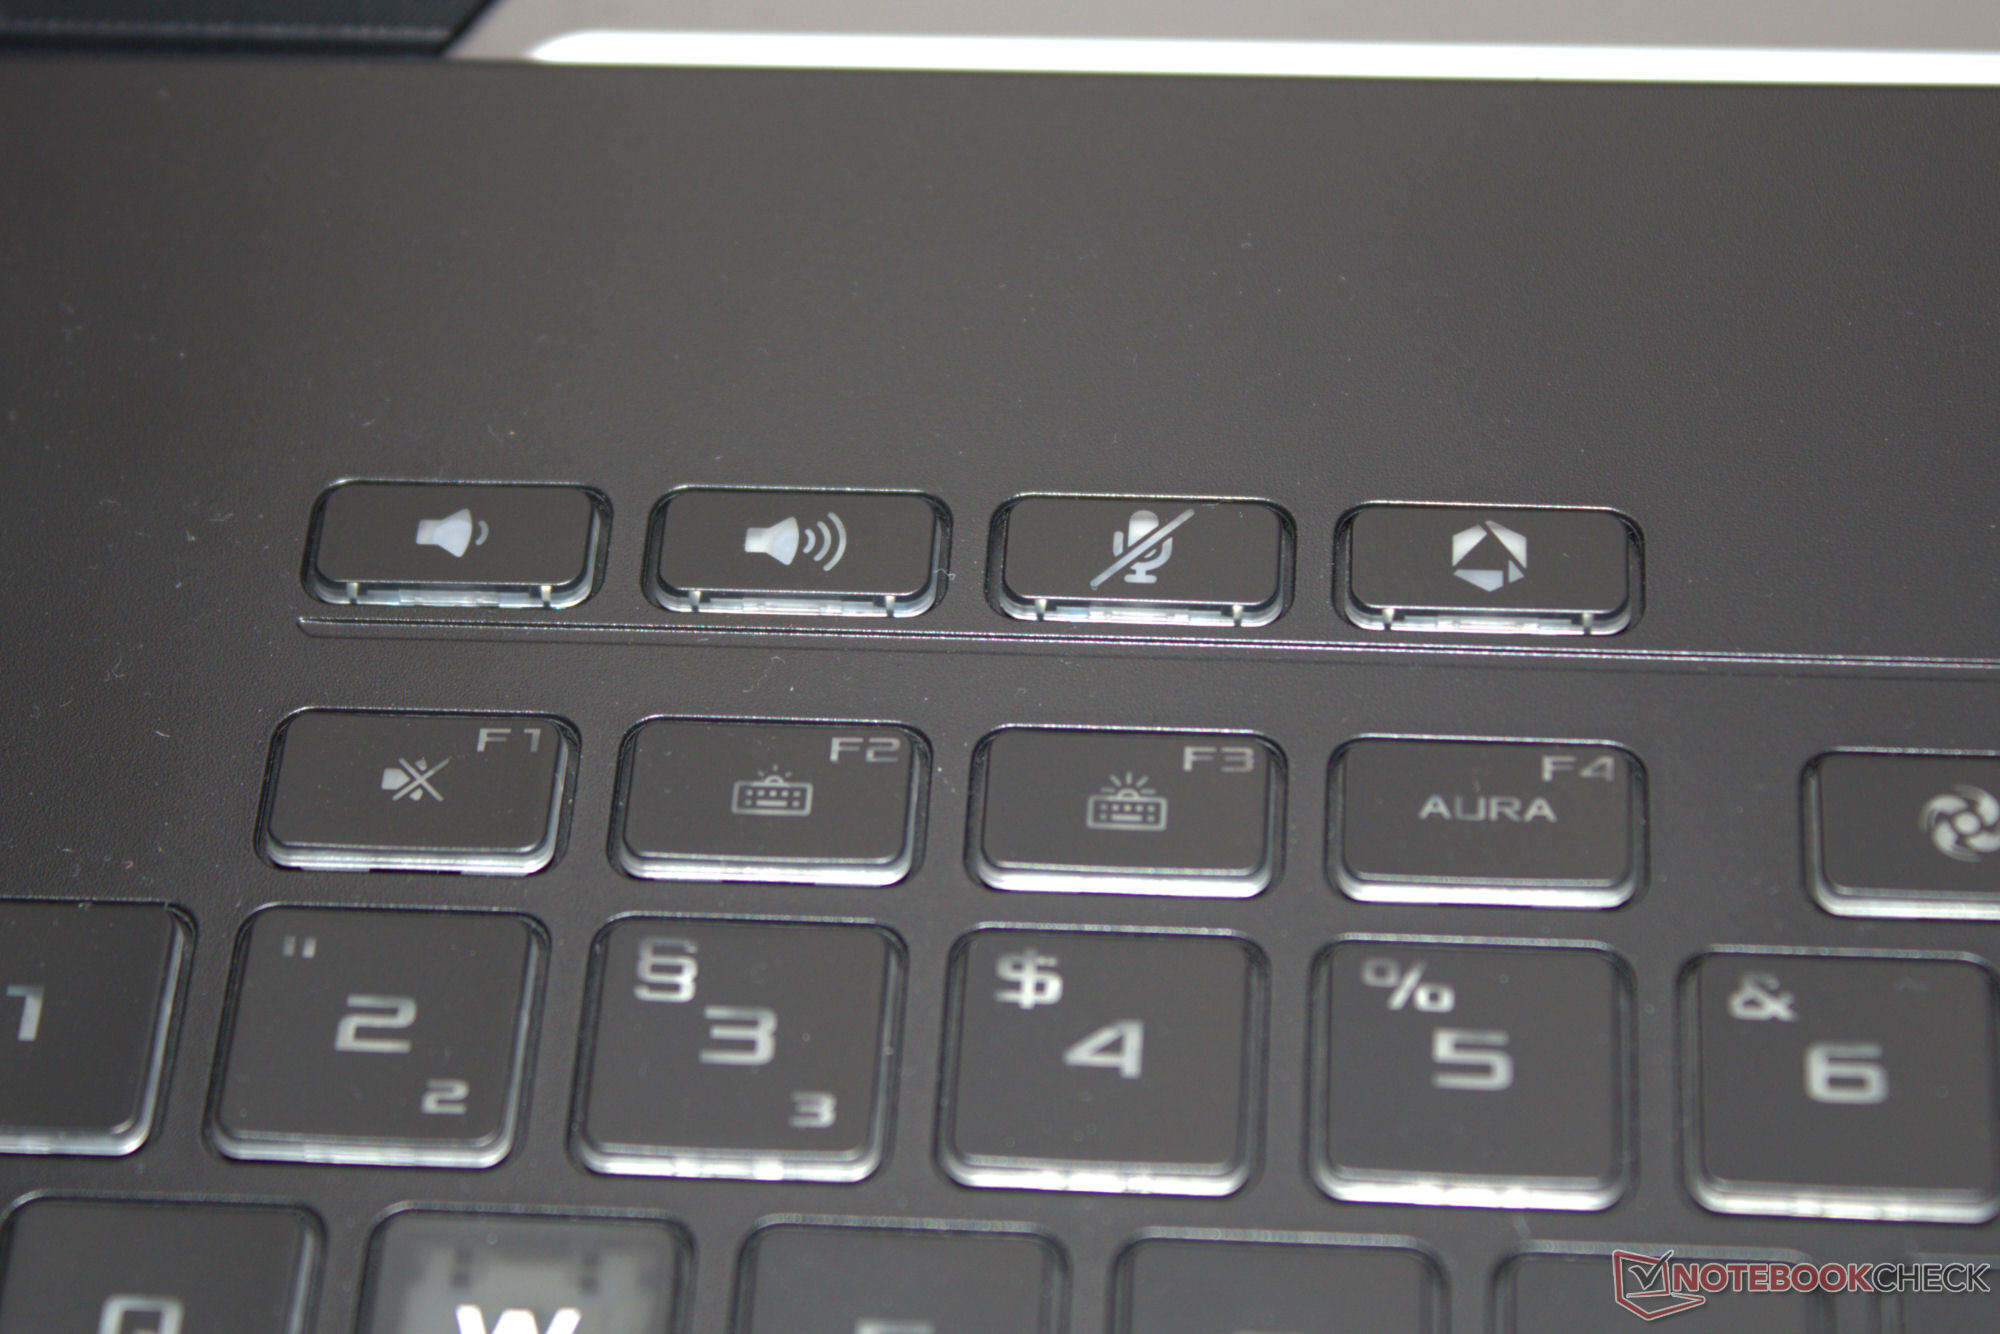
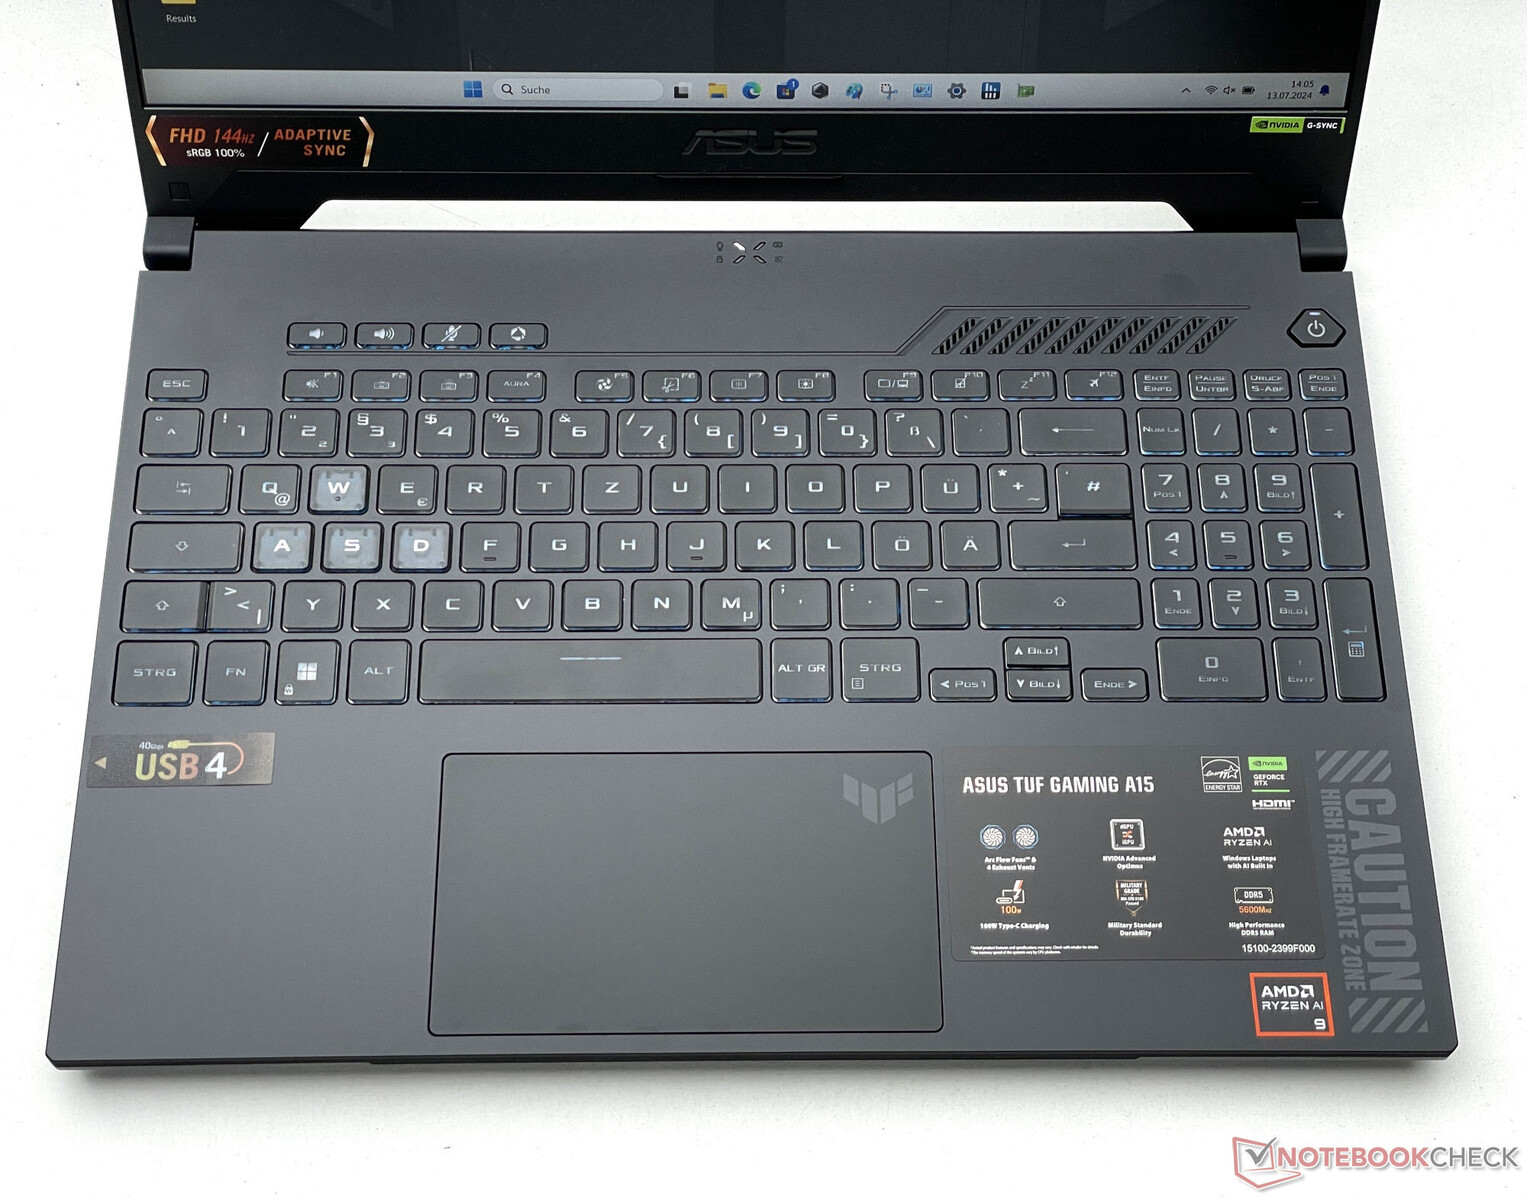
Périphériques d'entrée - L'A15 dispose de petites touches fléchées
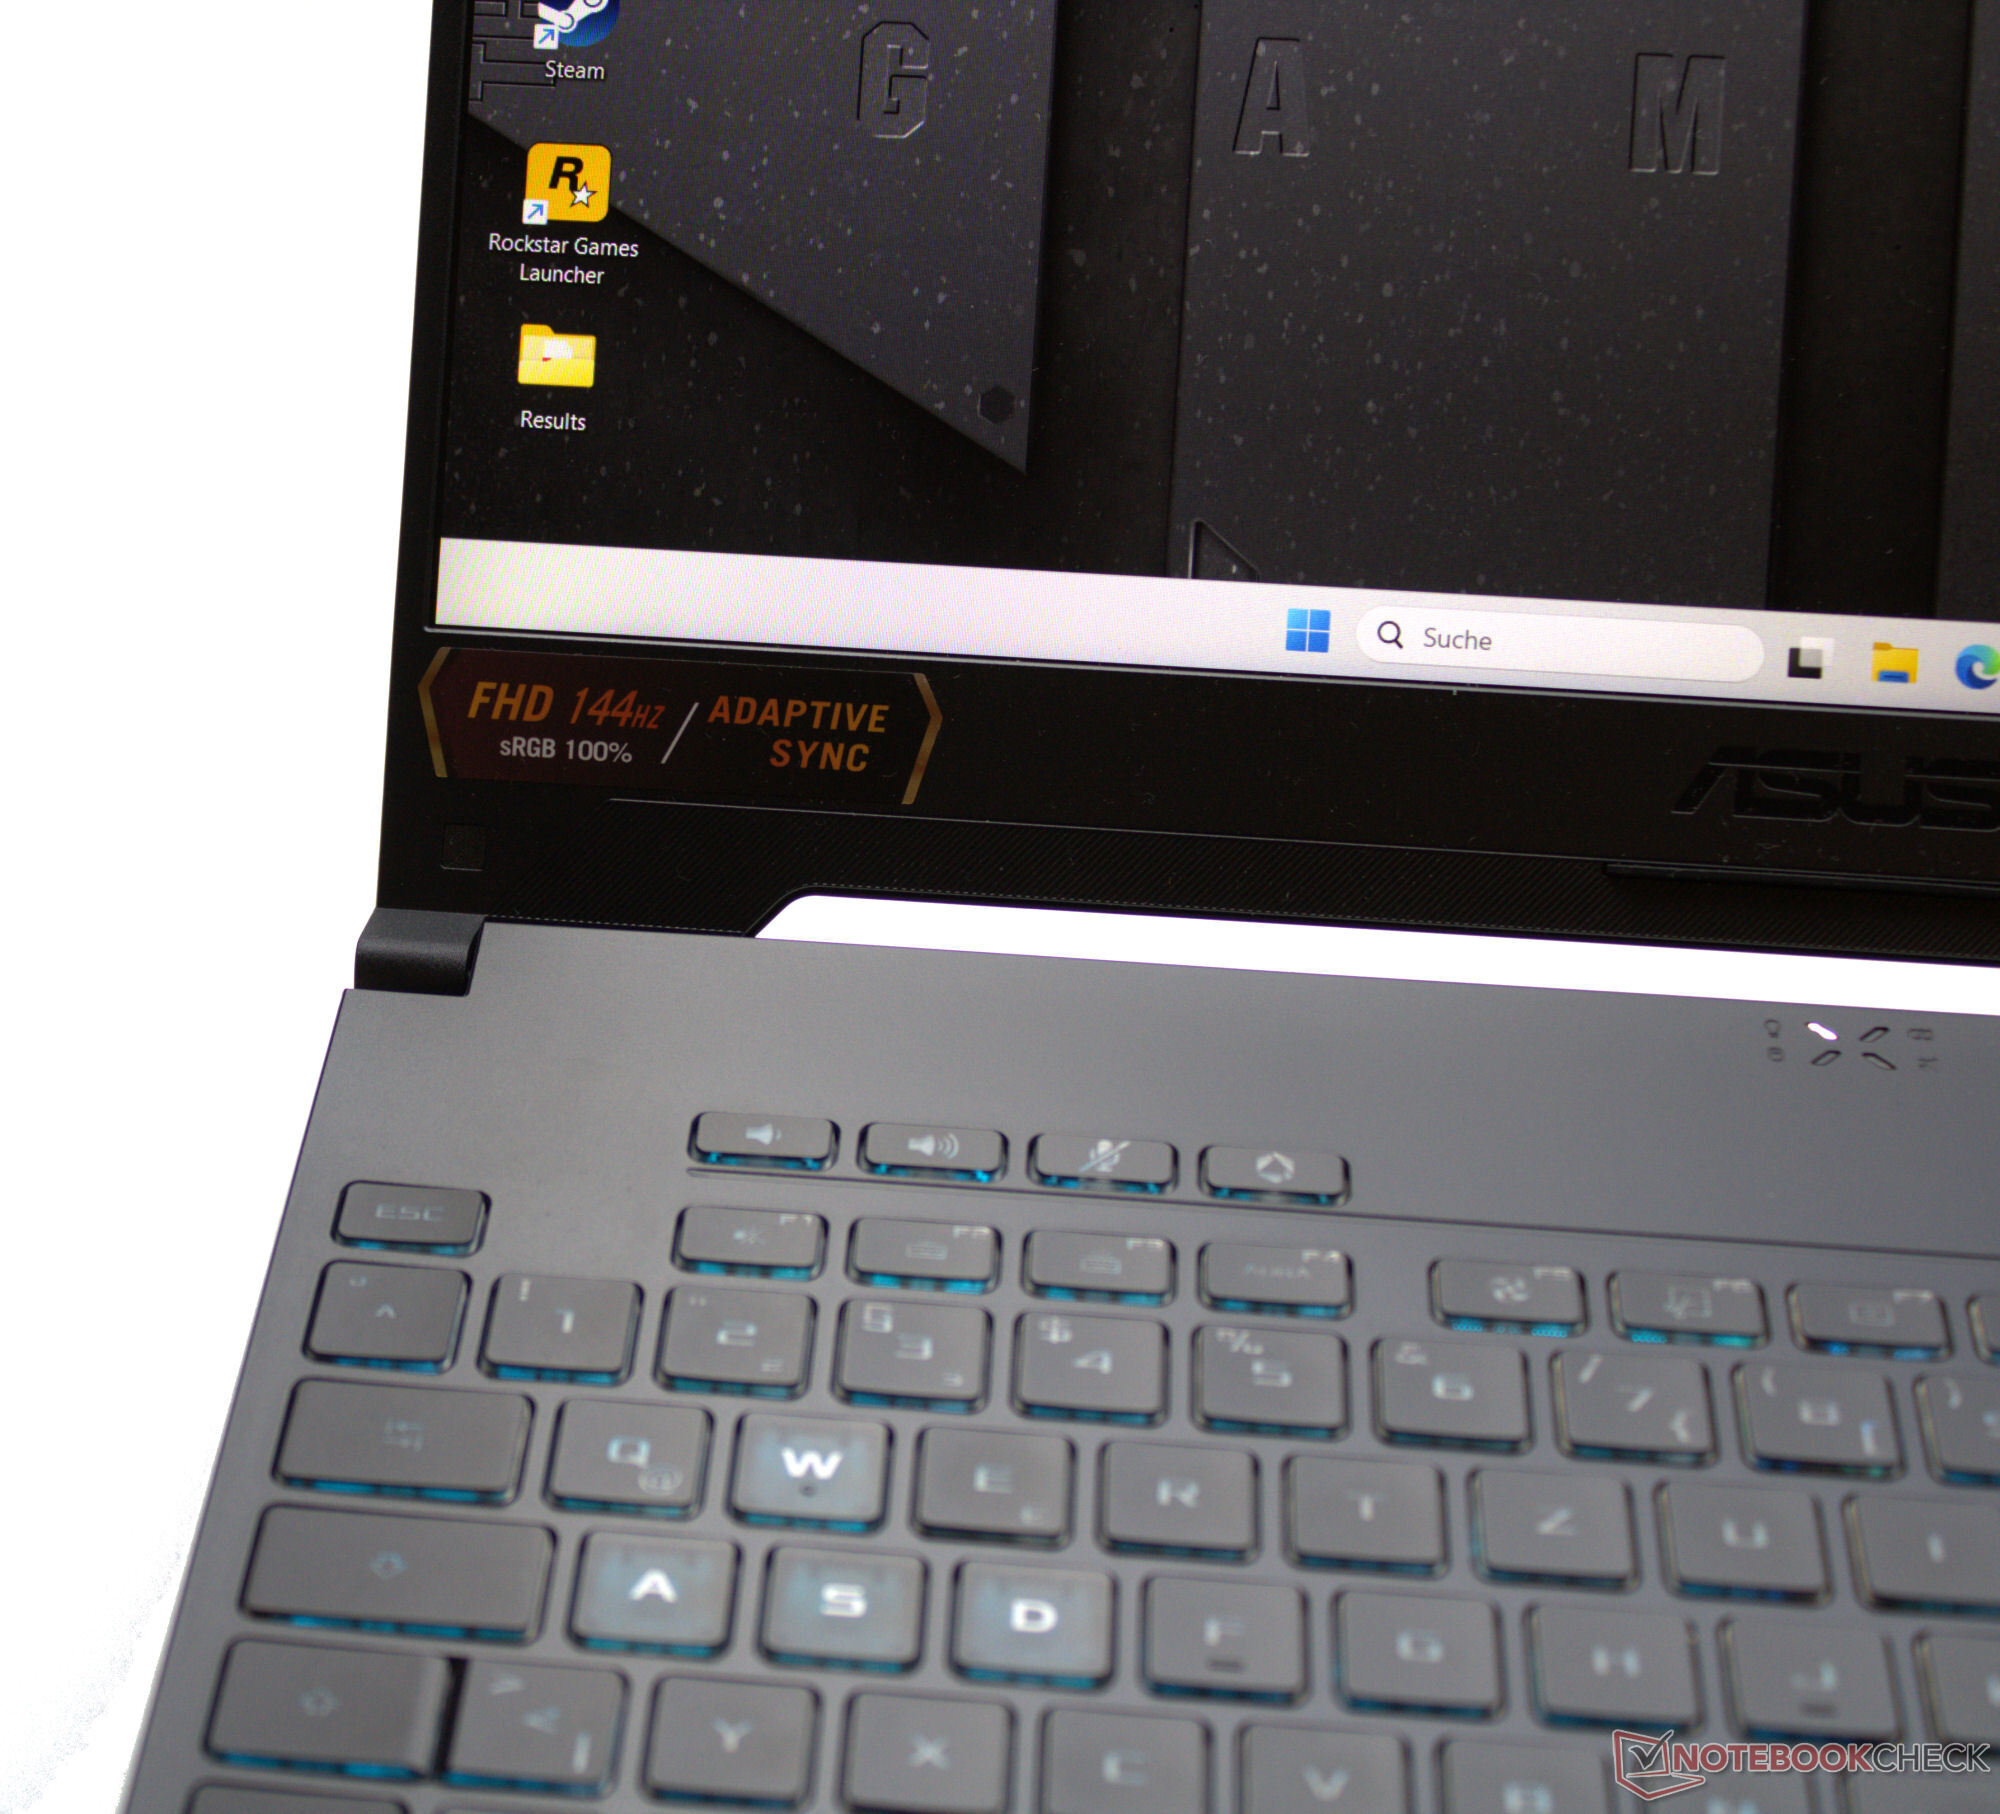
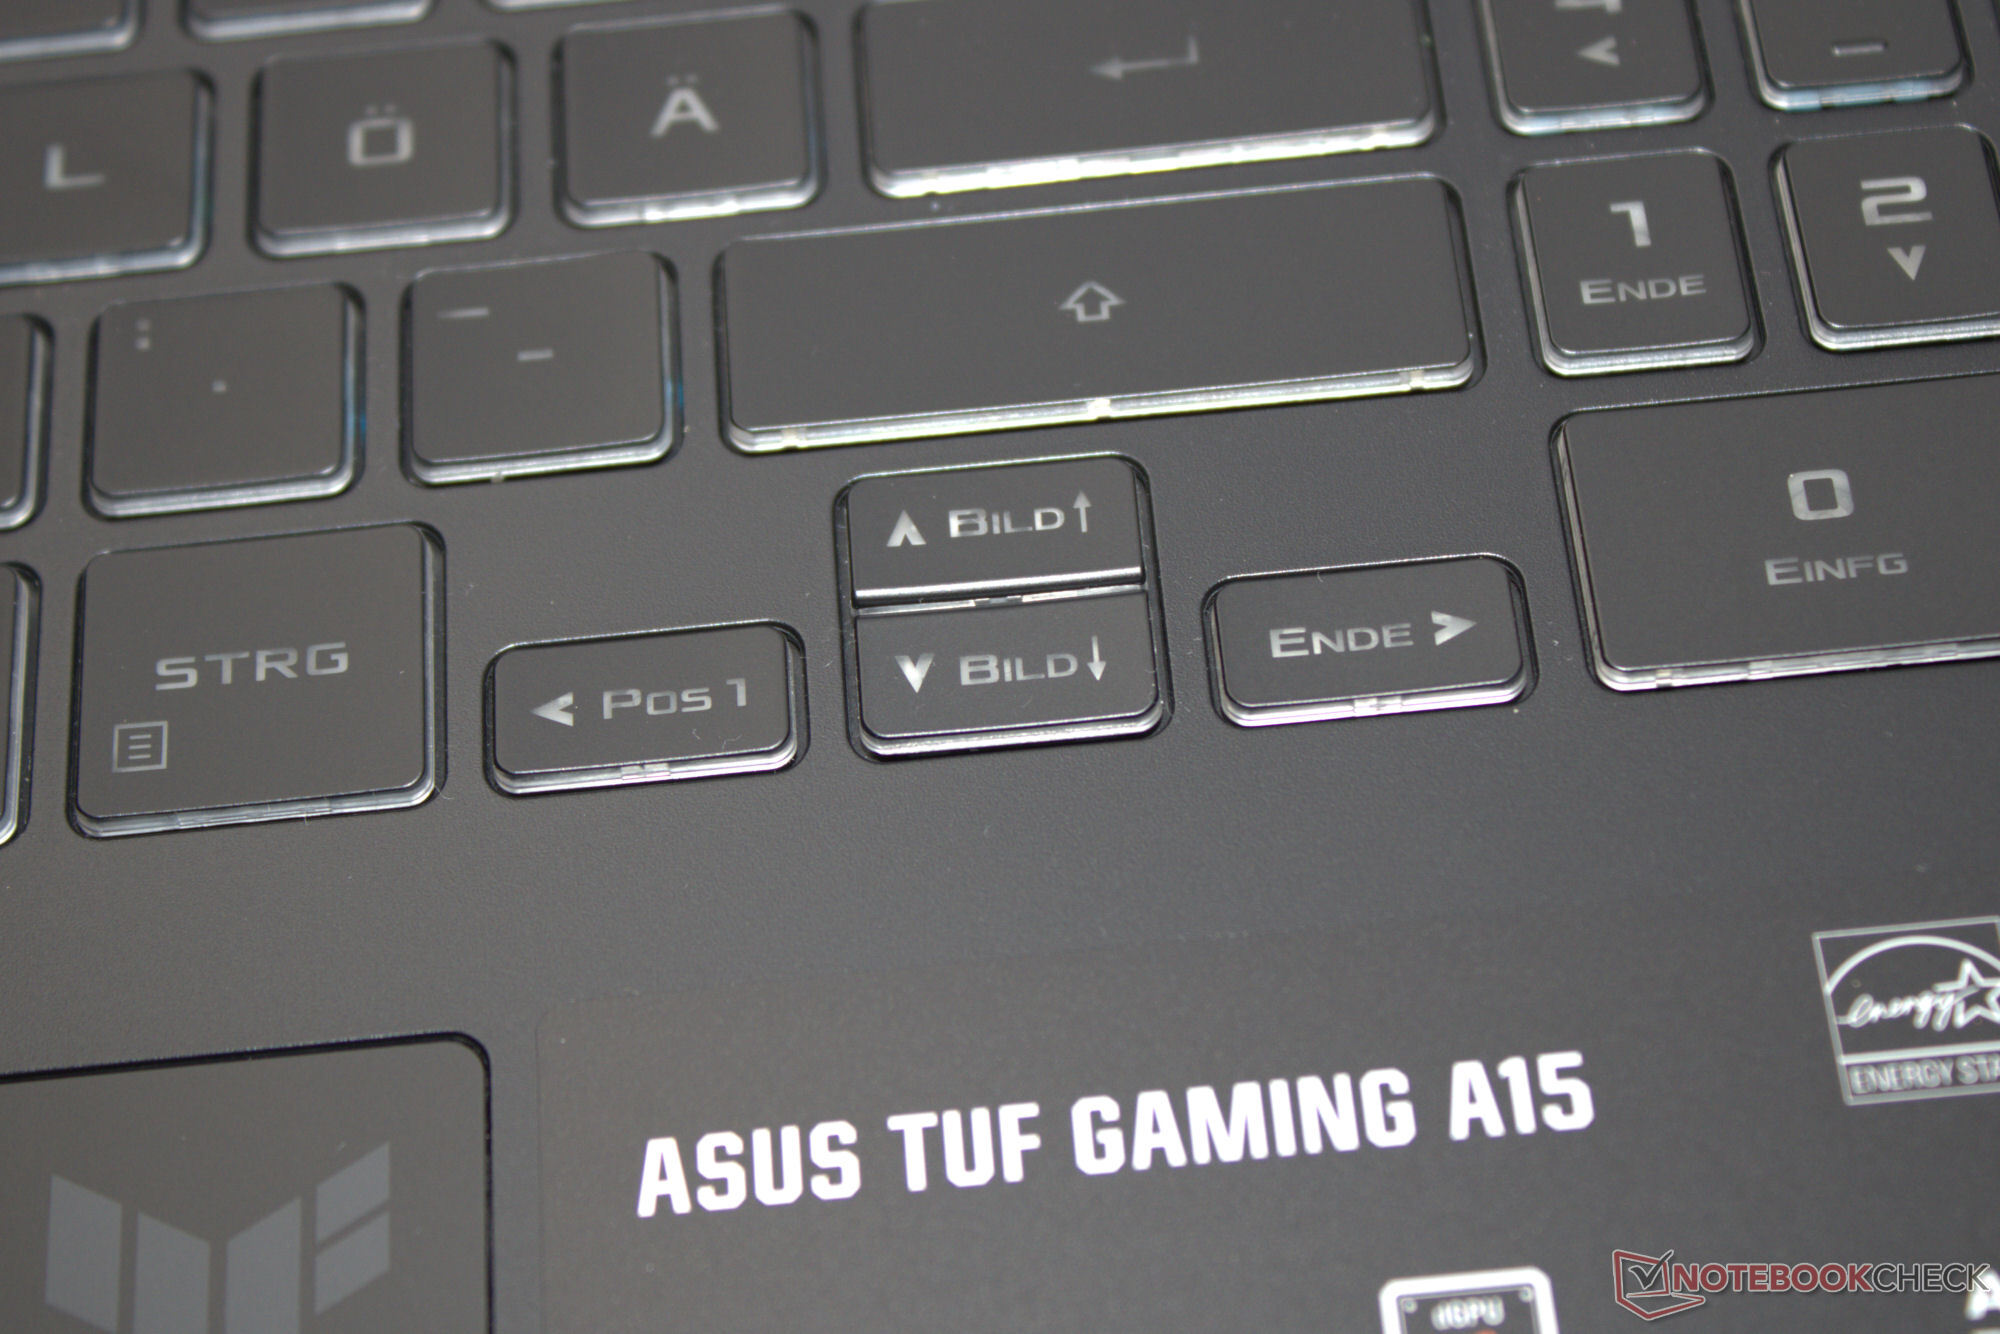
Asus utilise toute la largeur de l'appareil pour le clavier chiclet rétroéclairé (RGB), ce qui signifie qu'il y a de la place pour un pavé numérique. Ses touches lisses ont une course moyenne et un point de pression distinct. La résistance des touches est correcte. Lors de la frappe, le clavier ne fléchit pas. Ce que l'on remarque, c'est que la flèche et la touche "Entrée" sont petites et que les touches de contrôle (W, A, S, D) sont d'une couleur différente. Le pavé tactile multitouch (environ 13 x 7,7 cm) a une faible course, un point de pression distinct et sert de souris de remplacement.
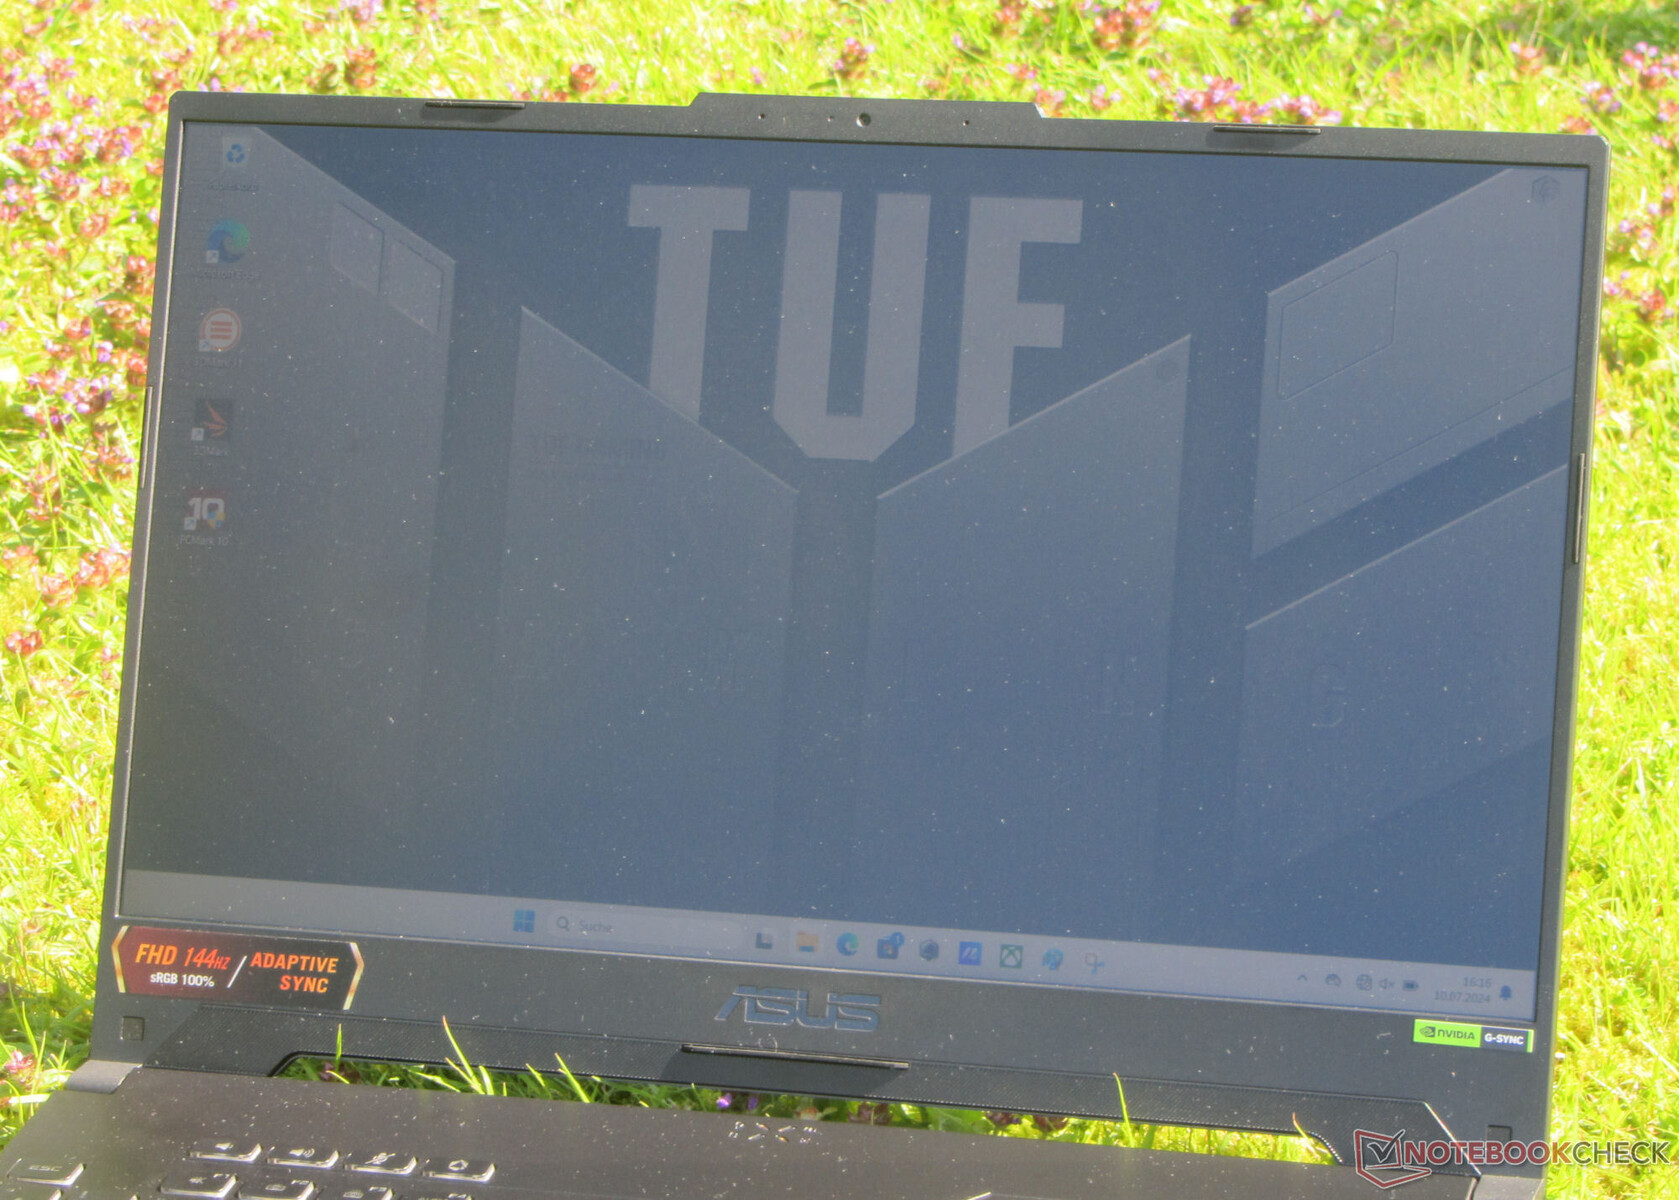
Écran - IPS embarqué
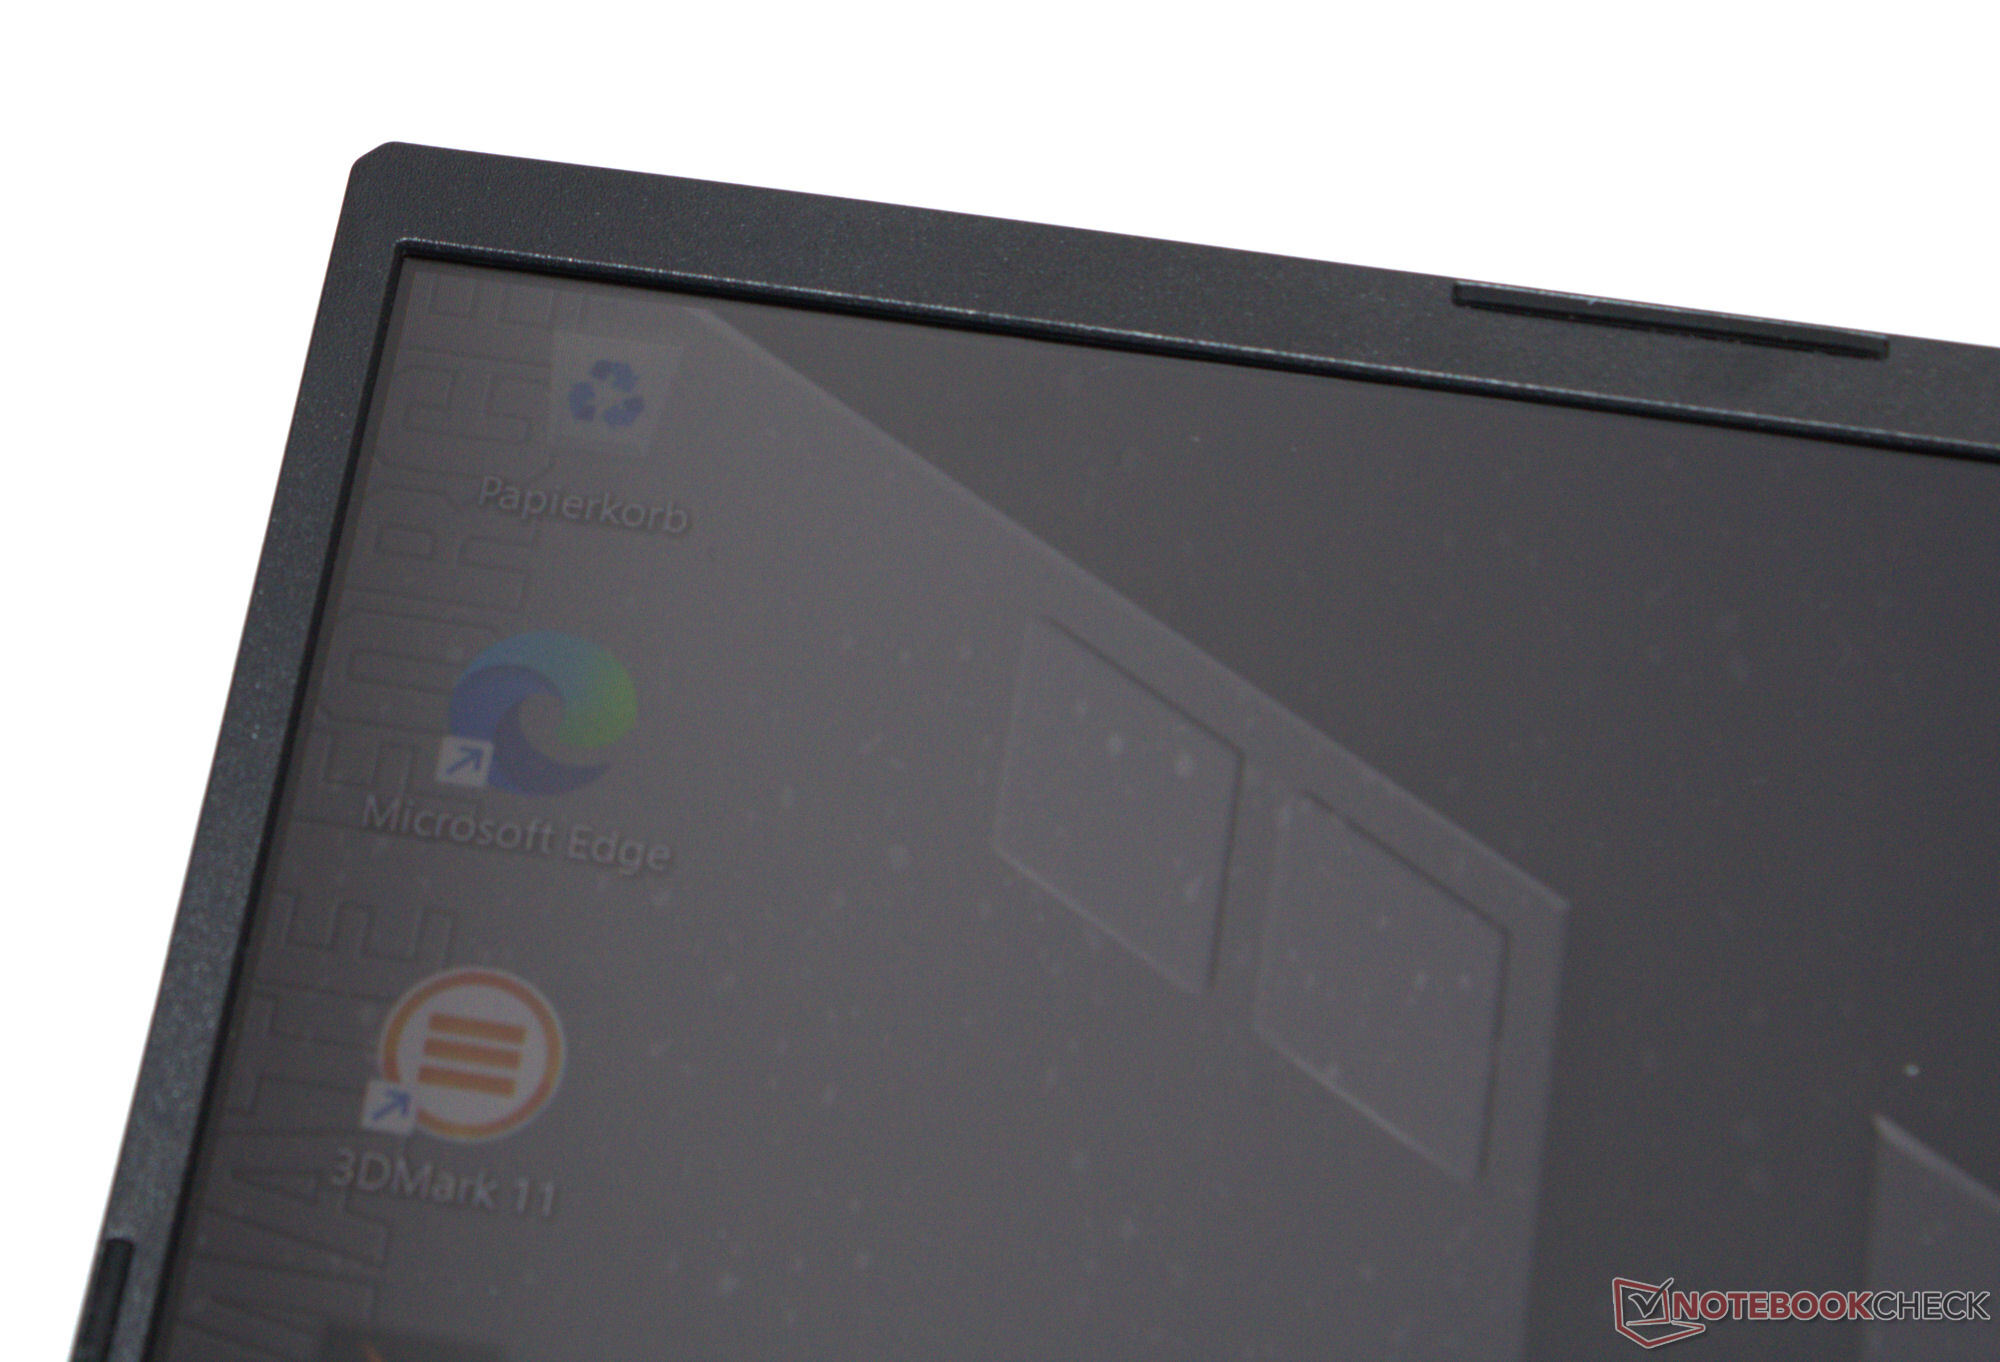
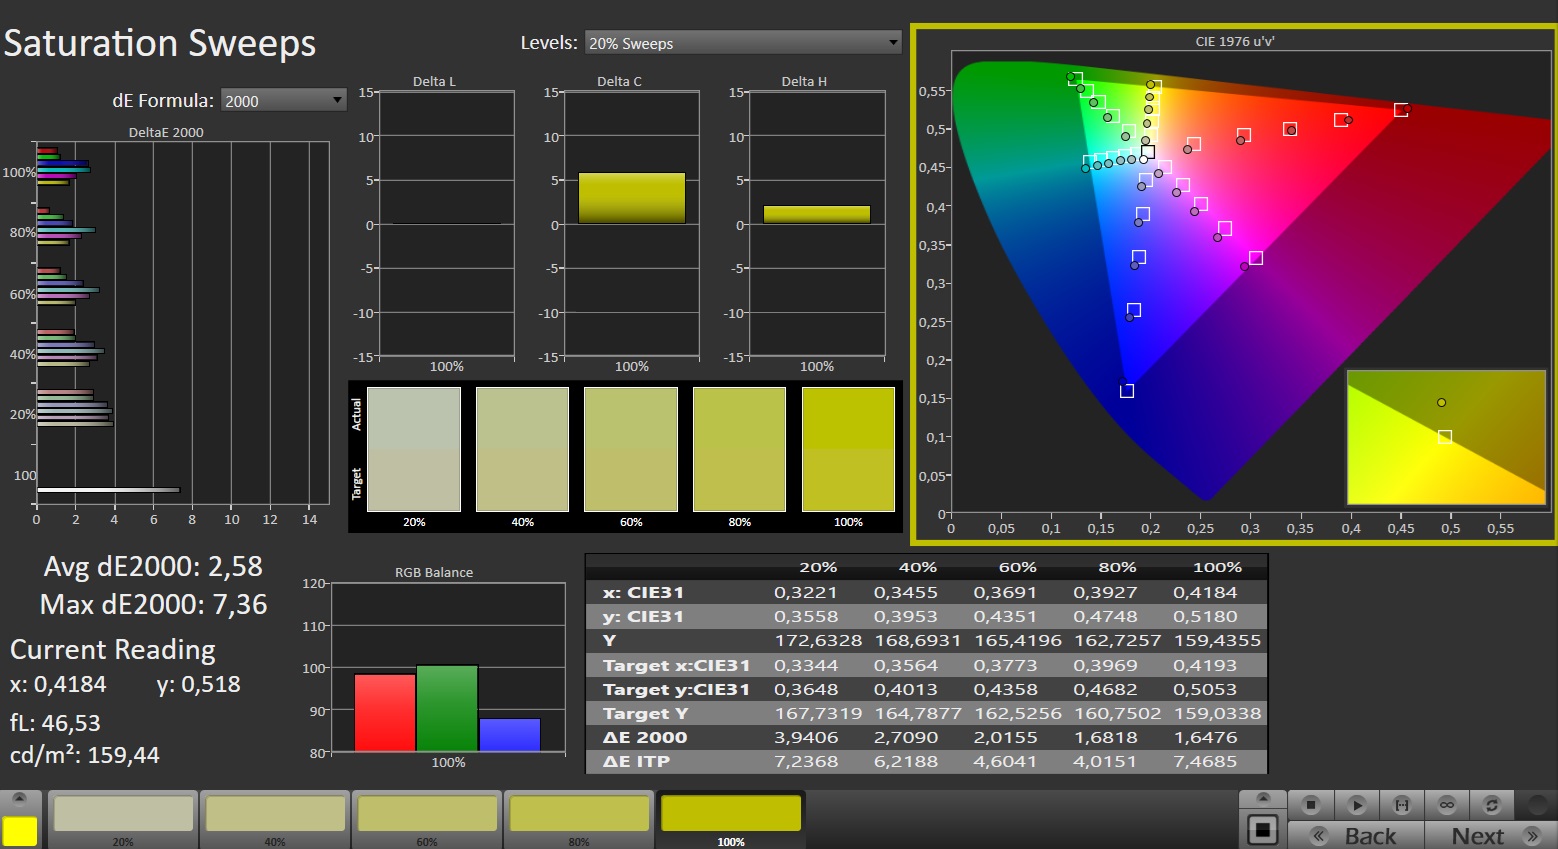
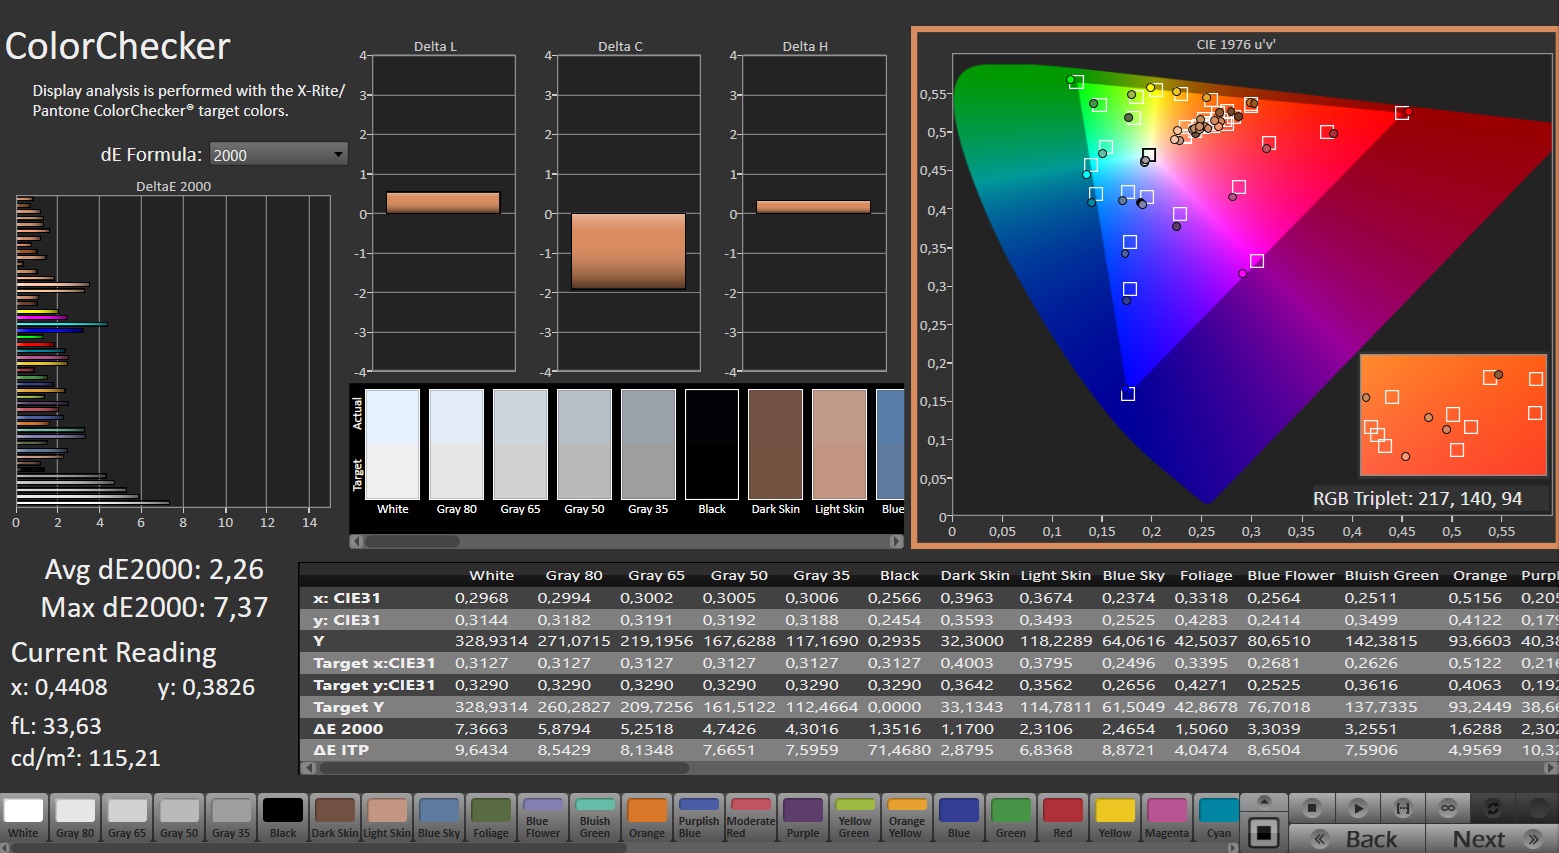
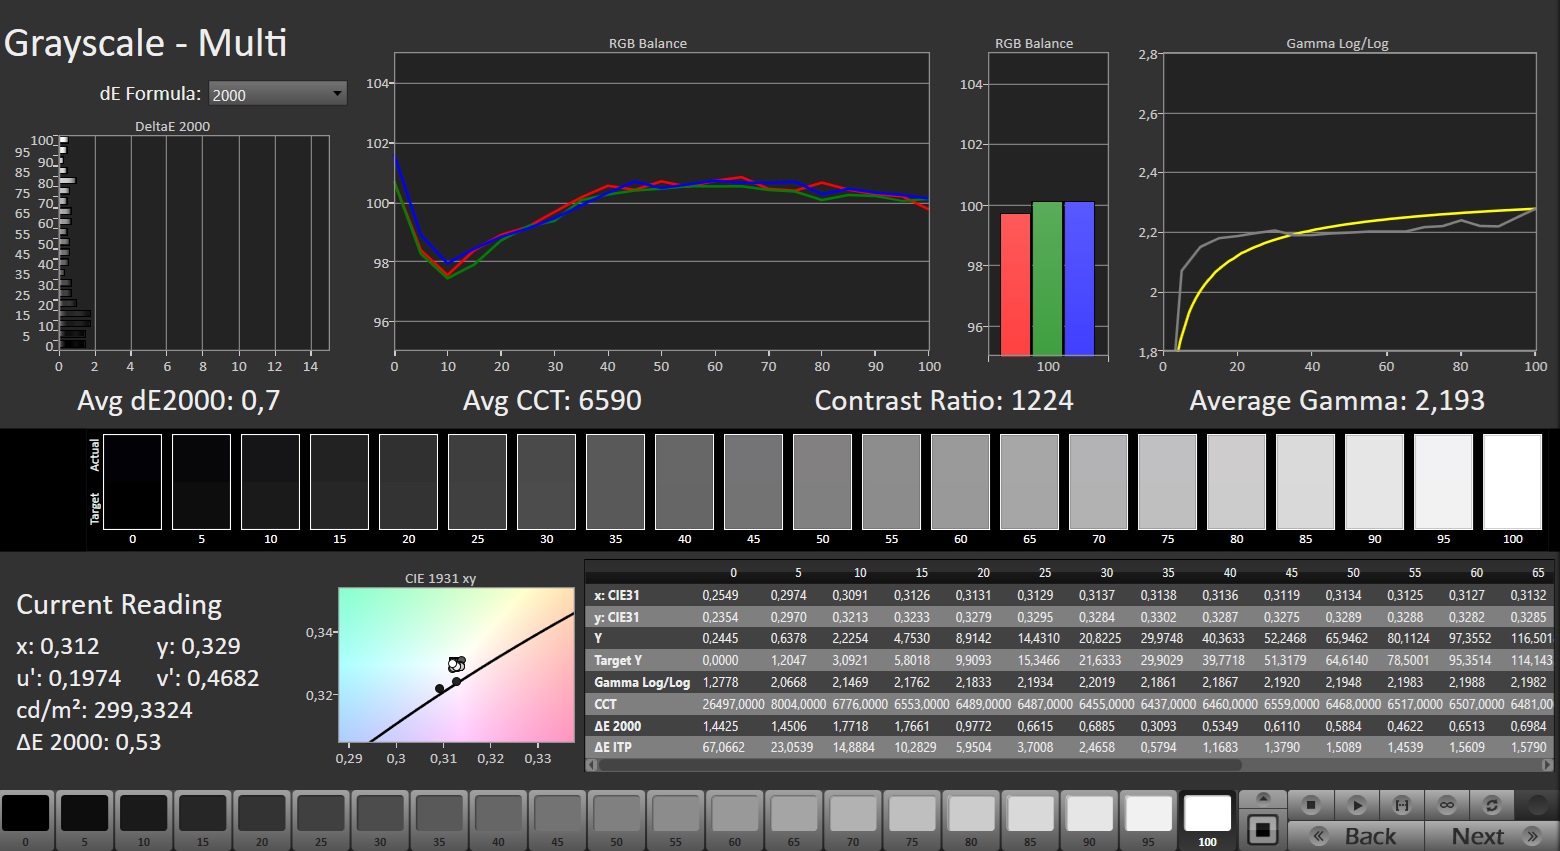
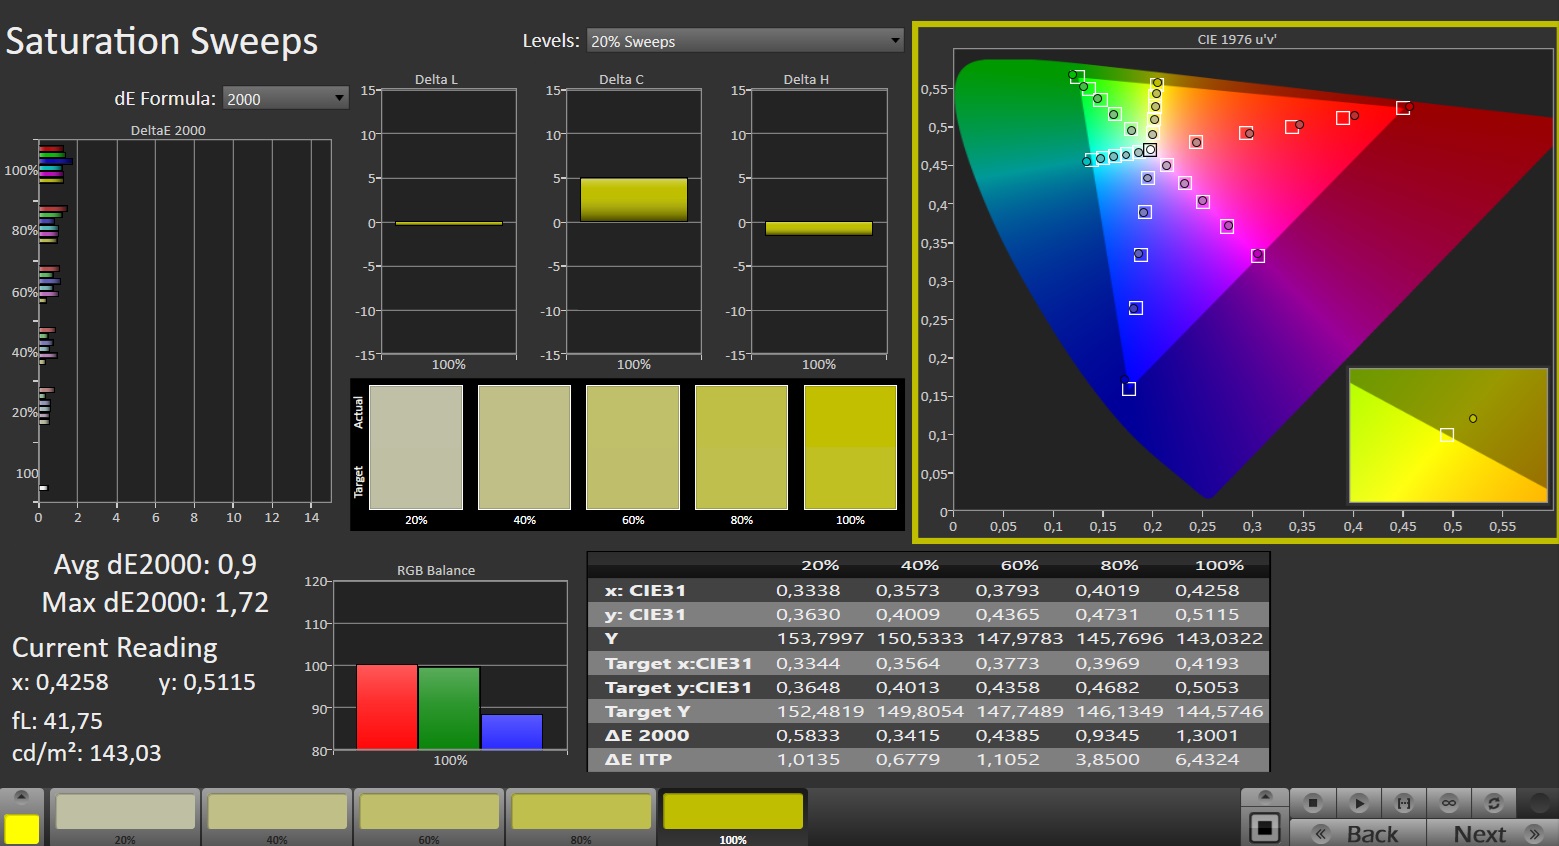
Asus a équipé l'appareil d'un écran 16:9 mat de 15,6 pouces (FHD, IPS, 144 Hz, G-Sync) qui offre des angles de vision stables. En ce qui concerne la luminosité et le contraste, l'écran n'est pas le meilleur de sa catégorie, mais il fait ce qu'il faut, ce qui le prédestine à une utilisation en intérieur. La lecture à l'extérieur est possible dans toutes les conditions autres que la lumière du soleil. Nous n'avons pas pu détecter de scintillement PWM.

| |||||||||||||||||||||||||
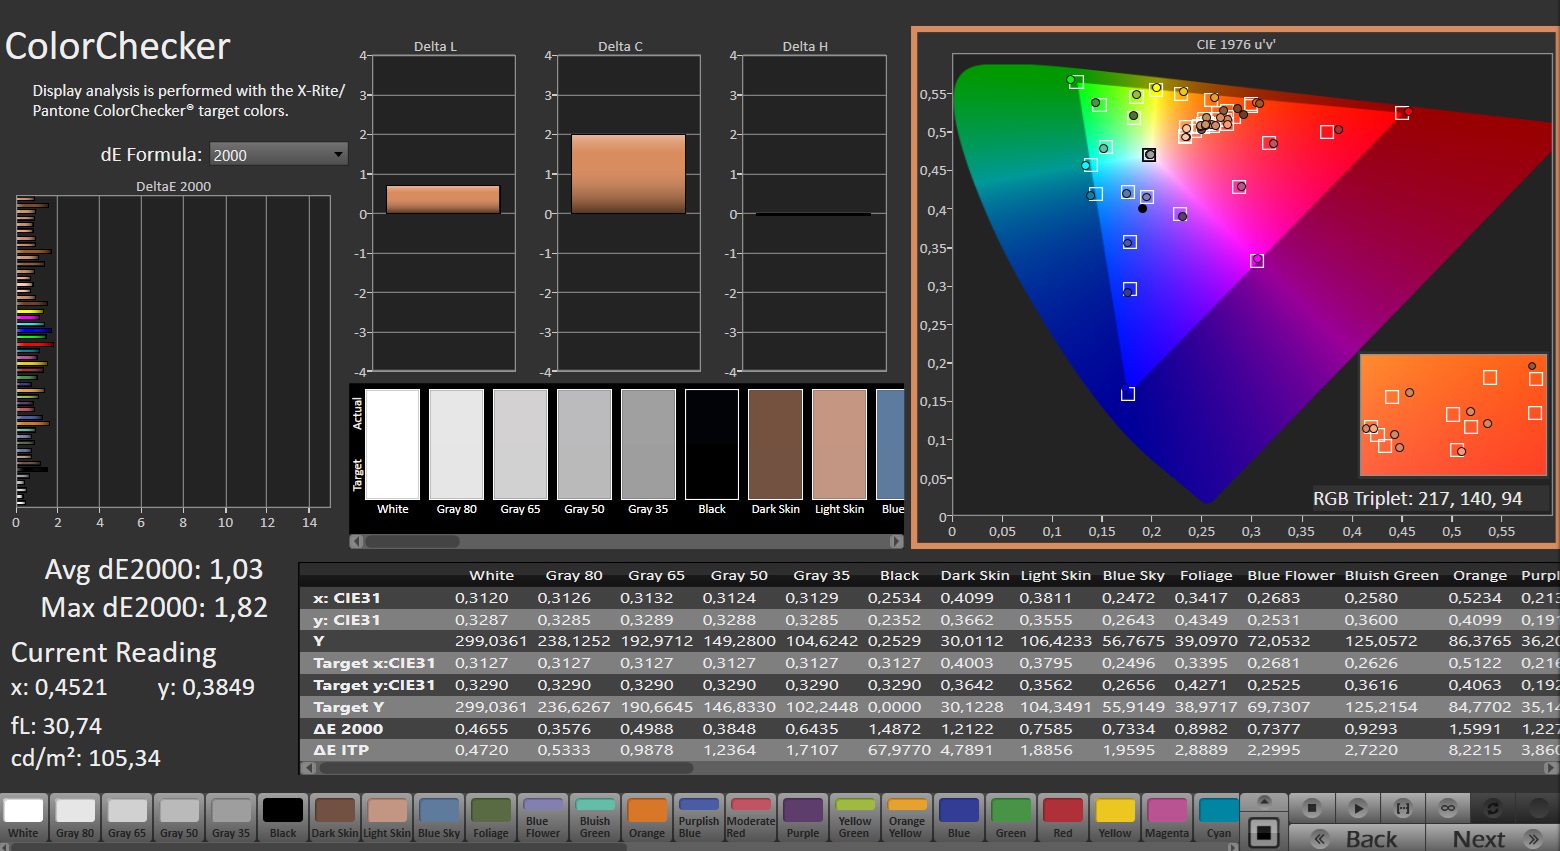
Homogénéité de la luminosité: 90 %
Valeur mesurée au centre, sur batterie: 315 cd/m²
Contraste: 1260:1 (Valeurs des noirs: 0.25 cd/m²)
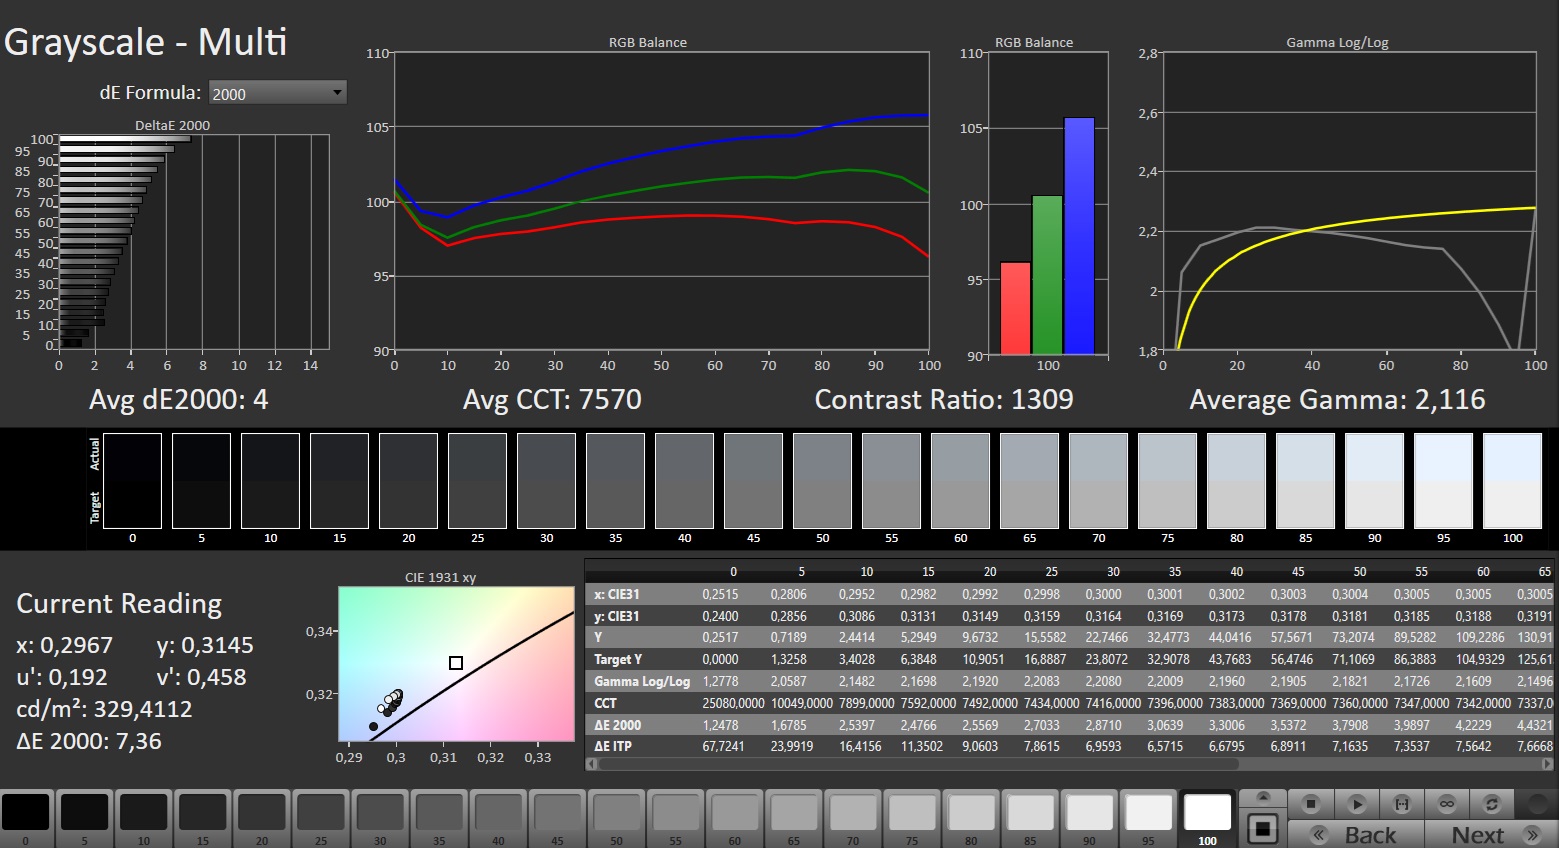
ΔE Color 2.26 | 0.5-29.43 Ø4.95, calibrated: 1.03
ΔE Greyscale 4 | 0.5-98 Ø5.2
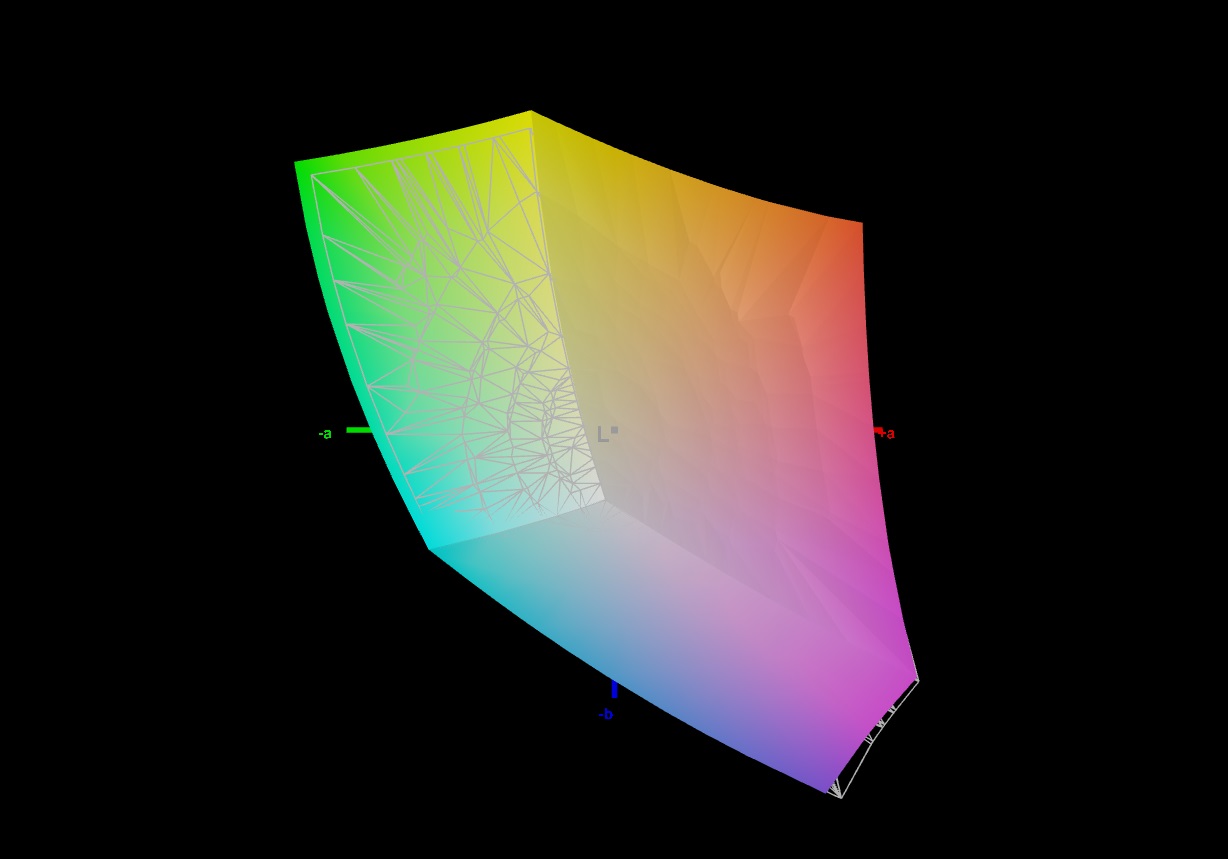
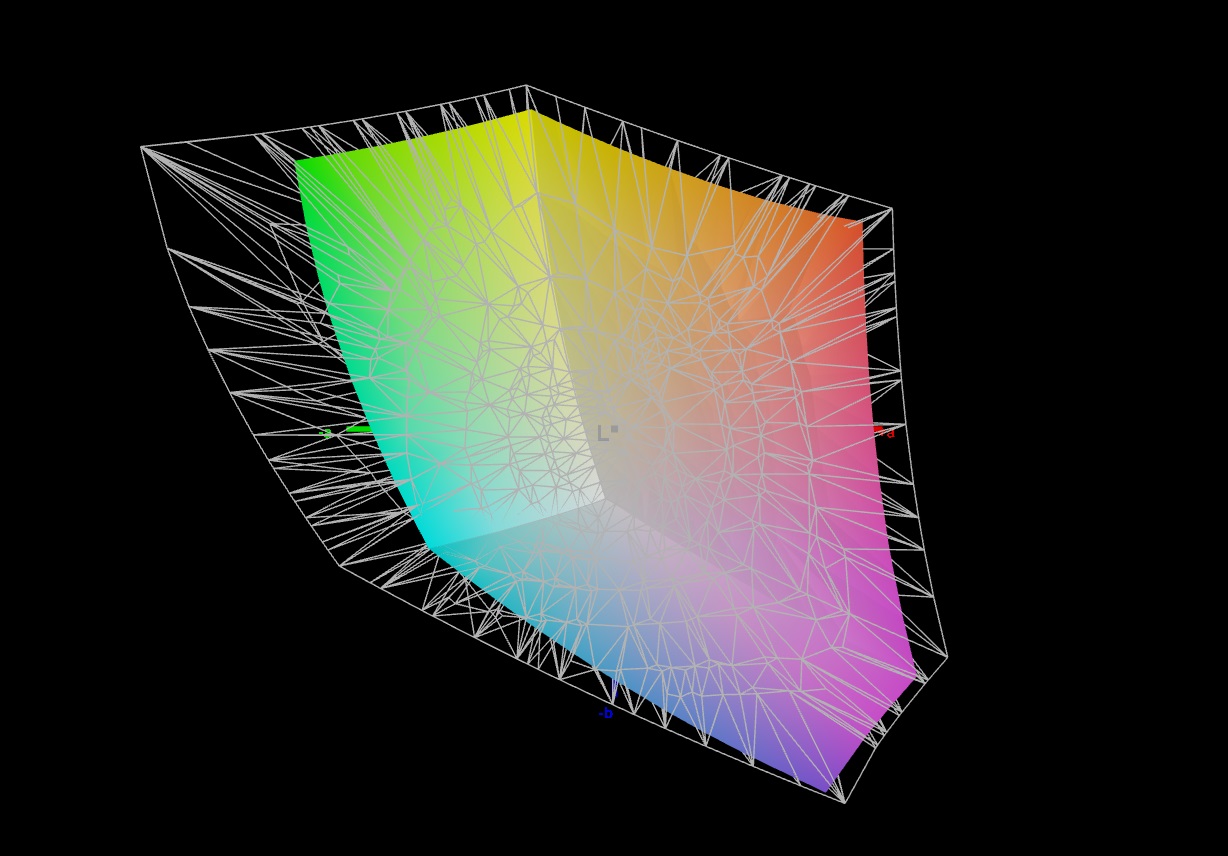
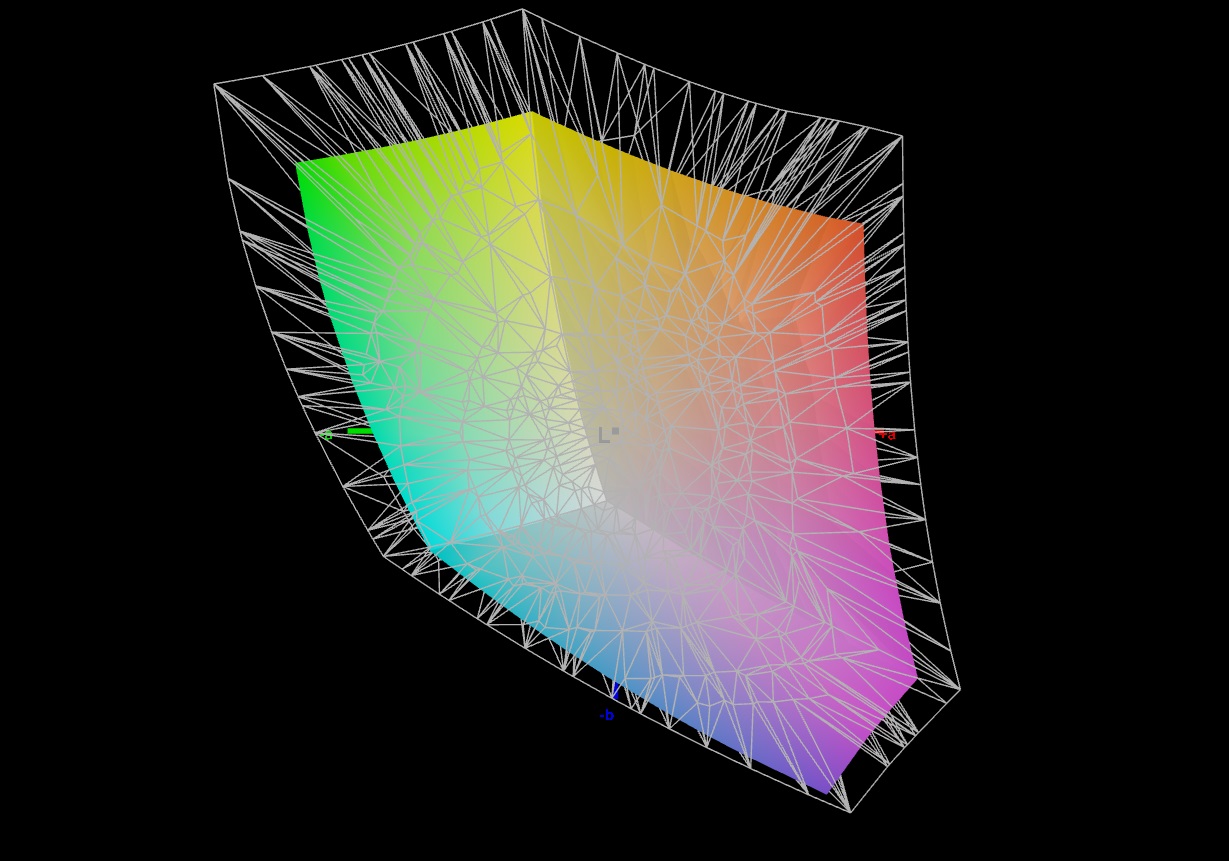
72.7% AdobeRGB 1998 (Argyll 2.2.0 3D)
98.5% sRGB (Argyll 2.2.0 3D)
70.5% Display P3 (Argyll 2.2.0 3D)
Gamma: 2.116
| Asus TUF Gaming A15 FA507UV AU Optronics B156HAN15.H, IPS, 1920x1080, 15.6" | Lenovo LOQ 15IRX9 BOE NJ NE156FHM-NX9, IPS, 1920x1080, 15.6" | HP Victus 16 (2024) Chi Mei CMN163E, IPS, 1920x1080, 16.1" | Gigabyte G6X 9KG (2024) BOE NE160WUM-NX6, IPS, 1920x1200, 16" | SCHENKER XMG Core 15 (M24) BOE NJ NE153QDM-NZ1 (BOE0C8E), IPS, 2560x1600, 15.3" | Dell G16, i7-13650HX, RTX 4060 Chi Mei CMN161D (160GME), IPS, 2560x1600, 16" | Asus TUF A15 FA507 N156HMA-GA1, IPS, 1920x1080, 15.6" | |
|---|---|---|---|---|---|---|---|
| Display | 2% | -40% | -39% | 3% | -3% | -6% | |
| Display P3 Coverage | 70.5 | 73.7 5% | 41.3 -41% | 41.8 -41% | 73.2 4% | 67.5 -4% | 64.9 -8% |
| sRGB Coverage | 98.5 | 99.1 1% | 61.7 -37% | 62.4 -37% | 100 2% | 98.5 0% | 96.5 -2% |
| AdobeRGB 1998 Coverage | 72.7 | 72.6 0% | 42.7 -41% | 43.3 -40% | 74.6 3% | 69.3 -5% | 66.6 -8% |
| Response Times | -16% | 14% | -11% | 65% | 66% | 7% | |
| Response Time Grey 50% / Grey 80% * | 31.7 ? | 42.2 ? -33% | 28.6 ? 10% | 40.5 ? -28% | 9.6 ? 70% | 7.6 ? 76% | 30.4 ? 4% |
| Response Time Black / White * | 22.9 ? | 22.6 ? 1% | 18.7 ? 18% | 21.6 ? 6% | 9.2 ? 60% | 10.4 ? 55% | 20.8 ? 9% |
| PWM Frequency | |||||||
| Screen | 6% | -62% | -54% | 14% | -9% | 18% | |
| Brightness middle | 315 | 306 -3% | 287 -9% | 353 12% | 635 102% | 369 17% | 288 -9% |
| Brightness | 303 | 287 -5% | 288 -5% | 318 5% | 604 99% | 344 14% | 271 -11% |
| Brightness Distribution | 90 | 88 -2% | 86 -4% | 81 -10% | 91 1% | 89 -1% | 91 1% |
| Black Level * | 0.25 | 0.21 16% | 0.19 24% | 0.21 16% | 0.64 -156% | 0.26 -4% | 0.17 32% |
| Contrast | 1260 | 1457 16% | 1511 20% | 1681 33% | 992 -21% | 1419 13% | 1694 34% |
| Colorchecker dE 2000 * | 2.26 | 2.25 -0% | 5.46 -142% | 5.21 -131% | 1.89 16% | 3.04 -35% | 1.9 16% |
| Colorchecker dE 2000 max. * | 7.37 | 4.84 34% | 20.36 -176% | 19.95 -171% | 3.14 57% | 5.56 25% | 3.3 55% |
| Colorchecker dE 2000 calibrated * | 1.03 | 1.45 -41% | 3.52 -242% | 3.61 -250% | 1.14 -11% | 2.35 -128% | 0.9 13% |
| Greyscale dE 2000 * | 4 | 2.4 40% | 4.8 -20% | 3.6 10% | 2.53 37% | 3.38 15% | 2.7 32% |
| Gamma | 2.116 104% | 2.259 97% | 2.108 104% | 2.367 93% | 2.36 93% | 2.47 89% | 2.32 95% |
| CCT | 7570 86% | 6790 96% | 6442 101% | 7138 91% | 6434 101% | 6040 108% | 6535 99% |
| Moyenne finale (programmes/paramètres) | -3% /
2% | -29% /
-46% | -35% /
-45% | 27% /
19% | 18% /
3% | 6% /
11% |
* ... Moindre est la valeur, meilleures sont les performances
L'écran est livré avec une déviation de couleur très faible d'environ 2,26 (objectif : DeltaE < 3). Un étalonnage réduit ce chiffre à 1,03. Comme c'est le cas pour les écrans de la plupart des concurrents, cet écran couvre (presque) entièrement l'espace colorimétrique sRGB, mais pas les espaces colorimétriques AdobeRGB et DCI P3.
Temps de réponse de l'écran
| ↔ Temps de réponse noir à blanc | ||
|---|---|---|
| 22.9 ms ... hausse ↗ et chute ↘ combinées | ↗ 11.7 ms hausse | 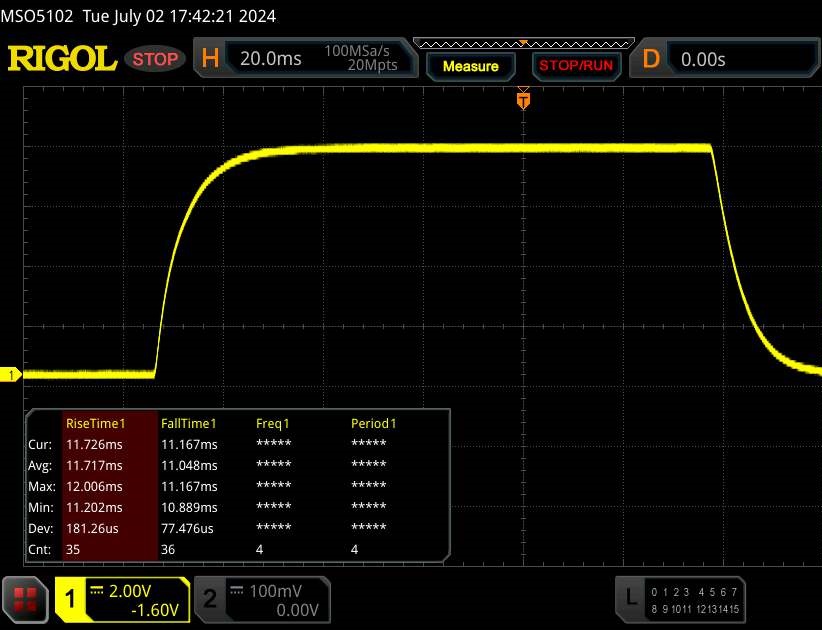 |
| ↘ 11.2 ms chute | ||
| L'écran montre de bons temps de réponse, mais insuffisant pour du jeu compétitif. En comparaison, tous les appareils testés affichent entre 0.1 (minimum) et 240 (maximum) ms. » 47 % des appareils testés affichent de meilleures performances. Cela signifie que les latences relevées sont similaires à la moyenne (21.2 ms) de tous les appareils testés. | ||
| ↔ Temps de réponse gris 50% à gris 80% | ||
| 31.7 ms ... hausse ↗ et chute ↘ combinées | ↗ 14.7 ms hausse | 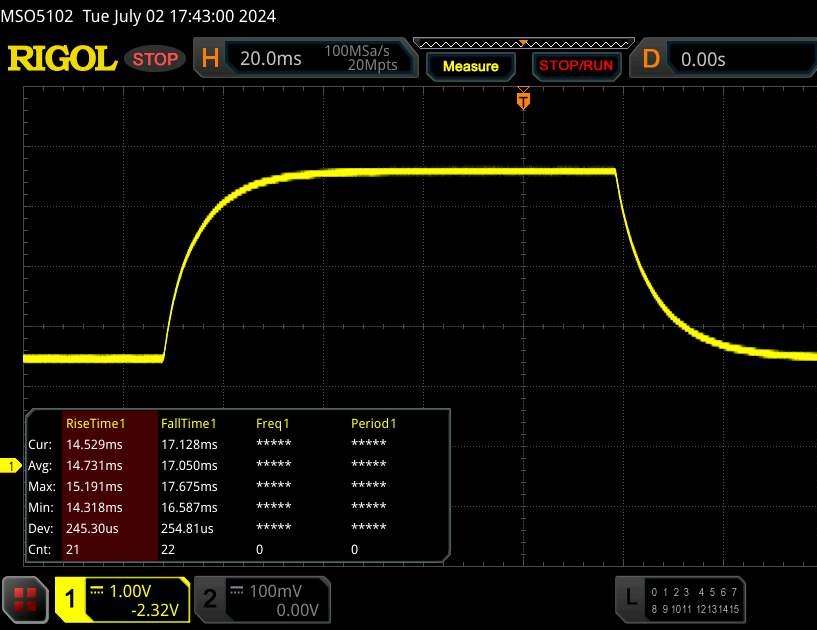 |
| ↘ 17 ms chute | ||
| L'écran souffre de latences très élevées, à éviter pour le jeu. En comparaison, tous les appareils testés affichent entre 0.165 (minimum) et 636 (maximum) ms. » 38 % des appareils testés affichent de meilleures performances. Cela signifie que les latences relevées sont similaires à la moyenne (33.2 ms) de tous les appareils testés. | ||
Scintillement / MLI (Modulation de largeur d'impulsion)
| Scintillement / MLI (Modulation de largeur d'impulsion) non décelé |  | ||
En comparaison, 53 % des appareils testés n'emploient pas MDI pour assombrir leur écran. Nous avons relevé une moyenne à 17373 (minimum : 5 - maximum : 3846000) Hz dans le cas où une MDI était active. | |||
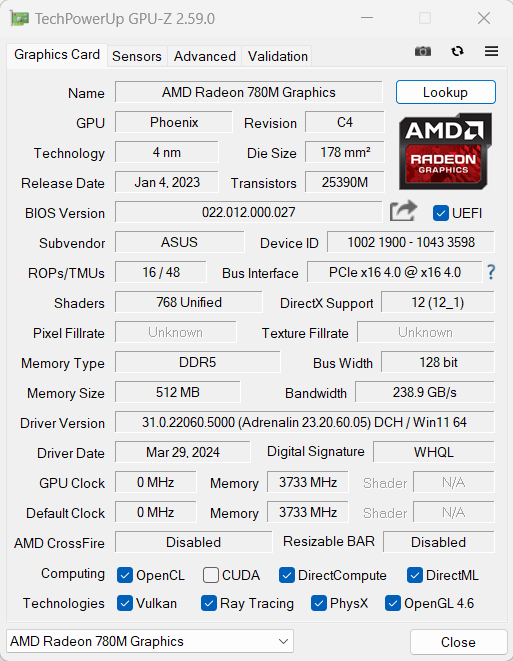
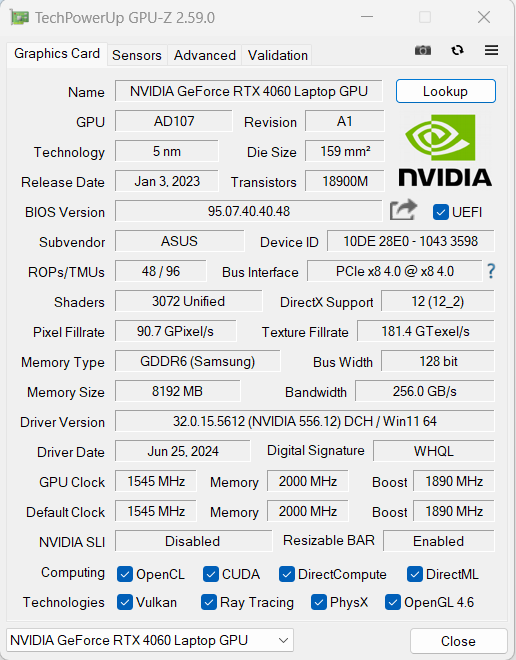
Performance - Hawk Point et Ada Lovelace alimentent l'ordinateur
Avec le TUF Gaming A15 FA507UV, Asus propose un ordinateur portable gaming de milieu de gamme dans le segment de prix inférieur. Le matériel nécessaire aux tâches de calcul provient d'AMD (Hawk Point, Zen 4) et de Nvidia (Ada Lovelace). L'appareil testé vous coûtera environ 1 399 dollars.

Conditions d'essai
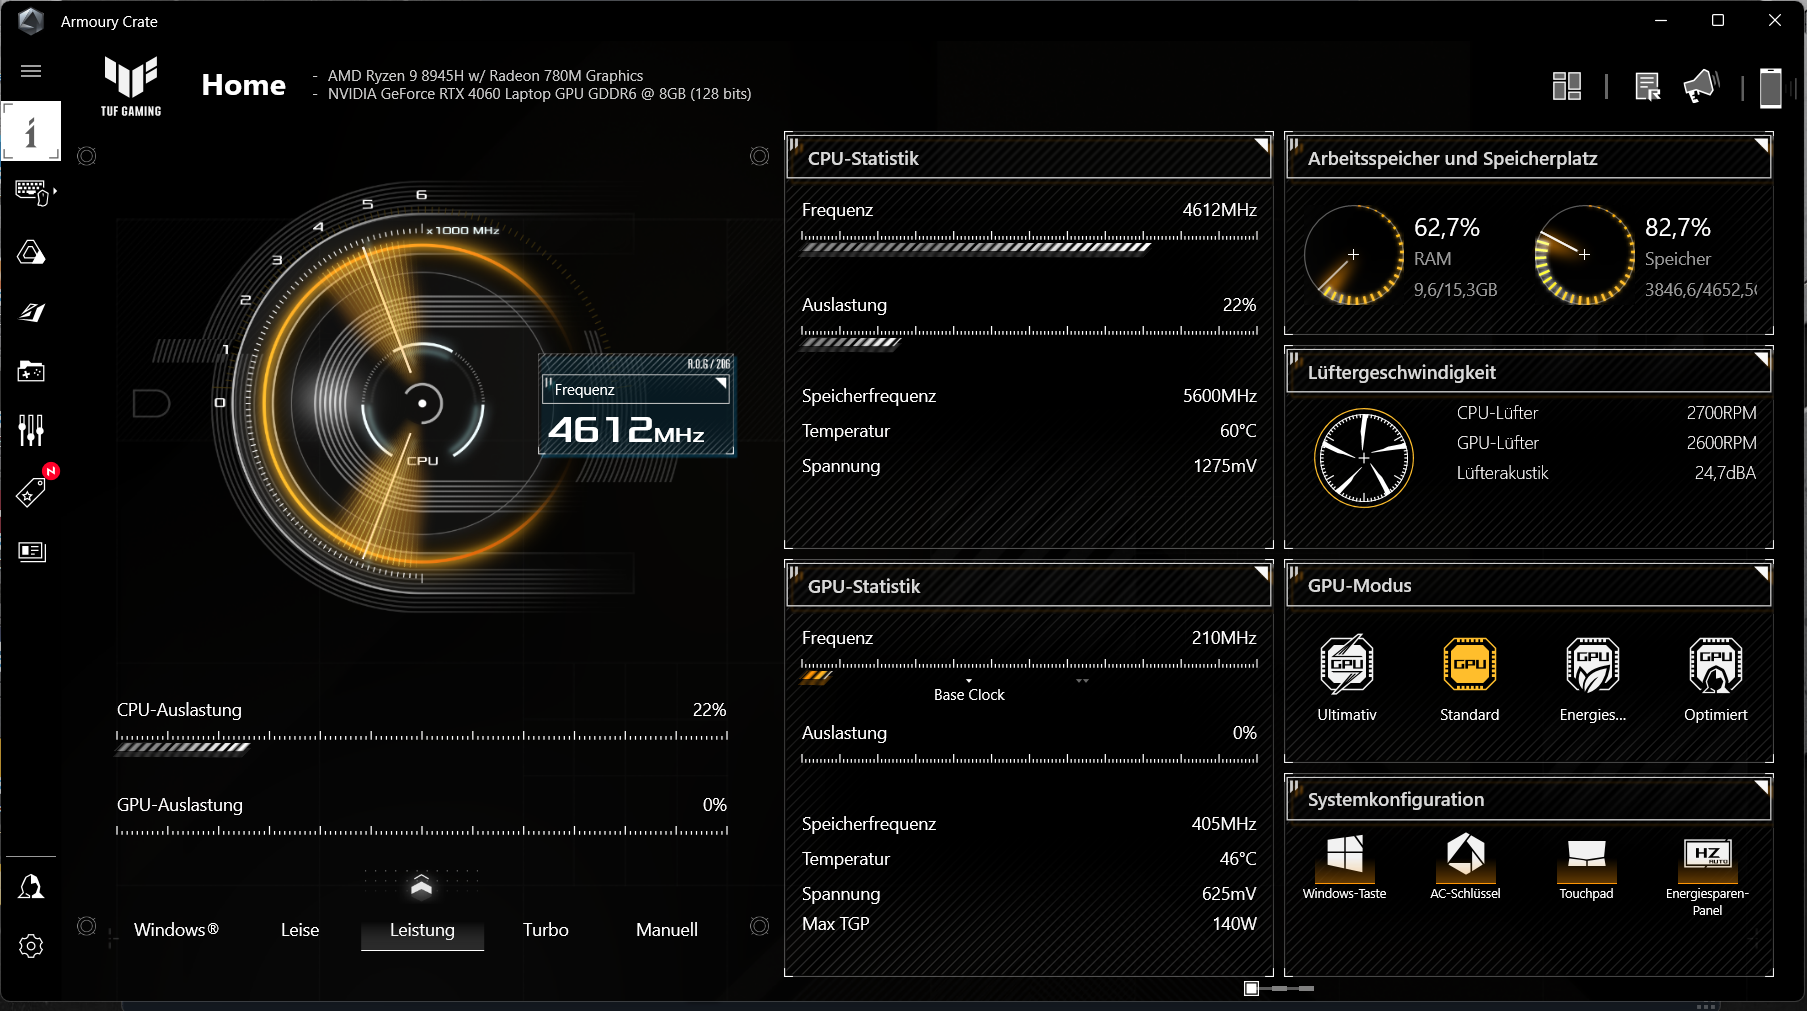
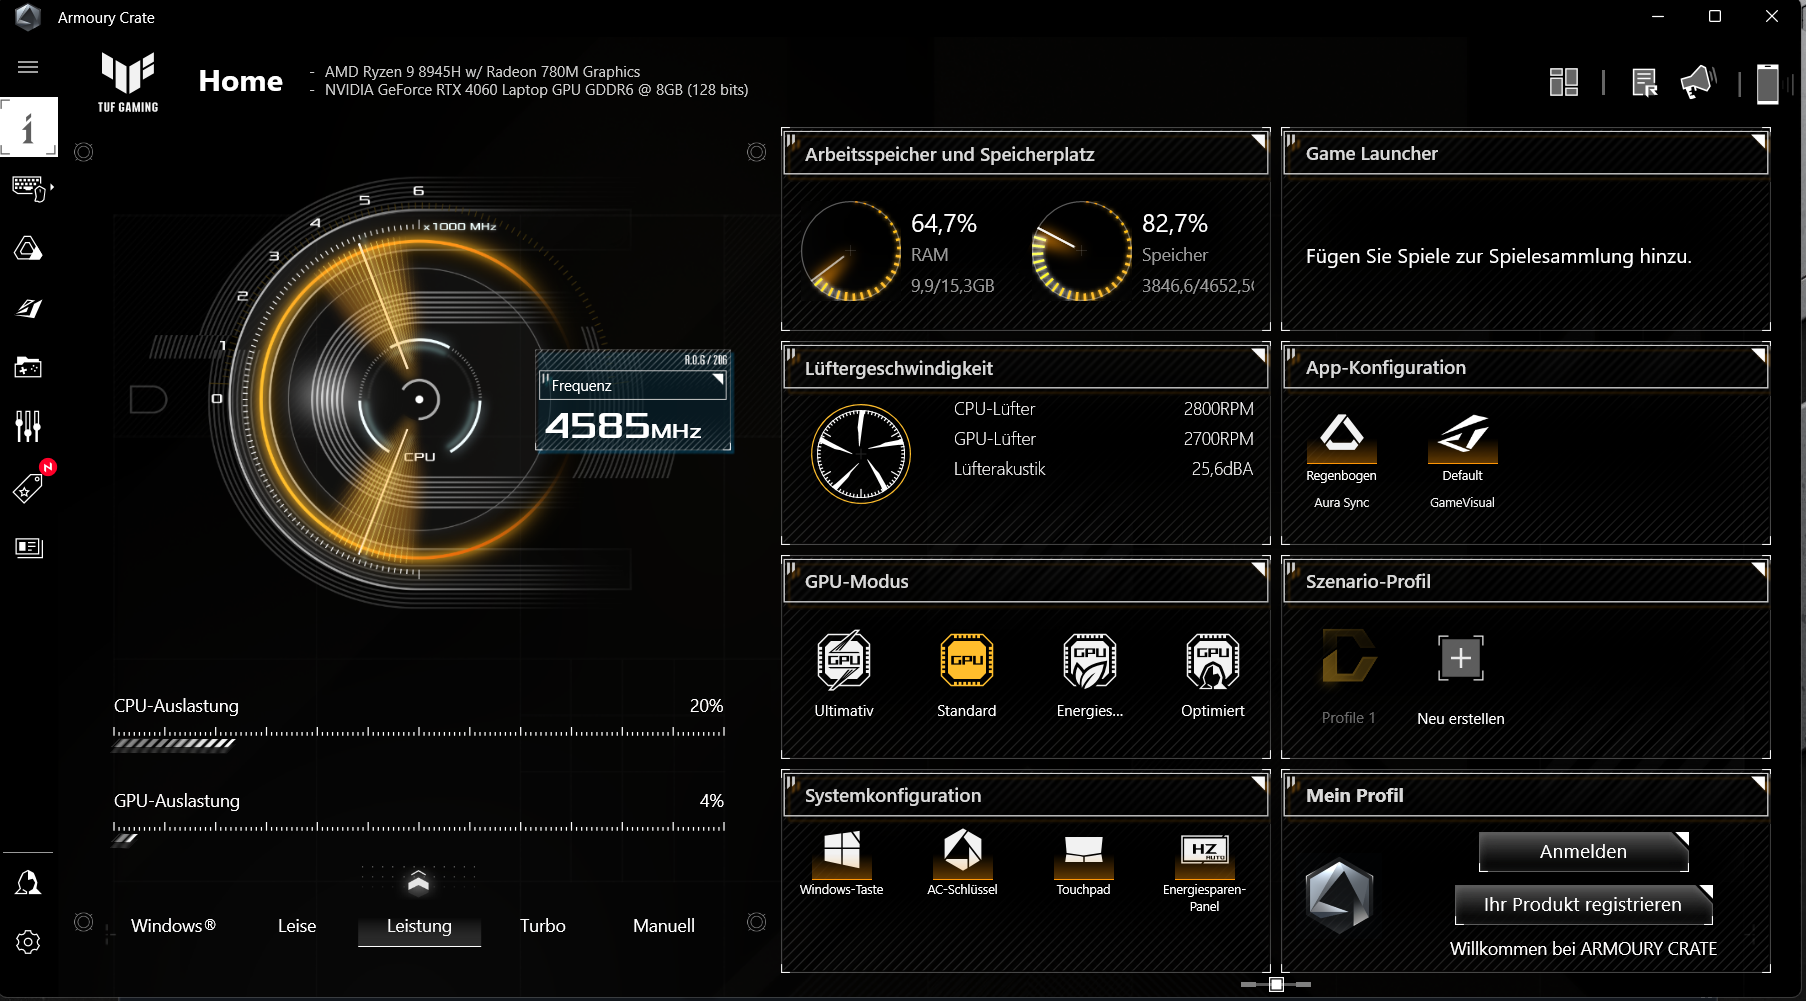
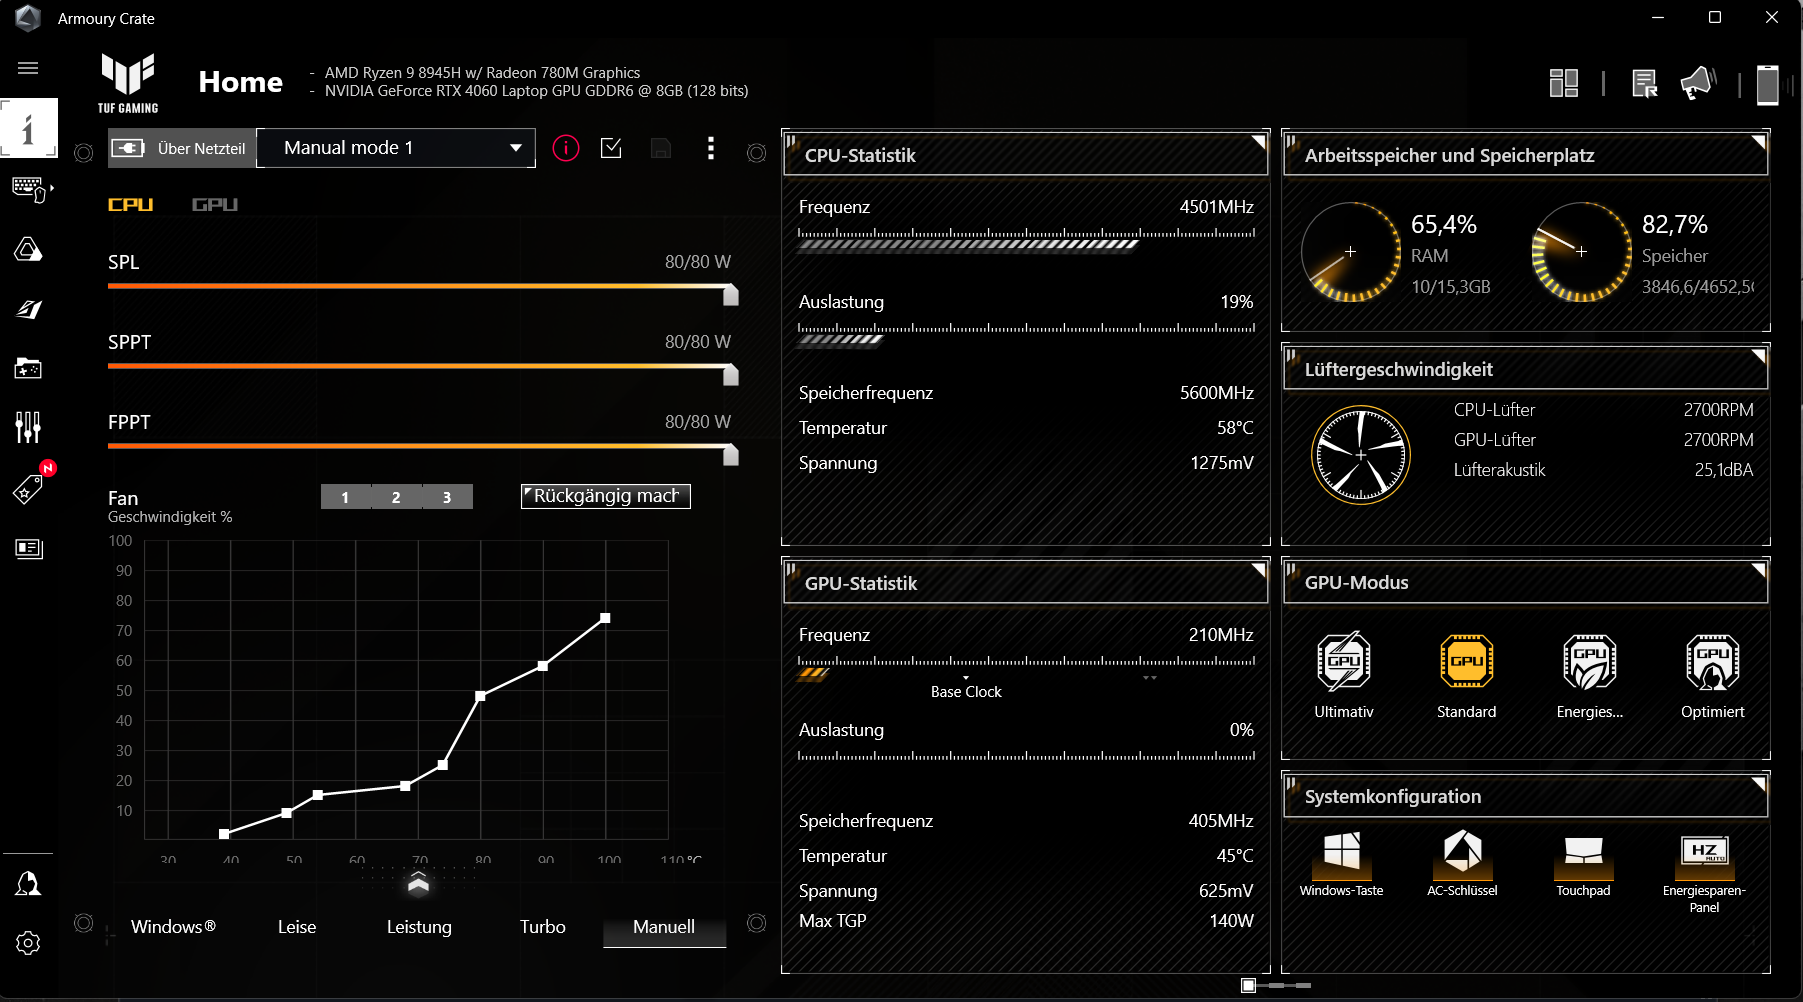
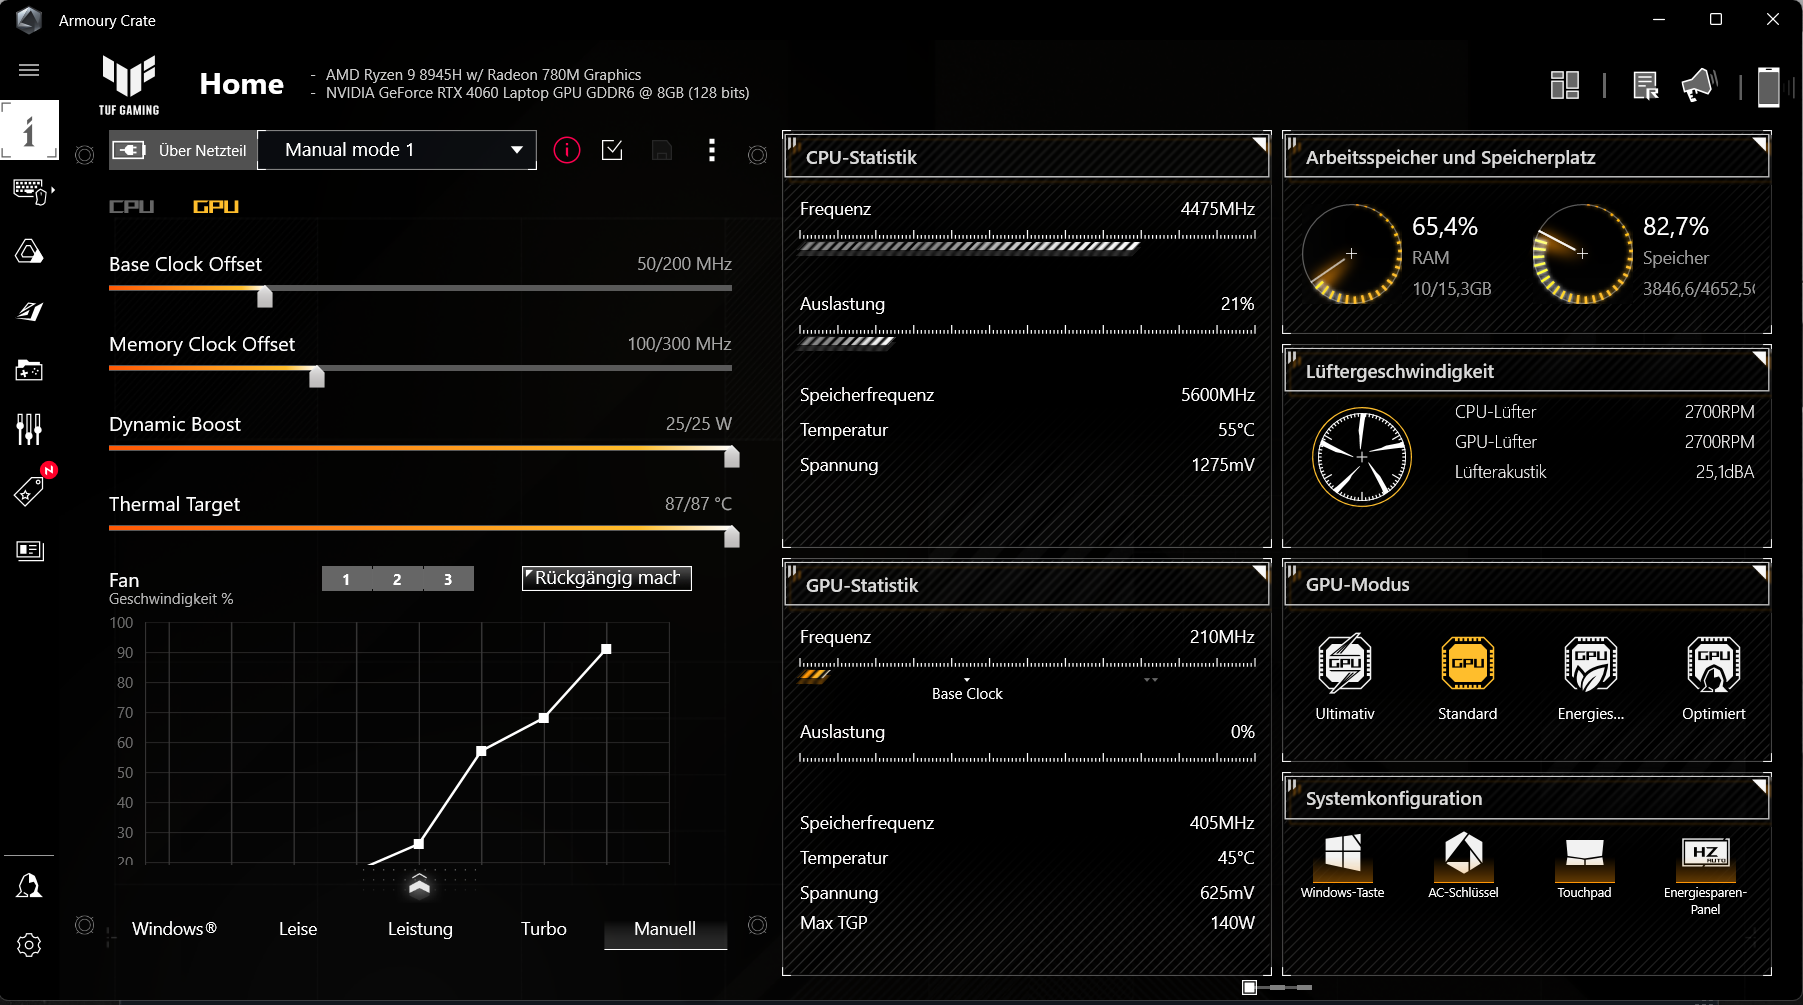
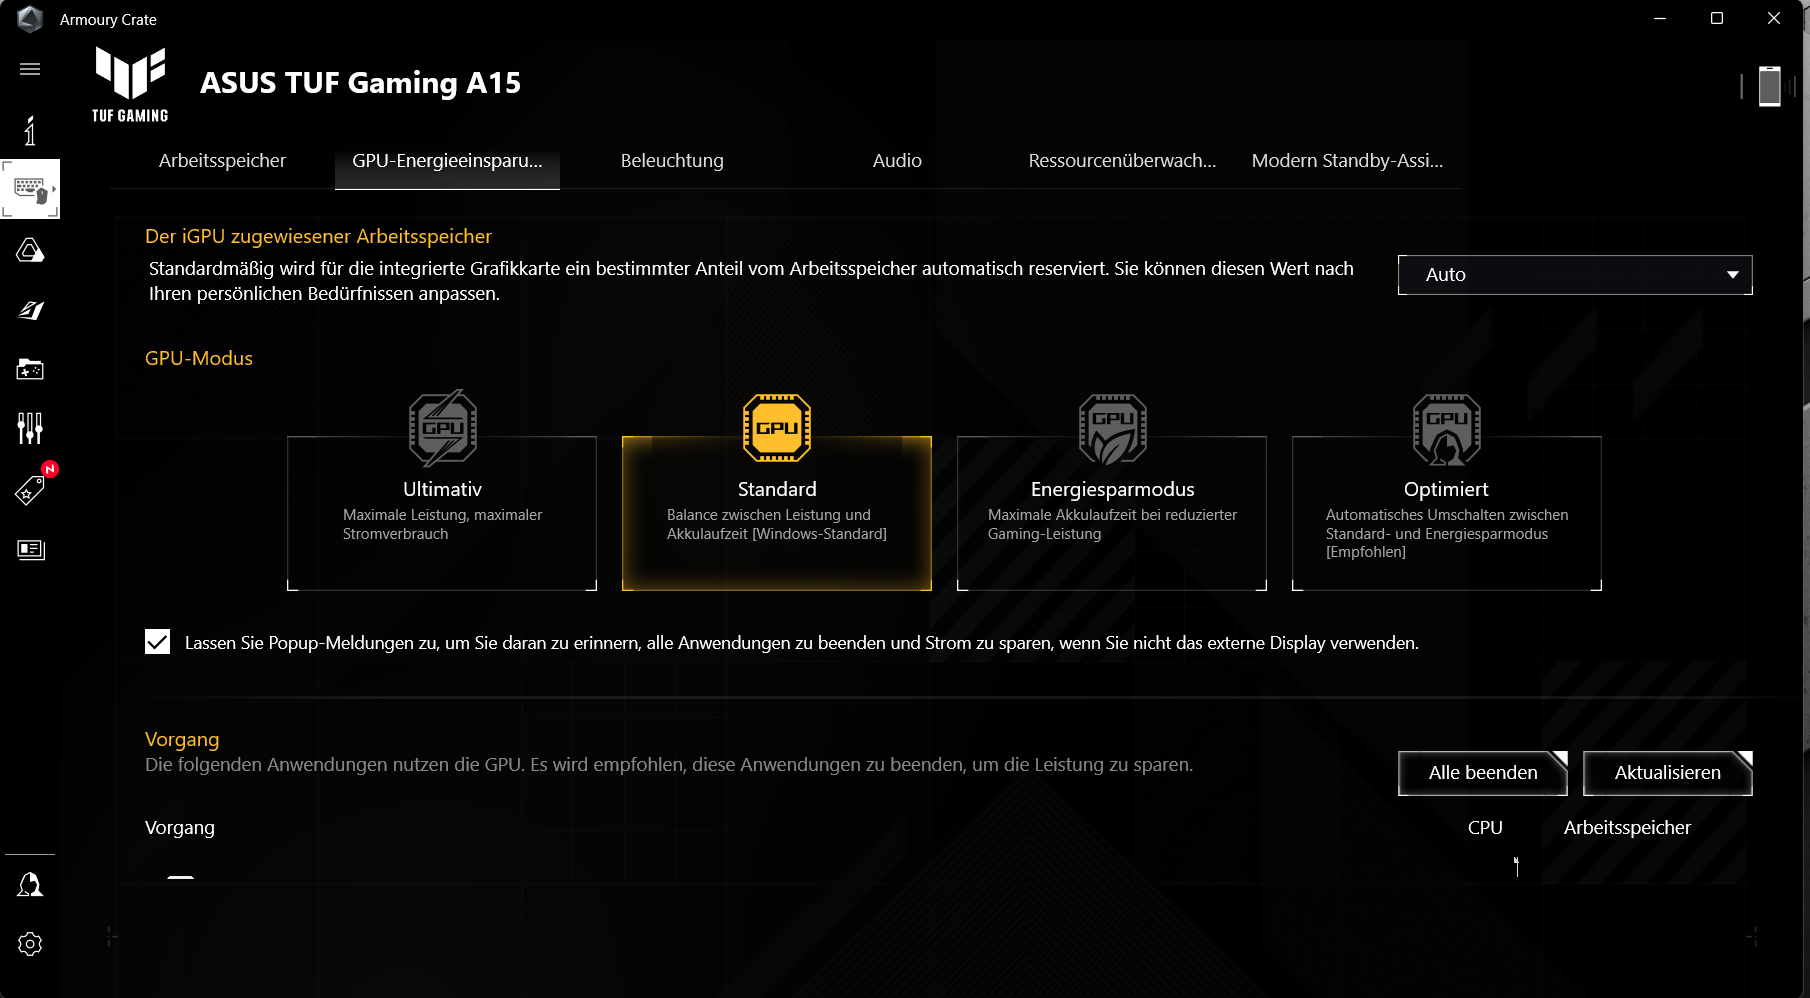
L'ordinateur portable dispose de trois profils de performance spécifiques au fabricant (voir tableau) qui peuvent être changés via la combinaison de touches "Fn" + "F5". Nous avons utilisé les profils "Performance" (benchmarks) et "Quiet" (test de batterie). Le mode GPU était réglé sur "Standard". Le centre de contrôle de l'ordinateur portable ("Armoury Crate") vous permet de définir un profil personnalisé ("Manuel") ainsi que les limites de puissance, le boost dynamique et les courbes de ventilateur.
| Performance | Turbo | Silencieux | |
|---|---|---|---|
| Limite de puissance 1 (HWInfo) | 70 watts | 80 watts | 54 watts |
| Limite de puissance 2 (HWInfo) | 80 watts | 80 watts | 65 watts |
| Bruit (CP 2077 Phantom) | 45 dB(A) | 56 dB(A) | 41 dB(A) |
| Performance (CP 2077 Phantom) | 64fps | 70fps | 56fps |
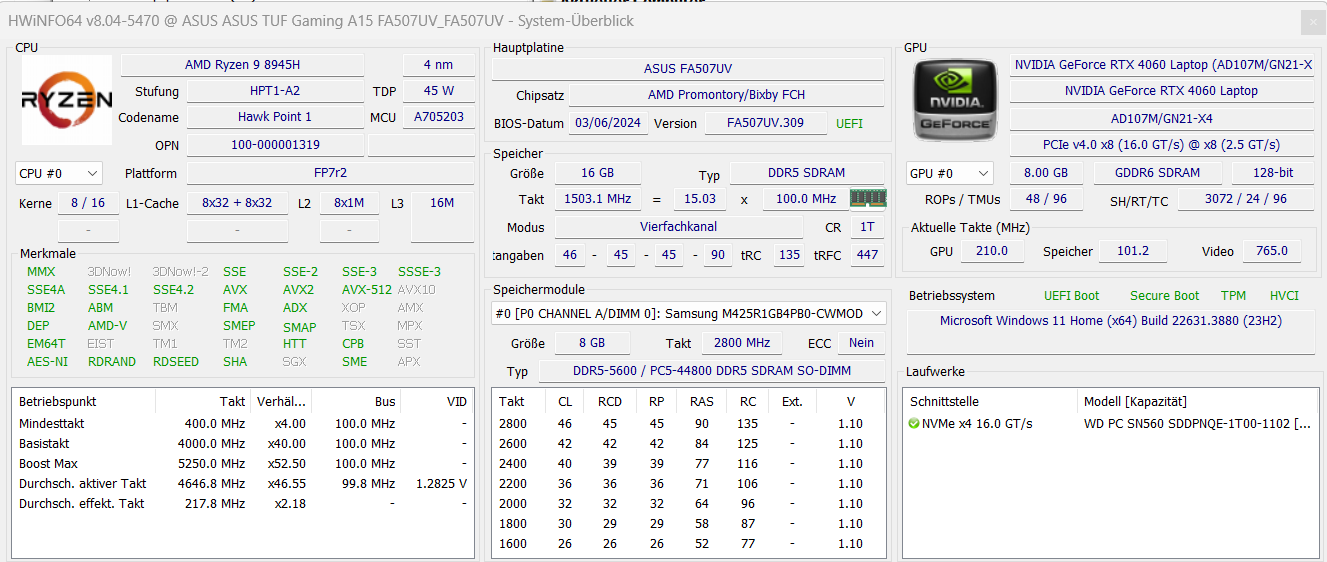
Processeur
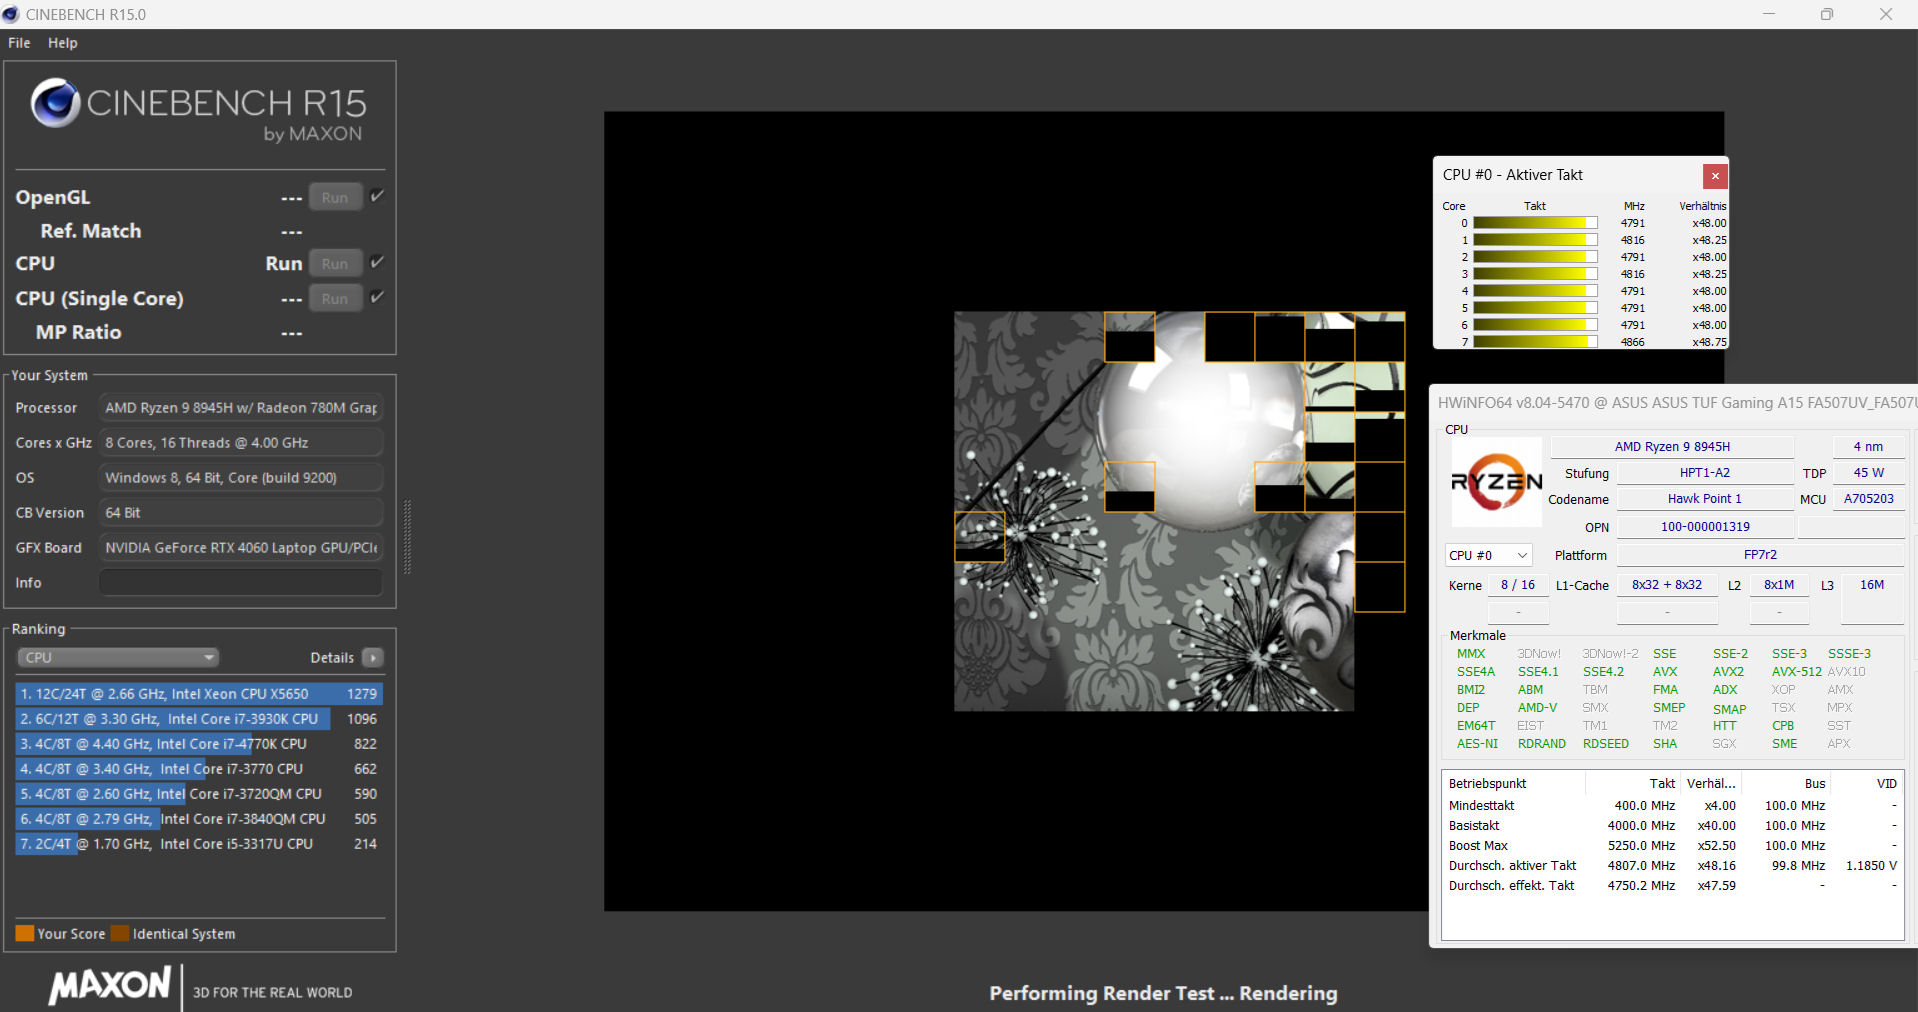
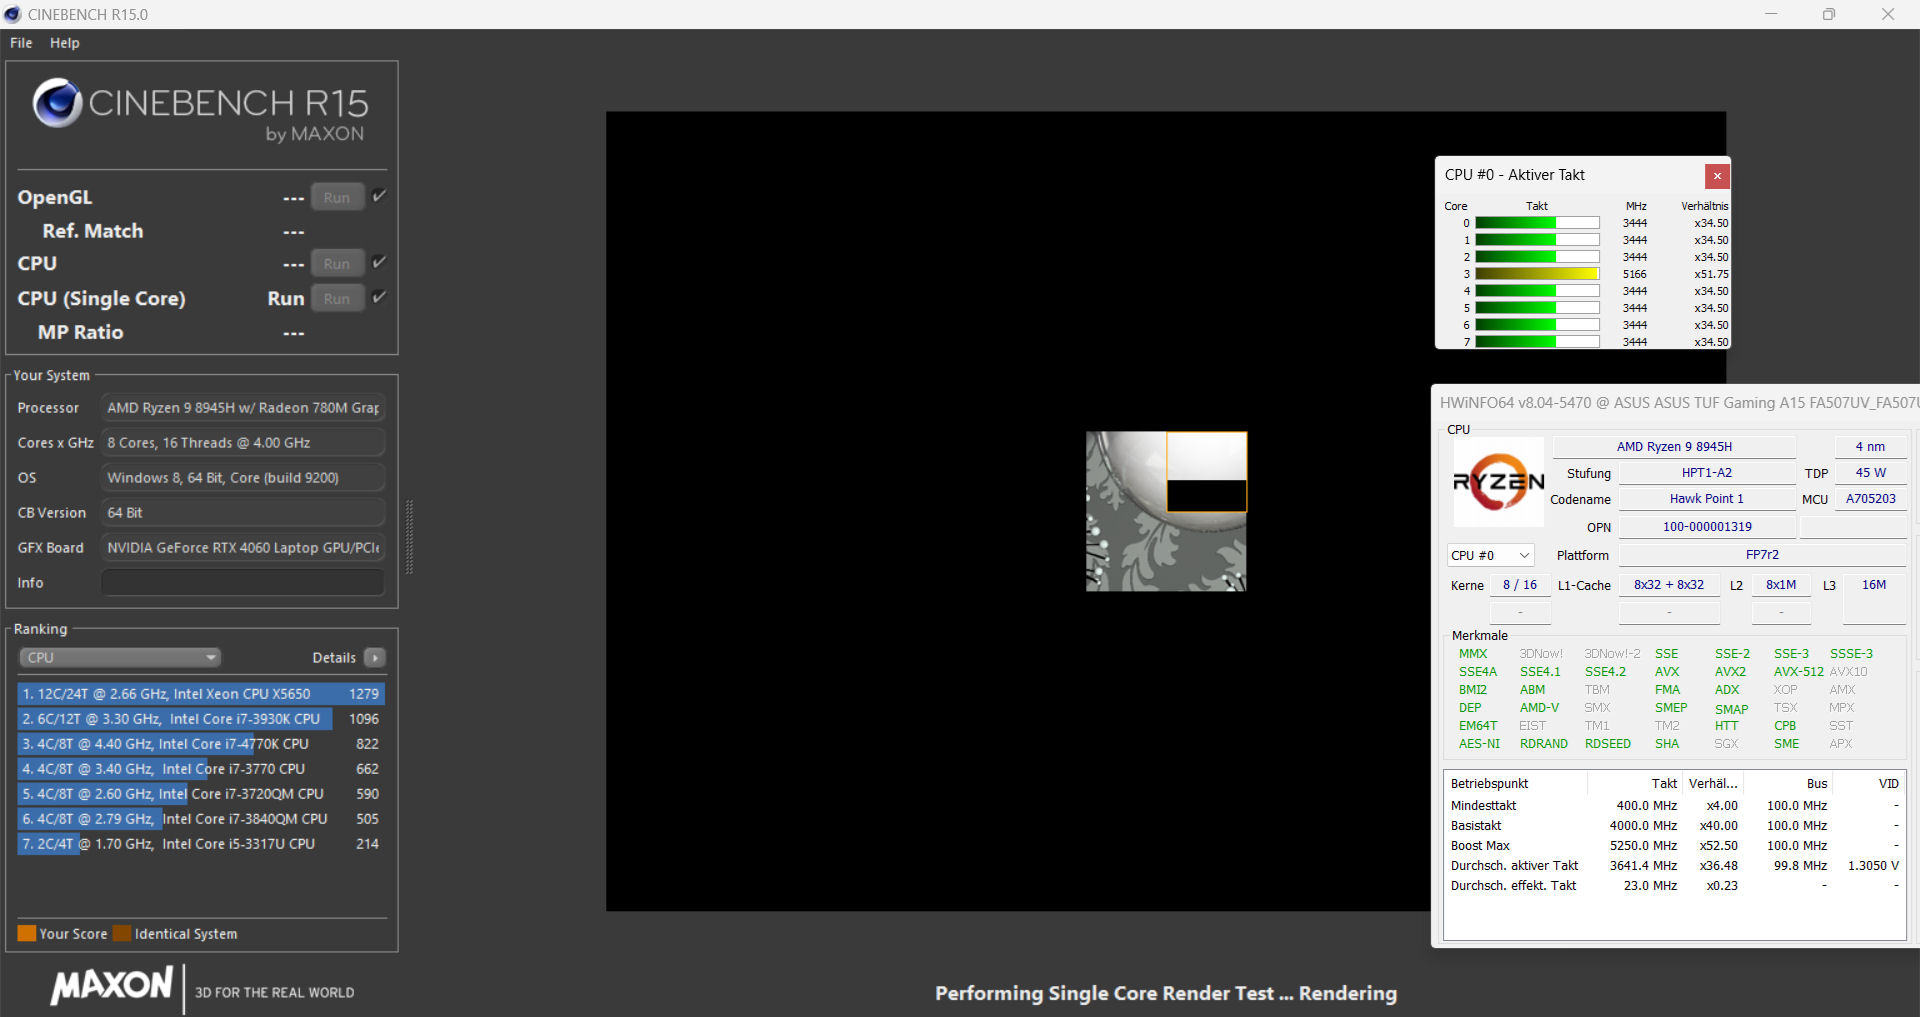
Ryzen 9 8945H (Hawk Point, Zen 4) offre huit cœurs de CPU avec un total de 16 threads à une vitesse d'horloge maximale de 5,25 GHz (un cœur). Le CPU répond à une charge multithread soutenue (boucle CB15) avec une vitesse turbo élevée et constante. Les performances de l'unité centrale varient en fonction du profil énergétique sélectionné et les différences sont assez faibles. Les résultats des benchmarks se situent au même niveau que ceux d'un processeur Ryzen 9 8945HS APU.
Cinebench R15 Multi Continuous Test
| CPU Performance Rating - Percent | |
| Moyenne de la classe Gaming | |
| HP Victus 16 (2024) | |
| SCHENKER XMG Core 15 (M24) | |
| Dell G16, i7-13650HX, RTX 4060 | |
| Asus TUF Gaming A15 FA507UV | |
| Asus TUF Gaming A15 FA507UV | |
| Moyenne AMD Ryzen 9 8945H | |
| Gigabyte G6X 9KG (2024) | |
| Lenovo LOQ 15IRX9 | |
| Asus TUF A15 FA507 -2! | |
| Blender - v2.79 BMW27 CPU | |
| Lenovo LOQ 15IRX9 | |
| Gigabyte G6X 9KG (2024) | |
| Asus TUF A15 FA507 | |
| Moyenne AMD Ryzen 9 8945H (178 - 206, n=3) | |
| Asus TUF Gaming A15 FA507UV | |
| SCHENKER XMG Core 15 (M24) | |
| Asus TUF Gaming A15 FA507UV (Turbo) | |
| Moyenne de la classe Gaming (87 - 555, n=201, 2 dernières années) | |
| HP Victus 16 (2024) | |
| Dell G16, i7-13650HX, RTX 4060 | |
| Geekbench 6.2 | |
| Multi-Core | |
| HP Victus 16 (2024) (6.2.1) | |
| Moyenne de la classe Gaming (5340 - 19665, n=105, 2 dernières années) | |
| SCHENKER XMG Core 15 (M24) (6.2.1) | |
| Dell G16, i7-13650HX, RTX 4060 (6.2.1) | |
| Gigabyte G6X 9KG (2024) (6.2.1) | |
| Moyenne AMD Ryzen 9 8945H (12638 - 13162, n=3) | |
| Lenovo LOQ 15IRX9 (6.2.1) | |
| Asus TUF Gaming A15 FA507UV (6.2.1) | |
| Asus TUF Gaming A15 FA507UV (6.2.1 Turbo) | |
| Single-Core | |
| Asus TUF Gaming A15 FA507UV (6.2.1) | |
| Asus TUF Gaming A15 FA507UV (6.2.1, Turbo) | |
| SCHENKER XMG Core 15 (M24) (6.2.1) | |
| Moyenne AMD Ryzen 9 8945H (2651 - 2711, n=3) | |
| Moyenne de la classe Gaming (1490 - 3129, n=105, 2 dernières années) | |
| Dell G16, i7-13650HX, RTX 4060 (6.2.1) | |
| Gigabyte G6X 9KG (2024) (6.2.1) | |
| Lenovo LOQ 15IRX9 (6.2.1) | |
| HP Victus 16 (2024) (6.2.1) | |
| HWBOT x265 Benchmark v2.2 - 4k Preset | |
| SCHENKER XMG Core 15 (M24) | |
| Moyenne de la classe Gaming (6.72 - 38.9, n=205, 2 dernières années) | |
| Asus TUF Gaming A15 FA507UV (Turbo) | |
| HP Victus 16 (2024) | |
| Asus TUF Gaming A15 FA507UV | |
| Moyenne AMD Ryzen 9 8945H (20.6 - 22.4, n=3) | |
| Dell G16, i7-13650HX, RTX 4060 | |
| Gigabyte G6X 9KG (2024) | |
| Lenovo LOQ 15IRX9 | |
| Asus TUF A15 FA507 | |
| LibreOffice - 20 Documents To PDF | |
| Lenovo LOQ 15IRX9 (6.3.4.2) | |
| HP Victus 16 (2024) (6.3.4.2) | |
| Dell G16, i7-13650HX, RTX 4060 (6.3.4.2) | |
| Asus TUF A15 FA507 | |
| SCHENKER XMG Core 15 (M24) (6.3.4.2) | |
| Moyenne de la classe Gaming (31.4 - 96.6, n=202, 2 dernières années) | |
| Asus TUF Gaming A15 FA507UV (6.3.4.2) | |
| Moyenne AMD Ryzen 9 8945H (44.2 - 49.8, n=3) | |
| Asus TUF Gaming A15 FA507UV (6.3.4.2, Turbo) | |
| Gigabyte G6X 9KG (2024) (6.3.4.2) | |
* ... Moindre est la valeur, meilleures sont les performances
AIDA64: FP32 Ray-Trace | FPU Julia | CPU SHA3 | CPU Queen | FPU SinJulia | FPU Mandel | CPU AES | CPU ZLib | FP64 Ray-Trace | CPU PhotoWorxx
| Performance Rating | |
| Asus TUF Gaming A15 FA507UV | |
| SCHENKER XMG Core 15 (M24) | |
| Asus TUF Gaming A15 FA507UV | |
| Moyenne AMD Ryzen 9 8945H | |
| Moyenne de la classe Gaming | |
| Dell G16, i7-13650HX, RTX 4060 | |
| HP Victus 16 (2024) | |
| Asus TUF A15 FA507 | |
| Gigabyte G6X 9KG (2024) | |
| Lenovo LOQ 15IRX9 | |
| AIDA64 / FP32 Ray-Trace | |
| SCHENKER XMG Core 15 (M24) (v6.92.6600) | |
| Asus TUF Gaming A15 FA507UV (v6.92.6600, Turbo) | |
| Asus TUF Gaming A15 FA507UV (v6.92.6600) | |
| Moyenne AMD Ryzen 9 8945H (24531 - 29423, n=3) | |
| Moyenne de la classe Gaming (4986 - 60169, n=202, 2 dernières années) | |
| Dell G16, i7-13650HX, RTX 4060 (v6.92.6600) | |
| HP Victus 16 (2024) (v6.92.6600) | |
| Asus TUF A15 FA507 (v6.85.6300) | |
| Lenovo LOQ 15IRX9 (v6.92.6600) | |
| Gigabyte G6X 9KG (2024) (v6.92.6600) | |
| AIDA64 / FPU Julia | |
| SCHENKER XMG Core 15 (M24) (v6.92.6600) | |
| Asus TUF Gaming A15 FA507UV (v6.92.6600, Turbo) | |
| Asus TUF Gaming A15 FA507UV (v6.92.6600) | |
| Moyenne AMD Ryzen 9 8945H (106518 - 125008, n=3) | |
| Moyenne de la classe Gaming (25360 - 252486, n=202, 2 dernières années) | |
| Asus TUF A15 FA507 (v6.85.6300) | |
| Dell G16, i7-13650HX, RTX 4060 (v6.92.6600) | |
| HP Victus 16 (2024) (v6.92.6600) | |
| Lenovo LOQ 15IRX9 (v6.92.6600) | |
| Gigabyte G6X 9KG (2024) (v6.92.6600) | |
| AIDA64 / CPU SHA3 | |
| Asus TUF Gaming A15 FA507UV (v6.92.6600, Turbo) | |
| SCHENKER XMG Core 15 (M24) (v6.92.6600) | |
| Asus TUF Gaming A15 FA507UV (v6.92.6600) | |
| Moyenne AMD Ryzen 9 8945H (4684 - 5209, n=3) | |
| Moyenne de la classe Gaming (1339 - 10389, n=202, 2 dernières années) | |
| Dell G16, i7-13650HX, RTX 4060 (v6.92.6600) | |
| HP Victus 16 (2024) (v6.92.6600) | |
| Lenovo LOQ 15IRX9 (v6.92.6600) | |
| Asus TUF A15 FA507 (v6.85.6300) | |
| Gigabyte G6X 9KG (2024) (v6.92.6600) | |
| AIDA64 / CPU Queen | |
| HP Victus 16 (2024) (v6.92.6600) | |
| Asus TUF Gaming A15 FA507UV (v6.92.6600) | |
| SCHENKER XMG Core 15 (M24) (v6.92.6600) | |
| Asus TUF Gaming A15 FA507UV (v6.92.6600, Turbo) | |
| Moyenne AMD Ryzen 9 8945H (114586 - 125950, n=3) | |
| Moyenne de la classe Gaming (41257 - 200651, n=202, 2 dernières années) | |
| Gigabyte G6X 9KG (2024) (v6.92.6600) | |
| Dell G16, i7-13650HX, RTX 4060 (v6.92.6600) | |
| Asus TUF A15 FA507 (v6.85.6300) | |
| Lenovo LOQ 15IRX9 (v6.92.6600) | |
| AIDA64 / FPU SinJulia | |
| Asus TUF Gaming A15 FA507UV (v6.92.6600, Turbo) | |
| Asus TUF Gaming A15 FA507UV (v6.92.6600) | |
| SCHENKER XMG Core 15 (M24) (v6.92.6600) | |
| Moyenne AMD Ryzen 9 8945H (14631 - 15889, n=3) | |
| Moyenne de la classe Gaming (3925 - 32988, n=202, 2 dernières années) | |
| Asus TUF A15 FA507 (v6.85.6300) | |
| HP Victus 16 (2024) (v6.92.6600) | |
| Dell G16, i7-13650HX, RTX 4060 (v6.92.6600) | |
| Lenovo LOQ 15IRX9 (v6.92.6600) | |
| Gigabyte G6X 9KG (2024) (v6.92.6600) | |
| AIDA64 / FPU Mandel | |
| SCHENKER XMG Core 15 (M24) (v6.92.6600) | |
| Asus TUF Gaming A15 FA507UV (v6.92.6600, Turbo) | |
| Asus TUF Gaming A15 FA507UV (v6.92.6600) | |
| Moyenne AMD Ryzen 9 8945H (56505 - 67020, n=3) | |
| Asus TUF A15 FA507 (v6.85.6300) | |
| Moyenne de la classe Gaming (12321 - 134044, n=202, 2 dernières années) | |
| Dell G16, i7-13650HX, RTX 4060 (v6.92.6600) | |
| HP Victus 16 (2024) (v6.92.6600) | |
| Lenovo LOQ 15IRX9 (v6.92.6600) | |
| Gigabyte G6X 9KG (2024) (v6.92.6600) | |
| AIDA64 / CPU AES | |
| Moyenne AMD Ryzen 9 8945H (90481 - 163032, n=3) | |
| Moyenne de la classe Gaming (19065 - 328679, n=202, 2 dernières années) | |
| SCHENKER XMG Core 15 (M24) (v6.92.6600) | |
| Asus TUF Gaming A15 FA507UV (v6.92.6600, Turbo) | |
| Asus TUF Gaming A15 FA507UV (v6.92.6600) | |
| Dell G16, i7-13650HX, RTX 4060 (v6.92.6600) | |
| HP Victus 16 (2024) (v6.92.6600) | |
| Lenovo LOQ 15IRX9 (v6.92.6600) | |
| Asus TUF A15 FA507 (v6.85.6300) | |
| Gigabyte G6X 9KG (2024) (v6.92.6600) | |
| AIDA64 / CPU ZLib | |
| Moyenne de la classe Gaming (269 - 2409, n=202, 2 dernières années) | |
| Dell G16, i7-13650HX, RTX 4060 (v6.92.6600) | |
| HP Victus 16 (2024) (v6.92.6600) | |
| Asus TUF Gaming A15 FA507UV (v6.92.6600, Turbo) | |
| Asus TUF Gaming A15 FA507UV (v6.92.6600) | |
| Gigabyte G6X 9KG (2024) (v6.92.6600) | |
| Moyenne AMD Ryzen 9 8945H (976 - 1164, n=3) | |
| Lenovo LOQ 15IRX9 (v6.92.6600) | |
| SCHENKER XMG Core 15 (M24) (v6.92.6600) | |
| Asus TUF A15 FA507 (v6.85.6300) | |
| AIDA64 / FP64 Ray-Trace | |
| SCHENKER XMG Core 15 (M24) (v6.92.6600) | |
| Asus TUF Gaming A15 FA507UV (v6.92.6600, Turbo) | |
| Asus TUF Gaming A15 FA507UV (v6.92.6600) | |
| Moyenne AMD Ryzen 9 8945H (13609 - 15727, n=3) | |
| Moyenne de la classe Gaming (2540 - 31796, n=202, 2 dernières années) | |
| Dell G16, i7-13650HX, RTX 4060 (v6.92.6600) | |
| HP Victus 16 (2024) (v6.92.6600) | |
| Asus TUF A15 FA507 (v6.85.6300) | |
| Lenovo LOQ 15IRX9 (v6.92.6600) | |
| Gigabyte G6X 9KG (2024) (v6.92.6600) | |
| AIDA64 / CPU PhotoWorxx | |
| SCHENKER XMG Core 15 (M24) (v6.92.6600) | |
| HP Victus 16 (2024) (v6.92.6600) | |
| Moyenne de la classe Gaming (10805 - 60161, n=203, 2 dernières années) | |
| Gigabyte G6X 9KG (2024) (v6.92.6600) | |
| Lenovo LOQ 15IRX9 (v6.92.6600) | |
| Dell G16, i7-13650HX, RTX 4060 (v6.92.6600) | |
| Moyenne AMD Ryzen 9 8945H (33327 - 40114, n=3) | |
| Asus TUF Gaming A15 FA507UV (v6.92.6600) | |
| Asus TUF Gaming A15 FA507UV (v6.92.6600, Turbo) | |
| Asus TUF A15 FA507 (v6.85.6300) | |
Performance du système
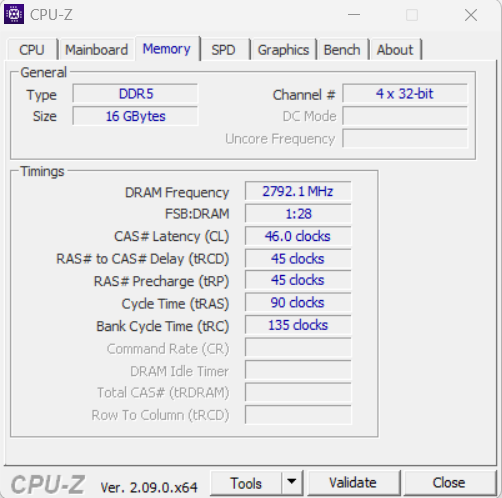
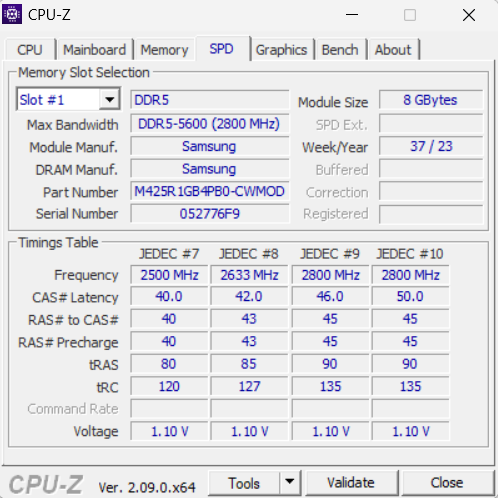
Le système fonctionne en douceur et fournit suffisamment de puissance pour le rendu, le streaming et les jeux, comme le confirment les bons résultats de PC Mark. Les vitesses de transfert de la RAM sont normales pour une RAM DDR5 5600.
CrossMark: Overall | Productivity | Creativity | Responsiveness
WebXPRT 3: Overall
WebXPRT 4: Overall
Mozilla Kraken 1.1: Total
| PCMark 10 / Score | |
| SCHENKER XMG Core 15 (M24) | |
| Asus TUF Gaming A15 FA507UV | |
| Moyenne AMD Ryzen 9 8945H, NVIDIA GeForce RTX 4060 Laptop GPU () | |
| Moyenne de la classe Gaming (5442 - 9852, n=181, 2 dernières années) | |
| Gigabyte G6X 9KG (2024) | |
| HP Victus 16 (2024) | |
| Dell G16, i7-13650HX, RTX 4060 | |
| Asus TUF A15 FA507 | |
| Lenovo LOQ 15IRX9 | |
| PCMark 10 / Essentials | |
| Asus TUF Gaming A15 FA507UV | |
| Moyenne AMD Ryzen 9 8945H, NVIDIA GeForce RTX 4060 Laptop GPU () | |
| Moyenne de la classe Gaming (8829 - 12334, n=180, 2 dernières années) | |
| HP Victus 16 (2024) | |
| Asus TUF A15 FA507 | |
| Gigabyte G6X 9KG (2024) | |
| SCHENKER XMG Core 15 (M24) | |
| Dell G16, i7-13650HX, RTX 4060 | |
| Lenovo LOQ 15IRX9 | |
| PCMark 10 / Productivity | |
| SCHENKER XMG Core 15 (M24) | |
| Asus TUF Gaming A15 FA507UV | |
| Moyenne AMD Ryzen 9 8945H, NVIDIA GeForce RTX 4060 Laptop GPU () | |
| Gigabyte G6X 9KG (2024) | |
| Dell G16, i7-13650HX, RTX 4060 | |
| HP Victus 16 (2024) | |
| Moyenne de la classe Gaming (6662 - 14612, n=180, 2 dernières années) | |
| Asus TUF A15 FA507 | |
| Lenovo LOQ 15IRX9 | |
| PCMark 10 / Digital Content Creation | |
| SCHENKER XMG Core 15 (M24) | |
| Asus TUF Gaming A15 FA507UV | |
| Moyenne AMD Ryzen 9 8945H, NVIDIA GeForce RTX 4060 Laptop GPU () | |
| Moyenne de la classe Gaming (6462 - 18475, n=180, 2 dernières années) | |
| Dell G16, i7-13650HX, RTX 4060 | |
| Gigabyte G6X 9KG (2024) | |
| Lenovo LOQ 15IRX9 | |
| HP Victus 16 (2024) | |
| Asus TUF A15 FA507 | |
| CrossMark / Overall | |
| Gigabyte G6X 9KG (2024) | |
| HP Victus 16 (2024) | |
| SCHENKER XMG Core 15 (M24) | |
| Moyenne de la classe Gaming (1247 - 2344, n=162, 2 dernières années) | |
| Dell G16, i7-13650HX, RTX 4060 | |
| Lenovo LOQ 15IRX9 | |
| Asus TUF Gaming A15 FA507UV | |
| Moyenne AMD Ryzen 9 8945H, NVIDIA GeForce RTX 4060 Laptop GPU () | |
| Asus TUF A15 FA507 | |
| CrossMark / Productivity | |
| Gigabyte G6X 9KG (2024) | |
| SCHENKER XMG Core 15 (M24) | |
| Moyenne de la classe Gaming (1299 - 2204, n=162, 2 dernières années) | |
| HP Victus 16 (2024) | |
| Asus TUF Gaming A15 FA507UV | |
| Moyenne AMD Ryzen 9 8945H, NVIDIA GeForce RTX 4060 Laptop GPU () | |
| Dell G16, i7-13650HX, RTX 4060 | |
| Lenovo LOQ 15IRX9 | |
| Asus TUF A15 FA507 | |
| CrossMark / Creativity | |
| HP Victus 16 (2024) | |
| SCHENKER XMG Core 15 (M24) | |
| Moyenne de la classe Gaming (1275 - 2660, n=162, 2 dernières années) | |
| Gigabyte G6X 9KG (2024) | |
| Dell G16, i7-13650HX, RTX 4060 | |
| Asus TUF Gaming A15 FA507UV | |
| Moyenne AMD Ryzen 9 8945H, NVIDIA GeForce RTX 4060 Laptop GPU () | |
| Lenovo LOQ 15IRX9 | |
| Asus TUF A15 FA507 | |
| CrossMark / Responsiveness | |
| Gigabyte G6X 9KG (2024) | |
| HP Victus 16 (2024) | |
| Lenovo LOQ 15IRX9 | |
| Dell G16, i7-13650HX, RTX 4060 | |
| Moyenne de la classe Gaming (1030 - 2330, n=162, 2 dernières années) | |
| SCHENKER XMG Core 15 (M24) | |
| Asus TUF Gaming A15 FA507UV | |
| Moyenne AMD Ryzen 9 8945H, NVIDIA GeForce RTX 4060 Laptop GPU () | |
| Asus TUF A15 FA507 | |
| WebXPRT 3 / Overall | |
| Asus TUF Gaming A15 FA507UV | |
| Moyenne AMD Ryzen 9 8945H, NVIDIA GeForce RTX 4060 Laptop GPU () | |
| SCHENKER XMG Core 15 (M24) | |
| Gigabyte G6X 9KG (2024) | |
| Moyenne de la classe Gaming (215 - 480, n=182, 2 dernières années) | |
| Asus TUF A15 FA507 | |
| HP Victus 16 (2024) | |
| Dell G16, i7-13650HX, RTX 4060 | |
| Lenovo LOQ 15IRX9 | |
| WebXPRT 4 / Overall | |
| SCHENKER XMG Core 15 (M24) | |
| Moyenne de la classe Gaming (157.9 - 328, n=167, 2 dernières années) | |
| Asus TUF Gaming A15 FA507UV | |
| Moyenne AMD Ryzen 9 8945H, NVIDIA GeForce RTX 4060 Laptop GPU () | |
| Gigabyte G6X 9KG (2024) | |
| HP Victus 16 (2024) | |
| Lenovo LOQ 15IRX9 | |
| Asus TUF A15 FA507 | |
| Mozilla Kraken 1.1 / Total | |
| Asus TUF A15 FA507 | |
| Lenovo LOQ 15IRX9 | |
| HP Victus 16 (2024) | |
| Moyenne de la classe Gaming (421 - 737, n=194, 2 dernières années) | |
| Gigabyte G6X 9KG (2024) | |
| Dell G16, i7-13650HX, RTX 4060 | |
| Asus TUF Gaming A15 FA507UV | |
| Moyenne AMD Ryzen 9 8945H, NVIDIA GeForce RTX 4060 Laptop GPU () | |
| SCHENKER XMG Core 15 (M24) | |
* ... Moindre est la valeur, meilleures sont les performances
| PCMark 10 Score | 7943 points | |
Aide | ||
| AIDA64 / Memory Copy | |
| SCHENKER XMG Core 15 (M24) | |
| HP Victus 16 (2024) | |
| Moyenne AMD Ryzen 9 8945H (61823 - 68924, n=3) | |
| Moyenne de la classe Gaming (21842 - 94222, n=202, 2 dernières années) | |
| Asus TUF Gaming A15 FA507UV | |
| Gigabyte G6X 9KG (2024) | |
| Dell G16, i7-13650HX, RTX 4060 | |
| Lenovo LOQ 15IRX9 | |
| Asus TUF A15 FA507 | |
| AIDA64 / Memory Read | |
| HP Victus 16 (2024) | |
| Gigabyte G6X 9KG (2024) | |
| Lenovo LOQ 15IRX9 | |
| Dell G16, i7-13650HX, RTX 4060 | |
| Moyenne de la classe Gaming (23681 - 99713, n=202, 2 dernières années) | |
| Moyenne AMD Ryzen 9 8945H (61624 - 61810, n=3) | |
| Asus TUF Gaming A15 FA507UV | |
| SCHENKER XMG Core 15 (M24) | |
| Asus TUF A15 FA507 | |
| AIDA64 / Memory Write | |
| SCHENKER XMG Core 15 (M24) | |
| Moyenne AMD Ryzen 9 8945H (78716 - 87138, n=3) | |
| Asus TUF Gaming A15 FA507UV | |
| HP Victus 16 (2024) | |
| Moyenne de la classe Gaming (22986 - 108954, n=202, 2 dernières années) | |
| Gigabyte G6X 9KG (2024) | |
| Lenovo LOQ 15IRX9 | |
| Dell G16, i7-13650HX, RTX 4060 | |
| Asus TUF A15 FA507 | |
| AIDA64 / Memory Latency | |
| HP Victus 16 (2024) | |
| Lenovo LOQ 15IRX9 | |
| Moyenne de la classe Gaming (59.5 - 259, n=201, 2 dernières années) | |
| Asus TUF Gaming A15 FA507UV | |
| Moyenne AMD Ryzen 9 8945H (91.4 - 92.6, n=3) | |
| Dell G16, i7-13650HX, RTX 4060 | |
| Gigabyte G6X 9KG (2024) | |
| SCHENKER XMG Core 15 (M24) | |
| Asus TUF A15 FA507 | |
* ... Moindre est la valeur, meilleures sont les performances
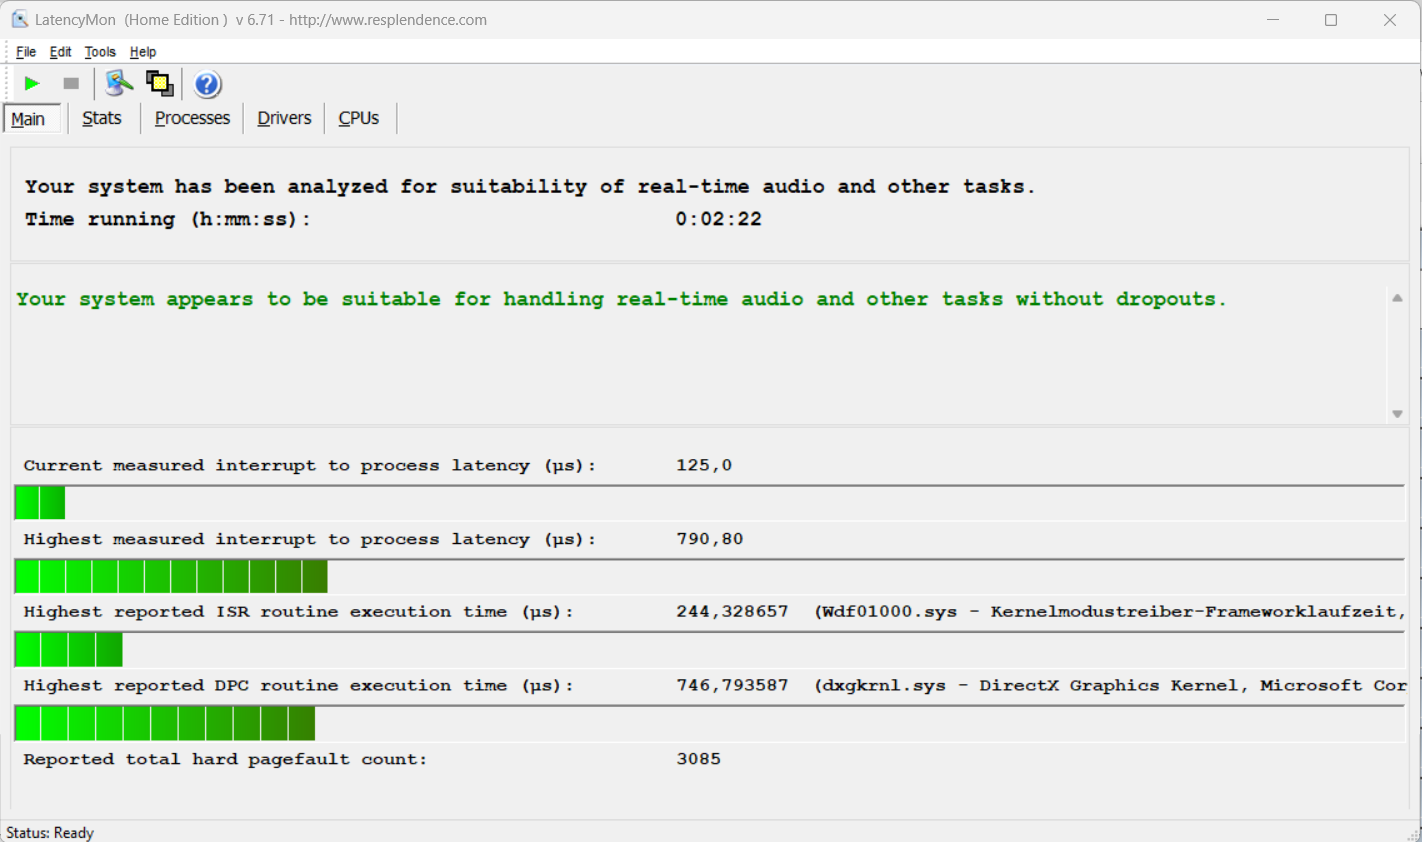
Latences DPC
Le test de latence (navigation sur Internet, lecture de vidéos 4k, charge élevée Prime95) n'a révélé aucune anomalie. Le système semble bien adapté à l'édition vidéo et audio en temps réel. Les futures mises à jour logicielles pourraient améliorer ou aggraver la situation.
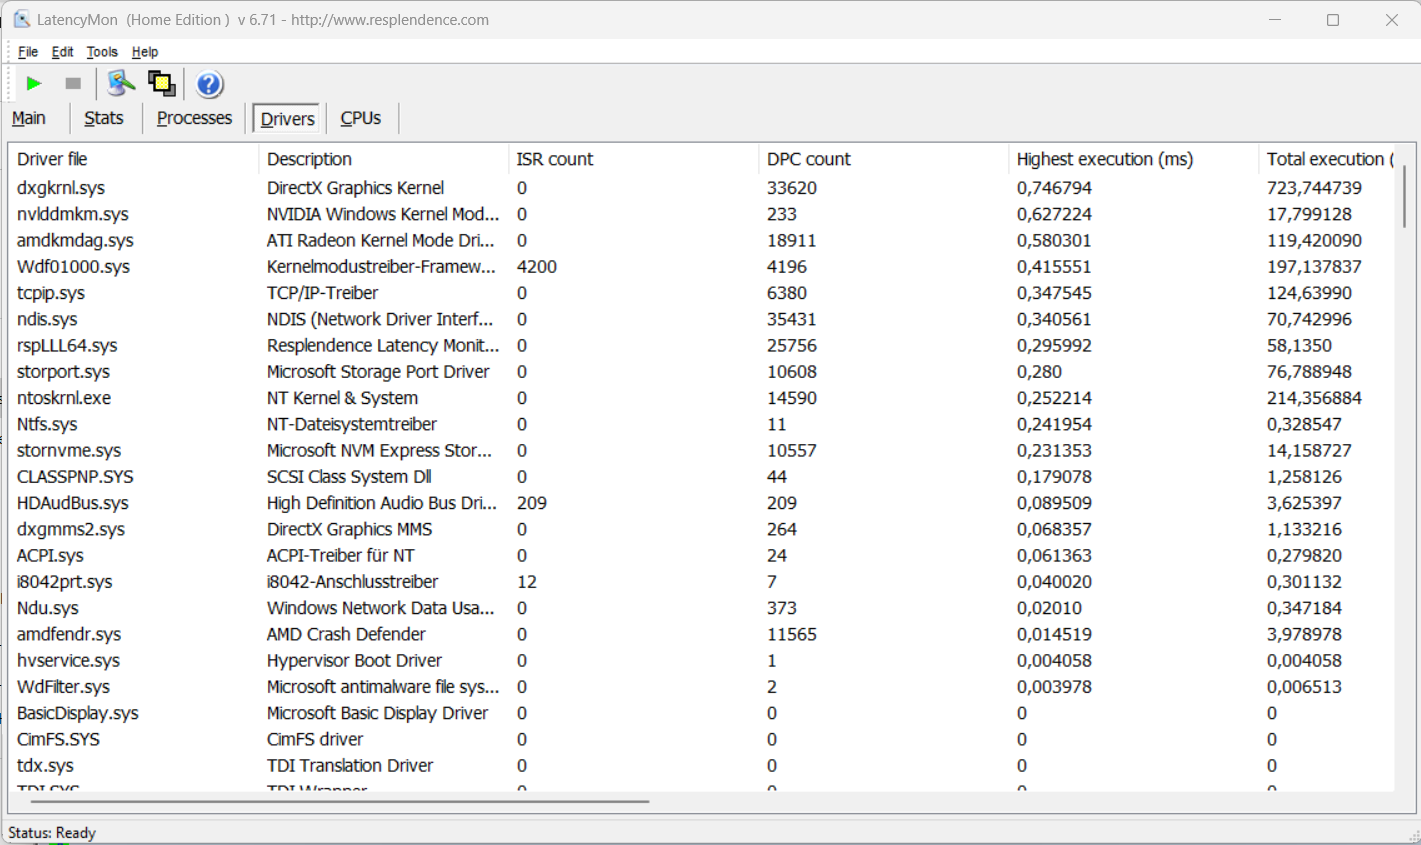
| DPC Latencies / LatencyMon - interrupt to process latency (max), Web, Youtube, Prime95 | |
| Gigabyte G6X 9KG (2024) | |
| Lenovo LOQ 15IRX9 | |
| SCHENKER XMG Core 15 (M24) | |
| Dell G16, i7-13650HX, RTX 4060 | |
| HP Victus 16 (2024) | |
| Asus TUF Gaming A15 FA507UV | |
* ... Moindre est la valeur, meilleures sont les performances
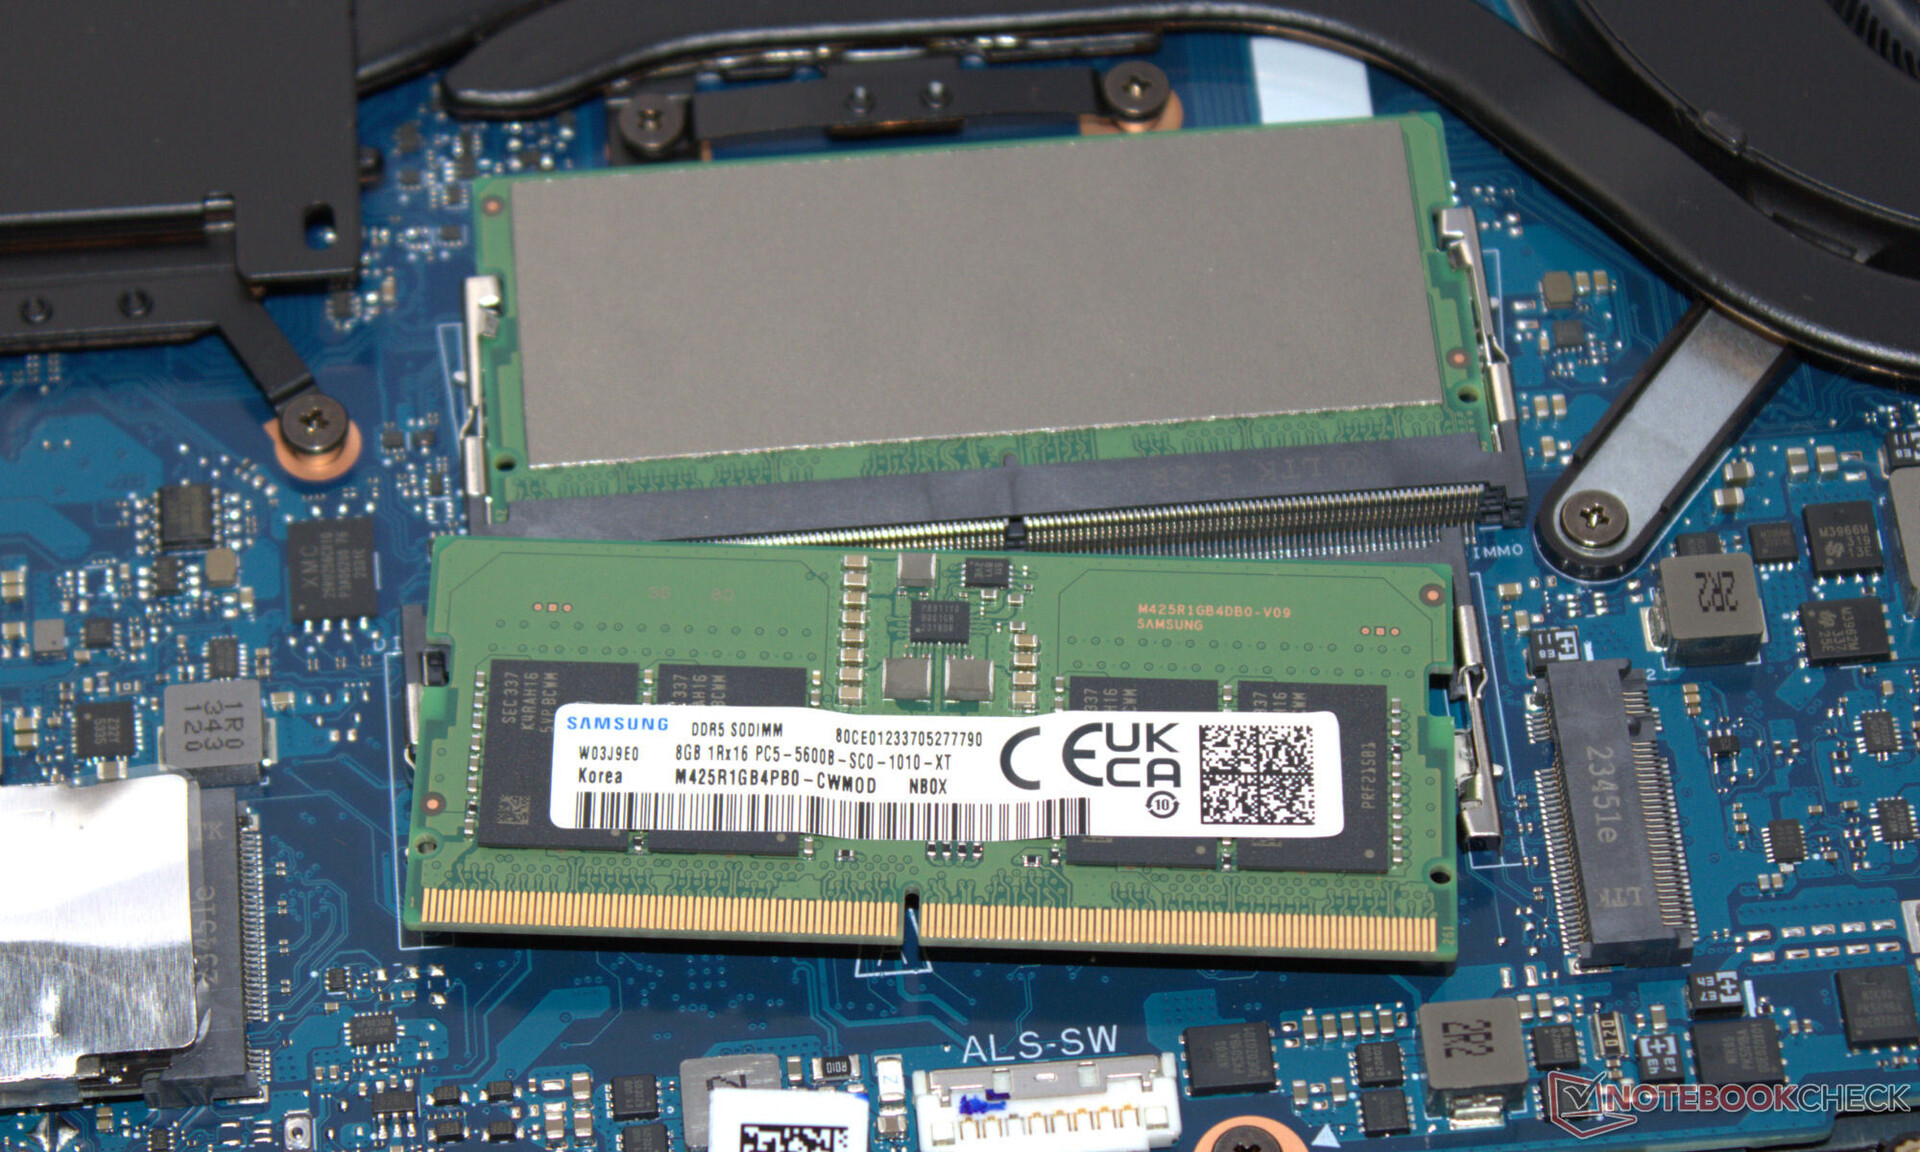
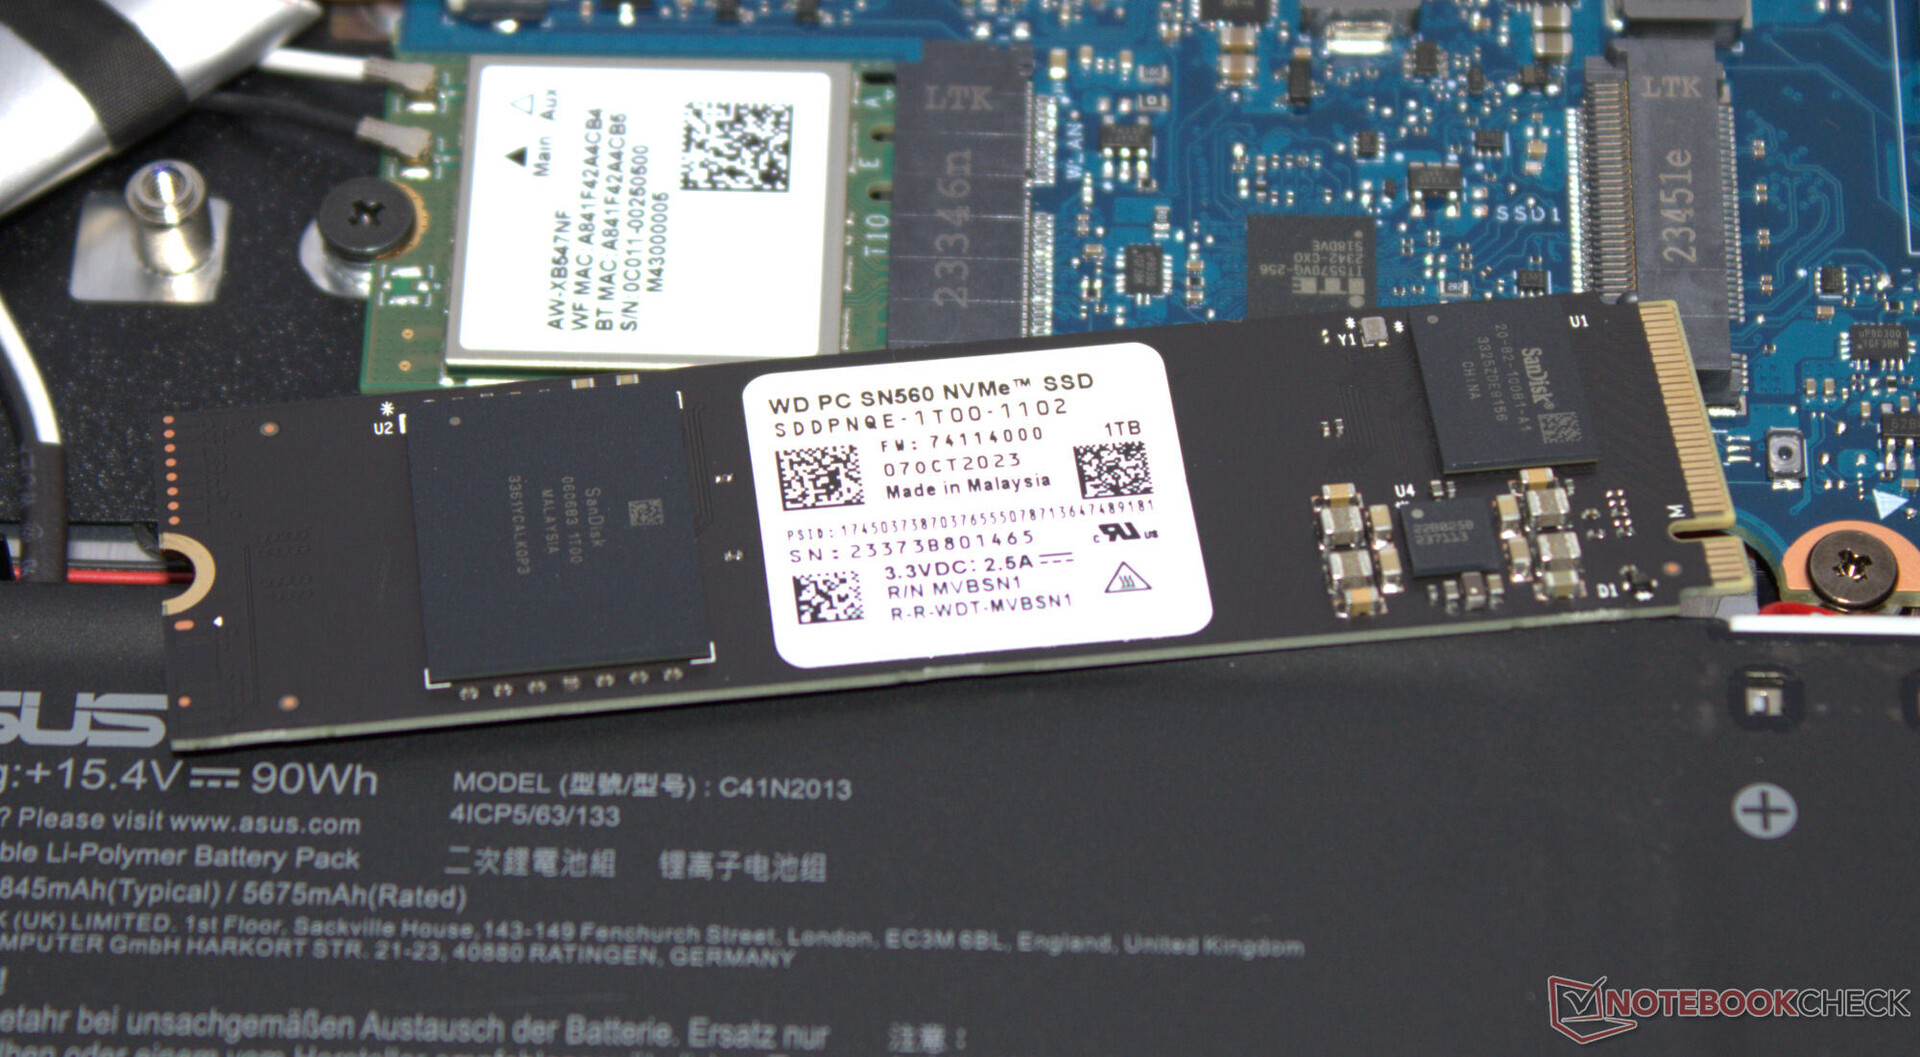
Mémoire de masse
Deux SSD PCIe 4 (M.2 2280) peuvent être logés dans le A15, un SSD est installé : Le périphérique de stockage Western Digital (1 To, M.2 2280) offre de bonnes vitesses de transfert de données mais ne fait pas partie des meilleurs modèles de SSD. Dans les dernières étapes de la boucle DiskSpd, nous avons observé un étranglement induit par la chaleur.

* ... Moindre est la valeur, meilleures sont les performances
Continuous Performance Read: DiskSpd Read Loop, Queue Depth 8
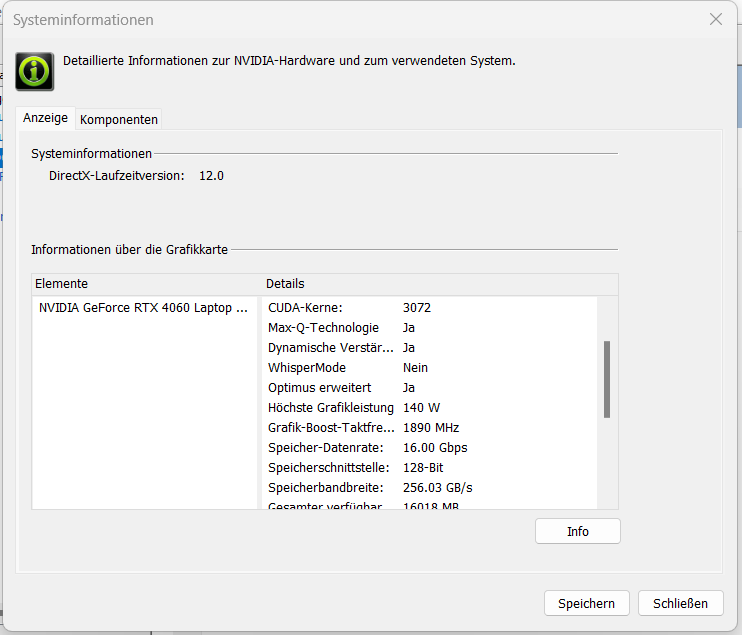
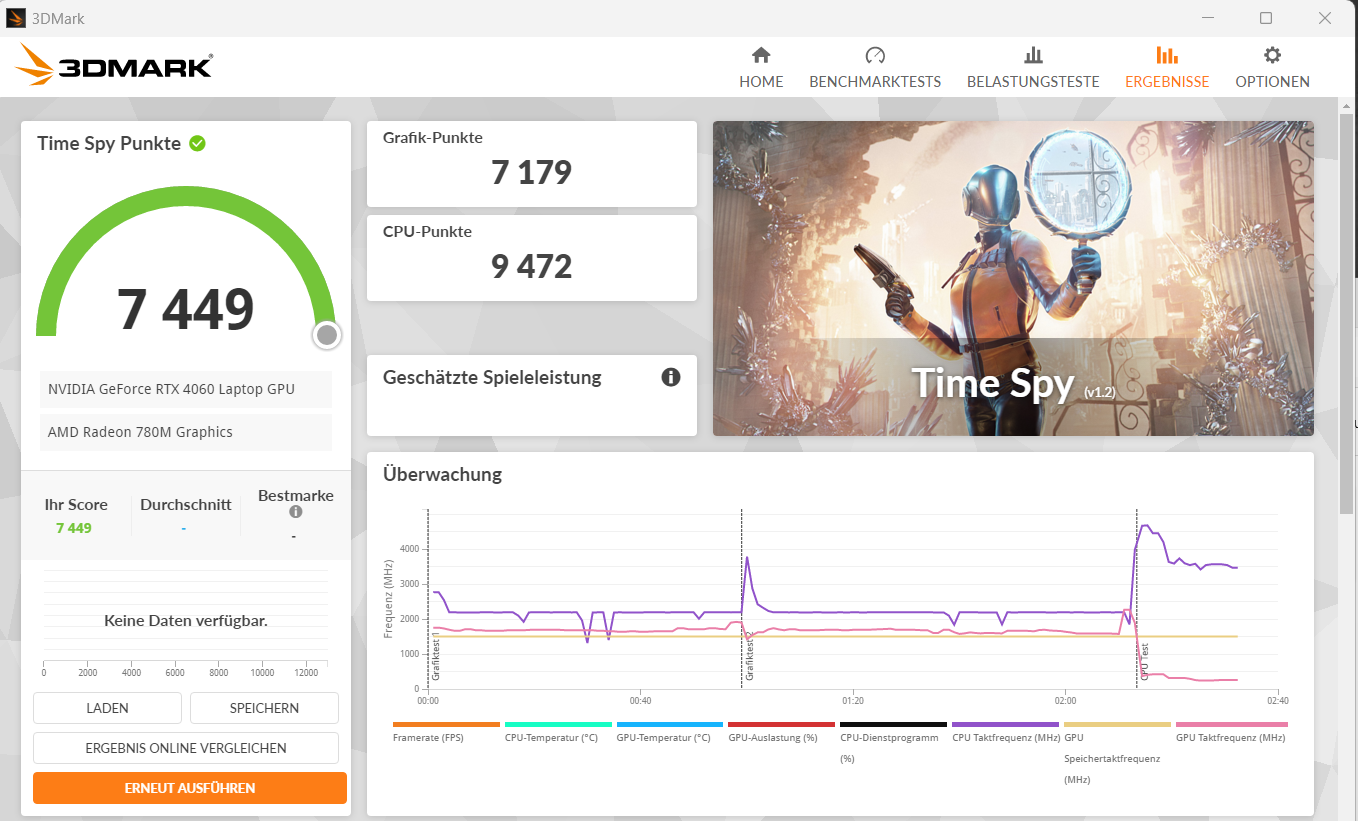
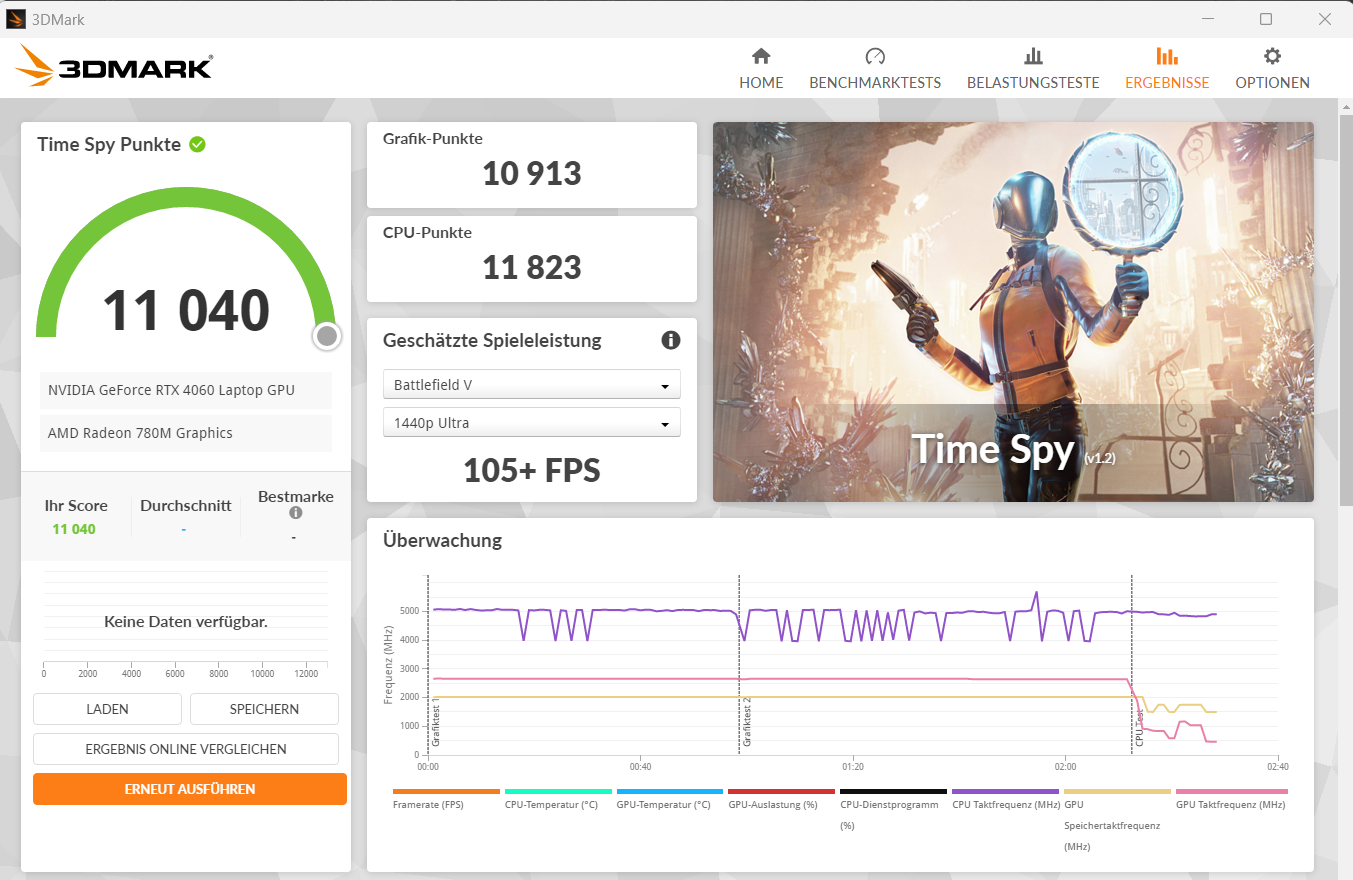
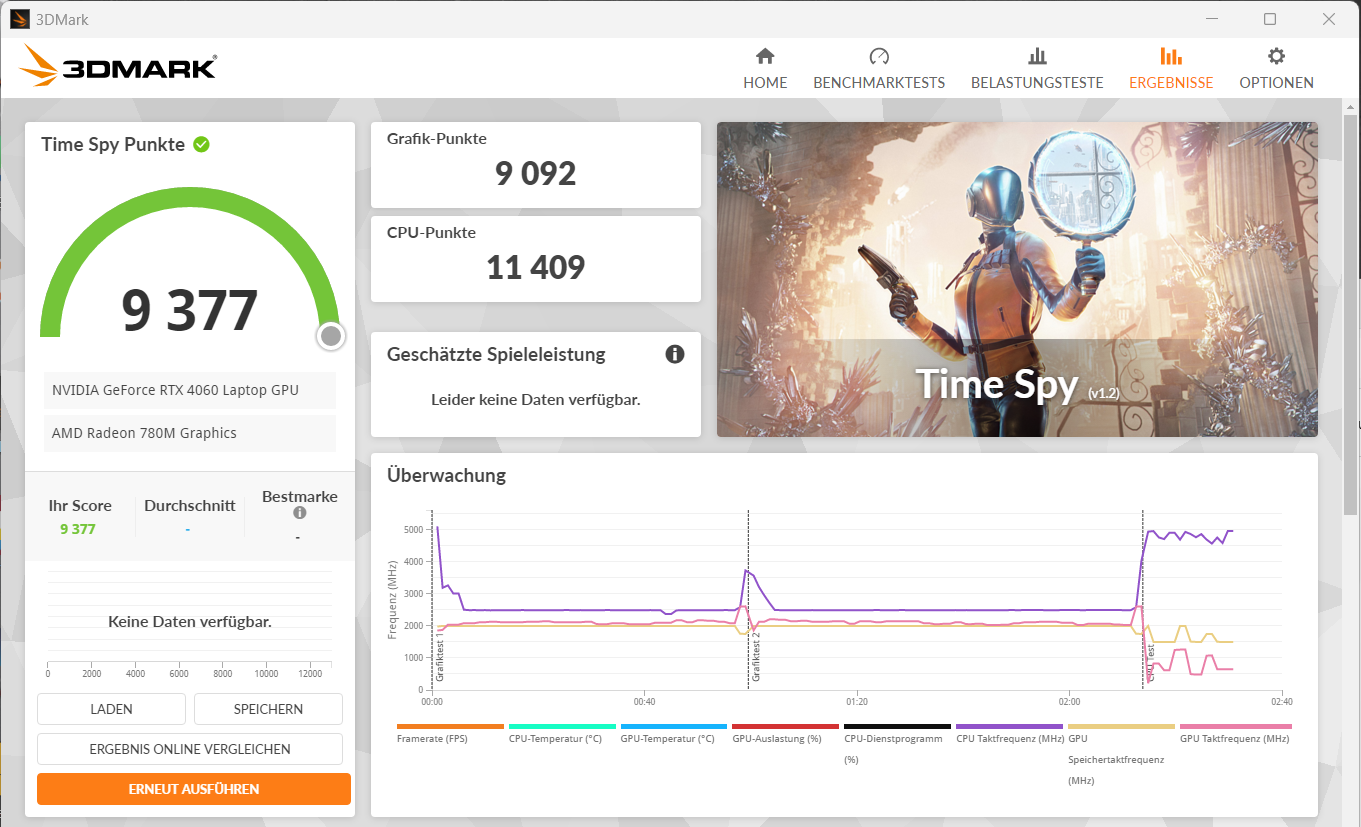
Carte graphique
La GeForce RTX 4060 (3 072 shaders, bus 128 bits, 8 Go GDDR6, 140 watts) est conçue pour les jeux FHD avec des paramètres élevés à maximaux. Les résultats des benchmarks et les taux de rafraîchissement sont comparables à la moyenne de la RTX 4060 ("Performance"). Dans certains cas, le profil "Turbo" n'apporte qu'une augmentation minime. Le passage de dGPU à Optimus ne nécessite pas de redémarrage : Advanced Optimus est pris en charge.
| 3DMark Performance Rating - Percent | |
| Moyenne de la classe Gaming | |
| SCHENKER XMG Core 15 (M24) | |
| Asus TUF Gaming A15 FA507UV | |
| Asus TUF Gaming A15 FA507UV | |
| Dell G16, i7-13650HX, RTX 4060 | |
| Lenovo LOQ 15IRX9 | |
| Gigabyte G6X 9KG (2024) | |
| HP Victus 16 (2024) | |
| Moyenne NVIDIA GeForce RTX 4060 Laptop GPU | |
| Asus TUF A15 FA507 | |
| 3DMark 11 - 1280x720 Performance GPU | |
| Moyenne de la classe Gaming (1029 - 72178, n=201, 2 dernières années) | |
| SCHENKER XMG Core 15 (M24) | |
| Asus TUF Gaming A15 FA507UV (Turbo) | |
| Asus TUF Gaming A15 FA507UV | |
| Dell G16, i7-13650HX, RTX 4060 | |
| Lenovo LOQ 15IRX9 | |
| Gigabyte G6X 9KG (2024) | |
| HP Victus 16 (2024) | |
| Moyenne NVIDIA GeForce RTX 4060 Laptop GPU (28136 - 38912, n=51) | |
| Asus TUF A15 FA507 | |
| 3DMark | |
| 1920x1080 Fire Strike Graphics | |
| Moyenne de la classe Gaming (781 - 53059, n=211, 2 dernières années) | |
| SCHENKER XMG Core 15 (M24) | |
| Asus TUF Gaming A15 FA507UV (Turbo) | |
| Asus TUF Gaming A15 FA507UV | |
| Lenovo LOQ 15IRX9 | |
| Gigabyte G6X 9KG (2024) | |
| Dell G16, i7-13650HX, RTX 4060 | |
| HP Victus 16 (2024) | |
| Moyenne NVIDIA GeForce RTX 4060 Laptop GPU (20533 - 29656, n=48) | |
| Asus TUF A15 FA507 | |
| 2560x1440 Time Spy Graphics | |
| Moyenne de la classe Gaming (224 - 22717, n=207, 2 dernières années) | |
| SCHENKER XMG Core 15 (M24) | |
| Asus TUF Gaming A15 FA507UV (Turbo) | |
| Dell G16, i7-13650HX, RTX 4060 | |
| Asus TUF Gaming A15 FA507UV | |
| Moyenne NVIDIA GeForce RTX 4060 Laptop GPU (7484 - 11451, n=50) | |
| HP Victus 16 (2024) | |
| Gigabyte G6X 9KG (2024) | |
| Lenovo LOQ 15IRX9 | |
| Asus TUF A15 FA507 | |
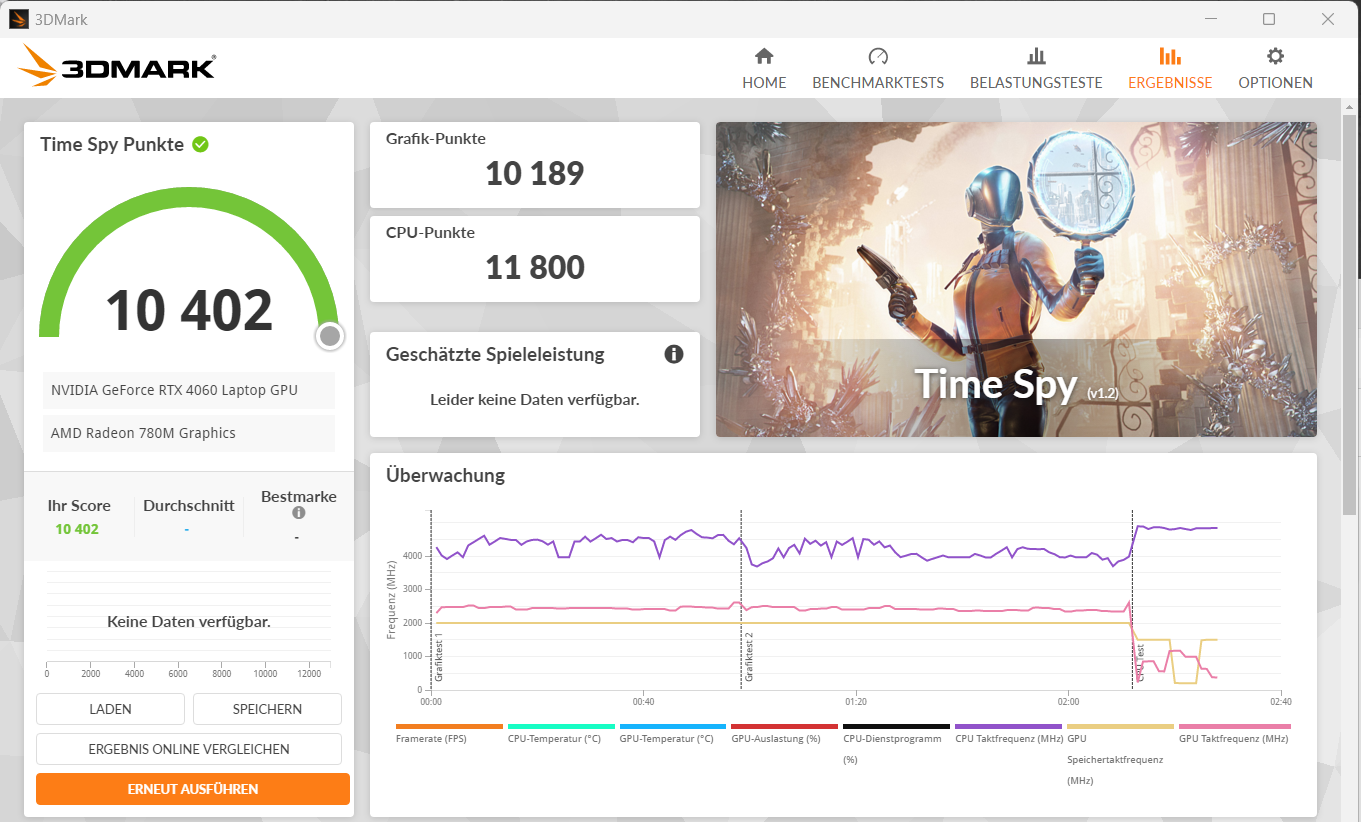
| 3DMark 06 Standard Score | 55024 points | |
| 3DMark 11 Performance | 31639 points | |
| 3DMark Fire Strike Score | 25032 points | |
| 3DMark Time Spy Score | 10402 points | |
| 3DMark Steel Nomad Score | 2200 points | |
Aide | ||
| Geekbench 6.2 | |
| GPU OpenCL | |
| Moyenne de la classe Gaming (4321 - 207373, n=104, 2 dernières années) | |
| Gigabyte G6X 9KG (2024) (6.2.1) | |
| SCHENKER XMG Core 15 (M24) (6.2.1) | |
| HP Victus 16 (2024) (6.2.1) | |
| Asus TUF Gaming A15 FA507UV (6.2.1 Turbo) | |
| Dell G16, i7-13650HX, RTX 4060 (6.2.1) | |
| Asus TUF Gaming A15 FA507UV (6.2.1) | |
| Lenovo LOQ 15IRX9 (6.2.1) | |
| Moyenne NVIDIA GeForce RTX 4060 Laptop GPU (4321 - 100831, n=34) | |
| GPU Vulkan 6.2 | |
| SCHENKER XMG Core 15 (M24) (6.2.1) | |
| Asus TUF Gaming A15 FA507UV (6.2.1) | |
| Asus TUF Gaming A15 FA507UV (6.2.1 Turbo) | |
| Gigabyte G6X 9KG (2024) (6.2.1) | |
| Lenovo LOQ 15IRX9 (6.2.1) | |
| HP Victus 16 (2024) (6.2.1) | |
| Moyenne de la classe Gaming (4286 - 196201, n=101, 2 dernières années) | |
| Moyenne NVIDIA GeForce RTX 4060 Laptop GPU (4286 - 101001, n=33) | |
| Dell G16, i7-13650HX, RTX 4060 (6.2.1) | |
| V-Ray Benchmark Next 4.10 | |
| GPU | |
| SCHENKER XMG Core 15 (M24) (v4.10.07 ) | |
| Moyenne de la classe Gaming (54 - 1334, n=162, 2 dernières années) | |
| Asus TUF Gaming A15 FA507UV (v4.10.07, Turbo) | |
| Gigabyte G6X 9KG (2024) (v4.10.07 ) | |
| Asus TUF Gaming A15 FA507UV (v4.10.07 ) | |
| Moyenne NVIDIA GeForce RTX 4060 Laptop GPU (483 - 715, n=40) | |
| HP Victus 16 (2024) (v4.10.07 ) | |
| Lenovo LOQ 15IRX9 (v4.10.07 ) | |
| Asus TUF A15 FA507 (v4.10.07 ) | |
| CPU | |
| HP Victus 16 (2024) (v4.10.07 ) | |
| Moyenne de la classe Gaming (5413 - 37629, n=162, 2 dernières années) | |
| Moyenne NVIDIA GeForce RTX 4060 Laptop GPU (12680 - 32360, n=40) | |
| SCHENKER XMG Core 15 (M24) (v4.10.07 ) | |
| Gigabyte G6X 9KG (2024) (v4.10.07 ) | |
| Asus TUF Gaming A15 FA507UV (v4.10.07, Turbo) | |
| Asus TUF Gaming A15 FA507UV (v4.10.07 ) | |
| Lenovo LOQ 15IRX9 (v4.10.07 ) | |
| Asus TUF A15 FA507 (v4.10.07 ) | |
* ... Moindre est la valeur, meilleures sont les performances
| Performance Rating - Percent | |
| Moyenne de la classe Gaming | |
| SCHENKER XMG Core 15 (M24) | |
| Dell G16, i7-13650HX, RTX 4060 | |
| Gigabyte G6X 9KG (2024) | |
| Moyenne NVIDIA GeForce RTX 4060 Laptop GPU | |
| HP Victus 16 (2024) | |
| Asus TUF Gaming A15 FA507UV | |
| Asus TUF Gaming A15 FA507UV | |
| Lenovo LOQ 15IRX9 | |
| Asus TUF A15 FA507 -1! | |
| Cyberpunk 2077 2.1 Phantom Liberty - 1920x1080 Ultra Preset (FSR off) | |
| SCHENKER XMG Core 15 (M24) (2.12) | |
| Moyenne de la classe Gaming (6.76 - 144.7, n=73, 2 dernières années) | |
| Asus TUF Gaming A15 FA507UV (2.12) | |
| Asus TUF Gaming A15 FA507UV (2.12, Turbo) | |
| Moyenne NVIDIA GeForce RTX 4060 Laptop GPU (56.7 - 93.1, n=25) | |
| Lenovo LOQ 15IRX9 (2.02) | |
| Dell G16, i7-13650HX, RTX 4060 (2.11) | |
| Gigabyte G6X 9KG (2024) (2.02) | |
| HP Victus 16 (2024) (2.02) | |
| GTA V - 1920x1080 Highest Settings possible AA:4xMSAA + FX AF:16x | |
| Dell G16, i7-13650HX, RTX 4060 | |
| SCHENKER XMG Core 15 (M24) | |
| Gigabyte G6X 9KG (2024) | |
| Lenovo LOQ 15IRX9 | |
| Moyenne de la classe Gaming (12.1 - 167.7, n=186, 2 dernières années) | |
| HP Victus 16 (2024) | |
| Moyenne NVIDIA GeForce RTX 4060 Laptop GPU (76.9 - 124.9, n=42) | |
| Asus TUF Gaming A15 FA507UV | |
| Asus TUF Gaming A15 FA507UV (Turbo) | |
| Asus TUF A15 FA507 | |
| Final Fantasy XV Benchmark - 1920x1080 High Quality | |
| Moyenne de la classe Gaming (19.2 - 201, n=198, 2 dernières années) | |
| SCHENKER XMG Core 15 (M24) (1.3) | |
| Asus TUF Gaming A15 FA507UV (1.3, Turbo) | |
| Dell G16, i7-13650HX, RTX 4060 (1.3) | |
| Gigabyte G6X 9KG (2024) (1.3) | |
| Asus TUF Gaming A15 FA507UV (1.3) | |
| Lenovo LOQ 15IRX9 (1.3) | |
| HP Victus 16 (2024) (1.3) | |
| Moyenne NVIDIA GeForce RTX 4060 Laptop GPU (75.1 - 109.8, n=45) | |
| Asus TUF A15 FA507 (1.3) | |
| Strange Brigade - 1920x1080 ultra AA:ultra AF:16 | |
| Moyenne de la classe Gaming (38.9 - 421, n=197, 2 dernières années) | |
| SCHENKER XMG Core 15 (M24) (1.47.22.14 D3D12) | |
| Dell G16, i7-13650HX, RTX 4060 (1.47.22.14 D3D12) | |
| Asus TUF Gaming A15 FA507UV (1.47.22.14 D3D12, Turbo) | |
| Asus TUF Gaming A15 FA507UV (1.47.22.14 D3D12) | |
| Lenovo LOQ 15IRX9 (1.47.22.14 D3D12) | |
| Gigabyte G6X 9KG (2024) (1.47.22.14 D3D12) | |
| Moyenne NVIDIA GeForce RTX 4060 Laptop GPU (135.3 - 210, n=46) | |
| HP Victus 16 (2024) (1.47.22.14 D3D12) | |
| Asus TUF A15 FA507 | |
| Dota 2 Reborn - 1920x1080 ultra (3/3) best looking | |
| HP Victus 16 (2024) | |
| Dell G16, i7-13650HX, RTX 4060 | |
| Moyenne de la classe Gaming (33.2 - 220, n=206, 2 dernières années) | |
| Moyenne NVIDIA GeForce RTX 4060 Laptop GPU (115 - 183.8, n=47) | |
| Gigabyte G6X 9KG (2024) | |
| Lenovo LOQ 15IRX9 | |
| Asus TUF Gaming A15 FA507UV | |
| SCHENKER XMG Core 15 (M24) | |
| Asus TUF Gaming A15 FA507UV (Turbo) | |
| Asus TUF A15 FA507 | |
| X-Plane 11.11 - 1920x1080 high (fps_test=3) | |
| Dell G16, i7-13650HX, RTX 4060 | |
| Gigabyte G6X 9KG (2024) | |
| Moyenne de la classe Gaming (31.5 - 166.2, n=212, 2 dernières années) | |
| Moyenne NVIDIA GeForce RTX 4060 Laptop GPU (66.5 - 141.1, n=48) | |
| HP Victus 16 (2024) | |
| SCHENKER XMG Core 15 (M24) | |
| Lenovo LOQ 15IRX9 | |
| Asus TUF Gaming A15 FA507UV | |
| Asus TUF Gaming A15 FA507UV (Turbo) | |
| Asus TUF A15 FA507 | |
| Baldur's Gate 3 - 1920x1080 Ultra Preset | |
| SCHENKER XMG Core 15 (M24) | |
| Moyenne de la classe Gaming (34.5 - 208, n=39, 2 dernières années) | |
| Asus TUF Gaming A15 FA507UV | |
| Moyenne NVIDIA GeForce RTX 4060 Laptop GPU (66.5 - 105.5, n=13) | |
| F1 24 - 1920x1080 Ultra High Preset AA:T AF:16x | |
| Moyenne de la classe Gaming (54.1 - 127, n=12, 2 dernières années) | |
| Moyenne NVIDIA GeForce RTX 4060 Laptop GPU (54.1 - 60.9, n=6) | |
| Asus TUF Gaming A15 FA507UV (1126333) | |
| Lenovo LOQ 15IRX9 (1122588) | |
| The First Descendant - 1920x1080 Ultra Preset | |
| Moyenne NVIDIA GeForce RTX 4060 Laptop GPU (67.6 - 69.4, n=3) | |
| Asus TUF Gaming A15 FA507UV | |
| Moyenne de la classe Gaming (15.4 - 80, n=5, 2 dernières années) | |
| Ghost of Tsushima - 1920x1080 Very High Preset AA:T | |
| Asus TUF Gaming A15 FA507UV | |
| Lenovo LOQ 15IRX9 | |
| Moyenne NVIDIA GeForce RTX 4060 Laptop GPU (55.6 - 63.4, n=5) | |
| Moyenne de la classe Gaming (28.5 - 73.7, n=7, 2 dernières années) | |
| Senua's Saga Hellblade 2 - 1920x1080 High Preset | |
| Moyenne de la classe Gaming (38.4 - 78.8, n=4, 2 dernières années) | |
| Asus TUF Gaming A15 FA507UV | |
| Moyenne NVIDIA GeForce RTX 4060 Laptop GPU (37.6 - 39.5, n=3) | |
| Lenovo LOQ 15IRX9 | |
| Dragon's Dogma 2 - 1920x1080 High Preset | |
| Moyenne de la classe Gaming (49.5 - 80, n=8, 2 dernières années) | |
| HP Victus 16 (2024) | |
| Lenovo LOQ 15IRX9 | |
| Moyenne NVIDIA GeForce RTX 4060 Laptop GPU (57.2 - 67.7, n=5) | |
| Asus TUF Gaming A15 FA507UV | |
Cyberpunk 2077 ultra FPS diagram
| Bas | Moyen | Élevé | Ultra | |
| GTA V (2015) | 182.6 | 177 | 168 | 107.2 |
| Dota 2 Reborn (2015) | 171.5 | 154.9 | 149.3 | 139.5 |
| Final Fantasy XV Benchmark (2018) | 210 | 138.8 | 100.7 | |
| X-Plane 11.11 (2018) | 135.3 | 117.5 | 91.7 | |
| Strange Brigade (2018) | 360 | 263 | 213 | 184.2 |
| Baldur's Gate 3 (2023) | 135 | 107.8 | 95.9 | 93.9 |
| Cyberpunk 2077 2.1 Phantom Liberty (2023) | 122.2 | 96.6 | 82.7 | 76.2 |
| Alone in the Dark (2024) | 159.1 | 150.1 | 143.8 | 126.9 |
| Dragon's Dogma 2 (2024) | 68.1 | 59.9 | ||
| Ghost of Tsushima (2024) | 94.1 | 83.9 | 76.9 | 62.1 |
| Senua's Saga Hellblade 2 (2024) | 66.1 | 55.1 | 39.5 | |
| F1 24 (2024) | 220 | 205 | 169.7 | 56.6 |
| The First Descendant (2024) | 155.5 | 96.8 | 79.1 | 67.6 |
Emissions et énergie - Un ordinateur portable de jeu avec une très bonne autonomie de batterie
Émissions sonores
Nous ne sommes ni positivement ni négativement surpris par la production de bruit de l'A15. Avec Cyberpunk 2077, le niveau sonore atteint 45 dB(A) ("Performance") et 56 dB(A) ("Turbo"). Le mode "Quiet" est responsable des niveaux de bruit modérés à des taux d'images encore jouables. Dans les situations quotidiennes (bureau, Internet), les deux ventilateurs fonctionnent souvent à faible vitesse et restent parfois immobiles.
Degré de la nuisance sonore
| Au repos |
| 25 / 27 / 33 dB(A) |
| Fortement sollicité |
| 40 / 46 dB(A) |
 | ||
30 dB silencieux 40 dB(A) audible 50 dB(A) bruyant |
||
min: | ||
| Asus TUF Gaming A15 FA507UV NVIDIA GeForce RTX 4060 Laptop GPU, R9 8945H, WD PC SN560 SDDPNQE-1T00 | Lenovo LOQ 15IRX9 NVIDIA GeForce RTX 4060 Laptop GPU, i5-13450HX, Micron 2400 MTFDKCD1T0QFM | HP Victus 16 (2024) NVIDIA GeForce RTX 4060 Laptop GPU, i7-14700HX, Kioxia XG8 KXG80ZNV512G | Gigabyte G6X 9KG (2024) NVIDIA GeForce RTX 4060 Laptop GPU, i7-13650HX, Gigabyte AG450E1024-SI | SCHENKER XMG Core 15 (M24) NVIDIA GeForce RTX 4060 Laptop GPU, R7 8845HS, Samsung 990 Pro 1 TB | Dell G16, i7-13650HX, RTX 4060 NVIDIA GeForce RTX 4060 Laptop GPU, i7-13650HX, WD PC SN740 SDDPNQD-1T00 | Asus TUF A15 FA507 NVIDIA GeForce RTX 4050 Laptop GPU, R7 7735HS, Micron 2400 MTFDKBA512QFM | |
|---|---|---|---|---|---|---|---|
| Noise | -11% | -6% | -16% | 5% | 12% | 15% | |
| off / environment * | 25 | 25 -0% | 25 -0% | 26 -4% | 23 8% | 23 8% | 23.3 7% |
| Idle Minimum * | 25 | 26 -4% | 28 -12% | 30 -20% | 23 8% | 23 8% | 23.3 7% |
| Idle Average * | 27 | 34 -26% | 29 -7% | 32 -19% | 23 15% | 23 15% | 23.3 14% |
| Idle Maximum * | 33 | 36 -9% | 33 -0% | 35 -6% | 23 30% | 27.96 15% | 23.3 29% |
| Load Average * | 40 | 48 -20% | 45 -13% | 51 -28% | 38.92 3% | 27.96 30% | 29.6 26% |
| Cyberpunk 2077 ultra * | 45 | 48 -7% | 52.06 -16% | ||||
| Load Maximum * | 46 | 50 -9% | 48 -4% | 54 -17% | 52.09 -13% | 47.89 -4% | 43 7% |
| Witcher 3 ultra * | 43 | 51 | 50.96 | 47.89 | 43 |
* ... Moindre est la valeur, meilleures sont les performances
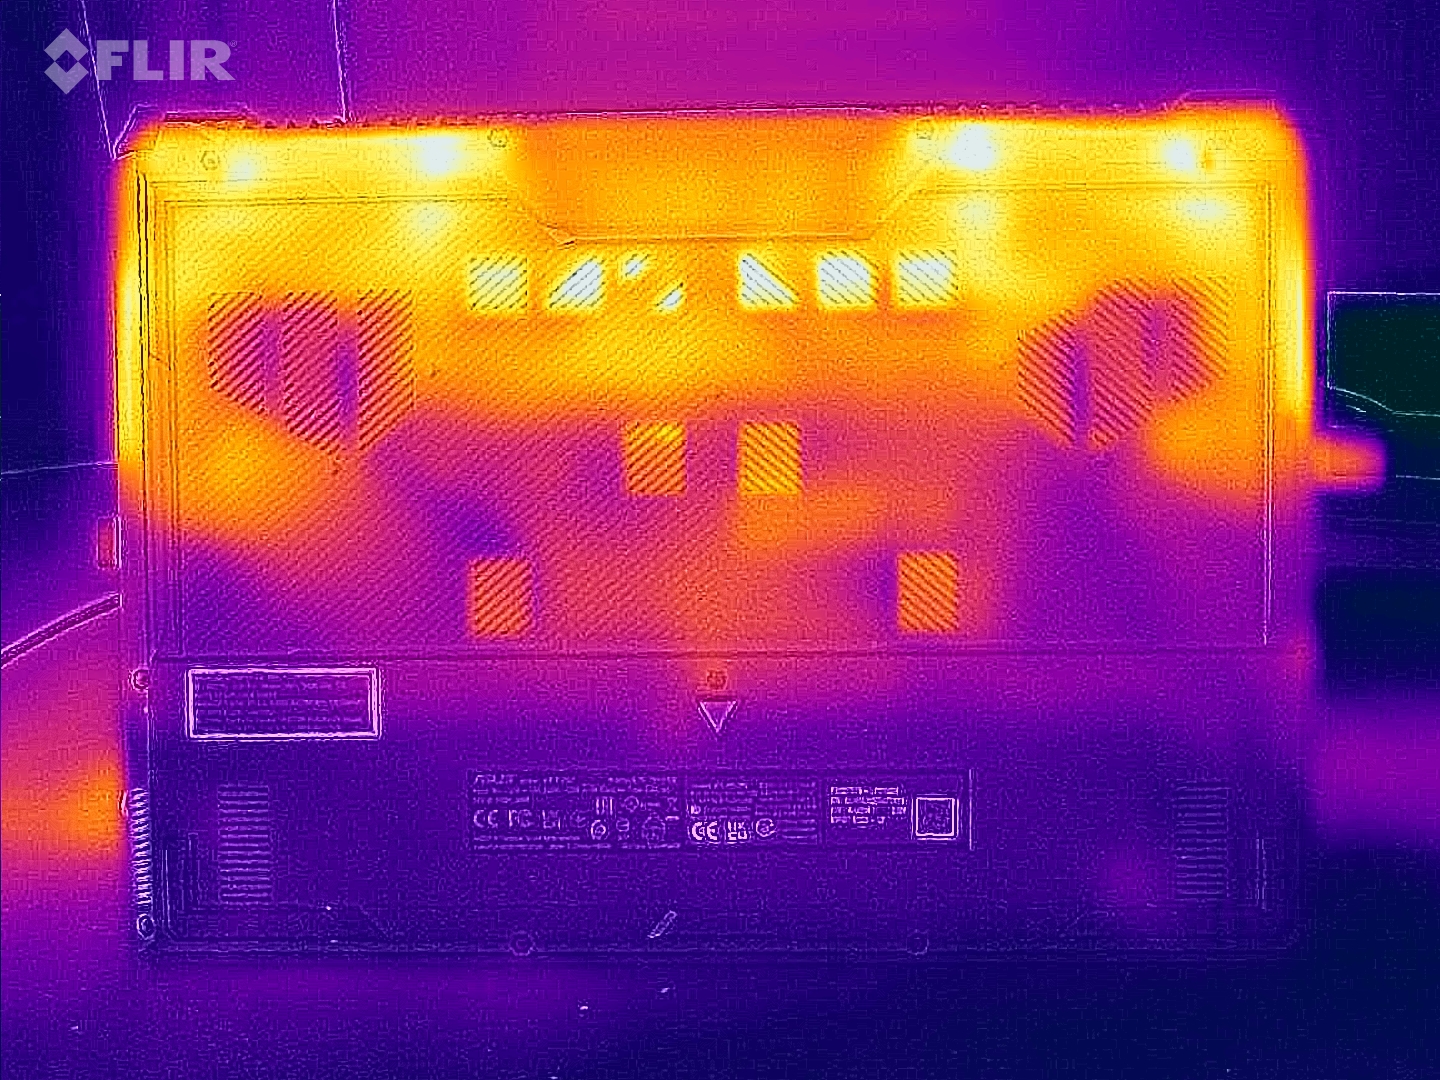
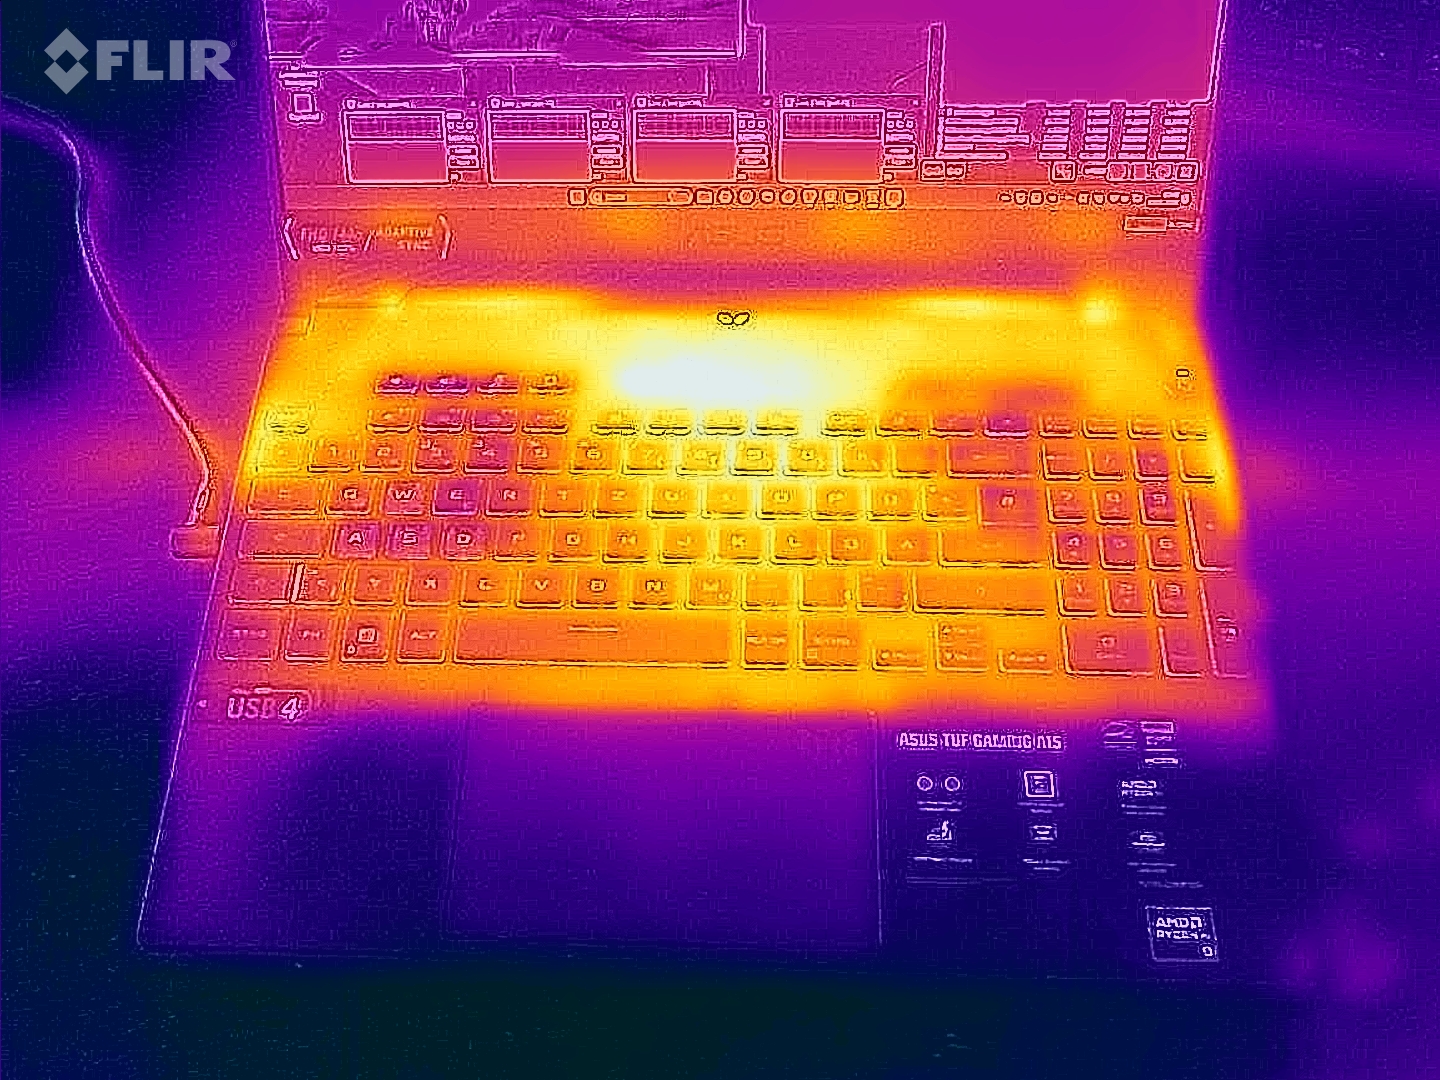
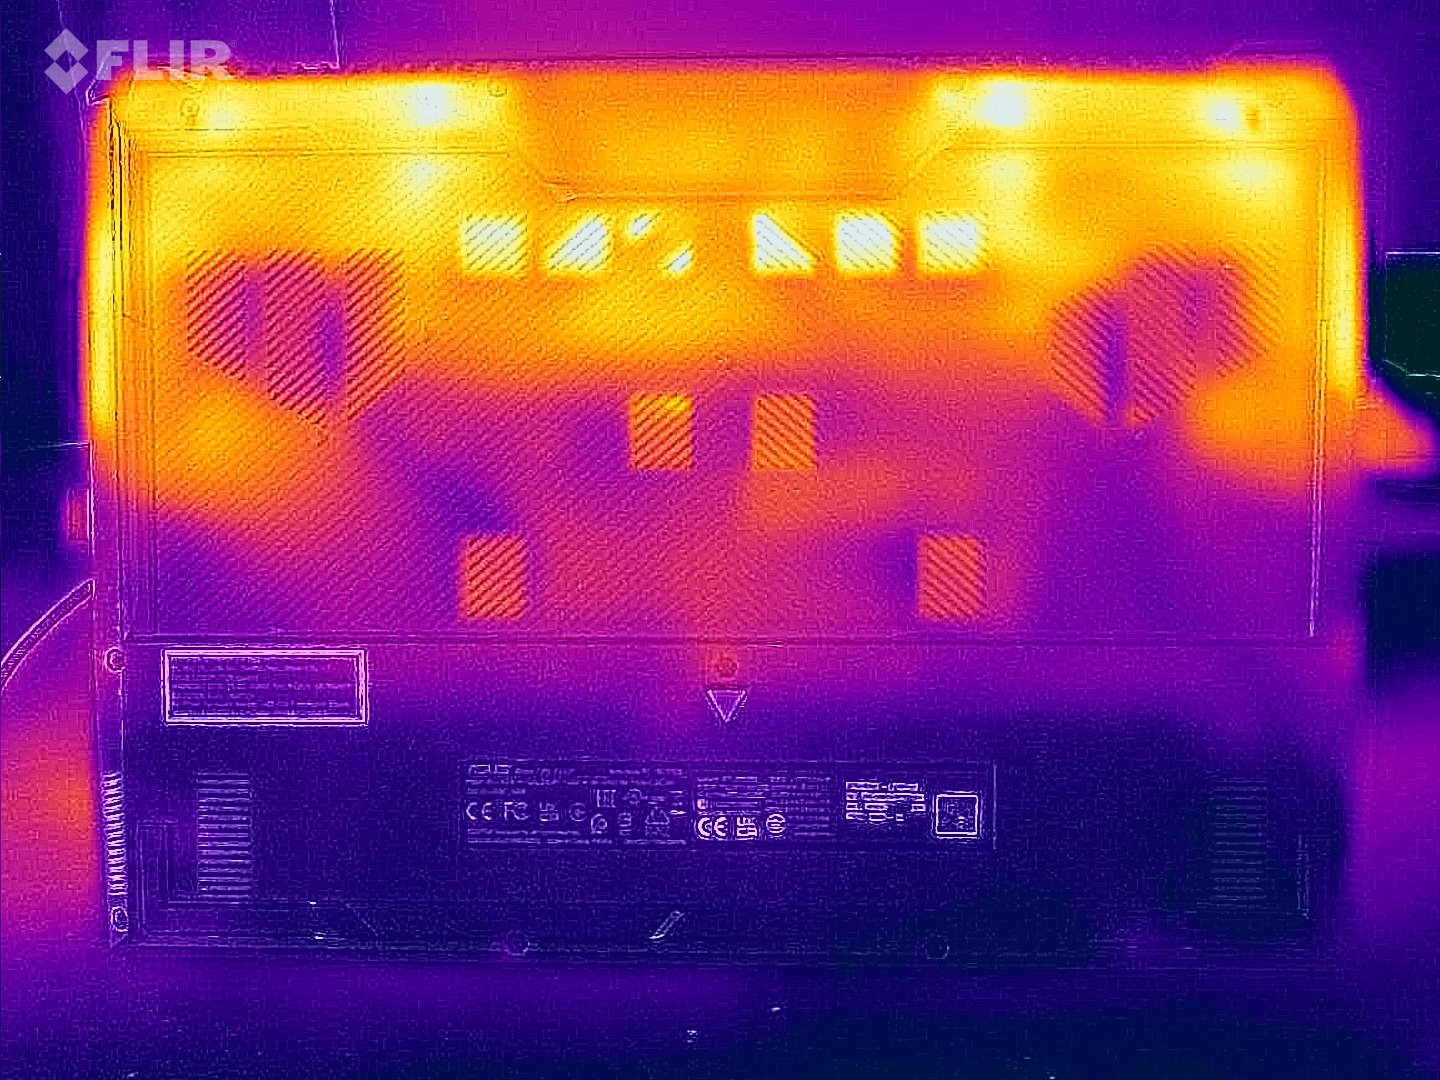
Température
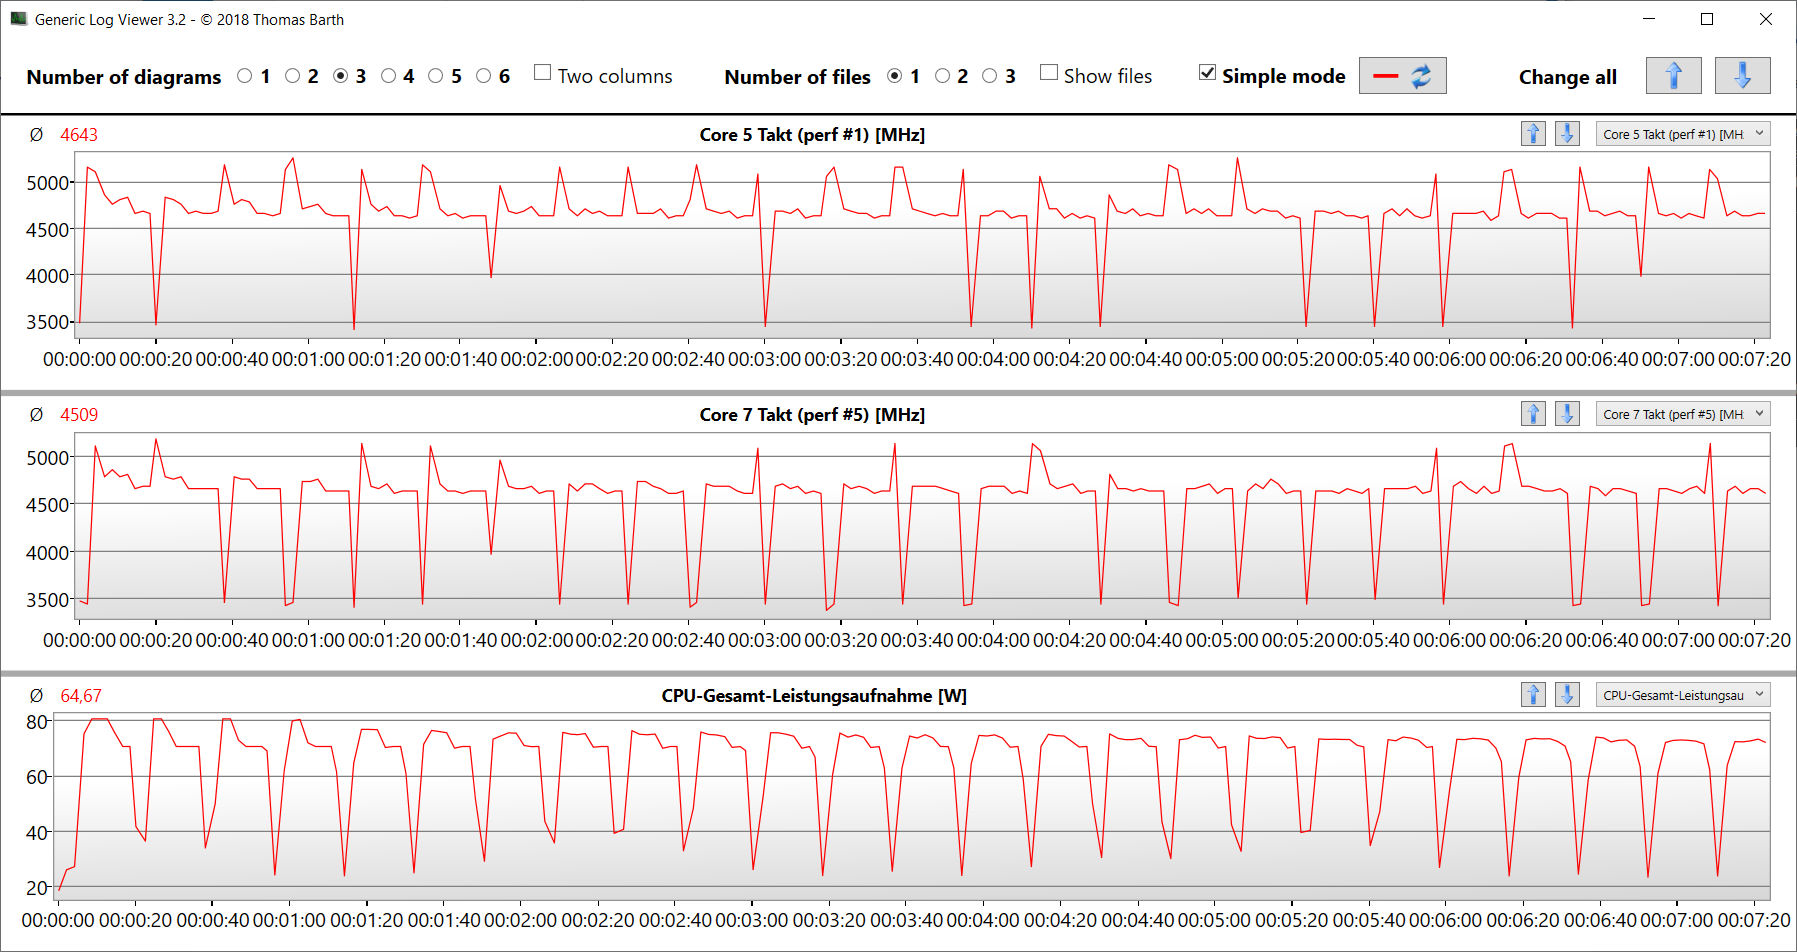
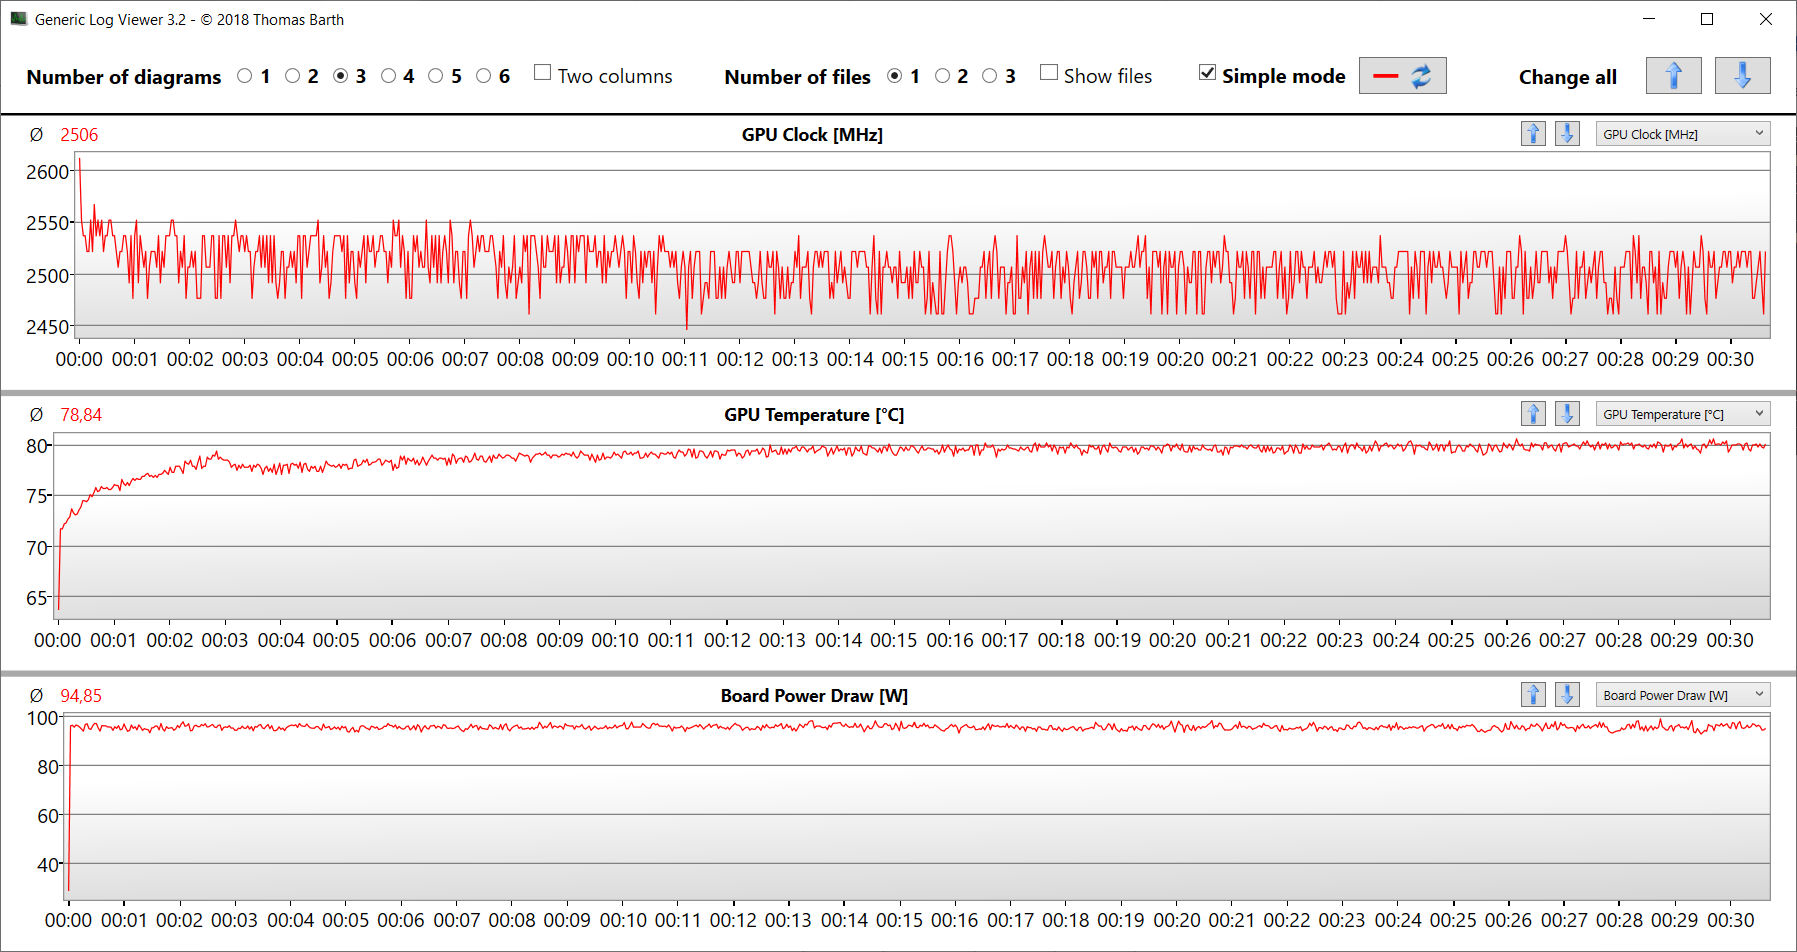
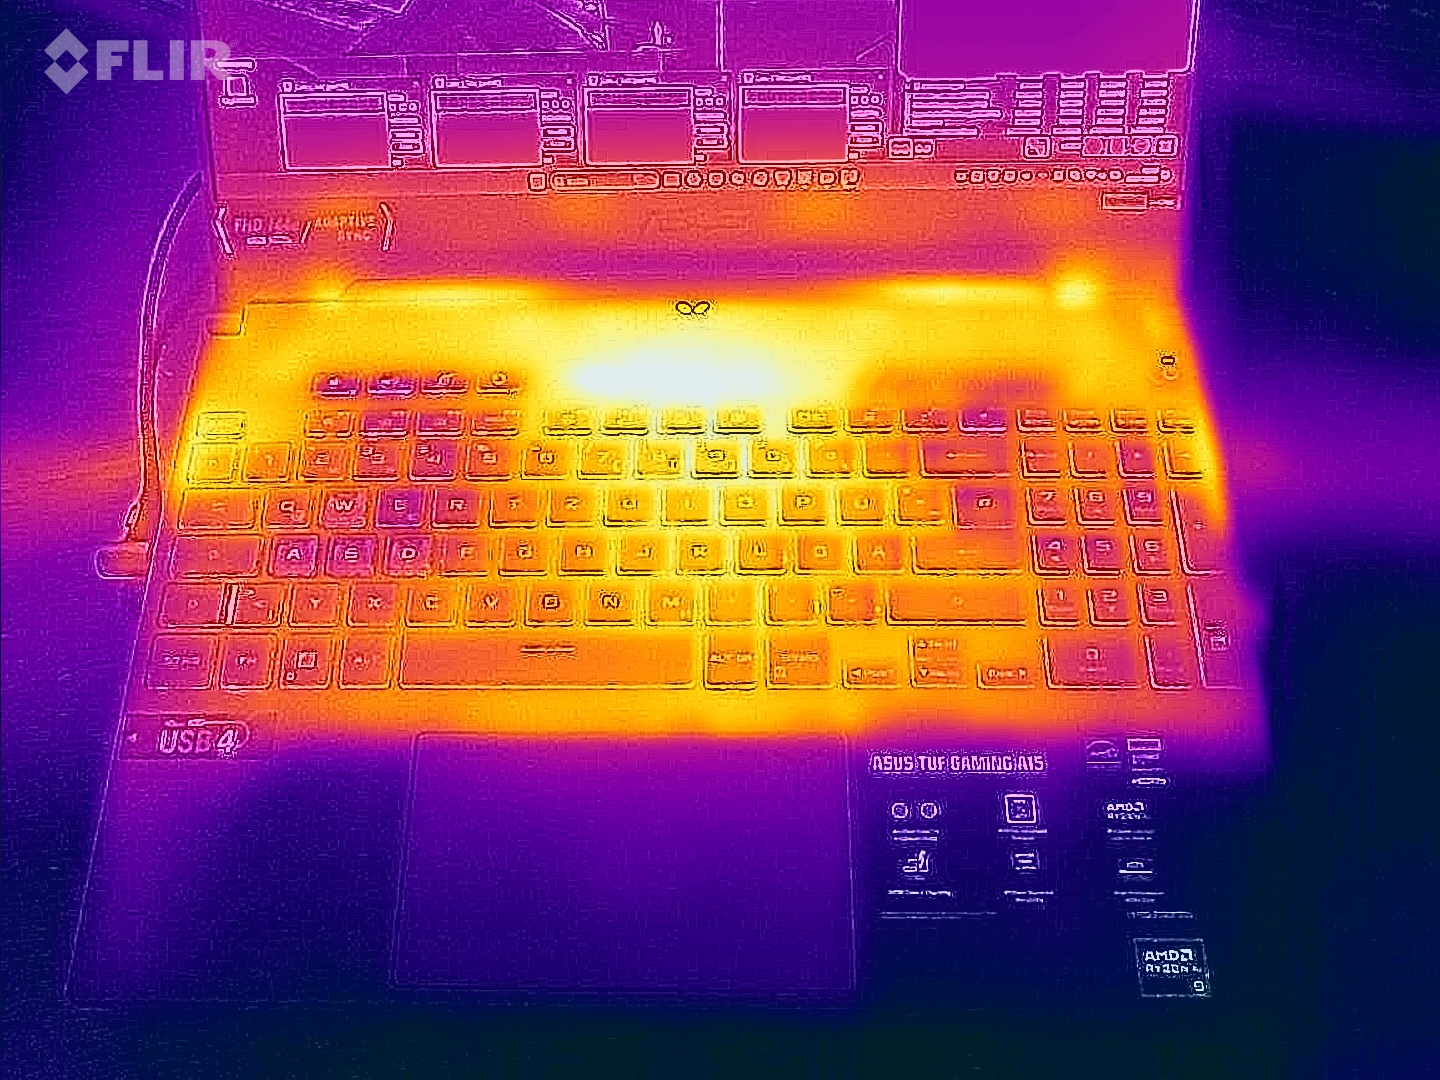
L'ordinateur portable chauffe sensiblement : Cyberpunk et le test de stress provoquent des températures de plus de 50 degrés Celsius à certains endroits. Dans les cas d'utilisation quotidienne (bureau, internet), les chiffres sont supérieurs à la moyenne. Les températures du repose-mains sont modérées.
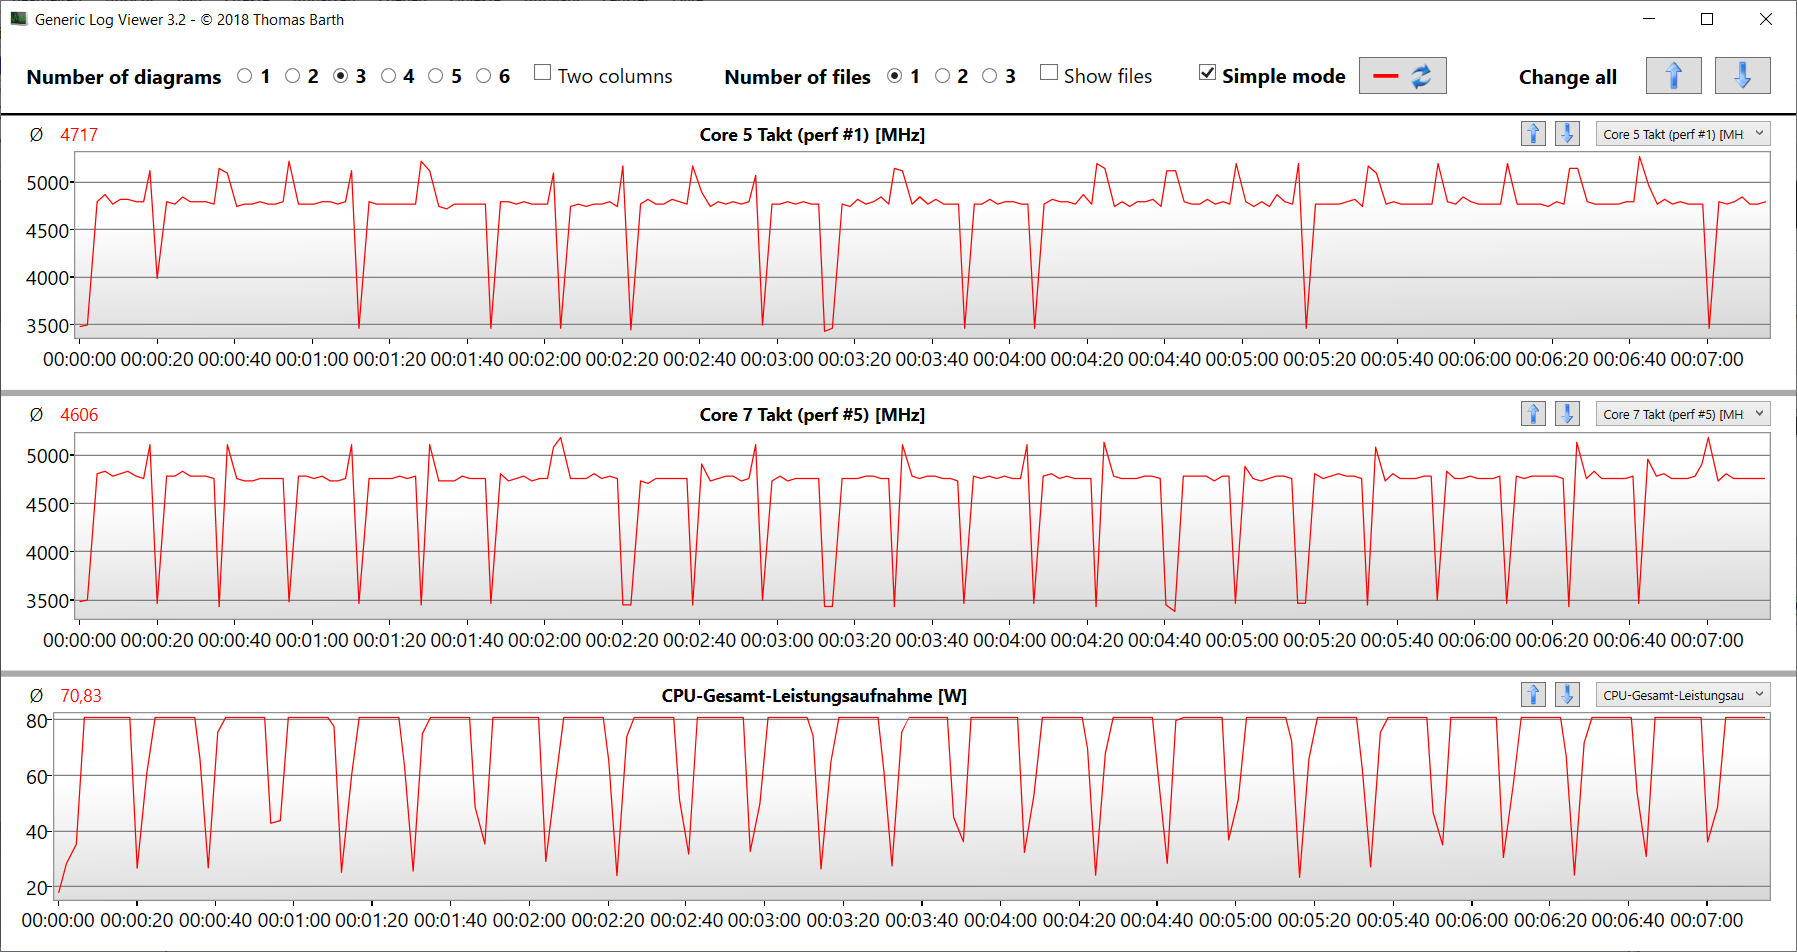
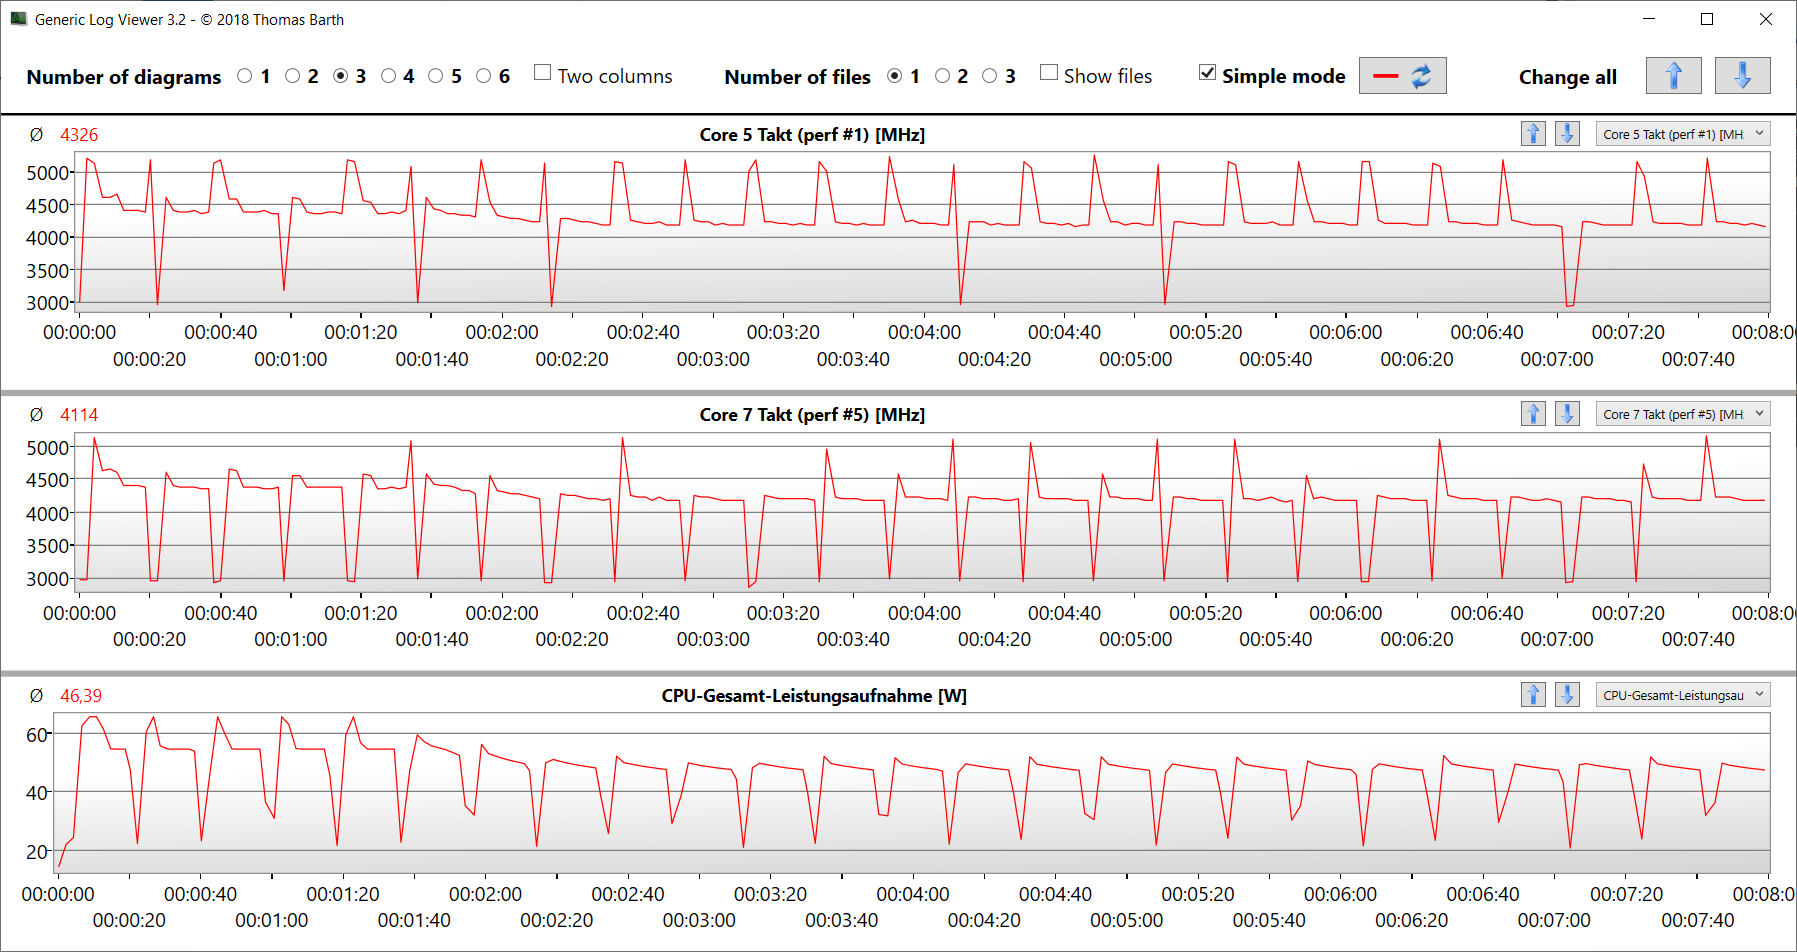
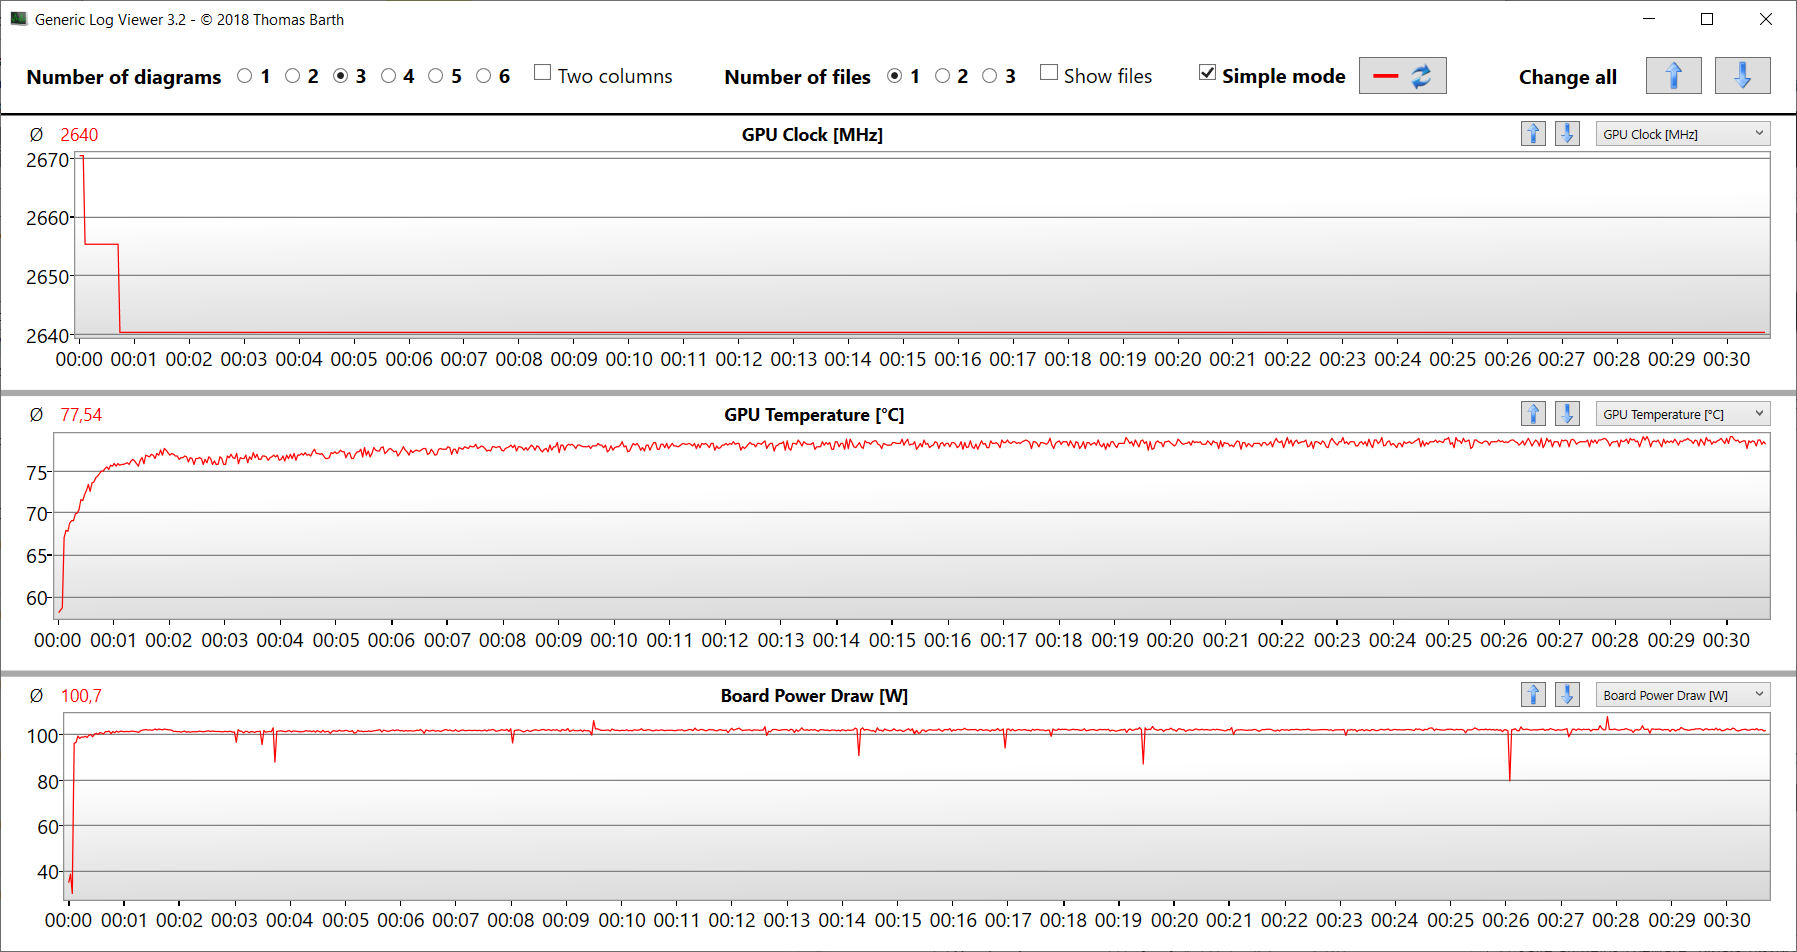
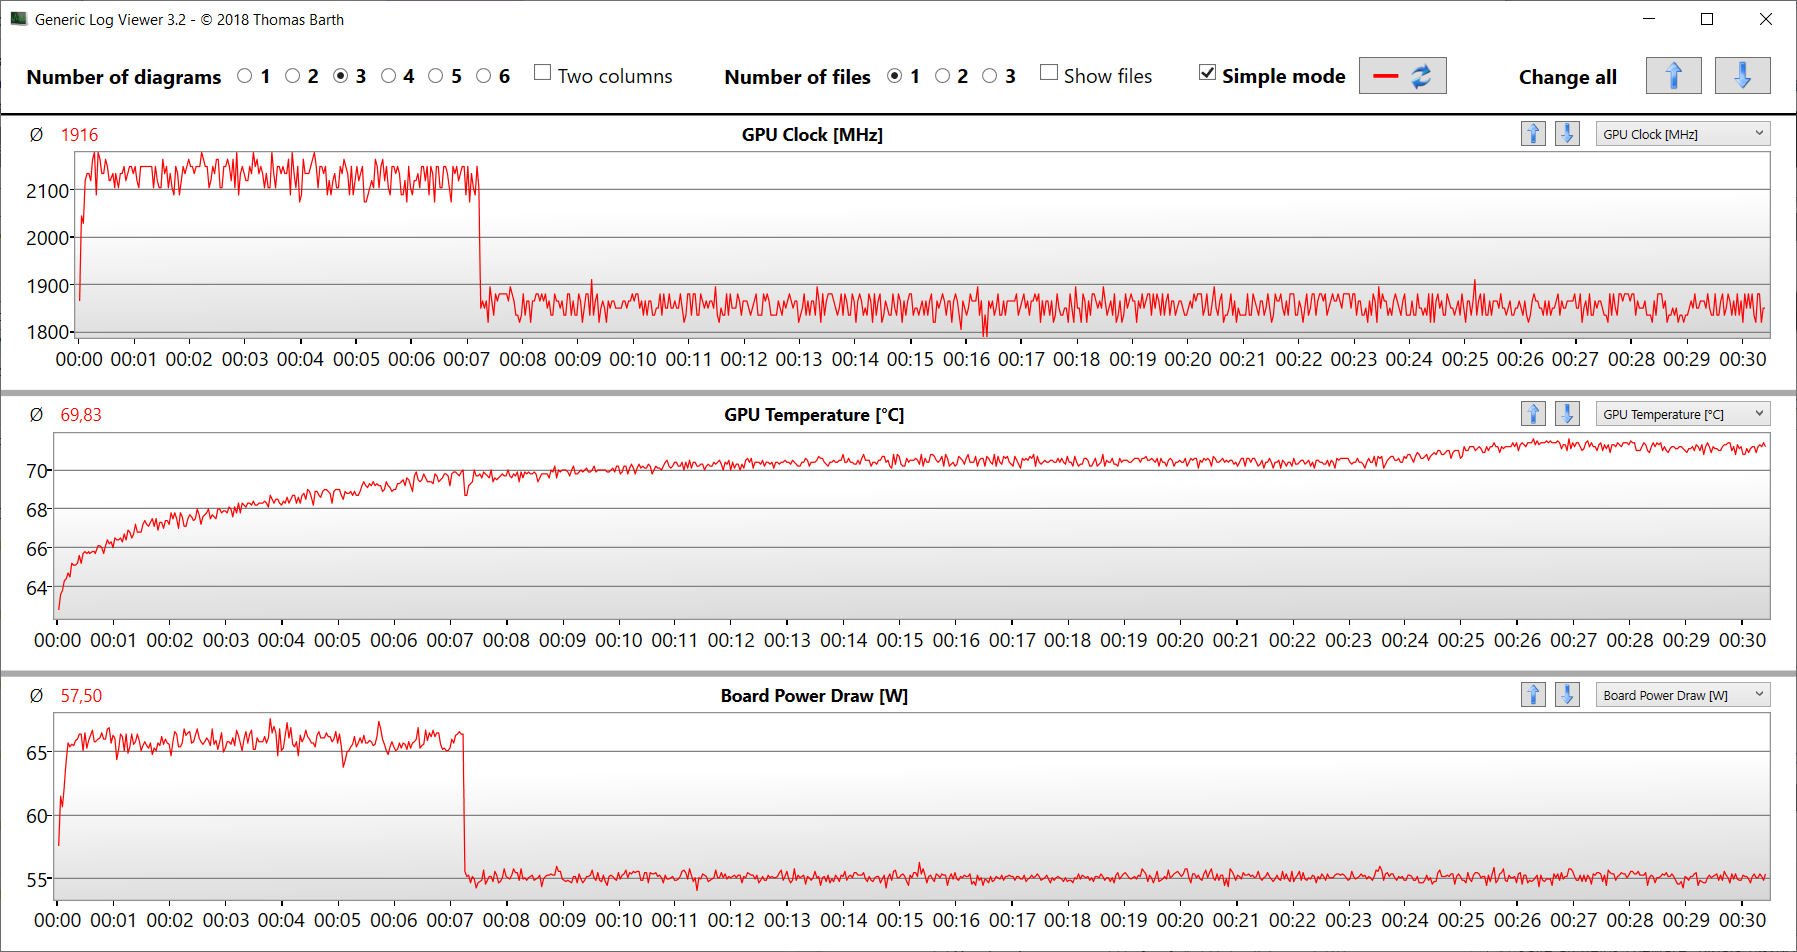
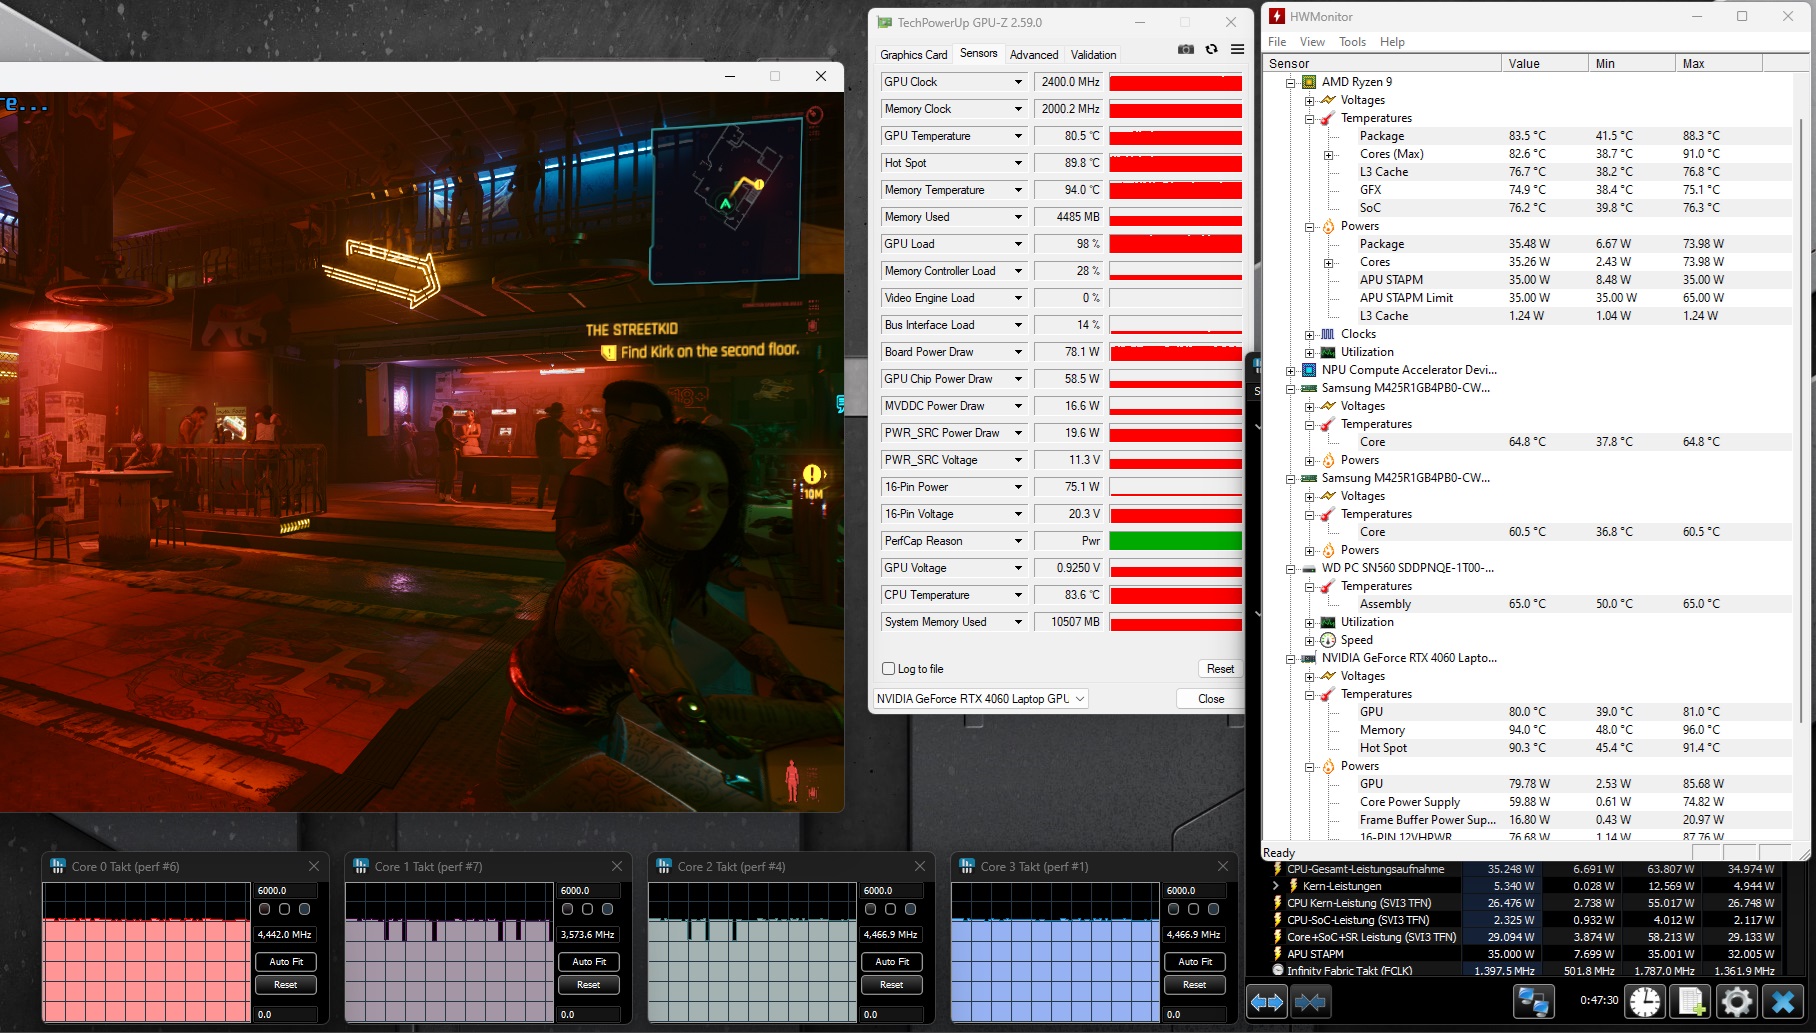
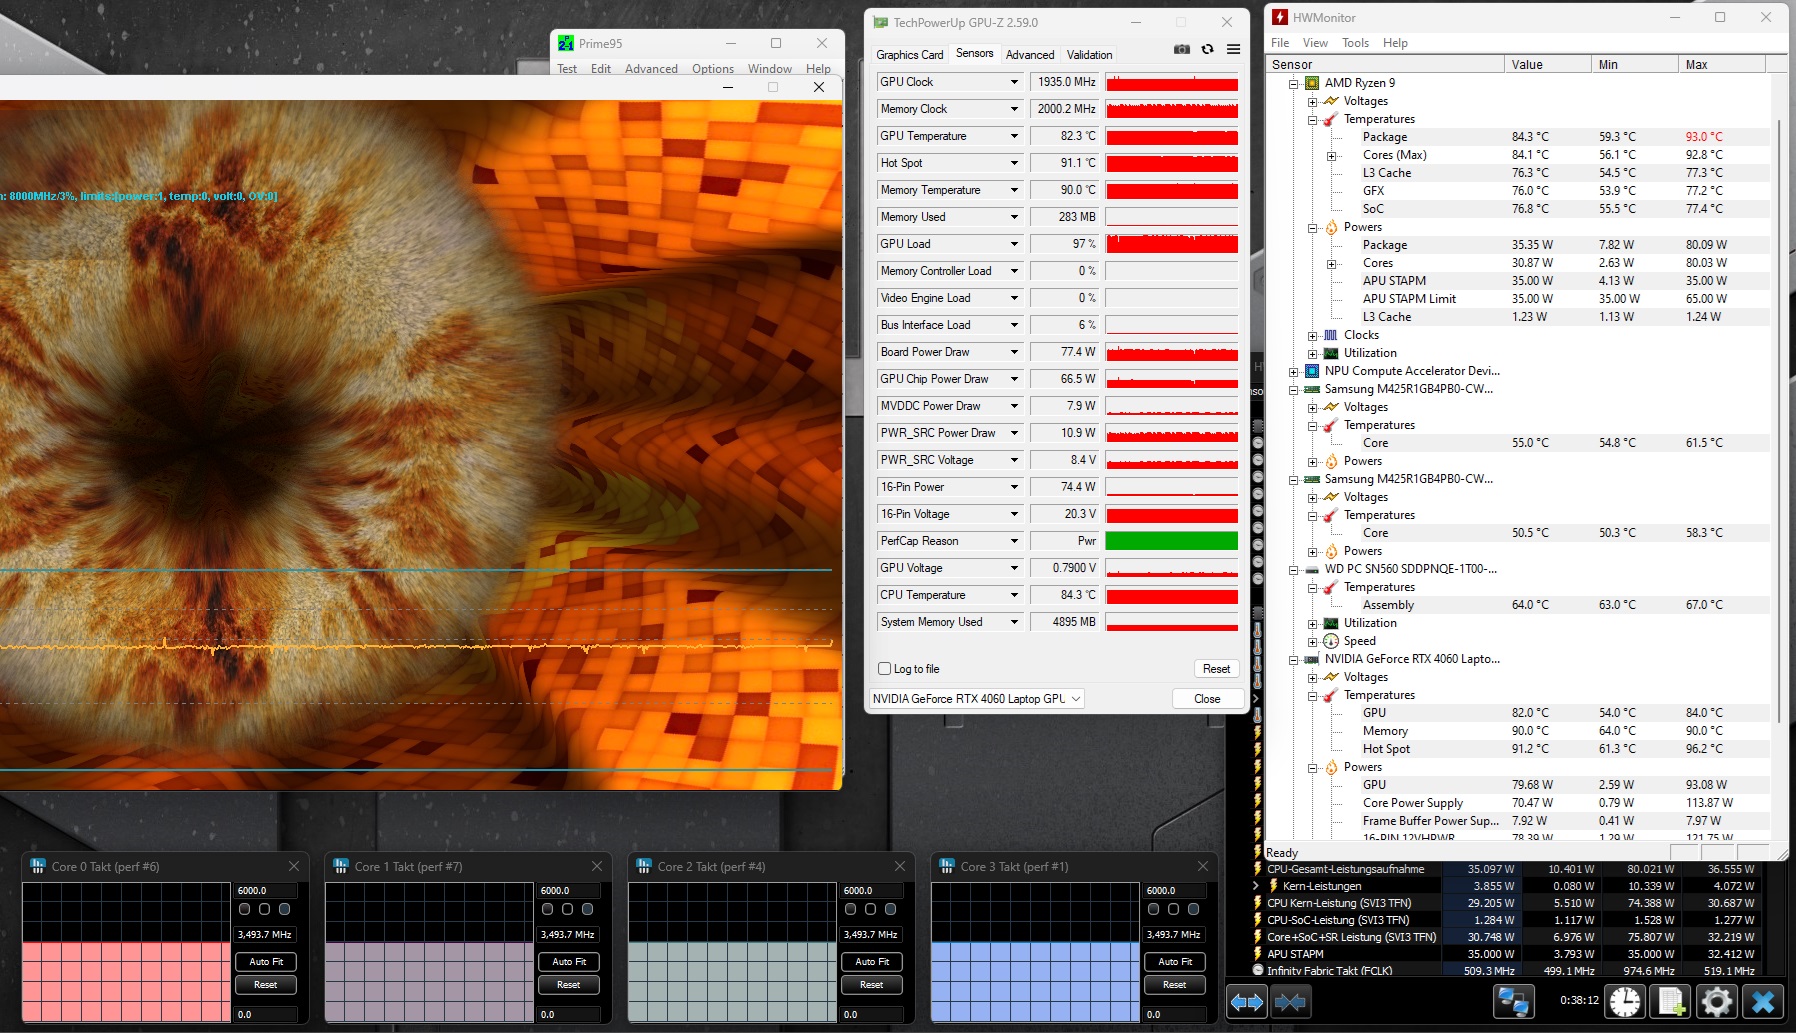
Le test de stress du scénario extrême (Prime95 et Furmark en fonctionnement continu) vérifie la stabilité du système à pleine charge. Les vitesses d'horloge élevées du CPU et du GPU chutent dès la première minute du test à 3,5 GHz (CPU) et 1,9 GHz (GPU), respectivement, et se maintiennent à ce niveau.
(-) La température maximale du côté supérieur est de 53 °C / 127 F, par rapport à la moyenne de 40.4 °C / 105 F, allant de 21.2 à 68.8 °C pour la classe Gaming.
(-) Le fond chauffe jusqu'à un maximum de 46 °C / 115 F, contre une moyenne de 43.2 °C / 110 F
(+) En utilisation inactive, la température moyenne du côté supérieur est de 29.9 °C / 86 F, par rapport à la moyenne du dispositif de 33.9 °C / 93 F.
(-) 3: The average temperature for the upper side is 41.9 °C / 107 F, compared to the average of 33.9 °C / 93 F for the class Gaming.
(+) Les repose-poignets et le pavé tactile atteignent la température maximale de la peau (35 °C / 95 F) et ne sont donc pas chauds.
(-) La température moyenne de la zone de l'appui-paume de dispositifs similaires était de 28.9 °C / 84 F (-6.1 °C / #-11 F).
| Asus TUF Gaming A15 FA507UV AMD Ryzen 9 8945H, NVIDIA GeForce RTX 4060 Laptop GPU | Lenovo LOQ 15IRX9 Intel Core i5-13450HX, NVIDIA GeForce RTX 4060 Laptop GPU | HP Victus 16 (2024) Intel Core i7-14700HX, NVIDIA GeForce RTX 4060 Laptop GPU | Gigabyte G6X 9KG (2024) Intel Core i7-13650HX, NVIDIA GeForce RTX 4060 Laptop GPU | SCHENKER XMG Core 15 (M24) AMD Ryzen 7 8845HS, NVIDIA GeForce RTX 4060 Laptop GPU | Dell G16, i7-13650HX, RTX 4060 Intel Core i7-13650HX, NVIDIA GeForce RTX 4060 Laptop GPU | Asus TUF A15 FA507 AMD Ryzen 7 7735HS, NVIDIA GeForce RTX 4050 Laptop GPU | |
|---|---|---|---|---|---|---|---|
| Heat | -5% | 11% | 5% | -14% | -8% | 11% | |
| Maximum Upper Side * | 53 | 47 11% | 50 6% | 41 23% | 52 2% | 49 8% | 48.9 8% |
| Maximum Bottom * | 46 | 58 -26% | 50 -9% | 43 7% | 61 -33% | 58 -26% | 44.6 3% |
| Idle Upper Side * | 32 | 32 -0% | 25 22% | 32 -0% | 35 -9% | 35 -9% | 27.1 15% |
| Idle Bottom * | 34 | 36 -6% | 26 24% | 37 -9% | 39 -15% | 35 -3% | 27.5 19% |
* ... Moindre est la valeur, meilleures sont les performances
Intervenants
Dans l'ensemble, les haut-parleurs stéréo produisent un son correct. Les basses pourraient être un peu plus prononcées.
Asus TUF Gaming A15 FA507UV analyse audio
(+) | les haut-parleurs peuvent jouer relativement fort (82# dB)
Bass 100 - 315 Hz
(±) | basse réduite - en moyenne 6.8% inférieure à la médiane
(±) | la linéarité des basses est moyenne (7.1% delta à la fréquence précédente)
Mids 400 - 2000 Hz
(±) | médiane supérieure - en moyenne 7.8% supérieure à la médiane
(±) | la linéarité des médiums est moyenne (7% delta à la fréquence précédente)
Aiguës 2 - 16 kHz
(+) | des sommets équilibrés - à seulement 2.4% de la médiane
(±) | la linéarité des aigus est moyenne (7.6% delta à la fréquence précédente)
Overall 100 - 16.000 Hz
(+) | le son global est linéaire (13.1% différence à la médiane)
Par rapport à la même classe
» 17% de tous les appareils testés de cette catégorie étaient meilleurs, 4% similaires, 79% pires
» Le meilleur avait un delta de 6%, la moyenne était de 18%, le pire était de 132%.
Par rapport à tous les appareils testés
» 11% de tous les appareils testés étaient meilleurs, 3% similaires, 87% pires
» Le meilleur avait un delta de 4%, la moyenne était de 25%, le pire était de 134%.
Lenovo LOQ 15IRX9 analyse audio
(±) | le niveau sonore du haut-parleur est moyen mais bon (81# dB)
Bass 100 - 315 Hz
(±) | basse réduite - en moyenne 14.6% inférieure à la médiane
(±) | la linéarité des basses est moyenne (9.6% delta à la fréquence précédente)
Mids 400 - 2000 Hz
(+) | médiane équilibrée - seulement 2.1% de la médiane
(+) | les médiums sont linéaires (3.6% delta à la fréquence précédente)
Aiguës 2 - 16 kHz
(±) | sommets plus élevés - en moyenne 5.9% plus élevés que la médiane
(±) | la linéarité des aigus est moyenne (8.2% delta à la fréquence précédente)
Overall 100 - 16.000 Hz
(+) | le son global est linéaire (14.7% différence à la médiane)
Par rapport à la même classe
» 27% de tous les appareils testés de cette catégorie étaient meilleurs, 7% similaires, 66% pires
» Le meilleur avait un delta de 6%, la moyenne était de 18%, le pire était de 132%.
Par rapport à tous les appareils testés
» 16% de tous les appareils testés étaient meilleurs, 4% similaires, 80% pires
» Le meilleur avait un delta de 4%, la moyenne était de 25%, le pire était de 134%.
Consommation électrique
En ce qui concerne la consommation d'énergie, il n'y a rien d'étrange à signaler. Les valeurs sont à un niveau normal pour le matériel installé. Cyberpunk et - plus tard - le test de stress ont fonctionné avec une consommation d'énergie constante. Le bloc d'alimentation (240 watts) est bien dimensionné.
| Éteint/en veille | |
| Au repos | |
| Fortement sollicité |
|
Power consumption Cyberpunk / stress test
Power consumption with an extrnal monitor
Durée de vie de la batterie
L'appareil de 15,6 pouces a obtenu une autonomie de 11 heures et 42 minutes lors d'un test Wi-Fi en conditions réelles (image de la charge lors de l'accès à des sites web exécutant un script), ce qui est un excellent chiffre. Cela le place au même niveau que le modèle A15 de l'année dernière.
Points positifs
Points négatifs
Verdict - Un jeu polyvalent

L'accent est mis sur les jeux en FHD, mais le rendu et le streaming ne posent aucun problème à l'appareil. Ryzen 9 8945H et GeForce RTX 4060 fournissent la puissance nécessaire et les deux puces peuvent tourner à des vitesses d'horloge élevées. L'écran 15.6 pouces (FHD, 144 Hz, G-Sync, sRGB) ne présente aucune faiblesse.
Avec le TUF Gaming A15 FA507UV, Asus a livré un ordinateur portable de jeu FHD bien équilibré avec une autonomie de batterie impressionnante.
Dans certains endroits, l'ordinateur chauffe sensiblement et devient assez bruyant. En sélectionnant le mode, vous obtiendrez un bon compromis entre les performances et le bruit, et la perte de performances qui en résulte n'est pas significative.
L'affiche de l'A15 est sa formidable autonomie : Une autonomie de près de 12 heures en conditions réelles est généralement réservée aux ordinateurs portables de bureau ou aux subnotebooks. Il est possible d'alimenter la batterie via un bloc d'alimentation USB-C - l'un des deux ports USB-C (USB 3.2 Gen 2, USB 4) prend en charge Power Delivery, ce qui signifie que vous n'avez pas nécessairement besoin de trimballer le bloc d'alimentation propriétaire.
Une alternative pourrait être le Lenovo LOQ 15IRX9. Il offre une puissance de calcul légèrement inférieure, n'est pas équipé de l'USB 4 et offre une autonomie de batterie nettement inférieure. Cependant, il a une longueur d'avance en ce qui concerne le prix : Le LOQ peut le LOQ peut être le vôtre pour seulement 999 $.
Prix et disponibilité
L'Asus TUF Gaming A15 FA507UV est actuellement (au 17.07.24) disponible pour environ 1 399 $ (512 Go SSD) sur Amazon.
Note : Nous avons récemment mis à jour notre système d'évaluation et les résultats de la version 8 ne sont pas comparables à ceux de la version 7. De plus amples informations sont disponibles ici.
Asus TUF Gaming A15 FA507UV
-
07/17/2024 v8
Sascha Mölck
 Total Sustainability Score:
 Transparency
The present review sample was made available to the author as a loan by the manufacturer or a shop for the purposes of review. The lender had no influence on this review, nor did the manufacturer receive a copy of this review before publication. There was no obligation to publish this review.
Price comparison

