

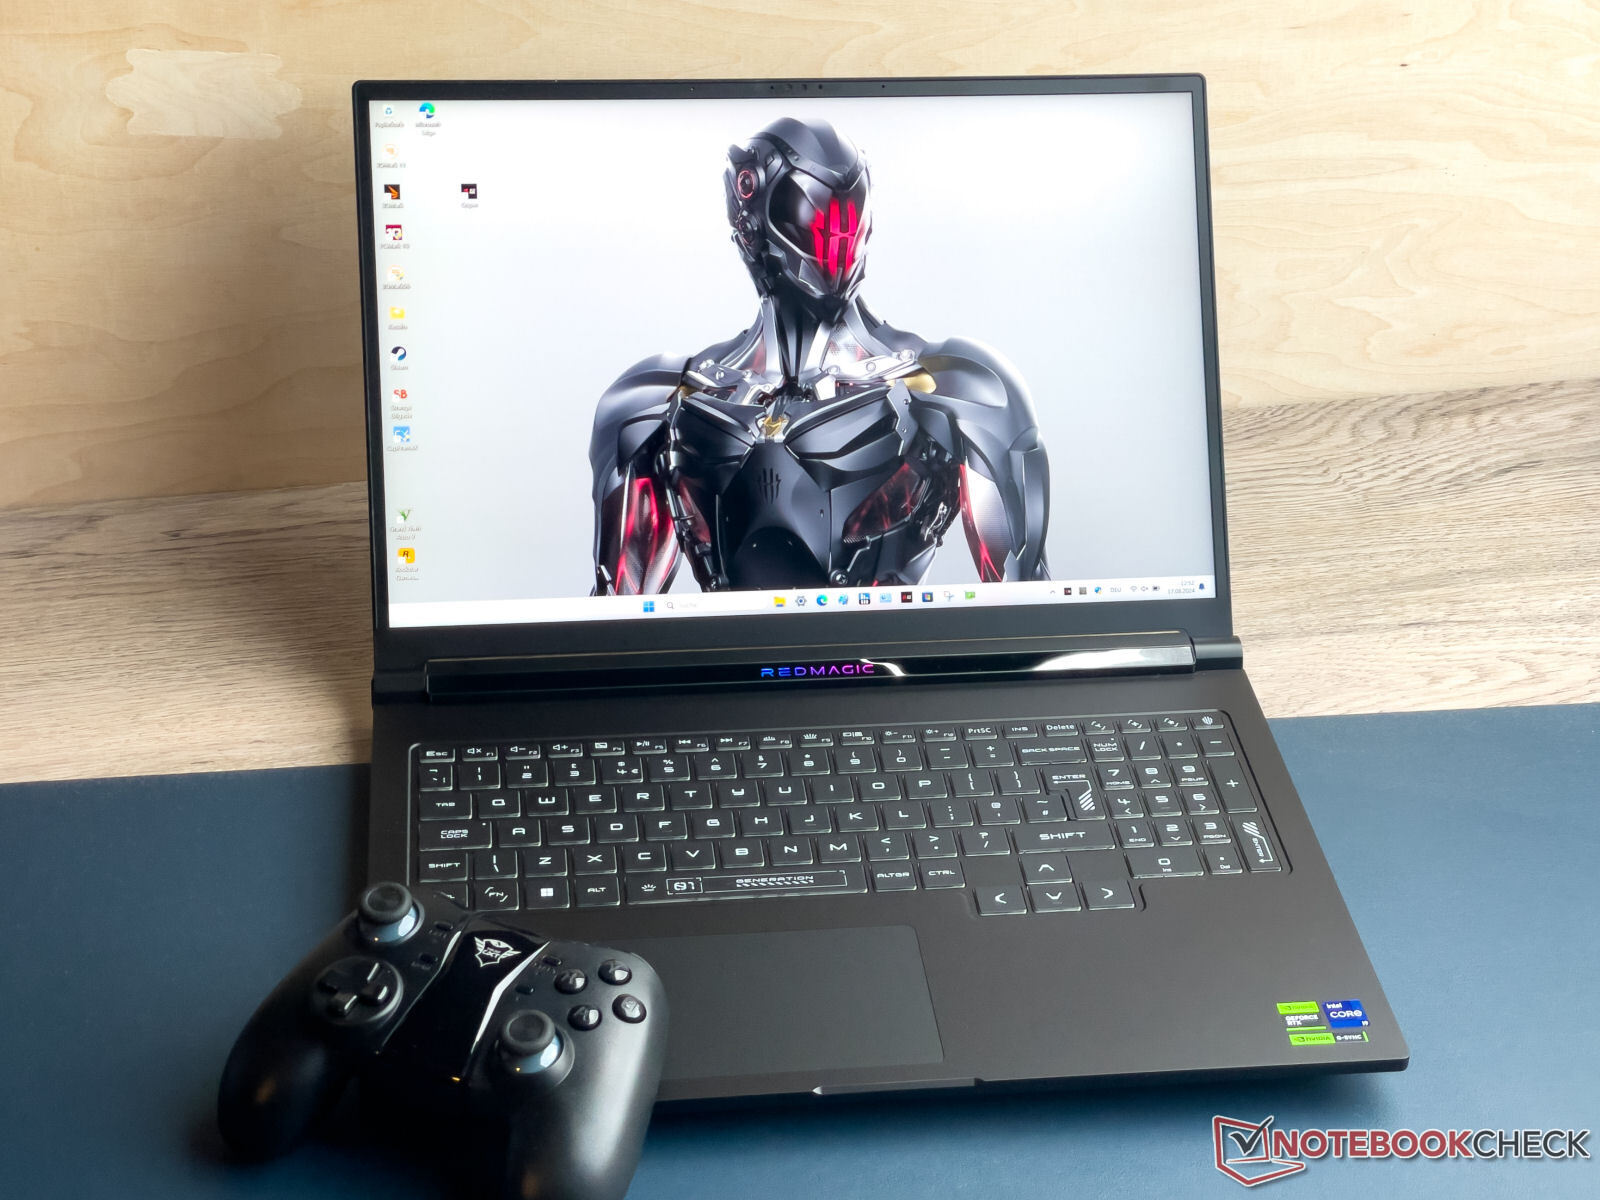
Test du RedMagic Titan 16 Pro : PC portable de jeu conçu par un fabricant de smartphones

Les visiteurs réguliers de ce site Web connaissent peut-être déjà la marque "RedMagic" dans le segment des smartphones de jeu (par exemple le Nubia RedMagic 9 Pro). Le RedMagic Titan 16 Pro est la première incursion de Nubia dans le monde des ordinateurs portables de jeu. Sa fiche technique est sans surprise : A Core i9-14900HX est associé à une GeForce RTX 4060. À cela s'ajoutent un écran de 16 pouces au format 16:10, Thunderbolt 4, de la RAM DDR5 et 2 emplacements pour disques SSD.
Il reste à voir si Nubia peut s'imposer face à une concurrence déjà bien établie. Le Titan est en concurrence avec les appareils suivants : Le Lenovo Legion Pro 5 16IRX9, HP Victus 16 (2024), Acer Predator Helios Neo 16 (2024), XMG Pro 16 Studio (Mid 24) et le Gigabyte G6X 9KG (2024).
Comparaison avec les concurrents potentiels
Note | Version | Date | Modèle | Poids | Épaisseur | Taille | Résolution | Prix |
|---|---|---|---|---|---|---|---|---|
| 81.2 % | v8 | 08/24 | Nubia RedMagic Titan 16 Pro i9-14900HX, NVIDIA GeForce RTX 4060 Laptop GPU | 2.4 kg | 23.9 mm | 16.00" | 2560x1600 | |
| 82.3 % | v8 | 07/24 | Lenovo Legion Pro 5 16IRX9 G9 i7-14700HX, NVIDIA GeForce RTX 4060 Laptop GPU | 2.5 kg | 26.55 mm | 16.00" | 2560x1600 | |
| 84.3 % v7 (old) | v7 (old) | 05/24 | HP Victus 16 (2024) i7-14700HX, NVIDIA GeForce RTX 4060 Laptop GPU | 2.4 kg | 23.9 mm | 16.10" | 1920x1080 | |
| 86.8 % v7 (old) | v7 (old) | 05/24 | Acer Predator Helios Neo 16 (2024) i7-14700HX, NVIDIA GeForce RTX 4070 Laptop GPU | 2.6 kg | 25.95 mm | 16.00" | 2560x1600 | |
| 81.2 % | v8 | 07/24 | SCHENKER XMG Pro 16 Studio (Mid 24) i9-14900HX, NVIDIA GeForce RTX 4070 Laptop GPU | 2.3 kg | 19.9 mm | 16.00" | 2560x1600 | |
| 83.2 % v7 (old) | v7 (old) | 03/24 | Gigabyte G6X 9KG (2024) i7-13650HX, NVIDIA GeForce RTX 4060 Laptop GPU | 2.6 kg | 25.1 mm | 16.00" | 1920x1200 |
Veuillez noter que nous avons récemment mis à jour notre système d'évaluation et que les résultats de la version 8 ne sont pas comparables à ceux de la version 7. Vous trouverez de plus amples informations ici.
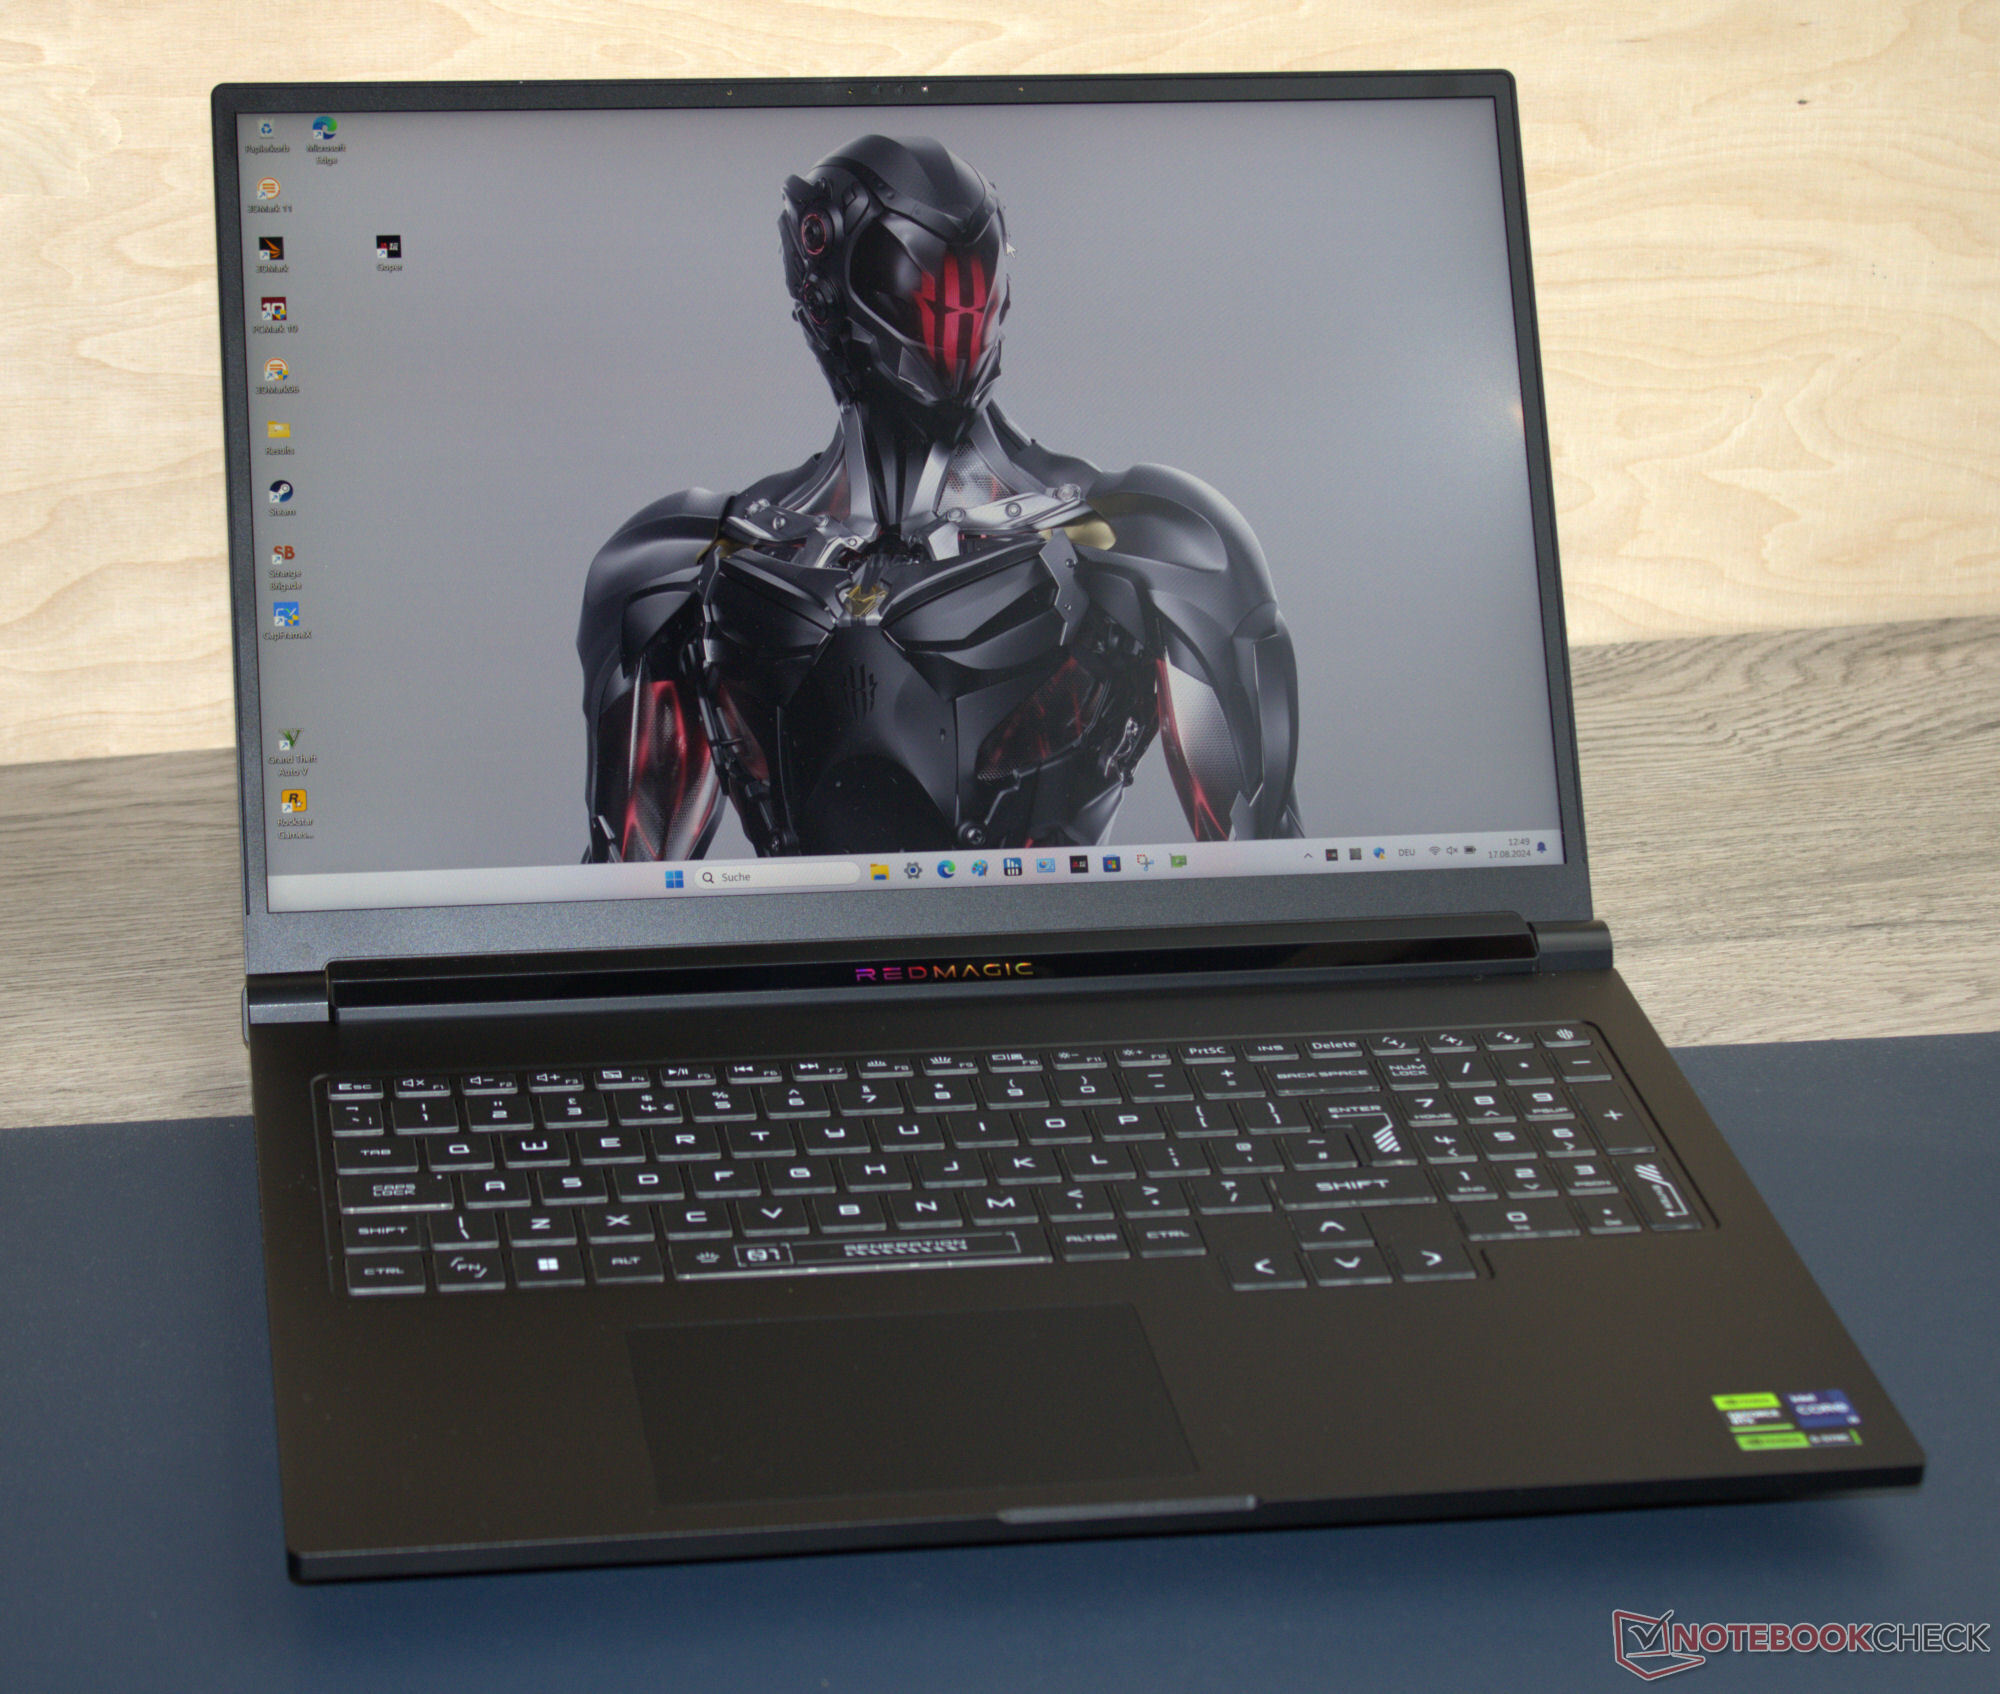
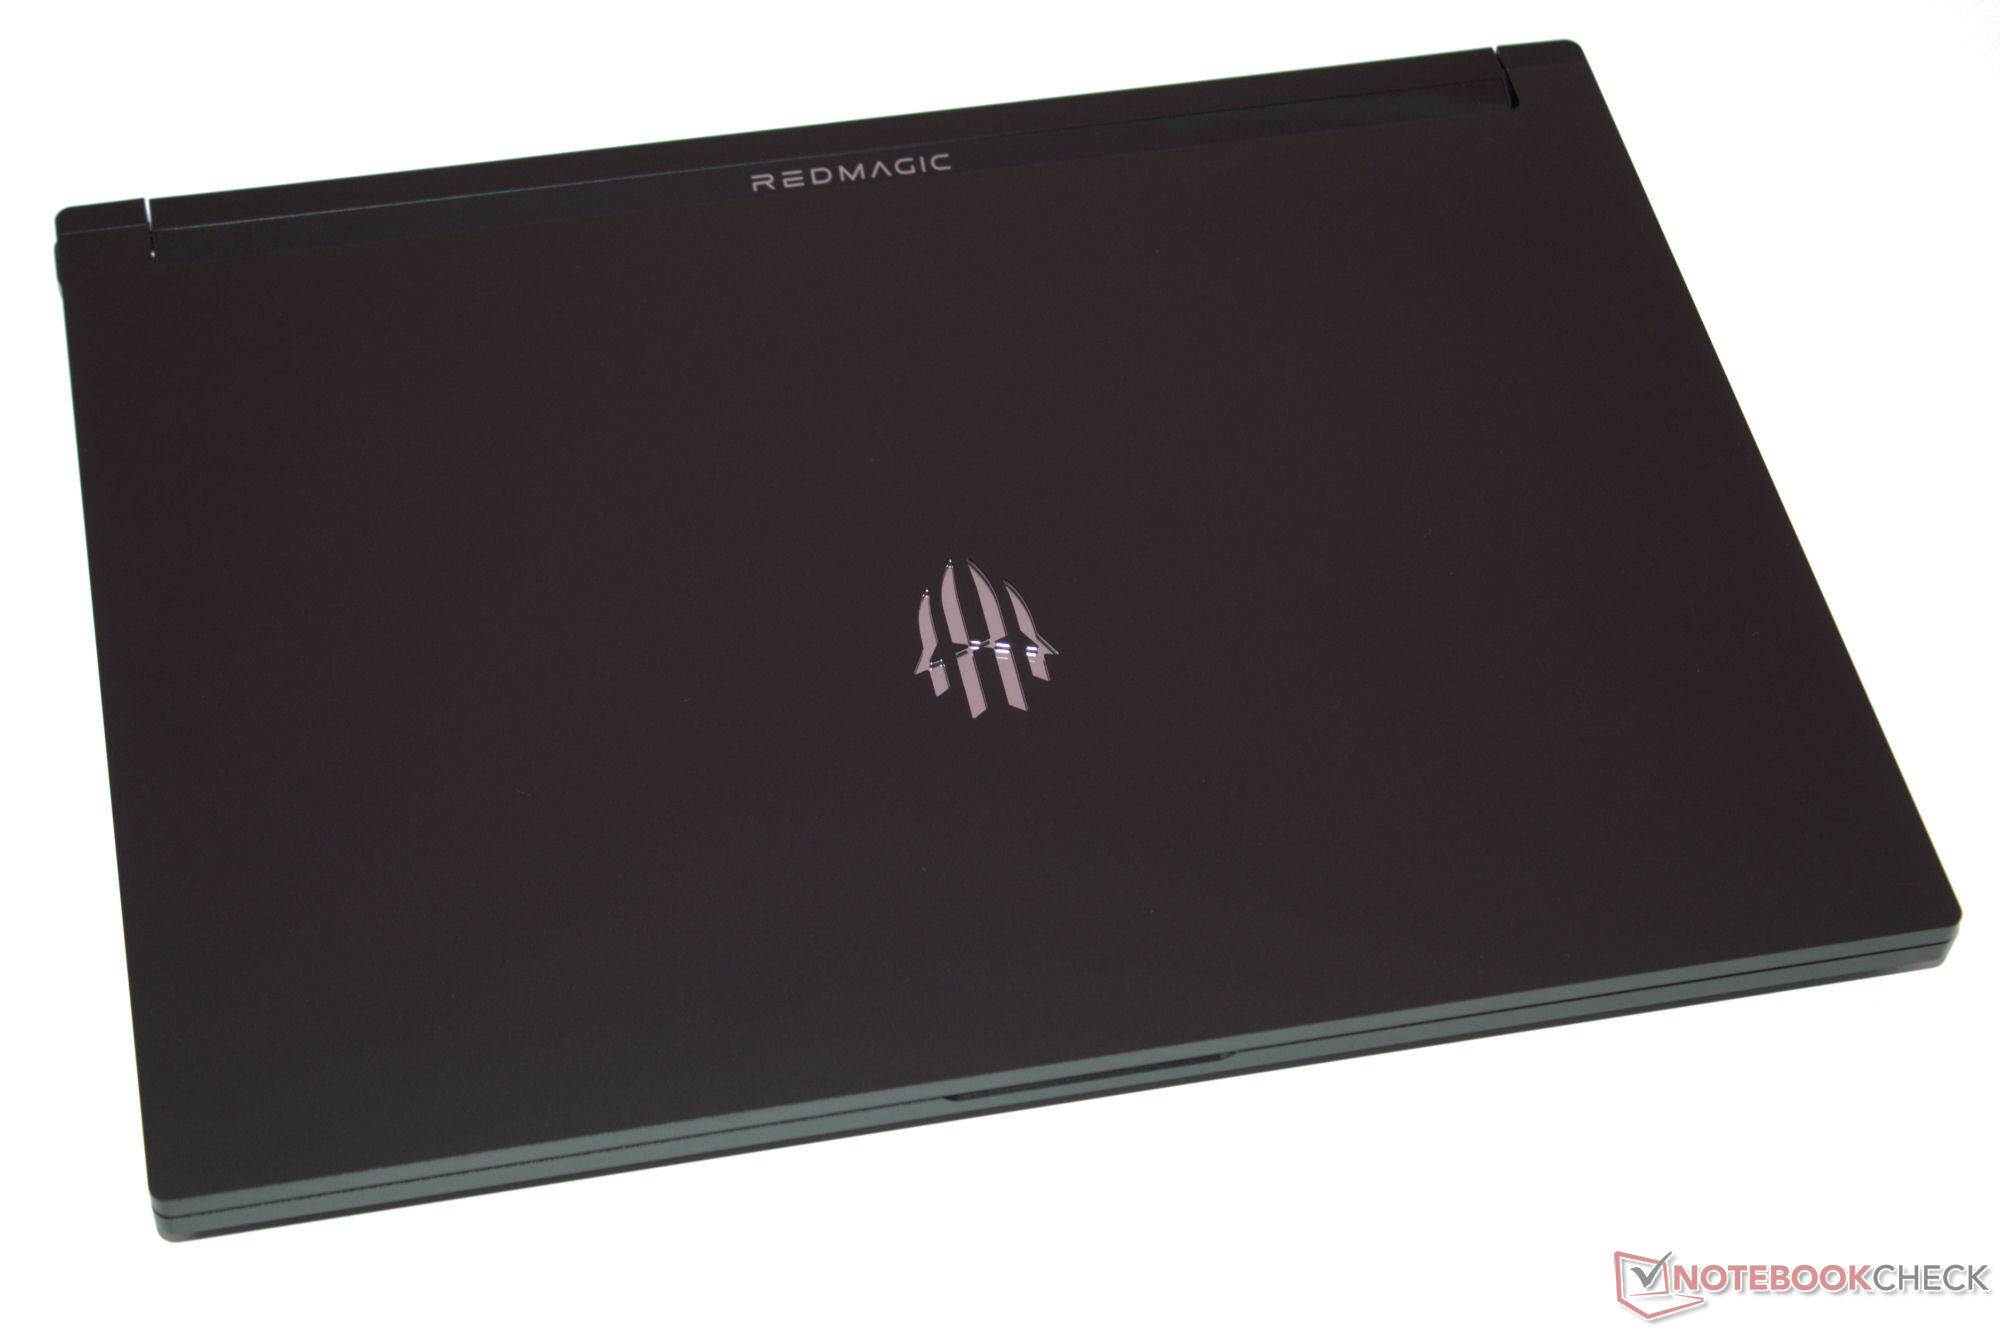
Boîtier - Nubia a opté pour un boîtier en aluminium
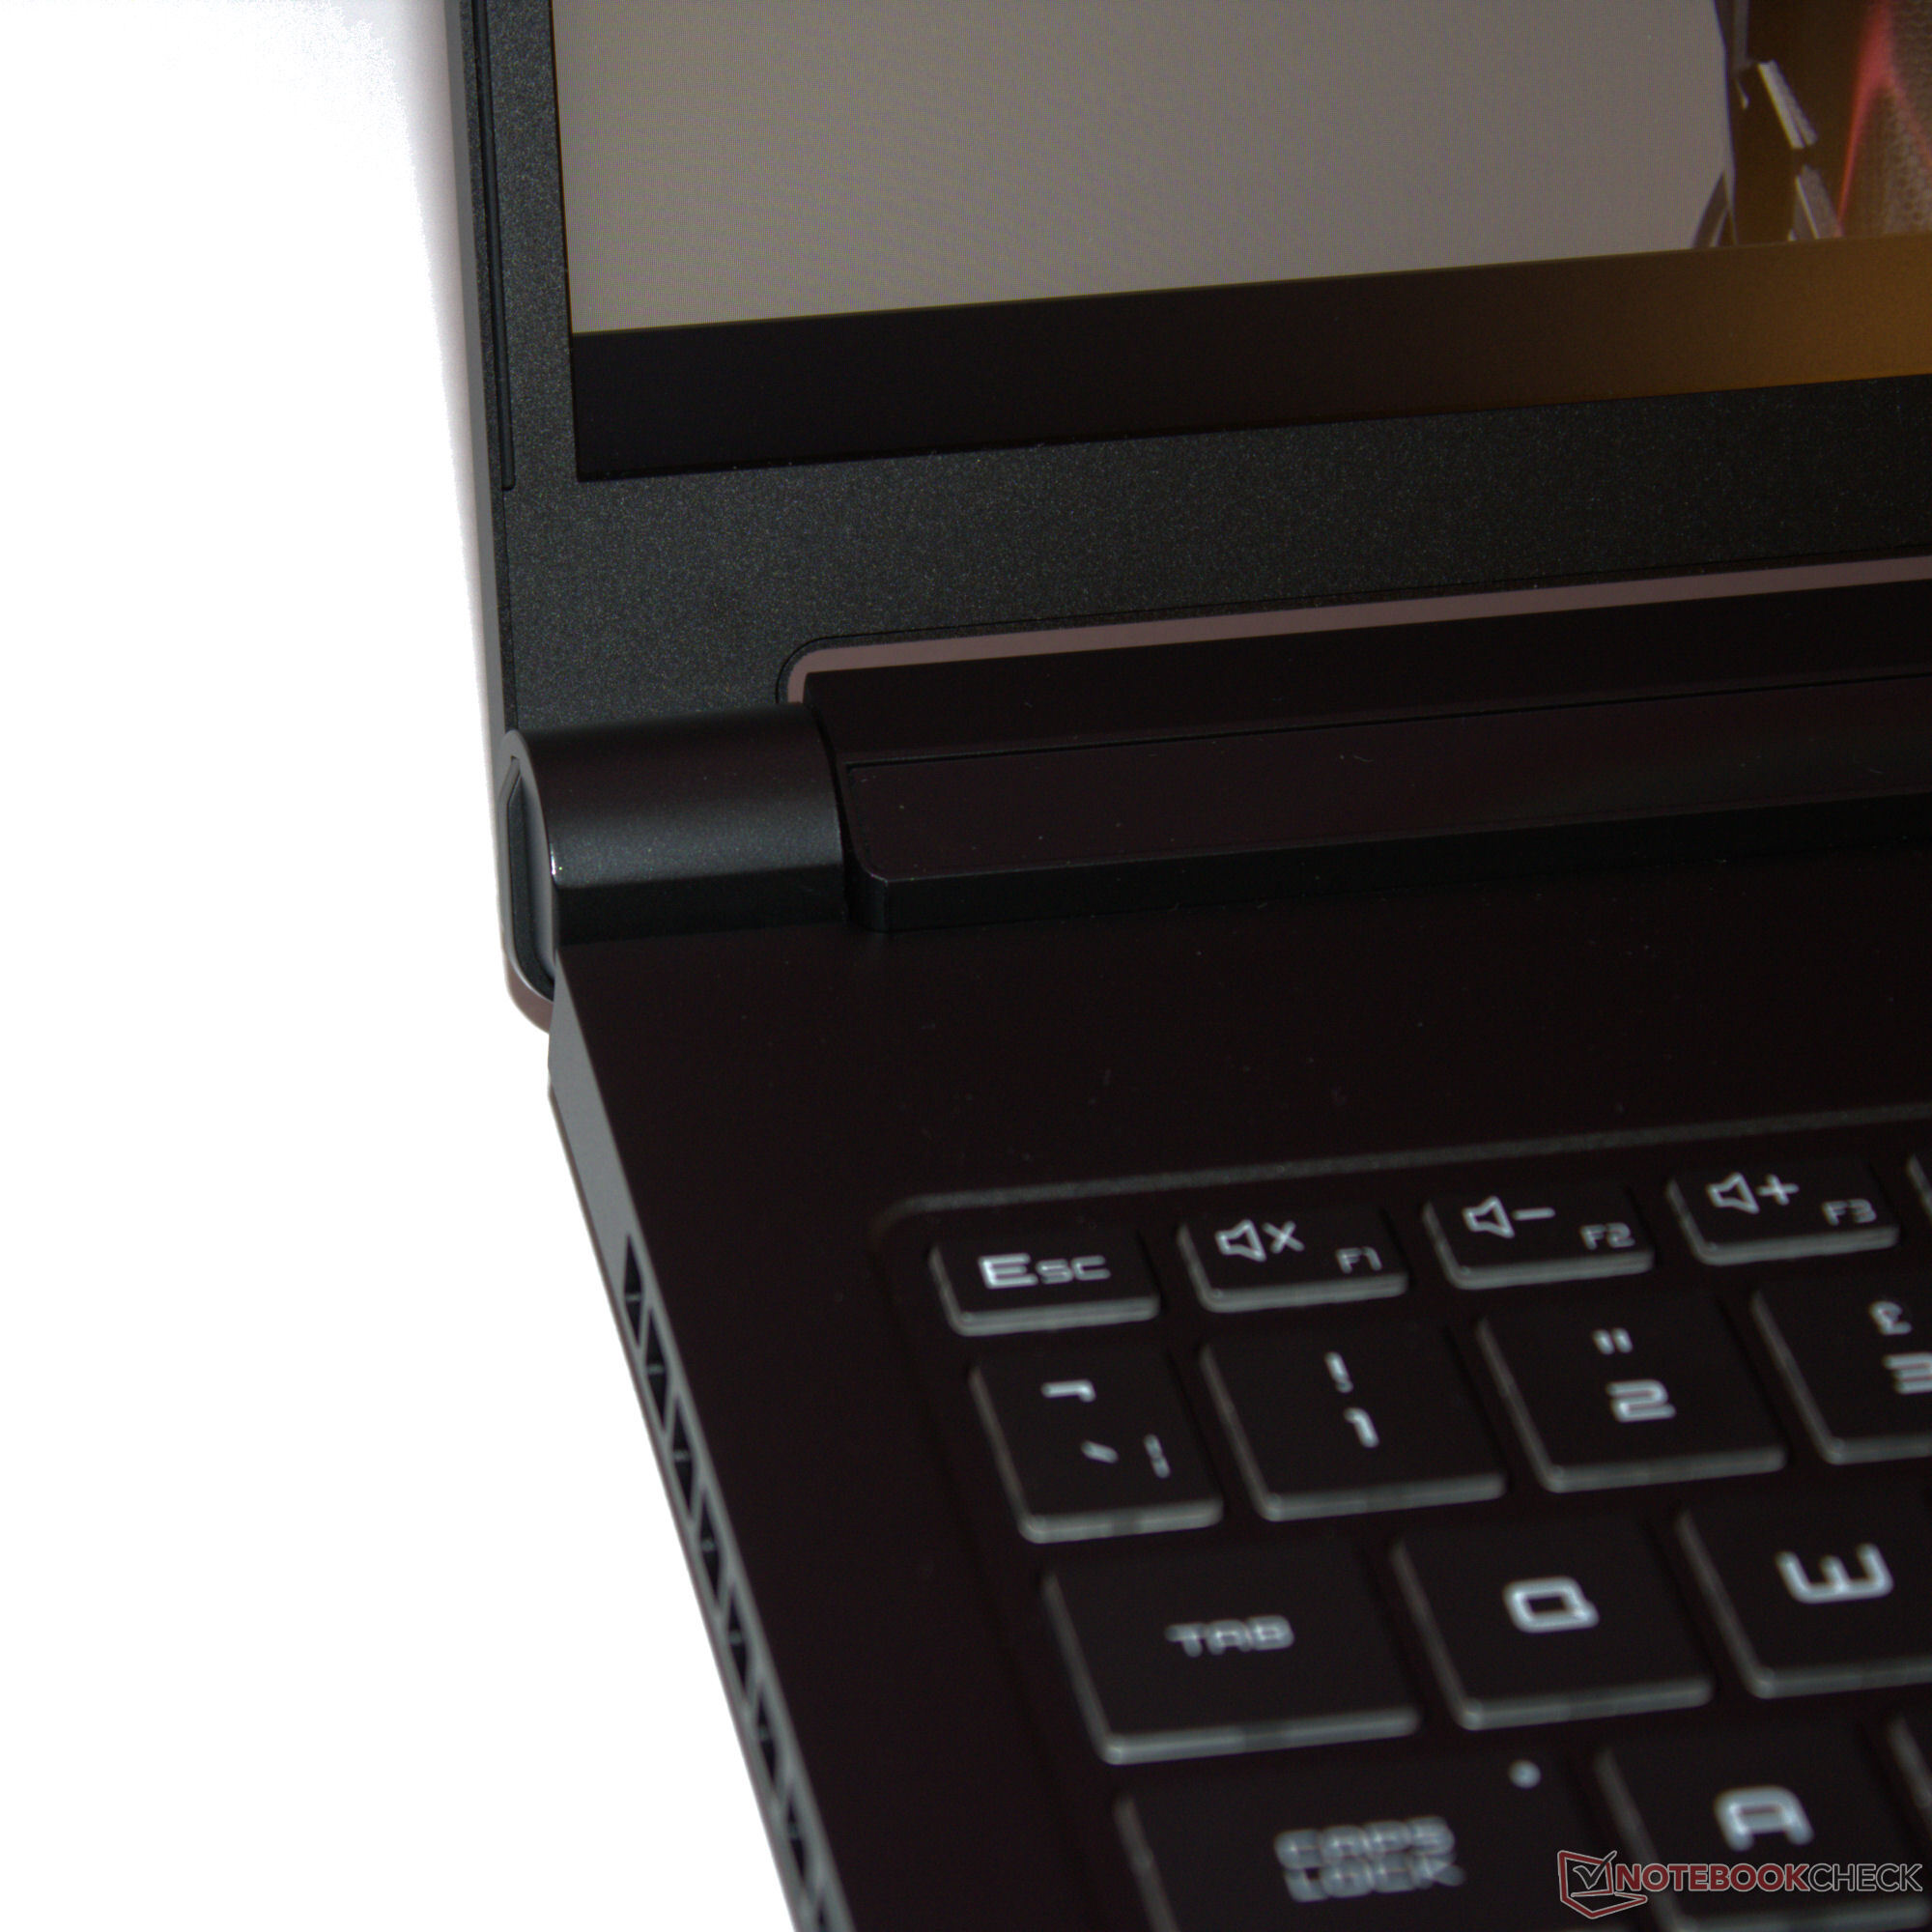
Vous devez toujours avoir un chiffon de nettoyage à portée de main : Les surfaces du boîtier noir mat sont très sensibles aux traces de doigts. L'unité de base et le couvercle du boîtier en aluminium ne peuvent être que légèrement tordus et nous n'avons pas rencontré d'erreurs de construction. L'application d'une pression à l'arrière du couvercle n'entraîne aucune modification de l'image. Les charnières très serrées maintiennent le couvercle fermement en position et il n'oscille que très peu. Son angle d'ouverture maximal est de 130 degrés et vous pouvez l'ouvrir d'une seule main.
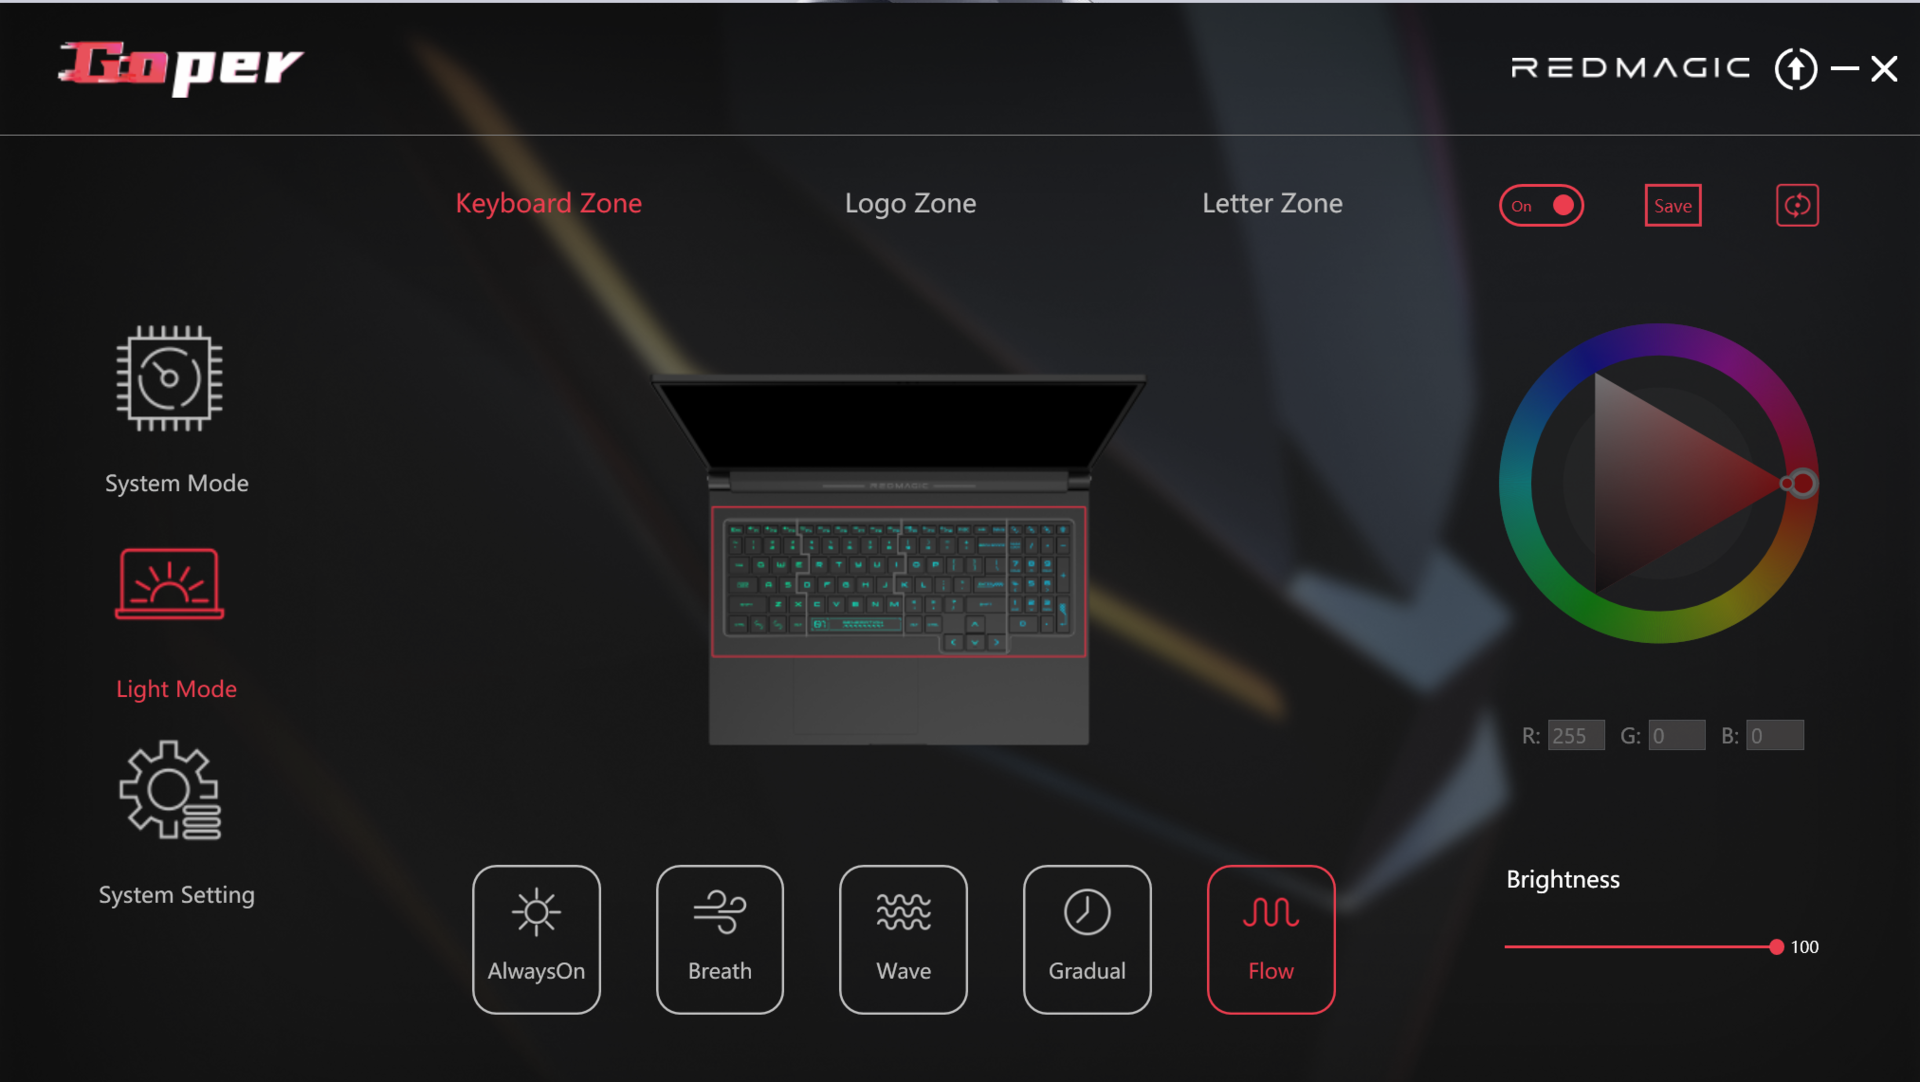
Outre le clavier rétroéclairé de l'ordinateur portable, deux éléments LED apportent de la couleur : Le lettrage RedMagic sur le couvercle de la charnière et le logo sur le couvercle brillent dans toutes les couleurs de l'arc-en-ciel. Tous les éléments peuvent être contrôlés individuellement. Le lettrage sert également d'indicateur de batterie : une lumière rouge clignotante signale un faible niveau de charge.

Dans le domaine de la comparaison, le Titan s'avère être l'un des appareils les plus compacts et les plus légers. Malgré cela, les différences par rapport à la concurrence sont assez faibles.
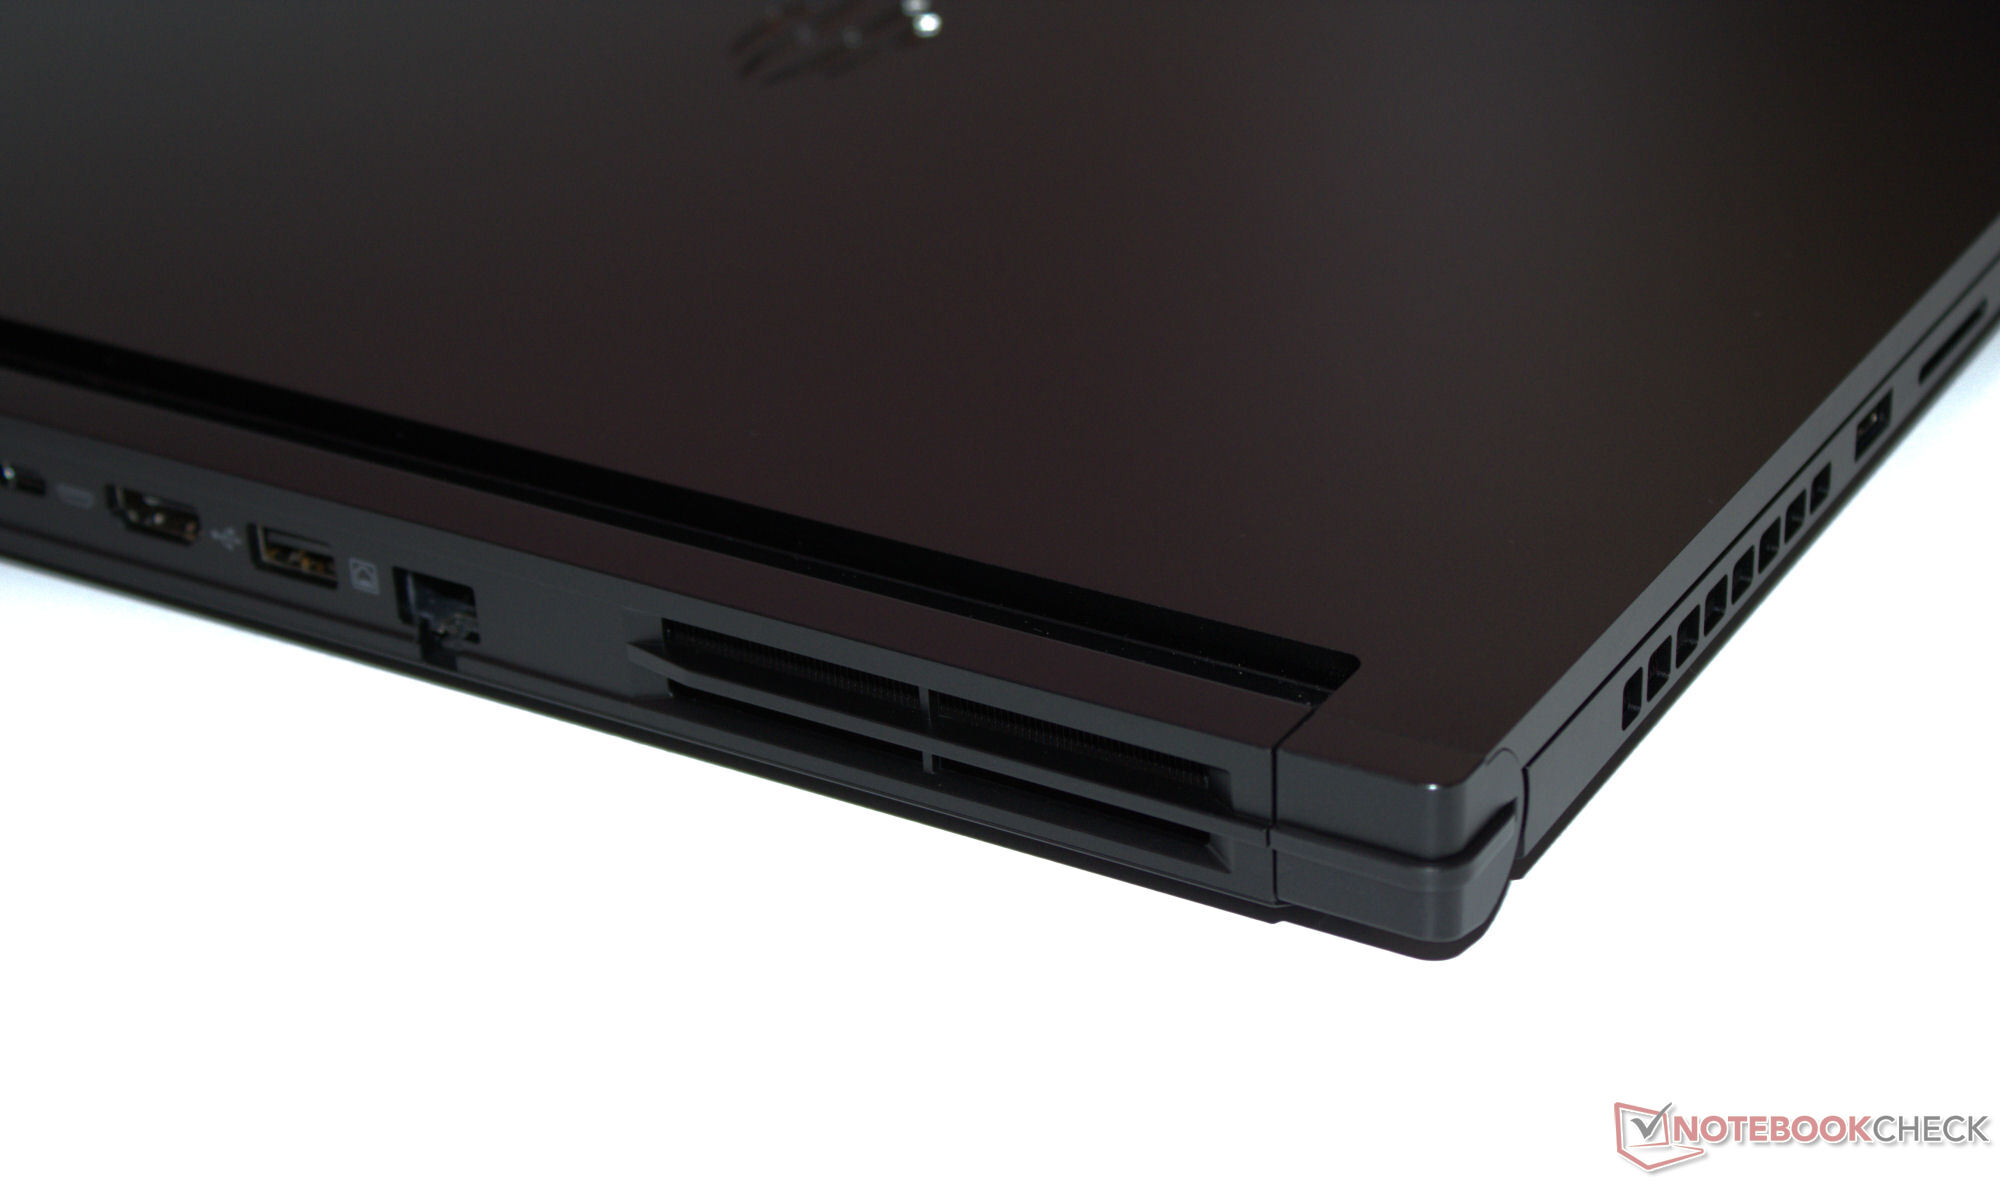
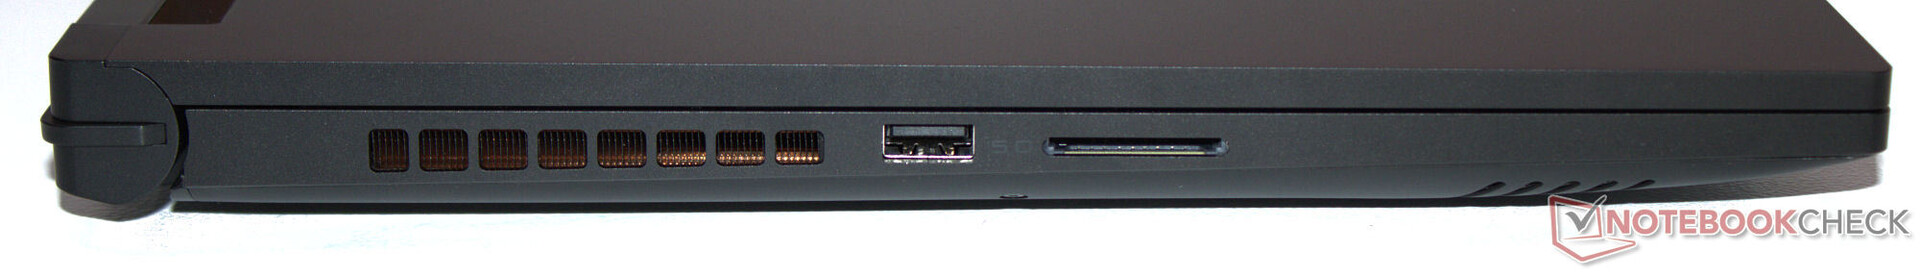
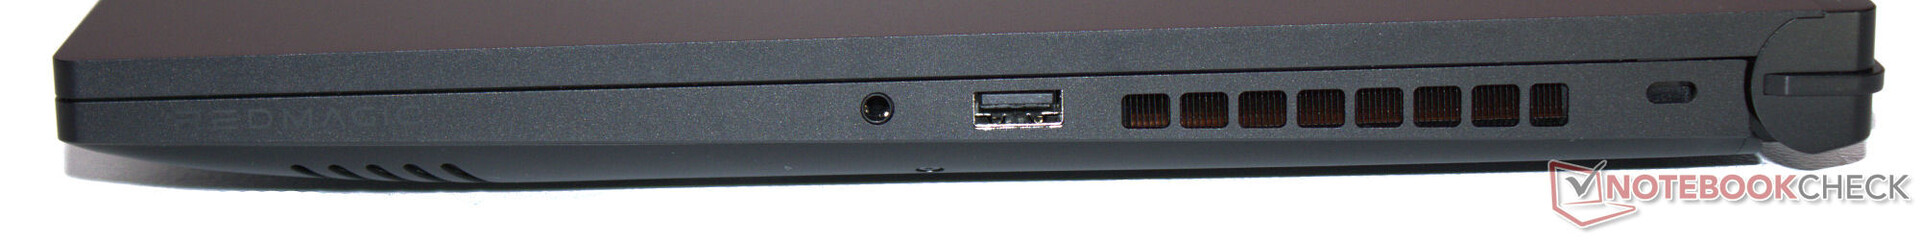
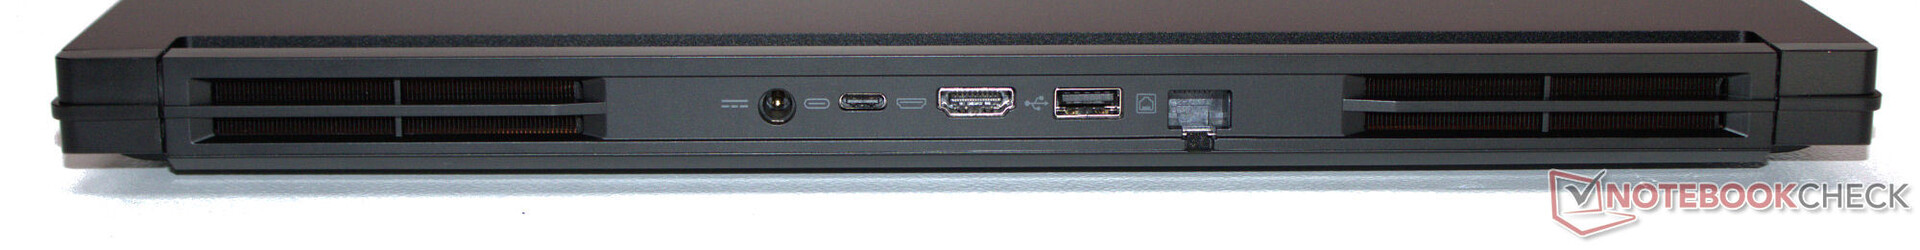
Connectivité - La Titan est équipée de Thunderbolt 4
La Titan est équipée de trois ports USB-A (2x USB 3.2 Gen 2, 1x USB 3.2 Gen 1) ainsi que d'un port USB-C (Thunderbolt 4). Ce dernier prend en charge le mode Power Delivery et DP Alt. Il dispose au total de deux sorties vidéo (1x HDMI, 1x DP). Une prise audio et un port ethernet (1 GBit/s) complètent l'ensemble.
Les sorties vidéo, la prise réseau et la connexion d'alimentation sont toutes situées à l'arrière de l'appareil, de sorte que les câbles correspondants ne devraient pas vous gêner pendant l'utilisation. Un point positif est la présence d'un port USB-A sur les côtés gauche et droit de l'ordinateur portable.
Lecteur de carte SD
Le lecteur de cartes SD (carte de référence : AV PRO microSD 128 GB V60) n'est pas l'un des plus rapides de sa catégorie, mais il fournit des débits de données solides dans la gamme moyenne-rapide. Si l'on compare avec les valeurs du Blade 16 (2024) prouve qu'il est possible d'obtenir des taux de transfert nettement plus élevés.
| SD Card Reader | |
| average JPG Copy Test (av. of 3 runs) | |
| Razer Blade 16 2024, RTX 4090 | |
| Moyenne de la classe Gaming (19 - 197.3, n=68, 2 dernières années) | |
| SCHENKER XMG Pro 16 Studio (Mid 24) (AV PRO microSD 128 GB V60) | |
| Nubia RedMagic Titan 16 Pro (AV PRO microSD 128 GB V60) | |
| Acer Predator Helios Neo 16 (2024) (AV PRO microSD 128 GB V60) | |
| maximum AS SSD Seq Read Test (1GB) | |
| Razer Blade 16 2024, RTX 4090 | |
| Moyenne de la classe Gaming (25.8 - 263, n=67, 2 dernières années) | |
| SCHENKER XMG Pro 16 Studio (Mid 24) (AV PRO microSD 128 GB V60) | |
| Nubia RedMagic Titan 16 Pro (AV PRO microSD 128 GB V60) | |
| Acer Predator Helios Neo 16 (2024) (AV PRO microSD 128 GB V60) | |
Communication
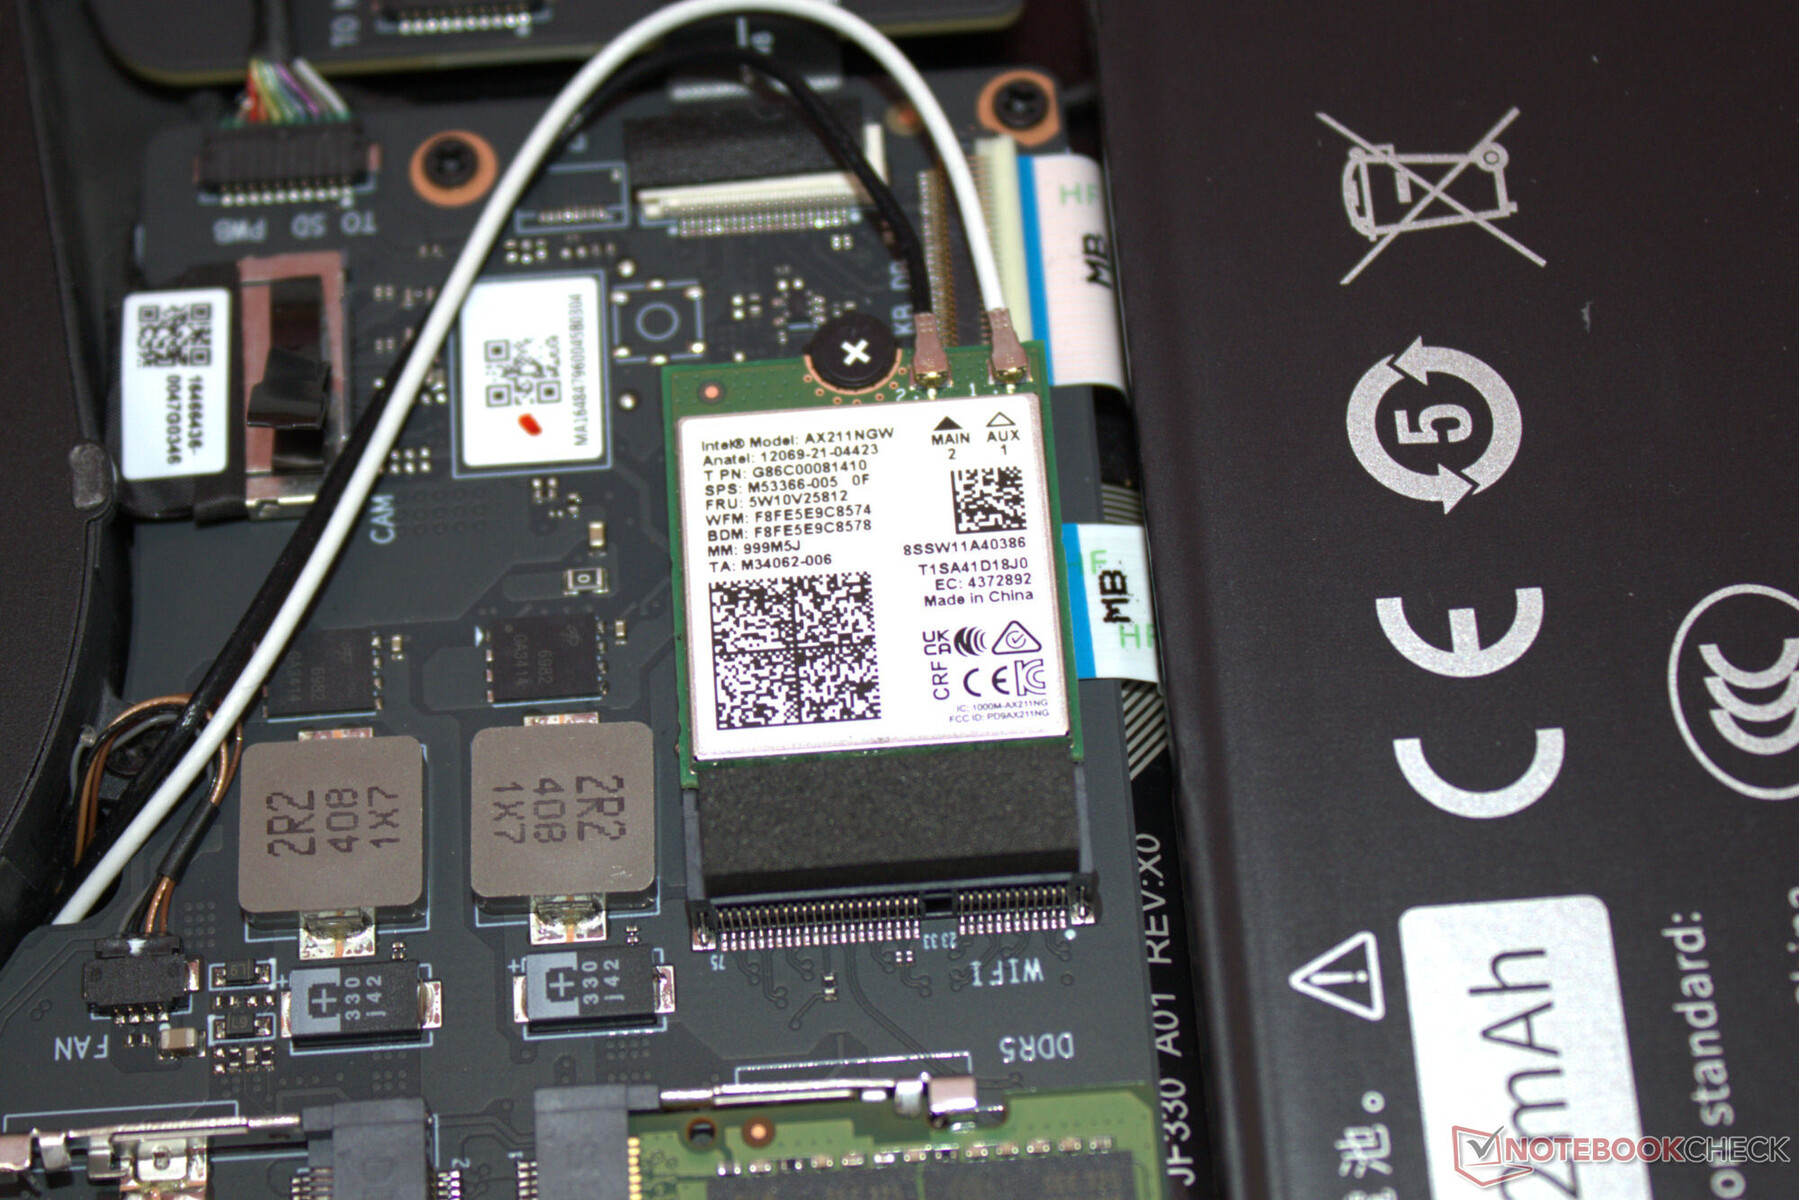
Il n'y a pas de surprise en ce qui concerne les options réseau : Les connexions filaires sont gérées par un contrôleur Gigabit Ethernet (RTL8168/8111, 1 GBit/s) de Realtek. La puce WiFi 6E d'Intel (AX211) fournit des débits de données bons à très bons dans des conditions optimales (pas d'appareils WiFi à proximité, courte distance entre l'ordinateur portable et le serveur).
Webcam
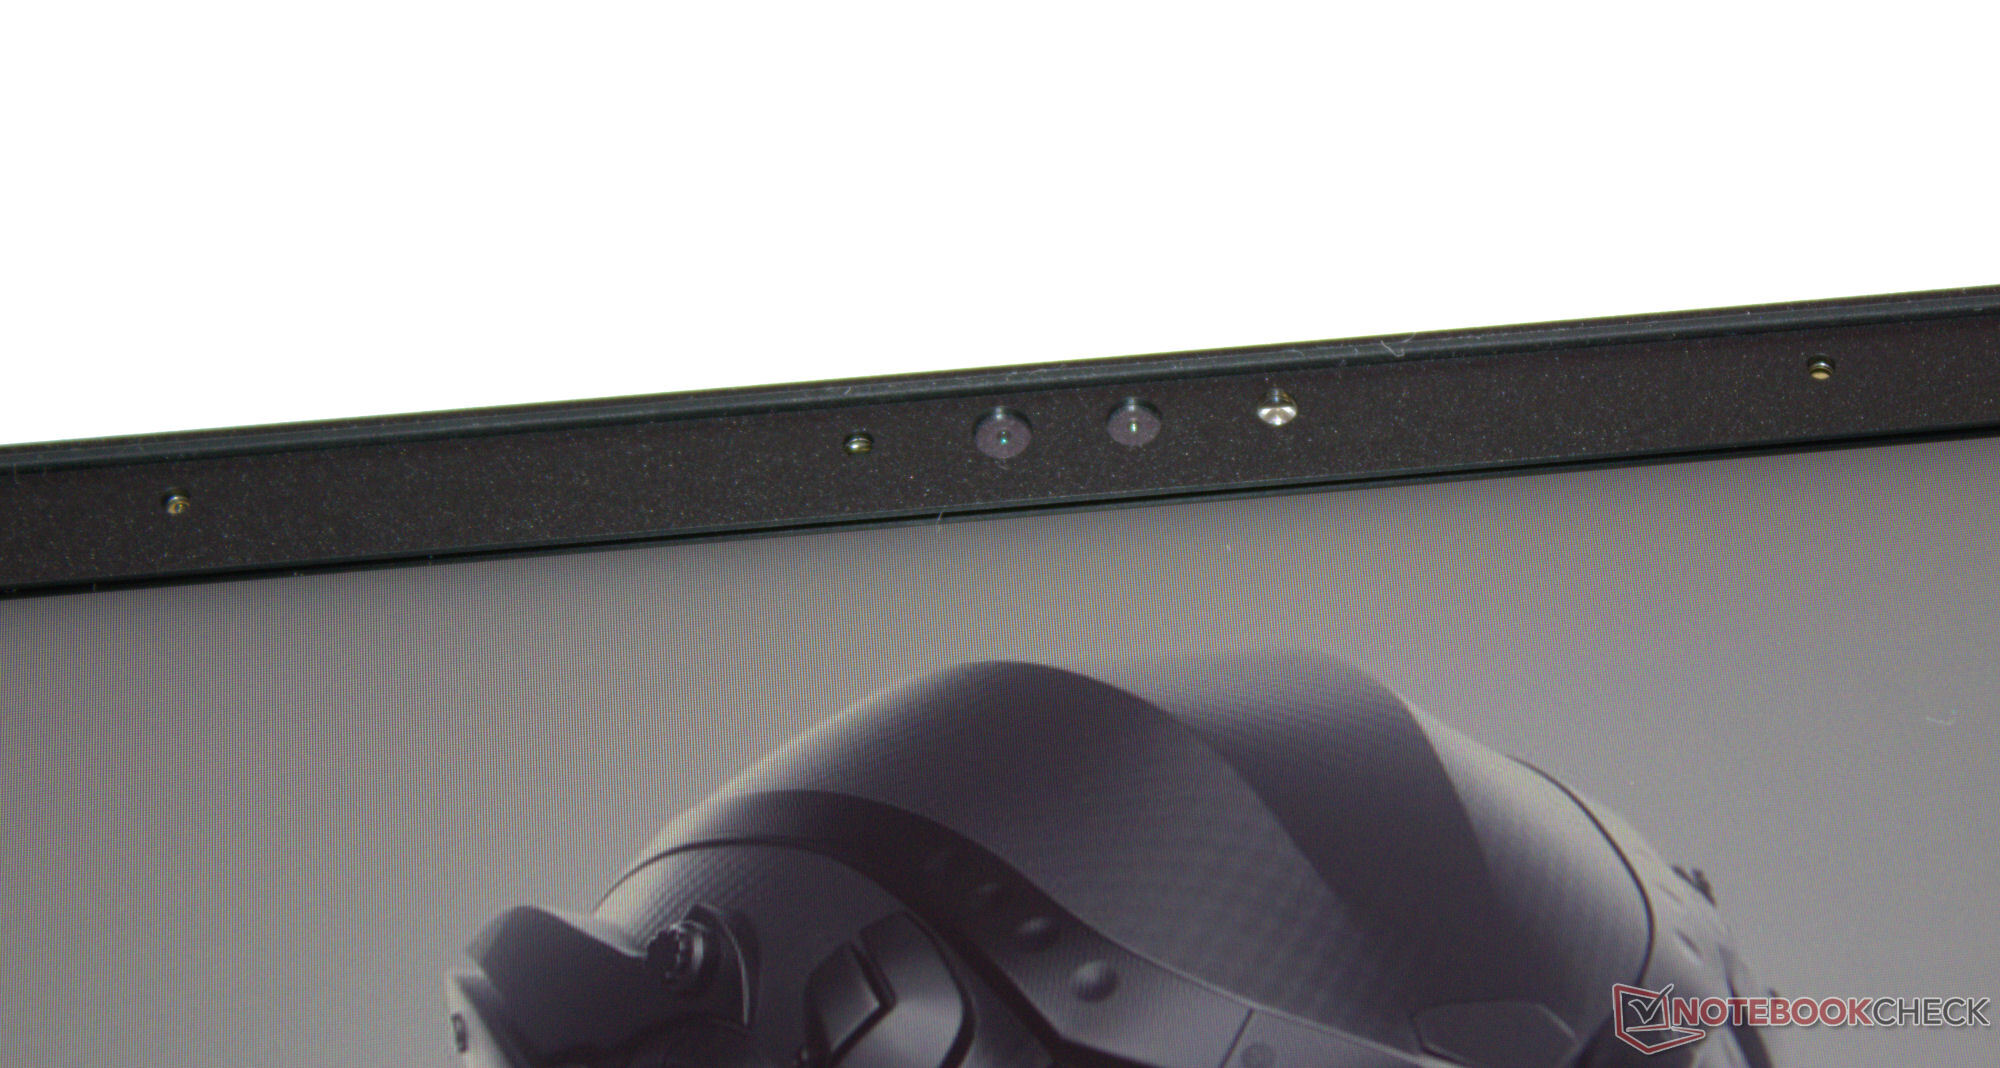
La webcam (2,1 MP) est standard et prend en charge Windows Hello. La caméra n'est pas dotée d'un couvercle mécanique ni d'un interrupteur marche/arrêt physique.


Accessoires
Outre les documents habituels (guide de démarrage rapide et informations sur la garantie), aucun accessoire supplémentaire n'est fourni avec l'ordinateur portable.
Maintenance
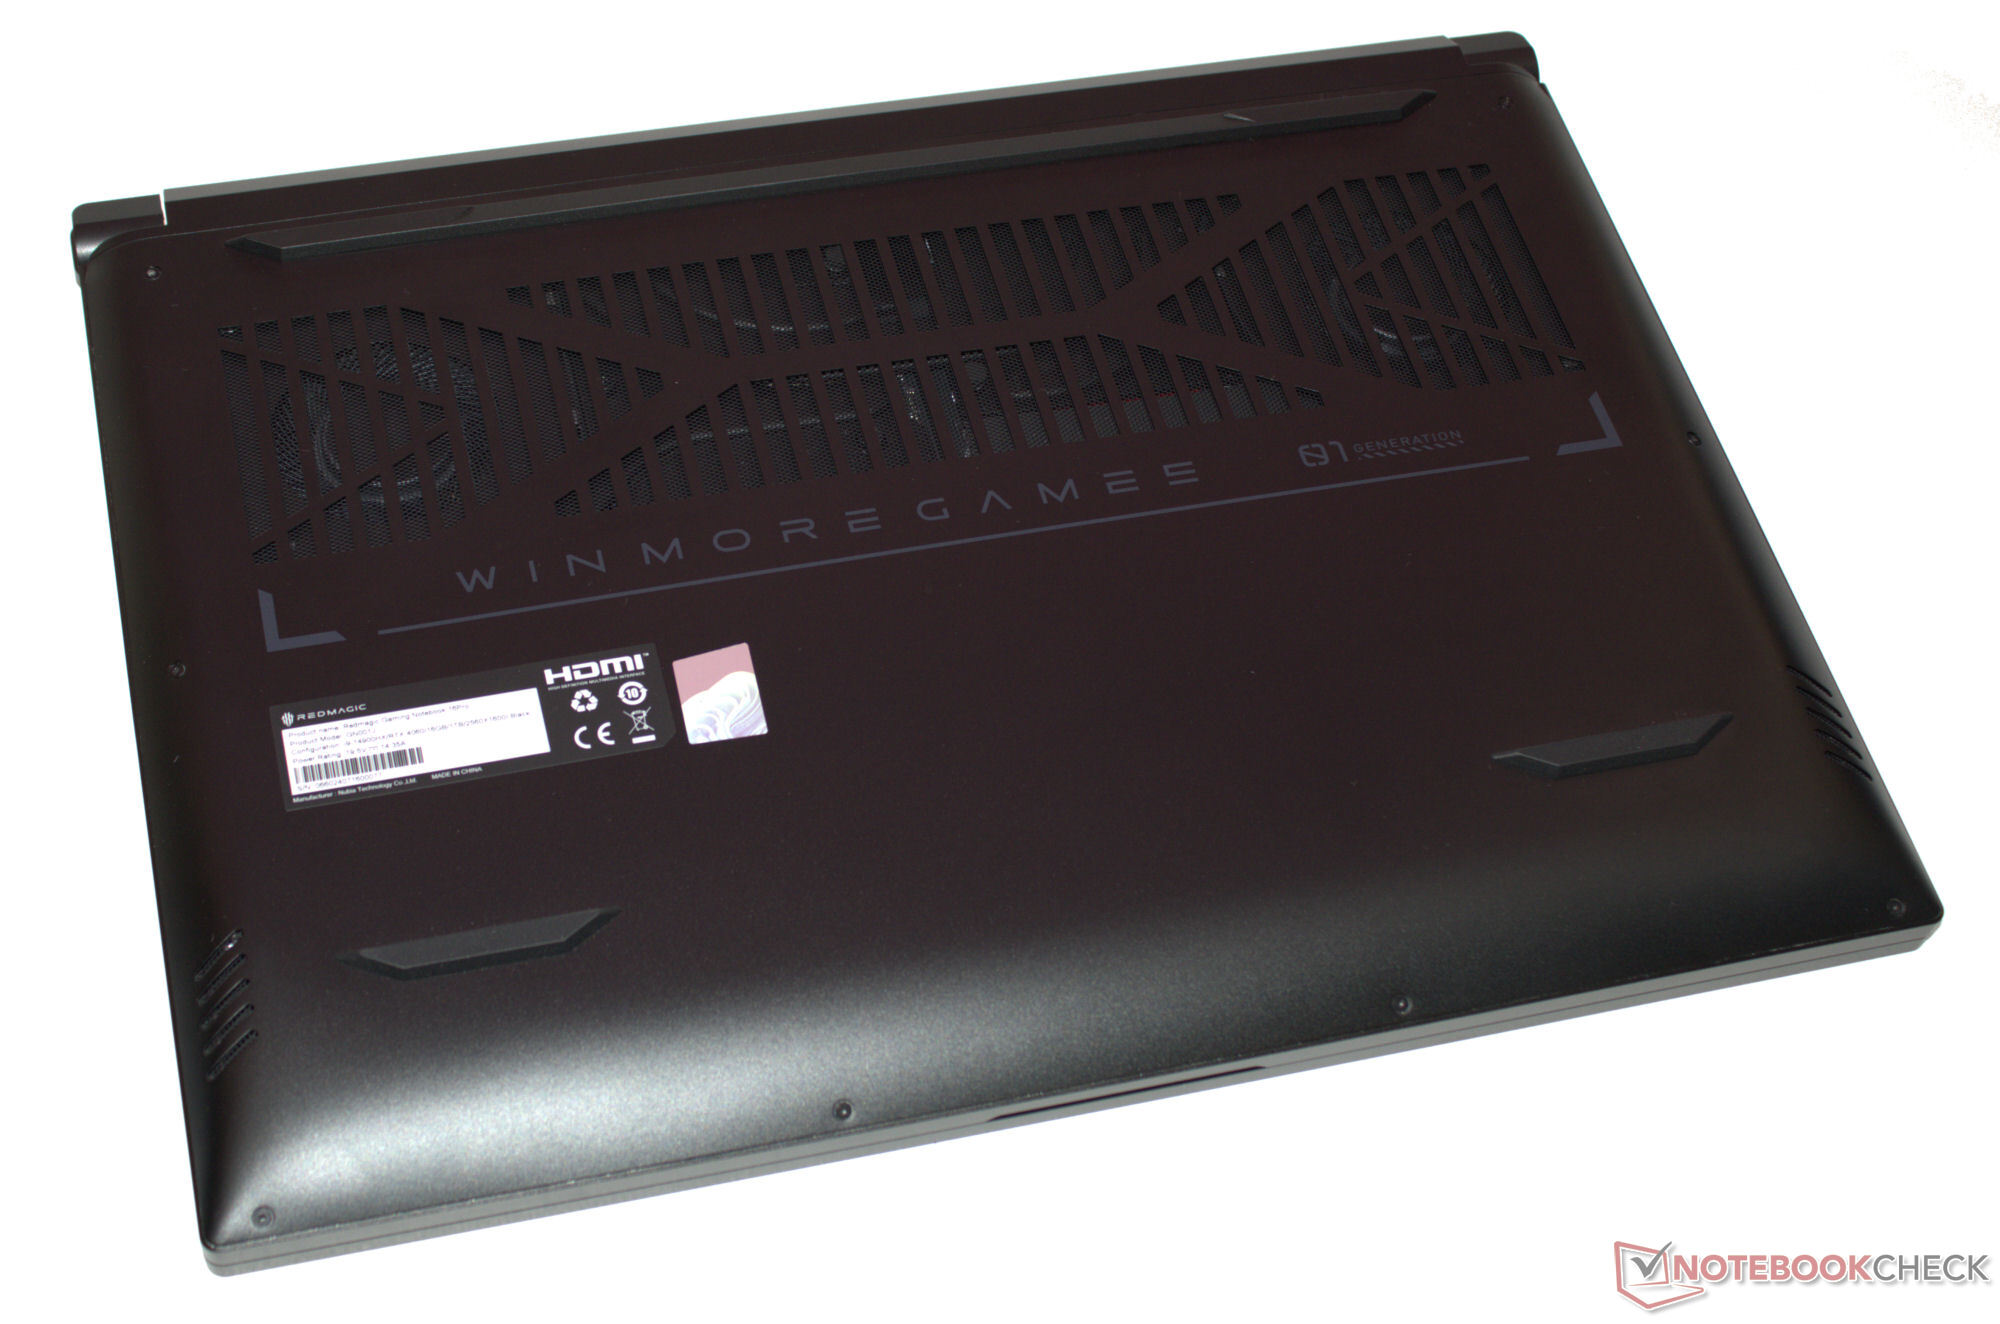
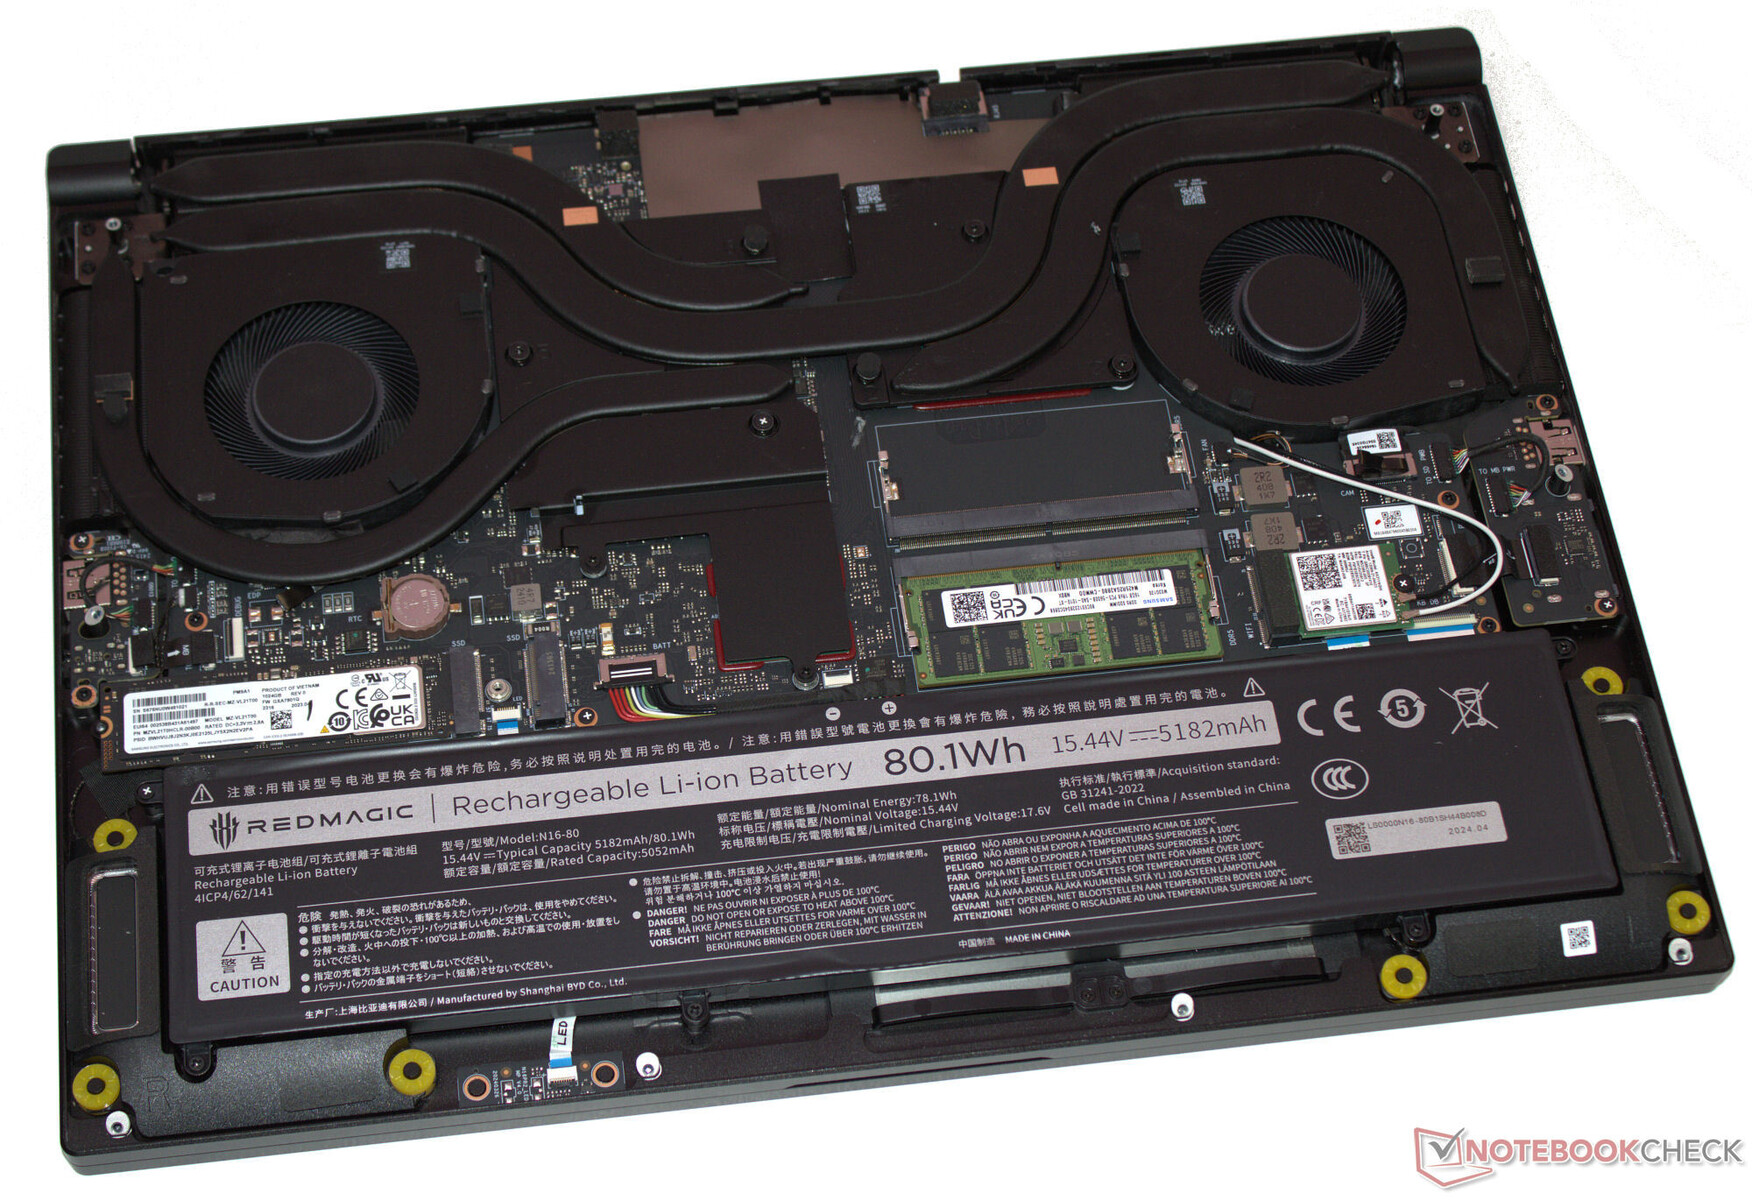
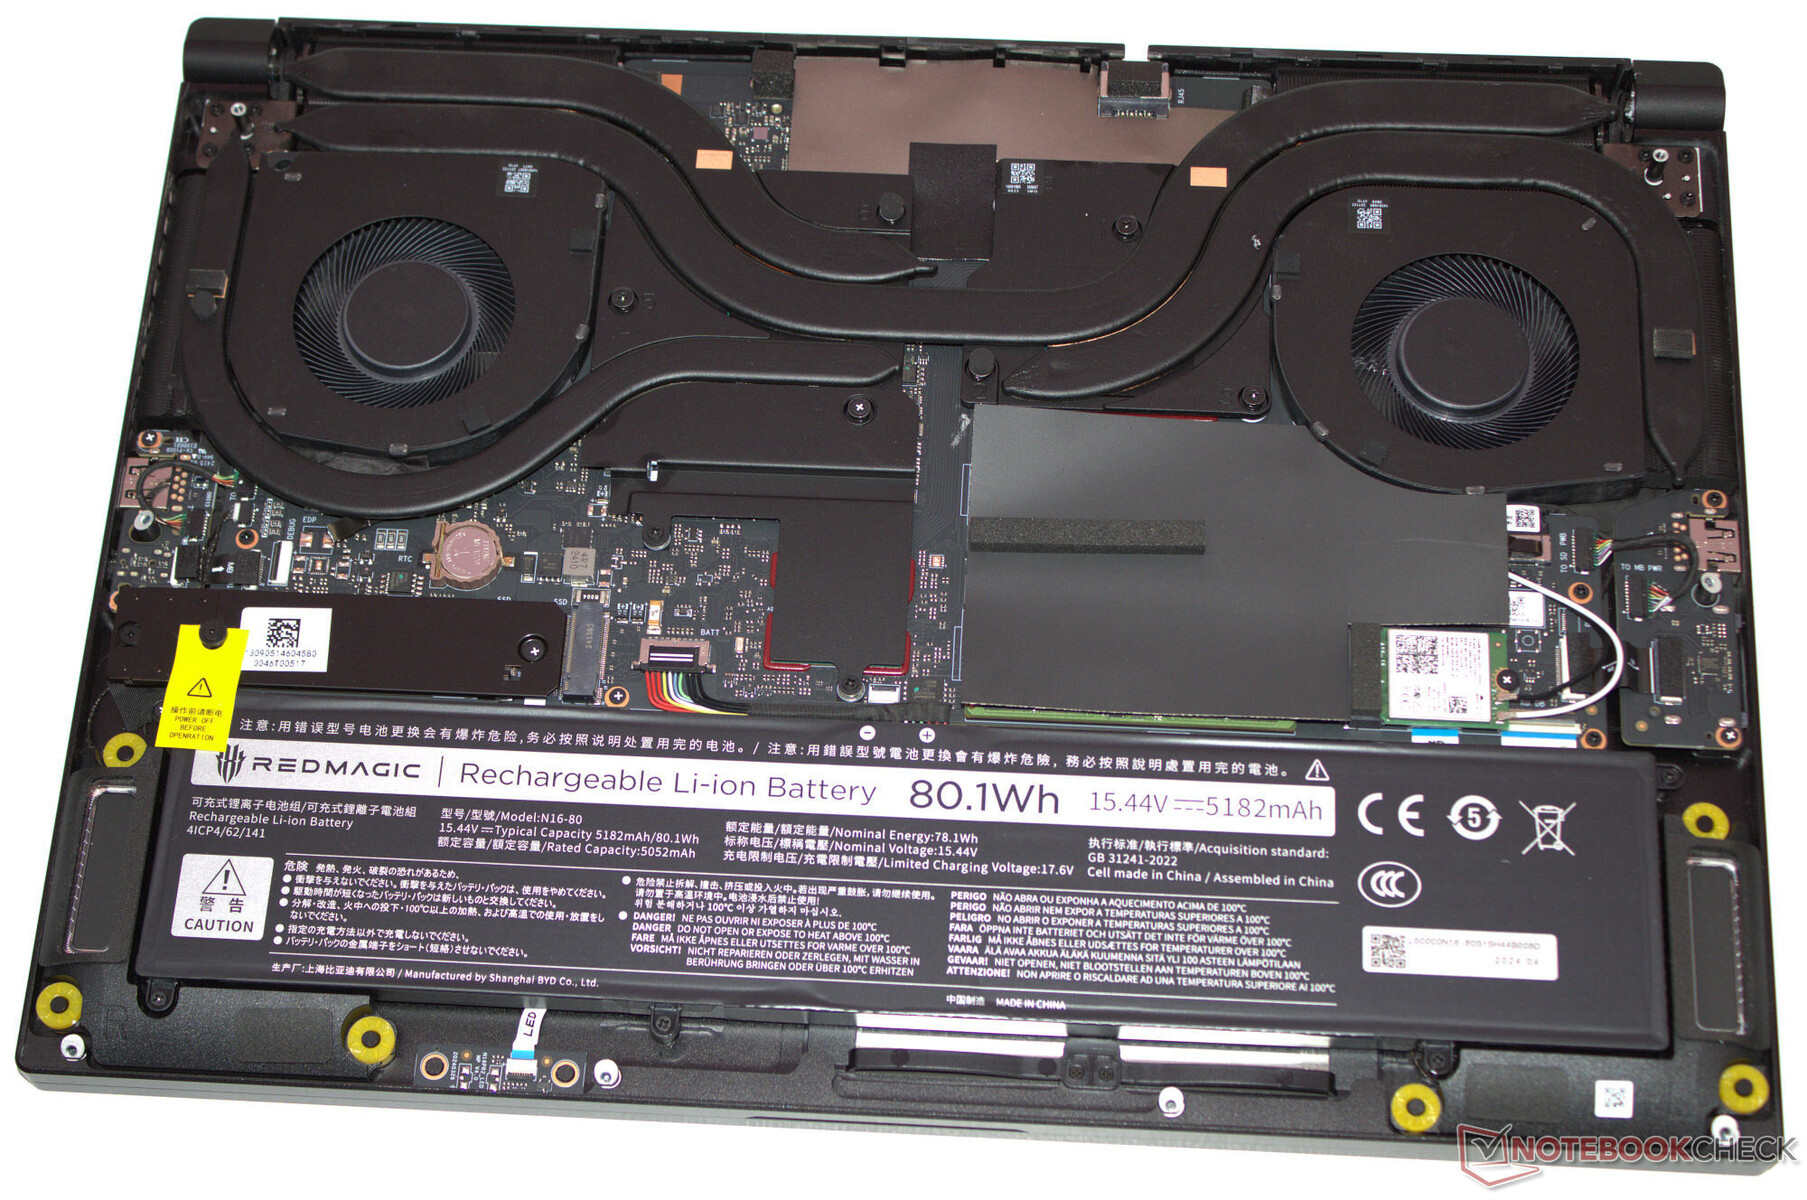
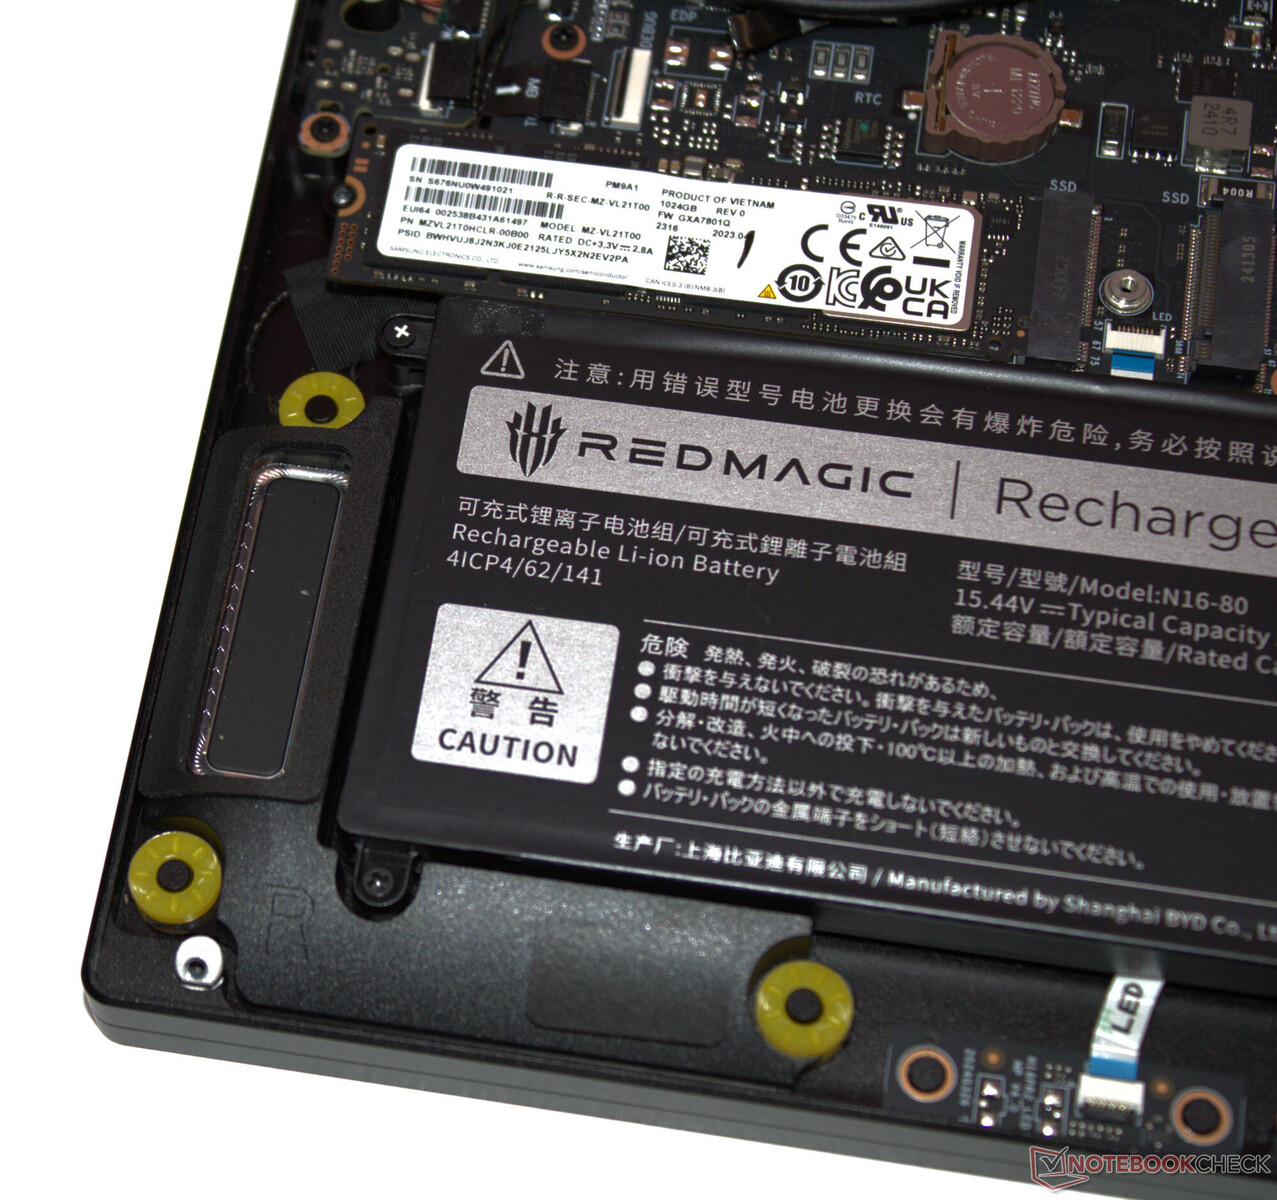
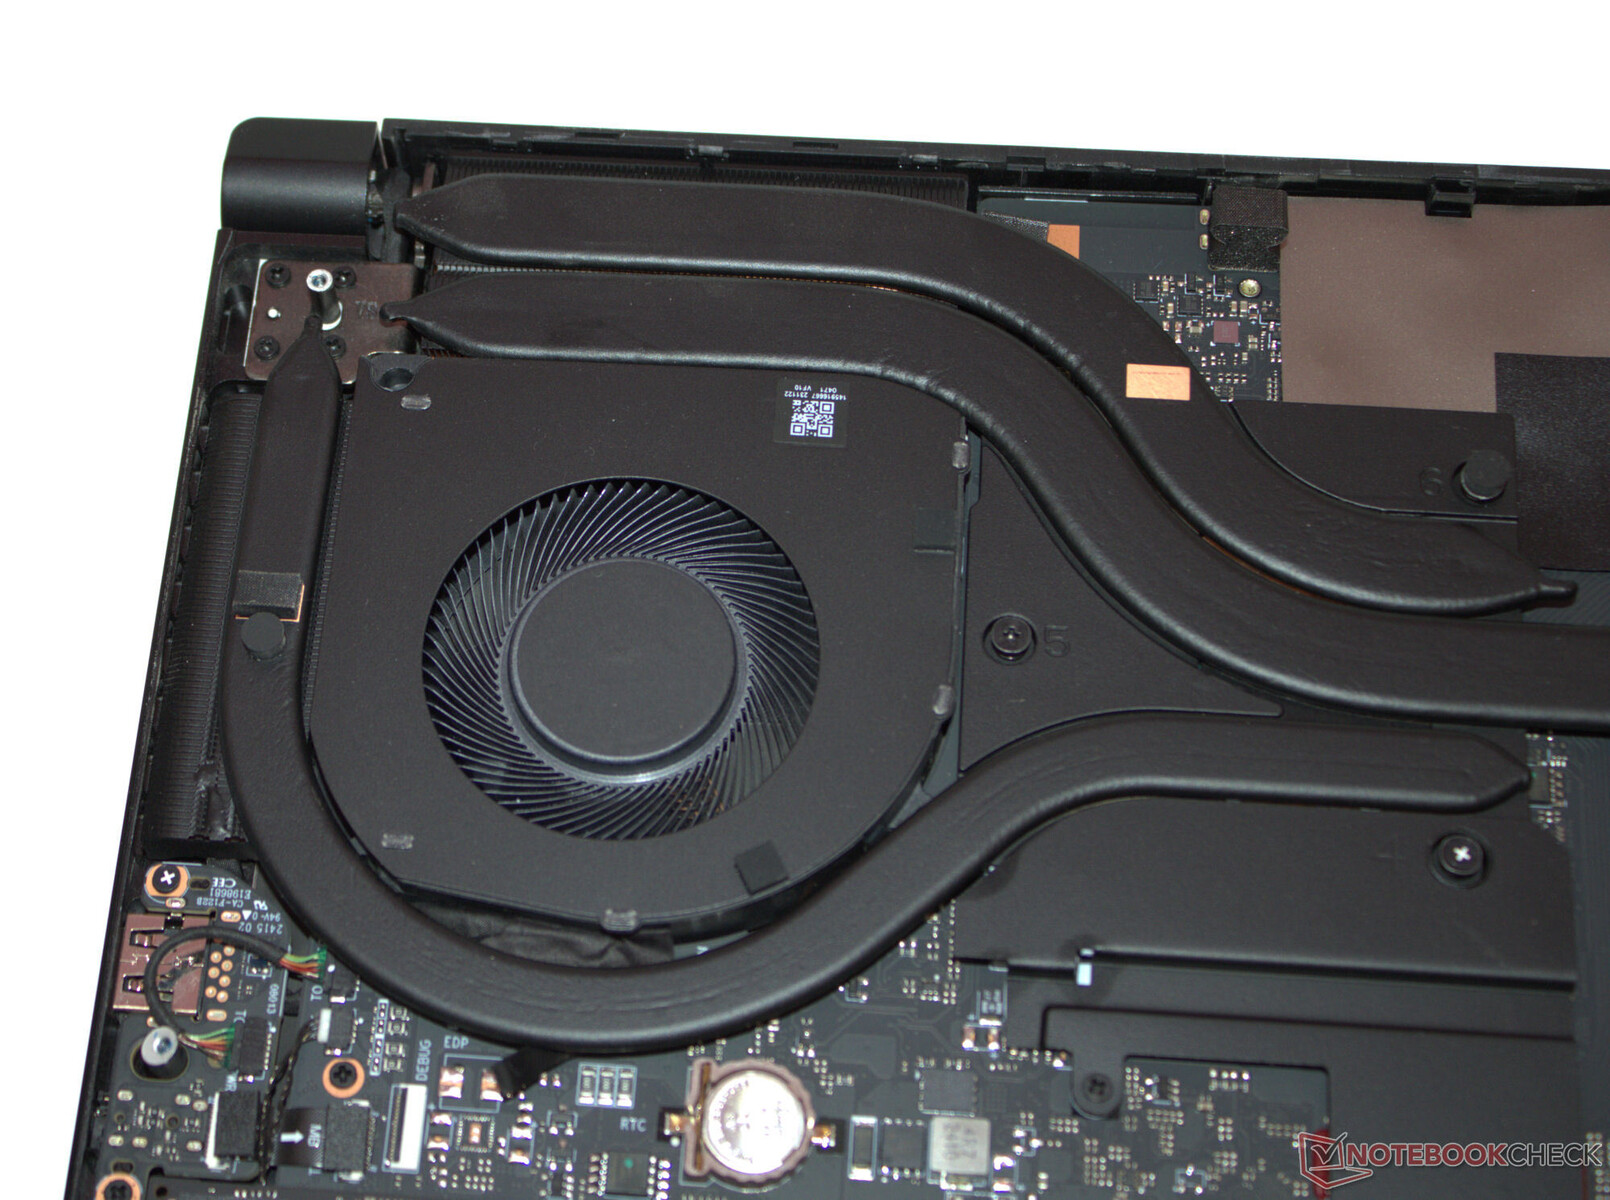
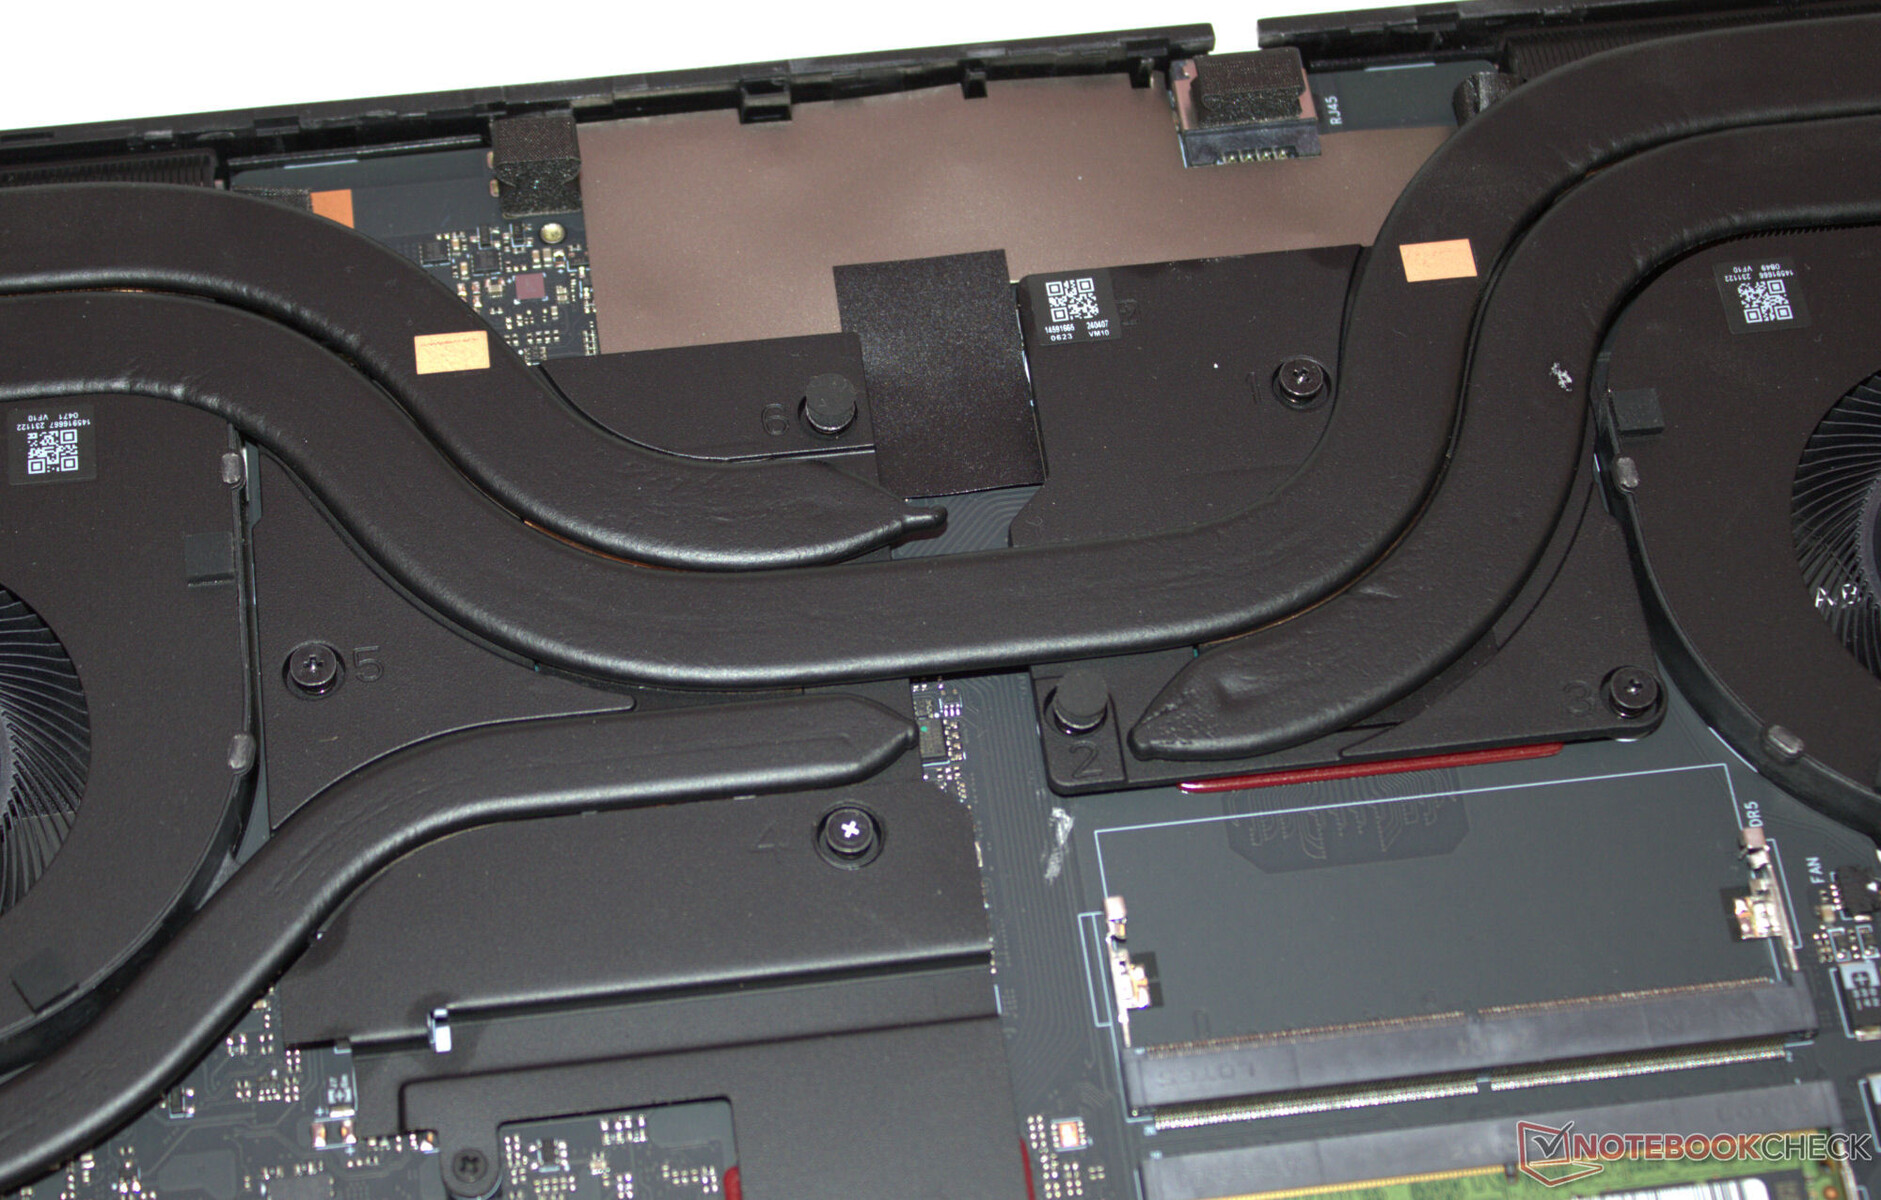
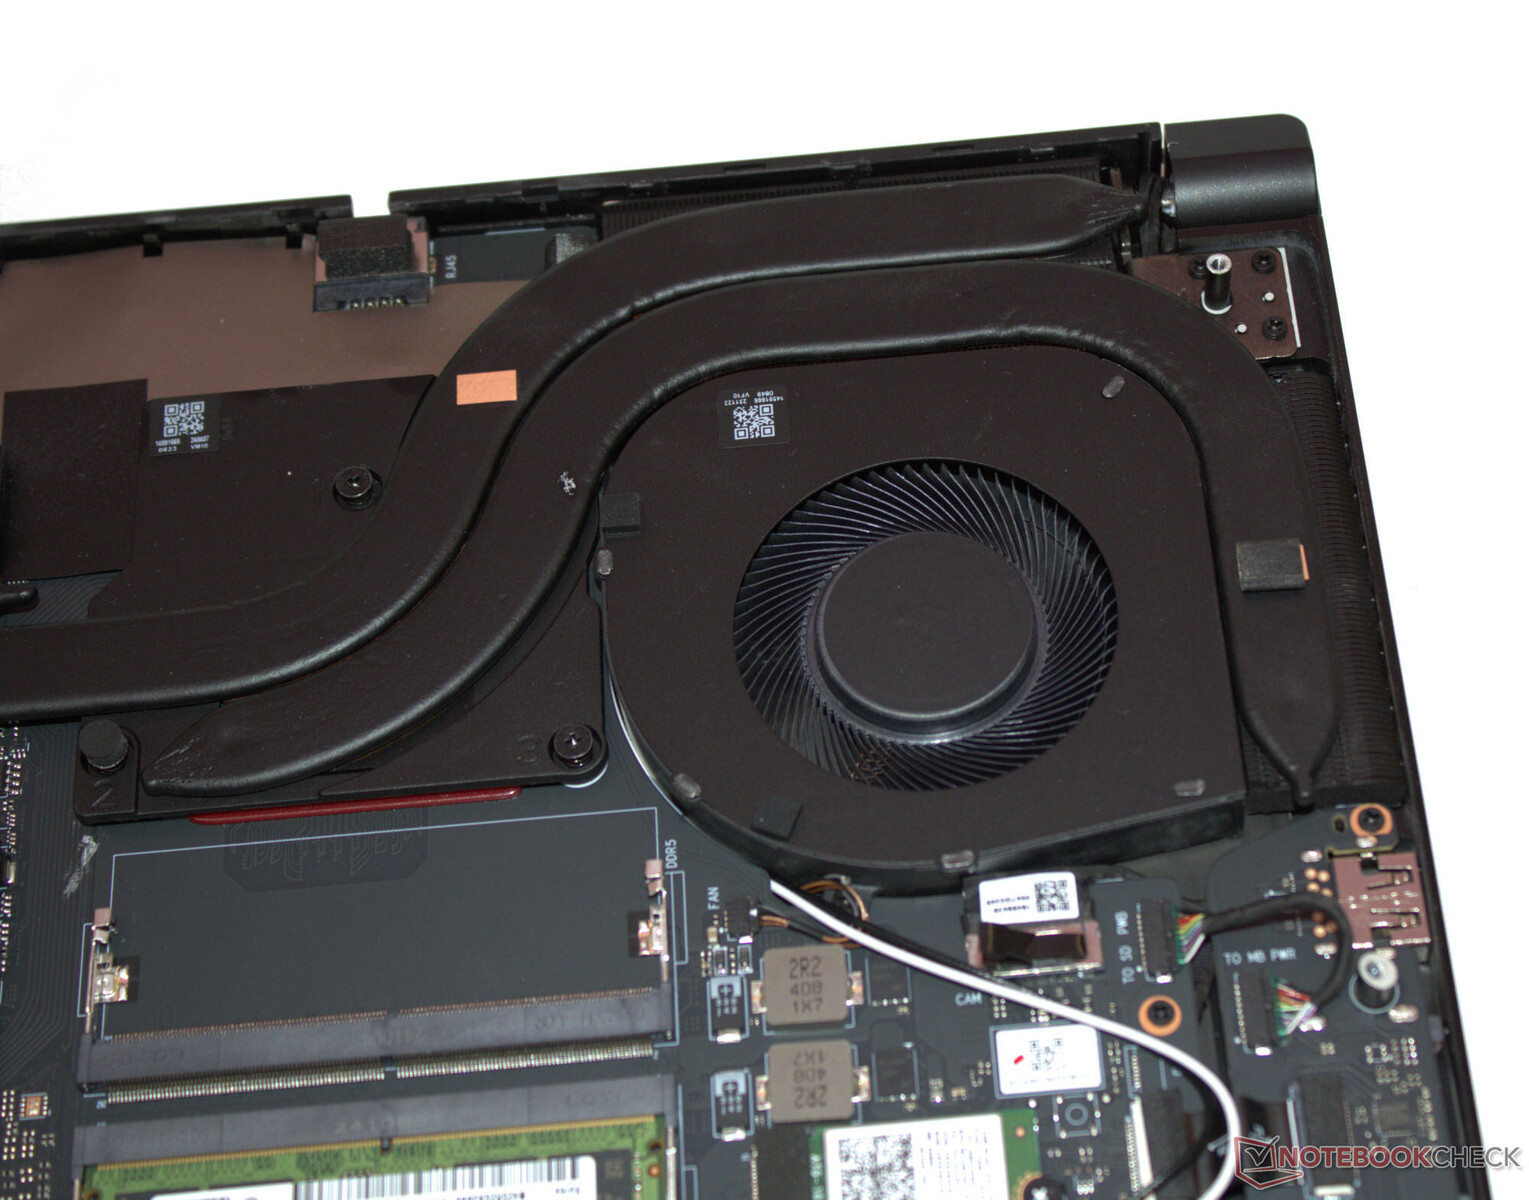
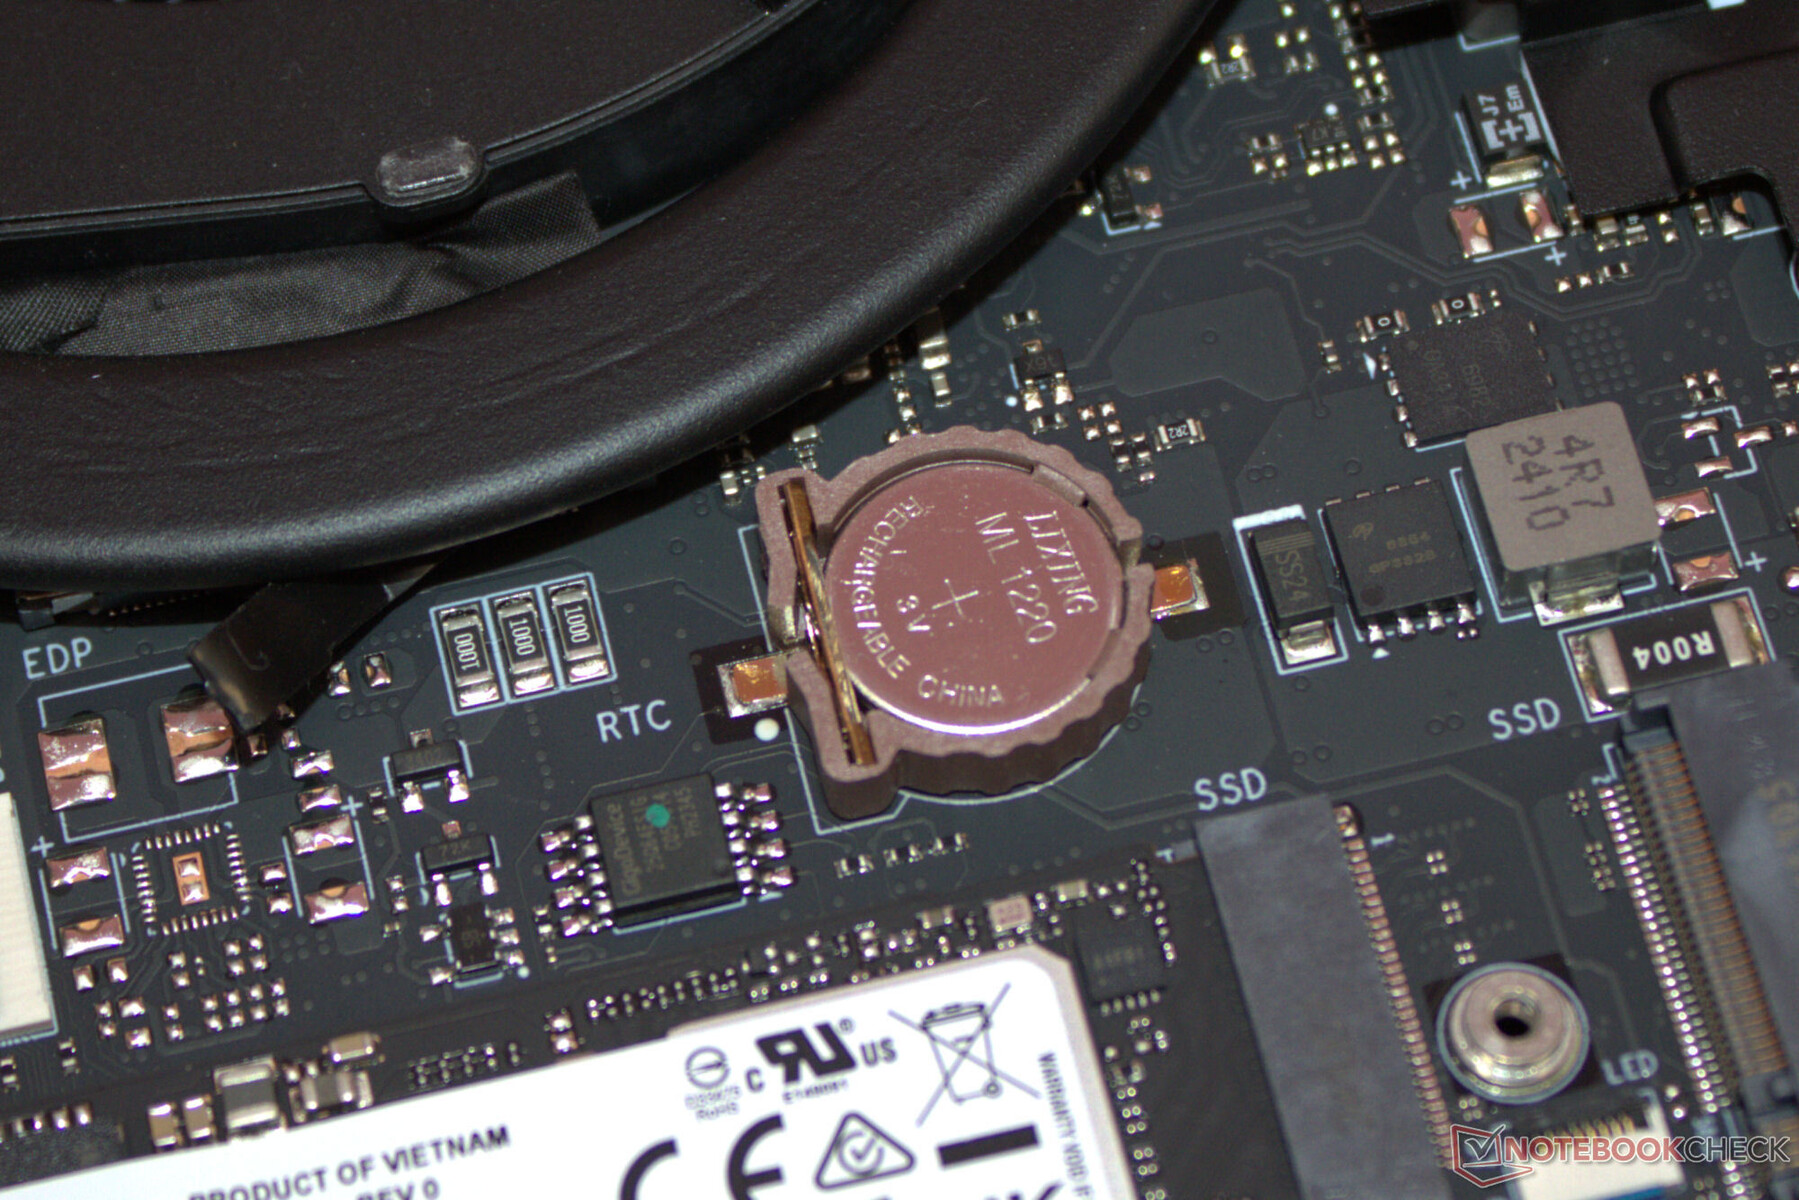
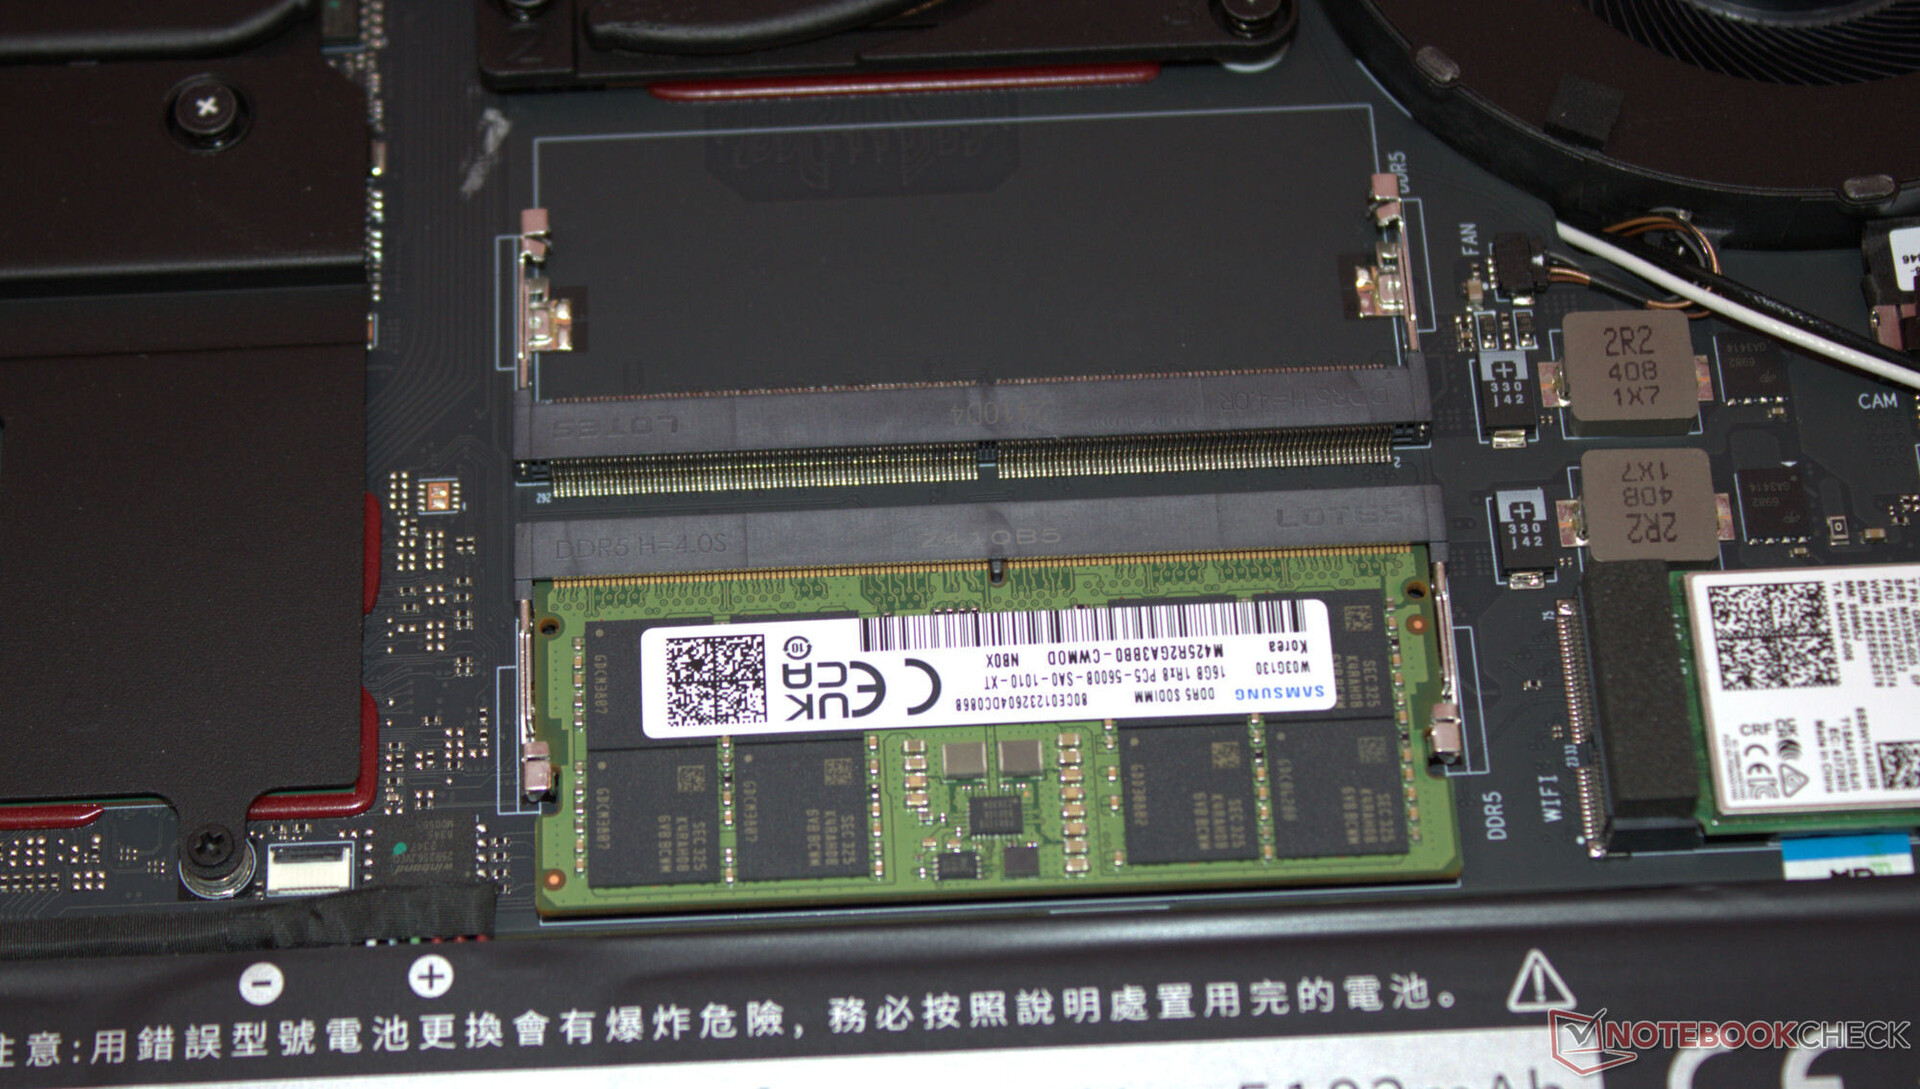
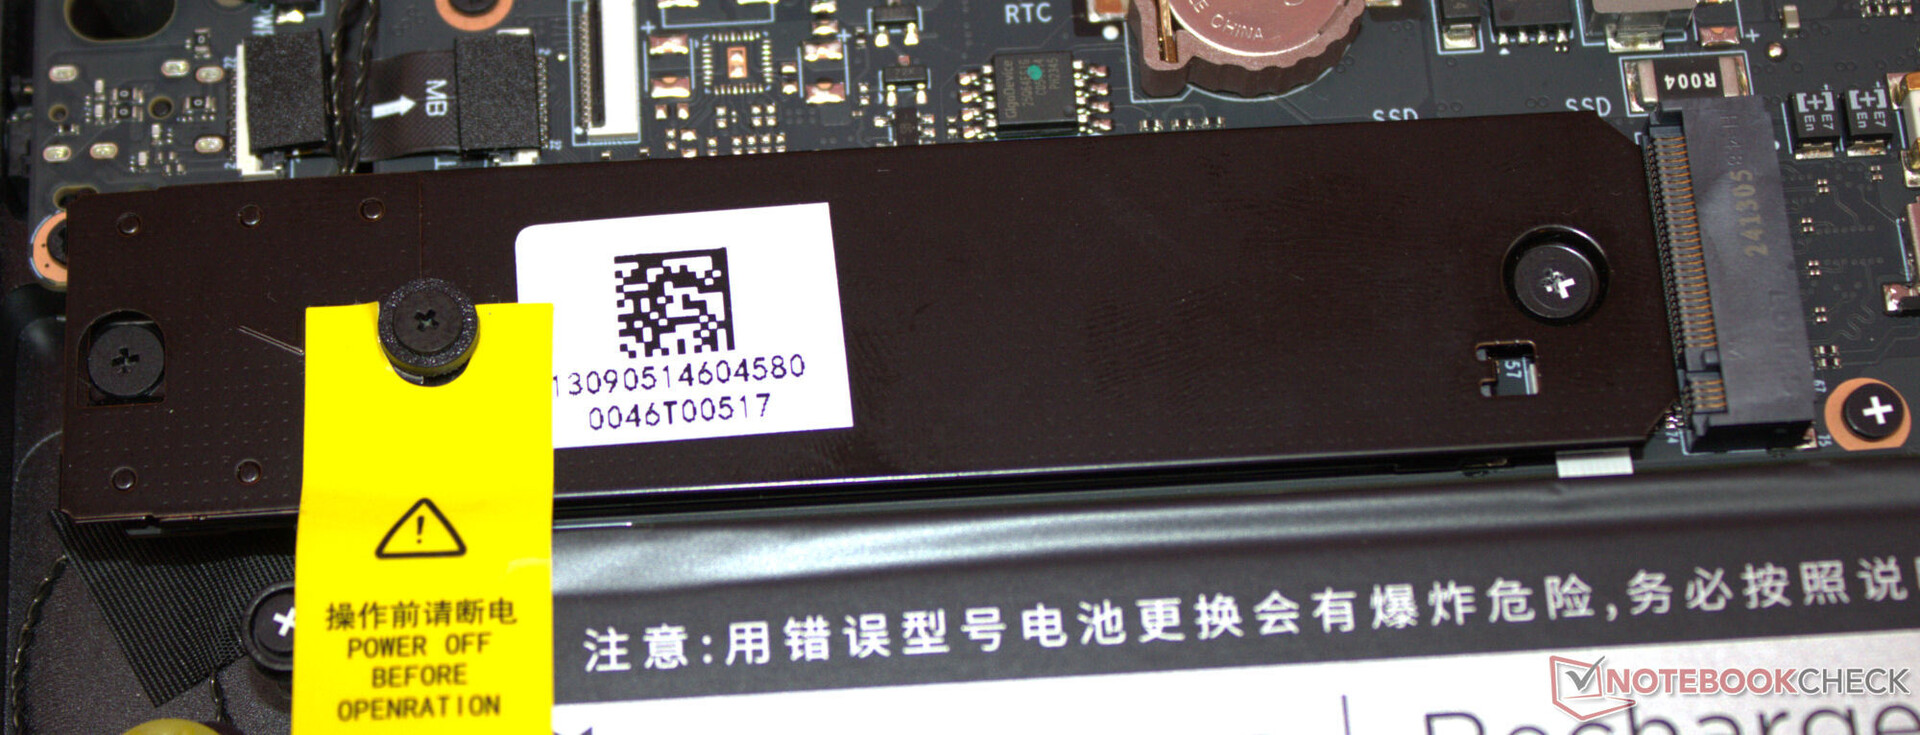
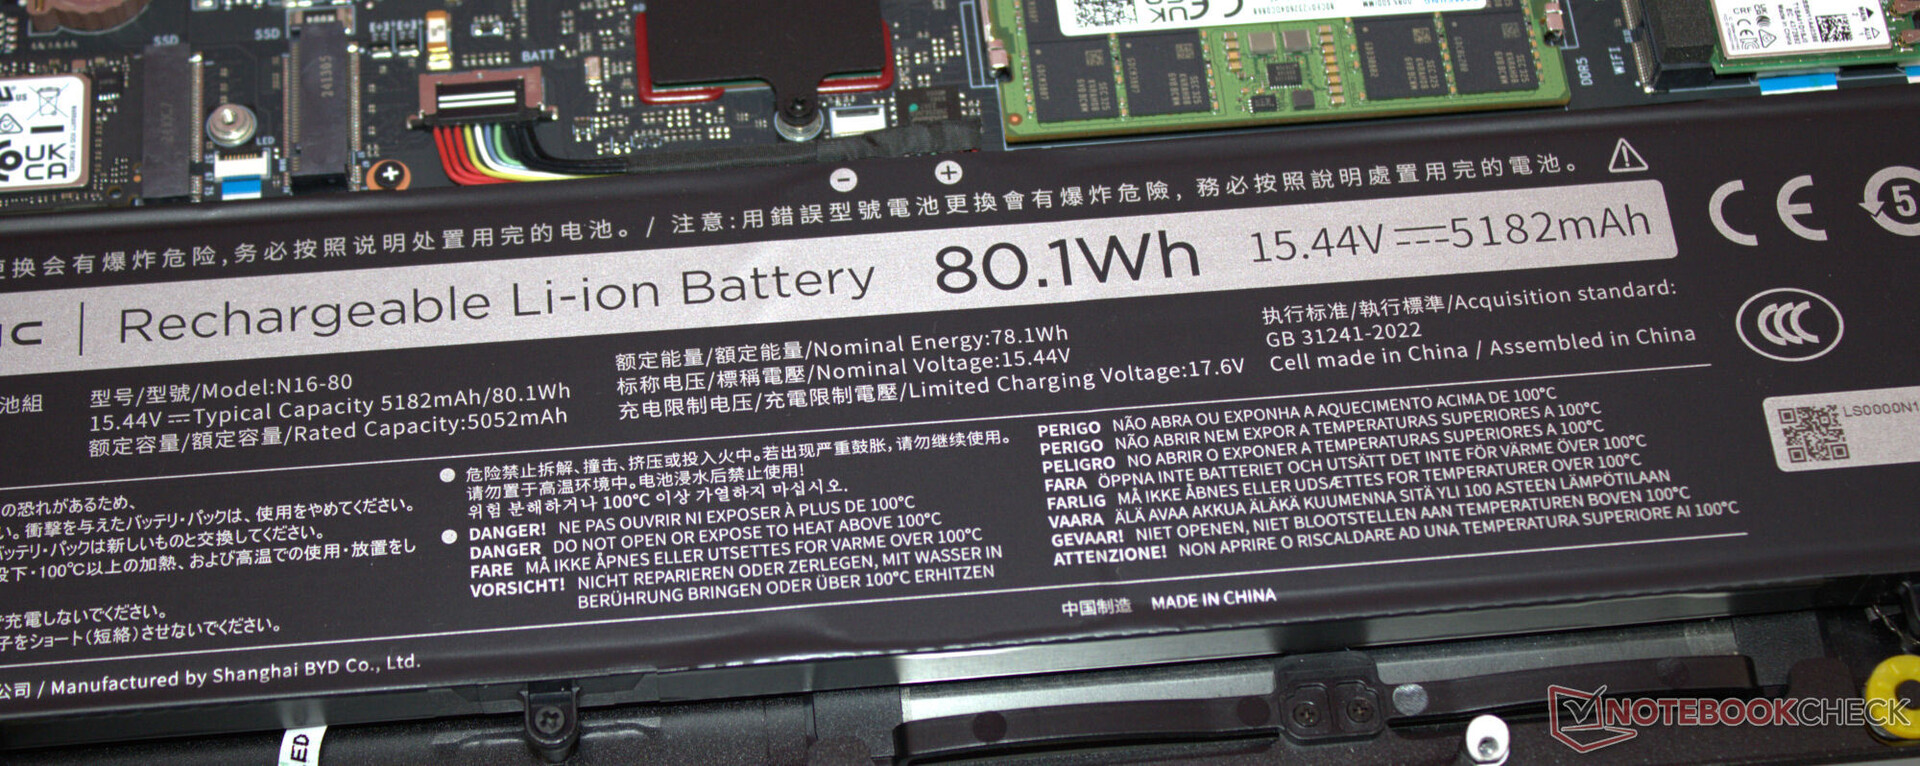
Après avoir retiré toutes les vis du fond du boîtier, la partie inférieure du boîtier peut être retirée à l'aide d'un plectre ou d'une spatule plate. Vous pouvez alors accéder aux banques de mémoire (dont une est occupée), au SSD (PCIe 4, M.2-2280), au deuxième emplacement SSD (PCIe 4, M.2-2280), au module WLAN, à la batterie du BIOS, aux ventilateurs et à la batterie.
Durabilité
Beaucoup de carton, peu de plastique : l'ordinateur portable est enveloppé dans un film, tandis qu'un fin tapis de mousse protège le dessus de l'appareil. Le guide de démarrage rapide imprimé se trouve dans un sac en plastique. Une plaque de base amovible permet de réparer l'ordinateur portable - l'ensemble du matériel est accessible. Les mises à jour logicielles ne devraient pas poser de problème au cours des prochaines années, car le système d'exploitation utilisé est Windows 11.
Il reste à voir comment Nubia gérera l'approvisionnement en pièces détachées et le support de ses propres logiciels. Au moment du test, il n'y a toujours pas de zone de téléchargement pour le Titan sur le site web de Nubia.
Garantie
Nous ne pouvons pas vous donner d'informations sur la garantie de l'ordinateur portable. Il est probable qu'elle soit d'environ 12 mois, ce qui est la norme aux États-Unis. Nous considérons que les extensions de garantie sont peu probables.
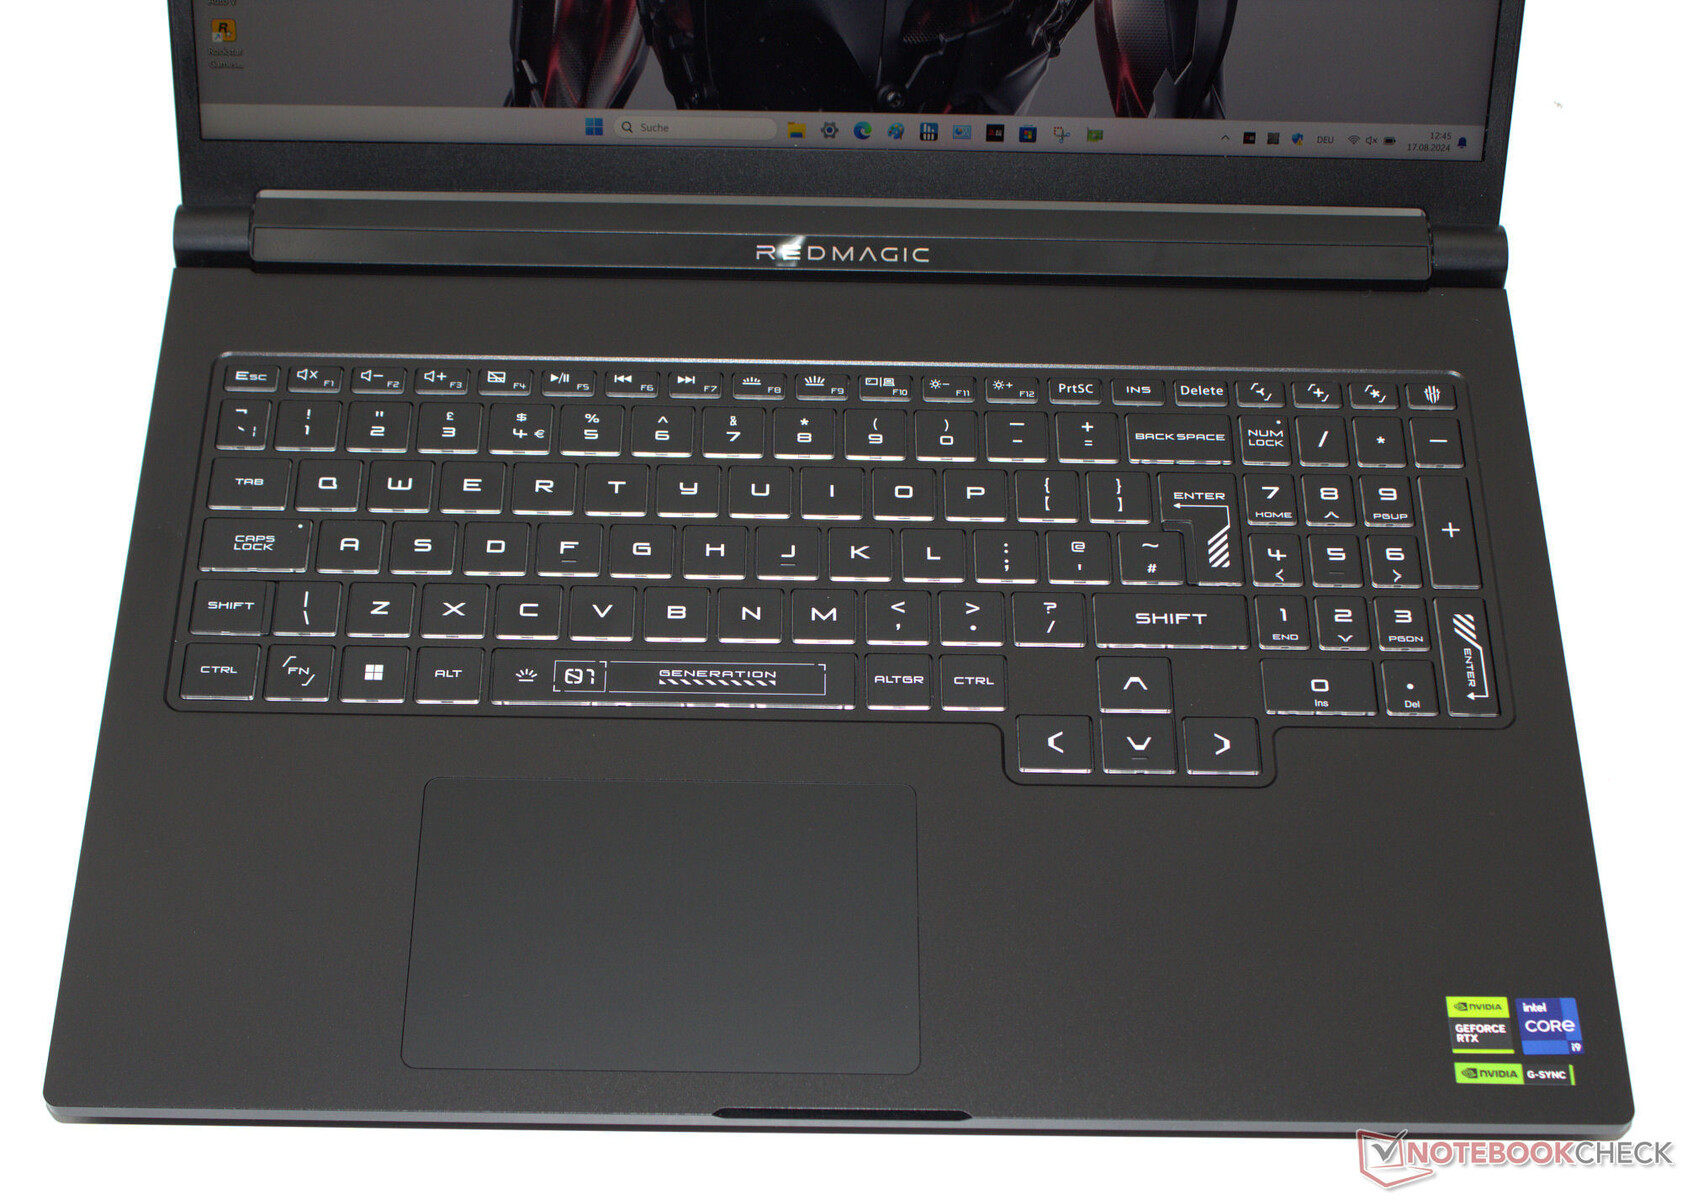
Périphériques d'entrée - L'ordinateur portable RedMagic avec éclairage RVB
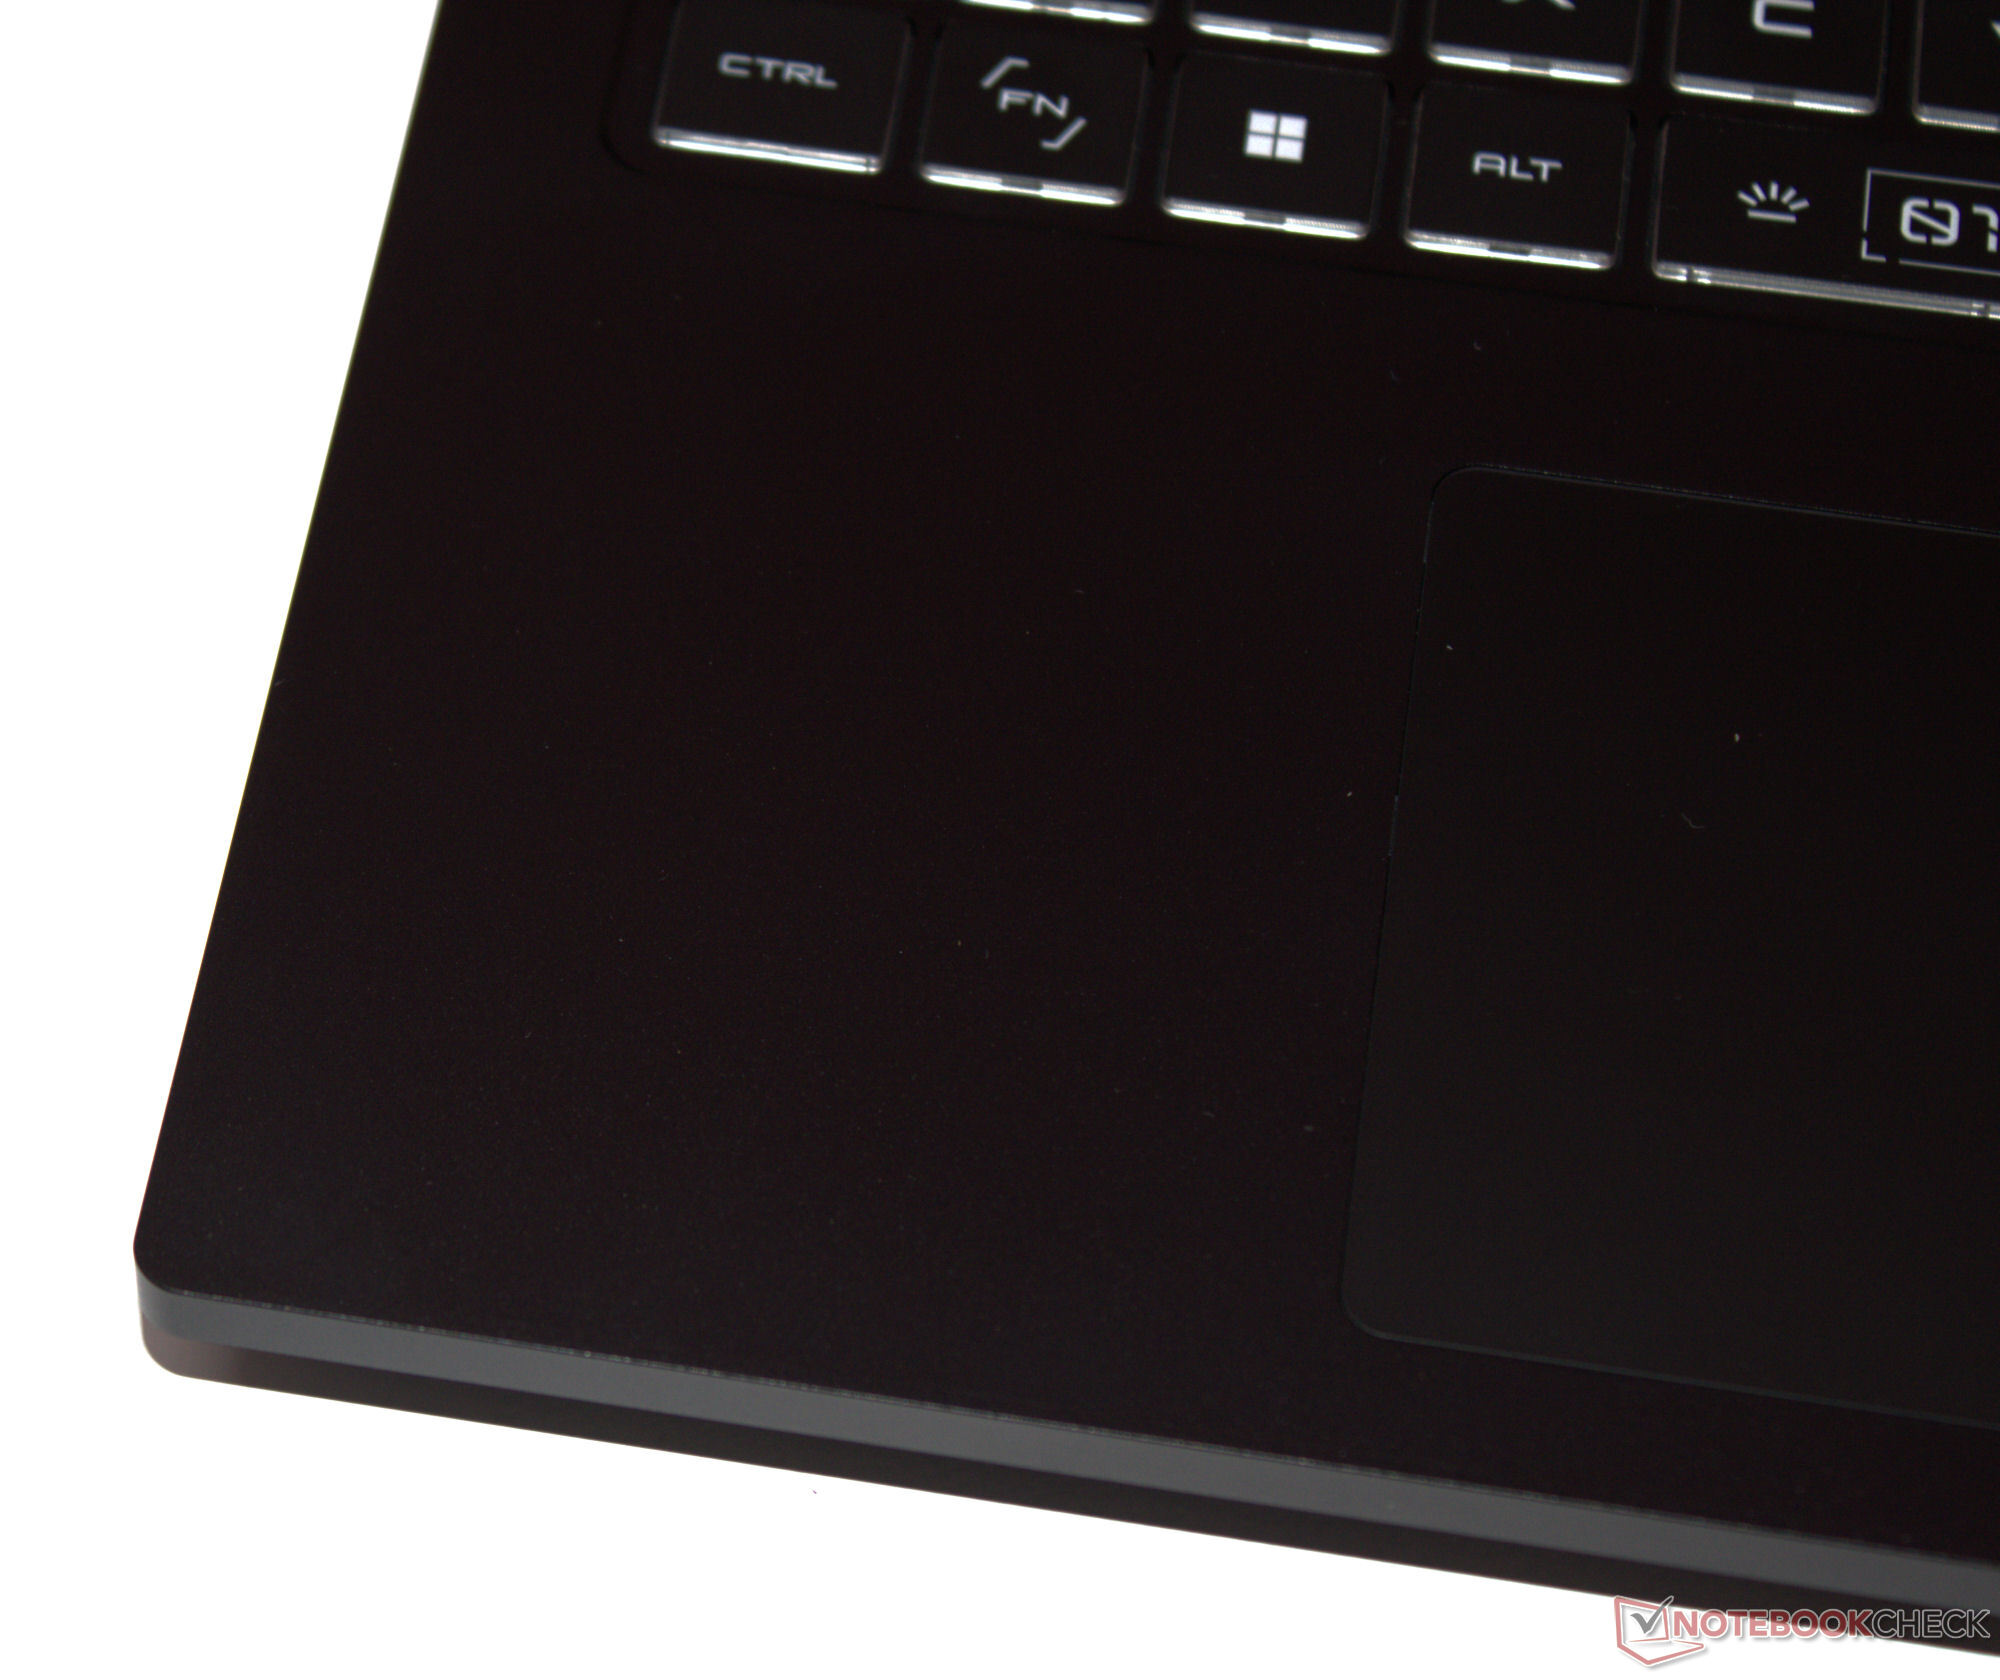
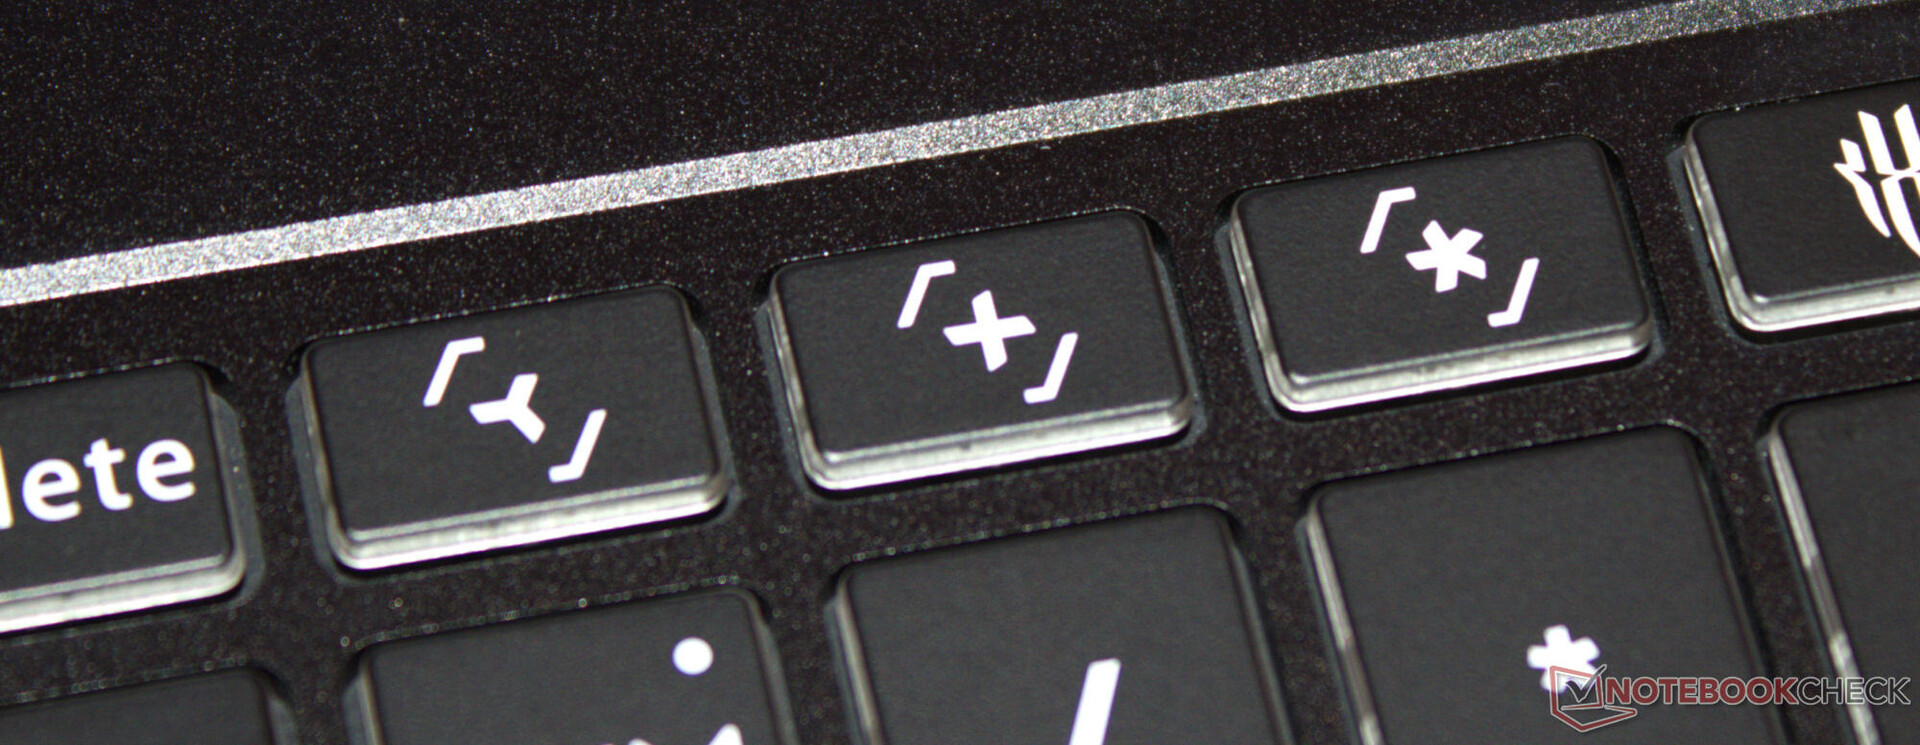
Clavier
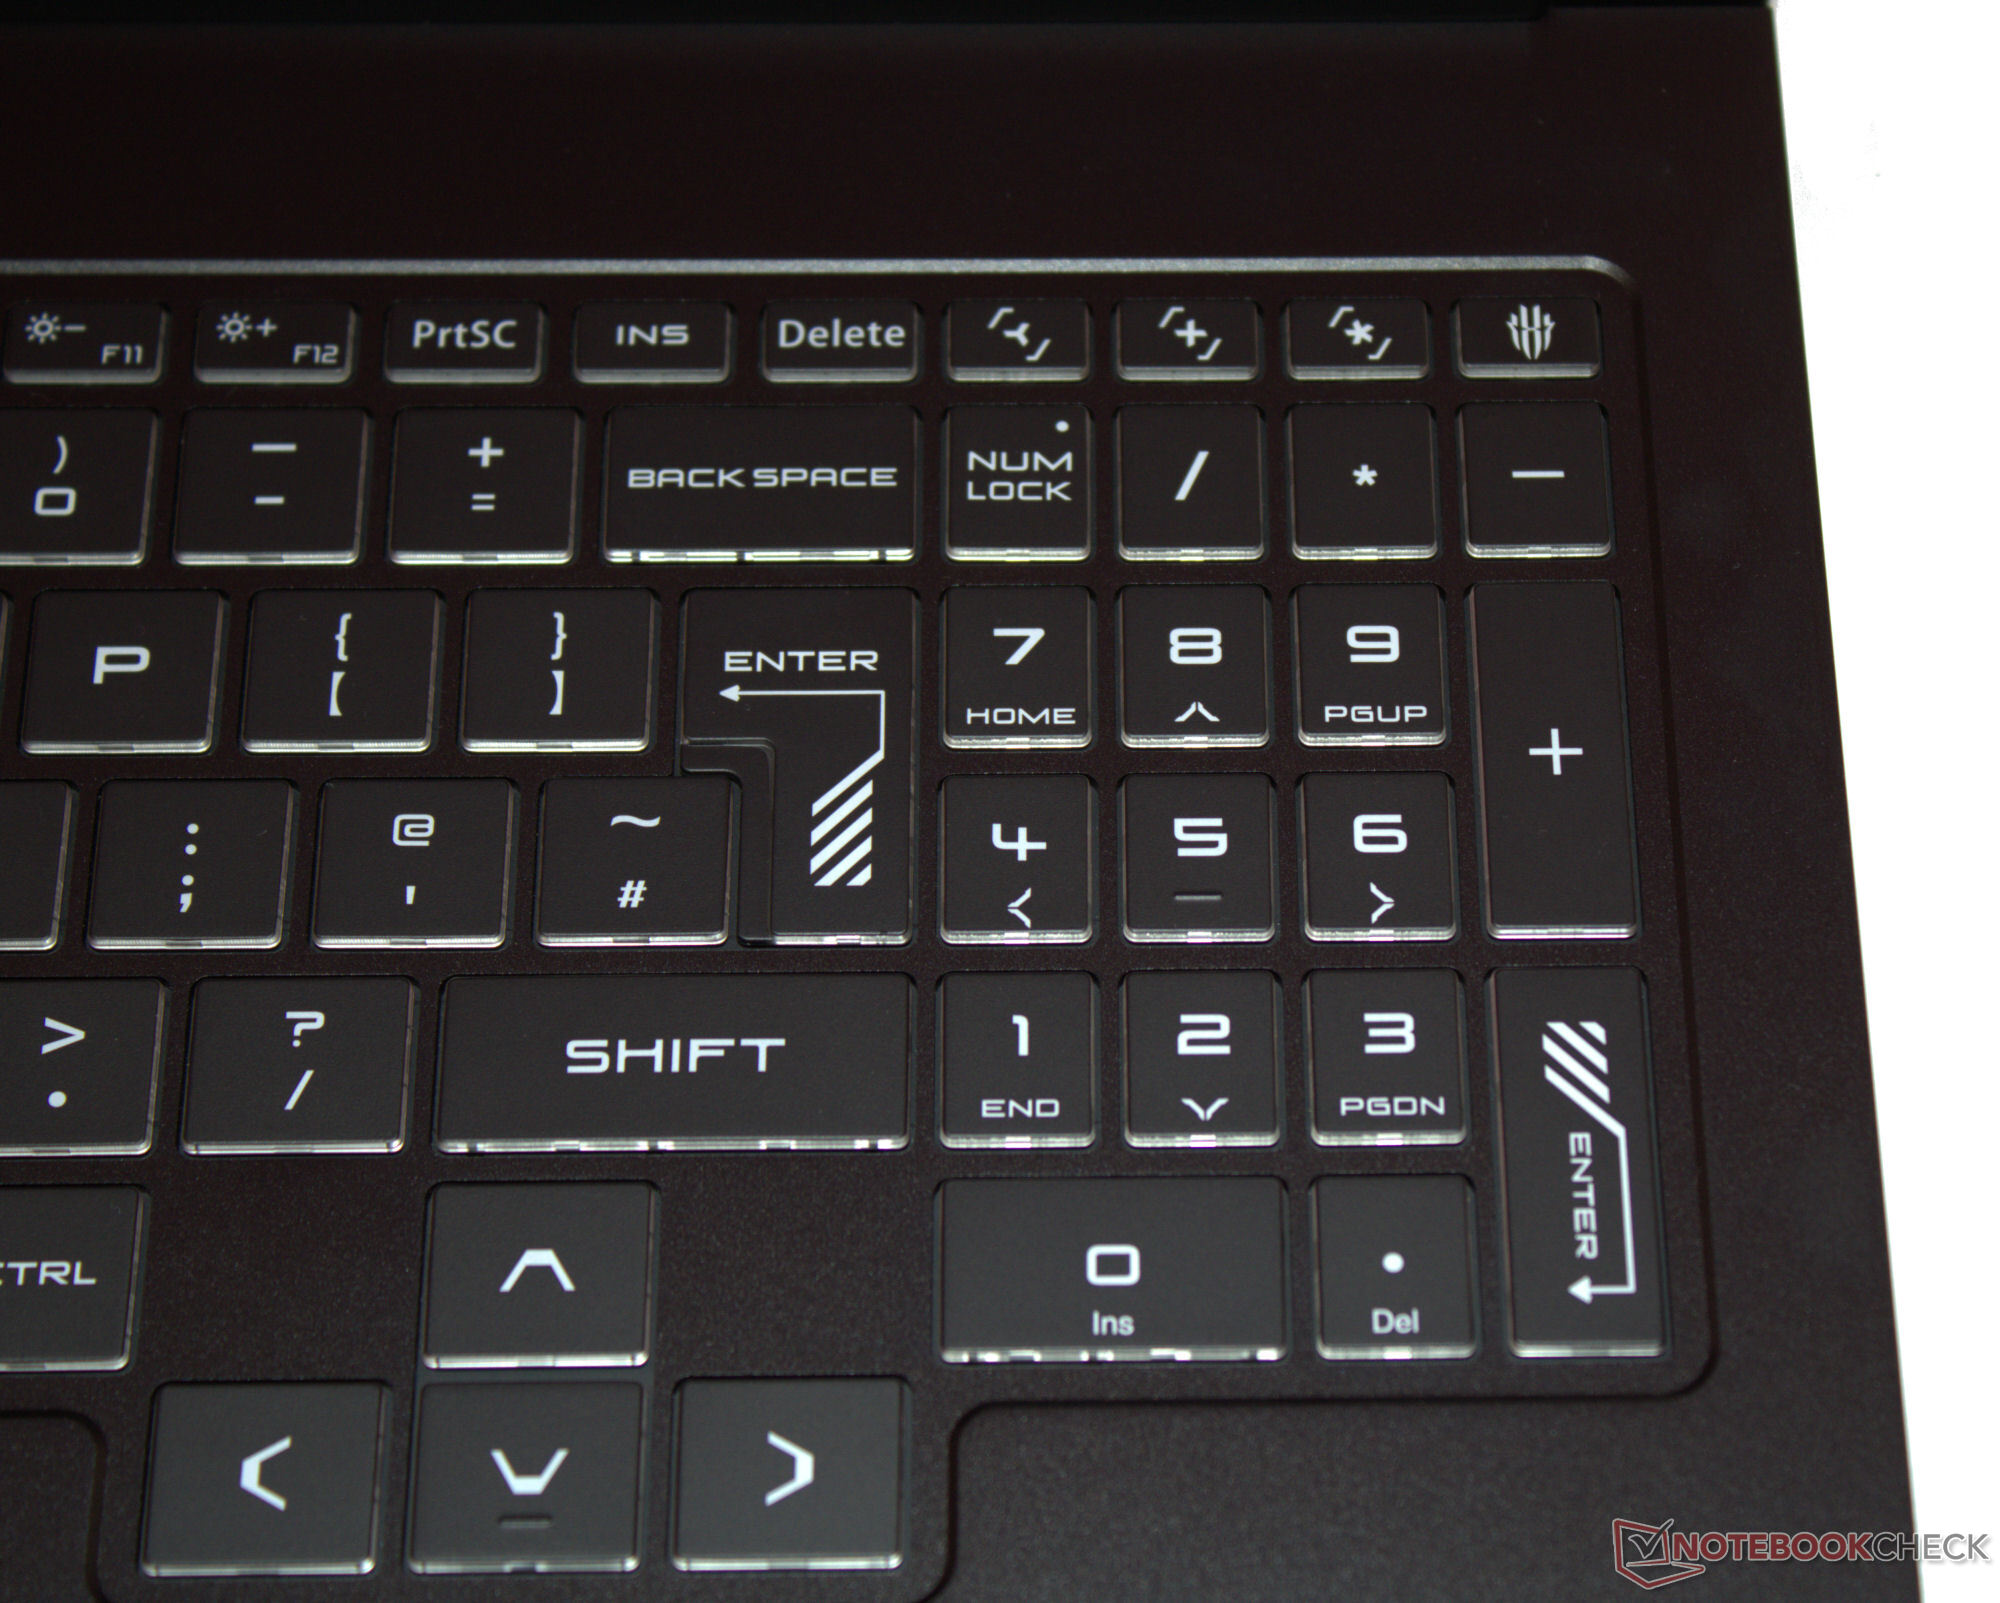
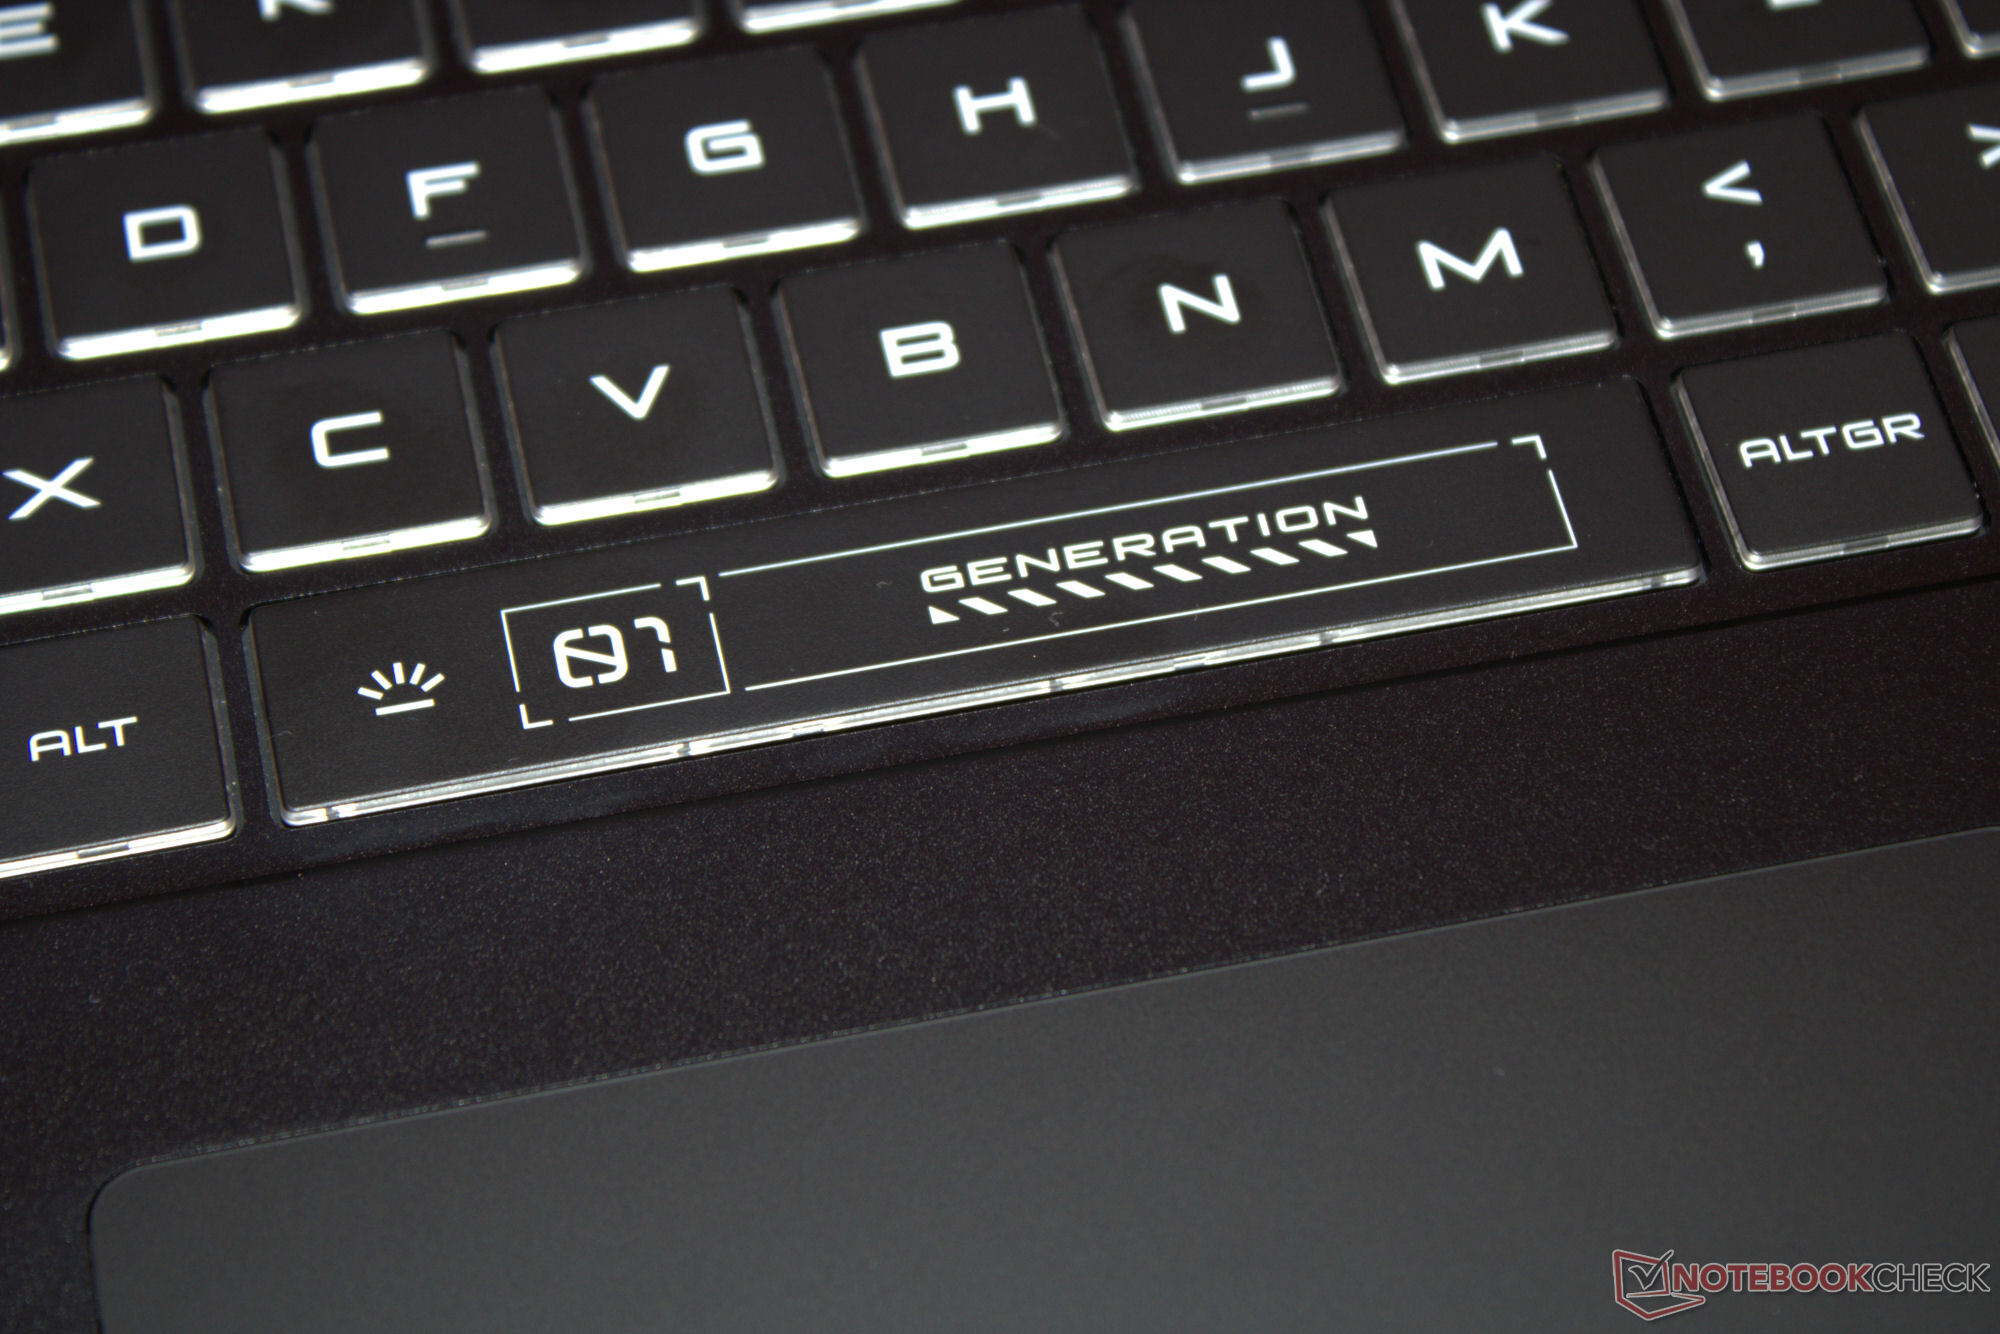
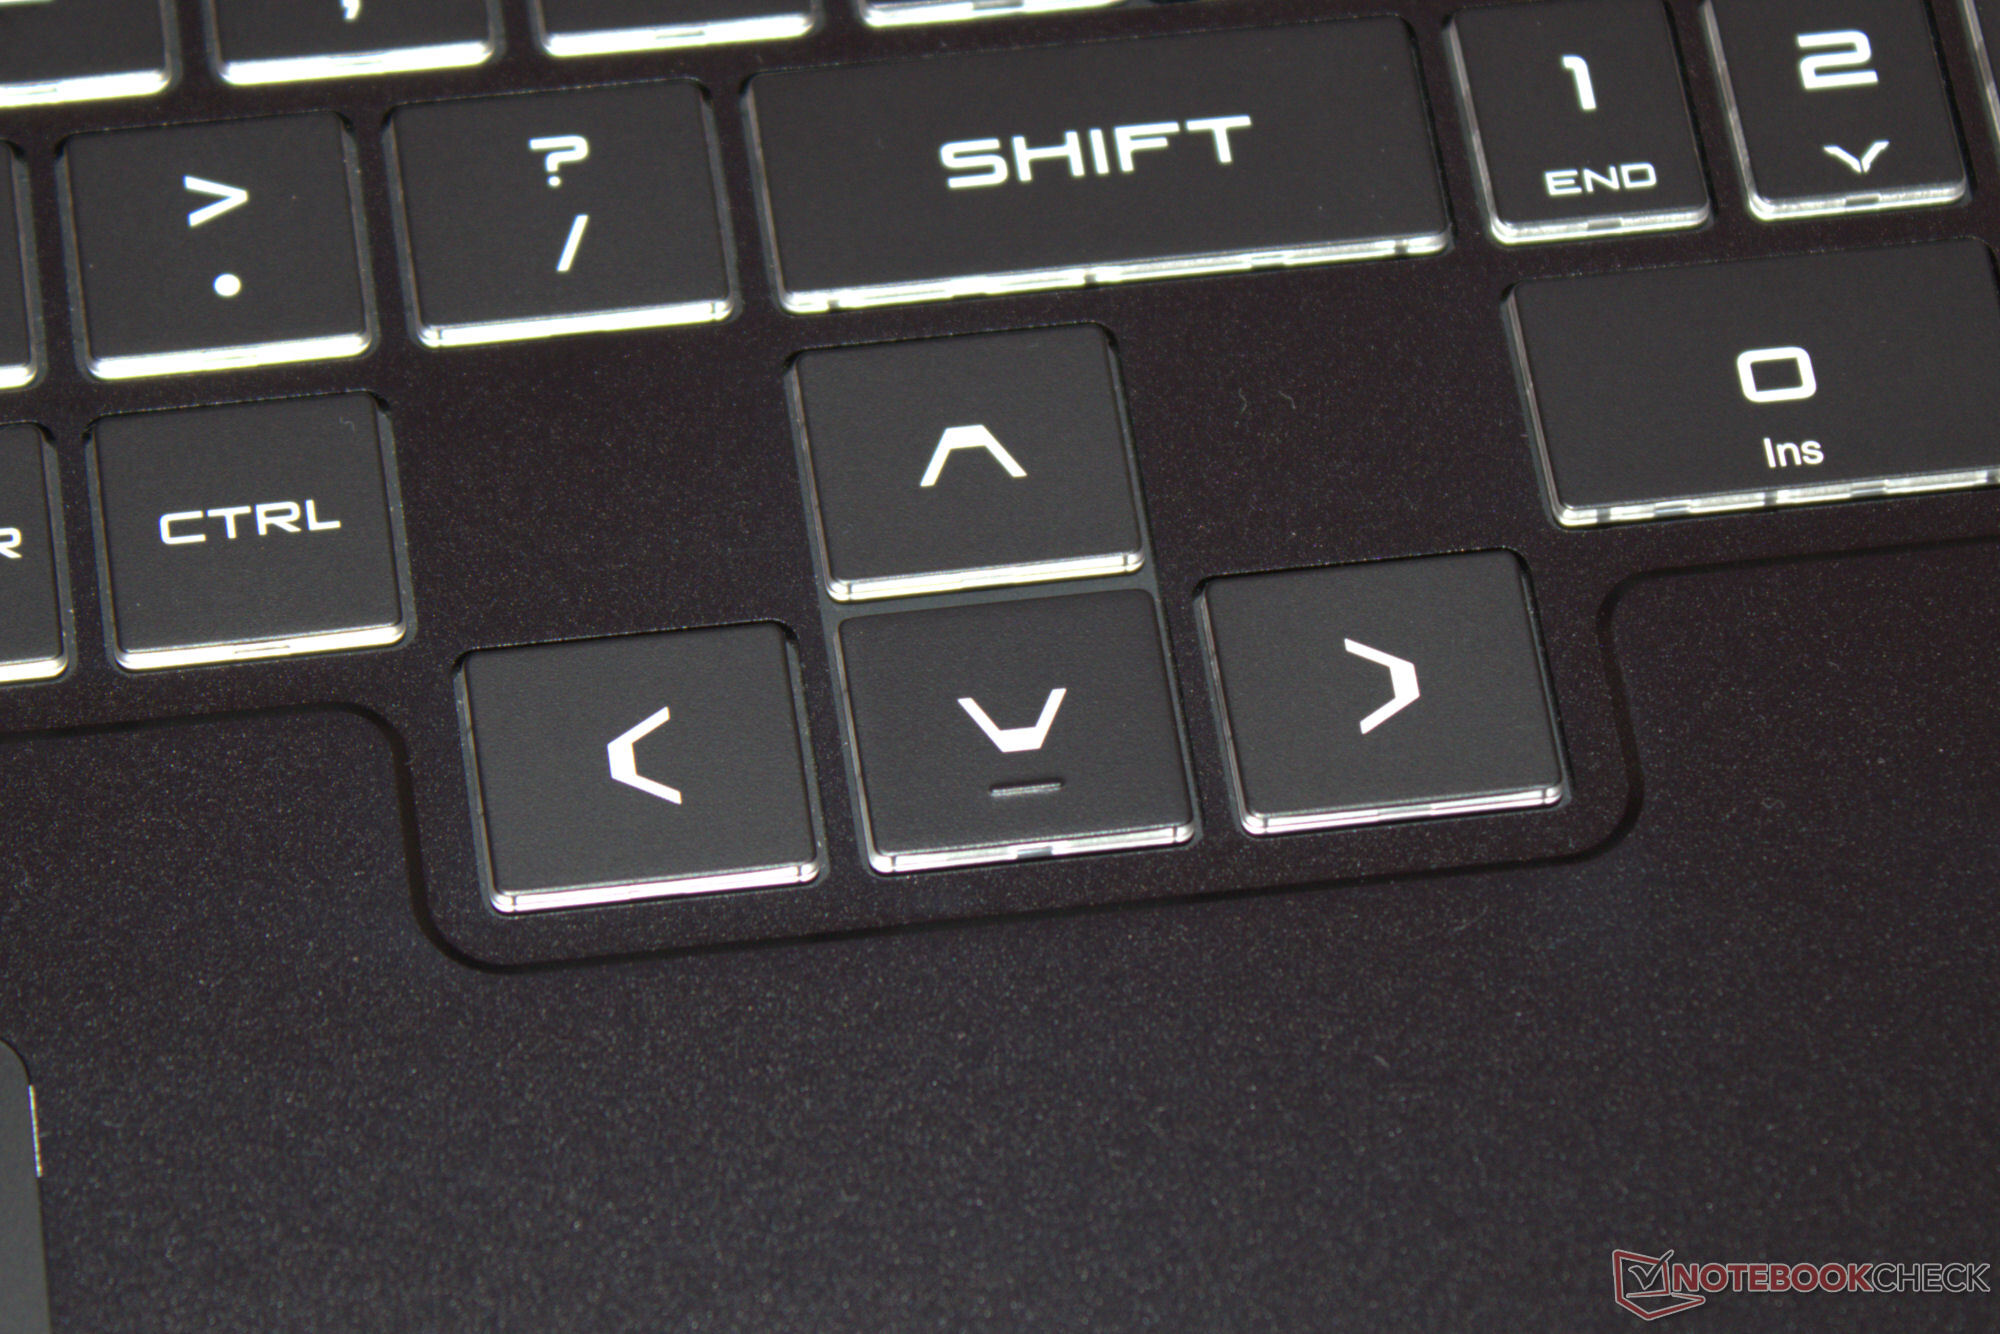
Nubia a opté pour un clavier chiclet comprenant un pavé numérique. Les touches, éclairées de manière homogène, ont une course courte et un point de pression clair. Le clavier ne cède pas lors de la frappe. Les touches fléchées décalées sont de taille normale, ce qui est un point positif. Le rétroéclairage RVB est divisé en quatre zones et notre appareil de test est doté d'un clavier QWERTY. Nous ne pouvons pas dire si le fabricant propose des configurations localisées.
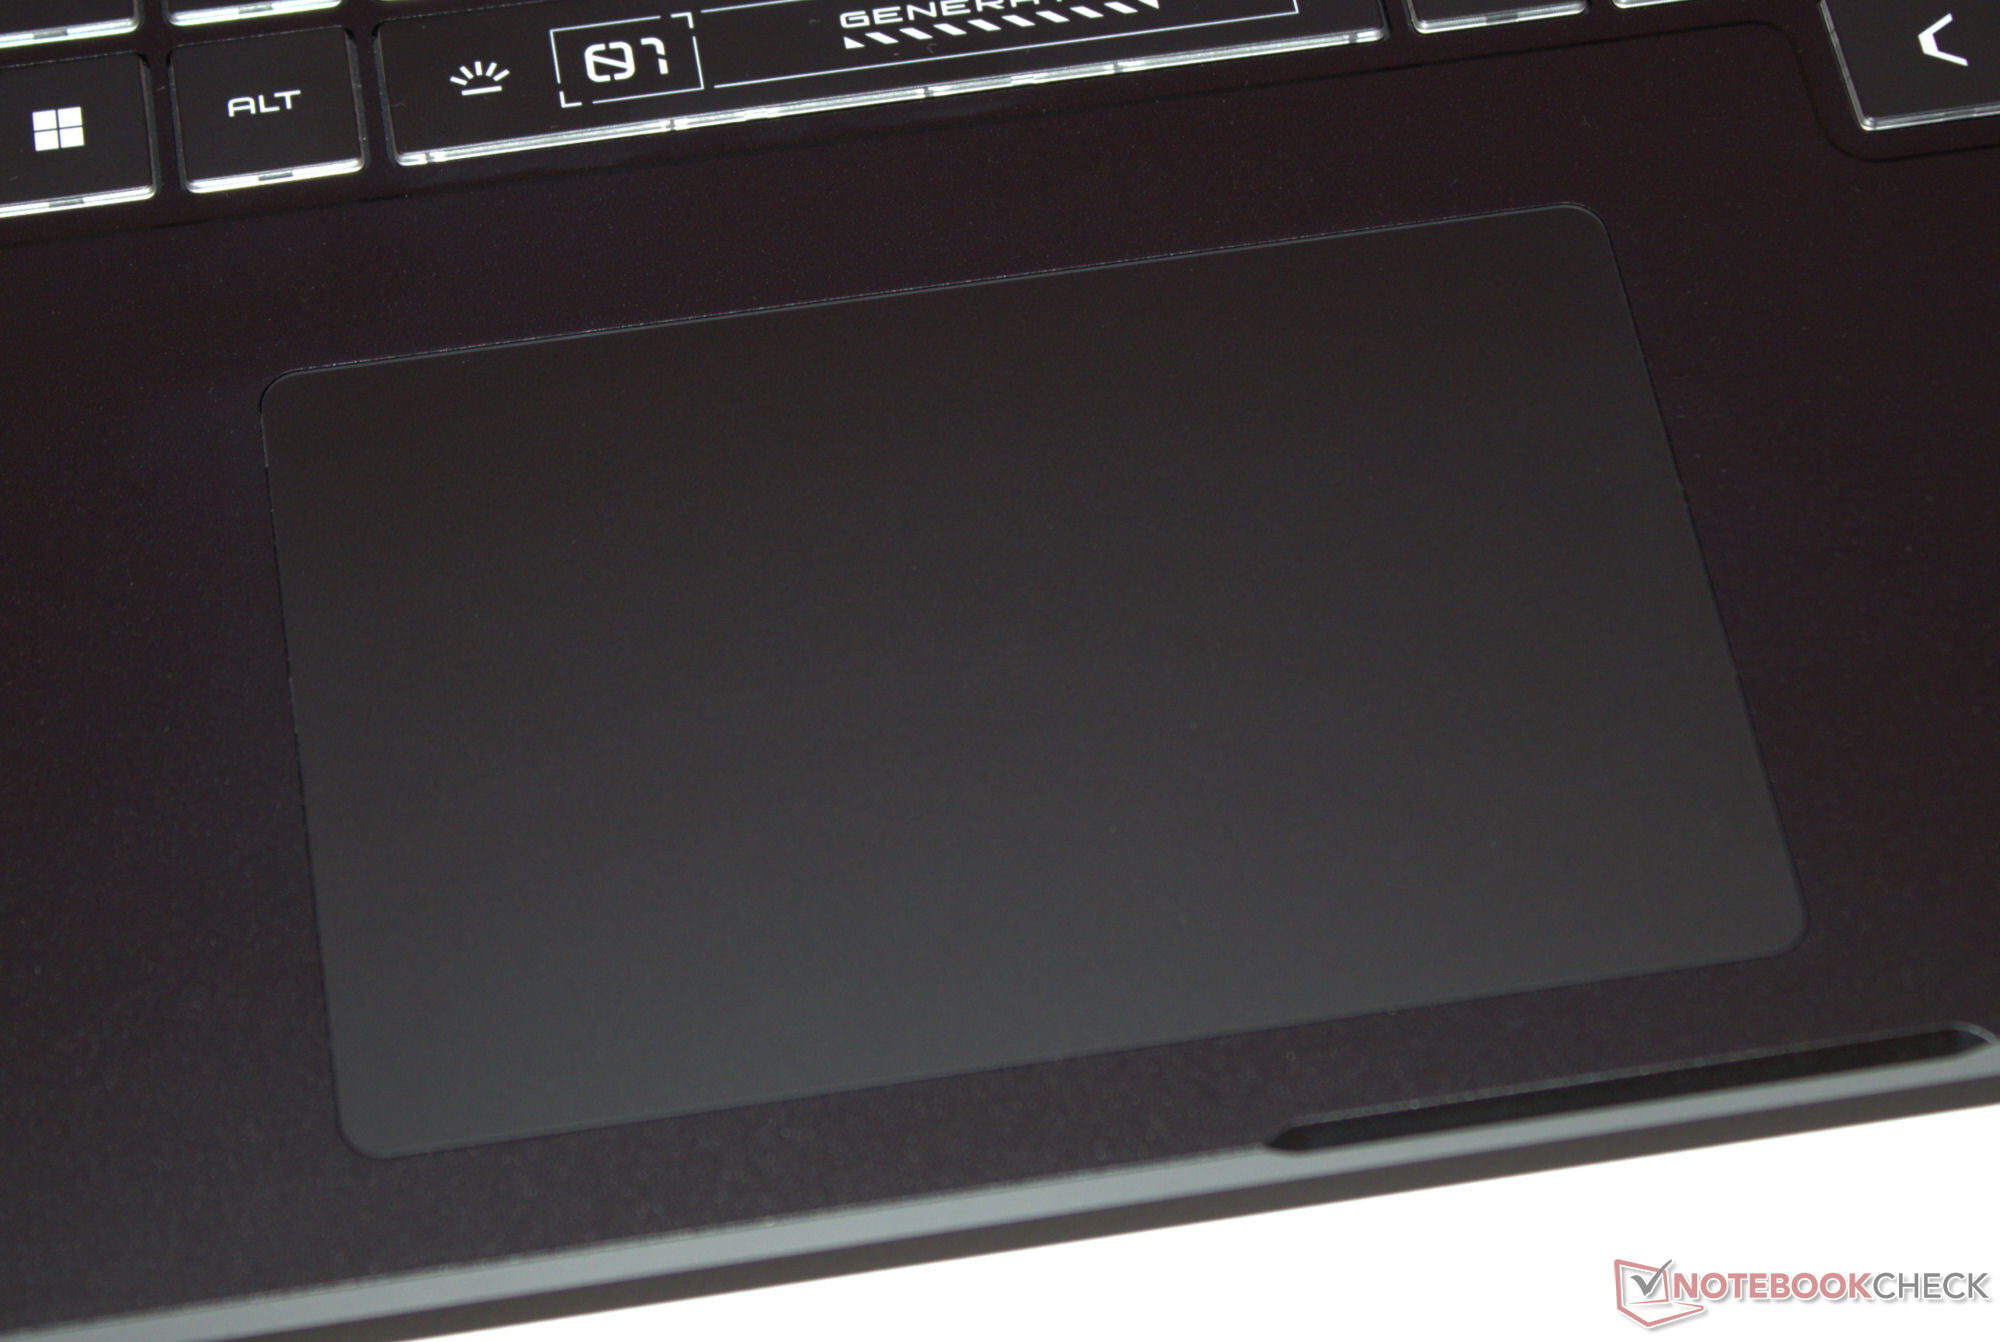
Pavé tactile
Un pavé tactile multi-touch (environ 11,7 x 7,5 cm) avec une surface en verre remplace la souris. Il a une course courte et un point de pression clair. Le pavé peut être désactivé si nécessaire.
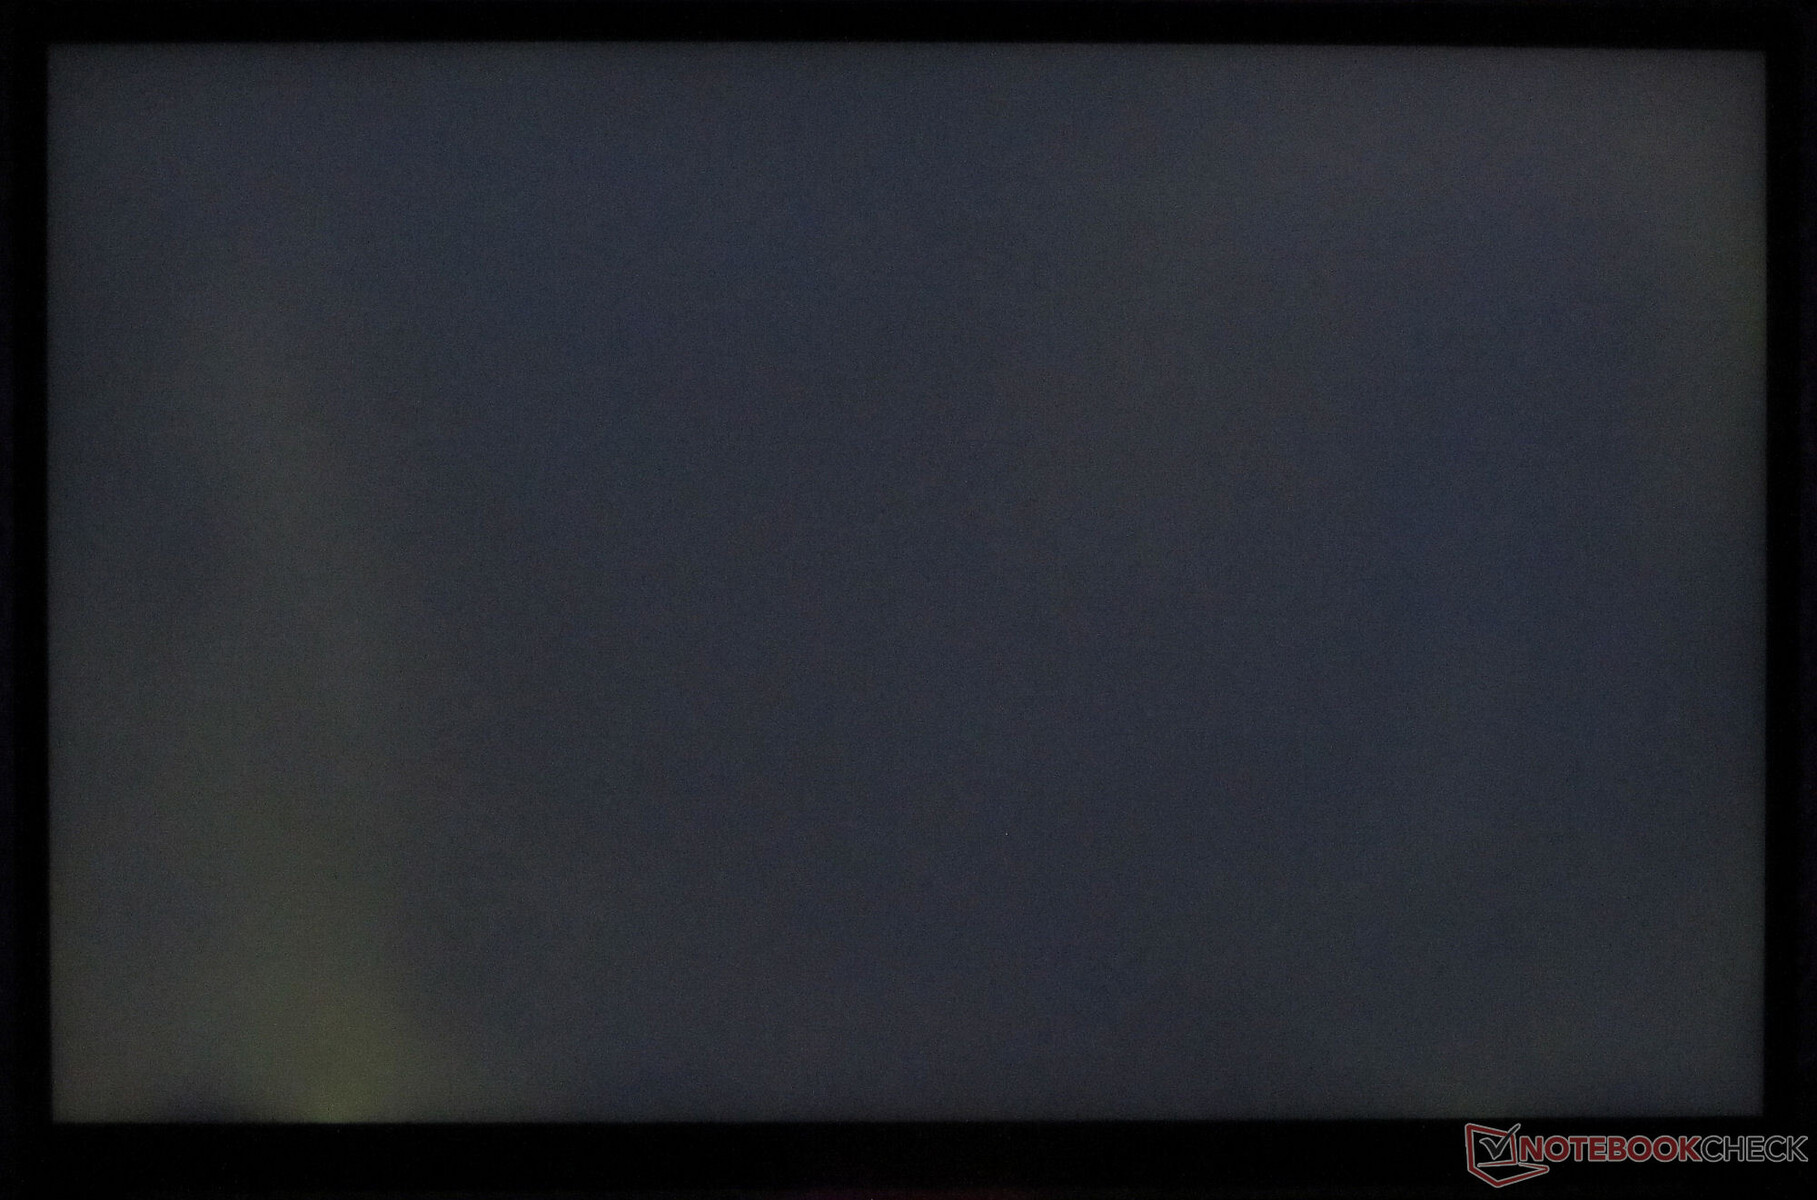
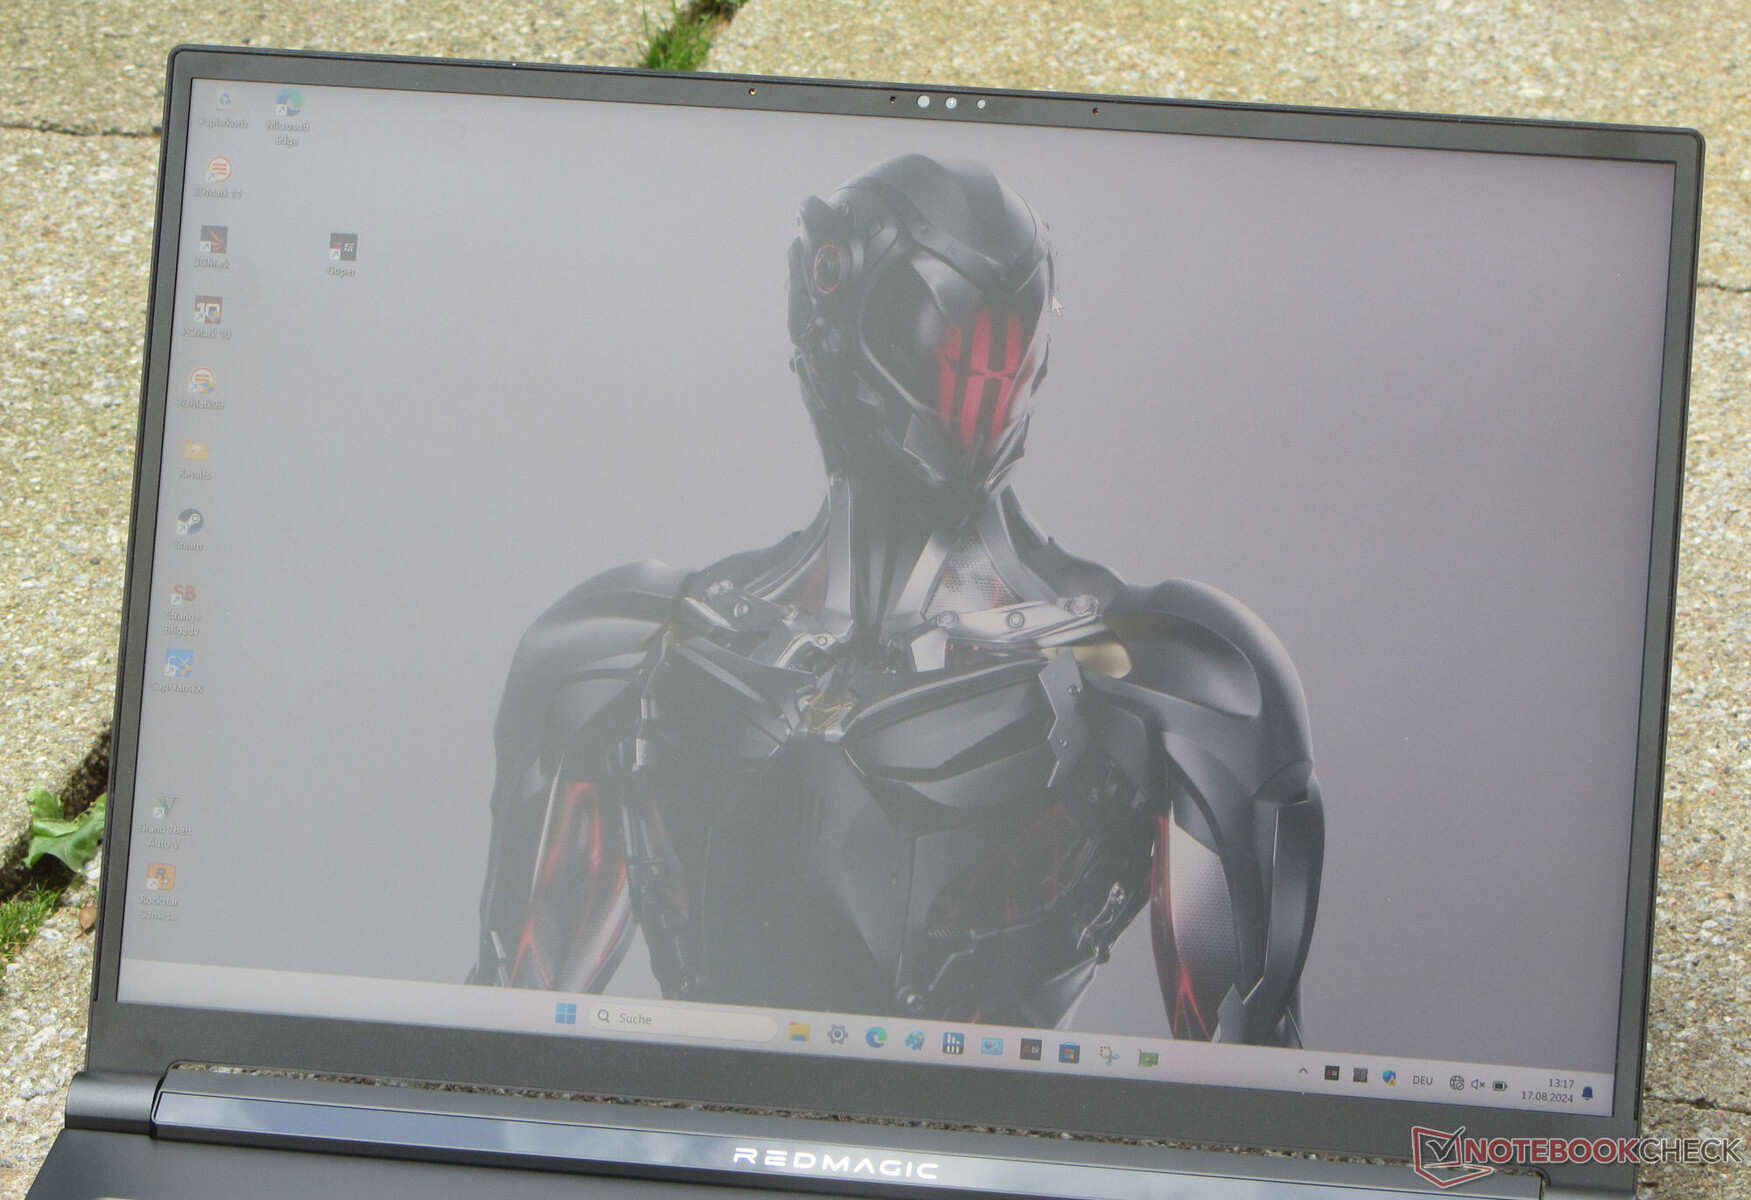
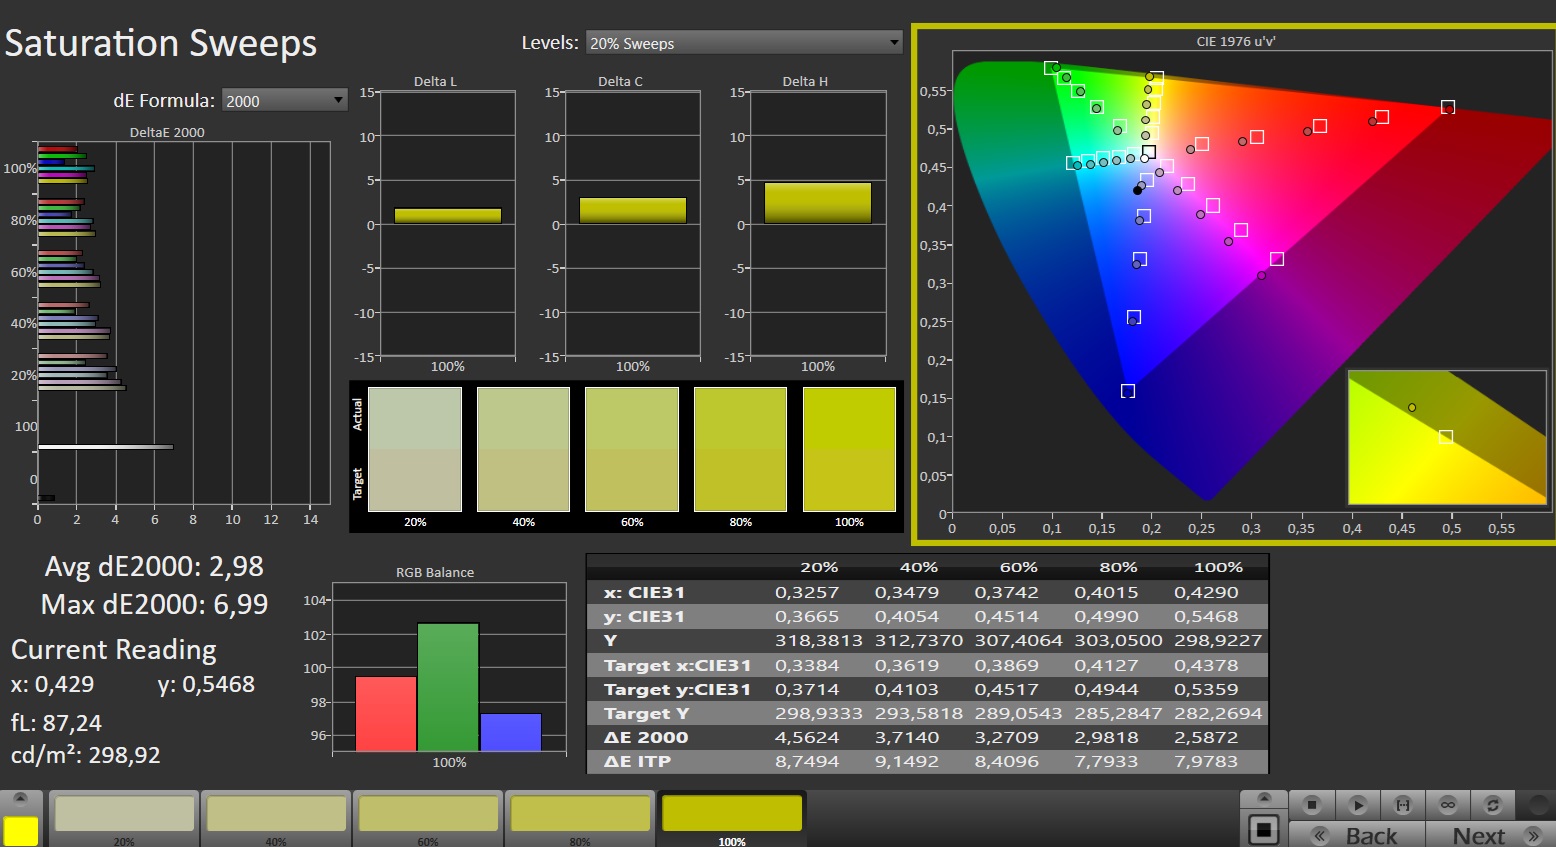
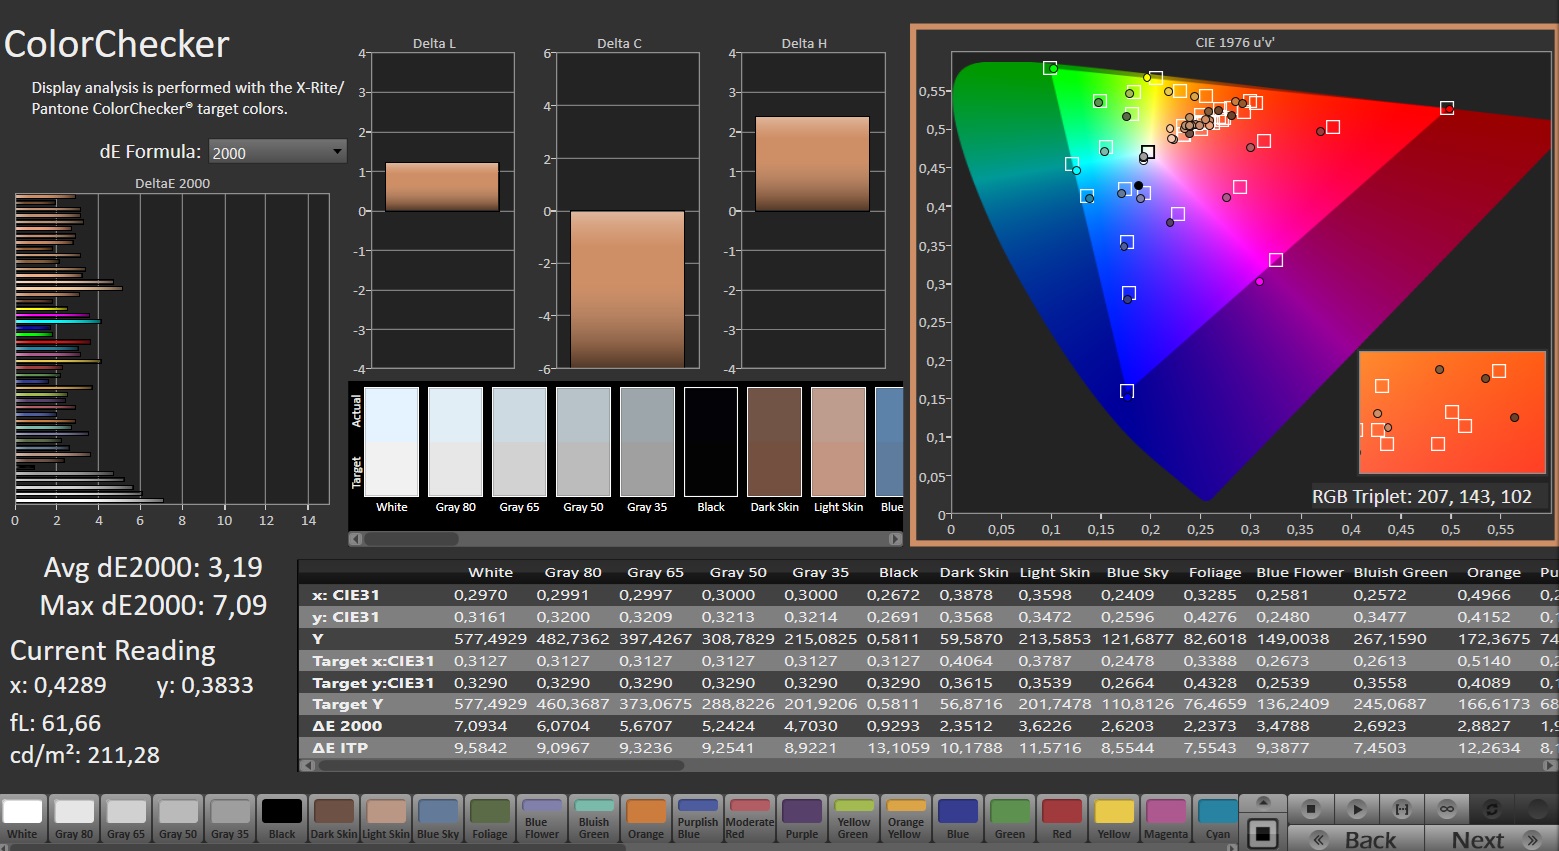
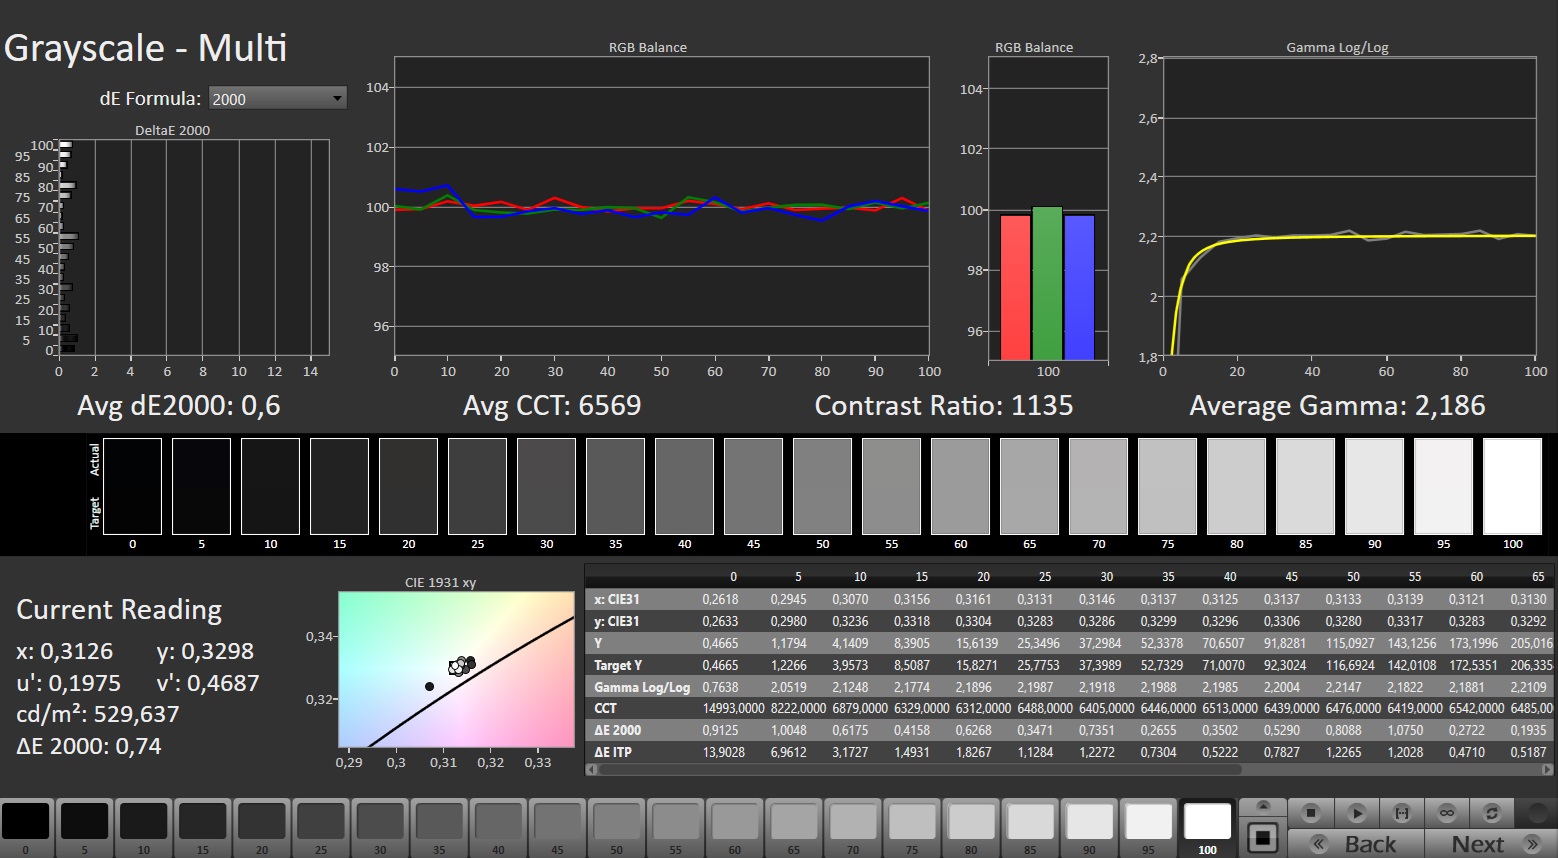
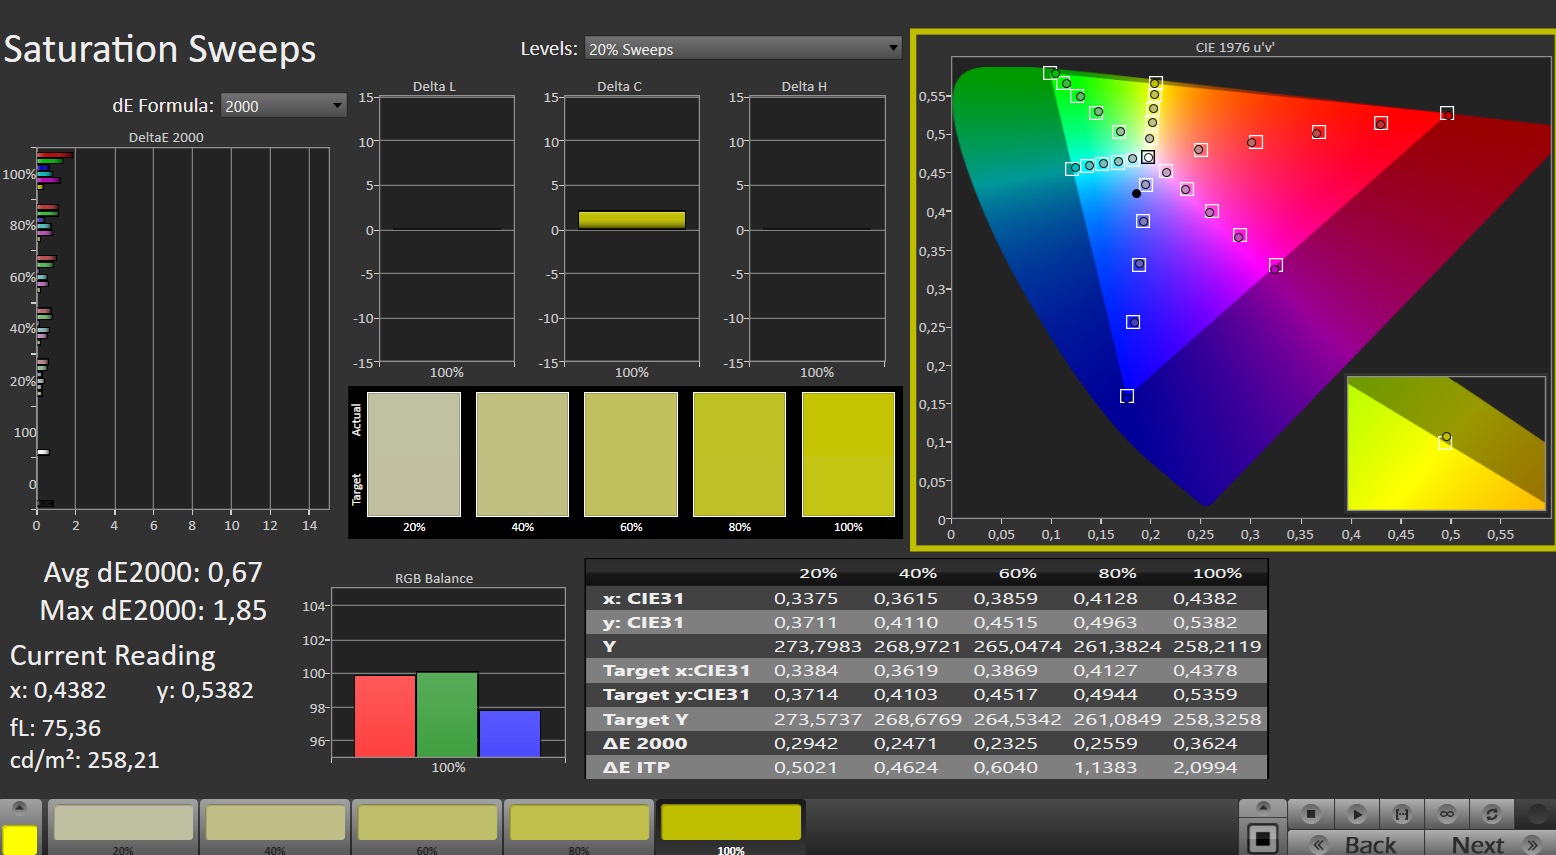
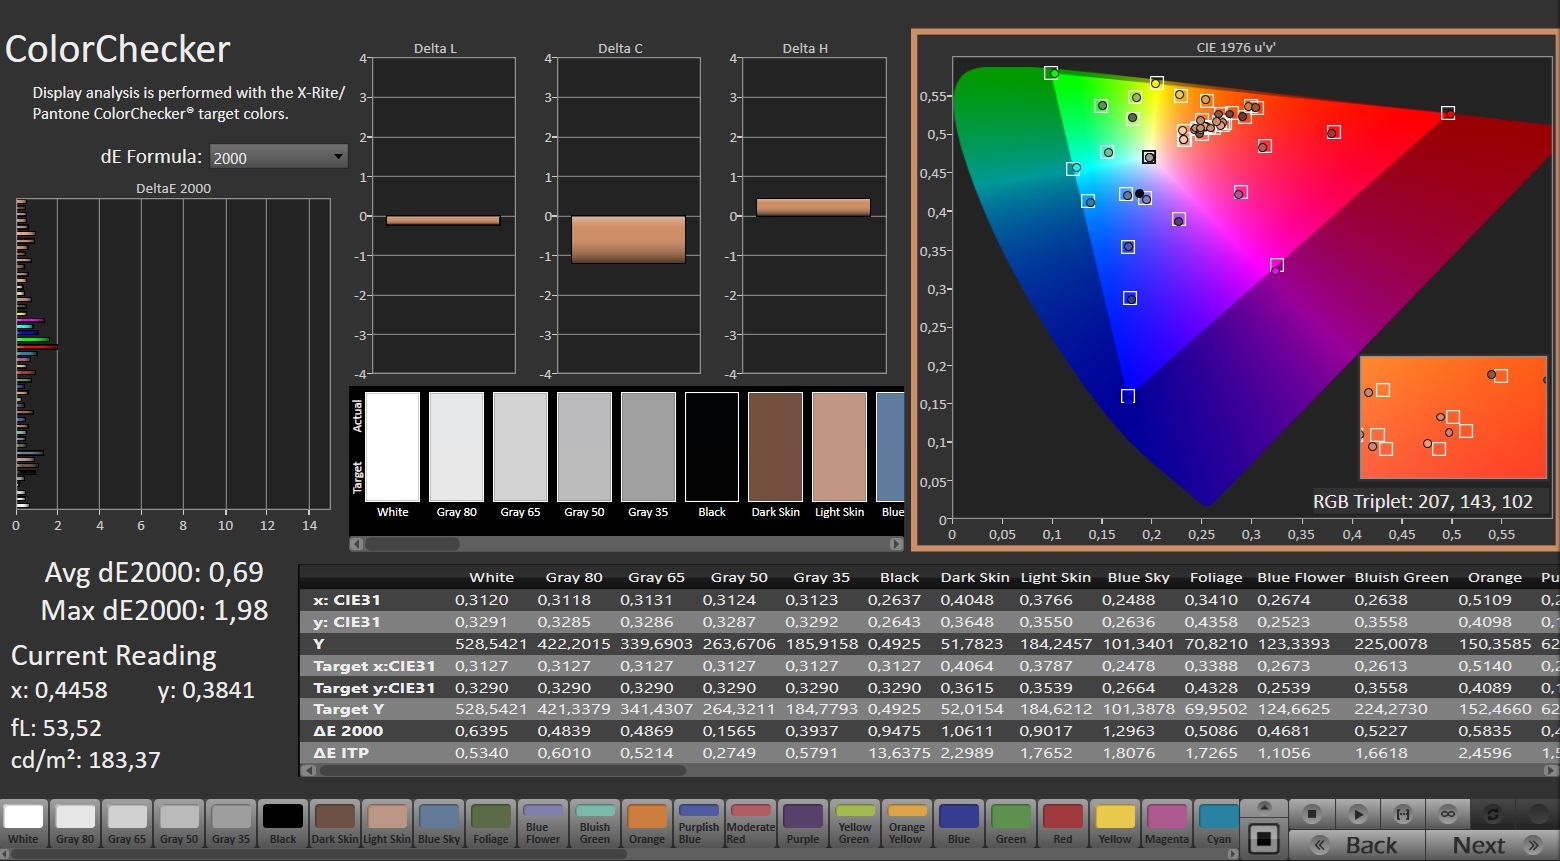
Affichage - Un écran IPS avec couverture DCI-P3
Il semble que le format 16:10, très pratique pour le travail, se soit imposé, car la plupart des ordinateurs portables comparés ont un écran de ce format, y compris le Titan. Nubia a équipé son ordinateur portable d'un écran IPS (2 560 x 1 600 pixels) mat et stable dans l'angle de vision, d'une diagonale de 16 pouces. La dalle est très lumineuse et son contraste atteint la valeur cible. Il est parfaitement possible de lire sur l'écran à l'extérieur. Un point positif est que le panneau 240-Hz ne montre aucun signe de scintillement PWM et prend en charge G-Sync. Aucun autre écran n'est disponible.

| |||||||||||||||||||||||||
Homogénéité de la luminosité: 86 %
Valeur mesurée au centre, sur batterie: 543 cd/m²
Contraste: 1065:1 (Valeurs des noirs: 0.51 cd/m²)
ΔE Color 3.19 | 0.5-29.43 Ø4.87, calibrated: 0.69
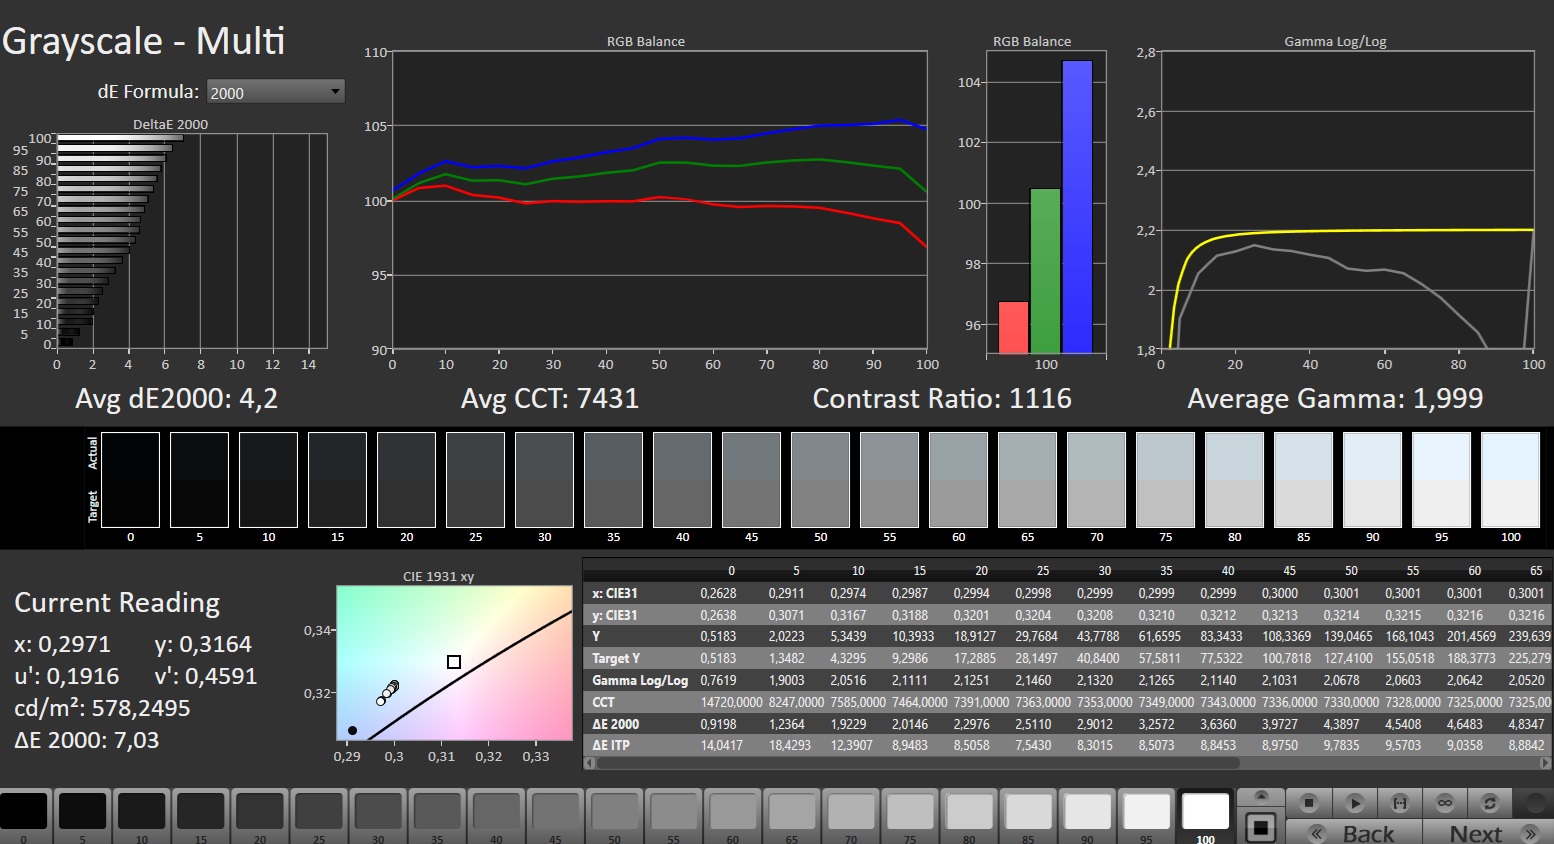
ΔE Greyscale 4.2 | 0.5-98 Ø5.1
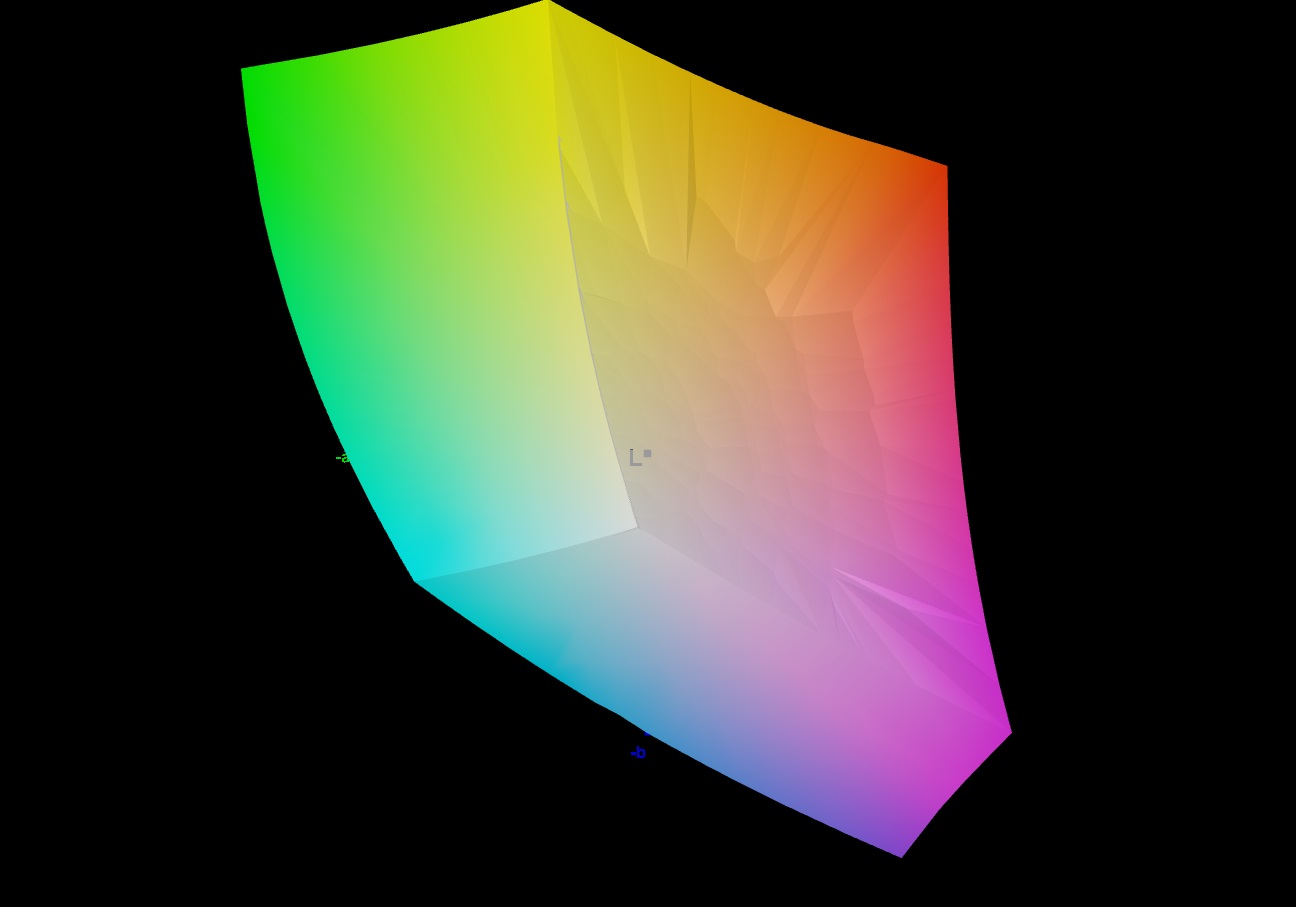
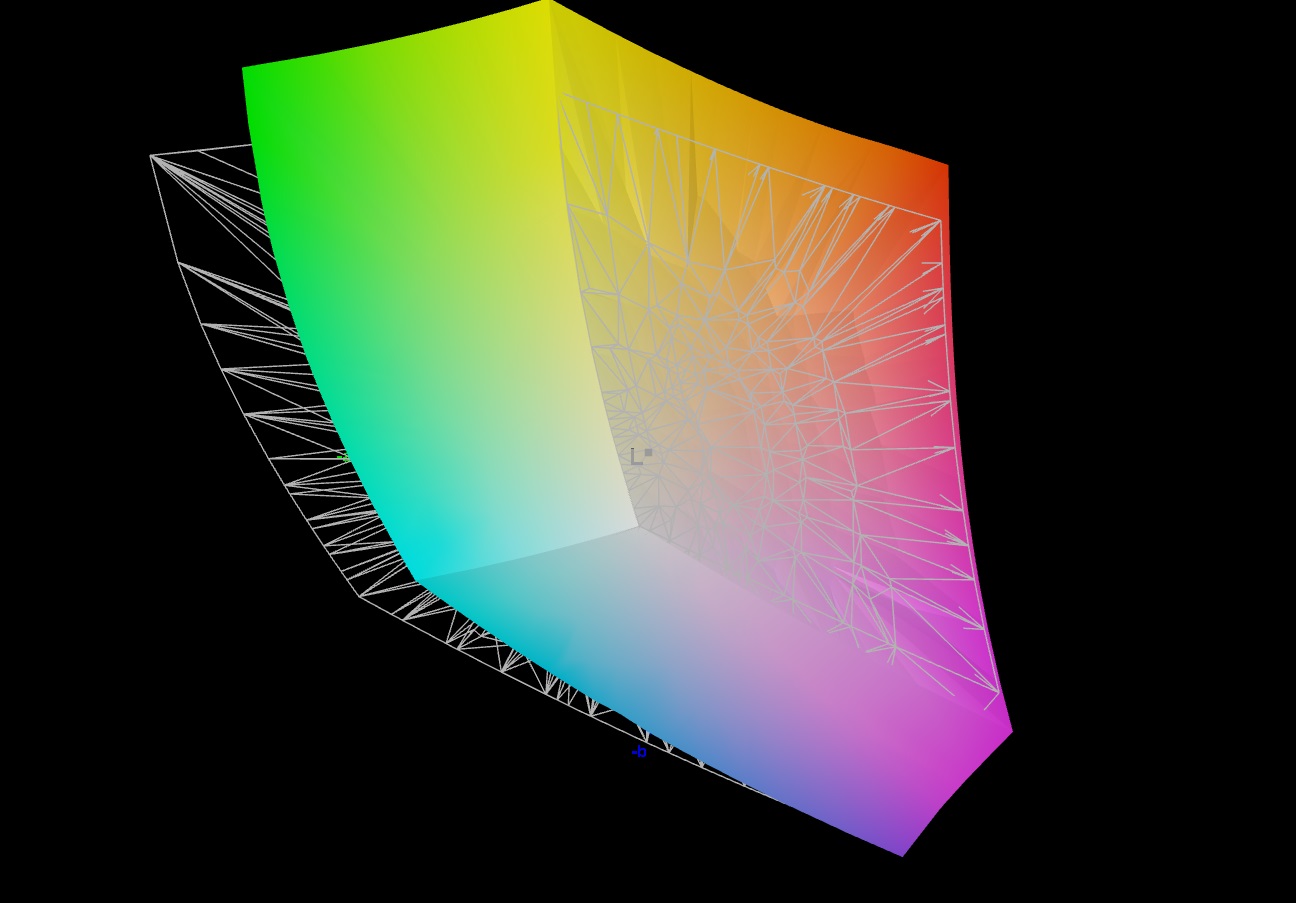
84.1% AdobeRGB 1998 (Argyll 2.2.0 3D)
100% sRGB (Argyll 2.2.0 3D)
96.3% Display P3 (Argyll 2.2.0 3D)
Gamma: 1.999
| Nubia RedMagic Titan 16 Pro BOE CQ NE160QDM-NZ2, IPS, 2560x1600, 16", 240 Hz | Lenovo Legion Pro 5 16IRX9 G9 BOE NE160QDM-NZB, IPS, 2560x1600, 16", 240 Hz | HP Victus 16 (2024) Chi Mei CMN163E, IPS, 1920x1080, 16.1", 144 Hz | Acer Predator Helios Neo 16 (2024) Chi Mei N160GME-GTB, LED, 2560x1600, 16", 240 Hz | SCHENKER XMG Pro 16 Studio (Mid 24) BOE CQ NE160QDM-NZ1, IPS, 2560x1600, 16", 240 Hz | Gigabyte G6X 9KG (2024) BOE NE160WUM-NX6, IPS, 1920x1200, 16", 165 Hz | |
|---|---|---|---|---|---|---|
| Display | 2% | -48% | 1% | -15% | -48% | |
| Display P3 Coverage | 96.3 | 99.22 3% | 41.3 -57% | 95.9 0% | 68.8 -29% | 41.8 -57% |
| sRGB Coverage | 100 | 99.93 0% | 61.7 -38% | 99.8 0% | 99.5 0% | 62.4 -38% |
| AdobeRGB 1998 Coverage | 84.1 | 87.81 4% | 42.7 -49% | 86.4 3% | 70.8 -16% | 43.3 -49% |
| Response Times | -54% | -454% | -52% | -126% | -635% | |
| Response Time Grey 50% / Grey 80% * | 3.9 ? | 4.8 ? -23% | 28.6 ? -633% | 5 ? -28% | 12.7 ? -226% | 40.5 ? -938% |
| Response Time Black / White * | 5 ? | 9.2 ? -84% | 18.7 ? -274% | 8.8 ? -76% | 6.3 ? -26% | 21.6 ? -332% |
| PWM Frequency | ||||||
| Screen | 4% | -74% | 18% | -2% | -68% | |
| Brightness middle | 543 | 518 -5% | 287 -47% | 521 -4% | 416 -23% | 353 -35% |
| Brightness | 516 | 491 -5% | 288 -44% | 506 -2% | 392 -24% | 318 -38% |
| Brightness Distribution | 86 | 90 5% | 86 0% | 85 -1% | 86 0% | 81 -6% |
| Black Level * | 0.51 | 0.36 29% | 0.19 63% | 0.44 14% | 0.38 25% | 0.21 59% |
| Contrast | 1065 | 1439 35% | 1511 42% | 1184 11% | 1095 3% | 1681 58% |
| Colorchecker dE 2000 * | 3.19 | 4.32 -35% | 5.46 -71% | 1.74 45% | 2.33 27% | 5.21 -63% |
| Colorchecker dE 2000 max. * | 7.09 | 6.37 10% | 20.36 -187% | 3.88 45% | 6.07 14% | 19.95 -181% |
| Colorchecker dE 2000 calibrated * | 0.69 | 0.75 -9% | 3.52 -410% | 0.52 25% | 1.02 -48% | 3.61 -423% |
| Greyscale dE 2000 * | 4.2 | 3.66 13% | 4.8 -14% | 3 29% | 3.7 12% | 3.6 14% |
| Gamma | 1.999 110% | 2.19 100% | 2.108 104% | 2.164 102% | 2.161 102% | 2.367 93% |
| CCT | 7431 87% | 6841 95% | 6442 101% | 6816 95% | 7102 92% | 7138 91% |
| Moyenne finale (programmes/paramètres) | -16% /
-4% | -192% /
-123% | -11% /
4% | -48% /
-22% | -250% /
-145% |
* ... Moindre est la valeur, meilleures sont les performances
L'écran couvre entièrement ou presque les espaces colorimétriques sRGB et DCI-P3, mais pas l'espace AdobeRGB, ce qui est similaire aux écrans de la plupart des concurrents. Sa reproduction des couleurs décente dès la sortie de la boîte peut être améliorée dans la gamme très bonne en effectuant un étalonnage : L'écart de couleur passe alors de 3,19 à 0,69 (objectif : DeltaE < 3). Dans le même temps, sa représentation en niveaux de gris semble beaucoup plus équilibrée.
Notre profil de couleurs peut être téléchargé et utilisé gratuitement. Vous trouverez un lien dans la boîte d'information de l'écran.

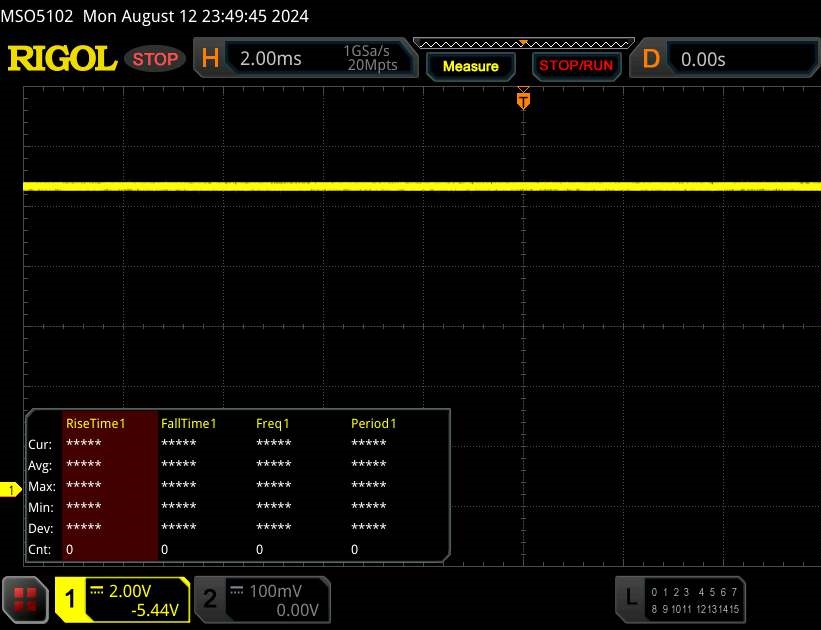
Temps de réponse de l'écran
| ↔ Temps de réponse noir à blanc | ||
|---|---|---|
| 5 ms ... hausse ↗ et chute ↘ combinées | ↗ 1.2 ms hausse | 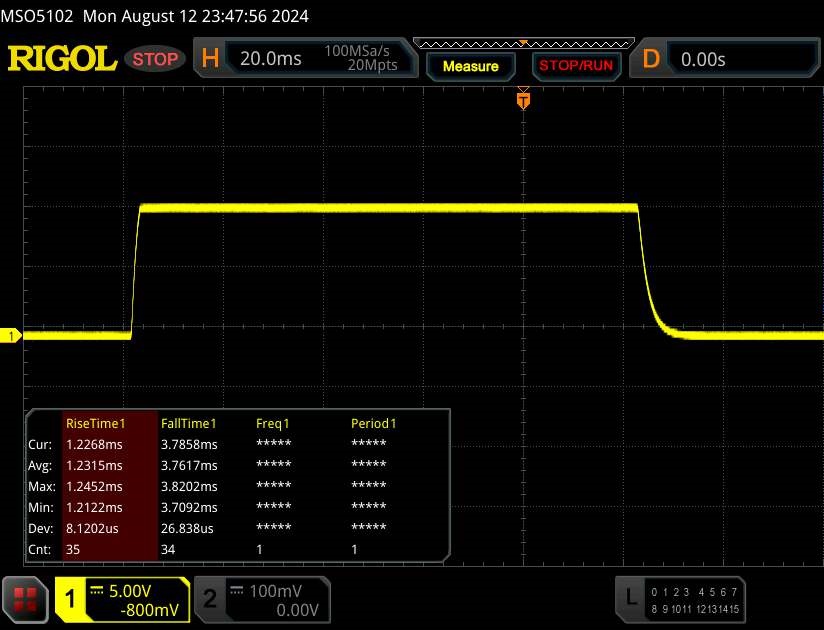 |
| ↘ 3.8 ms chute | ||
| L'écran montre de très faibles temps de réponse, parfait pour le jeu. En comparaison, tous les appareils testés affichent entre 0.1 (minimum) et 240 (maximum) ms. » 15 % des appareils testés affichent de meilleures performances. Cela signifie que les latences relevées sont meilleures que la moyenne (20.8 ms) de tous les appareils testés. | ||
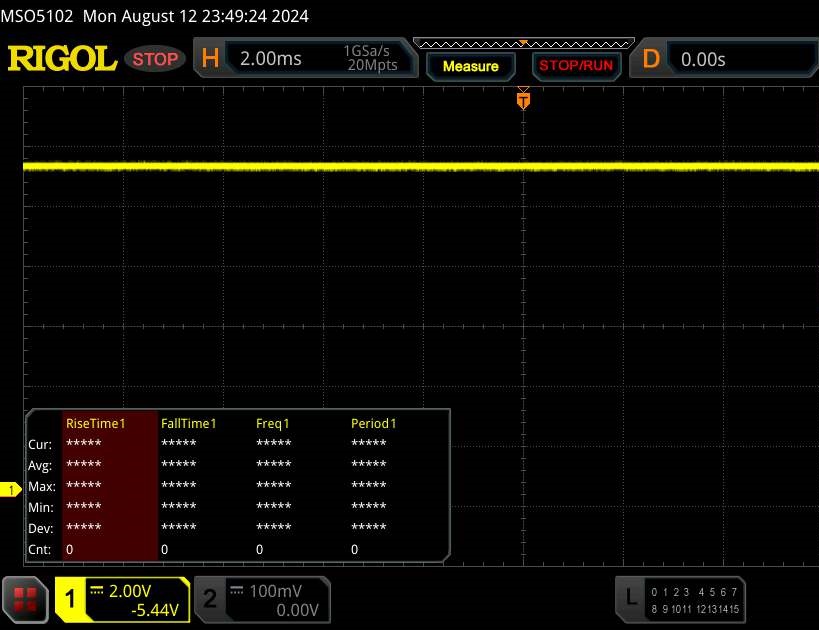
| ↔ Temps de réponse gris 50% à gris 80% | ||
| 3.9 ms ... hausse ↗ et chute ↘ combinées | ↗ 1.7 ms hausse | 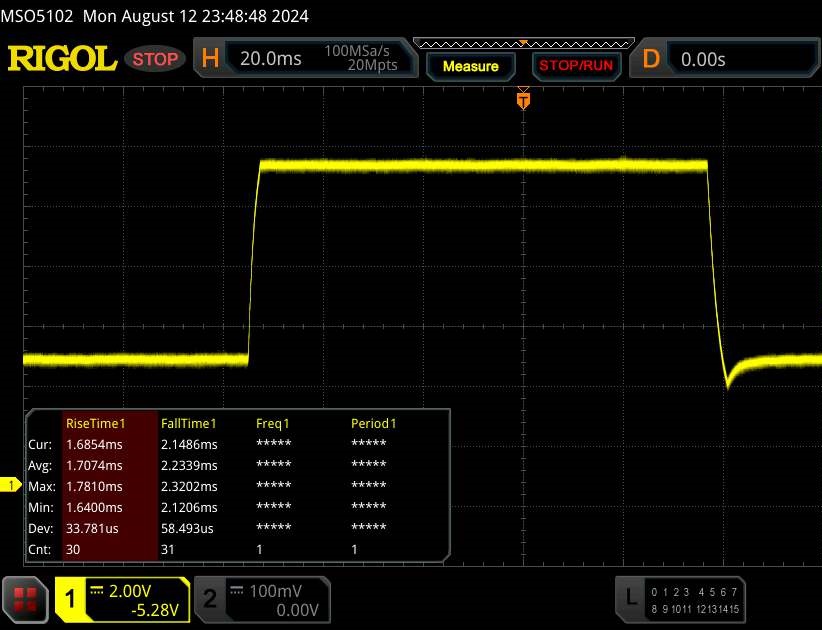 |
| ↘ 2.2 ms chute | ||
| L'écran montre de très faibles temps de réponse, parfait pour le jeu. En comparaison, tous les appareils testés affichent entre 0.165 (minimum) et 636 (maximum) ms. » 12 % des appareils testés affichent de meilleures performances. Cela signifie que les latences relevées sont meilleures que la moyenne (32.5 ms) de tous les appareils testés. | ||
Scintillement / MLI (Modulation de largeur d'impulsion)
| Scintillement / MLI (Modulation de largeur d'impulsion) non décelé | 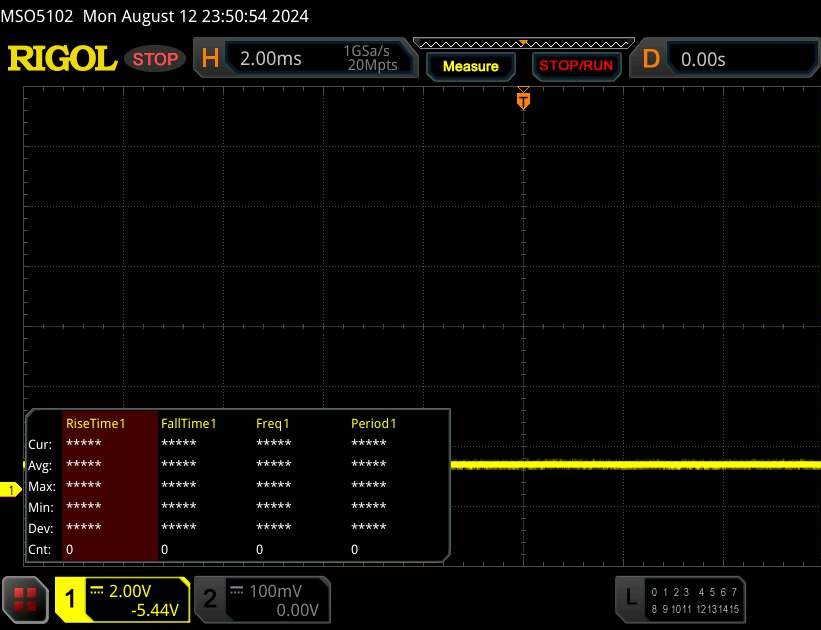 | ||
En comparaison, 53 % des appareils testés n'emploient pas MDI pour assombrir leur écran. Nous avons relevé une moyenne à 8516 (minimum : 5 - maximum : 343500) Hz dans le cas où une MDI était active. | |||
Performance - Raptor Lake et Ada Lovelace alimentent l'ordinateur portable
La Titan 16 Pro s'adresse aux joueurs et aux créateurs, et c'est probablement sur les premiers qu'elle se concentre. A Core i9-14900HX et une GeForce RTX 4060 équipent l'ordinateur portable. Son prix de vente conseillé est de 1 699 dollars. Nubia propose d'autres variantes de cet appareil, mais elles ne sont pas encore disponibles dans le monde entier.
Conditions d'essai
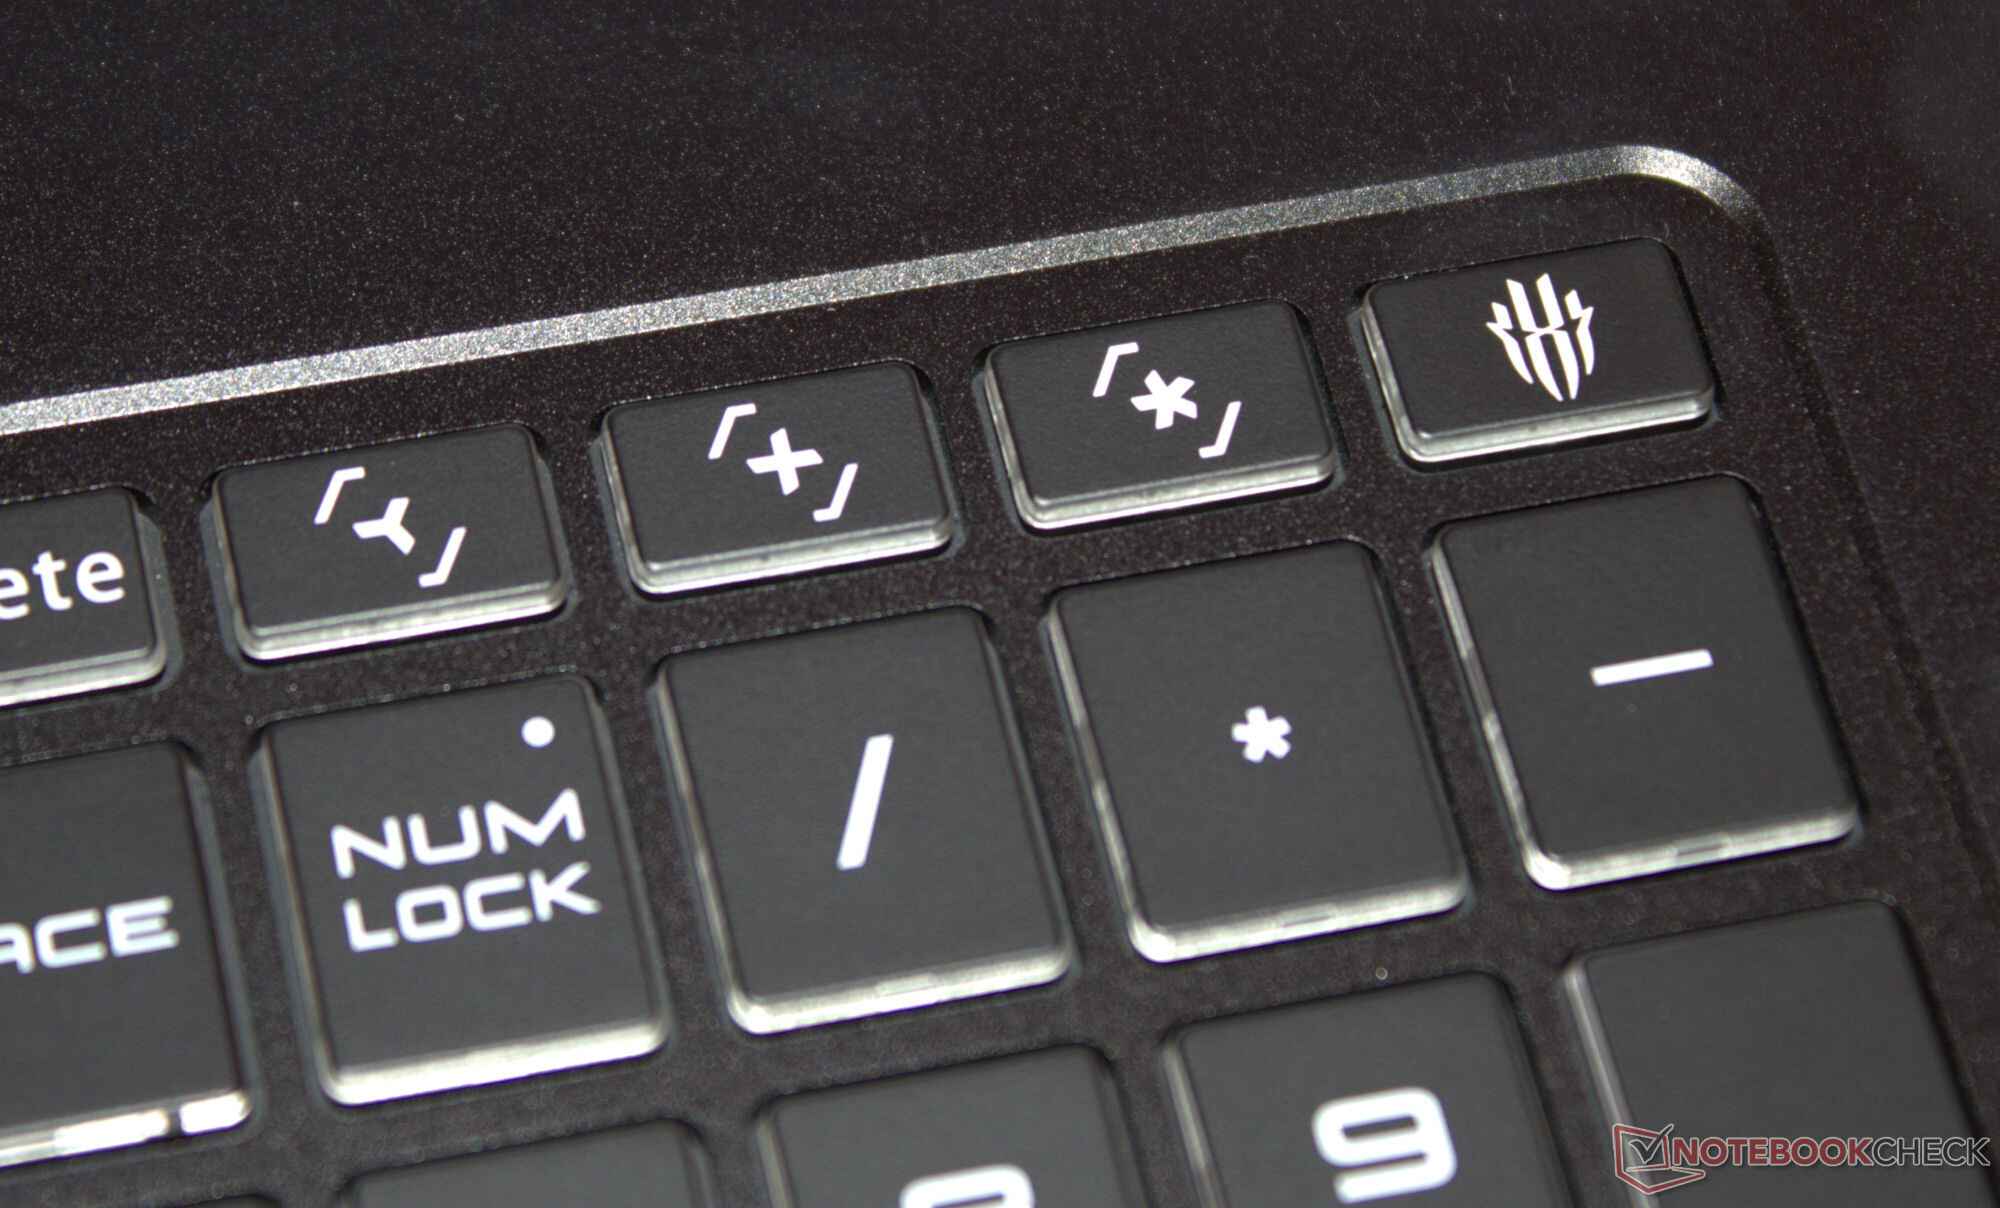
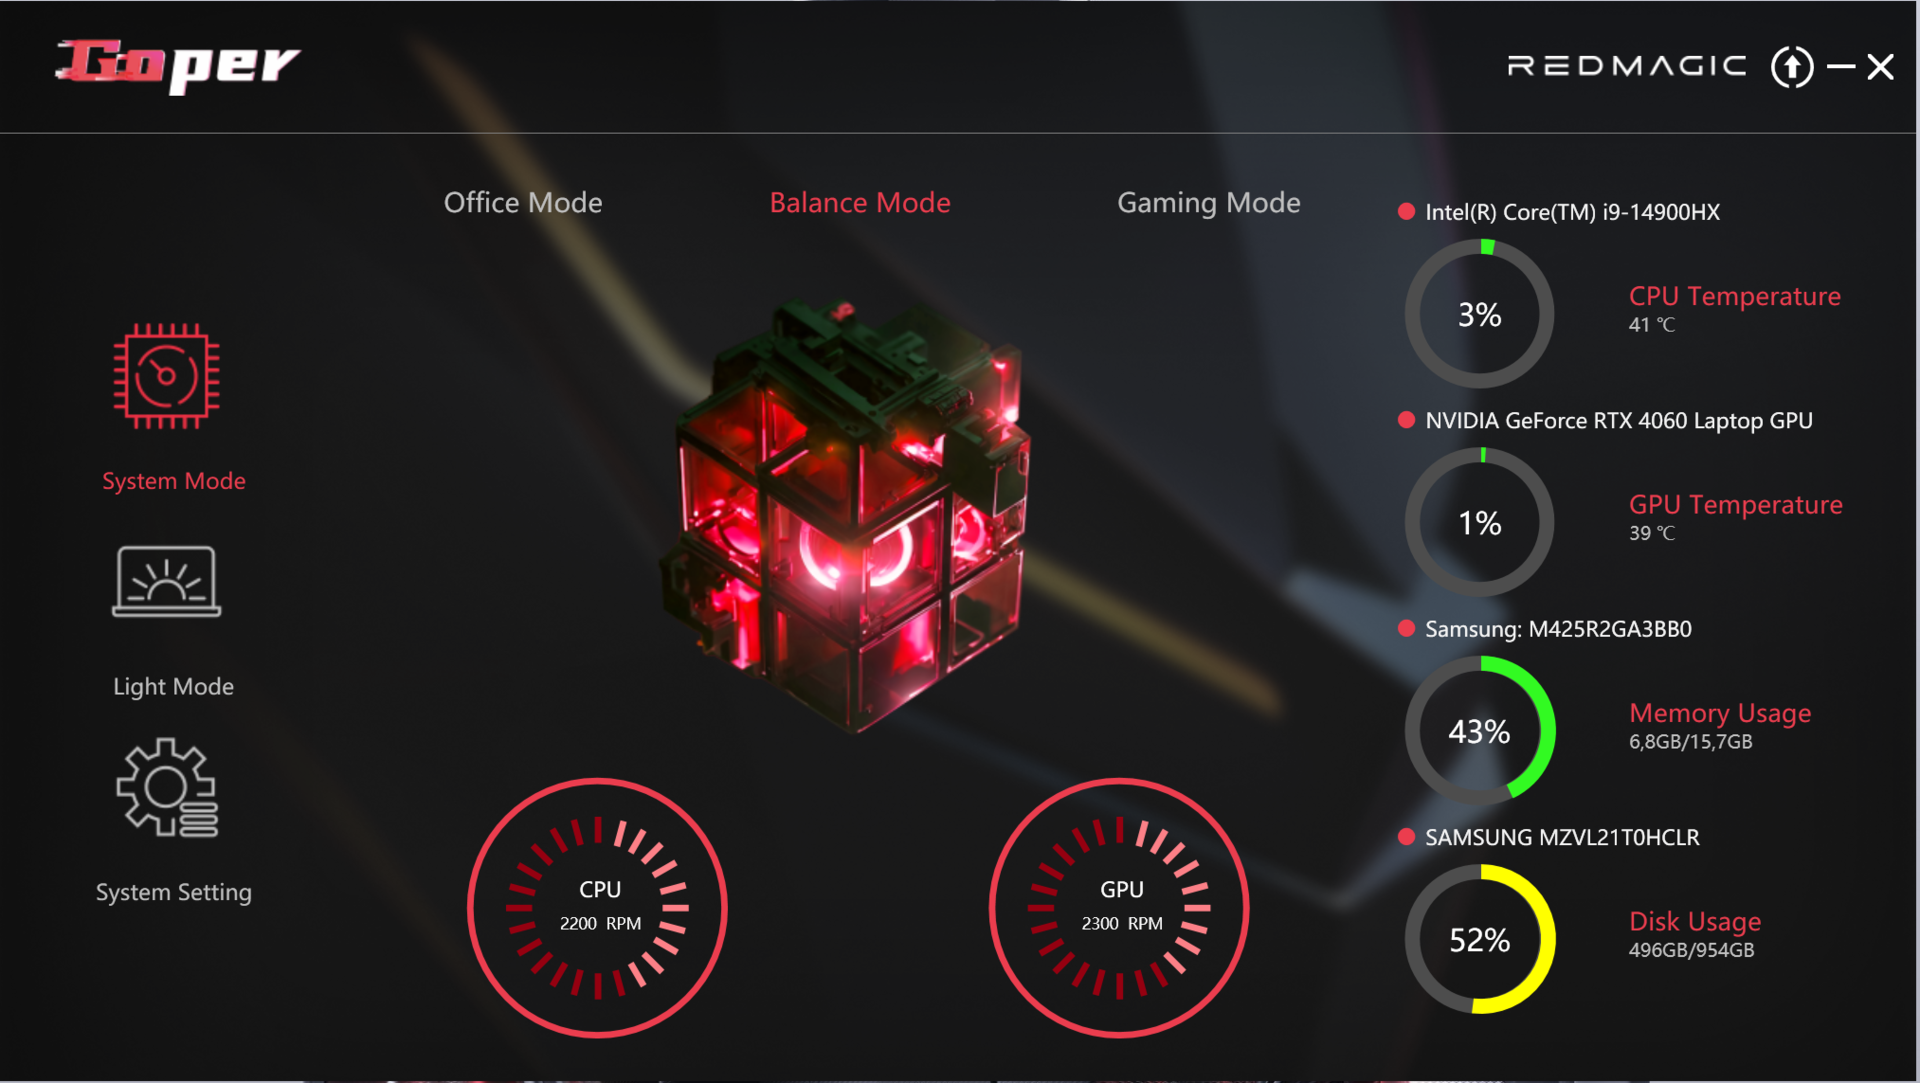
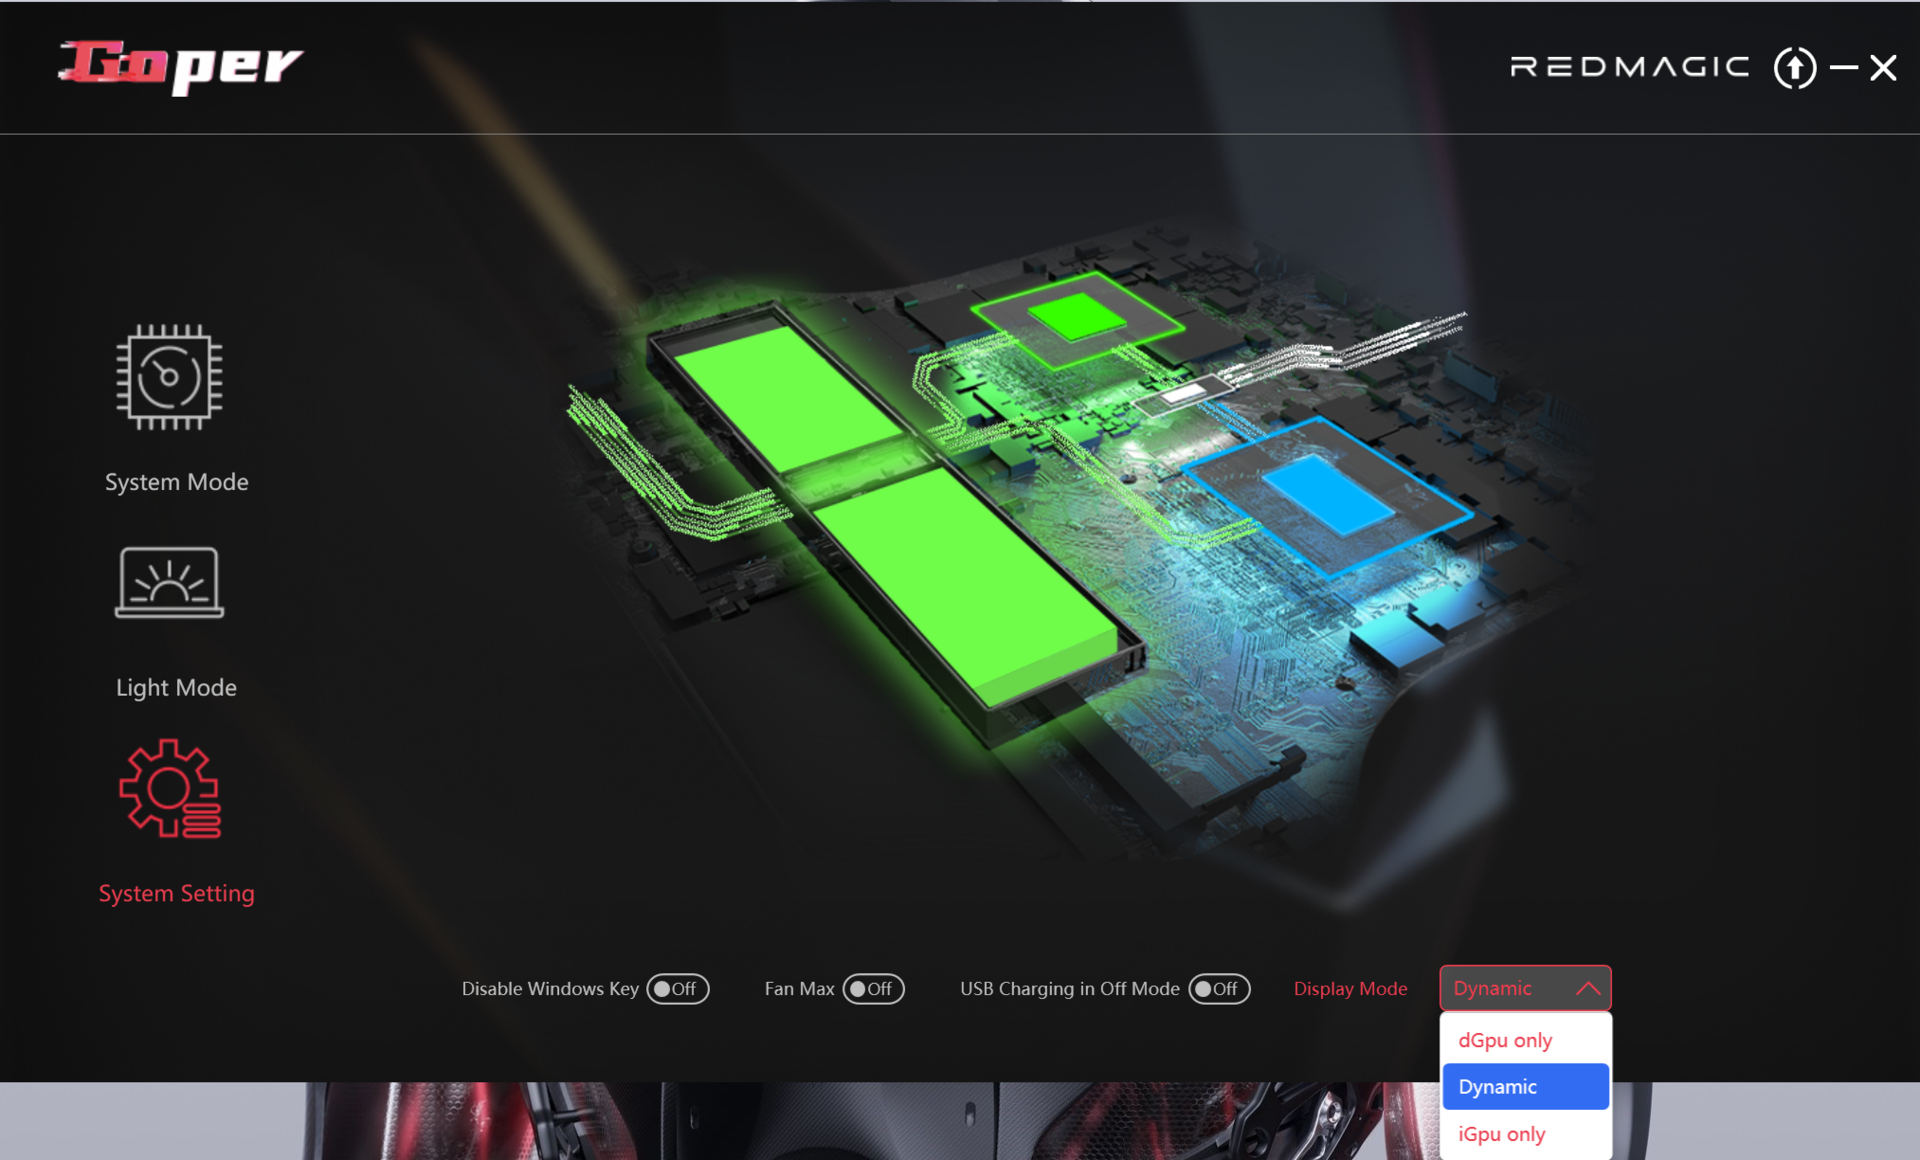
Vous avez le choix entre trois profils de performance spécifiques au fabricant (voir tableau). Le mode équilibré (benchmarks) et le mode bureautique (tests de batterie) ont été utilisés lors de notre test. Le mode GPU a été réglé sur dynamique (= Optimus). Chaque profil peut être appelé directement via une touche distincte dans la rangée supérieure du pavé numérique. Vous pouvez également les modifier via l'application Goper (centre de contrôle de l'ordinateur portable).
| Mode équilibré | Mode jeu | Mode bureautique | |
|---|---|---|---|
| Limite de puissance 1 (HWInfo) | 45 watts | 100 watts | 35 watts |
| Limite de puissance 2 (HWInfo) | 140 watts | 140 watts | 140 watts |
| Bruit (Cyberpunk 2077) | 50 dB(A) | 53 dB(A) | 47 dB(A) |
| Performances (Cyberpunk 2077) | 66 fps | 66 fps | 60 fps |
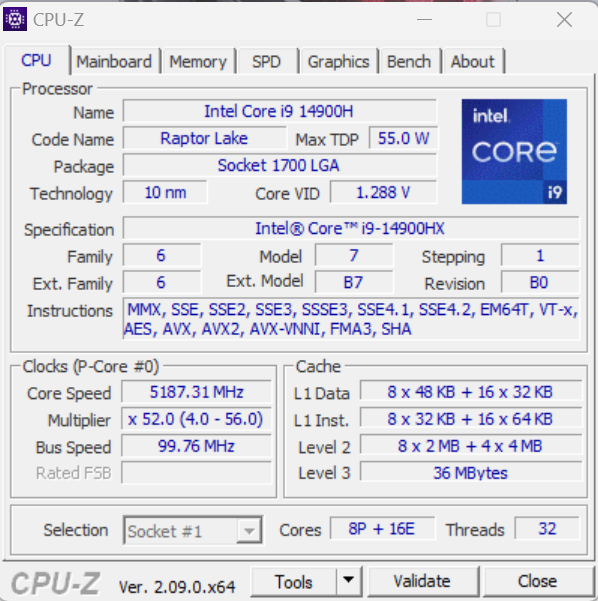
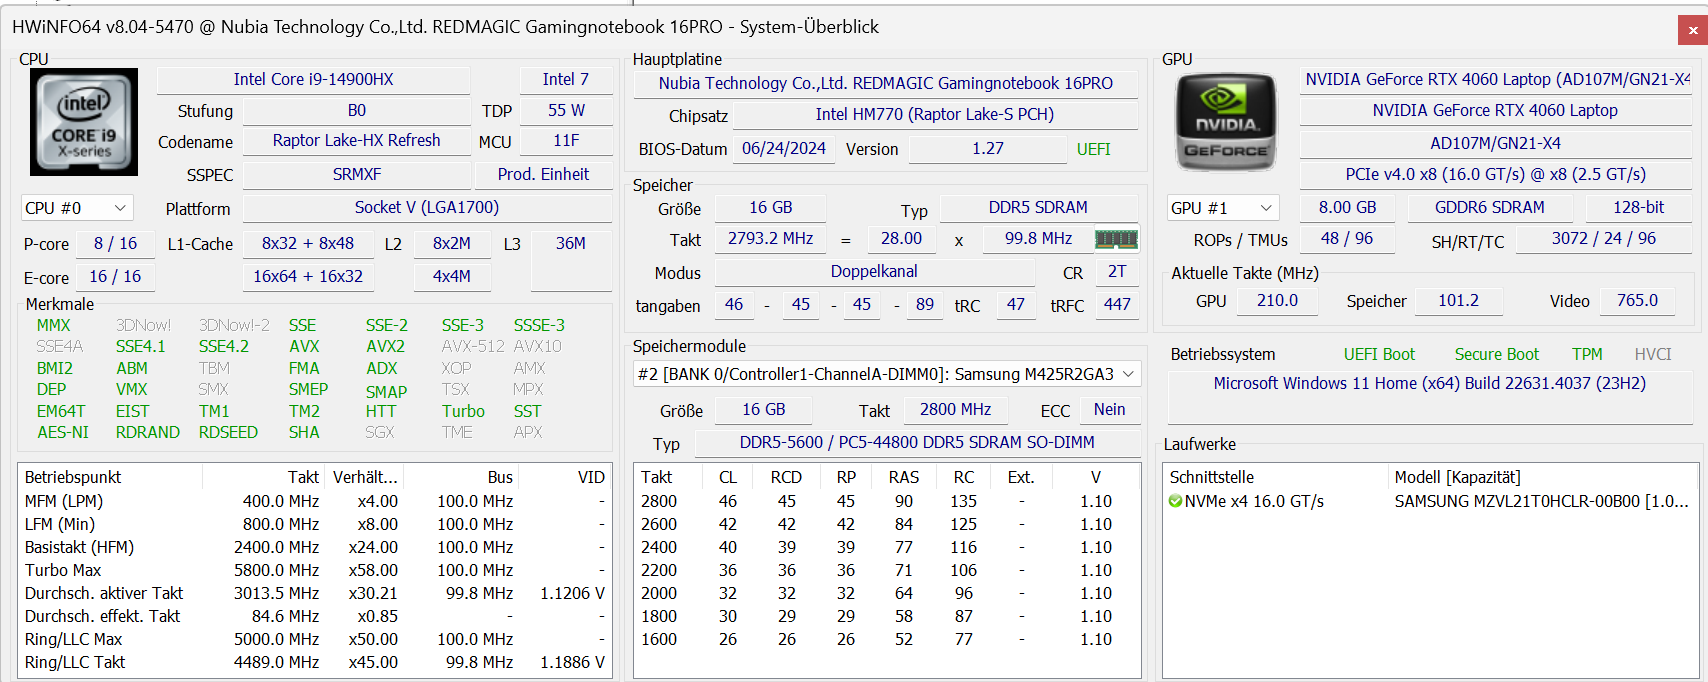
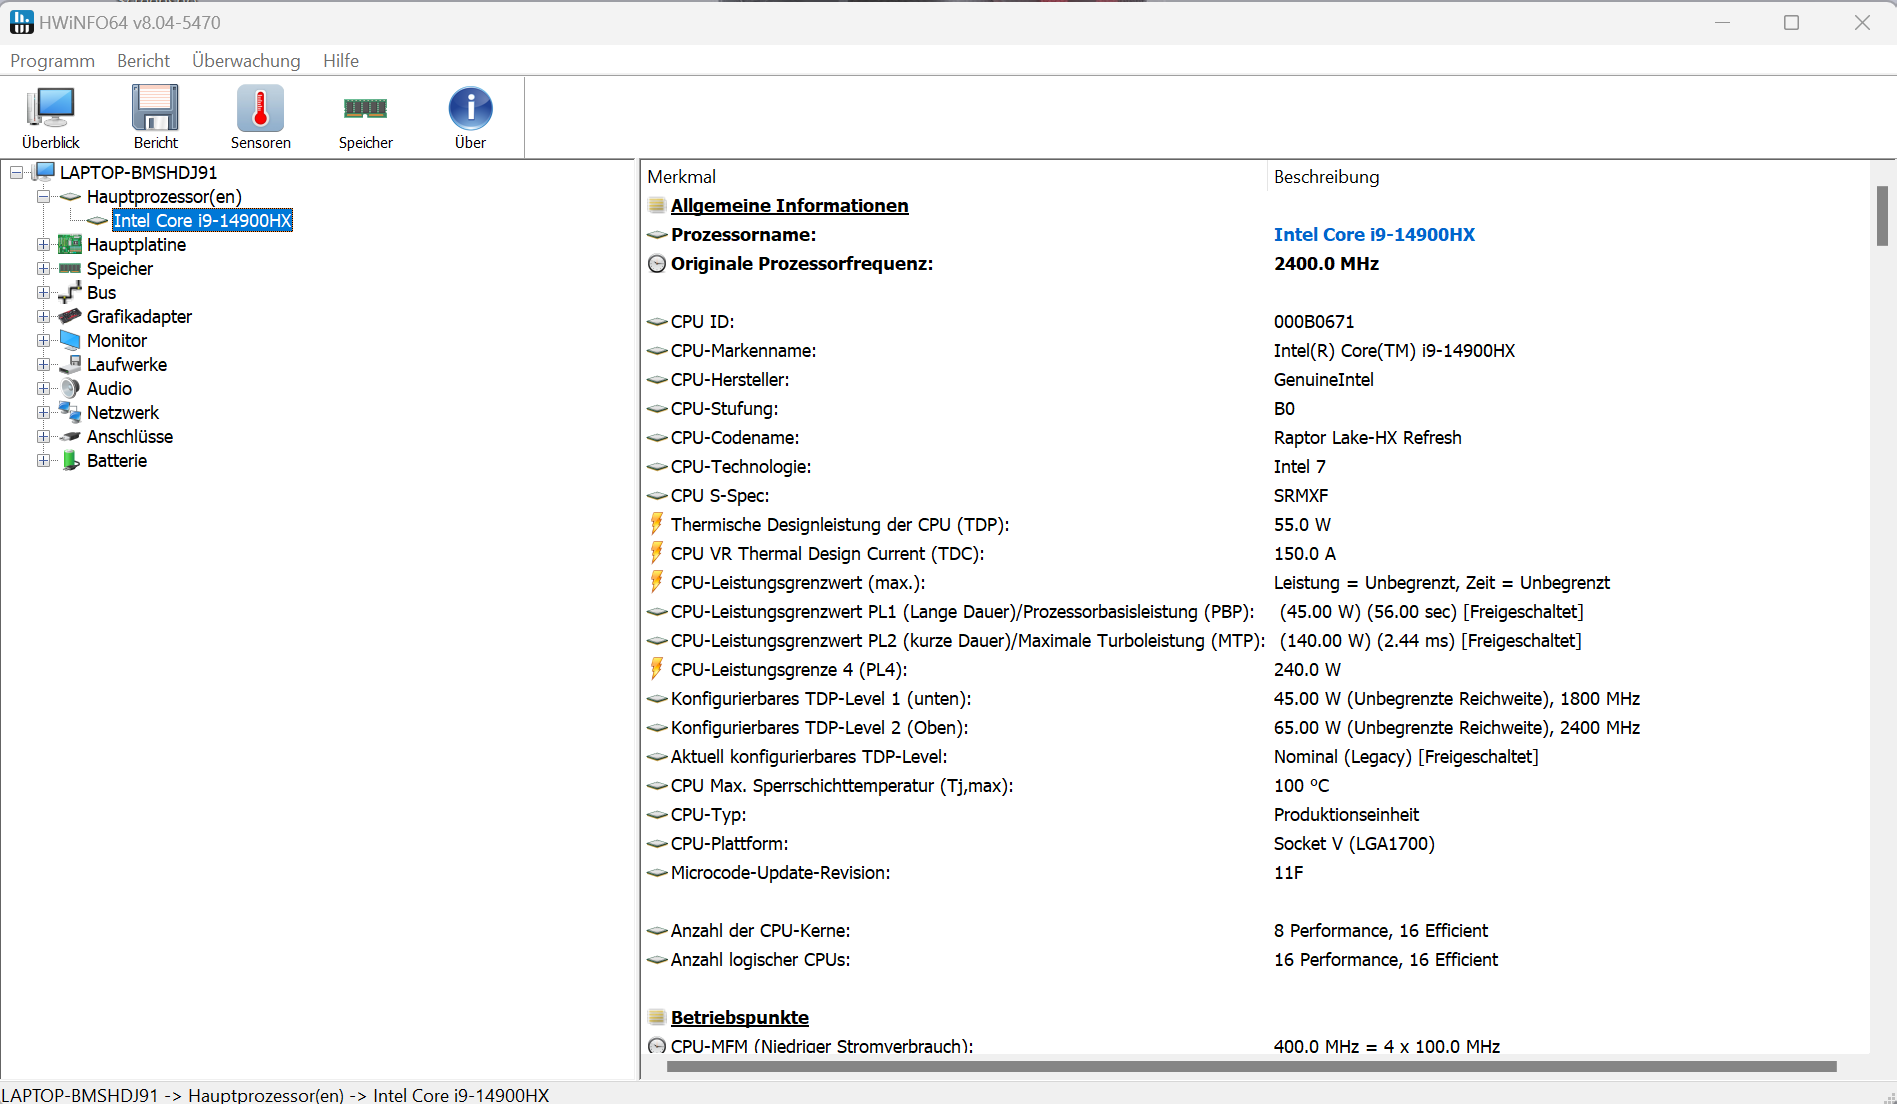
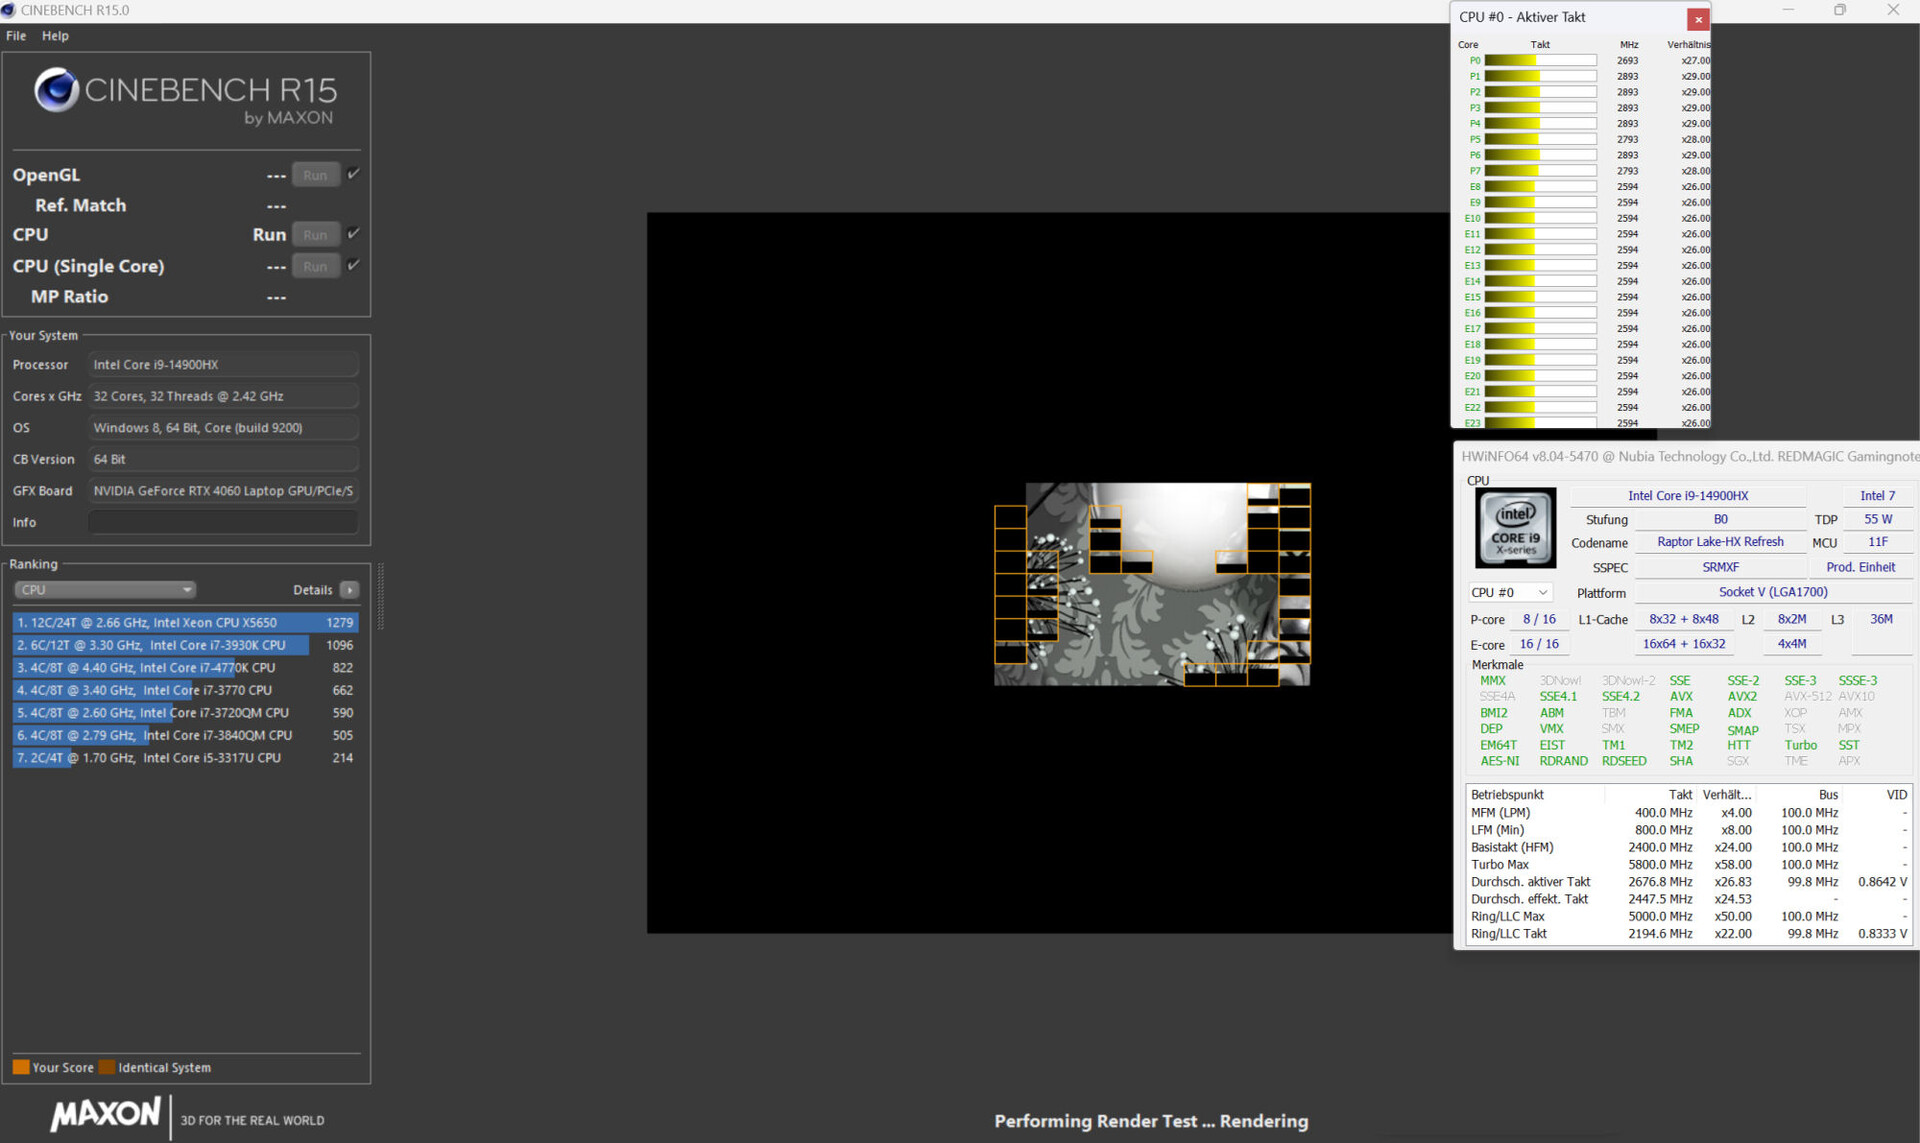
Processeur
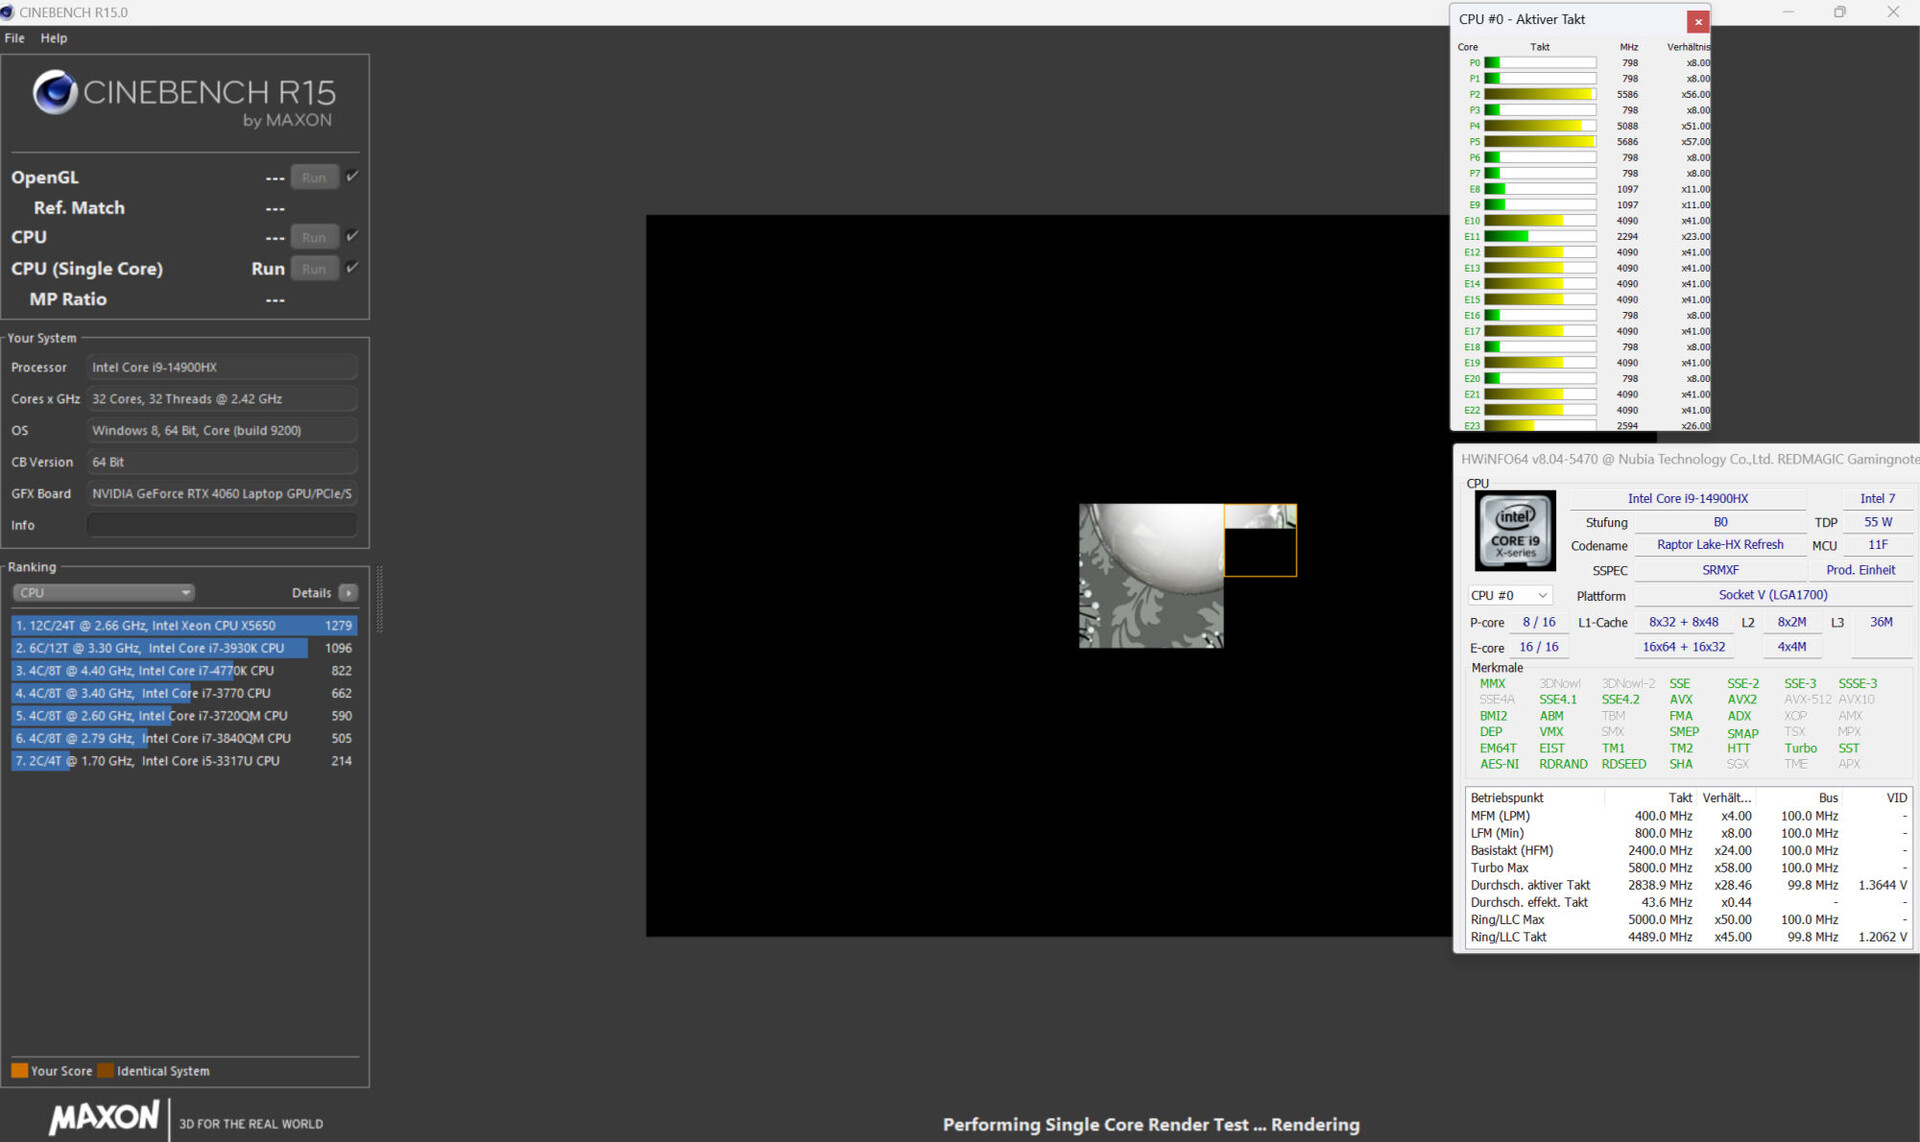
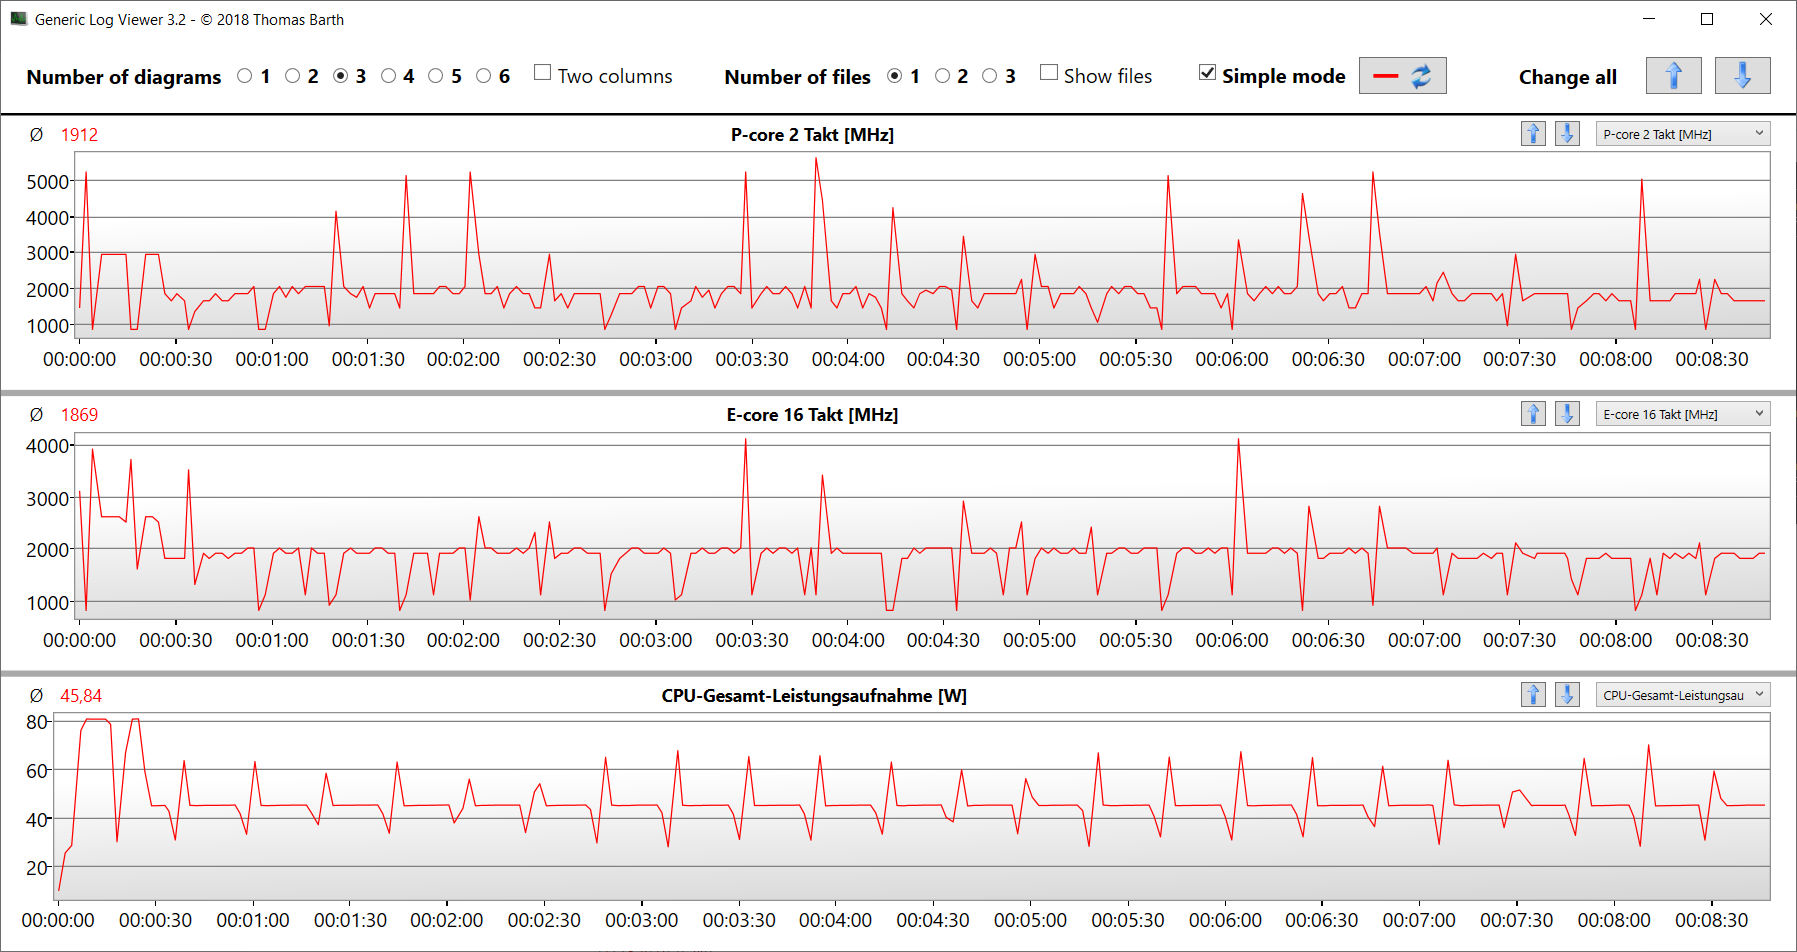
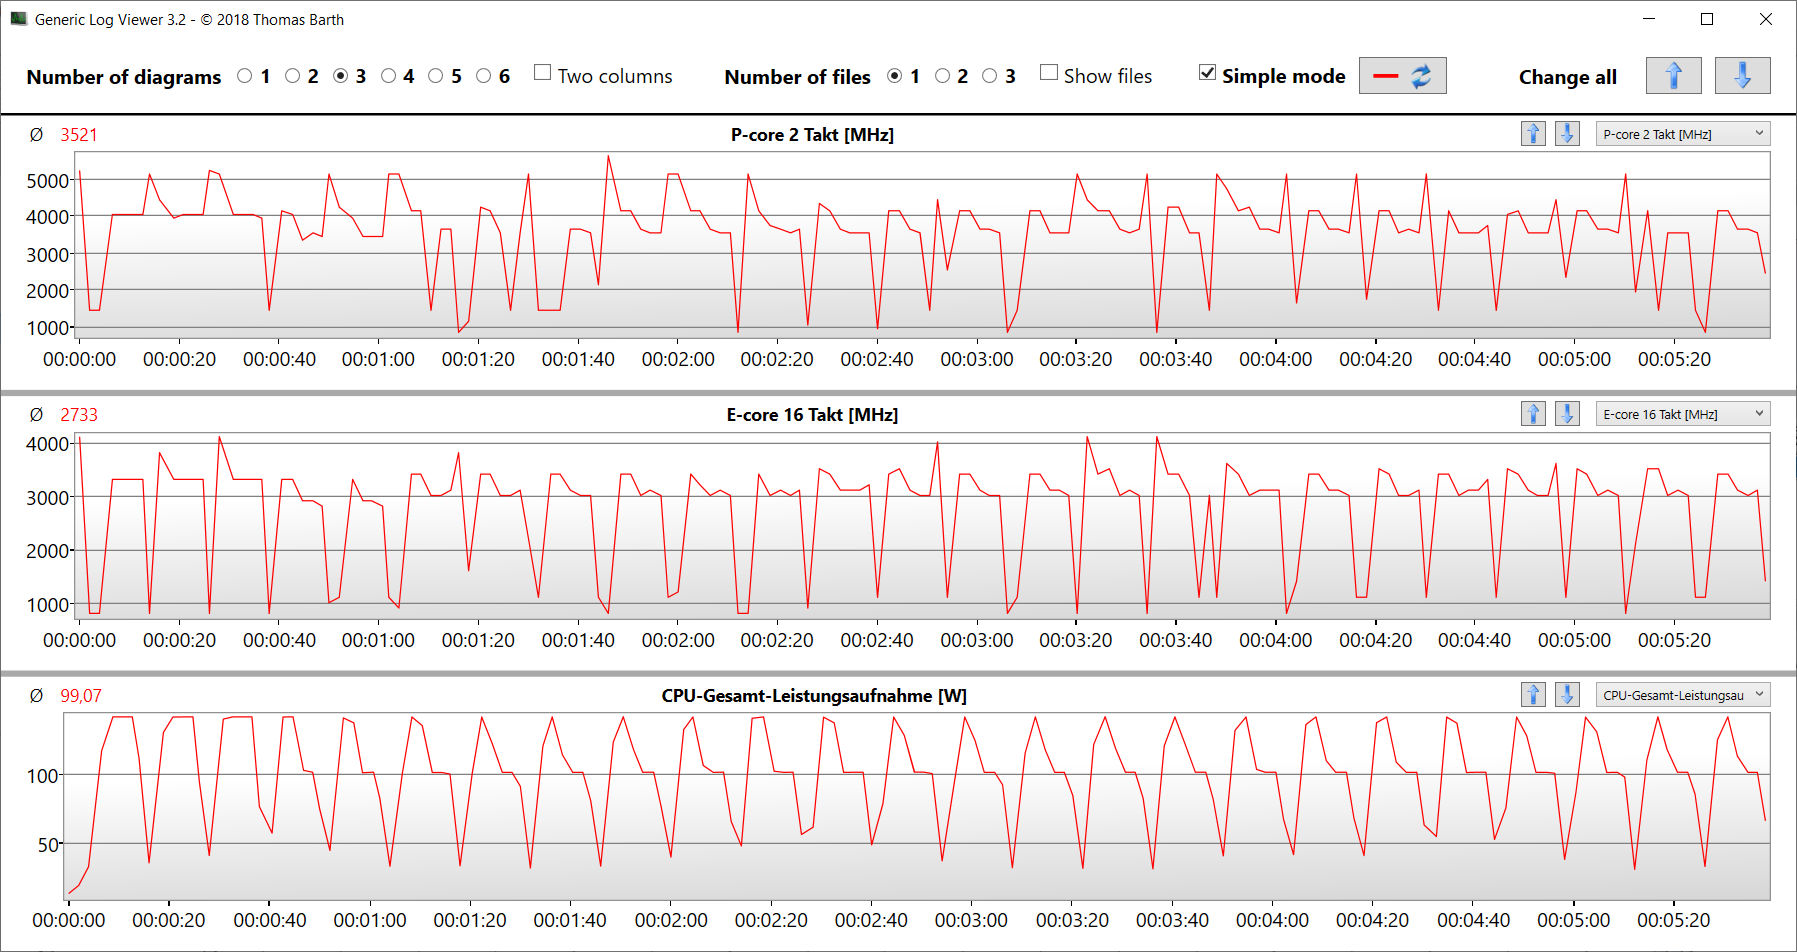
La Titan ne dispose que d'une seule option de processeur, à savoir le Core i9-14900HX (Raptor Lake). Ses 24 cœurs de CPU (8P + 16E = 32 threads) atteignent des fréquences d'horloge maximales de 5,8 GHz (P) et 4,1 GHz (E). La charge multithread continue (boucle CB15) a fait chuter l'horloge du CPU de manière significative de la première à la troisième exécution. Par la suite, un niveau relativement constant a été maintenu. Le profil du mode gaming garantit un niveau de performance nettement plus élevé.
Les trois modes d'alimentation offrent des performances mono-fil très similaires, à peu près au même niveau que la moyenne du CPU. Les performances multithread diffèrent beaucoup plus : Seul le mode gaming a permis d'obtenir des valeurs au niveau de la moyenne du CPU lors de notre test, alors que les deux autres modes étaient nettement inférieurs.
Vous trouverez plus d'informations sur le Core i9 dans notre article d'analyse.
Cinebench R15 Multi continuous test
| CPU Performance Rating - Percent | |
| Moyenne Intel Core i9-14900HX | |
| Lenovo Legion Pro 5 16IRX9 G9 | |
| Nubia RedMagic Titan 16 Pro | |
| SCHENKER XMG Pro 16 Studio (Mid 24) | |
| Acer Predator Helios Neo 16 (2024) | |
| Nubia RedMagic Titan 16 Pro | |
| Moyenne de la classe Gaming | |
| HP Victus 16 (2024) | |
| Gigabyte G6X 9KG (2024) | |
| Cinebench R20 | |
| CPU (Multi Core) | |
| Nubia RedMagic Titan 16 Pro (Gaming Mode) | |
| Moyenne Intel Core i9-14900HX (6579 - 13832, n=37) | |
| Lenovo Legion Pro 5 16IRX9 G9 | |
| SCHENKER XMG Pro 16 Studio (Mid 24) | |
| HP Victus 16 (2024) | |
| Acer Predator Helios Neo 16 (2024) | |
| Moyenne de la classe Gaming (2179 - 15517, n=151, 2 dernières années) | |
| Gigabyte G6X 9KG (2024) | |
| Nubia RedMagic Titan 16 Pro | |
| CPU (Single Core) | |
| Nubia RedMagic Titan 16 Pro | |
| Moyenne Intel Core i9-14900HX (657 - 859, n=37) | |
| Lenovo Legion Pro 5 16IRX9 G9 | |
| Nubia RedMagic Titan 16 Pro (Gaming Mode) | |
| Acer Predator Helios Neo 16 (2024) | |
| SCHENKER XMG Pro 16 Studio (Mid 24) | |
| Moyenne de la classe Gaming (439 - 866, n=151, 2 dernières années) | |
| Gigabyte G6X 9KG (2024) | |
| HP Victus 16 (2024) | |
| Cinebench R15 | |
| CPU Multi 64Bit | |
| Nubia RedMagic Titan 16 Pro (Gaming Mode) | |
| Moyenne Intel Core i9-14900HX (3263 - 5589, n=38) | |
| SCHENKER XMG Pro 16 Studio (Mid 24) | |
| Lenovo Legion Pro 5 16IRX9 G9 | |
| HP Victus 16 (2024) | |
| Acer Predator Helios Neo 16 (2024) | |
| Nubia RedMagic Titan 16 Pro | |
| Moyenne de la classe Gaming (905 - 6074, n=154, 2 dernières années) | |
| Gigabyte G6X 9KG (2024) | |
| CPU Single 64Bit | |
| Nubia RedMagic Titan 16 Pro | |
| Nubia RedMagic Titan 16 Pro (Gaming Mode) | |
| Moyenne Intel Core i9-14900HX (247 - 323, n=37) | |
| Lenovo Legion Pro 5 16IRX9 G9 | |
| Acer Predator Helios Neo 16 (2024) | |
| SCHENKER XMG Pro 16 Studio (Mid 24) | |
| Moyenne de la classe Gaming (191.9 - 343, n=151, 2 dernières années) | |
| Gigabyte G6X 9KG (2024) | |
| HP Victus 16 (2024) | |
| Blender - v2.79 BMW27 CPU | |
| Gigabyte G6X 9KG (2024) | |
| Nubia RedMagic Titan 16 Pro | |
| Moyenne de la classe Gaming (81 - 555, n=144, 2 dernières années) | |
| HP Victus 16 (2024) | |
| Acer Predator Helios Neo 16 (2024) | |
| SCHENKER XMG Pro 16 Studio (Mid 24) | |
| Nubia RedMagic Titan 16 Pro (Gaming Mode) | |
| Lenovo Legion Pro 5 16IRX9 G9 | |
| Moyenne Intel Core i9-14900HX (91 - 206, n=37) | |
| Geekbench 6.4 | |
| Multi-Core | |
| Lenovo Legion Pro 5 16IRX9 G9 (6.2.1) | |
| Moyenne Intel Core i9-14900HX (13158 - 19665, n=37) | |
| Acer Predator Helios Neo 16 (2024) (6.2.1) | |
| SCHENKER XMG Pro 16 Studio (Mid 24) (6.2.1) | |
| HP Victus 16 (2024) (6.2.1) | |
| Nubia RedMagic Titan 16 Pro (6.2.1, Gaming Mode) | |
| Moyenne de la classe Gaming (5340 - 21668, n=119, 2 dernières années) | |
| Gigabyte G6X 9KG (2024) (6.2.1) | |
| Nubia RedMagic Titan 16 Pro (6.2.1) | |
| Single-Core | |
| Nubia RedMagic Titan 16 Pro (6.2.1) | |
| Nubia RedMagic Titan 16 Pro (6.2.1, Gaming Mode) | |
| Acer Predator Helios Neo 16 (2024) (6.2.1) | |
| Moyenne Intel Core i9-14900HX (2419 - 3129, n=37) | |
| Lenovo Legion Pro 5 16IRX9 G9 (6.2.1) | |
| SCHENKER XMG Pro 16 Studio (Mid 24) (6.2.1) | |
| Moyenne de la classe Gaming (1490 - 3219, n=119, 2 dernières années) | |
| Gigabyte G6X 9KG (2024) (6.2.1) | |
| HP Victus 16 (2024) (6.2.1) | |
| HWBOT x265 Benchmark v2.2 - 4k Preset | |
| Nubia RedMagic Titan 16 Pro (Gaming Mode) | |
| Moyenne Intel Core i9-14900HX (16.8 - 38.9, n=37) | |
| Lenovo Legion Pro 5 16IRX9 G9 | |
| SCHENKER XMG Pro 16 Studio (Mid 24) | |
| Acer Predator Helios Neo 16 (2024) | |
| Moyenne de la classe Gaming (6.72 - 42.9, n=148, 2 dernières années) | |
| HP Victus 16 (2024) | |
| Gigabyte G6X 9KG (2024) | |
| Nubia RedMagic Titan 16 Pro | |
| LibreOffice - 20 Documents To PDF | |
| HP Victus 16 (2024) (6.3.4.2) | |
| Lenovo Legion Pro 5 16IRX9 G9 (6.3.4.2) | |
| Moyenne de la classe Gaming (19 - 96.6, n=147, 2 dernières années) | |
| SCHENKER XMG Pro 16 Studio (Mid 24) (6.3.4.2) | |
| Moyenne Intel Core i9-14900HX (19 - 85.1, n=37) | |
| Acer Predator Helios Neo 16 (2024) (6.3.4.2) | |
| Nubia RedMagic Titan 16 Pro (6.3.4.2, Gaming Mode) | |
| Gigabyte G6X 9KG (2024) (6.3.4.2) | |
| Nubia RedMagic Titan 16 Pro (6.3.4.2) | |
| R Benchmark 2.5 - Overall mean | |
| HP Victus 16 (2024) | |
| Moyenne de la classe Gaming (0.3609 - 0.759, n=150, 2 dernières années) | |
| Gigabyte G6X 9KG (2024) | |
| SCHENKER XMG Pro 16 Studio (Mid 24) | |
| Lenovo Legion Pro 5 16IRX9 G9 | |
| Moyenne Intel Core i9-14900HX (0.3604 - 0.4859, n=37) | |
| Acer Predator Helios Neo 16 (2024) | |
| Nubia RedMagic Titan 16 Pro | |
| Nubia RedMagic Titan 16 Pro (Gaming Mode) | |
* ... Moindre est la valeur, meilleures sont les performances
AIDA64: FP32 Ray-Trace | FPU Julia | CPU SHA3 | CPU Queen | FPU SinJulia | FPU Mandel | CPU AES | CPU ZLib | FP64 Ray-Trace | CPU PhotoWorxx
| Performance Rating | |
| Moyenne Intel Core i9-14900HX | |
| Nubia RedMagic Titan 16 Pro | |
| Lenovo Legion Pro 5 16IRX9 G9 | |
| SCHENKER XMG Pro 16 Studio (Mid 24) | |
| Acer Predator Helios Neo 16 (2024) | |
| Moyenne de la classe Gaming | |
| HP Victus 16 (2024) | |
| Nubia RedMagic Titan 16 Pro | |
| Gigabyte G6X 9KG (2024) | |
| AIDA64 / FP32 Ray-Trace | |
| Moyenne Intel Core i9-14900HX (13098 - 33474, n=36) | |
| Nubia RedMagic Titan 16 Pro (v6.92.6600, Gaming Mode) | |
| Lenovo Legion Pro 5 16IRX9 G9 (v6.92.6600) | |
| Moyenne de la classe Gaming (4986 - 81639, n=147, 2 dernières années) | |
| Acer Predator Helios Neo 16 (2024) (v6.92.6600) | |
| SCHENKER XMG Pro 16 Studio (Mid 24) (v6.92.6600) | |
| HP Victus 16 (2024) (v6.92.6600) | |
| Gigabyte G6X 9KG (2024) (v6.92.6600) | |
| Nubia RedMagic Titan 16 Pro (v6.92.6600) | |
| AIDA64 / FPU Julia | |
| Moyenne Intel Core i9-14900HX (67573 - 166040, n=36) | |
| Nubia RedMagic Titan 16 Pro (v6.92.6600, Gaming Mode) | |
| Lenovo Legion Pro 5 16IRX9 G9 (v6.92.6600) | |
| SCHENKER XMG Pro 16 Studio (Mid 24) (v6.92.6600) | |
| Acer Predator Helios Neo 16 (2024) (v6.92.6600) | |
| Moyenne de la classe Gaming (25360 - 252486, n=147, 2 dernières années) | |
| HP Victus 16 (2024) (v6.92.6600) | |
| Gigabyte G6X 9KG (2024) (v6.92.6600) | |
| Nubia RedMagic Titan 16 Pro (v6.92.6600) | |
| AIDA64 / CPU SHA3 | |
| Nubia RedMagic Titan 16 Pro (v6.92.6600, Gaming Mode) | |
| Moyenne Intel Core i9-14900HX (3589 - 7979, n=36) | |
| SCHENKER XMG Pro 16 Studio (Mid 24) (v6.92.6600) | |
| Lenovo Legion Pro 5 16IRX9 G9 (v6.92.6600) | |
| Acer Predator Helios Neo 16 (2024) (v6.92.6600) | |
| Moyenne de la classe Gaming (1339 - 10389, n=147, 2 dernières années) | |
| HP Victus 16 (2024) (v6.92.6600) | |
| Nubia RedMagic Titan 16 Pro (v6.92.6600) | |
| Gigabyte G6X 9KG (2024) (v6.92.6600) | |
| AIDA64 / CPU Queen | |
| Lenovo Legion Pro 5 16IRX9 G9 (v6.92.6600) | |
| Acer Predator Helios Neo 16 (2024) (v6.92.6600) | |
| Nubia RedMagic Titan 16 Pro (v6.92.6600, Gaming Mode) | |
| Moyenne Intel Core i9-14900HX (118405 - 148966, n=36) | |
| SCHENKER XMG Pro 16 Studio (Mid 24) (v6.92.6600) | |
| HP Victus 16 (2024) (v6.92.6600) | |
| Nubia RedMagic Titan 16 Pro (v6.92.6600) | |
| Moyenne de la classe Gaming (50699 - 200651, n=147, 2 dernières années) | |
| Gigabyte G6X 9KG (2024) (v6.92.6600) | |
| AIDA64 / FPU SinJulia | |
| Nubia RedMagic Titan 16 Pro (v6.92.6600, Gaming Mode) | |
| Moyenne Intel Core i9-14900HX (10475 - 18517, n=36) | |
| Lenovo Legion Pro 5 16IRX9 G9 (v6.92.6600) | |
| SCHENKER XMG Pro 16 Studio (Mid 24) (v6.92.6600) | |
| Acer Predator Helios Neo 16 (2024) (v6.92.6600) | |
| Moyenne de la classe Gaming (4800 - 32988, n=147, 2 dernières années) | |
| HP Victus 16 (2024) (v6.92.6600) | |
| Nubia RedMagic Titan 16 Pro (v6.92.6600) | |
| Gigabyte G6X 9KG (2024) (v6.92.6600) | |
| AIDA64 / FPU Mandel | |
| Moyenne Intel Core i9-14900HX (32543 - 83662, n=36) | |
| Nubia RedMagic Titan 16 Pro (v6.92.6600, Gaming Mode) | |
| Lenovo Legion Pro 5 16IRX9 G9 (v6.92.6600) | |
| Acer Predator Helios Neo 16 (2024) (v6.92.6600) | |
| Moyenne de la classe Gaming (12321 - 134044, n=147, 2 dernières années) | |
| SCHENKER XMG Pro 16 Studio (Mid 24) (v6.92.6600) | |
| HP Victus 16 (2024) (v6.92.6600) | |
| Gigabyte G6X 9KG (2024) (v6.92.6600) | |
| Nubia RedMagic Titan 16 Pro | |
| AIDA64 / CPU AES | |
| Nubia RedMagic Titan 16 Pro (v6.92.6600, Gaming Mode) | |
| Moyenne Intel Core i9-14900HX (86964 - 241777, n=36) | |
| Nubia RedMagic Titan 16 Pro (v6.92.6600) | |
| Lenovo Legion Pro 5 16IRX9 G9 (v6.92.6600) | |
| SCHENKER XMG Pro 16 Studio (Mid 24) (v6.92.6600) | |
| Moyenne de la classe Gaming (19065 - 328679, n=147, 2 dernières années) | |
| Acer Predator Helios Neo 16 (2024) (v6.92.6600) | |
| HP Victus 16 (2024) (v6.92.6600) | |
| Gigabyte G6X 9KG (2024) (v6.92.6600) | |
| AIDA64 / CPU ZLib | |
| Nubia RedMagic Titan 16 Pro (v6.92.6600, Gaming Mode) | |
| Moyenne Intel Core i9-14900HX (1054 - 2292, n=36) | |
| Lenovo Legion Pro 5 16IRX9 G9 (v6.92.6600) | |
| SCHENKER XMG Pro 16 Studio (Mid 24) (v6.92.6600) | |
| Acer Predator Helios Neo 16 (2024) (v6.92.6600) | |
| Moyenne de la classe Gaming (373 - 2531, n=147, 2 dernières années) | |
| HP Victus 16 (2024) (v6.92.6600) | |
| Gigabyte G6X 9KG (2024) (v6.92.6600) | |
| Nubia RedMagic Titan 16 Pro (v6.92.6600) | |
| AIDA64 / FP64 Ray-Trace | |
| Moyenne Intel Core i9-14900HX (6809 - 18349, n=36) | |
| Lenovo Legion Pro 5 16IRX9 G9 (v6.92.6600) | |
| Nubia RedMagic Titan 16 Pro (v6.92.6600, Gaming Mode) | |
| Moyenne de la classe Gaming (2540 - 43430, n=147, 2 dernières années) | |
| SCHENKER XMG Pro 16 Studio (Mid 24) (v6.92.6600) | |
| Acer Predator Helios Neo 16 (2024) (v6.92.6600) | |
| HP Victus 16 (2024) (v6.92.6600) | |
| Gigabyte G6X 9KG (2024) (v6.92.6600) | |
| Nubia RedMagic Titan 16 Pro (v6.92.6600) | |
| AIDA64 / CPU PhotoWorxx | |
| Lenovo Legion Pro 5 16IRX9 G9 (v6.92.6600) | |
| SCHENKER XMG Pro 16 Studio (Mid 24) (v6.92.6600) | |
| Moyenne Intel Core i9-14900HX (23903 - 54702, n=36) | |
| Acer Predator Helios Neo 16 (2024) (v6.92.6600) | |
| Moyenne de la classe Gaming (10805 - 60161, n=147, 2 dernières années) | |
| HP Victus 16 (2024) (v6.92.6600) | |
| Gigabyte G6X 9KG (2024) (v6.92.6600) | |
| Nubia RedMagic Titan 16 Pro (v6.92.6600) | |
| Nubia RedMagic Titan 16 Pro (v6.92.6600, Gaming Mode) | |
Performance du système
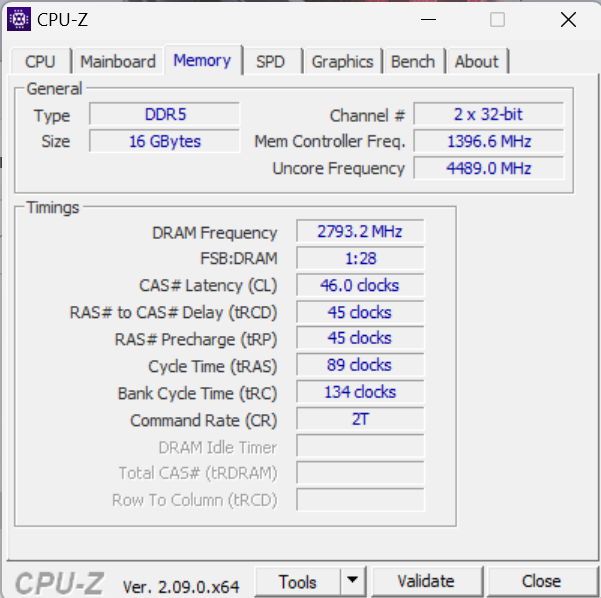
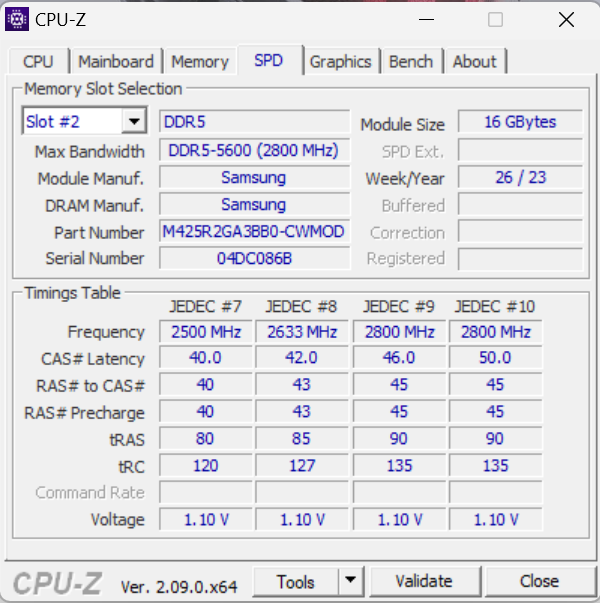
Le système, qui fonctionne en douceur, offre suffisamment de puissance pour les applications exigeantes telles que les jeux, le rendu et la diffusion en continu. Cependant, une partie de sa puissance de calcul reste inutilisée car la mémoire vive (16 Go, DDR5-5600) ne fonctionne qu'en mode monocanal, ce que confirment les faibles taux de transfert de mémoire de l'ordinateur portable par rapport à la concurrence. L'installation d'un second module de mémoire (= mode double canal actif) permettrait d'y remédier.
CrossMark: Overall | Productivity | Creativity | Responsiveness
WebXPRT 3: Overall
WebXPRT 4: Overall
Mozilla Kraken 1.1: Total
| PCMark 10 / Score | |
| Acer Predator Helios Neo 16 (2024) | |
| Lenovo Legion Pro 5 16IRX9 G9 | |
| SCHENKER XMG Pro 16 Studio (Mid 24) | |
| Moyenne Intel Core i9-14900HX, NVIDIA GeForce RTX 4060 Laptop GPU (7830 - 8322, n=2) | |
| Nubia RedMagic Titan 16 Pro | |
| Moyenne de la classe Gaming (5776 - 9852, n=133, 2 dernières années) | |
| Gigabyte G6X 9KG (2024) | |
| HP Victus 16 (2024) | |
| PCMark 10 / Essentials | |
| Acer Predator Helios Neo 16 (2024) | |
| Moyenne Intel Core i9-14900HX, NVIDIA GeForce RTX 4060 Laptop GPU (11022 - 11413, n=2) | |
| Lenovo Legion Pro 5 16IRX9 G9 | |
| Nubia RedMagic Titan 16 Pro | |
| HP Victus 16 (2024) | |
| Moyenne de la classe Gaming (9057 - 12600, n=133, 2 dernières années) | |
| SCHENKER XMG Pro 16 Studio (Mid 24) | |
| Gigabyte G6X 9KG (2024) | |
| PCMark 10 / Productivity | |
| SCHENKER XMG Pro 16 Studio (Mid 24) | |
| Acer Predator Helios Neo 16 (2024) | |
| Gigabyte G6X 9KG (2024) | |
| Moyenne Intel Core i9-14900HX, NVIDIA GeForce RTX 4060 Laptop GPU (9776 - 10558, n=2) | |
| HP Victus 16 (2024) | |
| Moyenne de la classe Gaming (6662 - 14612, n=133, 2 dernières années) | |
| Lenovo Legion Pro 5 16IRX9 G9 | |
| Nubia RedMagic Titan 16 Pro | |
| PCMark 10 / Digital Content Creation | |
| Lenovo Legion Pro 5 16IRX9 G9 | |
| Acer Predator Helios Neo 16 (2024) | |
| Moyenne Intel Core i9-14900HX, NVIDIA GeForce RTX 4060 Laptop GPU (12091 - 12979, n=2) | |
| SCHENKER XMG Pro 16 Studio (Mid 24) | |
| Moyenne de la classe Gaming (6807 - 18475, n=133, 2 dernières années) | |
| Nubia RedMagic Titan 16 Pro | |
| Gigabyte G6X 9KG (2024) | |
| HP Victus 16 (2024) | |
| CrossMark / Overall | |
| Acer Predator Helios Neo 16 (2024) | |
| Moyenne Intel Core i9-14900HX, NVIDIA GeForce RTX 4060 Laptop GPU (2103 - 2184, n=2) | |
| Lenovo Legion Pro 5 16IRX9 G9 | |
| Nubia RedMagic Titan 16 Pro | |
| SCHENKER XMG Pro 16 Studio (Mid 24) | |
| Gigabyte G6X 9KG (2024) | |
| HP Victus 16 (2024) | |
| Moyenne de la classe Gaming (1247 - 2344, n=114, 2 dernières années) | |
| CrossMark / Productivity | |
| Acer Predator Helios Neo 16 (2024) | |
| Nubia RedMagic Titan 16 Pro | |
| Moyenne Intel Core i9-14900HX, NVIDIA GeForce RTX 4060 Laptop GPU (2040 - 2042, n=2) | |
| Lenovo Legion Pro 5 16IRX9 G9 | |
| SCHENKER XMG Pro 16 Studio (Mid 24) | |
| Gigabyte G6X 9KG (2024) | |
| Moyenne de la classe Gaming (1299 - 2204, n=114, 2 dernières années) | |
| HP Victus 16 (2024) | |
| CrossMark / Creativity | |
| Acer Predator Helios Neo 16 (2024) | |
| Lenovo Legion Pro 5 16IRX9 G9 | |
| SCHENKER XMG Pro 16 Studio (Mid 24) | |
| Moyenne Intel Core i9-14900HX, NVIDIA GeForce RTX 4060 Laptop GPU (2240 - 2472, n=2) | |
| Nubia RedMagic Titan 16 Pro | |
| HP Victus 16 (2024) | |
| Moyenne de la classe Gaming (1275 - 2660, n=114, 2 dernières années) | |
| Gigabyte G6X 9KG (2024) | |
| CrossMark / Responsiveness | |
| Acer Predator Helios Neo 16 (2024) | |
| Gigabyte G6X 9KG (2024) | |
| Nubia RedMagic Titan 16 Pro | |
| Lenovo Legion Pro 5 16IRX9 G9 | |
| Moyenne Intel Core i9-14900HX, NVIDIA GeForce RTX 4060 Laptop GPU (1849 - 1899, n=2) | |
| HP Victus 16 (2024) | |
| SCHENKER XMG Pro 16 Studio (Mid 24) | |
| Moyenne de la classe Gaming (1030 - 2330, n=114, 2 dernières années) | |
| WebXPRT 3 / Overall | |
| Moyenne Intel Core i9-14900HX, NVIDIA GeForce RTX 4060 Laptop GPU (329 - 339, n=2) | |
| Nubia RedMagic Titan 16 Pro | |
| Acer Predator Helios Neo 16 (2024) | |
| SCHENKER XMG Pro 16 Studio (Mid 24) | |
| Gigabyte G6X 9KG (2024) | |
| Lenovo Legion Pro 5 16IRX9 G9 | |
| Moyenne de la classe Gaming (215 - 480, n=127, 2 dernières années) | |
| HP Victus 16 (2024) | |
| WebXPRT 4 / Overall | |
| Moyenne Intel Core i9-14900HX, NVIDIA GeForce RTX 4060 Laptop GPU (309 - 319, n=2) | |
| Nubia RedMagic Titan 16 Pro | |
| Acer Predator Helios Neo 16 (2024) | |
| SCHENKER XMG Pro 16 Studio (Mid 24) | |
| Lenovo Legion Pro 5 16IRX9 G9 | |
| Moyenne de la classe Gaming (176.4 - 335, n=115, 2 dernières années) | |
| Gigabyte G6X 9KG (2024) | |
| HP Victus 16 (2024) | |
| Mozilla Kraken 1.1 / Total | |
| HP Victus 16 (2024) | |
| Gigabyte G6X 9KG (2024) | |
| Moyenne de la classe Gaming (409 - 674, n=139, 2 dernières années) | |
| Lenovo Legion Pro 5 16IRX9 G9 | |
| SCHENKER XMG Pro 16 Studio (Mid 24) | |
| Acer Predator Helios Neo 16 (2024) | |
| Nubia RedMagic Titan 16 Pro | |
| Moyenne Intel Core i9-14900HX, NVIDIA GeForce RTX 4060 Laptop GPU (430 - 439, n=2) | |
* ... Moindre est la valeur, meilleures sont les performances
| PCMark 10 Score | 7830 points | |
Aide | ||
| AIDA64 / Memory Copy | |
| SCHENKER XMG Pro 16 Studio (Mid 24) | |
| Lenovo Legion Pro 5 16IRX9 G9 | |
| Acer Predator Helios Neo 16 (2024) | |
| Moyenne Intel Core i9-14900HX (38028 - 83392, n=36) | |
| HP Victus 16 (2024) | |
| Moyenne de la classe Gaming (21750 - 97515, n=147, 2 dernières années) | |
| Gigabyte G6X 9KG (2024) | |
| Nubia RedMagic Titan 16 Pro | |
| AIDA64 / Memory Read | |
| Lenovo Legion Pro 5 16IRX9 G9 | |
| SCHENKER XMG Pro 16 Studio (Mid 24) | |
| Acer Predator Helios Neo 16 (2024) | |
| Moyenne Intel Core i9-14900HX (43306 - 87568, n=36) | |
| HP Victus 16 (2024) | |
| Moyenne de la classe Gaming (22956 - 102937, n=147, 2 dernières années) | |
| Gigabyte G6X 9KG (2024) | |
| Nubia RedMagic Titan 16 Pro | |
| AIDA64 / Memory Write | |
| Lenovo Legion Pro 5 16IRX9 G9 | |
| SCHENKER XMG Pro 16 Studio (Mid 24) | |
| Moyenne Intel Core i9-14900HX (37146 - 80589, n=36) | |
| Acer Predator Helios Neo 16 (2024) | |
| Moyenne de la classe Gaming (22297 - 108954, n=147, 2 dernières années) | |
| HP Victus 16 (2024) | |
| Gigabyte G6X 9KG (2024) | |
| Nubia RedMagic Titan 16 Pro | |
| AIDA64 / Memory Latency | |
| HP Victus 16 (2024) | |
| Moyenne de la classe Gaming (59.5 - 259, n=147, 2 dernières années) | |
| Acer Predator Helios Neo 16 (2024) | |
| Gigabyte G6X 9KG (2024) | |
| Moyenne Intel Core i9-14900HX (76.1 - 105, n=36) | |
| SCHENKER XMG Pro 16 Studio (Mid 24) | |
| Lenovo Legion Pro 5 16IRX9 G9 | |
| Nubia RedMagic Titan 16 Pro | |
* ... Moindre est la valeur, meilleures sont les performances
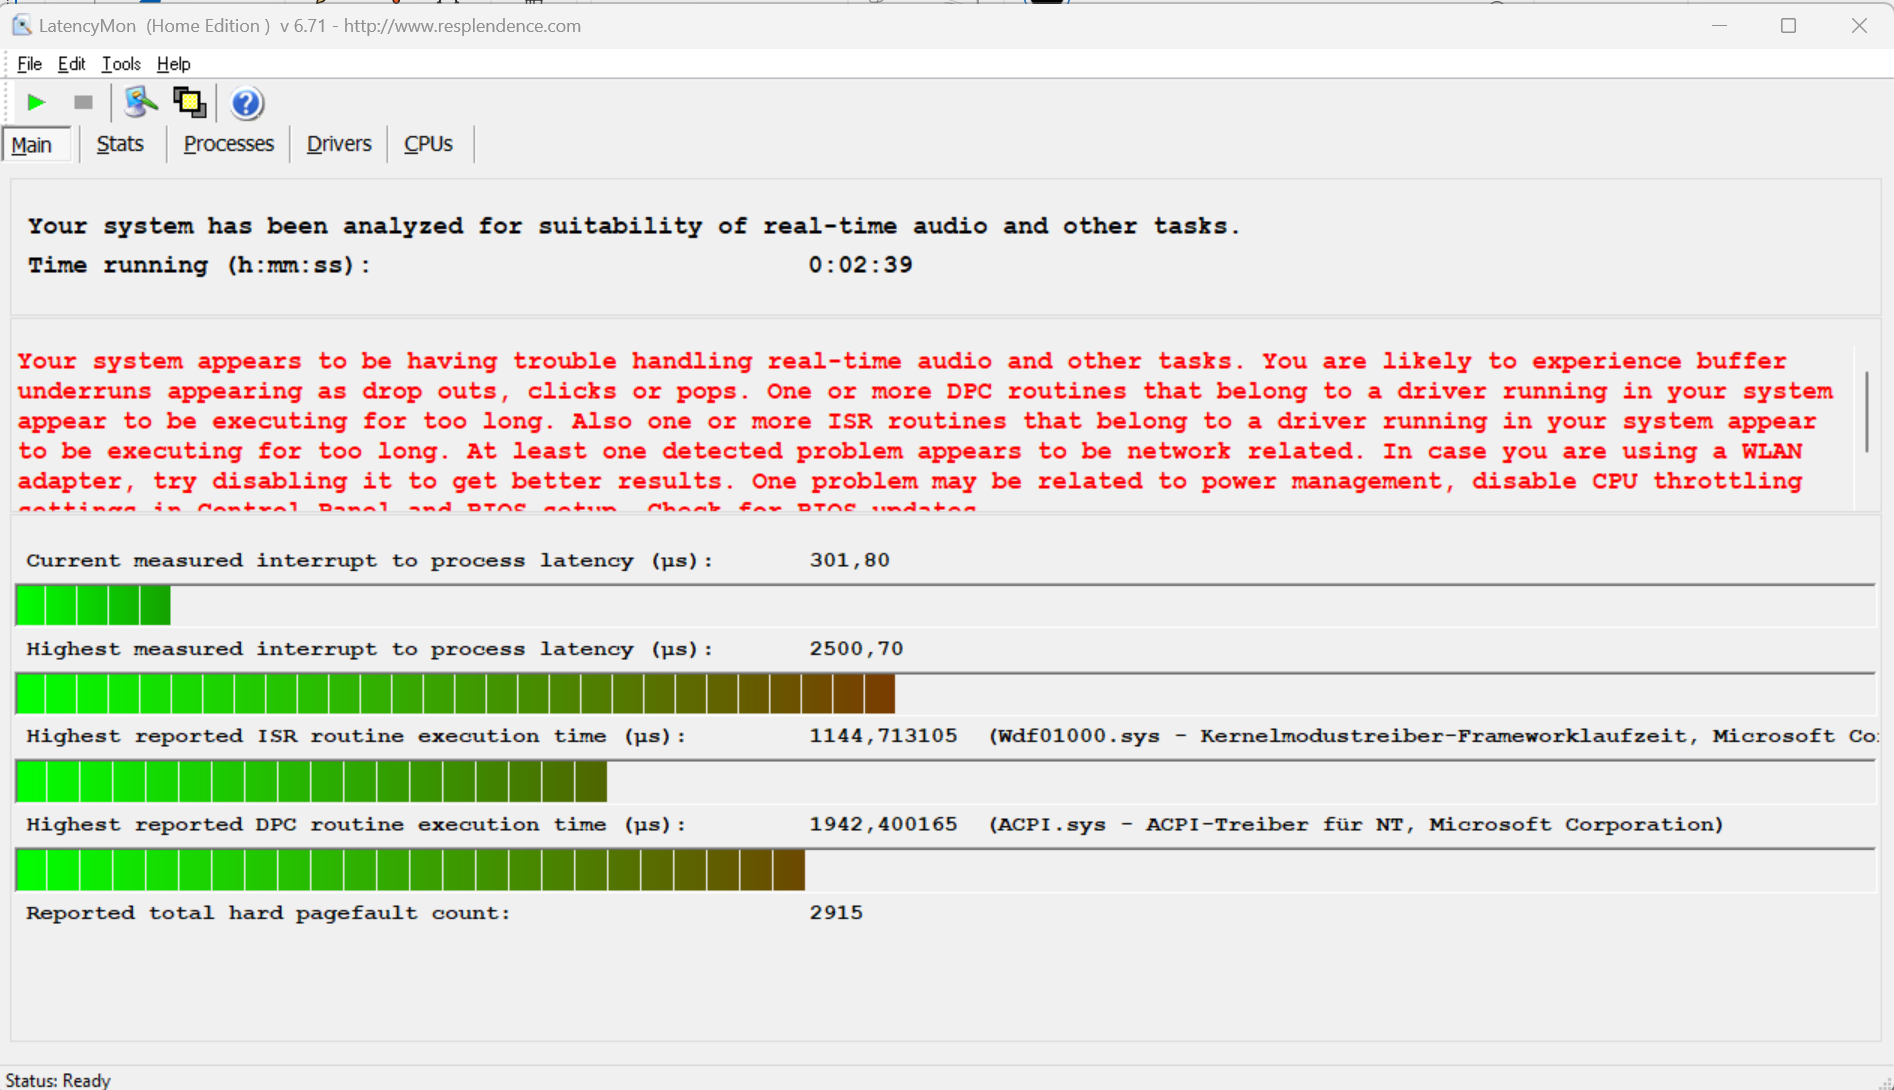
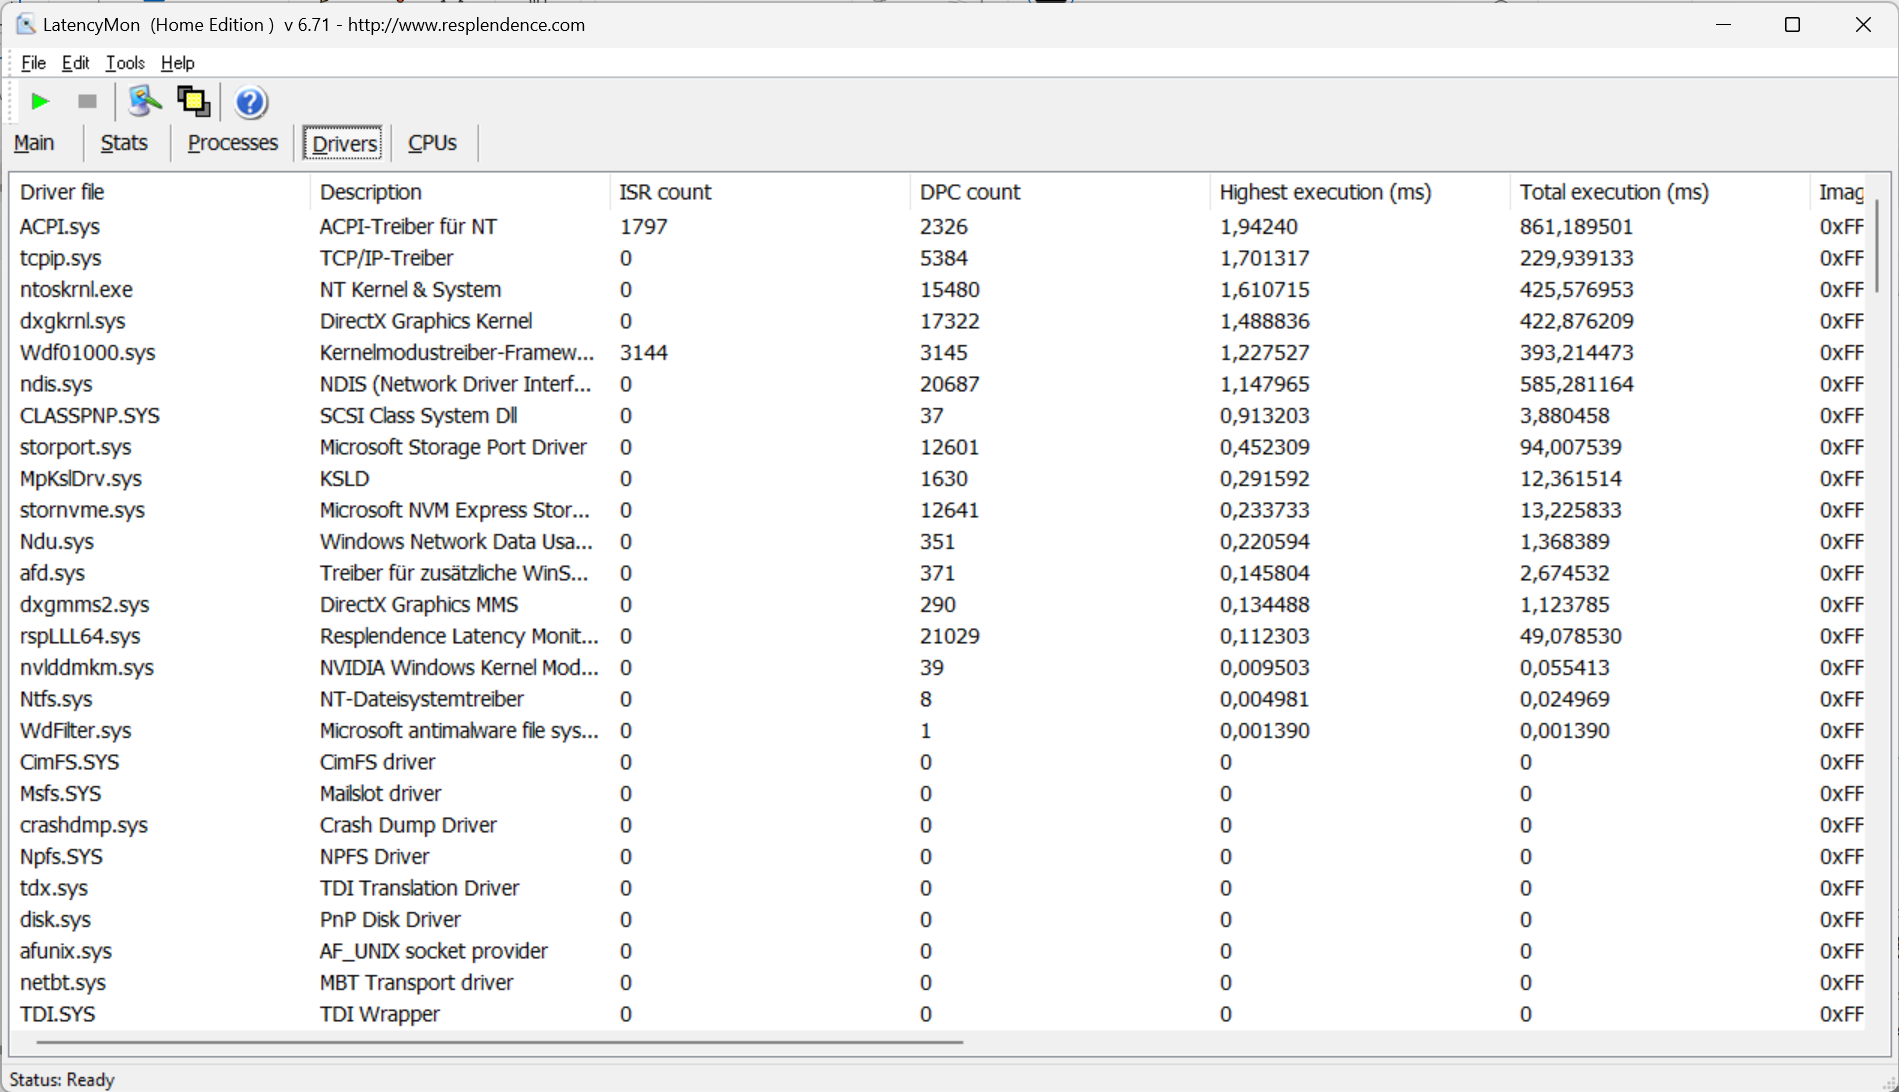
Latences DPC
Des latences élevées empêchent l'édition vidéo et audio en temps réel. Les futures mises à jour logicielles pourraient apporter des améliorations, voire des détériorations.
| DPC Latencies / LatencyMon - interrupt to process latency (max), Web, Youtube, Prime95 | |
| Nubia RedMagic Titan 16 Pro | |
| Gigabyte G6X 9KG (2024) | |
| SCHENKER XMG Pro 16 Studio (Mid 24) | |
| Acer Predator Helios Neo 16 (2024) | |
| Lenovo Legion Pro 5 16IRX9 G9 | |
| HP Victus 16 (2024) | |
* ... Moindre est la valeur, meilleures sont les performances
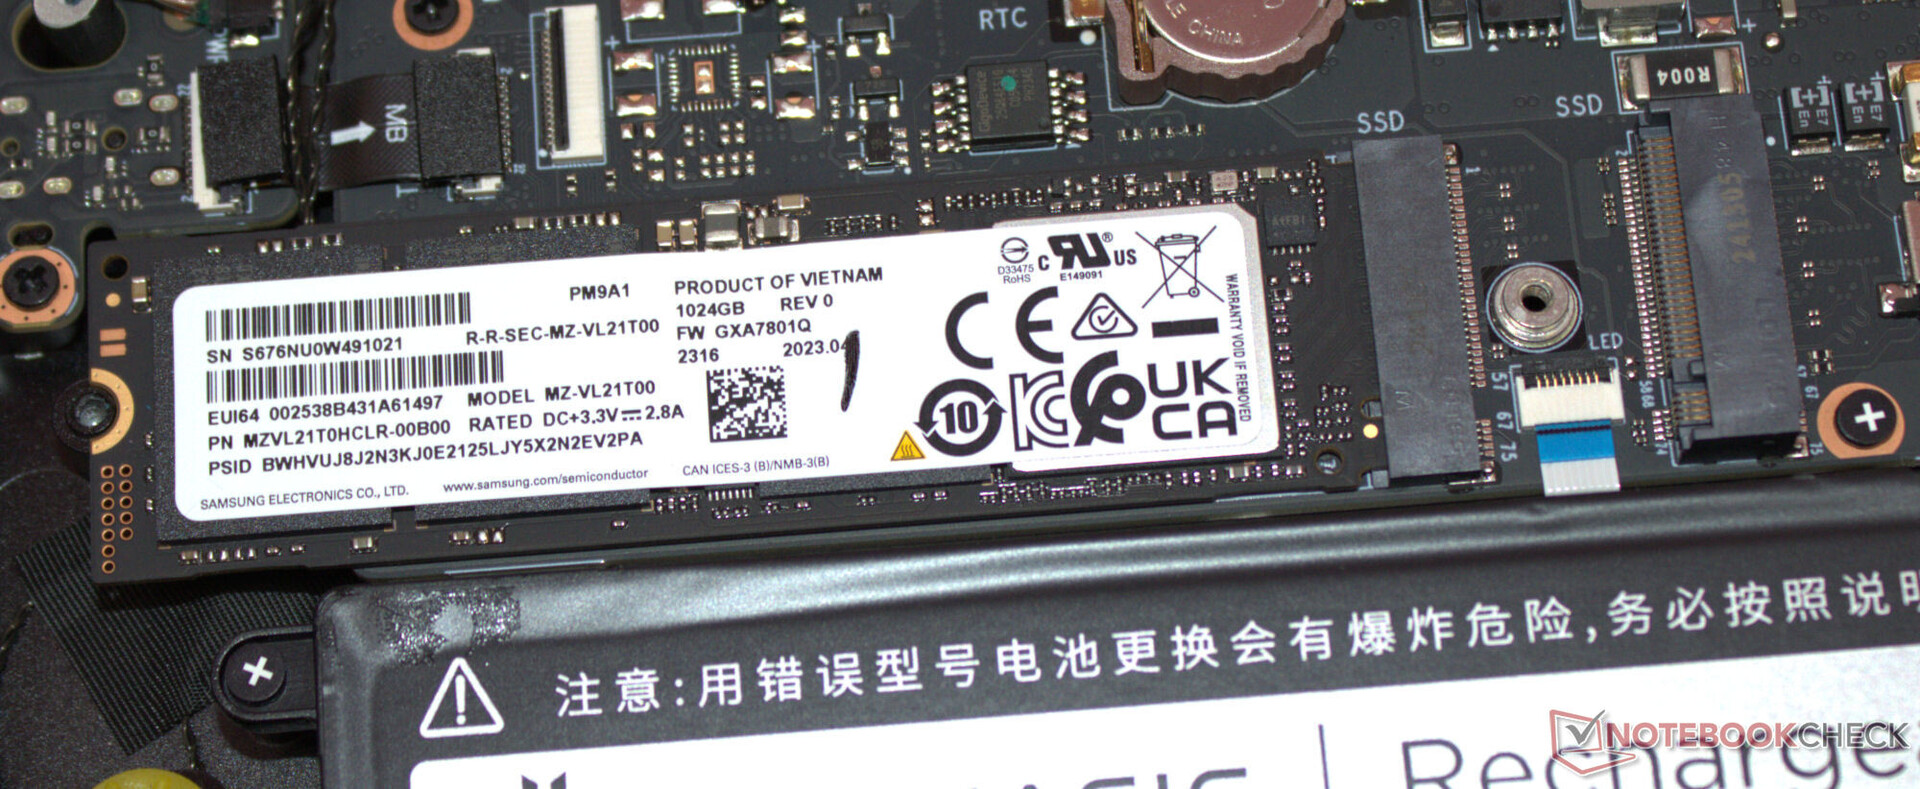
Dispositifs de stockage
Le SSD PCIe 4 (M.2-2280) de Samsung offre une capacité de stockage de 1 To et de très bons débits de données. Points positifs : Nous n'avons observé aucun ralentissement thermique. L'ordinateur portable dispose d'un espace pour un second SSD PCIe 4.

* ... Moindre est la valeur, meilleures sont les performances
Reading continuous performance: DiskSpd Read Loop, Queue Depth 8
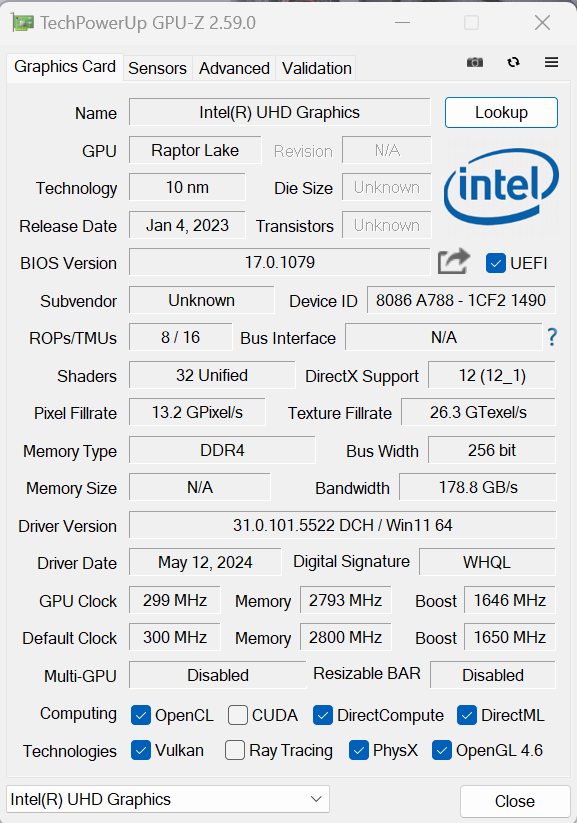
Carte graphique
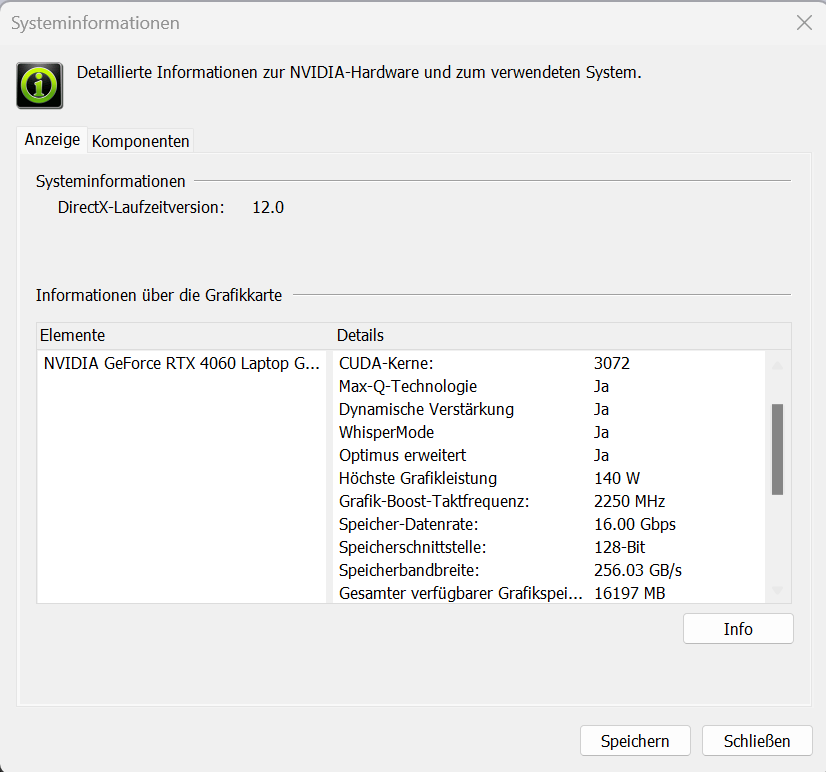
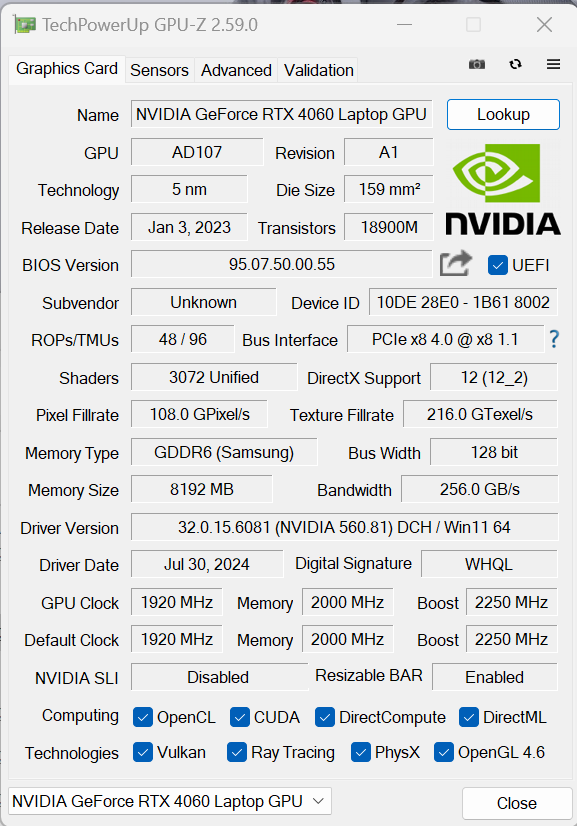
La GeForce RTX 4060 (3 072 shaders, bus 128 bits, 8 Go GDDR6) est actuellement un GPU de jeu de milieu de gamme (inférieur). Nubia lui accorde un TGP maximum de 140 watts - il n'est pas possible d'en faire plus. Ses résultats de benchmark sont légèrement supérieurs à la moyenne de la RTX-4060( modeéquilibré ). Le mode gaming n'entraîne pas d'augmentation. Passer de dGPU à Optimus ne nécessite pas de redémarrage - Optimus avancé est pris en charge.

| 3DMark Performance Rating - Percent | |
| Acer Predator Helios Neo 16 (2024) | |
| Moyenne de la classe Gaming | |
| SCHENKER XMG Pro 16 Studio (Mid 24) | |
| Lenovo Legion Pro 5 16IRX9 G9 | |
| Nubia RedMagic Titan 16 Pro | |
| Nubia RedMagic Titan 16 Pro | |
| Gigabyte G6X 9KG (2024) | |
| HP Victus 16 (2024) | |
| Moyenne NVIDIA GeForce RTX 4060 Laptop GPU | |
| 3DMark 11 - 1280x720 Performance GPU | |
| Acer Predator Helios Neo 16 (2024) | |
| Moyenne de la classe Gaming (10741 - 72178, n=143, 2 dernières années) | |
| SCHENKER XMG Pro 16 Studio (Mid 24) | |
| Lenovo Legion Pro 5 16IRX9 G9 | |
| Nubia RedMagic Titan 16 Pro (Gaming Mode) | |
| Nubia RedMagic Titan 16 Pro | |
| Gigabyte G6X 9KG (2024) | |
| HP Victus 16 (2024) | |
| Moyenne NVIDIA GeForce RTX 4060 Laptop GPU (28136 - 38912, n=57) | |
| 3DMark | |
| 1920x1080 Fire Strike Graphics | |
| Acer Predator Helios Neo 16 (2024) | |
| Moyenne de la classe Gaming (2913 - 56116, n=155, 2 dernières années) | |
| SCHENKER XMG Pro 16 Studio (Mid 24) | |
| Lenovo Legion Pro 5 16IRX9 G9 | |
| Gigabyte G6X 9KG (2024) | |
| HP Victus 16 (2024) | |
| Nubia RedMagic Titan 16 Pro (Gaming Mode) | |
| Nubia RedMagic Titan 16 Pro | |
| Moyenne NVIDIA GeForce RTX 4060 Laptop GPU (20533 - 29656, n=54) | |
| 2560x1440 Time Spy Graphics | |
| Acer Predator Helios Neo 16 (2024) | |
| Moyenne de la classe Gaming (2295 - 24599, n=151, 2 dernières années) | |
| SCHENKER XMG Pro 16 Studio (Mid 24) | |
| Lenovo Legion Pro 5 16IRX9 G9 | |
| Nubia RedMagic Titan 16 Pro (Gaming Mode) | |
| Nubia RedMagic Titan 16 Pro | |
| Moyenne NVIDIA GeForce RTX 4060 Laptop GPU (7484 - 11451, n=56) | |
| HP Victus 16 (2024) | |
| Gigabyte G6X 9KG (2024) | |
| 3DMark 06 Standard Score | 55770 points | |
| 3DMark 11 Performance | 28427 points | |
| 3DMark Fire Strike Score | 22307 points | |
| 3DMark Time Spy Score | 10789 points | |
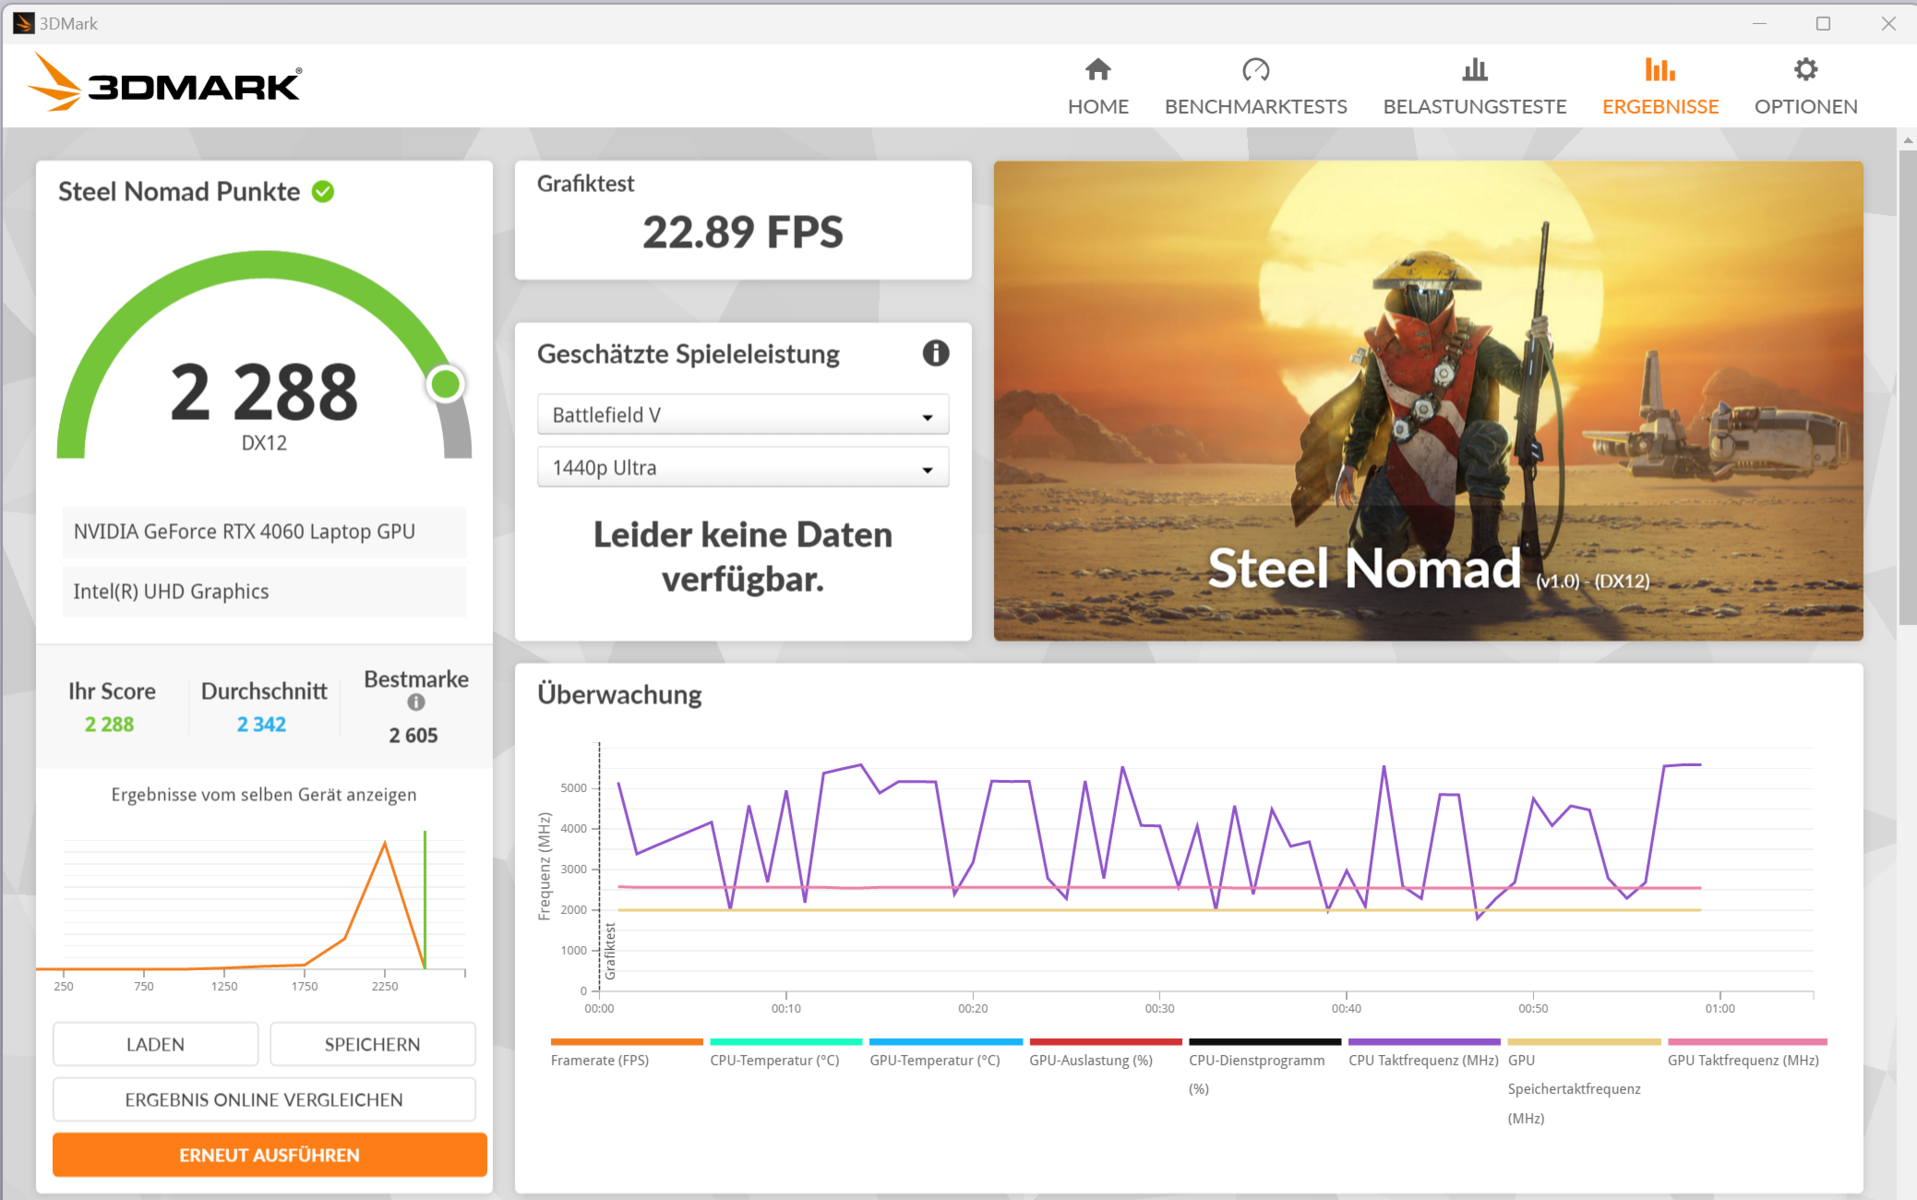
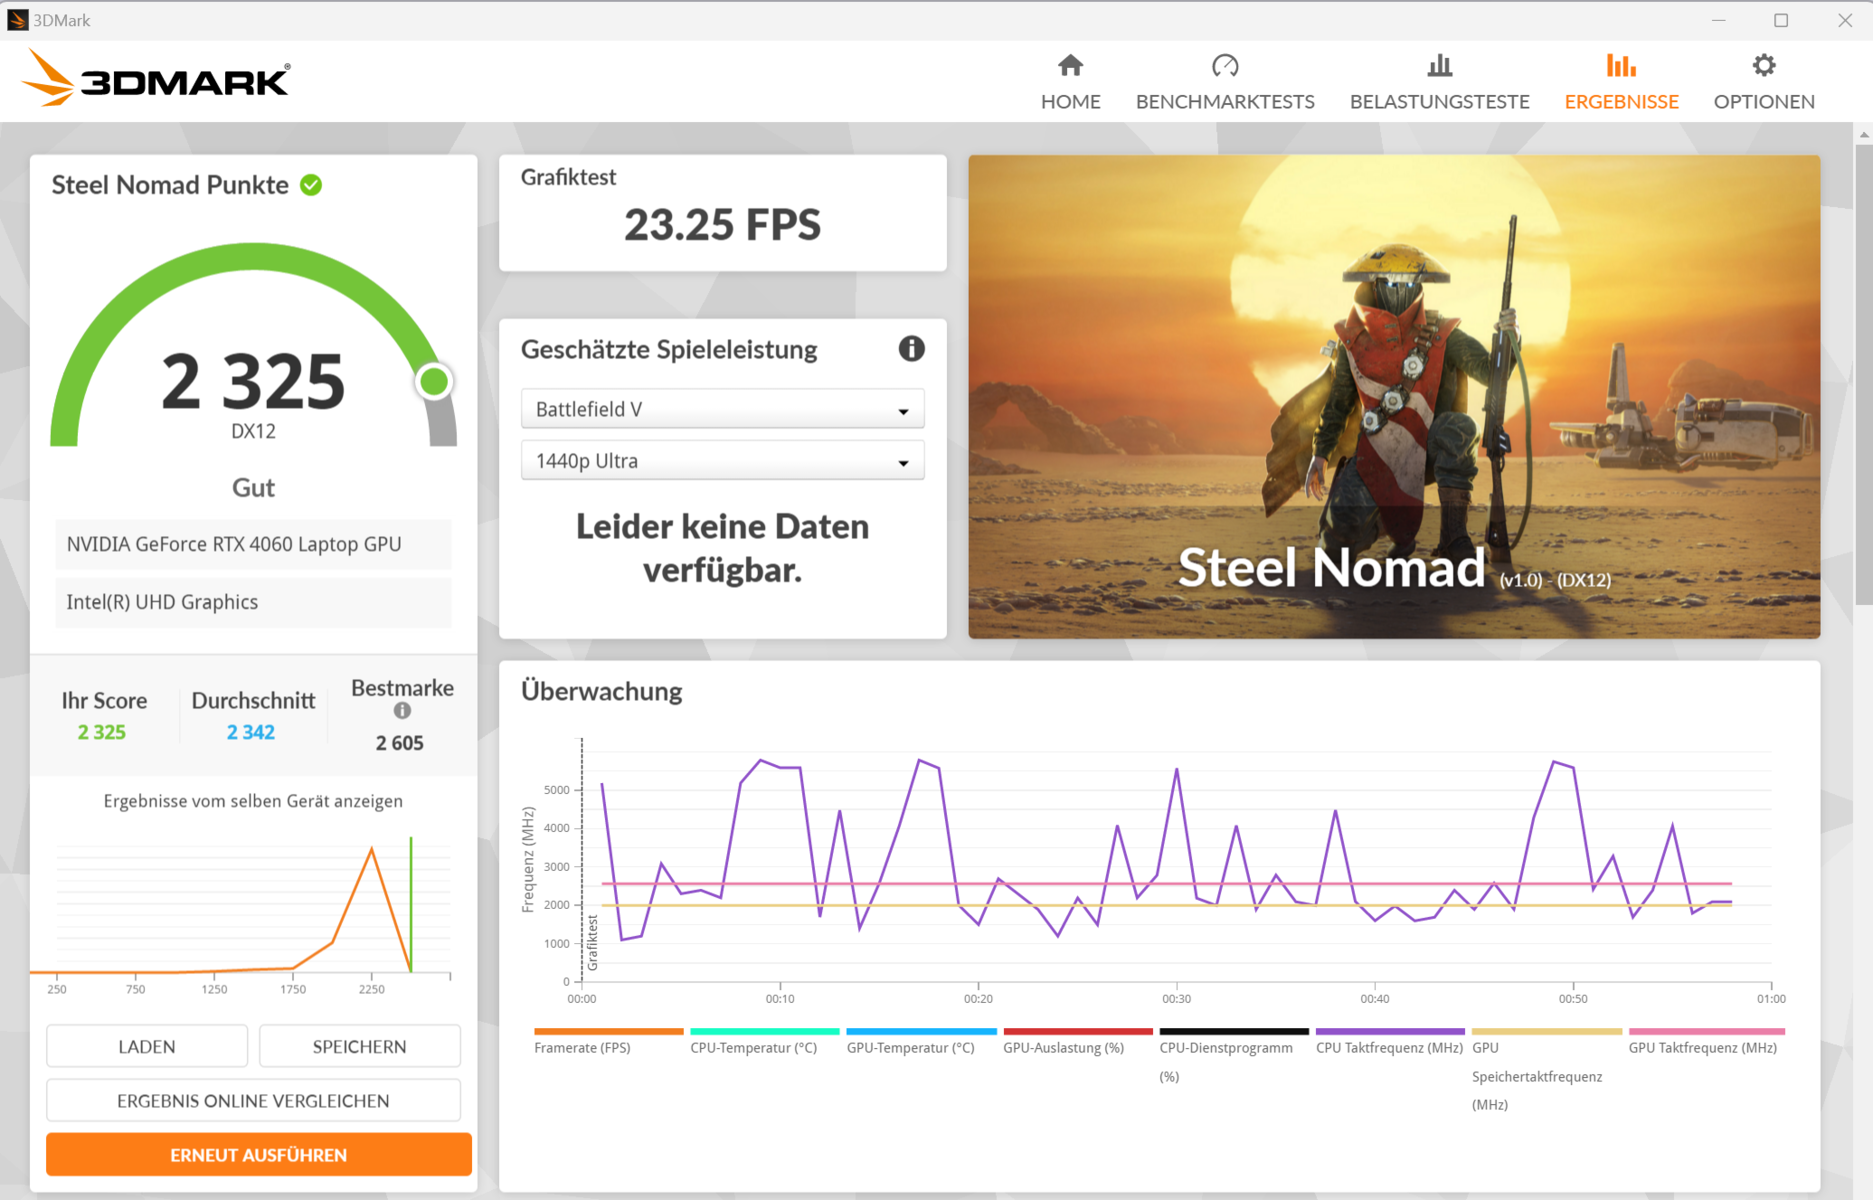
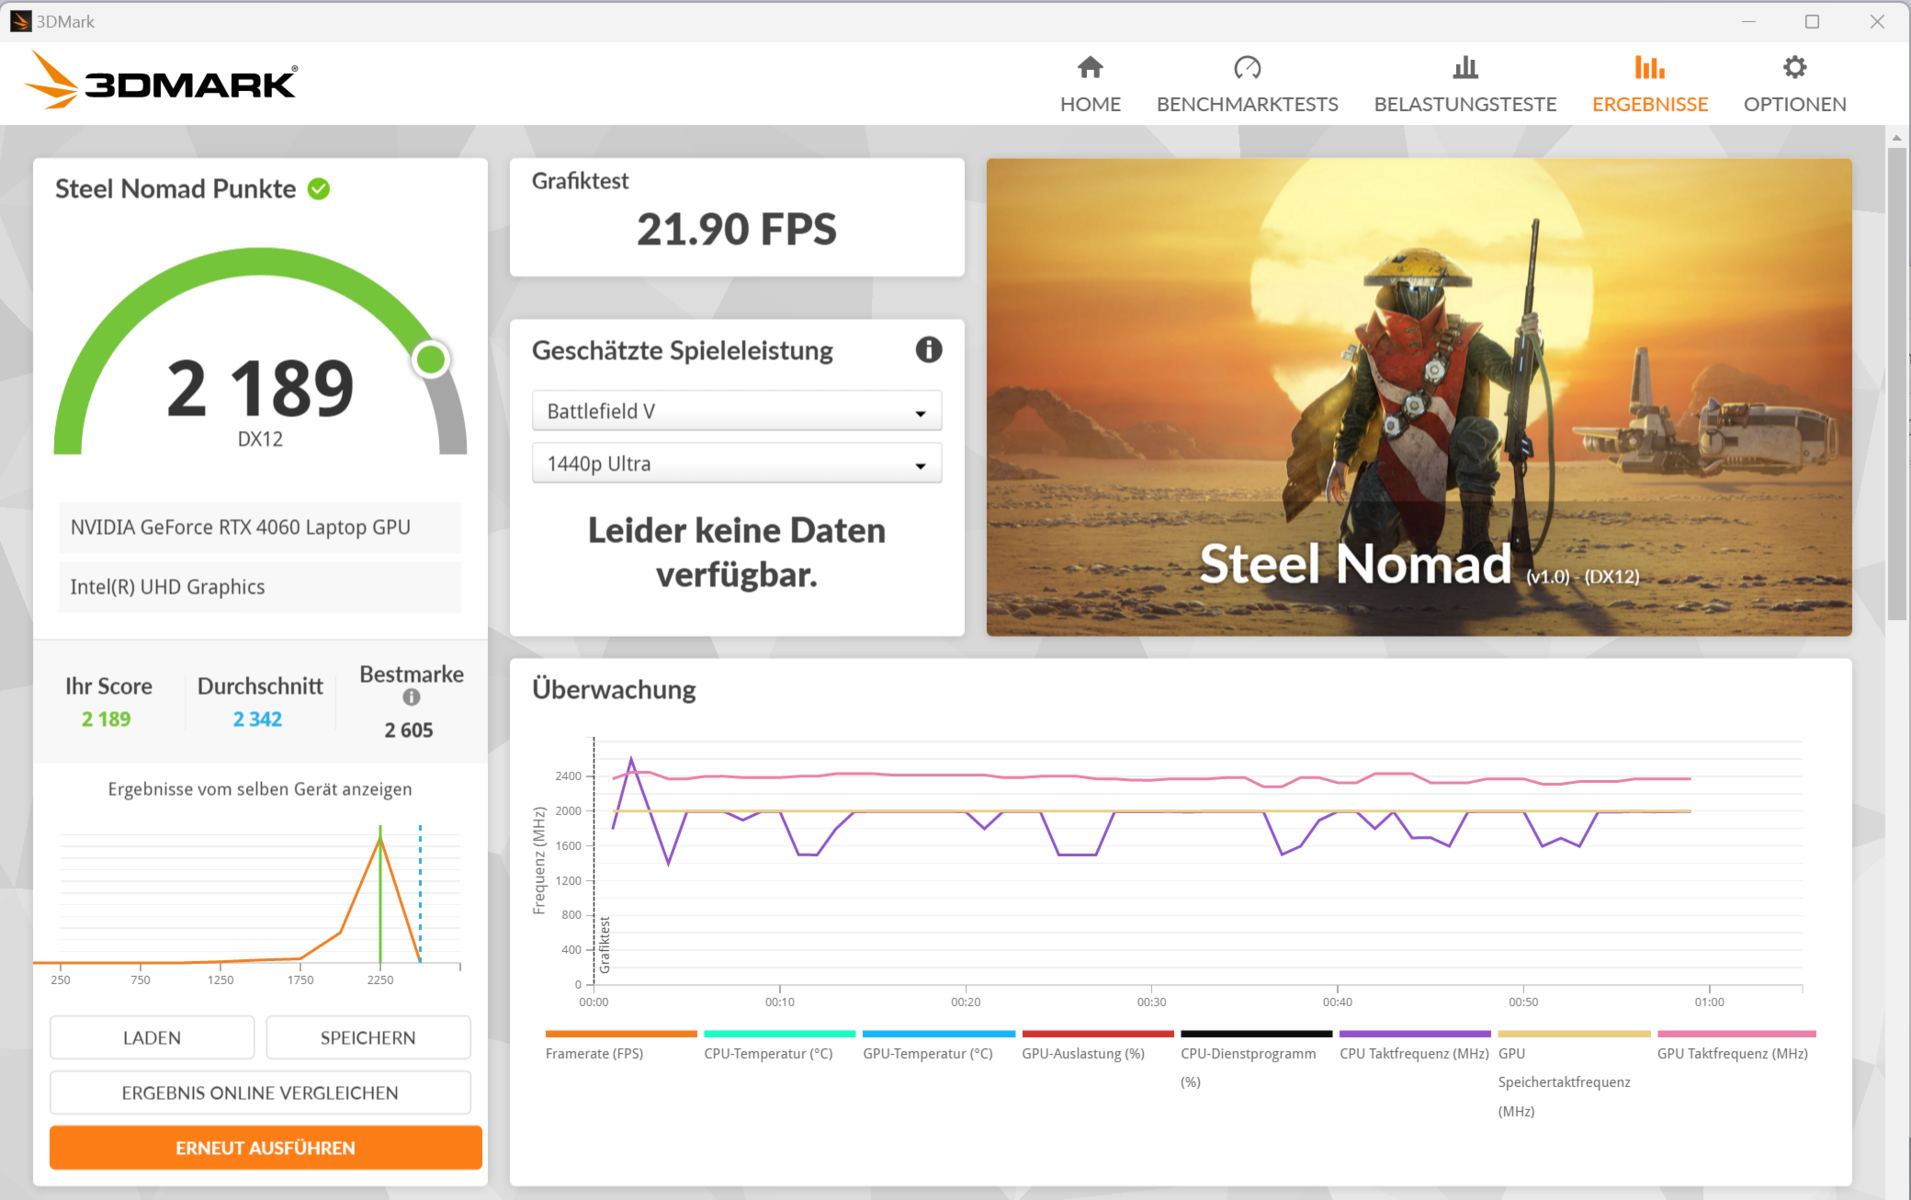
| 3DMark Steel Nomad Score | 2288 points | |
Aide | ||
| Geekbench 6.4 | |
| GPU OpenCL | |
| Acer Predator Helios Neo 16 (2024) (6.2.1) | |
| Moyenne de la classe Gaming (4321 - 234213, n=118, 2 dernières années) | |
| SCHENKER XMG Pro 16 Studio (Mid 24) (6.2.1) | |
| Nubia RedMagic Titan 16 Pro (6.2.1, Gaming Mode) | |
| Nubia RedMagic Titan 16 Pro (6.2.1) | |
| Gigabyte G6X 9KG (2024) (6.2.1) | |
| HP Victus 16 (2024) (6.2.1) | |
| Moyenne NVIDIA GeForce RTX 4060 Laptop GPU (4321 - 100831, n=40) | |
| Lenovo Legion Pro 5 16IRX9 G9 (6.2.1) | |
| GPU Vulkan | |
| SCHENKER XMG Pro 16 Studio (Mid 24) (6.2.1) | |
| Nubia RedMagic Titan 16 Pro (6.2.1, Gaming Mode) | |
| Gigabyte G6X 9KG (2024) (6.2.1) | |
| Acer Predator Helios Neo 16 (2024) (6.2.1) | |
| HP Victus 16 (2024) (6.2.1) | |
| Moyenne de la classe Gaming (4286 - 231659, n=110, 2 dernières années) | |
| Nubia RedMagic Titan 16 Pro (6.2.1) | |
| Lenovo Legion Pro 5 16IRX9 G9 (6.2.1) | |
| Moyenne NVIDIA GeForce RTX 4060 Laptop GPU (4286 - 101001, n=36) | |
| V-Ray Benchmark Next 4.10 | |
| GPU | |
| Moyenne de la classe Gaming (54 - 1317, n=122, 2 dernières années) | |
| Lenovo Legion Pro 5 16IRX9 G9 (v4.10.07 ) | |
| Acer Predator Helios Neo 16 (2024) (v4.10.07 ) | |
| Gigabyte G6X 9KG (2024) (v4.10.07 ) | |
| Nubia RedMagic Titan 16 Pro (v4.10.07 ) | |
| Nubia RedMagic Titan 16 Pro (v4.10.07, Gaming Mode ) | |
| Moyenne NVIDIA GeForce RTX 4060 Laptop GPU (483 - 715, n=46) | |
| HP Victus 16 (2024) (v4.10.07 ) | |
| SCHENKER XMG Pro 16 Studio (Mid 24) (v4.10.07 ) | |
| CPU | |
| Nubia RedMagic Titan 16 Pro (v4.10.07, Gaming Mode) | |
| Lenovo Legion Pro 5 16IRX9 G9 (v4.10.07 ) | |
| SCHENKER XMG Pro 16 Studio (Mid 24) (v4.10.07 ) | |
| Acer Predator Helios Neo 16 (2024) (v4.10.07 ) | |
| HP Victus 16 (2024) (v4.10.07 ) | |
| Moyenne de la classe Gaming (5413 - 44129, n=122, 2 dernières années) | |
| Moyenne NVIDIA GeForce RTX 4060 Laptop GPU (12680 - 32360, n=46) | |
| Gigabyte G6X 9KG (2024) (v4.10.07 ) | |
| Nubia RedMagic Titan 16 Pro (v4.10.07 ) | |
* ... Moindre est la valeur, meilleures sont les performances
Performances des jeux
La Titan est conçue pour les jeux en QHD avec des paramètres élevés à maximaux. Le matériel installé génère des taux de rafraîchissement légèrement supérieurs à la moyenne de la RTX 4060( modeéquilibré ). Le mode Gaming apporte un plus pour les jeux qui bénéficient d'une performance CPU plus élevée, tels que Dota 2 Reborn et X-Plane 11. Pour le reste, les performances graphiques sont identiques.
| Cyberpunk 2077 2.2 Phantom Liberty - 1920x1080 Ultra Preset (FSR off) | |
| Moyenne de la classe Gaming (6.76 - 158, n=90, 2 dernières années) | |
| Acer Predator Helios Neo 16 (2024) (2.02) | |
| SCHENKER XMG Pro 16 Studio (Mid 24) (2.12) | |
| Lenovo Legion Pro 5 16IRX9 G9 (2.12) | |
| Nubia RedMagic Titan 16 Pro (2.12, Gaming Mode) | |
| Nubia RedMagic Titan 16 Pro (2.12) | |
| Moyenne NVIDIA GeForce RTX 4060 Laptop GPU (56.4 - 93.1, n=31) | |
| Gigabyte G6X 9KG (2024) (2.02) | |
| HP Victus 16 (2024) (2.02) | |
| Final Fantasy XV Benchmark - 1920x1080 High Quality | |
| Acer Predator Helios Neo 16 (2024) (1.3) | |
| SCHENKER XMG Pro 16 Studio (Mid 24) (1.3) | |
| Moyenne de la classe Gaming (19.2 - 201, n=144, 2 dernières années) | |
| Lenovo Legion Pro 5 16IRX9 G9 (1.3) | |
| Nubia RedMagic Titan 16 Pro (1.3) | |
| Nubia RedMagic Titan 16 Pro (1.3, Gaming Mode ) | |
| Gigabyte G6X 9KG (2024) (1.3) | |
| HP Victus 16 (2024) (1.3) | |
| Moyenne NVIDIA GeForce RTX 4060 Laptop GPU (75.1 - 109.8, n=51) | |
| Strange Brigade - 1920x1080 ultra AA:ultra AF:16 | |
| Moyenne de la classe Gaming (38.9 - 420, n=140, 2 dernières années) | |
| Acer Predator Helios Neo 16 (2024) (1.47.22.14 D3D12) | |
| SCHENKER XMG Pro 16 Studio (Mid 24) (1.47.22.14 D3D12) | |
| Lenovo Legion Pro 5 16IRX9 G9 (1.47.22.14 D3D12) | |
| Nubia RedMagic Titan 16 Pro (1.47.22.14 D3D12, Gaming Mode ) | |
| Nubia RedMagic Titan 16 Pro (1.47.22.14 D3D12) | |
| Gigabyte G6X 9KG (2024) (1.47.22.14 D3D12) | |
| Moyenne NVIDIA GeForce RTX 4060 Laptop GPU (135.3 - 210, n=50) | |
| HP Victus 16 (2024) (1.47.22.14 D3D12) | |
| Dota 2 Reborn - 1920x1080 ultra (3/3) best looking | |
| Lenovo Legion Pro 5 16IRX9 G9 | |
| Acer Predator Helios Neo 16 (2024) | |
| Nubia RedMagic Titan 16 Pro (Gaming Mode) | |
| SCHENKER XMG Pro 16 Studio (Mid 24) | |
| HP Victus 16 (2024) | |
| Moyenne de la classe Gaming (65.1 - 220, n=148, 2 dernières années) | |
| Nubia RedMagic Titan 16 Pro | |
| Moyenne NVIDIA GeForce RTX 4060 Laptop GPU (115 - 183.8, n=53) | |
| Gigabyte G6X 9KG (2024) | |
| X-Plane 11.11 - 1920x1080 high (fps_test=3) | |
| Nubia RedMagic Titan 16 Pro (Gaming Mode) | |
| Lenovo Legion Pro 5 16IRX9 G9 | |
| Acer Predator Helios Neo 16 (2024) | |
| SCHENKER XMG Pro 16 Studio (Mid 24) | |
| Nubia RedMagic Titan 16 Pro | |
| Gigabyte G6X 9KG (2024) | |
| Moyenne de la classe Gaming (32.8 - 166.2, n=151, 2 dernières années) | |
| Moyenne NVIDIA GeForce RTX 4060 Laptop GPU (60.7 - 141.1, n=54) | |
| HP Victus 16 (2024) | |
| Once Human | |
| 1920x1080 Very High Preset | |
| Nubia RedMagic Titan 16 Pro | |
| Moyenne NVIDIA GeForce RTX 4060 Laptop GPU (88.7 - 94.2, n=2) | |
| Moyenne de la classe Gaming (14.2 - 94.2, n=2, 2 dernières années) | |
| 2560x1440 Very High Preset | |
| Nubia RedMagic Titan 16 Pro | |
| Moyenne de la classe Gaming (n=12 dernières années) | |
| Moyenne NVIDIA GeForce RTX 4060 Laptop GPU (59.1 - 62.3, n=2) | |
| 2560x1440 Very High Preset + Quality FSR | |
| Nubia RedMagic Titan 16 Pro | |
| Moyenne NVIDIA GeForce RTX 4060 Laptop GPU (n=1) | |
| Moyenne de la classe Gaming (n=12 dernières années) | |
| F1 24 | |
| 1920x1080 Ultra High Preset AA:T AF:16x | |
| Moyenne de la classe Gaming (54.1 - 148, n=19, 2 dernières années) | |
| SCHENKER XMG Pro 16 Studio (Mid 24) | |
| Lenovo Legion Pro 5 16IRX9 G9 | |
| Nubia RedMagic Titan 16 Pro | |
| Moyenne NVIDIA GeForce RTX 4060 Laptop GPU (47.5 - 61.6, n=10) | |
| 2560x1440 Ultra High Preset AA:T AF:16x | |
| Moyenne de la classe Gaming (36.7 - 100, n=16, 2 dernières années) | |
| SCHENKER XMG Pro 16 Studio (Mid 24) | |
| Nubia RedMagic Titan 16 Pro | |
| Moyenne NVIDIA GeForce RTX 4060 Laptop GPU (24.3 - 38.8, n=6) | |
| 2560x1440 Ultra High Preset + Quality DLSS AF:16x | |
| Moyenne de la classe Gaming (59.2 - 150.4, n=12, 2 dernières années) | |
| SCHENKER XMG Pro 16 Studio (Mid 24) | |
| Nubia RedMagic Titan 16 Pro | |
| Moyenne NVIDIA GeForce RTX 4060 Laptop GPU (48.6 - 61, n=3) | |
| Ghost of Tsushima | |
| 1920x1080 Very High Preset AA:T | |
| SCHENKER XMG Pro 16 Studio (Mid 24) | |
| Nubia RedMagic Titan 16 Pro | |
| Moyenne NVIDIA GeForce RTX 4060 Laptop GPU (55.6 - 63.4, n=5) | |
| Moyenne de la classe Gaming (28.5 - 73.7, n=7, 2 dernières années) | |
| 2560x1440 Very High Preset AA:T | |
| SCHENKER XMG Pro 16 Studio (Mid 24) | |
| Nubia RedMagic Titan 16 Pro | |
| Moyenne NVIDIA GeForce RTX 4060 Laptop GPU (41.1 - 47.7, n=3) | |
| Moyenne de la classe Gaming (22.7 - 56.1, n=5, 2 dernières années) | |
| 2560x1440 Very High Preset + Quality DLSS | |
| SCHENKER XMG Pro 16 Studio (Mid 24) | |
| Moyenne de la classe Gaming (63.6 - 74.2, n=3, 2 dernières années) | |
| Nubia RedMagic Titan 16 Pro | |
| Moyenne NVIDIA GeForce RTX 4060 Laptop GPU (n=1) | |
| The First Descendant | |
| 1920x1080 Ultra Preset | |
| SCHENKER XMG Pro 16 Studio (Mid 24) | |
| Nubia RedMagic Titan 16 Pro | |
| Moyenne NVIDIA GeForce RTX 4060 Laptop GPU (67.6 - 69.4, n=3) | |
| Moyenne de la classe Gaming (15.4 - 80, n=5, 2 dernières années) | |
| 2560x1440 Ultra Preset | |
| SCHENKER XMG Pro 16 Studio (Mid 24) | |
| Moyenne de la classe Gaming (43.7 - 51.2, n=3, 2 dernières années) | |
| Nubia RedMagic Titan 16 Pro | |
| Moyenne NVIDIA GeForce RTX 4060 Laptop GPU (43.5 - 43.7, n=2) | |
| 2560x1440 Ultra Preset + Ultra Ray Tracing + DLSS Quality | |
| SCHENKER XMG Pro 16 Studio (Mid 24) | |
| Moyenne de la classe Gaming (43.3 - 51.8, n=2, 2 dernières années) | |
| Nubia RedMagic Titan 16 Pro | |
| Moyenne NVIDIA GeForce RTX 4060 Laptop GPU (n=1) | |
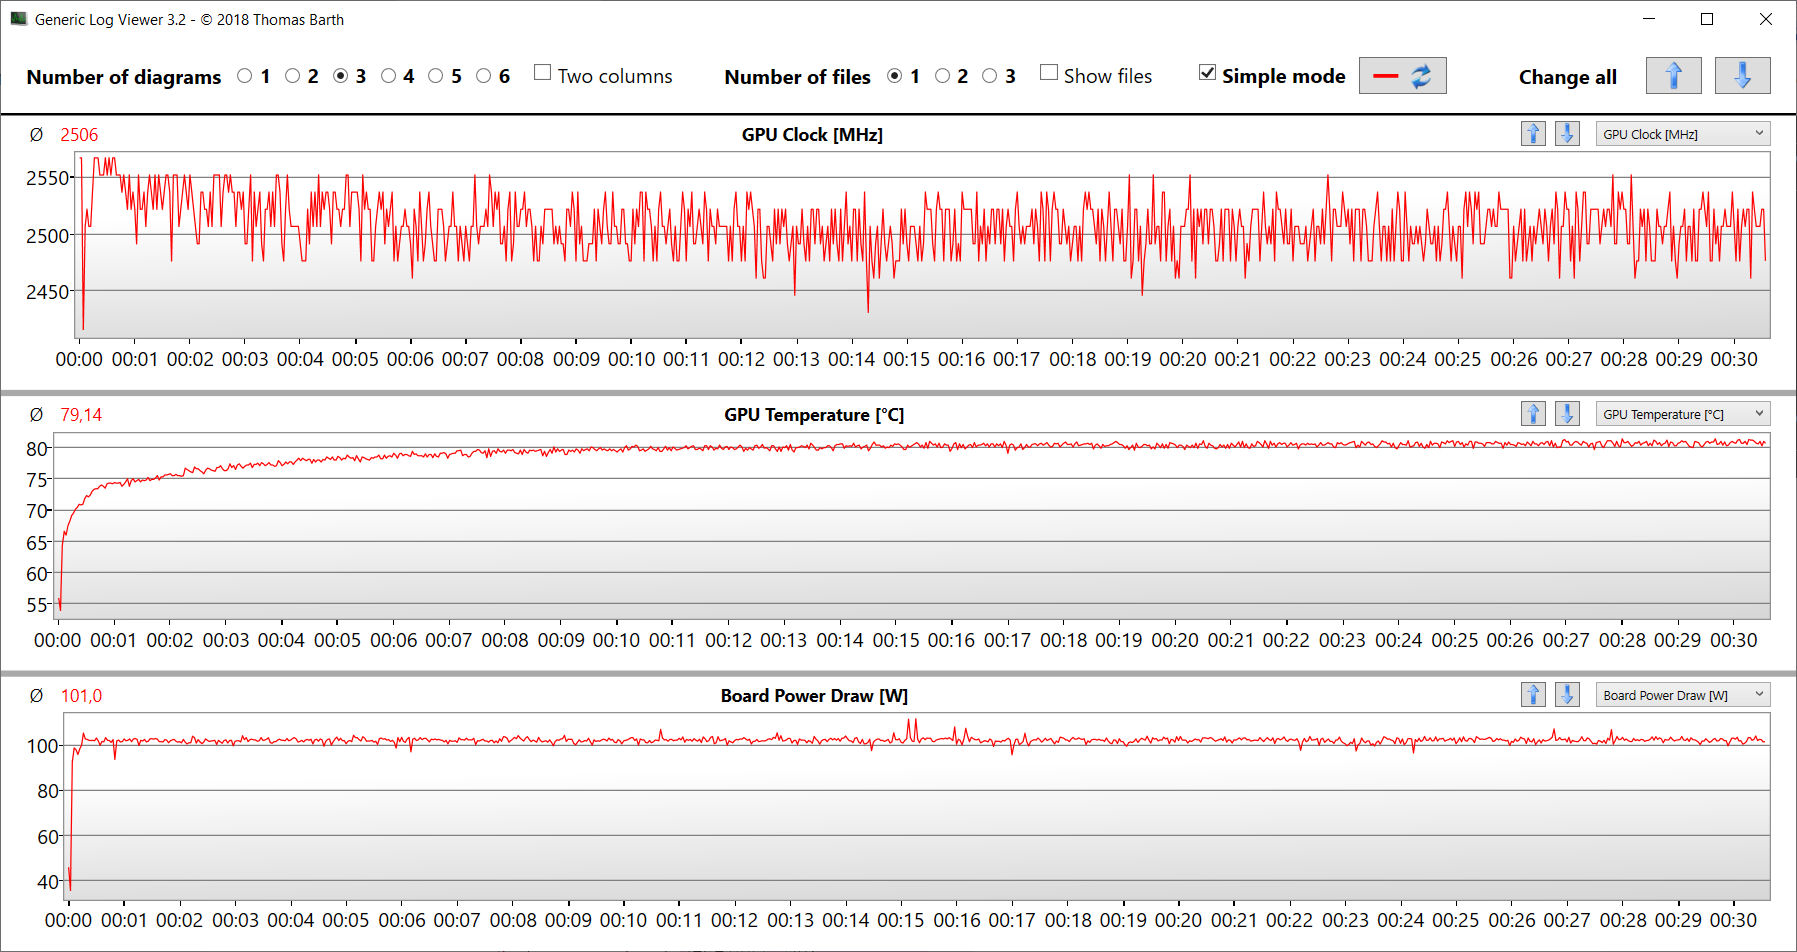
Cyberpunk 2077 Phantom Liberty a affiché des fréquences d'images légèrement fluctuantes à un niveau assez stable pendant notre test de 30 minutes (paramètres maximaux, FHD). Nous n'avons pas constaté de baisse notable des performances.
Cyberpunk 2077 ultra FPS diagram
| Bas | Moyen | Élevé | Ultra | QHD DLSS | QHD FSR | QHD | |
|---|---|---|---|---|---|---|---|
| GTA V (2015) | 186.1 | 184 | 177.7 | 118.4 | 89.3 | ||
| Dota 2 Reborn (2015) | 206 | 170.9 | 160.2 | 146.9 | |||
| Final Fantasy XV Benchmark (2018) | 199.7 | 146 | 105.4 | 76.9 | |||
| X-Plane 11.11 (2018) | 167 | 142.8 | 117.2 | ||||
| Strange Brigade (2018) | 480 | 277 | 219 | 189.2 | 126.9 | ||
| Baldur's Gate 3 (2023) | 140.3 | 110.8 | 97.5 | 96.5 | 65.9 | ||
| Cyberpunk 2077 2.2 Phantom Liberty (2023) | 121.4 | 101.1 | 86.2 | 74.7 | 46.9 | ||
| Dragon's Dogma 2 (2024) | 71.9 | 67.7 | 52.9 | ||||
| Ghost of Tsushima (2024) | 91.3 | 86.8 | 78.2 | 63.4 | 63.6 | 47.7 | |
| F1 24 (2024) | 243 | 225 | 175.8 | 58.8 | 36.7 | ||
| The First Descendant (2024) | 159 | 100.9 | 80.6 | 69.4 | 43.7 | ||
| Once Human (2024) | 164.8 | 132.9 | 108.3 | 94.2 | 76.5 | 62.3 |
Émissions - Trop bruyant, trop chaud
Émissions sonores
Le Titan est loin d'être un ordinateur portable silencieux. Même en mode veille, les deux ventilateurs sont constamment audibles. Cyberpunk a fait grimper le niveau jusqu'à 50 dB(A)( modeéquilibré ) ou 53 dB(A)( modejeu ). Le mode bureautique donne une valeur à peine plus modérée de 47 dB(A). Les ventilateurs sont plus silencieux en mode batterie et restent parfois immobiles.
Degré de la nuisance sonore
| Au repos |
| 35 / 36 / 40 dB(A) |
| Fortement sollicité |
| 49 / 52 dB(A) |
 | ||
30 dB silencieux 40 dB(A) audible 50 dB(A) bruyant |
||
min: | ||
| Nubia RedMagic Titan 16 Pro NVIDIA GeForce RTX 4060 Laptop GPU, i9-14900HX, Samsung PM9A1 MZVL21T0HCLR | Lenovo Legion Pro 5 16IRX9 G9 NVIDIA GeForce RTX 4060 Laptop GPU, i7-14700HX, Samsung PM9A1 MZVL21T0HCLR | HP Victus 16 (2024) NVIDIA GeForce RTX 4060 Laptop GPU, i7-14700HX, Kioxia XG8 KXG80ZNV512G | Acer Predator Helios Neo 16 (2024) NVIDIA GeForce RTX 4070 Laptop GPU, i7-14700HX, Samsung PM9A1a MZVL21T0HDLU | SCHENKER XMG Pro 16 Studio (Mid 24) NVIDIA GeForce RTX 4070 Laptop GPU, i9-14900HX, Samsung 990 Pro 1 TB | Gigabyte G6X 9KG (2024) NVIDIA GeForce RTX 4060 Laptop GPU, i7-13650HX, Gigabyte AG450E1024-SI | |
|---|---|---|---|---|---|---|
| Noise | 17% | 13% | 10% | 5% | 5% | |
| arrêt / environnement * | 26 | 23 12% | 25 4% | 25.2 3% | 25 4% | 26 -0% |
| Idle Minimum * | 35 | 23 34% | 28 20% | 27.8 21% | 28 20% | 30 14% |
| Idle Average * | 36 | 23 36% | 29 19% | 32 11% | 31 14% | 32 11% |
| Idle Maximum * | 40 | 25 37% | 33 17% | 29.6 26% | 35 12% | 35 12% |
| Load Average * | 49 | 45.18 8% | 45 8% | 45.2 8% | 52 -6% | 51 -4% |
| Cyberpunk 2077 ultra * | 50 | 52.69 -5% | 53 -6% | |||
| Load Maximum * | 52 | 53.13 -2% | 48 8% | 55.8 -7% | 52 -0% | 54 -4% |
| Witcher 3 ultra * | 43 | 51 |
* ... Moindre est la valeur, meilleures sont les performances
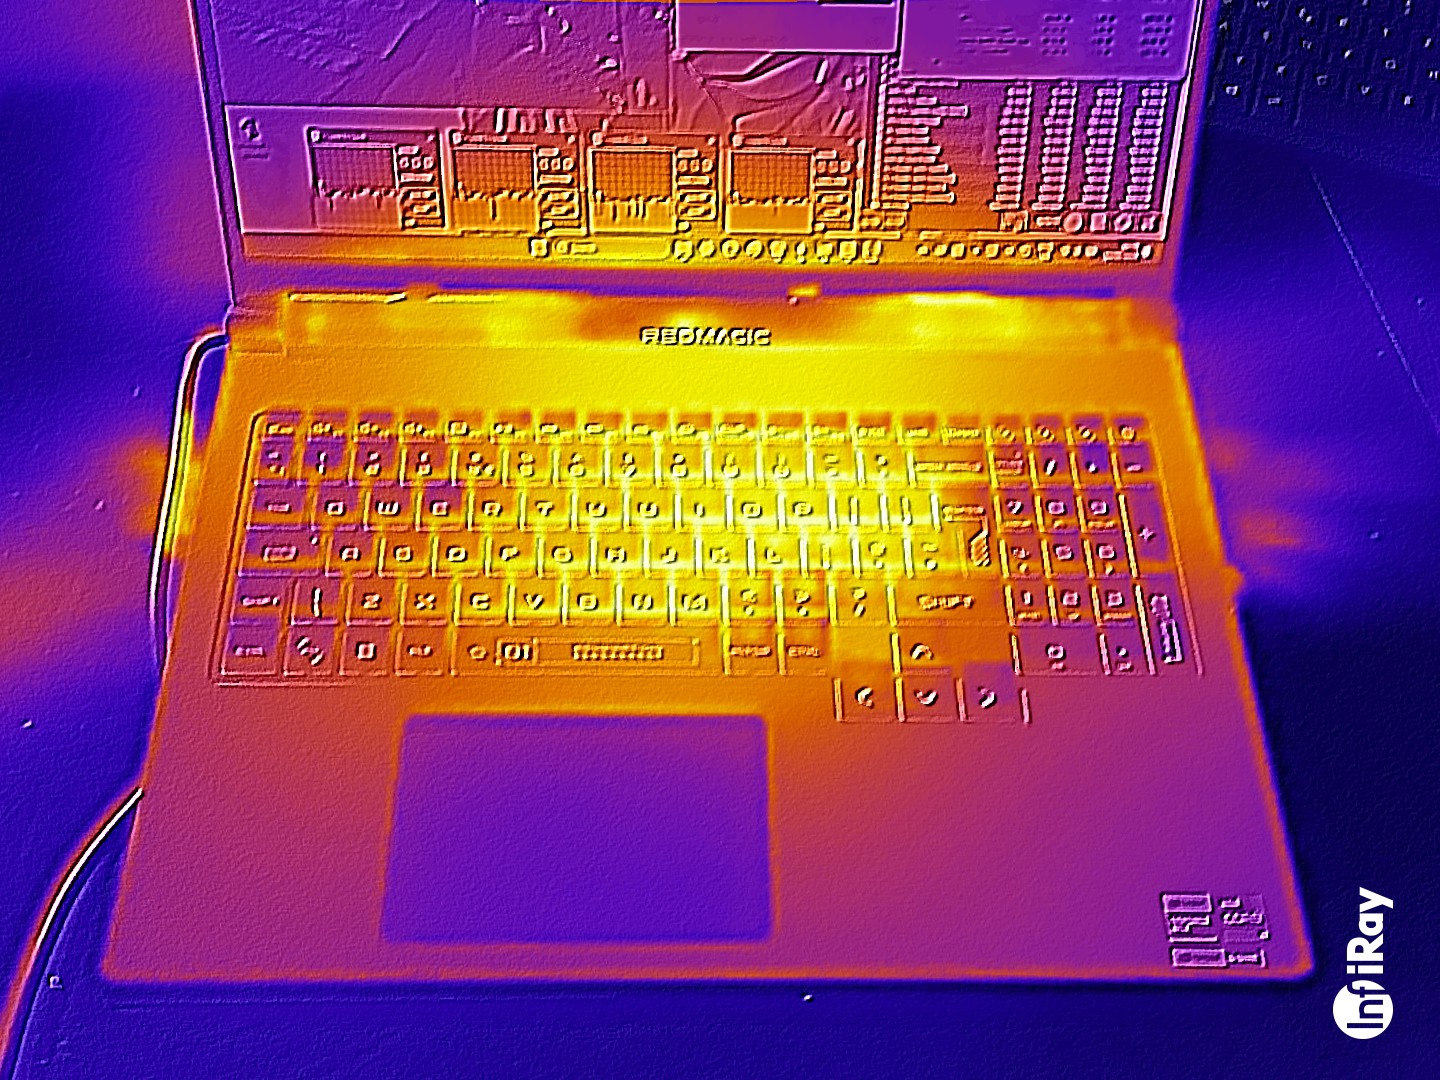
Température
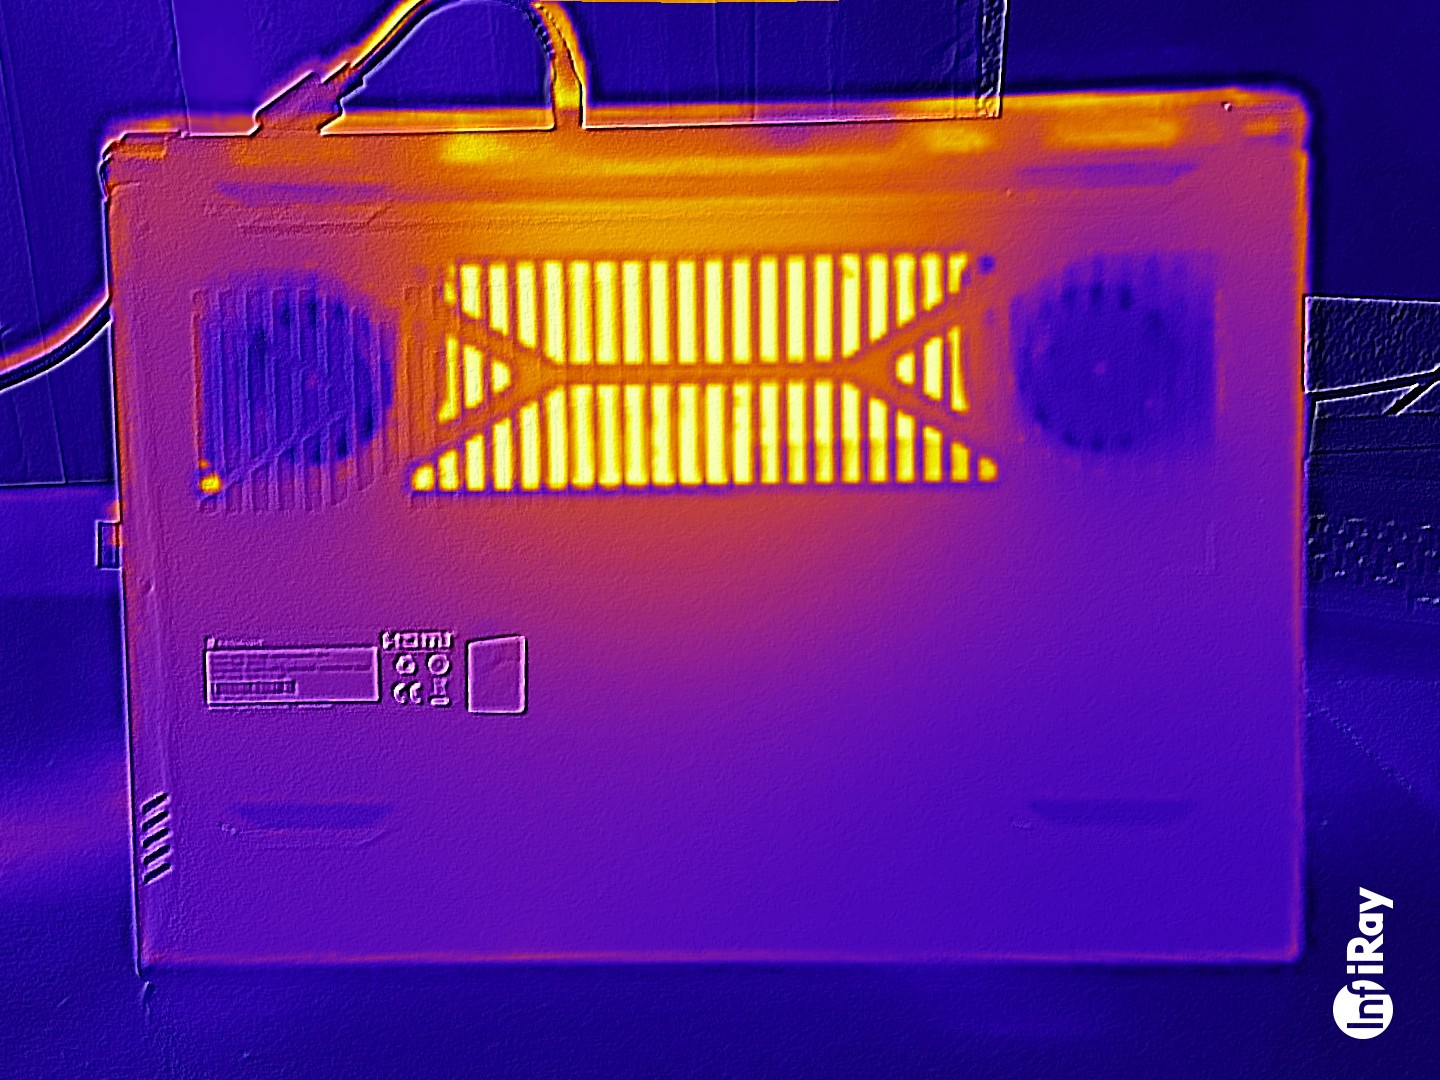
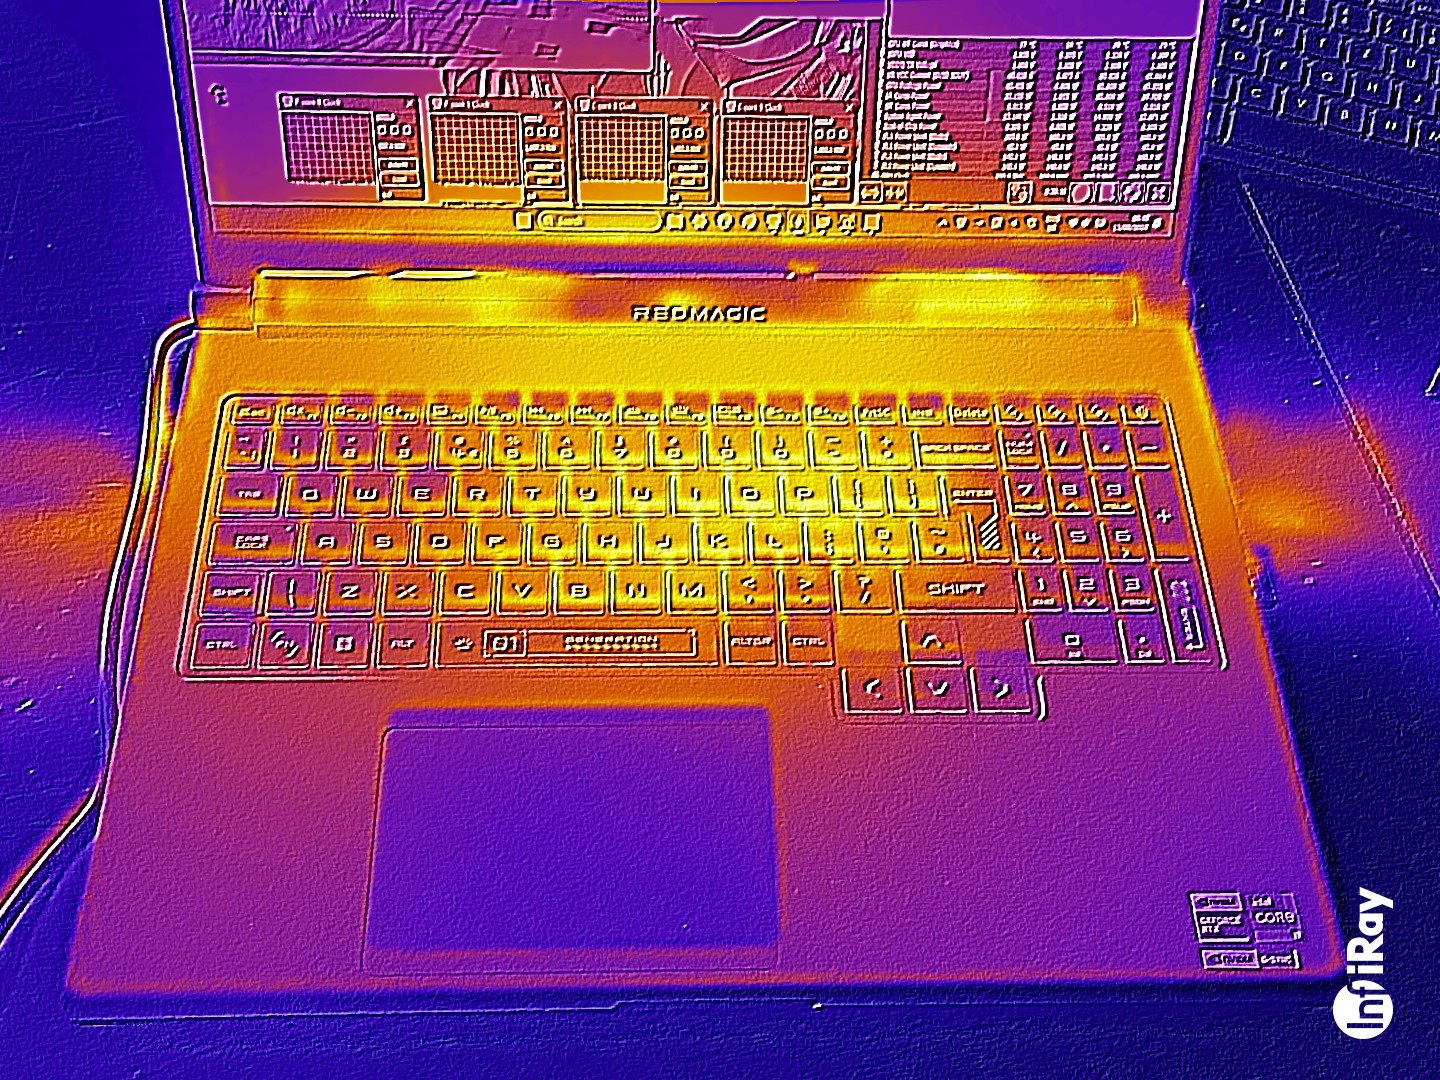
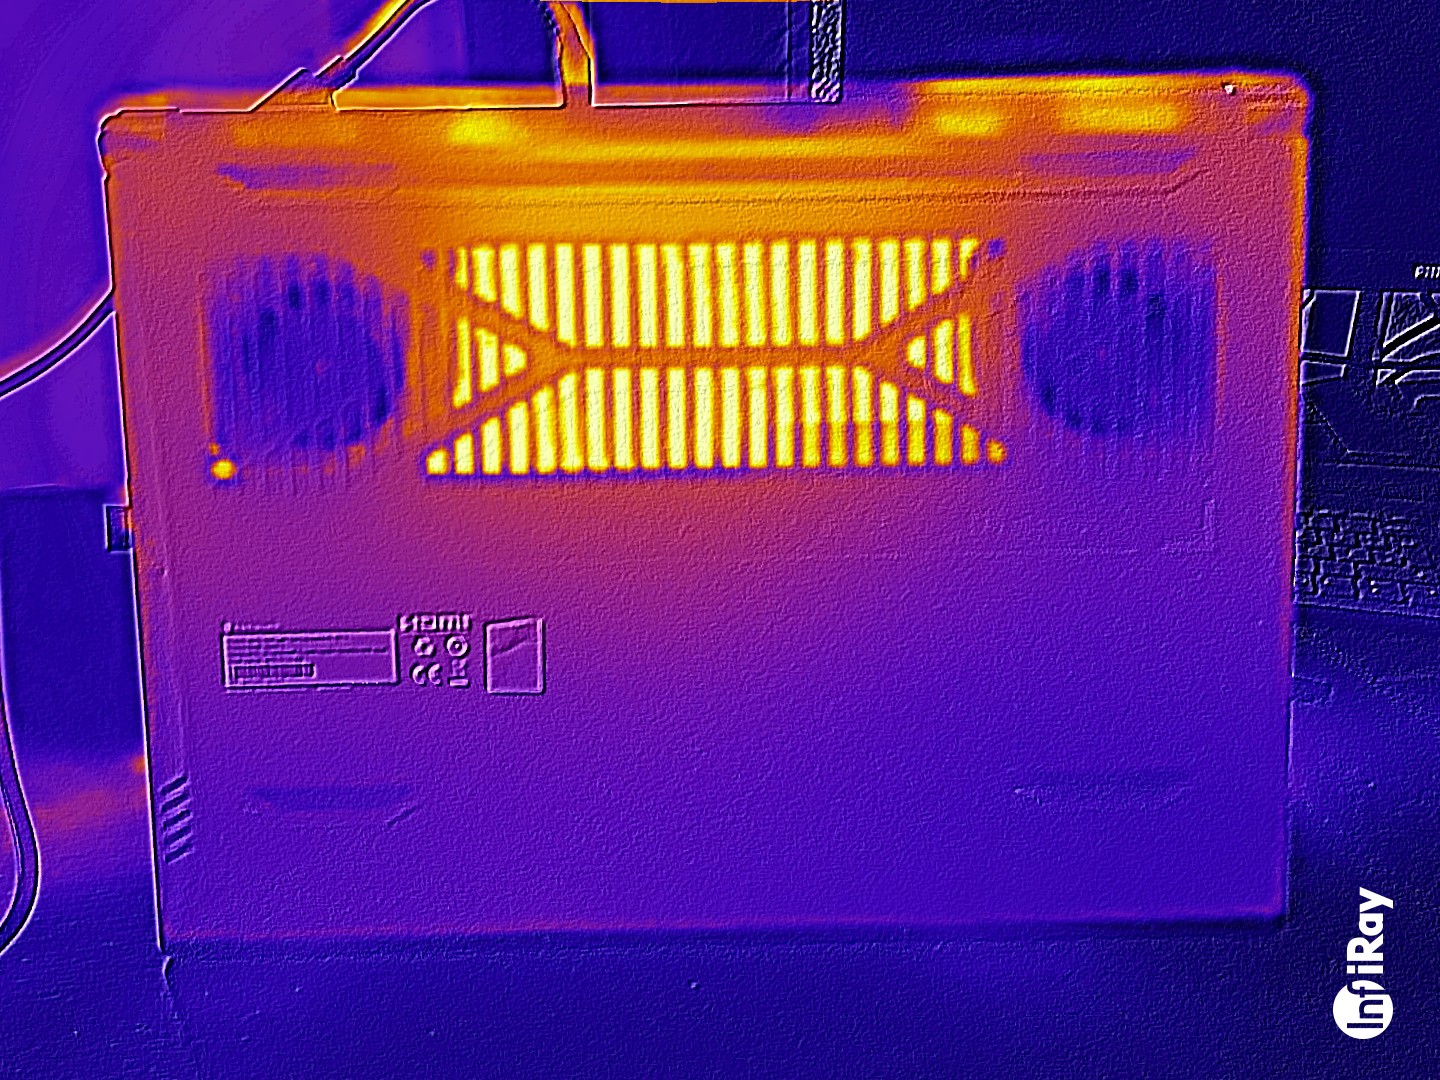
L'ordinateur portable chauffe considérablement sous charge : Cyberpunk 2077 et le test de stress ont provoqué des températures supérieures à 50 degrés Celsius à certains moments. Les températures du repose-paume étaient parfois presque trop élevées. Nous avons également noté des valeurs supérieures à la moyenne en mode veille.
(-) La température maximale du côté supérieur est de 50 °C / 122 F, par rapport à la moyenne de 40.4 °C / 105 F, allant de 21.2 à 68.8 °C pour la classe Gaming.
(-) Le fond chauffe jusqu'à un maximum de 58 °C / 136 F, contre une moyenne de 43.2 °C / 110 F
(+) En utilisation inactive, la température moyenne du côté supérieur est de 30.4 °C / 87 F, par rapport à la moyenne du dispositif de 33.9 °C / 93 F.
(-) 3: The average temperature for the upper side is 45.1 °C / 113 F, compared to the average of 33.9 °C / 93 F for the class Gaming.
(-) Les repose-poignets et le pavé tactile peuvent devenir très chauds au toucher, avec un maximum de 40 °C / 104# F.
(-) La température moyenne de la zone de l'appui-paume de dispositifs similaires était de 28.9 °C / 84 F (-11.1 °C / #-20 F).
| Nubia RedMagic Titan 16 Pro Intel Core i9-14900HX, NVIDIA GeForce RTX 4060 Laptop GPU | Lenovo Legion Pro 5 16IRX9 G9 Intel Core i7-14700HX, NVIDIA GeForce RTX 4060 Laptop GPU | HP Victus 16 (2024) Intel Core i7-14700HX, NVIDIA GeForce RTX 4060 Laptop GPU | Acer Predator Helios Neo 16 (2024) Intel Core i7-14700HX, NVIDIA GeForce RTX 4070 Laptop GPU | SCHENKER XMG Pro 16 Studio (Mid 24) Intel Core i9-14900HX, NVIDIA GeForce RTX 4070 Laptop GPU | Gigabyte G6X 9KG (2024) Intel Core i7-13650HX, NVIDIA GeForce RTX 4060 Laptop GPU | |
|---|---|---|---|---|---|---|
| Heat | -9% | 13% | -3% | -13% | 6% | |
| Maximum Upper Side * | 50 | 50 -0% | 50 -0% | 58 -16% | 51 -2% | 41 18% |
| Maximum Bottom * | 58 | 57 2% | 50 14% | 45.2 22% | 66 -14% | 43 26% |
| Idle Upper Side * | 31 | 36 -16% | 25 19% | 31.1 -0% | 35 -13% | 32 -3% |
| Idle Bottom * | 32 | 39 -22% | 26 19% | 37.2 -16% | 39 -22% | 37 -16% |
* ... Moindre est la valeur, meilleures sont les performances
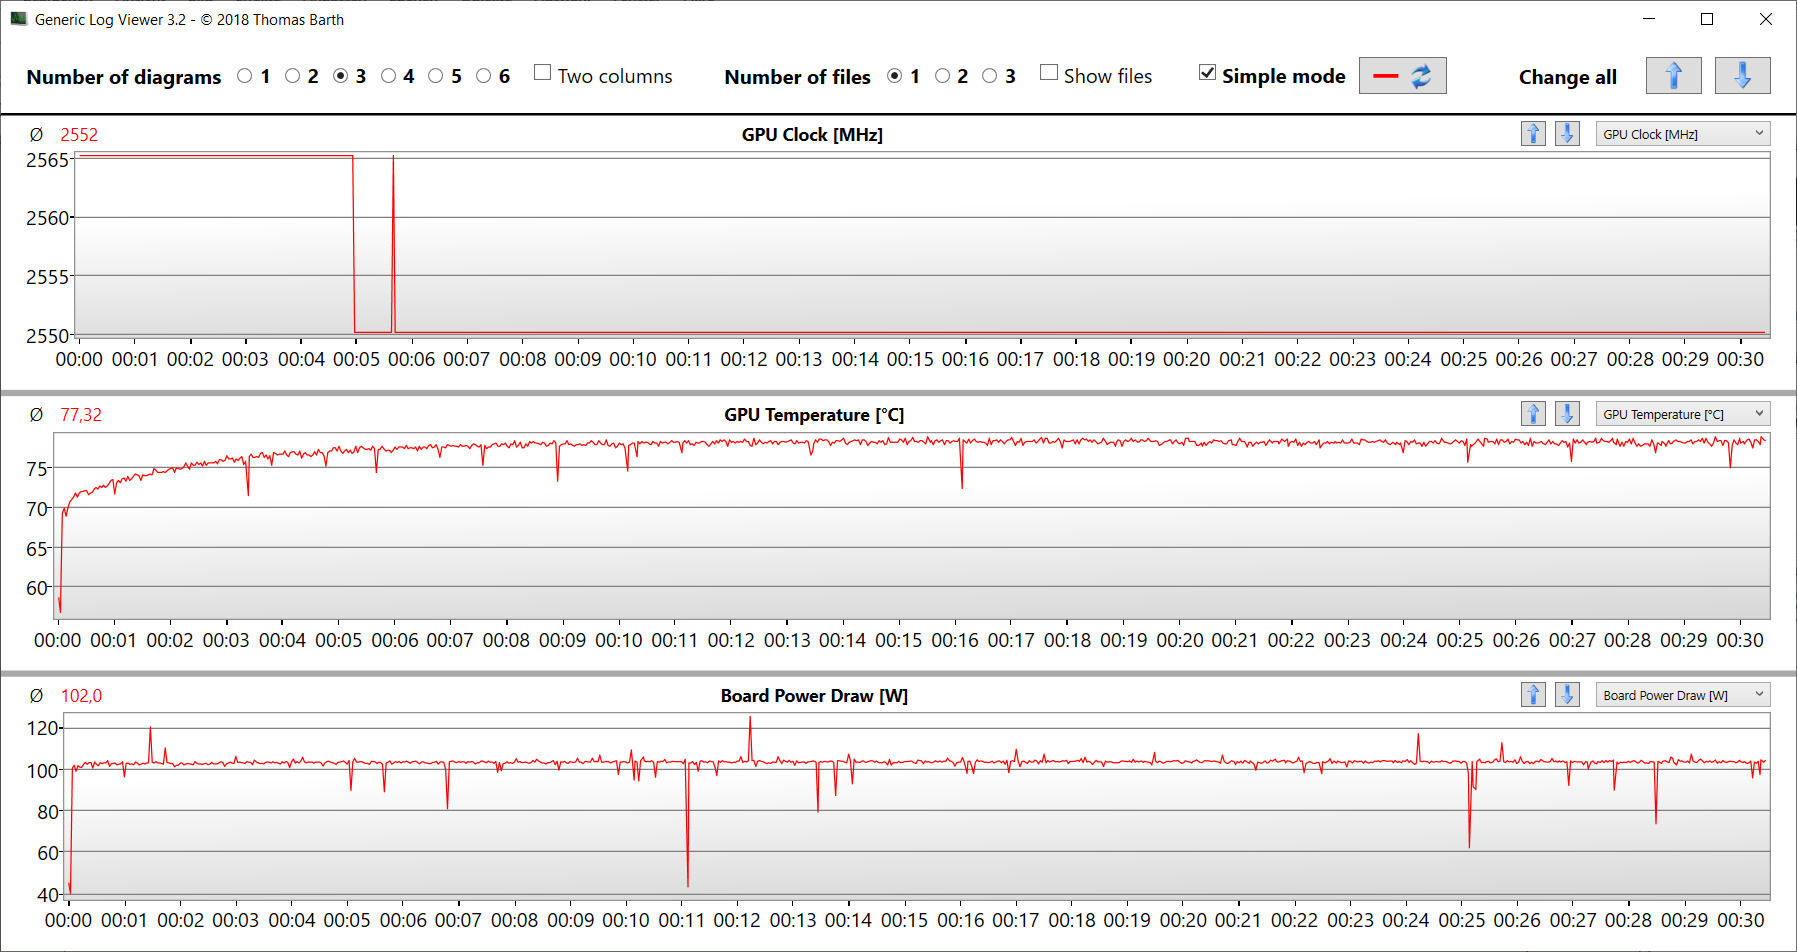
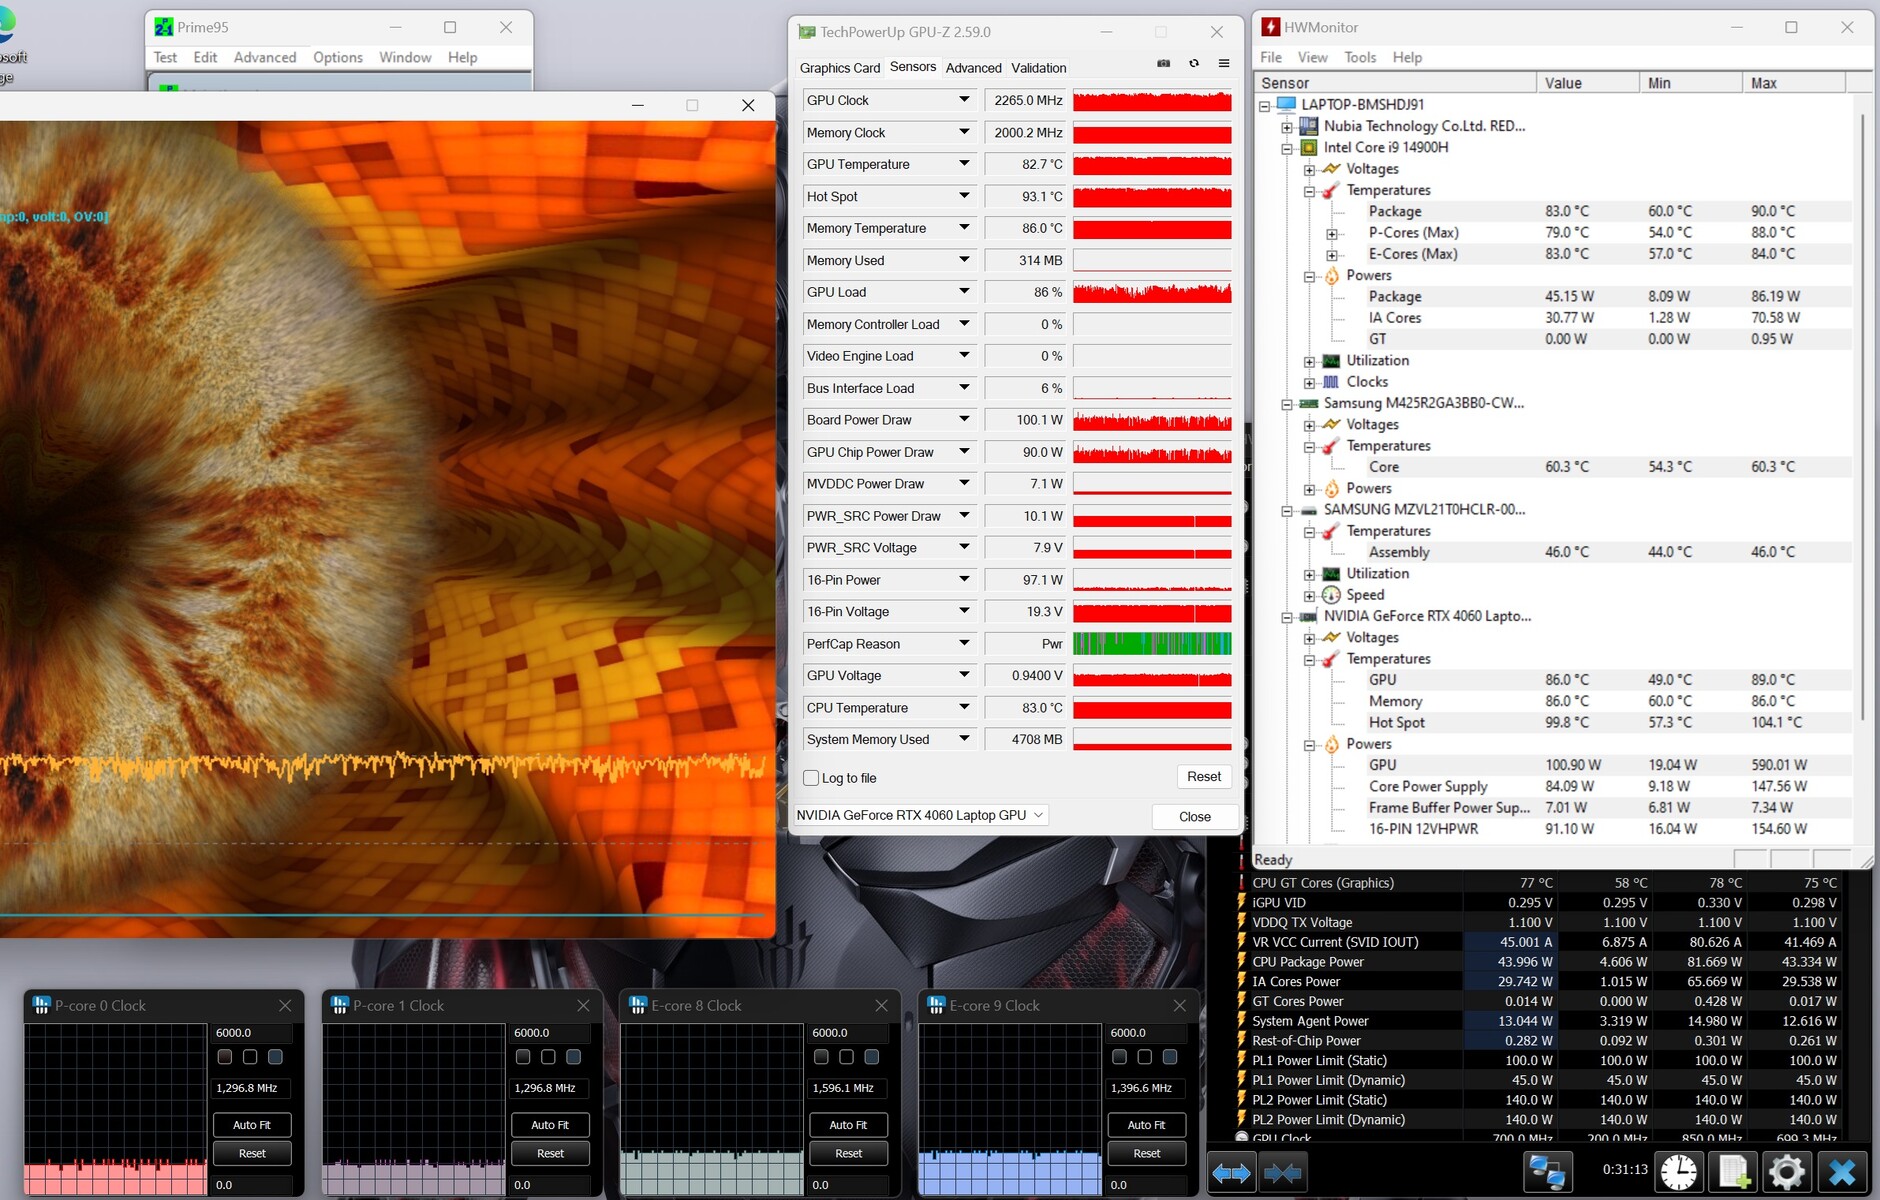
Épreuve d'effort
Le scénario du test de stress extrême (Prime95 et Furmark en fonctionnement continu) a permis de vérifier la stabilité du système à pleine charge. Le CPU a fonctionné à des fréquences d'horloge élevées au début du test, puis a été ramené à des valeurs inférieures à 2 GHz. Le GPU a fonctionné à pleine puissance.
Intervenants
Les haut-parleurs stéréo produisent un son assez correct dans l'ensemble. Les basses pourraient être un peu plus prononcées.
Nubia RedMagic Titan 16 Pro analyse audio
(+) | les haut-parleurs peuvent jouer relativement fort (84# dB)
Basses 100 - 315 Hz
(±) | basse réduite - en moyenne 14.3% inférieure à la médiane
(±) | la linéarité des basses est moyenne (11.3% delta à la fréquence précédente)
Médiums 400 - 2000 Hz
(+) | médiane équilibrée - seulement 1.8% de la médiane
(+) | les médiums sont linéaires (4.9% delta à la fréquence précédente)
Aiguës 2 - 16 kHz
(+) | des sommets équilibrés - à seulement 2.7% de la médiane
(+) | les aigus sont linéaires (5.4% delta à la fréquence précédente)
Globalement 100 - 16 000 Hz
(+) | le son global est linéaire (11.5% différence à la médiane)
Par rapport à la même classe
» 9% de tous les appareils testés de cette catégorie étaient meilleurs, 3% similaires, 88% pires
» Le meilleur avait un delta de 6%, la moyenne était de 18%, le pire était de 132%.
Par rapport à tous les appareils testés
» 6% de tous les appareils testés étaient meilleurs, 2% similaires, 92% pires
» Le meilleur avait un delta de 4%, la moyenne était de 24%, le pire était de 134%.
Lenovo Legion Pro 5 16IRX9 G9 analyse audio
(±) | le niveau sonore du haut-parleur est moyen mais bon (77.13# dB)
Basses 100 - 315 Hz
(-) | presque aucune basse - en moyenne 18.3% plus bas que la médiane
(±) | la linéarité des basses est moyenne (12% delta à la fréquence précédente)
Médiums 400 - 2000 Hz
(±) | médiane supérieure - en moyenne 6.9% supérieure à la médiane
(+) | les médiums sont linéaires (4.9% delta à la fréquence précédente)
Aiguës 2 - 16 kHz
(+) | des sommets équilibrés - à seulement 4.5% de la médiane
(±) | la linéarité des aigus est moyenne (9.5% delta à la fréquence précédente)
Globalement 100 - 16 000 Hz
(±) | la linéarité du son global est moyenne (21.6% de différence avec la médiane)
Par rapport à la même classe
» 76% de tous les appareils testés de cette catégorie étaient meilleurs, 5% similaires, 19% pires
» Le meilleur avait un delta de 6%, la moyenne était de 18%, le pire était de 132%.
Par rapport à tous les appareils testés
» 58% de tous les appareils testés étaient meilleurs, 7% similaires, 34% pires
» Le meilleur avait un delta de 4%, la moyenne était de 24%, le pire était de 134%.
Gestion de l'énergie - La Titan 16 offre une autonomie médiocre
Consommation électrique
Sa consommation d'énergie est normale pour le matériel installé. Cyberpunk 2077 et le test de stress ont été exécutés avec une consommation d'énergie constante. Le bloc d'alimentation (280 watts) est de taille suffisante.
| Éteint/en veille | |
| Au repos | |
| Fortement sollicité |
|
Légende:
min: | |
| Nubia RedMagic Titan 16 Pro i9-14900HX, NVIDIA GeForce RTX 4060 Laptop GPU | Lenovo Legion Pro 5 16IRX9 G9 i7-14700HX, NVIDIA GeForce RTX 4060 Laptop GPU | HP Victus 16 (2024) i7-14700HX, NVIDIA GeForce RTX 4060 Laptop GPU | Acer Predator Helios Neo 16 (2024) i7-14700HX, NVIDIA GeForce RTX 4070 Laptop GPU | SCHENKER XMG Pro 16 Studio (Mid 24) i9-14900HX, NVIDIA GeForce RTX 4070 Laptop GPU | Gigabyte G6X 9KG (2024) i7-13650HX, NVIDIA GeForce RTX 4060 Laptop GPU | Moyenne NVIDIA GeForce RTX 4060 Laptop GPU | Moyenne de la classe Gaming | |
|---|---|---|---|---|---|---|---|---|
| Power Consumption | -4% | 16% | -23% | -35% | 17% | 21% | 7% | |
| Idle Minimum * | 16 | 13.7 14% | 9 44% | 26.7 -67% | 31 -94% | 12 25% | 11.5 ? 28% | 13.4 ? 16% |
| Idle Average * | 19 | 17.7 7% | 15 21% | 24.4 -28% | 33 -74% | 13 32% | 16 ? 16% | 18.9 ? 1% |
| Idle Maximum * | 27 | 18.5 31% | 23 15% | 32.7 -21% | 41 -52% | 27 -0% | 20.3 ? 25% | 26.3 ? 3% |
| Load Average * | 123 | 124 -1% | 123 -0% | 122.1 1% | 114 7% | 105 15% | 92.9 ? 24% | 102.7 ? 17% |
| Cyberpunk 2077 ultra external monitor * | 174.2 | 224 -29% | 196.8 -13% | |||||
| Cyberpunk 2077 ultra * | 184.3 | 229 -24% | 218 -18% | |||||
| Load Maximum * | 240 | 297 -24% | 241 -0% | 241 -0% | 250 -4% | 210 12% | 210 ? 12% | 244 ? -2% |
| Witcher 3 ultra * | 143.7 | 190.6 | 167.8 |
* ... Moindre est la valeur, meilleures sont les performances
Power consumption Cyberpunk / stress test
Power consumption with external monitor
Délais d'exécution
L'appareil de 16 pouces a atteint des durées de fonctionnement de 4:40 h lors du test WiFi (accès à des sites web à l'aide d'un script) et de 5:16 h lors du test vidéo (court métrage Big Buck Bunny (encodage H.264, FHD) en boucle) - ce qui n'est pas une très bonne valeur. Certains de ses concurrents ont une autonomie nettement supérieure.
| Nubia RedMagic Titan 16 Pro i9-14900HX, NVIDIA GeForce RTX 4060 Laptop GPU, 80.1 Wh | Lenovo Legion Pro 5 16IRX9 G9 i7-14700HX, NVIDIA GeForce RTX 4060 Laptop GPU, 80 Wh | HP Victus 16 (2024) i7-14700HX, NVIDIA GeForce RTX 4060 Laptop GPU, 83 Wh | Acer Predator Helios Neo 16 (2024) i7-14700HX, NVIDIA GeForce RTX 4070 Laptop GPU, 90.61 Wh | SCHENKER XMG Pro 16 Studio (Mid 24) i9-14900HX, NVIDIA GeForce RTX 4070 Laptop GPU, 73 Wh | Gigabyte G6X 9KG (2024) i7-13650HX, NVIDIA GeForce RTX 4060 Laptop GPU, 73 Wh | Moyenne de la classe Gaming | |
|---|---|---|---|---|---|---|---|
| Autonomie de la batterie | 16% | 83% | -16% | 20% | 69% | 28% | |
| Reader / Idle | 481 | 356 -26% | 585 ? 22% | ||||
| H.264 | 316 | 312 -1% | 242 -23% | 447 ? 41% | |||
| WiFi v1.3 | 280 | 308 10% | 511 83% | 227 -19% | 337 20% | 474 69% | 387 ? 38% |
| Load | 76 | 105 38% | 79 4% | 84.5 ? 11% |
Points positifs
Points négatifs
Verdict - Des améliorations sont possibles
A Core i9-14900HX et une GeForce RTX 4060 garantissent des jeux en QHD avec des paramètres élevés à maximaux. Le matériel installé n'est pas utilisé à son plein potentiel, car la RAM fonctionne en mode monocanal. Il est recommandé d'installer un second module de mémoire.
Le premier produit de Nubia fait ce pour quoi il a été conçu : Faire apparaître les jeux sur l'écran en toute fluidité. Mais la concurrence n'a pas vraiment de raison d'être effrayée.
Ses valeurs d'émission sont extrêmement décevantes : L'ordinateur portable produit (trop) de bruit sur toute la plage de charge, et il chauffe beaucoup. L'écran IPS (16 pouces, 2 560 x 1 600 pixels, 240 Hz, G-Sync, DCI-P3), lumineux, aux couleurs fidèles et au format 16:10, nous a en revanche laissé une bonne impression.
L'autonomie de la batterie de l'ordinateur portable n'étonnera personne. On attendrait (un peu) plus d'un ordinateur portable de jeu avec une batterie de 80 Wh. Au moins, son port USB-C installé (Thunderbolt 4) prend en charge Power Delivery (et le mode DP Alt). Cela signifie que vous n'avez pas nécessairement toujours besoin de transporter l'encombrant bloc d'alimentation propriétaire avec vous.
Un fait que vous devriez prendre en compte avant d'acheter l'appareil : Contrairement à des fabricants bien établis comme Acer, Lenovo ou HP, Nubia n'est pas vraiment présent dans le monde entier. Il n'est donc pas possible d'évaluer la situation en matière de fourniture de pièces détachées, d'assistance et de réparations.
Son prix de 1 699 dollars ne plaide certainement pas en faveur de l'ordinateur portable : Par exemple, une configuration presque identique du Acer Predator Helios Neo 16 (à l'exception de la mémoire vive qui est de 32 Go au lieu de 16 Go) ne coûte actuellement que 1 350 dollars. Une autre alternative pourrait être le XMG Pro 16 Studio (Mid 24). Le prix d'une version comparable de cet appareil est d'environ 2 000 dollars (avec Windows 11) ou 1 950 dollars (sans Windows comme système d'exploitation).
Prix et disponibilité
Le Nubia RedMagic Titan 16 Pro est disponible à partir du 29/08/2024 et peut être acheté au prix de 1 699 dollars via la boutique RedMagic.
Veuillez noter que nous avons récemment mis à jour notre système d'évaluation et que les résultats de la version 8 ne sont pas comparables à ceux de la version 7. Vous trouverez de plus amples informations à l'adresse suivante http://www.notebookcheck.net/Our-new-rating-system-v8-explained-Lower-but-more-realistic-scores-together-with-sustainability-assessment.853123.0.html.
Nubia RedMagic Titan 16 Pro
- 08/21/2024 v8
Sascha Mölck
 Total Sustainability Score:
 Transparency
La sélection des appareils à examiner est effectuée par notre équipe éditoriale. L'échantillon de test a été prêté à l'auteur par le fabricant ou le détaillant pour les besoins de cet examen. Le prêteur n'a pas eu d'influence sur cette évaluation et le fabricant n'a pas reçu de copie de cette évaluation avant sa publication. Il n'y avait aucune obligation de publier cet article. Nous n'acceptons jamais de compensation ou de paiement en échange de nos commentaires. En tant que média indépendant, Notebookcheck n'est pas soumis à l'autorité des fabricants, des détaillants ou des éditeurs.
Voici comment Notebookcheck teste
Chaque année, Notebookcheck examine de manière indépendante des centaines d'ordinateurs portables et de smartphones en utilisant des procédures standardisées afin de garantir que tous les résultats sont comparables. Nous avons continuellement développé nos méthodes de test depuis environ 20 ans et avons établi des normes industrielles dans le processus. Dans nos laboratoires de test, des équipements de mesure de haute qualité sont utilisés par des techniciens et des rédacteurs expérimentés. Ces tests impliquent un processus de validation en plusieurs étapes. Notre système d'évaluation complexe repose sur des centaines de mesures et de points de référence bien fondés, ce qui garantit l'objectivité.Price comparison

