

Test du XMG Pro 16 Studio (mi-2024) : Core i9 et RTX 4070 pour joueurs et créatifs
Le plaisir du créateur ?
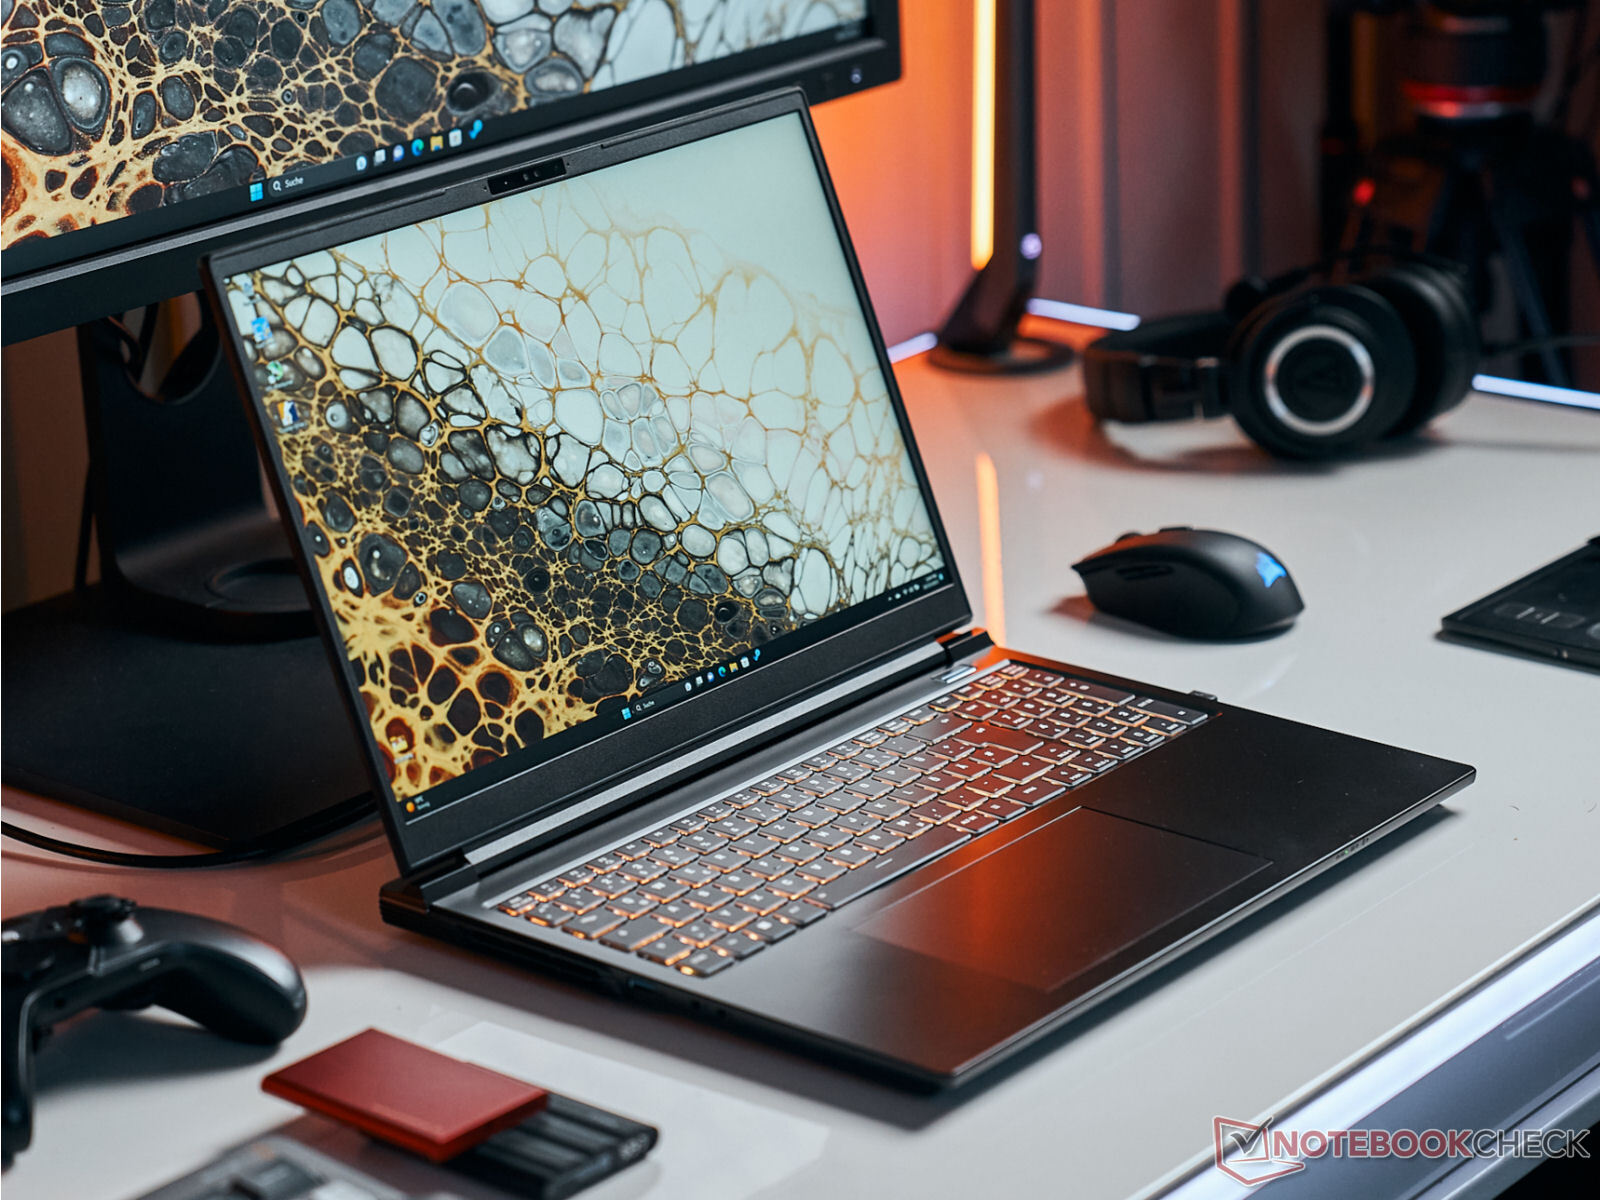
Les créateurs de contenu et les joueurs constituent le marché cible du XMG Pro 16 Studio : Schenker a élaboré une offre comprenant un processeur Core i9, une RTX 4070, un port Thunderbolt 4 et un écran 16:10 (QHD+, 240Hz, sRGB). Un bon refroidissement est censé être assuré par l'utilisation d'une chambre à vapeur.Sascha Mölck, 👁 Florian Glaser (traduit par DeepL / Ninh Duy) Publié 🇺🇸 🇩🇪 ...
Le XMG Pro 16 Studio (Mid 24) est destiné aux joueurs et aux créateurs. Le matériel correspondant est à bord : Un Core i9-14900HX, GeForce RTX 4070 ainsi qu'un écran calibré (X-Rite) de 16 pouces avec un rapport d'aspect de 16:10. Un barebone (PE60SNE-S) du fabricant Clevo sert de base. Il s'agit du successeur du XMG Pro 16 (mi 23) qui, visuellement, a la même apparence. Parmi les concurrents, on trouve le Lenovo Legion Pro 5 16IRX9, Acer Predator Helios Neo 16 (2024), Lenovo Legion 7 16 G9 et l'Aorus 16X (2024) Aorus 16X (2024).
Comparaison avec les concurrents potentiels
Note | Version | Date | Modèle | Poids | Épaisseur | Taille | Résolution | Prix |
|---|---|---|---|---|---|---|---|---|
| 81.2 % | v8 | 07/24 | SCHENKER XMG Pro 16 Studio (Mid 24) i9-14900HX, NVIDIA GeForce RTX 4070 Laptop GPU | 2.3 kg | 19.9 mm | 16.00" | 2560x1600 | |
| 86.8 % v7 (old) | v7 (old) | 05/24 | Acer Predator Helios Neo 16 (2024) i7-14700HX, NVIDIA GeForce RTX 4070 Laptop GPU | 2.6 kg | 25.95 mm | 16.00" | 2560x1600 | |
| 89.3 % v7 (old) | v7 (old) | 04/24 | Lenovo Legion Pro 5 16IRX9 i9-14900HX, NVIDIA GeForce RTX 4070 Laptop GPU | 2.5 kg | 26.95 mm | 16.00" | 2560x1600 | |
| 87.4 % v7 (old) | v7 (old) | 04/24 | Aorus 16X 2024 i9-14900HX, NVIDIA GeForce RTX 4070 Laptop GPU | 2.3 kg | 20 mm | 16.00" | 2560x1600 | |
| 90.8 % v7 (old) | v7 (old) | 04/24 | Lenovo Legion 7 16 IRX G9 i9-14900HX, NVIDIA GeForce RTX 4070 Laptop GPU | 2.3 kg | 19.8 mm | 16.00" | 3200x2000 |
Veuillez noter que nous avons récemment mis à jour notre système d'évaluation et que les résultats de la version 8 ne sont pas comparables à ceux de la version 7. Vous trouverez de plus amples informations ici.
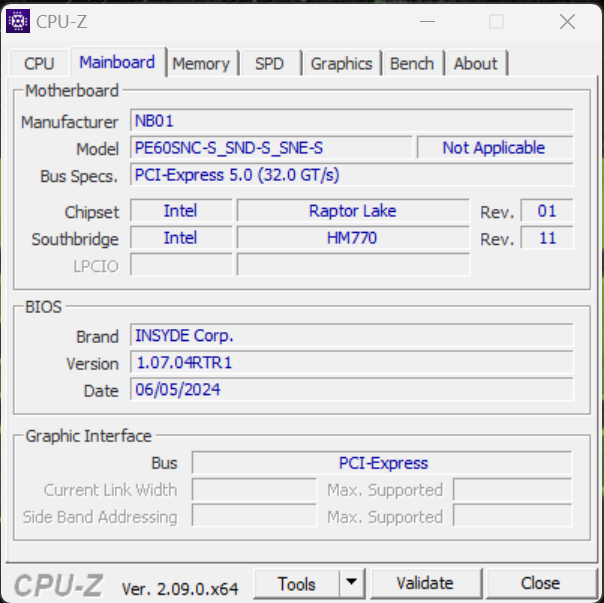
Boîtier et connectivité - Schenker utilise un barebone de Clevo
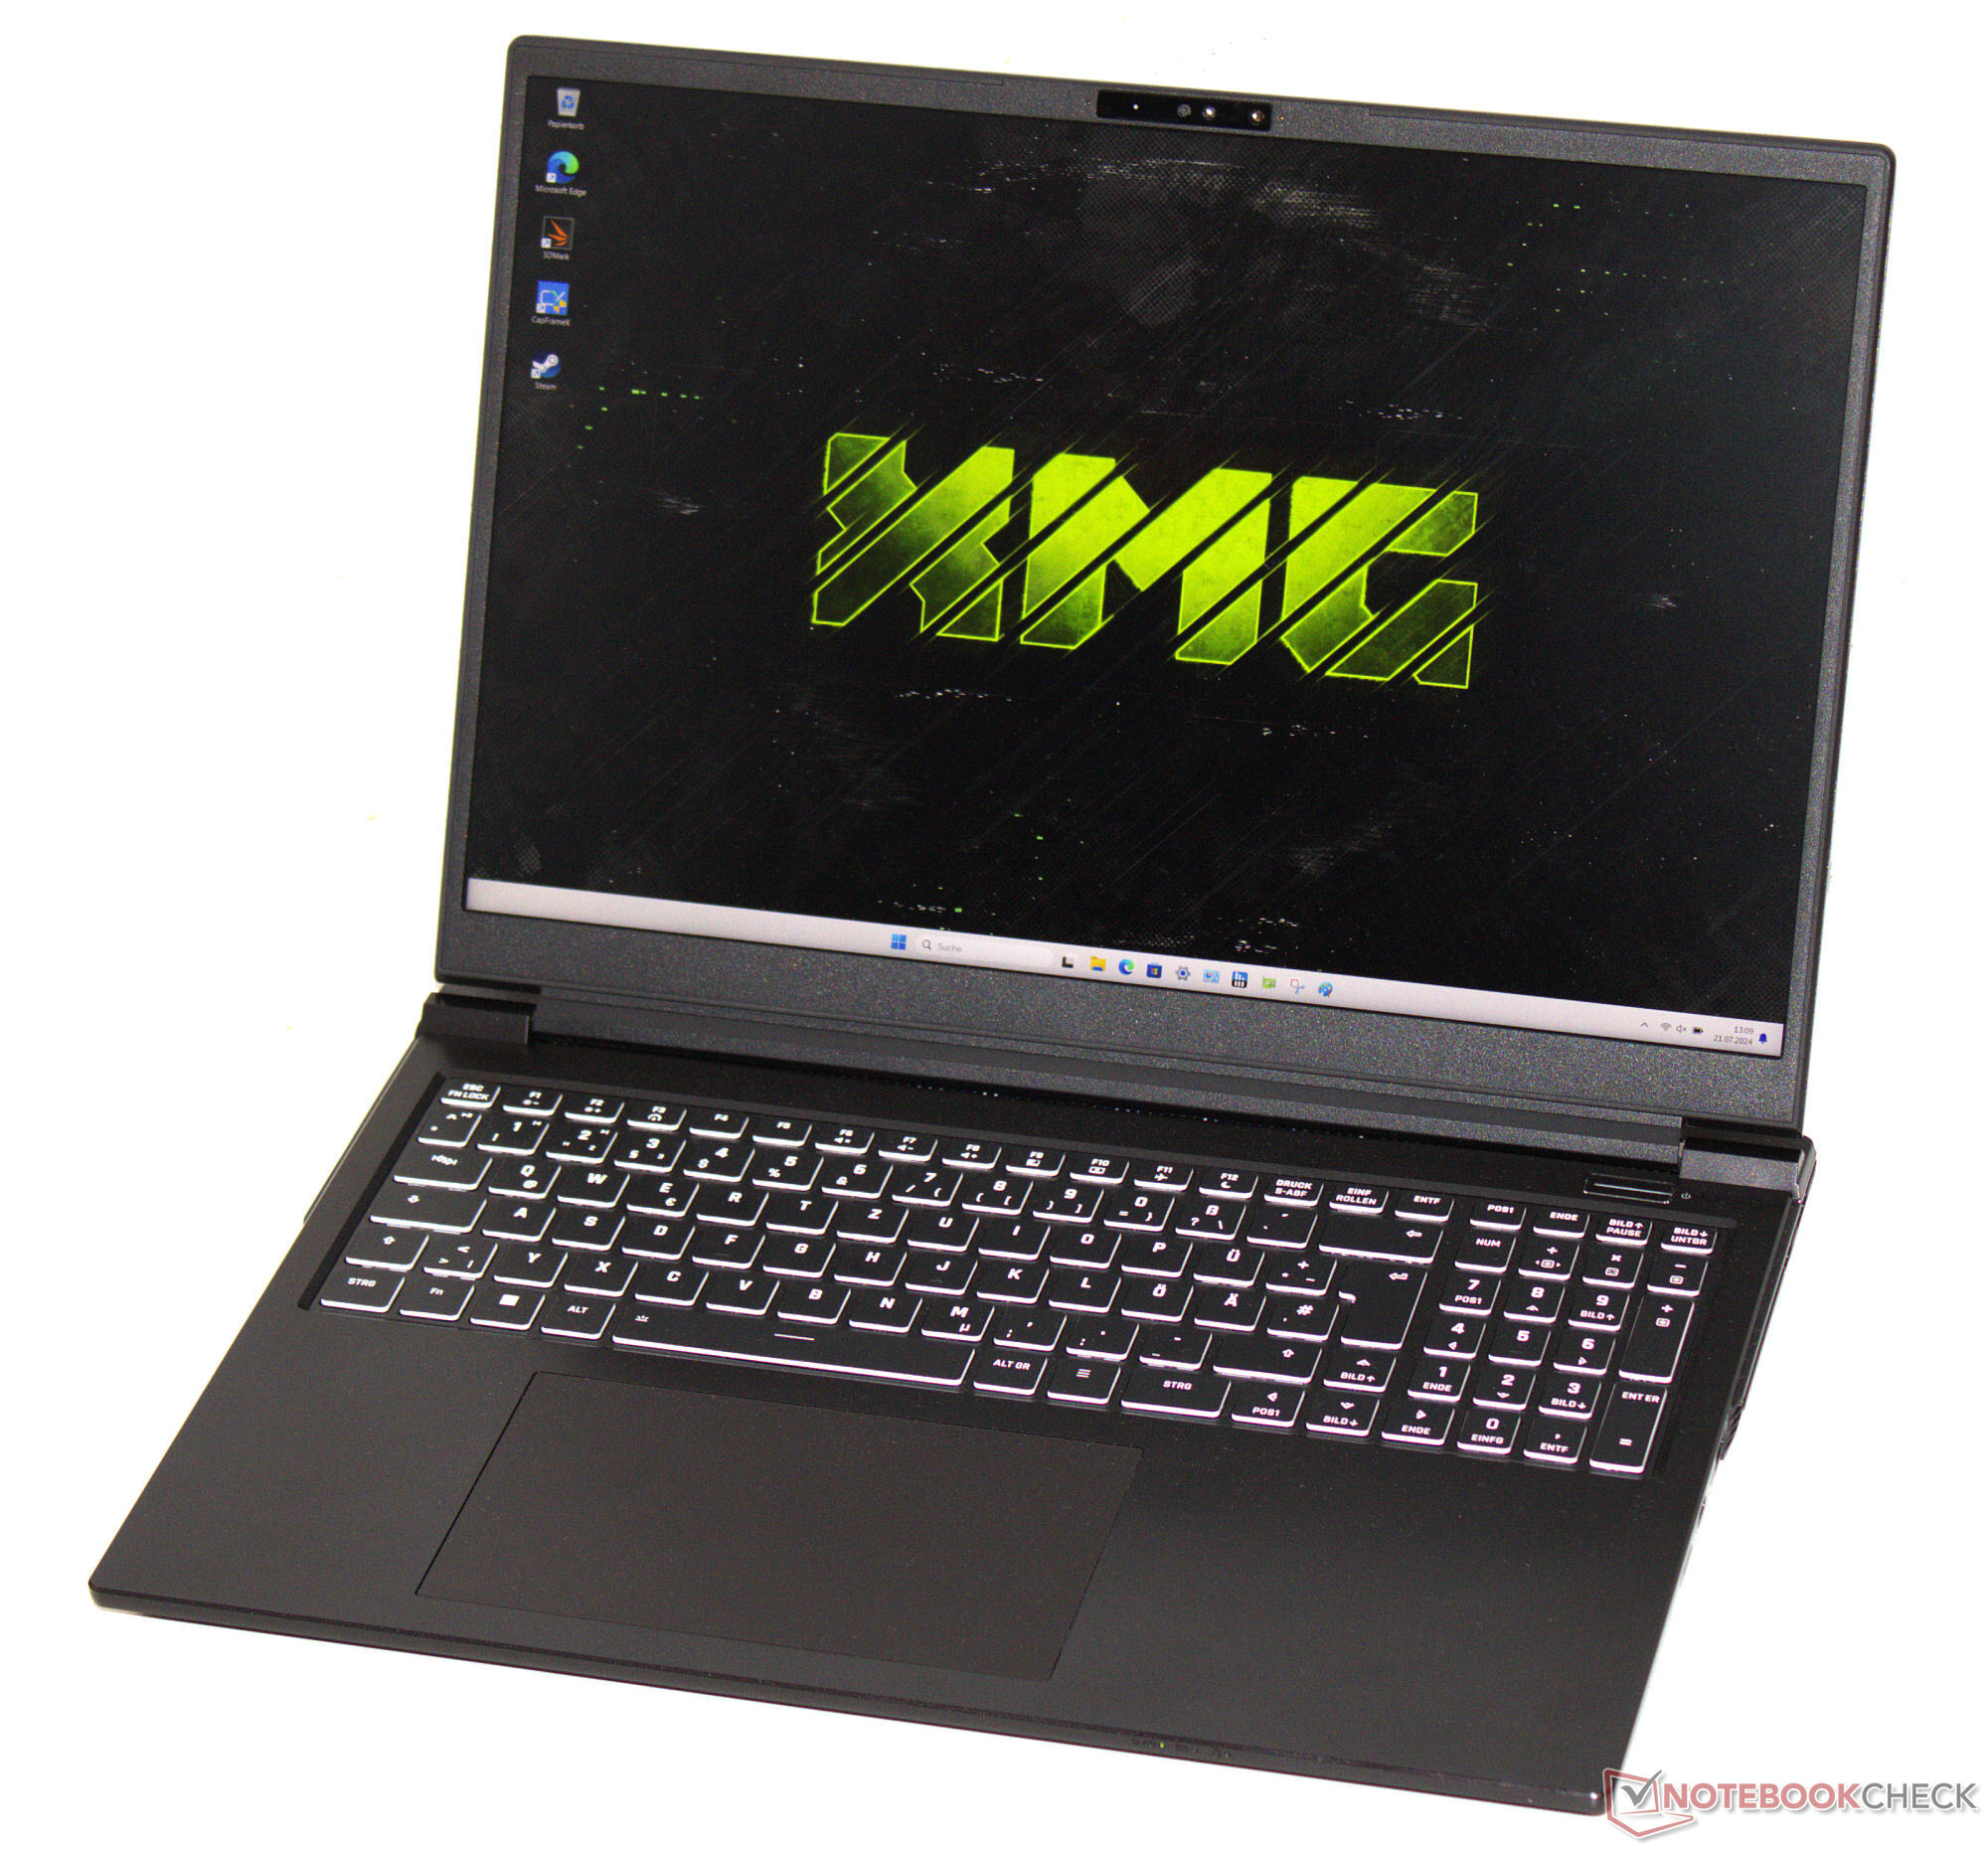
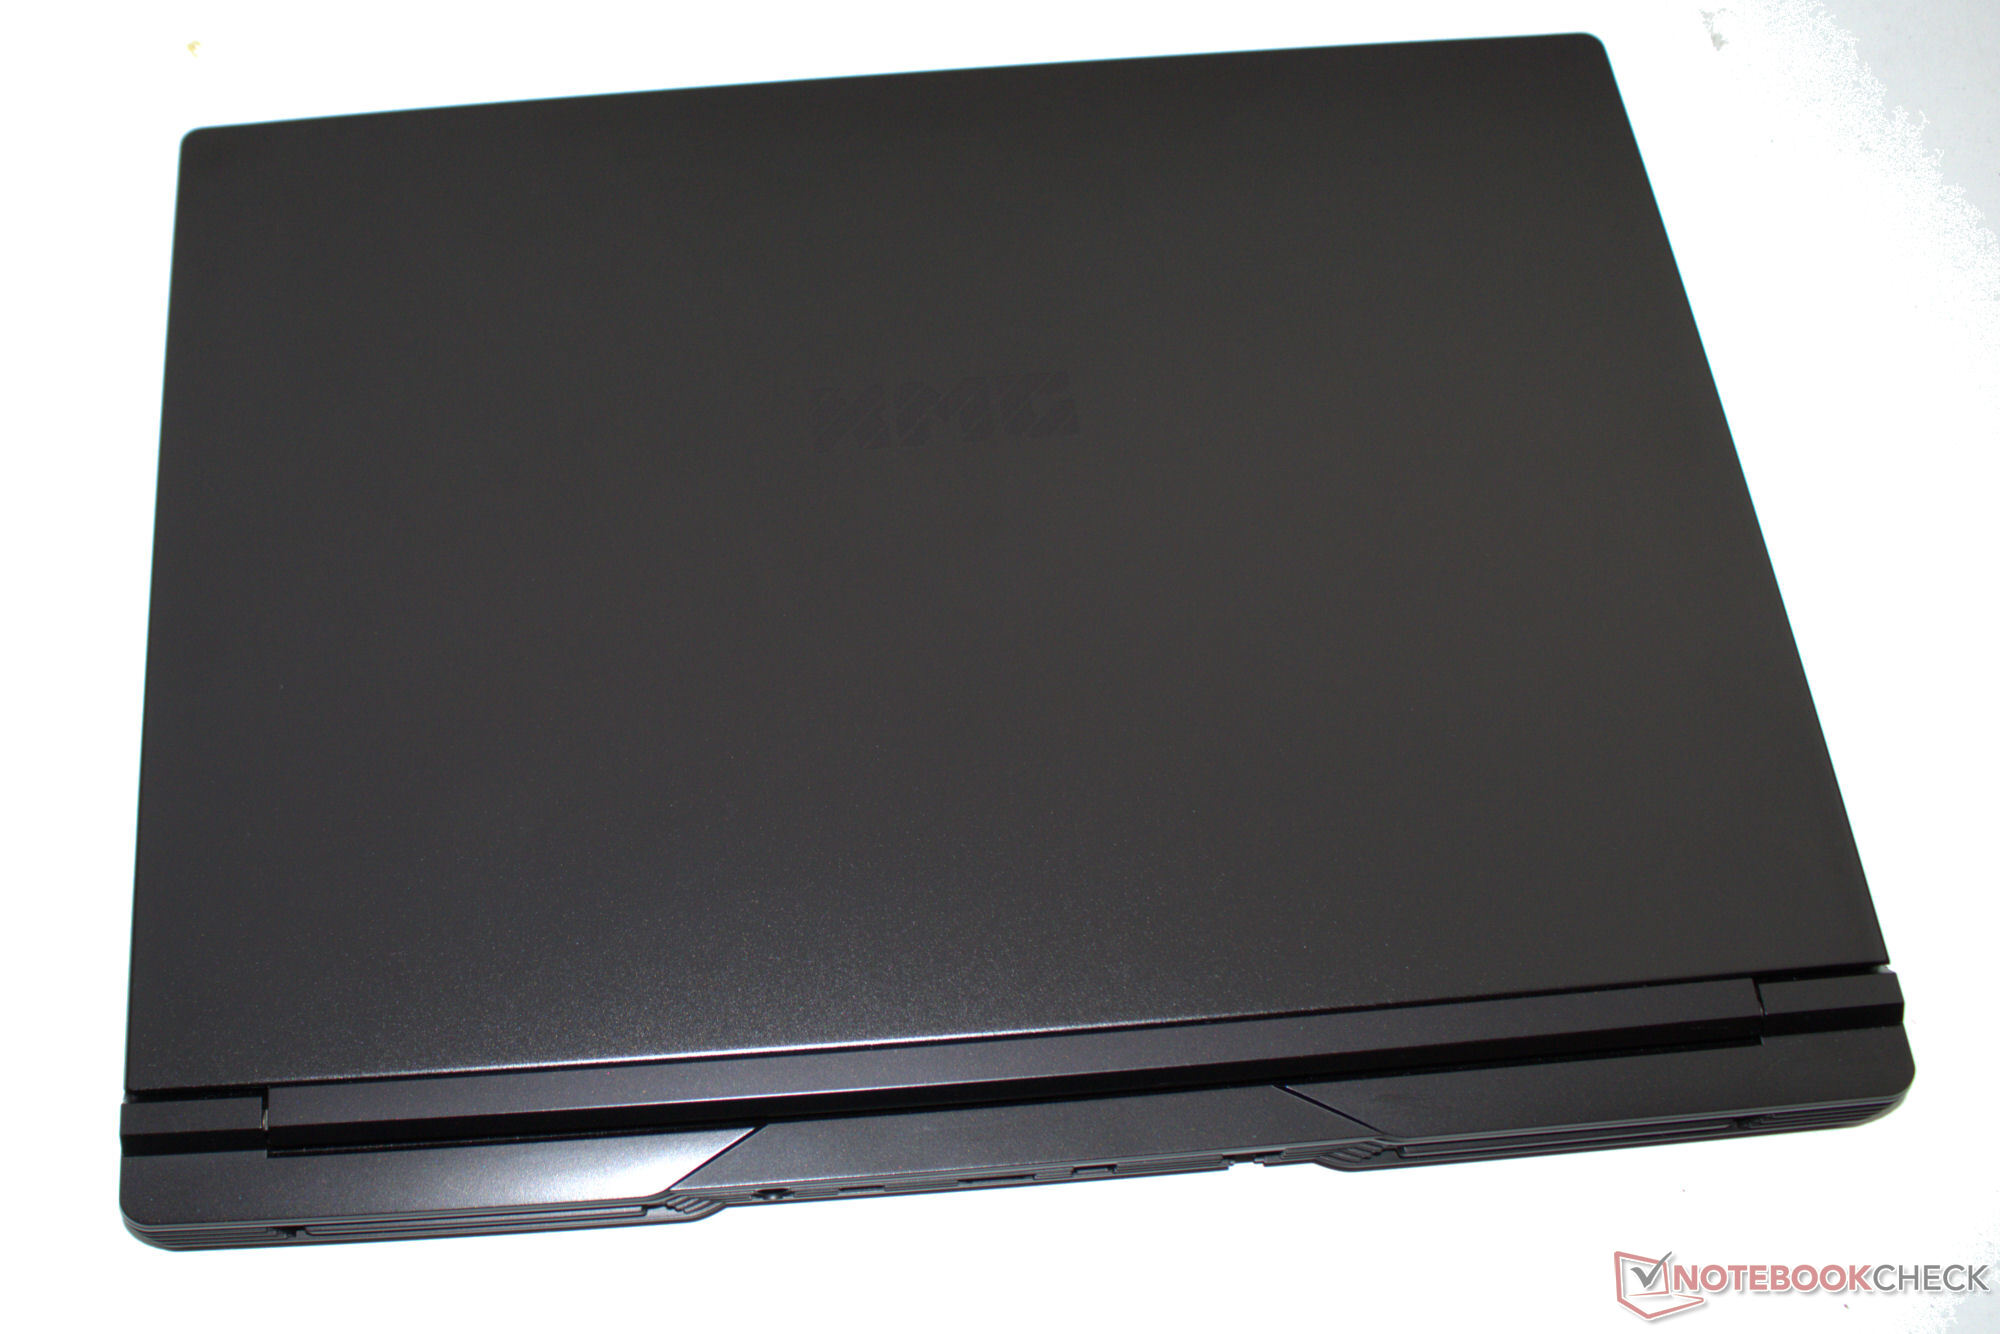
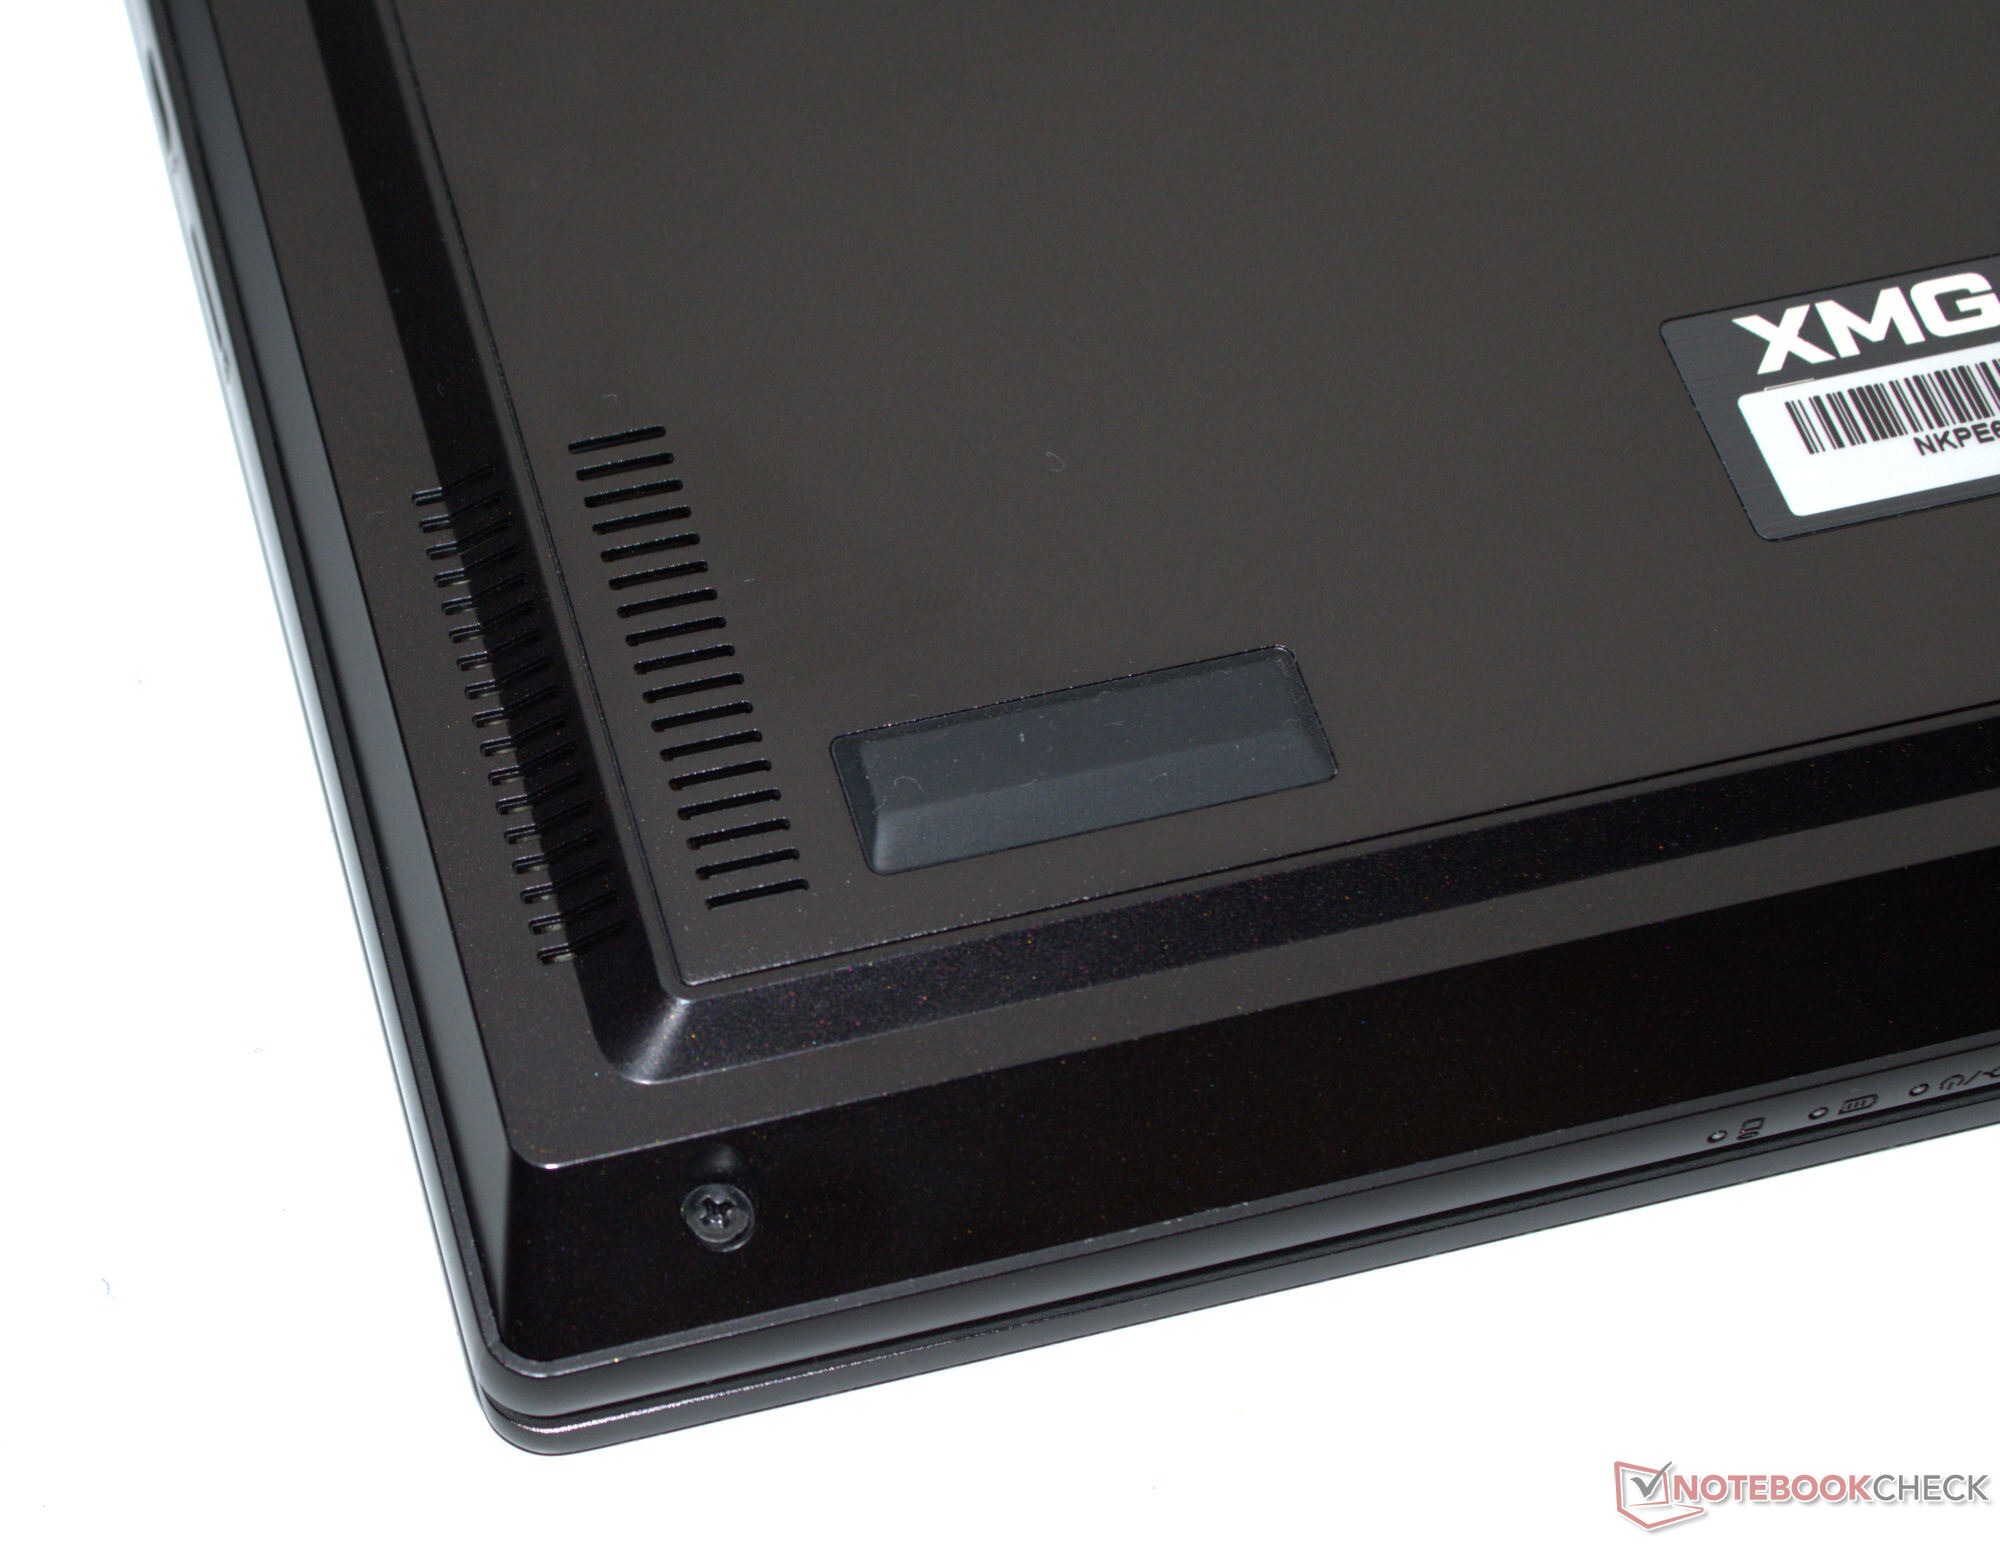
De l'extérieur, rien n'a changé : le dernier Pro 16 utilise le même boîtier en aluminium noir mat que le modèle de l'année dernière le modèle de l'année dernièresi l'on s'en tient à son boîtier extérieur. L'unité de base et le couvercle peuvent être légèrement tordus, mais leur qualité de fabrication est bonne. Vous chercherez en vain des bandes LED sur un boîtier d'apparence aussi sérieuse. L'angle d'ouverture maximal du couvercle est de 130 degrés.
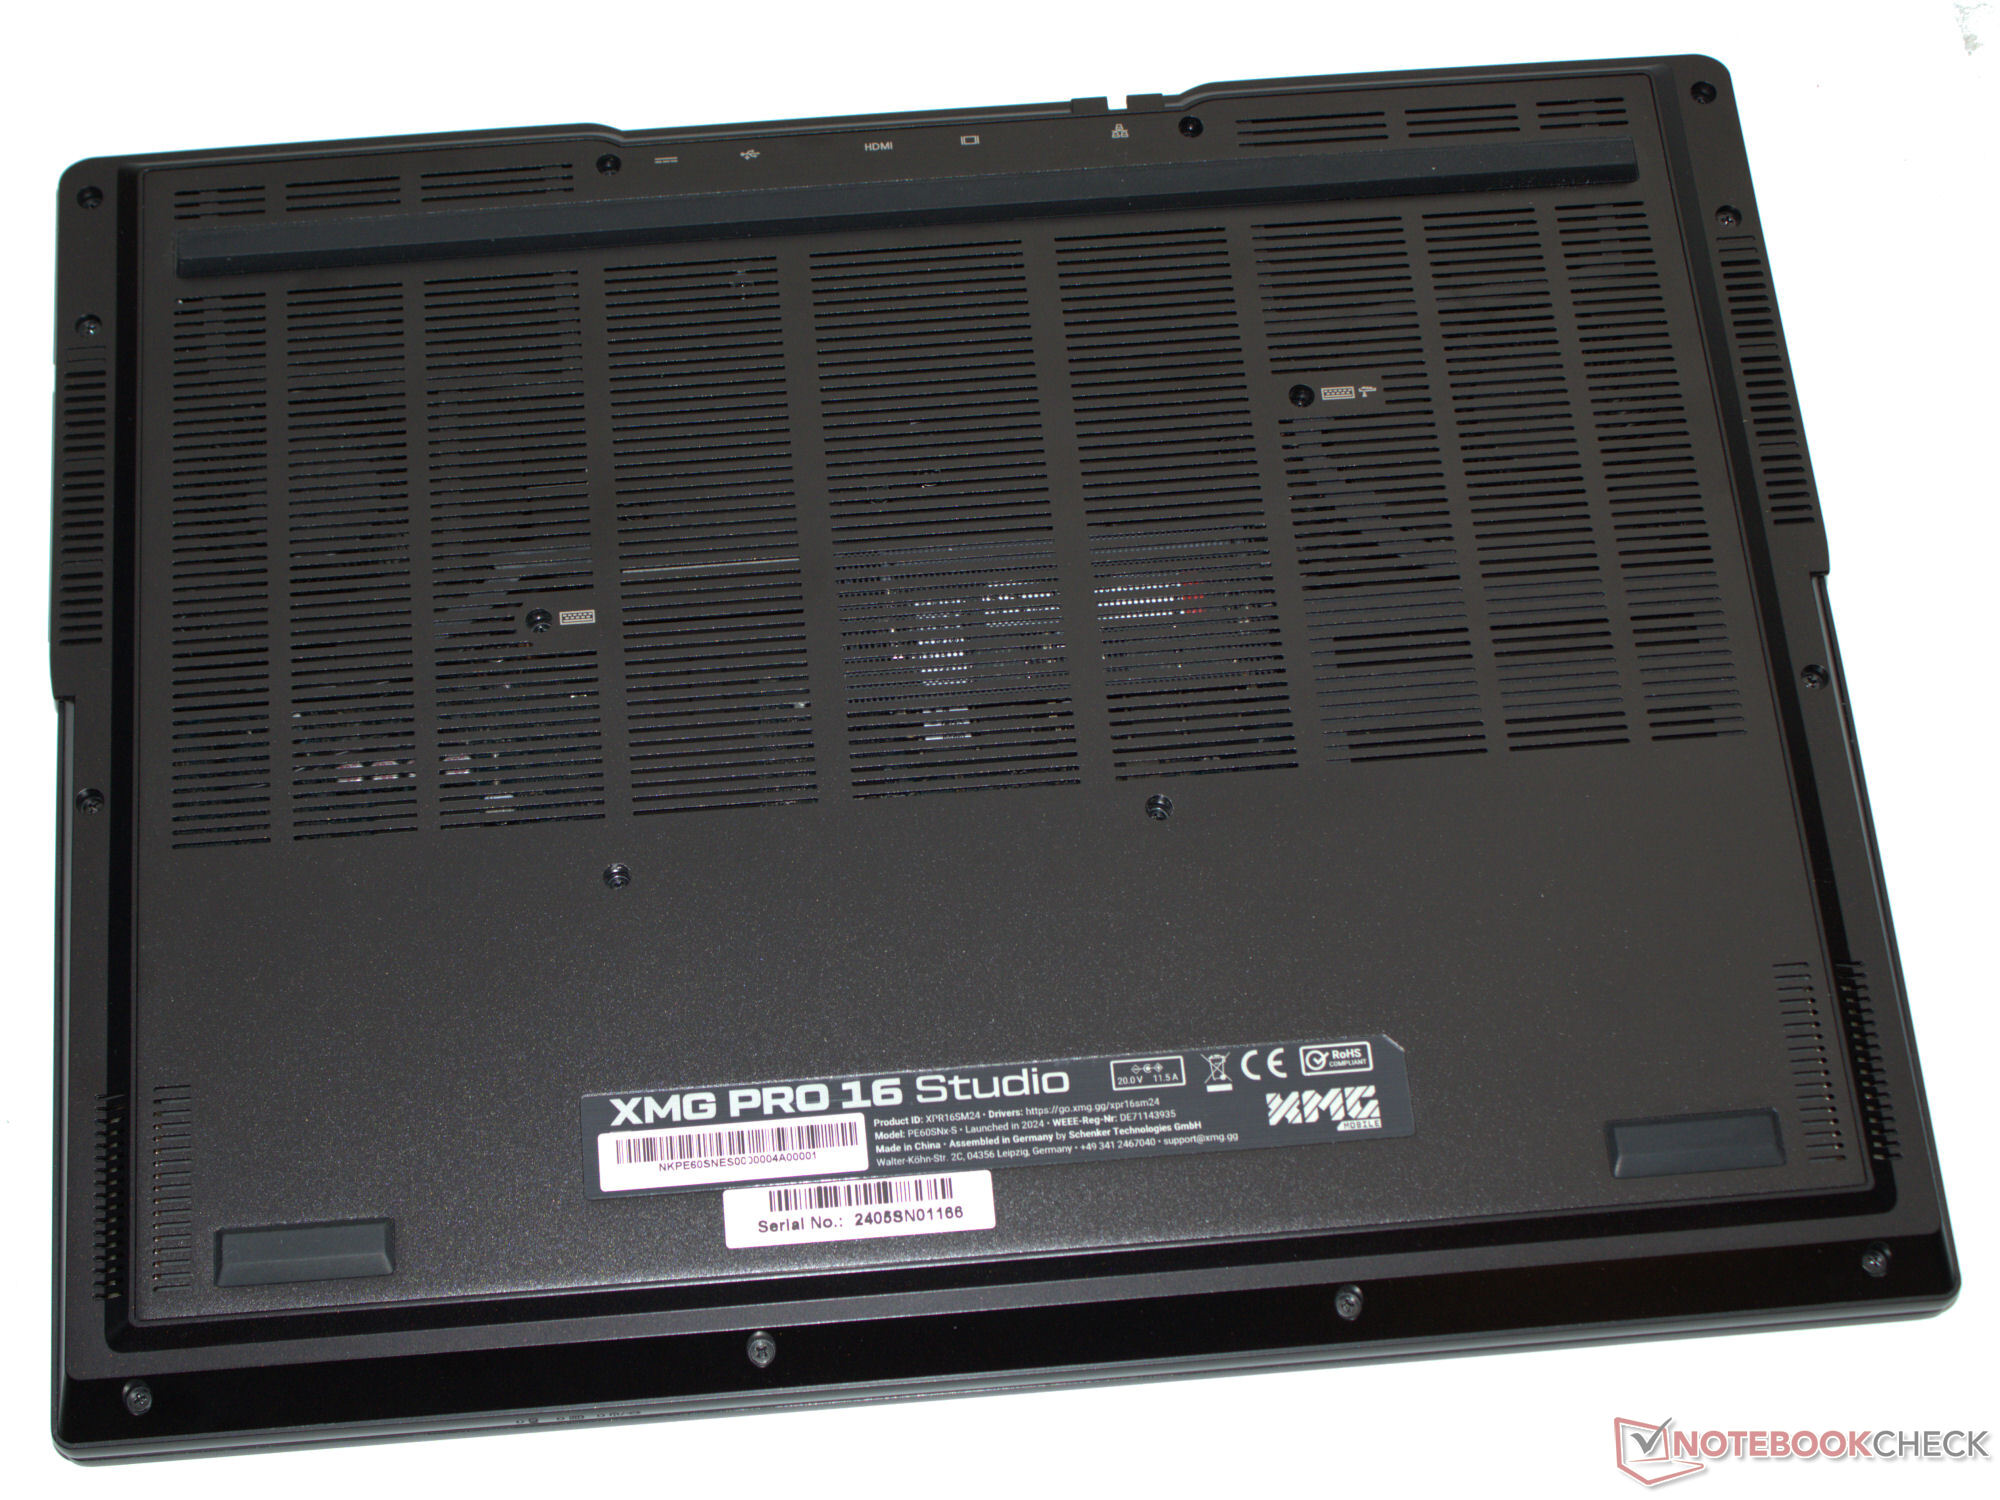
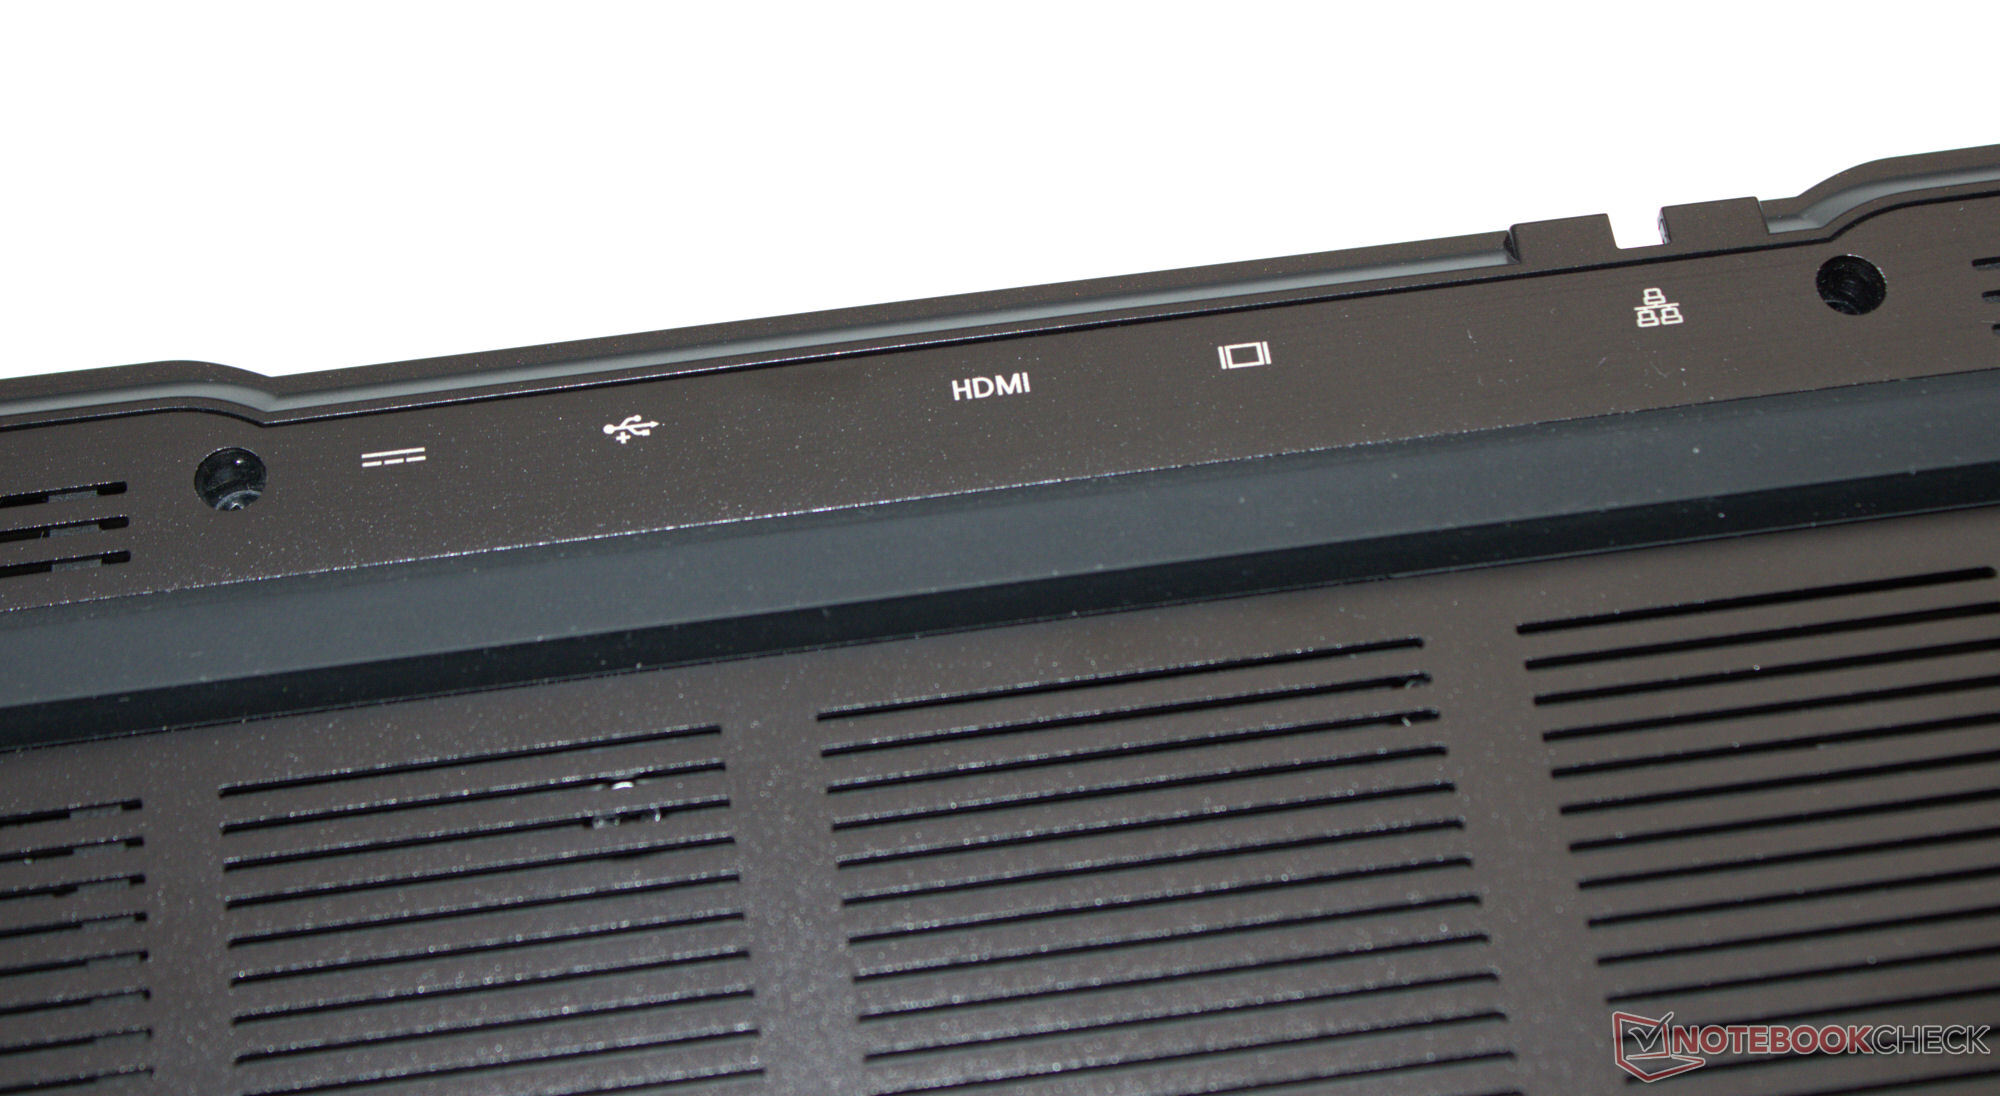
Deux ports USB-A (USB 3.2 Gen 1), deux ports USB-C (1x USB 3.2 Gen 2, 1x TB 4/USB 4) ainsi que trois sorties vidéo devraient suffire à la plupart des utilisateurs - dans le pire des cas, vous devrez peut-être vous tourner vers une station d'accueil. Power Delivery est pris en charge grâce au port TB4. Le port Gigabit Ethernet permet des débits de données allant jusqu'à 2,5 Gbit/s.
Dans des conditions optimales (pas d'appareils WiFi à proximité, courte distance entre l'ordinateur portable et le PC serveur), la puce WiFi-6E d'Intel (AX211) produit des débits de données bons à très bons. La webcam FHD (2,1 MP, sans cache) ne prend pas de photos surprenantes. Le lecteur de carte MicroSD (carte de référence : AV PRO microSD 128 GB V60) est d'une vitesse moyenne.


| SD Card Reader | |
| average JPG Copy Test (av. of 3 runs) | |
| Aorus 16X 2024 (AV PRO microSD 128 GB V60) | |
| Moyenne de la classe Gaming (19 - 197.3, n=68, 2 dernières années) | |
| SCHENKER XMG Pro 16 Studio (Mid 23) (AV PRO microSD 128 GB V60) | |
| SCHENKER XMG Pro 16 Studio (Mid 24) (AV PRO microSD 128 GB V60) | |
| Lenovo Legion 7 16 IRX G9 (Angelbird AV Pro V60) | |
| Acer Predator Helios Neo 16 (2024) (AV PRO microSD 128 GB V60) | |
| maximum AS SSD Seq Read Test (1GB) | |
| Aorus 16X 2024 (AV PRO microSD 128 GB V60) | |
| Moyenne de la classe Gaming (25.8 - 263, n=67, 2 dernières années) | |
| SCHENKER XMG Pro 16 Studio (Mid 23) (AV PRO microSD 128 GB V60) | |
| Lenovo Legion 7 16 IRX G9 (Angelbird AV Pro V60) | |
| SCHENKER XMG Pro 16 Studio (Mid 24) (AV PRO microSD 128 GB V60) | |
| Acer Predator Helios Neo 16 (2024) (AV PRO microSD 128 GB V60) | |

 NVIDIA GeForce RTX 4070 Laptop GPU, i9-14900HX, Samsung 990 Pro 1 TB")
 NVIDIA GeForce RTX 4070 Laptop GPU, i9-14900HX, Samsung 990 Pro 1 TB")
Durabilité
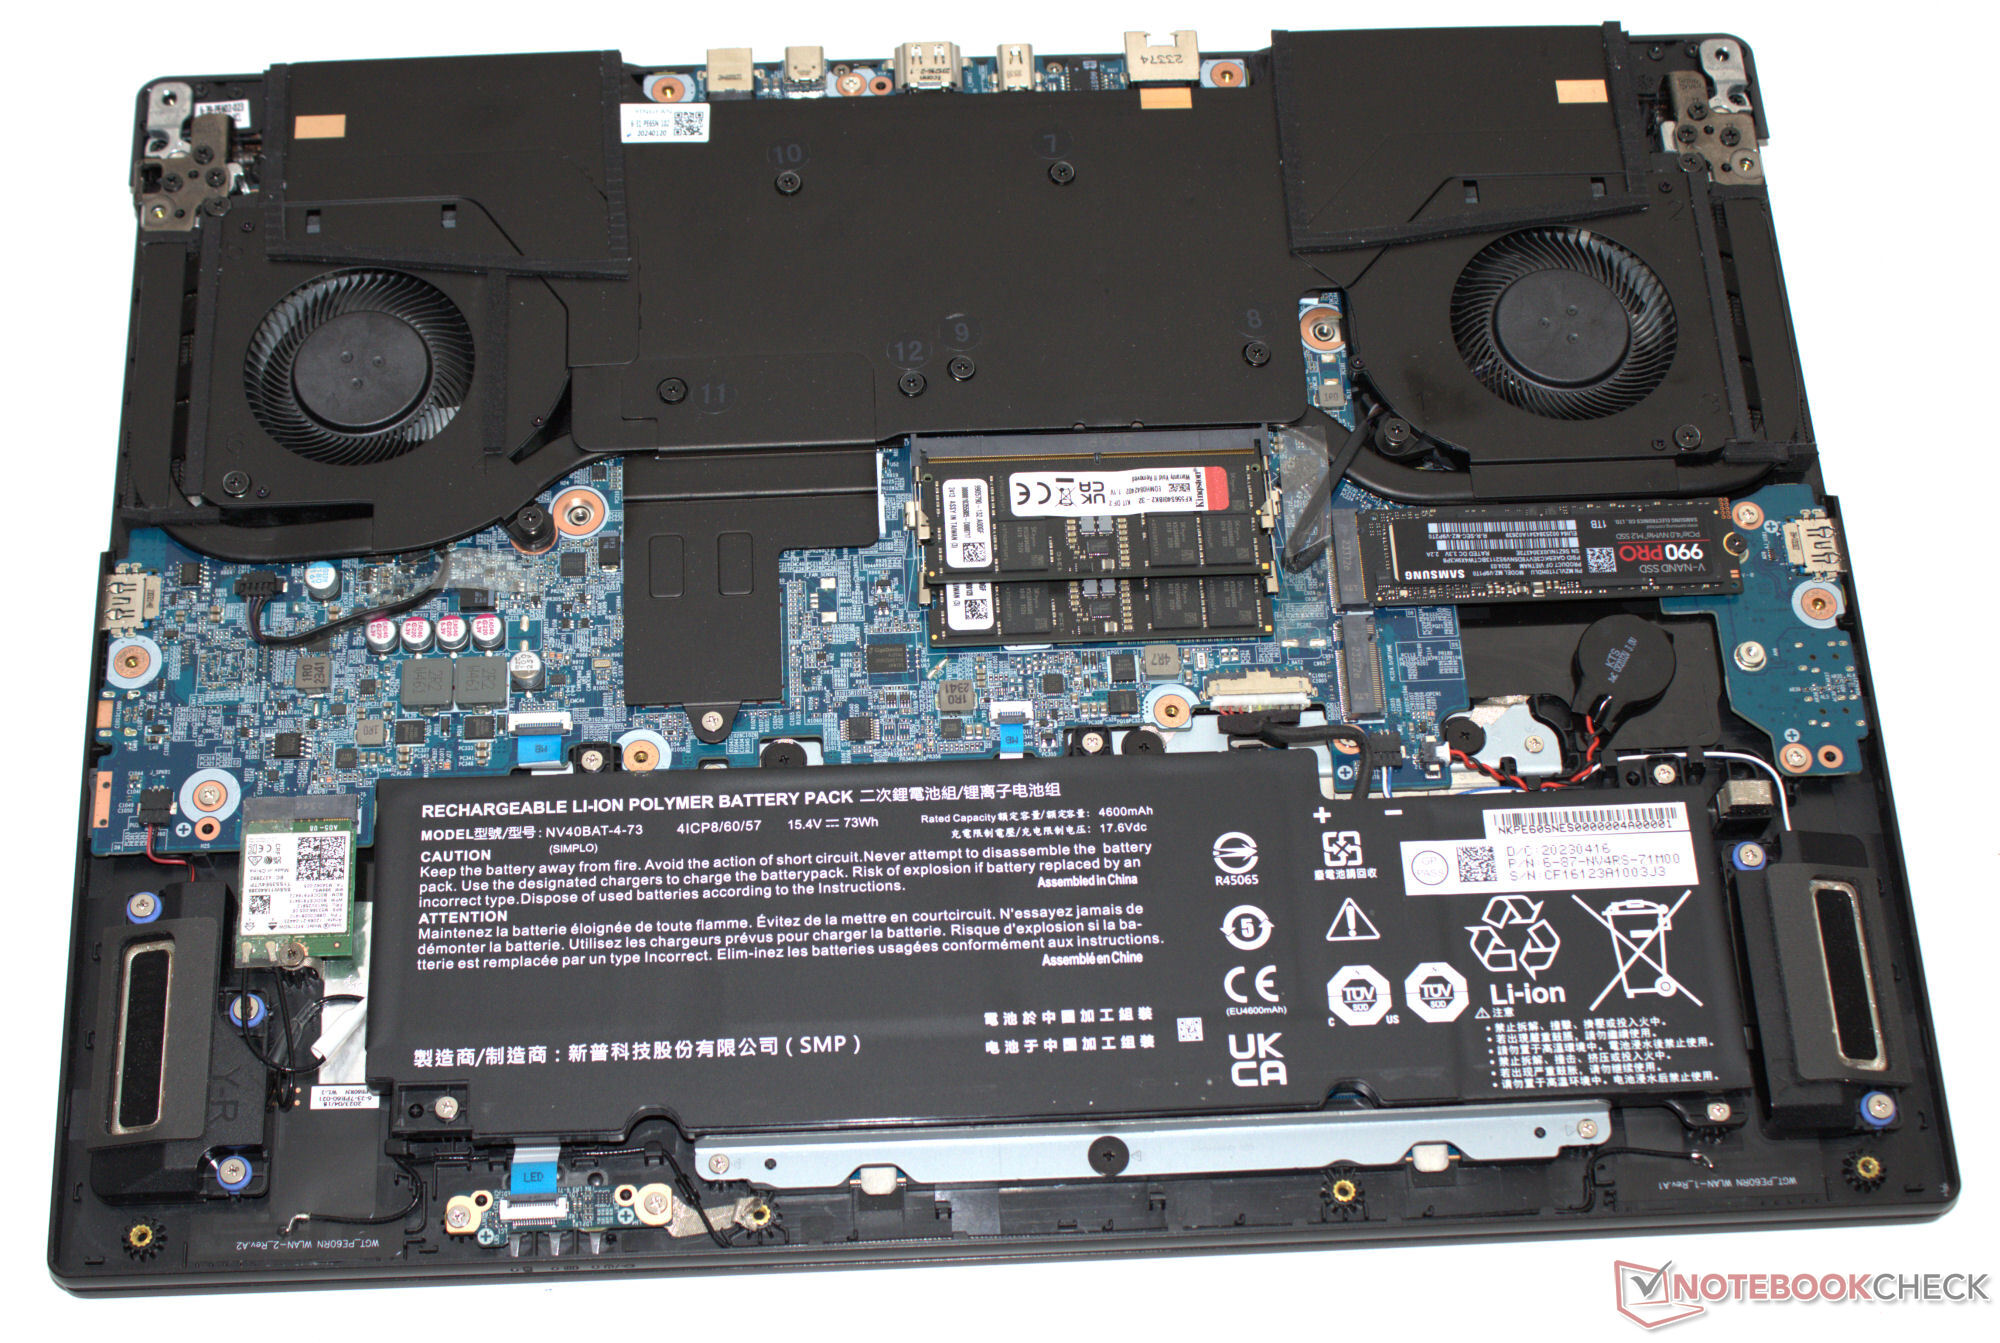
L'ordinateur portable et ses accessoires sont protégés par toutes sortes d'enveloppes en plastique (support en mousse, film, sac). Les noms des matières plastiques utilisées sont imprimés sur celles-ci. Exception : Le film transparent qui recouvre le couvercle ne comporte pas les informations correspondantes. Le matériel de l'appareil est accessible après avoir retiré la plaque de base, ce qui vous permet d'effectuer des travaux d'entretien et de réparation. Les mises à jour logicielles devraient être assurées pour les prochaines années.
Dispositifs d'entrée - L'ordinateur portable XMG avec un clavier interchangeable
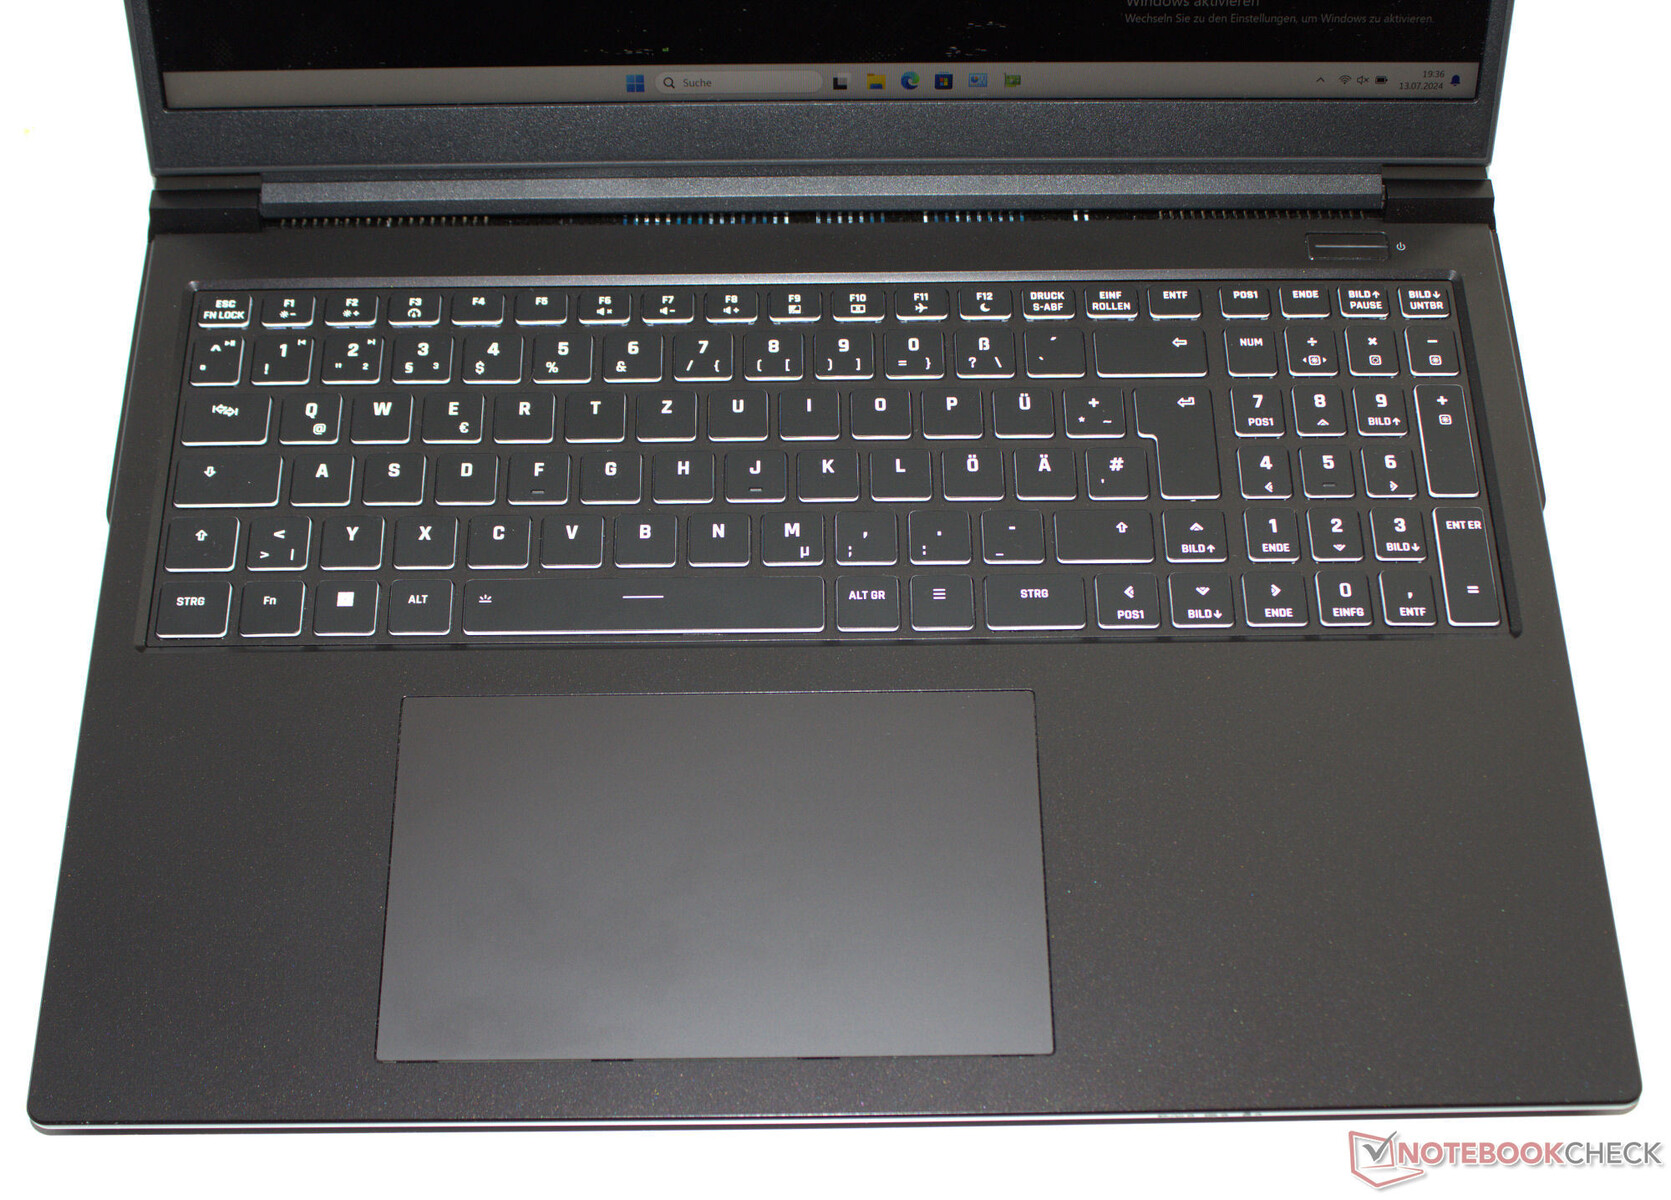
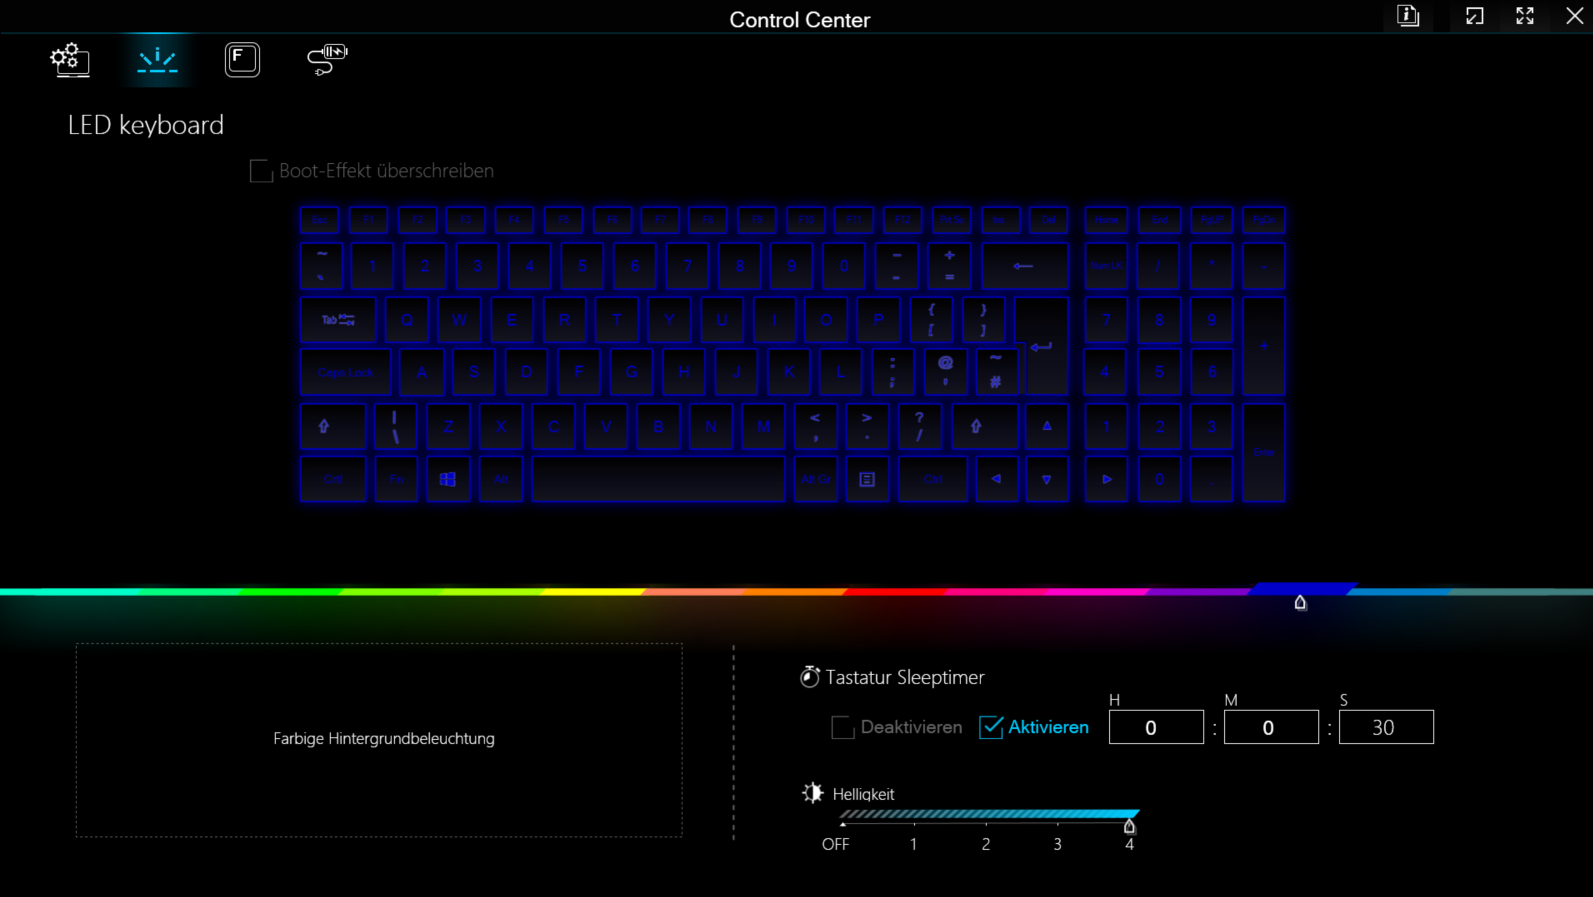
C'est souvent la règle chez Schenker, et l'exception chez les autres fabricants : Le clavier chiclet rétroéclairé (RVB, quatre niveaux) pourrait être facilement remplacé, car il n'est maintenu que par deux vis (et quelques clips). Ses touches plates et lisses ont une course moyenne et un point de pression clair. Leur résistance pourrait être plus nette, mais c'est une question de goût. Une légère flexion du clavier ne devrait pas vous gêner lors d'une utilisation quotidienne. Points positifs : Les quatre touches fléchées sont de taille normale. Un pavé tactile multipoint de taille généreuse (15,1 x 9,1 cm) permet de contrôler le pointeur de la souris.
Affichage - 16:10, IPS, sRGB
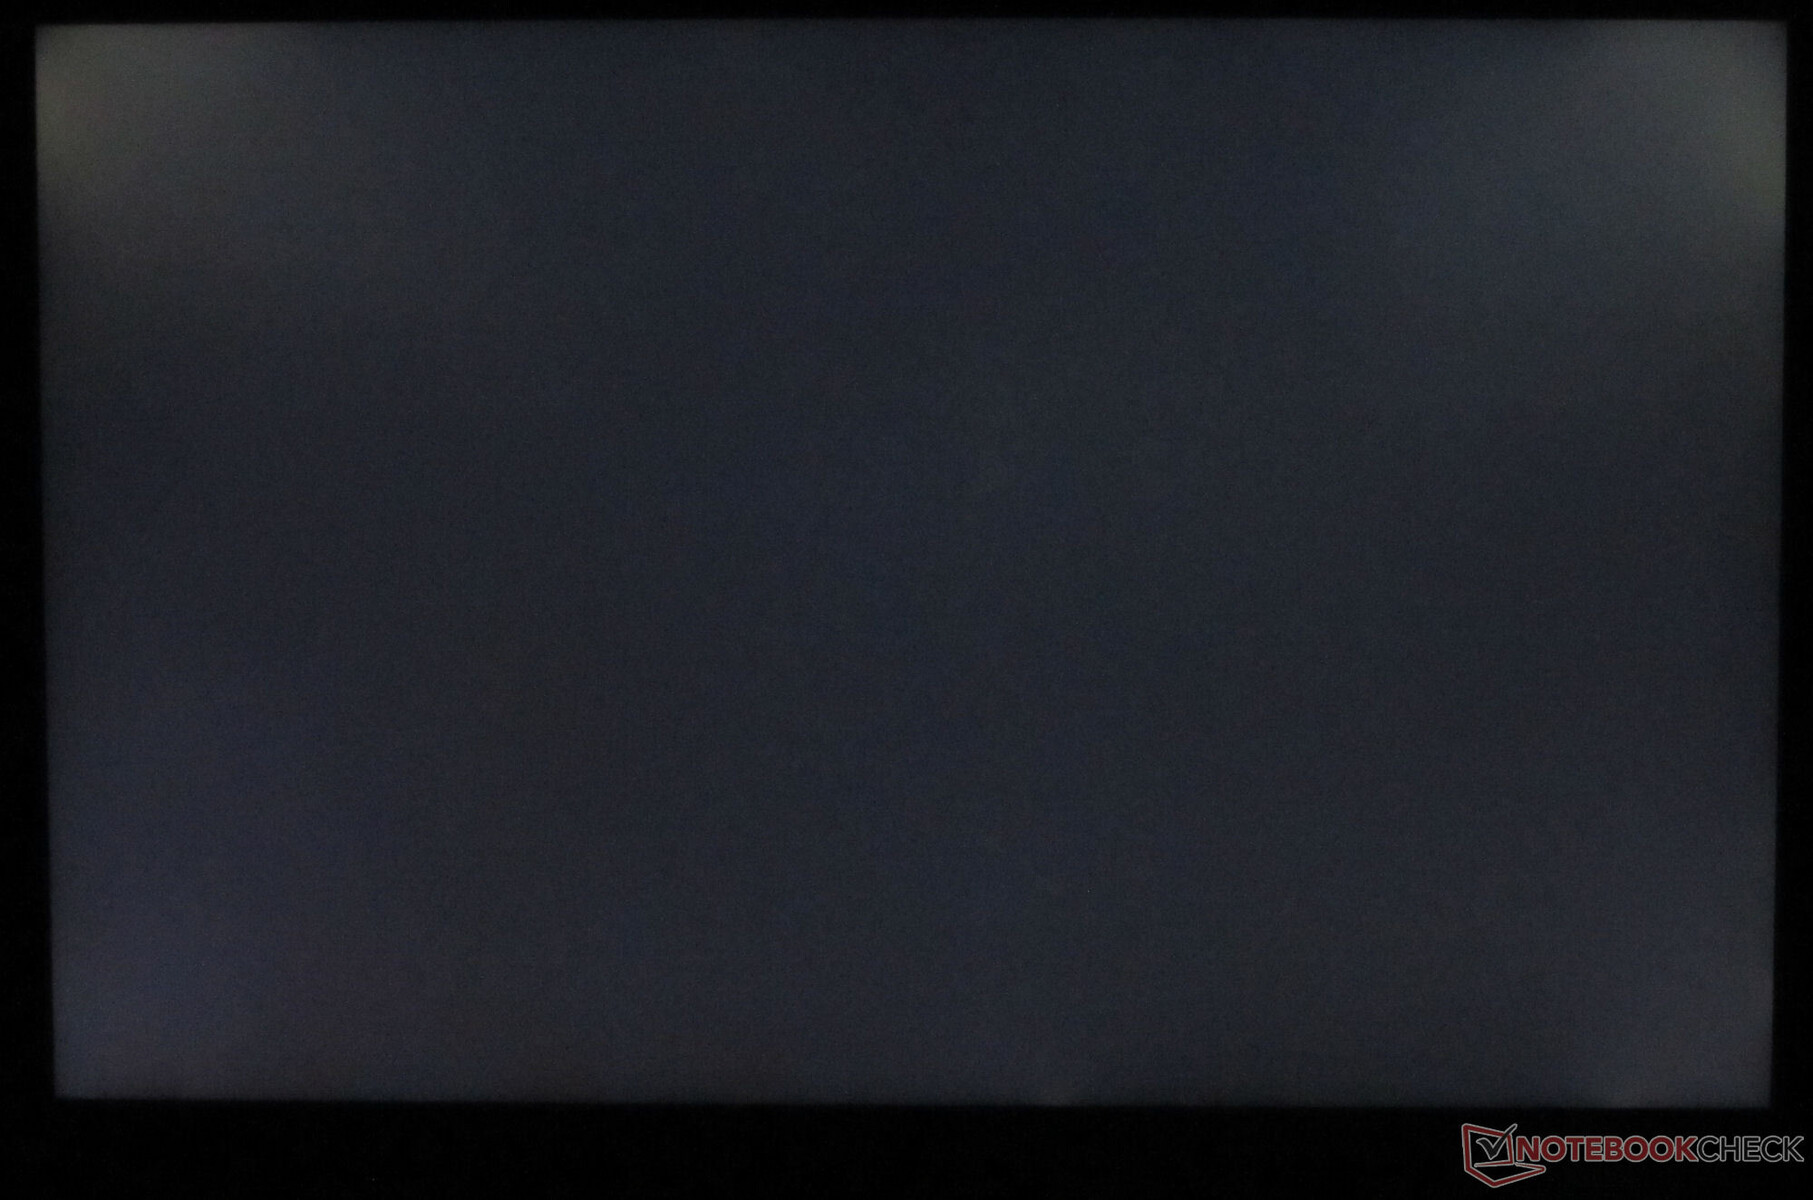
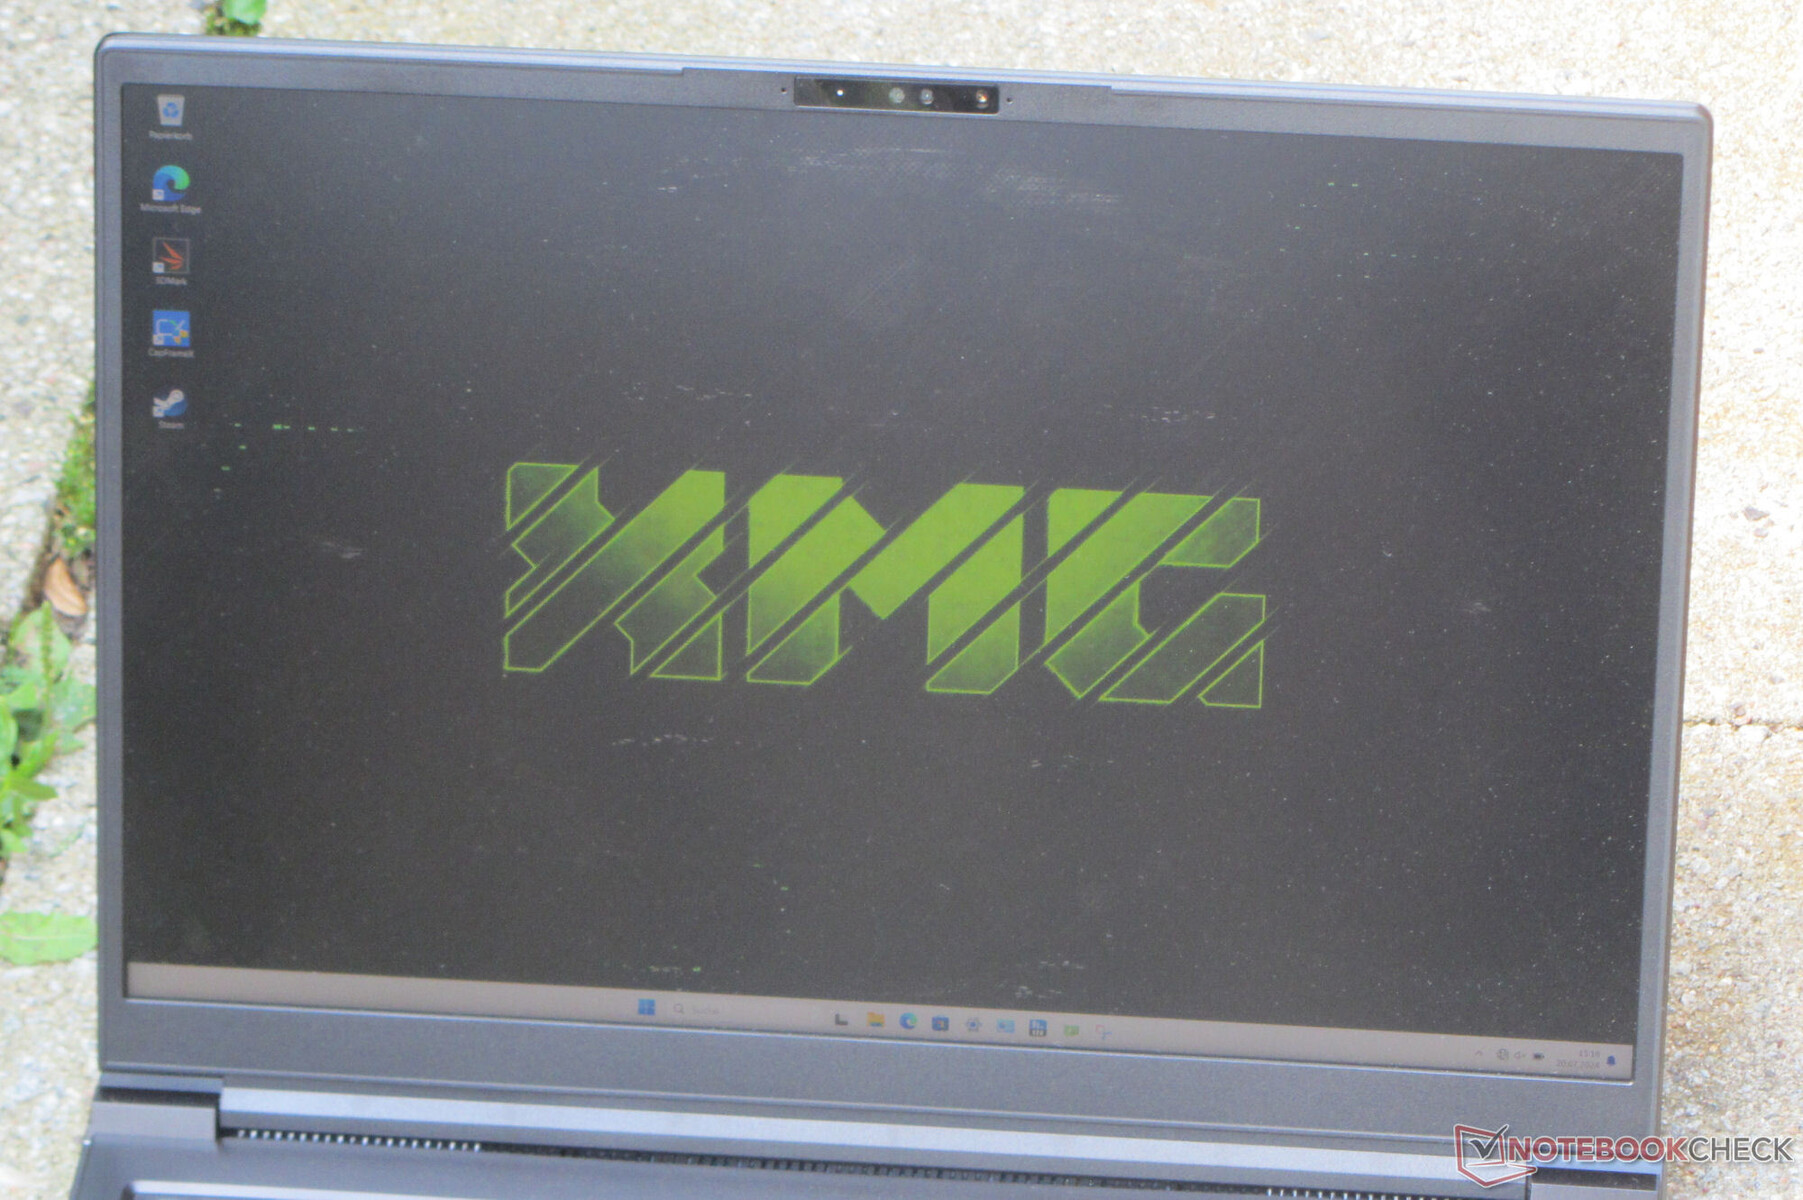
L'écran de 16 pouces (2.560 x 1.600 pixels) au format 16:10 est familier : L'ordinateur portable utilise la même dalle IPS de BOE qui était déjà utilisée dans la version 2023 du Pro 16 version 2023 du Pro 16. Il bénéficie toutefois d'une luminosité maximale légèrement plus élevée. Dans l'ensemble, les valeurs de l'écran que nous avons mesurées sont suffisantes pour une utilisation en intérieur. La lecture à l'extérieur devrait être possible tant que le soleil n'est pas trop fort. Points positifs : L'écran 240 Hz réactif ne présente aucun scintillement PWM. D'autres options d'affichage ne sont pas disponibles.
| |||||||||||||||||||||||||
Homogénéité de la luminosité: 86 %
Valeur mesurée au centre, sur batterie: 416 cd/m²
Contraste: 1095:1 (Valeurs des noirs: 0.38 cd/m²)
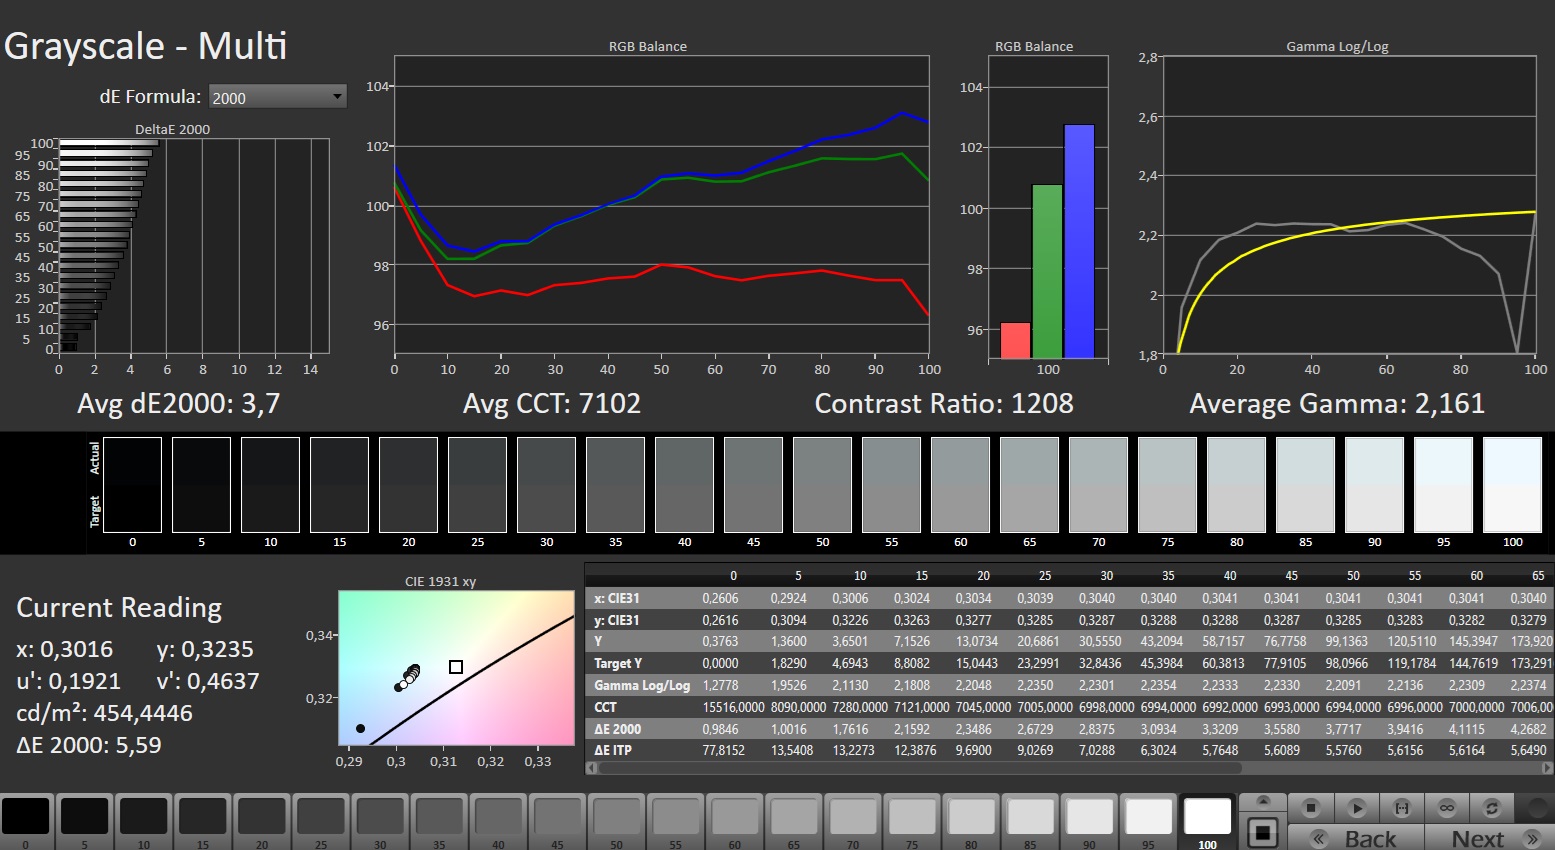
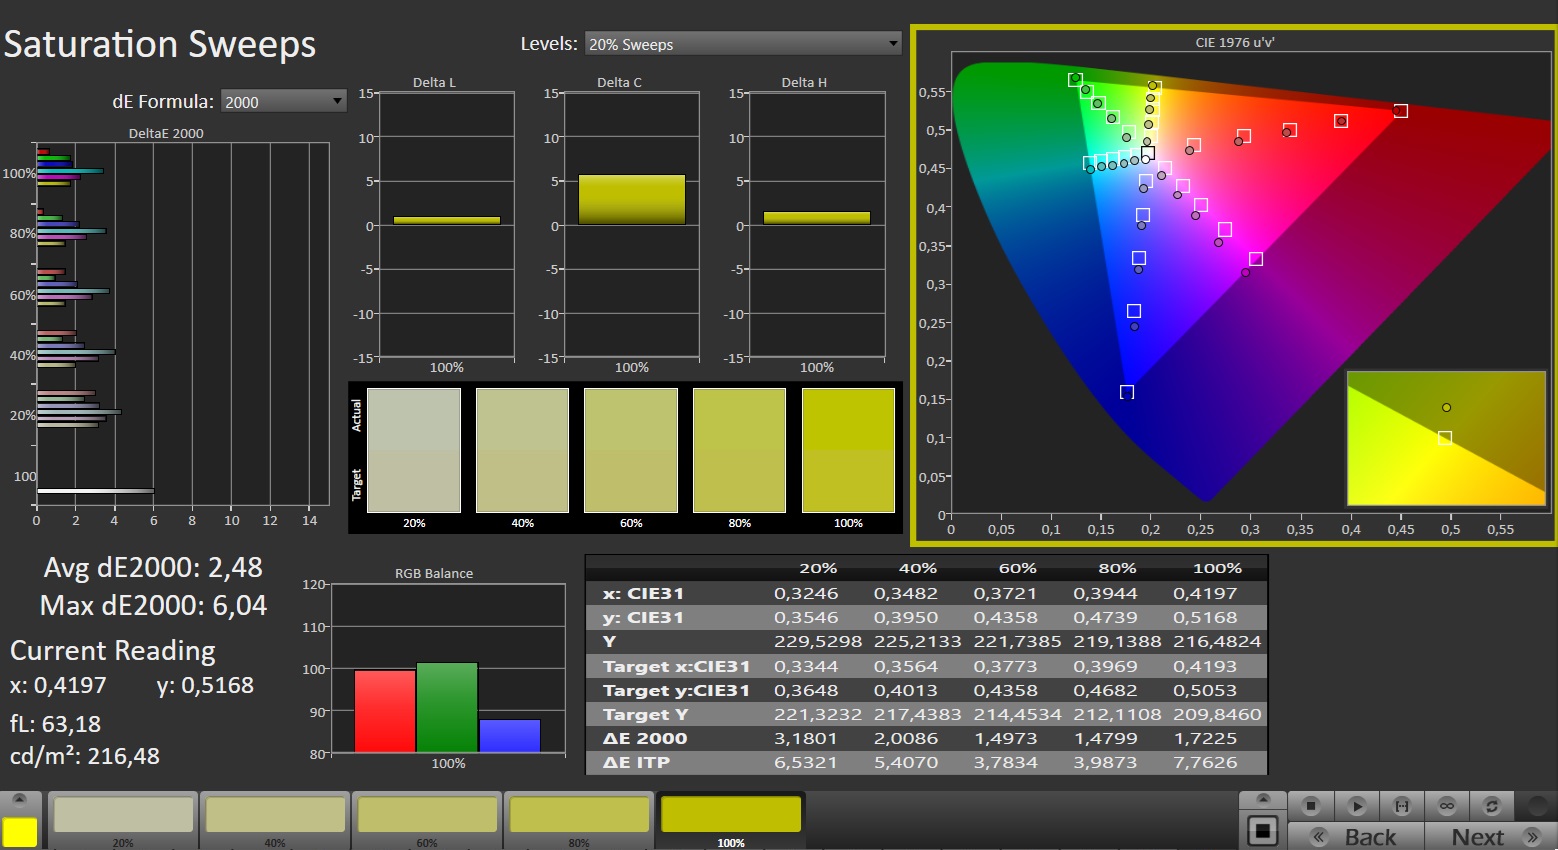
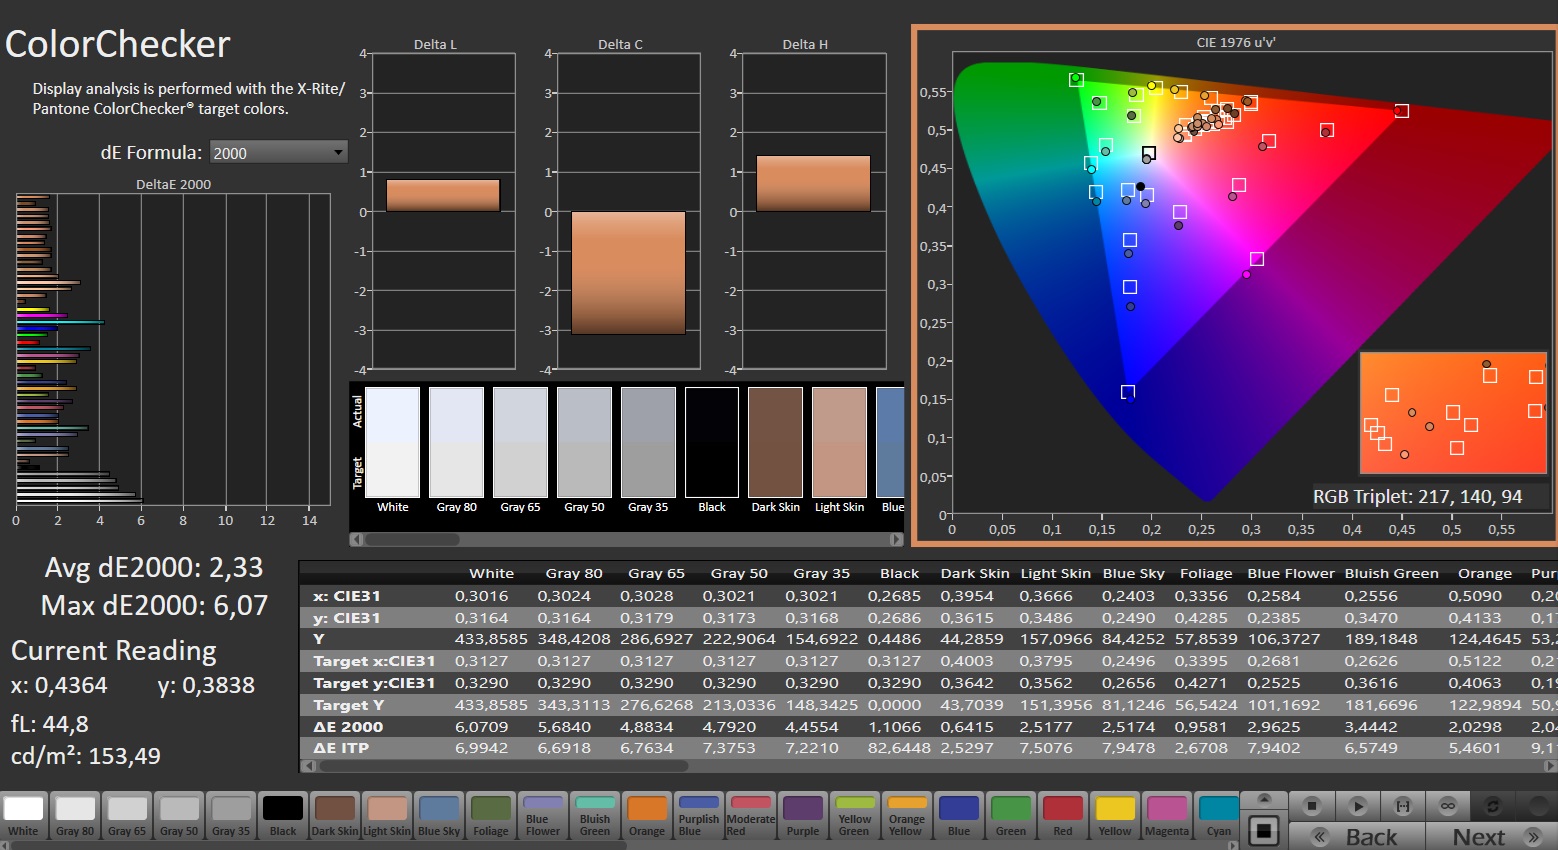
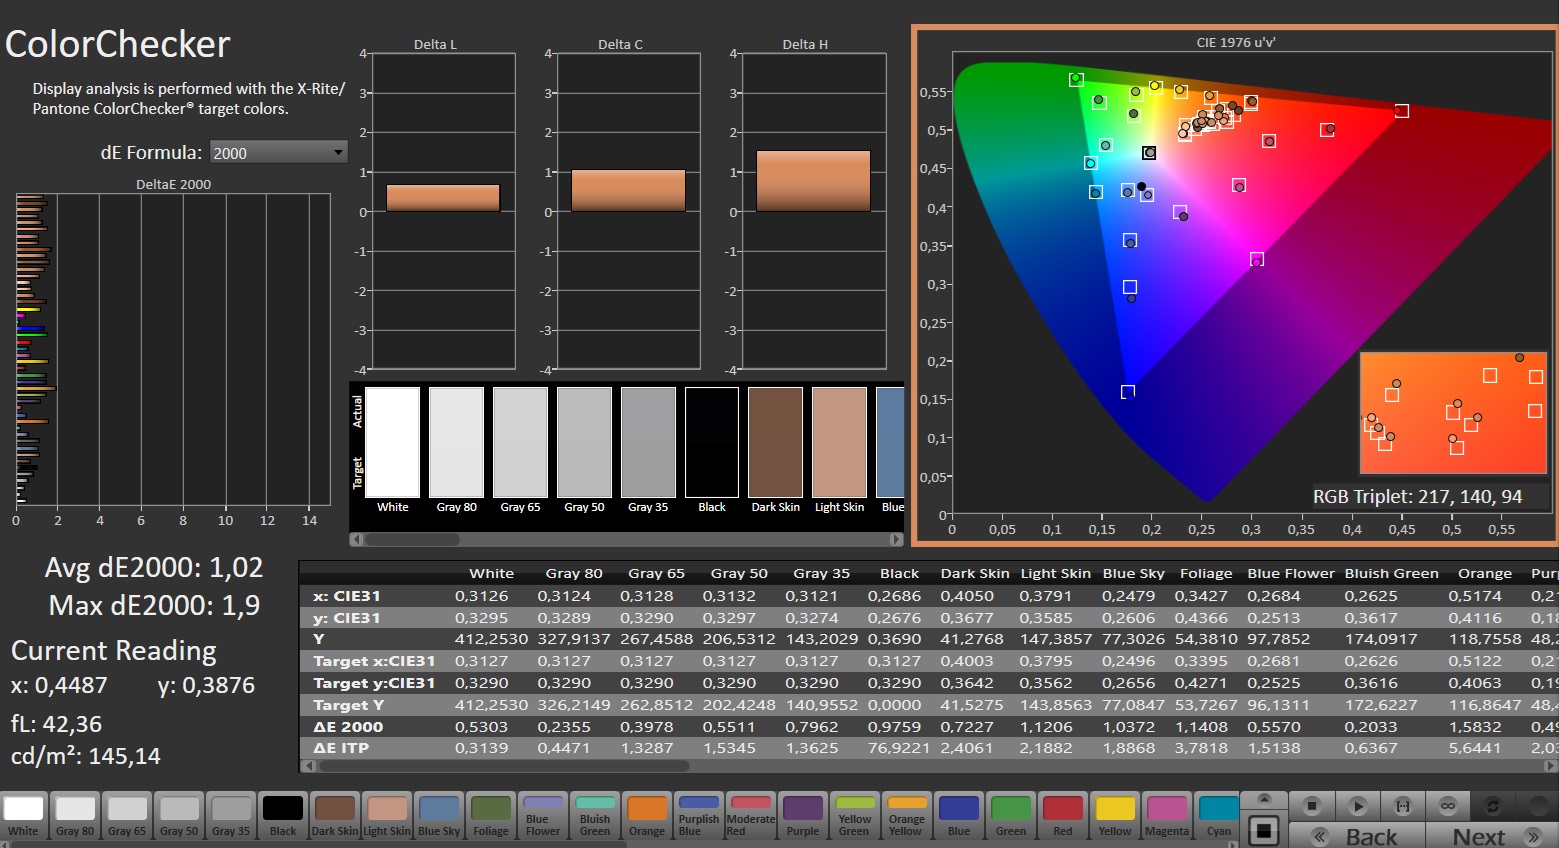
ΔE Color 2.33 | 0.5-29.43 Ø4.87, calibrated: 1.02
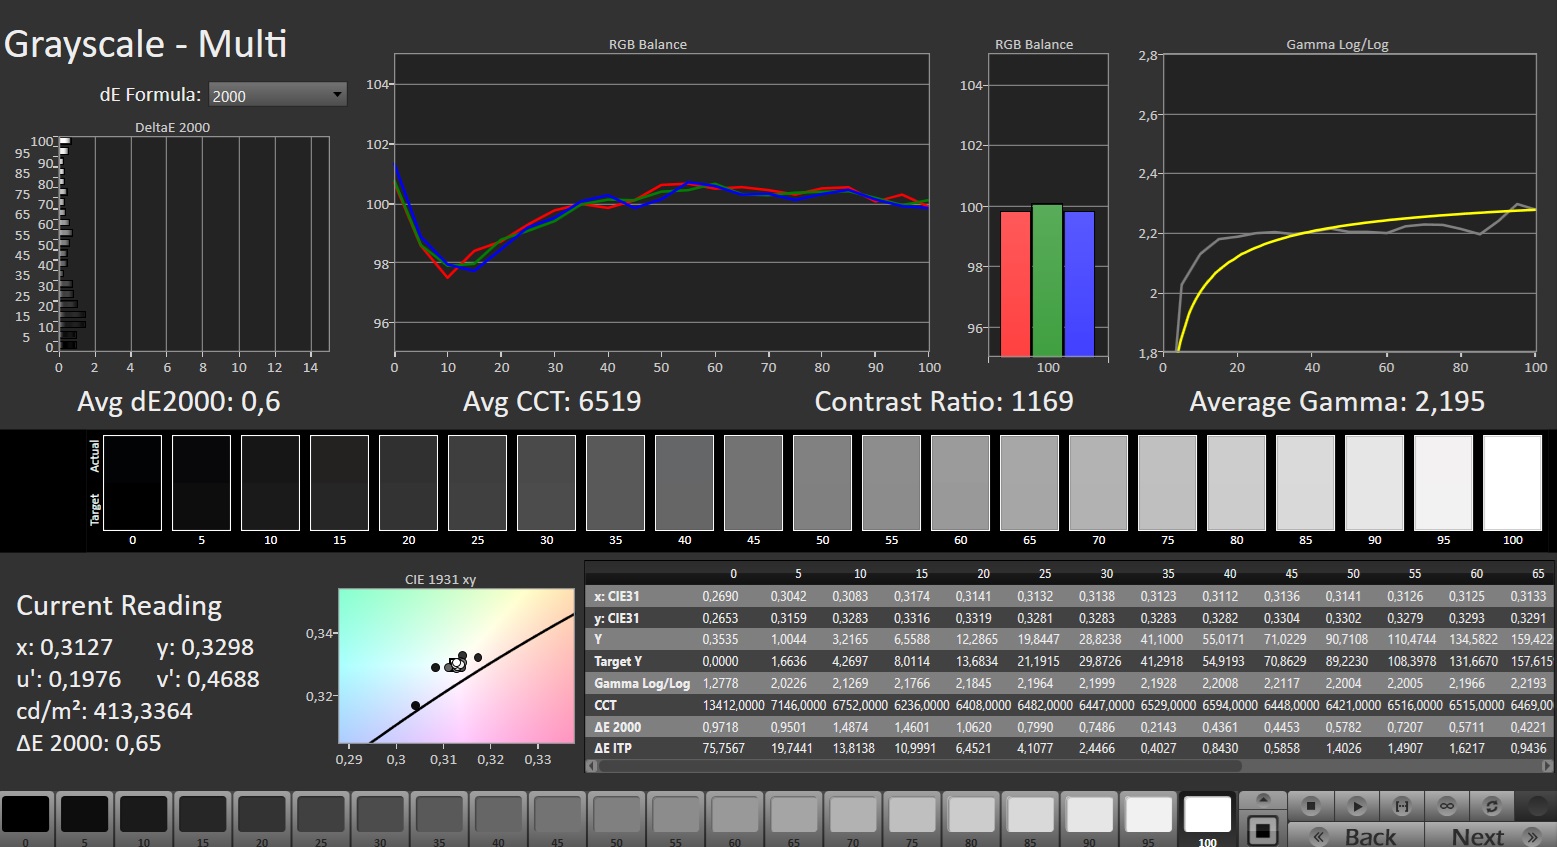
ΔE Greyscale 3.7 | 0.5-98 Ø5.1
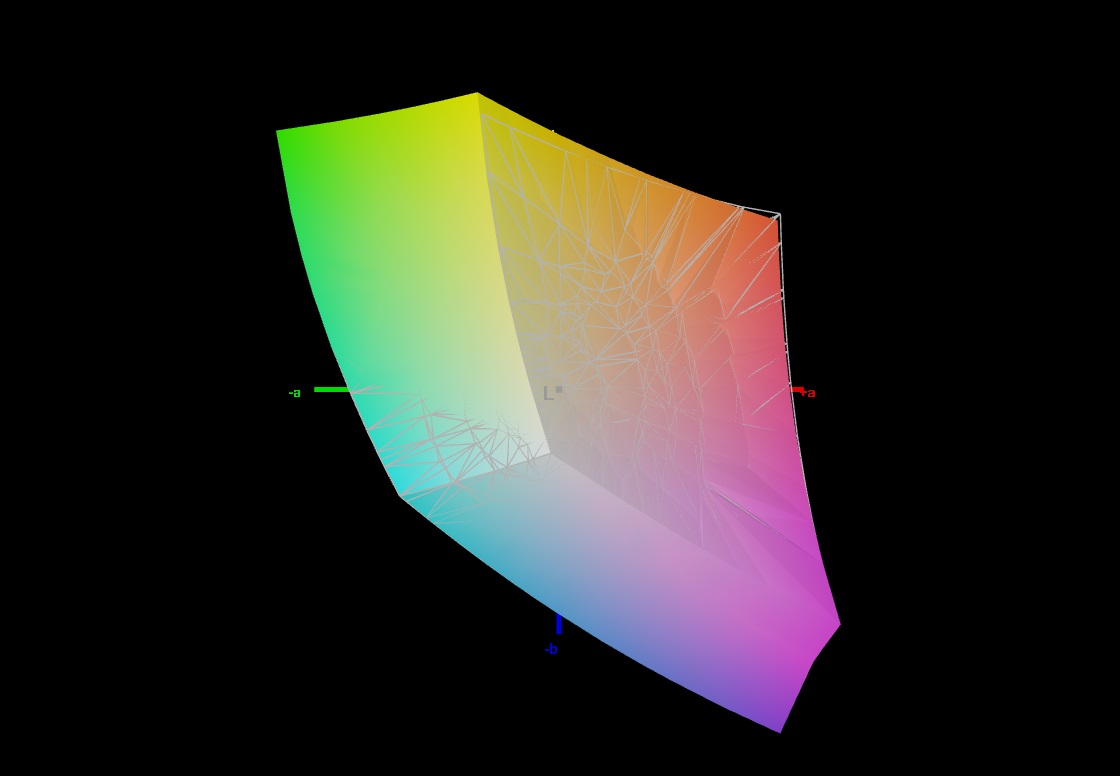
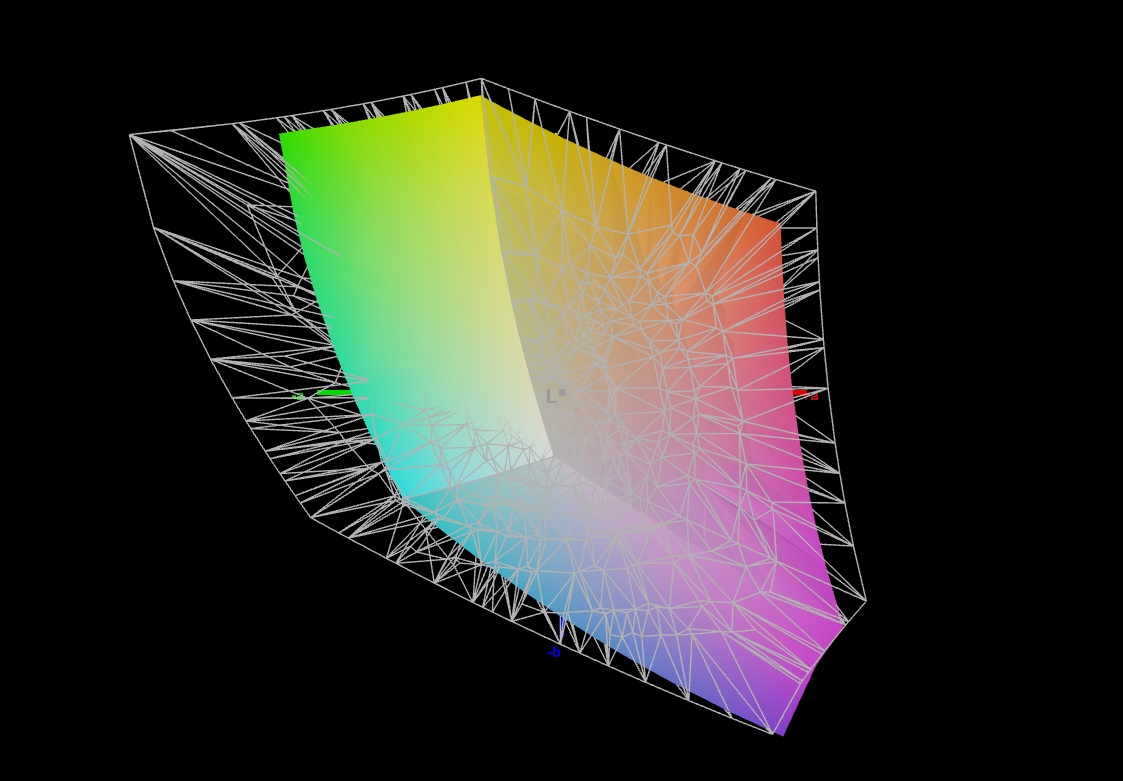
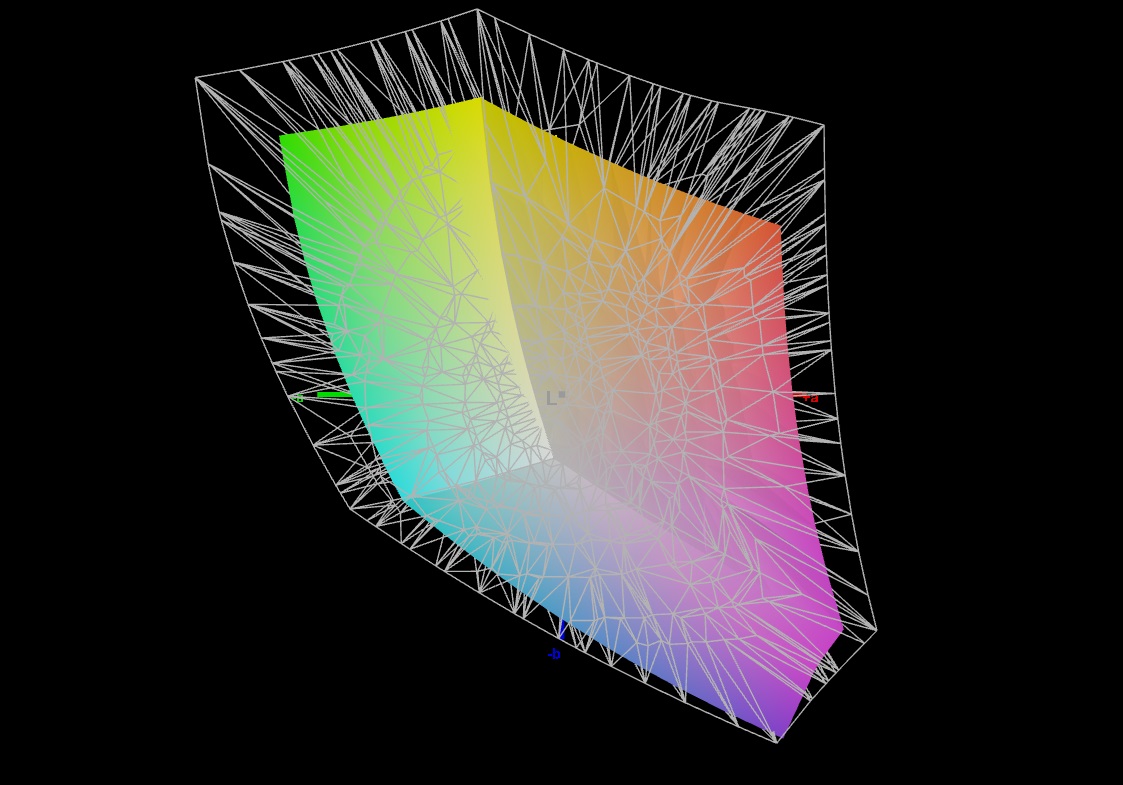
70.8% AdobeRGB 1998 (Argyll 2.2.0 3D)
99.5% sRGB (Argyll 2.2.0 3D)
68.8% Display P3 (Argyll 2.2.0 3D)
Gamma: 2.161
| SCHENKER XMG Pro 16 Studio (Mid 24) BOE CQ NE160QDM-NZ1, IPS, 2560x1600, 16" | Acer Predator Helios Neo 16 (2024) Chi Mei N160GME-GTB, LED, 2560x1600, 16" | Lenovo Legion Pro 5 16IRX9 BOE NE160QDM-NYC, IPS, 2560x1600, 16" | Aorus 16X 2024 BOE CQ NE160QDM-NY1, IPS, 2560x1600, 16" | SCHENKER XMG Pro 16 Studio (Mid 23) BOE CQ NE160QDM-NZ1, IPS, 2560x1600, 16" | Lenovo Legion 7 16 IRX G9 MNG007ZA1-2, IPS, 3200x2000, 16" | |
|---|---|---|---|---|---|---|
| Display | 20% | 0% | -2% | -0% | 21% | |
| Display P3 Coverage | 68.8 | 95.9 39% | 69.3 1% | 67.2 -2% | 69.4 1% | 95 38% |
| sRGB Coverage | 99.5 | 99.8 0% | 99.4 0% | 96.7 -3% | 98.2 -1% | 100 1% |
| AdobeRGB 1998 Coverage | 70.8 | 86.4 22% | 70.1 -1% | 69.3 -2% | 70.1 -1% | 87.2 23% |
| Response Times | 11% | -18% | 28% | -9% | -14% | |
| Response Time Grey 50% / Grey 80% * | 12.7 ? | 5 ? 61% | 11.9 ? 6% | 7.5 ? 41% | 12.2 ? 4% | 14.4 ? -13% |
| Response Time Black / White * | 6.3 ? | 8.8 ? -40% | 8.9 ? -41% | 5.4 ? 14% | 7.7 ? -22% | 7.2 ? -14% |
| PWM Frequency | ||||||
| Screen | 19% | 20% | 4% | -5% | 23% | |
| Brightness middle | 416 | 521 25% | 384 -8% | 542 30% | 349 -16% | 412 -1% |
| Brightness | 392 | 506 29% | 366 -7% | 504 29% | 348 -11% | 396 1% |
| Brightness Distribution | 86 | 85 -1% | 91 6% | 86 0% | 93 8% | 89 3% |
| Black Level * | 0.38 | 0.44 -16% | 0.35 8% | 0.45 -18% | 0.32 16% | 0.43 -13% |
| Contrast | 1095 | 1184 8% | 1097 0% | 1204 10% | 1091 0% | 958 -13% |
| Colorchecker dE 2000 * | 2.33 | 1.74 25% | 0.97 58% | 2.73 -17% | 1.98 15% | 0.9 61% |
| Colorchecker dE 2000 max. * | 6.07 | 3.88 36% | 3.57 41% | 5.29 13% | 7.56 -25% | 2 67% |
| Colorchecker dE 2000 calibrated * | 1.02 | 0.52 49% | 0.77 25% | 1.32 -29% | 1.45 -42% | 0.6 41% |
| Greyscale dE 2000 * | 3.7 | 3 19% | 1.5 59% | 2.9 22% | 3.3 11% | 1.4 62% |
| Gamma | 2.161 102% | 2.164 102% | 2.24 98% | 2.192 100% | 2.137 103% | 2.23 99% |
| CCT | 7102 92% | 6816 95% | 6709 97% | 6173 105% | 6672 97% | 6731 97% |
| Moyenne finale (programmes/paramètres) | 17% /
18% | 1% /
11% | 10% /
6% | -5% /
-5% | 10% /
17% |
* ... Moindre est la valeur, meilleures sont les performances
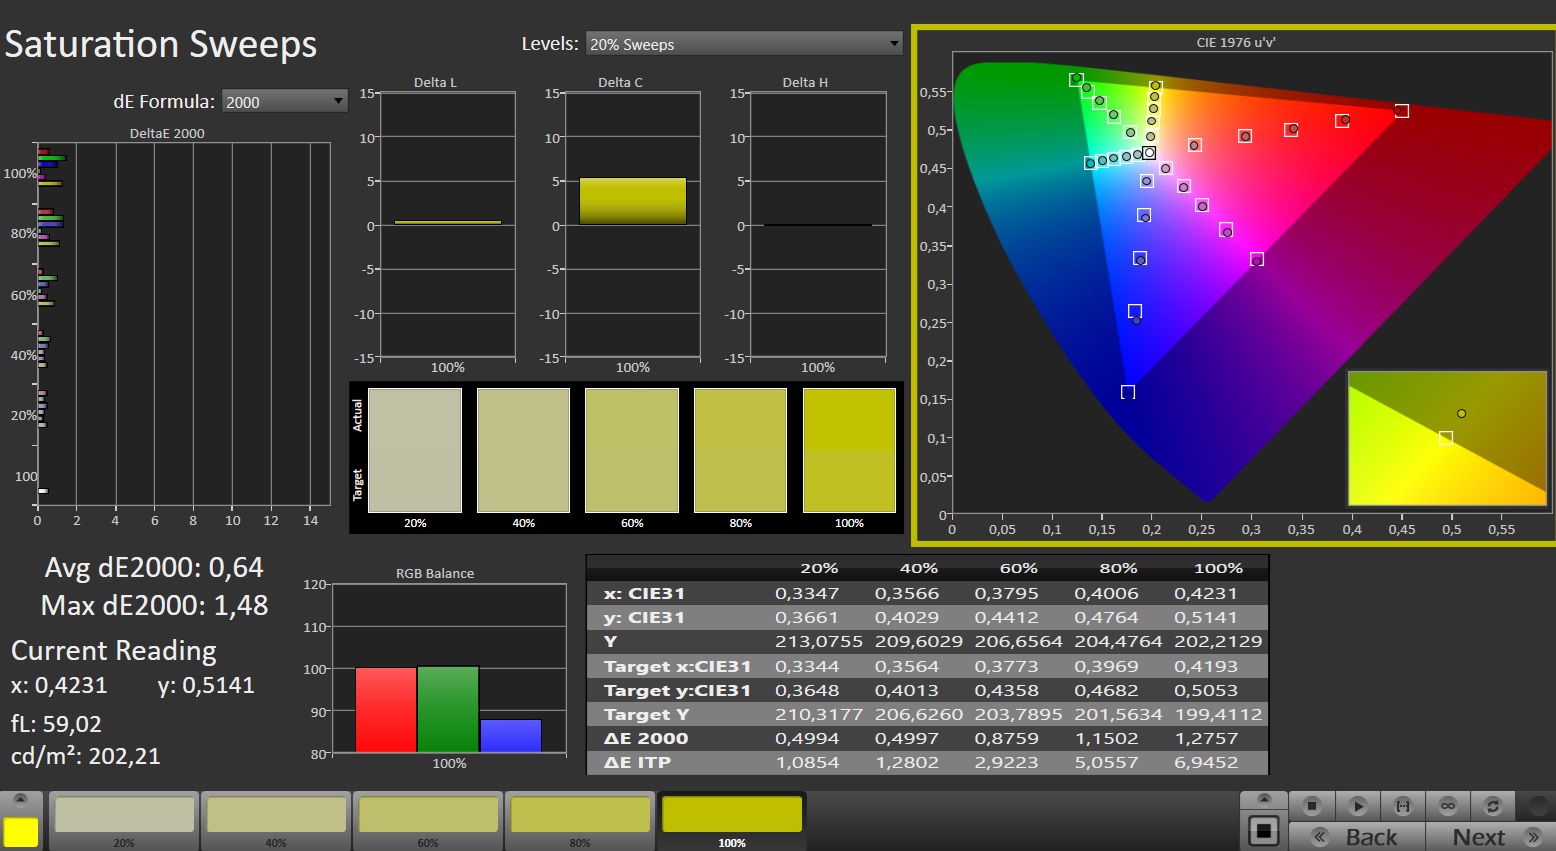
La couverture de l'espace colorimétrique du panneau installé est décevante. Seul l'espace sRGB peut être reproduit, et non les espaces AdobeRGB et DCI-P3. Cependant, ce n'est pas différent des écrans de la plupart des concurrents. Néanmoins, l'écran d'un ordinateur portable commercialisé en tant que "station de travail professionnelle pour la création de contenu" devrait vraiment offrir la gamme complète. La reproduction des couleurs est meilleure : Une légère déviation de 2,26 (objectif : DeltaE < 3) pourrait être réduite à 1,03 en effectuant un étalonnage.
Temps de réponse de l'écran
| ↔ Temps de réponse noir à blanc | ||
|---|---|---|
| 6.3 ms ... hausse ↗ et chute ↘ combinées | ↗ 2.5 ms hausse | 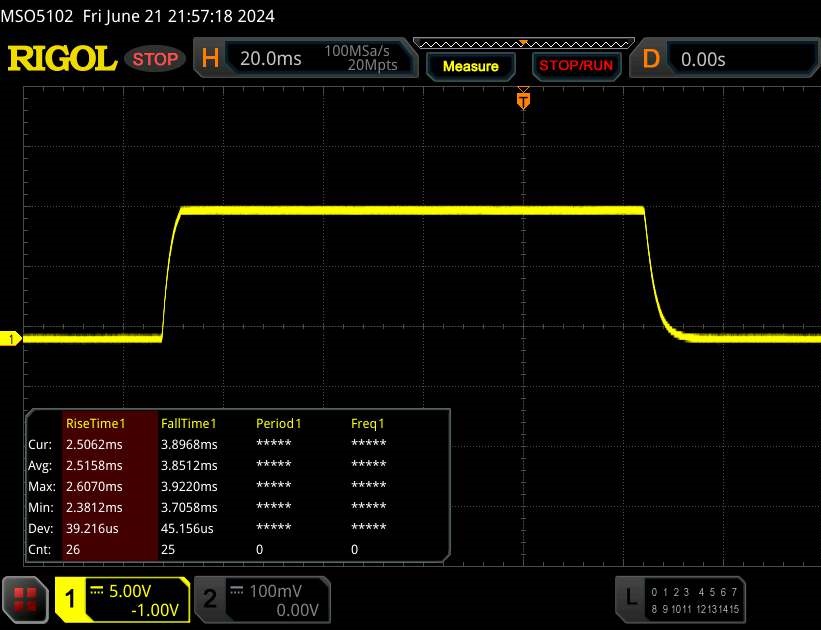 |
| ↘ 3.8 ms chute | ||
| L'écran montre de très faibles temps de réponse, parfait pour le jeu. En comparaison, tous les appareils testés affichent entre 0.1 (minimum) et 240 (maximum) ms. » 17 % des appareils testés affichent de meilleures performances. Cela signifie que les latences relevées sont meilleures que la moyenne (20.8 ms) de tous les appareils testés. | ||
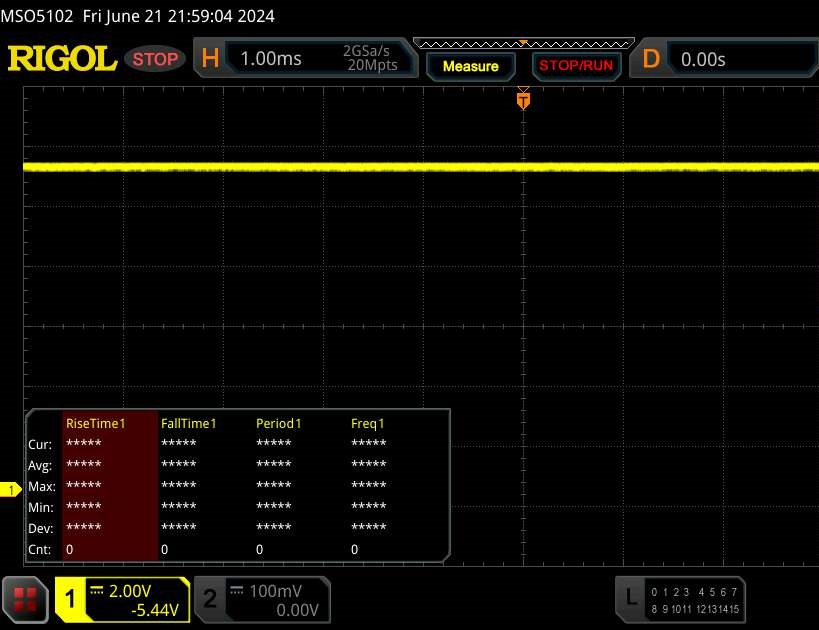
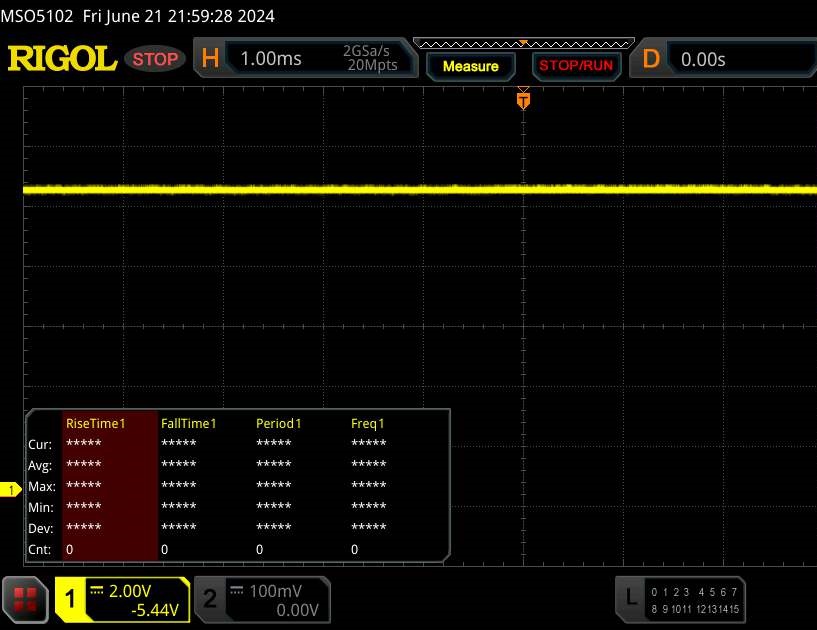
| ↔ Temps de réponse gris 50% à gris 80% | ||
| 12.7 ms ... hausse ↗ et chute ↘ combinées | ↗ 6 ms hausse | 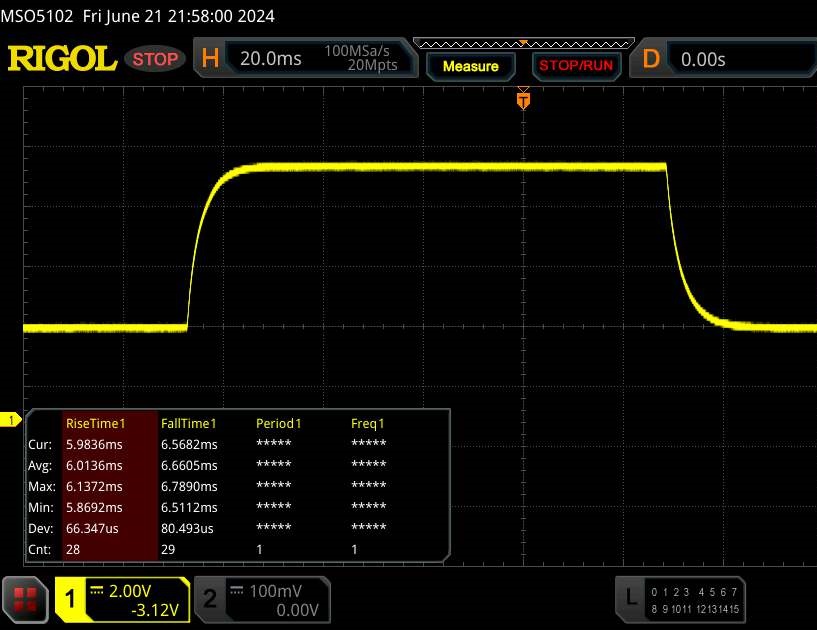 |
| ↘ 6.7 ms chute | ||
| L'écran montre de bons temps de réponse, mais insuffisant pour du jeu compétitif. En comparaison, tous les appareils testés affichent entre 0.165 (minimum) et 636 (maximum) ms. » 23 % des appareils testés affichent de meilleures performances. Cela signifie que les latences relevées sont meilleures que la moyenne (32.5 ms) de tous les appareils testés. | ||
Scintillement / MLI (Modulation de largeur d'impulsion)
| Scintillement / MLI (Modulation de largeur d'impulsion) non décelé | 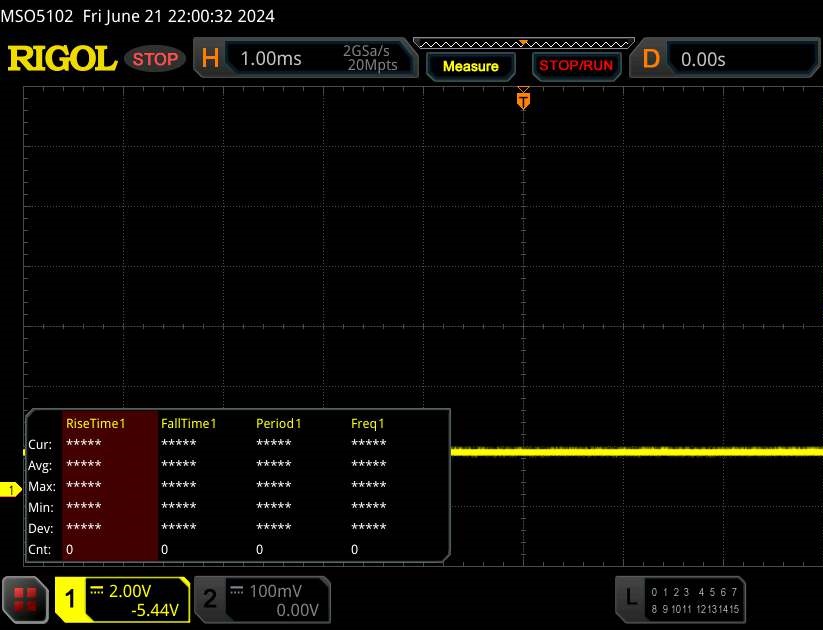 | ||
En comparaison, 53 % des appareils testés n'emploient pas MDI pour assombrir leur écran. Nous avons relevé une moyenne à 8516 (minimum : 5 - maximum : 343500) Hz dans le cas où une MDI était active. | |||
Performance - Raptor Lake Refresh remplace Raptor Lake
Le XMG Pro 16 Studio (Mid 24), décrit par Schenker comme un "ordinateur portable de création de contenu", est destiné aux joueurs et aux créateurs. Tous les modèles sont équipés d'un Core i9-14900HX et la sélection de GPU disponibles comprend une RTX 4060 et une RTX 4070 - notre appareil de test est équipé d'une RTX 4070. Cette variante est disponible pour environ 2 500 dollars. Les prix commencent à environ 1 800 dollars.
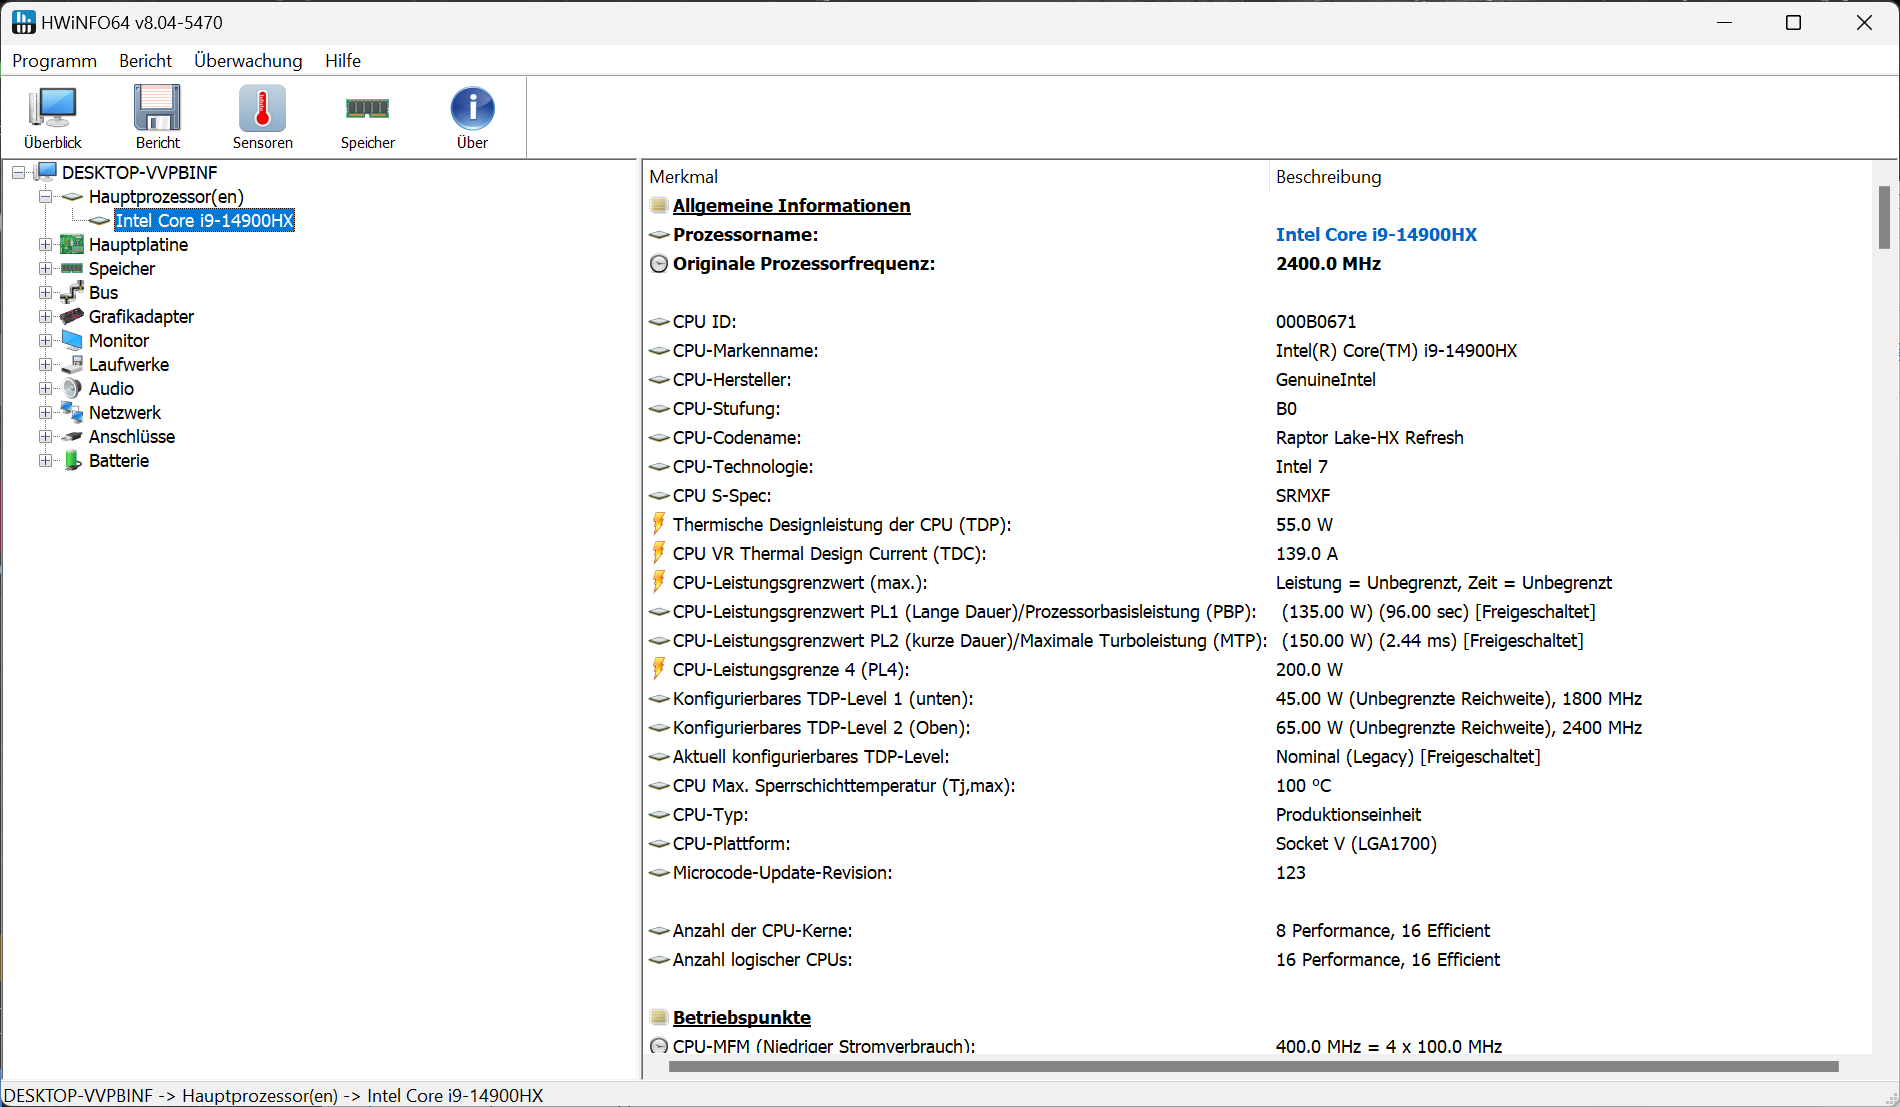
Conditions d'essai
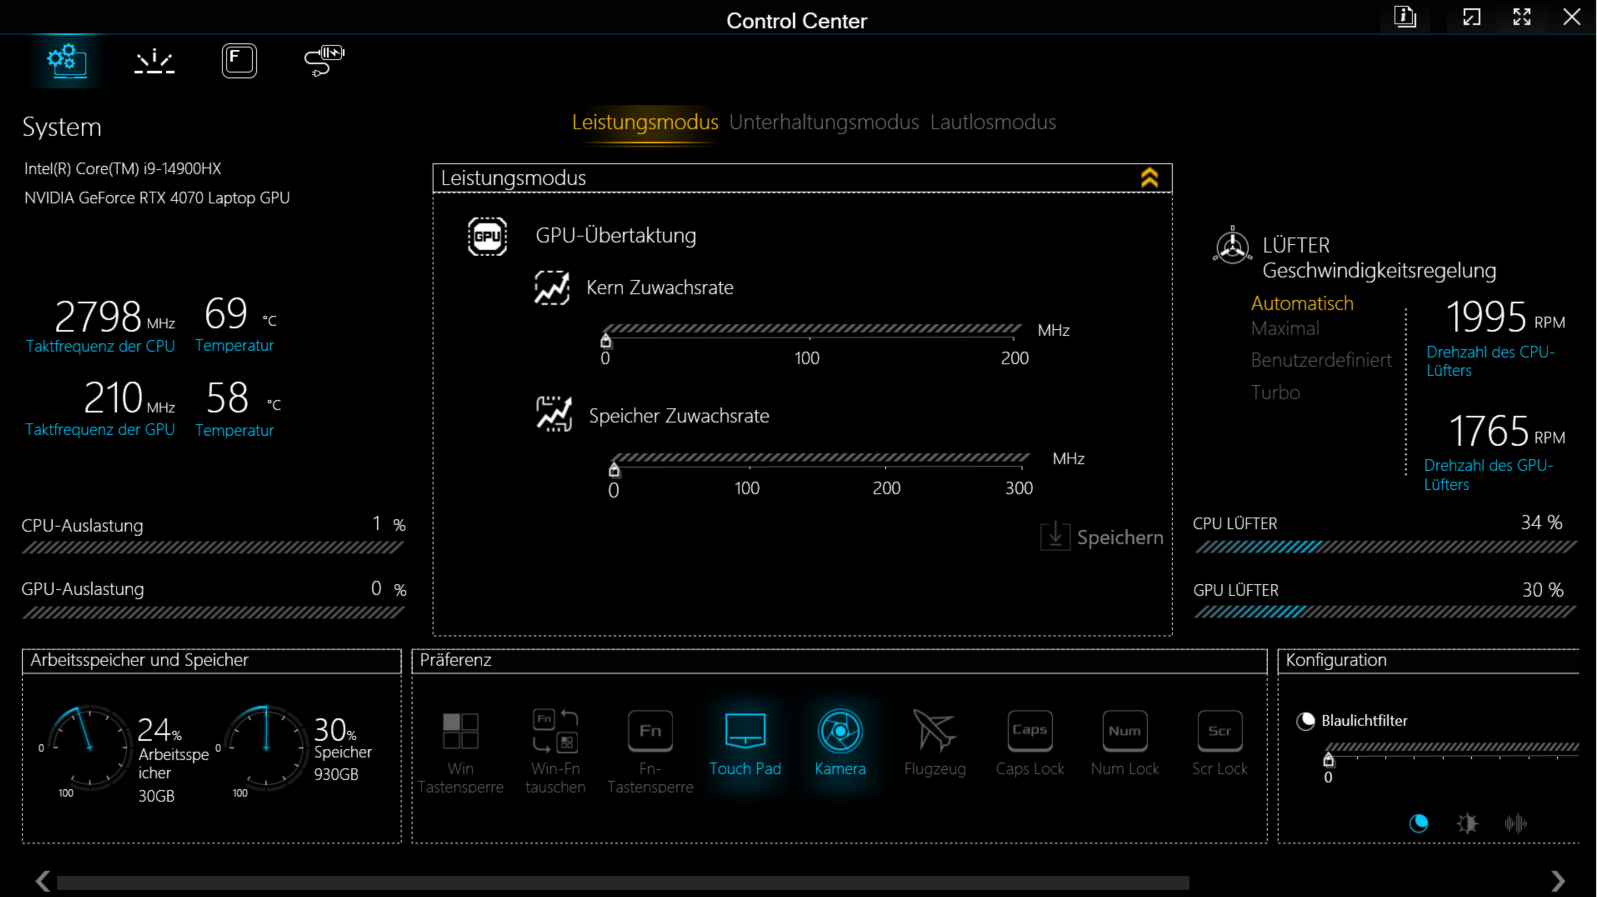
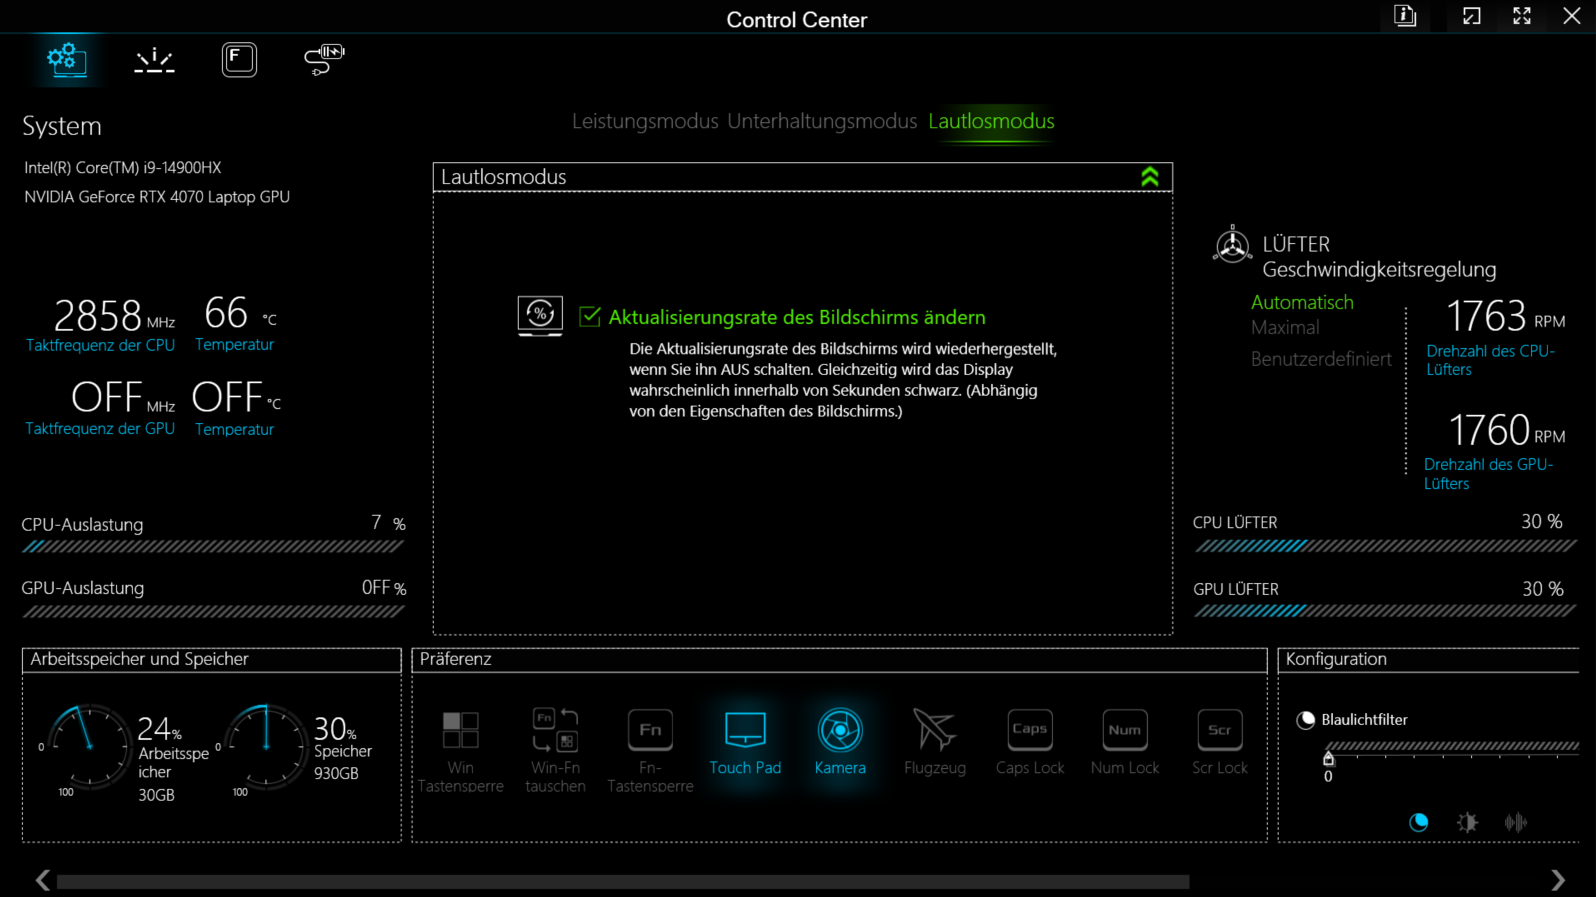
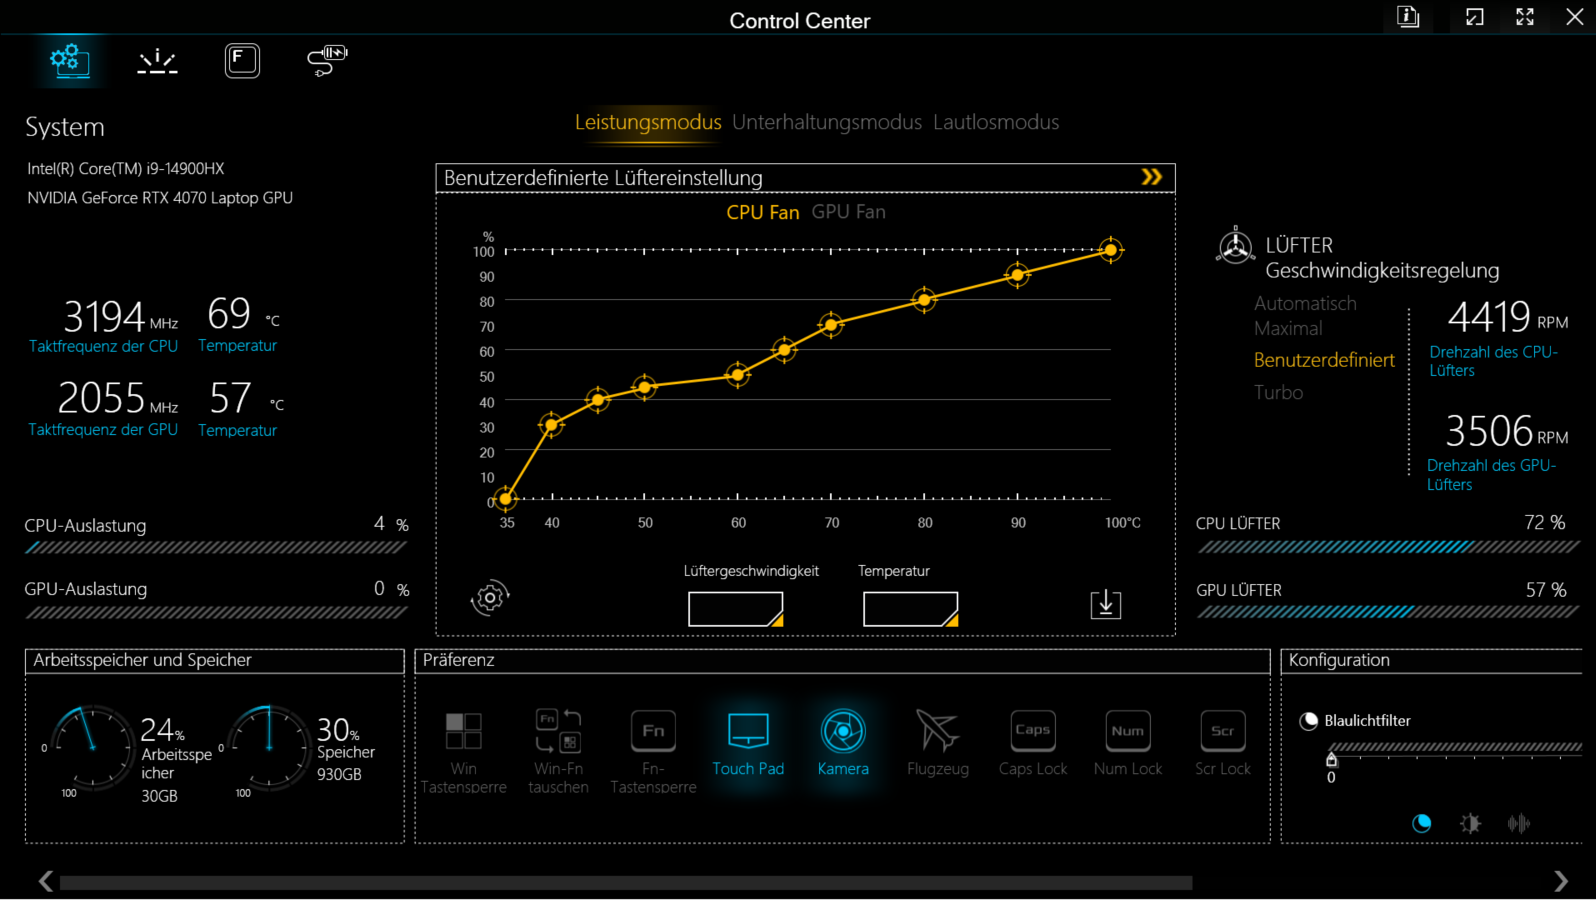
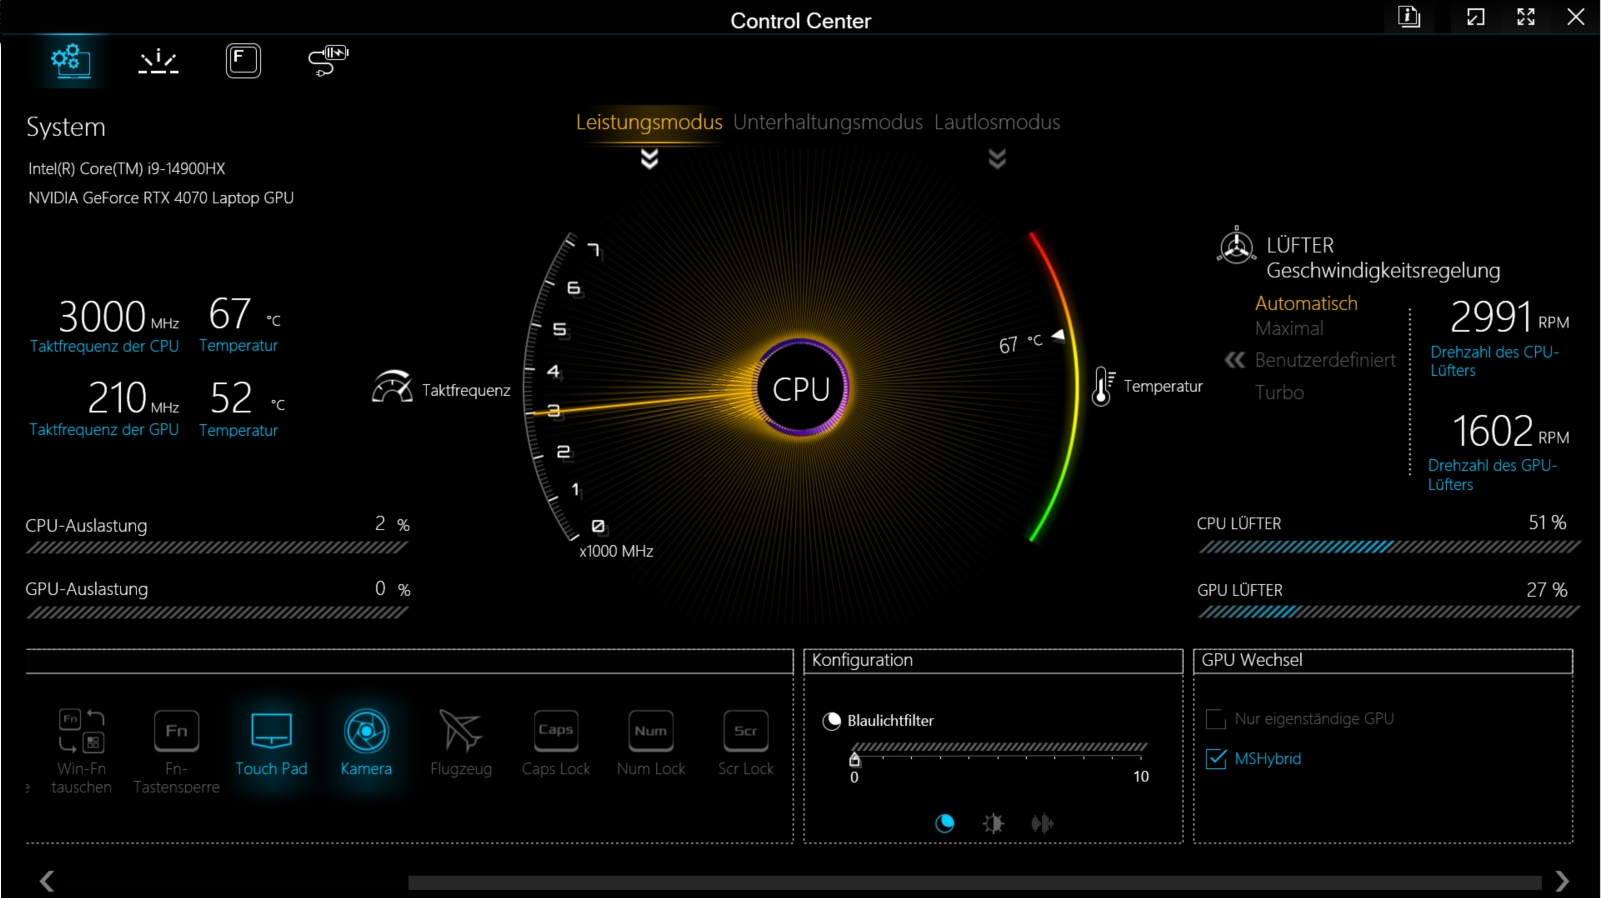
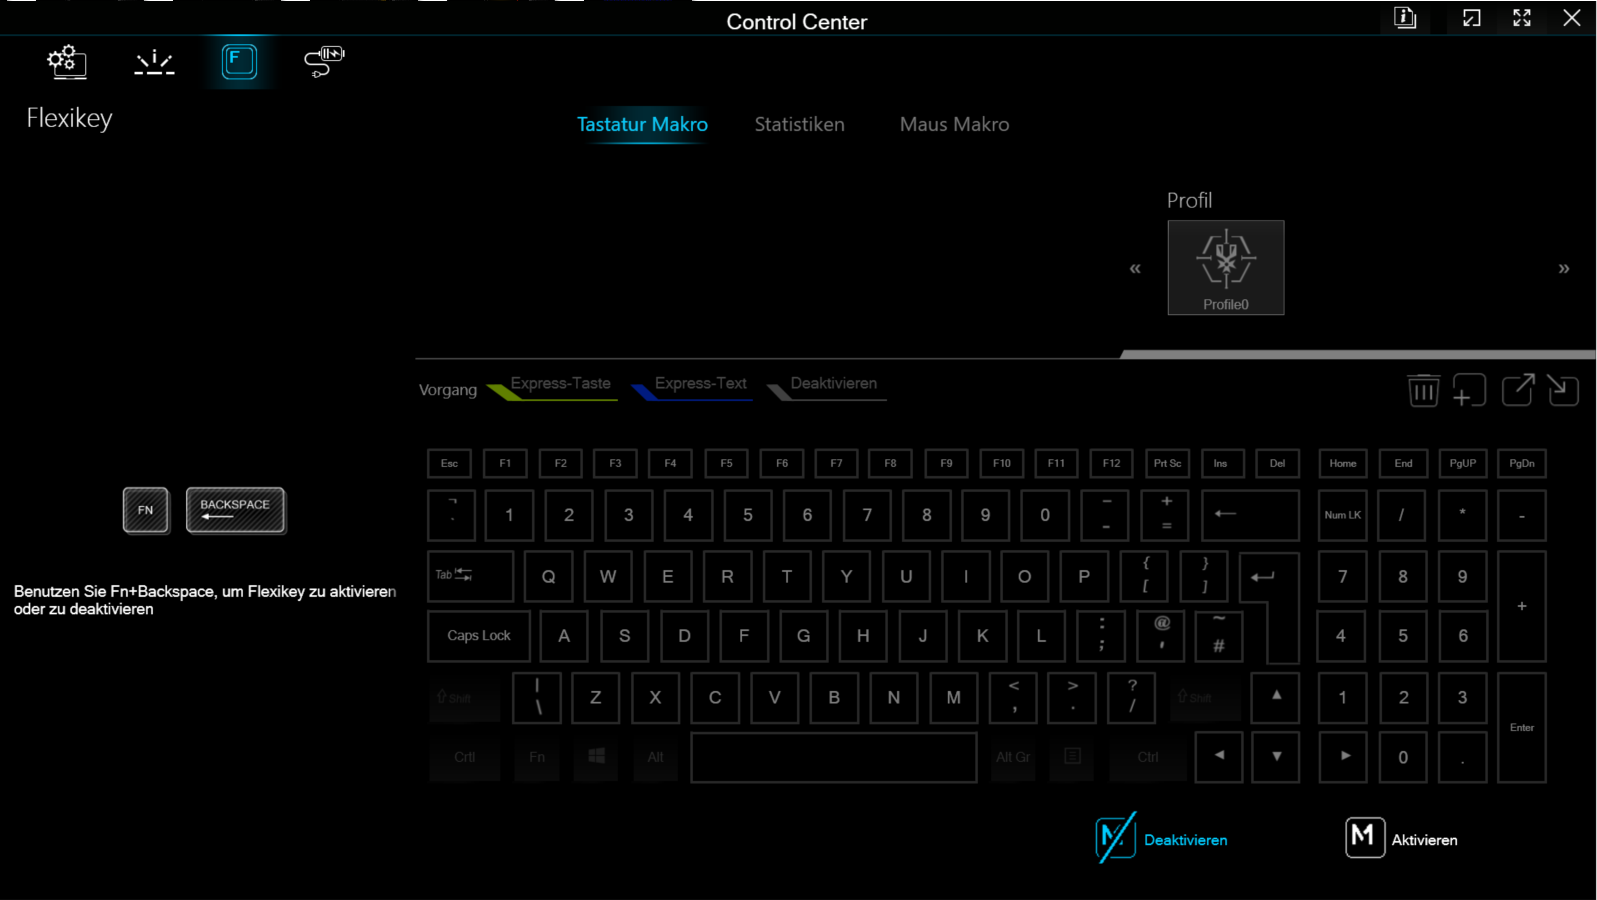
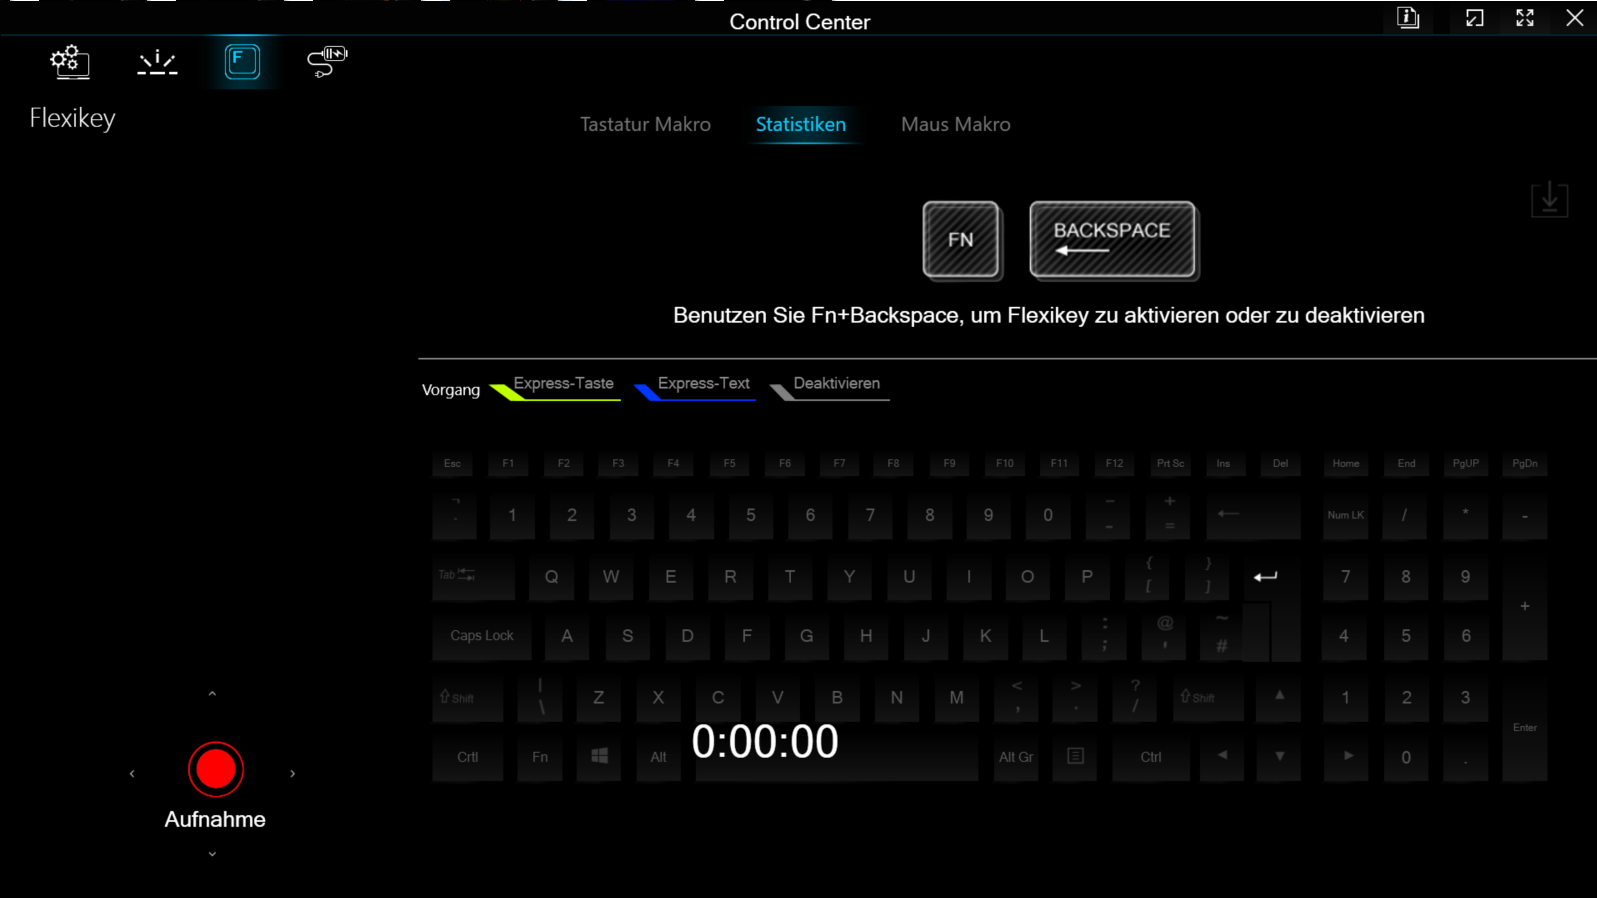
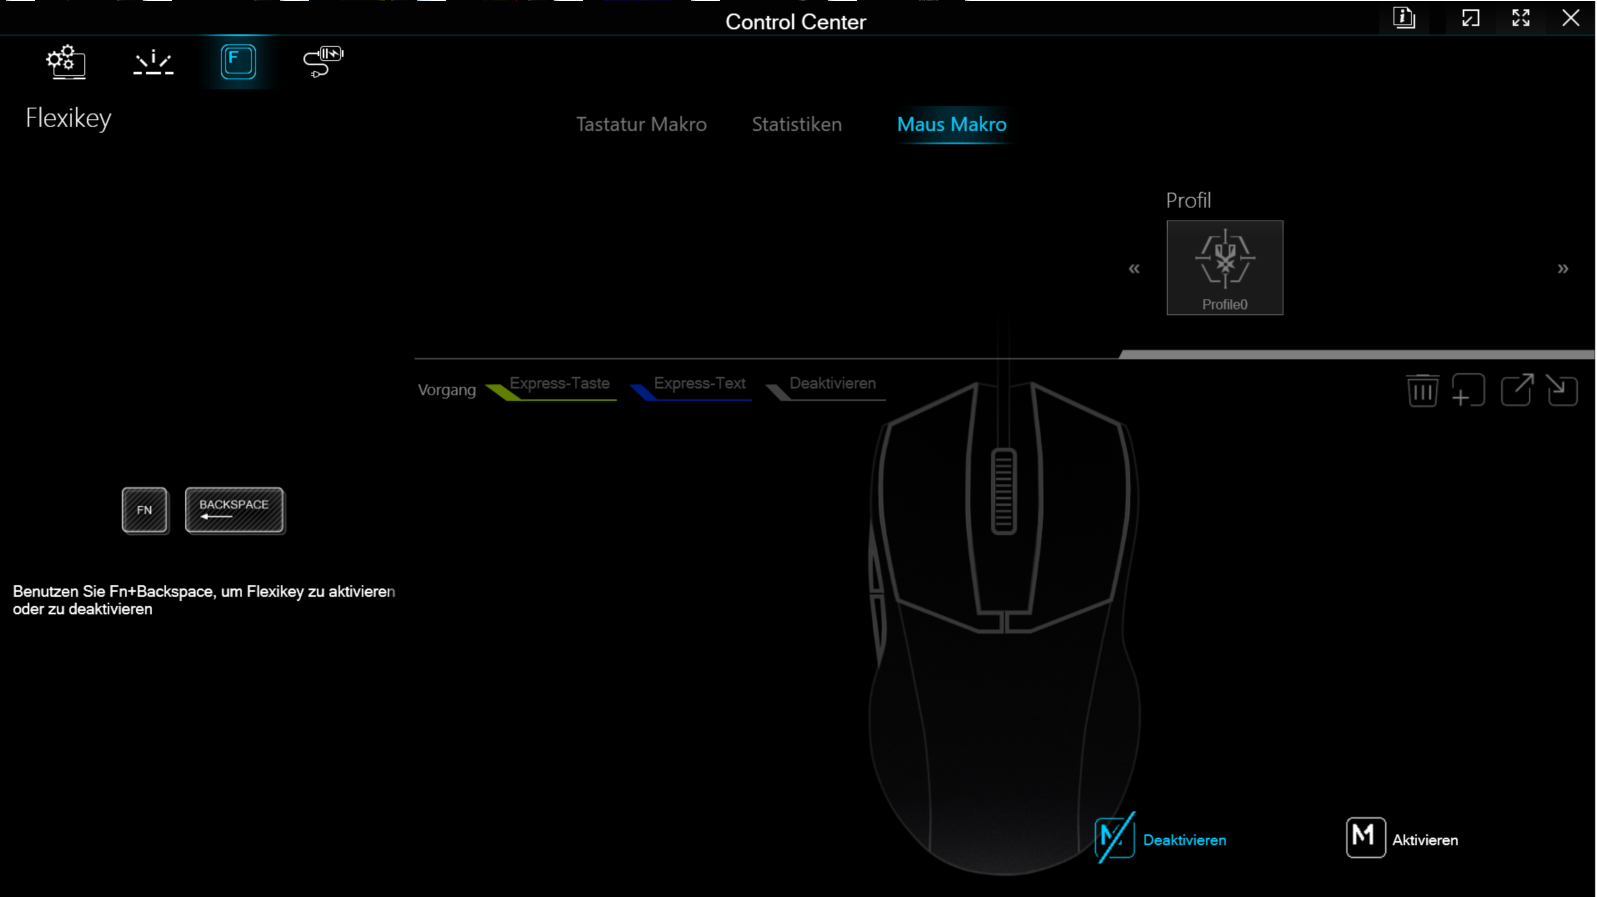
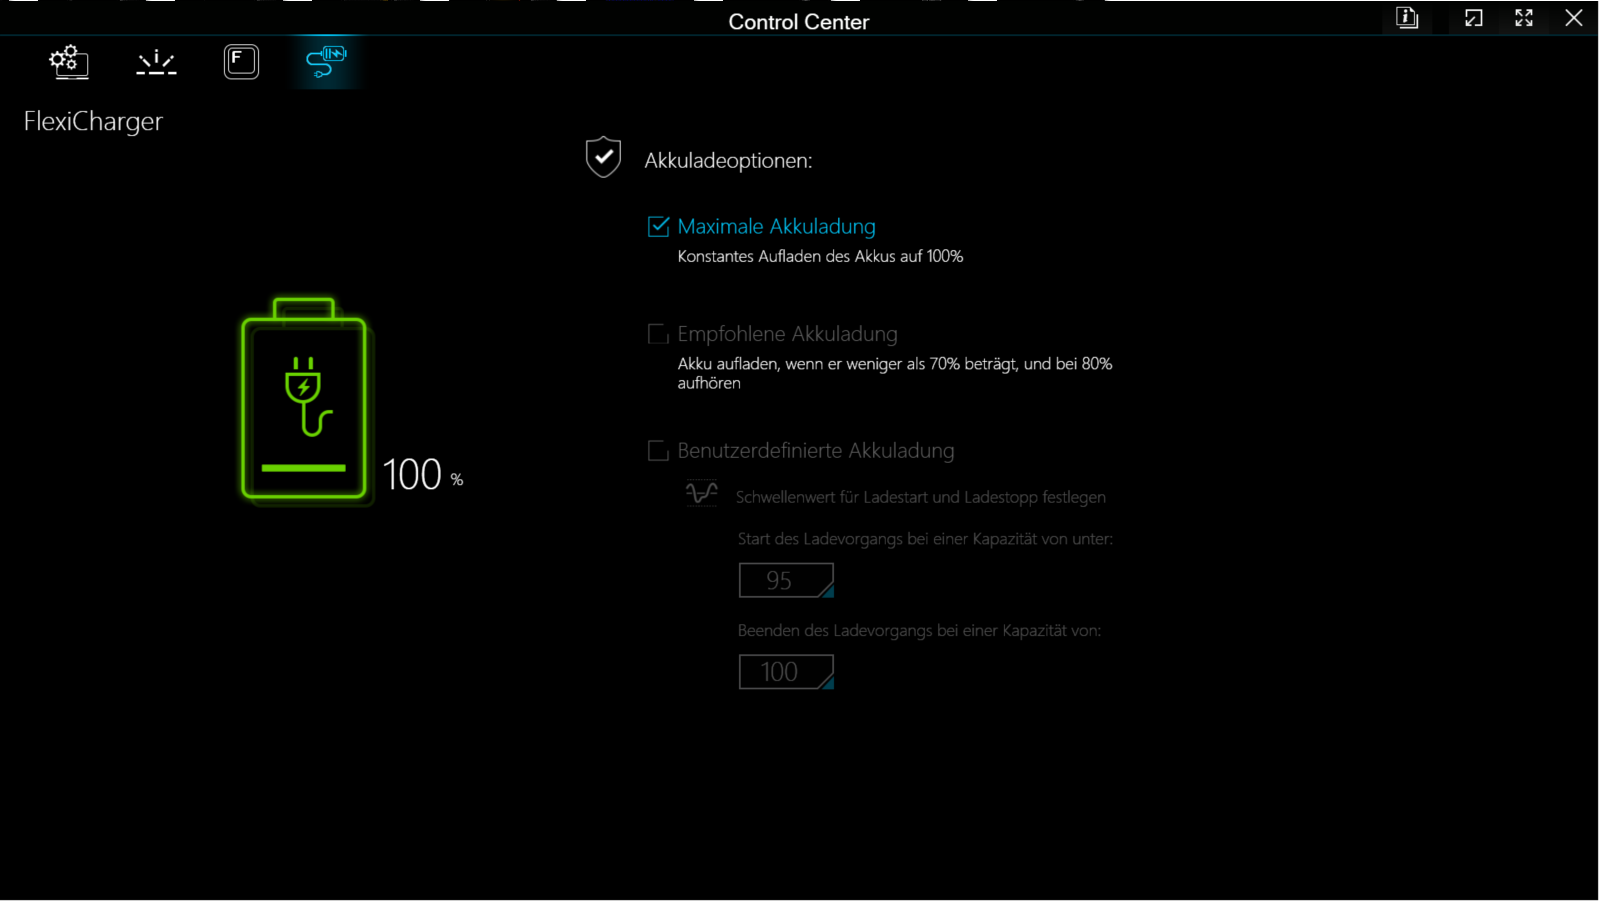
Vous avez le choix entre trois modes de performance spécifiques au fabricant (voir tableau), entre lesquels vous pouvez basculer à l'aide du logiciel Control Center (le centre de contrôle de l'ordinateur portable). Nous avons utilisé les modes performance (benchmarks) et silencieux (tests de batterie). Optimus était actif.
| Mode performance | Mode divertissement | Mode silencieux (dGPU désactivé) | |
|---|---|---|---|
| Limite de puissance 1 (HWInfo) | 135 watts | 55 watts | 25 watts |
| Limite de puissance 2 (HWInfo) | 150 watts | 135 watts | 35 watts |
| Bruit (CP 2077 Phantom) | 53 dB (A) | 49 dB (A) | - |
| Performance (CP 2077 Phantom) | 78 fps | 73 fps | - |
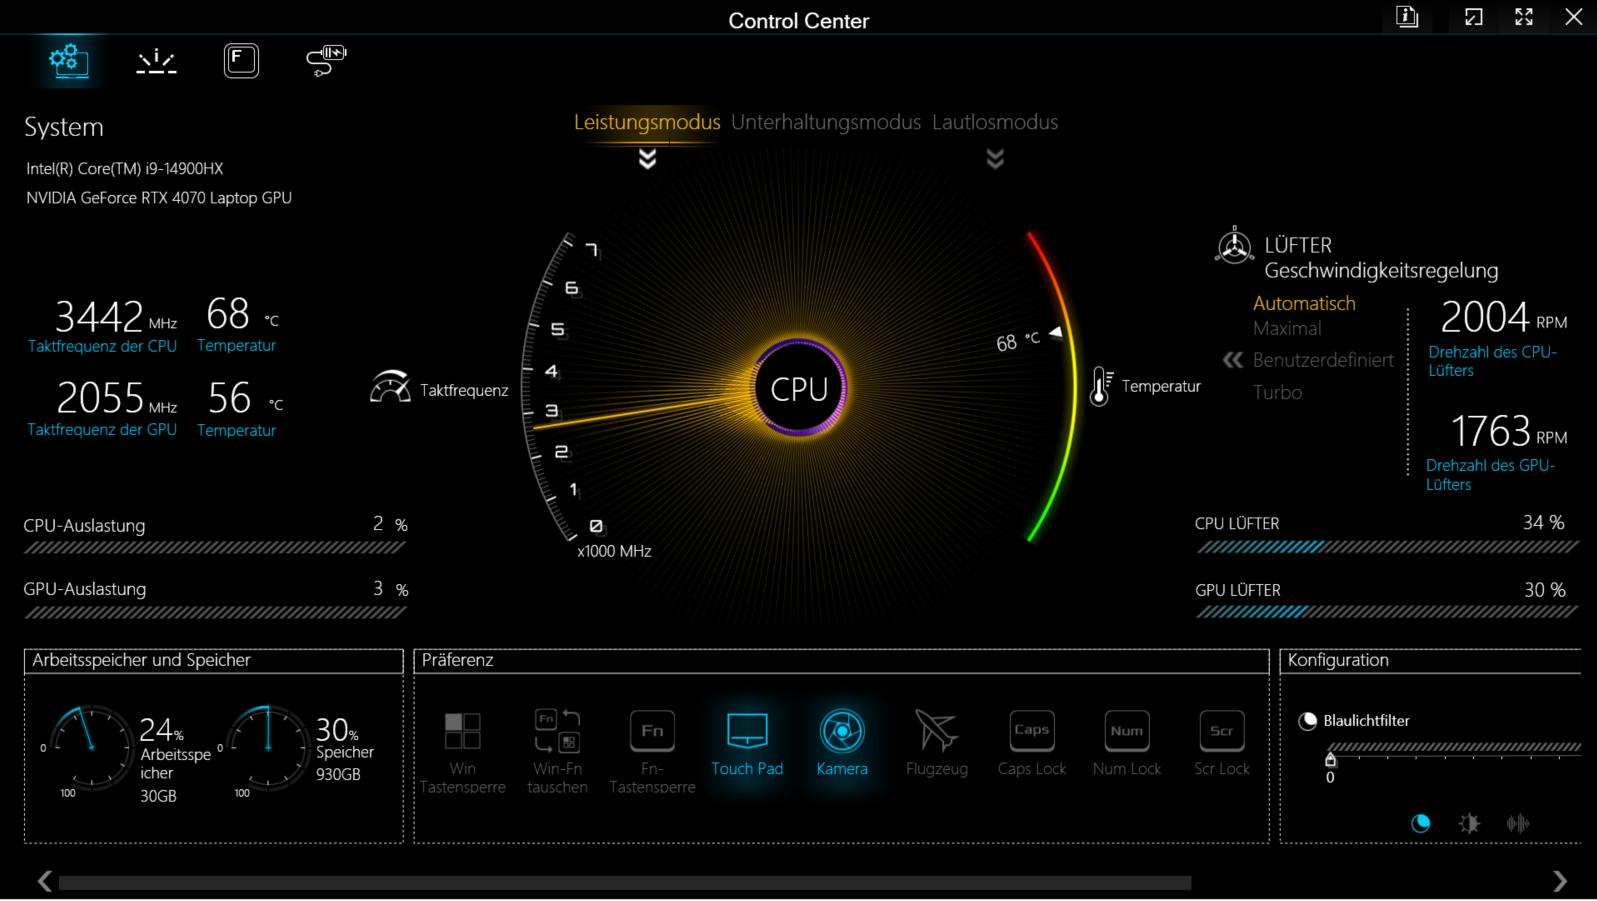
Problèmes avec le mode divertissement
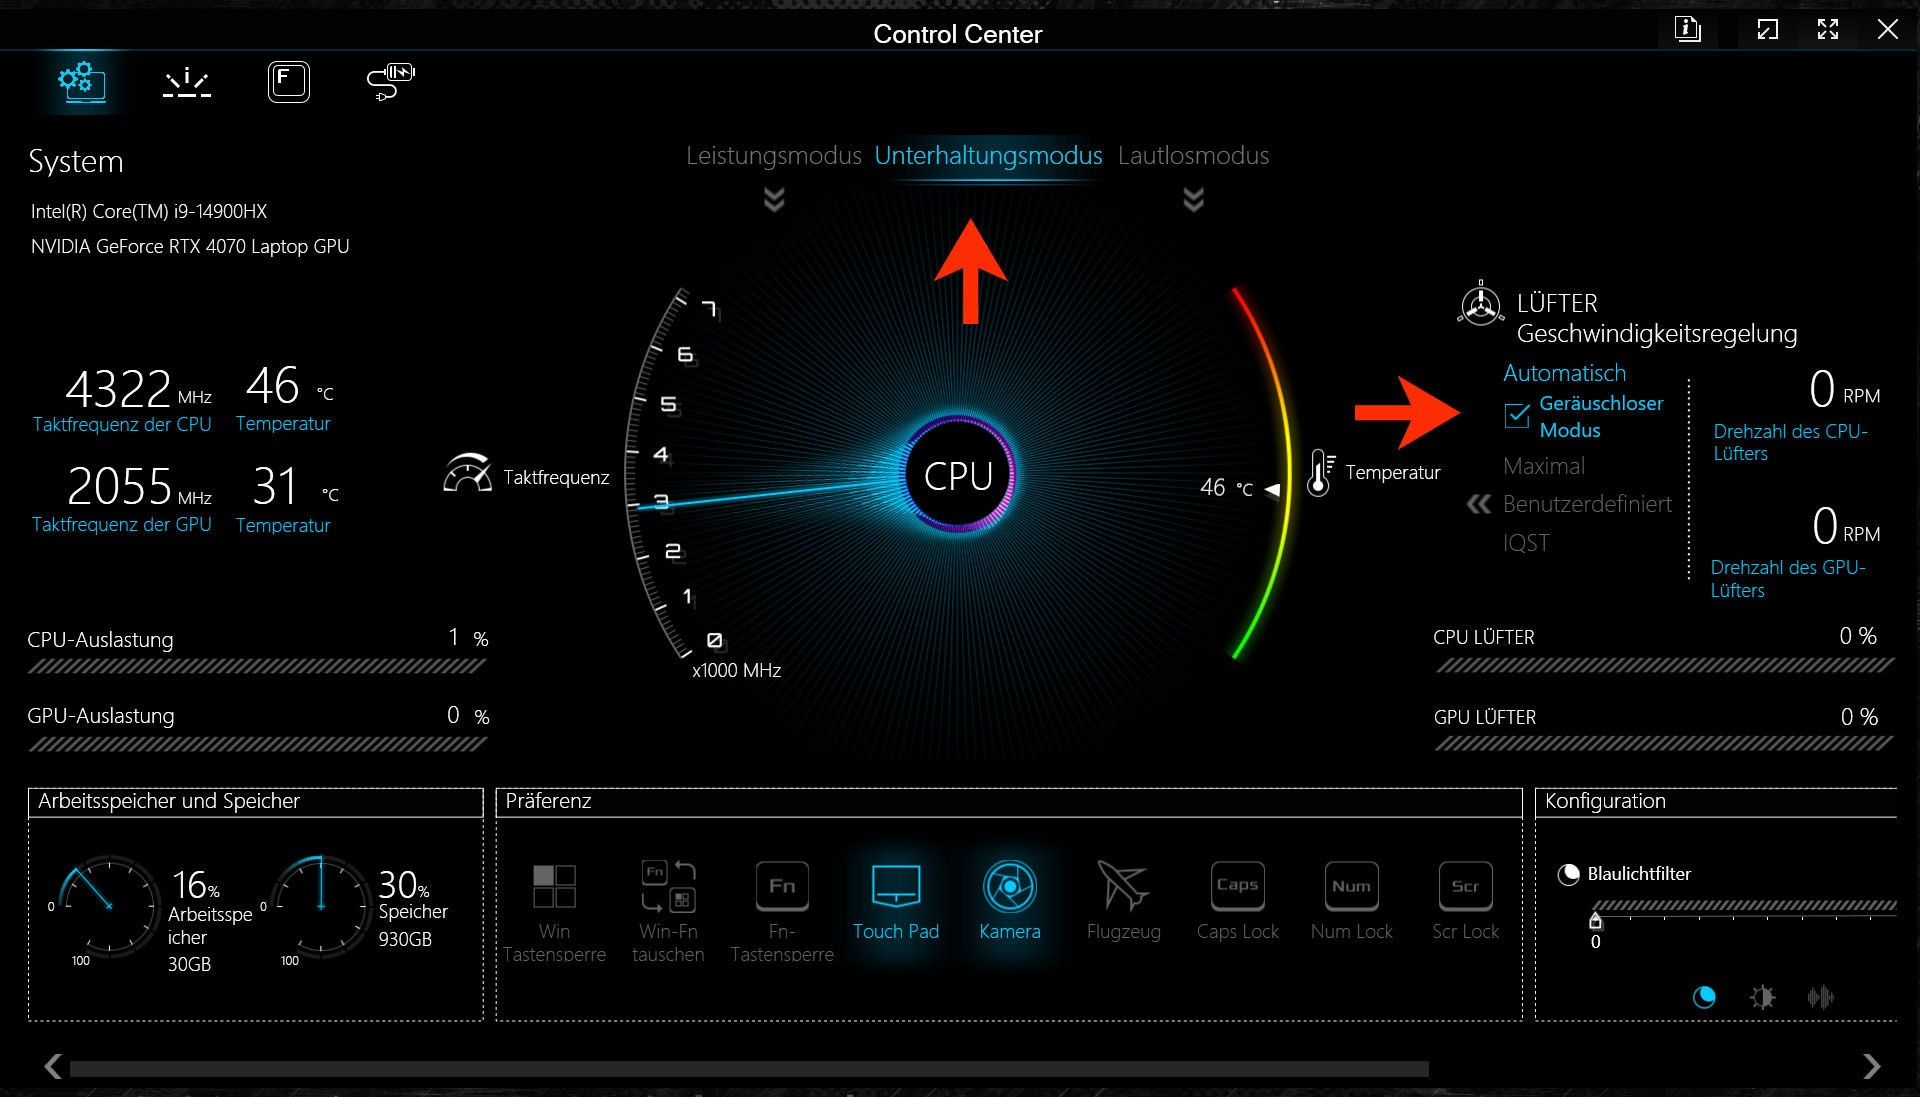
Le profil "divertissement" a provoqué d'importantes fluctuations de performances au cours de notre test. Nous avons donc renoncé à l'utiliser. Au cours du test, Schenker a trouvé un moyen de contourner le problème : l'activation de l'option de ventilation "mode silencieux" dans le centre de contrôle. Une prochaine mise à jour du BIOS devrait, espérons-le, corriger cette erreur.
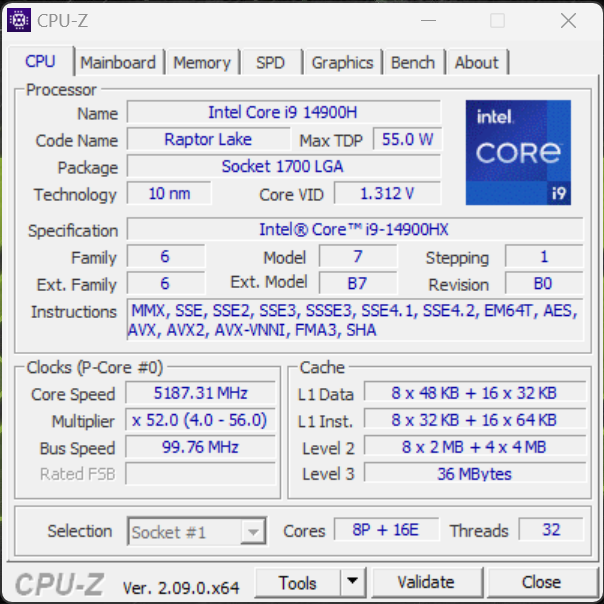
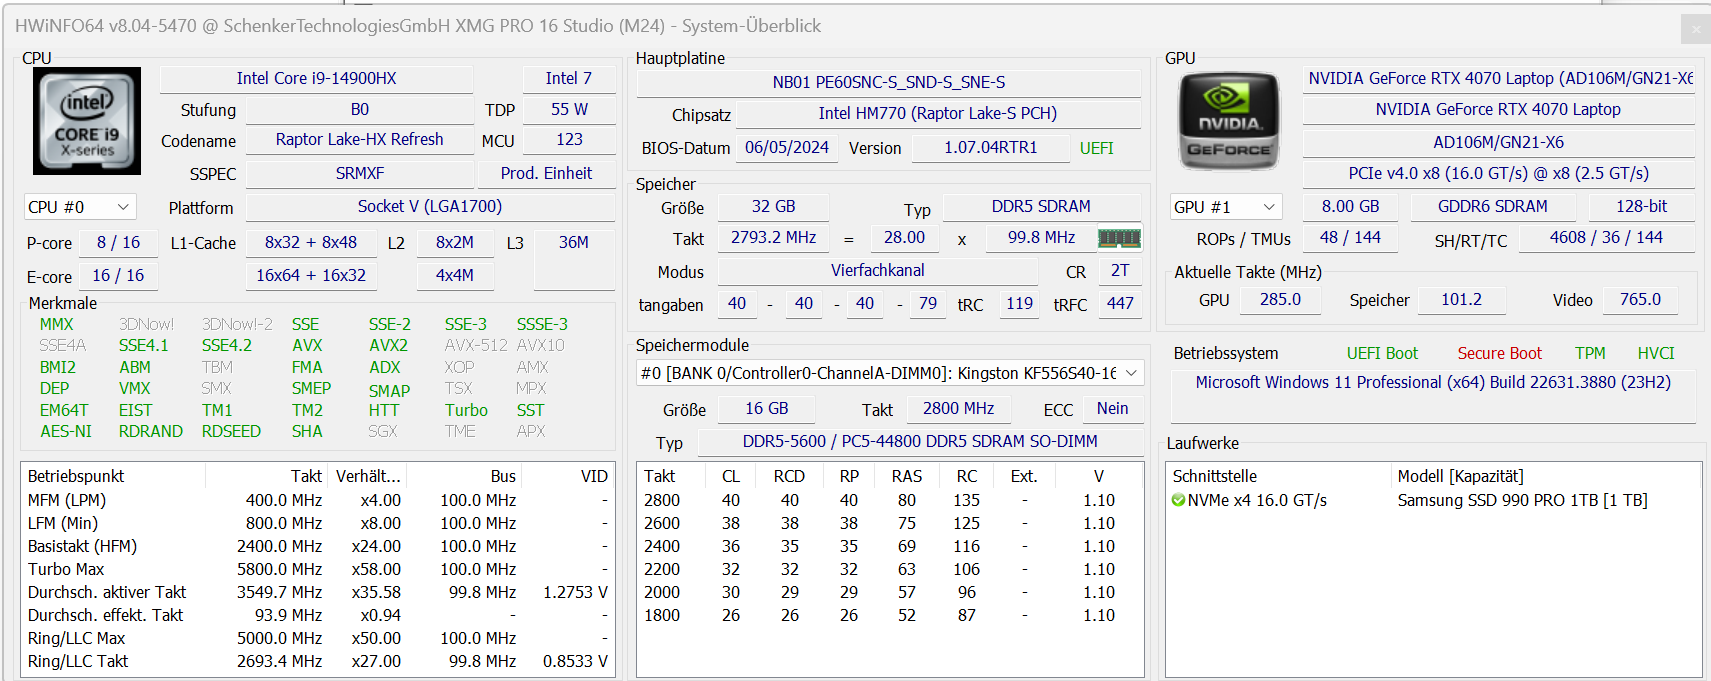
Processeur
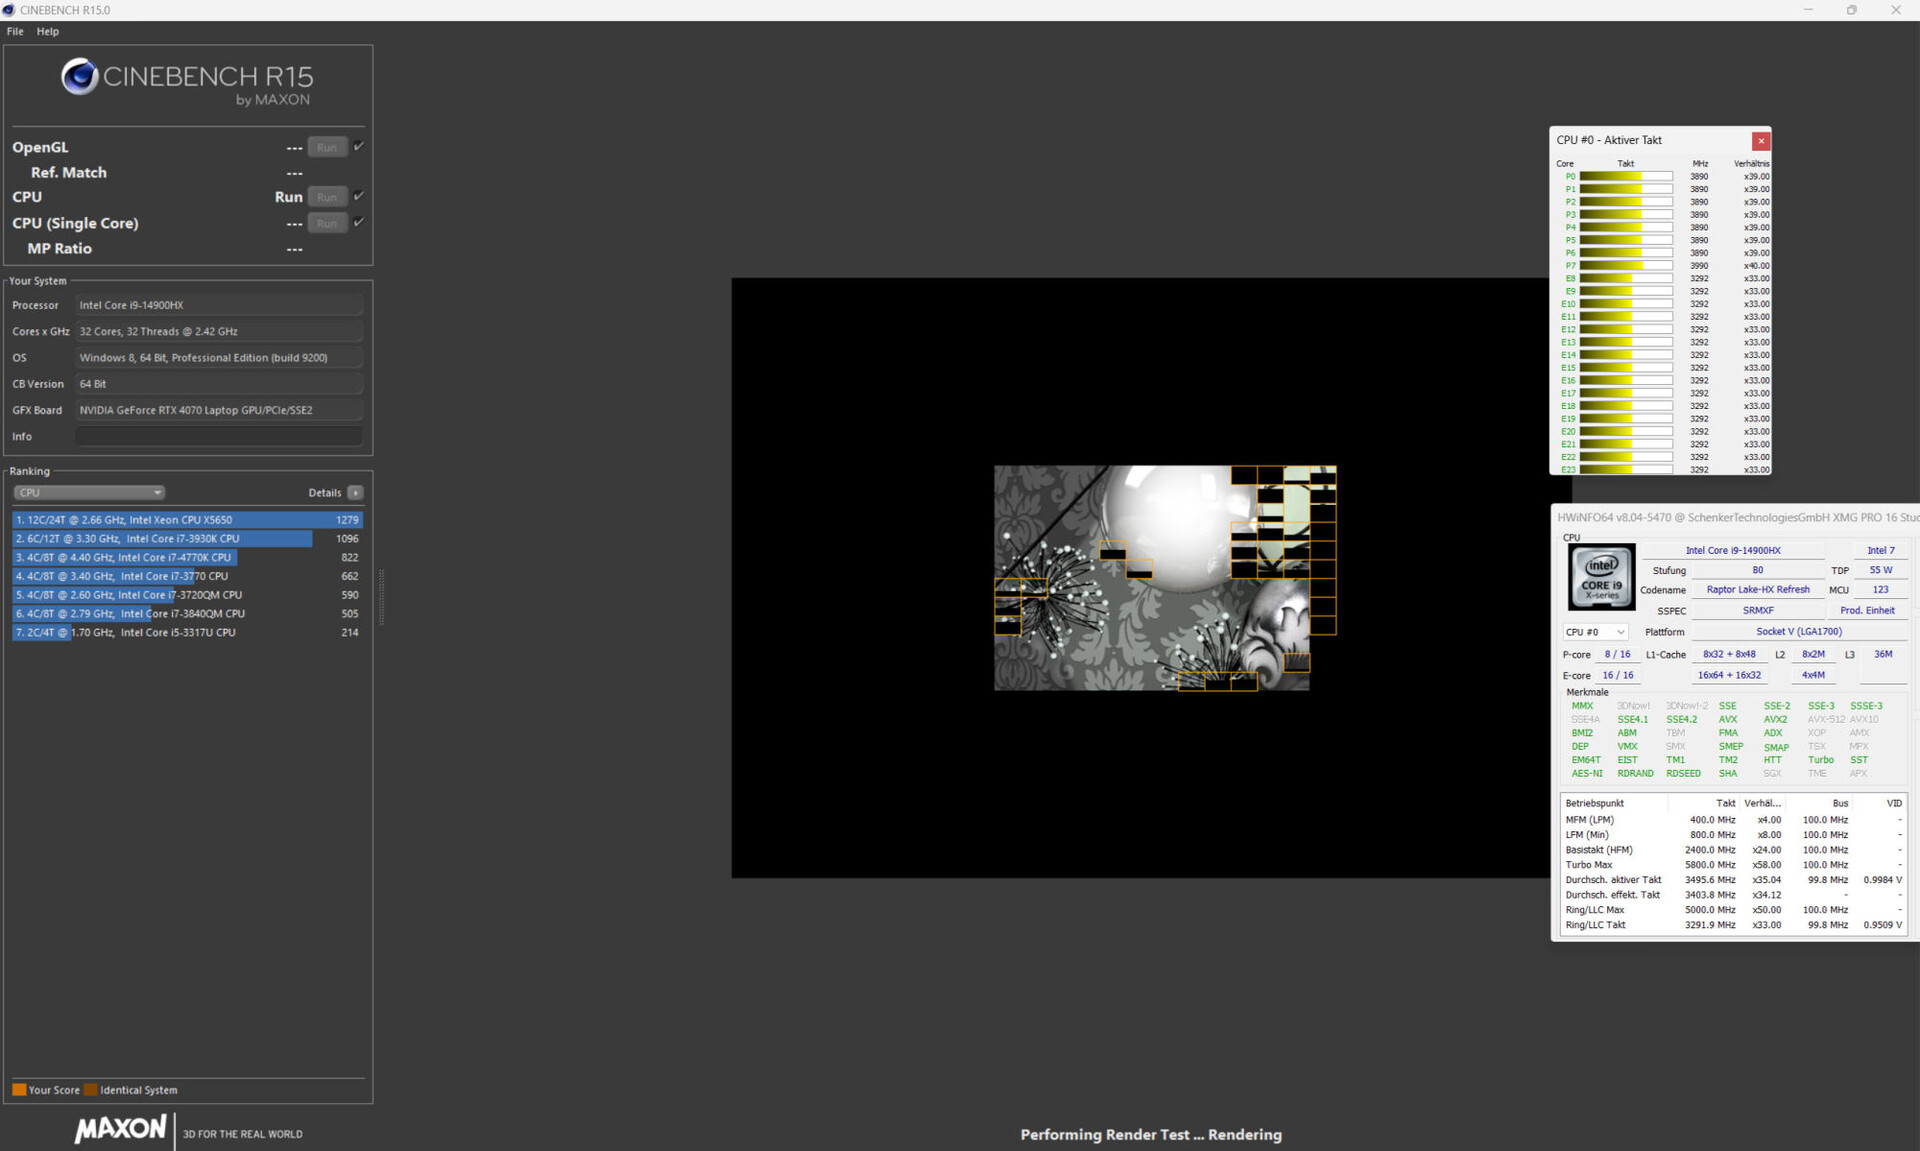
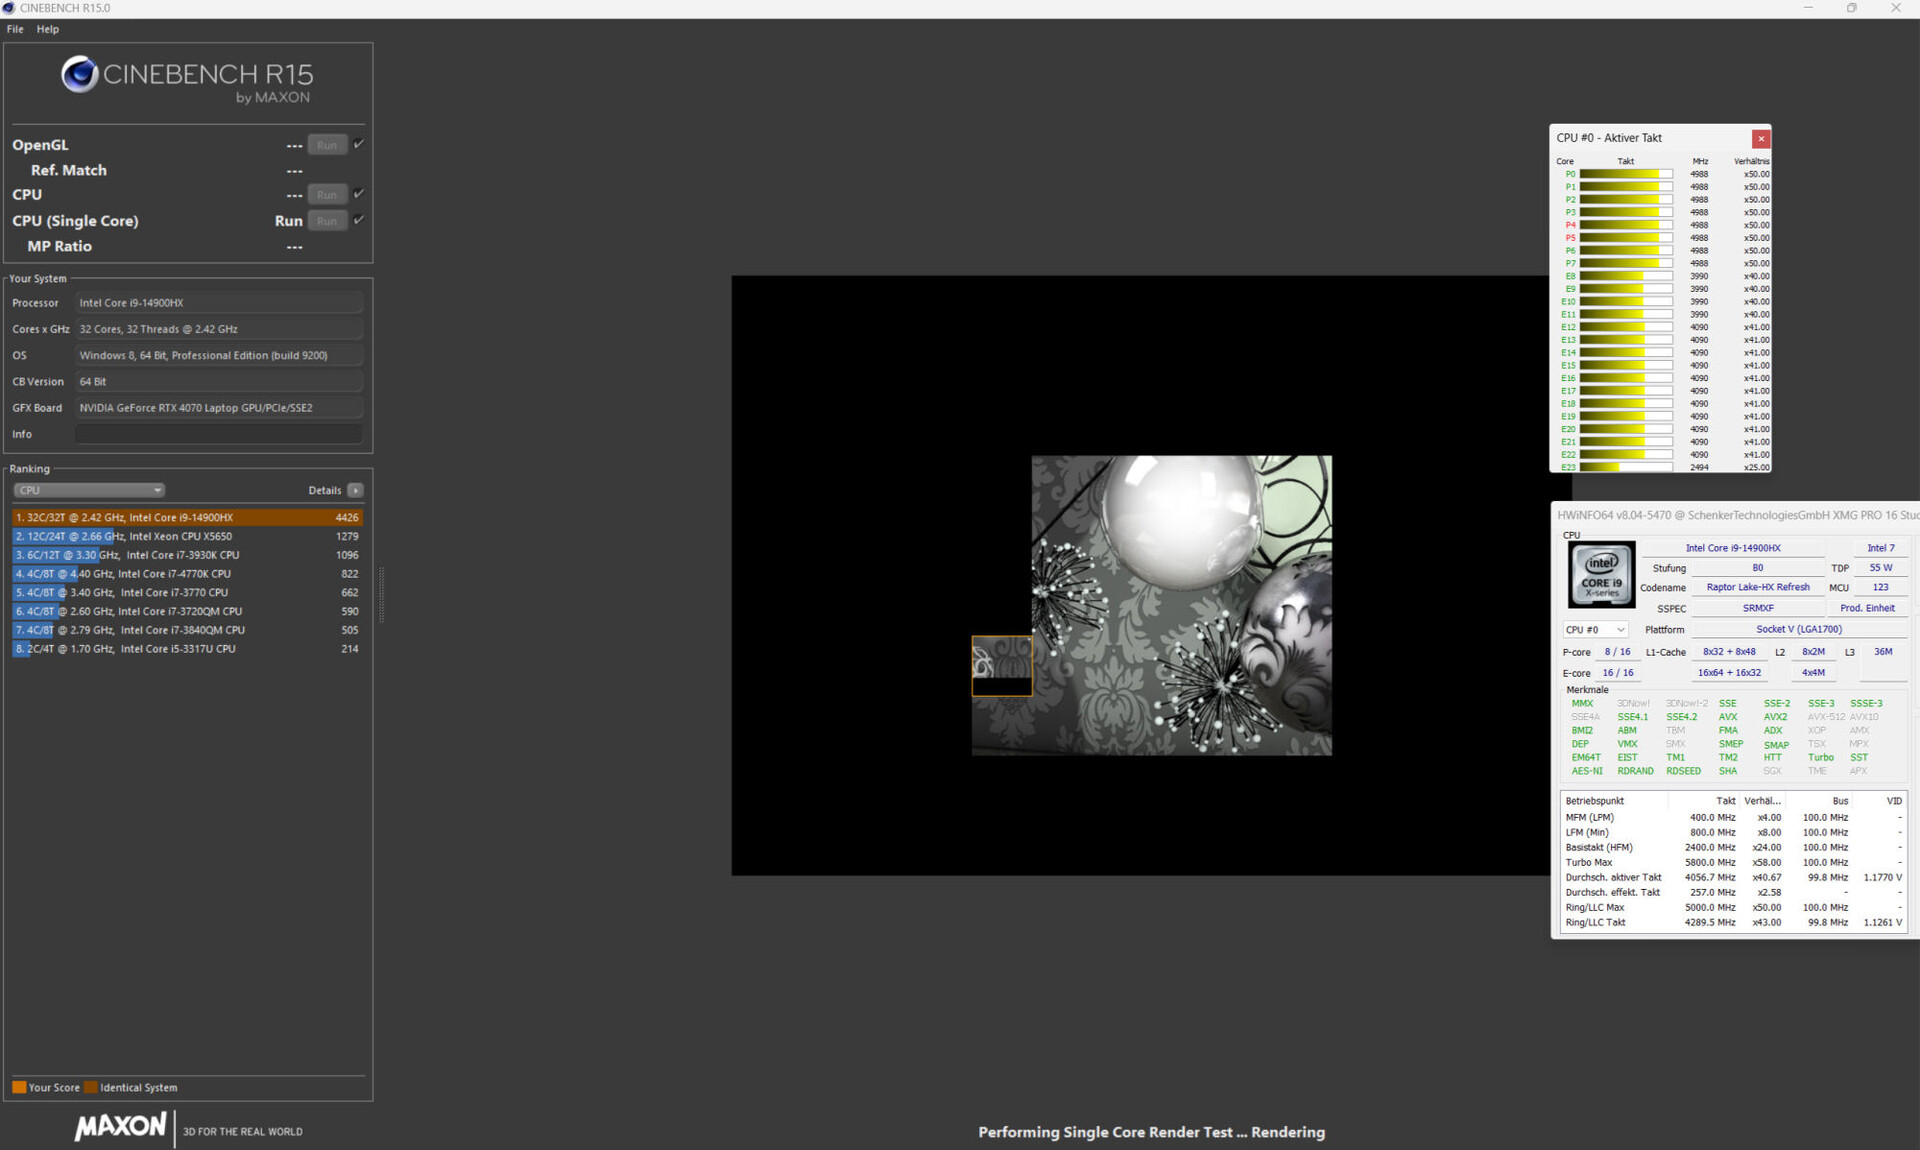
Le Core i9-14900HX (Raptor Lake) est utilisé pour toutes les variantes de configuration du Pro 16. Ses 24 cœurs (8P + 16E) peuvent traiter un total de 32 threads. Une surprise : Même lorsque le mode performance est activé, le processeur ne peut pas fonctionner à pleine puissance en permanence. La charge multithread continue (CB15 Loop) a fait chuter l'horloge du processeur de manière significative de la première à la cinquième exécution. Ensuite, la courbe s'est aplatie. Ses résultats aux tests de référence sont inférieurs à la moyenne précédente du processeur.
Cinebench R15 Multi continuous test
* ... Moindre est la valeur, meilleures sont les performances
AIDA64: FP32 Ray-Trace | FPU Julia | CPU SHA3 | CPU Queen | FPU SinJulia | FPU Mandel | CPU AES | CPU ZLib | FP64 Ray-Trace | CPU PhotoWorxx
| Performance Rating | |
| Lenovo Legion Pro 5 16IRX9 | |
| Moyenne Intel Core i9-14900HX | |
| Aorus 16X 2024 | |
| Lenovo Legion 7 16 IRX G9 | |
| SCHENKER XMG Pro 16 Studio (Mid 24) | |
| Acer Predator Helios Neo 16 (2024) | |
| Moyenne de la classe Gaming | |
| SCHENKER XMG Pro 16 Studio (Mid 23) | |
| AIDA64 / FP32 Ray-Trace | |
| Lenovo Legion 7 16 IRX G9 | |
| Lenovo Legion Pro 5 16IRX9 | |
| Moyenne Intel Core i9-14900HX (13098 - 33474, n=36) | |
| Aorus 16X 2024 | |
| Moyenne de la classe Gaming (4986 - 81639, n=147, 2 dernières années) | |
| Acer Predator Helios Neo 16 (2024) | |
| SCHENKER XMG Pro 16 Studio (Mid 24) | |
| SCHENKER XMG Pro 16 Studio (Mid 23) | |
| AIDA64 / FPU Julia | |
| Lenovo Legion Pro 5 16IRX9 | |
| Moyenne Intel Core i9-14900HX (67573 - 166040, n=36) | |
| Lenovo Legion 7 16 IRX G9 | |
| Aorus 16X 2024 | |
| SCHENKER XMG Pro 16 Studio (Mid 24) | |
| Acer Predator Helios Neo 16 (2024) | |
| Moyenne de la classe Gaming (25360 - 252486, n=147, 2 dernières années) | |
| SCHENKER XMG Pro 16 Studio (Mid 23) | |
| AIDA64 / CPU SHA3 | |
| Lenovo Legion Pro 5 16IRX9 | |
| Moyenne Intel Core i9-14900HX (3589 - 7979, n=36) | |
| Aorus 16X 2024 | |
| Lenovo Legion 7 16 IRX G9 | |
| SCHENKER XMG Pro 16 Studio (Mid 24) | |
| Acer Predator Helios Neo 16 (2024) | |
| Moyenne de la classe Gaming (1339 - 10389, n=147, 2 dernières années) | |
| SCHENKER XMG Pro 16 Studio (Mid 23) | |
| AIDA64 / CPU Queen | |
| Acer Predator Helios Neo 16 (2024) | |
| Lenovo Legion Pro 5 16IRX9 | |
| Lenovo Legion 7 16 IRX G9 | |
| Aorus 16X 2024 | |
| Moyenne Intel Core i9-14900HX (118405 - 148966, n=36) | |
| SCHENKER XMG Pro 16 Studio (Mid 24) | |
| Moyenne de la classe Gaming (50699 - 200651, n=147, 2 dernières années) | |
| SCHENKER XMG Pro 16 Studio (Mid 23) | |
| AIDA64 / FPU SinJulia | |
| Lenovo Legion Pro 5 16IRX9 | |
| Moyenne Intel Core i9-14900HX (10475 - 18517, n=36) | |
| Aorus 16X 2024 | |
| Lenovo Legion 7 16 IRX G9 | |
| SCHENKER XMG Pro 16 Studio (Mid 24) | |
| Acer Predator Helios Neo 16 (2024) | |
| Moyenne de la classe Gaming (4800 - 32988, n=147, 2 dernières années) | |
| SCHENKER XMG Pro 16 Studio (Mid 23) | |
| AIDA64 / FPU Mandel | |
| Lenovo Legion Pro 5 16IRX9 | |
| Moyenne Intel Core i9-14900HX (32543 - 83662, n=36) | |
| Aorus 16X 2024 | |
| Acer Predator Helios Neo 16 (2024) | |
| Moyenne de la classe Gaming (12321 - 134044, n=147, 2 dernières années) | |
| SCHENKER XMG Pro 16 Studio (Mid 24) | |
| Lenovo Legion 7 16 IRX G9 | |
| SCHENKER XMG Pro 16 Studio (Mid 23) | |
| AIDA64 / CPU AES | |
| SCHENKER XMG Pro 16 Studio (Mid 23) | |
| Moyenne Intel Core i9-14900HX (86964 - 241777, n=36) | |
| Lenovo Legion Pro 5 16IRX9 | |
| Aorus 16X 2024 | |
| Lenovo Legion 7 16 IRX G9 | |
| SCHENKER XMG Pro 16 Studio (Mid 24) | |
| Moyenne de la classe Gaming (19065 - 328679, n=147, 2 dernières années) | |
| Acer Predator Helios Neo 16 (2024) | |
| AIDA64 / CPU ZLib | |
| Lenovo Legion Pro 5 16IRX9 | |
| Moyenne Intel Core i9-14900HX (1054 - 2292, n=36) | |
| Aorus 16X 2024 | |
| SCHENKER XMG Pro 16 Studio (Mid 24) | |
| Lenovo Legion 7 16 IRX G9 | |
| Acer Predator Helios Neo 16 (2024) | |
| Moyenne de la classe Gaming (373 - 2531, n=147, 2 dernières années) | |
| SCHENKER XMG Pro 16 Studio (Mid 23) | |
| AIDA64 / FP64 Ray-Trace | |
| Lenovo Legion Pro 5 16IRX9 | |
| Moyenne Intel Core i9-14900HX (6809 - 18349, n=36) | |
| Lenovo Legion 7 16 IRX G9 | |
| Aorus 16X 2024 | |
| Moyenne de la classe Gaming (2540 - 43430, n=147, 2 dernières années) | |
| SCHENKER XMG Pro 16 Studio (Mid 24) | |
| Acer Predator Helios Neo 16 (2024) | |
| SCHENKER XMG Pro 16 Studio (Mid 23) | |
| AIDA64 / CPU PhotoWorxx | |
| Lenovo Legion Pro 5 16IRX9 | |
| Aorus 16X 2024 | |
| SCHENKER XMG Pro 16 Studio (Mid 24) | |
| Lenovo Legion 7 16 IRX G9 | |
| SCHENKER XMG Pro 16 Studio (Mid 23) | |
| Moyenne Intel Core i9-14900HX (23903 - 54702, n=36) | |
| Acer Predator Helios Neo 16 (2024) | |
| Moyenne de la classe Gaming (10805 - 60161, n=147, 2 dernières années) | |
Performance du système
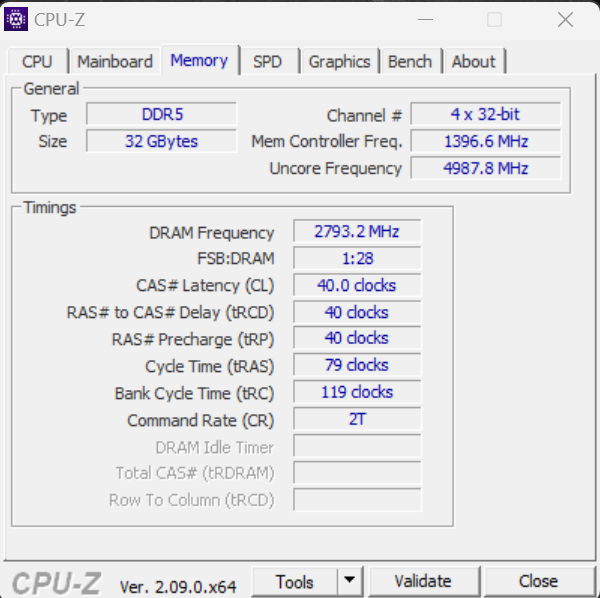
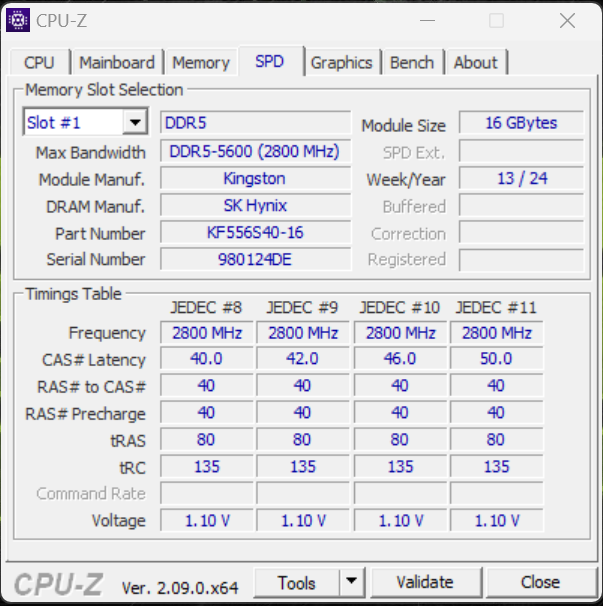
Le système fonctionne en douceur et offre suffisamment de performances pour les jeux, le rendu et le streaming, mais le matériel installé n'est pas en mesure d'établir de nouveaux records. Les taux de transfert de la RAM sont normaux pour une RAM DDR5-5600.

CrossMark: Overall | Productivity | Creativity | Responsiveness
WebXPRT 3: Overall
WebXPRT 4: Overall
Mozilla Kraken 1.1: Total
| PCMark 10 / Score | |
| Lenovo Legion Pro 5 16IRX9 | |
| Aorus 16X 2024 | |
| Acer Predator Helios Neo 16 (2024) | |
| Moyenne Intel Core i9-14900HX, NVIDIA GeForce RTX 4070 Laptop GPU (7768 - 8550, n=8) | |
| SCHENKER XMG Pro 16 Studio (Mid 24) | |
| Lenovo Legion 7 16 IRX G9 | |
| SCHENKER XMG Pro 16 Studio (Mid 23) | |
| Moyenne de la classe Gaming (5776 - 9852, n=133, 2 dernières années) | |
| PCMark 10 / Essentials | |
| SCHENKER XMG Pro 16 Studio (Mid 23) | |
| Acer Predator Helios Neo 16 (2024) | |
| Lenovo Legion Pro 5 16IRX9 | |
| Aorus 16X 2024 | |
| Lenovo Legion 7 16 IRX G9 | |
| Moyenne Intel Core i9-14900HX, NVIDIA GeForce RTX 4070 Laptop GPU (10104 - 11815, n=8) | |
| Moyenne de la classe Gaming (9057 - 12600, n=133, 2 dernières années) | |
| SCHENKER XMG Pro 16 Studio (Mid 24) | |
| PCMark 10 / Productivity | |
| Aorus 16X 2024 | |
| SCHENKER XMG Pro 16 Studio (Mid 24) | |
| Moyenne Intel Core i9-14900HX, NVIDIA GeForce RTX 4070 Laptop GPU (9577 - 11103, n=8) | |
| SCHENKER XMG Pro 16 Studio (Mid 23) | |
| Acer Predator Helios Neo 16 (2024) | |
| Lenovo Legion Pro 5 16IRX9 | |
| Moyenne de la classe Gaming (6662 - 14612, n=133, 2 dernières années) | |
| Lenovo Legion 7 16 IRX G9 | |
| PCMark 10 / Digital Content Creation | |
| Lenovo Legion Pro 5 16IRX9 | |
| Lenovo Legion 7 16 IRX G9 | |
| Moyenne Intel Core i9-14900HX, NVIDIA GeForce RTX 4070 Laptop GPU (12114 - 14827, n=8) | |
| Aorus 16X 2024 | |
| Acer Predator Helios Neo 16 (2024) | |
| SCHENKER XMG Pro 16 Studio (Mid 24) | |
| Moyenne de la classe Gaming (6807 - 18475, n=133, 2 dernières années) | |
| SCHENKER XMG Pro 16 Studio (Mid 23) | |
| CrossMark / Overall | |
| Aorus 16X 2024 | |
| Lenovo Legion 7 16 IRX G9 | |
| Acer Predator Helios Neo 16 (2024) | |
| Moyenne Intel Core i9-14900HX, NVIDIA GeForce RTX 4070 Laptop GPU (2002 - 2312, n=7) | |
| SCHENKER XMG Pro 16 Studio (Mid 24) | |
| Lenovo Legion Pro 5 16IRX9 | |
| SCHENKER XMG Pro 16 Studio (Mid 23) | |
| Moyenne de la classe Gaming (1247 - 2344, n=114, 2 dernières années) | |
| CrossMark / Productivity | |
| Aorus 16X 2024 | |
| Lenovo Legion 7 16 IRX G9 | |
| Acer Predator Helios Neo 16 (2024) | |
| Moyenne Intel Core i9-14900HX, NVIDIA GeForce RTX 4070 Laptop GPU (1827 - 2191, n=7) | |
| SCHENKER XMG Pro 16 Studio (Mid 24) | |
| SCHENKER XMG Pro 16 Studio (Mid 23) | |
| Lenovo Legion Pro 5 16IRX9 | |
| Moyenne de la classe Gaming (1299 - 2204, n=114, 2 dernières années) | |
| CrossMark / Creativity | |
| Aorus 16X 2024 | |
| Acer Predator Helios Neo 16 (2024) | |
| Lenovo Legion 7 16 IRX G9 | |
| SCHENKER XMG Pro 16 Studio (Mid 24) | |
| Moyenne Intel Core i9-14900HX, NVIDIA GeForce RTX 4070 Laptop GPU (2258 - 2458, n=7) | |
| Lenovo Legion Pro 5 16IRX9 | |
| Moyenne de la classe Gaming (1275 - 2660, n=114, 2 dernières années) | |
| SCHENKER XMG Pro 16 Studio (Mid 23) | |
| CrossMark / Responsiveness | |
| Lenovo Legion 7 16 IRX G9 | |
| Aorus 16X 2024 | |
| Moyenne Intel Core i9-14900HX, NVIDIA GeForce RTX 4070 Laptop GPU (1734 - 2330, n=7) | |
| Acer Predator Helios Neo 16 (2024) | |
| SCHENKER XMG Pro 16 Studio (Mid 23) | |
| Lenovo Legion Pro 5 16IRX9 | |
| SCHENKER XMG Pro 16 Studio (Mid 24) | |
| Moyenne de la classe Gaming (1030 - 2330, n=114, 2 dernières années) | |
| WebXPRT 3 / Overall | |
| Lenovo Legion 7 16 IRX G9 | |
| Aorus 16X 2024 | |
| Acer Predator Helios Neo 16 (2024) | |
| Lenovo Legion Pro 5 16IRX9 | |
| Moyenne Intel Core i9-14900HX, NVIDIA GeForce RTX 4070 Laptop GPU (269 - 342, n=8) | |
| SCHENKER XMG Pro 16 Studio (Mid 23) | |
| SCHENKER XMG Pro 16 Studio (Mid 24) | |
| Moyenne de la classe Gaming (215 - 480, n=127, 2 dernières années) | |
| WebXPRT 4 / Overall | |
| Acer Predator Helios Neo 16 (2024) | |
| SCHENKER XMG Pro 16 Studio (Mid 24) | |
| Moyenne Intel Core i9-14900HX, NVIDIA GeForce RTX 4070 Laptop GPU (291 - 304, n=6) | |
| Lenovo Legion 7 16 IRX G9 | |
| Lenovo Legion Pro 5 16IRX9 | |
| Moyenne de la classe Gaming (176.4 - 335, n=115, 2 dernières années) | |
| Mozilla Kraken 1.1 / Total | |
| SCHENKER XMG Pro 16 Studio (Mid 23) | |
| Moyenne de la classe Gaming (409 - 674, n=139, 2 dernières années) | |
| SCHENKER XMG Pro 16 Studio (Mid 24) | |
| Lenovo Legion Pro 5 16IRX9 | |
| Moyenne Intel Core i9-14900HX, NVIDIA GeForce RTX 4070 Laptop GPU (431 - 469, n=8) | |
| Acer Predator Helios Neo 16 (2024) | |
| Lenovo Legion 7 16 IRX G9 | |
| Aorus 16X 2024 | |
* ... Moindre est la valeur, meilleures sont les performances
| PCMark 10 Score | 8166 points | |
Aide | ||
| AIDA64 / Memory Copy | |
| Lenovo Legion Pro 5 16IRX9 | |
| Lenovo Legion 7 16 IRX G9 | |
| Aorus 16X 2024 | |
| SCHENKER XMG Pro 16 Studio (Mid 24) | |
| Acer Predator Helios Neo 16 (2024) | |
| Moyenne Intel Core i9-14900HX (38028 - 83392, n=36) | |
| SCHENKER XMG Pro 16 Studio (Mid 23) | |
| Moyenne de la classe Gaming (21750 - 97515, n=147, 2 dernières années) | |
| AIDA64 / Memory Read | |
| Aorus 16X 2024 | |
| Lenovo Legion Pro 5 16IRX9 | |
| Lenovo Legion 7 16 IRX G9 | |
| SCHENKER XMG Pro 16 Studio (Mid 24) | |
| Acer Predator Helios Neo 16 (2024) | |
| Moyenne Intel Core i9-14900HX (43306 - 87568, n=36) | |
| SCHENKER XMG Pro 16 Studio (Mid 23) | |
| Moyenne de la classe Gaming (22956 - 102937, n=147, 2 dernières années) | |
| AIDA64 / Memory Write | |
| Aorus 16X 2024 | |
| Lenovo Legion Pro 5 16IRX9 | |
| Lenovo Legion 7 16 IRX G9 | |
| SCHENKER XMG Pro 16 Studio (Mid 24) | |
| Moyenne Intel Core i9-14900HX (37146 - 80589, n=36) | |
| SCHENKER XMG Pro 16 Studio (Mid 23) | |
| Acer Predator Helios Neo 16 (2024) | |
| Moyenne de la classe Gaming (22297 - 108954, n=147, 2 dernières années) | |
| AIDA64 / Memory Latency | |
| Moyenne de la classe Gaming (59.5 - 259, n=147, 2 dernières années) | |
| Acer Predator Helios Neo 16 (2024) | |
| SCHENKER XMG Pro 16 Studio (Mid 23) | |
| Moyenne Intel Core i9-14900HX (76.1 - 105, n=36) | |
| SCHENKER XMG Pro 16 Studio (Mid 24) | |
| Lenovo Legion 7 16 IRX G9 | |
| Lenovo Legion Pro 5 16IRX9 | |
| Aorus 16X 2024 | |
* ... Moindre est la valeur, meilleures sont les performances
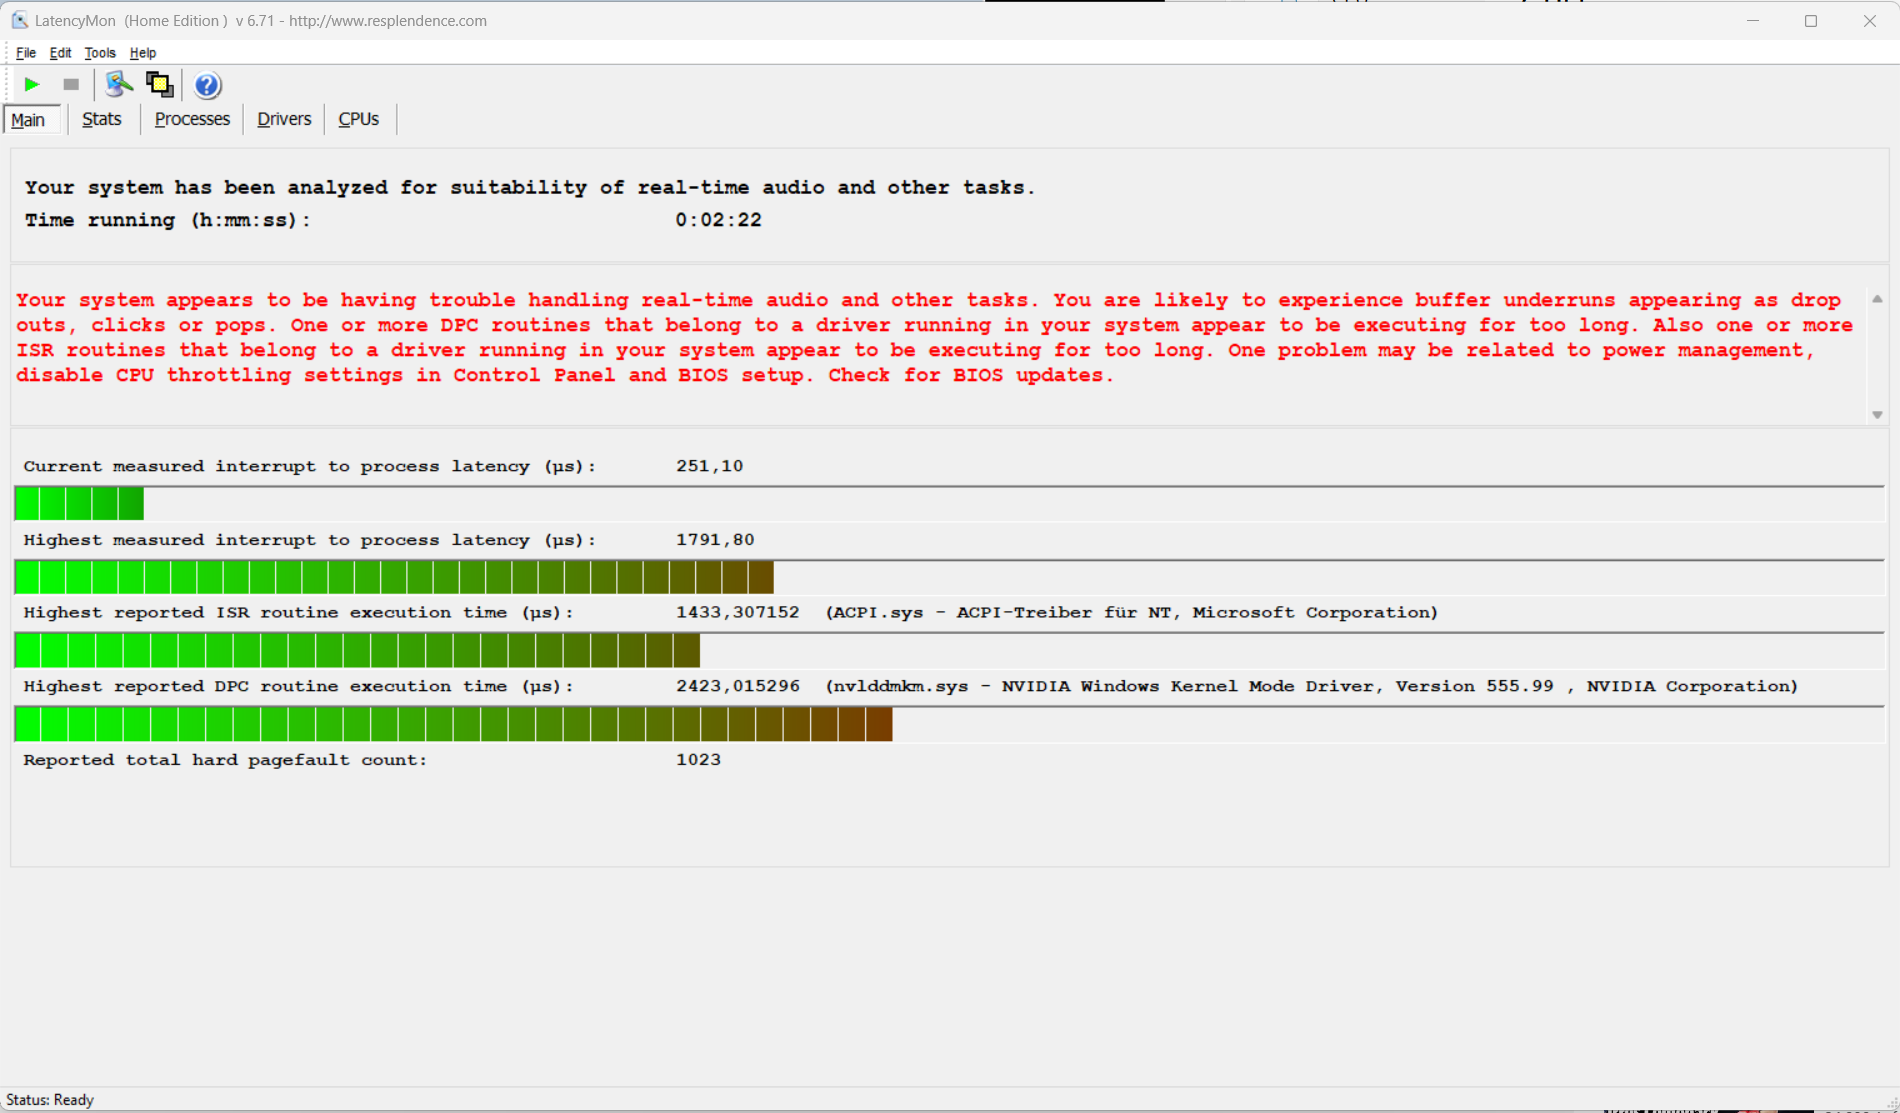
Latences DPC
En raison des latences relativement élevées de l'ordinateur portable, l'édition vidéo et audio en temps réel n'est pas prévue. Toutefois, de futures mises à jour logicielles pourraient apporter des changements à cet égard.
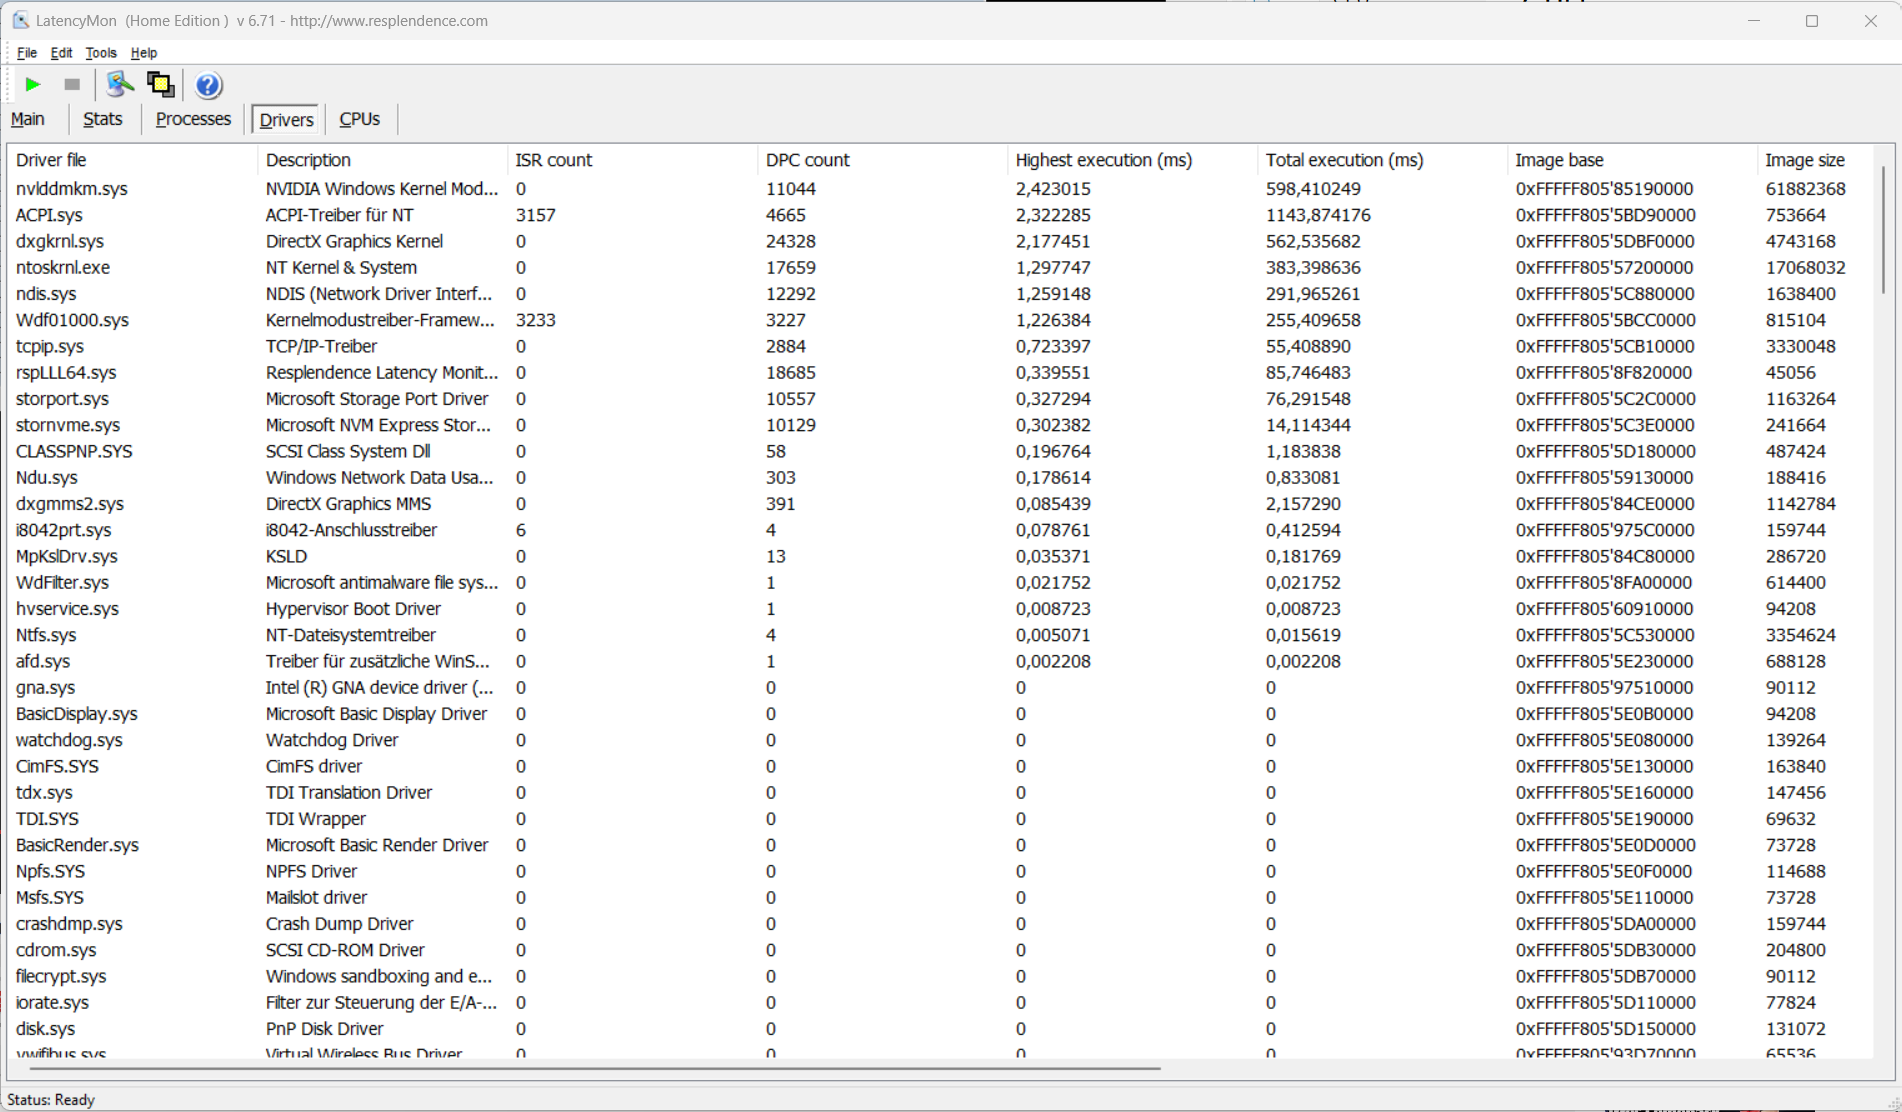
| DPC Latencies / LatencyMon - interrupt to process latency (max), Web, Youtube, Prime95 | |
| SCHENKER XMG Pro 16 Studio (Mid 23) | |
| SCHENKER XMG Pro 16 Studio (Mid 24) | |
| Lenovo Legion 7 16 IRX G9 | |
| Acer Predator Helios Neo 16 (2024) | |
| Aorus 16X 2024 | |
| Lenovo Legion Pro 5 16IRX9 | |
* ... Moindre est la valeur, meilleures sont les performances
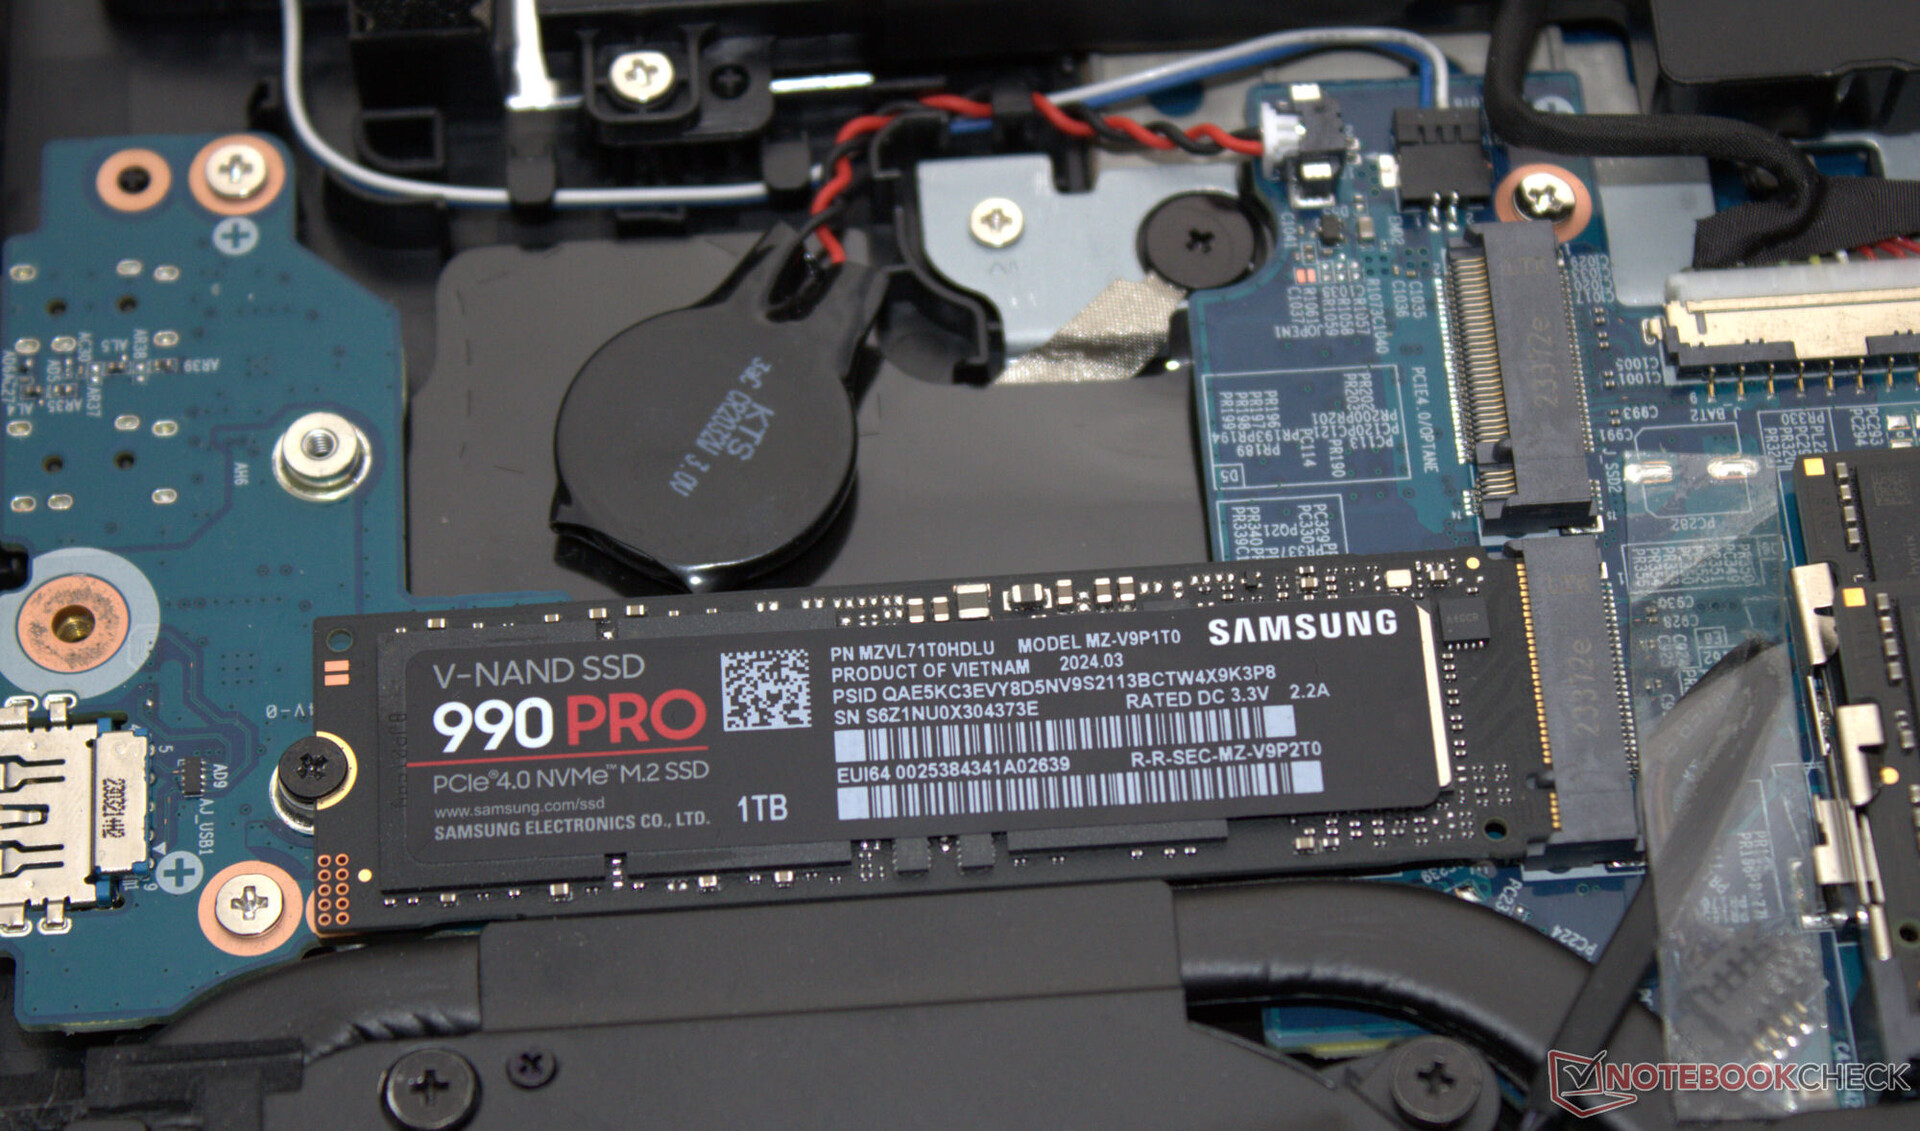
Dispositifs de stockage
La boutique en ligne de Schenker propose une grande variété de disques SSD. Notre appareil de test est équipé d'un modèle ultrarapide (1 To, PCIe 4, M.2-2280) de Samsung. Points positifs : Il n'y a pas eu d'étranglement d'origine thermique. L'ordinateur portable peut accueillir jusqu'à deux disques SSD PCIe 4 (M.2-2280). Le RAID-0/1 est pris en charge.

* ... Moindre est la valeur, meilleures sont les performances
Reading continuous performance: DiskSpd Read Loop, Queue Depth 8
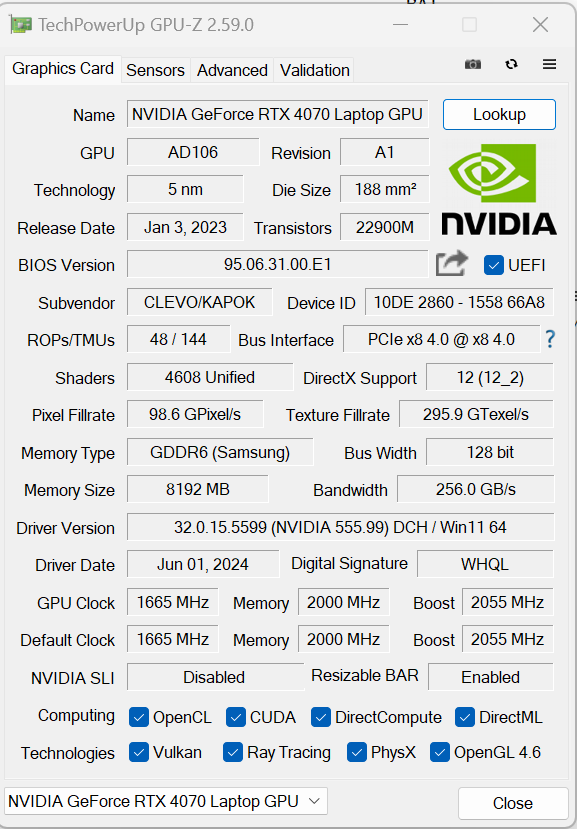
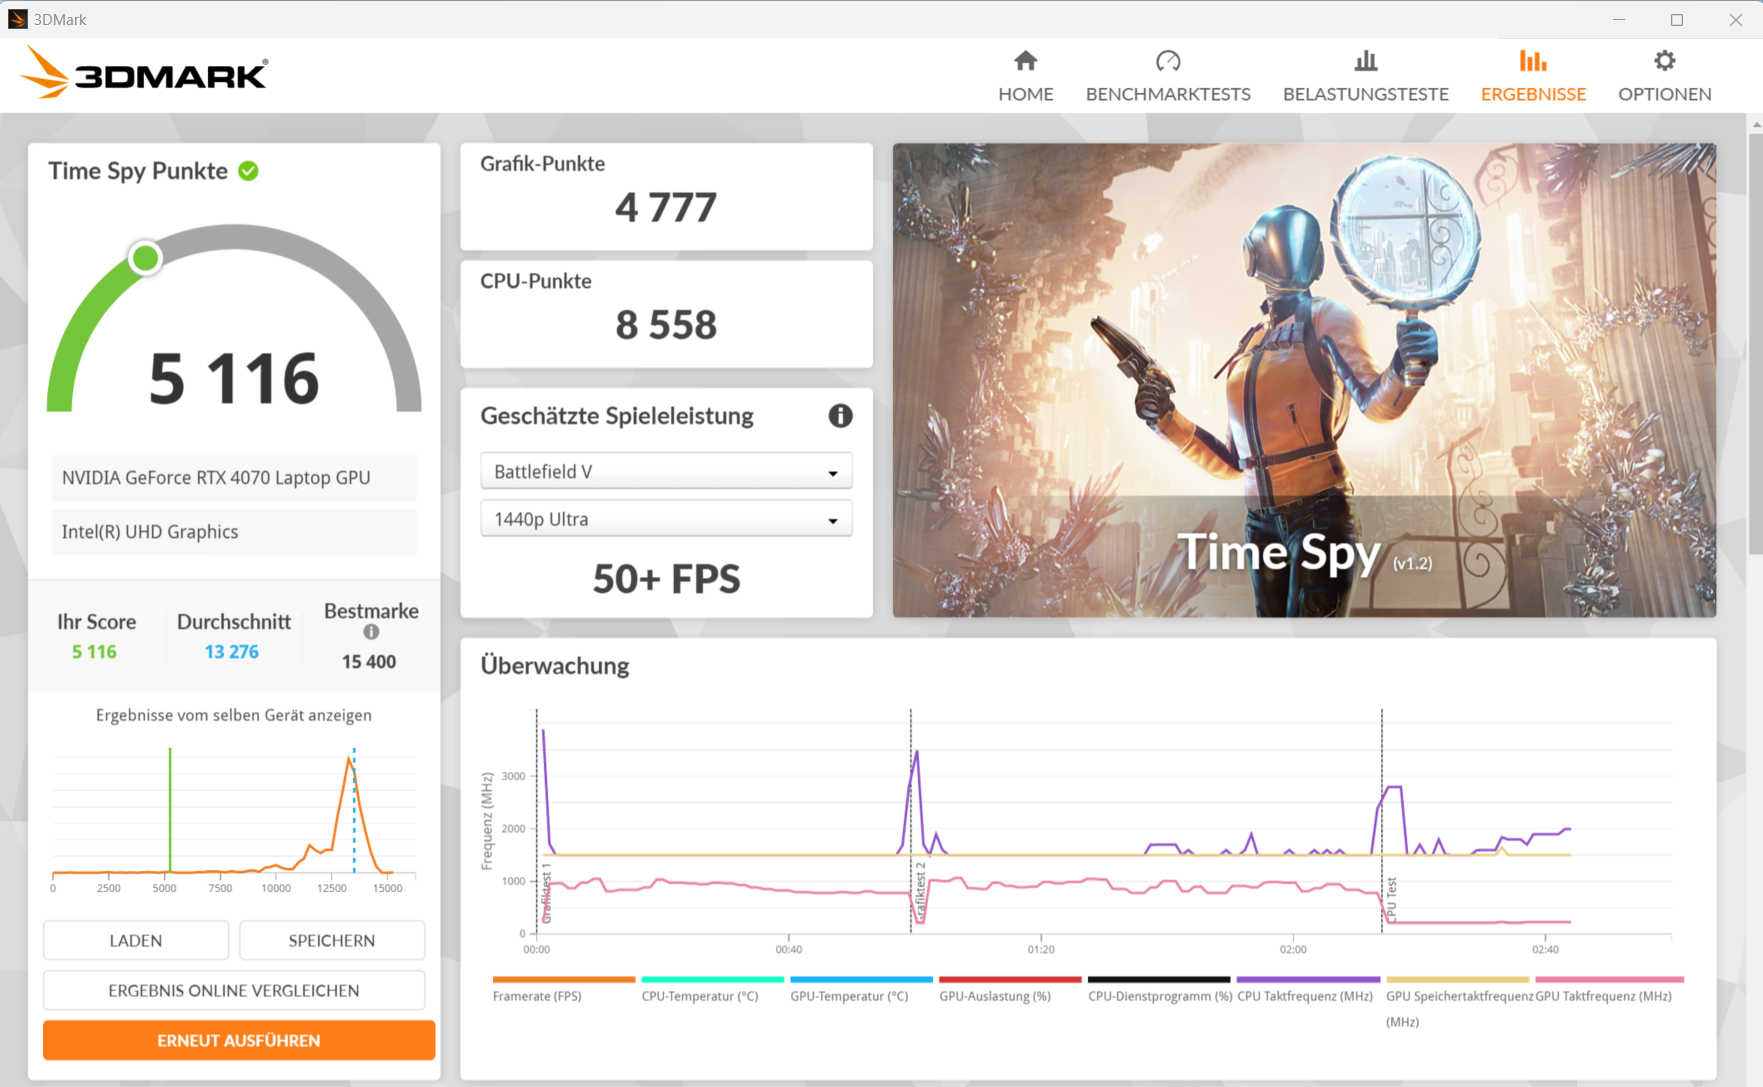
Carte graphique
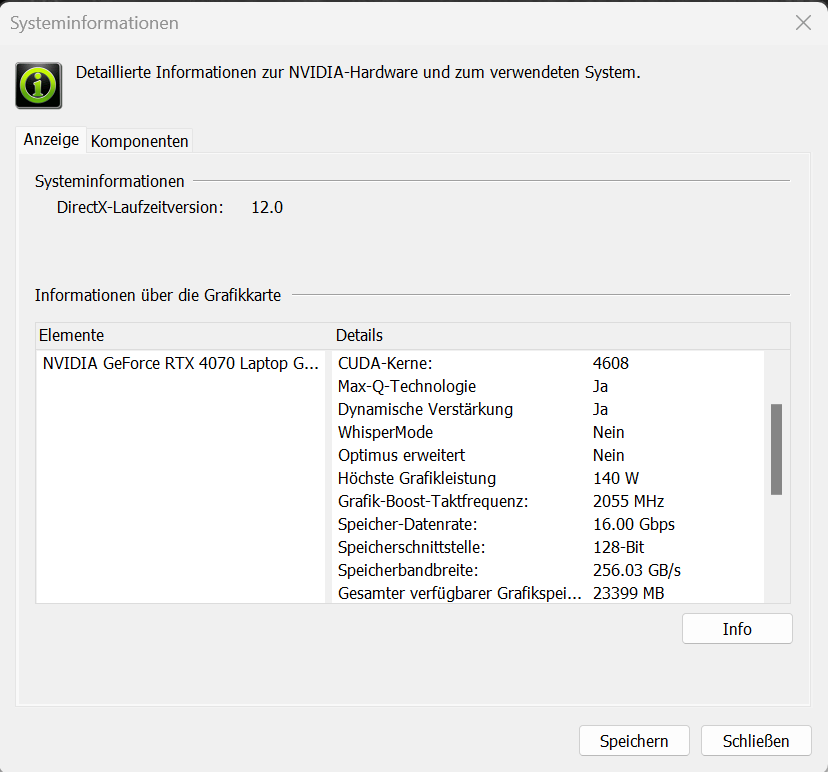
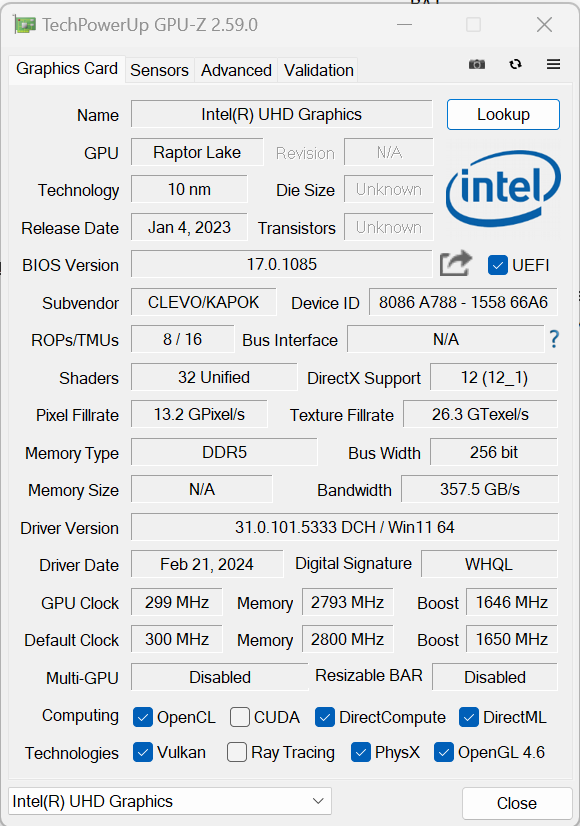
Les jeux en QHD avec des paramètres élevés à maximum ne posent aucun problème à la carte RTX 4070 installée GeForce RTX 4070 (TGP : 140 watts) : Elle offre des taux de rafraîchissement (et des résultats de tests) légèrement supérieurs à la moyenne du GPU. Un peu juste pour les besoins actuels : Le GPU ne dispose que de 8 Go de VRAM (GDDR6). Le passage de dGPU à Optimus nécessite un redémarrage.
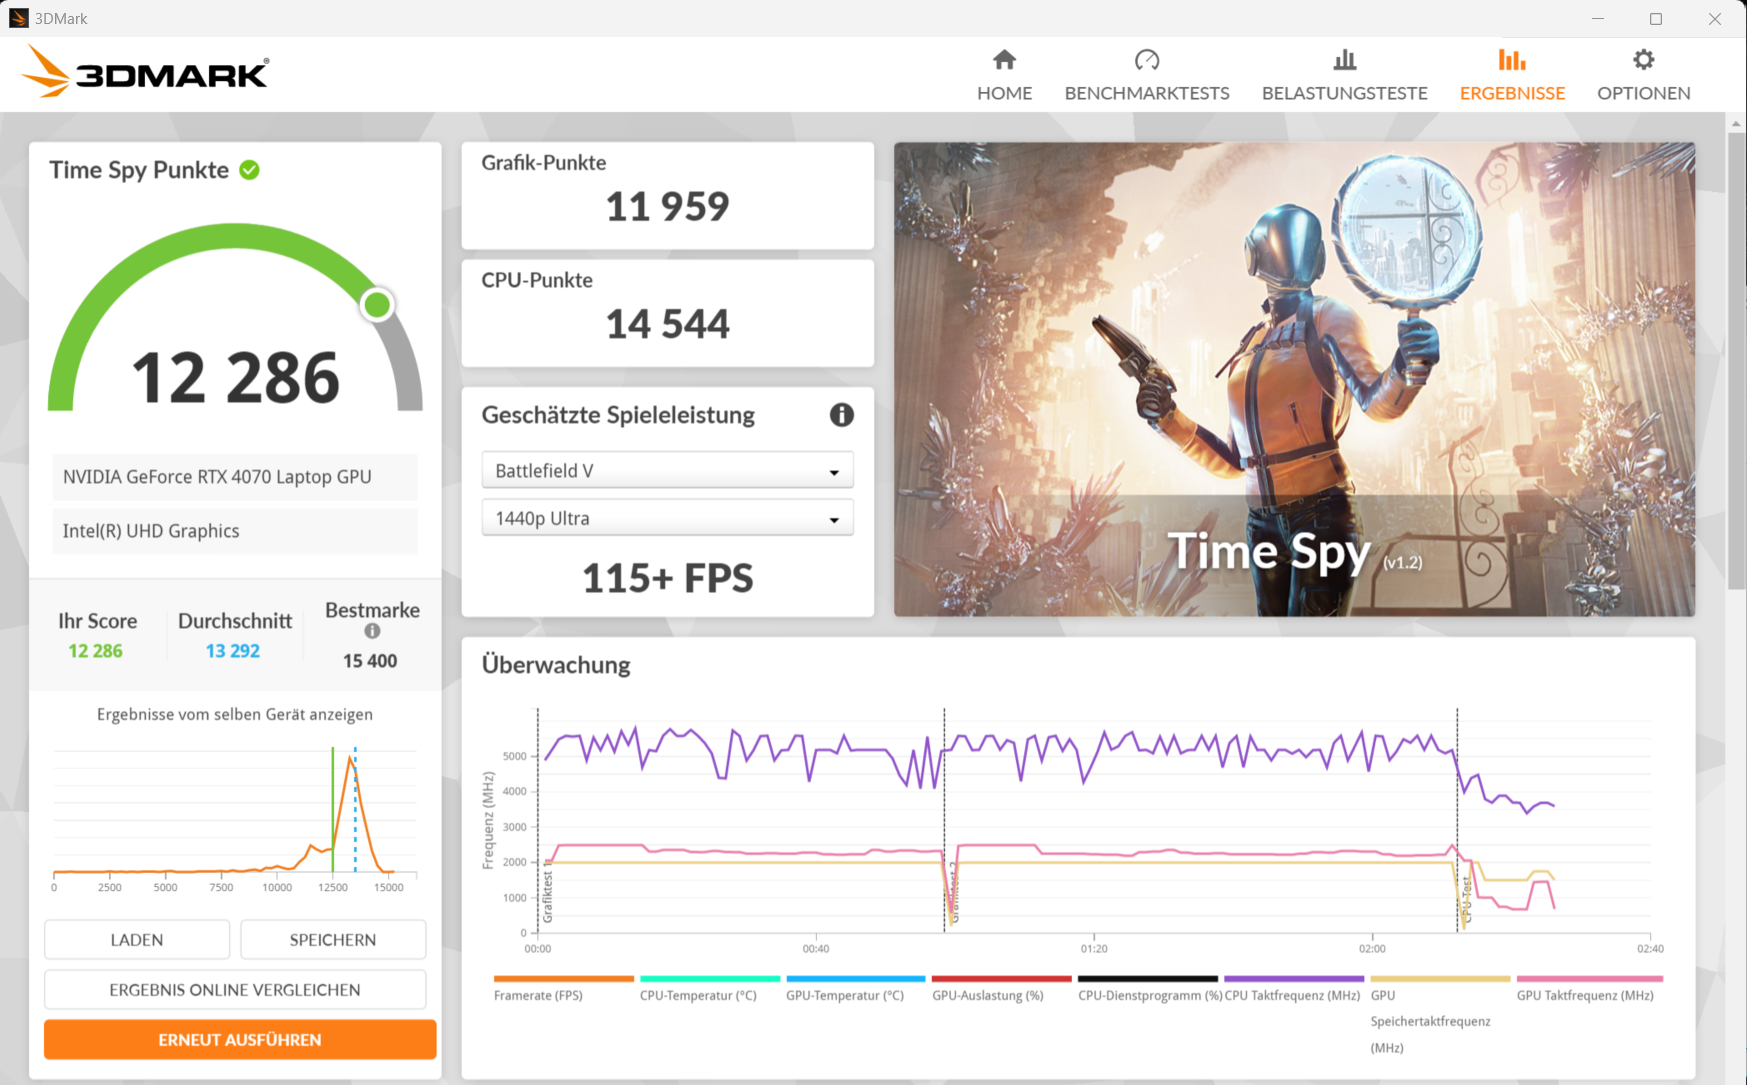

| 3DMark 11 Performance | 34173 points | |
| 3DMark Fire Strike Score | 23584 points | |
| 3DMark Time Spy Score | 12286 points | |
| 3DMark Steel Nomad Score | 2598 points | |
Aide | ||
* ... Moindre est la valeur, meilleures sont les performances
| Cyberpunk 2077 2.2 Phantom Liberty - 1920x1080 Ultra Preset (FSR off) | |
| Moyenne de la classe Gaming (6.76 - 158, n=90, 2 dernières années) | |
| SCHENKER XMG Pro 16 Studio (Mid 23) | |
| Lenovo Legion Pro 5 16IRX9 | |
| Lenovo Legion 7 16 IRX G9 | |
| Acer Predator Helios Neo 16 (2024) | |
| SCHENKER XMG Pro 16 Studio (Mid 24) | |
| Moyenne NVIDIA GeForce RTX 4070 Laptop GPU (30.7 - 90.7, n=38) | |
| Aorus 16X 2024 | |
| Senua's Saga Hellblade 2 | |
| 1920x1080 High Preset | |
| Moyenne de la classe Gaming (38.4 - 78.8, n=6, 2 dernières années) | |
| SCHENKER XMG Pro 16 Studio (Mid 24) | |
| Moyenne NVIDIA GeForce RTX 4070 Laptop GPU (34.3 - 51.2, n=4) | |
| 2560x1440 High Preset | |
| Moyenne de la classe Gaming (27.1 - 57.3, n=4, 2 dernières années) | |
| SCHENKER XMG Pro 16 Studio (Mid 24) | |
| Moyenne NVIDIA GeForce RTX 4070 Laptop GPU (23.7 - 33.3, n=4) | |
| 2560x1440 High Preset + Quality DLSS | |
| Moyenne de la classe Gaming (42.2 - 83.1, n=3, 2 dernières années) | |
| SCHENKER XMG Pro 16 Studio (Mid 24) | |
| Moyenne NVIDIA GeForce RTX 4070 Laptop GPU (42.2 - 47.8, n=2) | |
| Ghost of Tsushima | |
| 1920x1080 Very High Preset AA:T | |
| SCHENKER XMG Pro 16 Studio (Mid 24) | |
| Moyenne NVIDIA GeForce RTX 4070 Laptop GPU (55.3 - 73.7, n=5) | |
| Moyenne de la classe Gaming (28.5 - 73.7, n=7, 2 dernières années) | |
| 2560x1440 Very High Preset AA:T | |
| SCHENKER XMG Pro 16 Studio (Mid 24) | |
| Moyenne NVIDIA GeForce RTX 4070 Laptop GPU (43.6 - 56.1, n=5) | |
| Moyenne de la classe Gaming (22.7 - 56.1, n=5, 2 dernières années) | |
| 2560x1440 Very High Preset + Quality DLSS | |
| SCHENKER XMG Pro 16 Studio (Mid 24) | |
| Moyenne de la classe Gaming (63.6 - 74.2, n=3, 2 dernières années) | |
| Moyenne NVIDIA GeForce RTX 4070 Laptop GPU (57 - 74.2, n=3) | |
| The First Descendant | |
| 1920x1080 Ultra Preset | |
| SCHENKER XMG Pro 16 Studio (Mid 24) | |
| Moyenne NVIDIA GeForce RTX 4070 Laptop GPU (73.7 - 83.6, n=5) | |
| Moyenne de la classe Gaming (15.4 - 80, n=5, 2 dernières années) | |
| 2560x1440 Ultra Preset | |
| SCHENKER XMG Pro 16 Studio (Mid 24) | |
| Moyenne NVIDIA GeForce RTX 4070 Laptop GPU (48.2 - 52.5, n=5) | |
| Moyenne de la classe Gaming (43.7 - 51.2, n=3, 2 dernières années) | |
| 2560x1440 Ultra Preset + Ultra Ray Tracing + DLSS Quality | |
| SCHENKER XMG Pro 16 Studio (Mid 24) | |
| Moyenne NVIDIA GeForce RTX 4070 Laptop GPU (48.6 - 51.8, n=2) | |
| Moyenne de la classe Gaming (43.3 - 51.8, n=2, 2 dernières années) | |
| F1 24 | |
| 1920x1080 Ultra High Preset AA:T AF:16x | |
| Moyenne de la classe Gaming (54.1 - 148, n=19, 2 dernières années) | |
| SCHENKER XMG Pro 16 Studio (Mid 24) | |
| Moyenne NVIDIA GeForce RTX 4070 Laptop GPU (58.4 - 78.1, n=9) | |
| 2560x1440 Ultra High Preset AA:T AF:16x | |
| Moyenne de la classe Gaming (36.7 - 100, n=16, 2 dernières années) | |
| SCHENKER XMG Pro 16 Studio (Mid 24) | |
| Moyenne NVIDIA GeForce RTX 4070 Laptop GPU (36.8 - 50.9, n=9) | |
| 2560x1440 Ultra High Preset + Quality DLSS AF:16x | |
| Moyenne de la classe Gaming (59.2 - 150.4, n=12, 2 dernières années) | |
| SCHENKER XMG Pro 16 Studio (Mid 24) | |
| Moyenne NVIDIA GeForce RTX 4070 Laptop GPU (57 - 73.9, n=6) | |
Cyberpunk 2077 ultra FPS diagram
| Bas | Moyen | Élevé | Ultra | QHD DLSS | QHD | |
|---|---|---|---|---|---|---|
| GTA V (2015) | 186.7 | 184.9 | 180.9 | 126 | 95.9 | |
| Dota 2 Reborn (2015) | 231 | 196.2 | 181.6 | 160.8 | ||
| Final Fantasy XV Benchmark (2018) | 214 | 163.6 | 119.7 | 86.8 | ||
| X-Plane 11.11 (2018) | 178 | 147.3 | 119.5 | |||
| Strange Brigade (2018) | 457 | 297 | 236 | 206 | 135.9 | |
| Baldur's Gate 3 (2023) | 171.8 | 132 | 115.3 | 111.8 | 77.2 | |
| Cyberpunk 2077 2.2 Phantom Liberty (2023) | 126.3 | 112.1 | 95.5 | 82.5 | 48.6 | |
| Dragon's Dogma 2 (2024) | 81 | 70.4 | 58.5 | |||
| Ghost of Tsushima (2024) | 114.9 | 102.8 | 93 | 73.7 | 74.2 | 56.1 |
| Senua's Saga Hellblade 2 (2024) | 78.3 | 64.9 | 51.2 | 47.8 | 33.3 | |
| F1 24 (2024) | 239 | 238 | 203 | 70.4 | 45.1 | |
| The First Descendant (2024) | 171 | 110.9 | 91.3 | 80 | 51.2 |
Émissions et puissance - Le XMG Pro à forte consommation d'énergie
Émissions sonores
Cyberpunk 2077 augmente les émissions sonores de l'ordinateur portable jusqu'à 53 dB(A)( modeperformance ), tandis que le profil divertissement produit des valeurs légèrement plus modérées. Le mode silencieux n'est pas adapté aux jeux, car le dGPU est désactivé. Le niveau sonore de l'appareil est plus faible au ralenti et lors d'une utilisation quotidienne (bureau, internet) : Les ventilateurs ne tournent pas à plein régime et restent parfois immobiles. Parfois, un grésillement électronique peut être entendu à l'intérieur de l'ordinateur portable.
Degré de la nuisance sonore
| Au repos |
| 28 / 31 / 35 dB(A) |
| Fortement sollicité |
| 52 / 52 dB(A) |
 | ||
30 dB silencieux 40 dB(A) audible 50 dB(A) bruyant |
||
min: | ||
| SCHENKER XMG Pro 16 Studio (Mid 24) NVIDIA GeForce RTX 4070 Laptop GPU, i9-14900HX, Samsung 990 Pro 1 TB | Acer Predator Helios Neo 16 (2024) NVIDIA GeForce RTX 4070 Laptop GPU, i7-14700HX, Samsung PM9A1a MZVL21T0HDLU | Lenovo Legion Pro 5 16IRX9 NVIDIA GeForce RTX 4070 Laptop GPU, i9-14900HX, Samsung PM9A1 MZVL21T0HCLR | Aorus 16X 2024 NVIDIA GeForce RTX 4070 Laptop GPU, i9-14900HX, Gigabyte AG450E1024-SI | SCHENKER XMG Pro 16 Studio (Mid 23) NVIDIA GeForce RTX 4070 Laptop GPU, i9-13900H, Samsung 990 Pro 1 TB | Lenovo Legion 7 16 IRX G9 NVIDIA GeForce RTX 4070 Laptop GPU, i9-14900HX, SK Hynix HFS001TEJ9X115N | |
|---|---|---|---|---|---|---|
| Noise | 3% | 10% | -3% | 7% | 16% | |
| arrêt / environnement * | 25 | 25.2 -1% | 23.9 4% | 26 -4% | 25 -0% | 24.5 2% |
| Idle Minimum * | 28 | 27.8 1% | 24.3 13% | 26 7% | 26 7% | 24.5 12% |
| Idle Average * | 31 | 32 -3% | 24.3 22% | 32 -3% | 29 6% | 24.5 21% |
| Idle Maximum * | 35 | 29.6 15% | 28.9 17% | 38 -9% | 34 3% | 24.5 30% |
| Load Average * | 52 | 45.2 13% | 45.8 12% | 54 -4% | 43 17% | 34.8 33% |
| Cyberpunk 2077 ultra * | 53 | |||||
| Load Maximum * | 52 | 55.8 -7% | 56.6 -9% | 55 -6% | 48 8% | 54.1 -4% |
| Witcher 3 ultra * | 51 | 50 | 48 | 54.1 |
* ... Moindre est la valeur, meilleures sont les performances
Température
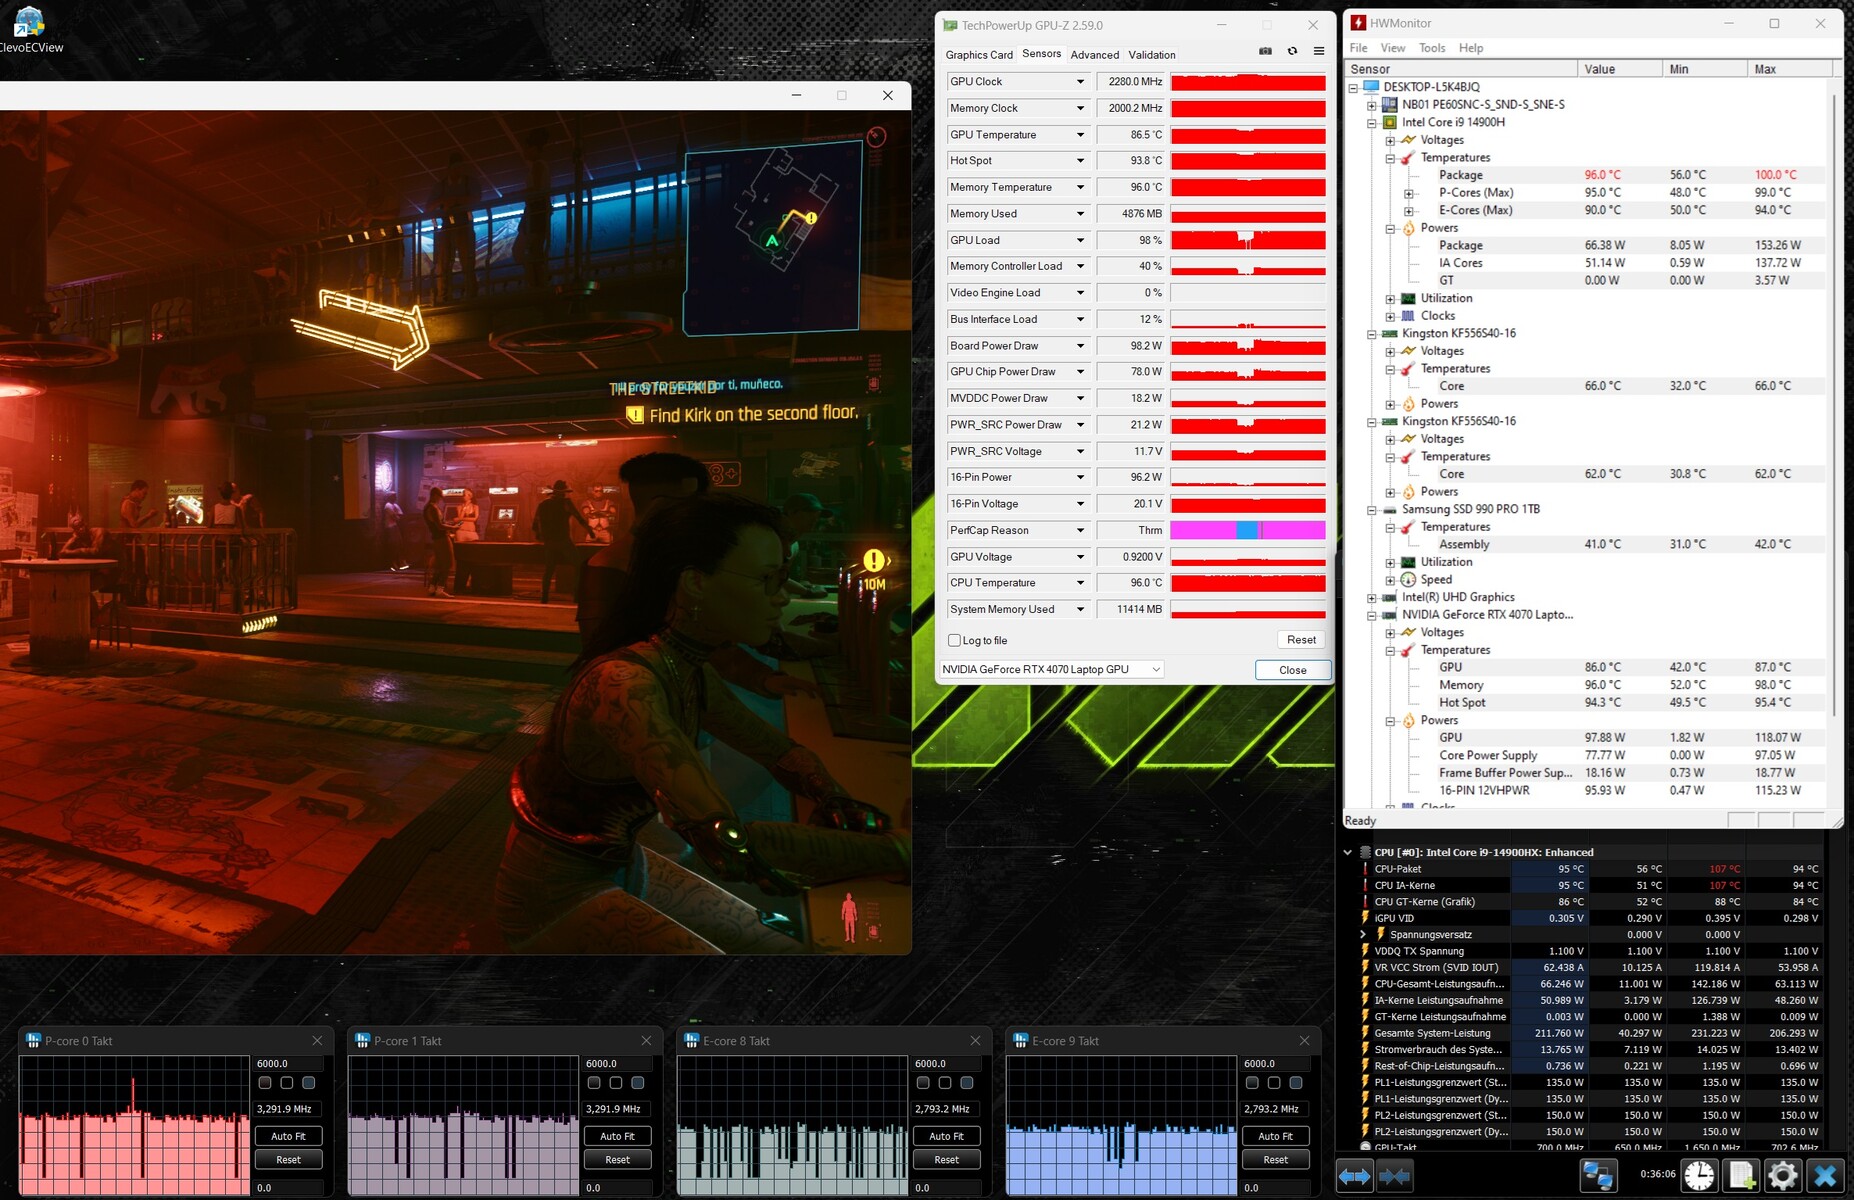
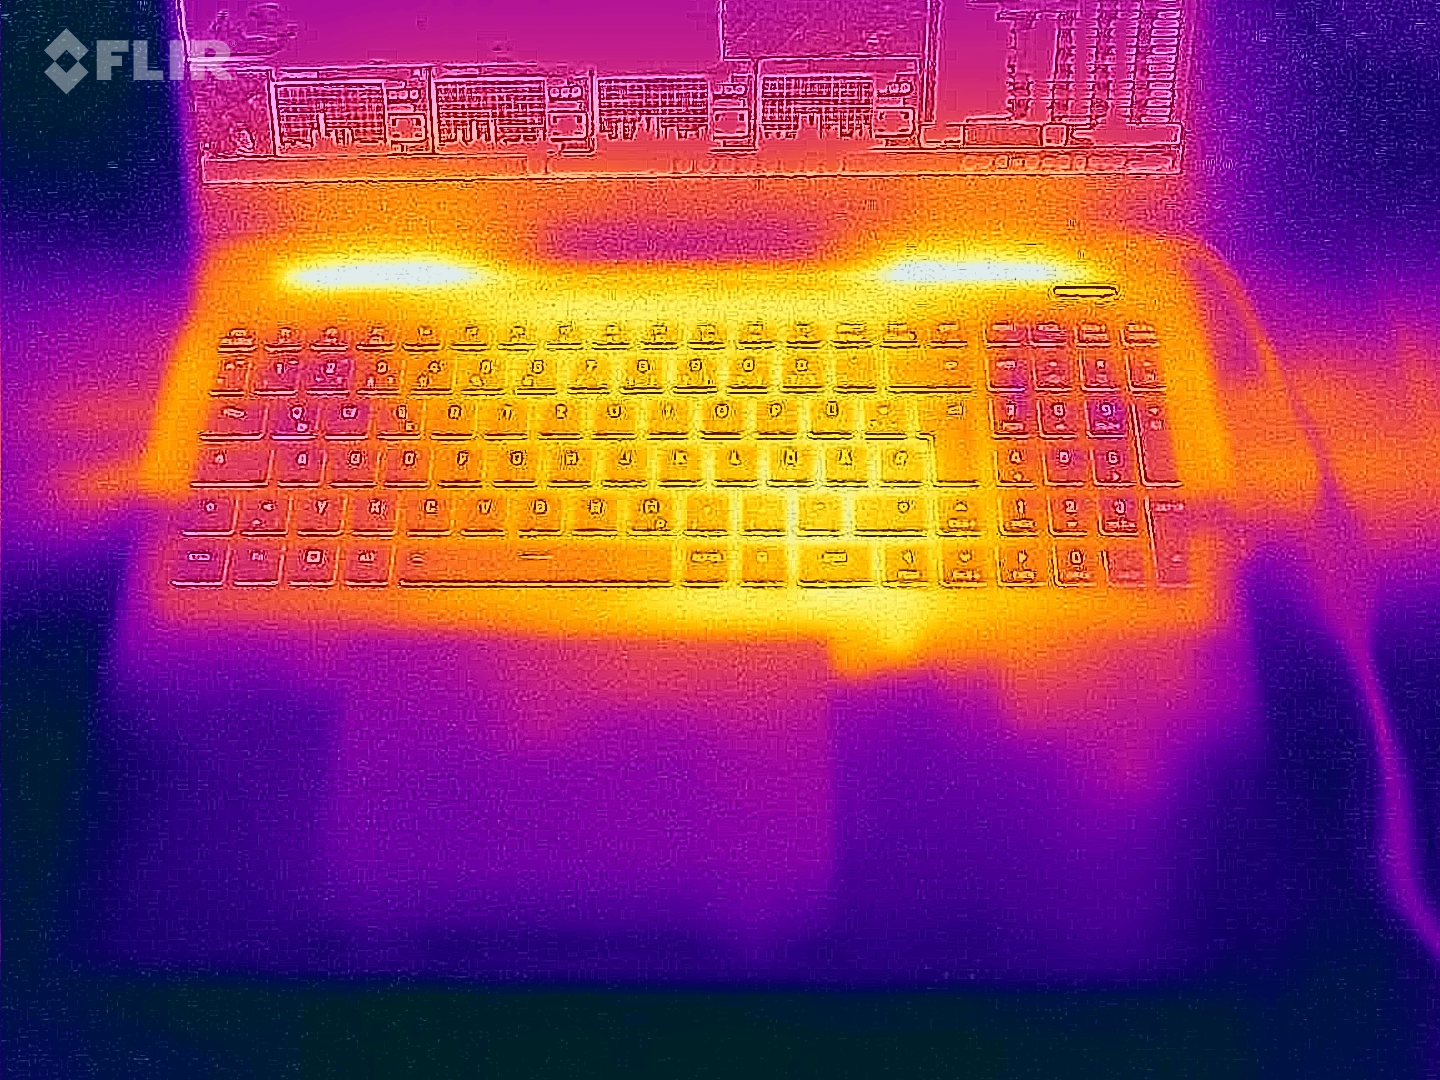
L'ordinateur portable chauffe sensiblement : Cyberpunk et les tests de stress ont entraîné des températures supérieures à 60 degrés Celsius à certains moments. Des valeurs supérieures à la moyenne peuvent également être atteintes lors d'une utilisation quotidienne (bureau, internet). Les températures du repose-paume ne sont pas aussi mauvaises.
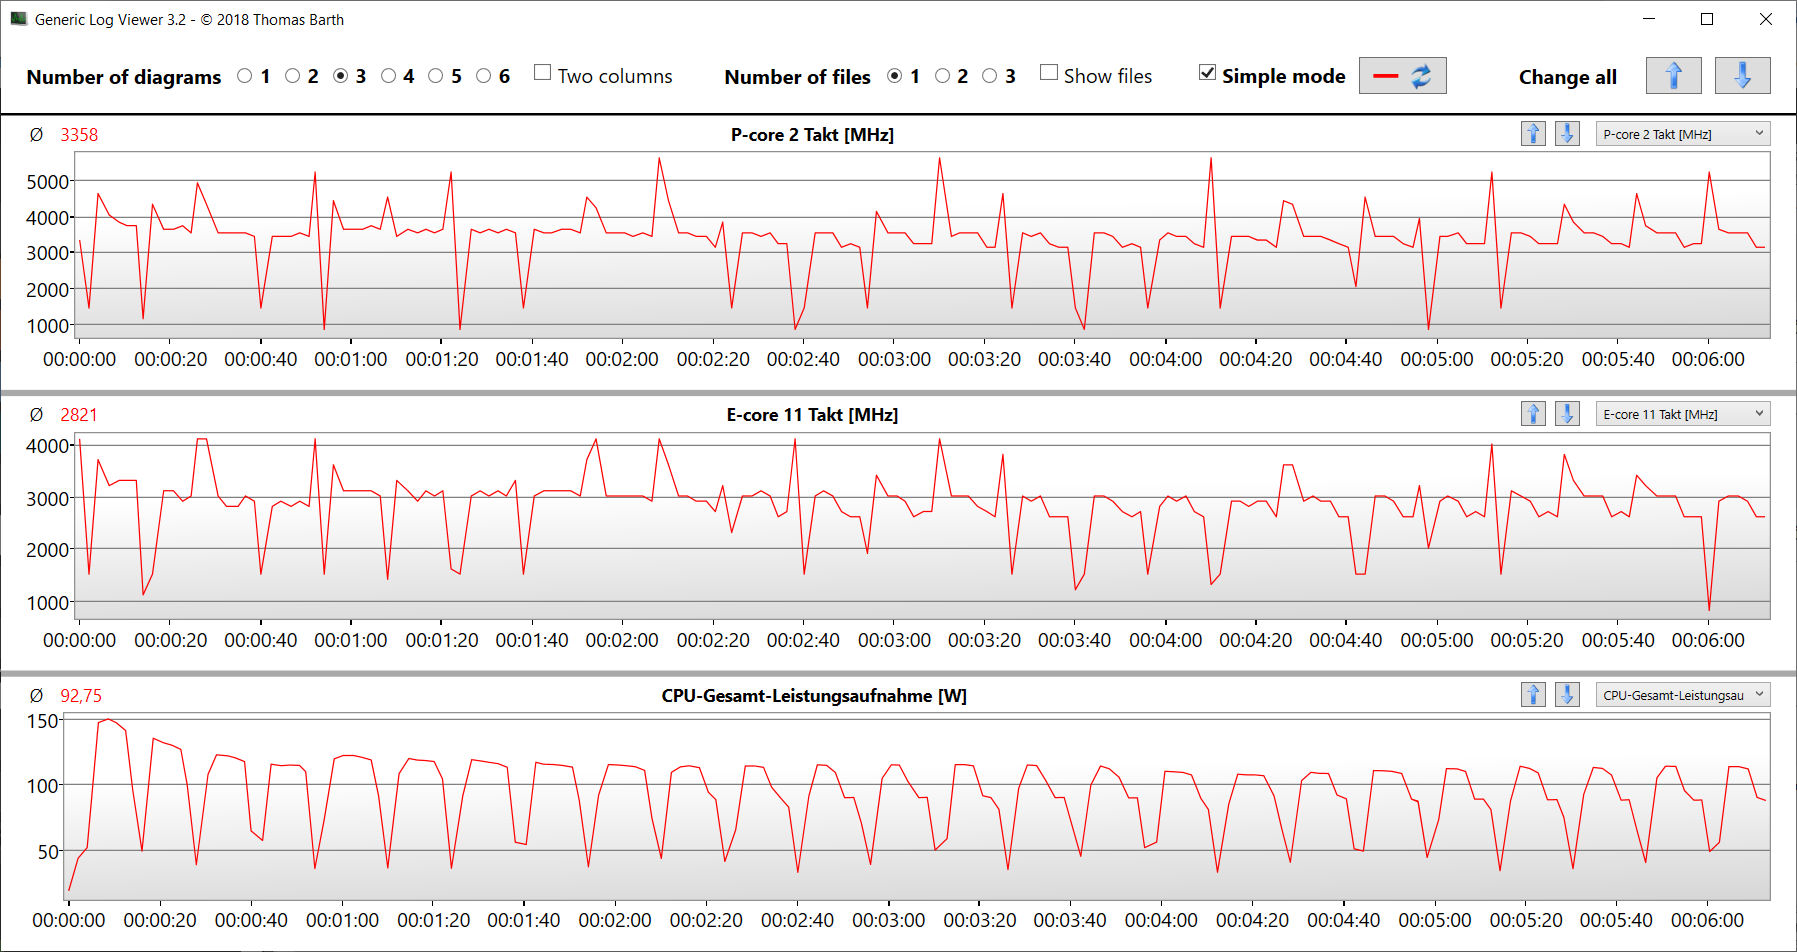
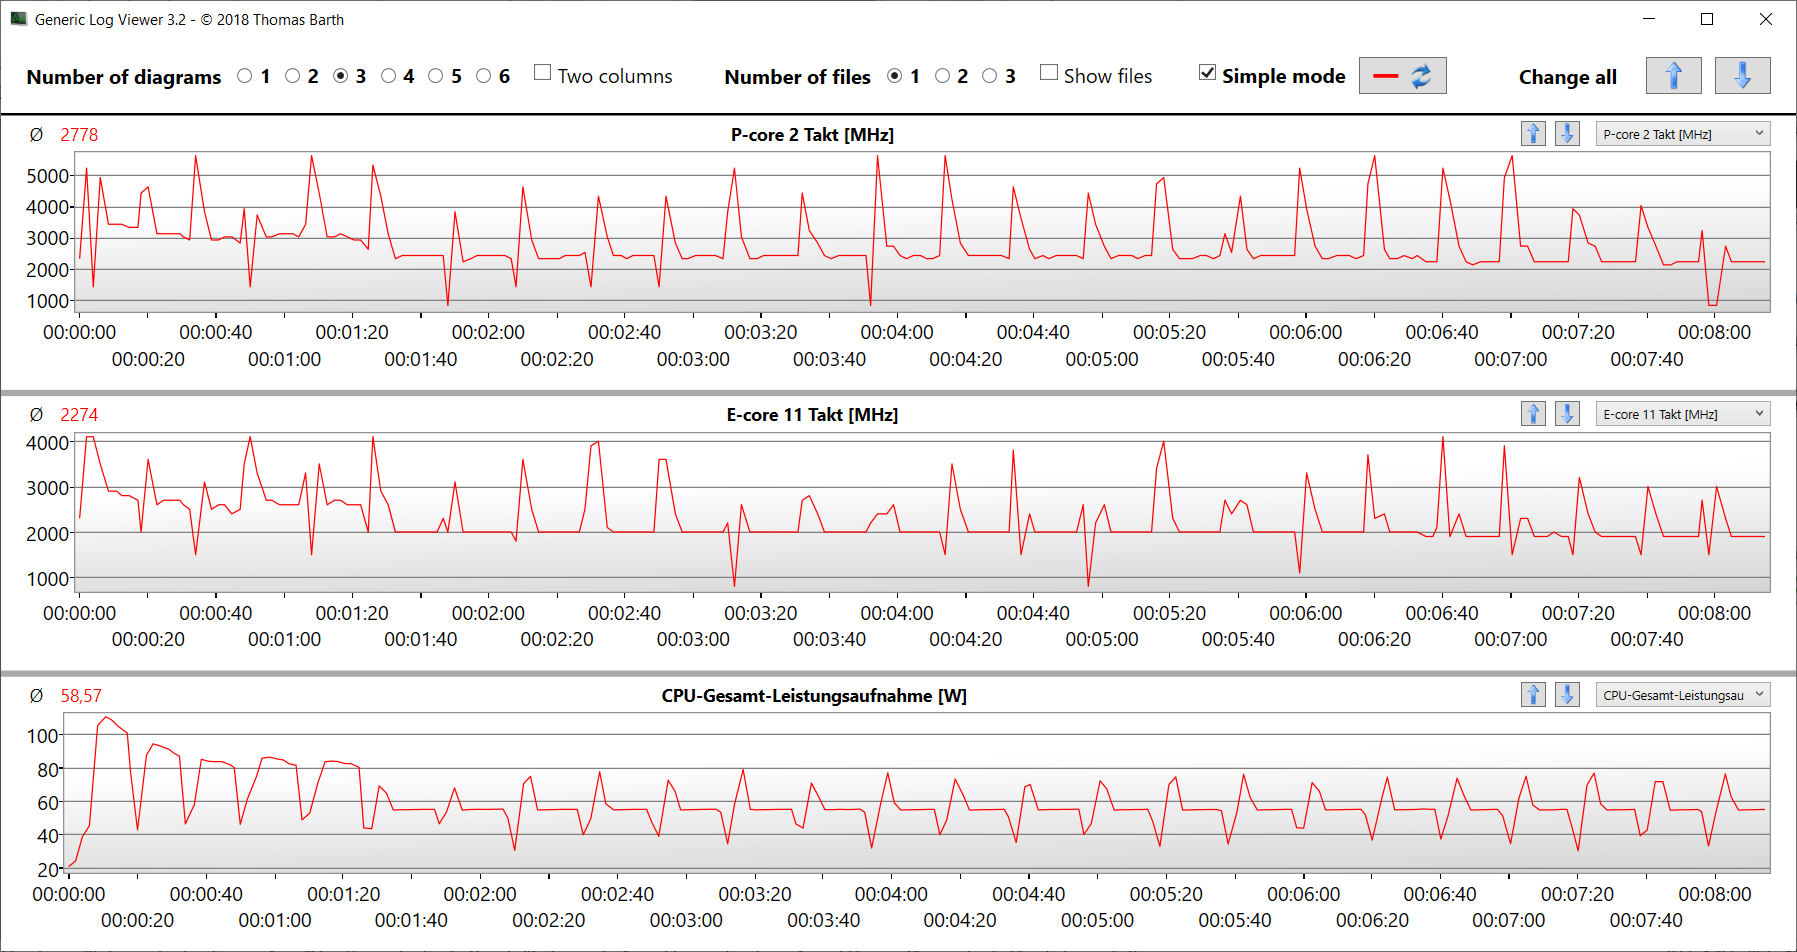
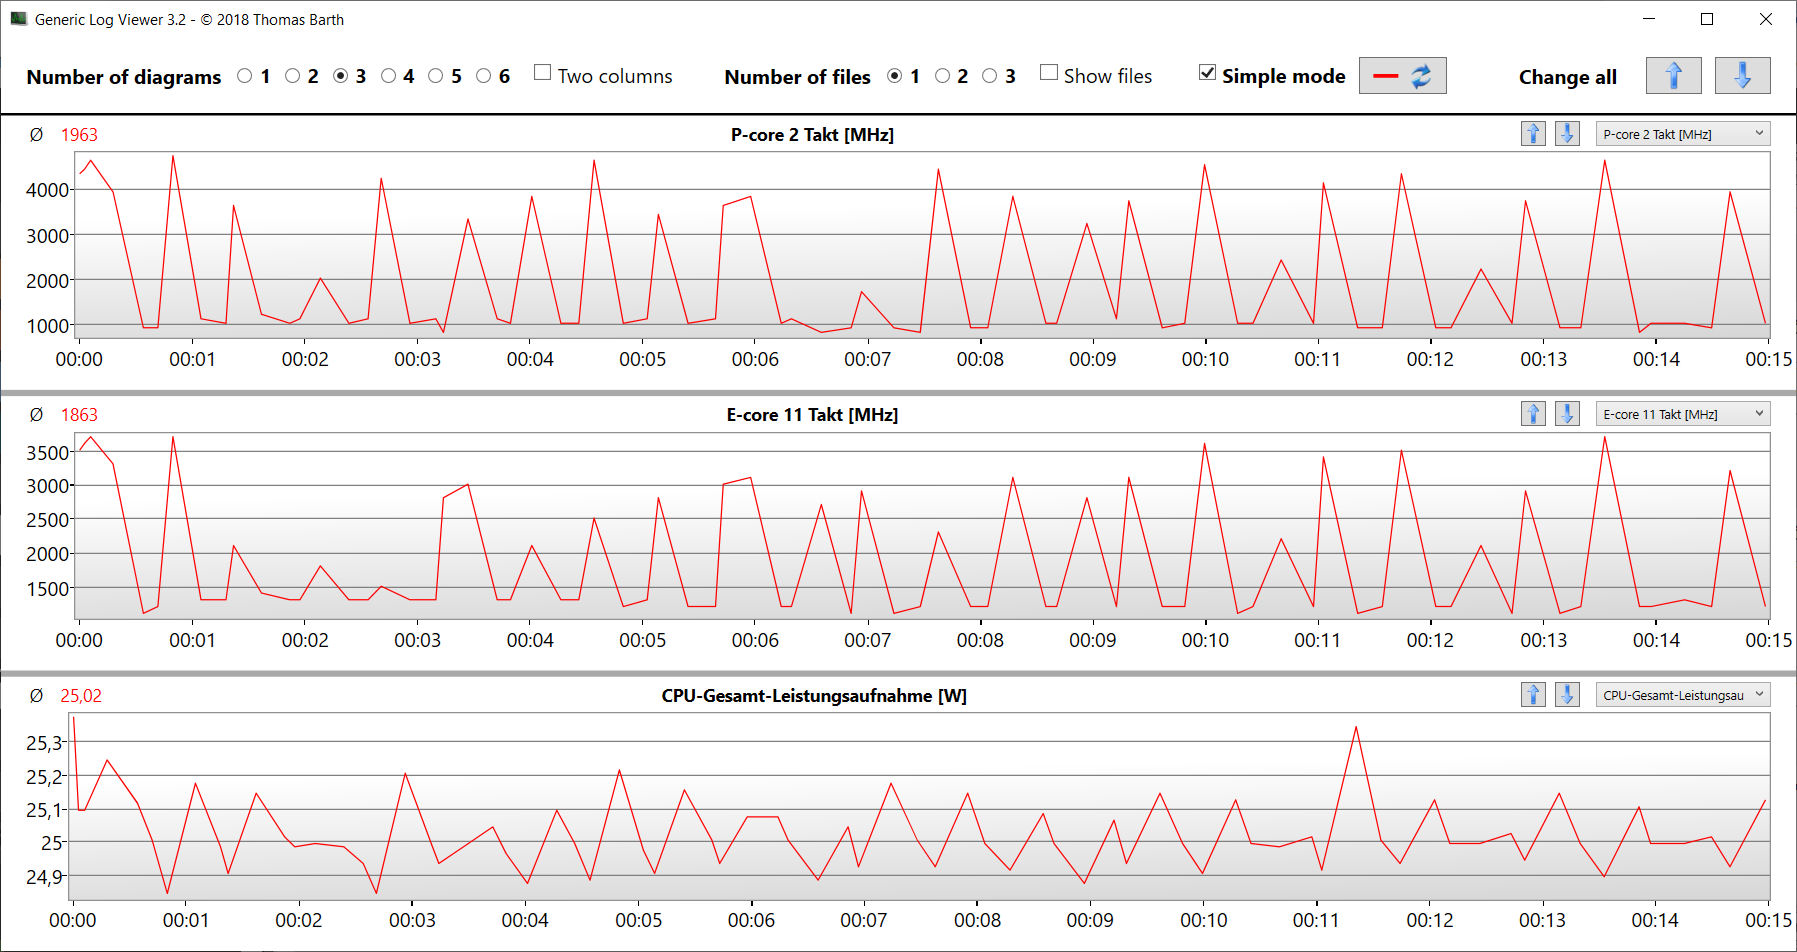
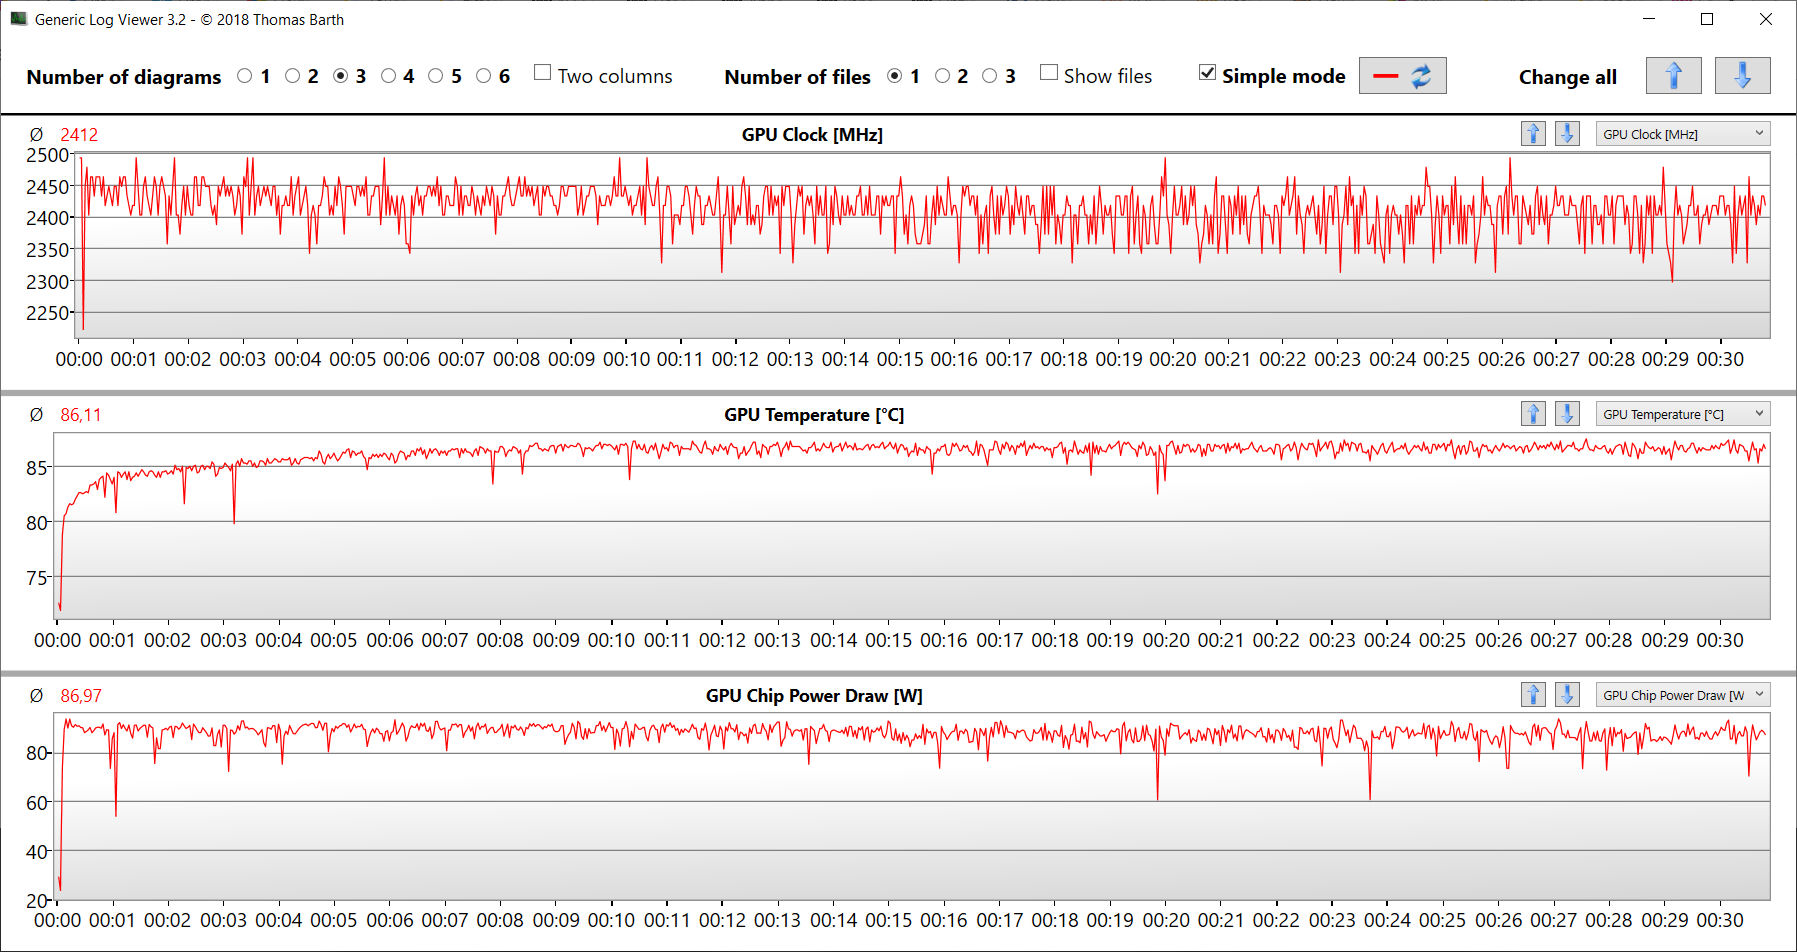
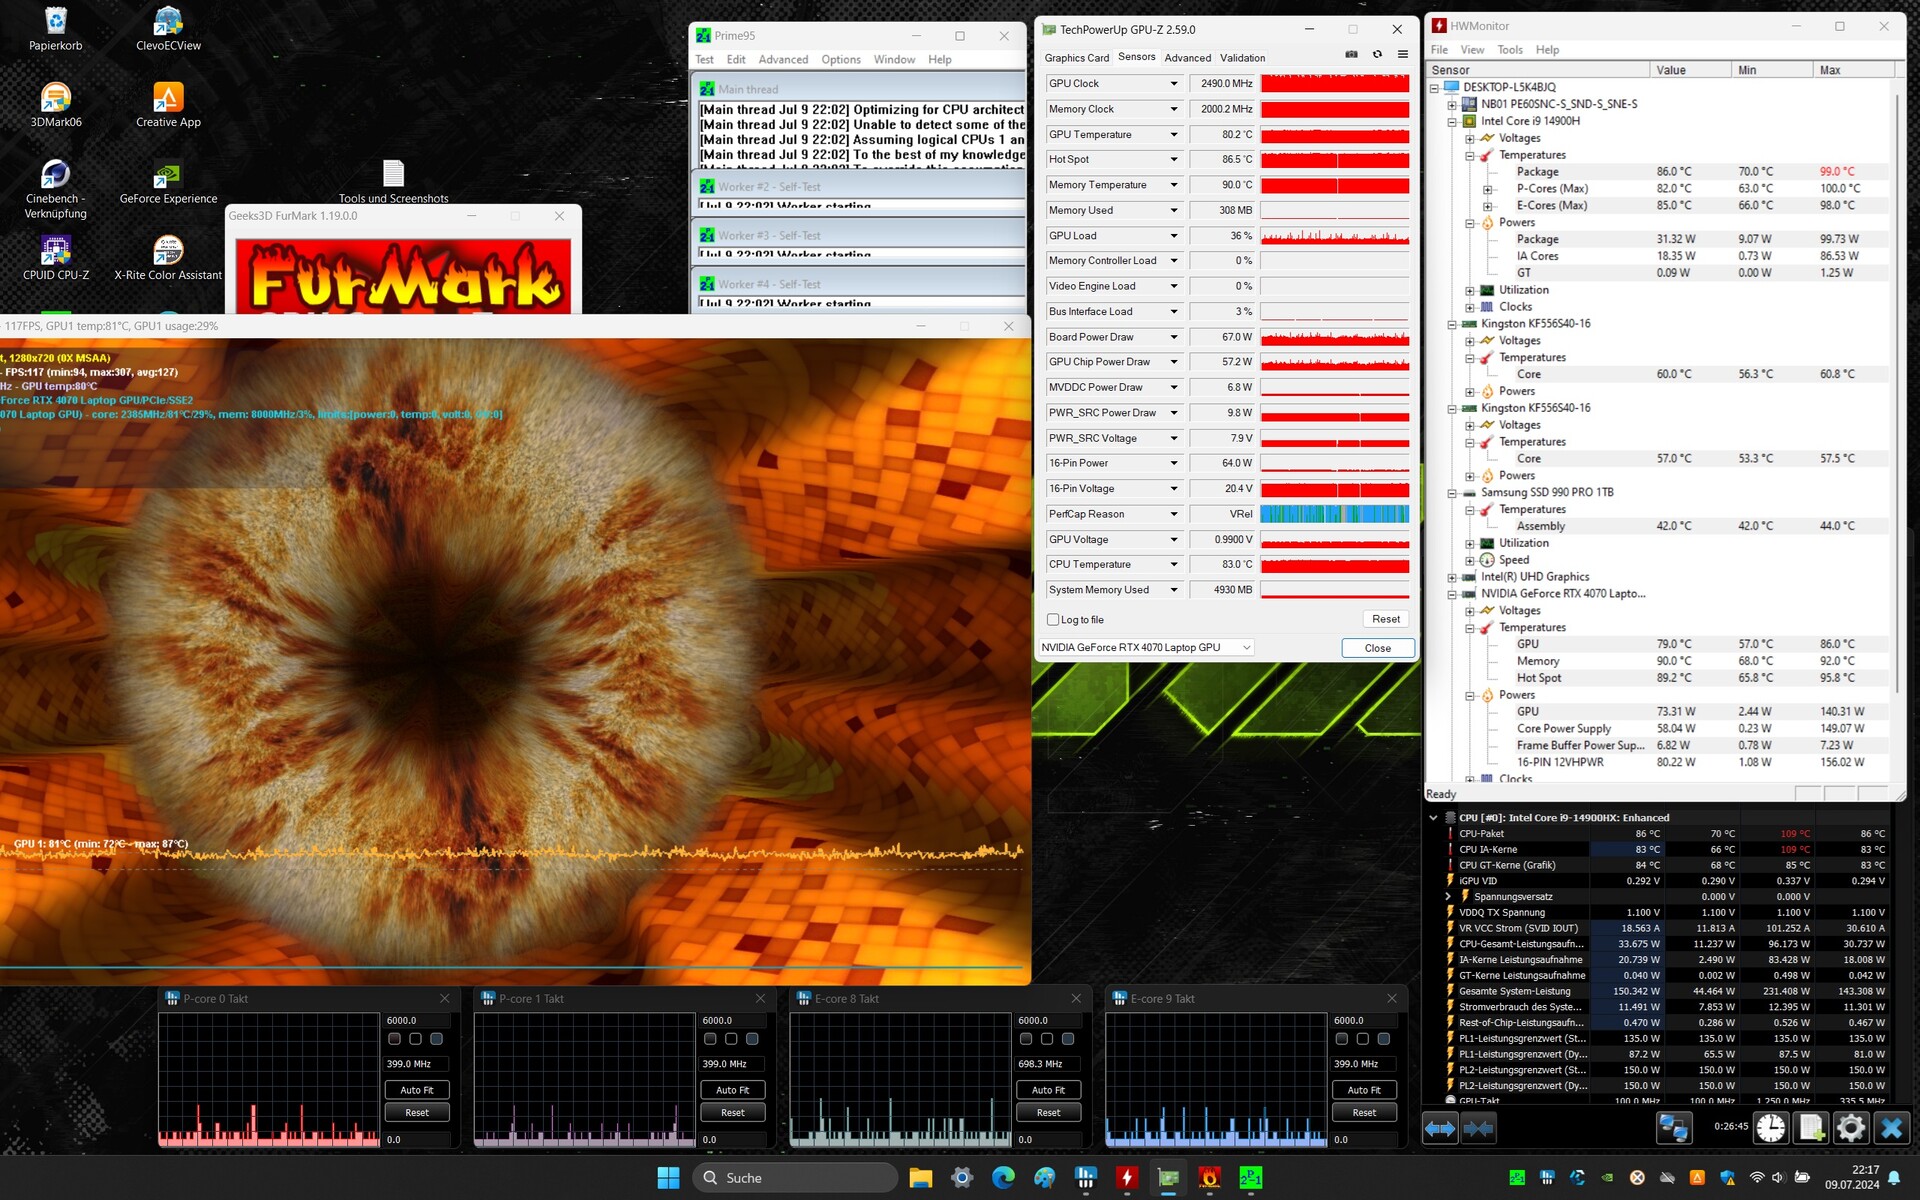
Le scénario de test de stress extrême (Prime95 et Furmark en fonctionnement continu) vérifie la stabilité du système à pleine charge. Les priorités de l'appareil sont clairement réparties : Alors que le GPU fonctionne à pleine puissance, l'horloge du CPU (400 MHz à 2 GHz) est en dessous de l'horloge de base.
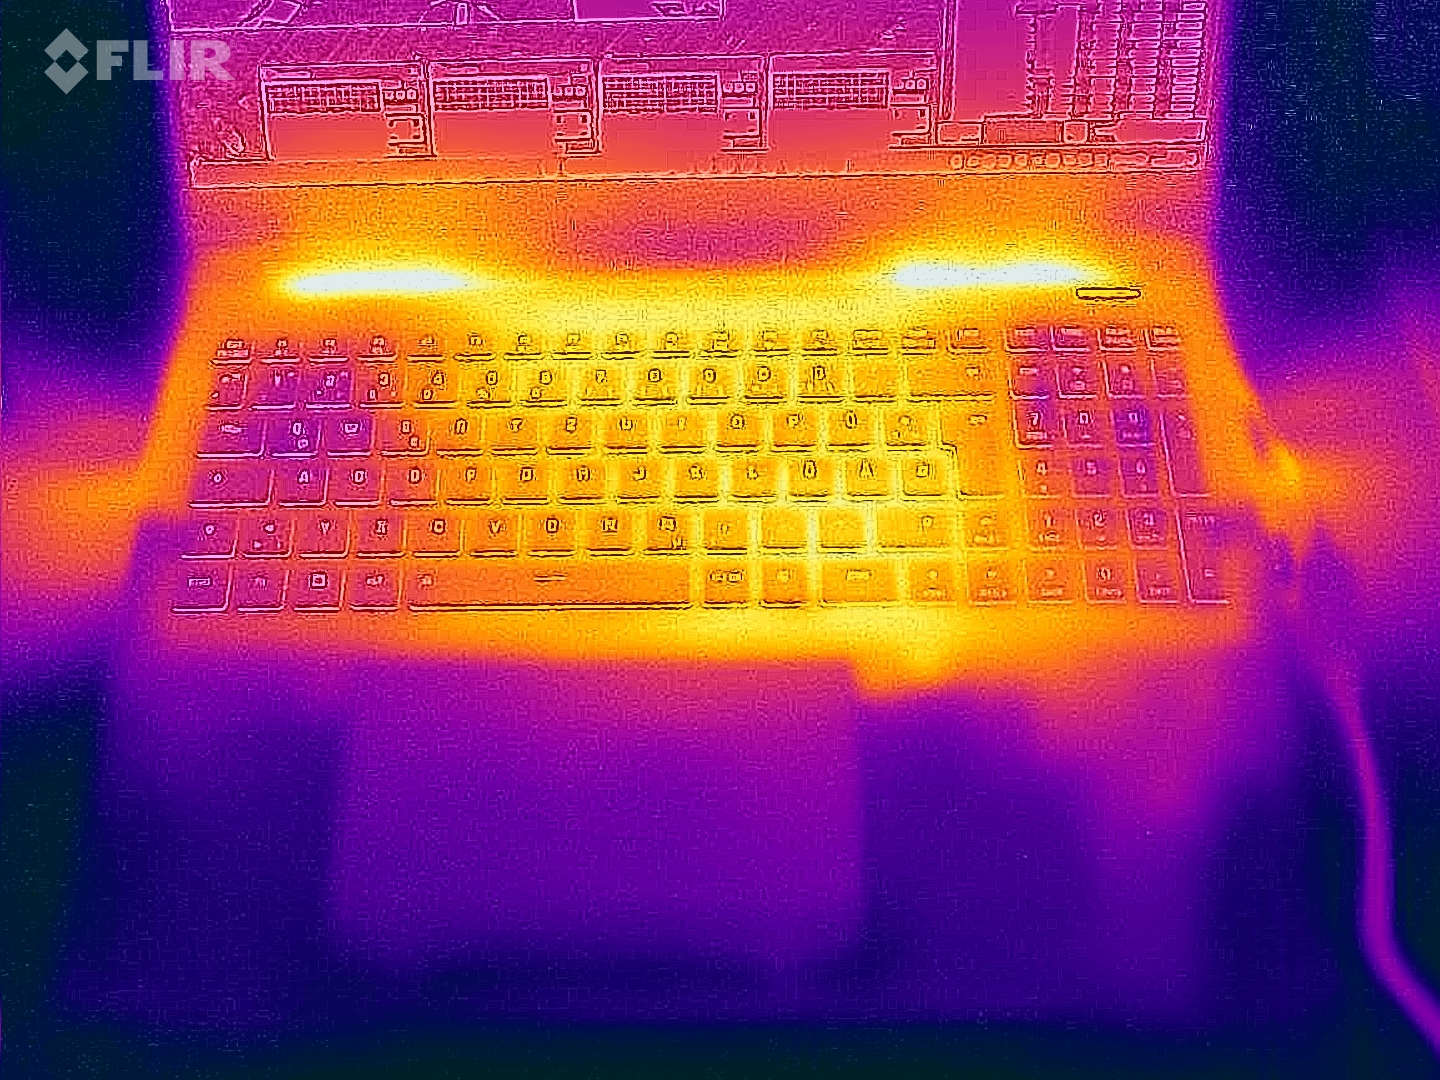
(-) La température maximale du côté supérieur est de 51 °C / 124 F, par rapport à la moyenne de 40.4 °C / 105 F, allant de 21.2 à 68.8 °C pour la classe Gaming.
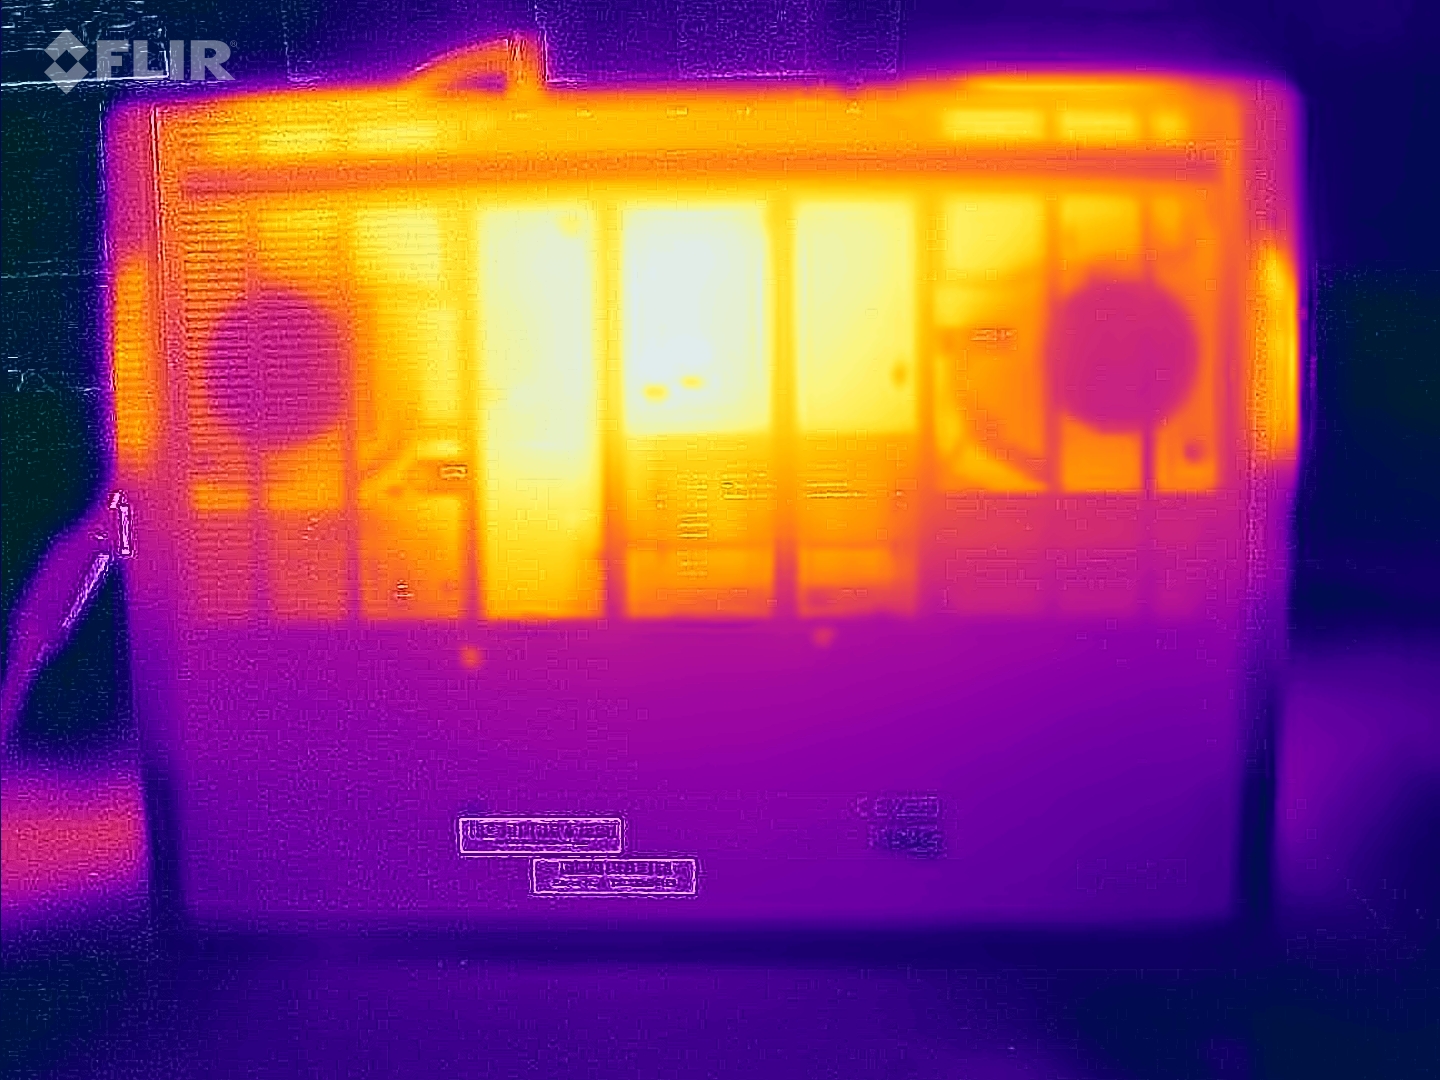
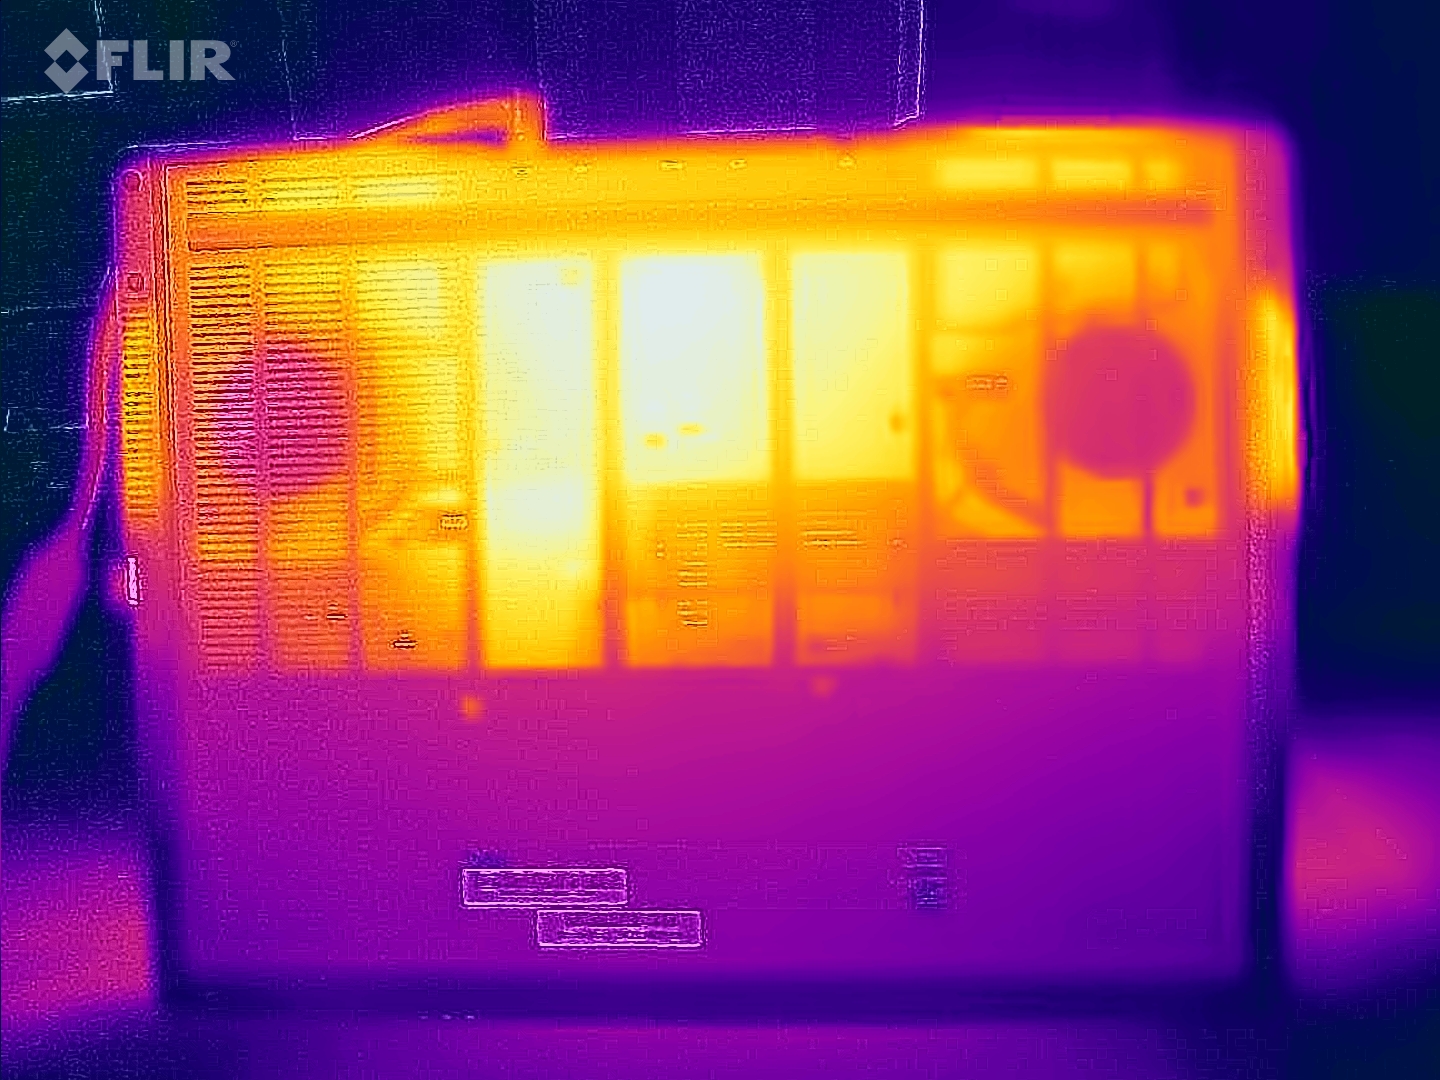
(-) Le fond chauffe jusqu'à un maximum de 66 °C / 151 F, contre une moyenne de 43.2 °C / 110 F
(±) En utilisation inactive, la température moyenne du côté supérieur est de 32.3 °C / 90 F, par rapport à la moyenne du dispositif de 33.9 °C / 93 F.
(-) 3: The average temperature for the upper side is 42.2 °C / 108 F, compared to the average of 33.9 °C / 93 F for the class Gaming.
(+) Les repose-poignets et le pavé tactile sont plus froids que la température de la peau avec un maximum de 31 °C / 87.8 F et sont donc froids au toucher.
(-) La température moyenne de la zone de l'appui-paume de dispositifs similaires était de 28.9 °C / 84 F (-2.1 °C / #-3.8 F).
| SCHENKER XMG Pro 16 Studio (Mid 24) Intel Core i9-14900HX, NVIDIA GeForce RTX 4070 Laptop GPU | Acer Predator Helios Neo 16 (2024) Intel Core i7-14700HX, NVIDIA GeForce RTX 4070 Laptop GPU | Lenovo Legion Pro 5 16IRX9 Intel Core i9-14900HX, NVIDIA GeForce RTX 4070 Laptop GPU | Aorus 16X 2024 Intel Core i9-14900HX, NVIDIA GeForce RTX 4070 Laptop GPU | SCHENKER XMG Pro 16 Studio (Mid 23) Intel Core i9-13900H, NVIDIA GeForce RTX 4070 Laptop GPU | Lenovo Legion 7 16 IRX G9 Intel Core i9-14900HX, NVIDIA GeForce RTX 4070 Laptop GPU | |
|---|---|---|---|---|---|---|
| Heat | 9% | 11% | 14% | 2% | 22% | |
| Maximum Upper Side * | 51 | 58 -14% | 43.8 14% | 41 20% | 55 -8% | 43.7 14% |
| Maximum Bottom * | 66 | 45.2 32% | 55.4 16% | 41 38% | 66 -0% | 42.9 35% |
| Idle Upper Side * | 35 | 31.1 11% | 32.8 6% | 37 -6% | 33 6% | 29.1 17% |
| Idle Bottom * | 39 | 37.2 5% | 36 8% | 38 3% | 35 10% | 30.6 22% |
* ... Moindre est la valeur, meilleures sont les performances
Intervenants
Il y a un manque évident de basses. Pour le reste, les haut-parleurs stéréo produisent un son acceptable. Leur niveau maximal pourrait être légèrement plus élevé.
SCHENKER XMG Pro 16 Studio (Mid 24) analyse audio
(±) | le niveau sonore du haut-parleur est moyen mais bon (79# dB)
Basses 100 - 315 Hz
(-) | presque aucune basse - en moyenne 15.1% plus bas que la médiane
(±) | la linéarité des basses est moyenne (13.6% delta à la fréquence précédente)
Médiums 400 - 2000 Hz
(±) | médiane supérieure - en moyenne 5.3% supérieure à la médiane
(+) | les médiums sont linéaires (4.4% delta à la fréquence précédente)
Aiguës 2 - 16 kHz
(+) | des sommets équilibrés - à seulement 4.4% de la médiane
(+) | les aigus sont linéaires (4.9% delta à la fréquence précédente)
Globalement 100 - 16 000 Hz
(±) | la linéarité du son global est moyenne (17.7% de différence avec la médiane)
Par rapport à la même classe
» 50% de tous les appareils testés de cette catégorie étaient meilleurs, 10% similaires, 40% pires
» Le meilleur avait un delta de 6%, la moyenne était de 18%, le pire était de 132%.
Par rapport à tous les appareils testés
» 33% de tous les appareils testés étaient meilleurs, 8% similaires, 59% pires
» Le meilleur avait un delta de 4%, la moyenne était de 24%, le pire était de 134%.
Lenovo Legion Pro 5 16IRX9 analyse audio
(±) | le niveau sonore du haut-parleur est moyen mais bon (80.7# dB)
Basses 100 - 315 Hz
(-) | presque aucune basse - en moyenne 19% plus bas que la médiane
(±) | la linéarité des basses est moyenne (10.1% delta à la fréquence précédente)
Médiums 400 - 2000 Hz
(+) | médiane équilibrée - seulement 4.7% de la médiane
(+) | les médiums sont linéaires (5.7% delta à la fréquence précédente)
Aiguës 2 - 16 kHz
(+) | des sommets équilibrés - à seulement 3.3% de la médiane
(+) | les aigus sont linéaires (5.6% delta à la fréquence précédente)
Globalement 100 - 16 000 Hz
(±) | la linéarité du son global est moyenne (17.2% de différence avec la médiane)
Par rapport à la même classe
» 45% de tous les appareils testés de cette catégorie étaient meilleurs, 11% similaires, 44% pires
» Le meilleur avait un delta de 6%, la moyenne était de 18%, le pire était de 132%.
Par rapport à tous les appareils testés
» 29% de tous les appareils testés étaient meilleurs, 8% similaires, 63% pires
» Le meilleur avait un delta de 4%, la moyenne était de 24%, le pire était de 134%.
Consommation électrique
En mode veille, la consommation d'énergie de l'ordinateur portable est beaucoup trop élevée, nettement supérieure à celle du modèle précédent équipé de la même manière. Cyberpunk et les tests de stress ont été exécutés avec une consommation d'énergie légèrement décroissante et constamment fluctuante. Le bloc d'alimentation de 230 watts est encore suffisamment puissant. Les pics de charge à court terme, comme au début du test de stress, ne lui posent pas de problème.
| Éteint/en veille | |
| Au repos | |
| Fortement sollicité |
|
Légende:
min: | |
| SCHENKER XMG Pro 16 Studio (Mid 24) NVIDIA GeForce RTX 4070 Laptop GPU, i9-14900HX, Samsung 990 Pro 1 TB | Acer Predator Helios Neo 16 (2024) NVIDIA GeForce RTX 4070 Laptop GPU, i7-14700HX, Samsung PM9A1a MZVL21T0HDLU | Lenovo Legion Pro 5 16IRX9 NVIDIA GeForce RTX 4070 Laptop GPU, i9-14900HX, Samsung PM9A1 MZVL21T0HCLR | Aorus 16X 2024 NVIDIA GeForce RTX 4070 Laptop GPU, i9-14900HX, Gigabyte AG450E1024-SI | SCHENKER XMG Pro 16 Studio (Mid 23) NVIDIA GeForce RTX 4070 Laptop GPU, i9-13900H, Samsung 990 Pro 1 TB | |
|---|---|---|---|---|---|
| Power Consumption | 11% | 23% | 22% | 43% | |
| Idle Minimum * | 31 | 26.7 14% | 12.5 60% | 13 58% | 8 74% |
| Idle Average * | 33 | 24.4 26% | 24.6 25% | 18 45% | 12 64% |
| Idle Maximum * | 41 | 32.7 20% | 24.8 40% | 35 15% | 23 44% |
| Load Average * | 114 | 122.1 -7% | 109.6 4% | 138 -21% | 94 18% |
| Cyberpunk 2077 ultra * | 218 | ||||
| Cyberpunk 2077 ultra external monitor * | 196.8 | ||||
| Load Maximum * | 250 | 241 4% | 284.9 -14% | 222 11% | 215 14% |
| Witcher 3 ultra * | 190.6 | 218 | 172.6 | 181.5 |
* ... Moindre est la valeur, meilleures sont les performances
Power consumption Cyberpunk / stress test
Power consumption with external monitor
Délais d'exécution
Le Pro 16 consomme également plus d'énergie que son prédécesseur lorsqu'il est faiblement sollicité en mode batterie. En conséquence, il a atteint une autonomie de 5:37 heures lors du test WiFi (en cartographiant la charge lors de l'accès à des sites web à l'aide d'un script). Il accuse donc un retard d'une bonne heure par rapport à son prédécesseur-qui avait la même capacité de batterie de 73 Wh.
Points positifs
Points négatifs
Verdict - Une centrale à problèmes
La Pro 16 se concentre sur une puissance GPU élevée et permanente avec des valeurs de performance légèrement supérieures à la moyenne du GPU. L'unité centrale doit déjà se ménager au bout d'un certain temps, comme l'a montré la boucle CB15.
Le XMG Pro 16 Studio (Mid 24) peut être affecté à la maintenance des modèles. Outre le passage de Raptor Lake à Raptor Lake Refresh, l'ordinateur portable ne présente pas de nouveautés significatives.
Le bruit, la chaleur et la consommation d'énergie en mode veille sont (trop) élevés. En ce qui concerne la consommation d'énergie de l'ordinateur portable, nous ne pouvons pas exclure que notre échantillon de test soit défectueux. Les durées d'exécution sont correctes.
Son écran 16:10 (16 pouces, 2.560 x 1.600 pixels, sRGB, IPS, 240 Hz) est bien, mais il manque l'espace colorimétrique DCI-P3 qui est un pré-requis pour un ordinateur portable de créateur. L'appareil peut encore accueillir deux SSD PCIe 4 et le RAID 0/1 est pris en charge. Un port TB-4 offre des options d'extension (GPU externe, docking) et supporte Power Delivery.
Une alternative pourrait être le Aorus 16X (2024). Il peut obtenir un peu plus de puissance de calcul à partir du même processeur, dispose d'un écran beaucoup plus lumineux (y compris Dolby Vision) et offre de meilleures durées d'exécution.
Prix et disponibilité
Le nouveau XMG Pro 16 Studio (Mid 24) peut être configuré et commandé sur bestware.coml'appareil de test actuel coûte environ 2 500 dollars.
Veuillez noter que nous avons récemment mis à jour notre système d'évaluation et que les résultats de la version 8 ne sont pas comparables à ceux de la version 7. Vous trouverez de plus amples informations ici.
SCHENKER XMG Pro 16 Studio (Mid 24)
- 07/23/2024 v8
Sascha Mölck
 Total Sustainability Score:
 Transparency
La sélection des appareils à examiner est effectuée par notre équipe éditoriale. L'échantillon de test a été prêté à l'auteur par le fabricant ou le détaillant pour les besoins de cet examen. Le prêteur n'a pas eu d'influence sur cette évaluation et le fabricant n'a pas reçu de copie de cette évaluation avant sa publication. Il n'y avait aucune obligation de publier cet article. Nous n'acceptons jamais de compensation ou de paiement en échange de nos commentaires. En tant que média indépendant, Notebookcheck n'est pas soumis à l'autorité des fabricants, des détaillants ou des éditeurs.
Voici comment Notebookcheck teste
Chaque année, Notebookcheck examine de manière indépendante des centaines d'ordinateurs portables et de smartphones en utilisant des procédures standardisées afin de garantir que tous les résultats sont comparables. Nous avons continuellement développé nos méthodes de test depuis environ 20 ans et avons établi des normes industrielles dans le processus. Dans nos laboratoires de test, des équipements de mesure de haute qualité sont utilisés par des techniciens et des rédacteurs expérimentés. Ces tests impliquent un processus de validation en plusieurs étapes. Notre système d'évaluation complexe repose sur des centaines de mesures et de points de référence bien fondés, ce qui garantit l'objectivité.Price comparison

