Notebookcheck Logo
Teaser

Test du Gigabyte G5 KF5 2024 : le jeu RTX 4060 à prix cassé - l'affaire en vaut-elle la peine ?

Ultra bonne affaire ?

Un Intel Core i7-13620H, une RTX 4060, 16 Go de RAM et un SSD de 1 To, le tout pour 899 euros. Vous ne pouvez pas trouver un RTX 4060 gamer beaucoup moins cher en ce moment. Nous vérifions si le dernier G5 en vaut la peine et s'il peut figurer dans notre liste des meilleurs ordinateurs portables de jeu.
Christian Hintze, 👁 Christian Hintze (traduit par DeepL / Ninh Duy) Published 🇺🇸 🇩🇪 ...
Alder Lake Deal Gaming Geforce GPU Laptop / Notebook Nvidia Raptor Lake

Verdict - Le système de refroidissement est le point problématique

Un ordinateur portable RTX 4060 pour seulement 899 euros a son charme, et vous pouvez accepter une webcam 720p, l'absence d'un port Thunderbolt, et peut-être même un bruit légèrement plus élevé. Le G5 fait aussi des choses étonnamment bien : le design subtil est agréable, le clavier est plus que solide, l'écran plutôt moyen brille avec une grande précision des couleurs et la performance du CPU est légèrement au-dessus de la moyenne.
En revanche, le système de refroidissement laisse à désirer : si le processeur atteint constamment 100 °C pendant les jeux, cela n'est pas forcément propice à la durabilité du matériel. Il n'est pas étonnant que l'ordinateur portable soit également assez bruyant. Il s'agit peut-être d'un défaut de notre modèle de test, mais son prédécesseur devait également faire face à des problèmes de température. Nous ne comprenons pas pourquoi Gigabyte n'a pas corrigé ce point faible entre les deux générations d'ordinateurs portables. Si le fabricant découvre un défaut dans notre modèle, nous mettrons à jour le test.

Points positifs

+ prix bas
+ 2 emplacements pour SSD M.2
+ bon clavier
+ l'écran calibré est très fidèle aux couleurs (sRGB)
+ bonnes performances du processeur

Points négatifs

- pas de Thunderbolt
- webcam 720p
- pas de commutateur MUX
- Le processeur chauffe trop pendant les jeux
- SSD throttling (étranglement du SSD)
- latences élevées
- performances graphiques quelque peu inférieures à la moyenne
- système de refroidissement surchargé
- relativement bruyant
Bestpreis 939€ hardwarecamp24
GIGABYTE G5 KF5-H3DE554KD, Core i7-13620H, 16GB RAM, 1TB SSD, GeForce RTX 4060, DE
2. 964.99 € ONEGAMING

Price comparison

Comparaison avec les concurrents potentiels

Image
Modèle
Geizhals
Poids
Épaisseur
Display
1.
76.3%
Gigabyte G5 KF5 2024
Intel Core i7-13620H ⎘
NVIDIA GeForce RTX 4060 Laptop GPU ⎘
16 Go Mémoire, 1024 Go SSD
Bestpreis 939€ hardwarecamp24
2. 964.99€ ONEGAMING
2 kg22.7 mm15.60"
1920x1080
141 PPI
IPS
2.
79%
Lenovo LOQ 15IRX9
Lenovo LOQ 15IRX9
Intel Core i5-13450HX ⎘
NVIDIA GeForce RTX 4060 Laptop GPU ⎘
16 Go Mémoire, 1024 Go SSD
Bestpreis 849€ computeruniverse.net
2. 849€ Cyberport Stores Österreich
3. 849€ Cyberport.at
2.4 kg23.9 mm15.60"
1920x1080
141 PPI
IPS
3.
80.3%
Asus TUF Gaming A15 FA507UV
AMD Ryzen 9 8945H ⎘
NVIDIA GeForce RTX 4060 Laptop GPU ⎘
16 Go Mémoire, 1024 Go SSD
Bestpreis 1243.63€ TechnikLaden
2. 1290.89€ Jacob Elektronik direkt
3. 1294.49€ haym.infotec
2.1 kg22.4 mm15.60"
1920x1080
141 PPI
IPS
4.
82.3%
Lenovo Legion Pro 5 16IRX9 G9
Intel Core i7-14700HX ⎘
NVIDIA GeForce RTX 4060 Laptop GPU ⎘
32 Go Mémoire, 1024 Go SSD
Bestpreis 1499€ Coolblue
2. 1549€ PC-KING
3. 1549€ galaxus
2.5 kg26.55 mm16.00"
2560x1600
189 PPI
IPS
5.
83.4%
Dell Inspiron 16 Plus 7640
Intel Core Ultra 7 155H ⎘
NVIDIA GeForce RTX 4060 Laptop GPU ⎘
16 Go Mémoire, 1024 Go SSD
Listenpreis 1300 USD
Geizhals Suche
2.2 kg19.9 mm16.00"
2560x1600
189 PPI
IPS

La série G5 marque l'entrée de Gigabyte dans le domaine des ordinateurs portables de jeu à un prix abordable. Par rapport au prédécesseur avec Intel Gen12 Alder Lake, le modèle 2024 bénéficie d'une mise à jour vers Intel Gen13 Raptor Lake, à savoir le Core i7-13620H et la RTX 4060 la mémoire vive de 16 Go est bien sûr conservée, tandis que la capacité du SSD a été doublée pour atteindre 1 To. À seulement 899 euros, il est encore moins cher que son prédécesseur, ce qui en fait l'un des prix les plus bas jamais atteints dans ce segment de performance. Nous allons tester si le G5 KF5 actuel est intéressant pour ceux qui cherchent à économiser de l'argent ou s'il ne fait pas trop d'économies.

En plus de son prédécesseur, nous comparons également le système avec d'autres ordinateurs portables de jeu économiques tels que le LOQ 15et le Asus TUF Gaming A15 (2024) mais aussi avec des appareils plus onéreux, faute d'alternatives Lenovo Legion Pro 5 16IRX9 G9 et Dell Inspiron 16 Plus 7640.

Spécifications - Core i7-13620H et RTX 4060 pour moins de 900 euros

G5 KF5 (G5 Gamme)
Processeur
Intel Core i7-13620H 10 x 1.8 - 4.9 GHz, Raptor Lake-H
Carte graphique
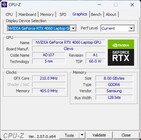
NVIDIA GeForce RTX 4060 Laptop GPU - 8 Go VRAM, 75 W TDP, Geforce 565.90, Optimus
Mémoire
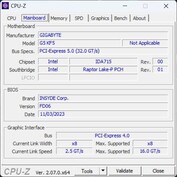
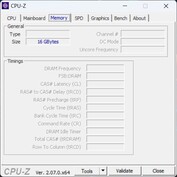
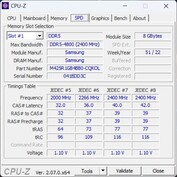
16 Go 
, 2x 8 GB Samsung DDR5-4800
Écran
15.60 pouces 16:9, 1920 x 1080 pixel 141 PPP, Sharp SHP153F (LQ156M1JW30), IPS, brillant: non, HDR, 360 Hz
Carte mère
Intel Alder Lake-P PCH
Disque dur
Gigabyte AG450E1024-SI, 1024 Go 
, 876 Go libres
Carte son
Intel Raptor Lake-P/U/H PCH - cAVS
Connexions
1 USB 2.0, 1 USB 3.0 / 3.1 Gen1, 2 USB 3.1 Gen2, 1 HDMI, 1 DisplayPort, 1 Encoche de Sécurité Kensington, Connectique audio: Headset + Microphone, Lecteur de cartes mémoires: MicroSD Reader
Réseau
Realtek Semiconductor RTL8168/8111 PCI-E Gigabit Ethernet NIC (10/100/1000MBit/s), Intel Wi-Fi 6E AX211 (a/b/g/h/n = Wi-Fi 4/ac = Wi-Fi 5/ax = Wi-Fi 6/ Wi-Fi 6E 6 GHz), Bluetooth Bluetooth 5.2
Taille
Hauteur x Largeur x Profondeur (en mm): 22.7 x 360 x 238
Batterie
54 Wh Lithium-Ion
Système d'exploitation
Microsoft Windows 11 Home
Appareil photo
Webcam: 720p IR Webcam
Appareil photo primaire: 0.9 MPix
Fonctionnalités additionnelles
Clavier: Chiclet 1 Zone RGB, Rétroéclairage du clavier: oui, 24 Mois Garantie
Poids
2.018 kg, Alimentation: 478 g
Prix
899 Euro
Remarque : le fabricant peut utiliser des composants provenant de différents fournisseurs, notamment des panneaux d'affichage, des lecteurs ou des clés USB ayant des spécifications similaires.


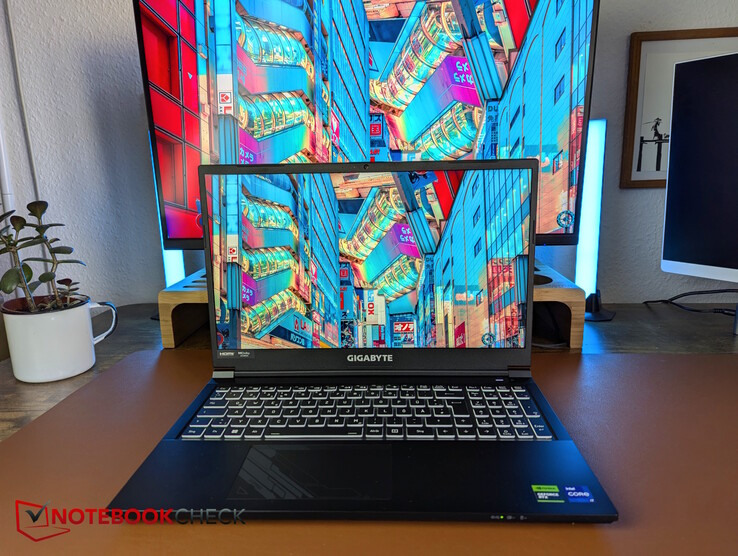
Boîtier et caractéristiques : Boîtier en plastique gris fer

Extérieurement, pratiquement rien n'a changé par rapport à son prédécesseur, puisqu'il a également copié le design en plastique Clevo ("Iron Gray") du Gigabyte G5 KE de Gigabyte (à l'époque encore équipé d'une RTX 3060). Il est intéressant de noter que l'ancien support Thunderbolt 4 du port USB-C gauche a été supprimé. Des économies ont également été faites sur la webcam, qui n'a qu'une résolution de 720p, et qui est assez floue ; elle présente également de fortes déviations de couleurs.

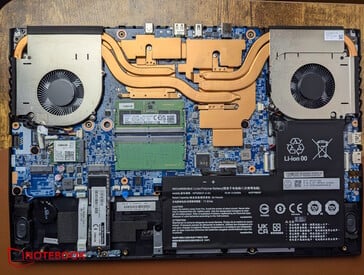
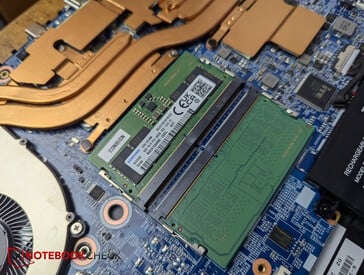
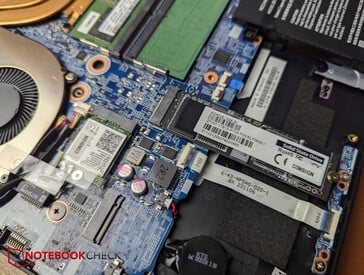
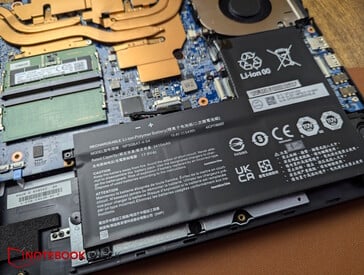
Pour la maintenance, il faut retirer 13 vis cruciformes, dont deux sont recouvertes d'un autocollant d'étanchéité, ce qui pourrait invalider la garantie si cela n'est pas fait correctement. À l'intérieur, vous avez accès aux deux emplacements SSD M.2, au module WiFi amovible, à la batterie, aux deux emplacements RAM et au système de refroidissement.

Sans plaque de base
Sans plaque de base
RAM DDR5
RAM DDR5
Deux emplacements pour disques SSD M.2 et module WiFi
La batterie
La batterie

La base se fissure et craque légèrement lorsque vous essayez de la tordre. Le couvercle ne bascule que légèrement lorsqu'il est ajusté et s'ouvre à un maximum de 140 degrés.

Comparaison des tailles

363.4 mm 261.75 mm 26.55 mm 2.5 kg359.86 mm 258.7 mm 23.9 mm 2.4 kg360 mm 238 mm 22.7 mm 2 kg360 mm 238 mm 22.7 mm 1.9 kg356.78 mm 250.6 mm 19.9 mm 2.2 kg354 mm 251 mm 22.4 mm 2.1 kg297 mm 210 mm 1 mm 5.7 g
À gauche : Kensington, USB-A 3.0, USB-A 2.0, prise pour microphone, prise pour casque d'écoute
À droite : Lecteur microSD, USB-C 3.2 Gen2, LAN (1 GbE)
Arrière : USB-C 3.2 Gen2, HDMI 2.1, MiniDP 1.4, alimentation
SD Card Reader
average JPG Copy Test (av. of 3 runs)
Moyenne de la classe Gaming
  (19 - 202, n=88, 2 dernières années)
95.7 MB/s +36%
Gigabyte G5 KF5 2024
Intel Core i7-13620H
70.6 (55.19min - 75.59max) MB/s
Gigabyte G5 KF
Intel Core i5-12500H
69.8 (63.44min - 75.35max) MB/s -1%
Dell Inspiron 16 Plus 7640
Intel Core Ultra 7 155H (Angelbird AV Pro V60)
22.2 MB/s -69%
maximum AS SSD Seq Read Test (1GB)
Moyenne de la classe Gaming
  (25.8 - 269, n=89, 2 dernières années)
119.6 MB/s +32%
Gigabyte G5 KF5 2024
Intel Core i7-13620H
90.74 MB/s
Gigabyte G5 KF
Intel Core i5-12500H
89.47 MB/s -1%
Dell Inspiron 16 Plus 7640
Intel Core Ultra 7 155H (Angelbird AV Pro V60)
28.7 MB/s -68%
Networking
iperf3 transmit AXE11000
Lenovo Legion Pro 5 16IRX9 G9
Intel Wi-Fi 6E AX211
1549 (752min - 1707max) MBit/s +8%
Gigabyte G5 KF5 2024
Intel Wi-Fi 6E AX211
1432 (1380min - 1467max) MBit/s
Gigabyte G5 KF
Intel Wi-Fi 6E AX211
1347 (1198min - 1410max) MBit/s -6%
Moyenne de la classe Gaming
  (469 - 1843, n=149, 2 dernières années)
1238 MBit/s -14%
Moyenne Intel Wi-Fi 6E AX211
  (464 - 1921, n=239)
1234 MBit/s -14%
Lenovo LOQ 15IRX9
Realtek RTL8852BE
830 (747min - 873max) MBit/s -42%
Dell Inspiron 16 Plus 7640
Intel Wi-Fi 6E AX211
811 (428min - 1008max) MBit/s -43%
Asus TUF Gaming A15 FA507UV
Realtek RTL8852BE
806 (513min - 843max) MBit/s -44%
iperf3 receive AXE11000
Gigabyte G5 KF5 2024
Intel Wi-Fi 6E AX211
1650 (1563min - 1691max) MBit/s
Gigabyte G5 KF
Intel Wi-Fi 6E AX211
1631 (1392min - 1669max) MBit/s -1%
Lenovo Legion Pro 5 16IRX9 G9
Intel Wi-Fi 6E AX211
1477 (1386min - 1517max) MBit/s -10%
Moyenne de la classe Gaming
  (680 - 1890, n=149, 2 dernières années)
1387 MBit/s -16%
Moyenne Intel Wi-Fi 6E AX211
  (582 - 1890, n=239)
1379 MBit/s -16%
Dell Inspiron 16 Plus 7640
Intel Wi-Fi 6E AX211
1000 (899min - 1078max) MBit/s -39%
Lenovo LOQ 15IRX9
Realtek RTL8852BE
975 (950min - 986max) MBit/s -41%
Asus TUF Gaming A15 FA507UV
Realtek RTL8852BE
956 (936min - 974max) MBit/s -42%
iperf3 transmit AXE11000 6GHz
Gigabyte G5 KF
Intel Wi-Fi 6E AX211
1594 (1547min - 1650max) MBit/s +2%
Lenovo Legion Pro 5 16IRX9 G9
Intel Wi-Fi 6E AX211
1585 (1369min - 1655max) MBit/s +1%
Gigabyte G5 KF5 2024
Intel Wi-Fi 6E AX211
1566 (780min - 1615max) MBit/s
Moyenne de la classe Gaming
  (648 - 1878, n=70, 2 dernières années)
1434 MBit/s -8%
Moyenne Intel Wi-Fi 6E AX211
  (632 - 1851, n=211)
1372 MBit/s -12%
Dell Inspiron 16 Plus 7640
Intel Wi-Fi 6E AX211
705 (634min - 769max) MBit/s -55%
iperf3 receive AXE11000 6GHz
Gigabyte G5 KF
Intel Wi-Fi 6E AX211
1654 (1581min - 1671max) MBit/s +4%
Gigabyte G5 KF5 2024
Intel Wi-Fi 6E AX211
1585 (1568min - 1606max) MBit/s
Lenovo Legion Pro 5 16IRX9 G9
Intel Wi-Fi 6E AX211
1540 (774min - 1556max) MBit/s -3%
Moyenne Intel Wi-Fi 6E AX211
  (700 - 1857, n=210)
1493 MBit/s -6%
Moyenne de la classe Gaming
  (853 - 1788, n=70, 2 dernières années)
1489 MBit/s -6%
Dell Inspiron 16 Plus 7640
Intel Wi-Fi 6E AX211
700 (607min - 805max) MBit/s -56%
05010015020025030035040045050055060065070075080085090095010001050110011501200125013001350140014501500155016001650Tooltip
Gigabyte G5 KF5 2024 Intel Wi-Fi 6E AX211; iperf3 transmit AXE11000 6GHz; iperf 3.1.3: Ø1540 (780-1615)
Gigabyte G5 KF5 2024 Intel Wi-Fi 6E AX211; iperf3 receive AXE11000 6GHz; iperf 3.1.3: Ø1584 (1568-1606)
Gigabyte G5 KF5 2024 Intel Wi-Fi 6E AX211; iperf3 transmit AXE11000; iperf 3.1.3: Ø1432 (1380-1467)
Lenovo LOQ 15IRX9 Realtek RTL8852BE; iperf3 transmit AXE11000; iperf 3.1.3: Ø830 (747-873)
Asus TUF Gaming A15 FA507UV Realtek RTL8852BE; iperf3 transmit AXE11000; iperf 3.1.3: Ø806 (513-843)
Gigabyte G5 KF5 2024 Intel Wi-Fi 6E AX211; iperf3 receive AXE11000; iperf 3.1.3: Ø1649 (1563-1691)
Lenovo LOQ 15IRX9 Realtek RTL8852BE; iperf3 receive AXE11000; iperf 3.1.3: Ø974 (950-986)
Asus TUF Gaming A15 FA507UV Realtek RTL8852BE; iperf3 receive AXE11000; iperf 3.1.3: Ø956 (936-974)
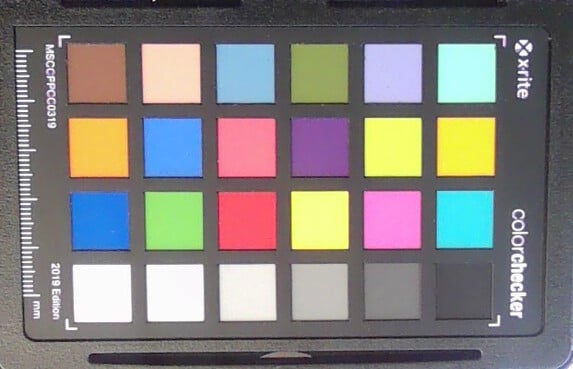
ColorChecker
19.3 ∆E
18.5 ∆E
23.1 ∆E
23.1 ∆E
20.4 ∆E
18 ∆E
23.3 ∆E
27.9 ∆E
17.2 ∆E
14 ∆E
17.4 ∆E
25.2 ∆E
26.2 ∆E
24.5 ∆E
20.6 ∆E
15.6 ∆E
19.3 ∆E
29.3 ∆E
1.8 ∆E
10.7 ∆E
20.7 ∆E
22.4 ∆E
21.5 ∆E
12.8 ∆E
ColorChecker Gigabyte G5 KF5 2024: 19.7 ∆E min: 1.76 - max: 29.31 ∆E

Durabilité

Bien que Gigabyte livre le G5 dans une boîte en carton, l'ordinateur portable de jeu et le bloc d'alimentation sont toujours emballés dans des sacs en plastique à l'intérieur et protégés des chocs par des matériaux en Styrodur. Les matériaux recyclés ne sont apparemment pas utilisés, et le fabricant ne fournit aucune information sur les émissions de CO2 lors de la production du G5.

Périphériques d'entrée - G5 avec de bons périphériques d'entrée

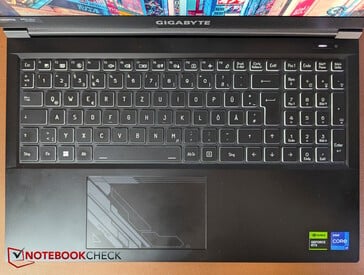
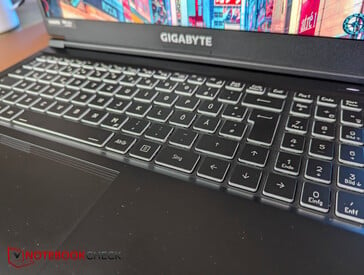
La disposition et le libellé sont légèrement différents de ceux du G5 KE, mais ils sont conformes à ceux de son prédécesseur direct, le G5 KF, avec une touche d'entrée plus grande et un libellé plus fin et plus clair. La disposition est claire et le lettrage est facile à lire, même sans rétroéclairage. L'éclairage du clavier à zone unique peut être configuré dans les couleurs et la luminosité peut être réglée sur quatre niveaux. Le point de pression est agréable avec une course moyenne, tandis que le retour d'information est bon. La frappe est rapide et les émissions sonores modérées.

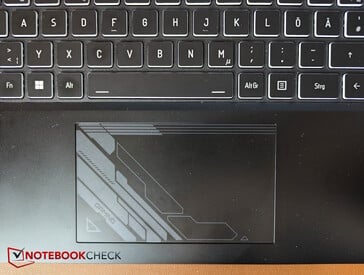
Le pavé tactile mesure environ 12 x 7,2 cm et offre des propriétés de glissement décentes, qui ne s'affaiblissent que légèrement lors de mouvements très lents. Les bruits de clic des boutons intégrés de la souris sont modérés.

Le clavier
Le clavier
Le pavé tactile
Le pavé tactile
Les touches sans éclairage
Le rétro-éclairage
Le rétro-éclairage

Écran - Gigabyte avec écran FHD net

Pas de saignement important du rétroéclairage
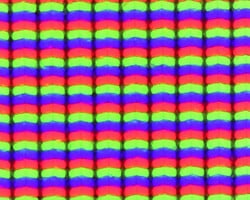
Structure du sous-pixel

Gigabyte a changé l'écran du G5. Les derniers modèles G5 utilisaient une dalle Chi-Mei, mais notre échantillon de test est maintenant équipé d'un écran Full HD IPS mat de Sharp avec un taux de rafraîchissement maximum de 144 Hz.

En moyenne, l'écran brille à un peu plus de 300 nits, ce qui est dans la fourchette basse de nos jours. L'uniformité de l'éclairage est de 87 %.

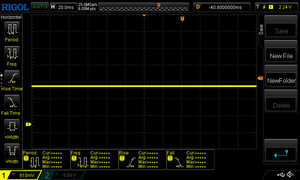
Le niveau de noir et le contraste sont moyens. L'écran ne commute pas les pixels trop rapidement, mais il n'est pas non plus particulièrement lent. L'extinction du rétroéclairage n'est pas un problème, pas plus que le PWM.

En résumé, nous avons un écran décent pour le prix global, qui n'est certainement pas l'un des meilleurs de sa catégorie, mais qui fait son travail de manière fiable. Pour des résolutions plus élevées, des couleurs plus vives, des contrastes plus marqués et d'autres technologies de panneaux (OLED, MiniLEDs), vous devrez mettre la main à la poche.

297
cd/m²
306
cd/m²
302
cd/m²
307
cd/m²
342
cd/m²
317
cd/m²
299
cd/m²
299
cd/m²
299
cd/m²
Homogénéité de la luminosité
Sharp SHP153F (LQ156M1JW30) tested with X-Rite i1Pro 3
Maximum: 342 cd/m² (Nits) Moyenne: 307.6 cd/m² Minimum: 18.8 cd/m²
Homogénéité de la luminosité: 87 %
Valeur mesurée au centre, sur batterie: 342 cd/m²
Contraste: 1179:1 (Valeurs des noirs: 0.29 cd/m²)
ΔE Color 2.46 | 0.5-29.43 Ø4.92, calibrated: 0.82
ΔE Greyscale 3.03 | 0.5-98 Ø5.2
68.8% AdobeRGB 1998 (Argyll 2.2.0 3D)
98.9% sRGB (Argyll 2.2.0 3D)
67.9% Display P3 (Argyll 2.2.0 3D)
Gamma: 2.51
Gigabyte G5 KF5 2024
Sharp SHP153F (LQ156M1JW30), IPS, 1920x1080, 15.6", 360 Hz
Gigabyte G5 KF
Chi Mei N156HRA-EA1, IPS, 1920x1080, 15.6", 144 Hz
Lenovo LOQ 15IRX9
BOE NJ NE156FHM-NX9, IPS, 1920x1080, 15.6", 144 Hz
Asus TUF Gaming A15 FA507UV
AU Optronics B156HAN15.H, IPS, 1920x1080, 15.6", 144 Hz
Lenovo Legion Pro 5 16IRX9 G9
BOE NE160QDM-NZB, IPS, 2560x1600, 16", 240 Hz
Dell Inspiron 16 Plus 7640
AU Optronics B160QAN, IPS, 2560x1600, 16", 120 Hz
Display
-35%
5%
3%
25%
8%
Display P3 Coverage
67.9
43.2
-36%
73.7
9%
70.5
4%
99.22
46%
76
12%
sRGB Coverage
98.9
64.3
-35%
99.1
0%
98.5
0%
99.93
1%
99.8
1%
AdobeRGB 1998 Coverage
68.8
44.7
-35%
72.6
6%
72.7
6%
87.81
28%
76.7
11%
Response Times
-58%
-191%
-152%
29%
-99%
Response Time Grey 50% / Grey 80% *
13 ?(6.6, 6.4)
25.1 ?(11.7, 13.4)
-93%
42.2 ?(19.1, 23.1)
-225%
31.7 ?(14.7, 17)
-144%
4.8 ?(2.2, 2.6)
63%
25.6 ?(12.3, 13.3)
-97%
Response Time Black / White *
8.8 ?(4.6, 4.2)
10.8 ?(9.9, 7.9)
-23%
22.6 ?(11.2, 11.4)
-157%
22.9 ?(11.7, 11.2)
-160%
9.2 ?(4.6, 4.6)
-5%
17.6 ?(8.5, 9.1)
-100%
PWM Frequency
Screen
-134%
-3%
-13%
-4%
8%
Brightness middle
342
297
-13%
306
-11%
315
-8%
518
51%
314.7
-8%
Brightness
308
275
-11%
287
-7%
303
-2%
491
59%
291
-6%
Brightness Distribution
87
85
-2%
88
1%
90
3%
90
3%
89
2%
Black Level *
0.29
0.34
-17%
0.21
28%
0.25
14%
0.36
-24%
0.28
3%
Contrast
1179
874
-26%
1457
24%
1260
7%
1439
22%
1124
-5%
Colorchecker dE 2000 *
2.46
6.23
-153%
2.25
9%
2.26
8%
4.32
-76%
1.62
34%
Colorchecker dE 2000 max. *
4.12
20.93
-408%
4.84
-17%
7.37
-79%
6.37
-55%
2.94
29%
Colorchecker dE 2000 calibrated *
0.82
4.74
-478%
1.45
-77%
1.03
-26%
0.75
9%
1.08
-32%
Greyscale dE 2000 *
3.03
5.92
-95%
2.4
21%
4
-32%
3.66
-21%
1.3
57%
Gamma
2.51 88%
2.49 88%
2.259 97%
2.116 104%
2.19 100%
2.26 97%
CCT
7056 92%
6279 104%
6790 96%
7570 86%
6841 95%
6385 102%
Moyenne finale (programmes/paramètres)
-76% / -102%
-63% / -28%
-54% / -29%
17% / 7%
-28% / -7%

* ... Moindre est la valeur, meilleures sont les performances

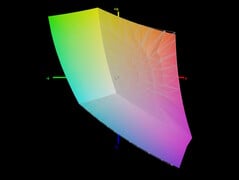
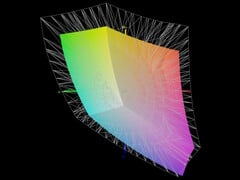
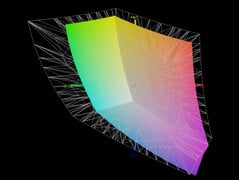
Avec le panel utilisé, il n'est pas surprenant que, parmi les espaces colorimétriques habituels, seul le sRGB soit presque entièrement couvert.

sRGB
sRGB
Affichage P3
Affichage P3
AdobeRGB
AdobeRGB

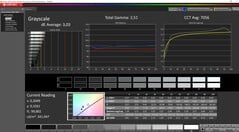
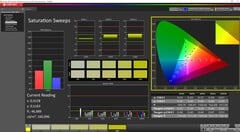
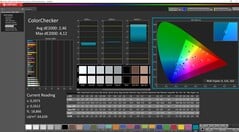
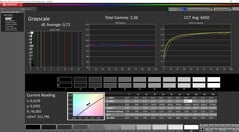
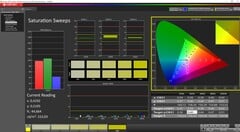
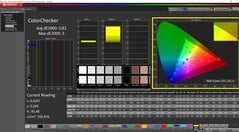
Les couleurs et les niveaux de gris de l'écran sont corrects au départ de l'usine, mais les valeurs DeltaE peuvent être réduites de manière significative grâce à notre étalonnage manuel via le colorimètre Xrite et le logiciel Calman, de sorte que les écarts dans les niveaux de gris passent de 3,03 à seulement 0,71 et de 2,46 à seulement 0,82 dans le ColorChecker. L'écran est donc très précis au niveau des couleurs et convient même à des tâches légères d'édition de photos et de vidéos, à condition que l'espace colorimétrique sRGB soit suffisant.

Niveaux de gris
Niveaux de gris
Saturation
Saturation
Contrôleur de couleurs
Niveaux de gris calibrés
Saturation calibrée
Saturation calibrée
ColorChecker calibré

Temps de réponse de l'écran

Le temps de réponse d'un écran mesure la rapidité à laquelle l'écran est capable de changer une couleur pour une autre. Un temps de réponse élevé se traduit par une image floutée pour les objets en mouvement. Les joueurs bénéficieront de faibles latences d'affichage en jeu.
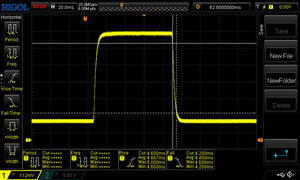
       Temps de réponse noir à blanc
8.8 ms ... hausse ↗ et chute ↘ combinées↗ 4.6 ms hausse
↘ 4.2 ms chute
L'écran montre de faibles temps de réponse, un bon écran pour jouer.
En comparaison, tous les appareils testés affichent entre 0.1 (minimum) et 240 (maximum) ms. » 21 % des appareils testés affichent de meilleures performances.
Cela signifie que les latences relevées sont meilleures que la moyenne (21 ms) de tous les appareils testés.
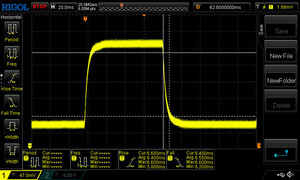
       Temps de réponse gris 50% à gris 80%
13 ms ... hausse ↗ et chute ↘ combinées↗ 6.6 ms hausse
↘ 6.4 ms chute
L'écran montre de bons temps de réponse, mais insuffisant pour du jeu compétitif.
En comparaison, tous les appareils testés affichent entre 0.165 (minimum) et 636 (maximum) ms. » 23 % des appareils testés affichent de meilleures performances.
Cela signifie que les latences relevées sont meilleures que la moyenne (32.9 ms) de tous les appareils testés.

Scintillement / MLI (Modulation de largeur d'impulsion)

Afin d'abaisser la luminosité de l'écran, certains ordinateurs portables font varier très rapidement le rétroéclairage entre éteint et allumé. La fréquence à laquelle le rétroéclairage s'éteint et se rallume est normalement fixée à une valeur qui permet de rendre la variation indétectable à l'œil nu? Si la fréquence est trop basse, certaines personnes peuvent être sujettes à une fatigue oculaire, des maux de tête ou même percevoir les variations.
Scintillement / MLI (Modulation de largeur d'impulsion) non décelé

En comparaison, 53 % des appareils testés n'emploient pas MDI pour assombrir leur écran. Nous avons relevé une moyenne à 8743 (minimum : 5 - maximum : 343500) Hz dans le cas où une MDI était active.

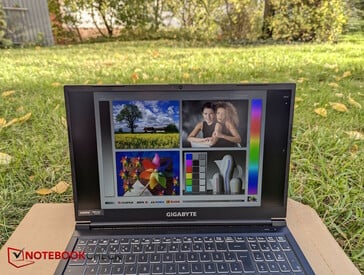
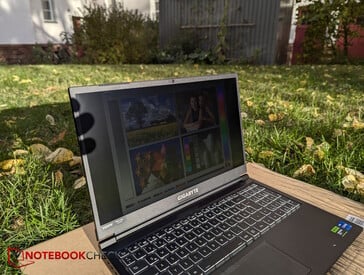
En extérieur, les 300 nits ne sont pas idéaux, mais utilisables. La lumière du soleil doit être évitée à tout prix.

A l'extérieur, à l'ombre
A l'extérieur, en plein soleil
Angles de vision IPS stables

Performances - CPU en tête, GPU en retrait

Notre G5 KF5 est équipé d'un processeur Intel Core i7-13620H et d'une RTX 4060 ainsi que de 16 Go de RAM DDR5 et d'un disque dur SSD de 1 To. Le G5 est également disponible en tant que modèle MF5, auquel cas une plus faible RTX 4050 plus faible, ce qui semble être la seule différence. Avec cette combinaison matérielle, le G5 se positionne comme un joueur à petit budget et est également capable de gérer quelques tâches créatrices légères.

Conditions d'essai

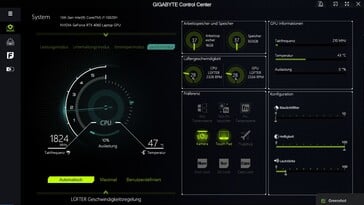
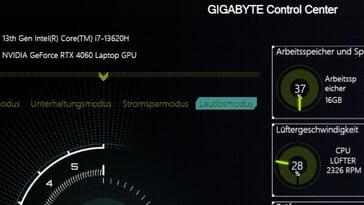
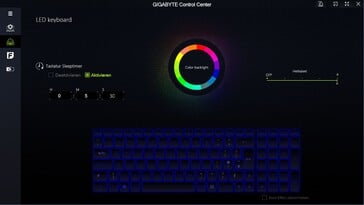
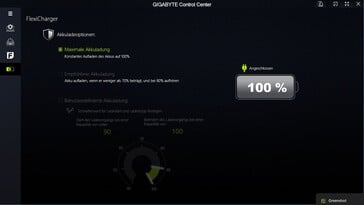
Le Gigabyte Control Center est préinstallé sur le G5. Le logiciel n'est pas particulièrement complet (pas de commutateur MUX) et nous avons rarement vu un centre de contrôle aussi pixellisé et inesthétique. Au moins, nous trouvons quatre profils de performance (silencieux, économie d'énergie, divertissement, performance) en plus des paramètres du clavier. Nous avons sélectionné le mode performance pour nos benchmarks et utilisé le mode économie d'énergie pour les tests de batterie. Étant donné que la manière dont ces modes interagissent avec les modes d'alimentation de Windows ou les influencent n'est pas claire du tout, nous avons également réglé Windows sur le mode performance (ou sur le mode économie d'énergie pour les tests sur batterie).

Le centre de contrôle Gigabyte
L'aspect pixellisé n'est pas vraiment agréable (en zoomant).
Macros et rétroéclairage du clavier
Paramètres de charge de la batterie

Processeur

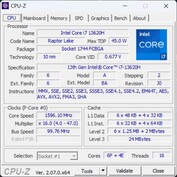
Le Intel Core i7-13620H est un processeur haut de gamme pour ordinateurs portables avec 6 cœurs P et 4 cœurs E, un total de 16 threads, et une fréquence d'horloge de 1,8 (horloge de base des cœurs E) à 4,9 GHz (cœur P turbo à un seul cœur). Une unité graphique Intel Xe avec seulement 64 des 96 UE est intégrée.

Dans notre test d'endurance Cinebench R15, il n'y a qu'une légère baisse de points au cours des quatre premières exécutions, après quoi la performance reste constante. Dans l'ensemble, le processeur du G5 affiche des performances légèrement supérieures à celles de la moyenne des ordinateurs portables équipés du même processeur dans notre base de données, et même supérieures à celles du Core i5-13450HX dans la LOQ 15. Par rapport à son prédécesseur, les performances du processeur ont augmenté de 21 %.

En mode batterie, les performances dans Cinebench R15 chutent d'environ 35 %.

Cinebench R15/Mode Performance Divertissement Silencieux Économie d'énergie batterie
Score 2 396 2 296 840 768 1 555
TDP d'abord 93, puis 65 W avec le temps d'abord 85, puis brièvement 65, puis 45 W d'abord 28, puis 20, puis 15 W 15 W 36 W

Cinebench R15 Multi loop

0210420630840105012601470168018902100231025202730294031503360357037803990Tooltip
Gigabyte G5 KF5 2024 Intel Core i7-13620H: Ø2161 (2113.38-2395.78)
Gigabyte G5 KF Intel Core i5-12500H: Ø1808 (1783.56-2001.16)
Lenovo LOQ 15IRX9 Intel Core i5-13450HX: Ø2170 (2104.93-2503.76)
Asus TUF Gaming A15 FA507UV AMD Ryzen 9 8945H: Ø2688 (2638-2777.2)
Lenovo Legion Pro 5 16IRX9 G9 Intel Core i7-14700HX: Ø3774 (3668.72-4136.93)
Dell Inspiron 16 Plus 7640 Intel Core Ultra 7 155H: Ø2341 (1793.16-2787.26)
CPU Performance Rating: Percent
Cinebench R23: Multi Core | Single Core
Cinebench R20: CPU (Multi Core) | CPU (Single Core)
Cinebench R15: CPU Multi 64Bit | CPU Single 64Bit
Blender: v2.79 BMW27 CPU
7-Zip 18.03: 7z b 4 | 7z b 4 -mmt1
Geekbench 6.3: Multi-Core | Single-Core
Geekbench 5.5: Multi-Core | Single-Core
HWBOT x265 Benchmark v2.2: 4k Preset
LibreOffice : 20 Documents To PDF
R Benchmark 2.5: Overall mean
CPU Performance Rating
Lenovo Legion Pro 5 16IRX9 G9
Intel Core i7-14700HX
86.7 pt
Moyenne de la classe Gaming
 
73.2 pt
Asus TUF Gaming A15 FA507UV
AMD Ryzen 9 8945H
68.1 pt
Dell Inspiron 16 Plus 7640
Intel Core Ultra 7 155H
63.8 pt
Gigabyte G5 KF5 2024
Intel Core i7-13620H
61.6 pt
Moyenne Intel Core i7-13620H
 
59.9 pt
Lenovo LOQ 15IRX9
Intel Core i5-13450HX
58.4 pt
Gigabyte G5 KF
Intel Core i5-12500H
51 pt
Cinebench R23 / Multi Core
Lenovo Legion Pro 5 16IRX9 G9
Intel Core i7-14700HX
28122 Points +91%
Moyenne de la classe Gaming
  (5668 - 36249, n=191, 2 dernières années)
21701 Points +48%
Dell Inspiron 16 Plus 7640
Intel Core Ultra 7 155H
17675 (14726min - 17675max) Points +20%
Asus TUF Gaming A15 FA507UV
AMD Ryzen 9 8945H
17423 Points +19%
Lenovo LOQ 15IRX9
Intel Core i5-13450HX
16797 Points +14%
Gigabyte G5 KF5 2024
Intel Core i7-13620H
14686 Points
Moyenne Intel Core i7-13620H
  (10819 - 15496, n=5)
14303 Points -3%
Gigabyte G5 KF
Intel Core i5-12500H
13471 Points -8%
Cinebench R23 / Single Core
Lenovo Legion Pro 5 16IRX9 G9
Intel Core i7-14700HX
2128 Points +14%
Moyenne de la classe Gaming
  (1088 - 2235, n=189, 2 dernières années)
1880 Points +1%
Gigabyte G5 KF5 2024
Intel Core i7-13620H
1862 Points
Moyenne Intel Core i7-13620H
  (1805 - 1871, n=5)
1843 Points -1%
Asus TUF Gaming A15 FA507UV
AMD Ryzen 9 8945H
1814 Points -3%
Dell Inspiron 16 Plus 7640
Intel Core Ultra 7 155H
1733 Points -7%
Lenovo LOQ 15IRX9
Intel Core i5-13450HX
1710 Points -8%
Gigabyte G5 KF
Intel Core i5-12500H
1690 Points -9%
Cinebench R20 / CPU (Multi Core)
Lenovo Legion Pro 5 16IRX9 G9
Intel Core i7-14700HX
10498 Points +89%
Moyenne de la classe Gaming
  (2179 - 13832, n=189, 2 dernières années)
8258 Points +49%
Asus TUF Gaming A15 FA507UV
AMD Ryzen 9 8945H
6859 Points +23%
Dell Inspiron 16 Plus 7640
Intel Core Ultra 7 155H
6807 Points +22%
Lenovo LOQ 15IRX9
Intel Core i5-13450HX
6532 Points +18%
Gigabyte G5 KF5 2024
Intel Core i7-13620H
5558 Points
Moyenne Intel Core i7-13620H
  (4214 - 5905, n=5)
5426 Points -2%
Gigabyte G5 KF
Intel Core i5-12500H
5115 Points -8%
Cinebench R20 / CPU (Single Core)
Lenovo Legion Pro 5 16IRX9 G9
Intel Core i7-14700HX
818 Points +17%
Moyenne de la classe Gaming
  (427 - 856, n=189, 2 dernières années)
722 Points +4%
Moyenne Intel Core i7-13620H
  (693 - 719, n=5)
704 Points +1%
Gigabyte G5 KF5 2024
Intel Core i7-13620H
697 Points
Asus TUF Gaming A15 FA507UV
AMD Ryzen 9 8945H
670 Points -4%
Dell Inspiron 16 Plus 7640
Intel Core Ultra 7 155H
666 Points -4%
Lenovo LOQ 15IRX9
Intel Core i5-13450HX
652 Points -6%
Gigabyte G5 KF
Intel Core i5-12500H
651 Points -7%
Cinebench R15 / CPU Multi 64Bit
Lenovo Legion Pro 5 16IRX9 G9
Intel Core i7-14700HX
4137 (3668.72min - 4136.93max) Points +73%
Moyenne de la classe Gaming
  (905 - 5663, n=196, 2 dernières années)
3402 Points +42%
Dell Inspiron 16 Plus 7640
Intel Core Ultra 7 155H
2787 (1793.16min - 2787.26max) Points +16%
Asus TUF Gaming A15 FA507UV
AMD Ryzen 9 8945H
2777 Points +16%
Lenovo LOQ 15IRX9
Intel Core i5-13450HX
2503 Points +4%
Gigabyte G5 KF5 2024
Intel Core i7-13620H
2396 (2113.38min - 2395.78max) Points
Moyenne Intel Core i7-13620H
  (1681 - 2492, n=5)
2239 Points -7%
Gigabyte G5 KF
Intel Core i5-12500H
2001 Points -16%
Cinebench R15 / CPU Single 64Bit
Lenovo Legion Pro 5 16IRX9 G9
Intel Core i7-14700HX
300 Points +12%
Asus TUF Gaming A15 FA507UV
AMD Ryzen 9 8945H
284 Points +6%
Moyenne de la classe Gaming
  (176.6 - 318, n=193, 2 dernières années)
277 Points +3%
Gigabyte G5 KF5 2024
Intel Core i7-13620H
269 Points
Moyenne Intel Core i7-13620H
  (258 - 269, n=5)
263 Points -2%
Dell Inspiron 16 Plus 7640
Intel Core Ultra 7 155H
255 Points -5%
Lenovo LOQ 15IRX9
Intel Core i5-13450HX
239 Points -11%
Gigabyte G5 KF
Intel Core i5-12500H
233 Points -13%
Blender / v2.79 BMW27 CPU
Gigabyte G5 KF
Intel Core i5-12500H
256 Seconds * -17%
Moyenne Intel Core i7-13620H
  (215 - 289, n=5)
238 Seconds * -9%
Lenovo LOQ 15IRX9
Intel Core i5-13450HX
229 Seconds * -5%
Gigabyte G5 KF5 2024
Intel Core i7-13620H
218 Seconds *
Dell Inspiron 16 Plus 7640
Intel Core Ultra 7 155H
191 Seconds * +12%
Asus TUF Gaming A15 FA507UV
AMD Ryzen 9 8945H
182 Seconds * +17%
Moyenne de la classe Gaming
  (87 - 555, n=184, 2 dernières années)
171.9 Seconds * +21%
Lenovo Legion Pro 5 16IRX9 G9
Intel Core i7-14700HX
126 Seconds * +42%
7-Zip 18.03 / 7z b 4
Lenovo Legion Pro 5 16IRX9 G9
Intel Core i7-14700HX
104730 MIPS +73%
Moyenne de la classe Gaming
  (23795 - 140932, n=188, 2 dernières années)
84837 MIPS +40%
Asus TUF Gaming A15 FA507UV
AMD Ryzen 9 8945H
73222 MIPS +21%
Dell Inspiron 16 Plus 7640
Intel Core Ultra 7 155H
61730 MIPS +2%
Gigabyte G5 KF5 2024
Intel Core i7-13620H
60545 MIPS
Lenovo LOQ 15IRX9
Intel Core i5-13450HX
59026 MIPS -3%
Moyenne Intel Core i7-13620H
  (45983 - 62324, n=5)
56733 MIPS -6%
Gigabyte G5 KF
Intel Core i5-12500H
49343 MIPS -19%
7-Zip 18.03 / 7z b 4 -mmt1
Lenovo Legion Pro 5 16IRX9 G9
Intel Core i7-14700HX
6979 MIPS +14%
Asus TUF Gaming A15 FA507UV
AMD Ryzen 9 8945H
6615 MIPS +9%
Moyenne de la classe Gaming
  (4168 - 7581, n=188, 2 dernières années)
6286 MIPS +3%
Gigabyte G5 KF5 2024
Intel Core i7-13620H
6096 MIPS
Moyenne Intel Core i7-13620H
  (5742 - 6326, n=5)
5994 MIPS -2%
Dell Inspiron 16 Plus 7640
Intel Core Ultra 7 155H
5461 MIPS -10%
Lenovo LOQ 15IRX9
Intel Core i5-13450HX
5370 MIPS -12%
Gigabyte G5 KF
Intel Core i5-12500H
5258 MIPS -14%
Geekbench 6.3 / Multi-Core
Lenovo Legion Pro 5 16IRX9 G9
Intel Core i7-14700HX
17562 Points +37%
Moyenne de la classe Gaming
  (5340 - 19665, n=110, 2 dernières années)
14171 Points +11%
Dell Inspiron 16 Plus 7640
Intel Core Ultra 7 155H
13018 Points +2%
Gigabyte G5 KF5 2024
Intel Core i7-13620H
12779 Points
Lenovo LOQ 15IRX9
Intel Core i5-13450HX
12684 Points -1%
Asus TUF Gaming A15 FA507UV
AMD Ryzen 9 8945H
12662 Points -1%
Moyenne Intel Core i7-13620H
  (9131 - 13077, n=4)
11886 Points -7%
Gigabyte G5 KF
Intel Core i5-12500H
8714 Points -32%
Geekbench 6.3 / Single-Core
Lenovo Legion Pro 5 16IRX9 G9
Intel Core i7-14700HX
2884 Points +13%
Asus TUF Gaming A15 FA507UV
AMD Ryzen 9 8945H
2711 Points +7%
Moyenne de la classe Gaming
  (1490 - 3129, n=110, 2 dernières années)
2641 Points +4%
Moyenne Intel Core i7-13620H
  (2544 - 2605, n=4)
2586 Points +2%
Gigabyte G5 KF5 2024
Intel Core i7-13620H
2544 Points
Dell Inspiron 16 Plus 7640
Intel Core Ultra 7 155H
2401 Points -6%
Lenovo LOQ 15IRX9
Intel Core i5-13450HX
2381 Points -6%
Gigabyte G5 KF
Intel Core i5-12500H
2239 Points -12%
Geekbench 5.5 / Multi-Core
Lenovo Legion Pro 5 16IRX9 G9
Intel Core i7-14700HX
19597 Points +68%
Moyenne de la classe Gaming
  (4557 - 23194, n=189, 2 dernières années)
14925 Points +28%
Dell Inspiron 16 Plus 7640
Intel Core Ultra 7 155H
12600 Points +8%
Lenovo LOQ 15IRX9
Intel Core i5-13450HX
12005 Points +3%
Asus TUF Gaming A15 FA507UV
AMD Ryzen 9 8945H
11949 Points +2%
Gigabyte G5 KF5 2024
Intel Core i7-13620H
11699 Points
Moyenne Intel Core i7-13620H
  (8357 - 12223, n=5)
11000 Points -6%
Gigabyte G5 KF
Intel Core i5-12500H
8194 Points -30%
Geekbench 5.5 / Single-Core
Lenovo Legion Pro 5 16IRX9 G9
Intel Core i7-14700HX
2133 Points +19%
Asus TUF Gaming A15 FA507UV
AMD Ryzen 9 8945H
1991 Points +11%
Moyenne de la classe Gaming
  (986 - 2210, n=189, 2 dernières années)
1885 Points +5%
Moyenne Intel Core i7-13620H
  (1793 - 1865, n=5)
1823 Points +1%
Gigabyte G5 KF5 2024
Intel Core i7-13620H
1799 Points
Dell Inspiron 16 Plus 7640
Intel Core Ultra 7 155H
1793 Points 0%
Lenovo LOQ 15IRX9
Intel Core i5-13450HX
1696 Points -6%
Gigabyte G5 KF
Intel Core i5-12500H
1618 Points -10%
HWBOT x265 Benchmark v2.2 / 4k Preset
Lenovo Legion Pro 5 16IRX9 G9
Intel Core i7-14700HX
27.4 fps +55%
Moyenne de la classe Gaming
  (6.72 - 38.9, n=188, 2 dernières années)
23.4 fps +32%
Asus TUF Gaming A15 FA507UV
AMD Ryzen 9 8945H
21.9 fps +24%
Dell Inspiron 16 Plus 7640
Intel Core Ultra 7 155H
19.5 fps +10%
Gigabyte G5 KF5 2024
Intel Core i7-13620H
17.7 fps
Lenovo LOQ 15IRX9
Intel Core i5-13450HX
17.5 fps -1%
Moyenne Intel Core i7-13620H
  (12.9 - 17.7, n=5)
16.2 fps -8%
Gigabyte G5 KF
Intel Core i5-12500H
14.2 fps -20%
LibreOffice / 20 Documents To PDF
Lenovo LOQ 15IRX9
Intel Core i5-13450HX
59.3 s * -15%
Lenovo Legion Pro 5 16IRX9 G9
Intel Core i7-14700HX
52.3 s * -2%
Gigabyte G5 KF5 2024
Intel Core i7-13620H
51.4 s *
Gigabyte G5 KF
Intel Core i5-12500H
50.1 s * +3%
Moyenne Intel Core i7-13620H
  (41.5 - 56.8, n=5)
47.8 s * +7%
Asus TUF Gaming A15 FA507UV
AMD Ryzen 9 8945H
47.5 s * +8%
Moyenne de la classe Gaming
  (31.4 - 96.6, n=185, 2 dernières années)
47.5 s * +8%
Dell Inspiron 16 Plus 7640
Intel Core Ultra 7 155H
43.5 s * +15%
R Benchmark 2.5 / Overall mean
Gigabyte G5 KF
Intel Core i5-12500H
0.535 sec * -20%
Lenovo LOQ 15IRX9
Intel Core i5-13450HX
0.4838 sec * -8%
Dell Inspiron 16 Plus 7640
Intel Core Ultra 7 155H
0.4709 sec * -6%
Moyenne Intel Core i7-13620H
  (0.4438 - 0.4509, n=5)
0.4471 sec * -0%
Gigabyte G5 KF5 2024
Intel Core i7-13620H
0.446 sec *
Moyenne de la classe Gaming
  (0.3609 - 0.759, n=189, 2 dernières années)
0.4399 sec * +1%
Asus TUF Gaming A15 FA507UV
AMD Ryzen 9 8945H
0.4298 sec * +4%
Lenovo Legion Pro 5 16IRX9 G9
Intel Core i7-14700HX
0.4003 sec * +10%

* ... Moindre est la valeur, meilleures sont les performances

Cinebench R15 CPU Multi 64Bit
2396 Points
Cinebench R15 OpenGL 64Bit
209 fps
Cinebench R15 Ref. Match 64Bit
99.6 %
Cinebench R15 CPU Single 64Bit
269 Points
Cinebench R20 CPU (Multi Core)
5558 Points
Cinebench R20 CPU (Single Core)
697 Points
Cinebench R23 Single Core
1862 Points
Cinebench R23 Multi Core
14686 Points
Aide
Performance Rating
Lenovo Legion Pro 5 16IRX9 G9
Intel Core i7-14700HX, NVIDIA GeForce RTX 4060 Laptop GPU
94.1 pt
Asus TUF Gaming A15 FA507UV
AMD Ryzen 9 8945H, NVIDIA GeForce RTX 4060 Laptop GPU
89 pt
Moyenne de la classe Gaming
 
82.4 pt
Dell Inspiron 16 Plus 7640
Intel Core Ultra 7 155H, NVIDIA GeForce RTX 4060 Laptop GPU
58.8 pt
Lenovo LOQ 15IRX9
Intel Core i5-13450HX, NVIDIA GeForce RTX 4060 Laptop GPU
58.2 pt
Gigabyte G5 KF
Intel Core i5-12500H, NVIDIA GeForce RTX 4060 Laptop GPU
52.7 pt
Gigabyte G5 KF5 2024
Intel Core i7-13620H, NVIDIA GeForce RTX 4060 Laptop GPU
49.7 pt
Moyenne Intel Core i7-13620H
 
49.4 pt
AIDA64 / FP32 Ray-Trace
Asus TUF Gaming A15 FA507UV
AMD Ryzen 9 8945H, NVIDIA GeForce RTX 4060 Laptop GPU
28698 KRay/s +125%
Lenovo Legion Pro 5 16IRX9 G9
Intel Core i7-14700HX, NVIDIA GeForce RTX 4060 Laptop GPU
23676 KRay/s +86%
Moyenne de la classe Gaming
  (4986 - 60169, n=185, 2 dernières années)
21686 KRay/s +70%
Dell Inspiron 16 Plus 7640
Intel Core Ultra 7 155H, NVIDIA GeForce RTX 4060 Laptop GPU
14038 KRay/s +10%
Lenovo LOQ 15IRX9
Intel Core i5-13450HX, NVIDIA GeForce RTX 4060 Laptop GPU
13747 KRay/s +8%
Gigabyte G5 KF5 2024
Intel Core i7-13620H, NVIDIA GeForce RTX 4060 Laptop GPU
12760 KRay/s
Moyenne Intel Core i7-13620H
  (10779 - 13601, n=5)
12202 KRay/s -4%
Gigabyte G5 KF
Intel Core i5-12500H, NVIDIA GeForce RTX 4060 Laptop GPU
11802 KRay/s -8%
AIDA64 / FPU Julia
Asus TUF Gaming A15 FA507UV
AMD Ryzen 9 8945H, NVIDIA GeForce RTX 4060 Laptop GPU
122466 Points +88%
Lenovo Legion Pro 5 16IRX9 G9
Intel Core i7-14700HX, NVIDIA GeForce RTX 4060 Laptop GPU
116556 Points +79%
Moyenne de la classe Gaming
  (25360 - 252486, n=185, 2 dernières années)
106189 Points +63%
Lenovo LOQ 15IRX9
Intel Core i5-13450HX, NVIDIA GeForce RTX 4060 Laptop GPU
71834 Points +10%
Dell Inspiron 16 Plus 7640
Intel Core Ultra 7 155H, NVIDIA GeForce RTX 4060 Laptop GPU
70839 Points +9%
Gigabyte G5 KF5 2024
Intel Core i7-13620H, NVIDIA GeForce RTX 4060 Laptop GPU
65073 Points
Moyenne Intel Core i7-13620H
  (54287 - 67187, n=5)
62844 Points -3%
Gigabyte G5 KF
Intel Core i5-12500H, NVIDIA GeForce RTX 4060 Laptop GPU
59683 Points -8%
AIDA64 / CPU SHA3
Lenovo Legion Pro 5 16IRX9 G9
Intel Core i7-14700HX, NVIDIA GeForce RTX 4060 Laptop GPU
5567 MB/s +110%
Asus TUF Gaming A15 FA507UV
AMD Ryzen 9 8945H, NVIDIA GeForce RTX 4060 Laptop GPU
5113 MB/s +92%
Moyenne de la classe Gaming
  (1339 - 10389, n=185, 2 dernières années)
4862 MB/s +83%
Lenovo LOQ 15IRX9
Intel Core i5-13450HX, NVIDIA GeForce RTX 4060 Laptop GPU
3530 MB/s +33%
Dell Inspiron 16 Plus 7640
Intel Core Ultra 7 155H, NVIDIA GeForce RTX 4060 Laptop GPU
3277 MB/s +23%
Gigabyte G5 KF
Intel Core i5-12500H, NVIDIA GeForce RTX 4060 Laptop GPU
2983 MB/s +12%
Gigabyte G5 KF5 2024
Intel Core i7-13620H, NVIDIA GeForce RTX 4060 Laptop GPU
2657 MB/s
Moyenne Intel Core i7-13620H
  (2357 - 2773, n=5)
2605 MB/s -2%
AIDA64 / CPU Queen
Lenovo Legion Pro 5 16IRX9 G9
Intel Core i7-14700HX, NVIDIA GeForce RTX 4060 Laptop GPU
152200 Points +94%
Asus TUF Gaming A15 FA507UV
AMD Ryzen 9 8945H, NVIDIA GeForce RTX 4060 Laptop GPU
125950 Points +60%
Moyenne de la classe Gaming
  (50699 - 200651, n=185, 2 dernières années)
116446 Points +48%
Dell Inspiron 16 Plus 7640
Intel Core Ultra 7 155H, NVIDIA GeForce RTX 4060 Laptop GPU
87819 Points +12%
Lenovo LOQ 15IRX9
Intel Core i5-13450HX, NVIDIA GeForce RTX 4060 Laptop GPU
86148 Points +10%
Gigabyte G5 KF
Intel Core i5-12500H, NVIDIA GeForce RTX 4060 Laptop GPU
79989 Points +2%
Gigabyte G5 KF5 2024
Intel Core i7-13620H, NVIDIA GeForce RTX 4060 Laptop GPU
78523 Points
Moyenne Intel Core i7-13620H
  (66885 - 78867, n=5)
76259 Points -3%
AIDA64 / FPU SinJulia
Asus TUF Gaming A15 FA507UV
AMD Ryzen 9 8945H, NVIDIA GeForce RTX 4060 Laptop GPU
15856 Points +95%
Lenovo Legion Pro 5 16IRX9 G9
Intel Core i7-14700HX, NVIDIA GeForce RTX 4060 Laptop GPU
14434 Points +78%
Moyenne de la classe Gaming
  (4800 - 32988, n=185, 2 dernières années)
13194 Points +62%
Dell Inspiron 16 Plus 7640
Intel Core Ultra 7 155H, NVIDIA GeForce RTX 4060 Laptop GPU
9893 Points +22%
Lenovo LOQ 15IRX9
Intel Core i5-13450HX, NVIDIA GeForce RTX 4060 Laptop GPU
9344 Points +15%
Gigabyte G5 KF5 2024
Intel Core i7-13620H, NVIDIA GeForce RTX 4060 Laptop GPU
8124 Points
Moyenne Intel Core i7-13620H
  (6737 - 8421, n=5)
7775 Points -4%
Gigabyte G5 KF
Intel Core i5-12500H, NVIDIA GeForce RTX 4060 Laptop GPU
7322 Points -10%
AIDA64 / FPU Mandel
Asus TUF Gaming A15 FA507UV
AMD Ryzen 9 8945H, NVIDIA GeForce RTX 4060 Laptop GPU
65523 Points +108%
Lenovo Legion Pro 5 16IRX9 G9
Intel Core i7-14700HX, NVIDIA GeForce RTX 4060 Laptop GPU
58380 Points +85%
Moyenne de la classe Gaming
  (12321 - 134044, n=185, 2 dernières années)
53500 Points +70%
Dell Inspiron 16 Plus 7640
Intel Core Ultra 7 155H, NVIDIA GeForce RTX 4060 Laptop GPU
35006 Points +11%
Lenovo LOQ 15IRX9
Intel Core i5-13450HX, NVIDIA GeForce RTX 4060 Laptop GPU
34956 Points +11%
Gigabyte G5 KF5 2024
Intel Core i7-13620H, NVIDIA GeForce RTX 4060 Laptop GPU
31508 Points
Moyenne Intel Core i7-13620H
  (27242 - 32787, n=5)
30835 Points -2%
Gigabyte G5 KF
Intel Core i5-12500H, NVIDIA GeForce RTX 4060 Laptop GPU
29112 Points -8%
AIDA64 / CPU AES
Lenovo Legion Pro 5 16IRX9 G9
Intel Core i7-14700HX, NVIDIA GeForce RTX 4060 Laptop GPU
113157 MB/s +109%
Moyenne de la classe Gaming
  (19065 - 328679, n=185, 2 dernières années)
109209 MB/s +102%
Gigabyte G5 KF
Intel Core i5-12500H, NVIDIA GeForce RTX 4060 Laptop GPU
105881 MB/s +96%
Asus TUF Gaming A15 FA507UV
AMD Ryzen 9 8945H, NVIDIA GeForce RTX 4060 Laptop GPU
90481 MB/s +67%
Lenovo LOQ 15IRX9
Intel Core i5-13450HX, NVIDIA GeForce RTX 4060 Laptop GPU
70330 MB/s +30%
Dell Inspiron 16 Plus 7640
Intel Core Ultra 7 155H, NVIDIA GeForce RTX 4060 Laptop GPU
68050 MB/s +26%
Moyenne Intel Core i7-13620H
  (52697 - 85895, n=5)
61535 MB/s +14%
Gigabyte G5 KF5 2024
Intel Core i7-13620H, NVIDIA GeForce RTX 4060 Laptop GPU
54096 MB/s
AIDA64 / CPU ZLib
Lenovo Legion Pro 5 16IRX9 G9
Intel Core i7-14700HX, NVIDIA GeForce RTX 4060 Laptop GPU
1682 MB/s +115%
Moyenne de la classe Gaming
  (373 - 2409, n=185, 2 dernières années)
1352 MB/s +73%
Asus TUF Gaming A15 FA507UV
AMD Ryzen 9 8945H, NVIDIA GeForce RTX 4060 Laptop GPU
1150 MB/s +47%
Dell Inspiron 16 Plus 7640
Intel Core Ultra 7 155H, NVIDIA GeForce RTX 4060 Laptop GPU
1045 MB/s +34%
Lenovo LOQ 15IRX9
Intel Core i5-13450HX, NVIDIA GeForce RTX 4060 Laptop GPU
1002 MB/s +28%
Gigabyte G5 KF
Intel Core i5-12500H, NVIDIA GeForce RTX 4060 Laptop GPU
864 MB/s +10%
Gigabyte G5 KF5 2024
Intel Core i7-13620H, NVIDIA GeForce RTX 4060 Laptop GPU
782 MB/s
Moyenne Intel Core i7-13620H
  (697 - 835, n=5)
778 MB/s -1%
AIDA64 / FP64 Ray-Trace
Asus TUF Gaming A15 FA507UV
AMD Ryzen 9 8945H, NVIDIA GeForce RTX 4060 Laptop GPU
15513 KRay/s +128%
Lenovo Legion Pro 5 16IRX9 G9
Intel Core i7-14700HX, NVIDIA GeForce RTX 4060 Laptop GPU
12928 KRay/s +90%
Moyenne de la classe Gaming
  (2540 - 31796, n=185, 2 dernières années)
11679 KRay/s +72%
Lenovo LOQ 15IRX9
Intel Core i5-13450HX, NVIDIA GeForce RTX 4060 Laptop GPU
7428 KRay/s +9%
Dell Inspiron 16 Plus 7640
Intel Core Ultra 7 155H, NVIDIA GeForce RTX 4060 Laptop GPU
7347 KRay/s +8%
Gigabyte G5 KF5 2024
Intel Core i7-13620H, NVIDIA GeForce RTX 4060 Laptop GPU
6800 KRay/s
Moyenne Intel Core i7-13620H
  (6077 - 7364, n=5)
6709 KRay/s -1%
Gigabyte G5 KF
Intel Core i5-12500H, NVIDIA GeForce RTX 4060 Laptop GPU
6169 KRay/s -9%
AIDA64 / CPU PhotoWorxx
Lenovo Legion Pro 5 16IRX9 G9
Intel Core i7-14700HX, NVIDIA GeForce RTX 4060 Laptop GPU
49671 MPixel/s +59%
Moyenne de la classe Gaming
  (10805 - 60161, n=186, 2 dernières années)
39997 MPixel/s +28%
Dell Inspiron 16 Plus 7640
Intel Core Ultra 7 155H, NVIDIA GeForce RTX 4060 Laptop GPU
39530 MPixel/s +27%
Lenovo LOQ 15IRX9
Intel Core i5-13450HX, NVIDIA GeForce RTX 4060 Laptop GPU
36764 MPixel/s +18%
Asus TUF Gaming A15 FA507UV
AMD Ryzen 9 8945H, NVIDIA GeForce RTX 4060 Laptop GPU
33410 MPixel/s +7%
Moyenne Intel Core i7-13620H
  (22766 - 34544, n=5)
31208 MPixel/s 0%
Gigabyte G5 KF5 2024
Intel Core i7-13620H, NVIDIA GeForce RTX 4060 Laptop GPU
31165 MPixel/s
Gigabyte G5 KF
Intel Core i5-12500H, NVIDIA GeForce RTX 4060 Laptop GPU
27635 MPixel/s -11%

Performance du système

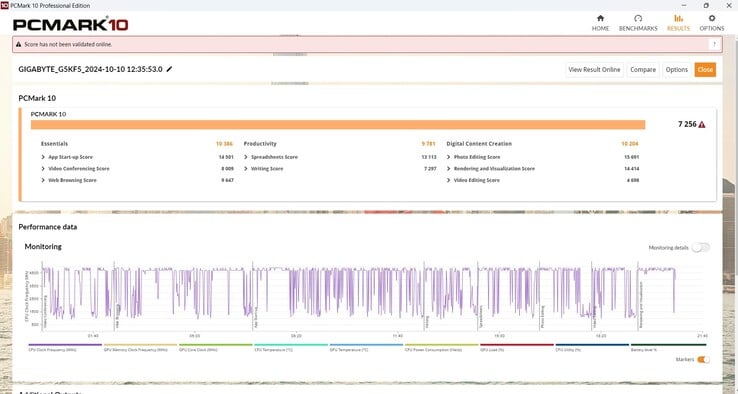
Les résultats du G5 dans PCMark 10 ne sont pas remarquables et il se situe en milieu de classement. Dans CrossMark, notre Gigabyte se comporte à peu près comme prévu. Nous avons rarement remarqué des problèmes en mode Windows, il n'y a que lors du défilement du navigateur qu'il y a quelques hoquets.

PCMark 10
PCMark 10
PCMark 10 / Score
Lenovo Legion Pro 5 16IRX9 G9
NVIDIA GeForce RTX 4060 Laptop GPU, i7-14700HX, Samsung PM9A1 MZVL21T0HCLR
8278 Points +14%
Asus TUF Gaming A15 FA507UV
NVIDIA GeForce RTX 4060 Laptop GPU, R9 8945H, WD PC SN560 SDDPNQE-1T00
7943 Points +9%
Moyenne de la classe Gaming
  (5776 - 9852, n=166, 2 dernières années)
7775 Points +7%
Gigabyte G5 KF5 2024
NVIDIA GeForce RTX 4060 Laptop GPU, i7-13620H, Gigabyte AG450E1024-SI
7256 Points
Dell Inspiron 16 Plus 7640
NVIDIA GeForce RTX 4060 Laptop GPU, Ultra 7 155H, SK hynix BC901 HFS001TEJ4X164N
7042 Points -3%
Moyenne Intel Core i7-13620H, NVIDIA GeForce RTX 4060 Laptop GPU
  (6678 - 7256, n=3)
7031 Points -3%
Lenovo LOQ 15IRX9
NVIDIA GeForce RTX 4060 Laptop GPU, i5-13450HX, Micron 2400 MTFDKCD1T0QFM
6929 Points -5%
Gigabyte G5 KF
NVIDIA GeForce RTX 4060 Laptop GPU, i5-12500H, SSSTC CA6-8D512
6318 Points -13%
PCMark 10 / Essentials
Lenovo Legion Pro 5 16IRX9 G9
NVIDIA GeForce RTX 4060 Laptop GPU, i7-14700HX, Samsung PM9A1 MZVL21T0HCLR
11087 Points +7%
Asus TUF Gaming A15 FA507UV
NVIDIA GeForce RTX 4060 Laptop GPU, R9 8945H, WD PC SN560 SDDPNQE-1T00
10873 Points +5%
Moyenne de la classe Gaming
  (9057 - 12334, n=165, 2 dernières années)
10833 Points +4%
Gigabyte G5 KF5 2024
NVIDIA GeForce RTX 4060 Laptop GPU, i7-13620H, Gigabyte AG450E1024-SI
10386 Points
Moyenne Intel Core i7-13620H, NVIDIA GeForce RTX 4060 Laptop GPU
  (9909 - 10809, n=3)
10368 Points 0%
Gigabyte G5 KF
NVIDIA GeForce RTX 4060 Laptop GPU, i5-12500H, SSSTC CA6-8D512
10328 Points -1%
Dell Inspiron 16 Plus 7640
NVIDIA GeForce RTX 4060 Laptop GPU, Ultra 7 155H, SK hynix BC901 HFS001TEJ4X164N
10279 Points -1%
Lenovo LOQ 15IRX9
NVIDIA GeForce RTX 4060 Laptop GPU, i5-13450HX, Micron 2400 MTFDKCD1T0QFM
9379 Points -10%
PCMark 10 / Productivity
Asus TUF Gaming A15 FA507UV
NVIDIA GeForce RTX 4060 Laptop GPU, R9 8945H, WD PC SN560 SDDPNQE-1T00
10269 Points +5%
Moyenne de la classe Gaming
  (6662 - 14612, n=165, 2 dernières années)
9877 Points +1%
Lenovo Legion Pro 5 16IRX9 G9
NVIDIA GeForce RTX 4060 Laptop GPU, i7-14700HX, Samsung PM9A1 MZVL21T0HCLR
9823 Points 0%
Gigabyte G5 KF5 2024
NVIDIA GeForce RTX 4060 Laptop GPU, i7-13620H, Gigabyte AG450E1024-SI
9781 Points
Gigabyte G5 KF
NVIDIA GeForce RTX 4060 Laptop GPU, i5-12500H, SSSTC CA6-8D512
9736 Points 0%
Moyenne Intel Core i7-13620H, NVIDIA GeForce RTX 4060 Laptop GPU
  (8642 - 9781, n=3)
9244 Points -5%
Lenovo LOQ 15IRX9
NVIDIA GeForce RTX 4060 Laptop GPU, i5-13450HX, Micron 2400 MTFDKCD1T0QFM
8800 Points -10%
Dell Inspiron 16 Plus 7640
NVIDIA GeForce RTX 4060 Laptop GPU, Ultra 7 155H, SK hynix BC901 HFS001TEJ4X164N
8079 Points -17%
PCMark 10 / Digital Content Creation
Lenovo Legion Pro 5 16IRX9 G9
NVIDIA GeForce RTX 4060 Laptop GPU, i7-14700HX, Samsung PM9A1 MZVL21T0HCLR
14135 Points +39%
Asus TUF Gaming A15 FA507UV
NVIDIA GeForce RTX 4060 Laptop GPU, R9 8945H, WD PC SN560 SDDPNQE-1T00
12182 Points +19%
Moyenne de la classe Gaming
  (6703 - 18475, n=165, 2 dernières années)
12039 Points +18%
Dell Inspiron 16 Plus 7640
NVIDIA GeForce RTX 4060 Laptop GPU, Ultra 7 155H, SK hynix BC901 HFS001TEJ4X164N
11413 Points +12%
Lenovo LOQ 15IRX9
NVIDIA GeForce RTX 4060 Laptop GPU, i5-13450HX, Micron 2400 MTFDKCD1T0QFM
10937 Points +7%
Gigabyte G5 KF5 2024
NVIDIA GeForce RTX 4060 Laptop GPU, i7-13620H, Gigabyte AG450E1024-SI
10204 Points
Moyenne Intel Core i7-13620H, NVIDIA GeForce RTX 4060 Laptop GPU
  (9437 - 10204, n=3)
9848 Points -3%
Gigabyte G5 KF
NVIDIA GeForce RTX 4060 Laptop GPU, i5-12500H, SSSTC CA6-8D512
6807 Points -33%
CrossMark / Overall
Lenovo Legion Pro 5 16IRX9 G9
NVIDIA GeForce RTX 4060 Laptop GPU, i7-14700HX, Samsung PM9A1 MZVL21T0HCLR
2132 Points +7%
Gigabyte G5 KF5 2024
NVIDIA GeForce RTX 4060 Laptop GPU, i7-13620H, Gigabyte AG450E1024-SI
1986 Points
Moyenne Intel Core i7-13620H, NVIDIA GeForce RTX 4060 Laptop GPU
  (1857 - 1986, n=3)
1929 Points -3%
Moyenne de la classe Gaming
  (1247 - 2344, n=149, 2 dernières années)
1900 Points -4%
Lenovo LOQ 15IRX9
NVIDIA GeForce RTX 4060 Laptop GPU, i5-13450HX, Micron 2400 MTFDKCD1T0QFM
1804 Points -9%
Asus TUF Gaming A15 FA507UV
NVIDIA GeForce RTX 4060 Laptop GPU, R9 8945H, WD PC SN560 SDDPNQE-1T00
1800 Points -9%
Gigabyte G5 KF
NVIDIA GeForce RTX 4060 Laptop GPU, i5-12500H, SSSTC CA6-8D512
1744 Points -12%
Dell Inspiron 16 Plus 7640
NVIDIA GeForce RTX 4060 Laptop GPU, Ultra 7 155H, SK hynix BC901 HFS001TEJ4X164N
1685 Points -15%
CrossMark / Productivity
Lenovo Legion Pro 5 16IRX9 G9
NVIDIA GeForce RTX 4060 Laptop GPU, i7-14700HX, Samsung PM9A1 MZVL21T0HCLR
1973 Points +3%
Gigabyte G5 KF5 2024
NVIDIA GeForce RTX 4060 Laptop GPU, i7-13620H, Gigabyte AG450E1024-SI
1908 Points
Moyenne Intel Core i7-13620H, NVIDIA GeForce RTX 4060 Laptop GPU
  (1765 - 1908, n=3)
1847 Points -3%
Moyenne de la classe Gaming
  (1299 - 2204, n=149, 2 dernières années)
1802 Points -6%
Asus TUF Gaming A15 FA507UV
NVIDIA GeForce RTX 4060 Laptop GPU, R9 8945H, WD PC SN560 SDDPNQE-1T00
1761 Points -8%
Lenovo LOQ 15IRX9
NVIDIA GeForce RTX 4060 Laptop GPU, i5-13450HX, Micron 2400 MTFDKCD1T0QFM
1728 Points -9%
Gigabyte G5 KF
NVIDIA GeForce RTX 4060 Laptop GPU, i5-12500H, SSSTC CA6-8D512
1708 Points -10%
Dell Inspiron 16 Plus 7640
NVIDIA GeForce RTX 4060 Laptop GPU, Ultra 7 155H, SK hynix BC901 HFS001TEJ4X164N
1592 Points -17%
CrossMark / Creativity
Lenovo Legion Pro 5 16IRX9 G9
NVIDIA GeForce RTX 4060 Laptop GPU, i7-14700HX, Samsung PM9A1 MZVL21T0HCLR
2399 Points +16%
Moyenne de la classe Gaming
  (1275 - 2660, n=149, 2 dernières années)
2085 Points +1%
Gigabyte G5 KF5 2024
NVIDIA GeForce RTX 4060 Laptop GPU, i7-13620H, Gigabyte AG450E1024-SI
2067 Points
Moyenne Intel Core i7-13620H, NVIDIA GeForce RTX 4060 Laptop GPU
  (2013 - 2067, n=3)
2042 Points -1%
Dell Inspiron 16 Plus 7640
NVIDIA GeForce RTX 4060 Laptop GPU, Ultra 7 155H, SK hynix BC901 HFS001TEJ4X164N
1929 Points -7%
Asus TUF Gaming A15 FA507UV
NVIDIA GeForce RTX 4060 Laptop GPU, R9 8945H, WD PC SN560 SDDPNQE-1T00
1918 Points -7%
Lenovo LOQ 15IRX9
NVIDIA GeForce RTX 4060 Laptop GPU, i5-13450HX, Micron 2400 MTFDKCD1T0QFM
1904 Points -8%
Gigabyte G5 KF
NVIDIA GeForce RTX 4060 Laptop GPU, i5-12500H, SSSTC CA6-8D512
1760 Points -15%
CrossMark / Responsiveness
Gigabyte G5 KF5 2024
NVIDIA GeForce RTX 4060 Laptop GPU, i7-13620H, Gigabyte AG450E1024-SI
1989 Points
Lenovo Legion Pro 5 16IRX9 G9
NVIDIA GeForce RTX 4060 Laptop GPU, i7-14700HX, Samsung PM9A1 MZVL21T0HCLR
1885 Points -5%
Moyenne Intel Core i7-13620H, NVIDIA GeForce RTX 4060 Laptop GPU
  (1734 - 1989, n=3)
1866 Points -6%
Gigabyte G5 KF
NVIDIA GeForce RTX 4060 Laptop GPU, i5-12500H, SSSTC CA6-8D512
1804 Points -9%
Lenovo LOQ 15IRX9
NVIDIA GeForce RTX 4060 Laptop GPU, i5-13450HX, Micron 2400 MTFDKCD1T0QFM
1748 Points -12%
Moyenne de la classe Gaming
  (1030 - 2330, n=149, 2 dernières années)
1698 Points -15%
Asus TUF Gaming A15 FA507UV
NVIDIA GeForce RTX 4060 Laptop GPU, R9 8945H, WD PC SN560 SDDPNQE-1T00
1593 Points -20%
Dell Inspiron 16 Plus 7640
NVIDIA GeForce RTX 4060 Laptop GPU, Ultra 7 155H, SK hynix BC901 HFS001TEJ4X164N
1333 Points -33%
WebXPRT 3 / Overall
Moyenne Intel Core i7-13620H, NVIDIA GeForce RTX 4060 Laptop GPU
  (292 - 319, n=3)
310 Points
Asus TUF Gaming A15 FA507UV
NVIDIA GeForce RTX 4060 Laptop GPU, R9 8945H, WD PC SN560 SDDPNQE-1T00
308 Points
Moyenne de la classe Gaming
  (215 - 480, n=163, 2 dernières années)
303 Points
Lenovo Legion Pro 5 16IRX9 G9
NVIDIA GeForce RTX 4060 Laptop GPU, i7-14700HX, Samsung PM9A1 MZVL21T0HCLR
301 Points
Dell Inspiron 16 Plus 7640
NVIDIA GeForce RTX 4060 Laptop GPU, Ultra 7 155H, SK hynix BC901 HFS001TEJ4X164N
290 Points
Lenovo LOQ 15IRX9
NVIDIA GeForce RTX 4060 Laptop GPU, i5-13450HX, Micron 2400 MTFDKCD1T0QFM
262 Points
Gigabyte G5 KF
NVIDIA GeForce RTX 4060 Laptop GPU, i5-12500H, SSSTC CA6-8D512
246 Points
WebXPRT 4 / Overall
Lenovo Legion Pro 5 16IRX9 G9
NVIDIA GeForce RTX 4060 Laptop GPU, i7-14700HX, Samsung PM9A1 MZVL21T0HCLR
273 Points
Moyenne Intel Core i7-13620H, NVIDIA GeForce RTX 4060 Laptop GPU
  ()
270 Points
Moyenne de la classe Gaming
  (157.9 - 328, n=151, 2 dernières années)
266 Points
Asus TUF Gaming A15 FA507UV
NVIDIA GeForce RTX 4060 Laptop GPU, R9 8945H, WD PC SN560 SDDPNQE-1T00
263 Points
Dell Inspiron 16 Plus 7640
NVIDIA GeForce RTX 4060 Laptop GPU, Ultra 7 155H, SK hynix BC901 HFS001TEJ4X164N
257 Points
Lenovo LOQ 15IRX9
NVIDIA GeForce RTX 4060 Laptop GPU, i5-13450HX, Micron 2400 MTFDKCD1T0QFM
243 Points
Mozilla Kraken 1.1 / Total
Gigabyte G5 KF
NVIDIA GeForce RTX 4060 Laptop GPU, i5-12500H, SSSTC CA6-8D512
562 ms * -10%
Gigabyte G5 KF
NVIDIA GeForce RTX 4060 Laptop GPU, i5-12500H, SSSTC CA6-8D512
562 ms * -10%
Lenovo LOQ 15IRX9
NVIDIA GeForce RTX 4060 Laptop GPU, i5-13450HX, Micron 2400 MTFDKCD1T0QFM
550 ms * -7%
Dell Inspiron 16 Plus 7640
NVIDIA GeForce RTX 4060 Laptop GPU, Ultra 7 155H, SK hynix BC901 HFS001TEJ4X164N
519 ms * -1%
Gigabyte G5 KF5 2024
NVIDIA GeForce RTX 4060 Laptop GPU, i7-13620H, Gigabyte AG450E1024-SI
513 ms *
Moyenne Intel Core i7-13620H, NVIDIA GeForce RTX 4060 Laptop GPU
  (508 - 516, n=4)
511 ms * -0%
Moyenne de la classe Gaming
  (421 - 779, n=177, 2 dernières années)
506 ms * +1%
Asus TUF Gaming A15 FA507UV
NVIDIA GeForce RTX 4060 Laptop GPU, R9 8945H, WD PC SN560 SDDPNQE-1T00
505 ms * +2%
Lenovo Legion Pro 5 16IRX9 G9
NVIDIA GeForce RTX 4060 Laptop GPU, i7-14700HX, Samsung PM9A1 MZVL21T0HCLR
467 ms * +9%

* ... Moindre est la valeur, meilleures sont les performances

PCMark 10 Score
7256 points
Aide
AIDA64 / Memory Copy
Lenovo Legion Pro 5 16IRX9 G9
Intel Core i7-14700HX, NVIDIA GeForce RTX 4060 Laptop GPU
78742 MB/s +53%
Moyenne de la classe Gaming
  (21842 - 94222, n=185, 2 dernières années)
65054 MB/s +27%
Dell Inspiron 16 Plus 7640
Intel Core Ultra 7 155H, NVIDIA GeForce RTX 4060 Laptop GPU
63520 MB/s +24%
Asus TUF Gaming A15 FA507UV
AMD Ryzen 9 8945H, NVIDIA GeForce RTX 4060 Laptop GPU
61823 MB/s +20%
Lenovo LOQ 15IRX9
Intel Core i5-13450HX, NVIDIA GeForce RTX 4060 Laptop GPU
58673 MB/s +14%
Gigabyte G5 KF5 2024
Intel Core i7-13620H, NVIDIA GeForce RTX 4060 Laptop GPU
51393 MB/s
Moyenne Intel Core i7-13620H
  (38066 - 53927, n=5)
50052 MB/s -3%
Gigabyte G5 KF
Intel Core i5-12500H, NVIDIA GeForce RTX 4060 Laptop GPU
43470 MB/s -15%
AIDA64 / Memory Read
Lenovo Legion Pro 5 16IRX9 G9
Intel Core i7-14700HX, NVIDIA GeForce RTX 4060 Laptop GPU
86175 MB/s +47%
Dell Inspiron 16 Plus 7640
Intel Core Ultra 7 155H, NVIDIA GeForce RTX 4060 Laptop GPU
77153 MB/s +31%
Moyenne de la classe Gaming
  (23681 - 99713, n=185, 2 dernières années)
68795 MB/s +17%
Lenovo LOQ 15IRX9
Intel Core i5-13450HX, NVIDIA GeForce RTX 4060 Laptop GPU
68109 MB/s +16%
Asus TUF Gaming A15 FA507UV
AMD Ryzen 9 8945H, NVIDIA GeForce RTX 4060 Laptop GPU
61696 MB/s +5%
Gigabyte G5 KF5 2024
Intel Core i7-13620H, NVIDIA GeForce RTX 4060 Laptop GPU
58755 MB/s
Moyenne Intel Core i7-13620H
  (40342 - 61853, n=5)
56860 MB/s -3%
Gigabyte G5 KF
Intel Core i5-12500H, NVIDIA GeForce RTX 4060 Laptop GPU
47117 MB/s -20%
AIDA64 / Memory Write
Asus TUF Gaming A15 FA507UV
AMD Ryzen 9 8945H, NVIDIA GeForce RTX 4060 Laptop GPU
78716 MB/s +54%
Lenovo Legion Pro 5 16IRX9 G9
Intel Core i7-14700HX, NVIDIA GeForce RTX 4060 Laptop GPU
76689 MB/s +50%
Moyenne de la classe Gaming
  (22986 - 108954, n=185, 2 dernières années)
66829 MB/s +30%
Dell Inspiron 16 Plus 7640
Intel Core Ultra 7 155H, NVIDIA GeForce RTX 4060 Laptop GPU
65616 MB/s +28%
Lenovo LOQ 15IRX9
Intel Core i5-13450HX, NVIDIA GeForce RTX 4060 Laptop GPU
59981 MB/s +17%
Gigabyte G5 KF5 2024
Intel Core i7-13620H, NVIDIA GeForce RTX 4060 Laptop GPU
51235 MB/s
Moyenne Intel Core i7-13620H
  (38595 - 54111, n=5)
49719 MB/s -3%
Gigabyte G5 KF
Intel Core i5-12500H, NVIDIA GeForce RTX 4060 Laptop GPU
46588 MB/s -9%
AIDA64 / Memory Latency
Dell Inspiron 16 Plus 7640
Intel Core Ultra 7 155H, NVIDIA GeForce RTX 4060 Laptop GPU
120.2 ns * -14%
Gigabyte G5 KF5 2024
Intel Core i7-13620H, NVIDIA GeForce RTX 4060 Laptop GPU
105.6 ns *
Moyenne Intel Core i7-13620H
  (75.9 - 108.2, n=5)
99.8 ns * +5%
Lenovo LOQ 15IRX9
Intel Core i5-13450HX, NVIDIA GeForce RTX 4060 Laptop GPU
94.2 ns * +11%
Moyenne de la classe Gaming
  (59.5 - 259, n=185, 2 dernières années)
94.2 ns * +11%
Asus TUF Gaming A15 FA507UV
AMD Ryzen 9 8945H, NVIDIA GeForce RTX 4060 Laptop GPU
92.6 ns * +12%
Gigabyte G5 KF
Intel Core i5-12500H, NVIDIA GeForce RTX 4060 Laptop GPU
83.8 ns * +21%
Lenovo Legion Pro 5 16IRX9 G9
Intel Core i7-14700HX, NVIDIA GeForce RTX 4060 Laptop GPU
82.7 ns * +22%

* ... Moindre est la valeur, meilleures sont les performances

Latences DPC

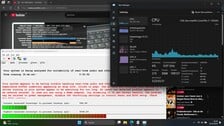
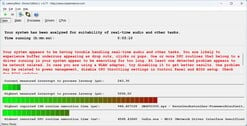
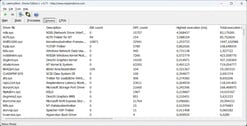
Même en déplaçant le pointeur de la souris après le lancement de LatencyMon, des latences plus élevées sont détectées, qui augmentent à chaque nouvelle action (ouverture du navigateur, ouverture de plusieurs onglets, lecture d'une vidéo). Notre vidéo YouTube présente également deux images perdues. Dans l'ensemble, les valeurs de latence sont clairement trop élevées, même en comparaison. La charge iGPU extrêmement élevée de 89 % lors de la lecture de la vidéo YouTube est également perceptible.

YouTube
YouTube
LatencyMon Main
LatencyMon Main
Pilotes LatencyMon
Pilotes LatencyMon
DPC Latencies / LatencyMon - interrupt to process latency (max), Web, Youtube, Prime95
Gigabyte G5 KF5 2024
NVIDIA GeForce RTX 4060 Laptop GPU, i7-13620H, Gigabyte AG450E1024-SI
5596.5 μs *
Gigabyte G5 KF
NVIDIA GeForce RTX 4060 Laptop GPU, i5-12500H, SSSTC CA6-8D512
1905 μs * +66%
Lenovo LOQ 15IRX9
NVIDIA GeForce RTX 4060 Laptop GPU, i5-13450HX, Micron 2400 MTFDKCD1T0QFM
1689.3 μs * +70%
Lenovo Legion Pro 5 16IRX9 G9
NVIDIA GeForce RTX 4060 Laptop GPU, i7-14700HX, Samsung PM9A1 MZVL21T0HCLR
951.7 μs * +83%
Asus TUF Gaming A15 FA507UV
NVIDIA GeForce RTX 4060 Laptop GPU, R9 8945H, WD PC SN560 SDDPNQE-1T00
790.8 μs * +86%
Dell Inspiron 16 Plus 7640
NVIDIA GeForce RTX 4060 Laptop GPU, Ultra 7 155H, SK hynix BC901 HFS001TEJ4X164N
770.1 μs * +86%

* ... Moindre est la valeur, meilleures sont les performances

Mémoire de masse

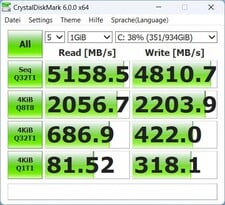
Le constructeur utilise dans notre échantillon de test un SSD NVMe avec 1 To de mémoire de sa propre marque Gigabyte. Il offre des taux de transfert séquentiels de 4 000 à 5 000 Mo/s. Cela signifie qu'il est généralement même légèrement plus rapide que les concurrents listés ici.

Cependant, il ne peut pas maintenir cette performance à cause de l'étranglement thermique dans notre test d'endurance après le 16ème passage de DiskSpd. Après cela, les performances fluctuent fortement et chutent encore et encore de manière drastique.

Marque de cristal 6
Marque de cristal 6
AS SSD
AS SSD
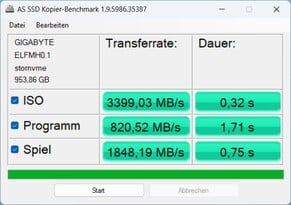
Copie SSD ASD
Copie SSD ASD
Gigabyte AG450E1024-SI
CDM 5/6 Read Seq Q32T1: 5159 MB/s
CDM 5/6 Write Seq Q32T1: 4811 MB/s
CDM 5/6 Read 4K Q32T1: 687 MB/s
CDM 5/6 Write 4K Q32T1: 422 MB/s
CDM 5/6 Read 4K: 81.5 MB/s
CDM 5/6 Write 4K: 318 MB/s
CDM 6 Write 4K Q8T8: 2204 MB/s
CDM 6 Read 4K Q8T8: 2057 MB/s
Drive Performance Rating - Percent
Gigabyte G5 KF5 2024
Gigabyte AG450E1024-SI
90.1 pt
Moyenne Gigabyte AG450E1024-SI
 
86.6 pt
Lenovo Legion Pro 5 16IRX9 G9
Samsung PM9A1 MZVL21T0HCLR
86.4 pt
Gigabyte G5 KF
SSSTC CA6-8D512
86.3 pt
Moyenne de la classe Gaming
 
77.1 pt
Lenovo LOQ 15IRX9
Micron 2400 MTFDKCD1T0QFM
68.8 pt
Asus TUF Gaming A15 FA507UV
WD PC SN560 SDDPNQE-1T00
63.7 pt
Dell Inspiron 16 Plus 7640
SK hynix BC901 HFS001TEJ4X164N
44.7 pt
DiskSpd
seq read
Gigabyte G5 KF
SSSTC CA6-8D512
4094 (1992.5min - 4093.83max) MB/s +37%
Lenovo Legion Pro 5 16IRX9 G9
Samsung PM9A1 MZVL21T0HCLR
3497 (3441.46min - 3497.42max) MB/s +17%
Moyenne de la classe Gaming
  (1319 - 7045, n=166, 2 dernières années)
3477 MB/s +17%
Gigabyte G5 KF5 2024
Gigabyte AG450E1024-SI
2981 (2922.38min - 2980.98max) MB/s
Asus TUF Gaming A15 FA507UV
WD PC SN560 SDDPNQE-1T00
2943 (2931.61min - 2942.92max) MB/s -1%
Moyenne Gigabyte AG450E1024-SI
  (2366 - 2981, n=3)
2656 MB/s -11%
Lenovo LOQ 15IRX9
Micron 2400 MTFDKCD1T0QFM
2364 (2348.18min - 2364.12max) MB/s -21%
Dell Inspiron 16 Plus 7640
SK hynix BC901 HFS001TEJ4X164N
2253 (2222.1min - 2252.66max) MB/s -24%
seq write
Gigabyte G5 KF5 2024
Gigabyte AG450E1024-SI
4772 (4589.99min - 4772.17max) MB/s
Moyenne Gigabyte AG450E1024-SI
  (4659 - 4772, n=3)
4729 MB/s -1%
Gigabyte G5 KF
SSSTC CA6-8D512
3870 (2222.52min - 3870.29max) MB/s -19%
Moyenne de la classe Gaming
  (535 - 9307, n=166, 2 dernières années)
3794 MB/s -20%
Lenovo Legion Pro 5 16IRX9 G9
Samsung PM9A1 MZVL21T0HCLR
3403 (3360.48min - 3402.53max) MB/s -29%
Asus TUF Gaming A15 FA507UV
WD PC SN560 SDDPNQE-1T00
3126 (3069.81min - 3126.43max) MB/s -34%
Lenovo LOQ 15IRX9
Micron 2400 MTFDKCD1T0QFM
3103 (3061.84min - 3102.82max) MB/s -35%
Dell Inspiron 16 Plus 7640
SK hynix BC901 HFS001TEJ4X164N
2368 (2226.29min - 2367.89max) MB/s -50%
seq q8 t1 read
Gigabyte G5 KF
SSSTC CA6-8D512
6922 (6017.7min - 6922.07max) MB/s +41%
Lenovo Legion Pro 5 16IRX9 G9
Samsung PM9A1 MZVL21T0HCLR
6599 (5813.31min - 6598.9max) MB/s +35%
Moyenne de la classe Gaming
  (2594 - 16089, n=166, 2 dernières années)
6320 MB/s +29%
Moyenne Gigabyte AG450E1024-SI
  (4897 - 5181, n=3)
5077 MB/s +4%
Gigabyte G5 KF5 2024
Gigabyte AG450E1024-SI
4897 (4033.03min - 4896.79max) MB/s
Asus TUF Gaming A15 FA507UV
WD PC SN560 SDDPNQE-1T00
4869 (4298.53min - 4868.87max) MB/s -1%
Lenovo LOQ 15IRX9
Micron 2400 MTFDKCD1T0QFM
4611 (4173.71min - 4610.79max) MB/s -6%
Dell Inspiron 16 Plus 7640
SK hynix BC901 HFS001TEJ4X164N
3290 (2756.65min - 3289.51max) MB/s -33%
seq q8 t1 write
Lenovo Legion Pro 5 16IRX9 G9
Samsung PM9A1 MZVL21T0HCLR
4934 (4925.79min - 4933.55max) MB/s +2%
Moyenne de la classe Gaming
  (539 - 14571, n=166, 2 dernières années)
4842 MB/s +1%
Gigabyte G5 KF5 2024
Gigabyte AG450E1024-SI
4817 (4142.4min - 4817.36max) MB/s
Moyenne Gigabyte AG450E1024-SI
  (4775 - 4821, n=3)
4804 MB/s 0%
Dell Inspiron 16 Plus 7640
SK hynix BC901 HFS001TEJ4X164N
4053 (3806.69min - 4053.03max) MB/s -16%
Gigabyte G5 KF
SSSTC CA6-8D512
3975 (1794.3min - 3974.73max) MB/s -17%
Lenovo LOQ 15IRX9
Micron 2400 MTFDKCD1T0QFM
3612 (3558.24min - 3612.04max) MB/s -25%
Asus TUF Gaming A15 FA507UV
WD PC SN560 SDDPNQE-1T00
3140 (3055.76min - 3139.87max) MB/s -35%
4k q1 t1 read
Gigabyte G5 KF
SSSTC CA6-8D512
81.7 MB/s 0%
Gigabyte G5 KF5 2024
Gigabyte AG450E1024-SI
81.5 (80.26min - 81.51max) MB/s
Lenovo Legion Pro 5 16IRX9 G9
Samsung PM9A1 MZVL21T0HCLR
80.5 (78.06min - 80.5max) MB/s -1%
Moyenne de la classe Gaming
  (30.6 - 95.9, n=166, 2 dernières années)
65.8 MB/s -19%
Asus TUF Gaming A15 FA507UV
WD PC SN560 SDDPNQE-1T00
62.9 (61.89min - 62.92max) MB/s -23%
Moyenne Gigabyte AG450E1024-SI
  (47.2 - 81.5, n=3)
61.6 MB/s -24%
Lenovo LOQ 15IRX9
Micron 2400 MTFDKCD1T0QFM
54.4 (52.28min - 54.35max) MB/s -33%
Dell Inspiron 16 Plus 7640
SK hynix BC901 HFS001TEJ4X164N
44.5 (43.13min - 44.5max) MB/s -45%
4k q1 t1 write
Gigabyte G5 KF5 2024
Gigabyte AG450E1024-SI
330 (328.21min - 330.19max) MB/s
Moyenne Gigabyte AG450E1024-SI
  (298 - 340, n=3)
323 MB/s -2%
Gigabyte G5 KF
SSSTC CA6-8D512
296 (231.06min - 296.08max) MB/s -10%
Lenovo LOQ 15IRX9
Micron 2400 MTFDKCD1T0QFM
266 (259.13min - 265.64max) MB/s -19%
Lenovo Legion Pro 5 16IRX9 G9
Samsung PM9A1 MZVL21T0HCLR
251 (246.36min - 251.38max) MB/s -24%
Asus TUF Gaming A15 FA507UV
WD PC SN560 SDDPNQE-1T00
229 (227.99min - 229max) MB/s -31%
Moyenne de la classe Gaming
  (66.6 - 397, n=166, 2 dernières années)
221 MB/s -33%
Dell Inspiron 16 Plus 7640
SK hynix BC901 HFS001TEJ4X164N
123 (117.55min - 122.97max) MB/s -63%
4k q32 t16 read
Lenovo Legion Pro 5 16IRX9 G9
Samsung PM9A1 MZVL21T0HCLR
4117 (4077.22min - 4117.27max) MB/s +18%
Gigabyte G5 KF5 2024
Gigabyte AG450E1024-SI
3485 (3458.58min - 3485.22max) MB/s
Moyenne Gigabyte AG450E1024-SI
  (3293 - 3485, n=3)
3360 MB/s -4%
Gigabyte G5 KF
SSSTC CA6-8D512
3181 (1310.9min - 3180.87max) MB/s -9%
Lenovo LOQ 15IRX9
Micron 2400 MTFDKCD1T0QFM
2852 (1702.21min - 2851.88max) MB/s -18%
Moyenne de la classe Gaming
  (417 - 6172, n=166, 2 dernières années)
2553 MB/s -27%
Asus TUF Gaming A15 FA507UV
WD PC SN560 SDDPNQE-1T00
1544 (1272.83min - 1543.53max) MB/s -56%
Dell Inspiron 16 Plus 7640
SK hynix BC901 HFS001TEJ4X164N
575 (568.91min - 575.1max) MB/s -84%
4k q32 t16 write
Lenovo Legion Pro 5 16IRX9 G9
Samsung PM9A1 MZVL21T0HCLR
3534 (3522.28min - 3534.26max) MB/s +11%
Moyenne Gigabyte AG450E1024-SI
  (3074 - 3443, n=3)
3237 MB/s +1%
Gigabyte G5 KF5 2024
Gigabyte AG450E1024-SI
3195 (3175.09min - 3194.61max) MB/s
Lenovo LOQ 15IRX9
Micron 2400 MTFDKCD1T0QFM
2535 (2457.97min - 2535.38max) MB/s -21%
Gigabyte G5 KF
SSSTC CA6-8D512
2147 (1232.2min - 2146.52max) MB/s -33%
Moyenne de la classe Gaming
  (162.3 - 4869, n=166, 2 dernières années)
2112 MB/s -34%
Asus TUF Gaming A15 FA507UV
WD PC SN560 SDDPNQE-1T00
2038 (1836.85min - 2038.27max) MB/s -36%
Dell Inspiron 16 Plus 7640
SK hynix BC901 HFS001TEJ4X164N
394 (375.37min - 394.14max) MB/s -88%
AS SSD
Score Total
Moyenne Gigabyte AG450E1024-SI
  (7807 - 8778, n=3)
8252 Points +1%
Gigabyte G5 KF5 2024
Gigabyte AG450E1024-SI
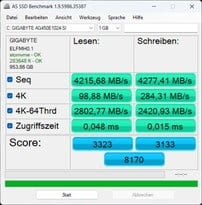
8170 Points
Lenovo Legion Pro 5 16IRX9 G9
Samsung PM9A1 MZVL21T0HCLR
7769 Points -5%
Gigabyte G5 KF
SSSTC CA6-8D512
7237 Points -11%
Moyenne de la classe Gaming
  (2271 - 13854, n=157, 2 dernières années)
6729 Points -18%
Lenovo LOQ 15IRX9
Micron 2400 MTFDKCD1T0QFM
5947 Points -27%
Asus TUF Gaming A15 FA507UV
WD PC SN560 SDDPNQE-1T00
5043 Points -38%
Dell Inspiron 16 Plus 7640
SK hynix BC901 HFS001TEJ4X164N
4307 Points -47%
Score Read
Gigabyte G5 KF5 2024
Gigabyte AG450E1024-SI
3323 Points
Moyenne Gigabyte AG450E1024-SI
  (3051 - 3323, n=3)
3175 Points -4%
Gigabyte G5 KF
SSSTC CA6-8D512
3127 Points -6%
Lenovo Legion Pro 5 16IRX9 G9
Samsung PM9A1 MZVL21T0HCLR
2963 Points -11%
Moyenne de la classe Gaming
  (776 - 4721, n=157, 2 dernières années)
2440 Points -27%
Lenovo LOQ 15IRX9
Micron 2400 MTFDKCD1T0QFM
2363 Points -29%
Asus TUF Gaming A15 FA507UV
WD PC SN560 SDDPNQE-1T00
1749 Points -47%
Dell Inspiron 16 Plus 7640
SK hynix BC901 HFS001TEJ4X164N
1260 Points -62%
Score Write
Moyenne Gigabyte AG450E1024-SI
  (3133 - 4006, n=3)
3443 Points +10%
Lenovo Legion Pro 5 16IRX9 G9
Samsung PM9A1 MZVL21T0HCLR
3262 Points +4%
Gigabyte G5 KF5 2024
Gigabyte AG450E1024-SI
3133 Points
Moyenne de la classe Gaming
  (515 - 7208, n=157, 2 dernières années)
3106 Points -1%
Gigabyte G5 KF
SSSTC CA6-8D512
2608 Points -17%
Dell Inspiron 16 Plus 7640
SK hynix BC901 HFS001TEJ4X164N
2482 Points -21%
Asus TUF Gaming A15 FA507UV
WD PC SN560 SDDPNQE-1T00
2449 Points -22%
Lenovo LOQ 15IRX9
Micron 2400 MTFDKCD1T0QFM
2414 Points -23%
Seq Read
Gigabyte G5 KF
SSSTC CA6-8D512
5712.7 MB/s +36%
Moyenne de la classe Gaming
  (2260 - 12763, n=157, 2 dernières années)
4939 MB/s +17%
Asus TUF Gaming A15 FA507UV
WD PC SN560 SDDPNQE-1T00
4260.13 MB/s +1%
Gigabyte G5 KF5 2024
Gigabyte AG450E1024-SI
4215 MB/s
Moyenne Gigabyte AG450E1024-SI
  (4161 - 4215, n=3)
4196 MB/s 0%
Dell Inspiron 16 Plus 7640
SK hynix BC901 HFS001TEJ4X164N
4056.14 MB/s -4%
Lenovo LOQ 15IRX9
Micron 2400 MTFDKCD1T0QFM
3796.49 MB/s -10%
Lenovo Legion Pro 5 16IRX9 G9
Samsung PM9A1 MZVL21T0HCLR
3027 MB/s -28%
Seq Write
Moyenne Gigabyte AG450E1024-SI
  (4234 - 4432, n=3)
4314 MB/s +1%
Gigabyte G5 KF5 2024
Gigabyte AG450E1024-SI
4277 MB/s
Moyenne de la classe Gaming
  (495 - 11316, n=157, 2 dernières années)
3737 MB/s -13%
Gigabyte G5 KF
SSSTC CA6-8D512
3701.25 MB/s -13%
Lenovo Legion Pro 5 16IRX9 G9
Samsung PM9A1 MZVL21T0HCLR
3510 MB/s -18%
Asus TUF Gaming A15 FA507UV
WD PC SN560 SDDPNQE-1T00
3100.95 MB/s -27%
Lenovo LOQ 15IRX9
Micron 2400 MTFDKCD1T0QFM
3051.23 MB/s -29%
Dell Inspiron 16 Plus 7640
SK hynix BC901 HFS001TEJ4X164N
2267 MB/s -47%
4K Read
Gigabyte G5 KF5 2024
Gigabyte AG450E1024-SI
98.9 MB/s
Moyenne Gigabyte AG450E1024-SI
  (61.9 - 98.9, n=3)
79.7 MB/s -19%
Gigabyte G5 KF
SSSTC CA6-8D512
79.16 MB/s -20%
Lenovo Legion Pro 5 16IRX9 G9
Samsung PM9A1 MZVL21T0HCLR
75.4 MB/s -24%
Moyenne de la classe Gaming
  (27.8 - 112.1, n=157, 2 dernières années)
65 MB/s -34%
Asus TUF Gaming A15 FA507UV
WD PC SN560 SDDPNQE-1T00
56.75 MB/s -43%
Lenovo LOQ 15IRX9
Micron 2400 MTFDKCD1T0QFM
53.84 MB/s -46%
Dell Inspiron 16 Plus 7640
SK hynix BC901 HFS001TEJ4X164N
49.59 MB/s -50%
4K Write
Gigabyte G5 KF5 2024
Gigabyte AG450E1024-SI
284 MB/s
Gigabyte G5 KF
SSSTC CA6-8D512
282.28 MB/s -1%
Moyenne Gigabyte AG450E1024-SI
  (255 - 284, n=3)
274 MB/s -4%
Lenovo LOQ 15IRX9
Micron 2400 MTFDKCD1T0QFM
226.41 MB/s -20%
Lenovo Legion Pro 5 16IRX9 G9
Samsung PM9A1 MZVL21T0HCLR
217 MB/s -24%
Moyenne de la classe Gaming
  (108.8 - 512, n=157, 2 dernières années)
211 MB/s -26%
Asus TUF Gaming A15 FA507UV
WD PC SN560 SDDPNQE-1T00
187.56 MB/s -34%
Dell Inspiron 16 Plus 7640
SK hynix BC901 HFS001TEJ4X164N
164.61 MB/s -42%
4K-64 Read
Gigabyte G5 KF5 2024
Gigabyte AG450E1024-SI
2803 MB/s
Moyenne Gigabyte AG450E1024-SI
  (2551 - 2803, n=3)
2676 MB/s -5%
Lenovo Legion Pro 5 16IRX9 G9
Samsung PM9A1 MZVL21T0HCLR
2585 MB/s -8%
Gigabyte G5 KF
SSSTC CA6-8D512
2476.84 MB/s -12%
Lenovo LOQ 15IRX9
Micron 2400 MTFDKCD1T0QFM
1929.3 MB/s -31%
Moyenne de la classe Gaming
  (451 - 3475, n=157, 2 dernières années)
1875 MB/s -33%
Asus TUF Gaming A15 FA507UV
WD PC SN560 SDDPNQE-1T00
1266.17 MB/s -55%
Dell Inspiron 16 Plus 7640
SK hynix BC901 HFS001TEJ4X164N
804.71 MB/s -71%
4K-64 Write
Moyenne Gigabyte AG450E1024-SI
  (2421 - 3279, n=3)
2738 MB/s +13%
Lenovo Legion Pro 5 16IRX9 G9
Samsung PM9A1 MZVL21T0HCLR
2694 MB/s +11%
Moyenne de la classe Gaming
  (277 - 5909, n=157, 2 dernières années)
2524 MB/s +4%
Gigabyte G5 KF5 2024
Gigabyte AG450E1024-SI
2421 MB/s
Dell Inspiron 16 Plus 7640
SK hynix BC901 HFS001TEJ4X164N
2090.45 MB/s -14%
Gigabyte G5 KF
SSSTC CA6-8D512
1955.15 MB/s -19%
Asus TUF Gaming A15 FA507UV
WD PC SN560 SDDPNQE-1T00
1951.29 MB/s -19%
Lenovo LOQ 15IRX9
Micron 2400 MTFDKCD1T0QFM
1882 MB/s -22%
Access Time Read
Dell Inspiron 16 Plus 7640
SK hynix BC901 HFS001TEJ4X164N
0.093 ms * -94%
Moyenne Gigabyte AG450E1024-SI
  (0.048 - 0.088, n=3)
0.06767 ms * -41%
Asus TUF Gaming A15 FA507UV
WD PC SN560 SDDPNQE-1T00
0.063 ms * -31%
Moyenne de la classe Gaming
  (0.016 - 0.379, n=156, 2 dernières années)
0.05537 ms * -15%
Gigabyte G5 KF5 2024
Gigabyte AG450E1024-SI
0.048 ms *
Lenovo LOQ 15IRX9
Micron 2400 MTFDKCD1T0QFM
0.033 ms * +31%
Lenovo Legion Pro 5 16IRX9 G9
Samsung PM9A1 MZVL21T0HCLR
0.032 ms * +33%
Gigabyte G5 KF
SSSTC CA6-8D512
0.025 ms * +48%
Access Time Write
Dell Inspiron 16 Plus 7640
SK hynix BC901 HFS001TEJ4X164N
0.318 ms * -2020%
Lenovo LOQ 15IRX9
Micron 2400 MTFDKCD1T0QFM
0.097 ms * -547%
Moyenne de la classe Gaming
  (0.011 - 1.028, n=157, 2 dernières années)
0.04852 ms * -223%
Lenovo Legion Pro 5 16IRX9 G9
Samsung PM9A1 MZVL21T0HCLR
0.02 ms * -33%
Asus TUF Gaming A15 FA507UV
WD PC SN560 SDDPNQE-1T00
0.02 ms * -33%
Gigabyte G5 KF
SSSTC CA6-8D512
0.017 ms * -13%
Gigabyte G5 KF5 2024
Gigabyte AG450E1024-SI
0.015 ms *
Moyenne Gigabyte AG450E1024-SI
  (0.015 - 0.015, n=3)
0.015 ms * -0%

* ... Moindre est la valeur, meilleures sont les performances

Continuous read: DiskSpd Read Loop, Queue Depth 8

033567010051340167520102345268030153350368540204355469050255360569560306365Tooltip
Gigabyte G5 KF5 2024 Gigabyte AG450E1024-SI; diskspd 2.0.17 f: Ø3808 (1282.15-5176.82)
Lenovo LOQ 15IRX9 Micron 2400 MTFDKCD1T0QFM; diskspd 2.0.17 f: Ø3364 (2261.87-4608.28)
Asus TUF Gaming A15 FA507UV WD PC SN560 SDDPNQE-1T00; diskspd 2.0.17 f: Ø4300 (3774.46-4795.98)
Lenovo Legion Pro 5 16IRX9 G9 Samsung PM9A1 MZVL21T0HCLR; diskspd 2.0.17 f: Ø4251 (3284.07-6624.06)

Graphique

La RTX 4060 a droit à un TGP maximum de 75 W dans le G5, ce qui est une valeur plutôt moyenne. C'est probablement la raison pour laquelle le G5 déçoit dans les benchmarks synthétiques 3D. Ce n'est que dans le test Cloud Gate, qui n'est plus supporté, qu'il obtient une valeur étonnamment bonne. Ses autres résultats reflètent davantage ceux de son prédécesseur et sont inférieurs d'environ 6 % à la moyenne des ordinateurs portables avec RTX 4060 de notre base de données. A l'exception du Dell Inspiron 16 Plus 7640 tous les concurrents sont plus rapides, en particulier le Legion 5 Pro, du moins si l'on exclut le test Cloud Gate.

La situation est similaire dans les jeux : Le G5 reste performant dans les jeux utilisant le processeur, mais n'arrive pas à suivre la concurrence dans les jeux utilisant le GPU. En outre, contrairement à la plupart des autres ordinateurs portables, notre test d'endurance Cyberpunk 2077 montre une baisse continue du taux de rafraîchissement au fil du temps. Ce comportement instable est le signe d'un système de refroidissement surchargé, et l'étranglement du SSD en est également une indication, nous y reviendrons plus bas. Malgré des performances relativement faibles, vous pouvez jouer à presque n'importe quel jeu en Full HD avec des détails moyens à maximum avec la RTX 4060 dans le G5.

En mode batterie, 73 % des performances 3D sont perdues sur Fire Strike.

3DMark 11
3DMark 11
Cloud Gate
Cloud Gate
Fire Strike
Fire Strike
Time Spy
Time Spy
3DMark Performance Rating - Percent
Moyenne de la classe Gaming
 
96 pt
Lenovo Legion Pro 5 16IRX9 G9
NVIDIA GeForce RTX 4060 Laptop GPU, Intel Core i7-14700HX
84 pt
Asus TUF Gaming A15 FA507UV -1!
NVIDIA GeForce RTX 4060 Laptop GPU, AMD Ryzen 9 8945H
83.6 pt
Gigabyte G5 KF5 2024
NVIDIA GeForce RTX 4060 Laptop GPU, Intel Core i7-13620H
81.8 pt
Moyenne NVIDIA GeForce RTX 4060 Laptop GPU
 
81.4 pt
Lenovo LOQ 15IRX9 -1!
NVIDIA GeForce RTX 4060 Laptop GPU, Intel Core i5-13450HX
81 pt
Gigabyte G5 KF
NVIDIA GeForce RTX 4060 Laptop GPU, Intel Core i5-12500H
78.4 pt
Dell Inspiron 16 Plus 7640 -1!
NVIDIA GeForce RTX 4060 Laptop GPU, Intel Core Ultra 7 155H
67.9 pt
3DMark 11 - 1280x720 Performance GPU
Moyenne de la classe Gaming
  (1029 - 72178, n=184, 2 dernières années)
43666 Points +33%
Lenovo Legion Pro 5 16IRX9 G9
NVIDIA GeForce RTX 4060 Laptop GPU, Intel Core i7-14700HX
36945 Points +12%
Asus TUF Gaming A15 FA507UV
NVIDIA GeForce RTX 4060 Laptop GPU, AMD Ryzen 9 8945H
36493 Points +11%
Lenovo LOQ 15IRX9
NVIDIA GeForce RTX 4060 Laptop GPU, Intel Core i5-13450HX
35608 Points +8%
Moyenne NVIDIA GeForce RTX 4060 Laptop GPU
  (28136 - 38912, n=54)
34842 Points +6%
Gigabyte G5 KF
NVIDIA GeForce RTX 4060 Laptop GPU, Intel Core i5-12500H
33490 Points +2%
Gigabyte G5 KF5 2024
NVIDIA GeForce RTX 4060 Laptop GPU, Intel Core i7-13620H
32903 Points
Dell Inspiron 16 Plus 7640
NVIDIA GeForce RTX 4060 Laptop GPU, Intel Core Ultra 7 155H
30097 Points -9%
3DMark
1280x720 Cloud Gate Standard Graphics
Gigabyte G5 KF5 2024
NVIDIA GeForce RTX 4060 Laptop GPU, Intel Core i7-13620H
170179 Points
Moyenne NVIDIA GeForce RTX 4060 Laptop GPU
  (81407 - 180228, n=27)
148916 Points -12%
Gigabyte G5 KF
NVIDIA GeForce RTX 4060 Laptop GPU, Intel Core i5-12500H
148762 Points -13%
Moyenne de la classe Gaming
  (15902 - 193851, n=100, 2 dernières années)
143183 Points -16%
Lenovo Legion Pro 5 16IRX9 G9
NVIDIA GeForce RTX 4060 Laptop GPU, Intel Core i7-14700HX
138926 Points -18%
1920x1080 Fire Strike Graphics
Moyenne de la classe Gaming
  (781 - 53059, n=194, 2 dernières années)
31337 Points +23%
Asus TUF Gaming A15 FA507UV
NVIDIA GeForce RTX 4060 Laptop GPU, AMD Ryzen 9 8945H
28015 Points +10%
Lenovo Legion Pro 5 16IRX9 G9
NVIDIA GeForce RTX 4060 Laptop GPU, Intel Core i7-14700HX
27046 Points +6%
Lenovo LOQ 15IRX9
NVIDIA GeForce RTX 4060 Laptop GPU, Intel Core i5-13450HX
27026 Points +6%
Moyenne NVIDIA GeForce RTX 4060 Laptop GPU
  (20533 - 29656, n=51)
25737 Points +1%
Gigabyte G5 KF5 2024
NVIDIA GeForce RTX 4060 Laptop GPU, Intel Core i7-13620H
25556 Points
Gigabyte G5 KF
NVIDIA GeForce RTX 4060 Laptop GPU, Intel Core i5-12500H
24789 Points -3%
Dell Inspiron 16 Plus 7640
NVIDIA GeForce RTX 4060 Laptop GPU, Intel Core Ultra 7 155H
22476 Points -12%
2560x1440 Time Spy Graphics
Moyenne de la classe Gaming
  (224 - 22717, n=189, 2 dernières années)
13077 Points +42%
Lenovo Legion Pro 5 16IRX9 G9
NVIDIA GeForce RTX 4060 Laptop GPU, Intel Core i7-14700HX
10919 Points +19%
Asus TUF Gaming A15 FA507UV
NVIDIA GeForce RTX 4060 Laptop GPU, AMD Ryzen 9 8945H
10189 Points +11%
Moyenne NVIDIA GeForce RTX 4060 Laptop GPU
  (7484 - 11451, n=53)
9945 Points +8%
Lenovo LOQ 15IRX9
NVIDIA GeForce RTX 4060 Laptop GPU, Intel Core i5-13450HX
9830 Points +7%
Gigabyte G5 KF
NVIDIA GeForce RTX 4060 Laptop GPU, Intel Core i5-12500H
9199 Points 0%
Gigabyte G5 KF5 2024
NVIDIA GeForce RTX 4060 Laptop GPU, Intel Core i7-13620H
9183 Points
Dell Inspiron 16 Plus 7640
NVIDIA GeForce RTX 4060 Laptop GPU, Intel Core Ultra 7 155H
8229 Points -10%
3DMark 11 Performance
29001 points
3DMark Cloud Gate Standard Score
58918 points
3DMark Fire Strike Score
20767 points
3DMark Time Spy Score
9497 points
Aide
Blender
v3.3 Classroom OPTIX/RTX
Lenovo LOQ 15IRX9
NVIDIA GeForce RTX 4060 Laptop GPU, Intel Core i5-13450HX
25 Seconds * -0%
Gigabyte G5 KF5 2024
NVIDIA GeForce RTX 4060 Laptop GPU, Intel Core i7-13620H
25 Seconds *
Gigabyte G5 KF
NVIDIA GeForce RTX 4060 Laptop GPU, Intel Core i5-12500H
24 Seconds * +4%
Dell Inspiron 16 Plus 7640
NVIDIA GeForce RTX 4060 Laptop GPU, Intel Core Ultra 7 155H
24 Seconds * +4%
Moyenne NVIDIA GeForce RTX 4060 Laptop GPU
  (19 - 28, n=50)
23 Seconds * +8%
Lenovo Legion Pro 5 16IRX9 G9
NVIDIA GeForce RTX 4060 Laptop GPU, Intel Core i7-14700HX
21 Seconds * +16%
Asus TUF Gaming A15 FA507UV
NVIDIA GeForce RTX 4060 Laptop GPU, AMD Ryzen 9 8945H
21 Seconds * +16%
Moyenne de la classe Gaming
  (9 - 95, n=175, 2 dernières années)
20.9 Seconds * +16%
v3.3 Classroom CUDA
Dell Inspiron 16 Plus 7640
NVIDIA GeForce RTX 4060 Laptop GPU, Intel Core Ultra 7 155H
44 Seconds * -2%
Lenovo LOQ 15IRX9
NVIDIA GeForce RTX 4060 Laptop GPU, Intel Core i5-13450HX
44 Seconds * -2%
Moyenne NVIDIA GeForce RTX 4060 Laptop GPU
  (39 - 53, n=50)
43.2 Seconds * -0%
Gigabyte G5 KF5 2024
NVIDIA GeForce RTX 4060 Laptop GPU, Intel Core i7-13620H
43 Seconds *
Gigabyte G5 KF
NVIDIA GeForce RTX 4060 Laptop GPU, Intel Core i5-12500H
42 Seconds * +2%
Lenovo Legion Pro 5 16IRX9 G9
NVIDIA GeForce RTX 4060 Laptop GPU, Intel Core i7-14700HX
41 Seconds * +5%
Asus TUF Gaming A15 FA507UV
NVIDIA GeForce RTX 4060 Laptop GPU, AMD Ryzen 9 8945H
41 Seconds * +5%
Moyenne de la classe Gaming
  (16 - 175, n=181, 2 dernières années)
36.5 Seconds * +15%
v3.3 Classroom CPU
Gigabyte G5 KF
NVIDIA GeForce RTX 4060 Laptop GPU, Intel Core i5-12500H
452 Seconds * -20%
Lenovo LOQ 15IRX9
NVIDIA GeForce RTX 4060 Laptop GPU, Intel Core i5-13450HX
397 Seconds * -5%
Gigabyte G5 KF5 2024
NVIDIA GeForce RTX 4060 Laptop GPU, Intel Core i7-13620H
378 Seconds *
Dell Inspiron 16 Plus 7640
NVIDIA GeForce RTX 4060 Laptop GPU, Intel Core Ultra 7 155H
365 Seconds * +3%
Moyenne NVIDIA GeForce RTX 4060 Laptop GPU
  (189 - 452, n=50)
309 Seconds * +18%
Moyenne de la classe Gaming
  (138 - 962, n=189, 2 dernières années)
297 Seconds * +21%
Asus TUF Gaming A15 FA507UV
NVIDIA GeForce RTX 4060 Laptop GPU, AMD Ryzen 9 8945H
293 Seconds * +22%
Lenovo Legion Pro 5 16IRX9 G9
NVIDIA GeForce RTX 4060 Laptop GPU, Intel Core i7-14700HX
228 Seconds * +40%

* ... Moindre est la valeur, meilleures sont les performances

Performance Rating - Percent
Moyenne de la classe Gaming
 
91.9 pt
Lenovo Legion Pro 5 16IRX9 G9
Intel Core i7-14700HX, NVIDIA GeForce RTX 4060 Laptop GPU
90.3 pt
Asus TUF Gaming A15 FA507UV
AMD Ryzen 9 8945H, NVIDIA GeForce RTX 4060 Laptop GPU
81.1 pt
Lenovo LOQ 15IRX9 -1!
Intel Core i5-13450HX, NVIDIA GeForce RTX 4060 Laptop GPU
79.8 pt
Gigabyte G5 KF5 2024
Intel Core i7-13620H, NVIDIA GeForce RTX 4060 Laptop GPU
79.5 pt
Gigabyte G5 KF
Intel Core i5-12500H, NVIDIA GeForce RTX 4060 Laptop GPU
74.7 pt
Dell Inspiron 16 Plus 7640 -1!
Intel Core Ultra 7 155H, NVIDIA GeForce RTX 4060 Laptop GPU
69.2 pt
Baldur's Gate 3 - 1920x1080 Ultra Preset
Moyenne de la classe Gaming
  (21.2 - 208, n=44, 2 dernières années)
102.1 fps +22%
Asus TUF Gaming A15 FA507UV
AMD Ryzen 9 8945H, NVIDIA GeForce RTX 4060 Laptop GPU
93.9 (67.7min, 75.2P0.1, 79P1) fps +12%
Gigabyte G5 KF5 2024
Intel Core i7-13620H, NVIDIA GeForce RTX 4060 Laptop GPU
84 fps
Dell Inspiron 16 Plus 7640
Intel Core Ultra 7 155H, NVIDIA GeForce RTX 4060 Laptop GPU
76.7 fps -9%
Gigabyte G5 KF
Intel Core i5-12500H, NVIDIA GeForce RTX 4060 Laptop GPU
75.1 (28.1min, 36.6P0.1, 54.5P1) fps -11%
Lenovo Legion Pro 5 16IRX9 G9
Intel Core i7-14700HX, NVIDIA GeForce RTX 4060 Laptop GPU
66.5 fps -21%
GTA V - 1920x1080 Highest Settings possible AA:4xMSAA + FX AF:16x
Lenovo Legion Pro 5 16IRX9 G9
Intel Core i7-14700HX, NVIDIA GeForce RTX 4060 Laptop GPU
124.9 (3.49min, 76.9P1) fps +22%
Moyenne de la classe Gaming
  (12.1 - 167.7, n=169, 2 dernières années)
113.1 fps +10%
Lenovo LOQ 15IRX9
Intel Core i5-13450HX, NVIDIA GeForce RTX 4060 Laptop GPU
112.6 (5.45min, 76.9P1) fps +10%
Gigabyte G5 KF
Intel Core i5-12500H, NVIDIA GeForce RTX 4060 Laptop GPU
107.6 (4.17min, 66.7P1) fps +5%
Asus TUF Gaming A15 FA507UV
AMD Ryzen 9 8945H, NVIDIA GeForce RTX 4060 Laptop GPU
107.2 (4.45min, 76.9P1) fps +5%
Gigabyte G5 KF5 2024
Intel Core i7-13620H, NVIDIA GeForce RTX 4060 Laptop GPU
102.4 (8.53min, 71.4P1) fps
Final Fantasy XV Benchmark - 1920x1080 High Quality
Moyenne de la classe Gaming
  (19.2 - 201, n=182, 2 dernières années)
119.3 fps +28%
Lenovo Legion Pro 5 16IRX9 G9
Intel Core i7-14700HX, NVIDIA GeForce RTX 4060 Laptop GPU
106.1 fps +14%
Asus TUF Gaming A15 FA507UV
AMD Ryzen 9 8945H, NVIDIA GeForce RTX 4060 Laptop GPU
100.7 fps +8%
Lenovo LOQ 15IRX9
Intel Core i5-13450HX, NVIDIA GeForce RTX 4060 Laptop GPU
99.9 fps +7%
Gigabyte G5 KF5 2024
Intel Core i7-13620H, NVIDIA GeForce RTX 4060 Laptop GPU
93.2 fps
Gigabyte G5 KF
Intel Core i5-12500H, NVIDIA GeForce RTX 4060 Laptop GPU
91.9 fps -1%
Dell Inspiron 16 Plus 7640
Intel Core Ultra 7 155H, NVIDIA GeForce RTX 4060 Laptop GPU
78.8 fps -15%
Strange Brigade - 1920x1080 ultra AA:ultra AF:16
Moyenne de la classe Gaming
  (38.9 - 421, n=180, 2 dernières années)
228 fps +33%
Lenovo Legion Pro 5 16IRX9 G9
Intel Core i7-14700HX, NVIDIA GeForce RTX 4060 Laptop GPU
199.9 (40.2min, 143.4P1) fps +17%
Asus TUF Gaming A15 FA507UV
AMD Ryzen 9 8945H, NVIDIA GeForce RTX 4060 Laptop GPU
184.2 (41min, 136.6P1) fps +8%
Lenovo LOQ 15IRX9
Intel Core i5-13450HX, NVIDIA GeForce RTX 4060 Laptop GPU
182.7 (43.5min, 133.1P1) fps +7%
Gigabyte G5 KF
Intel Core i5-12500H, NVIDIA GeForce RTX 4060 Laptop GPU
172.1 (71.6min, 126.4P1) fps +1%
Gigabyte G5 KF5 2024
Intel Core i7-13620H, NVIDIA GeForce RTX 4060 Laptop GPU
170.8 (53.4min, 126.3P1) fps
Dell Inspiron 16 Plus 7640
Intel Core Ultra 7 155H, NVIDIA GeForce RTX 4060 Laptop GPU
153.5 (48min, 114.7P1) fps -10%
Dota 2 Reborn - 1920x1080 ultra (3/3) best looking
Lenovo Legion Pro 5 16IRX9 G9
Intel Core i7-14700HX, NVIDIA GeForce RTX 4060 Laptop GPU
183.8 (158.1min) fps +19%
Gigabyte G5 KF5 2024
Intel Core i7-13620H, NVIDIA GeForce RTX 4060 Laptop GPU
154.5 (133.1min) fps
Moyenne de la classe Gaming
  (30.8 - 220, n=188, 2 dernières années)
149.4 fps -3%
Lenovo LOQ 15IRX9
Intel Core i5-13450HX, NVIDIA GeForce RTX 4060 Laptop GPU
141 (122.7min) fps -9%
Asus TUF Gaming A15 FA507UV
AMD Ryzen 9 8945H, NVIDIA GeForce RTX 4060 Laptop GPU
139.5 (122.4min) fps -10%
Dell Inspiron 16 Plus 7640
Intel Core Ultra 7 155H, NVIDIA GeForce RTX 4060 Laptop GPU
135.1 (116.3min) fps -13%
Gigabyte G5 KF
Intel Core i5-12500H, NVIDIA GeForce RTX 4060 Laptop GPU
131.2 (115min) fps -15%
X-Plane 11.11 - 1920x1080 high (fps_test=3)
Lenovo Legion Pro 5 16IRX9 G9
Intel Core i7-14700HX, NVIDIA GeForce RTX 4060 Laptop GPU
135.1 fps +32%
Moyenne de la classe Gaming
  (31.5 - 166.2, n=194, 2 dernières années)
107.3 fps +5%
Gigabyte G5 KF5 2024
Intel Core i7-13620H, NVIDIA GeForce RTX 4060 Laptop GPU
102 fps
Lenovo LOQ 15IRX9
Intel Core i5-13450HX, NVIDIA GeForce RTX 4060 Laptop GPU
92.2 fps -10%
Asus TUF Gaming A15 FA507UV
AMD Ryzen 9 8945H, NVIDIA GeForce RTX 4060 Laptop GPU
91.7 fps -10%
Gigabyte G5 KF
Intel Core i5-12500H, NVIDIA GeForce RTX 4060 Laptop GPU
87.1 fps -15%
Dell Inspiron 16 Plus 7640
Intel Core Ultra 7 155H, NVIDIA GeForce RTX 4060 Laptop GPU
86.5 fps -15%

Cyberpunk 2077 ultra FPS chart

05101520253035404550556065Tooltip
Gigabyte G5 KF5 2024 i7-13620H, NVIDIA GeForce RTX 4060 Laptop GPU: Ø57.1 (51.9-62.1)
Lenovo LOQ 15IRX9 i5-13450HX, NVIDIA GeForce RTX 4060 Laptop GPU: Ø65.1 (61.4-65.8)
Asus TUF Gaming A15 FA507UV R9 8945H, NVIDIA GeForce RTX 4060 Laptop GPU: Ø66.8 (63.8-67.8)
Lenovo Legion Pro 5 16IRX9 G9 i7-14700HX, NVIDIA GeForce RTX 4060 Laptop GPU: Ø68.5 (65-69.4)
BasMoyenÉlevéUltra
GTA V (2015) 186.4 181.2 170.6 102.4
Dota 2 Reborn (2015) 188.7 172.3 164.9 154.5
Final Fantasy XV Benchmark (2018) 187.2 129.6 93.2
X-Plane 11.11 (2018) 159.3 131.1 102
Strange Brigade (2018) 441 253 192.3 170.8
Baldur's Gate 3 (2023) 125 98 86 84
Cyberpunk 2077 2.1 Phantom Liberty (2023) 114 91 77.2 68.2

Émissions et énergie - Système de refroidissement surchargé

Émissions sonores

En mode performance, les ventilateurs sont souvent en marche et le bruit avoisine les 27,87 dB. Dans notre test 3dMark06, les ventilateurs restent longtemps à ce niveau, puis montent en puissance jusqu'à la vitesse maximale de 54,82 dB peu avant la fin, ce que nous avons également mesuré sur le Cyberpoint 2077 ou dans notre test de stress. Le prédécesseur était également aussi bruyant, la concurrence directe reste un peu plus silencieuse, le Legion Pro 5 atteint au moins des niveaux de bruit similaires, mais il est également plus performant que notre G5.

En outre, notre modèle de test est perturbé par un fort bruit de cliquetis lorsqu'il est soumis à de lourdes charges 3D. Il semble que quelque chose à l'intérieur se cogne périodiquement (environ 2 à 3 Hz) contre le boîtier, ce qui ne donne pas une bonne impression. Si nous soulevons l'ordinateur portable et changeons sa position dans la main, le bruit change et peut même disparaître complètement. Si nous le reposons, le bruit réapparaît généralement. En ce qui concerne la maintenance, nous n'avons ouvert le boîtier qu'après ces constatations, mais nous n'avons pu découvrir aucune pièce détachée.

Degré de la nuisance sonore

Au repos
23 / 23 / 27.87 dB(A)
Fortement sollicité
54.82 / 54.82 dB(A)
  red to green bar
 
 
30 dB
silencieux
40 dB(A)
audible
50 dB(A)
bruyant
 
min: dark, med: mid, max: light   Earthworks M23R, Arta (à 15 cm de distance)   bruit ambiant: 23 dB(A)
dB(A) 0102030405060708090Deep BassMiddle BassHigh BassLower RangeMidsHigher MidsLower HighsMid HighsUpper HighsSuper Highs2032.534.832.52525.525.325.53128.926.528.94024.620.824.65025.423.225.46326.828.226.88024.118.524.110023.822.223.812522.114.822.116025.713.925.720027.121.227.12503014.83031533.811.333.840034.69.834.650035.49.935.463036.510.336.580037.710.237.7100043.110.243.1125043.610.243.6160045.910.545.920004511.245250045.31245.3315043.611.643.6400043.812.243.8500042.912.642.9630041.112.441.1800036.712.436.71000033.912.733.9125003112.5311600025.911.725.9SPL54.823.954.8N9.30.59.3median 36.5median 12median 36.5Delta7.61.87.641.636.235.645.641.438.637.929.637.136.147.848.141.344.245.134.232.428.231.132.830.429.730.130.928.340.529.725.326.237.628.920.619.818.52931.422.320.41929.432.822.824.717.329.129.526.126.219.128.831.82422.520.730.532.122.722.116.430.730.921.722.21431.935.425.825.412.834.53731.235.812.538.636.425.527.7123837.325.426.311.738.538.924.926.911.940.438.221.923.912.14038.221.323.312.240.436.420.121.412.438.835.718.620.313.13836.117.818.313.138.33416.716.113.336.431.614.814.913.134.530.114.813.913.233.625.116.113.913.628.721.515.413.513.225.317.714.813.112.721.515.113.612.312.117.847.734.136.425.149.76.11.92.20.76.9median 32.8median 21.7median 22.1median 13.1median 34.55.44.45.21.85hearing rangehide median Fan NoiseGigabyte G5 KF5 2024Lenovo LOQ 15IRX9
Gigabyte G5 KF5 2024
NVIDIA GeForce RTX 4060 Laptop GPU, i7-13620H, Gigabyte AG450E1024-SI
Gigabyte G5 KF
NVIDIA GeForce RTX 4060 Laptop GPU, i5-12500H, SSSTC CA6-8D512
Lenovo LOQ 15IRX9
NVIDIA GeForce RTX 4060 Laptop GPU, i5-13450HX, Micron 2400 MTFDKCD1T0QFM
Asus TUF Gaming A15 FA507UV
NVIDIA GeForce RTX 4060 Laptop GPU, R9 8945H, WD PC SN560 SDDPNQE-1T00
Lenovo Legion Pro 5 16IRX9 G9
NVIDIA GeForce RTX 4060 Laptop GPU, i7-14700HX, Samsung PM9A1 MZVL21T0HCLR
Dell Inspiron 16 Plus 7640
NVIDIA GeForce RTX 4060 Laptop GPU, Ultra 7 155H, SK hynix BC901 HFS001TEJ4X164N
Noise
7%
-9%
1%
5%
9%
off / environment *
23
23
-0%
25
-9%
25
-9%
23
-0%
23.8
-3%
Idle Minimum *
23
23
-0%
26
-13%
25
-9%
23
-0%
24.2
-5%
Idle Average *
23
23
-0%
34
-48%
27
-17%
23
-0%
24.2
-5%
Idle Maximum *
27.87
28
-0%
36
-29%
33
-18%
25
10%
24.2
13%
Load Average *
54.82
29.94
45%
48
12%
40
27%
45.18
18%
28.9
47%
Cyberpunk 2077 ultra *
54.82
48
12%
45
18%
52.69
4%
Load Maximum *
54.82
55.5
-1%
50
9%
46
16%
53.13
3%
51
7%
Witcher 3 ultra *
55.05
51

* ... Moindre est la valeur, meilleures sont les performances

Température

Malgré les ventilateurs plutôt bruyants, les températures de surface sont loin d'être basses. Nous avons mesuré un point chaud de 67 °C sur la face inférieure, au centre de l'écran. C'est un peu trop à notre goût. Malheureusement, Gigabyte n'a pas réussi à optimiser son prédécesseur.

La température du GPU atteint 88 °C lors des tests de stress et de jeu. La température du CPU est encore pire : alors qu'elle se situe déjà entre 76 et 82 °C dans le test de stress, elle augmente continuellement jusqu'à 100 °C dans le jeu et ne diminue plus. C'est loin d'être idéal pour la durabilité du matériel ! En même temps, cela explique la baisse continue du nombre de fps dans Cyberpunk 2077 montrée ci-dessus.

La température du processeur augmente jusqu'à 100 °C pendant les jeux !
 45 °C50 °C39 °C 
 41 °C41 °C32 °C 
 25 °C33 °C27 °C 
Maximum: 50 °C
Moyenne: 37 °C
44 °C66 °C53 °C
31 °C39 °C28 °C
29 °C24 °C23 °C
Maximum: 66 °C
Moyenne: 37.4 °C
Alimentation (valeur maximale)  56 °C | Température ambiante de la pièce 18.5 °C | Fluke t3000FC (calibrated), Fluke 62 Mini
(±) La température moyenne de la face supérieure sous charge maximale est de 37 °C / 99 F, par rapport à la moyenne de 33.9 °C / 93 F pour les appareils de la classe Gaming.
(-) La température maximale du côté supérieur est de 50 °C / 122 F, par rapport à la moyenne de 40.5 °C / 105 F, allant de 21.2 à 68.8 °C pour la classe Gaming.
(-) Le fond chauffe jusqu'à un maximum de 66 °C / 151 F, contre une moyenne de 43.2 °C / 110 F
(+) En utilisation inactive, la température moyenne du côté supérieur est de 27.9 °C / 82 F, par rapport à la moyenne du dispositif de 33.9 °C / 93 F.
(±) 3: The average temperature for the upper side is 36.8 °C / 98 F, compared to the average of 33.9 °C / 93 F for the class Gaming.
(+) Les repose-poignets et le pavé tactile atteignent la température maximale de la peau (33 °C / 91.4 F) et ne sont donc pas chauds.
(-) La température moyenne de la zone de l'appui-paume de dispositifs similaires était de 28.9 °C / 84 F (-4.1 °C / #-7.4 F).
Gigabyte G5 KF5 2024
Intel Core i7-13620H, NVIDIA GeForce RTX 4060 Laptop GPU
Gigabyte G5 KF
Intel Core i5-12500H, NVIDIA GeForce RTX 4060 Laptop GPU
Lenovo LOQ 15IRX9
Intel Core i5-13450HX, NVIDIA GeForce RTX 4060 Laptop GPU
Asus TUF Gaming A15 FA507UV
AMD Ryzen 9 8945H, NVIDIA GeForce RTX 4060 Laptop GPU
Lenovo Legion Pro 5 16IRX9 G9
Intel Core i7-14700HX, NVIDIA GeForce RTX 4060 Laptop GPU
Dell Inspiron 16 Plus 7640
Intel Core Ultra 7 155H, NVIDIA GeForce RTX 4060 Laptop GPU
Heat
-1%
5%
8%
-1%
15%
Maximum Upper Side *
50
54
-8%
47
6%
53
-6%
50
-0%
43.4
13%
Maximum Bottom *
66
61
8%
58
12%
46
30%
57
14%
41.6
37%
Idle Upper Side *
32
34
-6%
32
-0%
32
-0%
36
-13%
32.8
-3%
Idle Bottom *
37
36
3%
36
3%
34
8%
39
-5%
32.4
12%

* ... Moindre est la valeur, meilleures sont les performances

Intervenants

Les deux haut-parleurs stéréo sont situés sur les côtés, vers l'avant, et rayonnent vers le bas. Ils ne sont pas particulièrement puissants et manquent de basses, bien que les aigus soient linéaires. Nous vous recommandons de brancher un casque sur la prise audio lorsque vous jouez.

dB(A) 0102030405060708090Deep BassMiddle BassHigh BassLower RangeMidsHigher MidsLower HighsMid HighsUpper HighsSuper Highs2027.634.827.62524.225.324.23125.826.525.84021.620.821.65022.723.222.76324.628.224.68017.418.517.410020.422.220.412519.114.819.116018.313.918.320028.721.228.725037.714.837.731547.111.347.1400539.85350057.29.957.263058.210.358.280068.610.268.610007110.271125059.410.259.4160070.510.570.520007311.273250071.21271.2315066.611.666.6400067.212.267.2500063.312.663.3630059.312.459.3800059.512.459.51000054.712.754.7125004812.5481600047.511.747.5SPL79.823.979.8N41.10.541.1median 58.2median 12median 58.2Delta12.91.812.945.63937.135.844.251.331.134.430.931.326.234.518.529.2193617.343.719.147.920.75216.458.31458.412.861.712.566.61267.811.767.311.966.912.163.712.263.712.464.913.16413.16013.358.513.166.313.271.813.677.113.272.712.768.812.167.425.180.70.747.7median 13.1median 641.85.3hearing rangehide median Pink NoiseGigabyte G5 KF5 2024Lenovo LOQ 15IRX9
Diagramme de fréquence (les cases peuvent être cochées et décochées pour comparer les appareils)
Gigabyte G5 KF5 2024 analyse audio

(±) | le niveau sonore du haut-parleur est moyen mais bon (79.8# dB)
Bass 100 - 315 Hz
(-) | presque aucune basse - en moyenne 29.6% plus bas que la médiane
(±) | la linéarité des basses est moyenne (12.3% delta à la fréquence précédente)
Mids 400 - 2000 Hz
(±) | médiane supérieure - en moyenne 7.2% supérieure à la médiane
(±) | la linéarité des médiums est moyenne (13.3% delta à la fréquence précédente)
Aiguës 2 - 16 kHz
(±) | sommets plus élevés - en moyenne 5.9% plus élevés que la médiane
(+) | les aigus sont linéaires (6.1% delta à la fréquence précédente)
Overall 100 - 16.000 Hz
(±) | la linéarité du son global est moyenne (29.1% de différence avec la médiane)
Par rapport à la même classe
» 94% de tous les appareils testés de cette catégorie étaient meilleurs, 2% similaires, 4% pires
» Le meilleur avait un delta de 6%, la moyenne était de 18%, le pire était de 132%.
Par rapport à tous les appareils testés
» 85% de tous les appareils testés étaient meilleurs, 3% similaires, 12% pires
» Le meilleur avait un delta de 4%, la moyenne était de 25%, le pire était de 134%.

Lenovo LOQ 15IRX9 analyse audio

(±) | le niveau sonore du haut-parleur est moyen mais bon (81# dB)
Bass 100 - 315 Hz
(±) | basse réduite - en moyenne 14.6% inférieure à la médiane
(±) | la linéarité des basses est moyenne (9.6% delta à la fréquence précédente)
Mids 400 - 2000 Hz
(+) | médiane équilibrée - seulement 2.1% de la médiane
(+) | les médiums sont linéaires (3.6% delta à la fréquence précédente)
Aiguës 2 - 16 kHz
(±) | sommets plus élevés - en moyenne 5.9% plus élevés que la médiane
(±) | la linéarité des aigus est moyenne (8.2% delta à la fréquence précédente)
Overall 100 - 16.000 Hz
(+) | le son global est linéaire (14.7% différence à la médiane)
Par rapport à la même classe
» 27% de tous les appareils testés de cette catégorie étaient meilleurs, 7% similaires, 66% pires
» Le meilleur avait un delta de 6%, la moyenne était de 18%, le pire était de 132%.
Par rapport à tous les appareils testés
» 17% de tous les appareils testés étaient meilleurs, 4% similaires, 79% pires
» Le meilleur avait un delta de 4%, la moyenne était de 25%, le pire était de 134%.

Consommation électrique

En mode économie d'énergie, la consommation au repos n'est que de 5,2 W. En revanche, dans les autres profils de performance, la consommation grimpe jusqu'à 20 W environ.

Dans les jeux (Cyberpunk 2077), nous avons mesuré une consommation moyenne de 144 W. Lors du test de stress, nous avons enregistré jusqu'à 165 W sur de courtes périodes. Le petit bloc d'alimentation (environ 13,6 x 6,7 x 2,3 cm (L x l x h)) est conçu pour 150 W et devrait être en mesure de faire face à toutes les consommations moyennes mesurées et d'absorber les courtes pointes. Cependant, il ne reste pas beaucoup de place pour la recharge pendant les sessions de jeu exigeantes.

Consommation énergétique
Éteint/en veilledarklight 0.1 / 1 Watts
Au reposdarkmidlight 5.2 / 19.6 / 23 Watts
Fortement sollicité midlight 84 / 165 Watts
 color bar
Légende: min: dark, med: mid, max: light        Metrahit Energy

Energieaufnahme Cyberpunk / Stresstest

0102030405060708090100110120130140150160Tooltip
Gigabyte G5 KF5 2024; 1280x720 Prime95 28.10 and Furmark 1.25: Ø141.1 (137.37-165.27)
Gigabyte G5 KF5 2024; Idle 150cd/m2: Ø21.7 (20.81-27.463)
Gigabyte G5 KF5 2024; Cyberpunk 2077 FHD ultra no FSR 150cd: Ø143.9 (137.73-151.57)

Power consumption with the external monitor

0102030405060708090100110120130140Tooltip
Gigabyte G5 KF5 2024; Prime95 V2810 Stress (external Monitor): Ø111.5 (97.03-142.09)
Gigabyte G5 KF5 2024; Cinebench R15 Multi (external Monitor): Ø125.6 (119.31-140.51)
Gigabyte G5 KF5 2024; Cinebench R23 Multi (external Monitor): Ø128.4 (110.8-142.44)
Gigabyte G5 KF5 2024; 1280x720 FurMark 1.19 GPU Stress Test (external Monitor): Ø125.5 (119.52-130.45)
Gigabyte G5 KF5 2024; Idle 1min (external Monitor): Ø19.2 (18.333-20.862)
Gigabyte G5 KF5 2024; Cyberpunk 2077 FHD ultra no FSR - external Monitor: Ø144 (140.8-147.04)

Durée de vie de la batterie

Le faible prix se reflète également dans la capacité de la batterie, qui n'est que de 54 Wh. Les appareils concurrents ont une capacité de 60 à 90 Wh. Néanmoins, notre G5 se comporte plutôt bien en termes d'autonomie, notamment par rapport au LOQ 15 (60 Wh) et au Legion Pro 5 (80 Wh), où il peut même atteindre de meilleures durées d'utilisation en WiFi (5,5 à 7h) et en vidéo (6h).

Autonomie
WiFi Websurfing
7h 15min
WiFi Websurfing max. Brightness
5h 23min
En lecture de Big Buck Bunny encodé en H.264 1080p
6h 03min
Fortement sollicité (luminosité au maximum)
1h 05min
Gigabyte G5 KF5 2024
i7-13620H, NVIDIA GeForce RTX 4060 Laptop GPU, 54 Wh
Gigabyte G5 KF
i5-12500H, NVIDIA GeForce RTX 4060 Laptop GPU, 54 Wh
Lenovo LOQ 15IRX9
i5-13450HX, NVIDIA GeForce RTX 4060 Laptop GPU, 60 Wh
Asus TUF Gaming A15 FA507UV
R9 8945H, NVIDIA GeForce RTX 4060 Laptop GPU, 90 Wh
Lenovo Legion Pro 5 16IRX9 G9
i7-14700HX, NVIDIA GeForce RTX 4060 Laptop GPU, 80 Wh
Dell Inspiron 16 Plus 7640
Ultra 7 155H, NVIDIA GeForce RTX 4060 Laptop GPU, 90 Wh
Moyenne de la classe Gaming
 
Autonomie de la batterie
-3%
-26%
61%
6%
84%
10%
H.264
363
268
-26%
312
-14%
WiFi v1.3
435
316
-27%
320
-26%
702
61%
308
-29%
799
84%
Load
65
94
45%
105
62%
Reader / Idle
514

Notebookcheck note globale

Un portable RTX 4060 pour 899 euros : Malgré quelques compromis comme une webcam 720p et l'absence d'un port Thunderbolt, le Gigabyte G5 impressionne par son design solide, son bon clavier et la grande précision des couleurs de l'écran. Cependant, son système de refroidissement semble trop faible, ce qui nous empêche d'en recommander l'achat.

Gigabyte G5 KF5 2024 - 10/17/2024 v8
Christian Hintze

Châssis
73 / 98 → 75%
Clavier
84%
Dispositif de pointage
82%
Connectivité
61 / 80 → 77%
Poids
63 / 10-68 → 91%
Autonomie
76 / 95 → 79%
Écran
81%
Performances en jeu
73%
Performances dans les applications
84%
AI Performance
94%
Chauffe
75 / 95 → 79%
Nuisance sonore
67 / 90 → 75%
Audio
60%
Appareil photo
24 / 75 → 32%
Moyenne
57%
76%
Gaming - Moyenne compensée
CO2 Emissions
No Data
Materials
0%
Packaging
15%
Power Use
77.1%
Repairability
50%
Software Updates
22.3%
Recycle Logo Total Sustainability Score: 27.4%

Transparency

The selection of devices to be reviewed is made by our editorial team. The test sample was provided to the author as a loan by the manufacturer or retailer for the purpose of this review. The lender had no influence on this review, nor did the manufacturer receive a copy of this review before publication. There was no obligation to publish this review. We never accept compensation or payment in return for our reviews. As an independent media company, Notebookcheck is not subjected to the authority of manufacturers, retailers or publishers.

This is how Notebookcheck is testing

Every year, Notebookcheck independently reviews hundreds of laptops and smartphones using standardized procedures to ensure that all results are comparable. We have continuously developed our test methods for around 20 years and set industry standards in the process. In our test labs, high-quality measuring equipment is utilized by experienced technicians and editors. These tests involve a multi-stage validation process. Our complex rating system is based on hundreds of well-founded measurements and benchmarks, which maintains objectivity. Further information on our test methods can be found here.

Please share our article, every link counts!
Mail Logo
> Revues et rapports de ordinateurs portatifs et smartphones, ordiphones > Critiques > Test du Gigabyte G5 KF5 2024 : le jeu RTX 4060 à prix cassé - l'affaire en vaut-elle la peine ?
Christian Hintze, 2024-10-24 (Update: 2024-10-24)