


Minisforum est principalement connu pour son offre de mini-PC dans toutes les catégories de performances. La plupart des fabricants de mini-PC ont tendance à rester à l'écart du marché des ordinateurs de bureau classiques, mais il s'avère que Minisforum ose s'implanter dans ce domaine également. Il y a quelques temps, nous avons pu découvrir les bonnes performances du Minisforum BD770i basé sur le AMD Ryzen 7 7745HX. En tant que modèle haut de gamme avec un APU AMD Ryzen, la carte mère BD790i de Minisforum est un modèle encore plus puissant dans le portefeuille du fabricant, que nous allons examiner en détail dans cette revue.
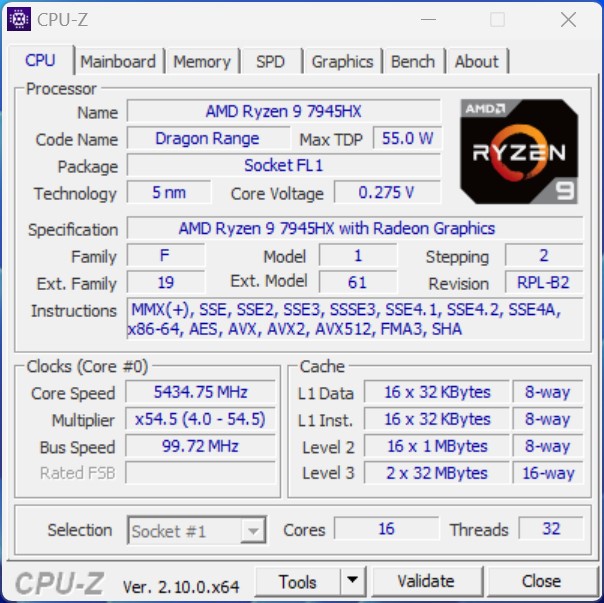
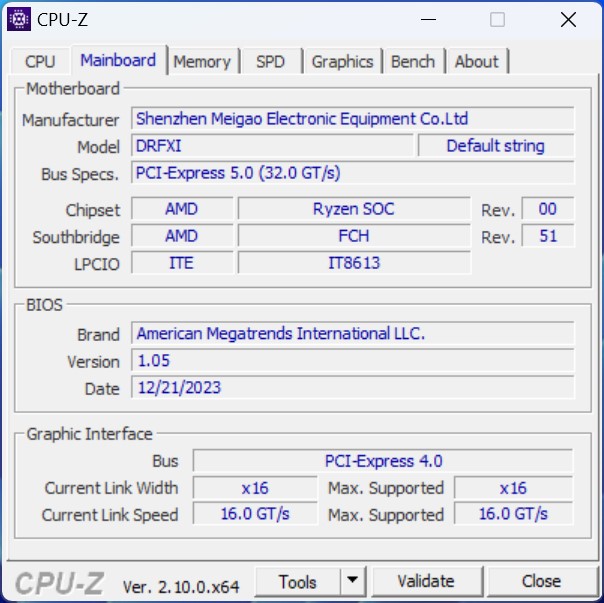
Minisforum a installé une carte mère AMD Ryzen 9 7945HX dans le BD790i, qui est équipé de 16 cœurs Zen4. Cela signifie que le SoC, qui provient du secteur mobile, est actuellement l'un des plus rapides qu'AMD ait à offrir. Afin d'évaluer ses performances en matière de jeu, nous l'avons examiné en combinaison avec un processeur Nvidia RTX95 Nvidia GeForce RTX 4090. Grâce à son emplacement PCIe x16 complet, la carte graphique a pu être connectée avec ses pleines performances.
Comparaison des cartes mères du Minisforum
| Nom | BD790i | BD790i SE | BD770i | AR900i |
| CPU | AMD Ryzen 9 7945HX | AMD Ryzen 9 7940HX | AMD Ryzen 7 7745HX | Intel Core i9-13900HX Processeur |
| Cœurs / threads | 16 / 32 | 16/32 | 8/16 | 24/32 |
| GPU | AMD Radeon 610M | AMD Radeon 610M | AMD Radeon 610M | Intel UHD Graphics |
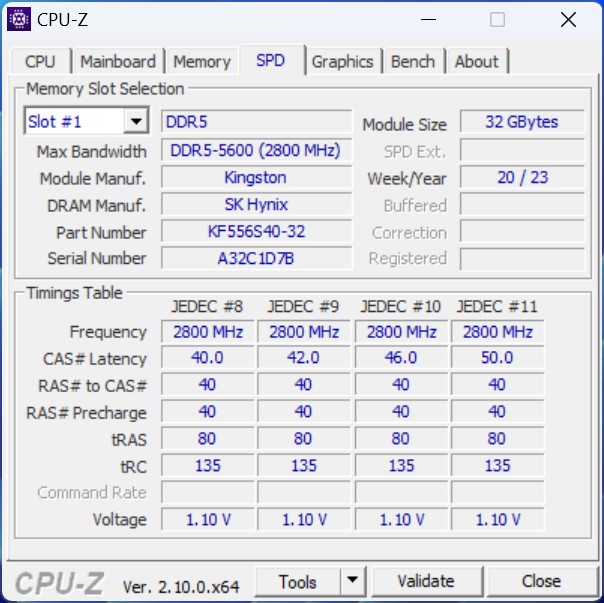
| Types de mémoire | DDR5-5200SODIMM | DDR5-5200 SODIMM | DDR5-5200 SODIMM | DDR5-5600 SODIMM |
| Taille maximale de la mémoire | 96 GB | 64 GB | 64 GB | 64 GB |
Le Minisforum BD790i et le système de test en détail


Cas et configuration de l'essai
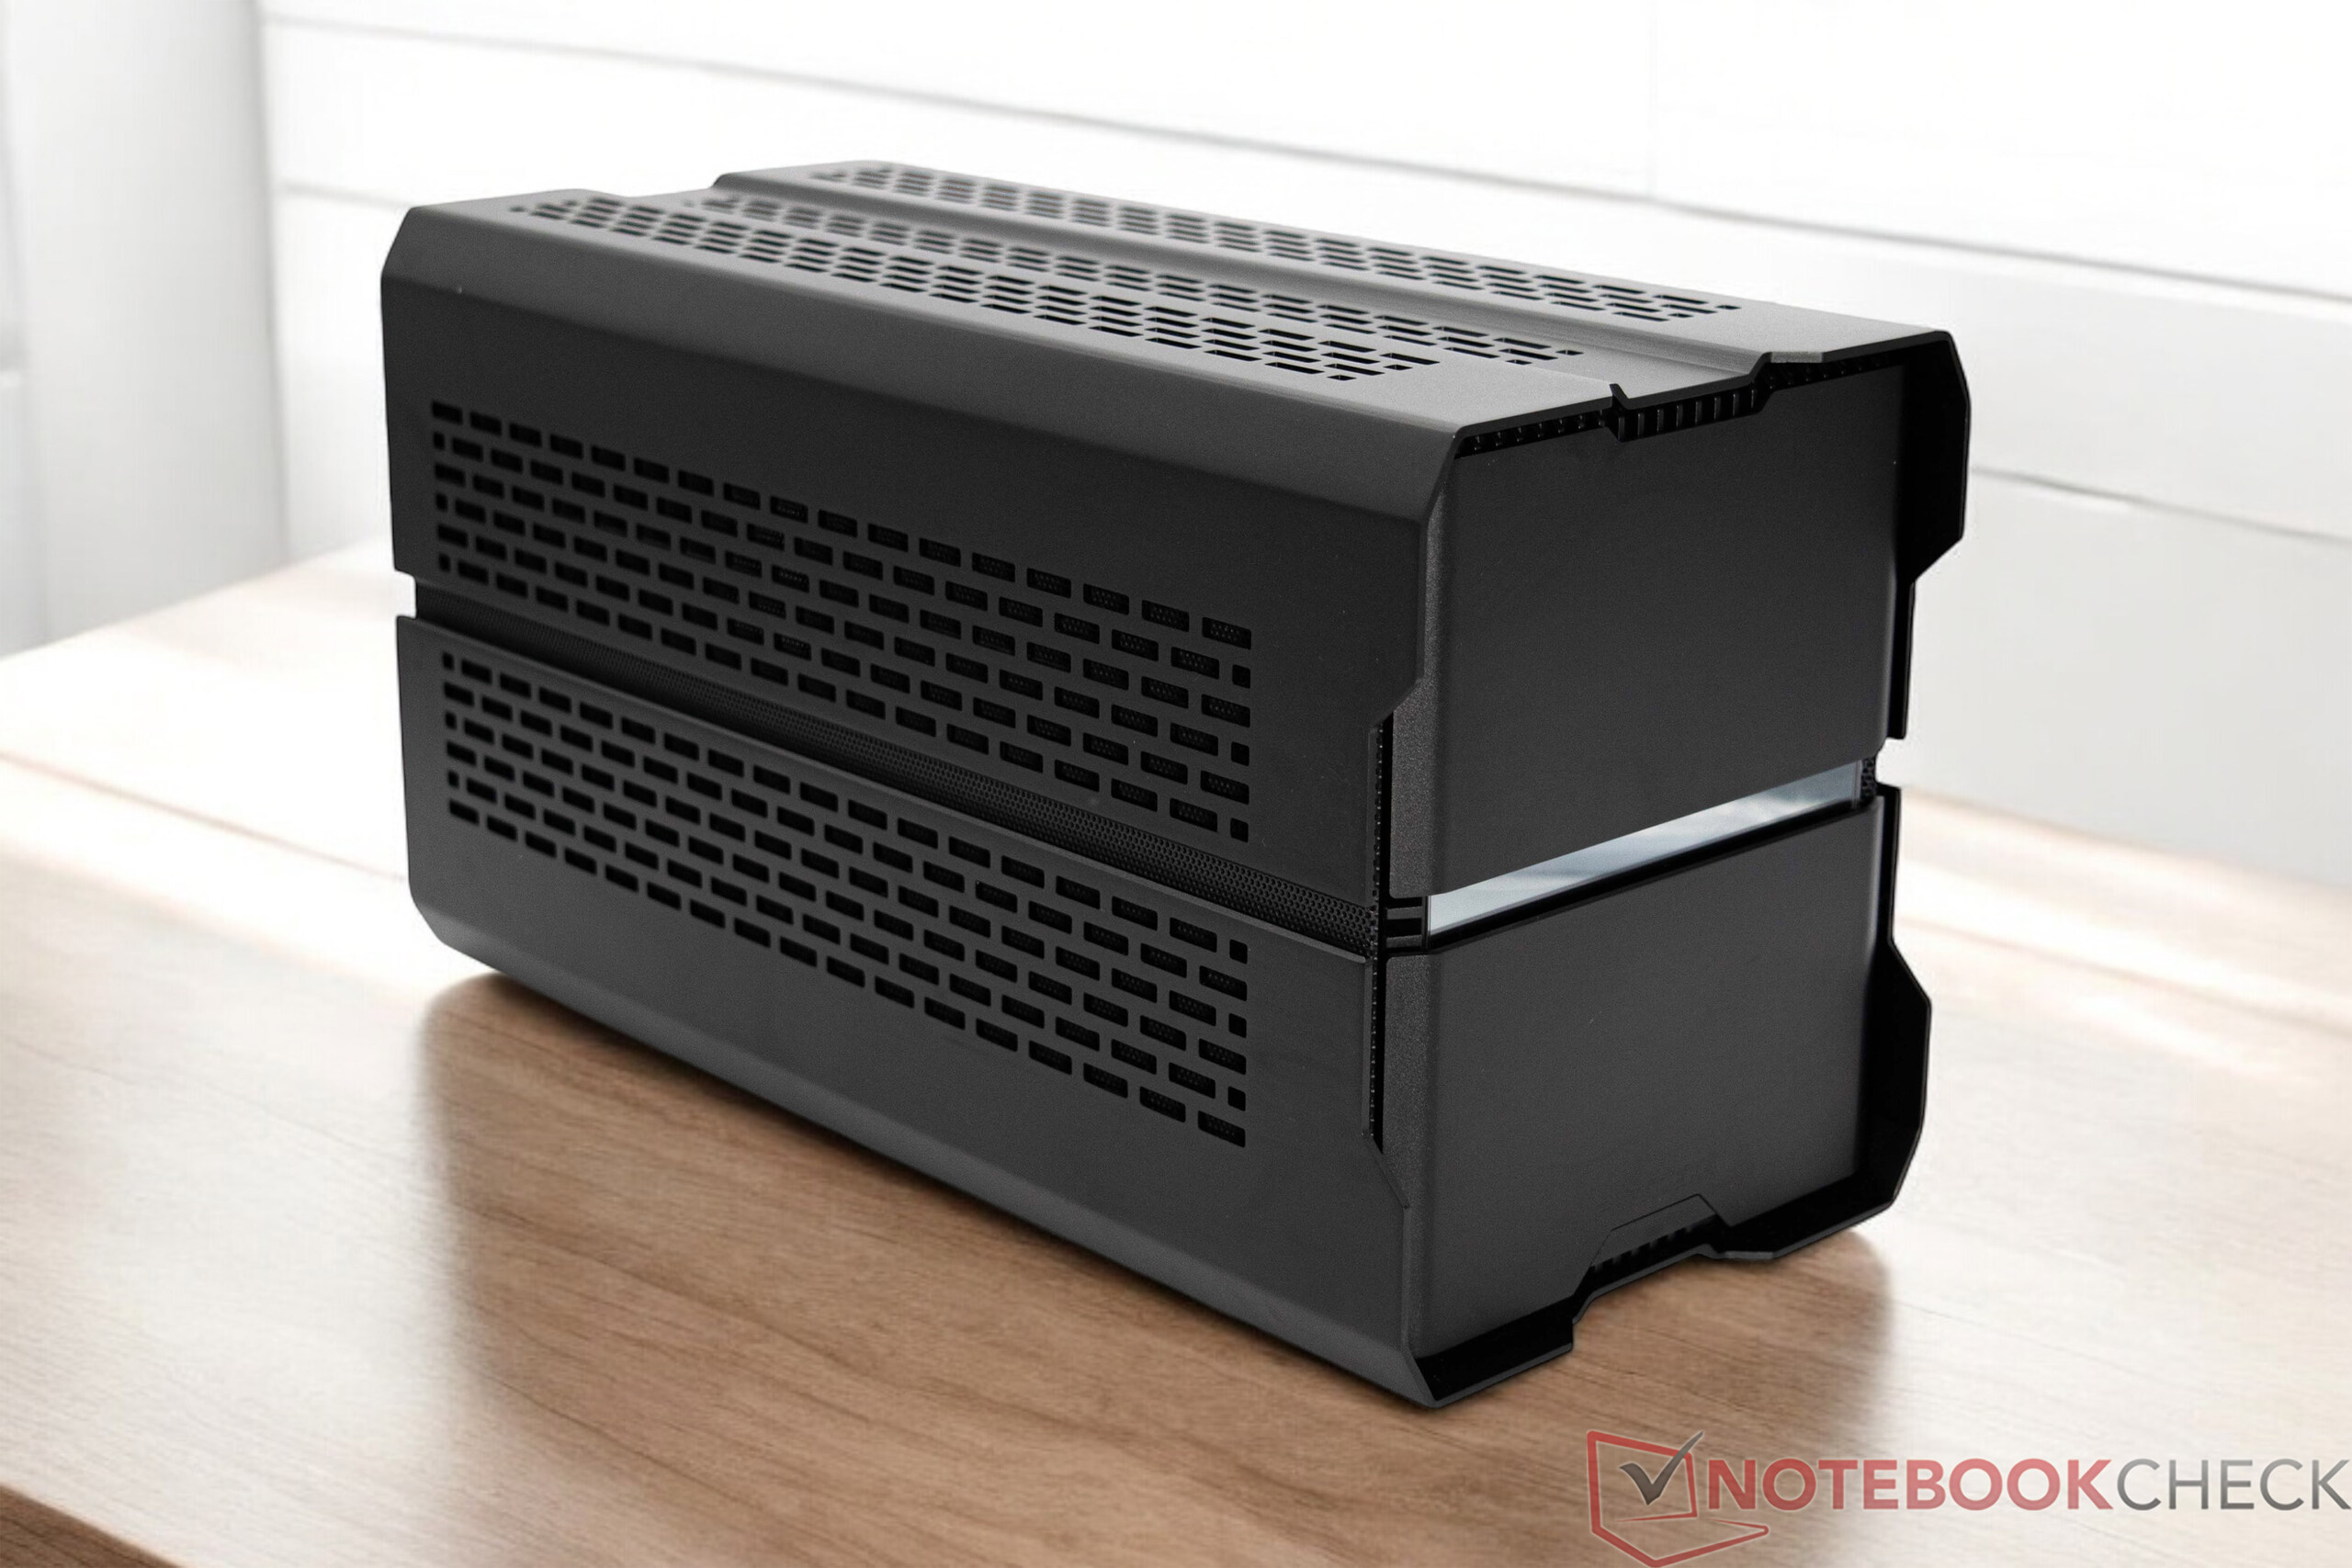
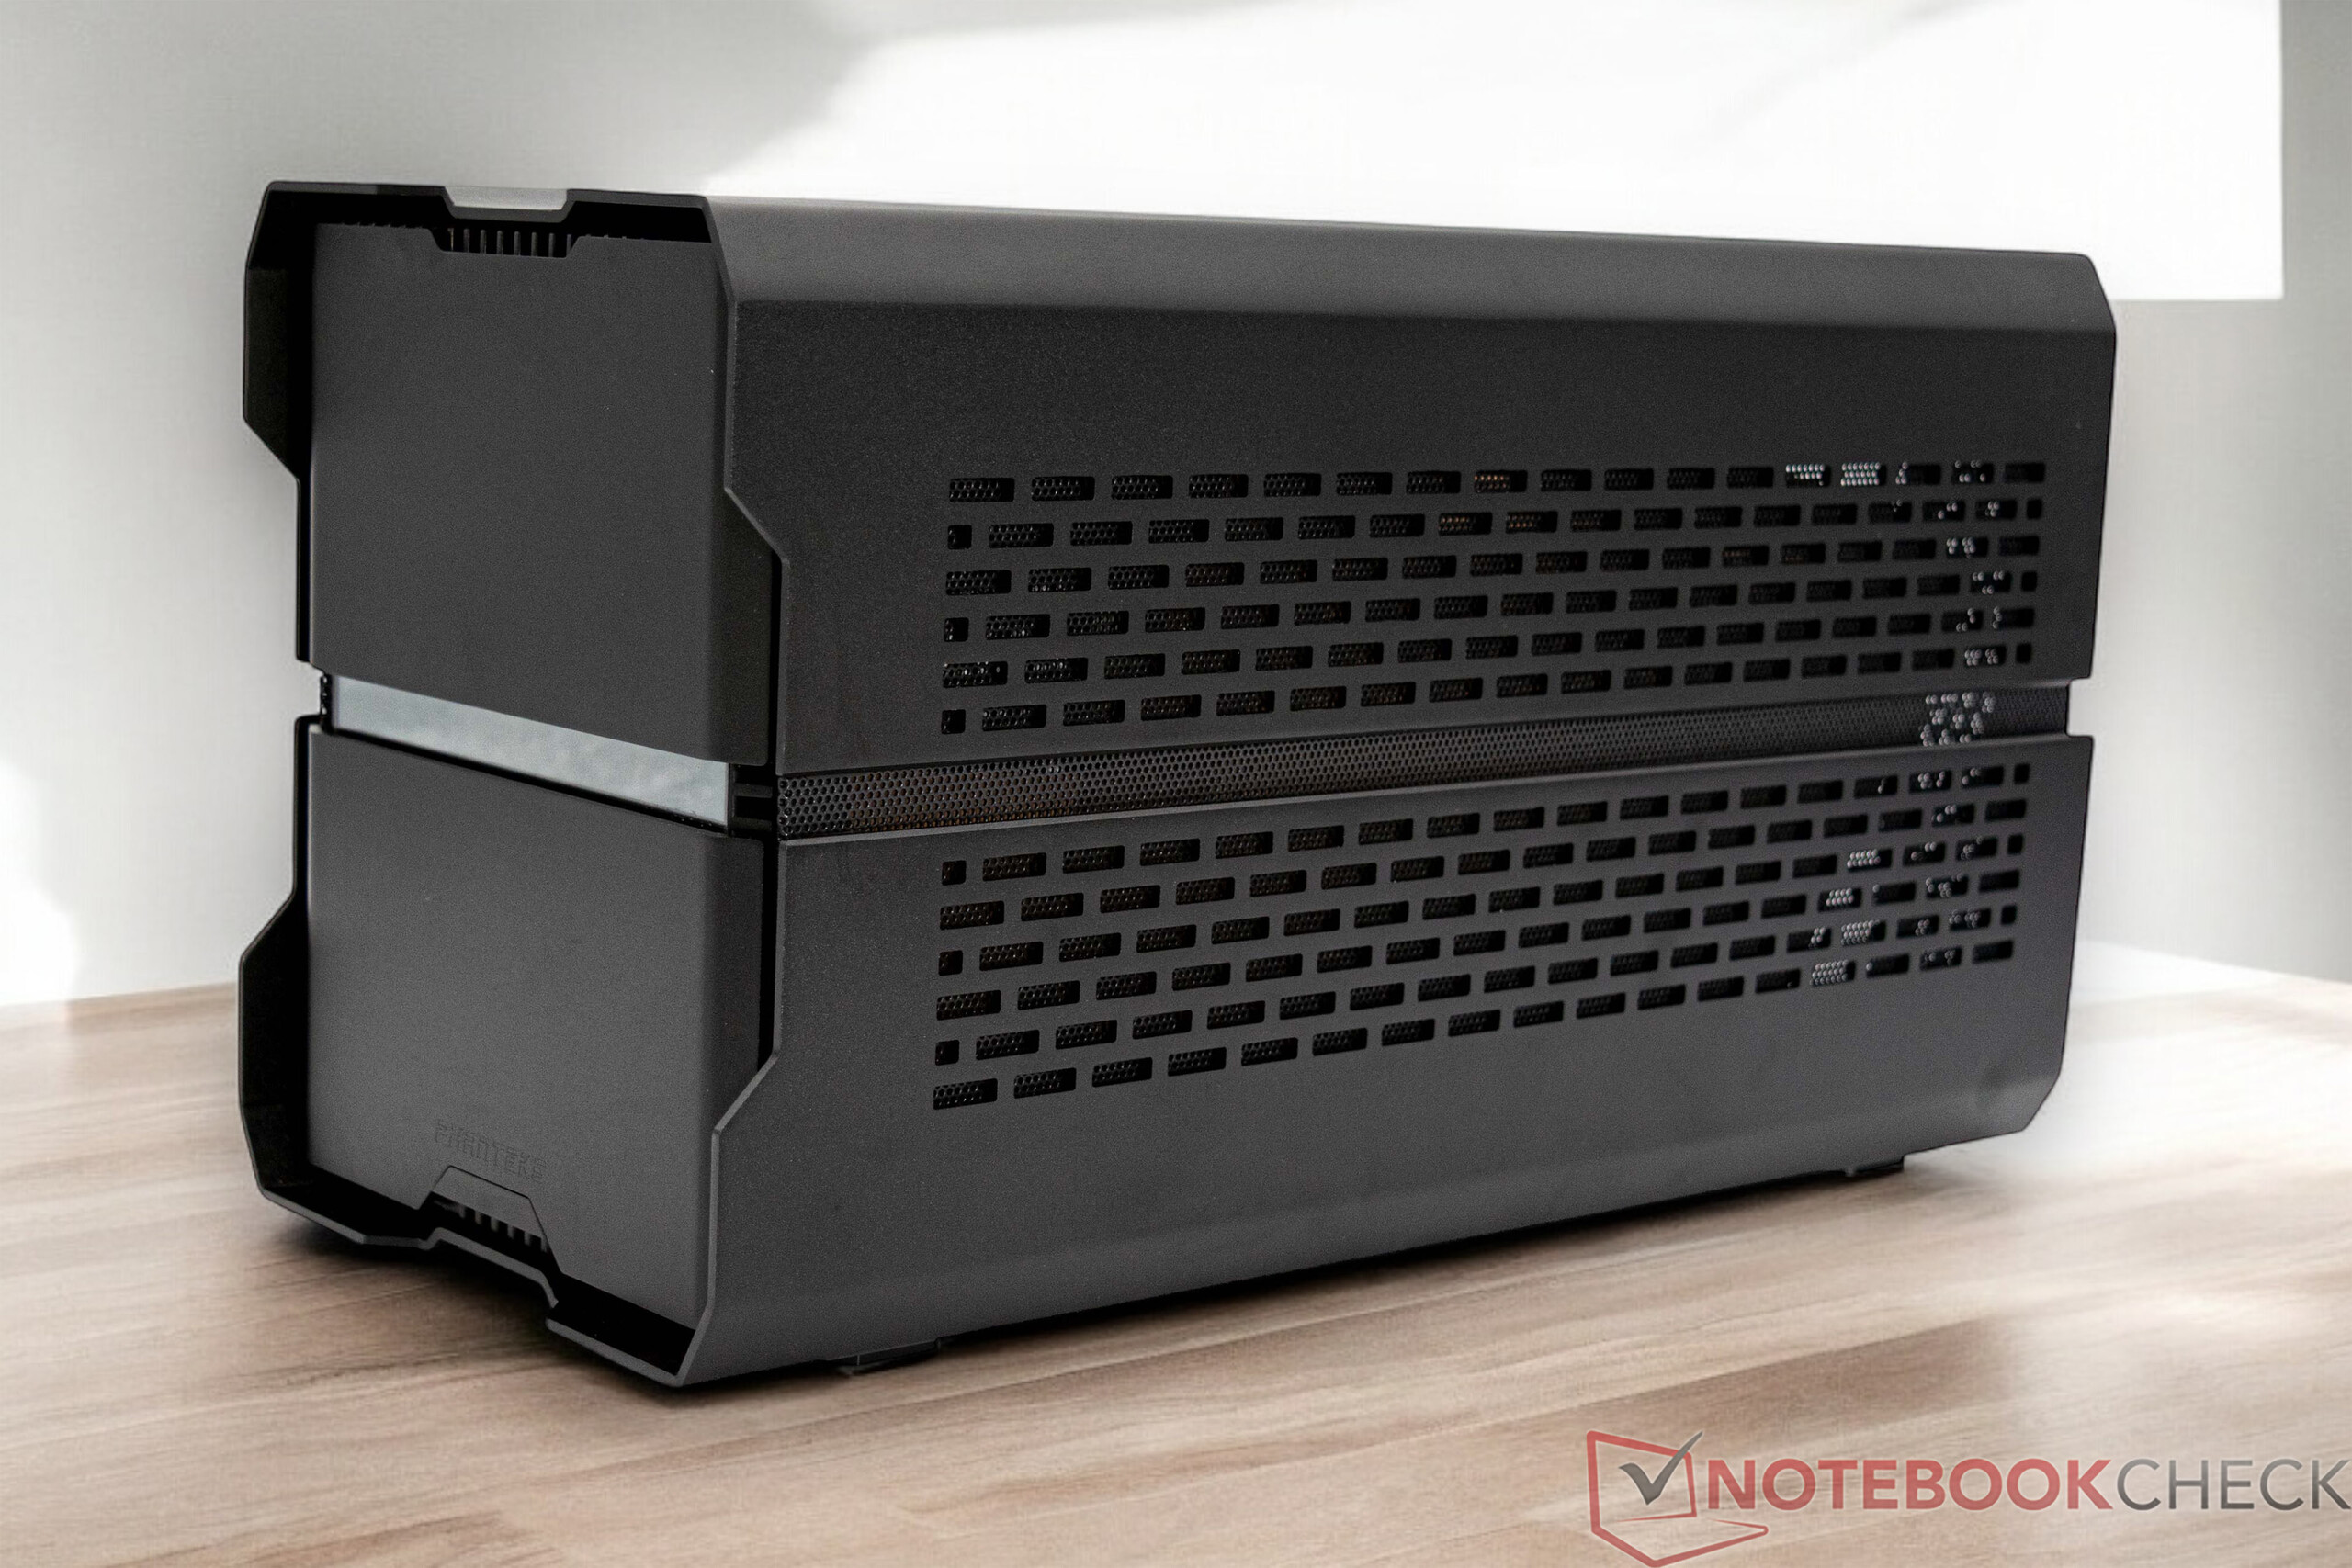
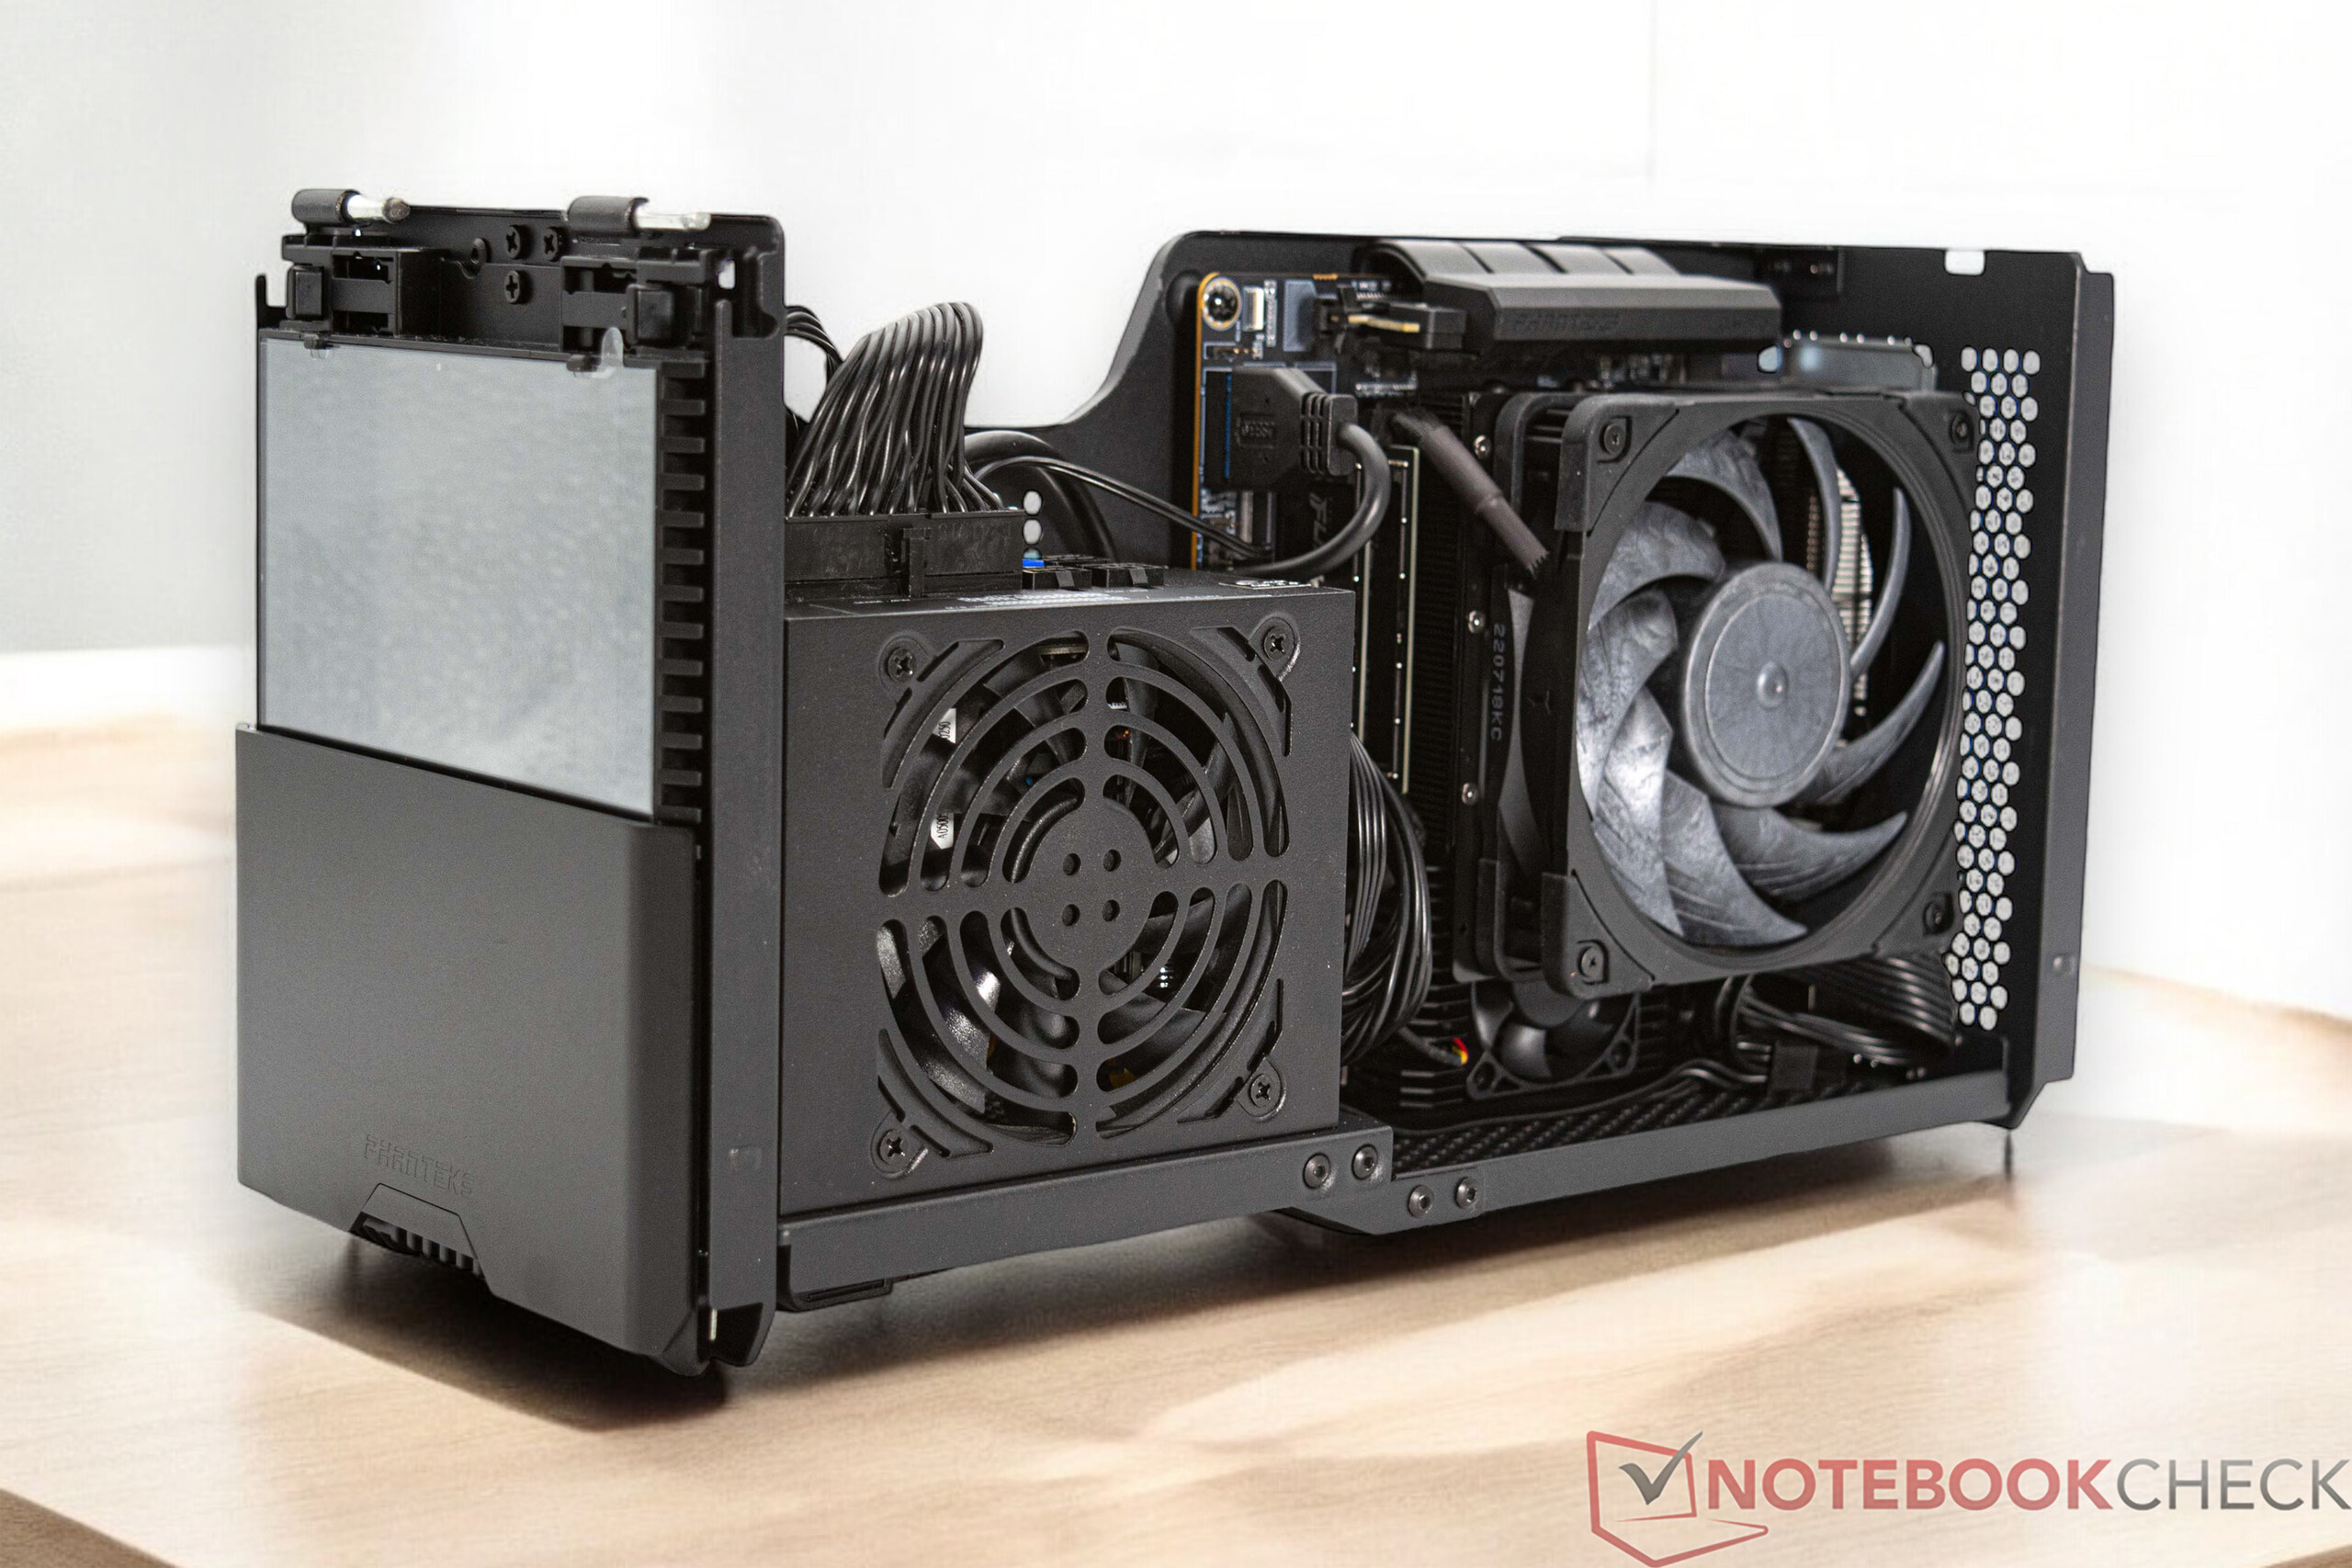
Pour assurer la meilleure comparaison possible avec le Minisforum BD770i que nous avons déjà testé, nous avons respecté exactement les mêmes conditions. Plus précisément, cela signifie que nous avons effectué tous les tests du processeur dans son état installé. Nous avons utilisé le boîtier Phanteks Enthoo Evolv Shift XT, qui offre une bonne base grâce à sa compacité.
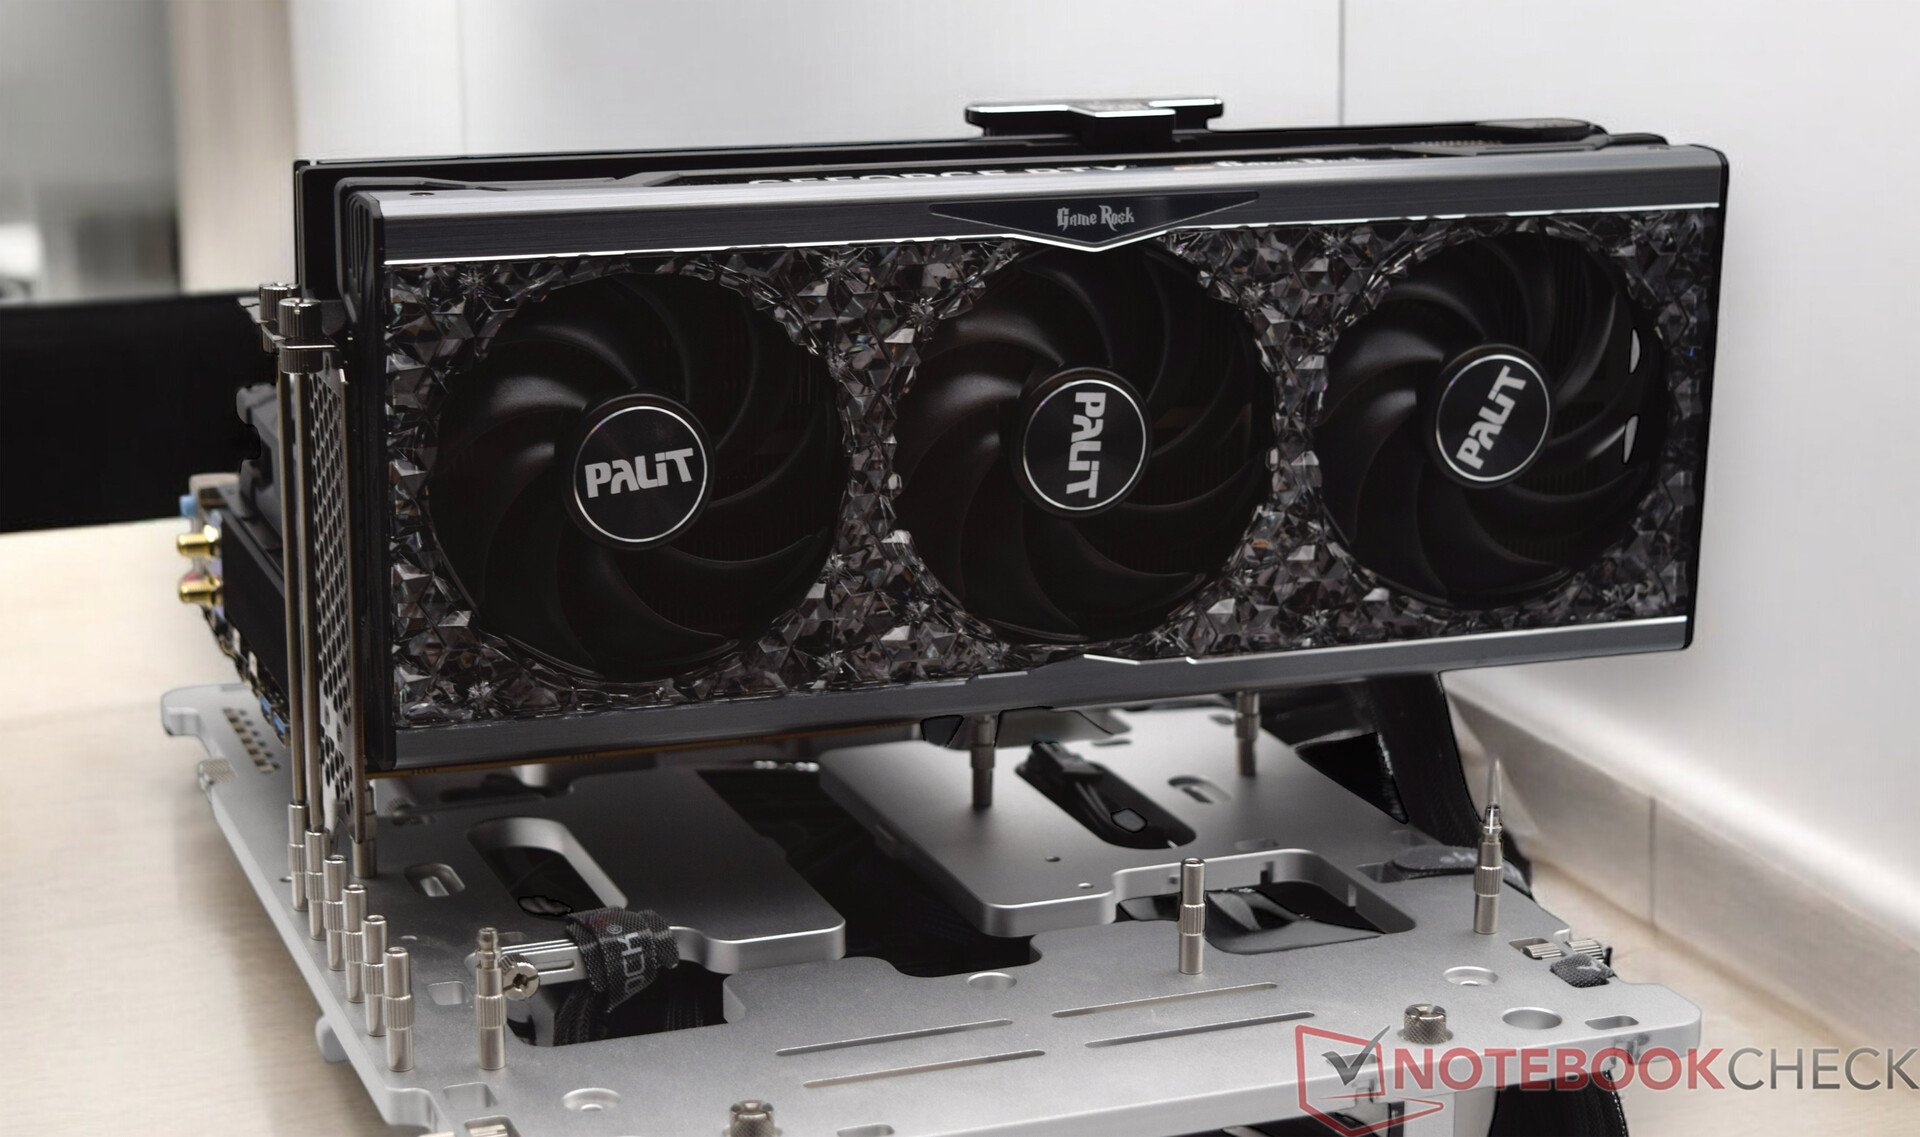
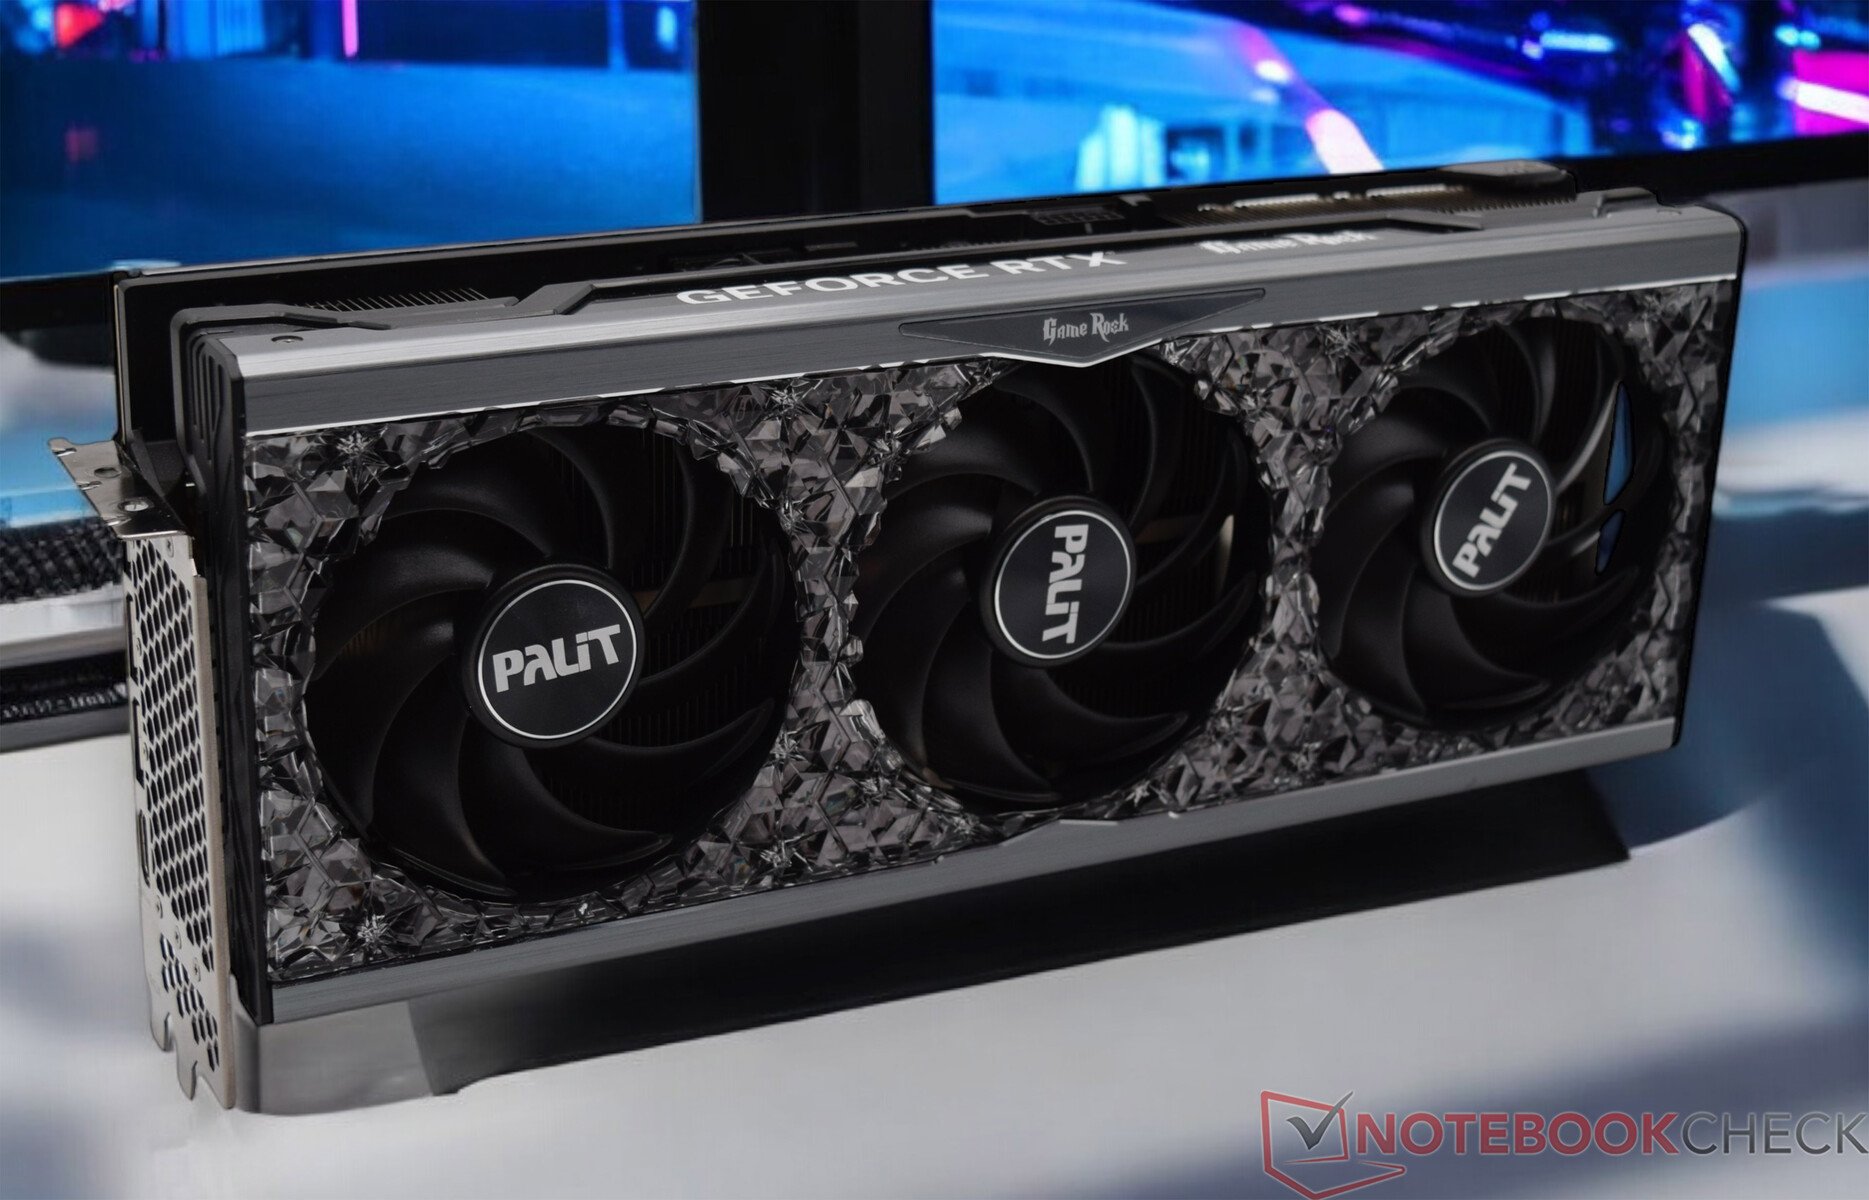
Pour notre comparaison des performances avec une carte graphique dédiée, nous avons testé le Minisforum BD790i avec les cartes suivantes Palit GeForce RTX 4090 GameRock OC dans une configuration ouverte. En raison de la taille de la carte graphique, il n'a pas été possible de l'installer dans le Phanteks Enthoo Evolv Shift XT. Les cartes graphiques qui ne dépassent pas une longueur de 32,4 centimètres peuvent être installées dans le Phanteks Enthoo Evolv Shift XT.
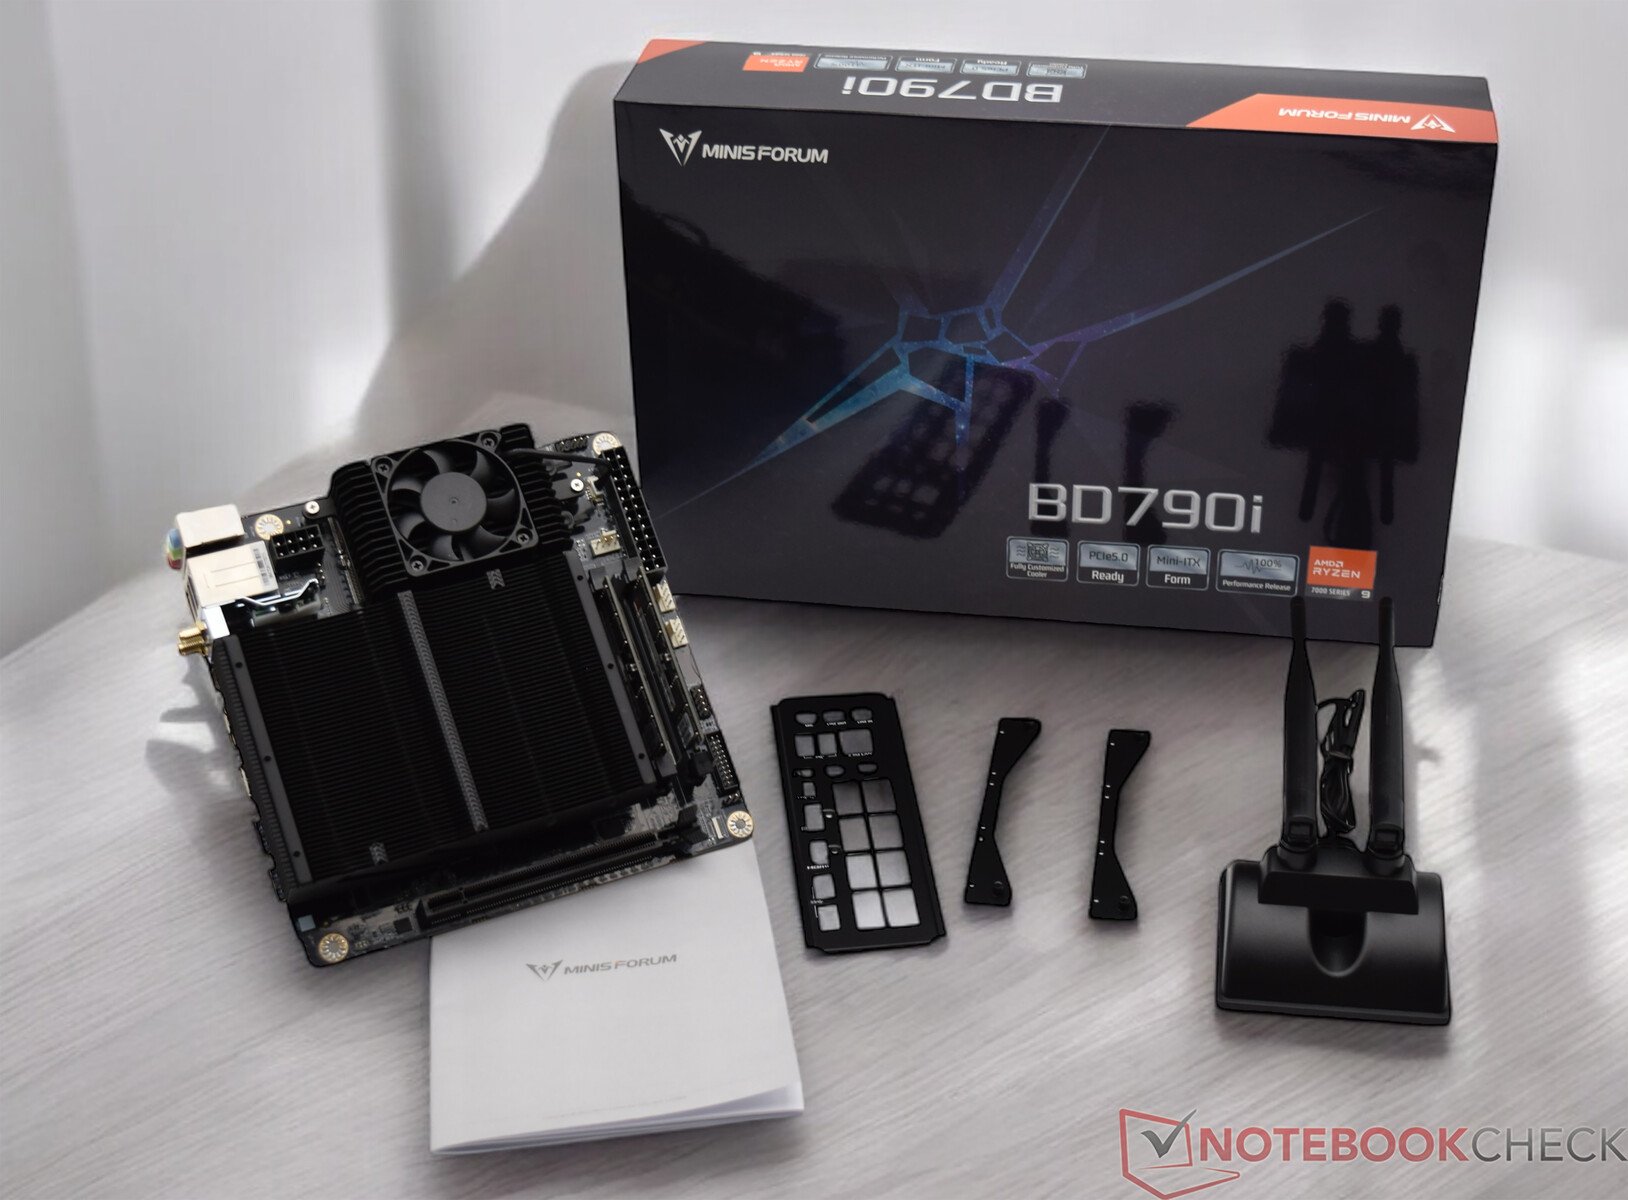
Portée de la livraison et connectivité
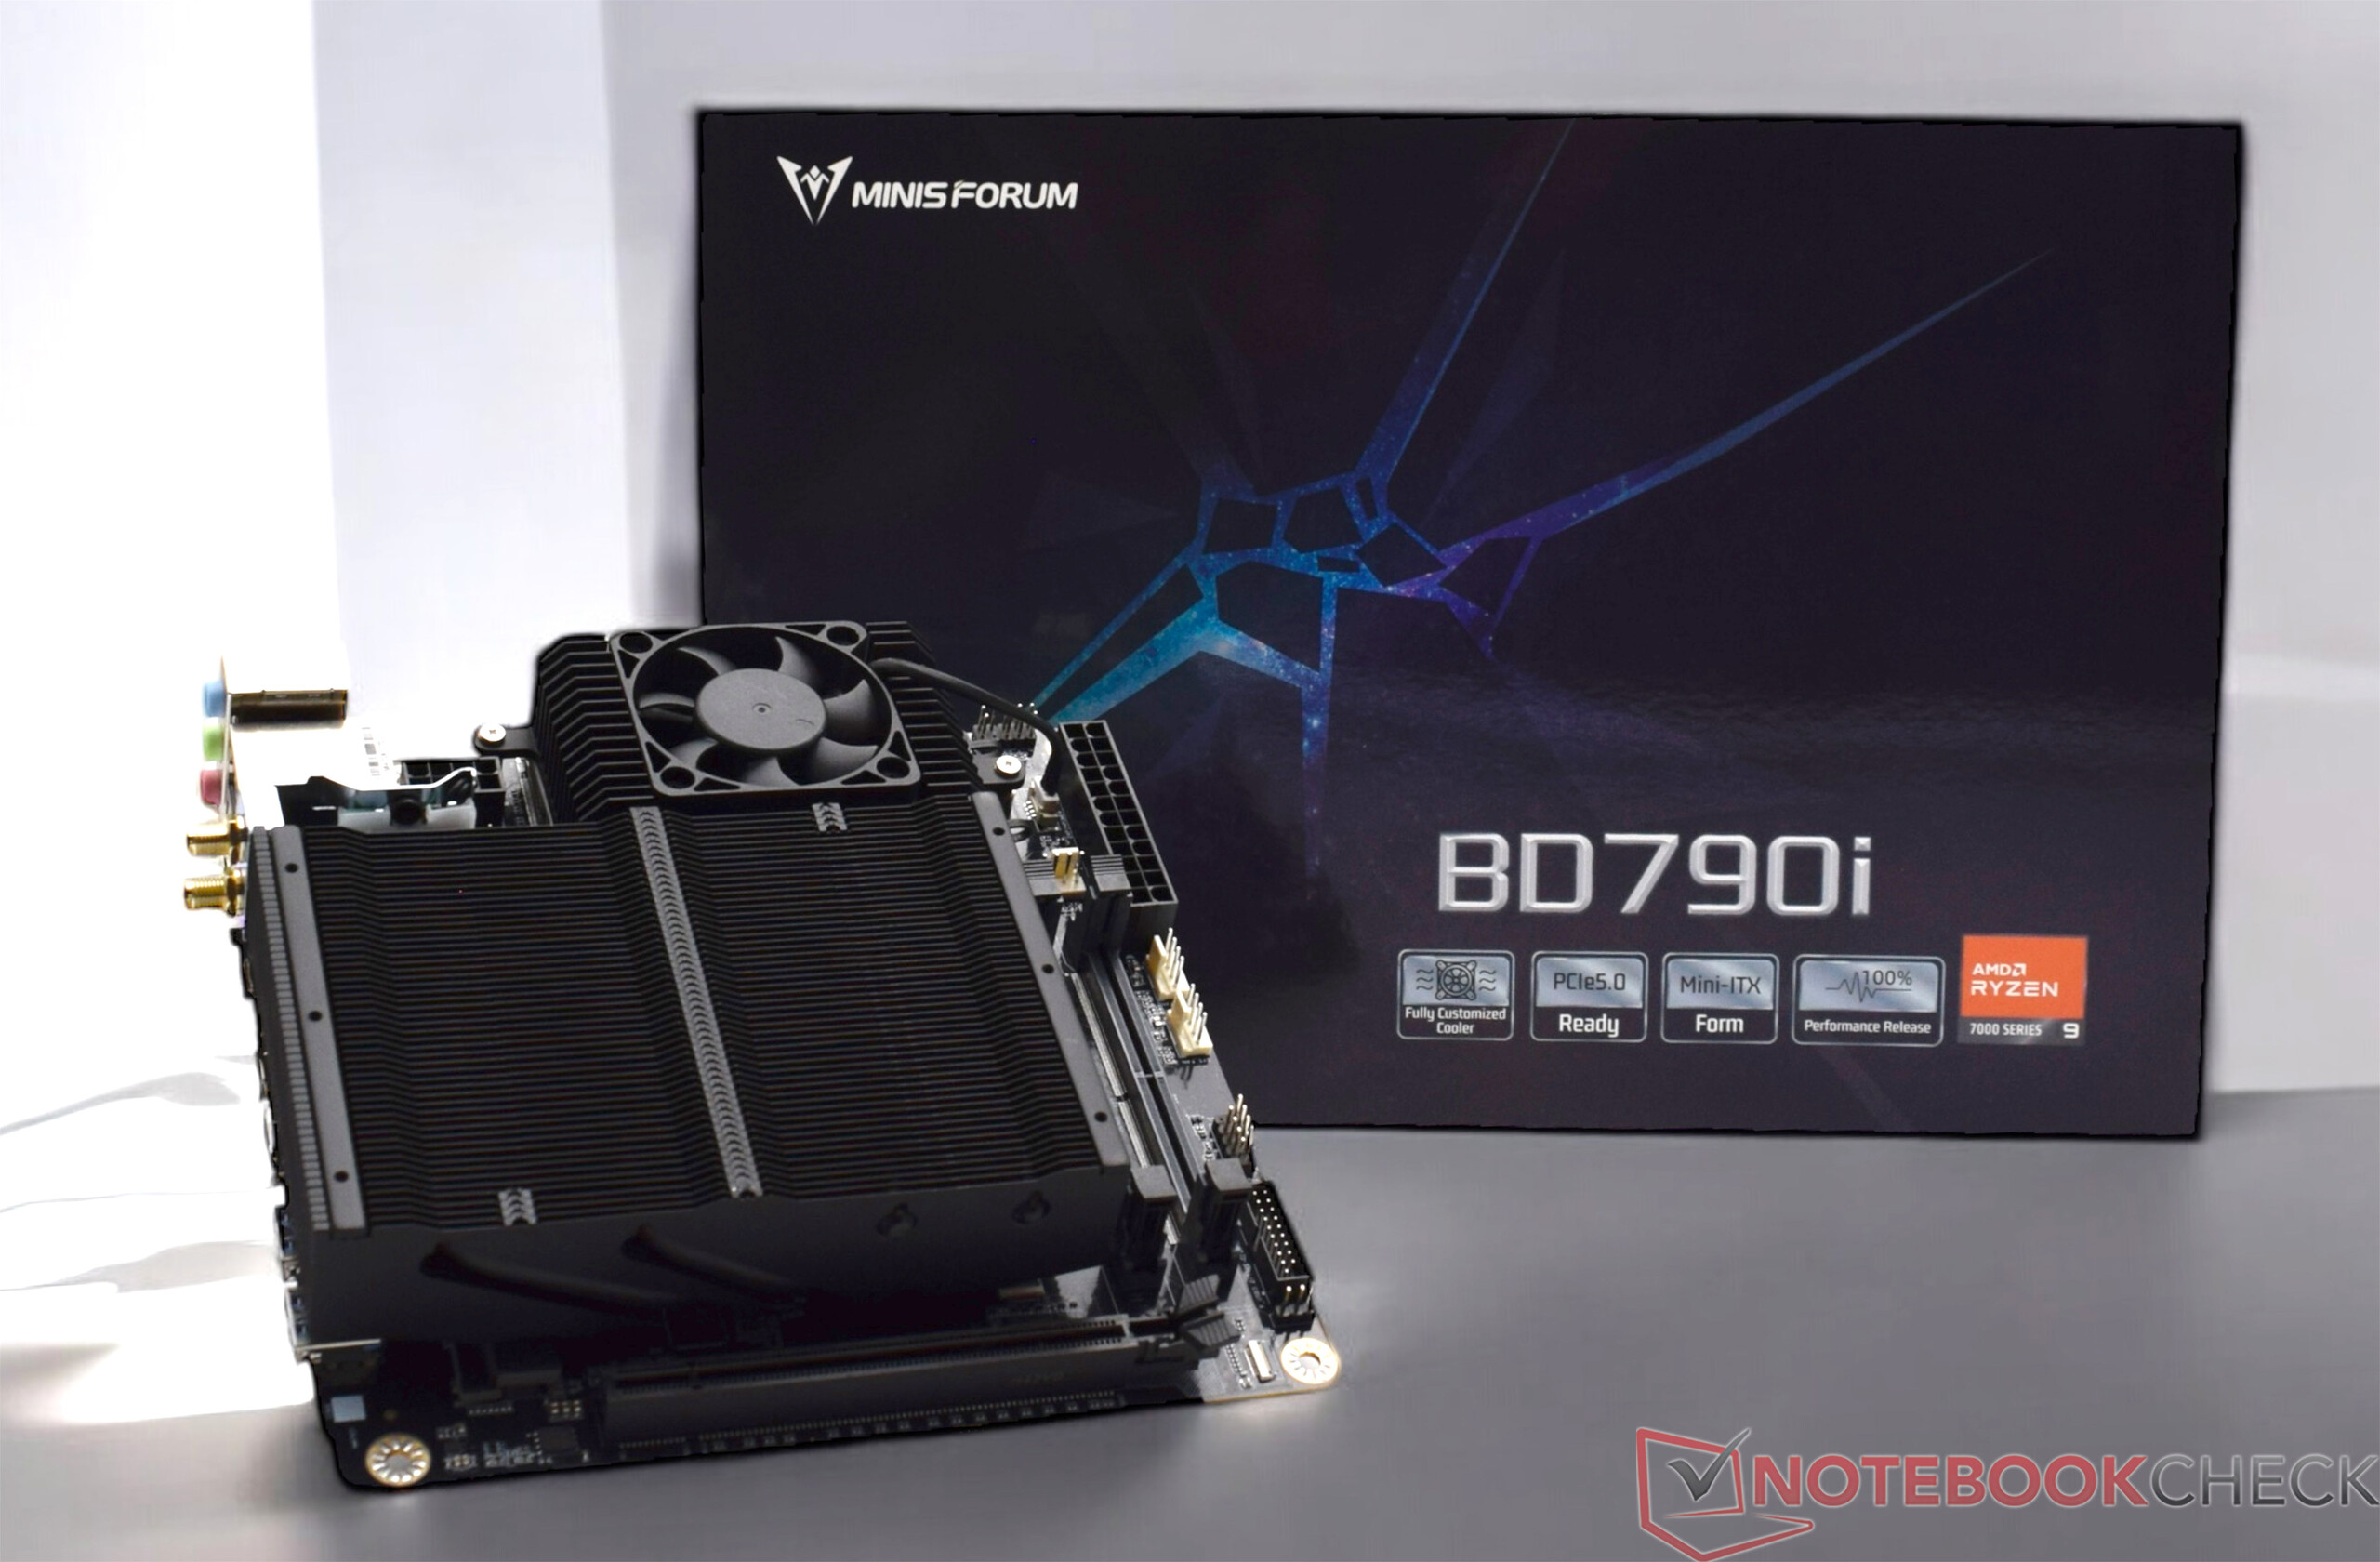
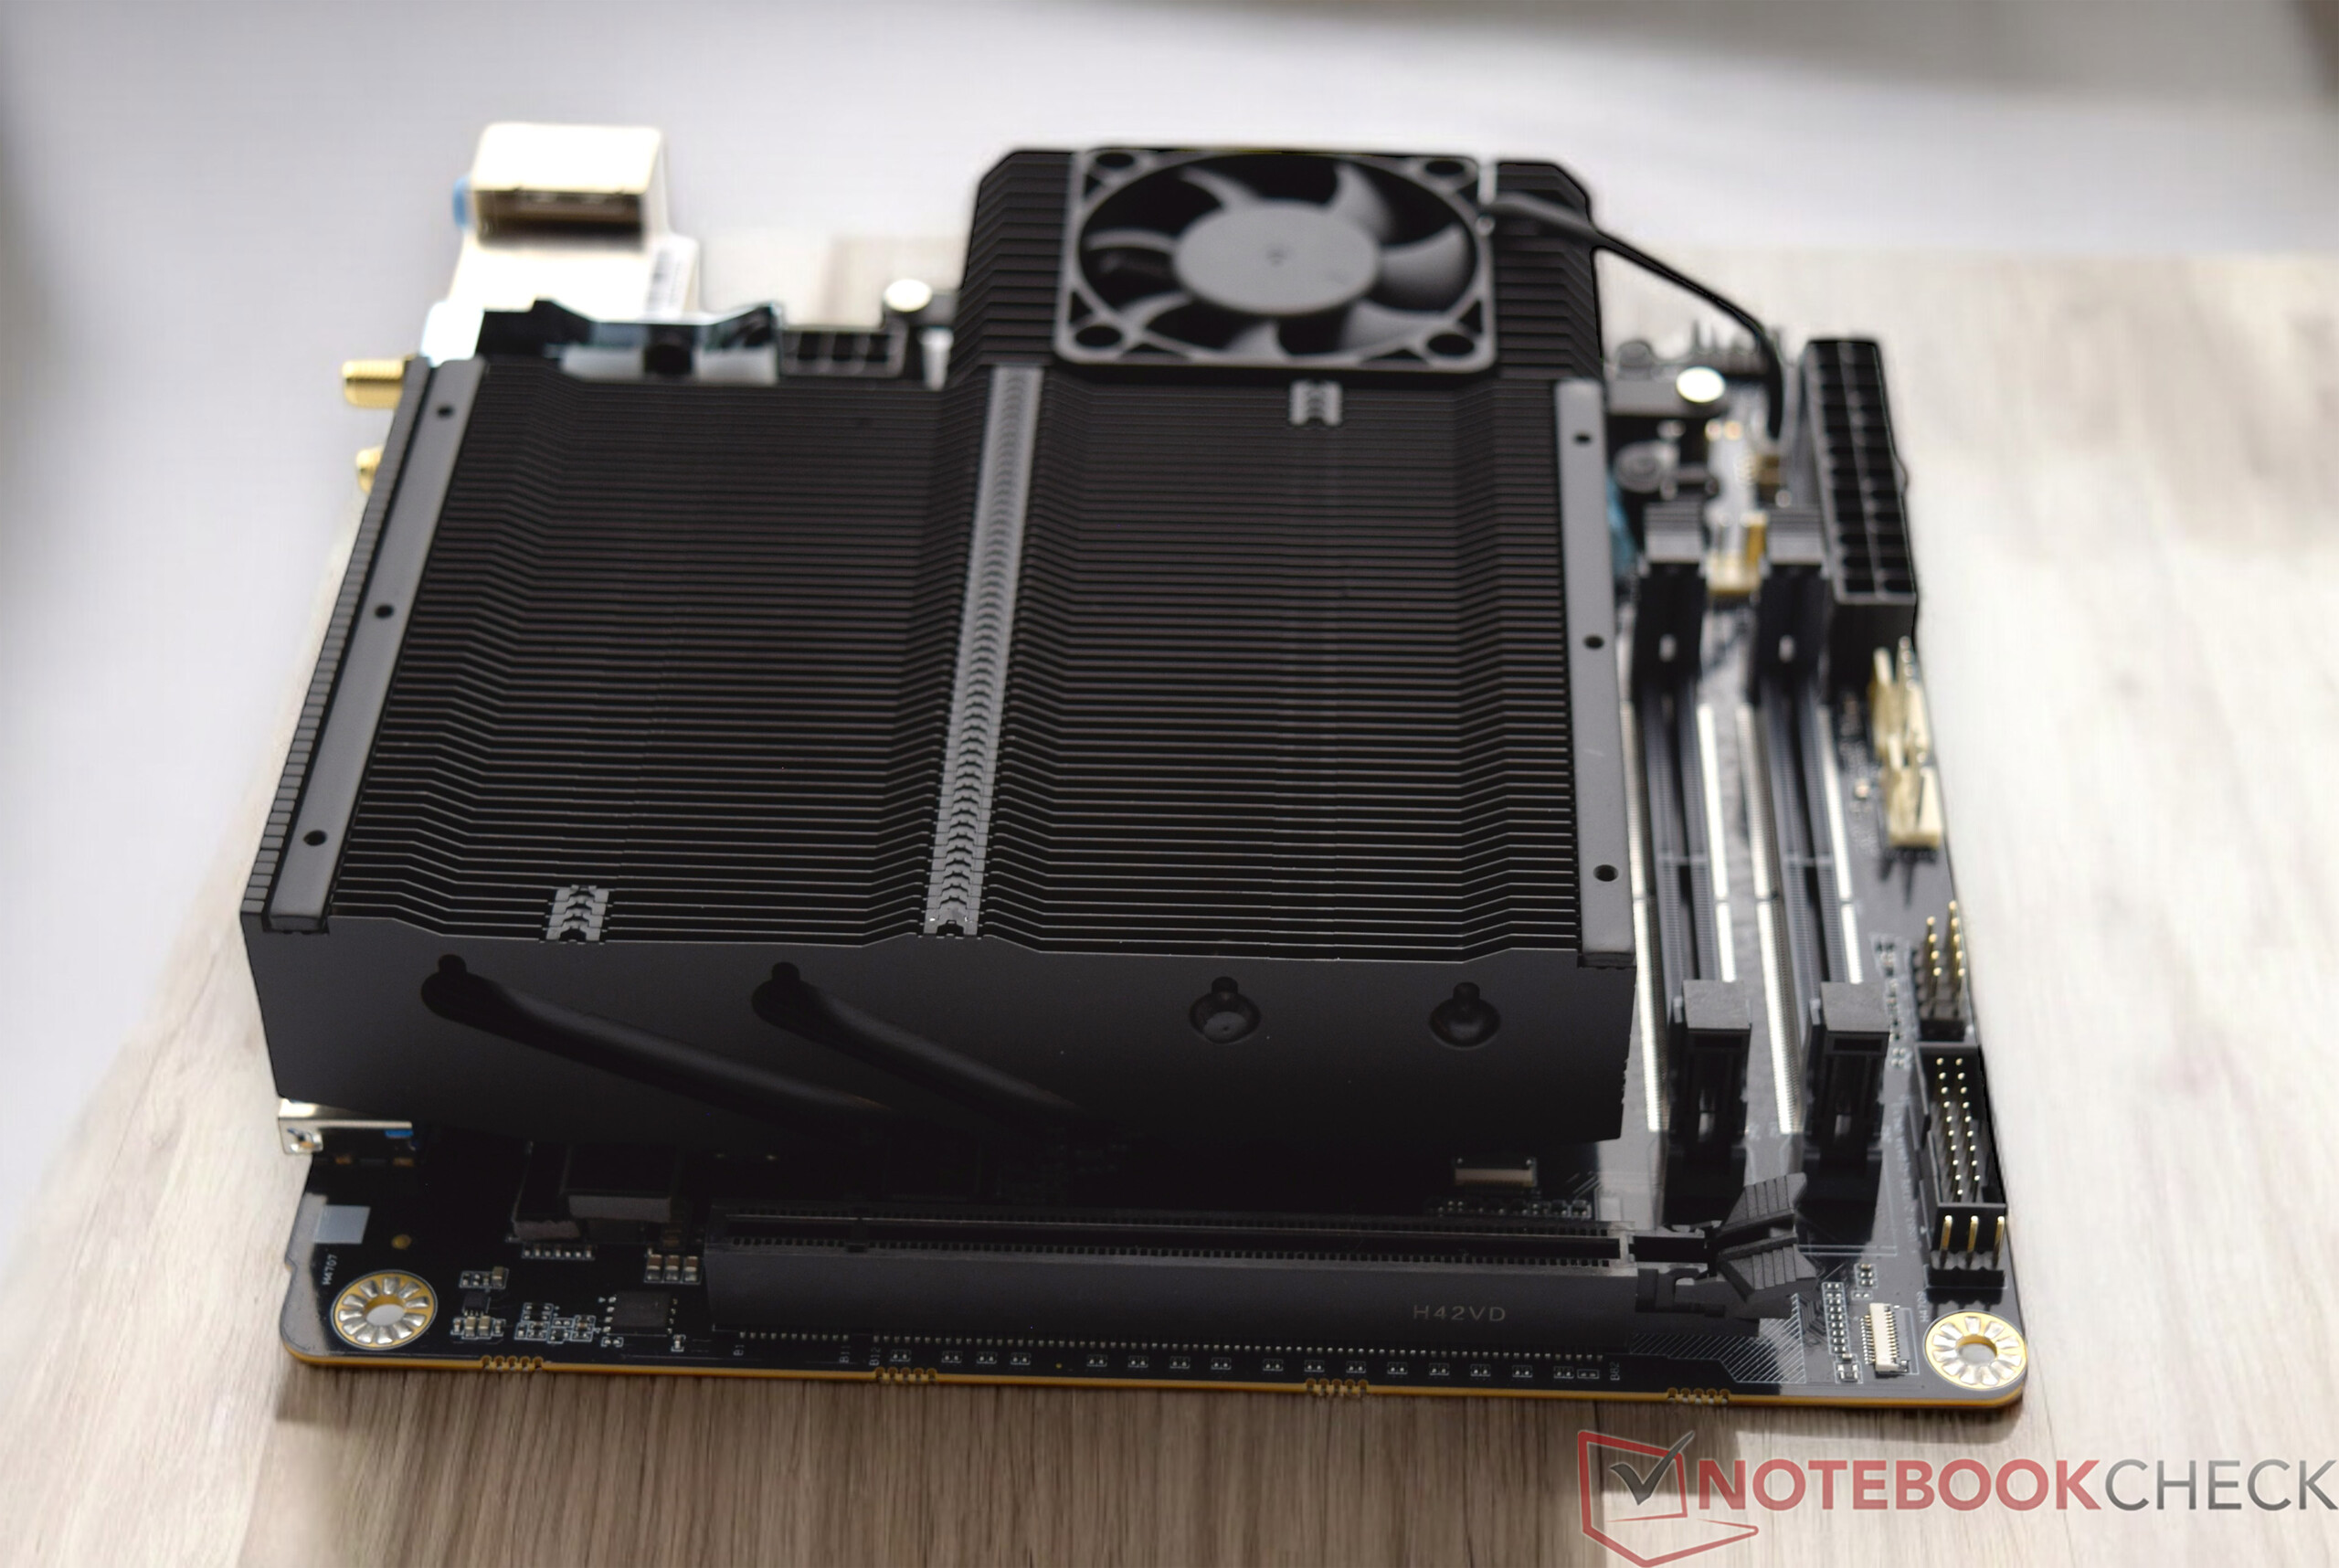
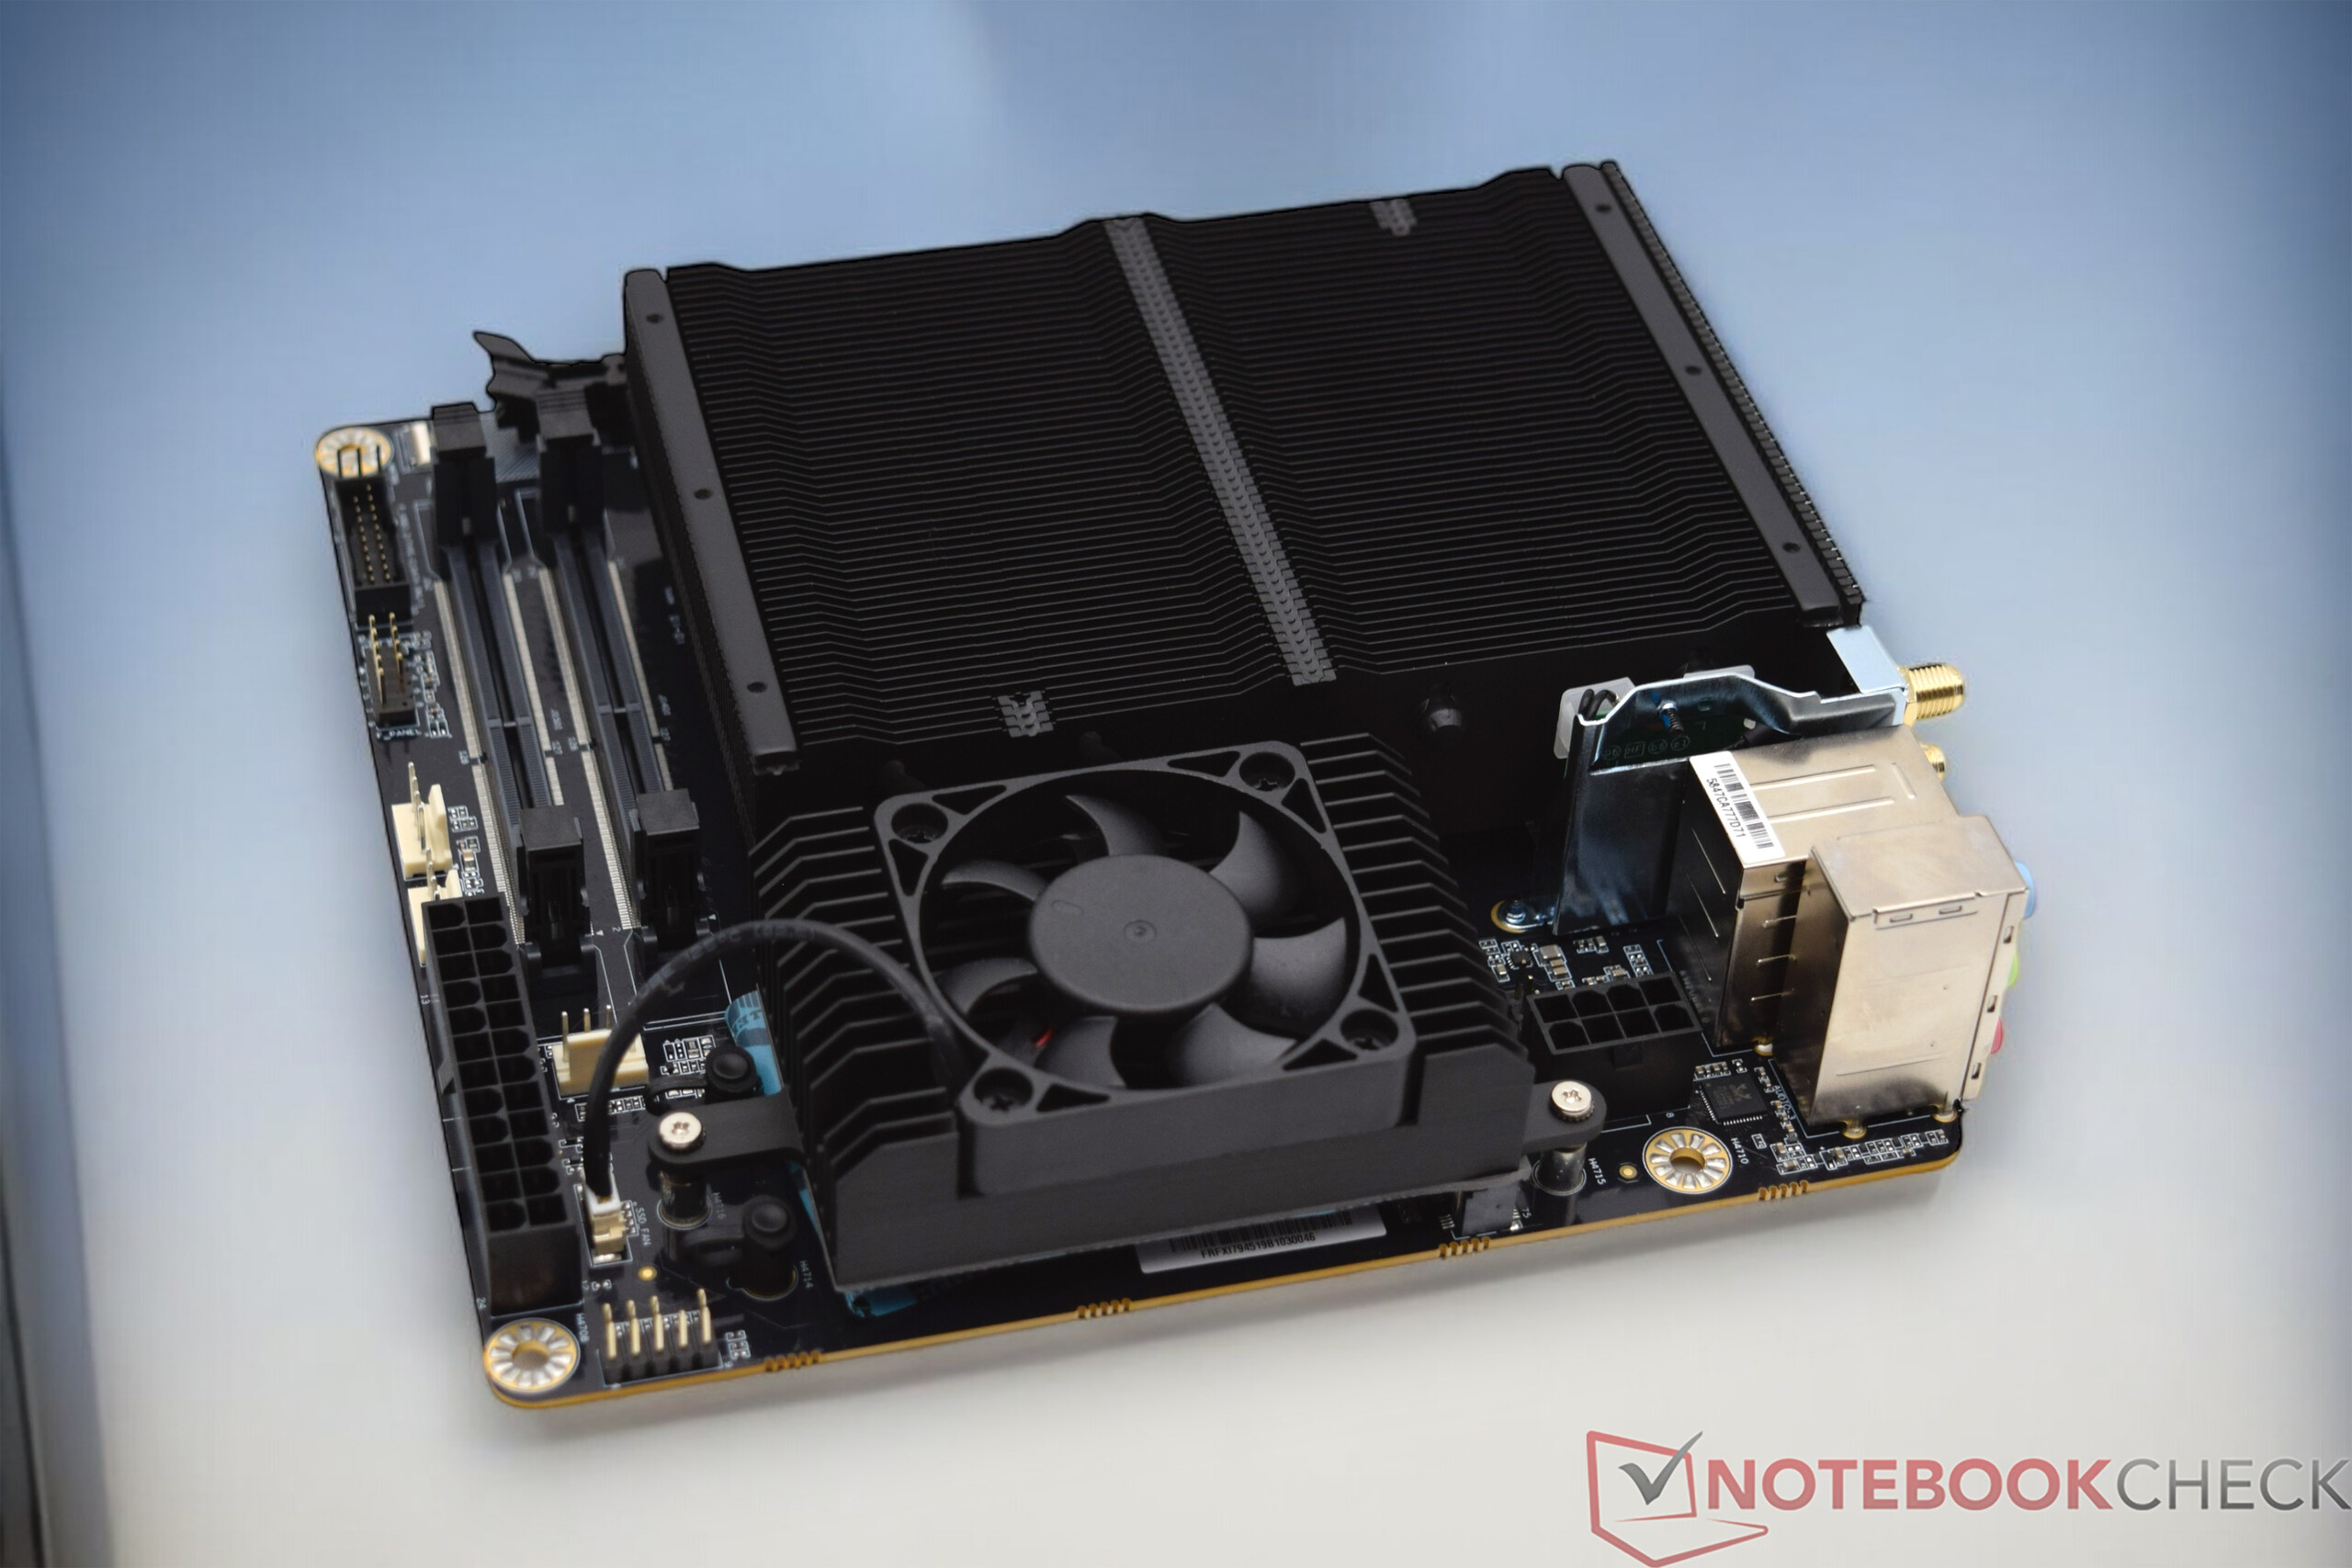
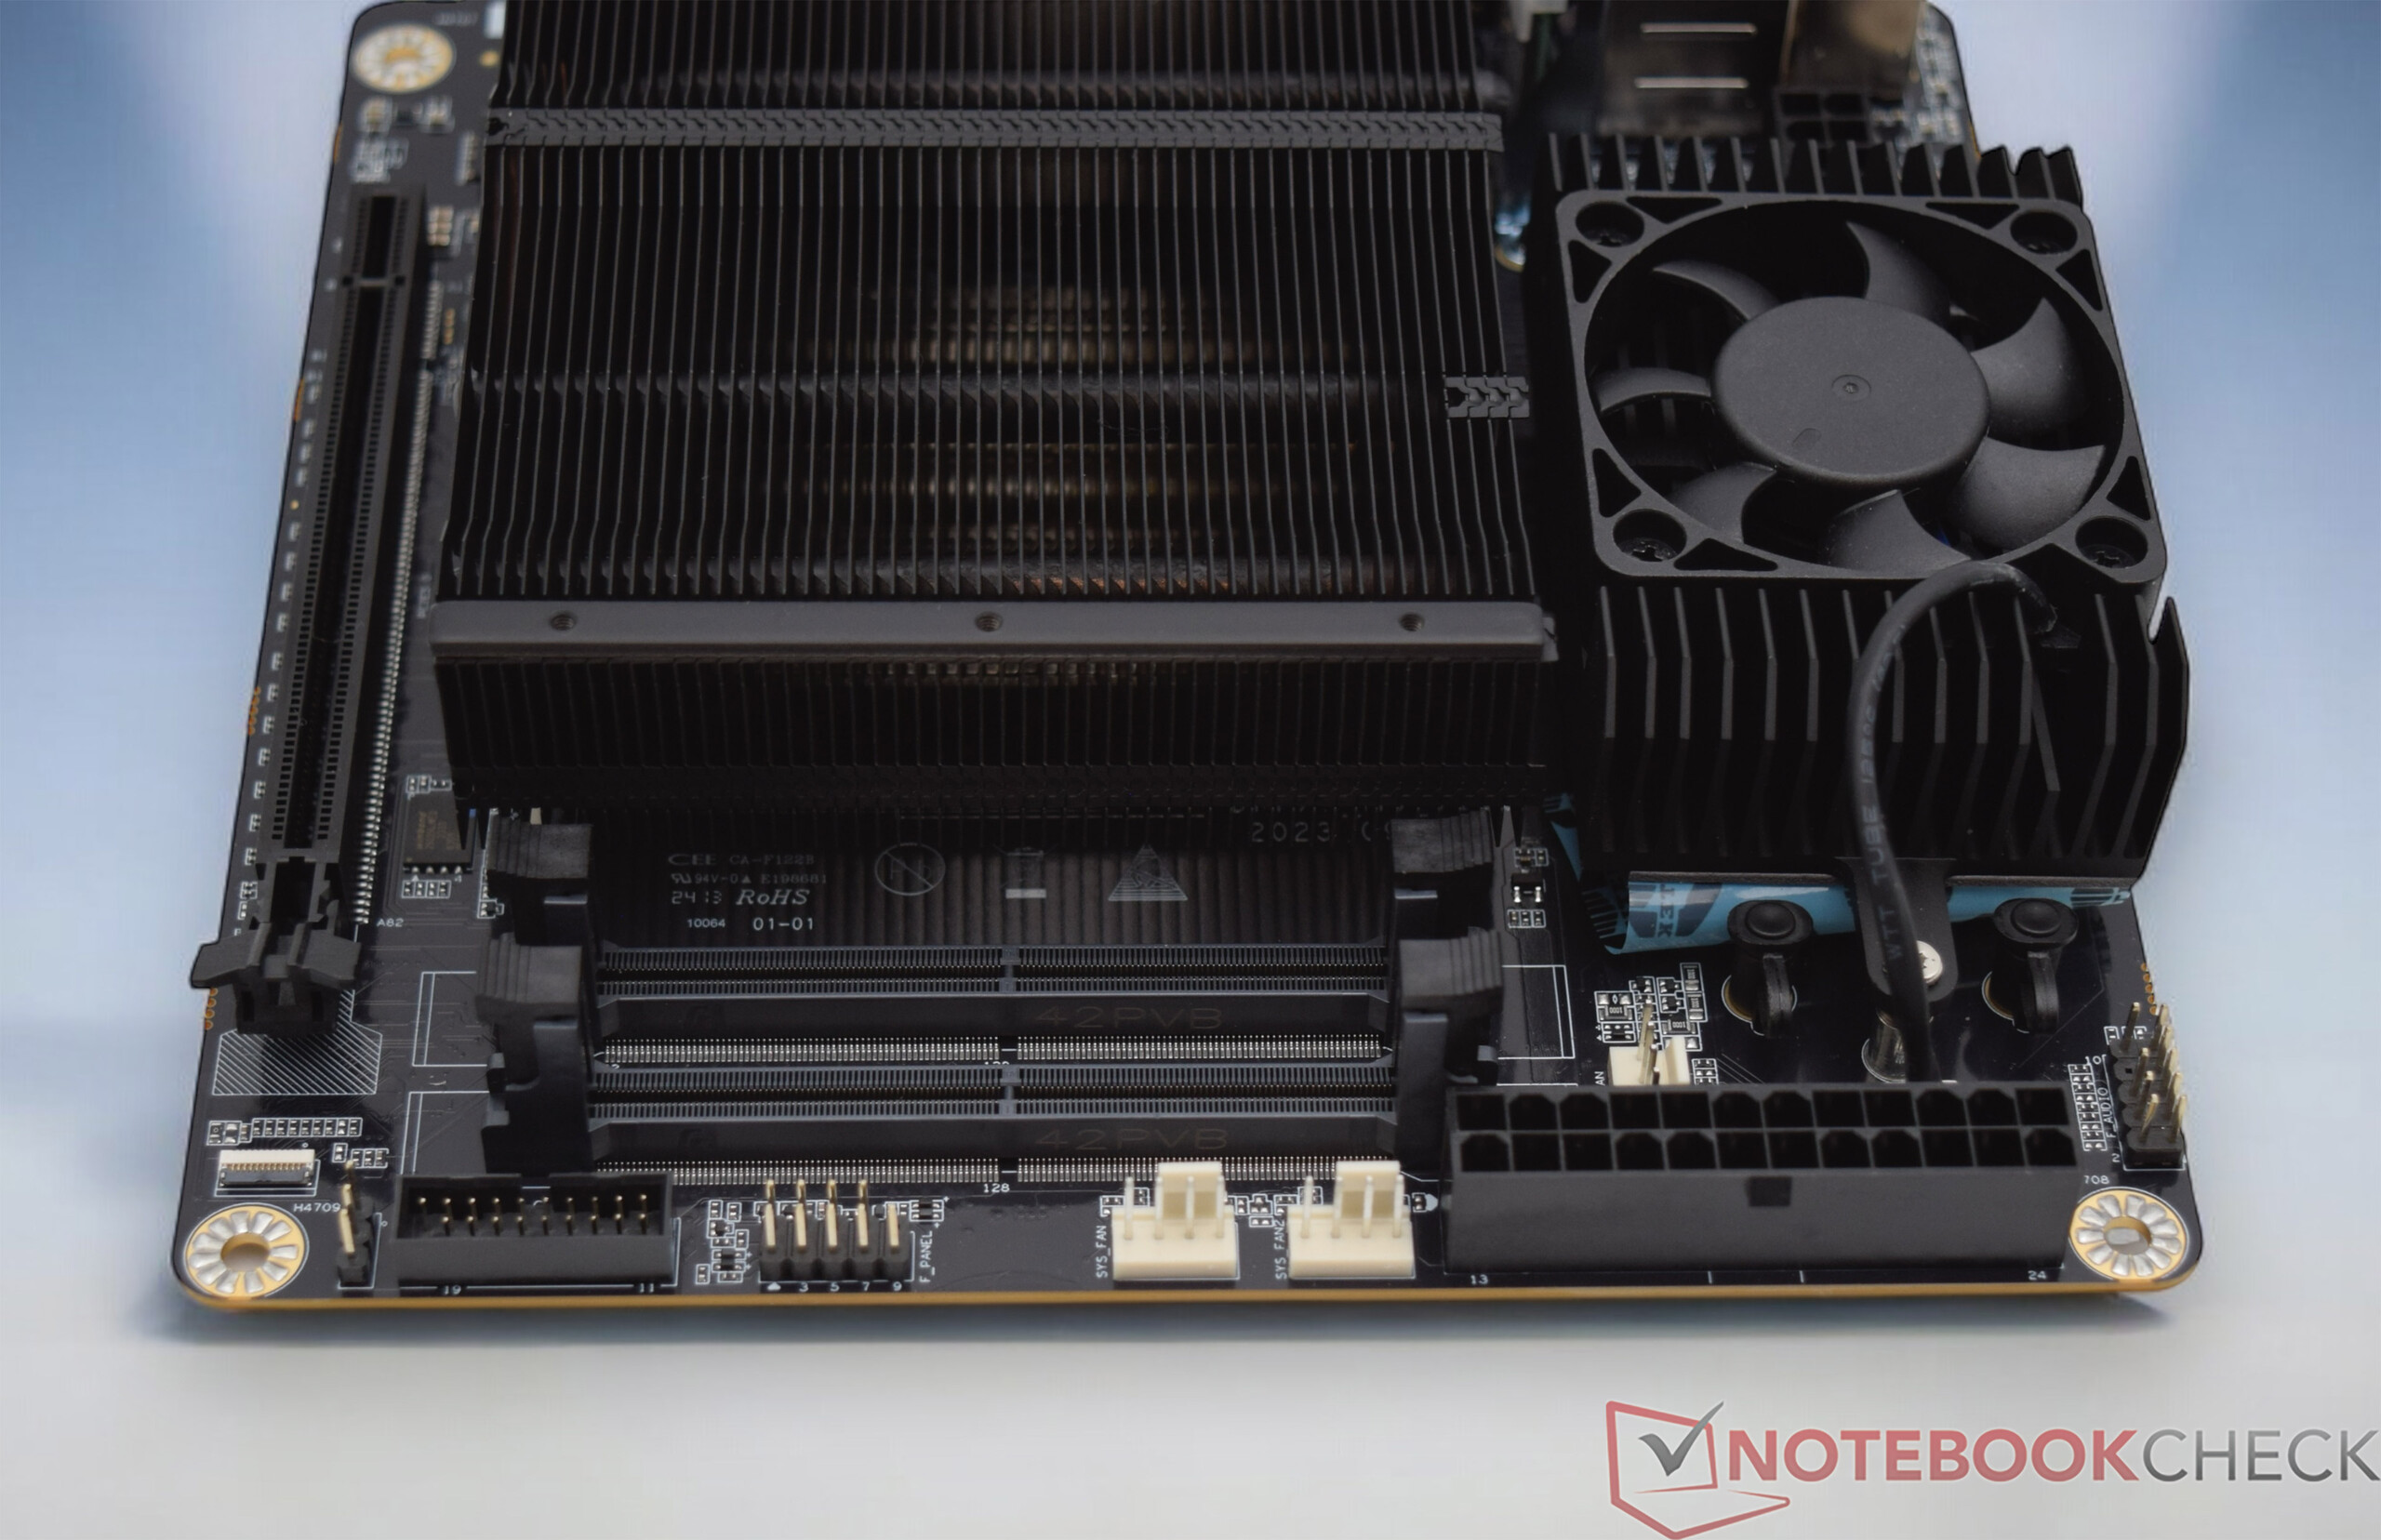
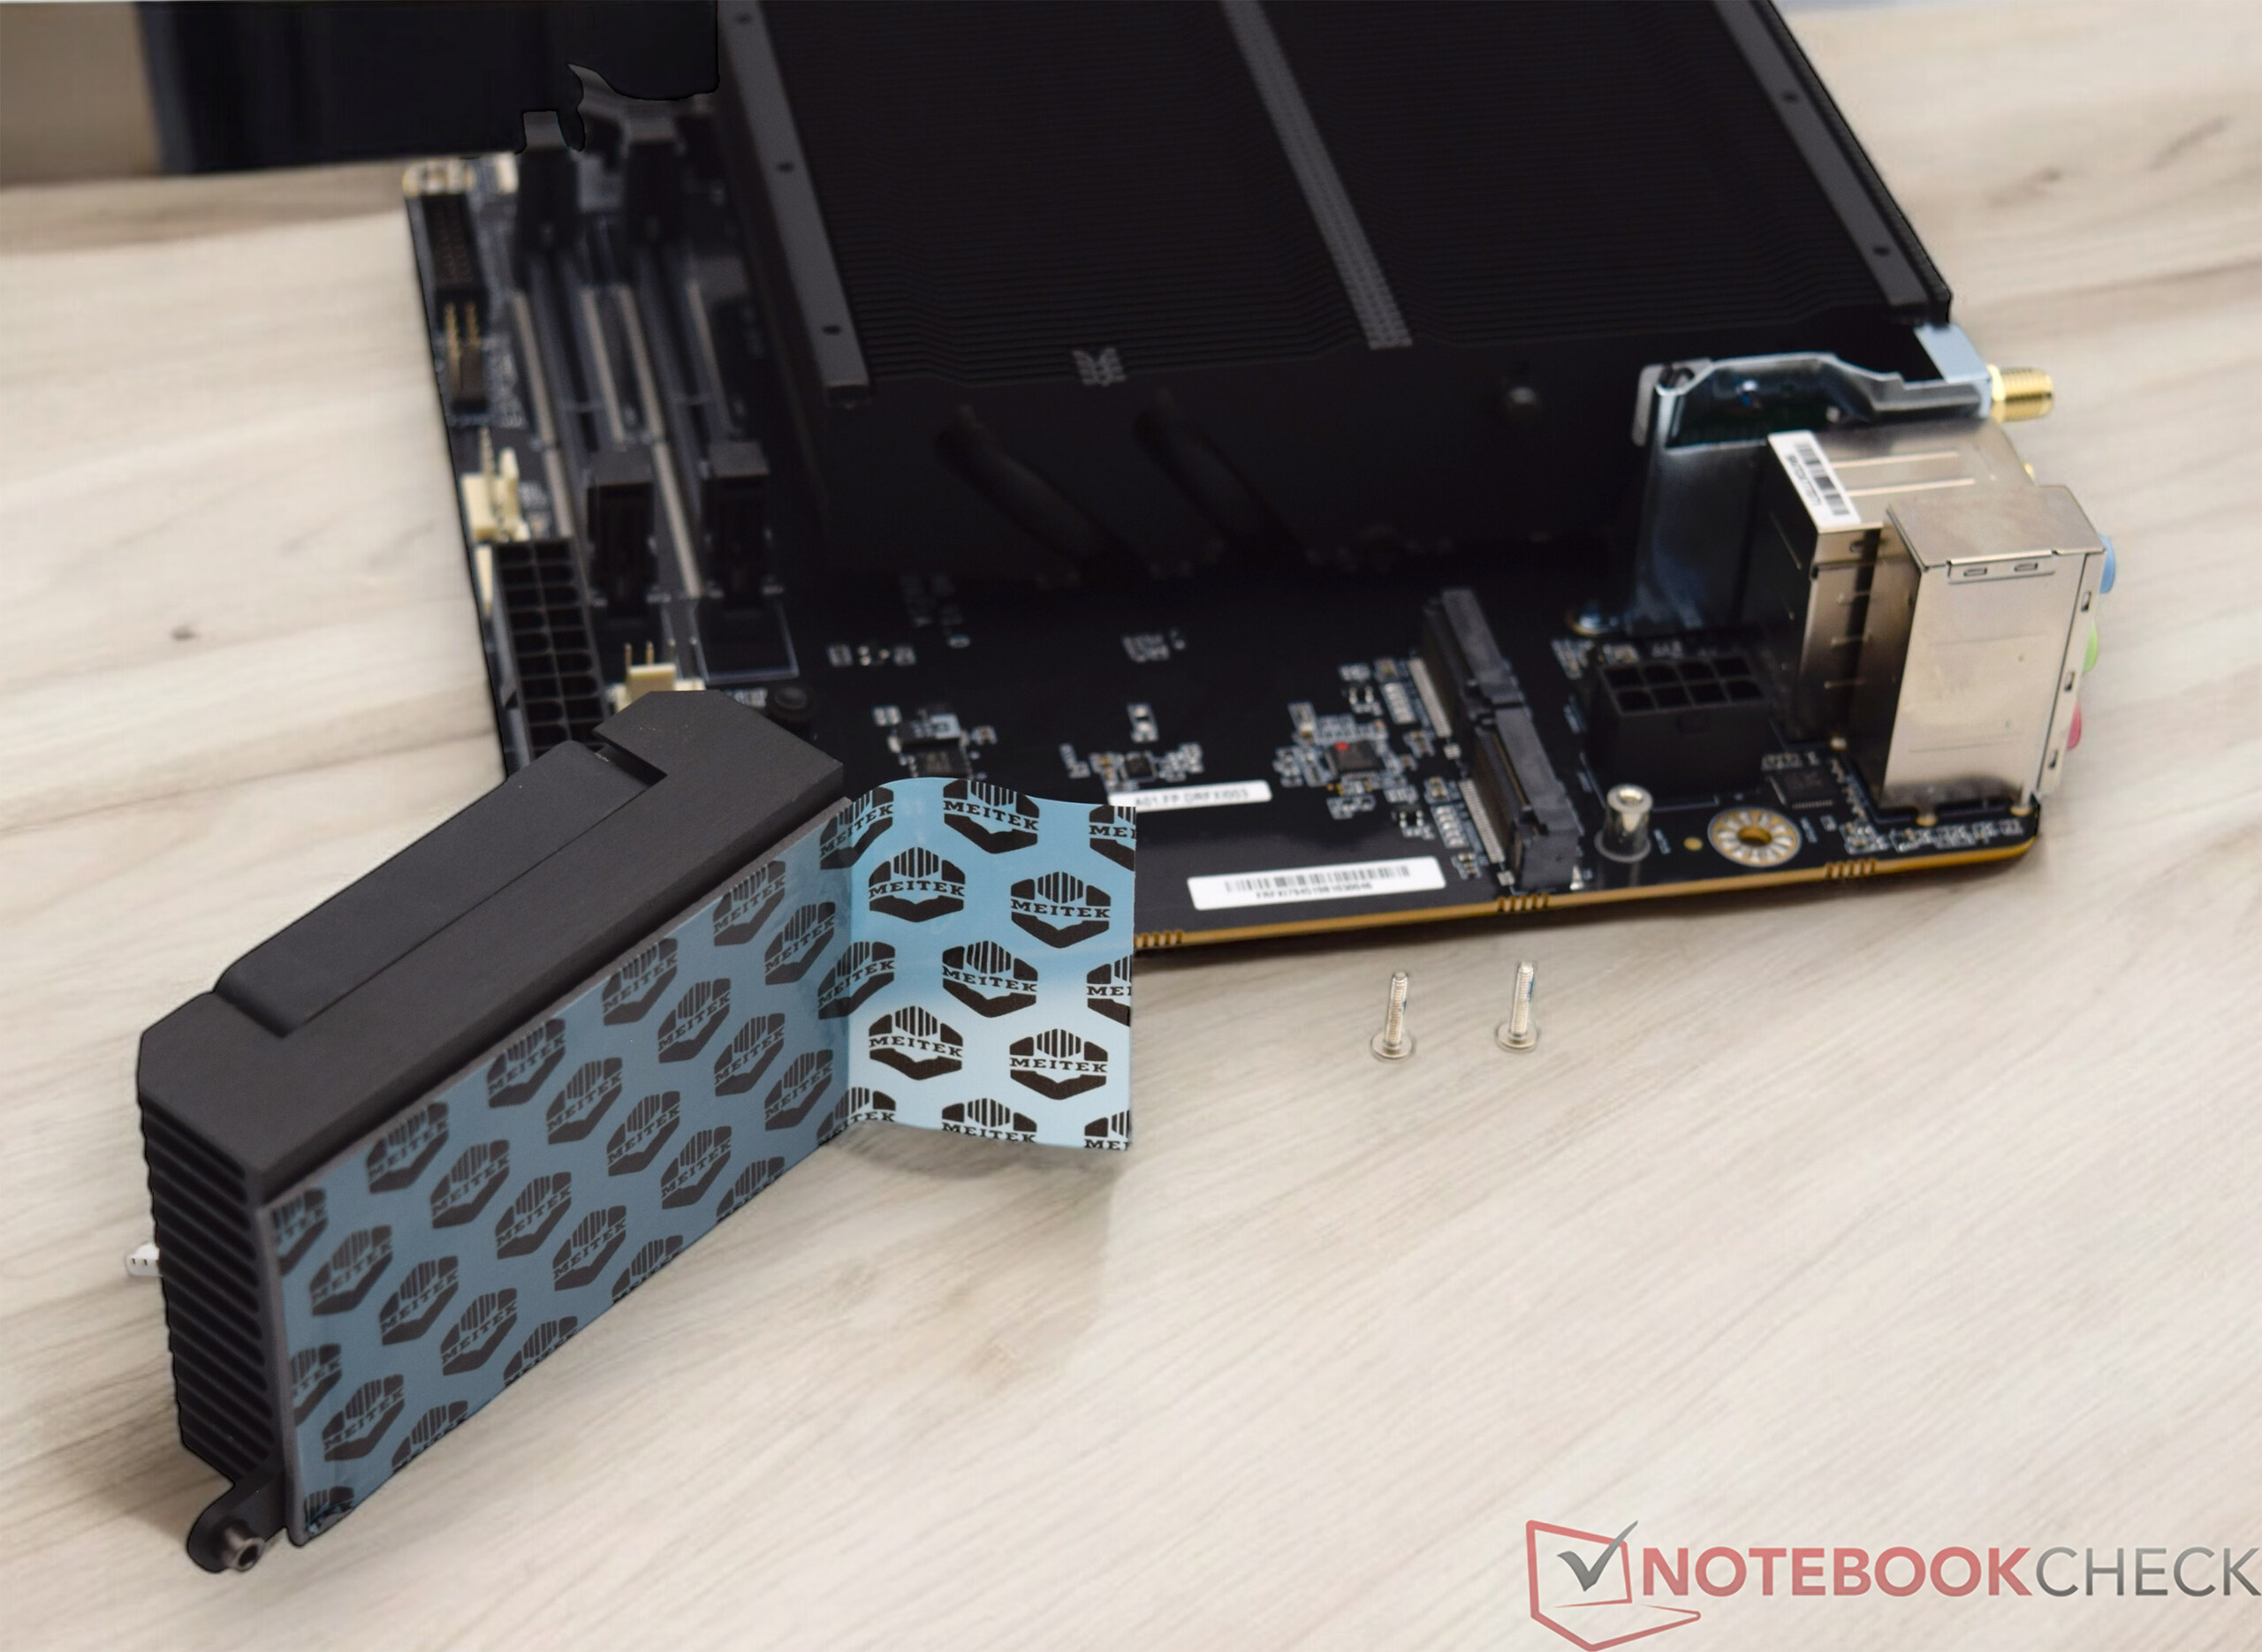
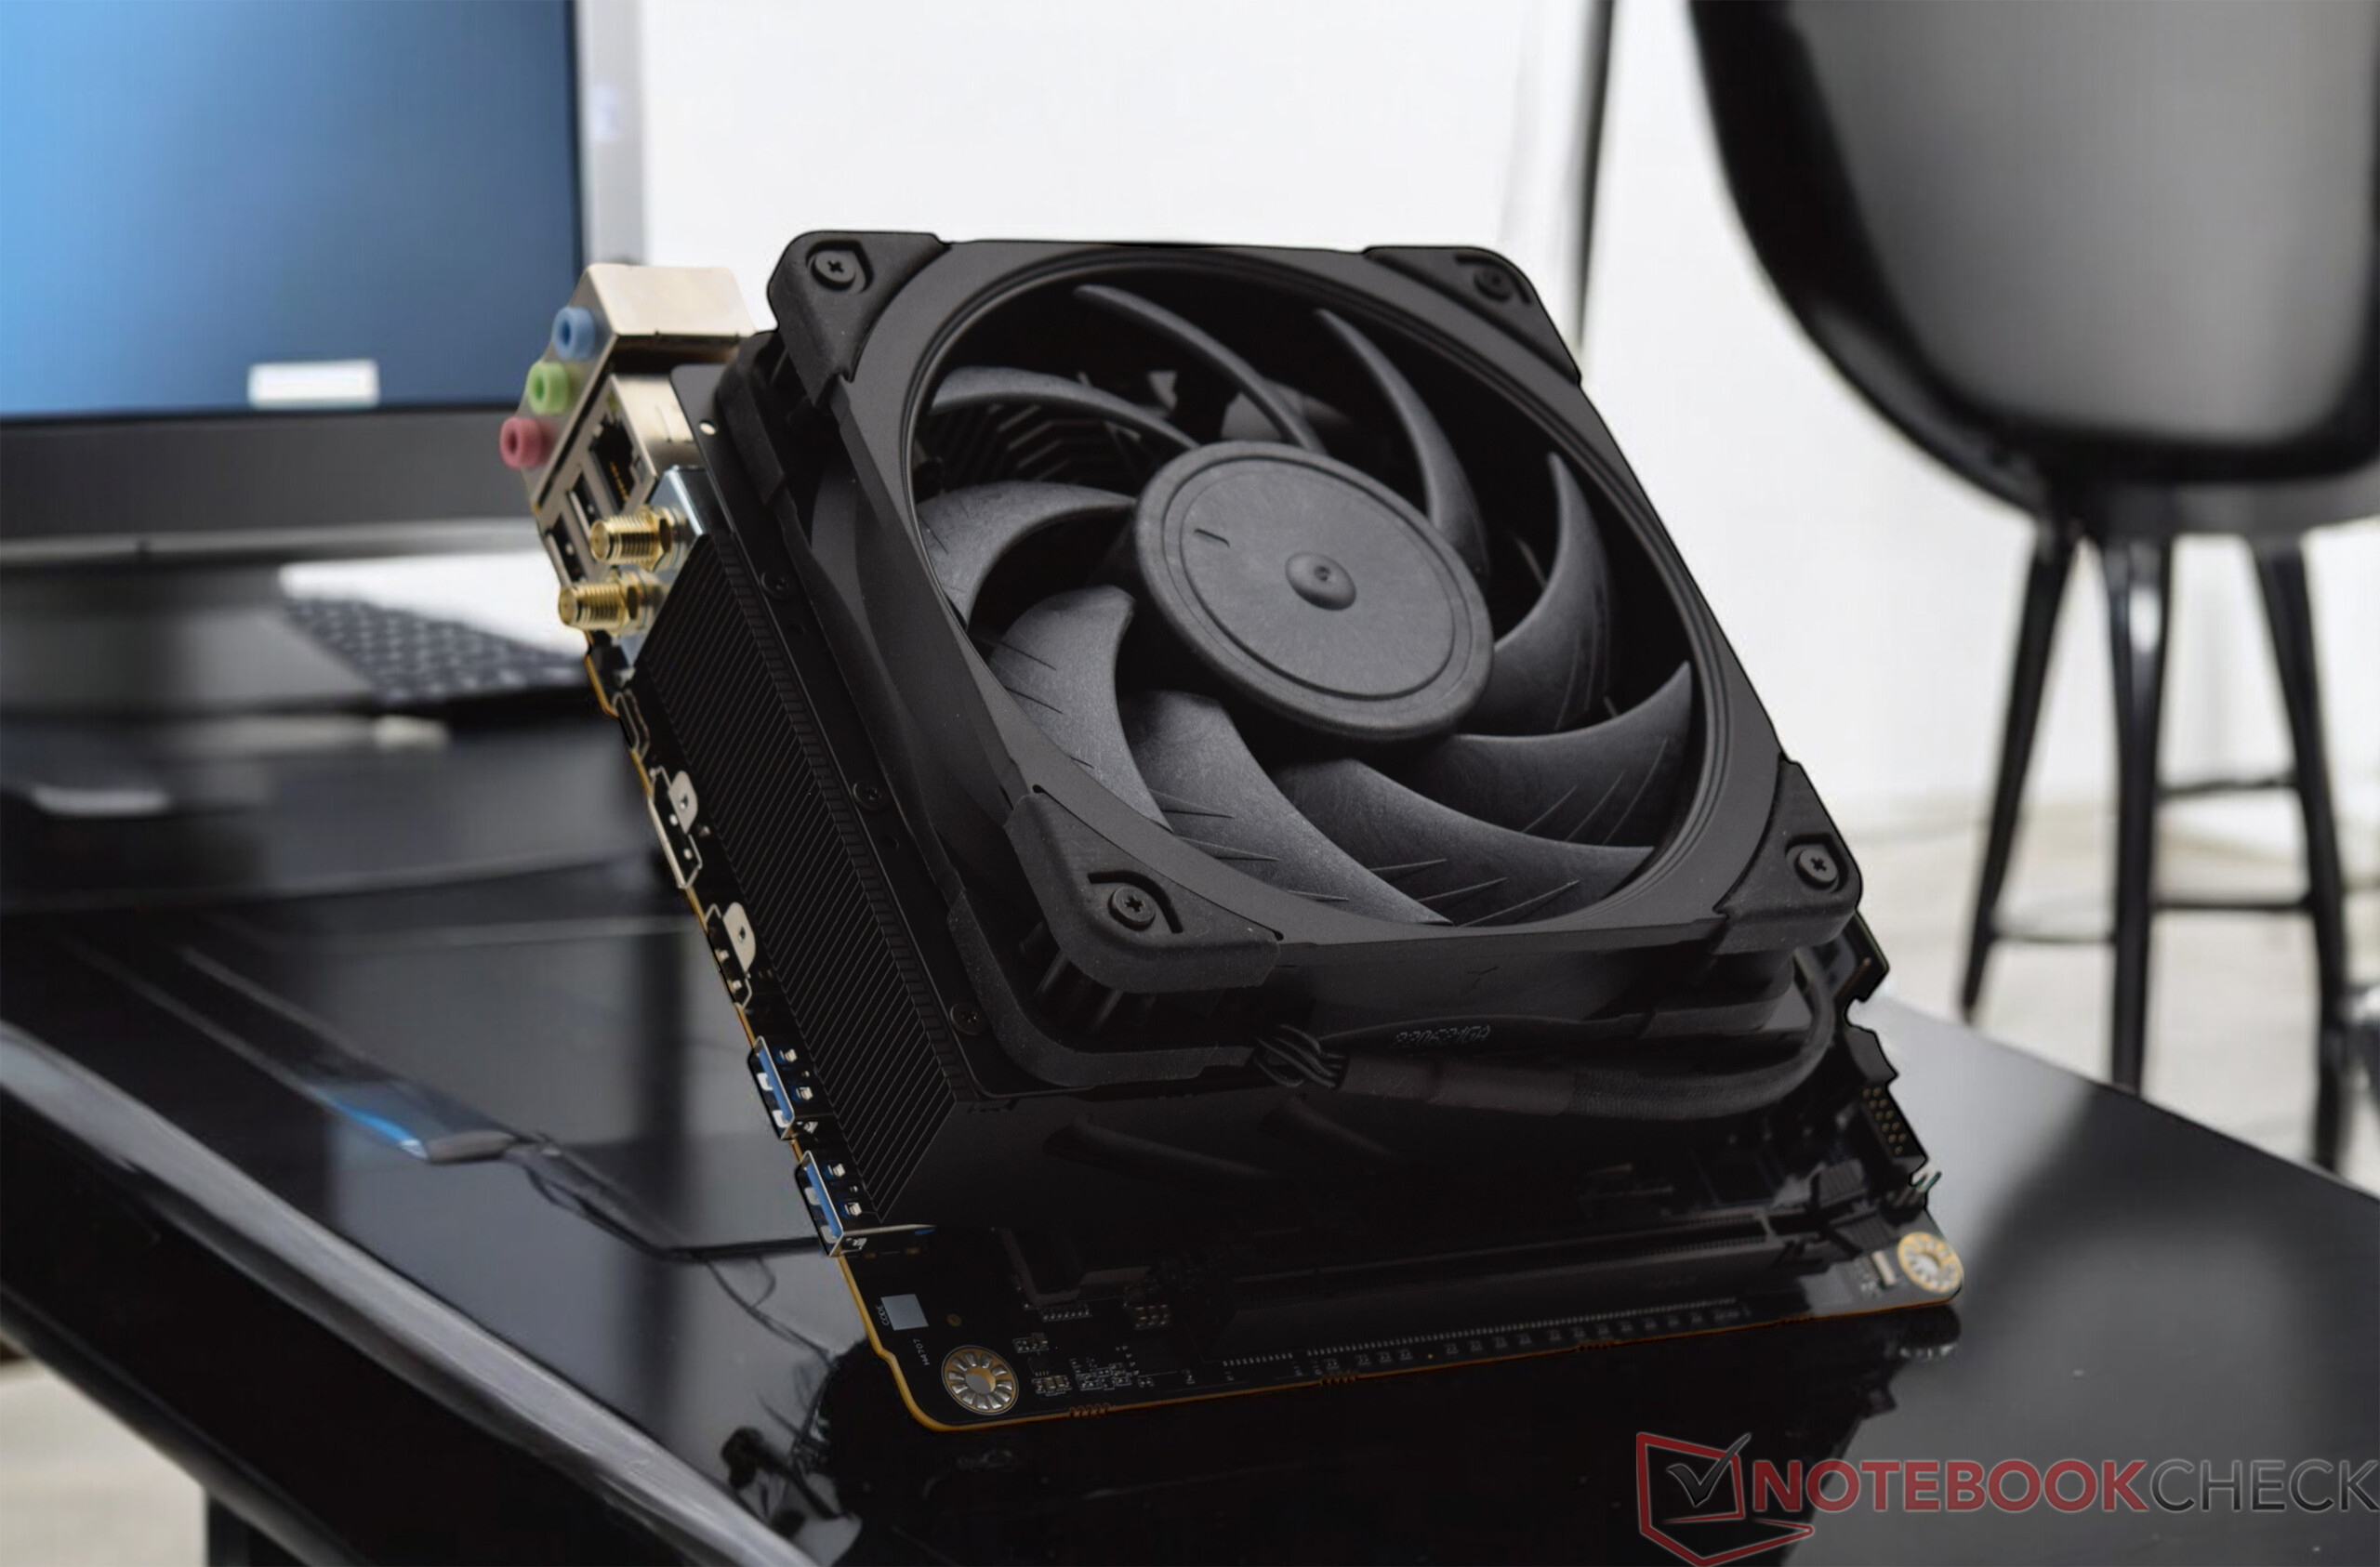
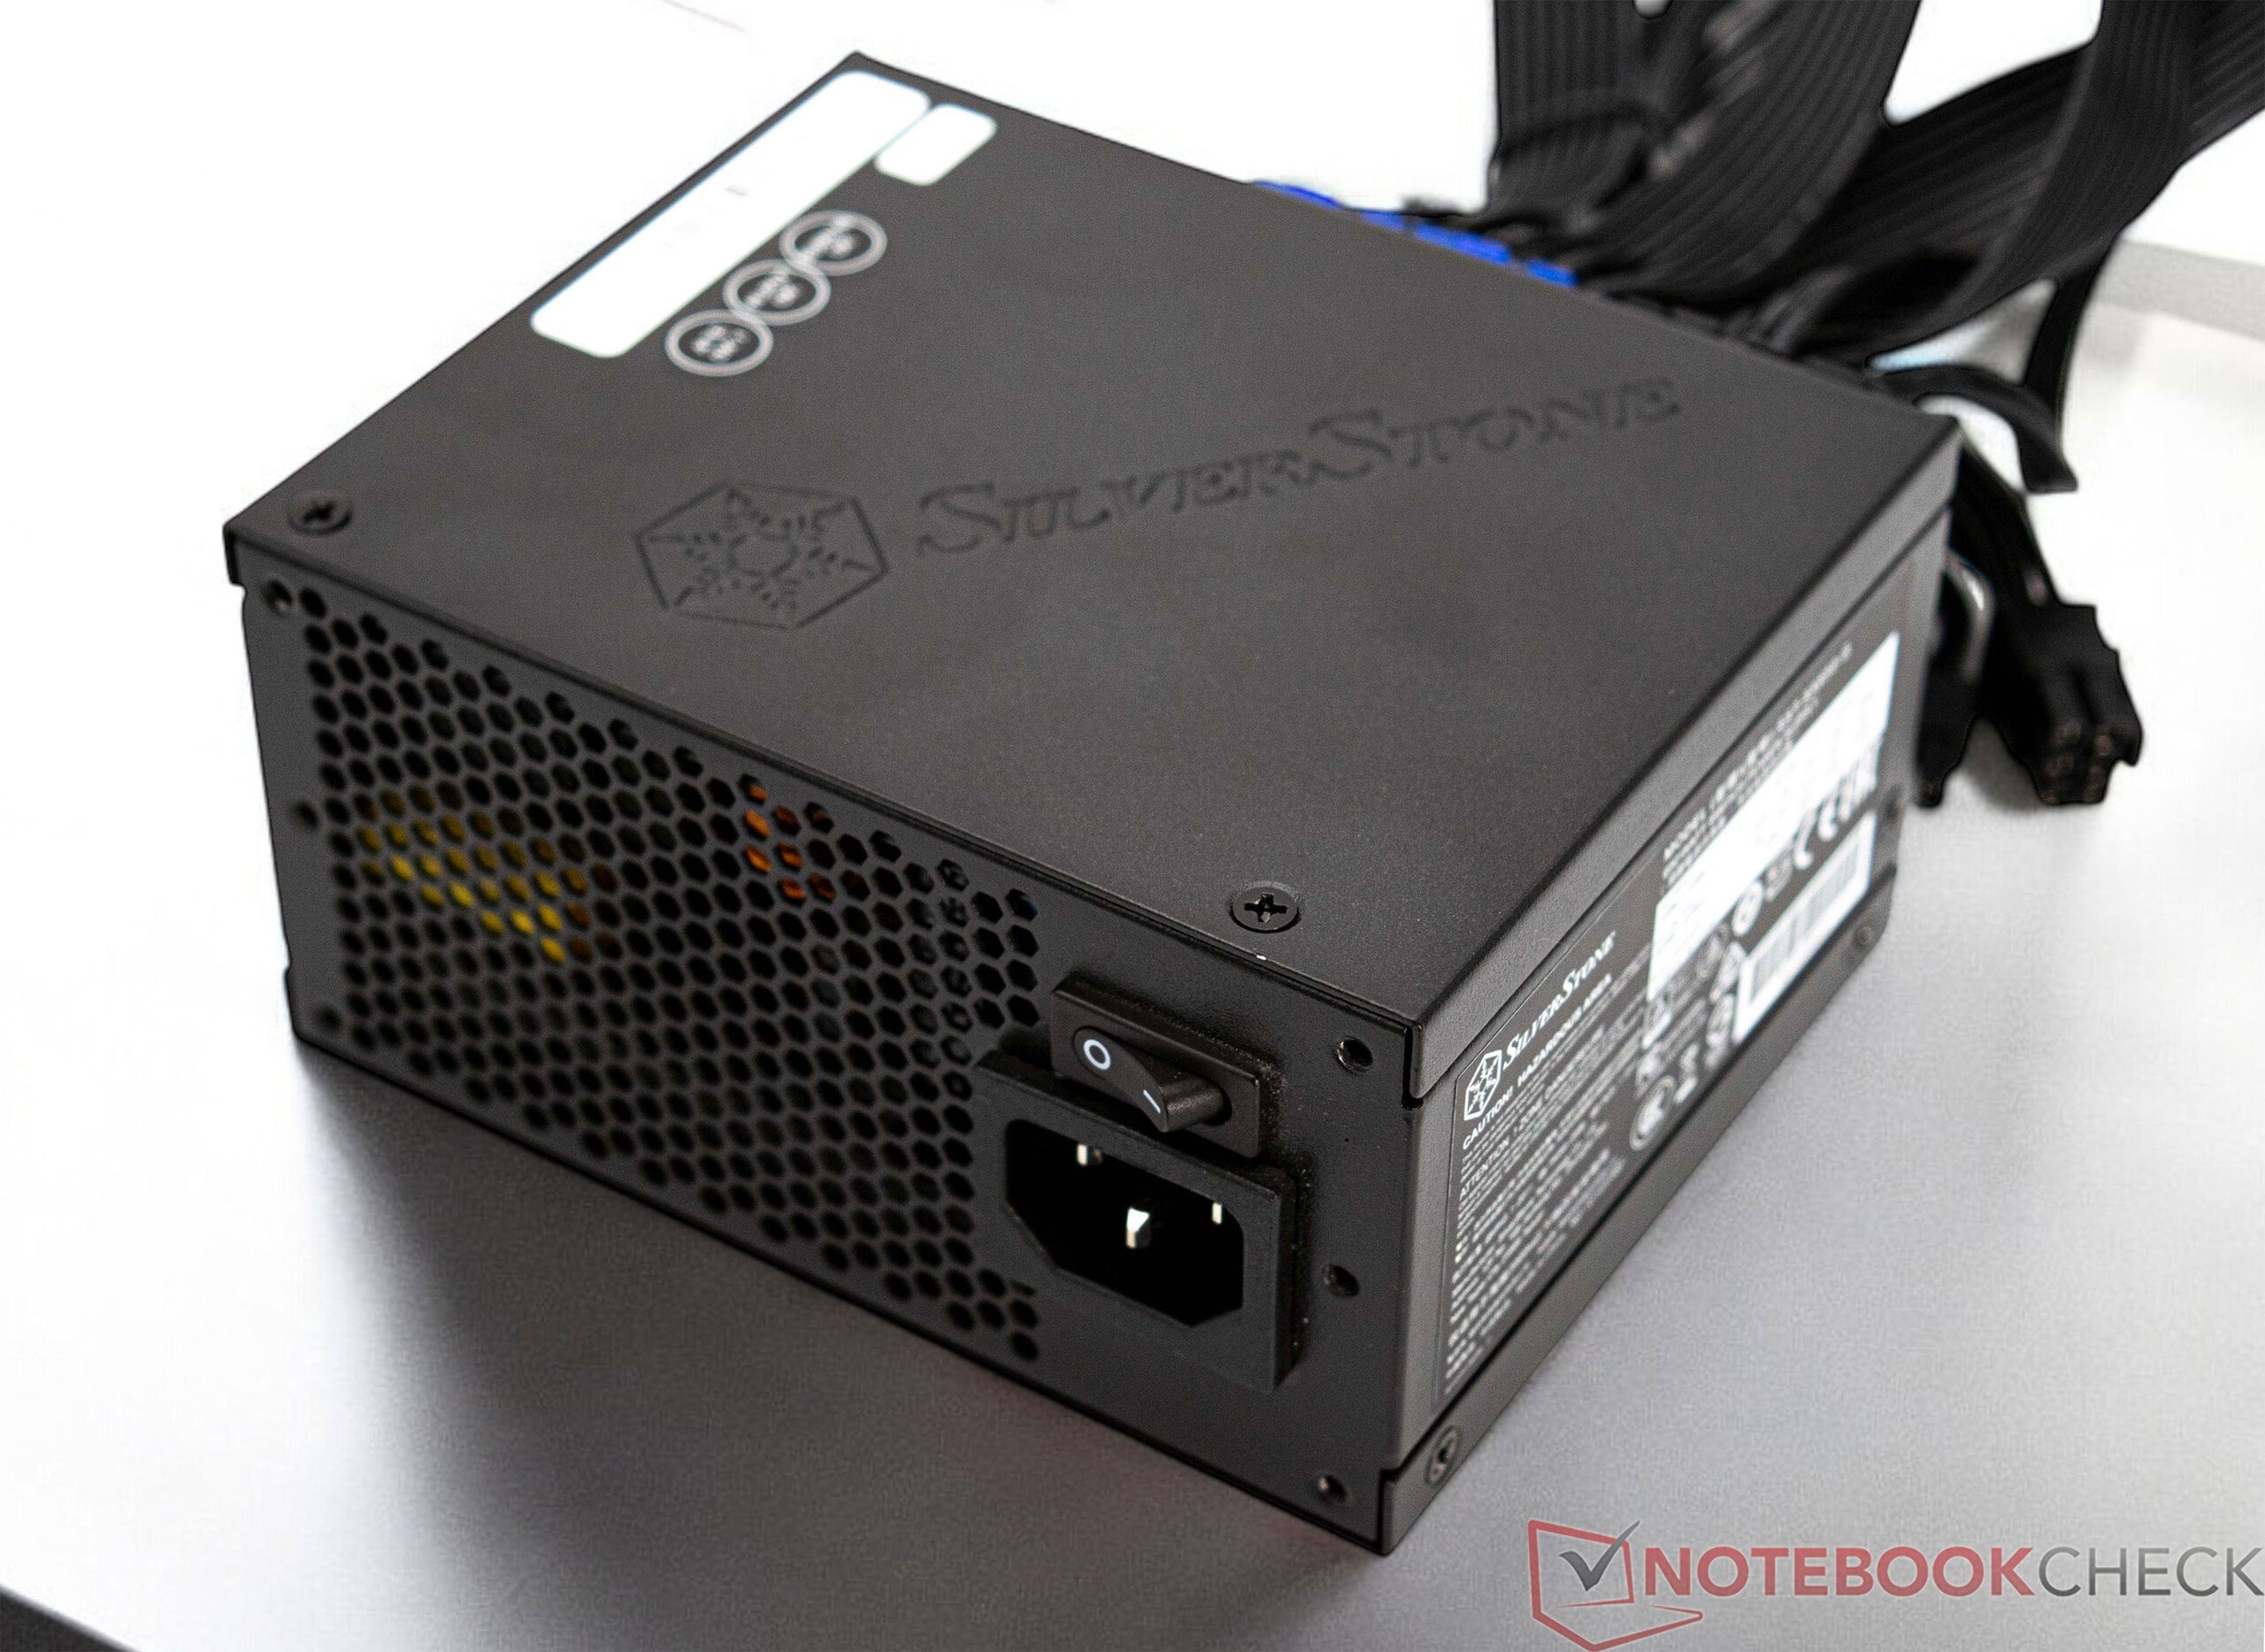
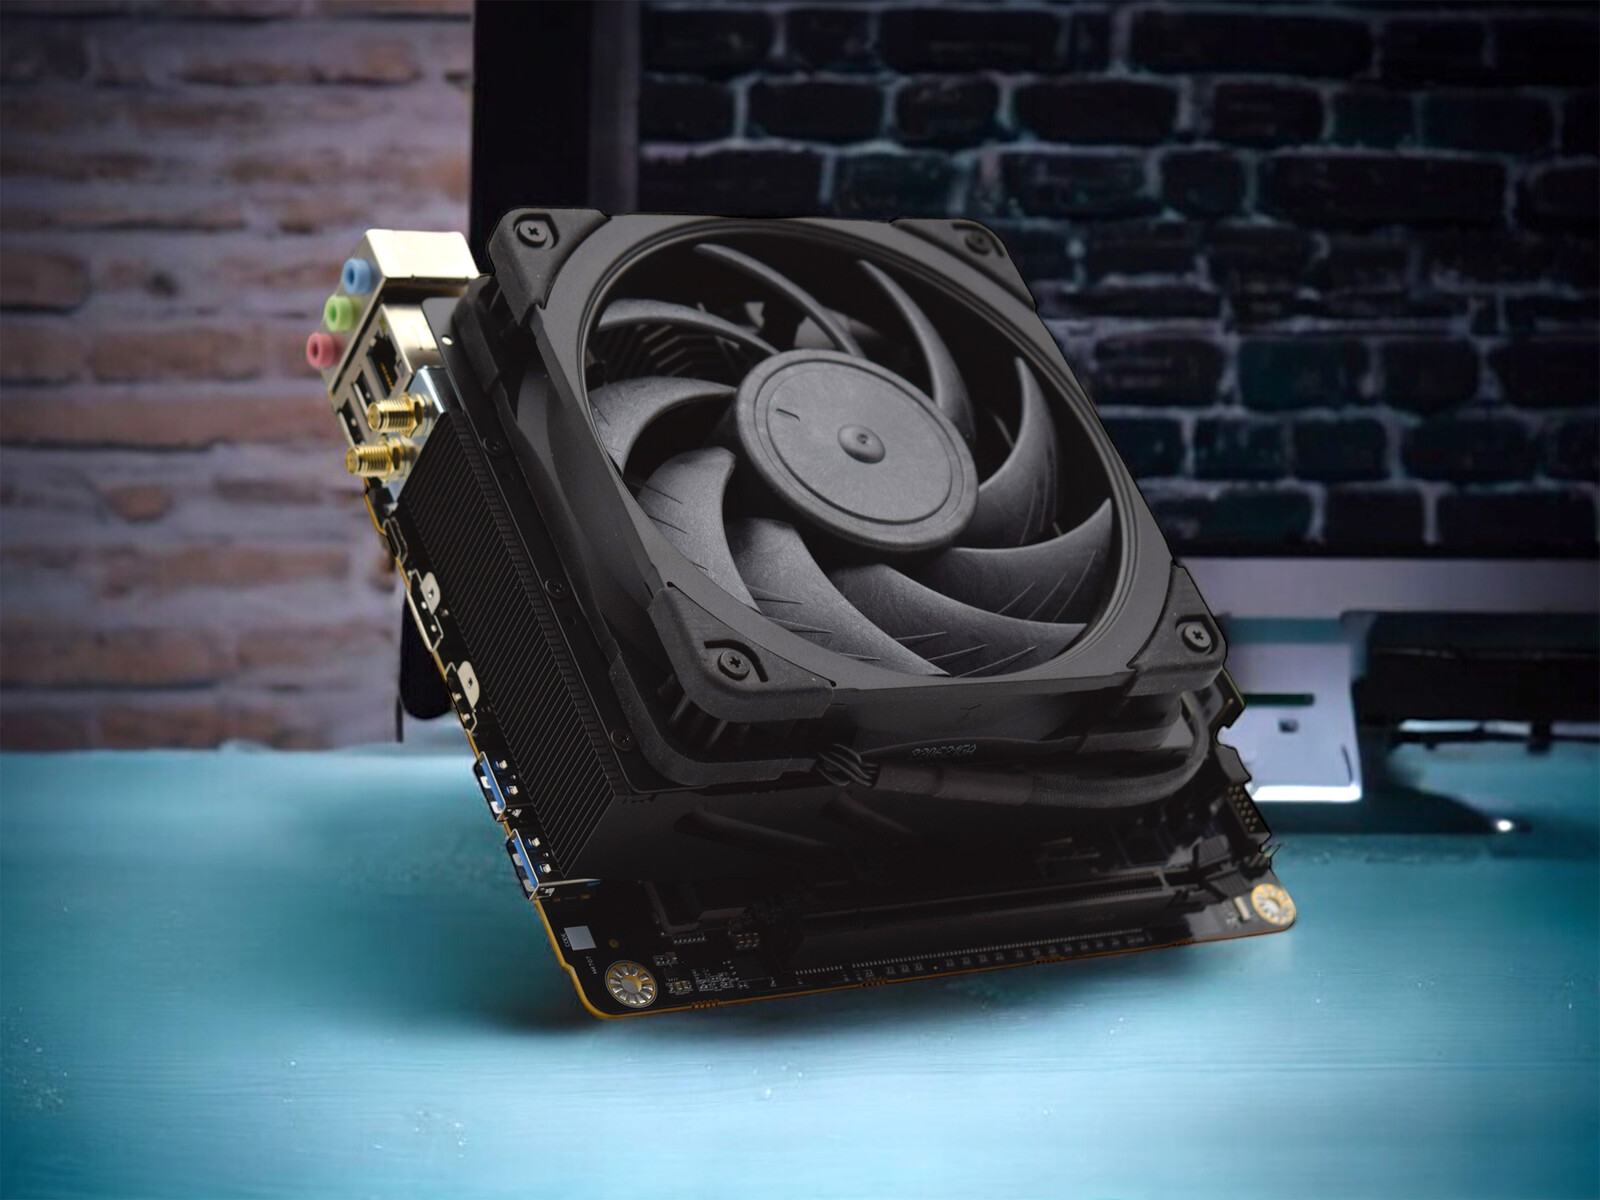
La livraison de la carte mère Minisforum BD790i est similaire à celle de la Minisforum BD770i. Le fabricant livre la carte mère avec un refroidisseur préinstallé qui couvre à la fois le processeur et les convertisseurs de tension. Un bouclier IO correspondant à la carte mère n'est malheureusement pas préinstallé. Une antenne WLAN relativement grande est également incluse dans la livraison. Il n'y a pas d'options entièrement préconfigurées, mais ce n'est pas un problème. Un ventilateur de 120 millimètres doit être acheté en tant que ventilateur de CPU, qui est rapidement installé à l'aide du matériel de montage. Un SSD et de la RAM ainsi qu'un bloc d'alimentation pour PC sont ensuite nécessaires pour le fonctionnement. Le Minisforum BD790i est une bonne base pour un PC de bricolage puissant et compact en format miniature.
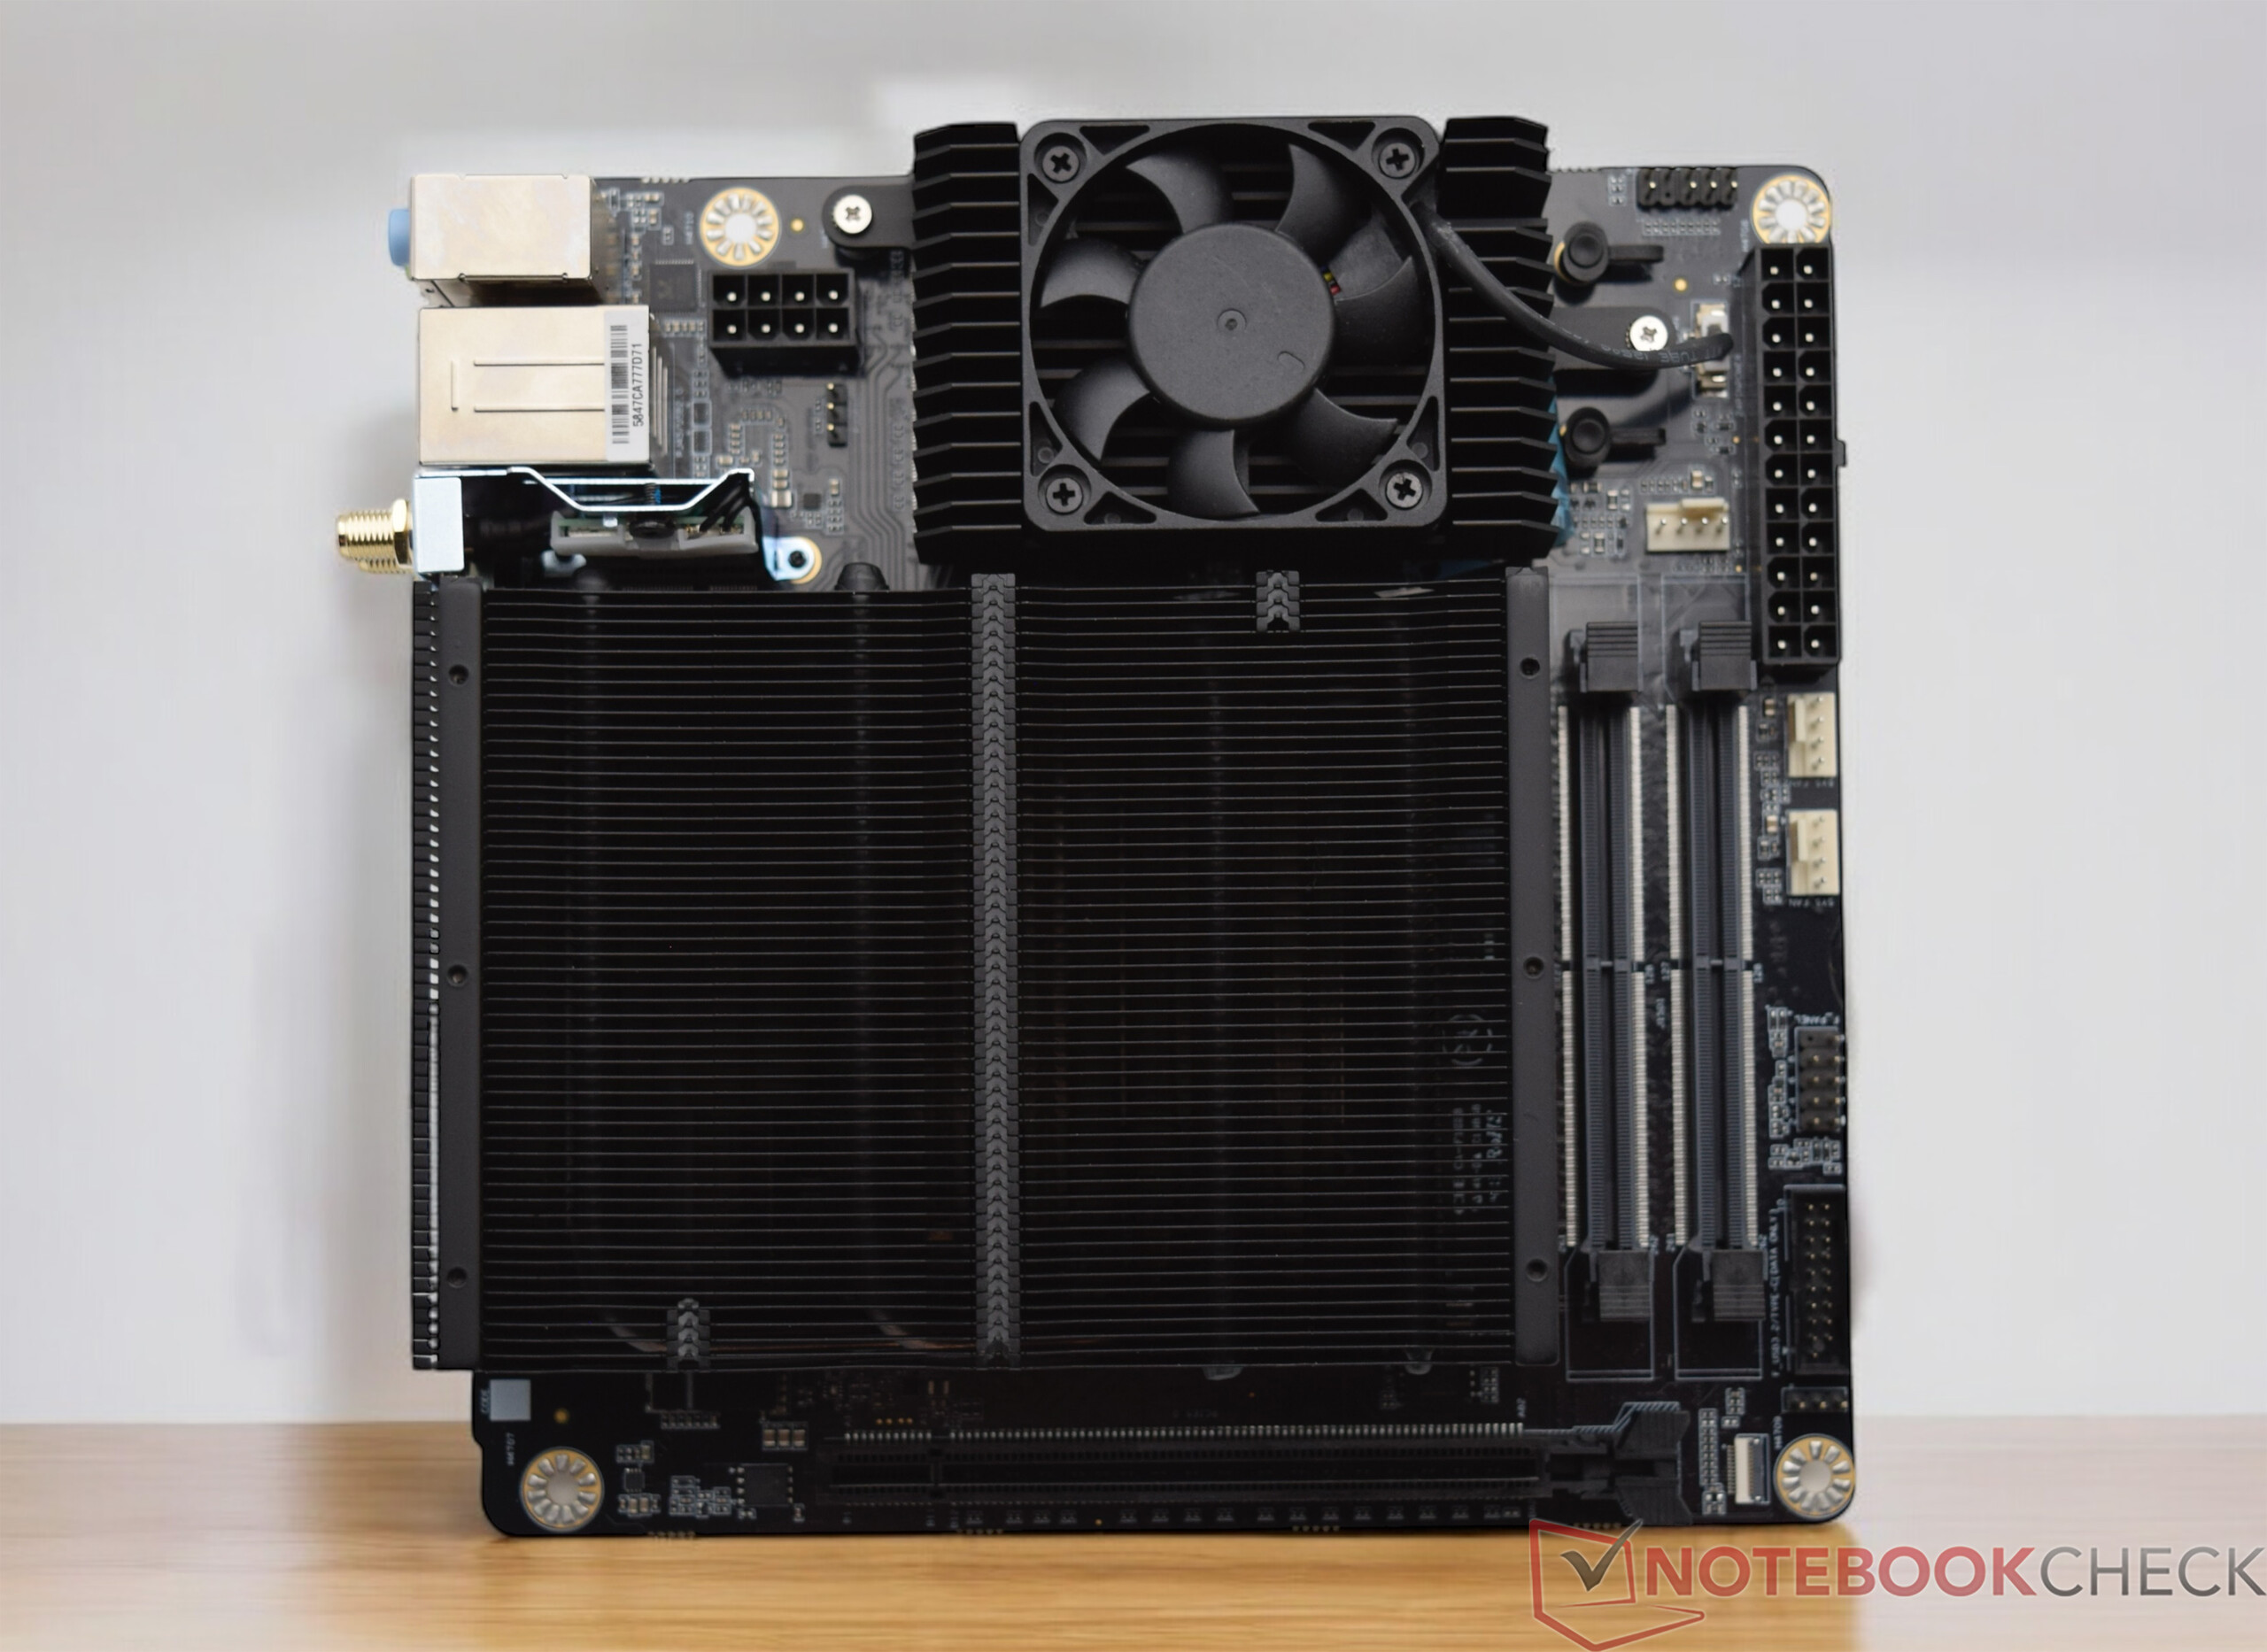
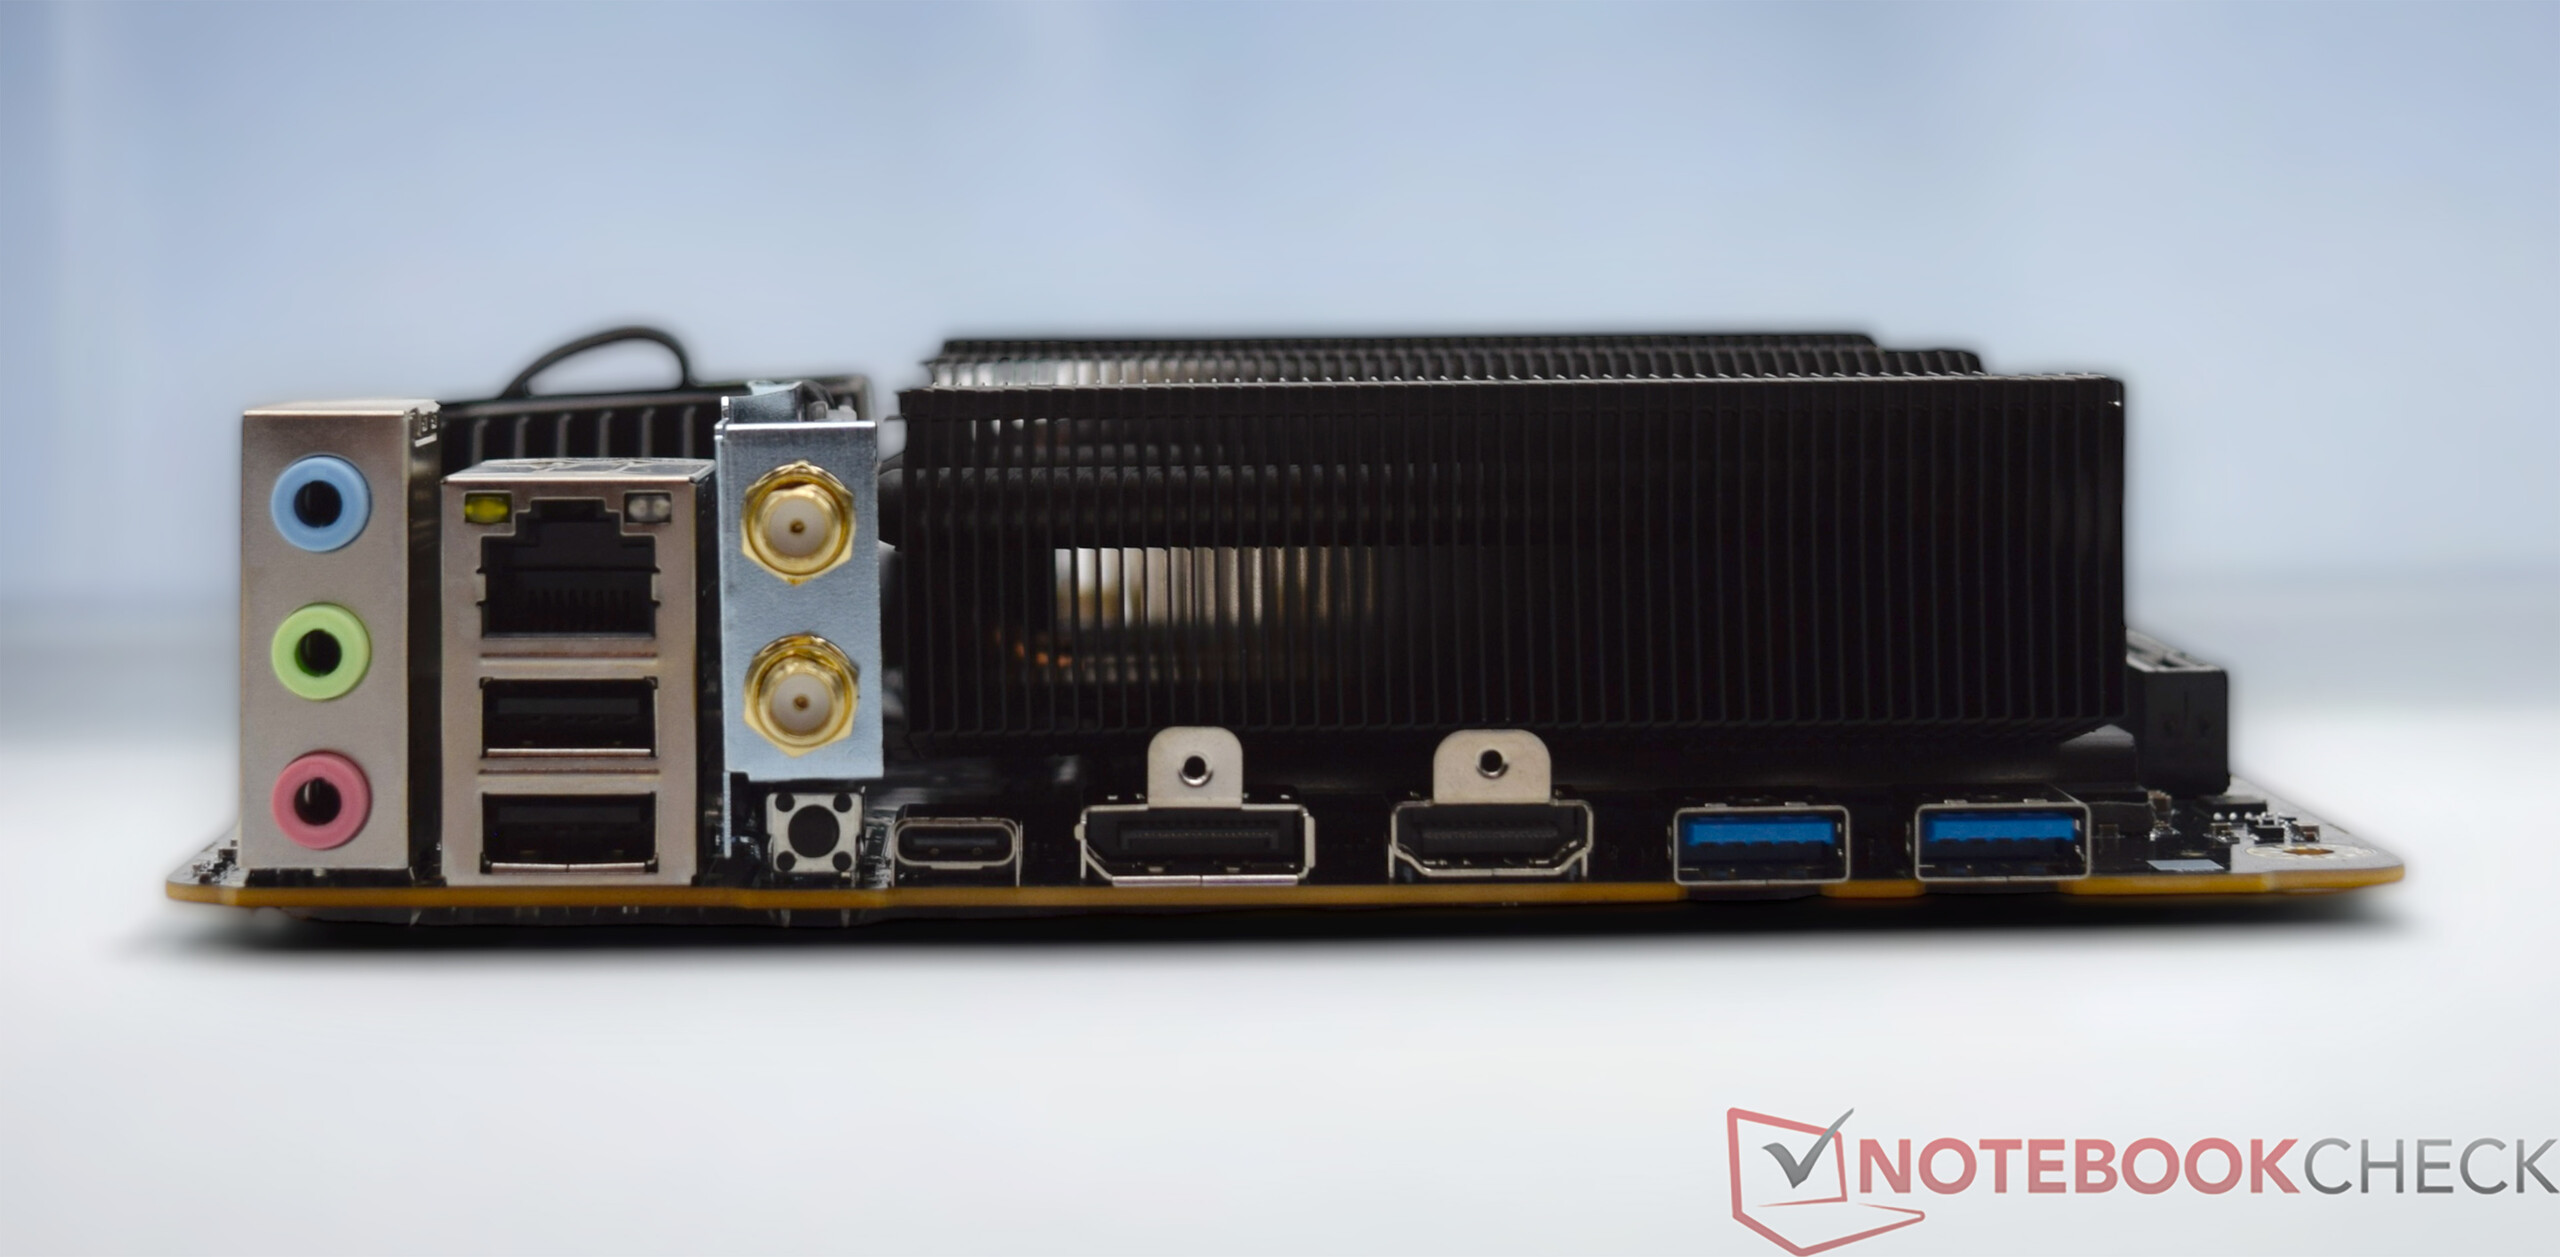
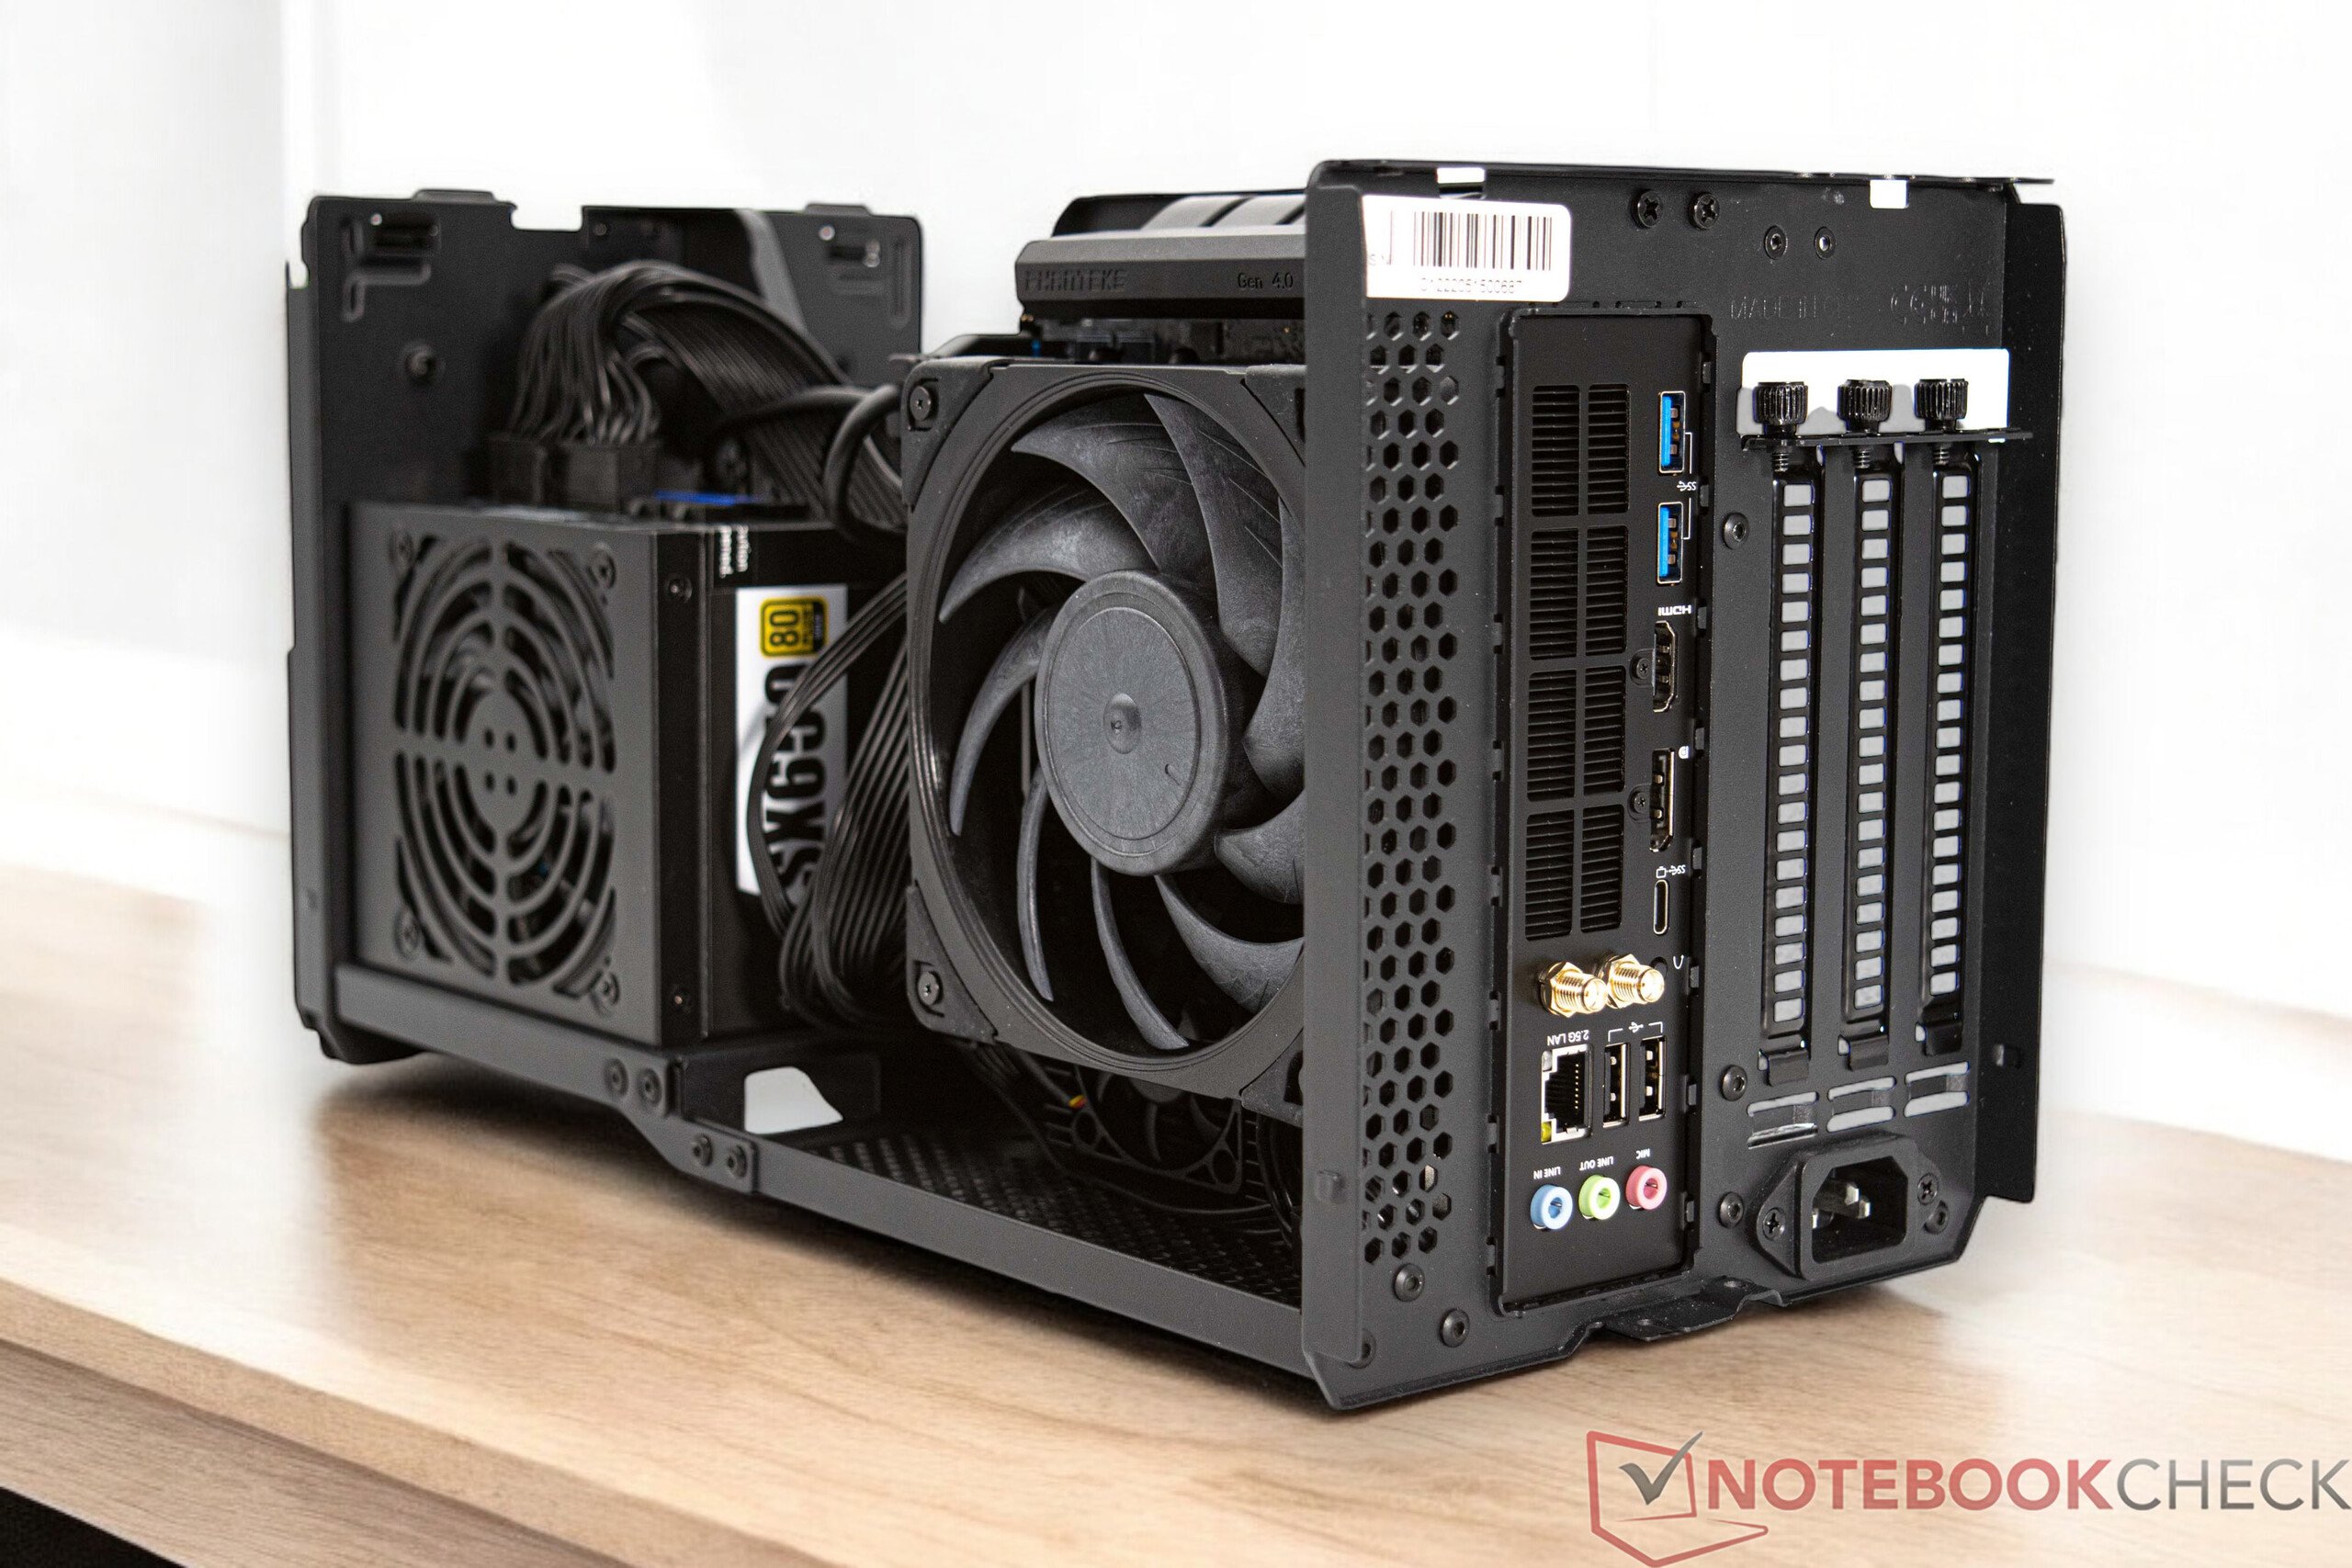
La connectique du Minisforum BD790i est assez limitée. Il n'y a que quelques connexions à l'arrière par rapport aux cartes mères conventionnelles, bien que les ports les plus importants soient à bord. Il y a également un connecteur USB 3.2 sur la carte elle-même, ce qui signifie qu'un total de 6 ports USB-A peut être utilisé. Malheureusement, il n'y a pas d'autres connexions, telles qu'un en-tête ARGB ou un port USB-C supplémentaire. En ce qui concerne le choix du ventilateur, vous êtes limité au refroidisseur préinstallé. Il n'y a pas d'option alternative pour installer un refroidisseur plus puissant. Il serait préférable de refroidir les convertisseurs de tension séparément afin de donner à l'utilisateur la possibilité d'installer sa propre solution de refroidissement.
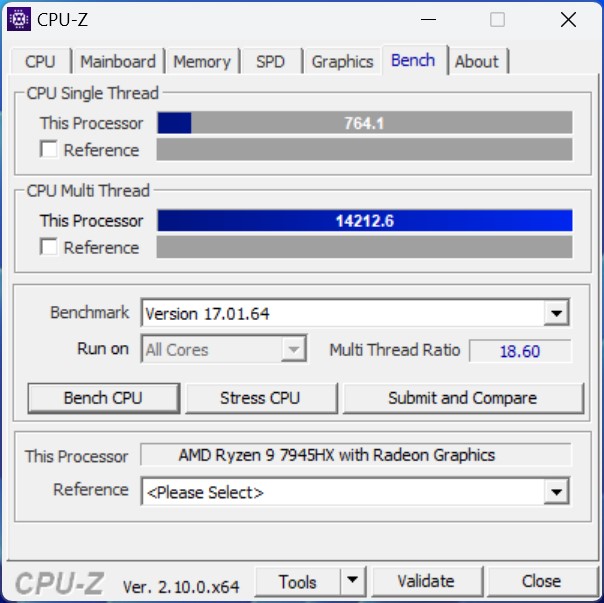
Benchmark des processeurs
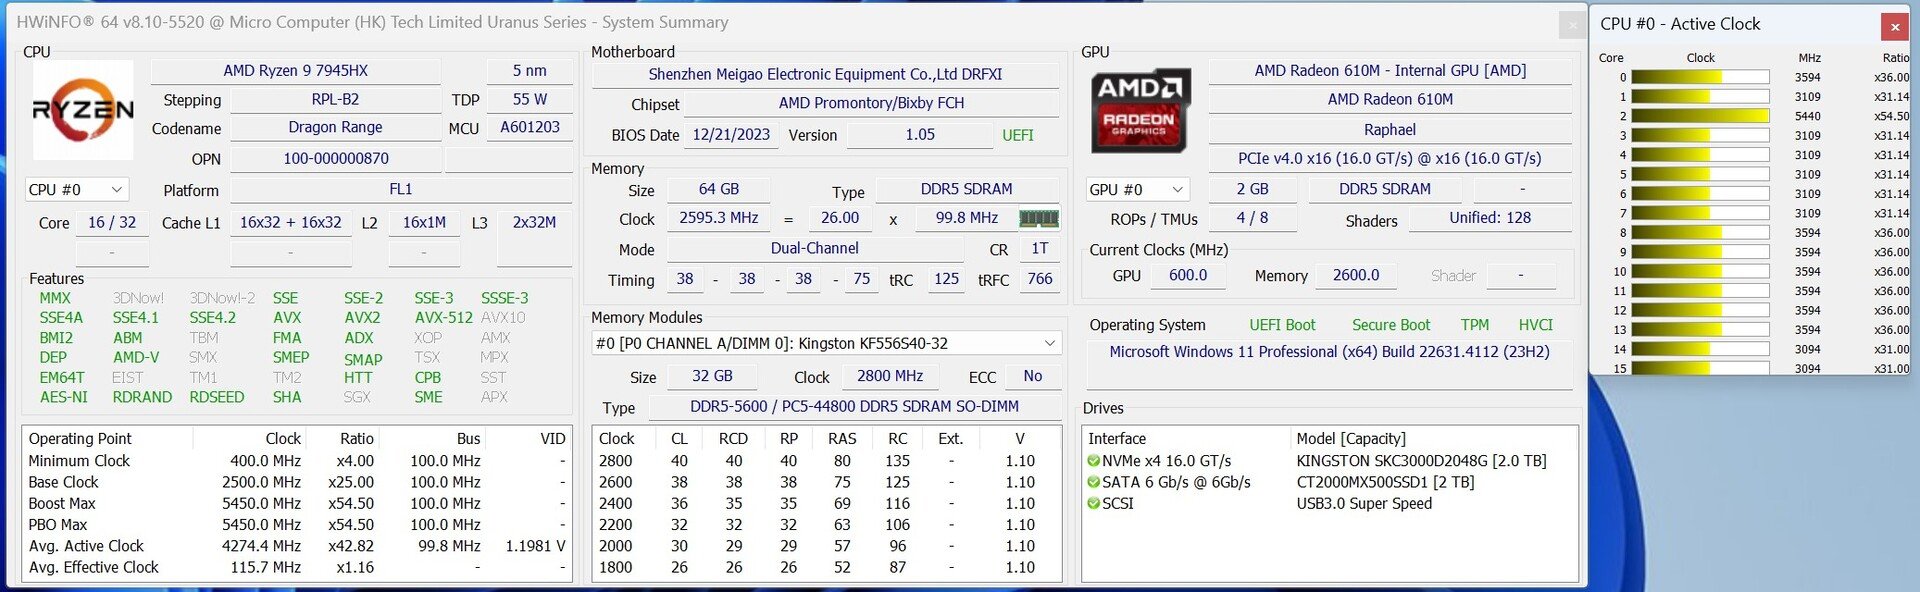
La carte mère Minisforum BD790i est équipée de l'un des processeurs les plus puissants actuellement disponibles dans le secteur des ordinateurs portables. Le processeur AMD Ryzen 9 7945HX dispose de 16 cœurs Zen4, qui peuvent traiter un total de 32 threads. En termes de performances, cela semble très prometteur, comme l'ont prouvé nos tests. Dans la comparaison des performances, l'AMD Ryzen 9 7945HX s'est classé entre l'AMD Ryzen 9 7900X et l'AMD Ryzen 9 7900X AMD Ryzen 9 7900X et un AMD Ryzen 9 7950X. Si l'on compare avec les processeurs Intel, les performances de l'AMD Ryzen 9 7945HX peuvent être comparées à celles de l'Intel Core i7-14700K et de l'AMD Ryzen 9 7945HX Intel Core i7-14700K. Par rapport aux processeurs de bureau classiques, la consommation d'énergie est le principal avantage de l'AMD Ryzen 9 7945HX. Avec seulement 100 watts, le processeur est nettement plus économe et plus facile à refroidir.
Pour d'autres comparaisons et benchmarks, consultez notre Tableau comparatif des processeurs.
| Performance Rating - Percent | |
| Intel Core i9-14900K | |
| Intel Core i9-13900K | |
| AMD Ryzen 9 7950X | |
| AMD Ryzen 9 7950X3D | |
| Intel Core i7-14700K | |
| AMD Ryzen 9 7945HX | |
| AMD Ryzen 9 7900X | |
| Intel Core i5-14600K | |
| Intel Core i9-12900K | |
| AMD Ryzen 9 5950X | |
| Intel Core i5-13600K | |
| AMD Ryzen 5 9600X | |
| AMD Ryzen 7 7800X3D | |
| AMD Ryzen 7 7745HX | |
| AMD Ryzen 5 7600X | |
| Intel Core i5-12600K | |
| AMD Ryzen 7 7840HS | |
| AMD Ryzen 9 7940HS | |
| Intel Core i5-13400 | |
| Intel Core i5-12400F | |
| Cinebench R20 | |
| CPU (Single Core) | |
| Intel Core i9-14900K | |
| AMD Ryzen 5 9600X | |
| Intel Core i7-14700K | |
| Intel Core i9-13900K | |
| AMD Ryzen 9 7950X | |
| AMD Ryzen 9 7950X3D | |
| Intel Core i5-14600K | |
| AMD Ryzen 9 7900X | |
| Intel Core i5-13600K | |
| Intel Core i9-12900K | |
| AMD Ryzen 5 7600X | |
| AMD Ryzen 9 7945HX | |
| Intel Core i5-12600K | |
| AMD Ryzen 7 7745HX | |
| AMD Ryzen 9 7940HS | |
| AMD Ryzen 7 7800X3D | |
| AMD Ryzen 7 7840HS | |
| Intel Core i5-13400 | |
| Intel Core i5-12400F | |
| AMD Ryzen 9 5950X | |
| CPU (Multi Core) | |
| Intel Core i9-14900K | |
| Intel Core i9-13900K | |
| AMD Ryzen 9 7950X | |
| AMD Ryzen 9 7950X3D | |
| Intel Core i7-14700K | |
| AMD Ryzen 9 7945HX | |
| AMD Ryzen 9 7900X | |
| AMD Ryzen 9 5950X | |
| Intel Core i9-12900K | |
| Intel Core i5-14600K | |
| Intel Core i5-13600K | |
| AMD Ryzen 7 7745HX | |
| AMD Ryzen 7 7800X3D | |
| AMD Ryzen 5 9600X | |
| Intel Core i5-12600K | |
| AMD Ryzen 9 7940HS | |
| AMD Ryzen 7 7840HS | |
| Intel Core i5-13400 | |
| AMD Ryzen 5 7600X | |
| Intel Core i5-12400F | |
| Cinebench R11.5 | |
| CPU Single 64Bit | |
| Intel Core i9-14900K | |
| AMD Ryzen 5 9600X | |
| Intel Core i9-13900K | |
| AMD Ryzen 9 7950X | |
| AMD Ryzen 9 7950X3D | |
| AMD Ryzen 9 7900X | |
| AMD Ryzen 5 7600X | |
| Intel Core i7-14700K | |
| AMD Ryzen 9 7945HX | |
| Intel Core i5-14600K | |
| AMD Ryzen 7 7745HX | |
| Intel Core i9-12900K | |
| Intel Core i5-13600K | |
| AMD Ryzen 9 7940HS | |
| AMD Ryzen 7 7800X3D | |
| AMD Ryzen 7 7840HS | |
| Intel Core i5-12600K | |
| AMD Ryzen 9 5950X | |
| Intel Core i5-13400 | |
| Intel Core i5-12400F | |
| CPU Multi 64Bit | |
| Intel Core i9-14900K | |
| Intel Core i9-13900K | |
| AMD Ryzen 9 7950X | |
| AMD Ryzen 9 7950X3D | |
| AMD Ryzen 9 7945HX | |
| Intel Core i7-14700K | |
| AMD Ryzen 9 7900X | |
| AMD Ryzen 9 5950X | |
| Intel Core i9-12900K | |
| Intel Core i5-13600K | |
| Intel Core i5-14600K | |
| AMD Ryzen 7 7745HX | |
| AMD Ryzen 7 7800X3D | |
| AMD Ryzen 9 7940HS | |
| AMD Ryzen 5 9600X | |
| AMD Ryzen 7 7840HS | |
| Intel Core i5-12600K | |
| AMD Ryzen 5 7600X | |
| Intel Core i5-13400 | |
| Intel Core i5-12400F | |
| Cinebench R10 | |
| Rendering Single CPUs 64Bit | |
| Intel Core i9-14900K | |
| Intel Core i9-13900K | |
| AMD Ryzen 5 9600X | |
| Intel Core i7-14700K | |
| Intel Core i5-14600K | |
| AMD Ryzen 9 7900X | |
| AMD Ryzen 9 7950X | |
| Intel Core i5-13600K | |
| Intel Core i9-12900K | |
| AMD Ryzen 5 7600X | |
| AMD Ryzen 9 7945HX | |
| Intel Core i5-12600K | |
| AMD Ryzen 7 7745HX | |
| AMD Ryzen 9 7940HS | |
| AMD Ryzen 7 7800X3D | |
| AMD Ryzen 7 7840HS | |
| Intel Core i5-13400 | |
| Intel Core i5-12400F | |
| AMD Ryzen 9 5950X | |
| AMD Ryzen 9 7950X3D | |
| Rendering Multiple CPUs 64Bit | |
| Intel Core i9-14900K | |
| Intel Core i7-14700K | |
| Intel Core i9-13900K | |
| AMD Ryzen 9 7945HX | |
| AMD Ryzen 9 7950X | |
| AMD Ryzen 9 7900X | |
| Intel Core i5-14600K | |
| Intel Core i9-12900K | |
| Intel Core i5-13600K | |
| AMD Ryzen 9 5950X | |
| AMD Ryzen 5 9600X | |
| AMD Ryzen 7 7745HX | |
| AMD Ryzen 7 7800X3D | |
| AMD Ryzen 5 7600X | |
| Intel Core i5-12600K | |
| AMD Ryzen 9 7940HS | |
| AMD Ryzen 7 7840HS | |
| Intel Core i5-13400 | |
| AMD Ryzen 9 7950X3D | |
| Intel Core i5-12400F | |
| Blender - v2.79 BMW27 CPU | |
| Intel Core i5-12400F | |
| Intel Core i5-13400 | |
| AMD Ryzen 5 7600X | |
| AMD Ryzen 7 7840HS | |
| Intel Core i5-12600K | |
| AMD Ryzen 9 7940HS | |
| AMD Ryzen 5 9600X | |
| AMD Ryzen 7 7800X3D | |
| AMD Ryzen 7 7745HX | |
| Intel Core i5-13600K | |
| Intel Core i5-14600K | |
| Intel Core i9-12900K | |
| AMD Ryzen 9 5950X | |
| AMD Ryzen 9 7900X | |
| AMD Ryzen 9 7945HX | |
| Intel Core i7-14700K | |
| AMD Ryzen 9 7950X3D | |
| AMD Ryzen 9 7950X | |
| Intel Core i9-13900K | |
| Intel Core i9-14900K | |
| Geekbench 4.4 | |
| 64 Bit Single-Core Score | |
| Intel Core i9-14900K | |
| AMD Ryzen 5 9600X | |
| Intel Core i9-13900K | |
| AMD Ryzen 9 7950X | |
| Intel Core i7-14700K | |
| AMD Ryzen 9 7950X3D | |
| AMD Ryzen 9 7900X | |
| AMD Ryzen 7 7800X3D | |
| AMD Ryzen 5 7600X | |
| Intel Core i5-14600K | |
| Intel Core i9-12900K | |
| Intel Core i5-13600K | |
| AMD Ryzen 9 7945HX | |
| AMD Ryzen 7 7745HX | |
| Intel Core i5-12600K | |
| AMD Ryzen 7 7840HS | |
| AMD Ryzen 9 7940HS | |
| Intel Core i5-13400 | |
| Intel Core i5-12400F | |
| AMD Ryzen 9 5950X | |
| 64 Bit Multi-Core Score | |
| AMD Ryzen 9 7950X | |
| Intel Core i9-14900K | |
| AMD Ryzen 9 7950X3D | |
| Intel Core i9-13900K | |
| Intel Core i7-14700K | |
| AMD Ryzen 9 7945HX | |
| AMD Ryzen 9 7900X | |
| Intel Core i5-14600K | |
| Intel Core i9-12900K | |
| AMD Ryzen 9 5950X | |
| Intel Core i5-13600K | |
| AMD Ryzen 7 7800X3D | |
| AMD Ryzen 7 7745HX | |
| AMD Ryzen 5 9600X | |
| AMD Ryzen 7 7840HS | |
| AMD Ryzen 5 7600X | |
| Intel Core i5-12600K | |
| AMD Ryzen 9 7940HS | |
| Intel Core i5-13400 | |
| Intel Core i5-12400F | |
| 3DMark 11 - 1280x720 Performance Physics | |
| AMD Ryzen 9 7950X3D | |
| AMD Ryzen 7 7800X3D | |
| Intel Core i7-14700K | |
| Intel Core i9-13900K | |
| Intel Core i9-14900K | |
| Intel Core i5-14600K | |
| Intel Core i5-13600K | |
| AMD Ryzen 9 7900X | |
| AMD Ryzen 9 7950X | |
| Intel Core i9-12900K | |
| AMD Ryzen 9 7945HX | |
| AMD Ryzen 7 7745HX | |
| AMD Ryzen 5 9600X | |
| AMD Ryzen 5 7600X | |
| AMD Ryzen 9 5950X | |
| Intel Core i5-12600K | |
| Intel Core i5-13400 | |
| AMD Ryzen 7 7840HS | |
| AMD Ryzen 9 7940HS | |
| Intel Core i5-12400F | |
| HWBOT x265 Benchmark v2.2 - 4k Preset | |
| AMD Ryzen 9 7950X | |
| Intel Core i9-14900K | |
| Intel Core i9-13900K | |
| AMD Ryzen 9 7950X3D | |
| AMD Ryzen 9 7945HX | |
| Intel Core i7-14700K | |
| AMD Ryzen 9 7900X | |
| AMD Ryzen 9 5950X | |
| Intel Core i5-12600K | |
| Intel Core i9-12900K | |
| Intel Core i5-14600K | |
| Intel Core i5-13600K | |
| AMD Ryzen 7 7800X3D | |
| AMD Ryzen 7 7745HX | |
| AMD Ryzen 5 9600X | |
| AMD Ryzen 5 7600X | |
| AMD Ryzen 7 7840HS | |
| AMD Ryzen 9 7940HS | |
| Intel Core i5-13400 | |
| Intel Core i5-12400F | |
| R Benchmark 2.5 - Overall mean | |
| Intel Core i5-12400F | |
| Intel Core i5-13400 | |
| AMD Ryzen 9 5950X | |
| Intel Core i5-12600K | |
| AMD Ryzen 7 7840HS | |
| Intel Core i9-12900K | |
| AMD Ryzen 9 7940HS | |
| AMD Ryzen 7 7800X3D | |
| AMD Ryzen 7 7745HX | |
| Intel Core i5-13600K | |
| Intel Core i5-14600K | |
| AMD Ryzen 9 7945HX | |
| Intel Core i7-14700K | |
| AMD Ryzen 5 7600X | |
| AMD Ryzen 9 7900X | |
| AMD Ryzen 9 7950X3D | |
| AMD Ryzen 9 7950X | |
| Intel Core i9-13900K | |
| Intel Core i9-14900K | |
| AMD Ryzen 5 9600X | |
| LibreOffice - 20 Documents To PDF | |
| Intel Core i5-12600K | |
| AMD Ryzen 7 7840HS | |
| Intel Core i5-12400F | |
| AMD Ryzen 5 9600X | |
| AMD Ryzen 9 7940HS | |
| AMD Ryzen 9 5950X | |
| AMD Ryzen 7 7745HX | |
| AMD Ryzen 7 7800X3D | |
| Intel Core i9-12900K | |
| Intel Core i7-14700K | |
| Intel Core i5-13400 | |
| AMD Ryzen 9 7950X3D | |
| AMD Ryzen 5 7600X | |
| Intel Core i9-13900K | |
| AMD Ryzen 9 7950X | |
| AMD Ryzen 9 7945HX | |
| Intel Core i5-13600K | |
| AMD Ryzen 9 7900X | |
| Intel Core i9-14900K | |
| Intel Core i5-14600K | |
| Mozilla Kraken 1.1 - Total | |
| Intel Core i5-12400F | |
| AMD Ryzen 9 5950X | |
| Intel Core i5-13400 | |
| AMD Ryzen 7 7840HS | |
| Intel Core i5-12600K | |
| AMD Ryzen 7 7800X3D | |
| AMD Ryzen 9 7940HS | |
| Intel Core i9-12900K | |
| AMD Ryzen 7 7745HX | |
| Intel Core i5-13600K | |
| Intel Core i5-14600K | |
| AMD Ryzen 9 7945HX | |
| AMD Ryzen 5 7600X | |
| Intel Core i7-14700K | |
| AMD Ryzen 9 7950X3D | |
| AMD Ryzen 9 7950X | |
| Intel Core i9-13900K | |
| AMD Ryzen 9 7900X | |
| Intel Core i9-14900K | |
| AMD Ryzen 5 9600X | |
| 3DMark | |
| 1920x1080 Fire Strike Physics | |
| Intel Core i9-14900K | |
| Intel Core i9-13900K | |
| Intel Core i7-14700K | |
| AMD Ryzen 9 7950X3D | |
| AMD Ryzen 9 7900X | |
| AMD Ryzen 9 7950X | |
| Intel Core i5-14600K | |
| AMD Ryzen 9 5950X | |
| Intel Core i9-12900K | |
| AMD Ryzen 9 7945HX | |
| Intel Core i5-13600K | |
| AMD Ryzen 5 9600X | |
| AMD Ryzen 7 7800X3D | |
| AMD Ryzen 5 7600X | |
| Intel Core i5-12600K | |
| AMD Ryzen 7 7840HS | |
| AMD Ryzen 9 7940HS | |
| Intel Core i5-13400 | |
| Intel Core i5-12400F | |
| AMD Ryzen 7 7745HX | |
| 2560x1440 Time Spy CPU | |
| Intel Core i9-14900K | |
| Intel Core i7-14700K | |
| Intel Core i9-13900K | |
| Intel Core i5-14600K | |
| Intel Core i9-12900K | |
| AMD Ryzen 9 7950X3D | |
| Intel Core i5-13600K | |
| AMD Ryzen 9 7900X | |
| AMD Ryzen 9 7950X | |
| AMD Ryzen 7 7800X3D | |
| Intel Core i5-12600K | |
| AMD Ryzen 9 5950X | |
| Intel Core i5-13400 | |
| AMD Ryzen 9 7945HX | |
| AMD Ryzen 7 7840HS | |
| AMD Ryzen 7 7745HX | |
| AMD Ryzen 5 9600X | |
| AMD Ryzen 9 7940HS | |
| AMD Ryzen 5 7600X | |
| Intel Core i5-12400F | |
* ... Moindre est la valeur, meilleures sont les performances
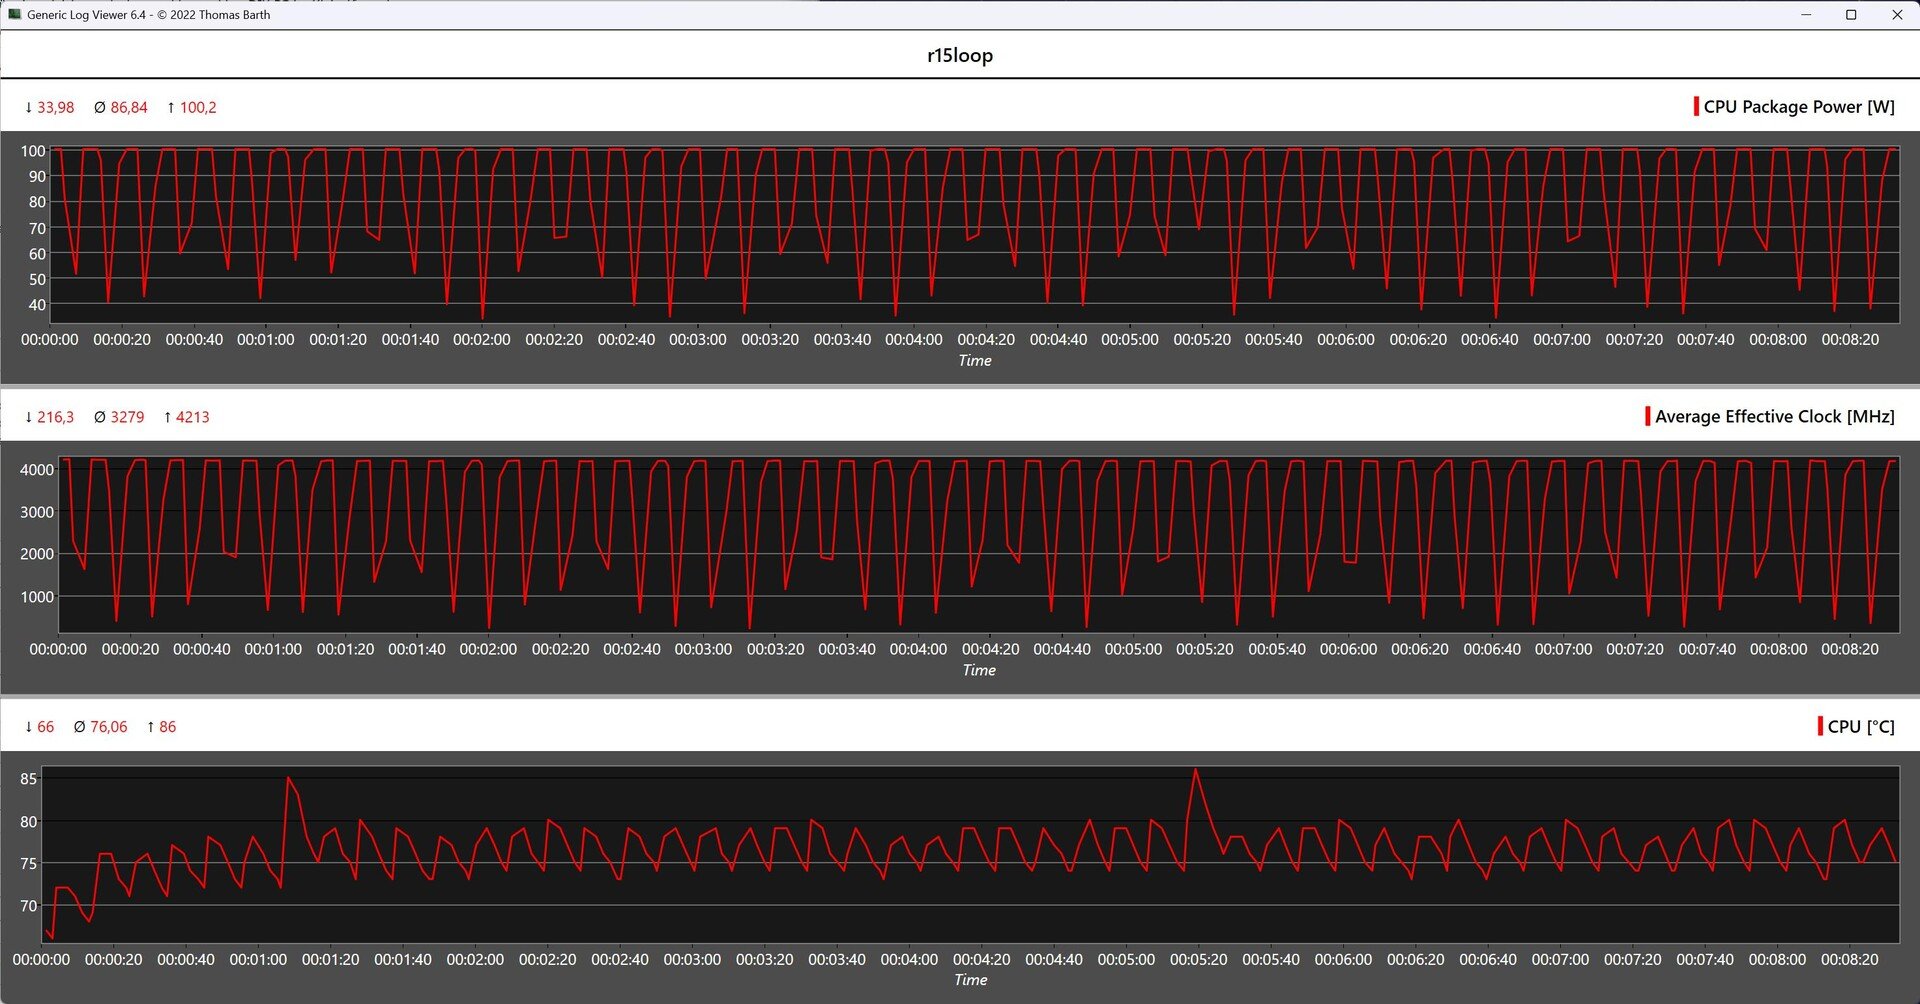
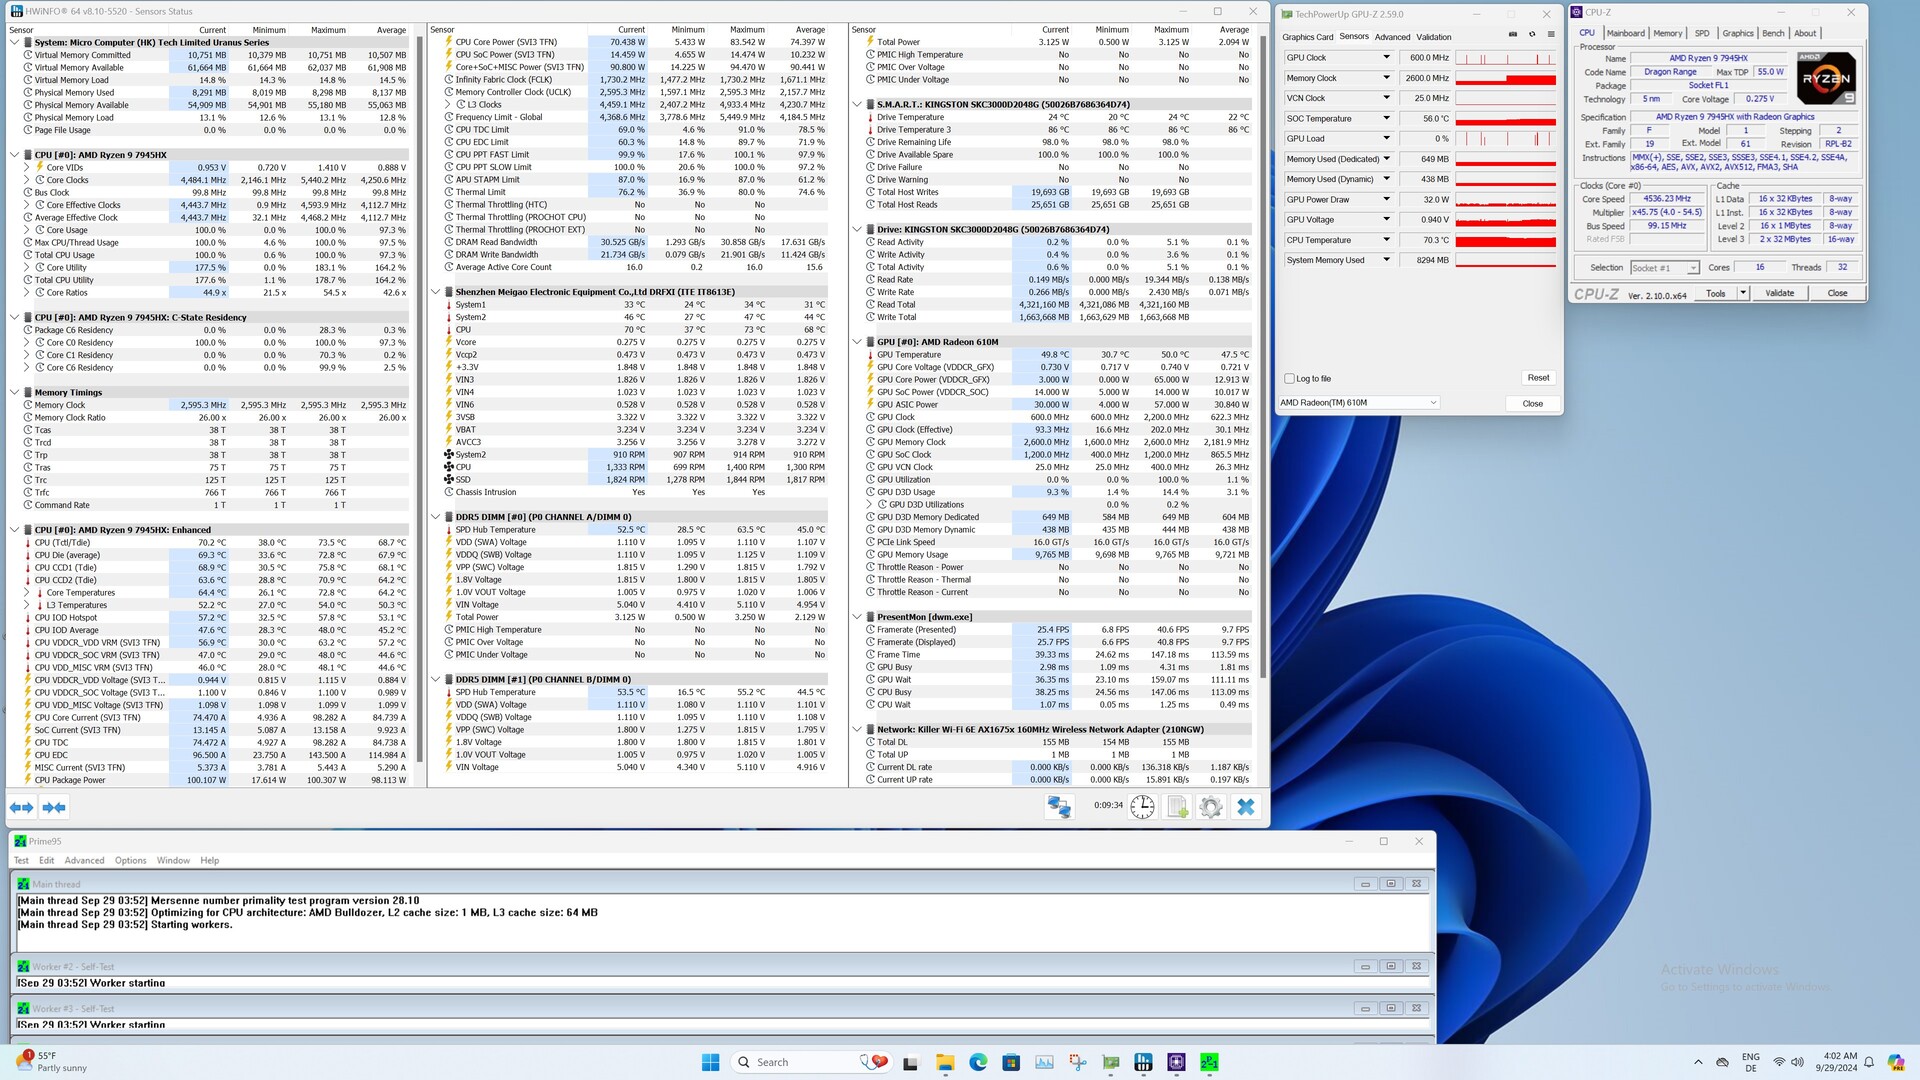
Résultats Cinebench AMD Ryzen 9 7945HX
Associée à la carte AMD Ryzen 9 7945HX, la carte mère Minisforum BD790i a parfaitement maîtrisé la boucle continue Cinebench R15. Les performances de ses 16 cœurs sont restées stables au cours des 50 exécutions, ce qui signifie qu'aucune perte de performance n'est à prévoir en cas de charge continue. Le refroidisseur installé en usine a bien fonctionné lors de ce test.
Performance du système
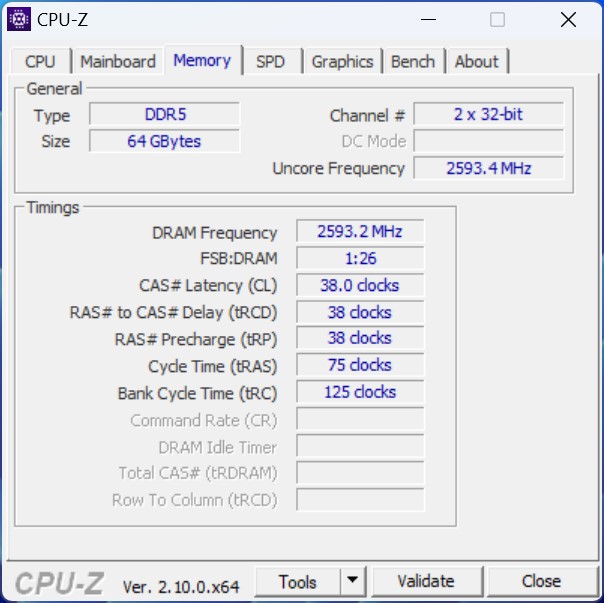
Le système de test basé sur le Minisforum BD790i n'a pas toujours été à la hauteur de ses concurrents lors des tests de performance. Néanmoins, les performances du système étaient généralement assez élevées. Le puissant et en même temps relativement frugal AMD Ryzen 9 7945HX ne montre aucune faiblesse dans l'utilisation quotidienne. La combinaison de son SSD NVMe rapide et de sa RAM DDR5 lui laisse une marge de manœuvre suffisante pour maîtriser même les tâches gourmandes en énergie.
| Performance Rating - Percent | |
| AMD Ryzen 9 7950X3D, NVIDIA GeForce RTX 4090 -1! | |
| AMD Ryzen 9 7950X, NVIDIA GeForce RTX 3090 | |
| AMD Ryzen 9 7900X, NVIDIA GeForce RTX 3090 | |
| Intel Core i9-14900K, NVIDIA GeForce RTX 4090 | |
| AMD Ryzen 5 7600X, NVIDIA GeForce RTX 3090 | |
| Intel Core i9-13900K, NVIDIA GeForce RTX 3090 | |
| Intel Core i5-13600K, NVIDIA GeForce RTX 3090 | |
| Intel Core i5-14600K, NVIDIA GeForce RTX 4090 | |
| AMD Ryzen 7 7800X3D, NVIDIA GeForce RTX 4090 | |
| AMD Ryzen 9 5950X, NVIDIA Titan RTX | |
| Intel Core i9-12900K, NVIDIA Titan RTX | |
| Intel Core i5-13400, NVIDIA GeForce RTX 4090 | |
| AMD Ryzen 9 7945HX, AMD Radeon 610M | |
| Intel Core i5-12600K, NVIDIA Titan RTX | |
| AMD Ryzen 7 7745HX, AMD Radeon 610M | |
| AMD Ryzen 7 7840HS, AMD Radeon 780M | |
| AMD Ryzen 9 7940HS, AMD Radeon 780M | |
| Intel Core i5-12400F, NVIDIA GeForce RTX 4090 | |
| CrossMark / Overall | |
| Intel Core i9-14900K, NVIDIA GeForce RTX 4090 | |
| Intel Core i9-13900K, NVIDIA GeForce RTX 3090 | |
| AMD Ryzen 9 7950X, NVIDIA GeForce RTX 3090 | |
| AMD Ryzen 9 7900X, NVIDIA GeForce RTX 3090 | |
| Intel Core i5-14600K, NVIDIA GeForce RTX 4090 | |
| Intel Core i5-13600K, NVIDIA GeForce RTX 3090 | |
| AMD Ryzen 9 7945HX, AMD Radeon 610M | |
| AMD Ryzen 5 7600X, NVIDIA GeForce RTX 3090 | |
| AMD Ryzen 7 7800X3D, NVIDIA GeForce RTX 4090 | |
| AMD Ryzen 9 7950X3D, NVIDIA GeForce RTX 4090 | |
| AMD Ryzen 7 7745HX, AMD Radeon 610M | |
| Intel Core i5-13400, NVIDIA GeForce RTX 4090 | |
| Intel Core i5-12400F, NVIDIA GeForce RTX 4090 | |
| AMD Ryzen 7 7840HS, AMD Radeon 780M | |
| AMD Ryzen 9 7940HS, AMD Radeon 780M | |
| AMD Ryzen 9 5950X, NVIDIA Titan RTX | |
| CrossMark / Productivity | |
| Intel Core i9-14900K, NVIDIA GeForce RTX 4090 | |
| Intel Core i9-13900K, NVIDIA GeForce RTX 3090 | |
| AMD Ryzen 9 7950X, NVIDIA GeForce RTX 3090 | |
| AMD Ryzen 9 7900X, NVIDIA GeForce RTX 3090 | |
| Intel Core i5-14600K, NVIDIA GeForce RTX 4090 | |
| Intel Core i5-13600K, NVIDIA GeForce RTX 3090 | |
| AMD Ryzen 5 7600X, NVIDIA GeForce RTX 3090 | |
| AMD Ryzen 9 7945HX, AMD Radeon 610M | |
| AMD Ryzen 7 7800X3D, NVIDIA GeForce RTX 4090 | |
| AMD Ryzen 7 7745HX, AMD Radeon 610M | |
| AMD Ryzen 9 7950X3D, NVIDIA GeForce RTX 4090 | |
| Intel Core i5-13400, NVIDIA GeForce RTX 4090 | |
| AMD Ryzen 9 7940HS, AMD Radeon 780M | |
| Intel Core i5-12400F, NVIDIA GeForce RTX 4090 | |
| AMD Ryzen 7 7840HS, AMD Radeon 780M | |
| AMD Ryzen 9 5950X, NVIDIA Titan RTX | |
| CrossMark / Creativity | |
| Intel Core i9-14900K, NVIDIA GeForce RTX 4090 | |
| AMD Ryzen 9 7950X, NVIDIA GeForce RTX 3090 | |
| Intel Core i9-13900K, NVIDIA GeForce RTX 3090 | |
| AMD Ryzen 9 7900X, NVIDIA GeForce RTX 3090 | |
| Intel Core i5-14600K, NVIDIA GeForce RTX 4090 | |
| AMD Ryzen 9 7950X3D, NVIDIA GeForce RTX 4090 | |
| AMD Ryzen 9 7945HX, AMD Radeon 610M | |
| AMD Ryzen 7 7800X3D, NVIDIA GeForce RTX 4090 | |
| AMD Ryzen 5 7600X, NVIDIA GeForce RTX 3090 | |
| Intel Core i5-13600K, NVIDIA GeForce RTX 3090 | |
| AMD Ryzen 7 7745HX, AMD Radeon 610M | |
| AMD Ryzen 7 7840HS, AMD Radeon 780M | |
| Intel Core i5-13400, NVIDIA GeForce RTX 4090 | |
| AMD Ryzen 9 7940HS, AMD Radeon 780M | |
| Intel Core i5-12400F, NVIDIA GeForce RTX 4090 | |
| AMD Ryzen 9 5950X, NVIDIA Titan RTX | |
| CrossMark / Responsiveness | |
| Intel Core i9-13900K, NVIDIA GeForce RTX 3090 | |
| Intel Core i9-14900K, NVIDIA GeForce RTX 4090 | |
| Intel Core i5-13600K, NVIDIA GeForce RTX 3090 | |
| AMD Ryzen 9 7950X, NVIDIA GeForce RTX 3090 | |
| AMD Ryzen 9 7900X, NVIDIA GeForce RTX 3090 | |
| AMD Ryzen 5 7600X, NVIDIA GeForce RTX 3090 | |
| Intel Core i5-14600K, NVIDIA GeForce RTX 4090 | |
| AMD Ryzen 7 7800X3D, NVIDIA GeForce RTX 4090 | |
| AMD Ryzen 9 7945HX, AMD Radeon 610M | |
| AMD Ryzen 7 7745HX, AMD Radeon 610M | |
| Intel Core i5-13400, NVIDIA GeForce RTX 4090 | |
| Intel Core i5-12400F, NVIDIA GeForce RTX 4090 | |
| AMD Ryzen 9 7950X3D, NVIDIA GeForce RTX 4090 | |
| AMD Ryzen 9 7940HS, AMD Radeon 780M | |
| AMD Ryzen 7 7840HS, AMD Radeon 780M | |
| AMD Ryzen 9 5950X, NVIDIA Titan RTX | |
| AIDA64 / Memory Copy | |
| Intel Core i9-14900K, NVIDIA GeForce RTX 4090 | |
| Intel Core i5-14600K, NVIDIA GeForce RTX 4090 | |
| Intel Core i9-13900K, NVIDIA GeForce RTX 3090 | |
| AMD Ryzen 9 7950X3D, NVIDIA GeForce RTX 4090 | |
| Intel Core i9-12900K, NVIDIA Titan RTX | |
| AMD Ryzen 9 7950X, NVIDIA GeForce RTX 3090 | |
| Intel Core i5-13400, NVIDIA GeForce RTX 4090 | |
| Intel Core i5-13600K, NVIDIA GeForce RTX 3090 | |
| Intel Core i5-12400F, NVIDIA GeForce RTX 4090 | |
| Intel Core i5-12600K, NVIDIA Titan RTX | |
| AMD Ryzen 9 7900X, NVIDIA GeForce RTX 3090 | |
| AMD Ryzen 7 7840HS, AMD Radeon 780M | |
| Moyenne de la classe Desktop (43747 - 88386, n=12, 2 dernières années) | |
| AMD Ryzen 7 7800X3D, NVIDIA GeForce RTX 4090 | |
| AMD Ryzen 9 7940HS, AMD Radeon 780M | |
| AMD Ryzen 5 7600X, NVIDIA GeForce RTX 3090 | |
| AMD Ryzen 9 5950X, NVIDIA Titan RTX | |
| AMD Ryzen 9 7945HX, AMD Radeon 610M | |
| AMD Ryzen 7 7745HX, AMD Radeon 610M | |
| Moyenne AMD Ryzen 9 7945HX (48948 - 57953, n=5) | |
| AIDA64 / Memory Read | |
| Intel Core i9-14900K, NVIDIA GeForce RTX 4090 | |
| Intel Core i5-14600K, NVIDIA GeForce RTX 4090 | |
| Intel Core i9-13900K, NVIDIA GeForce RTX 3090 | |
| Intel Core i9-12900K, NVIDIA Titan RTX | |
| AMD Ryzen 9 7950X3D, NVIDIA GeForce RTX 4090 | |
| AMD Ryzen 9 7950X, NVIDIA GeForce RTX 3090 | |
| Intel Core i5-13400, NVIDIA GeForce RTX 4090 | |
| Intel Core i5-12600K, NVIDIA Titan RTX | |
| Intel Core i5-13600K, NVIDIA GeForce RTX 3090 | |
| AMD Ryzen 9 7900X, NVIDIA GeForce RTX 3090 | |
| Intel Core i5-12400F, NVIDIA GeForce RTX 4090 | |
| Moyenne de la classe Desktop (47347 - 94830, n=12, 2 dernières années) | |
| AMD Ryzen 9 7945HX, AMD Radeon 610M | |
| AMD Ryzen 9 5950X, NVIDIA Titan RTX | |
| AMD Ryzen 7 7800X3D, NVIDIA GeForce RTX 4090 | |
| Moyenne AMD Ryzen 9 7945HX (59620 - 67753, n=5) | |
| AMD Ryzen 7 7840HS, AMD Radeon 780M | |
| AMD Ryzen 9 7940HS, AMD Radeon 780M | |
| AMD Ryzen 5 7600X, NVIDIA GeForce RTX 3090 | |
| AMD Ryzen 7 7745HX, AMD Radeon 610M | |
| AIDA64 / Memory Write | |
| AMD Ryzen 7 7800X3D, NVIDIA GeForce RTX 4090 | |
| AMD Ryzen 7 7840HS, AMD Radeon 780M | |
| AMD Ryzen 9 7950X3D, NVIDIA GeForce RTX 4090 | |
| Intel Core i5-14600K, NVIDIA GeForce RTX 4090 | |
| Intel Core i9-14900K, NVIDIA GeForce RTX 4090 | |
| AMD Ryzen 5 7600X, NVIDIA GeForce RTX 3090 | |
| AMD Ryzen 9 7950X, NVIDIA GeForce RTX 3090 | |
| AMD Ryzen 9 7940HS, AMD Radeon 780M | |
| AMD Ryzen 9 7900X, NVIDIA GeForce RTX 3090 | |
| Moyenne de la classe Desktop (46768 - 84869, n=12, 2 dernières années) | |
| Intel Core i9-13900K, NVIDIA GeForce RTX 3090 | |
| Intel Core i5-13400, NVIDIA GeForce RTX 4090 | |
| Intel Core i5-12600K, NVIDIA Titan RTX | |
| Intel Core i5-12400F, NVIDIA GeForce RTX 4090 | |
| Intel Core i9-12900K, NVIDIA Titan RTX | |
| Intel Core i5-13600K, NVIDIA GeForce RTX 3090 | |
| AMD Ryzen 7 7745HX, AMD Radeon 610M | |
| AMD Ryzen 9 7945HX, AMD Radeon 610M | |
| Moyenne AMD Ryzen 9 7945HX (58602 - 70063, n=5) | |
| AMD Ryzen 9 5950X, NVIDIA Titan RTX | |
| AIDA64 / Memory Latency | |
| AMD Ryzen 7 7840HS, AMD Radeon 780M | |
| AMD Ryzen 9 7940HS, AMD Radeon 780M | |
| Moyenne AMD Ryzen 9 7945HX (77.1 - 91.3, n=5) | |
| Intel Core i5-13600K, NVIDIA GeForce RTX 3090 | |
| AMD Ryzen 7 7745HX, AMD Radeon 610M | |
| Intel Core i5-12400F, NVIDIA GeForce RTX 4090 | |
| Intel Core i5-13400, NVIDIA GeForce RTX 4090 | |
| AMD Ryzen 9 7945HX, AMD Radeon 610M | |
| Intel Core i9-13900K, NVIDIA GeForce RTX 3090 | |
| Moyenne de la classe Desktop (64.3 - 90.3, n=12, 2 dernières années) | |
| Intel Core i9-14900K, NVIDIA GeForce RTX 4090 | |
| Intel Core i5-14600K, NVIDIA GeForce RTX 4090 | |
| AMD Ryzen 7 7800X3D, NVIDIA GeForce RTX 4090 | |
| AMD Ryzen 9 5950X, NVIDIA Titan RTX | |
| AMD Ryzen 9 7950X3D, NVIDIA GeForce RTX 4090 | |
| AMD Ryzen 5 7600X, NVIDIA GeForce RTX 3090 | |
| AMD Ryzen 9 7900X, NVIDIA GeForce RTX 3090 | |
| AMD Ryzen 9 7950X, NVIDIA GeForce RTX 3090 | |
* ... Moindre est la valeur, meilleures sont les performances
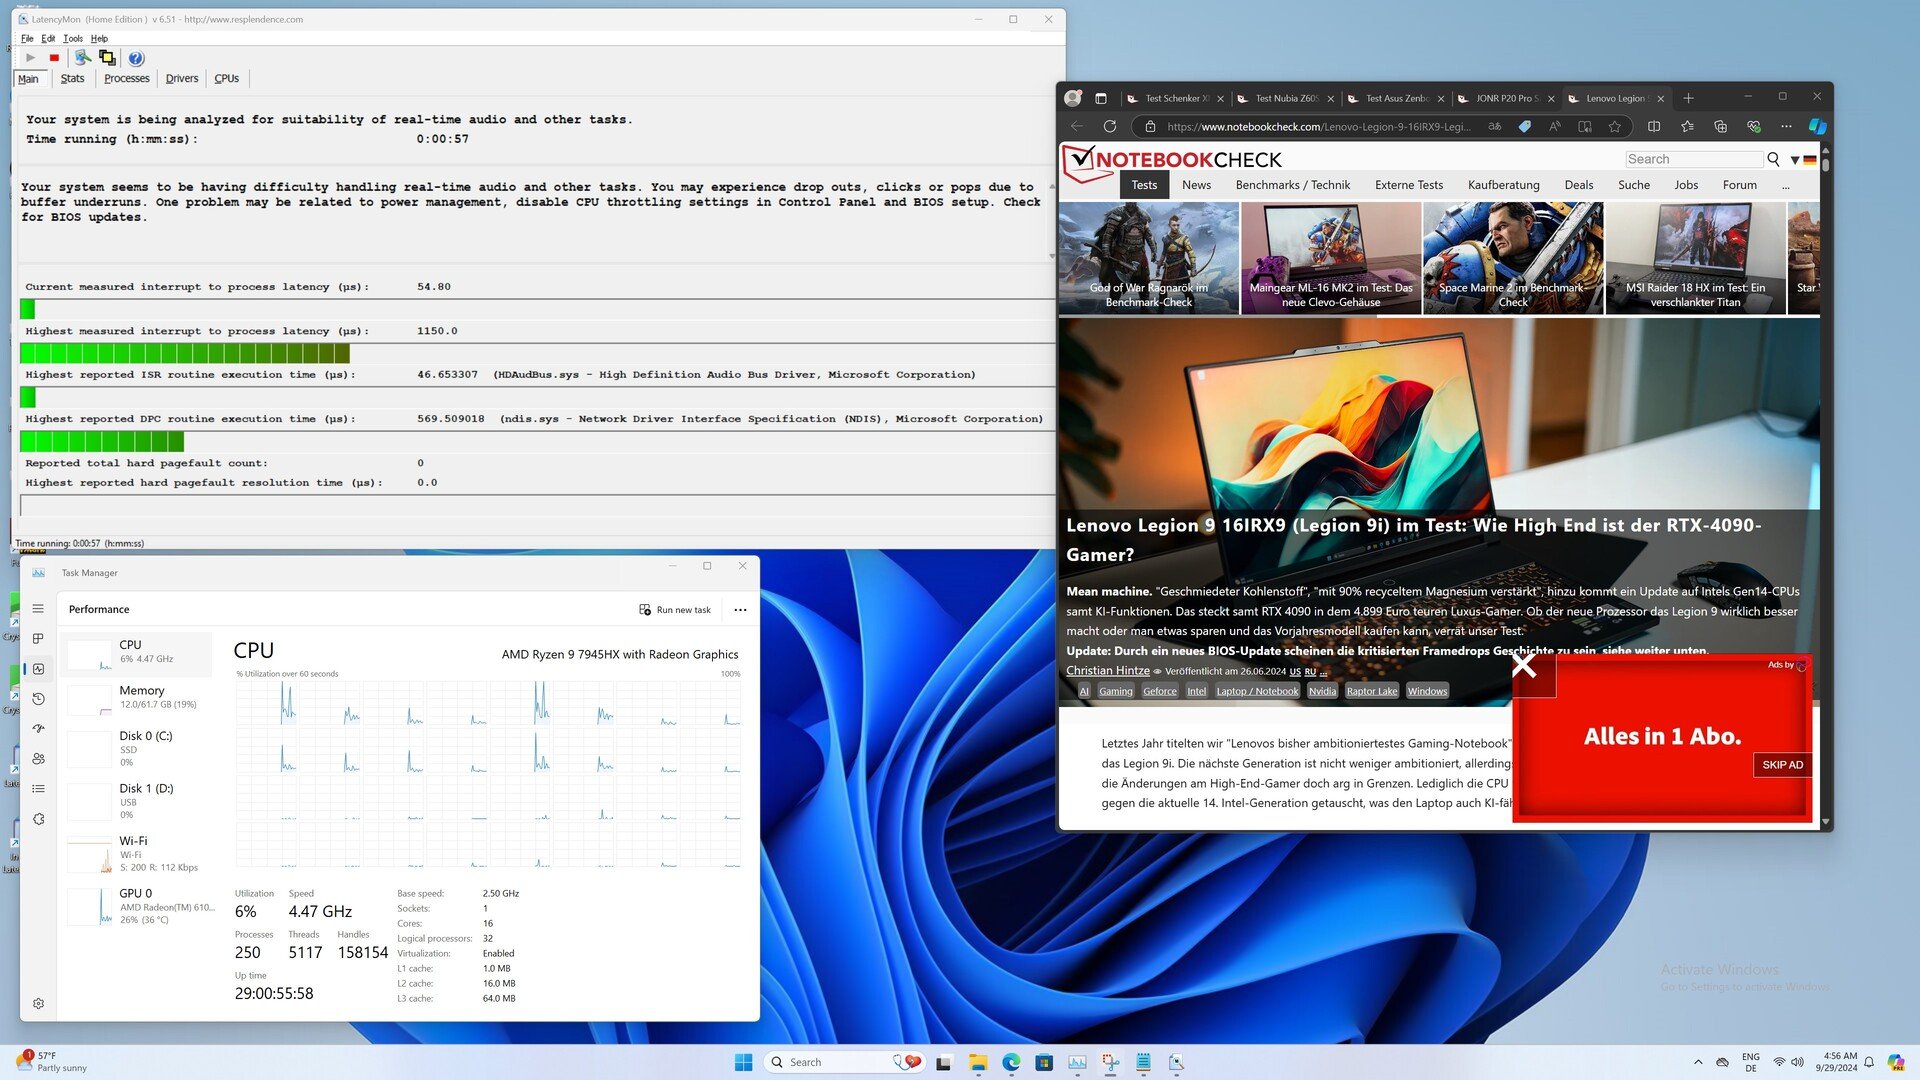
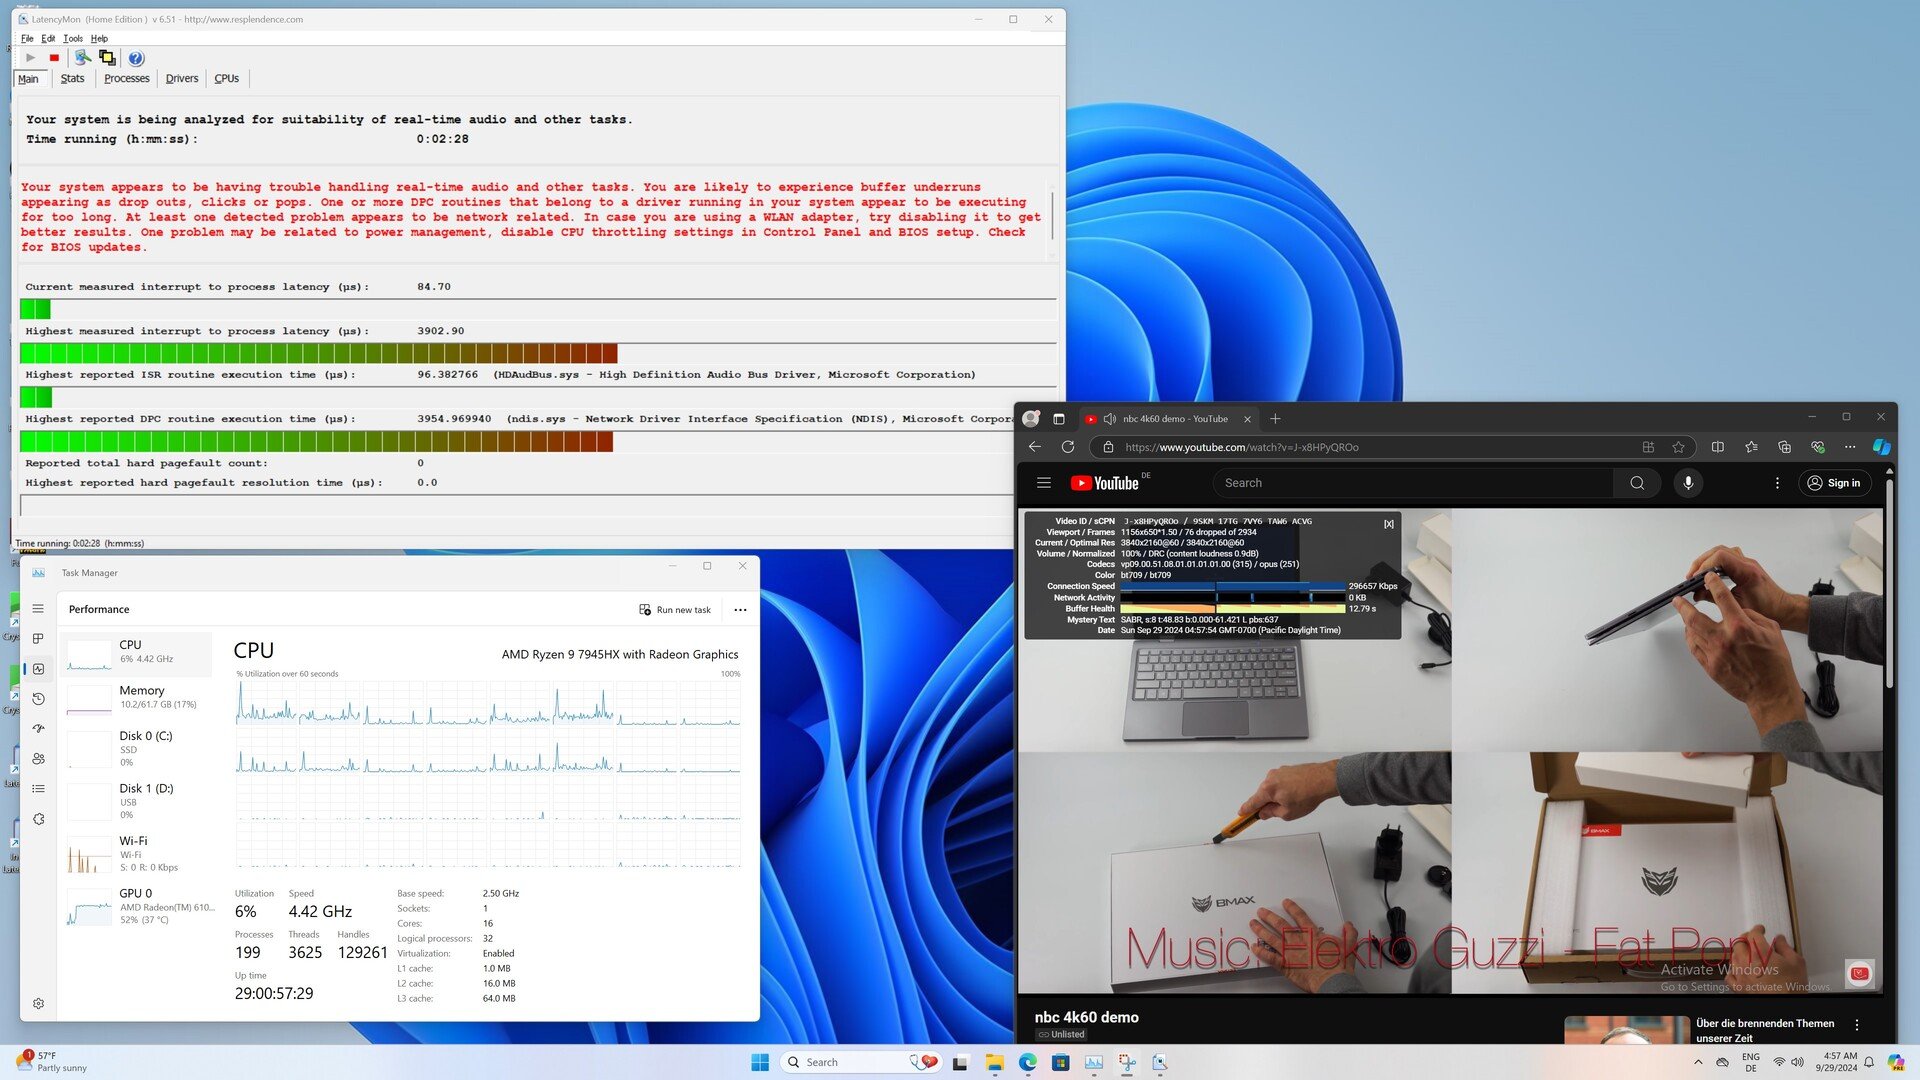
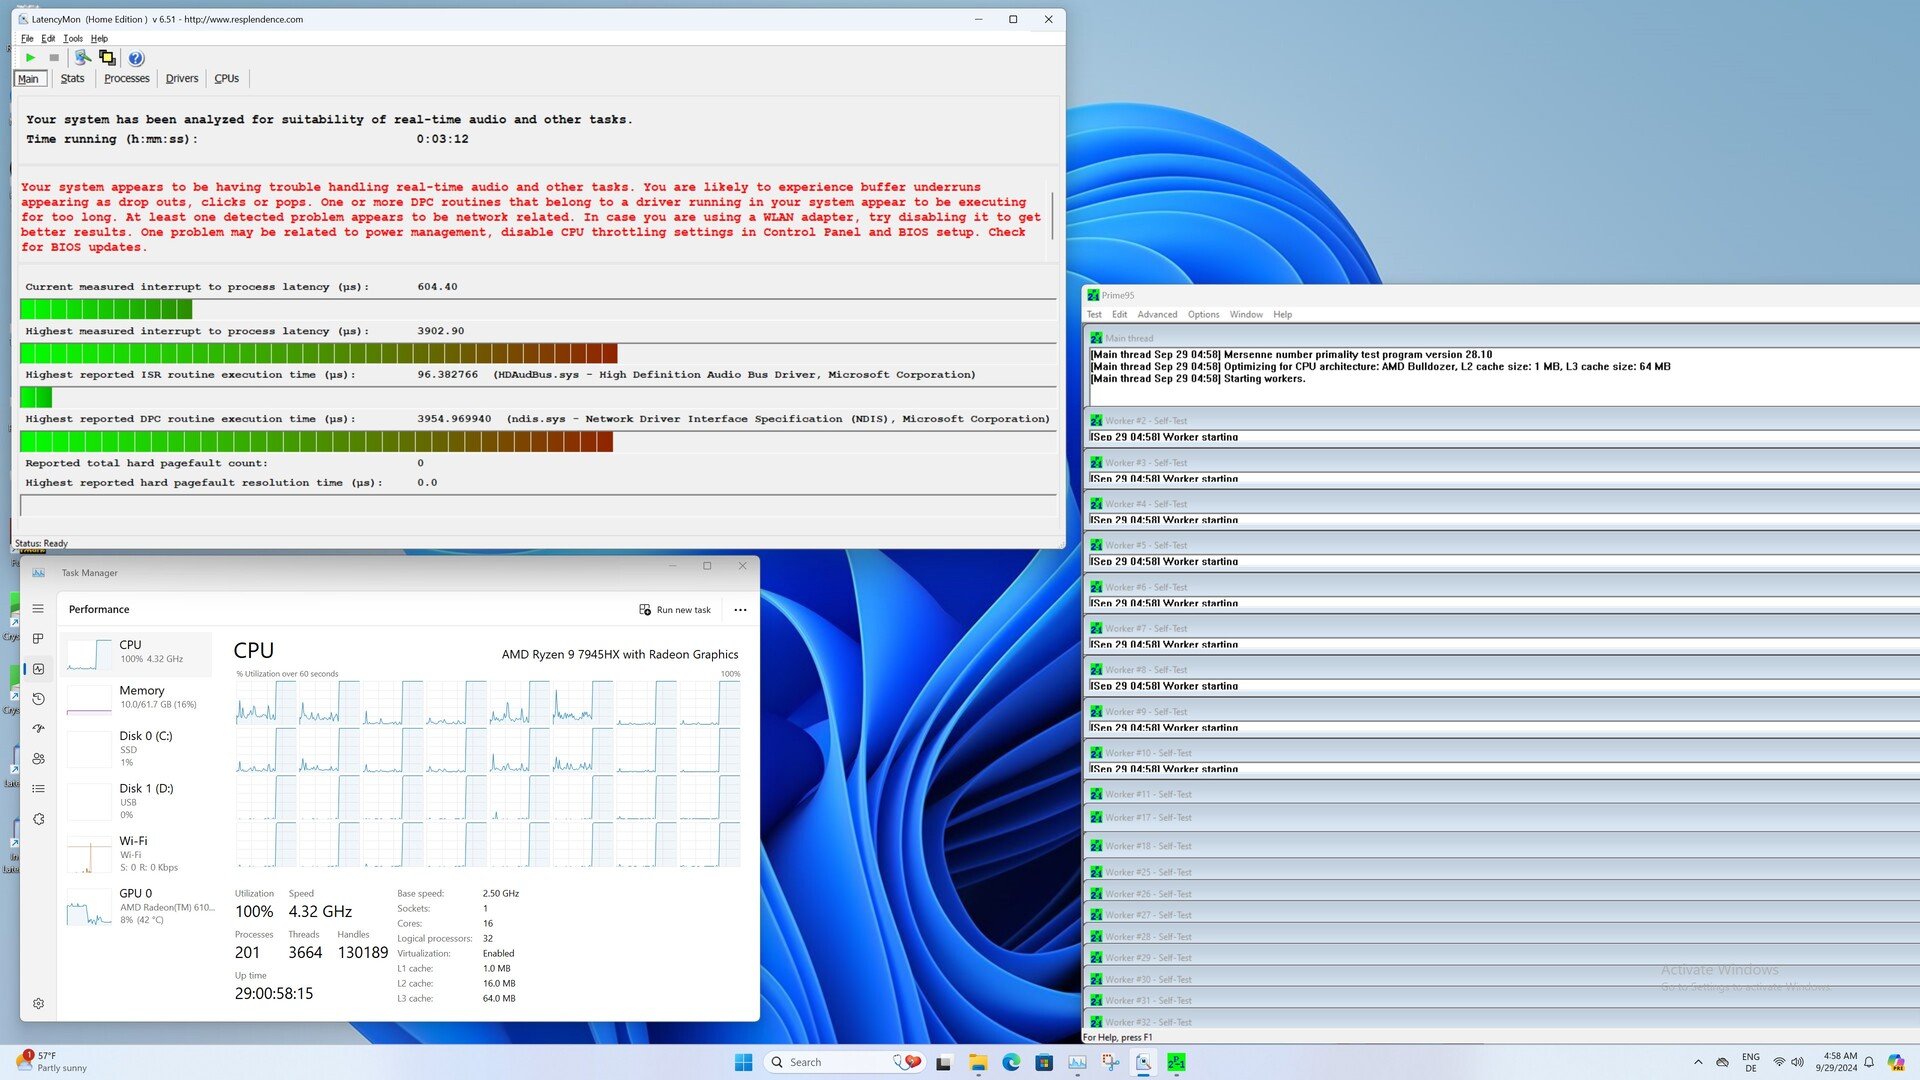
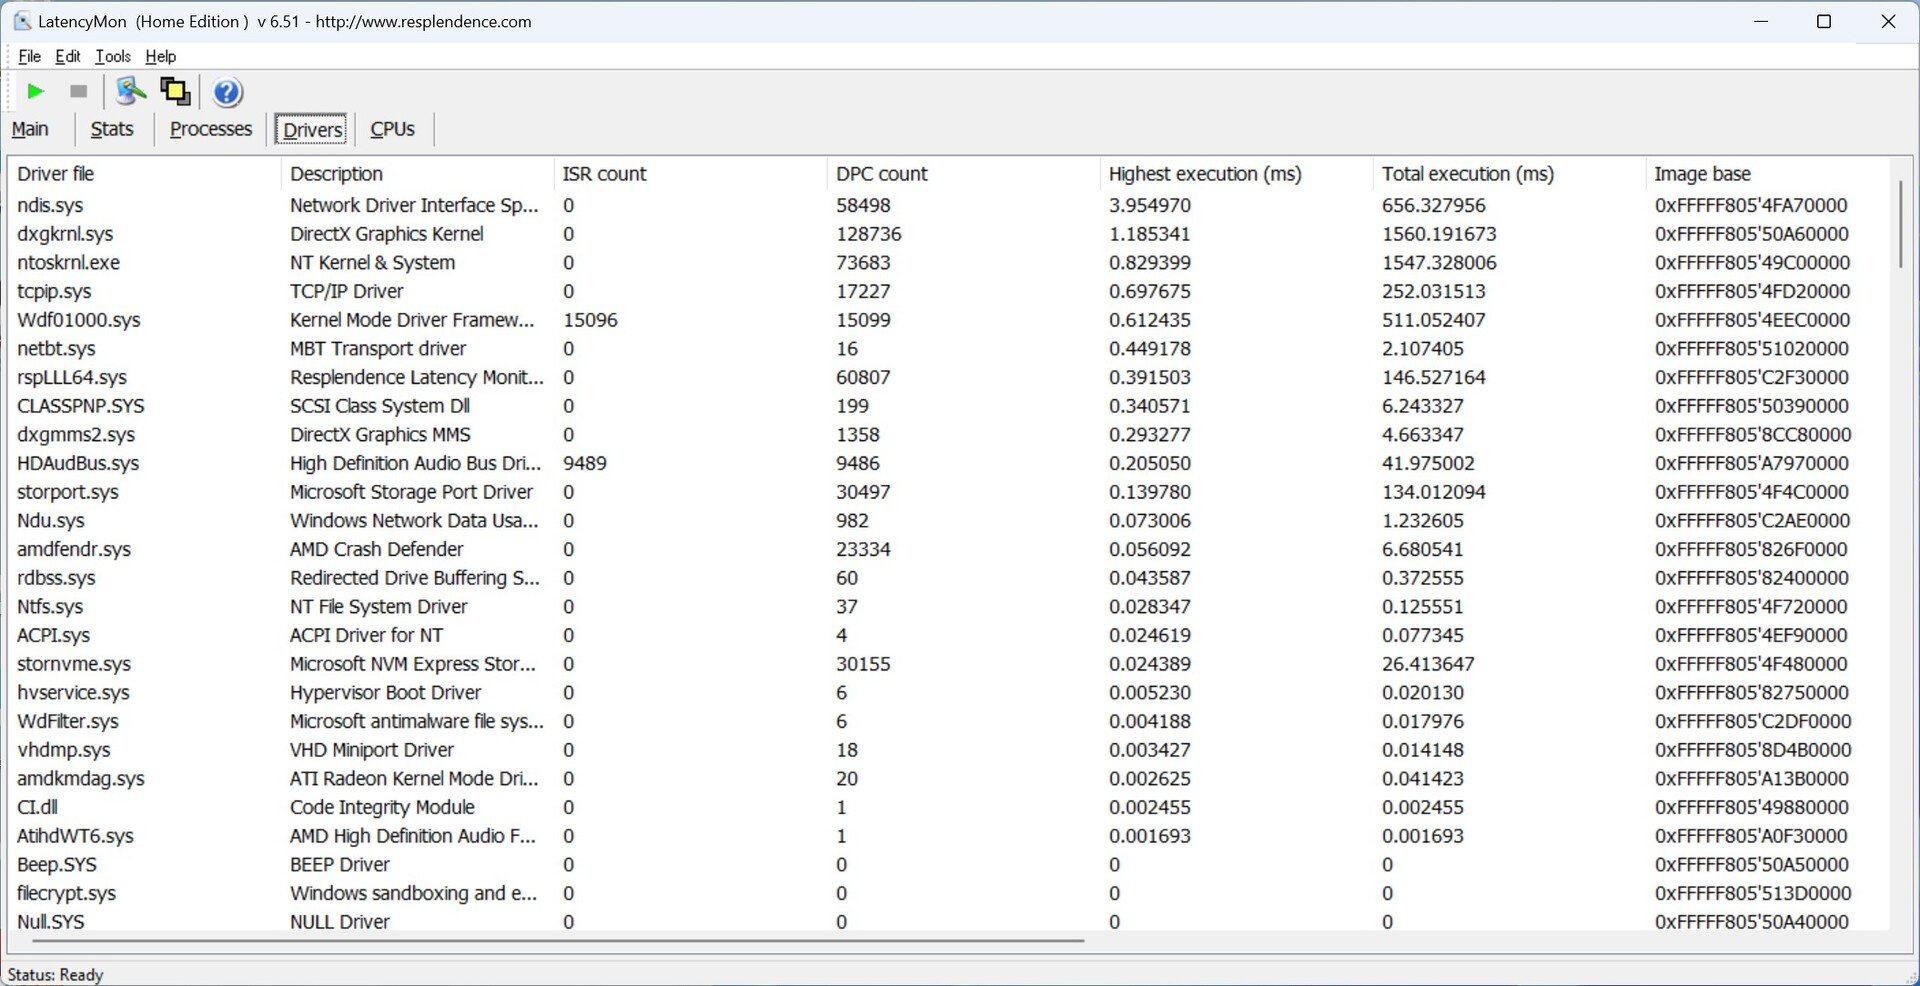
Latences DPC
Nous avons enregistré des latences relativement élevées dans notre système de test basé sur le Minisforum BD790i. Nous avons enregistré des valeurs élevées même en surfant simplement sur le web. Ces valeurs ont encore augmenté lors de la lecture de la vidéo de test 4K, ce qui signifie que le système ne semble pas adapté au traitement de matériel vidéo et audio en temps réel dans cette configuration.
| DPC Latencies / LatencyMon - interrupt to process latency (max), Web, Youtube, Prime95 | |
| Minisforum BD790i | |
| Minisforum EliteMini UM780 XTX | |
| Minisforum Venus Series UM790 Pro | |
| Minisforum BD770i | |
* ... Moindre est la valeur, meilleures sont les performances
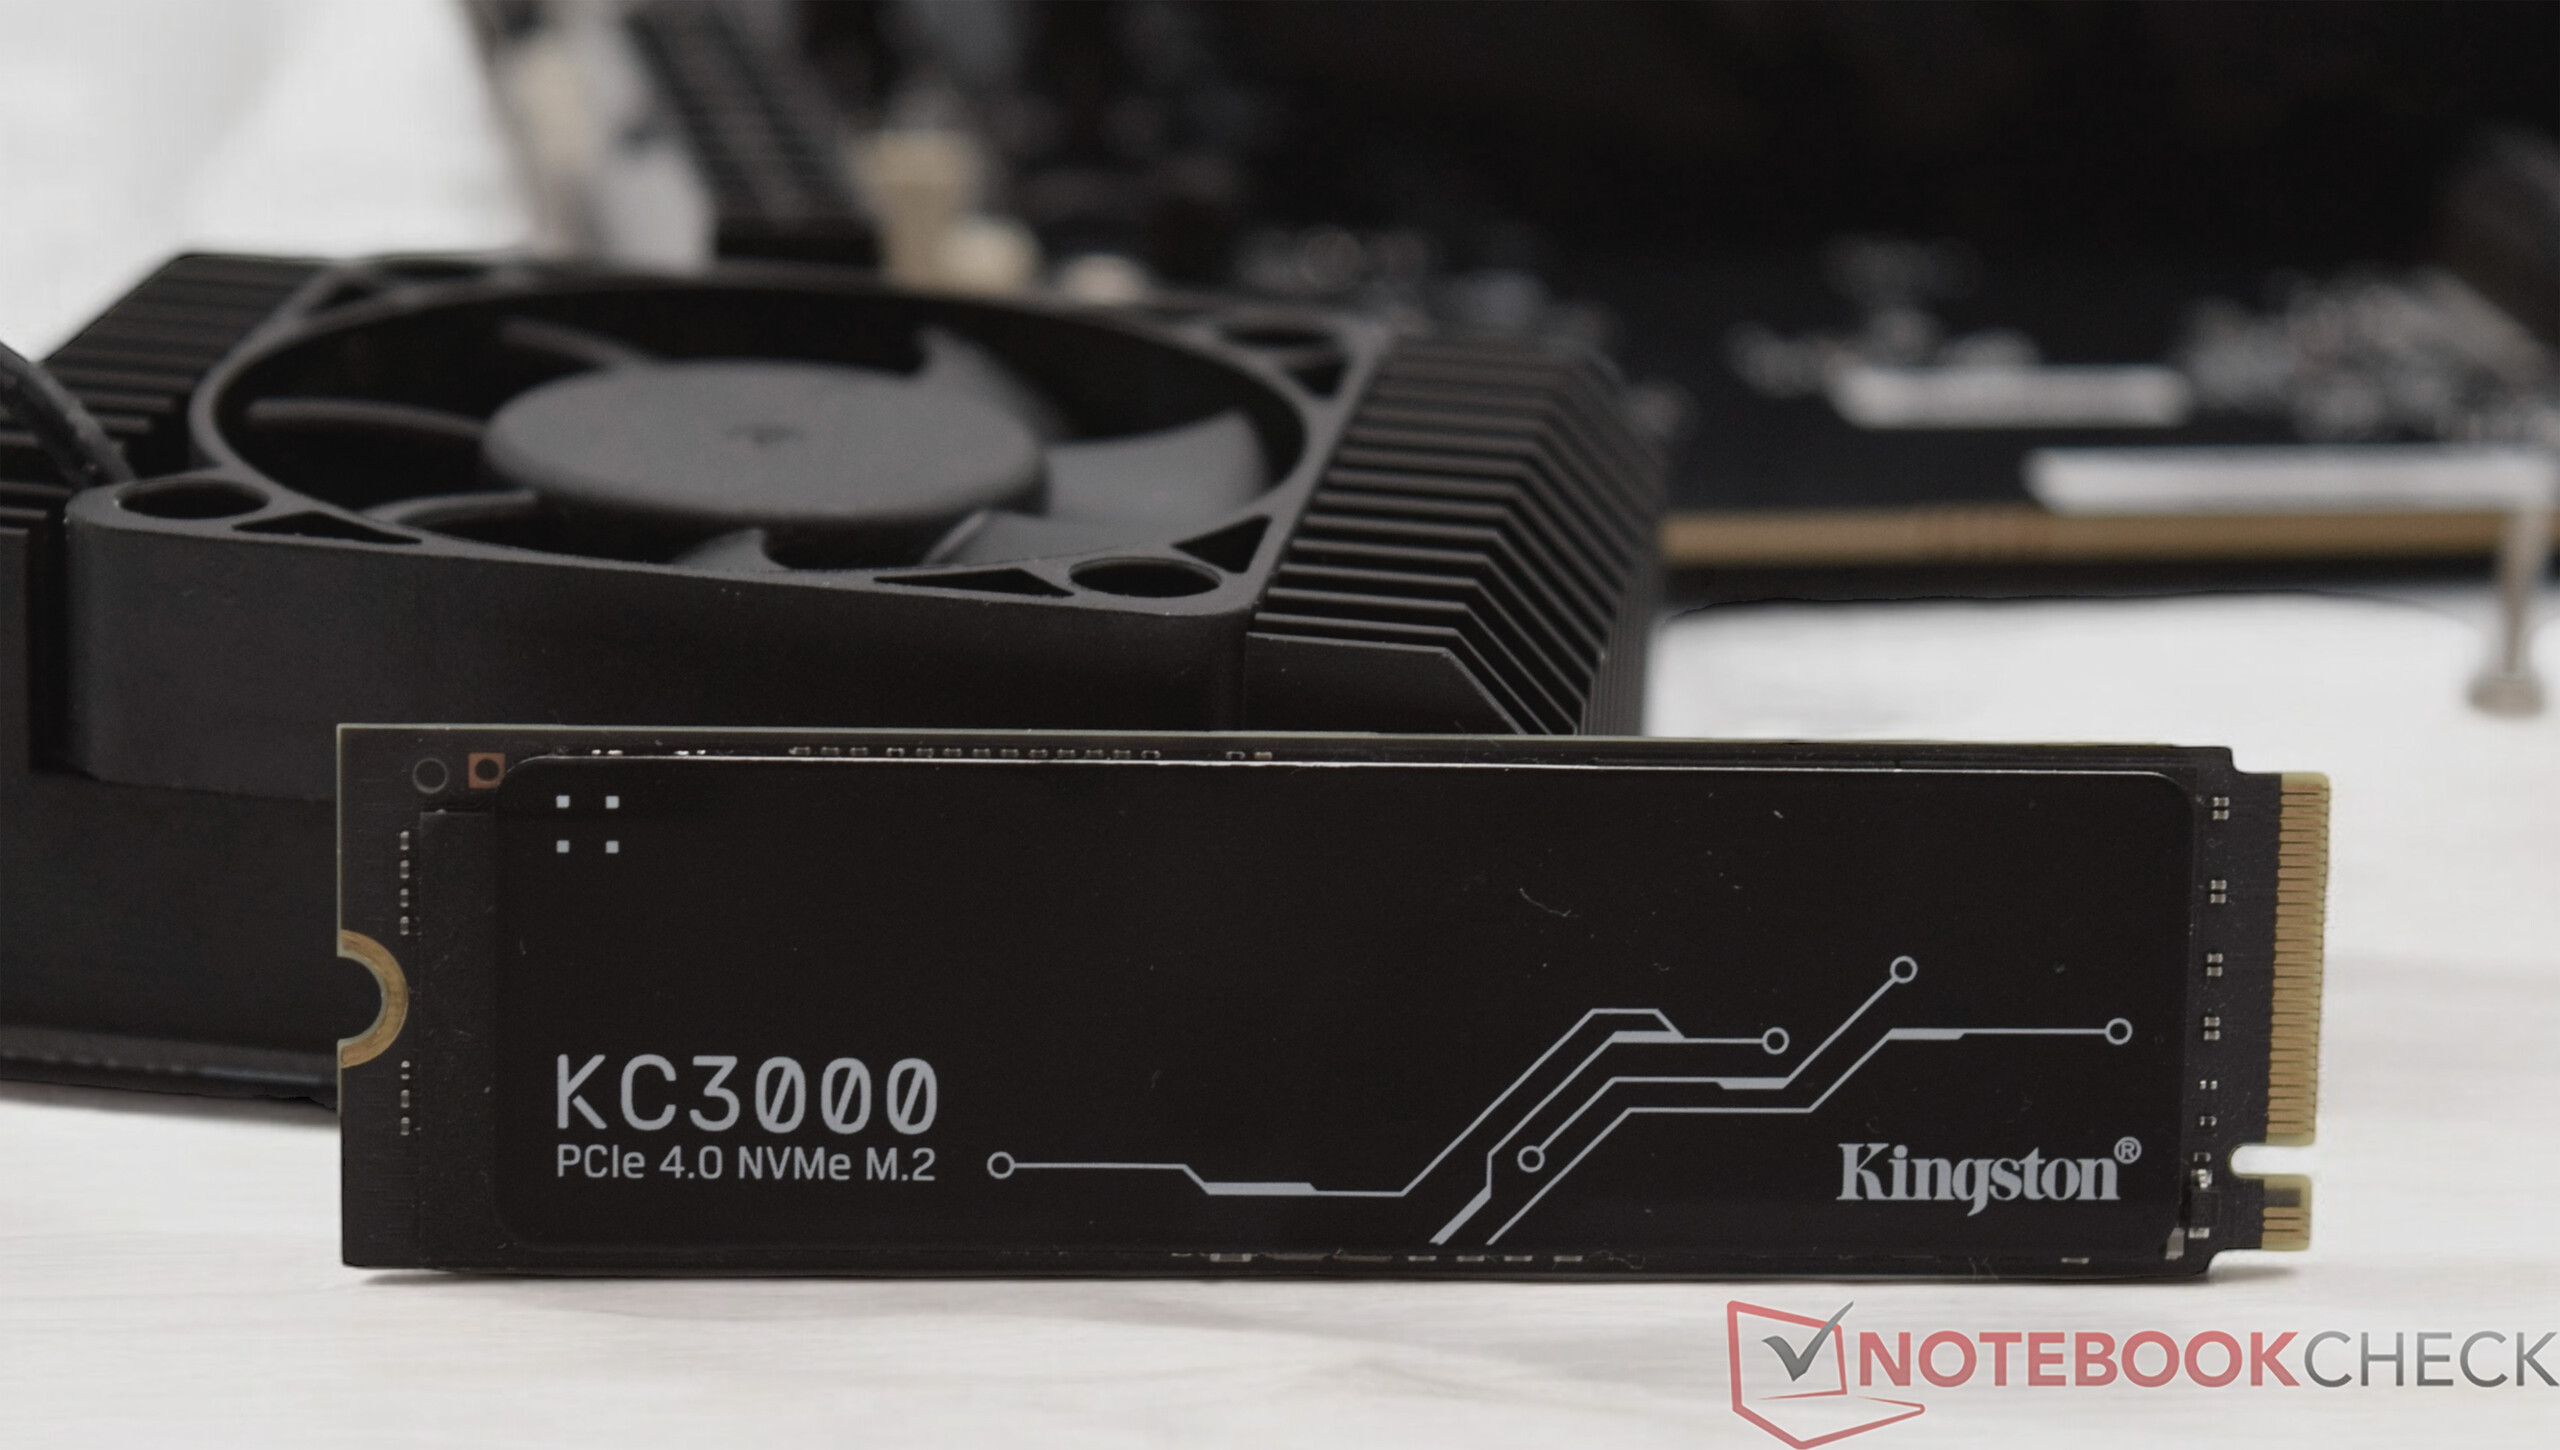
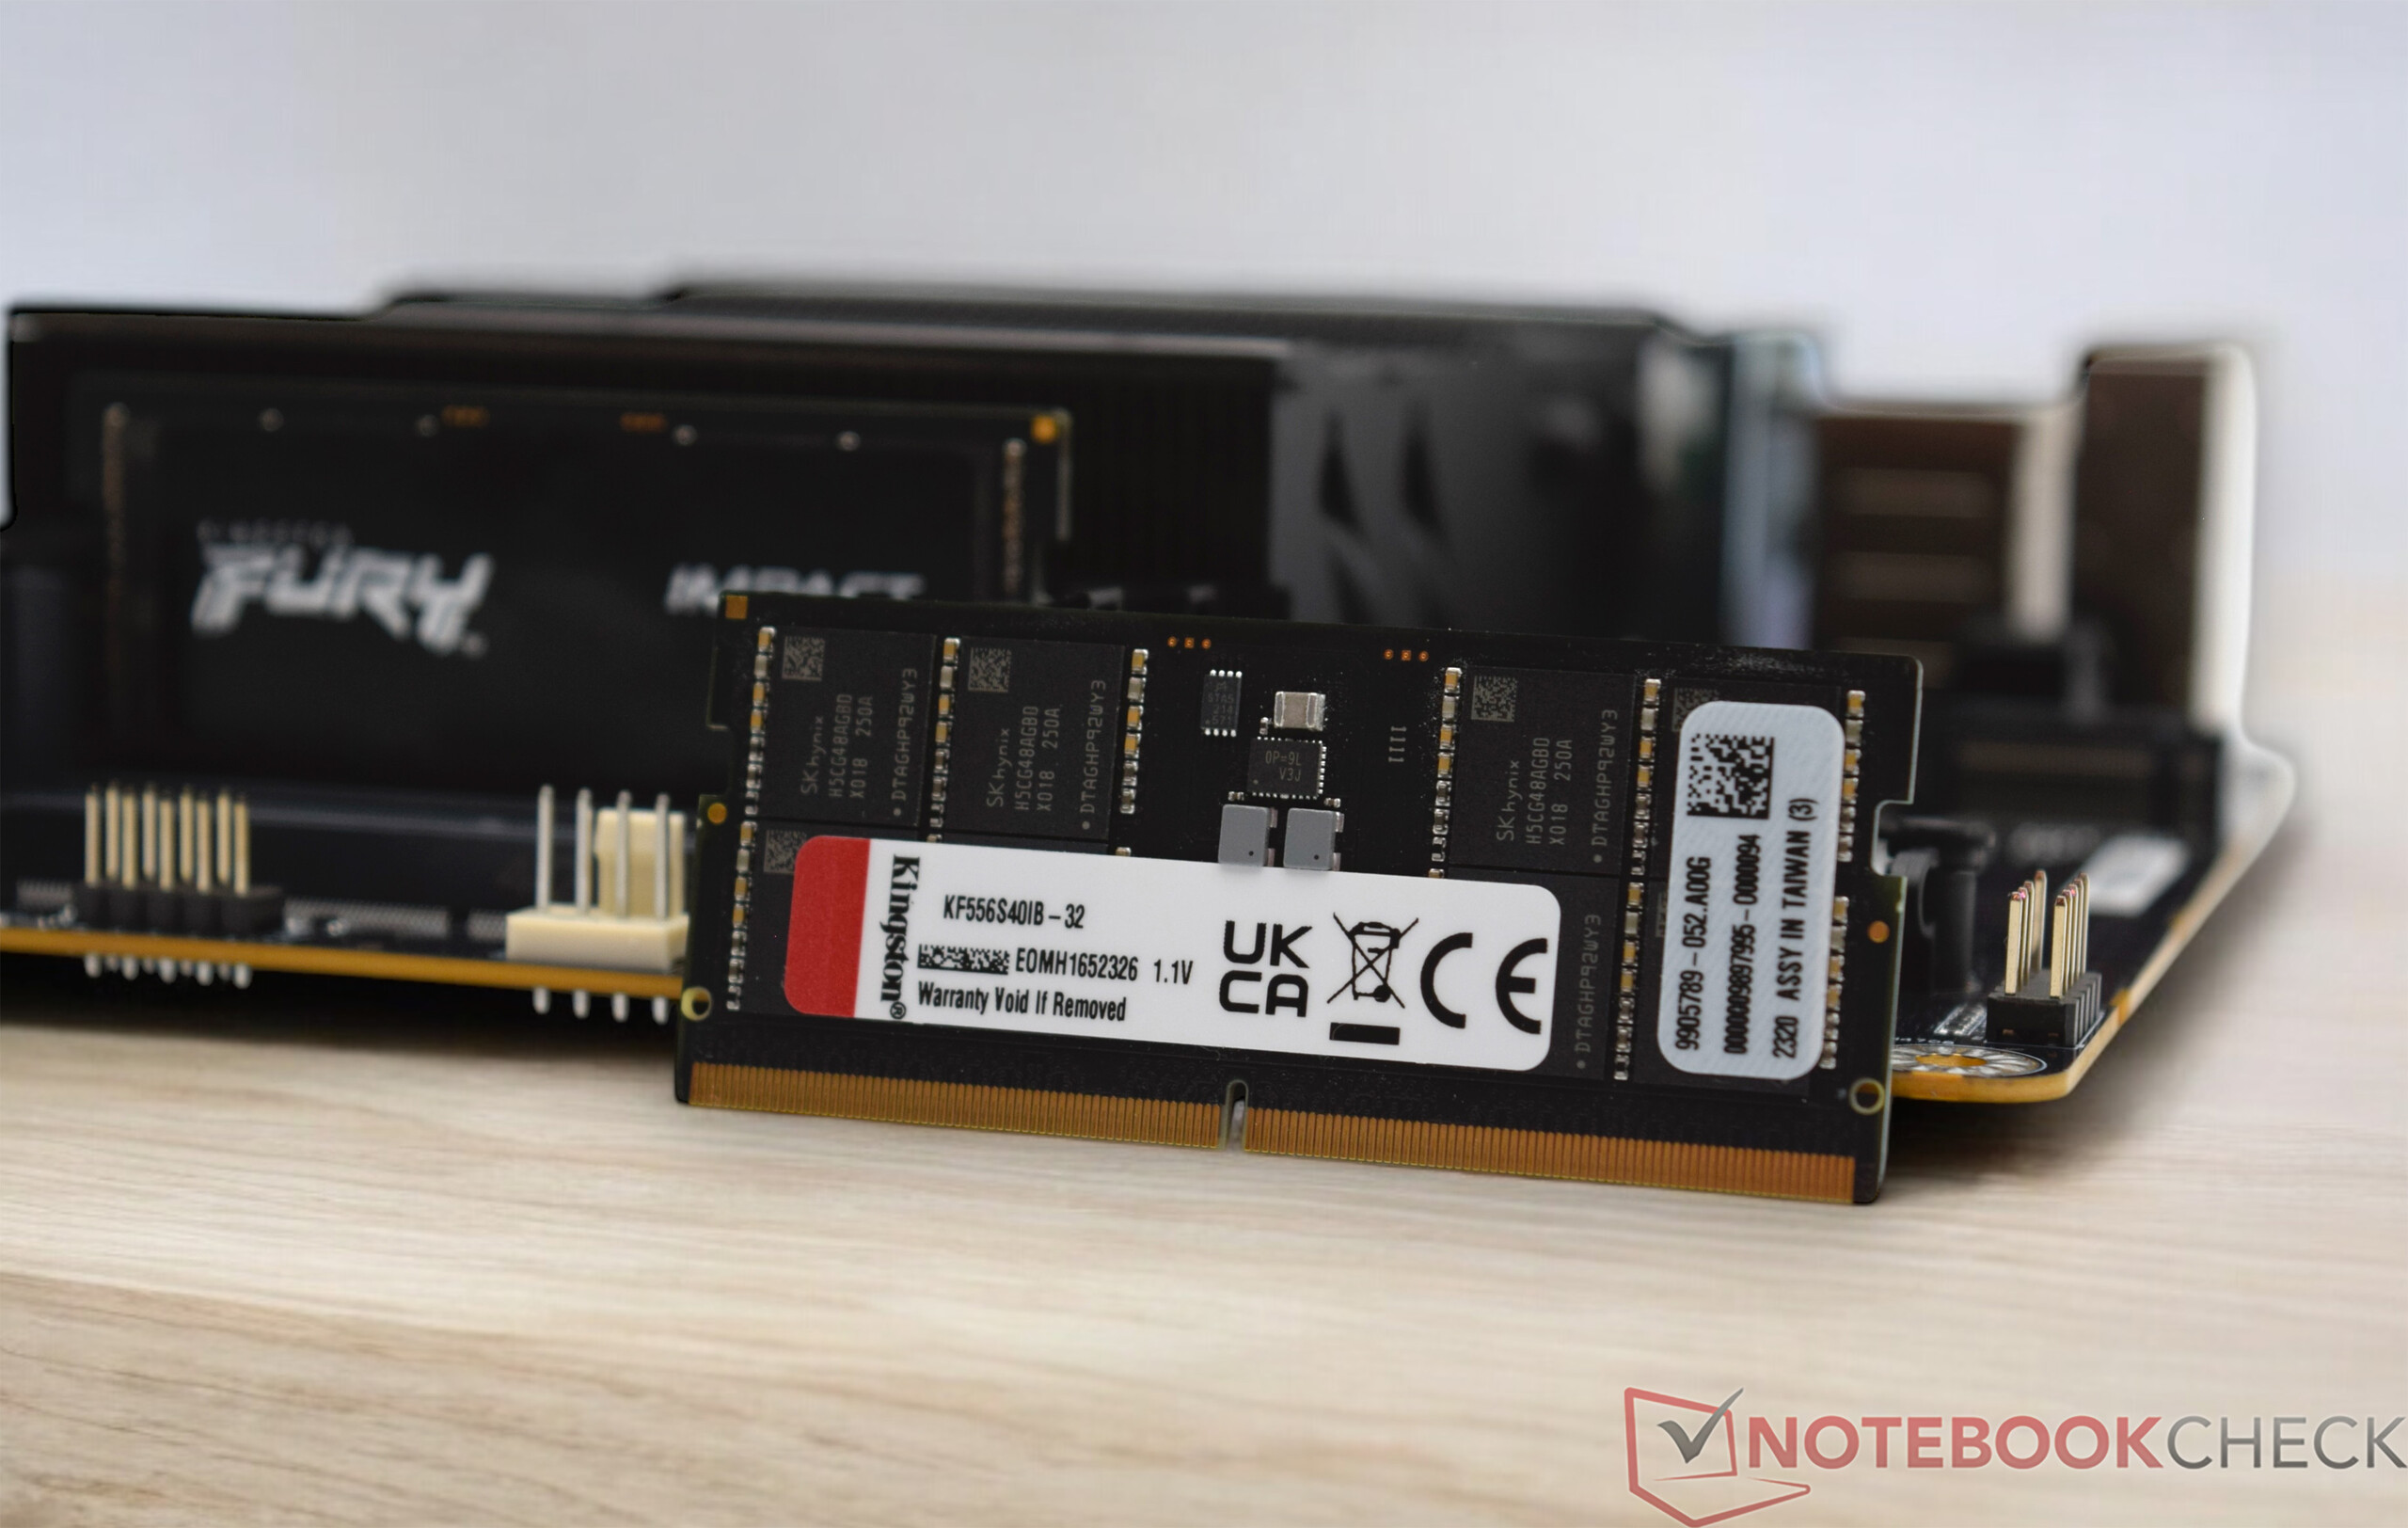
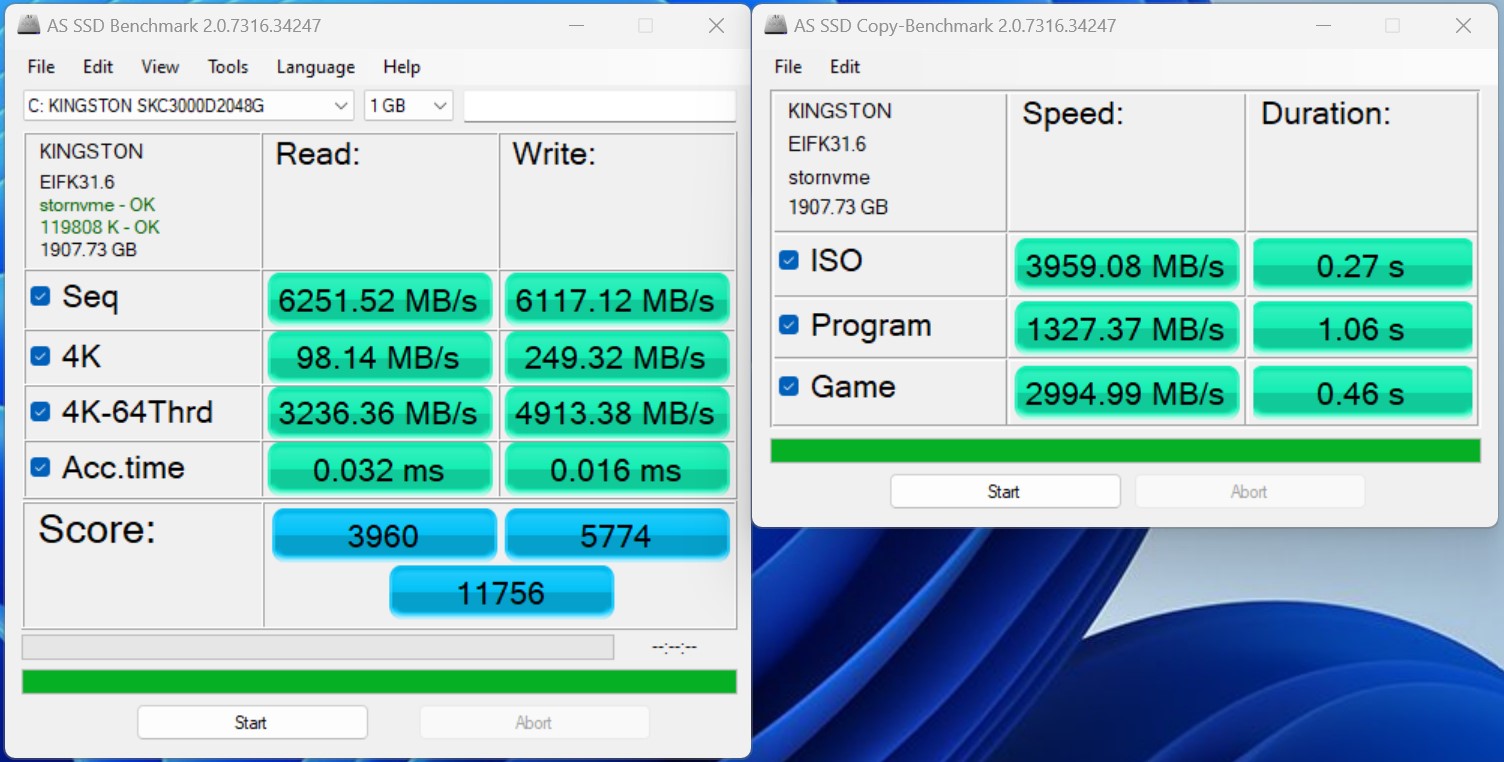
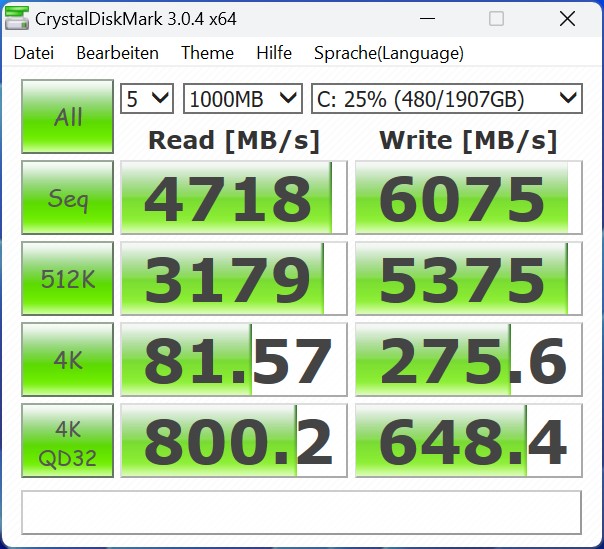
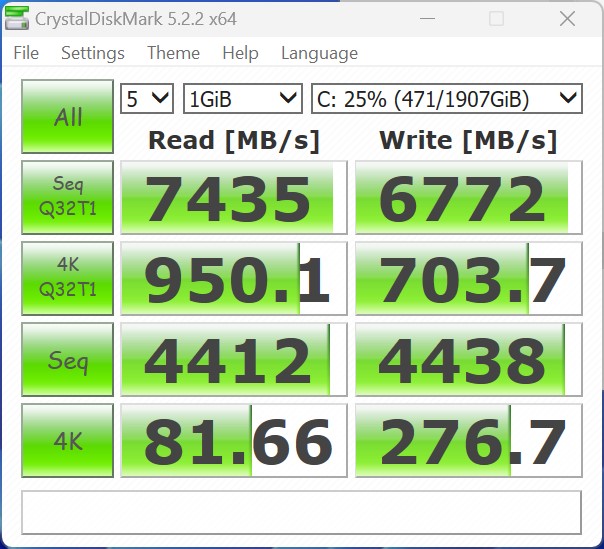
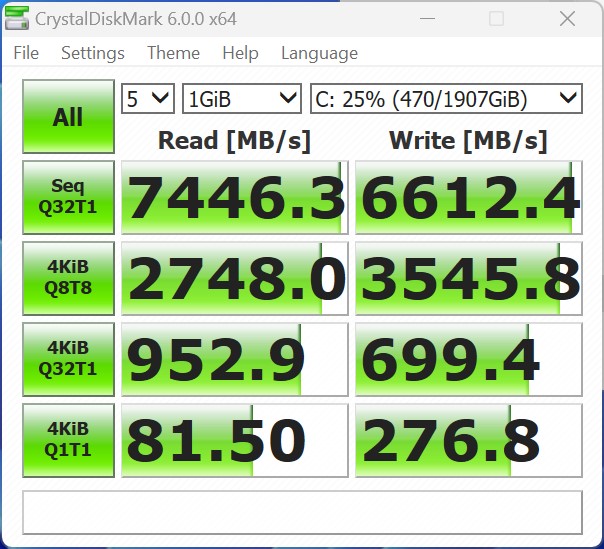
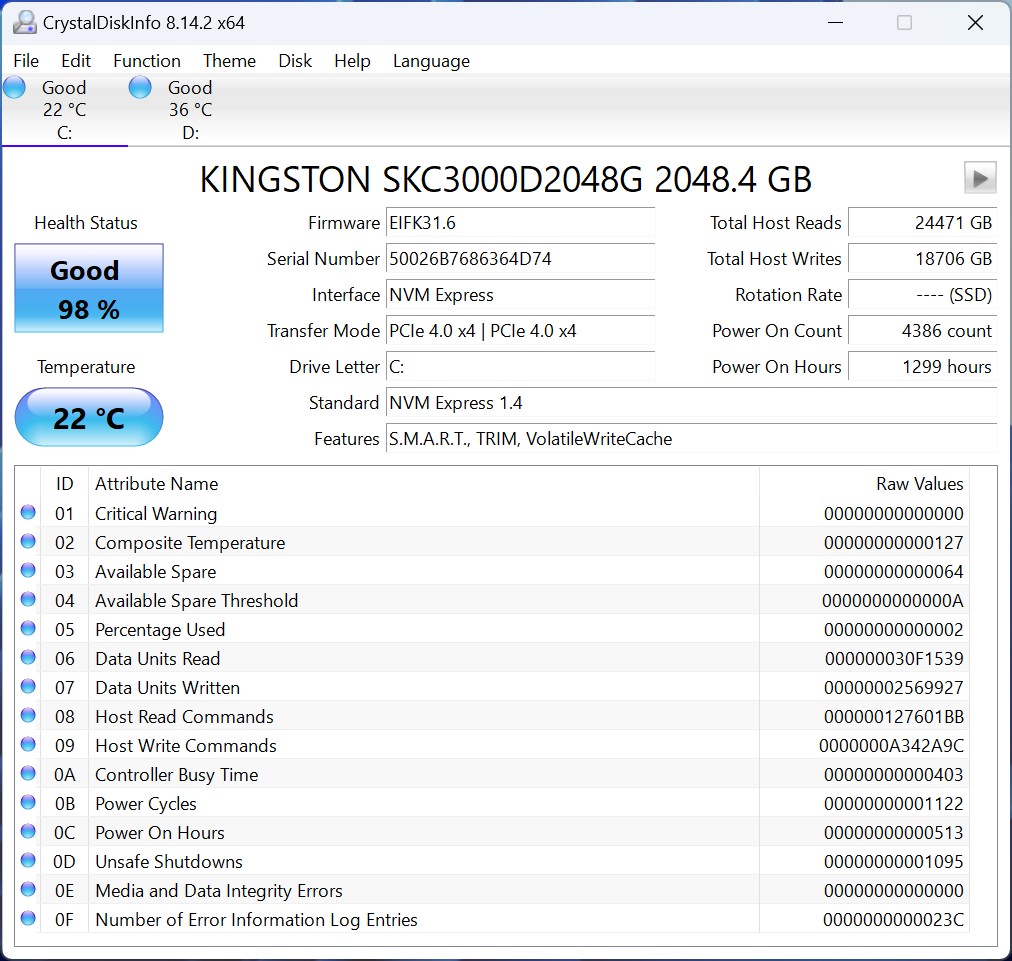
Dispositifs de stockage

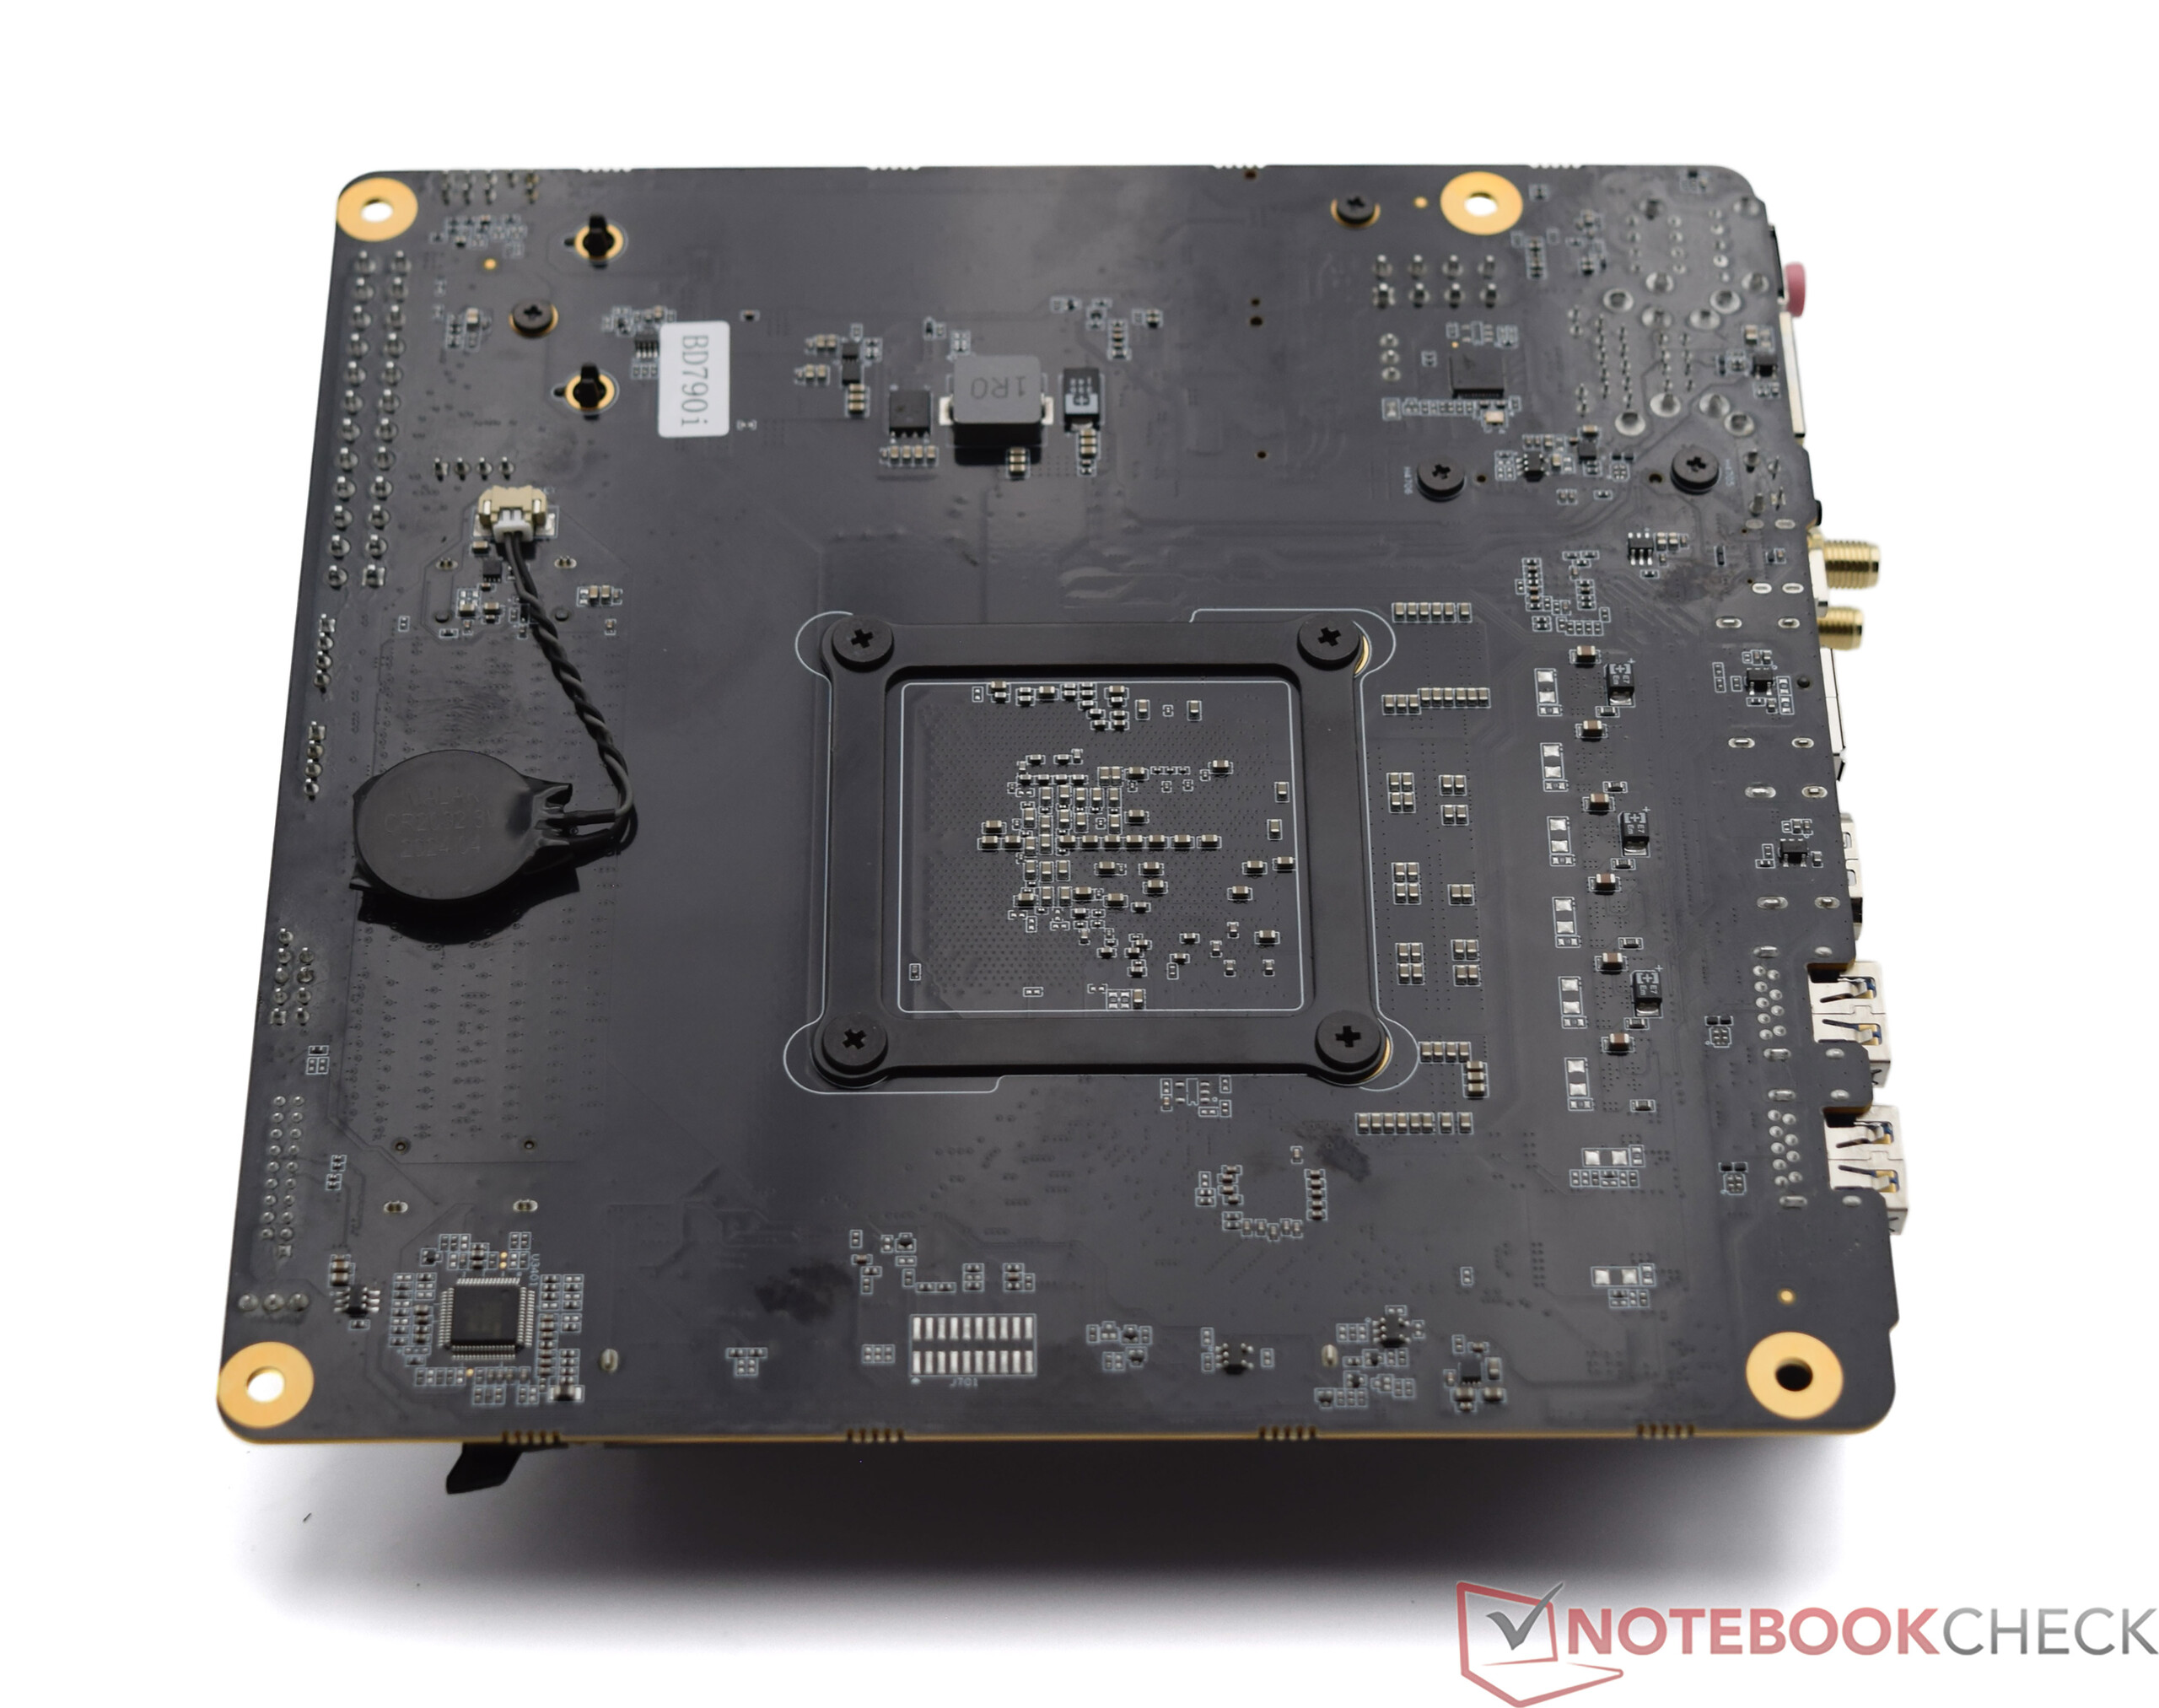
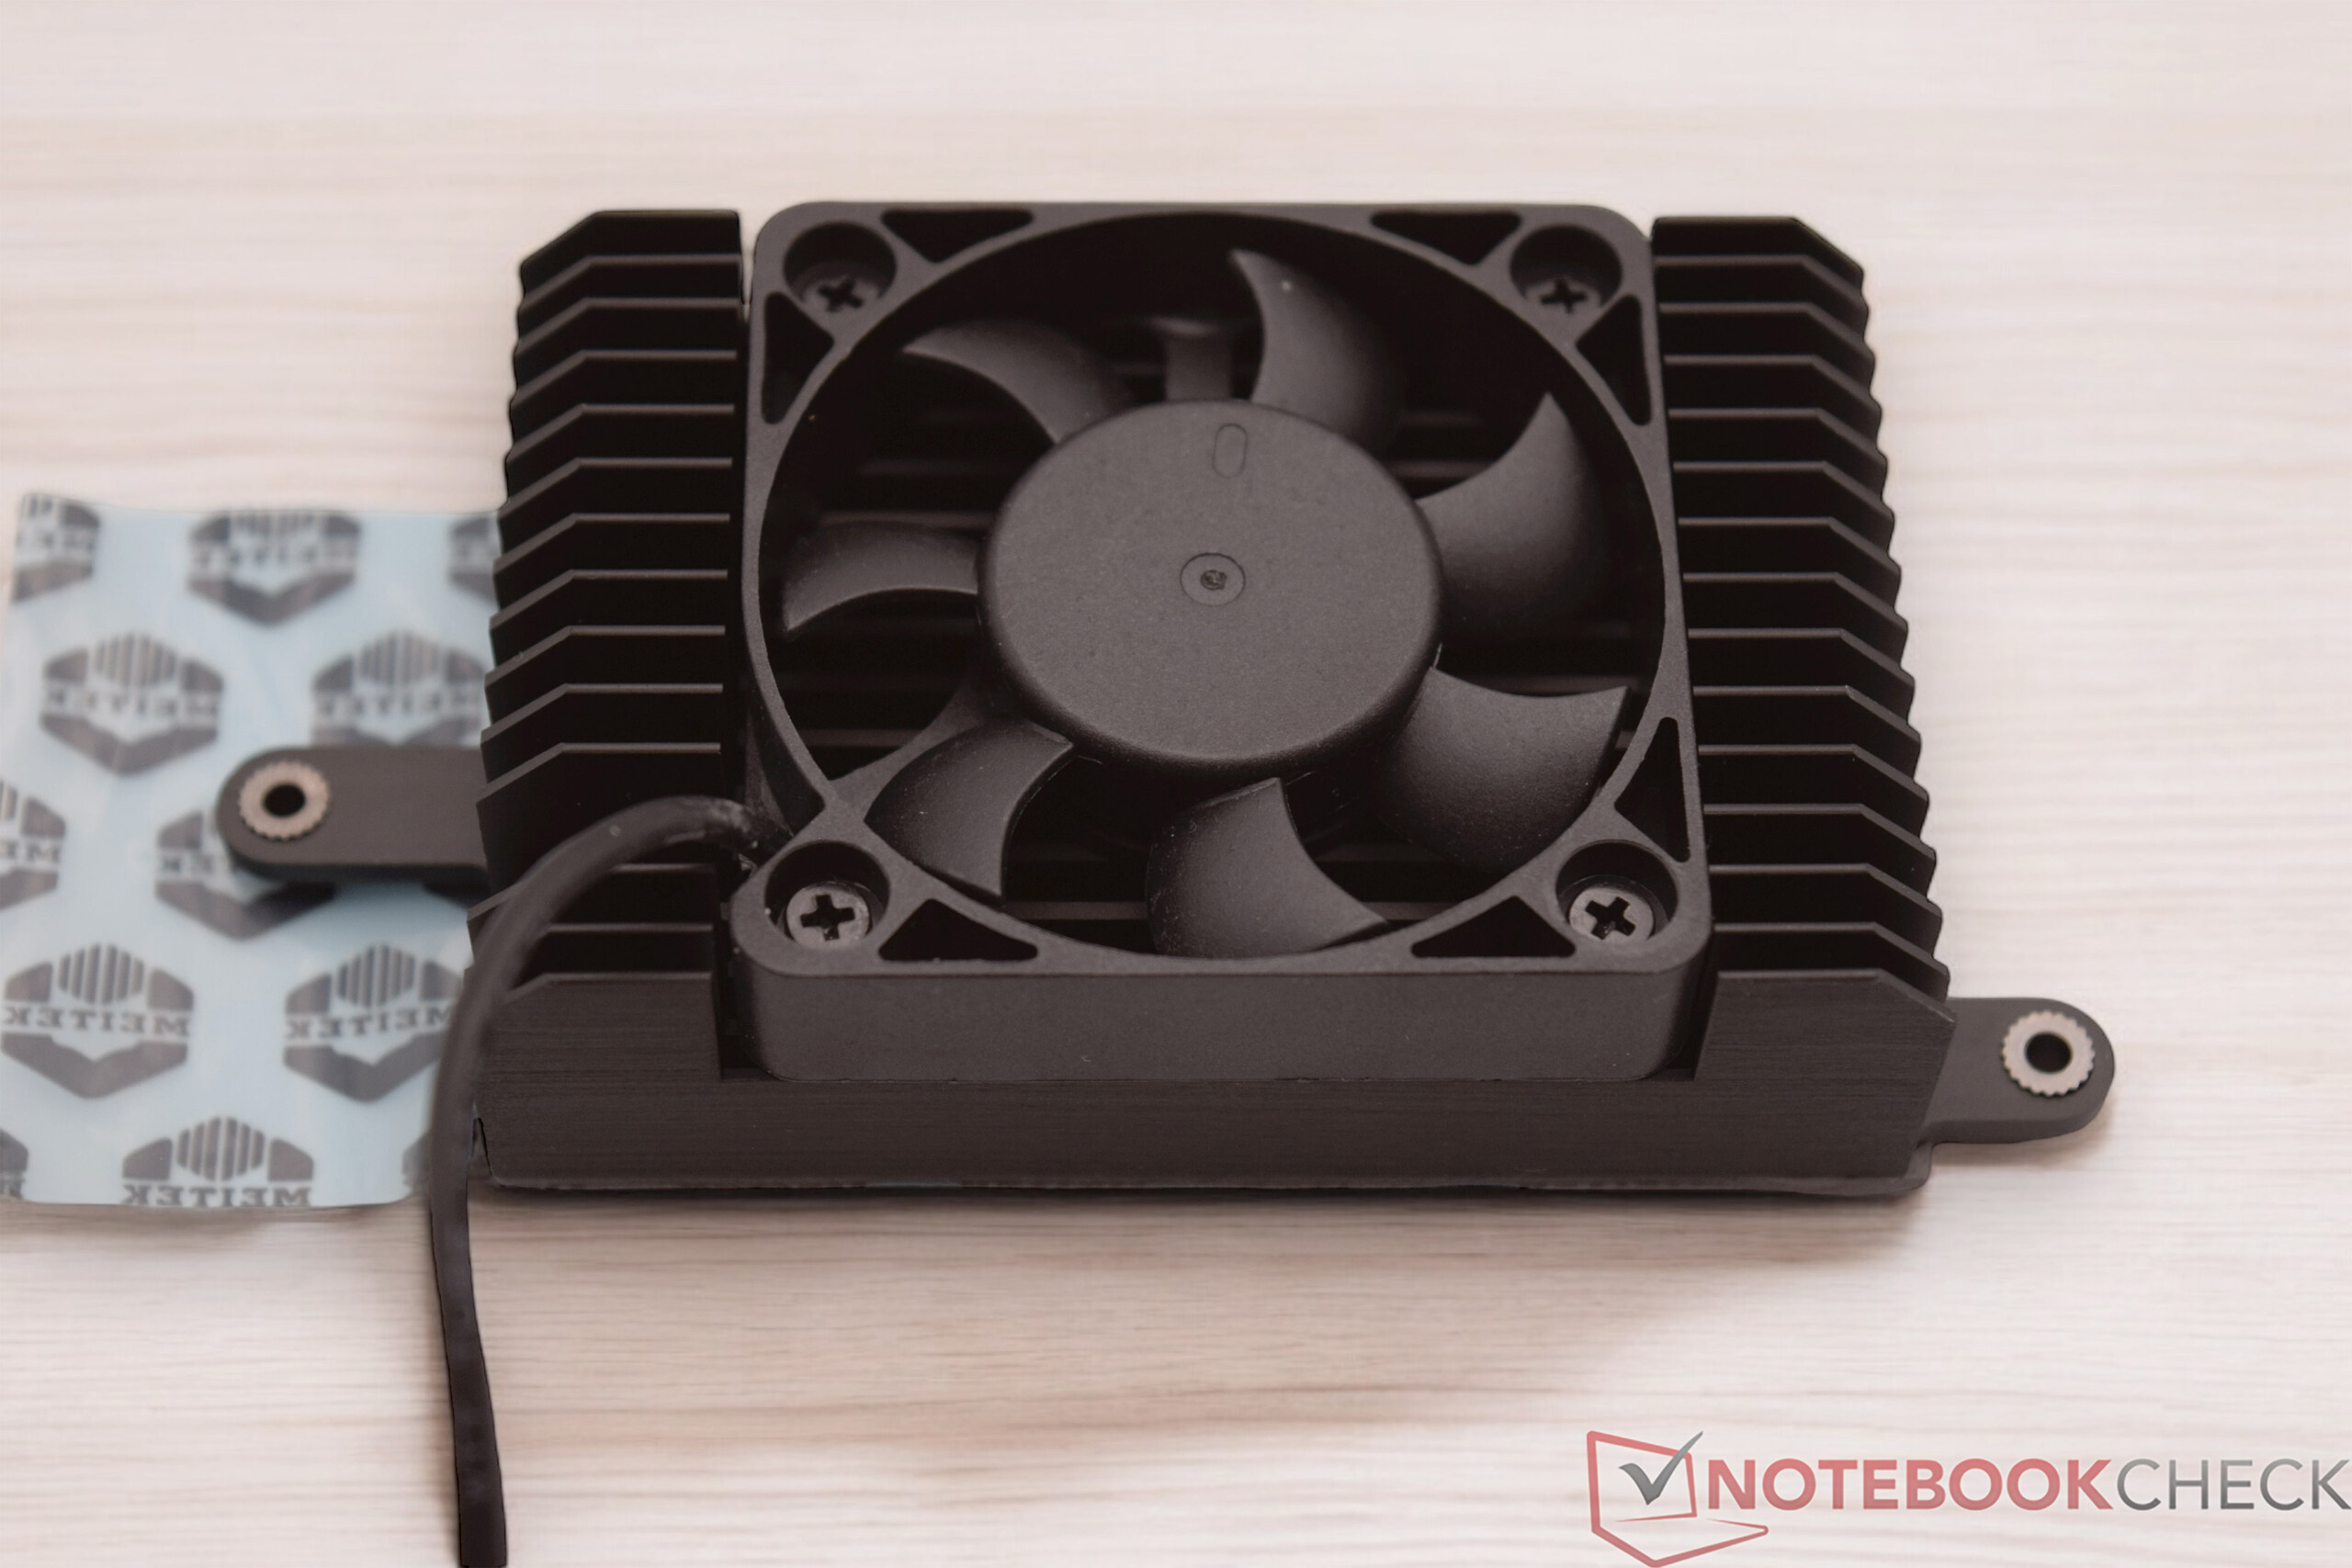
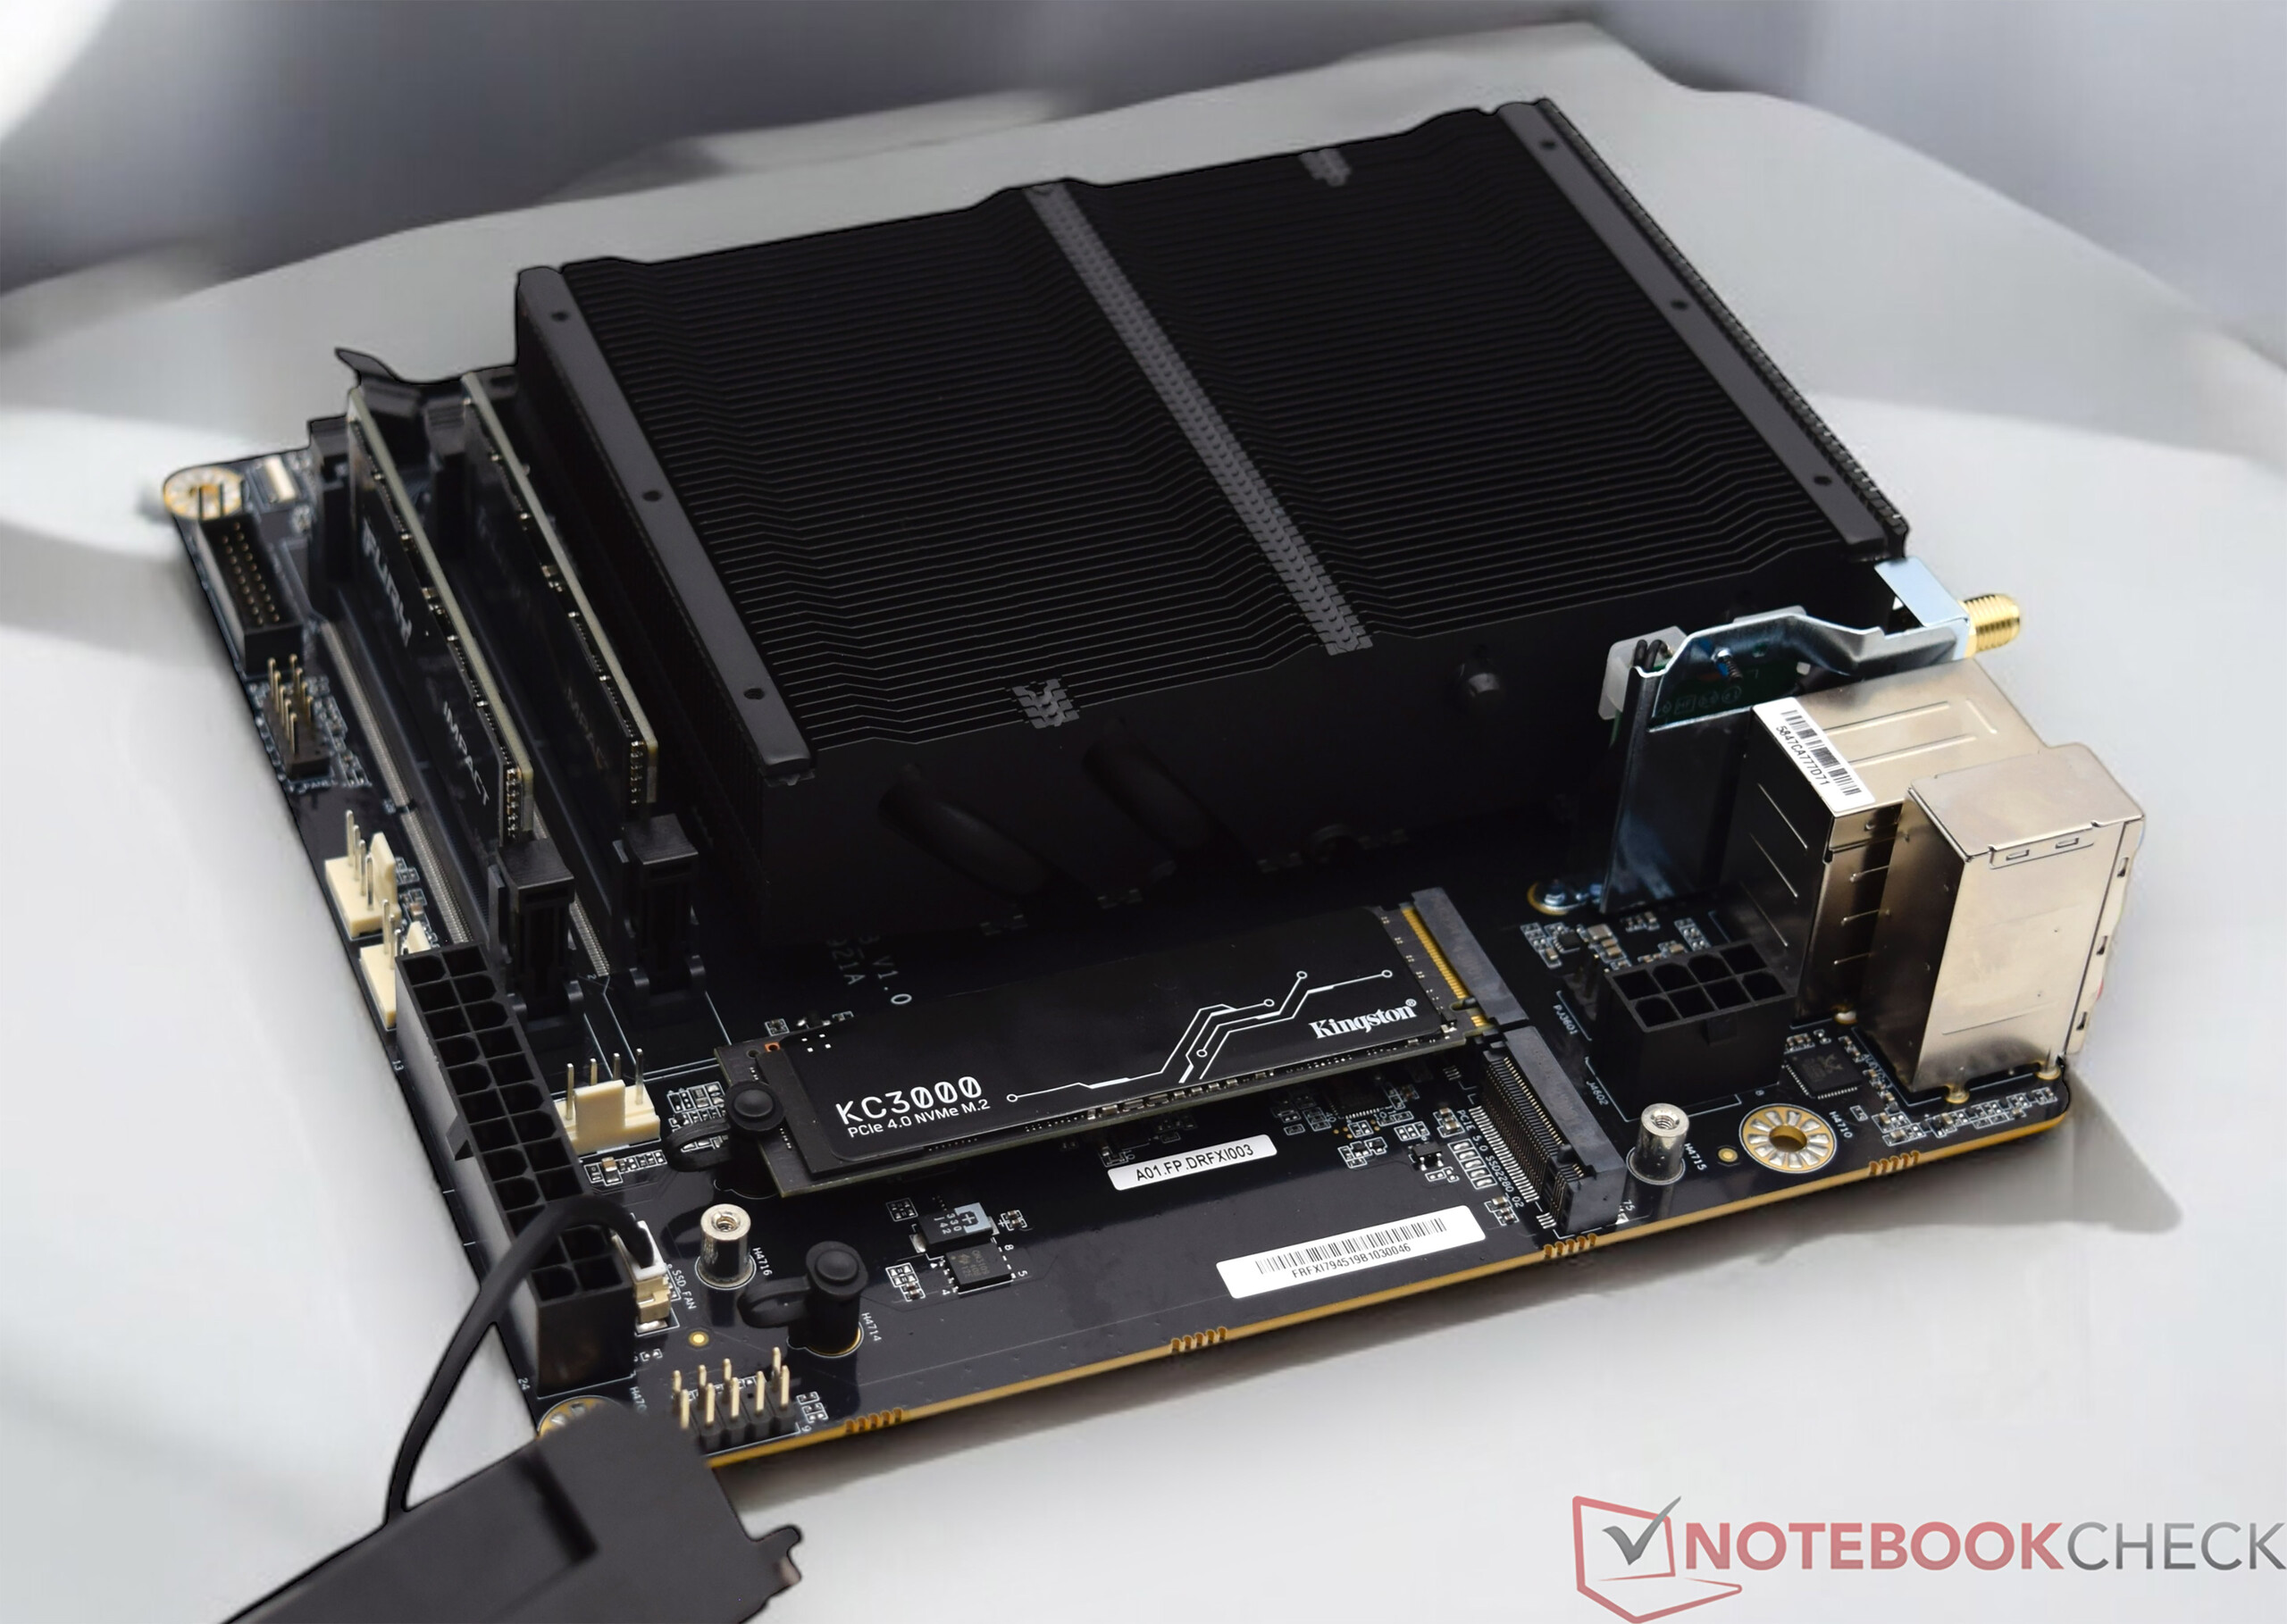
Comme mentionné au début de cet article, Minisforum ne fournit que la carte mère BD790i elle-même. Pour pouvoir mettre en service un système complet, vous devez vous occuper vous-même des composants manquants tels que la RAM, le SSD, l'alimentation et le ventilateur du processeur. Pour le SSD, nous avons opté pour un Kingston KC3000 avec 2 To d'espace de stockage. Le modèle est connecté via PCIe 4.0 x4 et ne profite pas pleinement de l'interface, car le Minisforum BD790i supporte techniquement deux SSD PCIe 5.0. Les deux interfaces M.2 sont situées sur le dessus de la carte mère. Recouvert d'un petit dissipateur thermique, également équipé d'un petit ventilateur, notre SSD n'a eu aucun mal à délivrer des performances stables. Nous pouvons rassurer ceux qui pensent que ce petit ventilateur leur fera mal aux oreilles, car il est très silencieux et ne s'entend pas à côté du ventilateur du processeur.
Pour d'autres comparaisons et benchmarks, veuillez vous référer à notre tableau de comparaison.

Reading continuous performance: DiskSpd Read Loop, Queue Depth 8
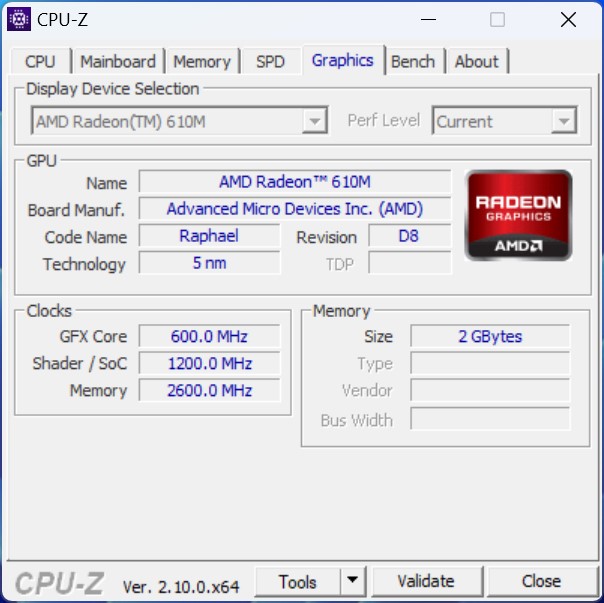
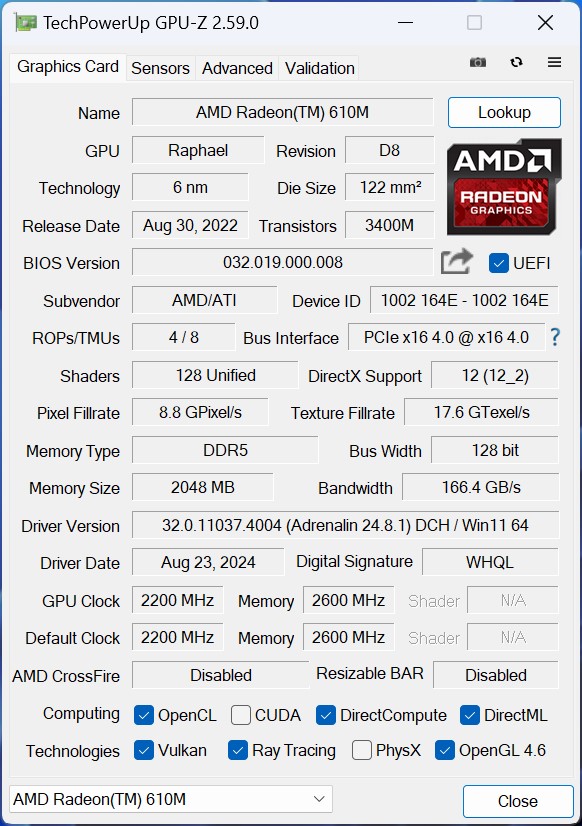
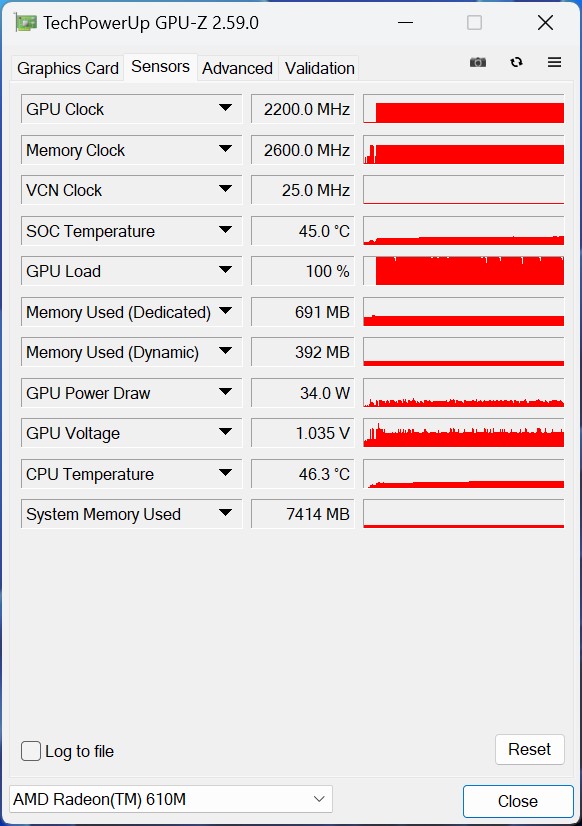
Carte graphique - L'AMD Radeon 610M comme iGPU
Le AMD Ryzen 9 7945HX ne dispose que d'une solution graphique simple en tant qu'iGPU, qui porte le nom de AMD Radeon 610M. Elle est toujours basée sur l'architecture RDNA2 et n'offre que 2 CU, ce qui signifie qu'il n'y a que 128 unités de shaders au total disponibles pour les calculs 3D. Par rapport à la AMD Ryzen 7 7745HXinstallé sur le Minisforum BD770iil n'y a pas plus de performance 3D. De ce fait, les résultats sont presque identiques. Par rapport à une AMD Radeon 780Ml'AMD Radeon 610M n'a aucune chance. À notre avis, cette solution graphique faible ne devrait pas être capable de faire plus qu'une simple sortie d'images.
Vous trouverez d'autres comparaisons et benchmarks dans notre Tableau de comparaison des GPU.
| Unigine Valley 1.0 | |
| 1920x1080 Extreme HD DirectX AA:x8 | |
| Minisforum EliteMini UM780 XTX | |
| Minisforum Venus Series UM790 Pro | |
| Minisforum Mars Series MC560 | |
| NiPoGi AD08 | |
| Minisforum BD770i | |
| Minisforum BD790i | |
| Moyenne AMD Radeon 610M (10 - 10, n=2) | |
| Acemagic AD15 | |
| 1920x1080 Extreme HD Preset OpenGL AA:x8 | |
| Minisforum EliteMini UM780 XTX | |
| Minisforum Venus Series UM790 Pro | |
| NiPoGi AD08 | |
| Minisforum Mars Series MC560 | |
| Acemagic AD15 | |
| Minisforum BD770i | |
| Moyenne AMD Radeon 610M (9.5 - 9.6, n=2) | |
| Minisforum BD790i | |
| Affinity Photo 2 - Combined (Single / Multi GPU) | |
| Minisforum BD790i | |
| NiPoGi AD08 | |
| Moyenne AMD Radeon 610M (889 - 5750, n=2) | |
| Acemagic AD15 | |
| Minisforum EliteMini UM780 XTX | |
| Minisforum Mars Series MC560 | |
| Minisforum Venus Series UM790 Pro | |
| Minisforum BD770i | |
| 3DMark 06 Standard Score | 20555 points | |
| 3DMark Vantage P Result | 12092 points | |
| 3DMark 11 Performance | 3873 points | |
| 3DMark Ice Storm Standard Score | 41556 points | |
| 3DMark Cloud Gate Standard Score | 14629 points | |
| 3DMark Fire Strike Score | 2156 points | |
| 3DMark Fire Strike Extreme Score | 530 points | |
| 3DMark Time Spy Score | 740 points | |
Aide | ||
Performances de jeu - AMD Radeon 610M
Afin de mieux évaluer la AMD Radeon 610Mnous l'avons soumise à quelques tests de jeu. Malheureusement, l'iGPU peu performant n'a pas pu afficher de bons taux de rafraîchissement. Même en jouant à des jeux plus anciens, l'AMD Radeon 610M a eu du mal à afficher des taux de rafraîchissement adéquats à l'écran. Les modèles équipés d'une AMD Radeon 780M offraient des performances nettement supérieures. Néanmoins, les limites d'une AMD Radeon 780M ont également été rapidement atteintes, ne laissant que l'option d'utiliser une carte graphique dédiée si vous souhaitez profiter des jeux les plus récents.
Pour avoir un aperçu des performances de l'iGPU par rapport à d'autres cartes graphiques, consultez notre Liste des jeux GPU.
| The Witcher 3 | |
| 1024x768 Low Graphics & Postprocessing | |
| Minisforum EliteMini UM780 XTX | |
| Minisforum Venus Series UM790 Pro | |
| NiPoGi AD08 | |
| Minisforum Mars Series MC560 | |
| Acemagic AD15 | |
| Minisforum BD790i | |
| Minisforum BD770i | |
| 1920x1080 High Graphics & Postprocessing (Nvidia HairWorks Off) | |
| Minisforum EliteMini UM780 XTX | |
| Minisforum Venus Series UM790 Pro | |
| NiPoGi AD08 | |
| Minisforum Mars Series MC560 | |
| Acemagic AD15 | |
| Minisforum BD790i | |
| Minisforum BD770i | |
| Borderlands 3 | |
| 1280x720 Very Low Overall Quality (DX11) | |
| Minisforum EliteMini UM780 XTX | |
| Minisforum Venus Series UM790 Pro | |
| Minisforum Mars Series MC560 | |
| NiPoGi AD08 | |
| Minisforum BD770i | |
| Minisforum BD790i | |
| Acemagic AD15 | |
| 1920x1080 High Overall Quality (DX11) | |
| Minisforum EliteMini UM780 XTX | |
| Minisforum Venus Series UM790 Pro | |
| Minisforum Mars Series MC560 | |
| NiPoGi AD08 | |
| Minisforum BD770i | |
| Minisforum BD790i | |
| Acemagic AD15 | |
| GTA V | |
| 1024x768 Lowest Settings possible | |
| Minisforum EliteMini UM780 XTX | |
| Minisforum Venus Series UM790 Pro | |
| Minisforum BD770i | |
| Minisforum BD790i | |
| Minisforum Mars Series MC560 | |
| NiPoGi AD08 | |
| Acemagic AD15 | |
| 1920x1080 High/On (Advanced Graphics Off) AA:2xMSAA + FX AF:8x | |
| Minisforum EliteMini UM780 XTX | |
| Minisforum Venus Series UM790 Pro | |
| Minisforum Mars Series MC560 | |
| Minisforum BD770i | |
| Minisforum BD790i | |
| NiPoGi AD08 | |
| Acemagic AD15 | |
| Tiny Tina's Wonderlands | |
| 1280x720 Lowest Preset (DX12) | |
| Minisforum EliteMini UM780 XTX | |
| Minisforum Venus Series UM790 Pro | |
| Minisforum Mars Series MC560 | |
| Minisforum BD770i | |
| Minisforum BD790i | |
| Acemagic AD15 | |
| 1920x1080 High Preset (DX12) | |
| Minisforum EliteMini UM780 XTX | |
| Minisforum Venus Series UM790 Pro | |
| Minisforum Mars Series MC560 | |
| Minisforum BD770i | |
| Minisforum BD790i | |
| Acemagic AD15 | |
| Metro Exodus | |
| 1280x720 Low Quality AF:4x | |
| Minisforum EliteMini UM780 XTX | |
| Minisforum Venus Series UM790 Pro | |
| NiPoGi AD08 | |
| Minisforum BD770i | |
| Minisforum BD790i | |
| 1920x1080 High Quality AF:16x | |
| Minisforum EliteMini UM780 XTX | |
| Minisforum Venus Series UM790 Pro | |
| NiPoGi AD08 | |
| Minisforum BD770i | |
| Minisforum BD790i | |
| Shadow of the Tomb Raider | |
| 1280x720 Lowest Preset | |
| Minisforum EliteMini UM780 XTX | |
| Minisforum Venus Series UM790 Pro | |
| NiPoGi AD08 | |
| Minisforum BD770i | |
| Minisforum BD790i | |
| Acemagic AD15 | |
| 1920x1080 High Preset AA:SM | |
| Minisforum EliteMini UM780 XTX | |
| Minisforum Venus Series UM790 Pro | |
| NiPoGi AD08 | |
| Minisforum BD770i | |
| Acemagic AD15 | |
| Minisforum BD790i | |
| Bas | Moyen | Élevé | Ultra | |
|---|---|---|---|---|
| GTA V (2015) | 131.2 | 99.5 | 21.6 | 9.61 |
| The Witcher 3 (2015) | 44.5 | 27 | 13.9 | 7.8 |
| Final Fantasy XV Benchmark (2018) | 25.9 | 11.4 | 7.97 | |
| X-Plane 11.11 (2018) | 39.8 | 23.5 | 20.8 | |
| Far Cry 5 (2018) | 25 | 13 | 12 | 11 |
| Strange Brigade (2018) | 20.9 | 18.8 | 14.3 | 12 |
| Shadow of the Tomb Raider (2018) | 35.7 | 12.5 | 11.5 | 9.4 |
| Far Cry New Dawn (2019) | 32 | 15 | 14 | 12 |
| Metro Exodus (2019) | 25.1 | 10.6 | 7.73 | 6.41 |
| Borderlands 3 (2019) | 38.1 | 14.3 | 8.43 | 6.4 |
| Tiny Tina's Wonderlands (2022) | 16.3 | 12.8 | 8.41 |
Le Minisforum BD790i avec une Nvidia GeForce RTX 4090
La carte mère Minisforum BD790i est idéale comme base d'un système de jeu compact. L'AMD Ryzen 9 7945HX offre de bonnes performances, et même les jeux exigeants en termes de CPU ne surchargent pas le composant à 16 cœurs. Les benchmarks synthétiques ne révèlent que des différences mineures entre les différents systèmes. La carte mère Minisforum BD790i dispose d'une interface PCIe x16 complète qui supporte déjà le standard 5.0. Cela signifie que les futures cartes graphiques, qui sortiront probablement dans les mois à venir, pourront également être exploitées avec leur pleine largeur de bande, ce qui renforce encore les qualités d'avenir de ce composant. Nous avons utilisé notre Palit GeForce RTX 4090 Gamerock OC pour les tests de jeu. En raison de la taille de la carte graphique, nous avons dû utiliser le Minisforum BD790i dans une configuration ouverte pour ces tests. La carte graphique est tout simplement trop grande pour le boîtier Phanteks Enthoo Evolv Shift XT.
Pour analyser les benchmarks de jeu, regardons d'abord les performances à la limite du CPU. C'est là que les différences entre les différents processeurs sont les plus importantes. Notre système de test a fourni à peu près le niveau de performance que l'on peut attendre d'un AMD Ryzen 5 9600X. Un Intel Core i9-14900K était à portée de main et n'offrait que des performances légèrement supérieures. Lorsque nous avons augmenté la résolution et le niveau de détail, les performances du processeur sont passées au second plan. À la limite du GPU, tous les appareils de comparaison étaient beaucoup plus proches les uns des autres, ce qui signifie qu'une différence réelle était à peine perceptible. La combinaison d'un AMD Ryzen 9 7945HX et du Palit GeForce RTX 4090 Gamerock OC a toujours assuré des performances de jeu impressionnantes, qui ne sont en rien inférieures à celles des PC de bureau conventionnels.
Tous les systèmes présentés dans ce comparatif ont été testés avec la même carte graphique, une Palit GeForce RTX 4090 Gamerock OC.
| Performance Rating - Percent | |
| AMD Ryzen 5 9600X, NVIDIA GeForce RTX 4090 | |
| Intel Core i9-14900K, NVIDIA GeForce RTX 4090 | |
| Intel Core i5-14600K, NVIDIA GeForce RTX 4090 | |
| AMD Ryzen 7 7745HX, NVIDIA GeForce RTX 4090 | |
| AMD Ryzen 9 7950X, NVIDIA GeForce RTX 4090 | |
| AMD Ryzen 7 7800X3D, NVIDIA GeForce RTX 4090 | |
| Intel Core i7-13700, NVIDIA GeForce RTX 4090 | |
| AMD Ryzen 9 7945HX, NVIDIA GeForce RTX 4090 | |
| Intel Core i7-12700, NVIDIA GeForce RTX 4090 | |
| Intel Core i5-13400, NVIDIA GeForce RTX 4090 | |
| 3DMark 11 - 1280x720 Performance GPU | |
| AMD Ryzen 7 7745HX, NVIDIA GeForce RTX 4090 | |
| AMD Ryzen 7 7800X3D, NVIDIA GeForce RTX 4090 | |
| Intel Core i5-14600K, NVIDIA GeForce RTX 4090 | |
| AMD Ryzen 9 7950X, NVIDIA GeForce RTX 4090 | |
| Intel Core i7-13700, NVIDIA GeForce RTX 4090 | |
| Intel Core i7-12700, NVIDIA GeForce RTX 4090 | |
| Intel Core i5-13400, NVIDIA GeForce RTX 4090 | |
| AMD Ryzen 5 9600X, NVIDIA GeForce RTX 4090 | |
| Intel Core i9-14900K, NVIDIA GeForce RTX 4090 | |
| AMD Ryzen 9 7945HX, NVIDIA GeForce RTX 4090 | |
| 3DMark | |
| 2560x1440 Time Spy Graphics | |
| AMD Ryzen 7 7745HX, NVIDIA GeForce RTX 4090 | |
| Intel Core i5-14600K, NVIDIA GeForce RTX 4090 | |
| Intel Core i9-14900K, NVIDIA GeForce RTX 4090 | |
| AMD Ryzen 7 7800X3D, NVIDIA GeForce RTX 4090 | |
| AMD Ryzen 5 9600X, NVIDIA GeForce RTX 4090 | |
| Intel Core i7-13700, NVIDIA GeForce RTX 4090 | |
| AMD Ryzen 9 7950X, NVIDIA GeForce RTX 4090 | |
| Intel Core i7-12700, NVIDIA GeForce RTX 4090 | |
| Intel Core i5-13400, NVIDIA GeForce RTX 4090 | |
| AMD Ryzen 9 7945HX, NVIDIA GeForce RTX 4090 | |
| 1920x1080 Fire Strike Graphics | |
| AMD Ryzen 7 7745HX, NVIDIA GeForce RTX 4090 | |
| Intel Core i5-14600K, NVIDIA GeForce RTX 4090 | |
| Intel Core i7-12700, NVIDIA GeForce RTX 4090 | |
| Intel Core i7-13700, NVIDIA GeForce RTX 4090 | |
| AMD Ryzen 5 9600X, NVIDIA GeForce RTX 4090 | |
| Intel Core i5-13400, NVIDIA GeForce RTX 4090 | |
| AMD Ryzen 7 7800X3D, NVIDIA GeForce RTX 4090 | |
| AMD Ryzen 9 7950X, NVIDIA GeForce RTX 4090 | |
| AMD Ryzen 9 7945HX, NVIDIA GeForce RTX 4090 | |
| Intel Core i9-14900K, NVIDIA GeForce RTX 4090 | |
| 3840x2160 Fire Strike Ultra Graphics | |
| AMD Ryzen 7 7800X3D, NVIDIA GeForce RTX 4090 | |
| AMD Ryzen 7 7745HX, NVIDIA GeForce RTX 4090 | |
| Intel Core i5-14600K, NVIDIA GeForce RTX 4090 | |
| Intel Core i7-13700, NVIDIA GeForce RTX 4090 | |
| Intel Core i5-13400, NVIDIA GeForce RTX 4090 | |
| AMD Ryzen 9 7950X, NVIDIA GeForce RTX 4090 | |
| Intel Core i9-14900K, NVIDIA GeForce RTX 4090 | |
| AMD Ryzen 5 9600X, NVIDIA GeForce RTX 4090 | |
| AMD Ryzen 9 7945HX, NVIDIA GeForce RTX 4090 | |
| Intel Core i7-12700, NVIDIA GeForce RTX 4090 | |
| Unigine Superposition | |
| 1280x720 720p Low | |
| AMD Ryzen 5 9600X, NVIDIA GeForce RTX 4090 | |
| Intel Core i9-14900K, NVIDIA GeForce RTX 4090 | |
| AMD Ryzen 7 7800X3D, NVIDIA GeForce RTX 4090 | |
| AMD Ryzen 9 7950X, NVIDIA GeForce RTX 4090 | |
| AMD Ryzen 7 7745HX, NVIDIA GeForce RTX 4090 | |
| Intel Core i7-13700, NVIDIA GeForce RTX 4090 | |
| Intel Core i5-14600K, NVIDIA GeForce RTX 4090 | |
| AMD Ryzen 9 7945HX, NVIDIA GeForce RTX 4090 | |
| Intel Core i7-12700, NVIDIA GeForce RTX 4090 | |
| Intel Core i5-13400, NVIDIA GeForce RTX 4090 | |
| 1920x1080 1080p High | |
| Intel Core i9-14900K, NVIDIA GeForce RTX 4090 | |
| AMD Ryzen 5 9600X, NVIDIA GeForce RTX 4090 | |
| AMD Ryzen 7 7800X3D, NVIDIA GeForce RTX 4090 | |
| AMD Ryzen 9 7950X, NVIDIA GeForce RTX 4090 | |
| AMD Ryzen 7 7745HX, NVIDIA GeForce RTX 4090 | |
| Intel Core i7-13700, NVIDIA GeForce RTX 4090 | |
| Intel Core i5-14600K, NVIDIA GeForce RTX 4090 | |
| AMD Ryzen 9 7945HX, NVIDIA GeForce RTX 4090 | |
| Intel Core i7-12700, NVIDIA GeForce RTX 4090 | |
| Intel Core i5-13400, NVIDIA GeForce RTX 4090 | |
| 1920x1080 1080p Extreme | |
| AMD Ryzen 7 7800X3D, NVIDIA GeForce RTX 4090 | |
| AMD Ryzen 7 7745HX, NVIDIA GeForce RTX 4090 | |
| Intel Core i5-14600K, NVIDIA GeForce RTX 4090 | |
| Intel Core i9-14900K, NVIDIA GeForce RTX 4090 | |
| AMD Ryzen 9 7950X, NVIDIA GeForce RTX 4090 | |
| Intel Core i7-13700, NVIDIA GeForce RTX 4090 | |
| Intel Core i5-13400, NVIDIA GeForce RTX 4090 | |
| Intel Core i7-12700, NVIDIA GeForce RTX 4090 | |
| AMD Ryzen 9 7945HX, NVIDIA GeForce RTX 4090 | |
| AMD Ryzen 5 9600X, NVIDIA GeForce RTX 4090 | |
| 3840x2160 4k Optimized | |
| AMD Ryzen 9 7950X, NVIDIA GeForce RTX 4090 | |
| Intel Core i7-13700, NVIDIA GeForce RTX 4090 | |
| Intel Core i9-14900K, NVIDIA GeForce RTX 4090 | |
| Intel Core i5-14600K, NVIDIA GeForce RTX 4090 | |
| AMD Ryzen 7 7800X3D, NVIDIA GeForce RTX 4090 | |
| AMD Ryzen 7 7745HX, NVIDIA GeForce RTX 4090 | |
| AMD Ryzen 5 9600X, NVIDIA GeForce RTX 4090 | |
| AMD Ryzen 9 7945HX, NVIDIA GeForce RTX 4090 | |
| Intel Core i7-12700, NVIDIA GeForce RTX 4090 | |
| Intel Core i5-13400, NVIDIA GeForce RTX 4090 | |
| 7680x4320 8k Optimized | |
| AMD Ryzen 9 7950X, NVIDIA GeForce RTX 4090 | |
| Intel Core i7-13700, NVIDIA GeForce RTX 4090 | |
| Intel Core i7-12700, NVIDIA GeForce RTX 4090 | |
| Intel Core i5-13400, NVIDIA GeForce RTX 4090 | |
| Intel Core i9-14900K, NVIDIA GeForce RTX 4090 | |
| Intel Core i5-14600K, NVIDIA GeForce RTX 4090 | |
| AMD Ryzen 7 7800X3D, NVIDIA GeForce RTX 4090 | |
| AMD Ryzen 7 7745HX, NVIDIA GeForce RTX 4090 | |
| AMD Ryzen 9 7945HX, NVIDIA GeForce RTX 4090 | |
| AMD Ryzen 5 9600X, NVIDIA GeForce RTX 4090 | |
| Unigine Valley 1.0 | |
| 1920x1080 Extreme HD DirectX AA:x8 | |
| AMD Ryzen 5 9600X, NVIDIA GeForce RTX 4090 | |
| Intel Core i9-14900K, NVIDIA GeForce RTX 4090 | |
| Intel Core i5-14600K, NVIDIA GeForce RTX 4090 | |
| AMD Ryzen 9 7950X, NVIDIA GeForce RTX 4090 | |
| Intel Core i7-13700, NVIDIA GeForce RTX 4090 | |
| AMD Ryzen 9 7945HX, NVIDIA GeForce RTX 4090 | |
| AMD Ryzen 7 7745HX, NVIDIA GeForce RTX 4090 | |
| AMD Ryzen 7 7800X3D, NVIDIA GeForce RTX 4090 | |
| Intel Core i7-12700, NVIDIA GeForce RTX 4090 | |
| Intel Core i5-13400, NVIDIA GeForce RTX 4090 | |
| 1920x1080 Extreme HD Preset OpenGL AA:x8 | |
| AMD Ryzen 5 9600X, NVIDIA GeForce RTX 4090 | |
| Intel Core i9-14900K, NVIDIA GeForce RTX 4090 | |
| Intel Core i5-14600K, NVIDIA GeForce RTX 4090 | |
| Intel Core i7-13700, NVIDIA GeForce RTX 4090 | |
| AMD Ryzen 9 7950X, NVIDIA GeForce RTX 4090 | |
| AMD Ryzen 7 7745HX, NVIDIA GeForce RTX 4090 | |
| AMD Ryzen 7 7800X3D, NVIDIA GeForce RTX 4090 | |
| AMD Ryzen 9 7945HX, NVIDIA GeForce RTX 4090 | |
| Intel Core i7-12700, NVIDIA GeForce RTX 4090 | |
| Intel Core i5-13400, NVIDIA GeForce RTX 4090 | |
| Unigine Heaven 4.0 | |
| Extreme Preset OpenGL | |
| AMD Ryzen 5 9600X, NVIDIA GeForce RTX 4090 | |
| Intel Core i9-14900K, NVIDIA GeForce RTX 4090 | |
| AMD Ryzen 7 7745HX, NVIDIA GeForce RTX 4090 | |
| AMD Ryzen 9 7945HX, NVIDIA GeForce RTX 4090 | |
| Intel Core i5-14600K, NVIDIA GeForce RTX 4090 | |
| AMD Ryzen 9 7950X, NVIDIA GeForce RTX 4090 | |
| Intel Core i7-13700, NVIDIA GeForce RTX 4090 | |
| AMD Ryzen 7 7800X3D, NVIDIA GeForce RTX 4090 | |
| Intel Core i7-12700, NVIDIA GeForce RTX 4090 | |
| Intel Core i5-13400, NVIDIA GeForce RTX 4090 | |
| Extreme Preset DX11 | |
| AMD Ryzen 9 7950X, NVIDIA GeForce RTX 4090 | |
| Intel Core i9-14900K, NVIDIA GeForce RTX 4090 | |
| AMD Ryzen 9 7945HX, NVIDIA GeForce RTX 4090 | |
| AMD Ryzen 5 9600X, NVIDIA GeForce RTX 4090 | |
| AMD Ryzen 7 7745HX, NVIDIA GeForce RTX 4090 | |
| Intel Core i5-14600K, NVIDIA GeForce RTX 4090 | |
| AMD Ryzen 7 7800X3D, NVIDIA GeForce RTX 4090 | |
| Intel Core i7-13700, NVIDIA GeForce RTX 4090 | |
| Intel Core i7-12700, NVIDIA GeForce RTX 4090 | |
| Intel Core i5-13400, NVIDIA GeForce RTX 4090 | |
| ComputeMark v2.1 | |
| 1024x600 Normal, Score | |
| AMD Ryzen 7 7745HX, NVIDIA GeForce RTX 4090 | |
| Intel Core i5-14600K, NVIDIA GeForce RTX 4090 | |
| AMD Ryzen 9 7945HX, NVIDIA GeForce RTX 4090 | |
| AMD Ryzen 5 9600X, NVIDIA GeForce RTX 4090 | |
| AMD Ryzen 9 7950X, NVIDIA GeForce RTX 4090 | |
| Intel Core i9-14900K, NVIDIA GeForce RTX 4090 | |
| Intel Core i7-12700, NVIDIA GeForce RTX 4090 | |
| AMD Ryzen 7 7800X3D, NVIDIA GeForce RTX 4090 | |
| Intel Core i5-13400, NVIDIA GeForce RTX 4090 | |
| Intel Core i7-13700, NVIDIA GeForce RTX 4090 | |
| 1024x600 Normal, Fluid 3DTex | |
| AMD Ryzen 7 7800X3D, NVIDIA GeForce RTX 4090 | |
| Intel Core i5-14600K, NVIDIA GeForce RTX 4090 | |
| Intel Core i7-13700, NVIDIA GeForce RTX 4090 | |
| AMD Ryzen 9 7945HX, NVIDIA GeForce RTX 4090 | |
| Intel Core i5-13400, NVIDIA GeForce RTX 4090 | |
| AMD Ryzen 5 9600X, NVIDIA GeForce RTX 4090 | |
| Intel Core i7-12700, NVIDIA GeForce RTX 4090 | |
| AMD Ryzen 9 7950X, NVIDIA GeForce RTX 4090 | |
| AMD Ryzen 7 7745HX, NVIDIA GeForce RTX 4090 | |
| Intel Core i9-14900K, NVIDIA GeForce RTX 4090 | |
| 1024x600 Normal, Fluid 2DTexArr | |
| AMD Ryzen 9 7945HX, NVIDIA GeForce RTX 4090 | |
| AMD Ryzen 5 9600X, NVIDIA GeForce RTX 4090 | |
| AMD Ryzen 7 7745HX, NVIDIA GeForce RTX 4090 | |
| Intel Core i5-14600K, NVIDIA GeForce RTX 4090 | |
| Intel Core i9-14900K, NVIDIA GeForce RTX 4090 | |
| AMD Ryzen 9 7950X, NVIDIA GeForce RTX 4090 | |
| Intel Core i7-12700, NVIDIA GeForce RTX 4090 | |
| Intel Core i7-13700, NVIDIA GeForce RTX 4090 | |
| AMD Ryzen 7 7800X3D, NVIDIA GeForce RTX 4090 | |
| Intel Core i5-13400, NVIDIA GeForce RTX 4090 | |
| 1024x600 Normal, Mandel Vector | |
| AMD Ryzen 7 7745HX, NVIDIA GeForce RTX 4090 | |
| AMD Ryzen 9 7945HX, NVIDIA GeForce RTX 4090 | |
| Intel Core i5-14600K, NVIDIA GeForce RTX 4090 | |
| AMD Ryzen 9 7950X, NVIDIA GeForce RTX 4090 | |
| AMD Ryzen 5 9600X, NVIDIA GeForce RTX 4090 | |
| Intel Core i9-14900K, NVIDIA GeForce RTX 4090 | |
| Intel Core i7-13700, NVIDIA GeForce RTX 4090 | |
| Intel Core i7-12700, NVIDIA GeForce RTX 4090 | |
| AMD Ryzen 7 7800X3D, NVIDIA GeForce RTX 4090 | |
| Intel Core i5-13400, NVIDIA GeForce RTX 4090 | |
| 1024x600 Normal, Mandel Scalar | |
| AMD Ryzen 7 7745HX, NVIDIA GeForce RTX 4090 | |
| Intel Core i5-14600K, NVIDIA GeForce RTX 4090 | |
| Intel Core i9-14900K, NVIDIA GeForce RTX 4090 | |
| AMD Ryzen 9 7945HX, NVIDIA GeForce RTX 4090 | |
| AMD Ryzen 7 7800X3D, NVIDIA GeForce RTX 4090 | |
| AMD Ryzen 9 7950X, NVIDIA GeForce RTX 4090 | |
| AMD Ryzen 5 9600X, NVIDIA GeForce RTX 4090 | |
| Intel Core i7-12700, NVIDIA GeForce RTX 4090 | |
| Intel Core i7-13700, NVIDIA GeForce RTX 4090 | |
| Intel Core i5-13400, NVIDIA GeForce RTX 4090 | |
| 1024x600 Normal, QJuliaRayTrace | |
| AMD Ryzen 7 7745HX, NVIDIA GeForce RTX 4090 | |
| AMD Ryzen 5 9600X, NVIDIA GeForce RTX 4090 | |
| Intel Core i5-14600K, NVIDIA GeForce RTX 4090 | |
| AMD Ryzen 9 7950X, NVIDIA GeForce RTX 4090 | |
| AMD Ryzen 9 7945HX, NVIDIA GeForce RTX 4090 | |
| Intel Core i9-14900K, NVIDIA GeForce RTX 4090 | |
| Intel Core i5-13400, NVIDIA GeForce RTX 4090 | |
| Intel Core i7-12700, NVIDIA GeForce RTX 4090 | |
| Intel Core i7-13700, NVIDIA GeForce RTX 4090 | |
| AMD Ryzen 7 7800X3D, NVIDIA GeForce RTX 4090 | |
Performance comparison at CPU limit at 720p
| Performance Rating - Percent | |
| AMD Ryzen 7 7800X3D, NVIDIA GeForce RTX 4090 | |
| Intel Core i9-14900K, NVIDIA GeForce RTX 4090 | |
| AMD Ryzen 5 9600X, NVIDIA GeForce RTX 4090 | |
| AMD Ryzen 9 7950X, NVIDIA GeForce RTX 4090 | |
| Intel Core i5-14600K, NVIDIA GeForce RTX 4090 | |
| Intel Core i7-13700, NVIDIA GeForce RTX 4090 | |
| AMD Ryzen 7 7745HX, NVIDIA GeForce RTX 4090 | |
| AMD Ryzen 9 7945HX, NVIDIA GeForce RTX 4090 | |
| Intel Core i7-12700, NVIDIA GeForce RTX 4090 | |
| Intel Core i5-13400, NVIDIA GeForce RTX 4090 | |
| F1 22 - 1280x720 Ultra Low Preset AA:T AF:16x | |
| AMD Ryzen 7 7800X3D, NVIDIA GeForce RTX 4090 | |
| Intel Core i9-14900K, NVIDIA GeForce RTX 4090 | |
| AMD Ryzen 9 7950X, NVIDIA GeForce RTX 4090 | |
| AMD Ryzen 5 9600X, NVIDIA GeForce RTX 4090 | |
| Intel Core i5-14600K, NVIDIA GeForce RTX 4090 | |
| AMD Ryzen 7 7745HX, NVIDIA GeForce RTX 4090 | |
| Intel Core i7-13700, NVIDIA GeForce RTX 4090 | |
| AMD Ryzen 9 7945HX, NVIDIA GeForce RTX 4090 | |
| Intel Core i7-12700, NVIDIA GeForce RTX 4090 | |
| Intel Core i5-13400, NVIDIA GeForce RTX 4090 | |
| Far Cry 5 - 1280x720 Low Preset AA:T | |
| AMD Ryzen 7 7800X3D, NVIDIA GeForce RTX 4090 | |
| AMD Ryzen 5 9600X, NVIDIA GeForce RTX 4090 | |
| Intel Core i9-14900K, NVIDIA GeForce RTX 4090 | |
| Intel Core i5-14600K, NVIDIA GeForce RTX 4090 | |
| AMD Ryzen 9 7950X, NVIDIA GeForce RTX 4090 | |
| Intel Core i7-13700, NVIDIA GeForce RTX 4090 | |
| AMD Ryzen 7 7745HX, NVIDIA GeForce RTX 4090 | |
| Intel Core i7-12700, NVIDIA GeForce RTX 4090 | |
| AMD Ryzen 9 7945HX, NVIDIA GeForce RTX 4090 | |
| Intel Core i5-13400, NVIDIA GeForce RTX 4090 | |
| X-Plane 11.11 - 1280x720 low (fps_test=1) | |
| Intel Core i9-14900K, NVIDIA GeForce RTX 4090 | |
| AMD Ryzen 5 9600X, NVIDIA GeForce RTX 4090 | |
| Intel Core i5-14600K, NVIDIA GeForce RTX 4090 | |
| AMD Ryzen 9 7950X, NVIDIA GeForce RTX 4090 | |
| AMD Ryzen 7 7800X3D, NVIDIA GeForce RTX 4090 | |
| Intel Core i7-13700, NVIDIA GeForce RTX 4090 | |
| AMD Ryzen 9 7945HX, NVIDIA GeForce RTX 4090 | |
| AMD Ryzen 7 7745HX, NVIDIA GeForce RTX 4090 | |
| Intel Core i7-12700, NVIDIA GeForce RTX 4090 | |
| Intel Core i5-13400, NVIDIA GeForce RTX 4090 | |
| Final Fantasy XV Benchmark - 1280x720 Lite Quality | |
| AMD Ryzen 7 7745HX, NVIDIA GeForce RTX 4090 | |
| AMD Ryzen 5 9600X, NVIDIA GeForce RTX 4090 | |
| AMD Ryzen 9 7950X, NVIDIA GeForce RTX 4090 | |
| Intel Core i7-13700, NVIDIA GeForce RTX 4090 | |
| AMD Ryzen 7 7800X3D, NVIDIA GeForce RTX 4090 | |
| Intel Core i5-14600K, NVIDIA GeForce RTX 4090 | |
| Intel Core i9-14900K, NVIDIA GeForce RTX 4090 | |
| AMD Ryzen 9 7945HX, NVIDIA GeForce RTX 4090 | |
| Intel Core i7-12700, NVIDIA GeForce RTX 4090 | |
| Intel Core i5-13400, NVIDIA GeForce RTX 4090 | |
| Dota 2 Reborn - 1280x720 min (0/3) fastest | |
| AMD Ryzen 7 7800X3D, NVIDIA GeForce RTX 4090 | |
| AMD Ryzen 9 7950X, NVIDIA GeForce RTX 4090 | |
| Intel Core i9-14900K, NVIDIA GeForce RTX 4090 | |
| AMD Ryzen 5 9600X, NVIDIA GeForce RTX 4090 | |
| AMD Ryzen 9 7945HX, NVIDIA GeForce RTX 4090 | |
| Intel Core i5-14600K, NVIDIA GeForce RTX 4090 | |
| AMD Ryzen 7 7745HX, NVIDIA GeForce RTX 4090 | |
| Intel Core i7-13700, NVIDIA GeForce RTX 4090 | |
| Intel Core i7-12700, NVIDIA GeForce RTX 4090 | |
| Intel Core i5-13400, NVIDIA GeForce RTX 4090 | |
| The Witcher 3 - 1024x768 Low Graphics & Postprocessing | |
| AMD Ryzen 7 7800X3D, NVIDIA GeForce RTX 4090 | |
| AMD Ryzen 9 7950X, NVIDIA GeForce RTX 4090 | |
| Intel Core i9-14900K, NVIDIA GeForce RTX 4090 | |
| AMD Ryzen 5 9600X, NVIDIA GeForce RTX 4090 | |
| AMD Ryzen 9 7945HX, NVIDIA GeForce RTX 4090 | |
| AMD Ryzen 7 7745HX, NVIDIA GeForce RTX 4090 | |
| Intel Core i7-13700, NVIDIA GeForce RTX 4090 | |
| Intel Core i5-14600K, NVIDIA GeForce RTX 4090 | |
| Intel Core i7-12700, NVIDIA GeForce RTX 4090 | |
| Intel Core i5-13400, NVIDIA GeForce RTX 4090 | |
| GTA V - 1024x768 Lowest Settings possible | |
| AMD Ryzen 7 7800X3D, NVIDIA GeForce RTX 4090 | |
| AMD Ryzen 9 7950X, NVIDIA GeForce RTX 4090 | |
| AMD Ryzen 5 9600X, NVIDIA GeForce RTX 4090 | |
| Intel Core i9-14900K, NVIDIA GeForce RTX 4090 | |
| Intel Core i7-13700, NVIDIA GeForce RTX 4090 | |
| Intel Core i5-14600K, NVIDIA GeForce RTX 4090 | |
| AMD Ryzen 7 7745HX, NVIDIA GeForce RTX 4090 | |
| AMD Ryzen 9 7945HX, NVIDIA GeForce RTX 4090 | |
| Intel Core i7-12700, NVIDIA GeForce RTX 4090 | |
| Intel Core i5-13400, NVIDIA GeForce RTX 4090 | |
| Borderlands 3 - 1280x720 Very Low Overall Quality (DX11) | |
| AMD Ryzen 7 7800X3D, NVIDIA GeForce RTX 4090 | |
| Intel Core i9-14900K, NVIDIA GeForce RTX 4090 | |
| AMD Ryzen 9 7950X, NVIDIA GeForce RTX 4090 | |
| Intel Core i5-14600K, NVIDIA GeForce RTX 4090 | |
| AMD Ryzen 5 9600X, NVIDIA GeForce RTX 4090 | |
| Intel Core i7-13700, NVIDIA GeForce RTX 4090 | |
| AMD Ryzen 9 7945HX, NVIDIA GeForce RTX 4090 | |
| AMD Ryzen 7 7745HX, NVIDIA GeForce RTX 4090 | |
| Intel Core i7-12700, NVIDIA GeForce RTX 4090 | |
| Intel Core i5-13400, NVIDIA GeForce RTX 4090 | |
| Far Cry New Dawn - 1280x720 Low Preset | |
| AMD Ryzen 7 7800X3D, NVIDIA GeForce RTX 4090 | |
| Intel Core i9-14900K, NVIDIA GeForce RTX 4090 | |
| AMD Ryzen 5 9600X, NVIDIA GeForce RTX 4090 | |
| Intel Core i5-14600K, NVIDIA GeForce RTX 4090 | |
| Intel Core i7-13700, NVIDIA GeForce RTX 4090 | |
| AMD Ryzen 9 7950X, NVIDIA GeForce RTX 4090 | |
| Intel Core i7-12700, NVIDIA GeForce RTX 4090 | |
| AMD Ryzen 7 7745HX, NVIDIA GeForce RTX 4090 | |
| AMD Ryzen 9 7945HX, NVIDIA GeForce RTX 4090 | |
| Intel Core i5-13400, NVIDIA GeForce RTX 4090 | |
| Shadow of the Tomb Raider - 1280x720 Lowest Preset | |
| AMD Ryzen 7 7800X3D, NVIDIA GeForce RTX 4090 | |
| Intel Core i9-14900K, NVIDIA GeForce RTX 4090 | |
| AMD Ryzen 9 7950X, NVIDIA GeForce RTX 4090 | |
| AMD Ryzen 5 9600X, NVIDIA GeForce RTX 4090 | |
| Intel Core i5-14600K, NVIDIA GeForce RTX 4090 | |
| AMD Ryzen 7 7745HX, NVIDIA GeForce RTX 4090 | |
| AMD Ryzen 9 7945HX, NVIDIA GeForce RTX 4090 | |
| Intel Core i7-13700, NVIDIA GeForce RTX 4090 | |
| Intel Core i7-12700, NVIDIA GeForce RTX 4090 | |
| Intel Core i5-13400, NVIDIA GeForce RTX 4090 | |
| Tiny Tina's Wonderlands - 1280x720 Lowest Preset (DX12) | |
| AMD Ryzen 7 7800X3D, NVIDIA GeForce RTX 4090 | |
| Intel Core i9-14900K, NVIDIA GeForce RTX 4090 | |
| AMD Ryzen 9 7950X, NVIDIA GeForce RTX 4090 | |
| Intel Core i5-14600K, NVIDIA GeForce RTX 4090 | |
| AMD Ryzen 5 9600X, NVIDIA GeForce RTX 4090 | |
| AMD Ryzen 7 7745HX, NVIDIA GeForce RTX 4090 | |
| Intel Core i7-13700, NVIDIA GeForce RTX 4090 | |
| AMD Ryzen 9 7945HX, NVIDIA GeForce RTX 4090 | |
| Intel Core i7-12700, NVIDIA GeForce RTX 4090 | |
| Intel Core i5-13400, NVIDIA GeForce RTX 4090 | |
| Strange Brigade - 1280x720 lowest AF:1 | |
| Intel Core i9-14900K, NVIDIA GeForce RTX 4090 | |
| AMD Ryzen 7 7800X3D, NVIDIA GeForce RTX 4090 | |
| AMD Ryzen 5 9600X, NVIDIA GeForce RTX 4090 | |
| Intel Core i5-14600K, NVIDIA GeForce RTX 4090 | |
| AMD Ryzen 9 7950X, NVIDIA GeForce RTX 4090 | |
| AMD Ryzen 7 7745HX, NVIDIA GeForce RTX 4090 | |
| Intel Core i7-13700, NVIDIA GeForce RTX 4090 | |
| AMD Ryzen 9 7945HX, NVIDIA GeForce RTX 4090 | |
| Intel Core i7-12700, NVIDIA GeForce RTX 4090 | |
| Intel Core i5-13400, NVIDIA GeForce RTX 4090 | |
| Metro Exodus - 1280x720 Low Quality AF:4x | |
| AMD Ryzen 7 7800X3D, NVIDIA GeForce RTX 4090 | |
| AMD Ryzen 5 9600X, NVIDIA GeForce RTX 4090 | |
| Intel Core i9-14900K, NVIDIA GeForce RTX 4090 | |
| AMD Ryzen 9 7950X, NVIDIA GeForce RTX 4090 | |
| Intel Core i5-14600K, NVIDIA GeForce RTX 4090 | |
| AMD Ryzen 7 7745HX, NVIDIA GeForce RTX 4090 | |
| AMD Ryzen 9 7945HX, NVIDIA GeForce RTX 4090 | |
| Intel Core i7-13700, NVIDIA GeForce RTX 4090 | |
| Intel Core i7-12700, NVIDIA GeForce RTX 4090 | |
| Intel Core i5-13400, NVIDIA GeForce RTX 4090 | |
| F1 2020 - 1280x720 Ultra Low Preset | |
| AMD Ryzen 7 7800X3D, NVIDIA GeForce RTX 4090 | |
| AMD Ryzen 5 9600X, NVIDIA GeForce RTX 4090 | |
| Intel Core i9-14900K, NVIDIA GeForce RTX 4090 | |
| AMD Ryzen 9 7950X, NVIDIA GeForce RTX 4090 | |
| AMD Ryzen 7 7745HX, NVIDIA GeForce RTX 4090 | |
| AMD Ryzen 9 7945HX, NVIDIA GeForce RTX 4090 | |
| Intel Core i7-13700, NVIDIA GeForce RTX 4090 | |
| Intel Core i5-14600K, NVIDIA GeForce RTX 4090 | |
| Intel Core i7-12700, NVIDIA GeForce RTX 4090 | |
| Intel Core i5-13400, NVIDIA GeForce RTX 4090 | |
| F1 2021 - 1280x720 Ultra Low Preset | |
| AMD Ryzen 7 7800X3D, NVIDIA GeForce RTX 4090 | |
| Intel Core i9-14900K, NVIDIA GeForce RTX 4090 | |
| AMD Ryzen 9 7950X, NVIDIA GeForce RTX 4090 | |
| AMD Ryzen 5 9600X, NVIDIA GeForce RTX 4090 | |
| AMD Ryzen 7 7745HX, NVIDIA GeForce RTX 4090 | |
| Intel Core i7-13700, NVIDIA GeForce RTX 4090 | |
| Intel Core i5-14600K, NVIDIA GeForce RTX 4090 | |
| AMD Ryzen 9 7945HX, NVIDIA GeForce RTX 4090 | |
| Intel Core i7-12700, NVIDIA GeForce RTX 4090 | |
| Intel Core i5-13400, NVIDIA GeForce RTX 4090 | |
Performance comparison at GPU limit at 2,160p
| Performance Rating - Percent | |
| AMD Ryzen 7 7800X3D, NVIDIA GeForce RTX 4090 | |
| Intel Core i9-14900K, NVIDIA GeForce RTX 4090 -1! | |
| Intel Core i5-14600K, NVIDIA GeForce RTX 4090 | |
| AMD Ryzen 9 7950X, NVIDIA GeForce RTX 4090 | |
| AMD Ryzen 5 9600X, NVIDIA GeForce RTX 4090 | |
| Intel Core i7-13700, NVIDIA GeForce RTX 4090 | |
| AMD Ryzen 7 7745HX, NVIDIA GeForce RTX 4090 | |
| AMD Ryzen 9 7945HX, NVIDIA GeForce RTX 4090 | |
| Intel Core i7-12700, NVIDIA GeForce RTX 4090 | |
| Intel Core i5-13400, NVIDIA GeForce RTX 4090 | |
| F1 22 - 3840x2160 Ultra High Preset AA:T AF:16x | |
| AMD Ryzen 5 9600X, NVIDIA GeForce RTX 4090 | |
| AMD Ryzen 9 7945HX, NVIDIA GeForce RTX 4090 | |
| AMD Ryzen 7 7745HX, NVIDIA GeForce RTX 4090 | |
| AMD Ryzen 7 7800X3D, NVIDIA GeForce RTX 4090 | |
| Intel Core i9-14900K, NVIDIA GeForce RTX 4090 | |
| Intel Core i5-14600K, NVIDIA GeForce RTX 4090 | |
| AMD Ryzen 9 7950X, NVIDIA GeForce RTX 4090 | |
| Intel Core i7-13700, NVIDIA GeForce RTX 4090 | |
| Intel Core i7-12700, NVIDIA GeForce RTX 4090 | |
| Intel Core i5-13400, NVIDIA GeForce RTX 4090 | |
| Far Cry 5 - 3840x2160 Ultra Preset AA:T | |
| AMD Ryzen 7 7800X3D, NVIDIA GeForce RTX 4090 | |
| Intel Core i5-14600K, NVIDIA GeForce RTX 4090 | |
| Intel Core i9-14900K, NVIDIA GeForce RTX 4090 | |
| AMD Ryzen 9 7950X, NVIDIA GeForce RTX 4090 | |
| Intel Core i7-13700, NVIDIA GeForce RTX 4090 | |
| AMD Ryzen 5 9600X, NVIDIA GeForce RTX 4090 | |
| Intel Core i7-12700, NVIDIA GeForce RTX 4090 | |
| AMD Ryzen 7 7745HX, NVIDIA GeForce RTX 4090 | |
| AMD Ryzen 9 7945HX, NVIDIA GeForce RTX 4090 | |
| Intel Core i5-13400, NVIDIA GeForce RTX 4090 | |
| Final Fantasy XV Benchmark - 3840x2160 High Quality | |
| Intel Core i9-14900K, NVIDIA GeForce RTX 4090 | |
| Intel Core i5-14600K, NVIDIA GeForce RTX 4090 | |
| AMD Ryzen 9 7950X, NVIDIA GeForce RTX 4090 | |
| AMD Ryzen 7 7745HX, NVIDIA GeForce RTX 4090 | |
| AMD Ryzen 7 7800X3D, NVIDIA GeForce RTX 4090 | |
| Intel Core i7-13700, NVIDIA GeForce RTX 4090 | |
| Intel Core i7-12700, NVIDIA GeForce RTX 4090 | |
| AMD Ryzen 9 7945HX, NVIDIA GeForce RTX 4090 | |
| AMD Ryzen 5 9600X, NVIDIA GeForce RTX 4090 | |
| Intel Core i5-13400, NVIDIA GeForce RTX 4090 | |
| Dota 2 Reborn - 3840x2160 ultra (3/3) best looking | |
| AMD Ryzen 7 7800X3D, NVIDIA GeForce RTX 4090 | |
| AMD Ryzen 9 7950X, NVIDIA GeForce RTX 4090 | |
| Intel Core i9-14900K, NVIDIA GeForce RTX 4090 | |
| AMD Ryzen 5 9600X, NVIDIA GeForce RTX 4090 | |
| Intel Core i5-14600K, NVIDIA GeForce RTX 4090 | |
| Intel Core i7-13700, NVIDIA GeForce RTX 4090 | |
| AMD Ryzen 9 7945HX, NVIDIA GeForce RTX 4090 | |
| AMD Ryzen 7 7745HX, NVIDIA GeForce RTX 4090 | |
| Intel Core i7-12700, NVIDIA GeForce RTX 4090 | |
| Intel Core i5-13400, NVIDIA GeForce RTX 4090 | |
| The Witcher 3 - 3840x2160 High Graphics & Postprocessing (Nvidia HairWorks Off) | |
| AMD Ryzen 9 7945HX, NVIDIA GeForce RTX 4090 | |
| Intel Core i5-14600K, NVIDIA GeForce RTX 4090 | |
| AMD Ryzen 9 7950X, NVIDIA GeForce RTX 4090 | |
| Intel Core i5-13400, NVIDIA GeForce RTX 4090 | |
| Intel Core i7-13700, NVIDIA GeForce RTX 4090 | |
| Intel Core i7-12700, NVIDIA GeForce RTX 4090 | |
| AMD Ryzen 7 7800X3D, NVIDIA GeForce RTX 4090 | |
| AMD Ryzen 7 7745HX, NVIDIA GeForce RTX 4090 | |
| AMD Ryzen 5 9600X, NVIDIA GeForce RTX 4090 | |
| GTA V - 3840x2160 Highest Settings possible AA:4xMSAA + FX AF:16x | |
| AMD Ryzen 7 7800X3D, NVIDIA GeForce RTX 4090 | |
| Intel Core i9-14900K, NVIDIA GeForce RTX 4090 | |
| Intel Core i5-14600K, NVIDIA GeForce RTX 4090 | |
| AMD Ryzen 5 9600X, NVIDIA GeForce RTX 4090 | |
| AMD Ryzen 9 7950X, NVIDIA GeForce RTX 4090 | |
| Intel Core i7-13700, NVIDIA GeForce RTX 4090 | |
| AMD Ryzen 7 7745HX, NVIDIA GeForce RTX 4090 | |
| AMD Ryzen 9 7945HX, NVIDIA GeForce RTX 4090 | |
| Intel Core i7-12700, NVIDIA GeForce RTX 4090 | |
| Intel Core i5-13400, NVIDIA GeForce RTX 4090 | |
| Borderlands 3 - 3840x2160 Badass Overall Quality (DX11) | |
| Intel Core i9-14900K, NVIDIA GeForce RTX 4090 | |
| AMD Ryzen 7 7800X3D, NVIDIA GeForce RTX 4090 | |
| Intel Core i5-14600K, NVIDIA GeForce RTX 4090 | |
| AMD Ryzen 9 7950X, NVIDIA GeForce RTX 4090 | |
| AMD Ryzen 9 7945HX, NVIDIA GeForce RTX 4090 | |
| Intel Core i7-13700, NVIDIA GeForce RTX 4090 | |
| AMD Ryzen 5 9600X, NVIDIA GeForce RTX 4090 | |
| AMD Ryzen 7 7745HX, NVIDIA GeForce RTX 4090 | |
| Intel Core i7-12700, NVIDIA GeForce RTX 4090 | |
| Intel Core i5-13400, NVIDIA GeForce RTX 4090 | |
| Far Cry New Dawn - 3840x2160 Ultra Preset | |
| AMD Ryzen 7 7800X3D, NVIDIA GeForce RTX 4090 | |
| Intel Core i9-14900K, NVIDIA GeForce RTX 4090 | |
| Intel Core i5-14600K, NVIDIA GeForce RTX 4090 | |
| AMD Ryzen 5 9600X, NVIDIA GeForce RTX 4090 | |
| AMD Ryzen 9 7950X, NVIDIA GeForce RTX 4090 | |
| Intel Core i7-13700, NVIDIA GeForce RTX 4090 | |
| Intel Core i7-12700, NVIDIA GeForce RTX 4090 | |
| AMD Ryzen 7 7745HX, NVIDIA GeForce RTX 4090 | |
| AMD Ryzen 9 7945HX, NVIDIA GeForce RTX 4090 | |
| Intel Core i5-13400, NVIDIA GeForce RTX 4090 | |
| Shadow of the Tomb Raider - 3840x2160 Highest Preset AA:T | |
| Intel Core i5-14600K, NVIDIA GeForce RTX 4090 | |
| Intel Core i9-14900K, NVIDIA GeForce RTX 4090 | |
| AMD Ryzen 5 9600X, NVIDIA GeForce RTX 4090 | |
| AMD Ryzen 7 7800X3D, NVIDIA GeForce RTX 4090 | |
| Intel Core i7-13700, NVIDIA GeForce RTX 4090 | |
| AMD Ryzen 9 7945HX, NVIDIA GeForce RTX 4090 | |
| AMD Ryzen 7 7745HX, NVIDIA GeForce RTX 4090 | |
| AMD Ryzen 9 7950X, NVIDIA GeForce RTX 4090 | |
| Intel Core i7-12700, NVIDIA GeForce RTX 4090 | |
| Intel Core i5-13400, NVIDIA GeForce RTX 4090 | |
| Tiny Tina's Wonderlands - 3840x2160 Badass Preset (DX12) | |
| Intel Core i9-14900K, NVIDIA GeForce RTX 4090 | |
| AMD Ryzen 7 7745HX, NVIDIA GeForce RTX 4090 | |
| Intel Core i5-14600K, NVIDIA GeForce RTX 4090 | |
| AMD Ryzen 9 7950X, NVIDIA GeForce RTX 4090 | |
| Intel Core i7-13700, NVIDIA GeForce RTX 4090 | |
| AMD Ryzen 5 9600X, NVIDIA GeForce RTX 4090 | |
| AMD Ryzen 7 7800X3D, NVIDIA GeForce RTX 4090 | |
| AMD Ryzen 9 7945HX, NVIDIA GeForce RTX 4090 | |
| Intel Core i7-12700, NVIDIA GeForce RTX 4090 | |
| Intel Core i5-13400, NVIDIA GeForce RTX 4090 | |
| Strange Brigade - 3840x2160 ultra AA:ultra AF:16 | |
| Intel Core i9-14900K, NVIDIA GeForce RTX 4090 | |
| AMD Ryzen 7 7800X3D, NVIDIA GeForce RTX 4090 | |
| Intel Core i5-14600K, NVIDIA GeForce RTX 4090 | |
| AMD Ryzen 9 7945HX, NVIDIA GeForce RTX 4090 | |
| AMD Ryzen 7 7745HX, NVIDIA GeForce RTX 4090 | |
| AMD Ryzen 5 9600X, NVIDIA GeForce RTX 4090 | |
| Intel Core i7-12700, NVIDIA GeForce RTX 4090 | |
| Intel Core i7-13700, NVIDIA GeForce RTX 4090 | |
| AMD Ryzen 9 7950X, NVIDIA GeForce RTX 4090 | |
| Intel Core i5-13400, NVIDIA GeForce RTX 4090 | |
| Metro Exodus - 3840x2160 Ultra Quality AF:16x | |
| Intel Core i9-14900K, NVIDIA GeForce RTX 4090 | |
| Intel Core i5-14600K, NVIDIA GeForce RTX 4090 | |
| AMD Ryzen 7 7800X3D, NVIDIA GeForce RTX 4090 | |
| AMD Ryzen 9 7950X, NVIDIA GeForce RTX 4090 | |
| AMD Ryzen 5 9600X, NVIDIA GeForce RTX 4090 | |
| Intel Core i7-13700, NVIDIA GeForce RTX 4090 | |
| AMD Ryzen 7 7745HX, NVIDIA GeForce RTX 4090 | |
| AMD Ryzen 9 7945HX, NVIDIA GeForce RTX 4090 | |
| Intel Core i7-12700, NVIDIA GeForce RTX 4090 | |
| Intel Core i5-13400, NVIDIA GeForce RTX 4090 | |
| F1 2020 - 3840x2160 Ultra High Preset AA:T AF:16x | |
| AMD Ryzen 7 7800X3D, NVIDIA GeForce RTX 4090 | |
| Intel Core i5-14600K, NVIDIA GeForce RTX 4090 | |
| AMD Ryzen 7 7745HX, NVIDIA GeForce RTX 4090 | |
| AMD Ryzen 5 9600X, NVIDIA GeForce RTX 4090 | |
| AMD Ryzen 9 7950X, NVIDIA GeForce RTX 4090 | |
| Intel Core i9-14900K, NVIDIA GeForce RTX 4090 | |
| Intel Core i7-13700, NVIDIA GeForce RTX 4090 | |
| AMD Ryzen 9 7945HX, NVIDIA GeForce RTX 4090 | |
| Intel Core i7-12700, NVIDIA GeForce RTX 4090 | |
| Intel Core i5-13400, NVIDIA GeForce RTX 4090 | |
| F1 2021 - 3840x2160 Ultra High Preset + Raytracing AA:T AF:16x | |
| AMD Ryzen 7 7800X3D, NVIDIA GeForce RTX 4090 | |
| AMD Ryzen 7 7745HX, NVIDIA GeForce RTX 4090 | |
| AMD Ryzen 5 9600X, NVIDIA GeForce RTX 4090 | |
| AMD Ryzen 9 7945HX, NVIDIA GeForce RTX 4090 | |
| Intel Core i5-14600K, NVIDIA GeForce RTX 4090 | |
| Intel Core i9-14900K, NVIDIA GeForce RTX 4090 | |
| AMD Ryzen 9 7950X, NVIDIA GeForce RTX 4090 | |
| Intel Core i7-13700, NVIDIA GeForce RTX 4090 | |
| Intel Core i7-12700, NVIDIA GeForce RTX 4090 | |
| Intel Core i5-13400, NVIDIA GeForce RTX 4090 | |
| Bas | Moyen | Élevé | Ultra | QHD | 4K | |
|---|---|---|---|---|---|---|
| GTA V (2015) | 187.6 | 187.3 | 183 | 141 | 140.5 | 183.6 |
| The Witcher 3 (2015) | 709 | 618 | 563 | 310 | 272 | 292 |
| Dota 2 Reborn (2015) | 268.7 | 234.8 | 221.4 | 202.6 | 196.7 | |
| Final Fantasy XV Benchmark (2018) | 234 | 234 | 213 | 208 | 152 | |
| X-Plane 11.11 (2018) | 196.4 | 169.4 | 127.6 | 105.9 | ||
| Far Cry 5 (2018) | 191 | 168 | 163 | 151 | 151 | 146 |
| Strange Brigade (2018) | 592 | 470 | 465 | 463 | 461 | 289 |
| Shadow of the Tomb Raider (2018) | 273 | 266 | 264 | 263 | 252 | 186.8 |
| Far Cry New Dawn (2019) | 165 | 142 | 139 | 124 | 129 | 123 |
| Metro Exodus (2019) | 270 | 243 | 210 | 183.2 | 167.7 | 133.7 |
| Borderlands 3 (2019) | 213 | 189.6 | 175.5 | 165.6 | 163.2 | 134.1 |
| F1 2020 (2020) | 470 | 390 | 379 | 359 | 354 | 283 |
| F1 2021 (2021) | 562 | 533 | 455 | 220 | 222 | 203 |
| Tiny Tina's Wonderlands (2022) | 365 | 308 | 269 | 258 | 222 | 129.8 |
| F1 22 (2022) | 382 | 366 | 339 | 170 | 159.4 | 85 |
| F1 23 (2023) | 368 | 390 | 373 | 164.3 | 147.9 | 80.9 |
| Cyberpunk 2077 2.1 Phantom Liberty (2023) | 186 | 183.2 | 177.4 | 163.9 | 151.4 | 75.3 |
| Assassin's Creed Mirage (2023) | 250 | 244 | 236 | 167 | 163 | 128 |
| Avatar Frontiers of Pandora (2023) | 232 | 212 | 202 | 170 | 126 | 70 |
| F1 24 (2024) | 350 | 371 | 345 | 176.7 | 146.3 | 80 |
Consommation électrique et températures
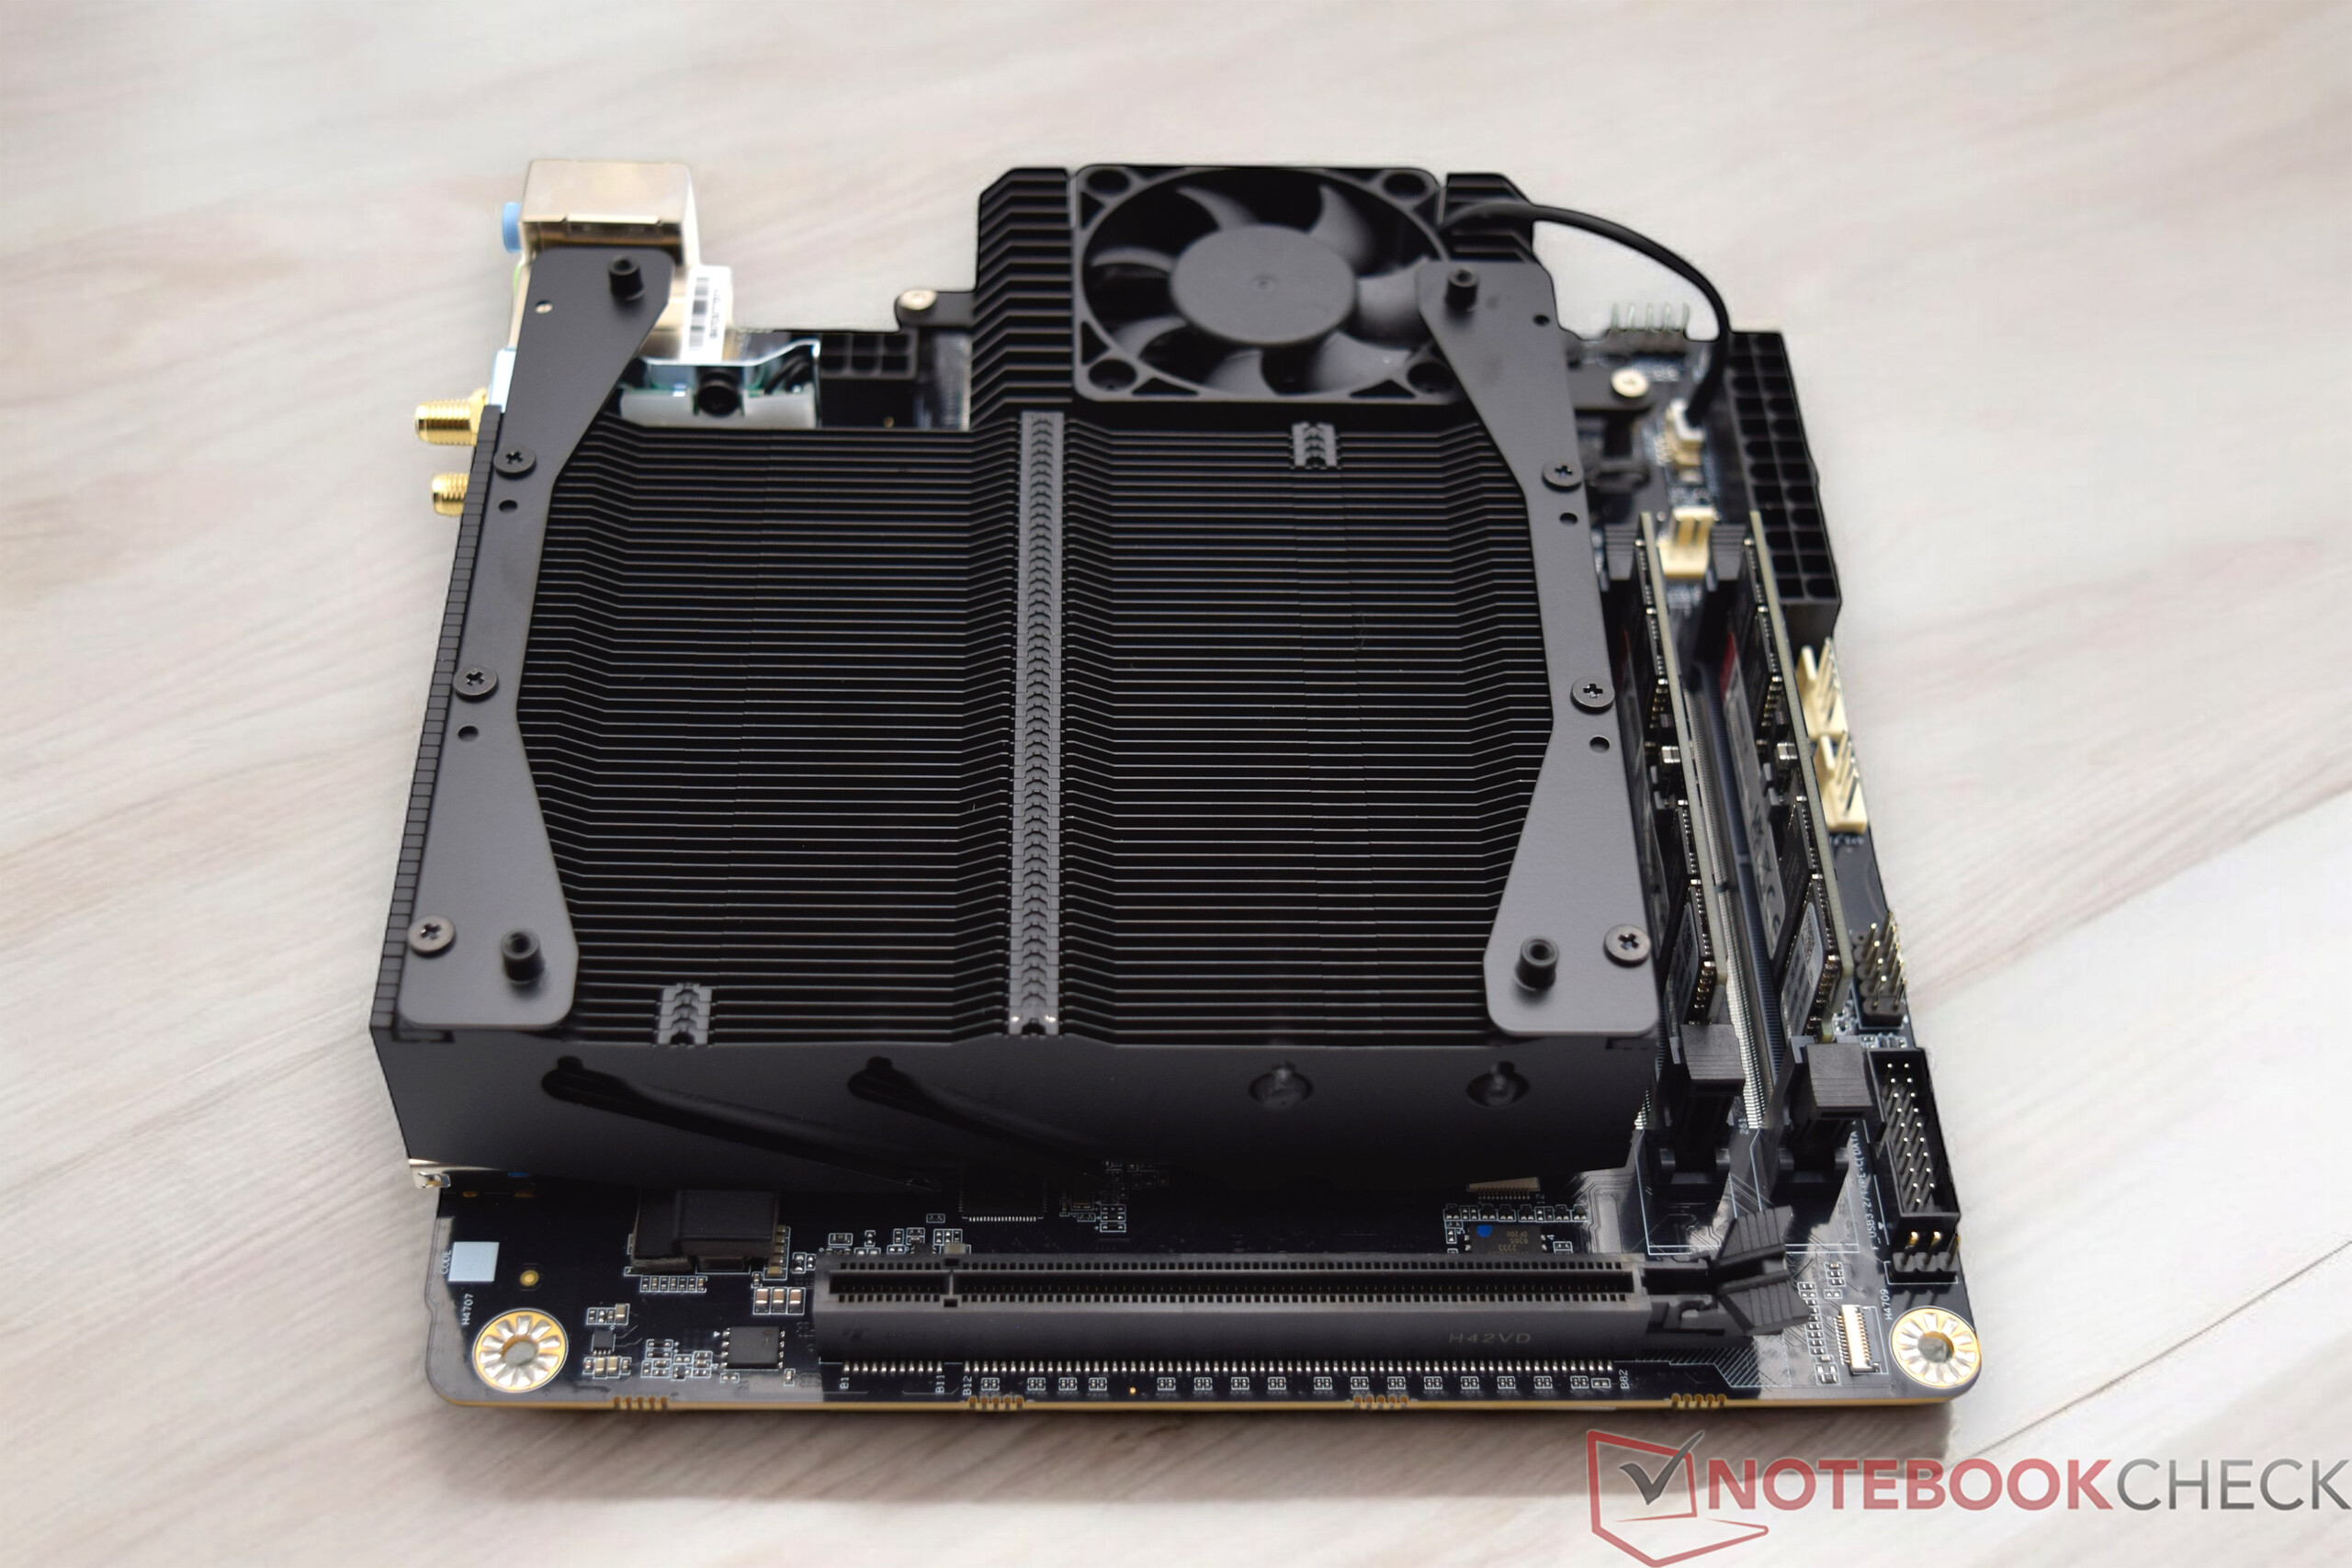
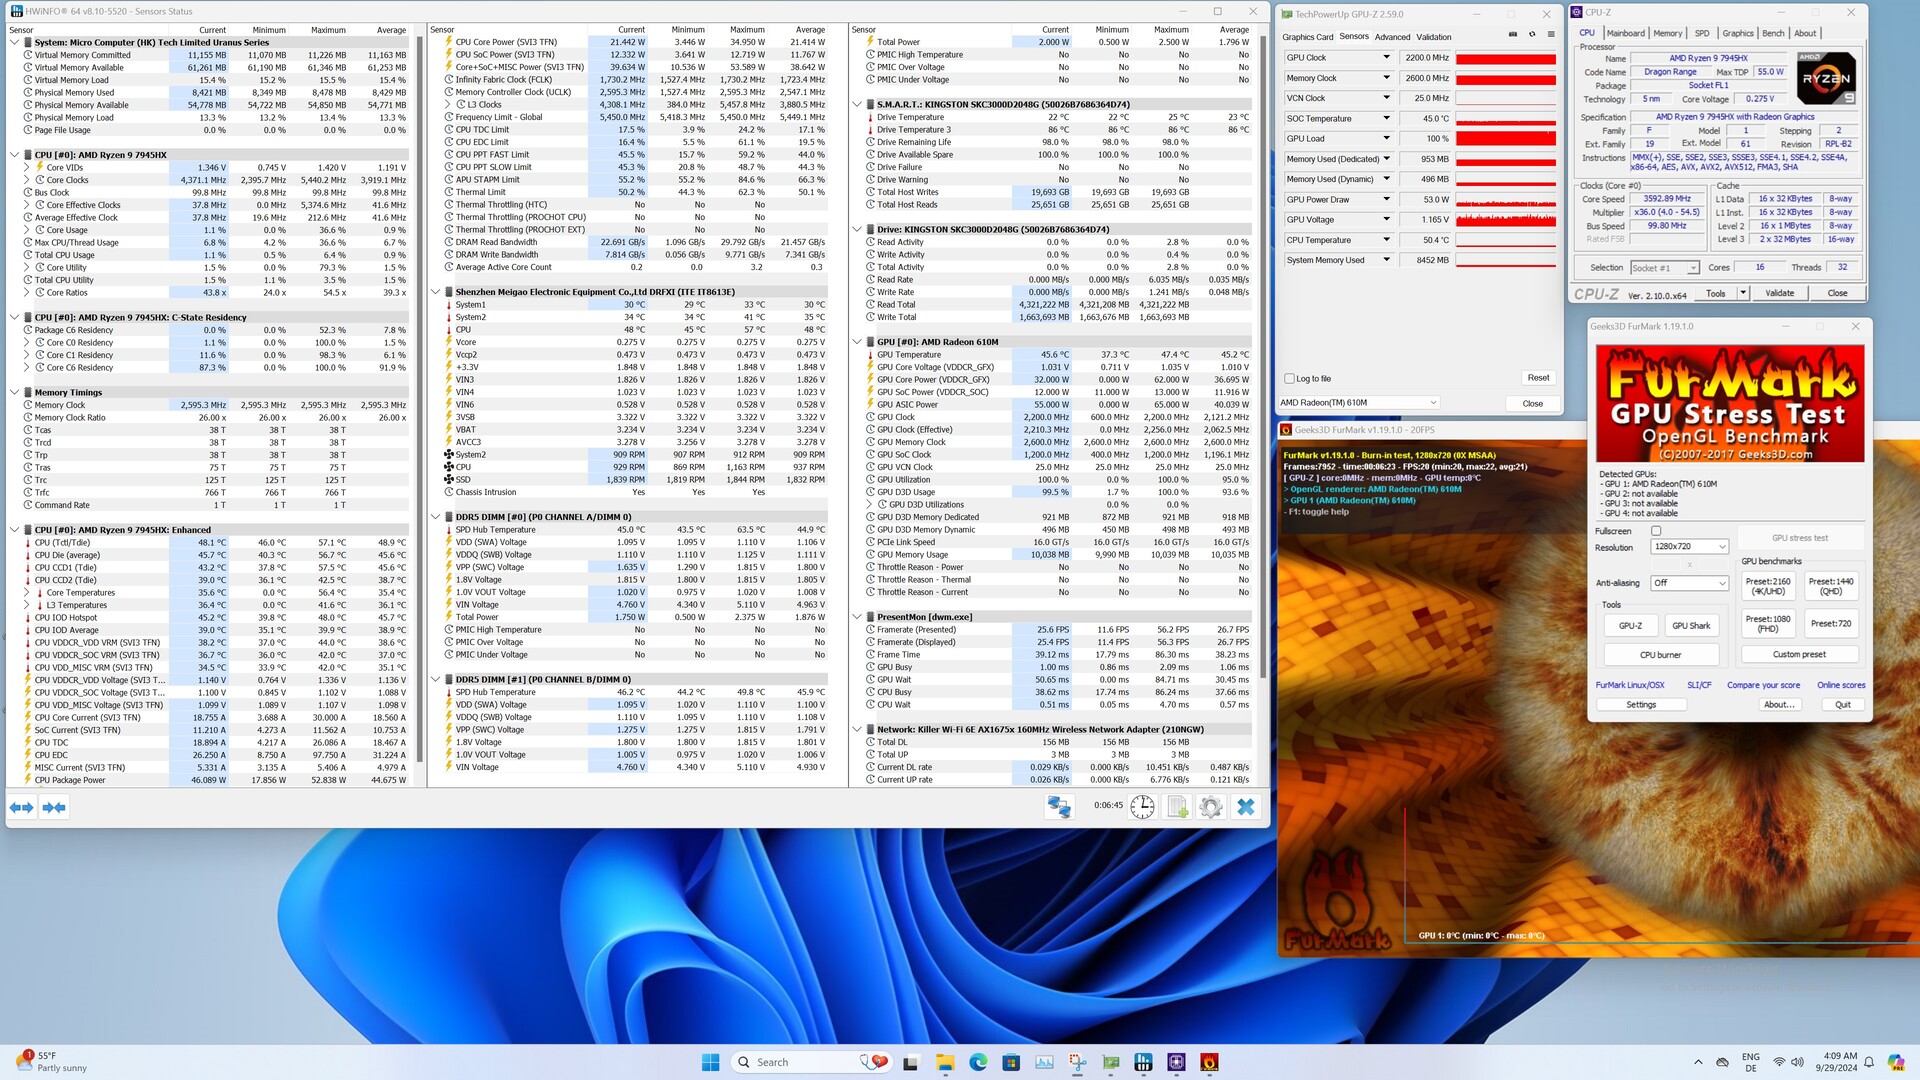
Minisforum livre la carte mère BD790i avec une unité de refroidissement heatpipe préinstallée, qui refroidit le processeur et les convertisseurs de tension sur la carte mère. Le choix du ventilateur est laissé à l'utilisateur et doit être installé par ses soins. Le matériel de montage correspondant à l'installation d'un ventilateur de 120 millimètres est inclus. Nous avons choisi un ventilateur Noctua NF-A12x25, qui avait déjà été utilisé lors de notre test du Minisforum BD770i. Le plus grand avantage du Minisforum BD790i par rapport aux PC de bureau conventionnels est sa faible consommation d'énergie. Nous n'avons mesuré qu'environ 140 watts pendant le test multiple Cinebench R15, ce qui est très efficace par rapport aux performances qu'il offre.
En ce qui concerne le fonctionnement général et le niveau de bruit pendant le fonctionnement, nous pouvons seulement dire que le bloc d'alimentation intégré est audible dans notre configuration de test. Que ce soit en mode veille ou en charge, nous n'avons pas pu prendre de mesures qui auraient pu être influencées par le bloc d'alimentation installé. Le ventilateur du processeur et le ventilateur pré-installé pour refroidir le SSD ne sont pas audibles depuis le boîtier fermé. Le refroidissement fonctionne très efficacement et nous n'avons pas relevé de valeurs critiques sous charge. Néanmoins, nous sommes d'avis qu'il serait judicieux de séparer le refroidisseur du CPU et du VRM afin de pouvoir installer une solution de refroidissement pour le processeur lui-même. Le SoC pourrait certainement être refroidi encore plus efficacement avec une solution AiO.
Par rapport aux fabricants de cartes mères connus, les options de réglage dans le BIOS de la carte mère Minisforum BD790i sont très limitées. La consommation d'énergie du processeur peut être modifiée, mais la courbe du ventilateur ne peut pas être réglée séparément. Si Minisforum continue à couvrir ce marché, nous serions très heureux de disposer d'une option plus conviviale.

Efficiency overview
| Performance Rating - Percent | |
| Minisforum BD790i | |
| Minisforum BD770i | |
| Power Consumption | |
| Cinebench R23 Multi Power Efficiency - external Monitor | |
| Minisforum BD790i | |
| Minisforum BD770i | |
| Cinebench R23 Single Power Efficiency - external Monitor | |
| Minisforum BD770i | |
| Minisforum BD790i | |
| Cinebench R15 Multi Efficiency (external Monitor) | |
| Minisforum BD790i | |
| Minisforum BD770i | |
| Power Consumption / Cinebench R15 Multi (external Monitor) | |
| Intel Core i9-14900K | |
| Intel Core i9-13900K | |
| AMD Ryzen 9 7950X (Idle: 95.2 W) | |
| Intel Core i7-13700K | |
| Intel Core i5-14600K | |
| Intel Core i5-13600K | |
| Intel Core i7-12700 | |
| AMD Ryzen 9 7950X3D | |
| AMD Ryzen 7 7800X3D | |
| Intel Core i5-13400 | |
| Intel Core i5-12400F | |
| AMD Ryzen 9 7945HX | |
| AMD Ryzen 7 7745HX | |
| Power Consumption / Prime95 V2810 Stress (external Monitor) | |
| Intel Core i9-14900K | |
| Intel Core i9-13900K | |
| Intel Core i5-14600K | |
| Intel Core i7-13700K | |
| Intel Core i5-13600K | |
| AMD Ryzen 9 7950X (Idle: 95.2 W) | |
| Intel Core i7-12700 | |
| AMD Ryzen 9 7950X3D | |
| Intel Core i5-12400F | |
| Intel Core i5-13400 | |
| AMD Ryzen 7 7800X3D | |
| AMD Ryzen 9 7945HX | |
| AMD Ryzen 7 7745HX | |
| Power Consumption / Cinebench R23 Multi (external Monitor) | |
| Intel Core i9-14900K | |
| AMD Ryzen 9 7950X (95.2) | |
| Intel Core i5-14600K | |
| AMD Ryzen 9 7950X3D | |
| AMD Ryzen 7 7800X3D | |
| AMD Ryzen 9 7945HX | |
| AMD Ryzen 7 7745HX | |
| Power Consumption / Cinebench R23 Single (external Monitor) | |
| AMD Ryzen 7 7800X3D | |
| AMD Ryzen 9 7950X (95.2) | |
| Intel Core i9-14900K | |
| Intel Core i5-14600K | |
| AMD Ryzen 9 7945HX | |
| AMD Ryzen 7 7745HX | |
| Power Consumption / Cinebench R15 Multi Efficiency (external Monitor) | |
| AMD Ryzen 9 7945HX | |
| AMD Ryzen 7 7745HX | |
| AMD Ryzen 9 7950X3D | |
| AMD Ryzen 9 7950X | |
| AMD Ryzen 7 7800X3D | |
| Intel Core i9-13900K | |
| Intel Core i5-13600K | |
| Intel Core i9-14900K | |
| Intel Core i5-14600K | |
* ... Moindre est la valeur, meilleures sont les performances
Power consumption with and without dedicated graphics card
Power consumption with Nvidia GeForce RTX 4090
Points positifs
Points négatifs
Verdict - La puissante AMD Ryzen 9 7945HX
La Minisforum BD790i est une carte mère très puissante incluant un SoC, qui, en tant que carte mère Mini-ITX, offre une base parfaite pour la construction de petits systèmes. Comme il ne s'agit que d'une carte mère, le fabricant vise les clients désireux de construire eux-mêmes leur système. Contrairement aux mini-PC prêts à l'emploi, vous devez vous occuper des composants supplémentaires. Il va sans dire que cela entraîne des coûts supplémentaires.
En combinaison avec l'AMD Ryzen 9 7945HX, le Minisforum BD790i offre des performances impressionnantes, une grande efficacité et, grâce à son support PCIe-5.0, de bonnes qualités d'avenir pour les cartes graphiques et les disques durs SSD.
Sur la base de nos tests du Minisforum BD790i lui-même, nous pouvons dire que l'AMD Ryzen 9 7945HX est un processeur extrêmement puissant qui peut actuellement gérer toutes les tâches avec facilité. Comparé à un Intel Core i9-14900K ou à un AMD Ryzen 9 7950X, l'AMD Ryzen 9 7945HX doit s'avouer vaincu, même si la différence de performance n'est que très légère. En ce qui concerne la consommation d'énergie, les processeurs d'ordinateur de bureau classiques ne peuvent plus suivre. La décision d'intégrer la technologie des ordinateurs portables dans une carte mère classique est judicieuse en termes d'efficacité. Cependant, le principal inconvénient est que le SoC ne peut pas être simplement remplacé. En outre, vous êtes limité à une unité de refroidissement fixe, ce qui signifie que vous ne pouvez pas utiliser d'autres unités de refroidissement.
À première vue, le prix actuel d'un peu moins de 500 dollars US semble très élevé. Cependant, si l'on compare les performances, l'AMD Ryzen 9 7945HX n'a certainement pas besoin de se cacher derrière les processeurs de bureau les plus rapides. Nous considérons donc que son prix actuel est justifié, et si vous ne souhaitez pas mettre à niveau le CPU ultérieurement, vous pouvez l'acheter sans hésiter.
Prix et disponibilité
Au moment où nous écrivons ces lignes, vous pouvez acheter le Minisforum BD790i sur Amazon au prix de 479,99 dollars US.
Transparency
The selection of devices to be reviewed is made by our editorial team. The test sample was given to the author by the manufacturer free of charge for the purposes of review. There was no third-party influence on this review, nor did the manufacturer receive a copy of this review before publication. There was no obligation to publish this review. We never accept compensation or payment in return for our reviews. As an independent media company, Notebookcheck is not subjected to the authority of manufacturers, retailers or publishers.
This is how Notebookcheck is testing
Every year, Notebookcheck independently reviews hundreds of laptops and smartphones using standardized procedures to ensure that all results are comparable. We have continuously developed our test methods for around 20 years and set industry standards in the process. In our test labs, high-quality measuring equipment is utilized by experienced technicians and editors. These tests involve a multi-stage validation process. Our complex rating system is based on hundreds of well-founded measurements and benchmarks, which maintains objectivity. Further information on our test methods can be found here.

