

Critique de l'ordinateur portable Asus V16 V3607V : GeForce Des graphismes RTX sans se ruiner
Début des performances du Core 7 240H.
Pour autant que vous sachiez où sont les économies, l'Asus V16 peut être une solution solide et polyvalente qui fonctionne suffisamment bien pour la plupart des scénarios à la maison, au bureau ou dans les salles de classe.Allen Ngo, 👁 Allen Ngo (traduit par DeepL / Ninh Duy) Publié 🇺🇸
Verdict - Bien équilibré et bon marché
Alors que la série Vivobook grimpe en prix, le V16 a été introduit comme une nouvelle option bas de gamme pour les utilisateurs ayant un budget plus serré. Le V16 satisfait assez bien cet espace de ~1000$ en équilibrant un nouveau CPU assez rapide avec un GPU RTX discret dans un design qui est assez fin et portable pour être compétitif par rapport au HP Pavilion Plus 16 ou plus lourd Dell Inspiron 16 Plus 7640.
Les coupes sont néanmoins perceptibles. L'écran, par exemple, offre une couverture étroite des couleurs, tandis que le châssis en plastique peut sembler bon marché. Le HP susmentionné semble plus solide et il offre même des couleurs sRGB >99%, bien qu'il soit plus cher que notre Asus.
La configuration RTX 4050 est vendue 100 $ de plus que la configuration RTX 3050. Les acheteurs potentiels peuvent envisager l'option RTX 4050 car elle offre des performances graphiques 50 % plus rapides que la RTX 3050.
Points positifs
Points négatifs
Prix et disponibilité
L'Asus V16 est disponible dès à présent sur Best Buy au prix de 900 $ sur Best Buy pour 900 $.
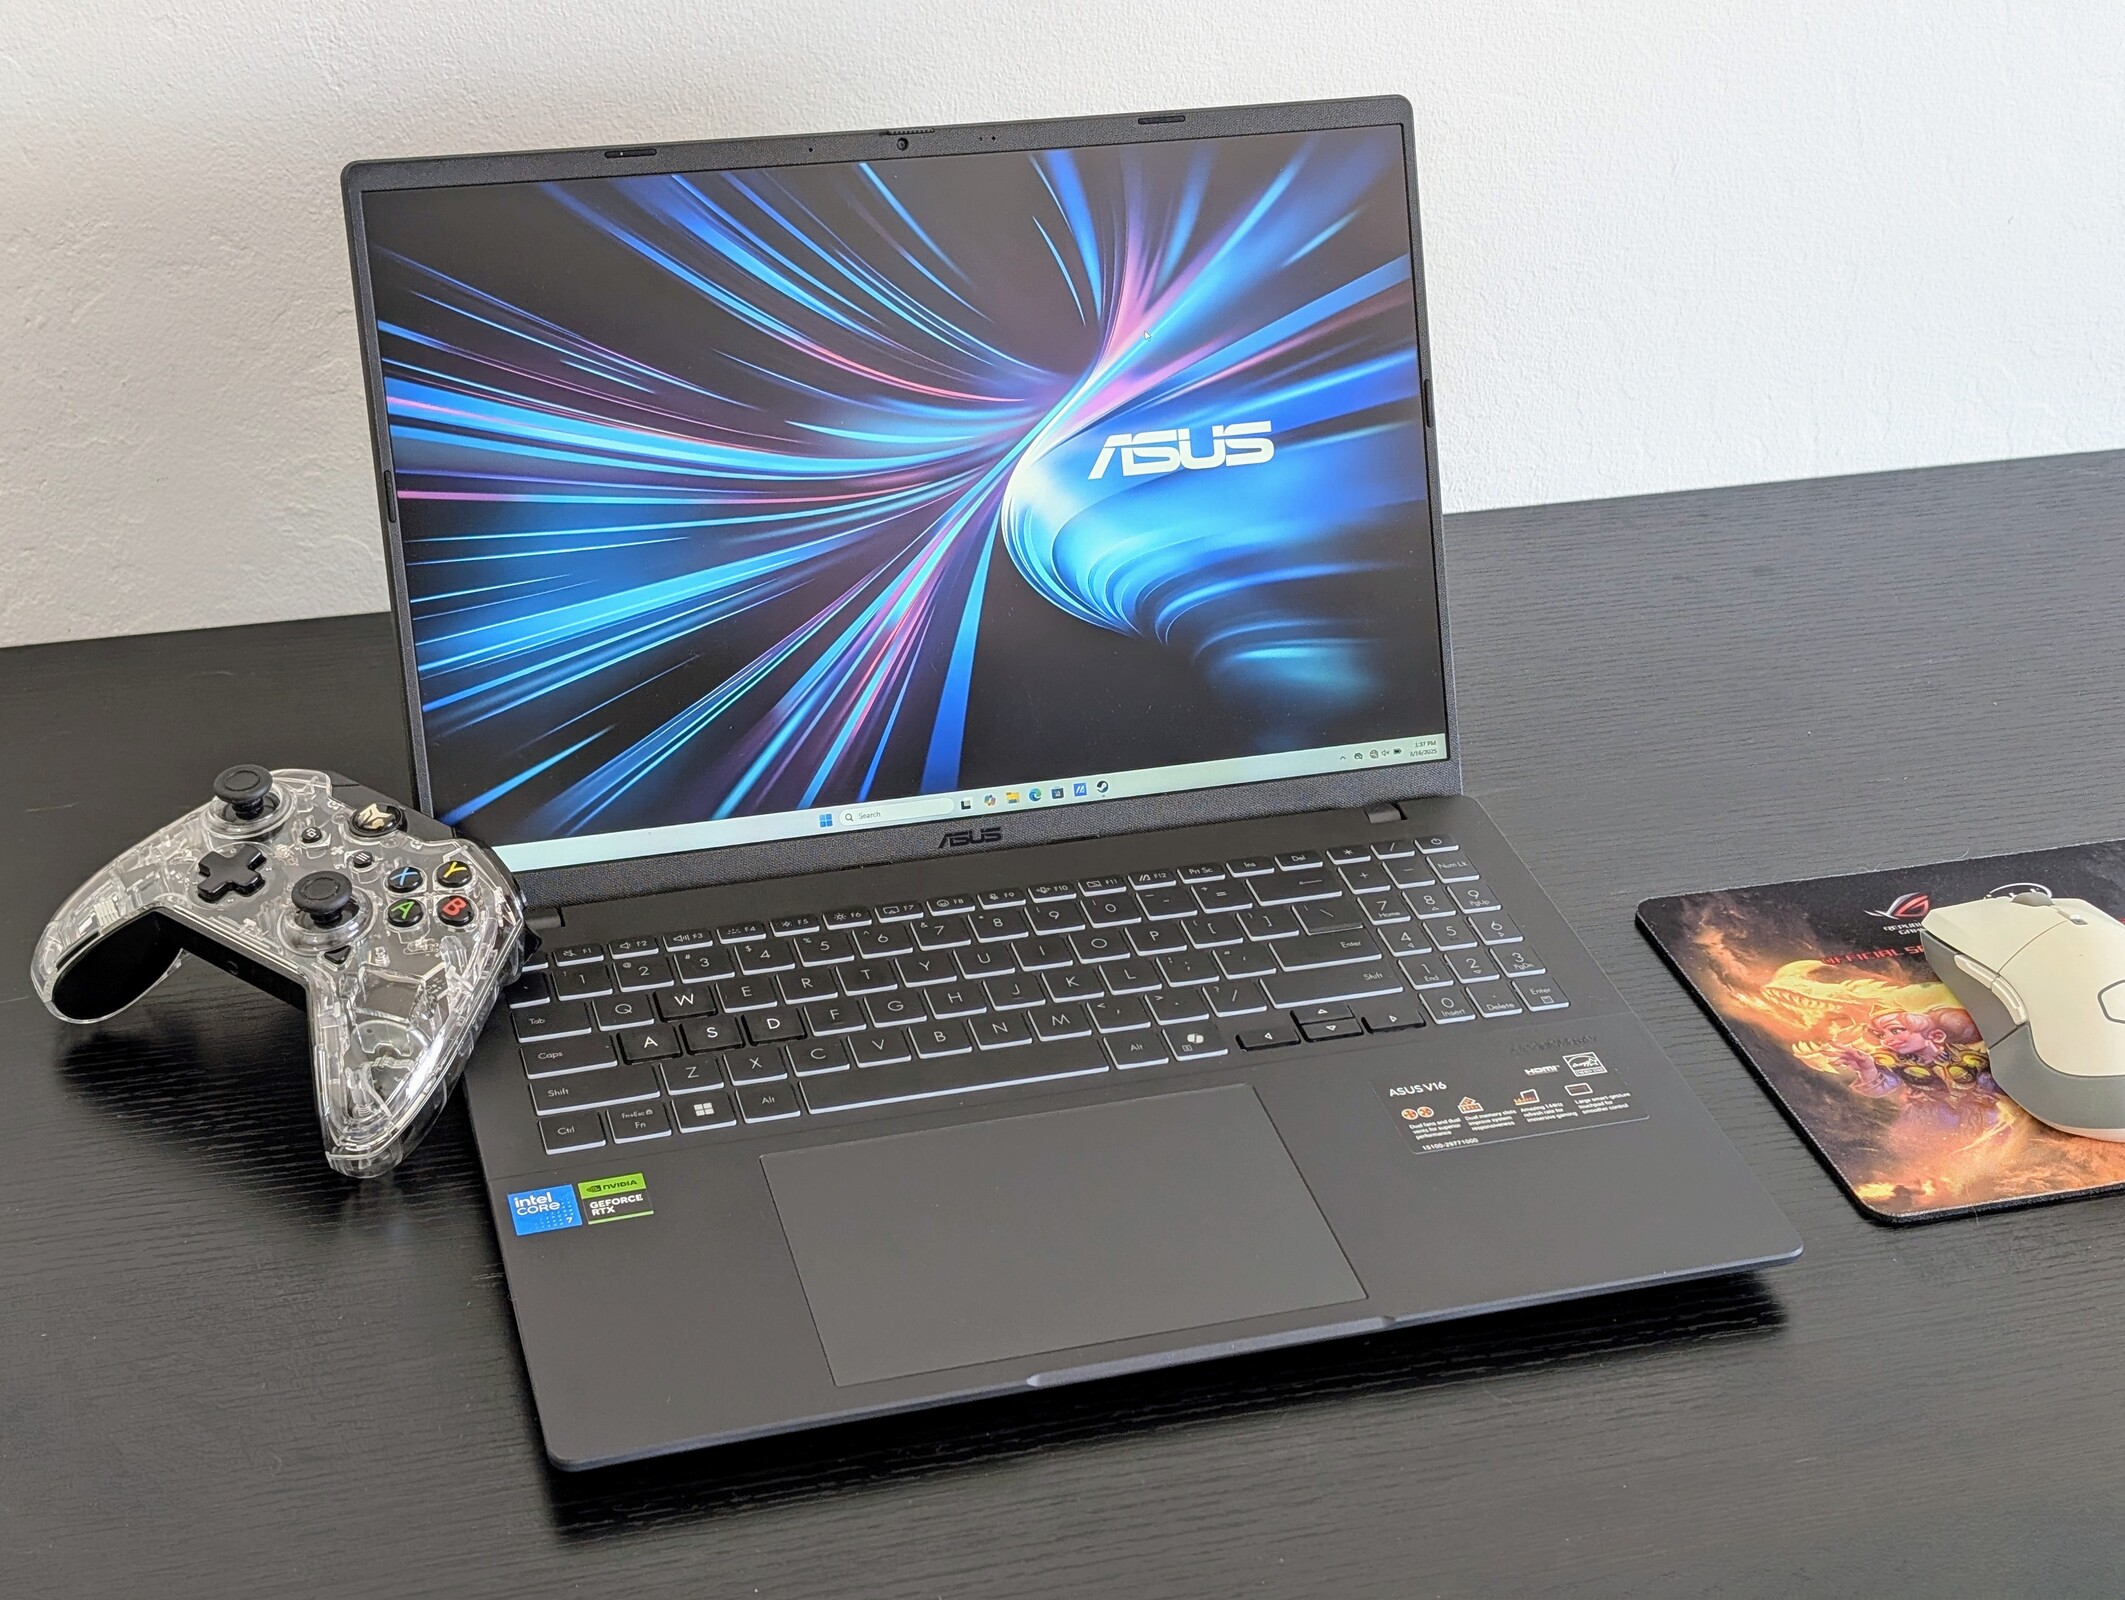
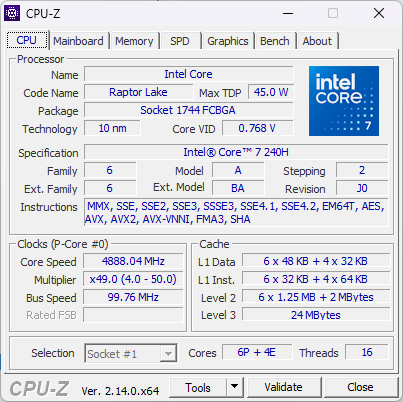
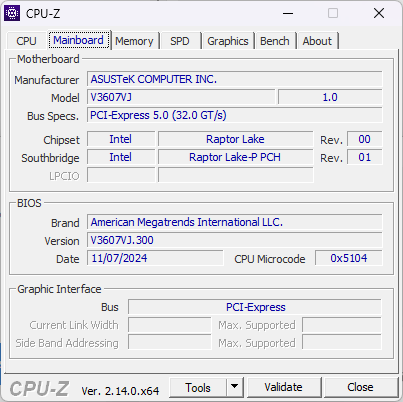
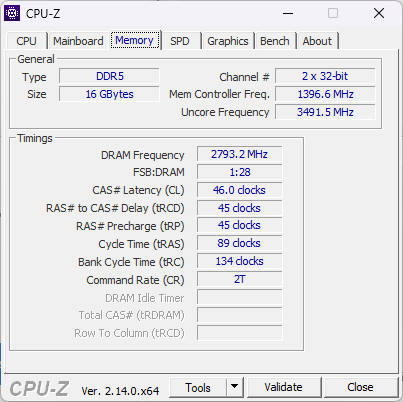
À ne pas confondre avec le VivoBook 16, le V16 est le modèle multimédia économique d'Asus, dont les prix de départ sont encore plus bas que ceux de la série VivoBook. Il est dépourvu de certaines caractéristiques de luxe que l'on retrouve sur le VivoBook, comme l'OLED et les designs métalliques attrayants. Le 2025 V16 est livré avec le nouveau Core 7 240H de milieu de gamme supérieur.
Notre unité de test est livrée avec le CPU susmentionné, un écran IPS 1200p 144 Hz, et l'ancienne RTX 3050 de 6 Go GeForce pour maintenir le prix sous la barre des 1000 $. D'autres SKUs peuvent être livrés avec la RTX 4050 à la place.
Les alternatives au V16 incluent d'autres ordinateurs portables multimédias économiques avec des GPU discrets comme le HP Pavilion Plus 16, Dell Inspiron 16 Plus, ou le Lenovo IdeaPad Pro 5 16.
Plus de commentaires sur Asus :
Spécifications
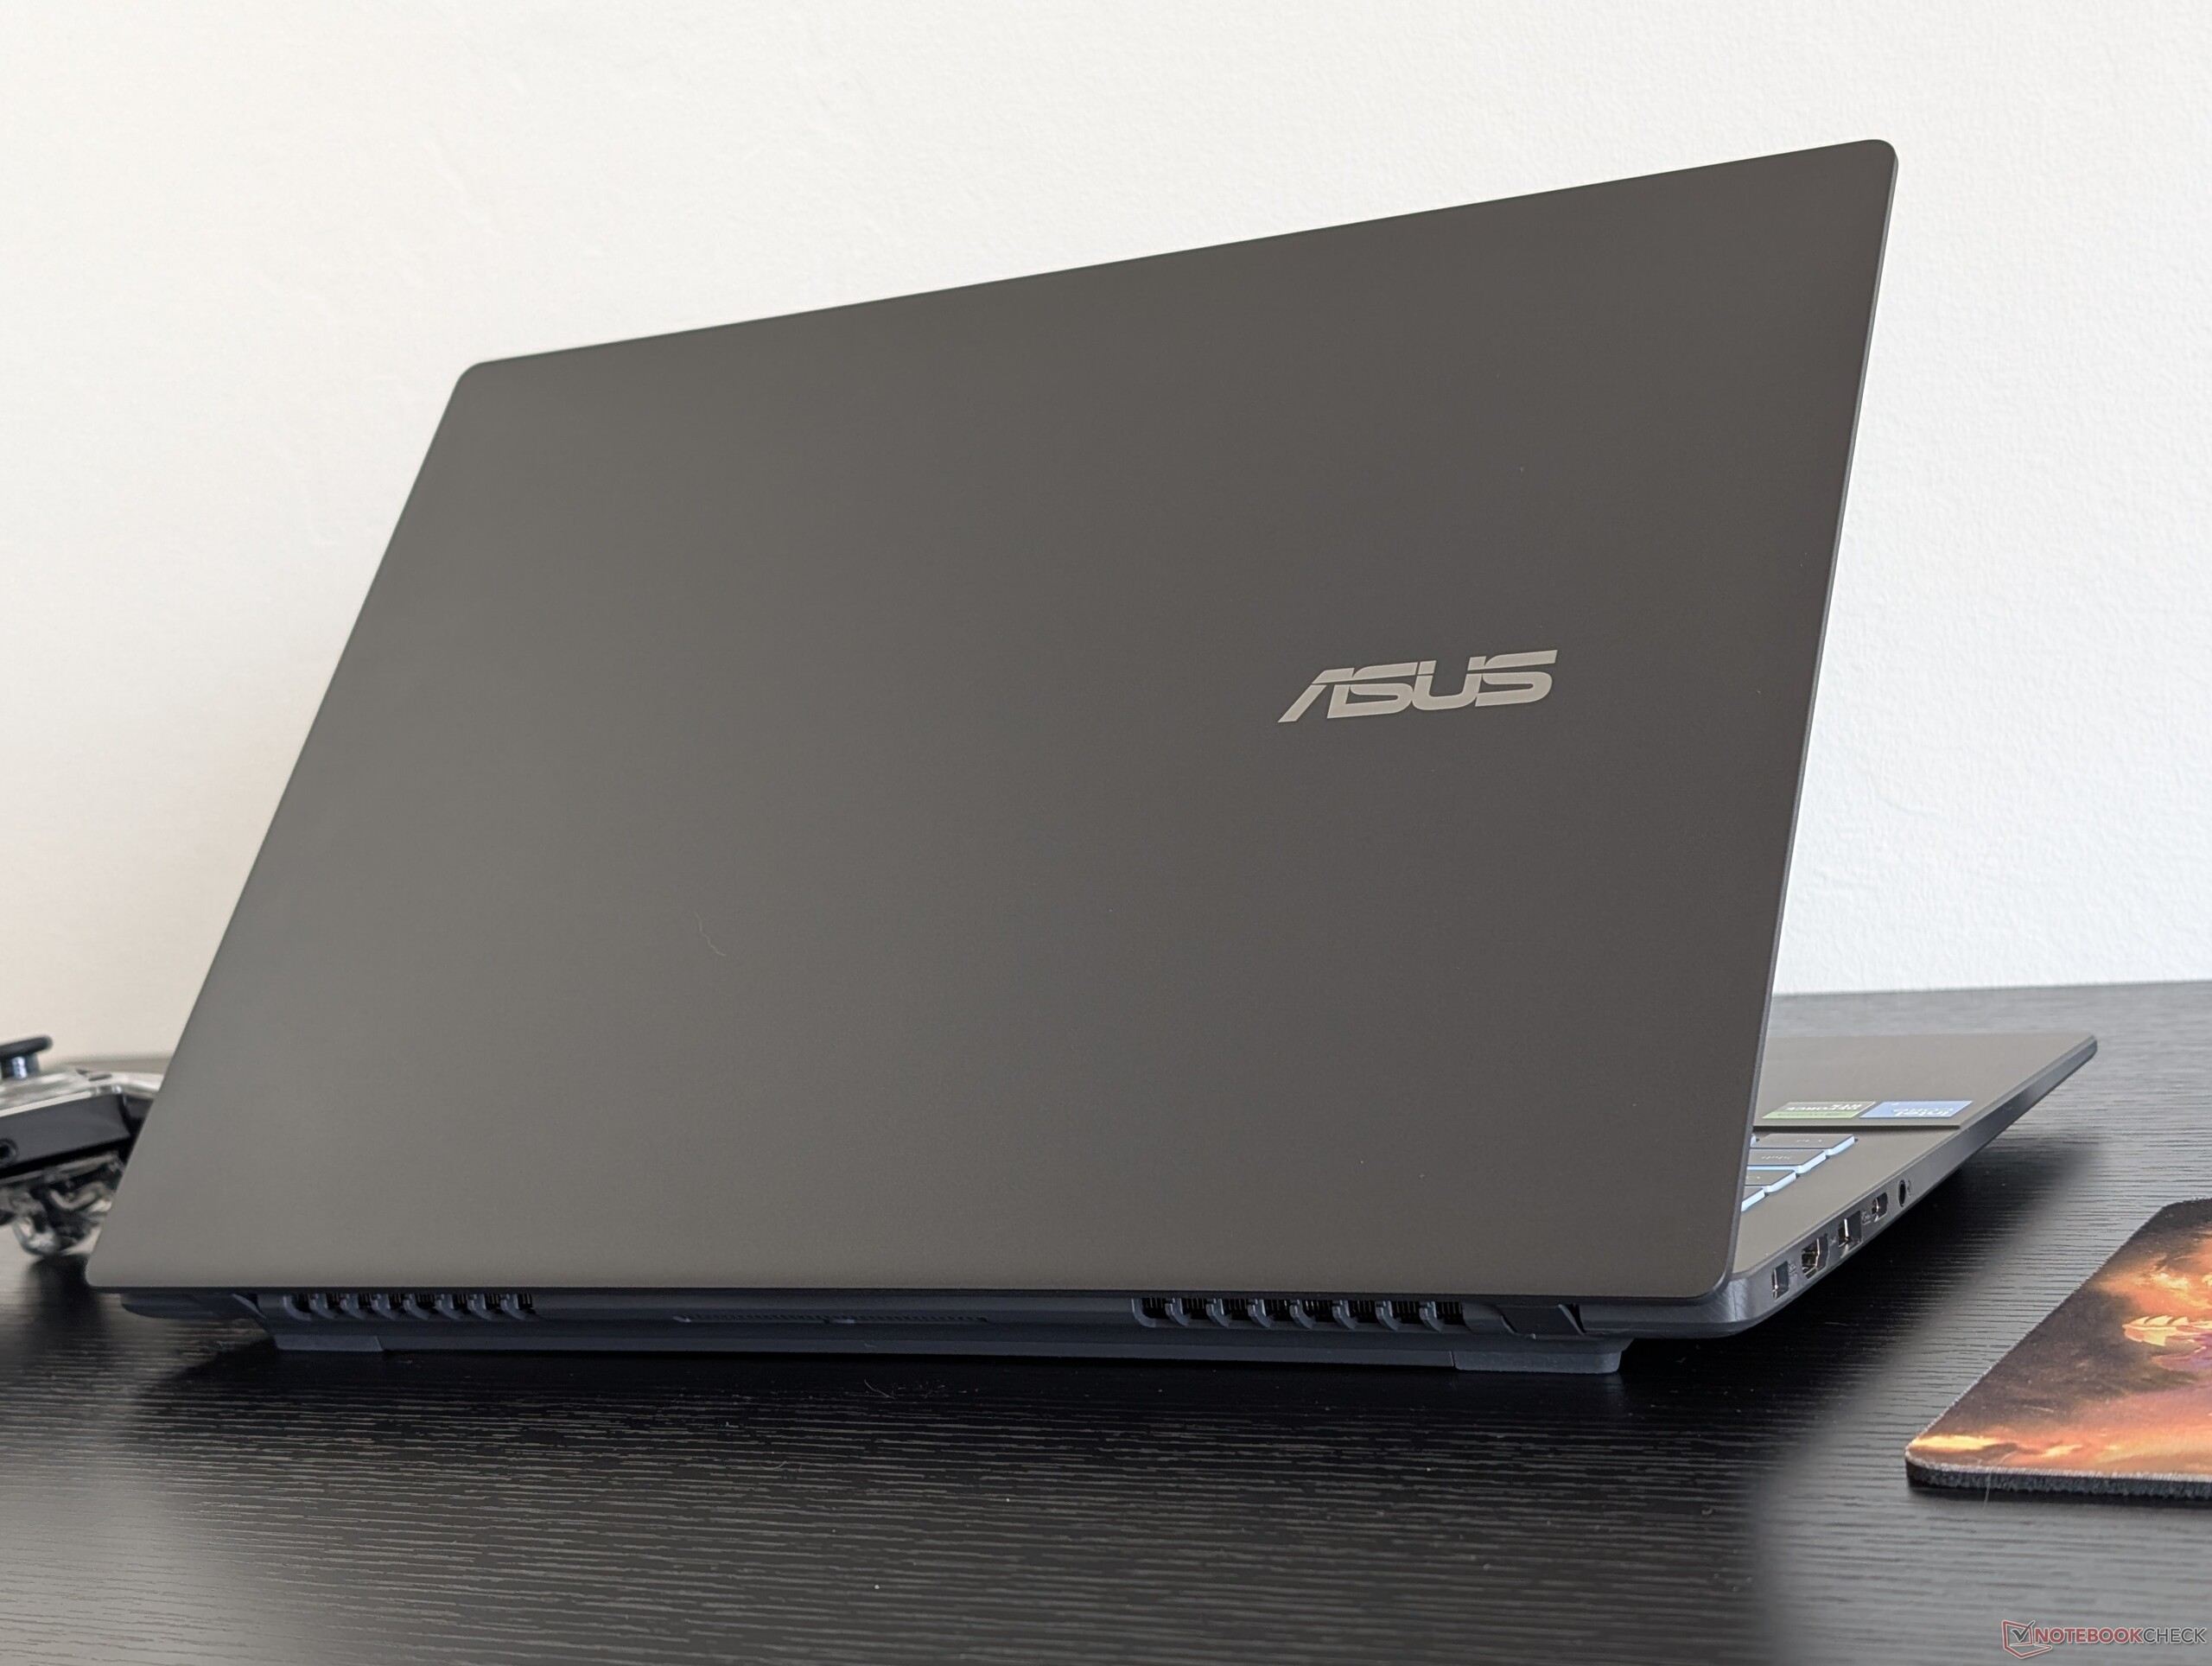
Boîtier - Plastique noir monotone
Le châssis est résolument en plastique, y compris le couvercle extérieur, alors que les fabricants utilisent souvent du métal pour améliorer la première impression. La base et le couvercle ont tendance à se tordre et sont extrêmement sensibles aux traces de doigts disgracieuses.
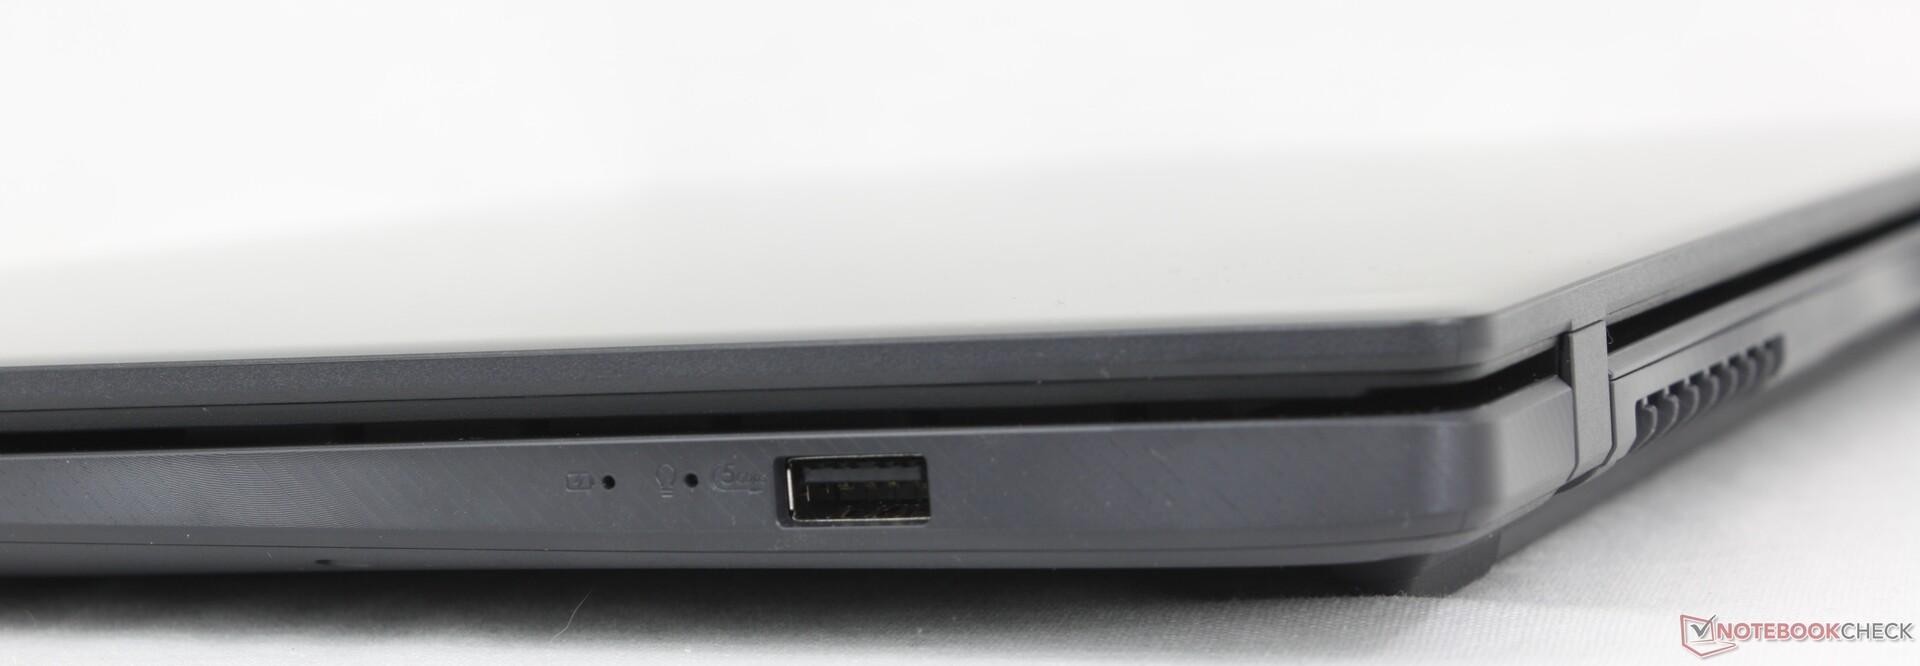
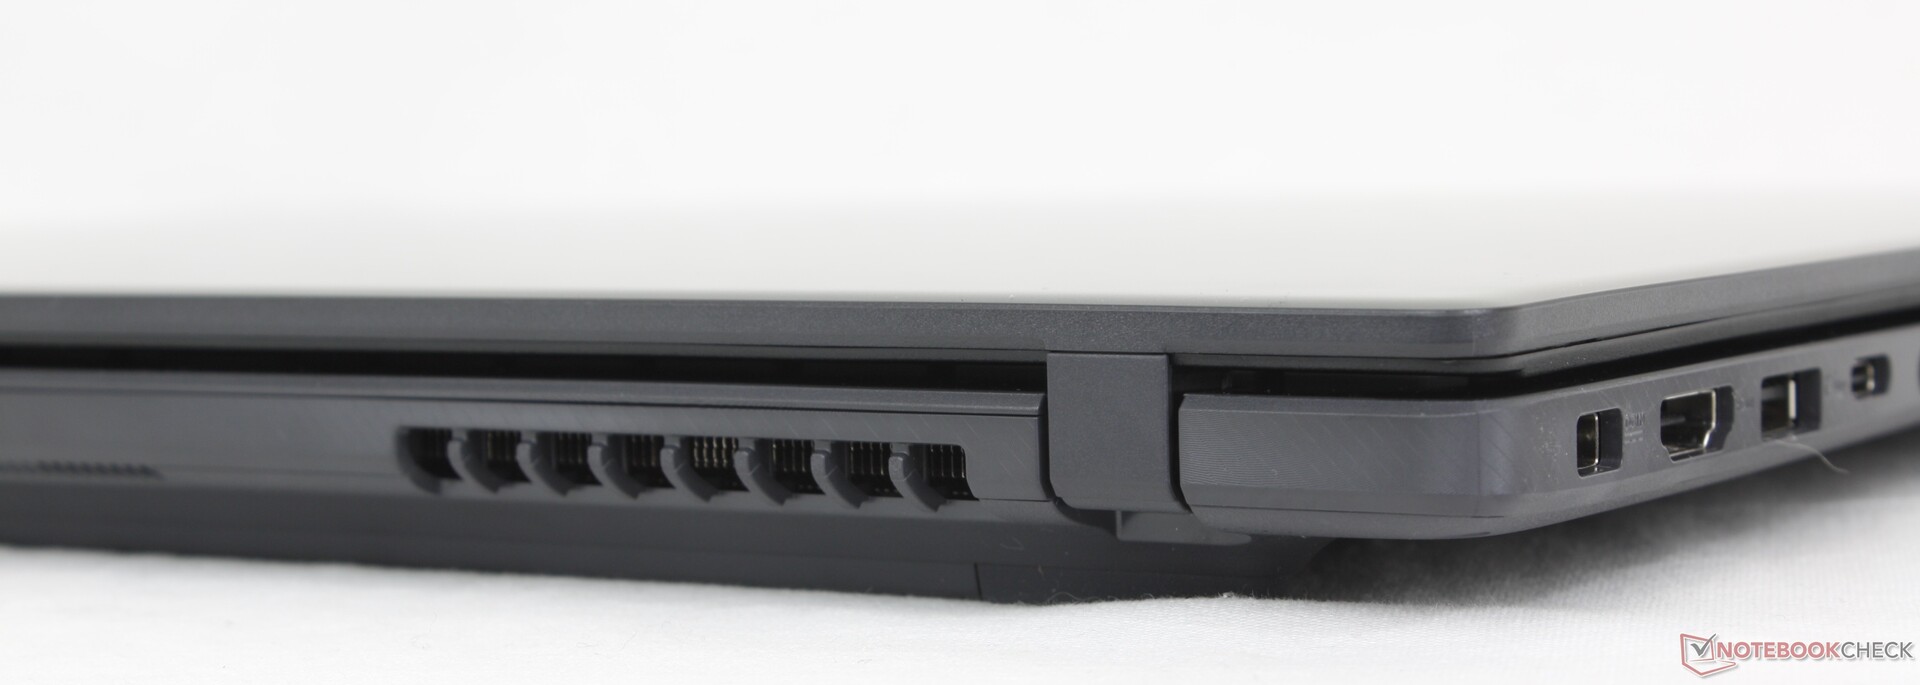
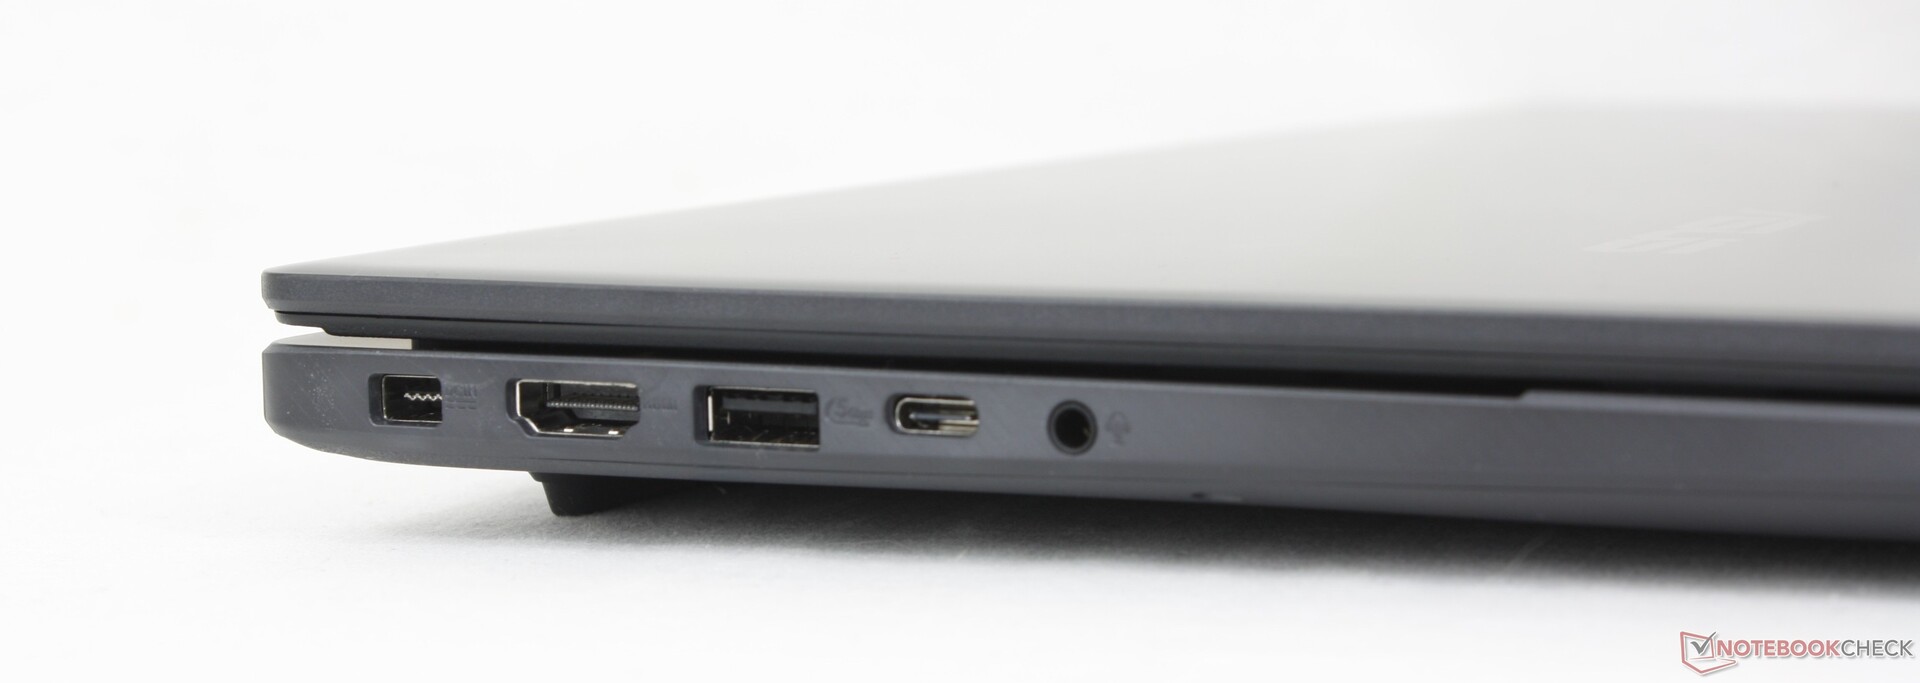
Connectivité
Le port USB-C n'est pas compatible avec Thunderbolt, contrairement aux modèles plus onéreux de la série VivoBook Pro 16 plus cher, qui intègre une plus grande variété de ports. Malheureusement, le V16 utilise un câble d'adaptateur secteur différent de celui de la série VivoBook.
Communication
Le Realtek RTL8852BE amovible est livré en standard avec une connectivité Wi-Fi 6 et Bluetooth 5.3. Il n'y a pas de prise en charge du Wi-Fi 6E ou du Wi-Fi 7.
Webcam
Une webcam de 2 mégapixels avec obturateur physique est fournie en standard. Il n'y a pas de caméra infrarouge pour réduire les coûts.


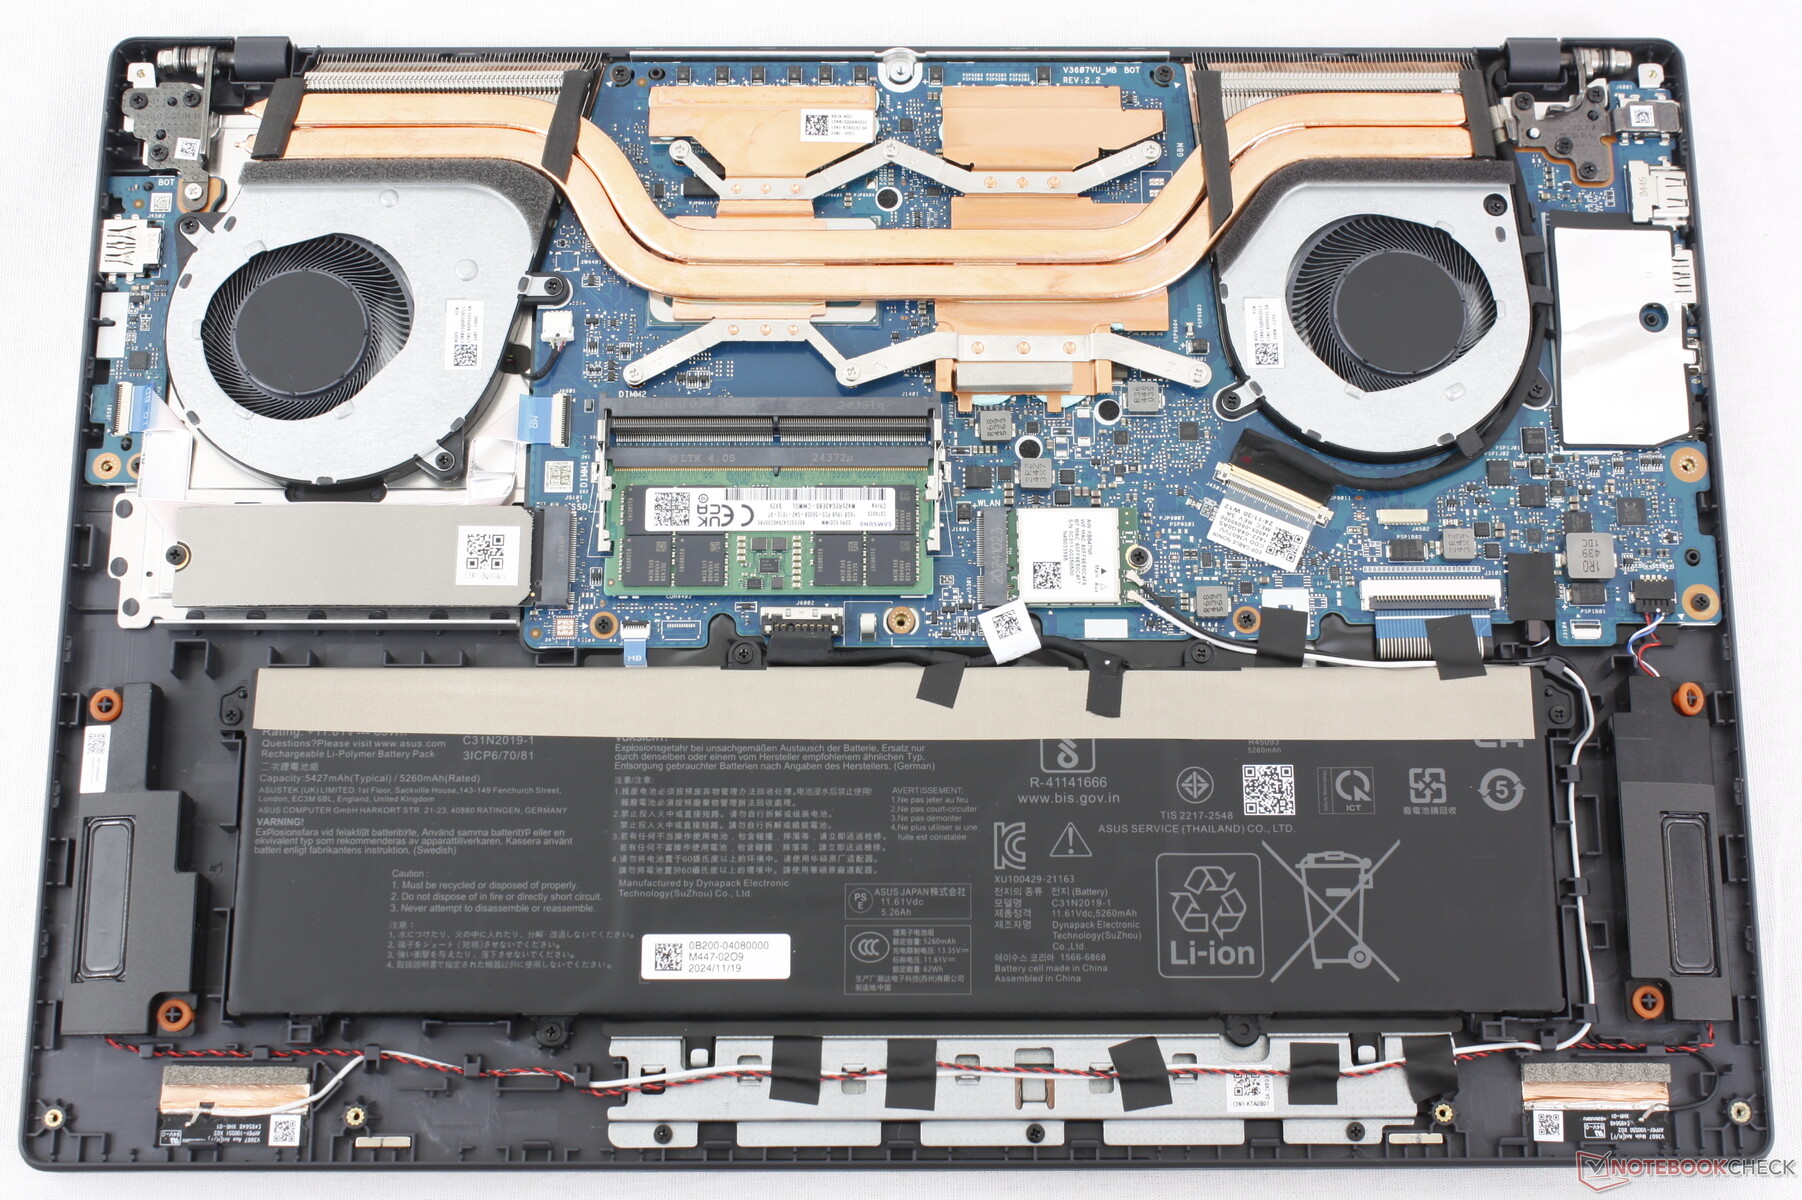
Maintenance
Le panneau inférieur se détache relativement facilement à l'aide d'un simple tournevis Phillips pour faciliter l'entretien. Le SSD secondaire n'est pas pris en charge.
Durabilité
Asus s'efforce d'être neutre en carbone, mais aucune précision n'est donnée sur le processus de fabrication du V16. L'emballage est principalement composé de papier et de carton, avec très peu d'emballage plastique.
Accessoires et garantie
La boîte ne contient pas d'autres éléments que l'adaptateur secteur et la documentation. Une garantie fabricant d'un an s'applique si l'appareil est acheté aux États-Unis.
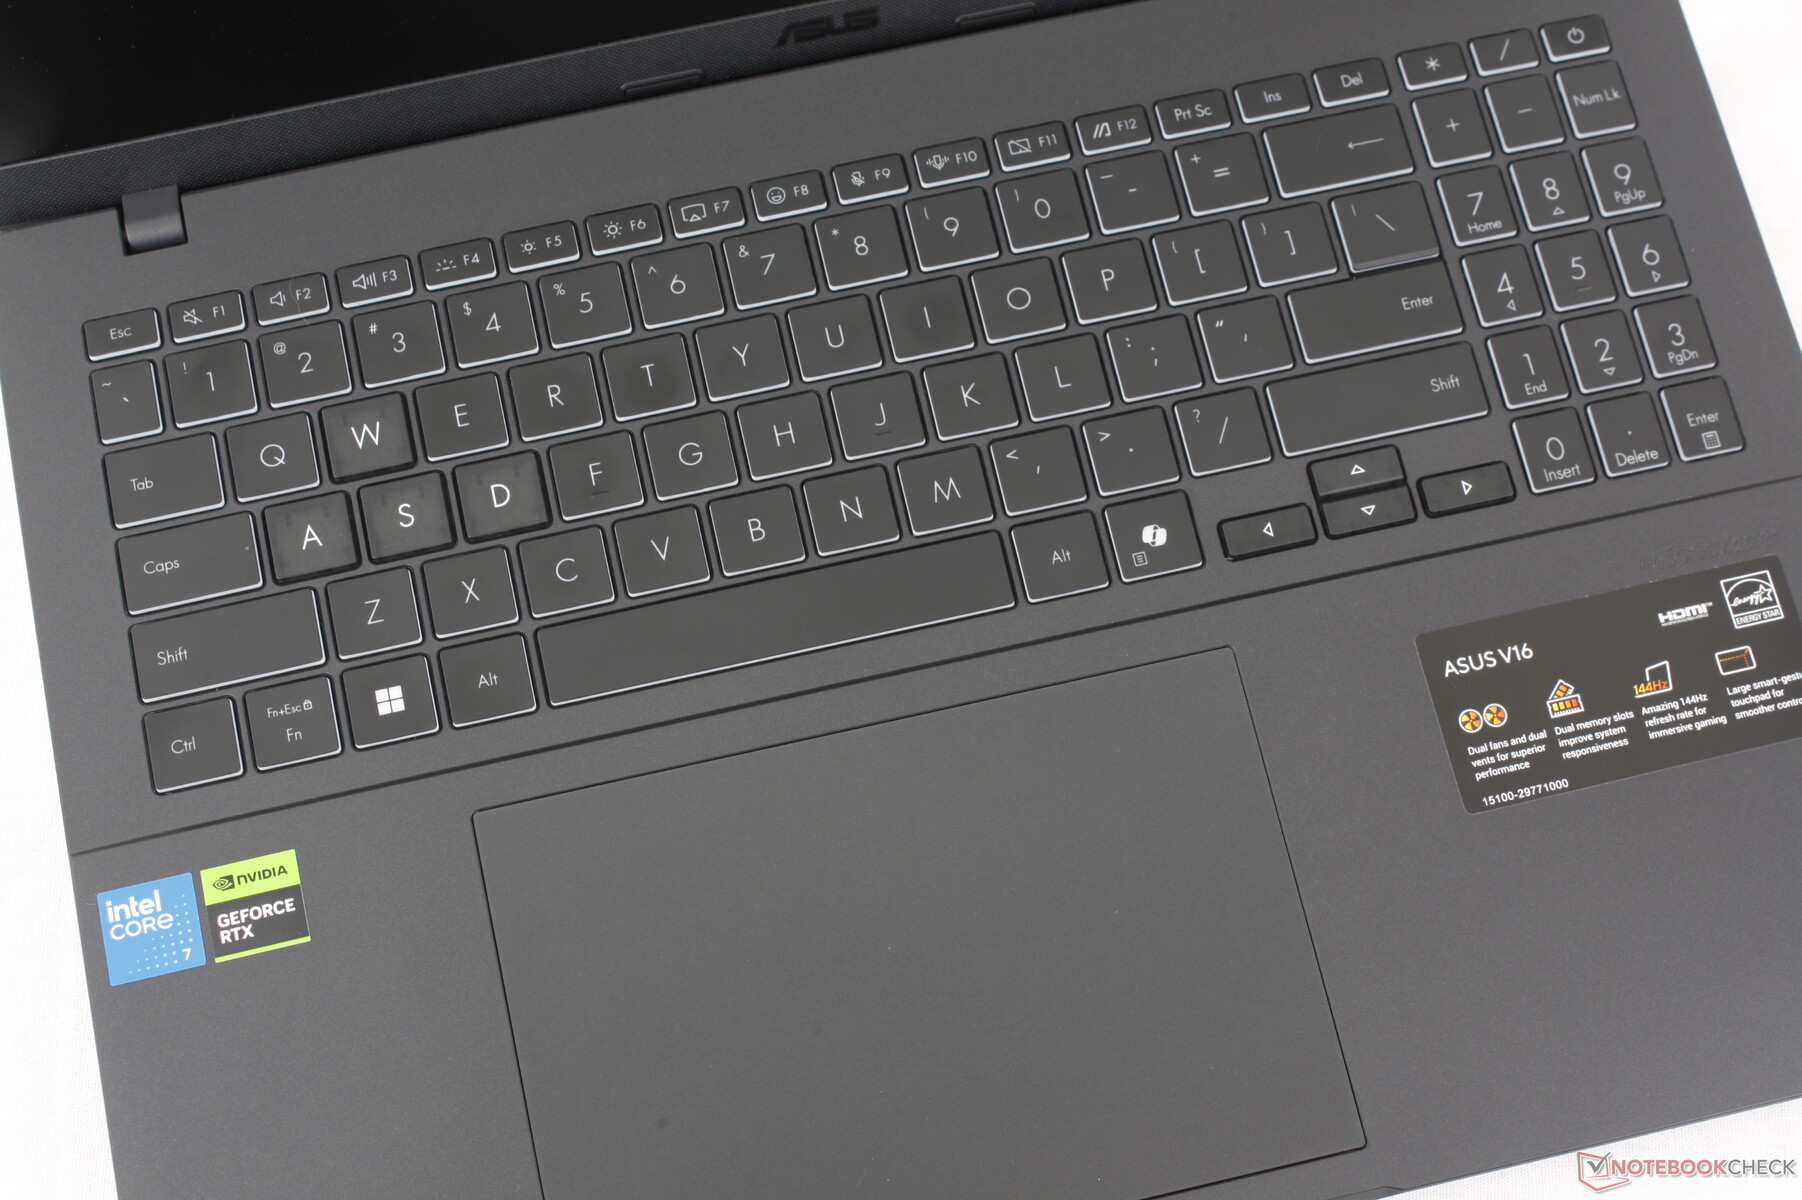
Périphériques d'entrée - VivoBook Vibes
Clavier
Le V16 reprend le clavier de la série VivoBook 16 pour le meilleur et pour le pire. La course et le retour d'information auraient pu être plus profonds et plus forts, respectivement, mais il fonctionne de manière suffisamment fiable sans qu'il soit nécessaire de dépenser plus pour des alternatives avec de meilleurs claviers comme un ThinkPad série T ou EliteBook.
Pavé tactile
Le pavé tactile est grand (15 x 10 cm), contre seulement 11,5 x 8 cm sur le modèle Dell Inspiron 16 Plus Dell Inspiron 16 Plus 7640. Malheureusement, le retour d'information est très doux et silencieux. Appuyer sur le pavé tactile demande plus de force que sur la plupart des autres ordinateurs portables, ce qui peut devenir inconfortable au bout d'un certain temps.
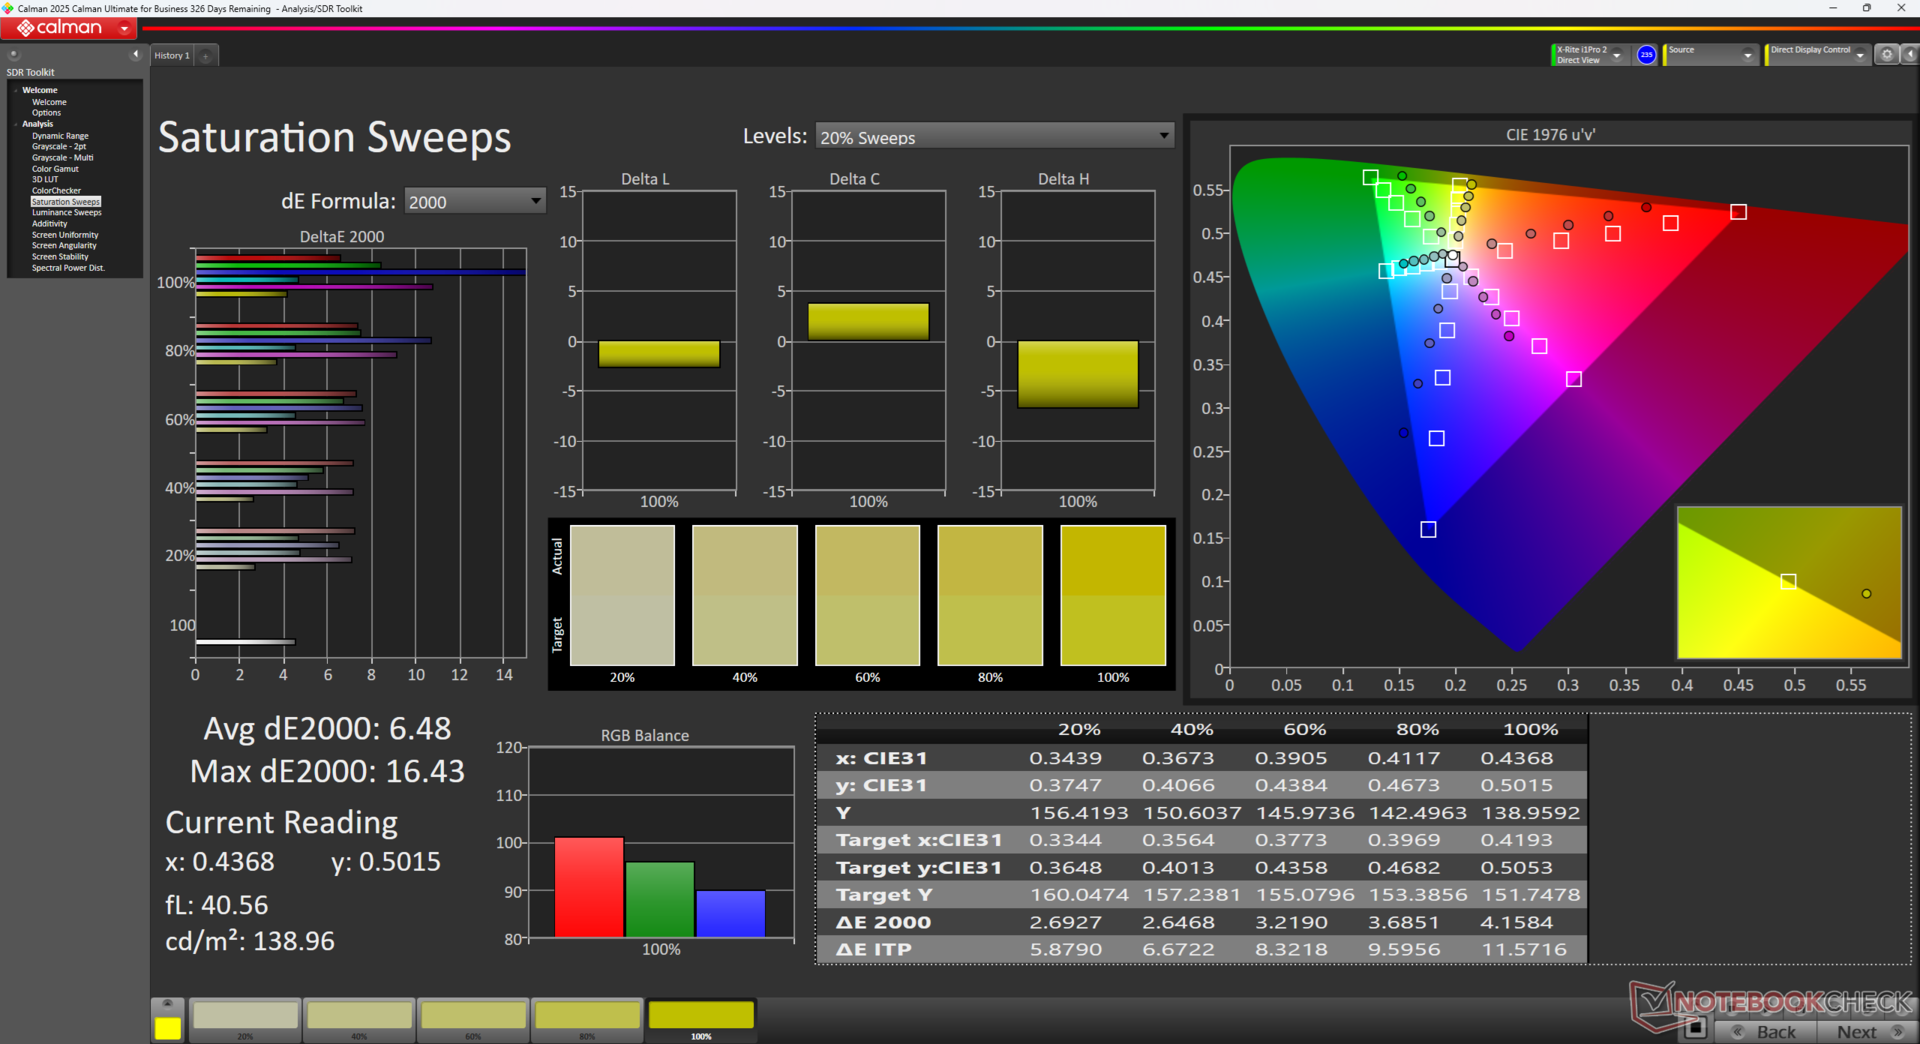
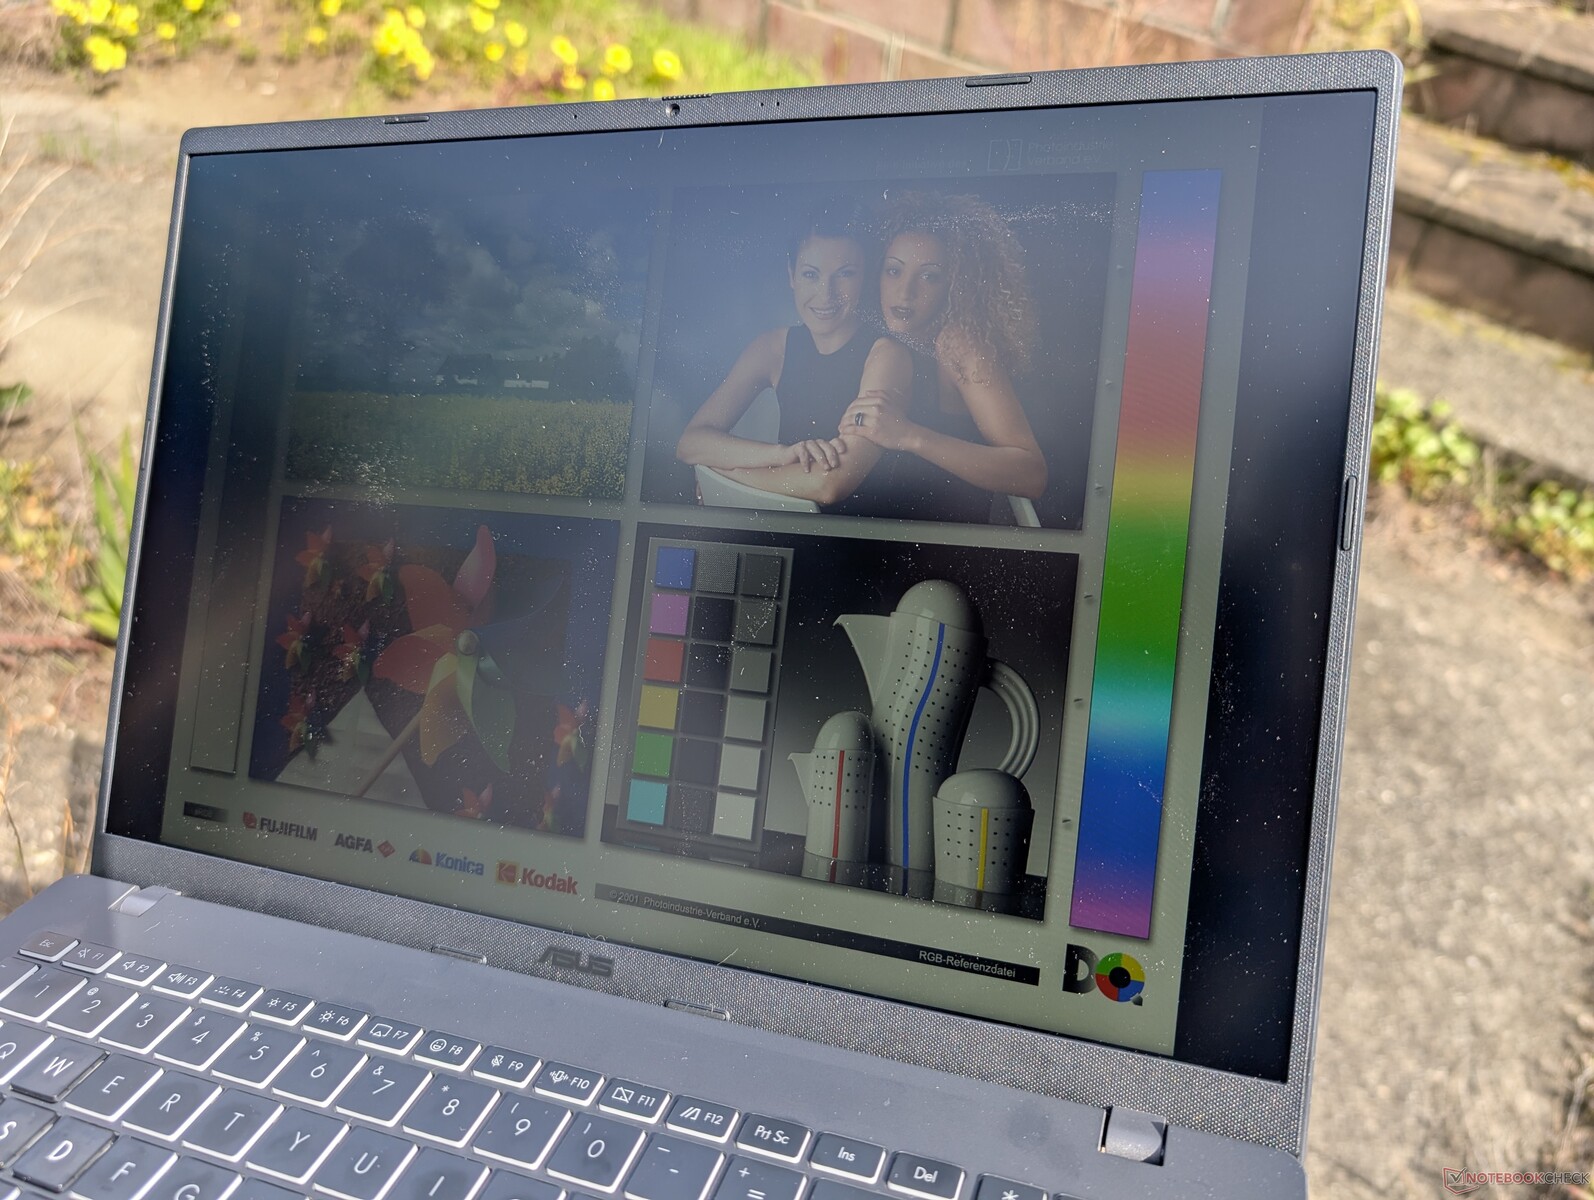
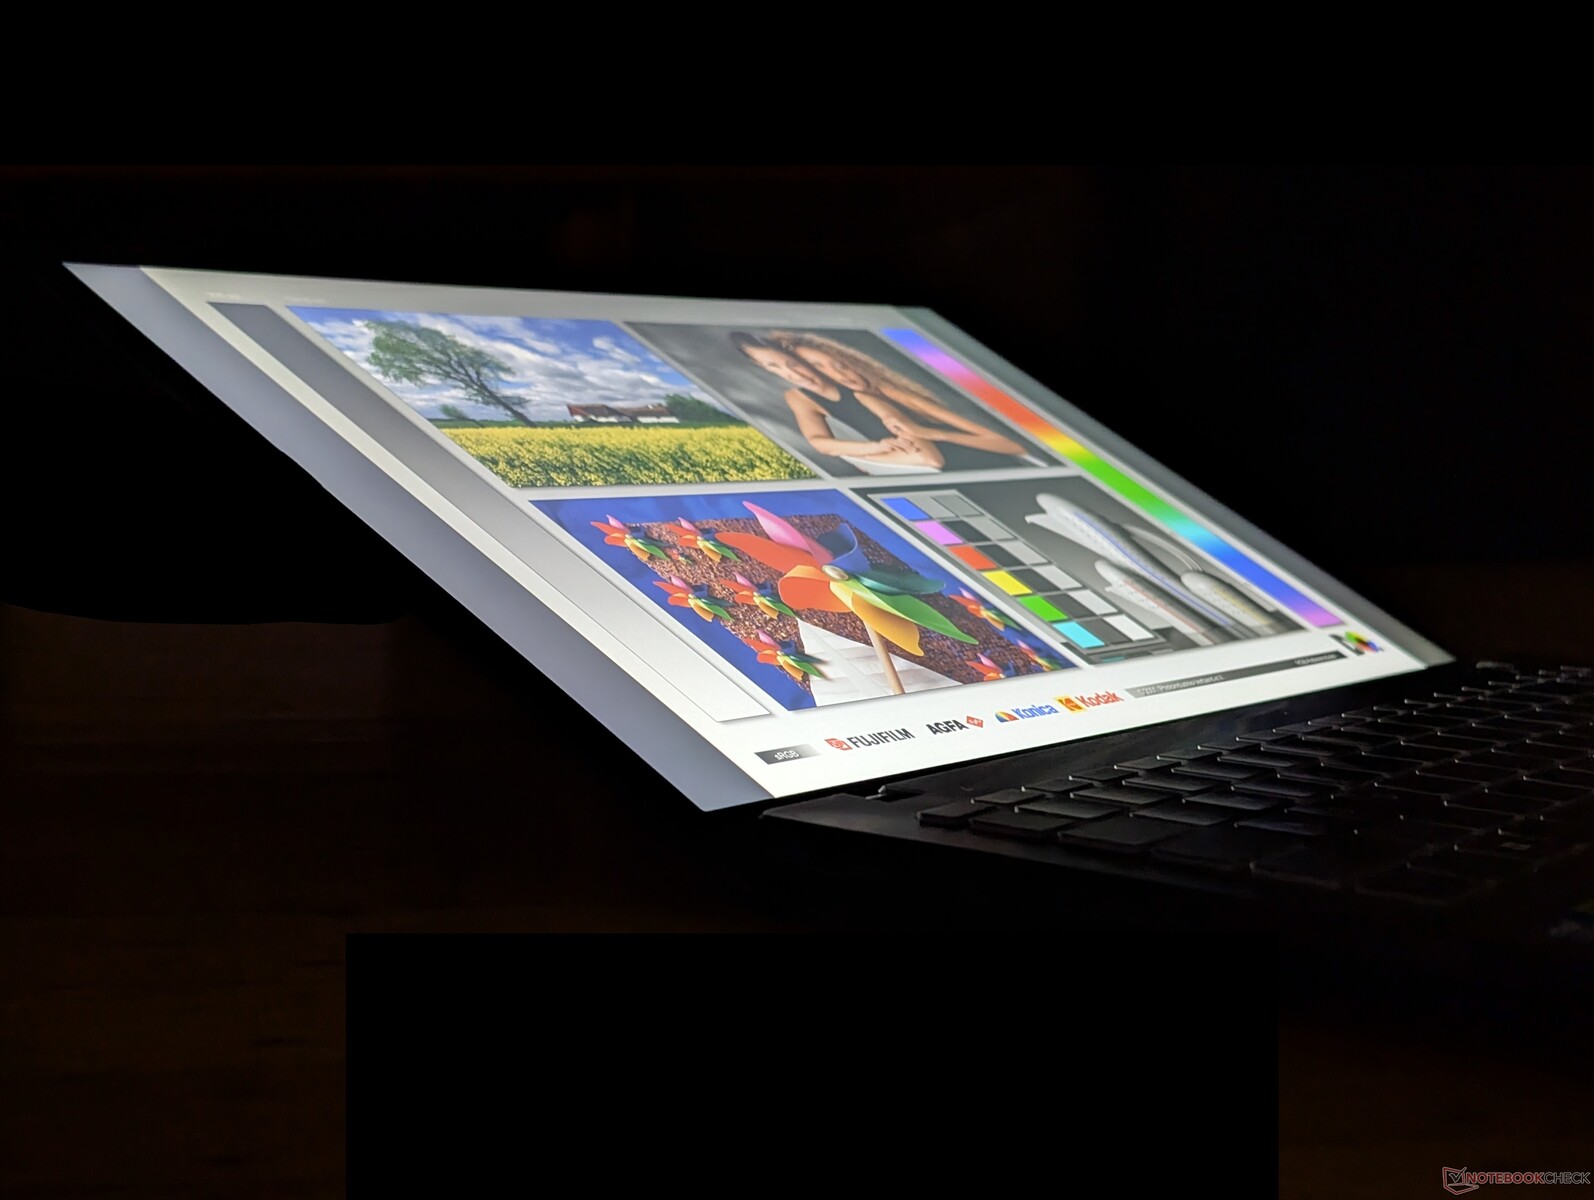
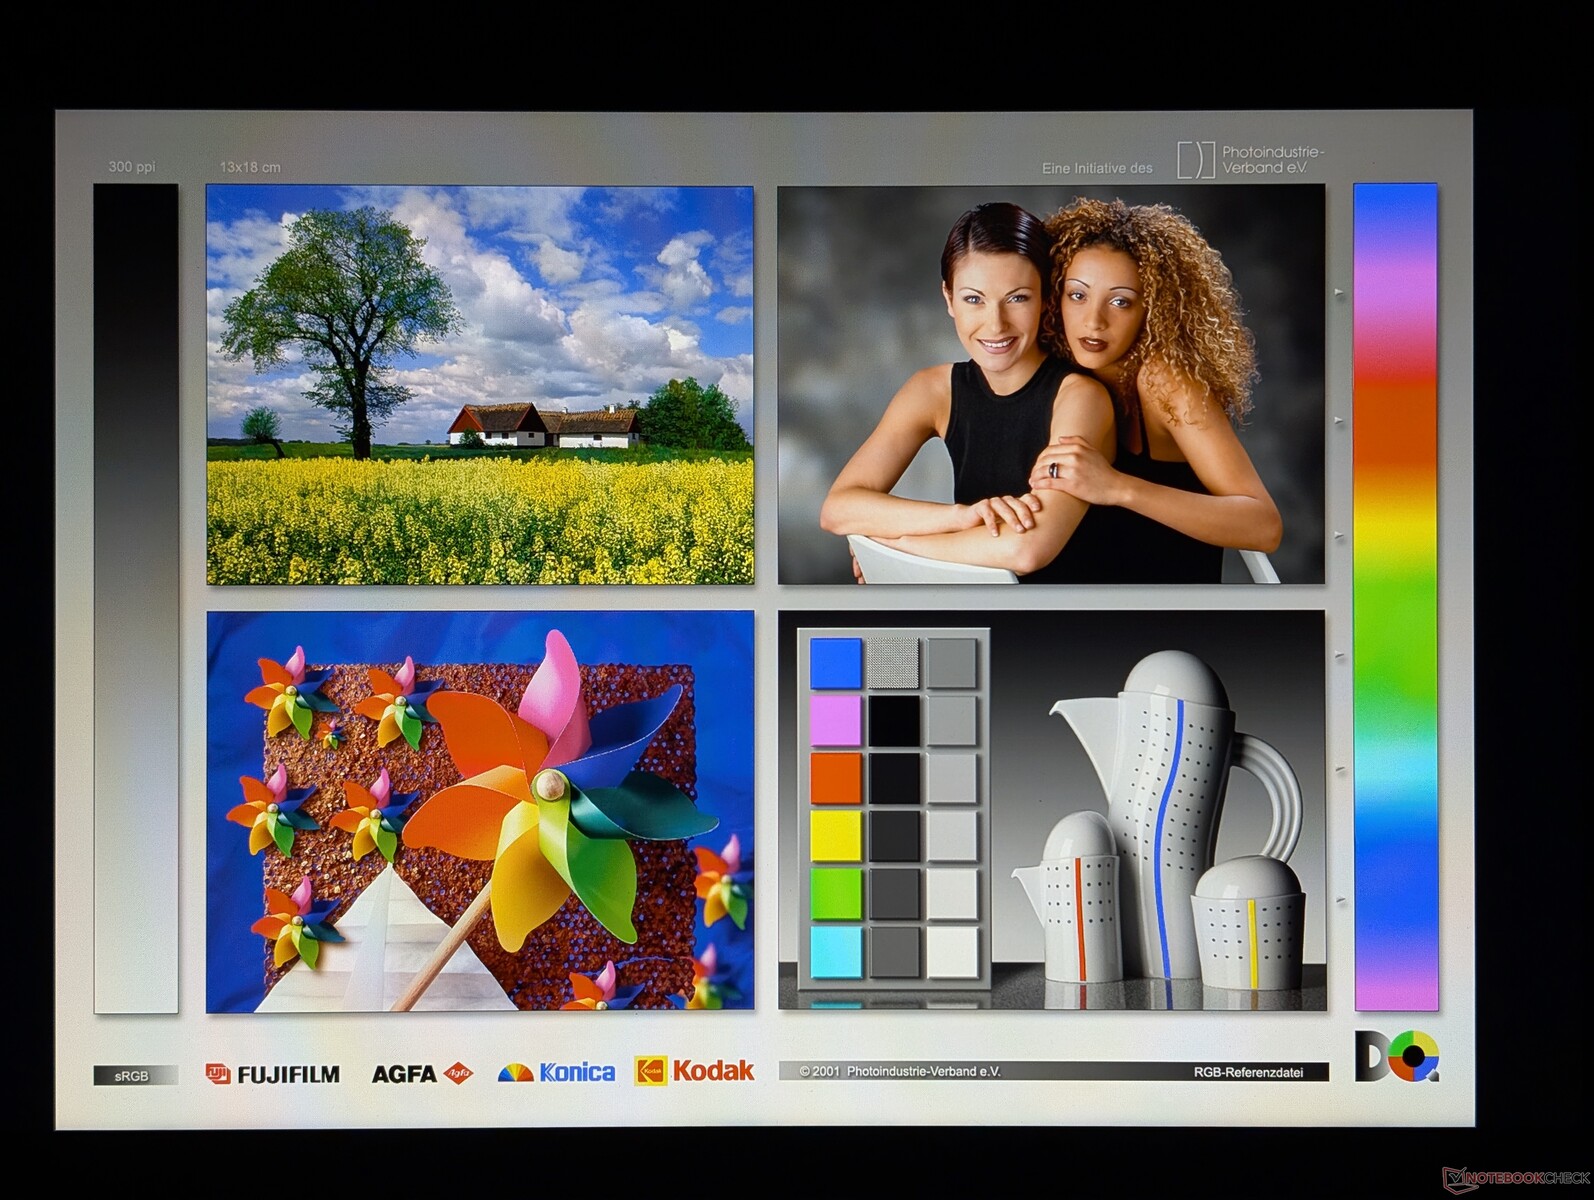
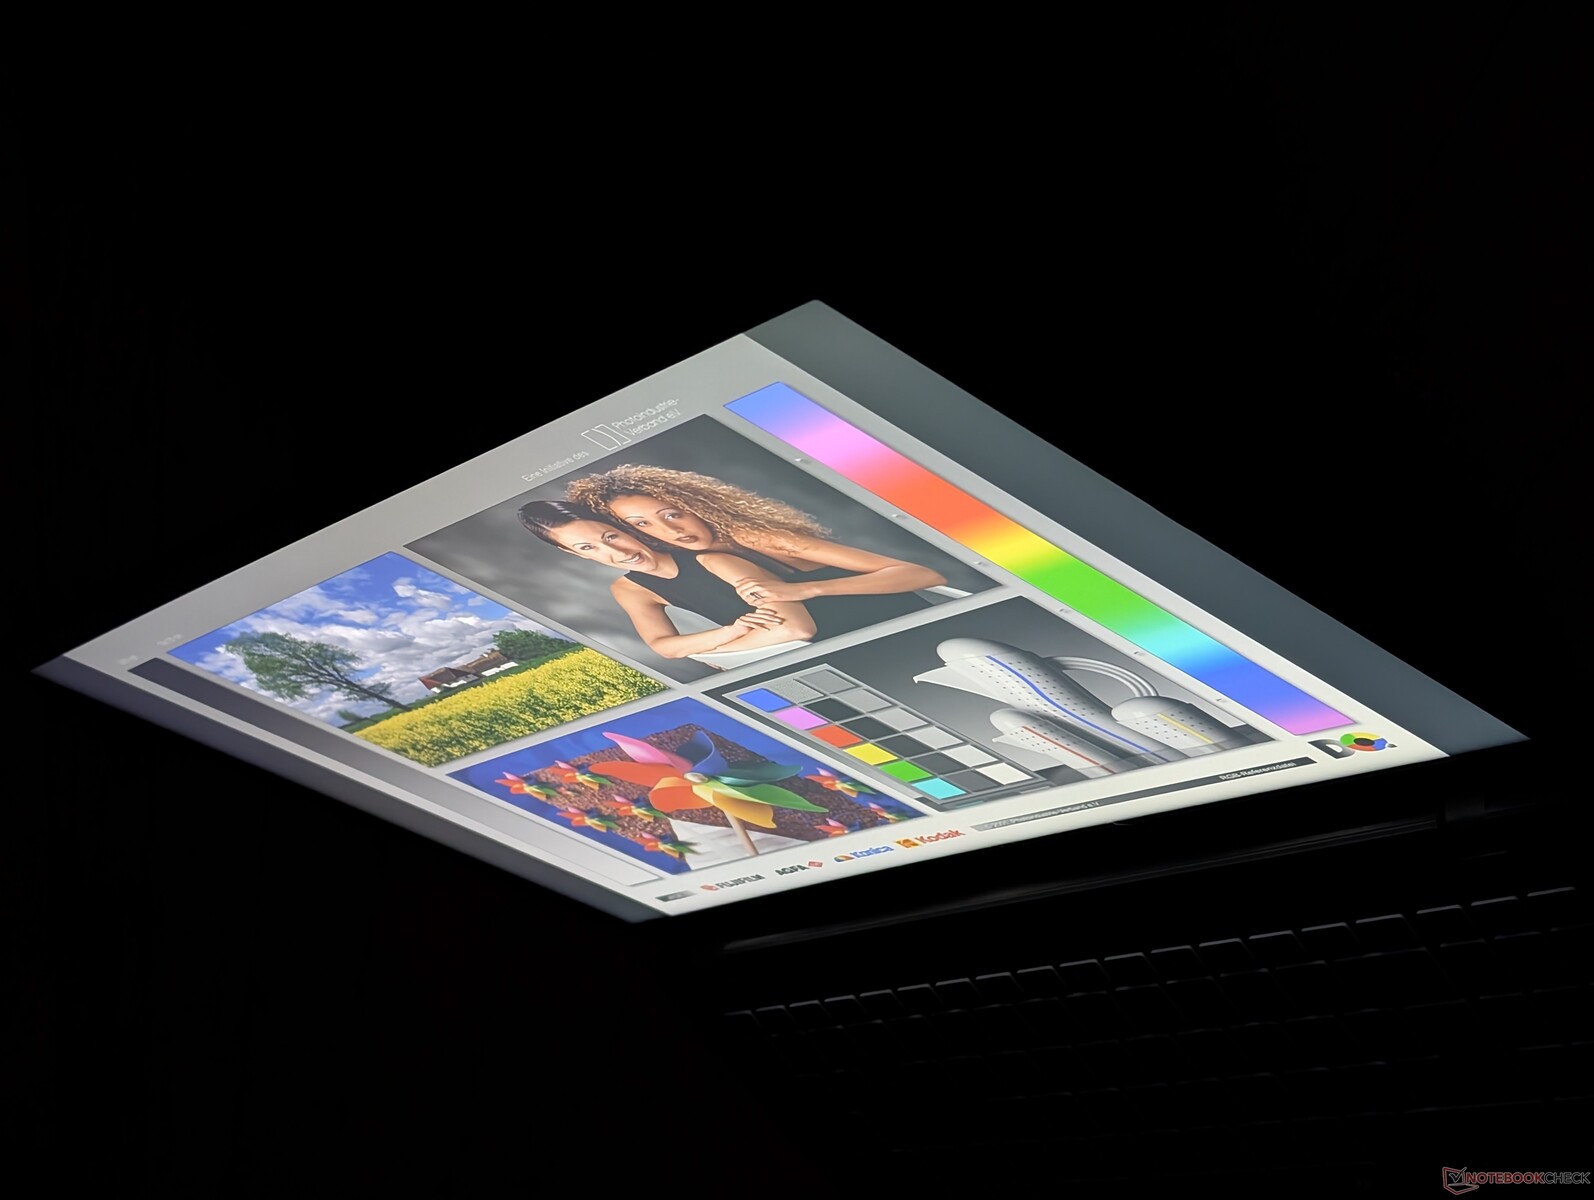
Affichage - 144 Hz en standard
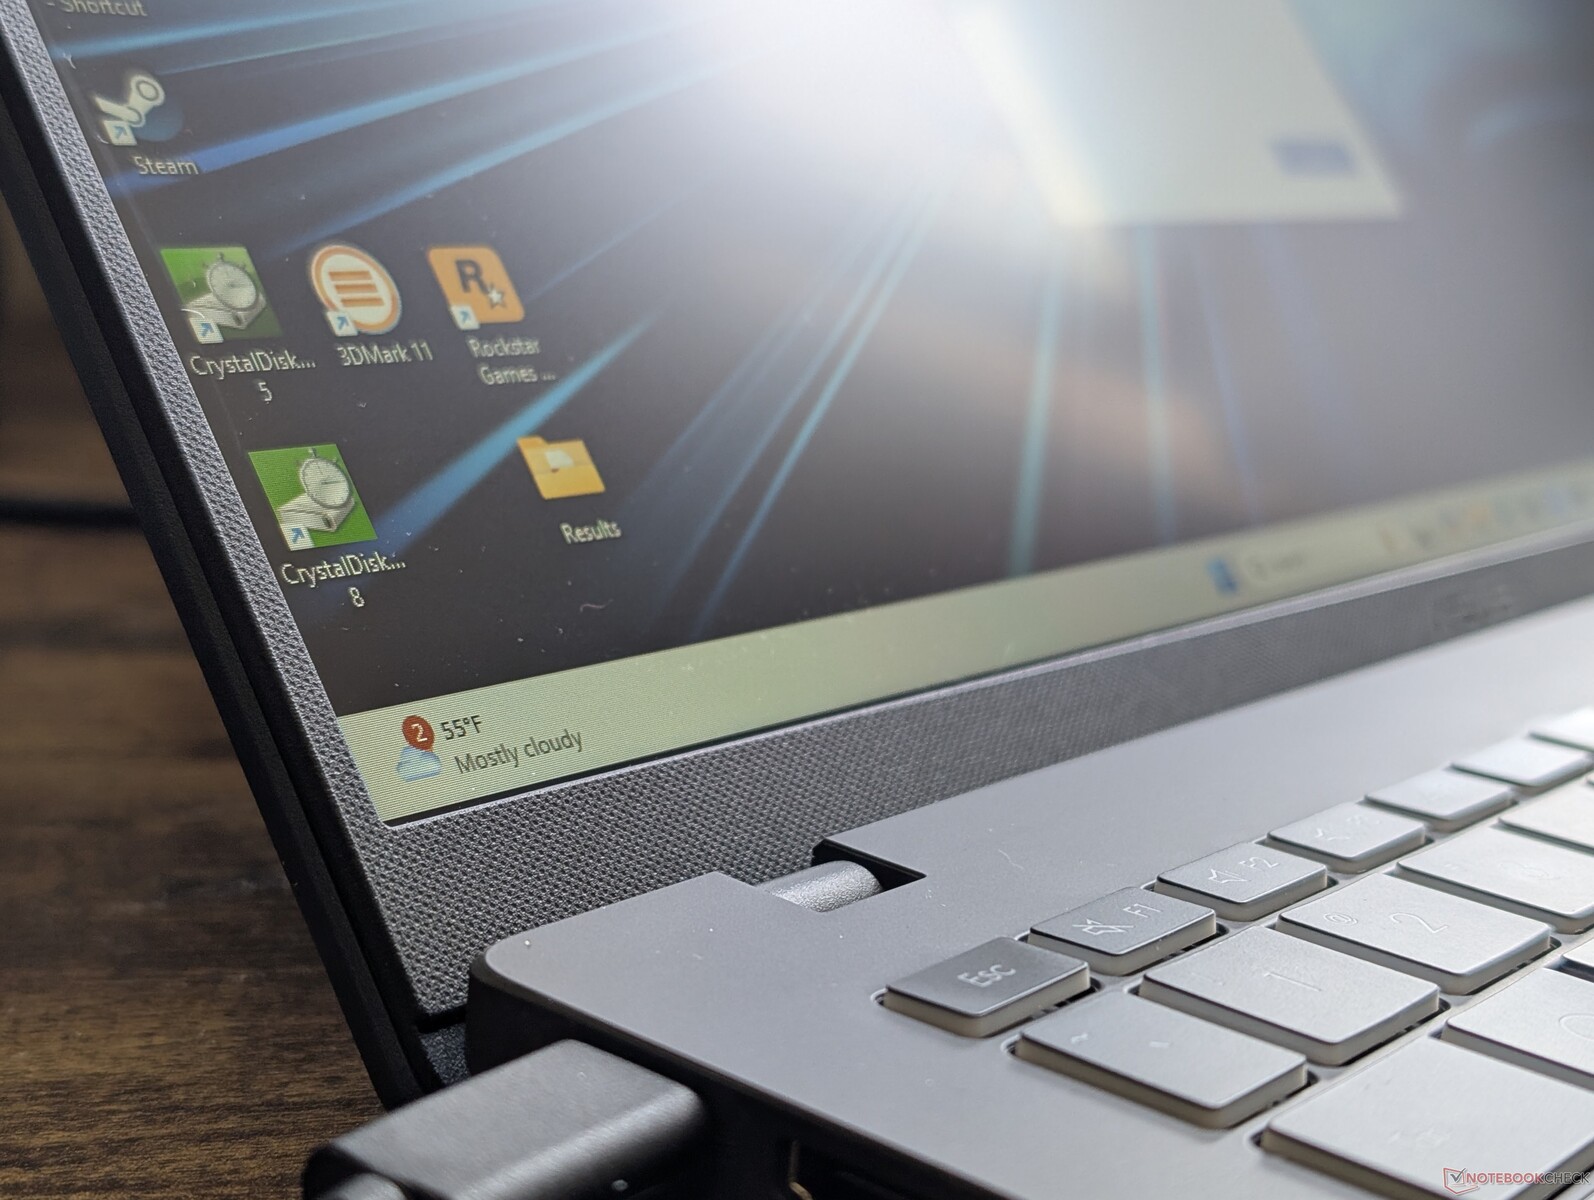
La caractéristique la plus remarquable de l'écran est son taux de rafraîchissement natif de 144 Hz, qui permet un contrôle du curseur et une réactivité sans faille. Il s'agit par ailleurs d'une dalle économique avec ses couleurs étroites, son faible taux de contraste et sa luminosité maximale moyenne.

| |||||||||||||||||||||||||
Homogénéité de la luminosité: 88 %
Valeur mesurée au centre, sur batterie: 313.3 cd/m²
Contraste: 627:1 (Valeurs des noirs: 0.5 cd/m²)
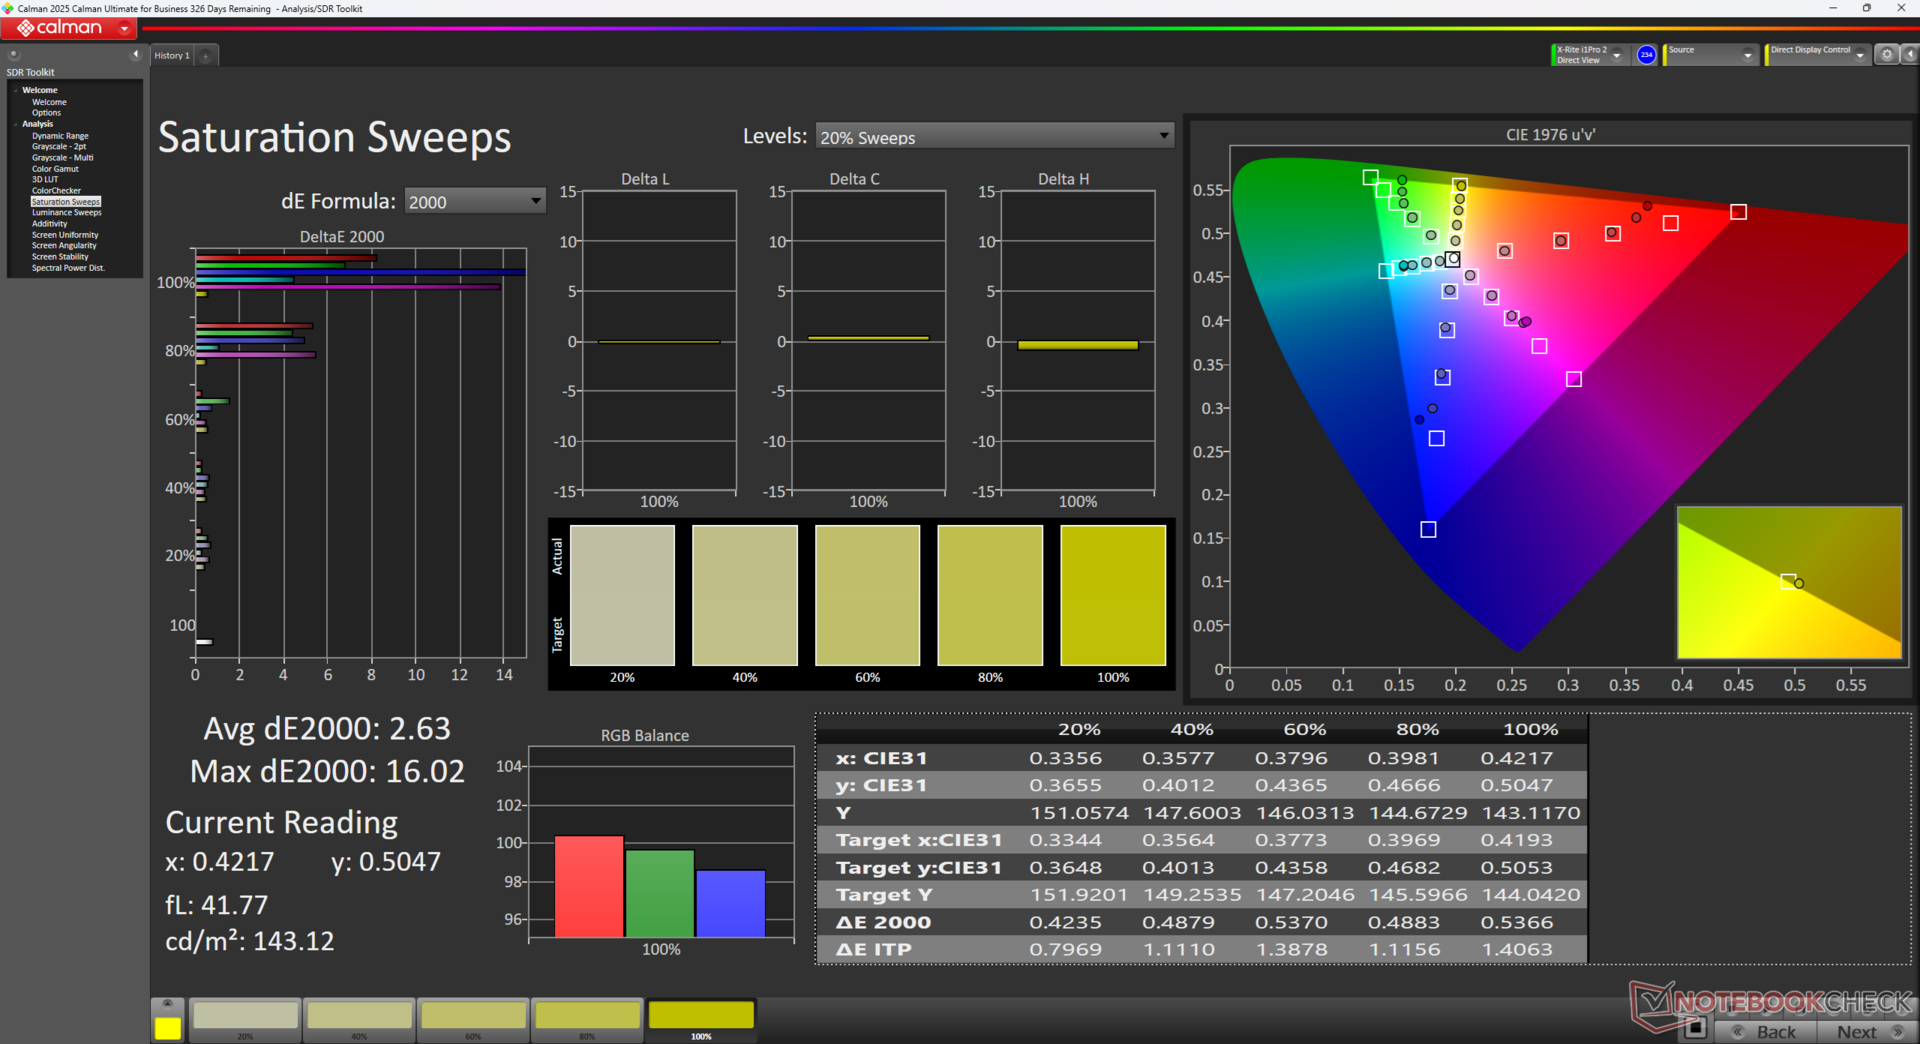
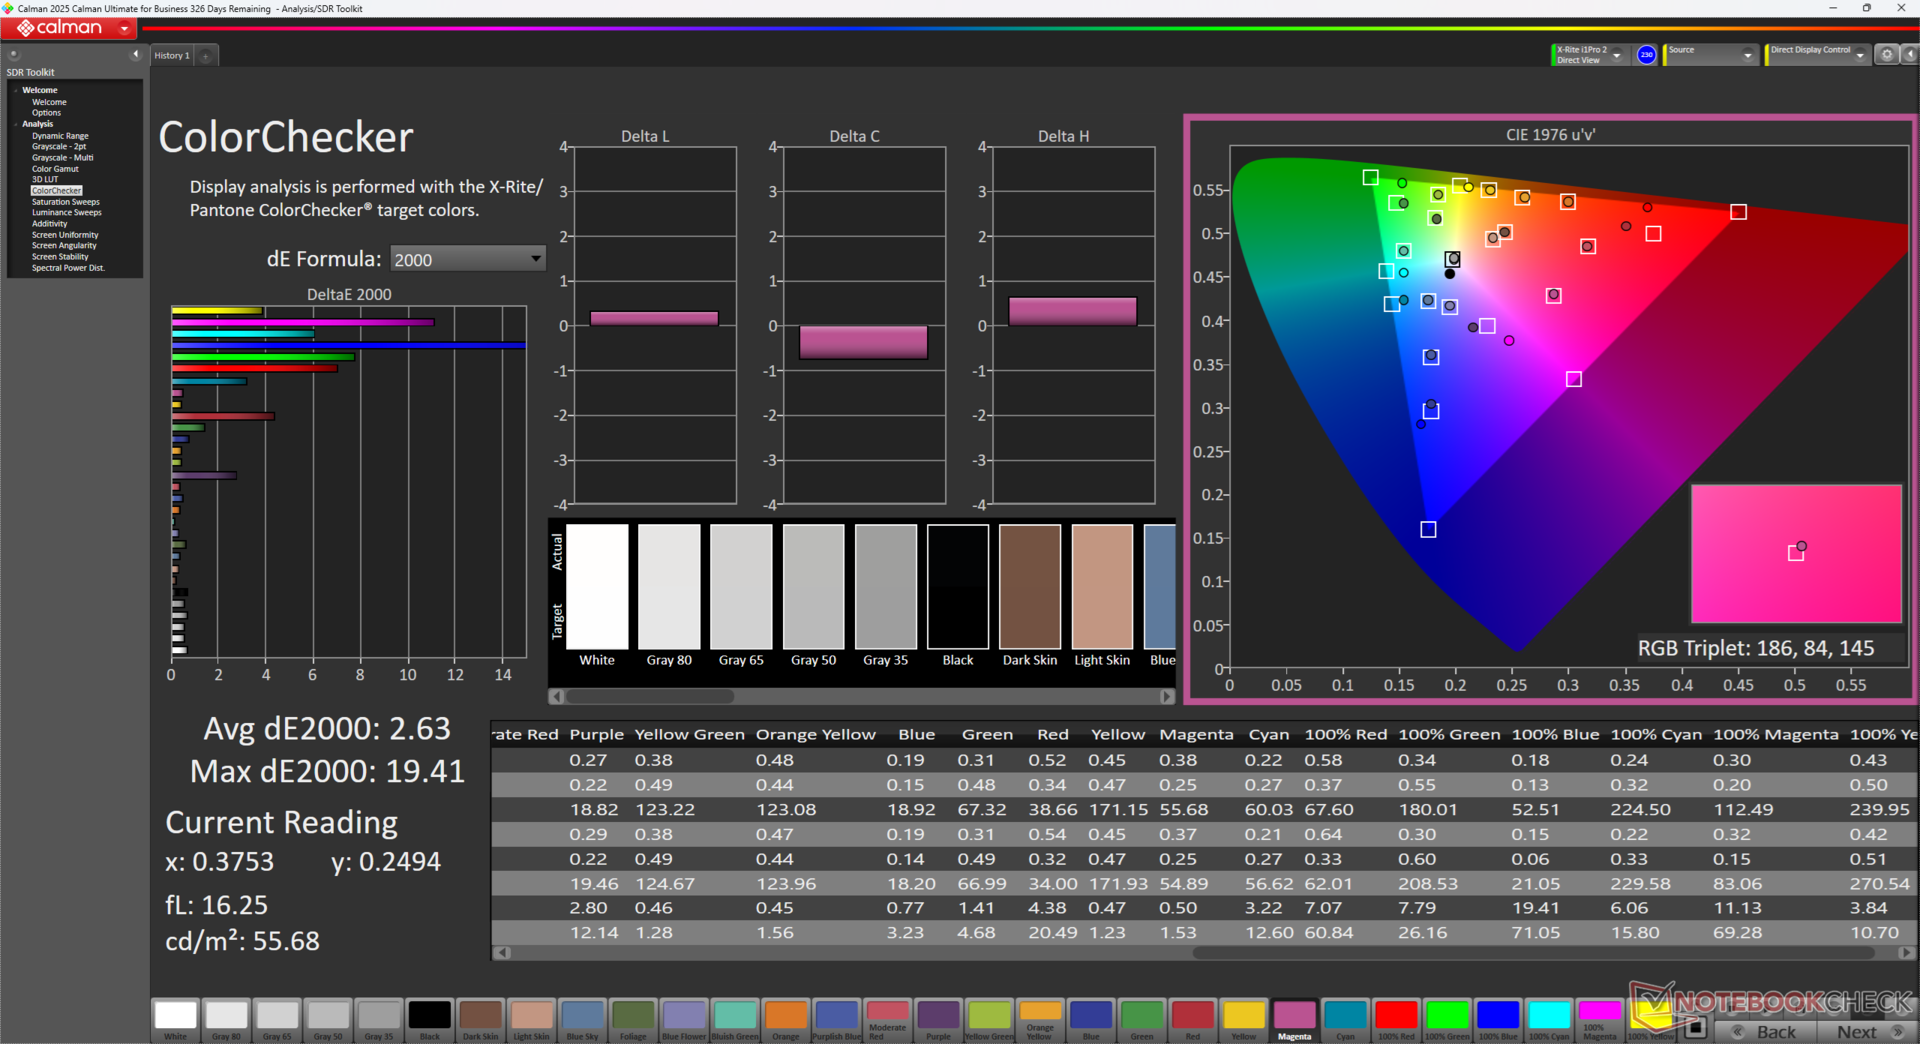
ΔE Color 6.09 | 0.5-29.43 Ø4.88, calibrated: 2.63
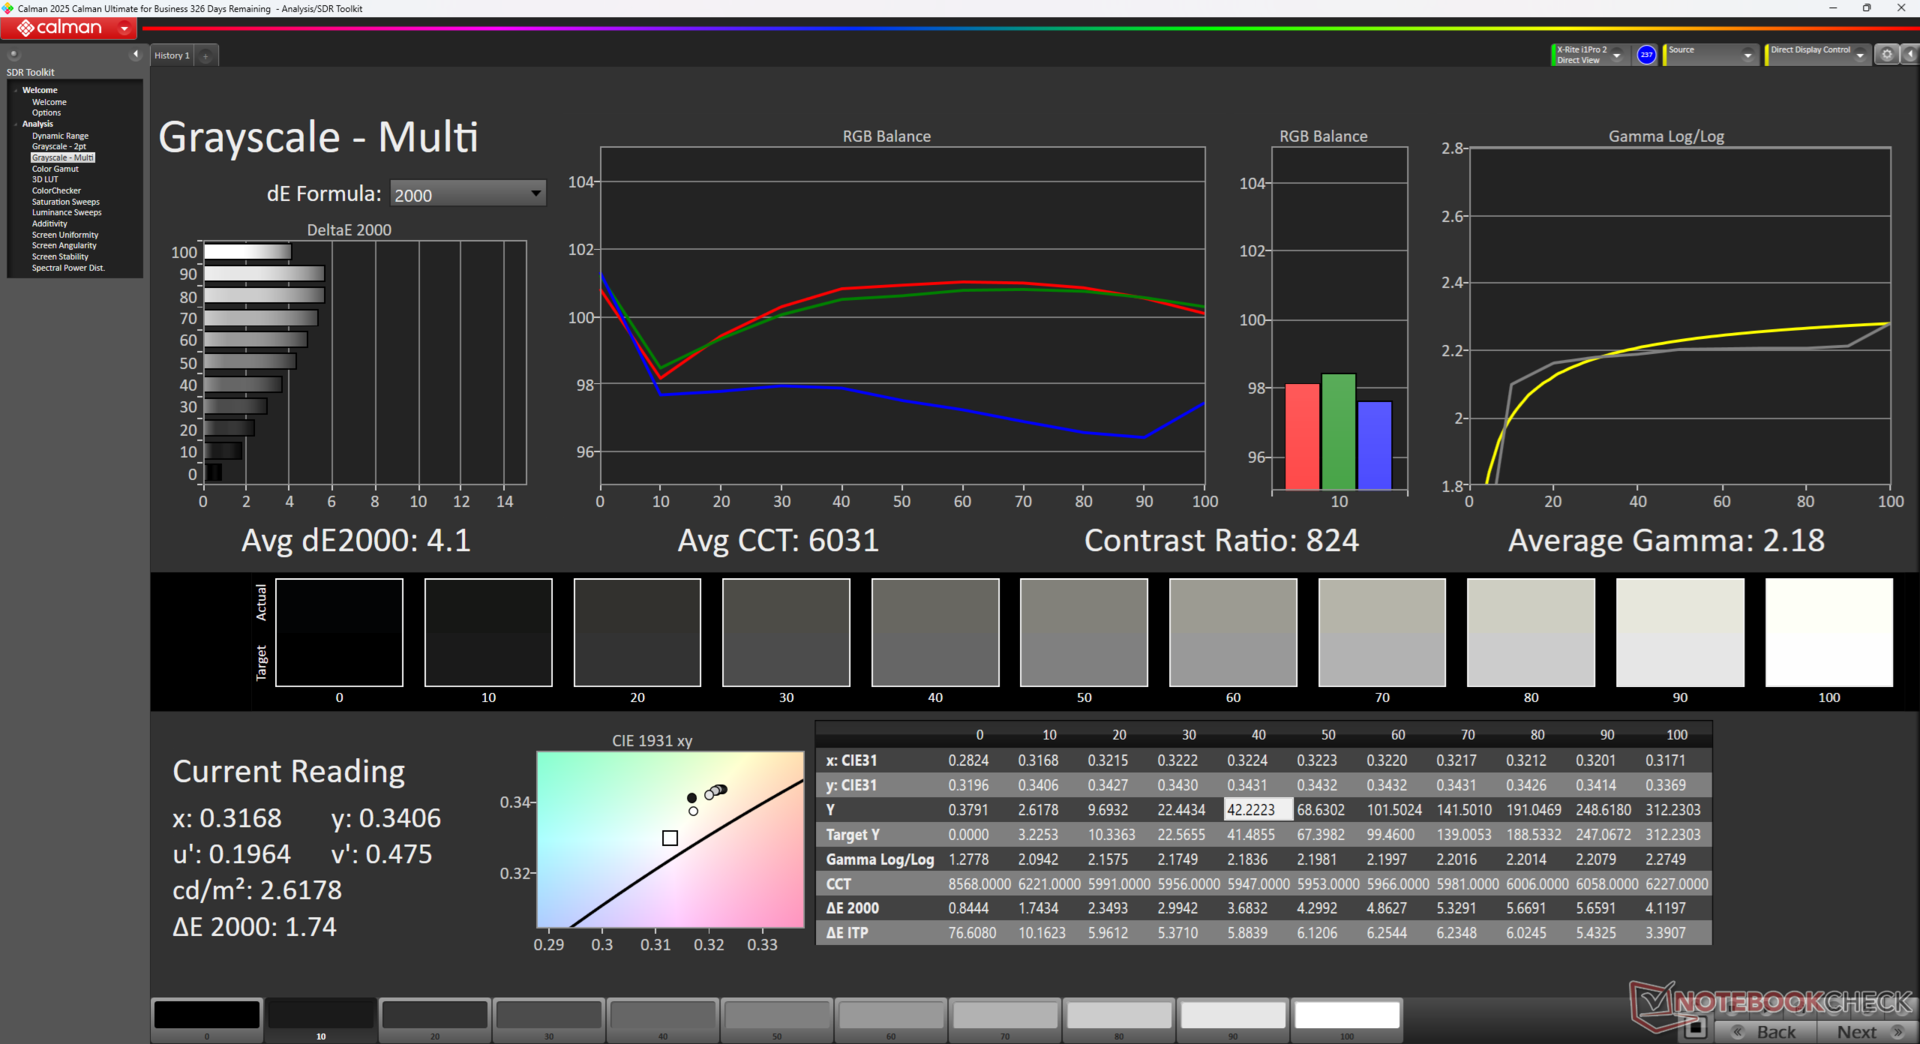
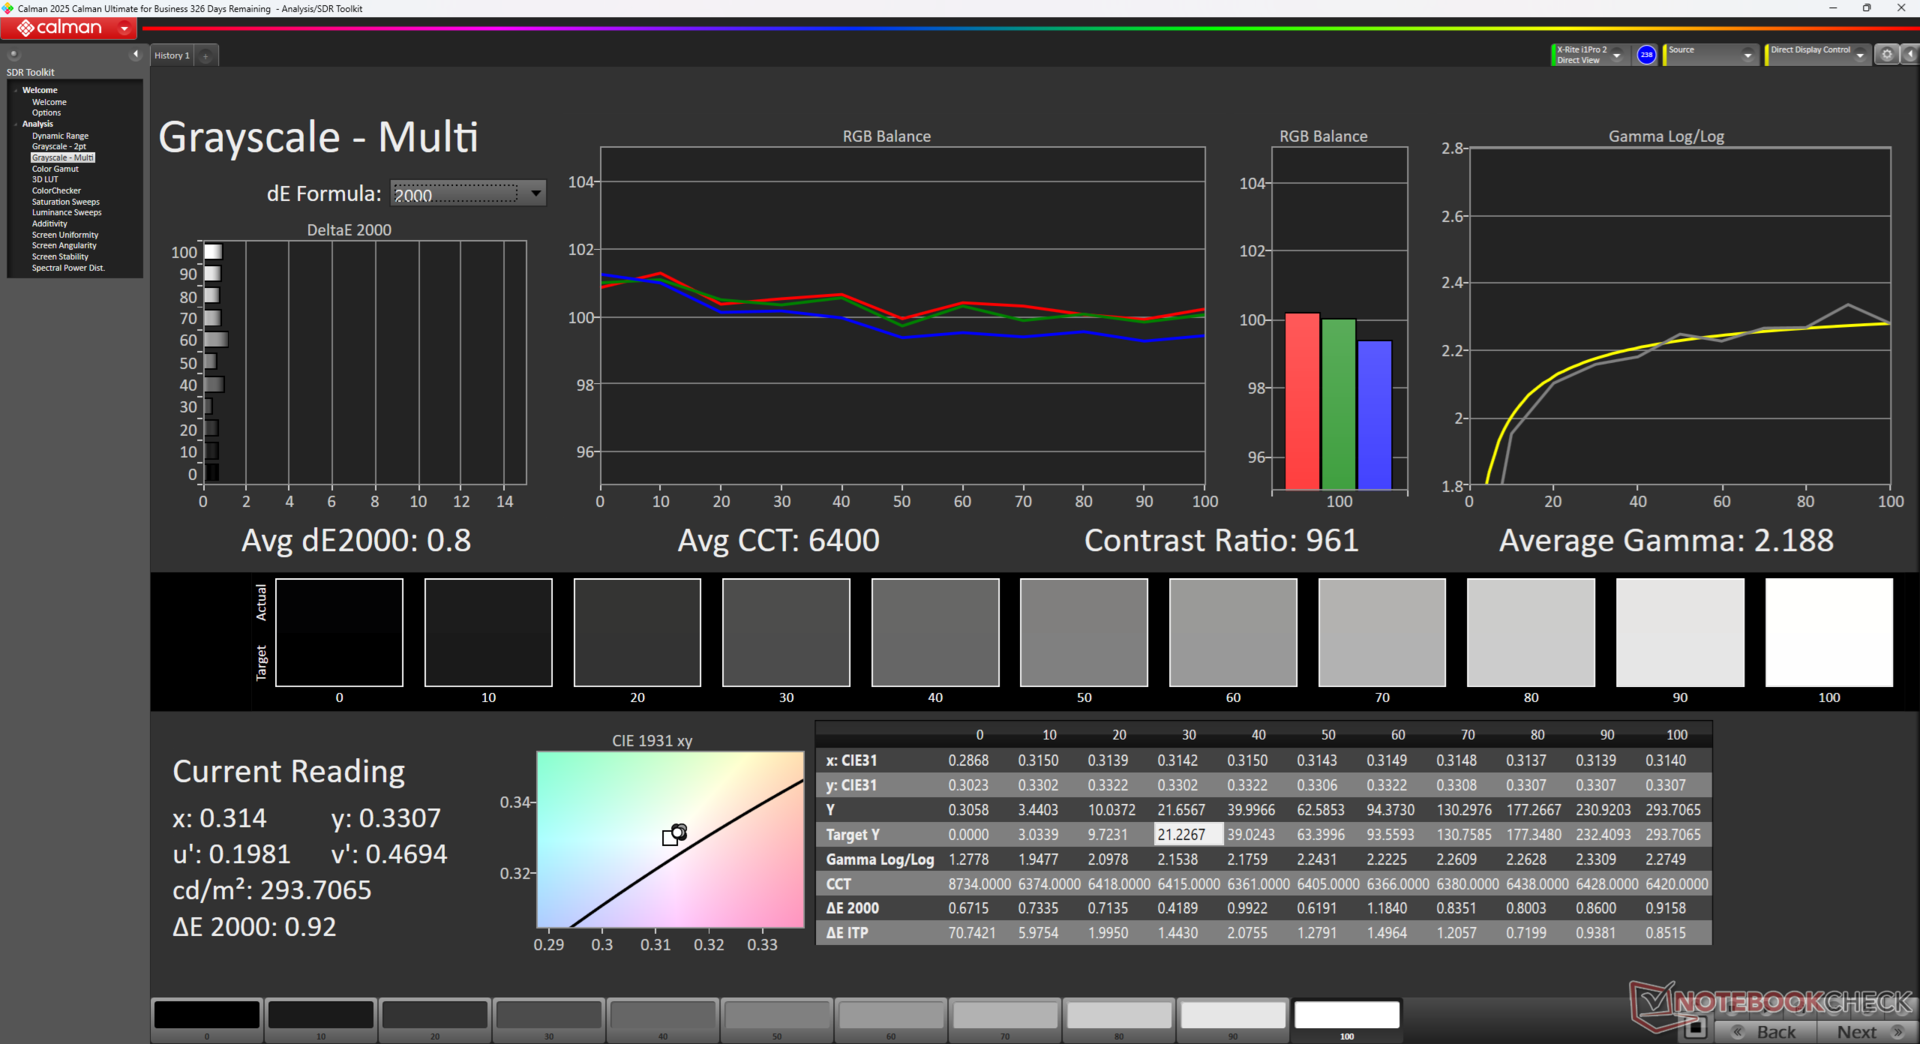
ΔE Greyscale 4.1 | 0.5-98 Ø5.1
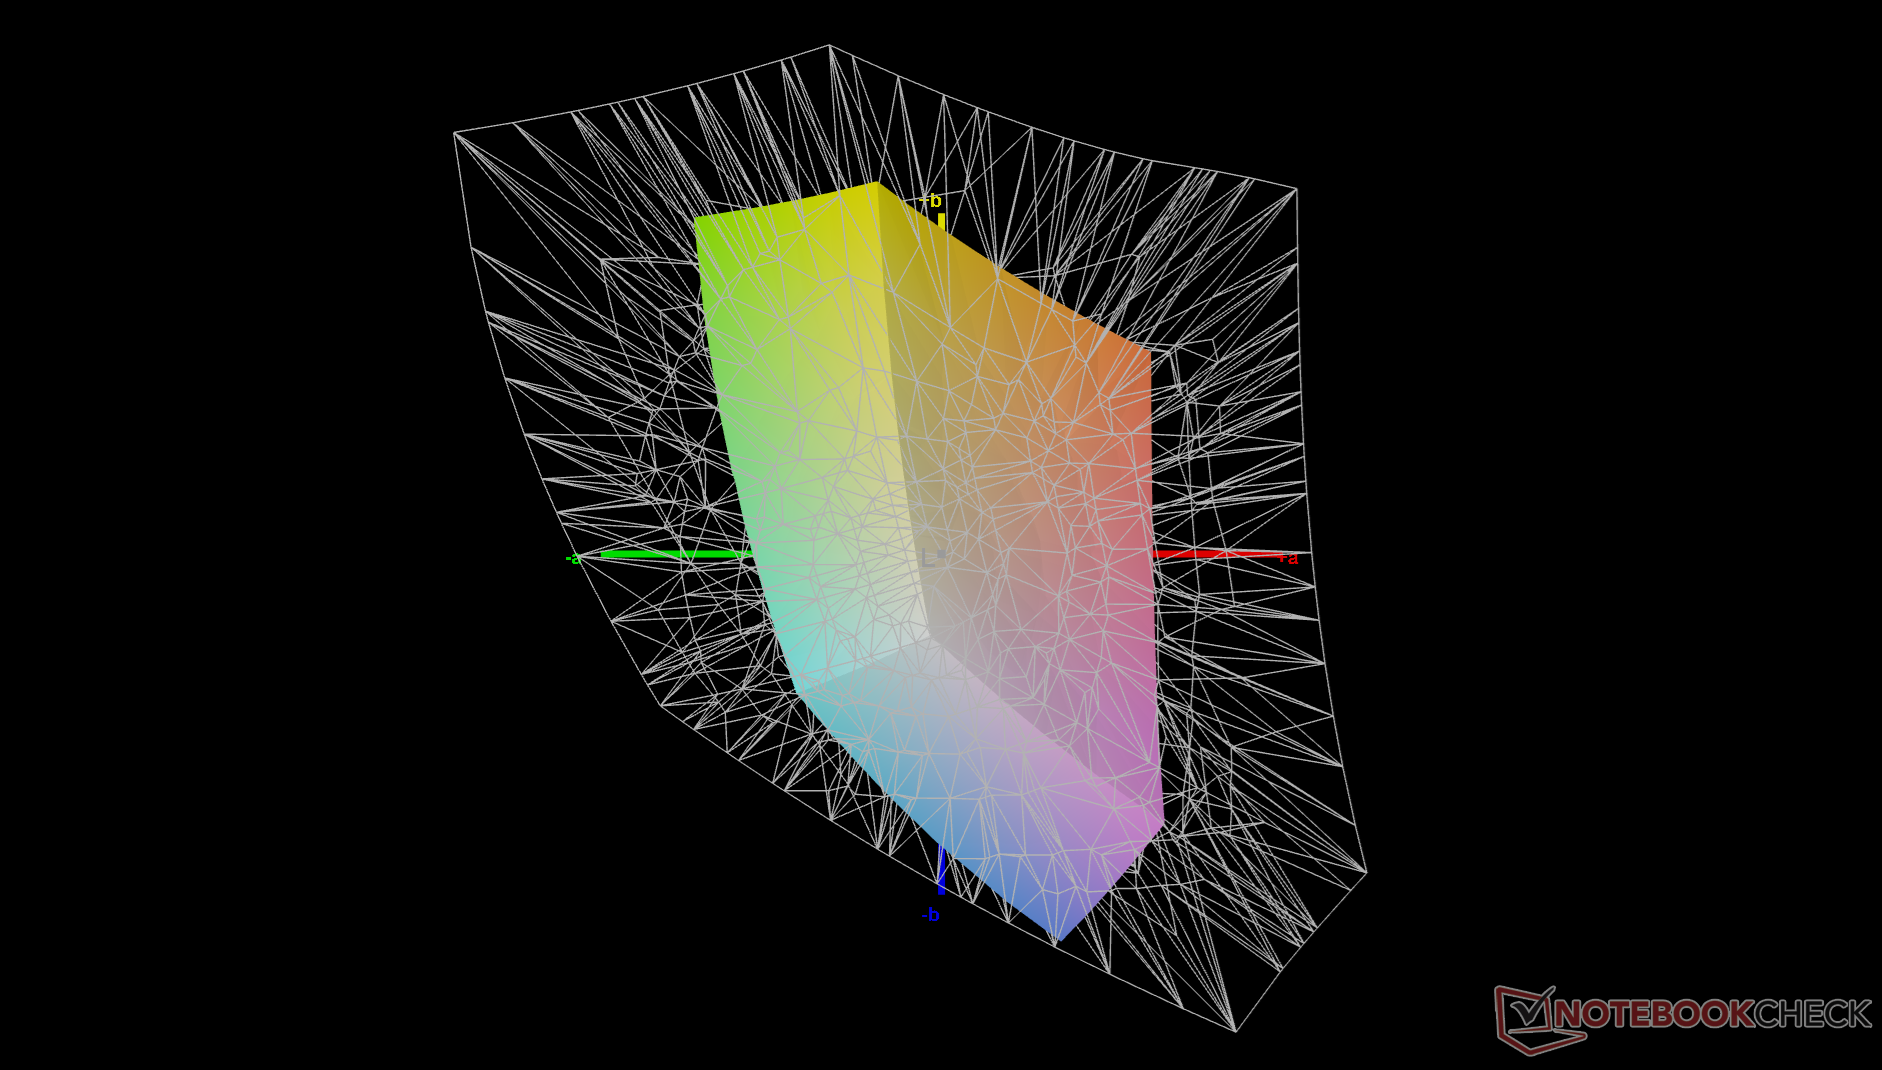
42.2% AdobeRGB 1998 (Argyll 2.2.0 3D)
59.7% sRGB (Argyll 2.2.0 3D)
40.9% Display P3 (Argyll 2.2.0 3D)
Gamma: 2.18
| Asus V16 V3607V MNG007QX2-2, IPS, 1920x1200, 16", 144 Hz | Asus VivoBook Pro 16 K6602VU Samsung ATNA60BX01-1, OLED, 3200x2000, 16", 120 Hz | Dell Inspiron 16 Plus 7640 AU Optronics B160QAN, IPS, 2560x1600, 16", 120 Hz | Lenovo ThinkBook 16 G7 IML LEN160WUXGA, IPS, 1920x1200, 16", 60 Hz | HP Pavilion Plus 16-ab0456tx AU Optronics AUOFDA4, IPS, 2560x1600, 16", 120 Hz | Acer Swift Edge 16 SFE16-44-R0XV Samsung ATNA60BX03-0, OLED, 3200x2000, 16", 120 Hz | |
|---|---|---|---|---|---|---|
| Display | 112% | 78% | 2% | 76% | 115% | |
| Display P3 Coverage | 40.9 | 98.7 141% | 76 86% | 41.6 2% | 74.6 82% | 99.9 144% |
| sRGB Coverage | 59.7 | 99.7 67% | 99.8 67% | 61.2 3% | 99 66% | 100 68% |
| AdobeRGB 1998 Coverage | 42.2 | 96.5 129% | 76.7 82% | 43 2% | 76.5 81% | 98 132% |
| Response Times | 58% | -11% | 9% | 59% | 97% | |
| Response Time Grey 50% / Grey 80% * | 22.9 ? | 0.68 ? 97% | 25.6 ? -12% | 18.4 ? 20% | 9.06 ? 60% | 0.4 ? 98% |
| Response Time Black / White * | 16.1 ? | 13.2 ? 18% | 17.6 ? -9% | 16.5 ? -2% | 6.7 ? 58% | 0.6 ? 96% |
| PWM Frequency | 240 ? | 120 ? | ||||
| Screen | 26% | 45% | -7% | 36% | 7243% | |
| Brightness middle | 313.3 | 353 13% | 314.7 0% | 321.2 3% | 403 29% | 407 30% |
| Brightness | 298 | 354 19% | 291 -2% | 319 7% | 394 32% | 405 36% |
| Brightness Distribution | 88 | 98 11% | 89 1% | 92 5% | 90 2% | 98 11% |
| Black Level * | 0.5 | 0.28 44% | 0.37 26% | 0.34 32% | 0.001 100% | |
| Contrast | 627 | 1124 79% | 868 38% | 1185 89% | 407000 64812% | |
| Colorchecker dE 2000 * | 6.09 | 4.23 31% | 1.62 73% | 8.7 -43% | 3.13 49% | 2.27 63% |
| Colorchecker dE 2000 max. * | 19.31 | 7.13 63% | 2.94 85% | 19.85 -3% | 6.14 68% | 4.46 77% |
| Colorchecker dE 2000 calibrated * | 2.63 | 2.42 8% | 1.08 59% | 1.82 31% | 1.65 37% | 2.17 17% |
| Greyscale dE 2000 * | 4.1 | 2.5 39% | 1.3 68% | 9.2 -124% | 4.5 -10% | 2.3 44% |
| Gamma | 2.18 101% | 2.4 92% | 2.26 97% | 2.83 78% | 2.18 101% | 2.231 99% |
| CCT | 6031 108% | 6642 98% | 6385 102% | 6200 105% | 6261 104% | 6443 101% |
| Moyenne finale (programmes/paramètres) | 65% /
53% | 37% /
44% | 1% /
-3% | 57% /
48% | 2485% /
4695% |
* ... Moindre est la valeur, meilleures sont les performances

Les valeurs moyennes de deltaE en niveaux de gris et en couleurs sont satisfaisantes dès la sortie de la boîte, avec respectivement 4,1 et 6,09. Nos propres efforts d'étalonnage avec un colorimètre X-Rite amélioreraient ces valeurs à seulement 0,8 et 2,63.

Temps de réponse de l'écran
| ↔ Temps de réponse noir à blanc | ||
|---|---|---|
| 16.1 ms ... hausse ↗ et chute ↘ combinées | ↗ 8.2 ms hausse | 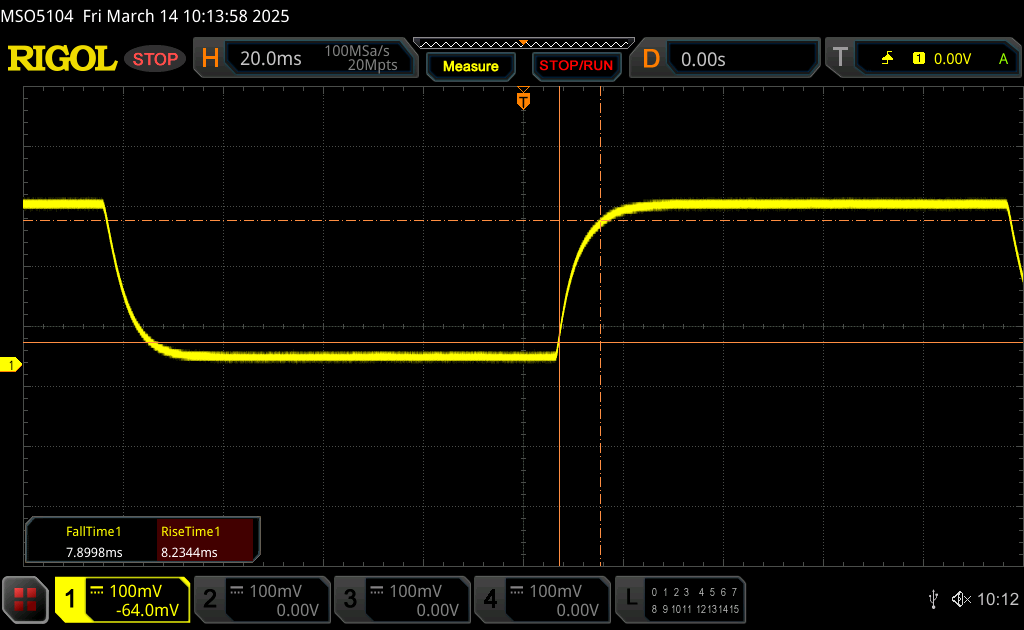 |
| ↘ 7.9 ms chute | ||
| L'écran montre de bons temps de réponse, mais insuffisant pour du jeu compétitif. En comparaison, tous les appareils testés affichent entre 0.1 (minimum) et 240 (maximum) ms. » 35 % des appareils testés affichent de meilleures performances. Cela signifie que les latences relevées sont meilleures que la moyenne (20.8 ms) de tous les appareils testés. | ||
| ↔ Temps de réponse gris 50% à gris 80% | ||
| 22.9 ms ... hausse ↗ et chute ↘ combinées | ↗ 11.2 ms hausse | 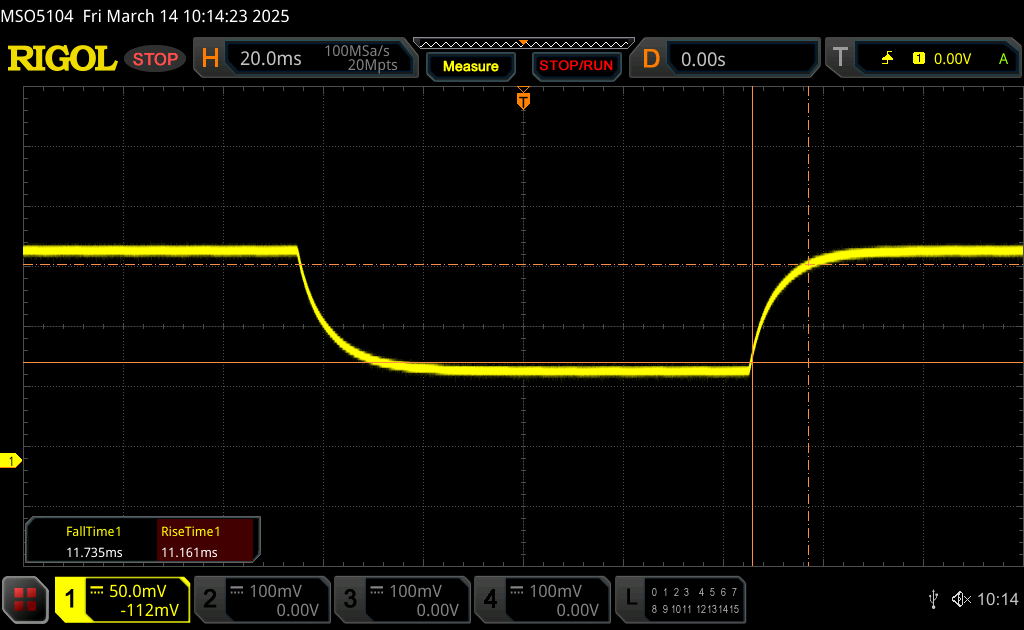 |
| ↘ 11.7 ms chute | ||
| L'écran montre de bons temps de réponse, mais insuffisant pour du jeu compétitif. En comparaison, tous les appareils testés affichent entre 0.165 (minimum) et 636 (maximum) ms. » 31 % des appareils testés affichent de meilleures performances. Cela signifie que les latences relevées sont meilleures que la moyenne (32.6 ms) de tous les appareils testés. | ||
Scintillement / MLI (Modulation de largeur d'impulsion)
| Scintillement / MLI (Modulation de largeur d'impulsion) non décelé | 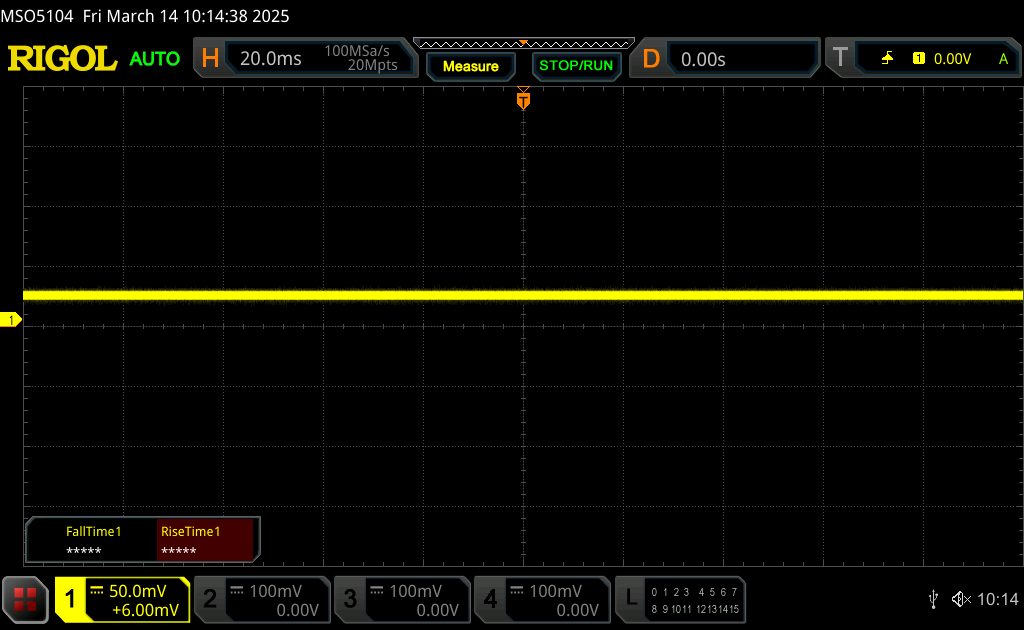 | ||
En comparaison, 53 % des appareils testés n'emploient pas MDI pour assombrir leur écran. Nous avons relevé une moyenne à 8556 (minimum : 5 - maximum : 343500) Hz dans le cas où une MDI était active. | |||


Performance - Pas d'amélioration notable
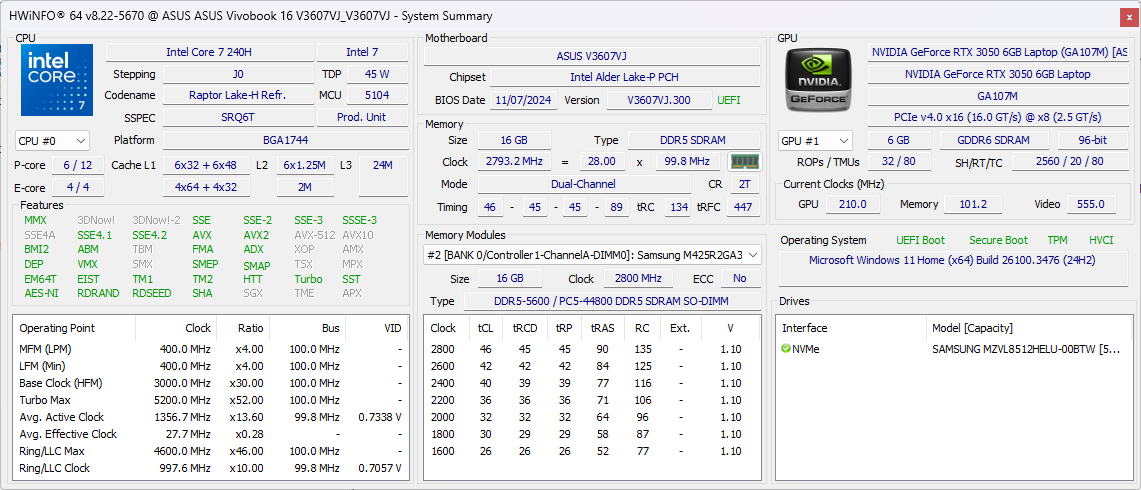
Conditions d'essai
Nous avons réglé Windows sur le mode Performance et MyAsus sur le mode Performance et le mode Optimisé avant de lancer les tests ci-dessous. Le GPU discret peut être complètement désactivé sans qu'il soit nécessaire de redémarrer.
Processeur
Le Core 7 240H présente des performances similaires à celles du Core Ultra 155H, mais sans le NPU intégré pour réduire les coûts. Il est peu probable que le public cible, à savoir les joueurs ou les rédacteurs à petit budget, ait besoin du NPU ou l'utilise.
Cinebench R15 Multi Loop
Cinebench R23: Multi Core | Single Core
Cinebench R20: CPU (Multi Core) | CPU (Single Core)
Cinebench R15: CPU Multi 64Bit | CPU Single 64Bit
Blender: v2.79 BMW27 CPU
7-Zip 18.03: 7z b 4 | 7z b 4 -mmt1
Geekbench 6.4: Multi-Core | Single-Core
Geekbench 5.5: Multi-Core | Single-Core
HWBOT x265 Benchmark v2.2: 4k Preset
LibreOffice : 20 Documents To PDF
R Benchmark 2.5: Overall mean
| CPU Performance Rating | |
| Lenovo ThinkBook 16p G5 IRX 21N50011GE | |
| Asus TUF Gaming A16 FA608WV | |
| MSI Prestige 16 AI Evo B2HMG | |
| Lenovo ThinkPad Z16 Gen 2 | |
| Moyenne Intel Core 7 240H | |
| Asus V16 V3607V | |
| HP Spectre x360 16 RTX 4050 -1! | |
| Acer Aspire 16 A16-51GM-77G2 | |
| Cinebench R23 / Multi Core | |
| Lenovo ThinkBook 16p G5 IRX 21N50011GE | |
| Asus TUF Gaming A16 FA608WV | |
| MSI Prestige 16 AI Evo B2HMG | |
| Lenovo ThinkPad Z16 Gen 2 | |
| HP Spectre x360 16 RTX 4050 | |
| Asus V16 V3607V | |
| Moyenne Intel Core 7 240H (n=1) | |
| Acer Aspire 16 A16-51GM-77G2 | |
| Cinebench R23 / Single Core | |
| Lenovo ThinkBook 16p G5 IRX 21N50011GE | |
| MSI Prestige 16 AI Evo B2HMG | |
| Asus TUF Gaming A16 FA608WV | |
| Acer Aspire 16 A16-51GM-77G2 | |
| Asus V16 V3607V | |
| Moyenne Intel Core 7 240H (n=1) | |
| Lenovo ThinkPad Z16 Gen 2 | |
| HP Spectre x360 16 RTX 4050 | |
| Cinebench R20 / CPU (Multi Core) | |
| Lenovo ThinkBook 16p G5 IRX 21N50011GE | |
| Asus TUF Gaming A16 FA608WV | |
| MSI Prestige 16 AI Evo B2HMG | |
| Lenovo ThinkPad Z16 Gen 2 | |
| Asus V16 V3607V | |
| Moyenne Intel Core 7 240H (n=1) | |
| HP Spectre x360 16 RTX 4050 | |
| Acer Aspire 16 A16-51GM-77G2 | |
| Cinebench R20 / CPU (Single Core) | |
| Lenovo ThinkBook 16p G5 IRX 21N50011GE | |
| MSI Prestige 16 AI Evo B2HMG | |
| Asus TUF Gaming A16 FA608WV | |
| Acer Aspire 16 A16-51GM-77G2 | |
| Asus V16 V3607V | |
| Moyenne Intel Core 7 240H (n=1) | |
| Lenovo ThinkPad Z16 Gen 2 | |
| HP Spectre x360 16 RTX 4050 | |
| Cinebench R15 / CPU Multi 64Bit | |
| Lenovo ThinkBook 16p G5 IRX 21N50011GE | |
| Asus TUF Gaming A16 FA608WV | |
| MSI Prestige 16 AI Evo B2HMG | |
| Lenovo ThinkPad Z16 Gen 2 | |
| Asus V16 V3607V | |
| Moyenne Intel Core 7 240H (n=1) | |
| HP Spectre x360 16 RTX 4050 | |
| Acer Aspire 16 A16-51GM-77G2 | |
| Cinebench R15 / CPU Single 64Bit | |
| Lenovo ThinkBook 16p G5 IRX 21N50011GE | |
| MSI Prestige 16 AI Evo B2HMG | |
| Asus TUF Gaming A16 FA608WV | |
| Acer Aspire 16 A16-51GM-77G2 | |
| Lenovo ThinkPad Z16 Gen 2 | |
| Asus V16 V3607V | |
| Moyenne Intel Core 7 240H (n=1) | |
| HP Spectre x360 16 RTX 4050 | |
| Blender / v2.79 BMW27 CPU | |
| Acer Aspire 16 A16-51GM-77G2 | |
| Asus V16 V3607V | |
| Moyenne Intel Core 7 240H (n=1) | |
| MSI Prestige 16 AI Evo B2HMG | |
| Lenovo ThinkPad Z16 Gen 2 | |
| Asus TUF Gaming A16 FA608WV | |
| Lenovo ThinkBook 16p G5 IRX 21N50011GE | |
| 7-Zip 18.03 / 7z b 4 | |
| Lenovo ThinkBook 16p G5 IRX 21N50011GE | |
| Asus TUF Gaming A16 FA608WV | |
| Lenovo ThinkPad Z16 Gen 2 | |
| MSI Prestige 16 AI Evo B2HMG | |
| HP Spectre x360 16 RTX 4050 | |
| Asus V16 V3607V | |
| Moyenne Intel Core 7 240H (n=1) | |
| Acer Aspire 16 A16-51GM-77G2 | |
| 7-Zip 18.03 / 7z b 4 -mmt1 | |
| Lenovo ThinkBook 16p G5 IRX 21N50011GE | |
| Acer Aspire 16 A16-51GM-77G2 | |
| Lenovo ThinkPad Z16 Gen 2 | |
| Asus V16 V3607V | |
| Moyenne Intel Core 7 240H (n=1) | |
| Asus TUF Gaming A16 FA608WV | |
| MSI Prestige 16 AI Evo B2HMG | |
| HP Spectre x360 16 RTX 4050 | |
| Geekbench 6.4 / Multi-Core | |
| Lenovo ThinkBook 16p G5 IRX 21N50011GE | |
| MSI Prestige 16 AI Evo B2HMG | |
| Asus TUF Gaming A16 FA608WV | |
| Lenovo ThinkPad Z16 Gen 2 | |
| Moyenne Intel Core 7 240H (11285 - 12846, n=2) | |
| HP Spectre x360 16 RTX 4050 | |
| Asus V16 V3607V | |
| Acer Aspire 16 A16-51GM-77G2 | |
| Geekbench 6.4 / Single-Core | |
| Lenovo ThinkBook 16p G5 IRX 21N50011GE | |
| MSI Prestige 16 AI Evo B2HMG | |
| Asus TUF Gaming A16 FA608WV | |
| Acer Aspire 16 A16-51GM-77G2 | |
| Moyenne Intel Core 7 240H (2646 - 2648, n=2) | |
| Asus V16 V3607V | |
| Lenovo ThinkPad Z16 Gen 2 | |
| HP Spectre x360 16 RTX 4050 | |
| Geekbench 5.5 / Multi-Core | |
| Lenovo ThinkBook 16p G5 IRX 21N50011GE | |
| MSI Prestige 16 AI Evo B2HMG | |
| Asus TUF Gaming A16 FA608WV | |
| HP Spectre x360 16 RTX 4050 | |
| Lenovo ThinkPad Z16 Gen 2 | |
| Asus V16 V3607V | |
| Moyenne Intel Core 7 240H (n=1) | |
| Acer Aspire 16 A16-51GM-77G2 | |
| Geekbench 5.5 / Single-Core | |
| Lenovo ThinkBook 16p G5 IRX 21N50011GE | |
| Asus TUF Gaming A16 FA608WV | |
| MSI Prestige 16 AI Evo B2HMG | |
| Acer Aspire 16 A16-51GM-77G2 | |
| Lenovo ThinkPad Z16 Gen 2 | |
| Asus V16 V3607V | |
| Moyenne Intel Core 7 240H (n=1) | |
| HP Spectre x360 16 RTX 4050 | |
| HWBOT x265 Benchmark v2.2 / 4k Preset | |
| Lenovo ThinkBook 16p G5 IRX 21N50011GE | |
| Asus TUF Gaming A16 FA608WV | |
| MSI Prestige 16 AI Evo B2HMG | |
| Lenovo ThinkPad Z16 Gen 2 | |
| Asus V16 V3607V | |
| Moyenne Intel Core 7 240H (n=1) | |
| HP Spectre x360 16 RTX 4050 | |
| Acer Aspire 16 A16-51GM-77G2 | |
| LibreOffice / 20 Documents To PDF | |
| Asus V16 V3607V | |
| Moyenne Intel Core 7 240H (n=1) | |
| Asus TUF Gaming A16 FA608WV | |
| Lenovo ThinkPad Z16 Gen 2 | |
| Lenovo ThinkBook 16p G5 IRX 21N50011GE | |
| HP Spectre x360 16 RTX 4050 | |
| MSI Prestige 16 AI Evo B2HMG | |
| Acer Aspire 16 A16-51GM-77G2 | |
| R Benchmark 2.5 / Overall mean | |
| HP Spectre x360 16 RTX 4050 | |
| Lenovo ThinkPad Z16 Gen 2 | |
| Acer Aspire 16 A16-51GM-77G2 | |
| MSI Prestige 16 AI Evo B2HMG | |
| Asus V16 V3607V | |
| Moyenne Intel Core 7 240H (n=1) | |
| Asus TUF Gaming A16 FA608WV | |
| Lenovo ThinkBook 16p G5 IRX 21N50011GE | |
* ... Moindre est la valeur, meilleures sont les performances
AIDA64: FP32 Ray-Trace | FPU Julia | CPU SHA3 | CPU Queen | FPU SinJulia | FPU Mandel | CPU AES | CPU ZLib | FP64 Ray-Trace | CPU PhotoWorxx
| Performance Rating | |
| Asus VivoBook Pro 16 K6602VU | |
| HP Pavilion Plus 16-ab0456tx | |
| Dell Inspiron 16 Plus 7640 | |
| Acer Swift Edge 16 SFE16-44-R0XV | |
| Asus V16 V3607V | |
| Moyenne Intel Core 7 240H | |
| Lenovo ThinkBook 16 G7 IML | |
| AIDA64 / FP32 Ray-Trace | |
| Acer Swift Edge 16 SFE16-44-R0XV | |
| HP Pavilion Plus 16-ab0456tx | |
| Dell Inspiron 16 Plus 7640 | |
| Asus V16 V3607V | |
| Moyenne Intel Core 7 240H (n=1) | |
| Asus VivoBook Pro 16 K6602VU | |
| Lenovo ThinkBook 16 G7 IML | |
| AIDA64 / FPU Julia | |
| HP Pavilion Plus 16-ab0456tx | |
| Asus VivoBook Pro 16 K6602VU | |
| Dell Inspiron 16 Plus 7640 | |
| Acer Swift Edge 16 SFE16-44-R0XV | |
| Asus V16 V3607V | |
| Moyenne Intel Core 7 240H (n=1) | |
| Lenovo ThinkBook 16 G7 IML | |
| AIDA64 / CPU SHA3 | |
| HP Pavilion Plus 16-ab0456tx | |
| Dell Inspiron 16 Plus 7640 | |
| Asus VivoBook Pro 16 K6602VU | |
| Acer Swift Edge 16 SFE16-44-R0XV | |
| Asus V16 V3607V | |
| Moyenne Intel Core 7 240H (n=1) | |
| Lenovo ThinkBook 16 G7 IML | |
| AIDA64 / CPU Queen | |
| HP Pavilion Plus 16-ab0456tx | |
| Asus VivoBook Pro 16 K6602VU | |
| Dell Inspiron 16 Plus 7640 | |
| Acer Swift Edge 16 SFE16-44-R0XV | |
| Asus V16 V3607V | |
| Moyenne Intel Core 7 240H (n=1) | |
| Lenovo ThinkBook 16 G7 IML | |
| AIDA64 / FPU SinJulia | |
| Acer Swift Edge 16 SFE16-44-R0XV | |
| Dell Inspiron 16 Plus 7640 | |
| HP Pavilion Plus 16-ab0456tx | |
| Asus VivoBook Pro 16 K6602VU | |
| Asus V16 V3607V | |
| Moyenne Intel Core 7 240H (n=1) | |
| Lenovo ThinkBook 16 G7 IML | |
| AIDA64 / FPU Mandel | |
| Acer Swift Edge 16 SFE16-44-R0XV | |
| HP Pavilion Plus 16-ab0456tx | |
| Dell Inspiron 16 Plus 7640 | |
| Asus VivoBook Pro 16 K6602VU | |
| Asus V16 V3607V | |
| Moyenne Intel Core 7 240H (n=1) | |
| Lenovo ThinkBook 16 G7 IML | |
| AIDA64 / CPU AES | |
| Asus VivoBook Pro 16 K6602VU | |
| Dell Inspiron 16 Plus 7640 | |
| HP Pavilion Plus 16-ab0456tx | |
| Acer Swift Edge 16 SFE16-44-R0XV | |
| Asus V16 V3607V | |
| Moyenne Intel Core 7 240H (n=1) | |
| Lenovo ThinkBook 16 G7 IML | |
| AIDA64 / CPU ZLib | |
| Dell Inspiron 16 Plus 7640 | |
| HP Pavilion Plus 16-ab0456tx | |
| Asus VivoBook Pro 16 K6602VU | |
| Asus V16 V3607V | |
| Moyenne Intel Core 7 240H (n=1) | |
| Lenovo ThinkBook 16 G7 IML | |
| Acer Swift Edge 16 SFE16-44-R0XV | |
| AIDA64 / FP64 Ray-Trace | |
| Acer Swift Edge 16 SFE16-44-R0XV | |
| HP Pavilion Plus 16-ab0456tx | |
| Asus VivoBook Pro 16 K6602VU | |
| Dell Inspiron 16 Plus 7640 | |
| Asus V16 V3607V | |
| Moyenne Intel Core 7 240H (n=1) | |
| Lenovo ThinkBook 16 G7 IML | |
| AIDA64 / CPU PhotoWorxx | |
| HP Pavilion Plus 16-ab0456tx | |
| Dell Inspiron 16 Plus 7640 | |
| Asus VivoBook Pro 16 K6602VU | |
| Acer Swift Edge 16 SFE16-44-R0XV | |
| Lenovo ThinkBook 16 G7 IML | |
| Asus V16 V3607V | |
| Moyenne Intel Core 7 240H (n=1) | |
Test de stress
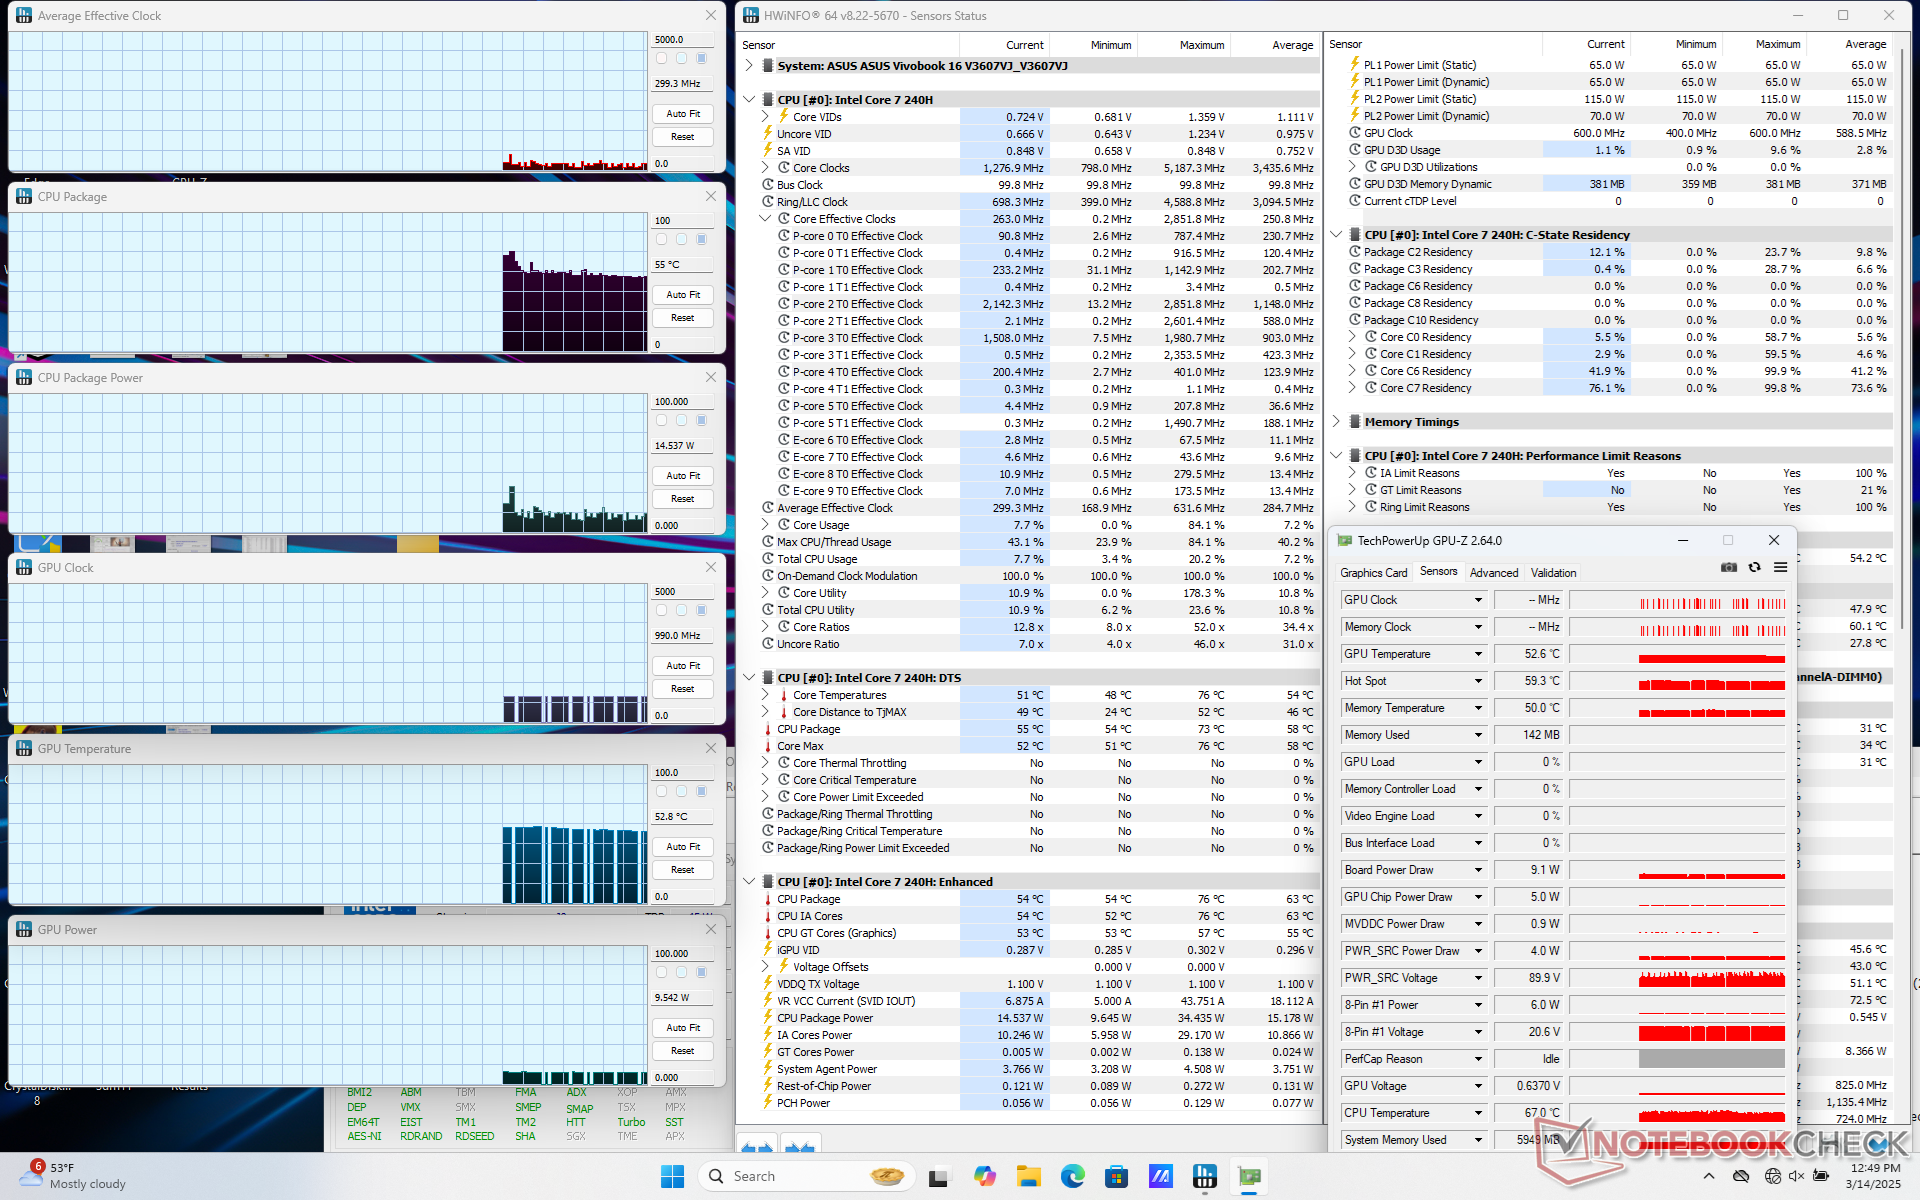
Le CPU atteignait 3,9 GHz et 71 W pendant une minute environ, jusqu'à ce qu'il atteigne une température de 94 C. Il descendait ensuite à 2,4 GHz et 33 W avant de remonter à environ 3,1 GHz et 50 W.
Les performances de jeu diminuent également légèrement si vous utilisez le mode équilibré/standard au lieu du mode performance. Un mode "Full-speed" est également disponible sur MyAsus, mais il n'offre aucun avantage en termes de performances par rapport au mode Performance dans nos tests.
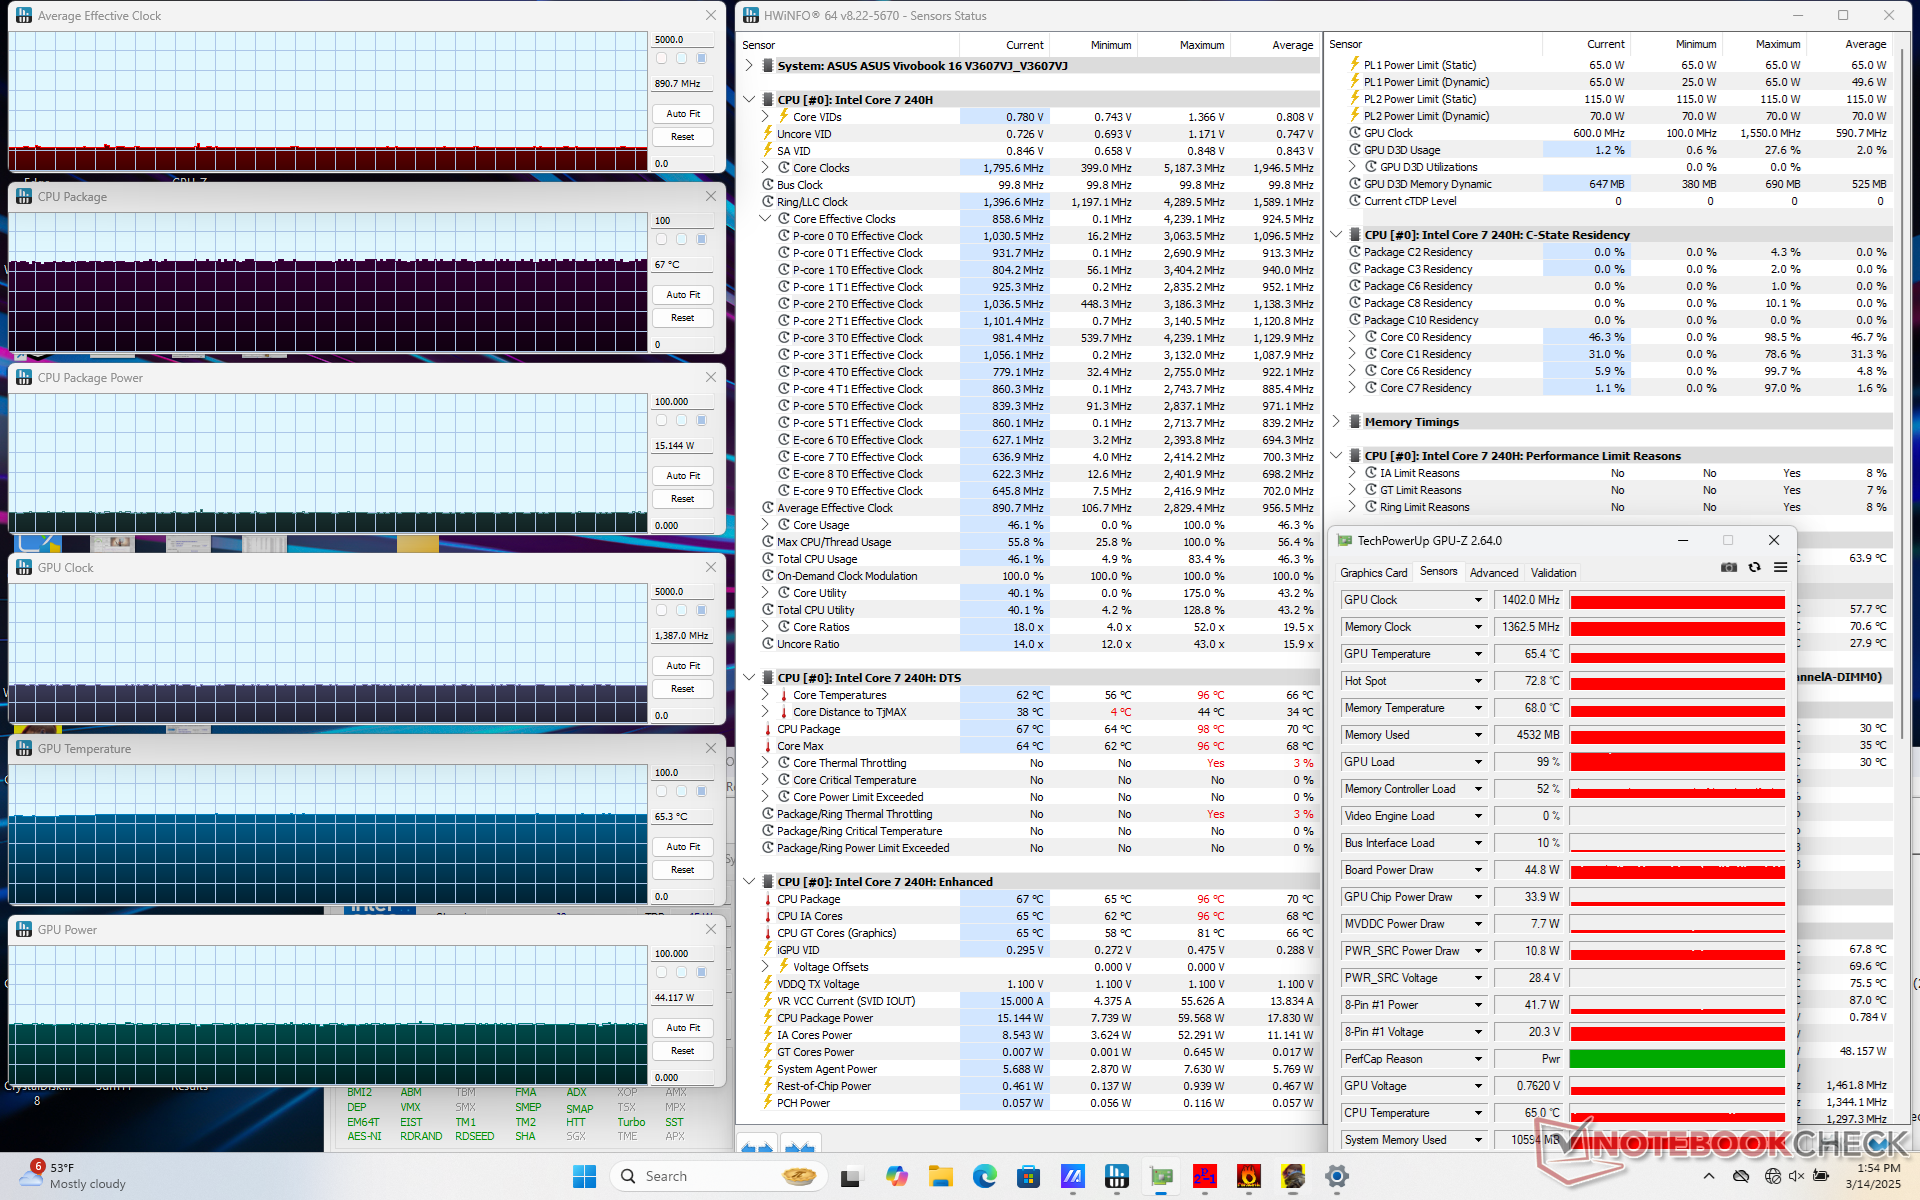
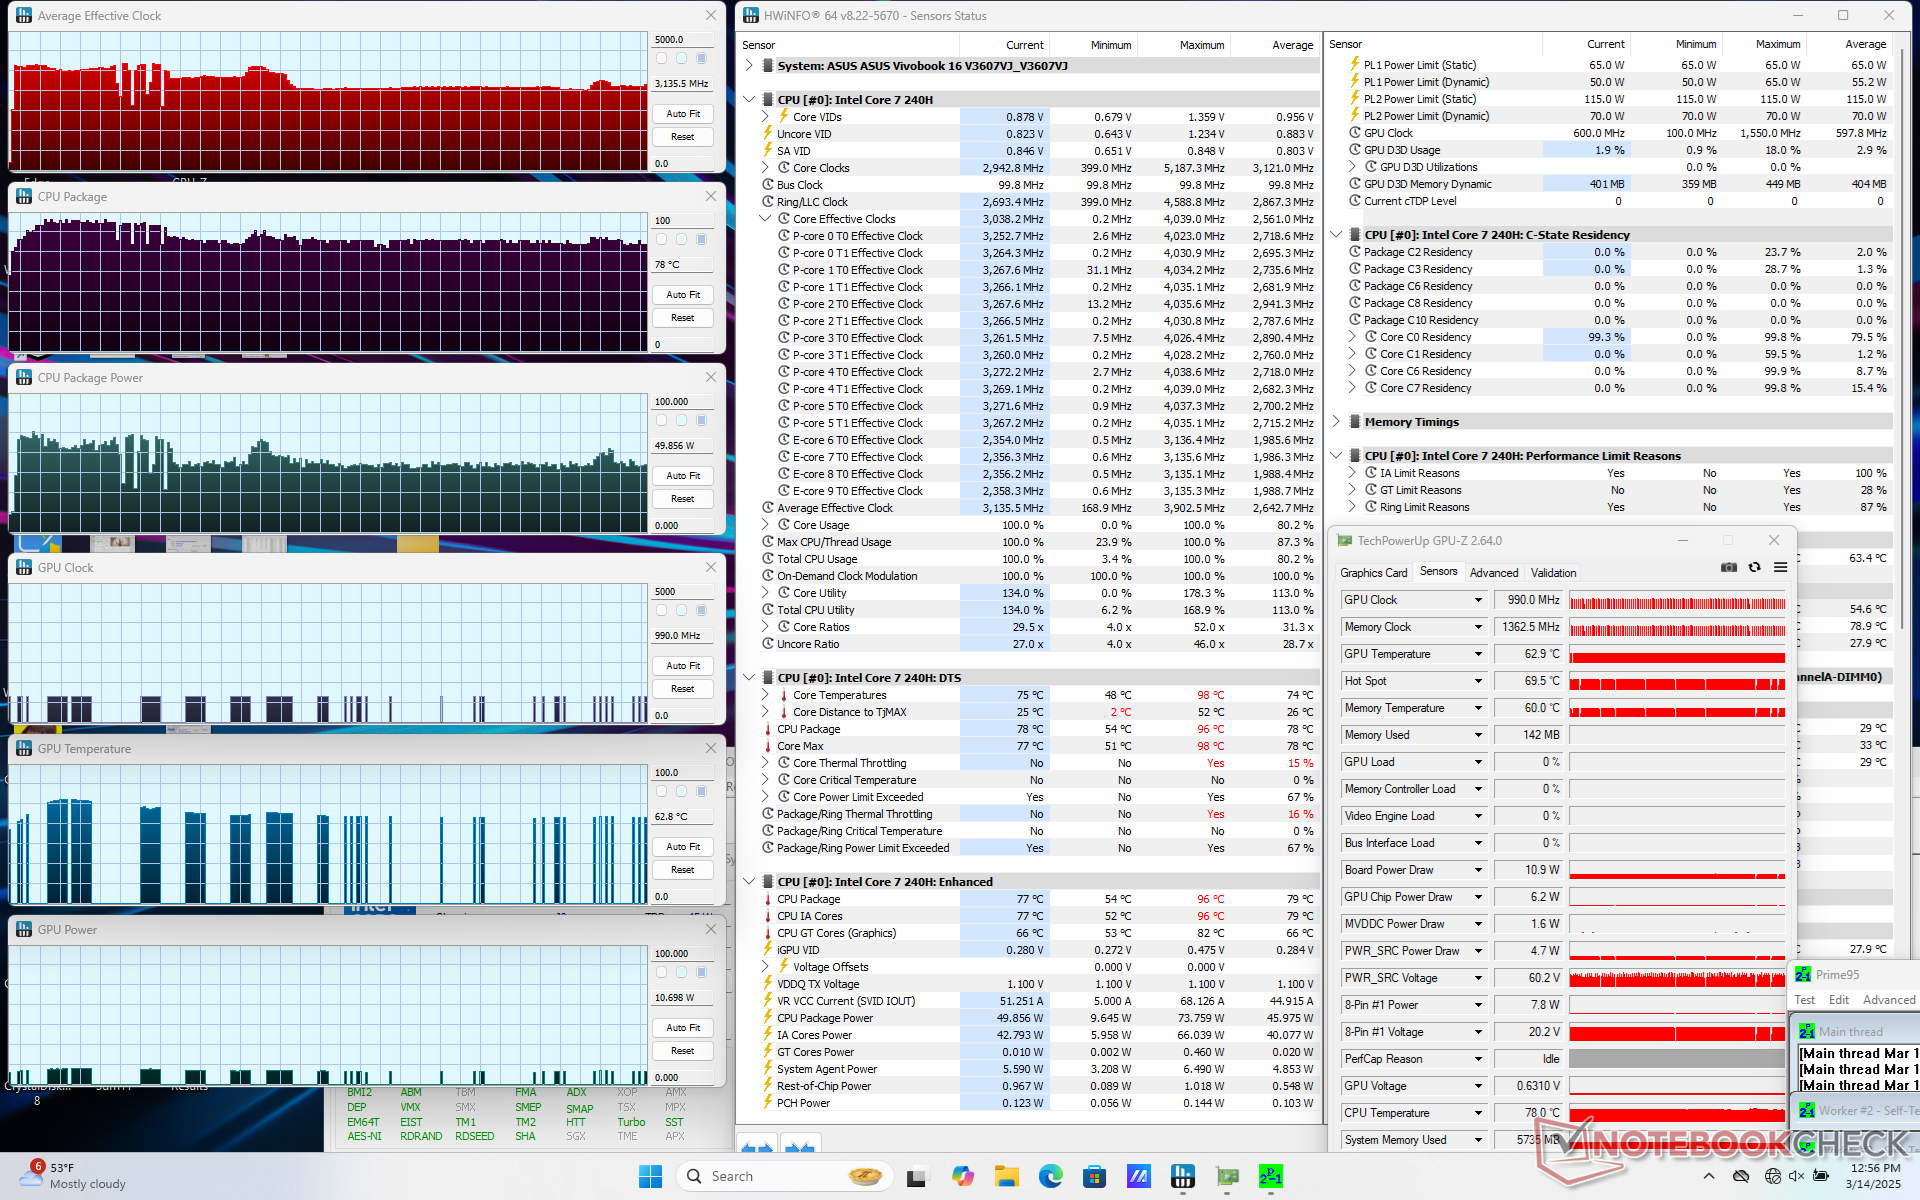
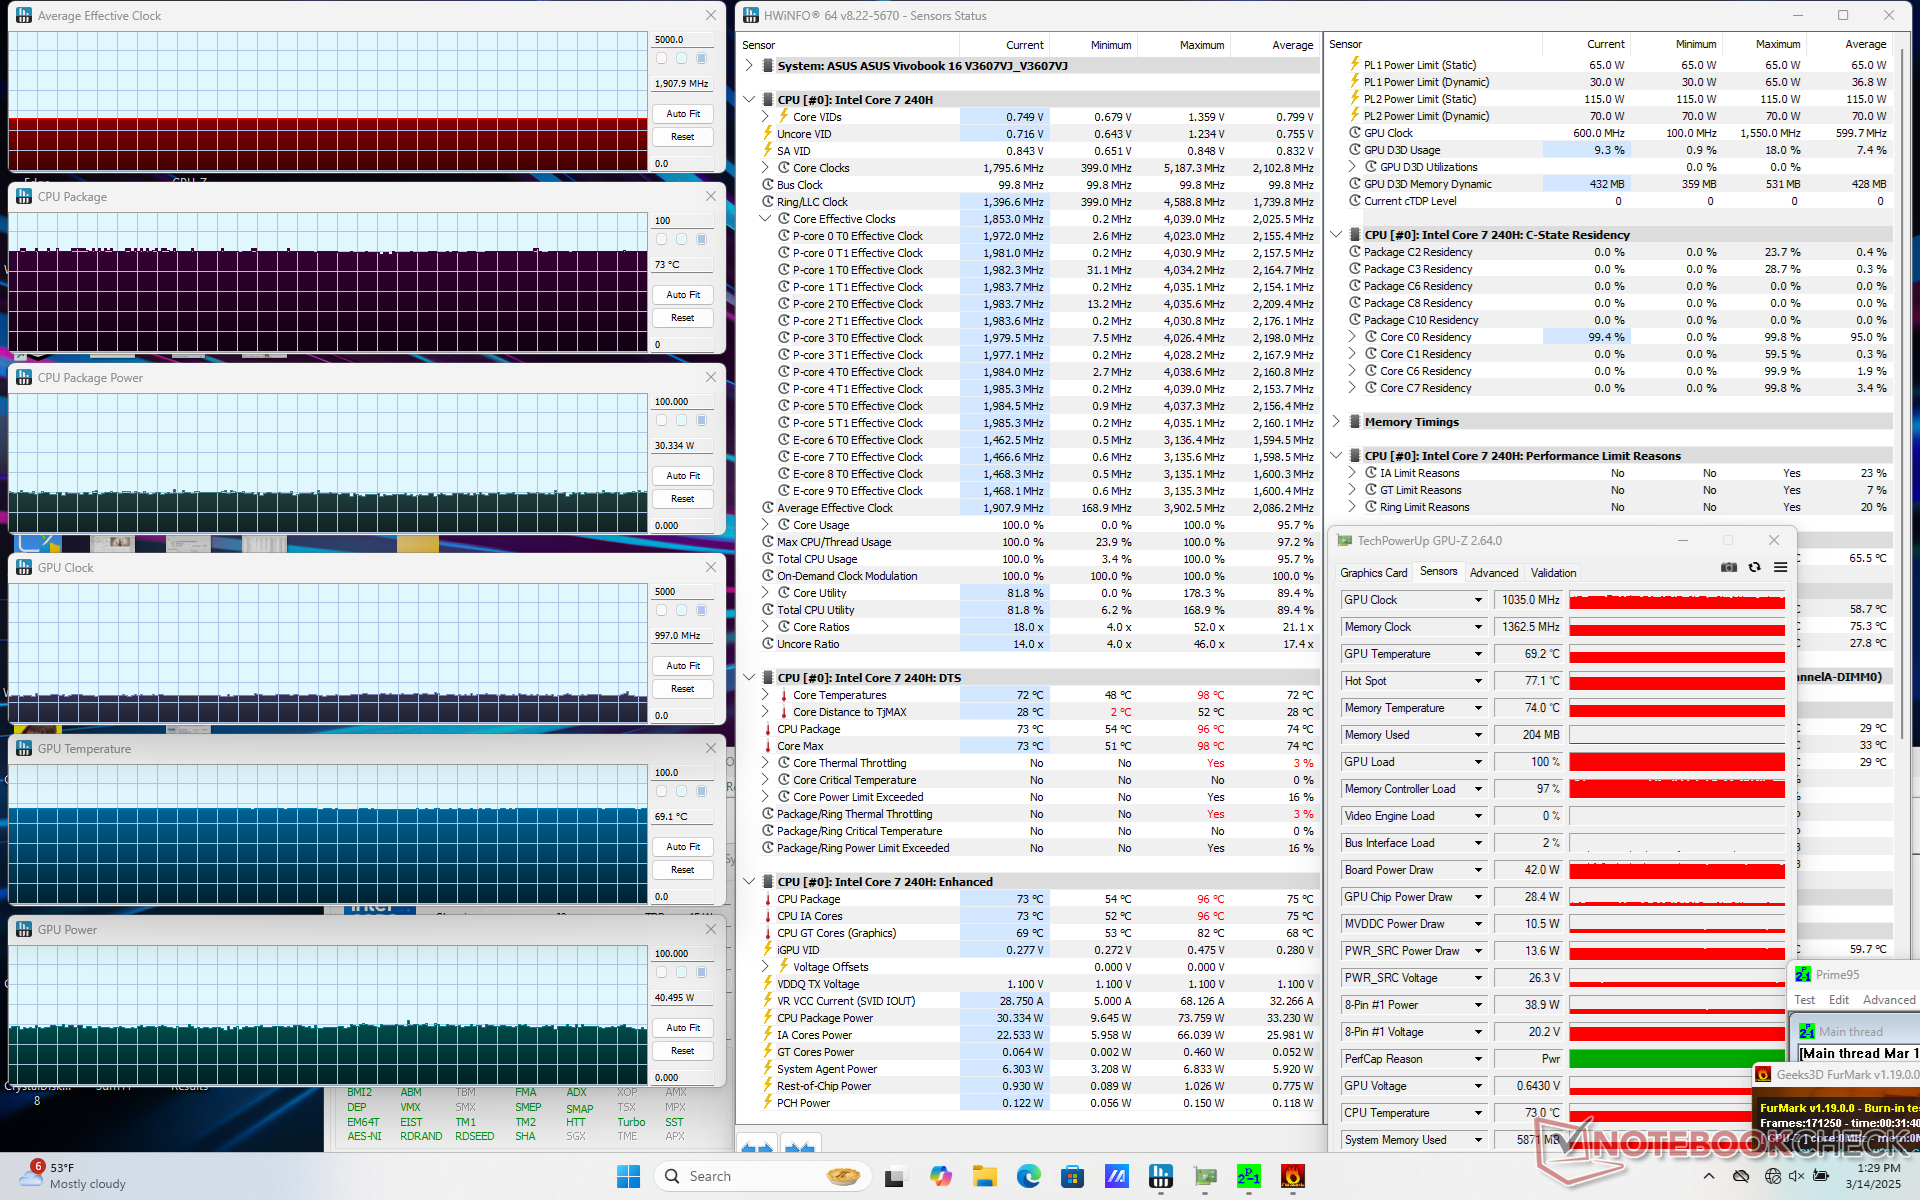
| Horloge moyenne du CPU (GHz) | Horloge du GPU (MHz) | Température moyenne du CPU (°C) | Température moyenne du GPU (°C) | |
| Système au repos | -- | -- | 55 | 53 |
| Prime95 Stress | 3.1 | -- | 78 | 63 |
| Prime95 + FurMark Stress | 1.9 | 1035 | 73 | 69 |
| Cyberpunk 2077 Stress (mode Performance) | 0.9 | 1612 | 71 | 70 |
| Cyberpunk 2077 Stress (mode équilibré) | 0.9 | 1402 | 67 | 65 |
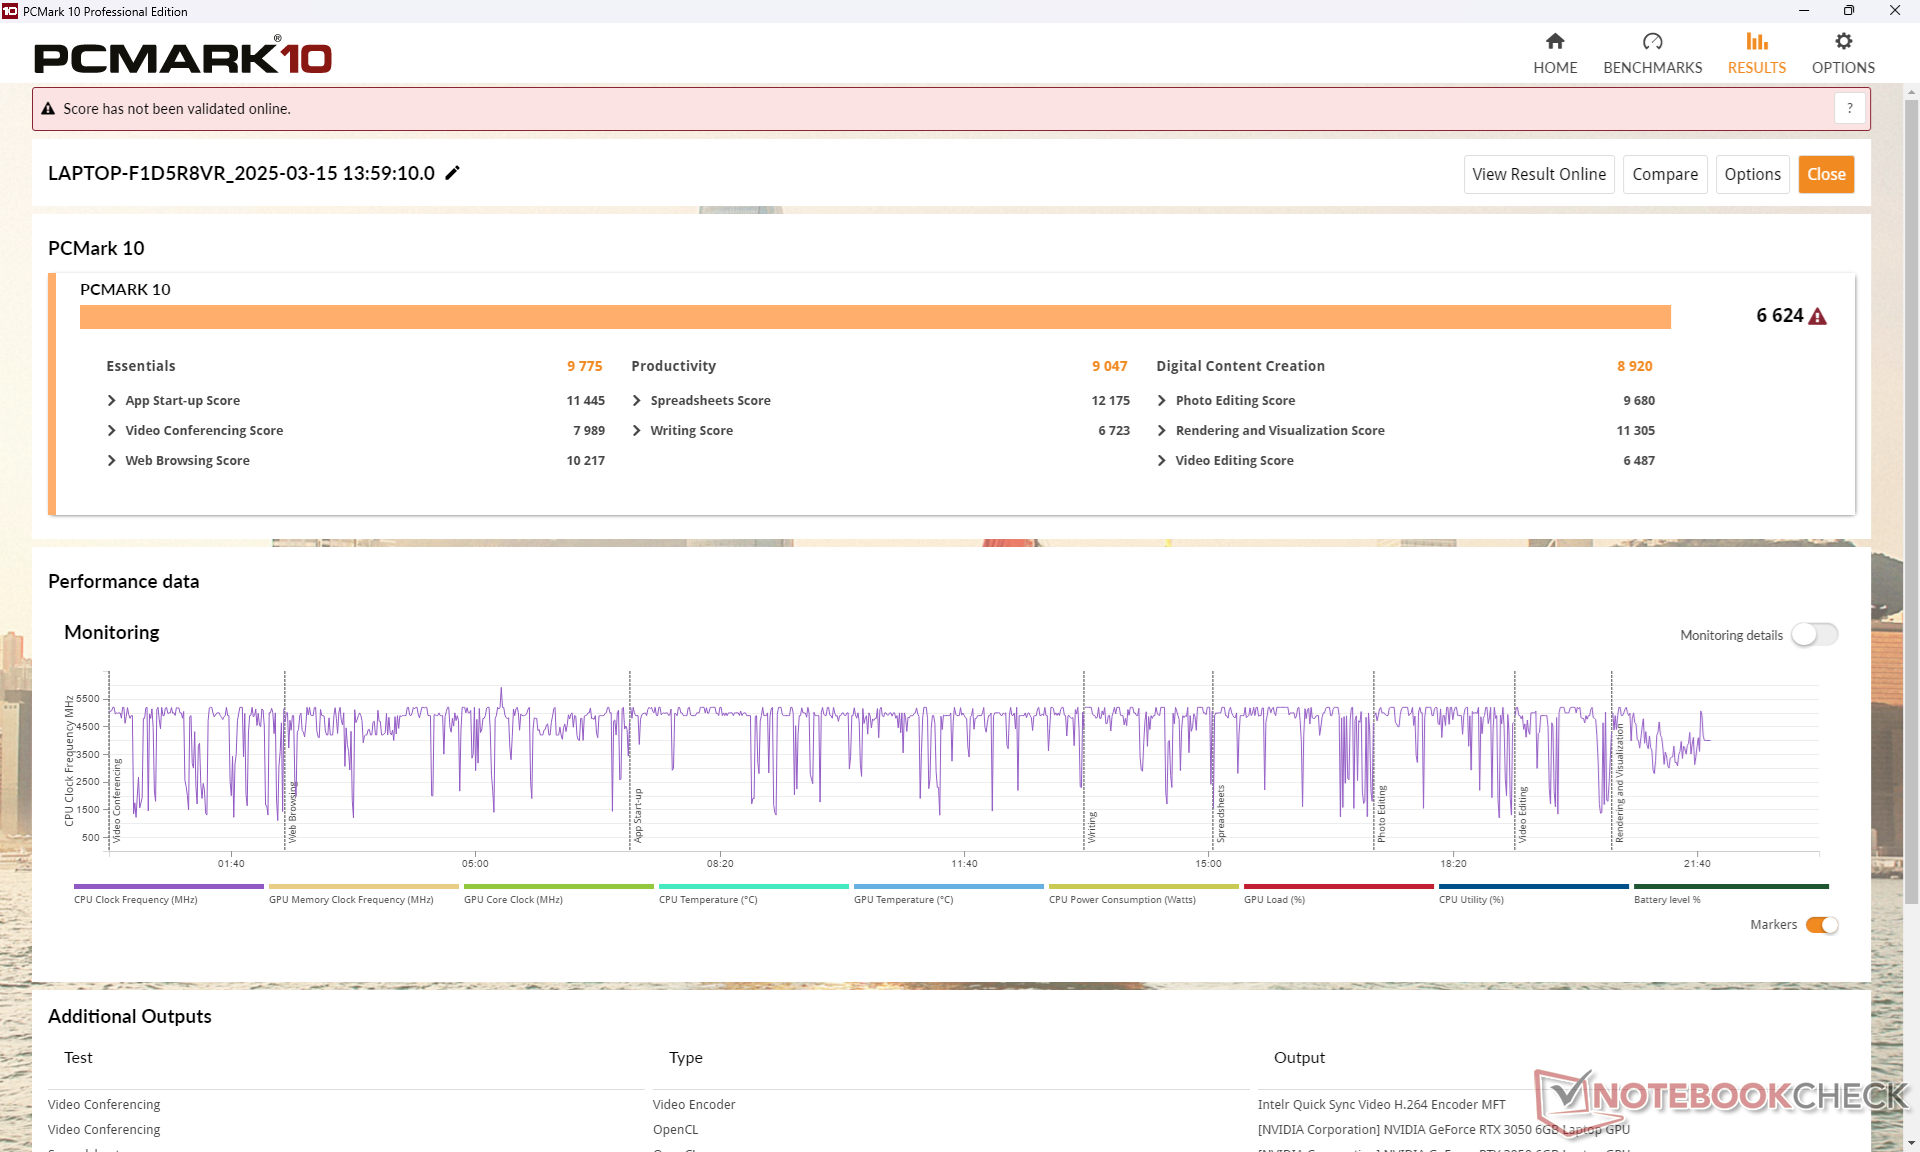
Performance du système
CrossMark: Overall | Productivity | Creativity | Responsiveness
WebXPRT 3: Overall
WebXPRT 4: Overall
Mozilla Kraken 1.1: Total
| PCMark 10 / Score | |
| Asus VivoBook Pro 16 K6602VU | |
| Dell Inspiron 16 Plus 7640 | |
| Asus V16 V3607V | |
| Moyenne Intel Core 7 240H, NVIDIA GeForce RTX 3050 6GB Laptop GPU (n=1) | |
| HP Pavilion Plus 16-ab0456tx | |
| Acer Swift Edge 16 SFE16-44-R0XV | |
| Lenovo ThinkBook 16 G7 IML | |
| PCMark 10 / Essentials | |
| Dell Inspiron 16 Plus 7640 | |
| Asus VivoBook Pro 16 K6602VU | |
| Acer Swift Edge 16 SFE16-44-R0XV | |
| HP Pavilion Plus 16-ab0456tx | |
| Lenovo ThinkBook 16 G7 IML | |
| Asus V16 V3607V | |
| Moyenne Intel Core 7 240H, NVIDIA GeForce RTX 3050 6GB Laptop GPU (n=1) | |
| PCMark 10 / Productivity | |
| Acer Swift Edge 16 SFE16-44-R0XV | |
| Asus V16 V3607V | |
| Moyenne Intel Core 7 240H, NVIDIA GeForce RTX 3050 6GB Laptop GPU (n=1) | |
| HP Pavilion Plus 16-ab0456tx | |
| Asus VivoBook Pro 16 K6602VU | |
| Dell Inspiron 16 Plus 7640 | |
| Lenovo ThinkBook 16 G7 IML | |
| PCMark 10 / Digital Content Creation | |
| Dell Inspiron 16 Plus 7640 | |
| Asus VivoBook Pro 16 K6602VU | |
| Asus V16 V3607V | |
| Moyenne Intel Core 7 240H, NVIDIA GeForce RTX 3050 6GB Laptop GPU (n=1) | |
| HP Pavilion Plus 16-ab0456tx | |
| Acer Swift Edge 16 SFE16-44-R0XV | |
| Lenovo ThinkBook 16 G7 IML | |
| CrossMark / Overall | |
| Asus V16 V3607V | |
| Moyenne Intel Core 7 240H, NVIDIA GeForce RTX 3050 6GB Laptop GPU (n=1) | |
| HP Pavilion Plus 16-ab0456tx | |
| Asus VivoBook Pro 16 K6602VU | |
| Dell Inspiron 16 Plus 7640 | |
| Lenovo ThinkBook 16 G7 IML | |
| CrossMark / Productivity | |
| Asus V16 V3607V | |
| Moyenne Intel Core 7 240H, NVIDIA GeForce RTX 3050 6GB Laptop GPU (n=1) | |
| Asus VivoBook Pro 16 K6602VU | |
| HP Pavilion Plus 16-ab0456tx | |
| Dell Inspiron 16 Plus 7640 | |
| Lenovo ThinkBook 16 G7 IML | |
| CrossMark / Creativity | |
| HP Pavilion Plus 16-ab0456tx | |
| Asus V16 V3607V | |
| Moyenne Intel Core 7 240H, NVIDIA GeForce RTX 3050 6GB Laptop GPU (n=1) | |
| Dell Inspiron 16 Plus 7640 | |
| Asus VivoBook Pro 16 K6602VU | |
| Lenovo ThinkBook 16 G7 IML | |
| CrossMark / Responsiveness | |
| Asus V16 V3607V | |
| Moyenne Intel Core 7 240H, NVIDIA GeForce RTX 3050 6GB Laptop GPU (n=1) | |
| Asus VivoBook Pro 16 K6602VU | |
| HP Pavilion Plus 16-ab0456tx | |
| Dell Inspiron 16 Plus 7640 | |
| Lenovo ThinkBook 16 G7 IML | |
| WebXPRT 3 / Overall | |
| Dell Inspiron 16 Plus 7640 | |
| HP Pavilion Plus 16-ab0456tx | |
| Acer Swift Edge 16 SFE16-44-R0XV | |
| Acer Swift Edge 16 SFE16-44-R0XV | |
| Lenovo ThinkBook 16 G7 IML | |
| WebXPRT 4 / Overall | |
| Asus V16 V3607V | |
| Moyenne Intel Core 7 240H, NVIDIA GeForce RTX 3050 6GB Laptop GPU (n=1) | |
| HP Pavilion Plus 16-ab0456tx | |
| Dell Inspiron 16 Plus 7640 | |
| Acer Swift Edge 16 SFE16-44-R0XV | |
| Asus VivoBook Pro 16 K6602VU | |
| Lenovo ThinkBook 16 G7 IML | |
| Mozilla Kraken 1.1 / Total | |
| Lenovo ThinkBook 16 G7 IML | |
| Acer Swift Edge 16 SFE16-44-R0XV | |
| Acer Swift Edge 16 SFE16-44-R0XV | |
| Asus VivoBook Pro 16 K6602VU | |
| Dell Inspiron 16 Plus 7640 | |
| Asus V16 V3607V | |
| Moyenne Intel Core 7 240H, NVIDIA GeForce RTX 3050 6GB Laptop GPU (n=1) | |
| HP Pavilion Plus 16-ab0456tx | |
* ... Moindre est la valeur, meilleures sont les performances
| PCMark 10 Score | 6624 points | |
Aide | ||
| AIDA64 / Memory Copy | |
| Acer Swift Edge 16 SFE16-44-R0XV | |
| HP Pavilion Plus 16-ab0456tx | |
| Dell Inspiron 16 Plus 7640 | |
| Asus VivoBook Pro 16 K6602VU | |
| Lenovo ThinkBook 16 G7 IML | |
| Asus V16 V3607V | |
| Moyenne Intel Core 7 240H (n=1) | |
| AIDA64 / Memory Read | |
| Dell Inspiron 16 Plus 7640 | |
| Asus VivoBook Pro 16 K6602VU | |
| HP Pavilion Plus 16-ab0456tx | |
| Acer Swift Edge 16 SFE16-44-R0XV | |
| Asus V16 V3607V | |
| Moyenne Intel Core 7 240H (n=1) | |
| Lenovo ThinkBook 16 G7 IML | |
| AIDA64 / Memory Write | |
| Acer Swift Edge 16 SFE16-44-R0XV | |
| HP Pavilion Plus 16-ab0456tx | |
| Dell Inspiron 16 Plus 7640 | |
| Asus VivoBook Pro 16 K6602VU | |
| Lenovo ThinkBook 16 G7 IML | |
| Asus V16 V3607V | |
| Moyenne Intel Core 7 240H (n=1) | |
| AIDA64 / Memory Latency | |
| Lenovo ThinkBook 16 G7 IML | |
| Dell Inspiron 16 Plus 7640 | |
| Acer Swift Edge 16 SFE16-44-R0XV | |
| Asus V16 V3607V | |
| Moyenne Intel Core 7 240H (n=1) | |
| Asus VivoBook Pro 16 K6602VU | |
| HP Pavilion Plus 16-ab0456tx | |
* ... Moindre est la valeur, meilleures sont les performances
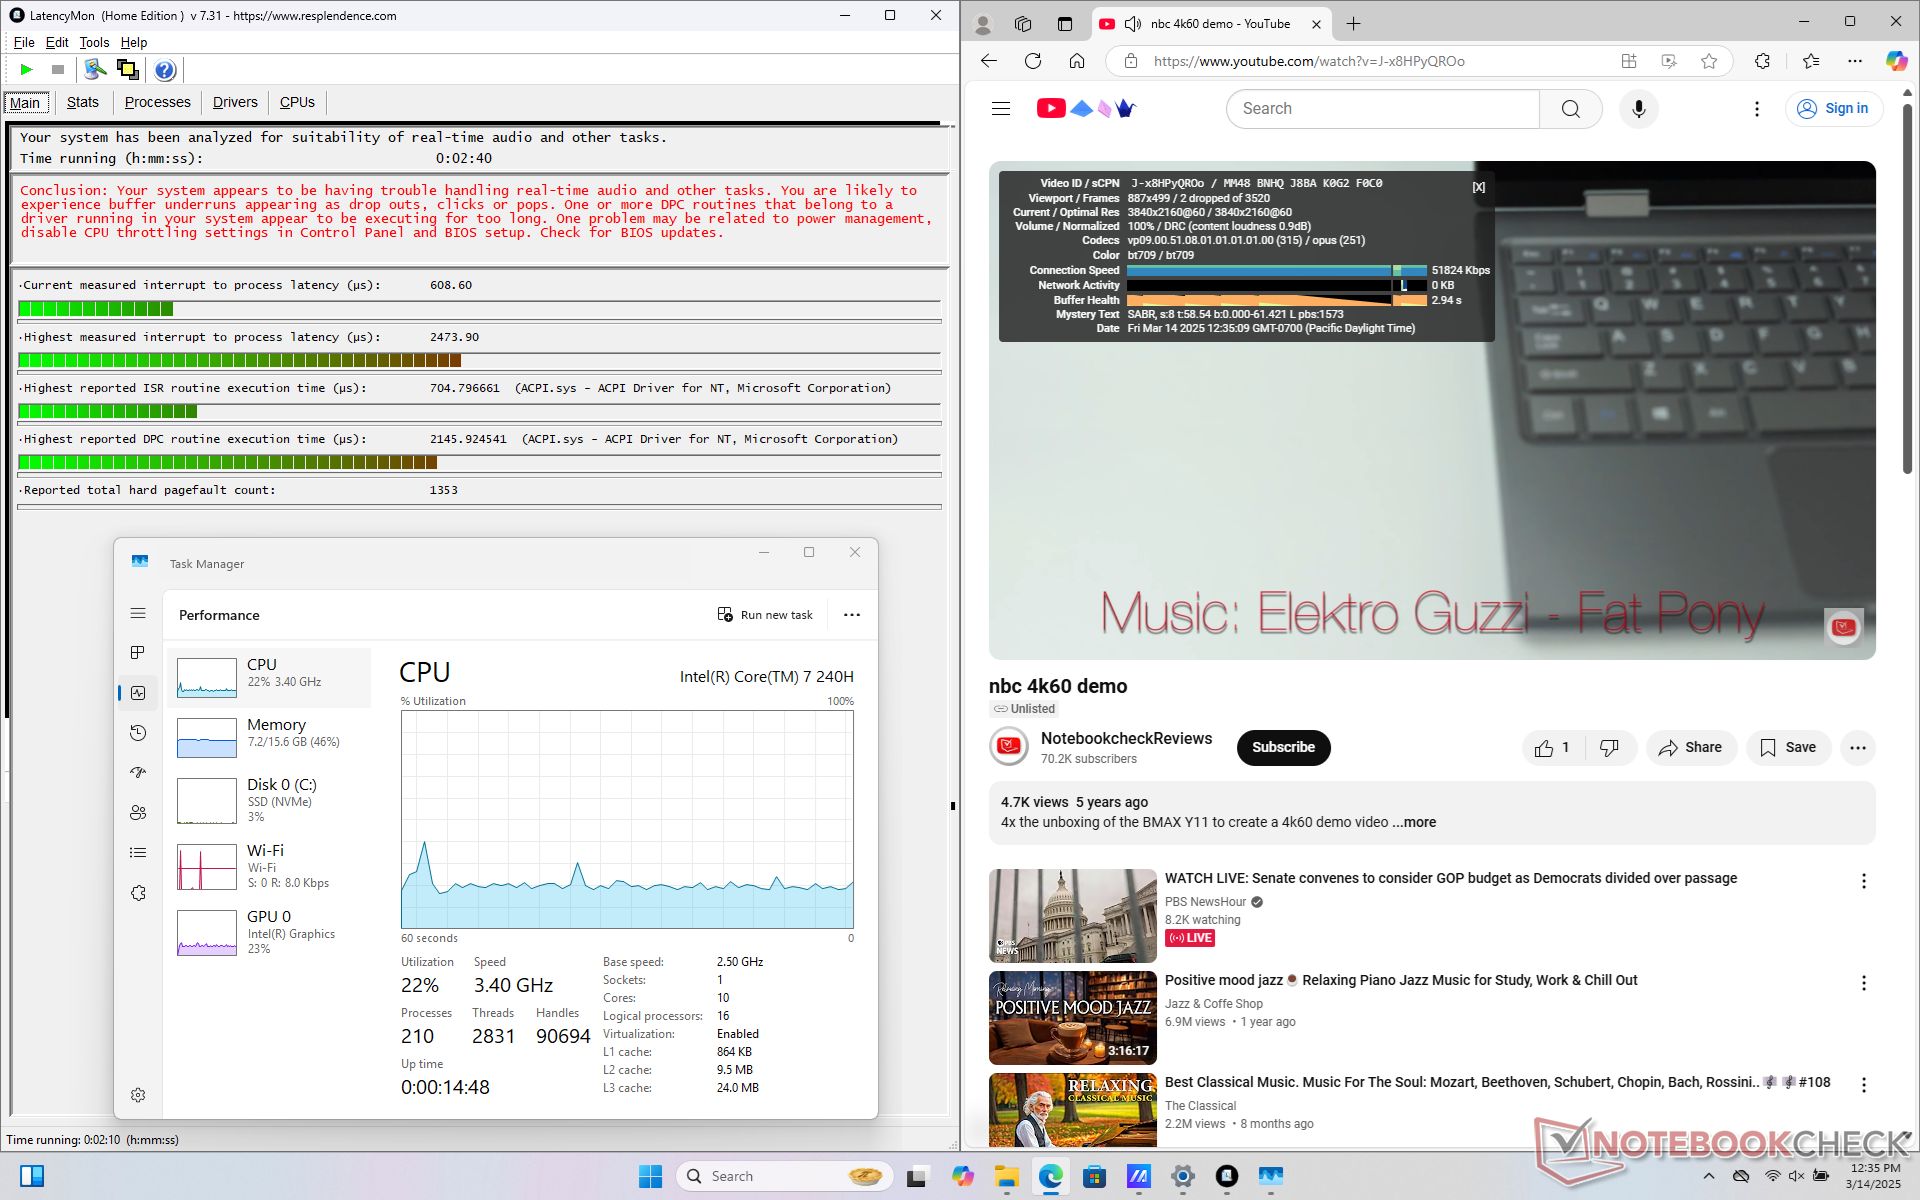
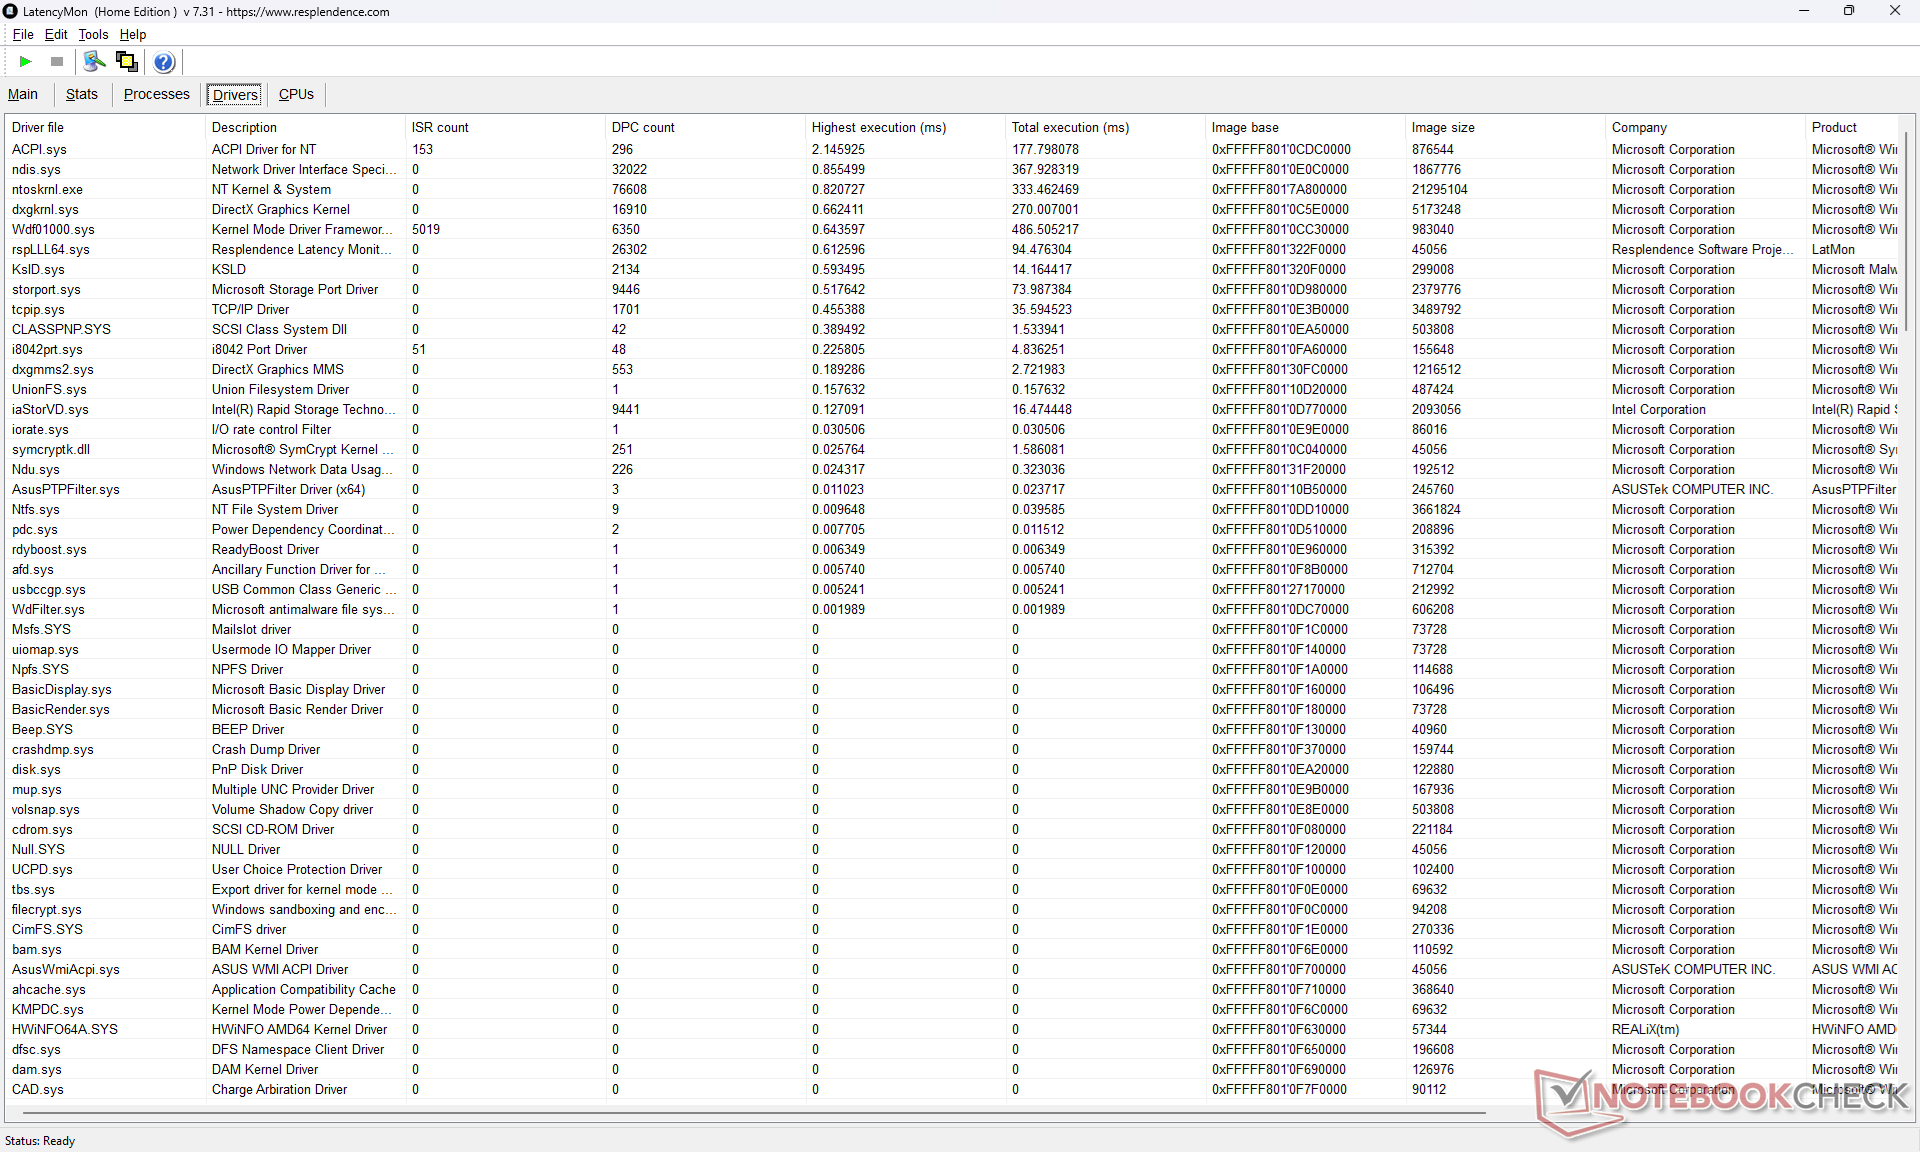
Latence DPC
LatencyMon montre des problèmes de DPC lors de l'ouverture de plusieurs onglets de notre page d'accueil et seulement quelques images perdues lors de notre test de lecture vidéo 4K60.
| DPC Latencies / LatencyMon - interrupt to process latency (max), Web, Youtube, Prime95 | |
| Acer Swift Edge 16 SFE16-44-R0XV | |
| HP Pavilion Plus 16-ab0456tx | |
| Asus V16 V3607V | |
| Asus VivoBook Pro 16 K6602VU | |
| Lenovo ThinkBook 16 G7 IML | |
| Dell Inspiron 16 Plus 7640 | |
* ... Moindre est la valeur, meilleures sont les performances
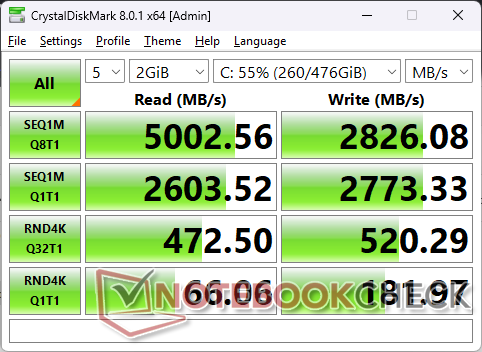
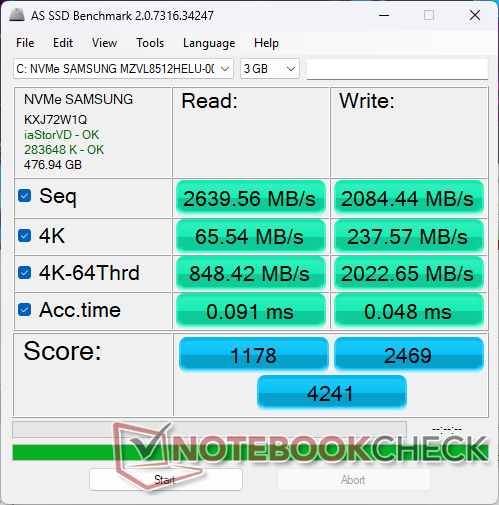
Dispositifs de stockage
Le disque SSD Samsung MZVL8512HELU PCIe4 de 512 Go atteint une vitesse maximale de 5 000 Mo/s. Cependant, les performances s'essoufflent après quelques minutes d'utilisation, comme le montre le graphique ci-dessous.

| Drive Performance Rating - Percent | |
| Acer Swift Edge 16 SFE16-44-R0XV | |
| HP Pavilion Plus 16-ab0456tx | |
| Asus V16 V3607V | |
| Asus VivoBook Pro 16 K6602VU | |
| Dell Inspiron 16 Plus 7640 | |
| Lenovo ThinkBook 16 G7 IML | |
* ... Moindre est la valeur, meilleures sont les performances
Disk Throttling: DiskSpd Read Loop, Queue Depth 8
Performance du GPU
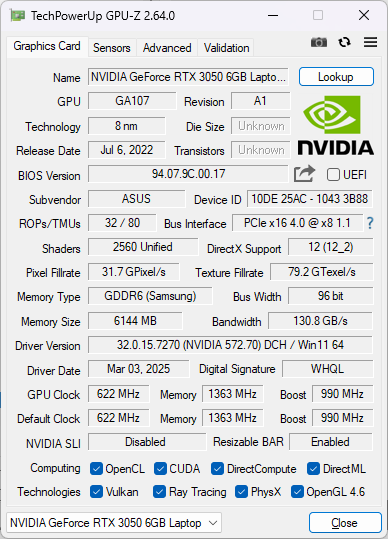
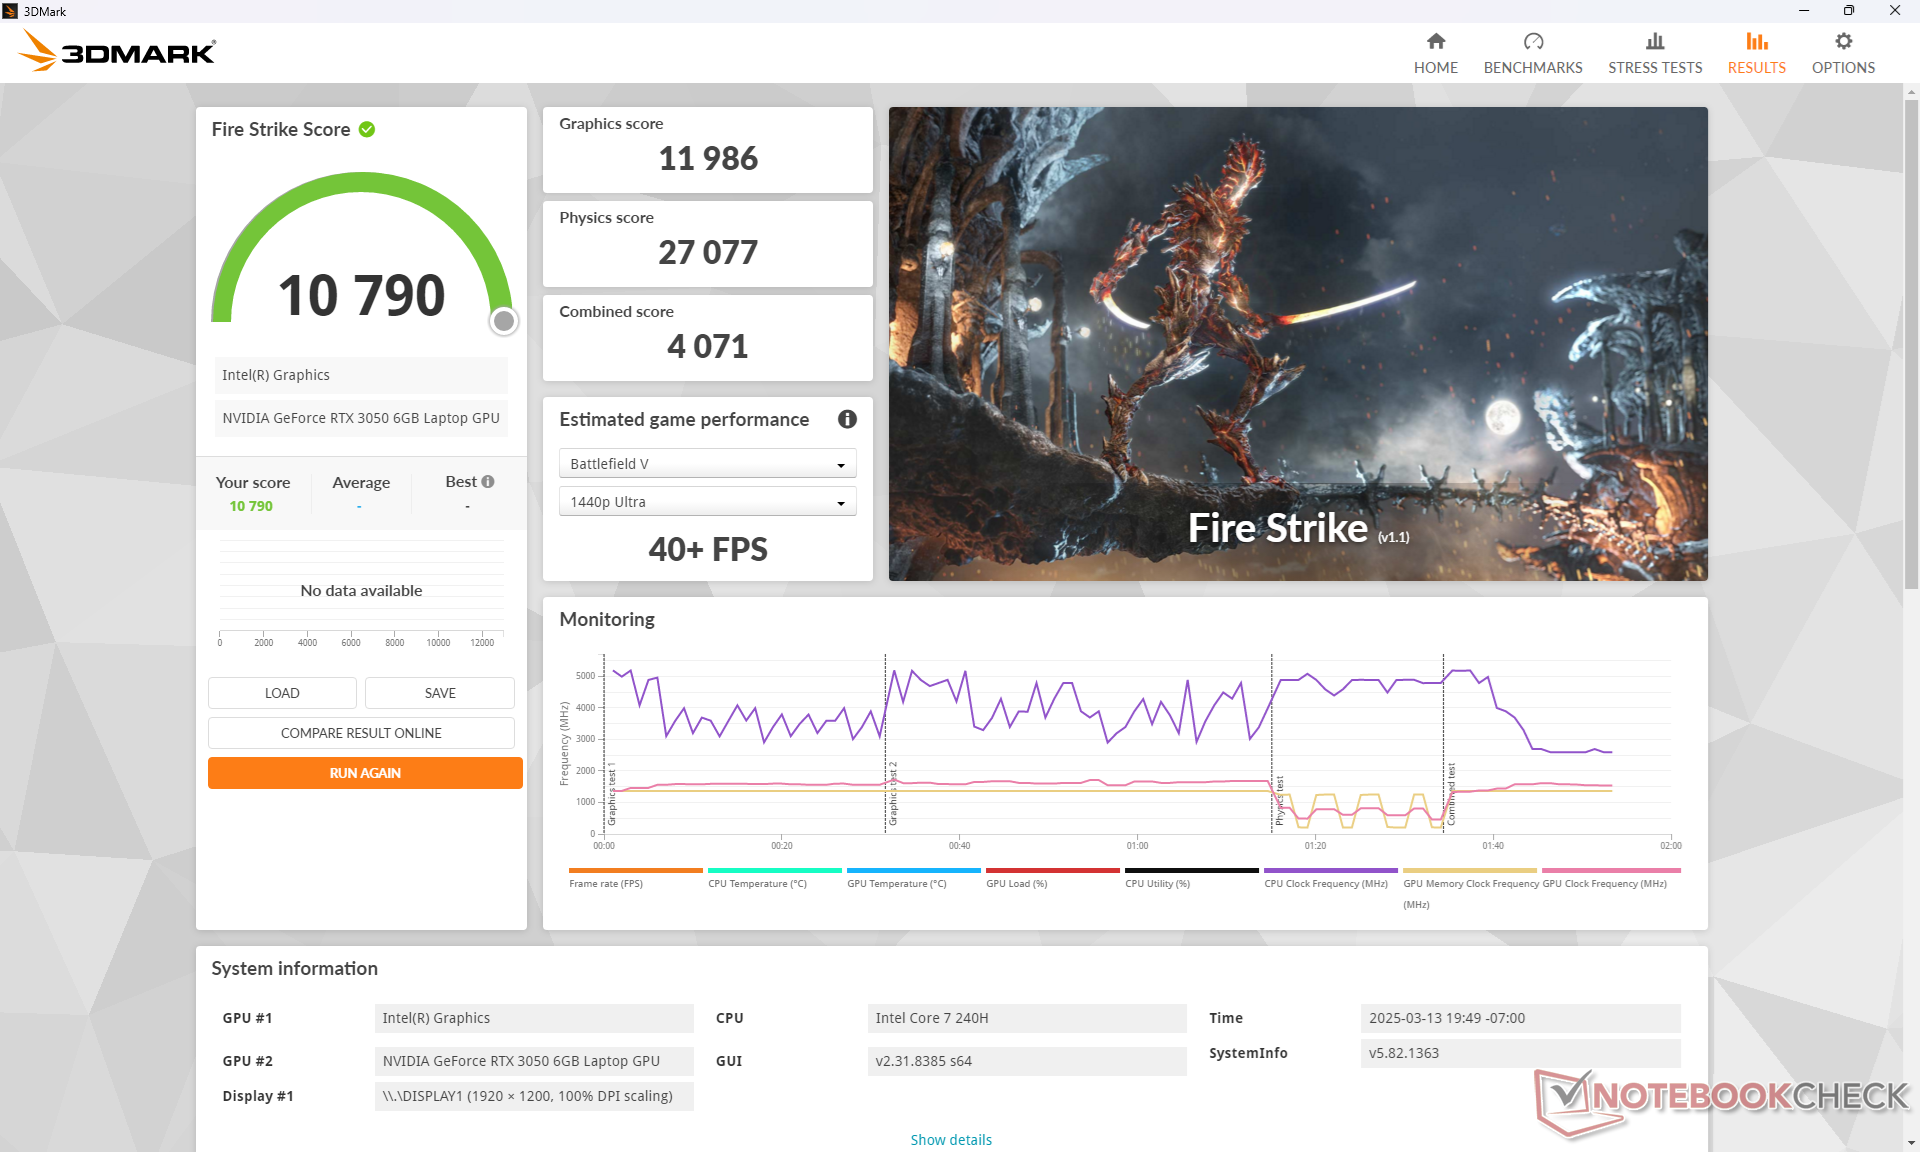
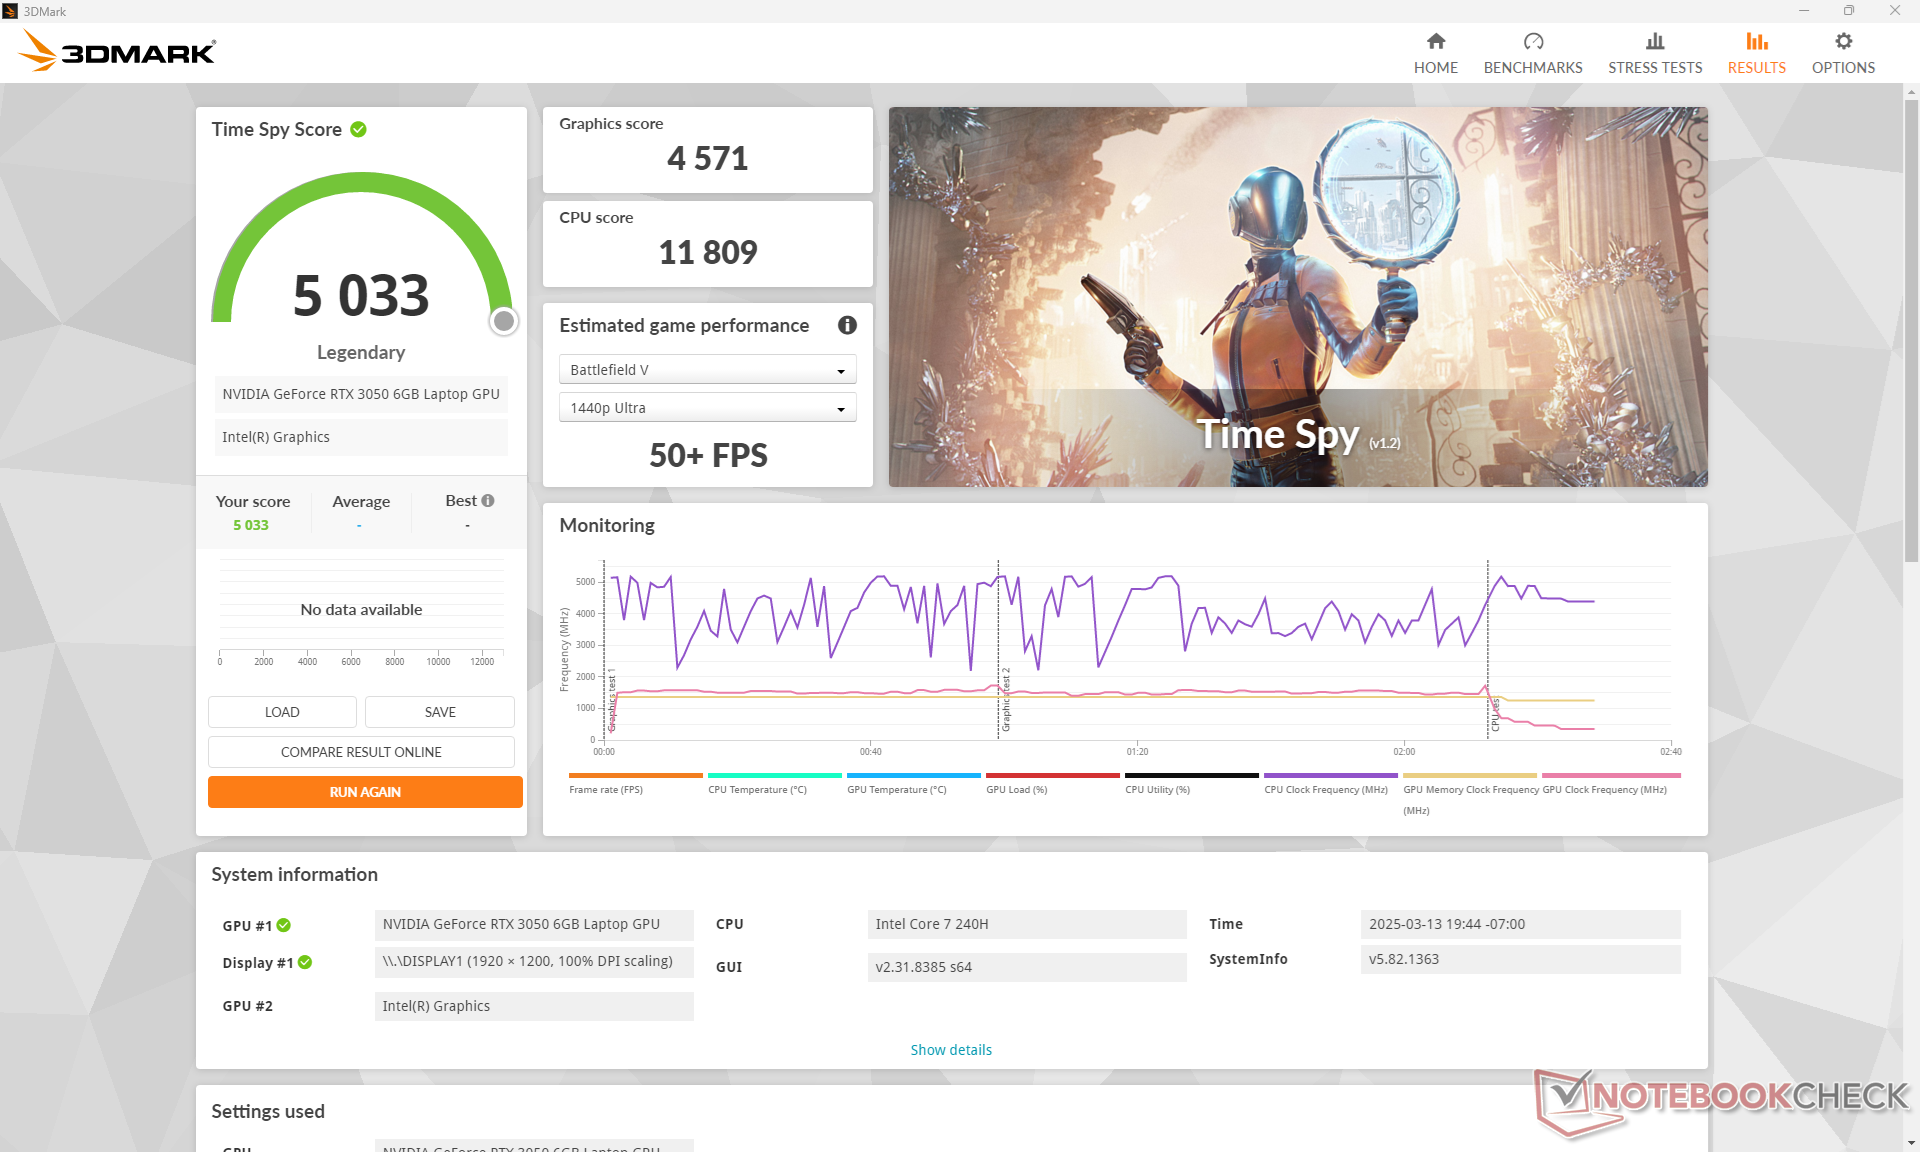
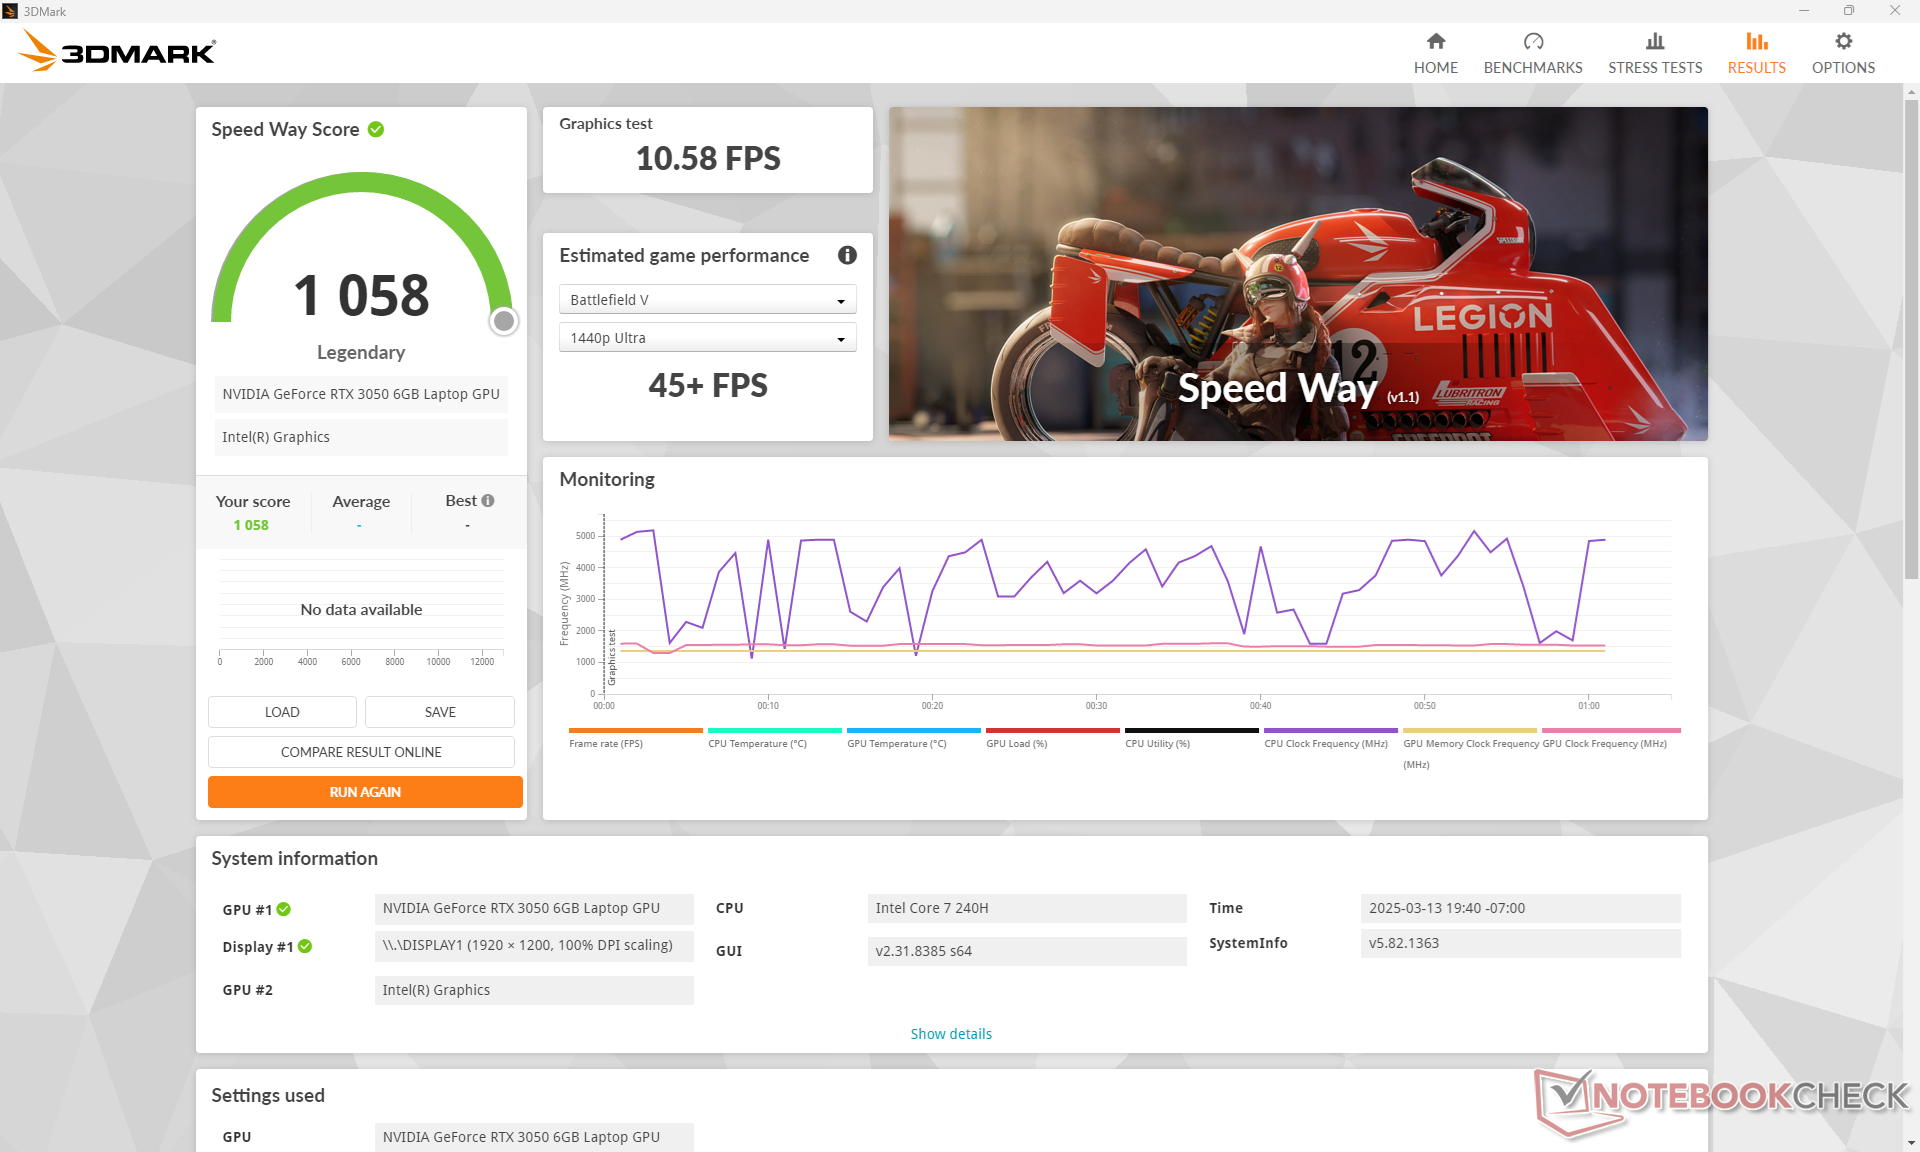
La GeForce RTX 3050 est environ 20 à 25 % plus rapide que la RTX 2050 ou 30 à 35 % plus lente que la RTX 4050. Notez que l'Asus est livrée avec la version 6 Go de la RTX 3050 au lieu de la version 4 Go version 4 Go.
| Profil de puissance | Score graphique | Score physique | Score combiné |
| Mode Performance | 11986 | 27077 | 4071 |
| Mode équilibré | 11317 (-6%) | 28246 (-0%) | 3842 (-6%) |
| Puissance de la batterie | 9900 (-17%) | 20557 (-24%) | 3573 (-12%) |
L'exécution en mode équilibré a un léger impact sur les performances graphiques, tandis que le mode batterie réduit encore davantage les performances, comme le montre notre tableau de résultats Fire Strike ci-dessus.
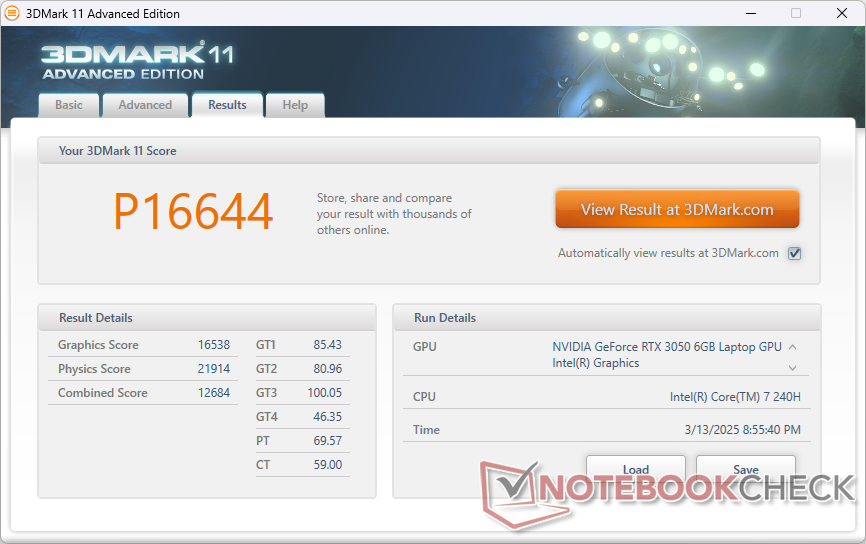
| 3DMark 11 Performance | 16644 points | |
| 3DMark Fire Strike Score | 10790 points | |
| 3DMark Time Spy Score | 5033 points | |
Aide | ||
* ... Moindre est la valeur, meilleures sont les performances
Performances des jeux
La RTX 3050 est peut-être un peu vieille, mais elle est encore assez puissante pour faire tourner des titres exigeants comme Cyberpunk 2077 à la résolution native de 1080p ou 1200p avec la plupart des paramètres sur High.
| F1 22 | |
| 1280x720 Ultra Low Preset AA:T AF:16x | |
| Lenovo ThinkPad Z16 Gen 2 | |
| Asus V16 V3607V | |
| Moyenne NVIDIA GeForce RTX 3050 6GB Laptop GPU (198 - 236, n=3) | |
| HP Spectre x360 16 RTX 4050 | |
| 1920x1080 Low Preset AA:T AF:16x | |
| HP Spectre x360 16 RTX 4050 | |
| Asus V16 V3607V | |
| Moyenne NVIDIA GeForce RTX 3050 6GB Laptop GPU (110.9 - 163.5, n=4) | |
| Lenovo ThinkPad Z16 Gen 2 | |
| 1920x1080 Medium Preset AA:T AF:16x | |
| HP Spectre x360 16 RTX 4050 | |
| Asus V16 V3607V | |
| Moyenne NVIDIA GeForce RTX 3050 6GB Laptop GPU (106.1 - 151.5, n=4) | |
| Lenovo ThinkPad Z16 Gen 2 | |
| 1920x1080 High Preset AA:T AF:16x | |
| HP Spectre x360 16 RTX 4050 | |
| Asus V16 V3607V | |
| Moyenne NVIDIA GeForce RTX 3050 6GB Laptop GPU (85.5 - 109.7, n=4) | |
| Lenovo ThinkPad Z16 Gen 2 | |
| 1920x1080 Ultra High Preset AA:T AF:16x | |
| HP Spectre x360 16 RTX 4050 | |
| Moyenne NVIDIA GeForce RTX 3050 6GB Laptop GPU (30.7 - 34, n=4) | |
| Asus V16 V3607V | |
| Lenovo ThinkPad Z16 Gen 2 | |
| Tiny Tina's Wonderlands | |
| 1280x720 Lowest Preset (DX12) | |
| Lenovo ThinkPad Z16 Gen 2 | |
| Asus V16 V3607V | |
| Moyenne NVIDIA GeForce RTX 3050 6GB Laptop GPU (n=1) | |
| 1920x1080 Low Preset (DX12) | |
| HP Spectre x360 16 RTX 4050 | |
| Lenovo ThinkPad Z16 Gen 2 | |
| Moyenne NVIDIA GeForce RTX 3050 6GB Laptop GPU (105.6 - 113.3, n=2) | |
| Asus V16 V3607V | |
| 1920x1080 Medium Preset (DX12) | |
| HP Spectre x360 16 RTX 4050 | |
| Lenovo ThinkPad Z16 Gen 2 | |
| Moyenne NVIDIA GeForce RTX 3050 6GB Laptop GPU (84.7 - 89.7, n=2) | |
| Asus V16 V3607V | |
| 1920x1080 High Preset (DX12) | |
| HP Spectre x360 16 RTX 4050 | |
| Lenovo ThinkPad Z16 Gen 2 | |
| Moyenne NVIDIA GeForce RTX 3050 6GB Laptop GPU (55.9 - 59.2, n=2) | |
| Asus V16 V3607V | |
| 1920x1080 Badass Preset (DX12) | |
| HP Spectre x360 16 RTX 4050 | |
| Moyenne NVIDIA GeForce RTX 3050 6GB Laptop GPU (44.3 - 46.4, n=2) | |
| Asus V16 V3607V | |
| Lenovo ThinkPad Z16 Gen 2 | |
Cyberpunk 2077 ultra FPS Chart
| Bas | Moyen | Élevé | Ultra | |
|---|---|---|---|---|
| GTA V (2015) | 184.2 | 178.4 | 127.3 | 63.2 |
| Dota 2 Reborn (2015) | 181.4 | 161.2 | 146.8 | 135.1 |
| Final Fantasy XV Benchmark (2018) | 126.5 | 67.6 | 49.1 | |
| X-Plane 11.11 (2018) | 96.3 | 89.3 | 78.6 | |
| Far Cry 5 (2018) | 149 | 85 | 78 | 74 |
| Strange Brigade (2018) | 246 | 106.9 | 88.4 | 77 |
| Tiny Tina's Wonderlands (2022) | 105.6 | 84.7 | 55.9 | 44.3 |
| F1 22 (2022) | 149.9 | 138.9 | 102 | 31.6 |
| Baldur's Gate 3 (2023) | 59.7 | 50.3 | 45.4 | 44.3 |
| Cyberpunk 2077 2.2 Phantom Liberty (2023) | 66.7 | 51.4 | 42.7 | 36.1 |
Émissions
Bruit du système
Le bruit du ventilateur est généralement silencieux en cas de faible charge, mais il augmente malheureusement assez rapidement lorsque des charges plus exigeantes sont introduites, par exemple lors du lancement d'applications. Le jeu en mode équilibré est légèrement plus silencieux qu'en mode performance (38,3 dB(A) contre 40,5 dB(A)), au prix d'une performance graphique légèrement plus lente, comme indiqué ci-dessus.
Degré de la nuisance sonore
| Au repos |
| 23.5 / 23.7 / 23.7 dB(A) |
| Fortement sollicité |
| 48 / 51 dB(A) |
 | ||
30 dB silencieux 40 dB(A) audible 50 dB(A) bruyant |
||
min: | ||
| Asus V16 V3607V GeForce RTX 3050 6GB Laptop GPU, Core 7 240H | Asus VivoBook Pro 16 K6602VU NVIDIA GeForce RTX 4050 Laptop GPU, i9-13900H, Micron 2400 MTFDKBA1T0QFM | Dell Inspiron 16 Plus 7640 NVIDIA GeForce RTX 4060 Laptop GPU, Ultra 7 155H, SK hynix BC901 HFS001TEJ4X164N | Lenovo ThinkBook 16 G7 IML Graphics 4-Core, Ultra 5 125U, SK hynix HFS512GEJ4X112N | HP Pavilion Plus 16-ab0456tx GeForce RTX 3050 6GB Laptop GPU, i7-13700H, WDC PC SN810 1TB | Acer Swift Edge 16 SFE16-44-R0XV Radeon 760M, R5 8640U, Micron 3400 MTFDKBA512TFH 512GB | |
|---|---|---|---|---|---|---|
| Noise | -4% | 5% | 18% | 9% | -13% | |
| arrêt / environnement * | 23.3 | 20.96 10% | 23.8 -2% | 23.1 1% | 22.22 5% | 25 -7% |
| Idle Minimum * | 23.5 | 25.28 -8% | 24.2 -3% | 23.1 2% | 22.22 5% | 26 -11% |
| Idle Average * | 23.7 | 25.28 -7% | 24.2 -2% | 23.1 3% | 22.22 6% | 29 -22% |
| Idle Maximum * | 23.7 | 25.28 -7% | 24.2 -2% | 23.1 3% | 22.22 6% | 39 -65% |
| Load Average * | 48 | 51.88 -8% | 28.9 40% | 23.2 52% | 42.03 12% | 45 6% |
| Cyberpunk 2077 ultra * | 40.5 | 29.2 28% | 43 -6% | |||
| Load Maximum * | 51 | 51.8 -2% | 51 -0% | 32.6 36% | 42.1 17% | 45 12% |
| Witcher 3 ultra * | 49 | 51 | 42.1 |
* ... Moindre est la valeur, meilleures sont les performances
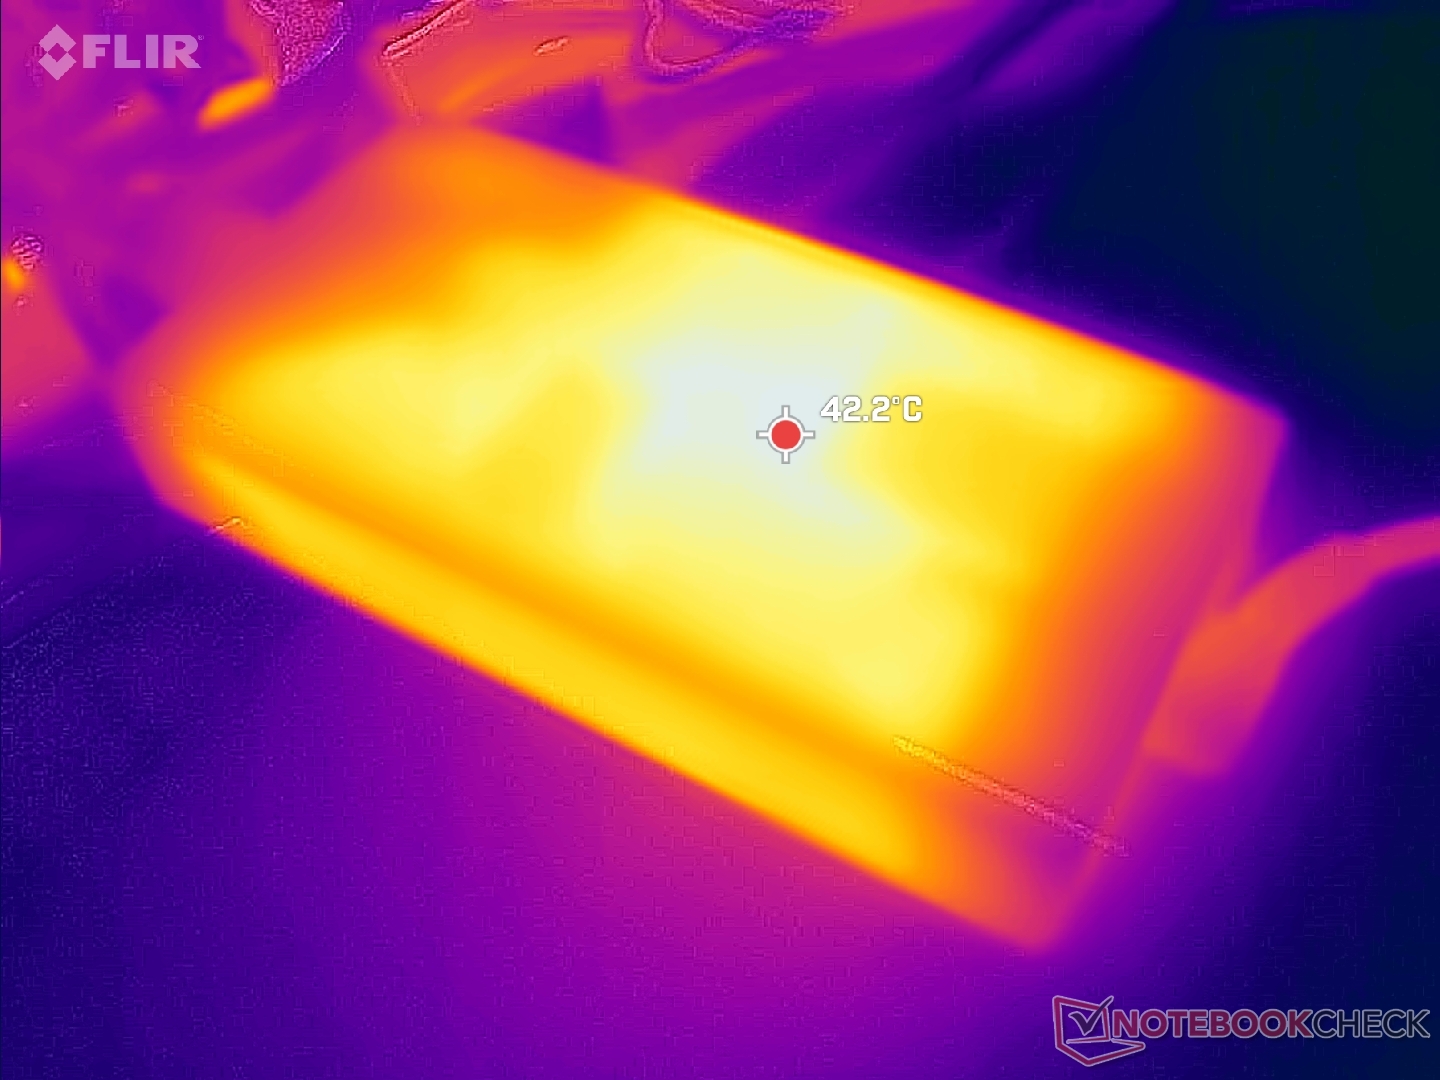
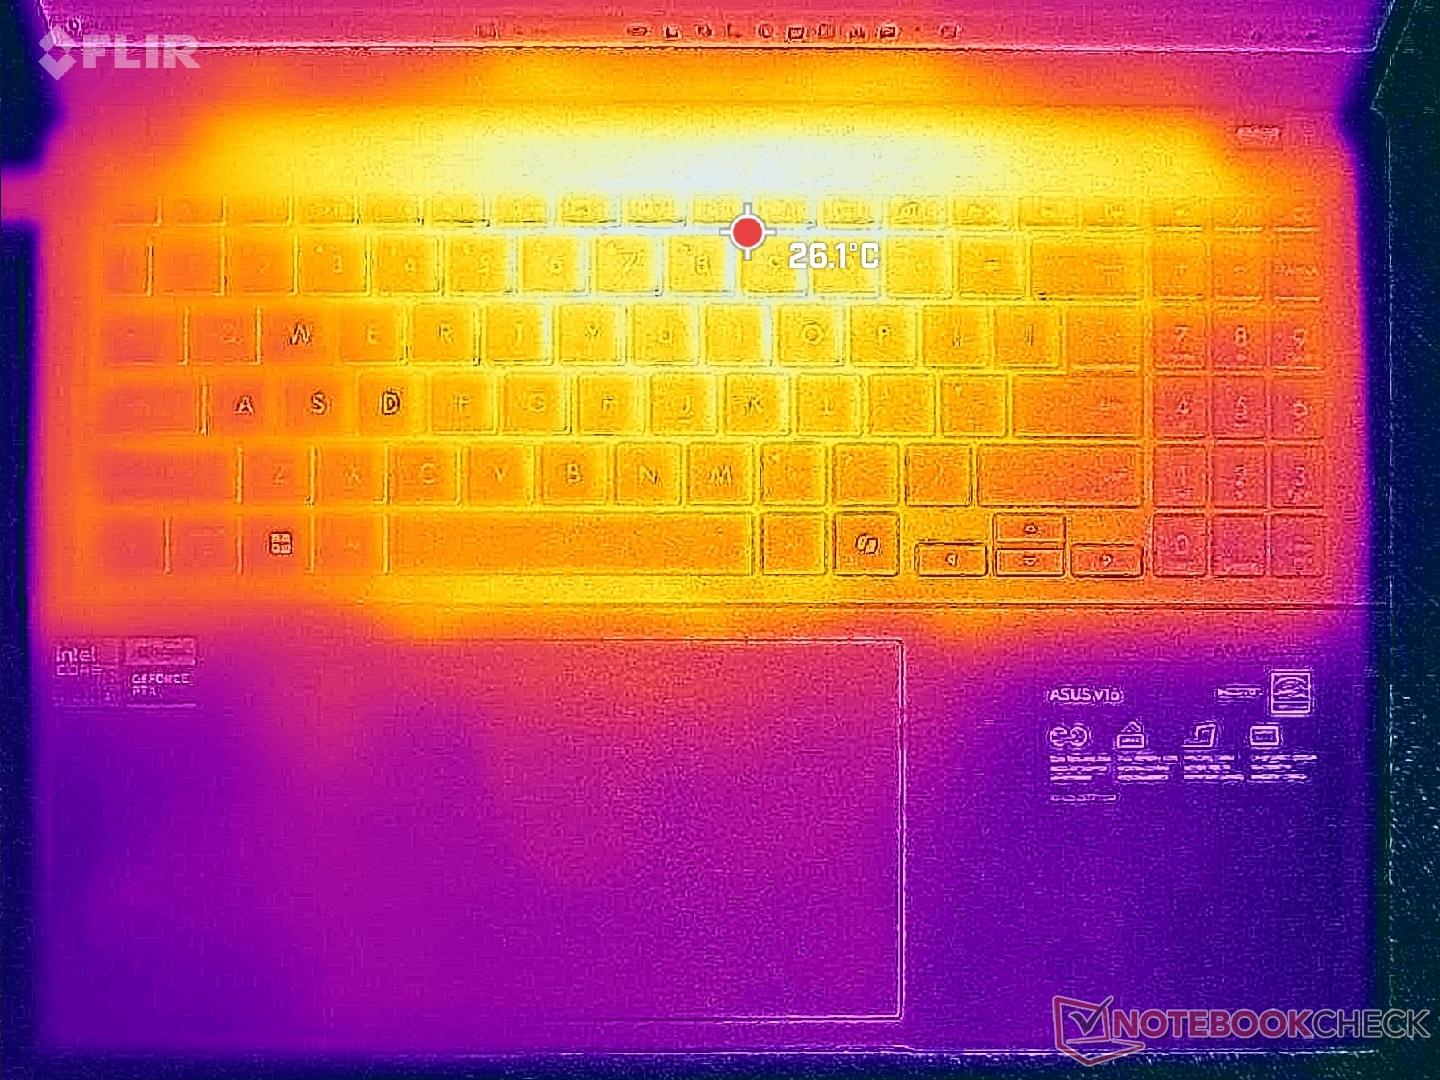
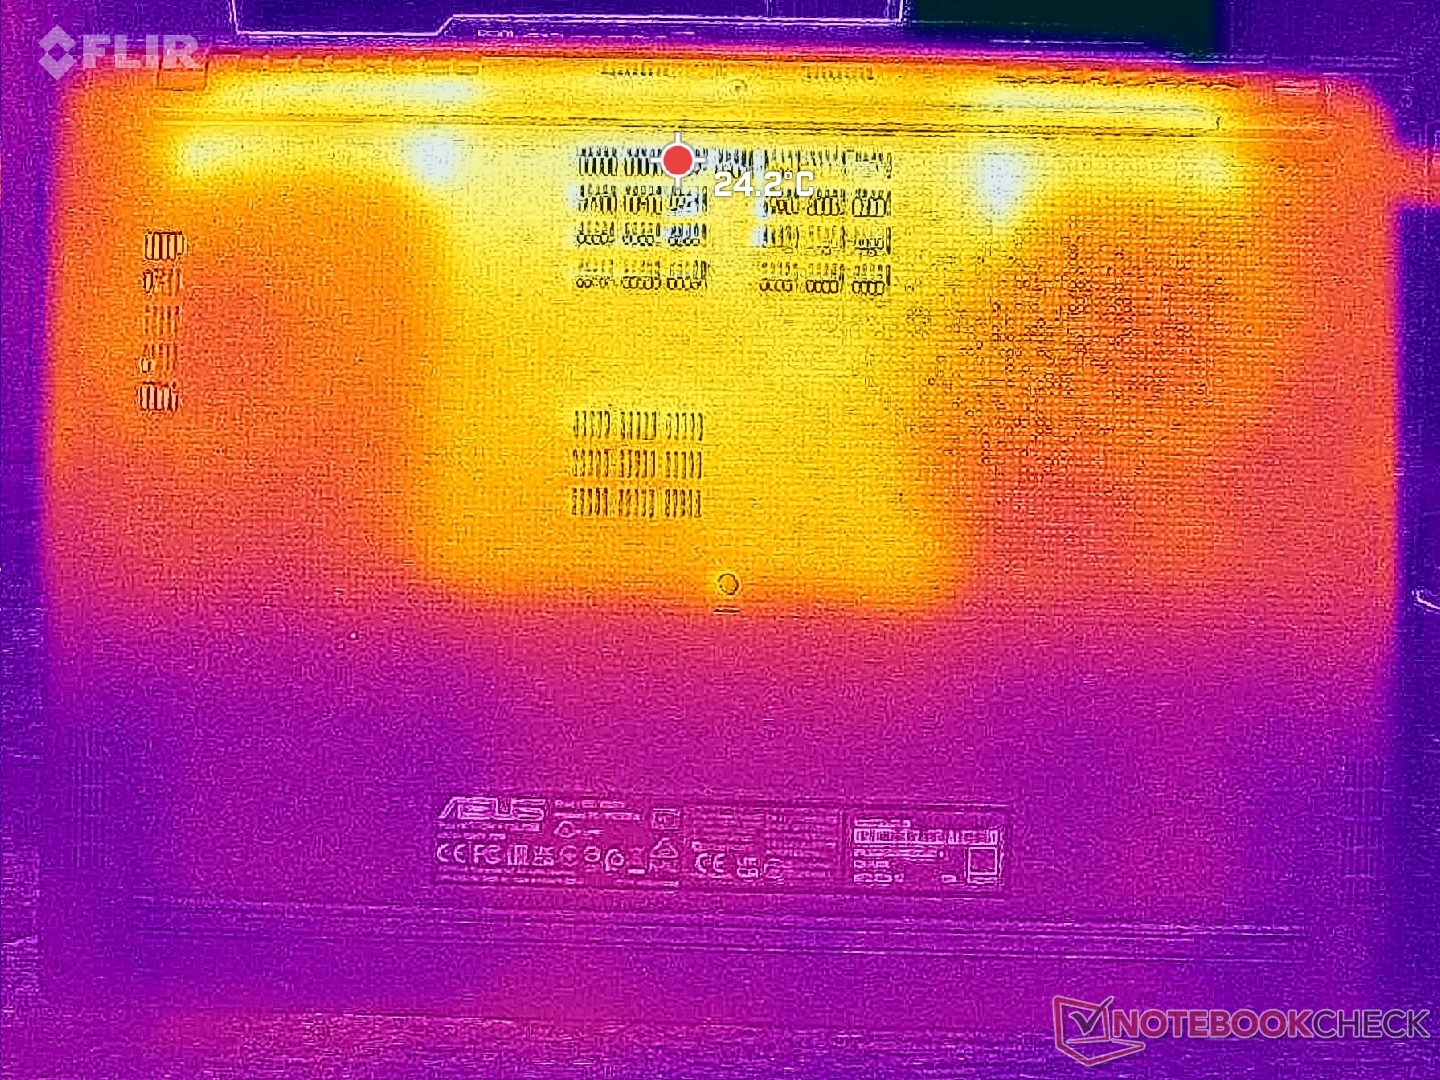
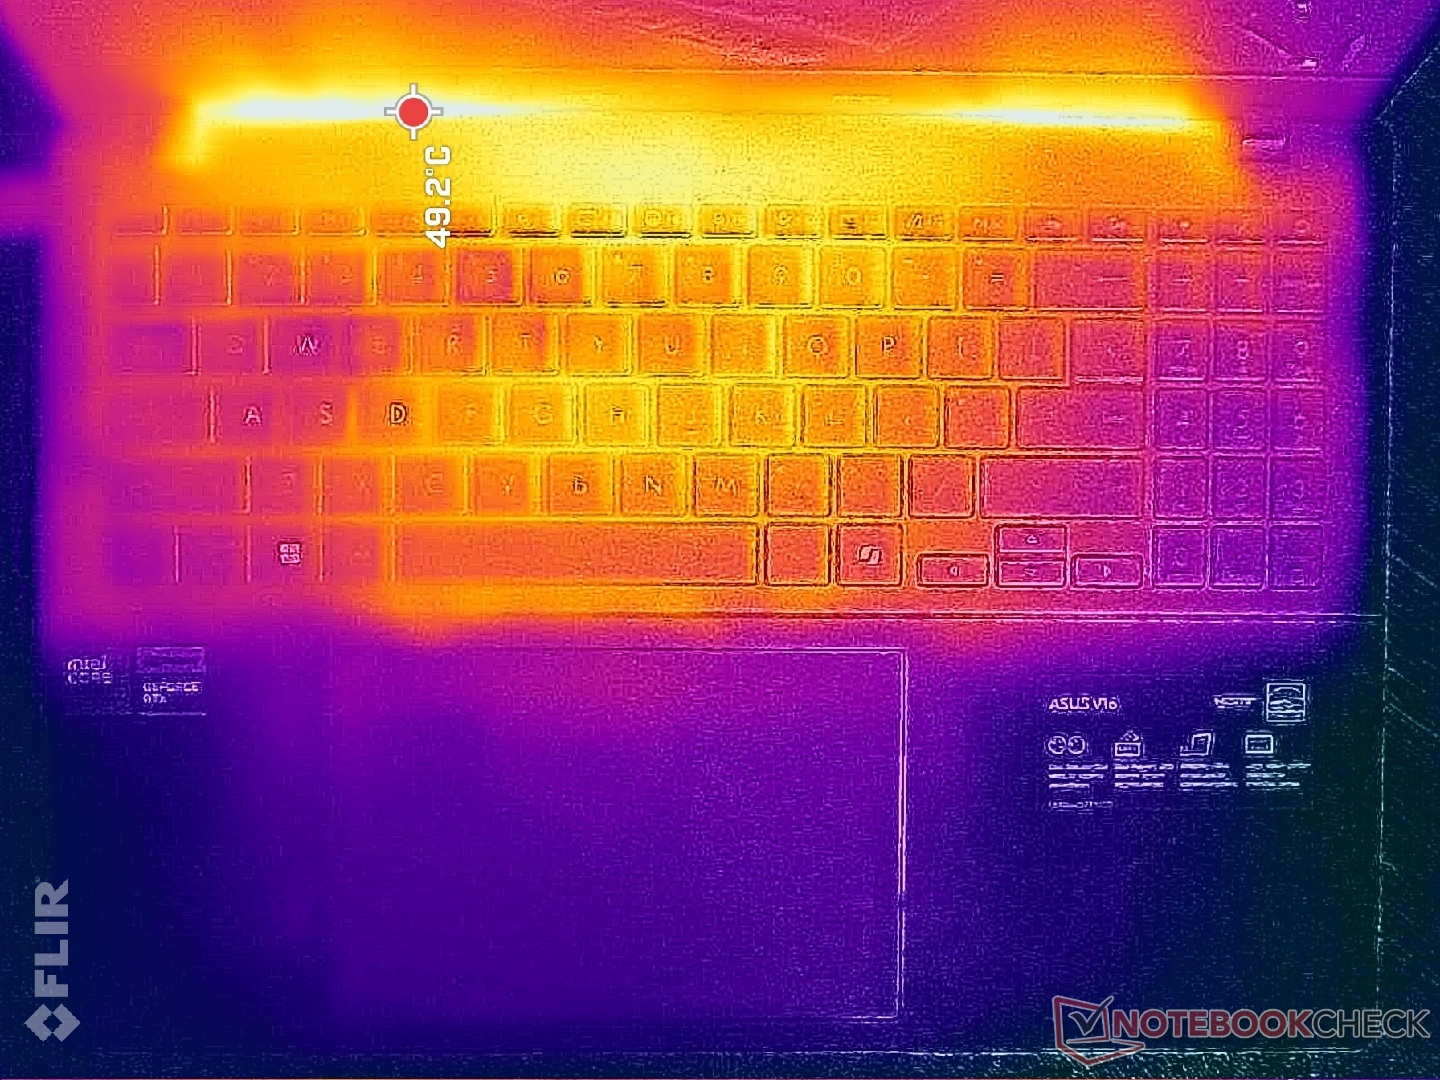
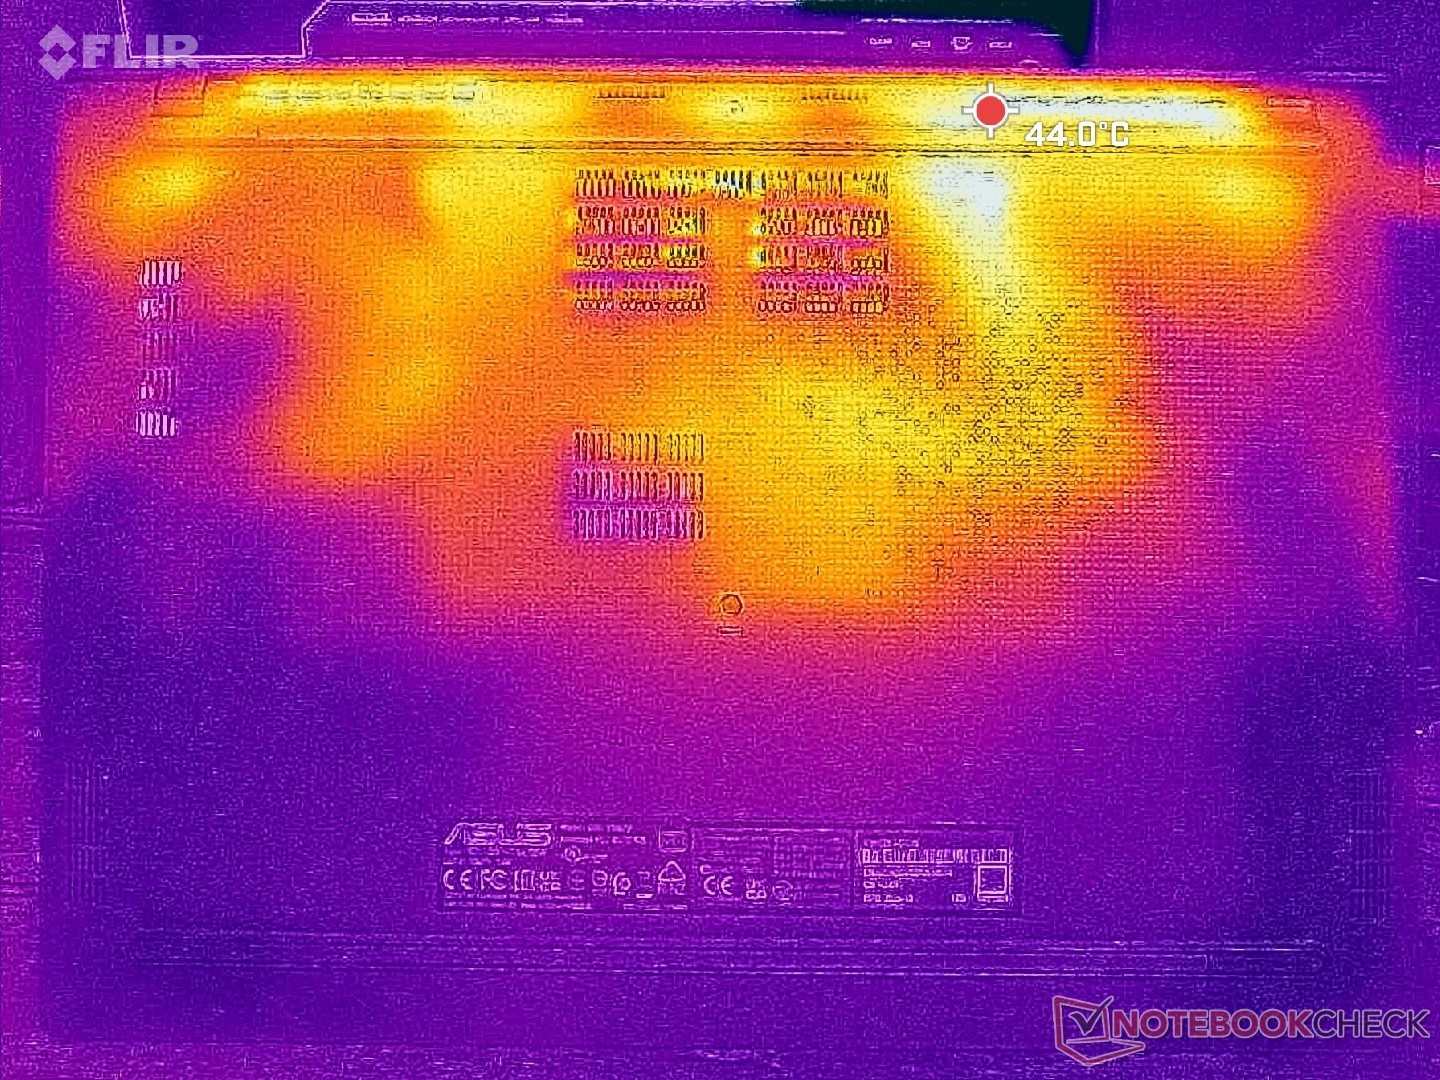
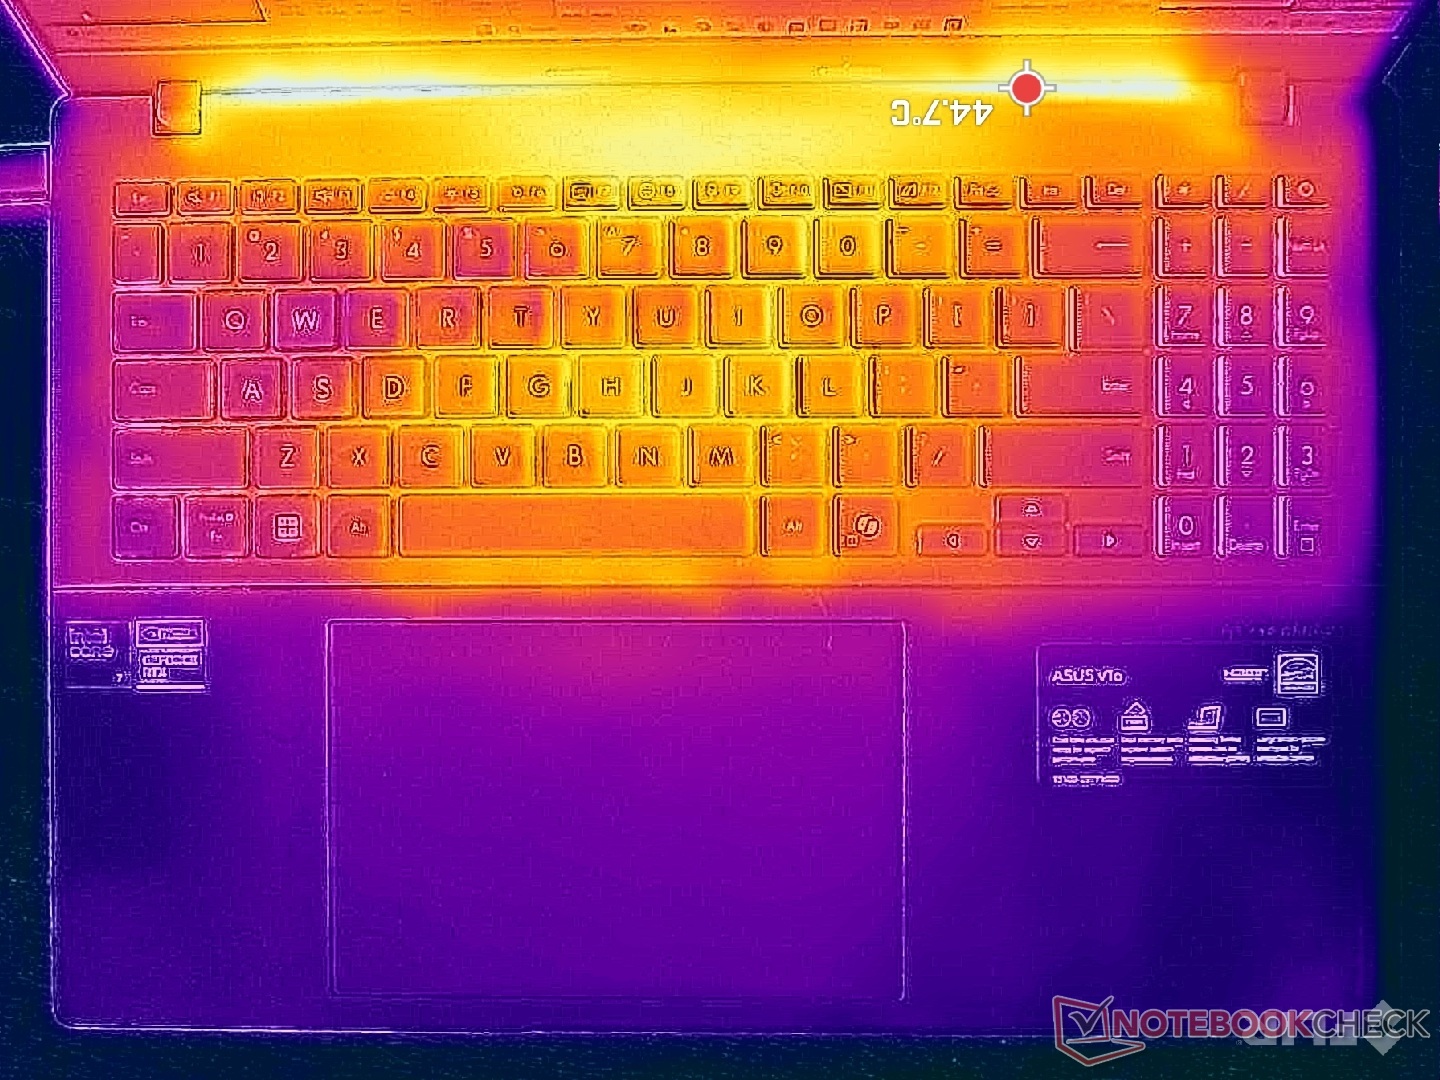
Température
Les points chauds se situent à l'arrière, où ils peuvent atteindre plus de 40°C, comme le montrent les cartes de température ci-dessous. Les appuis palmaires, le pavé numérique et les touches WASD resteraient moins chauds pour la saisie ou les jeux.
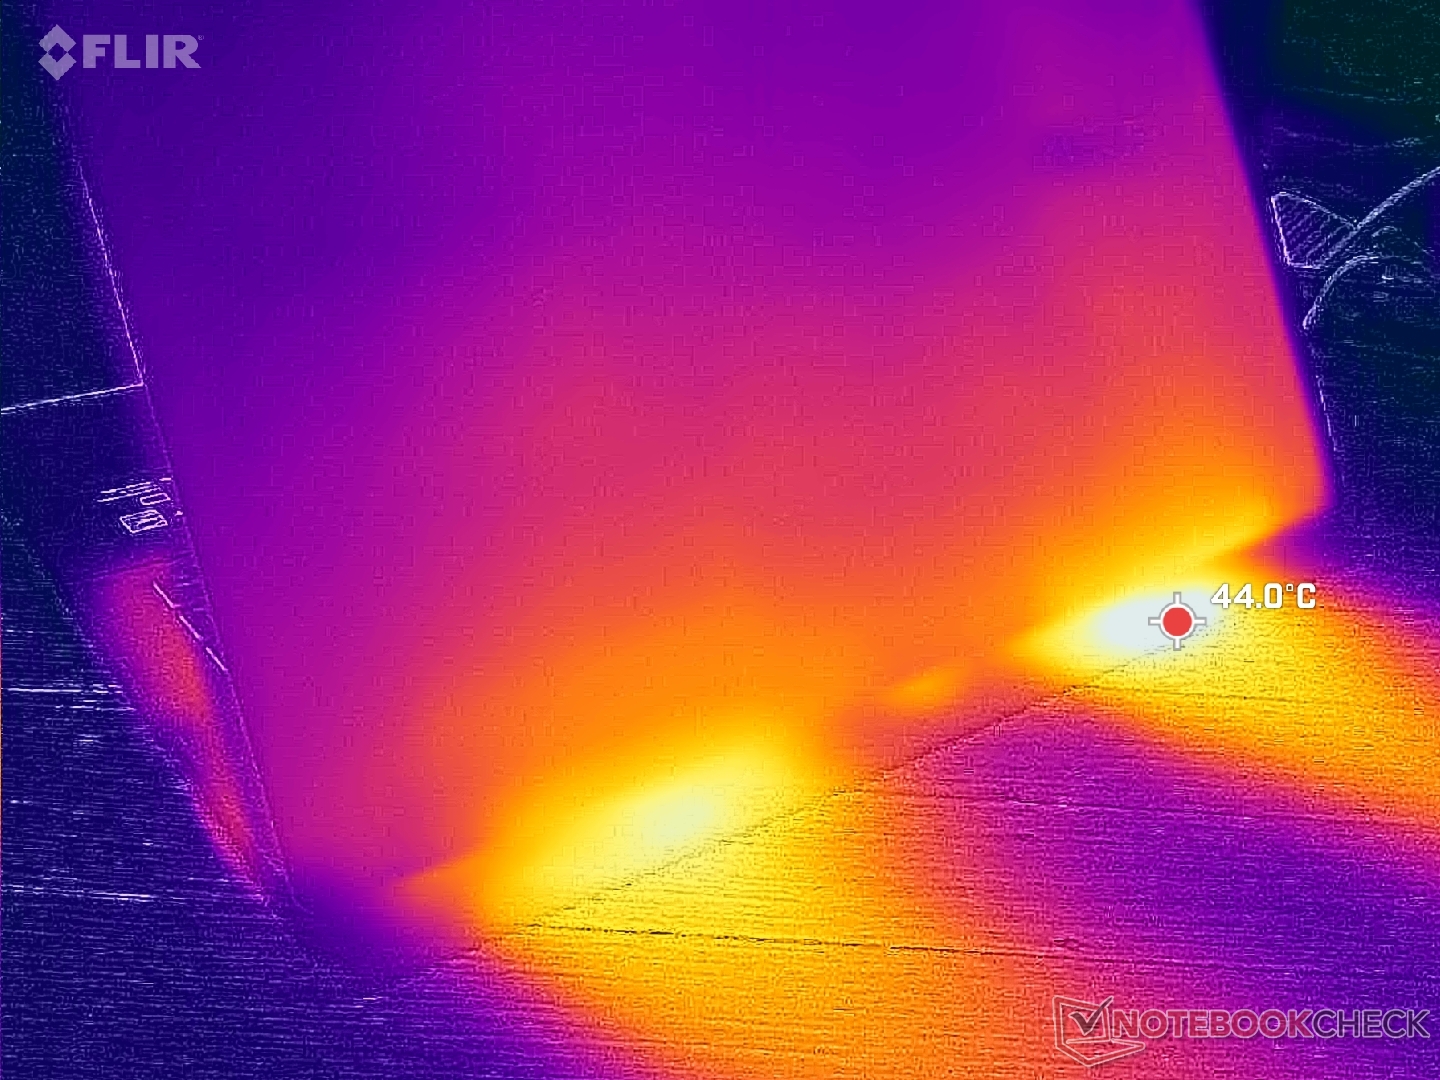
(±) La température maximale du côté supérieur est de 41.2 °C / 106 F, par rapport à la moyenne de 36.9 °C / 98 F, allant de 21.1 à 71 °C pour la classe Multimedia.
(+) Le fond chauffe jusqu'à un maximum de 34.4 °C / 94 F, contre une moyenne de 39.2 °C / 103 F
(+) En utilisation inactive, la température moyenne du côté supérieur est de 24.6 °C / 76 F, par rapport à la moyenne du dispositif de 31.3 °C / 88 F.
(+) 3: The average temperature for the upper side is 31.2 °C / 88 F, compared to the average of 31.3 °C / 88 F for the class Multimedia.
(+) Les repose-poignets et le pavé tactile sont plus froids que la température de la peau avec un maximum de 21.8 °C / 71.2 F et sont donc froids au toucher.
(+) La température moyenne de la zone de l'appui-paume de dispositifs similaires était de 28.8 °C / 83.8 F (+7 °C / #12.6 F).

| Asus V16 V3607V Intel Core 7 240H, NVIDIA GeForce RTX 3050 6GB Laptop GPU | Asus VivoBook Pro 16 K6602VU Intel Core i9-13900H, NVIDIA GeForce RTX 4050 Laptop GPU | Dell Inspiron 16 Plus 7640 Intel Core Ultra 7 155H, NVIDIA GeForce RTX 4060 Laptop GPU | Lenovo ThinkBook 16 G7 IML Intel Core Ultra 5 125U, Intel Graphics 4-Core iGPU (Arc) | HP Pavilion Plus 16-ab0456tx Intel Core i7-13700H, NVIDIA GeForce RTX 3050 6GB Laptop GPU | Acer Swift Edge 16 SFE16-44-R0XV AMD Ryzen 5 8640U, AMD Radeon 760M | |
|---|---|---|---|---|---|---|
| Heat | -30% | -13% | 7% | -28% | -24% | |
| Maximum Upper Side * | 41.2 | 42.6 -3% | 43.4 -5% | 33.2 19% | 49.6 -20% | 48 -17% |
| Maximum Bottom * | 34.4 | 48.4 -41% | 41.6 -21% | 41.2 -20% | 45.8 -33% | 60 -74% |
| Idle Upper Side * | 28.8 | 39.4 -37% | 32.8 -14% | 23.4 19% | 39.2 -36% | 28 3% |
| Idle Bottom * | 29 | 39.8 -37% | 32.4 -12% | 26.6 8% | 35.4 -22% | 31 -7% |
* ... Moindre est la valeur, meilleures sont les performances
Intervenants
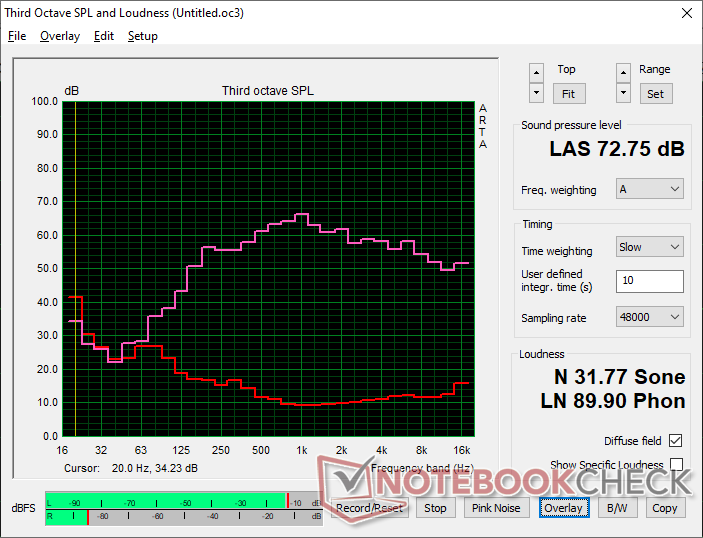
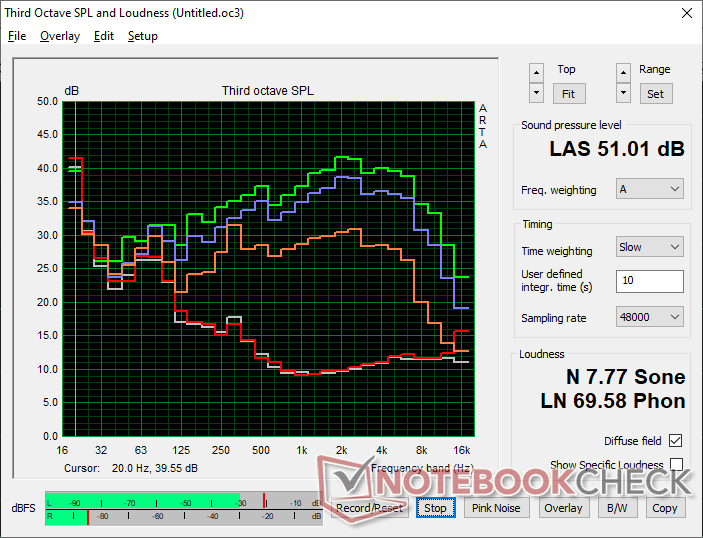
Asus V16 V3607V analyse audio
(±) | le niveau sonore du haut-parleur est moyen mais bon (72.8# dB)
Basses 100 - 315 Hz
(±) | basse réduite - en moyenne 7.7% inférieure à la médiane
(±) | la linéarité des basses est moyenne (7.8% delta à la fréquence précédente)
Médiums 400 - 2000 Hz
(+) | médiane équilibrée - seulement 4.7% de la médiane
(+) | les médiums sont linéaires (4.8% delta à la fréquence précédente)
Aiguës 2 - 16 kHz
(+) | des sommets équilibrés - à seulement 1.9% de la médiane
(+) | les aigus sont linéaires (5.3% delta à la fréquence précédente)
Globalement 100 - 16 000 Hz
(+) | le son global est linéaire (13.2% différence à la médiane)
Par rapport à la même classe
» 23% de tous les appareils testés de cette catégorie étaient meilleurs, 5% similaires, 72% pires
» Le meilleur avait un delta de 5%, la moyenne était de 18%, le pire était de 45%.
Par rapport à tous les appareils testés
» 12% de tous les appareils testés étaient meilleurs, 3% similaires, 86% pires
» Le meilleur avait un delta de 4%, la moyenne était de 24%, le pire était de 134%.
Apple MacBook Pro 16 2021 M1 Pro analyse audio
(+) | les haut-parleurs peuvent jouer relativement fort (84.7# dB)
Basses 100 - 315 Hz
(+) | bonne basse - seulement 3.8% loin de la médiane
(+) | les basses sont linéaires (5.2% delta à la fréquence précédente)
Médiums 400 - 2000 Hz
(+) | médiane équilibrée - seulement 1.3% de la médiane
(+) | les médiums sont linéaires (2.1% delta à la fréquence précédente)
Aiguës 2 - 16 kHz
(+) | des sommets équilibrés - à seulement 1.9% de la médiane
(+) | les aigus sont linéaires (2.7% delta à la fréquence précédente)
Globalement 100 - 16 000 Hz
(+) | le son global est linéaire (4.6% différence à la médiane)
Par rapport à la même classe
» 0% de tous les appareils testés de cette catégorie étaient meilleurs, 0% similaires, 100% pires
» Le meilleur avait un delta de 5%, la moyenne était de 18%, le pire était de 45%.
Par rapport à tous les appareils testés
» 0% de tous les appareils testés étaient meilleurs, 0% similaires, 100% pires
» Le meilleur avait un delta de 4%, la moyenne était de 24%, le pire était de 134%.
Gestion de l'énergie
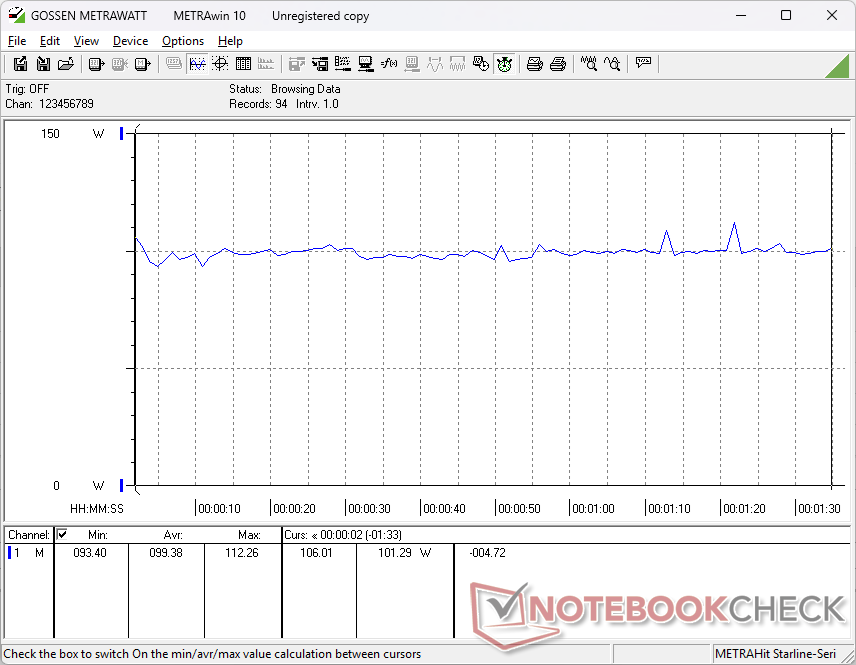
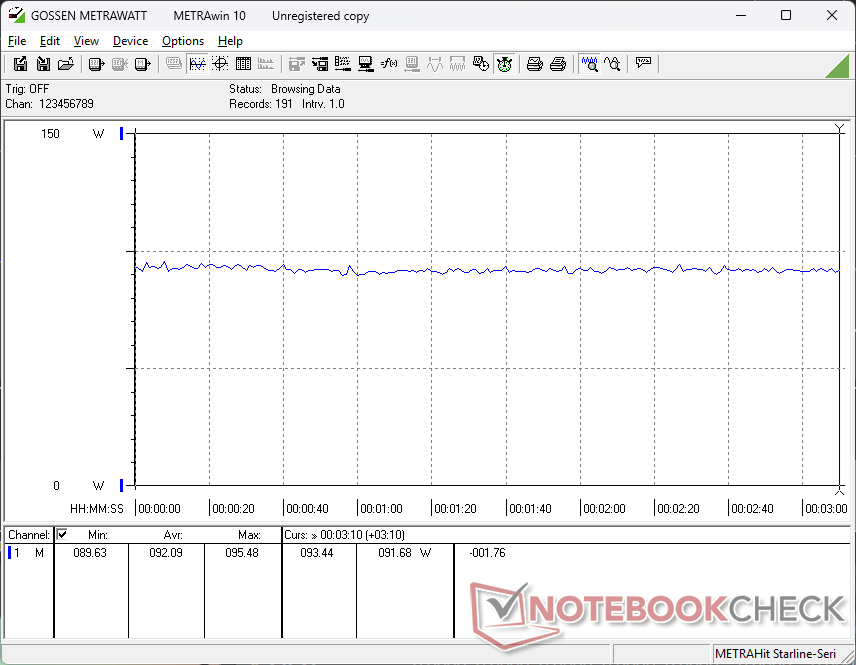
Consommation électrique
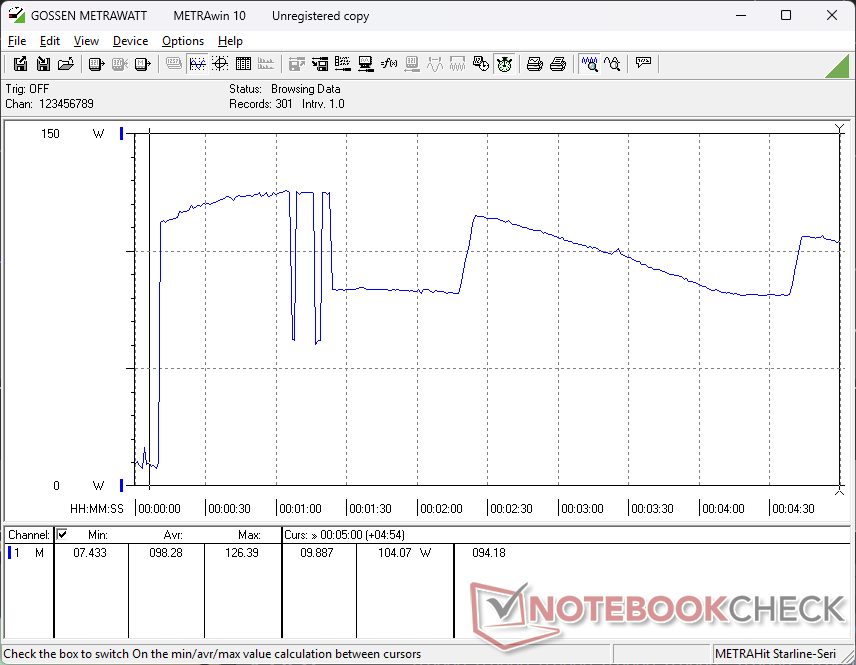
La consommation peut varier de 2 W lorsque le dGPU est désactivé à 11 W lorsque le dGPU est activé et que la luminosité est maximale. La consommation fluctue énormément lors de l'exécution du stress Prime95 en raison du comportement d'étranglement des performances mentionné ci-dessus.
| Éteint/en veille | |
| Au repos | |
| Fortement sollicité |
|
Légende:
min: | |
| Asus V16 V3607V Core 7 240H, GeForce RTX 3050 6GB Laptop GPU, , IPS, 1920x1200, 16" | Asus VivoBook Pro 16 K6602VU i9-13900H, NVIDIA GeForce RTX 4050 Laptop GPU, Micron 2400 MTFDKBA1T0QFM, OLED, 3200x2000, 16" | Dell Inspiron 16 Plus 7640 Ultra 7 155H, NVIDIA GeForce RTX 4060 Laptop GPU, SK hynix BC901 HFS001TEJ4X164N, IPS, 2560x1600, 16" | Lenovo ThinkBook 16 G7 IML Ultra 5 125U, Graphics 4-Core, SK hynix HFS512GEJ4X112N, IPS, 1920x1200, 16" | HP Pavilion Plus 16-ab0456tx i7-13700H, GeForce RTX 3050 6GB Laptop GPU, WDC PC SN810 1TB, IPS, 2560x1600, 16" | Acer Swift Edge 16 SFE16-44-R0XV R5 8640U, Radeon 760M, Micron 3400 MTFDKBA512TFH 512GB, OLED, 3200x2000, 16" | |
|---|---|---|---|---|---|---|
| Power Consumption | -247% | -22% | 18% | -13% | -19% | |
| Idle Minimum * | 2.1 | 21.06 -903% | 4.2 -100% | 4.3 -105% | 3.3 -57% | 8 -281% |
| Idle Average * | 7.2 | 24.27 -237% | 6.9 4% | 8.9 -24% | 7.3 -1% | 10 -39% |
| Idle Maximum * | 10.7 | 25.12 -135% | 15.2 -42% | 9.1 15% | 14.24 -33% | 15 -40% |
| Load Average * | 99.4 | 52.4 47% | 70.4 29% | 31.7 68% | 91.7 8% | 42 58% |
| Cyberpunk 2077 ultra external monitor * | 88.7 | 35.2 60% | 42.8 52% | |||
| Cyberpunk 2077 ultra * | 92.1 | 39.4 57% | 44.4 52% | |||
| Load Maximum * | 137.8 | 146 -6% | 137.4 -0% | 66.7 52% | 115.8 16% | 49 64% |
| Witcher 3 ultra * | 110.2 | 115.9 | 96.2 |
* ... Moindre est la valeur, meilleures sont les performances
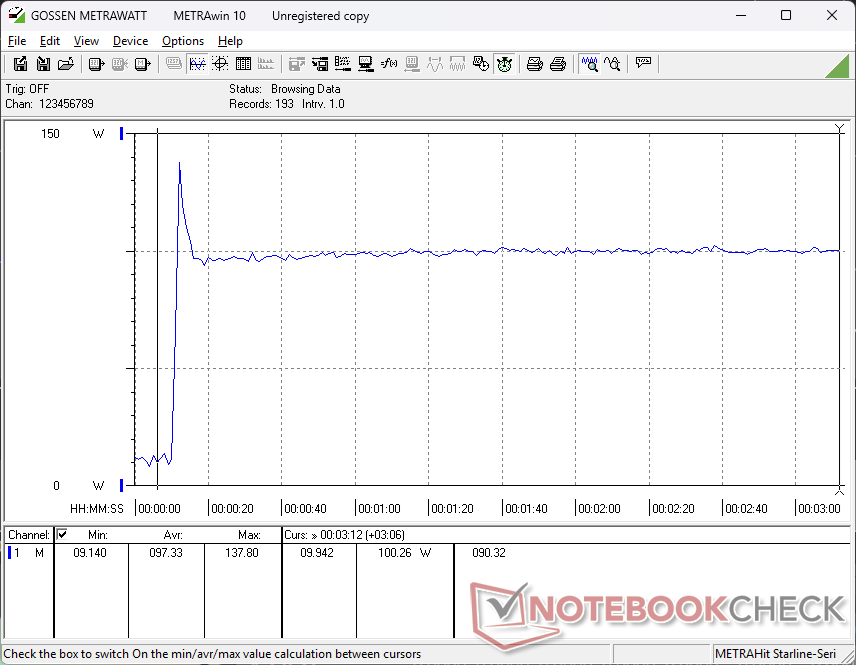
Power Consumption Cyberpunk / Stress Test
Power Consumption external Monitor
Autonomie de la batterie
L'autonomie du réseau local sans fil est respectable, avec près de 9 heures de navigation dans le monde réel, malgré la taille moyenne de la batterie de 63 Wh. Le test a été réalisé avec le dGPU inactif et en mode Eco/Balanced.
| Asus V16 V3607V Core 7 240H, GeForce RTX 3050 6GB Laptop GPU, 63 Wh | Asus VivoBook Pro 16 K6602VU i9-13900H, NVIDIA GeForce RTX 4050 Laptop GPU, 96 Wh | Dell Inspiron 16 Plus 7640 Ultra 7 155H, NVIDIA GeForce RTX 4060 Laptop GPU, 90 Wh | Lenovo ThinkBook 16 G7 IML Ultra 5 125U, Graphics 4-Core, 45 Wh | HP Pavilion Plus 16-ab0456tx i7-13700H, GeForce RTX 3050 6GB Laptop GPU, 68 Wh | Acer Swift Edge 16 SFE16-44-R0XV R5 8640U, Radeon 760M, 54 Wh | |
|---|---|---|---|---|---|---|
| Autonomie de la batterie | 12% | 48% | -2% | 16% | -46% | |
| WiFi v1.3 | 539 | 606 12% | 799 48% | 528 -2% | 624 16% | 290 -46% |
| H.264 | 585 | 720 | ||||
| Reader / Idle | 1150 | |||||
| Load | 79 |
Notebookcheck Rating
Asus V16 V3607V
- 03/19/2025 v8
Allen Ngo
 Total Sustainability Score:
 Potential Competitors in Comparison
Image | Modèle | Prix | Poids | Épaisseur | Écran |
|---|---|---|---|---|---|
1. 78.5%  | Asus V16 V3607V Intel Core 7 240H ⎘ NVIDIA GeForce RTX 3050 6GB Laptop GPU ⎘ 16 Go Mémoire | Prix de liste: 900 USD | 2 kg | 22 mm | 16.00" 1920x1200 142 PPI IPS |
2. 87.6% v7 (old)  | Asus VivoBook Pro 16 K6602VU Intel Core i9-13900H ⎘ NVIDIA GeForce RTX 4050 Laptop GPU ⎘ 16 Go Mémoire, 1024 Go SSD | Amazon: 1. $41.99 JUYOON 20V 7.5A Charger for ... 2. $2,199.99 ASUS Vivobook Pro 16X Laptop... 3. $39.99 150W 4.5mm Tip AC Charger fo... Prix de liste: 2199 EUR | 1.9 kg | 19 mm | 16.00" 3200x2000 236 PPI OLED |
3. 83.4%  | Dell Inspiron 16 Plus 7640 Intel Core Ultra 7 155H ⎘ NVIDIA GeForce RTX 4060 Laptop GPU ⎘ 16 Go Mémoire, 1024 Go SSD | Amazon: $1,299.99 Prix de liste: 1300 USD | 2.2 kg | 19.9 mm | 16.00" 2560x1600 189 PPI IPS |
4. 83%  | Lenovo ThinkBook 16 G7 IML Intel Core Ultra 5 125U ⎘ Intel Graphics 4-Core iGPU (Arc) ⎘ 16 Go Mémoire, 512 Go SSD | Amazon: $772.20 Prix de liste: 750 USD | 1.8 kg | 17.5 mm | 16.00" 1920x1200 142 PPI IPS |
5. 88.7% v7 (old)  | HP Pavilion Plus 16-ab0456tx Intel Core i7-13700H ⎘ NVIDIA GeForce RTX 3050 6GB Laptop GPU ⎘ 16 Go Mémoire, 1024 Go SSD | Amazon: 1. $1,089.99 HP Pavilion Plus 16 inch Lap... 2. $29.99 200W 150W 135W AC Charger Fo... 3. $50.99 Power4Laptops 5 Volt Version... Prix de liste: 1350 USD | 1.9 kg | 19.9 mm | 16.00" 2560x1600 189 PPI IPS |
6. 81.3%  | Acer Swift Edge 16 SFE16-44-R0XV AMD Ryzen 5 8640U ⎘ AMD Radeon 760M ⎘ 16 Go Mémoire, 512 Go SSD | Amazon: 1. $219.89 HOULISE Replacement for Acer... Prix de liste: 1000 EUR | 1.2 kg | 13 mm | 16.00" 3200x2000 236 PPI OLED |
Transparency
La sélection des appareils à examiner est effectuée par notre équipe éditoriale. L'échantillon de test a été prêté à l'auteur par le fabricant ou le détaillant pour les besoins de cet examen. Le prêteur n'a pas eu d'influence sur cette évaluation et le fabricant n'a pas reçu de copie de cette évaluation avant sa publication. Il n'y avait aucune obligation de publier cet article. Nous n'acceptons jamais de compensation ou de paiement en échange de nos commentaires. En tant que média indépendant, Notebookcheck n'est pas soumis à l'autorité des fabricants, des détaillants ou des éditeurs.
Voici comment Notebookcheck teste
Chaque année, Notebookcheck examine de manière indépendante des centaines d'ordinateurs portables et de smartphones en utilisant des procédures standardisées afin de garantir que tous les résultats sont comparables. Nous avons continuellement développé nos méthodes de test depuis environ 20 ans et avons établi des normes industrielles dans le processus. Dans nos laboratoires de test, des équipements de mesure de haute qualité sont utilisés par des techniciens et des rédacteurs expérimentés. Ces tests impliquent un processus de validation en plusieurs étapes. Notre système d'évaluation complexe repose sur des centaines de mesures et de points de référence bien fondés, ce qui garantit l'objectivité.
