Notebookcheck Logo

Test du Lenovo Yoga 7 2-en-1 16IML9 : les débuts du Core Ultra 5 125U dans ce convertible

Silence, autonomie et efficacité en hausse Comparé à l'ancien Core i7-1255U, le nouveau Core Ultra 5 125U n'offre pas grand-chose en termes de performances globales. En revanche, l'efficacité énergétique est nettement améliorée grâce au bruit du ventilateur et à la durée de vie de la batterie.
2024 Lenovo Yoga 7 2-en-1 16IML9

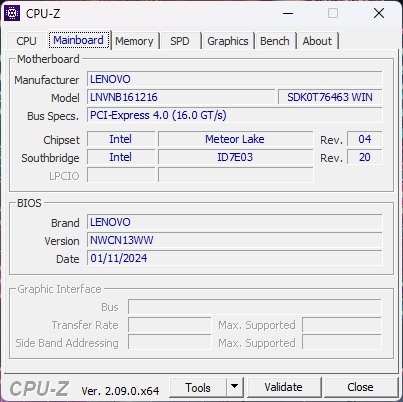
Le Lenovo Yoga 7 2-en-1 16IML9 (ou Yoga 7 2-en-1 16 G9) succède au Yoga 7 2-en-1 G8 de l'année dernière en introduisant les nouveaux processeurs Meteor Lake-U. Le châssis est par ailleurs le même et nous vous recommandons de consulter notre avis sur le Yoga 7 2-en-1 G8 pour en savoir plus sur les caractéristiques physiques du modèle.

Notre unité de test est la configuration de base avec le processeur Core Ultra 5 125U pour un prix de détail d'environ 900 USD. Une option plus haut de gamme est également disponible avec le Core Ultra 7 155U, mais tous les modèles pour le moment sont équipés du même écran tactile IPS 1920 x 1200 et de 16 Go de RAM soudée LPDDR5x-7467.

Les alternatives au Yoga 7 2-en-1 16 G9 incluent d'autres convertibles multimédias de 16 pouces comme le Dell Inspiron 16 7635 2-en-1 ou le futur HP Envy x360 16.

Plus d'avis sur Lenovo :

Lenovo Yoga 7 2-in-1 16IML9 (Yoga 7 16 Gamme)
Processeur
Intel Core Ultra 5 125U 12 x 3.6 - 4.3 GHz, 41 W PL2 / Short Burst, 29 W PL1 / Sustained, Meteor Lake-P
Carte graphique
Intel Graphics 4-Cores iGPU (Arc), Processeur: 1850 MHz, LPDDR5x, 31.0.101.5008
Mémoire
16 Go 
, LPDDR5x-7467, Soldered, Dual-Channel
Écran
16.00 pouces 16:10, 1920 x 1200 pixel 142 PPP, 10-point capacitive, LEN160FHD, IPS, brillant: oui, 60 Hz
Carte mère
Intel Meteor Lake-U/P/H PCH
Carte son
Intel Meteor Lake-U/P/H PCH - cAVS (Audio, Voice, Speech)
Connexions
4 USB 3.0 / 3.1 Gen1, 2 Thunderbolt, USB-C Power Delivery (PD), 2 DisplayPort, Connectique audio: 3.5 mm headset, Capteurs: Accelerometer
Réseau
Intel Wi-Fi 6E AX211 (a/b/g/h/n = Wi-Fi 4/ac = Wi-Fi 5/ax = Wi-Fi 6/ Wi-Fi 6E 6 GHz), Bluetooth 5.3
Taille
Hauteur x Largeur x Profondeur (en mm): 16.99 x 362.2 x 250.1
Batterie
71 Wh Lithium-Polymère
Système d'exploitation
Microsoft Windows 11 Home
Appareil photo
Webcam: 1080p30
Appareil photo primaire: 2.1 MPix
Fonctionnalités additionnelles
Haut-parleurs: 2x 2 W, Rétroéclairage du clavier: oui, Lenovo Vantage, 12 Mois Garantie
Poids
2.052 kg, Alimentation: 286 g
Prix
900 USD
Remarque : le fabricant peut utiliser des composants provenant de différents fournisseurs, notamment des panneaux d'affichage, des lecteurs ou des clés USB ayant des spécifications similaires.


Comparaison avec les concurrents potentiels

Note
Date
Modèle
Poids
Épaisseur
Taille
Résolution
Meilleur prix
86.7 %
04/24
Lenovo Yoga 7 2-in-1 16IML9
Ultra 5 125U, Graphics 4-Core
2.1 kg16.99 mm16.00"1920x1200
85.8 %
05/23
Lenovo Yoga 7 16IRL8
i7-1355U, Iris Xe G7 96EUs
2 kg16.99 mm16.00"1920x1200
88.9 %
04/24
Samsung Galaxy Book4 Pro 16
Ultra 7 155H, Arc 8-Core
1.5 kg12.5 mm16.00"2880x1800
88.7 %
02/24
HP Pavilion Plus 16-ab0456tx
i7-13700H, GeForce RTX 3050 6GB Laptop GPU
1.9 kg19.9 mm16.00"2560x1600
85.8 %
11/23
LG Gram 2in1 16 16T90R - G.AA78G
i7-1360P, Iris Xe G7 96EUs
1.5 kg17.2 mm16.00"2560x1600
84.6 %
07/23
Dell Inspiron 16 7635 2-in-1
R5 7530U, Vega 7
2 kg18.99 mm16.00"1920x1200

Comparaison des tailles

362.2 mm 250.1 mm 16.99 mm 2.1 kg362.2 mm 250.1 mm 16.99 mm 2 kg357 mm 253.5 mm 19.9 mm 1.9 kg356.78 mm 251.7 mm 18.99 mm 2 kg355 mm 248 mm 17.2 mm 1.5 kg355.4 mm 250.4 mm 12.5 mm 1.5 kg297 mm 210 mm 1 mm 5.7 g

Connectivité

Les options de port restent identiques, à l'exception du port HDMI, qui passe de 1,4 à 2,1.

Avant : Pas de ports
A droite : Bouton d'alimentation, lecteur MicroSD, 2x USB-A 3.2
Arrière : Pas de ports
À gauche : HDMI 2.1 TMDS, 2x USB-C 3.2 avec Thunderbolt 4 + DisplayPort 2.1 + Power Delivery 3.1, casque 3,5 mm

Lecteur de carte SD

SD Card Reader
average JPG Copy Test (av. of 3 runs)
Lenovo Yoga 7 2-in-1 16IML9
Intel Core Ultra 5 125U (AV Pro SD microSD 128 GB V60)
84.83 MB/s
Samsung Galaxy Book4 Pro 16
Intel Core Ultra 7 155H (Angelbird AV Pro V60)
76.6 MB/s -10%
Lenovo Yoga 7 16IRL8
Intel Core i7-1355U (AV Pro SD microSD 128 GB V60)
58.58 MB/s -31%
Dell Inspiron 16 7635 2-in-1
AMD Ryzen 5 7530U (PNY EliteX-Pro60 V60 256 GB)
32.2 MB/s -62%
LG Gram 2in1 16 16T90R - G.AA78G
Intel Core i7-1360P
22.4 MB/s -74%
maximum AS SSD Seq Read Test (1GB)
Lenovo Yoga 7 16IRL8
Intel Core i7-1355U (AV Pro SD microSD 128 GB V60)
91.44 MB/s +1%
Lenovo Yoga 7 2-in-1 16IML9
Intel Core Ultra 5 125U (AV Pro SD microSD 128 GB V60)
90.22 MB/s
Samsung Galaxy Book4 Pro 16
Intel Core Ultra 7 155H (Angelbird AV Pro V60)
87.8 MB/s -3%
Dell Inspiron 16 7635 2-in-1
AMD Ryzen 5 7530U (PNY EliteX-Pro60 V60 256 GB)
36.9 MB/s -59%
LG Gram 2in1 16 16T90R - G.AA78G
Intel Core i7-1360P
25.19 MB/s -72%

Communication

Networking
iperf3 transmit AXE11000
HP Pavilion Plus 16-ab0456tx
Intel Wi-Fi 6E AX211
1638 (1387min - 1701max) MBit/s +131%
Samsung Galaxy Book4 Pro 16
Intel Wi-Fi 6E AX211
1625 (1307min, 1314.54P1 - 1751max) MBit/s +129%
Dell Inspiron 16 7635 2-in-1
MediaTek Wi-Fi 6E MT7922 160MHz Wireless LAN Card
1199 (655min - 1384max) MBit/s +69%
Lenovo Yoga 7 16IRL8
Intel Wi-Fi 6E AX211
1086 (810min - 1178max) MBit/s +53%
LG Gram 2in1 16 16T90R - G.AA78G
Intel Wi-Fi 6E AX211
947 (905min - 990max) MBit/s +34%
Lenovo Yoga 7 2-in-1 16IML9
Intel Wi-Fi 6E AX211
709 (595min - 781max) MBit/s
iperf3 receive AXE11000
Samsung Galaxy Book4 Pro 16
Intel Wi-Fi 6E AX211
1666 (1613min, 1621.7P1 - 1691max) MBit/s +105%
HP Pavilion Plus 16-ab0456tx
Intel Wi-Fi 6E AX211
1640 (1599min - 1664max) MBit/s +101%
Dell Inspiron 16 7635 2-in-1
MediaTek Wi-Fi 6E MT7922 160MHz Wireless LAN Card
1361 (1256min - 1412max) MBit/s +67%
Lenovo Yoga 7 16IRL8
Intel Wi-Fi 6E AX211
1327 (1121min - 1384max) MBit/s +63%
LG Gram 2in1 16 16T90R - G.AA78G
Intel Wi-Fi 6E AX211
907 (767min - 946max) MBit/s +11%
Lenovo Yoga 7 2-in-1 16IML9
Intel Wi-Fi 6E AX211
814 (710min - 867max) MBit/s
iperf3 transmit AXE11000 6GHz
HP Pavilion Plus 16-ab0456tx
Intel Wi-Fi 6E AX211
1640 (1548min - 1676max) MBit/s +56%
LG Gram 2in1 16 16T90R - G.AA78G
Intel Wi-Fi 6E AX211
1625 (1580min - 1676max) MBit/s +54%
Dell Inspiron 16 7635 2-in-1
MediaTek Wi-Fi 6E MT7922 160MHz Wireless LAN Card
1329 (1277min - 1424max) MBit/s +26%
Lenovo Yoga 7 16IRL8
Intel Wi-Fi 6E AX211
1180 (1054min - 1237max) MBit/s +12%
Lenovo Yoga 7 2-in-1 16IML9
Intel Wi-Fi 6E AX211
1052 (678min - 1199max) MBit/s
iperf3 receive AXE11000 6GHz
HP Pavilion Plus 16-ab0456tx
Intel Wi-Fi 6E AX211
1686 (1621min - 1705max) MBit/s +30%
Lenovo Yoga 7 16IRL8
Intel Wi-Fi 6E AX211
1501 (1422min - 1563max) MBit/s +15%
LG Gram 2in1 16 16T90R - G.AA78G
Intel Wi-Fi 6E AX211
1472 (1012min - 1576max) MBit/s +13%
Dell Inspiron 16 7635 2-in-1
MediaTek Wi-Fi 6E MT7922 160MHz Wireless LAN Card
1320 (1251min - 1377max) MBit/s +2%
Lenovo Yoga 7 2-in-1 16IML9
Intel Wi-Fi 6E AX211
1300 (1261min - 1348max) MBit/s
0501001502002503003504004505005506006507007508008509009501000105011001150120012501300Tooltip
Lenovo Yoga 7 2-in-1 16IML9; iperf3 transmit AXE11000 6GHz; iperf 3.1.3: Ø1051 (678-1199)
Lenovo Yoga 7 2-in-1 16IML9; iperf3 receive AXE11000 6GHz; iperf 3.1.3: Ø1300 (1261-1348)

Webcam

ColorChecker
11.9 ∆E
10.2 ∆E
16.8 ∆E
21.1 ∆E
16 ∆E
11.4 ∆E
8.6 ∆E
18 ∆E
16.7 ∆E
15 ∆E
11.6 ∆E
8.4 ∆E
10 ∆E
14.7 ∆E
21.3 ∆E
11 ∆E
14.6 ∆E
15.4 ∆E
2 ∆E
4.3 ∆E
10.5 ∆E
15.1 ∆E
16.1 ∆E
4.6 ∆E
ColorChecker Lenovo Yoga 7 2-in-1 16IML9: 12.71 ∆E min: 2 - max: 21.31 ∆E

Maintenance

Yoga 7 2-en-1 16IML9
Yoga 7 2-en-1 16IRL8 à titre de comparaison. Il n'y a pas de changements internes majeurs

Affichage

Aucune nouvelle option d'affichage n'est disponible, ce qui signifie que toutes les configurations utilisent la même dalle IPS que celle du modèle 2023. Cette dalle ne couvre que 60 % de sRGB (soit 45 % de NTSC), ce qui la classe automatiquement dans la catégorie des dalles bas de gamme. La plupart des autres ordinateurs portables de 16 pouces offrent une couverture sRGB complète, y compris le modèle de prix similaire Dell Inspiron 16 7635 2-en-1.

Légère décoloration inégale du rétroéclairage
Pas de problème majeur de granularité dû à la brillance de la matrice RVB
305.2
cd/m²
313.2
cd/m²
312
cd/m²
299.6
cd/m²
313.3
cd/m²
297.3
cd/m²
257.4
cd/m²
285.4
cd/m²
264.6
cd/m²
Homogénéité de la luminosité
LEN160FHD tested with X-Rite i1Pro 2
Maximum: 313.3 cd/m² (Nits) Moyenne: 294.2 cd/m² Minimum: 4.28 cd/m²
Homogénéité de la luminosité: 82 %
Valeur mesurée au centre, sur batterie: 313.3 cd/m²
Contraste: 895:1 (Valeurs des noirs: 0.35 cd/m²)
ΔE Color 4.41 | 0.5-29.43 Ø5, calibrated: 1.84
ΔE Greyscale 4.4 | 0.57-98 Ø5.3
42.3% AdobeRGB 1998 (Argyll 2.2.0 3D)
61.4% sRGB (Argyll 2.2.0 3D)
40.9% Display P3 (Argyll 2.2.0 3D)
Gamma: 2.3
Lenovo Yoga 7 2-in-1 16IML9
LEN160FHD, IPS, 1920x1200, 16.00
Lenovo Yoga 7 16IRL8
LEN160FHD, IPS, 1920x1200, 16.00
Samsung Galaxy Book4 Pro 16
ATNA60CL07-0, OLED, 2880x1800, 16.00
HP Pavilion Plus 16-ab0456tx
AU Optronics AUOFDA4, IPS, 2560x1600, 16.00
LG Gram 2in1 16 16T90R - G.AA78G
LP160WQ1-SPB2, IPS, 2560x1600, 16.00
Dell Inspiron 16 7635 2-in-1
Chi Mei 160JCA, IPS, 1920x1200, 16.00
Display
3%
112%
75%
100%
63%
Display P3 Coverage
40.9
42
3%
99.5
143%
74.6
82%
96.5
136%
67.4
65%
sRGB Coverage
61.4
62.8
2%
100
63%
99
61%
99.9
63%
98.2
60%
AdobeRGB 1998 Coverage
42.3
43.5
3%
97.5
130%
76.5
81%
84.6
100%
69.5
64%
Response Times
3%
98%
71%
-9%
16%
Response Time Grey 50% / Grey 80% *
32.1 ?(15.3, 16.8)
31.8 ?(15.4, 16.4)
1%
0.64 ?(0.33, 0.31)
98%
9.06 ?(4.27, 4.79)
72%
38.4 ?(18.6, 19.8)
-20%
27.6 ?(13.2, 14.3)
14%
Response Time Black / White *
21.8 ?(12.6, 9.2)
20.9 ?(11.2, 9.7)
4%
0.68 ?(0.38, 0.3)
97%
6.7 ?(3.6, 3.1)
69%
21.4 ?(9.8, 11.6)
2%
18.2 ?(9.6, 7.6)
17%
PWM Frequency
240 ?(100)
Screen
4%
51%
23%
9%
22%
Brightness middle
313.3
279.4
-11%
385
23%
403
29%
329
5%
301.3
-4%
Brightness
294
257
-13%
391
33%
394
34%
310
5%
269
-9%
Brightness Distribution
82
81
-1%
97
18%
90
10%
88
7%
79
-4%
Black Level *
0.35
0.18
49%
0.34
3%
0.39
-11%
0.28
20%
Contrast
895
1552
73%
1185
32%
844
-6%
1076
20%
Colorchecker dE 2000 *
4.41
5.12
-16%
1.1
75%
3.13
29%
3.52
20%
3.1
30%
Colorchecker dE 2000 max. *
15.75
19.42
-23%
1.8
89%
6.14
61%
6.96
56%
5.5
65%
Colorchecker dE 2000 calibrated *
1.84
1.84
-0%
1.65
10%
1.15
37%
0.49
73%
Greyscale dE 2000 *
4.4
5.5
-25%
1.4
68%
4.5
-2%
5.75
-31%
3.9
11%
Gamma
2.3 96%
2.22 99%
2.24 98%
2.18 101%
2.137 103%
2.19 100%
CCT
7395 88%
6407 101%
6444 101%
6261 104%
7584 86%
6186 105%
Moyenne finale (programmes/paramètres)
3% / 3%
87% / 76%
56% / 41%
33% / 26%
34% / 30%

* ... Moindre est la valeur, meilleures sont les performances

vs. sRGB
vs. sRGB
vs. P3
vs. P3

La température des couleurs est légèrement trop froide en sortie d'usine. Nous vous recommandons d'appliquer notre profil ICM calibré ci-dessus pour améliorer les couleurs et les rapprocher de la norme sRGB.

Niveaux de gris avant étalonnage
Balayages de saturation avant étalonnage
ColorChecker avant étalonnage
Niveaux de gris après étalonnage
Balayages de saturation après étalonnage
ColorChecker après étalonnage

Temps de réponse de l'écran

Le temps de réponse d'un écran mesure la rapidité à laquelle l'écran est capable de changer une couleur pour une autre. Un temps de réponse élevé se traduit par une image floutée pour les objets en mouvement. Les joueurs bénéficieront de faibles latences d'affichage en jeu.
       Temps de réponse noir à blanc
21.8 ms ... hausse ↗ et chute ↘ combinées↗ 12.6 ms hausse
↘ 9.2 ms chute
L'écran montre de bons temps de réponse, mais insuffisant pour du jeu compétitif.
En comparaison, tous les appareils testés affichent entre 0.1 (minimum) et 240 (maximum) ms. » 42 % des appareils testés affichent de meilleures performances.
Cela signifie que les latences relevées sont similaires à la moyenne (21.4 ms) de tous les appareils testés.
       Temps de réponse gris 50% à gris 80%
32.1 ms ... hausse ↗ et chute ↘ combinées↗ 15.3 ms hausse
↘ 16.8 ms chute
L'écran souffre de latences très élevées, à éviter pour le jeu.
En comparaison, tous les appareils testés affichent entre 0.2 (minimum) et 636 (maximum) ms. » 38 % des appareils testés affichent de meilleures performances.
Cela signifie que les latences relevées sont similaires à la moyenne (33.7 ms) de tous les appareils testés.

Scintillement / MLI (Modulation de largeur d'impulsion)

Afin d'abaisser la luminosité de l'écran, certains ordinateurs portables font varier très rapidement le rétroéclairage entre éteint et allumé. La fréquence à laquelle le rétroéclairage s'éteint et se rallume est normalement fixée à une valeur qui permet de rendre la variation indétectable à l'œil nu? Si la fréquence est trop basse, certaines personnes peuvent être sujettes à une fatigue oculaire, des maux de tête ou même percevoir les variations.
Scintillement / MLI (Modulation de largeur d'impulsion) non décelé

En comparaison, 53 % des appareils testés n'emploient pas MDI pour assombrir leur écran. Nous avons relevé une moyenne à 17803 (minimum : 5 - maximum : 3846000) Hz dans le cas où une MDI était active.

A l'extérieur, sous la lumière du soleil
A l'extérieur, à l'ombre
A l'extérieur, sous la lumière du soleil
Angles de vision IPS étendus

Performance - Meteor Lake-U pour l'accélération de l'IA


Conditions d'essai

Nous avons réglé Windows et Lenovo Vantage sur le mode Performance avant d'effectuer les tests ci-dessous.

Écran d'accueil de Vantage
Menu des réglages de puissance
Profil de puissance et paramètres de charge
Réglages automatiques de la lumière bleue pour le "soin des yeux"

Processeur

Les performances brutes du Core Ultra 5 125U sont presque identiques à celles du Core i5-1335U de l'année dernière, même si le nouveau processeur le remplace directement. En fait, l'ancien Core i7-1355U qui équipe le Yoga 7 2-en-1 16IRL8 peut surpasser le Core Ultra 5 125U de 5 à 10 %. Les utilisateurs qui préfèrent le Core Ultra 5 125U devraient donc être attirés par son NPU intégré pour aider à accélérer certaines tâches d'IA qui arriveront sous Windows dans un avenir proche.

Mise à niveau vers le Core Ultra 7 155U ne devrait augmenter les performances que de manière marginale, d'après notre expérience avec le Yoga Book 9.

Cinebench R15 Multi Loop

0130260390520650780910104011701300143015601690182019502080221023402470Tooltip
Lenovo Yoga 7 2-in-1 16IML9 Intel Core Ultra 5 125U: Ø1351 (1250.47-1657.34)
Lenovo Yoga 7 16IRL8 Intel Core i7-1355U: Ø1298 (1272.02-1735.28)
Samsung Galaxy Book4 Pro 16 Intel Core Ultra 7 155H: Ø2016 (1825.4-2515.57)
HP Pavilion Plus 16-ab0456tx Intel Core i7-13700H: Ø2200 (2140.07-2224.08)
LG Gram 2in1 16 16T90R - G.AA78G Intel Core i7-1360P: Ø1547 (1472-2214.1)
Dell Inspiron 16 7635 2-in-1 AMD Ryzen 5 7530U: Ø1360 (1321.57-1414.73)
CPU Performance Rating: Percent
Cinebench R23: Multi Core | Single Core
Cinebench R20: CPU (Multi Core) | CPU (Single Core)
Cinebench R15: CPU Multi 64Bit | CPU Single 64Bit
Blender: v2.79 BMW27 CPU
7-Zip 18.03: 7z b 4 | 7z b 4 -mmt1
Geekbench 6.2: Multi-Core | Single-Core
Geekbench 5.5: Multi-Core | Single-Core
HWBOT x265 Benchmark v2.2: 4k Preset
LibreOffice : 20 Documents To PDF
R Benchmark 2.5: Overall mean
CPU Performance Rating
Lenovo Yoga Pro 9 16IMH9
Intel Core Ultra 9 185H
90.5 pt
Lenovo ThinkPad Z16 Gen 2
AMD Ryzen 9 PRO 7940HS
84.6 pt
Samsung Galaxy Book4 Pro 16
Intel Core Ultra 7 155H
78.6 pt
HP Pavilion Plus 16-ab0456tx
Intel Core i7-13700H
77.1 pt
HP Spectre x360 2-in-1 16-f1075ng -2!
Intel Core i7-12700H
70 pt
Lenovo ThinkBook 16p G3 ARH -2!
AMD Ryzen 9 6900HX
67.8 pt
LG Gram 2in1 16 16T90R - G.AA78G
Intel Core i7-1360P
66.2 pt
Lenovo Yoga 7 16IRL8 -2!
Intel Core i7-1355U
65.1 pt
Acer Swift X SFX16-52G-52VE -2!
Intel Core i5-1240P
64 pt
Lenovo IdeaPad Flex 5 16ABR G8 -2!
AMD Ryzen 7 7730U
61 pt
Lenovo Yoga 7 2-in-1 16IML9
Intel Core Ultra 5 125U
60.4 pt
Moyenne Intel Core Ultra 5 125U
 
60.3 pt
Lenovo ThinkPad E16 G1 Core i5-1335U -2!
Intel Core i5-1335U
59.6 pt
Samsung Galaxy Book3 Ultra 16, i9-13900H RTX 4070 -2!
Intel Core i9-13900H
55.9 pt
Dell Inspiron 16 7635 2-in-1 -2!
AMD Ryzen 5 7530U
55.5 pt
Lenovo Thinkpad X1 Fold 16
Intel Core i7-1250U
53.4 pt
Lenovo IdeaPad 5 Pro 16IHU6 -2!
Intel Core i5-11300H
44.6 pt
LG Gram 16 2-in-1 16T90P -2!
Intel Core i7-1165G7
43.4 pt
Cinebench R23 / Multi Core
Lenovo Yoga Pro 9 16IMH9
Intel Core Ultra 9 185H
19851 Points +108%
Lenovo ThinkPad Z16 Gen 2
AMD Ryzen 9 PRO 7940HS
16938 (16164.3min - 16938.4max) Points +78%
Samsung Galaxy Book4 Pro 16
Intel Core Ultra 7 155H
15171 Points +59%
Lenovo ThinkBook 16p G3 ARH
AMD Ryzen 9 6900HX
13463 (13112.3min - 13463.1max) Points +41%
Samsung Galaxy Book3 Ultra 16, i9-13900H RTX 4070
Intel Core i9-13900H
13177 Points +38%
HP Spectre x360 2-in-1 16-f1075ng
Intel Core i7-12700H
12071 Points +27%
LG Gram 2in1 16 16T90R - G.AA78G
Intel Core i7-1360P
11676 Points +22%
Lenovo IdeaPad Flex 5 16ABR G8
AMD Ryzen 7 7730U
11490 Points +21%
Acer Swift X SFX16-52G-52VE
Intel Core i5-1240P
11427 Points +20%
Lenovo Yoga 7 16IRL8
Intel Core i7-1355U
10252 (8193.94min - 10252.5max) Points +8%
HP Pavilion Plus 16-ab0456tx
Intel Core i7-13700H
10053 Points +5%
Moyenne Intel Core Ultra 5 125U
  (9533 - 9574, n=2)
9554 Points 0%
Lenovo Yoga 7 2-in-1 16IML9
Intel Core Ultra 5 125U
9533 (8675.99min - 9532.96max) Points
Lenovo ThinkPad E16 G1 Core i5-1335U
Intel Core i5-1335U
9157 (5866.85min - 9157.36max) Points -4%
Dell Inspiron 16 7635 2-in-1
AMD Ryzen 5 7530U
8361 (8000.1min - 8361.05max) Points -12%
Lenovo Thinkpad X1 Fold 16
Intel Core i7-1250U
7021 (5691.06min - 7020.54max) Points -26%
Lenovo IdeaPad 5 Pro 16IHU6
Intel Core i5-11300H
6465 Points -32%
LG Gram 16 2-in-1 16T90P
Intel Core i7-1165G7
5073 (4126.58min - 5073.21max) Points -47%
Cinebench R23 / Single Core
HP Pavilion Plus 16-ab0456tx
Intel Core i7-13700H
1914 Points +24%
Lenovo Yoga Pro 9 16IMH9
Intel Core Ultra 9 185H
1906 Points +23%
Lenovo Yoga 7 16IRL8
Intel Core i7-1355U
1825 Points +18%
HP Spectre x360 2-in-1 16-f1075ng
Intel Core i7-12700H
1808 Points +17%
Lenovo ThinkPad Z16 Gen 2
AMD Ryzen 9 PRO 7940HS
1794 Points +16%
Samsung Galaxy Book4 Pro 16
Intel Core Ultra 7 155H
1755 Points +13%
Lenovo ThinkPad E16 G1 Core i5-1335U
Intel Core i5-1335U
1714 Points +11%
LG Gram 2in1 16 16T90R - G.AA78G
Intel Core i7-1360P
1705 Points +10%
Lenovo Thinkpad X1 Fold 16
Intel Core i7-1250U
1606 Points +4%
Acer Swift X SFX16-52G-52VE
Intel Core i5-1240P
1600 Points +3%
Moyenne Intel Core Ultra 5 125U
  (1548 - 1573, n=2)
1561 Points +1%
Lenovo ThinkBook 16p G3 ARH
AMD Ryzen 9 6900HX
1556 Points +1%
Lenovo Yoga 7 2-in-1 16IML9
Intel Core Ultra 5 125U
1548 Points
Lenovo IdeaPad Flex 5 16ABR G8
AMD Ryzen 7 7730U
1442 Points -7%
Dell Inspiron 16 7635 2-in-1
AMD Ryzen 5 7530U
1439 Points -7%
Lenovo IdeaPad 5 Pro 16IHU6
Intel Core i5-11300H
1431 Points -8%
LG Gram 16 2-in-1 16T90P
Intel Core i7-1165G7
1423 Points -8%
Samsung Galaxy Book3 Ultra 16, i9-13900H RTX 4070
Intel Core i9-13900H
1297 Points -16%
Cinebench R20 / CPU (Multi Core)
Lenovo Yoga Pro 9 16IMH9
Intel Core Ultra 9 185H
7651 Points +106%
Lenovo ThinkPad Z16 Gen 2
AMD Ryzen 9 PRO 7940HS
6601 Points +77%
HP Pavilion Plus 16-ab0456tx
Intel Core i7-13700H
5873 Points +58%
Samsung Galaxy Book4 Pro 16
Intel Core Ultra 7 155H
5865 Points +58%
Lenovo ThinkBook 16p G3 ARH
AMD Ryzen 9 6900HX
5253 Points +41%
Samsung Galaxy Book3 Ultra 16, i9-13900H RTX 4070
Intel Core i9-13900H
4960 Points +33%
HP Spectre x360 2-in-1 16-f1075ng
Intel Core i7-12700H
4693 Points +26%
LG Gram 2in1 16 16T90R - G.AA78G
Intel Core i7-1360P
4506 Points +21%
Acer Swift X SFX16-52G-52VE
Intel Core i5-1240P
4365 Points +17%
Lenovo Yoga 7 16IRL8
Intel Core i7-1355U
3907 Points +5%
Lenovo ThinkPad E16 G1 Core i5-1335U
Intel Core i5-1335U
3849 Points +3%
Lenovo IdeaPad Flex 5 16ABR G8
AMD Ryzen 7 7730U
3798 Points +2%
Moyenne Intel Core Ultra 5 125U
  (3720 - 3760, n=2)
3740 Points +1%
Lenovo Yoga 7 2-in-1 16IML9
Intel Core Ultra 5 125U
3720 Points
Dell Inspiron 16 7635 2-in-1
AMD Ryzen 5 7530U
3281 Points -12%
Lenovo Thinkpad X1 Fold 16
Intel Core i7-1250U
2745 Points -26%
Lenovo IdeaPad 5 Pro 16IHU6
Intel Core i5-11300H
2382 Points -36%
LG Gram 16 2-in-1 16T90P
Intel Core i7-1165G7
1948 Points -48%
Cinebench R20 / CPU (Single Core)
HP Pavilion Plus 16-ab0456tx
Intel Core i7-13700H
741 Points +22%
Lenovo Yoga Pro 9 16IMH9
Intel Core Ultra 9 185H
735 Points +21%
Lenovo Yoga 7 16IRL8
Intel Core i7-1355U
708 Points +17%
HP Spectre x360 2-in-1 16-f1075ng
Intel Core i7-12700H
697 Points +15%
Lenovo ThinkPad Z16 Gen 2
AMD Ryzen 9 PRO 7940HS
695 Points +15%
Samsung Galaxy Book4 Pro 16
Intel Core Ultra 7 155H
670 Points +11%
Lenovo ThinkPad E16 G1 Core i5-1335U
Intel Core i5-1335U
663 Points +10%
LG Gram 2in1 16 16T90R - G.AA78G
Intel Core i7-1360P
658 Points +9%
Acer Swift X SFX16-52G-52VE
Intel Core i5-1240P
631 Points +4%
Lenovo Thinkpad X1 Fold 16
Intel Core i7-1250U
621 Points +3%
Lenovo Yoga 7 2-in-1 16IML9
Intel Core Ultra 5 125U
605 Points
Lenovo ThinkBook 16p G3 ARH
AMD Ryzen 9 6900HX
604 Points 0%
Moyenne Intel Core Ultra 5 125U
  (592 - 605, n=2)
599 Points -1%
Dell Inspiron 16 7635 2-in-1
AMD Ryzen 5 7530U
564 Points -7%
Lenovo IdeaPad Flex 5 16ABR G8
AMD Ryzen 7 7730U
552 Points -9%
Lenovo IdeaPad 5 Pro 16IHU6
Intel Core i5-11300H
548 Points -9%
LG Gram 16 2-in-1 16T90P
Intel Core i7-1165G7
540 Points -11%
Samsung Galaxy Book3 Ultra 16, i9-13900H RTX 4070
Intel Core i9-13900H
428 Points -29%
Cinebench R15 / CPU Multi 64Bit
Lenovo Yoga Pro 9 16IMH9
Intel Core Ultra 9 185H
3005 (2869.44min - 3004.58max) Points +81%
Lenovo ThinkPad Z16 Gen 2
AMD Ryzen 9 PRO 7940HS
2718 (2534.21min - 2717.95max) Points +64%
Samsung Galaxy Book4 Pro 16
Intel Core Ultra 7 155H
2516 (1825.4min - 2515.57max) Points +52%
HP Pavilion Plus 16-ab0456tx
Intel Core i7-13700H
2224 (2140.07min - 2224.08max) Points +34%
LG Gram 2in1 16 16T90R - G.AA78G
Intel Core i7-1360P
2214 (1472min - 2214.1max) Points +34%
Lenovo ThinkBook 16p G3 ARH
AMD Ryzen 9 6900HX
2160 (2133.11min - 2160.06max) Points +30%
Samsung Galaxy Book3 Ultra 16, i9-13900H RTX 4070
Intel Core i9-13900H
2134 (1993.52min - 2134.02max) Points +29%
HP Spectre x360 2-in-1 16-f1075ng
Intel Core i7-12700H
2080 Points +26%
Lenovo IdeaPad Flex 5 16ABR G8
AMD Ryzen 7 7730U
1942 (1610.5min - 1942.41max) Points +17%
Acer Swift X SFX16-52G-52VE
Intel Core i5-1240P
1859 (1391.21min - 1858.82max) Points +12%
Lenovo Yoga 7 16IRL8
Intel Core i7-1355U
1735 (1272.02min - 1735.28max) Points +5%
Moyenne Intel Core Ultra 5 125U
  (1657 - 1680, n=2)
1669 Points +1%
Lenovo Yoga 7 2-in-1 16IML9
Intel Core Ultra 5 125U
1657 (1250.47min - 1657.34max) Points
Lenovo ThinkPad E16 G1 Core i5-1335U
Intel Core i5-1335U
1527 (602.98min - 1527max) Points -8%
Dell Inspiron 16 7635 2-in-1
AMD Ryzen 5 7530U
1415 (1321.57min - 1414.73max) Points -15%
Lenovo Thinkpad X1 Fold 16
Intel Core i7-1250U
1085 (795.91min - 1085.04max) Points -35%
Lenovo IdeaPad 5 Pro 16IHU6
Intel Core i5-11300H
990 Points -40%
LG Gram 16 2-in-1 16T90P
Intel Core i7-1165G7
674 (631.63min - 673.8max) Points -59%
Cinebench R15 / CPU Single 64Bit
Lenovo ThinkPad Z16 Gen 2
AMD Ryzen 9 PRO 7940HS
280 Points +24%
Lenovo Yoga Pro 9 16IMH9
Intel Core Ultra 9 185H
280 Points +24%
HP Pavilion Plus 16-ab0456tx
Intel Core i7-13700H
273 Points +21%
HP Spectre x360 2-in-1 16-f1075ng
Intel Core i7-12700H
262 Points +16%
Lenovo Yoga 7 16IRL8
Intel Core i7-1355U
257 Points +14%
Samsung Galaxy Book4 Pro 16
Intel Core Ultra 7 155H
254 Points +12%
LG Gram 2in1 16 16T90R - G.AA78G
Intel Core i7-1360P
244 Points +8%
Lenovo ThinkBook 16p G3 ARH
AMD Ryzen 9 6900HX
241 Points +7%
Lenovo ThinkPad E16 G1 Core i5-1335U
Intel Core i5-1335U
236 Points +4%
Acer Swift X SFX16-52G-52VE
Intel Core i5-1240P
235 Points +4%
Dell Inspiron 16 7635 2-in-1
AMD Ryzen 5 7530U
231 Points +2%
Moyenne Intel Core Ultra 5 125U
  (226 - 228, n=2)
227 Points 0%
Lenovo IdeaPad Flex 5 16ABR G8
AMD Ryzen 7 7730U
226 Points 0%
Lenovo Yoga 7 2-in-1 16IML9
Intel Core Ultra 5 125U
226 Points
Lenovo Thinkpad X1 Fold 16
Intel Core i7-1250U
218 Points -4%
LG Gram 16 2-in-1 16T90P
Intel Core i7-1165G7
213 Points -6%
Samsung Galaxy Book3 Ultra 16, i9-13900H RTX 4070
Intel Core i9-13900H
211 Points -7%
Lenovo IdeaPad 5 Pro 16IHU6
Intel Core i5-11300H
176 Points -22%
Blender / v2.79 BMW27 CPU
LG Gram 16 2-in-1 16T90P
Intel Core i7-1165G7
650 Seconds * -82%
Lenovo Thinkpad X1 Fold 16
Intel Core i7-1250U
556 Seconds * -55%
Lenovo IdeaPad 5 Pro 16IHU6
Intel Core i5-11300H
542 Seconds * -51%
Lenovo ThinkPad E16 G1 Core i5-1335U
Intel Core i5-1335U
455 Seconds * -27%
Dell Inspiron 16 7635 2-in-1
AMD Ryzen 5 7530U
362 Seconds * -1%
Lenovo Yoga 7 2-in-1 16IML9
Intel Core Ultra 5 125U
358 Seconds *
Moyenne Intel Core Ultra 5 125U
  (349 - 358, n=2)
354 Seconds * +1%
Lenovo Yoga 7 16IRL8
Intel Core i7-1355U
349 Seconds * +3%
LG Gram 2in1 16 16T90R - G.AA78G
Intel Core i7-1360P
324 Seconds * +9%
Acer Swift X SFX16-52G-52VE
Intel Core i5-1240P
311 Seconds * +13%
Lenovo IdeaPad Flex 5 16ABR G8
AMD Ryzen 7 7730U
277 Seconds * +23%
HP Spectre x360 2-in-1 16-f1075ng
Intel Core i7-12700H
273 Seconds * +24%
Lenovo ThinkBook 16p G3 ARH
AMD Ryzen 9 6900HX
247 Seconds * +31%
Samsung Galaxy Book3 Ultra 16, i9-13900H RTX 4070
Intel Core i9-13900H
239 Seconds * +33%
Samsung Galaxy Book4 Pro 16
Intel Core Ultra 7 155H
224 Seconds * +37%
HP Pavilion Plus 16-ab0456tx
Intel Core i7-13700H
217 Seconds * +39%
Lenovo ThinkPad Z16 Gen 2
AMD Ryzen 9 PRO 7940HS
191 Seconds * +47%
Lenovo Yoga Pro 9 16IMH9
Intel Core Ultra 9 185H
163 Seconds * +54%
7-Zip 18.03 / 7z b 4
Lenovo Yoga Pro 9 16IMH9
Intel Core Ultra 9 185H
76331 MIPS +95%
Lenovo ThinkPad Z16 Gen 2
AMD Ryzen 9 PRO 7940HS
67813 MIPS +74%
HP Pavilion Plus 16-ab0456tx
Intel Core i7-13700H
62209 MIPS +59%
Samsung Galaxy Book4 Pro 16
Intel Core Ultra 7 155H
61091 MIPS +56%
Lenovo ThinkBook 16p G3 ARH
AMD Ryzen 9 6900HX
55816 MIPS +43%
Lenovo IdeaPad Flex 5 16ABR G8
AMD Ryzen 7 7730U
49961 MIPS +28%
Samsung Galaxy Book3 Ultra 16, i9-13900H RTX 4070
Intel Core i9-13900H
49917 MIPS +28%
HP Spectre x360 2-in-1 16-f1075ng
Intel Core i7-12700H
46548 MIPS +19%
Acer Swift X SFX16-52G-52VE
Intel Core i5-1240P
44778 MIPS +15%
LG Gram 2in1 16 16T90R - G.AA78G
Intel Core i7-1360P
42886 MIPS +10%
Lenovo Yoga 7 16IRL8
Intel Core i7-1355U
40711 MIPS +4%
Lenovo Yoga 7 2-in-1 16IML9
Intel Core Ultra 5 125U
39065 MIPS
Moyenne Intel Core Ultra 5 125U
  (39025 - 39065, n=2)
39045 MIPS 0%
Dell Inspiron 16 7635 2-in-1
AMD Ryzen 5 7530U
38450 MIPS -2%
Lenovo ThinkPad E16 G1 Core i5-1335U
Intel Core i5-1335U
32972 MIPS -16%
Lenovo Thinkpad X1 Fold 16
Intel Core i7-1250U
27072 MIPS -31%
Lenovo IdeaPad 5 Pro 16IHU6
Intel Core i5-11300H
25353 MIPS -35%
LG Gram 16 2-in-1 16T90P
Intel Core i7-1165G7
23385 MIPS -40%
7-Zip 18.03 / 7z b 4 -mmt1
Lenovo ThinkPad Z16 Gen 2
AMD Ryzen 9 PRO 7940HS
6215 MIPS +38%
HP Pavilion Plus 16-ab0456tx
Intel Core i7-13700H
6101 MIPS +36%
HP Spectre x360 2-in-1 16-f1075ng
Intel Core i7-12700H
5897 MIPS +31%
Lenovo Yoga Pro 9 16IMH9
Intel Core Ultra 9 185H
5781 MIPS +29%
Lenovo Yoga 7 16IRL8
Intel Core i7-1355U
5651 MIPS +26%
Samsung Galaxy Book4 Pro 16
Intel Core Ultra 7 155H
5496 MIPS +22%
Lenovo IdeaPad Flex 5 16ABR G8
AMD Ryzen 7 7730U
5333 MIPS +19%
Dell Inspiron 16 7635 2-in-1
AMD Ryzen 5 7530U
5278 MIPS +17%
Lenovo ThinkPad E16 G1 Core i5-1335U
Intel Core i5-1335U
5171 MIPS +15%
Lenovo ThinkBook 16p G3 ARH
AMD Ryzen 9 6900HX
5090 MIPS +13%
LG Gram 16 2-in-1 16T90P
Intel Core i7-1165G7
5060 MIPS +13%
Lenovo Thinkpad X1 Fold 16
Intel Core i7-1250U
5041 MIPS +12%
Acer Swift X SFX16-52G-52VE
Intel Core i5-1240P
5002 MIPS +11%
Lenovo IdeaPad 5 Pro 16IHU6
Intel Core i5-11300H
4947 MIPS +10%
LG Gram 2in1 16 16T90R - G.AA78G
Intel Core i7-1360P
4651 MIPS +4%
Moyenne Intel Core Ultra 5 125U
  (4492 - 4659, n=2)
4576 MIPS +2%
Lenovo Yoga 7 2-in-1 16IML9
Intel Core Ultra 5 125U
4492 MIPS
Samsung Galaxy Book3 Ultra 16, i9-13900H RTX 4070
Intel Core i9-13900H
3665 MIPS -18%
Geekbench 6.2 / Multi-Core
Lenovo Yoga Pro 9 16IMH9
Intel Core Ultra 9 185H
14031 Points +46%
Lenovo ThinkPad Z16 Gen 2
AMD Ryzen 9 PRO 7940HS
13028 Points +36%
Samsung Galaxy Book4 Pro 16
Intel Core Ultra 7 155H
12422 Points +29%
HP Pavilion Plus 16-ab0456tx
Intel Core i7-13700H
11936 Points +24%
LG Gram 2in1 16 16T90R - G.AA78G
Intel Core i7-1360P
11511 Points +20%
Lenovo Yoga 7 2-in-1 16IML9
Intel Core Ultra 5 125U
9601 Points
Moyenne Intel Core Ultra 5 125U
  (8487 - 9601, n=2)
9044 Points -6%
Lenovo Thinkpad X1 Fold 16
Intel Core i7-1250U
7943 Points -17%
Lenovo ThinkPad E16 G1 Core i5-1335U
Intel Core i5-1335U
7691 Points -20%
Geekbench 6.2 / Single-Core
Lenovo ThinkPad Z16 Gen 2
AMD Ryzen 9 PRO 7940HS
2605 Points +21%
HP Pavilion Plus 16-ab0456tx
Intel Core i7-13700H
2598 Points +21%
Lenovo Yoga Pro 9 16IMH9
Intel Core Ultra 9 185H
2570 Points +20%
Samsung Galaxy Book4 Pro 16
Intel Core Ultra 7 155H
2440 Points +14%
LG Gram 2in1 16 16T90R - G.AA78G
Intel Core i7-1360P
2301 Points +7%
Lenovo Thinkpad X1 Fold 16
Intel Core i7-1250U
2298 Points +7%
Moyenne Intel Core Ultra 5 125U
  (2148 - 2163, n=2)
2156 Points 0%
Lenovo Yoga 7 2-in-1 16IML9
Intel Core Ultra 5 125U
2148 Points
Geekbench 5.5 / Multi-Core
Lenovo Yoga Pro 9 16IMH9
Intel Core Ultra 9 185H
13936 Points +67%
Samsung Galaxy Book4 Pro 16
Intel Core Ultra 7 155H
12158 Points +46%
Lenovo ThinkPad Z16 Gen 2
AMD Ryzen 9 PRO 7940HS
12038 Points +44%
HP Pavilion Plus 16-ab0456tx
Intel Core i7-13700H
11405 Points +37%
LG Gram 2in1 16 16T90R - G.AA78G
Intel Core i7-1360P
10450 Points +25%
Acer Swift X SFX16-52G-52VE
Intel Core i5-1240P
10112 Points +21%
Samsung Galaxy Book3 Ultra 16, i9-13900H RTX 4070
Intel Core i9-13900H
9521 Points +14%
Lenovo ThinkBook 16p G3 ARH
AMD Ryzen 9 6900HX
9341 Points +12%
Lenovo Yoga 7 16IRL8
Intel Core i7-1355U
9159 Points +10%
HP Spectre x360 2-in-1 16-f1075ng
Intel Core i7-12700H
8946 Points +7%
Lenovo Yoga 7 2-in-1 16IML9
Intel Core Ultra 5 125U
8355 Points
Moyenne Intel Core Ultra 5 125U
  (7909 - 8355, n=2)
8132 Points -3%
Lenovo IdeaPad Flex 5 16ABR G8
AMD Ryzen 7 7730U
7723 Points -8%
Lenovo ThinkPad E16 G1 Core i5-1335U
Intel Core i5-1335U
7194 Points -14%
Lenovo Thinkpad X1 Fold 16
Intel Core i7-1250U
6753 Points -19%
Dell Inspiron 16 7635 2-in-1
AMD Ryzen 5 7530U
6648 Points -20%
LG Gram 16 2-in-1 16T90P
Intel Core i7-1165G7
5656 Points -32%
Lenovo IdeaPad 5 Pro 16IHU6
Intel Core i5-11300H
4905 Points -41%
Geekbench 5.5 / Single-Core
Lenovo ThinkPad Z16 Gen 2
AMD Ryzen 9 PRO 7940HS
1956 Points +25%
Lenovo Yoga Pro 9 16IMH9
Intel Core Ultra 9 185H
1902 Points +22%
HP Pavilion Plus 16-ab0456tx
Intel Core i7-13700H
1822 Points +17%
Samsung Galaxy Book4 Pro 16
Intel Core Ultra 7 155H
1764 Points +13%
HP Spectre x360 2-in-1 16-f1075ng
Intel Core i7-12700H
1754 Points +12%
Lenovo Yoga 7 16IRL8
Intel Core i7-1355U
1751 Points +12%
Lenovo ThinkPad E16 G1 Core i5-1335U
Intel Core i5-1335U
1674 Points +7%
Acer Swift X SFX16-52G-52VE
Intel Core i5-1240P
1658 Points +6%
Lenovo Thinkpad X1 Fold 16
Intel Core i7-1250U
1650 Points +6%
LG Gram 2in1 16 16T90R - G.AA78G
Intel Core i7-1360P
1648 Points +6%
Moyenne Intel Core Ultra 5 125U
  (1560 - 1587, n=2)
1574 Points +1%
Lenovo Yoga 7 2-in-1 16IML9
Intel Core Ultra 5 125U
1560 Points
Lenovo ThinkBook 16p G3 ARH
AMD Ryzen 9 6900HX
1549 Points -1%
LG Gram 16 2-in-1 16T90P
Intel Core i7-1165G7
1532 Points -2%
Dell Inspiron 16 7635 2-in-1
AMD Ryzen 5 7530U
1479 Points -5%
Lenovo IdeaPad Flex 5 16ABR G8
AMD Ryzen 7 7730U
1464 Points -6%
Lenovo IdeaPad 5 Pro 16IHU6
Intel Core i5-11300H
1447 Points -7%
Samsung Galaxy Book3 Ultra 16, i9-13900H RTX 4070
Intel Core i9-13900H
1140 Points -27%
HWBOT x265 Benchmark v2.2 / 4k Preset
Lenovo Yoga Pro 9 16IMH9
Intel Core Ultra 9 185H
22.7 fps +105%
Lenovo ThinkPad Z16 Gen 2
AMD Ryzen 9 PRO 7940HS
20.4 fps +84%
Lenovo ThinkBook 16p G3 ARH
AMD Ryzen 9 6900HX
16.8 fps +51%
Samsung Galaxy Book4 Pro 16
Intel Core Ultra 7 155H
16.8 fps +51%
HP Pavilion Plus 16-ab0456tx
Intel Core i7-13700H
16.3 fps +47%
Samsung Galaxy Book3 Ultra 16, i9-13900H RTX 4070
Intel Core i9-13900H
14.8 fps +33%
HP Spectre x360 2-in-1 16-f1075ng
Intel Core i7-12700H
13.4 fps +21%
Acer Swift X SFX16-52G-52VE
Intel Core i5-1240P
12.5 fps +13%
Lenovo IdeaPad Flex 5 16ABR G8
AMD Ryzen 7 7730U
12.4 fps +12%
LG Gram 2in1 16 16T90R - G.AA78G
Intel Core i7-1360P
11.2 fps +1%
Lenovo Yoga 7 2-in-1 16IML9
Intel Core Ultra 5 125U
11.1 fps
Moyenne Intel Core Ultra 5 125U
  (10.6 - 11.1, n=2)
10.9 fps -2%
Dell Inspiron 16 7635 2-in-1
AMD Ryzen 5 7530U
10.7 fps -4%
Lenovo Yoga 7 16IRL8
Intel Core i7-1355U
10.6 fps -5%
Lenovo ThinkPad E16 G1 Core i5-1335U
Intel Core i5-1335U
9.79 fps -12%
Lenovo Thinkpad X1 Fold 16
Intel Core i7-1250U
7.84 fps -29%
Lenovo IdeaPad 5 Pro 16IHU6
Intel Core i5-11300H
7.08 fps -36%
LG Gram 16 2-in-1 16T90P
Intel Core i7-1165G7
6.57 fps -41%
LibreOffice / 20 Documents To PDF
Samsung Galaxy Book3 Ultra 16, i9-13900H RTX 4070
Intel Core i9-13900H
74.9 s * -59%
HP Pavilion Plus 16-ab0456tx
Intel Core i7-13700H
62.4 s * -33%
Lenovo ThinkBook 16p G3 ARH
AMD Ryzen 9 6900HX
57.8 s * -23%
LG Gram 2in1 16 16T90R - G.AA78G
Intel Core i7-1360P
57.2 s * -22%
Lenovo Thinkpad X1 Fold 16
Intel Core i7-1250U
53.8 s * -14%
Lenovo IdeaPad 5 Pro 16IHU6
Intel Core i5-11300H
52.4 s * -11%
Lenovo IdeaPad Flex 5 16ABR G8
AMD Ryzen 7 7730U
51.3 s * -9%
Lenovo ThinkPad E16 G1 Core i5-1335U
Intel Core i5-1335U
50.5 s * -7%
LG Gram 16 2-in-1 16T90P
Intel Core i7-1165G7
49.6 s * -6%
Dell Inspiron 16 7635 2-in-1
AMD Ryzen 5 7530U
49.3 s * -5%
Acer Swift X SFX16-52G-52VE
Intel Core i5-1240P
47.2 s * -0%
Moyenne Intel Core Ultra 5 125U
  (47 - 47.1, n=2)
47.1 s * -0%
Lenovo Yoga 7 2-in-1 16IML9
Intel Core Ultra 5 125U
47 s *
Lenovo ThinkPad Z16 Gen 2
AMD Ryzen 9 PRO 7940HS
46.1 s * +2%
Lenovo Yoga 7 16IRL8
Intel Core i7-1355U
45.3 s * +4%
HP Spectre x360 2-in-1 16-f1075ng
Intel Core i7-12700H
42 s * +11%
Samsung Galaxy Book4 Pro 16
Intel Core Ultra 7 155H
40.9 s * +13%
Lenovo Yoga Pro 9 16IMH9
Intel Core Ultra 9 185H
39.7 s * +16%
R Benchmark 2.5 / Overall mean
Samsung Galaxy Book3 Ultra 16, i9-13900H RTX 4070
Intel Core i9-13900H
0.723 sec * -36%
Lenovo IdeaPad 5 Pro 16IHU6
Intel Core i5-11300H
0.604 sec * -13%
LG Gram 16 2-in-1 16T90P
Intel Core i7-1165G7
0.594 sec * -11%
LG Gram 2in1 16 16T90R - G.AA78G
Intel Core i7-1360P
0.583 sec * -9%
Lenovo IdeaPad Flex 5 16ABR G8
AMD Ryzen 7 7730U
0.534 sec * -0%
Acer Swift X SFX16-52G-52VE
Intel Core i5-1240P
0.533 sec * -0%
Lenovo Yoga 7 2-in-1 16IML9
Intel Core Ultra 5 125U
0.533 sec *
Moyenne Intel Core Ultra 5 125U
  (0.526 - 0.533, n=2)
0.53 sec * +1%
Dell Inspiron 16 7635 2-in-1
AMD Ryzen 5 7530U
0.528 sec * +1%
Lenovo Thinkpad X1 Fold 16
Intel Core i7-1250U
0.508 sec * +5%
Lenovo ThinkBook 16p G3 ARH
AMD Ryzen 9 6900HX
0.4974 sec * +7%
Samsung Galaxy Book4 Pro 16
Intel Core Ultra 7 155H
0.4688 sec * +12%
HP Spectre x360 2-in-1 16-f1075ng
Intel Core i7-12700H
0.4632 sec * +13%
Lenovo Yoga 7 16IRL8
Intel Core i7-1355U
0.4593 sec * +14%
Lenovo ThinkPad Z16 Gen 2
AMD Ryzen 9 PRO 7940HS
0.4514 sec * +15%
Lenovo Yoga Pro 9 16IMH9
Intel Core Ultra 9 185H
0.4457 sec * +16%
HP Pavilion Plus 16-ab0456tx
Intel Core i7-13700H
0.4386 sec * +18%
CPU Performance Rating: Percent
Cinebench R23: Multi Core | Single Core
Cinebench R20: CPU (Multi Core) | CPU (Single Core)
Cinebench R15: CPU Multi 64Bit | CPU Single 64Bit
Blender: v2.79 BMW27 CPU
7-Zip 18.03: 7z b 4 | 7z b 4 -mmt1
Geekbench 6.2: Multi-Core | Single-Core
Geekbench 5.5: Multi-Core | Single-Core
HWBOT x265 Benchmark v2.2: 4k Preset
LibreOffice : 20 Documents To PDF
R Benchmark 2.5: Overall mean

* ... Moindre est la valeur, meilleures sont les performances

Cinebench R15 CPU Multi 64Bit
1657 Points
Cinebench R15 OpenGL 64Bit
104 fps
Cinebench R15 Ref. Match 64Bit
97.8 %
Cinebench R15 CPU Single 64Bit
226 Points
Aide
Performance Rating
HP Pavilion Plus 16-ab0456tx
Intel Core i7-13700H, GeForce RTX 3050 6GB Laptop GPU
95.3 pt
Samsung Galaxy Book4 Pro 16
Intel Core Ultra 7 155H, Arc 8-Core
92.7 pt
LG Gram 2in1 16 16T90R - G.AA78G
Intel Core i7-1360P, Iris Xe G7 96EUs
75.5 pt
Dell Inspiron 16 7635 2-in-1
AMD Ryzen 5 7530U, Vega 7
67.6 pt
Lenovo Yoga 7 2-in-1 16IML9
Intel Core Ultra 5 125U, Graphics 4-Core
63.1 pt
Moyenne Intel Core Ultra 5 125U
 
60 pt
Lenovo Yoga 7 16IRL8
Intel Core i7-1355U, Iris Xe G7 96EUs
59.8 pt
AIDA64 / FP32 Ray-Trace
HP Pavilion Plus 16-ab0456tx
Intel Core i7-13700H, GeForce RTX 3050 6GB Laptop GPU
14424 KRay/s +69%
Samsung Galaxy Book4 Pro 16
Intel Core Ultra 7 155H, Arc 8-Core
13431 KRay/s +57%
Dell Inspiron 16 7635 2-in-1
AMD Ryzen 5 7530U, Vega 7
9804 KRay/s +15%
LG Gram 2in1 16 16T90R - G.AA78G
Intel Core i7-1360P, Iris Xe G7 96EUs
9693 KRay/s +13%
LG Gram 2in1 16 16T90R - G.AA78G
Intel Core i7-1360P, Iris Xe G7 96EUs
8619 KRay/s +1%
Lenovo Yoga 7 2-in-1 16IML9
Intel Core Ultra 5 125U, Graphics 4-Core
8556 KRay/s
Moyenne Intel Core Ultra 5 125U
  (8239 - 8556, n=2)
8398 KRay/s -2%
Lenovo Yoga 7 16IRL8
Intel Core i7-1355U, Iris Xe G7 96EUs
7486 KRay/s -13%
AIDA64 / FPU Julia
HP Pavilion Plus 16-ab0456tx
Intel Core i7-13700H, GeForce RTX 3050 6GB Laptop GPU
74809 Points +68%
Samsung Galaxy Book4 Pro 16
Intel Core Ultra 7 155H, Arc 8-Core
68747 Points +54%
Dell Inspiron 16 7635 2-in-1
AMD Ryzen 5 7530U, Vega 7
62595 Points +40%
LG Gram 2in1 16 16T90R - G.AA78G
Intel Core i7-1360P, Iris Xe G7 96EUs
50702 Points +14%
Lenovo Yoga 7 2-in-1 16IML9
Intel Core Ultra 5 125U, Graphics 4-Core
44602 Points
Moyenne Intel Core Ultra 5 125U
  (41650 - 44602, n=2)
43126 Points -3%
Lenovo Yoga 7 16IRL8
Intel Core i7-1355U, Iris Xe G7 96EUs
40675 Points -9%
AIDA64 / CPU SHA3
Samsung Galaxy Book4 Pro 16
Intel Core Ultra 7 155H, Arc 8-Core
3320 MB/s +44%
HP Pavilion Plus 16-ab0456tx
Intel Core i7-13700H, GeForce RTX 3050 6GB Laptop GPU
3288 MB/s +42%
LG Gram 2in1 16 16T90R - G.AA78G
Intel Core i7-1360P, Iris Xe G7 96EUs
2522 MB/s +9%
Lenovo Yoga 7 2-in-1 16IML9
Intel Core Ultra 5 125U, Graphics 4-Core
2312 MB/s
Moyenne Intel Core Ultra 5 125U
  (2219 - 2312, n=2)
2266 MB/s -2%
Lenovo Yoga 7 16IRL8
Intel Core i7-1355U, Iris Xe G7 96EUs
2179 MB/s -6%
Dell Inspiron 16 7635 2-in-1
AMD Ryzen 5 7530U, Vega 7
2068 MB/s -11%
AIDA64 / CPU Queen
HP Pavilion Plus 16-ab0456tx
Intel Core i7-13700H, GeForce RTX 3050 6GB Laptop GPU
99616 Points +109%
Samsung Galaxy Book4 Pro 16
Intel Core Ultra 7 155H, Arc 8-Core
83844 Points +76%
LG Gram 2in1 16 16T90R - G.AA78G
Intel Core i7-1360P, Iris Xe G7 96EUs
82121 Points +72%
Dell Inspiron 16 7635 2-in-1
AMD Ryzen 5 7530U, Vega 7
73066 Points +53%
Lenovo Yoga 7 16IRL8
Intel Core i7-1355U, Iris Xe G7 96EUs
66277 Points +39%
Lenovo Yoga 7 2-in-1 16IML9
Intel Core Ultra 5 125U, Graphics 4-Core
47712 Points
Moyenne Intel Core Ultra 5 125U
  (47142 - 47712, n=2)
47427 Points -1%
AIDA64 / FPU SinJulia
Samsung Galaxy Book4 Pro 16
Intel Core Ultra 7 155H, Arc 8-Core
9521 Points +73%
HP Pavilion Plus 16-ab0456tx
Intel Core i7-13700H, GeForce RTX 3050 6GB Laptop GPU
9366 Points +70%
Dell Inspiron 16 7635 2-in-1
AMD Ryzen 5 7530U, Vega 7
8803 Points +60%
LG Gram 2in1 16 16T90R - G.AA78G
Intel Core i7-1360P, Iris Xe G7 96EUs
6679 Points +21%
Lenovo Yoga 7 2-in-1 16IML9
Intel Core Ultra 5 125U, Graphics 4-Core
5507 Points
Moyenne Intel Core Ultra 5 125U
  (5481 - 5507, n=2)
5494 Points 0%
Lenovo Yoga 7 16IRL8
Intel Core i7-1355U, Iris Xe G7 96EUs
5113 Points -7%
AIDA64 / FPU Mandel
HP Pavilion Plus 16-ab0456tx
Intel Core i7-13700H, GeForce RTX 3050 6GB Laptop GPU
36086 Points +52%
Dell Inspiron 16 7635 2-in-1
AMD Ryzen 5 7530U, Vega 7
34487 Points +45%
Samsung Galaxy Book4 Pro 16
Intel Core Ultra 7 155H, Arc 8-Core
34153 Points +44%
LG Gram 2in1 16 16T90R - G.AA78G
Intel Core i7-1360P, Iris Xe G7 96EUs
24392 Points +3%
Lenovo Yoga 7 2-in-1 16IML9
Intel Core Ultra 5 125U, Graphics 4-Core
23731 Points
Moyenne Intel Core Ultra 5 125U
  (20640 - 23731, n=2)
22186 Points -7%
Lenovo Yoga 7 16IRL8
Intel Core i7-1355U, Iris Xe G7 96EUs
19985 Points -16%
AIDA64 / CPU AES
LG Gram 2in1 16 16T90R - G.AA78G
Intel Core i7-1360P, Iris Xe G7 96EUs
92044 MB/s +99%
Samsung Galaxy Book4 Pro 16
Intel Core Ultra 7 155H, Arc 8-Core
68954 MB/s +49%
HP Pavilion Plus 16-ab0456tx
Intel Core i7-13700H, GeForce RTX 3050 6GB Laptop GPU
67762 MB/s +47%
Lenovo Yoga 7 2-in-1 16IML9
Intel Core Ultra 5 125U, Graphics 4-Core
46209 MB/s
Moyenne Intel Core Ultra 5 125U
  (44193 - 46209, n=2)
45201 MB/s -2%
Lenovo Yoga 7 16IRL8
Intel Core i7-1355U, Iris Xe G7 96EUs
42670 MB/s -8%
Dell Inspiron 16 7635 2-in-1
AMD Ryzen 5 7530U, Vega 7
35283 MB/s -24%
AIDA64 / CPU ZLib
HP Pavilion Plus 16-ab0456tx
Intel Core i7-13700H, GeForce RTX 3050 6GB Laptop GPU
976 MB/s +38%
Samsung Galaxy Book4 Pro 16
Intel Core Ultra 7 155H, Arc 8-Core
966 MB/s +36%
LG Gram 2in1 16 16T90R - G.AA78G
Intel Core i7-1360P, Iris Xe G7 96EUs
752 MB/s +6%
Moyenne Intel Core Ultra 5 125U
  (709 - 776, n=2)
743 MB/s +5%
Lenovo Yoga 7 2-in-1 16IML9
Intel Core Ultra 5 125U, Graphics 4-Core
709 MB/s
Lenovo Yoga 7 16IRL8
Intel Core i7-1355U, Iris Xe G7 96EUs
684 MB/s -4%
Dell Inspiron 16 7635 2-in-1
AMD Ryzen 5 7530U, Vega 7
554 MB/s -22%
AIDA64 / FP64 Ray-Trace
HP Pavilion Plus 16-ab0456tx
Intel Core i7-13700H, GeForce RTX 3050 6GB Laptop GPU
7818 KRay/s +82%
Samsung Galaxy Book4 Pro 16
Intel Core Ultra 7 155H, Arc 8-Core
6970 KRay/s +62%
LG Gram 2in1 16 16T90R - G.AA78G
Intel Core i7-1360P, Iris Xe G7 96EUs
5266 KRay/s +23%
Dell Inspiron 16 7635 2-in-1
AMD Ryzen 5 7530U, Vega 7
5246 KRay/s +22%
Lenovo Yoga 7 2-in-1 16IML9
Intel Core Ultra 5 125U, Graphics 4-Core
4297 KRay/s
Moyenne Intel Core Ultra 5 125U
  (4195 - 4297, n=2)
4246 KRay/s -1%
Lenovo Yoga 7 16IRL8
Intel Core i7-1355U, Iris Xe G7 96EUs
4016 KRay/s -7%
AIDA64 / CPU PhotoWorxx
Samsung Galaxy Book4 Pro 16
Intel Core Ultra 7 155H, Arc 8-Core
51338 MPixel/s +8%
Lenovo Yoga 7 2-in-1 16IML9
Intel Core Ultra 5 125U, Graphics 4-Core
47564 MPixel/s
LG Gram 2in1 16 16T90R - G.AA78G
Intel Core i7-1360P, Iris Xe G7 96EUs
42905 MPixel/s -10%
Lenovo Yoga 7 16IRL8
Intel Core i7-1355U, Iris Xe G7 96EUs
42678 MPixel/s -10%
HP Pavilion Plus 16-ab0456tx
Intel Core i7-13700H, GeForce RTX 3050 6GB Laptop GPU
41881 MPixel/s -12%
Moyenne Intel Core Ultra 5 125U
  (24082 - 47564, n=2)
35823 MPixel/s -25%
Dell Inspiron 16 7635 2-in-1
AMD Ryzen 5 7530U, Vega 7
19525 MPixel/s -59%

Test de stress

La température du cœur est généralement plus élevée que celle que nous avons enregistrée sur le modèle de l'année dernière de quelques degrés C. Lorsque vous exécutez Prime95 ou Witcher 3par exemple, le CPU se stabilise à 79 C et 68 C, respectivement, contre 64 C et 63 C sur le Yoga 7 16IRL8. Le processeur atteignait 4,1 GHz et 41 W lors de l'exécution de Prime95 avant de redescendre rapidement et de se stabiliser à 2,4 GHz et 28 W, démontrant ainsi la durabilité limitée de Turbo Boost.

Système en veille
Système en veille
Witcher 3 stress
Witcher 3 stress
Prime95 stress
Prime95 stress
Prime95+FurMark stress
Horloge du CPU (GHz) Horloge du GPU (MHz) Température moyenne du CPU (°C)
Système au repos -- -- 44
Prime95 Stress ~2.8 400 79
Prime95 + FurMark Stress ~2.1 950 - 1450 74
Witcher 3 Stress ~0.4 1850 68

Performance du système

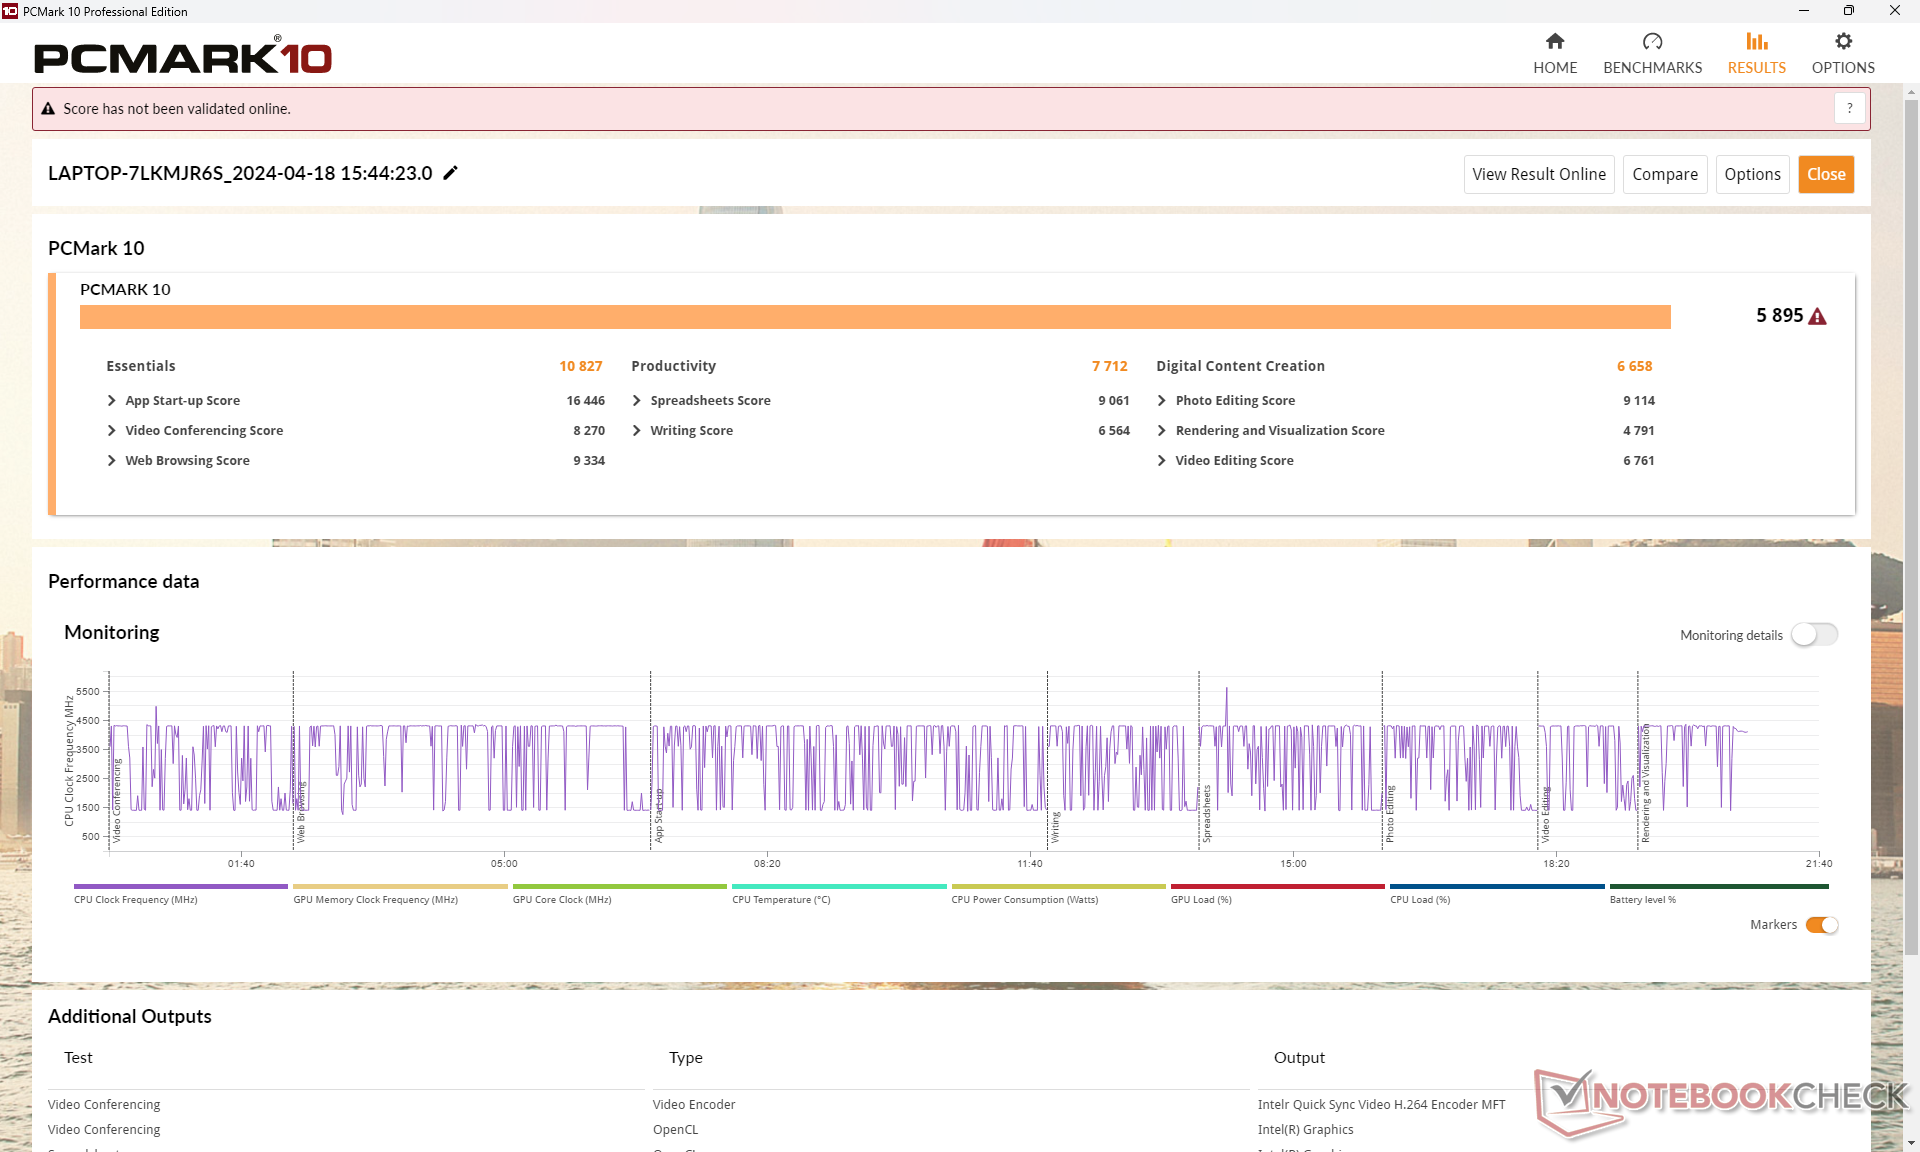
Les scores PCMark sont pratiquement identiques à ceux du modèle de l'année dernière et ne montrent pas de gains de performances majeurs lors de la navigation quotidienne ou des tâches d'édition.

PCMark 10 Standard
PCMark 10 Standard
PCMark 10 / Score
Samsung Galaxy Book4 Pro 16
Arc 8-Core, Ultra 7 155H, Samsung PM9B1 512GB MZVL4512HBLU
6713 Points +14%
HP Pavilion Plus 16-ab0456tx
GeForce RTX 3050 6GB Laptop GPU, i7-13700H, WDC PC SN810 1TB
6597 Points +12%
Dell Inspiron 16 7635 2-in-1
Vega 7, R5 7530U, Kioxia BG5 KBG50ZNS512G
6127 Points +4%
Lenovo Yoga 7 16IRL8
Iris Xe G7 96EUs, i7-1355U, WD PC SN740 512GB SDDPMQD-512G-1101
5933 Points +1%
Lenovo Yoga 7 2-in-1 16IML9
Graphics 4-Core, Ultra 5 125U
5895 Points
Moyenne Intel Core Ultra 5 125U, Intel Graphics 4-Cores iGPU (Arc)
  (5821 - 5895, n=2)
5858 Points -1%
LG Gram 2in1 16 16T90R - G.AA78G
Iris Xe G7 96EUs, i7-1360P, Samsung PM9A1 MZVL21T0HCLR
5781 Points -2%
PCMark 10 / Essentials
Lenovo Yoga 7 16IRL8
Iris Xe G7 96EUs, i7-1355U, WD PC SN740 512GB SDDPMQD-512G-1101
11822 Points +9%
LG Gram 2in1 16 16T90R - G.AA78G
Iris Xe G7 96EUs, i7-1360P, Samsung PM9A1 MZVL21T0HCLR
11359 Points +5%
Samsung Galaxy Book4 Pro 16
Arc 8-Core, Ultra 7 155H, Samsung PM9B1 512GB MZVL4512HBLU
11079 Points +2%
Lenovo Yoga 7 2-in-1 16IML9
Graphics 4-Core, Ultra 5 125U
10827 Points
Moyenne Intel Core Ultra 5 125U, Intel Graphics 4-Cores iGPU (Arc)
  (10680 - 10827, n=2)
10754 Points -1%
Dell Inspiron 16 7635 2-in-1
Vega 7, R5 7530U, Kioxia BG5 KBG50ZNS512G
10603 Points -2%
HP Pavilion Plus 16-ab0456tx
GeForce RTX 3050 6GB Laptop GPU, i7-13700H, WDC PC SN810 1TB
10112 Points -7%
PCMark 10 / Productivity
Dell Inspiron 16 7635 2-in-1
Vega 7, R5 7530U, Kioxia BG5 KBG50ZNS512G
9772 Points +27%
HP Pavilion Plus 16-ab0456tx
GeForce RTX 3050 6GB Laptop GPU, i7-13700H, WDC PC SN810 1TB
8803 Points +14%
Samsung Galaxy Book4 Pro 16
Arc 8-Core, Ultra 7 155H, Samsung PM9B1 512GB MZVL4512HBLU
8343 Points +8%
Lenovo Yoga 7 2-in-1 16IML9
Graphics 4-Core, Ultra 5 125U
7712 Points
Moyenne Intel Core Ultra 5 125U, Intel Graphics 4-Cores iGPU (Arc)
  (7548 - 7712, n=2)
7630 Points -1%
Lenovo Yoga 7 16IRL8
Iris Xe G7 96EUs, i7-1355U, WD PC SN740 512GB SDDPMQD-512G-1101
7197 Points -7%
LG Gram 2in1 16 16T90R - G.AA78G
Iris Xe G7 96EUs, i7-1360P, Samsung PM9A1 MZVL21T0HCLR
6572 Points -15%
PCMark 10 / Digital Content Creation
Samsung Galaxy Book4 Pro 16
Arc 8-Core, Ultra 7 155H, Samsung PM9B1 512GB MZVL4512HBLU
8885 Points +33%
HP Pavilion Plus 16-ab0456tx
GeForce RTX 3050 6GB Laptop GPU, i7-13700H, WDC PC SN810 1TB
8752 Points +31%
LG Gram 2in1 16 16T90R - G.AA78G
Iris Xe G7 96EUs, i7-1360P, Samsung PM9A1 MZVL21T0HCLR
7027 Points +6%
Lenovo Yoga 7 16IRL8
Iris Xe G7 96EUs, i7-1355U, WD PC SN740 512GB SDDPMQD-512G-1101
6663 Points 0%
Lenovo Yoga 7 2-in-1 16IML9
Graphics 4-Core, Ultra 5 125U
6658 Points
Moyenne Intel Core Ultra 5 125U, Intel Graphics 4-Cores iGPU (Arc)
  (6641 - 6658, n=2)
6650 Points 0%
Dell Inspiron 16 7635 2-in-1
Vega 7, R5 7530U, Kioxia BG5 KBG50ZNS512G
6024 Points -10%
CrossMark / Overall
HP Pavilion Plus 16-ab0456tx
GeForce RTX 3050 6GB Laptop GPU, i7-13700H, WDC PC SN810 1TB
1752 Points +6%
Samsung Galaxy Book4 Pro 16
Arc 8-Core, Ultra 7 155H, Samsung PM9B1 512GB MZVL4512HBLU
1751 Points +6%
Lenovo Yoga 7 2-in-1 16IML9
Graphics 4-Core, Ultra 5 125U
1648 Points
Lenovo Yoga 7 16IRL8
Iris Xe G7 96EUs, i7-1355U, WD PC SN740 512GB SDDPMQD-512G-1101
1623 Points -2%
LG Gram 2in1 16 16T90R - G.AA78G
Iris Xe G7 96EUs, i7-1360P, Samsung PM9A1 MZVL21T0HCLR
1527 Points -7%
Moyenne Intel Core Ultra 5 125U, Intel Graphics 4-Cores iGPU (Arc)
  (1363 - 1648, n=2)
1506 Points -9%
Dell Inspiron 16 7635 2-in-1
Vega 7, R5 7530U, Kioxia BG5 KBG50ZNS512G
1223 Points -26%
CrossMark / Productivity
Samsung Galaxy Book4 Pro 16
Arc 8-Core, Ultra 7 155H, Samsung PM9B1 512GB MZVL4512HBLU
1685 Points +29%
HP Pavilion Plus 16-ab0456tx
GeForce RTX 3050 6GB Laptop GPU, i7-13700H, WDC PC SN810 1TB
1657 Points +26%
Lenovo Yoga 7 16IRL8
Iris Xe G7 96EUs, i7-1355U, WD PC SN740 512GB SDDPMQD-512G-1101
1595 Points +22%
LG Gram 2in1 16 16T90R - G.AA78G
Iris Xe G7 96EUs, i7-1360P, Samsung PM9A1 MZVL21T0HCLR
1503 Points +15%
Moyenne Intel Core Ultra 5 125U, Intel Graphics 4-Cores iGPU (Arc)
  (1310 - 1354, n=2)
1332 Points +2%
Lenovo Yoga 7 2-in-1 16IML9
Graphics 4-Core, Ultra 5 125U
1310 Points
Dell Inspiron 16 7635 2-in-1
Vega 7, R5 7530U, Kioxia BG5 KBG50ZNS512G
1254 Points -4%
CrossMark / Creativity
HP Pavilion Plus 16-ab0456tx
GeForce RTX 3050 6GB Laptop GPU, i7-13700H, WDC PC SN810 1TB
1970 Points +31%
Samsung Galaxy Book4 Pro 16
Arc 8-Core, Ultra 7 155H, Samsung PM9B1 512GB MZVL4512HBLU
1911 Points +27%
Lenovo Yoga 7 16IRL8
Iris Xe G7 96EUs, i7-1355U, WD PC SN740 512GB SDDPMQD-512G-1101
1727 Points +15%
LG Gram 2in1 16 16T90R - G.AA78G
Iris Xe G7 96EUs, i7-1360P, Samsung PM9A1 MZVL21T0HCLR
1558 Points +4%
Lenovo Yoga 7 2-in-1 16IML9
Graphics 4-Core, Ultra 5 125U
1499 Points
Moyenne Intel Core Ultra 5 125U, Intel Graphics 4-Cores iGPU (Arc)
  (1433 - 1499, n=2)
1466 Points -2%
Dell Inspiron 16 7635 2-in-1
Vega 7, R5 7530U, Kioxia BG5 KBG50ZNS512G
1315 Points -12%
CrossMark / Responsiveness
Samsung Galaxy Book4 Pro 16
Arc 8-Core, Ultra 7 155H, Samsung PM9B1 512GB MZVL4512HBLU
1514 Points +42%
LG Gram 2in1 16 16T90R - G.AA78G
Iris Xe G7 96EUs, i7-1360P, Samsung PM9A1 MZVL21T0HCLR
1508 Points +41%
HP Pavilion Plus 16-ab0456tx
GeForce RTX 3050 6GB Laptop GPU, i7-13700H, WDC PC SN810 1TB
1458 Points +37%
Lenovo Yoga 7 16IRL8
Iris Xe G7 96EUs, i7-1355U, WD PC SN740 512GB SDDPMQD-512G-1101
1418 Points +33%
Moyenne Intel Core Ultra 5 125U, Intel Graphics 4-Cores iGPU (Arc)
  (1066 - 1199, n=2)
1133 Points +6%
Lenovo Yoga 7 2-in-1 16IML9
Graphics 4-Core, Ultra 5 125U
1066 Points
Dell Inspiron 16 7635 2-in-1
Vega 7, R5 7530U, Kioxia BG5 KBG50ZNS512G
912 Points -14%
WebXPRT 3 / Overall
Lenovo Yoga 7 16IRL8
Iris Xe G7 96EUs, i7-1355U, WD PC SN740 512GB SDDPMQD-512G-1101
295 Points +24%
HP Pavilion Plus 16-ab0456tx
GeForce RTX 3050 6GB Laptop GPU, i7-13700H, WDC PC SN810 1TB
286 Points +21%
Samsung Galaxy Book4 Pro 16
Arc 8-Core, Ultra 7 155H, Samsung PM9B1 512GB MZVL4512HBLU
275 Points +16%
Dell Inspiron 16 7635 2-in-1
Vega 7, R5 7530U, Kioxia BG5 KBG50ZNS512G
272 Points +15%
LG Gram 2in1 16 16T90R - G.AA78G
Iris Xe G7 96EUs, i7-1360P, Samsung PM9A1 MZVL21T0HCLR
251 Points +6%
Moyenne Intel Core Ultra 5 125U, Intel Graphics 4-Cores iGPU (Arc)
  (237 - 251, n=2)
244 Points +3%
Lenovo Yoga 7 2-in-1 16IML9
Graphics 4-Core, Ultra 5 125U
237 Points
WebXPRT 4 / Overall
HP Pavilion Plus 16-ab0456tx
GeForce RTX 3050 6GB Laptop GPU, i7-13700H, WDC PC SN810 1TB
273 Points +20%
Samsung Galaxy Book4 Pro 16
Arc 8-Core, Ultra 7 155H, Samsung PM9B1 512GB MZVL4512HBLU
257 Points +13%
Lenovo Yoga 7 16IRL8
Iris Xe G7 96EUs, i7-1355U, WD PC SN740 512GB SDDPMQD-512G-1101
255 Points +12%
Moyenne Intel Core Ultra 5 125U, Intel Graphics 4-Cores iGPU (Arc)
  (227 - 231, n=2)
229 Points +1%
Lenovo Yoga 7 2-in-1 16IML9
Graphics 4-Core, Ultra 5 125U
227 Points
Dell Inspiron 16 7635 2-in-1
Vega 7, R5 7530U, Kioxia BG5 KBG50ZNS512G
209 Points -8%
Mozilla Kraken 1.1 / Total
LG Gram 2in1 16 16T90R - G.AA78G
Iris Xe G7 96EUs, i7-1360P, Samsung PM9A1 MZVL21T0HCLR
633 ms * -8%
Dell Inspiron 16 7635 2-in-1
Vega 7, R5 7530U, Kioxia BG5 KBG50ZNS512G
627 ms * -7%
Lenovo Yoga 7 2-in-1 16IML9
Graphics 4-Core, Ultra 5 125U
587 ms *
Moyenne Intel Core Ultra 5 125U, Intel Graphics 4-Cores iGPU (Arc)
  (581 - 587, n=2)
584 ms * +1%
Samsung Galaxy Book4 Pro 16
Arc 8-Core, Ultra 7 155H, Samsung PM9B1 512GB MZVL4512HBLU
528 ms * +10%
Lenovo Yoga 7 16IRL8
Iris Xe G7 96EUs, i7-1355U, WD PC SN740 512GB SDDPMQD-512G-1101
515 ms * +12%
HP Pavilion Plus 16-ab0456tx
GeForce RTX 3050 6GB Laptop GPU, i7-13700H, WDC PC SN810 1TB
490 ms * +17%

* ... Moindre est la valeur, meilleures sont les performances

PCMark 10 Score
5895 points
Aide
AIDA64 / Memory Copy
Samsung Galaxy Book4 Pro 16
Intel Core Ultra 7 155H, Arc 8-Core
91209 MB/s +10%
Lenovo Yoga 7 2-in-1 16IML9
Intel Core Ultra 5 125U, Graphics 4-Core
82786 MB/s
HP Pavilion Plus 16-ab0456tx
Intel Core i7-13700H, GeForce RTX 3050 6GB Laptop GPU
64356 MB/s -22%
Lenovo Yoga 7 16IRL8
Intel Core i7-1355U, Iris Xe G7 96EUs
62918 MB/s -24%
LG Gram 2in1 16 16T90R - G.AA78G
Intel Core i7-1360P, Iris Xe G7 96EUs
62716 MB/s -24%
Moyenne Intel Core Ultra 5 125U
  (36019 - 82786, n=2)
59403 MB/s -28%
Dell Inspiron 16 7635 2-in-1
AMD Ryzen 5 7530U, Vega 7
42853 MB/s -48%
AIDA64 / Memory Read
Samsung Galaxy Book4 Pro 16
Intel Core Ultra 7 155H, Arc 8-Core
90142 MB/s +43%
HP Pavilion Plus 16-ab0456tx
Intel Core i7-13700H, GeForce RTX 3050 6GB Laptop GPU
65825 MB/s +4%
Lenovo Yoga 7 2-in-1 16IML9
Intel Core Ultra 5 125U, Graphics 4-Core
63131 MB/s
Lenovo Yoga 7 16IRL8
Intel Core i7-1355U, Iris Xe G7 96EUs
58380 MB/s -8%
LG Gram 2in1 16 16T90R - G.AA78G
Intel Core i7-1360P, Iris Xe G7 96EUs
55798 MB/s -12%
Moyenne Intel Core Ultra 5 125U
  (38849 - 63131, n=2)
50990 MB/s -19%
Dell Inspiron 16 7635 2-in-1
AMD Ryzen 5 7530U, Vega 7
39517 MB/s -37%
AIDA64 / Memory Write
Lenovo Yoga 7 16IRL8
Intel Core i7-1355U, Iris Xe G7 96EUs
77448 MB/s +25%
HP Pavilion Plus 16-ab0456tx
Intel Core i7-13700H, GeForce RTX 3050 6GB Laptop GPU
76930 MB/s +24%
LG Gram 2in1 16 16T90R - G.AA78G
Intel Core i7-1360P, Iris Xe G7 96EUs
76173 MB/s +23%
Samsung Galaxy Book4 Pro 16
Intel Core Ultra 7 155H, Arc 8-Core
75823 MB/s +22%
Lenovo Yoga 7 2-in-1 16IML9
Intel Core Ultra 5 125U, Graphics 4-Core
62028 MB/s
Moyenne Intel Core Ultra 5 125U
  (37153 - 62028, n=2)
49591 MB/s -20%
Dell Inspiron 16 7635 2-in-1
AMD Ryzen 5 7530U, Vega 7
41838 MB/s -33%
AIDA64 / Memory Latency
Lenovo Yoga 7 2-in-1 16IML9
Intel Core Ultra 5 125U, Graphics 4-Core
149.8 ns *
Moyenne Intel Core Ultra 5 125U
  (125.5 - 149.8, n=2)
137.7 ns * +8%
Samsung Galaxy Book4 Pro 16
Intel Core Ultra 7 155H, Arc 8-Core
125.8 ns * +16%
LG Gram 2in1 16 16T90R - G.AA78G
Intel Core i7-1360P, Iris Xe G7 96EUs
109.8 ns * +27%
Dell Inspiron 16 7635 2-in-1
AMD Ryzen 5 7530U, Vega 7
109 ns * +27%
Lenovo Yoga 7 16IRL8
Intel Core i7-1355U, Iris Xe G7 96EUs
95.5 ns * +36%
HP Pavilion Plus 16-ab0456tx
Intel Core i7-13700H, GeForce RTX 3050 6GB Laptop GPU
89.7 ns * +40%

* ... Moindre est la valeur, meilleures sont les performances

Latence DPC

LatencyMon ne révèle aucun problème majeur de DPC ni de perte d'images pour une lecture vidéo 4K60 parfaite.

LatencyMon
LatencyMon
Liste des conducteurs
DPC Latencies / LatencyMon - interrupt to process latency (max), Web, Youtube, Prime95
LG Gram 2in1 16 16T90R - G.AA78G
Iris Xe G7 96EUs, i7-1360P, Samsung PM9A1 MZVL21T0HCLR
16478 μs * -2026%
HP Pavilion Plus 16-ab0456tx
GeForce RTX 3050 6GB Laptop GPU, i7-13700H, WDC PC SN810 1TB
5325.1 μs * -587%
Samsung Galaxy Book4 Pro 16
Arc 8-Core, Ultra 7 155H, Samsung PM9B1 512GB MZVL4512HBLU
1736.9 μs * -124%
Lenovo Yoga 7 16IRL8
Iris Xe G7 96EUs, i7-1355U, WD PC SN740 512GB SDDPMQD-512G-1101
877 μs * -13%
Lenovo Yoga 7 2-in-1 16IML9
Graphics 4-Core, Ultra 5 125U
775.1 μs *
Dell Inspiron 16 7635 2-in-1
Vega 7, R5 7530U, Kioxia BG5 KBG50ZNS512G
722.5 μs * +7%

* ... Moindre est la valeur, meilleures sont les performances

Dispositifs de stockage

Notre unité est livrée avec les éléments suivants SK Hynix HFS512GEJ4X112N alors que le modèle de l'année dernière était livré avec le Western Digital PC SN740. Malheureusement, le disque SK Hynix est légèrement plus lent et il présente même des problèmes de taux de transfert lorsqu'il est testé avec DiskSpd, comme le montre le graphique ci-dessous. Les courtes baisses de performances se produisent même après des tests répétés pour confirmer leur reproductibilité. Heureusement, ce problème n'a pas d'incidence sur l'utilisation quotidienne, mais il n'en est pas moins désagréable à constater.

CDM 8
CDM 8
AS SSD
AS SSD
Prise en charge d'un disque SSD M.2 2242
CDM 5/6 Read Seq Q32T1: 4608 MB/s
CDM 5/6 Write Seq Q32T1: 3118 MB/s
CDM 5/6 Read 4K Q32T1: 379.4 MB/s
CDM 5/6 Write 4K Q32T1: 201 MB/s
CDM 5 Read Seq: 2900 MB/s
CDM 5 Write Seq: 2201 MB/s
CDM 5/6 Read 4K: 62.45 MB/s
CDM 5/6 Write 4K: 65.84 MB/s
Drive Performance Rating - Percent
LG Gram 2in1 16 16T90R - G.AA78G
Samsung PM9A1 MZVL21T0HCLR
91.9 pt
HP Pavilion Plus 16-ab0456tx
WDC PC SN810 1TB
78.3 pt
Samsung Galaxy Book4 Pro 16
Samsung PM9B1 512GB MZVL4512HBLU
68.9 pt
Lenovo Yoga 7 16IRL8
WD PC SN740 512GB SDDPMQD-512G-1101
66.1 pt
Lenovo Yoga 7 2-in-1 16IML9
 
45 pt
Global Average -3
 
42.7 pt
Dell Inspiron 16 7635 2-in-1
Kioxia BG5 KBG50ZNS512G
41.7 pt
DiskSpd
seq read
HP Pavilion Plus 16-ab0456tx
WDC PC SN810 1TB
3726 (3653.9min - 3725.91max) MB/s +38%
Lenovo Yoga 7 16IRL8
WD PC SN740 512GB SDDPMQD-512G-1101
2942 (2917.56min - 2942.08max) MB/s +9%
LG Gram 2in1 16 16T90R - G.AA78G
Samsung PM9A1 MZVL21T0HCLR
2882 (2725.88min - 2882.22max) MB/s +7%
Lenovo Yoga 7 2-in-1 16IML9
 
2699 (2655.97min - 2699.09max) MB/s
Samsung Galaxy Book4 Pro 16
Samsung PM9B1 512GB MZVL4512HBLU
2652 (2626.88min - 2652.48max) MB/s -2%
Global Average -3
  (113.3 - 7045, n=1559)
2281 MB/s -15%
Dell Inspiron 16 7635 2-in-1
Kioxia BG5 KBG50ZNS512G
1724 (1710.37min - 1724.49max) MB/s -36%
seq write
HP Pavilion Plus 16-ab0456tx
WDC PC SN810 1TB
3695 (3332.75min - 3695.39max) MB/s +84%
LG Gram 2in1 16 16T90R - G.AA78G
Samsung PM9A1 MZVL21T0HCLR
3431 (3289.51min - 3431.36max) MB/s +71%
Lenovo Yoga 7 16IRL8
WD PC SN740 512GB SDDPMQD-512G-1101
3054 (3027.48min - 3054.47max) MB/s +52%
Samsung Galaxy Book4 Pro 16
Samsung PM9B1 512GB MZVL4512HBLU
2328 (2307.7min - 2328.26max) MB/s +16%
Global Average -3
  (43 - 9307, n=1559)
2309 MB/s +15%
Dell Inspiron 16 7635 2-in-1
Kioxia BG5 KBG50ZNS512G
2025 (1674.58min - 2025.43max) MB/s +1%
Lenovo Yoga 7 2-in-1 16IML9
 
2007 (1120.16min - 2006.74max) MB/s
seq q8 t1 read
HP Pavilion Plus 16-ab0456tx
WDC PC SN810 1TB
6674 (5476.76min - 6673.56max) MB/s +55%
LG Gram 2in1 16 16T90R - G.AA78G
Samsung PM9A1 MZVL21T0HCLR
6562 (5825.59min - 6561.57max) MB/s +52%
Lenovo Yoga 7 16IRL8
WD PC SN740 512GB SDDPMQD-512G-1101
4947 (4060.3min - 4947.18max) MB/s +15%
Lenovo Yoga 7 2-in-1 16IML9
 
4319 (3684.49min - 4319.04max) MB/s
Global Average -3
  (114.5 - 16089, n=1559)
3824 MB/s -11%
Samsung Galaxy Book4 Pro 16
Samsung PM9B1 512GB MZVL4512HBLU
3562 (3054.5min - 3562.01max) MB/s -18%
Dell Inspiron 16 7635 2-in-1
Kioxia BG5 KBG50ZNS512G
2129 (1793.69min - 2129.38max) MB/s -51%
seq q8 t1 write
HP Pavilion Plus 16-ab0456tx
WDC PC SN810 1TB
5256 (5149.35min - 5256.09max) MB/s +95%
LG Gram 2in1 16 16T90R - G.AA78G
Samsung PM9A1 MZVL21T0HCLR
4947 (4921.79min - 4946.59max) MB/s +84%
Lenovo Yoga 7 16IRL8
WD PC SN740 512GB SDDPMQD-512G-1101
3548 (3383.07min - 3547.61max) MB/s +32%
Global Average -3
  (46.7 - 14571, n=1559)
2862 MB/s +6%
Dell Inspiron 16 7635 2-in-1
Kioxia BG5 KBG50ZNS512G
2718 (421.94min - 2718.14max) MB/s +1%
Lenovo Yoga 7 2-in-1 16IML9
 
2692 (2518.05min - 2692.39max) MB/s
Samsung Galaxy Book4 Pro 16
Samsung PM9B1 512GB MZVL4512HBLU
2344 (1404.04min - 2343.99max) MB/s -13%
4k q1 t1 read
LG Gram 2in1 16 16T90R - G.AA78G
Samsung PM9A1 MZVL21T0HCLR
81.6 (74.82min - 81.55max) MB/s +92%
Samsung Galaxy Book4 Pro 16
Samsung PM9B1 512GB MZVL4512HBLU
80.8 (80.01min - 80.76max) MB/s +91%
Lenovo Yoga 7 16IRL8
WD PC SN740 512GB SDDPMQD-512G-1101
71.3 (68.49min - 71.32max) MB/s +68%
HP Pavilion Plus 16-ab0456tx
WDC PC SN810 1TB
71.1 (69.82min - 71.06max) MB/s +68%
Global Average -3
  (0.67 - 361, n=1559)
58.2 MB/s +37%
Dell Inspiron 16 7635 2-in-1
Kioxia BG5 KBG50ZNS512G
47.4 (45.51min - 47.39max) MB/s +12%
Lenovo Yoga 7 2-in-1 16IML9
 
42.4 (41.92min - 42.35max) MB/s
4k q1 t1 write
LG Gram 2in1 16 16T90R - G.AA78G
Samsung PM9A1 MZVL21T0HCLR
226 (219.95min - 225.84max) MB/s +245%
Samsung Galaxy Book4 Pro 16
Samsung PM9B1 512GB MZVL4512HBLU
190.9 (186.79min - 190.93max) MB/s +191%
Global Average -3
  (1.23 - 435, n=1558)
165.1 MB/s +152%
HP Pavilion Plus 16-ab0456tx
WDC PC SN810 1TB
162.5 (153.64min - 162.52max) MB/s +148%
Lenovo Yoga 7 16IRL8
WD PC SN740 512GB SDDPMQD-512G-1101
151.3 (143.2min - 151.32max) MB/s +131%
Dell Inspiron 16 7635 2-in-1
Kioxia BG5 KBG50ZNS512G
104.3 (96.19min - 104.26max) MB/s +59%
Lenovo Yoga 7 2-in-1 16IML9
 
65.6 (57.11min - 65.62max) MB/s
4k q32 t16 read
LG Gram 2in1 16 16T90R - G.AA78G
Samsung PM9A1 MZVL21T0HCLR
3881 (3853min - 3881.23max) MB/s +539%
Samsung Galaxy Book4 Pro 16
Samsung PM9B1 512GB MZVL4512HBLU
1821 (1804.4min - 1821.4max) MB/s +200%
Global Average -3
  (1.03 - 6172, n=1558)
1391 MB/s +129%
HP Pavilion Plus 16-ab0456tx
WDC PC SN810 1TB
890 (816.66min - 890.41max) MB/s +47%
Lenovo Yoga 7 16IRL8
WD PC SN740 512GB SDDPMQD-512G-1101
795 (763.75min - 794.53max) MB/s +31%
Dell Inspiron 16 7635 2-in-1
Kioxia BG5 KBG50ZNS512G
687 (664.05min - 686.61max) MB/s +13%
Lenovo Yoga 7 2-in-1 16IML9
 
607 (582.45min - 607.33max) MB/s
4k q32 t16 write
LG Gram 2in1 16 16T90R - G.AA78G
Samsung PM9A1 MZVL21T0HCLR
3537 (3009.8min - 3536.52max) MB/s +1019%
Samsung Galaxy Book4 Pro 16
Samsung PM9B1 512GB MZVL4512HBLU
1643 (1597.74min - 1643.45max) MB/s +420%
Global Average -3
  (1.5 - 5015, n=1558)
1205 MB/s +281%
HP Pavilion Plus 16-ab0456tx
WDC PC SN810 1TB
471 (443.18min - 471.38max) MB/s +49%
Lenovo Yoga 7 16IRL8
WD PC SN740 512GB SDDPMQD-512G-1101
423 (381.07min - 423.49max) MB/s +34%
Dell Inspiron 16 7635 2-in-1
Kioxia BG5 KBG50ZNS512G
342 (305min - 341.74max) MB/s +8%
Lenovo Yoga 7 2-in-1 16IML9
 
316 (305.01min - 315.67max) MB/s
AS SSD
Score Total
LG Gram 2in1 16 16T90R - G.AA78G
Samsung PM9A1 MZVL21T0HCLR
6136 Points +137%
HP Pavilion Plus 16-ab0456tx
WDC PC SN810 1TB
4977 Points +92%
Samsung Galaxy Book4 Pro 16
Samsung PM9B1 512GB MZVL4512HBLU
4643 Points +79%
Lenovo Yoga 7 16IRL8
WD PC SN740 512GB SDDPMQD-512G-1101
3865 Points +49%
Global Average -3
  (19 - 13854, n=3234)
2780 Points +7%
Lenovo Yoga 7 2-in-1 16IML9
 
2591 Points
Dell Inspiron 16 7635 2-in-1
Kioxia BG5 KBG50ZNS512G
1924 Points -26%
Score Read
LG Gram 2in1 16 16T90R - G.AA78G
Samsung PM9A1 MZVL21T0HCLR
2943 Points +179%
Samsung Galaxy Book4 Pro 16
Samsung PM9B1 512GB MZVL4512HBLU
1795 Points +70%
HP Pavilion Plus 16-ab0456tx
WDC PC SN810 1TB
1346 Points +28%
Lenovo Yoga 7 16IRL8
WD PC SN740 512GB SDDPMQD-512G-1101
1255 Points +19%
Global Average -3
  (6 - 26650, n=3235)
1088 Points +3%
Lenovo Yoga 7 2-in-1 16IML9
 
1054 Points
Dell Inspiron 16 7635 2-in-1
Kioxia BG5 KBG50ZNS512G
933 Points -11%
Score Write
HP Pavilion Plus 16-ab0456tx
WDC PC SN810 1TB
3040 Points +169%
Lenovo Yoga 7 16IRL8
WD PC SN740 512GB SDDPMQD-512G-1101
2034 Points +80%
Samsung Galaxy Book4 Pro 16
Samsung PM9B1 512GB MZVL4512HBLU
1962 Points +73%
LG Gram 2in1 16 16T90R - G.AA78G
Samsung PM9A1 MZVL21T0HCLR
1731 Points +53%
Global Average -3
  (4 - 7208, n=3235)
1176 Points +4%
Lenovo Yoga 7 2-in-1 16IML9
 
1131 Points
Dell Inspiron 16 7635 2-in-1
Kioxia BG5 KBG50ZNS512G
573 Points -49%
Seq Read
LG Gram 2in1 16 16T90R - G.AA78G
Samsung PM9A1 MZVL21T0HCLR
4943.25 MB/s +33%
HP Pavilion Plus 16-ab0456tx
WDC PC SN810 1TB
4834.58 MB/s +30%
Lenovo Yoga 7 16IRL8
WD PC SN740 512GB SDDPMQD-512G-1101
4139.39 MB/s +11%
Lenovo Yoga 7 2-in-1 16IML9
 
3724.94 MB/s
Samsung Galaxy Book4 Pro 16
Samsung PM9B1 512GB MZVL4512HBLU
3189 MB/s -14%
Dell Inspiron 16 7635 2-in-1
Kioxia BG5 KBG50ZNS512G
2689.62 MB/s -28%
Global Average -3
  (226 - 12763, n=3451)
1856 MB/s -50%
Seq Write
LG Gram 2in1 16 16T90R - G.AA78G
Samsung PM9A1 MZVL21T0HCLR
3967.06 MB/s +350%
HP Pavilion Plus 16-ab0456tx
WDC PC SN810 1TB
2527.26 MB/s +187%
Lenovo Yoga 7 16IRL8
WD PC SN740 512GB SDDPMQD-512G-1101
2462.4 MB/s +179%
Samsung Galaxy Book4 Pro 16
Samsung PM9B1 512GB MZVL4512HBLU
2260 MB/s +157%
Dell Inspiron 16 7635 2-in-1
Kioxia BG5 KBG50ZNS512G
1273.97 MB/s +45%
Global Average -3
  (52.2 - 11316, n=3454)
1245 MB/s +41%
Lenovo Yoga 7 2-in-1 16IML9
 
881.04 MB/s
4K Read
LG Gram 2in1 16 16T90R - G.AA78G
Samsung PM9A1 MZVL21T0HCLR
78.02 MB/s +85%
Samsung Galaxy Book4 Pro 16
Samsung PM9B1 512GB MZVL4512HBLU
69.8 MB/s +66%
HP Pavilion Plus 16-ab0456tx
WDC PC SN810 1TB
66.24 MB/s +57%
Lenovo Yoga 7 16IRL8
WD PC SN740 512GB SDDPMQD-512G-1101
63.93 MB/s +52%
Dell Inspiron 16 7635 2-in-1
Kioxia BG5 KBG50ZNS512G
45.37 MB/s +8%
Lenovo Yoga 7 2-in-1 16IML9
 
42.06 MB/s
Global Average -3
  (6.08 - 314, n=3444)
41.2 MB/s -2%
4K Write
HP Pavilion Plus 16-ab0456tx
WDC PC SN810 1TB
215.02 MB/s +45%
Lenovo Yoga 7 16IRL8
WD PC SN740 512GB SDDPMQD-512G-1101
205.1 MB/s +38%
LG Gram 2in1 16 16T90R - G.AA78G
Samsung PM9A1 MZVL21T0HCLR
196.81 MB/s +33%
Samsung Galaxy Book4 Pro 16
Samsung PM9B1 512GB MZVL4512HBLU
168.8 MB/s +14%
Lenovo Yoga 7 2-in-1 16IML9
 
148.14 MB/s
Dell Inspiron 16 7635 2-in-1
Kioxia BG5 KBG50ZNS512G
111.85 MB/s -24%
Global Average -3
  (13.5 - 512, n=3444)
109.1 MB/s -26%
4K-64 Read
LG Gram 2in1 16 16T90R - G.AA78G
Samsung PM9A1 MZVL21T0HCLR
2370.92 MB/s +271%
Samsung Galaxy Book4 Pro 16
Samsung PM9B1 512GB MZVL4512HBLU
1407 MB/s +120%
Global Average -3
  (13.1 - 3475, n=3443)
800 MB/s +25%
HP Pavilion Plus 16-ab0456tx
WDC PC SN810 1TB
796.27 MB/s +24%
Lenovo Yoga 7 16IRL8
WD PC SN740 512GB SDDPMQD-512G-1101
777.37 MB/s +22%
Lenovo Yoga 7 2-in-1 16IML9
 
639.81 MB/s
Dell Inspiron 16 7635 2-in-1
Kioxia BG5 KBG50ZNS512G
618.54 MB/s -3%
4K-64 Write
HP Pavilion Plus 16-ab0456tx
WDC PC SN810 1TB
2572.5 MB/s +188%
Lenovo Yoga 7 16IRL8
WD PC SN740 512GB SDDPMQD-512G-1101
1582.9 MB/s +77%
Samsung Galaxy Book4 Pro 16
Samsung PM9B1 512GB MZVL4512HBLU
1567 MB/s +75%
LG Gram 2in1 16 16T90R - G.AA78G
Samsung PM9A1 MZVL21T0HCLR
1137.26 MB/s +27%
Lenovo Yoga 7 2-in-1 16IML9
 
894.74 MB/s
Global Average -3
  (13.7 - 5909, n=3441)
881 MB/s -2%
Dell Inspiron 16 7635 2-in-1
Kioxia BG5 KBG50ZNS512G
333.93 MB/s -63%
Access Time Read
Global Average -3
  (0.012 - 33, n=3375)
0.653 ms * -418%
Dell Inspiron 16 7635 2-in-1
Kioxia BG5 KBG50ZNS512G
0.129 ms * -2%
Lenovo Yoga 7 2-in-1 16IML9
 
0.126 ms *
Lenovo Yoga 7 16IRL8
WD PC SN740 512GB SDDPMQD-512G-1101
0.078 ms * +38%
HP Pavilion Plus 16-ab0456tx
WDC PC SN810 1TB
0.074 ms * +41%
Samsung Galaxy Book4 Pro 16
Samsung PM9B1 512GB MZVL4512HBLU
0.033 ms * +74%
LG Gram 2in1 16 16T90R - G.AA78G
Samsung PM9A1 MZVL21T0HCLR
0.028 ms * +78%
Access Time Write
Global Average -3
  (0.011 - 60.7, n=3417)
0.557 ms * -42%
Lenovo Yoga 7 2-in-1 16IML9
 
0.393 ms *
Dell Inspiron 16 7635 2-in-1
Kioxia BG5 KBG50ZNS512G
0.122 ms * +69%
Lenovo Yoga 7 16IRL8
WD PC SN740 512GB SDDPMQD-512G-1101
0.064 ms * +84%
Samsung Galaxy Book4 Pro 16
Samsung PM9B1 512GB MZVL4512HBLU
0.032 ms * +92%
LG Gram 2in1 16 16T90R - G.AA78G
Samsung PM9A1 MZVL21T0HCLR
0.023 ms * +94%
HP Pavilion Plus 16-ab0456tx
WDC PC SN810 1TB
0.016 ms * +96%

* ... Moindre est la valeur, meilleures sont les performances

Disk Throttling: DiskSpd Read Loop, Queue Depth 8

02505007501000125015001750200022502500275030003250350037504000425045004750Tooltip
Lenovo Yoga 7 2-in-1 16IML9  ; diskspd 2.0.17 f: Ø4697 (118.46-4984.09)
Lenovo Yoga 7 16IRL8 WD PC SN740 512GB SDDPMQD-512G-1101: Ø4933 (4129.92-4955.57)

Performance du GPU

Comme mentionné dans notre Yoga Book 9 le système arc 4 intégré intégrée a des performances presque identiques à celles de l'ancienne Iris Xe 96 EU tout en étant supérieur à l Iris Xe 80 EUs d'environ 30 %. Seule la série Série Arc 8 peut fournir une augmentation plus importante des performances d'une année sur l'autre, mais cette option n'est disponible qu'avec les processeurs Core Ultra-H ; le Yoga 7 2-en-1 16IML9 n'est livré qu'avec des processeurs Core Ultra-U.

Profil de puissanceScore graphiqueScore physiqueScore combiné
Mode Performance4786196721816
Mode équilibré4568 (-5%)194301778
Alimentation par batterie4870197061709

L'utilisation du mode équilibré ou de la batterie n'entraîne pas de déficit de performance majeur, comme le montre notre tableau de résultats Fire Strike ci-dessus.

3DMark 11
3DMark 11
Time Spy
Time Spy
Fire Strike
Fire Strike
Fire Strike Ultra
Fire Strike Ultra
3DMark Performance Rating - Percent
Lenovo Yoga Pro 9 16IMH9 -1!
NVIDIA GeForce RTX 4070 Laptop GPU, Intel Core Ultra 9 185H
100 pt
HP Pavilion Plus 16-ab0456tx -1!
NVIDIA GeForce RTX 3050 6GB Laptop GPU, Intel Core i7-13700H
60.5 pt
Lenovo ThinkPad Z16 Gen 2 -1!
AMD Radeon RX 6550M, AMD Ryzen 9 PRO 7940HS
45.1 pt
Acer Swift X SFX16-52G-52VE
Intel Arc A370M, Intel Core i5-1240P
32.6 pt
Samsung Galaxy Book4 Pro 16 -1!
Intel Arc 8-Core iGPU, Intel Core Ultra 7 155H
28.9 pt
Lenovo IdeaPad 5 Pro 16IHU6
NVIDIA GeForce MX450, Intel Core i5-11300H
26.8 pt
LG Gram 2in1 16 16T90R - G.AA78G
Intel Iris Xe Graphics G7 96EUs, Intel Core i7-1360P
23.4 pt
LG Gram 16 2-in-1 16T90P
Intel Iris Xe Graphics G7 96EUs, Intel Core i7-1165G7
22.7 pt
Moyenne Intel Graphics 4-Cores iGPU (Arc)
 
21.5 pt
Lenovo Yoga 7 2-in-1 16IML9
Intel Graphics 4-Cores iGPU (Arc), Intel Core Ultra 5 125U
20.9 pt
HP Spectre x360 2-in-1 16-f1075ng
Intel Iris Xe Graphics G7 96EUs, Intel Core i7-12700H
19.1 pt
Lenovo ThinkPad E16 G1 Core i5-1335U
Intel Iris Xe Graphics G7 80EUs, Intel Core i5-1335U
16.5 pt
Lenovo Thinkpad X1 Fold 16
Intel Iris Xe Graphics G7 96EUs, Intel Core i7-1250U
15.9 pt
Lenovo Yoga 7 16IRL8 -1!
Intel Iris Xe Graphics G7 96EUs, Intel Core i7-1355U
15.6 pt
Lenovo IdeaPad Flex 5 16ABR G8 -1!
AMD Radeon RX Vega 8 (Ryzen 4000/5000), AMD Ryzen 7 7730U
13.5 pt
Dell Inspiron 16 7635 2-in-1 -1!
AMD Radeon RX Vega 7, AMD Ryzen 5 7530U
12.8 pt
3DMark 11 - 1280x720 Performance GPU
Lenovo Yoga Pro 9 16IMH9
NVIDIA GeForce RTX 4070 Laptop GPU, Intel Core Ultra 9 185H
40646 Points +506%
Lenovo ThinkPad Z16 Gen 2
AMD Radeon RX 6550M, AMD Ryzen 9 PRO 7940HS
20506 Points +206%
HP Pavilion Plus 16-ab0456tx
NVIDIA GeForce RTX 3050 6GB Laptop GPU, Intel Core i7-13700H
17421 Points +160%
Samsung Galaxy Book4 Pro 16
Intel Arc 8-Core iGPU, Intel Core Ultra 7 155H
12099 Points +80%
Acer Swift X SFX16-52G-52VE
Intel Arc A370M, Intel Core i5-1240P
11748 Points +75%
Lenovo IdeaPad 5 Pro 16IHU6
NVIDIA GeForce MX450, Intel Core i5-11300H
9580 Points +43%
LG Gram 2in1 16 16T90R - G.AA78G
Intel Iris Xe Graphics G7 96EUs, Intel Core i7-1360P
7098 Points +6%
LG Gram 16 2-in-1 16T90P
Intel Iris Xe Graphics G7 96EUs, Intel Core i7-1165G7
6939 Points +3%
Lenovo Yoga 7 2-in-1 16IML9
Intel Graphics 4-Cores iGPU (Arc), Intel Core Ultra 5 125U
6711 Points
Moyenne Intel Graphics 4-Cores iGPU (Arc)
  (6007 - 7055, n=4)
6629 Points -1%
HP Spectre x360 2-in-1 16-f1075ng
Intel Iris Xe Graphics G7 96EUs, Intel Core i7-12700H
6582 Points -2%
Lenovo IdeaPad Flex 5 16ABR G8
AMD Radeon RX Vega 8 (Ryzen 4000/5000), AMD Ryzen 7 7730U
6556 Points -2%
Lenovo Yoga 7 16IRL8
Intel Iris Xe Graphics G7 96EUs, Intel Core i7-1355U
6430 Points -4%
Dell Inspiron 16 7635 2-in-1
AMD Radeon RX Vega 7, AMD Ryzen 5 7530U
6249 Points -7%
Lenovo ThinkPad E16 G1 Core i5-1335U
Intel Iris Xe Graphics G7 80EUs, Intel Core i5-1335U
5160 Points -23%
Lenovo Thinkpad X1 Fold 16
Intel Iris Xe Graphics G7 96EUs, Intel Core i7-1250U
4817 Points -28%
3DMark
1280x720 Cloud Gate Standard Graphics
HP Pavilion Plus 16-ab0456tx
NVIDIA GeForce RTX 3050 6GB Laptop GPU, Intel Core i7-13700H
72486 Points +165%
Acer Swift X SFX16-52G-52VE
Intel Arc A370M, Intel Core i5-1240P
35604 Points +30%
Lenovo IdeaPad 5 Pro 16IHU6
NVIDIA GeForce MX450, Intel Core i5-11300H
33806 Points +24%
LG Gram 2in1 16 16T90R - G.AA78G
Intel Iris Xe Graphics G7 96EUs, Intel Core i7-1360P
31618 Points +16%
LG Gram 16 2-in-1 16T90P
Intel Iris Xe Graphics G7 96EUs, Intel Core i7-1165G7
30255 Points +11%
Moyenne Intel Graphics 4-Cores iGPU (Arc)
  (25786 - 30198, n=4)
28204 Points +3%
Lenovo Yoga 7 2-in-1 16IML9
Intel Graphics 4-Cores iGPU (Arc), Intel Core Ultra 5 125U
27316 Points
HP Spectre x360 2-in-1 16-f1075ng
Intel Iris Xe Graphics G7 96EUs, Intel Core i7-12700H
24123 Points -12%
Lenovo ThinkPad E16 G1 Core i5-1335U
Intel Iris Xe Graphics G7 80EUs, Intel Core i5-1335U
23328 Points -15%
Lenovo Thinkpad X1 Fold 16
Intel Iris Xe Graphics G7 96EUs, Intel Core i7-1250U
20456 Points -25%
1920x1080 Fire Strike Graphics
Lenovo Yoga Pro 9 16IMH9
NVIDIA GeForce RTX 4070 Laptop GPU, Intel Core Ultra 9 185H
30874 Points +545%
Lenovo ThinkPad Z16 Gen 2
AMD Radeon RX 6550M, AMD Ryzen 9 PRO 7940HS
14696 Points +207%
HP Pavilion Plus 16-ab0456tx
NVIDIA GeForce RTX 3050 6GB Laptop GPU, Intel Core i7-13700H
11960 Points +150%
Samsung Galaxy Book4 Pro 16
Intel Arc 8-Core iGPU, Intel Core Ultra 7 155H
8886 Points +86%
Acer Swift X SFX16-52G-52VE
Intel Arc A370M, Intel Core i5-1240P
8149 Points +70%
LG Gram 2in1 16 16T90R - G.AA78G
Intel Iris Xe Graphics G7 96EUs, Intel Core i7-1360P
5779 Points +21%
LG Gram 16 2-in-1 16T90P
Intel Iris Xe Graphics G7 96EUs, Intel Core i7-1165G7
5725 Points +20%
Lenovo IdeaPad 5 Pro 16IHU6
NVIDIA GeForce MX450, Intel Core i5-11300H
5573 Points +16%
Lenovo Yoga 7 16IRL8
Intel Iris Xe Graphics G7 96EUs, Intel Core i7-1355U
5419 Points +13%
Moyenne Intel Graphics 4-Cores iGPU (Arc)
  (4284 - 5468, n=4)
4982 Points +4%
Lenovo Yoga 7 2-in-1 16IML9
Intel Graphics 4-Cores iGPU (Arc), Intel Core Ultra 5 125U
4786 Points
HP Spectre x360 2-in-1 16-f1075ng
Intel Iris Xe Graphics G7 96EUs, Intel Core i7-12700H
4629 Points -3%
Lenovo Thinkpad X1 Fold 16
Intel Iris Xe Graphics G7 96EUs, Intel Core i7-1250U
4186 Points -13%
Lenovo IdeaPad Flex 5 16ABR G8
AMD Radeon RX Vega 8 (Ryzen 4000/5000), AMD Ryzen 7 7730U
4159 Points -13%
Dell Inspiron 16 7635 2-in-1
AMD Radeon RX Vega 7, AMD Ryzen 5 7530U
3996 Points -17%
Lenovo ThinkPad E16 G1 Core i5-1335U
Intel Iris Xe Graphics G7 80EUs, Intel Core i5-1335U
3596 Points -25%
2560x1440 Time Spy Graphics
Lenovo Yoga Pro 9 16IMH9
NVIDIA GeForce RTX 4070 Laptop GPU, Intel Core Ultra 9 185H
12181 Points +615%
Lenovo ThinkPad Z16 Gen 2
AMD Radeon RX 6550M, AMD Ryzen 9 PRO 7940HS
4546 Points +167%
Samsung Galaxy Book4 Pro 16
Intel Arc 8-Core iGPU, Intel Core Ultra 7 155H
3426 Points +101%
Acer Swift X SFX16-52G-52VE
Intel Arc A370M, Intel Core i5-1240P
3167 Points +86%
Lenovo IdeaPad 5 Pro 16IHU6
NVIDIA GeForce MX450, Intel Core i5-11300H
2300 Points +35%
Moyenne Intel Graphics 4-Cores iGPU (Arc)
  (1668 - 2067, n=4)
1788 Points +5%
Lenovo Yoga 7 2-in-1 16IML9
Intel Graphics 4-Cores iGPU (Arc), Intel Core Ultra 5 125U
1704 Points
LG Gram 2in1 16 16T90R - G.AA78G
Intel Iris Xe Graphics G7 96EUs, Intel Core i7-1360P
1662 Points -2%
LG Gram 16 2-in-1 16T90P
Intel Iris Xe Graphics G7 96EUs, Intel Core i7-1165G7
1631 Points -4%
Lenovo Yoga 7 16IRL8
Intel Iris Xe Graphics G7 96EUs, Intel Core i7-1355U
1628 Points -4%
HP Spectre x360 2-in-1 16-f1075ng
Intel Iris Xe Graphics G7 96EUs, Intel Core i7-12700H
1444 Points -15%
Lenovo IdeaPad Flex 5 16ABR G8
AMD Radeon RX Vega 8 (Ryzen 4000/5000), AMD Ryzen 7 7730U
1330 Points -22%
Dell Inspiron 16 7635 2-in-1
AMD Radeon RX Vega 7, AMD Ryzen 5 7530U
1245 Points -27%
Lenovo Thinkpad X1 Fold 16
Intel Iris Xe Graphics G7 96EUs, Intel Core i7-1250U
1209 Points -29%
Lenovo ThinkPad E16 G1 Core i5-1335U
Intel Iris Xe Graphics G7 80EUs, Intel Core i5-1335U
1150 Points -33%
3DMark 11 Performance
7264 points
3DMark Cloud Gate Standard Score
21927 points
3DMark Fire Strike Score
4557 points
3DMark Time Spy Score
1919 points
Aide
Blender
v3.3 Classroom HIP/AMD
Dell Inspiron 16 7635 2-in-1
AMD Radeon RX Vega 7, AMD Ryzen 5 7530U
622 Seconds *
Lenovo IdeaPad Flex 5 16ABR G8
AMD Radeon RX Vega 8 (Ryzen 4000/5000), AMD Ryzen 7 7730U
612 Seconds *
v3.3 Classroom OPTIX/RTX
HP Pavilion Plus 16-ab0456tx
NVIDIA GeForce RTX 3050 6GB Laptop GPU, Intel Core i7-13700H
68 Seconds *
Lenovo Yoga Pro 9 16IMH9
NVIDIA GeForce RTX 4070 Laptop GPU, Intel Core Ultra 9 185H
19 Seconds *
v3.3 Classroom CUDA
HP Pavilion Plus 16-ab0456tx
NVIDIA GeForce RTX 3050 6GB Laptop GPU, Intel Core i7-13700H
107 Seconds *
Lenovo Yoga Pro 9 16IMH9
NVIDIA GeForce RTX 4070 Laptop GPU, Intel Core Ultra 9 185H
32 Seconds *
v3.3 Classroom CPU
Lenovo Thinkpad X1 Fold 16
Intel Iris Xe Graphics G7 96EUs, Intel Core i7-1250U
1001 Seconds * -54%
Lenovo Yoga 7 16IRL8
Intel Iris Xe Graphics G7 96EUs, Intel Core i7-1355U
664 Seconds * -2%
Lenovo Yoga 7 2-in-1 16IML9
Intel Graphics 4-Cores iGPU (Arc), Intel Core Ultra 5 125U
648 Seconds *
Dell Inspiron 16 7635 2-in-1
AMD Radeon RX Vega 7, AMD Ryzen 5 7530U
646 Seconds * -0%
Moyenne Intel Graphics 4-Cores iGPU (Arc)
  (592 - 649, n=4)
632 Seconds * +2%
LG Gram 2in1 16 16T90R - G.AA78G
Intel Iris Xe Graphics G7 96EUs, Intel Core i7-1360P
607 Seconds * +6%
Acer Swift X SFX16-52G-52VE
Intel Arc A370M, Intel Core i5-1240P
552 Seconds * +15%
Lenovo IdeaPad Flex 5 16ABR G8
AMD Radeon RX Vega 8 (Ryzen 4000/5000), AMD Ryzen 7 7730U
488 Seconds * +25%
HP Spectre x360 2-in-1 16-f1075ng
Intel Iris Xe Graphics G7 96EUs, Intel Core i7-12700H
487 Seconds * +25%
Samsung Galaxy Book4 Pro 16
Intel Arc 8-Core iGPU, Intel Core Ultra 7 155H
412 Seconds * +36%
HP Pavilion Plus 16-ab0456tx
NVIDIA GeForce RTX 3050 6GB Laptop GPU, Intel Core i7-13700H
384 Seconds * +41%
Lenovo ThinkPad Z16 Gen 2
AMD Radeon RX 6550M, AMD Ryzen 9 PRO 7940HS
305 Seconds * +53%
Lenovo Yoga Pro 9 16IMH9
NVIDIA GeForce RTX 4070 Laptop GPU, Intel Core Ultra 9 185H
285 Seconds * +56%

* ... Moindre est la valeur, meilleures sont les performances

Performance Rating - Percent
HP Pavilion Plus 16-ab0456tx
Intel Core i7-13700H, NVIDIA GeForce RTX 3050 6GB Laptop GPU
100 pt
Samsung Galaxy Book4 Pro 16
Intel Core Ultra 7 155H, Intel Arc 8-Core iGPU
49.8 pt
Lenovo Yoga 7 16IRL8 -1!
Intel Core i7-1355U, Intel Iris Xe Graphics G7 96EUs
38.9 pt
LG Gram 2in1 16 16T90R - G.AA78G
Intel Core i7-1360P, Intel Iris Xe Graphics G7 96EUs
37.8 pt
Lenovo Yoga 7 2-in-1 16IML9
Intel Core Ultra 5 125U, Intel Graphics 4-Cores iGPU (Arc)
34.4 pt
Dell Inspiron 16 7635 2-in-1
AMD Ryzen 5 7530U, AMD Radeon RX Vega 7
31.4 pt
The Witcher 3 - 1920x1080 Ultra Graphics & Postprocessing (HBAO+)
HP Pavilion Plus 16-ab0456tx
Intel Core i7-13700H, NVIDIA GeForce RTX 3050 6GB Laptop GPU
50.1 (45min, 45P1) fps +234%
Samsung Galaxy Book4 Pro 16
Intel Core Ultra 7 155H, Intel Arc 8-Core iGPU
23.1 (12min, 21P1) fps +54%
Dell Inspiron 16 7635 2-in-1
AMD Ryzen 5 7530U, AMD Radeon RX Vega 7
15.7 (14min) fps +5%
Lenovo Yoga 7 16IRL8
Intel Core i7-1355U, Intel Iris Xe Graphics G7 96EUs
15.6 (14min) fps +4%
Lenovo Yoga 7 2-in-1 16IML9
Intel Core Ultra 5 125U, Intel Graphics 4-Cores iGPU (Arc)
15 (11min) fps
LG Gram 2in1 16 16T90R - G.AA78G
Intel Core i7-1360P, Intel Iris Xe Graphics G7 96EUs
13.9 (13min, 13P1) fps -7%
Final Fantasy XV Benchmark - 1920x1080 High Quality
HP Pavilion Plus 16-ab0456tx
Intel Core i7-13700H, NVIDIA GeForce RTX 3050 6GB Laptop GPU
52 fps +219%
Samsung Galaxy Book4 Pro 16
Intel Core Ultra 7 155H, Intel Arc 8-Core iGPU
24.4 fps +50%
Lenovo Yoga 7 16IRL8
Intel Core i7-1355U, Intel Iris Xe Graphics G7 96EUs
17.5 fps +7%
LG Gram 2in1 16 16T90R - G.AA78G
Intel Core i7-1360P, Intel Iris Xe Graphics G7 96EUs
17.2 fps +6%
Lenovo Yoga 7 2-in-1 16IML9
Intel Core Ultra 5 125U, Intel Graphics 4-Cores iGPU (Arc)
16.3 fps
Dell Inspiron 16 7635 2-in-1
AMD Ryzen 5 7530U, AMD Radeon RX Vega 7
12.9 fps -21%
Strange Brigade - 1920x1080 ultra AA:ultra AF:16
HP Pavilion Plus 16-ab0456tx
Intel Core i7-13700H, NVIDIA GeForce RTX 3050 6GB Laptop GPU
80.5 (56.9min, 62P1) fps +167%
Samsung Galaxy Book4 Pro 16
Intel Core Ultra 7 155H, Intel Arc 8-Core iGPU
47 fps +56%
Lenovo Yoga 7 2-in-1 16IML9
Intel Core Ultra 5 125U, Intel Graphics 4-Cores iGPU (Arc)
30.2 (7.6min, 10.6P1) fps
LG Gram 2in1 16 16T90R - G.AA78G
Intel Core i7-1360P, Intel Iris Xe Graphics G7 96EUs
28.5 (5.7min, 7.83P1) fps -6%
Dell Inspiron 16 7635 2-in-1
AMD Ryzen 5 7530U, AMD Radeon RX Vega 7
23.2 (7.3min, 9.35P1) fps -23%
Dota 2 Reborn - 1920x1080 ultra (3/3) best looking
HP Pavilion Plus 16-ab0456tx
Intel Core i7-13700H, NVIDIA GeForce RTX 3050 6GB Laptop GPU
116.9 (102.4min) fps +103%
Samsung Galaxy Book4 Pro 16
Intel Core Ultra 7 155H, Intel Arc 8-Core iGPU
73.6 (51.1min) fps +28%
LG Gram 2in1 16 16T90R - G.AA78G
Intel Core i7-1360P, Intel Iris Xe Graphics G7 96EUs
62.9 (53.2min) fps +9%
Lenovo Yoga 7 16IRL8
Intel Core i7-1355U, Intel Iris Xe Graphics G7 96EUs
59.8 (50.7min) fps +4%
Lenovo Yoga 7 2-in-1 16IML9
Intel Core Ultra 5 125U, Intel Graphics 4-Cores iGPU (Arc)
57.6 (37.5min) fps
Dell Inspiron 16 7635 2-in-1
AMD Ryzen 5 7530U, AMD Radeon RX Vega 7
52.4 (46.9min) fps -9%
X-Plane 11.11 - 1920x1080 high (fps_test=3)
HP Pavilion Plus 16-ab0456tx
Intel Core i7-13700H, NVIDIA GeForce RTX 3050 6GB Laptop GPU
97.3 fps +316%
Lenovo Yoga 7 16IRL8
Intel Core i7-1355U, Intel Iris Xe Graphics G7 96EUs
38.5 fps +65%
LG Gram 2in1 16 16T90R - G.AA78G
Intel Core i7-1360P, Intel Iris Xe Graphics G7 96EUs
37.95 fps +62%
Samsung Galaxy Book4 Pro 16
Intel Core Ultra 7 155H, Intel Arc 8-Core iGPU
33.5 fps +43%
Dell Inspiron 16 7635 2-in-1
AMD Ryzen 5 7530U, AMD Radeon RX Vega 7
26.3 fps +12%
Lenovo Yoga 7 2-in-1 16IML9
Intel Core Ultra 5 125U, Intel Graphics 4-Cores iGPU (Arc)
23.4 fps
F1 22
1280x720 Ultra Low Preset AA:T AF:16x
Lenovo ThinkPad Z16 Gen 2
AMD Ryzen 9 PRO 7940HS, AMD Radeon RX 6550M
255 (191min, 167P1) fps +299%
HP Pavilion Plus 16-ab0456tx
Intel Core i7-13700H, NVIDIA GeForce RTX 3050 6GB Laptop GPU
228 (183min, 130P1) fps +257%
Lenovo Yoga 7 16IRL8
Intel Core i7-1355U, Intel Iris Xe Graphics G7 96EUs
84.7 (57min, 63P1) fps +33%
HP Spectre x360 2-in-1 16-f1075ng
Intel Core i7-12700H, Intel Iris Xe Graphics G7 96EUs
69.9 (57min, 54P1) fps +9%
Dell Inspiron 16 7635 2-in-1
AMD Ryzen 5 7530U, AMD Radeon RX Vega 7
69.2 (56min, 56P1) fps +8%
Moyenne Intel Graphics 4-Cores iGPU (Arc)
  (60.6 - 77.2, n=4)
66.4 fps +4%
Lenovo Yoga 7 2-in-1 16IML9
Intel Core Ultra 5 125U, Intel Graphics 4-Cores iGPU (Arc)
63.9 (54min, 53P1) fps
Lenovo Thinkpad X1 Fold 16
Intel Core i7-1250U, Intel Iris Xe Graphics G7 96EUs
59.4 (49min, 47P1) fps -7%
1920x1080 Low Preset AA:T AF:16x
HP Pavilion Plus 16-ab0456tx
Intel Core i7-13700H, NVIDIA GeForce RTX 3050 6GB Laptop GPU
150.2 (131min, 99P1) fps +260%
Lenovo ThinkPad Z16 Gen 2
AMD Ryzen 9 PRO 7940HS, AMD Radeon RX 6550M
132.5 (107min, 94P1) fps +218%
Acer Swift X SFX16-52G-52VE
Intel Core i5-1240P, Intel Arc A370M
127.2 (99min, 92P1) fps +205%
Lenovo Yoga 7 16IRL8
Intel Core i7-1355U, Intel Iris Xe Graphics G7 96EUs
47.6 (38min, 38P1) fps +14%
Moyenne Intel Graphics 4-Cores iGPU (Arc)
  (39.9 - 46.3, n=4)
42.9 fps +3%
Lenovo Yoga 7 2-in-1 16IML9
Intel Core Ultra 5 125U, Intel Graphics 4-Cores iGPU (Arc)
41.7 (34min, 33P1) fps
HP Spectre x360 2-in-1 16-f1075ng
Intel Core i7-12700H, Intel Iris Xe Graphics G7 96EUs
40.4 (35min, 32P1) fps -3%
Lenovo IdeaPad Flex 5 16ABR G8
AMD Ryzen 7 7730U, AMD Radeon RX Vega 8 (Ryzen 4000/5000)
39.4 (33min, 32P1) fps -6%
Dell Inspiron 16 7635 2-in-1
AMD Ryzen 5 7530U, AMD Radeon RX Vega 7
36.2 (28min, 28P1) fps -13%
Lenovo Thinkpad X1 Fold 16
Intel Core i7-1250U, Intel Iris Xe Graphics G7 96EUs
34.8 (27min, 27P1) fps -17%
1920x1080 Medium Preset AA:T AF:16x
HP Pavilion Plus 16-ab0456tx
Intel Core i7-13700H, NVIDIA GeForce RTX 3050 6GB Laptop GPU
145.3 (126min, 95P1) fps +266%
Lenovo ThinkPad Z16 Gen 2
AMD Ryzen 9 PRO 7940HS, AMD Radeon RX 6550M
120.8 (99min, 87P1) fps +204%
Acer Swift X SFX16-52G-52VE
Intel Core i5-1240P, Intel Arc A370M
49.5 (41min, 38P1) fps +25%
Lenovo Yoga 7 16IRL8
Intel Core i7-1355U, Intel Iris Xe Graphics G7 96EUs
43.3 (36min, 35P1) fps +9%
Lenovo Yoga 7 2-in-1 16IML9
Intel Core Ultra 5 125U, Intel Graphics 4-Cores iGPU (Arc)
39.7 (33min, 32P1) fps
Moyenne Intel Graphics 4-Cores iGPU (Arc)
  (35.9 - 42, n=4)
39.5 fps -1%
HP Spectre x360 2-in-1 16-f1075ng
Intel Core i7-12700H, Intel Iris Xe Graphics G7 96EUs
37.2 (32min, 29P1) fps -6%
Lenovo IdeaPad Flex 5 16ABR G8
AMD Ryzen 7 7730U, AMD Radeon RX Vega 8 (Ryzen 4000/5000)
34.8 (29min, 27P1) fps -12%
Dell Inspiron 16 7635 2-in-1
AMD Ryzen 5 7530U, AMD Radeon RX Vega 7
32.3 (28min, 26P1) fps -19%
Lenovo Thinkpad X1 Fold 16
Intel Core i7-1250U, Intel Iris Xe Graphics G7 96EUs
28 (19min, 20P1) fps -29%
The Witcher 3
1024x768 Low Graphics & Postprocessing
Lenovo ThinkPad Z16 Gen 2
AMD Ryzen 9 PRO 7940HS, AMD Radeon RX 6550M
277.2 (223min) fps +219%
HP Pavilion Plus 16-ab0456tx
Intel Core i7-13700H, NVIDIA GeForce RTX 3050 6GB Laptop GPU
244 (223min, 223.3P1) fps +181%
Samsung Galaxy Book4 Pro 16
Intel Core Ultra 7 155H, Intel Arc 8-Core iGPU
141 fps +62%
Lenovo IdeaPad 5 Pro 16IHU6
Intel Core i5-11300H, NVIDIA GeForce MX450
136 (12.2min, 38.3P0.1, 86.7P1) fps +57%
Acer Swift X SFX16-52G-52VE
Intel Core i5-1240P, Intel Arc A370M
121 fps +39%
LG Gram 16 2-in-1 16T90P
Intel Core i7-1165G7, Intel Iris Xe Graphics G7 96EUs
97.1 (84min) fps +12%
Lenovo Yoga 7 16IRL8
Intel Core i7-1355U, Intel Iris Xe Graphics G7 96EUs
95.9 (48min) fps +10%
Lenovo Yoga 7 2-in-1 16IML9
Intel Core Ultra 5 125U, Intel Graphics 4-Cores iGPU (Arc)
86.8 (78min) fps
Moyenne Intel Graphics 4-Cores iGPU (Arc)
  (66.5 - 92.1, n=4)
84.4 fps -3%
HP Spectre x360 2-in-1 16-f1075ng
Intel Core i7-12700H, Intel Iris Xe Graphics G7 96EUs
82.4 (24.1min, 37.8P0.1, 50.3P1) fps -5%
Dell Inspiron 16 7635 2-in-1
AMD Ryzen 5 7530U, AMD Radeon RX Vega 7
79.6 (70min) fps -8%
Lenovo IdeaPad Flex 5 16ABR G8
AMD Ryzen 7 7730U, AMD Radeon RX Vega 8 (Ryzen 4000/5000)
77 fps -11%
Lenovo Thinkpad X1 Fold 16
Intel Core i7-1250U, Intel Iris Xe Graphics G7 96EUs
75.3 (59min) fps -13%
1366x768 Medium Graphics & Postprocessing
Lenovo ThinkPad Z16 Gen 2
AMD Ryzen 9 PRO 7940HS, AMD Radeon RX 6550M
171.5 (160min) fps +246%
HP Pavilion Plus 16-ab0456tx
Intel Core i7-13700H, NVIDIA GeForce RTX 3050 6GB Laptop GPU
159.1 (142min, 142.3P1) fps +221%
Samsung Galaxy Book4 Pro 16
Intel Core Ultra 7 155H, Intel Arc 8-Core iGPU
89 fps +79%
Acer Swift X SFX16-52G-52VE
Intel Core i5-1240P, Intel Arc A370M
87 fps +75%
Lenovo IdeaPad 5 Pro 16IHU6
Intel Core i5-11300H, NVIDIA GeForce MX450
81.4 (34.1min, 42.6P0.1, 59.5P1) fps +64%
Lenovo Yoga 7 16IRL8
Intel Core i7-1355U, Intel Iris Xe Graphics G7 96EUs
64 (58min) fps +29%
LG Gram 16 2-in-1 16T90P
Intel Core i7-1165G7, Intel Iris Xe Graphics G7 96EUs
60.5 (56min) fps +22%
HP Spectre x360 2-in-1 16-f1075ng
Intel Core i7-12700H, Intel Iris Xe Graphics G7 96EUs
52.7 (21.9min, 22.9P0.1, 28.6P1) fps +6%
Moyenne Intel Graphics 4-Cores iGPU (Arc)
  (41.3 - 57, n=4)
51.2 fps +3%
Lenovo Yoga 7 2-in-1 16IML9
Intel Core Ultra 5 125U, Intel Graphics 4-Cores iGPU (Arc)
49.6 (40min) fps
Lenovo Thinkpad X1 Fold 16
Intel Core i7-1250U, Intel Iris Xe Graphics G7 96EUs
47.7 (44min) fps -4%
LG Gram 2in1 16 16T90R - G.AA78G
Intel Core i7-1360P, Intel Iris Xe Graphics G7 96EUs
37.2 (10min) fps -25%
1920x1080 High Graphics & Postprocessing (Nvidia HairWorks Off)
Lenovo Yoga Pro 9 16IMH9
Intel Core Ultra 9 185H, NVIDIA GeForce RTX 4070 Laptop GPU
242 fps +752%
HP Pavilion Plus 16-ab0456tx
Intel Core i7-13700H, NVIDIA GeForce RTX 3050 6GB Laptop GPU
91.4 (81min, 81.66P1) fps +222%
Lenovo ThinkPad Z16 Gen 2
AMD Ryzen 9 PRO 7940HS, AMD Radeon RX 6550M
83.2 (78min) fps +193%
Samsung Galaxy Book4 Pro 16
Intel Core Ultra 7 155H, Intel Arc 8-Core iGPU
51 fps +80%
Acer Swift X SFX16-52G-52VE
Intel Core i5-1240P, Intel Arc A370M
45 fps +58%
LG Gram 16 2-in-1 16T90P
Intel Core i7-1165G7, Intel Iris Xe Graphics G7 96EUs
44.7 (42min) fps +57%
Lenovo IdeaPad 5 Pro 16IHU6
Intel Core i5-11300H, NVIDIA GeForce MX450
42.8 (12.2min, 16.6P0.1, 29.7P1) fps +51%
Lenovo Yoga 7 16IRL8
Intel Core i7-1355U, Intel Iris Xe Graphics G7 96EUs
33.5 (30min) fps +18%
Moyenne Intel Graphics 4-Cores iGPU (Arc)
  (21.4 - 32.4, n=4)
28.7 fps +1%
Lenovo Yoga 7 2-in-1 16IML9
Intel Core Ultra 5 125U, Intel Graphics 4-Cores iGPU (Arc)
28.4 (25min) fps
Lenovo Thinkpad X1 Fold 16
Intel Core i7-1250U, Intel Iris Xe Graphics G7 96EUs
25.8 (23min) fps -9%
HP Spectre x360 2-in-1 16-f1075ng
Intel Core i7-12700H, Intel Iris Xe Graphics G7 96EUs
25.6 (12.6min, 13.1P0.1, 15.9P1) fps -10%
Dell Inspiron 16 7635 2-in-1
AMD Ryzen 5 7530U, AMD Radeon RX Vega 7
24.5 (22min) fps -14%
Lenovo IdeaPad Flex 5 16ABR G8
AMD Ryzen 7 7730U, AMD Radeon RX Vega 8 (Ryzen 4000/5000)
24 fps -15%
1920x1080 Ultra Graphics & Postprocessing (HBAO+)
Lenovo Yoga Pro 9 16IMH9
Intel Core Ultra 9 185H, NVIDIA GeForce RTX 4070 Laptop GPU
107.8 (103min, 103P1) fps +619%
HP Pavilion Plus 16-ab0456tx
Intel Core i7-13700H, NVIDIA GeForce RTX 3050 6GB Laptop GPU
50.1 (45min, 45P1) fps +234%
Lenovo ThinkPad Z16 Gen 2
AMD Ryzen 9 PRO 7940HS, AMD Radeon RX 6550M
49.4 (42min) fps +229%
Acer Swift X SFX16-52G-52VE
Intel Core i5-1240P, Intel Arc A370M
25 fps +67%
Lenovo IdeaPad 5 Pro 16IHU6
Intel Core i5-11300H, NVIDIA GeForce MX450
24.3 (12.1min, 14.5P0.1, 19.1P1) fps +62%
Samsung Galaxy Book4 Pro 16
Intel Core Ultra 7 155H, Intel Arc 8-Core iGPU
23.1 (12min, 21P1) fps +54%
Dell Inspiron 16 7635 2-in-1
AMD Ryzen 5 7530U, AMD Radeon RX Vega 7
15.7 (14min) fps +5%
Moyenne Intel Graphics 4-Cores iGPU (Arc)
  (11.9 - 17.9, n=4)
15.7 fps +5%
Lenovo Yoga 7 16IRL8
Intel Core i7-1355U, Intel Iris Xe Graphics G7 96EUs
15.6 (14min) fps +4%
LG Gram 16 2-in-1 16T90P
Intel Core i7-1165G7, Intel Iris Xe Graphics G7 96EUs
15.3 (13min) fps +2%
Lenovo Yoga 7 2-in-1 16IML9
Intel Core Ultra 5 125U, Intel Graphics 4-Cores iGPU (Arc)
15 (11min) fps
Lenovo IdeaPad Flex 5 16ABR G8
AMD Ryzen 7 7730U, AMD Radeon RX Vega 8 (Ryzen 4000/5000)
14.7 (12min, 14P1) fps -2%
LG Gram 2in1 16 16T90R - G.AA78G
Intel Core i7-1360P, Intel Iris Xe Graphics G7 96EUs
13.9 (13min, 13P1) fps -7%
HP Spectre x360 2-in-1 16-f1075ng
Intel Core i7-12700H, Intel Iris Xe Graphics G7 96EUs
12.8 (4.76min, 5.9P0.1, 7.32P1) fps -15%
Lenovo Thinkpad X1 Fold 16
Intel Core i7-1250U, Intel Iris Xe Graphics G7 96EUs
11.6 (10min) fps -23%
Dota 2 Reborn
1280x720 min (0/3) fastest
Lenovo Yoga Pro 9 16IMH9
Intel Core Ultra 9 185H, NVIDIA GeForce RTX 4070 Laptop GPU
171.7 (150.3min) fps +68%
HP Pavilion Plus 16-ab0456tx
Intel Core i7-13700H, NVIDIA GeForce RTX 3050 6GB Laptop GPU
155.2 (137.5min) fps +52%
Lenovo ThinkPad Z16 Gen 2
AMD Ryzen 9 PRO 7940HS, AMD Radeon RX 6550M
137.1 (116.8min) fps +35%
LG Gram 2in1 16 16T90R - G.AA78G
Intel Core i7-1360P, Intel Iris Xe Graphics G7 96EUs
124 (95.9min) fps +22%
Lenovo IdeaPad 5 Pro 16IHU6
Intel Core i5-11300H, NVIDIA GeForce MX450
123 (110.1min) fps +21%
HP Spectre x360 2-in-1 16-f1075ng
Intel Core i7-12700H, Intel Iris Xe Graphics G7 96EUs
116.4 (98min) fps +14%
Lenovo Yoga 7 16IRL8
Intel Core i7-1355U, Intel Iris Xe Graphics G7 96EUs
115 (89.7min) fps +13%
Lenovo IdeaPad Flex 5 16ABR G8
AMD Ryzen 7 7730U, AMD Radeon RX Vega 8 (Ryzen 4000/5000)
109.6 (94.8min) fps +8%
Dell Inspiron 16 7635 2-in-1
AMD Ryzen 5 7530U, AMD Radeon RX Vega 7
109 (92.7min) fps +7%
Lenovo Yoga 7 2-in-1 16IML9
Intel Core Ultra 5 125U, Intel Graphics 4-Cores iGPU (Arc)
101.9 (62min) fps
Samsung Galaxy Book4 Pro 16
Intel Core Ultra 7 155H, Intel Arc 8-Core iGPU
101.2 (57.4min) fps -1%
Moyenne Intel Graphics 4-Cores iGPU (Arc)
  (82.6 - 101.9, n=4)
92.4 fps -9%
Lenovo Thinkpad X1 Fold 16
Intel Core i7-1250U, Intel Iris Xe Graphics G7 96EUs
89.8 (69.2min) fps -12%
LG Gram 16 2-in-1 16T90P
Intel Core i7-1165G7, Intel Iris Xe Graphics G7 96EUs
82.8 (44.9min) fps -19%
Acer Swift X SFX16-52G-52VE
Intel Core i5-1240P, Intel Arc A370M
82.6 (55.3min) fps -19%
1366x768 med (1/3)
Lenovo Yoga Pro 9 16IMH9
Intel Core Ultra 9 185H, NVIDIA GeForce RTX 4070 Laptop GPU
155.7 (133.6min) fps +157%
HP Pavilion Plus 16-ab0456tx
Intel Core i7-13700H, NVIDIA GeForce RTX 3050 6GB Laptop GPU
131 (116.5min) fps +116%
Lenovo ThinkPad Z16 Gen 2
AMD Ryzen 9 PRO 7940HS, AMD Radeon RX 6550M
127.3 (98.2min) fps +110%
Lenovo IdeaPad 5 Pro 16IHU6
Intel Core i5-11300H, NVIDIA GeForce MX450
112 (100.6min) fps +85%
Samsung Galaxy Book4 Pro 16
Intel Core Ultra 7 155H, Intel Arc 8-Core iGPU
92.9 (56.3min) fps +53%
Lenovo IdeaPad Flex 5 16ABR G8
AMD Ryzen 7 7730U, AMD Radeon RX Vega 8 (Ryzen 4000/5000)
92.6 (75.3min) fps +53%
Lenovo Yoga 7 16IRL8
Intel Core i7-1355U, Intel Iris Xe Graphics G7 96EUs
91.1 (71.5min) fps +50%
Dell Inspiron 16 7635 2-in-1
AMD Ryzen 5 7530U, AMD Radeon RX Vega 7
90.7 (73.5min) fps +49%
LG Gram 2in1 16 16T90R - G.AA78G
Intel Core i7-1360P, Intel Iris Xe Graphics G7 96EUs
89.1 (65.8min) fps +47%
HP Spectre x360 2-in-1 16-f1075ng
Intel Core i7-12700H, Intel Iris Xe Graphics G7 96EUs
83.7 (68.2min) fps +38%
Acer Swift X SFX16-52G-52VE
Intel Core i5-1240P, Intel Arc A370M
69.2 (50.3min) fps +14%
LG Gram 16 2-in-1 16T90P
Intel Core i7-1165G7, Intel Iris Xe Graphics G7 96EUs
69 (42.9min) fps +14%
Lenovo Thinkpad X1 Fold 16
Intel Core i7-1250U, Intel Iris Xe Graphics G7 96EUs
69 (52.3min) fps +14%
Lenovo Yoga 7 2-in-1 16IML9
Intel Core Ultra 5 125U, Intel Graphics 4-Cores iGPU (Arc)
60.7 (38.1min) fps
Moyenne Intel Graphics 4-Cores iGPU (Arc)
  (52.2 - 69, n=4)
60.4 fps 0%
1920x1080 high (2/3)
Lenovo Yoga Pro 9 16IMH9
Intel Core Ultra 9 185H, NVIDIA GeForce RTX 4070 Laptop GPU
148.1 (129min) fps +142%
HP Pavilion Plus 16-ab0456tx
Intel Core i7-13700H, NVIDIA GeForce RTX 3050 6GB Laptop GPU
124.2 (108.9min) fps +103%
Lenovo ThinkPad Z16 Gen 2
AMD Ryzen 9 PRO 7940HS, AMD Radeon RX 6550M
112.3 (96.6min) fps +84%
Lenovo IdeaPad 5 Pro 16IHU6
Intel Core i5-11300H, NVIDIA GeForce MX450
104 (91.9min) fps +70%
Samsung Galaxy Book4 Pro 16
Intel Core Ultra 7 155H, Intel Arc 8-Core iGPU
75.7 (51min) fps +24%
LG Gram 2in1 16 16T90R - G.AA78G
Intel Core i7-1360P, Intel Iris Xe Graphics G7 96EUs
71.2 (58.9min) fps +17%
Lenovo Yoga 7 16IRL8
Intel Core i7-1355U, Intel Iris Xe Graphics G7 96EUs
66.5 (56.2min) fps +9%
Acer Swift X SFX16-52G-52VE
Intel Core i5-1240P, Intel Arc A370M
62.2 (45.3min) fps +2%
Lenovo Yoga 7 2-in-1 16IML9
Intel Core Ultra 5 125U, Intel Graphics 4-Cores iGPU (Arc)
61.1 (37.9min) fps
Moyenne Intel Graphics 4-Cores iGPU (Arc)
  (52.8 - 61.1, n=4)
58 fps -5%
Lenovo IdeaPad Flex 5 16ABR G8
AMD Ryzen 7 7730U, AMD Radeon RX Vega 8 (Ryzen 4000/5000)
56.8 (49.8min) fps -7%
Dell Inspiron 16 7635 2-in-1
AMD Ryzen 5 7530U, AMD Radeon RX Vega 7
55.4 (47.9min) fps -9%
Lenovo Thinkpad X1 Fold 16
Intel Core i7-1250U, Intel Iris Xe Graphics G7 96EUs
55.3 (45.5min) fps -9%
HP Spectre x360 2-in-1 16-f1075ng
Intel Core i7-12700H, Intel Iris Xe Graphics G7 96EUs
53 (48.5min) fps -13%
LG Gram 16 2-in-1 16T90P
Intel Core i7-1165G7, Intel Iris Xe Graphics G7 96EUs
50.1 (32.9min) fps -18%
1920x1080 ultra (3/3) best looking
Lenovo Yoga Pro 9 16IMH9
Intel Core Ultra 9 185H, NVIDIA GeForce RTX 4070 Laptop GPU
139 (119.7min) fps +141%
HP Pavilion Plus 16-ab0456tx
Intel Core i7-13700H, NVIDIA GeForce RTX 3050 6GB Laptop GPU
116.9 (102.4min) fps +103%
Lenovo ThinkPad Z16 Gen 2
AMD Ryzen 9 PRO 7940HS, AMD Radeon RX 6550M
103 (86.2min) fps +79%
Lenovo IdeaPad 5 Pro 16IHU6
Intel Core i5-11300H, NVIDIA GeForce MX450
95.5 (80.2min) fps +66%
Samsung Galaxy Book4 Pro 16
Intel Core Ultra 7 155H, Intel Arc 8-Core iGPU
73.6 (51.1min) fps +28%
LG Gram 2in1 16 16T90R - G.AA78G
Intel Core i7-1360P, Intel Iris Xe Graphics G7 96EUs
62.9 (53.2min) fps +9%
Lenovo Yoga 7 16IRL8
Intel Core i7-1355U, Intel Iris Xe Graphics G7 96EUs
59.8 (50.7min) fps +4%
Acer Swift X SFX16-52G-52VE
Intel Core i5-1240P, Intel Arc A370M
57.7 (43.4min) fps 0%
Lenovo Yoga 7 2-in-1 16IML9
Intel Core Ultra 5 125U, Intel Graphics 4-Cores iGPU (Arc)
57.6 (37.5min) fps
Moyenne Intel Graphics 4-Cores iGPU (Arc)
  (50 - 57.6, n=4)
54.8 fps -5%
Lenovo IdeaPad Flex 5 16ABR G8
AMD Ryzen 7 7730U, AMD Radeon RX Vega 8 (Ryzen 4000/5000)
53.3 (46.9min) fps -7%
Dell Inspiron 16 7635 2-in-1
AMD Ryzen 5 7530U, AMD Radeon RX Vega 7
52.4 (46.9min) fps -9%
HP Spectre x360 2-in-1 16-f1075ng
Intel Core i7-12700H, Intel Iris Xe Graphics G7 96EUs
48.8 (44.1min) fps -15%
Lenovo Thinkpad X1 Fold 16
Intel Core i7-1250U, Intel Iris Xe Graphics G7 96EUs
41.3 (32.3min) fps -28%
LG Gram 16 2-in-1 16T90P
Intel Core i7-1165G7, Intel Iris Xe Graphics G7 96EUs
40.9 (27.9min) fps -29%
Final Fantasy XV Benchmark
1280x720 Lite Quality
Lenovo Yoga Pro 9 16IMH9
Intel Core Ultra 9 185H, NVIDIA GeForce RTX 4070 Laptop GPU
189.6 fps +404%
Lenovo ThinkPad Z16 Gen 2
AMD Ryzen 9 PRO 7940HS, AMD Radeon RX 6550M
129.3 fps +244%
HP Pavilion Plus 16-ab0456tx
Intel Core i7-13700H, NVIDIA GeForce RTX 3050 6GB Laptop GPU
128.2 fps +241%
Acer Swift X SFX16-52G-52VE
Intel Core i5-1240P, Intel Arc A370M
66.9 fps +78%
Lenovo IdeaPad 5 Pro 16IHU6
Intel Core i5-11300H, NVIDIA GeForce MX450
65.3 fps +74%
Samsung Galaxy Book4 Pro 16
Intel Core Ultra 7 155H, Intel Arc 8-Core iGPU
58.1 fps +55%
LG Gram 2in1 16 16T90R - G.AA78G
Intel Core i7-1360P, Intel Iris Xe Graphics G7 96EUs
46.8 fps +24%
Lenovo Yoga 7 16IRL8
Intel Core i7-1355U, Intel Iris Xe Graphics G7 96EUs
46.5 fps +24%
Moyenne Intel Graphics 4-Cores iGPU (Arc)
  (35.4 - 48.2, n=4)
39.7 fps +6%
HP Spectre x360 2-in-1 16-f1075ng
Intel Core i7-12700H, Intel Iris Xe Graphics G7 96EUs
38.5 fps +2%
Lenovo Yoga 7 2-in-1 16IML9
Intel Core Ultra 5 125U, Intel Graphics 4-Cores iGPU (Arc)
37.6 fps
Dell Inspiron 16 7635 2-in-1
AMD Ryzen 5 7530U, AMD Radeon RX Vega 7
37.5 fps 0%
LG Gram 16 2-in-1 16T90P
Intel Core i7-1165G7, Intel Iris Xe Graphics G7 96EUs
36.1 fps -4%
Lenovo Thinkpad X1 Fold 16
Intel Core i7-1250U, Intel Iris Xe Graphics G7 96EUs
33.2 fps -12%
1920x1080 Standard Quality
Lenovo Yoga Pro 9 16IMH9
Intel Core Ultra 9 185H, NVIDIA GeForce RTX 4070 Laptop GPU
156.2 fps +579%
HP Pavilion Plus 16-ab0456tx
Intel Core i7-13700H, NVIDIA GeForce RTX 3050 6GB Laptop GPU
70.9 fps +208%
Lenovo ThinkPad Z16 Gen 2
AMD Ryzen 9 PRO 7940HS, AMD Radeon RX 6550M
67.4 fps +193%
Samsung Galaxy Book4 Pro 16
Intel Core Ultra 7 155H, Intel Arc 8-Core iGPU
36.1 fps +57%
Acer Swift X SFX16-52G-52VE
Intel Core i5-1240P, Intel Arc A370M
34.4 fps +50%
Lenovo IdeaPad 5 Pro 16IHU6
Intel Core i5-11300H, NVIDIA GeForce MX450
33 fps +43%
Lenovo Yoga 7 16IRL8
Intel Core i7-1355U, Intel Iris Xe Graphics G7 96EUs
24.5 fps +7%
LG Gram 2in1 16 16T90R - G.AA78G
Intel Core i7-1360P, Intel Iris Xe Graphics G7 96EUs
23.8 fps +3%
Lenovo Yoga 7 2-in-1 16IML9
Intel Core Ultra 5 125U, Intel Graphics 4-Cores iGPU (Arc)
23 fps
Moyenne Intel Graphics 4-Cores iGPU (Arc)
  (19.5 - 25.9, n=4)
23 fps 0%
LG Gram 16 2-in-1 16T90P
Intel Core i7-1165G7, Intel Iris Xe Graphics G7 96EUs
20.7 fps -10%
HP Spectre x360 2-in-1 16-f1075ng
Intel Core i7-12700H, Intel Iris Xe Graphics G7 96EUs
19.9 fps -13%
Dell Inspiron 16 7635 2-in-1
AMD Ryzen 5 7530U, AMD Radeon RX Vega 7
18.8 fps -18%
Lenovo Thinkpad X1 Fold 16
Intel Core i7-1250U, Intel Iris Xe Graphics G7 96EUs
18.5 fps -20%
1920x1080 High Quality
Lenovo Yoga Pro 9 16IMH9
Intel Core Ultra 9 185H, NVIDIA GeForce RTX 4070 Laptop GPU
115.7 fps +610%
HP Pavilion Plus 16-ab0456tx
Intel Core i7-13700H, NVIDIA GeForce RTX 3050 6GB Laptop GPU
52 fps +219%
Lenovo ThinkPad Z16 Gen 2
AMD Ryzen 9 PRO 7940HS, AMD Radeon RX 6550M
47.8 fps +193%
Samsung Galaxy Book4 Pro 16
Intel Core Ultra 7 155H, Intel Arc 8-Core iGPU
24.4 fps +50%
Lenovo IdeaPad 5 Pro 16IHU6
Intel Core i5-11300H, NVIDIA GeForce MX450
21.2 fps +30%
Acer Swift X SFX16-52G-52VE
Intel Core i5-1240P, Intel Arc A370M
19.6 fps +20%
Lenovo Yoga 7 16IRL8
Intel Core i7-1355U, Intel Iris Xe Graphics G7 96EUs
17.5 fps +7%
LG Gram 2in1 16 16T90R - G.AA78G
Intel Core i7-1360P, Intel Iris Xe Graphics G7 96EUs
17.2 fps +6%
Moyenne Intel Graphics 4-Cores iGPU (Arc)
  (15.7 - 18.2, n=4)
16.6 fps +2%
Lenovo Yoga 7 2-in-1 16IML9
Intel Core Ultra 5 125U, Intel Graphics 4-Cores iGPU (Arc)
16.3 fps
LG Gram 16 2-in-1 16T90P
Intel Core i7-1165G7, Intel Iris Xe Graphics G7 96EUs
16.2 fps -1%
Lenovo Thinkpad X1 Fold 16
Intel Core i7-1250U, Intel Iris Xe Graphics G7 96EUs
15.7 fps -4%
HP Spectre x360 2-in-1 16-f1075ng
Intel Core i7-12700H, Intel Iris Xe Graphics G7 96EUs
14.6 fps -10%
Dell Inspiron 16 7635 2-in-1
AMD Ryzen 5 7530U, AMD Radeon RX Vega 7
12.9 fps -21%
X-Plane 11.11
1280x720 low (fps_test=1)
HP Pavilion Plus 16-ab0456tx
Intel Core i7-13700H, NVIDIA GeForce RTX 3050 6GB Laptop GPU
140.6 fps +285%
Lenovo Yoga Pro 9 16IMH9
Intel Core Ultra 9 185H, NVIDIA GeForce RTX 4070 Laptop GPU
133.9 fps +267%
Lenovo IdeaPad 5 Pro 16IHU6
Intel Core i5-11300H, NVIDIA GeForce MX450
88.3 fps +142%
LG Gram 2in1 16 16T90R - G.AA78G
Intel Core i7-1360P, Intel Iris Xe Graphics G7 96EUs
58.46 fps +60%
HP Spectre x360 2-in-1 16-f1075ng
Intel Core i7-12700H, Intel Iris Xe Graphics G7 96EUs
54.9 fps +50%
Lenovo ThinkPad Z16 Gen 2
AMD Ryzen 9 PRO 7940HS, AMD Radeon RX 6550M
53.7 fps +47%
Samsung Galaxy Book4 Pro 16
Intel Core Ultra 7 155H, Intel Arc 8-Core iGPU
51.4 fps +41%
Lenovo Yoga 7 16IRL8
Intel Core i7-1355U, Intel Iris Xe Graphics G7 96EUs
43.5 fps +19%
LG Gram 16 2-in-1 16T90P
Intel Core i7-1165G7, Intel Iris Xe Graphics G7 96EUs
43.3 fps +19%
Lenovo Thinkpad X1 Fold 16
Intel Core i7-1250U, Intel Iris Xe Graphics G7 96EUs
40.7 fps +12%
Lenovo IdeaPad Flex 5 16ABR G8
AMD Ryzen 7 7730U, AMD Radeon RX Vega 8 (Ryzen 4000/5000)
38.9 fps +7%
Dell Inspiron 16 7635 2-in-1
AMD Ryzen 5 7530U, AMD Radeon RX Vega 7
38.4 fps +5%
Acer Swift X SFX16-52G-52VE
Intel Core i5-1240P, Intel Arc A370M
36.9 fps +1%
Lenovo Yoga 7 2-in-1 16IML9
Intel Core Ultra 5 125U, Intel Graphics 4-Cores iGPU (Arc)
36.5 fps
Moyenne Intel Graphics 4-Cores iGPU (Arc)
  (34.7 - 37.6, n=4)
36.4 fps 0%
1920x1080 med (fps_test=2)
Lenovo Yoga Pro 9 16IMH9
Intel Core Ultra 9 185H, NVIDIA GeForce RTX 4070 Laptop GPU
118.7 fps +324%
HP Pavilion Plus 16-ab0456tx
Intel Core i7-13700H, NVIDIA GeForce RTX 3050 6GB Laptop GPU
117 fps +318%
Lenovo IdeaPad 5 Pro 16IHU6
Intel Core i5-11300H, NVIDIA GeForce MX450
73.4 fps +162%
HP Spectre x360 2-in-1 16-f1075ng
Intel Core i7-12700H, Intel Iris Xe Graphics G7 96EUs
44.4 fps +59%
LG Gram 2in1 16 16T90R - G.AA78G
Intel Core i7-1360P, Intel Iris Xe Graphics G7 96EUs
43.46 fps +55%
Lenovo Yoga 7 16IRL8
Intel Core i7-1355U, Intel Iris Xe Graphics G7 96EUs
43.3 fps +55%
Lenovo ThinkPad Z16 Gen 2
AMD Ryzen 9 PRO 7940HS, AMD Radeon RX 6550M
41.2 fps +47%
Samsung Galaxy Book4 Pro 16
Intel Core Ultra 7 155H, Intel Arc 8-Core iGPU
41.1 fps +47%
LG Gram 16 2-in-1 16T90P
Intel Core i7-1165G7, Intel Iris Xe Graphics G7 96EUs
35.2 fps +26%
Lenovo IdeaPad Flex 5 16ABR G8
AMD Ryzen 7 7730U, AMD Radeon RX Vega 8 (Ryzen 4000/5000)
32.3 fps +15%
Lenovo Thinkpad X1 Fold 16
Intel Core i7-1250U, Intel Iris Xe Graphics G7 96EUs
32 fps +14%
Dell Inspiron 16 7635 2-in-1
AMD Ryzen 5 7530U, AMD Radeon RX Vega 7
30.4 fps +9%
Moyenne Intel Graphics 4-Cores iGPU (Arc)
  (28 - 30.1, n=4)
28.7 fps +3%
Lenovo Yoga 7 2-in-1 16IML9
Intel Core Ultra 5 125U, Intel Graphics 4-Cores iGPU (Arc)
28 fps
Acer Swift X SFX16-52G-52VE
Intel Core i5-1240P, Intel Arc A370M
27.4 fps -2%
1920x1080 high (fps_test=3)
HP Pavilion Plus 16-ab0456tx
Intel Core i7-13700H, NVIDIA GeForce RTX 3050 6GB Laptop GPU
97.3 fps +316%
Lenovo Yoga Pro 9 16IMH9
Intel Core Ultra 9 185H, NVIDIA GeForce RTX 4070 Laptop GPU
90.5 fps +287%
Lenovo IdeaPad 5 Pro 16IHU6
Intel Core i5-11300H, NVIDIA GeForce MX450
62.6 fps +168%
HP Spectre x360 2-in-1 16-f1075ng
Intel Core i7-12700H, Intel Iris Xe Graphics G7 96EUs
40.1 fps +71%
Lenovo Yoga 7 16IRL8
Intel Core i7-1355U, Intel Iris Xe Graphics G7 96EUs
38.5 fps +65%
LG Gram 2in1 16 16T90R - G.AA78G
Intel Core i7-1360P, Intel Iris Xe Graphics G7 96EUs
37.95 fps +62%
LG Gram 16 2-in-1 16T90P
Intel Core i7-1165G7, Intel Iris Xe Graphics G7 96EUs
35.3 fps +51%
Samsung Galaxy Book4 Pro 16
Intel Core Ultra 7 155H, Intel Arc 8-Core iGPU
33.5 fps +43%
Lenovo ThinkPad Z16 Gen 2
AMD Ryzen 9 PRO 7940HS, AMD Radeon RX 6550M
33 fps +41%
Lenovo Thinkpad X1 Fold 16
Intel Core i7-1250U, Intel Iris Xe Graphics G7 96EUs
28.8 fps +23%
Lenovo IdeaPad Flex 5 16ABR G8
AMD Ryzen 7 7730U, AMD Radeon RX Vega 8 (Ryzen 4000/5000)
27.7 fps +18%
Dell Inspiron 16 7635 2-in-1
AMD Ryzen 5 7530U, AMD Radeon RX Vega 7
26.3 fps +12%
Acer Swift X SFX16-52G-52VE
Intel Core i5-1240P, Intel Arc A370M
23.9 fps +2%
Moyenne Intel Graphics 4-Cores iGPU (Arc)
  (23.4 - 25.3, n=4)
23.9 fps +2%
Lenovo Yoga 7 2-in-1 16IML9
Intel Core Ultra 5 125U, Intel Graphics 4-Cores iGPU (Arc)
23.4 fps
Strange Brigade
1280x720 lowest AF:1
Lenovo Yoga Pro 9 16IMH9
Intel Core Ultra 9 185H, NVIDIA GeForce RTX 4070 Laptop GPU
418 fps +247%
Lenovo ThinkPad Z16 Gen 2
AMD Ryzen 9 PRO 7940HS, AMD Radeon RX 6550M
319 (144.2min, 238P1) fps +165%
HP Pavilion Plus 16-ab0456tx
Intel Core i7-13700H, NVIDIA GeForce RTX 3050 6GB Laptop GPU
256 (108min, 203P1) fps +113%
Acer Swift X SFX16-52G-52VE
Intel Core i5-1240P, Intel Arc A370M
184.8 (101.3min, 113.5P1) fps +53%
Samsung Galaxy Book4 Pro 16
Intel Core Ultra 7 155H, Intel Arc 8-Core iGPU
166 fps +38%
Lenovo IdeaPad 5 Pro 16IHU6
Intel Core i5-11300H, NVIDIA GeForce MX450
134 (96.7min, 110P1) fps +11%
Lenovo Yoga 7 2-in-1 16IML9
Intel Core Ultra 5 125U, Intel Graphics 4-Cores iGPU (Arc)
120.4 (39.2min, 96.2P1) fps
Moyenne Intel Graphics 4-Cores iGPU (Arc)
  (73.7 - 121.1, n=4)
108.3 fps -10%
LG Gram 16 2-in-1 16T90P
Intel Core i7-1165G7, Intel Iris Xe Graphics G7 96EUs
97.8 (18.1min, 32P1) fps -19%
LG Gram 2in1 16 16T90R - G.AA78G
Intel Core i7-1360P, Intel Iris Xe Graphics G7 96EUs
97.6 (11.3min, 36.4P1) fps -19%
Lenovo IdeaPad Flex 5 16ABR G8
AMD Ryzen 7 7730U, AMD Radeon RX Vega 8 (Ryzen 4000/5000)
88.6 (62.5min, 76.7P1) fps -26%
Dell Inspiron 16 7635 2-in-1
AMD Ryzen 5 7530U, AMD Radeon RX Vega 7
86.8 (40.5min, 74P1) fps -28%
HP Spectre x360 2-in-1 16-f1075ng
Intel Core i7-12700H, Intel Iris Xe Graphics G7 96EUs
86.6 (20.5min, 30.7P1) fps -28%
Lenovo Thinkpad X1 Fold 16
Intel Core i7-1250U, Intel Iris Xe Graphics G7 96EUs
70.2 (15.4min, 22.4P1) fps -42%
1920x1080 medium AA:medium AF:4
Lenovo Yoga Pro 9 16IMH9
Intel Core Ultra 9 185H, NVIDIA GeForce RTX 4070 Laptop GPU
300 fps +500%
Lenovo ThinkPad Z16 Gen 2
AMD Ryzen 9 PRO 7940HS, AMD Radeon RX 6550M
122.5 (94.7min, 108.8P1) fps +145%
HP Pavilion Plus 16-ab0456tx
Intel Core i7-13700H, NVIDIA GeForce RTX 3050 6GB Laptop GPU
112.8 (54.6min, 93.7P1) fps +126%
Acer Swift X SFX16-52G-52VE
Intel Core i5-1240P, Intel Arc A370M
76.7 (63min, 65.8P1) fps +53%
Samsung Galaxy Book4 Pro 16
Intel Core Ultra 7 155H, Intel Arc 8-Core iGPU
70 fps +40%
Lenovo IdeaPad 5 Pro 16IHU6
Intel Core i5-11300H, NVIDIA GeForce MX450
53.2 (44.2min, 46.6P1) fps +6%
Lenovo Yoga 7 2-in-1 16IML9
Intel Core Ultra 5 125U, Intel Graphics 4-Cores iGPU (Arc)
50 (24.3min, 41.3P1) fps
Moyenne Intel Graphics 4-Cores iGPU (Arc)
  (32.9 - 52.1, n=4)
46.5 fps -7%
LG Gram 2in1 16 16T90R - G.AA78G
Intel Core i7-1360P, Intel Iris Xe Graphics G7 96EUs
43.8 (9min, 24P1) fps -12%
LG Gram 16 2-in-1 16T90P
Intel Core i7-1165G7, Intel Iris Xe Graphics G7 96EUs
41 (9.2min, 10.7P1) fps -18%
HP Spectre x360 2-in-1 16-f1075ng
Intel Core i7-12700H, Intel Iris Xe Graphics G7 96EUs
36.1 (13.1min, 20.5P1) fps -28%
Lenovo IdeaPad Flex 5 16ABR G8
AMD Ryzen 7 7730U, AMD Radeon RX Vega 8 (Ryzen 4000/5000)
34.9 (28.5min, 30.8P1) fps -30%
Dell Inspiron 16 7635 2-in-1
AMD Ryzen 5 7530U, AMD Radeon RX Vega 7
33.8 (22.5min, 29.6P1) fps -32%
Lenovo Thinkpad X1 Fold 16
Intel Core i7-1250U, Intel Iris Xe Graphics G7 96EUs
31.5 (8.5min, 15.9P1) fps -37%
1920x1080 high AA:high AF:8
Lenovo Yoga Pro 9 16IMH9
Intel Core Ultra 9 185H, NVIDIA GeForce RTX 4070 Laptop GPU
244 fps +522%
Lenovo ThinkPad Z16 Gen 2
AMD Ryzen 9 PRO 7940HS, AMD Radeon RX 6550M
101.1 (76.4min, 80.5P1) fps +158%
HP Pavilion Plus 16-ab0456tx
Intel Core i7-13700H, NVIDIA GeForce RTX 3050 6GB Laptop GPU
91.9 (16.3min, 69.6P1) fps +134%
Acer Swift X SFX16-52G-52VE
Intel Core i5-1240P, Intel Arc A370M
64.2 (45min, 49P1) fps +64%
Samsung Galaxy Book4 Pro 16
Intel Core Ultra 7 155H, Intel Arc 8-Core iGPU
59 fps +51%
Lenovo IdeaPad 5 Pro 16IHU6
Intel Core i5-11300H, NVIDIA GeForce MX450
46.7 (38.7min, 39.3P1) fps +19%
Lenovo Yoga 7 2-in-1 16IML9
Intel Core Ultra 5 125U, Intel Graphics 4-Cores iGPU (Arc)
39.2 (10min, 24P1) fps
Moyenne Intel Graphics 4-Cores iGPU (Arc)
  (26.6 - 41.9, n=4)
36.4 fps -7%
LG Gram 2in1 16 16T90R - G.AA78G
Intel Core i7-1360P, Intel Iris Xe Graphics G7 96EUs
35.3 (9min, 14.1P1) fps -10%
LG Gram 16 2-in-1 16T90P
Intel Core i7-1165G7, Intel Iris Xe Graphics G7 96EUs
32 (6.4min, 8.35P1) fps -18%
HP Spectre x360 2-in-1 16-f1075ng
Intel Core i7-12700H, Intel Iris Xe Graphics G7 96EUs
29.6 (10.8min, 15.8P1) fps -24%
Lenovo IdeaPad Flex 5 16ABR G8
AMD Ryzen 7 7730U, AMD Radeon RX Vega 8 (Ryzen 4000/5000)
29.1 (9.9min, 20.8P1) fps -26%
Dell Inspiron 16 7635 2-in-1
AMD Ryzen 5 7530U, AMD Radeon RX Vega 7
28.1 (7.3min, 13.2P1) fps -28%
Lenovo Thinkpad X1 Fold 16
Intel Core i7-1250U, Intel Iris Xe Graphics G7 96EUs
24.1 (6.2min, 8.71P1) fps -39%
1920x1080 ultra AA:ultra AF:16
Lenovo Yoga Pro 9 16IMH9
Intel Core Ultra 9 185H, NVIDIA GeForce RTX 4070 Laptop GPU
213 fps +605%
Lenovo ThinkPad Z16 Gen 2
AMD Ryzen 9 PRO 7940HS, AMD Radeon RX 6550M
88.4 (66.9min, 70.8P1) fps +193%
HP Pavilion Plus 16-ab0456tx
Intel Core i7-13700H, NVIDIA GeForce RTX 3050 6GB Laptop GPU
80.5 (56.9min, 62P1) fps +167%
Acer Swift X SFX16-52G-52VE
Intel Core i5-1240P, Intel Arc A370M
54.3 (41.2min, 42.6P1) fps +80%
Samsung Galaxy Book4 Pro 16
Intel Core Ultra 7 155H, Intel Arc 8-Core iGPU
47 fps +56%
Lenovo IdeaPad 5 Pro 16IHU6
Intel Core i5-11300H, NVIDIA GeForce MX450
32.2 (15.7min, 25.4P1) fps +7%
Lenovo Yoga 7 2-in-1 16IML9
Intel Core Ultra 5 125U, Intel Graphics 4-Cores iGPU (Arc)
30.2 (7.6min, 10.6P1) fps
Moyenne Intel Graphics 4-Cores iGPU (Arc)
  (22.9 - 33.3, n=4)
29.2 fps -3%
LG Gram 2in1 16 16T90R - G.AA78G
Intel Core i7-1360P, Intel Iris Xe Graphics G7 96EUs
28.5 (5.7min, 7.83P1) fps -6%
LG Gram 16 2-in-1 16T90P
Intel Core i7-1165G7, Intel Iris Xe Graphics G7 96EUs
25.8 (5min, 6.37P1) fps -15%
Lenovo IdeaPad Flex 5 16ABR G8
AMD Ryzen 7 7730U, AMD Radeon RX Vega 8 (Ryzen 4000/5000)
24.1 (6.1min, 7.58P1) fps -20%
HP Spectre x360 2-in-1 16-f1075ng
Intel Core i7-12700H, Intel Iris Xe Graphics G7 96EUs
23.7 (7.7min, 9.06P1) fps -22%
Dell Inspiron 16 7635 2-in-1
AMD Ryzen 5 7530U, AMD Radeon RX Vega 7
23.2 (7.3min, 9.35P1) fps -23%
Lenovo Thinkpad X1 Fold 16
Intel Core i7-1250U, Intel Iris Xe Graphics G7 96EUs
19 (5min, 5P1) fps -37%
Cyberpunk 2077 2.0 Phantom Liberty
1280x720 Low Preset (FSR off)
HP Pavilion Plus 16-ab0456tx
Intel Core i7-13700H, NVIDIA GeForce RTX 3050 6GB Laptop GPU
100.6 (45.2min) fps +207%
Lenovo ThinkPad Z16 Gen 2
AMD Ryzen 9 PRO 7940HS, AMD Radeon RX 6550M
99.1 (61.6min) fps +202%
Lenovo Yoga 7 2-in-1 16IML9
Intel Core Ultra 5 125U, Intel Graphics 4-Cores iGPU (Arc)
32.8 (7.65min) fps
Moyenne Intel Graphics 4-Cores iGPU (Arc)
  (29.1 - 32.8, n=4)
31.5 fps -4%
LG Gram 2in1 16 16T90R - G.AA78G
Intel Core i7-1360P, Intel Iris Xe Graphics G7 96EUs
29.2 (6.93min) fps -11%
Lenovo Thinkpad X1 Fold 16
Intel Core i7-1250U, Intel Iris Xe Graphics G7 96EUs
21.4 (3.17min) fps -35%
1920x1080 Low Preset (FSR off)
Lenovo Yoga Pro 9 16IMH9
Intel Core Ultra 9 185H, NVIDIA GeForce RTX 4070 Laptop GPU
129.6 (37.7min) fps +520%
HP Pavilion Plus 16-ab0456tx
Intel Core i7-13700H, NVIDIA GeForce RTX 3050 6GB Laptop GPU
67.6 (41min) fps +223%
Lenovo ThinkPad Z16 Gen 2
AMD Ryzen 9 PRO 7940HS, AMD Radeon RX 6550M
62.8 (41.5min) fps +200%
Samsung Galaxy Book4 Pro 16
Intel Core Ultra 7 155H, Intel Arc 8-Core iGPU
27.6 (20.7min) fps +32%
Lenovo Yoga 7 2-in-1 16IML9
Intel Core Ultra 5 125U, Intel Graphics 4-Cores iGPU (Arc)
20.9 (8.34min) fps
Moyenne Intel Graphics 4-Cores iGPU (Arc)
  (18.5 - 21.6, n=4)
20.3 fps -3%
LG Gram 2in1 16 16T90R - G.AA78G
Intel Core i7-1360P, Intel Iris Xe Graphics G7 96EUs
17.7 (12min) fps -15%
Lenovo Thinkpad X1 Fold 16
Intel Core i7-1250U, Intel Iris Xe Graphics G7 96EUs
13.1 (9.86min) fps -37%
1920x1080 Medium Preset (FSR off)
Lenovo Yoga Pro 9 16IMH9
Intel Core Ultra 9 185H, NVIDIA GeForce RTX 4070 Laptop GPU
106.8 (53.2min) fps +532%
HP Pavilion Plus 16-ab0456tx
Intel Core i7-13700H, NVIDIA GeForce RTX 3050 6GB Laptop GPU
52.1 (27.1min) fps +208%
Lenovo ThinkPad Z16 Gen 2
AMD Ryzen 9 PRO 7940HS, AMD Radeon RX 6550M
45.9 (34.5min) fps +172%
Samsung Galaxy Book4 Pro 16
Intel Core Ultra 7 155H, Intel Arc 8-Core iGPU
25.4 (20.9min) fps +50%
Lenovo Yoga 7 2-in-1 16IML9
Intel Core Ultra 5 125U, Intel Graphics 4-Cores iGPU (Arc)
16.9 (7.96min) fps
Moyenne Intel Graphics 4-Cores iGPU (Arc)
  (15 - 17.6, n=4)
16.6 fps -2%
LG Gram 2in1 16 16T90R - G.AA78G
Intel Core i7-1360P, Intel Iris Xe Graphics G7 96EUs
14.2 (3.7min) fps -16%
1920x1080 High Preset (FSR off)
Lenovo Yoga Pro 9 16IMH9
Intel Core Ultra 9 185H, NVIDIA GeForce RTX 4070 Laptop GPU
90.5 (40.2min) fps +533%
HP Pavilion Plus 16-ab0456tx
Intel Core i7-13700H, NVIDIA GeForce RTX 3050 6GB Laptop GPU
43.2 (16.2min) fps +202%
Lenovo ThinkPad Z16 Gen 2
AMD Ryzen 9 PRO 7940HS, AMD Radeon RX 6550M
34.7 (15.3min) fps +143%
Samsung Galaxy Book4 Pro 16
Intel Core Ultra 7 155H, Intel Arc 8-Core iGPU
22.8 (19.1min) fps +59%
Lenovo Yoga 7 2-in-1 16IML9
Intel Core Ultra 5 125U, Intel Graphics 4-Cores iGPU (Arc)
14.3 (3.34min) fps
Moyenne Intel Graphics 4-Cores iGPU (Arc)
  (12.4 - 14.9, n=4)
14 fps -2%
LG Gram 2in1 16 16T90R - G.AA78G
Intel Core i7-1360P, Intel Iris Xe Graphics G7 96EUs
11.9 (2.78min) fps -17%
Tiny Tina's Wonderlands
1280x720 Lowest Preset (DX12)
Lenovo ThinkPad Z16 Gen 2
AMD Ryzen 9 PRO 7940HS, AMD Radeon RX 6550M
212.5 fps +288%
Dell Inspiron 16 7635 2-in-1
AMD Ryzen 5 7530U, AMD Radeon RX Vega 7
59.2 fps +8%
Moyenne Intel Graphics 4-Cores iGPU (Arc)
  (49 - 61.8, n=4)
55.8 fps +2%
Lenovo Yoga 7 2-in-1 16IML9
Intel Core Ultra 5 125U, Intel Graphics 4-Cores iGPU (Arc)
54.8 fps
1920x1080 Low Preset (DX12)
Lenovo ThinkPad Z16 Gen 2
AMD Ryzen 9 PRO 7940HS, AMD Radeon RX 6550M
124.1 fps +315%
Lenovo Yoga 7 2-in-1 16IML9
Intel Core Ultra 5 125U, Intel Graphics 4-Cores iGPU (Arc)
29.9 fps
Moyenne Intel Graphics 4-Cores iGPU (Arc)
  (27.2 - 30.8, n=3)
29.3 fps -2%
Dell Inspiron 16 7635 2-in-1
AMD Ryzen 5 7530U, AMD Radeon RX Vega 7
28.8 fps -4%
1920x1080 Medium Preset (DX12)
Lenovo ThinkPad Z16 Gen 2
AMD Ryzen 9 PRO 7940HS, AMD Radeon RX 6550M
95.5 fps +298%
Lenovo Yoga 7 2-in-1 16IML9
Intel Core Ultra 5 125U, Intel Graphics 4-Cores iGPU (Arc)
24 fps
Moyenne Intel Graphics 4-Cores iGPU (Arc)
  (21.1 - 24.2, n=3)
23.1 fps -4%
Dell Inspiron 16 7635 2-in-1
AMD Ryzen 5 7530U, AMD Radeon RX Vega 7
21.2 fps -12%
1920x1080 High Preset (DX12)
Lenovo ThinkPad Z16 Gen 2
AMD Ryzen 9 PRO 7940HS, AMD Radeon RX 6550M
59.7 fps +271%
Lenovo Yoga 7 2-in-1 16IML9
Intel Core Ultra 5 125U, Intel Graphics 4-Cores iGPU (Arc)
16.1 fps
Moyenne Intel Graphics 4-Cores iGPU (Arc)
  (14.1 - 16.3, n=3)
15.5 fps -4%
Dell Inspiron 16 7635 2-in-1
AMD Ryzen 5 7530U, AMD Radeon RX Vega 7
12.9 fps -20%
1920x1080 Badass Preset (DX12)
Lenovo ThinkPad Z16 Gen 2
AMD Ryzen 9 PRO 7940HS, AMD Radeon RX 6550M
30.3 fps +139%
Lenovo Yoga 7 2-in-1 16IML9
Intel Core Ultra 5 125U, Intel Graphics 4-Cores iGPU (Arc)
12.7 fps
Moyenne Intel Graphics 4-Cores iGPU (Arc)
  (11.3 - 13.8, n=3)
12.6 fps -1%
Dell Inspiron 16 7635 2-in-1
AMD Ryzen 5 7530U, AMD Radeon RX Vega 7
9.2 fps -28%
Baldur's Gate 3
1920x1080 Low Preset
Lenovo Yoga Pro 9 16IMH9
Intel Core Ultra 9 185H, NVIDIA GeForce RTX 4070 Laptop GPU
166.3 fps +980%
Lenovo ThinkPad Z16 Gen 2
AMD Ryzen 9 PRO 7940HS, AMD Radeon RX 6550M
61.6 fps +300%
Moyenne Intel Graphics 4-Cores iGPU (Arc)
  (15 - 17.7, n=4)
16.1 fps +5%
Lenovo Yoga 7 2-in-1 16IML9
Intel Core Ultra 5 125U, Intel Graphics 4-Cores iGPU (Arc)
15.4 fps
1920x1080 Medium Preset
Lenovo Yoga Pro 9 16IMH9
Intel Core Ultra 9 185H, NVIDIA GeForce RTX 4070 Laptop GPU
136.6 fps
Lenovo ThinkPad Z16 Gen 2
AMD Ryzen 9 PRO 7940HS, AMD Radeon RX 6550M
52.9 fps
Moyenne Intel Graphics 4-Cores iGPU (Arc)
  (12.3 - 14.5, n=3)
13.1 fps
1920x1080 High Preset
Lenovo Yoga Pro 9 16IMH9
Intel Core Ultra 9 185H, NVIDIA GeForce RTX 4070 Laptop GPU
119.9 fps
Lenovo ThinkPad Z16 Gen 2
AMD Ryzen 9 PRO 7940HS, AMD Radeon RX 6550M
44.7 fps
Moyenne Intel Graphics 4-Cores iGPU (Arc)
  ()
11 fps
1920x1080 Ultra Preset
Lenovo Yoga Pro 9 16IMH9
Intel Core Ultra 9 185H, NVIDIA GeForce RTX 4070 Laptop GPU
117.7 fps
Lenovo ThinkPad Z16 Gen 2
AMD Ryzen 9 PRO 7940HS, AMD Radeon RX 6550M
43 fps
Moyenne Intel Graphics 4-Cores iGPU (Arc)
  ()
10.6 fps
Far Cry 5
1280x720 Low Preset AA:T
Lenovo Yoga Pro 9 16IMH9
Intel Core Ultra 9 185H, NVIDIA GeForce RTX 4070 Laptop GPU
156 fps +239%
Lenovo ThinkPad Z16 Gen 2
AMD Ryzen 9 PRO 7940HS, AMD Radeon RX 6550M
115 (90min) fps +150%
Lenovo IdeaPad 5 Pro 16IHU6
Intel Core i5-11300H, NVIDIA GeForce MX450
94 (73min) fps +104%
Acer Swift X SFX16-52G-52VE
Intel Core i5-1240P, Intel Arc A370M
87 (49min) fps +89%
Samsung Galaxy Book4 Pro 16
Intel Core Ultra 7 155H, Intel Arc 8-Core iGPU
67 fps +46%
Lenovo IdeaPad Flex 5 16ABR G8
AMD Ryzen 7 7730U, AMD Radeon RX Vega 8 (Ryzen 4000/5000)
48 fps +4%
HP Spectre x360 2-in-1 16-f1075ng
Intel Core i7-12700H, Intel Iris Xe Graphics G7 96EUs
47 (41min) fps +2%
Lenovo Yoga 7 2-in-1 16IML9
Intel Core Ultra 5 125U, Intel Graphics 4-Cores iGPU (Arc)
46 (39min) fps
Moyenne Intel Graphics 4-Cores iGPU (Arc)
  (38 - 48, n=4)
44.8 fps -3%
Lenovo Thinkpad X1 Fold 16
Intel Core i7-1250U, Intel Iris Xe Graphics G7 96EUs
27 (22min) fps -41%
1920x1080 Medium Preset AA:T
Lenovo Yoga Pro 9 16IMH9
Intel Core Ultra 9 185H, NVIDIA GeForce RTX 4070 Laptop GPU
133 fps +432%
Lenovo ThinkPad Z16 Gen 2
AMD Ryzen 9 PRO 7940HS, AMD Radeon RX 6550M
91 (73min) fps +264%
HP Pavilion Plus 16-ab0456tx
Intel Core i7-13700H, NVIDIA GeForce RTX 3050 6GB Laptop GPU
89 (75min) fps +256%
Acer Swift X SFX16-52G-52VE
Intel Core i5-1240P, Intel Arc A370M
48 (43min) fps +92%
Lenovo IdeaPad 5 Pro 16IHU6
Intel Core i5-11300H, NVIDIA GeForce MX450
41 (35min) fps +64%
Samsung Galaxy Book4 Pro 16
Intel Core Ultra 7 155H, Intel Arc 8-Core iGPU
39 fps +56%
Lenovo Yoga 7 2-in-1 16IML9
Intel Core Ultra 5 125U, Intel Graphics 4-Cores iGPU (Arc)
25 (17min) fps
Moyenne Intel Graphics 4-Cores iGPU (Arc)
  (20 - 25, n=4)
23.5 fps -6%
HP Spectre x360 2-in-1 16-f1075ng
Intel Core i7-12700H, Intel Iris Xe Graphics G7 96EUs
23 (20min) fps -8%
Lenovo IdeaPad Flex 5 16ABR G8
AMD Ryzen 7 7730U, AMD Radeon RX Vega 8 (Ryzen 4000/5000)
23 fps -8%
Lenovo Thinkpad X1 Fold 16
Intel Core i7-1250U, Intel Iris Xe Graphics G7 96EUs
18 (15min) fps -28%
1920x1080 High Preset AA:T
Lenovo Yoga Pro 9 16IMH9
Intel Core Ultra 9 185H, NVIDIA GeForce RTX 4070 Laptop GPU
130 fps +420%
Lenovo ThinkPad Z16 Gen 2
AMD Ryzen 9 PRO 7940HS, AMD Radeon RX 6550M
84 (74min) fps +236%
HP Pavilion Plus 16-ab0456tx
Intel Core i7-13700H, NVIDIA GeForce RTX 3050 6GB Laptop GPU
82 (70min) fps +228%
Acer Swift X SFX16-52G-52VE
Intel Core i5-1240P, Intel Arc A370M
45 (40min) fps +80%
Samsung Galaxy Book4 Pro 16
Intel Core Ultra 7 155H, Intel Arc 8-Core iGPU
38 fps +52%
Lenovo IdeaPad 5 Pro 16IHU6
Intel Core i5-11300H, NVIDIA GeForce MX450
35 (26min) fps +40%
LG Gram 2in1 16 16T90R - G.AA78G
Intel Core i7-1360P, Intel Iris Xe Graphics G7 96EUs
29 (26min) fps +16%
Lenovo Yoga 7 2-in-1 16IML9
Intel Core Ultra 5 125U, Intel Graphics 4-Cores iGPU (Arc)
25 (22min) fps
Moyenne Intel Graphics 4-Cores iGPU (Arc)
  (19 - 25, n=4)
22.8 fps -9%
HP Spectre x360 2-in-1 16-f1075ng
Intel Core i7-12700H, Intel Iris Xe Graphics G7 96EUs
22 (20min) fps -12%
Lenovo IdeaPad Flex 5 16ABR G8
AMD Ryzen 7 7730U, AMD Radeon RX Vega 8 (Ryzen 4000/5000)
20 fps -20%
Lenovo Thinkpad X1 Fold 16
Intel Core i7-1250U, Intel Iris Xe Graphics G7 96EUs
16 (14min) fps -36%
1920x1080 Ultra Preset AA:T
Lenovo Yoga Pro 9 16IMH9
Intel Core Ultra 9 185H, NVIDIA GeForce RTX 4070 Laptop GPU
116 fps +404%
Lenovo ThinkPad Z16 Gen 2
AMD Ryzen 9 PRO 7940HS, AMD Radeon RX 6550M
79 (70min) fps +243%
HP Pavilion Plus 16-ab0456tx
Intel Core i7-13700H, NVIDIA GeForce RTX 3050 6GB Laptop GPU
76 (63min) fps +230%
Acer Swift X SFX16-52G-52VE
Intel Core i5-1240P, Intel Arc A370M
42 (39min) fps +83%
Samsung Galaxy Book4 Pro 16
Intel Core Ultra 7 155H, Intel Arc 8-Core iGPU
35 fps +52%
Lenovo IdeaPad 5 Pro 16IHU6
Intel Core i5-11300H, NVIDIA GeForce MX450
33 (25min) fps +43%
LG Gram 2in1 16 16T90R - G.AA78G
Intel Core i7-1360P, Intel Iris Xe Graphics G7 96EUs
27 (24min) fps +17%
Lenovo Yoga 7 2-in-1 16IML9
Intel Core Ultra 5 125U, Intel Graphics 4-Cores iGPU (Arc)
23 (20min) fps
Moyenne Intel Graphics 4-Cores iGPU (Arc)
  (18 - 23, n=4)
21 fps -9%
HP Spectre x360 2-in-1 16-f1075ng
Intel Core i7-12700H, Intel Iris Xe Graphics G7 96EUs
20 (18min) fps -13%
Lenovo IdeaPad Flex 5 16ABR G8
AMD Ryzen 7 7730U, AMD Radeon RX Vega 8 (Ryzen 4000/5000)
19 fps -17%
Lenovo Thinkpad X1 Fold 16
Intel Core i7-1250U, Intel Iris Xe Graphics G7 96EUs
15 (13min) fps -35%

Witcher 3 FPS Chart

0510152025303540455055606570758085Tooltip
Bas Moyen Élevé Ultra
The Witcher 3 (2015) 86.8 49.6 28.4 15
Dota 2 Reborn (2015) 101.9 60.7 61.1 57.6
Final Fantasy XV Benchmark (2018) 37.6 23 16.3
X-Plane 11.11 (2018) 36.5 28 23.4
Far Cry 5 (2018) 46 25 25 23
Strange Brigade (2018) 120.4 50 39.2 30.2
Tiny Tina's Wonderlands (2022) 29.9 24 16.1 12.7
F1 22 (2022) 41.7 39.7
Baldur's Gate 3 (2023) 15.4
Cyberpunk 2077 2.0 Phantom Liberty (2023) 20.9 16.9 14.3 12.5

Émissions - Plus silencieuses, mais plus chaudes

Bruit du système

Le bruit des ventilateurs est plus silencieux que sur le modèle de l'année dernière, ce qui est probablement lié à la consommation d'énergie plus faible de Meteor Lake-U et à des températures de cœur légèrement plus chaudes. Lors de l'exécution de 3DMark 06, par exemple, notre modèle 2024 peut rester beaucoup plus silencieux pendant de longues périodes par rapport au modèle 2023, et il en va de même pour les charges de jeu. Le maximum temporaire de >40 dB(A) peut encore être atteint lors de l'exécution de Prime95.

Profil de bruit du ventilateur (Blanc : Arrière-plan, Rouge : Système au repos, Bleu : 3DMark 06, Orange : Witcher 3 vert : Prime95+FurMark stress)

Degré de la nuisance sonore

Au repos
22.8 / 22.8 / 22.8 dB(A)
Fortement sollicité
30.8 / 40.8 dB(A)
  red to green bar
 
 
30 dB
silencieux
40 dB(A)
audible
50 dB(A)
bruyant
 
min: dark, med: mid, max: light   Earthworks M23R, Arta (à 15 cm de distance)   bruit ambiant: 22.8 dB(A)
dB(A) 0102030405060708090Deep BassMiddle BassHigh BassLower RangeMidsHigher MidsLower HighsMid HighsUpper HighsSuper Highs2028.225.629.52936.62522.51820.221.124.9312019.220.119.321.84019.81919.517.724.15018.717.317.21724.16318.51918.918.329.58017.619.118.615.919.410016.517.615.614.617.612515.716.213.413.217.216016.115.112.311.62120016.516.812.112.220.625015.415.611.211.618.931515.715.412.412.220.14001516.111.611.720.250015.514.810.811.322.363015.916.31010.123.880019.418.510.911.730.6100019189.29.725.7125020.620.59.19.429.5160021.221.19.69.430.720002222.39.910.132250021.52110.210.331.4315019.619.610.710.529.440001817.5111127.2500015.114.610.911.128.2630013.913.711.211.427.4800012.912.811.311.424.6100001211.911.411.619.51250011.711.611.311.414.71600011.311.410.410.712.4SPL3130.822.622.840.7N1.21.20.40.43.3median 15.9median 16.2median 11median 11.4median 23.8Delta2.42.30.80.75.1hearing rangehide median Fan NoiseLenovo Yoga 7 2-in-1 16IML9
Lenovo Yoga 7 2-in-1 16IML9
Graphics 4-Core, Ultra 5 125U
Lenovo Yoga 7 16IRL8
Iris Xe G7 96EUs, i7-1355U, WD PC SN740 512GB SDDPMQD-512G-1101
Samsung Galaxy Book4 Pro 16
Arc 8-Core, Ultra 7 155H, Samsung PM9B1 512GB MZVL4512HBLU
HP Pavilion Plus 16-ab0456tx
GeForce RTX 3050 6GB Laptop GPU, i7-13700H, WDC PC SN810 1TB
LG Gram 2in1 16 16T90R - G.AA78G
Iris Xe G7 96EUs, i7-1360P, Samsung PM9A1 MZVL21T0HCLR
Dell Inspiron 16 7635 2-in-1
Vega 7, R5 7530U, Kioxia BG5 KBG50ZNS512G
Noise
-13%
-14%
-9%
-10%
-14%
off / environment *
22.8
22.8
-0%
24.6
-8%
22.22
3%
25.1
-10%
23.6
-4%
Idle Minimum *
22.8
22.9
-0%
24.6
-8%
22.22
3%
25.1
-10%
23.6
-4%
Idle Average *
22.8
22.9
-0%
24.6
-8%
22.22
3%
25.1
-10%
23.6
-4%
Idle Maximum *
22.8
26.9
-18%
26.4
-16%
22.22
3%
26.1
-14%
23.6
-4%
Load Average *
30.8
41.7
-35%
40
-30%
42.03
-36%
31.4
-2%
40.3
-31%
Witcher 3 ultra *
31
41.5
-34%
40
-29%
42.1
-36%
41.1
-33%
44.2
-43%
Load Maximum *
40.8
43.6
-7%
40
2%
42.1
-3%
36.6
10%
44.2
-8%

* ... Moindre est la valeur, meilleures sont les performances

Température

Les températures de surface sont les plus élevées sur le côté gauche du système où les points chauds peuvent atteindre 38°C en haut et en bas. C'est à peine moins chaud que sur le Galaxy Book4 Pro 16, plus cher, qui est livré avec le Core Ultra 7 155H, beaucoup plus rapide.

Échappement arrière
Échappement arrière
L'adaptateur CA atteint plus de 41°C lorsque les charges sont élevées
 37.6 °C37 °C35.6 °C 
 37.8 °C36.8 °C28.6 °C 
 29.6 °C24.8 °C23.8 °C 
Maximum: 37.8 °C
Moyenne: 32.4 °C
30.8 °C36.4 °C38.8 °C
26.4 °C34.2 °C35.2 °C
25.4 °C28.4 °C29.4 °C
Maximum: 38.8 °C
Moyenne: 31.7 °C
Alimentation (valeur maximale)  42 °C | Température ambiante de la pièce 20 °C | Fluke 62 Mini IR Thermometer
(±) La température moyenne de la face supérieure sous charge maximale est de 32.4 °C / 90 F, par rapport à la moyenne de 30.2 °C / 86 F pour les appareils de la classe Convertible.
(+) La température maximale du côté supérieur est de 37.8 °C / 100 F, par rapport à la moyenne de 35.3 °C / 96 F, allant de 19.6 à 55.7 °C pour la classe Convertible.
(+) Le fond chauffe jusqu'à un maximum de 38.8 °C / 102 F, contre une moyenne de 36.7 °C / 98 F
(+) En utilisation inactive, la température moyenne du côté supérieur est de 24.2 °C / 76 F, par rapport à la moyenne du dispositif de 30.2 °C / 86 F.
(+) Les repose-poignets et le pavé tactile sont plus froids que la température de la peau avec un maximum de 29.6 °C / 85.3 F et sont donc froids au toucher.
(±) La température moyenne de la zone de l'appui-paume de dispositifs similaires était de 28.1 °C / 82.6 F (-1.5 °C / #-2.7 F).
Système au repos (en haut)
Système en veille (en bas)
Prime95+FurMark stress (haut)
Stress Prime95+FurMark (en bas)
Lenovo Yoga 7 2-in-1 16IML9
Intel Core Ultra 5 125U, Intel Graphics 4-Cores iGPU (Arc)
Lenovo Yoga 7 16IRL8
Intel Core i7-1355U, Intel Iris Xe Graphics G7 96EUs
Samsung Galaxy Book4 Pro 16
Intel Core Ultra 7 155H, Intel Arc 8-Core iGPU
HP Pavilion Plus 16-ab0456tx
Intel Core i7-13700H, NVIDIA GeForce RTX 3050 6GB Laptop GPU
LG Gram 2in1 16 16T90R - G.AA78G
Intel Core i7-1360P, Intel Iris Xe Graphics G7 96EUs
Dell Inspiron 16 7635 2-in-1
AMD Ryzen 5 7530U, AMD Radeon RX Vega 7
Heat
-9%
-2%
-34%
-35%
-9%
Maximum Upper Side *
37.8
37.6
1%
40.9
-8%
49.6
-31%
55
-46%
41.6
-10%
Maximum Bottom *
38.8
40
-3%
42.6
-10%
45.8
-18%
55.4
-43%
39
-1%
Idle Upper Side *
25.4
30.4
-20%
24.5
4%
39.2
-54%
34.9
-37%
29.4
-16%
Idle Bottom *
26.8
30.6
-14%
24.8
7%
35.4
-32%
30
-12%
28.6
-7%

* ... Moindre est la valeur, meilleures sont les performances

Intervenants

Bruit rose au volume maximum
dB(A) 0102030405060708090Deep BassMiddle BassHigh BassLower RangeMidsHigher MidsLower HighsMid HighsUpper HighsSuper Highs2031.529.531.52525.520.225.53120.820.120.84021.119.521.15025.317.225.36332.918.932.98035.318.635.310038.615.638.612541.313.441.316050.312.350.320050.512.150.525054.111.254.131558.612.458.640061.811.661.850066.510.866.563070.71070.780069.510.969.5100068.59.268.5125069.79.169.7160071.29.671.2200067.69.967.6250064.610.264.6315066.510.766.5400070.41170.4500065.310.965.3630066.511.266.5800063.711.363.71000057.811.457.81250054.711.354.71600053.110.453.1SPL79.922.679.9N47.90.447.9median 64.6median 11median 64.6Delta7.50.87.526.325.821.422.12624.925.127.622.532.523.448.72655.818.860.922.167.2267019.372.317.674.217.774.319.575.31571.711.871.311.27410.574.21072.710.17210.67210.97511.374.811.671.71269.71269.612.371.112.669.61270.111.269.824.784.70.666.6median 12median 71.73.42.2hearing rangehide median Pink NoiseLenovo Yoga 7 2-in-1 16IML9Apple MacBook Pro 16 2021 M1 Pro
Diagramme de fréquence (les cases peuvent être cochées et décochées pour comparer les appareils)
Lenovo Yoga 7 2-in-1 16IML9 analyse audio

(±) | le niveau sonore du haut-parleur est moyen mais bon (79.9# dB)
Bass 100 - 315 Hz
(-) | presque aucune basse - en moyenne 15.7% plus bas que la médiane
(±) | la linéarité des basses est moyenne (7.2% delta à la fréquence précédente)
Mids 400 - 2000 Hz
(+) | médiane équilibrée - seulement 4.3% de la médiane
(+) | les médiums sont linéaires (4.8% delta à la fréquence précédente)
Aiguës 2 - 16 kHz
(+) | des sommets équilibrés - à seulement 2.6% de la médiane
(+) | les aigus sont linéaires (6.3% delta à la fréquence précédente)
Overall 100 - 16.000 Hz
(+) | le son global est linéaire (14.9% différence à la médiane)
Par rapport à la même classe
» 20% de tous les appareils testés de cette catégorie étaient meilleurs, 3% similaires, 77% pires
» Le meilleur avait un delta de 6%, la moyenne était de 21%, le pire était de 57%.
Par rapport à tous les appareils testés
» 16% de tous les appareils testés étaient meilleurs, 4% similaires, 80% pires
» Le meilleur avait un delta de 4%, la moyenne était de 25%, le pire était de 134%.

Apple MacBook Pro 16 2021 M1 Pro analyse audio

(+) | les haut-parleurs peuvent jouer relativement fort (84.7# dB)
Bass 100 - 315 Hz
(+) | bonne basse - seulement 3.8% loin de la médiane
(+) | les basses sont linéaires (5.2% delta à la fréquence précédente)
Mids 400 - 2000 Hz
(+) | médiane équilibrée - seulement 1.3% de la médiane
(+) | les médiums sont linéaires (2.1% delta à la fréquence précédente)
Aiguës 2 - 16 kHz
(+) | des sommets équilibrés - à seulement 1.9% de la médiane
(+) | les aigus sont linéaires (2.7% delta à la fréquence précédente)
Overall 100 - 16.000 Hz
(+) | le son global est linéaire (4.6% différence à la médiane)
Par rapport à la même classe
» 0% de tous les appareils testés de cette catégorie étaient meilleurs, 0% similaires, 100% pires
» Le meilleur avait un delta de 5%, la moyenne était de 18%, le pire était de 45%.
Par rapport à tous les appareils testés
» 0% de tous les appareils testés étaient meilleurs, 0% similaires, 100% pires
» Le meilleur avait un delta de 4%, la moyenne était de 25%, le pire était de 134%.

Gestion de l'énergie

Consommation électrique

Le fonctionnement Witcher 3 pour représenter une charge élevée consommerait 30 W contre 44 W pour le modèle 2023. Si l'on considère que notre carte Arc 4 intégrée affiche des performances similaires à celles des anciennes cartes Iris Xe 96 EU, les gains en termes de performances par watt sont significatifs et constituent l'un des points forts de la gamme Meteor Lake. Les économies d'énergie s'alignent sur le bruit du ventilateur généralement plus silencieux et l'autonomie de la batterie plus longue, comme indiqué dans leurs sections respectives.

Il est intéressant de noter que le modèle 2024 est livré avec un adaptateur secteur USB-C 65 W différent de celui du modèle 2023. Le nouvel adaptateur est plus mince mais plus long (~9 x 4,6 x 2,8 cm) et nécessite un cordon d'alimentation NEMA séparé, contrairement à l'ancien adaptateur de prise murale.

(Note de la rédaction: cette section sera mise à jour lorsque les réparations de notre multimètre Metrahit Energy seront terminées dans le courant du mois. Nous vous prions de nous excuser pour la gêne occasionnée)

Consommation énergétique
Éteint/en veilledarklight 0.32 / 0.61 Watts
Au reposdarkmidlight 3 / 8.5 / 8.9 Watts
Fortement sollicité midlight 41.1 / 64.6 Watts
 color bar
Légende: min: dark, med: mid, max: light        Metrahit Energy
Currently we use the Metrahit Energy, a professional single phase power quality and energy measurement digital multimeter, for our measurements. Find out more about it here. All of our test methods can be found here.
Lenovo Yoga 7 2-in-1 16IML9
Ultra 5 125U, Graphics 4-Core, , IPS, 1920x1200, 16.00
Lenovo Yoga 7 16IRL8
i7-1355U, Iris Xe G7 96EUs, WD PC SN740 512GB SDDPMQD-512G-1101, IPS, 1920x1200, 16.00
Samsung Galaxy Book4 Pro 16
Ultra 7 155H, Arc 8-Core, Samsung PM9B1 512GB MZVL4512HBLU, OLED, 2880x1800, 16.00
HP Pavilion Plus 16-ab0456tx
i7-13700H, GeForce RTX 3050 6GB Laptop GPU, WDC PC SN810 1TB, IPS, 2560x1600, 16.00
LG Gram 2in1 16 16T90R - G.AA78G
i7-1360P, Iris Xe G7 96EUs, Samsung PM9A1 MZVL21T0HCLR, IPS, 2560x1600, 16.00
Dell Inspiron 16 7635 2-in-1
R5 7530U, Vega 7, Kioxia BG5 KBG50ZNS512G, IPS, 1920x1200, 16.00
Power Consumption
-21%
-6%
-79%
-33%
-17%
Idle Minimum *
3
3.3
-10%
3.6
-20%
3.3
-10%
5.5
-83%
4.8
-60%
Idle Average *
8.5
10.2
-20%
5.7
33%
7.3
14%
7.2
15%
7.6
11%
Idle Maximum *
8.9
10.3
-16%
6.1
31%
14.24
-60%
12.9
-45%
8.7
2%
Load Average *
41.1
55.2
-34%
52.5
-28%
91.7
-123%
55
-34%
47.1
-15%
Witcher 3 ultra *
30.7
43.8
-43%
46.6
-52%
96.2
-213%
47
-53%
46.6
-52%
Load Maximum *
64.6
65.7
-2%
64.7
-0%
115.8
-79%
63.6
2%
56.4
13%

* ... Moindre est la valeur, meilleures sont les performances

Autonomie de la batterie

L'autonomie du réseau local sans fil a augmenté de 3 heures, pour un total de plus de 12 heures d'utilisation en conditions réelles. Cette augmentation s'aligne sur l'efficacité énergétique généralement plus élevée mentionnée ci-dessus. En fait, l'autonomie de la batterie est en hausse pour presque tous les systèmes fonctionnant avec des CPU Meteor Lake-U.

Autonomie
WiFi Websurfing
12h 18min
Lenovo Yoga 7 2-in-1 16IML9
Ultra 5 125U, Graphics 4-Core, 71 Wh
Lenovo Yoga 7 16IRL8
i7-1355U, Iris Xe G7 96EUs, 71 Wh
Samsung Galaxy Book4 Pro 16
Ultra 7 155H, Arc 8-Core, 76 Wh
HP Pavilion Plus 16-ab0456tx
i7-13700H, GeForce RTX 3050 6GB Laptop GPU, 68 Wh
LG Gram 2in1 16 16T90R - G.AA78G
i7-1360P, Iris Xe G7 96EUs, 80 Wh
Dell Inspiron 16 7635 2-in-1
R5 7530U, Vega 7, 64 Wh
Autonomie de la batterie
-23%
-13%
-15%
-3%
18%
WiFi v1.3
738
566
-23%
644
-13%
624
-15%
716
-3%
869
18%
Reader / Idle
1138
1560
Load
124
100
121
114
H.264
1144
720

Points positifs

+ bonne variété de ports
+ plus grande autonomie de la batterie
+ ventilateur plus silencieux
+ nPU intégré

Points négatifs

- pas de nouvelles options d'affichage ; gamme NTSC étroite à 45%
- pas d'amélioration majeure des performances du CPU ou du GPU
- pas de prise en charge des disques durs SSD de 80 mm de long
- les haut-parleurs pourraient être plus puissants

Verdict - Plus silencieux, plus durable et plus efficace

En revue : Lenovo Yoga 7 2-en-1 16IML9

Le Yoga 7 2-en-1 16 G9 n'est au mieux qu'une mise à jour mineure par rapport au Yoga 7 2-en-1 16 G8. Les avantages les plus notables par rapport au modèle 2023 sont les gains d'efficacité qui permettent à la fois des durées de fonctionnement plus longues et des ventilateurs plus silencieux. Si une meilleure autonomie est toujours la bienvenue, elle n'était pas particulièrement mauvaise sur le modèle de l'année dernière et nous aurions préféré des améliorations ailleurs, comme des options d'affichage supplémentaires ou des haut-parleurs et une webcam de meilleure qualité.

Le Yoga 7 2-en-1 16IML9 2024 apporte l'IA intégrée et une meilleure autonomie. À part cela, il n'y a pas grand-chose qui le distingue du modèle 2023, visuellement identique.

Les nouvelles options de processeurs Meteor Lake-U se distinguent par leurs NPU intégrés pour accélérer les tâches d'IA locales. Ces fonctionnalités ne sont toutefois pas encore largement disponibles, et la grande majorité des utilisateurs ne peuvent donc pas encore exploiter le NPU à l'heure où nous écrivons ces lignes. Les nouveaux Core Ultra 5 125U et Ultra 7 155U sont par ailleurs identiques au Core i7-1355U en termes de performances du CPU et du GPU.

Une alternative solide au Yoga 7 2-en-1 16IML9 est le modèle AMD à prix similaire Dell Inspiron 16 7635 2-en-1 et son écran tactile full sRGB plus vibrant. Si vous préférez toujours le Lenovo, nous vous recommandons d'opter pour le moins cher des deux modèles suivants 2023 Yoga 7 2-en-1 16 G8 qui offre essentiellement la même expérience utilisateur que le modèle 2024 pour moins cher.

Prix et disponibilité

Best Buy propose désormais le Lenovo Yoga 7 2-en-1 16IML9 à partir de 900 $ pour la configuration de base Core i5/512 Go et jusqu'à 1050 $ pour la configuration Core i7/1 TB.

Lenovo Yoga 7 2-in-1 16IML9 - 04/28/2024 v7
Allen Ngo

Châssis
85 / 98 → 87%
Clavier
87%
Dispositif de pointage
85%
Connectivité
64 / 75 → 86%
Poids
63 / 20-75 → 78%
Autonomie
89%
Écran
78%
Performances en jeu
67 / 78 → 86%
Performances dans les applications
92 / 85 → 100%
Chauffe
94%
Nuisance sonore
95%
Audio
79 / 91 → 87%
Appareil photo
42 / 85 → 49%
Moyenne
78%
87%
Convertible - Moyenne compensée

Transparency

The present review sample was made available to the author as a loan by the manufacturer or a shop for the purposes of review. The lender had no influence on this review, nor did the manufacturer receive a copy of this review before publication. There was no obligation to publish this review.

Pricecompare

Please share our article, every link counts!
> Revues et rapports de ordinateurs portatifs et smartphones, ordiphones > Critiques > Test du Lenovo Yoga 7 2-en-1 16IML9 : les débuts du Core Ultra 5 125U dans ce convertible
Allen Ngo, 2024-04-29 (Update: 2024-05- 1)