

Test du Minisforum MS-01 : Core i9-13900H, mais pas de carte graphique dédiée
Minisforum est une marque bien connue sur le marché des mini-PC et dispose d'un large portefeuille pour faire face à toutes les éventualités. Le fabricant d'Extrême-Orient a jusqu'à présent laissé de côté le secteur des stations de travail, ce qui devrait changer avec le Minisforum MS-01. La meilleure configuration du modèle est équipée de Intel Core i9-13900H qui, avec 32 Go de RAM et un SSD de 1 To, a été testé de près dans notre laboratoire. À 979 euros, le Minisforum MS-01 n'est certainement pas une bonne affaire, même si l'appareil peut également être commandé en tant qu'option barebone. Sans RAM ni SSD, le prix est encore de 799 euros. Si vous n'avez pas besoin de la performance de l'Intel Core i9-13900H, la station de travail compacte peut également être équipée d'un Intel Core i5-12600H (à partir de 499 euros) ou d'un Intel Core i9-12900H (à partir de 619 euros).
Avant de passer à l'examen du Minisforum MS-01, voici quelques informations importantes !
Les tests effectués sur notre échantillon ont été à plusieurs reprises accompagnés de plantages imprévisibles. Ceux-ci se sont principalement produits lors de scénarios de chargement plus longs, tels que la boucle multiple de Cinebench R15. Le test de stress SSD et le benchmark Adobe Premiere ont également posé des problèmes. Des plantages se sont reproduits à plusieurs reprises lors de ces tests. Nous avons constaté une amélioration lorsque nous avons réduit les limites de puissance du processeur à 35 watts, mais cela a entraîné une détérioration significative des performances du CPU. Pour mieux cerner le problème, nous avons remplacé tous les composants tels que la RAM, le SSD et le bloc d'alimentation, mais cela n'a donné aucun résultat. Finalement, nous sommes arrivés à la conclusion qu'il ne peut s'agir que d'un problème avec l'Intel Core i9-13900H lui-même. Nous avons informé le fabricant afin d'obtenir une solution. Minisforum a l'intention de nous envoyer un autre échantillon dès que possible. Une évaluation finale ne sera donc possible que lorsque nous aurons examiné l'appareil de remplacement.
Si quelqu'un a rencontré des problèmes similaires avec le Minisforum MS-01, n'hésitez pas à nous en faire part. Si vous possédez un Minisforum MS-01 et que vous n'avez pas rencontré de tels problèmes, n'hésitez pas à nous en faire part.
Karşılaştırmalı olarak olası rakipler
Note | Date | Modèle | Mémoire | Poids | Épaisseur |
|---|---|---|---|---|---|
| 81.5 % v7 (old) | 05/24 | Minisforum MS-01 i9-13900H, Iris Xe G7 96EUs | 32768 Mo | 1.5 kg | 48 mm |
| 83.4 % v7 (old) | 04/24 | Acemagic F2A Ultra 7 155H, Arc 8-Core | 32768 Mo | 768 g | 57 mm |
| 84.1 % | 04/24 | Geekom XT12 Pro i9-12900H, Iris Xe G7 96EUs | 32768 Mo | 545 g | 37 mm |
| 82.6 % v7 (old) | 03/24 | Geekom A7 R9 7940HS, Radeon 780M | 32768 Mo | 417 g | 38 mm |
| 82.4 % v7 (old) | 05/24 | Minisforum Venus Series NAB9 i9-12900HK, Iris Xe G7 96EUs | 32768 Mo | 615 g | 55 mm |
| 81.7 % v7 (old) | 08/23 | Minisforum Venus Series NPB5 i5-13500H, Iris Xe G7 80EUs | 16384 Mo | 604 g | 55 mm |
| 79.5 % v7 (old) | 02/24 | Maxtang MTN-FP750 R7 7735HS, Radeon 680M | 16384 Mo | 601 g | 52 mm |
Minisforum La station de travail MS-01 en détail


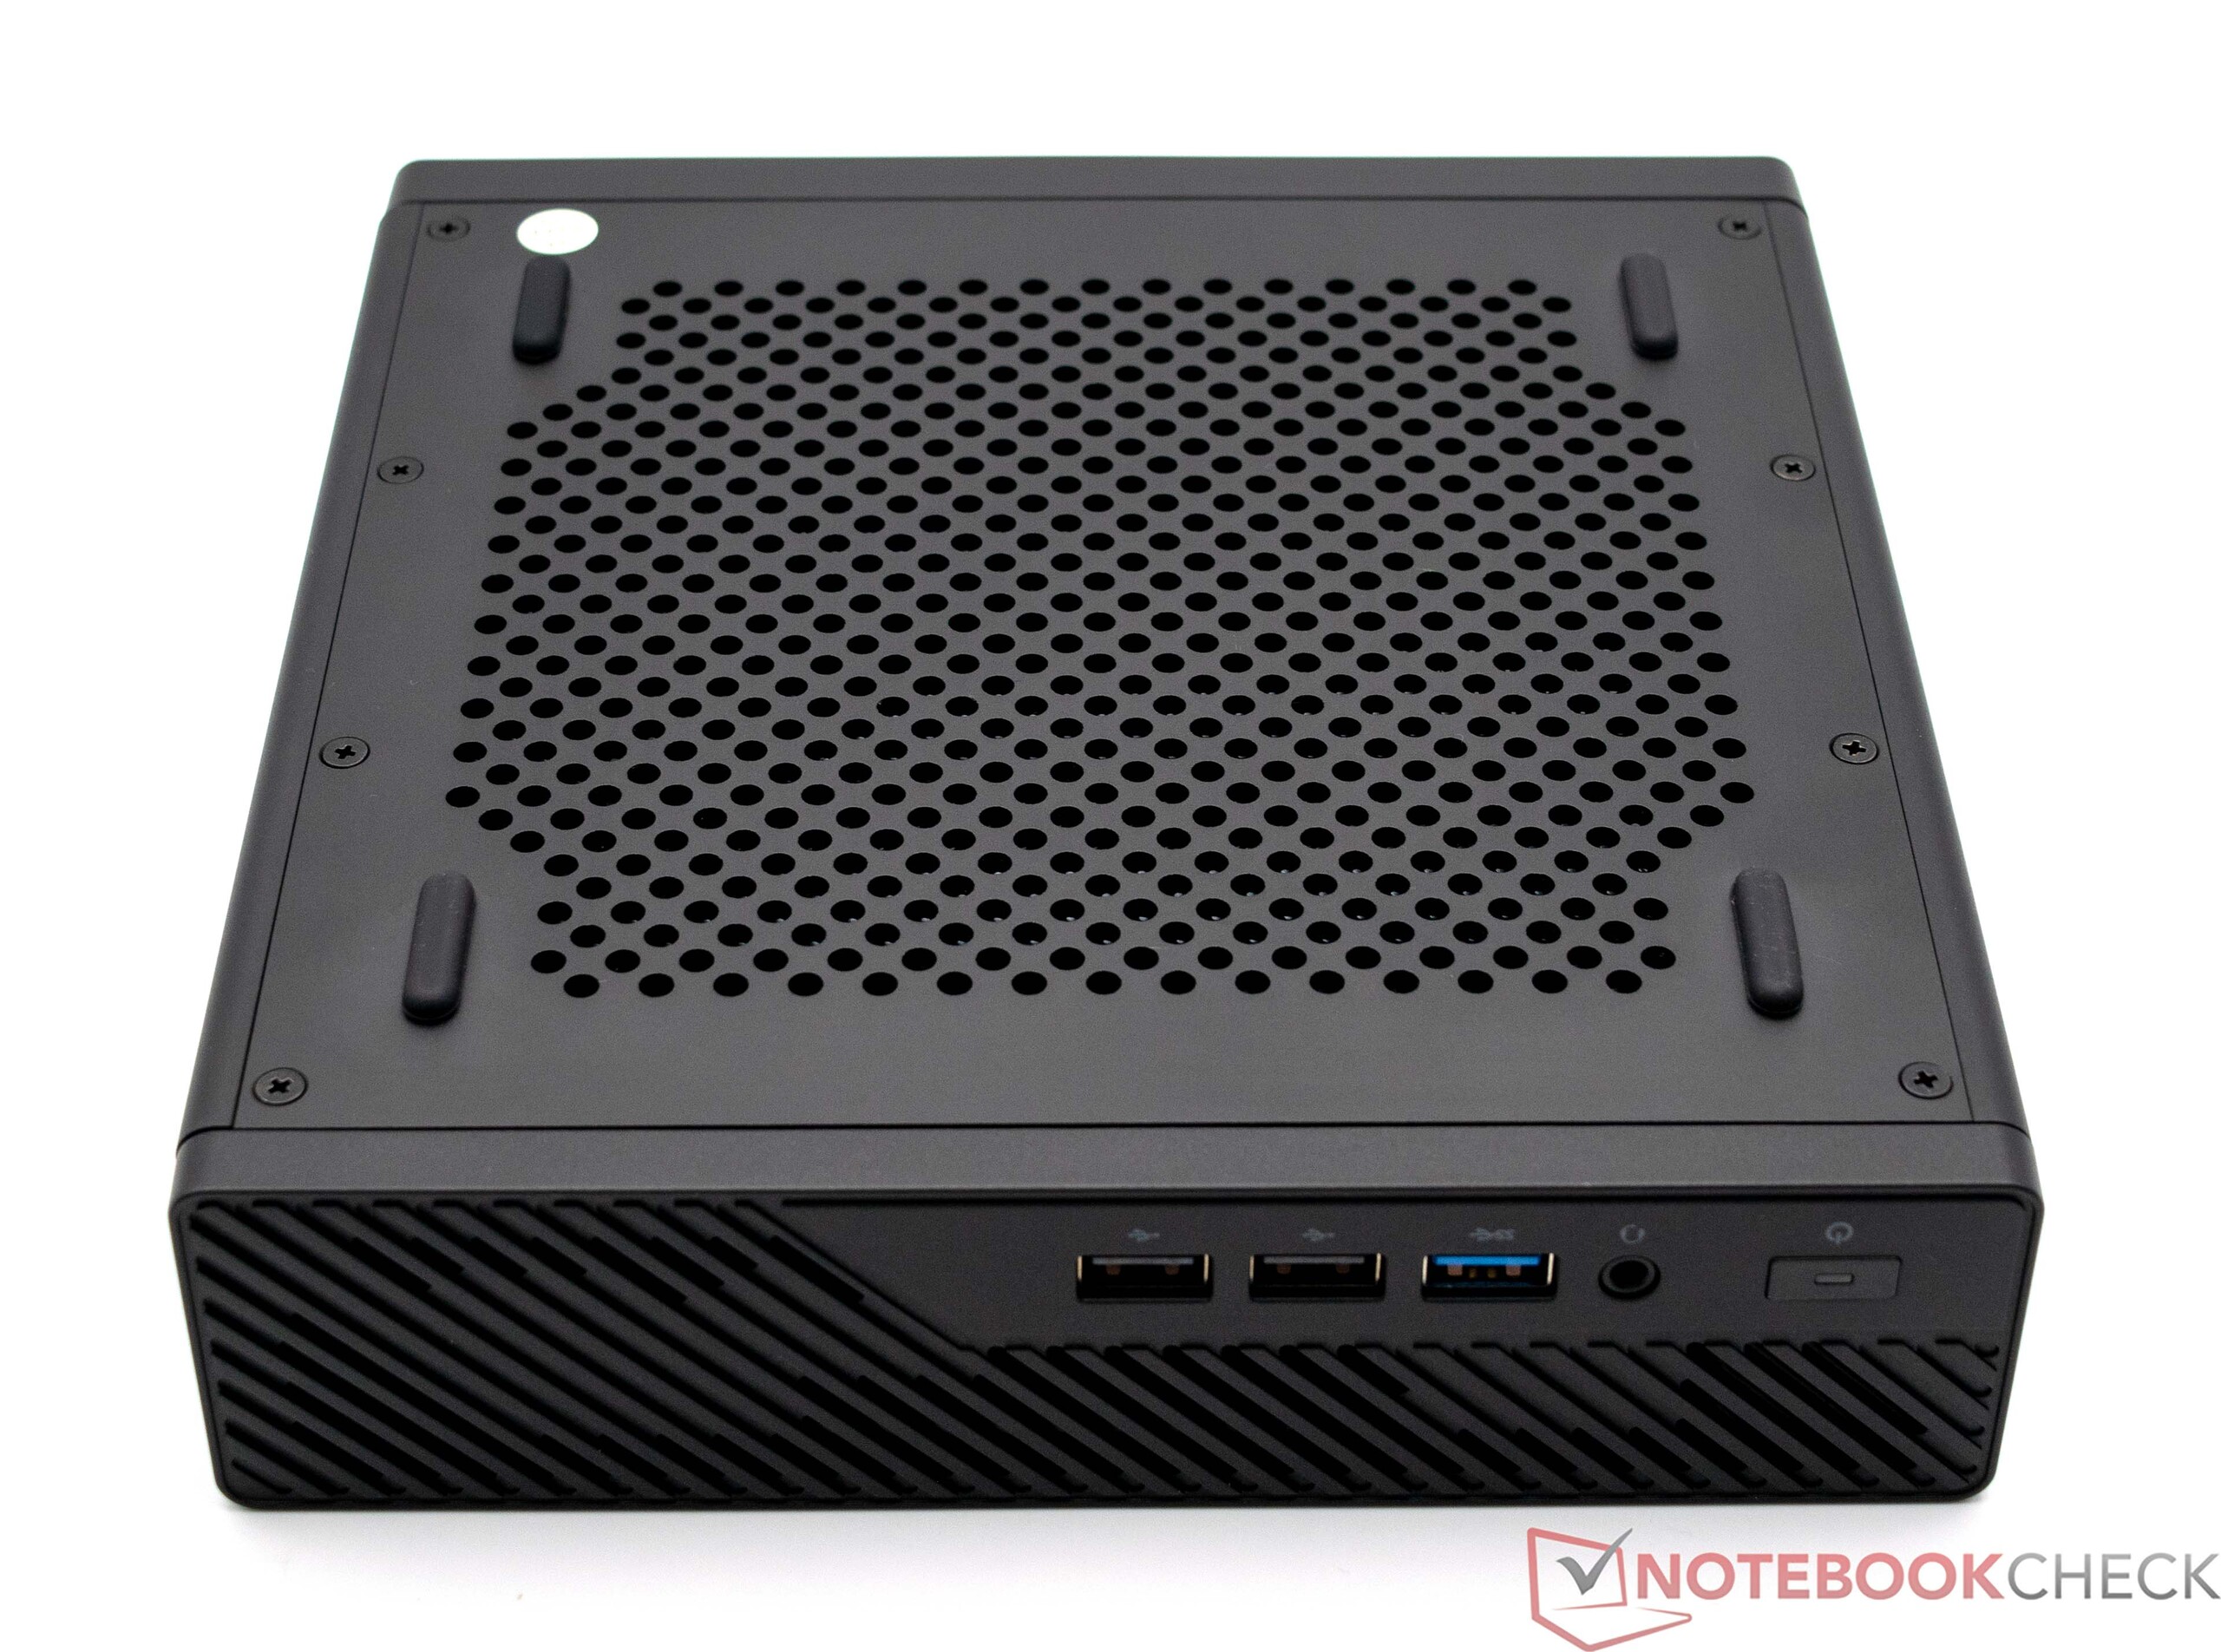

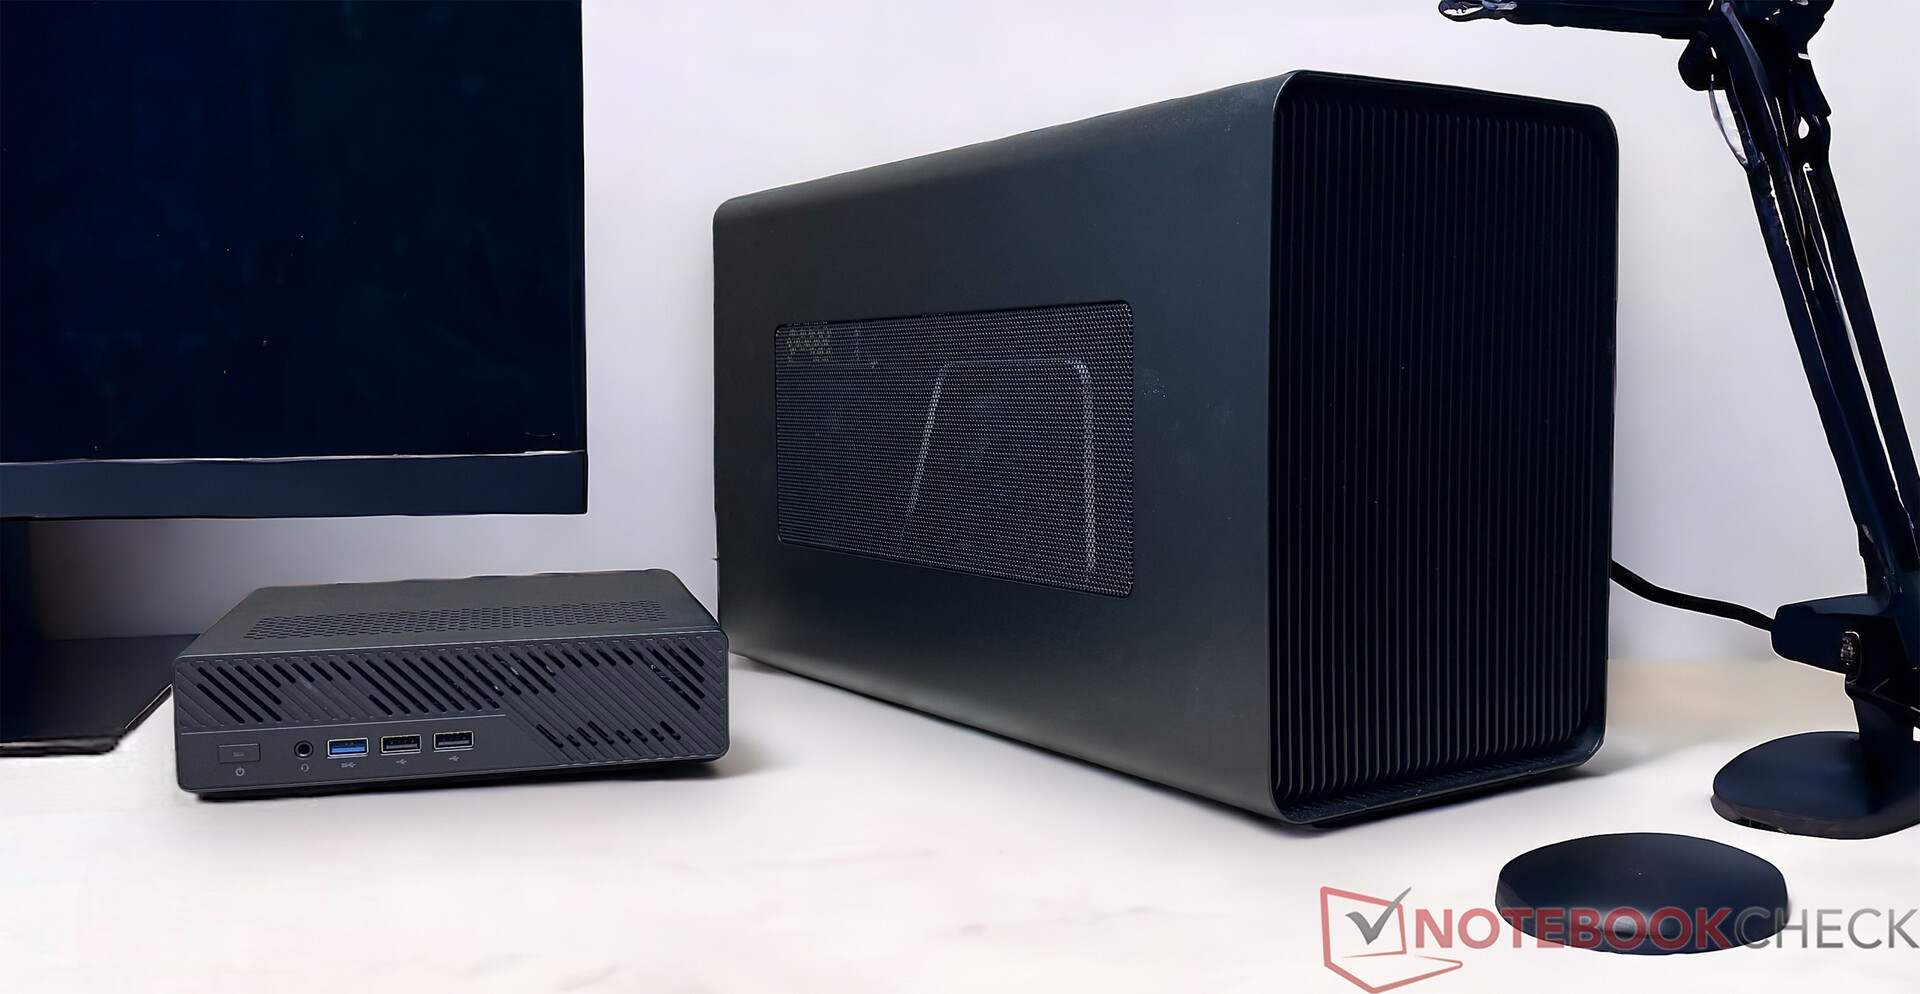
Boîtier - Métal et plastique à l'aspect industriel
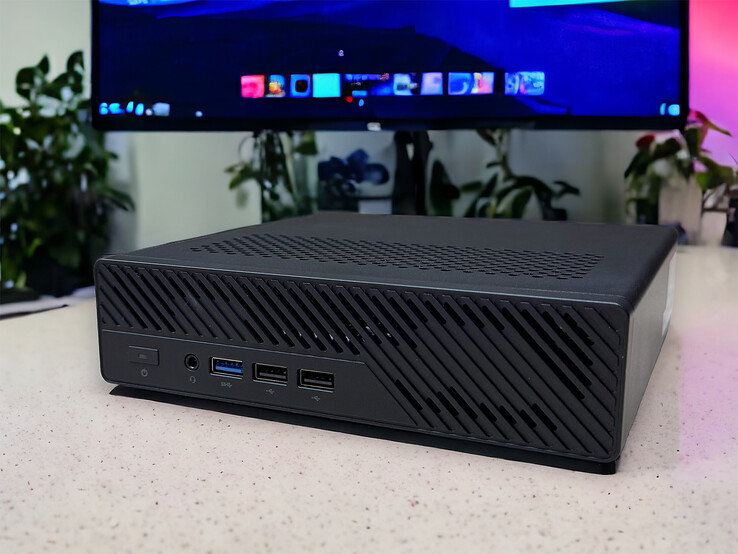
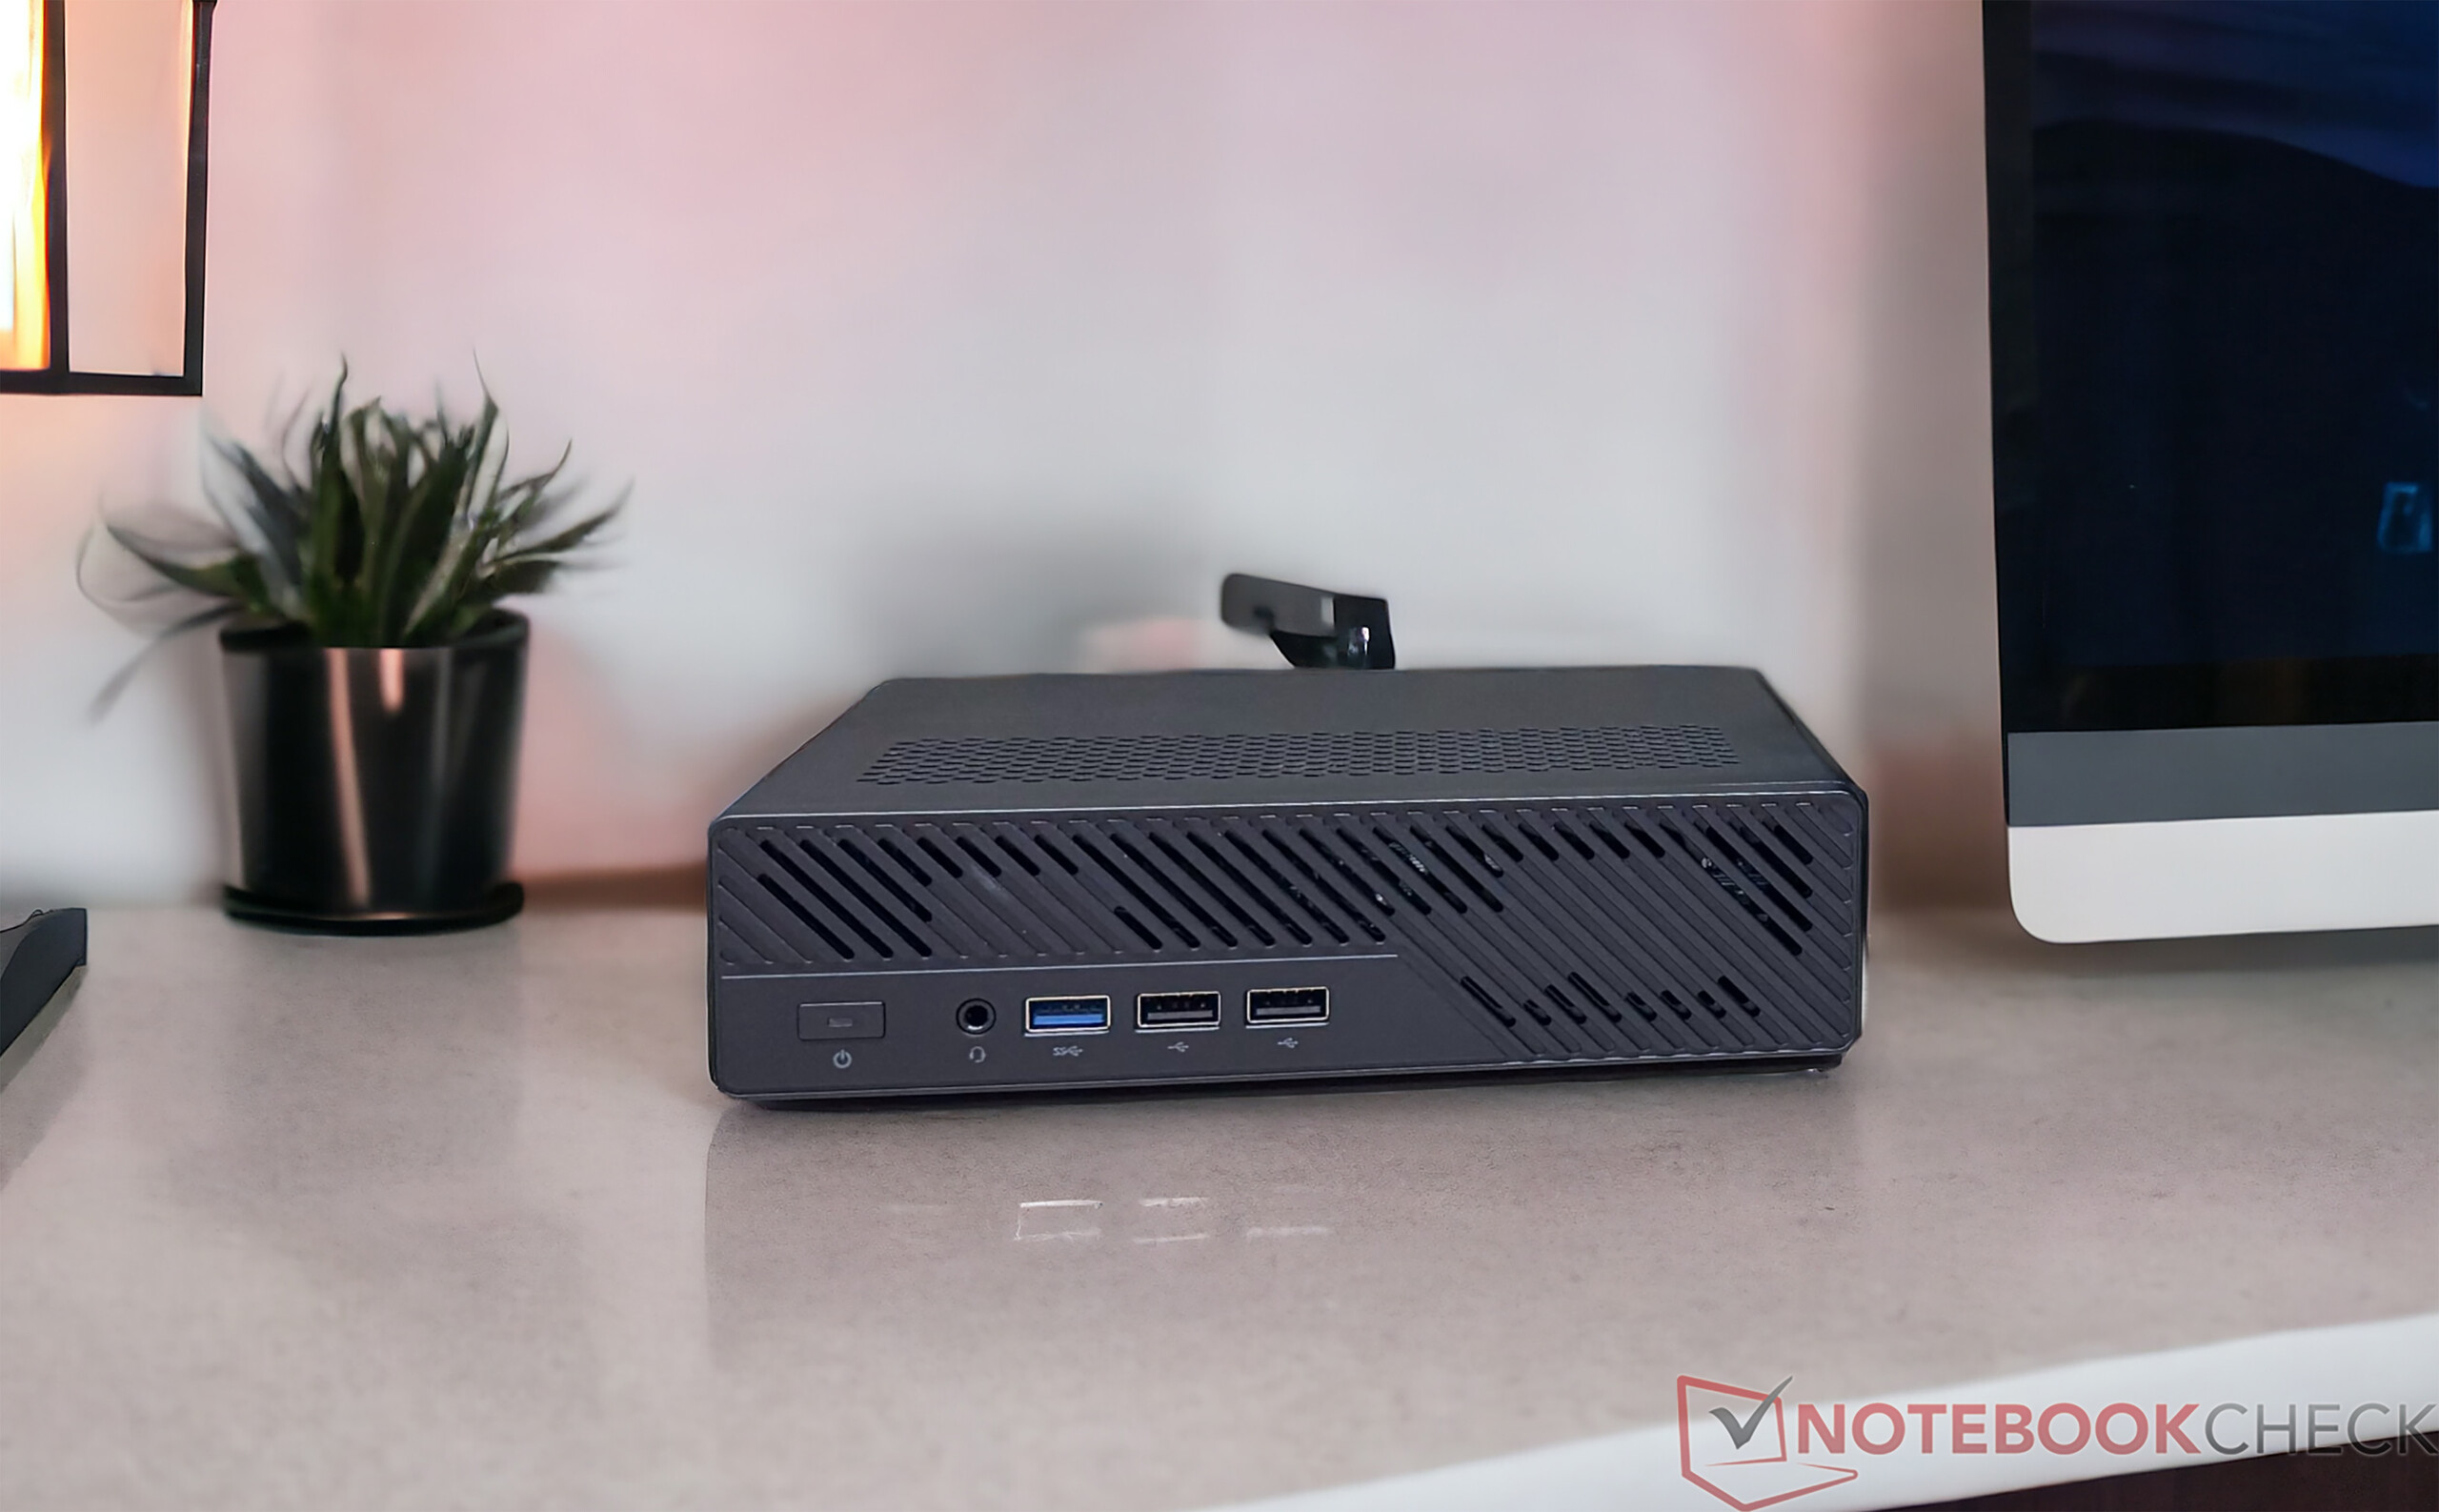
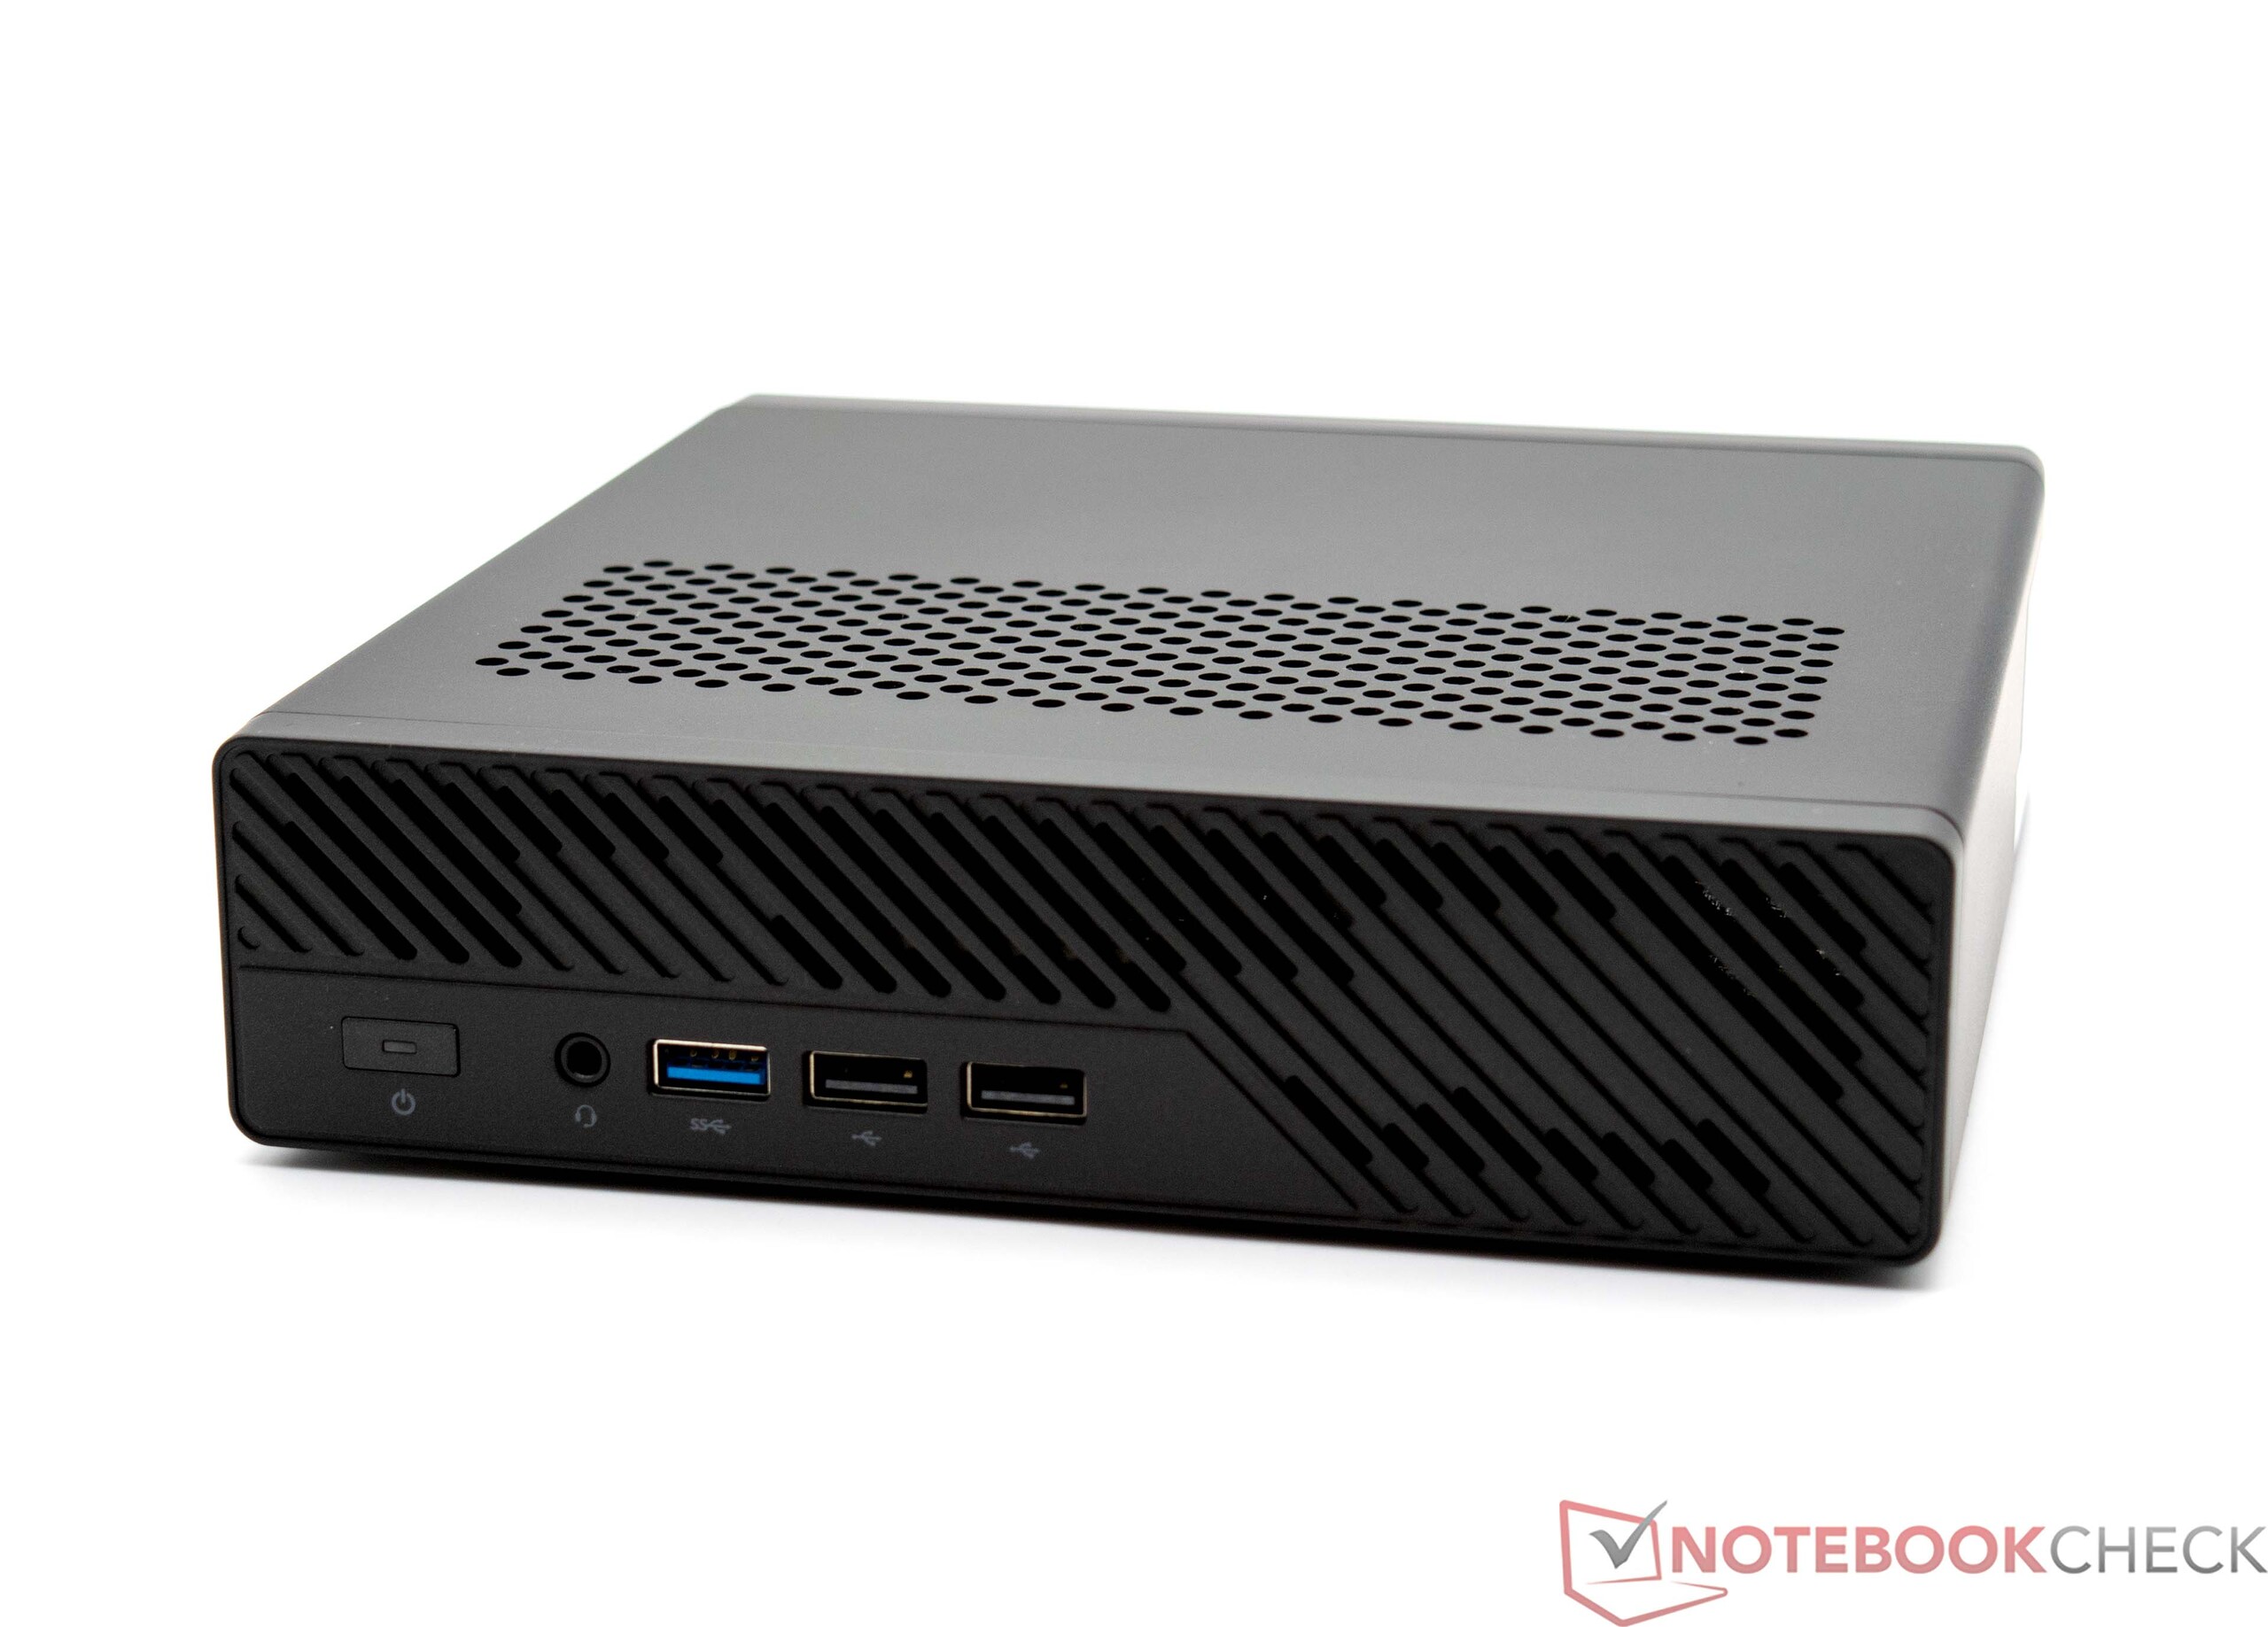
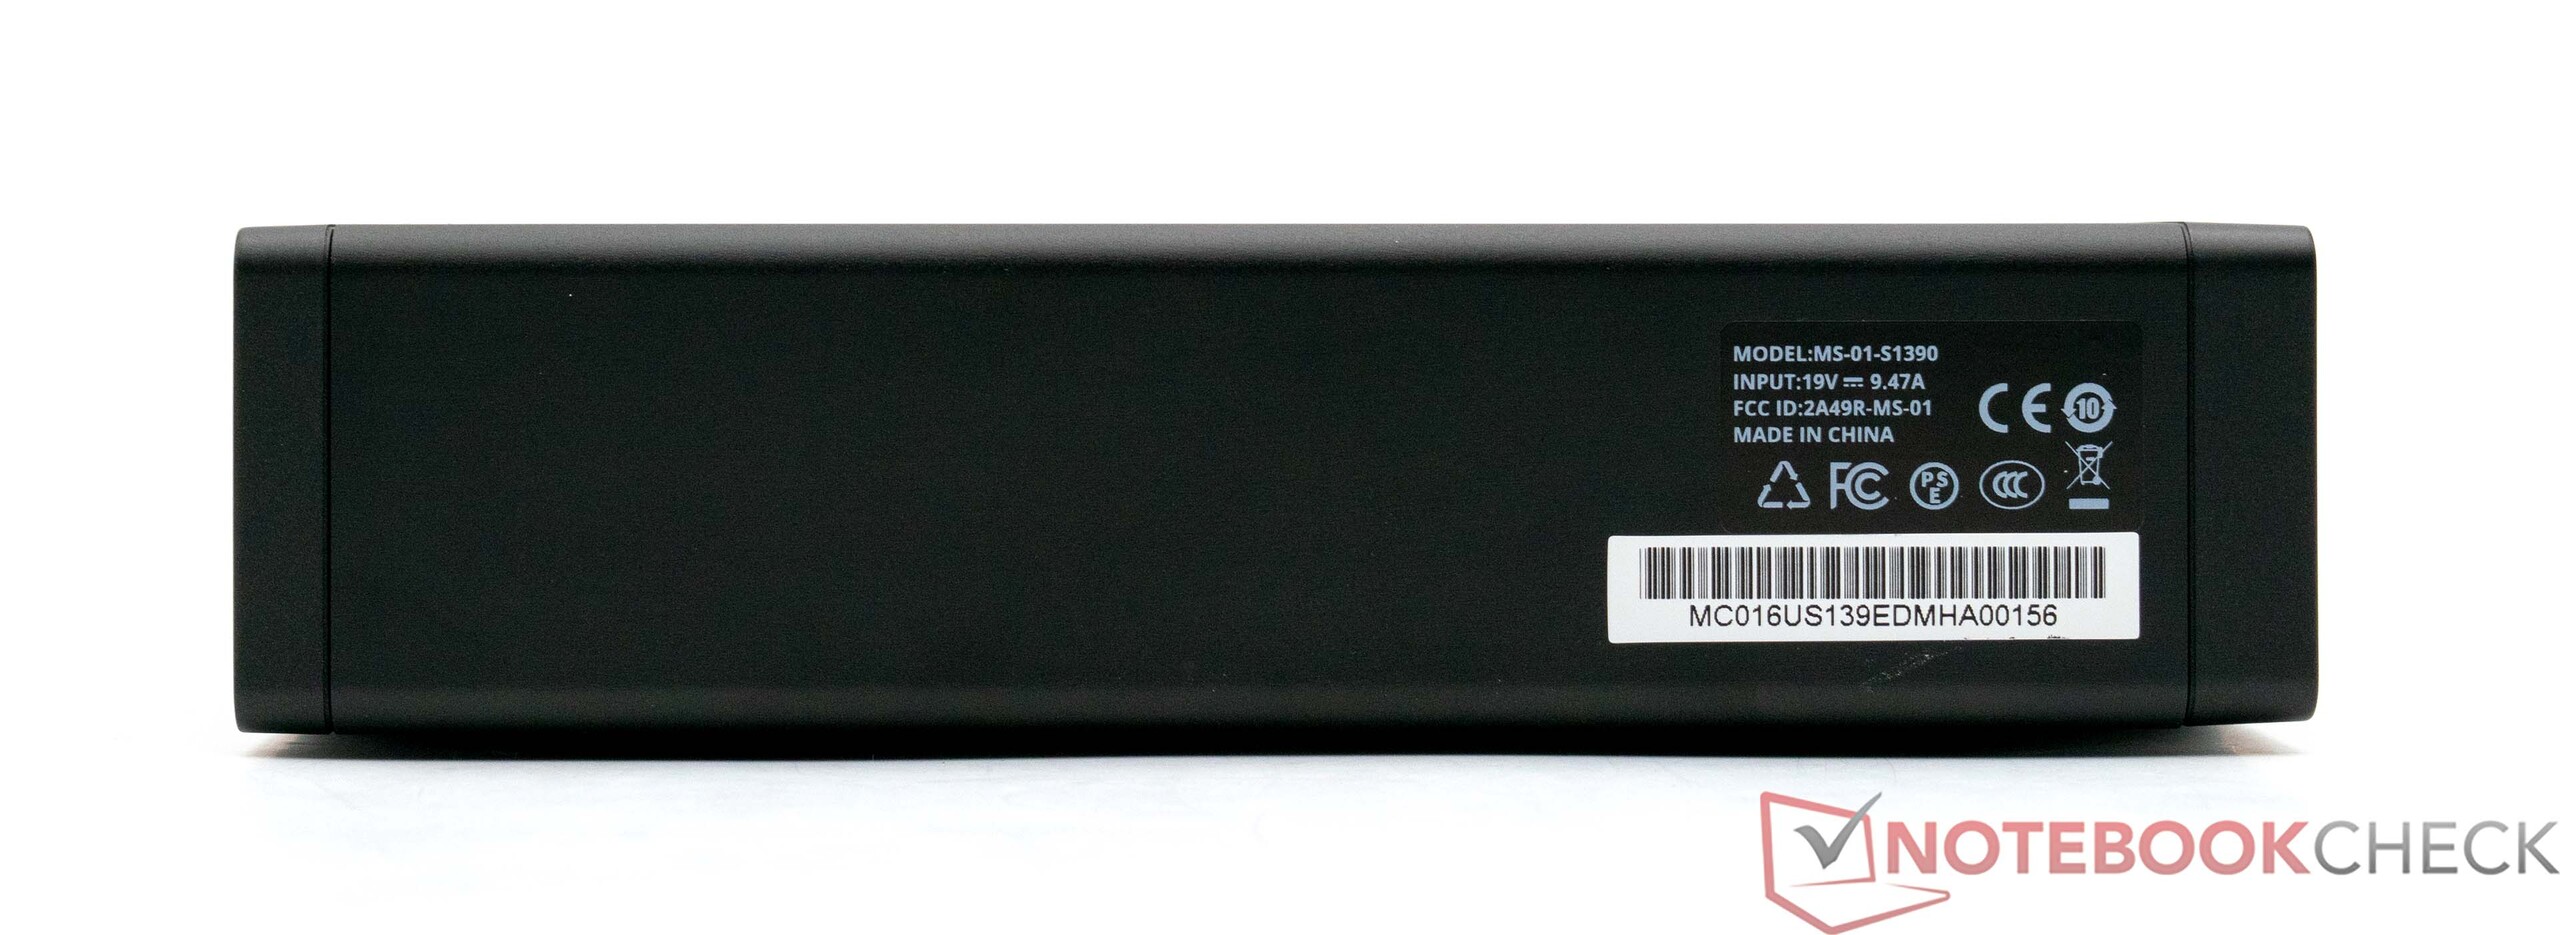
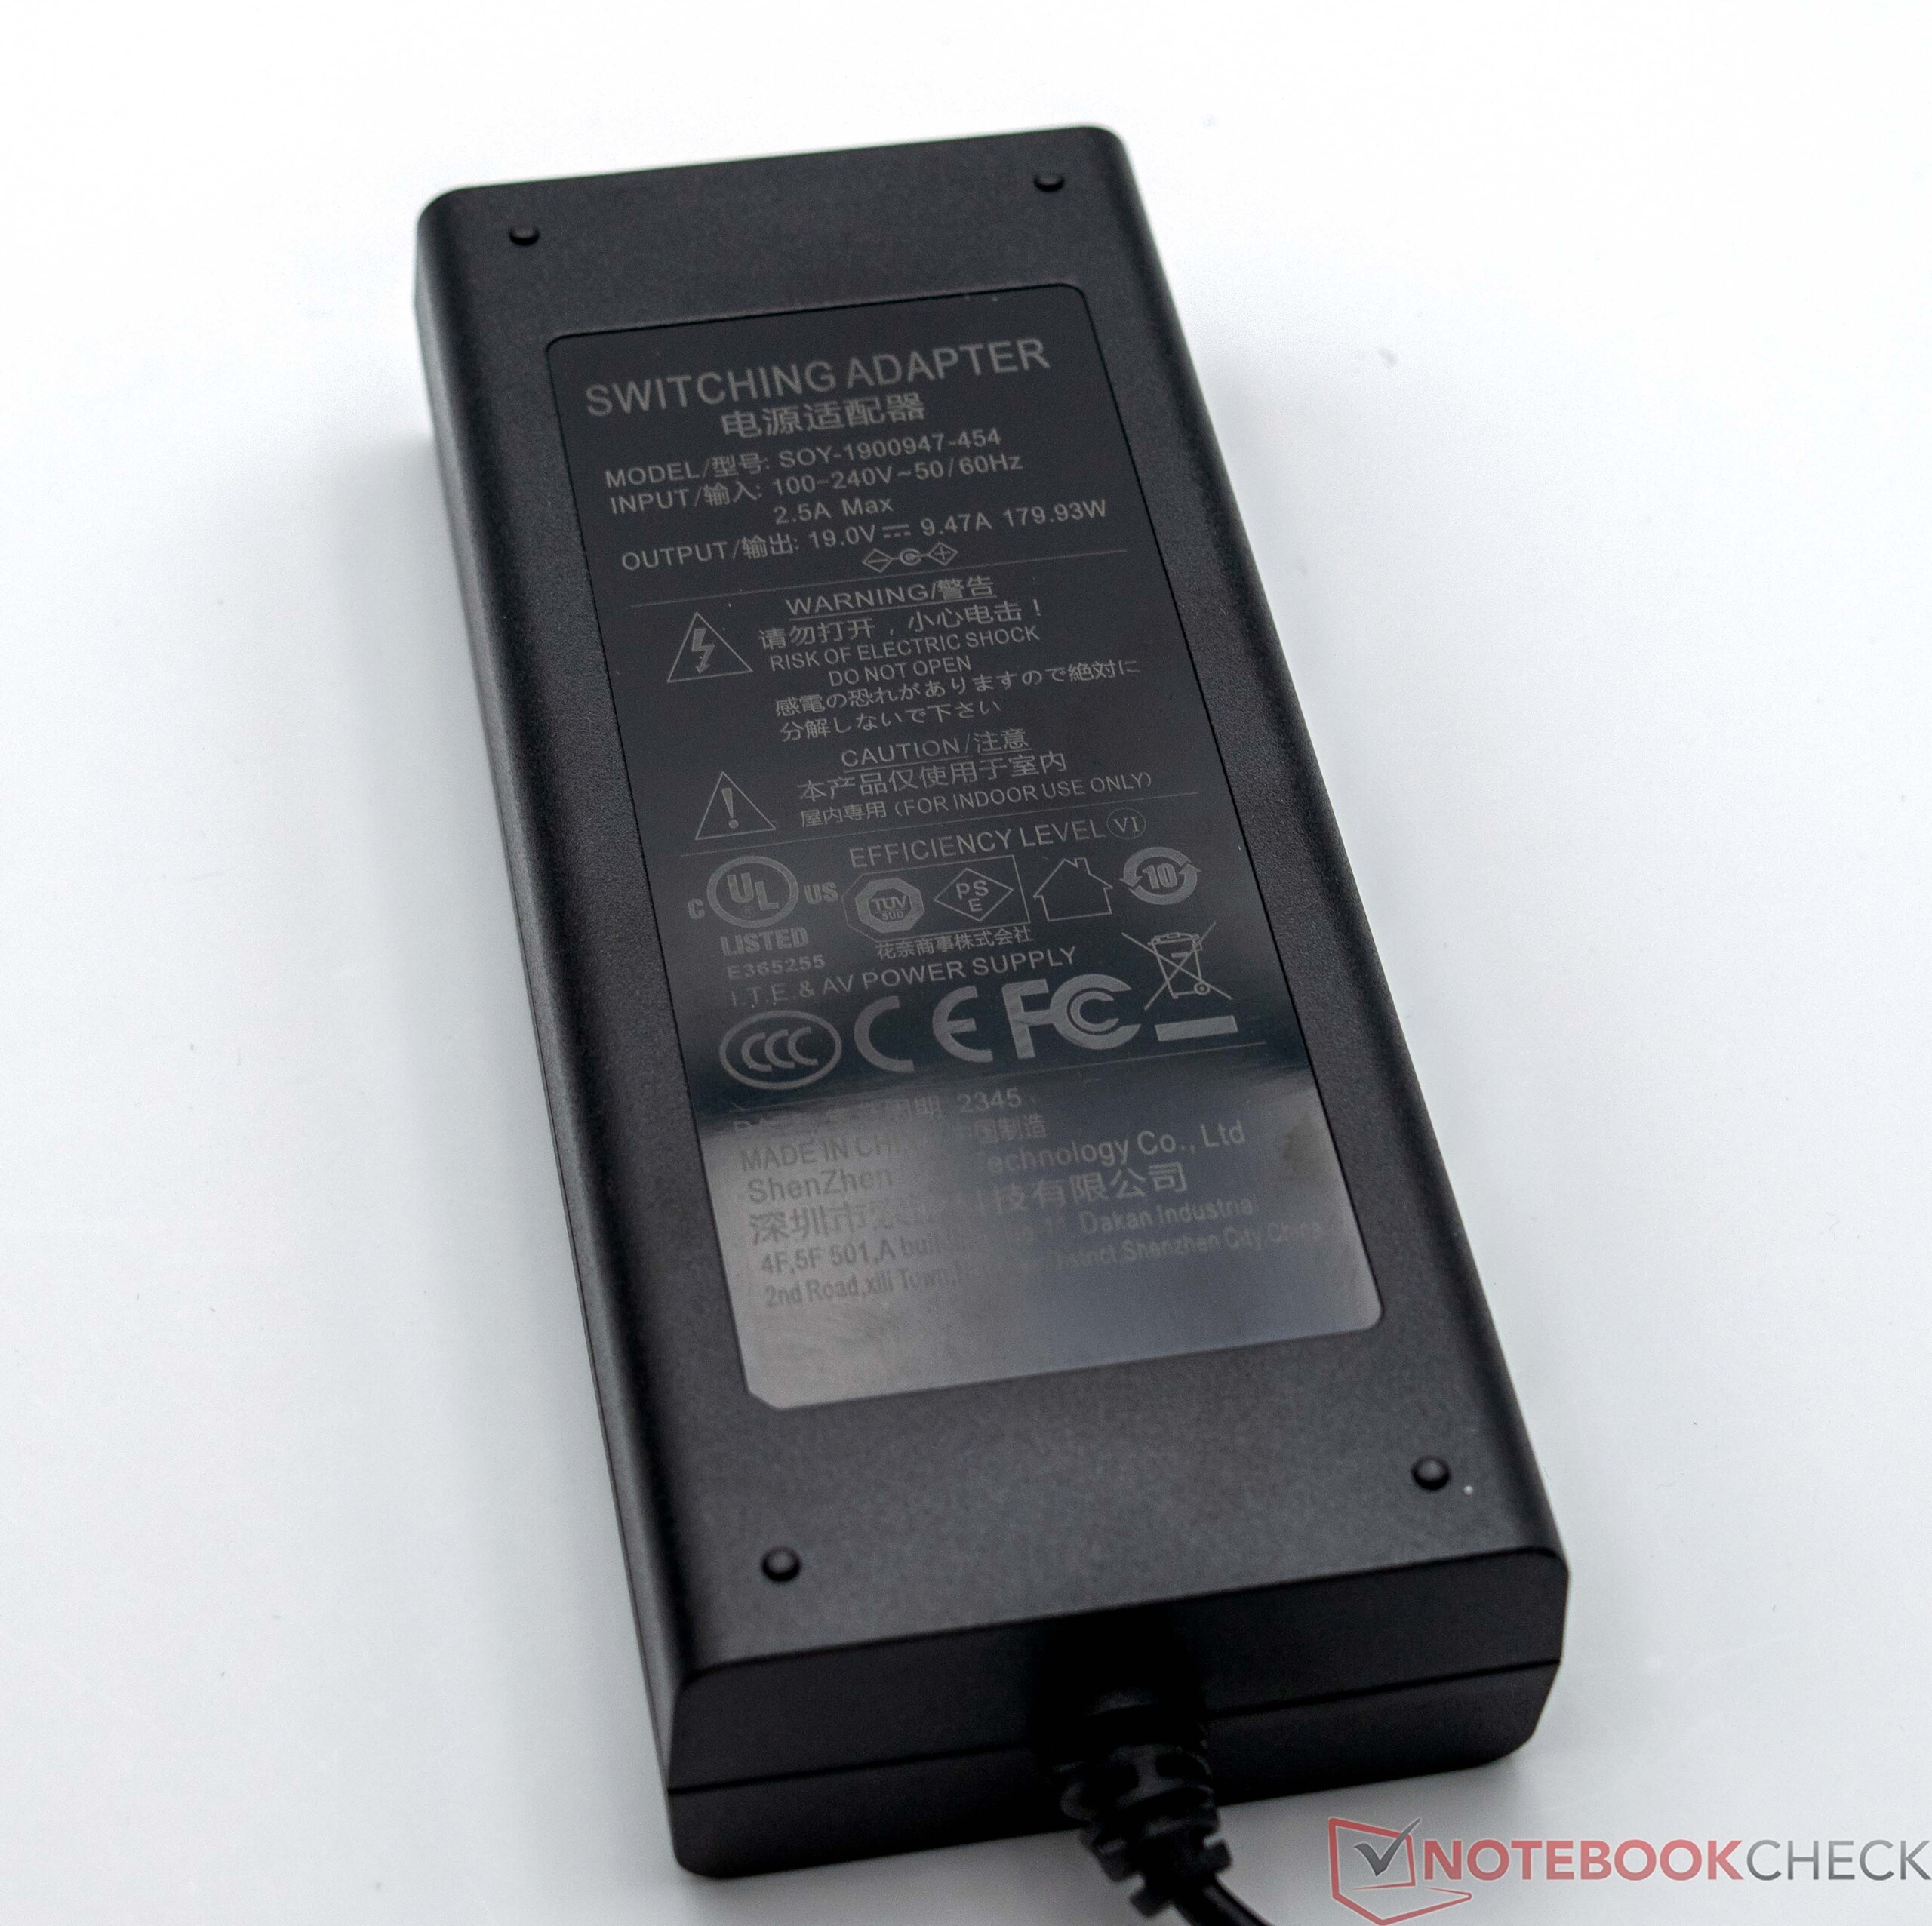
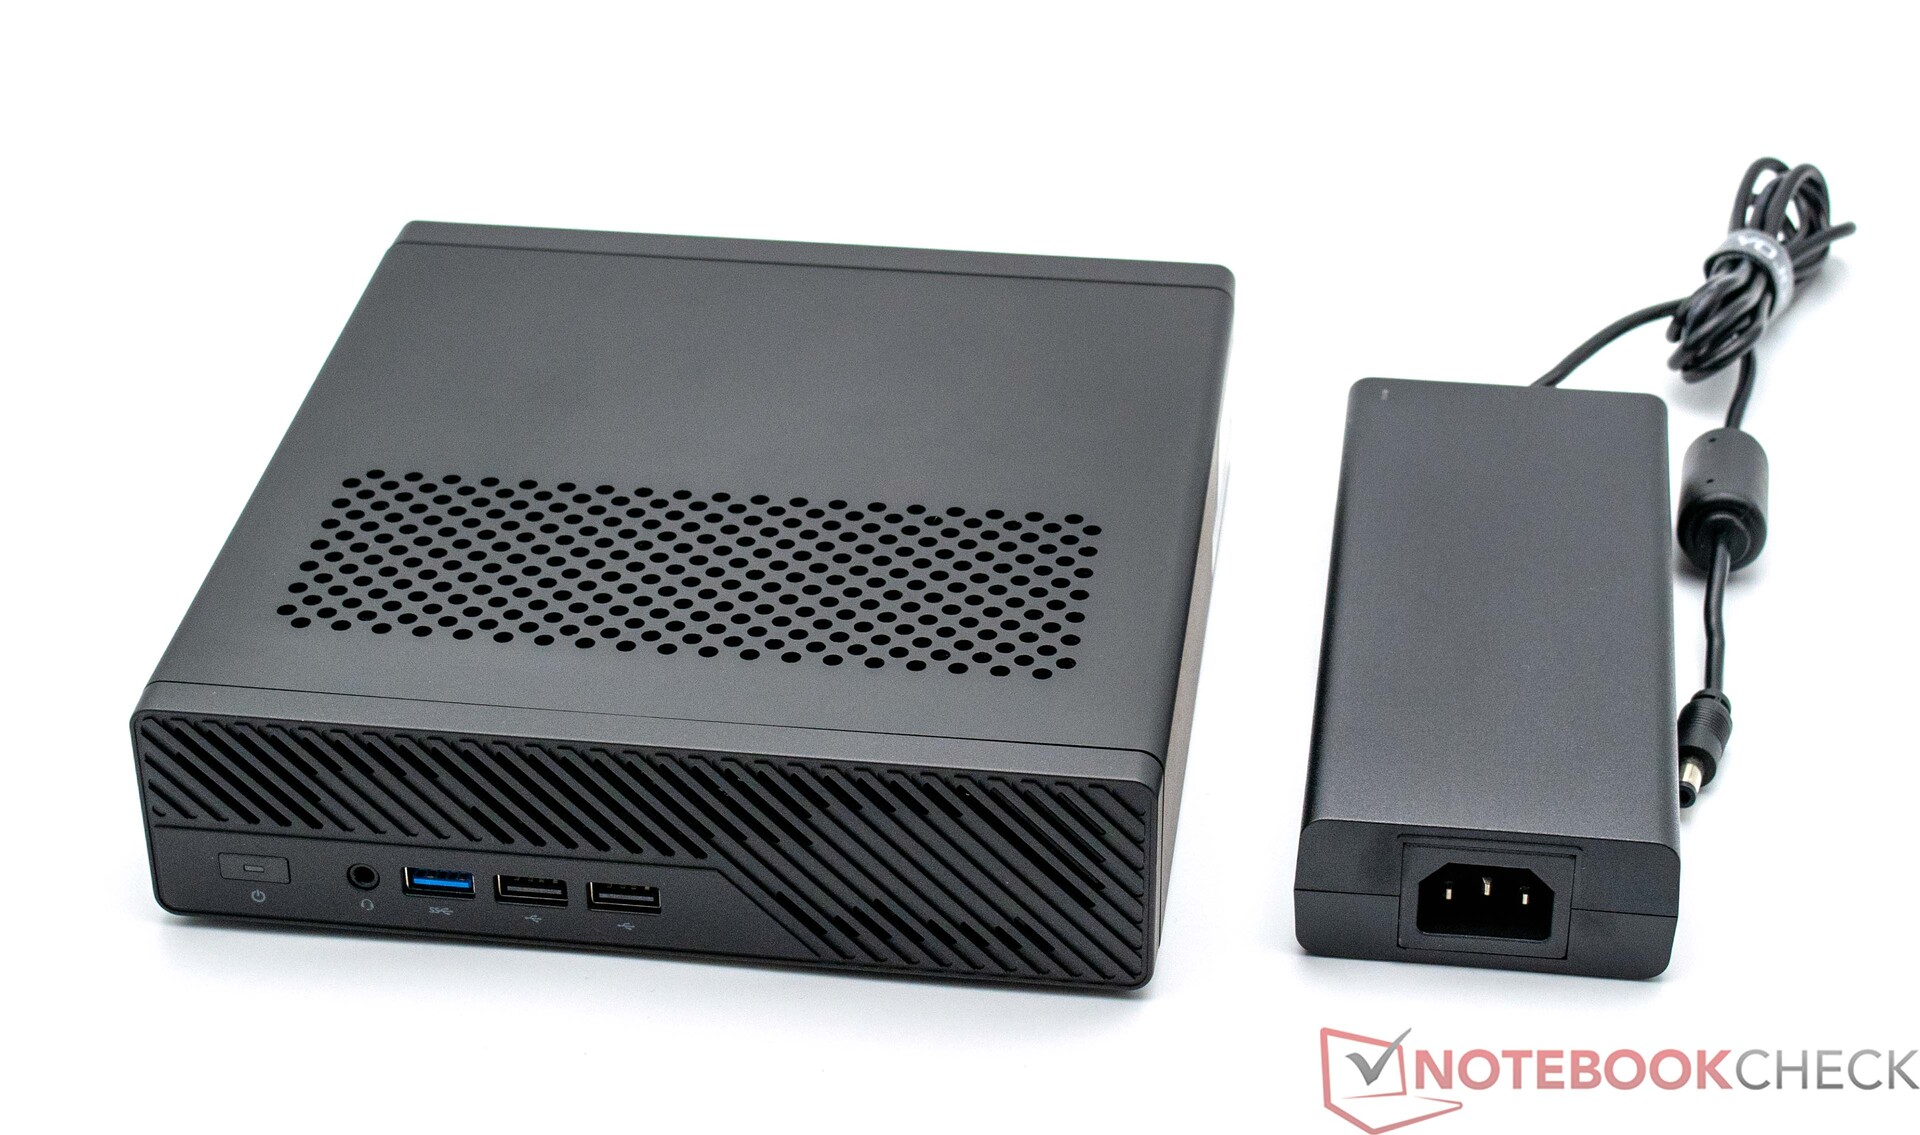
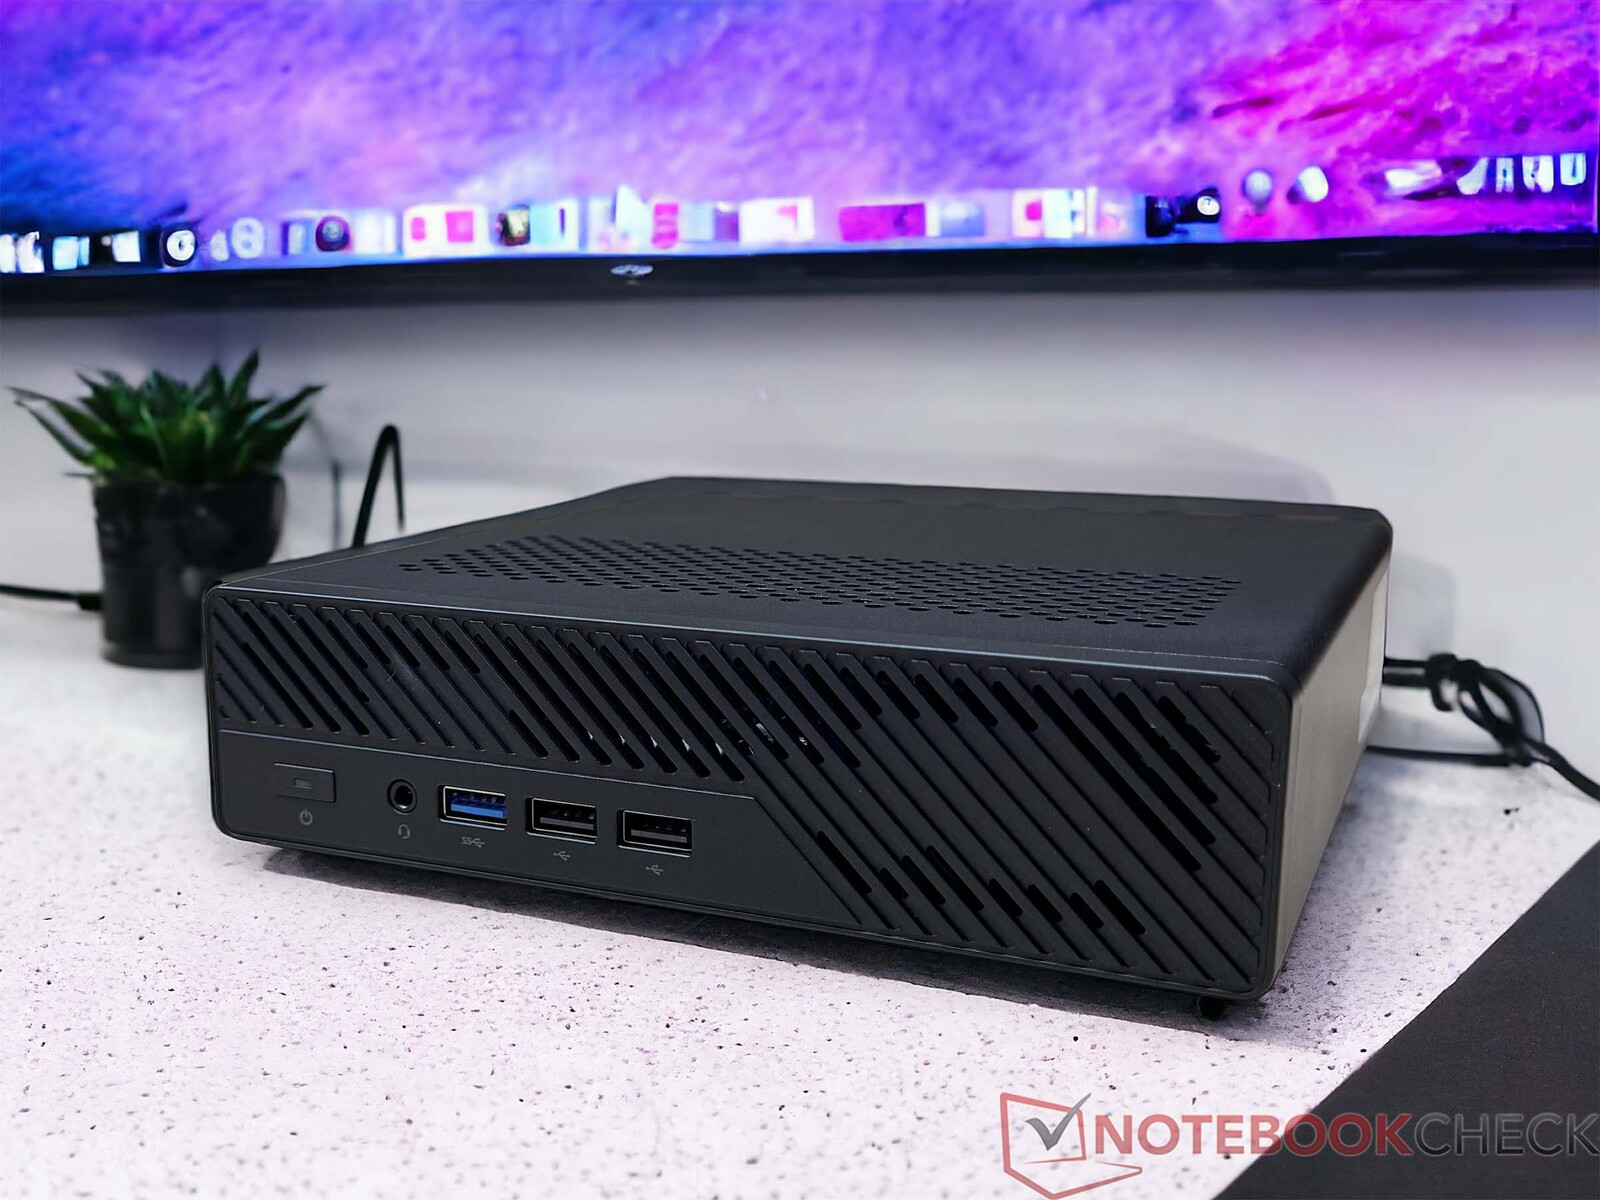
Visuellement, le Minisforum MS-01 ne ressemble à aucun des modèles précédents du fabricant. Au contraire, son look rappelle les appareils industriels tels que le ThinkCentre de Lenovo ou les modèles Elite Mini-800 de HP. Les matériaux utilisés sont principalement le métal, bien que le plastique orne l'avant et l'arrière. Le Minisforum MS-01 prend beaucoup plus de place sur le bureau que d'autres mini-PC conventionnels. Il n'y a pas de points forts visuels et aucun n'est nécessaire. Il n'y a rien à redire sur la qualité de fabrication. Toutes les pièces sont bien fabriquées et s'emboîtent parfaitement. Il convient de souligner la très grande stabilité de l'appareil, même si cela se répercute sur son poids. Avec ses 1,5 kilogrammes, le Minisforum MS-01 se distingue nettement des autres mini-PC. Le bloc d'alimentation de 180 watts pèse 525 grammes.
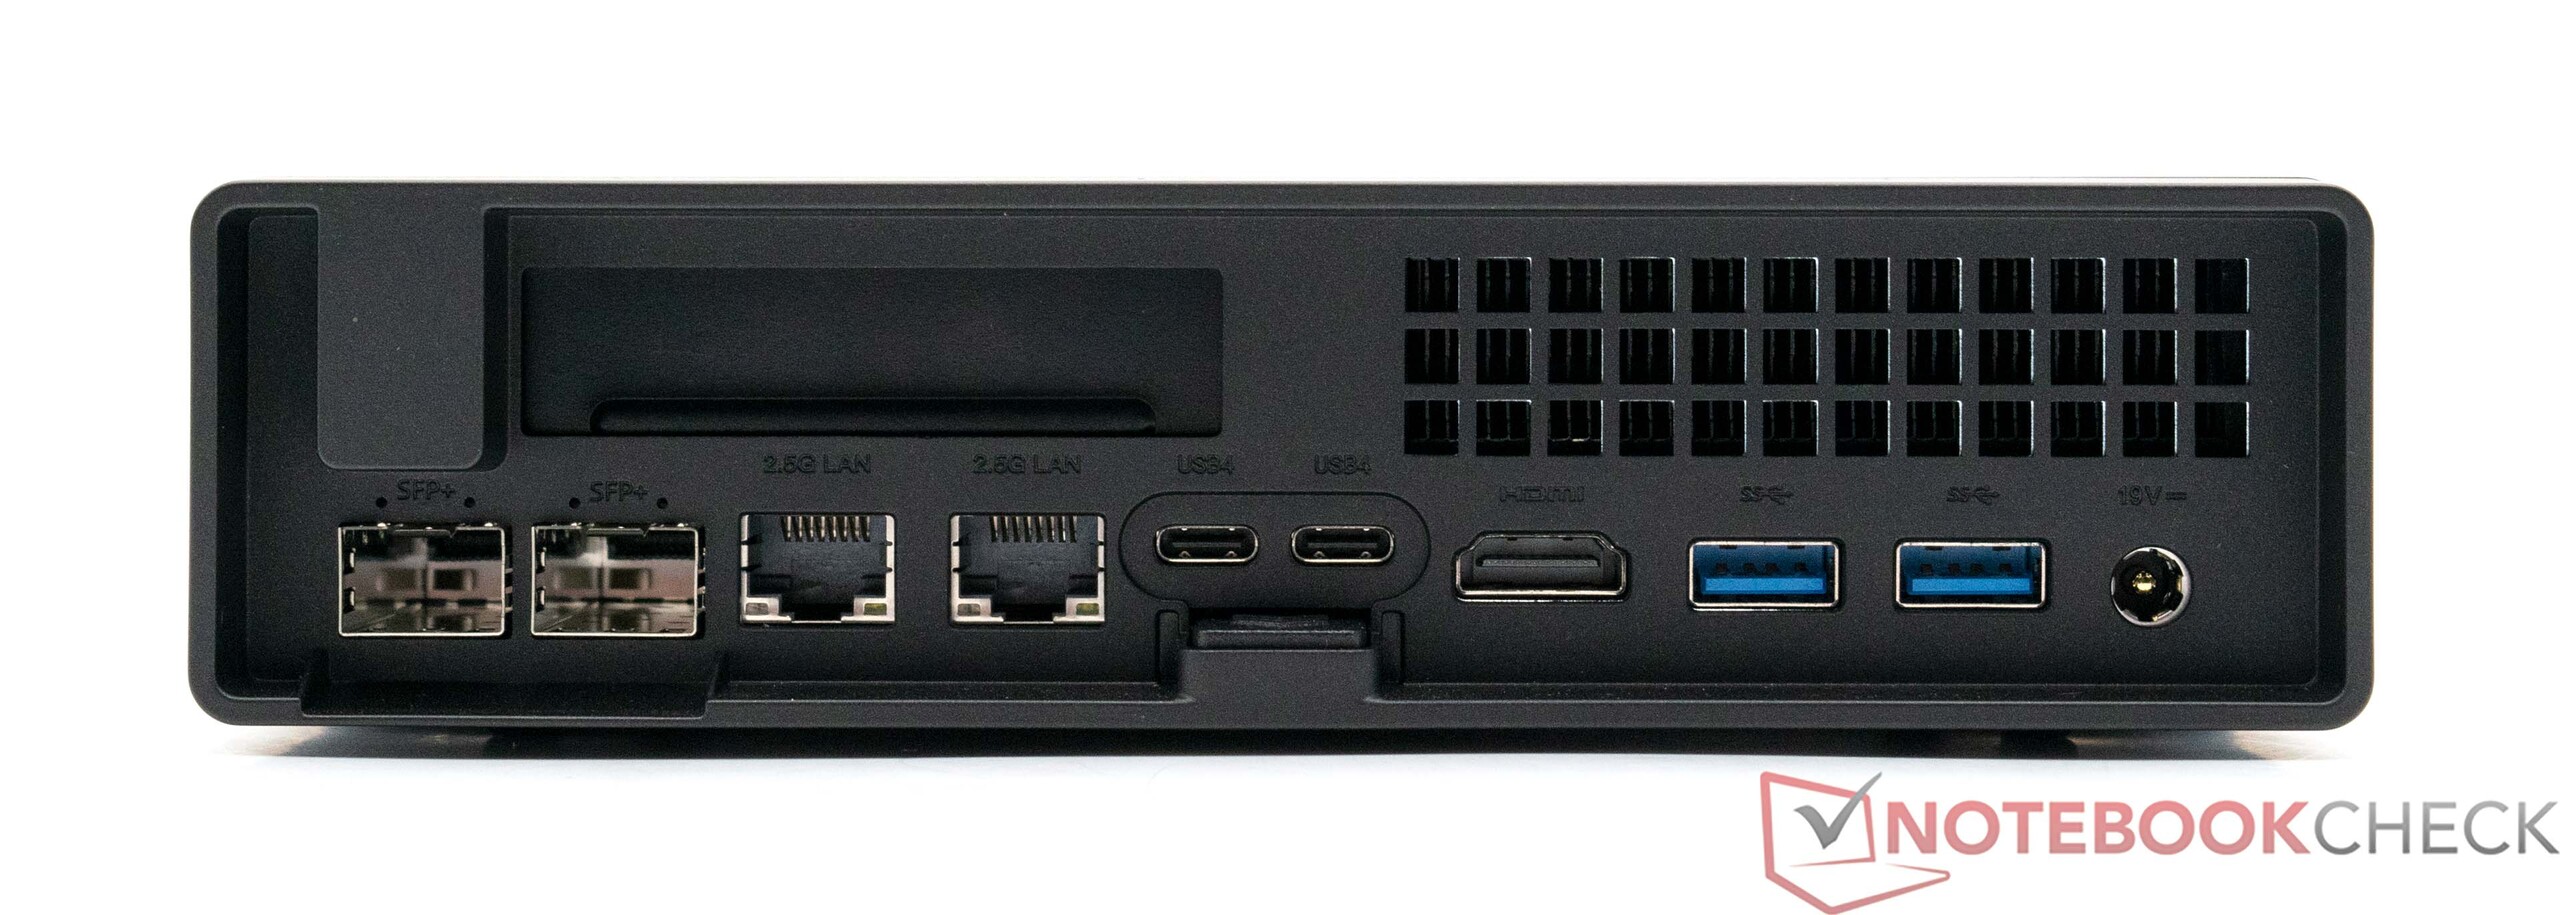
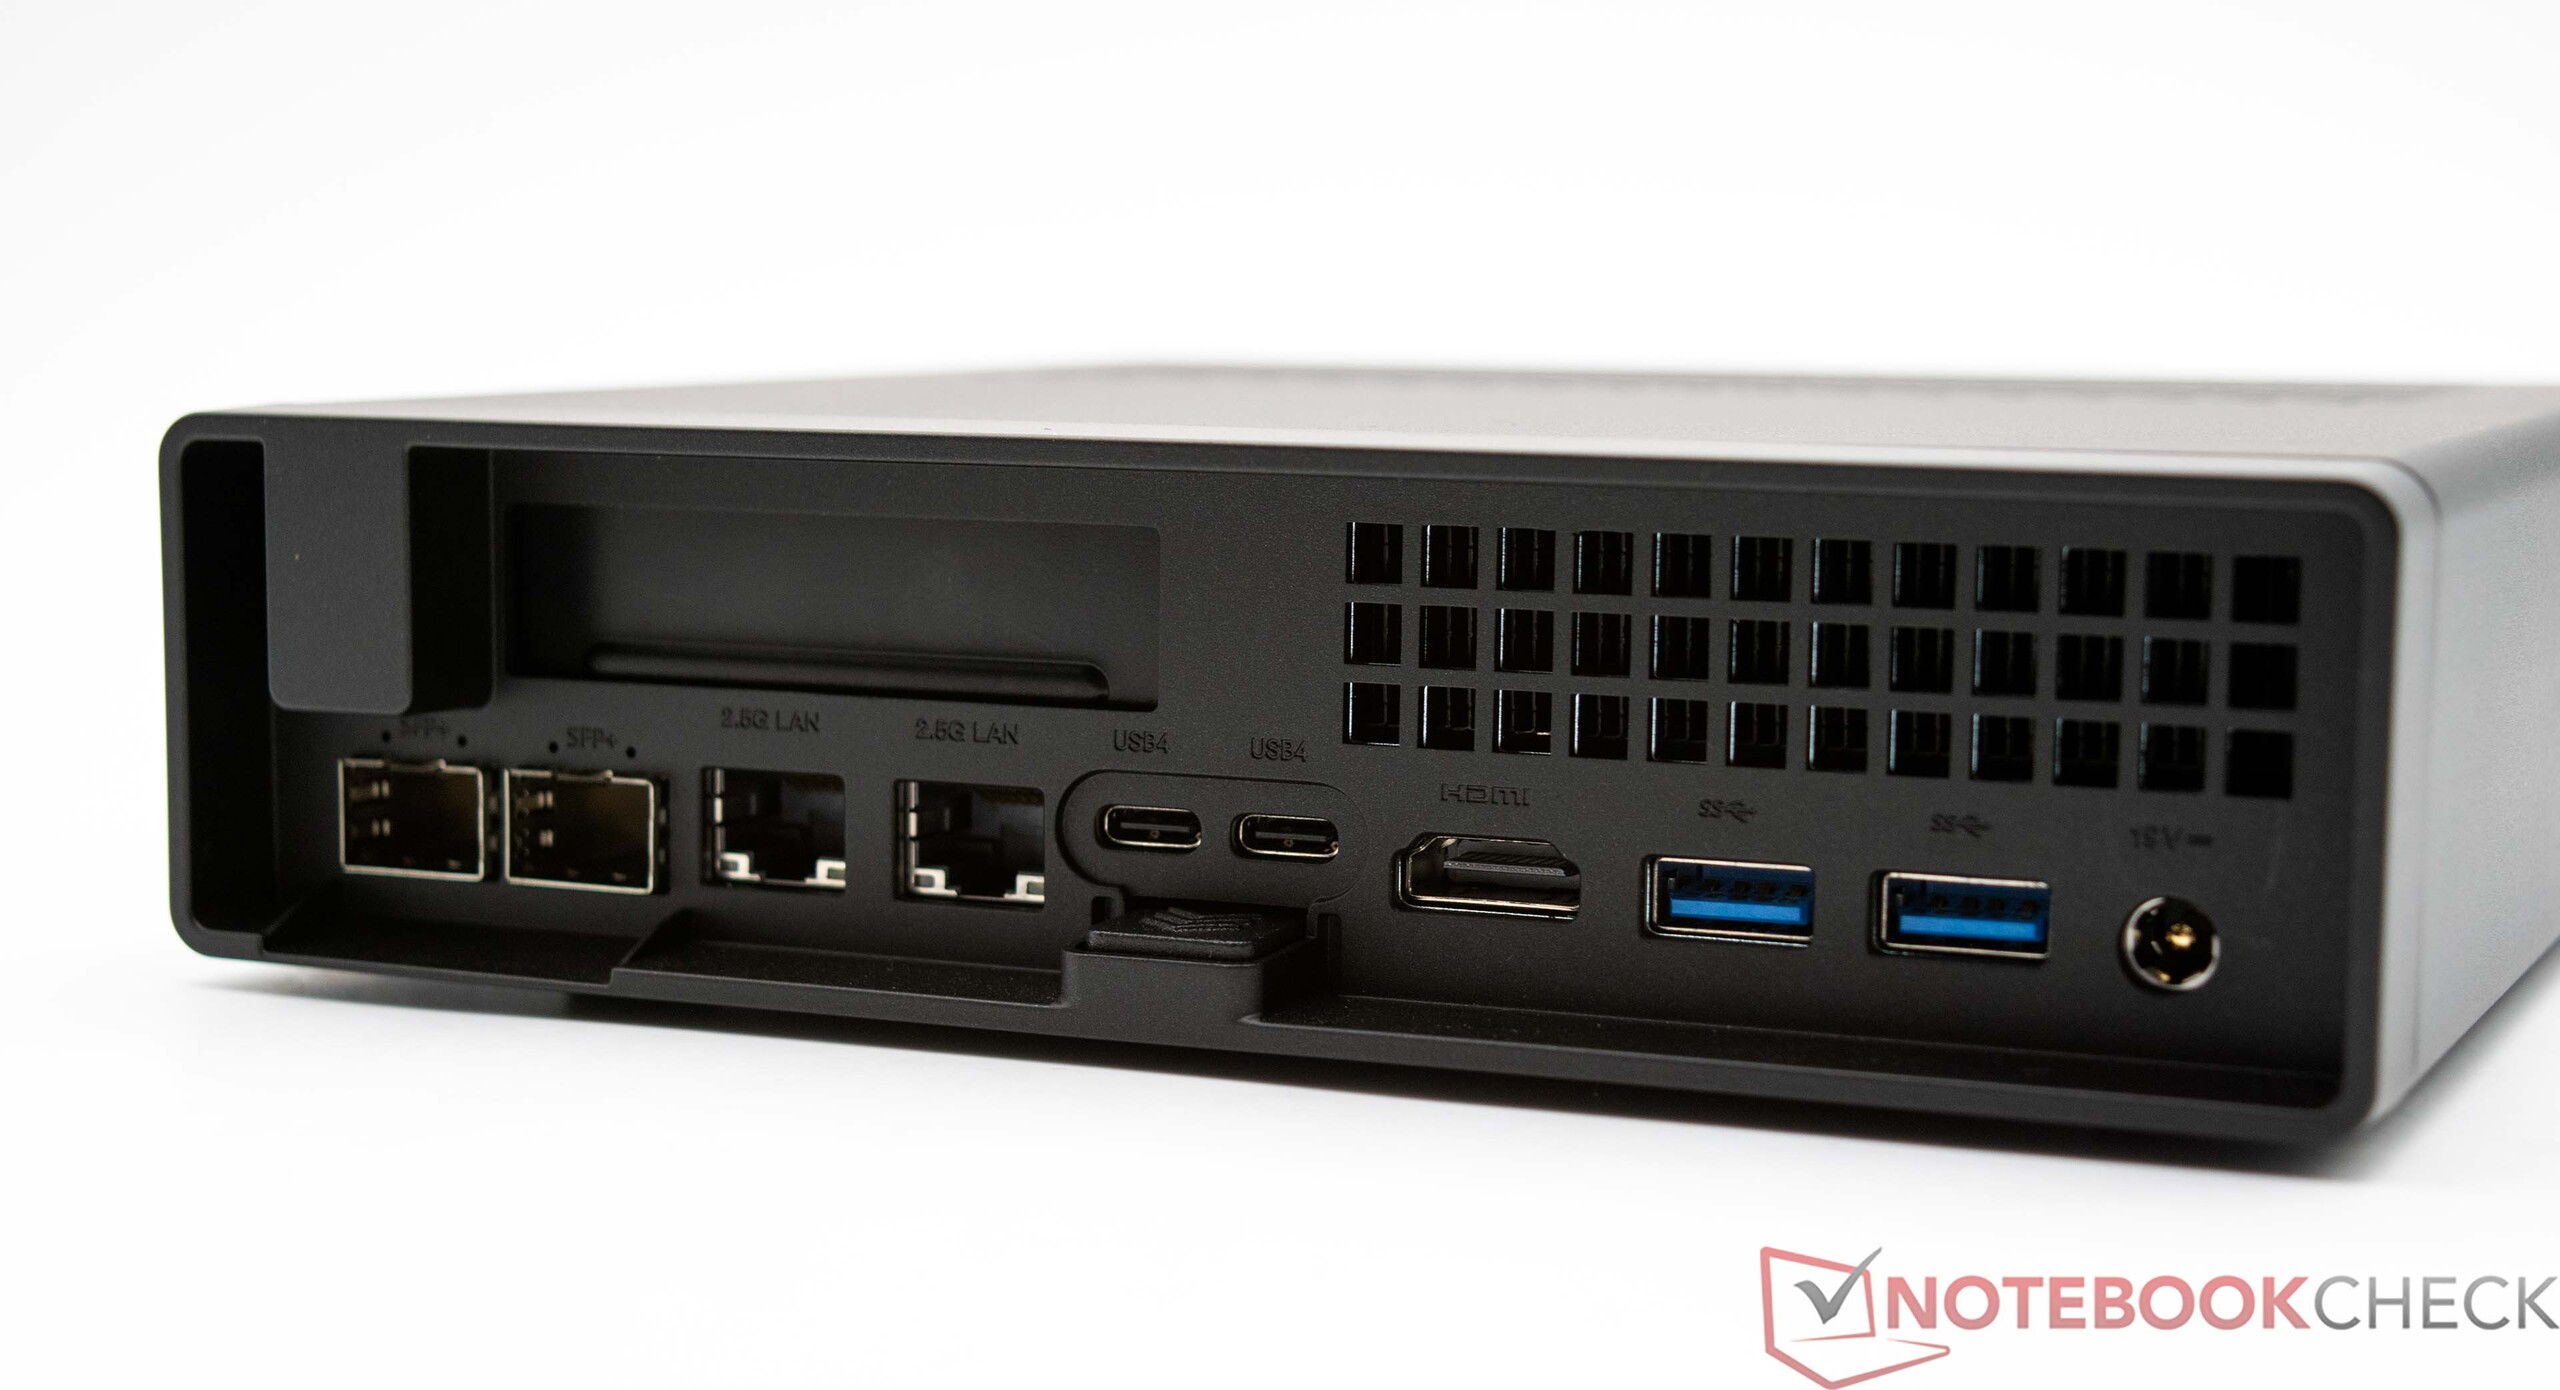
Equipement - PCIe x16 interne et 2x USB4 externe
Les ports disponibles sont répartis à l'avant et à l'arrière. Le Minisforum MS-01 dispose de sept ports USB, dont deux prennent en charge la norme lente 2.0. Cependant, cela est plus que suffisant pour les périphériques d'entrée. Après tout, le Minisforum MS-01 peut marquer des points avec deux ports USB4, qui sont situés au milieu de l'arrière. En revanche, le fabricant est économe en ce qui concerne le nombre de ports HDMI, car une seule option de connexion est nettement inférieure à ce à quoi nous sommes habitués sur les mini-PC. Les écrans peuvent également être connectés via USB4, ce qui signifie que le Minisforum MS-01 peut contrôler un total de trois écrans simultanément. Même les écrans 8K sont pris en charge de manière native par le Minisforum MS-01. Cependant, vous devrez vous contenter d'un taux de rafraîchissement de 30 Hz. Le Minisforum MS-01 dispose d'une interface physique PCIe x16, qui offre la vitesse native PCIe 4.0 x8. Cela signifie que l'ordinateur compact peut être équipé d'une carte graphique dédiée. Cependant, le facteur de forme limite considérablement le choix du modèle, car seules les cartes à mi-hauteur peuvent entrer dans le boîtier. Seule une conception à fente unique peut être utilisée pour le refroidissement.

Communication
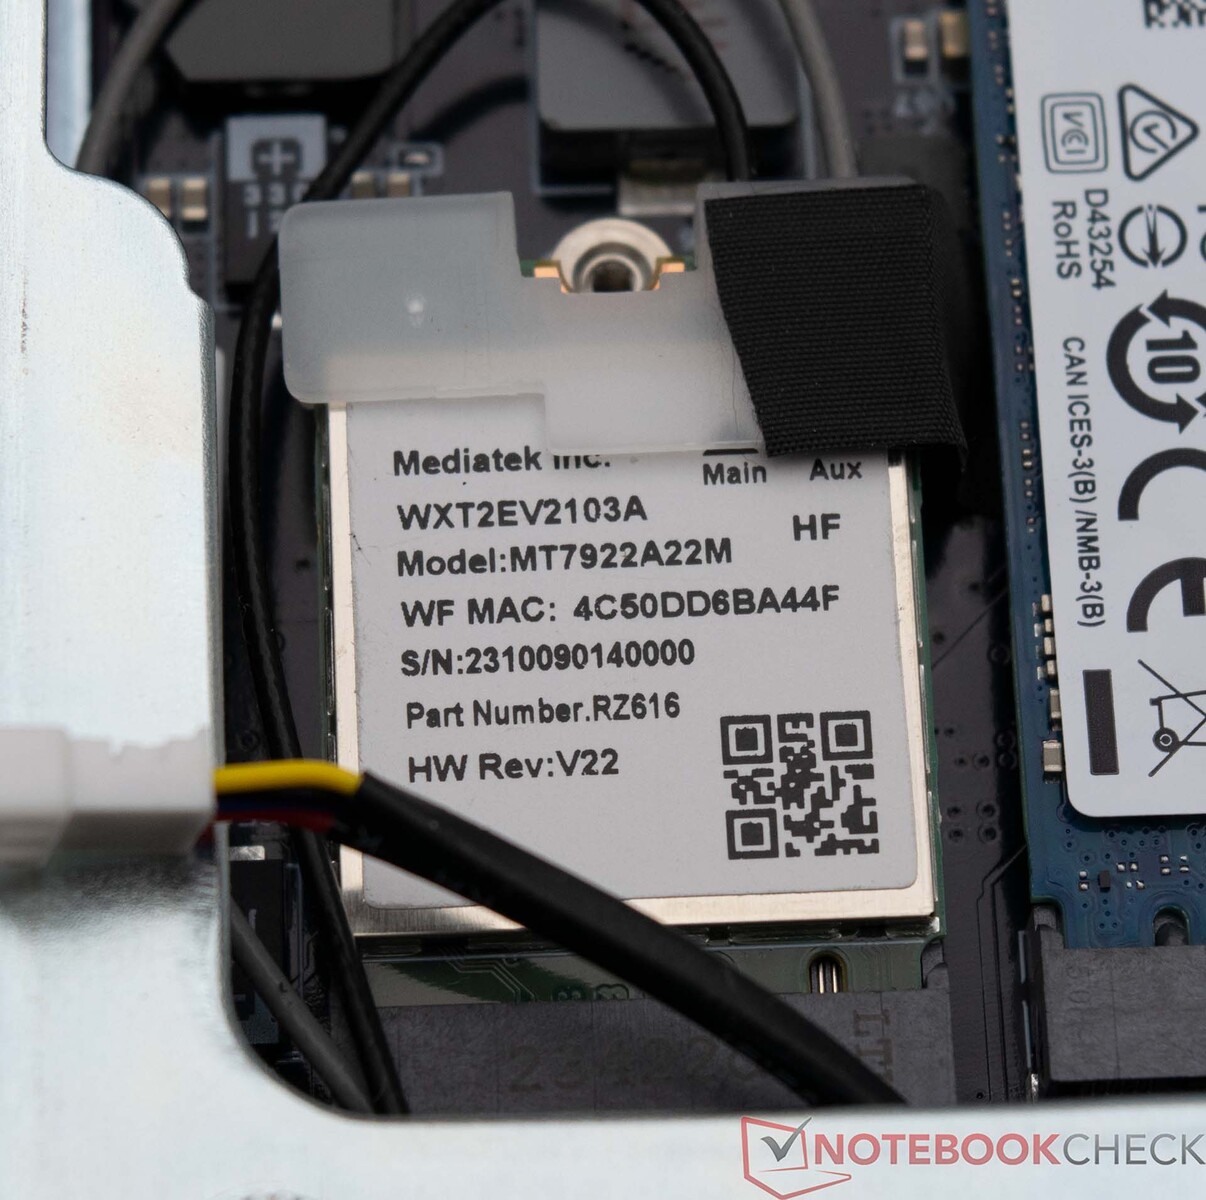
Dans le Minisforum MS-01, nous trouvons un module Wi-Fi que nous avons déjà rencontré à maintes reprises. Le module WLAN MediaTek Wi-Fi 6E MT7922 a obtenu d'excellents résultats en combinaison avec notre échantillon de test. Qu'il s'agisse du réseau sans fil de 5 GHz ou de la gamme de fréquences de 6 GHz, notre échantillon de test s'est presque toujours montré à la hauteur. L'Asus ROG Rapture GT-AXE11000 a été utilisé comme routeur de test. Outre la connexion sans fil, le Minisforum MS-01 offre de nombreux autres ports réseau. Deux prises RJ45 se trouvent à l'arrière du MS-01. La transmission de données jusqu'à 2,5 GBit/s est possible ici. Il est également possible d'installer ultérieurement des adaptateurs réseau supplémentaires grâce à deux interfaces SFP+.
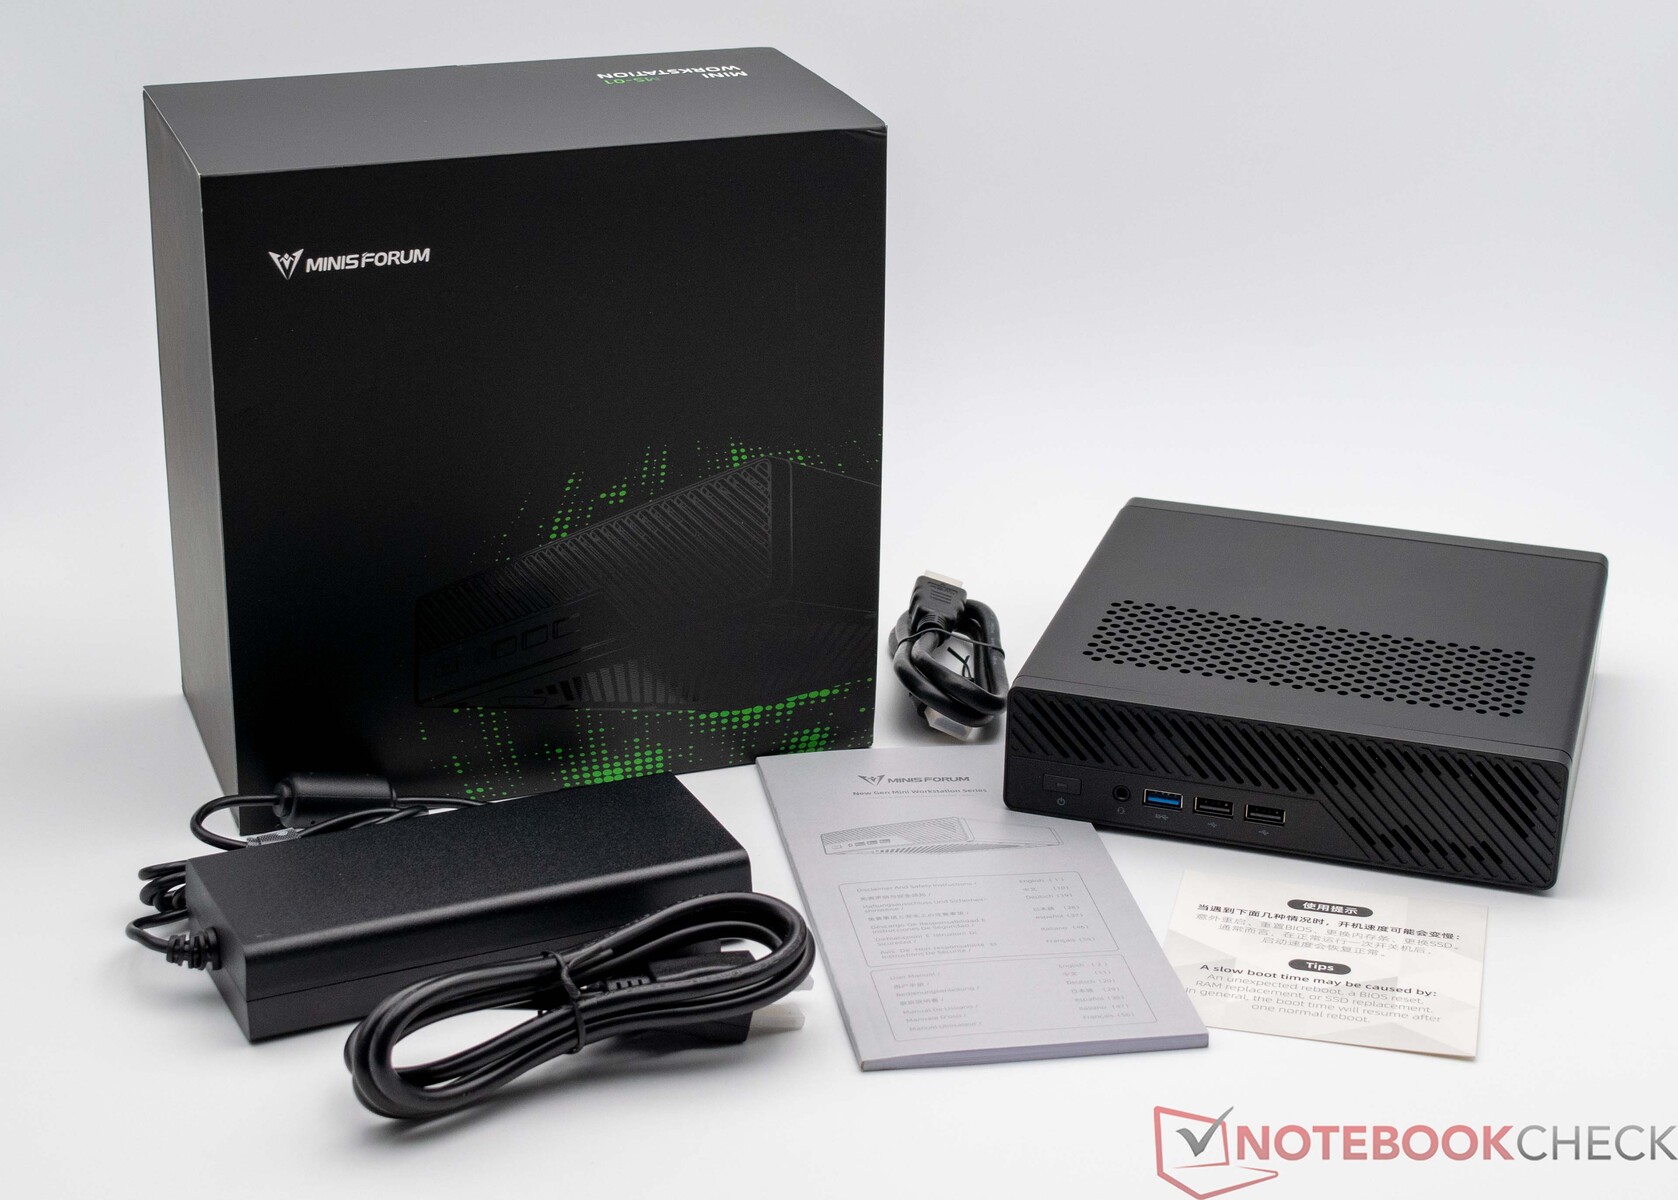
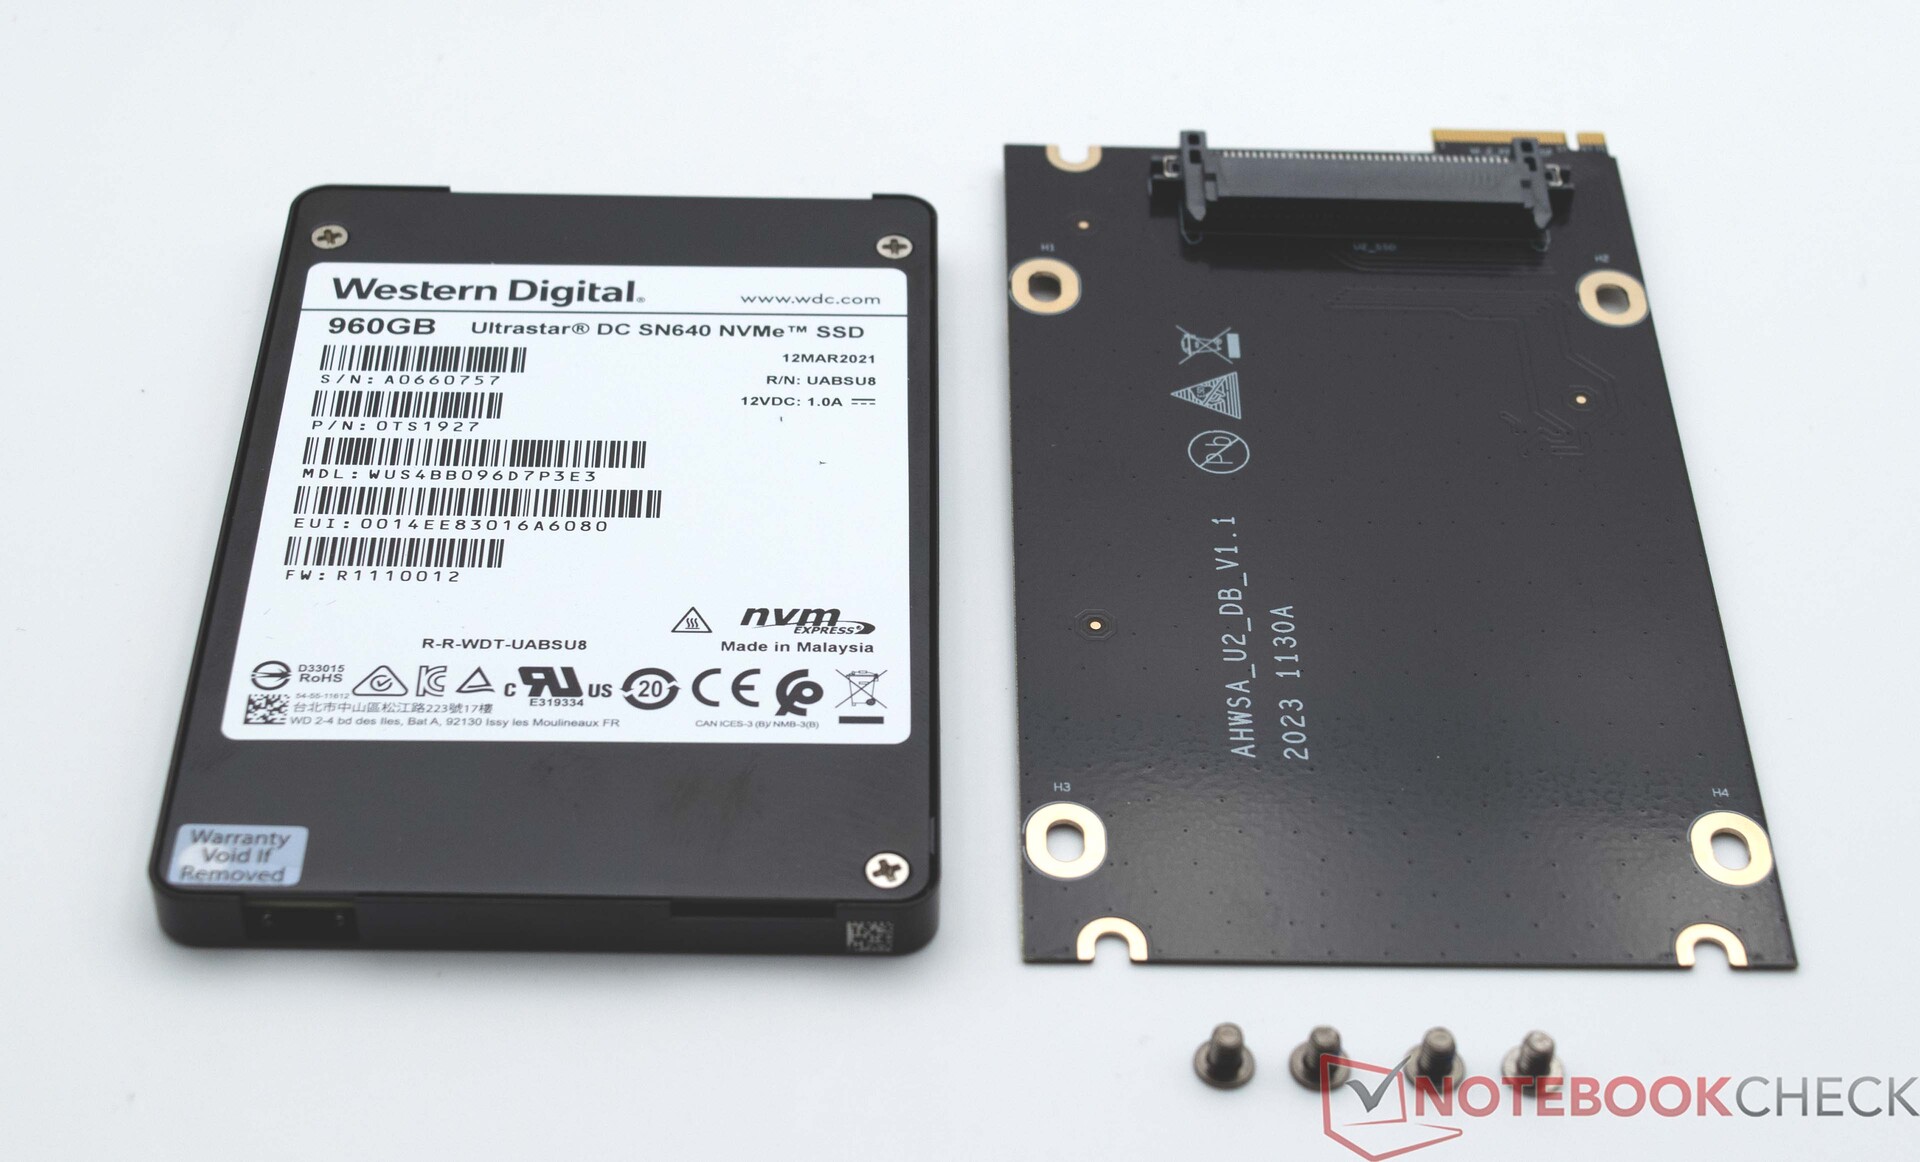
Accessoires
La livraison du Minisforum MS-01 n'est pas très étendue. Outre le mini-PC lui-même, le bloc d'alimentation de 180 watts et un câble HDMI sont également inclus. L'appareil est également livré avec un adaptateur pour l'installation d'un SSD U.2.
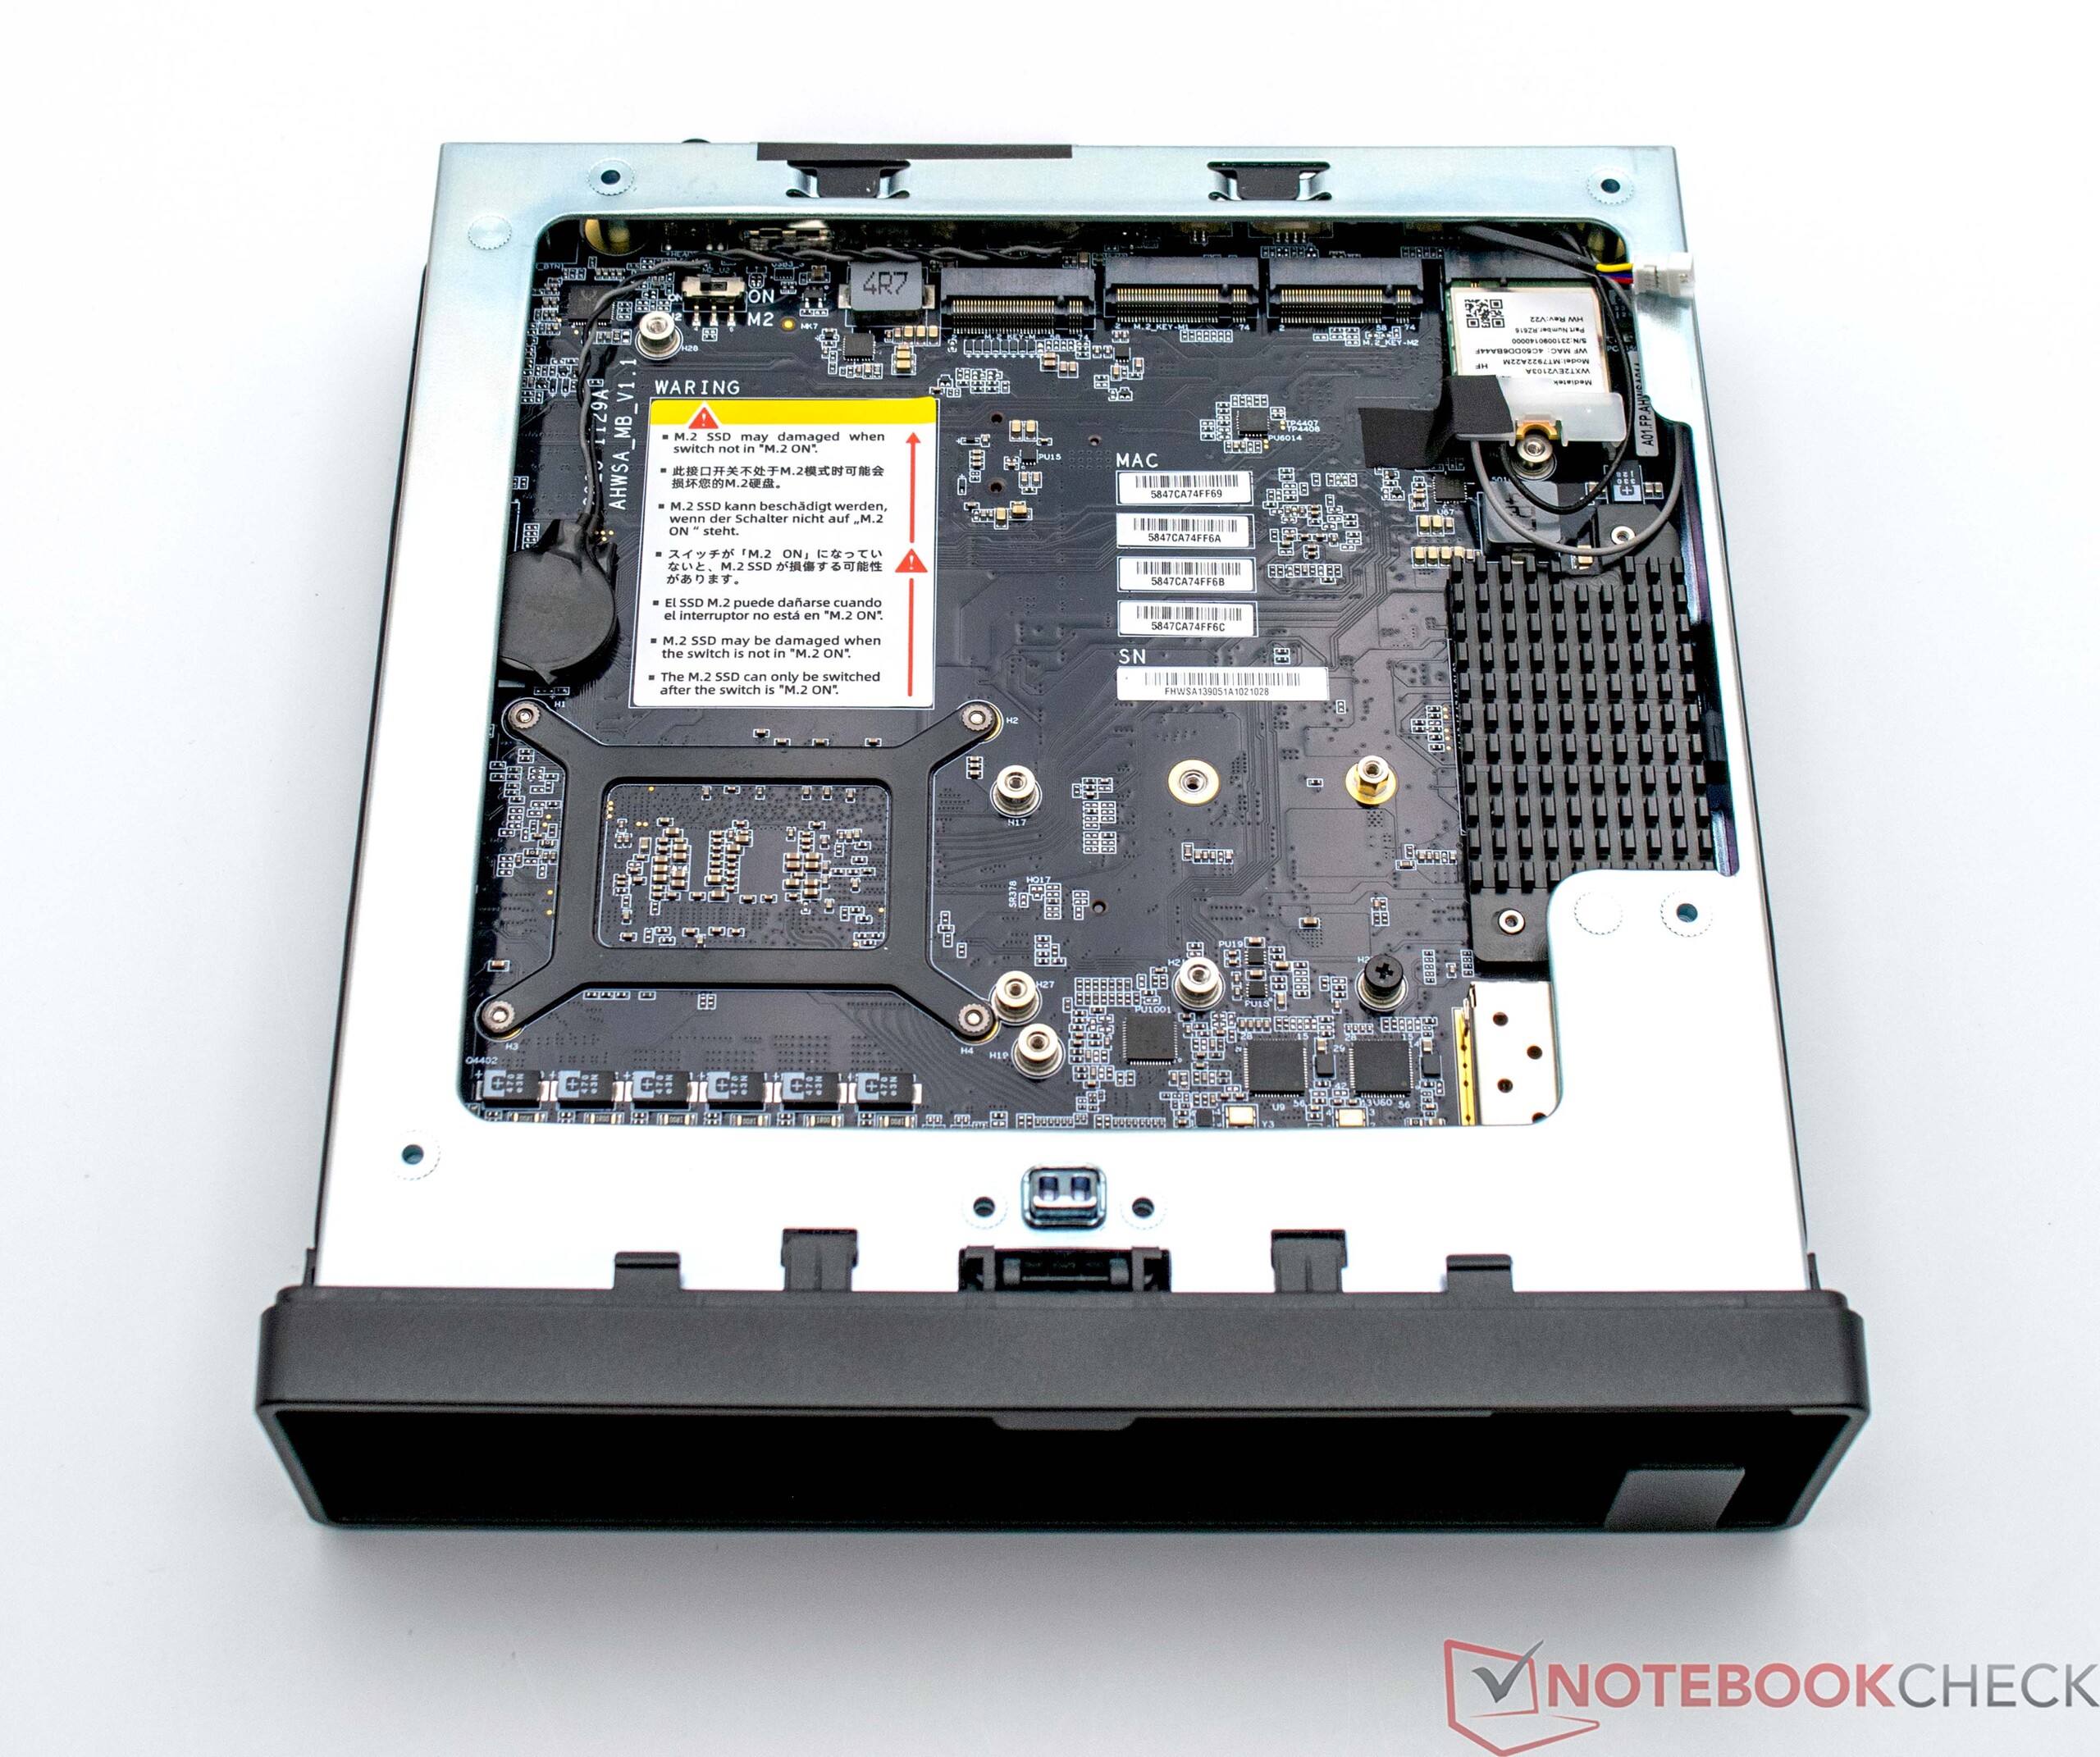
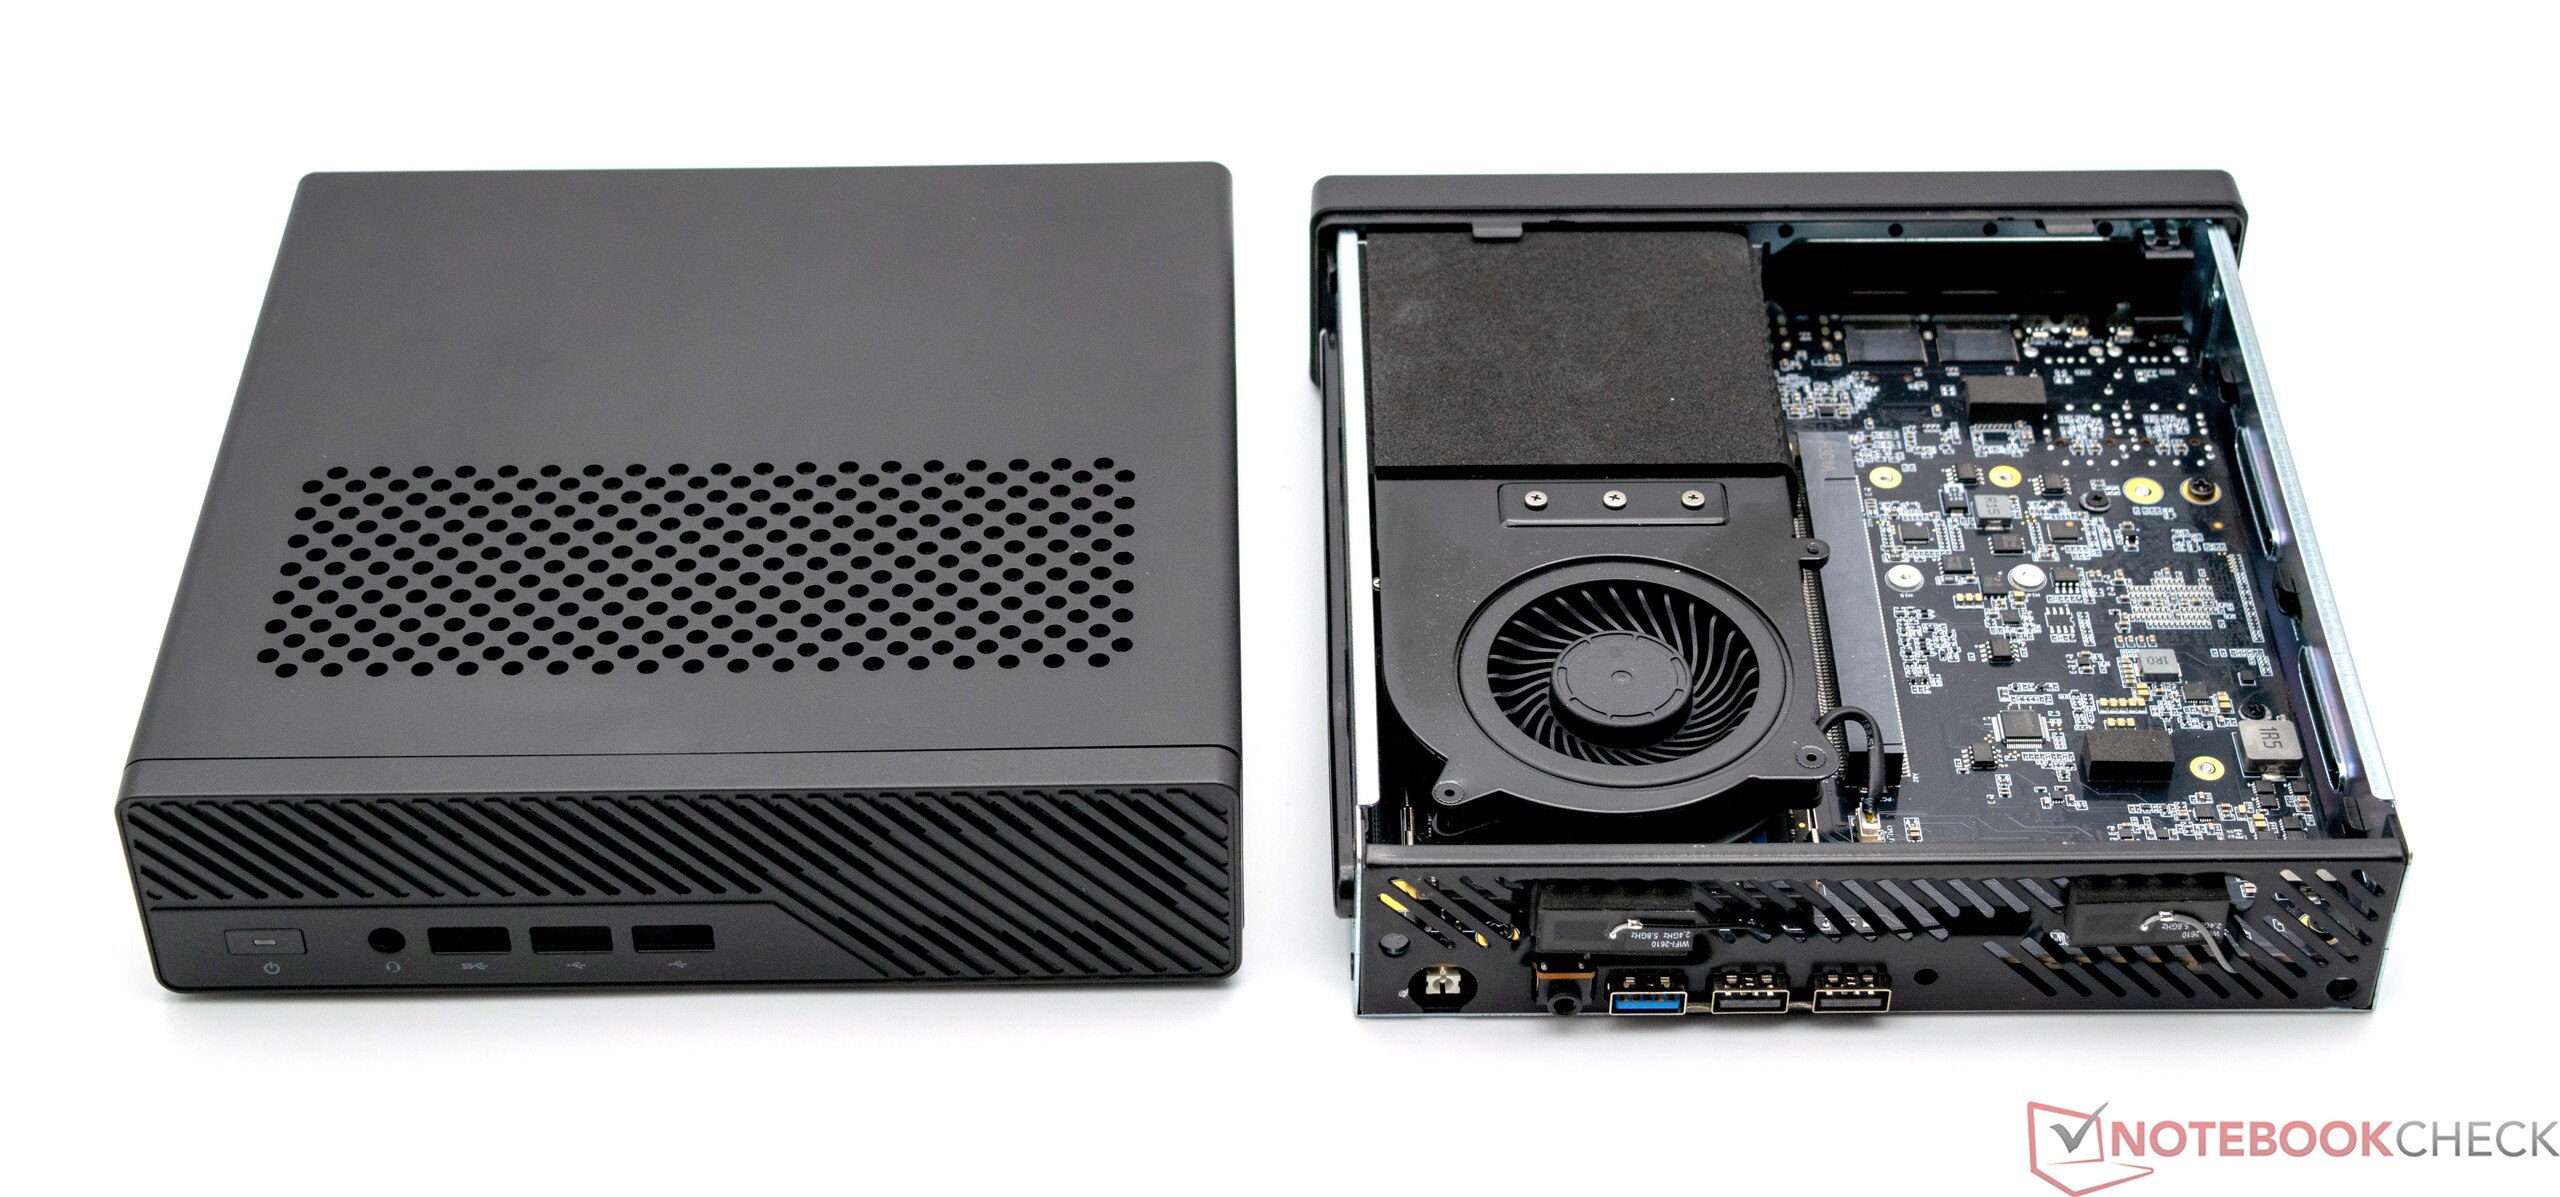
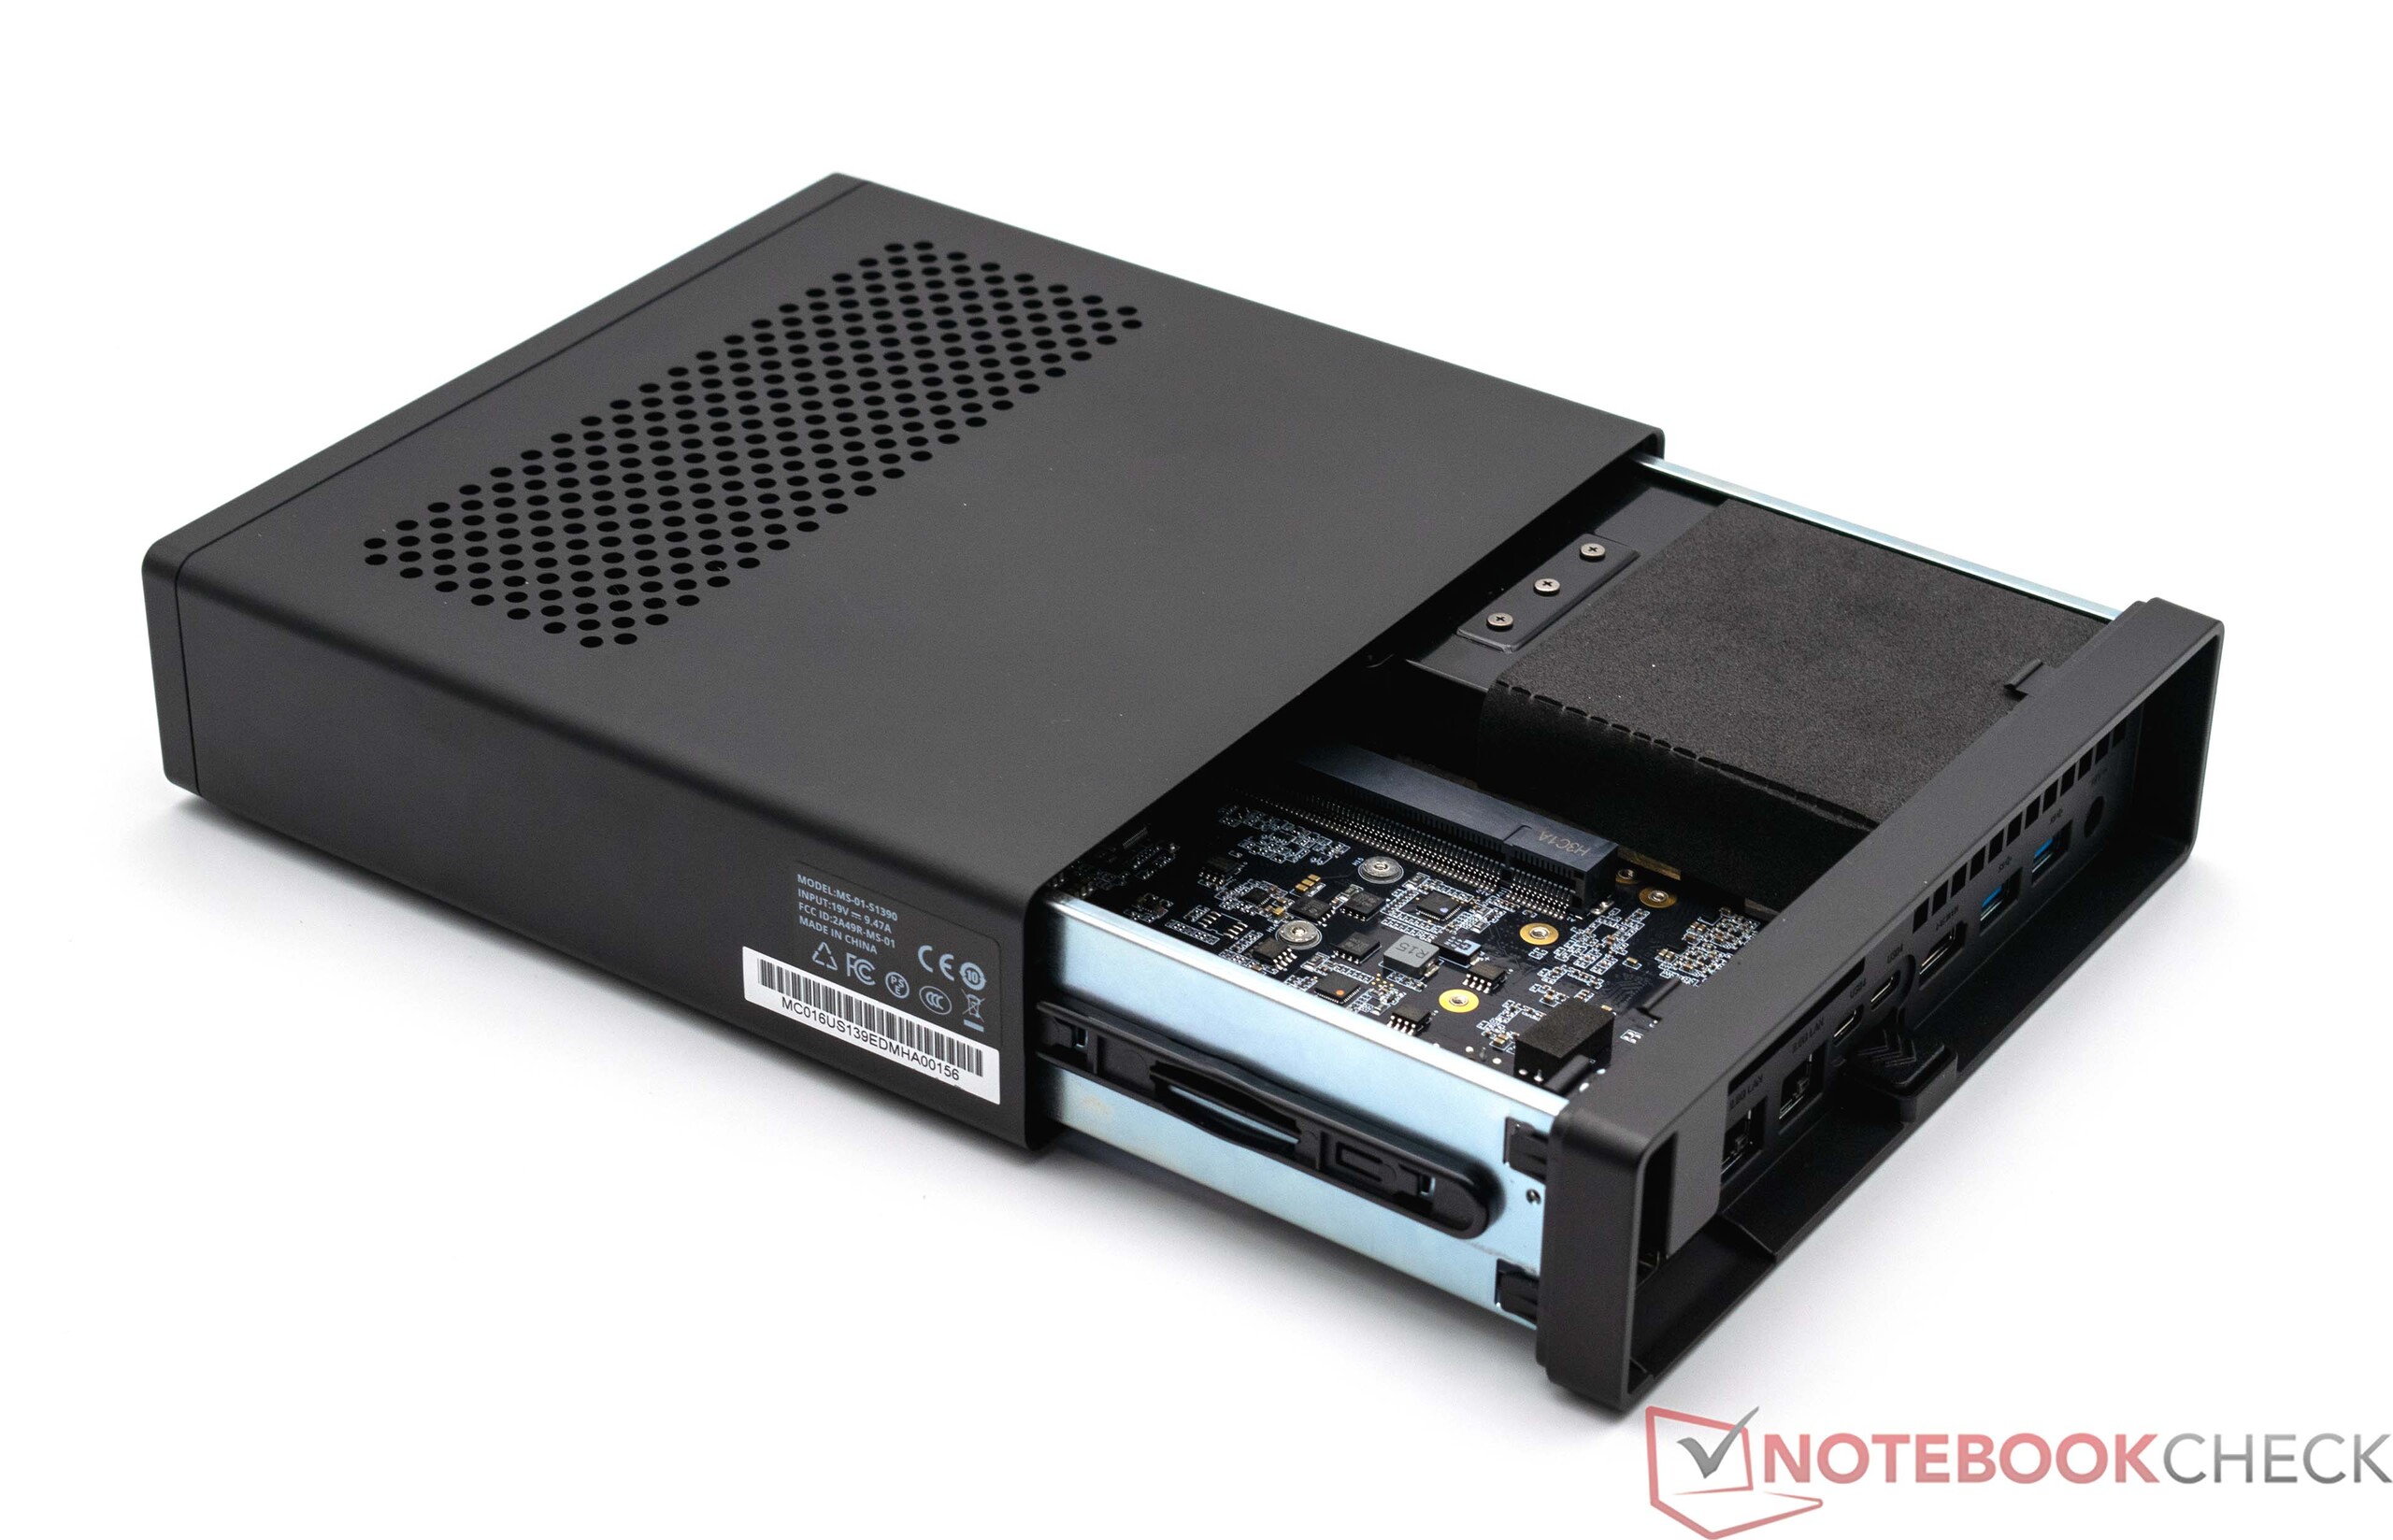
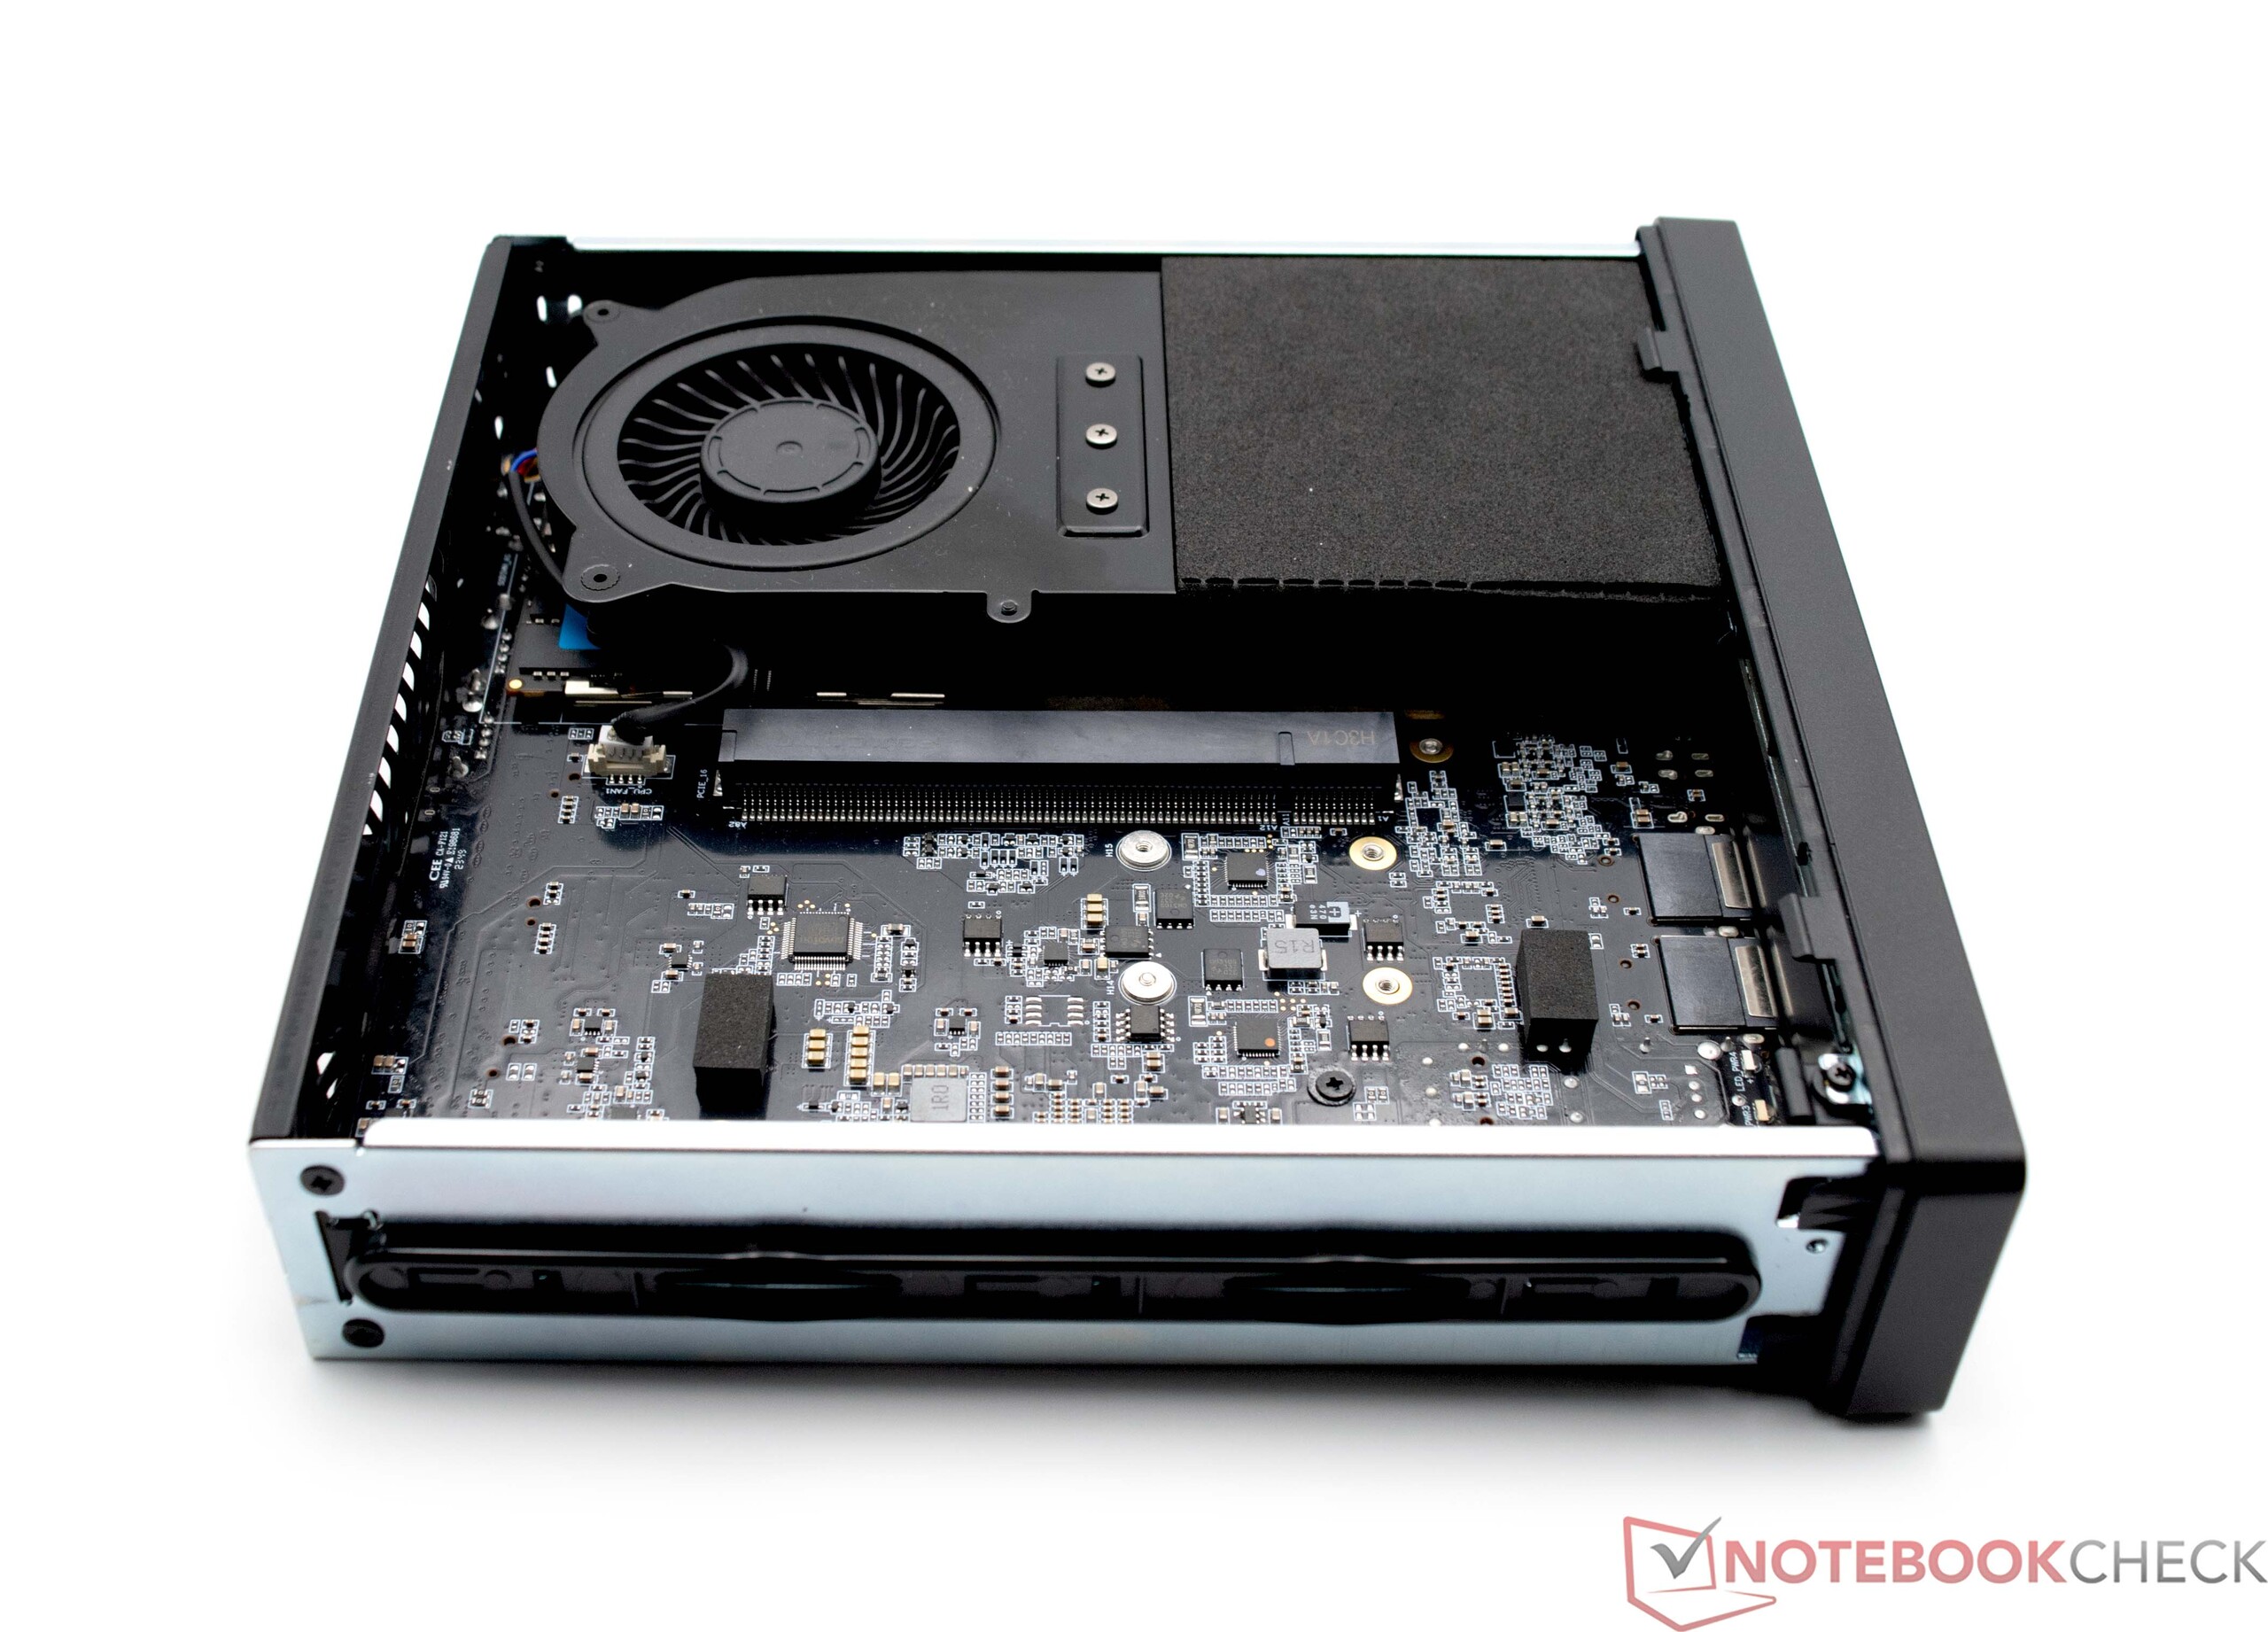
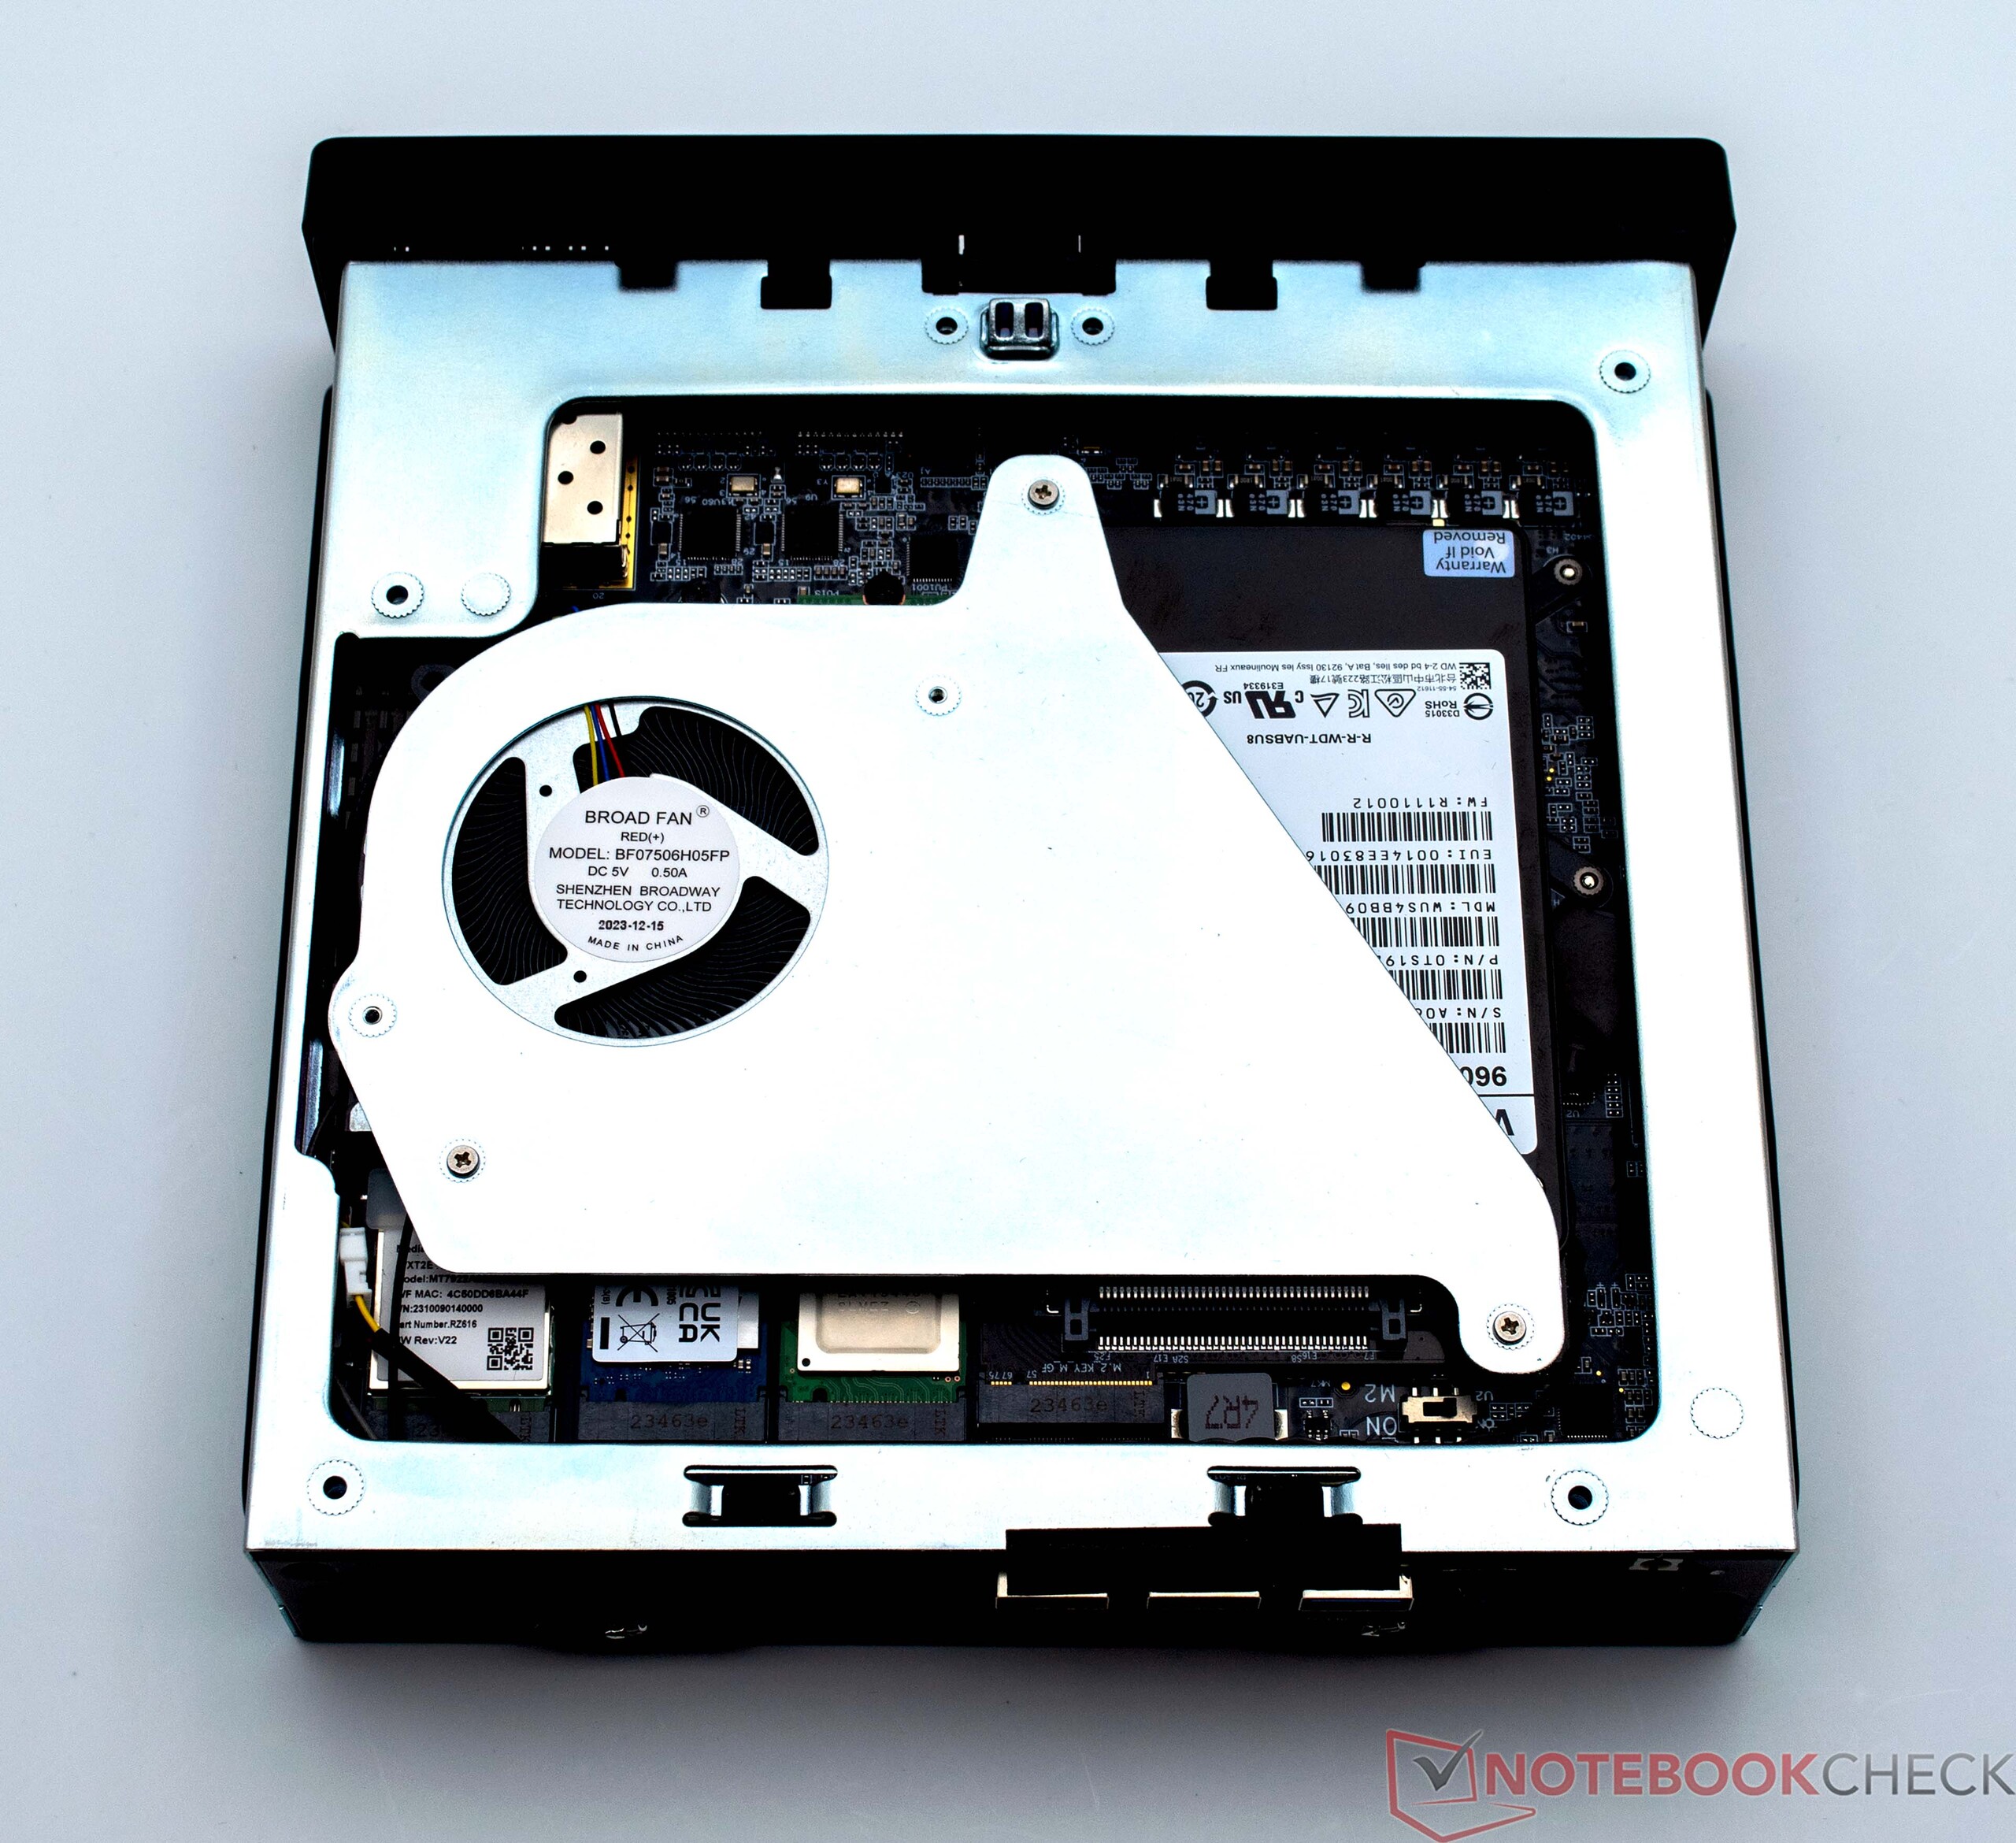
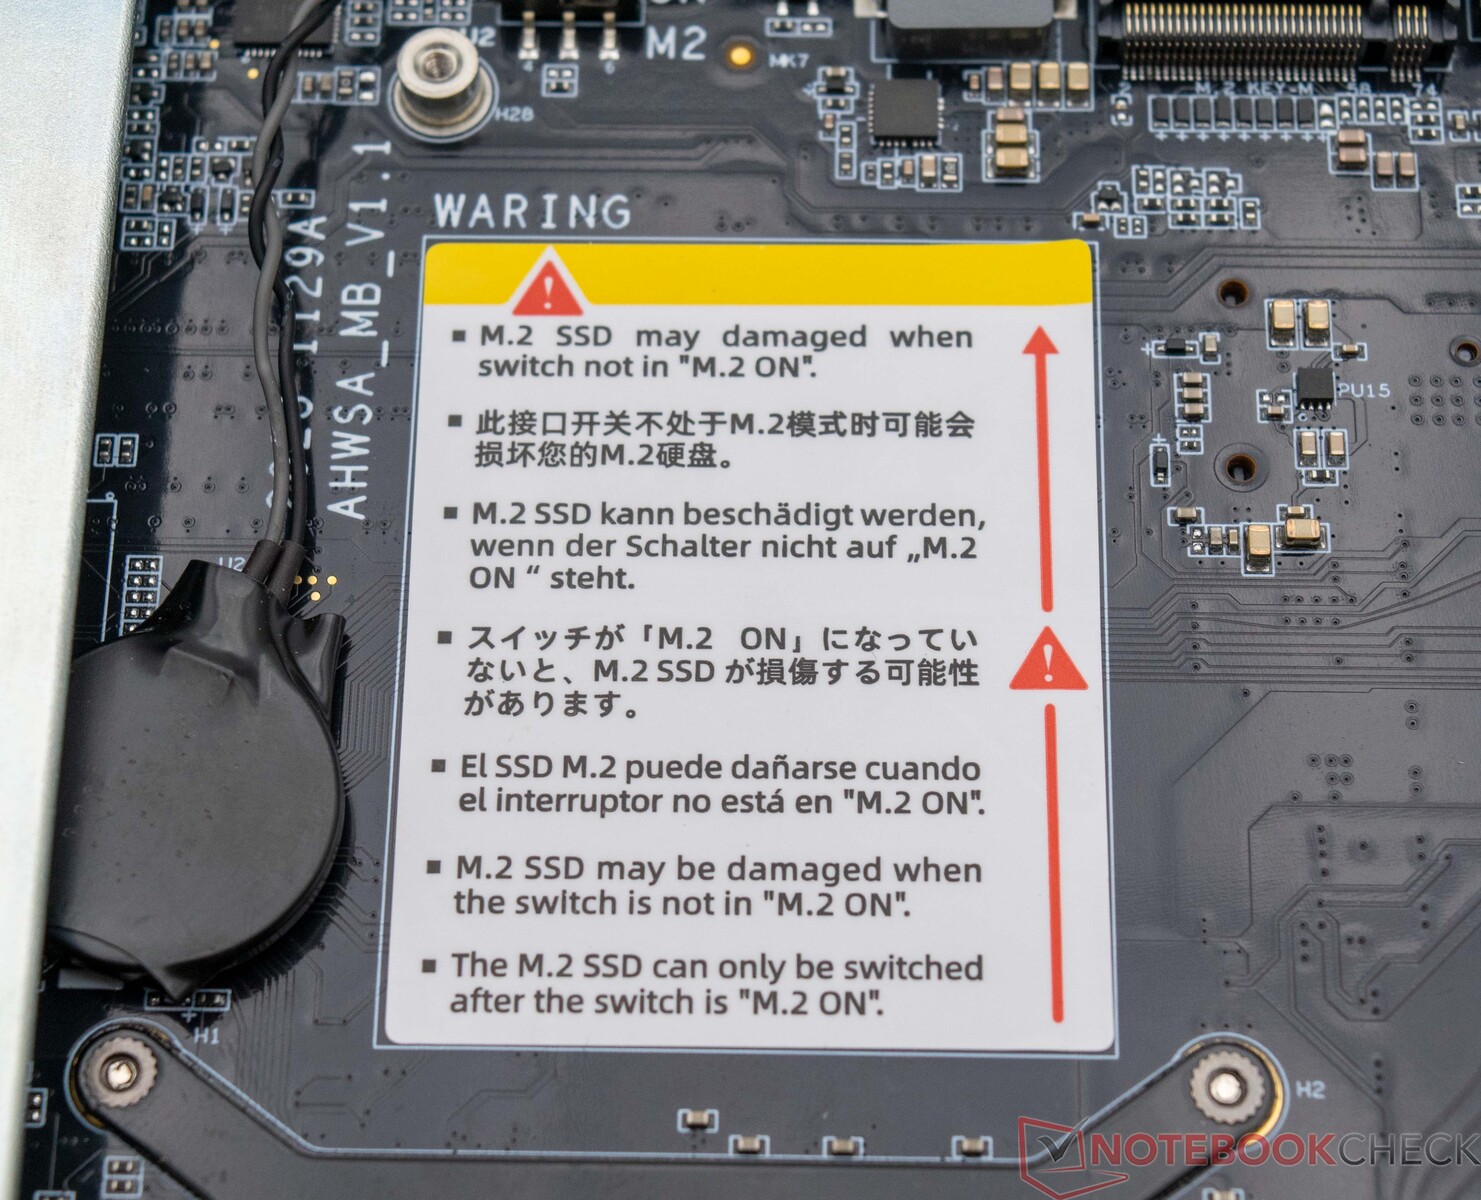
Maintenance
Le Minisforum MS-01 ne pose aucun problème en termes d'équipement. L'appareil lui-même peut être ouvert sans outils. Cela fonctionne très bien dans la réalité. Si vous achetez l'appareil en tant qu'option barebone, vous devrez inévitablement installer la RAM et le SSD, ce qui n'est pas possible sans outils. Les deux emplacements SO-DIMM sont situés directement sous le ventilateur du processeur, et les disques SSD peuvent être installés sur la face inférieure. Pour cela, il faut retirer un large couvercle métallique avec un autre ventilateur. Seuls les SSD PCIe peuvent être logés dans le Minisforum MS-01. Même les SSD U.2 peuvent être installés, bien que l'adaptateur fourni doive être utilisé pour cela.

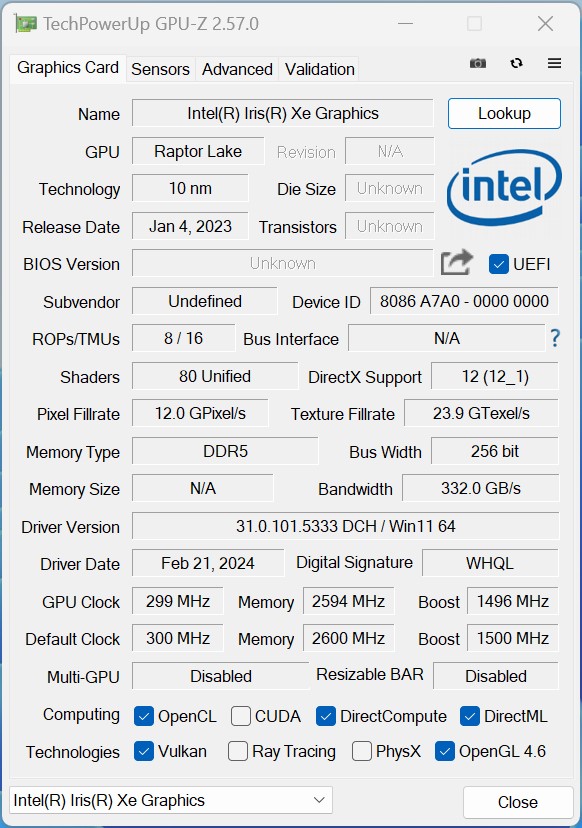
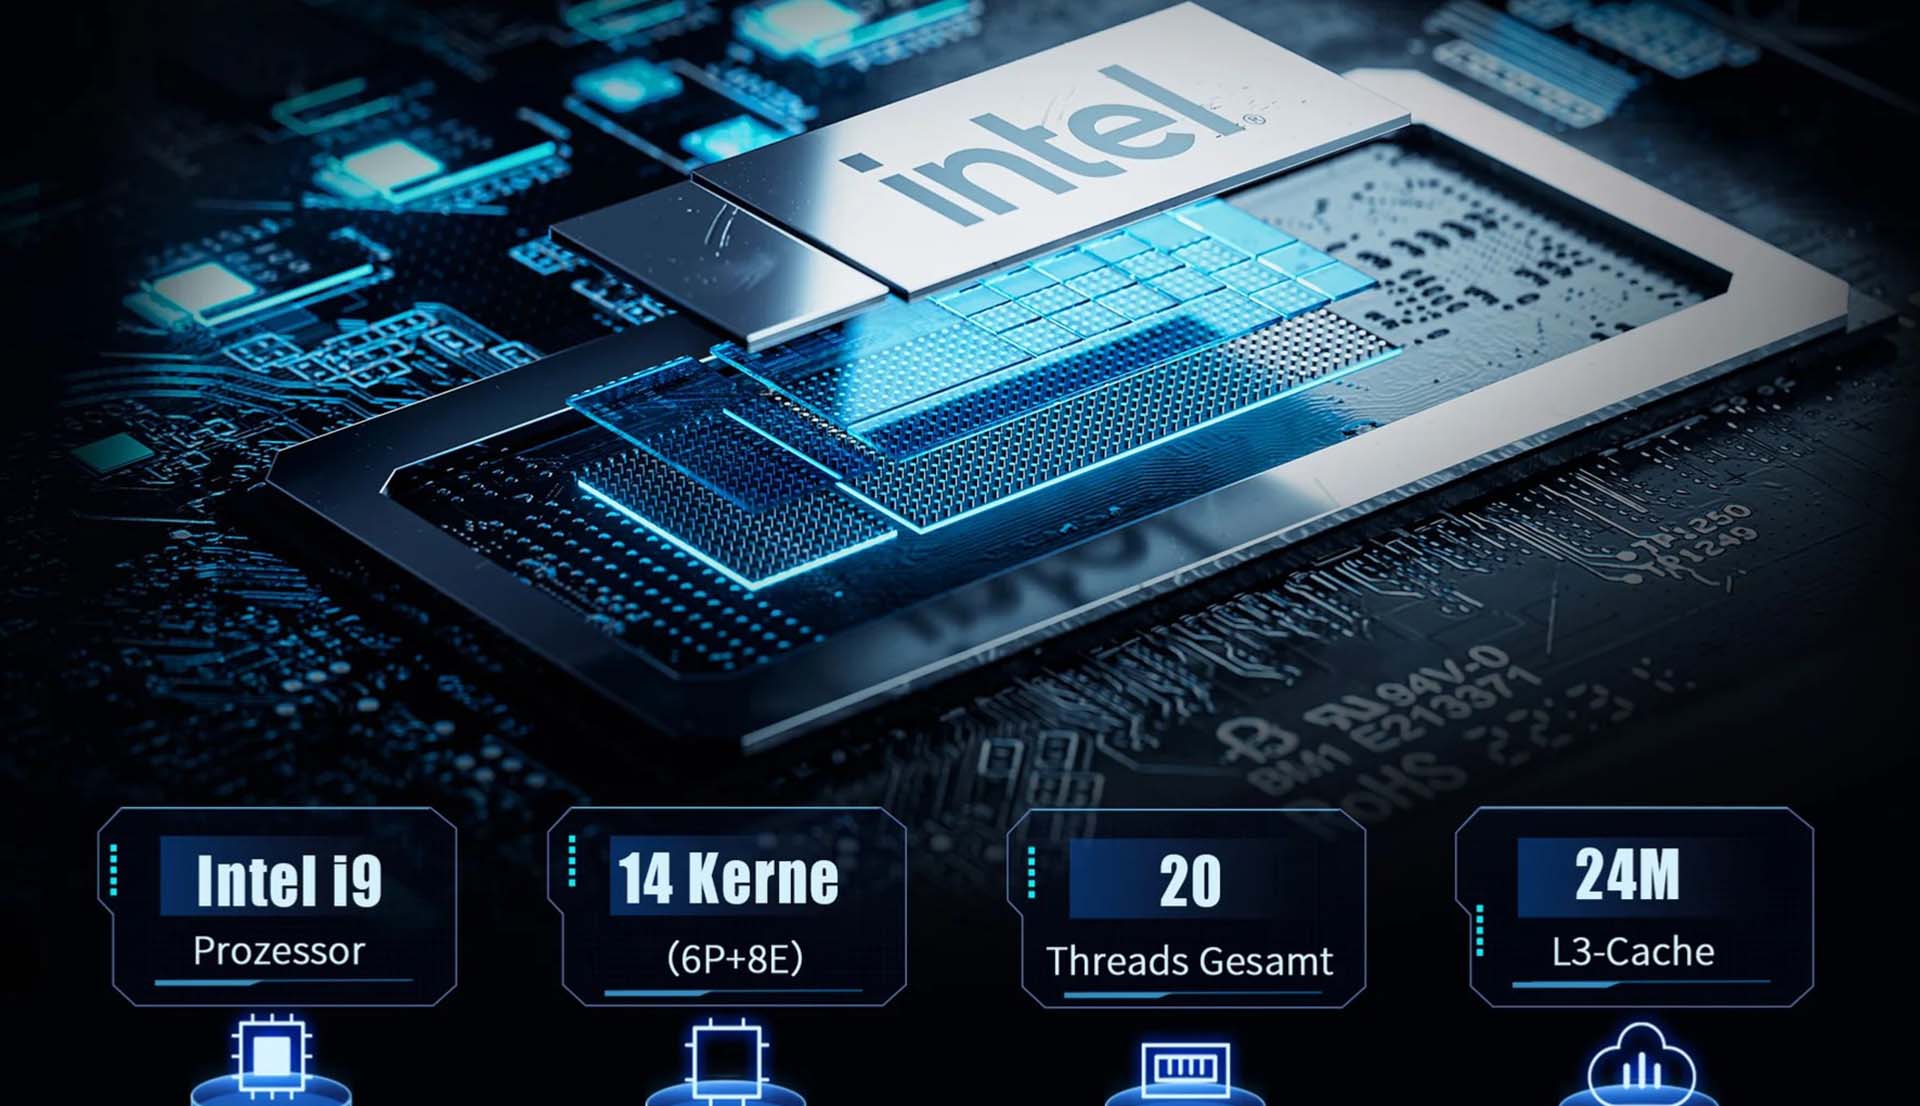
Performance - Intel Raptor Lake-H avec 14 cœurs et 20 threads
Le Minisforum MS-01 est disponible avec les technologies suivantes Intel Core i9-13900H dans la configuration supérieure. Le modèle est également disponible avec un Intel Core i9-12900Hqui ne serait probablement pas plus performant. Toutefois, les acheteurs soucieux du prix peuvent également opter pour le modèle Intel Core i5-12600H. Ce SoC combine toujours 12 cœurs et 16 threads et devrait également être en mesure de gérer la plupart des tâches.
Conditions d'essai
Pour tous les tests de performance avec le Minisforum MS-01, nous utilisons le plan d'alimentation "performance maximale". Il n'y a eu que des écarts dans les mesures d'énergie et de bruit selon nos critères de test Critères de test. Les limites de puissance du processeur PL1 (60 watts) et PL2 (80 watts) n'ont pas été modifiées en fonction de l'état de livraison.
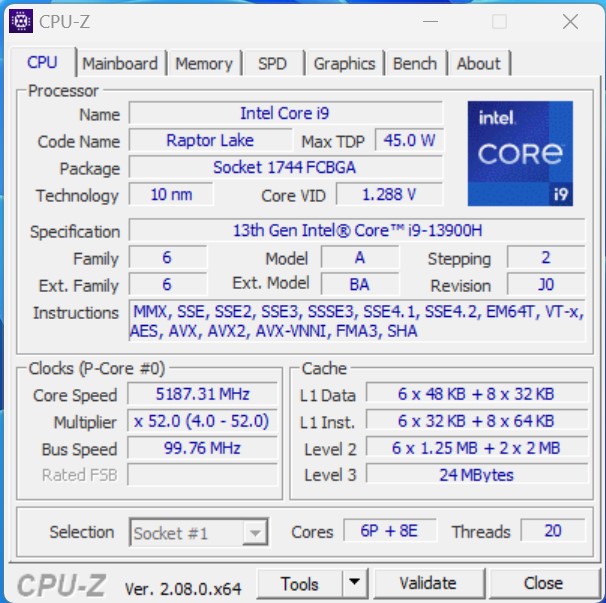
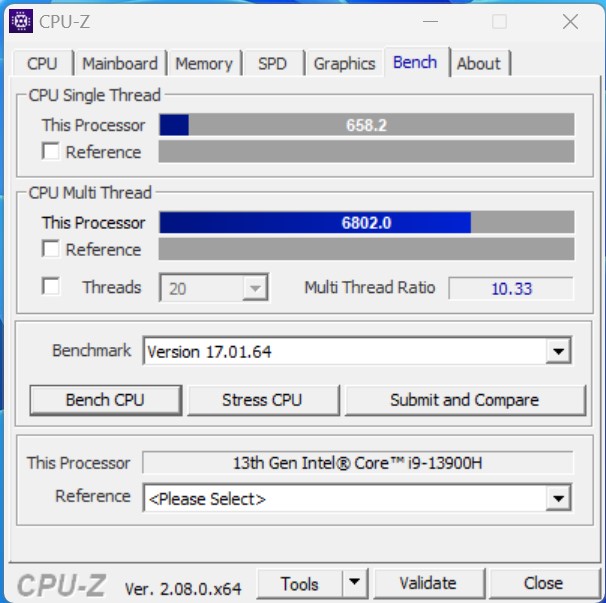
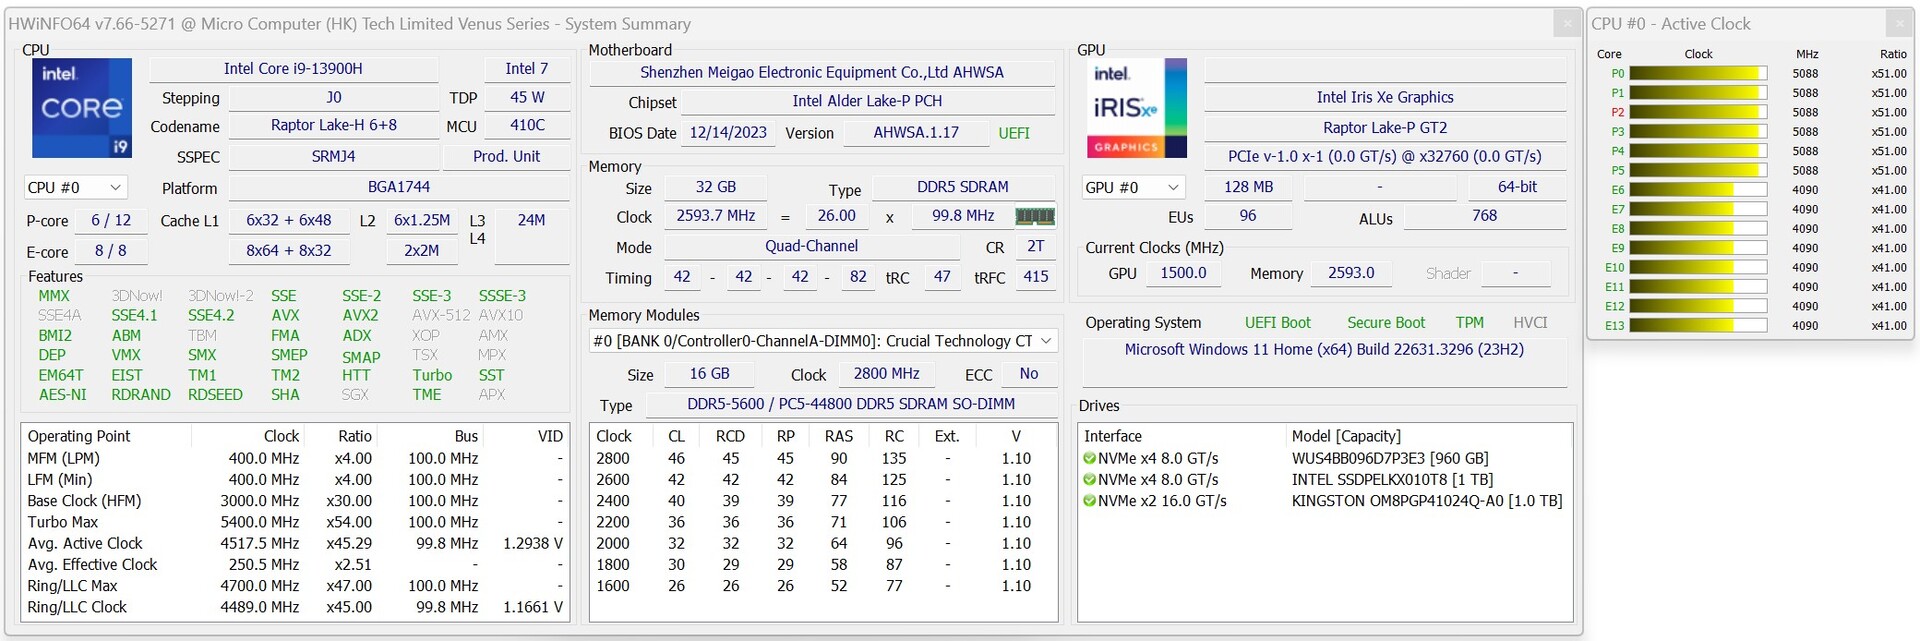
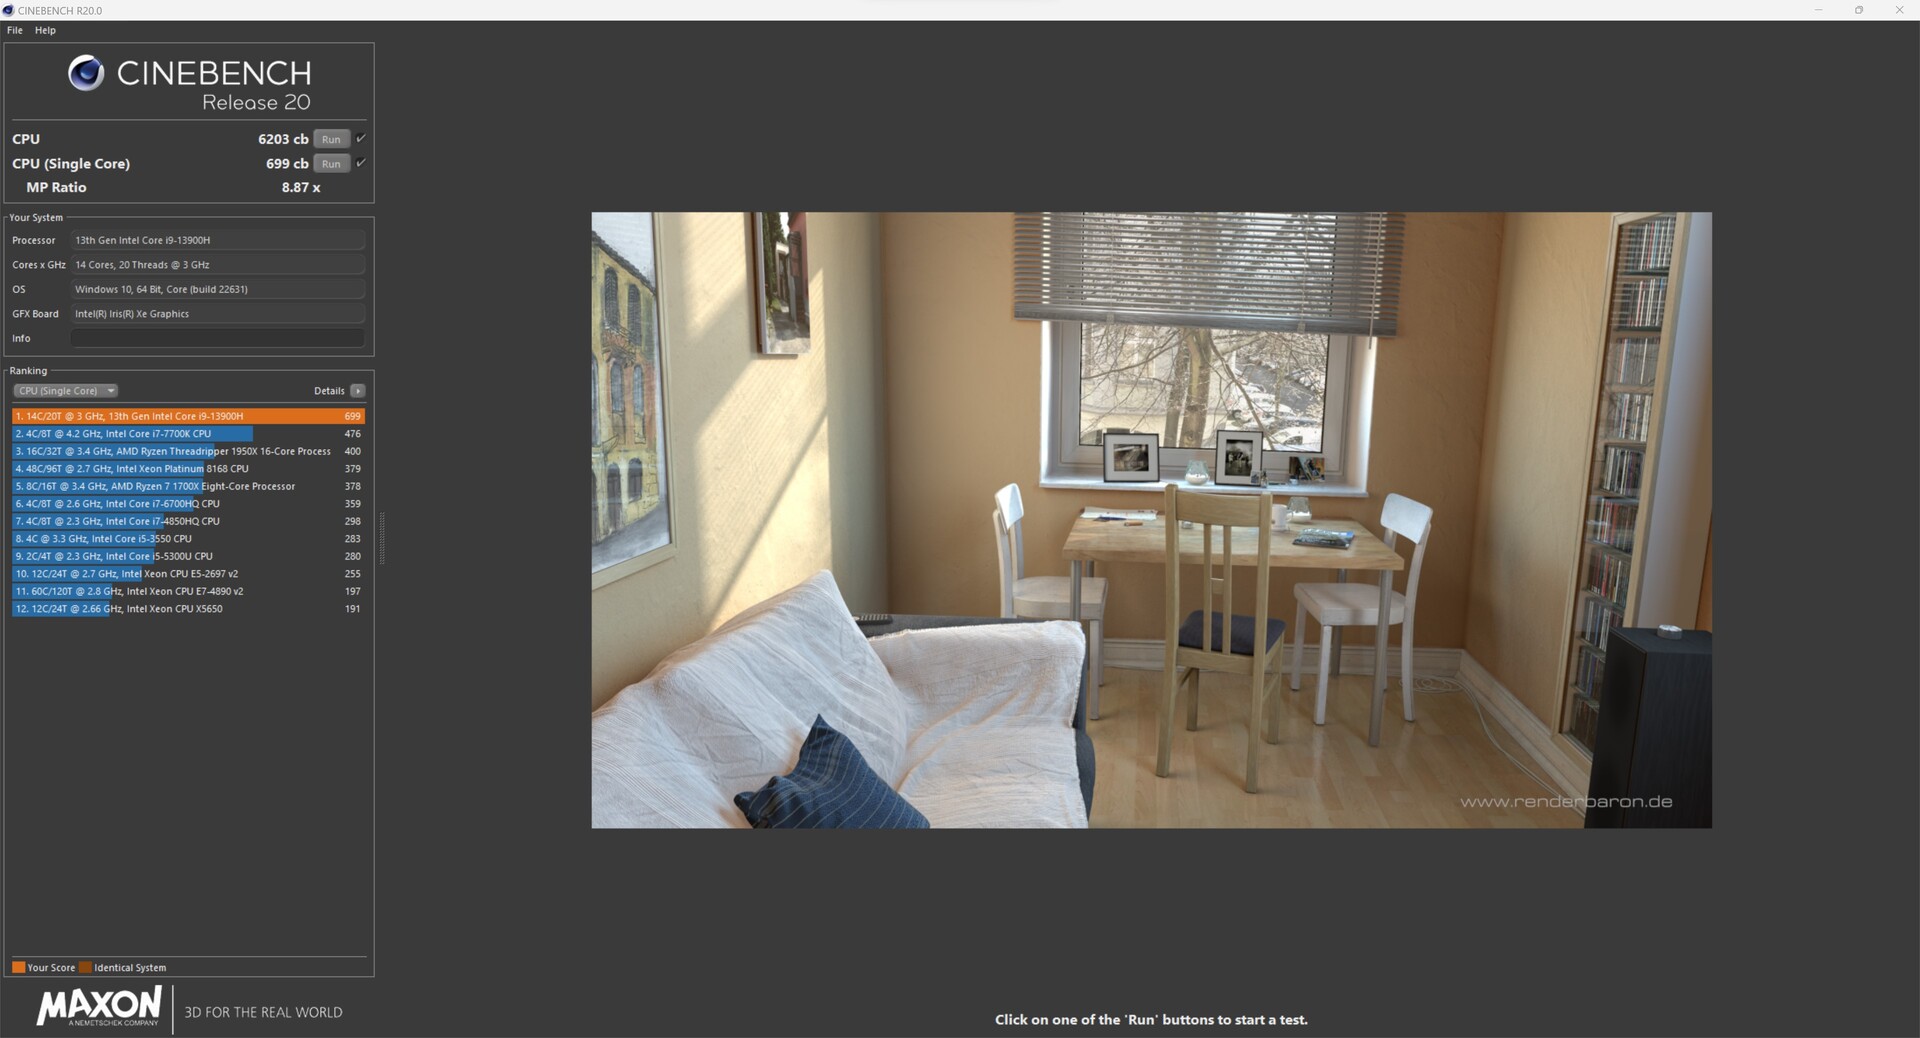
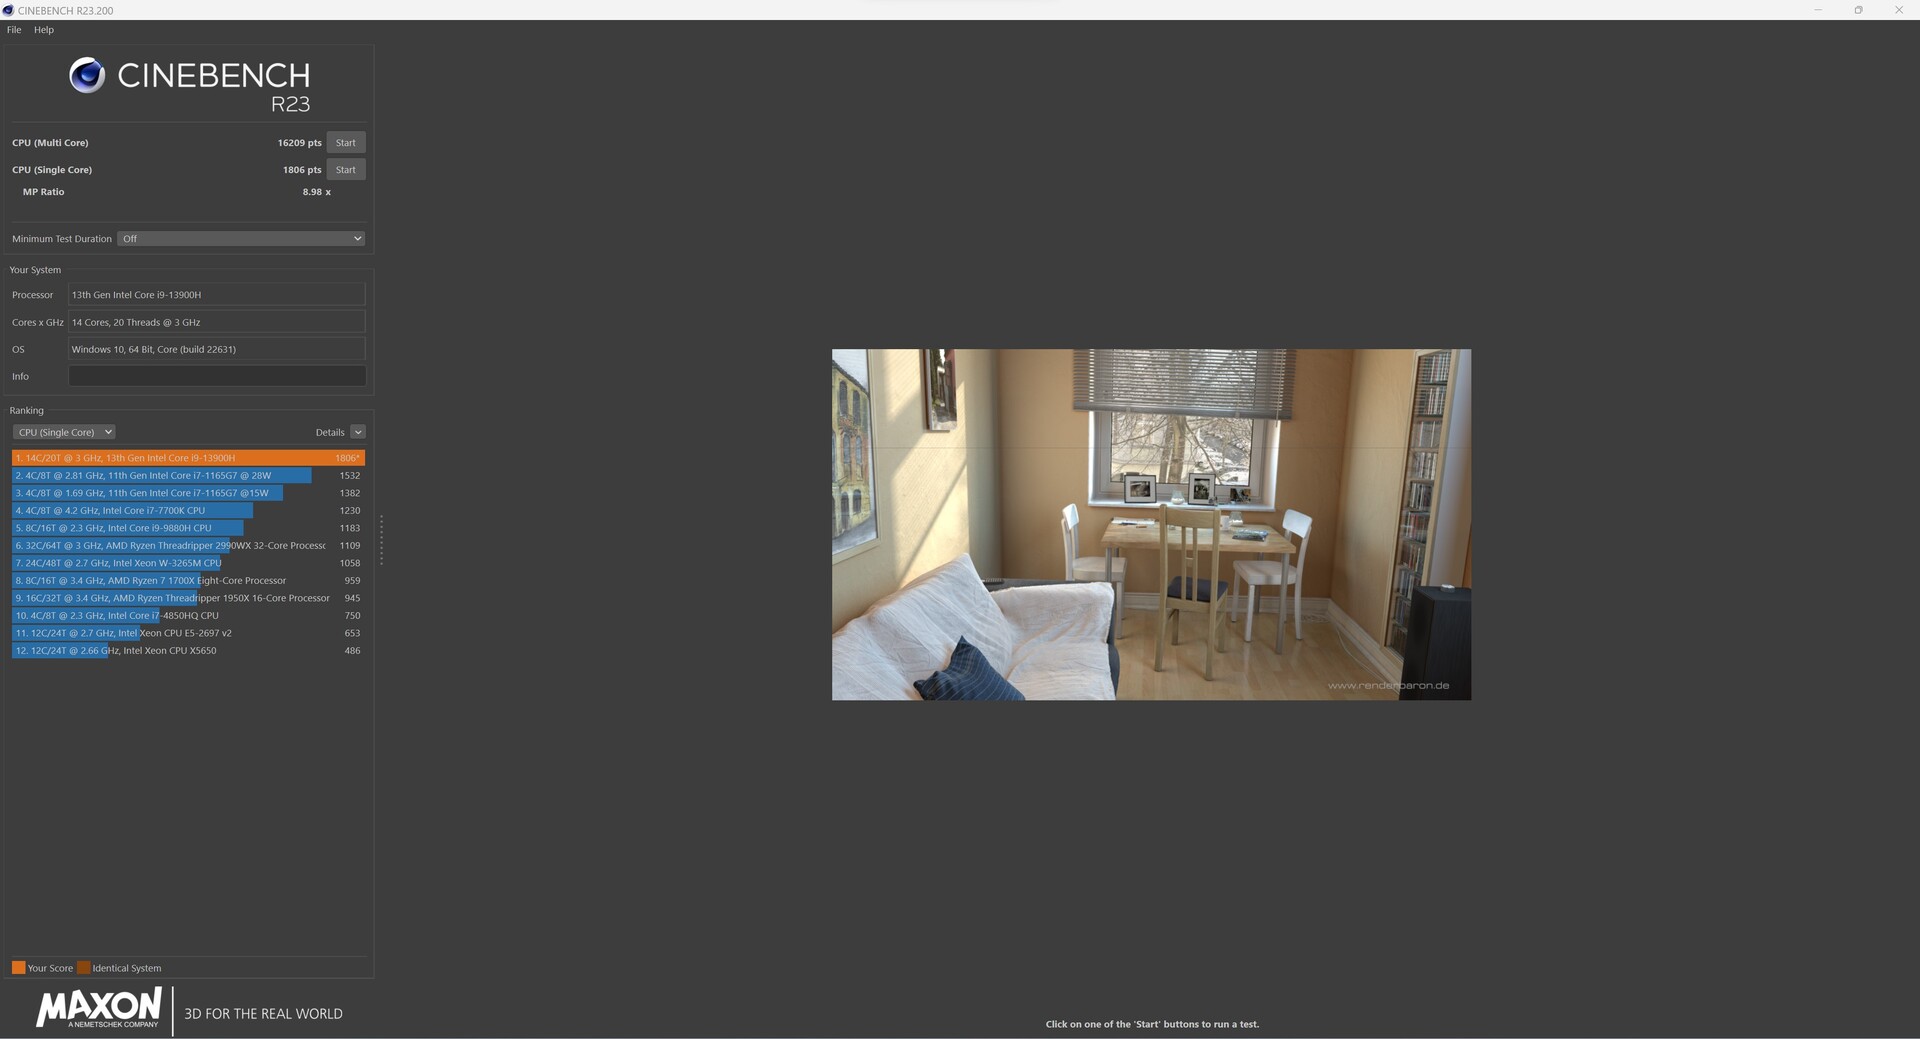
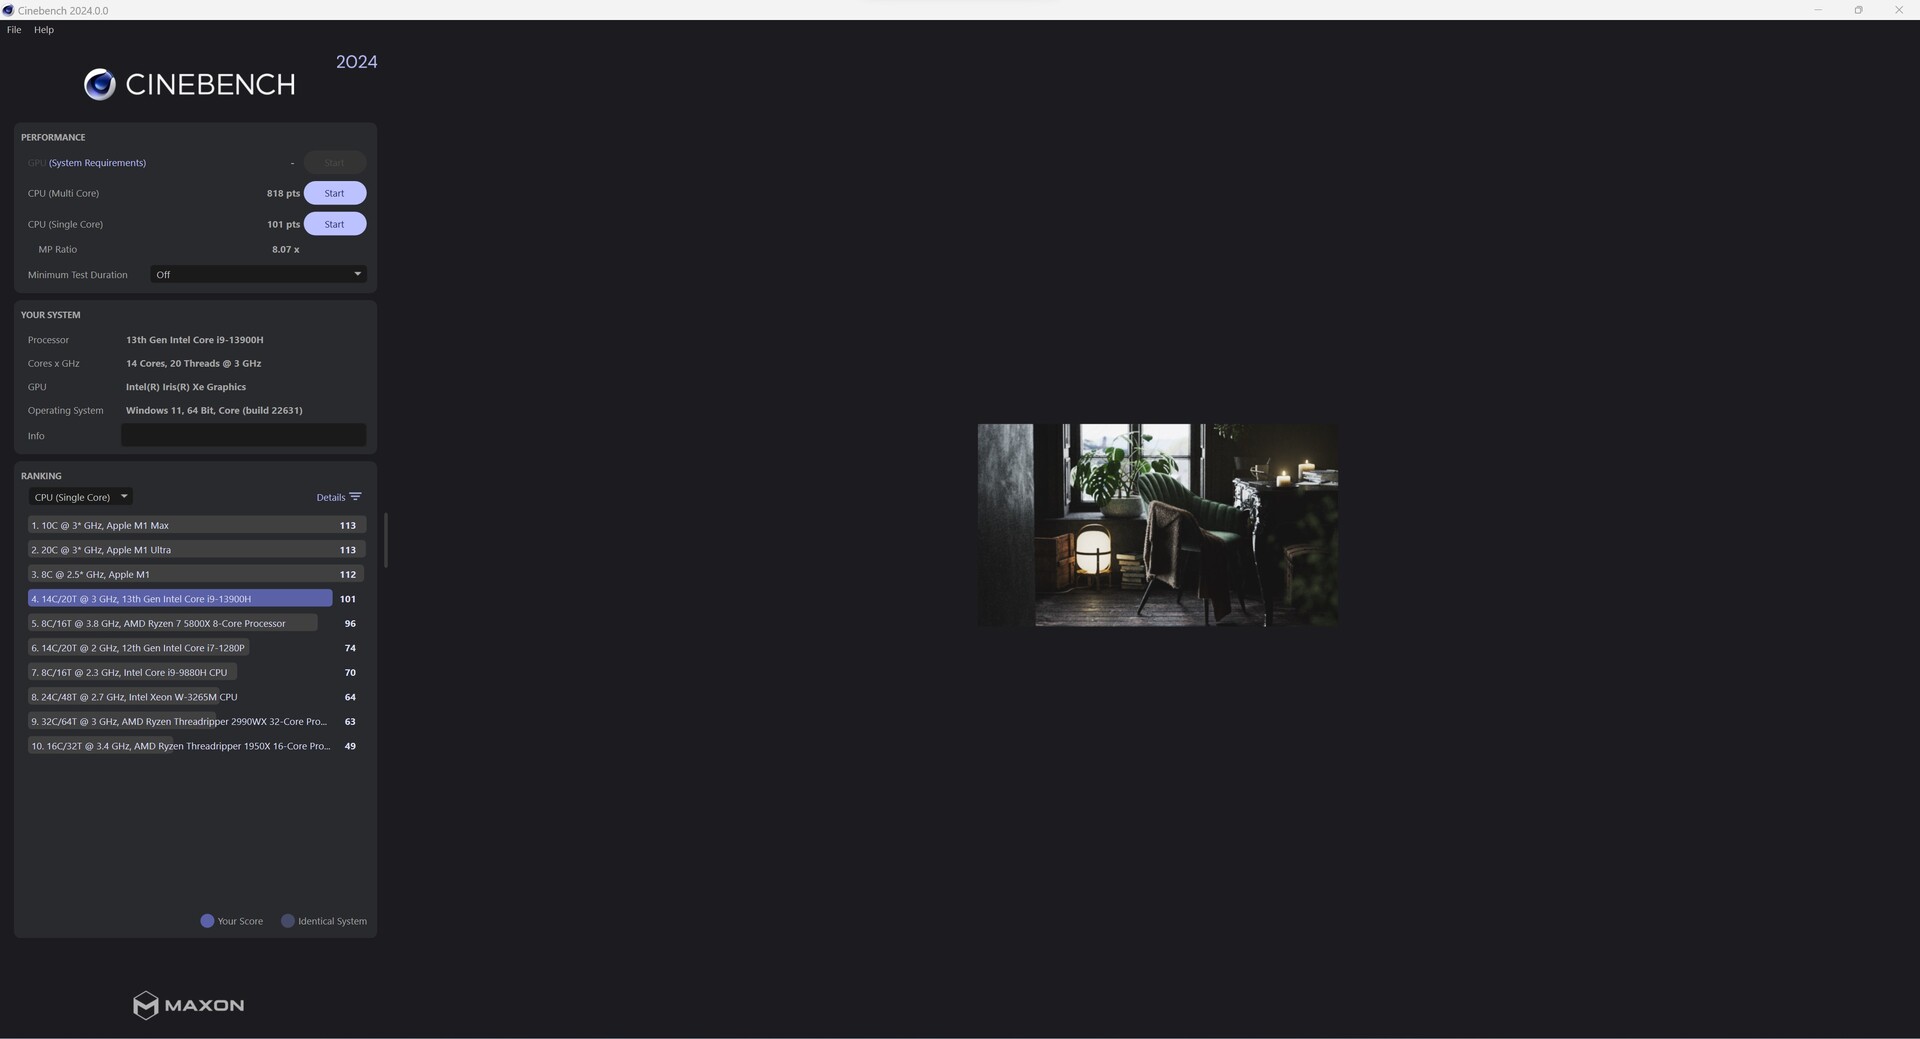
Processeur
Le Minisforum MS-01 est livré avec les éléments suivants Intel Core i9-13900H dans la configuration supérieure. En termes de performances, le SoC offre des performances exceptionnelles dans notre échantillon de test et se classe très près du Geekom A7 équipé d'un AMD Ryzen 9 7940HS.
L'Intel Core i9-13900H offre un total de 14 cœurs avec 20 threads. Le Minisforum donne au processeur une limite de puissance à court terme allant jusqu'à 80 watts. En charge continue, il devrait atteindre 60 watts. Pour l'instant, nous allons un peu vite en besogne et pouvons confirmer les limites de performance.
Pour d'autres comparaisons et benchmarks, veuillez vous référer à notre tableau comparatif des CPU Processeurs mobiles - indice de référence .
| Performance Rating - Percent | |
| Geekom A7 | |
| Minisforum MS-01 | |
| Acemagic F2A | |
| Minisforum Venus Series NAB9 | |
| Minisforum Venus Series NPB5 | |
| Geekom XT12 Pro | |
| Maxtang MTN-FP750 | |
| Cinebench R10 | |
| Rendering Single CPUs 64Bit | |
| Minisforum Venus Series NAB9 | |
| Minisforum Venus Series NPB5 | |
| Geekom A7 | |
| Acemagic F2A | |
| Minisforum MS-01 | |
| Geekom XT12 Pro | |
| Maxtang MTN-FP750 | |
| Rendering Multiple CPUs 64Bit | |
| Acemagic F2A | |
| Minisforum Venus Series NPB5 | |
| Geekom A7 | |
| Minisforum MS-01 | |
| Minisforum Venus Series NAB9 | |
| Geekom XT12 Pro | |
| Maxtang MTN-FP750 | |
| Blender - v2.79 BMW27 CPU | |
| Geekom XT12 Pro | |
| Maxtang MTN-FP750 | |
| Minisforum Venus Series NPB5 | |
| Minisforum Venus Series NAB9 | |
| Geekom A7 | |
| Minisforum MS-01 | |
| Acemagic F2A | |
| WinRAR - Result | |
| Minisforum MS-01 | |
| Minisforum Venus Series NAB9 | |
| Geekom XT12 Pro | |
| Acemagic F2A | |
| Geekom A7 | |
| Minisforum Venus Series NPB5 | |
| Maxtang MTN-FP750 | |
| 3DMark 11 - 1280x720 Performance Physics | |
| Geekom A7 | |
| Minisforum MS-01 | |
| Minisforum Venus Series NPB5 | |
| Acemagic F2A | |
| Minisforum Venus Series NAB9 | |
| Geekom XT12 Pro | |
| Maxtang MTN-FP750 | |
| HWBOT x265 Benchmark v2.2 - 4k Preset | |
| Geekom A7 | |
| Acemagic F2A | |
| Minisforum MS-01 | |
| Minisforum Venus Series NAB9 | |
| Minisforum Venus Series NPB5 | |
| Maxtang MTN-FP750 | |
| Geekom XT12 Pro | |
| R Benchmark 2.5 - Overall mean | |
| Maxtang MTN-FP750 | |
| Minisforum Venus Series NPB5 | |
| Acemagic F2A | |
| Geekom XT12 Pro | |
| Minisforum Venus Series NAB9 | |
| Minisforum MS-01 | |
| Geekom A7 | |
| LibreOffice - 20 Documents To PDF | |
| Maxtang MTN-FP750 | |
| Geekom A7 | |
| Acemagic F2A | |
| Minisforum Venus Series NPB5 | |
| Geekom XT12 Pro | |
| Minisforum Venus Series NAB9 | |
| Minisforum MS-01 | |
| WebXPRT 3 - Overall | |
| Geekom A7 | |
| Minisforum MS-01 | |
| Minisforum Venus Series NPB5 | |
| Minisforum Venus Series NAB9 | |
| Geekom XT12 Pro | |
| Maxtang MTN-FP750 | |
| Acemagic F2A | |
| Mozilla Kraken 1.1 - Total | |
| Maxtang MTN-FP750 | |
| Acemagic F2A | |
| Minisforum Venus Series NPB5 | |
| Geekom XT12 Pro | |
| Minisforum MS-01 | |
| Geekom A7 | |
| Minisforum Venus Series NAB9 | |
| Super Pi mod 1.5 XS 1M - 1M | |
| Maxtang MTN-FP750 | |
| Geekom XT12 Pro | |
| Geekom A7 | |
| Minisforum Venus Series NAB9 | |
| Acemagic F2A | |
| Minisforum Venus Series NPB5 | |
| Minisforum MS-01 | |
| Super Pi mod 1.5 XS 2M - 2M | |
| Maxtang MTN-FP750 | |
| Geekom A7 | |
| Minisforum Venus Series NAB9 | |
| Geekom XT12 Pro | |
| Acemagic F2A | |
| Minisforum Venus Series NPB5 | |
| Minisforum MS-01 | |
| Super Pi Mod 1.5 XS 32M - 32M | |
| Maxtang MTN-FP750 | |
| Geekom A7 | |
| Minisforum Venus Series NAB9 | |
| Geekom XT12 Pro | |
| Acemagic F2A | |
| Minisforum MS-01 | |
| Minisforum Venus Series NPB5 | |
* ... Moindre est la valeur, meilleures sont les performances
| Performance Rating - Percent | |
| Geekom A7 | |
| Minisforum MS-01 | |
| Acemagic F2A | |
| Minisforum Venus Series NPB5 | |
| Minisforum Venus Series NAB9 | |
| Geekom XT12 Pro | |
| Maxtang MTN-FP750 | |
AIDA64: FP32 Ray-Trace | FPU Julia | CPU SHA3 | CPU Queen | FPU SinJulia | FPU Mandel | CPU AES | CPU ZLib | FP64 Ray-Trace | CPU PhotoWorxx
| Performance Rating | |
| Geekom A7 | |
| Acemagic F2A | |
| Minisforum MS-01 | |
| Moyenne de la classe Mini PC | |
| Minisforum Venus Series NAB9 | |
| Maxtang MTN-FP750 | |
| Minisforum Venus Series NPB5 | |
| Geekom XT12 Pro | |
| AIDA64 / FP32 Ray-Trace | |
| Geekom A7 | |
| Acemagic F2A | |
| Moyenne de la classe Mini PC (764 - 51004, n=114, 2 dernières années) | |
| Minisforum MS-01 | |
| Maxtang MTN-FP750 | |
| Minisforum Venus Series NAB9 | |
| Minisforum Venus Series NPB5 | |
| Geekom XT12 Pro | |
| AIDA64 / FPU Julia | |
| Geekom A7 | |
| Acemagic F2A | |
| Maxtang MTN-FP750 | |
| Minisforum MS-01 | |
| Moyenne de la classe Mini PC (4140 - 214250, n=114, 2 dernières années) | |
| Minisforum Venus Series NAB9 | |
| Minisforum Venus Series NPB5 | |
| Geekom XT12 Pro | |
| AIDA64 / CPU SHA3 | |
| Geekom A7 | |
| Acemagic F2A | |
| Minisforum MS-01 | |
| Moyenne de la classe Mini PC (290 - 9399, n=114, 2 dernières années) | |
| Minisforum Venus Series NAB9 | |
| Maxtang MTN-FP750 | |
| Minisforum Venus Series NPB5 | |
| Geekom XT12 Pro | |
| AIDA64 / CPU Queen | |
| Geekom A7 | |
| Minisforum Venus Series NAB9 | |
| Maxtang MTN-FP750 | |
| Acemagic F2A | |
| Minisforum MS-01 | |
| Minisforum Venus Series NPB5 | |
| Geekom XT12 Pro | |
| Moyenne de la classe Mini PC (8172 - 184747, n=114, 2 dernières années) | |
| AIDA64 / FPU SinJulia | |
| Geekom A7 | |
| Maxtang MTN-FP750 | |
| Acemagic F2A | |
| Moyenne de la classe Mini PC (408 - 29064, n=114, 2 dernières années) | |
| Minisforum MS-01 | |
| Minisforum Venus Series NAB9 | |
| Geekom XT12 Pro | |
| Minisforum Venus Series NPB5 | |
| AIDA64 / FPU Mandel | |
| Geekom A7 | |
| Acemagic F2A | |
| Maxtang MTN-FP750 | |
| Moyenne de la classe Mini PC (2088 - 113499, n=114, 2 dernières années) | |
| Minisforum MS-01 | |
| Minisforum Venus Series NAB9 | |
| Minisforum Venus Series NPB5 | |
| Geekom XT12 Pro | |
| AIDA64 / CPU AES | |
| Geekom A7 | |
| Acemagic F2A | |
| Minisforum MS-01 | |
| Minisforum Venus Series NAB9 | |
| Minisforum Venus Series NPB5 | |
| Geekom XT12 Pro | |
| Moyenne de la classe Mini PC (3691 - 325960, n=114, 2 dernières années) | |
| Maxtang MTN-FP750 | |
| AIDA64 / CPU ZLib | |
| Acemagic F2A | |
| Geekom A7 | |
| Minisforum MS-01 | |
| Minisforum Venus Series NAB9 | |
| Moyenne de la classe Mini PC (76.7 - 2039, n=114, 2 dernières années) | |
| Minisforum Venus Series NPB5 | |
| Geekom XT12 Pro | |
| Maxtang MTN-FP750 | |
| AIDA64 / FP64 Ray-Trace | |
| Geekom A7 | |
| Acemagic F2A | |
| Moyenne de la classe Mini PC (432 - 26952, n=114, 2 dernières années) | |
| Minisforum MS-01 | |
| Maxtang MTN-FP750 | |
| Minisforum Venus Series NAB9 | |
| Minisforum Venus Series NPB5 | |
| Geekom XT12 Pro | |
| AIDA64 / CPU PhotoWorxx | |
| Minisforum MS-01 | |
| Geekom A7 | |
| Minisforum Venus Series NPB5 | |
| Acemagic F2A | |
| Moyenne de la classe Mini PC (5296 - 51727, n=114, 2 dernières années) | |
| Minisforum Venus Series NAB9 | |
| Geekom XT12 Pro | |
| Maxtang MTN-FP750 | |
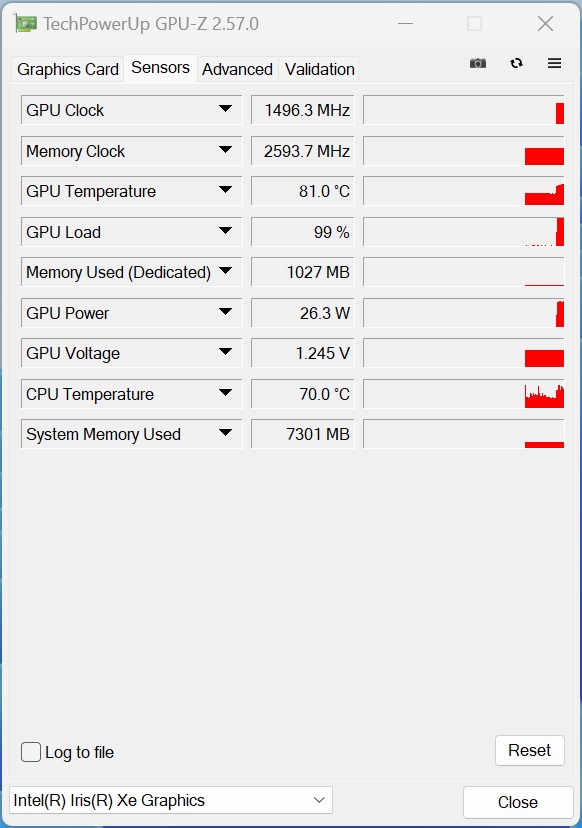
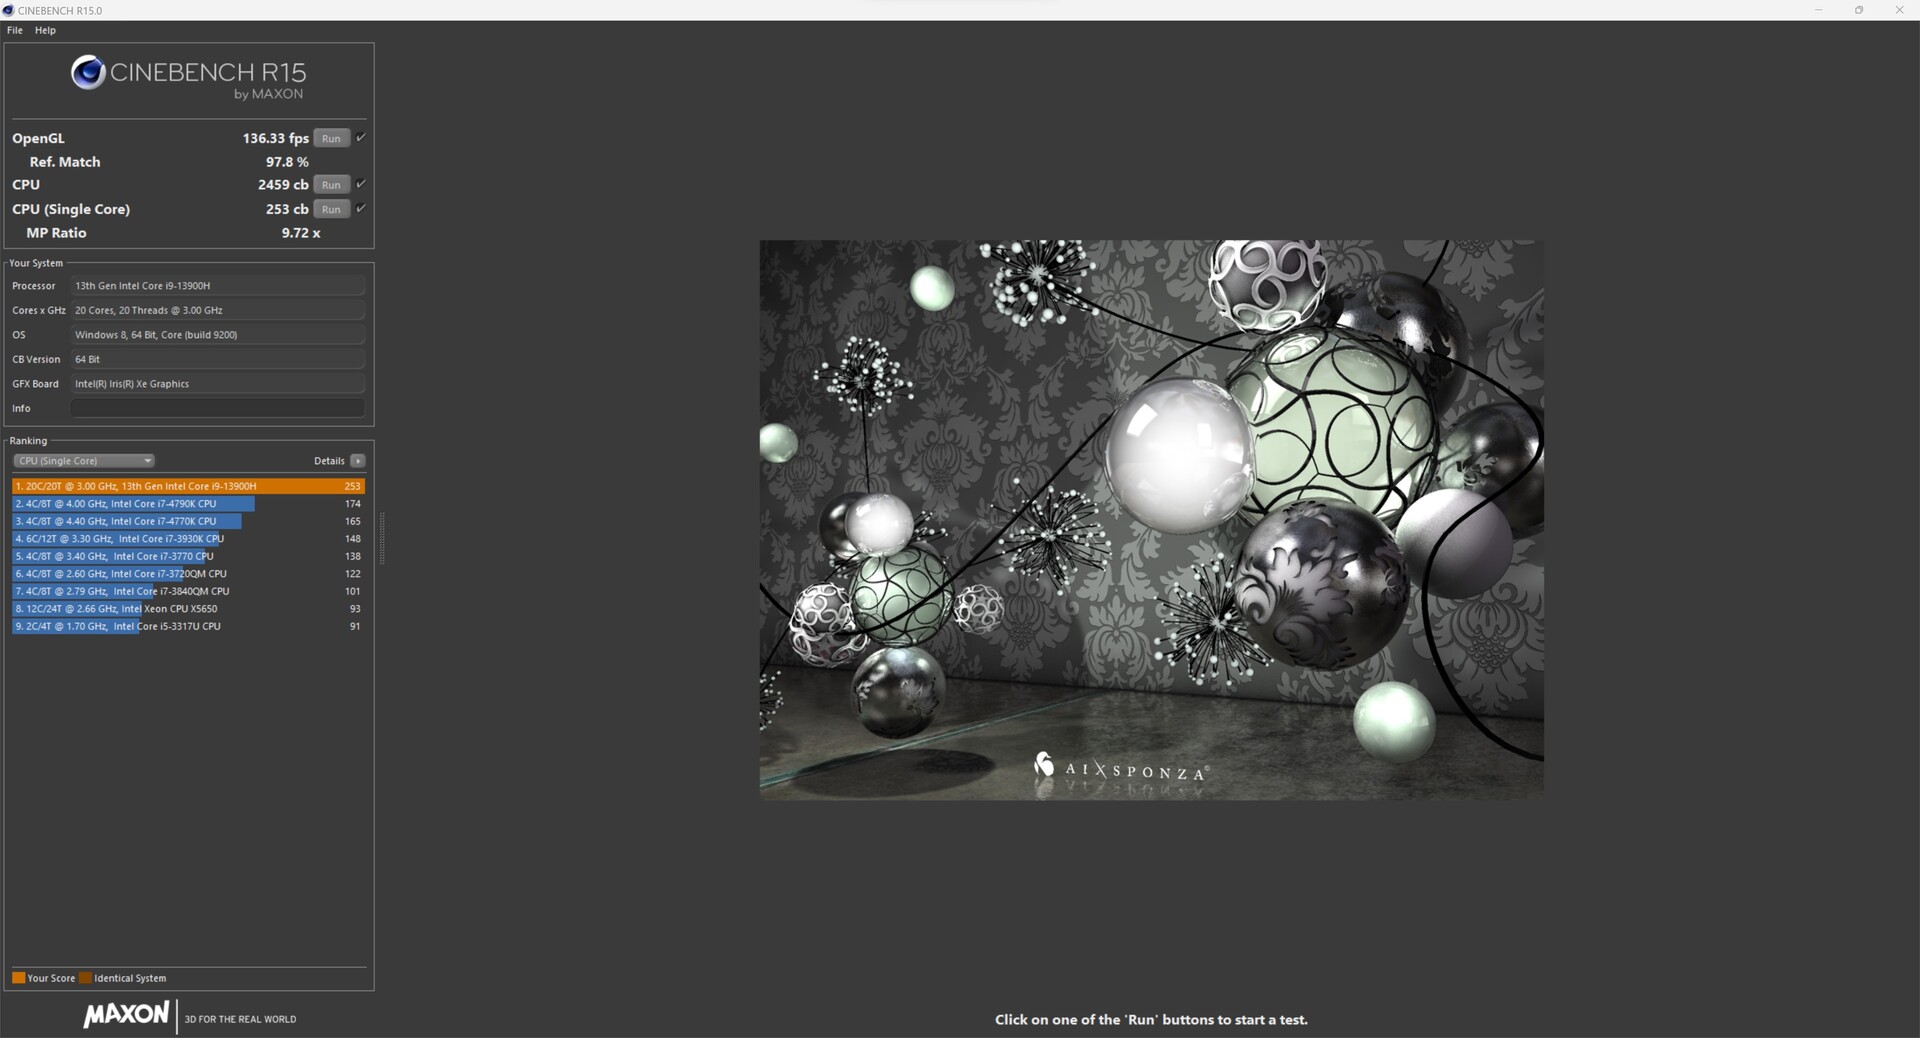
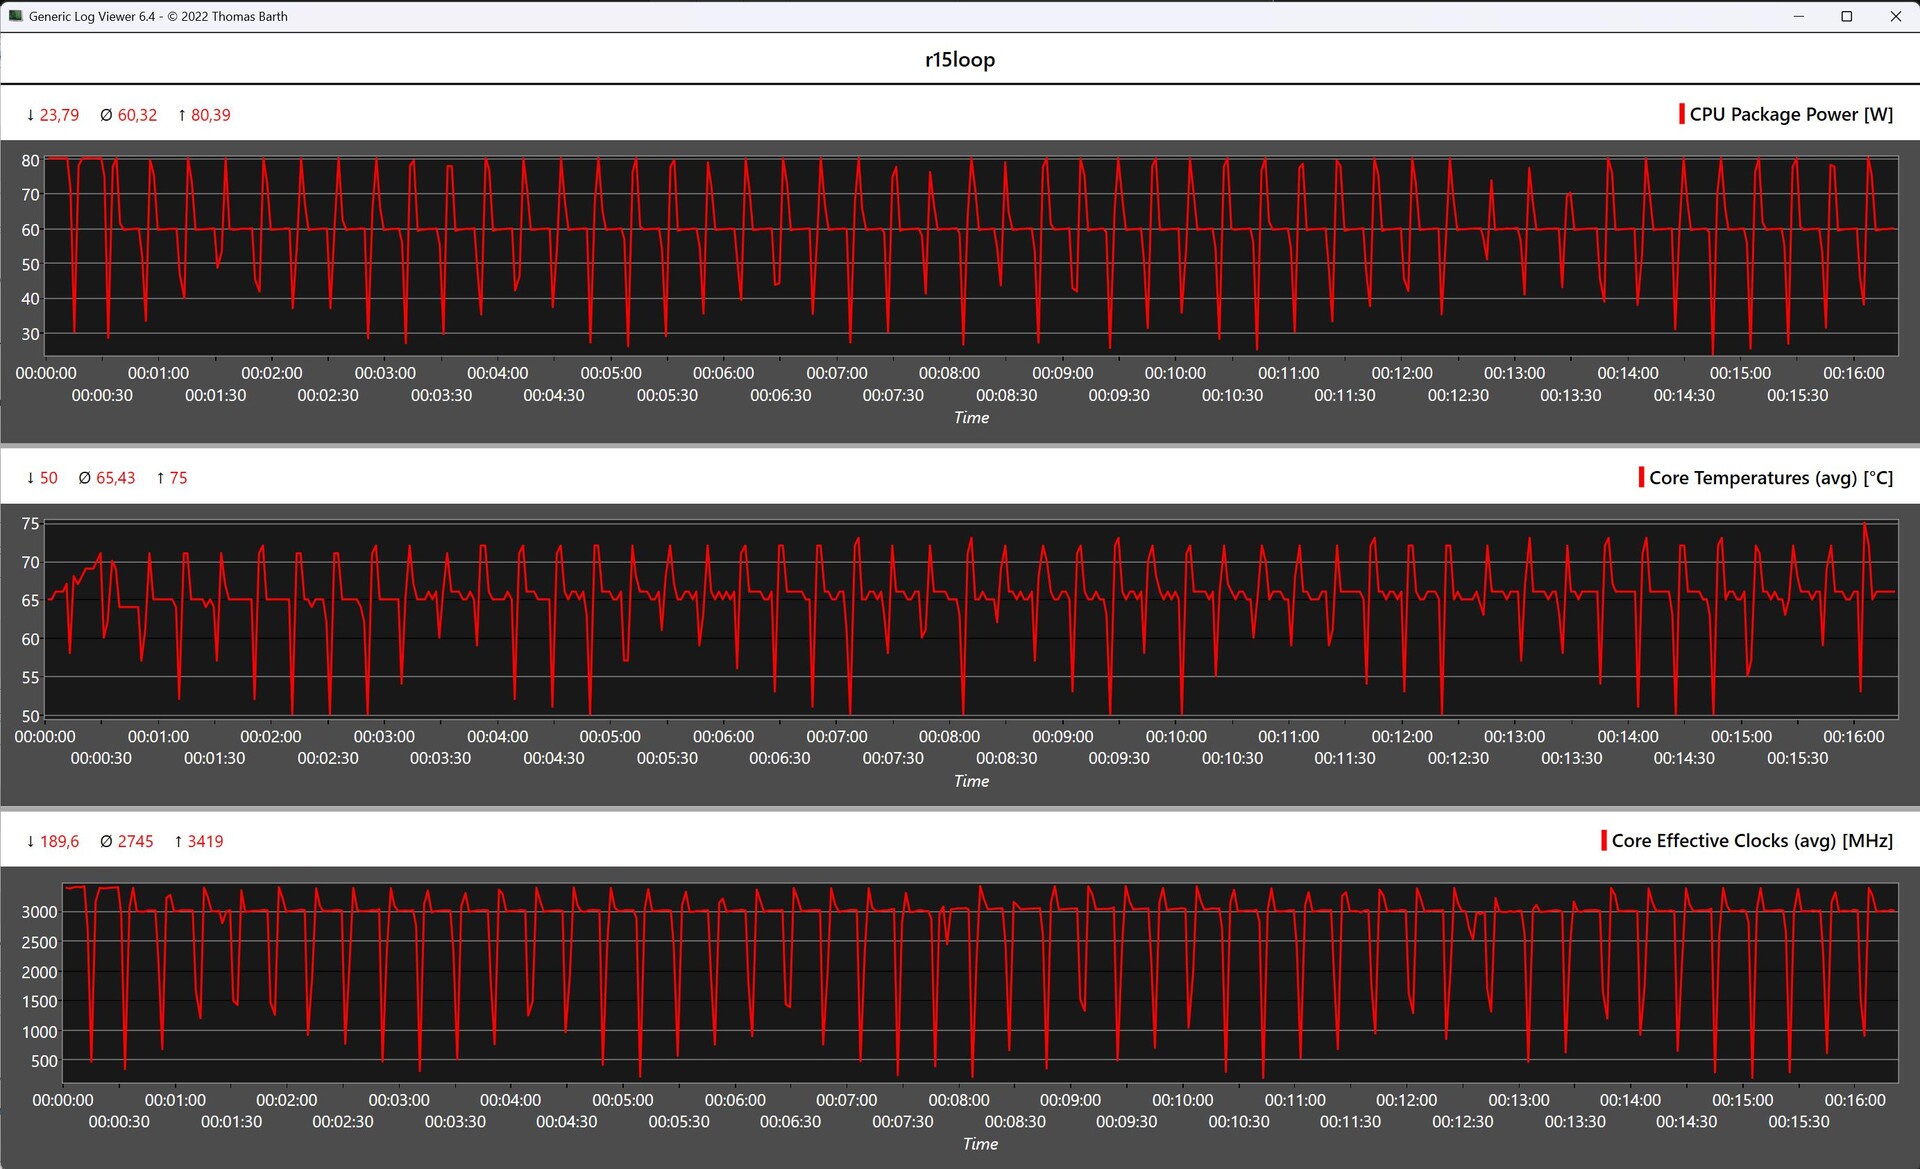
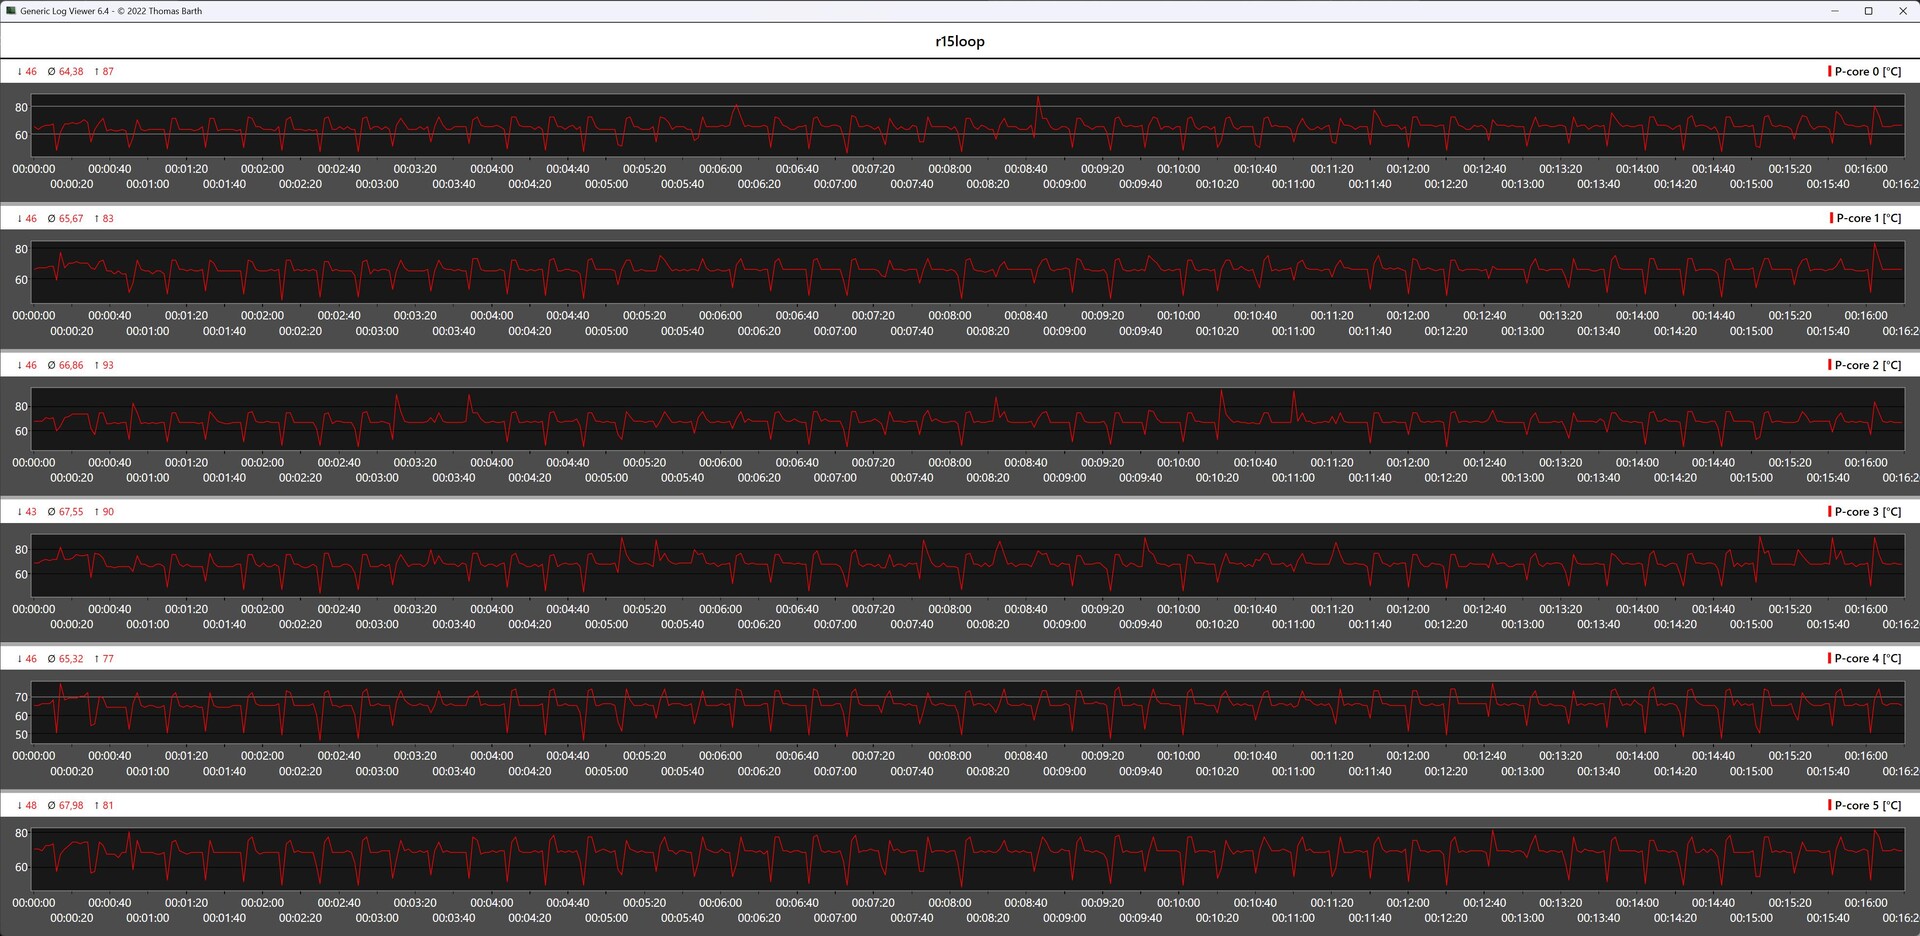
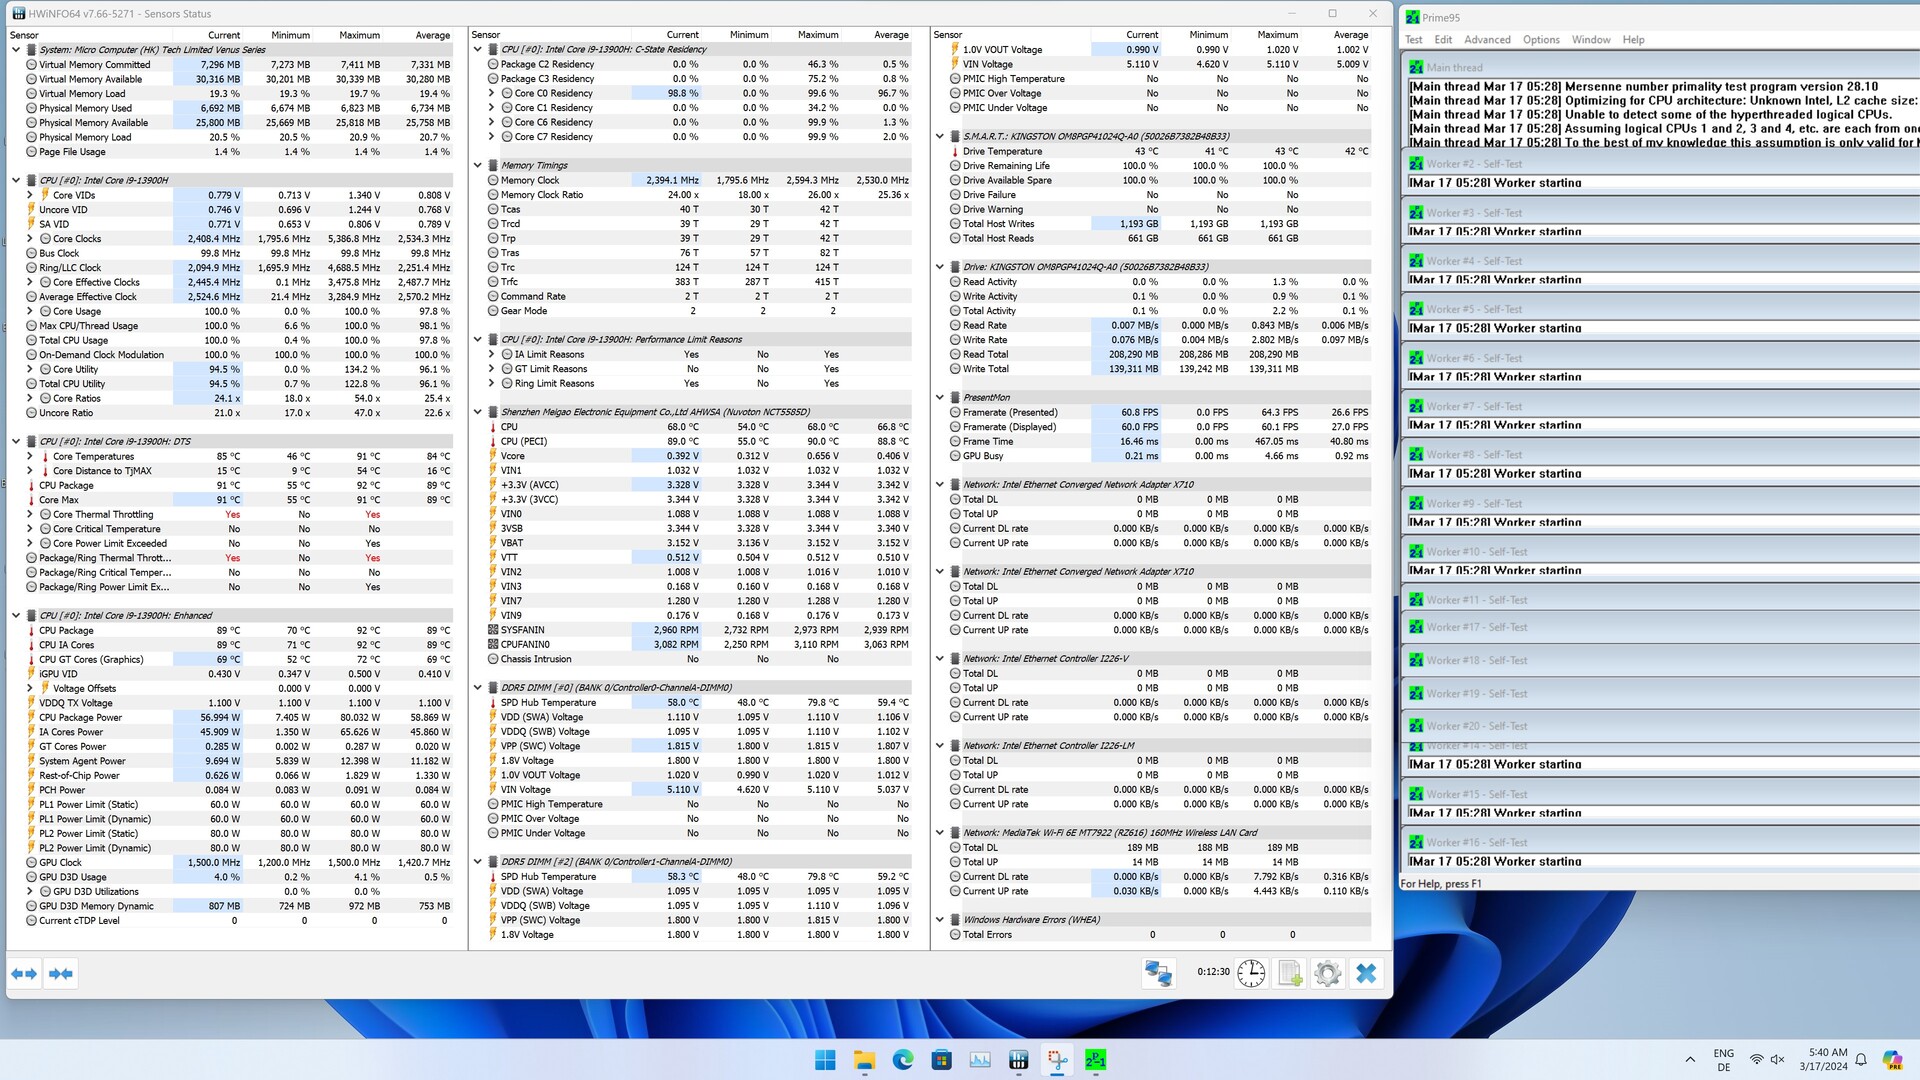
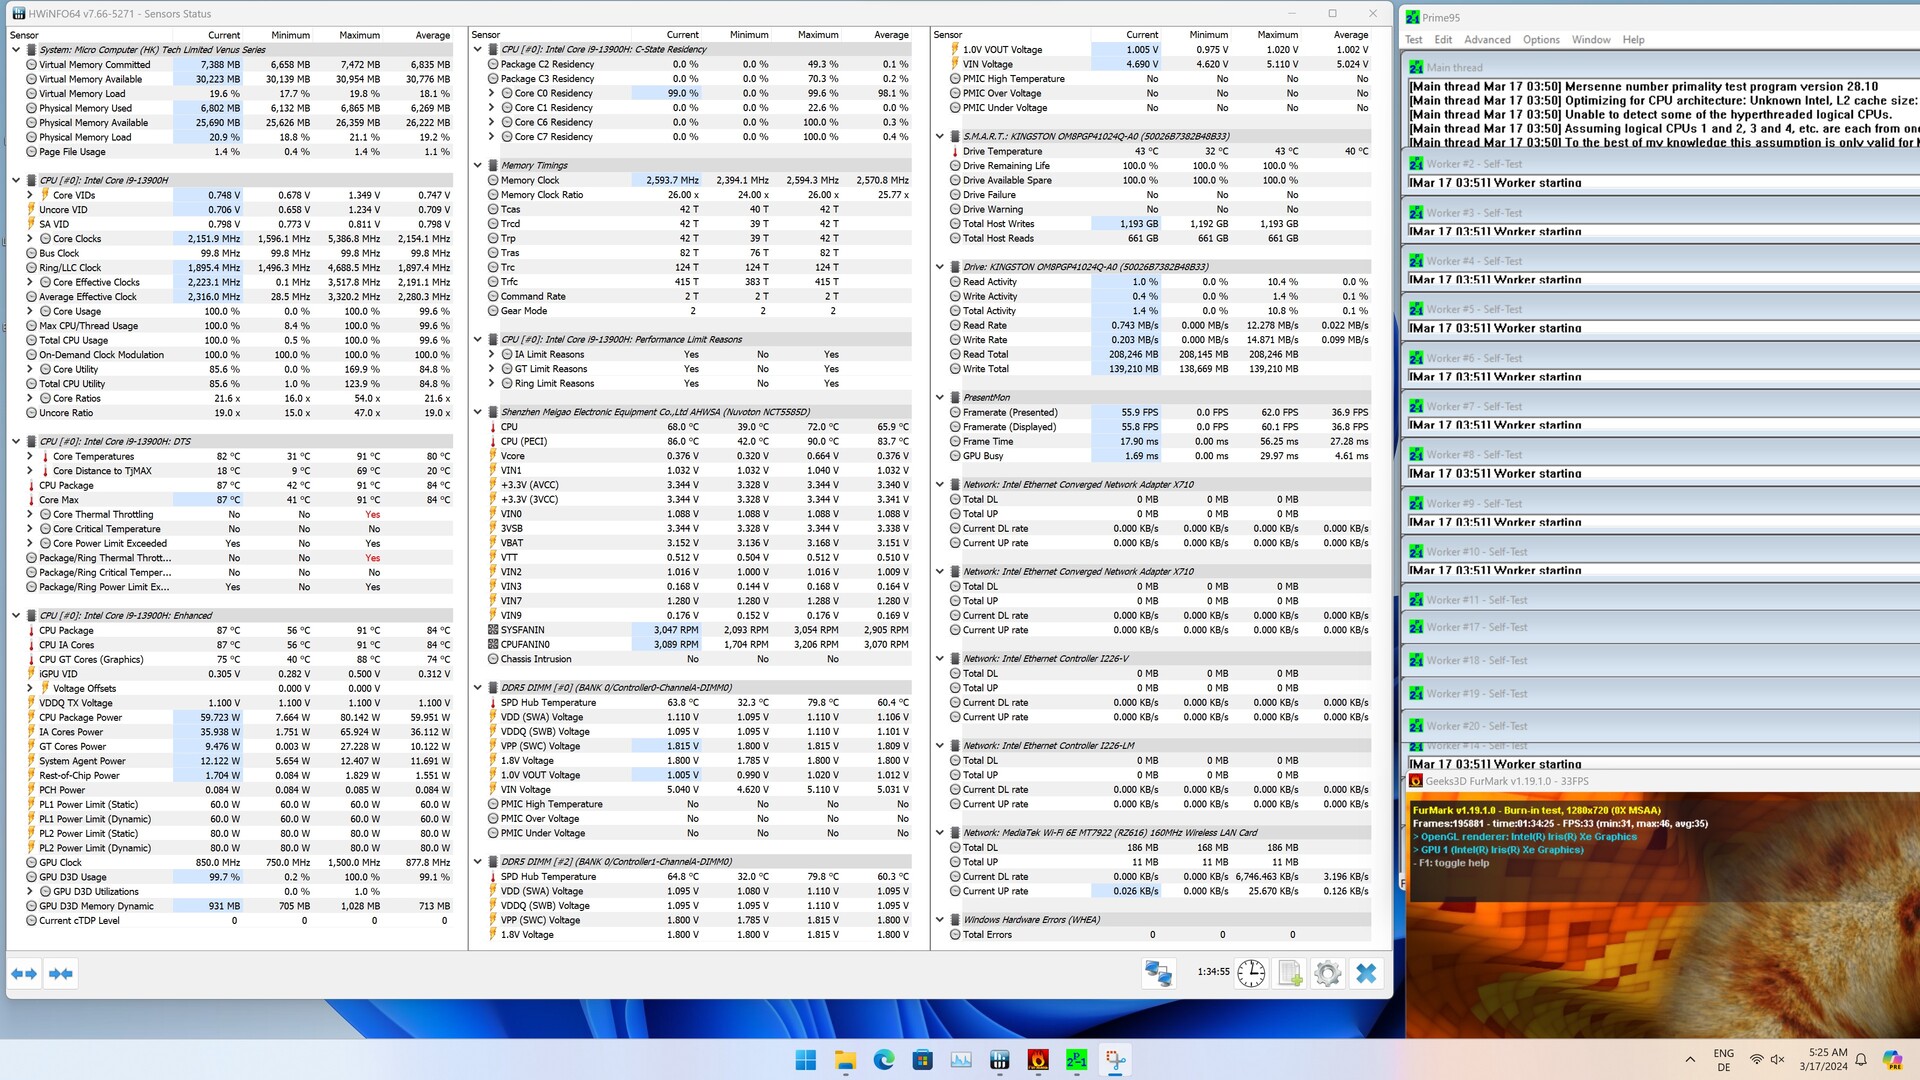
Minisforum MS-01 sur la boucle multiple Cinebench R15
Notre système de test n'a exécuté la boucle continue de Cinebench R15 qu'à la vitesse maximale du ventilateur du processeur. Cependant, une perte de performance ne peut être évitée, comme le montrent les résultats individuels. Au final, le Minisforum MS-01 se classe à peu près au même niveau que le Geekom A7.
Les données télémétriques enregistrées montrent que deux cœurs P deviennent significativement plus chauds et dépassent les 90 °C. Malgré la vitesse maximale du ventilateur, le SoC ne peut pas fonctionner à des températures plus basses, même si les processeurs mobiles peuvent généralement supporter des températures élevées. Néanmoins, nous pouvons également constater que les limites de puissance de 80 et 60 watts respectivement sont atteintes et respectées.
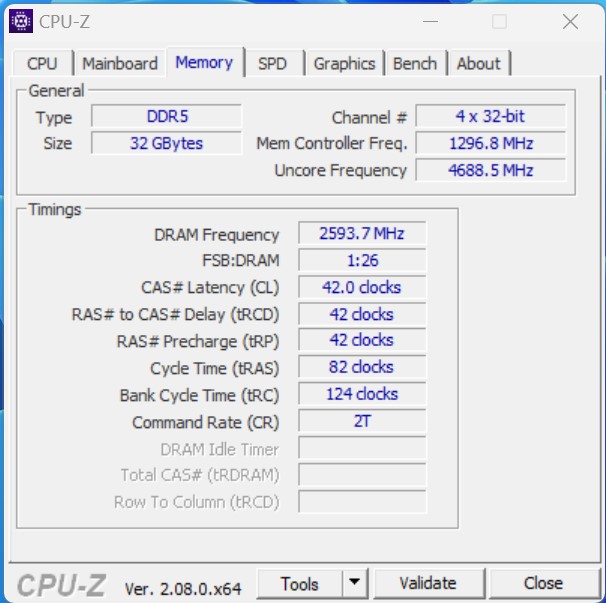
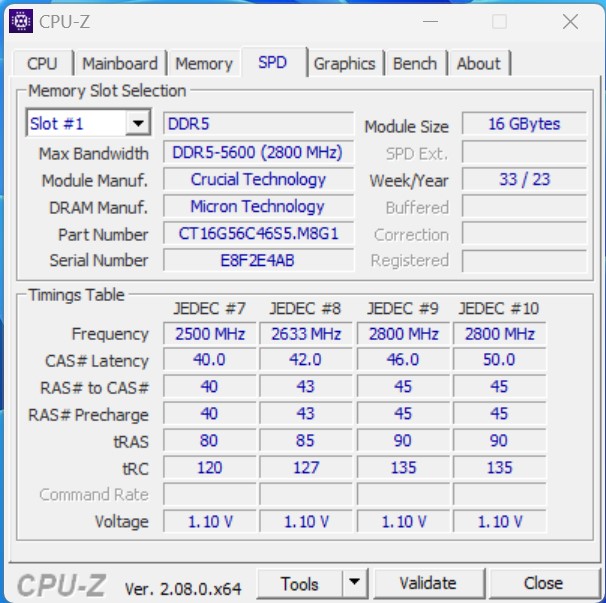
Performance du système
Les performances globales du système sont bonnes. La combinaison de l'Intel Core i9-13900H et de la mémoire vive DDR5 est particulièrement utile et permet au Minisforum MS-01 d'utiliser les performances du processeur sans autres restrictions. Cela se traduit également par d'excellents résultats dans les benchmarks AIDA64 en termes de performance de la RAM.
| AIDA64 / Memory Copy | |
| Minisforum MS-01 | |
| Geekom A7 | |
| Acemagic F2A | |
| Minisforum Venus Series NPB5 | |
| Moyenne de la classe Mini PC (8377 - 89287, n=114, 2 dernières années) | |
| Geekom XT12 Pro | |
| Minisforum Venus Series NAB9 | |
| Maxtang MTN-FP750 | |
| AIDA64 / Memory Read | |
| Minisforum MS-01 | |
| Minisforum Venus Series NPB5 | |
| Acemagic F2A | |
| Geekom A7 | |
| Moyenne de la classe Mini PC (8974 - 100086, n=114, 2 dernières années) | |
| Geekom XT12 Pro | |
| Minisforum Venus Series NAB9 | |
| Maxtang MTN-FP750 | |
| AIDA64 / Memory Write | |
| Geekom A7 | |
| Minisforum MS-01 | |
| Acemagic F2A | |
| Minisforum Venus Series NPB5 | |
| Moyenne de la classe Mini PC (8762 - 100538, n=114, 2 dernières années) | |
| Geekom XT12 Pro | |
| Minisforum Venus Series NAB9 | |
| Maxtang MTN-FP750 | |
| AIDA64 / Memory Latency | |
| Acemagic F2A | |
| Minisforum Venus Series NPB5 | |
| Moyenne de la classe Mini PC (44.9 - 184.8, n=114, 2 dernières années) | |
| Minisforum MS-01 | |
| Geekom A7 | |
| Minisforum Venus Series NAB9 | |
| Maxtang MTN-FP750 | |
| Geekom XT12 Pro | |
* ... Moindre est la valeur, meilleures sont les performances
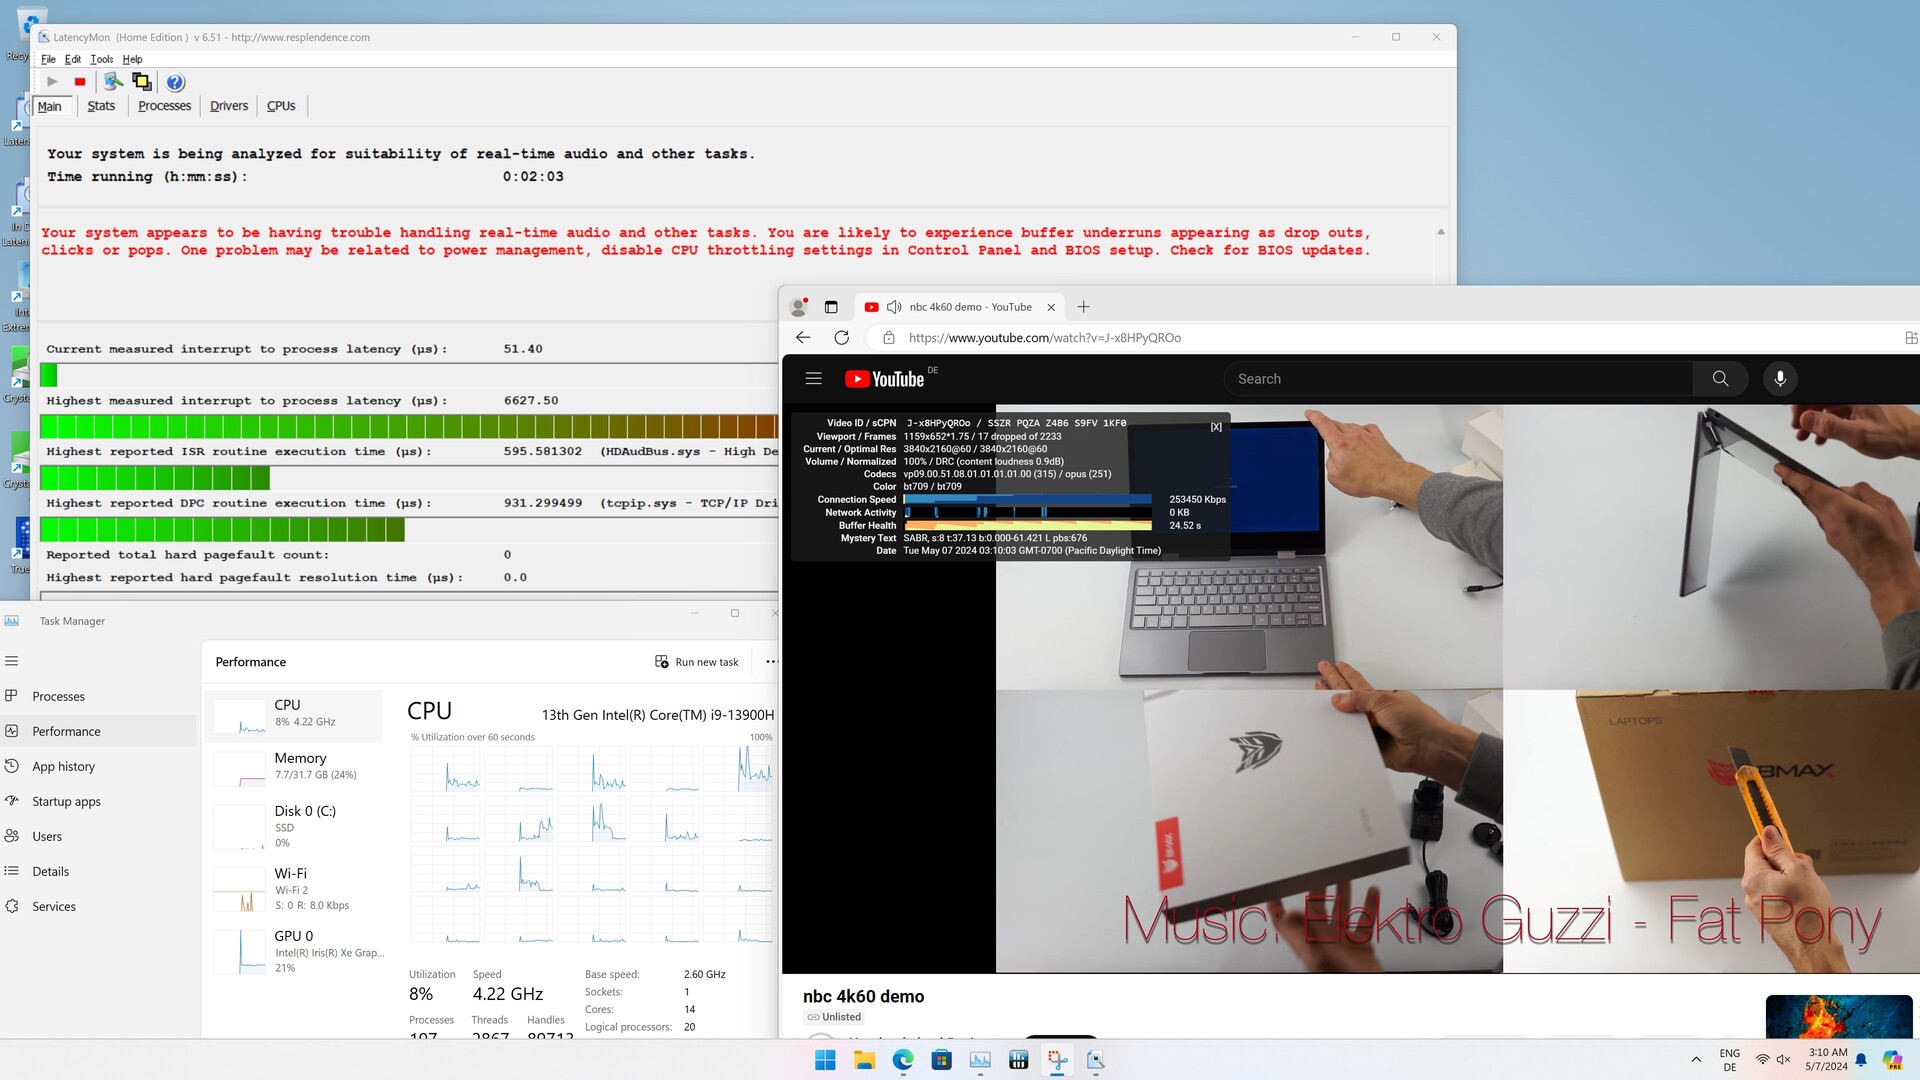
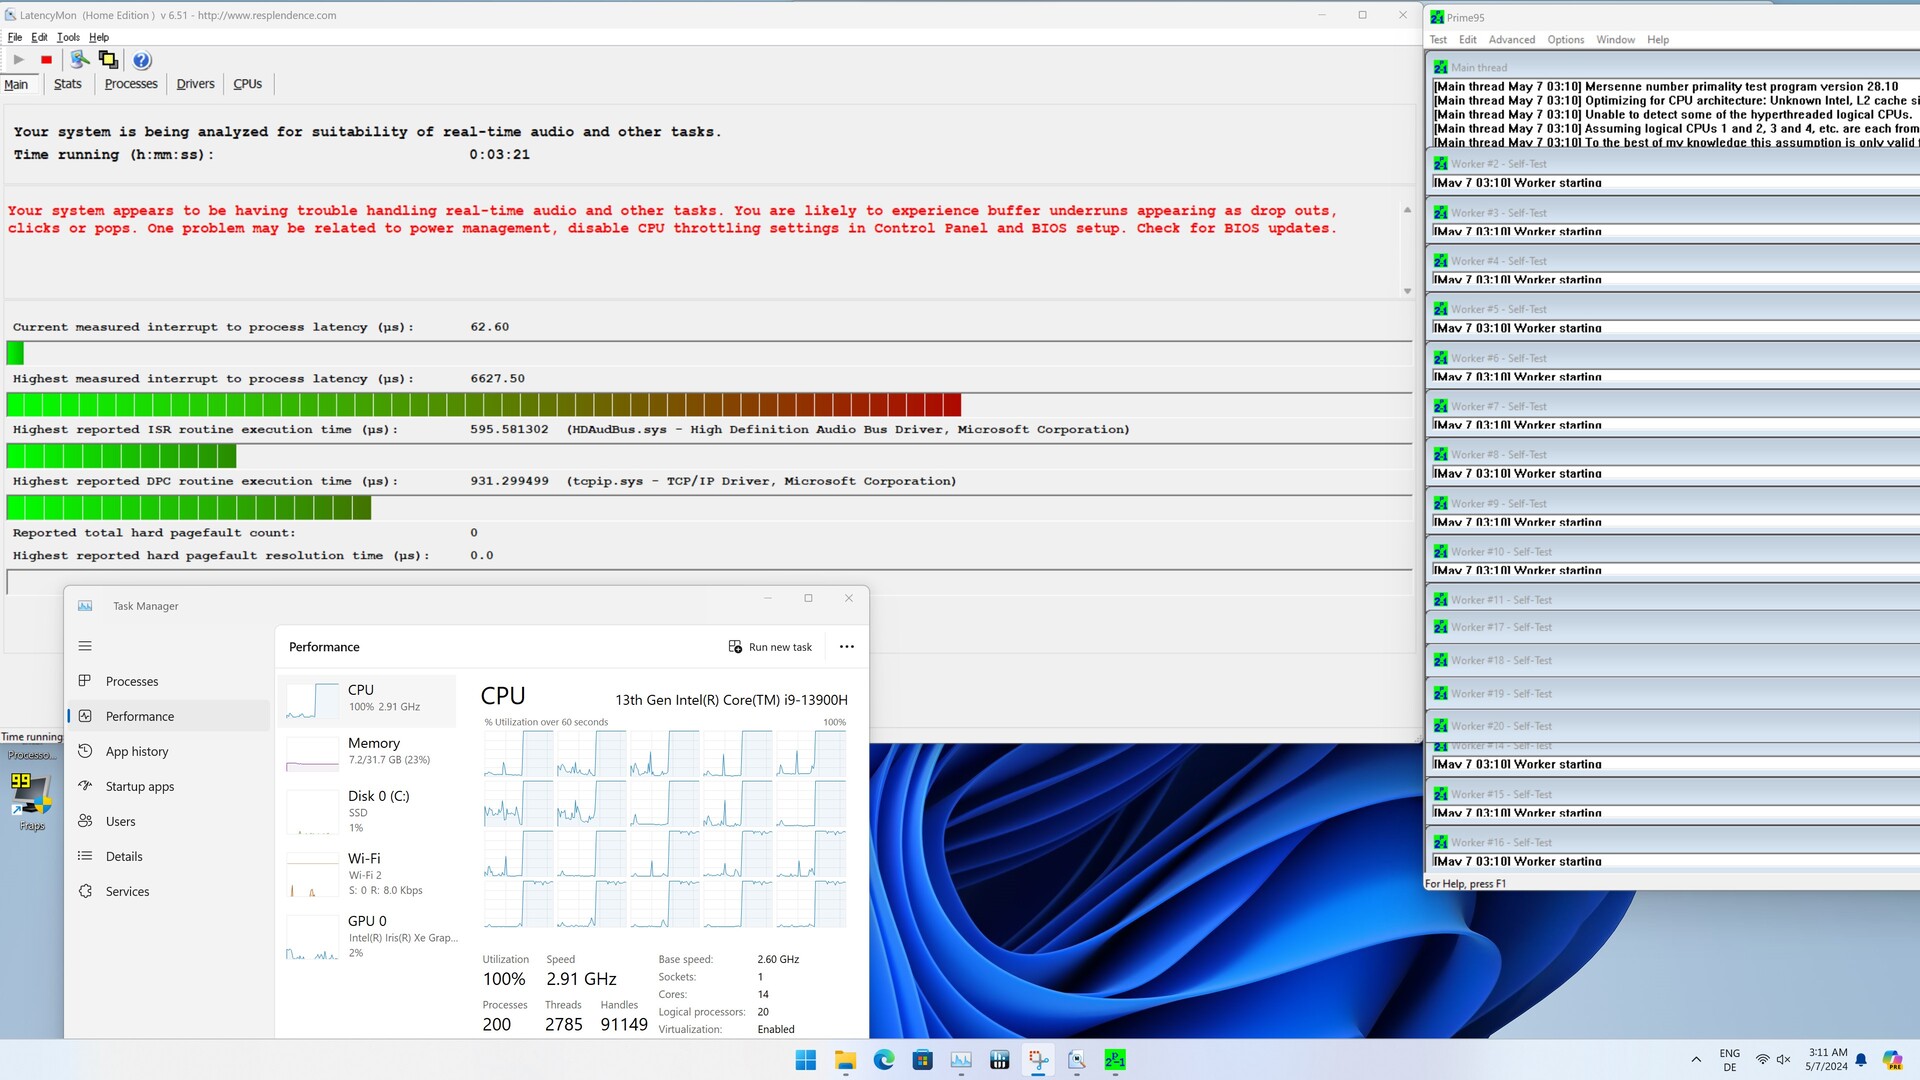
Latences DPC
Nous avons déjà constaté des latences accrues lors de l'ouverture de plusieurs onglets dans le navigateur Edge, qui augmentent encore légèrement lors de la lecture de la vidéo de test 4K. Un bref test de charge avec Prime95 n'entraîne pas d'augmentation supplémentaire. En comparaison, notre échantillon de test est toujours aussi performant et occupe la deuxième place.
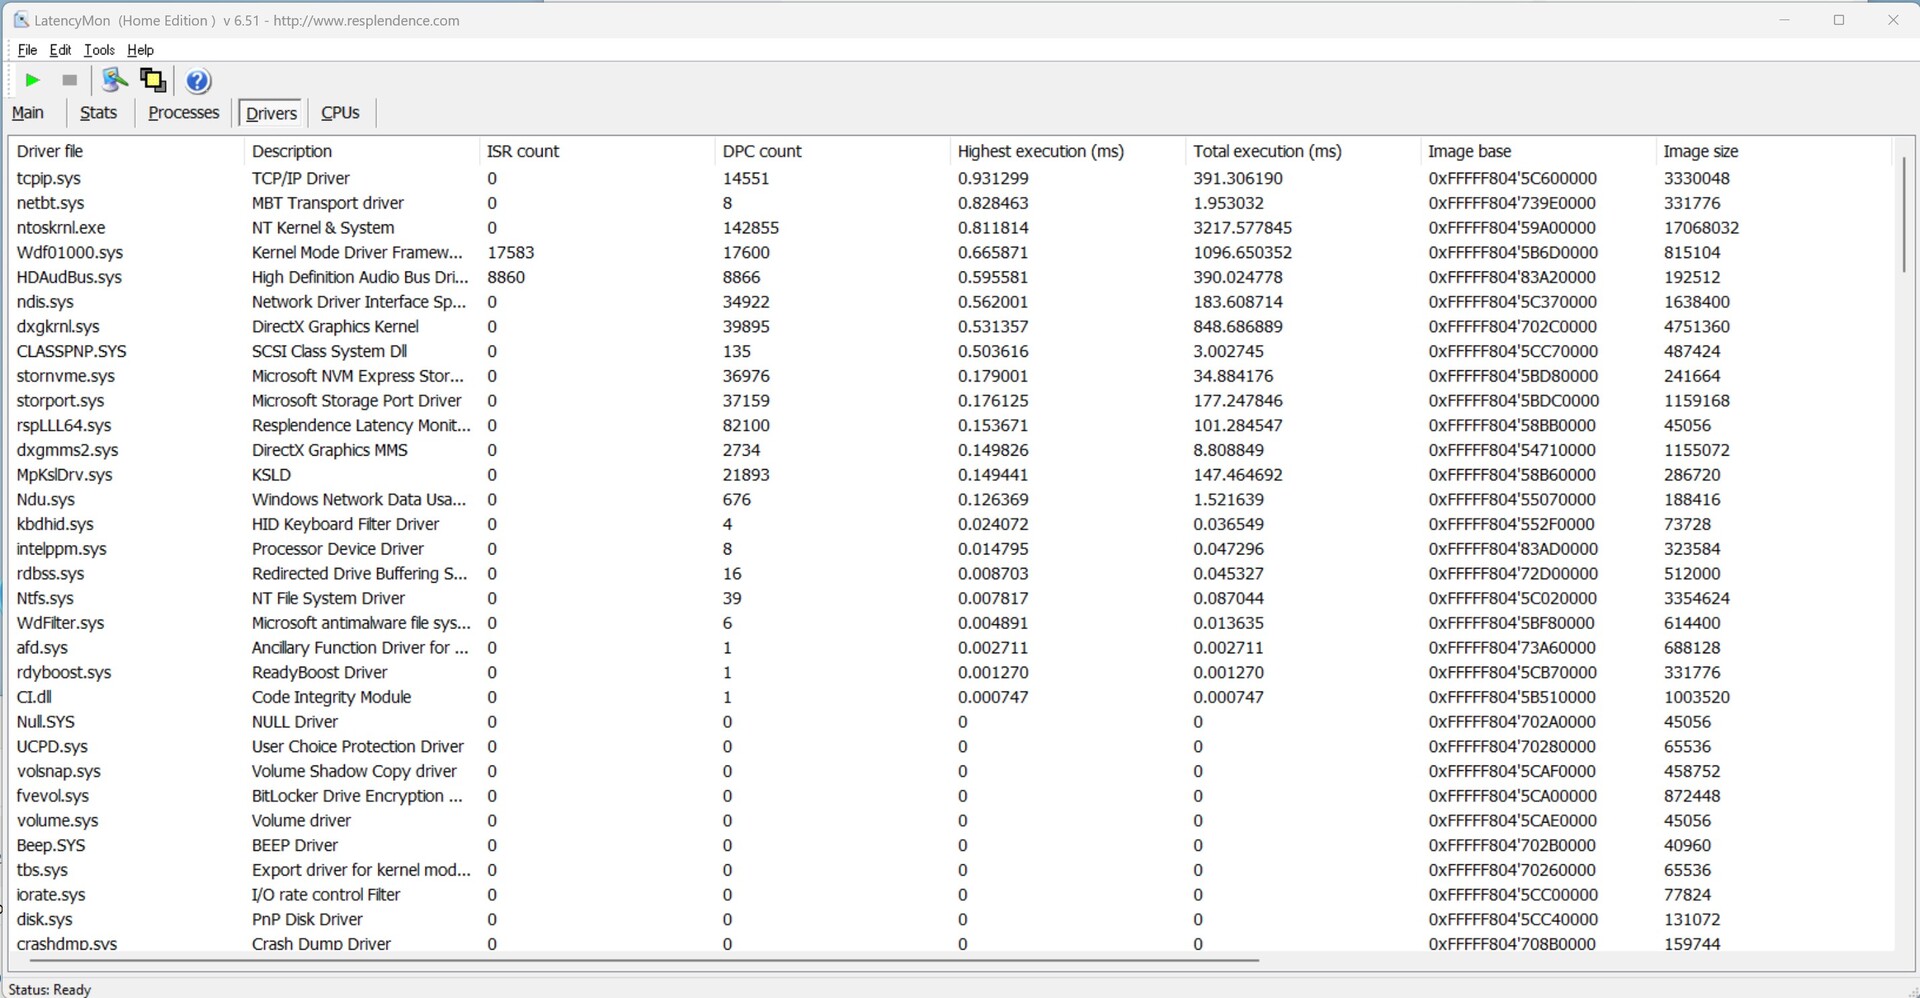
| DPC Latencies / LatencyMon - interrupt to process latency (max), Web, Youtube, Prime95 | |
| Acemagic F2A | |
| Geekom XT12 Pro | |
| Geekom A7 | |
| Maxtang MTN-FP750 | |
| Minisforum Venus Series NAB9 | |
| Minisforum MS-01 | |
| Minisforum Venus Series NPB5 | |
* ... Moindre est la valeur, meilleures sont les performances
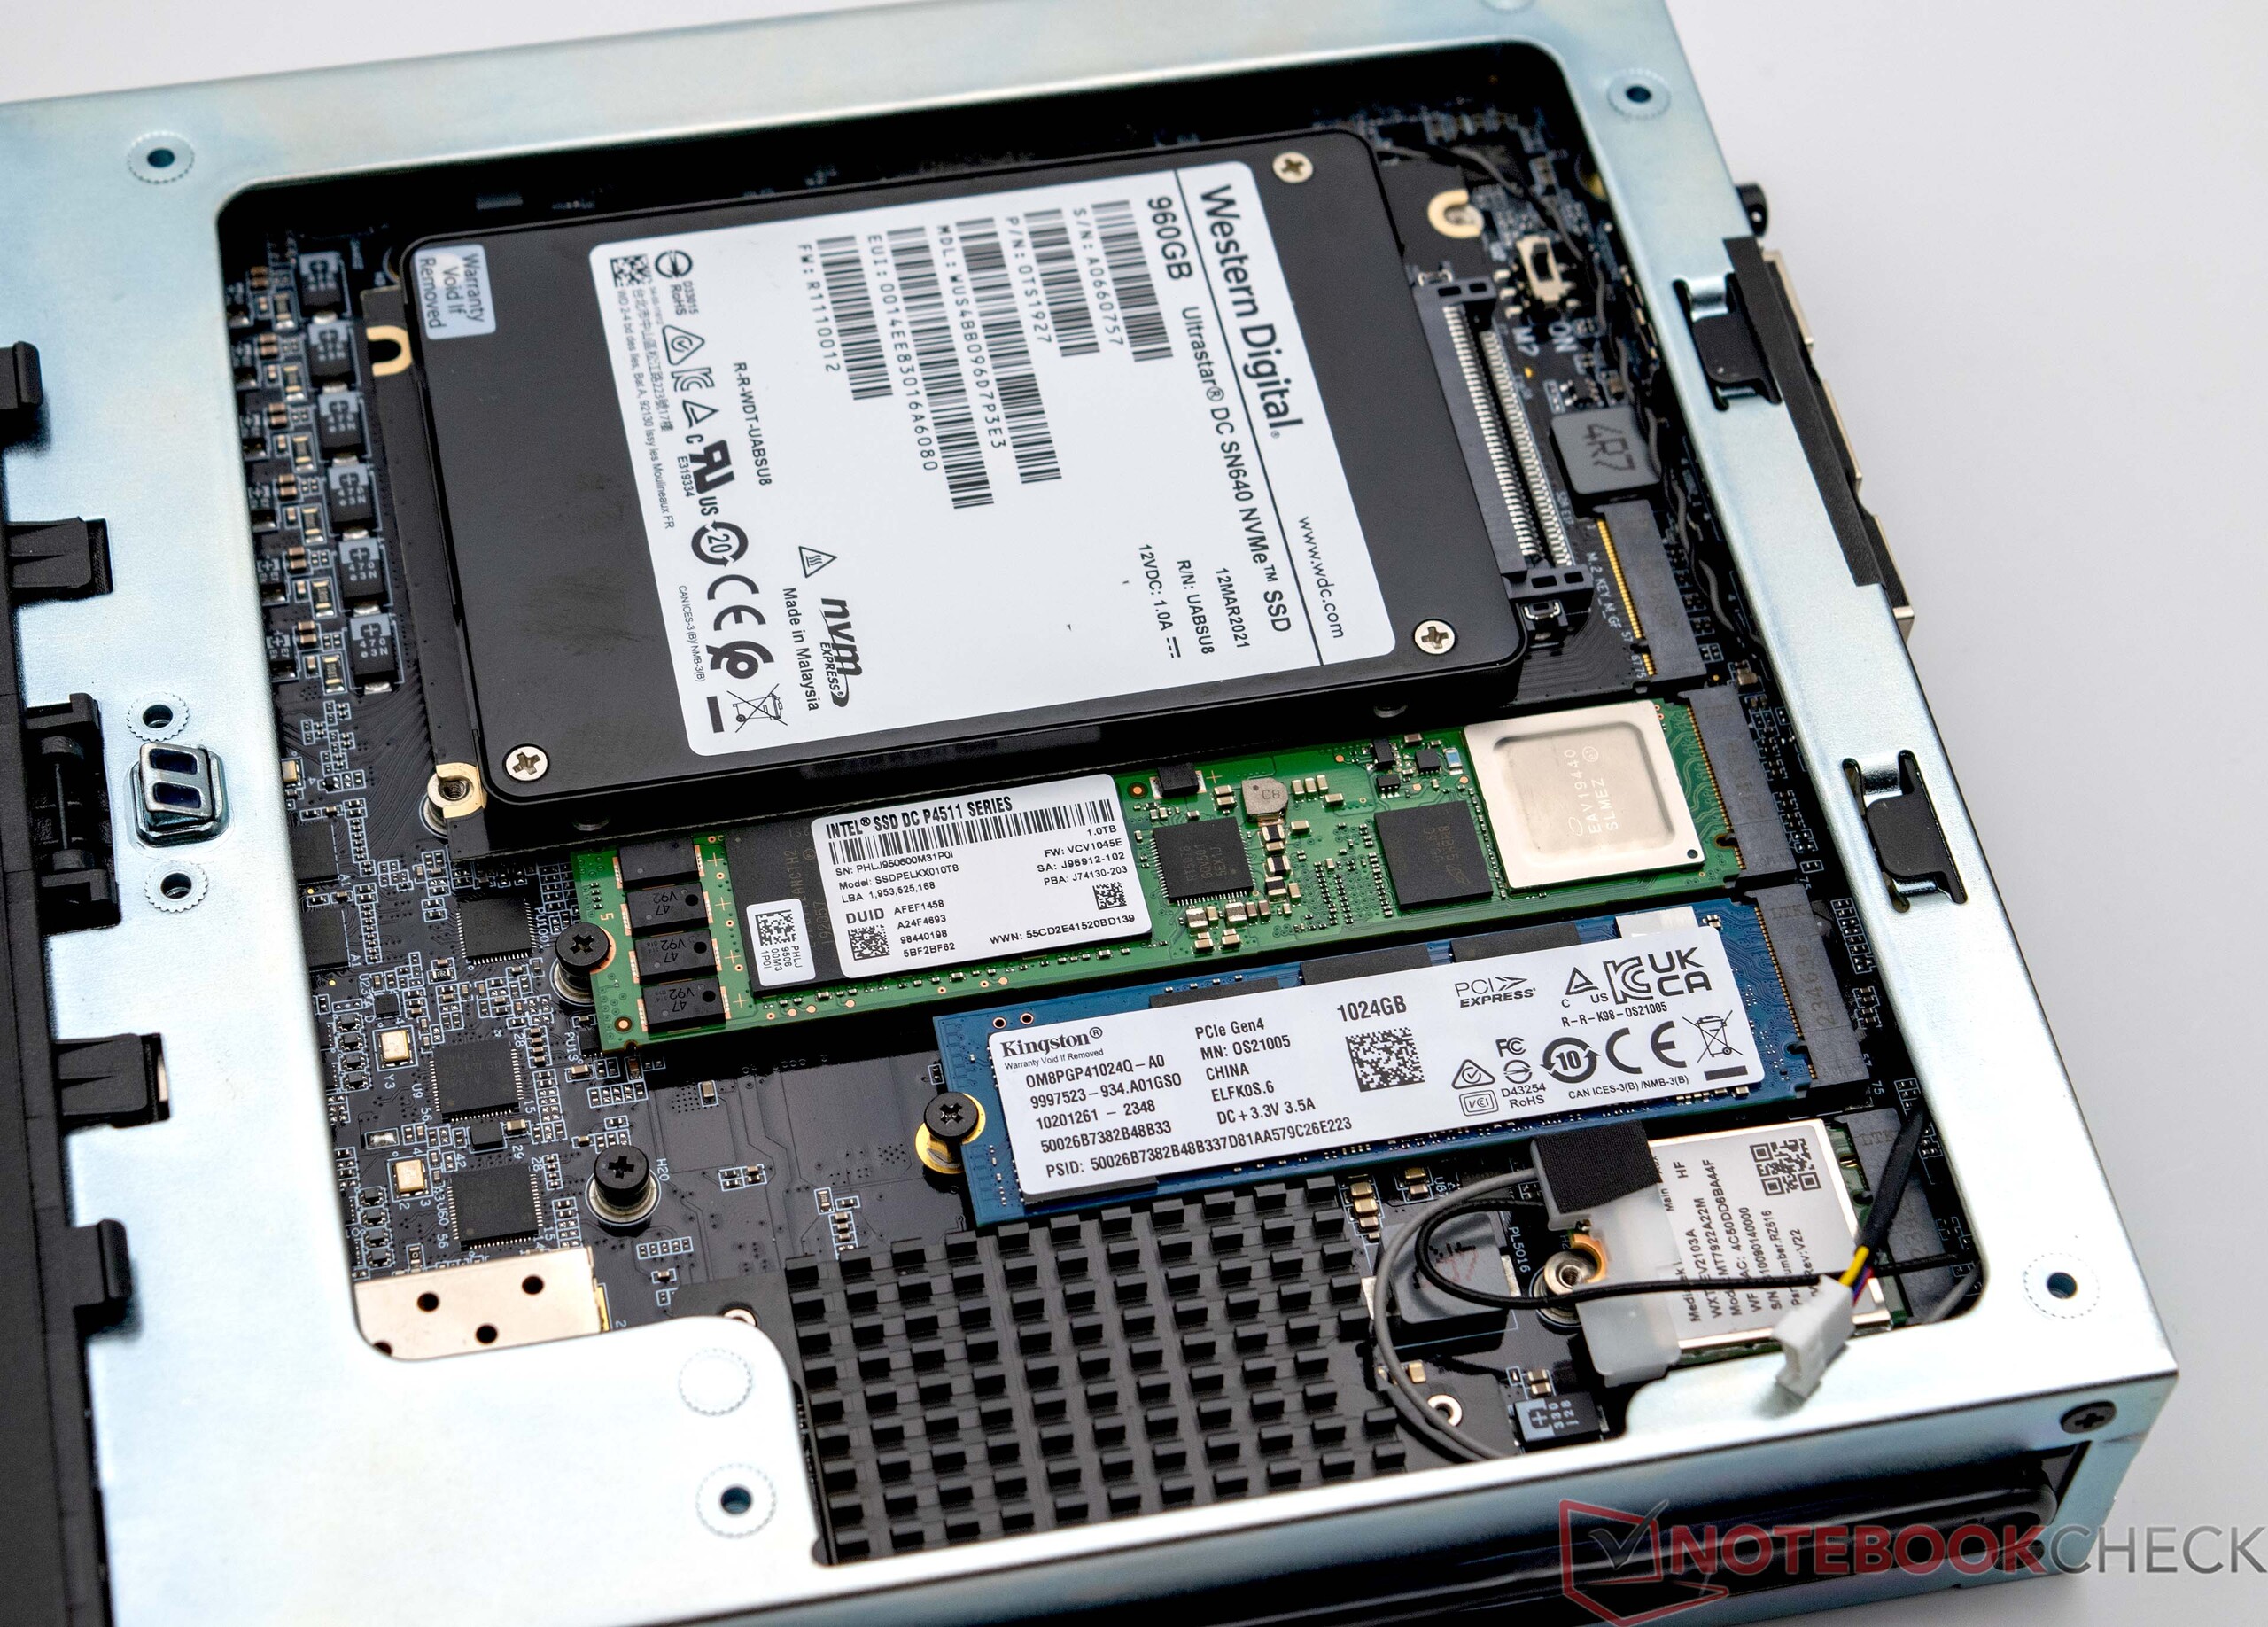
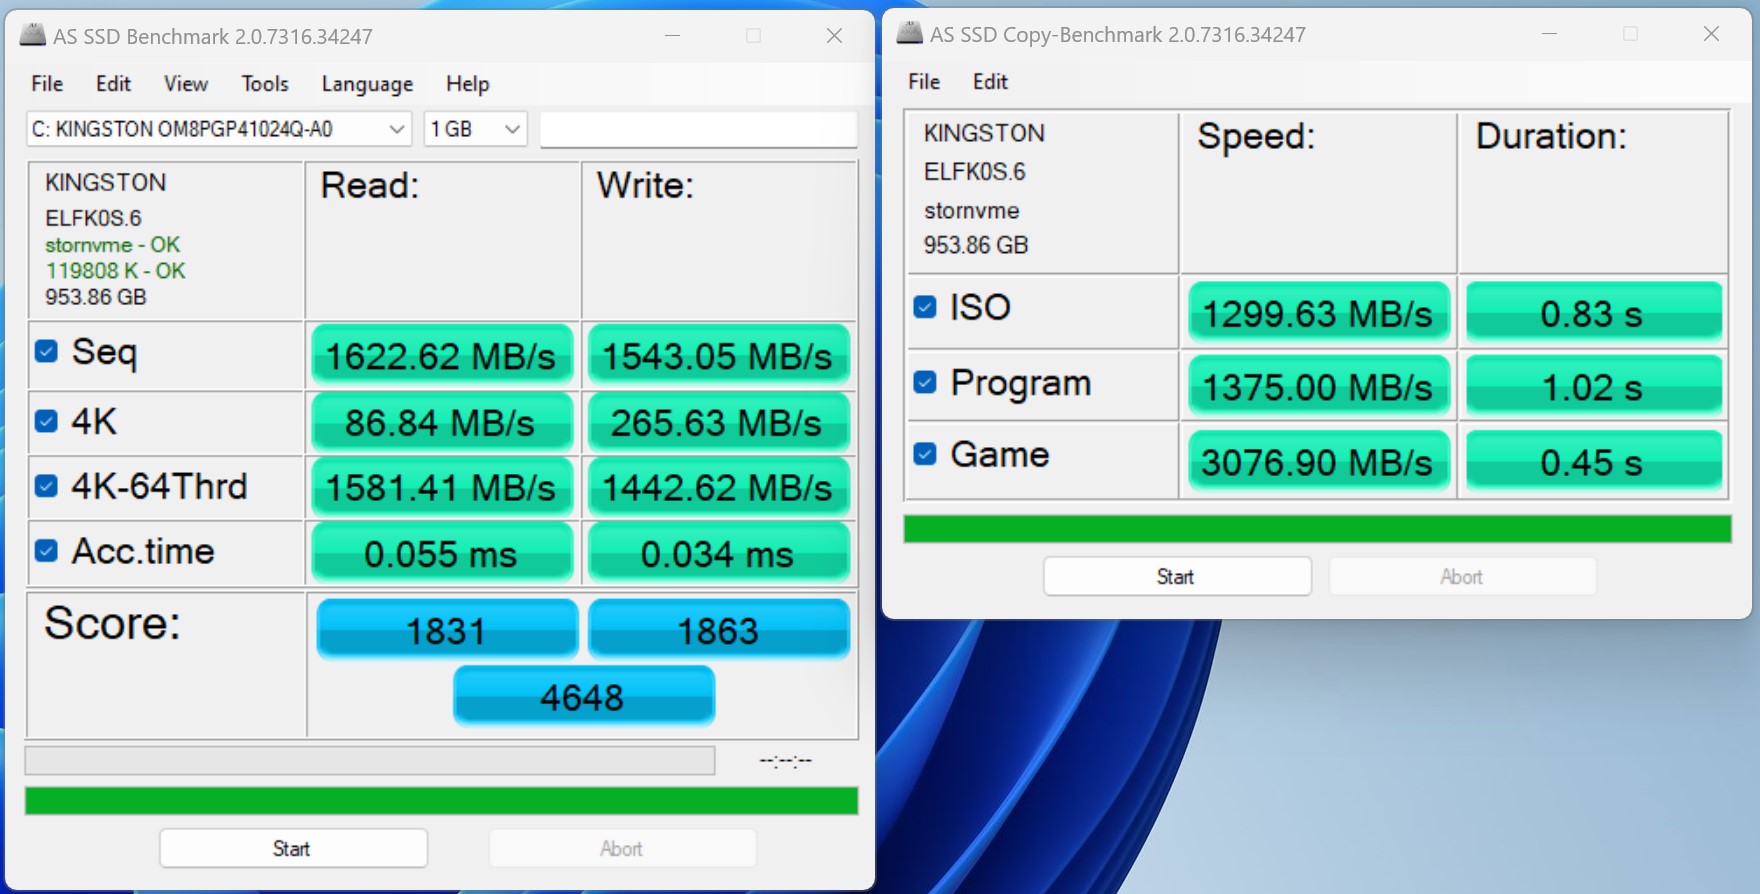
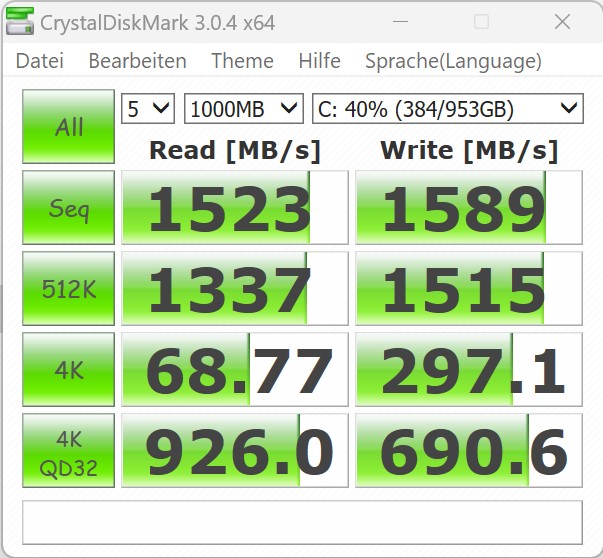
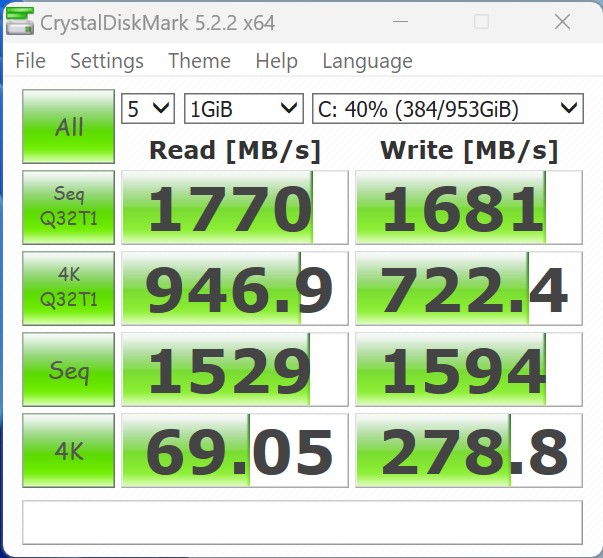
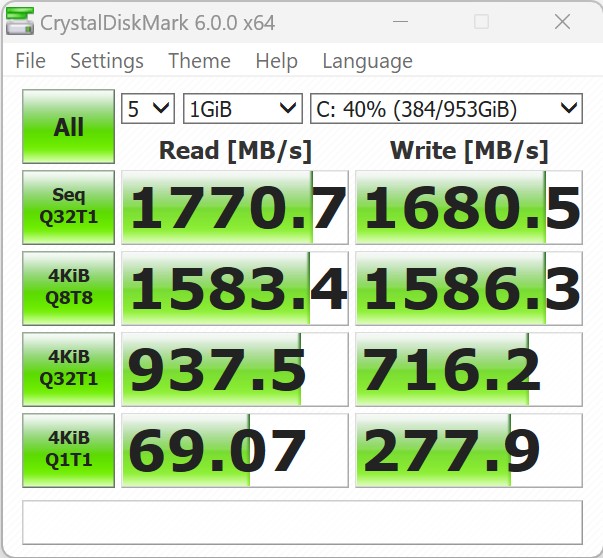
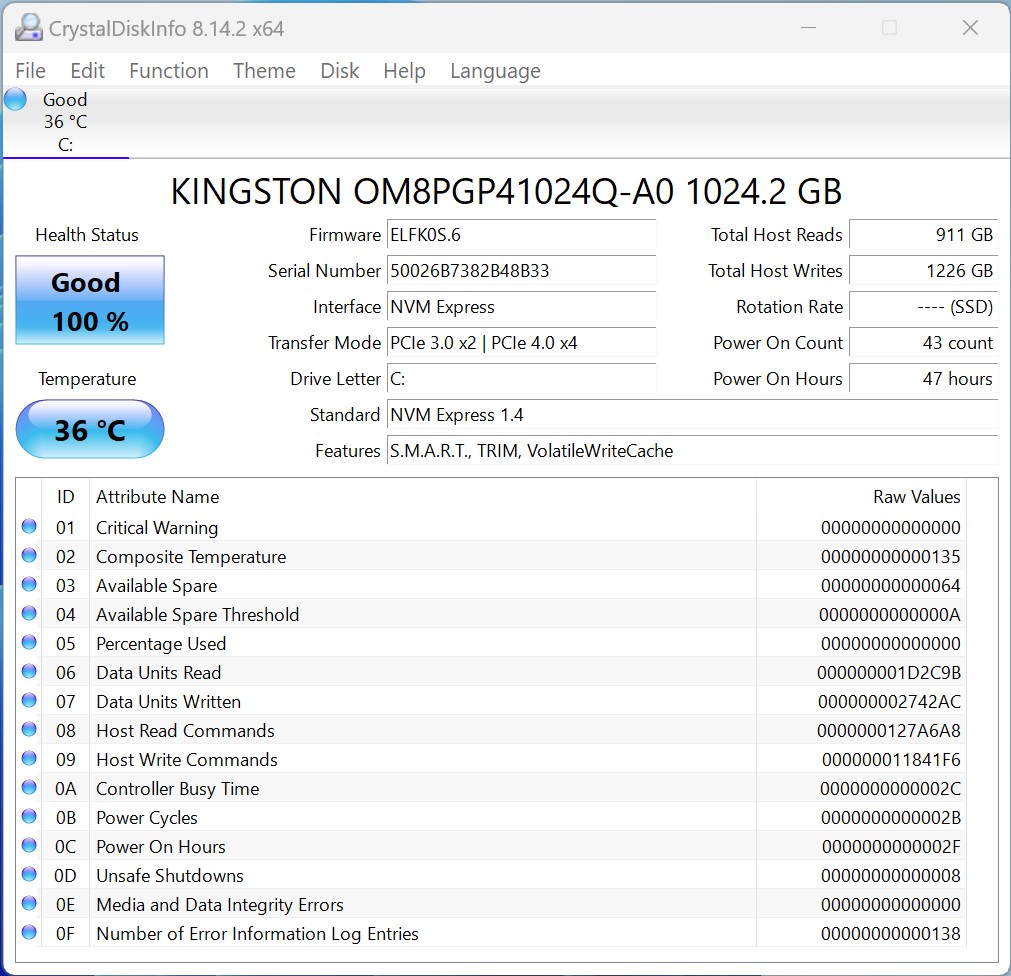
Mémoire de masse
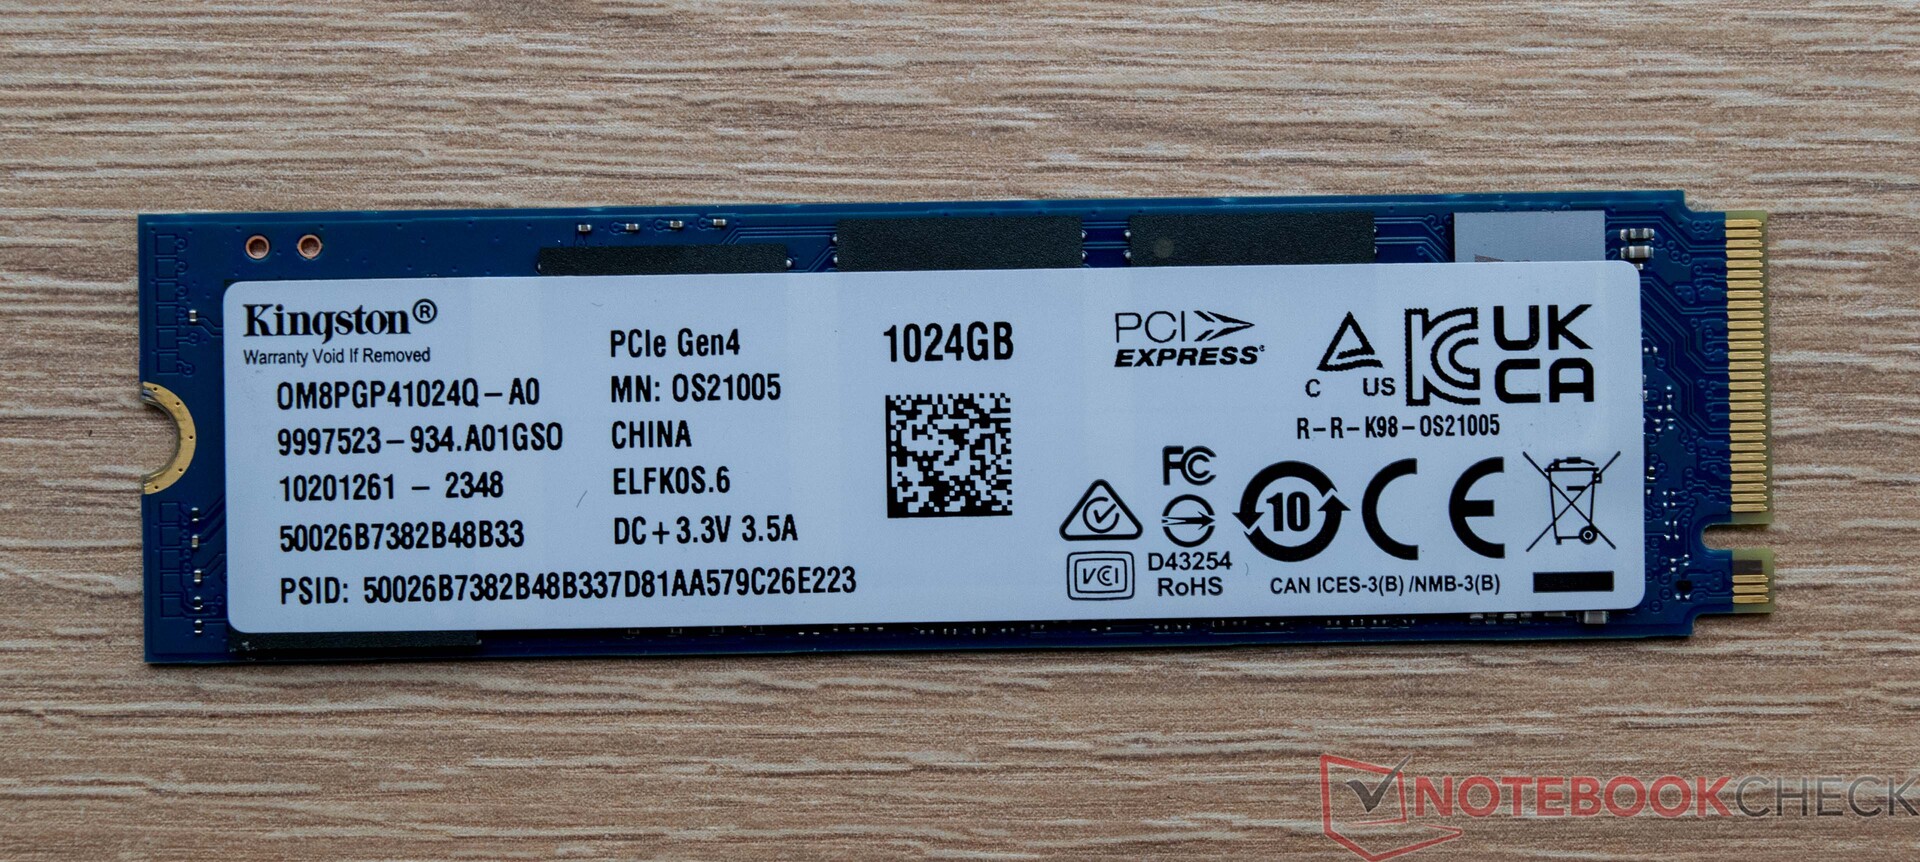
Il est possible d'installer différents disques SSD dans le Minisforum MS-01. Toutefois, il est important de savoir qu'il doit s'agir de SSD NVMe. Le MS-01 marque également des points en termes de facteur de forme, puisque des SSD de 110 millimètres peuvent également être installés en plus de la longueur standard de 80 millimètres. En revanche, il n'est pas possible d'installer, ou plus précisément de fixer, des disques SSD plus courts. Le système d'exploitation se trouve sur un SSD de 1 TB de Kingston. La connexion du SSD ne correspond pas à ce qui serait techniquement possible. Cela affecte les taux de transfert, mais ce n'est pas un problème dans l'utilisation quotidienne.
Les résultats de nos mesures en termes de performance de lecture continue montrent que l'unité de refroidissement intégrée ne peut pas garantir un refroidissement optimal. Il y a toujours des baisses de performances significatives, mais elles sont de courte durée. Si vous voulez pousser les choses à l'extrême et ne pas installer une carte graphique dédiée dans le système, le Minisforum MS-01 peut même être équipé d'un total de quatre périphériques de stockage de masse. Nous avons fait le test et installé un Intel SSD DC P4618 PCIe 3.1 x8 dans le système.
Pour d'autres comparaisons et benchmarks, veuillez vous référer à notre tableau comparatif Laptop SSD & HDD Benchmarks .


| Drive Performance Rating - Percent | |
| Minisforum Venus Series NAB9 | |
| Minisforum Venus Series NPB5 | |
| Minisforum MS-01 | |
| Geekom XT12 Pro | |
| Geekom A7 | |
| Moyenne de la classe Mini PC | |
| Acemagic F2A | |
| Maxtang MTN-FP750 | |
* ... Moindre est la valeur, meilleures sont les performances
Continuous read: DiskSpd Read Loop, Queue Depth 8
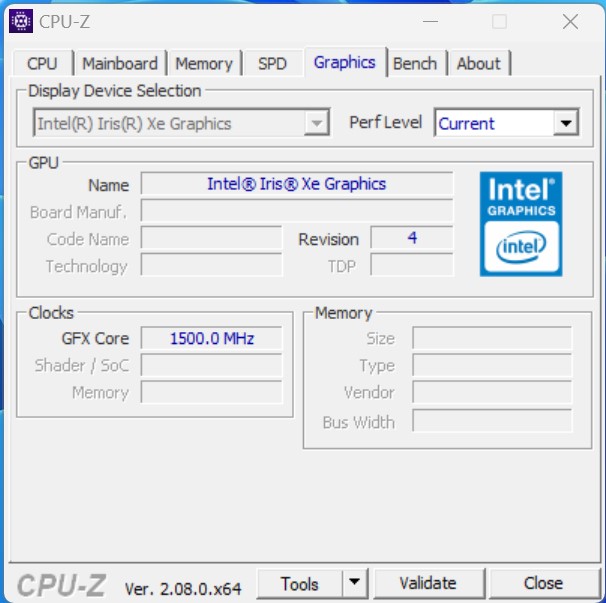
Carte graphique
La carte graphique Intel Iris Xe G7, largement utilisée, prend en charge les calculs 3D et la sortie des images dans le Minisforum MS-01. Comparé aux nouveaux modèles, appelés Intel Arc8, l'ancien modèle de notre échantillon de test est à la traîne. Dans certains cas, l'Intel Iris Xe Graphics G7 peut toutefois suivre relativement bien le modèle supposé plus rapide de l'Acemagic F2A et même le surpasser.
Si nous considérons à nouveau l'utilisation en tant que station de travail, nous pouvons nous demander pourquoi le fabricant n'utilise pas directement une carte graphique dédiée. Pour illustrer les performances par rapport à un GPU pour ordinateur portable Nvidia GeForce RTX A2000, nous l'avons inclus dans le graphique de comparaison. En combinaison avec cet accélérateur graphique, les performances 3D seraient massivement accrues. Les tests de rendu, qui sont optimisés pour l'utilisation de cartes graphiques professionnelles, font apparaître une augmentation considérable des performances.
Pour d'autres comparaisons et repères, veuillez consulter notre tableau comparatif des GPU Cartes graphiques mobiles - indice de référence .
| Unigine Valley 1.0 | |
| 1920x1080 Extreme HD DirectX AA:x8 | |
| Minisforum MS-01 | |
| Geekom A7 | |
| Acemagic F2A | |
| Minisforum Venus Series NPB5 | |
| Moyenne Intel Iris Xe Graphics G7 96EUs (11.3 - 20, n=21) | |
| Minisforum Venus Series NAB9 | |
| Geekom XT12 Pro | |
| Maxtang MTN-FP750 | |
| 1920x1080 Extreme HD Preset OpenGL AA:x8 | |
| Minisforum MS-01 | |
| Acemagic F2A | |
| Moyenne Intel Iris Xe Graphics G7 96EUs (11.7 - 21.7, n=21) | |
| Minisforum Venus Series NPB5 | |
| Minisforum Venus Series NAB9 | |
| Geekom XT12 Pro | |
| Maxtang MTN-FP750 | |
| Geekom A7 | |
| Affinity Photo 2 - Combined (Single / Multi GPU) | |
| Minisforum MS-01 | |
| Acemagic F2A | |
| Minisforum Venus Series NAB9 | |
| Moyenne Intel Iris Xe Graphics G7 96EUs (1560 - 4958, n=13) | |
| Geekom XT12 Pro | |
| Geekom A7 | |
| Minisforum MS-01, Intel Iris Xe Graphics G7 96EUs i9-13900H | Acemagic F2A, Intel Arc 8-Core iGPU Ultra 7 155H | Geekom XT12 Pro, Intel Iris Xe Graphics G7 96EUs i9-12900H | Geekom A7, AMD Radeon 780M R9 7940HS | Minisforum Venus Series NAB9, Intel Iris Xe Graphics G7 96EUs i9-12900HK | Minisforum Venus Series NPB5, Intel Iris Xe Graphics G7 80EUs i5-13500H | Maxtang MTN-FP750, AMD Radeon 680M R7 7735HS | Moyenne NVIDIA RTX A2000 Laptop GPU | Moyenne de la classe Mini PC | |
|---|---|---|---|---|---|---|---|---|---|
| SPECviewperf 12 | 7% | -19% | 601% | -17% | -24% | 7% | 457% | 381% | |
| 1900x1060 3ds Max (3dsmax-05) | 46.7 | 49.8 7% | 40.1 -14% | 84.7 81% | 40.2 -14% | 41.5 -11% | 46.9 0% | 75.9 ? 63% | |
| 1900x1060 Catia (catia-04) | 41.7 | 48.2 16% | 37.1 -11% | 89 113% | 35.9 -14% | 31 -26% | 51.5 24% | 134.9 ? 224% | 63.9 ? 53% |
| 1900x1060 Creo (creo-01) | 30 | 23.1 -23% | 26.9 -10% | 55.4 85% | 27.7 -8% | 23.4 -22% | 33.2 11% | 116.2 ? 287% | 38.3 ? 28% |
| 1900x1060 Energy (energy-01) | 0.5 | 0.91 82% | 0.4 -20% | 20.7 4040% | 0.4 -20% | 0.35 -30% | 10.7 ? 2040% | 14 ? 2700% | |
| 1900x1060 Maya (maya-04) | 51.9 | 54.9 6% | 38.3 -26% | 69.7 34% | 39.8 -23% | 35.9 -31% | 45.2 -13% | 96 ? 85% | 64.5 ? 24% |
| 1900x1060 Medical (medical-01) | 14.5 | 16.9 17% | 11.8 -19% | 60.5 317% | 12.2 -16% | 8.44 -42% | 17.9 23% | 45 ? 210% | 29.3 ? 102% |
| 1900x1060 Showcase (showcase-01) | 24.8 | 18.2 -27% | 16.6 -33% | 30.3 22% | 17.4 -30% | 20.4 -18% | 17.5 -29% | 70 ? 182% | 34.5 ? 39% |
| 1900x1060 Solidworks (sw-03) | 53.1 | 42.7 -20% | 45.3 -15% | 116 118% | 47.3 -11% | 46.1 -13% | 72.1 36% | 142.1 ? 168% | 73.9 ? 39% |
| SPECviewperf 13 | 5% | -14% | 157% | -14% | -27% | 33% | 266% | 95% | |
| 3ds Max (3dsmax-06) | 46.5 | 46.4 0% | 40.1 -14% | 83.9 80% | 39.9 -14% | 41.5 -11% | 48.3 4% | 139.4 ? 200% | 75.2 ? 62% |
| Catia (catia-05) | 58.9 | 71.6 22% | 51.3 -13% | 130 121% | 51.6 -12% | 44.8 -24% | 73.9 25% | 205 ? 248% | 90.4 ? 53% |
| Creo (creo-02) | 46.2 | 29.6 -36% | 41.1 -11% | 93.4 102% | 40.2 -13% | 37.1 -20% | 44.9 -3% | 165.1 ? 257% | 74.7 ? 62% |
| Energy (energy-02) | 4.72 | 5.69 21% | 4.5 -5% | 23.8 404% | 4.39 -7% | 2.03 -57% | 11.4 142% | 32.1 ? 580% | 19.2 ? 307% |
| Maya (maya-05) | 58.4 | 59.5 2% | 47.5 -19% | 107 83% | 48.3 -17% | 46 -21% | 58.3 0% | 174.5 ? 199% | 97.3 ? 67% |
| Medical (medical-02) | 15.8 | 29.7 88% | 14.4 -9% | 77.6 391% | 14.4 -9% | 7.92 -50% | 32.8 108% | 70.4 ? 346% | 39.4 ? 149% |
| Showcase (showcase-02) | 25 | 18.2 -27% | 17.3 -31% | 25.4 2% | 17.3 -31% | 20.4 -18% | 17.4 -30% | 68 ? 172% | 34 ? 36% |
| Solidworks (sw-04) | 63.7 | 44.8 -30% | 57.1 -10% | 109 71% | 57.4 -10% | 56 -12% | 72.9 14% | 144.6 ? 127% | 77.6 ? 22% |
| SPECviewperf 2020 | 11% | -15% | 232% | -14% | -32% | 69% | 429% | 156% | |
| 3840x2160 Medical (medical-03) | 2.72 | 5.05 86% | 3.49 28% | 11.1 308% | 3.48 28% | 1.37 -50% | 4.72 74% | 10.6 ? 290% | 8.13 ? 199% |
| 3840x2160 Energy (energy-03) | 4.75 | 4.61 -3% | 3.05 -36% | 14.1 197% | 3 -37% | 1.18 -75% | 6.6 39% | 25.6 ? 439% | 11.6 ? 144% |
| 3840x2160 Creo (creo-03) | 19.2 | 17.9 -7% | 14.8 -23% | 31.4 64% | 15.1 -21% | 13.6 -29% | 17.5 -9% | 55.5 ? 189% | 30.7 ? 60% |
| 3840x2160 CATIA (catia-06) | 9.99 | 10 0% | 7.78 -22% | 24.8 148% | 8.08 -19% | 7.41 -26% | 13.1 31% | 29.7 ? 197% | 18.6 ? 86% |
| 3840x2160 3ds Max (3dsmax-07) | 11.6 | 12.9 11% | 9.69 -16% | 20.9 80% | 9.78 -16% | 10.1 -13% | 9.26 -20% | 36 ? 210% | 22.6 ? 95% |
| 3840x2160 Siemens NX (snx-04) | 6.9 | 5.7 -17% | 6.29 -9% | 61.4 790% | 6.67 -3% | 6.71 -3% | 33 378% | 112.5 ? 1530% | 37.3 ? 441% |
| 3840x2160 Maya (maya-06) | 34.1 | 35.4 4% | 23.9 -30% | 47 38% | 24.4 -28% | 23.6 -31% | 29.5 -13% | 83.5 ? 145% | 57.8 ? 70% |
| Moyenne finale (programmes/paramètres) | 8% /
7% | -16% /
-16% | 330% /
334% | -15% /
-15% | -28% /
-28% | 36% /
36% | 384% /
378% | 211% /
213% |
| 3DMark 05 Standard | 50056 points | |
| 3DMark 06 Score 1366x768 | 38453 points | |
| 3DMark Vantage P Result | 33312 points | |
| 3DMark 11 Performance | 8500 points | |
| 3DMark Ice Storm Standard Score | 179358 points | |
| 3DMark Cloud Gate Standard Score | 30468 points | |
| 3DMark Fire Strike Score | 6105 points | |
| 3DMark Fire Strike Extreme Score | 3023 points | |
| 3DMark Time Spy Score | 2118 points | |
Aide | ||
Performances des jeux
Dans la configuration que nous avons testée, le Minisforum MS-01 ne convient que partiellement comme système de jeu. L'iGPU du processeur Intel Core i9-13900H parvient tout de même à afficher certains jeux à l'écran avec des taux de rafraîchissement acceptables. Les performances sont nettement supérieures avec une AMD Radeon 780Mqui est utilisée dans le Geekom A7. Si vous souhaitez installer une carte graphique dédiée dans le Minisforum MS-01, vous obtiendrez certainement une augmentation considérable des performances. Cependant, il faut d'abord trouver un modèle approprié qui puisse être logé dans l'appareil. Parmi les modèles de GPU actuels, il existe un modèle Intel Arc A380 qui répondrait aux exigences. Afin d'obtenir une estimation approximative des performances en combinaison avec un Intel Arc A380, nous l'avons inclus dans l'aperçu comparatif. Indépendamment de cela, vous pouvez également utiliser une carte graphique externe via USB4.
| The Witcher 3 | |
| 1024x768 Low Graphics & Postprocessing | |
| Sparkle Intel Arc A380 Elf | |
| Geekom A7 | |
| Acemagic F2A | |
| Minisforum MS-01 | |
| Minisforum Venus Series NAB9 | |
| Minisforum Venus Series NPB5 | |
| Geekom XT12 Pro | |
| Maxtang MTN-FP750 | |
| 1920x1080 High Graphics & Postprocessing (Nvidia HairWorks Off) | |
| Sparkle Intel Arc A380 Elf | |
| Geekom A7 | |
| Acemagic F2A | |
| Minisforum MS-01 | |
| Minisforum Venus Series NPB5 | |
| Minisforum Venus Series NAB9 | |
| Geekom XT12 Pro | |
| Maxtang MTN-FP750 | |
| Borderlands 3 | |
| 1280x720 Very Low Overall Quality (DX11) | |
| Sparkle Intel Arc A380 Elf | |
| Geekom A7 | |
| Acemagic F2A | |
| Minisforum MS-01 | |
| Maxtang MTN-FP750 | |
| Minisforum Venus Series NPB5 | |
| Minisforum Venus Series NAB9 | |
| Geekom XT12 Pro | |
| 1920x1080 High Overall Quality (DX11) | |
| Sparkle Intel Arc A380 Elf | |
| Acemagic F2A | |
| Geekom A7 | |
| Minisforum MS-01 | |
| Minisforum Venus Series NAB9 | |
| Minisforum Venus Series NPB5 | |
| Maxtang MTN-FP750 | |
| Geekom XT12 Pro | |
| GTA V | |
| 1024x768 Lowest Settings possible | |
| Sparkle Intel Arc A380 Elf | |
| Geekom A7 | |
| Minisforum MS-01 | |
| Acemagic F2A | |
| Minisforum Venus Series NPB5 | |
| Minisforum Venus Series NAB9 | |
| Maxtang MTN-FP750 | |
| 1920x1080 High/On (Advanced Graphics Off) AA:2xMSAA + FX AF:8x | |
| Geekom A7 | |
| Sparkle Intel Arc A380 Elf | |
| Acemagic F2A | |
| Minisforum MS-01 | |
| Maxtang MTN-FP750 | |
| Minisforum Venus Series NPB5 | |
| Minisforum Venus Series NAB9 | |
| Shadow of the Tomb Raider | |
| 1280x720 Lowest Preset | |
| Sparkle Intel Arc A380 Elf | |
| Acemagic F2A | |
| Geekom A7 | |
| Minisforum MS-01 | |
| Minisforum Venus Series NPB5 | |
| Maxtang MTN-FP750 | |
| Geekom XT12 Pro | |
| 1920x1080 High Preset AA:SM | |
| Sparkle Intel Arc A380 Elf | |
| Acemagic F2A | |
| Geekom A7 | |
| Minisforum MS-01 | |
| Minisforum Venus Series NPB5 | |
| Maxtang MTN-FP750 | |
| Geekom XT12 Pro | |
| F1 2021 | |
| 1280x720 Ultra Low Preset | |
| Sparkle Intel Arc A380 Elf | |
| Geekom A7 | |
| Acemagic F2A | |
| Minisforum MS-01 | |
| Minisforum Venus Series NAB9 | |
| Maxtang MTN-FP750 | |
| Geekom XT12 Pro | |
| 1920x1080 High Preset AA:T AF:16x | |
| Sparkle Intel Arc A380 Elf | |
| Geekom A7 | |
| Acemagic F2A | |
| Minisforum MS-01 | |
| Minisforum Venus Series NAB9 | |
| Maxtang MTN-FP750 | |
| Geekom XT12 Pro | |
| Tiny Tina's Wonderlands | |
| 1280x720 Lowest Preset (DX12) | |
| Sparkle Intel Arc A380 Elf | |
| Geekom A7 | |
| Acemagic F2A | |
| Maxtang MTN-FP750 | |
| Minisforum MS-01 | |
| Minisforum Venus Series NAB9 | |
| Minisforum Venus Series NPB5 | |
| Geekom XT12 Pro | |
| 1920x1080 High Preset (DX12) | |
| Sparkle Intel Arc A380 Elf | |
| Geekom A7 | |
| Acemagic F2A | |
| Minisforum Venus Series NAB9 | |
| Maxtang MTN-FP750 | |
| Minisforum MS-01 | |
| Minisforum Venus Series NPB5 | |
| Geekom XT12 Pro | |
Witcher 3 FPS chart
| Bas | Moyen | Élevé | Ultra | |
|---|---|---|---|---|
| GTA V (2015) | 166.4 | 149.3 | 31.1 | 12.5 |
| The Witcher 3 (2015) | 117.2 | 77.8 | 43 | 19.5 |
| Dota 2 Reborn (2015) | 128.6 | 94.5 | 80.8 | 70.6 |
| Final Fantasy XV Benchmark (2018) | 56.3 | 31.2 | 21.4 | |
| X-Plane 11.11 (2018) | 65.5 | 48.3 | 40.7 | |
| Far Cry 5 (2018) | 75 | 39 | 35 | 33 |
| Strange Brigade (2018) | 115.1 | 51.4 | 39.8 | 31.7 |
| Shadow of the Tomb Raider (2018) | 68.7 | 32.4 | 30.3 | 25.7 |
| Far Cry New Dawn (2019) | 69 | 38 | 36 | 33 |
| Metro Exodus (2019) | 45.8 | 23.8 | 17.1 | 13.2 |
| Borderlands 3 (2019) | 67.2 | 30.9 | 18.9 | 14 |
| F1 2020 (2020) | 109.6 | 57.5 | 44.4 | 28 |
| F1 2021 (2021) | 129.9 | 64.9 | 50.8 | 34.4 |
| God of War (2022) | 26.4 | 23 | 18.4 | 13.6 |
| GRID Legends (2022) | 66.2 | 49.3 | 36.7 | 33.2 |
| Tiny Tina's Wonderlands (2022) | 37.5 | 29.5 | 18.2 | 14.2 |
| F1 22 (2022) | 57.2 | 52.3 | 37.1 | 28 |
| F1 23 (2023) | 53.7 | 48.6 | 33.3 | 25 |
| Cyberpunk 2077 2.2 Phantom Liberty (2023) | 22.5 | 17.7 | 15 | 13.1 |
| Total War Pharaoh (2023) | 87.5 | 60.2 | 41.6 | 36.7 |
| Prince of Persia The Lost Crown (2024) | 178 | 124.2 | 115.8 |
Le Minisforum MS-01 avec le Razer Core X dans le contrôle de performance
Si vous souhaitez équiper le Minisforum MS-01 d'un eGPU au lieu de trouver un modèle approprié qui peut être installé directement dans l'appareil, vous pouvez obtenir un aperçu de l'augmentation attendue des performances ici. Nous avons examiné de plus près le Minisforum MS-01 en combinaison avec le Razer Core X et une Nvidia GeForce RTX 3060 Ti. Comparé à ses concurrents, notre échantillon de test offre une performance exceptionnelle à ce stade. Nos résultats montrent également que l'Intel Core i9-13900H associé à notre Razer Core X est nettement plus performant que les appareils de comparaison équipés de processeurs AMD.
Ces tests ne sont qu'une représentation des performances possibles avec une carte graphique externe. Ces résultats n'influencent pas la note globale de ce test.
| Performance Rating - Percent | |
| Minisforum MS-01 (Nvidia GeForce RTX 3060 Ti FE) | |
| Geekom A7 (Nvidia GeForce RTX 3060 Ti FE) | |
| Intel NUC 13 Pro Kit NUC13ANK (Nvidia GeForce RTX 3060 Ti FE TB3) | |
| Acemagic AM18 (Nvidia GeForce RTX 3060 Ti FE) | |
| Geekom XT12 Pro (Nvidia GeForce RTX 3060 Ti FE) | |
| Minisforum Venus Series UM790 Pro (Nvidia GeForce RTX 3060 Ti FE TB3) | |
| Ace Magician AM08Pro (Nvidia GeForce RTX 3060 Ti FE TB3) | |
| 3DMark | |
| 1280x720 Sky Diver Graphics | |
| Geekom A7 (Nvidia GeForce RTX 3060 Ti FE) | |
| Minisforum MS-01 (Nvidia GeForce RTX 3060 Ti FE) | |
| Intel NUC 13 Pro Kit NUC13ANK (Nvidia GeForce RTX 3060 Ti FE TB3) | |
| Ace Magician AM08Pro (Nvidia GeForce RTX 3060 Ti FE TB3) | |
| Minisforum Venus Series UM790 Pro (Nvidia GeForce RTX 3060 Ti FE TB3) | |
| Acemagic AM18 (Nvidia GeForce RTX 3060 Ti FE) | |
| Geekom XT12 Pro (Nvidia GeForce RTX 3060 Ti FE) | |
| 1920x1080 Fire Strike Graphics | |
| Geekom A7 (Nvidia GeForce RTX 3060 Ti FE) | |
| Intel NUC 13 Pro Kit NUC13ANK (Nvidia GeForce RTX 3060 Ti FE TB3) | |
| Minisforum MS-01 (Nvidia GeForce RTX 3060 Ti FE) | |
| Acemagic AM18 (Nvidia GeForce RTX 3060 Ti FE) | |
| Geekom XT12 Pro (Nvidia GeForce RTX 3060 Ti FE) | |
| Ace Magician AM08Pro (Nvidia GeForce RTX 3060 Ti FE TB3) | |
| Minisforum Venus Series UM790 Pro (Nvidia GeForce RTX 3060 Ti FE TB3) | |
| Unigine Superposition | |
| 1280x720 720p Low | |
| Minisforum MS-01 (Nvidia GeForce RTX 3060 Ti FE) | |
| Geekom A7 (Nvidia GeForce RTX 3060 Ti FE) | |
| Minisforum Venus Series UM790 Pro (Nvidia GeForce RTX 3060 Ti FE TB3) | |
| Acemagic AM18 (Nvidia GeForce RTX 3060 Ti FE) | |
| Geekom XT12 Pro (Nvidia GeForce RTX 3060 Ti FE) | |
| Intel NUC 13 Pro Kit NUC13ANK (Nvidia GeForce RTX 3060 Ti FE TB3) | |
| Ace Magician AM08Pro (Nvidia GeForce RTX 3060 Ti FE TB3) | |
| 1920x1080 1080p High | |
| Intel NUC 13 Pro Kit NUC13ANK (Nvidia GeForce RTX 3060 Ti FE TB3) | |
| Minisforum MS-01 (Nvidia GeForce RTX 3060 Ti FE) | |
| Geekom A7 (Nvidia GeForce RTX 3060 Ti FE) | |
| Acemagic AM18 (Nvidia GeForce RTX 3060 Ti FE) | |
| Geekom XT12 Pro (Nvidia GeForce RTX 3060 Ti FE) | |
| Ace Magician AM08Pro (Nvidia GeForce RTX 3060 Ti FE TB3) | |
| Minisforum Venus Series UM790 Pro (Nvidia GeForce RTX 3060 Ti FE TB3) | |
| 1920x1080 1080p Extreme | |
| Intel NUC 13 Pro Kit NUC13ANK (Nvidia GeForce RTX 3060 Ti FE TB3) | |
| Minisforum MS-01 (Nvidia GeForce RTX 3060 Ti FE) | |
| Geekom XT12 Pro (Nvidia GeForce RTX 3060 Ti FE) | |
| Acemagic AM18 (Nvidia GeForce RTX 3060 Ti FE) | |
| Geekom A7 (Nvidia GeForce RTX 3060 Ti FE) | |
| Ace Magician AM08Pro (Nvidia GeForce RTX 3060 Ti FE TB3) | |
| Minisforum Venus Series UM790 Pro (Nvidia GeForce RTX 3060 Ti FE TB3) | |
| 3840x2160 4k Optimized | |
| Minisforum MS-01 (Nvidia GeForce RTX 3060 Ti FE) | |
| Intel NUC 13 Pro Kit NUC13ANK (Nvidia GeForce RTX 3060 Ti FE TB3) | |
| Geekom XT12 Pro (Nvidia GeForce RTX 3060 Ti FE) | |
| Geekom A7 (Nvidia GeForce RTX 3060 Ti FE) | |
| Acemagic AM18 (Nvidia GeForce RTX 3060 Ti FE) | |
| Ace Magician AM08Pro (Nvidia GeForce RTX 3060 Ti FE TB3) | |
| Minisforum Venus Series UM790 Pro (Nvidia GeForce RTX 3060 Ti FE TB3) | |
| 7680x4320 8k Optimized | |
| Geekom XT12 Pro (Nvidia GeForce RTX 3060 Ti FE) | |
| Minisforum MS-01 (Nvidia GeForce RTX 3060 Ti FE) | |
| Intel NUC 13 Pro Kit NUC13ANK (Nvidia GeForce RTX 3060 Ti FE TB3) | |
| Acemagic AM18 (Nvidia GeForce RTX 3060 Ti FE) | |
| Geekom A7 (Nvidia GeForce RTX 3060 Ti FE) | |
| Ace Magician AM08Pro (Nvidia GeForce RTX 3060 Ti FE TB3) | |
| Minisforum Venus Series UM790 Pro (Nvidia GeForce RTX 3060 Ti FE TB3) | |
| Unigine Valley 1.0 | |
| 1920x1080 Extreme HD DirectX AA:x8 | |
| Geekom XT12 Pro (Nvidia GeForce RTX 3060 Ti FE) | |
| Minisforum MS-01 (Nvidia GeForce RTX 3060 Ti FE) | |
| Intel NUC 13 Pro Kit NUC13ANK (Nvidia GeForce RTX 3060 Ti FE TB3) | |
| Geekom A7 (Nvidia GeForce RTX 3060 Ti FE) | |
| Acemagic AM18 (Nvidia GeForce RTX 3060 Ti FE) | |
| Minisforum Venus Series UM790 Pro (Nvidia GeForce RTX 3060 Ti FE TB3) | |
| Ace Magician AM08Pro (Nvidia GeForce RTX 3060 Ti FE TB3) | |
| 1920x1080 Extreme HD Preset OpenGL AA:x8 | |
| Minisforum MS-01 (Nvidia GeForce RTX 3060 Ti FE) | |
| Geekom XT12 Pro (Nvidia GeForce RTX 3060 Ti FE) | |
| Geekom A7 (Nvidia GeForce RTX 3060 Ti FE) | |
| Acemagic AM18 (Nvidia GeForce RTX 3060 Ti FE) | |
| Intel NUC 13 Pro Kit NUC13ANK (Nvidia GeForce RTX 3060 Ti FE TB3) | |
| Ace Magician AM08Pro (Nvidia GeForce RTX 3060 Ti FE TB3) | |
| Minisforum Venus Series UM790 Pro (Nvidia GeForce RTX 3060 Ti FE TB3) | |
| Unigine Heaven 4.0 | |
| Extreme Preset OpenGL | |
| Geekom A7 (Nvidia GeForce RTX 3060 Ti FE) | |
| Minisforum MS-01 (Nvidia GeForce RTX 3060 Ti FE) | |
| Acemagic AM18 (Nvidia GeForce RTX 3060 Ti FE) | |
| Geekom XT12 Pro (Nvidia GeForce RTX 3060 Ti FE) | |
| Intel NUC 13 Pro Kit NUC13ANK (Nvidia GeForce RTX 3060 Ti FE TB3) | |
| Ace Magician AM08Pro (Nvidia GeForce RTX 3060 Ti FE TB3) | |
| Minisforum Venus Series UM790 Pro (Nvidia GeForce RTX 3060 Ti FE TB3) | |
| Extreme Preset DX11 | |
| Geekom A7 (Nvidia GeForce RTX 3060 Ti FE) | |
| Intel NUC 13 Pro Kit NUC13ANK (Nvidia GeForce RTX 3060 Ti FE TB3) | |
| Minisforum MS-01 (Nvidia GeForce RTX 3060 Ti FE) | |
| Geekom XT12 Pro (Nvidia GeForce RTX 3060 Ti FE) | |
| Acemagic AM18 (Nvidia GeForce RTX 3060 Ti FE) | |
| Ace Magician AM08Pro (Nvidia GeForce RTX 3060 Ti FE TB3) | |
| Minisforum Venus Series UM790 Pro (Nvidia GeForce RTX 3060 Ti FE TB3) | |
| ComputeMark v2.1 | |
| 1024x600 Normal, Score | |
| Geekom A7 (Nvidia GeForce RTX 3060 Ti FE) | |
| Minisforum MS-01 (Nvidia GeForce RTX 3060 Ti FE) | |
| Acemagic AM18 (Nvidia GeForce RTX 3060 Ti FE) | |
| Minisforum Venus Series UM790 Pro (Nvidia GeForce RTX 3060 Ti FE TB3) | |
| Intel NUC 13 Pro Kit NUC13ANK (Nvidia GeForce RTX 3060 Ti FE TB3) | |
| Ace Magician AM08Pro (Nvidia GeForce RTX 3060 Ti FE TB3) | |
| Geekom XT12 Pro (Nvidia GeForce RTX 3060 Ti FE) | |
| 1024x600 Normal, Fluid 3DTex | |
| Geekom A7 (Nvidia GeForce RTX 3060 Ti FE) | |
| Minisforum MS-01 (Nvidia GeForce RTX 3060 Ti FE) | |
| Intel NUC 13 Pro Kit NUC13ANK (Nvidia GeForce RTX 3060 Ti FE TB3) | |
| Minisforum Venus Series UM790 Pro (Nvidia GeForce RTX 3060 Ti FE TB3) | |
| Acemagic AM18 (Nvidia GeForce RTX 3060 Ti FE) | |
| Ace Magician AM08Pro (Nvidia GeForce RTX 3060 Ti FE TB3) | |
| Geekom XT12 Pro (Nvidia GeForce RTX 3060 Ti FE) | |
| 1024x600 Normal, Fluid 2DTexArr | |
| Minisforum MS-01 (Nvidia GeForce RTX 3060 Ti FE) | |
| Geekom A7 (Nvidia GeForce RTX 3060 Ti FE) | |
| Intel NUC 13 Pro Kit NUC13ANK (Nvidia GeForce RTX 3060 Ti FE TB3) | |
| Minisforum Venus Series UM790 Pro (Nvidia GeForce RTX 3060 Ti FE TB3) | |
| Acemagic AM18 (Nvidia GeForce RTX 3060 Ti FE) | |
| Ace Magician AM08Pro (Nvidia GeForce RTX 3060 Ti FE TB3) | |
| Geekom XT12 Pro (Nvidia GeForce RTX 3060 Ti FE) | |
| 1024x600 Normal, Mandel Vector | |
| Geekom A7 (Nvidia GeForce RTX 3060 Ti FE) | |
| Minisforum MS-01 (Nvidia GeForce RTX 3060 Ti FE) | |
| Acemagic AM18 (Nvidia GeForce RTX 3060 Ti FE) | |
| Minisforum Venus Series UM790 Pro (Nvidia GeForce RTX 3060 Ti FE TB3) | |
| Intel NUC 13 Pro Kit NUC13ANK (Nvidia GeForce RTX 3060 Ti FE TB3) | |
| Ace Magician AM08Pro (Nvidia GeForce RTX 3060 Ti FE TB3) | |
| Geekom XT12 Pro (Nvidia GeForce RTX 3060 Ti FE) | |
| 1024x600 Normal, Mandel Scalar | |
| Geekom A7 (Nvidia GeForce RTX 3060 Ti FE) | |
| Minisforum MS-01 (Nvidia GeForce RTX 3060 Ti FE) | |
| Acemagic AM18 (Nvidia GeForce RTX 3060 Ti FE) | |
| Minisforum Venus Series UM790 Pro (Nvidia GeForce RTX 3060 Ti FE TB3) | |
| Intel NUC 13 Pro Kit NUC13ANK (Nvidia GeForce RTX 3060 Ti FE TB3) | |
| Ace Magician AM08Pro (Nvidia GeForce RTX 3060 Ti FE TB3) | |
| Geekom XT12 Pro (Nvidia GeForce RTX 3060 Ti FE) | |
| 1024x600 Normal, QJuliaRayTrace | |
| Minisforum MS-01 (Nvidia GeForce RTX 3060 Ti FE) | |
| Acemagic AM18 (Nvidia GeForce RTX 3060 Ti FE) | |
| Geekom A7 (Nvidia GeForce RTX 3060 Ti FE) | |
| Intel NUC 13 Pro Kit NUC13ANK (Nvidia GeForce RTX 3060 Ti FE TB3) | |
| Minisforum Venus Series UM790 Pro (Nvidia GeForce RTX 3060 Ti FE TB3) | |
| Ace Magician AM08Pro (Nvidia GeForce RTX 3060 Ti FE TB3) | |
| Geekom XT12 Pro (Nvidia GeForce RTX 3060 Ti FE) | |
| Bas | Moyen | Élevé | Ultra | QHD | 4K | |
|---|---|---|---|---|---|---|
| GTA V (2015) | 186.2 | 184.2 | 177.4 | 111.8 | 96.1 | 103.5 |
| The Witcher 3 (2015) | 317 | 213 | 155 | 76.2 | 64.9 | 72.7 |
| Dota 2 Reborn (2015) | 202 | 167.4 | 157.5 | 144.6 | 107 | |
| Final Fantasy XV Benchmark (2018) | 205 | 146.8 | 99.6 | 77.9 | 49 | |
| X-Plane 11.11 (2018) | 168.4 | 150.4 | 116.4 | 106.7 | ||
| Far Cry 5 (2018) | 185 | 151 | 139 | 131 | 101 | 59 |
| Strange Brigade (2018) | 231 | 174.9 | 168 | 159.9 | 131.8 | 83.8 |
| Shadow of the Tomb Raider (2018) | 183.7 | 115.4 | 109.9 | 101.6 | 80.8 | 50.3 |
| Far Cry New Dawn (2019) | 160 | 134 | 127 | 115 | 98 | 61 |
| Metro Exodus (2019) | 147.8 | 93.6 | 70.9 | 53.6 | 46.5 | 33.9 |
| Borderlands 3 (2019) | 184.1 | 143 | 108 | 86 | 65.3 | 38.5 |
| F1 2020 (2020) | 223 | 136.2 | 135.8 | 107.2 | 92.5 | 61.5 |
| F1 2021 (2021) | 147.6 | 115.8 | 68.9 | 54.5 | 51 | 42.9 |
| God of War (2022) | 113 | 100.9 | 85.1 | 67.4 | 58.3 | 40.9 |
| Tiny Tina's Wonderlands (2022) | 180 | 140.9 | 101.1 | 81.7 | 62 | 36 |
| F1 22 (2022) | 63.1 | 57.5 | 44.1 | 28.5 | 27.5 | 19.9 |
| F1 23 (2023) | 70.3 | 71 | 56.9 | 36 | 32.6 | 17.4 |
| Cyberpunk 2077 2.2 Phantom Liberty (2023) | 91.7 | 81.5 | 71.6 | 64.6 | 44.6 | 22.4 |
| Assassin's Creed Mirage (2023) | 88 | 82 | 78 | 60 | 55 | 38 |
| Total War Pharaoh (2023) | 334.2 | 179 | 104.6 | 77.3 | 62.7 | 39.2 |
| Avatar Frontiers of Pandora (2023) | 67 | 64 | 57 | 45 | 32 |
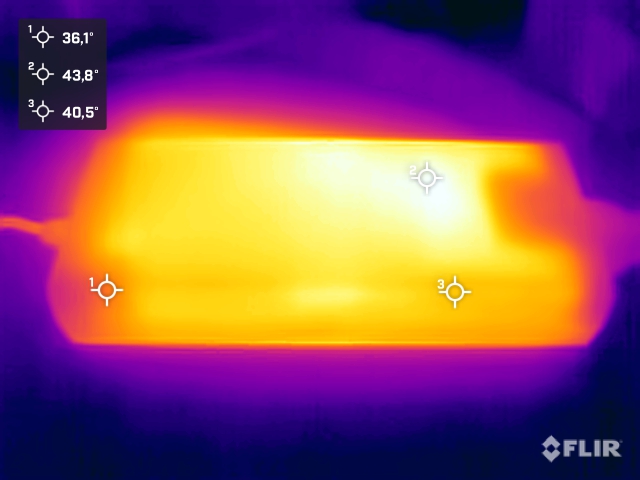
Émissions - Malheureusement peu économique
Émissions sonores
Si vous regardez l'unité de refroidissement, il devient rapidement évident que le ventilateur est trop petit pour le CPU installé, et qu'il doit travailler à grande vitesse pour souffler une quantité suffisante d'air frais à travers le radiateur. Le résultat est un fonctionnement audible en charge. Néanmoins, l'appareil est relativement silencieux au ralenti. Avec 33,7 à 34,7 dB(A), il est à peu près au même niveau que le Geekom A7. En charge, il devient assez bruyant, et notre échantillon de test se bat avec le Acemagic F2Aqui a obtenu des résultats similaires lors de notre test.
Degré de la nuisance sonore
| Au repos |
| 33.7 / 33.9 / 34.7 dB(A) |
| Fortement sollicité |
| 47.7 / 49.1 dB(A) |
 | ||
30 dB silencieux 40 dB(A) audible 50 dB(A) bruyant |
||
min: | ||
| Minisforum MS-01 i9-13900H, Iris Xe G7 96EUs | Acemagic F2A Ultra 7 155H, Arc 8-Core | Geekom XT12 Pro i9-12900H, Iris Xe G7 96EUs | Geekom A7 R9 7940HS, Radeon 780M | Minisforum Venus Series NAB9 i9-12900HK, Iris Xe G7 96EUs | Minisforum Venus Series NPB5 i5-13500H, Iris Xe G7 80EUs | Maxtang MTN-FP750 R7 7735HS, Radeon 680M | |
|---|---|---|---|---|---|---|---|
| Noise | 12% | 11% | 5% | 9% | 13% | 15% | |
| arrêt / environnement * | 24.4 | 24.9 -2% | 25.4 -4% | 25.4 -4% | 25.4 -4% | 25.1 -3% | 25 -2% |
| Idle Minimum * | 33.7 | 25.4 25% | 28 17% | 33.3 1% | 27.5 18% | 27.8 18% | 25.3 25% |
| Idle Average * | 33.9 | 25.7 24% | 28.1 17% | 33.6 1% | 28 17% | 27.8 18% | 25.3 25% |
| Idle Maximum * | 34.7 | 25.7 26% | 28.5 18% | 33.7 3% | 33 5% | 27.9 20% | 25.4 27% |
| Load Average * | 47.7 | 47.8 -0% | 39.6 17% | 43.3 9% | 42.8 10% | 38.9 18% | 45.1 5% |
| Witcher 3 ultra * | 48.9 | 45.23 8% | 47.2 3% | 43.2 12% | 44.5 9% | ||
| Load Maximum * | 49.1 | 49 -0% | 44.2 10% | 43.3 12% | 44.9 9% | 45.8 7% | 45.3 8% |
* ... Moindre est la valeur, meilleures sont les performances
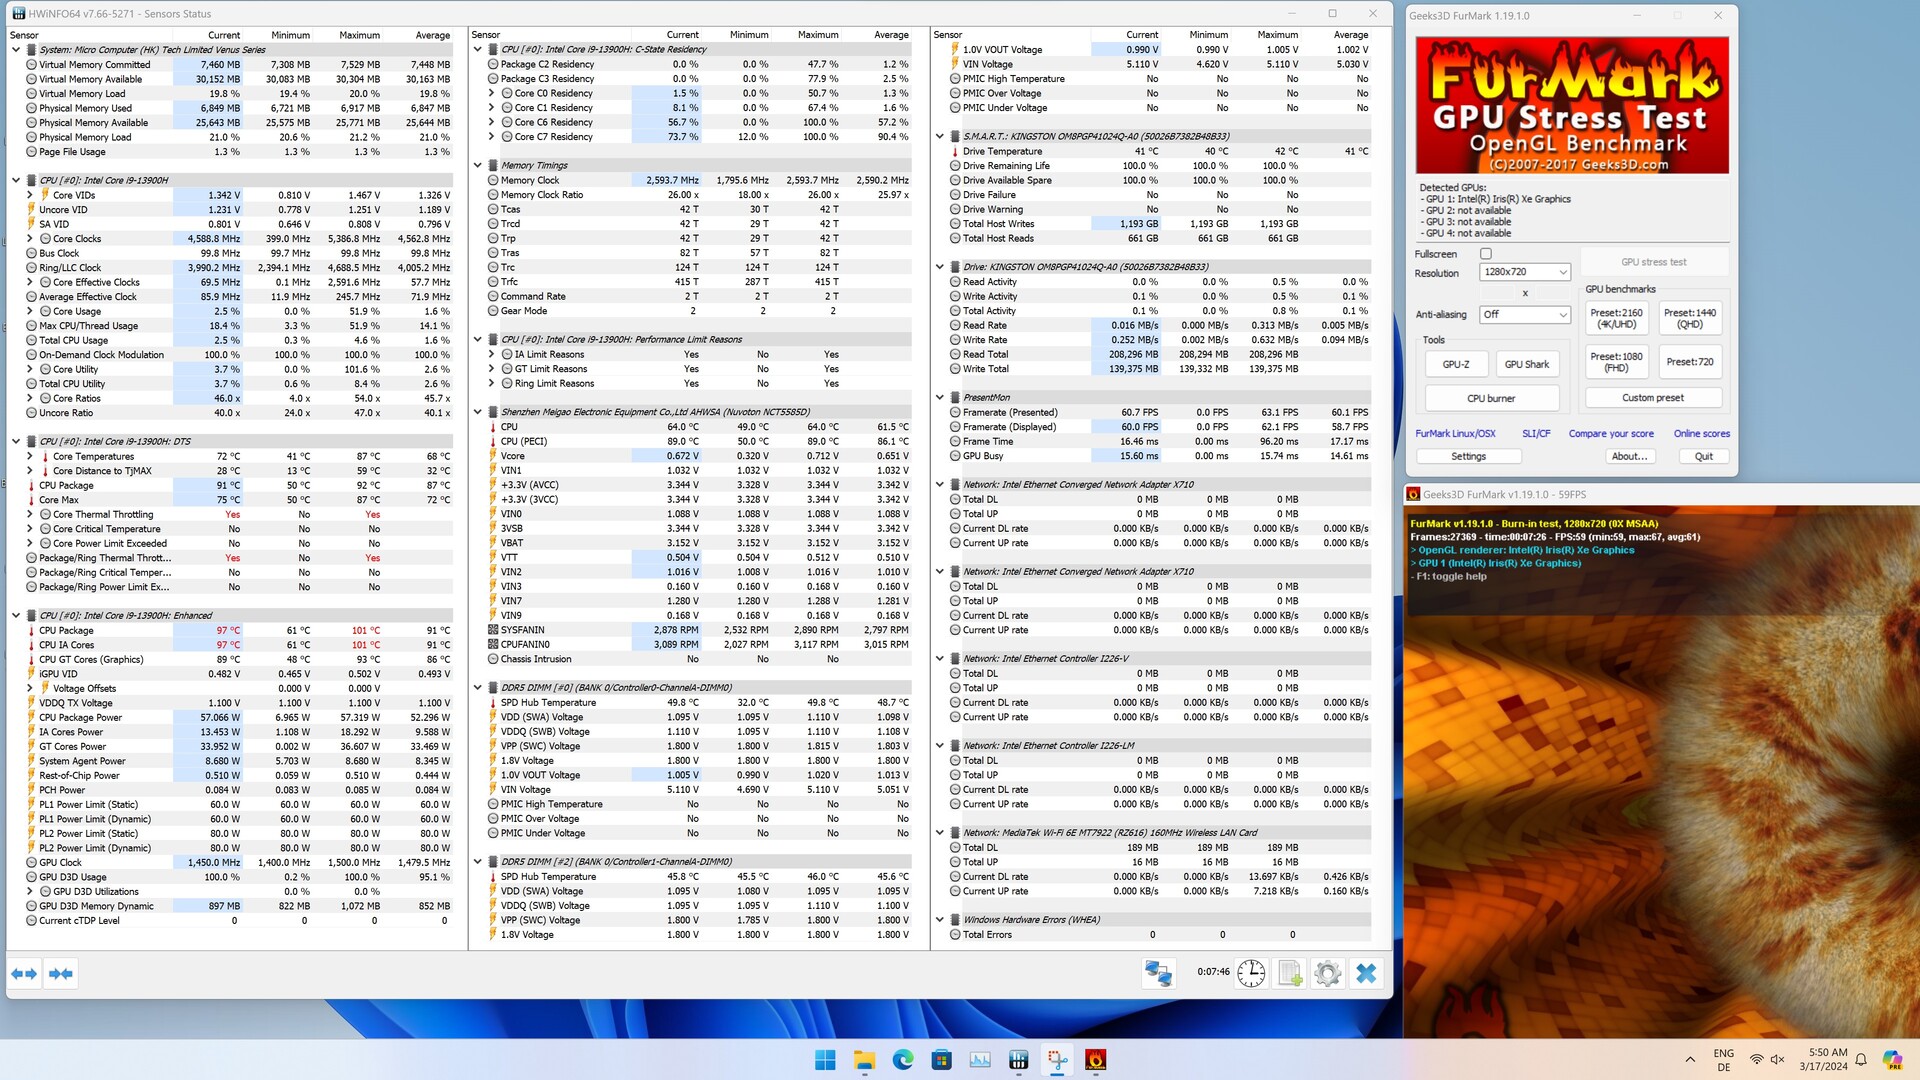
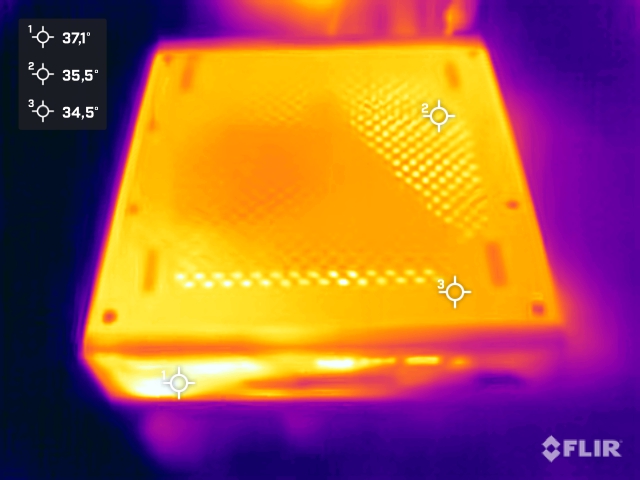
Température
Le boîtier du Minisforum MS-01 est relativement froid au repos et en charge. Avec une température nettement inférieure à 40 °C, il n'y a rien à redire. Il en va tout autrement pour le processeur : À 101 °C, nous notons la valeur la plus élevée, qui a été exceptionnellement atteinte dans le test de stress FurMark. En raison des problèmes mentionnés au début, nous examinerons à nouveau cette partie dès que nous aurons reçu l'échantillon de test de remplacement.
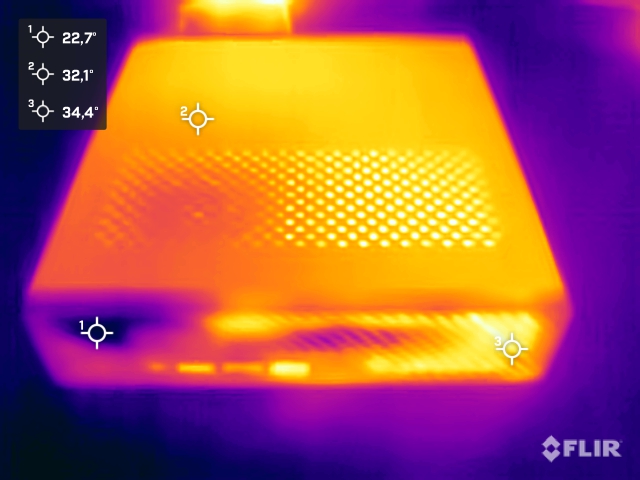
(+) La température maximale du côté supérieur est de 36.6 °C / 98 F, par rapport à la moyenne de 35.8 °C / 96 F, allant de 21.6 à 69.5 °C pour la classe Mini PC.
(+) Le fond chauffe jusqu'à un maximum de 33.6 °C / 92 F, contre une moyenne de 36.1 °C / 97 F
(+) En utilisation inactive, la température moyenne du côté supérieur est de 28.4 °C / 83 F, par rapport à la moyenne du dispositif de 32.3 °C / 90 F.
Consommation électrique
Le Minisforum MS-01 n'est pas un appareil économique. Même au ralenti, nous avons relevé des valeurs assez élevées qui sont bien supérieures à la moyenne de la plupart des mini-PC. En charge moyenne, le besoin en énergie grimpe à 87 watts, bien que 123,3 watts aient été atteints en pointe. En comparaison avec ses concurrents, le Minisforum Venus Series NAB9 atteint des valeurs similaires. A première vue, le bloc d'alimentation fourni semble surdimensionné avec ses 180 watts. La possibilité d'équiper le Minisforum MS-01 d'une carte graphique dédiée ne doit pas être perdue de vue, ce qui signifie que l'alimentation de 180 watts a sa raison d'être.

| Éteint/en veille | |
| Au repos | |
| Fortement sollicité |
|
Légende:
min: | |
| Minisforum MS-01 i9-13900H, Iris Xe G7 96EUs | Acemagic F2A Ultra 7 155H, Arc 8-Core | Geekom XT12 Pro i9-12900H, Iris Xe G7 96EUs | Geekom A7 R9 7940HS, Radeon 780M | Minisforum Venus Series NAB9 i9-12900HK, Iris Xe G7 96EUs | Minisforum Venus Series NPB5 i5-13500H, Iris Xe G7 80EUs | Maxtang MTN-FP750 R7 7735HS, Radeon 680M | Moyenne Intel Iris Xe Graphics G7 96EUs | Moyenne de la classe Mini PC | |
|---|---|---|---|---|---|---|---|---|---|
| Power Consumption | 33% | 41% | 52% | 19% | 23% | 51% | 52% | 30% | |
| Idle Minimum * | 14.4 | 9.1 37% | 5.7 60% | 3.8 74% | 12.1 16% | 8.4 42% | 7 51% | 5.41 ? 62% | 9.59 ? 33% |
| Idle Average * | 16.1 | 10.3 36% | 9.5 41% | 4.8 70% | 13.2 18% | 11.3 30% | 8.1 50% | 8.6 ? 47% | 11.7 ? 27% |
| Idle Maximum * | 25.5 | 14.4 44% | 16.5 35% | 6.5 75% | 14.1 45% | 14.5 43% | 8.4 67% | 10.9 ? 57% | 15.1 ? 41% |
| Load Average * | 87.3 | 54.9 37% | 53.3 39% | 71.9 18% | 82.9 5% | 70 20% | 54.2 38% | 45.4 ? 48% | 59 ? 32% |
| Load Maximum * | 123.3 | 110.4 10% | 87.8 29% | 94.7 23% | 106.8 13% | 149 -21% | 61.4 50% | 67.6 ? 45% | 100.1 ? 19% |
* ... Moindre est la valeur, meilleures sont les performances
Power consumption with external monitor
Power consumption with external monitor
Points positifs
Points négatifs
Verdict - Un outil puissant avec des fonctionnalités supérieures à la moyenne
Le Minisforum MS-01 est visuellement très différent de la plupart des mini-PC, mais ce n'est pas une mauvaise chose. Son aspect industriel indique clairement qu'il s'agit d'un appareil de travail. En termes de performances, la puissance de calcul du processeur Intel Core i9-13900H fournit beaucoup de puissance, qui peut également être utilisée. Les limites de puissance prédéfinies garantissent des performances élevées, et les modèles haut de gamme actuels d'AMD ne sont pas sensiblement plus rapides. En raison des émissions sonores, nous aurions souhaité une unité de refroidissement beaucoup plus puissante.
Les nombreuses possibilités de connexion, qui ouvrent un large éventail d'applications, sont un point positif. Deux ports USB4 sont probablement les interfaces les plus importantes du Minisforum MS-01, mais le mini-PC se distingue également par ses nombreuses options de connexion internes. Une interface physique PCIe x16 est actuellement une caractéristique unique dans ce design compact. Il est donc possible d'y installer une carte graphique dédiée. Cependant, il est nécessaire de faire une recherche intensive pour trouver un modèle adéquat.
Le Minisforum MS-01 est une station de travail puissante et a le potentiel de devenir une station de travail avec les bons accessoires.
Nous ne qualifierions pas le Minisforum MS-01 de pure station de travail dans la forme sous laquelle nous avons testé le modèle. Rien qu'en termes de performances, il n'y a pas de grand avantage par rapport à d'autres mini-PC pour le secteur de la consommation. A notre avis, une solution graphique professionnelle serait le bon moyen de se différencier plus clairement. Malheureusement, Minisforum ne propose pas de modèle adapté de carte graphique dédiée.
Enfin, regardons le prix d'achat, car le Minisforum MS-01 n'est pas une bonne affaire à 979 euros. De nombreux concurrents sont bien moins chers et parfois plus puissants. Néanmoins, le Minisforum MS-01 offre des avantages particuliers en termes d'options d'utilisation que d'autres mini-PC n'offrent pas.
Pendant toute la durée du test, nous avons dû faire face à d'énormes problèmes de stabilité. Nous avons déjà signalé les problèmes de notre échantillon de test au début de l'évaluation. Certains tests ont été accompagnés à plusieurs reprises de plantages soudains, ce qui a rendu impossible un fonctionnement régulier pour les utilisateurs finaux dans cet état. En raison de ce problème, nous nous sommes abstenus de donner une note finale pour l'instant et nous nous pencherons à nouveau sur la question dès que le fabricant nous aura envoyé un appareil de remplacement.
Prix et disponibilité
Vous pouvez acheter le Minisforum MS-01 directement dans le magasin de Minisforum. Amazon propose également quelques variantes du Minisforum MS-01 à partir de 580 $.
Transparency
La sélection des appareils à examiner est effectuée par notre équipe éditoriale. L'échantillon d'essai a été remis gratuitement à l'auteur par le fabricant à des fins d'évaluation. Cet examen n'a pas été influencé par des tiers et le fabricant n'a pas reçu de copie de cet examen avant sa publication. Il n'y avait aucune obligation de publier cet article. Nous n'acceptons jamais de compensation ou de paiement en échange de nos commentaires. En tant que média indépendant, Notebookcheck n'est pas soumis à l'autorité des fabricants, des détaillants ou des éditeurs.
Voici comment Notebookcheck teste
Chaque année, Notebookcheck examine de manière indépendante des centaines d'ordinateurs portables et de smartphones en utilisant des procédures standardisées afin de garantir que tous les résultats sont comparables. Nous avons continuellement développé nos méthodes de test depuis environ 20 ans et avons établi des normes industrielles dans le processus. Dans nos laboratoires de test, des équipements de mesure de haute qualité sont utilisés par des techniciens et des rédacteurs expérimentés. Ces tests impliquent un processus de validation en plusieurs étapes. Notre système d'évaluation complexe repose sur des centaines de mesures et de points de référence bien fondés, ce qui garantit l'objectivité.