

Test du Geekom XT13 Pro : le mini PC NUC renonce à Meteor Lake pour un Core i9-13900H
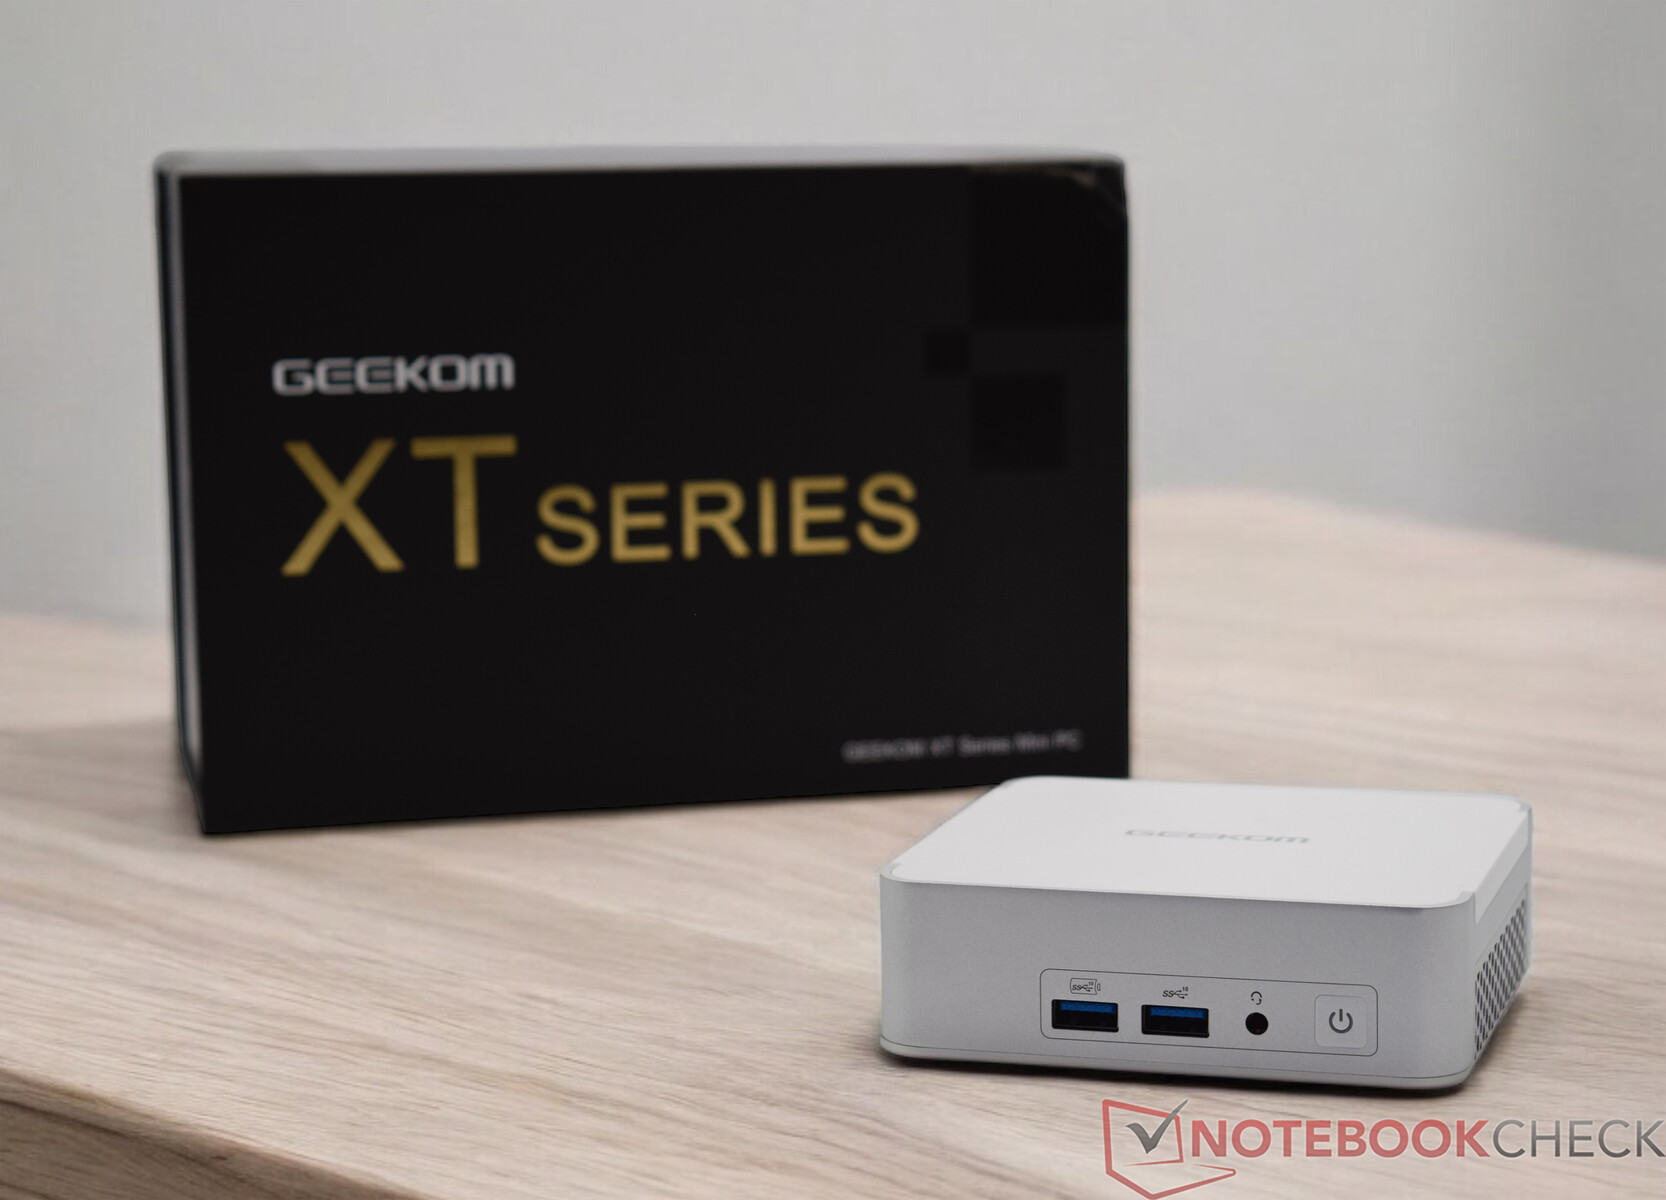
Le Geekom XT13 Pro hérite du modèle Geekom XT12 Pro et se présente dans la configuration supérieure avec un Intel Core i9-13900H équipé. Il dispose également de 32 Go de RAM DDR4 et d'un SSD de 2 To, mais cela a un prix. Le prix est de 999 euros, ce qui n'est pas vraiment une bonne affaire. Pour 769 euros, le Geekom XT13 Pro est disponible avec un processeur Intel Core i7-13620H et un disque dur SSD de 1 To. Geekom a décidé de ne pas utiliser les nouveaux processeurs Meteor Lake et de s'en tenir aux anciens processeurs Raptor Lake. Ce test montrera si c'est la bonne façon de résister à la concurrence.
La question se pose également de savoir si ce prix est justifié. Nous aborderons ce point important spécifiquement après l'analyse des performances. Quoi qu'il en soit, le fabricant lui-même place la barre très haut.
Comparaison avec les concurrents potentiels
Note | Version | Date | Modèle | Mémoire | Poids | Épaisseur |
|---|---|---|---|---|---|---|
| 72.4 % | v8 | 08/24 | Geekom XT13 Pro i9-13900H, Iris Xe G7 96EUs | 32768 Mo | 555 g | 37 mm |
| 80.8 % | v8 | 06/24 | Aoostar GEM12 R7 8845HS, Radeon 780M | 32768 Mo | 653 g | 60 mm |
| 87.5 % v7 (old) | v7 (old) | 05/24 | Minisforum AtomMan X7 Ti Ultra 9 185H, Arc 8-Core | 32768 Mo | 863 g | 48.6 mm |
| 83.4 % v7 (old) | v7 (old) | 04/24 | Acemagic F2A Ultra 7 155H, Arc 8-Core | 32768 Mo | 768 g | 57 mm |
| 84.1 % | v8 | 04/24 | Geekom XT12 Pro i9-12900H, Iris Xe G7 96EUs | 32768 Mo | 545 g | 37 mm |
| 82.6 % v7 (old) | v7 (old) | 03/24 | Geekom A7 R9 7940HS, Radeon 780M | 32768 Mo | 417 g | 38 mm |
Note : Nous avons mis à jour notre système d'évaluation et les résultats de la version 8 ne sont pas comparables aux résultats de la version 7 disponible ici.

Cas - Traitement parfait du métal et du plastique
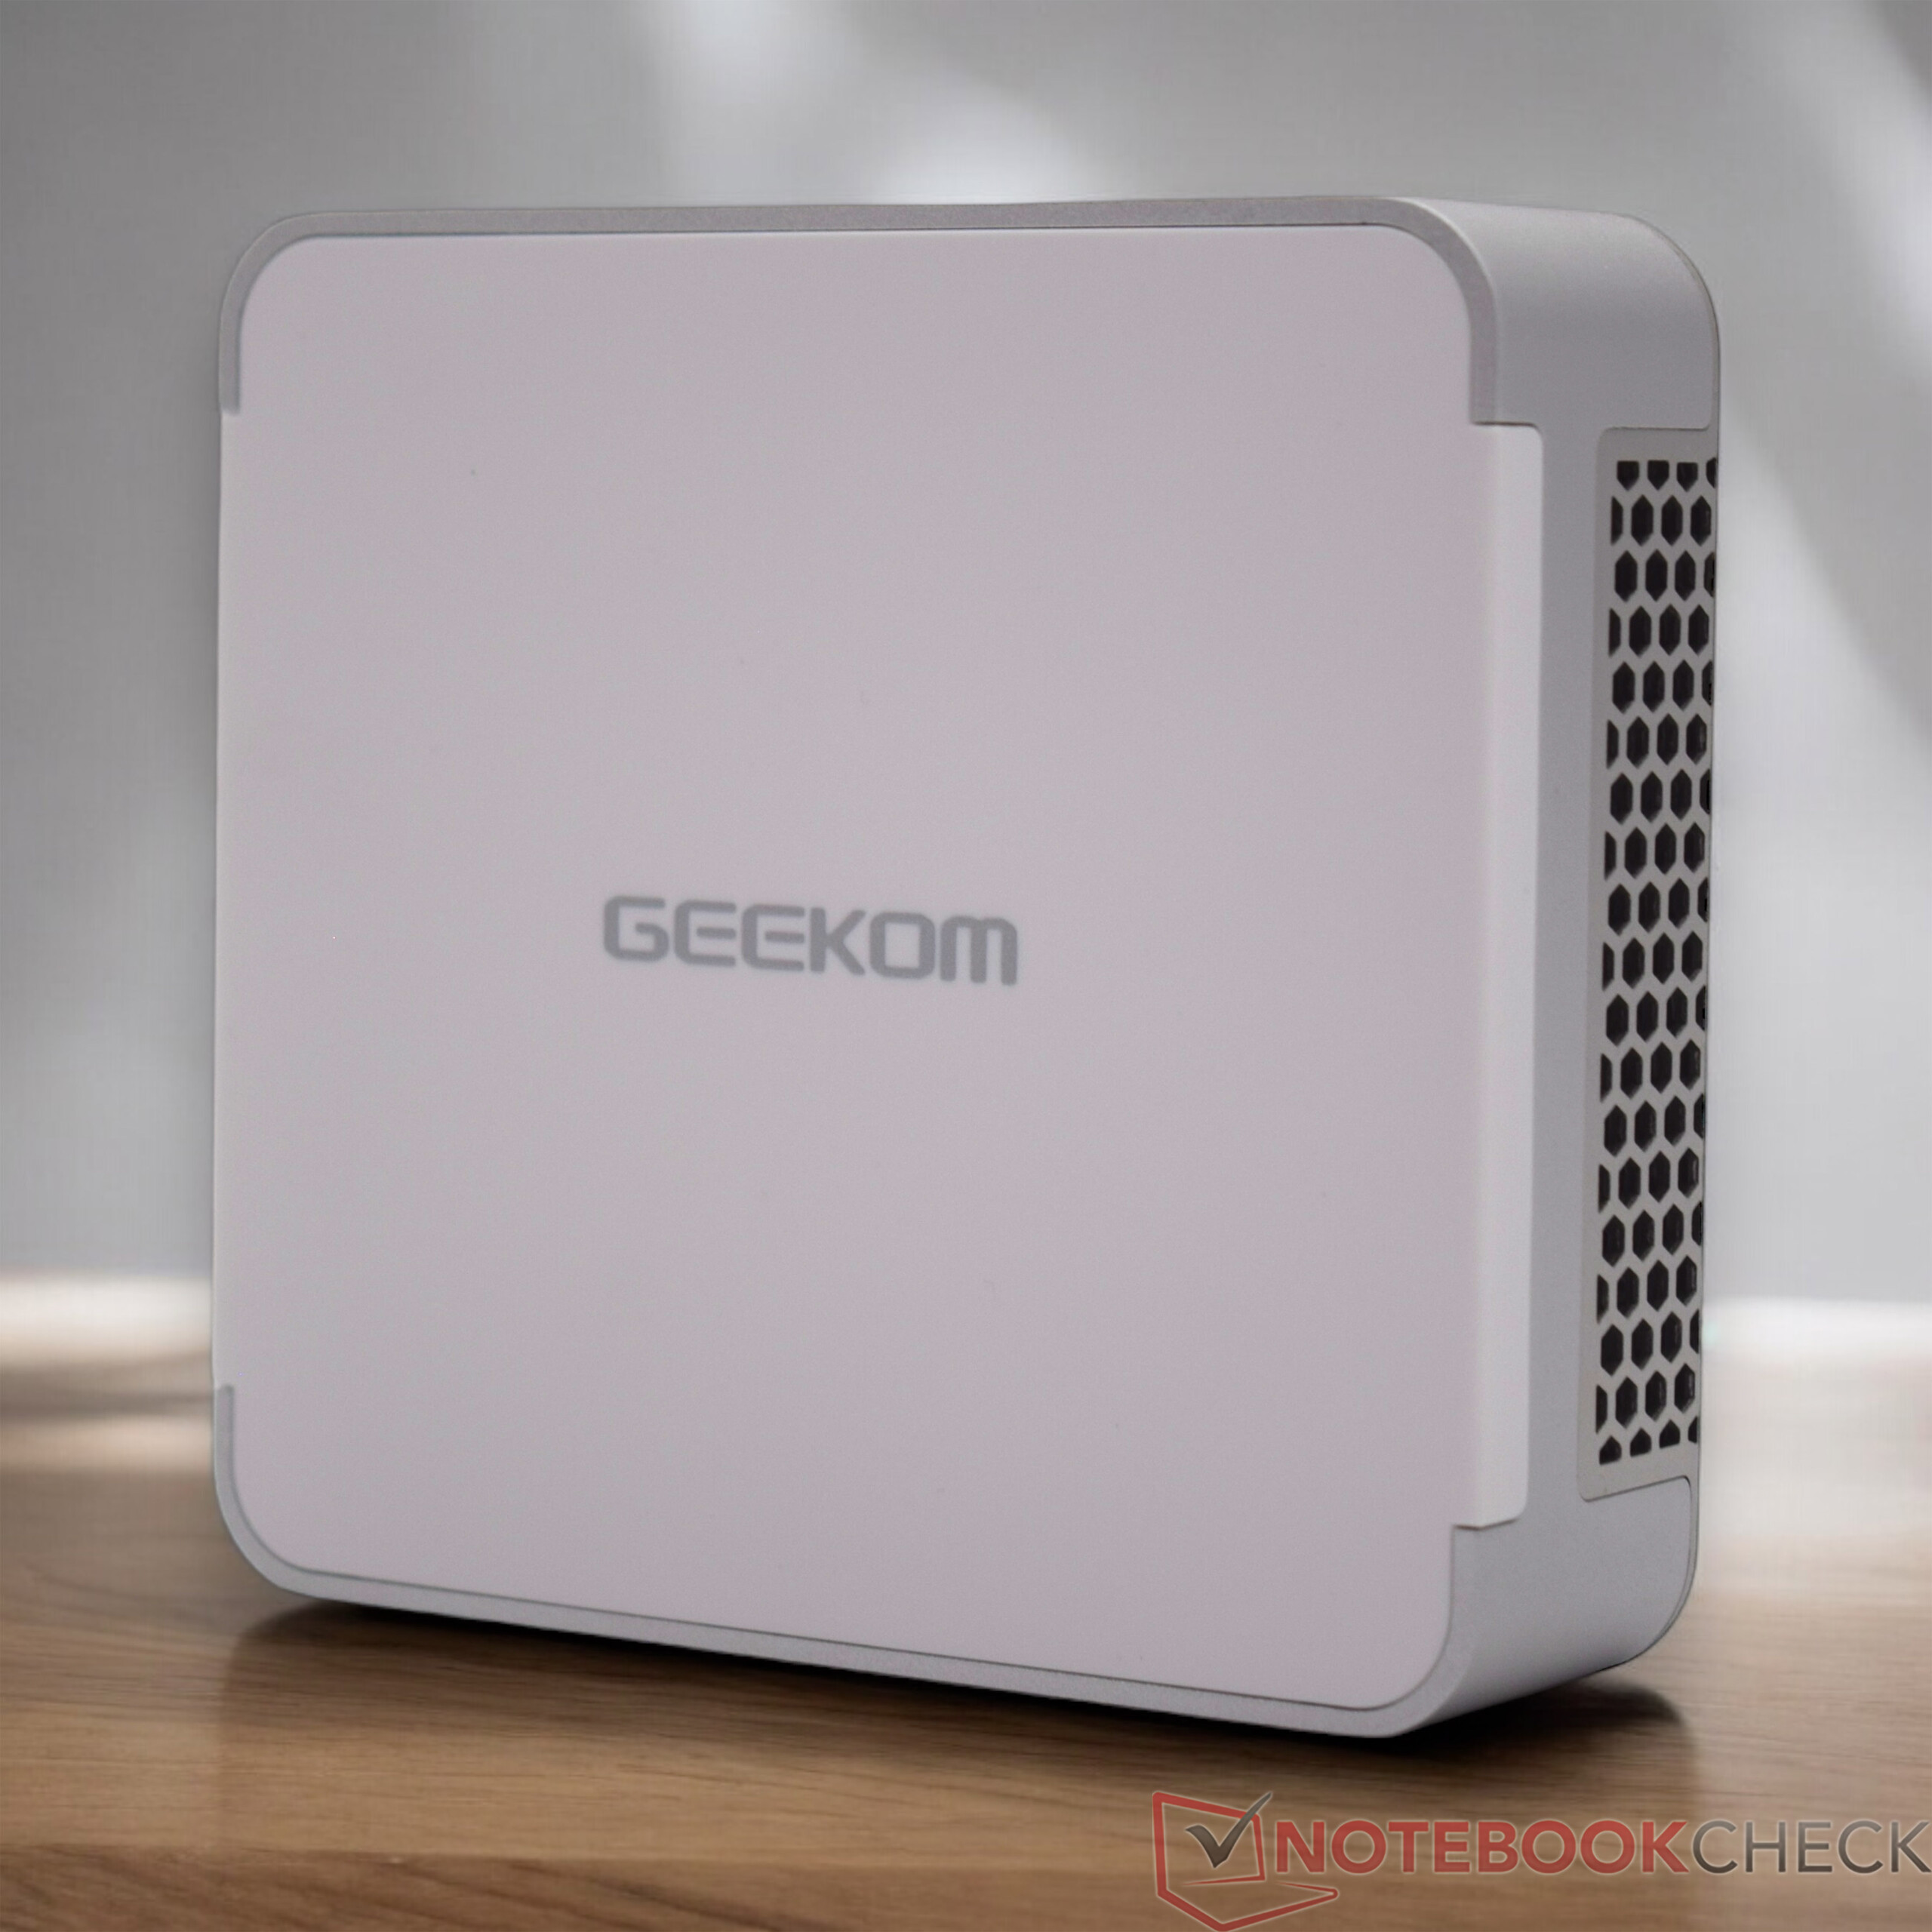
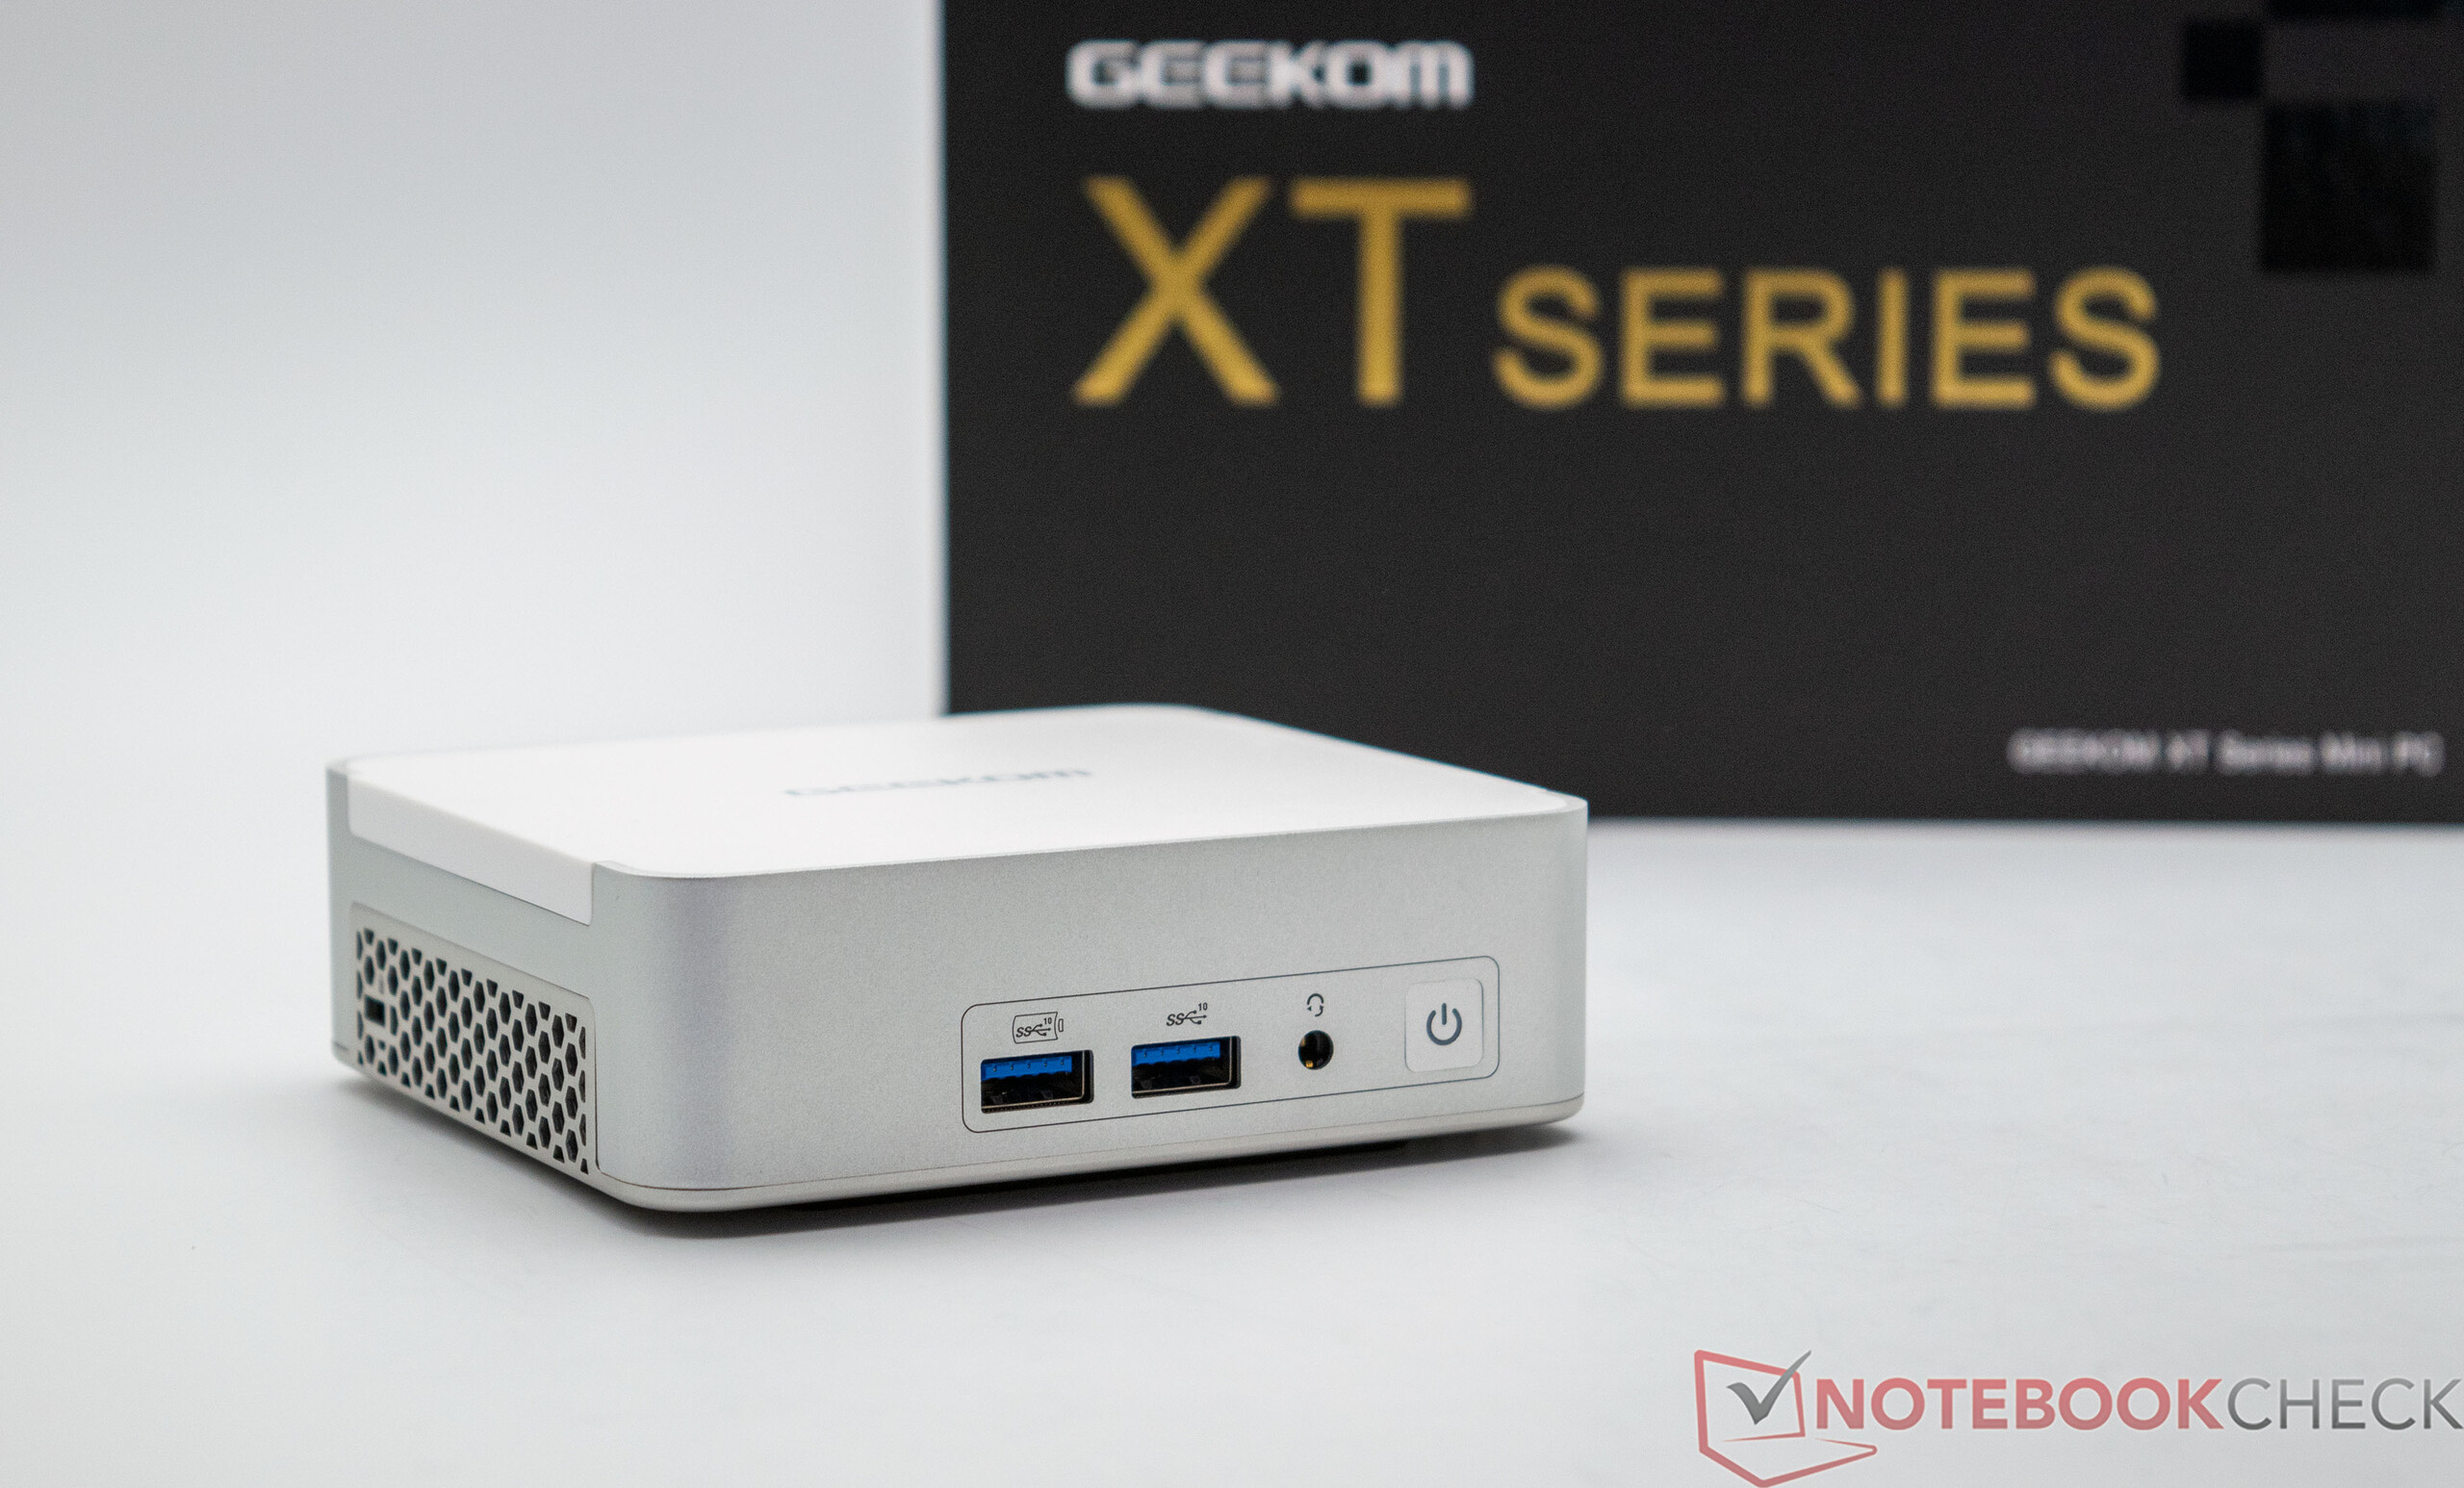
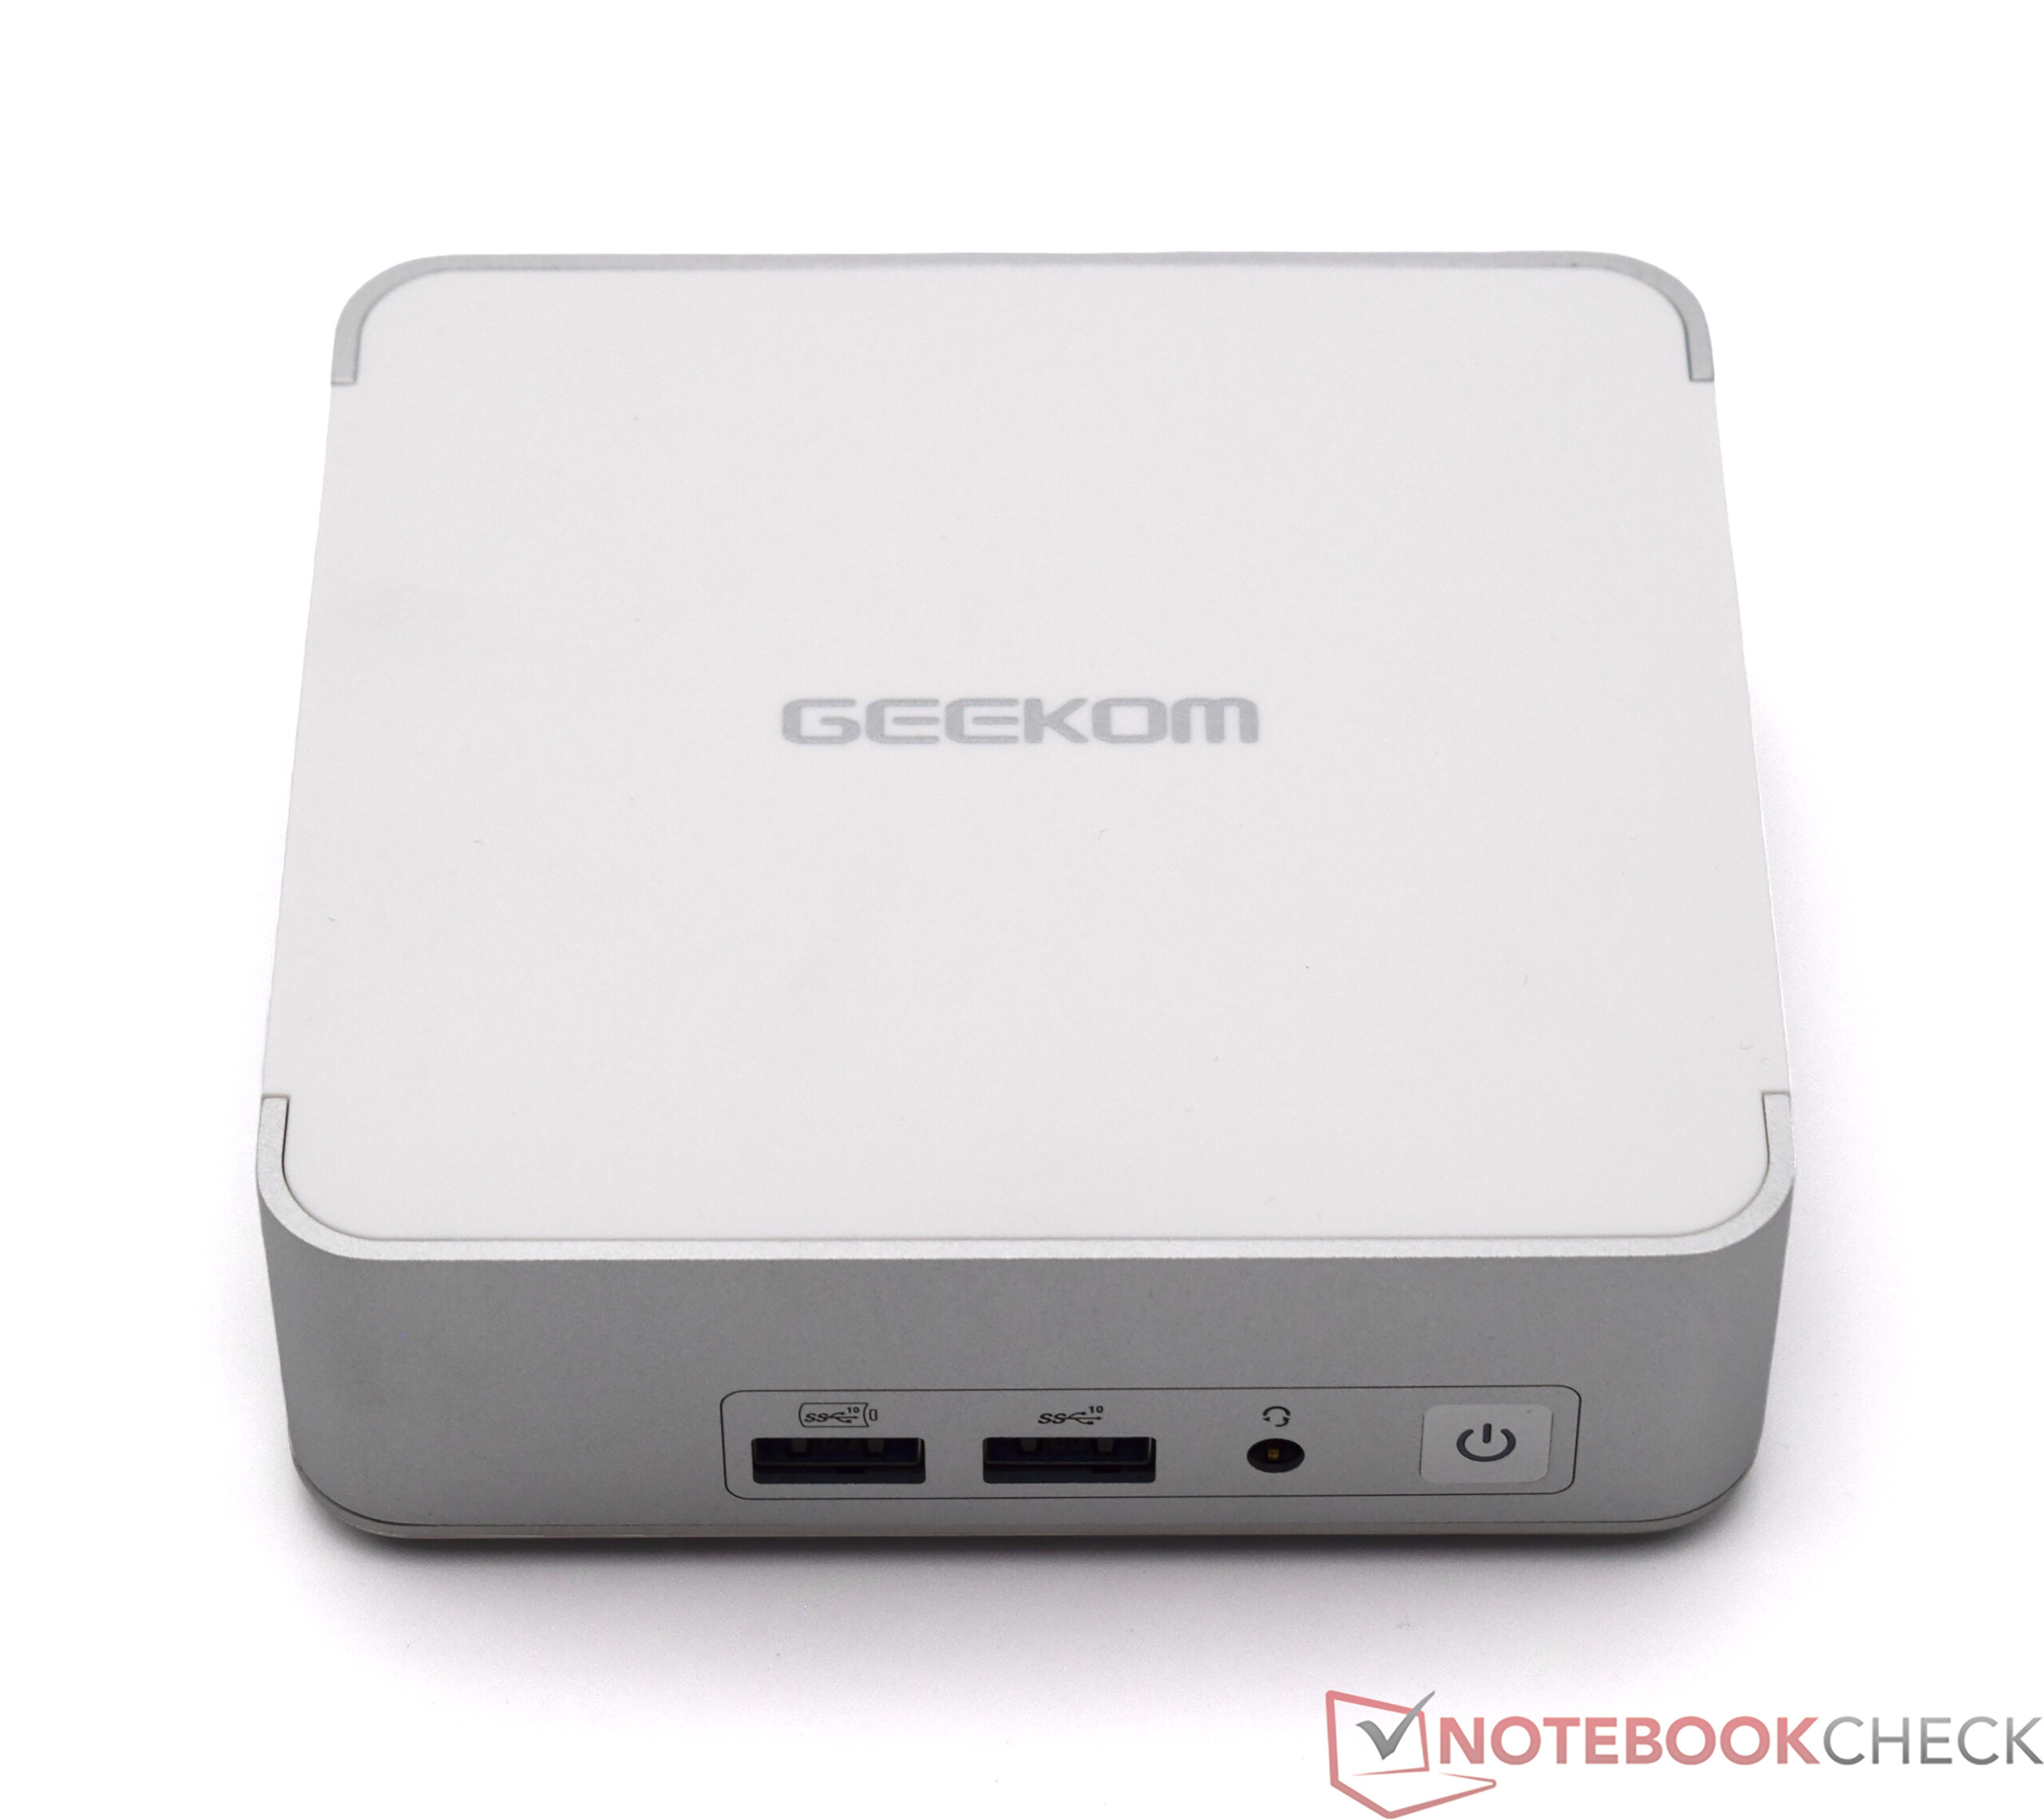
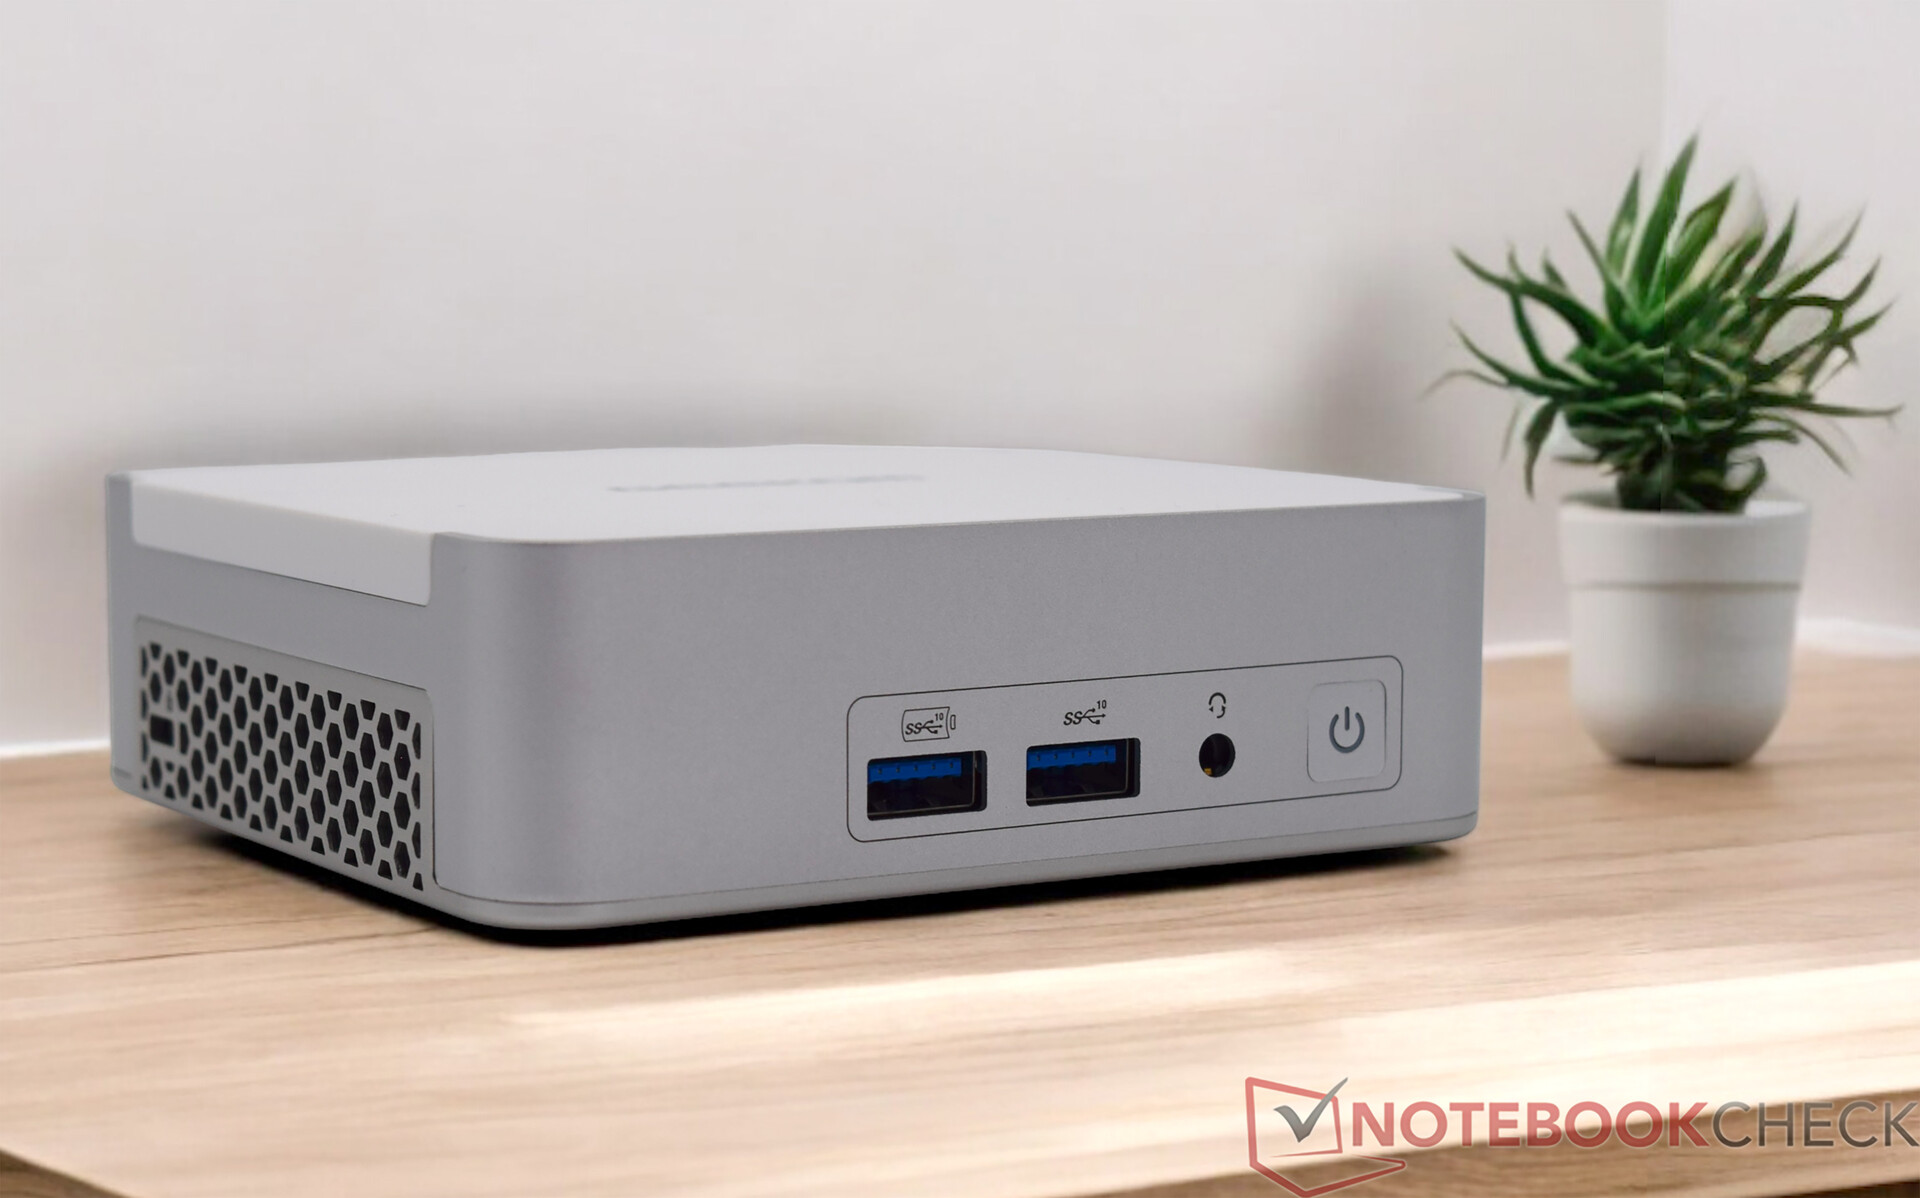
Le boîtier du Geekom XT13 Pro est familier, il a été utilisé pour le Geekom XT12 Pro. Une similitude avec le kit Intel NUC 13 Pro Desk Edition ne peut être niée non plus. Fondamentalement, il n'y a rien à redire sur le look. Notre échantillon de test est une fois de plus parfaitement fini et tout s'imbrique à merveille. Néanmoins, nous aurions aimé voir un nouveau boîtier pour le différencier légèrement de la concurrence interne. Le mini-PC ne prend que 11,7 x 11,2 centimètres sur le bureau, ce qui en fait l'un des appareils les plus compacts. Le Geekom XT13 Pro peut également être fixé directement sur un moniteur à l'aide du support VESA fourni.
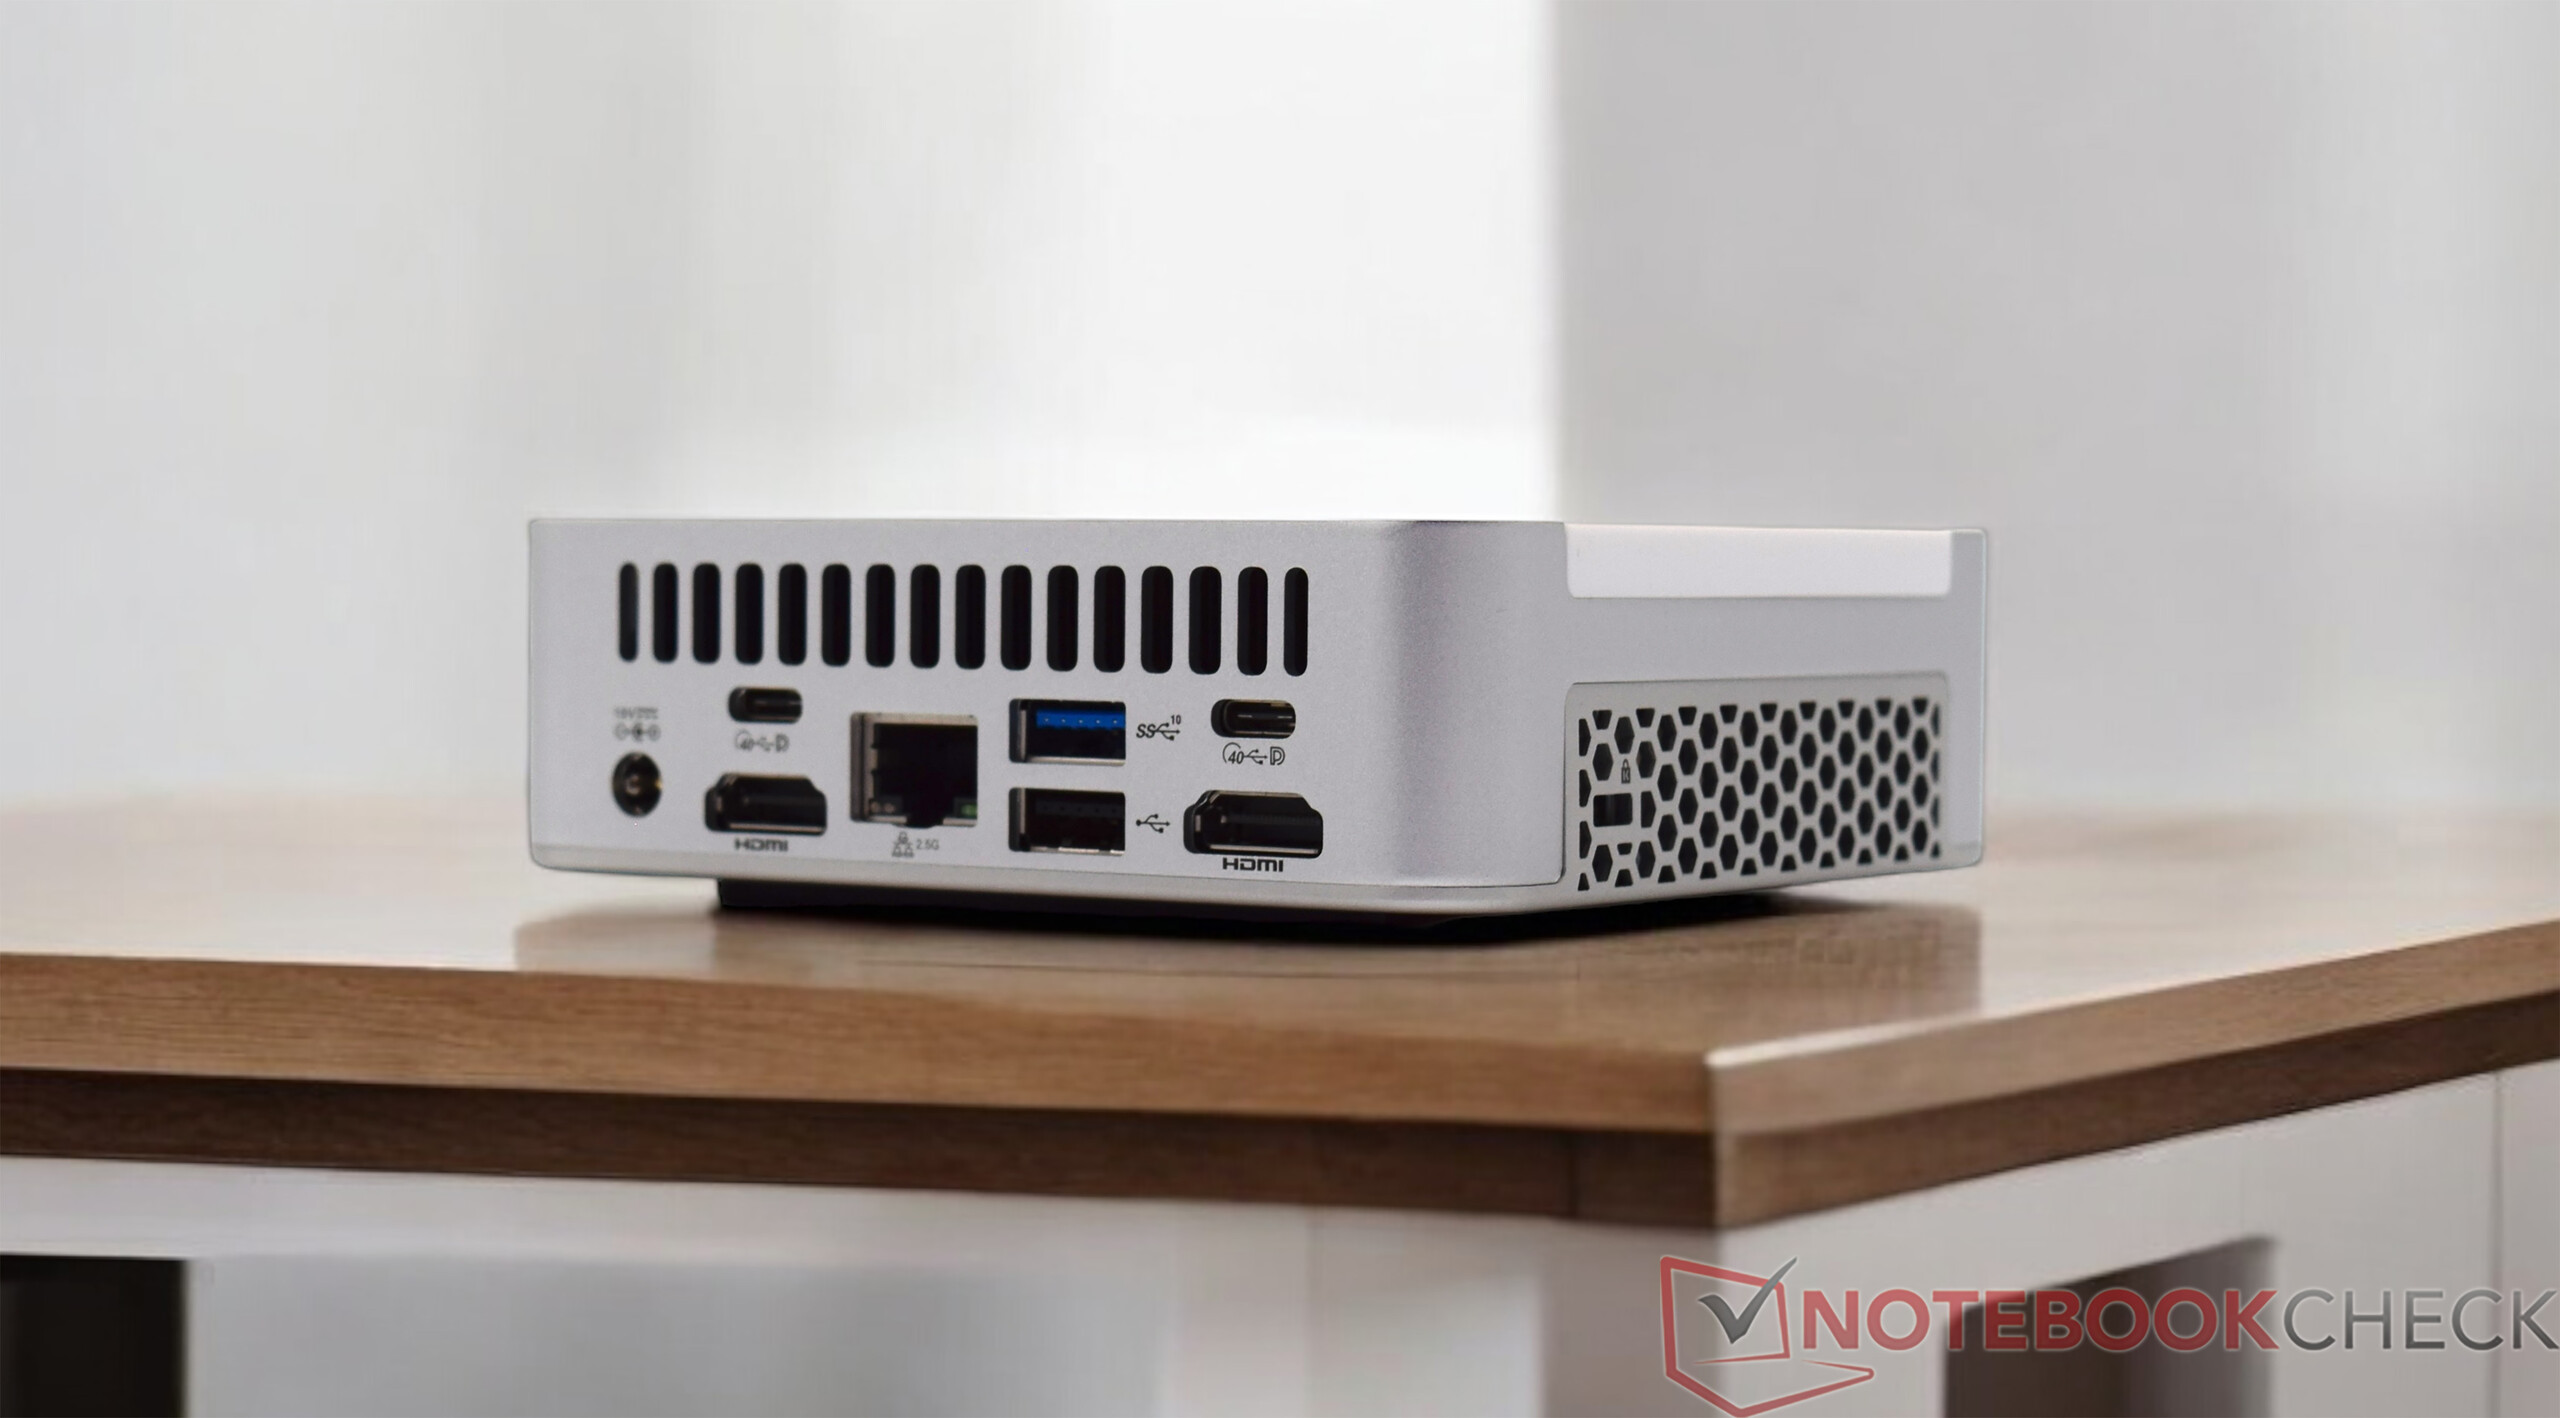
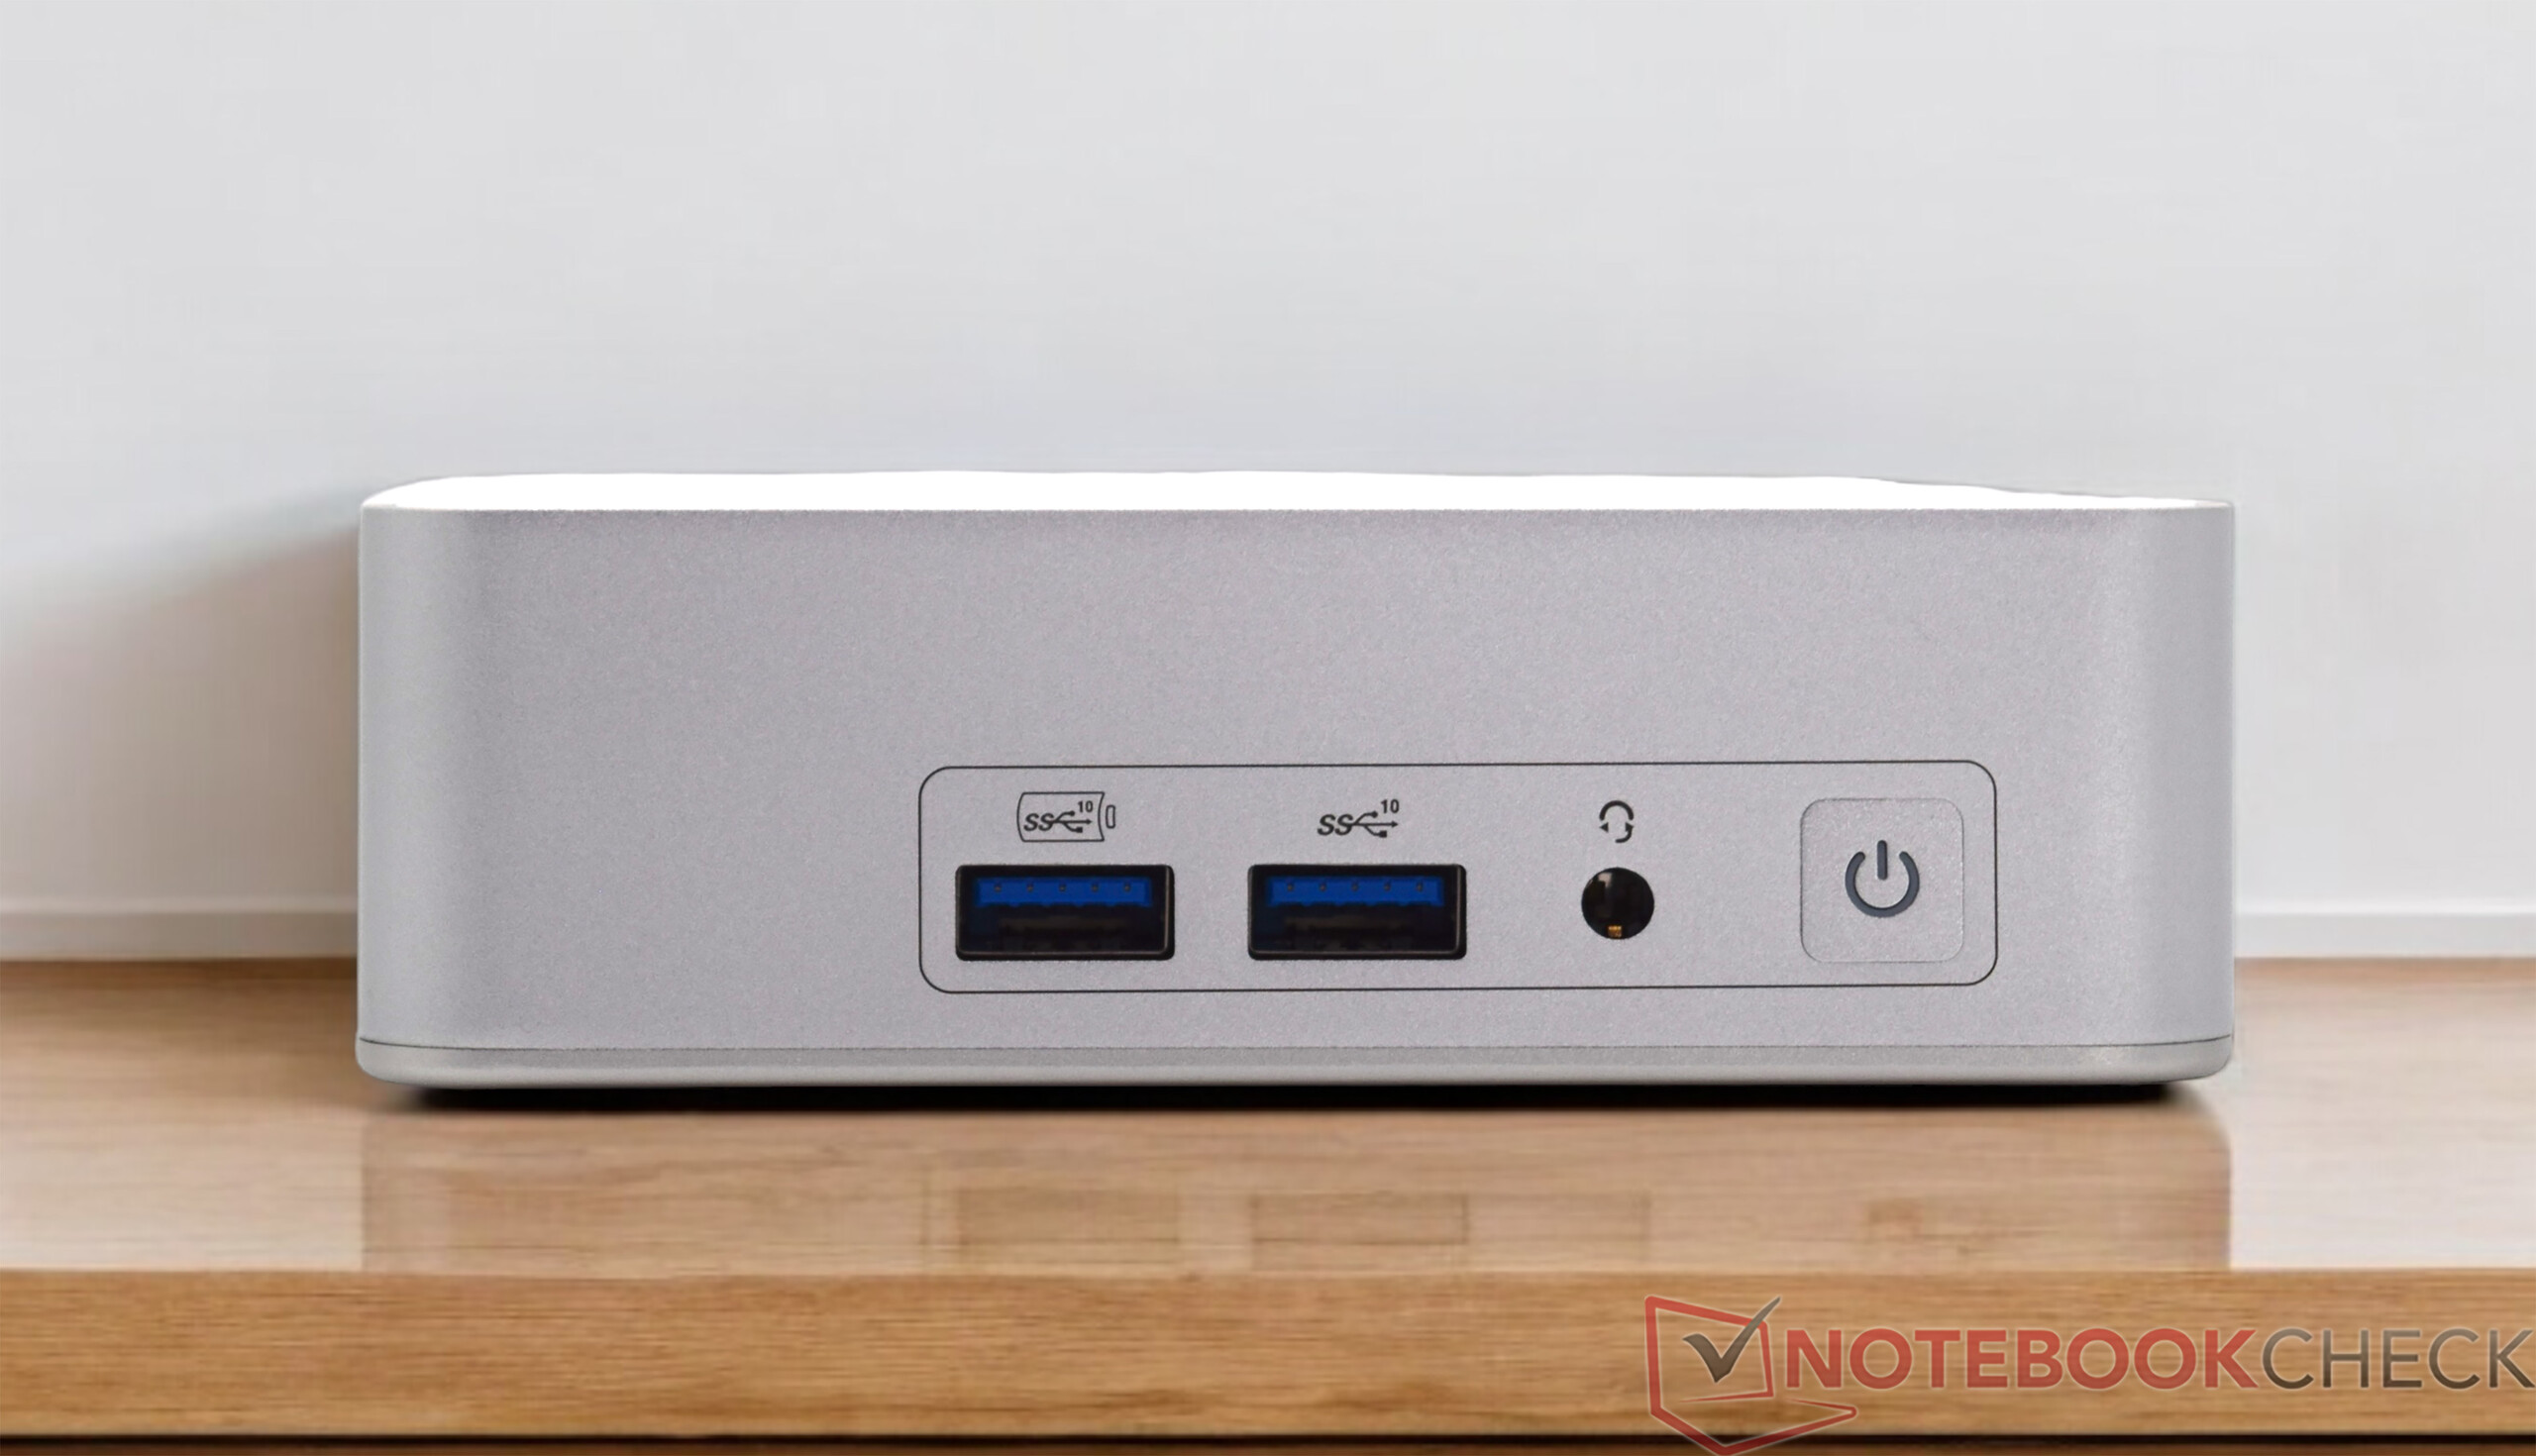
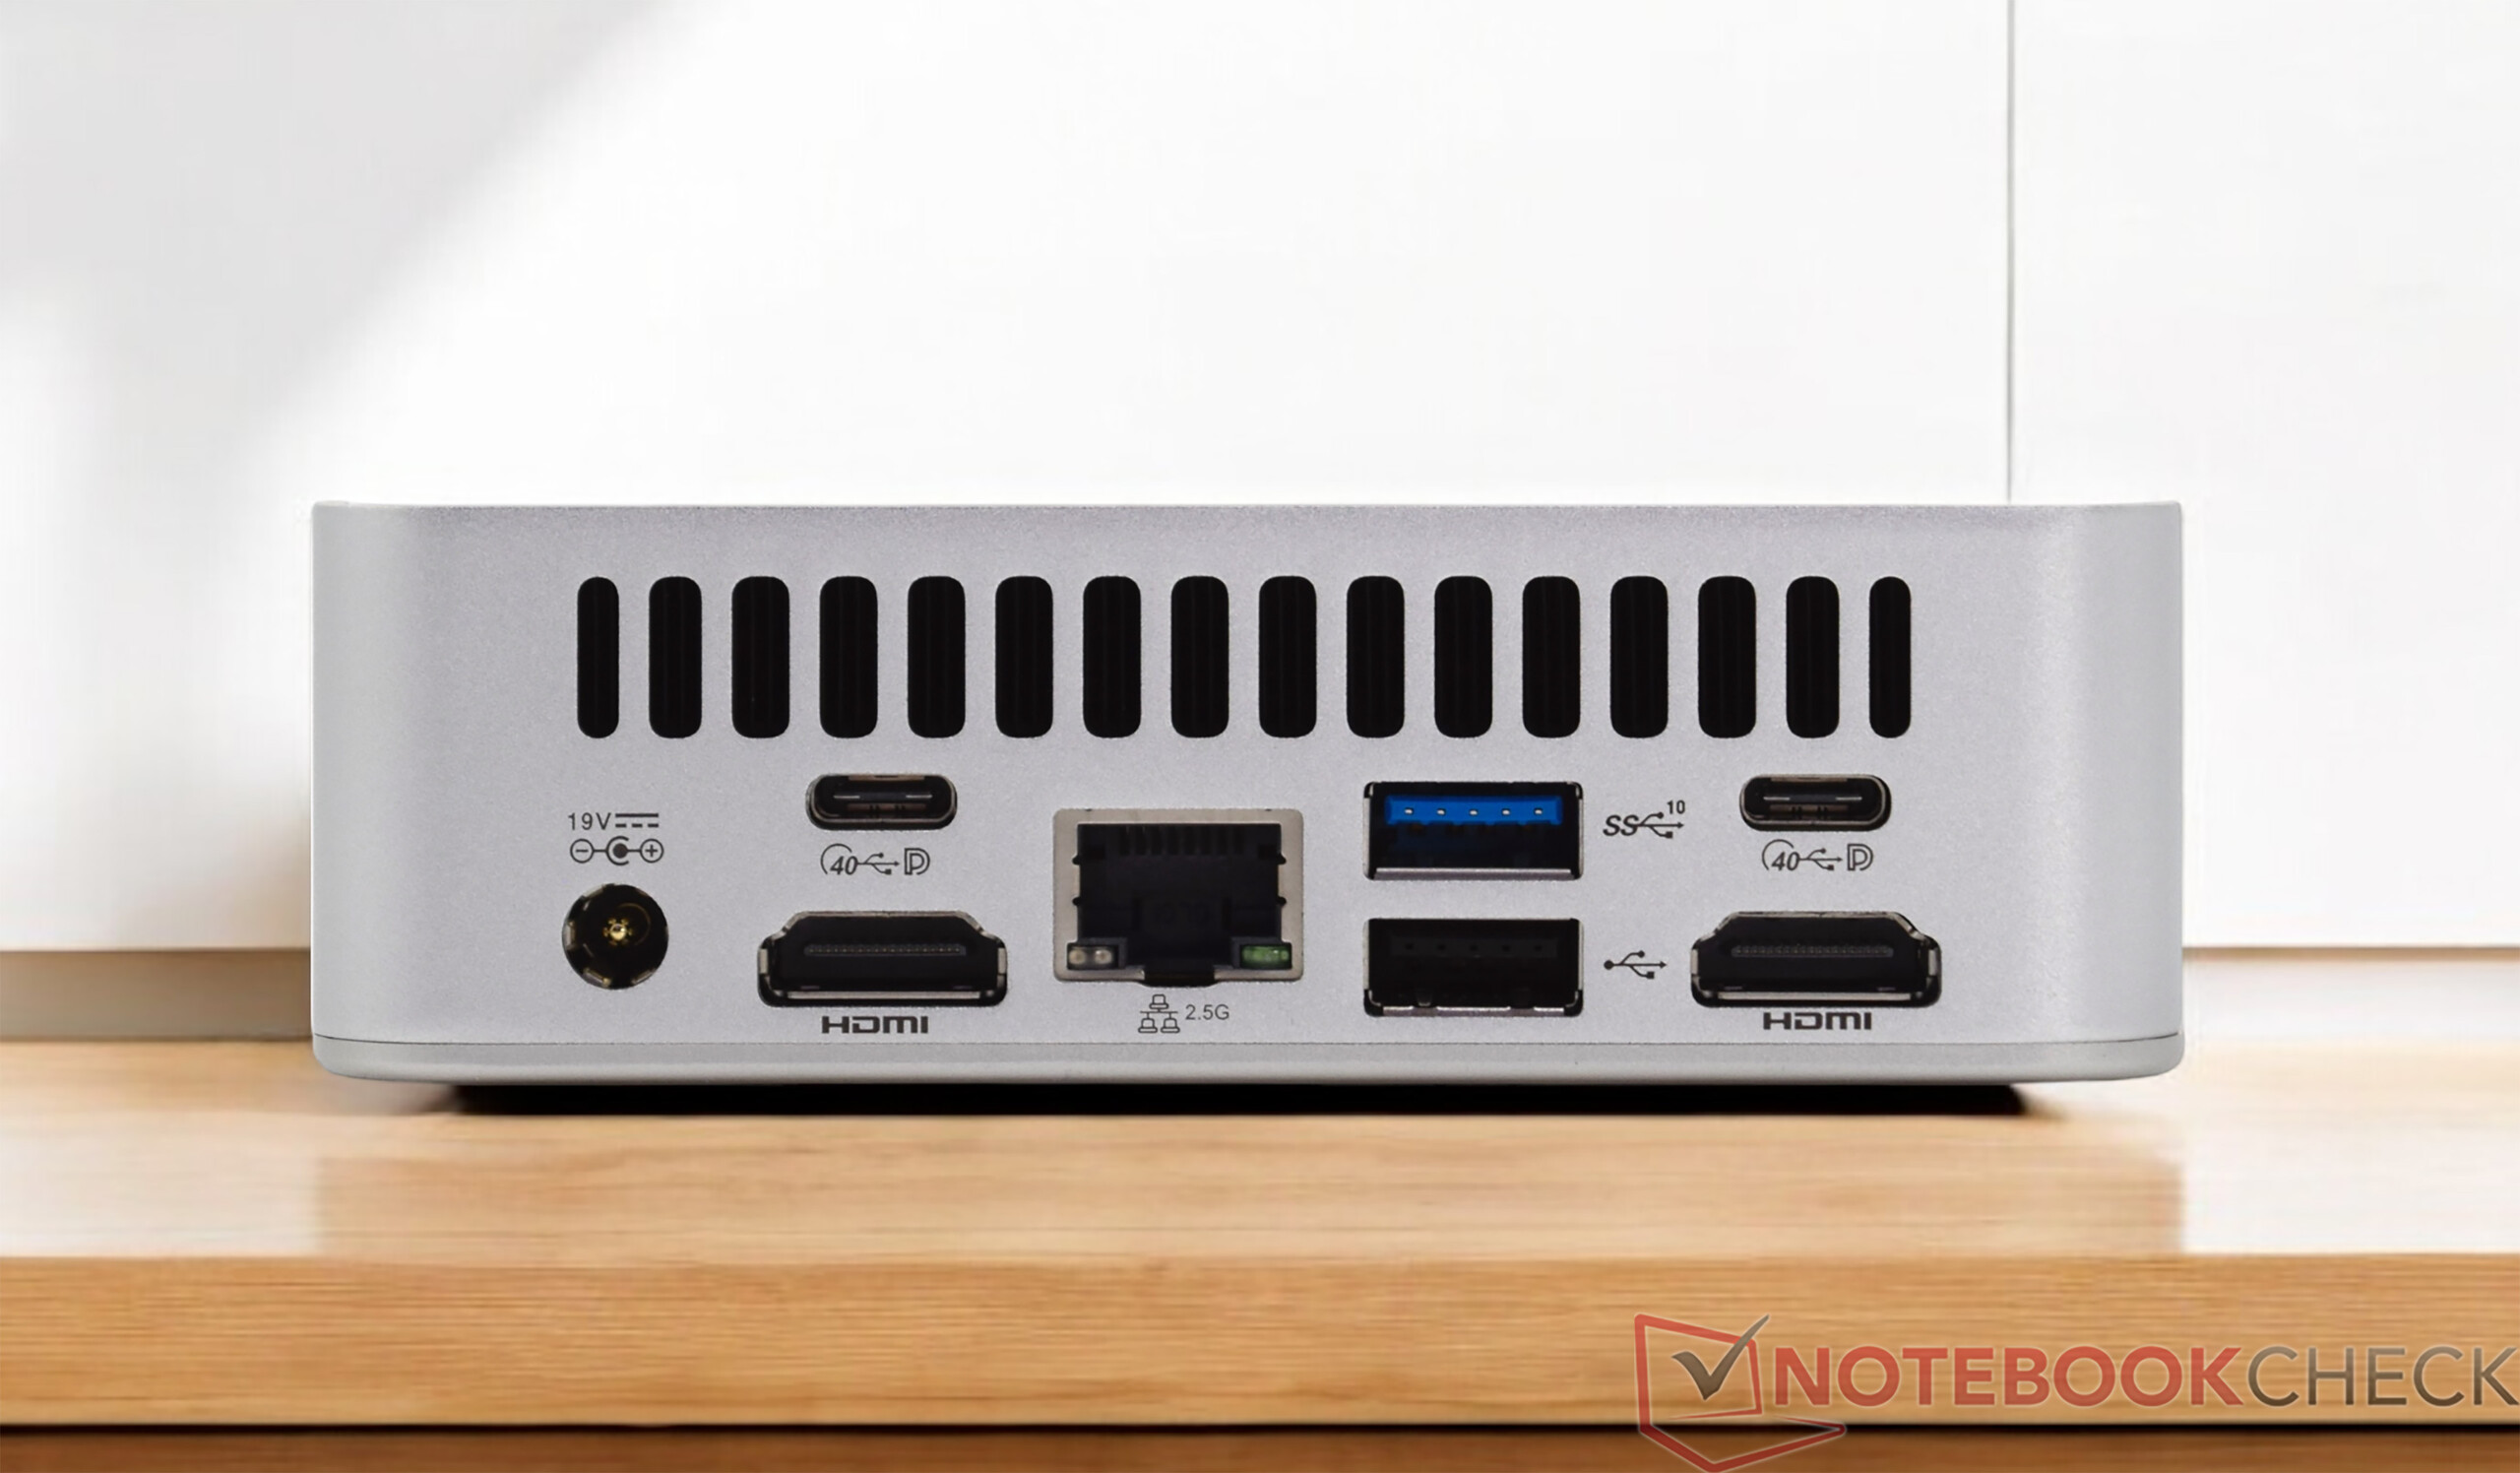
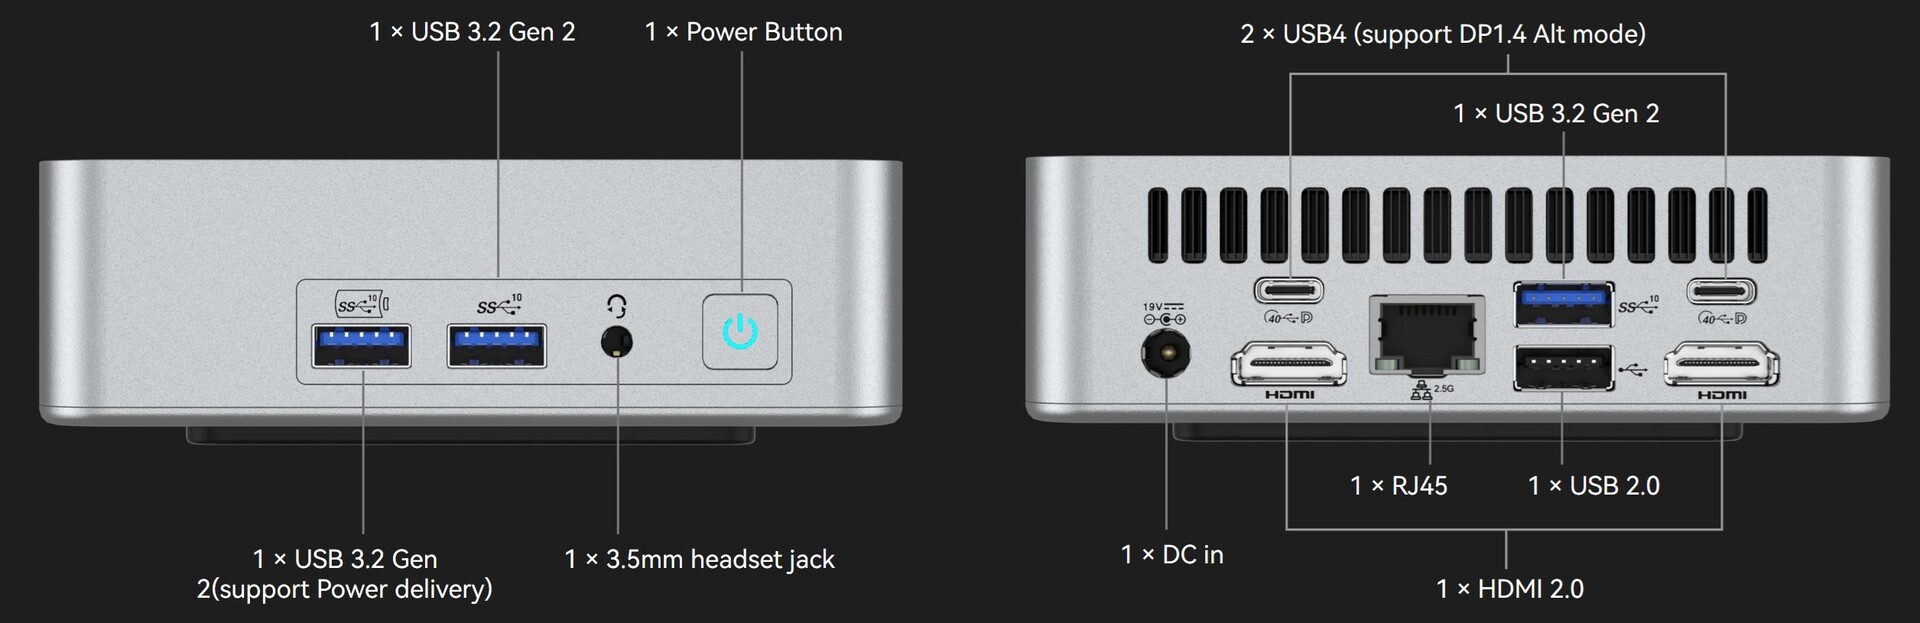
Equipement - Bonne sélection et 2x USB4
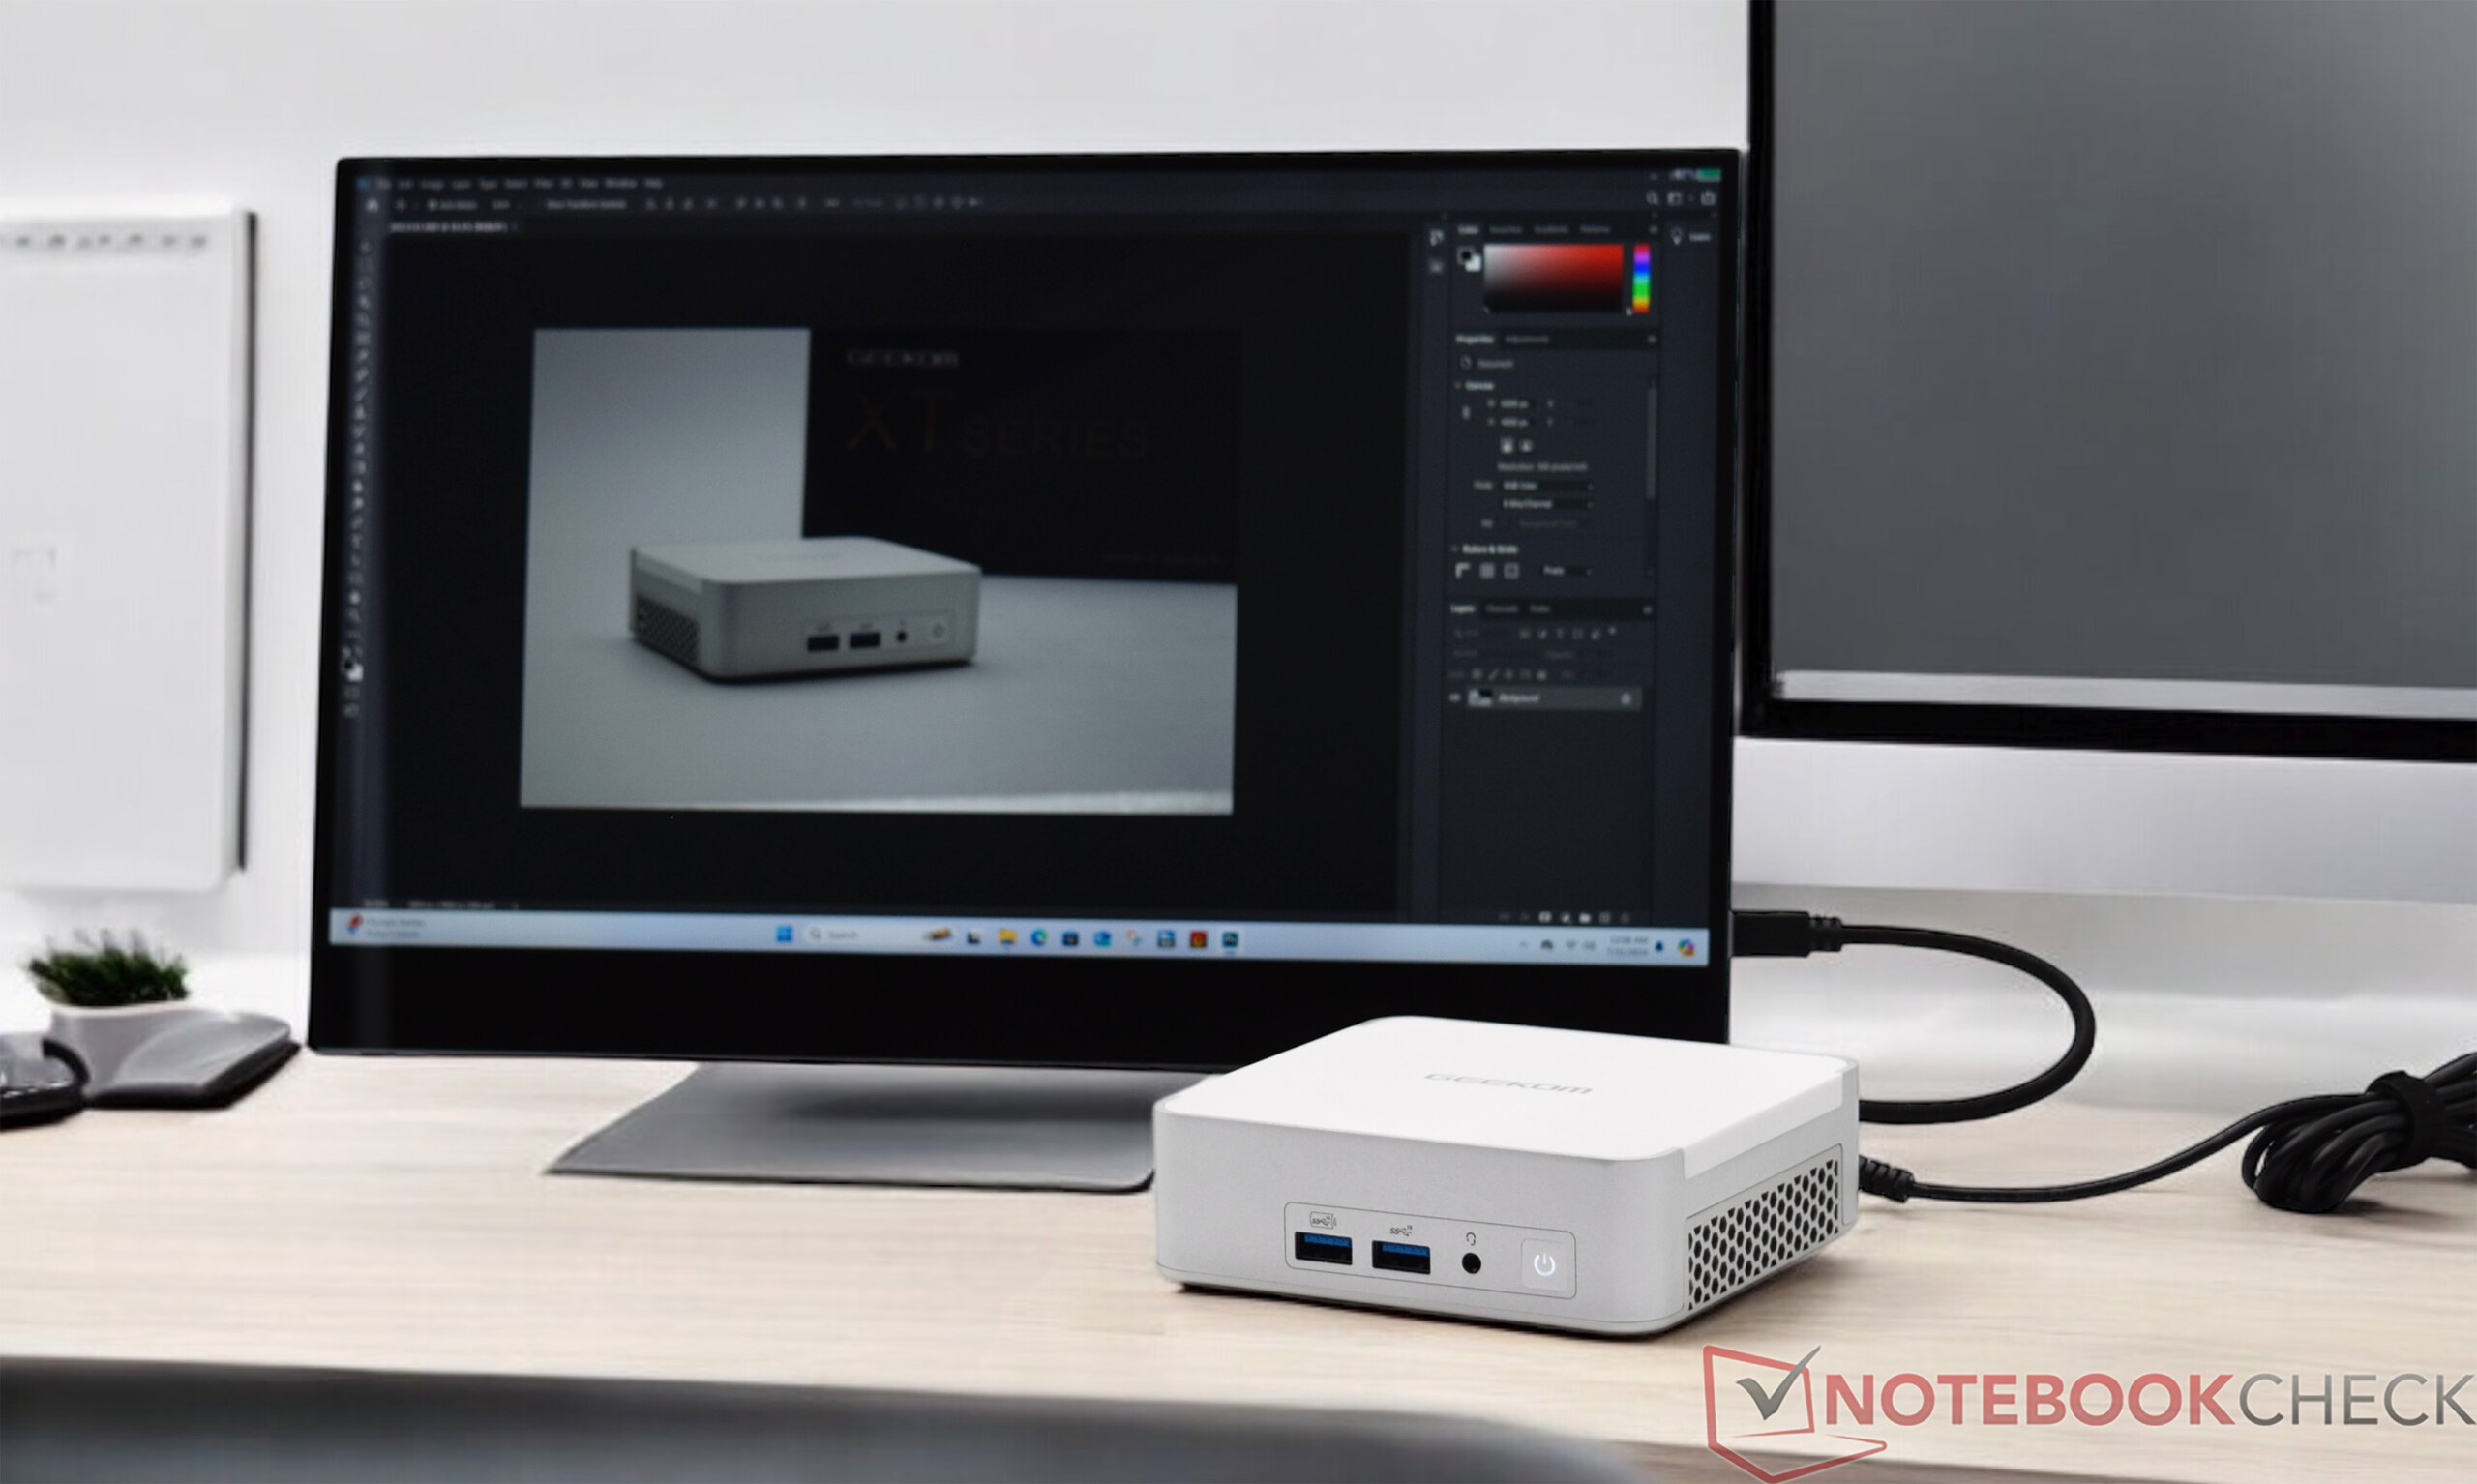
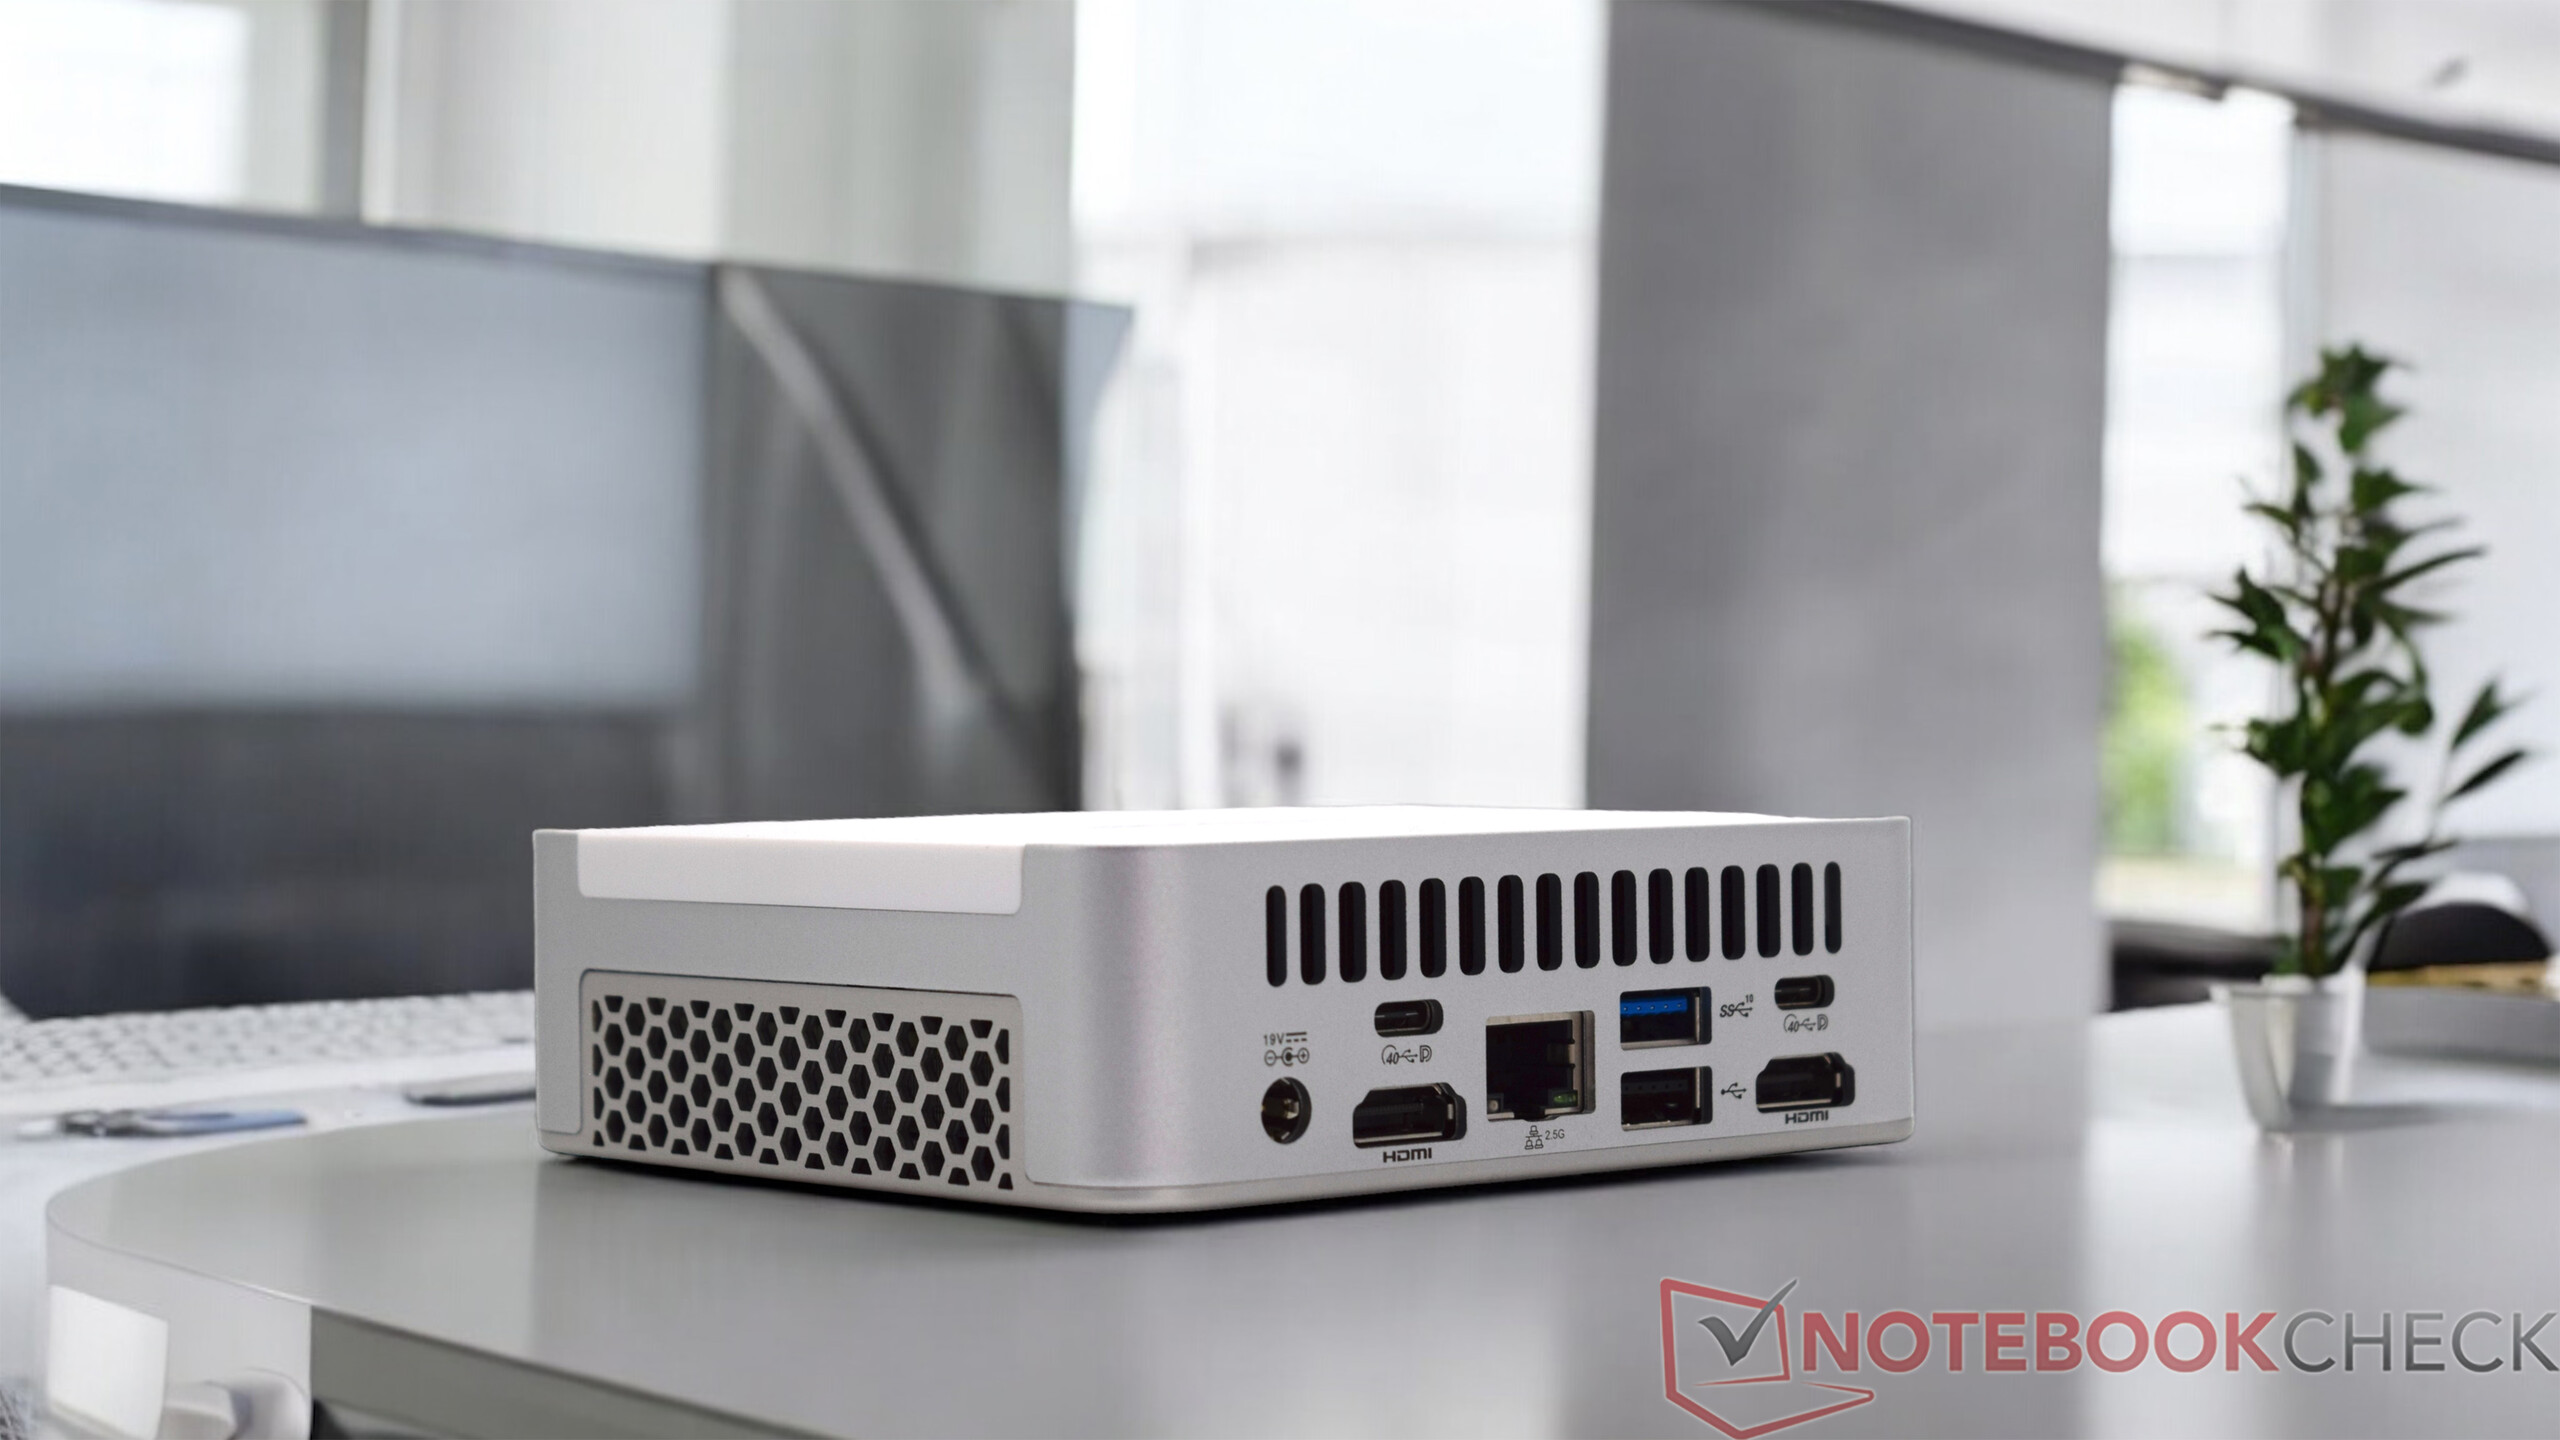
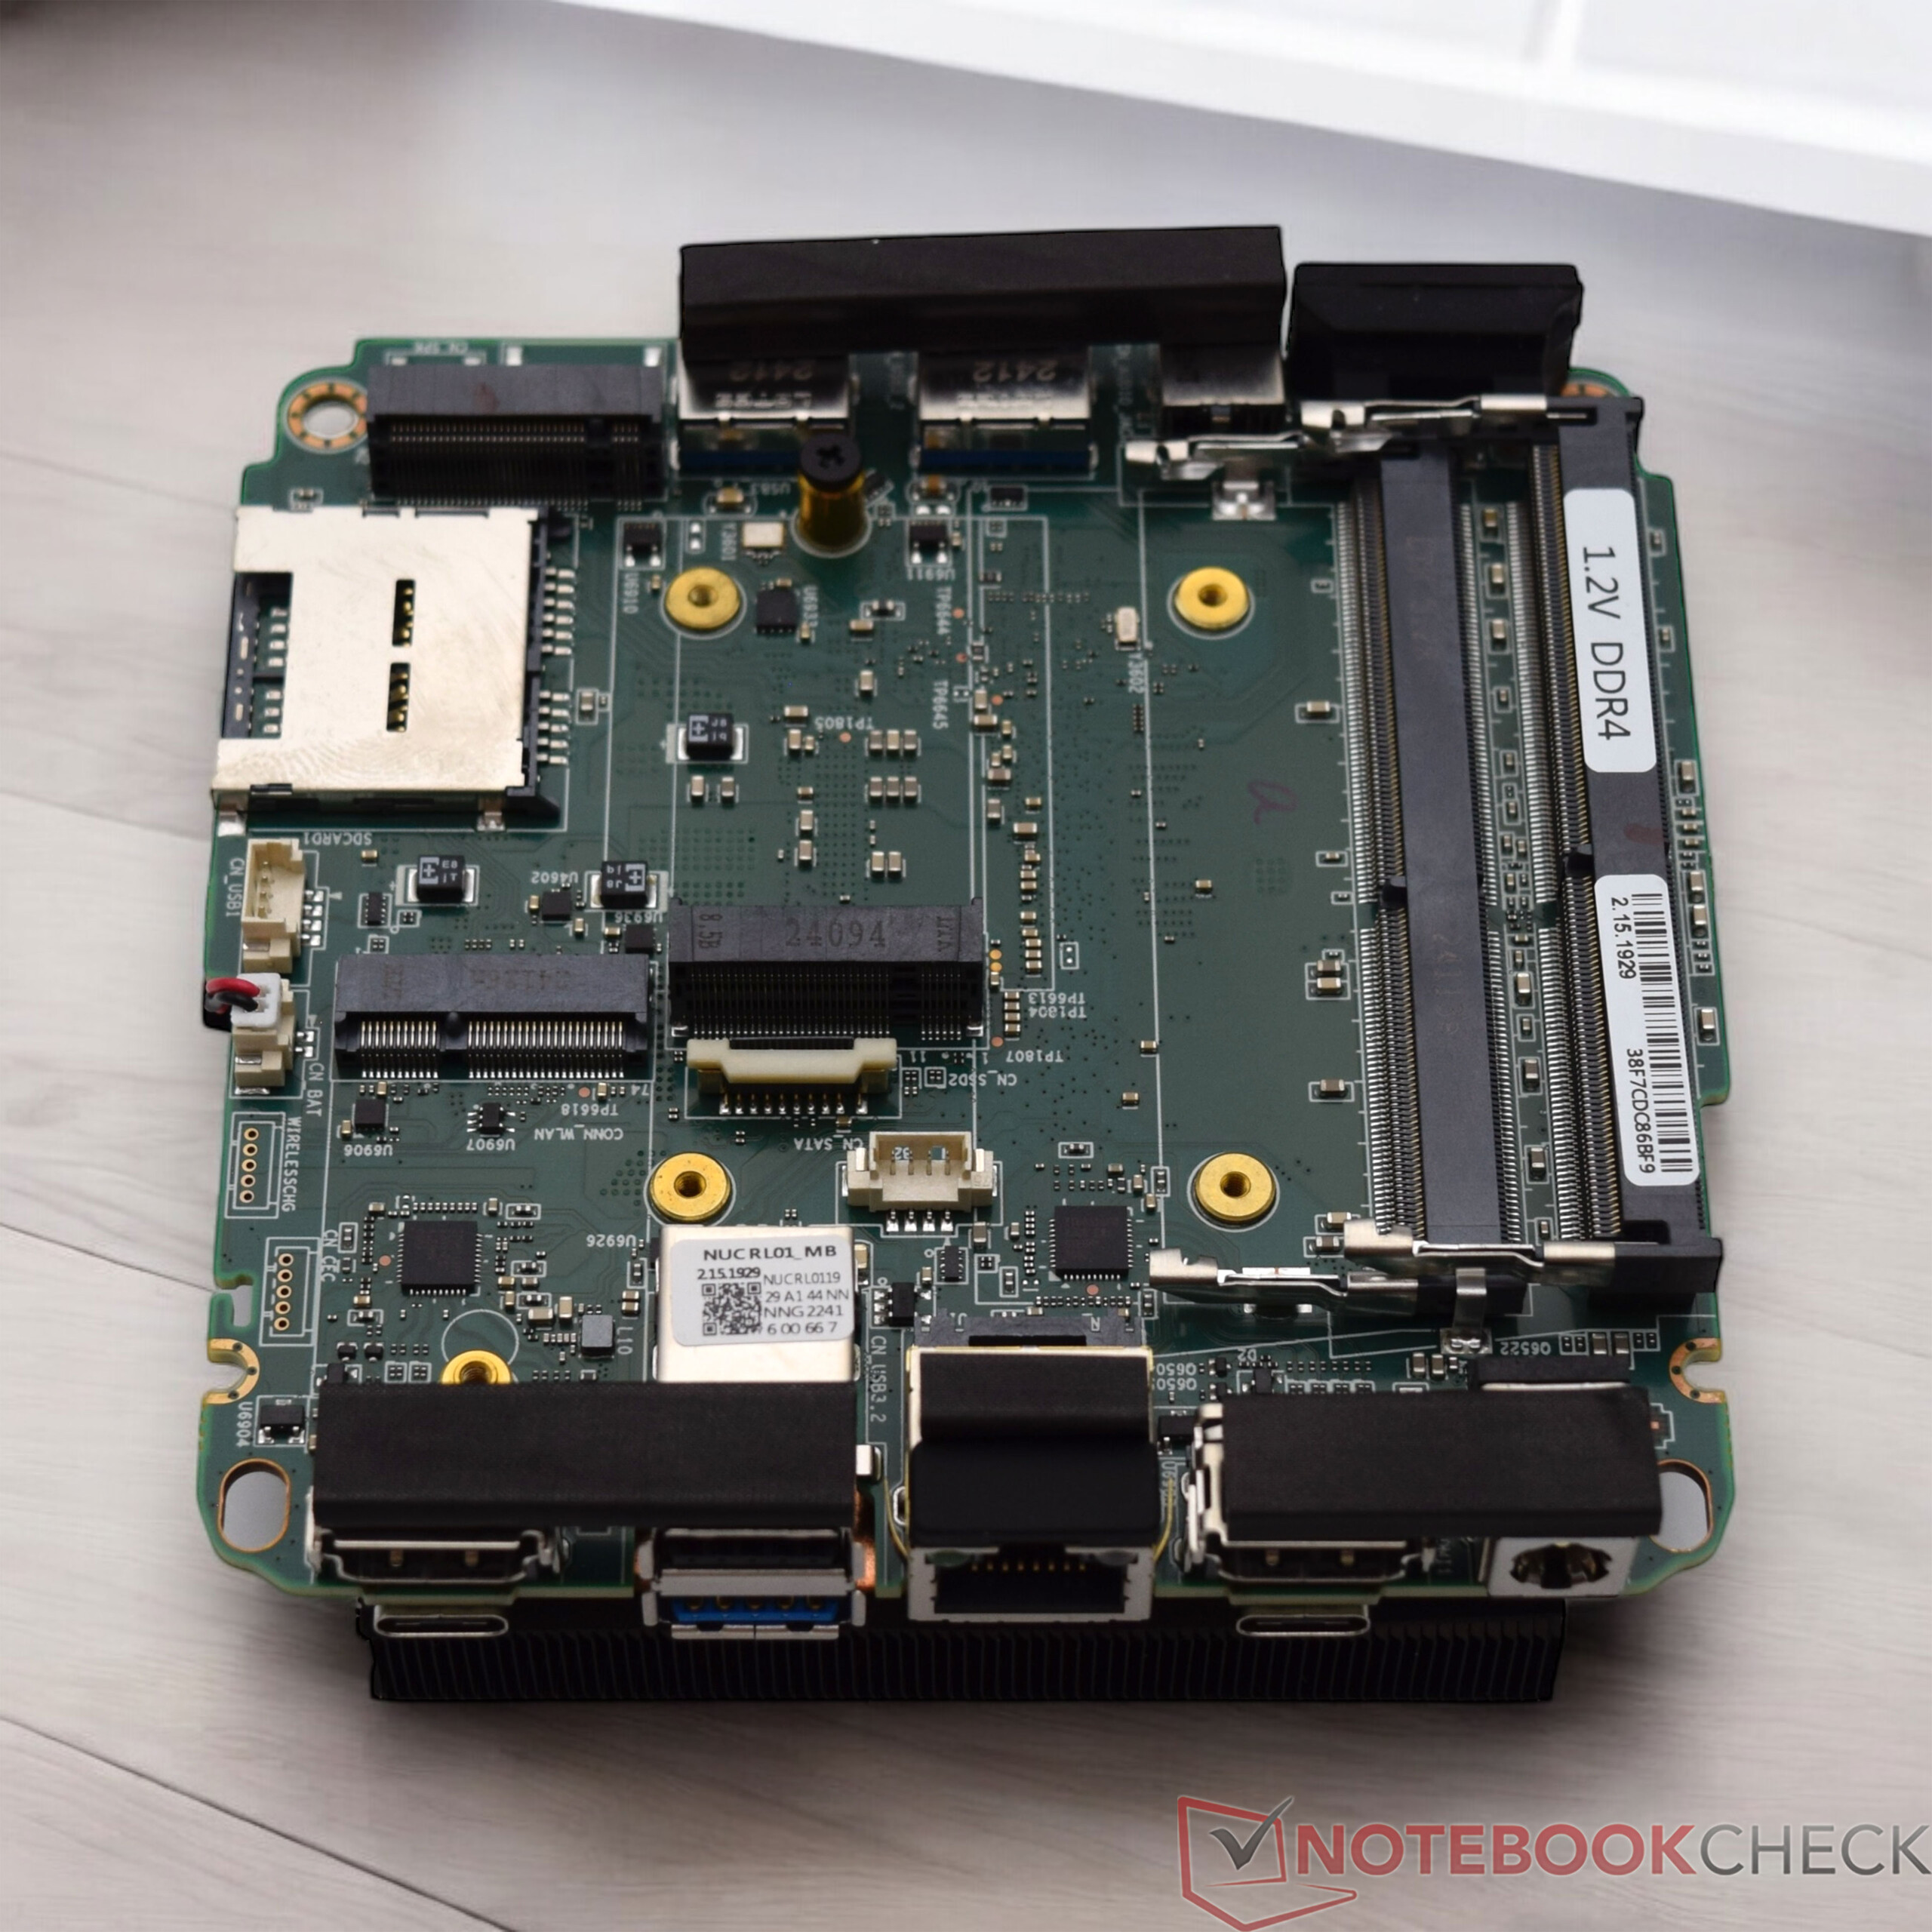
En termes d'interfaces externes, le Geekom XT13 Pro dispose des mêmes options que le Geekom XT12 Pro. Bien que l'appareil soit très compact, il y a beaucoup de connexions différentes. Les deux prises USB-C à l'arrière sont des ports USB4 modernes, ce qui élargit considérablement la gamme d'applications avec les bons accessoires. Au total, quatre écrans peuvent être utilisés simultanément et il y a également une connexion LAN.
Communication
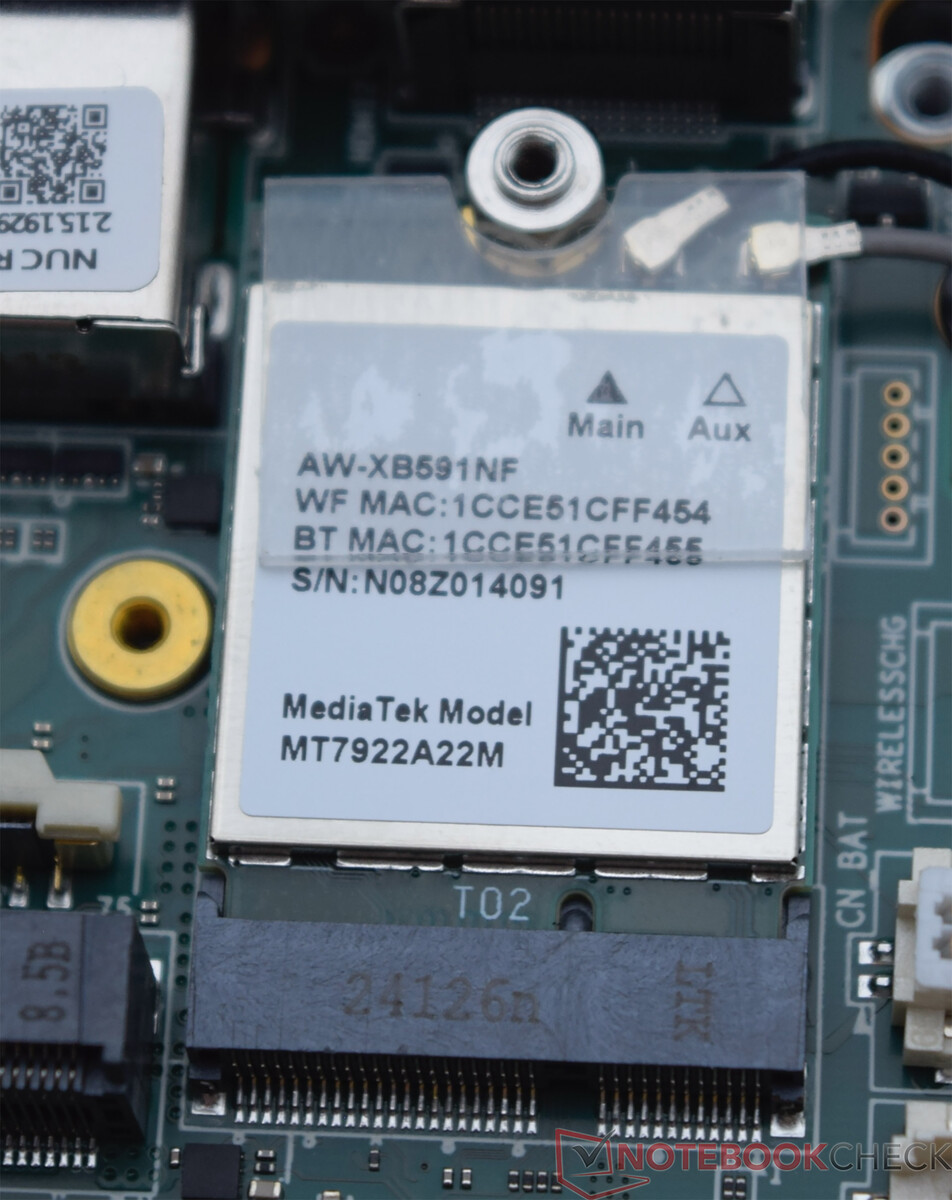
Le Geekom XT13 Pro utilise un module sans fil bien connu que Geekom installe dans un grand nombre de ses appareils. Le module WLAN MediaTek Wi-Fi 6E MT7922 peut fournir des performances adéquates dans notre appareil de test. Dans la mesure du possible, il convient toutefois d'utiliser en priorité la plage de fréquences de 6 GHz. Il est également possible d'utiliser la connexion par câble. Des débits de données allant jusqu'à 2,5 GBit/s sont alors possibles.
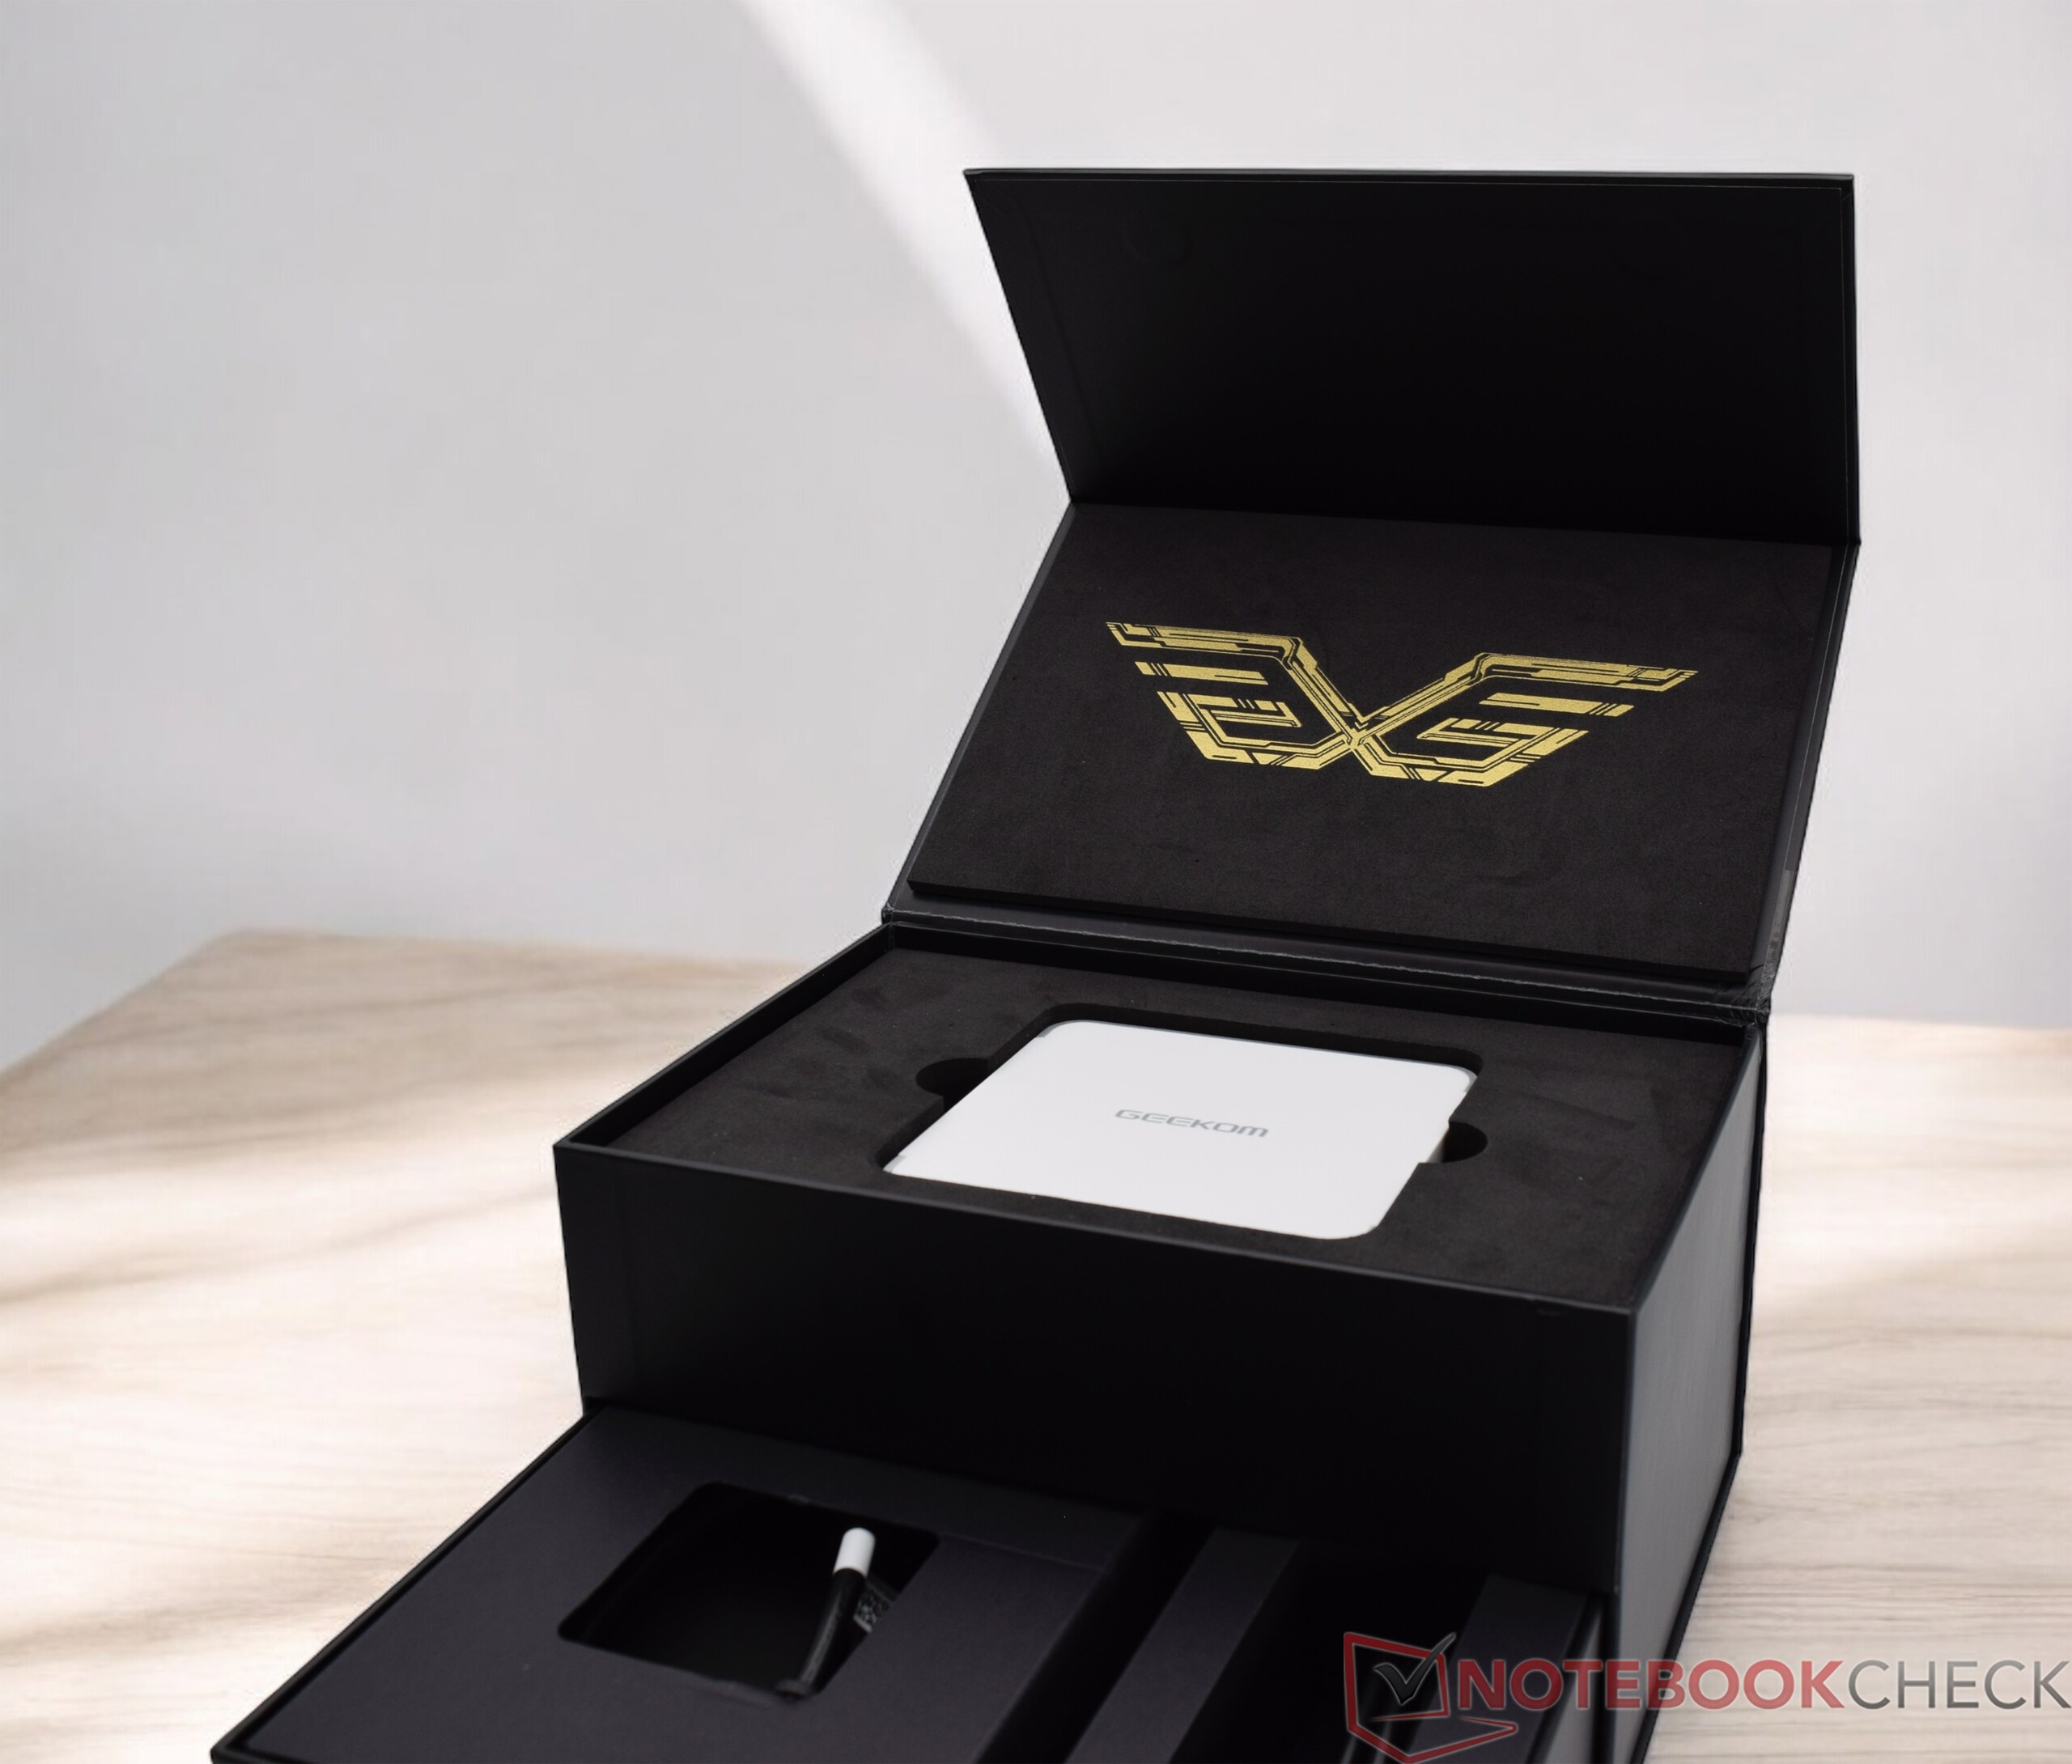
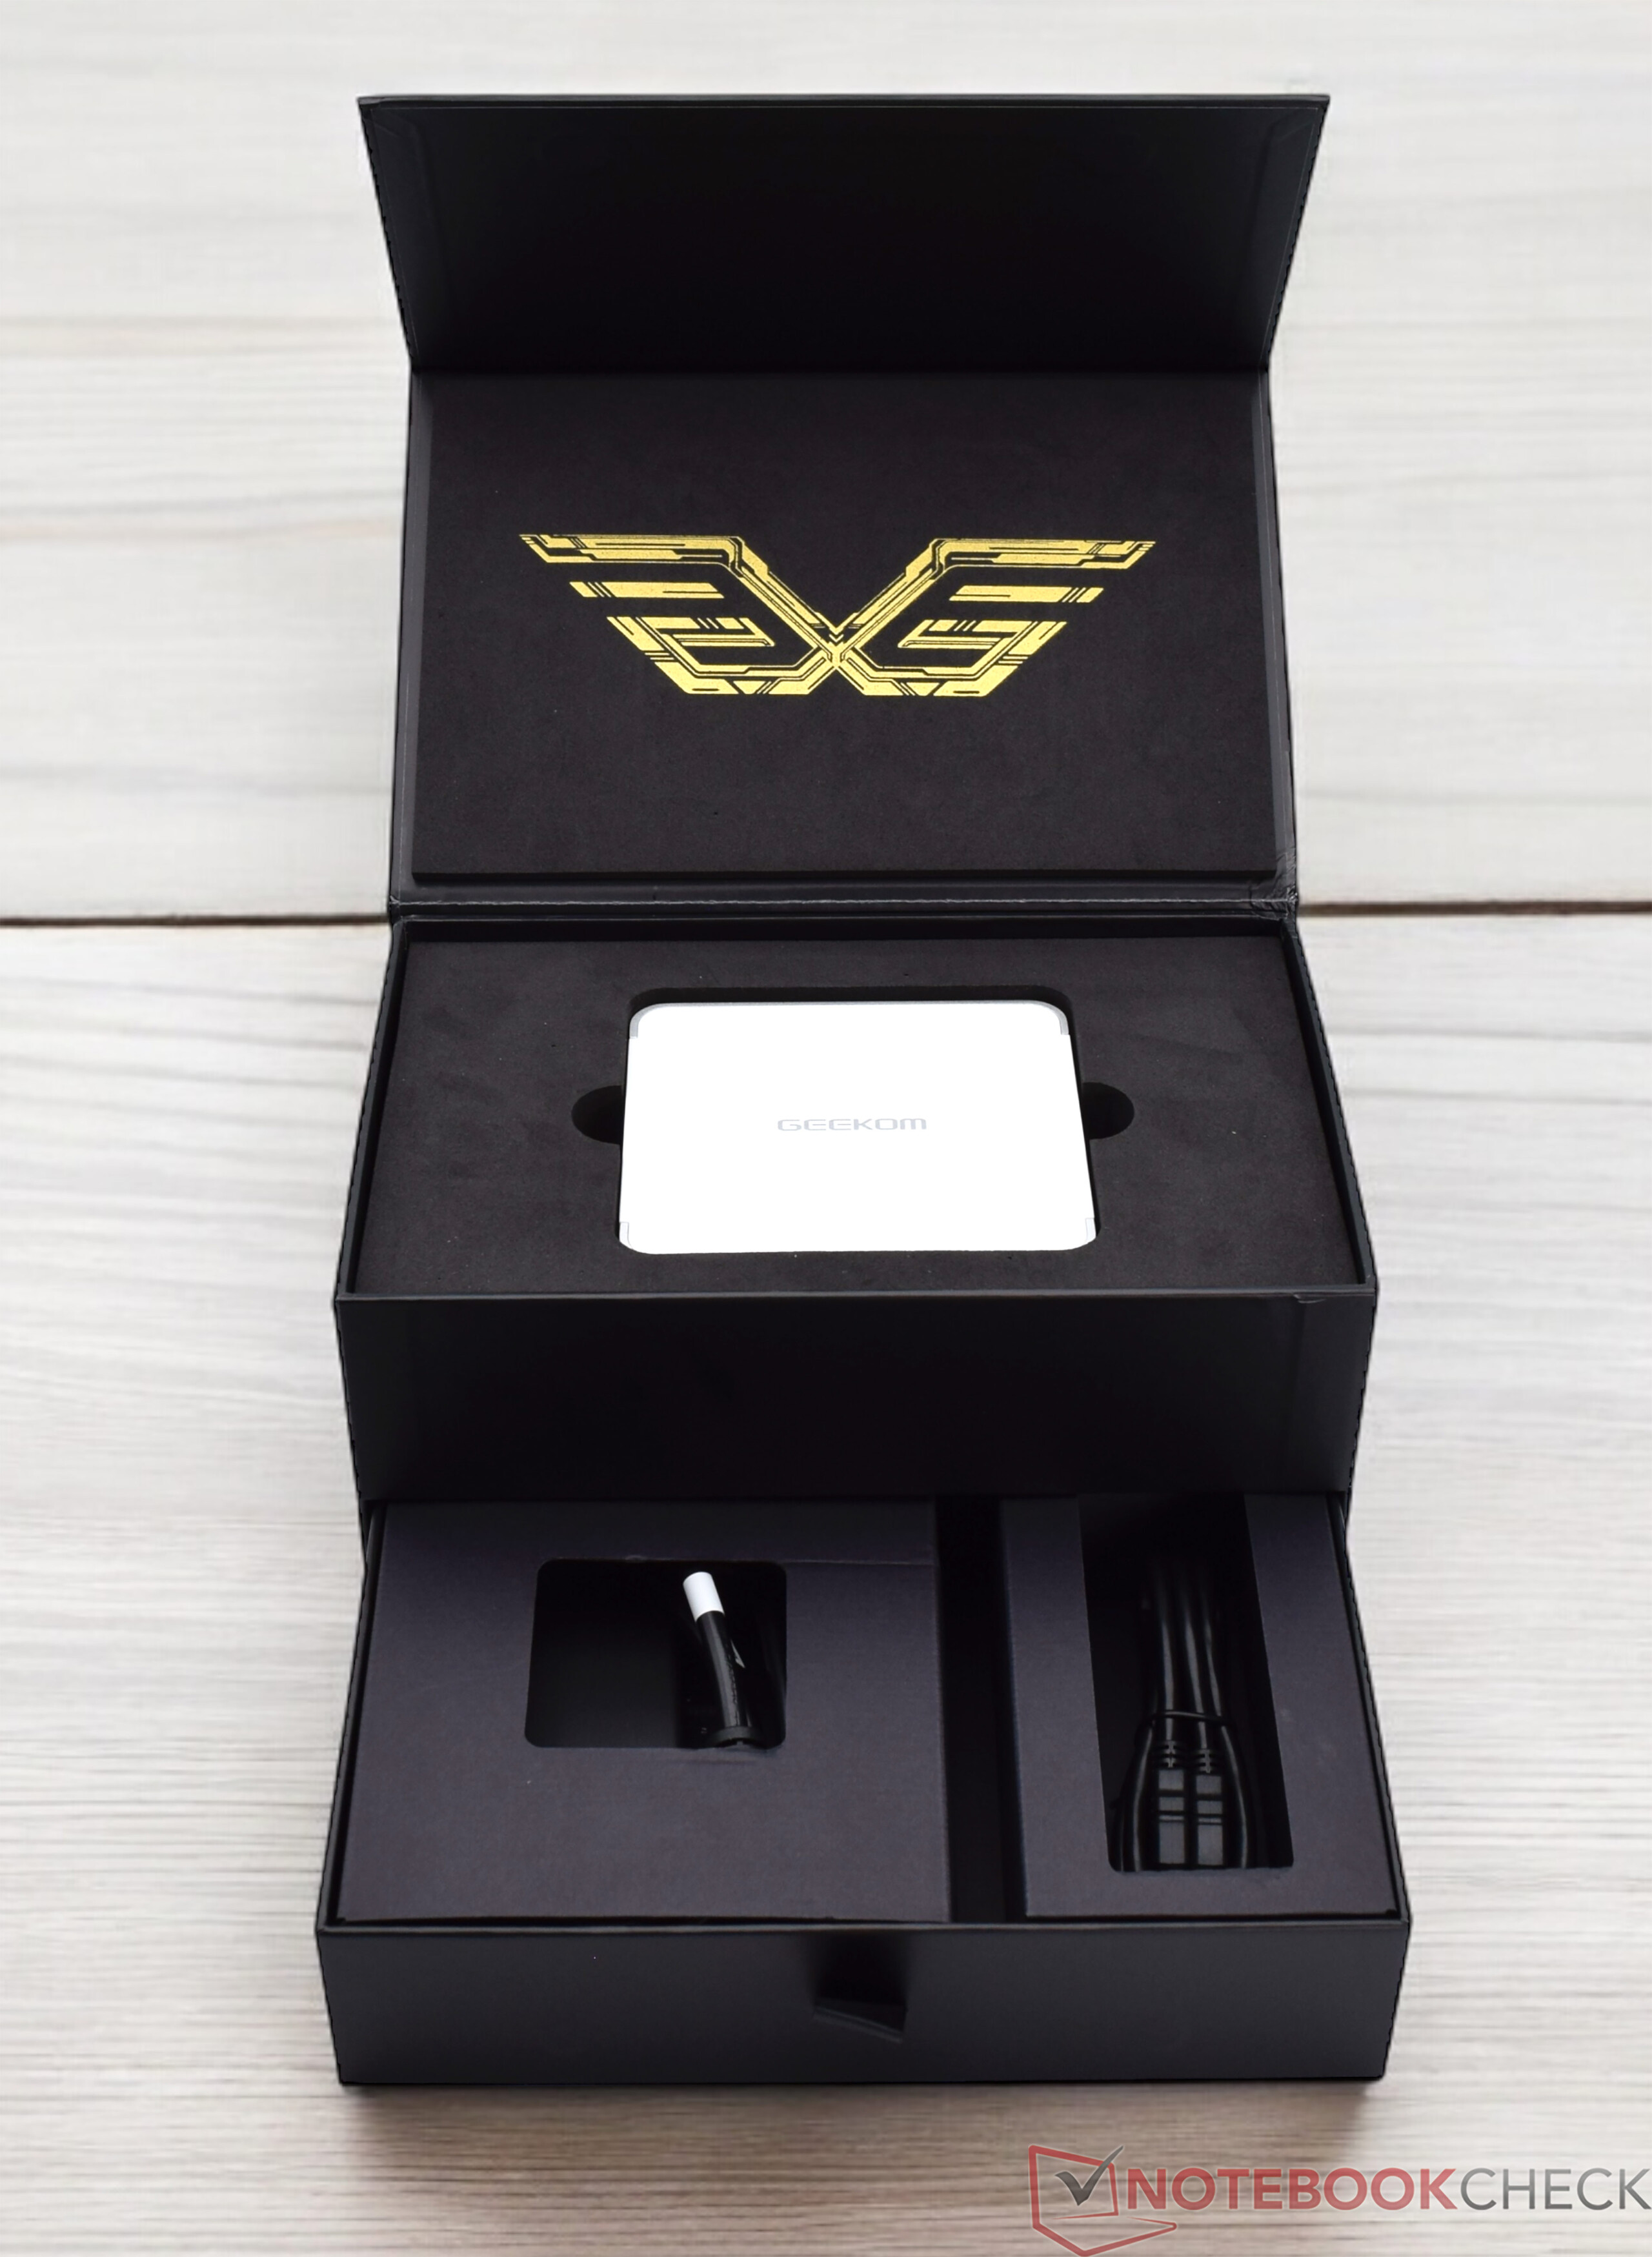
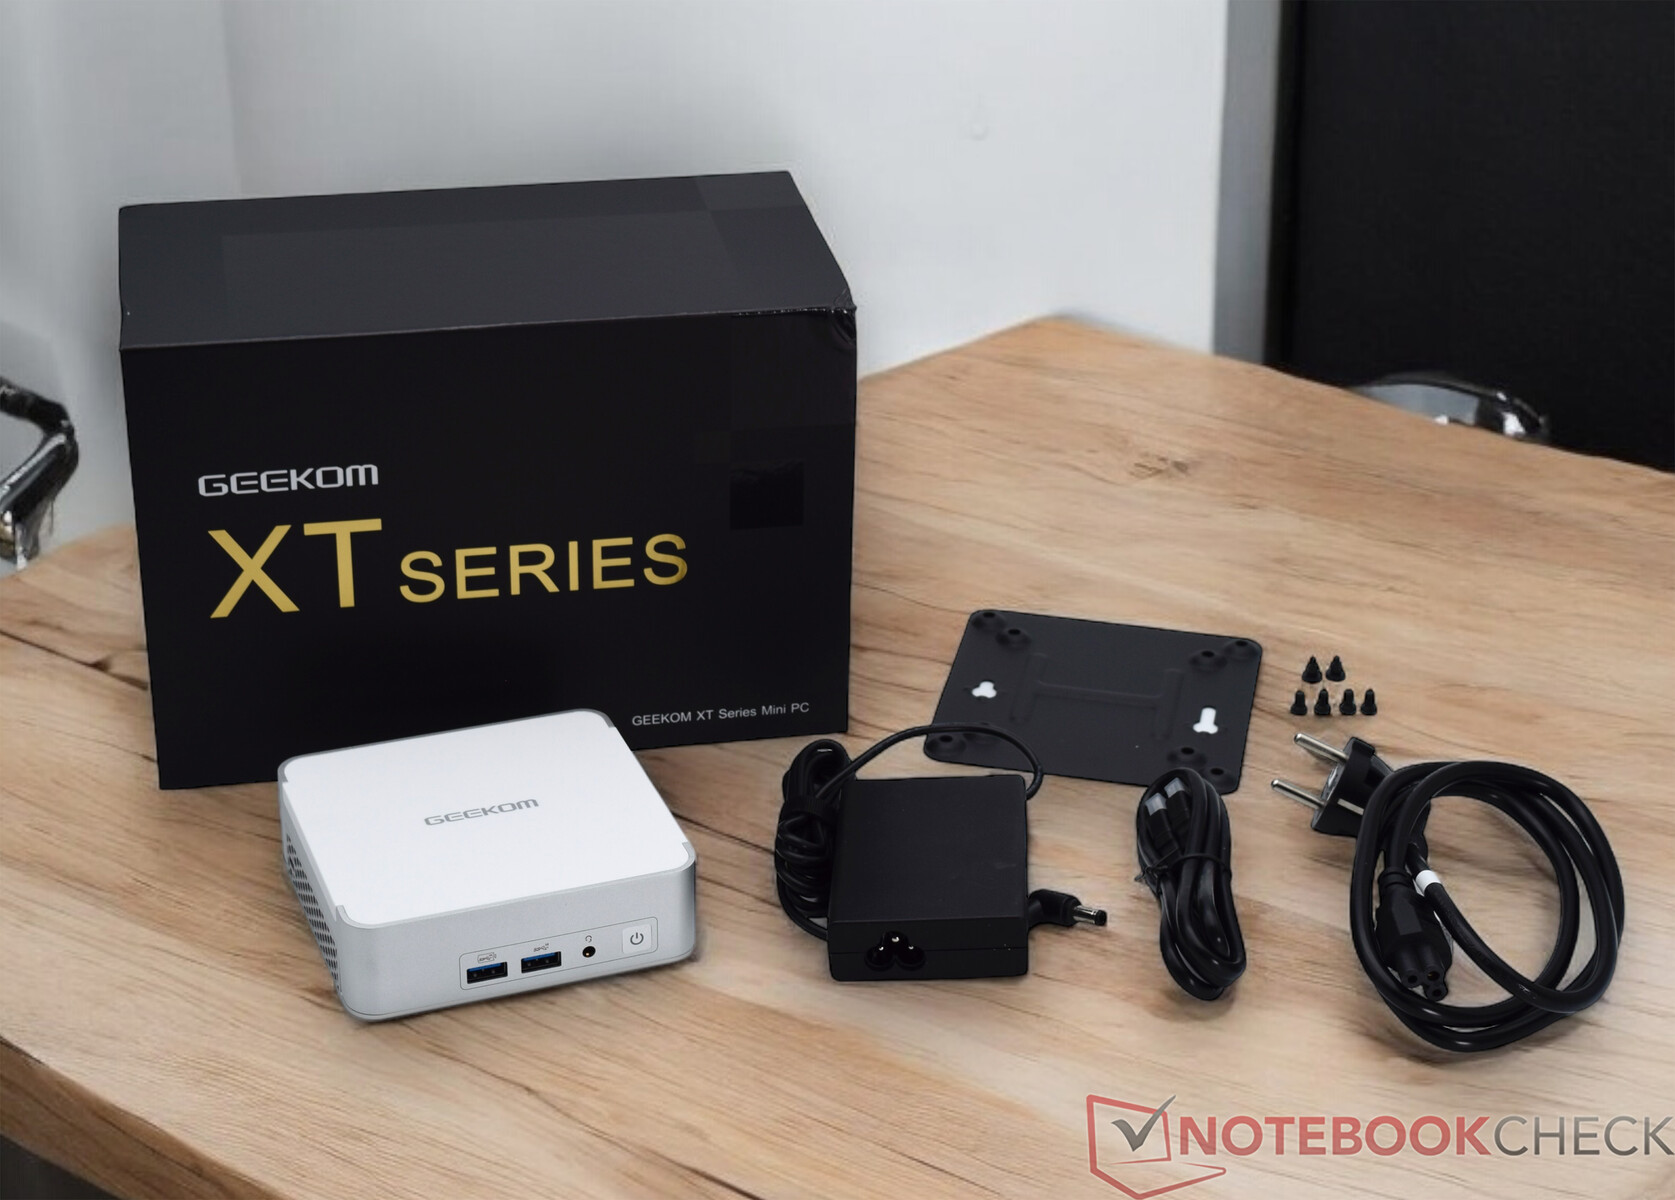
Accessoires
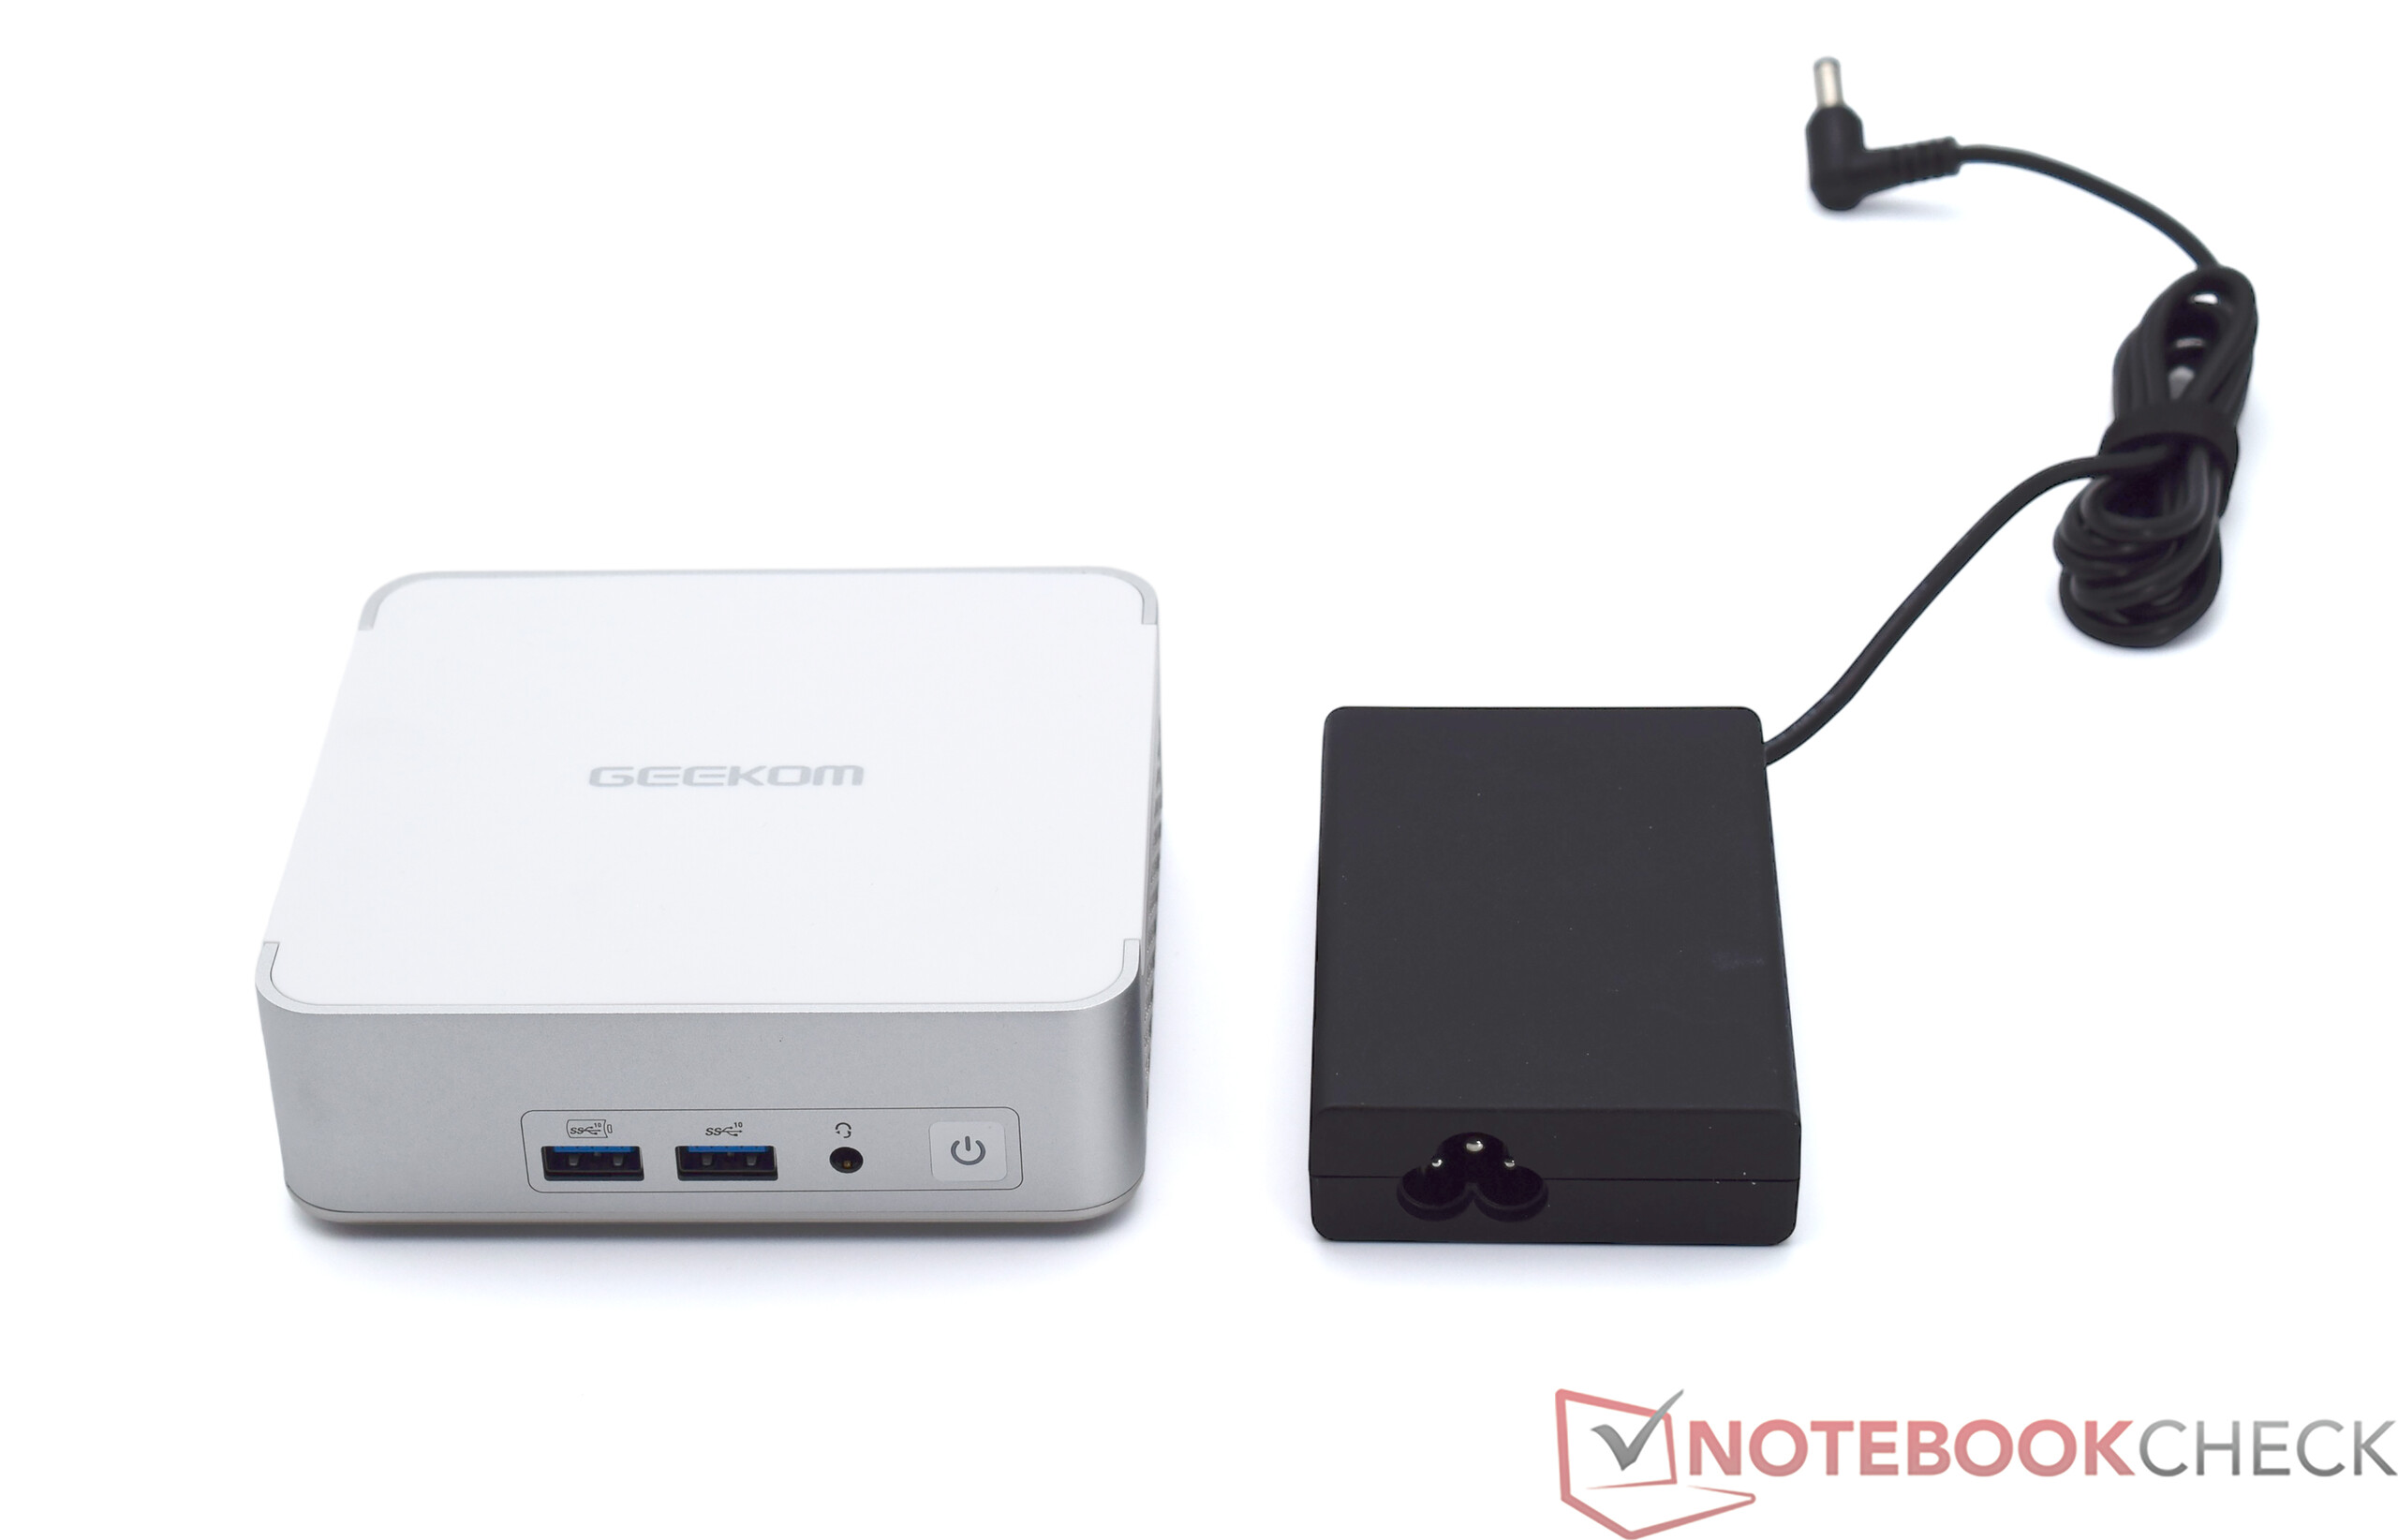
La livraison du Geekom XT13 Pro est conforme aux normes habituelles. Outre l'appareil lui-même, la boîte contient également le bloc d'alimentation de 120 watts et un support VESA avec le matériel de montage. Un câble HDMI et la carte de remerciement obligatoire de Geekom sont également inclus.
Maintenance
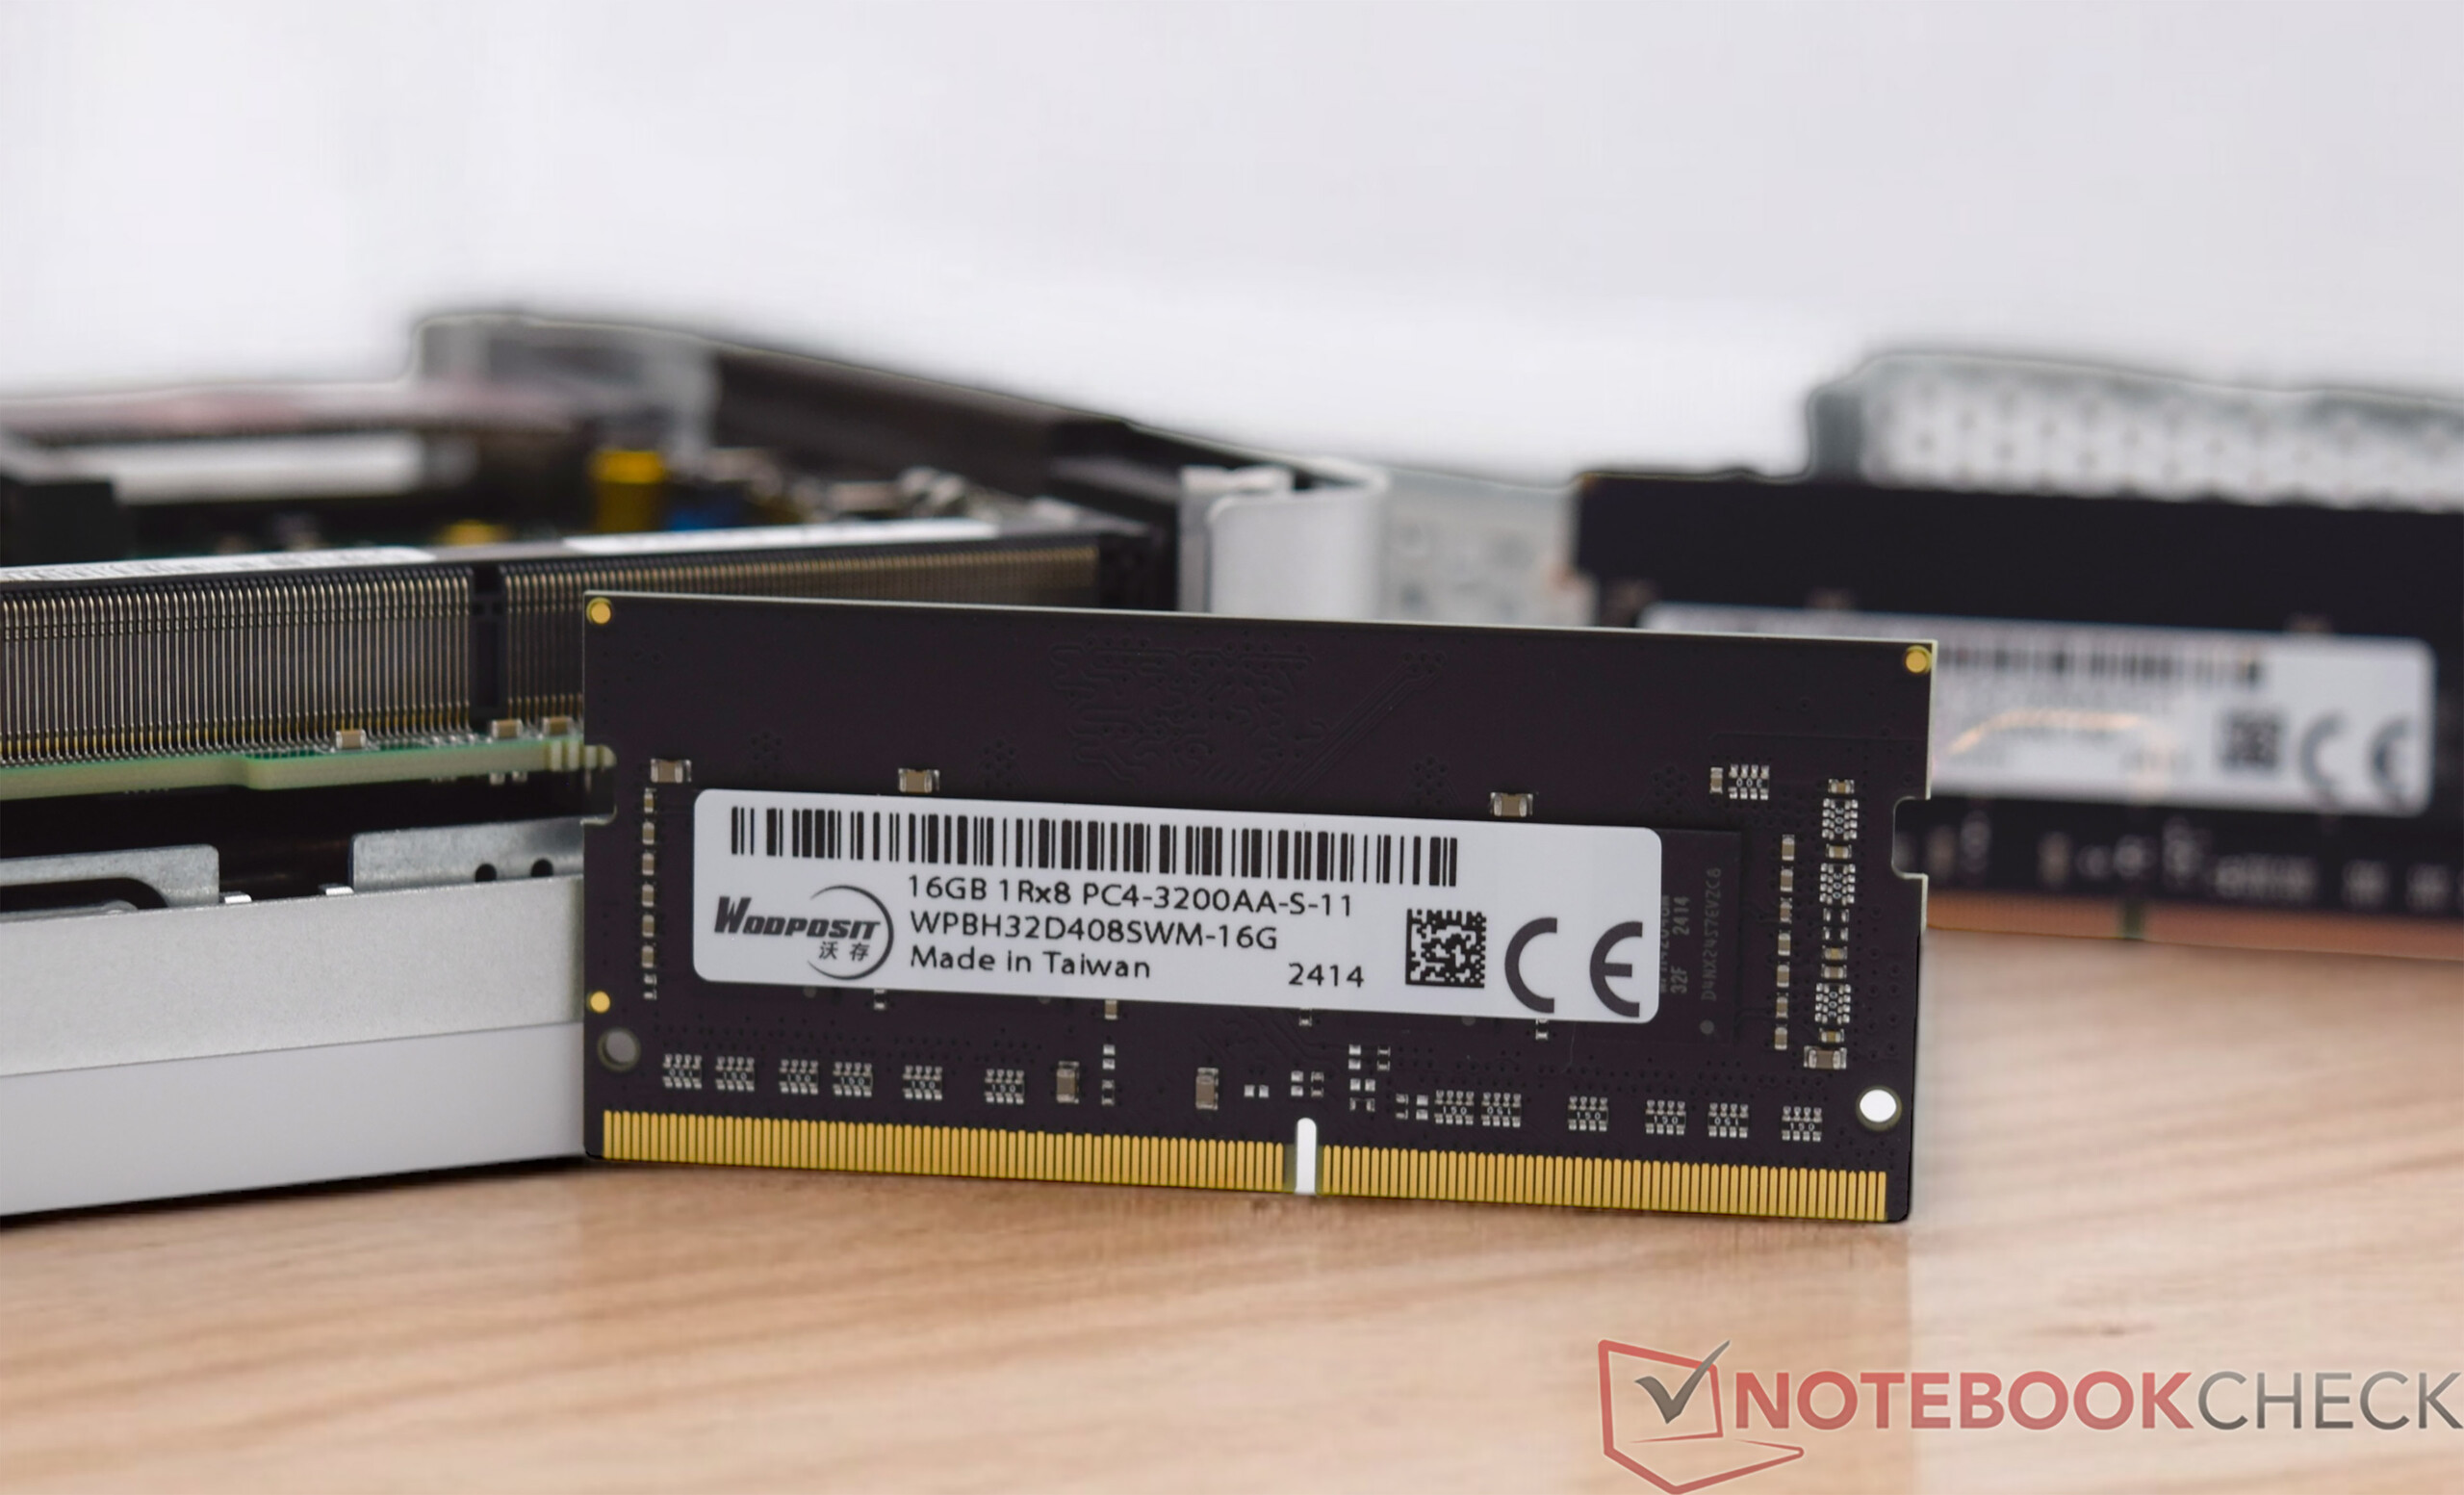
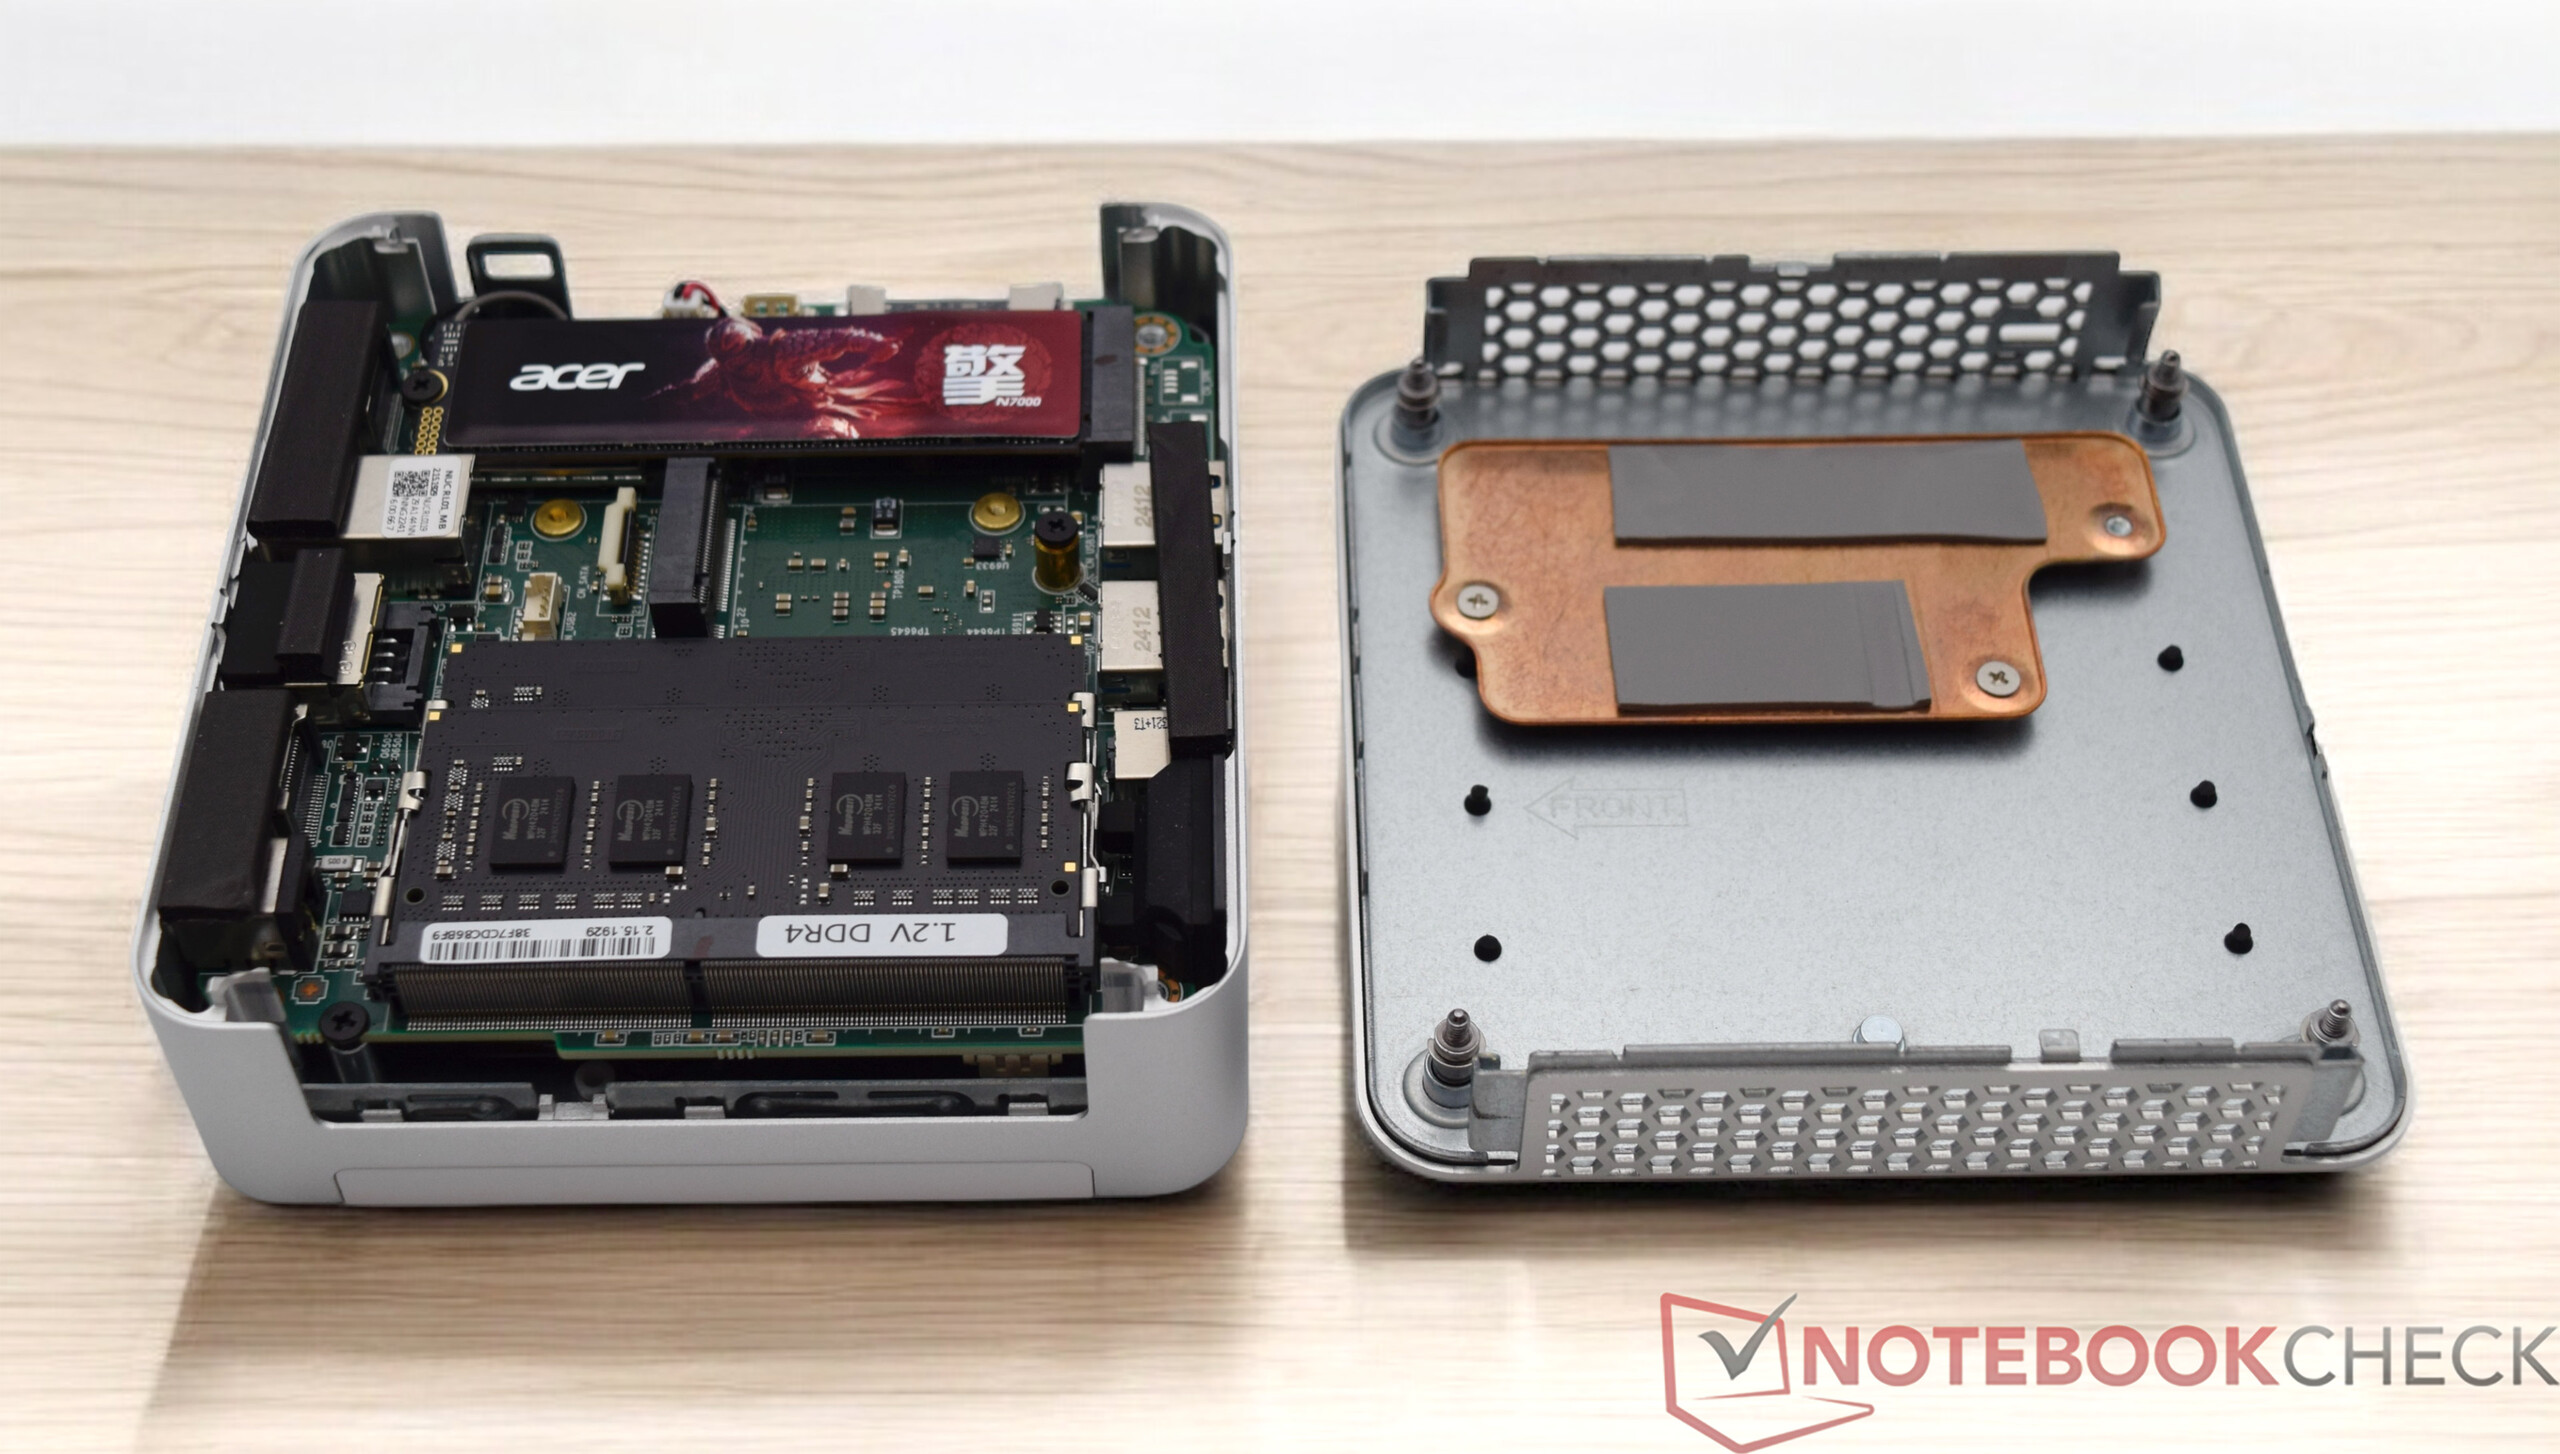
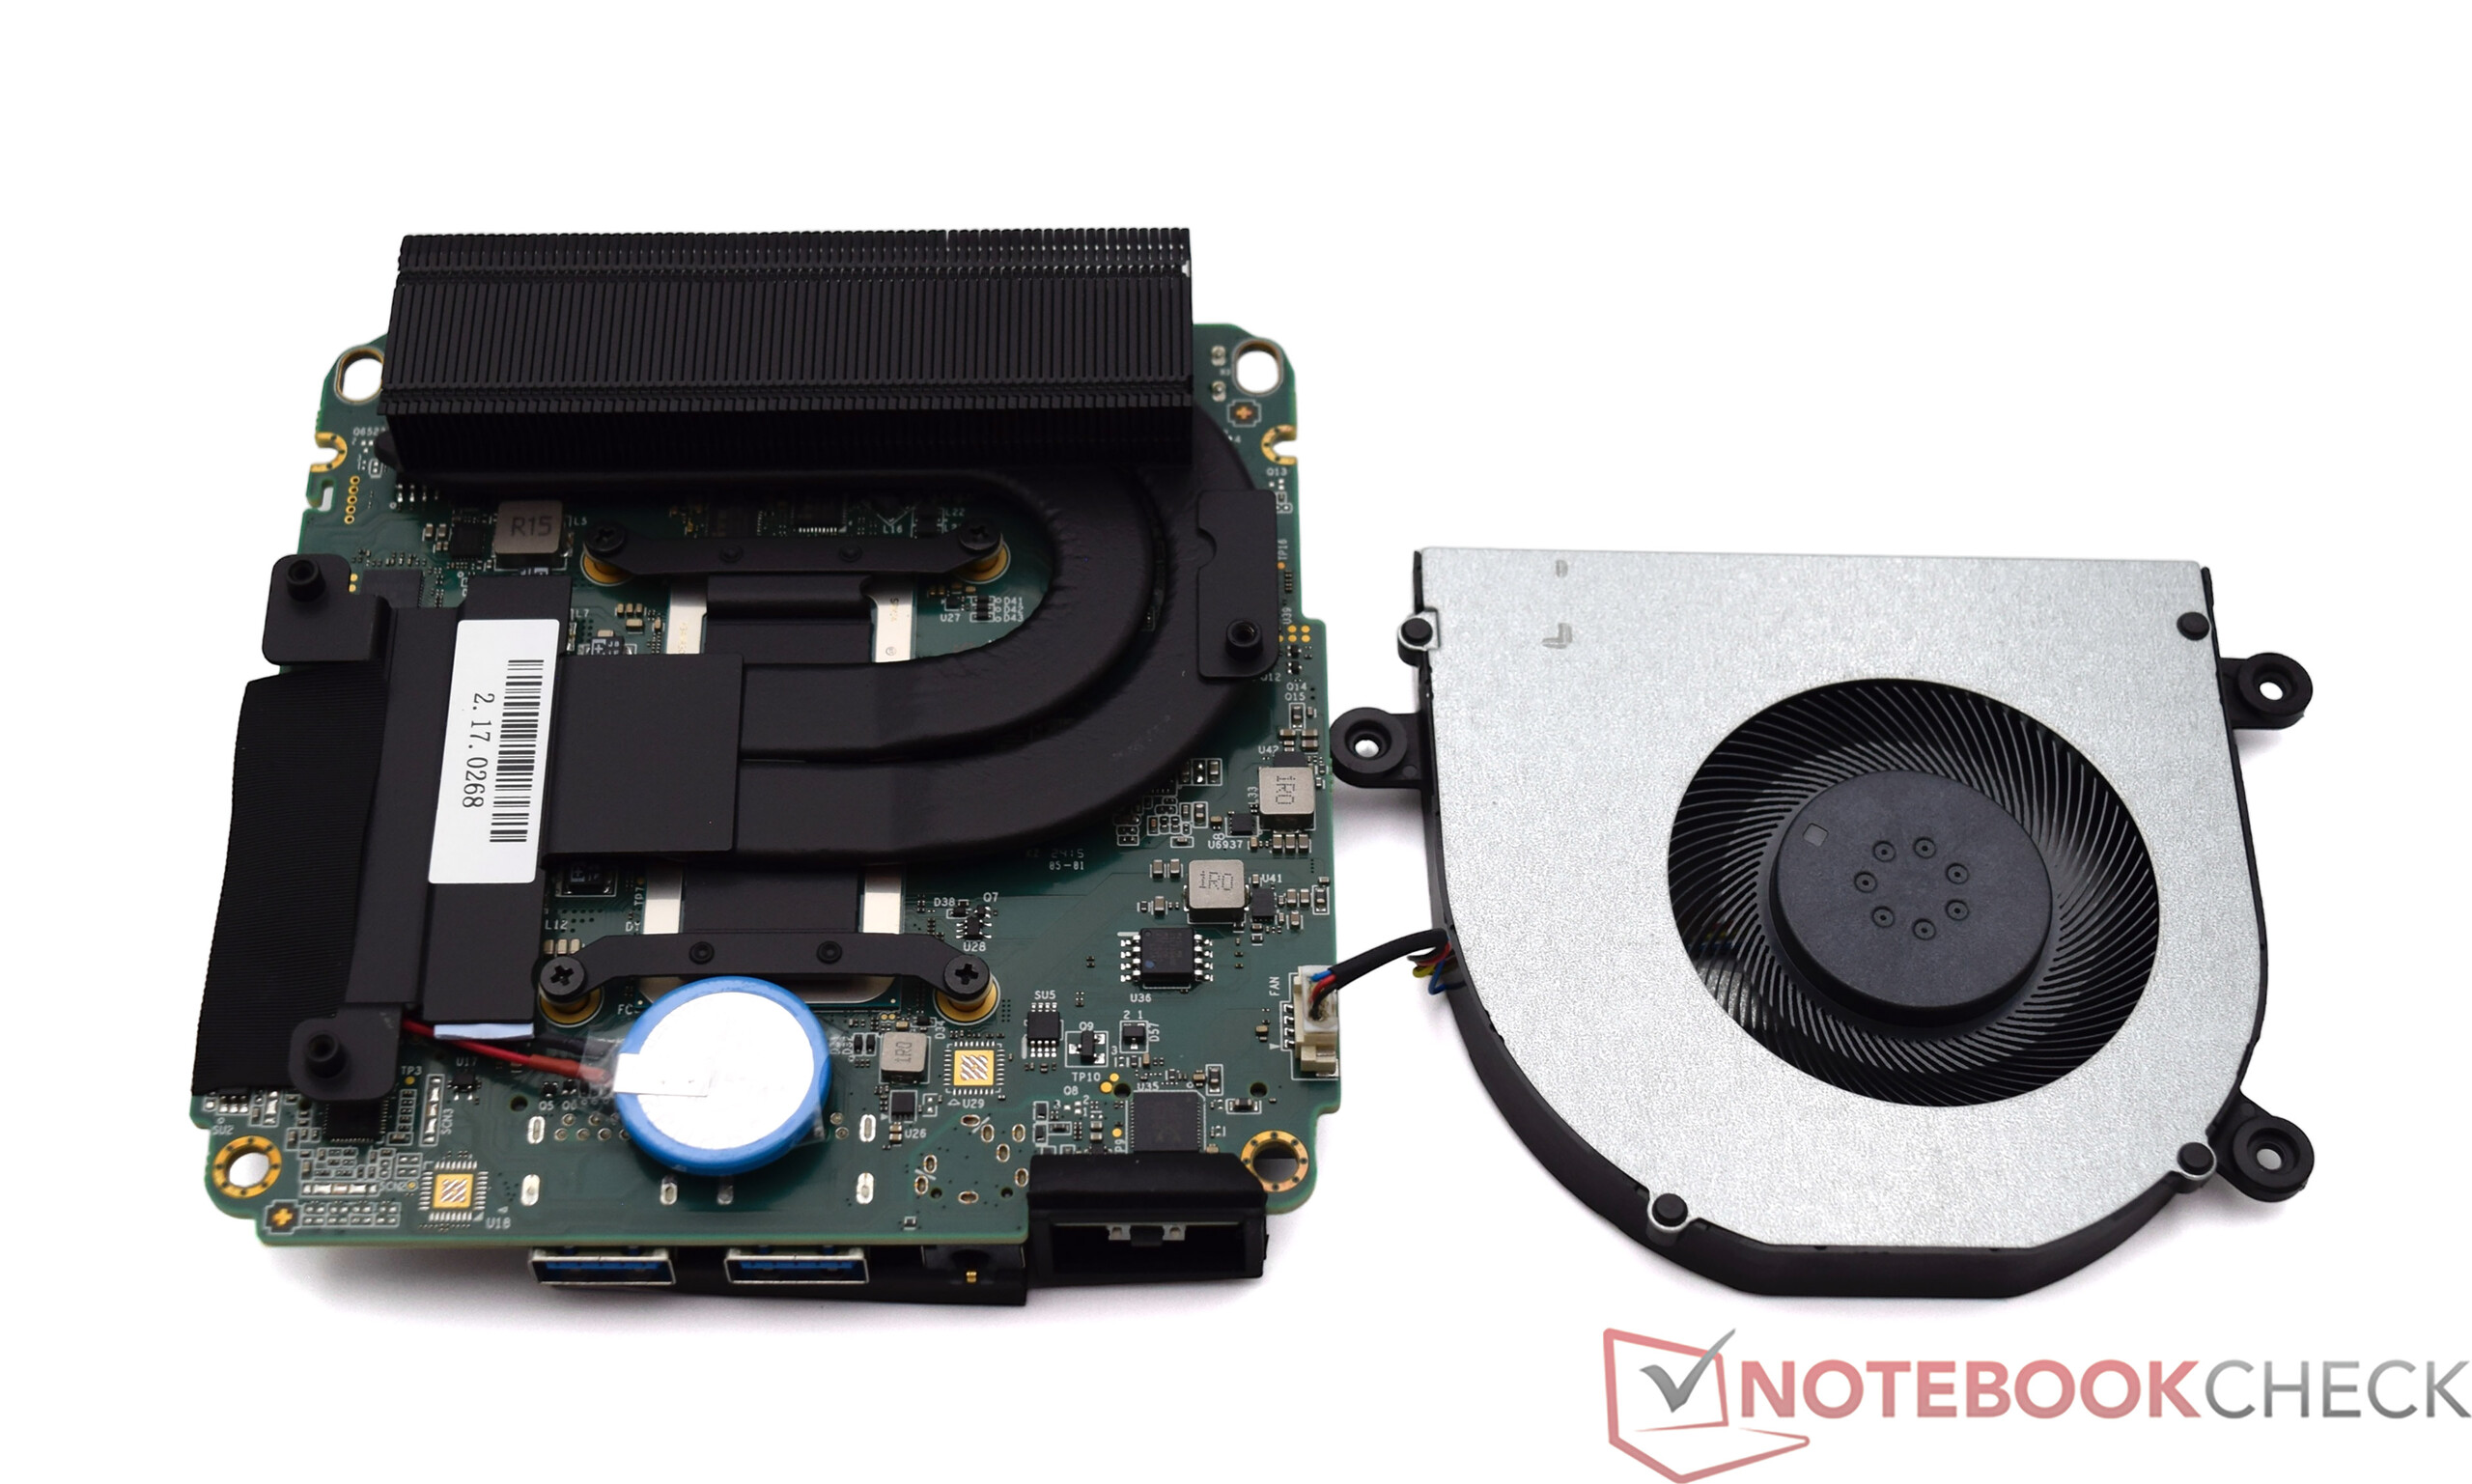
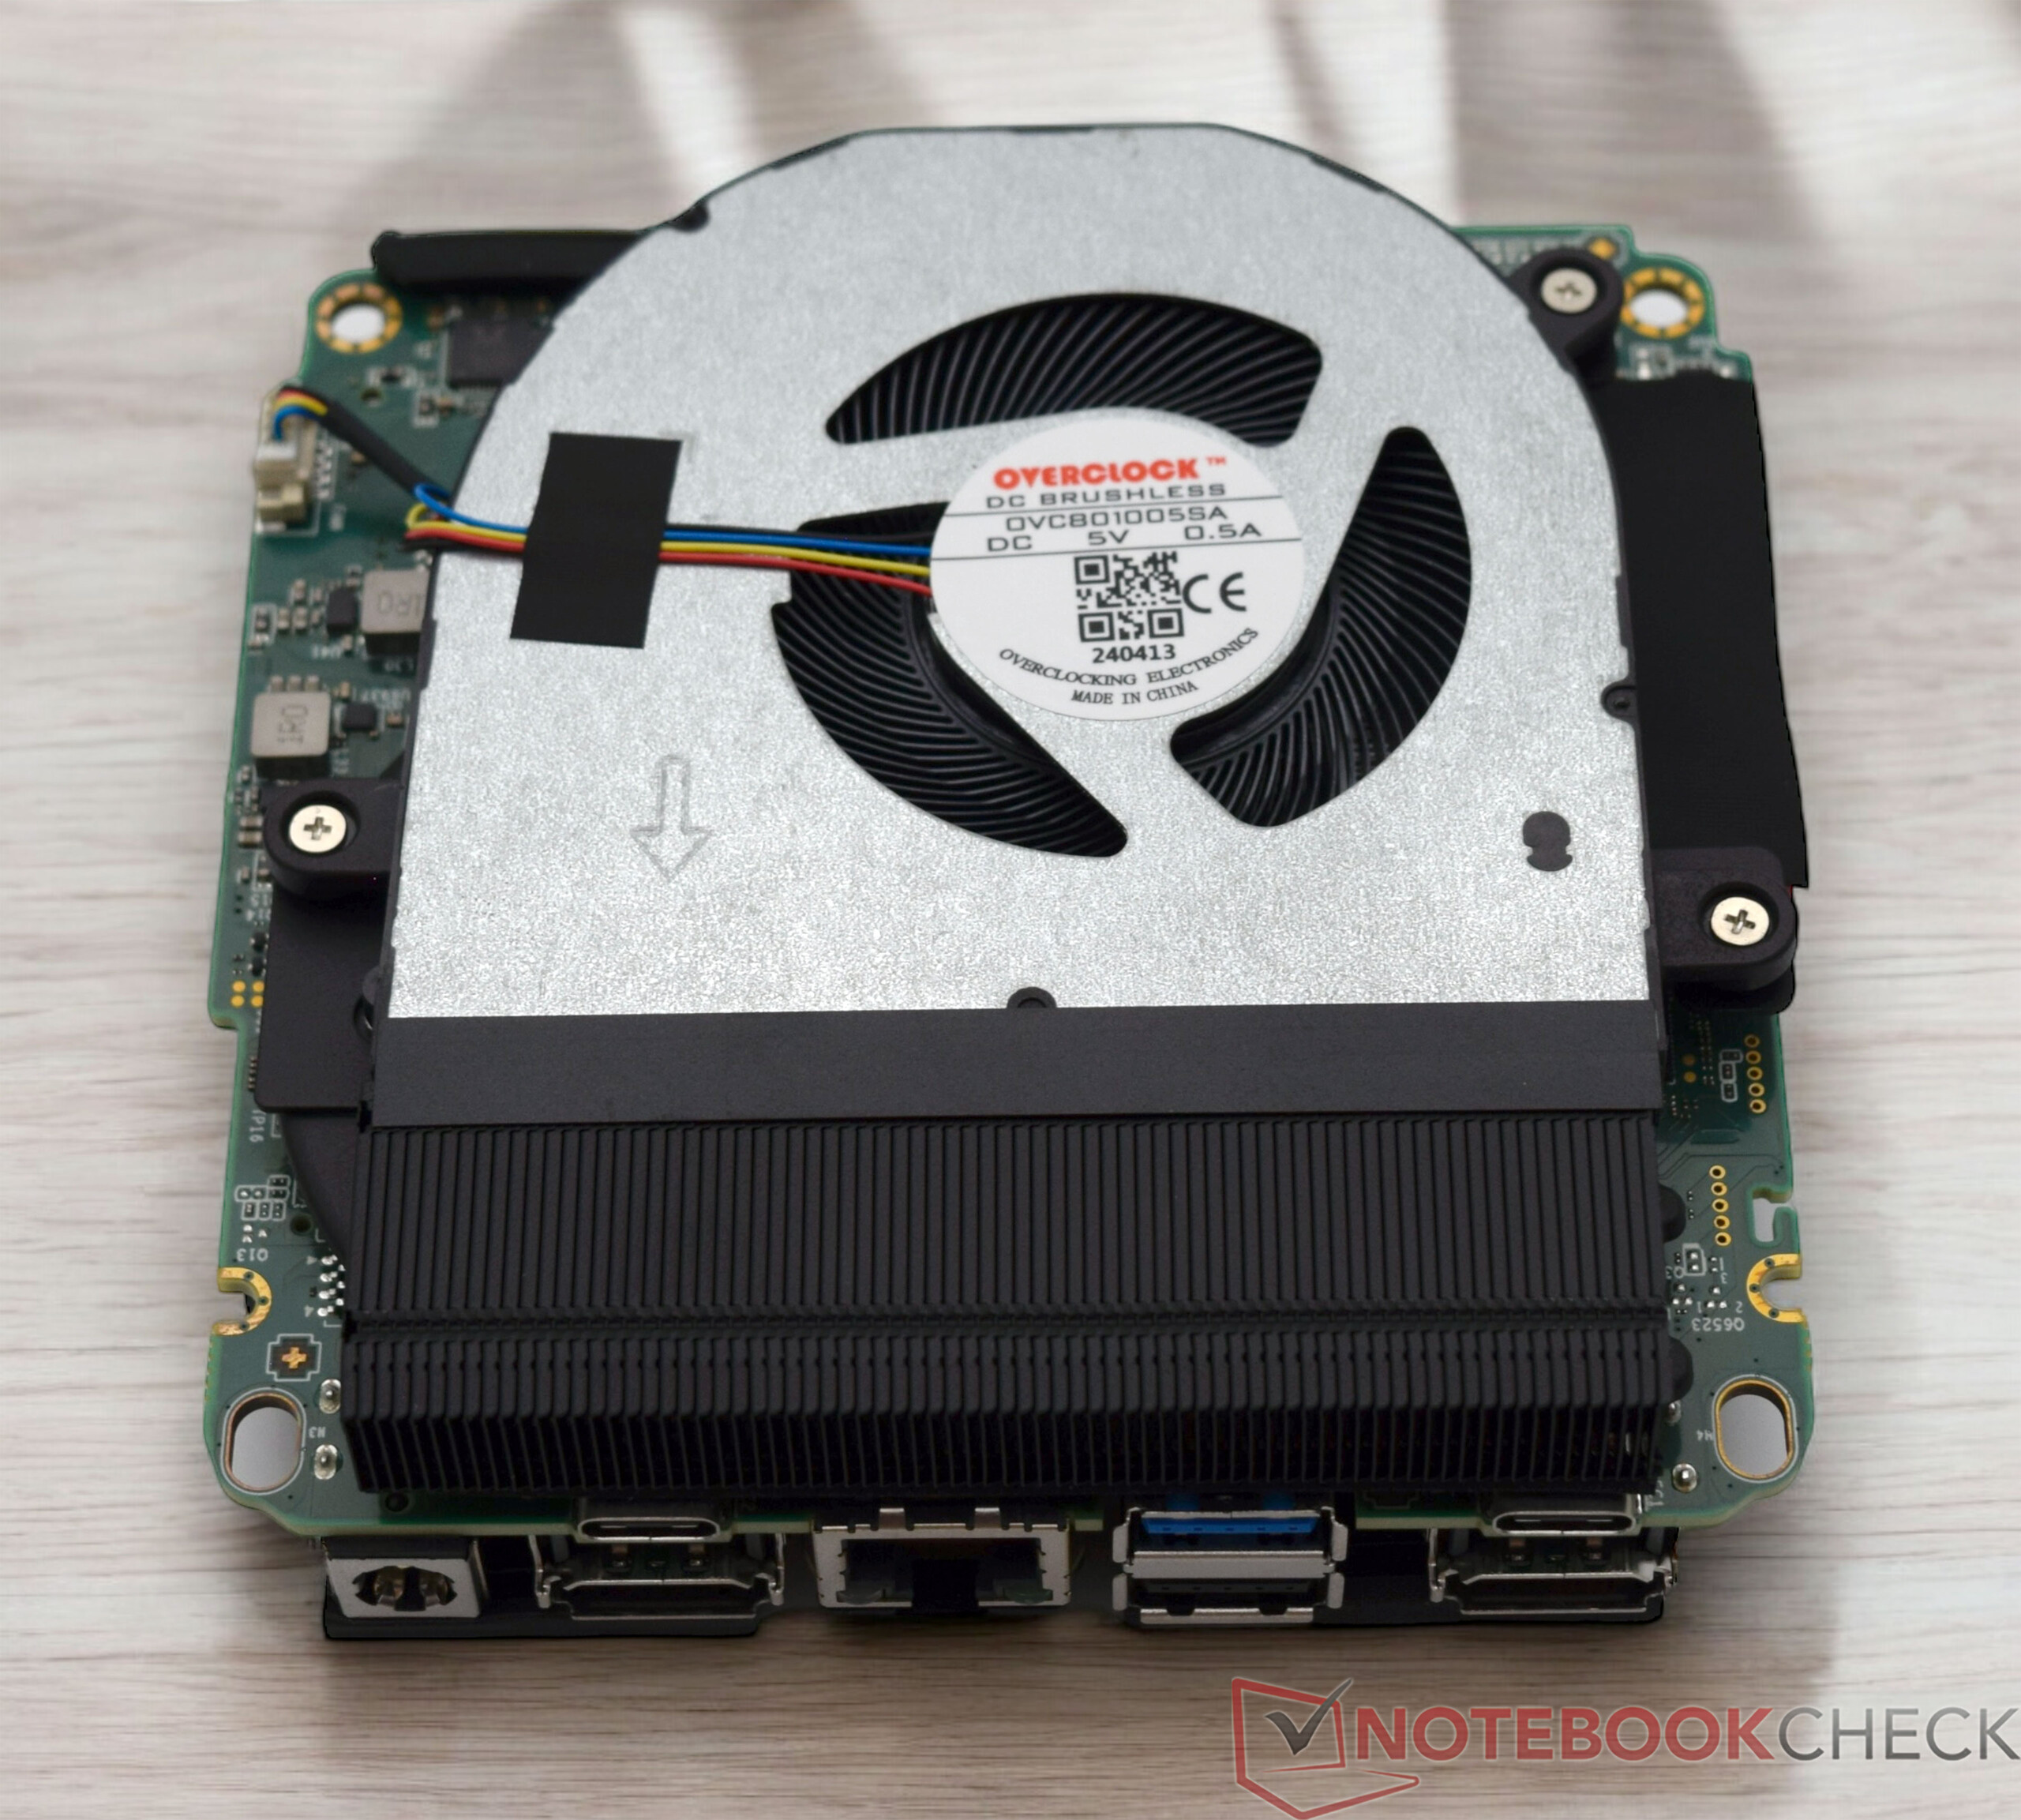
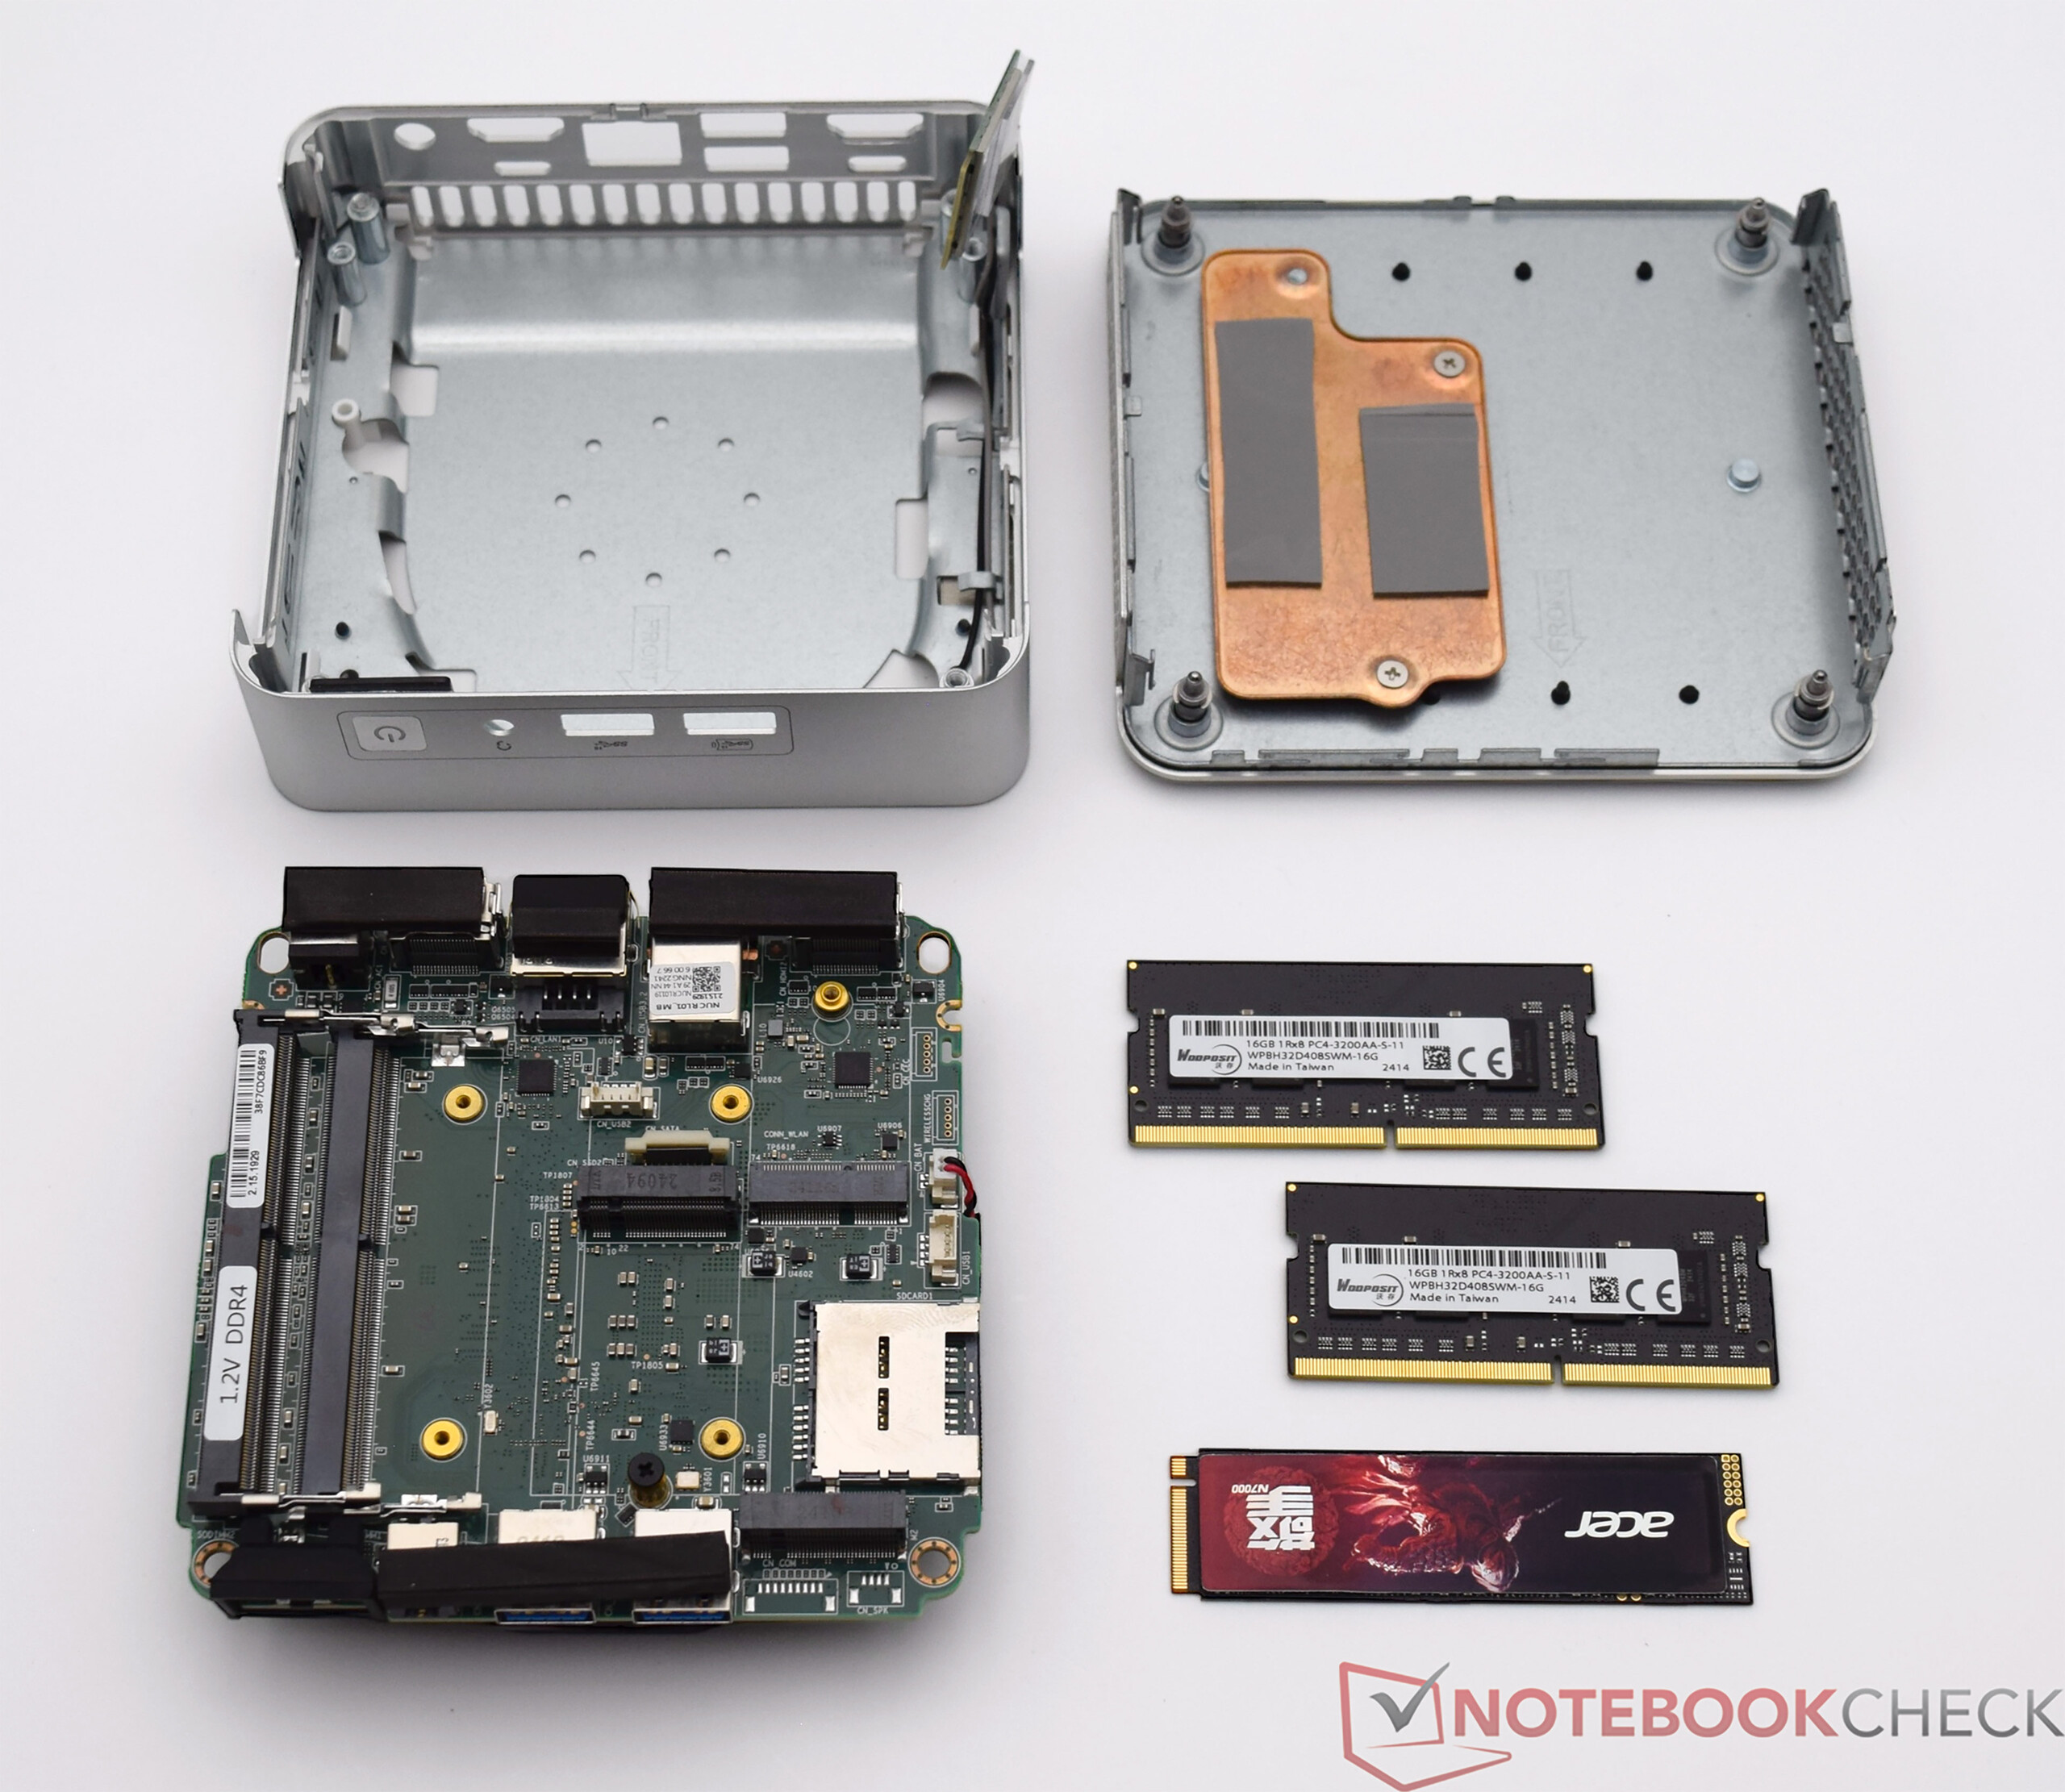
Le Geekom XT13 Pro est facile à ouvrir. Seules quatre petites vis doivent être desserrées sur la face inférieure, qui fixent la plaque de base au reste du boîtier. Il y a un refroidisseur SSD sur la plaque de base elle-même, c'est pourquoi vous devez être un peu plus prudent à ce stade. La RAM et la mémoire de masse sont alors facilement accessibles. Dans notre cas, il est possible d'installer un SSD supplémentaire. Il convient toutefois de respecter la norme en vigueur, car seuls les SSD SATA d'une longueur de 42 millimètres sont compatibles.
Durabilité
Le Geekom XT13 Pro est livré dans une boîte relativement grande avec beaucoup d'air. Nous avons vu Geekom faire les choses différemment. En outre, les accessoires standard fournis sont emballés dans des sacs en plastique séparés, ce qui pourrait être amélioré en termes de durabilité. L'appareil lui-même est principalement composé de métal et de plastique. Nous ne savons toutefois pas si des matériaux recyclés ont été utilisés pour sa fabrication. Point positif, le fabricant offre une garantie de 36 mois.
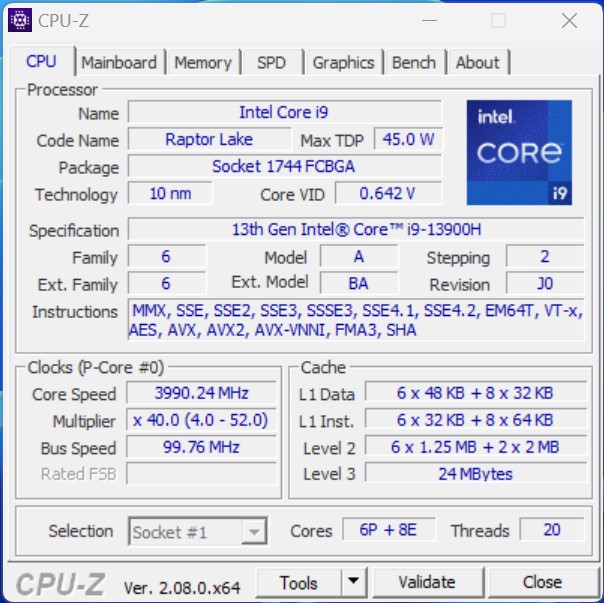
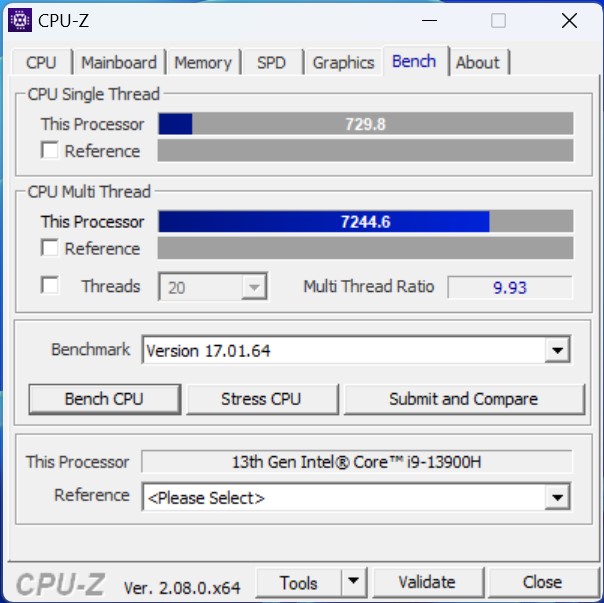
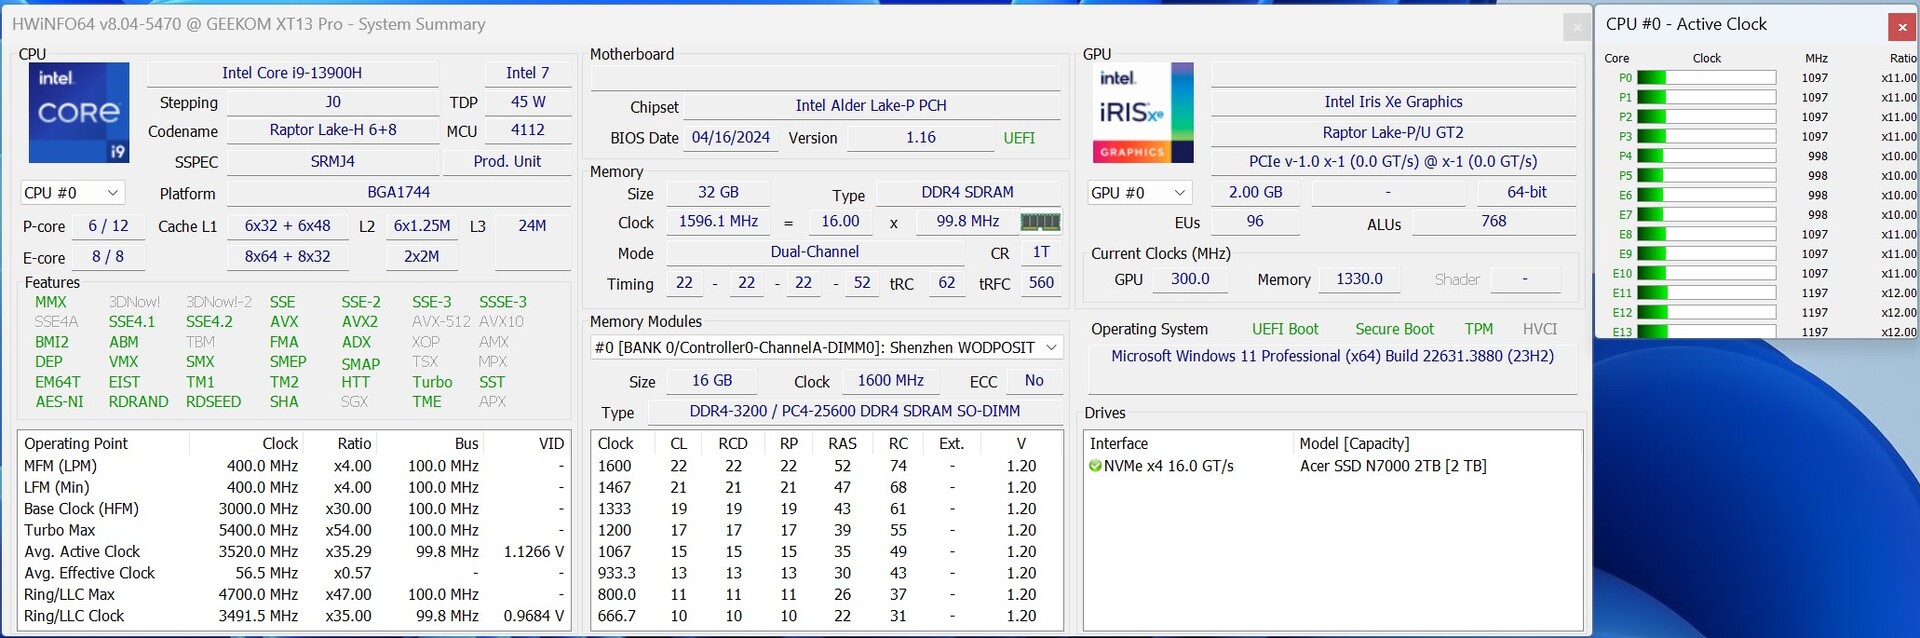
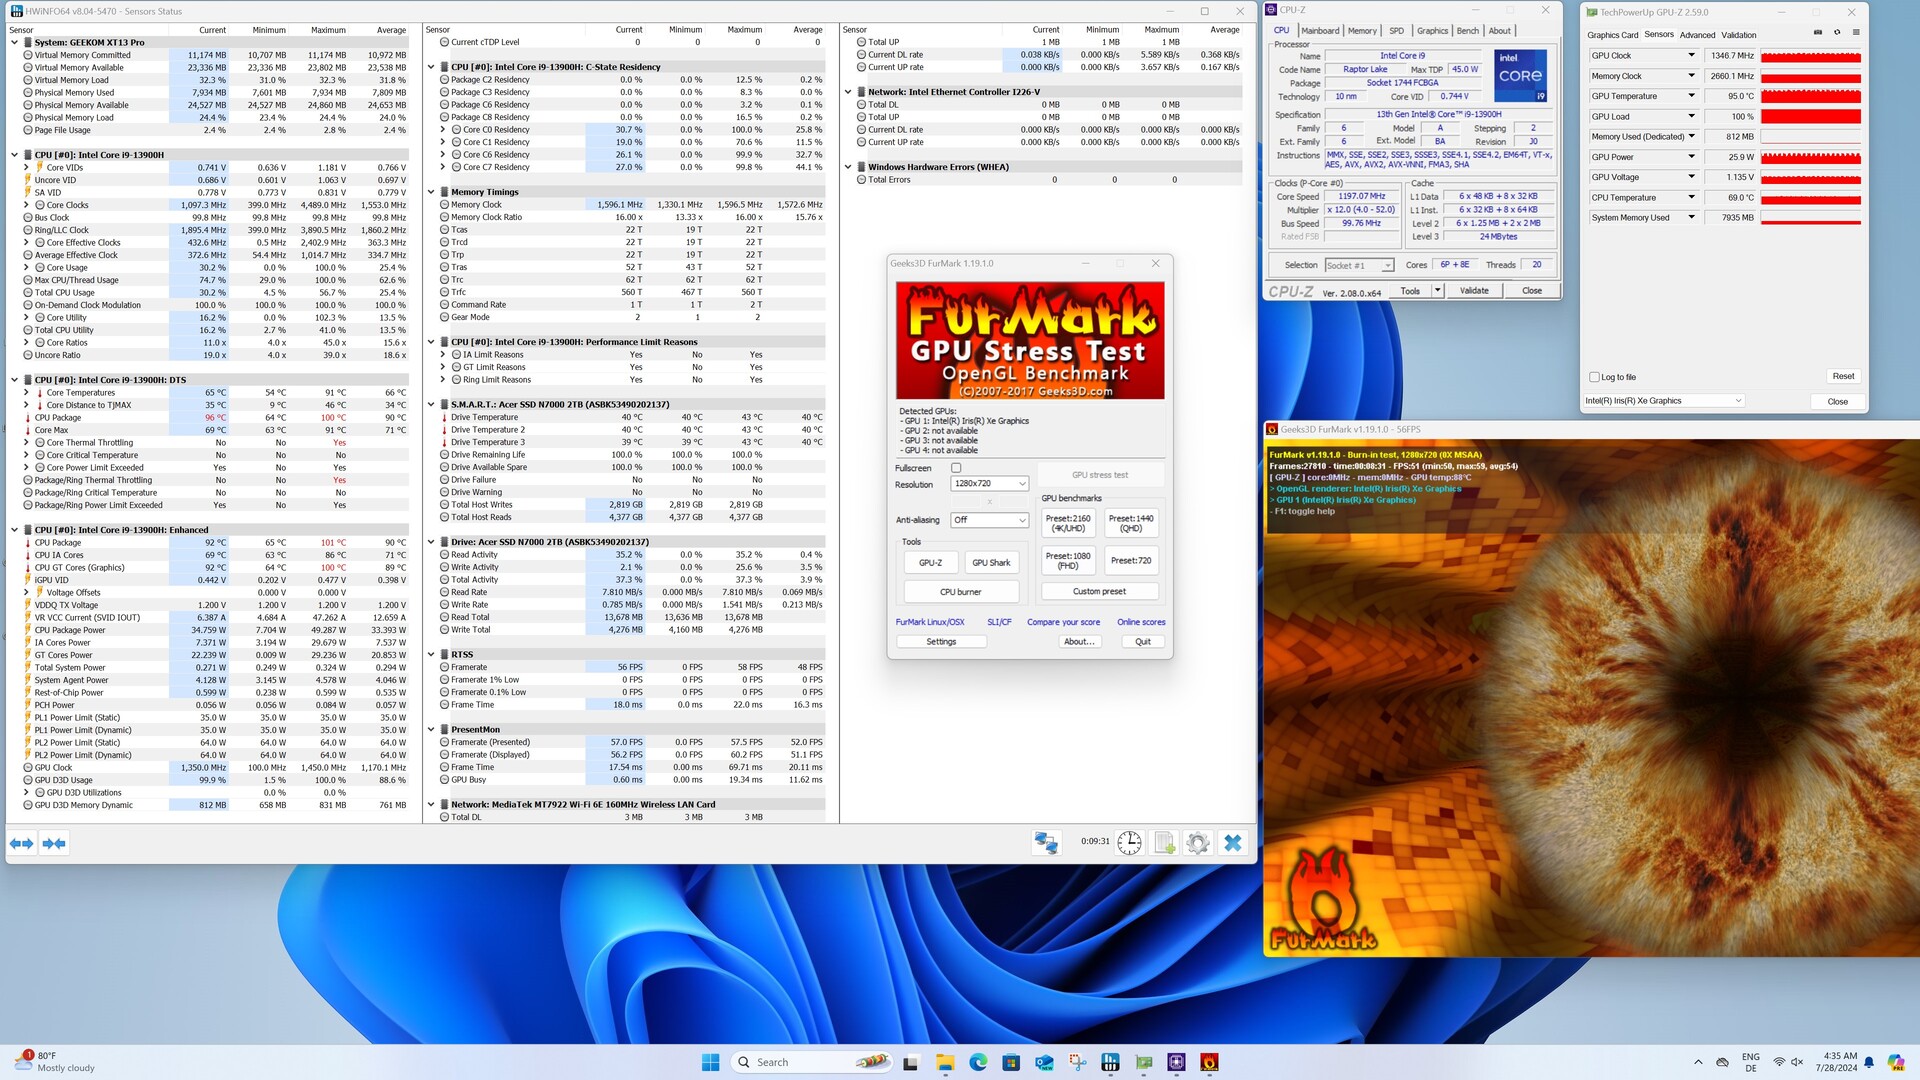
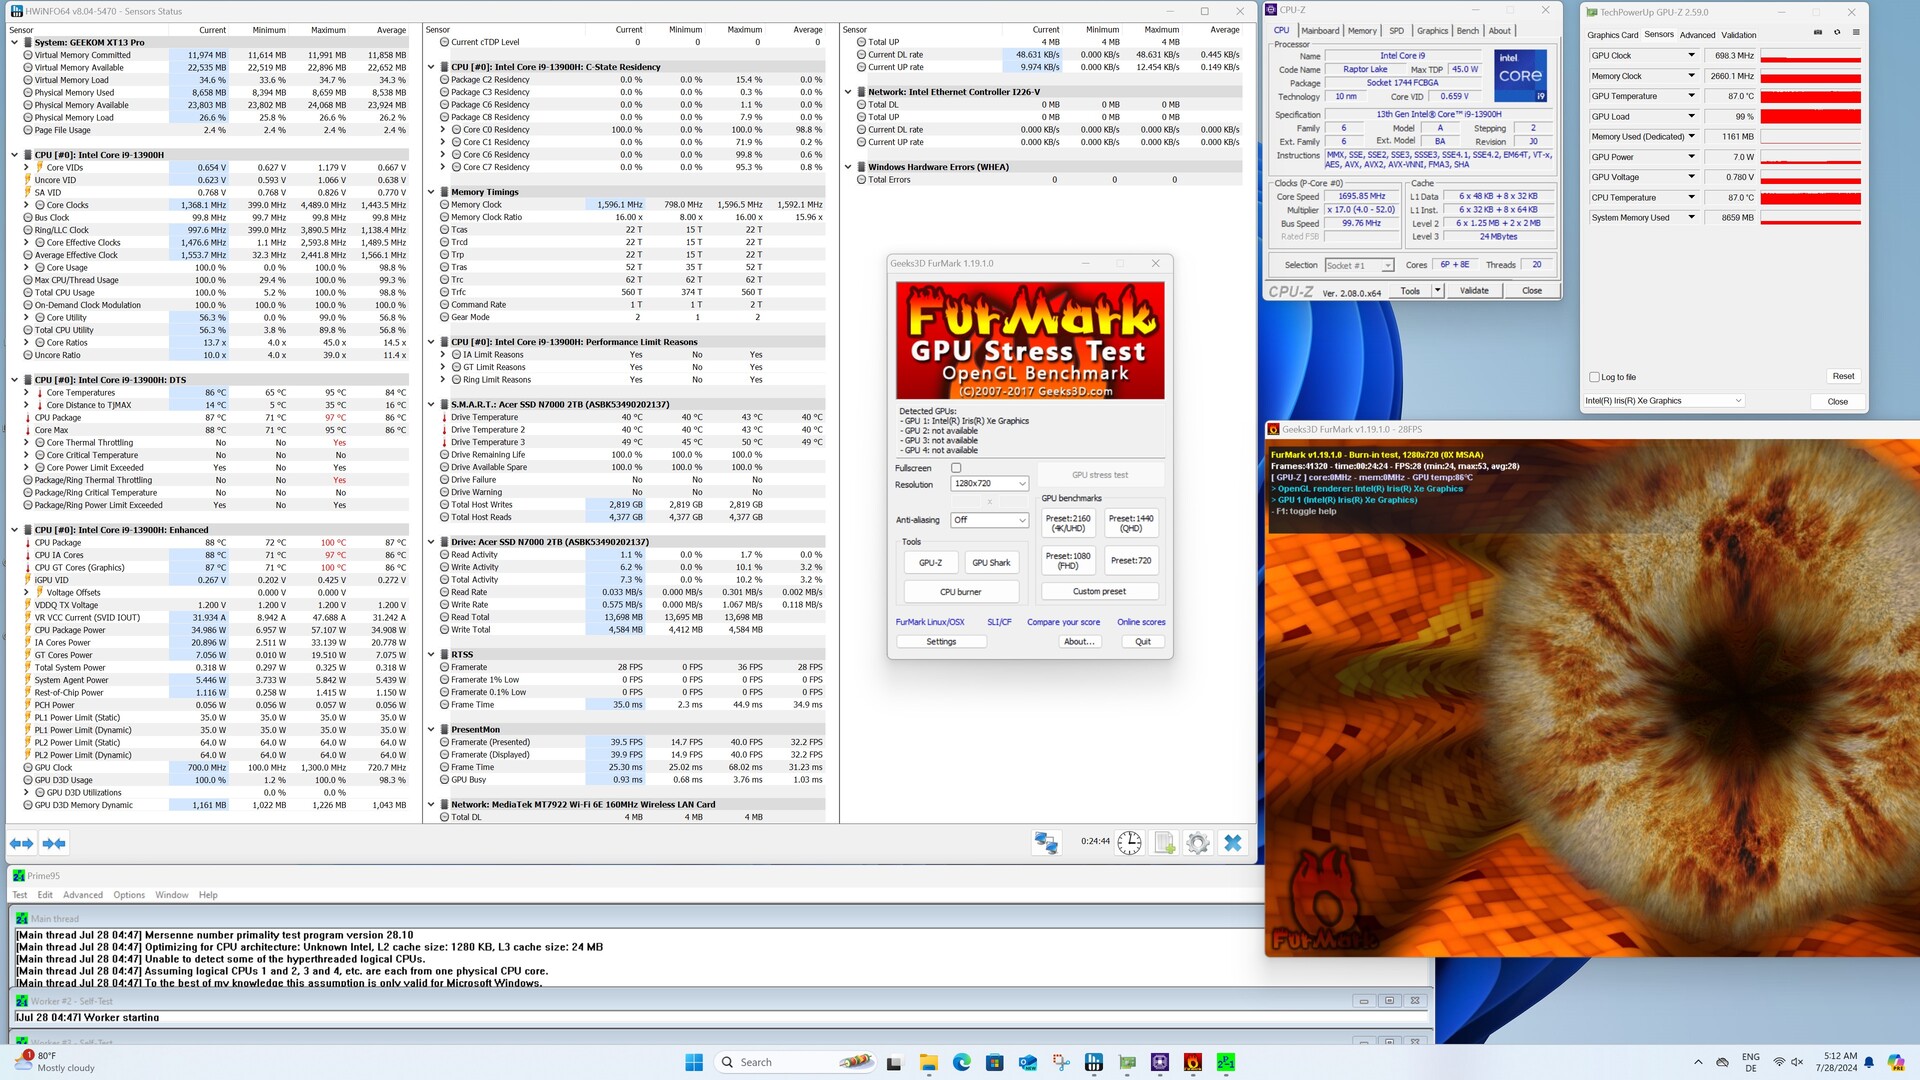
Performance - Intel Core i9-13900H avec 14 cœurs et 20 threads
Le Geekom XT13 Pro est livré dans la configuration supérieure avec le processeur Intel Core i9-13900H dans la configuration supérieure. Le NUC PC peut également être équipé d'un processeur Intel Core i7-13620H légèrement plus faible Intel Core i7-13620H qui est également équipé de 6 cœurs et ne devrait présenter qu'un léger désavantage par rapport au modèle supérieur en termes de performances. 32 Go de RAM DDR4 sont toujours inclus, bien que le SSD NVMe rapide fournisse une configuration de base solide. Le Geekom XT13 Pro n'est pas non plus une tâche insurmontable pour les applications gourmandes en performances. Néanmoins, la performance 3D de l'iGPU est le plus gros point faible, mais il peut être sensiblement amélioré avec un eGPU.
Conditions d'essai
Pour tous les tests de performance avec le Geekom XT13 Pro, nous utilisons le profil énergétique "Haute performance". Il n'y a eu que des écarts par rapport à ce profil dans les mesures de consommation d'énergie et de bruit selon nos critères de test Critères de test. Conformément aux spécifications du fabricant, Geekom permet au SoC de fonctionner à la consommation d'énergie la plus faible. En chiffres, cela signifie une limite de puissance de 35 watts en charge continue, bien que jusqu'à 64 watts soient autorisés pour de courtes périodes.
Processeur

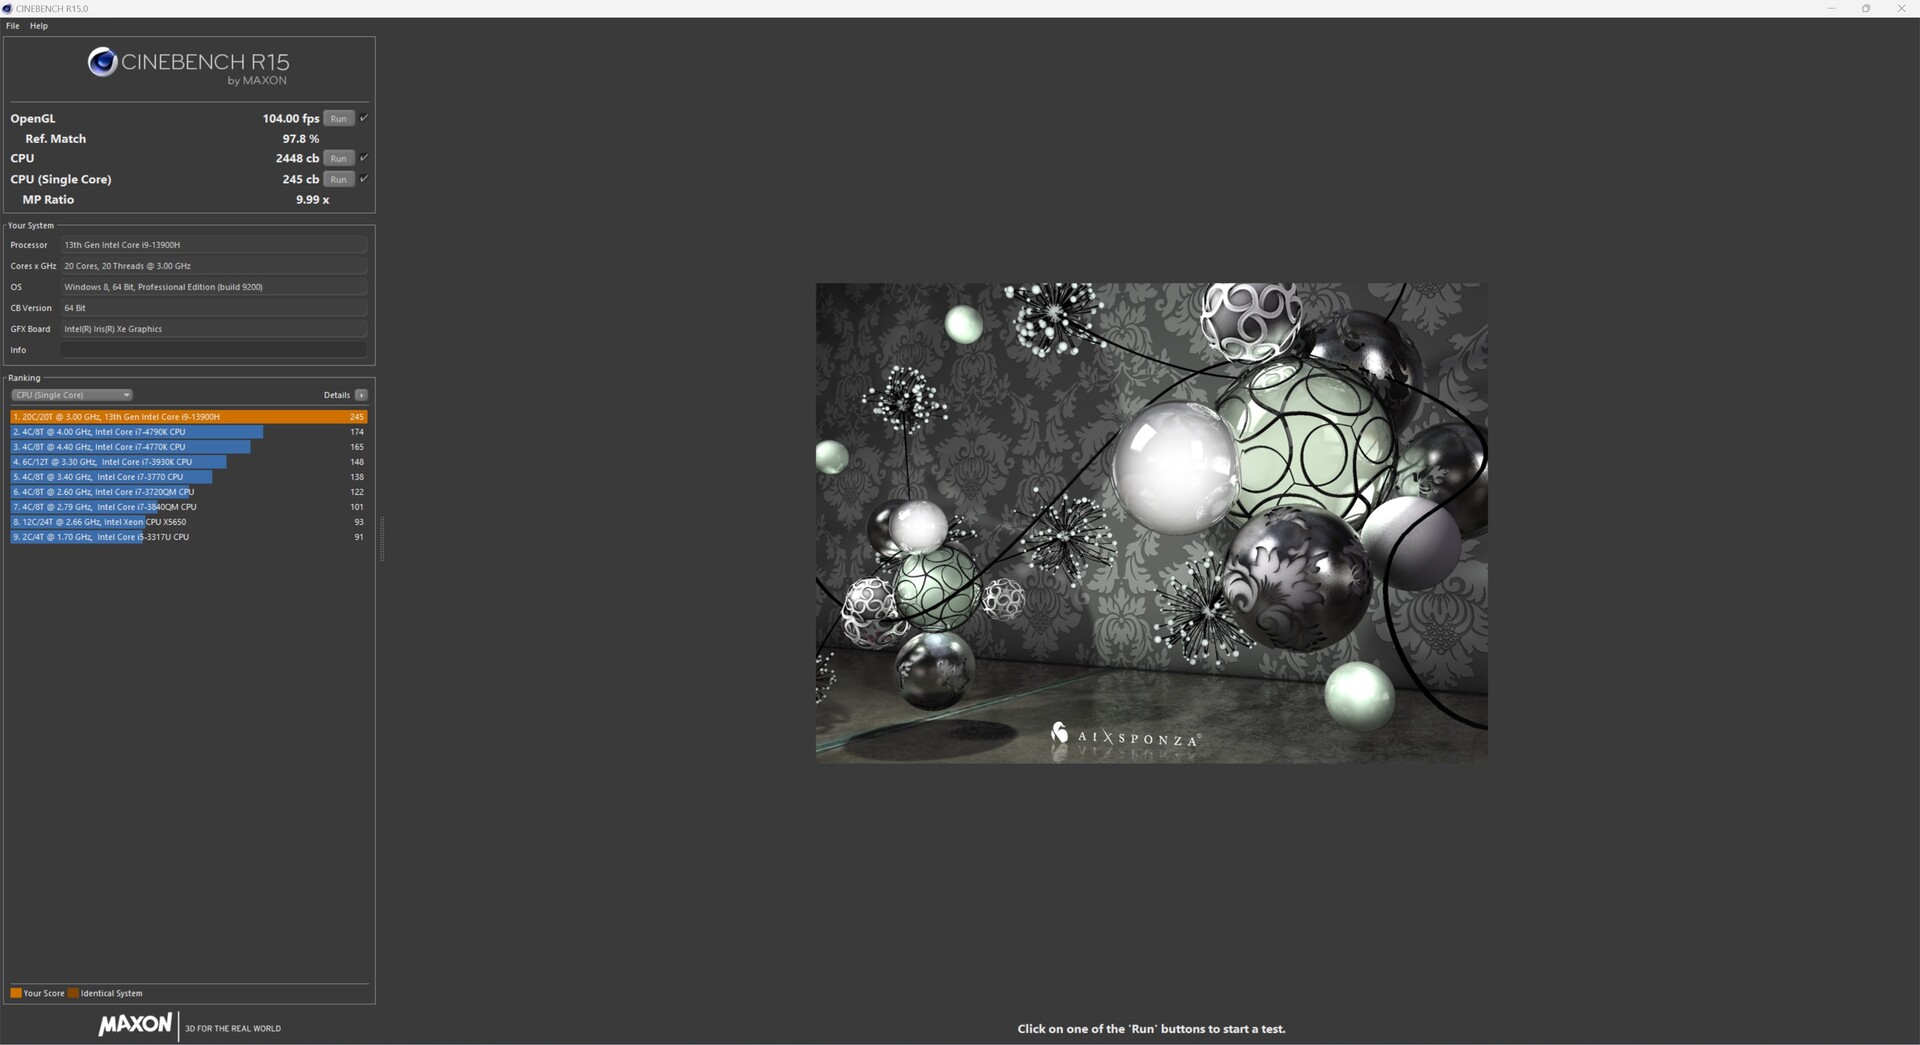
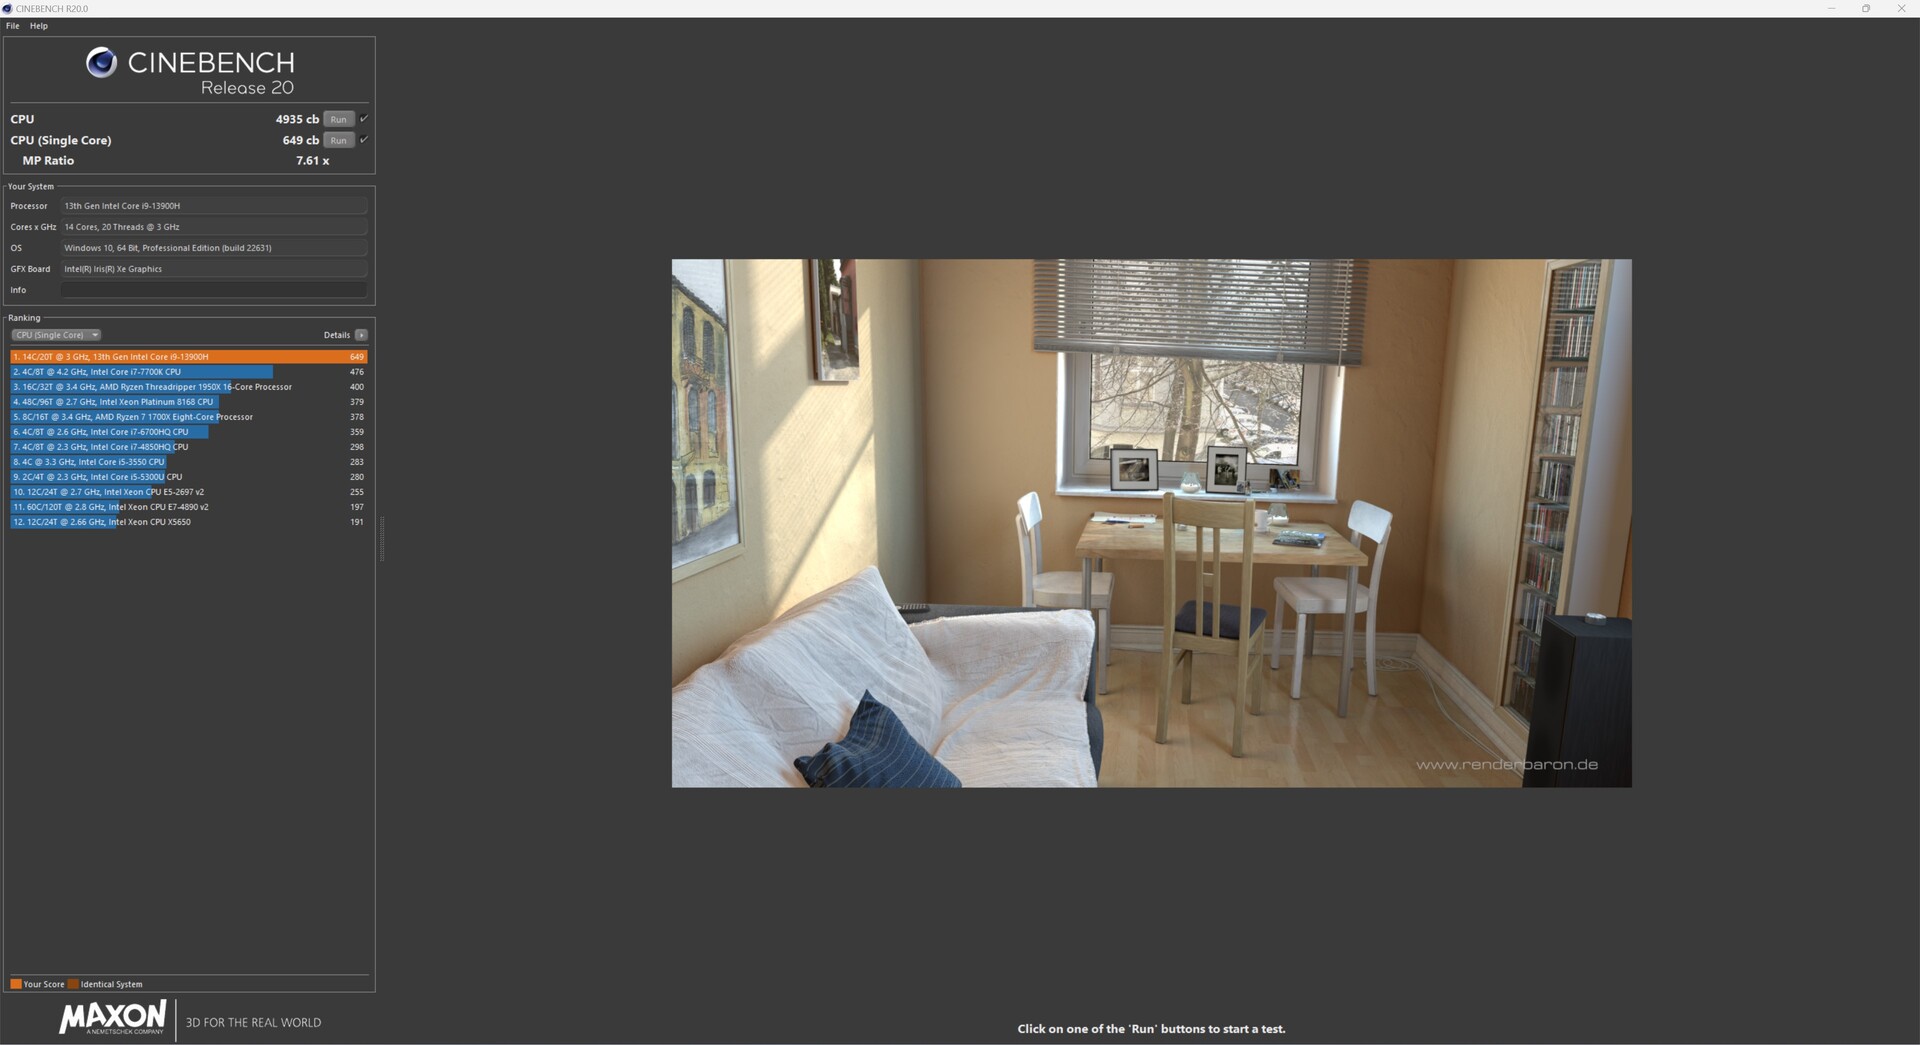
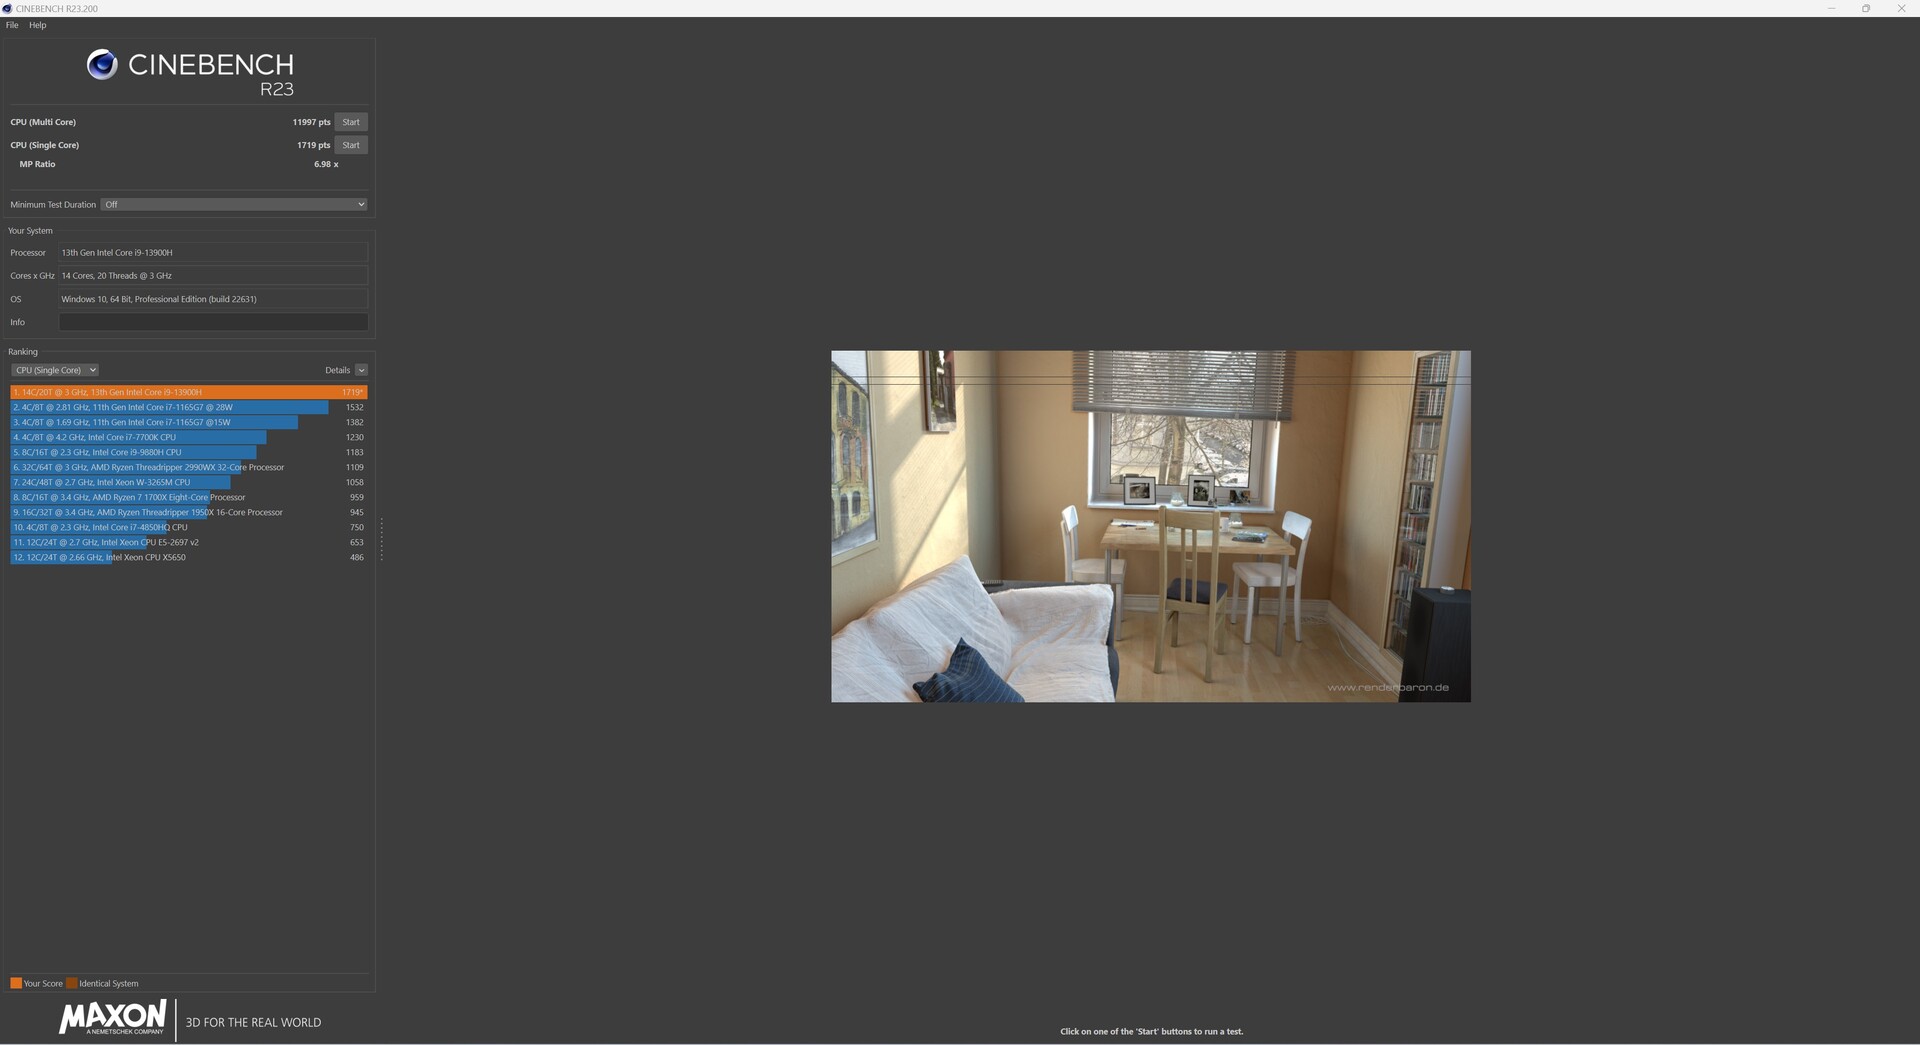
Le Intel Core i9-13900H est basé sur l'architecture Raptor Lake et combine des cœurs 6P et 8E. Techniquement, il y a Intel Core i9-12900H comme le montrent les résultats de notre benchmark dans l'évaluation des performances par rapport au Geekom XT12 Pro. Dans le détail, nous constatons toutefois un léger avantage en faveur de l'Intel Core i9-13900H, qui peut attirer l'attention sur lui grâce à une performance multicœur légèrement supérieure. Un AMD Ryzen 9 7940HS ou les nouveaux modèles d'Intel de la série Meteor Lake. Toutefois, l'écart avec les modèles légèrement plus rapides des concurrents n'est pas très important. Il n'est pas question d'une différence notable de performance dans l'utilisation quotidienne en raison des petites différences.
Vous trouverez d'autres benchmarks pour les processeurs ici.
| Performance Rating - Percent | |
| Geekom A7 | |
| Aoostar GEM12 | |
| Minisforum AtomMan X7 Ti | |
| Acemagic F2A | |
| Geekom XT13 Pro | |
| Geekom XT12 Pro | |
| Cinebench 2024 | |
| CPU Multi Core | |
| Minisforum AtomMan X7 Ti | |
| Acemagic F2A | |
| Aoostar GEM12 | |
| Geekom A7 | |
| Geekom XT13 Pro | |
| Geekom XT12 Pro | |
| CPU Single Core | |
| Minisforum AtomMan X7 Ti | |
| Geekom A7 | |
| Geekom XT12 Pro | |
| Aoostar GEM12 | |
| Acemagic F2A | |
| Geekom XT13 Pro | |
| Cinebench R15 | |
| CPU Single 64Bit | |
| Aoostar GEM12 | |
| Geekom A7 | |
| Minisforum AtomMan X7 Ti | |
| Acemagic F2A | |
| Geekom XT12 Pro | |
| Geekom XT13 Pro | |
| CPU Multi 64Bit | |
| Minisforum AtomMan X7 Ti | |
| Acemagic F2A | |
| Aoostar GEM12 | |
| Geekom A7 | |
| Geekom XT13 Pro | |
| Geekom XT12 Pro | |
| Cinebench R20 | |
| CPU (Single Core) | |
| Minisforum AtomMan X7 Ti | |
| Geekom XT12 Pro | |
| Geekom A7 | |
| Aoostar GEM12 | |
| Acemagic F2A | |
| Geekom XT13 Pro | |
| CPU (Multi Core) | |
| Minisforum AtomMan X7 Ti | |
| Acemagic F2A | |
| Aoostar GEM12 | |
| Geekom A7 | |
| Geekom XT13 Pro | |
| Geekom XT12 Pro | |
| Cinebench R11.5 | |
| CPU Single 64Bit | |
| Geekom A7 | |
| Aoostar GEM12 | |
| Minisforum AtomMan X7 Ti | |
| Acemagic F2A | |
| Geekom XT12 Pro | |
| Geekom XT13 Pro | |
| CPU Multi 64Bit | |
| Minisforum AtomMan X7 Ti | |
| Acemagic F2A | |
| Geekom A7 | |
| Aoostar GEM12 | |
| Geekom XT13 Pro | |
| Geekom XT12 Pro | |
| Cinebench R10 | |
| Rendering Single CPUs 64Bit | |
| Minisforum AtomMan X7 Ti | |
| Geekom A7 | |
| Aoostar GEM12 | |
| Acemagic F2A | |
| Geekom XT13 Pro | |
| Geekom XT12 Pro | |
| Rendering Multiple CPUs 64Bit | |
| Acemagic F2A | |
| Minisforum AtomMan X7 Ti | |
| Aoostar GEM12 | |
| Geekom A7 | |
| Geekom XT13 Pro | |
| Geekom XT12 Pro | |
| Blender - v2.79 BMW27 CPU | |
| Geekom XT12 Pro | |
| Geekom XT13 Pro | |
| Geekom A7 | |
| Aoostar GEM12 | |
| Acemagic F2A | |
| Minisforum AtomMan X7 Ti | |
| wPrime 2.10 | |
| 32m | |
| Geekom XT12 Pro | |
| Acemagic F2A | |
| Geekom XT13 Pro | |
| Minisforum AtomMan X7 Ti | |
| Aoostar GEM12 | |
| Geekom A7 | |
| 1024m | |
| Minisforum AtomMan X7 Ti | |
| Geekom XT13 Pro | |
| Geekom XT12 Pro | |
| Acemagic F2A | |
| Aoostar GEM12 | |
| Geekom A7 | |
| WinRAR - Result | |
| Geekom XT12 Pro | |
| Minisforum AtomMan X7 Ti | |
| Acemagic F2A | |
| Geekom A7 | |
| Aoostar GEM12 | |
| Geekom XT13 Pro | |
| Geekbench 5.0 | |
| 5.0 Multi-Core | |
| Minisforum AtomMan X7 Ti | |
| Acemagic F2A | |
| Geekom A7 | |
| Aoostar GEM12 | |
| Geekom XT13 Pro | |
| Geekom XT12 Pro | |
| 5.0 Single-Core | |
| Geekom A7 | |
| Aoostar GEM12 | |
| Minisforum AtomMan X7 Ti | |
| Geekom XT12 Pro | |
| Acemagic F2A | |
| Geekom XT13 Pro | |
| Geekbench 4.4 | |
| 64 Bit Single-Core Score | |
| Geekom A7 | |
| Aoostar GEM12 | |
| Geekom XT12 Pro | |
| Minisforum AtomMan X7 Ti | |
| Geekom XT13 Pro | |
| Acemagic F2A | |
| 64 Bit Multi-Core Score | |
| Geekom A7 | |
| Minisforum AtomMan X7 Ti | |
| Aoostar GEM12 | |
| Acemagic F2A | |
| Geekom XT13 Pro | |
| Geekom XT12 Pro | |
| 3DMark 11 - 1280x720 Performance Physics | |
| Geekom A7 | |
| Minisforum AtomMan X7 Ti | |
| Aoostar GEM12 | |
| Acemagic F2A | |
| Geekom XT13 Pro | |
| Geekom XT12 Pro | |
| HWBOT x265 Benchmark v2.2 - 4k Preset | |
| Minisforum AtomMan X7 Ti | |
| Geekom A7 | |
| Aoostar GEM12 | |
| Acemagic F2A | |
| Geekom XT13 Pro | |
| Geekom XT12 Pro | |
| R Benchmark 2.5 - Overall mean | |
| Geekom XT13 Pro | |
| Acemagic F2A | |
| Geekom XT12 Pro | |
| Minisforum AtomMan X7 Ti | |
| Aoostar GEM12 | |
| Geekom A7 | |
| LibreOffice - 20 Documents To PDF | |
| Geekom A7 | |
| Minisforum AtomMan X7 Ti | |
| Aoostar GEM12 | |
| Geekom XT13 Pro | |
| Acemagic F2A | |
| Geekom XT12 Pro | |
| WebXPRT 3 - Overall | |
| Geekom A7 | |
| Aoostar GEM12 | |
| Geekom XT12 Pro | |
| Acemagic F2A | |
| Geekom XT13 Pro | |
| Minisforum AtomMan X7 Ti | |
| Mozilla Kraken 1.1 - Total | |
| Geekom XT13 Pro | |
| Acemagic F2A | |
| Minisforum AtomMan X7 Ti | |
| Aoostar GEM12 | |
| Geekom XT12 Pro | |
| Geekom A7 | |
| 3DMark | |
| 1920x1080 Fire Strike Physics | |
| Aoostar GEM12 | |
| Minisforum AtomMan X7 Ti | |
| Geekom A7 | |
| Acemagic F2A | |
| Geekom XT13 Pro | |
| Geekom XT12 Pro | |
| 2560x1440 Time Spy CPU | |
| Minisforum AtomMan X7 Ti | |
| Aoostar GEM12 | |
| Geekom A7 | |
| Acemagic F2A | |
| Geekom XT13 Pro | |
| Geekom XT12 Pro | |
| Super Pi mod 1.5 XS 1M - 1M | |
| Geekom XT13 Pro | |
| Geekom XT12 Pro | |
| Geekom A7 | |
| Aoostar GEM12 | |
| Acemagic F2A | |
| Minisforum AtomMan X7 Ti | |
| Super Pi mod 1.5 XS 2M - 2M | |
| Geekom A7 | |
| Aoostar GEM12 | |
| Geekom XT13 Pro | |
| Geekom XT12 Pro | |
| Acemagic F2A | |
| Minisforum AtomMan X7 Ti | |
| Super Pi Mod 1.5 XS 32M - 32M | |
| Aoostar GEM12 | |
| Geekom A7 | |
| Geekom XT13 Pro | |
| Geekom XT12 Pro | |
| Acemagic F2A | |
| Minisforum AtomMan X7 Ti | |
* ... Moindre est la valeur, meilleures sont les performances
AIDA64: FP32 Ray-Trace | FPU Julia | CPU SHA3 | CPU Queen | FPU SinJulia | FPU Mandel | CPU AES | CPU ZLib | FP64 Ray-Trace | CPU PhotoWorxx
| Performance Rating | |
| Geekom A7 | |
| Aoostar GEM12 | |
| Minisforum AtomMan X7 Ti | |
| Acemagic F2A | |
| Moyenne de la classe Mini PC | |
| Geekom XT13 Pro | |
| Geekom XT12 Pro | |
| AIDA64 / FP32 Ray-Trace | |
| Aoostar GEM12 | |
| Geekom A7 | |
| Acemagic F2A | |
| Minisforum AtomMan X7 Ti | |
| Moyenne de la classe Mini PC (764 - 51004, n=116, 2 dernières années) | |
| Geekom XT13 Pro | |
| Geekom XT12 Pro | |
| AIDA64 / FPU Julia | |
| Aoostar GEM12 | |
| Geekom A7 | |
| Minisforum AtomMan X7 Ti | |
| Acemagic F2A | |
| Moyenne de la classe Mini PC (4140 - 214250, n=116, 2 dernières années) | |
| Geekom XT13 Pro | |
| Geekom XT12 Pro | |
| AIDA64 / CPU SHA3 | |
| Geekom A7 | |
| Aoostar GEM12 | |
| Minisforum AtomMan X7 Ti | |
| Acemagic F2A | |
| Moyenne de la classe Mini PC (290 - 9399, n=116, 2 dernières années) | |
| Geekom XT13 Pro | |
| Geekom XT12 Pro | |
| AIDA64 / CPU Queen | |
| Geekom A7 | |
| Aoostar GEM12 | |
| Geekom XT13 Pro | |
| Acemagic F2A | |
| Minisforum AtomMan X7 Ti | |
| Geekom XT12 Pro | |
| Moyenne de la classe Mini PC (8172 - 184747, n=116, 2 dernières années) | |
| AIDA64 / FPU SinJulia | |
| Aoostar GEM12 | |
| Geekom A7 | |
| Minisforum AtomMan X7 Ti | |
| Acemagic F2A | |
| Moyenne de la classe Mini PC (408 - 29064, n=116, 2 dernières années) | |
| Geekom XT13 Pro | |
| Geekom XT12 Pro | |
| AIDA64 / FPU Mandel | |
| Aoostar GEM12 | |
| Geekom A7 | |
| Acemagic F2A | |
| Minisforum AtomMan X7 Ti | |
| Moyenne de la classe Mini PC (2088 - 113499, n=116, 2 dernières années) | |
| Geekom XT13 Pro | |
| Geekom XT12 Pro | |
| AIDA64 / CPU AES | |
| Geekom A7 | |
| Minisforum AtomMan X7 Ti | |
| Acemagic F2A | |
| Geekom XT13 Pro | |
| Geekom XT12 Pro | |
| Moyenne de la classe Mini PC (3691 - 325960, n=116, 2 dernières années) | |
| Aoostar GEM12 | |
| AIDA64 / CPU ZLib | |
| Minisforum AtomMan X7 Ti | |
| Acemagic F2A | |
| Aoostar GEM12 | |
| Geekom A7 | |
| Geekom XT13 Pro | |
| Moyenne de la classe Mini PC (76.7 - 2039, n=116, 2 dernières années) | |
| Geekom XT12 Pro | |
| AIDA64 / FP64 Ray-Trace | |
| Aoostar GEM12 | |
| Geekom A7 | |
| Acemagic F2A | |
| Minisforum AtomMan X7 Ti | |
| Moyenne de la classe Mini PC (432 - 26952, n=116, 2 dernières années) | |
| Geekom XT13 Pro | |
| Geekom XT12 Pro | |
| AIDA64 / CPU PhotoWorxx | |
| Minisforum AtomMan X7 Ti | |
| Geekom A7 | |
| Aoostar GEM12 | |
| Acemagic F2A | |
| Moyenne de la classe Mini PC (5296 - 51727, n=116, 2 dernières années) | |
| Geekom XT13 Pro | |
| Geekom XT12 Pro | |
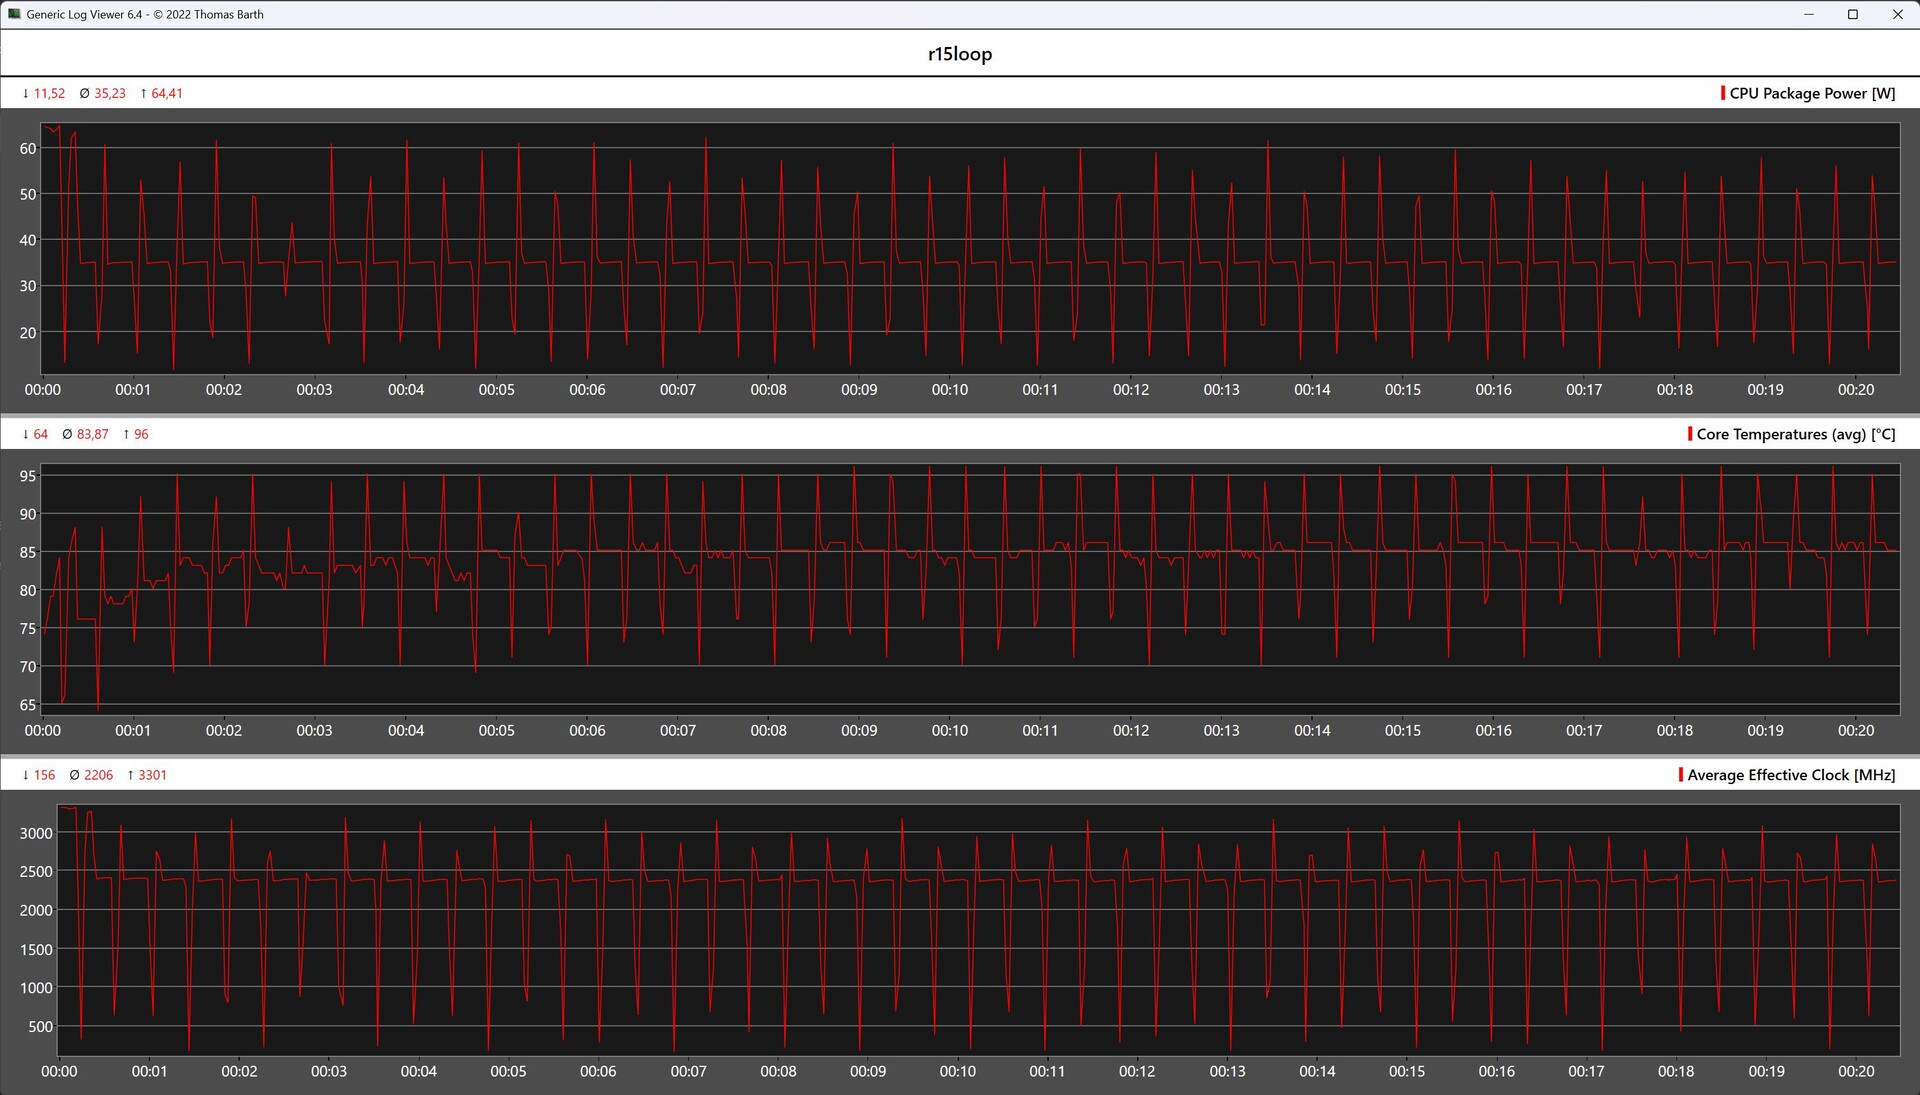
Cinebench R15 Multi loop
La boucle continue Cinebench R15 de notre échantillon de test est presque parallèle à celle du Geekom XT12 Pro. A la fin, cependant, le nouveau modèle XT13 Pro est capable de s'imposer avec une nette avance. On constate également que le petit système de refroidissement ne parvient pas à maintenir le Turbo du SoC sur une longue période. La limite de puissance maximale de 64 watts n'est atteinte que pendant une courte période, car la consommation d'énergie doit être réduite en raison des températures élevées.
Performance du système
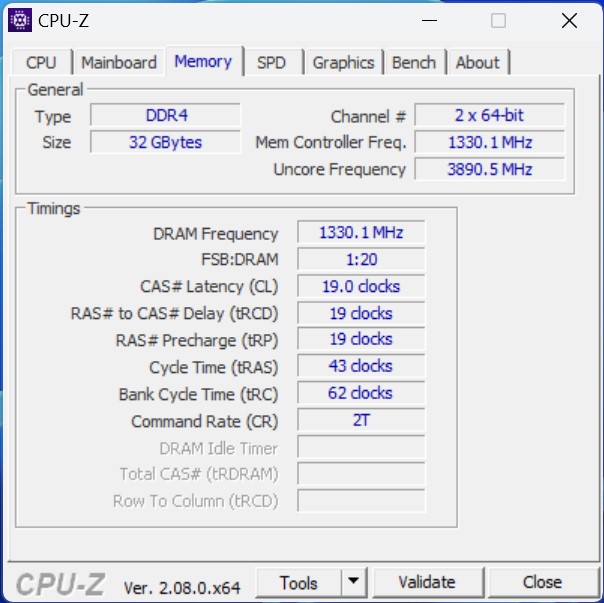
Dans les tests de performance du système, la performance documentée du Geekom XT13 Pro est juste assez bonne pour une place dans le bas du classement. D'un point de vue subjectif, cependant, nous pouvons dire que le Geekom XT13 Pro offre des performances décentes. Nous n'avons pas observé de latences notables lors de la phase de test. En ce qui concerne le choix de la mémoire vive, la norme DDR4, plus lente, prend sa revanche, comme le montrent les repères AIDA64. Techniquement, le Intel Core i9-13900H pourrait être associé à la DDR5 (5.200 MT/s).
| AIDA64 / Memory Copy | |
| Minisforum AtomMan X7 Ti | |
| Aoostar GEM12 | |
| Geekom A7 | |
| Acemagic F2A | |
| Moyenne de la classe Mini PC (8377 - 89287, n=116, 2 dernières années) | |
| Geekom XT13 Pro | |
| Geekom XT12 Pro | |
| AIDA64 / Memory Read | |
| Minisforum AtomMan X7 Ti | |
| Acemagic F2A | |
| Geekom A7 | |
| Aoostar GEM12 | |
| Moyenne de la classe Mini PC (8974 - 100086, n=116, 2 dernières années) | |
| Geekom XT12 Pro | |
| Geekom XT13 Pro | |
| AIDA64 / Memory Write | |
| Geekom A7 | |
| Aoostar GEM12 | |
| Minisforum AtomMan X7 Ti | |
| Acemagic F2A | |
| Moyenne de la classe Mini PC (8762 - 100538, n=116, 2 dernières années) | |
| Geekom XT13 Pro | |
| Geekom XT12 Pro | |
| AIDA64 / Memory Latency | |
| Acemagic F2A | |
| Minisforum AtomMan X7 Ti | |
| Moyenne de la classe Mini PC (44.9 - 184.8, n=116, 2 dernières années) | |
| Geekom A7 | |
| Aoostar GEM12 | |
| Geekom XT13 Pro | |
| Geekom XT12 Pro | |
* ... Moindre est la valeur, meilleures sont les performances
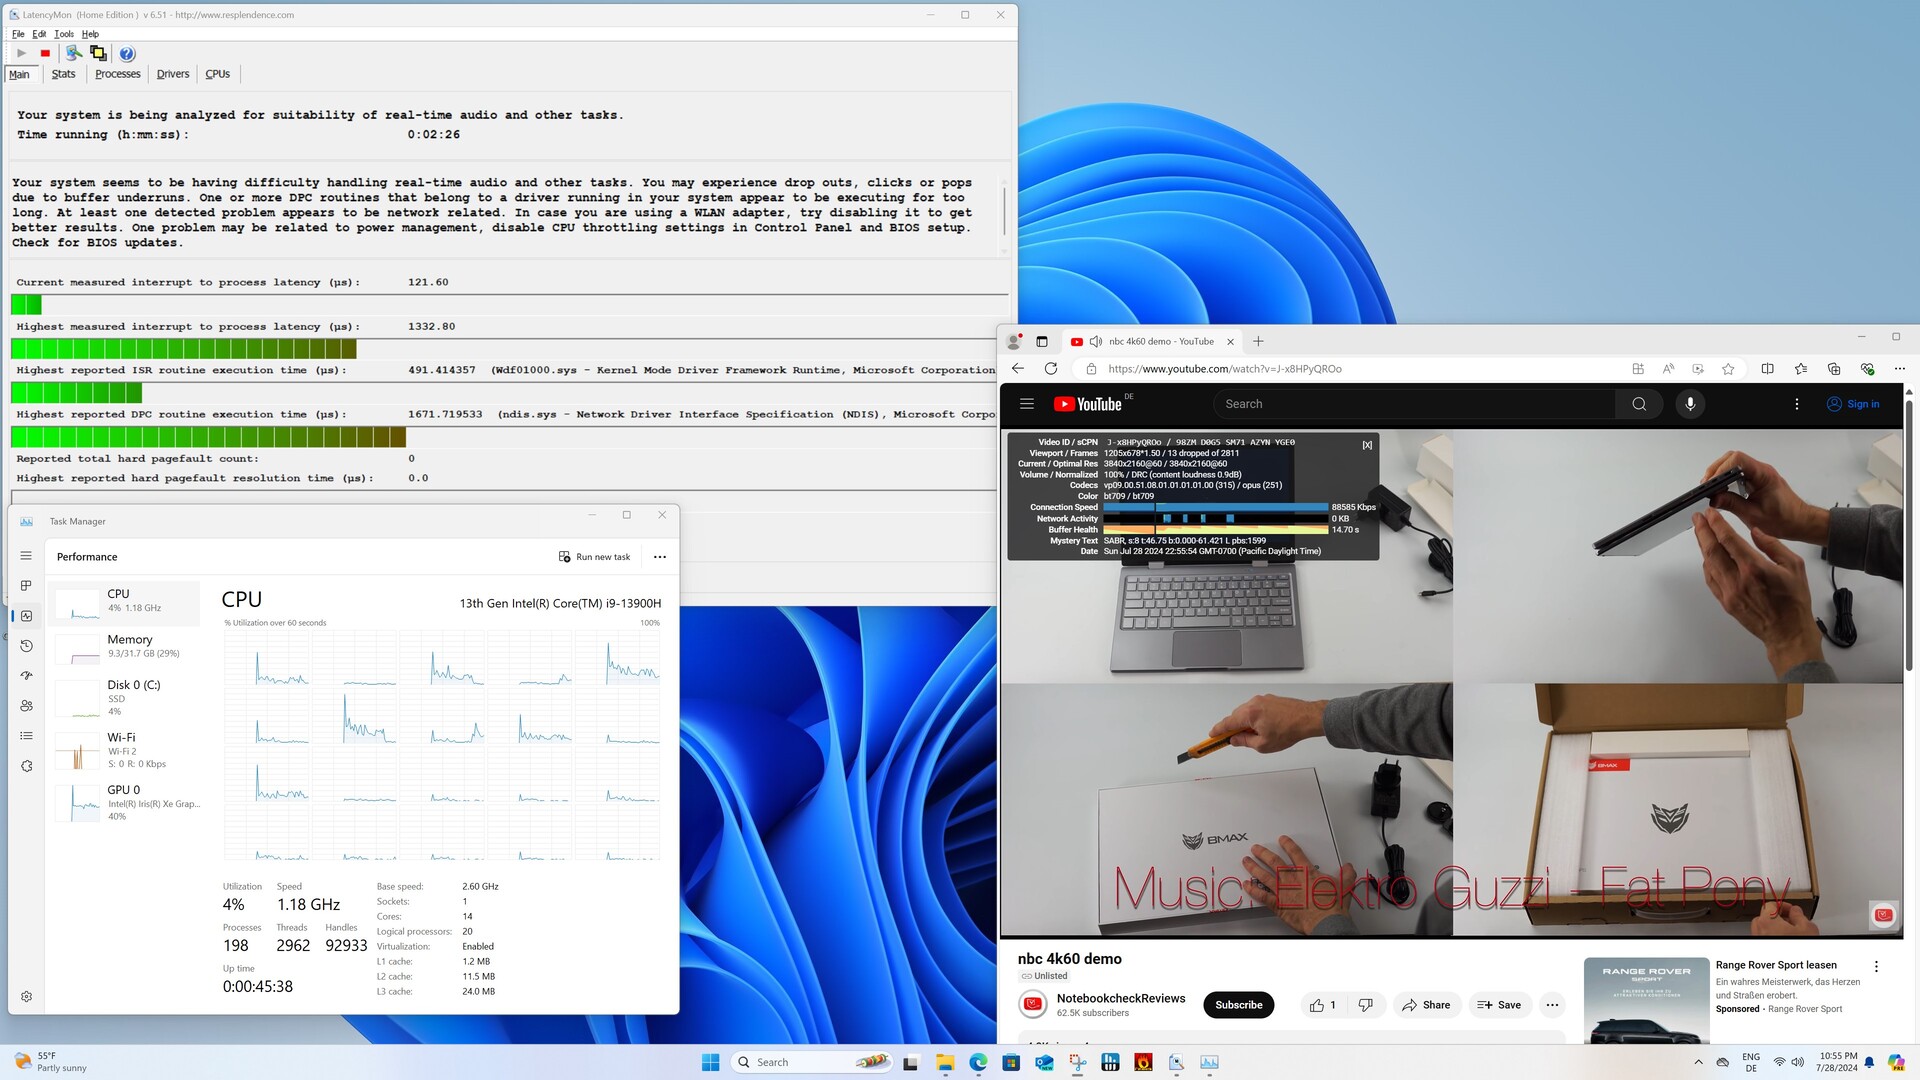
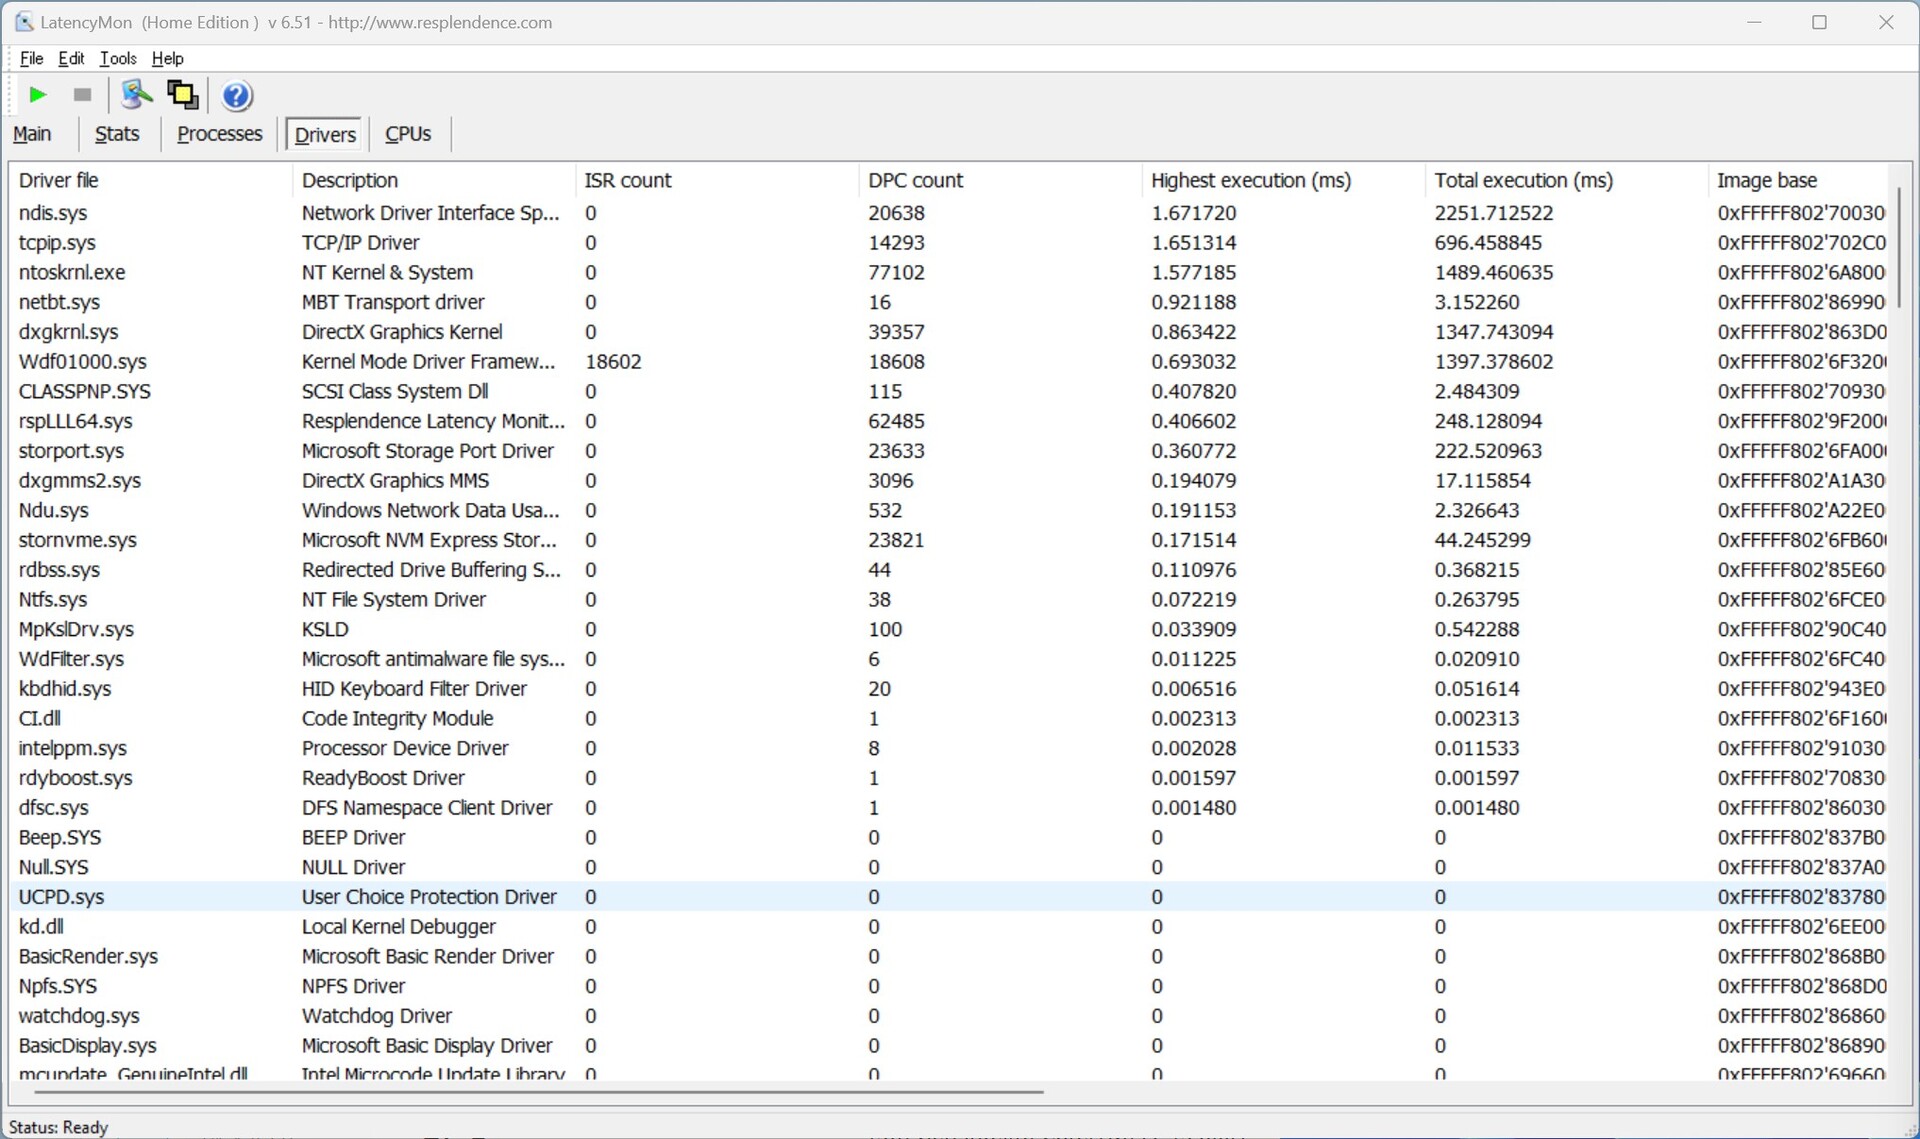
Latences DPC
Nous ne constatons pas de latences DPC extrêmement excessives avec le Geekom XT13 Pro. C'était le cas avec le Geekom XT12 Pro. Néanmoins, notre échantillon de test est loin d'être exceptionnel. Nous avons atteint la valeur maximale même en surfant simplement avec le navigateur Edge.

| DPC Latencies / LatencyMon - interrupt to process latency (max), Web, Youtube, Prime95 | |
| Acemagic F2A | |
| Geekom XT12 Pro | |
| Minisforum AtomMan X7 Ti | |
| Geekom XT13 Pro | |
| Geekom A7 | |
| Aoostar GEM12 | |
* ... Moindre est la valeur, meilleures sont les performances
Mémoire de masse
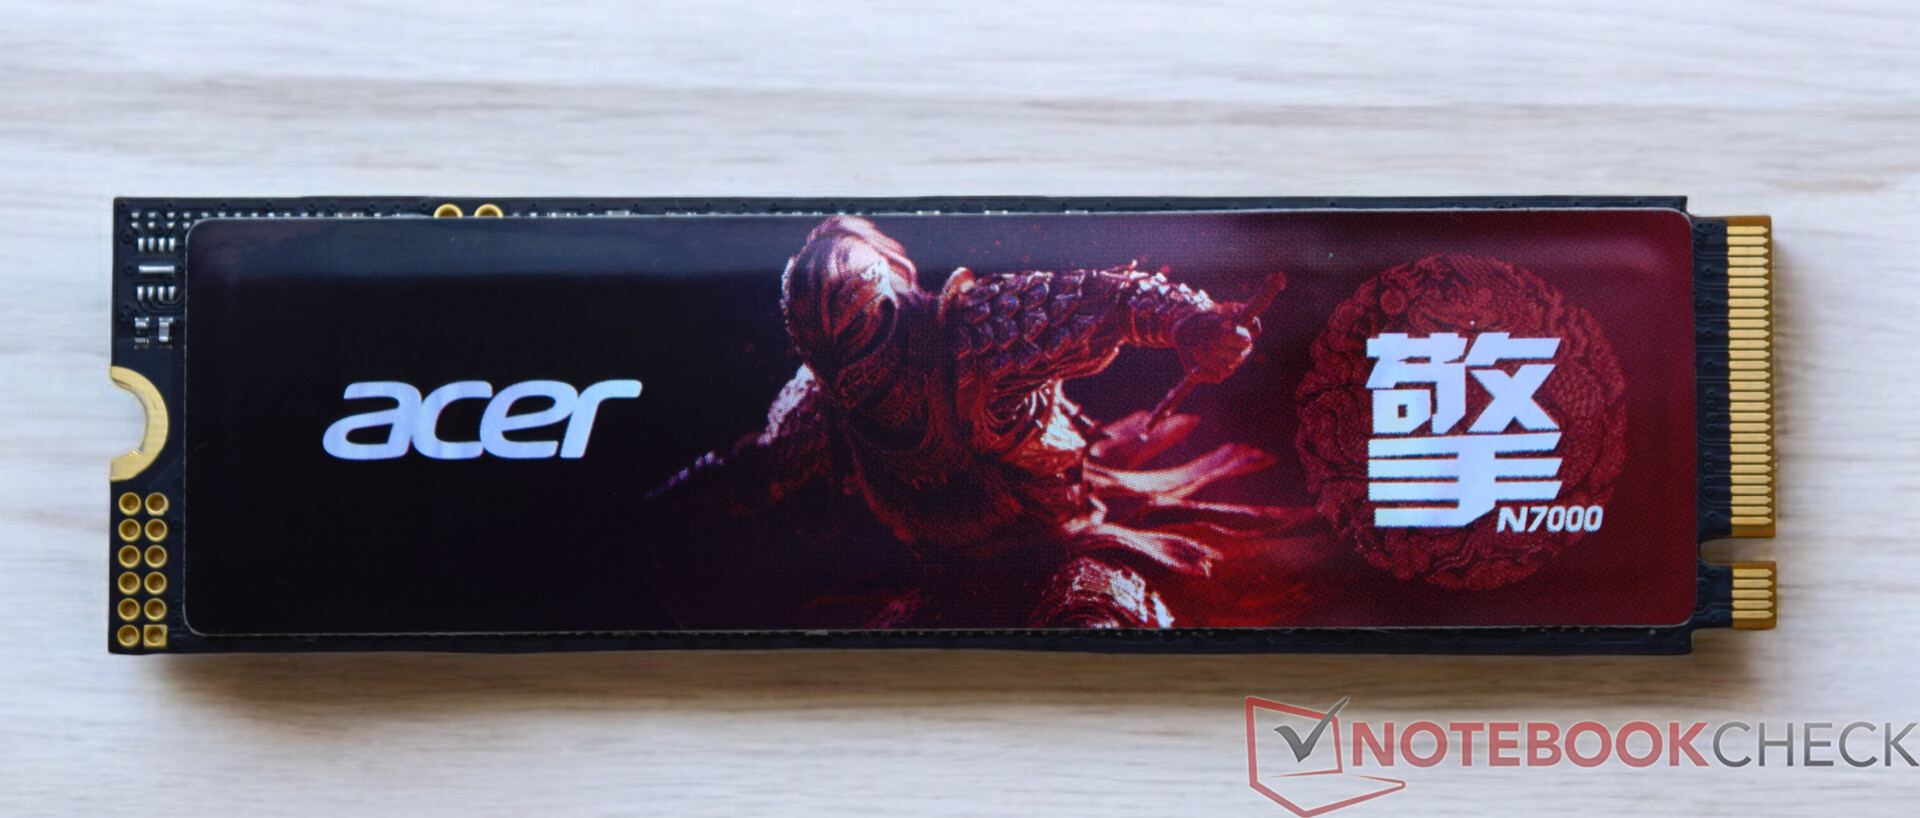
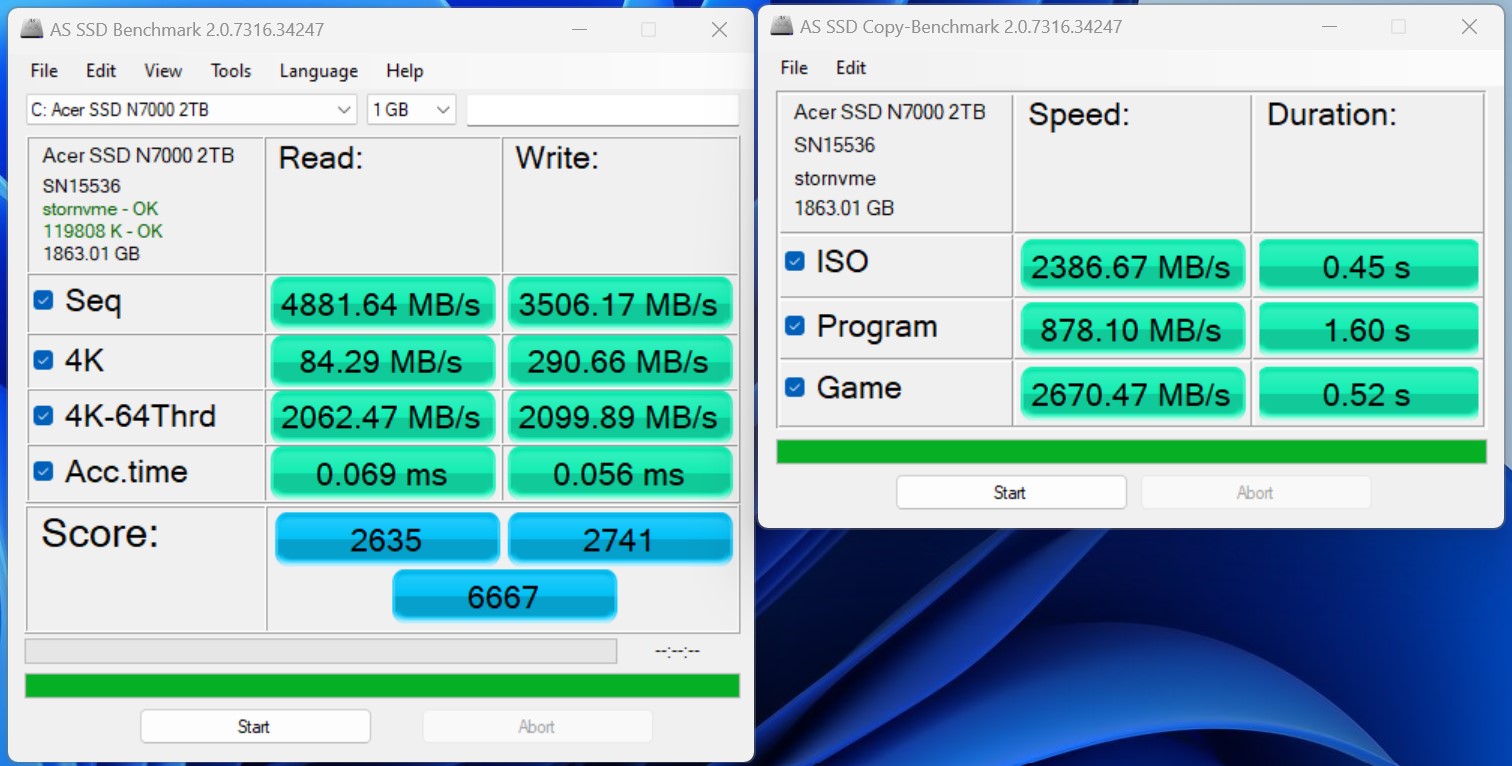
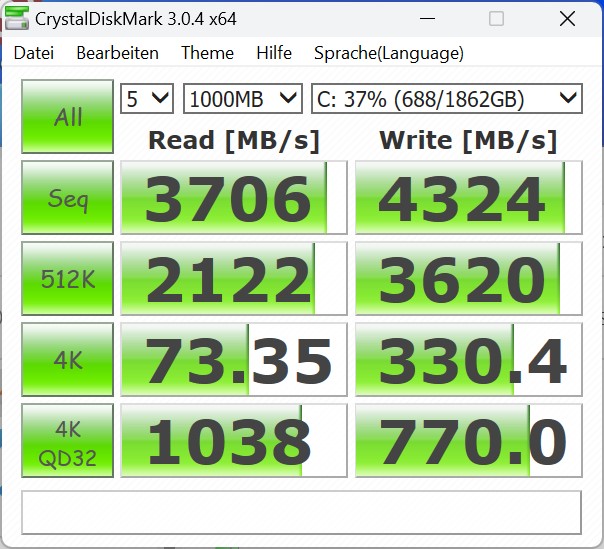
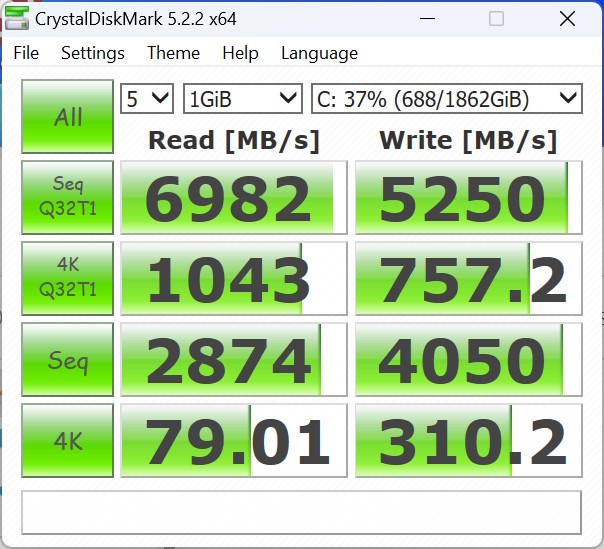
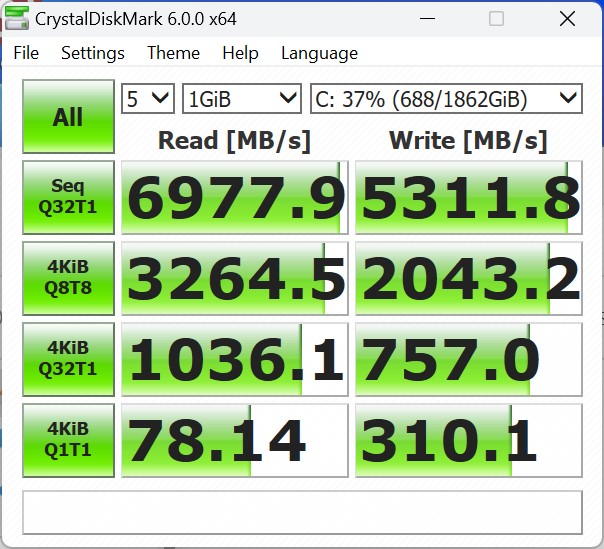
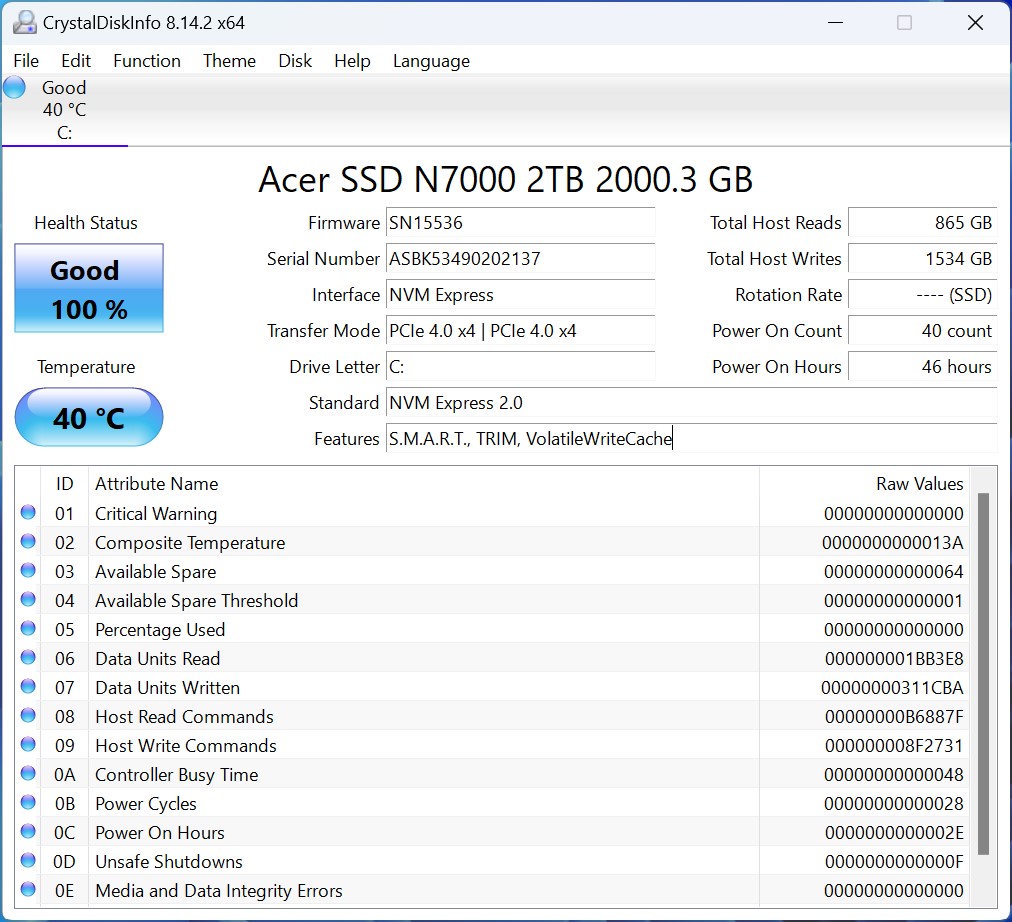
Le Geekom XT13 Pro est équipé d'un SSD de 2 To d'espace de stockage d'Acer. Le même modèle était déjà présent dans le Geekom GT13 et a fourni une excellente performance dans tous les tests. La connexion technique est optimale et les taux de transfert résultants sont très élevés. En cas de charge continue, l'Acer N7000 a un peu de mal à maintenir les performances de lecture stables. Heureusement, il n'y a pas de désavantage extrême. Comme le montre le graphique, l'Acer N7000 peut encore être nettement plus performant en lecture que le Geekom XT12 Pro ou l Acemagic F2A. Le test du Geekom XT12 Pro a révélé un problème de position du pad thermique, ce qui n'est pas le cas du Geekom XT13 Pro. Les coussinets thermiques sont dans la bonne position. Comme nous l'avons déjà mentionné dans la section maintenance, un SSD supplémentaire peut être installé dans le Geekom XT13 Pro. Cependant, le second slot M.2 ne supporte que les SSD SATA d'une longueur de 42 millimètres (M.2-2242).
Pour d'autres comparaisons et benchmarks, veuillez vous référer à notre Tableau de comparaison.

| Drive Performance Rating - Percent | |
| Aoostar GEM12 | |
| Geekom XT13 Pro | |
| Geekom XT12 Pro | |
| Minisforum AtomMan X7 Ti | |
| Geekom A7 | |
| Moyenne de la classe Mini PC | |
| Acemagic F2A | |
* ... Moindre est la valeur, meilleures sont les performances
Continuous read: DiskSpd Read Loop, Queue Depth 8
Graphique
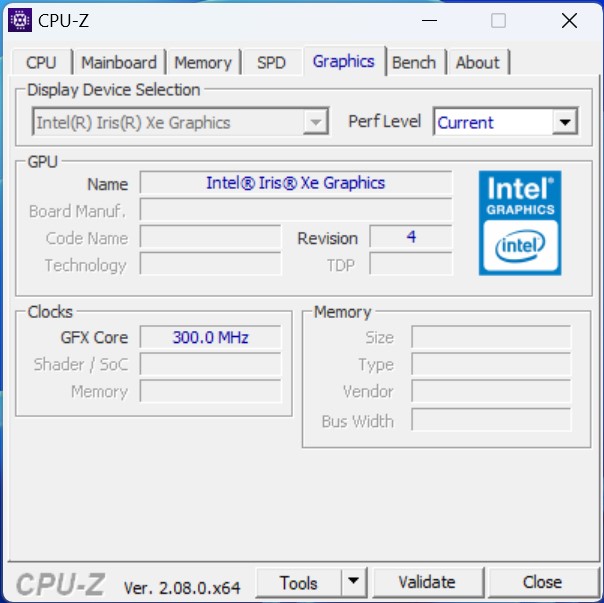
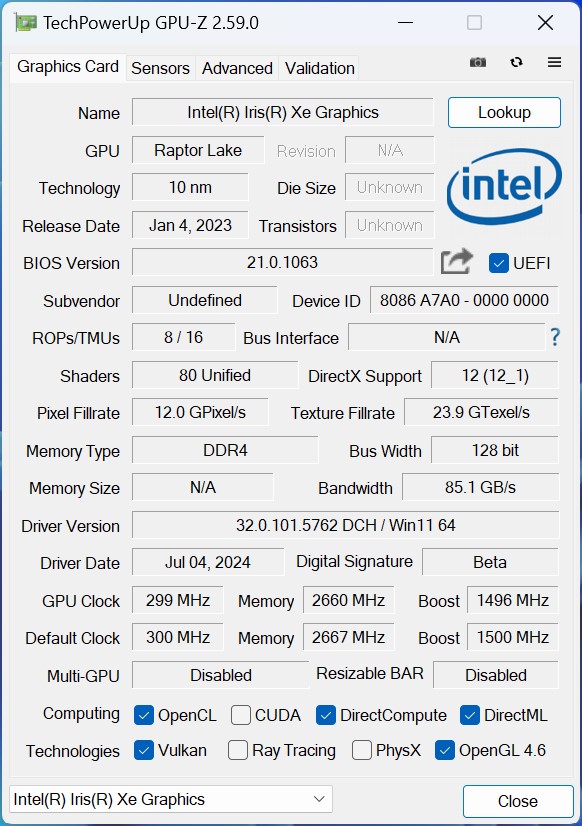
Les cartes graphiques Intel Iris Xe Graphics G7 prend en charge les calculs 3D et est responsable de la sortie des images. Avec 96 UE, le processeur Intel Core i9-13900H est le modèle le plus rapide de la série. Toutefois, ce modèle dépassé a du mal à s'imposer face aux représentants modernes. Si Geekom avait déjà osé franchir le pas en installant un SoC Meteor Lake dans le XT13 Pro, on aurait pu s'attendre à une augmentation nettement perceptible des performances 3D. Les performances d'un iGPU Intel Arc à 8 cœurs sont parfaitement visibles dans les données de comparaison. En revanche, vous obtiendrez des performances 3D encore plus élevées si vous installez une AMD Radeon 780M dans le système. Geekom lui-même propose désormais plusieurs appareils équipés de cet iGPU, ce qui signifie que le fabricant se complique la vie dans cette discipline. Un exemple en est le Geekom A7le Geekom A8 Geekom A8ou le Geekom AE7.
Vous trouverez d'autres comparaisons et benchmarks dans notre Tableau de comparaison des GPU.
| 3DMark Performance Rating - Percent | |
| Geekom A7 | |
| Aoostar GEM12 | |
| Acemagic F2A | |
| Minisforum AtomMan X7 Ti | |
| Geekom XT13 Pro | |
| Geekom XT12 Pro | |
| 3DMark 11 - 1280x720 Performance GPU | |
| Geekom A7 | |
| Aoostar GEM12 | |
| Acemagic F2A | |
| Minisforum AtomMan X7 Ti | |
| Geekom XT13 Pro | |
| Geekom XT12 Pro | |
| 3DMark | |
| 2560x1440 Time Spy Graphics | |
| Acemagic F2A | |
| Minisforum AtomMan X7 Ti | |
| Geekom A7 | |
| Aoostar GEM12 | |
| Geekom XT13 Pro | |
| Geekom XT12 Pro | |
| 1920x1080 Fire Strike Graphics | |
| Geekom A7 | |
| Aoostar GEM12 | |
| Acemagic F2A | |
| Minisforum AtomMan X7 Ti | |
| Geekom XT13 Pro | |
| Geekom XT12 Pro | |
| Unigine Heaven 4.0 | |
| Extreme Preset OpenGL | |
| Aoostar GEM12 | |
| Acemagic F2A | |
| Minisforum AtomMan X7 Ti | |
| Geekom A7 | |
| Geekom XT13 Pro | |
| Geekom XT12 Pro | |
| Extreme Preset DX11 | |
| Aoostar GEM12 | |
| Minisforum AtomMan X7 Ti | |
| Acemagic F2A | |
| Geekom A7 | |
| Geekom XT13 Pro | |
| Geekom XT12 Pro | |
| Unigine Valley 1.0 | |
| 1920x1080 Extreme HD DirectX AA:x8 | |
| Aoostar GEM12 | |
| Minisforum AtomMan X7 Ti | |
| Geekom A7 | |
| Acemagic F2A | |
| Geekom XT13 Pro | |
| Geekom XT12 Pro | |
| 1920x1080 Extreme HD Preset OpenGL AA:x8 | |
| Minisforum AtomMan X7 Ti | |
| Aoostar GEM12 | |
| Acemagic F2A | |
| Geekom XT13 Pro | |
| Geekom XT12 Pro | |
| Geekom A7 | |
| Unigine Superposition | |
| 1280x720 720p Low | |
| Aoostar GEM12 | |
| Acemagic F2A | |
| Minisforum AtomMan X7 Ti | |
| Geekom A7 | |
| Geekom XT13 Pro | |
| Geekom XT12 Pro | |
| 1920x1080 1080p High | |
| Aoostar GEM12 | |
| Acemagic F2A | |
| Minisforum AtomMan X7 Ti | |
| Geekom A7 | |
| Geekom XT13 Pro | |
| Geekom XT12 Pro | |
| 1920x1080 1080p Extreme | |
| Acemagic F2A | |
| Minisforum AtomMan X7 Ti | |
| Aoostar GEM12 | |
| Geekom A7 | |
| Geekom XT13 Pro | |
| Geekom XT12 Pro | |
| ComputeMark v2.1 | |
| 1024x600 Normal, Score | |
| Geekom A7 | |
| Aoostar GEM12 | |
| Acemagic F2A | |
| Minisforum AtomMan X7 Ti | |
| Geekom XT13 Pro | |
| Geekom XT12 Pro | |
| 1024x600 Normal, Fluid 3DTex | |
| Aoostar GEM12 | |
| Geekom A7 | |
| Minisforum AtomMan X7 Ti | |
| Acemagic F2A | |
| Geekom XT13 Pro | |
| Geekom XT12 Pro | |
| 1024x600 Normal, Fluid 2DTexArr | |
| Geekom A7 | |
| Aoostar GEM12 | |
| Minisforum AtomMan X7 Ti | |
| Acemagic F2A | |
| Geekom XT13 Pro | |
| Geekom XT12 Pro | |
| 1024x600 Normal, Mandel Vector | |
| Geekom A7 | |
| Aoostar GEM12 | |
| Acemagic F2A | |
| Minisforum AtomMan X7 Ti | |
| Geekom XT12 Pro | |
| Geekom XT13 Pro | |
| 1024x600 Normal, Mandel Scalar | |
| Geekom A7 | |
| Aoostar GEM12 | |
| Acemagic F2A | |
| Minisforum AtomMan X7 Ti | |
| Geekom XT12 Pro | |
| Geekom XT13 Pro | |
| 1024x600 Normal, QJuliaRayTrace | |
| Geekom A7 | |
| Aoostar GEM12 | |
| Acemagic F2A | |
| Minisforum AtomMan X7 Ti | |
| Geekom XT13 Pro | |
| Geekom XT12 Pro | |
| LuxMark v2.0 64Bit | |
| Room GPUs-only | |
| Geekom A7 | |
| Aoostar GEM12 | |
| Minisforum AtomMan X7 Ti | |
| Geekom XT13 Pro | |
| Acemagic F2A | |
| Sala GPUs-only | |
| Minisforum AtomMan X7 Ti | |
| Acemagic F2A | |
| Geekom XT13 Pro | |
| Geekom A7 | |
| Aoostar GEM12 | |
| Affinity Photo 2 - Combined (Single / Multi GPU) | |
| Minisforum AtomMan X7 Ti | |
| Acemagic F2A | |
| Geekom XT13 Pro | |
| Geekom XT12 Pro | |
| Aoostar GEM12 | |
| Geekom A7 | |
| Geekom XT13 Pro, Intel Iris Xe Graphics G7 96EUs i9-13900H | Aoostar GEM12, AMD Radeon 780M R7 8845HS | Minisforum AtomMan X7 Ti, Intel Arc 8-Core iGPU Ultra 9 185H | Acemagic F2A, Intel Arc 8-Core iGPU Ultra 7 155H | Geekom XT12 Pro, Intel Iris Xe Graphics G7 96EUs i9-12900H | Geekom A7, AMD Radeon 780M R9 7940HS | Moyenne de la classe Mini PC | |
|---|---|---|---|---|---|---|---|
| SPECviewperf 2020 | 309% | 36% | 25% | -4% | 278% | 188% | |
| 3840x2160 Medical (medical-03) | 3.63 | 11.2 209% | 4.23 17% | 5.05 39% | 3.49 -4% | 11.1 206% | 7.95 ? 119% |
| 3840x2160 Energy (energy-03) | 3.15 | 19.9 532% | 6.03 91% | 4.61 46% | 3.05 -3% | 14.1 348% | 11.4 ? 262% |
| 3840x2160 Creo (creo-03) | 16 | 33.4 109% | 18.5 16% | 17.9 12% | 14.8 -7% | 31.4 96% | 30.1 ? 88% |
| 3840x2160 CATIA (catia-06) | 7.9 | 23.2 194% | 11.1 41% | 10 27% | 7.78 -2% | 24.8 214% | 18.3 ? 132% |
| 3840x2160 3ds Max (3dsmax-07) | 10.3 | 20.4 98% | 14.9 45% | 12.9 25% | 9.69 -6% | 20.9 103% | 22.1 ? 115% |
| 3840x2160 Siemens NX (snx-04) | 6.13 | 64.1 946% | 6.24 2% | 5.7 -7% | 6.29 3% | 61.4 902% | 36.3 ? 492% |
| 3840x2160 Maya (maya-06) | 26.8 | 47.7 78% | 37.7 41% | 35.4 32% | 23.9 -11% | 47 75% | 56.6 ? 111% |
| 3DMark 05 Standard | 29045 points | |
| 3DMark 06 Score 1366x768 | 30156 points | |
| 3DMark Vantage P Result | 28599 points | |
| 3DMark 11 Performance | 8024 points | |
| 3DMark Ice Storm Standard Score | 155640 points | |
| 3DMark Cloud Gate Standard Score | 28112 points | |
| 3DMark Fire Strike Score | 5448 points | |
| 3DMark Fire Strike Extreme Score | 2570 points | |
| 3DMark Time Spy Score | 1920 points | |
| 3DMark Steel Nomad Score | 183 points | |
| 3DMark Steel Nomad Light Score | 1276 points | |
Aide | ||
Performances des jeux
L'iGPU Intel Iris Xe est incapable de gérer la plupart des jeux. L'iGPU vieillissant n'atteint des taux de rafraîchissement adéquats que dans des résolutions faibles et un préréglage graphique faible ou moyen. Si vous souhaitez tout de même utiliser le Geekom XT13 Pro pour jouer, vous devez faire le détour par une carte graphique externe. Différents modèles peuvent être utilisés avec l'appareil via USB4.
| Dota 2 Reborn | |
| 1280x720 min (0/3) fastest | |
| Geekom A7 | |
| Aoostar GEM12 | |
| Geekom XT13 Pro | |
| Minisforum AtomMan X7 Ti | |
| Geekom XT12 Pro | |
| Acemagic F2A | |
| 1920x1080 high (2/3) | |
| Geekom A7 | |
| Aoostar GEM12 | |
| Minisforum AtomMan X7 Ti | |
| Acemagic F2A | |
| Geekom XT13 Pro | |
| Geekom XT12 Pro | |
| GTA V | |
| 1024x768 Lowest Settings possible | |
| Geekom A7 | |
| Aoostar GEM12 | |
| Minisforum AtomMan X7 Ti | |
| Acemagic F2A | |
| Geekom XT13 Pro | |
| 1920x1080 High/On (Advanced Graphics Off) AA:2xMSAA + FX AF:8x | |
| Geekom A7 | |
| Aoostar GEM12 | |
| Minisforum AtomMan X7 Ti | |
| Acemagic F2A | |
| Geekom XT13 Pro | |
| Cyberpunk 2077 2.2 Phantom Liberty | |
| 1920x1080 Low Preset (FSR off) | |
| Aoostar GEM12 | |
| Minisforum AtomMan X7 Ti | |
| Acemagic F2A | |
| Geekom XT13 Pro | |
| Geekom XT12 Pro | |
| 1920x1080 High Preset (FSR off) | |
| Aoostar GEM12 | |
| Minisforum AtomMan X7 Ti | |
| Acemagic F2A | |
| Geekom XT13 Pro | |
| Geekom XT12 Pro | |
| Baldur's Gate 3 | |
| 1280x720 Low Preset | |
| Aoostar GEM12 | |
| Minisforum AtomMan X7 Ti | |
| Geekom XT13 Pro | |
| 1920x1080 High Preset | |
| Aoostar GEM12 | |
| Minisforum AtomMan X7 Ti | |
| Geekom XT13 Pro | |
| F1 24 | |
| 1920x1080 Low Preset AA:T AF:16x | |
| Minisforum AtomMan X7 Ti | |
| Geekom XT13 Pro | |
| 1920x1080 High Preset AA:T AF:16x | |
| Minisforum AtomMan X7 Ti | |
| Geekom XT13 Pro | |
FPS chart
| Bas | Moyen | Élevé | Ultra | |
|---|---|---|---|---|
| GTA V (2015) | 123.5 | 105.9 | 22.1 | 9 |
| Dota 2 Reborn (2015) | 117.2 | 82.9 | 72.5 | 66.5 |
| Final Fantasy XV Benchmark (2018) | 46 | 25.7 | 18.2 | |
| Baldur's Gate 3 (2023) | 19.9 | 15.4 | 13.5 | 13 |
| Cyberpunk 2077 2.2 Phantom Liberty (2023) | 18.6 | 15 | 13 | 11.4 |
| F1 24 (2024) | 43.1 | 37.3 | 26.7 |
Vérification des performances du Geekom XT13 Pro avec une Nvidia GeForce RTX 3060 Ti
Le Geekom XT13 Pro dispose de deux ports USB4 qui permettent l'utilisation de cartes graphiques externes. Sans influencer le résultat global, nous avons effectué quelques tests avec le Razer Core X et une Nvidia GeForce RTX 3060 Ti. Par rapport à l'iGPU vieillissant de l'Intel Core i9-13900H, les performances 3D peuvent être massivement augmentées. La comparaison avec les autres appareils de test montre un résultat presque identique dans les tests synthétiques. Les performances de jeu peuvent également être améliorées de manière significative avec cette combinaison, comme le montrent les jeux testés. Parfois, même les jeux les plus modernes peuvent être appréciés dans tous leurs détails.
| Performance Rating - Percent | |
| Geekom AE7 (Nvidia GeForce RTX 3060 Ti FE) | |
| Geekom A8 (Nvidia GeForce RTX 3060 Ti FE) | |
| Geekom GT13 Pro (Nvidia GeForce RTX 3060 Ti FE) | |
| Geekom XT13 Pro (Nvidia GeForce RTX 3060 Ti FE) | |
| Geekom XT12 Pro (Nvidia GeForce RTX 3060 Ti FE) | |
| Minisforum UH125 Pro (Nvidia GeForce RTX 3060 Ti FE) | |
| 3DMark 11 - 1280x720 Performance GPU | |
| Geekom A8 (Nvidia GeForce RTX 3060 Ti FE) | |
| Geekom AE7 (Nvidia GeForce RTX 3060 Ti FE) | |
| Geekom XT13 Pro (Nvidia GeForce RTX 3060 Ti FE) | |
| Geekom GT13 Pro (Nvidia GeForce RTX 3060 Ti FE) | |
| Geekom XT12 Pro (Nvidia GeForce RTX 3060 Ti FE) | |
| Minisforum UH125 Pro (Nvidia GeForce RTX 3060 Ti FE) | |
| 3DMark | |
| 2560x1440 Time Spy Graphics | |
| Geekom A8 (Nvidia GeForce RTX 3060 Ti FE) | |
| Geekom AE7 (Nvidia GeForce RTX 3060 Ti FE) | |
| Geekom XT13 Pro (Nvidia GeForce RTX 3060 Ti FE) | |
| Geekom GT13 Pro (Nvidia GeForce RTX 3060 Ti FE) | |
| Geekom XT12 Pro (Nvidia GeForce RTX 3060 Ti FE) | |
| Minisforum UH125 Pro (Nvidia GeForce RTX 3060 Ti FE) | |
| 1920x1080 Fire Strike Graphics | |
| Geekom AE7 (Nvidia GeForce RTX 3060 Ti FE) | |
| Geekom GT13 Pro (Nvidia GeForce RTX 3060 Ti FE) | |
| Geekom A8 (Nvidia GeForce RTX 3060 Ti FE) | |
| Geekom XT13 Pro (Nvidia GeForce RTX 3060 Ti FE) | |
| Minisforum UH125 Pro (Nvidia GeForce RTX 3060 Ti FE) | |
| Geekom XT12 Pro (Nvidia GeForce RTX 3060 Ti FE) | |
| 3840x2160 Fire Strike Ultra Graphics | |
| Geekom GT13 Pro (Nvidia GeForce RTX 3060 Ti FE) | |
| Geekom AE7 (Nvidia GeForce RTX 3060 Ti FE) | |
| Geekom XT12 Pro (Nvidia GeForce RTX 3060 Ti FE) | |
| Geekom XT13 Pro (Nvidia GeForce RTX 3060 Ti FE) | |
| Geekom A8 (Nvidia GeForce RTX 3060 Ti FE) | |
| Minisforum UH125 Pro (Nvidia GeForce RTX 3060 Ti FE) | |
| Unigine Superposition | |
| 1280x720 720p Low | |
| Geekom AE7 (Nvidia GeForce RTX 3060 Ti FE) | |
| Geekom GT13 Pro (Nvidia GeForce RTX 3060 Ti FE) | |
| Geekom A8 (Nvidia GeForce RTX 3060 Ti FE) | |
| Geekom XT13 Pro (Nvidia GeForce RTX 3060 Ti FE) | |
| Geekom XT12 Pro (Nvidia GeForce RTX 3060 Ti FE) | |
| Minisforum UH125 Pro (Nvidia GeForce RTX 3060 Ti FE) | |
| 1920x1080 1080p High | |
| Geekom GT13 Pro (Nvidia GeForce RTX 3060 Ti FE) | |
| Geekom A8 (Nvidia GeForce RTX 3060 Ti FE) | |
| Geekom AE7 (Nvidia GeForce RTX 3060 Ti FE) | |
| Geekom XT13 Pro (Nvidia GeForce RTX 3060 Ti FE) | |
| Minisforum UH125 Pro (Nvidia GeForce RTX 3060 Ti FE) | |
| Geekom XT12 Pro (Nvidia GeForce RTX 3060 Ti FE) | |
| 1920x1080 1080p Extreme | |
| Geekom GT13 Pro (Nvidia GeForce RTX 3060 Ti FE) | |
| Geekom XT13 Pro (Nvidia GeForce RTX 3060 Ti FE) | |
| Geekom XT12 Pro (Nvidia GeForce RTX 3060 Ti FE) | |
| Minisforum UH125 Pro (Nvidia GeForce RTX 3060 Ti FE) | |
| Geekom A8 (Nvidia GeForce RTX 3060 Ti FE) | |
| Geekom AE7 (Nvidia GeForce RTX 3060 Ti FE) | |
| 3840x2160 4k Optimized | |
| Geekom GT13 Pro (Nvidia GeForce RTX 3060 Ti FE) | |
| Geekom XT13 Pro (Nvidia GeForce RTX 3060 Ti FE) | |
| Geekom XT12 Pro (Nvidia GeForce RTX 3060 Ti FE) | |
| Geekom A8 (Nvidia GeForce RTX 3060 Ti FE) | |
| Minisforum UH125 Pro (Nvidia GeForce RTX 3060 Ti FE) | |
| Geekom AE7 (Nvidia GeForce RTX 3060 Ti FE) | |
| 7680x4320 8k Optimized | |
| Geekom GT13 Pro (Nvidia GeForce RTX 3060 Ti FE) | |
| Geekom XT13 Pro (Nvidia GeForce RTX 3060 Ti FE) | |
| Geekom XT12 Pro (Nvidia GeForce RTX 3060 Ti FE) | |
| Minisforum UH125 Pro (Nvidia GeForce RTX 3060 Ti FE) | |
| Geekom A8 (Nvidia GeForce RTX 3060 Ti FE) | |
| Geekom AE7 (Nvidia GeForce RTX 3060 Ti FE) | |
| Unigine Valley 1.0 | |
| 1920x1080 Extreme HD DirectX AA:x8 | |
| Geekom XT12 Pro (Nvidia GeForce RTX 3060 Ti FE) | |
| Geekom GT13 Pro (Nvidia GeForce RTX 3060 Ti FE) | |
| Geekom XT13 Pro (Nvidia GeForce RTX 3060 Ti FE) | |
| Geekom A8 (Nvidia GeForce RTX 3060 Ti FE) | |
| Geekom AE7 (Nvidia GeForce RTX 3060 Ti FE) | |
| Minisforum UH125 Pro (Nvidia GeForce RTX 3060 Ti FE) | |
| 1920x1080 Extreme HD Preset OpenGL AA:x8 | |
| Geekom GT13 Pro (Nvidia GeForce RTX 3060 Ti FE) | |
| Geekom XT12 Pro (Nvidia GeForce RTX 3060 Ti FE) | |
| Geekom XT13 Pro (Nvidia GeForce RTX 3060 Ti FE) | |
| Geekom A8 (Nvidia GeForce RTX 3060 Ti FE) | |
| Geekom AE7 (Nvidia GeForce RTX 3060 Ti FE) | |
| Minisforum UH125 Pro (Nvidia GeForce RTX 3060 Ti FE) | |
| Unigine Heaven 4.0 | |
| Extreme Preset OpenGL | |
| Geekom A8 (Nvidia GeForce RTX 3060 Ti FE) | |
| Geekom AE7 (Nvidia GeForce RTX 3060 Ti FE) | |
| Geekom GT13 Pro (Nvidia GeForce RTX 3060 Ti FE) | |
| Geekom XT13 Pro (Nvidia GeForce RTX 3060 Ti FE) | |
| Minisforum UH125 Pro (Nvidia GeForce RTX 3060 Ti FE) | |
| Geekom XT12 Pro (Nvidia GeForce RTX 3060 Ti FE) | |
| Extreme Preset DX11 | |
| Geekom XT13 Pro (Nvidia GeForce RTX 3060 Ti FE) | |
| Geekom GT13 Pro (Nvidia GeForce RTX 3060 Ti FE) | |
| Geekom A8 (Nvidia GeForce RTX 3060 Ti FE) | |
| Geekom XT12 Pro (Nvidia GeForce RTX 3060 Ti FE) | |
| Geekom AE7 (Nvidia GeForce RTX 3060 Ti FE) | |
| Minisforum UH125 Pro (Nvidia GeForce RTX 3060 Ti FE) | |
| ComputeMark v2.1 | |
| 1024x600 Normal, Score | |
| Geekom GT13 Pro (Nvidia GeForce RTX 3060 Ti FE) | |
| Geekom AE7 (Nvidia GeForce RTX 3060 Ti FE) | |
| Geekom A8 (Nvidia GeForce RTX 3060 Ti FE) | |
| Geekom XT13 Pro (Nvidia GeForce RTX 3060 Ti FE) | |
| Minisforum UH125 Pro (Nvidia GeForce RTX 3060 Ti FE) | |
| Geekom XT12 Pro (Nvidia GeForce RTX 3060 Ti FE) | |
| 1024x600 Normal, Fluid 3DTex | |
| Geekom GT13 Pro (Nvidia GeForce RTX 3060 Ti FE) | |
| Geekom AE7 (Nvidia GeForce RTX 3060 Ti FE) | |
| Minisforum UH125 Pro (Nvidia GeForce RTX 3060 Ti FE) | |
| Geekom A8 (Nvidia GeForce RTX 3060 Ti FE) | |
| Geekom XT13 Pro (Nvidia GeForce RTX 3060 Ti FE) | |
| Geekom XT12 Pro (Nvidia GeForce RTX 3060 Ti FE) | |
| 1024x600 Normal, Fluid 2DTexArr | |
| Geekom GT13 Pro (Nvidia GeForce RTX 3060 Ti FE) | |
| Geekom AE7 (Nvidia GeForce RTX 3060 Ti FE) | |
| Minisforum UH125 Pro (Nvidia GeForce RTX 3060 Ti FE) | |
| Geekom A8 (Nvidia GeForce RTX 3060 Ti FE) | |
| Geekom XT13 Pro (Nvidia GeForce RTX 3060 Ti FE) | |
| Geekom XT12 Pro (Nvidia GeForce RTX 3060 Ti FE) | |
| 1024x600 Normal, Mandel Vector | |
| Geekom GT13 Pro (Nvidia GeForce RTX 3060 Ti FE) | |
| Geekom AE7 (Nvidia GeForce RTX 3060 Ti FE) | |
| Geekom A8 (Nvidia GeForce RTX 3060 Ti FE) | |
| Geekom XT13 Pro (Nvidia GeForce RTX 3060 Ti FE) | |
| Minisforum UH125 Pro (Nvidia GeForce RTX 3060 Ti FE) | |
| Geekom XT12 Pro (Nvidia GeForce RTX 3060 Ti FE) | |
| 1024x600 Normal, Mandel Scalar | |
| Geekom GT13 Pro (Nvidia GeForce RTX 3060 Ti FE) | |
| Geekom AE7 (Nvidia GeForce RTX 3060 Ti FE) | |
| Geekom A8 (Nvidia GeForce RTX 3060 Ti FE) | |
| Geekom XT13 Pro (Nvidia GeForce RTX 3060 Ti FE) | |
| Minisforum UH125 Pro (Nvidia GeForce RTX 3060 Ti FE) | |
| Geekom XT12 Pro (Nvidia GeForce RTX 3060 Ti FE) | |
| 1024x600 Normal, QJuliaRayTrace | |
| Geekom GT13 Pro (Nvidia GeForce RTX 3060 Ti FE) | |
| Geekom AE7 (Nvidia GeForce RTX 3060 Ti FE) | |
| Geekom A8 (Nvidia GeForce RTX 3060 Ti FE) | |
| Geekom XT13 Pro (Nvidia GeForce RTX 3060 Ti FE) | |
| Minisforum UH125 Pro (Nvidia GeForce RTX 3060 Ti FE) | |
| Geekom XT12 Pro (Nvidia GeForce RTX 3060 Ti FE) | |
| Photoshop PugetBench - GPU Score | |
| Geekom A8 (Nvidia GeForce RTX 3060 Ti FE) | |
| Geekom AE7 (Nvidia GeForce RTX 3060 Ti FE) | |
| Geekom XT12 Pro (Nvidia GeForce RTX 3060 Ti FE) | |
| Geekom GT13 Pro (Nvidia GeForce RTX 3060 Ti FE) | |
| Minisforum UH125 Pro (Nvidia GeForce RTX 3060 Ti FE) | |
| Geekom XT13 Pro (Nvidia GeForce RTX 3060 Ti FE) | |
| Premiere Pro PugetBench - GPU 0.9 | |
| Geekom A8 (Nvidia GeForce RTX 3060 Ti FE) | |
| Geekom AE7 (Nvidia GeForce RTX 3060 Ti FE) | |
| Geekom GT13 Pro (Nvidia GeForce RTX 3060 Ti FE) | |
| Minisforum UH125 Pro (Nvidia GeForce RTX 3060 Ti FE) | |
| Geekom XT13 Pro (Nvidia GeForce RTX 3060 Ti FE) | |
| Geekom XT12 Pro (Nvidia GeForce RTX 3060 Ti FE) | |
| Cyberpunk 2077 2.2 Phantom Liberty | |
| 1280x720 Low Preset (FSR off) | |
| Geekom AE7 (Nvidia GeForce RTX 3060 Ti FE) | |
| Geekom A8 (Nvidia GeForce RTX 3060 Ti FE) | |
| Geekom XT13 Pro (Nvidia GeForce RTX 3060 Ti FE) | |
| Geekom GT13 Pro (Nvidia GeForce RTX 3060 Ti FE) | |
| Geekom XT12 Pro (Nvidia GeForce RTX 3060 Ti FE) | |
| Minisforum UH125 Pro (Nvidia GeForce RTX 3060 Ti FE) | |
| Geekom XT13 Pro | |
| 1920x1080 Medium Preset (FSR off) | |
| Geekom AE7 (Nvidia GeForce RTX 3060 Ti FE) | |
| Geekom XT13 Pro (Nvidia GeForce RTX 3060 Ti FE) | |
| Geekom A8 (Nvidia GeForce RTX 3060 Ti FE) | |
| Geekom GT13 Pro (Nvidia GeForce RTX 3060 Ti FE) | |
| Geekom XT12 Pro (Nvidia GeForce RTX 3060 Ti FE) | |
| Minisforum UH125 Pro (Nvidia GeForce RTX 3060 Ti FE) | |
| Geekom XT13 Pro | |
| 1920x1080 Ultra Preset (FSR off) | |
| Geekom AE7 (Nvidia GeForce RTX 3060 Ti FE) | |
| Geekom XT13 Pro (Nvidia GeForce RTX 3060 Ti FE) | |
| Geekom GT13 Pro (Nvidia GeForce RTX 3060 Ti FE) | |
| Geekom A8 (Nvidia GeForce RTX 3060 Ti FE) | |
| Geekom XT12 Pro (Nvidia GeForce RTX 3060 Ti FE) | |
| Minisforum UH125 Pro (Nvidia GeForce RTX 3060 Ti FE) | |
| Geekom XT13 Pro | |
| Baldur's Gate 3 | |
| 1920x1080 Low Preset | |
| Geekom GT13 Pro (Nvidia GeForce RTX 3060 Ti FE) | |
| Geekom XT12 Pro (Nvidia GeForce RTX 3060 Ti FE) | |
| Geekom XT13 Pro (Nvidia GeForce RTX 3060 Ti FE) | |
| Geekom AE7 (Nvidia GeForce RTX 3060 Ti FE) | |
| Geekom A8 (Nvidia GeForce RTX 3060 Ti FE) | |
| Minisforum UH125 Pro (Nvidia GeForce RTX 3060 Ti FE) | |
| Geekom XT13 Pro | |
| 1920x1080 Medium Preset | |
| Geekom XT13 Pro (Nvidia GeForce RTX 3060 Ti FE) | |
| Geekom GT13 Pro (Nvidia GeForce RTX 3060 Ti FE) | |
| Geekom A8 (Nvidia GeForce RTX 3060 Ti FE) | |
| Geekom XT12 Pro (Nvidia GeForce RTX 3060 Ti FE) | |
| Geekom AE7 (Nvidia GeForce RTX 3060 Ti FE) | |
| Minisforum UH125 Pro (Nvidia GeForce RTX 3060 Ti FE) | |
| Geekom XT13 Pro | |
| 1920x1080 Ultra Preset | |
| Geekom GT13 Pro (Nvidia GeForce RTX 3060 Ti FE) | |
| Geekom XT13 Pro (Nvidia GeForce RTX 3060 Ti FE) | |
| Geekom A8 (Nvidia GeForce RTX 3060 Ti FE) | |
| Geekom XT12 Pro (Nvidia GeForce RTX 3060 Ti FE) | |
| Geekom AE7 (Nvidia GeForce RTX 3060 Ti FE) | |
| Minisforum UH125 Pro (Nvidia GeForce RTX 3060 Ti FE) | |
| Geekom XT13 Pro | |
| F1 24 | |
| 1920x1080 Low Preset AA:T AF:16x | |
| Geekom AE7 (Nvidia GeForce RTX 3060 Ti FE) | |
| Geekom A8 (Nvidia GeForce RTX 3060 Ti FE) | |
| Geekom GT13 Pro (Nvidia GeForce RTX 3060 Ti FE) | |
| Geekom XT13 Pro (Nvidia GeForce RTX 3060 Ti FE) | |
| Geekom XT12 Pro (Nvidia GeForce RTX 3060 Ti FE) | |
| Minisforum UH125 Pro (Nvidia GeForce RTX 3060 Ti FE) | |
| Geekom XT13 Pro | |
| 1920x1080 Medium Preset AA:T AF:16x | |
| Geekom A8 (Nvidia GeForce RTX 3060 Ti FE) | |
| Geekom AE7 (Nvidia GeForce RTX 3060 Ti FE) | |
| Geekom XT12 Pro (Nvidia GeForce RTX 3060 Ti FE) | |
| Geekom XT13 Pro (Nvidia GeForce RTX 3060 Ti FE) | |
| Geekom GT13 Pro (Nvidia GeForce RTX 3060 Ti FE) | |
| Minisforum UH125 Pro (Nvidia GeForce RTX 3060 Ti FE) | |
| Geekom XT13 Pro | |
| 1920x1080 Ultra High Preset AA:T AF:16x | |
| Geekom AE7 (Nvidia GeForce RTX 3060 Ti FE) | |
| Geekom A8 (Nvidia GeForce RTX 3060 Ti FE) | |
| Geekom XT13 Pro (Nvidia GeForce RTX 3060 Ti FE) | |
| Geekom GT13 Pro (Nvidia GeForce RTX 3060 Ti FE) | |
| Geekom XT12 Pro (Nvidia GeForce RTX 3060 Ti FE) | |
| Minisforum UH125 Pro (Nvidia GeForce RTX 3060 Ti FE) | |
| Geekom XT13 Pro, Intel Iris Xe Graphics G7 96EUs i9-13900H | Geekom XT13 Pro (Nvidia GeForce RTX 3060 Ti FE), i9-13900H | Geekom GT13 Pro (Nvidia GeForce RTX 3060 Ti FE), i9-13900H | Geekom XT12 Pro (Nvidia GeForce RTX 3060 Ti FE), i9-12900H | Minisforum UH125 Pro (Nvidia GeForce RTX 3060 Ti FE), Ultra 5 125H | Geekom AE7 (Nvidia GeForce RTX 3060 Ti FE), R9 7940HS | Geekom A8 (Nvidia GeForce RTX 3060 Ti FE), R9 8945HS | Moyenne de la classe Mini PC | |
|---|---|---|---|---|---|---|---|---|
| SPECviewperf 2020 | 391% | 387% | 321% | 182% | 395% | 516% | 188% | |
| 3840x2160 Medical (medical-03) | 3.63 | 13 258% | 10.8 198% | 11.8 225% | 10.9 200% | 13 258% | 10.8 198% | 7.95 ? 119% |
| 3840x2160 Energy (energy-03) | 3.15 | 20.9 563% | 21 567% | 18.9 500% | 17.8 465% | 20.9 563% | 50.3 1497% | 11.4 ? 262% |
| 3840x2160 Creo (creo-03) | 16 | 74.2 364% | 76.4 378% | 62.7 292% | 26.6 66% | 76.8 380% | 76.6 379% | 30.1 ? 88% |
| 3840x2160 CATIA (catia-06) | 7.9 | 39.4 399% | 40.1 408% | 32.8 315% | 23.6 199% | 39.2 396% | 38.8 391% | 18.3 ? 132% |
| 3840x2160 3ds Max (3dsmax-07) | 10.3 | 47.2 358% | 47.3 359% | 40 288% | 28.7 179% | 46.5 351% | 45.9 346% | 22.1 ? 115% |
| 3840x2160 Siemens NX (snx-04) | 6.13 | 16.5 169% | 16.5 169% | 15.2 148% | 11.4 86% | 16.6 171% | 16.6 171% | 36.3 ? 492% |
| 3840x2160 Maya (maya-06) | 26.8 | 194 624% | 196 631% | 155 478% | 47.5 77% | 199 643% | 195 628% | 56.6 ? 111% |
| Bas | Moyen | Élevé | Ultra | QHD | 4K | |
|---|---|---|---|---|---|---|
| GTA V (2015) | 182.2 | 178.4 | 170.3 | 104.2 | 92.7 | 103.4 |
| Dota 2 Reborn (2015) | 165.8 | 138.3 | 132 | 121.9 | 104.6 | |
| Final Fantasy XV Benchmark (2018) | 183.7 | 142.2 | 98.8 | 77.6 | 48.6 | |
| X-Plane 11.11 (2018) | 146.4 | 137.9 | 106.3 | 92.1 | ||
| Baldur's Gate 3 (2023) | 113 | 91.3 | 79 | 78.5 | 61.6 | 37.1 |
| Cyberpunk 2077 2.2 Phantom Liberty (2023) | 88.2 | 81.4 | 71.7 | 64.4 | 44.5 | 22.2 |
| F1 24 (2024) | 76.9 | 73.1 | 60.5 | 42.2 | 36.9 | 19.2 |
Émissions - Faible refroidissement et faible consommation d'énergie
Émissions sonores
Même les appareils de même conception n'ont pas été en mesure d'impressionner avec des valeurs supérieures en termes d'émissions sonores. Cela vaut également pour le Geekom XT13 Pro, du moins en charge. Le mini-PC est très silencieux au repos et est à peine audible. Cependant, le ventilateur est toujours en marche, ce qui signifie qu'un fonctionnement semi-passif n'est pas possible. En charge, le ventilateur s'emballe parfois considérablement et nous avons pu mesurer un niveau de pression acoustique de 49,5 dB(A). Cependant, le volume maximal n'est pas toujours présent. Lors du test de stress, la vitesse du ventilateur a fluctué à plusieurs reprises, de sorte que le Geekom XT13 Pro n'a atteint que 38 dB(A) en charge. Nous avons observé le même phénomène en charge moyenne. Ici, le volume mesurable fluctue entre 38 et 42,2 dB(A)
Malheureusement, le Geekom XT12 Pro n'est pas l'un des appareils les plus silencieux. L'appareil fonctionne presque silencieusement au ralenti, seul un léger bruit de ventilateur est audible. Cela change en charge, car le mini-PC est clairement audible jusqu'à 44,2 dB(A). Nous avons même pu mesurer jusqu'à 47,2 dB(A) pendant les jeux. Cependant, nous n'avons pas réussi à détecter un niveau de pression sonore élevé en permanence pendant les jeux. Le résultat a oscillé entre 39 et 47,2 dB(A).
Degré de la nuisance sonore
| Au repos |
| 27.6 / 27.8 / 27.9 dB(A) |
| Fortement sollicité |
| 42.2 / 49.5 dB(A) |
 | ||
30 dB silencieux 40 dB(A) audible 50 dB(A) bruyant |
||
min: | ||
| Geekom XT13 Pro i9-13900H, Iris Xe G7 96EUs | Aoostar GEM12 R7 8845HS, Radeon 780M | Minisforum AtomMan X7 Ti Ultra 9 185H, Arc 8-Core | Acemagic F2A Ultra 7 155H, Arc 8-Core | Geekom XT12 Pro i9-12900H, Iris Xe G7 96EUs | Geekom A7 R9 7940HS, Radeon 780M | |
|---|---|---|---|---|---|---|
| Noise | 10% | 1% | 2% | 2% | -9% | |
| arrêt / environnement * | 25 | 24.3 3% | 24.1 4% | 24.9 -0% | 25.4 -2% | 25.4 -2% |
| Idle Minimum * | 27.6 | 27.5 -0% | 29.8 -8% | 25.4 8% | 28 -1% | 33.3 -21% |
| Idle Average * | 27.8 | 27.6 1% | 29.9 -8% | 25.7 8% | 28.1 -1% | 33.6 -21% |
| Idle Maximum * | 27.9 | 27.6 1% | 30 -8% | 25.7 8% | 28.5 -2% | 33.7 -21% |
| Load Average * | 42.2 | 36 15% | 37.3 12% | 47.8 -13% | 39.6 6% | 43.3 -3% |
| Cyberpunk 2077 ultra * | 46.6 | 35.4 24% | ||||
| Load Maximum * | 49.5 | 38.2 23% | 43.5 12% | 49 1% | 44.2 11% | 43.3 13% |
| Witcher 3 ultra * | 35.4 | 40.2 | 45.23 | 47.2 | 43.2 |
* ... Moindre est la valeur, meilleures sont les performances
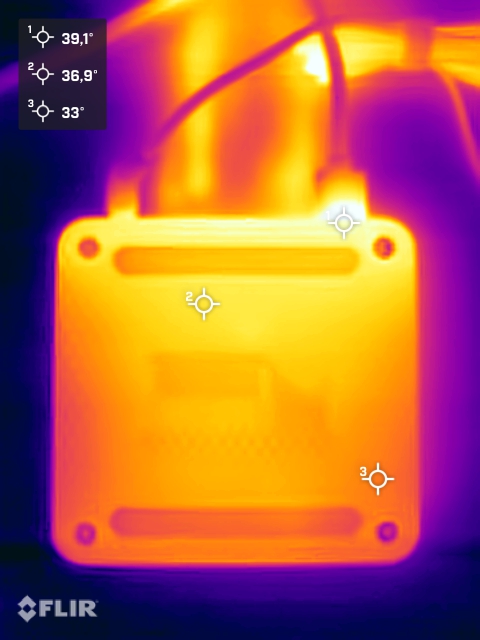
Température
Le boîtier s'échauffe sensiblement sous charge. Cependant, nous ne trouvons pas de valeurs critiques. Le SoC est un peu différent, car Geekom ne limite pas la température maximale, qui atteint rapidement 100 °C sous charge. Contrairement à la boucle multiple de Cinebench R15, l'Intel Core i9-13900H ne dépasse pas la limite de 64 watts dans le test de stress. Le SoC chauffe trop rapidement et les performances doivent être réduites. Sur une période plus longue, la température se stabilise ensuite à environ 90 °C, ce qui n'est pas un problème pour le processeur. Le design extrêmement compact rend tout simplement impossible l'installation d'un système de refroidissement plus puissant.
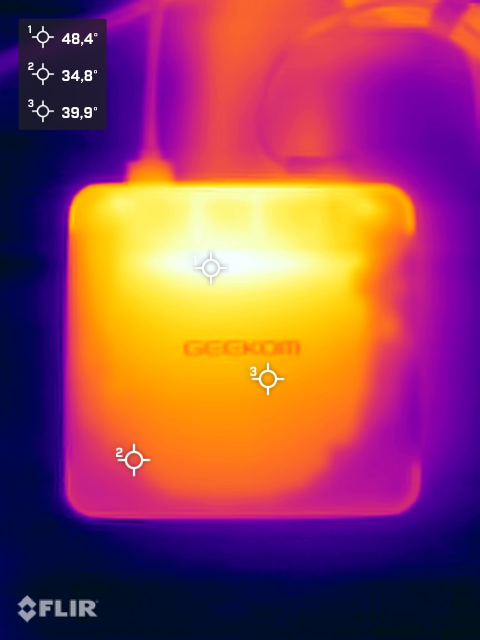
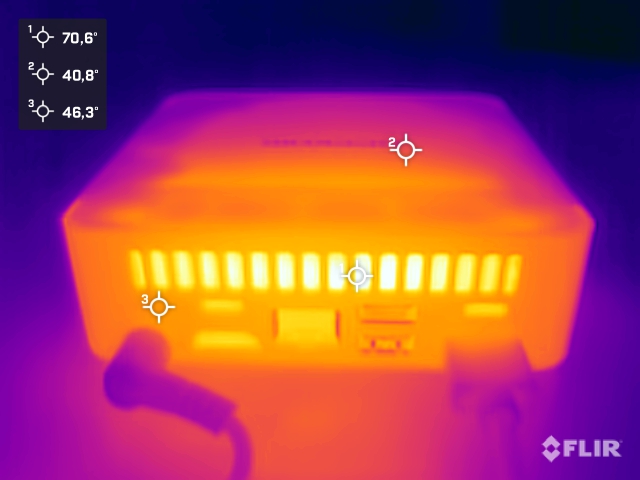
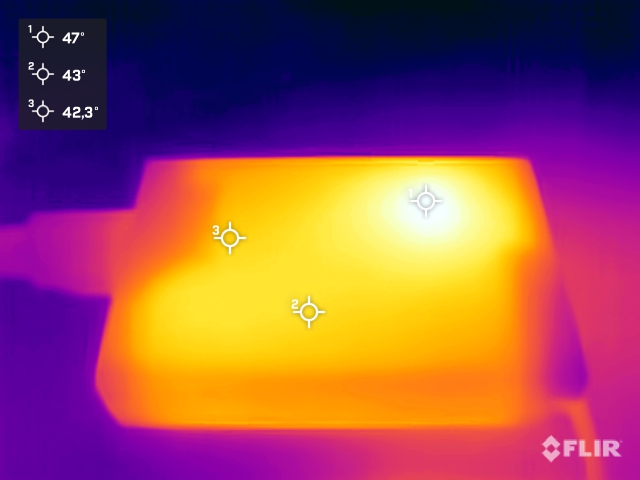
(-) La température maximale du côté supérieur est de 45.7 °C / 114 F, par rapport à la moyenne de 35.8 °C / 96 F, allant de 21.6 à 69.5 °C pour la classe Mini PC.
(±) Le fond chauffe jusqu'à un maximum de 40.3 °C / 105 F, contre une moyenne de 36.1 °C / 97 F
(+) En utilisation inactive, la température moyenne du côté supérieur est de 27.9 °C / 82 F, par rapport à la moyenne du dispositif de 32.3 °C / 90 F.
Consommation électrique
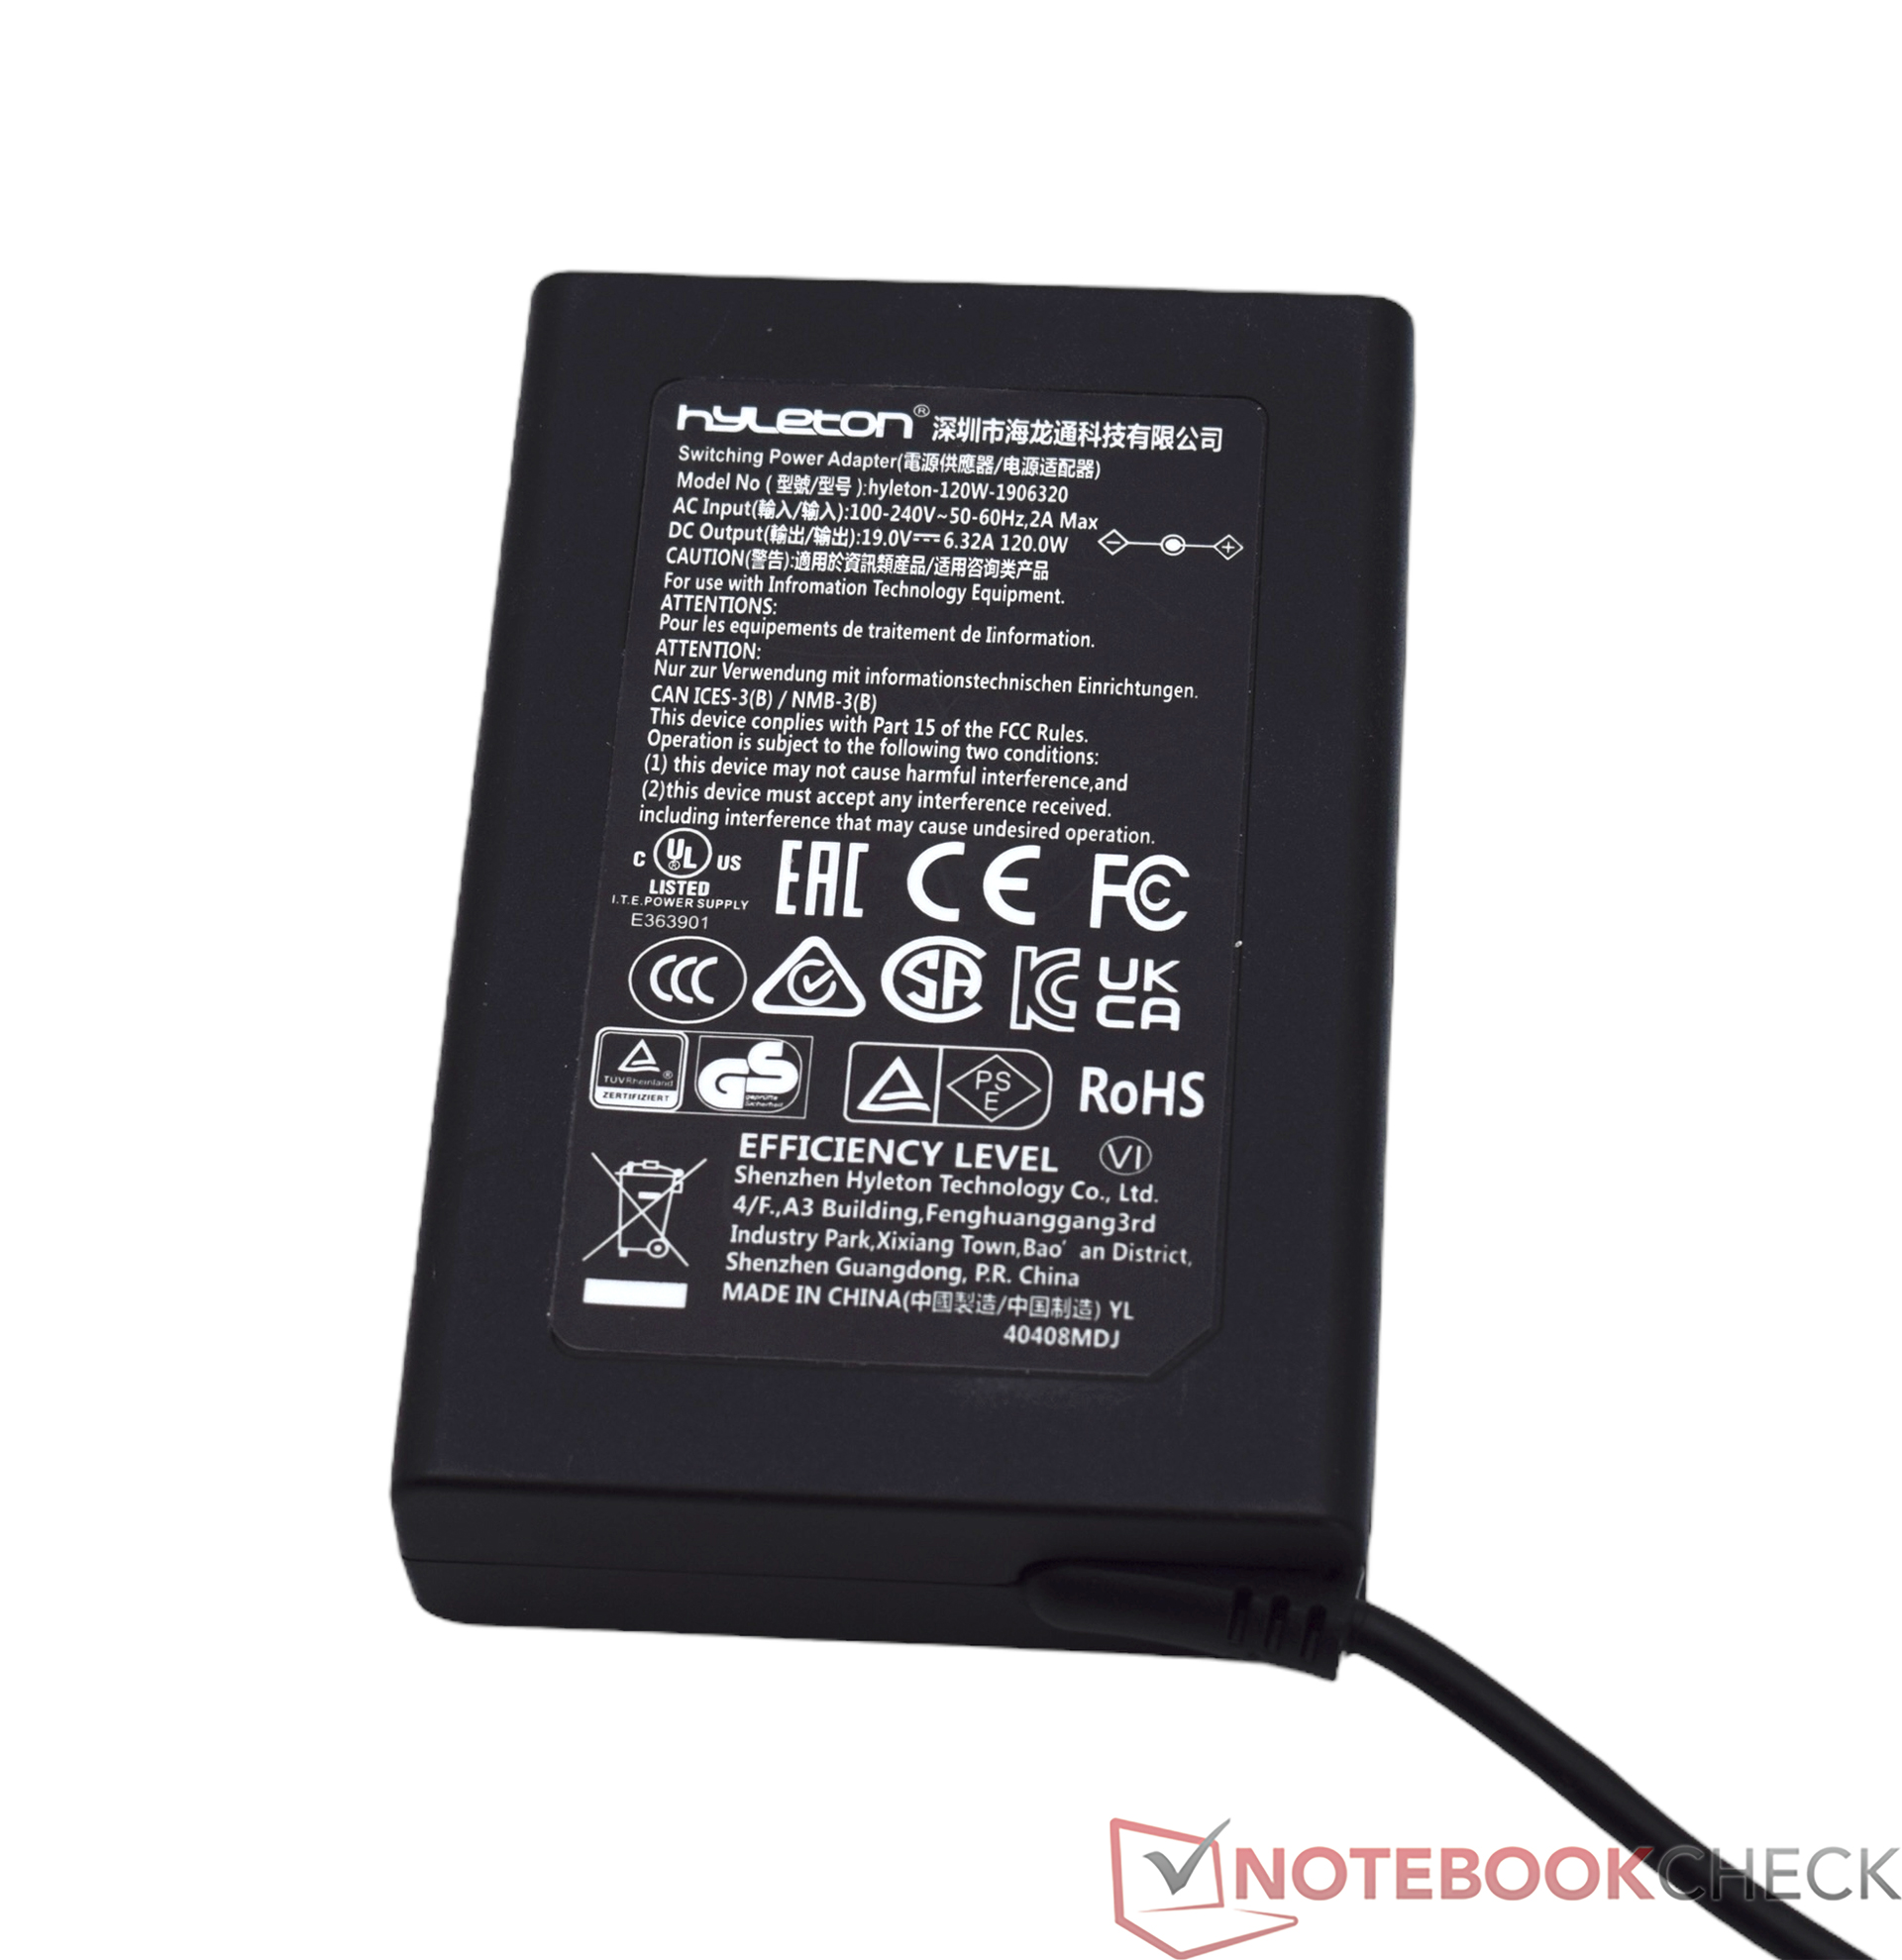
La consommation d'énergie de la Geekom XT13 Pro se compare très favorablement à celle de ses concurrents. Nous n'avons mesuré que des valeurs faibles, même en mode veille. Les limites de puissance (PL1 et PL2) de l'Intel Core i9-13900H garantissent un besoin d'énergie relativement faible en charge. En charge moyenne, le système fonctionne avec un peu moins de 50 watts. En charge, nous ne voyons les 94,5 watts que pendant un court laps de temps, lorsque le système peut encore utiliser le Turbo. Nous avons pu observer un comportement un peu particulier. Dans le test Cinebench R23 Sigle, nous avons constaté de nombreux pics, ce qui n'a jamais été observé dans d'autres dispositifs de test. Nous avons répété le test plusieurs fois, avec le même résultat. Il est raisonnable de supposer que le SoC travaille de manière répétée à une température limite dans ce cas, ce qui lui permet d'absorber brièvement plus d'énergie. L'alimentation électrique est assurée par un petit bloc d'alimentation de 120 watts. Le même bloc d'alimentation est fourni avec de nombreux appareils Geekom.
| Éteint/en veille | |
| Au repos | |
| Fortement sollicité |
|
Légende:
min: | |
| Geekom XT13 Pro i9-13900H, Iris Xe G7 96EUs | Aoostar GEM12 R7 8845HS, Radeon 780M | Minisforum AtomMan X7 Ti Ultra 9 185H, Arc 8-Core | Acemagic F2A Ultra 7 155H, Arc 8-Core | Geekom XT12 Pro i9-12900H, Iris Xe G7 96EUs | Geekom A7 R9 7940HS, Radeon 780M | Moyenne Intel Iris Xe Graphics G7 96EUs | Moyenne de la classe Mini PC | |
|---|---|---|---|---|---|---|---|---|
| Power Consumption | -38% | -34% | -35% | -21% | 11% | 2% | -41% | |
| Idle Minimum * | 6.3 | 8.2 -30% | 8.2 -30% | 9.1 -44% | 5.7 10% | 3.8 40% | 5.41 ? 14% | 9.52 ? -51% |
| Idle Average * | 7.1 | 10 -41% | 12.1 -70% | 10.3 -45% | 9.5 -34% | 4.8 32% | 8.6 ? -21% | 11.6 ? -63% |
| Idle Maximum * | 9 | 14.6 -62% | 14 -56% | 14.4 -60% | 16.5 -83% | 6.5 28% | 10.9 ? -21% | 14.9 ? -66% |
| Load Average * | 49.8 | 73.9 -48% | 53.1 -7% | 54.9 -10% | 53.3 -7% | 71.9 -44% | 45.4 ? 9% | 58.8 ? -18% |
| Cyberpunk 2077 ultra external monitor * | 54 | 79.9 -48% | ||||||
| Load Maximum * | 94.5 | 95.3 -1% | 100.4 -6% | 110.4 -17% | 87.8 7% | 94.7 -0% | 67.6 ? 28% | 99.7 ? -6% |
* ... Moindre est la valeur, meilleures sont les performances
Efficiency
| Performance Rating - Percent | |
| Geekom A8 | |
| Minisforum AtomMan X7 Ti | |
| Acemagic F2A | |
| Geekom XT13 Pro | |
| Geekom XT12 Pro | |
| Power Consumption | |
| Cinebench R23 Multi Power Efficiency - external Monitor | |
| Geekom A8 | |
| Minisforum AtomMan X7 Ti | |
| Geekom XT13 Pro | |
| Acemagic F2A | |
| Geekom XT12 Pro | |
| Cinebench R23 Single Power Efficiency - external Monitor | |
| Geekom A8 | |
| Minisforum AtomMan X7 Ti | |
| Acemagic F2A | |
| Geekom XT13 Pro | |
| Geekom XT12 Pro | |
| Cinebench R15 Multi Efficiency (external Monitor) | |
| Geekom A8 | |
| Minisforum AtomMan X7 Ti | |
| Geekom XT13 Pro | |
| Acemagic F2A | |
| Geekom XT12 Pro | |
Power consumption with external monitor
Power consumption with external monitor
Points positifs
Points négatifs
Verdict - Un prix haut de gamme sans performances haut de gamme
Le Geekom XT13 Pro est un mini-PC puissant. Cependant, nous avons déjà pu le constater avec le Geekom XT12 Pro. Si nous comparons uniquement ces deux modèles entre eux, vous pouvez opter pour l'appareil plus ancien sans perte de performance notable. Le Geekom XT12 Pro Intel Core i9-13900H du Geekom XT13 Pro ne permet pas d'augmenter sensiblement les performances. Les différences techniques par rapport à l'Intel Core i9-12900H sont trop faibles. Geekom n'ose pas se lancer dans l'aventure d'un mini-PC basé sur la série Meteor Lake. Geekom se retrouve ainsi à la traîne, car de nombreux autres fabricants ont déjà équipé leur série de modèles avec les derniers processeurs d'Intel. Le plus grand inconvénient du Geekom XT13 Pro est l'iGPU, qui est inférieur aux représentants modernes dans tous les tests. Cependant, Geekom n'est pas seulement inférieur à ses concurrents, mais aussi à lui-même. Le portefeuille de Geekom comprend des mini-PC avec les derniers SoC AMD, qui ne sont techniquement pas beaucoup plus mauvais, mais qui offrent un meilleur résultat global. Nous n'avons même pas encore parlé du prix. Malheureusement, le Geekom XT13 Pro n'est pas du tout à la hauteur. il faut compter 999 euros s'il s'agit du modèle haut de gamme. D'autres mini-PC coûtent un peu moins cher mais sont plus performants.
Le Geekom XT13 Pro offre des performances suffisantes grâce à l'Intel Core i9-13900H et impressionne par sa polyvalence. Cependant, le rapport qualité-prix du Geekom XT13 Pro n'est pas du tout à la hauteur.
La bonne connectivité, avec laquelle Geekom a toujours marqué des points dans le passé, doit être soulignée positivement. Les nombreuses connexions incluent deux ports USB4, ce qui peut influencer la décision d'achat en termes de protection future. La garantie de trois ans du fabricant plaide également en faveur d'un appareil de Geekom. Bien entendu, cette garantie s'applique également à d'autres appareils du fabricant. L'efficacité n'a pu être que légèrement améliorée par rapport au Geekom XT12 Pro. Dans cette discipline, l'Intel Core i9-13900H est clairement inférieur aux processeurs Meteor Lake plus modernes. Pour cette raison, nous ne pouvons pas recommander l'achat du Geekom XT13 Pro, même si le prix d'achat est élevé. Si le Geekom XT13 Pro ne veut pas devenir un produit d'appoint, Geekom doit d'urgence revoir ses prix actuels.
Note : Nous avons récemment mis à jour notre système d'évaluation et les résultats de la version 8 ne sont pas comparables à ceux de la version 7. Vous trouverez de plus amples informations ici.
Geekom XT13 Pro
- 07/30/2024 v8
Sebastian Bade
 Total Sustainability Score:
 Transparency
La sélection des appareils à examiner est effectuée par notre équipe éditoriale. L'échantillon d'essai a été remis gratuitement à l'auteur par le fabricant à des fins d'évaluation. Cet examen n'a pas été influencé par des tiers et le fabricant n'a pas reçu de copie de cet examen avant sa publication. Il n'y avait aucune obligation de publier cet article. Nous n'acceptons jamais de compensation ou de paiement en échange de nos commentaires. En tant que média indépendant, Notebookcheck n'est pas soumis à l'autorité des fabricants, des détaillants ou des éditeurs.
Voici comment Notebookcheck teste
Chaque année, Notebookcheck examine de manière indépendante des centaines d'ordinateurs portables et de smartphones en utilisant des procédures standardisées afin de garantir que tous les résultats sont comparables. Nous avons continuellement développé nos méthodes de test depuis environ 20 ans et avons établi des normes industrielles dans le processus. Dans nos laboratoires de test, des équipements de mesure de haute qualité sont utilisés par des techniciens et des rédacteurs expérimentés. Ces tests impliquent un processus de validation en plusieurs étapes. Notre système d'évaluation complexe repose sur des centaines de mesures et de points de référence bien fondés, ce qui garantit l'objectivité.Price comparison
