

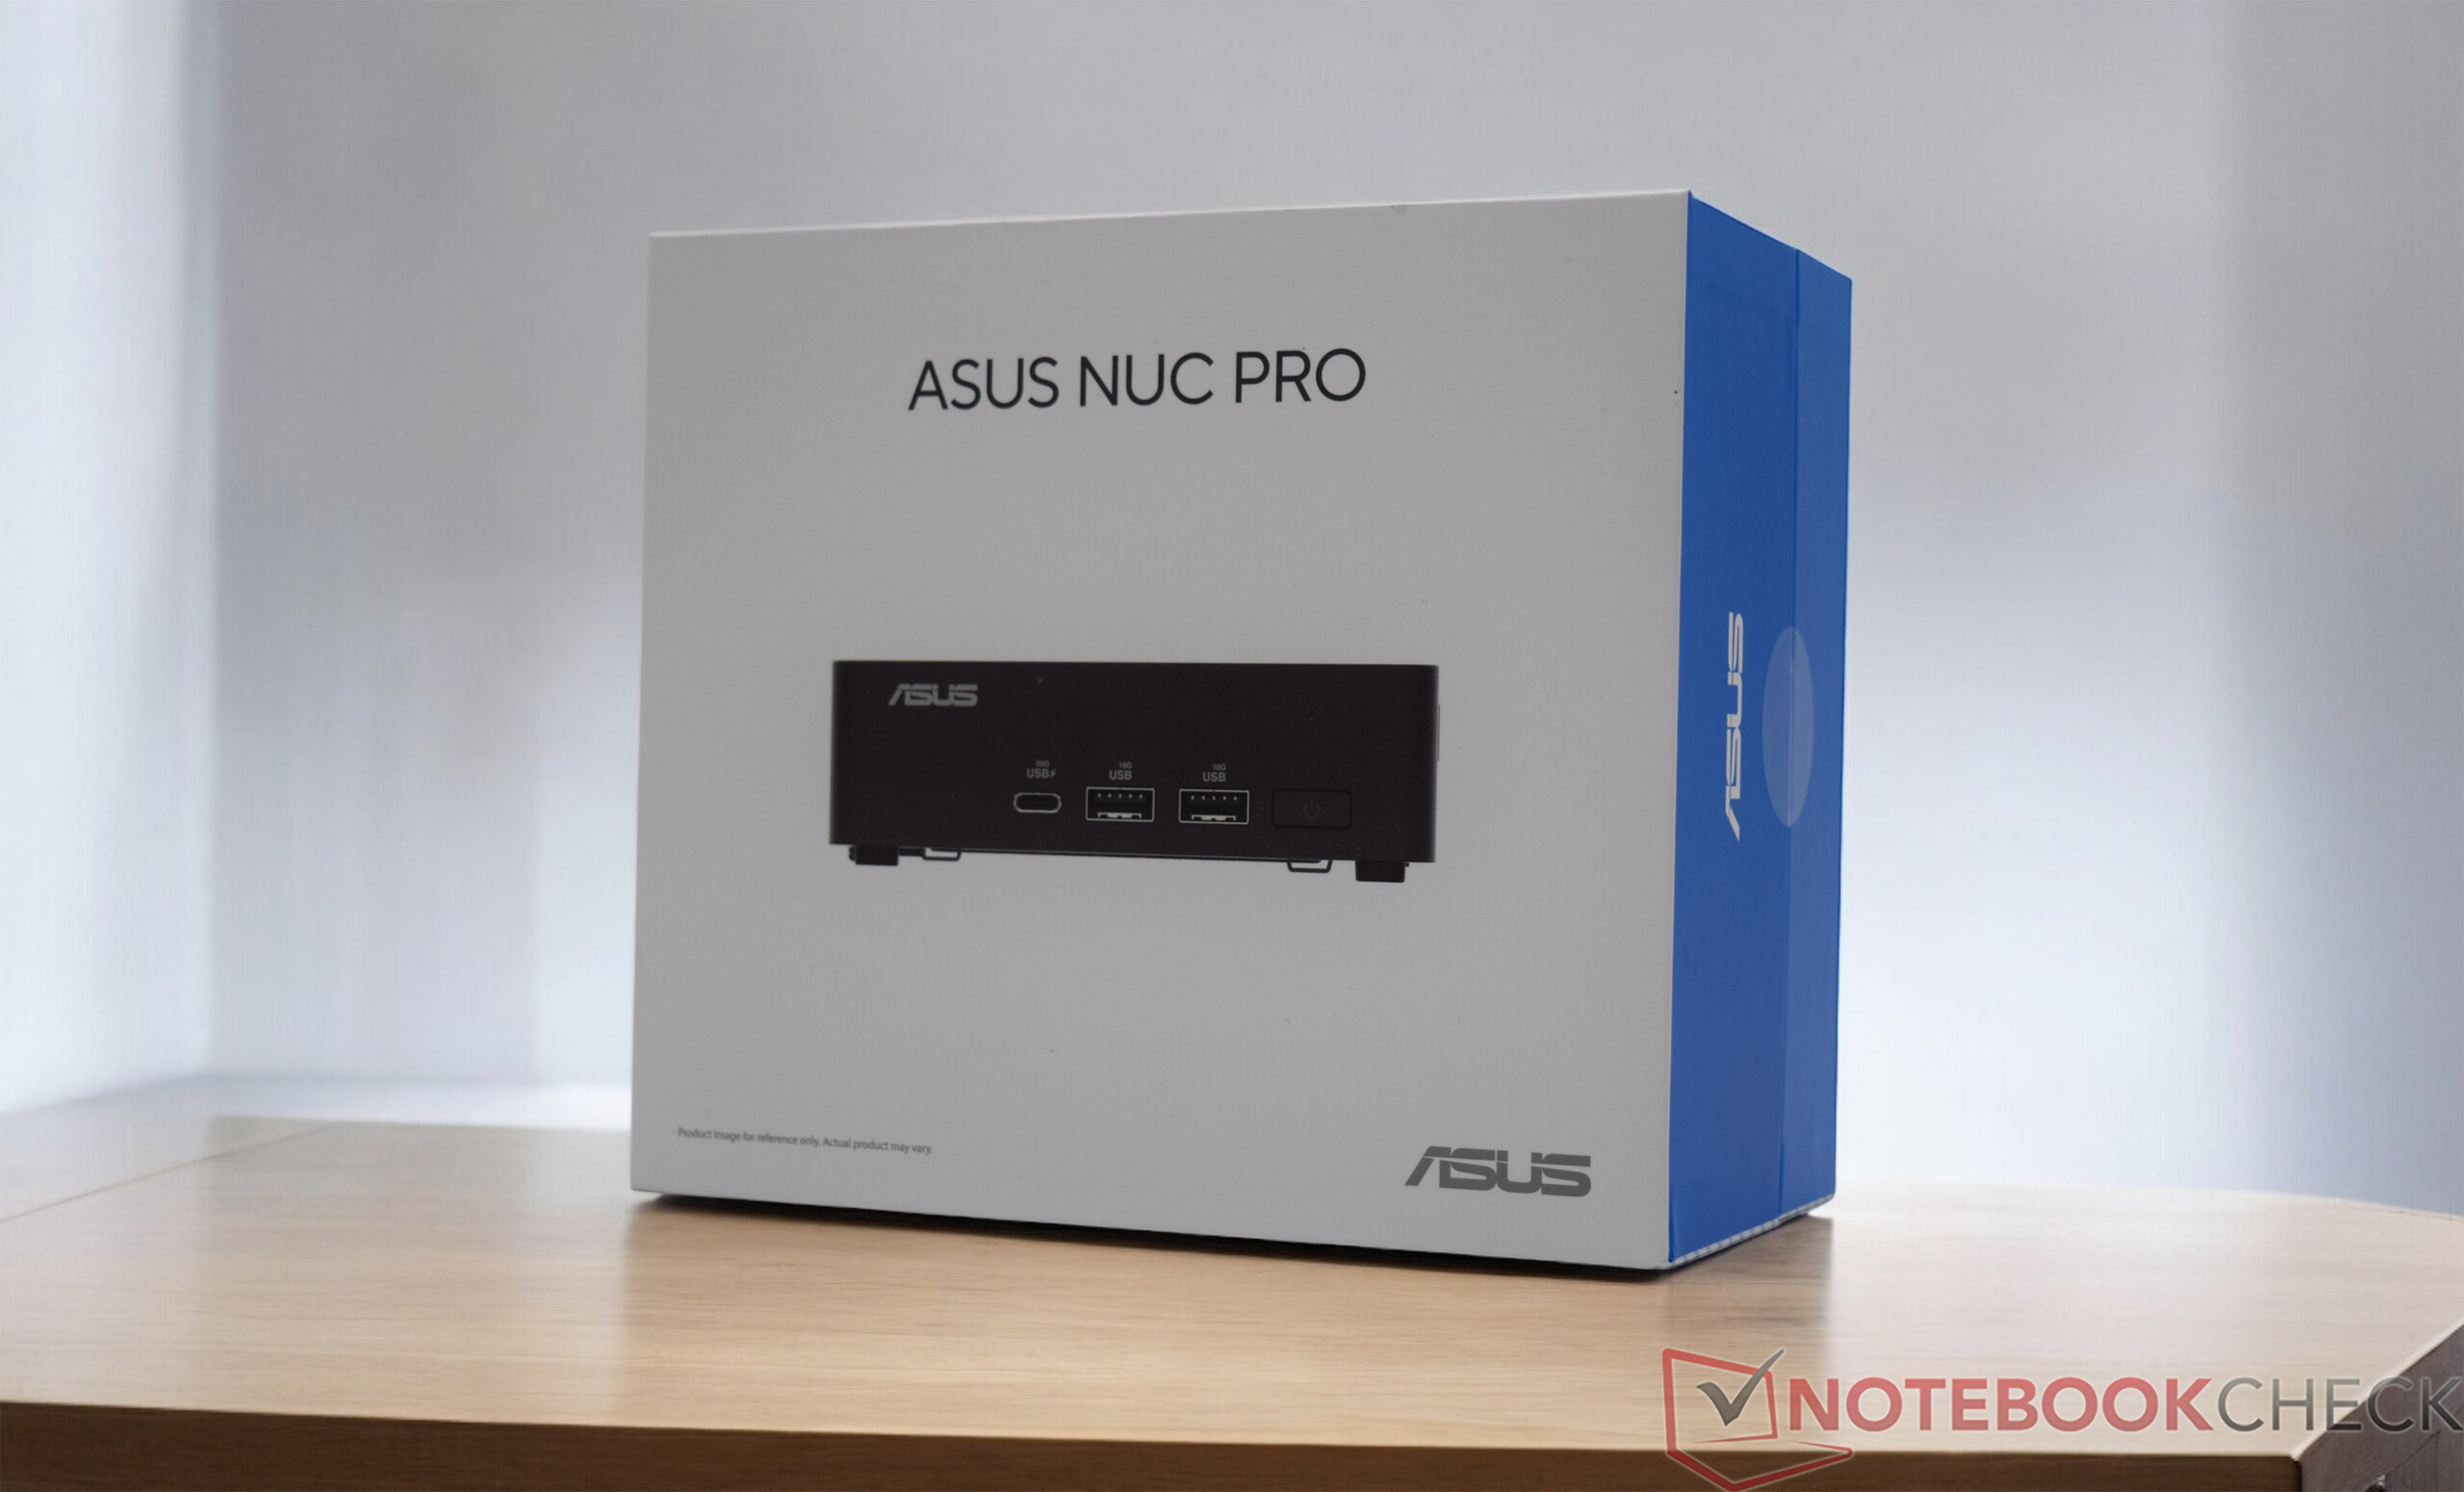
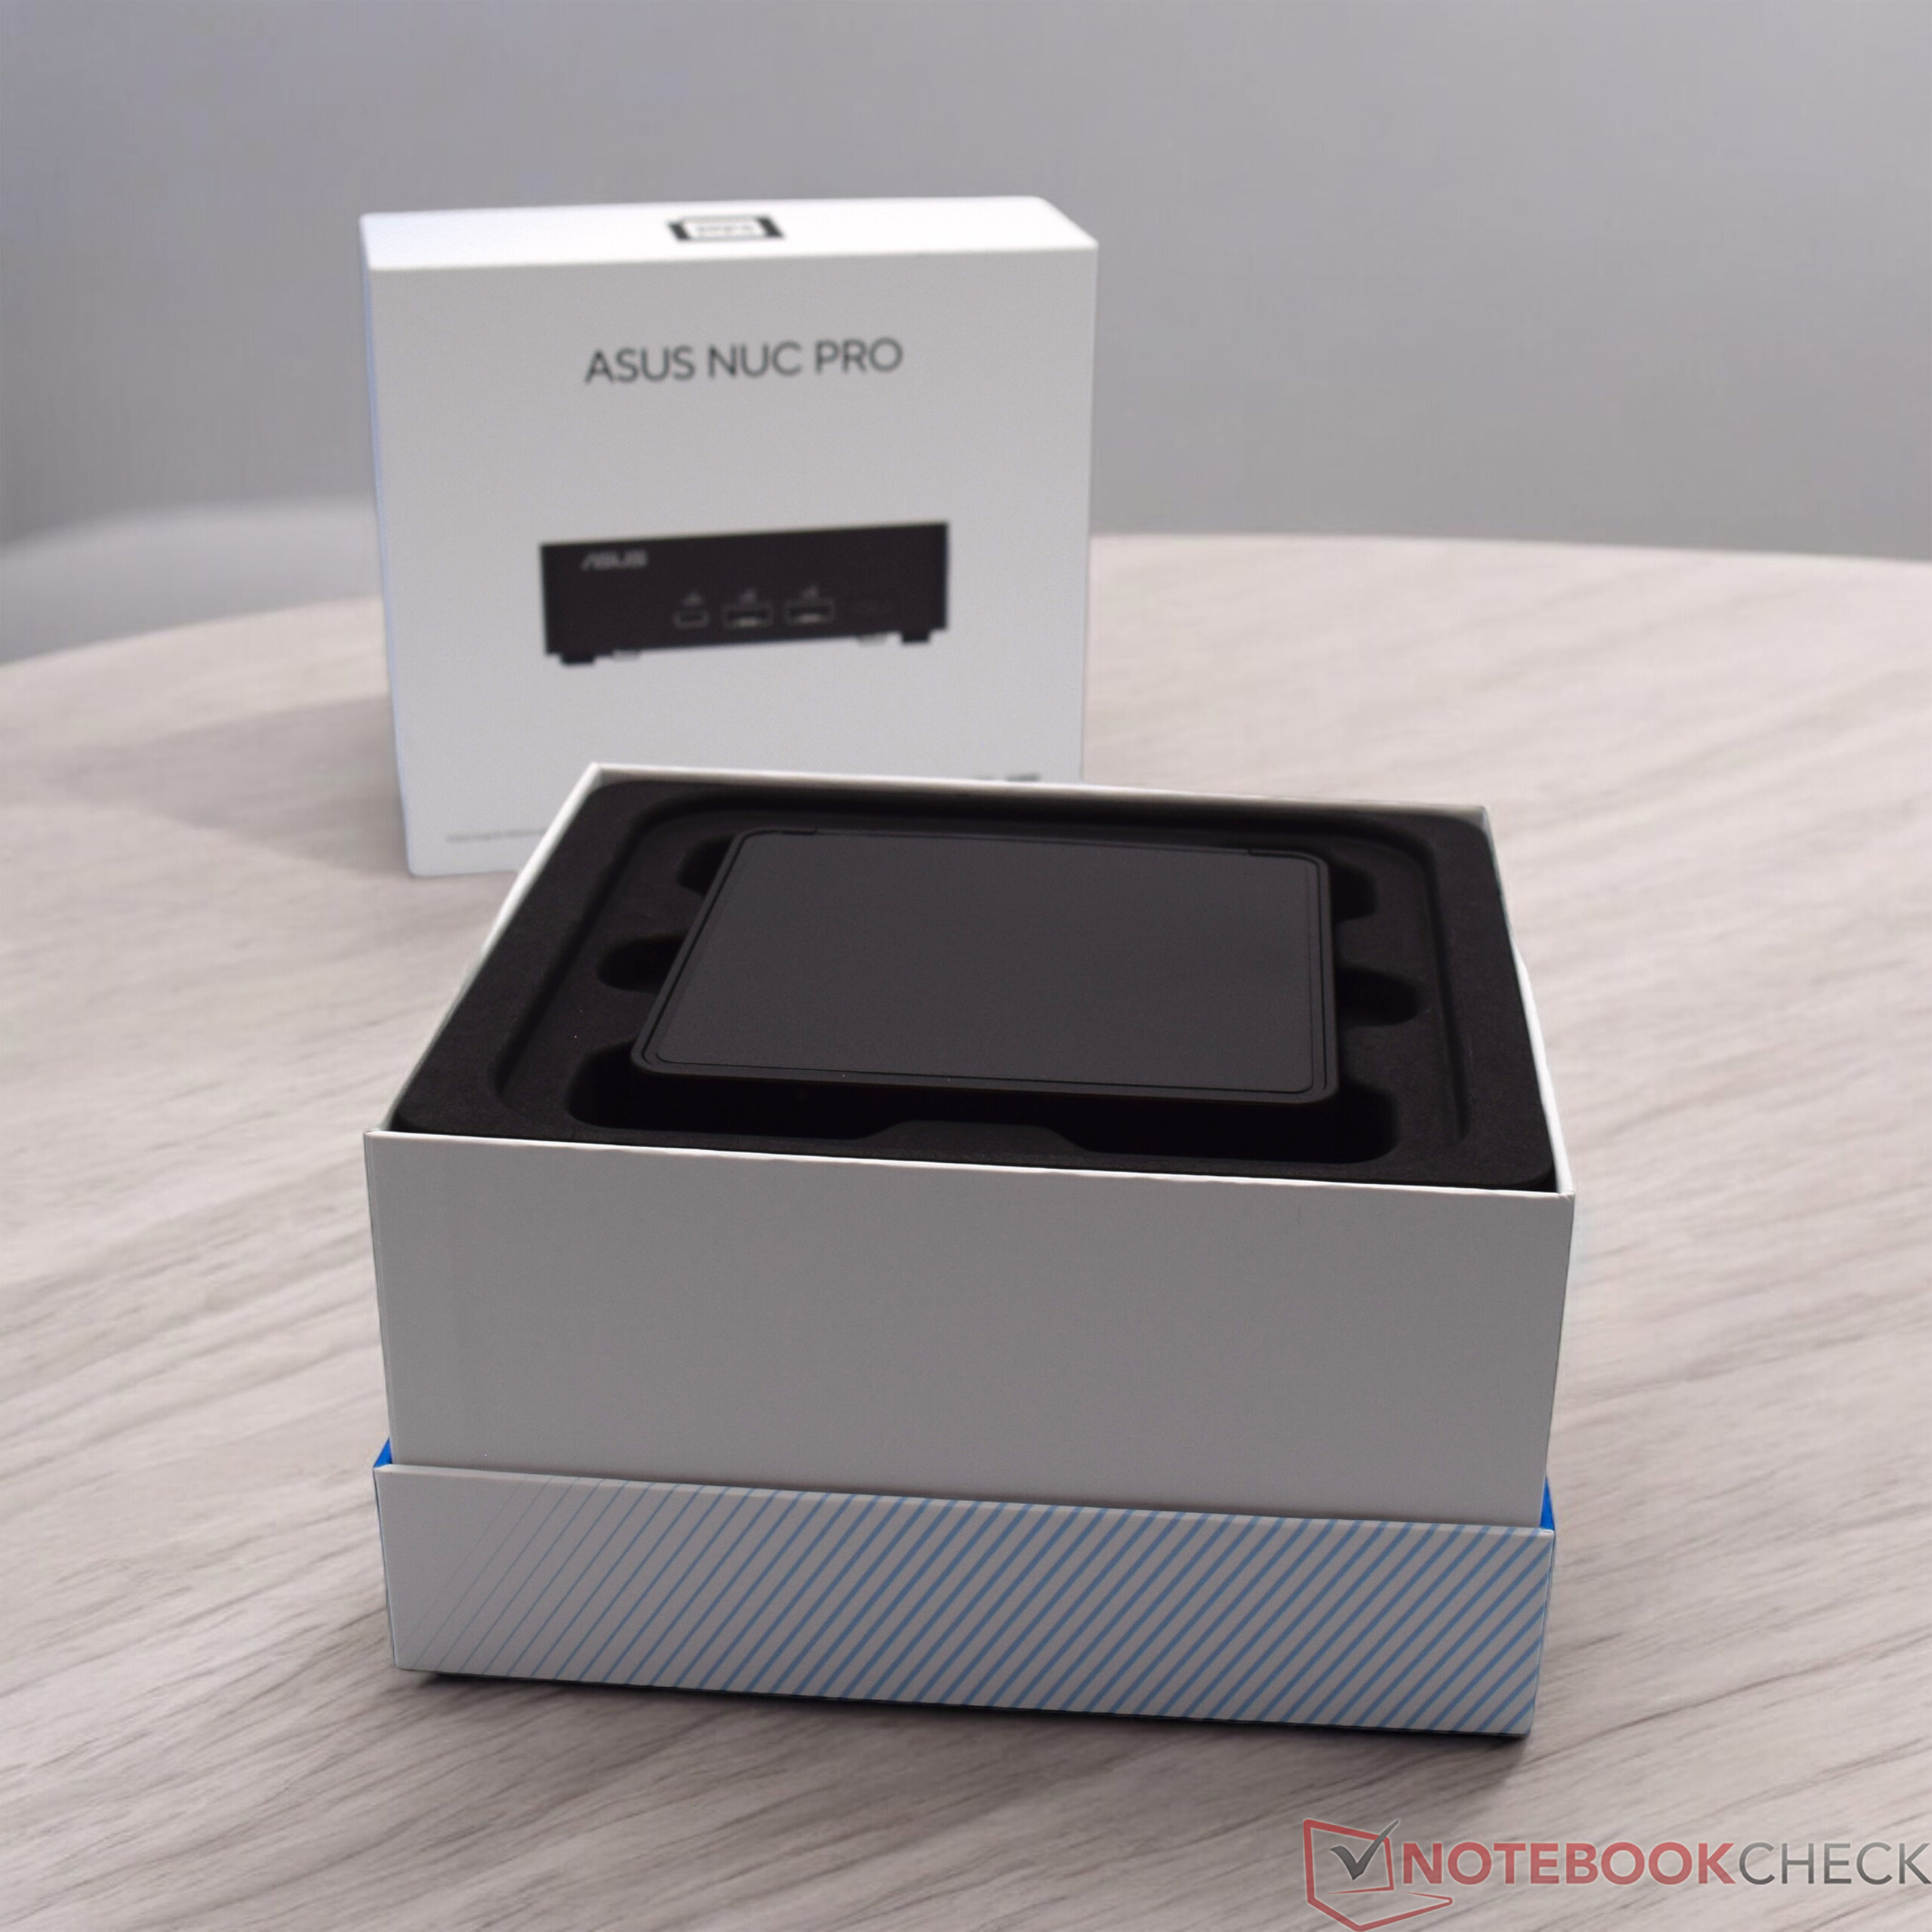
La série NUC (Next Unit of Computing), lancée par Intel, a été reprise par Asus. Asus propose désormais les modèles connus dans le même style, même si des appareils plus récents sont également introduits. Basées sur Intel Meteor Lake, les machines informatiques compactes reçoivent plus de puissance et, surtout, bénéficient de l'iGPU révisé avec l'architecture Arc. L'Asus NUC 14 Pro est disponible avec différents processeurs et, comme d'habitude, dans une version plate et légèrement plus épaisse, qui offre un espace supplémentaire pour un disque de 2,5 pouces. Nous avons testé l'Asus NUC 14 Pro dans la version mince avec un processeur Intel Core Ultra 5 125H. L'appareil nous est parvenu en tant que barebone, ce qui signifie que nous avons dû installer la RAM et le SSD avant de le tester. Le système d'exploitation n'est pas non plus inclus dans la livraison. Il vous faut donc mettre un peu plus de 500 euros sur la table pour notre échantillon de test. Comparé à ses concurrents, c'est beaucoup si vous considérez qu'il y a des coûts supplémentaires en raison de l'option barebone. Par rapport aux autres marques, Asus est plus connu et offre un meilleur support.
Les concurrents auxquels nous avons comparé l'Asus NUC 14 Pro sont énumérés dans le tableau suivant.
Comparaison avec les concurrents potentiels
Note | Version | Date | Modèle | Poids | Épaisseur | Meilleur prix |
|---|---|---|---|---|---|---|
| 74.7 % | v8 | 08/24 | Asus NUC 14 Pro Ultra 5 125H, Arc 7-Core | 525 g | 37 mm | |
| 78 % | v8 | 07/24 | Geekom AE7 R9 7940HS, Radeon 780M | 578 g | 49.2 mm | |
| 74.5 % | v8 | 07/24 | Minisforum UH125 Pro Ultra 5 125H, Arc 7-Core | 797 g | 49 mm | |
| 73.7 % | v8 | Aoostar GEM10 R7 6800H, Radeon 680M | 525 g | 60 mm | ||
| 83.4 % v7 (old) | v7 (old) | 04/24 | Acemagic F2A Ultra 7 155H, Arc 8-Core | 768 g | 57 mm | |
| 81.2 % v7 (old) | v7 (old) | 10/23 | Geekom A5 R7 5800H, Vega 8 | 555 g | 49.2 mm |
Note : Nous avons mis à jour notre système d'évaluation et les résultats de la version 8 ne sont pas comparables aux résultats de la version 7 disponible ici.

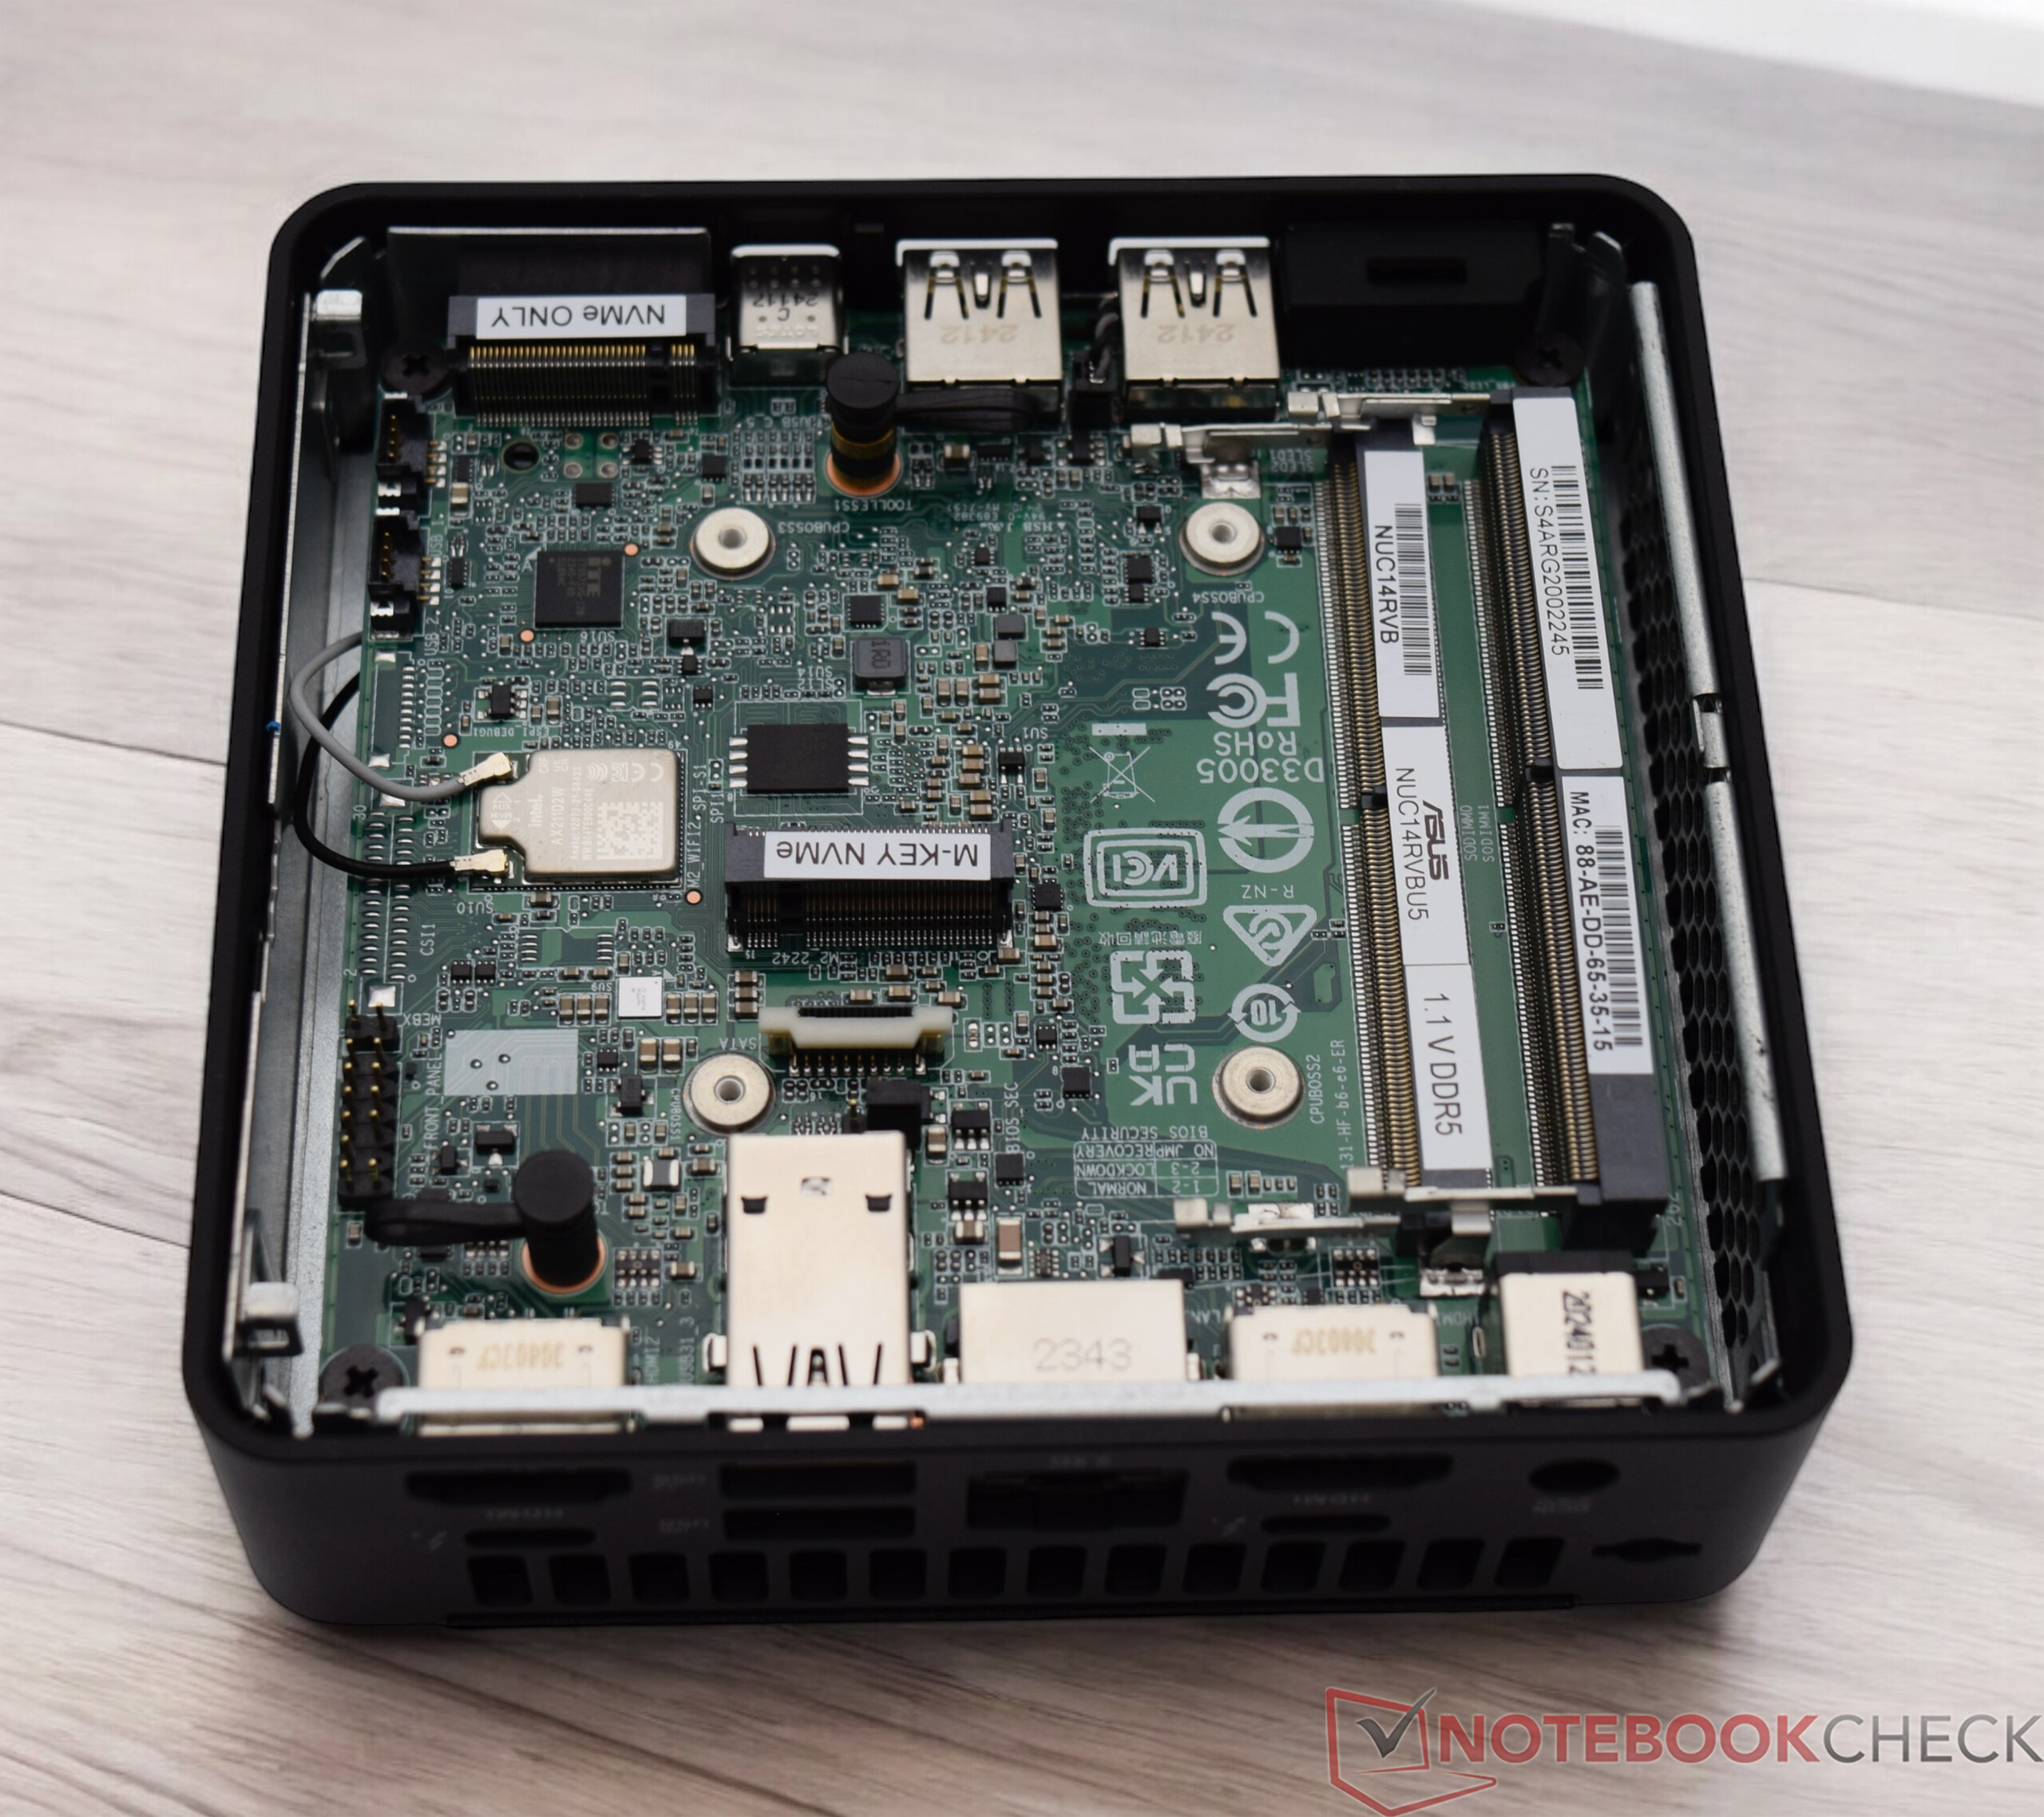
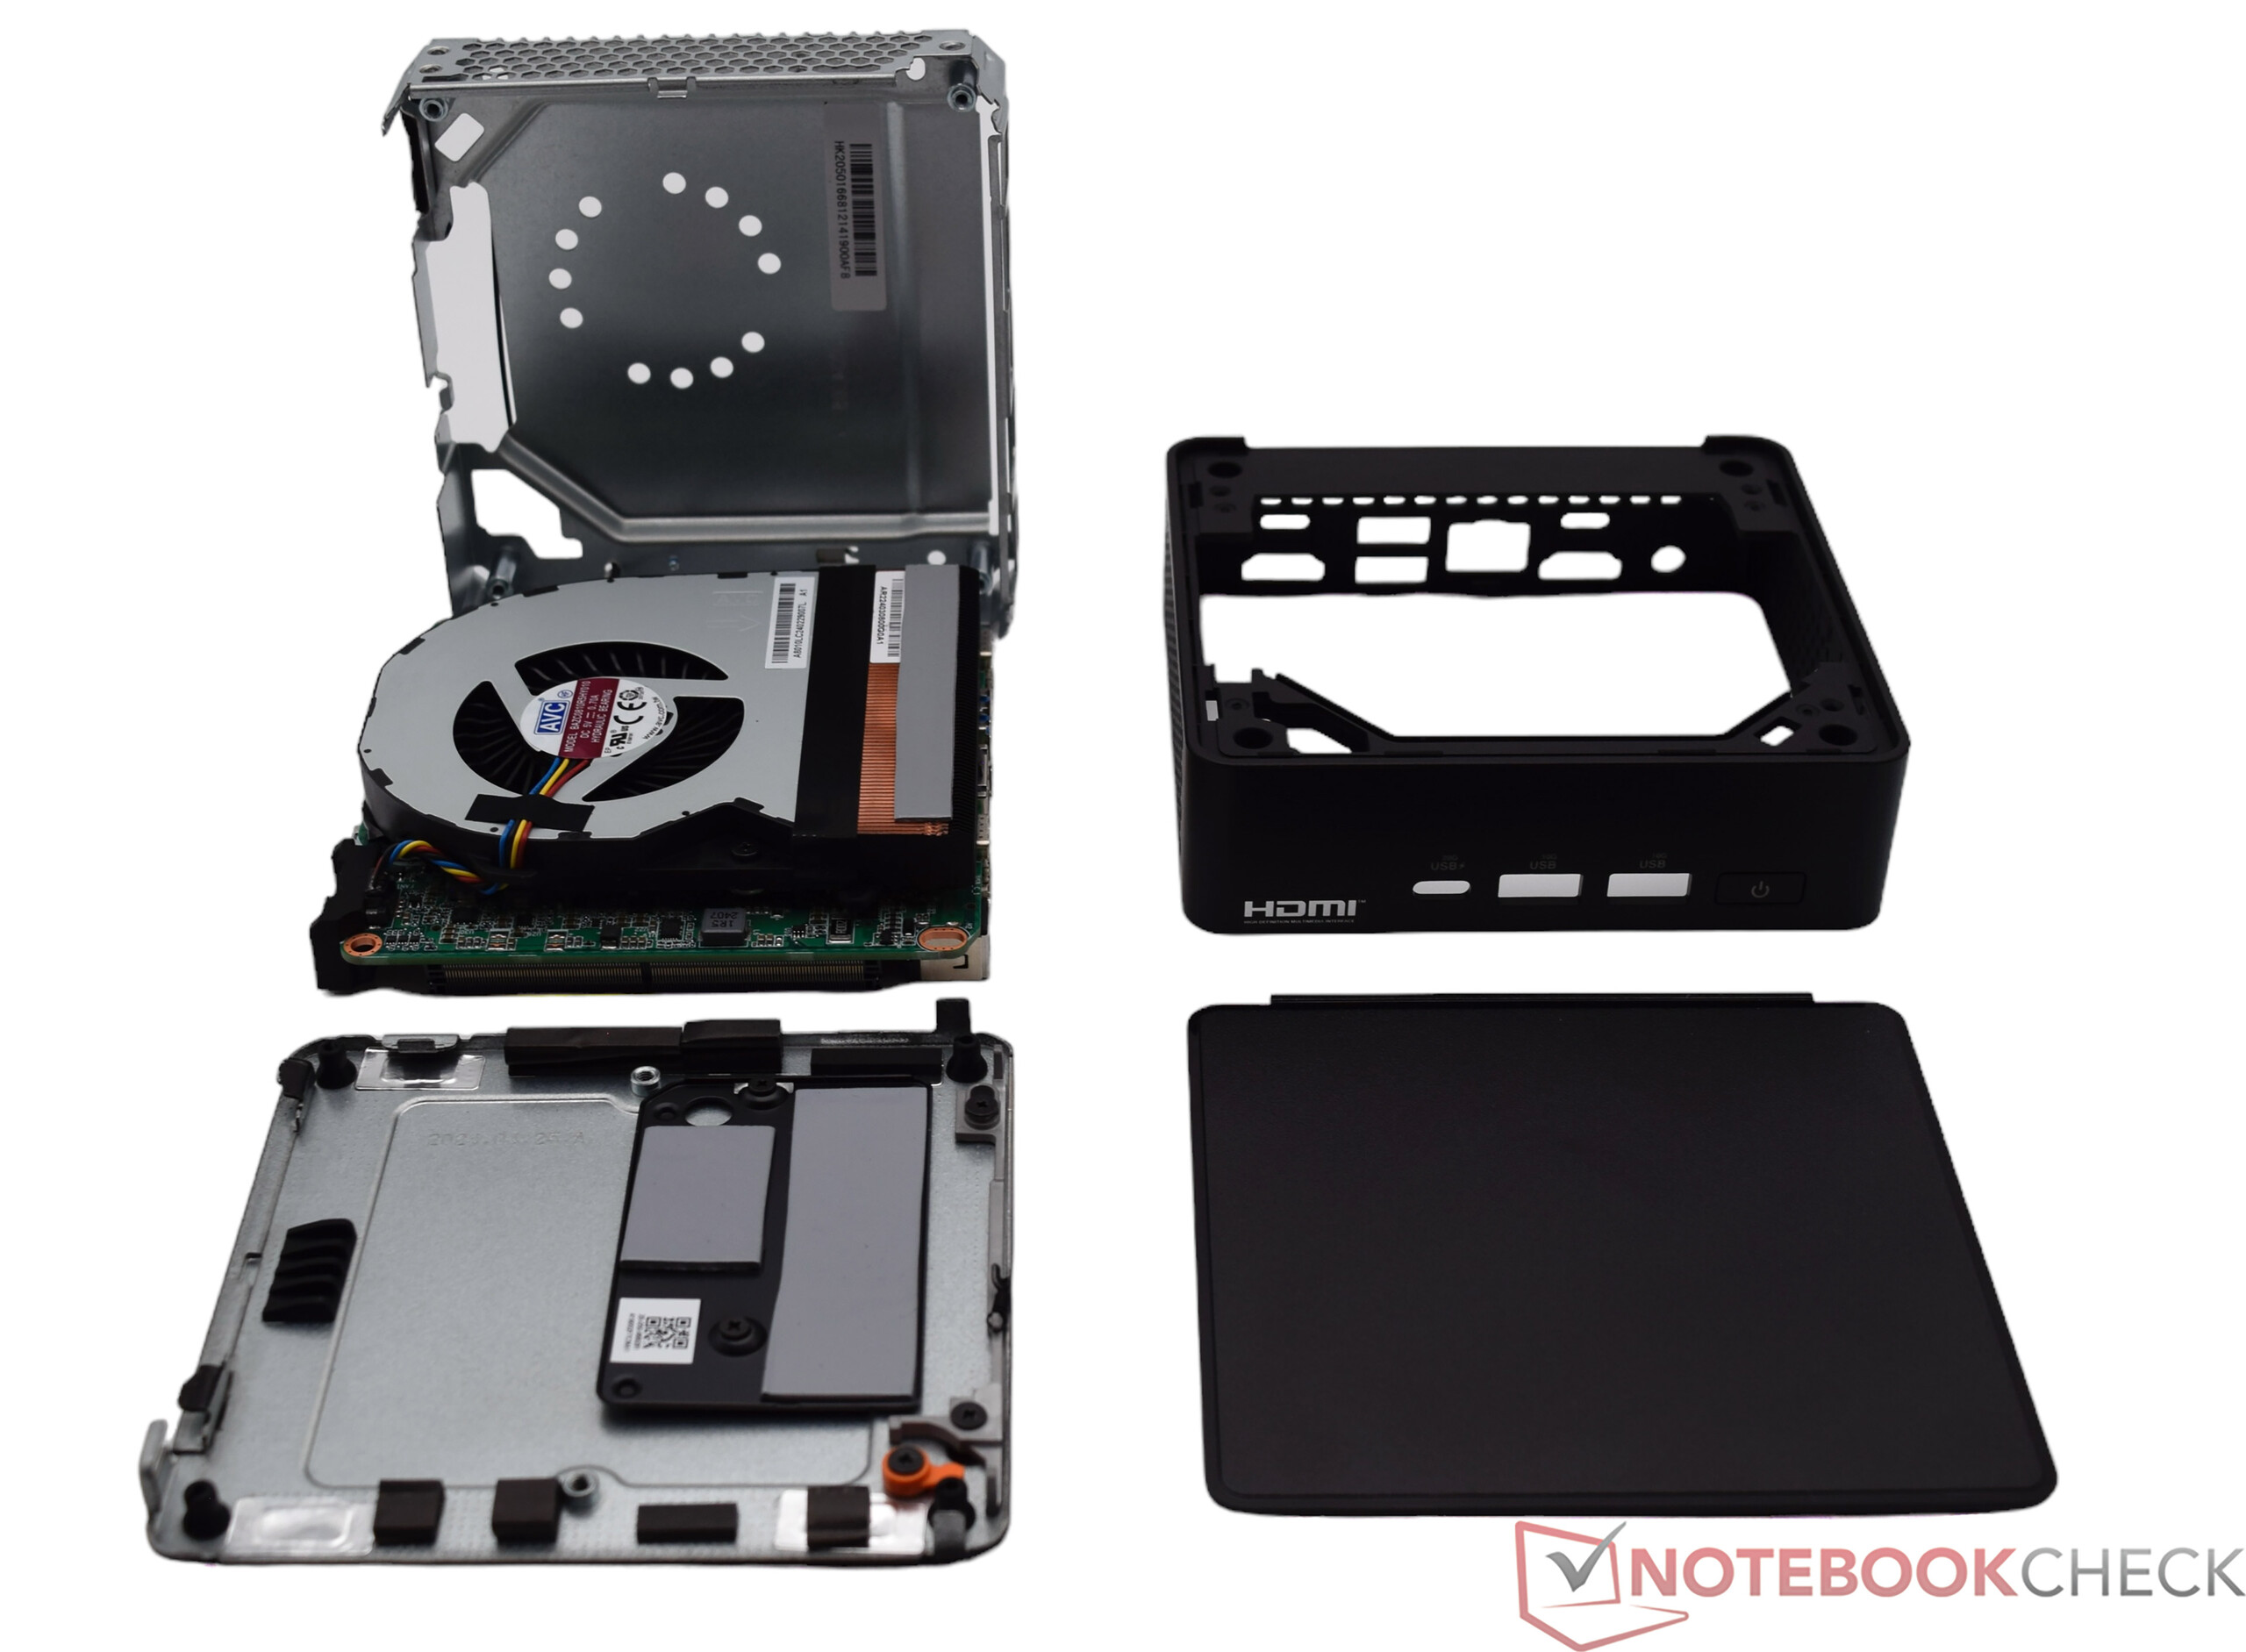
Boîtier - Un boîtier en plastique noir recouvre la cage métallique
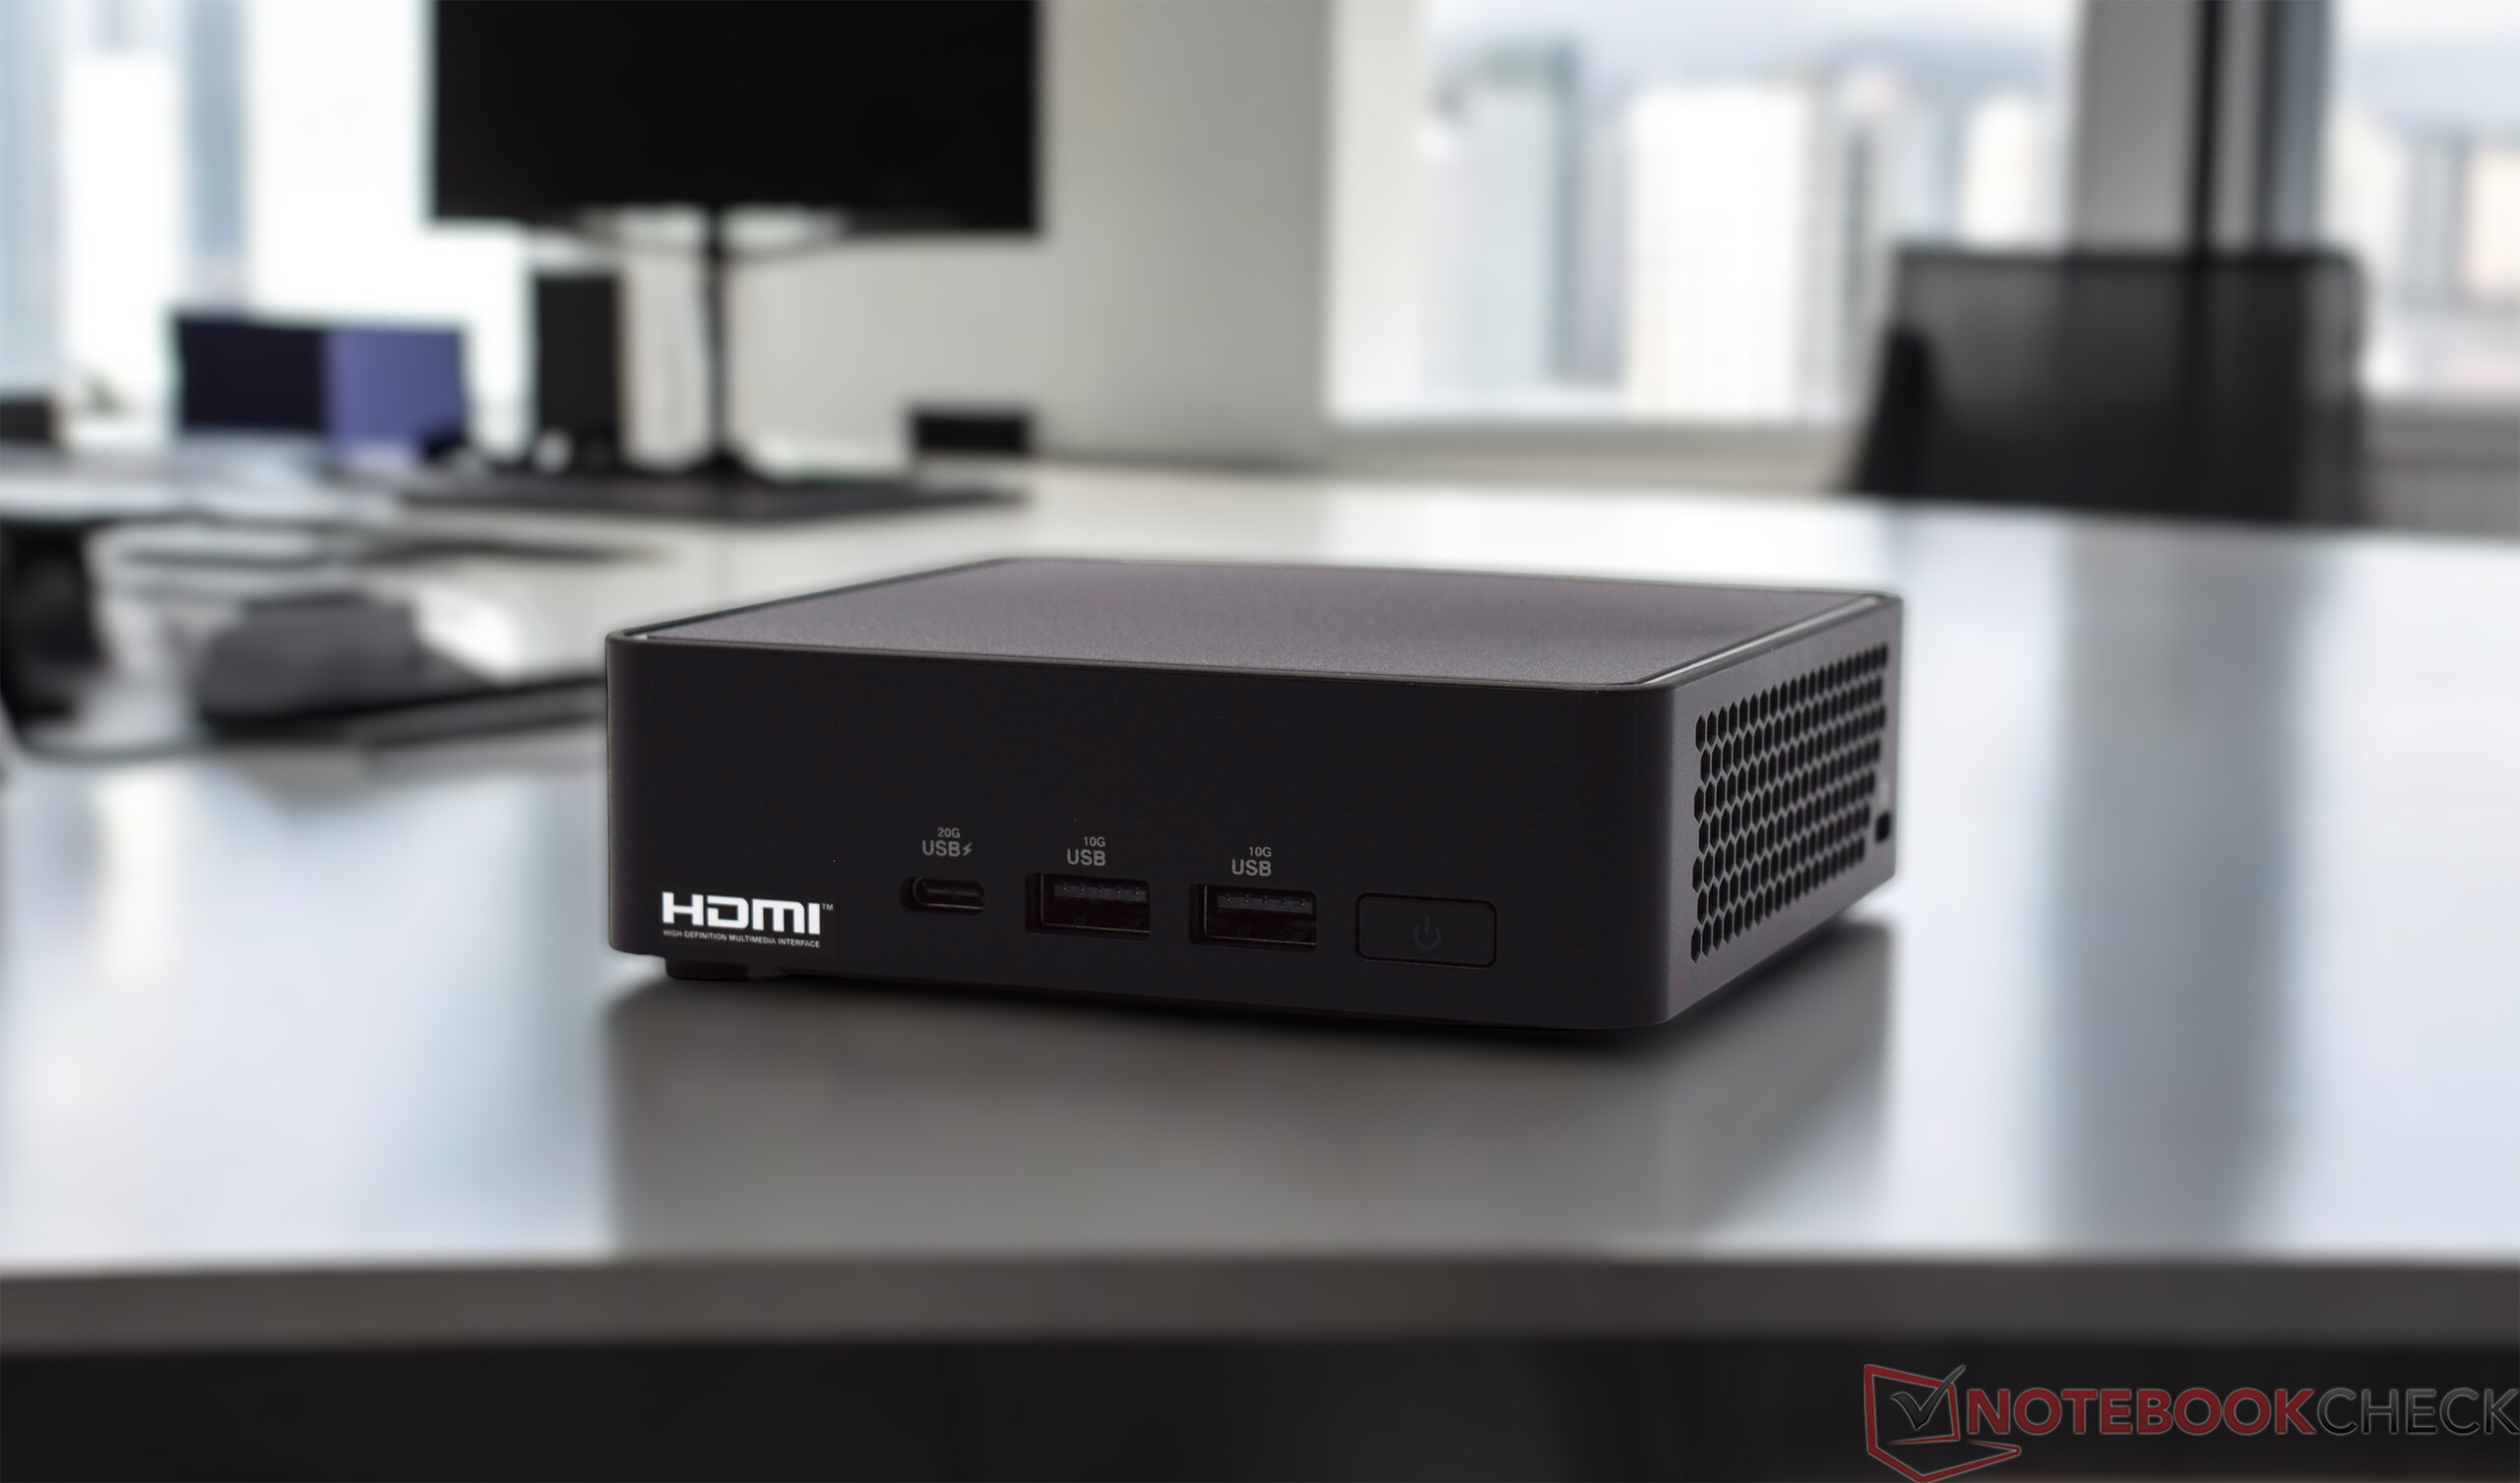
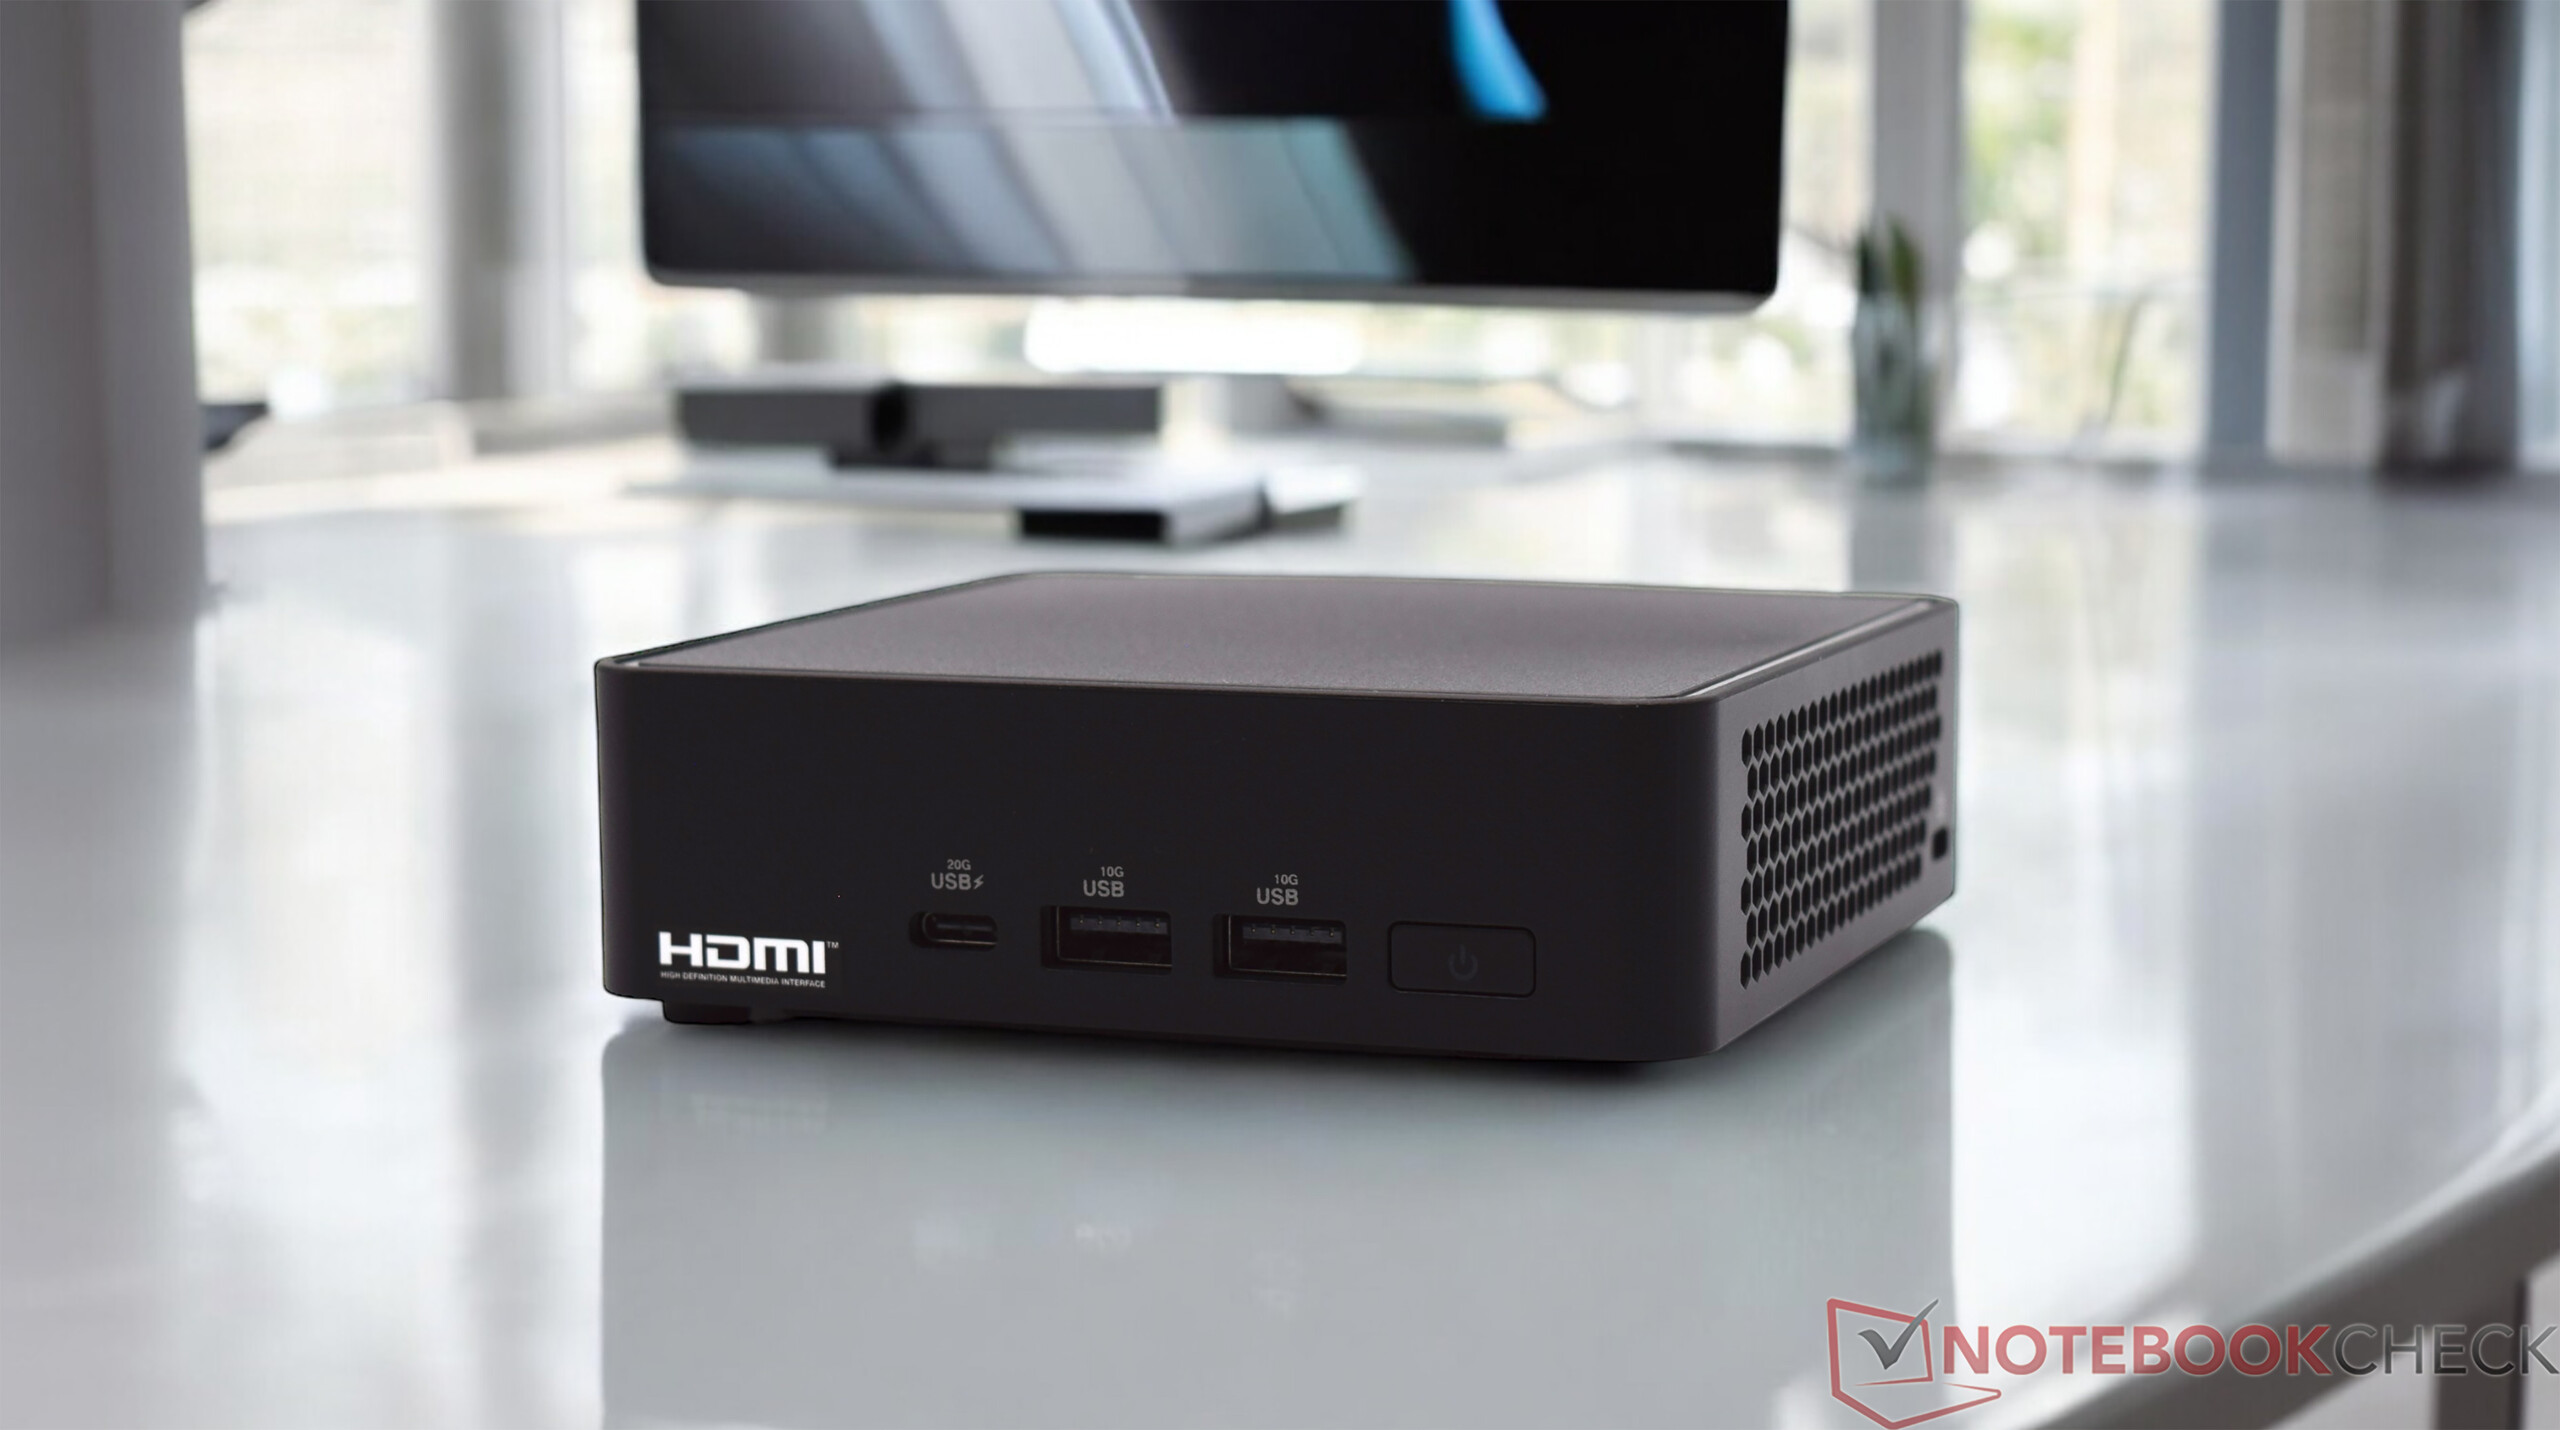
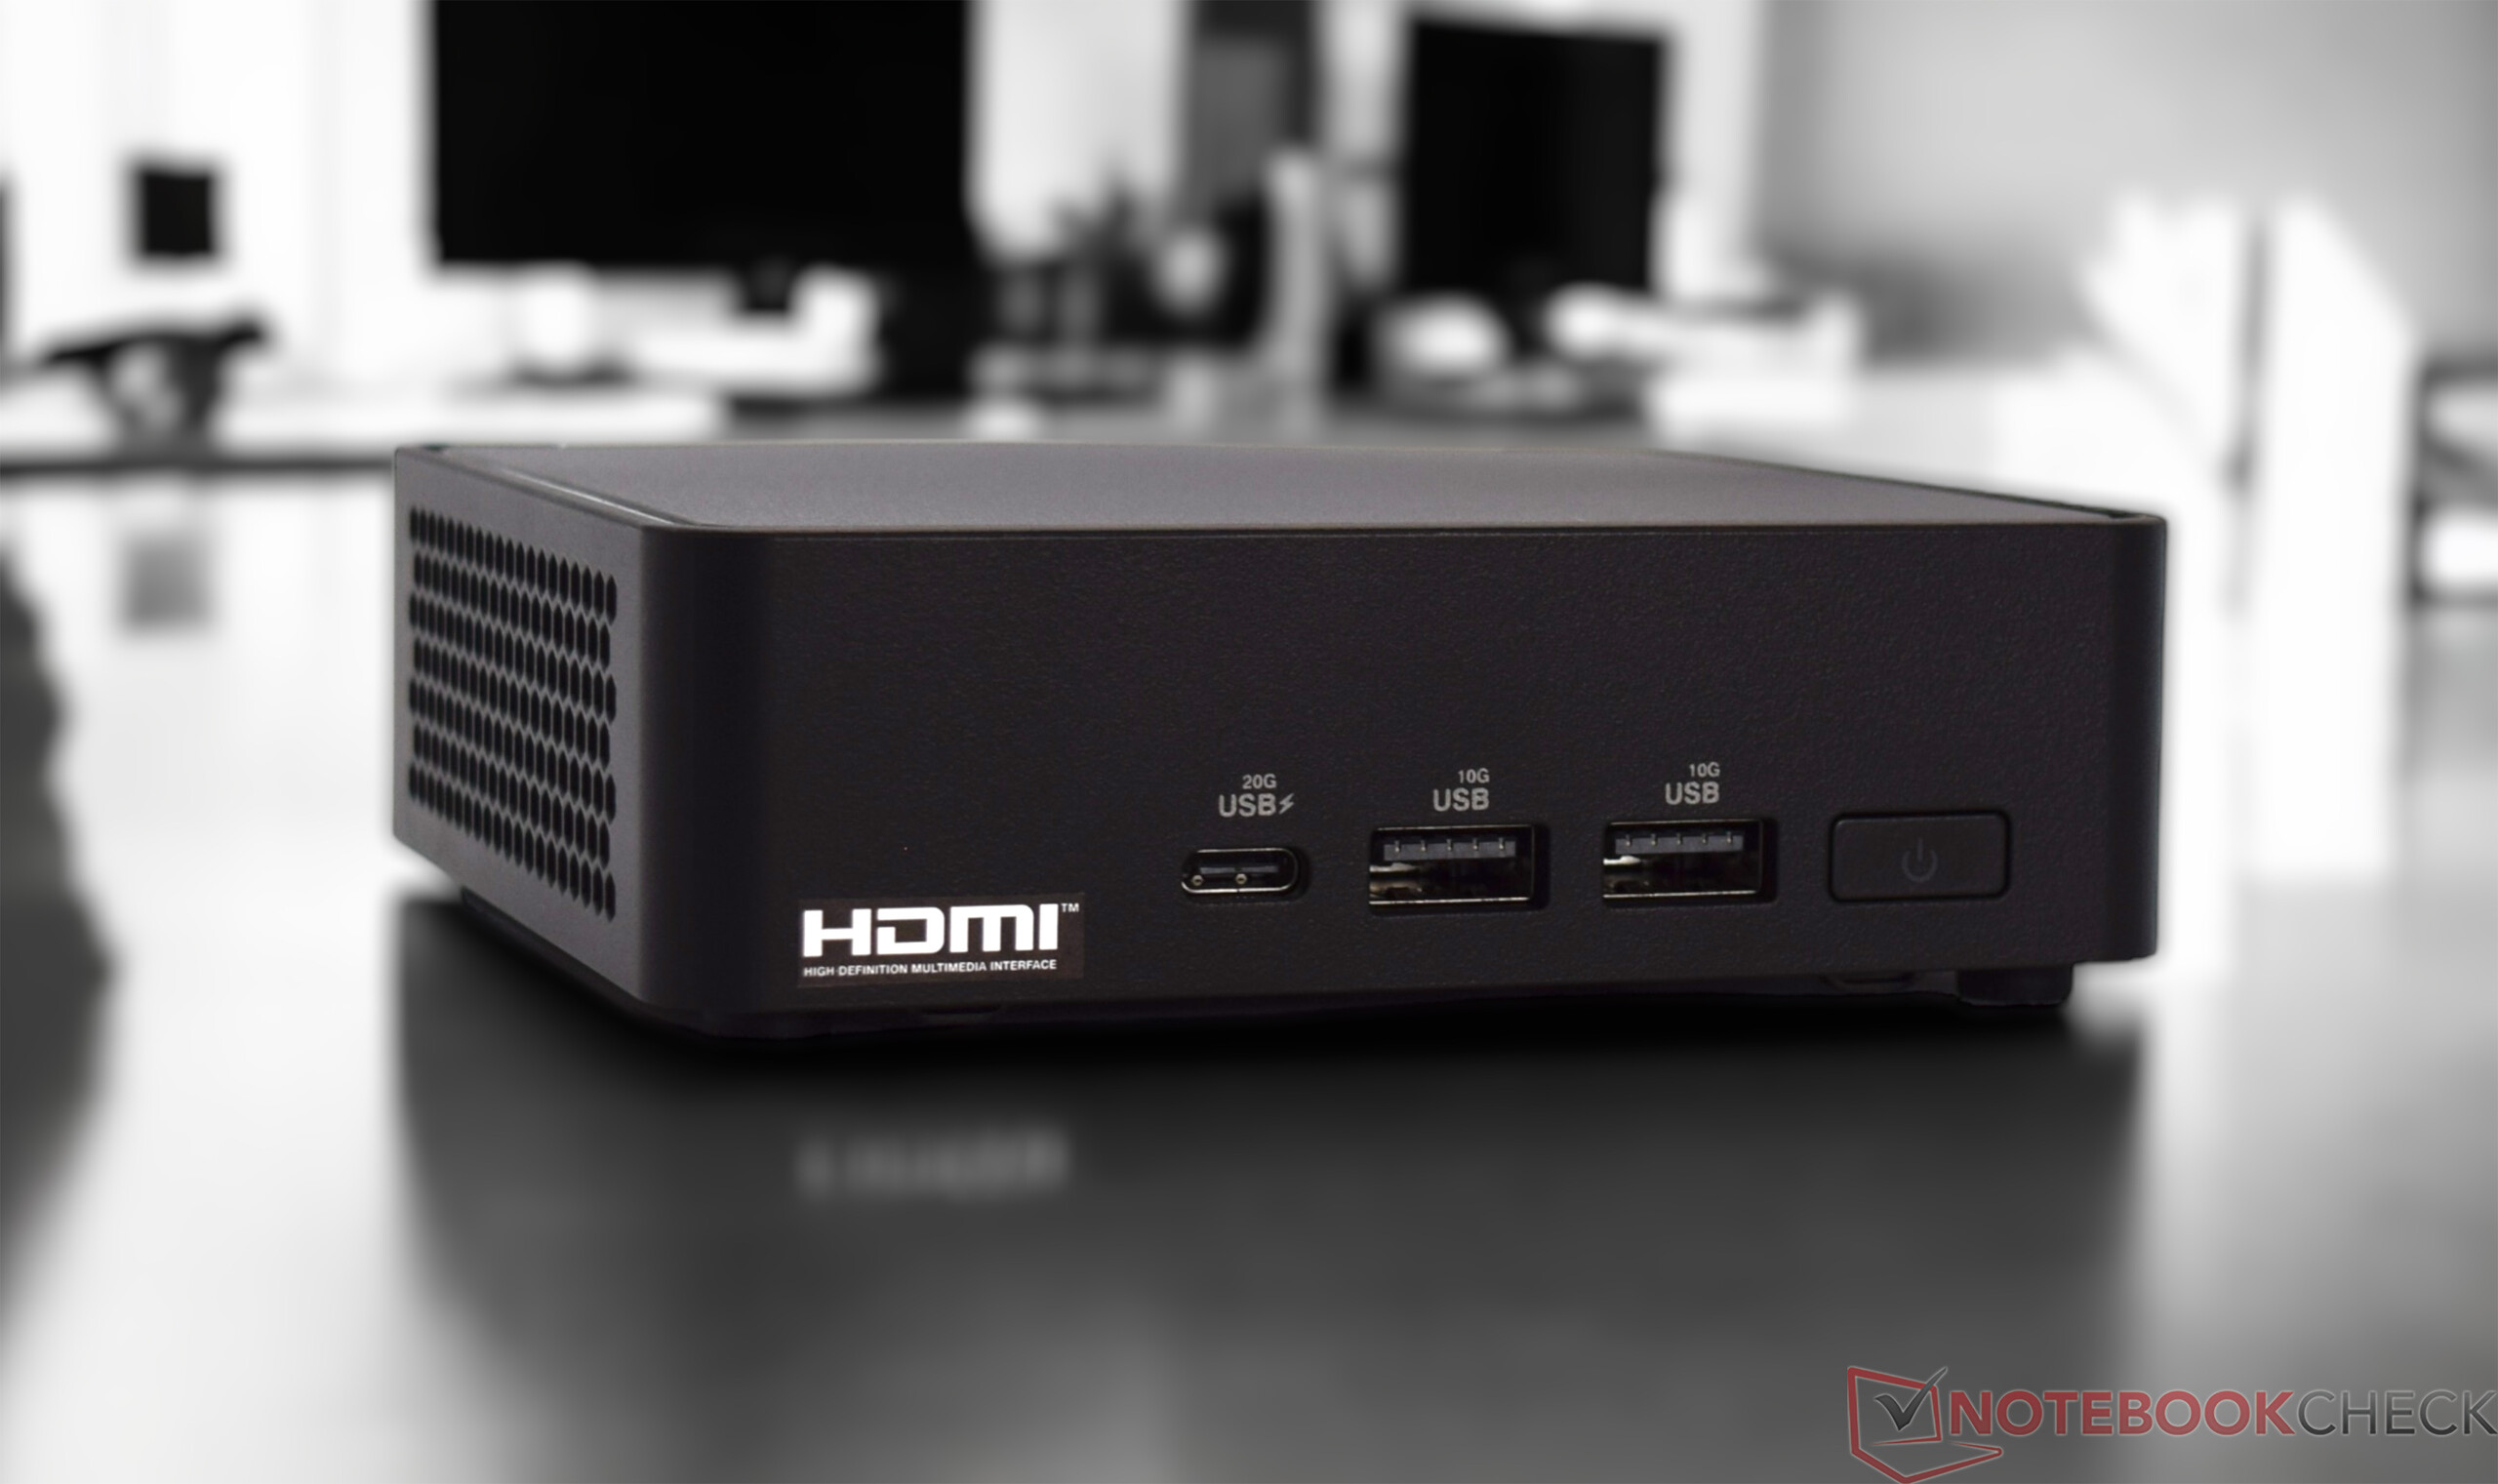
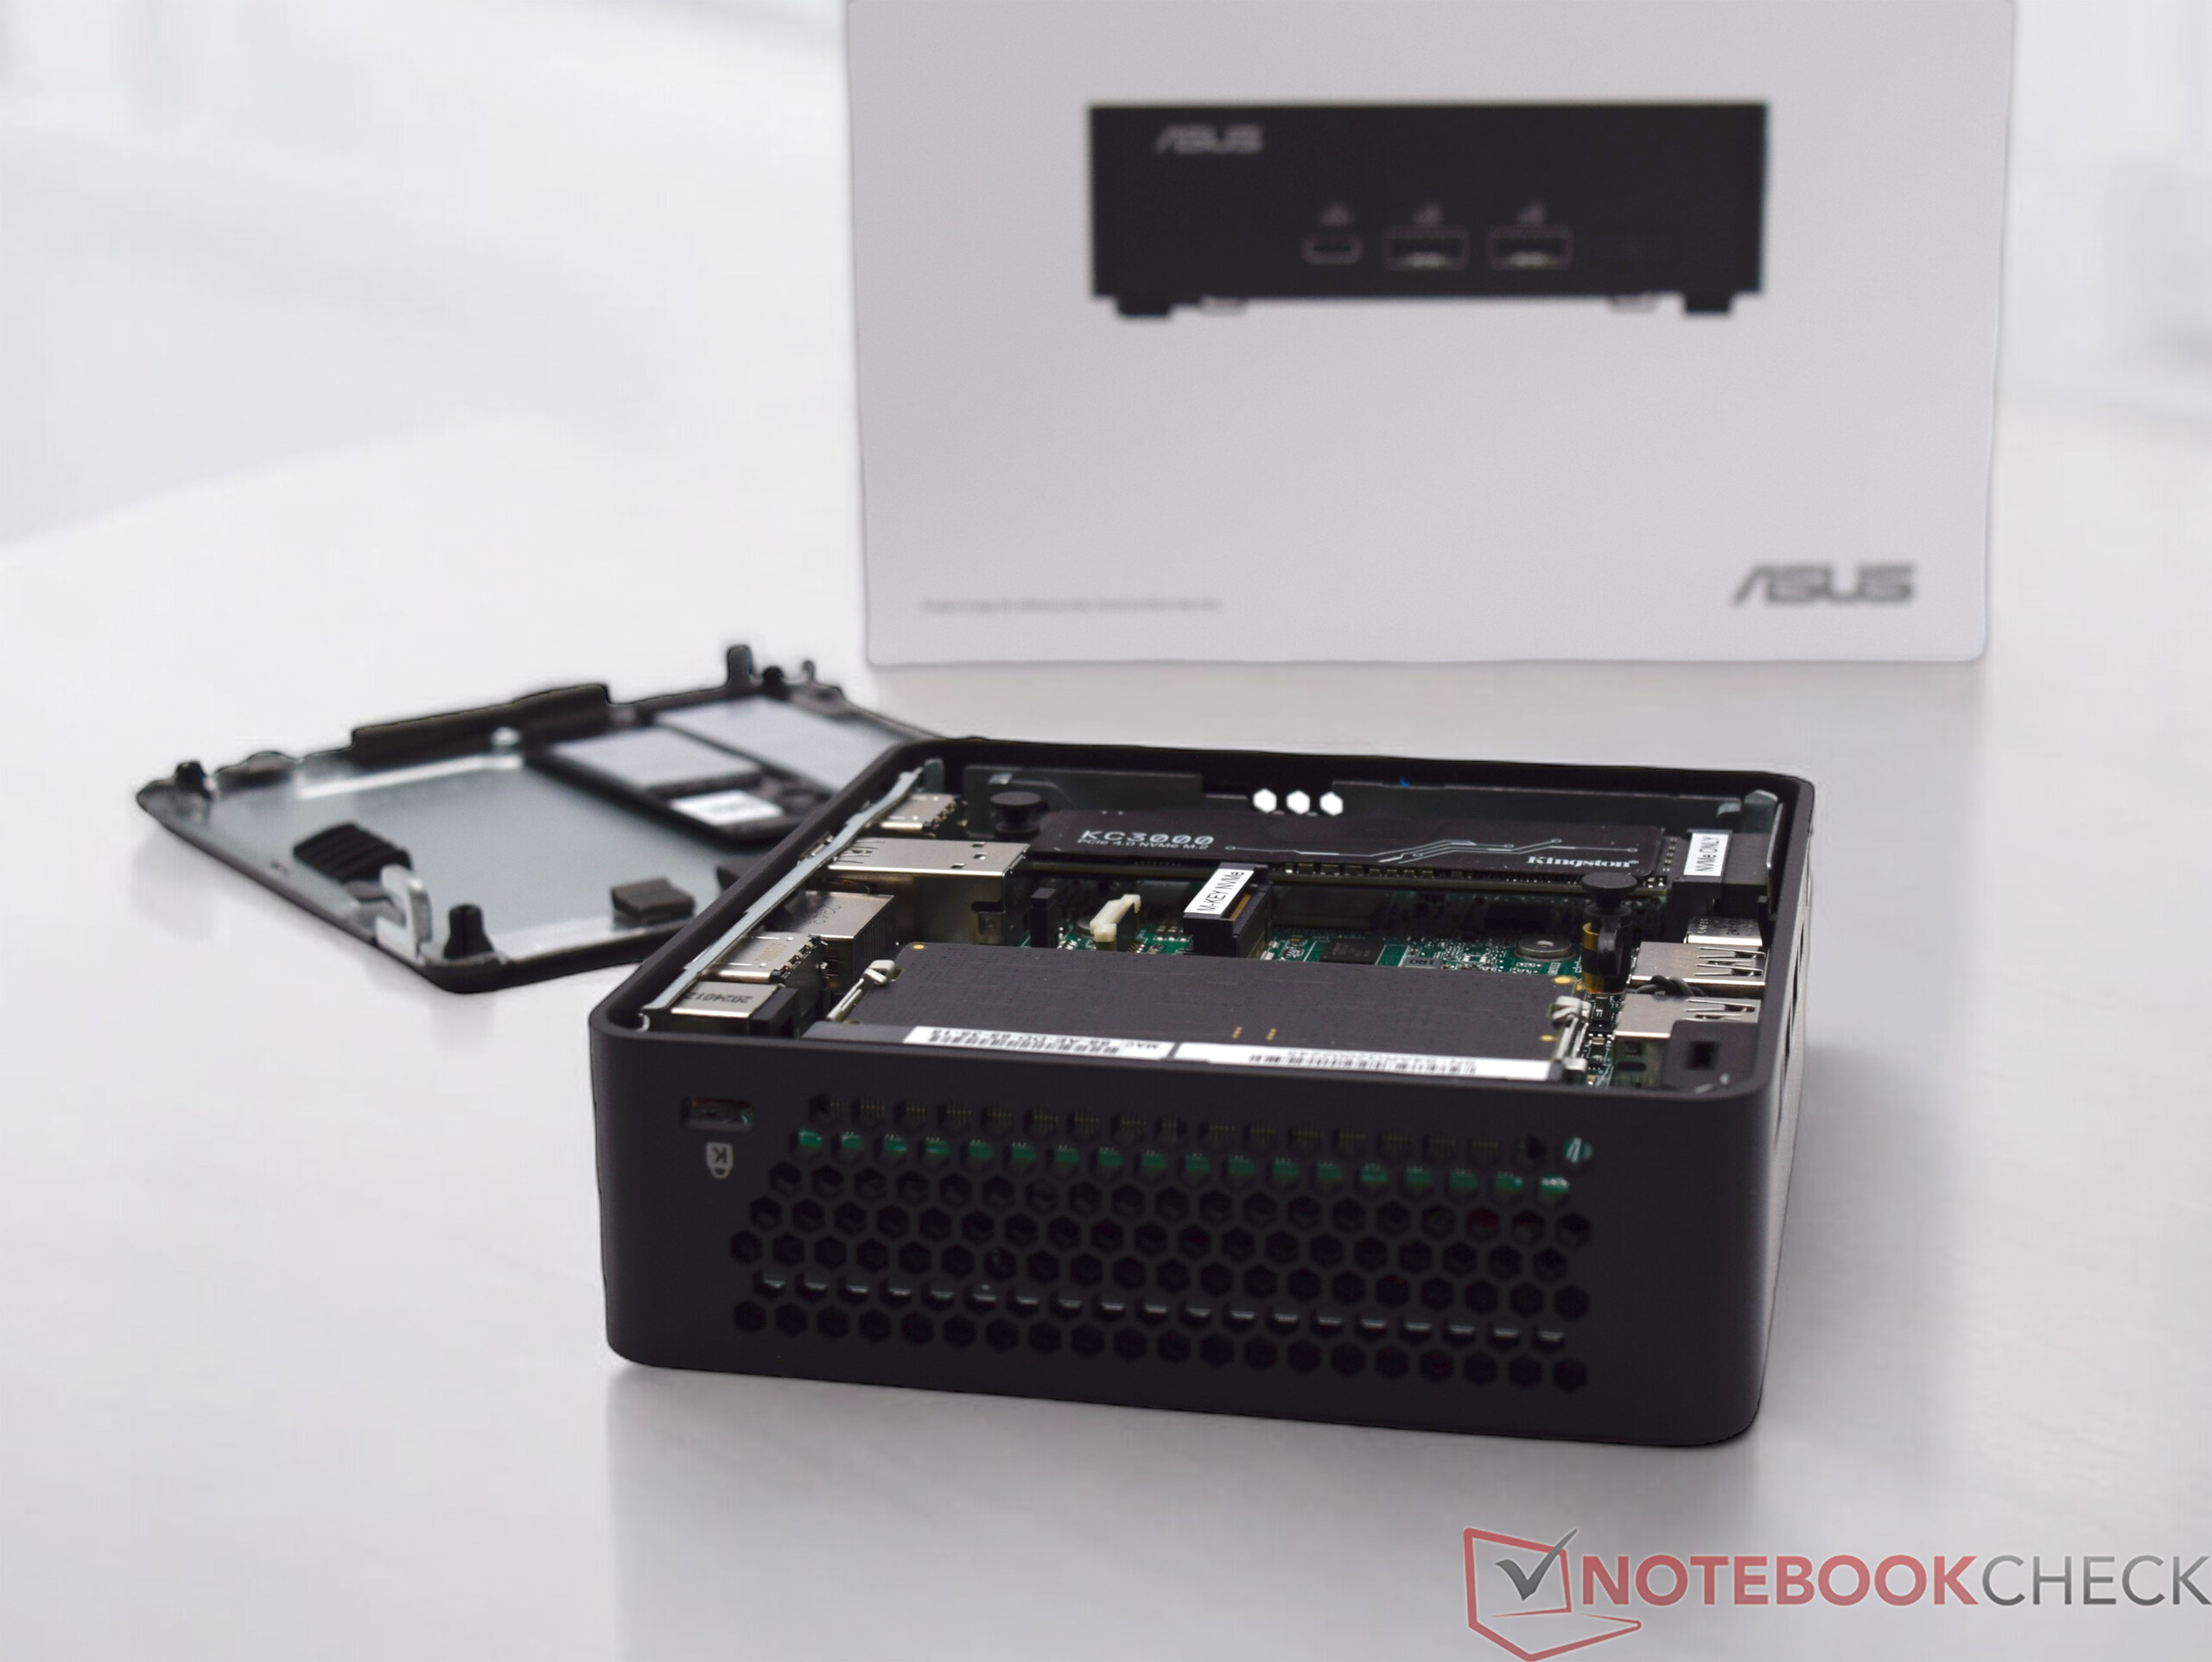
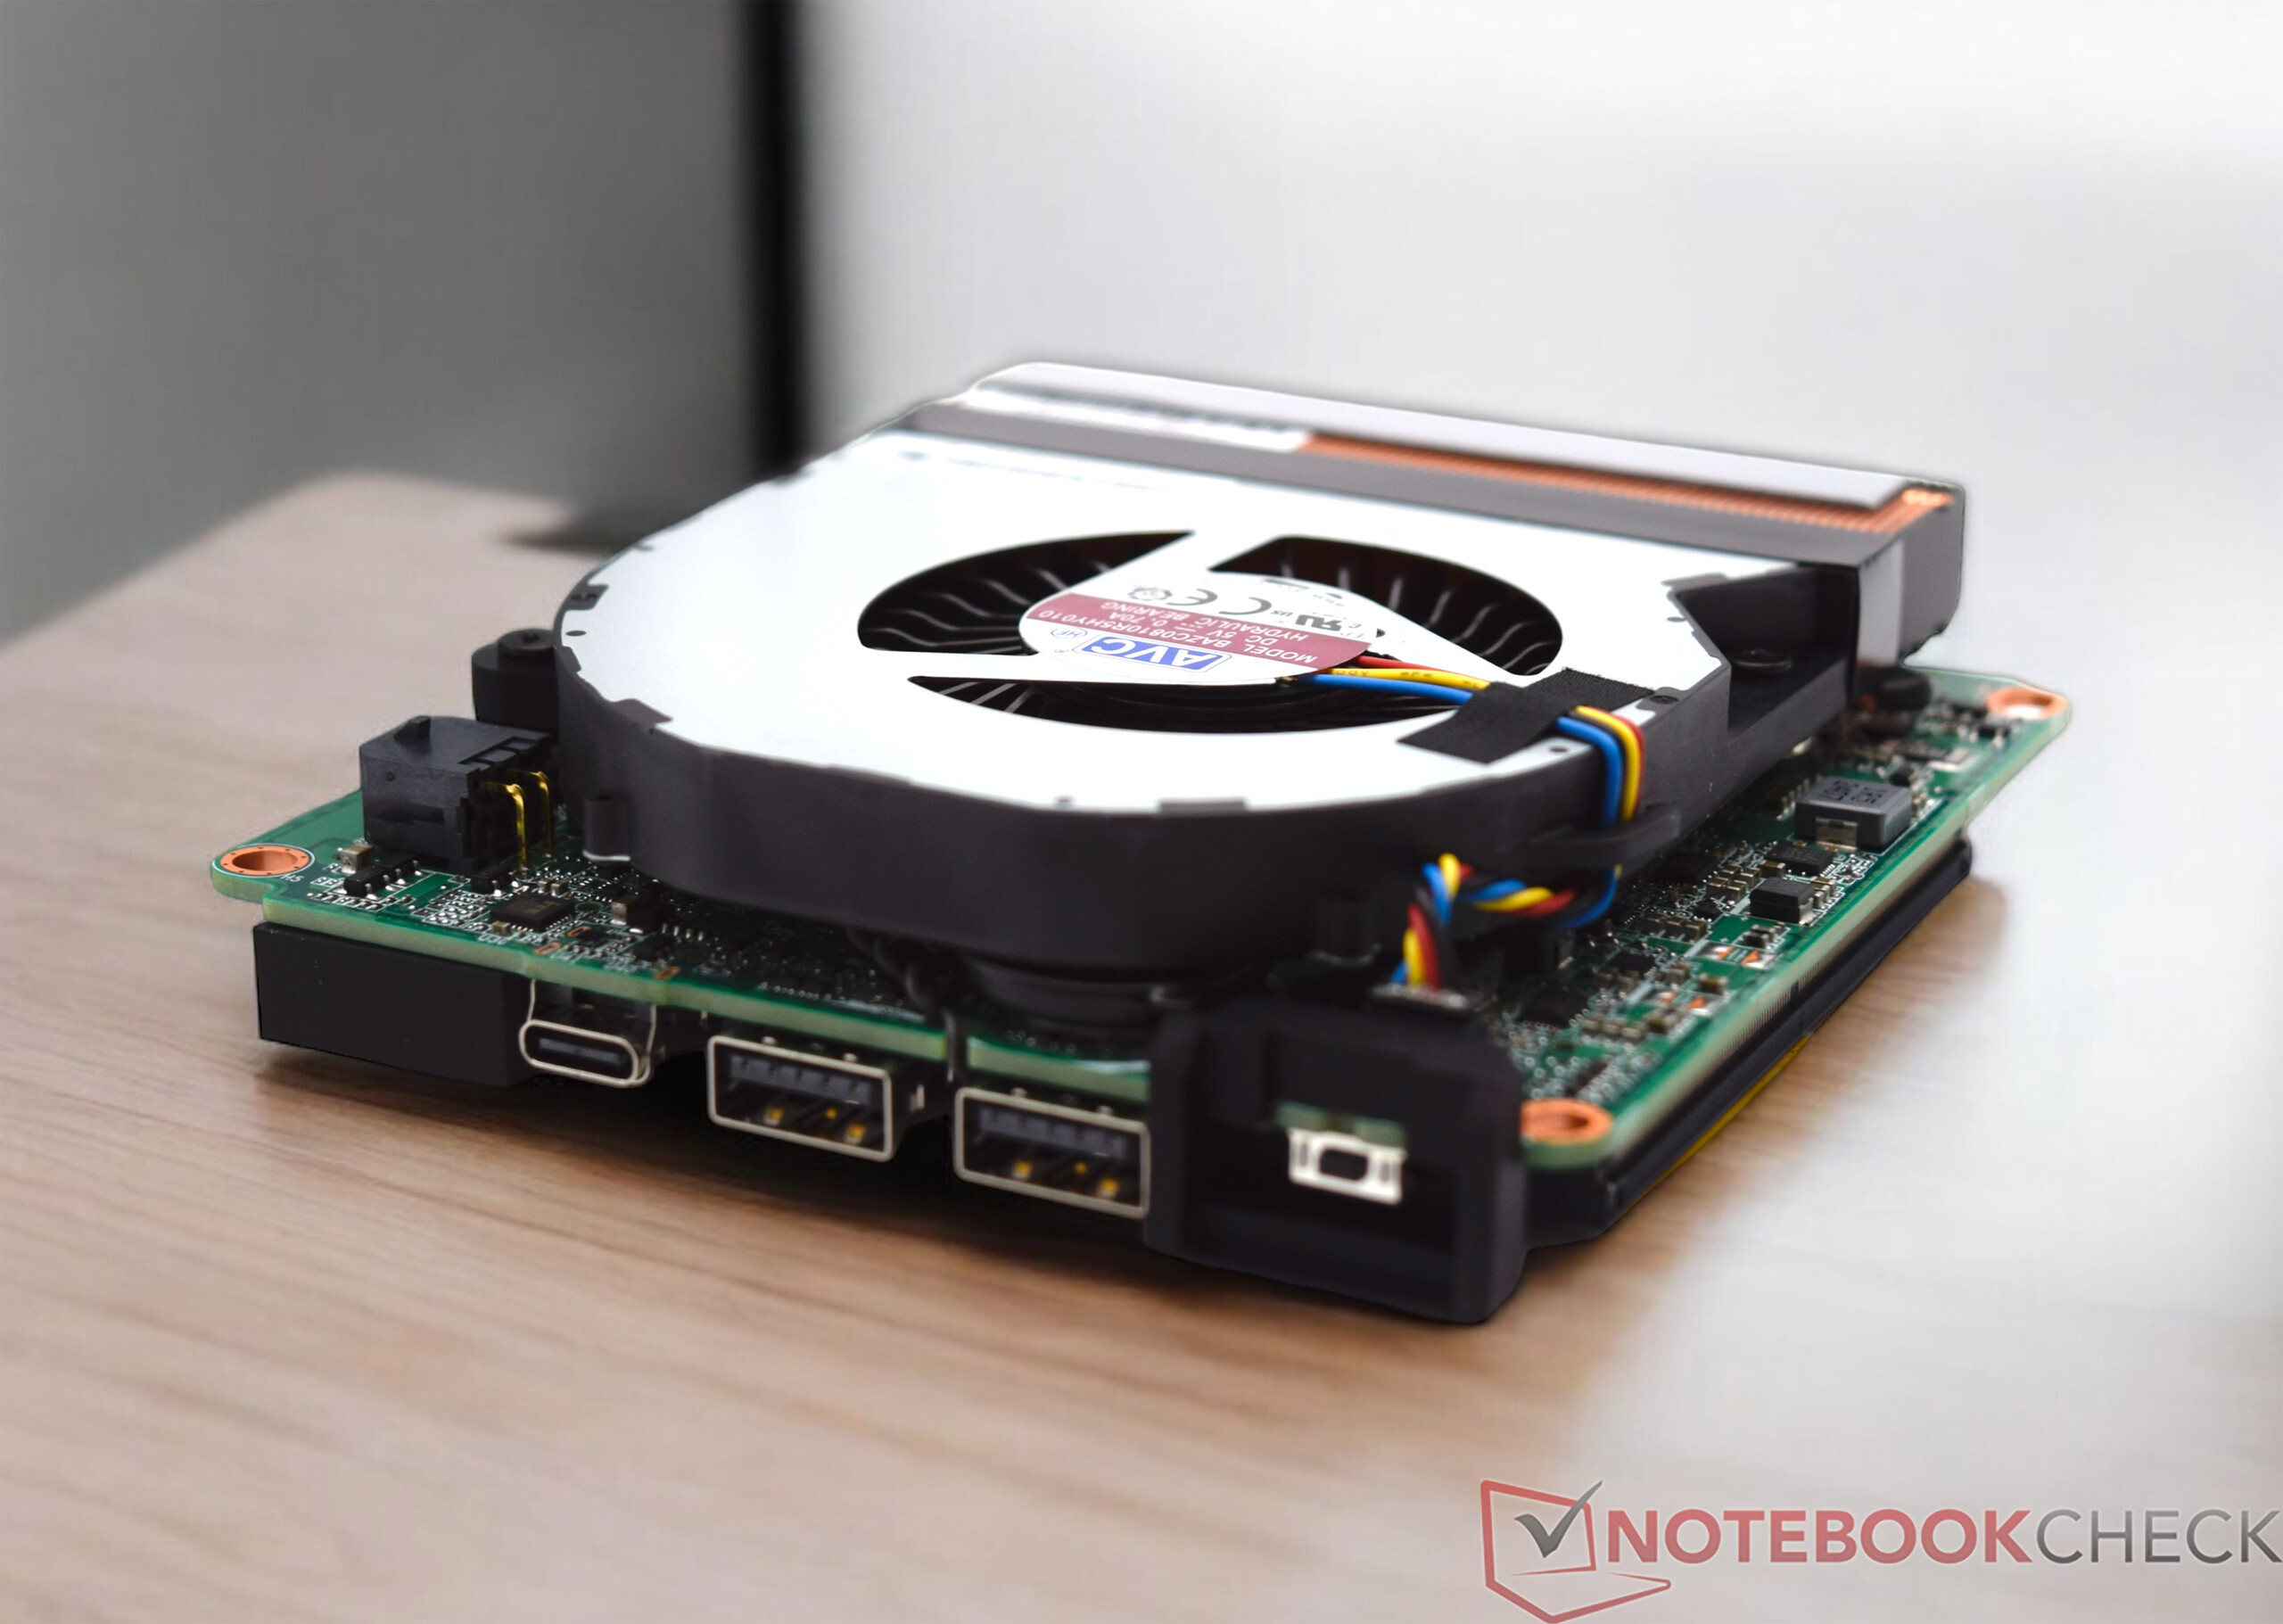
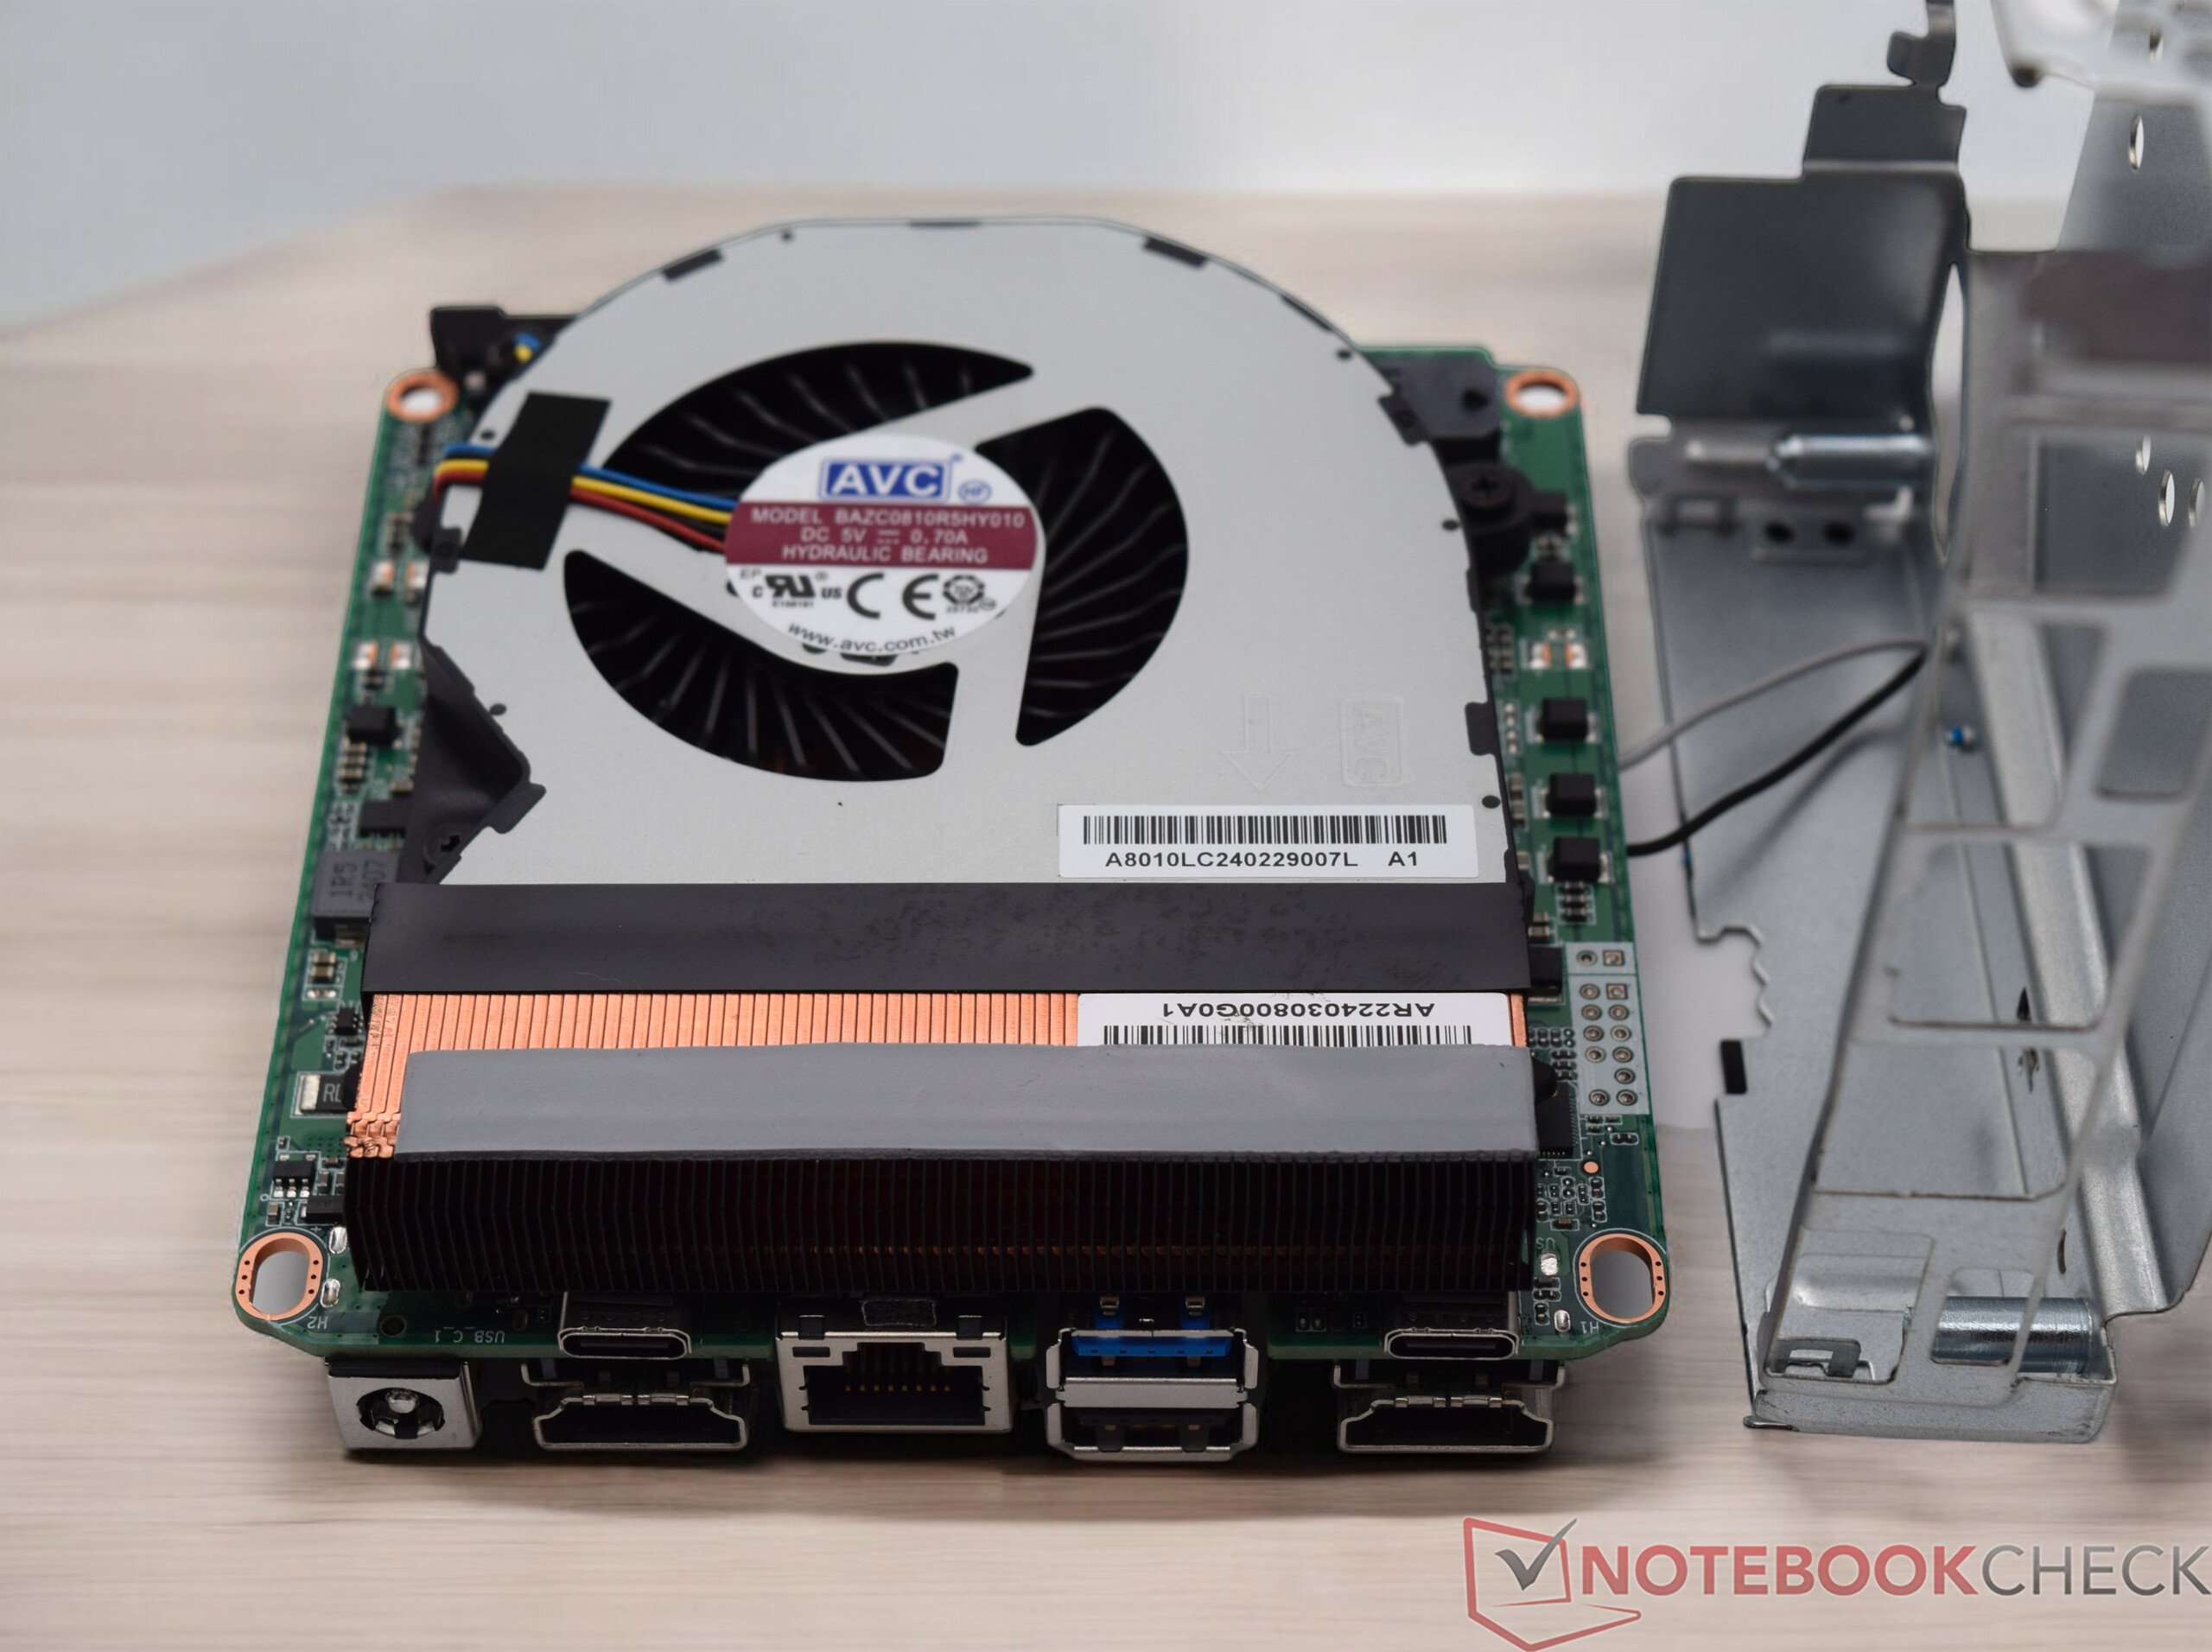
Visuellement, le NUC 14 Pro d'Asus rappelle le Kit NUC 12 Pro d'Intel Kit Intel NUC 12 Pro bien que le design ait été légèrement revu. Cependant, le choix des matériaux est le même. Le concept de base est également inchangé, puisque le plastique noir cache un cadre métallique robuste. D'un point de vue tactile, l'Asus NUC 14 Pro est inférieur aux mini-PC, qui utilisent un boîtier en aluminium. L'appareil d'Asus n'est pas non plus convaincant sur le plan visuel, si cet aspect est important pour vous. La finition n'est cependant pas critiquable. Le dessous de l'appareil a été redessiné et comprend un verrou mécanique qui permet d'ouvrir l'appareil sans outil. La version fine, que nous avons testée ici, présente un design très plat avec une hauteur de 37 millimètres. Avec un encombrement presque carré de 11,7 x 11,2 centimètres, l'appareil prend peu de place sur le bureau. Le support VESA fourni permet également de le monter sur un moniteur.
Equipement
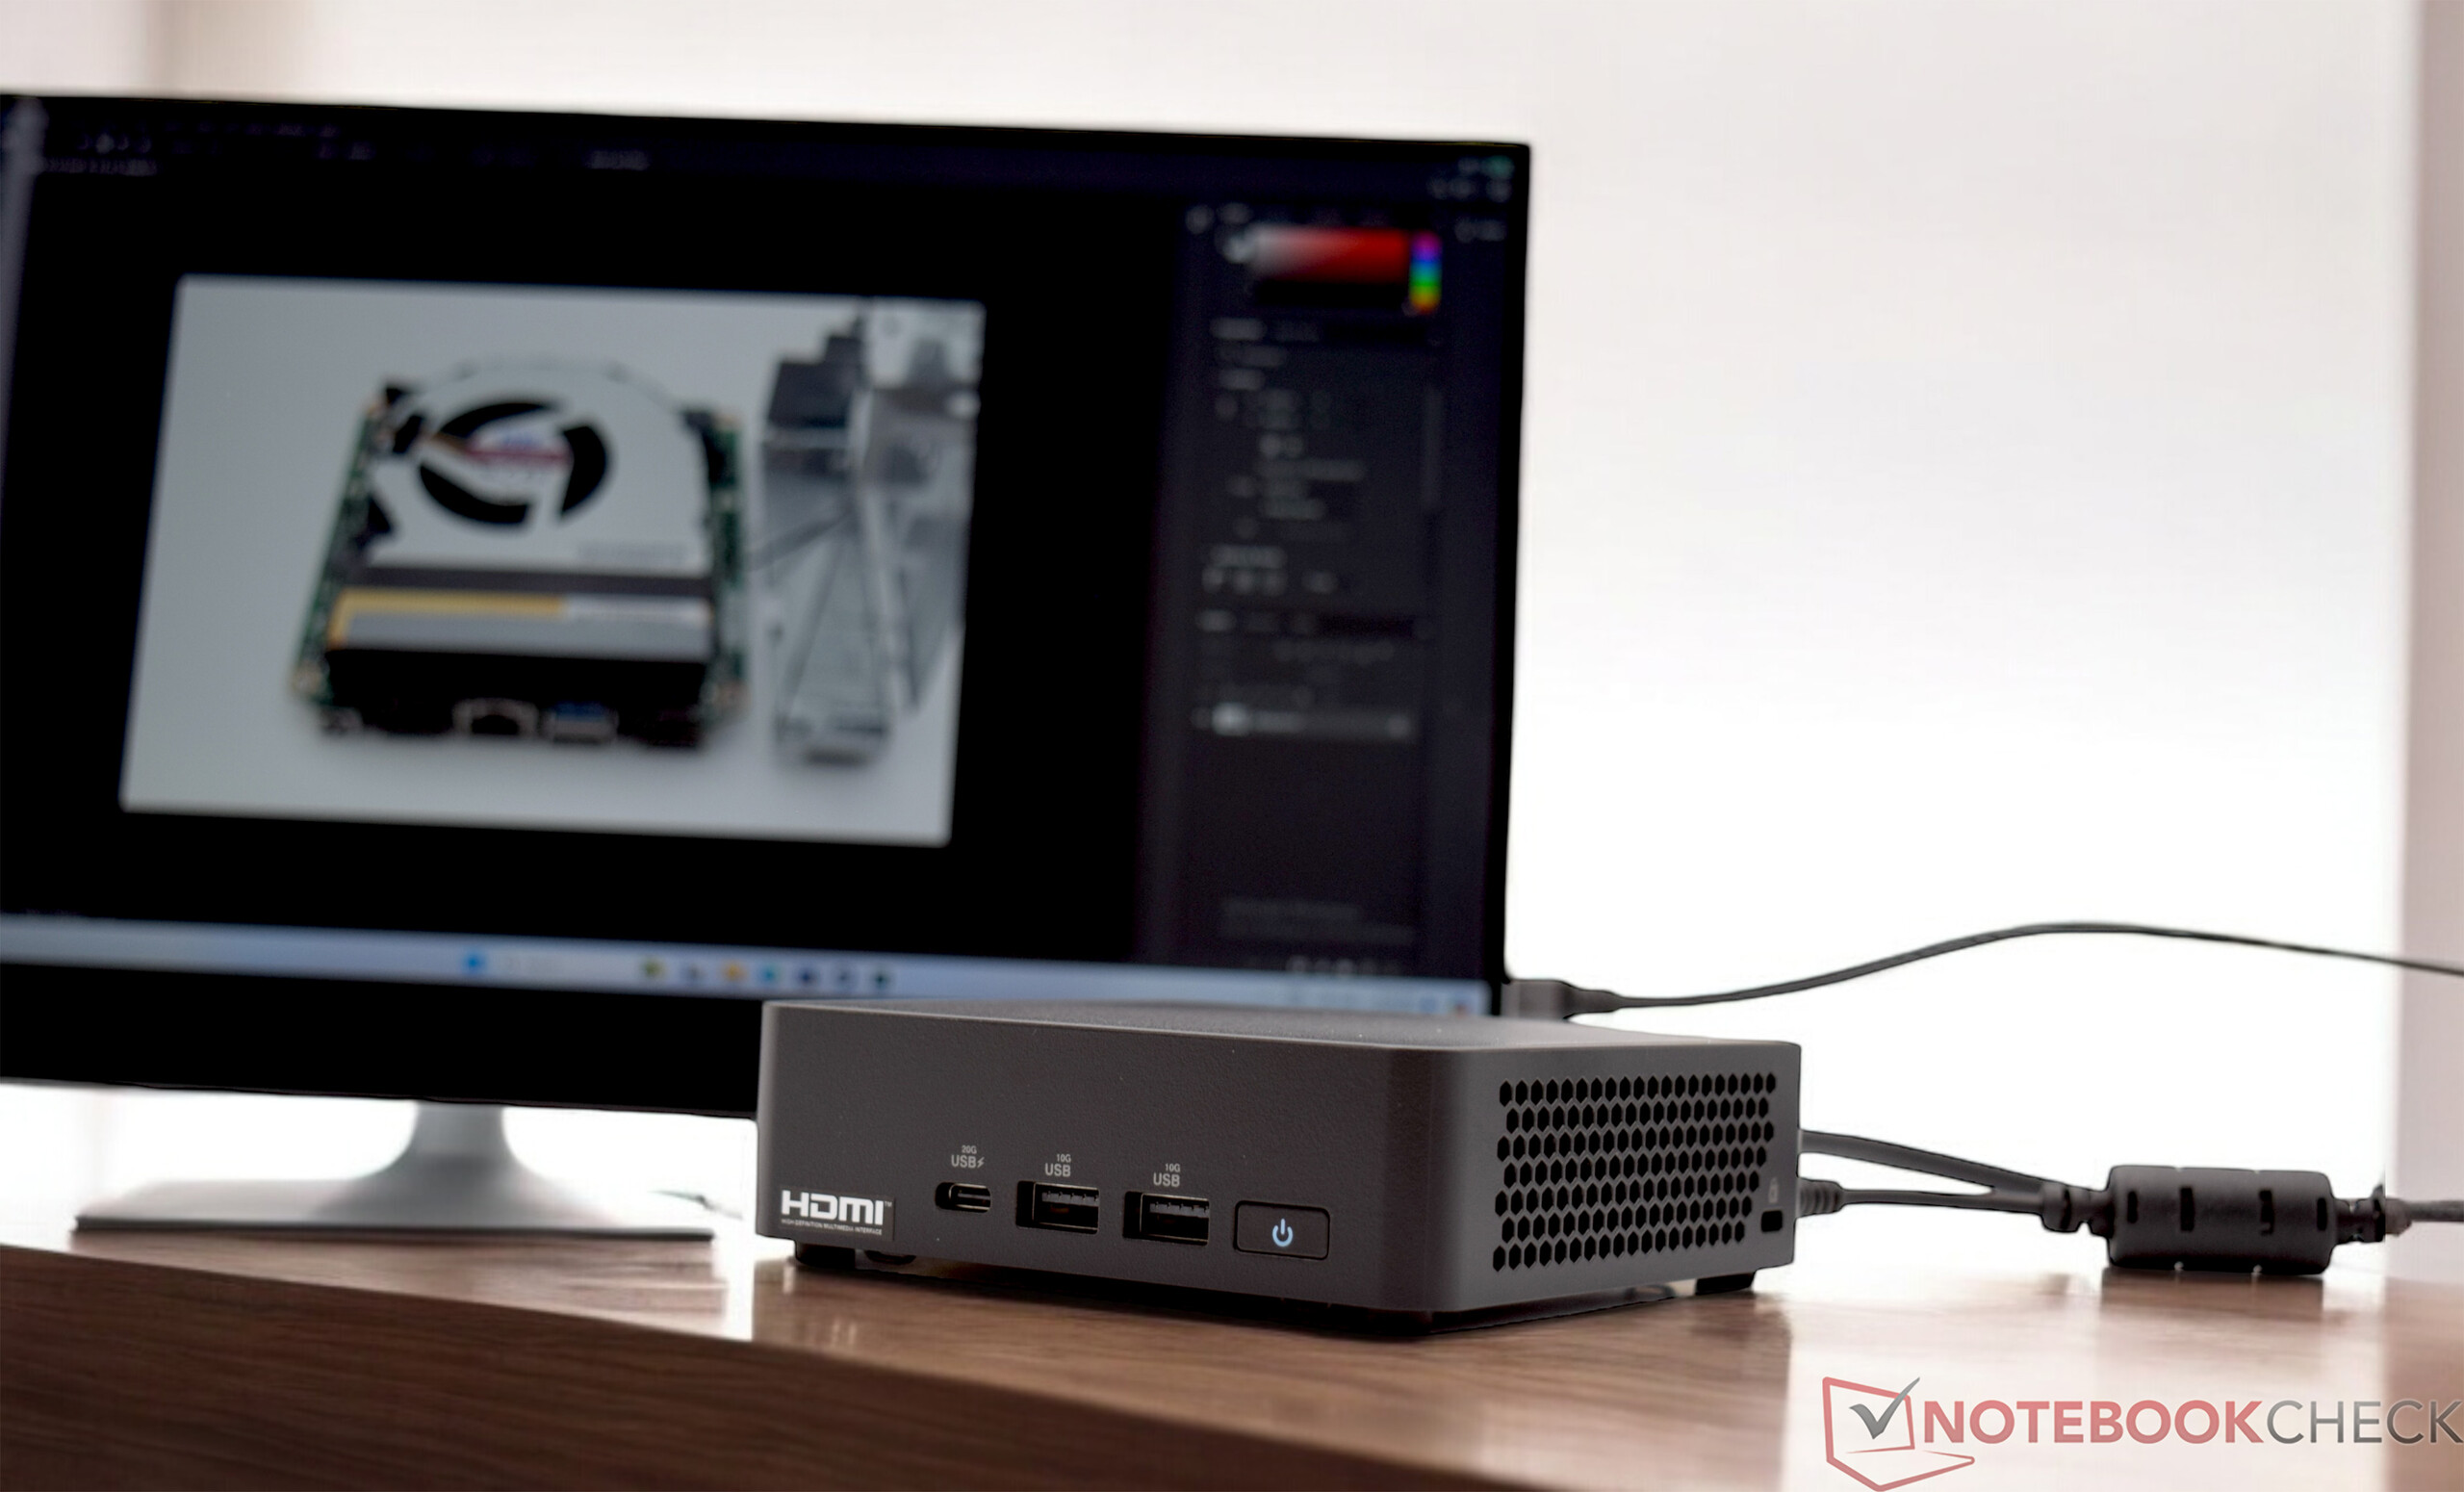
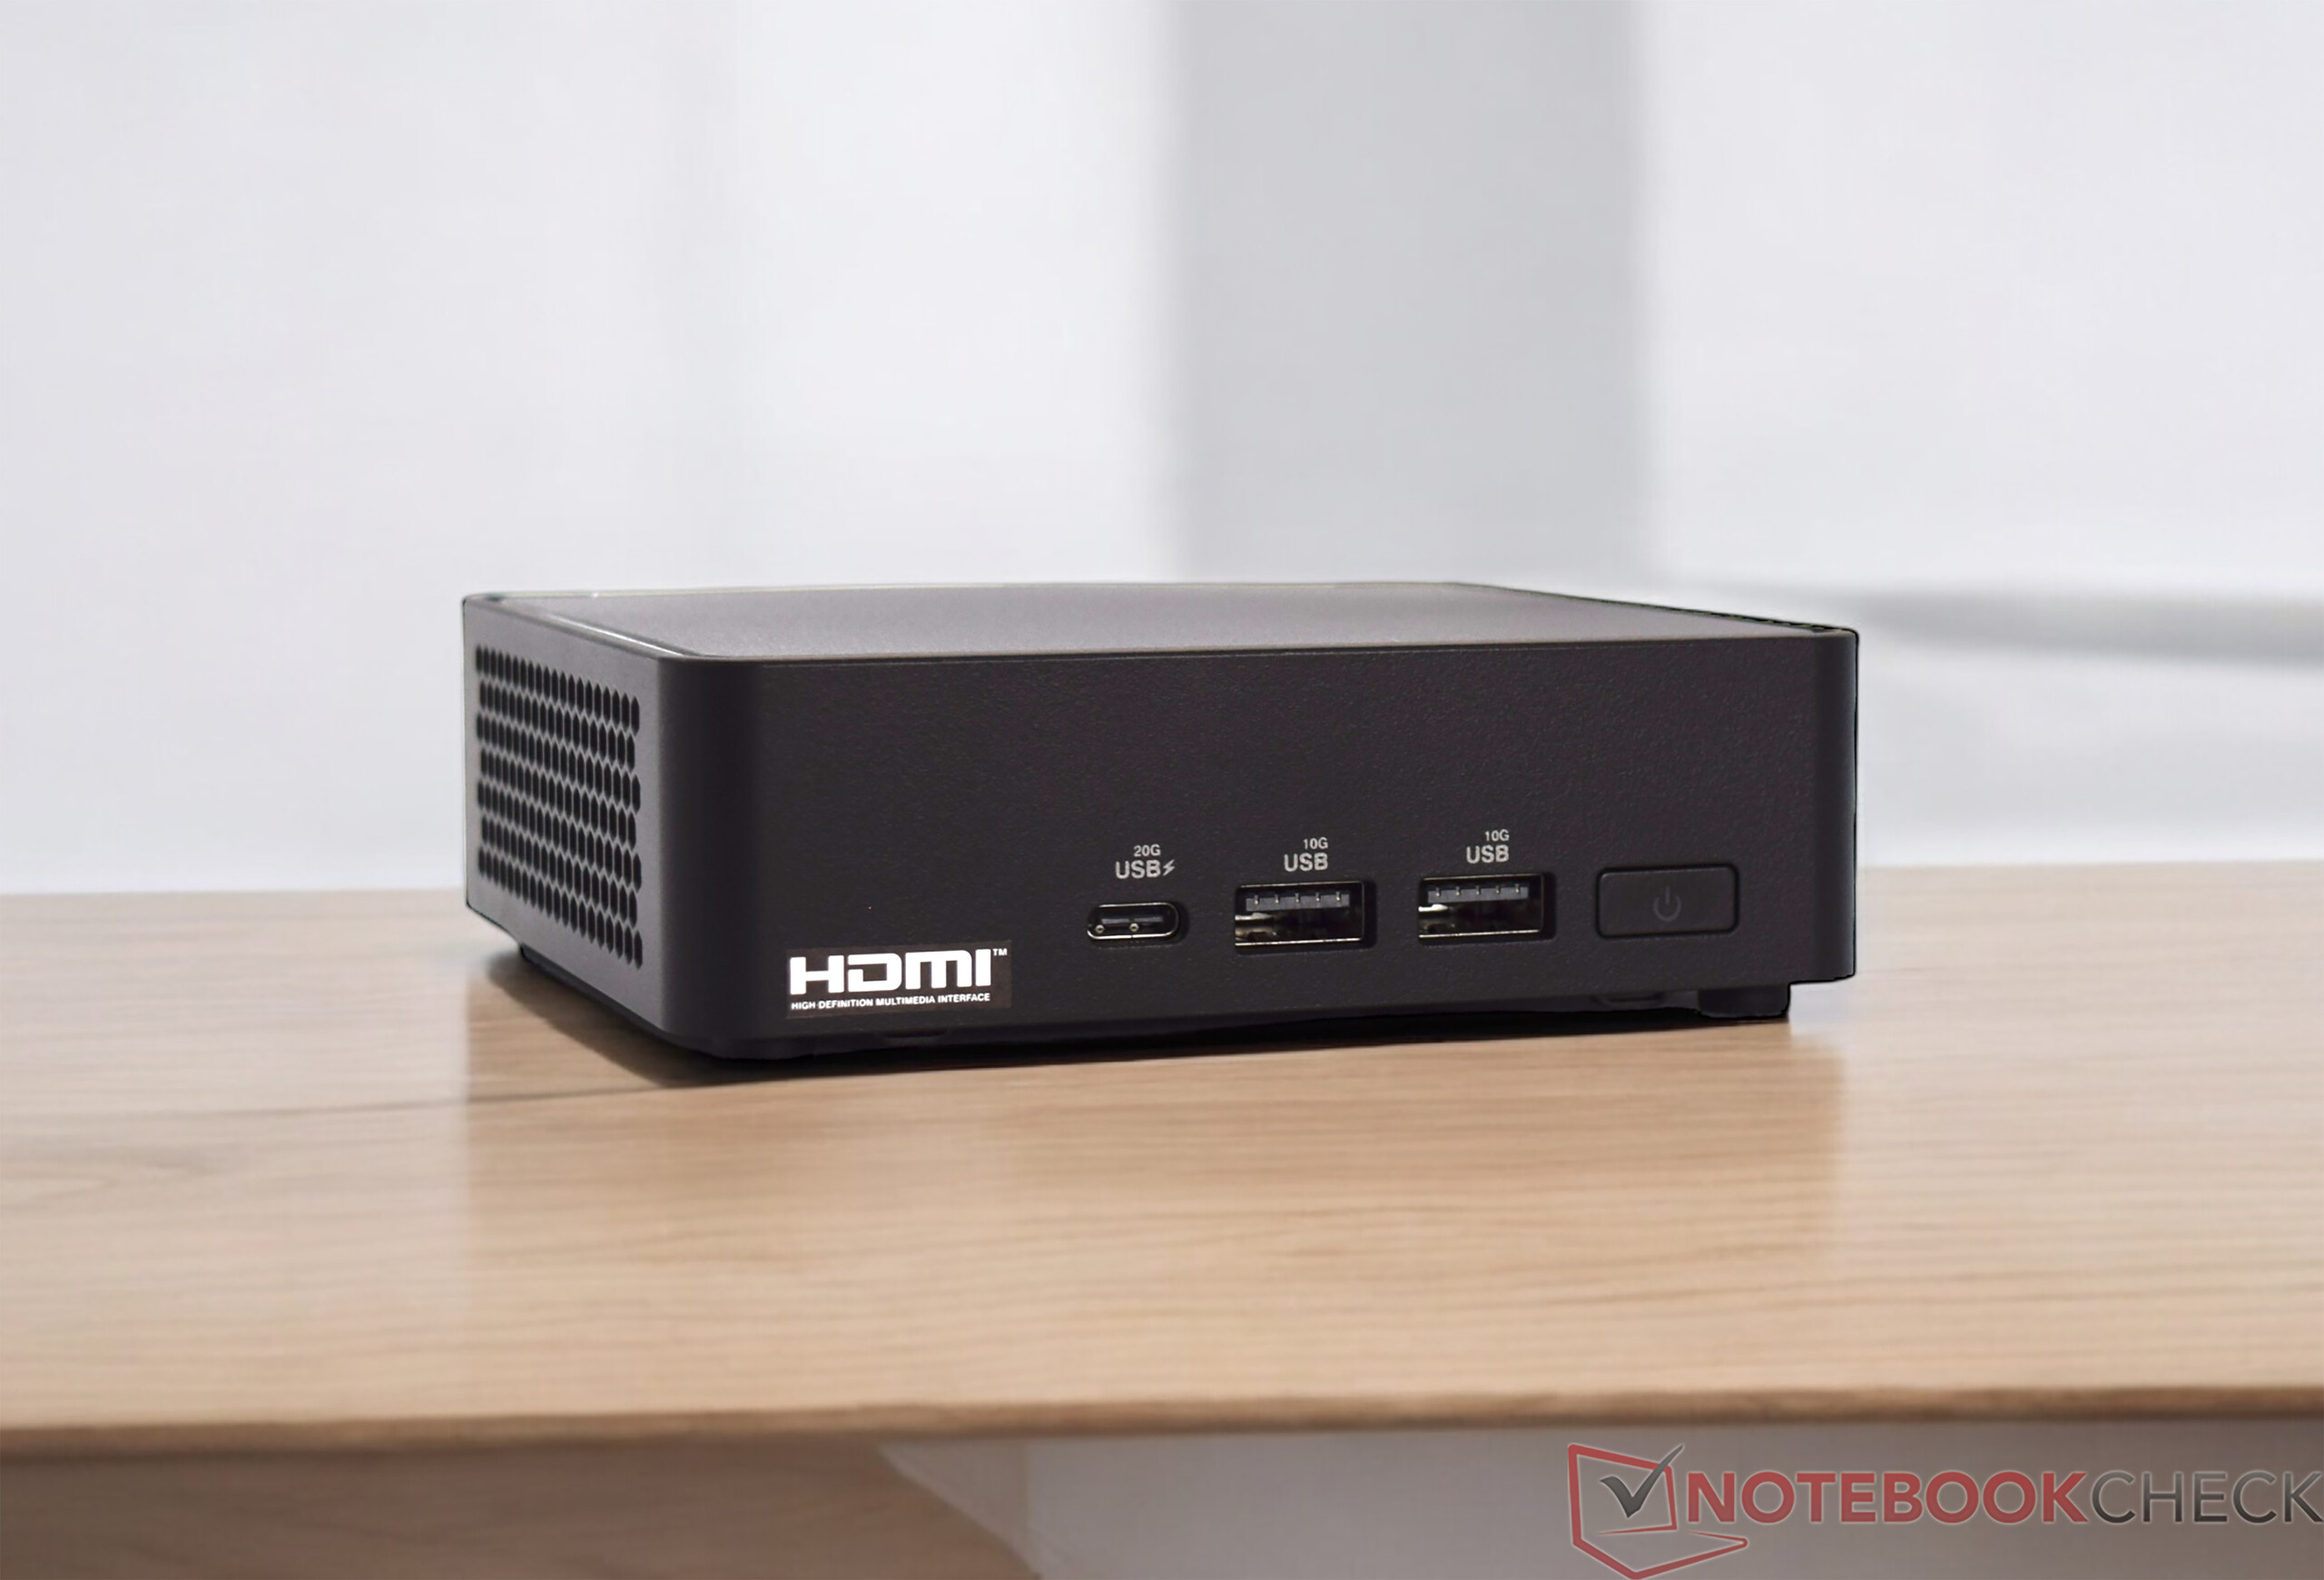
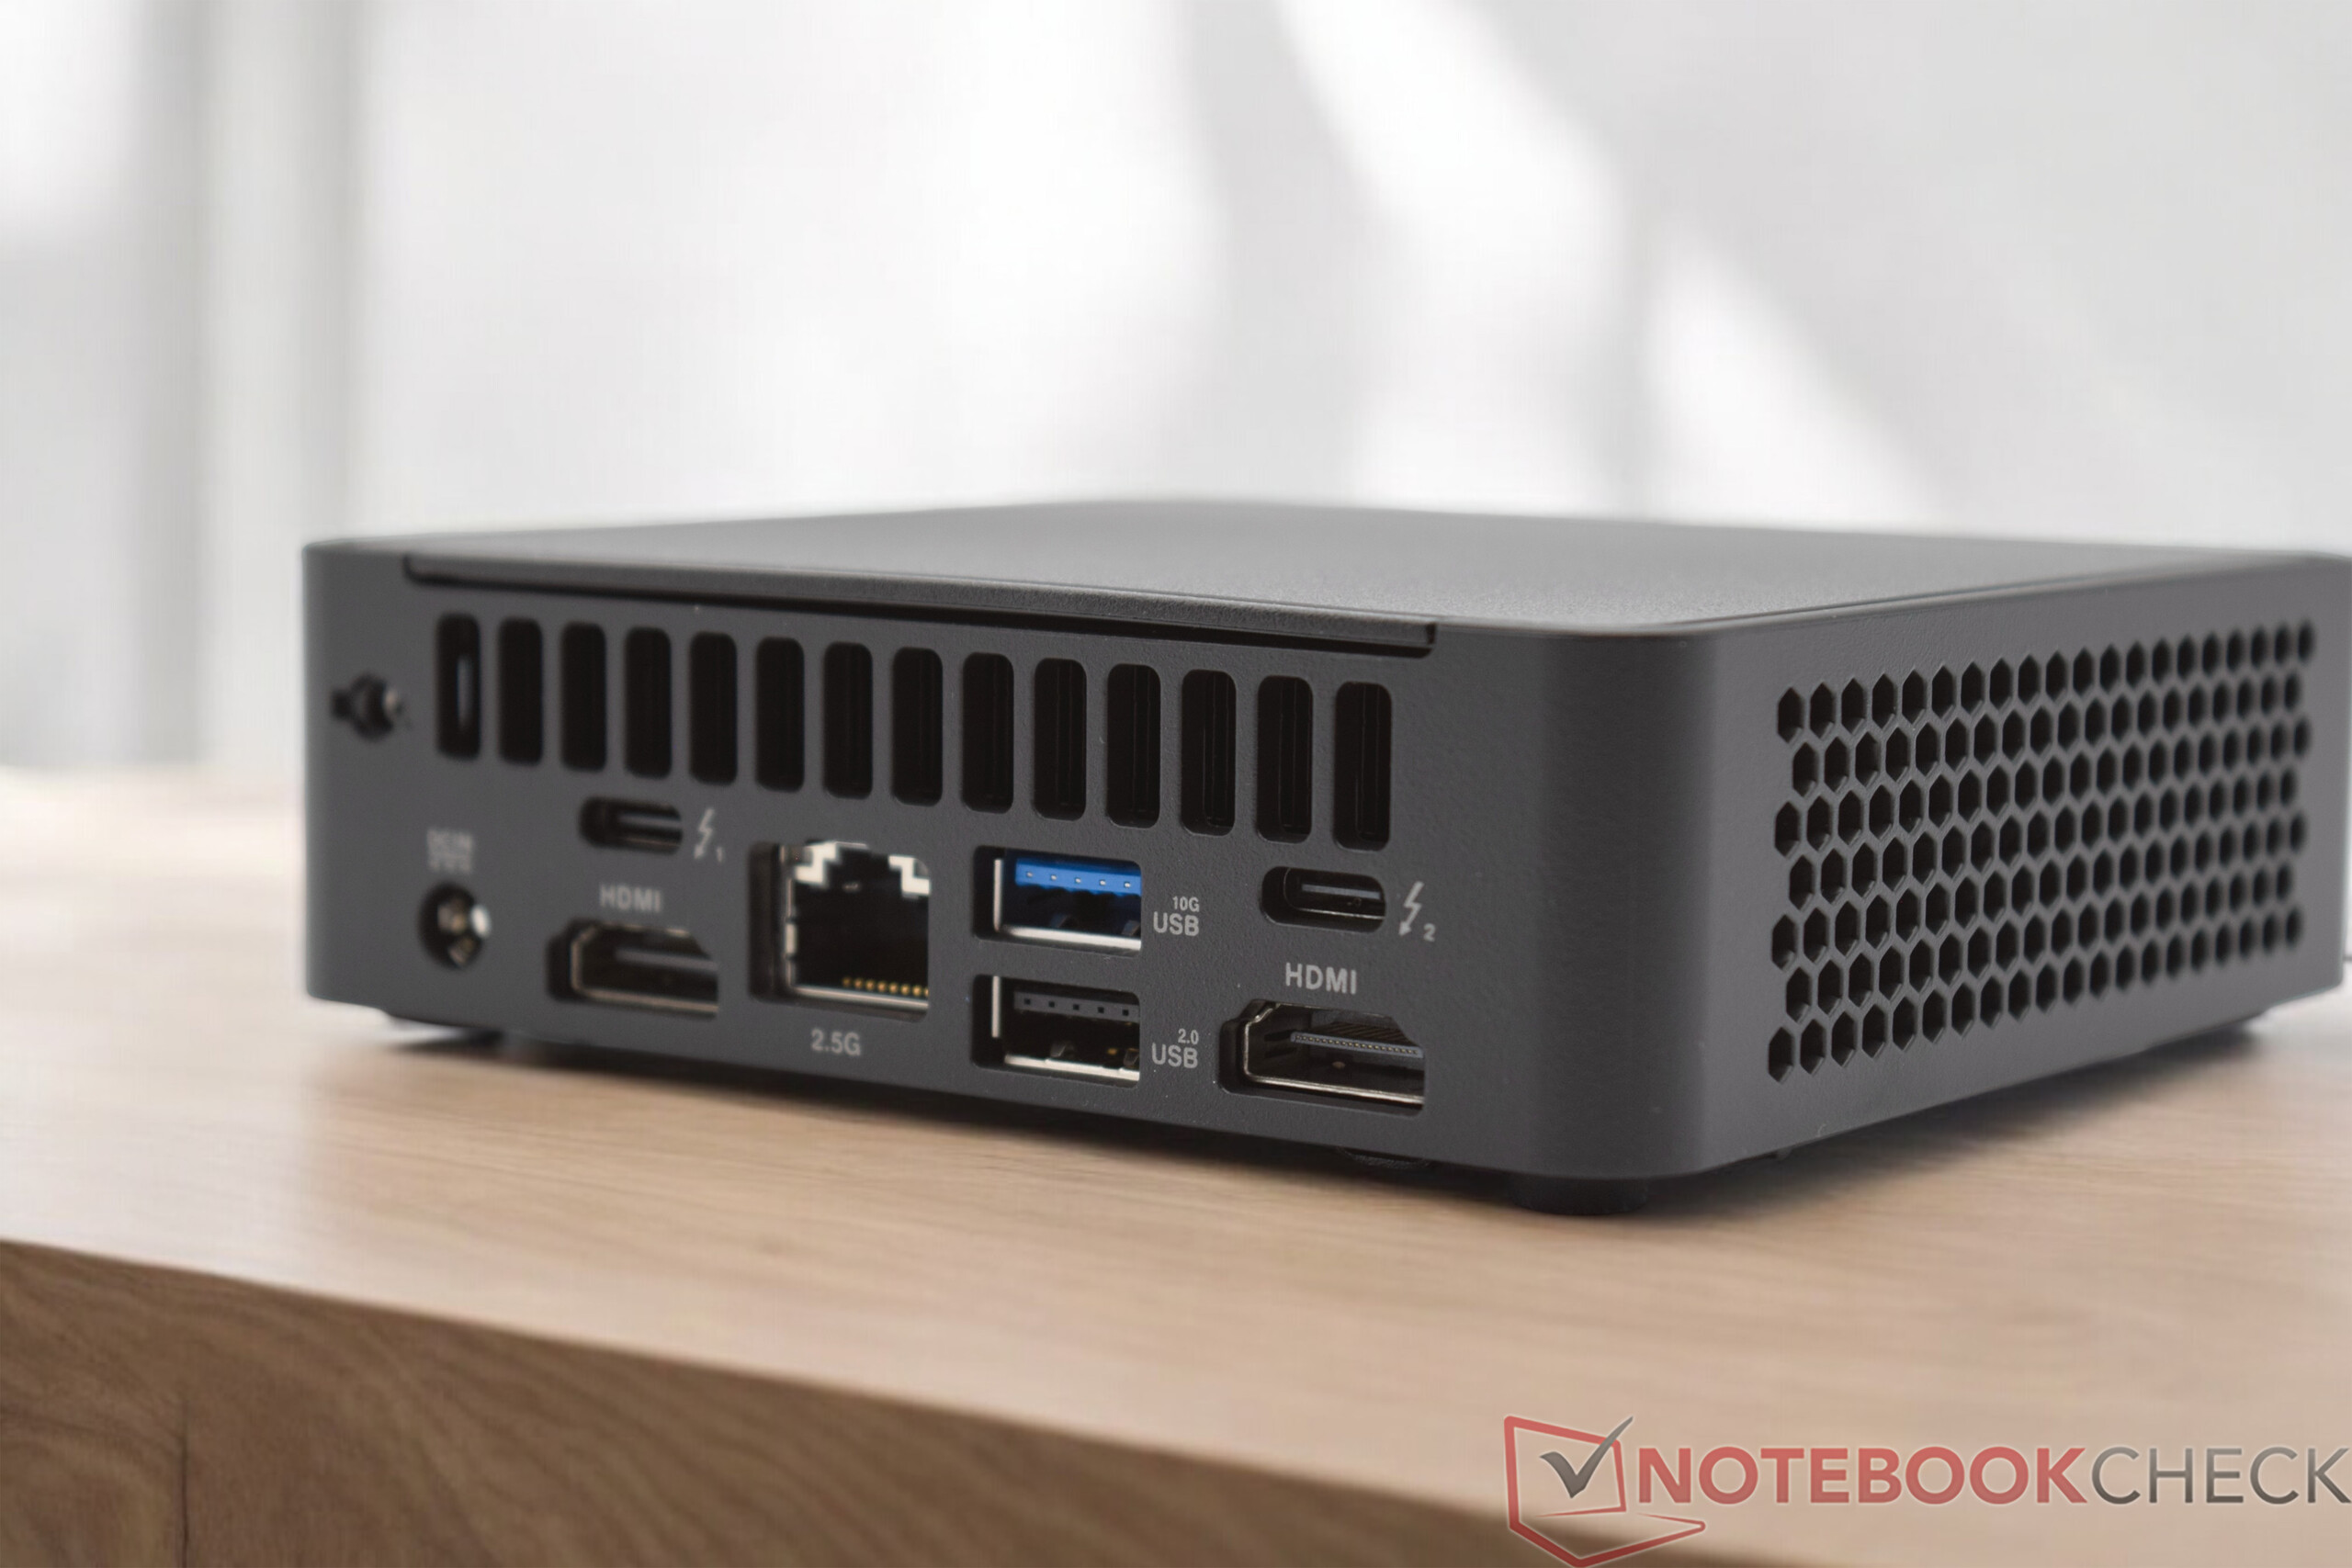
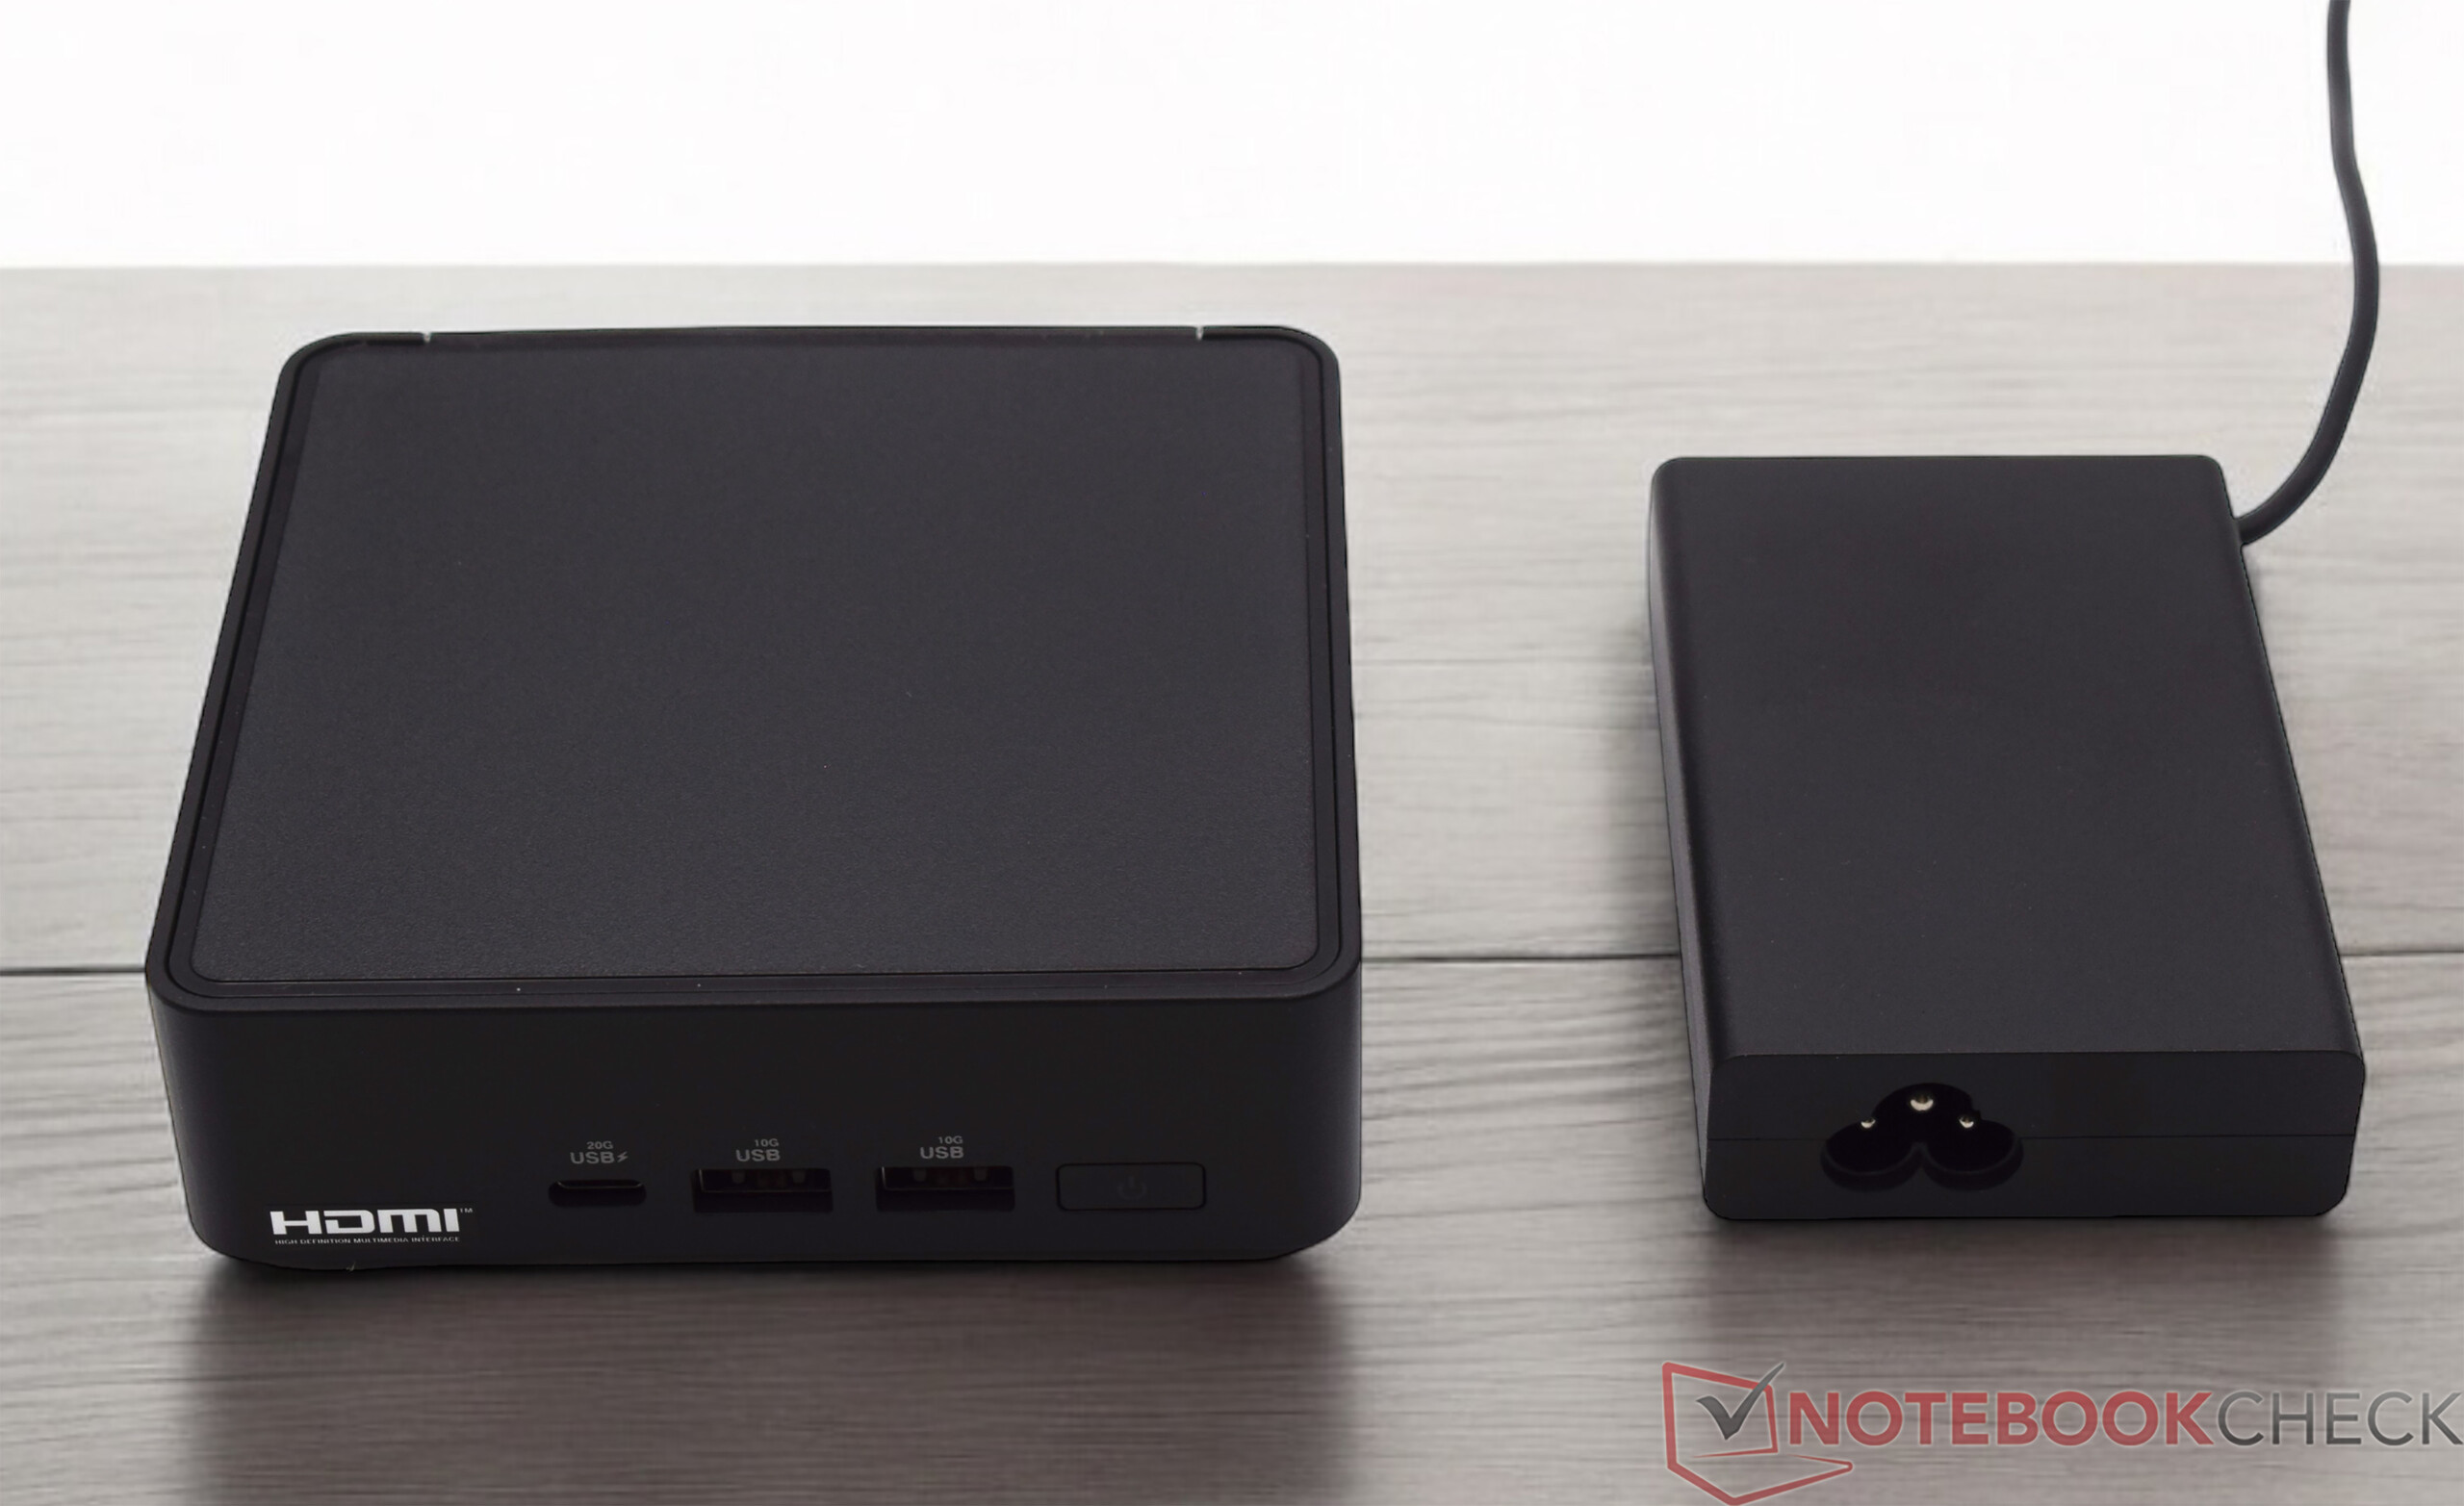
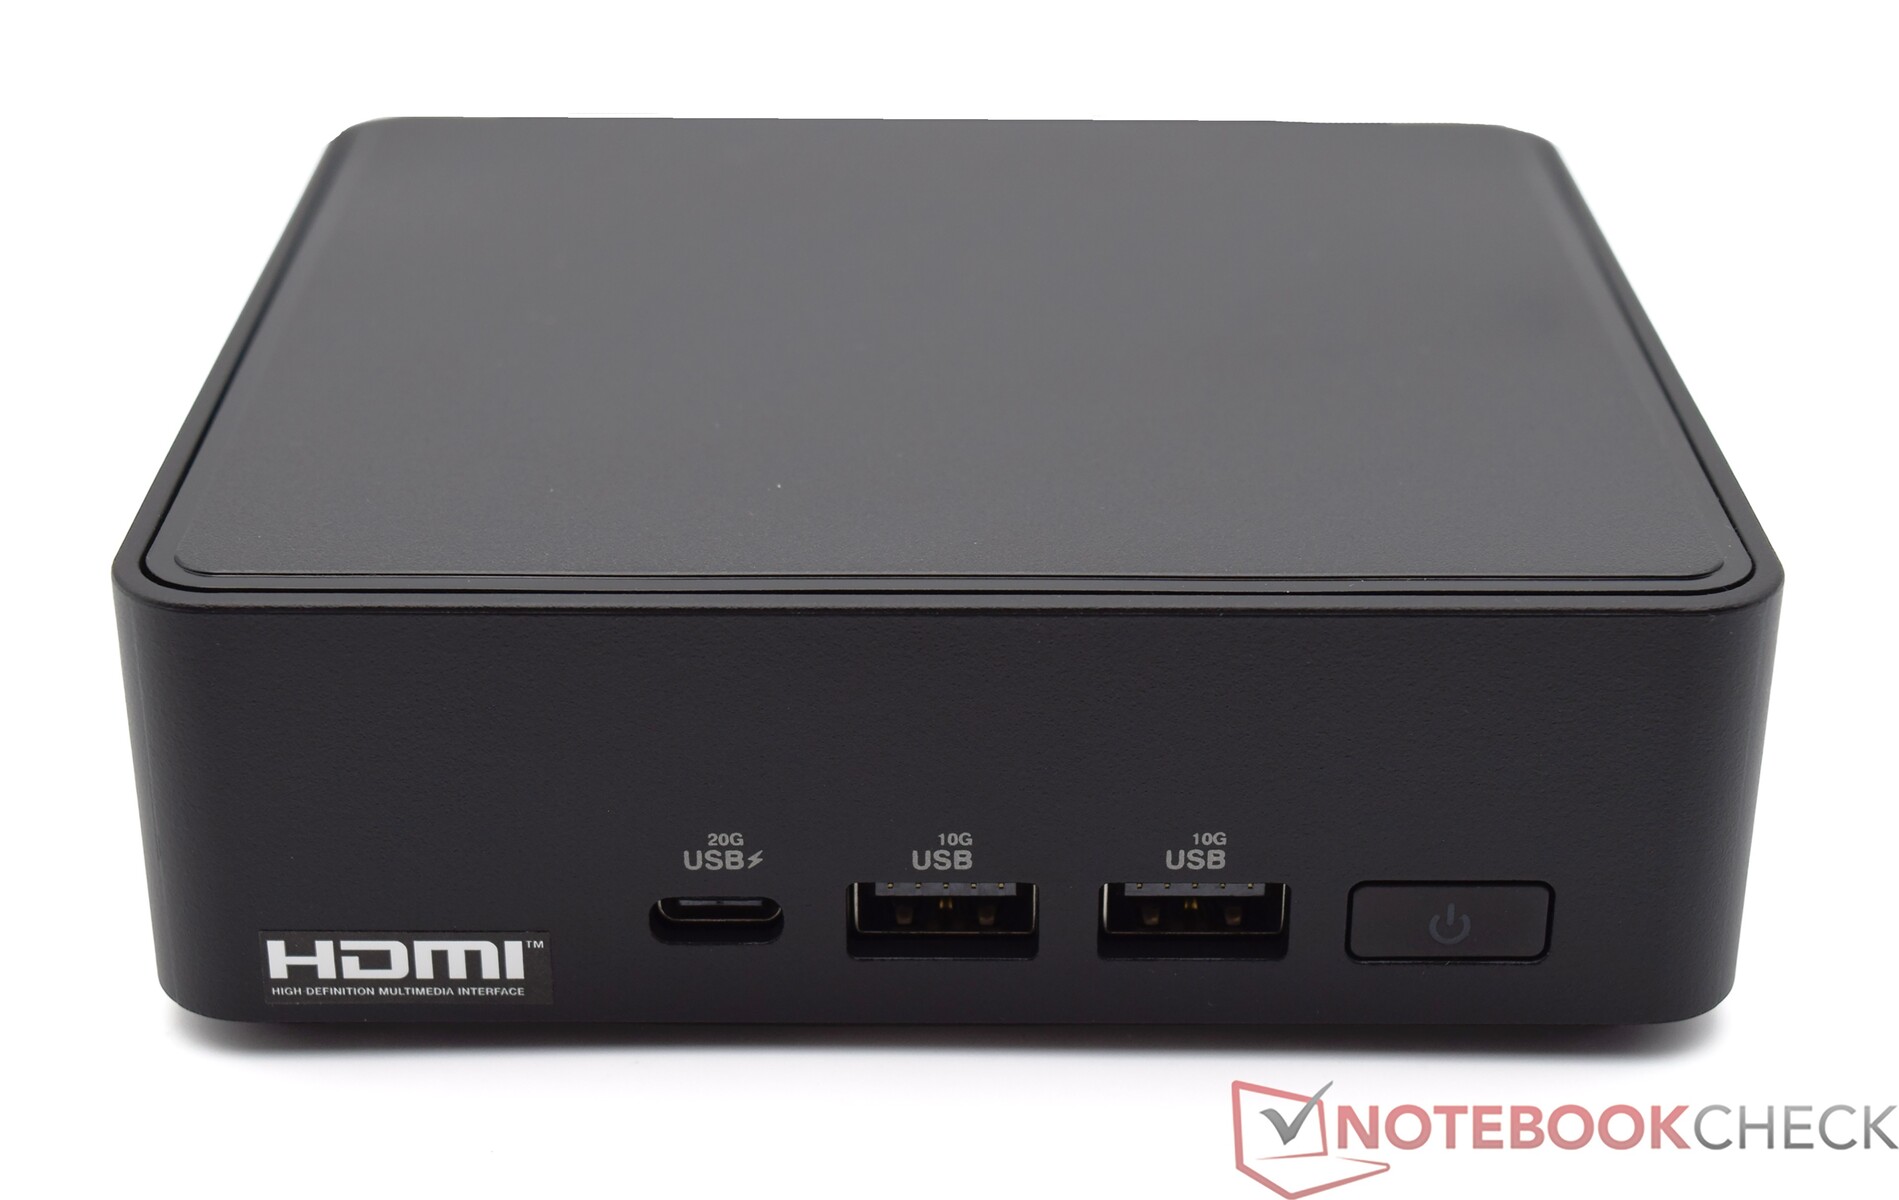
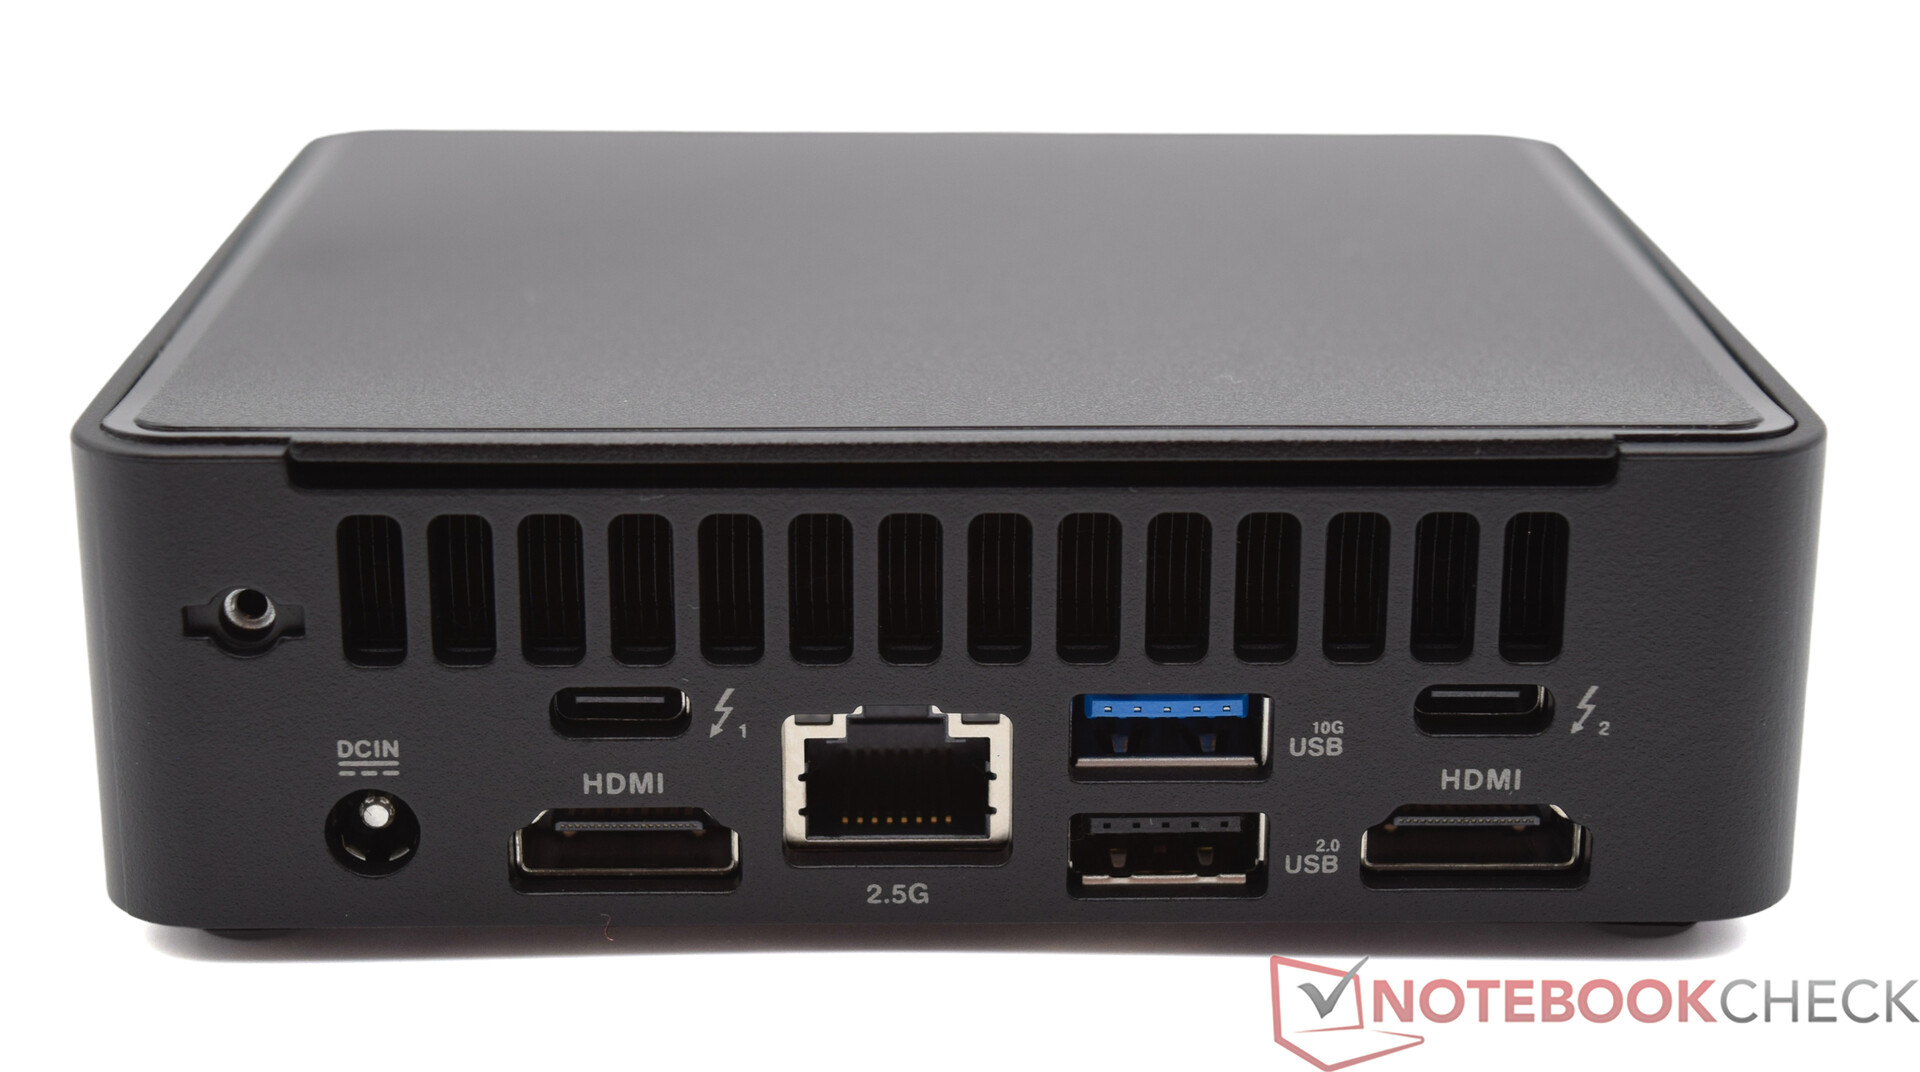
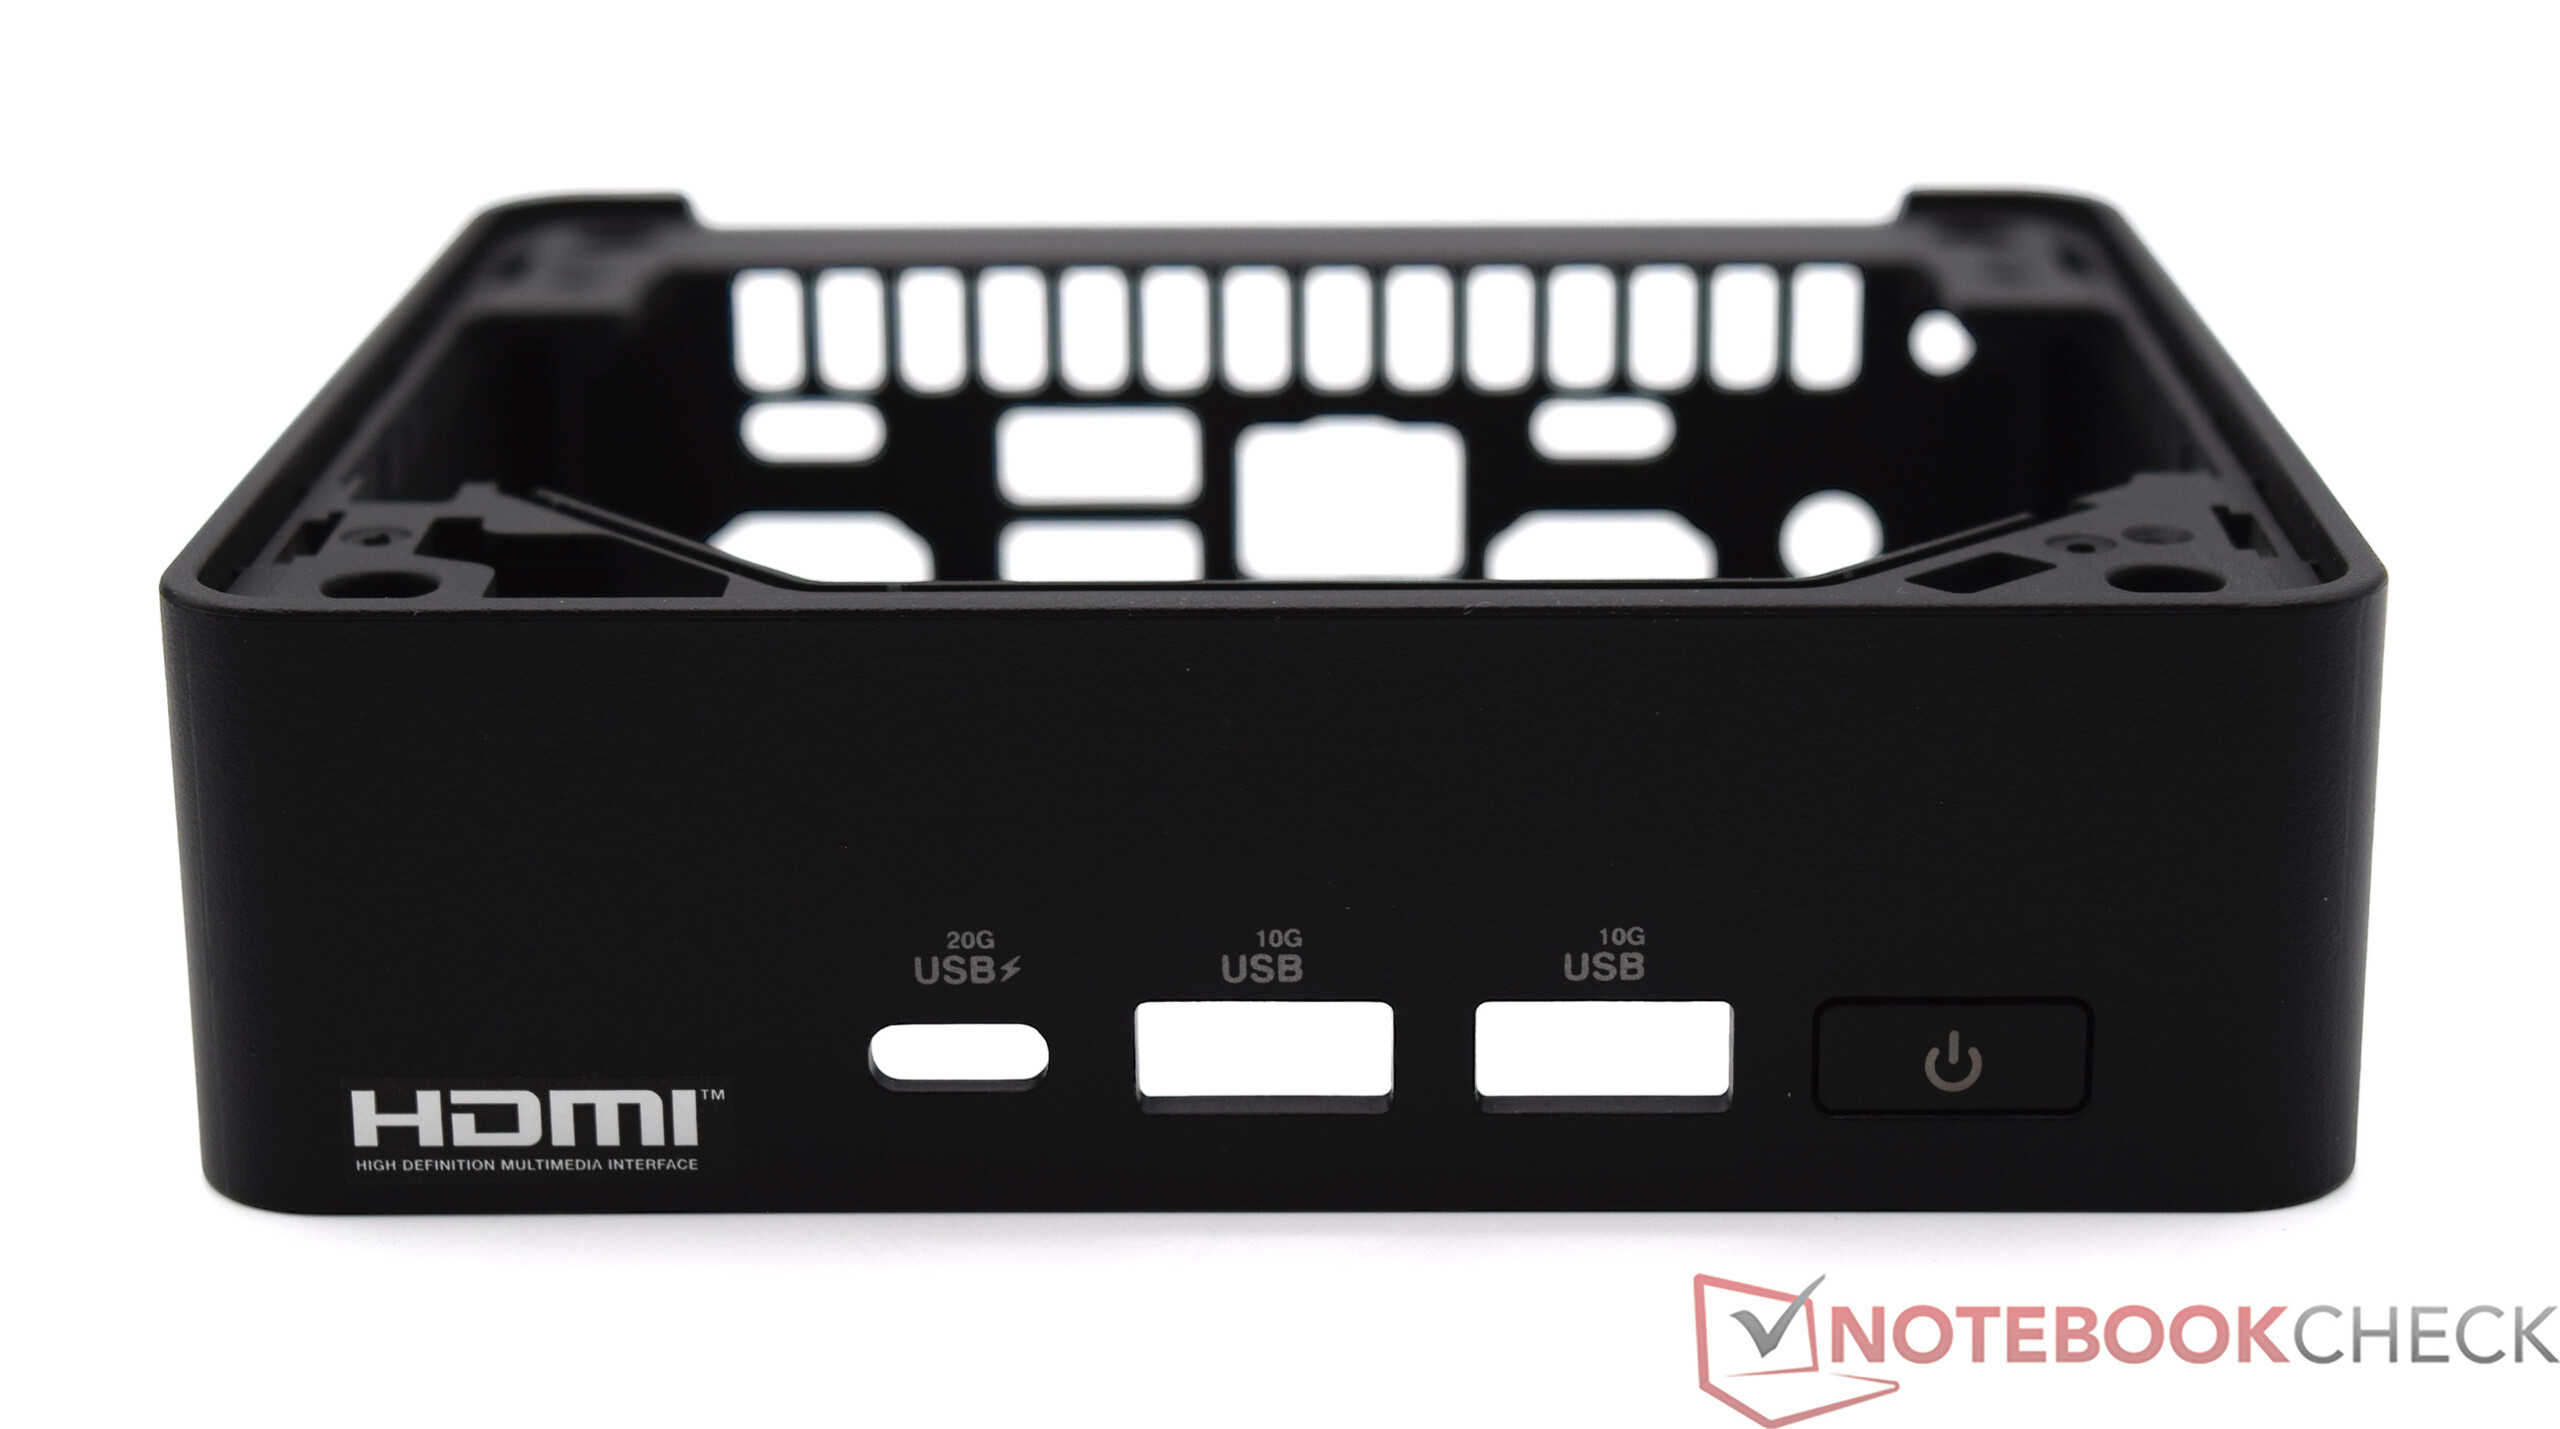
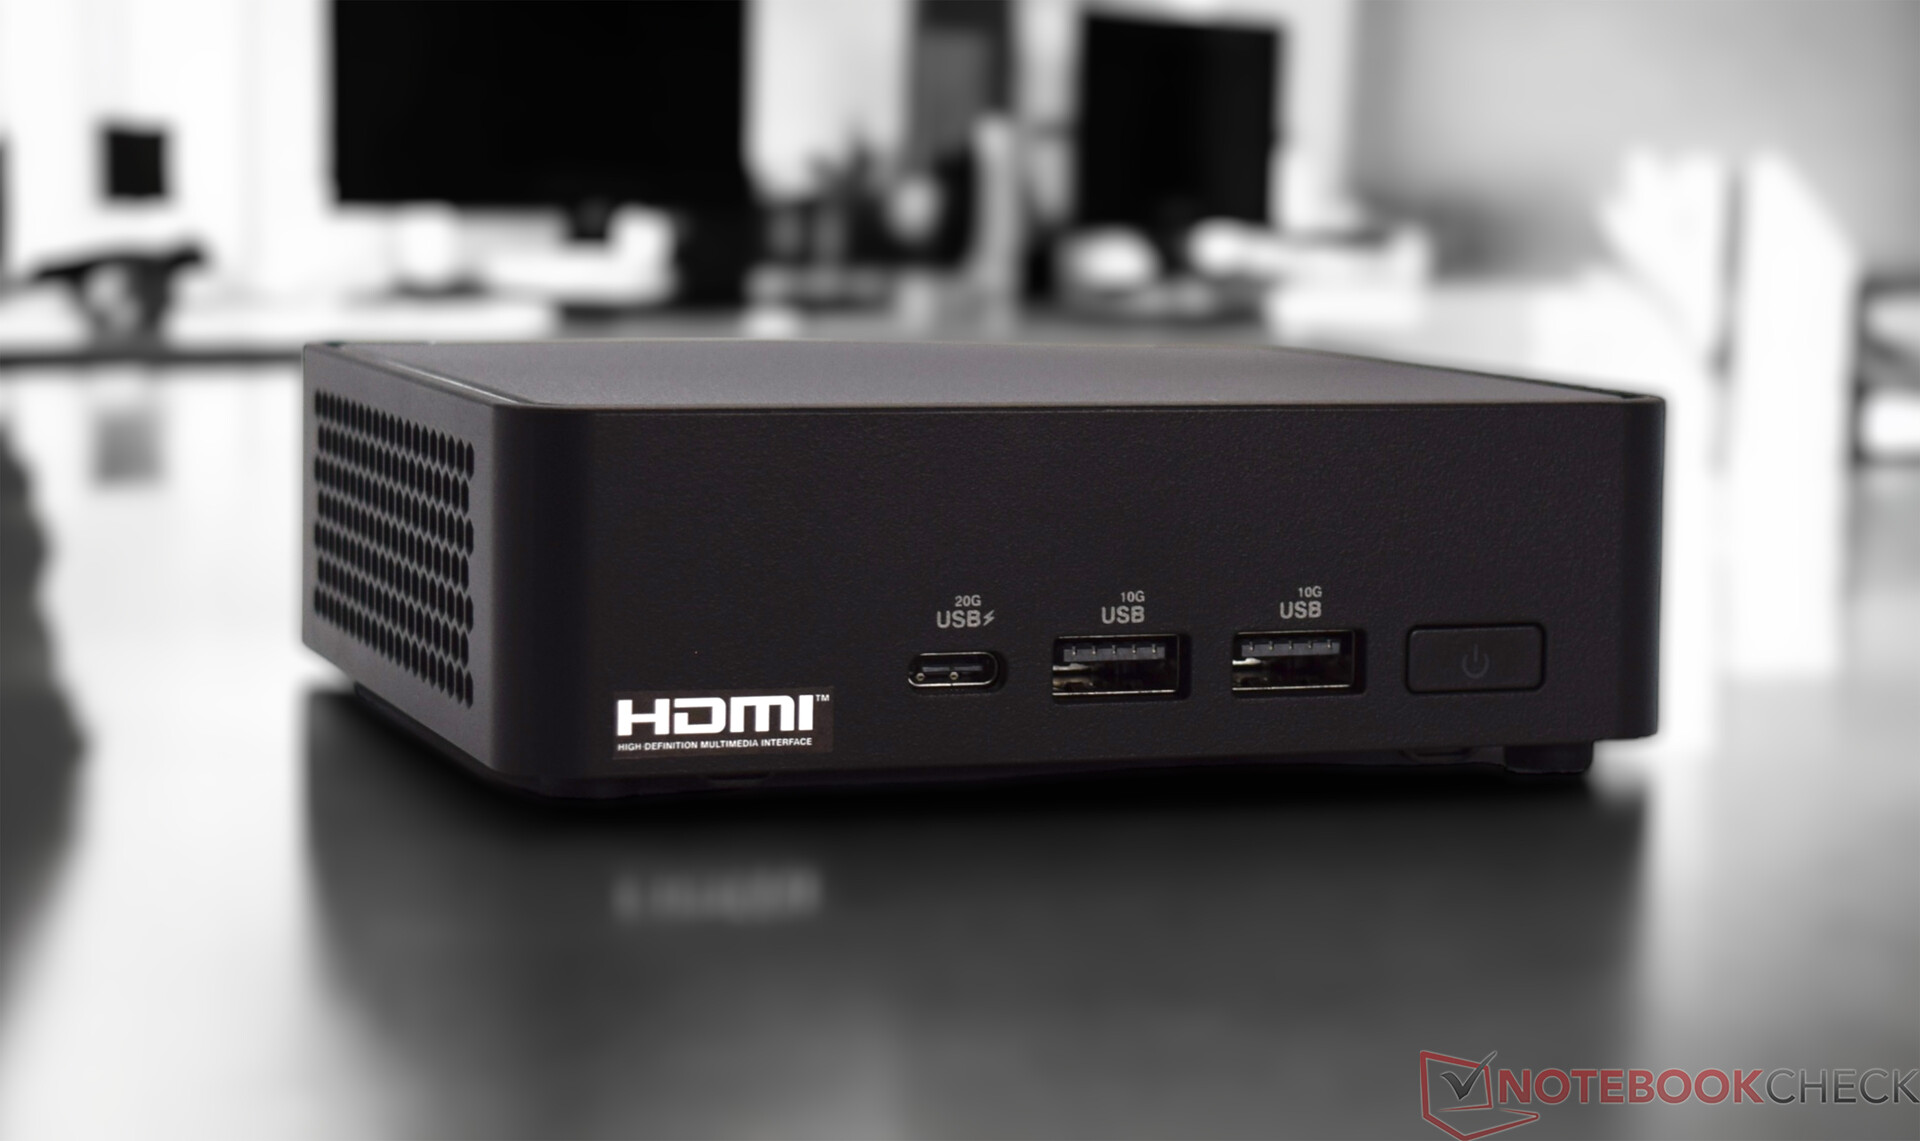
Le mini PC Asus NUC 14 Pro offre de nombreuses interfaces malgré son design compact. Il y a un total de six ports USB, dont quatre sont des prises de type A très répandues, et deux autres sont des prises de type C. Ces dernières offrent également un support Thunderbolt complet. Ces derniers offrent également un support Thunderbolt complet. L'Asus NUC 14 Pro se distingue ainsi des autres mini PC, qui n'offrent souvent que de simples ports USB 4 ou des ports Type-C conventionnels. Vous trouverez également deux ports HDMI et une connexion réseau 2,5G.
Communication
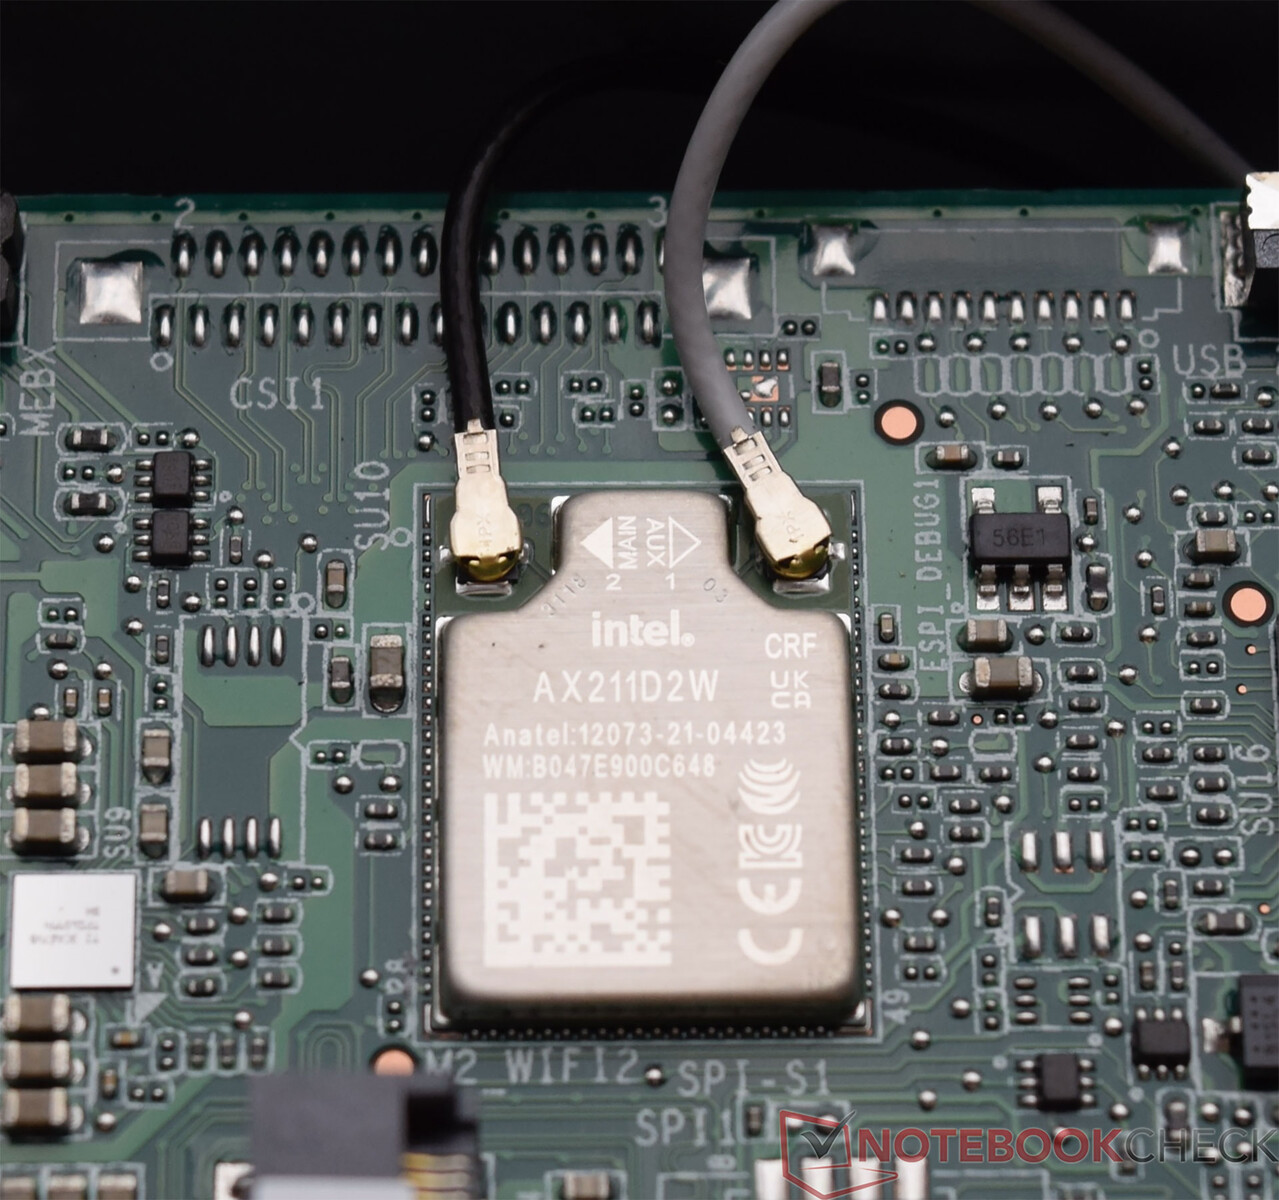
Asus a équipé le NUC 14 Pro du module Intel Wi-Fi 6E AX211, qui a donné d'excellents résultats lors du test. En combinaison avec le routeur ASUS ROG Rapture GT-AXE11000, nous avons obtenu de meilleurs résultats qu'avec les appareils de comparaison.
Accessoires
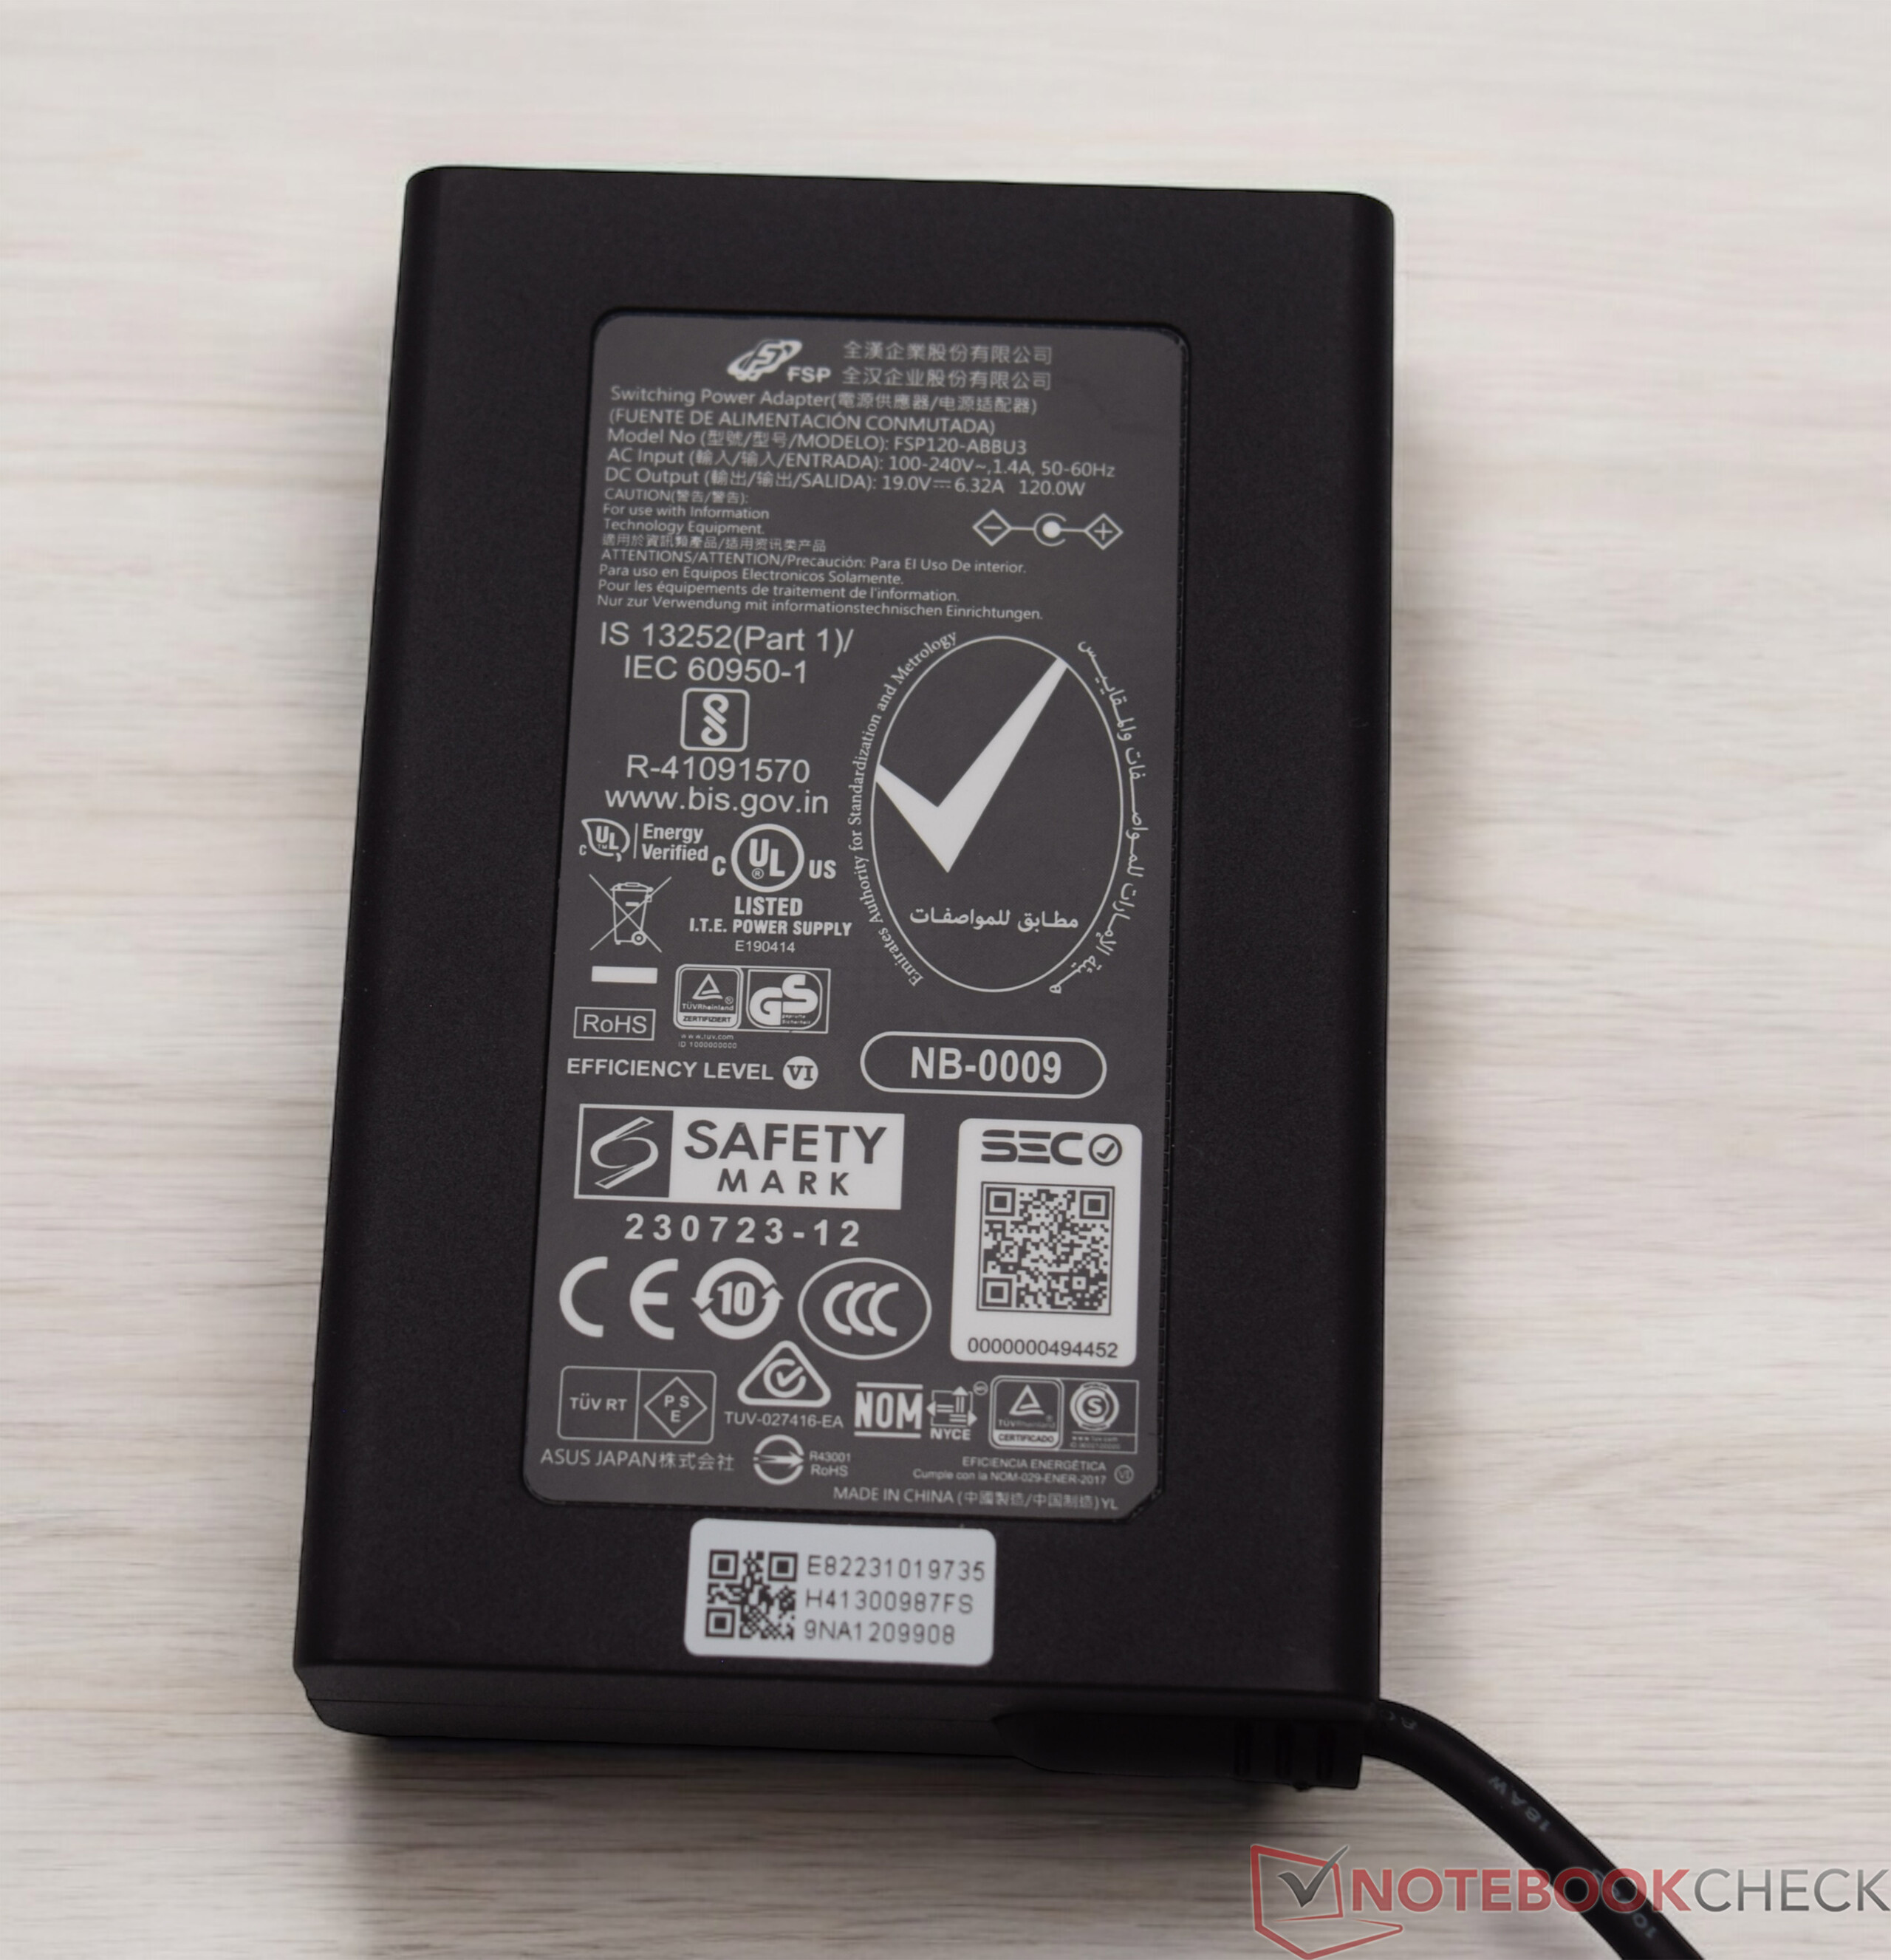
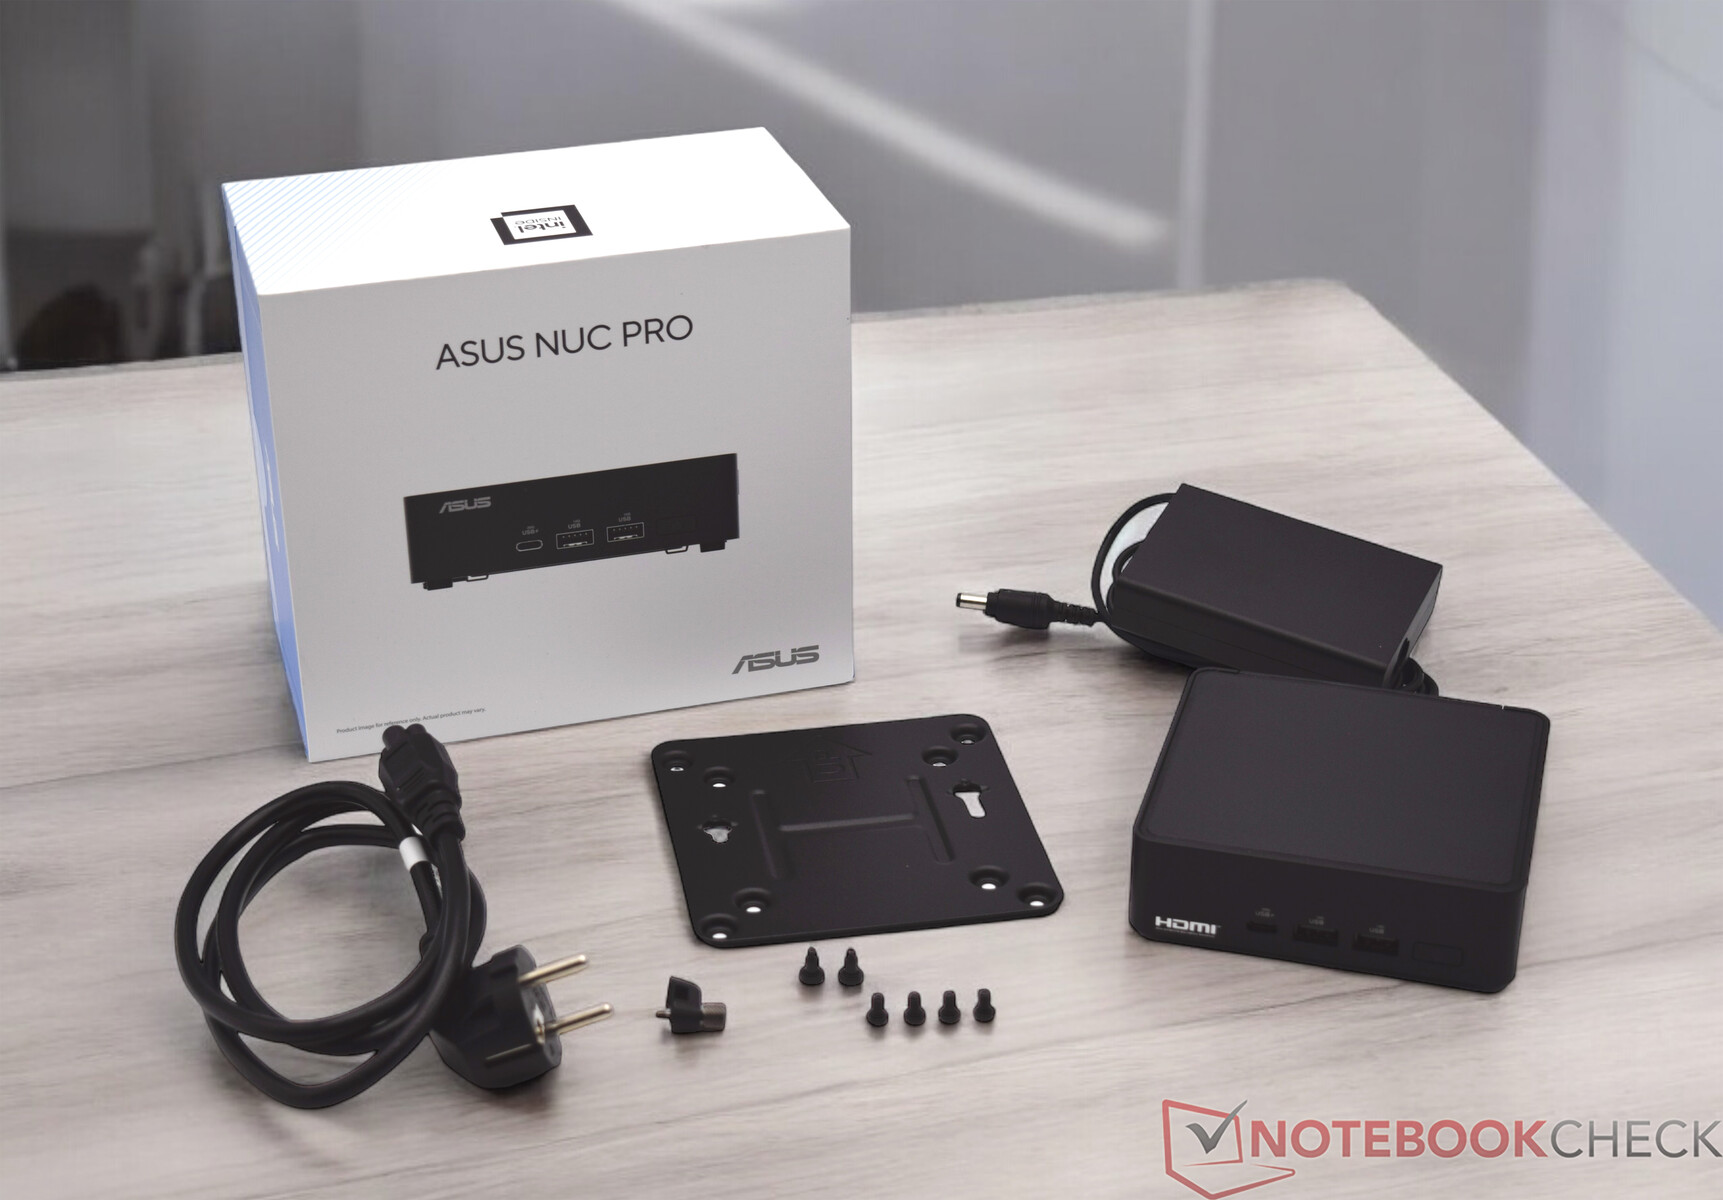
L'Asus NUC 14 Pro est livré avec un bloc d'alimentation de 120 watts et un support VESA avec matériel de montage. Le fabricant n'inclut pas d'autres accessoires tels qu'un clavier ou une souris.
Maintenance
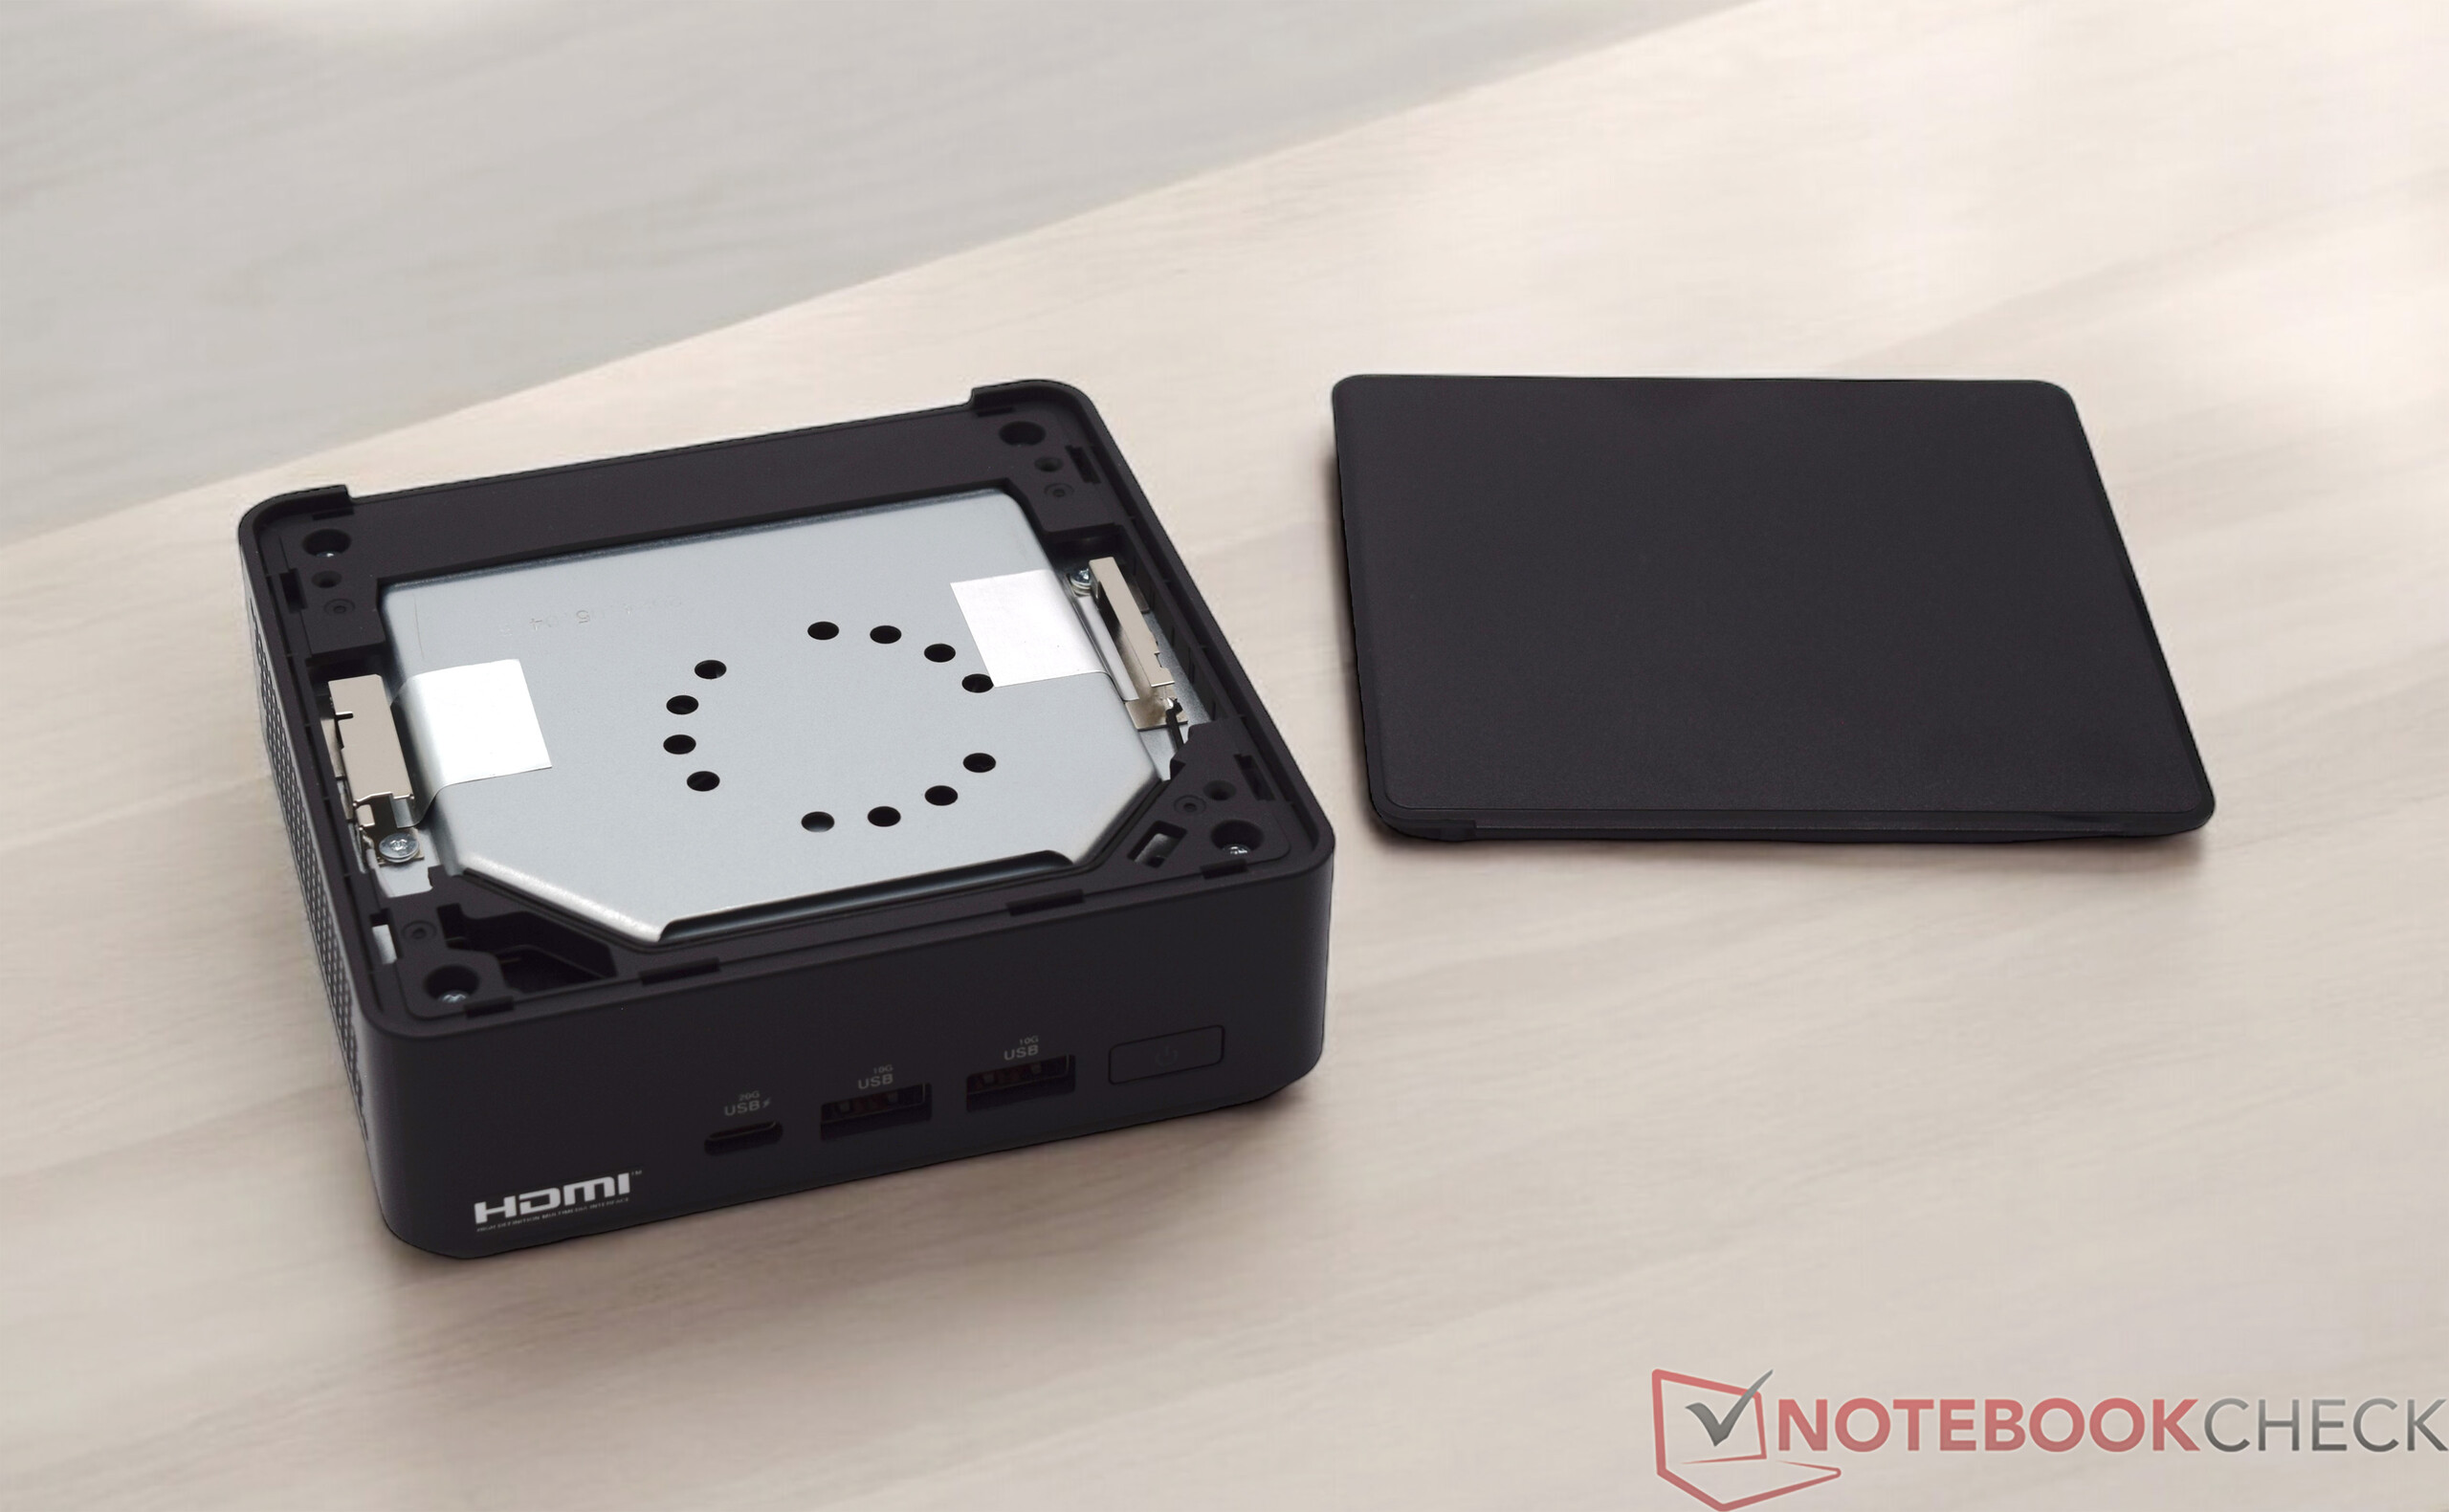
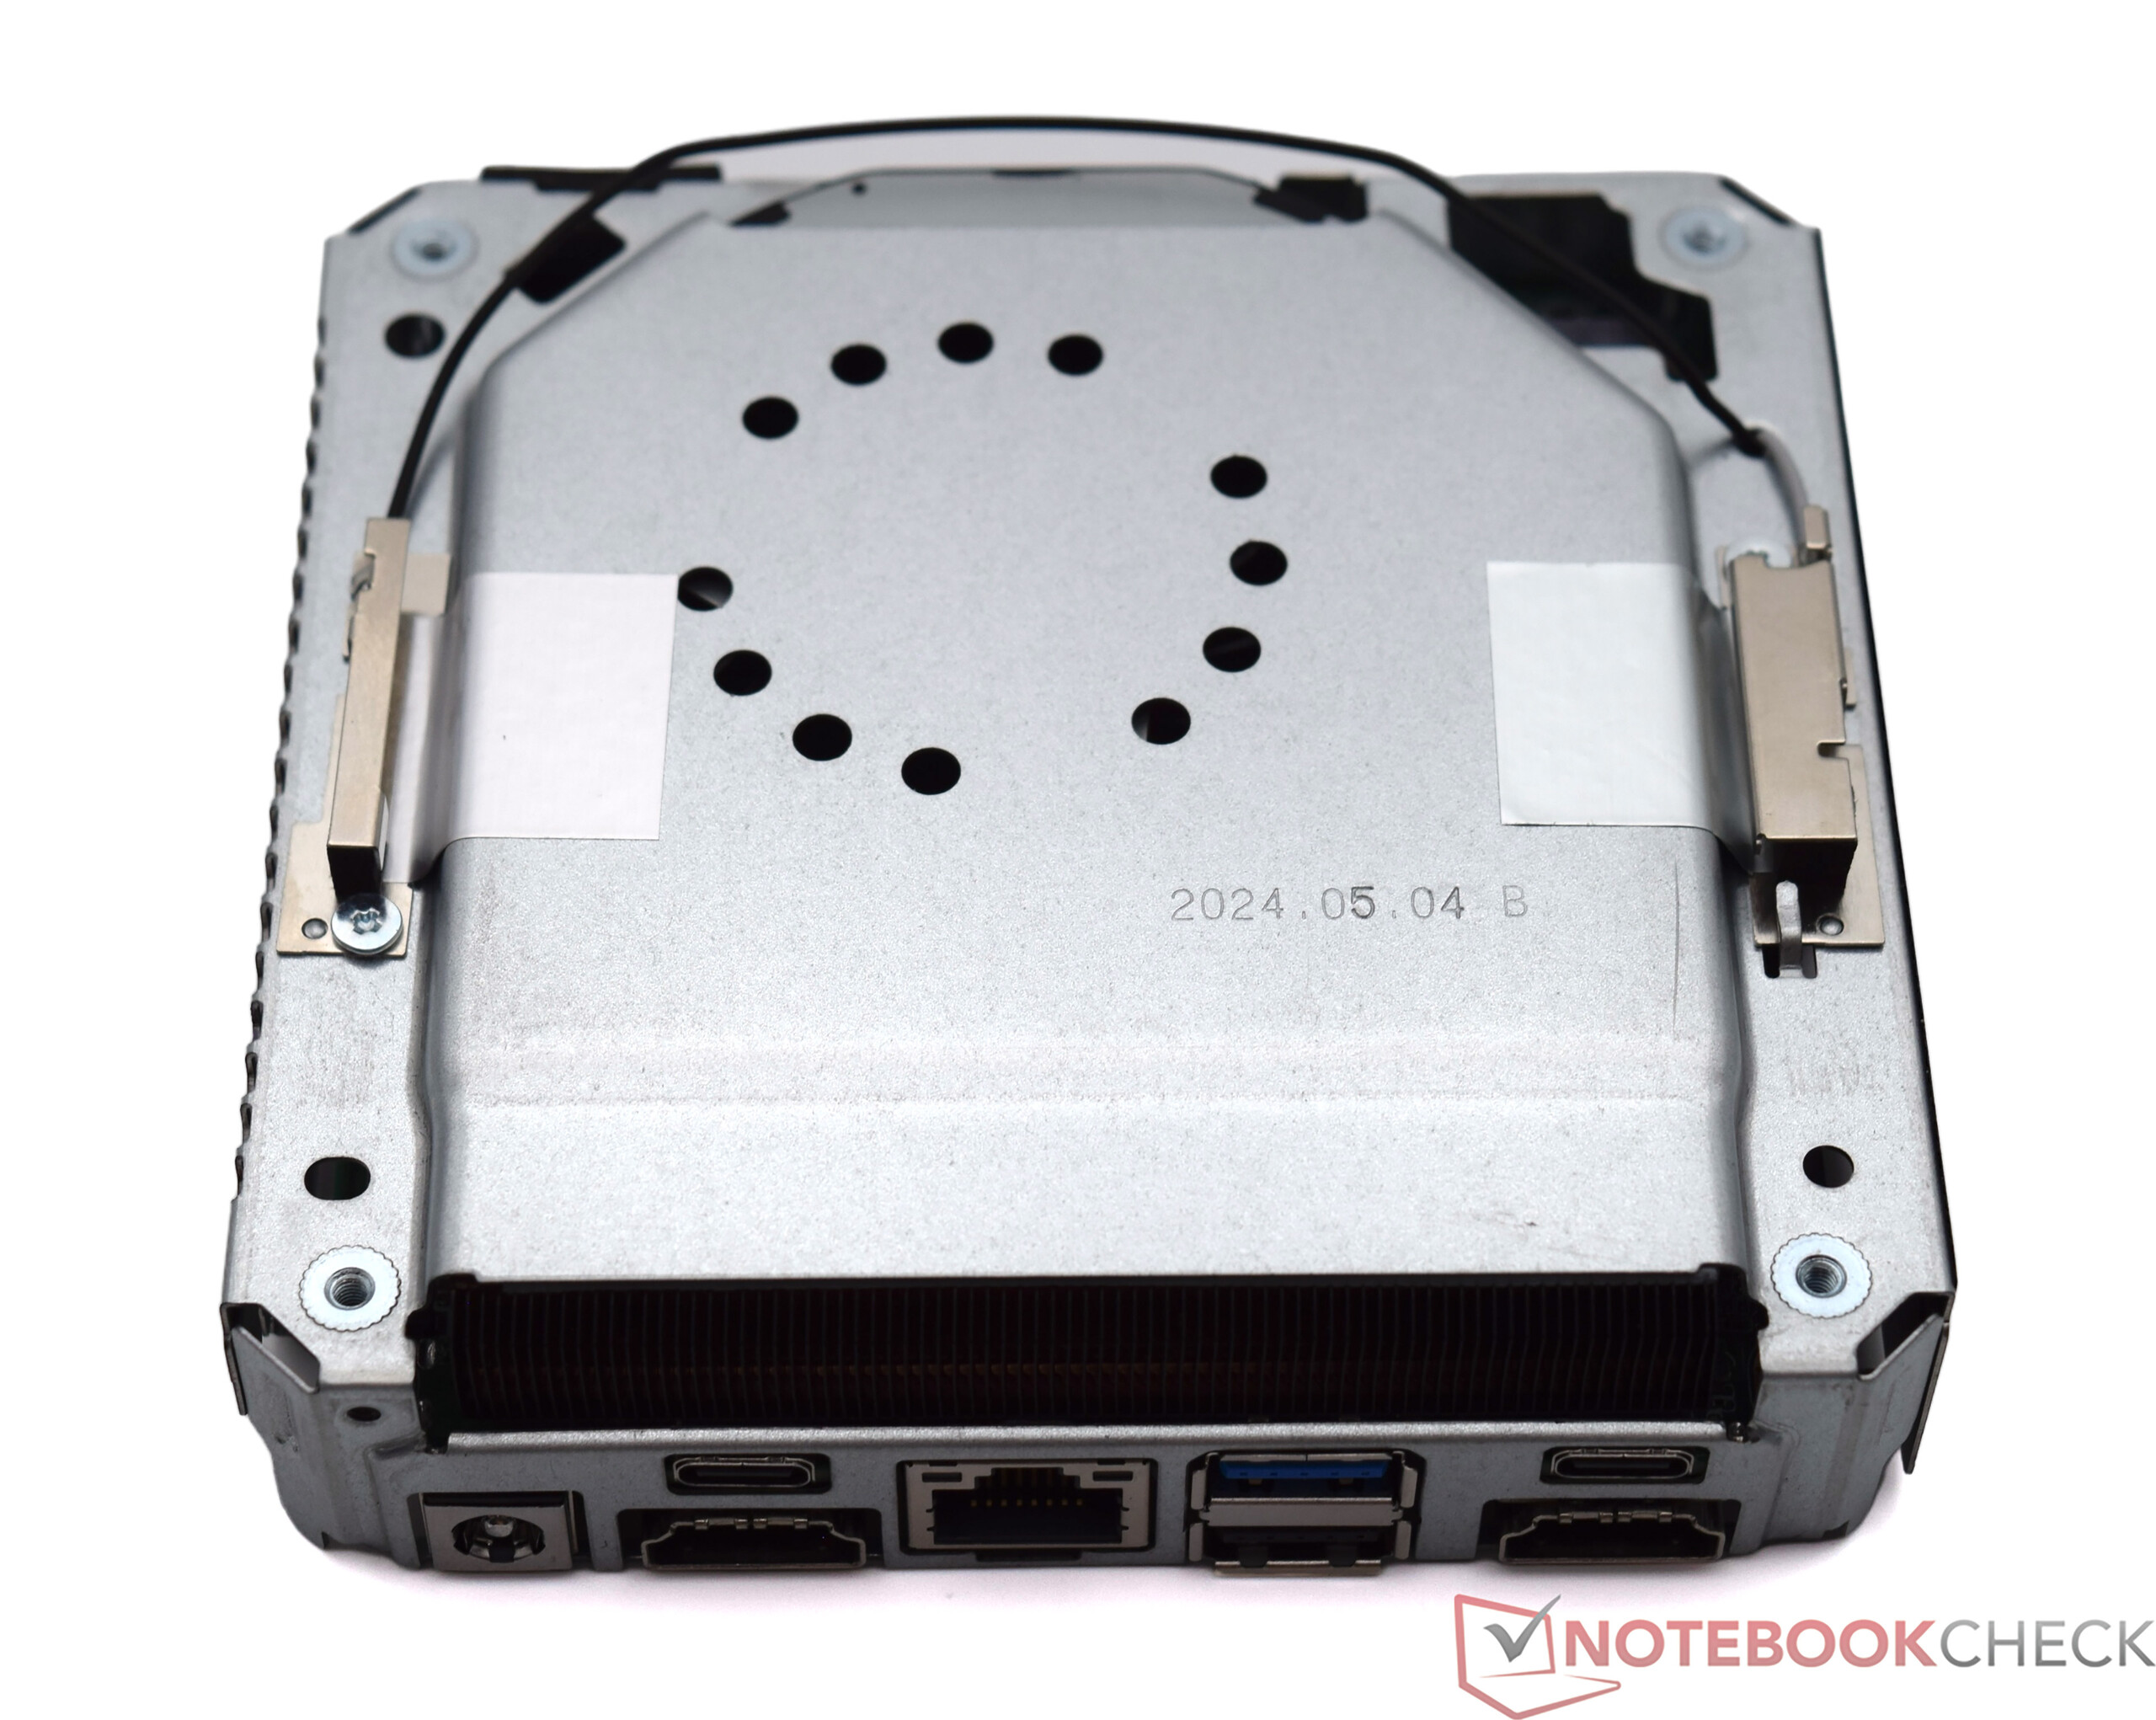
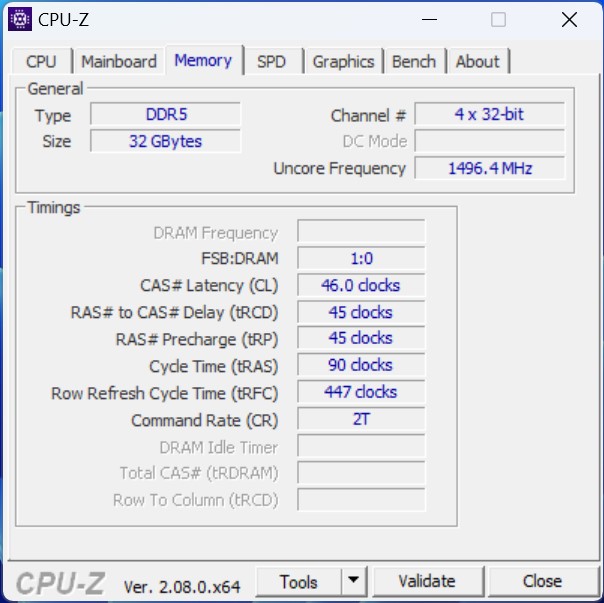
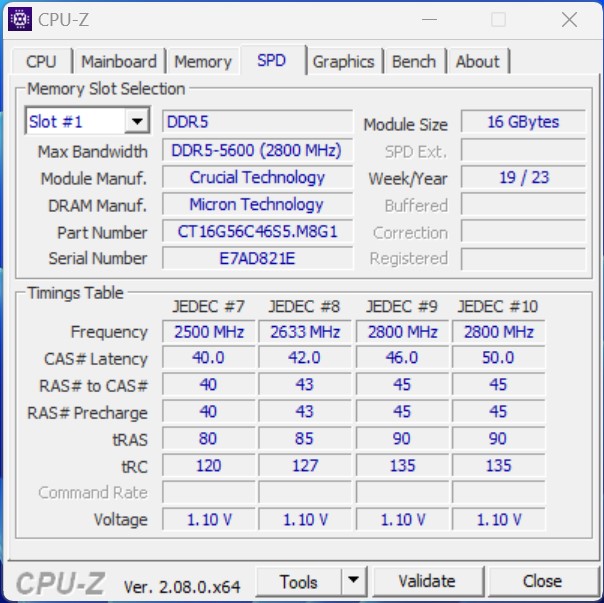
Nous avons reçu l'Asus NUC 14 Pro en version barebone, ce qui signifie que la RAM, le SSD et le système d'exploitation ne sont pas inclus dans la livraison. Il est donc important que l'utilisateur puisse facilement ouvrir l'appareil pour installer lui-même les composants manquants. Avec l'Asus NUC 14 Pro, la plaque de base peut être retirée facilement et sans outils. Le fabricant a intégré un petit loquet mécanique qui rend cette opération possible : La RAM et le SSD peuvent être installés rapidement et le mini PC est alors prêt pour le premier démarrage. Deux SSD peuvent être installés dans l'appareil et deux emplacements SO-DIMM sont prévus pour la RAM. Pour un fonctionnement optimal, les deux emplacements SO-DIMM doivent être occupés.
Durabilité
L'Asus NUC 14 Pro est un mini PC très compact, qui présente des avantages significatifs en termes de consommation d'énergie par rapport à un PC de bureau classique. L'appareil est livré dans une petite boîte, qui n'est pas excessivement grande. Le mini-PC lui-même est principalement constitué de métal et de plastique. Nous ne savons pas si des matériaux spécialement recyclés sont utilisés dans le processus de production. Asus est félicité pour la période de garantie de trois ans.
Performance
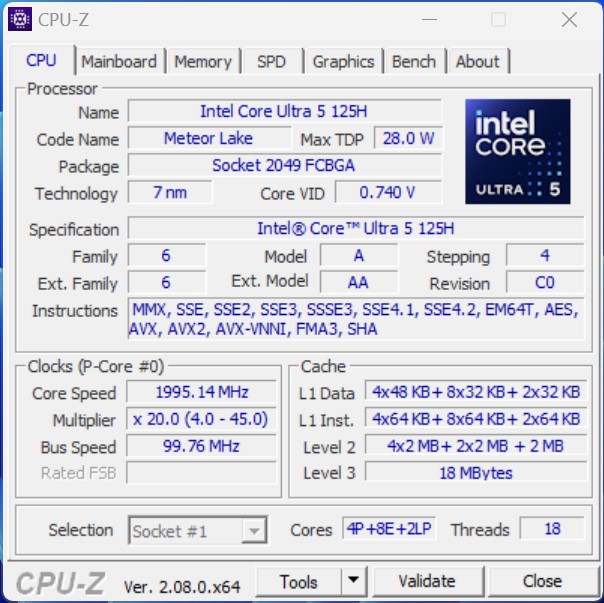
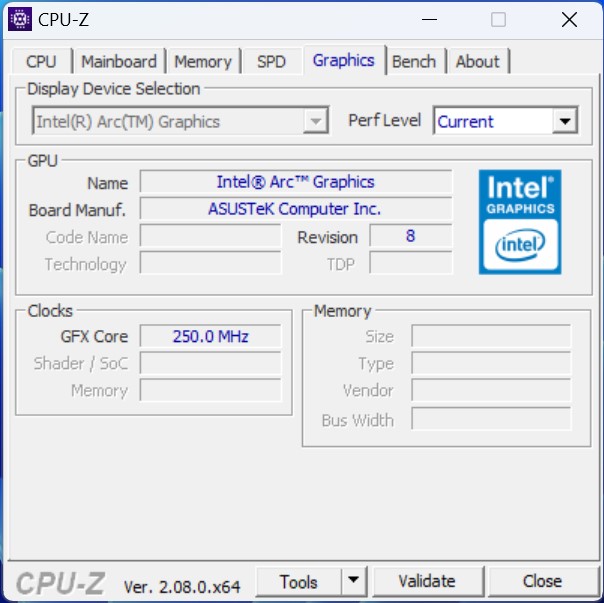
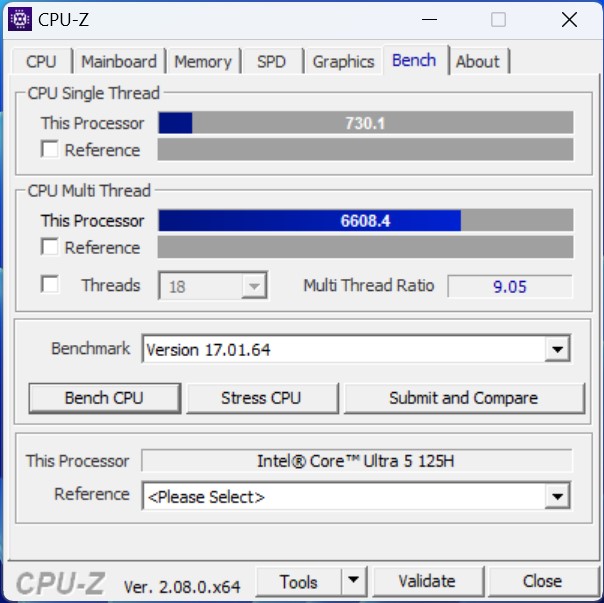
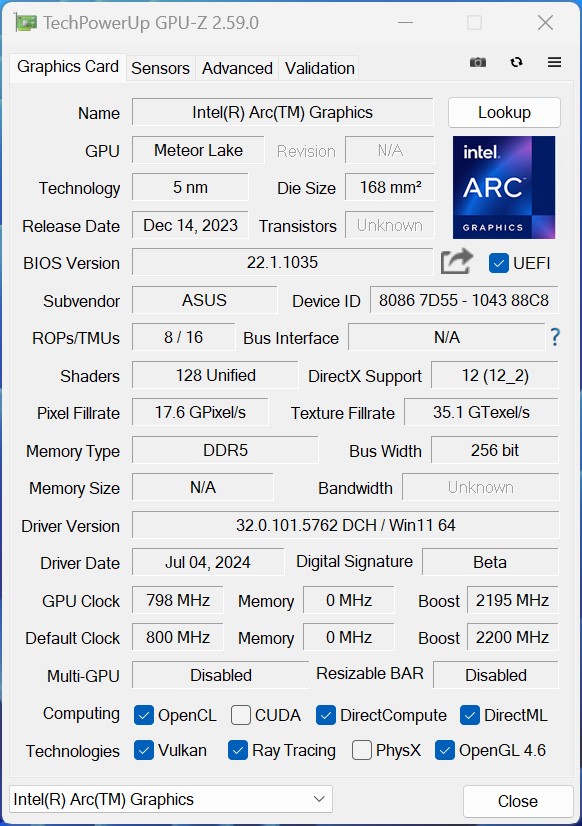
Le Intel Core Ultra 5 125H est un solide mais puissant SoC de milieu de gamme de la série Meteor Lake d'Intel. Le grand nombre de cœurs de calcul physiques que le SoC apporte avec lui assure en fin de compte de bonnes performances multithread. Le SoC Meteor Lake dispose également d'un iGPU révisé, qui offre nettement plus de performances que les iGPU Intel Iris Xe dépassés de la série précédente, basés sur l'architecture Arc. L'Asus NUC 14 Pro est également disponible avec un Intel Core 3 100U légèrement plus faible ainsi qu'une variante légèrement plus puissante avec le SoC Intel Core Ultra 7.
Conditions d'essai
Nous avons effectué tous les tests de performance avec le profil énergétique Balanced
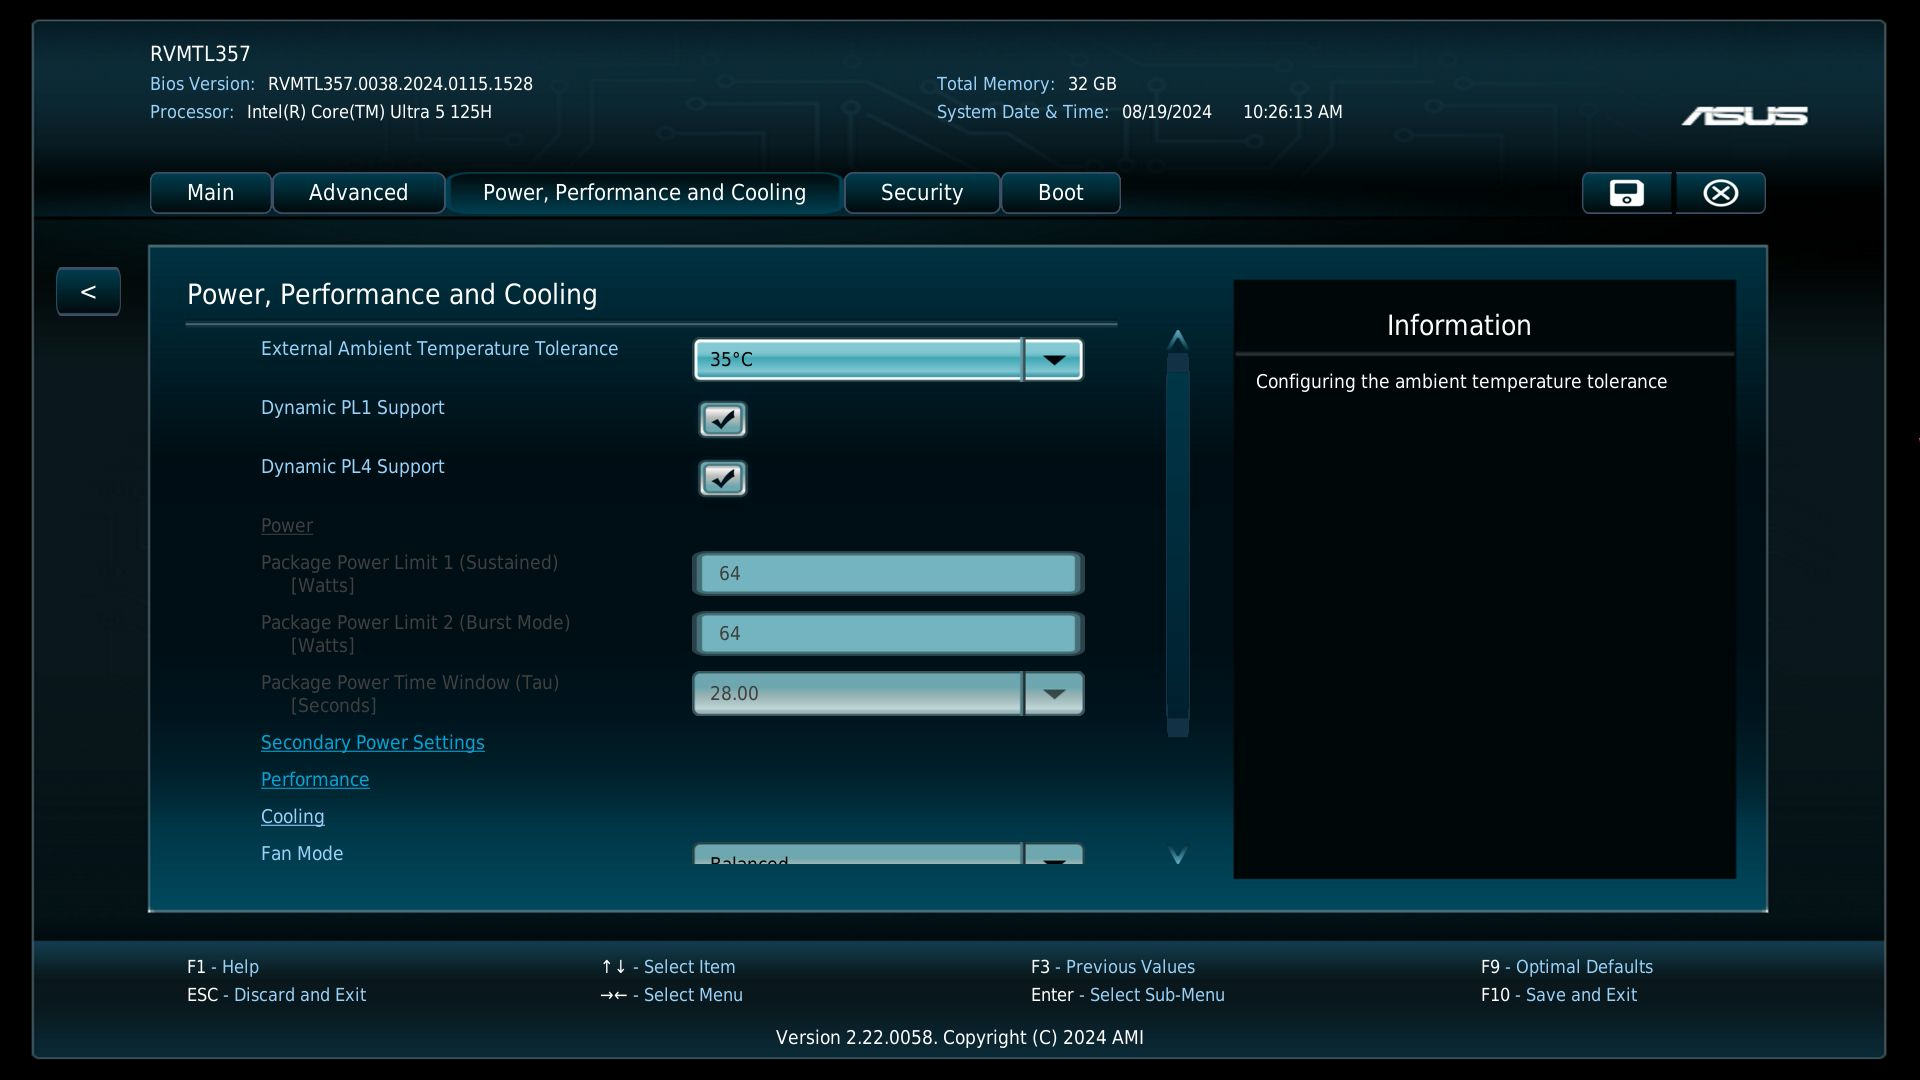
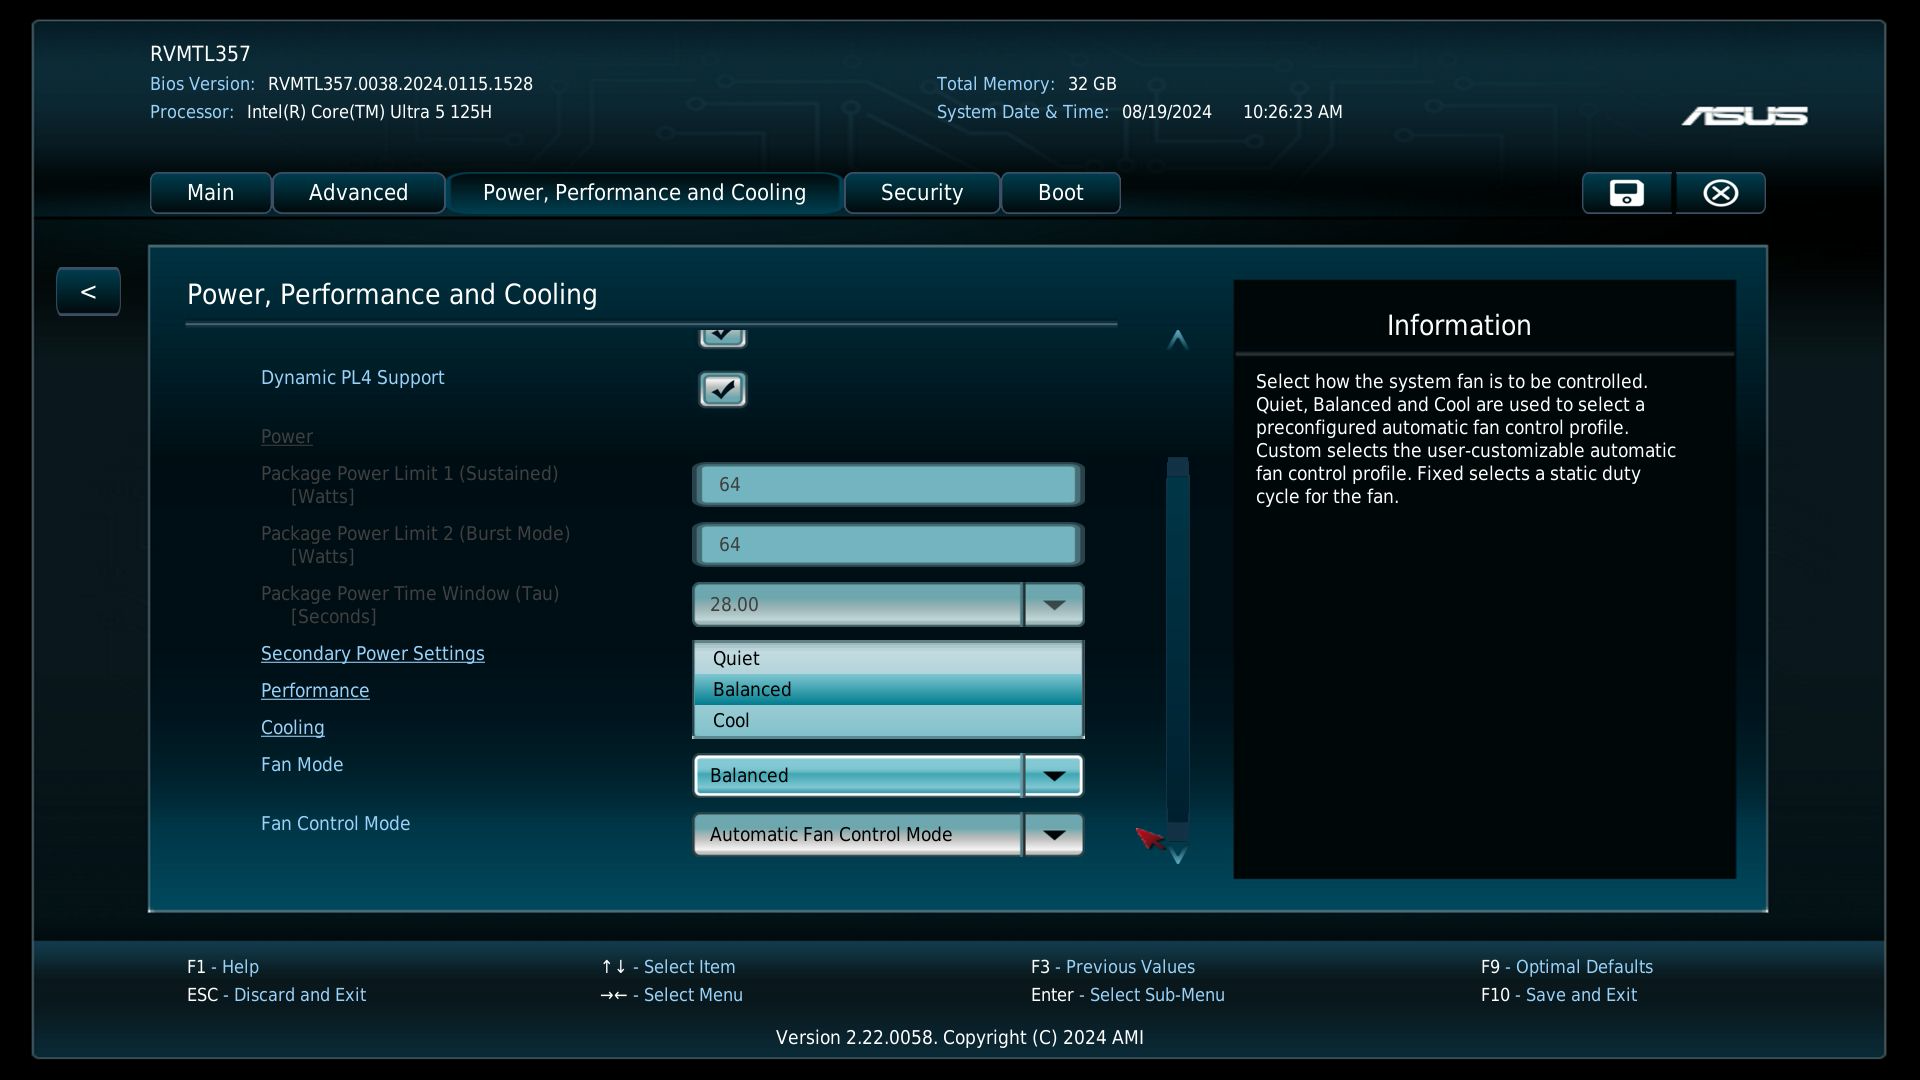
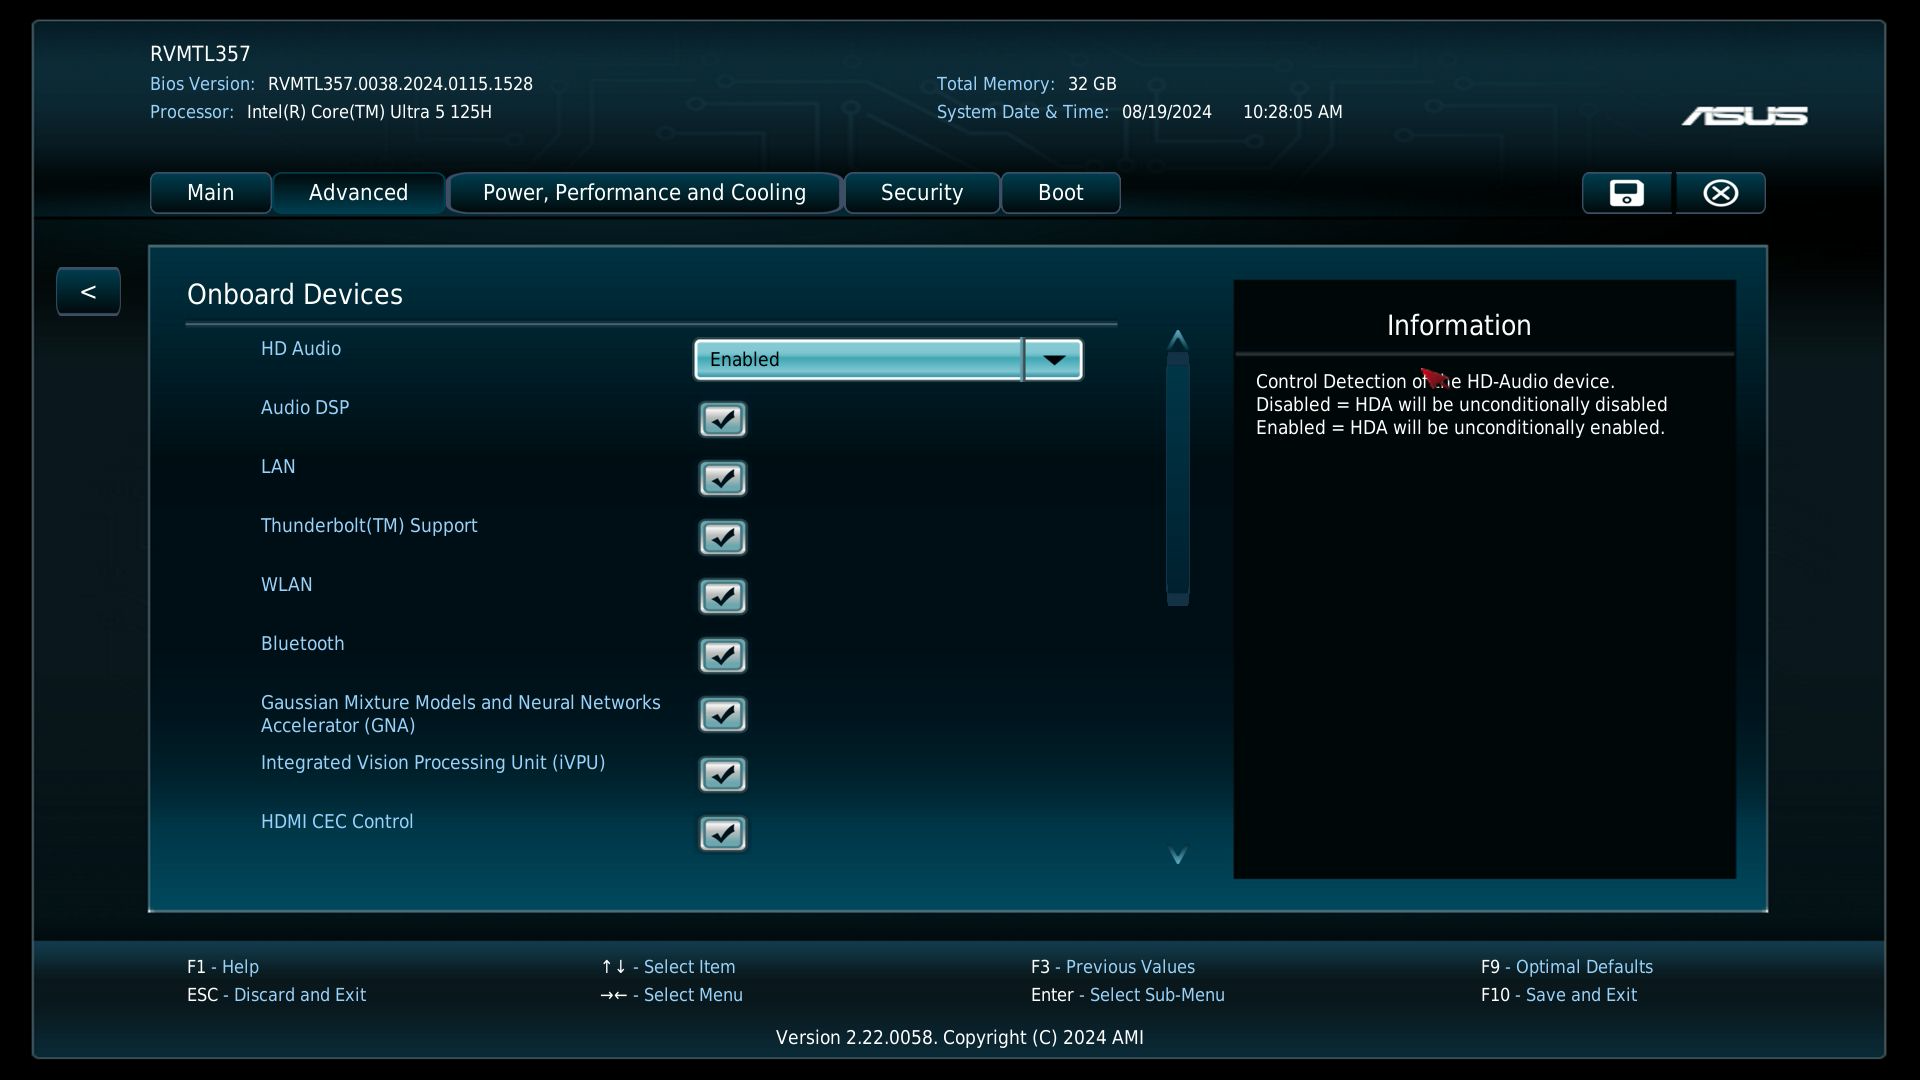
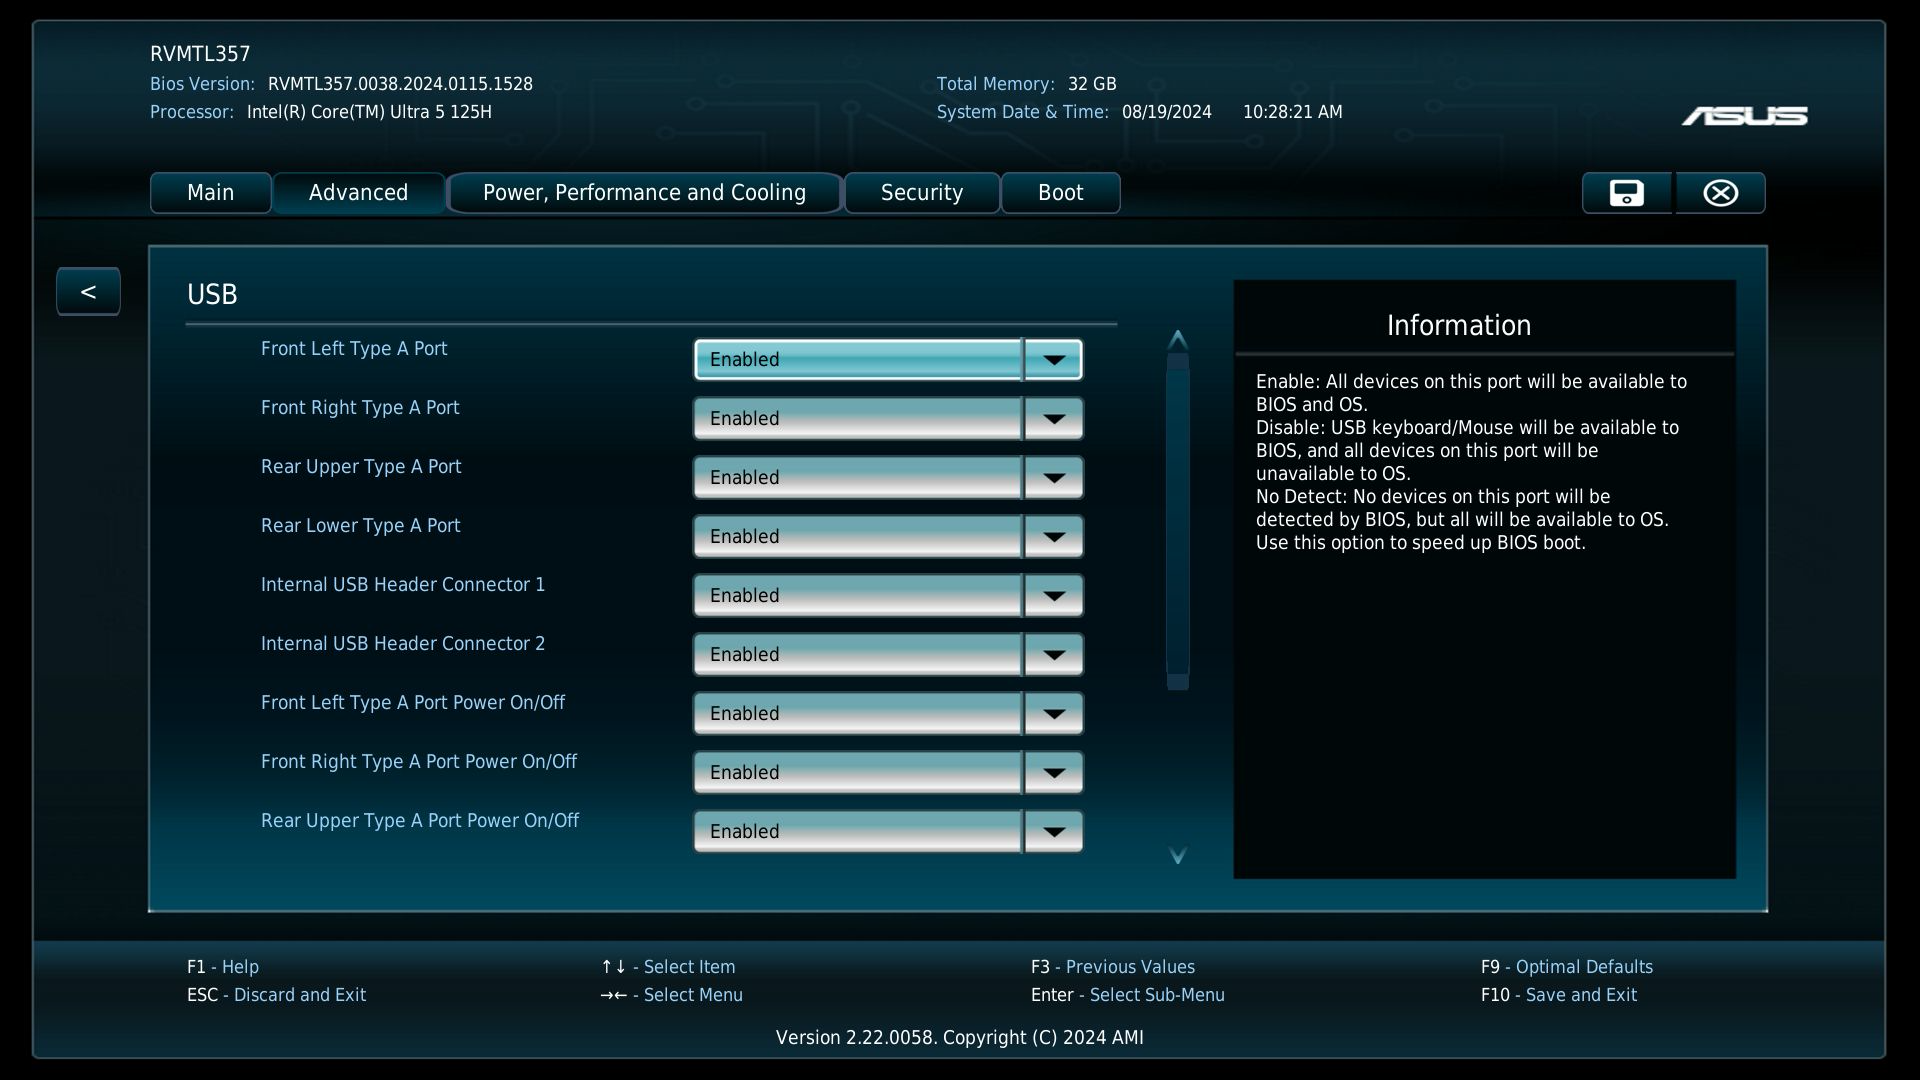
. Nous n'avons pas modifié les performances du SoC et l'avons laissé dans son état par défaut, conformément aux paramètres du BIOS (Balanced). Les paramètres du BIOS sont très étendus. Comparé aux mini-PC de Geekom, Minisforum, ou Acemagic, Asus est clairement en avance ici. Outre la consommation d'énergie du processeur, il est même possible de désactiver certains ports USB.
Processeur
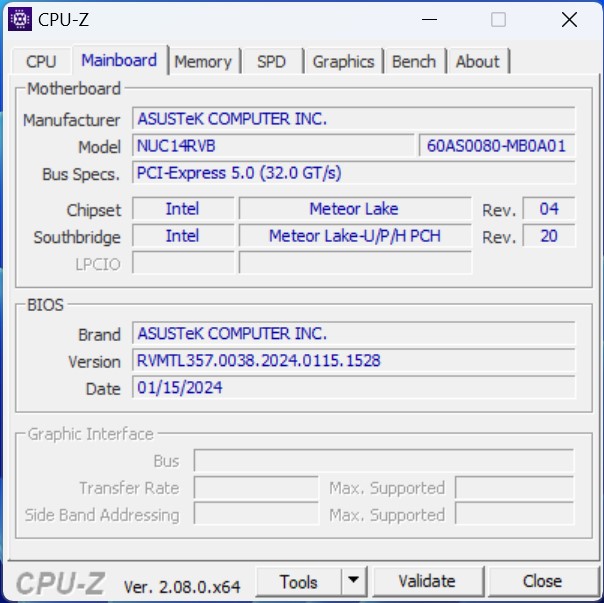
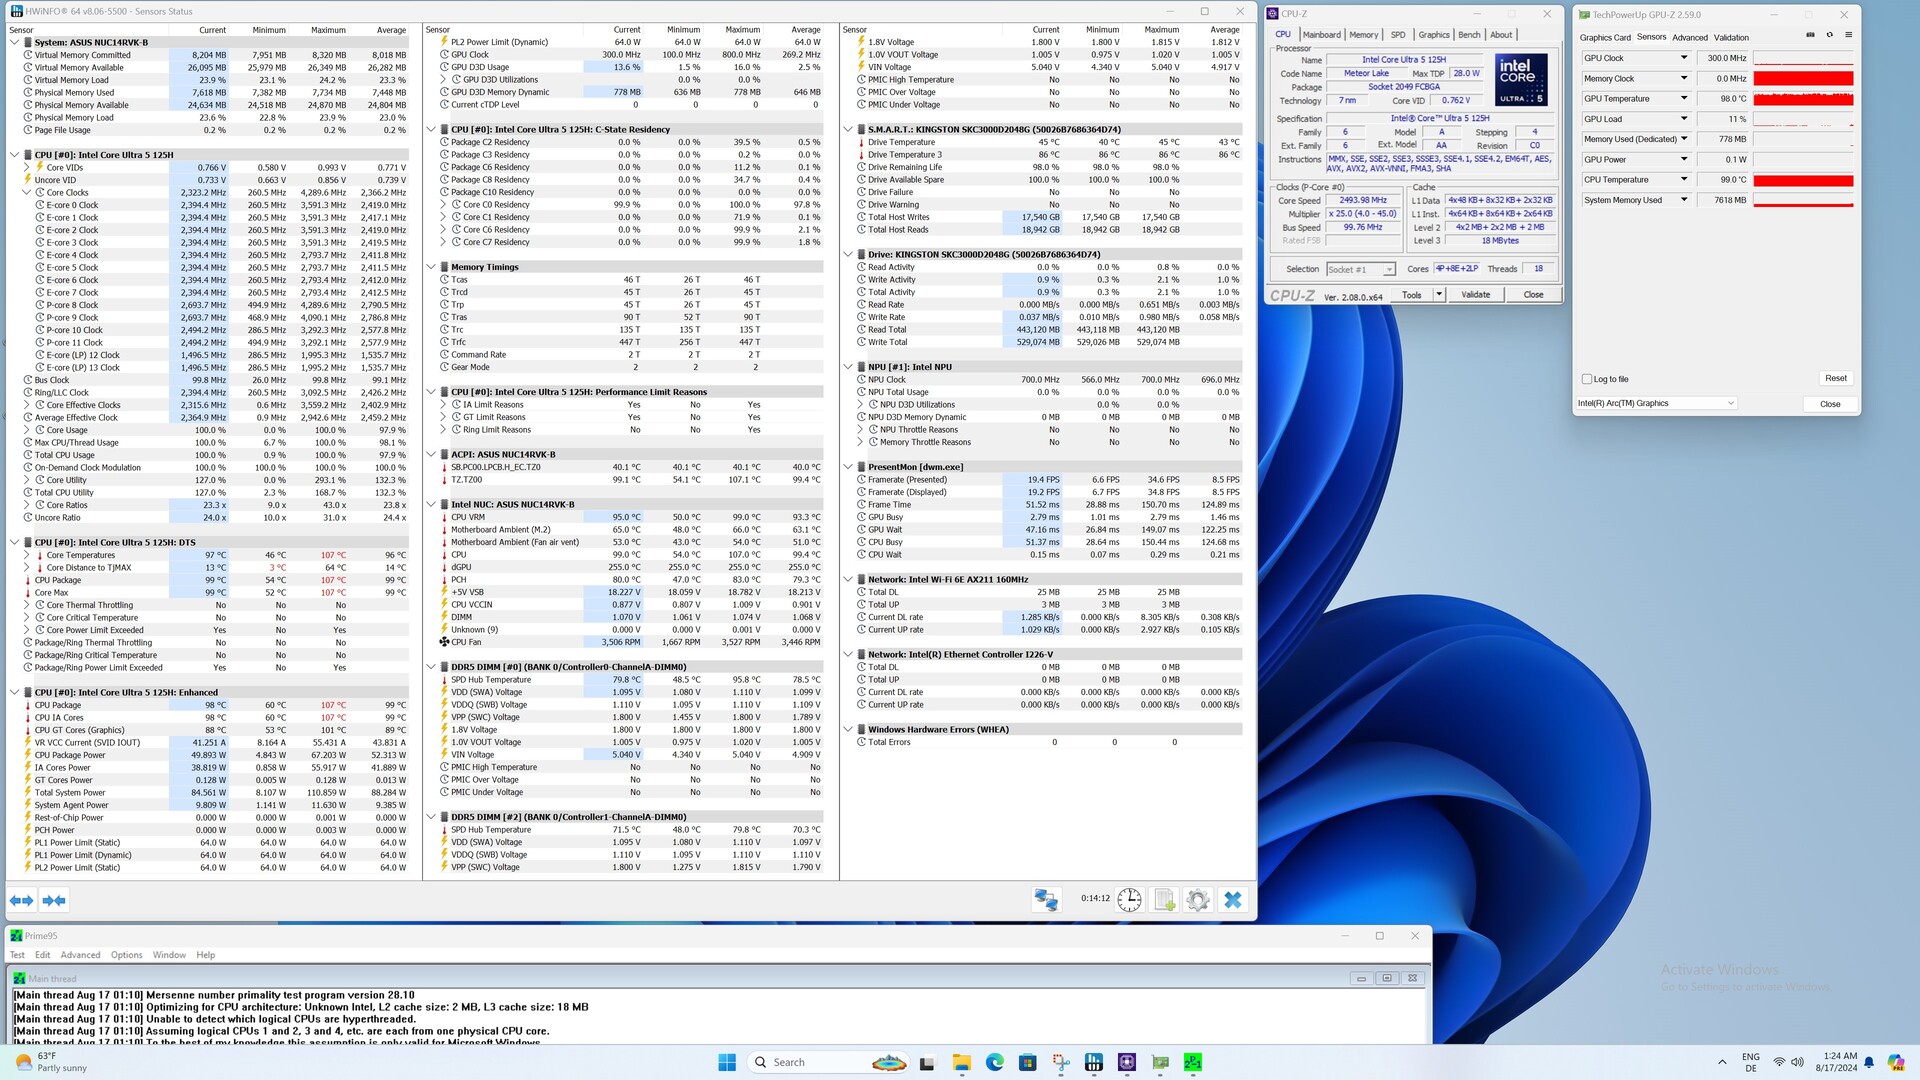
Dans notre cas, l'Asus NUC 14 Pro est équipé d'un processeur Intel Core Ultra 5 125H. 14 cœurs avec un total de 18 threads assurent une vitesse de travail élevée, ce qui place notre échantillon de test à une bonne troisième place. La limite de puissance du processeur est de 64 watts et est atteinte à plusieurs reprises sur de courtes périodes. Dans les scénarios de charge plus longs, le SoC ne s'étrangle qu'en raison de températures excessives. Celles-ci dépassent alors les 100 °C sous charge et ne sont pas rares. Asus ne semble pas vouloir ralentir davantage le SoC d'Intel, car le SoC est spécifié avec une température de fonctionnement maximale de 110 °C selon les spécifications. Une comparaison directe avec le Minisforum UH125 Pro est remportée par notre échantillon de test d'Asus. Dans les tests individuels, le NUC 14 Pro d'Asus a un léger avantage avec une meilleure performance à cœur unique.
Pour d'autres comparaisons et benchmarks, veuillez vous référer à notre Tableau de comparaison des processeurs.

| Performance Rating - Percent | |
| Geekom AE7 | |
| Acemagic F2A | |
| Asus NUC 14 Pro | |
| Aoostar GEM10 | |
| Minisforum UH125 Pro | |
| Geekom A5 | |
| Cinebench 2024 | |
| CPU Multi Core | |
| Acemagic F2A | |
| Geekom AE7 | |
| Asus NUC 14 Pro | |
| Minisforum UH125 Pro | |
| Aoostar GEM10 | |
| Geekom A5 | |
| CPU Single Core | |
| Geekom AE7 | |
| Acemagic F2A | |
| Asus NUC 14 Pro | |
| Minisforum UH125 Pro | |
| Aoostar GEM10 | |
| Geekom A5 | |
| Cinebench R23 | |
| Multi Core | |
| Acemagic F2A | |
| Geekom AE7 | |
| Minisforum UH125 Pro | |
| Asus NUC 14 Pro | |
| Aoostar GEM10 | |
| Geekom A5 | |
| Single Core | |
| Geekom AE7 | |
| Acemagic F2A | |
| Asus NUC 14 Pro | |
| Minisforum UH125 Pro | |
| Aoostar GEM10 | |
| Geekom A5 | |
| Cinebench R20 | |
| CPU (Single Core) | |
| Geekom AE7 | |
| Acemagic F2A | |
| Minisforum UH125 Pro | |
| Asus NUC 14 Pro | |
| Aoostar GEM10 | |
| Geekom A5 | |
| CPU (Multi Core) | |
| Acemagic F2A | |
| Geekom AE7 | |
| Minisforum UH125 Pro | |
| Asus NUC 14 Pro | |
| Aoostar GEM10 | |
| Geekom A5 | |
| Cinebench R15 | |
| CPU Single 64Bit | |
| Geekom AE7 | |
| Acemagic F2A | |
| Asus NUC 14 Pro | |
| Aoostar GEM10 | |
| Minisforum UH125 Pro | |
| Geekom A5 | |
| CPU Multi 64Bit | |
| Acemagic F2A | |
| Geekom AE7 | |
| Minisforum UH125 Pro | |
| Asus NUC 14 Pro | |
| Aoostar GEM10 | |
| Geekom A5 | |
| Cinebench R11.5 | |
| CPU Single 64Bit | |
| Geekom AE7 | |
| Acemagic F2A | |
| Asus NUC 14 Pro | |
| Aoostar GEM10 | |
| Minisforum UH125 Pro | |
| Geekom A5 | |
| CPU Multi 64Bit | |
| Acemagic F2A | |
| Geekom AE7 | |
| Minisforum UH125 Pro | |
| Asus NUC 14 Pro | |
| Aoostar GEM10 | |
| Geekom A5 | |
| Cinebench R10 | |
| Rendering Single CPUs 64Bit | |
| Geekom AE7 | |
| Acemagic F2A | |
| Asus NUC 14 Pro | |
| Minisforum UH125 Pro | |
| Aoostar GEM10 | |
| Geekom A5 | |
| Rendering Multiple CPUs 64Bit | |
| Acemagic F2A | |
| Geekom AE7 | |
| Minisforum UH125 Pro | |
| Asus NUC 14 Pro | |
| Aoostar GEM10 | |
| Geekom A5 | |
| Blender - v2.79 BMW27 CPU | |
| Geekom A5 | |
| Aoostar GEM10 | |
| Minisforum UH125 Pro | |
| Asus NUC 14 Pro | |
| Geekom AE7 | |
| Acemagic F2A | |
| wPrime 2.10 | |
| 32m | |
| Minisforum UH125 Pro | |
| Asus NUC 14 Pro | |
| Geekom A5 | |
| Aoostar GEM10 | |
| Acemagic F2A | |
| Geekom AE7 | |
| 1024m | |
| Minisforum UH125 Pro | |
| Asus NUC 14 Pro | |
| Acemagic F2A | |
| Geekom A5 | |
| Aoostar GEM10 | |
| Geekom AE7 | |
| X264 HD Benchmark 4.0 | |
| Pass 1 | |
| Acemagic F2A | |
| Asus NUC 14 Pro | |
| Minisforum UH125 Pro | |
| Geekom AE7 | |
| Aoostar GEM10 | |
| Geekom A5 | |
| Pass 2 | |
| Acemagic F2A | |
| Geekom AE7 | |
| Minisforum UH125 Pro | |
| Asus NUC 14 Pro | |
| Aoostar GEM10 | |
| Geekom A5 | |
| WinRAR - Result | |
| Acemagic F2A | |
| Geekom AE7 | |
| Geekom A5 | |
| Asus NUC 14 Pro | |
| Aoostar GEM10 | |
| Minisforum UH125 Pro | |
| TrueCrypt | |
| AES Mean 100MB | |
| Geekom AE7 | |
| Aoostar GEM10 | |
| Geekom A5 | |
| Acemagic F2A | |
| Minisforum UH125 Pro | |
| Asus NUC 14 Pro | |
| Twofish Mean 100MB | |
| Geekom AE7 | |
| Aoostar GEM10 | |
| Acemagic F2A | |
| Geekom A5 | |
| Minisforum UH125 Pro | |
| Asus NUC 14 Pro | |
| Serpent Mean 100MB | |
| Geekom AE7 | |
| Aoostar GEM10 | |
| Geekom A5 | |
| Acemagic F2A | |
| Asus NUC 14 Pro | |
| Minisforum UH125 Pro | |
| Geekbench 5.5 | |
| Multi-Core | |
| Acemagic F2A | |
| Geekom AE7 | |
| Asus NUC 14 Pro | |
| Minisforum UH125 Pro | |
| Aoostar GEM10 | |
| Geekom A5 | |
| Single-Core | |
| Geekom AE7 | |
| Acemagic F2A | |
| Asus NUC 14 Pro | |
| Minisforum UH125 Pro | |
| Aoostar GEM10 | |
| Geekom A5 | |
| Geekbench 5.0 | |
| 5.0 Multi-Core | |
| Acemagic F2A | |
| Geekom AE7 | |
| Asus NUC 14 Pro | |
| Minisforum UH125 Pro | |
| Aoostar GEM10 | |
| Geekom A5 | |
| 5.0 Single-Core | |
| Geekom AE7 | |
| Acemagic F2A | |
| Asus NUC 14 Pro | |
| Minisforum UH125 Pro | |
| Aoostar GEM10 | |
| Geekom A5 | |
| Geekbench 4.4 | |
| 64 Bit Single-Core Score | |
| Geekom AE7 | |
| Asus NUC 14 Pro | |
| Acemagic F2A | |
| Minisforum UH125 Pro | |
| Aoostar GEM10 | |
| Geekom A5 | |
| 64 Bit Multi-Core Score | |
| Geekom AE7 | |
| Acemagic F2A | |
| Asus NUC 14 Pro | |
| Minisforum UH125 Pro | |
| Aoostar GEM10 | |
| Geekom A5 | |
| 3DMark 11 - 1280x720 Performance Physics | |
| Geekom AE7 | |
| Acemagic F2A | |
| Asus NUC 14 Pro | |
| Minisforum UH125 Pro | |
| Geekom A5 | |
| Aoostar GEM10 | |
| 7-Zip 18.03 | |
| 7z b 4 | |
| Geekom AE7 | |
| Acemagic F2A | |
| Aoostar GEM10 | |
| Geekom A5 | |
| Minisforum UH125 Pro | |
| Asus NUC 14 Pro | |
| 7z b 4 -mmt1 | |
| Geekom AE7 | |
| Aoostar GEM10 | |
| Geekom A5 | |
| Acemagic F2A | |
| Asus NUC 14 Pro | |
| Minisforum UH125 Pro | |
| HWBOT x265 Benchmark v2.2 - 4k Preset | |
| Geekom AE7 | |
| Acemagic F2A | |
| Minisforum UH125 Pro | |
| Asus NUC 14 Pro | |
| Aoostar GEM10 | |
| Geekom A5 | |
| R Benchmark 2.5 - Overall mean | |
| Geekom A5 | |
| Aoostar GEM10 | |
| Minisforum UH125 Pro | |
| Asus NUC 14 Pro | |
| Acemagic F2A | |
| Geekom AE7 | |
| LibreOffice - 20 Documents To PDF | |
| Minisforum UH125 Pro | |
| Asus NUC 14 Pro | |
| Geekom A5 | |
| Geekom AE7 | |
| Aoostar GEM10 | |
| Acemagic F2A | |
| WebXPRT 3 - Overall | |
| Geekom AE7 | |
| Acemagic F2A | |
| Aoostar GEM10 | |
| Geekom A5 | |
| Minisforum UH125 Pro | |
| Asus NUC 14 Pro | |
| Mozilla Kraken 1.1 - Total | |
| Geekom A5 | |
| Minisforum UH125 Pro | |
| Aoostar GEM10 | |
| Asus NUC 14 Pro | |
| Acemagic F2A | |
| Geekom AE7 | |
| 3DMark | |
| 1920x1080 Fire Strike Physics | |
| Geekom AE7 | |
| Acemagic F2A | |
| Aoostar GEM10 | |
| Asus NUC 14 Pro | |
| Geekom A5 | |
| Minisforum UH125 Pro | |
| 2560x1440 Time Spy CPU | |
| Geekom AE7 | |
| Acemagic F2A | |
| Minisforum UH125 Pro | |
| Asus NUC 14 Pro | |
| Geekom A5 | |
| Aoostar GEM10 | |
| Super Pi mod 1.5 XS 1M - 1M | |
| Geekom A5 | |
| Aoostar GEM10 | |
| Minisforum UH125 Pro | |
| Asus NUC 14 Pro | |
| Acemagic F2A | |
| Geekom AE7 | |
| Super Pi mod 1.5 XS 2M - 2M | |
| Geekom A5 | |
| Aoostar GEM10 | |
| Geekom AE7 | |
| Minisforum UH125 Pro | |
| Asus NUC 14 Pro | |
| Acemagic F2A | |
| Super Pi Mod 1.5 XS 32M - 32M | |
| Aoostar GEM10 | |
| Geekom AE7 | |
| Geekom A5 | |
| Minisforum UH125 Pro | |
| Acemagic F2A | |
| Asus NUC 14 Pro | |
| Affinity Photo 2 - Combined (Multi CPU) | |
| Acemagic F2A | |
| Geekom AE7 | |
| Minisforum UH125 Pro | |
| Asus NUC 14 Pro | |
| Aoostar GEM10 | |
| Geekom A5 | |
* ... Moindre est la valeur, meilleures sont les performances
AIDA64: FP32 Ray-Trace | FPU Julia | CPU SHA3 | CPU Queen | FPU SinJulia | FPU Mandel | CPU AES | CPU ZLib | FP64 Ray-Trace | CPU PhotoWorxx
| Performance Rating | |
| Geekom AE7 | |
| Acemagic F2A | |
| Aoostar GEM10 | |
| Minisforum UH125 Pro | |
| Asus NUC 14 Pro | |
| Geekom A5 | |
| Moyenne de la classe Mini PC | |
| AIDA64 / FP32 Ray-Trace | |
| Geekom AE7 | |
| Acemagic F2A | |
| Aoostar GEM10 | |
| Minisforum UH125 Pro | |
| Asus NUC 14 Pro | |
| Moyenne de la classe Mini PC (646 - 51004, n=118, 2 dernières années) | |
| Geekom A5 | |
| AIDA64 / FPU Julia | |
| Geekom AE7 | |
| Acemagic F2A | |
| Aoostar GEM10 | |
| Geekom A5 | |
| Minisforum UH125 Pro | |
| Asus NUC 14 Pro | |
| Moyenne de la classe Mini PC (3857 - 214250, n=118, 2 dernières années) | |
| AIDA64 / CPU SHA3 | |
| Geekom AE7 | |
| Acemagic F2A | |
| Minisforum UH125 Pro | |
| Asus NUC 14 Pro | |
| Aoostar GEM10 | |
| Moyenne de la classe Mini PC (260 - 9399, n=118, 2 dernières années) | |
| Geekom A5 | |
| AIDA64 / CPU Queen | |
| Geekom AE7 | |
| Aoostar GEM10 | |
| Geekom A5 | |
| Acemagic F2A | |
| Moyenne de la classe Mini PC (8172 - 184747, n=118, 2 dernières années) | |
| Asus NUC 14 Pro | |
| Minisforum UH125 Pro | |
| AIDA64 / FPU SinJulia | |
| Geekom AE7 | |
| Aoostar GEM10 | |
| Geekom A5 | |
| Acemagic F2A | |
| Moyenne de la classe Mini PC (408 - 29064, n=118, 2 dernières années) | |
| Asus NUC 14 Pro | |
| Minisforum UH125 Pro | |
| AIDA64 / FPU Mandel | |
| Geekom AE7 | |
| Aoostar GEM10 | |
| Acemagic F2A | |
| Geekom A5 | |
| Minisforum UH125 Pro | |
| Asus NUC 14 Pro | |
| Moyenne de la classe Mini PC (1987 - 113499, n=118, 2 dernières années) | |
| AIDA64 / CPU AES | |
| Geekom AE7 | |
| Acemagic F2A | |
| Aoostar GEM10 | |
| Geekom A5 | |
| Moyenne de la classe Mini PC (3691 - 325960, n=118, 2 dernières années) | |
| Minisforum UH125 Pro | |
| Asus NUC 14 Pro | |
| AIDA64 / CPU ZLib | |
| Acemagic F2A | |
| Geekom AE7 | |
| Minisforum UH125 Pro | |
| Asus NUC 14 Pro | |
| Aoostar GEM10 | |
| Moyenne de la classe Mini PC (74.9 - 2039, n=118, 2 dernières années) | |
| Geekom A5 | |
| AIDA64 / FP64 Ray-Trace | |
| Geekom AE7 | |
| Acemagic F2A | |
| Aoostar GEM10 | |
| Minisforum UH125 Pro | |
| Moyenne de la classe Mini PC (350 - 26952, n=118, 2 dernières années) | |
| Asus NUC 14 Pro | |
| Geekom A5 | |
| AIDA64 / CPU PhotoWorxx | |
| Asus NUC 14 Pro | |
| Minisforum UH125 Pro | |
| Geekom AE7 | |
| Acemagic F2A | |
| Moyenne de la classe Mini PC (4408 - 50500, n=118, 2 dernières années) | |
| Aoostar GEM10 | |
| Geekom A5 | |
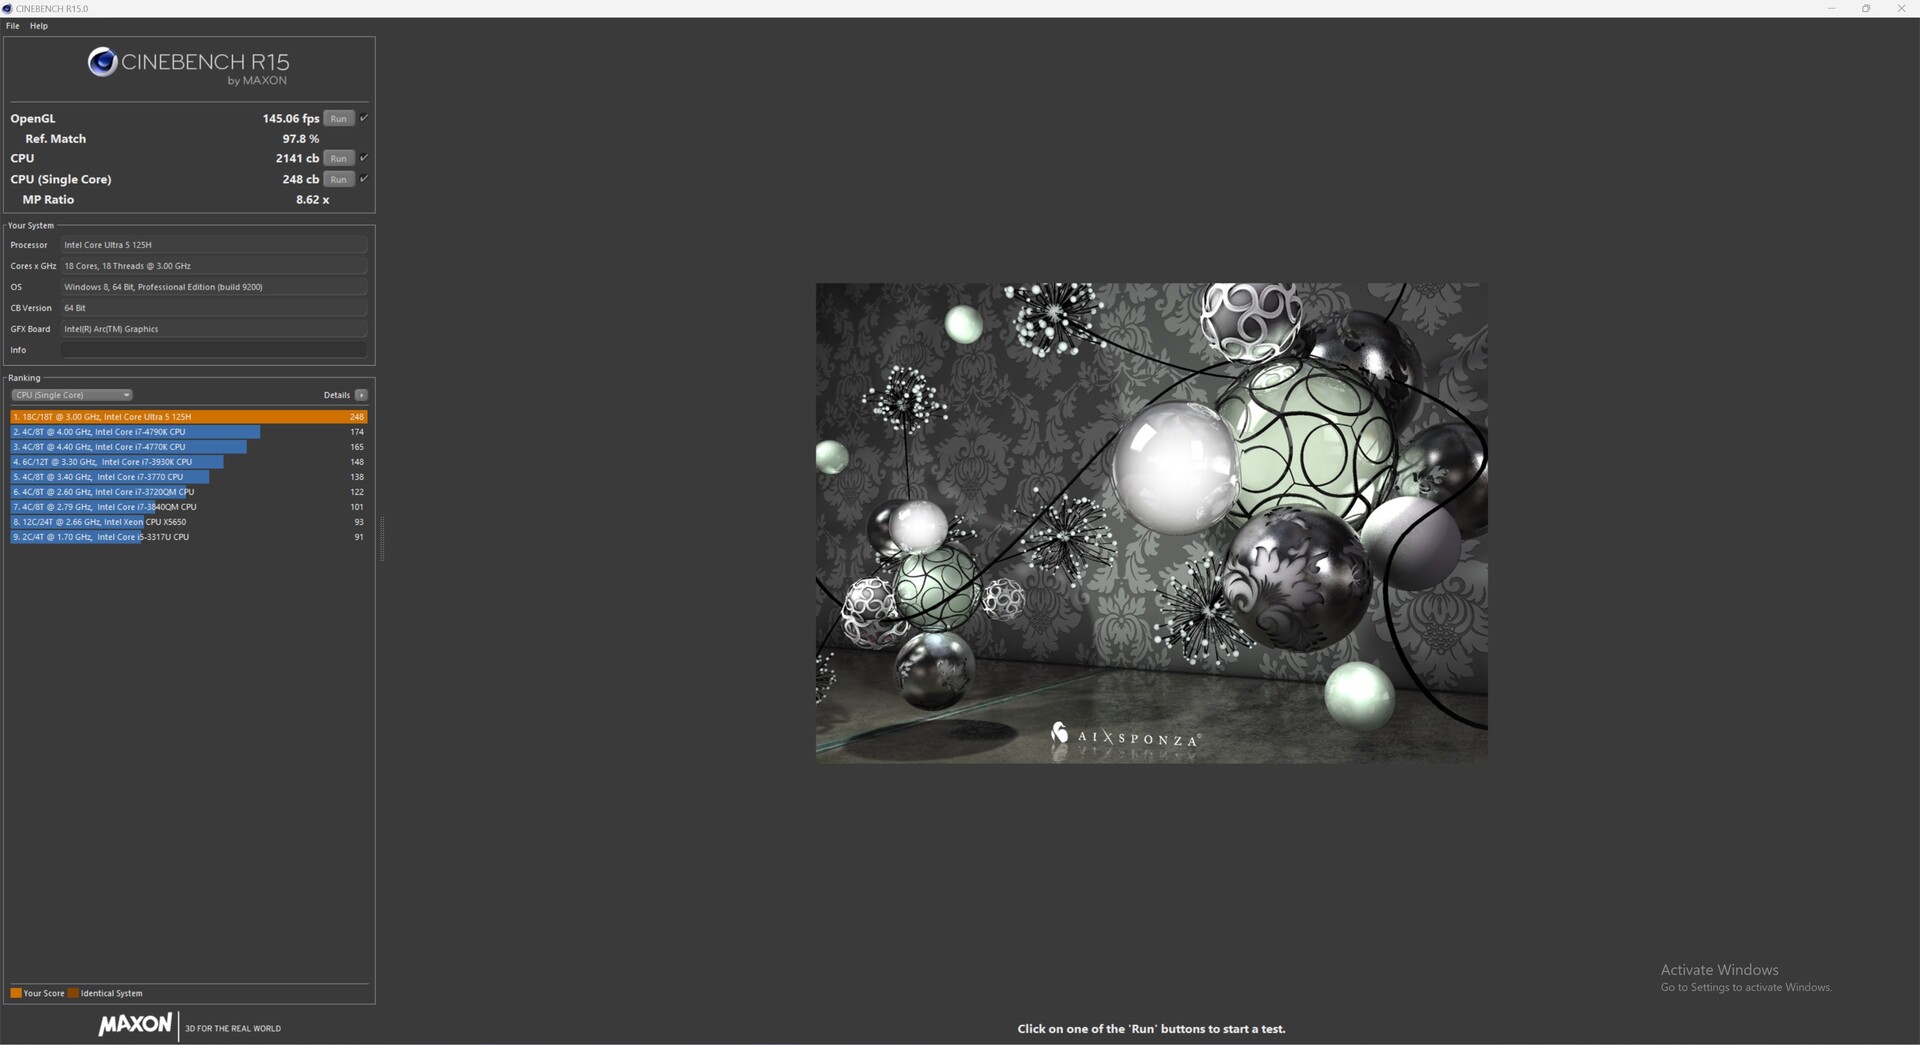
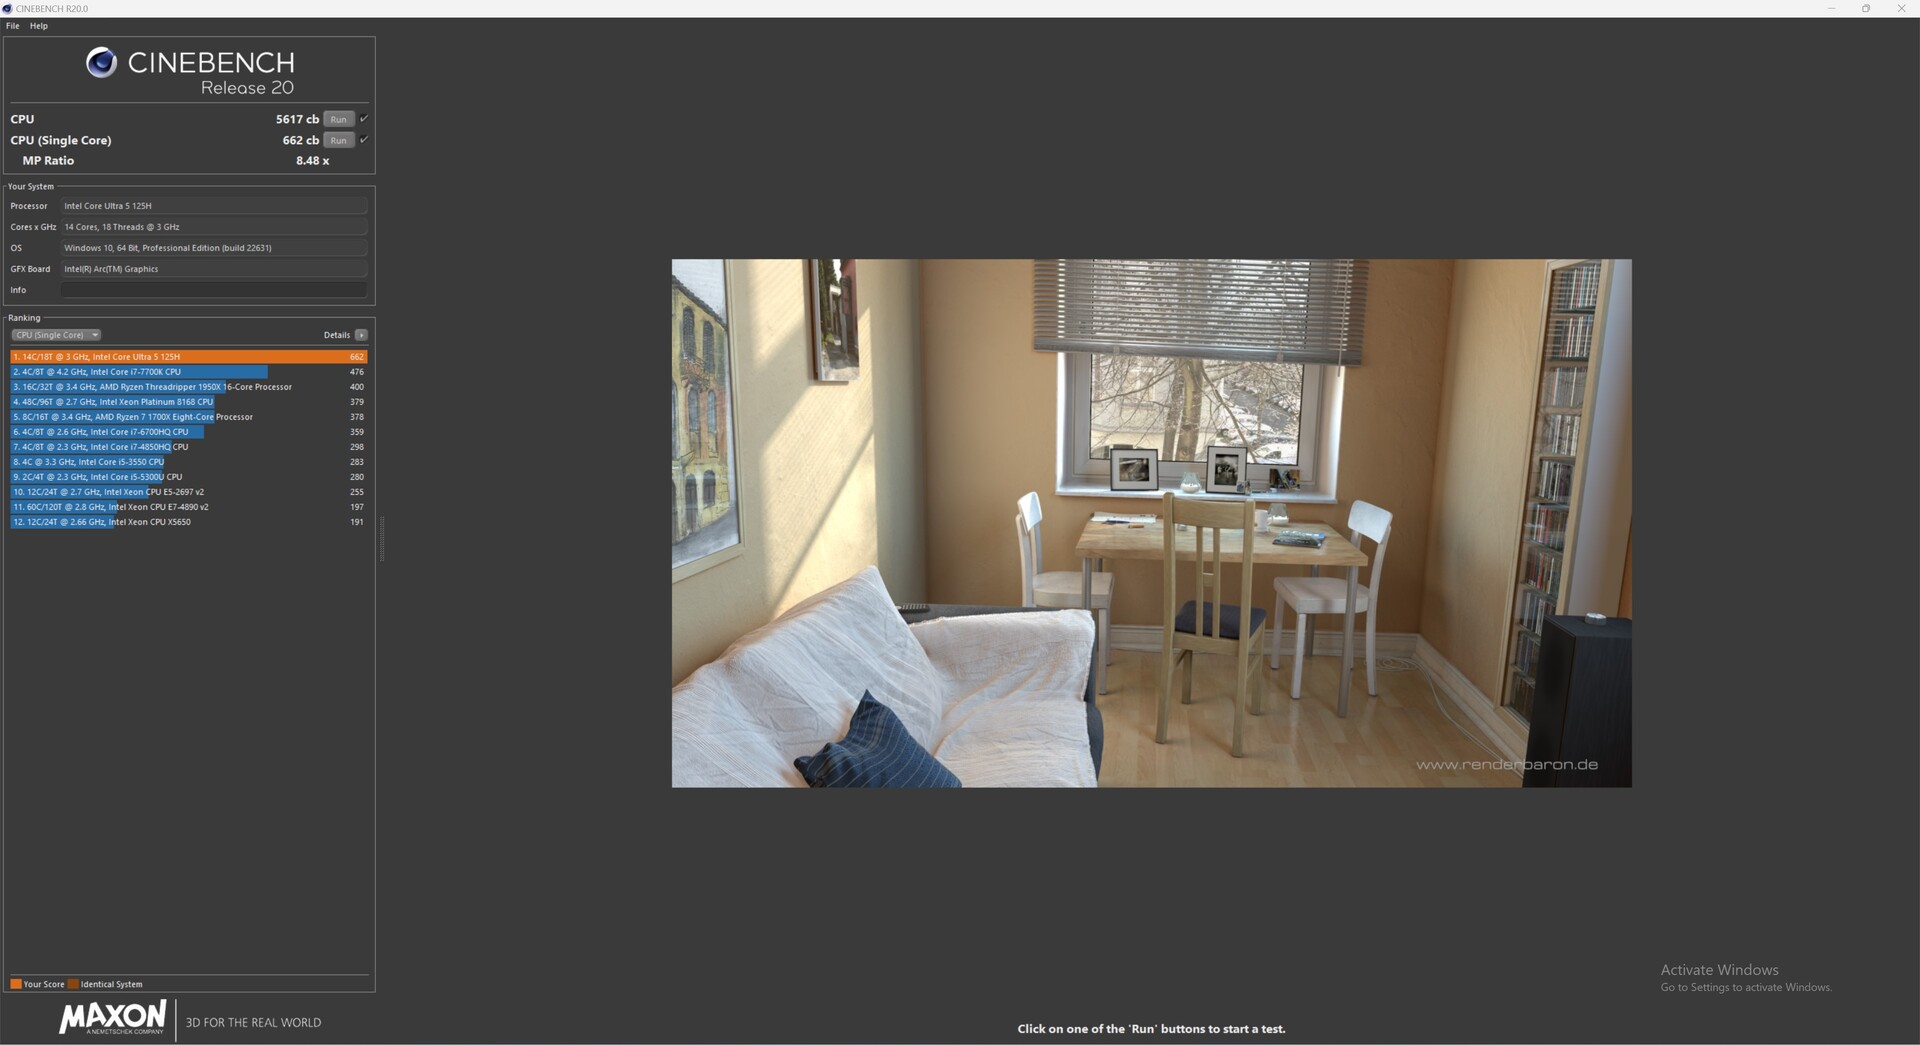
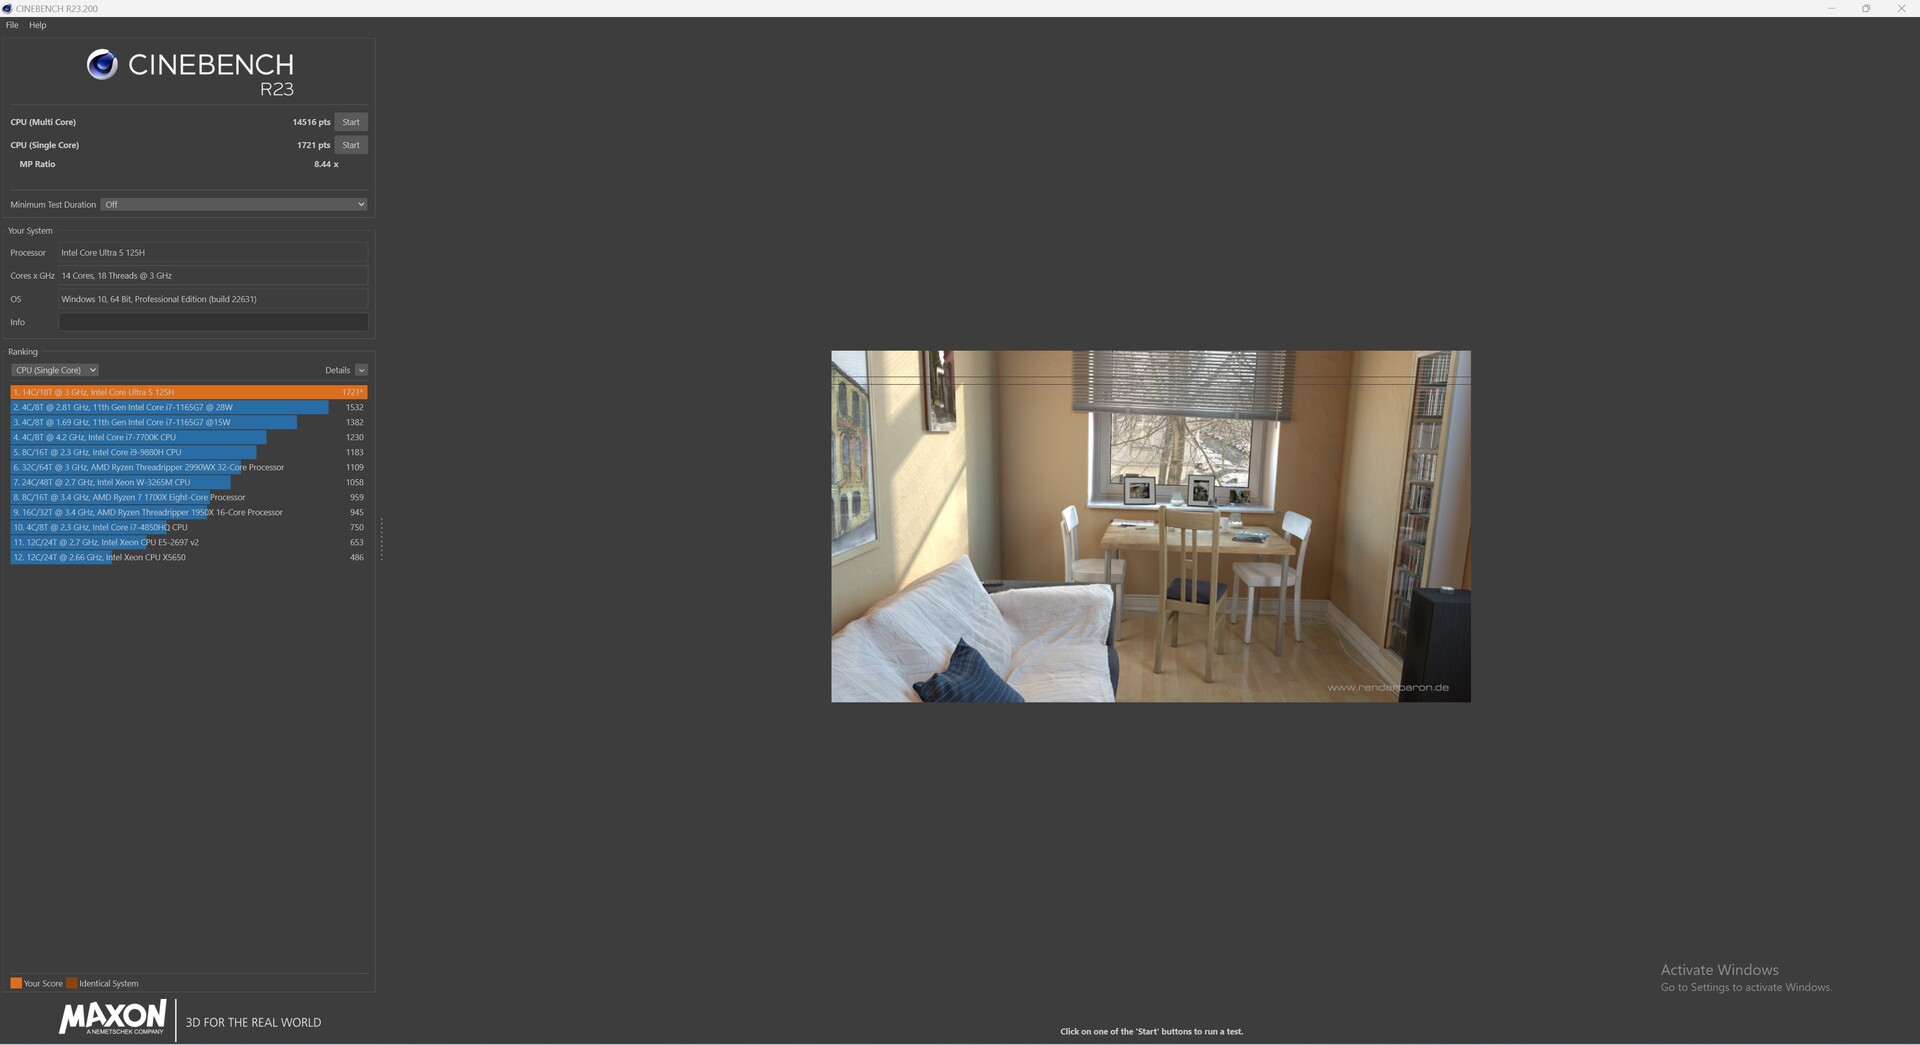
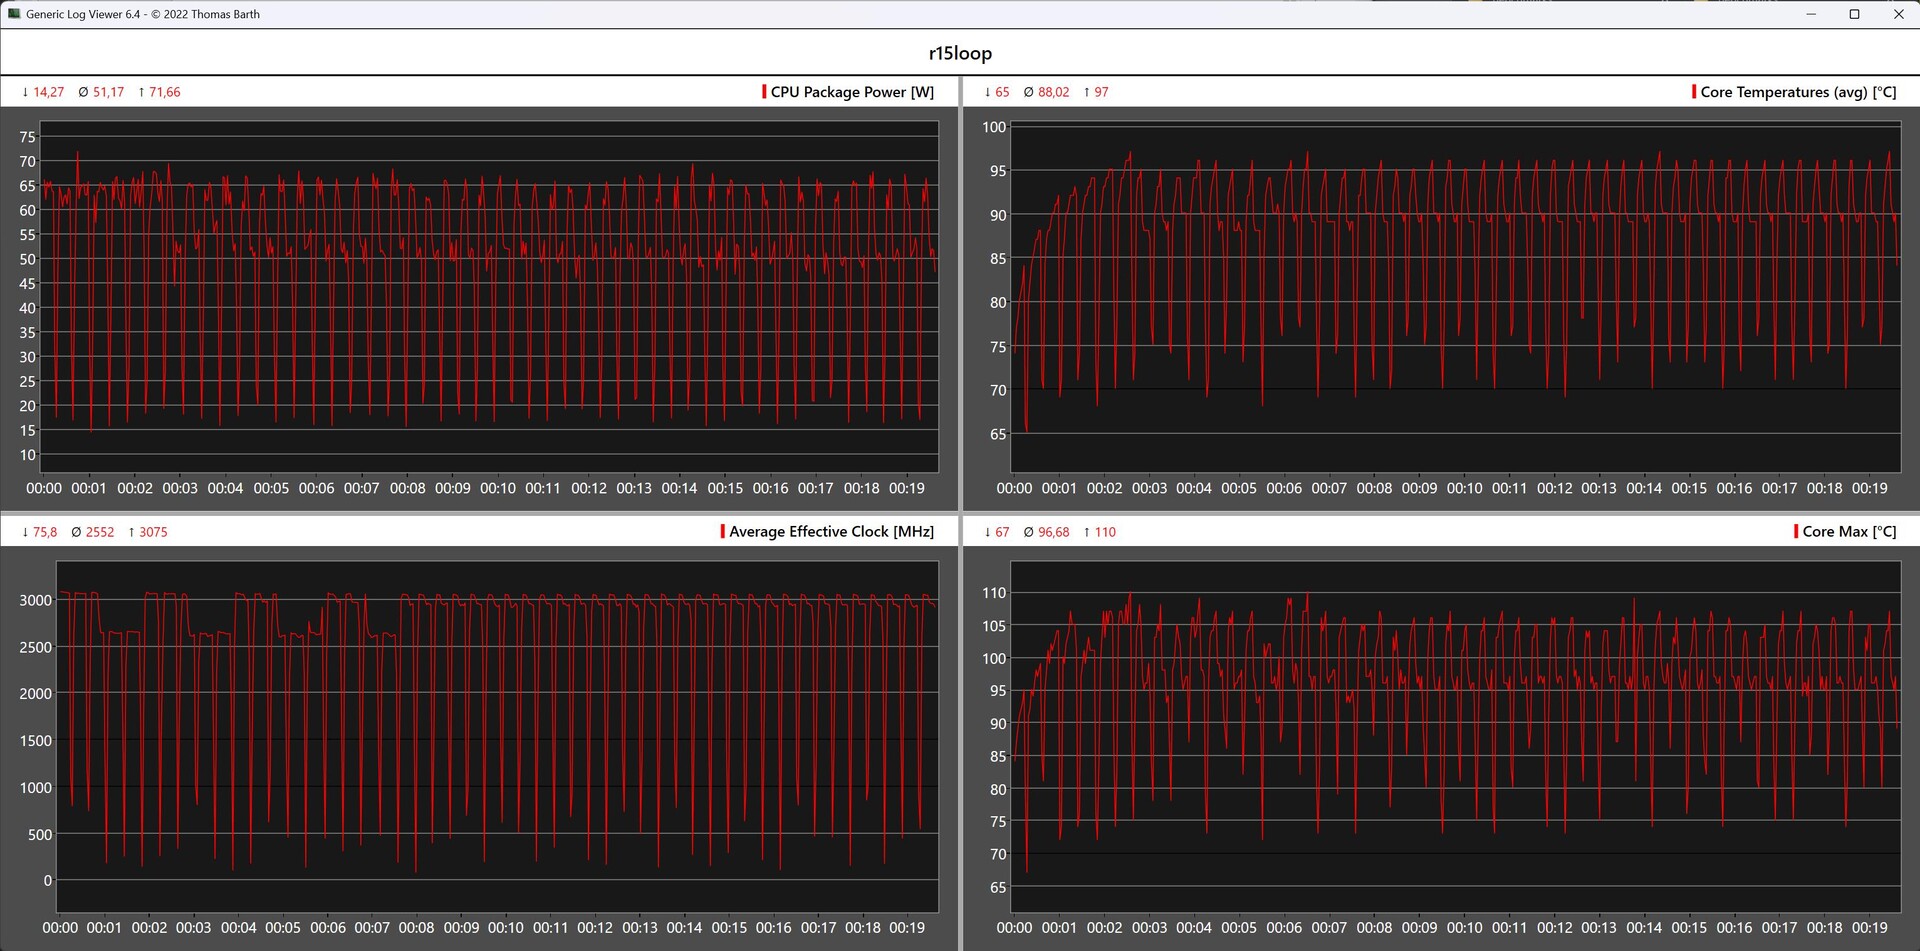
Cinebench R15 Multi loop
Malheureusement, l'Asus NUC 14 Pro n'arrive pas à maintenir sa performance CPU légèrement supérieure dans la boucle continue de Cinebench R15 par rapport à l'Asus NUC 14 Pro Minisforum UH125 Pro. L'augmentation de la température du processeur entraîne des baisses de performance à court terme, ce qui explique pourquoi les résultats ne sont pas très cohérents. Avec une moyenne de 2 021 points, l'Asus NUC 14 Pro ne peut pas battre le Minisforum UH125 Pro.
Performance du système
Les performances du système reflètent exactement ce qu'il est possible de faire avec le système Intel Core Ultra 5 125H. Basé sur le même SoC, le Minisforum UH125 Pro est le principal concurrent et offre des performances similaires à celles de l'Asus NUC 14 Pro. D'un point de vue subjectif, l'Asus NUC 14 Pro offre d'excellentes performances au quotidien et notre échantillon de test peut obtenir la deuxième place dans les tests de mémoire vive.
| PCMark 10 / Score | |
| Geekom AE7, AMD Ryzen 9 7940HS | |
| Acemagic F2A, Intel Core Ultra 7 155H | |
| Aoostar GEM10, AMD Ryzen 7 6800H | |
| Asus NUC 14 Pro, Intel Core Ultra 5 125H | |
| Minisforum UH125 Pro, Intel Core Ultra 5 125H | |
| Geekom A5, AMD Ryzen 7 5800H | |
| PCMark 10 / Essentials | |
| Acemagic F2A, Intel Core Ultra 7 155H | |
| Geekom AE7, AMD Ryzen 9 7940HS | |
| Aoostar GEM10, AMD Ryzen 7 6800H | |
| Geekom A5, AMD Ryzen 7 5800H | |
| Asus NUC 14 Pro, Intel Core Ultra 5 125H | |
| Minisforum UH125 Pro, Intel Core Ultra 5 125H | |
| PCMark 10 / Productivity | |
| Geekom AE7, AMD Ryzen 9 7940HS | |
| Aoostar GEM10, AMD Ryzen 7 6800H | |
| Geekom A5, AMD Ryzen 7 5800H | |
| Acemagic F2A, Intel Core Ultra 7 155H | |
| Minisforum UH125 Pro, Intel Core Ultra 5 125H | |
| Asus NUC 14 Pro, Intel Core Ultra 5 125H | |
| CrossMark / Overall | |
| Geekom AE7, AMD Ryzen 9 7940HS | |
| Acemagic F2A, Intel Core Ultra 7 155H | |
| Aoostar GEM10, AMD Ryzen 7 6800H | |
| Minisforum UH125 Pro, Intel Core Ultra 5 125H | |
| Asus NUC 14 Pro, Intel Core Ultra 5 125H | |
| Geekom A5, AMD Ryzen 7 5800H | |
| CrossMark / Responsiveness | |
| Acemagic F2A, Intel Core Ultra 7 155H | |
| Aoostar GEM10, AMD Ryzen 7 6800H | |
| Geekom AE7, AMD Ryzen 9 7940HS | |
| Minisforum UH125 Pro, Intel Core Ultra 5 125H | |
| Geekom A5, AMD Ryzen 7 5800H | |
| Asus NUC 14 Pro, Intel Core Ultra 5 125H | |
| CrossMark / Creativity | |
| Geekom AE7, AMD Ryzen 9 7940HS | |
| Acemagic F2A, Intel Core Ultra 7 155H | |
| Asus NUC 14 Pro, Intel Core Ultra 5 125H | |
| Aoostar GEM10, AMD Ryzen 7 6800H | |
| Minisforum UH125 Pro, Intel Core Ultra 5 125H | |
| Geekom A5, AMD Ryzen 7 5800H | |
| CrossMark / Productivity | |
| Geekom AE7, AMD Ryzen 9 7940HS | |
| Acemagic F2A, Intel Core Ultra 7 155H | |
| Aoostar GEM10, AMD Ryzen 7 6800H | |
| Minisforum UH125 Pro, Intel Core Ultra 5 125H | |
| Asus NUC 14 Pro, Intel Core Ultra 5 125H | |
| Geekom A5, AMD Ryzen 7 5800H | |
| AIDA64 / Memory Copy | |
| Minisforum UH125 Pro | |
| Asus NUC 14 Pro | |
| Geekom AE7 | |
| Acemagic F2A | |
| Aoostar GEM10 | |
| Moyenne de la classe Mini PC (6481 - 89287, n=118, 2 dernières années) | |
| Geekom A5 | |
| AIDA64 / Memory Read | |
| Asus NUC 14 Pro | |
| Minisforum UH125 Pro | |
| Acemagic F2A | |
| Geekom AE7 | |
| Moyenne de la classe Mini PC (6914 - 99171, n=118, 2 dernières années) | |
| Geekom A5 | |
| Aoostar GEM10 | |
| AIDA64 / Memory Write | |
| Geekom AE7 | |
| Asus NUC 14 Pro | |
| Minisforum UH125 Pro | |
| Acemagic F2A | |
| Moyenne de la classe Mini PC (6862 - 98583, n=118, 2 dernières années) | |
| Aoostar GEM10 | |
| Geekom A5 | |
| AIDA64 / Memory Latency | |
| Minisforum UH125 Pro | |
| Acemagic F2A | |
| Asus NUC 14 Pro | |
| Aoostar GEM10 | |
| Moyenne de la classe Mini PC (44.9 - 184.8, n=118, 2 dernières années) | |
| Geekom AE7 | |
| Geekom A5 | |
* ... Moindre est la valeur, meilleures sont les performances
| UL Procyon for Windows | |
| Overall Score Integer NPU | |
| Asus NUC 14 Pro | |
| Minisforum UH125 Pro | |
| Acemagic F2A | |
| Overall Score Integer GPU | |
| Asus NUC 14 Pro | |
| Acemagic F2A | |
| Minisforum UH125 Pro | |
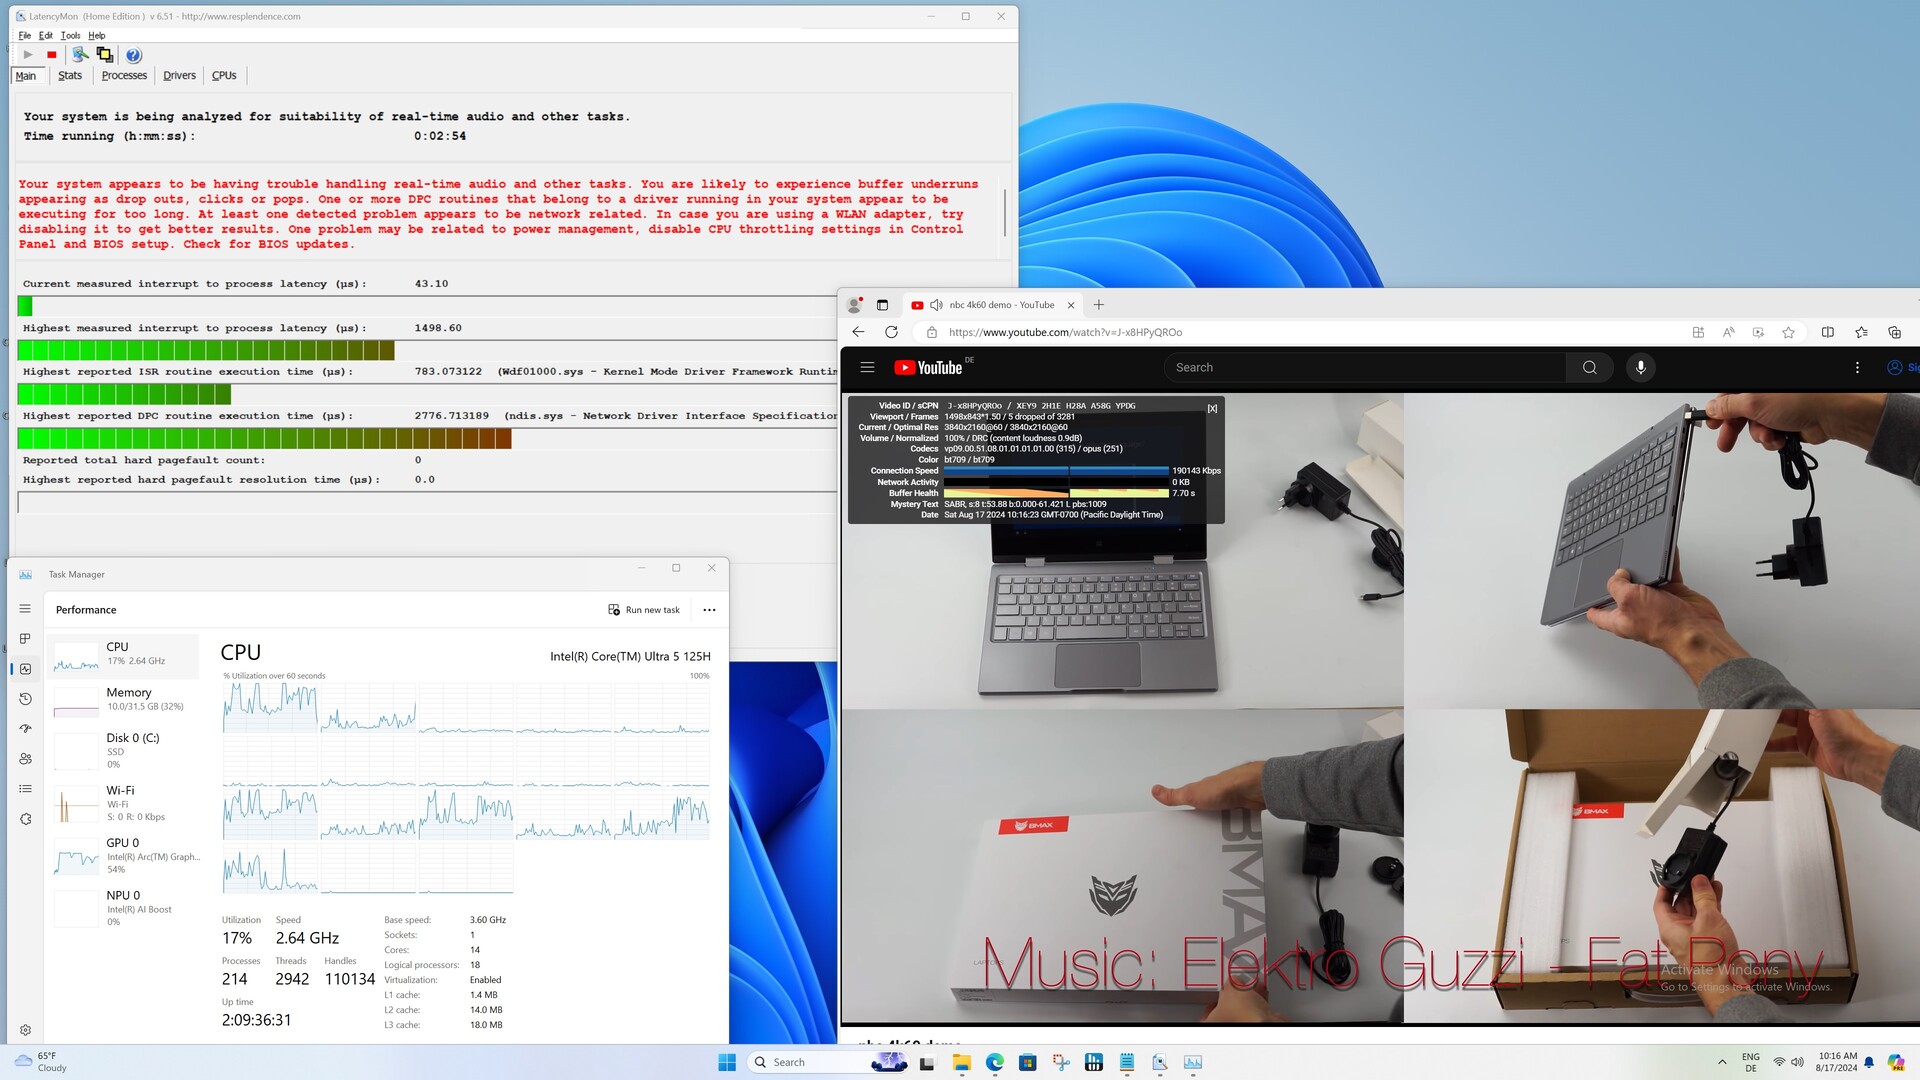
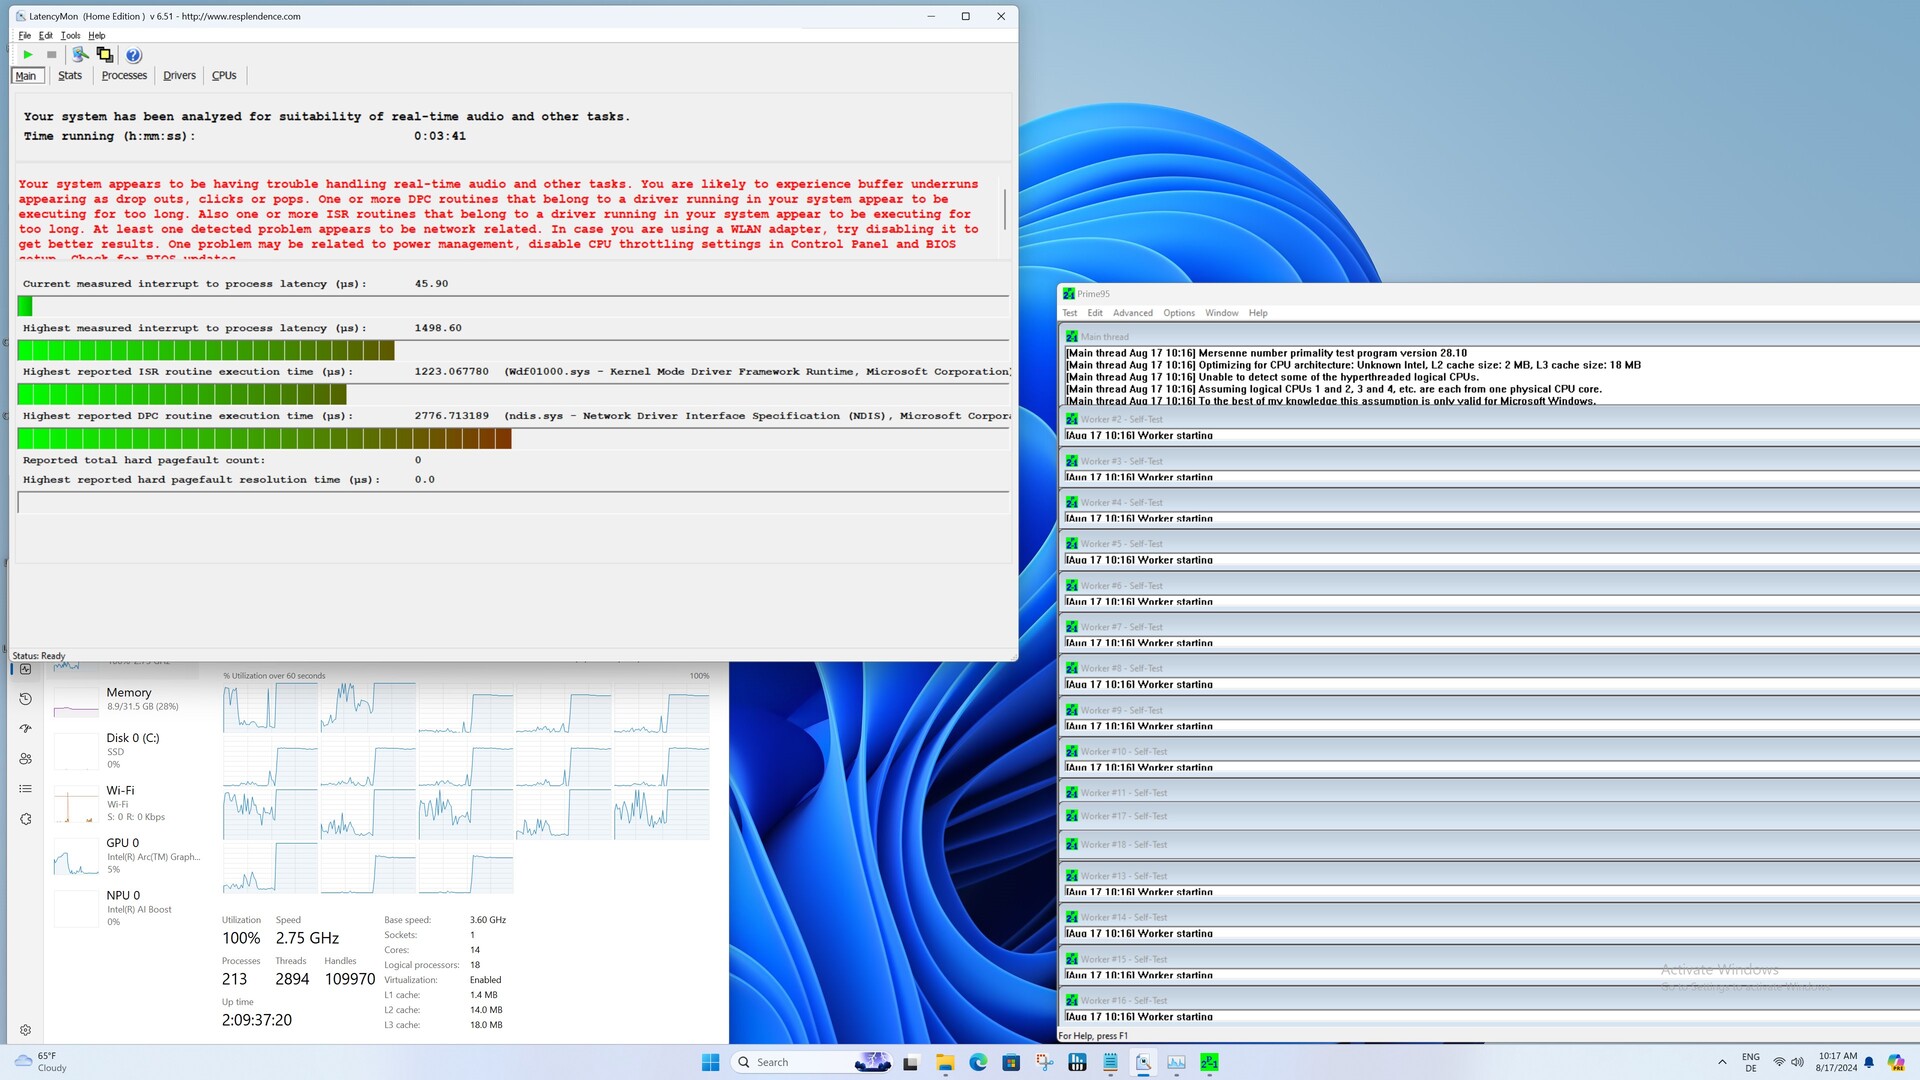
Latences DPC
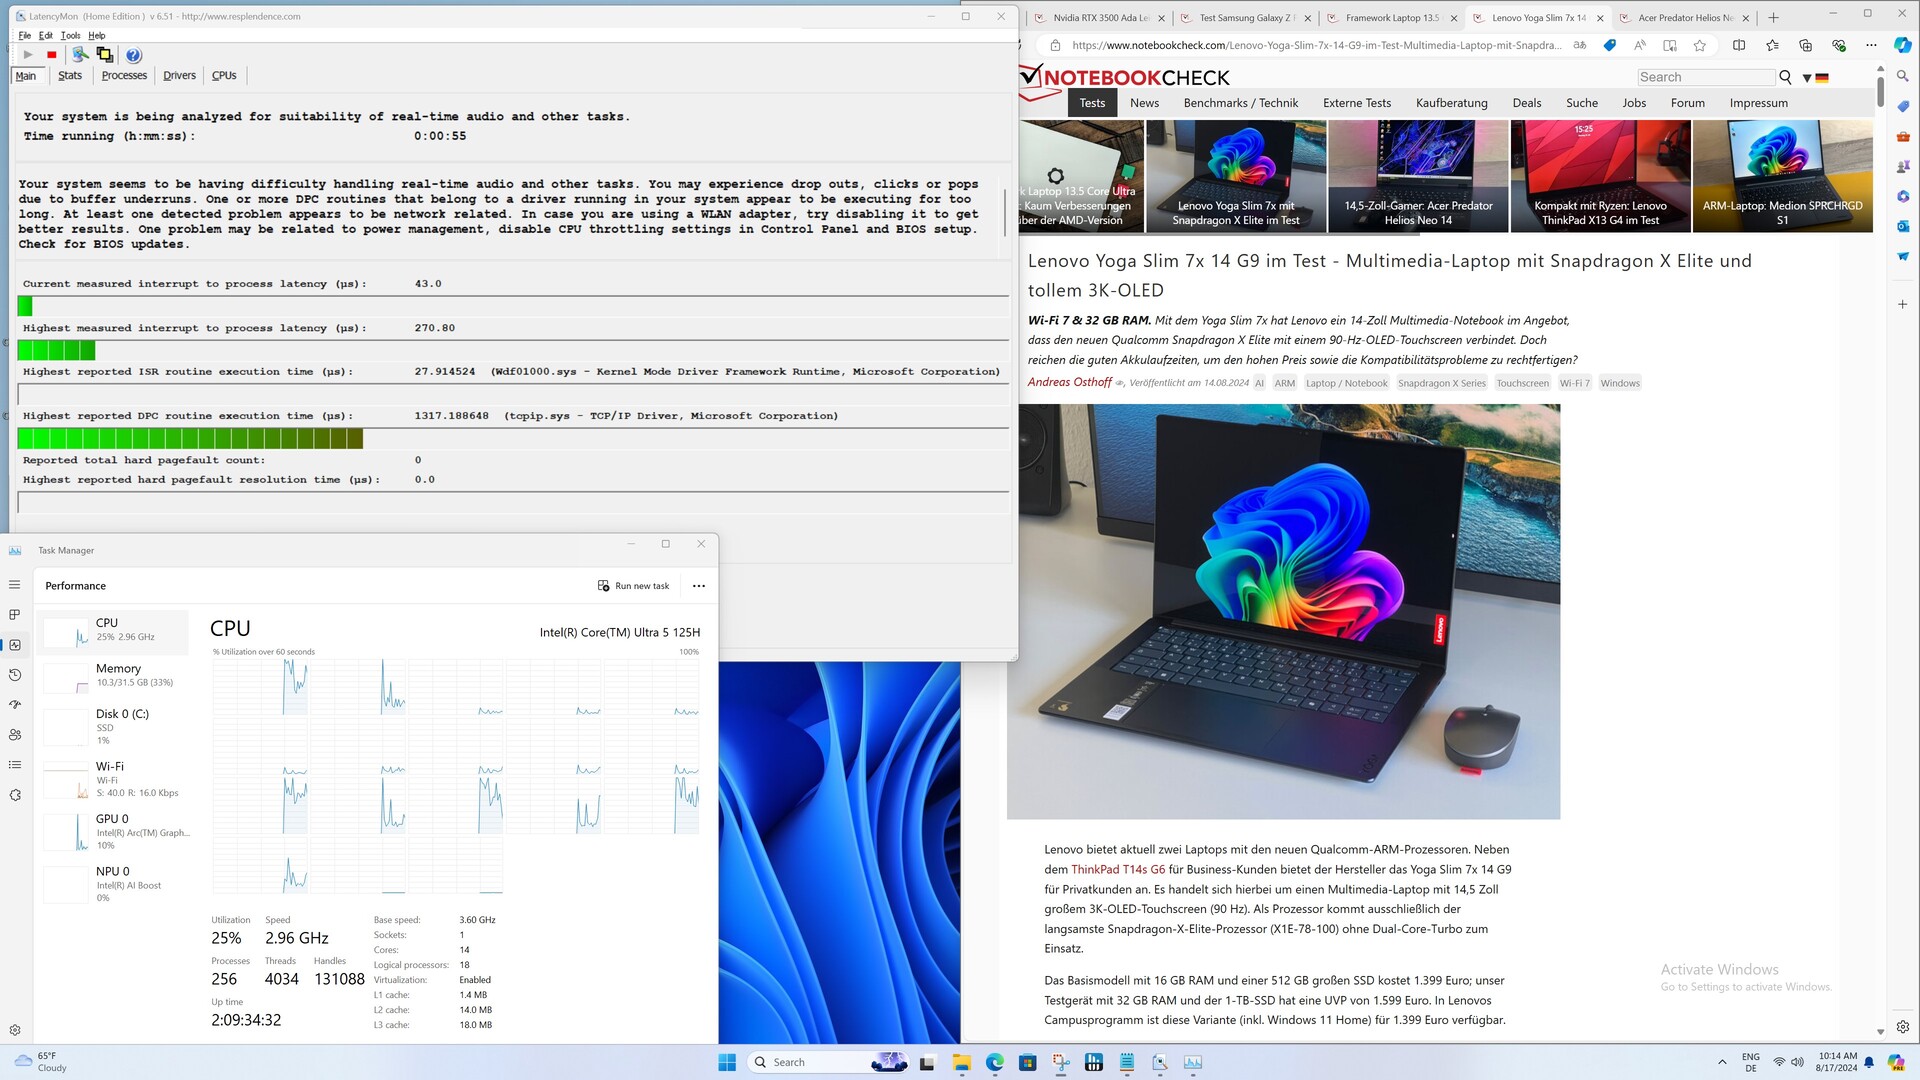
Les latences DPC de l'Asus NUC 14 Pro ne sont pas convaincantes. Même en surfant simplement sur Internet, nous constatons des valeurs élevées, qui se détériorent encore plus lors de la lecture de la vidéo de test 4K. De futures mises à jour du BIOS ou des pilotes pourraient permettre d'améliorer la situation à l'avenir.
| DPC Latencies / LatencyMon - interrupt to process latency (max), Web, Youtube, Prime95 | |
| Asus NUC 14 Pro | |
| Acemagic F2A | |
| Geekom AE7 | |
| Minisforum UH125 Pro | |
| Geekom A5 | |
| Aoostar GEM10 | |
* ... Moindre est la valeur, meilleures sont les performances
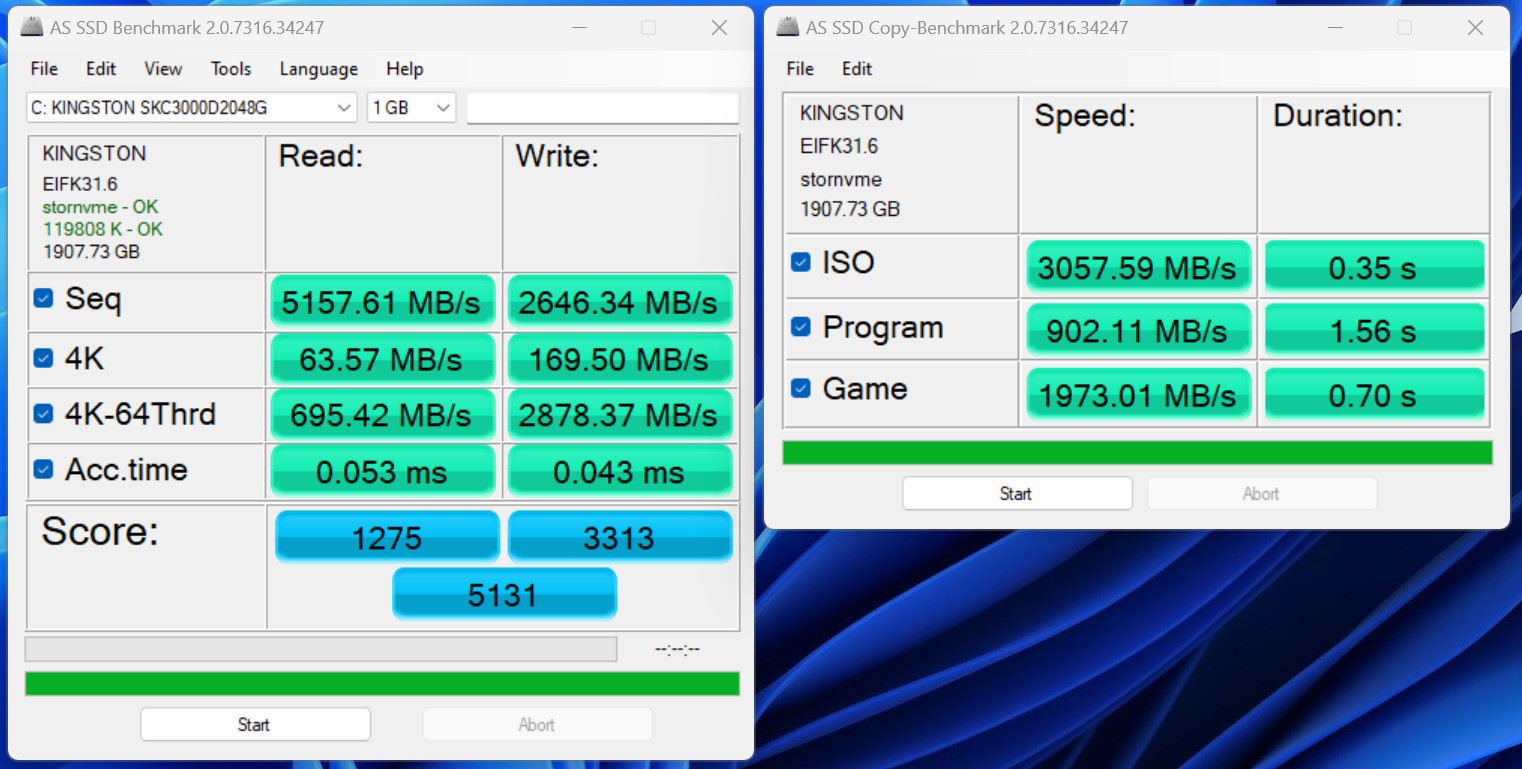
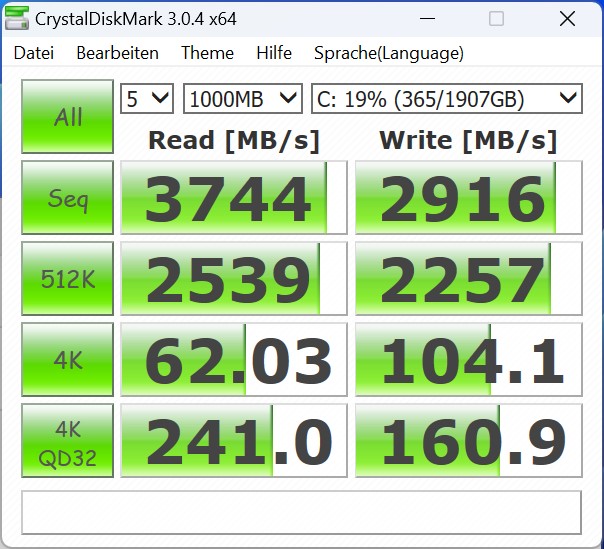
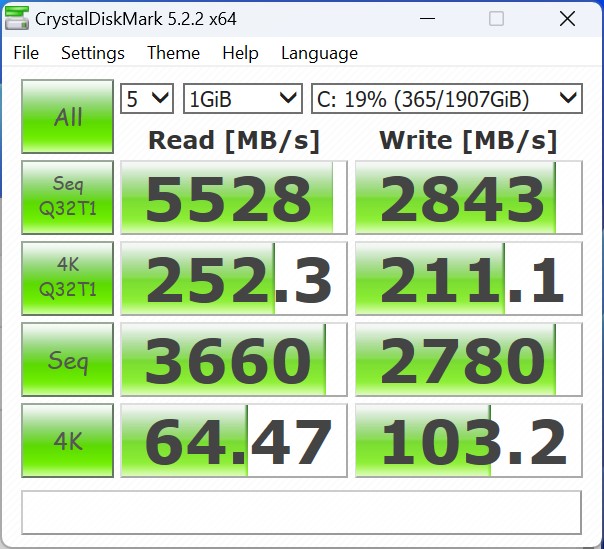
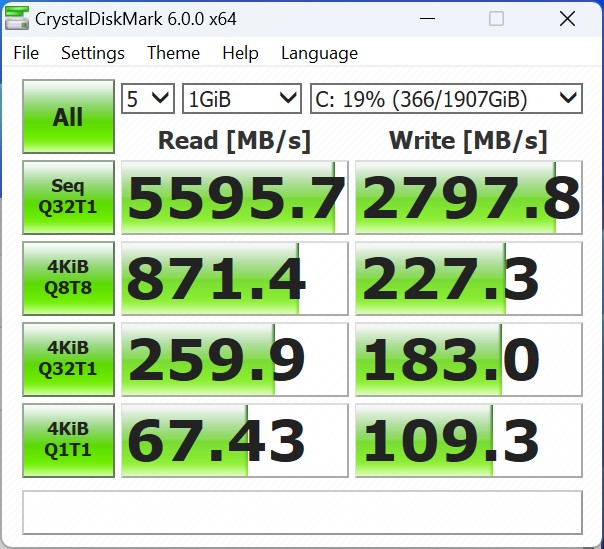
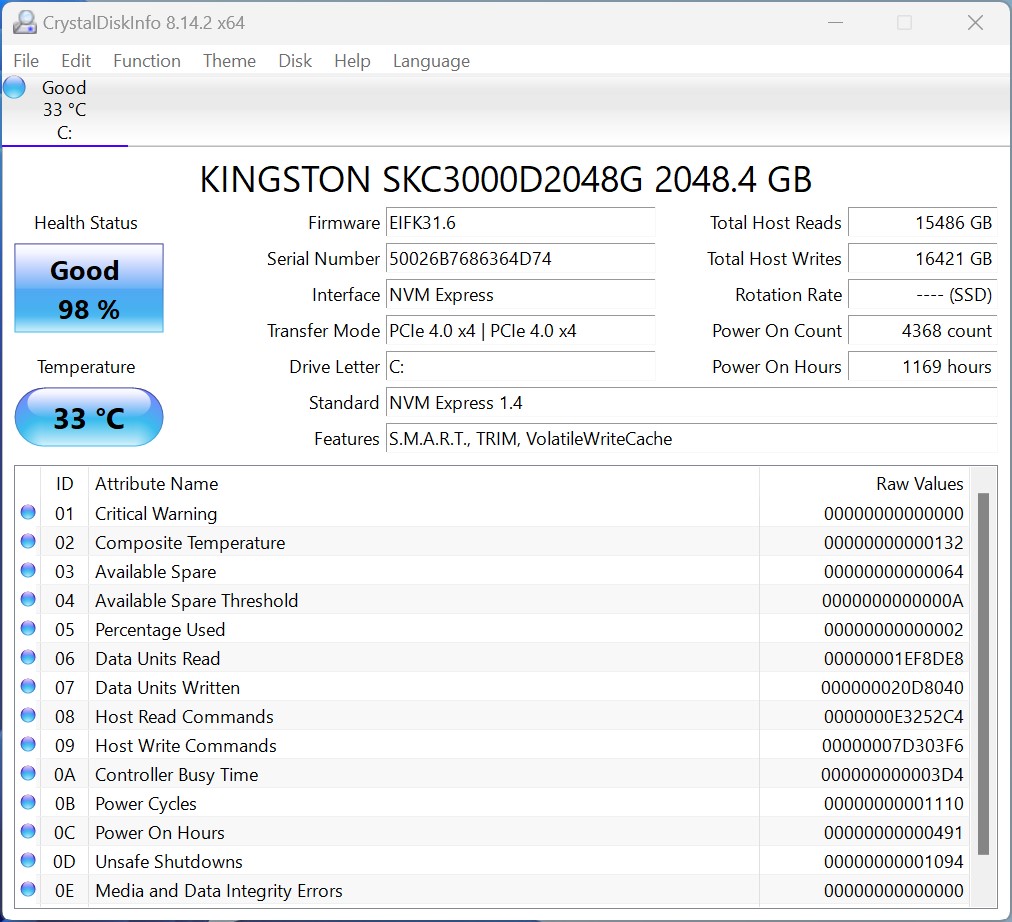
Mémoire de masse
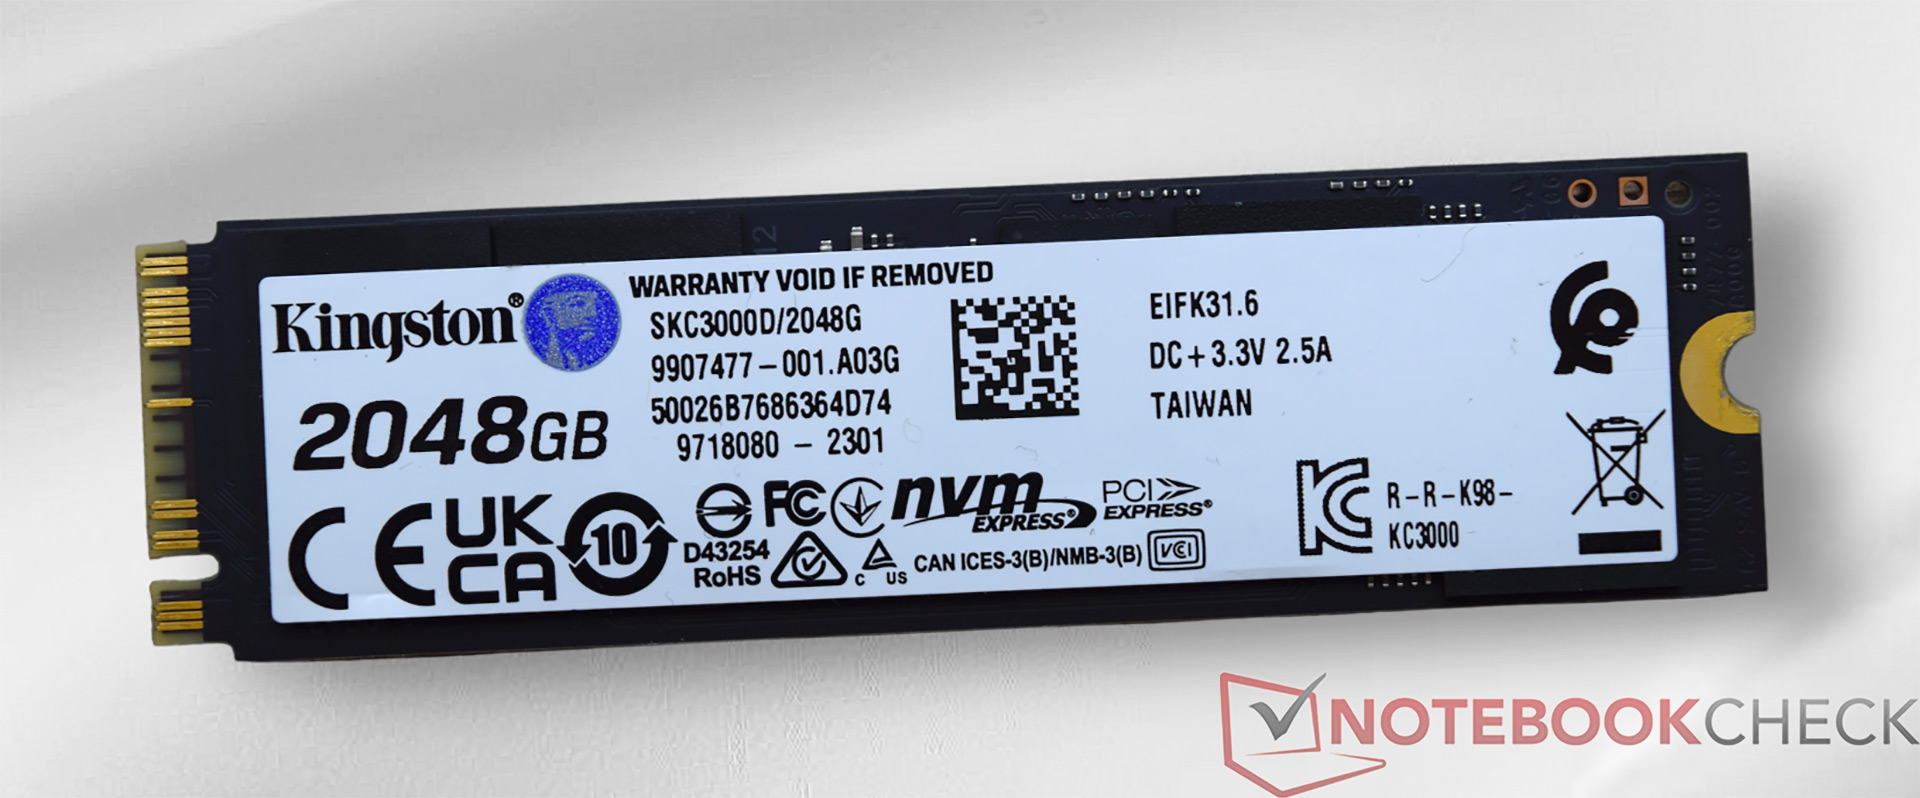
Nous avons équipé le dispositif de test d'un disque SSD Kingston KC3000. Les performances théoriques du SSD ne peuvent pas être atteintes dans la pratique. Néanmoins, nous avons enregistré des résultats relativement bons, ce qui nous a permis d'obtenir une bonne troisième place au classement général. De légers problèmes sont apparus lors du test de stress : En combinaison avec le Kingston SC3000 utilisé, la performance de lecture ne peut pas être maintenue au même niveau en permanence.
Pour d'autres comparaisons et benchmarks, veuillez consulter notre tableau comparatif Laptop SSD & HDD Benchmarks .

| Drive Performance Rating - Percent | |
| Aoostar GEM10 | |
| Geekom AE7 | |
| Asus NUC 14 Pro | |
| Moyenne de la classe Mini PC | |
| Minisforum UH125 Pro | |
| Acemagic F2A | |
| Geekom A5 | |
* ... Moindre est la valeur, meilleures sont les performances
Continuous read: DiskSpd Read Loop, Queue Depth 8
Carte graphique
Les performances 3D de l'Asus NUC 14 Pro sont nettement meilleures que celles de l'ancien Intel Iris Xe G7 avec 96 EUs grâce à l'architecture Intel Arc révisée. Cependant, l Intel Arc 7-core iGPU à 7 cœurs d'Intel Arc ne peut pas rivaliser avec la Radeon 780M d'AMD. Néanmoins, l'Asus NUC 14 Pro offre des performances exceptionnelles, puisque notre échantillon de test remporte la comparaison avec l'Asus NUC 14 Pro Acemagic F2A dans plusieurs tests.
Vous trouverez d'autres comparaisons et benchmarks dans notre tableau comparatif des GPU Cartes graphiques mobiles - indice de référence .
| 3DMark Performance Rating - Percent | |
| Geekom AE7 | |
| Asus NUC 14 Pro | |
| Acemagic F2A | |
| Aoostar GEM10 | |
| Minisforum UH125 Pro | |
| Geekom A5 | |
| 3DMark 11 - 1280x720 Performance GPU | |
| Geekom AE7 | |
| Acemagic F2A | |
| Asus NUC 14 Pro | |
| Aoostar GEM10 | |
| Minisforum UH125 Pro | |
| Geekom A5 | |
| 3DMark | |
| 2560x1440 Time Spy Graphics | |
| Acemagic F2A | |
| Asus NUC 14 Pro | |
| Geekom AE7 | |
| Minisforum UH125 Pro | |
| Aoostar GEM10 | |
| Geekom A5 | |
| 1920x1080 Fire Strike Graphics | |
| Geekom AE7 | |
| Asus NUC 14 Pro | |
| Acemagic F2A | |
| Aoostar GEM10 | |
| Minisforum UH125 Pro | |
| Geekom A5 | |
| Unigine Heaven 4.0 | |
| Extreme Preset OpenGL | |
| Aoostar GEM10 | |
| Asus NUC 14 Pro | |
| Geekom AE7 | |
| Acemagic F2A | |
| Minisforum UH125 Pro | |
| Geekom A5 | |
| Extreme Preset DX11 | |
| Geekom AE7 | |
| Aoostar GEM10 | |
| Asus NUC 14 Pro | |
| Acemagic F2A | |
| Minisforum UH125 Pro | |
| Geekom A5 | |
| Unigine Valley 1.0 | |
| 1920x1080 Extreme HD DirectX AA:x8 | |
| Geekom AE7 | |
| Aoostar GEM10 | |
| Asus NUC 14 Pro | |
| Acemagic F2A | |
| Minisforum UH125 Pro | |
| Geekom A5 | |
| 1920x1080 Extreme HD Preset OpenGL AA:x8 | |
| Aoostar GEM10 | |
| Asus NUC 14 Pro | |
| Geekom AE7 | |
| Acemagic F2A | |
| Minisforum UH125 Pro | |
| Geekom A5 | |
| Unigine Superposition | |
| 1280x720 720p Low | |
| Geekom AE7 | |
| Aoostar GEM10 | |
| Asus NUC 14 Pro | |
| Acemagic F2A | |
| Minisforum UH125 Pro | |
| Geekom A5 | |
| 1920x1080 1080p High | |
| Geekom AE7 | |
| Asus NUC 14 Pro | |
| Acemagic F2A | |
| Aoostar GEM10 | |
| Minisforum UH125 Pro | |
| Geekom A5 | |
| 1920x1080 1080p Extreme | |
| Asus NUC 14 Pro | |
| Acemagic F2A | |
| Geekom AE7 | |
| Minisforum UH125 Pro | |
| Aoostar GEM10 | |
| Geekom A5 | |
| ComputeMark v2.1 | |
| 1024x600 Normal, Score | |
| Geekom AE7 | |
| Acemagic F2A | |
| Aoostar GEM10 | |
| Asus NUC 14 Pro | |
| Minisforum UH125 Pro | |
| Geekom A5 | |
| 1024x600 Normal, Fluid 3DTex | |
| Asus NUC 14 Pro | |
| Geekom AE7 | |
| Minisforum UH125 Pro | |
| Acemagic F2A | |
| Aoostar GEM10 | |
| Geekom A5 | |
| 1024x600 Normal, Fluid 2DTexArr | |
| Geekom AE7 | |
| Asus NUC 14 Pro | |
| Aoostar GEM10 | |
| Minisforum UH125 Pro | |
| Acemagic F2A | |
| Geekom A5 | |
| 1024x600 Normal, Mandel Vector | |
| Geekom AE7 | |
| Acemagic F2A | |
| Aoostar GEM10 | |
| Asus NUC 14 Pro | |
| Minisforum UH125 Pro | |
| Geekom A5 | |
| 1024x600 Normal, Mandel Scalar | |
| Geekom AE7 | |
| Aoostar GEM10 | |
| Acemagic F2A | |
| Asus NUC 14 Pro | |
| Minisforum UH125 Pro | |
| Geekom A5 | |
| 1024x600 Normal, QJuliaRayTrace | |
| Geekom AE7 | |
| Acemagic F2A | |
| Asus NUC 14 Pro | |
| Aoostar GEM10 | |
| Minisforum UH125 Pro | |
| Geekom A5 | |
| LuxMark v2.0 64Bit | |
| Room GPUs-only | |
| Geekom AE7 | |
| Asus NUC 14 Pro | |
| Minisforum UH125 Pro | |
| Aoostar GEM10 | |
| Acemagic F2A | |
| Sala GPUs-only | |
| Asus NUC 14 Pro | |
| Minisforum UH125 Pro | |
| Acemagic F2A | |
| Geekom AE7 | |
| Aoostar GEM10 | |
| Affinity Photo 2 - Combined (Single / Multi GPU) | |
| Minisforum UH125 Pro | |
| Asus NUC 14 Pro | |
| Acemagic F2A | |
| Aoostar GEM10 | |
| Geekom AE7 | |
| Geekom A5 | |
| Asus NUC 14 Pro, Intel Arc 7-Core iGPU Ultra 5 125H | Geekom AE7, AMD Radeon 780M R9 7940HS | Minisforum UH125 Pro, Intel Arc 7-Core iGPU Ultra 5 125H | Aoostar GEM10, AMD Radeon 680M R7 6800H | Acemagic F2A, Intel Arc 8-Core iGPU Ultra 7 155H | Geekom A5, AMD Radeon RX Vega 8 (Ryzen 4000/5000) R7 5800H | Moyenne de la classe Mini PC | |
|---|---|---|---|---|---|---|---|
| SPECviewperf 2020 | 236% | -8% | 217% | 1% | 83% | 154% | |
| 3840x2160 Medical (medical-03) | 5.87 | 12.7 116% | 4.8 -18% | 10.7 82% | 5.05 -14% | 4.82 -18% | 7.85 ? 34% |
| 3840x2160 Energy (energy-03) | 3.81 | 14.4 278% | 3.38 -11% | 10.6 178% | 4.61 21% | 5.33 40% | 11.3 ? 197% |
| 3840x2160 Creo (creo-03) | 15.3 | 30.2 97% | 15.4 1% | 32 109% | 17.9 17% | 19.1 25% | 30.7 ? 101% |
| 3840x2160 CATIA (catia-06) | 10.4 | 23.7 128% | 9.7 -7% | 22.8 119% | 10 -4% | 13.1 26% | 18.6 ? 79% |
| 3840x2160 3ds Max (3dsmax-07) | 14.5 | 20.7 43% | 13.2 -9% | 18.9 30% | 12.9 -11% | 11.3 -22% | 22.5 ? 55% |
| 3840x2160 Siemens NX (snx-04) | 5.82 | 61.3 953% | 5.54 -5% | 61.4 955% | 5.7 -2% | 38 553% | 37.2 ? 539% |
| 3840x2160 Maya (maya-06) | 34.7 | 47.4 37% | 32.8 -5% | 49.7 43% | 35.4 2% | 25.8 -26% | 58.9 ? 70% |
| 3DMark 05 Standard | 48550 points | |
| 3DMark 06 Standard Score | 40475 points | |
| 3DMark Vantage P Result | 39395 points | |
| 3DMark 11 Performance | 11870 points | |
| 3DMark Ice Storm Standard Score | 126152 points | |
| 3DMark Cloud Gate Standard Score | 29960 points | |
| 3DMark Fire Strike Score | 7302 points | |
| 3DMark Fire Strike Extreme Score | 3819 points | |
| 3DMark Time Spy Score | 3540 points | |
| 3DMark Steel Nomad Score | 699 points | |
| 3DMark Steel Nomad Light Score | 2798 points | |
Aide | ||
Performances des jeux
L'Asus NUC 14 Pro n'est adapté aux jeux modernes que dans une mesure limitée. Par rapport à l'ancienne carte Intel Iris Xe G7 avec 96 UE, les performances de jeu peuvent toutefois être améliorées de manière significative. Intel perd le duel avec l'iGPU d'AMD plus clairement que dans les tests synthétiques en termes de performances 3D. Afin de mieux classer les performances de l'iGPU, nous vous renvoyons à notre Liste de jeux GPU.
| GTA V | |
| 1024x768 Lowest Settings possible | |
| Geekom AE7 | |
| Acemagic F2A | |
| Asus NUC 14 Pro | |
| Aoostar GEM10 | |
| Geekom A5 | |
| Minisforum UH125 Pro | |
| 1920x1080 High/On (Advanced Graphics Off) AA:2xMSAA + FX AF:8x | |
| Geekom AE7 | |
| Aoostar GEM10 | |
| Asus NUC 14 Pro | |
| Minisforum UH125 Pro | |
| Geekom A5 | |
| Acemagic F2A | |
| Dota 2 Reborn | |
| 1280x720 min (0/3) fastest | |
| Geekom AE7 | |
| Geekom A5 | |
| Aoostar GEM10 | |
| Acemagic F2A | |
| Asus NUC 14 Pro | |
| Minisforum UH125 Pro | |
| 1920x1080 high (2/3) | |
| Geekom AE7 | |
| Aoostar GEM10 | |
| Acemagic F2A | |
| Asus NUC 14 Pro | |
| Minisforum UH125 Pro | |
| Geekom A5 | |
| Cyberpunk 2077 2.1 Phantom Liberty | |
| 1920x1080 Low Preset (FSR off) | |
| Geekom AE7 | |
| Aoostar GEM10 | |
| Asus NUC 14 Pro | |
| Acemagic F2A | |
| Minisforum UH125 Pro | |
| 1920x1080 High Preset (FSR off) | |
| Geekom AE7 | |
| Asus NUC 14 Pro | |
| Aoostar GEM10 | |
| Minisforum UH125 Pro | |
| Acemagic F2A | |
| Baldur's Gate 3 | |
| 1280x720 Low Preset | |
| Geekom AE7 | |
| Asus NUC 14 Pro | |
| Aoostar GEM10 | |
| Minisforum UH125 Pro | |
| 1920x1080 High Preset | |
| Geekom AE7 | |
| Aoostar GEM10 | |
| Asus NUC 14 Pro | |
| Minisforum UH125 Pro | |
| F1 24 | |
| 1920x1080 Low Preset AA:T AF:16x | |
| Geekom AE7 | |
| Asus NUC 14 Pro | |
| Minisforum UH125 Pro | |
| 1920x1080 High Preset AA:T AF:16x | |
| Geekom AE7 | |
| Asus NUC 14 Pro | |
| Minisforum UH125 Pro | |
FPS chart
| Bas | Moyen | Élevé | Ultra | |
|---|---|---|---|---|
| GTA V (2015) | 156.3 | 148.8 | 39.9 | 16.6 |
| Dota 2 Reborn (2015) | 97.1 | 79.2 | 75.9 | 72.9 |
| Final Fantasy XV Benchmark (2018) | 60.6 | 35.4 | 25.3 | |
| X-Plane 11.11 (2018) | 47.5 | 38.5 | 32.9 | |
| Baldur's Gate 3 (2023) | 33.5 | 25.9 | 22.4 | 21.5 |
| Cyberpunk 2077 2.1 Phantom Liberty (2023) | 30.1 | 25.2 | 21.7 | 19.6 |
| F1 24 (2024) | 66.2 | 57.6 | 43.4 |
Vérification des performances de l'Asus NUC 14 Pro avec une Nvidia GeForce RTX 3060 Ti
Les performances 3D peuvent être sensiblement améliorées avec une carte graphique externe. Cependant, les accélérateurs 3D externes ne peuvent être connectés que via USB-C. Sans influencer l'évaluation globale, nous avons effectué quelques tests en combinaison avec le Razer Core X et une carte graphique Nvidia RTX 3060 Ti Nvidia GeForce RTX 3060 Ti. Nous constatons une amélioration constante des performances 3D, et même les jeux modernes peuvent maintenant être joués sans problème. En comparaison avec le Minisforum UH125 Prol'Asus NUC 14 Pro offre des performances identiques.
| Performance Rating - Percent | |
| Geekom XT13 Pro (Nvidia GeForce RTX 3060 Ti FE) | |
| Geekom AX8 Pro (Nvidia GeForce RTX 3060 Ti FE) | |
| Asus NUC 14 Pro (Nvidia GeForce RTX 3060 Ti FE) | |
| Minisforum UH125 Pro (Nvidia GeForce RTX 3060 Ti FE) | |
| 3DMark 11 - 1280x720 Performance GPU | |
| Geekom AX8 Pro (Nvidia GeForce RTX 3060 Ti FE) | |
| Geekom XT13 Pro (Nvidia GeForce RTX 3060 Ti FE) | |
| Minisforum UH125 Pro (Nvidia GeForce RTX 3060 Ti FE) | |
| Asus NUC 14 Pro (Nvidia GeForce RTX 3060 Ti FE) | |
| 3DMark | |
| 2560x1440 Time Spy Graphics | |
| Geekom AX8 Pro (Nvidia GeForce RTX 3060 Ti FE) | |
| Geekom XT13 Pro (Nvidia GeForce RTX 3060 Ti FE) | |
| Minisforum UH125 Pro (Nvidia GeForce RTX 3060 Ti FE) | |
| Asus NUC 14 Pro (Nvidia GeForce RTX 3060 Ti FE) | |
| 1920x1080 Fire Strike Graphics | |
| Geekom AX8 Pro (Nvidia GeForce RTX 3060 Ti FE) | |
| Geekom XT13 Pro (Nvidia GeForce RTX 3060 Ti FE) | |
| Minisforum UH125 Pro (Nvidia GeForce RTX 3060 Ti FE) | |
| Asus NUC 14 Pro (Nvidia GeForce RTX 3060 Ti FE) | |
| 3840x2160 Fire Strike Ultra Graphics | |
| Geekom AX8 Pro (Nvidia GeForce RTX 3060 Ti FE) | |
| Geekom XT13 Pro (Nvidia GeForce RTX 3060 Ti FE) | |
| Asus NUC 14 Pro (Nvidia GeForce RTX 3060 Ti FE) | |
| Minisforum UH125 Pro (Nvidia GeForce RTX 3060 Ti FE) | |
| Unigine Superposition | |
| 1280x720 720p Low | |
| Geekom AX8 Pro (Nvidia GeForce RTX 3060 Ti FE) | |
| Geekom XT13 Pro (Nvidia GeForce RTX 3060 Ti FE) | |
| Asus NUC 14 Pro (Nvidia GeForce RTX 3060 Ti FE) | |
| Minisforum UH125 Pro (Nvidia GeForce RTX 3060 Ti FE) | |
| 1920x1080 1080p High | |
| Geekom AX8 Pro (Nvidia GeForce RTX 3060 Ti FE) | |
| Geekom XT13 Pro (Nvidia GeForce RTX 3060 Ti FE) | |
| Asus NUC 14 Pro (Nvidia GeForce RTX 3060 Ti FE) | |
| Minisforum UH125 Pro (Nvidia GeForce RTX 3060 Ti FE) | |
| 1920x1080 1080p Extreme | |
| Geekom AX8 Pro (Nvidia GeForce RTX 3060 Ti FE) | |
| Asus NUC 14 Pro (Nvidia GeForce RTX 3060 Ti FE) | |
| Geekom XT13 Pro (Nvidia GeForce RTX 3060 Ti FE) | |
| Minisforum UH125 Pro (Nvidia GeForce RTX 3060 Ti FE) | |
| 3840x2160 4k Optimized | |
| Geekom XT13 Pro (Nvidia GeForce RTX 3060 Ti FE) | |
| Asus NUC 14 Pro (Nvidia GeForce RTX 3060 Ti FE) | |
| Geekom AX8 Pro (Nvidia GeForce RTX 3060 Ti FE) | |
| Minisforum UH125 Pro (Nvidia GeForce RTX 3060 Ti FE) | |
| 7680x4320 8k Optimized | |
| Geekom XT13 Pro (Nvidia GeForce RTX 3060 Ti FE) | |
| Geekom AX8 Pro (Nvidia GeForce RTX 3060 Ti FE) | |
| Minisforum UH125 Pro (Nvidia GeForce RTX 3060 Ti FE) | |
| Asus NUC 14 Pro (Nvidia GeForce RTX 3060 Ti FE) | |
| Unigine Valley 1.0 | |
| 1920x1080 Extreme HD DirectX AA:x8 | |
| Geekom XT13 Pro (Nvidia GeForce RTX 3060 Ti FE) | |
| Geekom AX8 Pro (Nvidia GeForce RTX 3060 Ti FE) | |
| Asus NUC 14 Pro (Nvidia GeForce RTX 3060 Ti FE) | |
| Minisforum UH125 Pro (Nvidia GeForce RTX 3060 Ti FE) | |
| 1920x1080 Extreme HD Preset OpenGL AA:x8 | |
| Geekom XT13 Pro (Nvidia GeForce RTX 3060 Ti FE) | |
| Geekom AX8 Pro (Nvidia GeForce RTX 3060 Ti FE) | |
| Asus NUC 14 Pro (Nvidia GeForce RTX 3060 Ti FE) | |
| Minisforum UH125 Pro (Nvidia GeForce RTX 3060 Ti FE) | |
| Unigine Heaven 4.0 | |
| Extreme Preset OpenGL | |
| Geekom AX8 Pro (Nvidia GeForce RTX 3060 Ti FE) | |
| Geekom XT13 Pro (Nvidia GeForce RTX 3060 Ti FE) | |
| Asus NUC 14 Pro (Nvidia GeForce RTX 3060 Ti FE) | |
| Minisforum UH125 Pro (Nvidia GeForce RTX 3060 Ti FE) | |
| Extreme Preset DX11 | |
| Geekom XT13 Pro (Nvidia GeForce RTX 3060 Ti FE) | |
| Geekom AX8 Pro (Nvidia GeForce RTX 3060 Ti FE) | |
| Minisforum UH125 Pro (Nvidia GeForce RTX 3060 Ti FE) | |
| Asus NUC 14 Pro (Nvidia GeForce RTX 3060 Ti FE) | |
| ComputeMark v2.1 | |
| 1024x600 Normal, Score | |
| Geekom XT13 Pro (Nvidia GeForce RTX 3060 Ti FE) | |
| Asus NUC 14 Pro (Nvidia GeForce RTX 3060 Ti FE) | |
| Minisforum UH125 Pro (Nvidia GeForce RTX 3060 Ti FE) | |
| Geekom AX8 Pro (Nvidia GeForce RTX 3060 Ti FE) | |
| 1024x600 Normal, Fluid 3DTex | |
| Minisforum UH125 Pro (Nvidia GeForce RTX 3060 Ti FE) | |
| Geekom AX8 Pro (Nvidia GeForce RTX 3060 Ti FE) | |
| Geekom XT13 Pro (Nvidia GeForce RTX 3060 Ti FE) | |
| Asus NUC 14 Pro (Nvidia GeForce RTX 3060 Ti FE) | |
| 1024x600 Normal, Fluid 2DTexArr | |
| Minisforum UH125 Pro (Nvidia GeForce RTX 3060 Ti FE) | |
| Geekom AX8 Pro (Nvidia GeForce RTX 3060 Ti FE) | |
| Geekom XT13 Pro (Nvidia GeForce RTX 3060 Ti FE) | |
| Asus NUC 14 Pro (Nvidia GeForce RTX 3060 Ti FE) | |
| 1024x600 Normal, Mandel Vector | |
| Geekom XT13 Pro (Nvidia GeForce RTX 3060 Ti FE) | |
| Asus NUC 14 Pro (Nvidia GeForce RTX 3060 Ti FE) | |
| Minisforum UH125 Pro (Nvidia GeForce RTX 3060 Ti FE) | |
| Geekom AX8 Pro (Nvidia GeForce RTX 3060 Ti FE) | |
| 1024x600 Normal, Mandel Scalar | |
| Geekom XT13 Pro (Nvidia GeForce RTX 3060 Ti FE) | |
| Asus NUC 14 Pro (Nvidia GeForce RTX 3060 Ti FE) | |
| Minisforum UH125 Pro (Nvidia GeForce RTX 3060 Ti FE) | |
| Geekom AX8 Pro (Nvidia GeForce RTX 3060 Ti FE) | |
| 1024x600 Normal, QJuliaRayTrace | |
| Geekom XT13 Pro (Nvidia GeForce RTX 3060 Ti FE) | |
| Asus NUC 14 Pro (Nvidia GeForce RTX 3060 Ti FE) | |
| Minisforum UH125 Pro (Nvidia GeForce RTX 3060 Ti FE) | |
| Geekom AX8 Pro (Nvidia GeForce RTX 3060 Ti FE) | |
| Performance Rating - Percent | |
| Geekom AX8 Pro (Nvidia GeForce RTX 3060 Ti FE) | |
| Geekom XT13 Pro (Nvidia GeForce RTX 3060 Ti FE) | |
| Minisforum UH125 Pro (Nvidia GeForce RTX 3060 Ti FE) | |
| Asus NUC 14 Pro (Nvidia GeForce RTX 3060 Ti FE) | |
| Cyberpunk 2077 2.1 Phantom Liberty | |
| 1280x720 Low Preset (FSR off) | |
| Geekom AX8 Pro (Nvidia GeForce RTX 3060 Ti FE) | |
| Geekom XT13 Pro (Nvidia GeForce RTX 3060 Ti FE) | |
| Asus NUC 14 Pro (Nvidia GeForce RTX 3060 Ti FE) | |
| Minisforum UH125 Pro (Nvidia GeForce RTX 3060 Ti FE) | |
| 1920x1080 Medium Preset (FSR off) | |
| Geekom AX8 Pro (Nvidia GeForce RTX 3060 Ti FE) | |
| Geekom XT13 Pro (Nvidia GeForce RTX 3060 Ti FE) | |
| Minisforum UH125 Pro (Nvidia GeForce RTX 3060 Ti FE) | |
| Asus NUC 14 Pro (Nvidia GeForce RTX 3060 Ti FE) | |
| 1920x1080 Ultra Preset (FSR off) | |
| Geekom XT13 Pro (Nvidia GeForce RTX 3060 Ti FE) | |
| Geekom AX8 Pro (Nvidia GeForce RTX 3060 Ti FE) | |
| Minisforum UH125 Pro (Nvidia GeForce RTX 3060 Ti FE) | |
| Asus NUC 14 Pro (Nvidia GeForce RTX 3060 Ti FE) | |
| Baldur's Gate 3 | |
| 1920x1080 Low Preset | |
| Geekom XT13 Pro (Nvidia GeForce RTX 3060 Ti FE) | |
| Asus NUC 14 Pro (Nvidia GeForce RTX 3060 Ti FE) | |
| Geekom AX8 Pro (Nvidia GeForce RTX 3060 Ti FE) | |
| Minisforum UH125 Pro (Nvidia GeForce RTX 3060 Ti FE) | |
| 1920x1080 Medium Preset | |
| Geekom XT13 Pro (Nvidia GeForce RTX 3060 Ti FE) | |
| Geekom AX8 Pro (Nvidia GeForce RTX 3060 Ti FE) | |
| Minisforum UH125 Pro (Nvidia GeForce RTX 3060 Ti FE) | |
| Asus NUC 14 Pro (Nvidia GeForce RTX 3060 Ti FE) | |
| 1920x1080 Ultra Preset | |
| Geekom XT13 Pro (Nvidia GeForce RTX 3060 Ti FE) | |
| Geekom AX8 Pro (Nvidia GeForce RTX 3060 Ti FE) | |
| Minisforum UH125 Pro (Nvidia GeForce RTX 3060 Ti FE) | |
| Asus NUC 14 Pro (Nvidia GeForce RTX 3060 Ti FE) | |
| F1 24 | |
| 1920x1080 Low Preset AA:T AF:16x | |
| Geekom AX8 Pro (Nvidia GeForce RTX 3060 Ti FE) | |
| Geekom XT13 Pro (Nvidia GeForce RTX 3060 Ti FE) | |
| Asus NUC 14 Pro (Nvidia GeForce RTX 3060 Ti FE) | |
| Minisforum UH125 Pro (Nvidia GeForce RTX 3060 Ti FE) | |
| 1920x1080 Medium Preset AA:T AF:16x | |
| Geekom AX8 Pro (Nvidia GeForce RTX 3060 Ti FE) | |
| Geekom XT13 Pro (Nvidia GeForce RTX 3060 Ti FE) | |
| Asus NUC 14 Pro (Nvidia GeForce RTX 3060 Ti FE) | |
| Minisforum UH125 Pro (Nvidia GeForce RTX 3060 Ti FE) | |
| 1920x1080 High Preset AA:T AF:16x | |
| Geekom AX8 Pro (Nvidia GeForce RTX 3060 Ti FE) | |
| Geekom XT13 Pro (Nvidia GeForce RTX 3060 Ti FE) | |
| Asus NUC 14 Pro (Nvidia GeForce RTX 3060 Ti FE) | |
| Minisforum UH125 Pro (Nvidia GeForce RTX 3060 Ti FE) | |
| Asus NUC 14 Pro (Nvidia GeForce RTX 3060 Ti FE), Ultra 5 125H | Minisforum UH125 Pro (Nvidia GeForce RTX 3060 Ti FE), Ultra 5 125H | Geekom AX8 Pro (Nvidia GeForce RTX 3060 Ti FE), R9 8945HS | Geekom XT13 Pro (Nvidia GeForce RTX 3060 Ti FE), i9-13900H | Moyenne de la classe Mini PC | |
|---|---|---|---|---|---|
| SPECviewperf 2020 | 290% | 126% | 304% | 300% | 154% |
| 3840x2160 Medical (medical-03) | 13 121% | 10.9 86% | 13 121% | 13 121% | 7.85 ? 34% |
| 3840x2160 Energy (energy-03) | 20.9 449% | 17.8 367% | 21 451% | 20.9 449% | 11.3 ? 197% |
| 3840x2160 Creo (creo-03) | 68.3 346% | 26.6 74% | 77.2 405% | 74.2 385% | 30.7 ? 101% |
| 3840x2160 CATIA (catia-06) | 37.3 259% | 23.6 127% | 39.2 277% | 39.4 279% | 18.6 ? 79% |
| 3840x2160 3ds Max (3dsmax-07) | 46.5 221% | 28.7 98% | 46.1 218% | 47.2 226% | 22.5 ? 55% |
| 3840x2160 Siemens NX (snx-04) | 16.2 178% | 11.4 96% | 16.7 187% | 16.5 184% | 37.2 ? 539% |
| 3840x2160 Maya (maya-06) | 193 456% | 47.5 37% | 198 471% | 194 459% | 58.9 ? 70% |
| Bas | Moyen | Élevé | Ultra | QHD | 4K | |
|---|---|---|---|---|---|---|
| GTA V (2015) | 178.7 | 174 | 162.9 | 100.6 | 90 | 102.6 |
| Dota 2 Reborn (2015) | 159 | 138.8 | 131 | 122.6 | 104.3 | |
| Final Fantasy XV Benchmark (2018) | 163.8 | 141 | 97.3 | 75.6 | 47.4 | |
| X-Plane 11.11 (2018) | 119.6 | 107.5 | 83.7 | 71.7 | ||
| Baldur's Gate 3 (2023) | 111.6 | 86 | 72.8 | 72.1 | 57.5 | 36.4 |
| Cyberpunk 2077 2.1 Phantom Liberty (2023) | 72.4 | 69.8 | 63.7 | 58.3 | 43.5 | 22.2 |
| F1 24 (2024) | 75.3 | 71.7 | 59.5 | 41.1 | 35.7 | 16.9 |
Émissions
Émissions sonores
L'Asus NUC 14 Pro est très silencieux la plupart du temps. Cependant, le ventilateur fonctionne également en mode veille, et le fonctionnement n'est donc pas silencieux. En charge moyenne, nous avons enregistré un niveau de pression sonore de 42,4 dB(A). Le Minisforum UH125 Pro et l'Aoostar GEM10 se situent à peu près au même niveau. À charge maximale, notre échantillon de test atteint 47,8 dB(A). Cela signifie que l'Asus NUC 14 Pro est clairement audible, bien que la perception subjective du niveau sonore soit un peu plus faible.
Degré de la nuisance sonore
| Au repos |
| 26 / 26.2 / 26.2 dB(A) |
| Fortement sollicité |
| 42.4 / 47.8 dB(A) |
 | ||
30 dB silencieux 40 dB(A) audible 50 dB(A) bruyant |
||
min: | ||
| Asus NUC 14 Pro Ultra 5 125H, Arc 7-Core | Geekom AE7 R9 7940HS, Radeon 780M | Minisforum UH125 Pro Ultra 5 125H, Arc 7-Core | Aoostar GEM10 R7 6800H, Radeon 680M | Acemagic F2A Ultra 7 155H, Arc 8-Core | Geekom A5 R7 5800H, Vega 8 | |
|---|---|---|---|---|---|---|
| Noise | -4% | -12% | -13% | -2% | -7% | |
| off / environment * | 24 | 24.4 -2% | 24.8 -3% | 24.3 -1% | 24.9 -4% | 25 -4% |
| Idle Minimum * | 26 | 24.9 4% | 35 -35% | 36.5 -40% | 25.4 2% | 28.2 -8% |
| Idle Average * | 26.2 | 25 5% | 35 -34% | 36.6 -40% | 25.7 2% | 28.2 -8% |
| Idle Maximum * | 26.2 | 25 5% | 35 -34% | 36.6 -40% | 25.7 2% | 28.2 -8% |
| Load Average * | 42.4 | 52 -23% | 42.2 -0% | 41.7 2% | 47.8 -13% | 47.8 -13% |
| Cyberpunk 2077 ultra * | 47.7 | 52 -9% | 40.8 14% | 40.3 16% | ||
| Load Maximum * | 47.8 | 51.4 -8% | 43.9 8% | 40.8 15% | 49 -3% | 47.4 1% |
| Witcher 3 ultra * | 40.18 | 45.23 |
* ... Moindre est la valeur, meilleures sont les performances
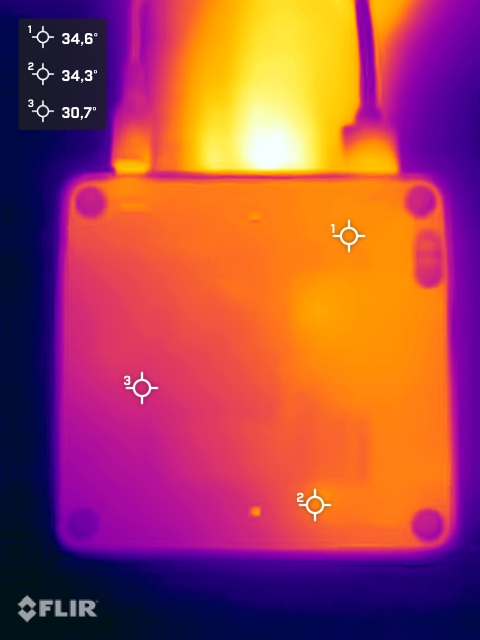
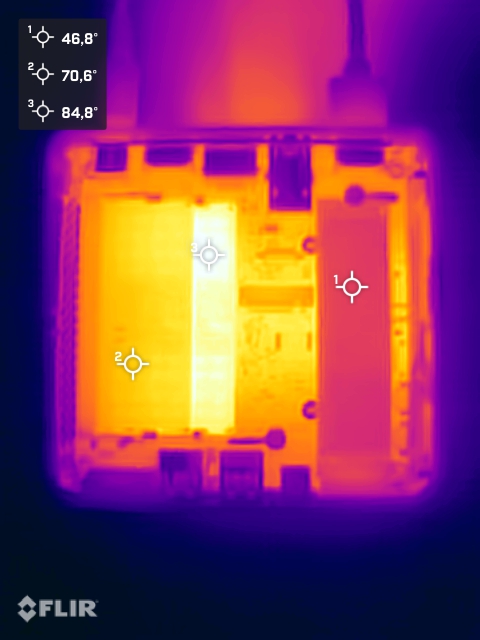
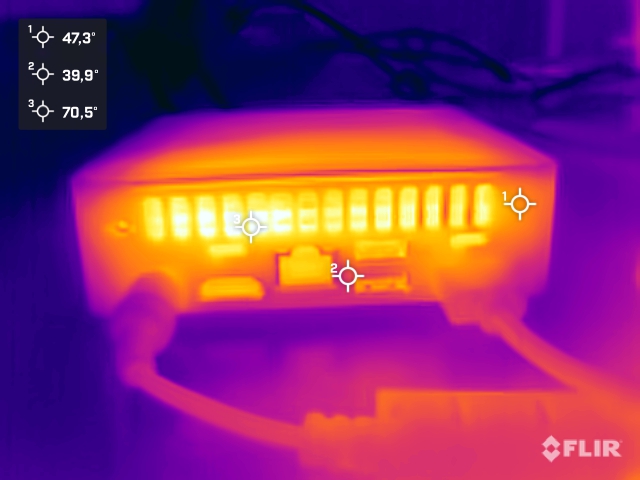
Température
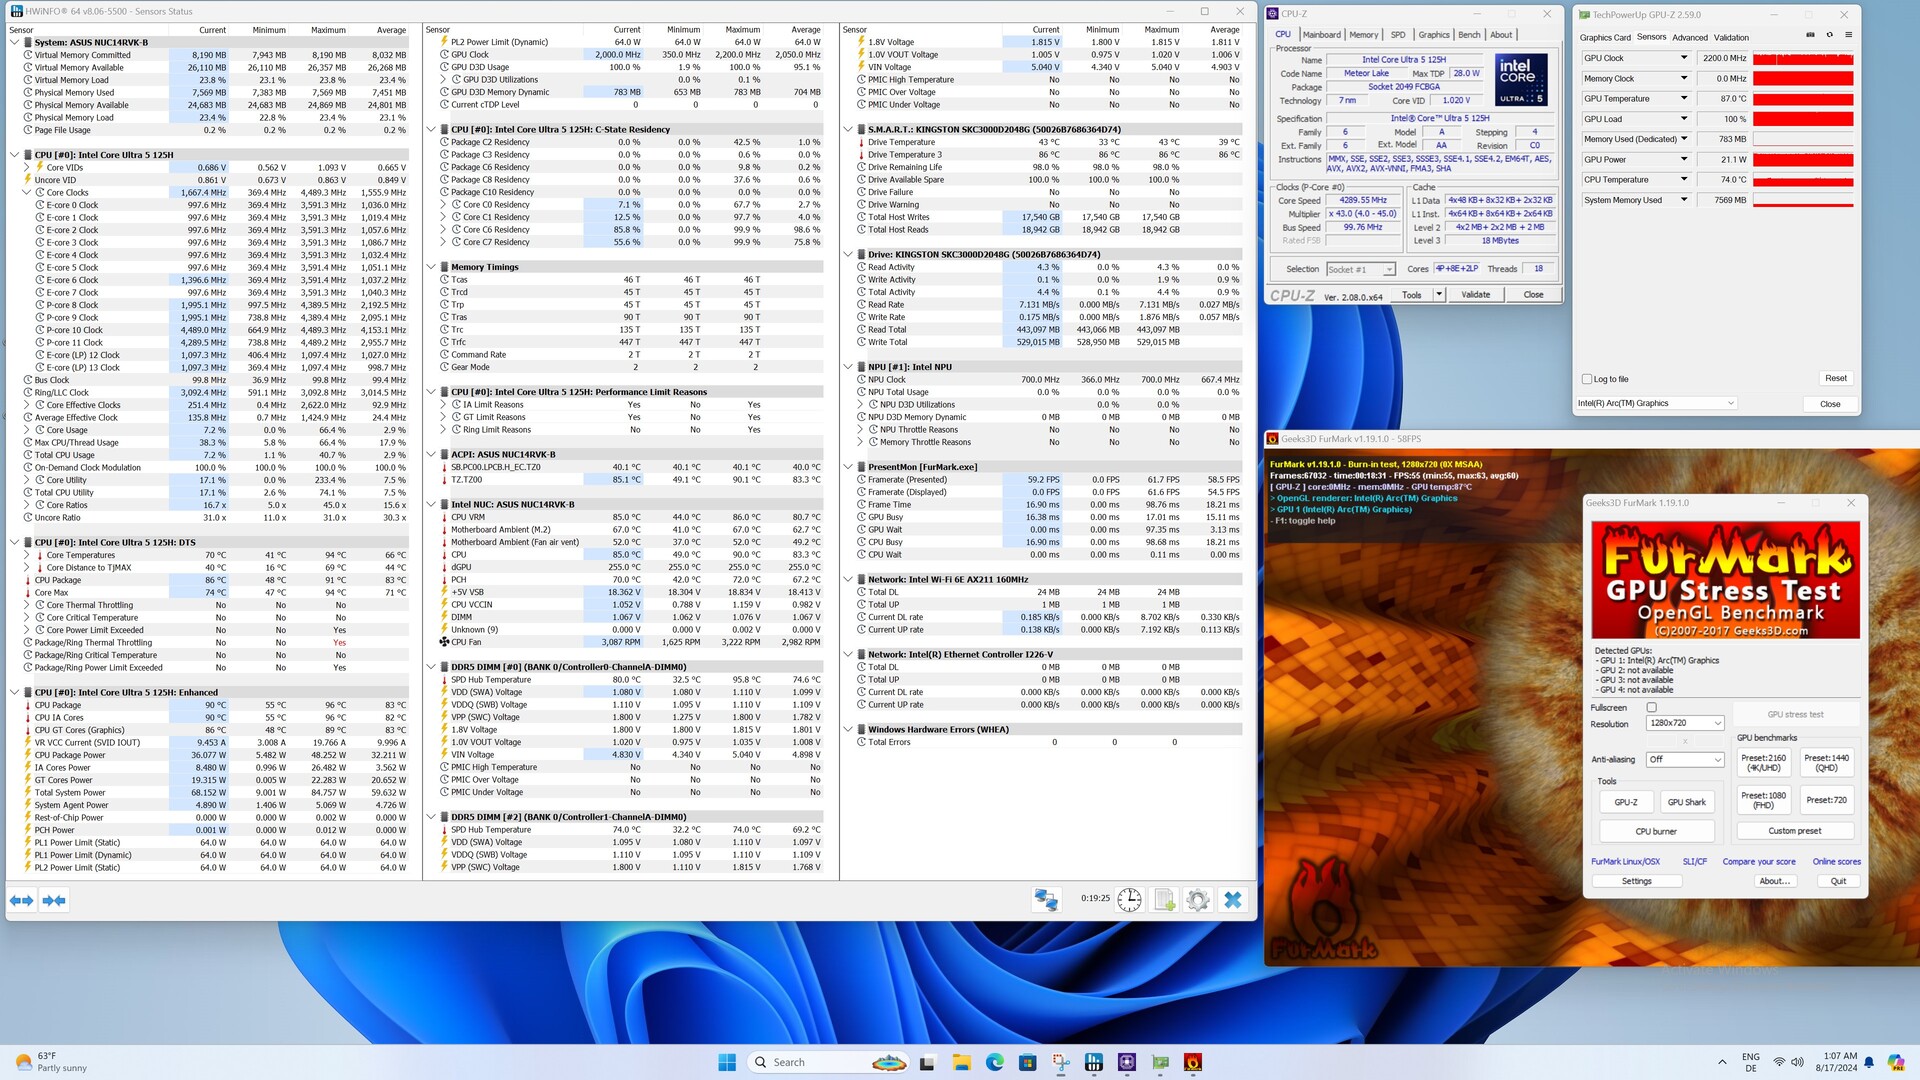
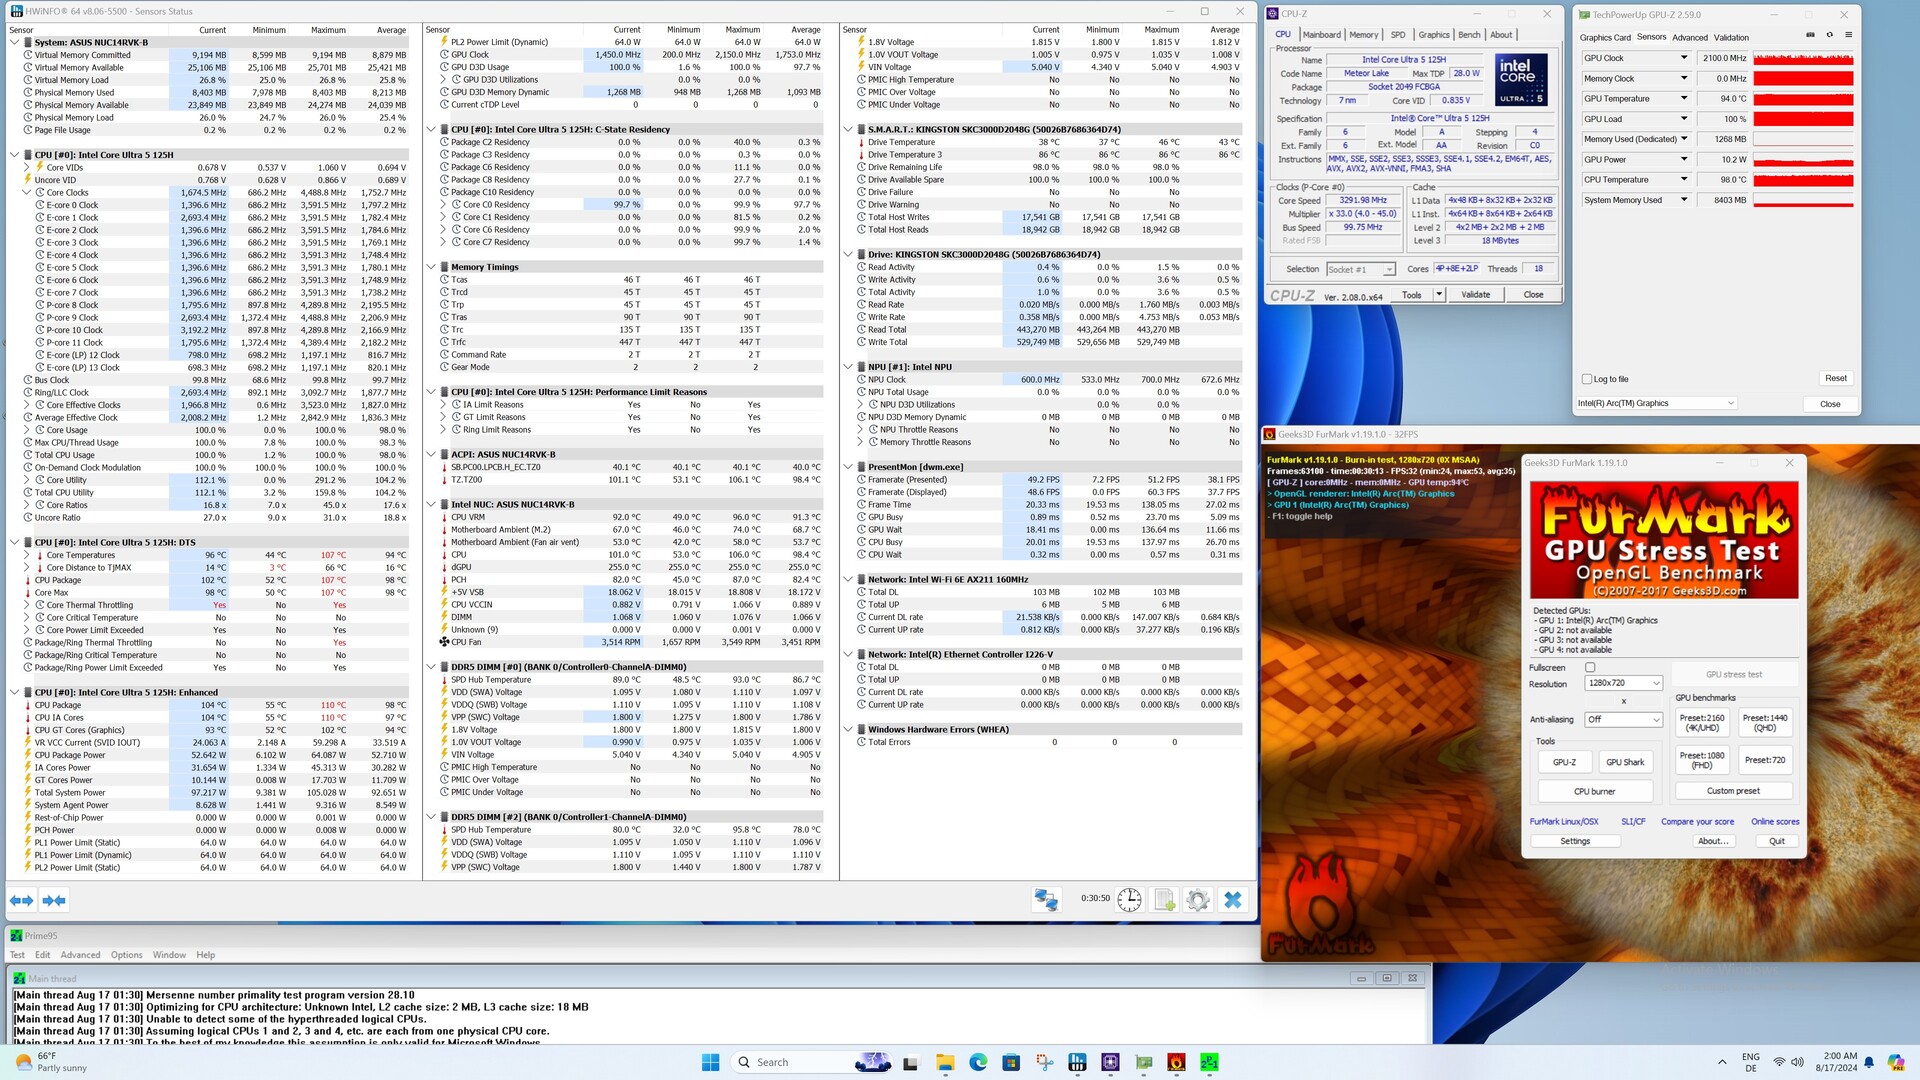
Le boîtier de l'Asus NUC 14 Pro chauffe considérablement aux endroits sollicités. Nous avons enregistré un maximum de 55,1 °C sur le dessus. Il n'y a pas d'anomalie notable en mode veille. Lors du test de stress, nous avons facilement atteint des valeurs supérieures à 100 °C pour le SoC. Selon Intel, l'Intel Core Ultra 5 125H est conçu pour une température de fonctionnement allant jusqu'à 110 °C. Nous avons atteint cette température lors du test de stress, bien que la consommation d'énergie ait été réduite à environ 50 watts. Le système de refroidissement n'est pas en mesure de dissiper en permanence les 64 watts définis comme PL1 et PL2.
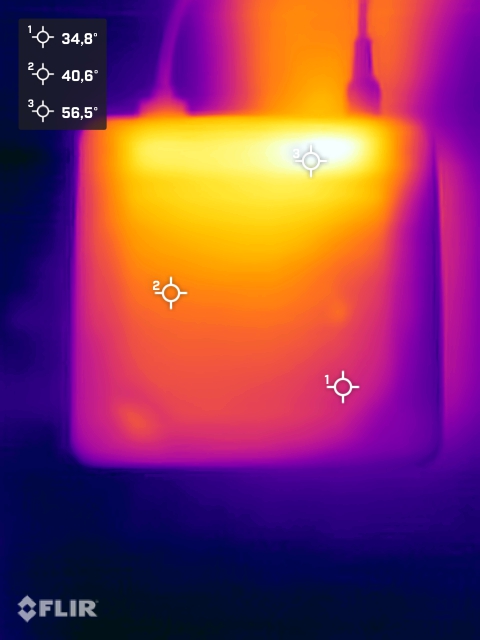
(-) La température maximale du côté supérieur est de 55.1 °C / 131 F, par rapport à la moyenne de 35.8 °C / 96 F, allant de 24 à 69.5 °C pour la classe Mini PC.
(+) Le fond chauffe jusqu'à un maximum de 39.3 °C / 103 F, contre une moyenne de 36.1 °C / 97 F
(+) En utilisation inactive, la température moyenne du côté supérieur est de 30.8 °C / 87 F, par rapport à la moyenne du dispositif de 32.3 °C / 90 F.
Consommation électrique
Asus a relativement bien maîtrisé la consommation d'énergie du NUC 14 Pro. En charge moyenne, notre échantillon de test ne nécessite que 55,5 watts, ce qui est un peu plus que le Miniforum UH125 Pro. La raison en est la limite de puissance légèrement plus élevée qu'Asus impose au SoC. Nous avons brièvement enregistré une consommation de 103,3 watts, ce que le bloc d'alimentation de 120 watts peut facilement supporter.


| Éteint/en veille | |
| Au repos | |
| Fortement sollicité |
|
Légende:
min: | |
| Asus NUC 14 Pro Ultra 5 125H, Arc 7-Core | Geekom AE7 R9 7940HS, Radeon 780M | Minisforum UH125 Pro Ultra 5 125H, Arc 7-Core | Aoostar GEM10 R7 6800H, Radeon 680M | Acemagic F2A Ultra 7 155H, Arc 8-Core | Geekom A5 R7 5800H, Vega 8 | Moyenne Intel Arc 7-Core iGPU | Moyenne de la classe Mini PC | |
|---|---|---|---|---|---|---|---|---|
| Power Consumption | 3% | -38% | -11% | -29% | -3% | -6% | -36% | |
| Idle Minimum * | 5.1 | 4.5 12% | 11.9 -133% | 7.3 -43% | 9.1 -78% | 6.9 -35% | 6.88 ? -35% | 9.64 ? -89% |
| Idle Average * | 6.4 | 4.7 27% | 14.6 -128% | 8.7 -36% | 10.3 -61% | 7.9 -23% | 9.02 ? -41% | 11.8 ? -84% |
| Idle Maximum * | 14.7 | 8.1 45% | 15.4 -5% | 10.4 29% | 14.4 2% | 8.9 39% | 12.2 ? 17% | 15.1 ? -3% |
| Load Average * | 55.5 | 81.8 -47% | 48.3 13% | 67.2 -21% | 54.9 1% | 60.8 -10% | 51.4 ? 7% | 59.3 ? -7% |
| Cyberpunk 2077 ultra external monitor * | 59.1 | 71.2 -20% | 52.7 11% | 58.8 1% | ||||
| Load Maximum * | 103.3 | 100.3 3% | 89.8 13% | 101.6 2% | 110.4 -7% | 89.7 13% | 78.3 ? 24% | 101.1 ? 2% |
* ... Moindre est la valeur, meilleures sont les performances
Efficiency
| Performance Rating - Percent | |
| Geekom AE7 | |
| Minisforum UH125 Pro | |
| Asus NUC 14 Pro | |
| Acemagic F2A | |
| Power Consumption | |
| Cinebench R23 Multi Power Efficiency - external Monitor | |
| Geekom AE7 | |
| Acemagic F2A | |
| Minisforum UH125 Pro | |
| Asus NUC 14 Pro | |
| Cinebench R23 Single Power Efficiency - external Monitor | |
| Asus NUC 14 Pro | |
| Geekom AE7 | |
| Minisforum UH125 Pro | |
| Acemagic F2A | |
| Cinebench R15 Multi Efficiency (external Monitor) | |
| Geekom AE7 | |
| Minisforum UH125 Pro | |
| Acemagic F2A | |
| Asus NUC 14 Pro | |
Power consumtion with the external monitor
Power consumtion with the external monitor
Points positifs
Points négatifs
Verdict - Mini PC professionnel avec options BIOS étendues
Les célèbres mini-PC NUC, autrefois commercialisés directement par Intel, sont désormais poursuivis par Asus de la même manière. Basés sur les processeurs Meteor Lake, les PC compacts bénéficient d'un gain de performance notable en termes de performances 3D.
Peu de choses ont changé en termes de design par rapport aux mini PC NUC déjà connus. Un boîtier entièrement métallique serait souhaitable, car l'Asus NUC 14 Pro est inférieur à certains de ses concurrents à cet égard. En termes de dimensions, le mini PC est plus petit que beaucoup d'autres appareils. Malheureusement, cette conception conduit à un compromis que tous les fabricants doivent faire. Les performances du SoC doivent être dissipées de manière fiable. Le NUC 14 Pro d'Asus y parvient plutôt bien s'il n'est pas soumis à des charges continues. Asus repousse la limite de température du processeur Intel Core Ultra 5 125H ce qui ne manquera pas de faire transpirer certains utilisateurs. En principe, les processeurs sont conçus pour ces plages de température. Entre-temps, le BIOS offre de nombreuses options qui influencent également la limite de température du processeur. Il est possible de fixer manuellement une limite. Il faut alors s'attendre à des performances légèrement inférieures. L'excellente connectivité doit être soulignée positivement : de nombreux ports USB et deux ports Thunderbolt 4 sont embarqués. Le Wi-Fi rapide et le réseau local 2,5G sont également inclus.
L'Asus NUC 14 Pro est un mini PC NUC puissant. La connectivité est meilleure que celle de la plupart des concurrents et les options BIOS étendues sont également un véritable argument de vente.
Le prix de l'Asus NUC 14 Pro ne sort pas de l'ordinaire. À 510 euros, l'appareil barebone n'est certainement pas une bonne affaire. Cependant, ses concurrents peuvent facilement coûter plus de 700 euros, y compris le SSD, la RAM et le système d'exploitation. En ce qui concerne le rapport qualité-prix, le Aoostar GEM10 est déjà disponible pour 459 dollars américains.
Note : Nous avons récemment mis à jour notre système d'évaluation et les résultats de la version 8 ne sont pas comparables à ceux de la version 7. Vous trouverez de plus amples informations ici.
Prix et disponibilité
L'Asus NUC 14 Pro est disponible dans différentes configurations. Le mini PC avec Intel Core Ultra 5 125H est actuellement disponible pour 500 euros. Notre appareil de test est listé chez Alternate et Notebooksbilliger. L'option Tall avec le même SoC offre un espace supplémentaire pour un support de données de 2,5 pouces et peut également être commandée chez Alternate ou Notebooksbilliger. Le prix est d'environ 520 euros.
Asus NUC 14 Pro
- 08/26/2024 v8
Sebastian Bade
 Total Sustainability Score:
 Transparency
The selection of devices to be reviewed is made by our editorial team. The test sample was provided to the author as a loan by the manufacturer or retailer for the purpose of this review. The lender had no influence on this review, nor did the manufacturer receive a copy of this review before publication. There was no obligation to publish this review. We never accept compensation or payment in return for our reviews. As an independent media company, Notebookcheck is not subjected to the authority of manufacturers, retailers or publishers.
This is how Notebookcheck is testing
Every year, Notebookcheck independently reviews hundreds of laptops and smartphones using standardized procedures to ensure that all results are comparable. We have continuously developed our test methods for around 20 years and set industry standards in the process. In our test labs, high-quality measuring equipment is utilized by experienced technicians and editors. These tests involve a multi-stage validation process. Our complex rating system is based on hundreds of well-founded measurements and benchmarks, which maintains objectivity. Further information on our test methods can be found here.
Price comparison
