


Critique du Dell Pro 13 Premium : L'ordinateur portable professionnel presque parfait
L'ordinateur portable "Promium".
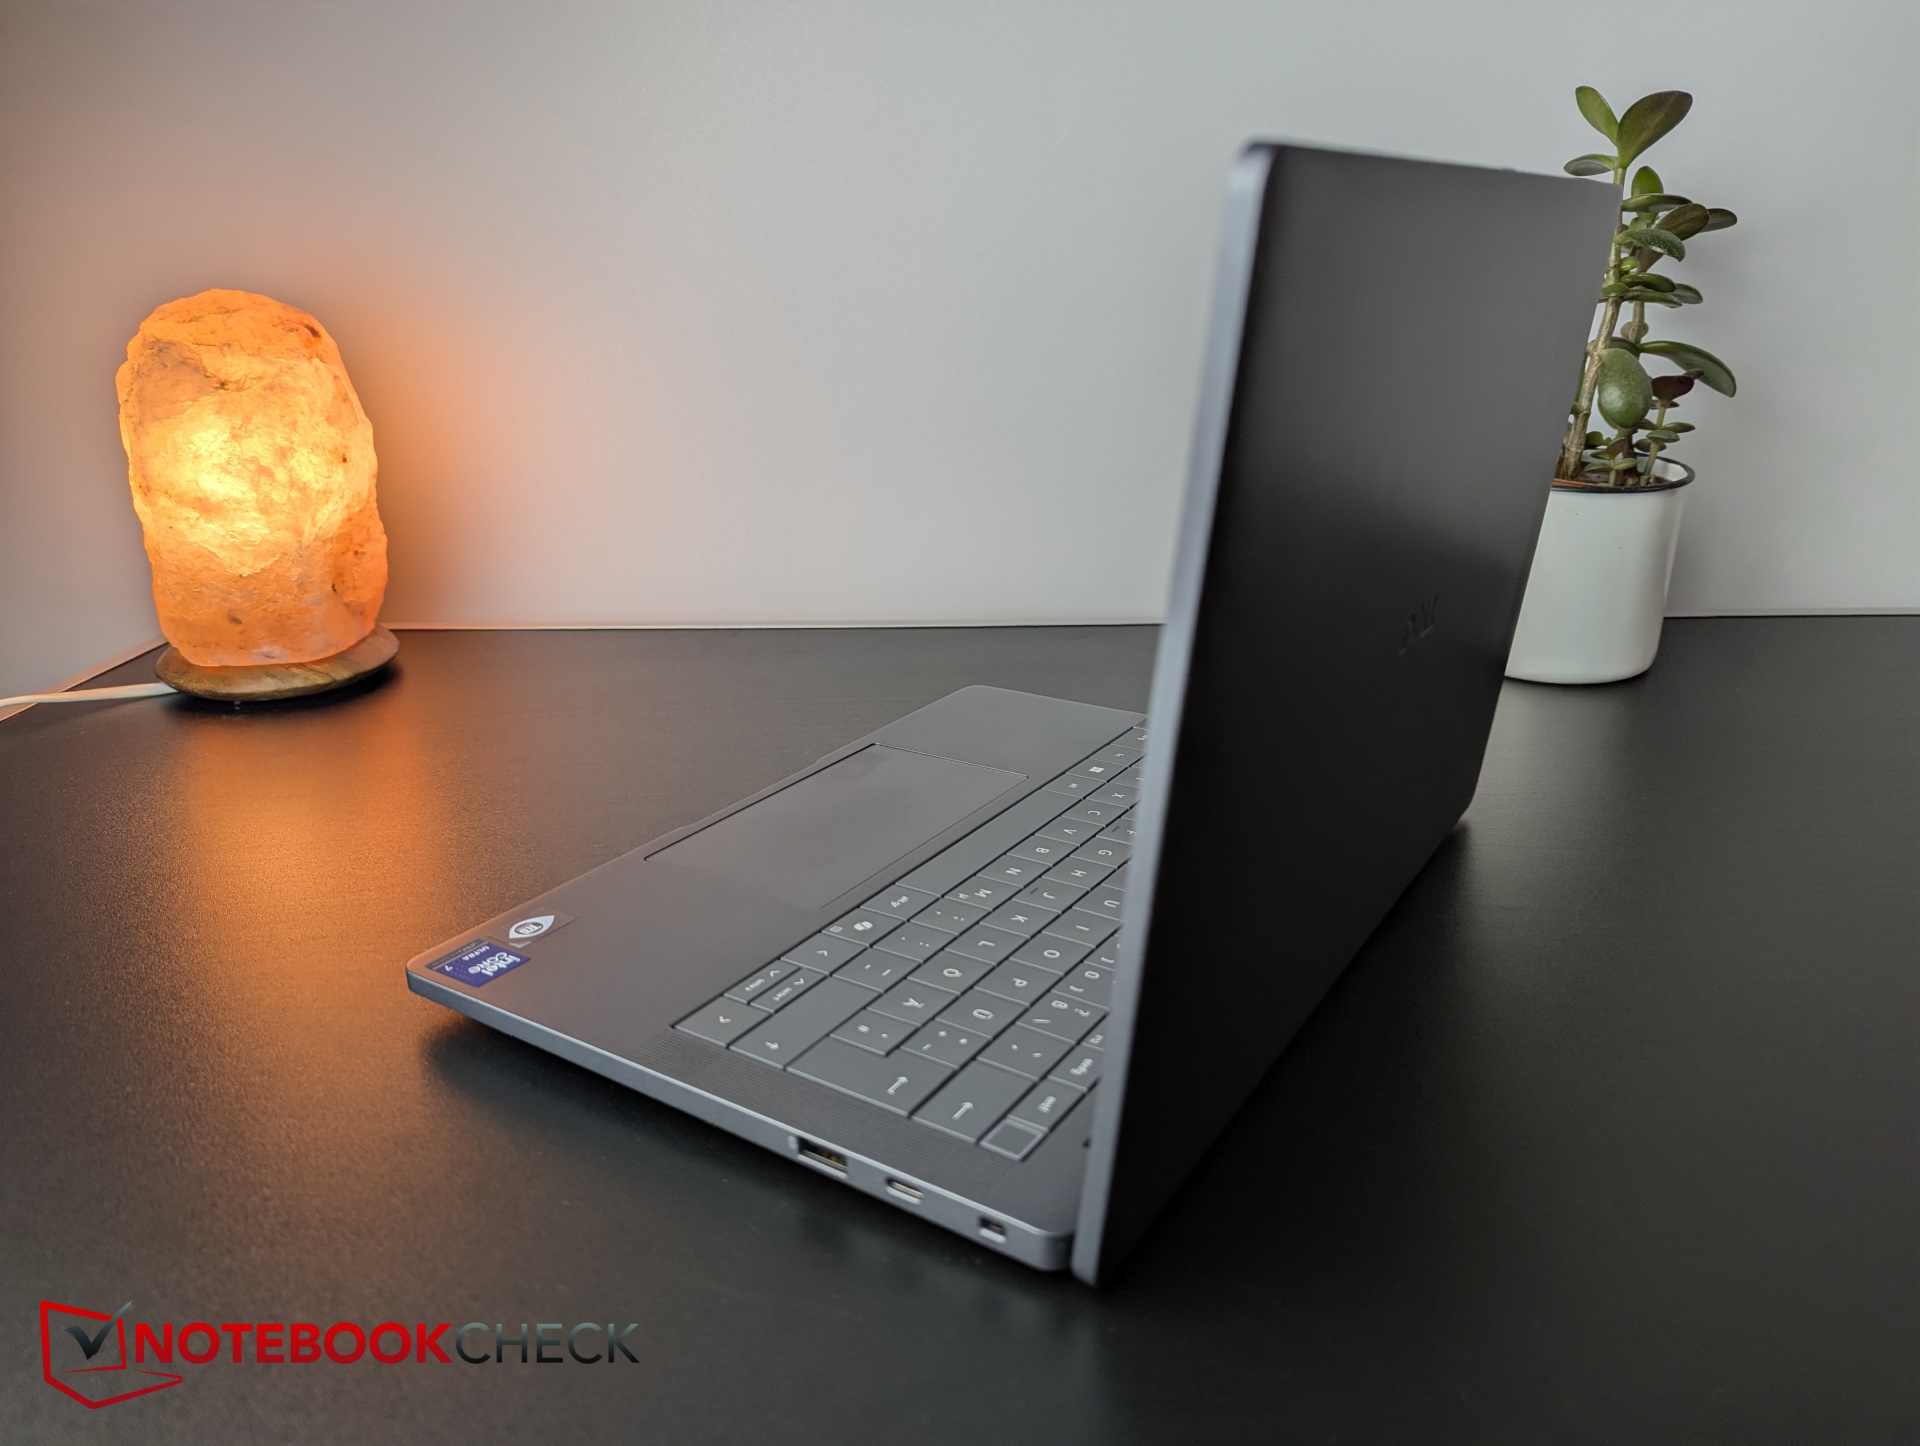
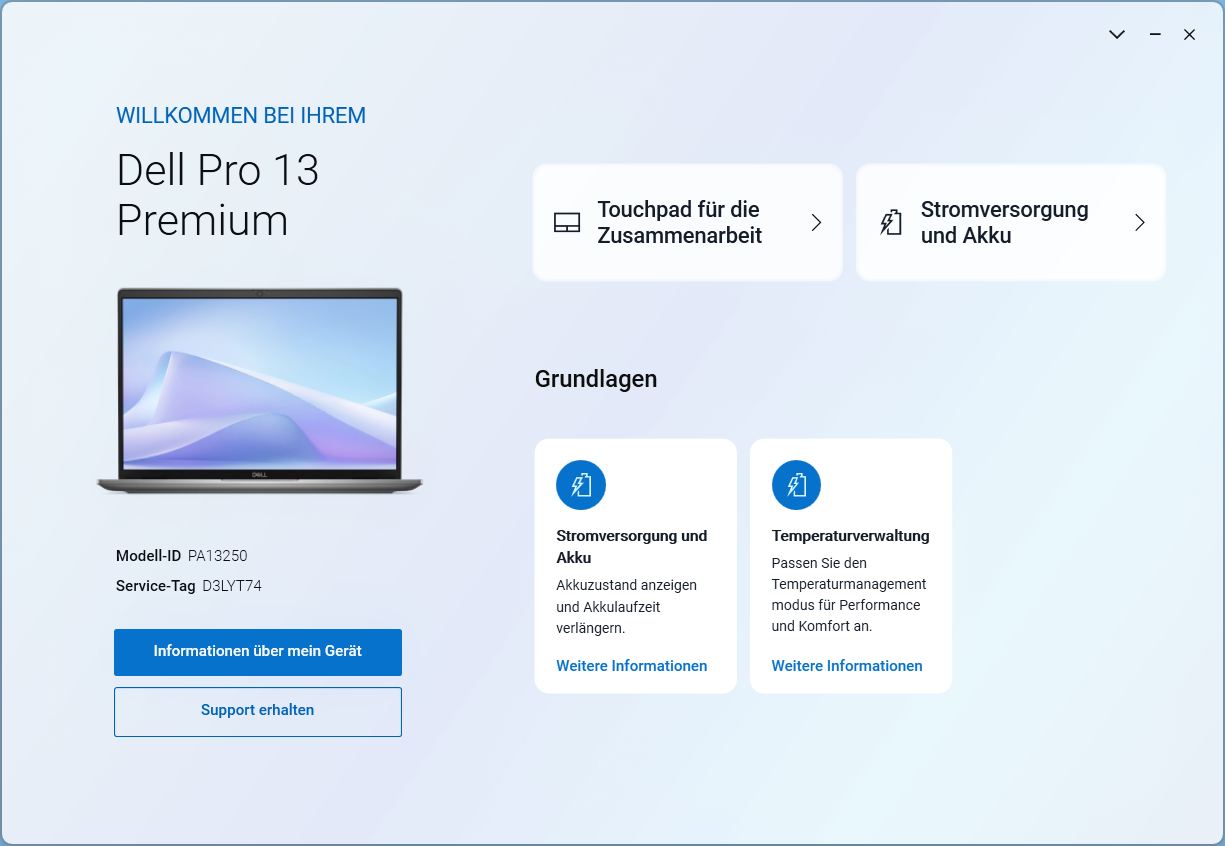
Nous profitons de l'occasion pour passer en revue l'ordinateur portable professionnel de 13 pouces de la gamme Dell. Destiné aux utilisateurs professionnels exigeants et conçu pour séduire les entrepreneurs grâce à ses ports modernes, le Dell Pro 13 Premium est doté d'un châssis en magnésium robuste et léger, d'une interface utilisateur et d'une batterie très longue durée.Christian Hintze, 👁 Christian Hintze (traduit par DeepL / Ninh Duy) Publié 🇺🇸 🇩🇪
Verdict - Un ordinateur portable professionnel presque complet
Le Dell Pro 13 Premium est un excellent ordinateur portable professionnel qui ne présente pratiquement aucune faiblesse, mais qui possède de nombreuses caractéristiques positives qui lui ont valu notre prix. Les employés d'entreprise et autres acheteurs potentiels disposent d'un ordinateur portable compact, petit, léger, économique, extrêmement autonome (24 heures !) et puissant, doté d'un châssis en magnésium de haute qualité, d'une webcam haute résolution de 8 MP et d'interfaces modernes telles que le double Thunderbolt 4 et le Wi-Fi 7. De plus, l'ordinateur portable reste toujours froid dans pratiquement toutes les situations.
Cependant, cela a un coût, puisque le prix de l'ordinateur portable est compris entre 1 900 et 2 500 dollars ! En gardant cela à l'esprit, le SSD M.2 2230 boiteux est presque scandaleux, mais dans les situations de tous les jours, vous remarquerez à peine la différence. Les seuls points à améliorer sont le nom et l'évolutivité.
Points positifs
Points négatifs
Prix et disponibilité
Notre modèle d'évaluation est équipé d'un écran FHD+ et coûte environ 2 100 $ sur la boutique en ligne de Dell.
- $29.99Smatree Hard EVA Protective Sleeve Compatible for 13.3 inch Dell Pro 13 Premium (PA13250), for 13 inch DELL Latitude 7350/7320 Detachable, for 12 inch DELL Latitude 7230 Rugged Extreme Tablet (X8016)
- $26.992025 New AI PC Charger HKY 65W USB C Charger PD3.0 Laptop Power Adapter for Dell Pro Series Dell Pro 13 14 Premium Dell Pro 16 14 Plus Dell Pro Rugged 13 14 inch Notebook Computer Power Supply Cord
Comparaison des alternatives possibles
Image | Modèle | Prix | Poids | Épaisseur | Écran |
|---|---|---|---|---|---|
1. 89.9%  | Dell Pro 13 Premium PA13250 Intel Core Ultra 7 268V ⎘ Intel Arc Graphics 140V ⎘ 32 Go Mémoire, 1024 Go SSD | Amazon: 1. $39.99 Smatree Hard Shell Laptop Ca... 2. $29.99 Smatree Hard EVA Protective ... 3. $26.99 2025 New AI PC Charger HKY 6... Prix de liste: 2700 Euro | 1.1 kg | 17.2 mm | 13.30" 1920x1200 170 PPI IPS |
2. 85%  | MSI Prestige 13 AI Plus Evo A2VMG Intel Core Ultra 7 258V ⎘ Intel Arc Graphics 140V ⎘ 32 Go Mémoire | Amazon: $1,349.99 Prix de liste: 1400 USD | 970 g | 16.9 mm | 13.30" 2880x1800 255 PPI OLED |
3. 85.1%  | Lenovo ThinkPad X13 2-in-1 Gen 5 Intel Core Ultra 7 165U ⎘ Intel Graphics 4-Core iGPU (Arc) ⎘ 32 Go Mémoire, 1000 Go SSD | Amazon: $1,589.00 Prix de liste: 2107.23 Euro | 1.3 kg | 16.4 mm | 13.30" 1920x1200 170 PPI IPS |
4. 84%  | Framework Laptop 13.5 Core Ultra 7 155H Intel Core Ultra 7 155H ⎘ Intel Arc 8-Core iGPU ⎘ 32 Go Mémoire | Prix de liste: 1500 USD | 1.4 kg | 15.85 mm | 13.50" 2880x1920 256 PPI IPS |
5. 85.3%  | Dell XPS 13 9350 Intel Core Ultra 7 256V ⎘ Intel Arc Graphics 140V ⎘ 16 Go Mémoire, 512 Go SSD | Amazon: 1. $1,499.99 2025 Latest Dell XPS 13 9350... 2. $2,099.00 NewDell XPS 13 9350 Powerful... 3. $949.00 Dell XPS 13-9350 13.3-Inch H... Prix de liste: 1400 USD | 1.2 kg | 15.3 mm | 13.40" 1920x1200 169 PPI IPS |
6. 80.7%  | Microsoft Surface Pro Copilot+ Qualcomm Snapdragon X Plus X1P-64-100 ⎘ Qualcomm SD X Adreno X1-85 3.8 TFLOPS ⎘ 16 Go Mémoire, 256 Go SSD | Amazon: $1,099.99 Prix de liste: 1199€ | 872 g | 9.3 mm | 13.00" 2880x1920 266 PPI IPS |
Table des matières
- Verdict - Un ordinateur portable professionnel presque complet
- Spécifications
- Boîtier et caractéristiques - Ce modèle Dell est équipé d'une webcam de 8 mégapixels
- Périphériques d'entrée - Le 13 Premium est équipé d'un pavé tactile pour les conférences téléphoniques
- Affichage - Un panneau de bureau à contraste élevé avec des options supplémentaires
- Performance - Un arc puissant 140V
- Émissions et énergie - Le Dell Pro est économique
- Notebookcheck note globale
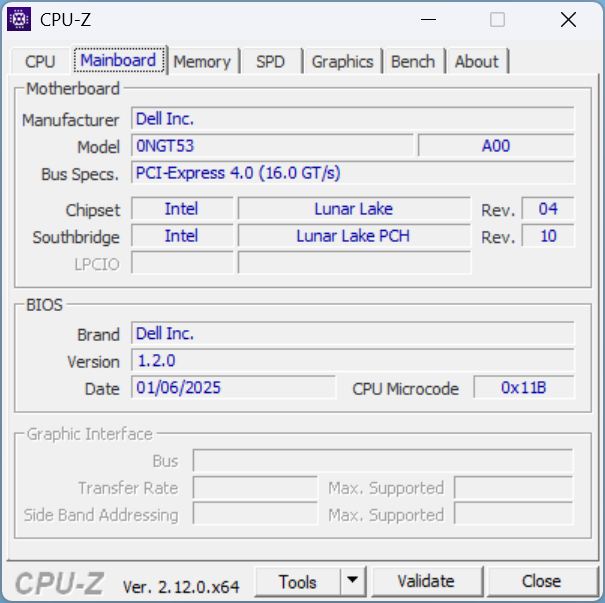
Dell a récemment modifié son système de dénomination. Avec la série Pro, Dell vise l'utilisateur professionnel typique, remplaçant essentiellement la série précédente Latitude. Notre modèle actuel de 13 pouces est équipé de ports modernes, d'une sécurité étendue, de beaucoup d'intelligence artificielle, d'un châssis robuste en magnésium et, malgré tout, pèse un peu plus d'un kilogramme. Alors, s'agit-il de l'ordinateur portable haut de gamme pour les utilisateurs professionnels ?
Spécifications
Boîtier et caractéristiques - Ce modèle Dell est équipé d'une webcam de 8 mégapixels
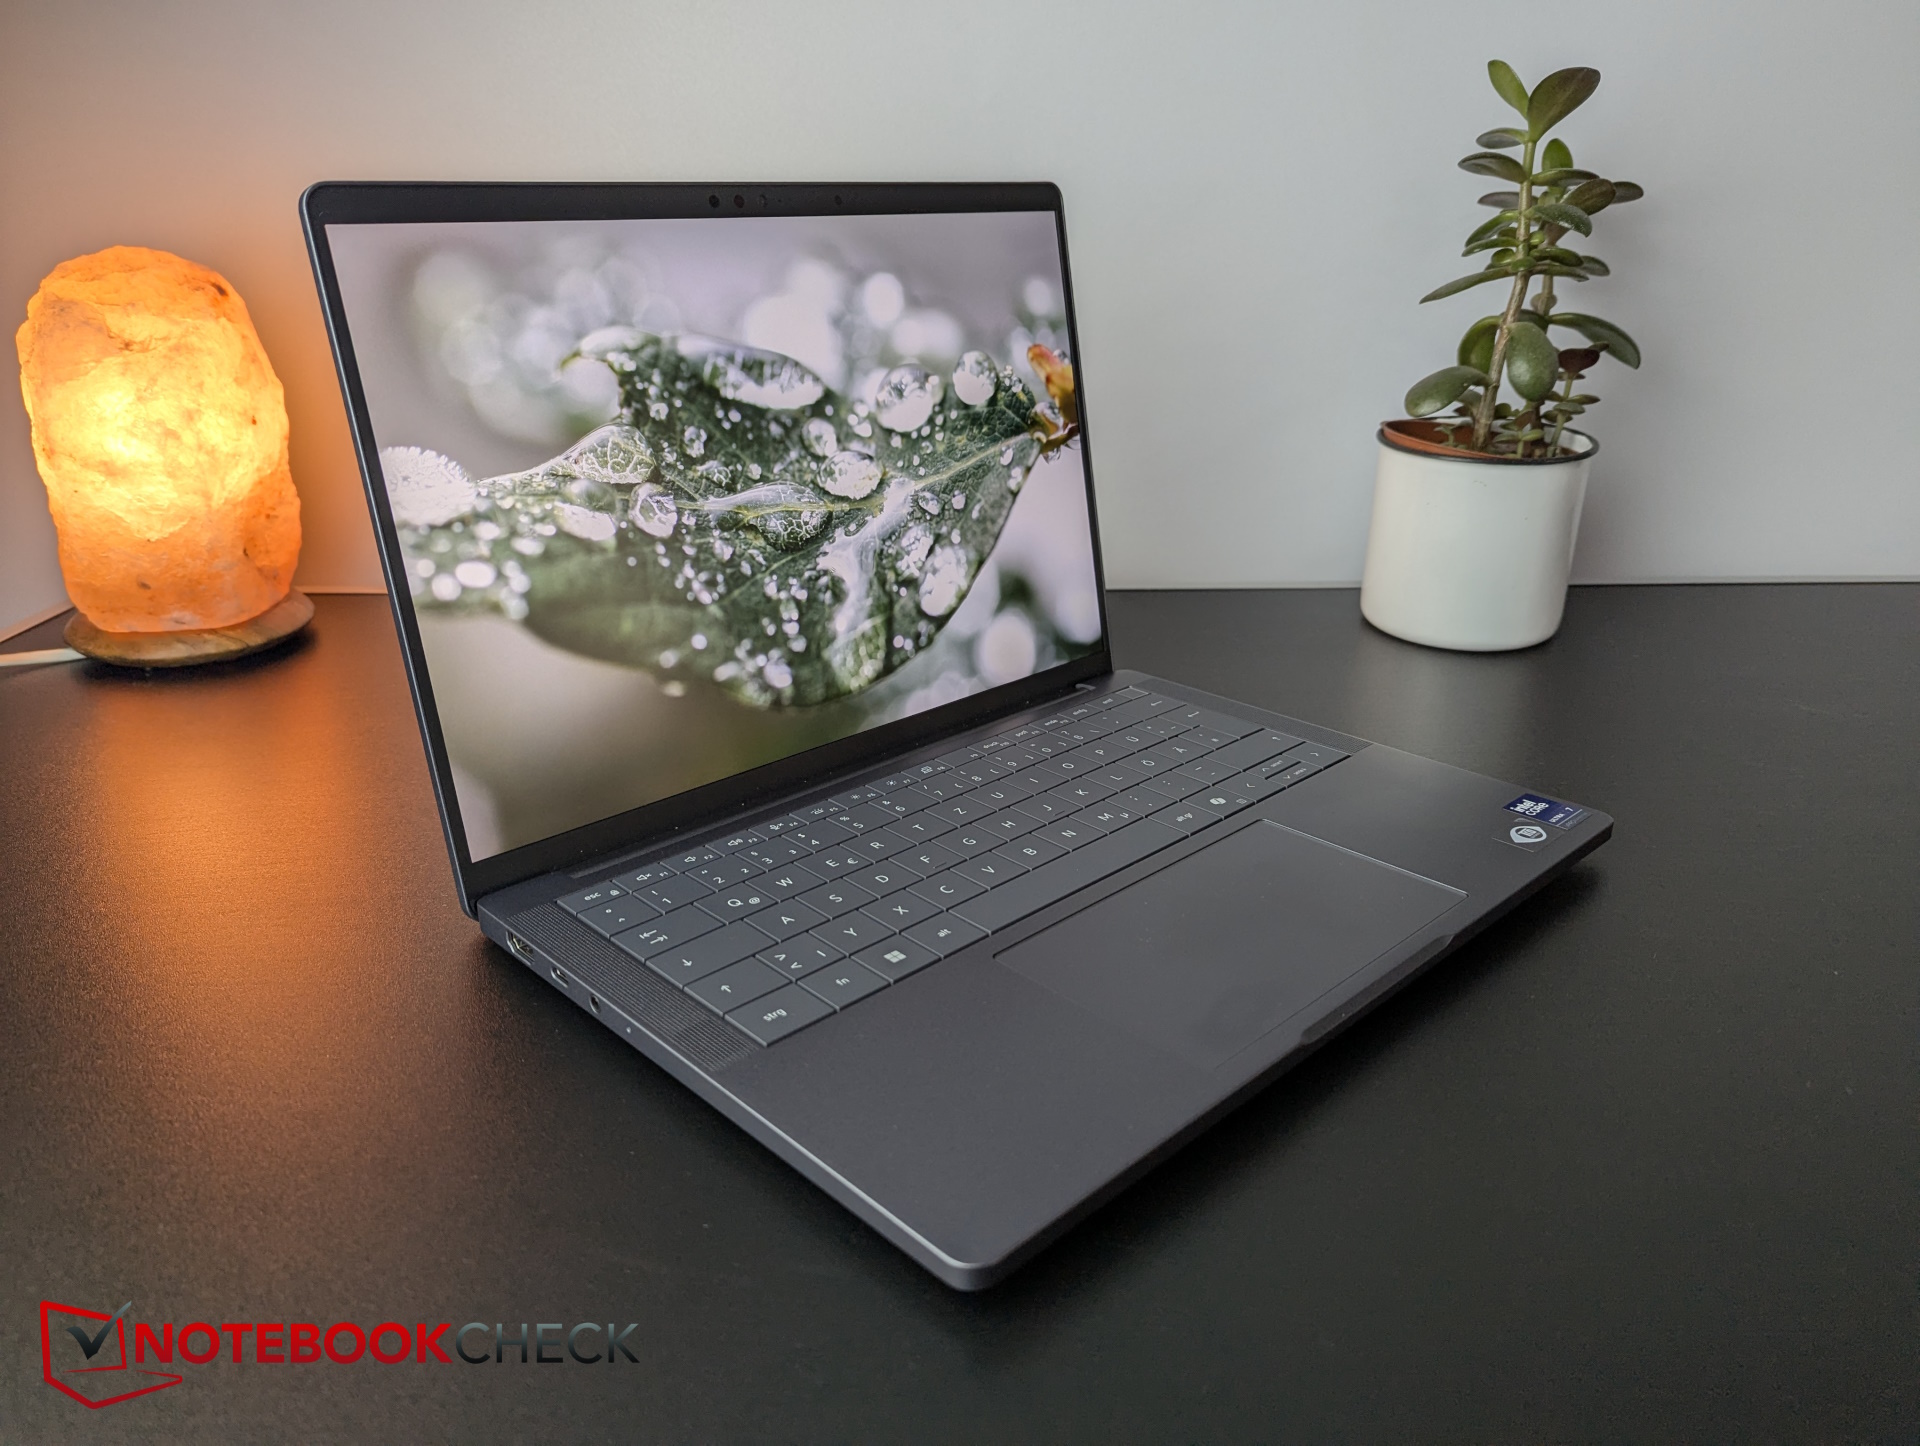
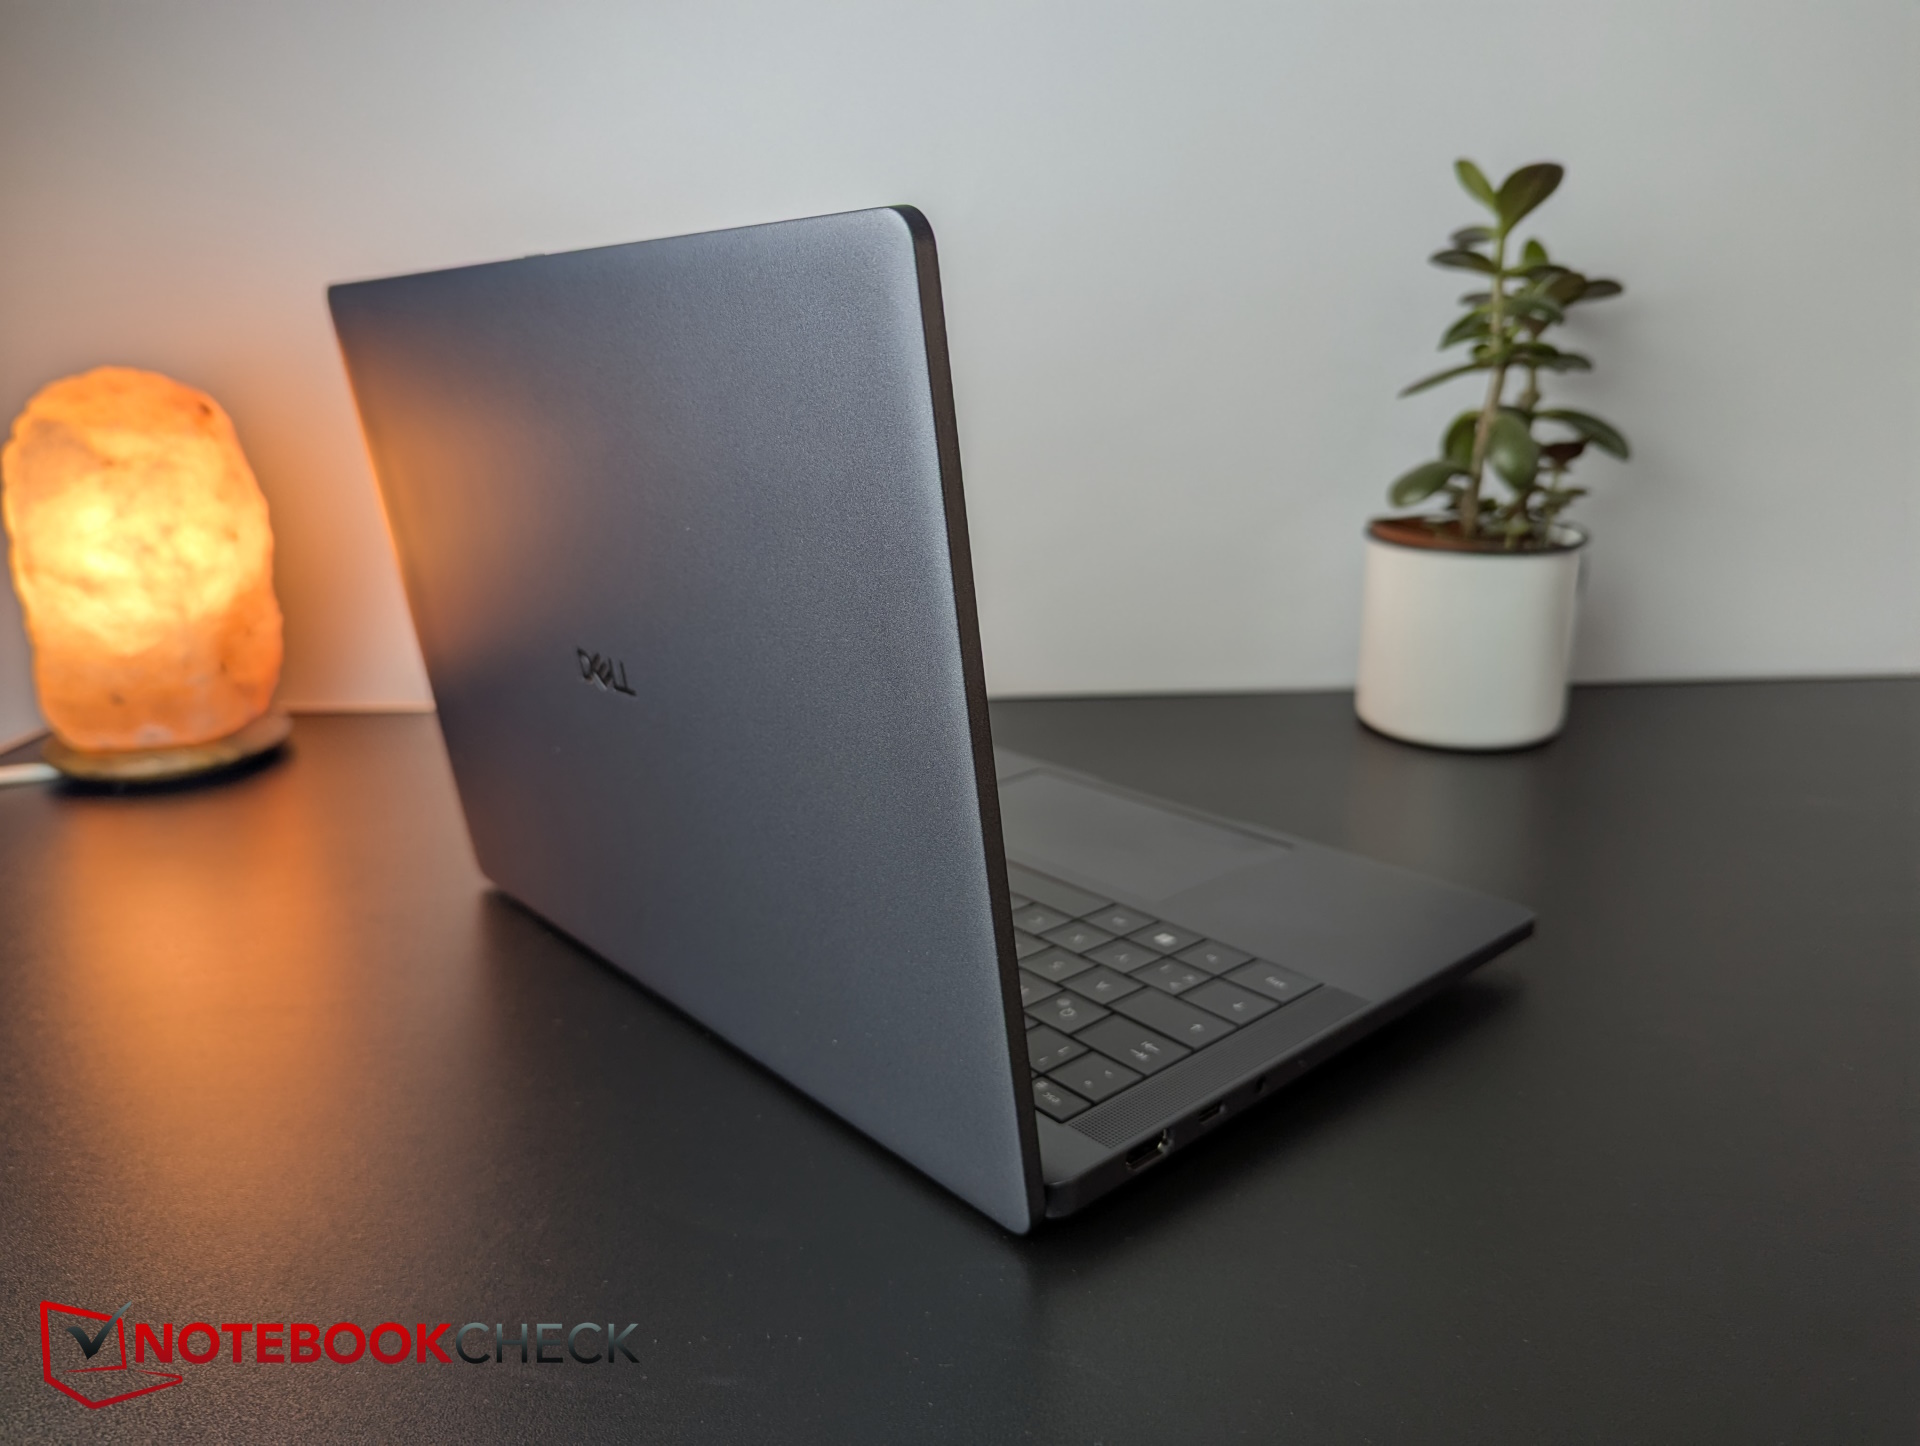
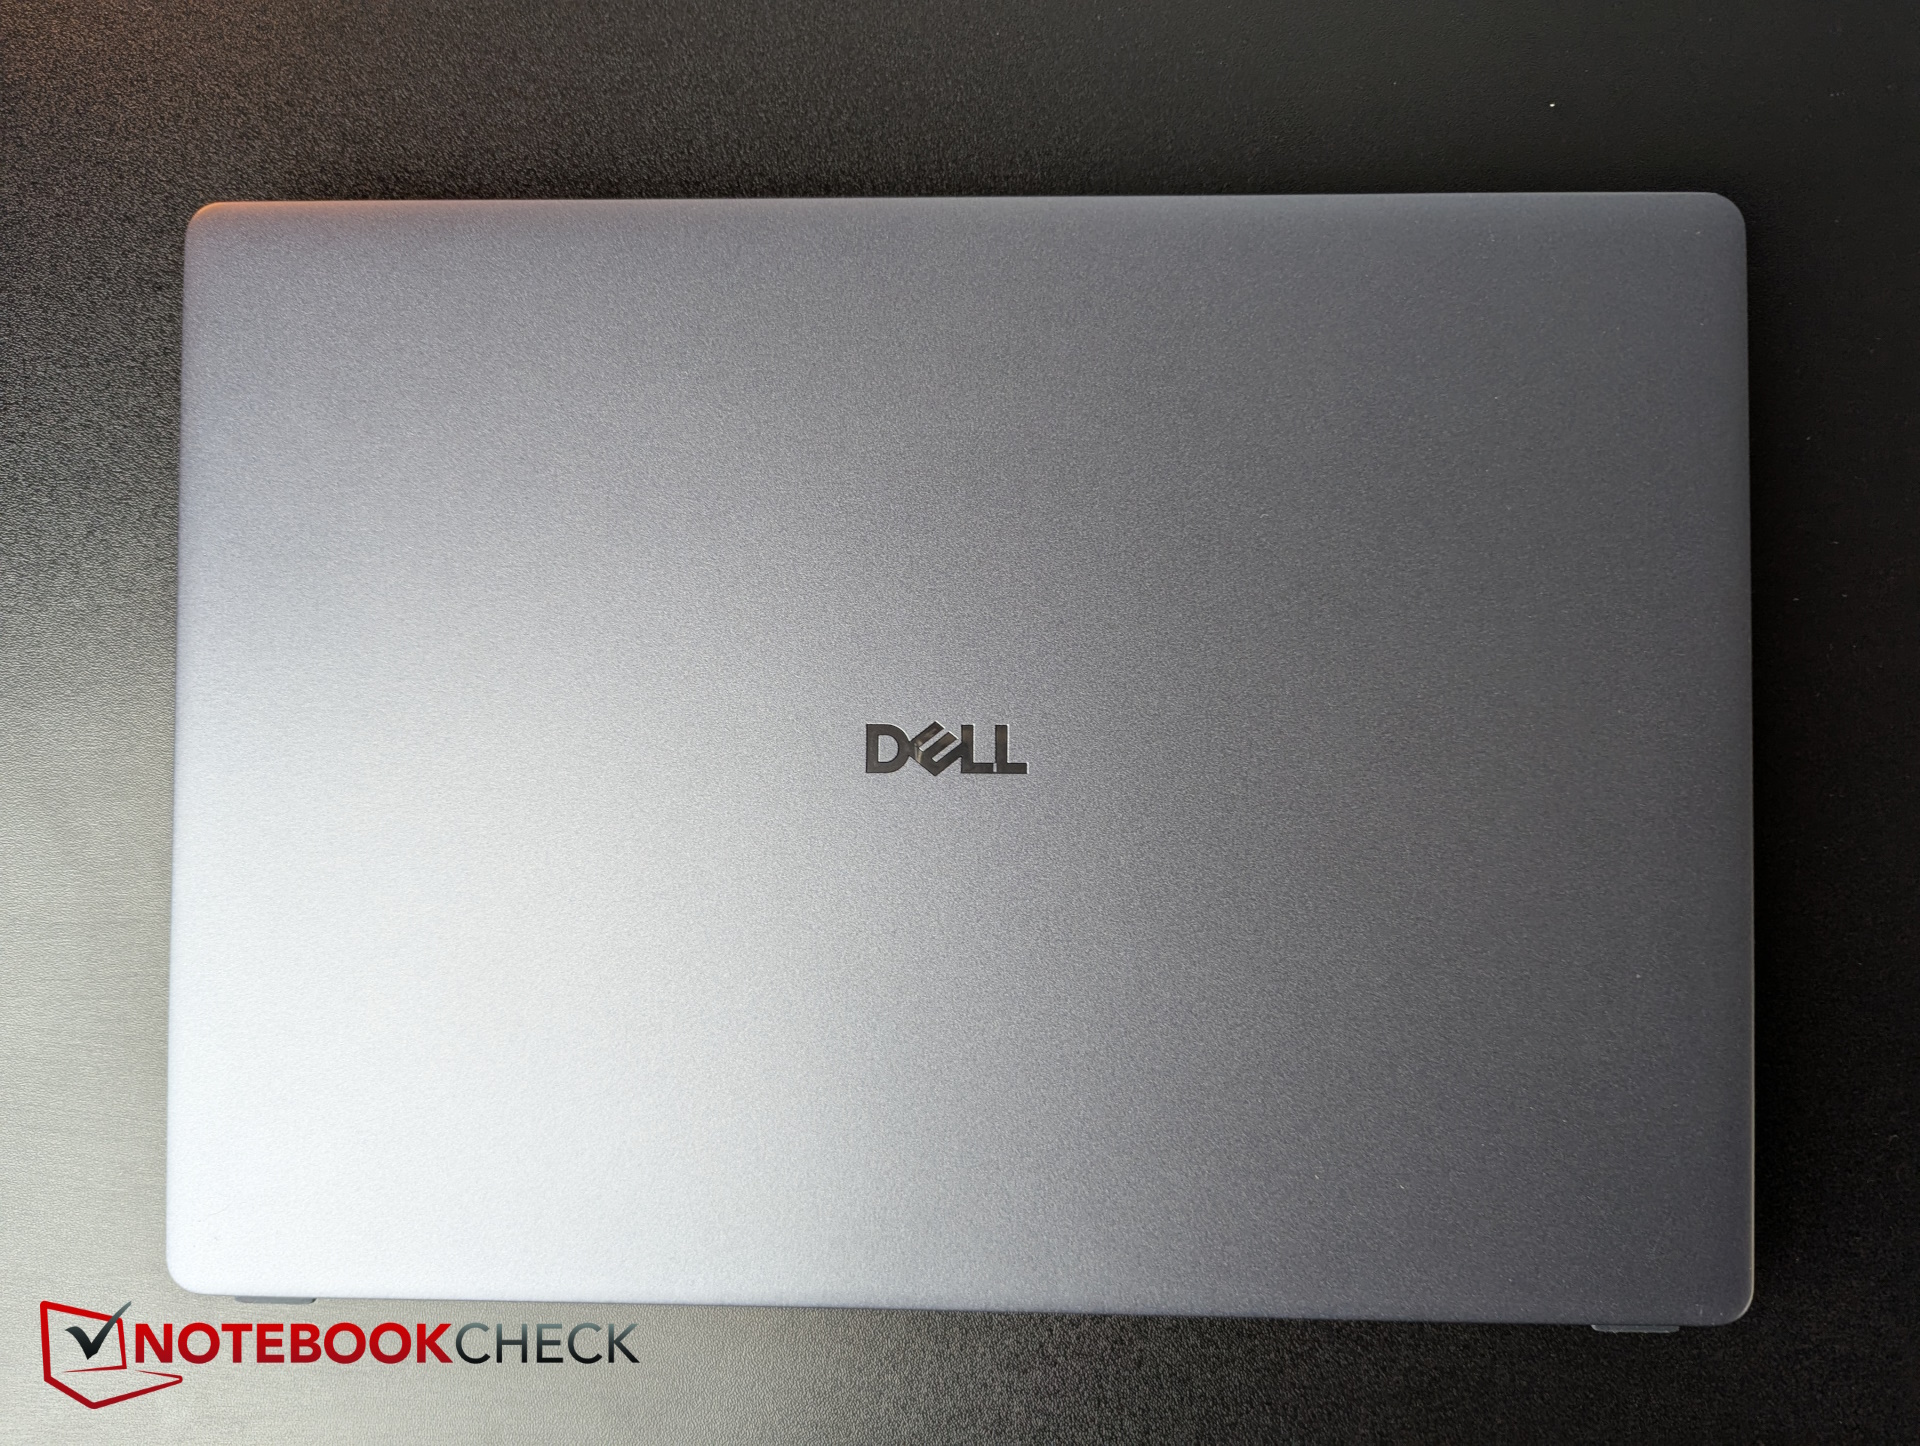
Le boîtier gris foncé est composé à 90 % de magnésium recyclé. L'unité de base et le couvercle à 180 degrés sont donc très stables, et nous n'avons détecté aucun grincement lorsque nous avons fait pivoter l'appareil. Le design est extrêmement compact et simple, mais élégant.
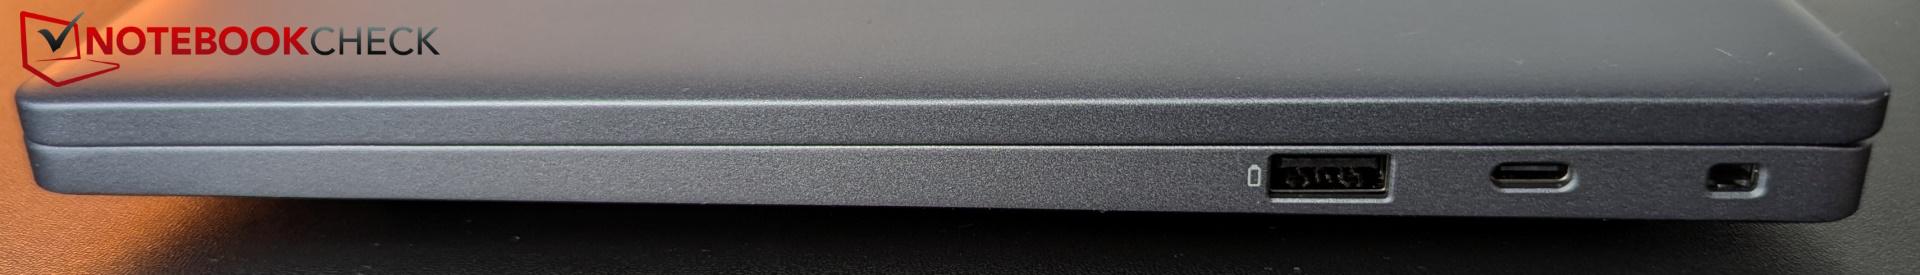
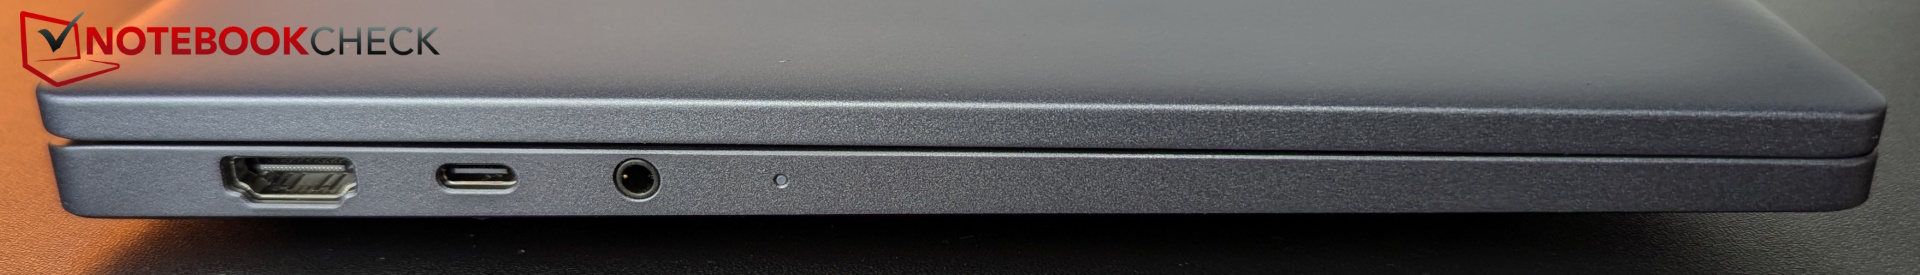
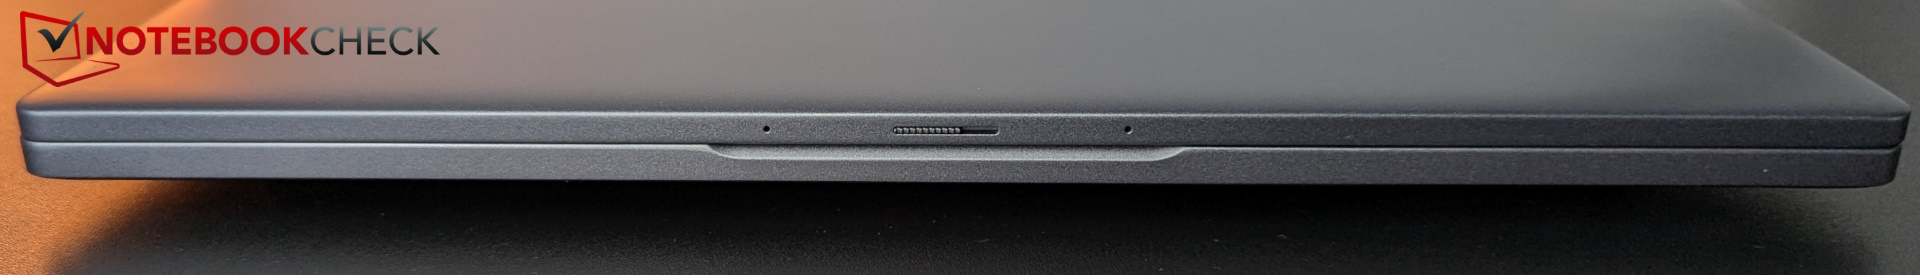
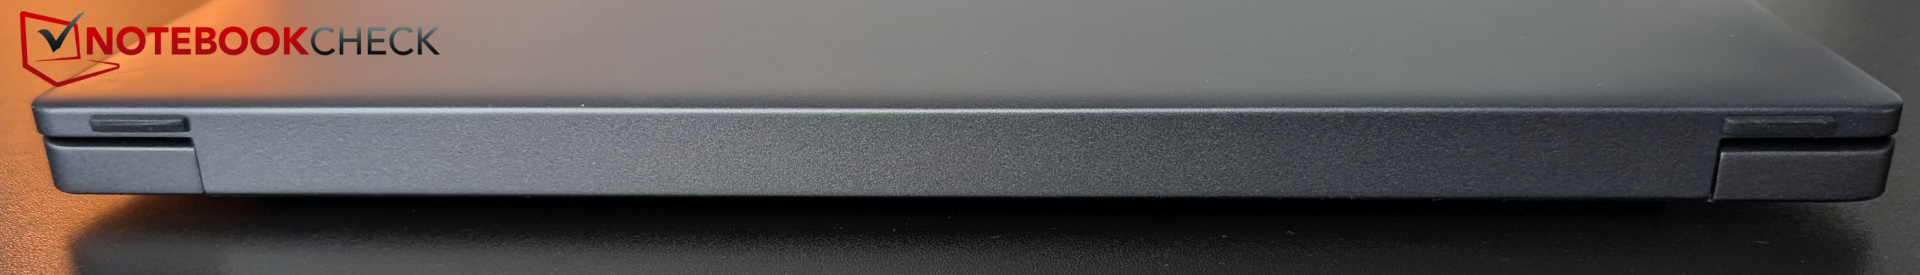
Le Pro 13 Premium dispose de deux ports Thunderbolt 4, un de chaque côté, et d'un port HDMI de taille normale. Un capteur d'empreintes digitales est intégré au bouton d'alimentation. Il n'y a pas de lecteur de cartes ni de port LAN dédié. Dell propose toutefois le Wi-Fi 7. Un emplacement pour carte SIM est proposé en option.
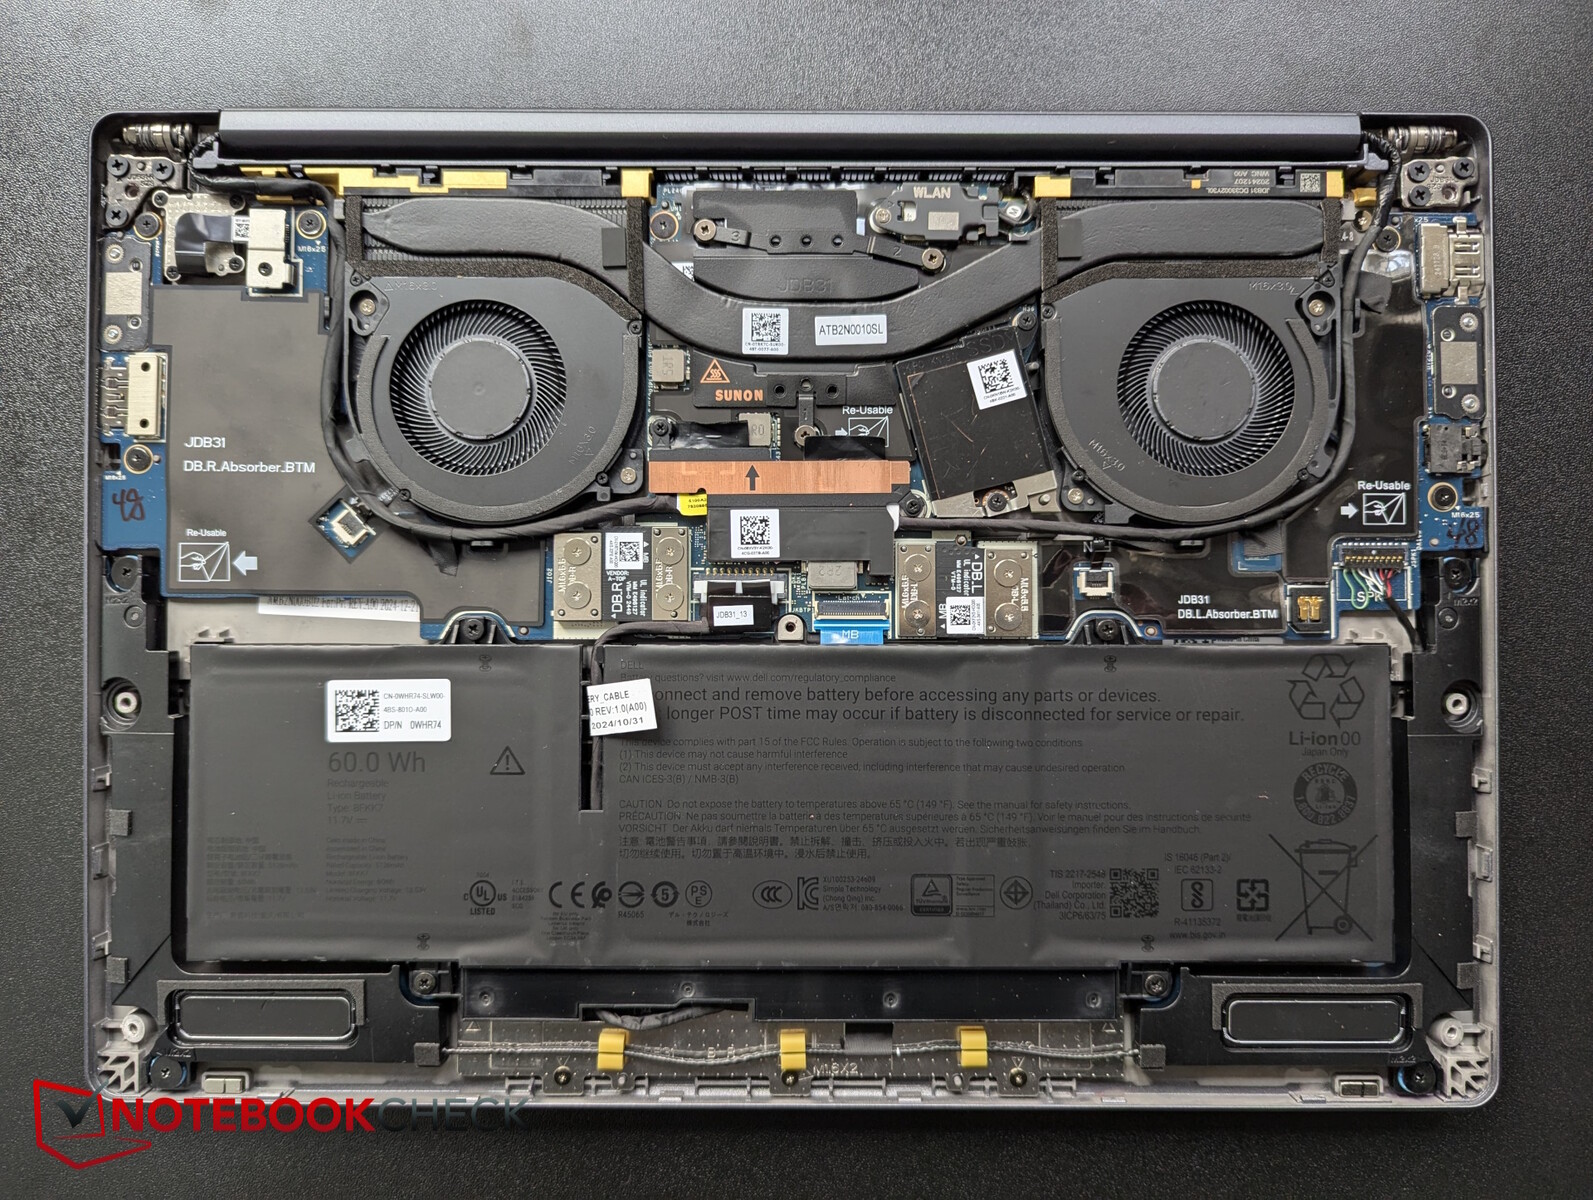
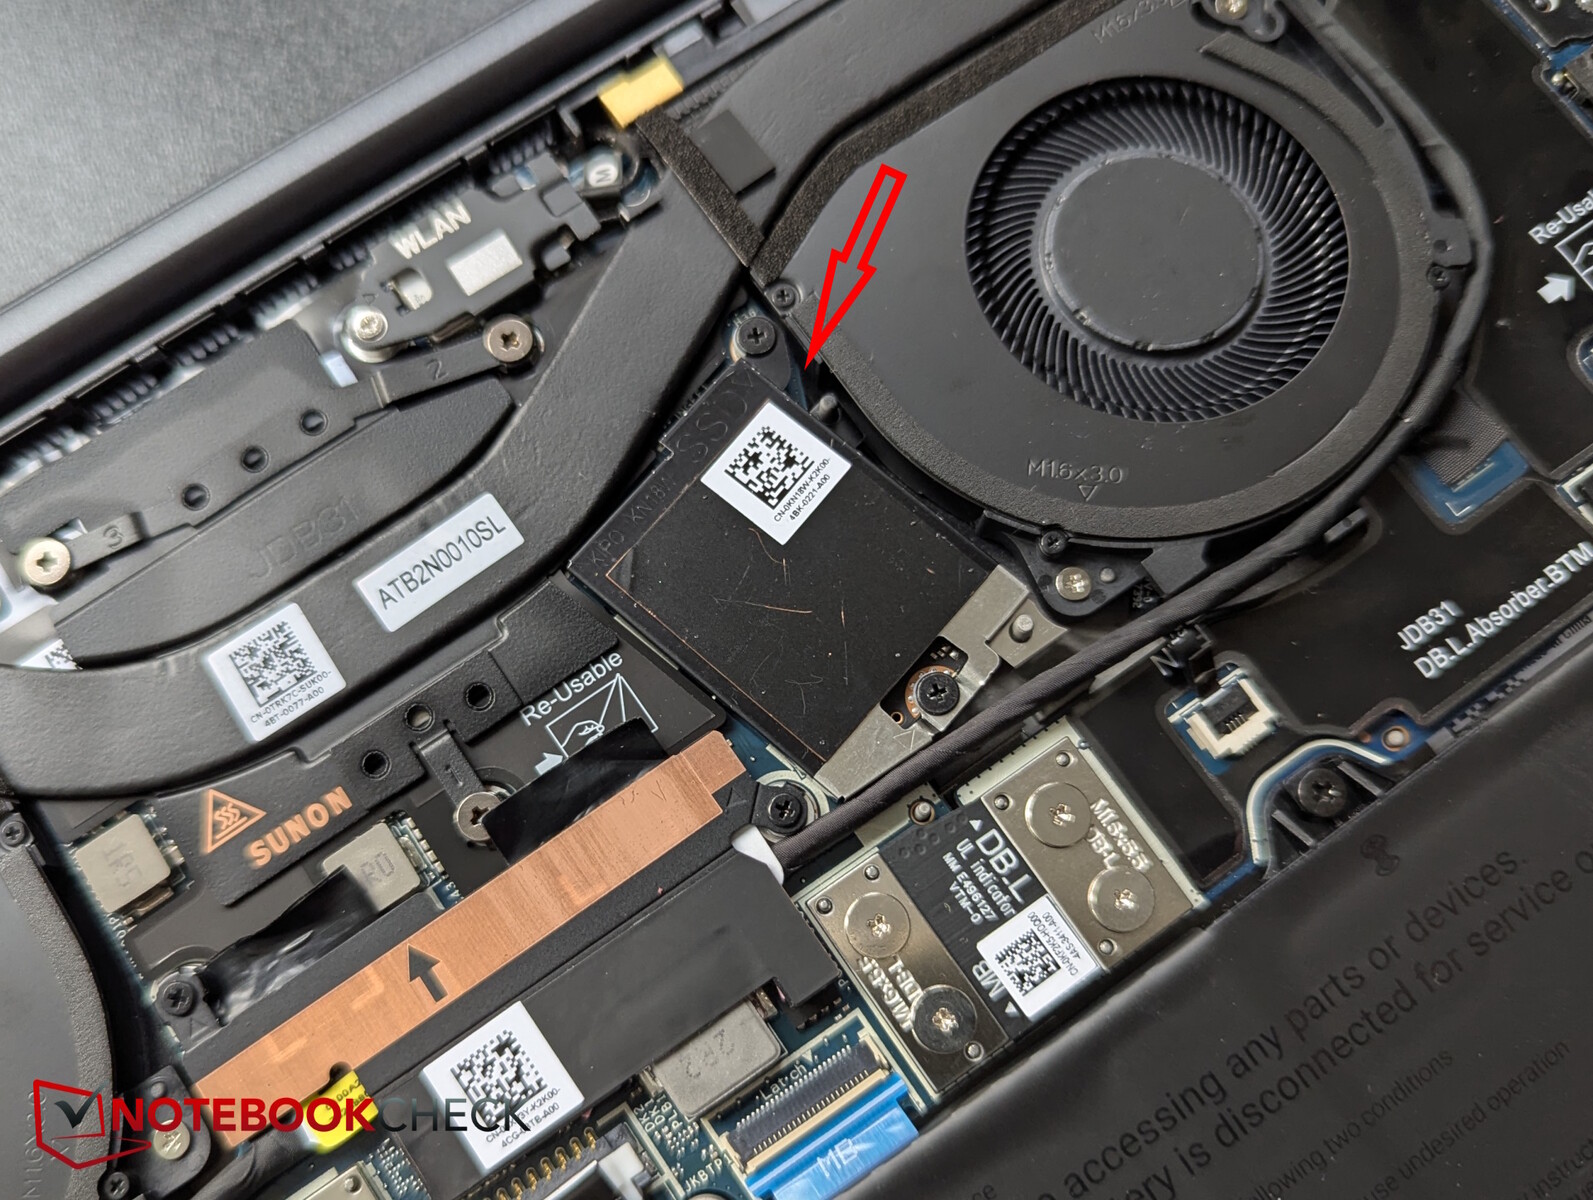
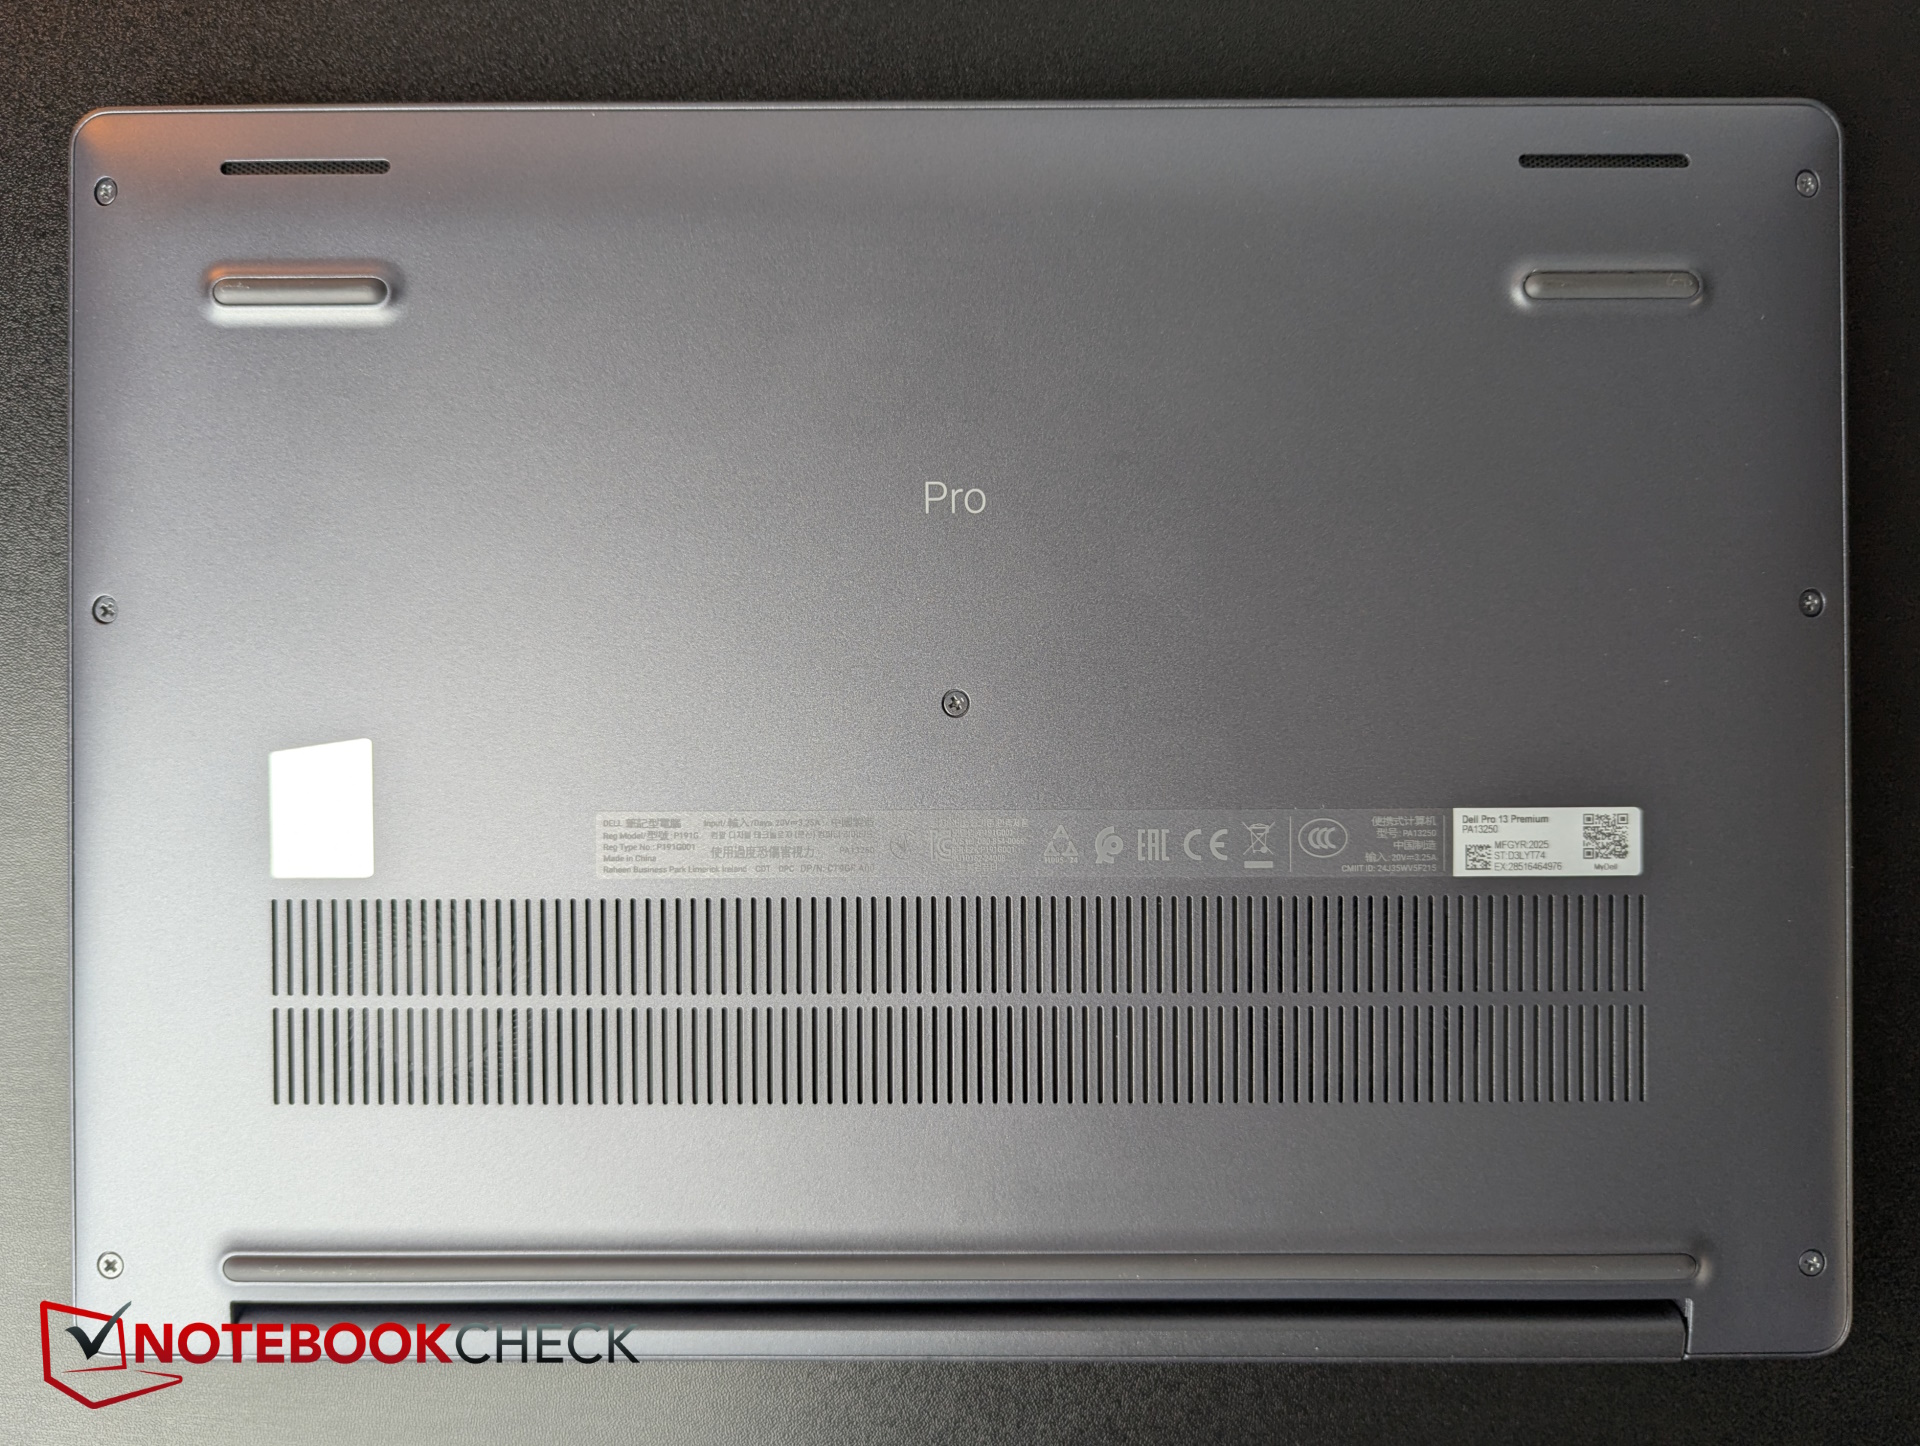
L'ordinateur portable professionnel est relativement facile à ouvrir, les vis Phillips restant dans la plaque de base. Cependant, la RAM et le module Wi-Fi sont installés de manière permanente à l'intérieur, et le SSD n'est qu'au petit format M.2 2230 et ne dispose pas d'un second emplacement.
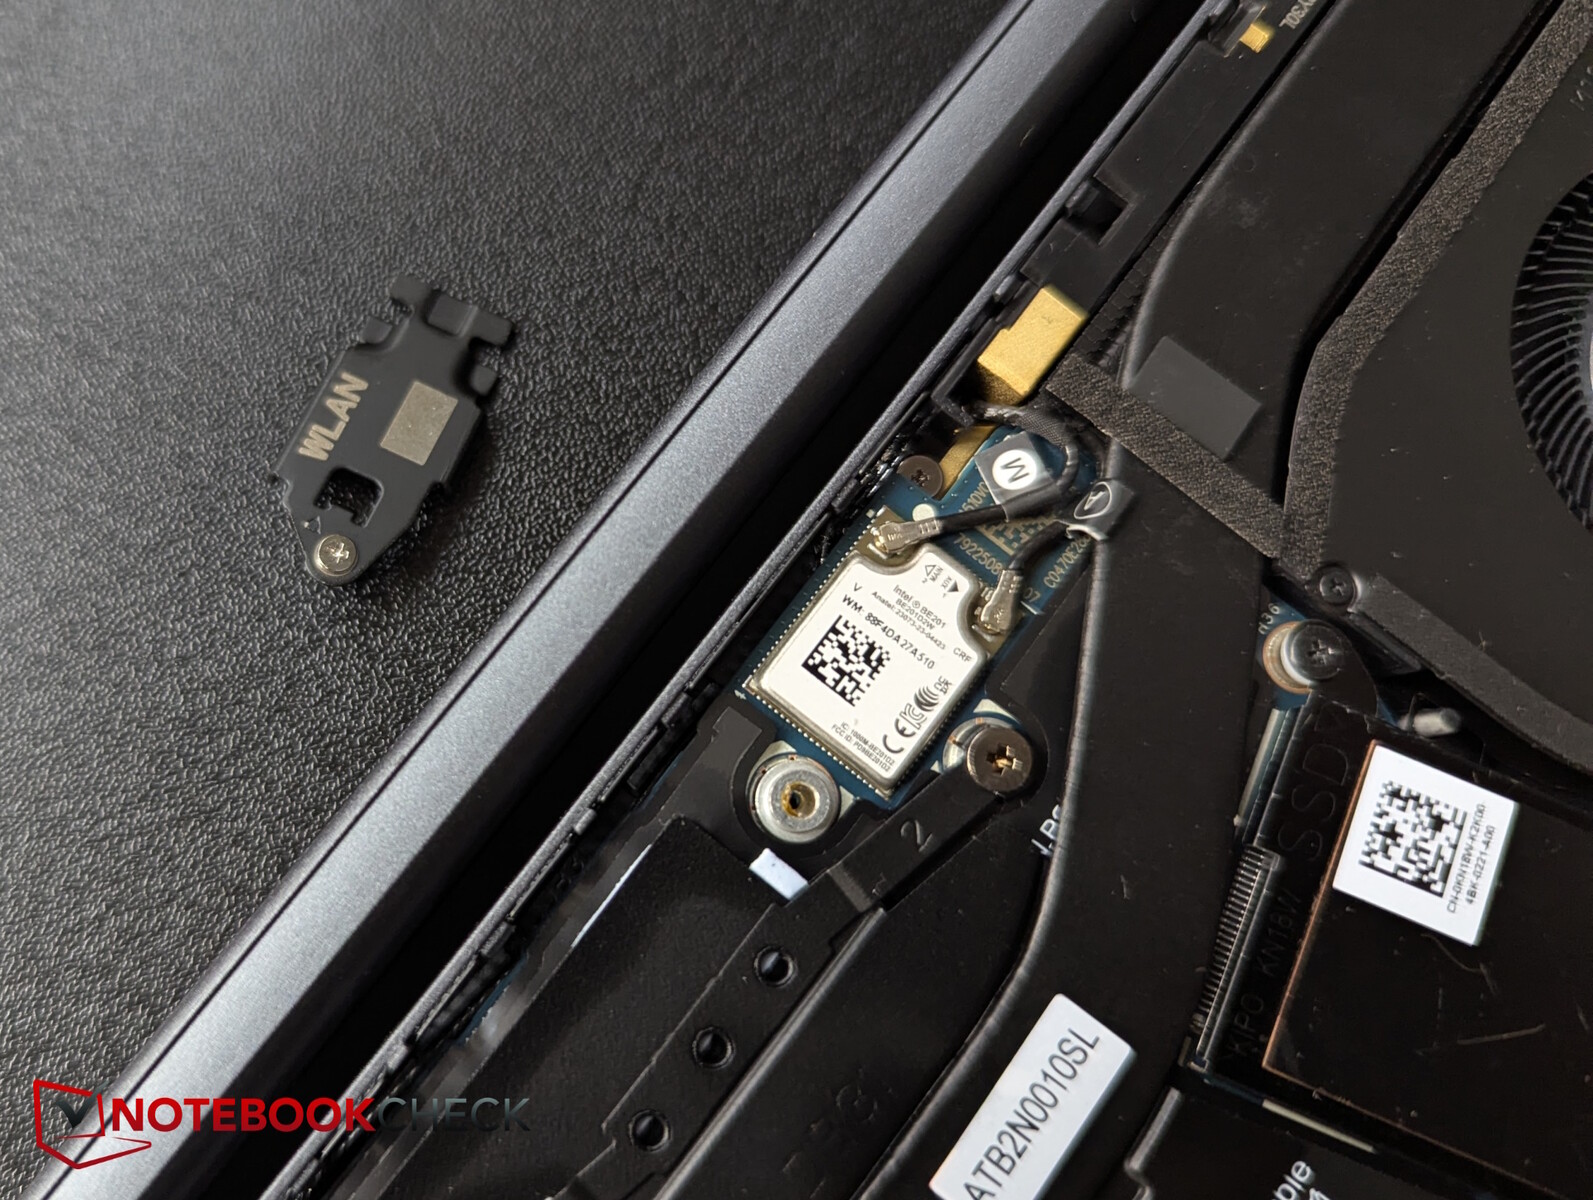

Avec 8 MP, la webcam IR a une résolution exceptionnellement élevée. Cela confère aux images testées une bonne netteté, mais les écarts de couleur sont moyens à élevés, en particulier dans la gamme des verts. Le module WiFi 7 offre des vitesses de transfert élevées et constantes.


Durabilité
Selon Asus, le Pro 13 Premium est certifié ENERGY STAR, EPEAT Gold et possède le label Climate+. Il répond également à la dernière certification TCO Generation 9 pour la consommation d'énergie et la réparabilité.
Les matériaux utilisés comprennent le plastique PCR, le magnésium recyclé, le plastique biosourcé et le cobalt recyclé, et l'emballage est composé à 100 % de matériaux recyclés ou renouvelables, principalement du carton.
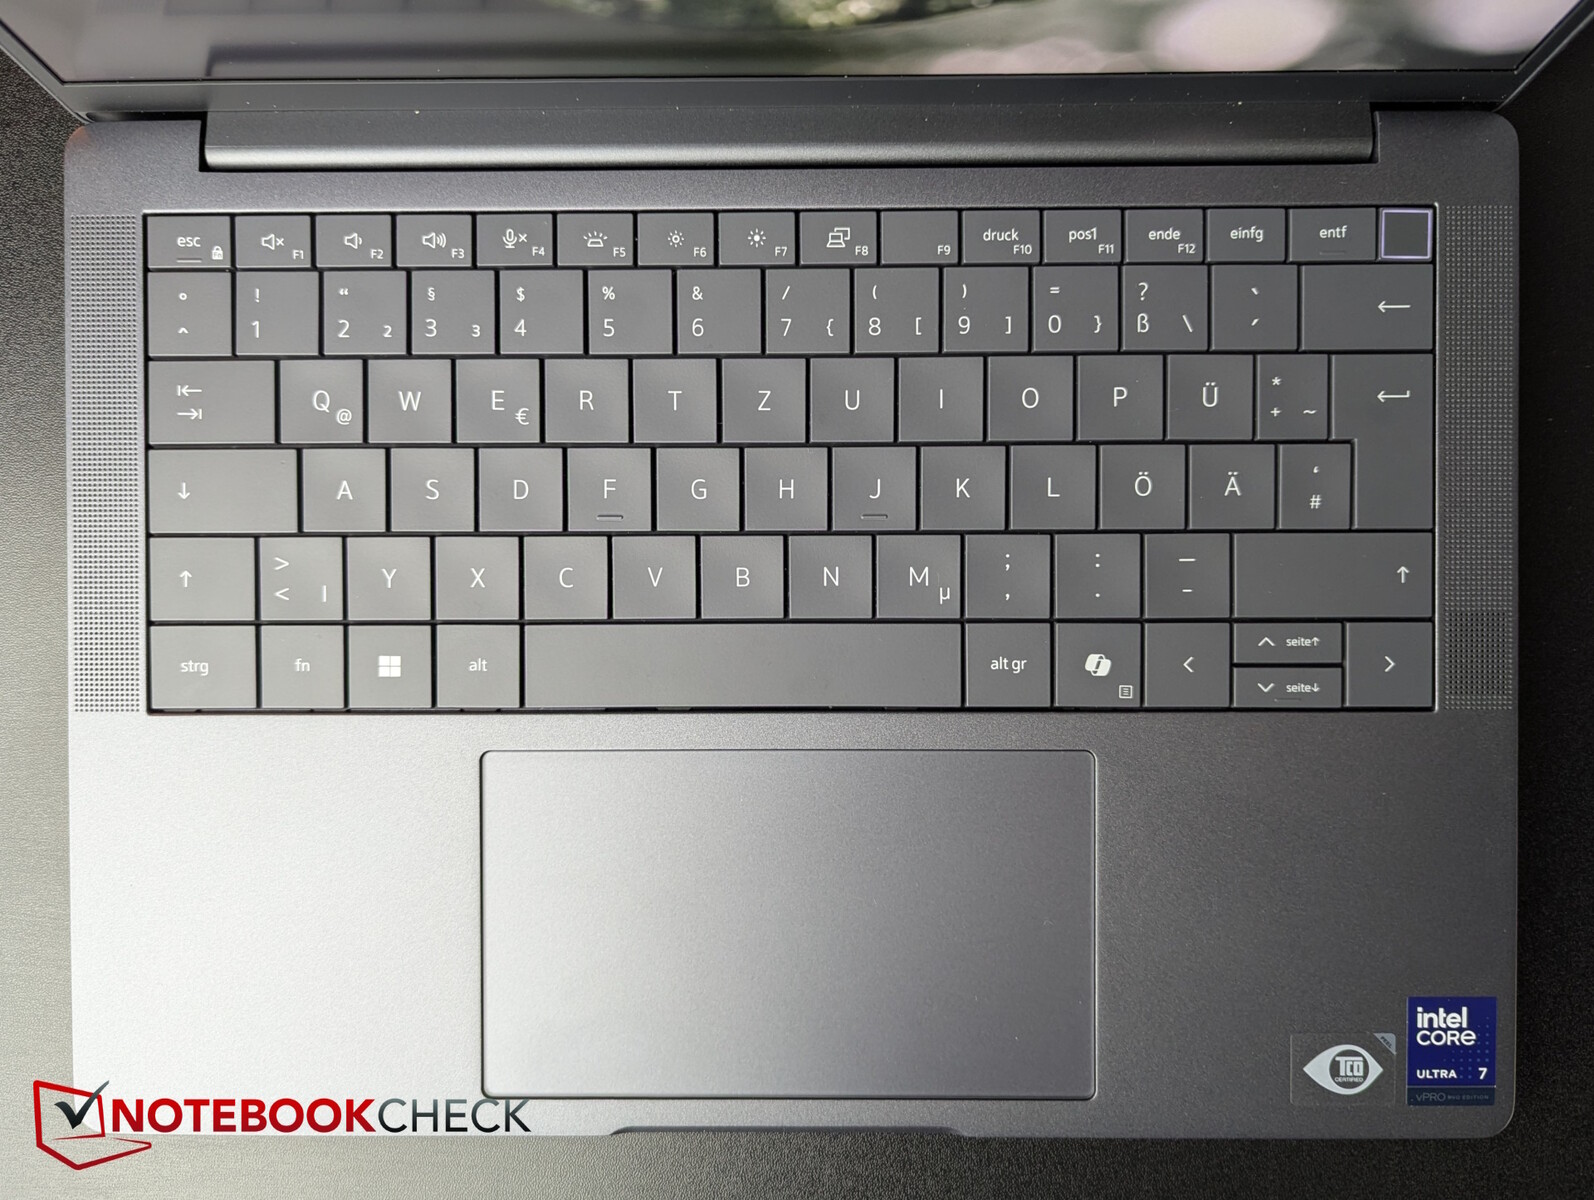
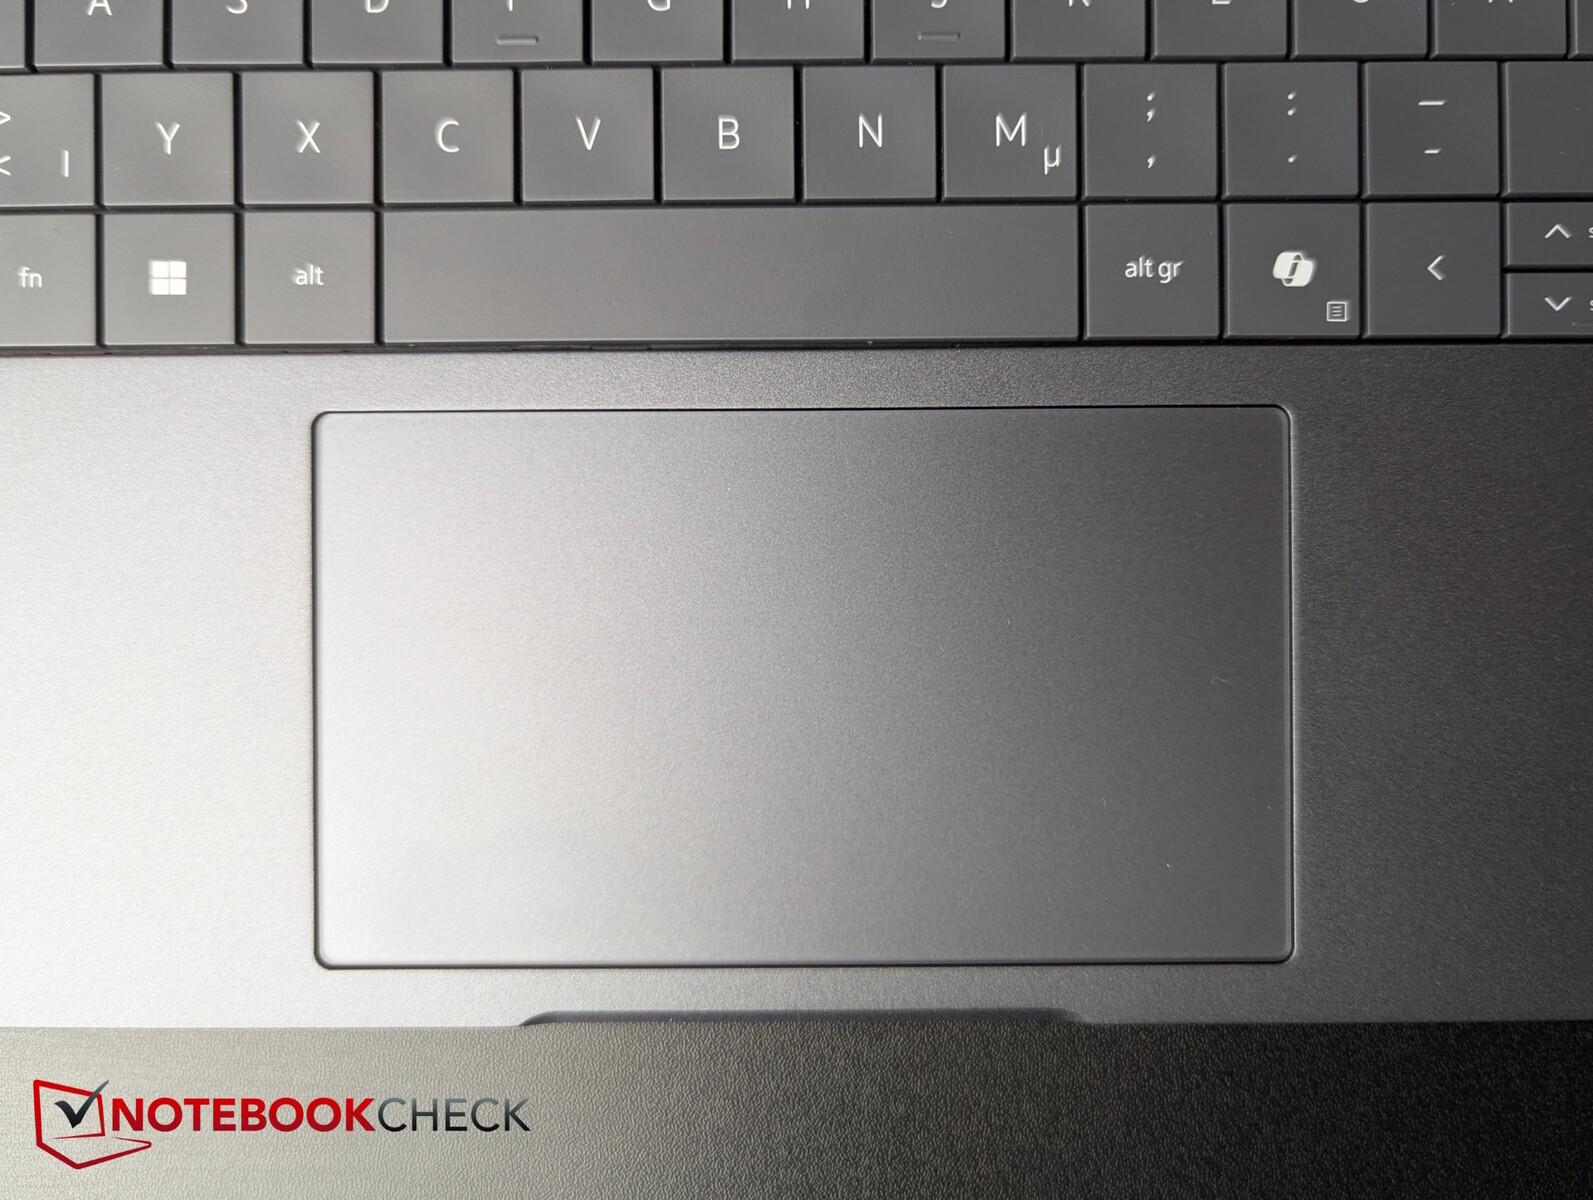
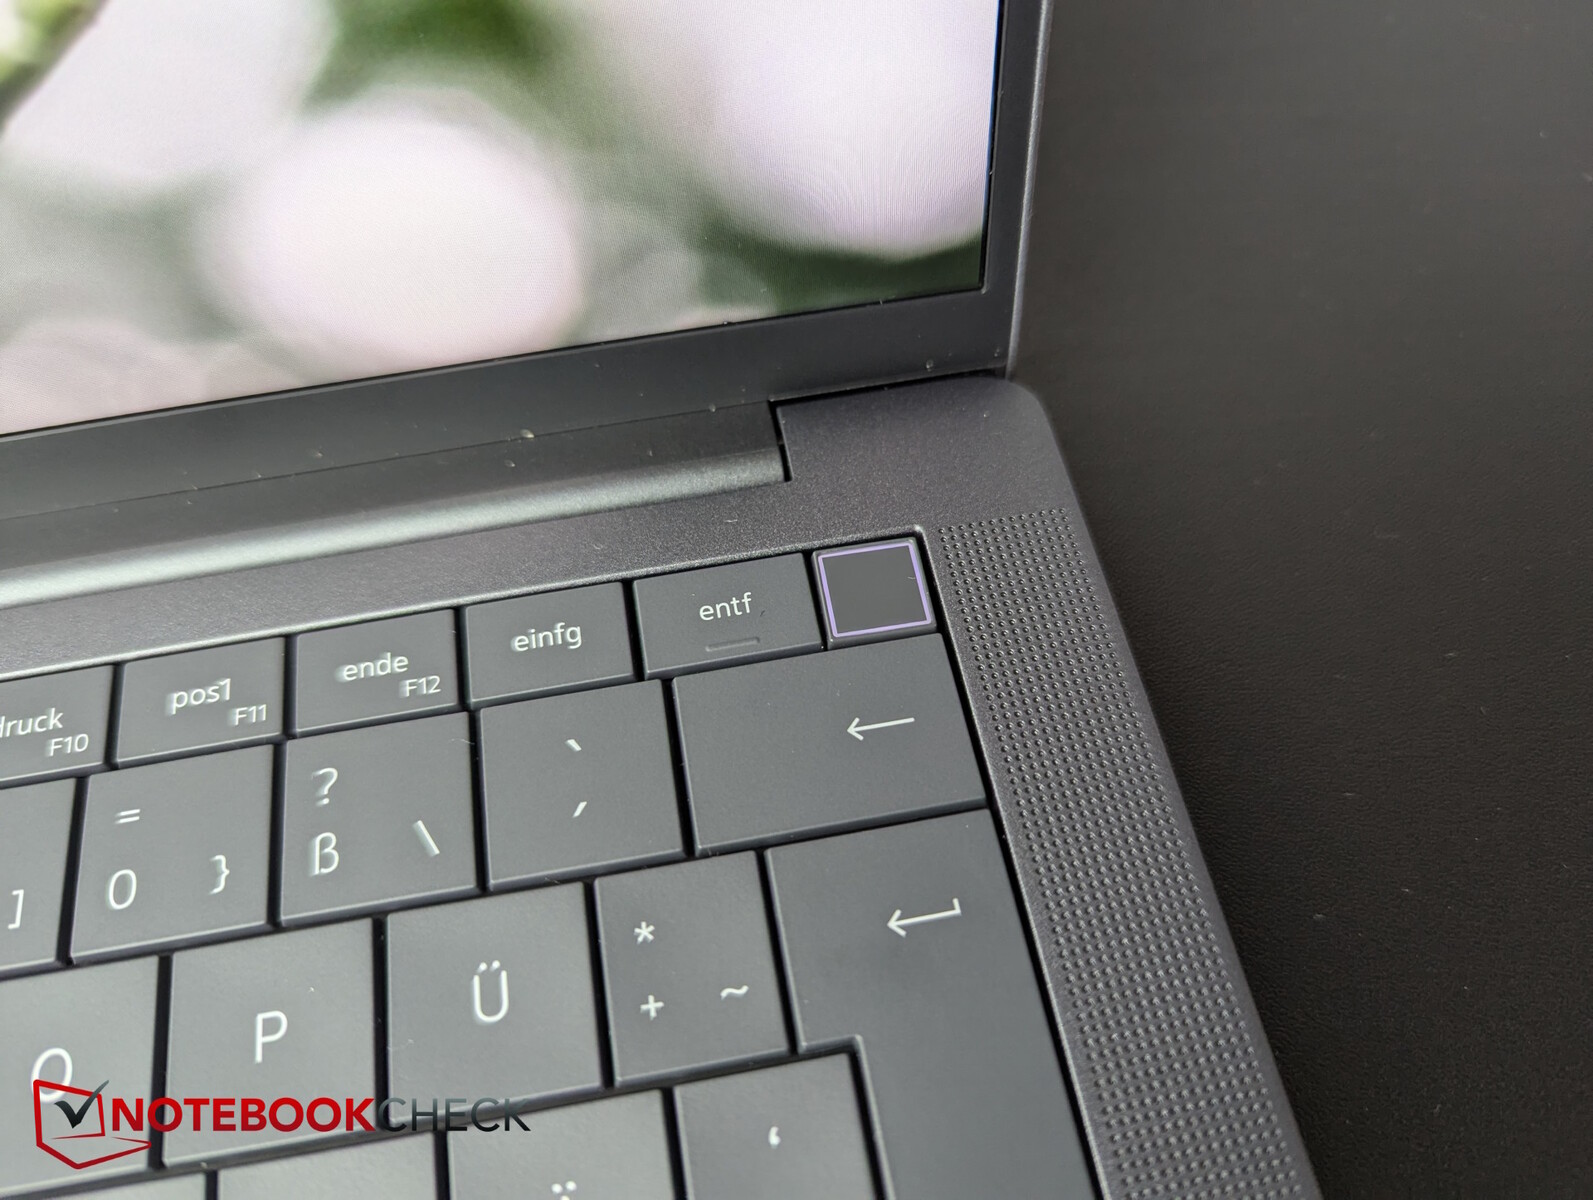
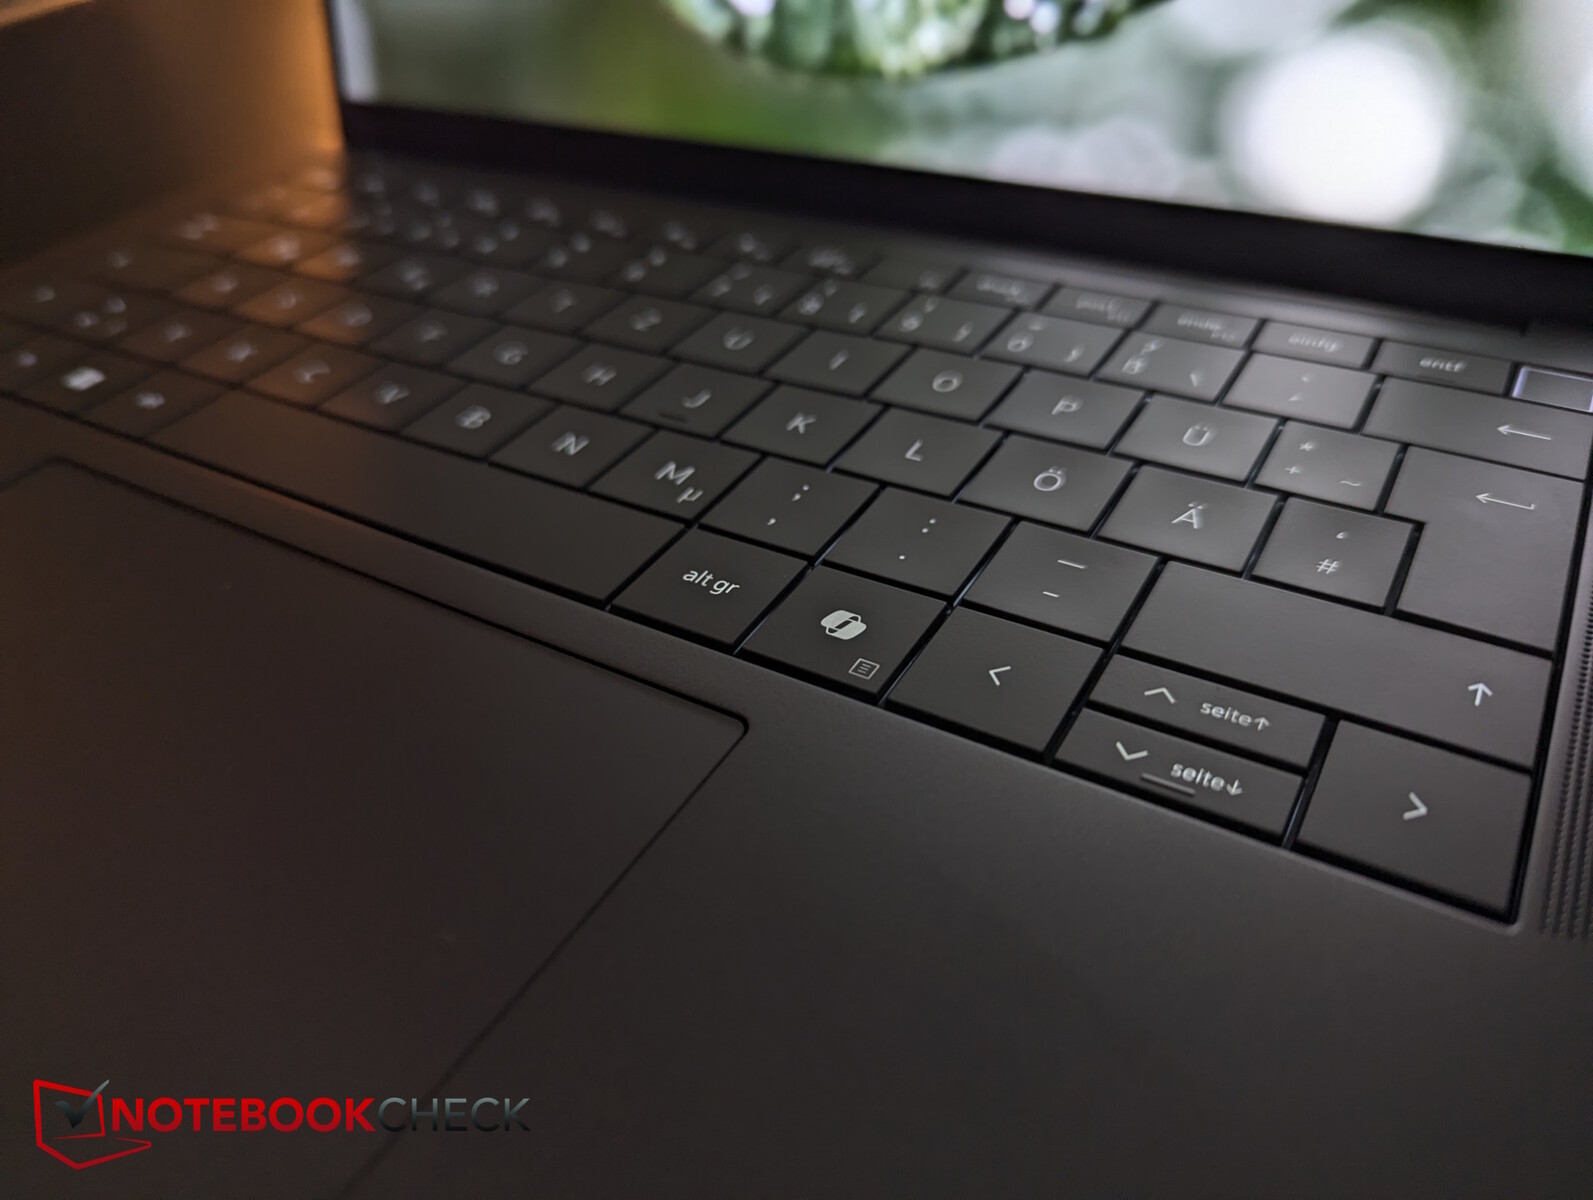
Périphériques d'entrée - Le 13 Premium est équipé d'un pavé tactile pour les conférences téléphoniques
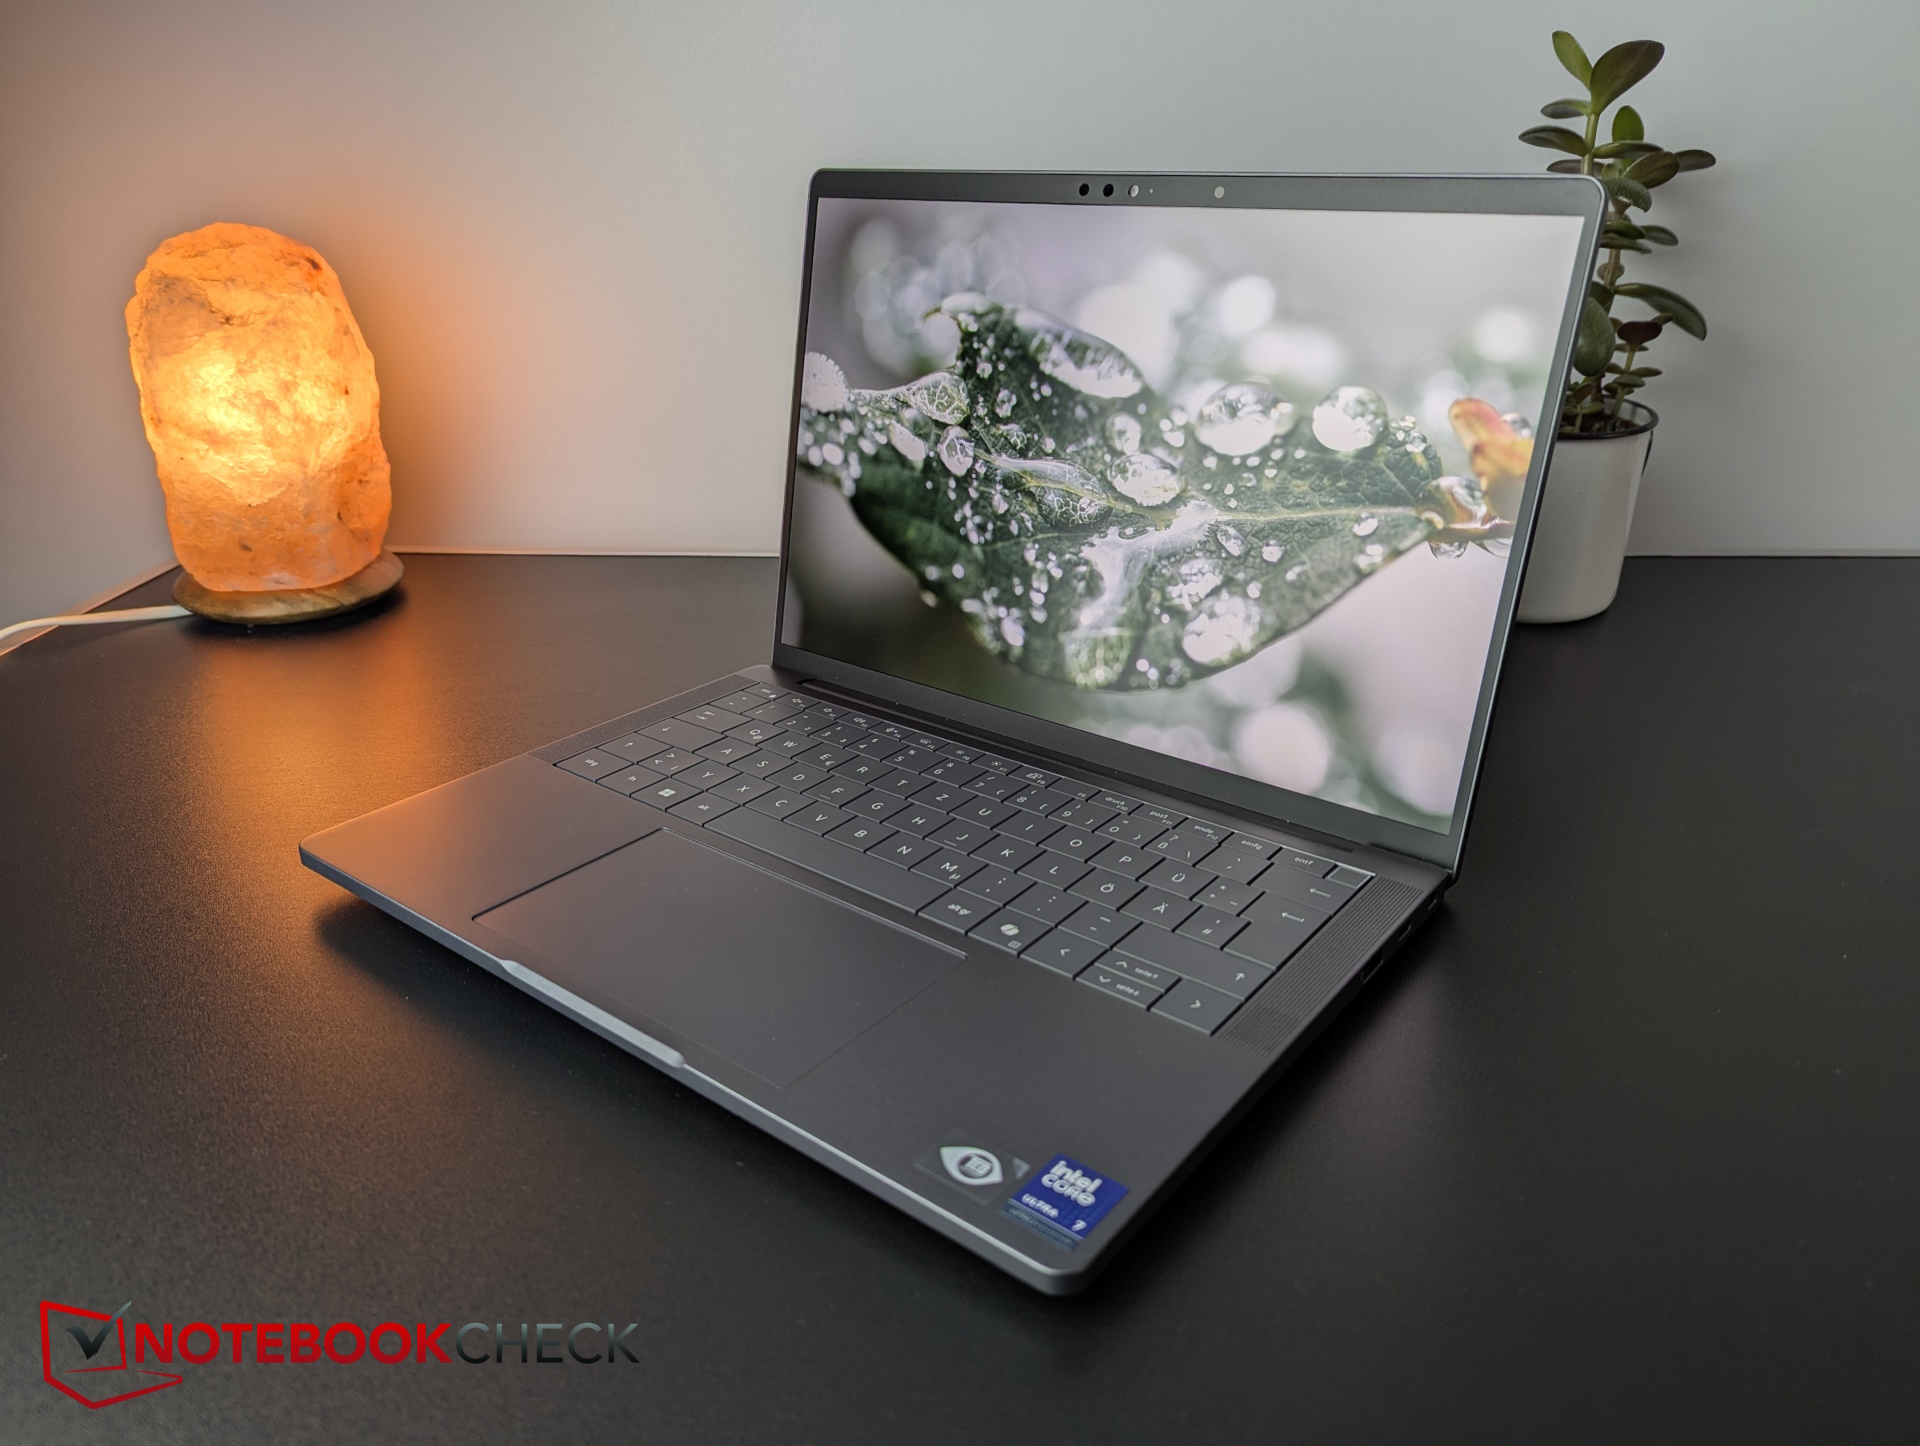
Le Dell offre une disposition très épurée et compacte avec de grandes touches (environ 1,7 cm), sans espace entre elles, et les touches fléchées verticales sont réduites de moitié en hauteur. Le bouton d'alimentation intégré au clavier en haut à droite abrite également un capteur d'empreintes digitales.
Les touches ont une course faible à moyenne mais un retour d'information tangible. Cela permet à l'utilisateur de taper rapidement et le bruit de la frappe est plus que modéré. La consommation d'énergie du rétroéclairage à deux niveaux aurait été réduite de 75 % grâce à des mini diodes électroluminescentes.
Le pavé tactile mesure environ 12,5 x 7,1 cm, et sa caractéristique principale est l'inclusion de touches spéciales pour le chat vidéo dans la rangée supérieure (caméra activée/désactivée, partage d'écran, chat, microphone activé/désactivé). Les symboles tactiles ne sont visibles que pendant les appels Zoom ou Microsoft Teams. La surface est très lisse, mais si vous venez de vous laver les mains ou si vous avez les doigts légèrement humides pour une autre raison, elle bégaiera considérablement. Les clics silencieux des boutons de souris intégrés offrent un retour d'information agréable et se déclenchent de manière fiable.
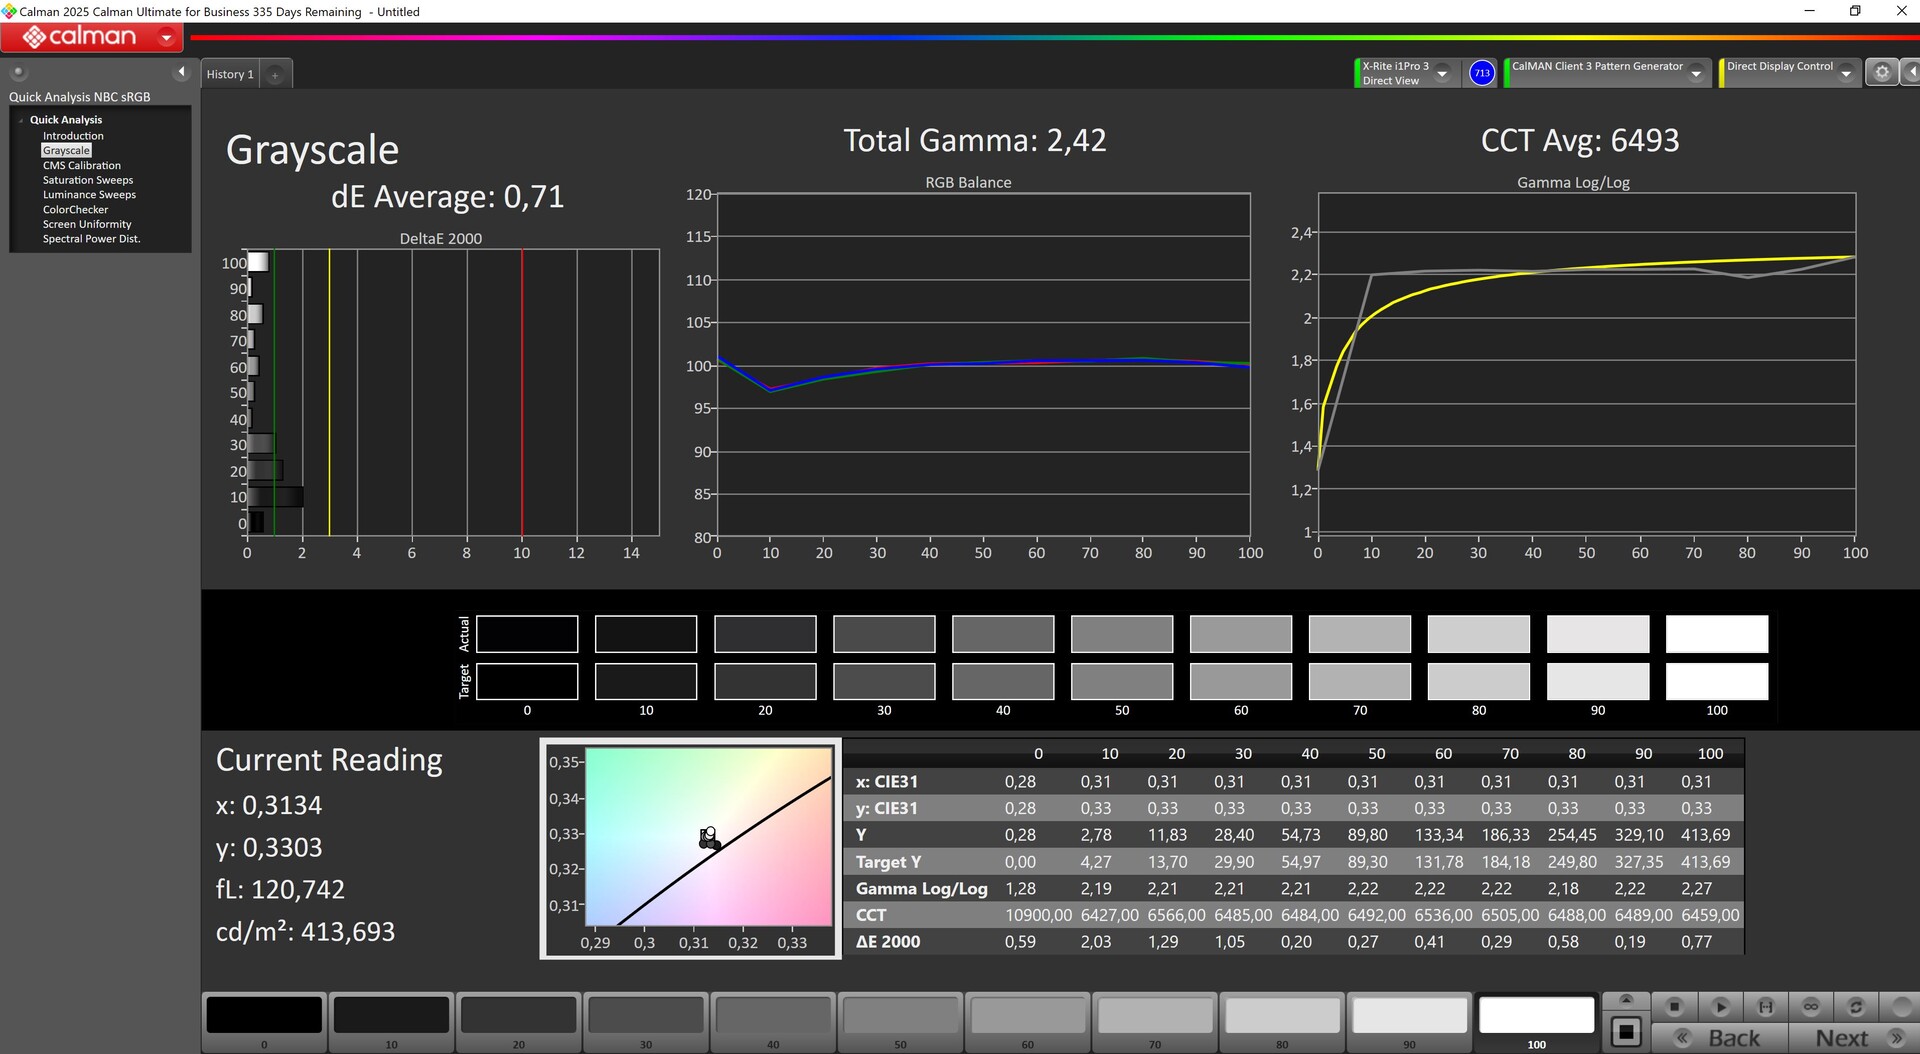
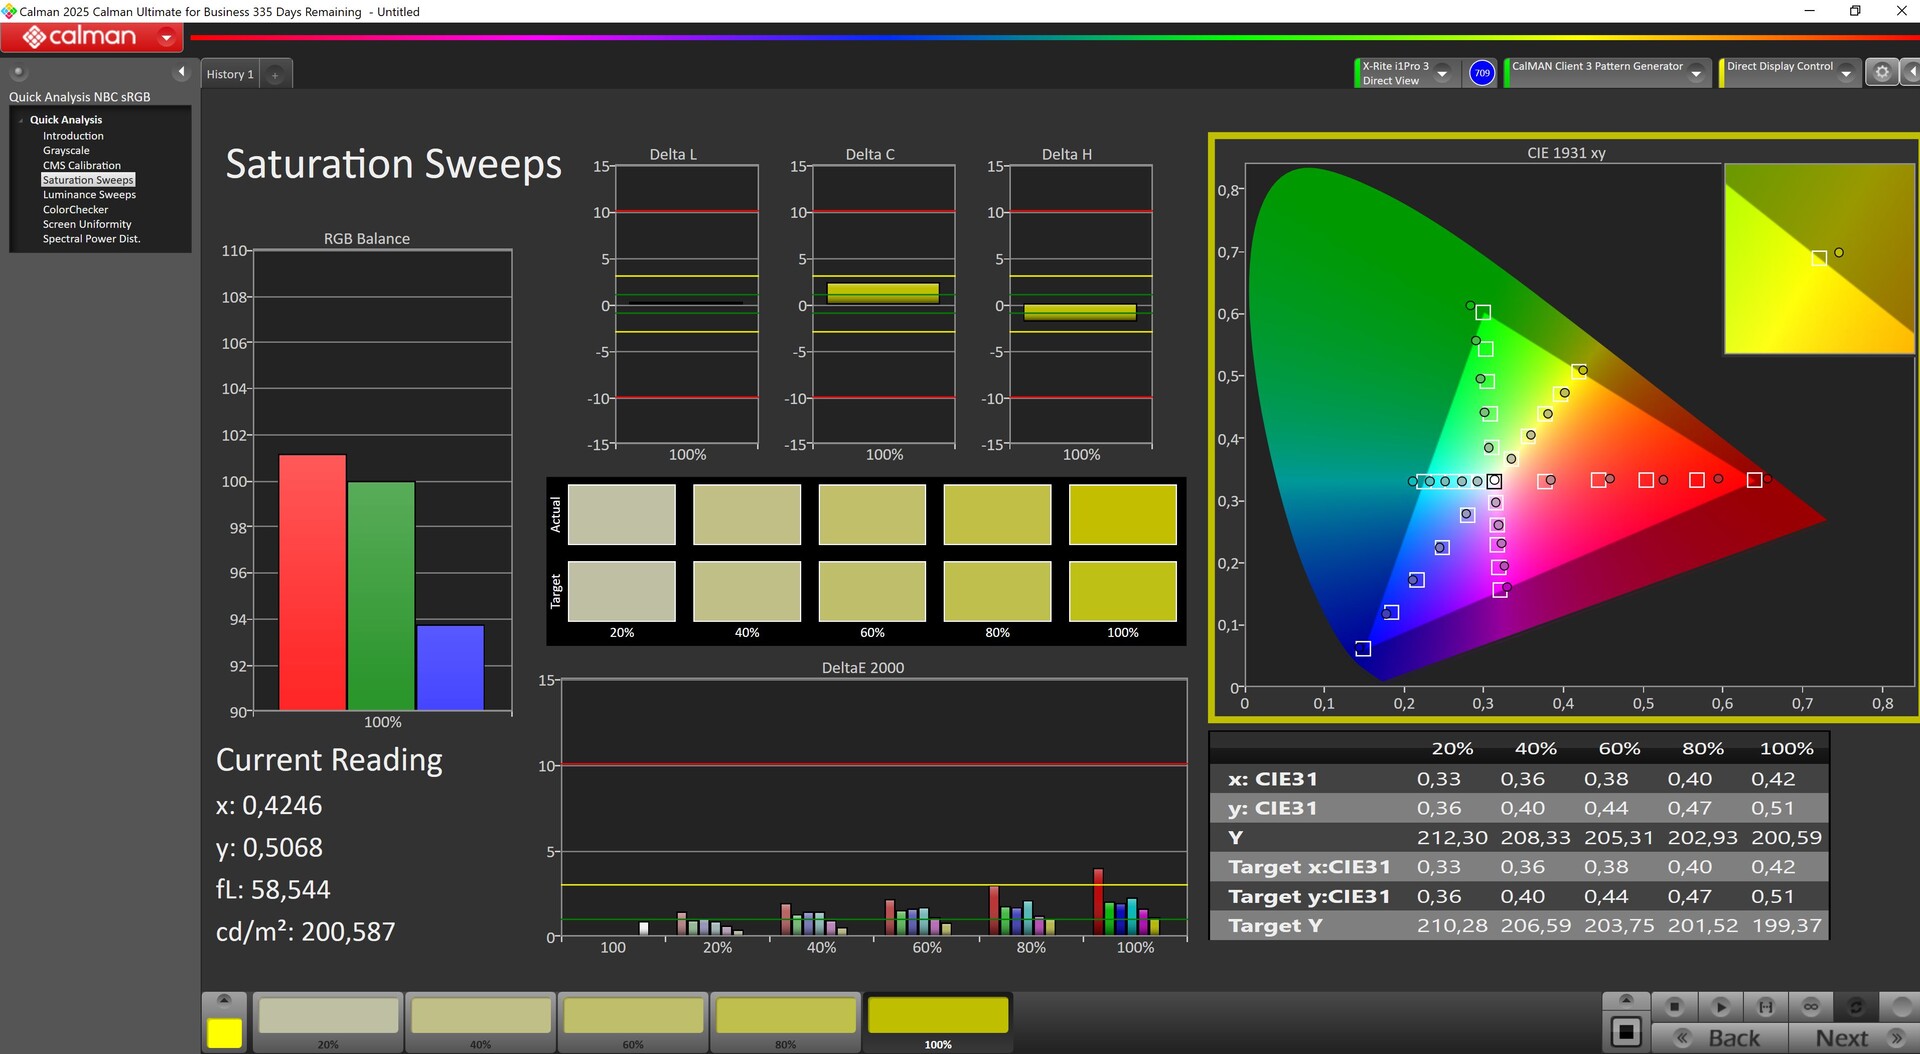
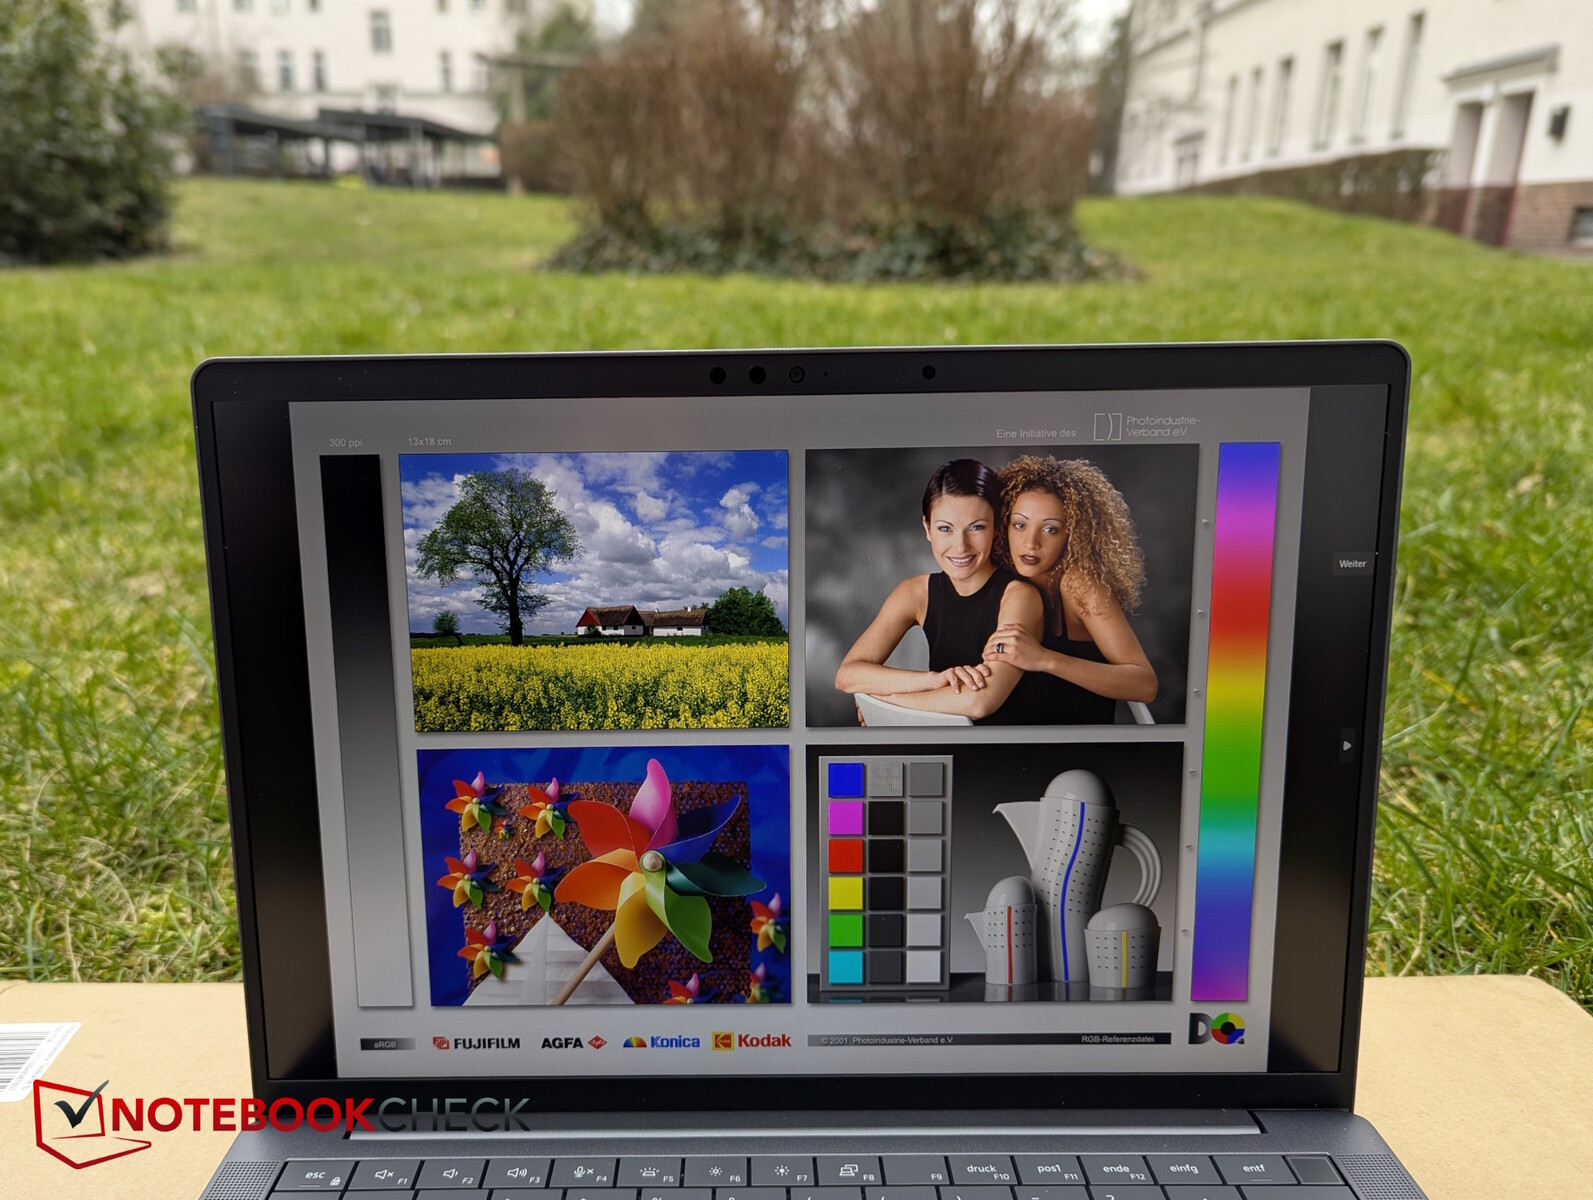
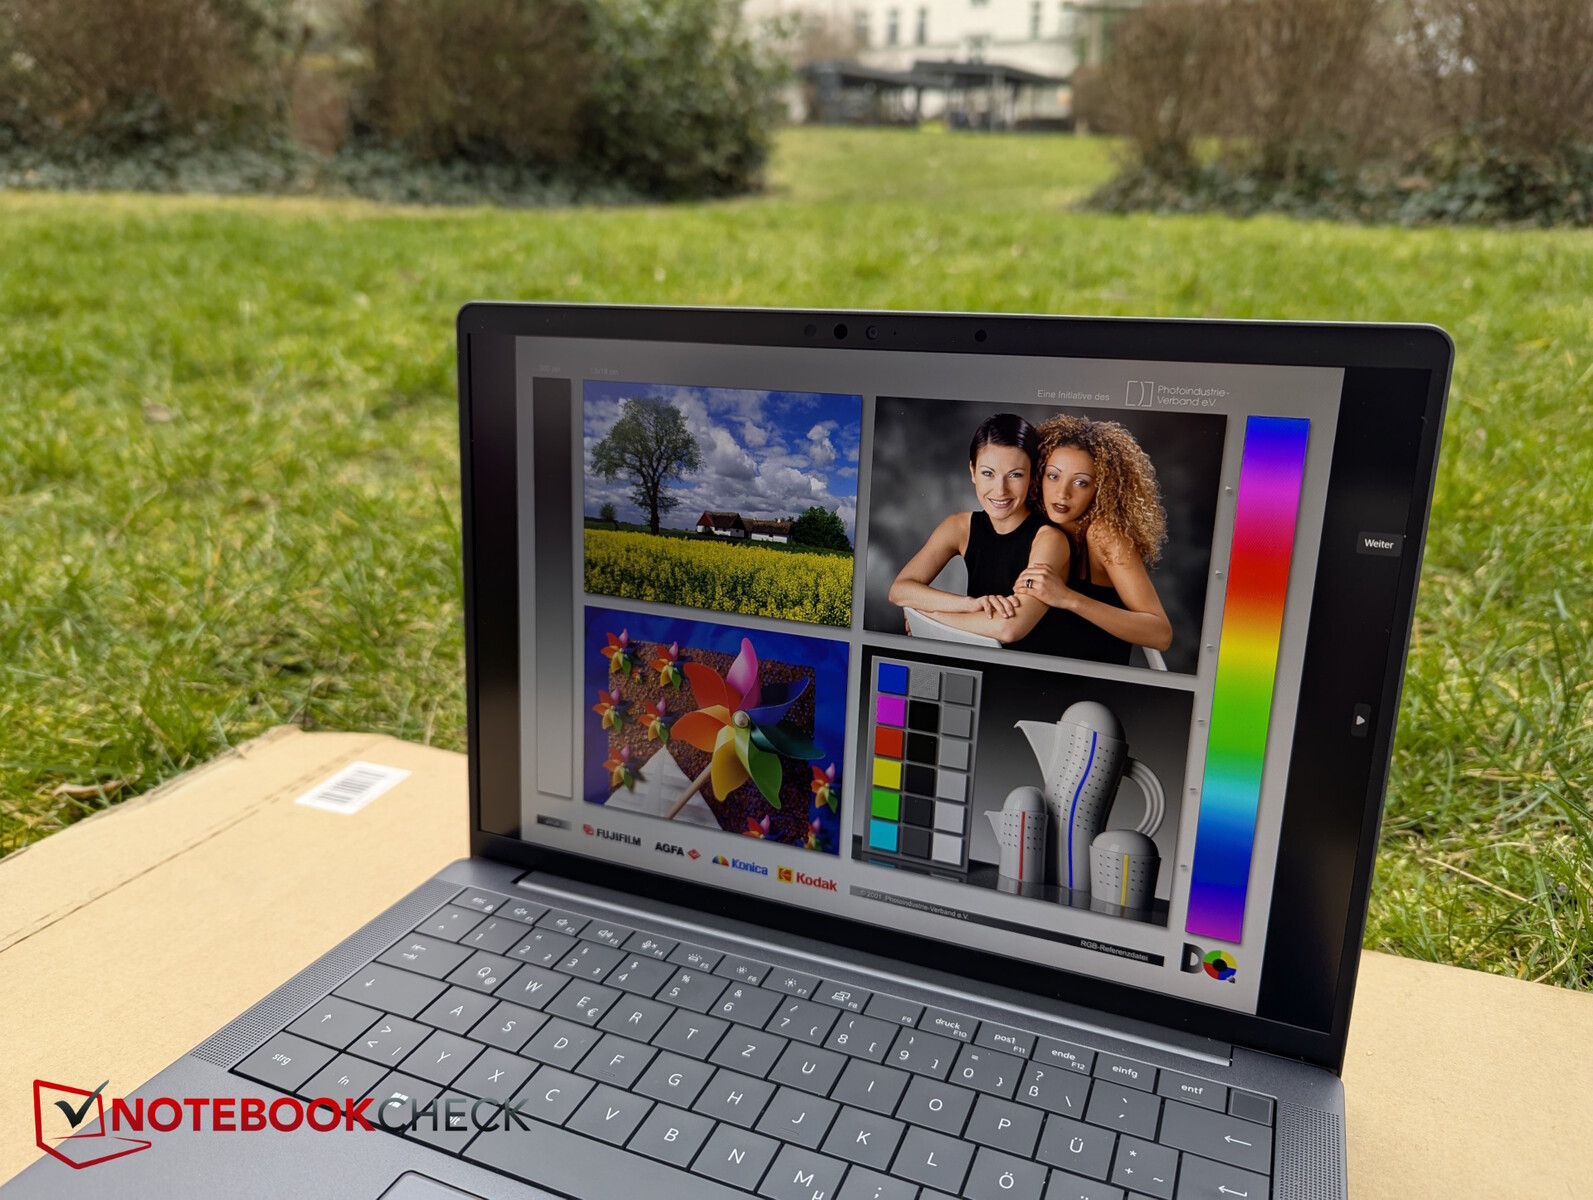
Affichage - Un panneau de bureau à contraste élevé avec des options supplémentaires
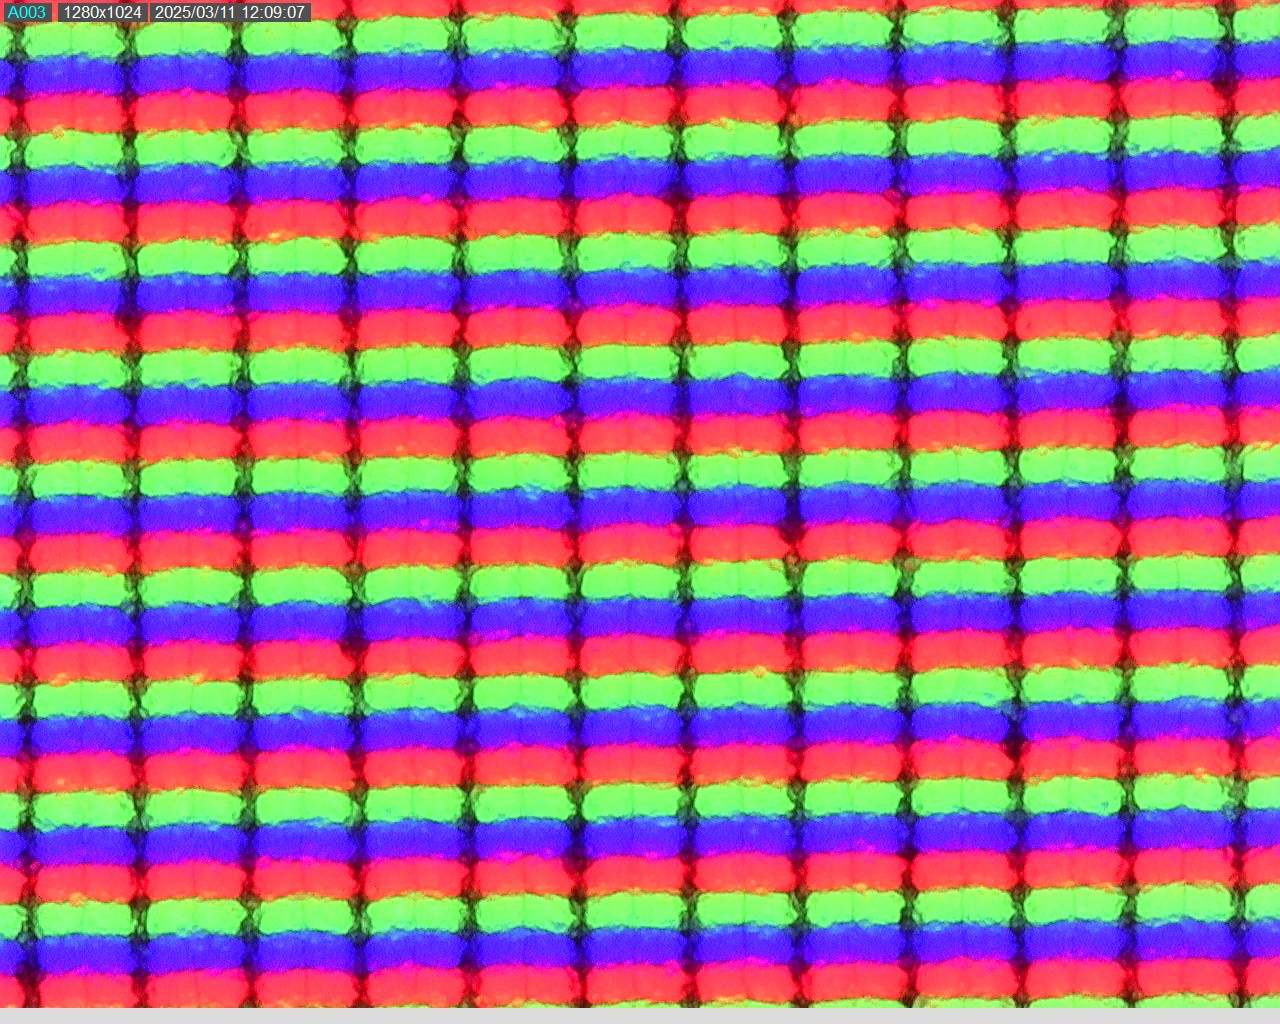
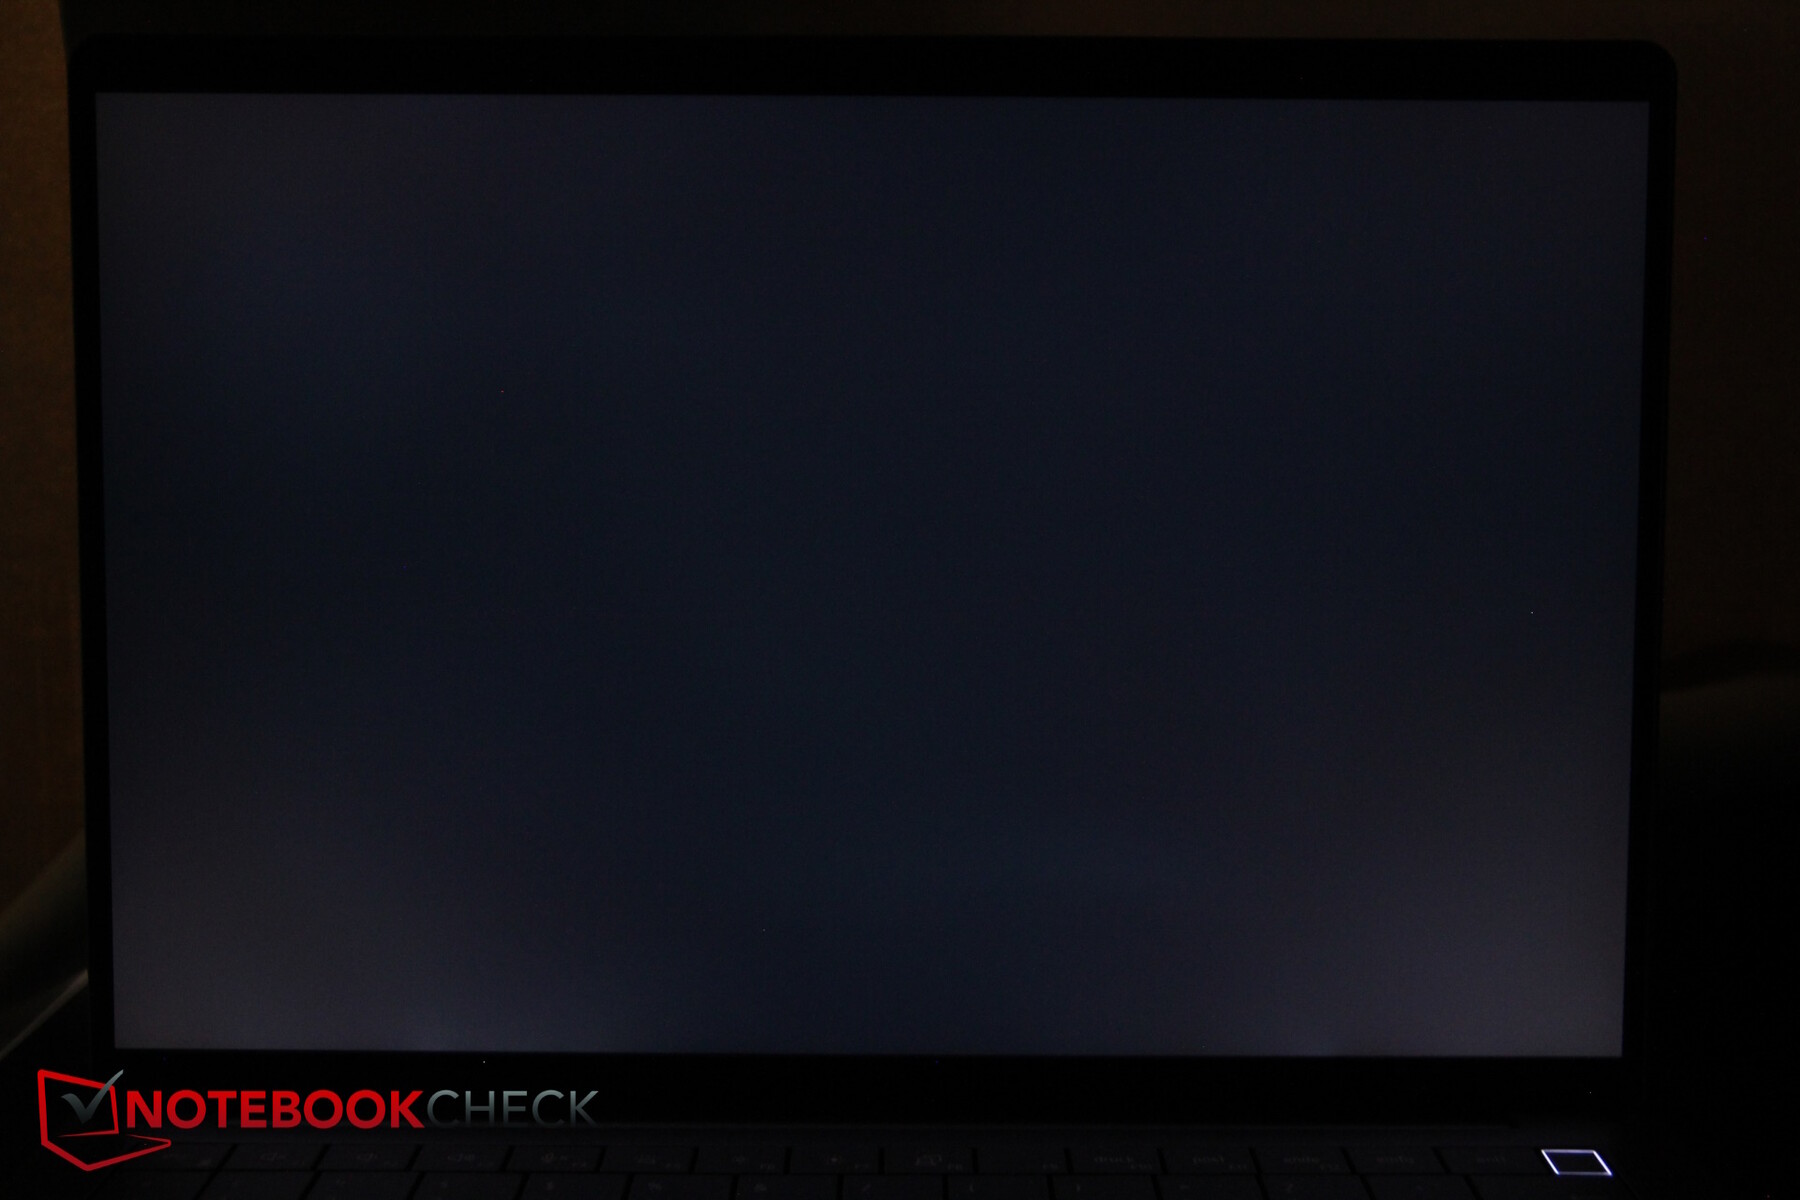
Il existe plusieurs options d'affichage, mais ce que nous voyons ici est un écran mat, au format 16:10, de 1 920 x 1 200 pixels, avec une luminosité officielle de 400 nits et sans entrée tactile. Il existe également une version 300 nits, ainsi que l'option supérieure, qui offre une résolution de 2 560 x 1 600 pixels, 500 nits et une fonctionnalité tactile. Dell souligne que tous ses écrans sont particulièrement économes en énergie.
Nous avons mesuré une luminosité moyenne de 460 nits. Le contraste est également plus que correct, grâce à un niveau de noir relativement bas. AdobeRGB et Display P3 sont couverts à environ 75 %, et sRGB presque entièrement.
Les temps de réponse sont toutefois assez lents et l'écran ne prend en charge que 60 Hz.
| |||||||||||||||||||||||||
Homogénéité de la luminosité: 89 %
Valeur mesurée au centre, sur batterie: 456 cd/m²
Contraste: 1983:1 (Valeurs des noirs: 0.23 cd/m²)
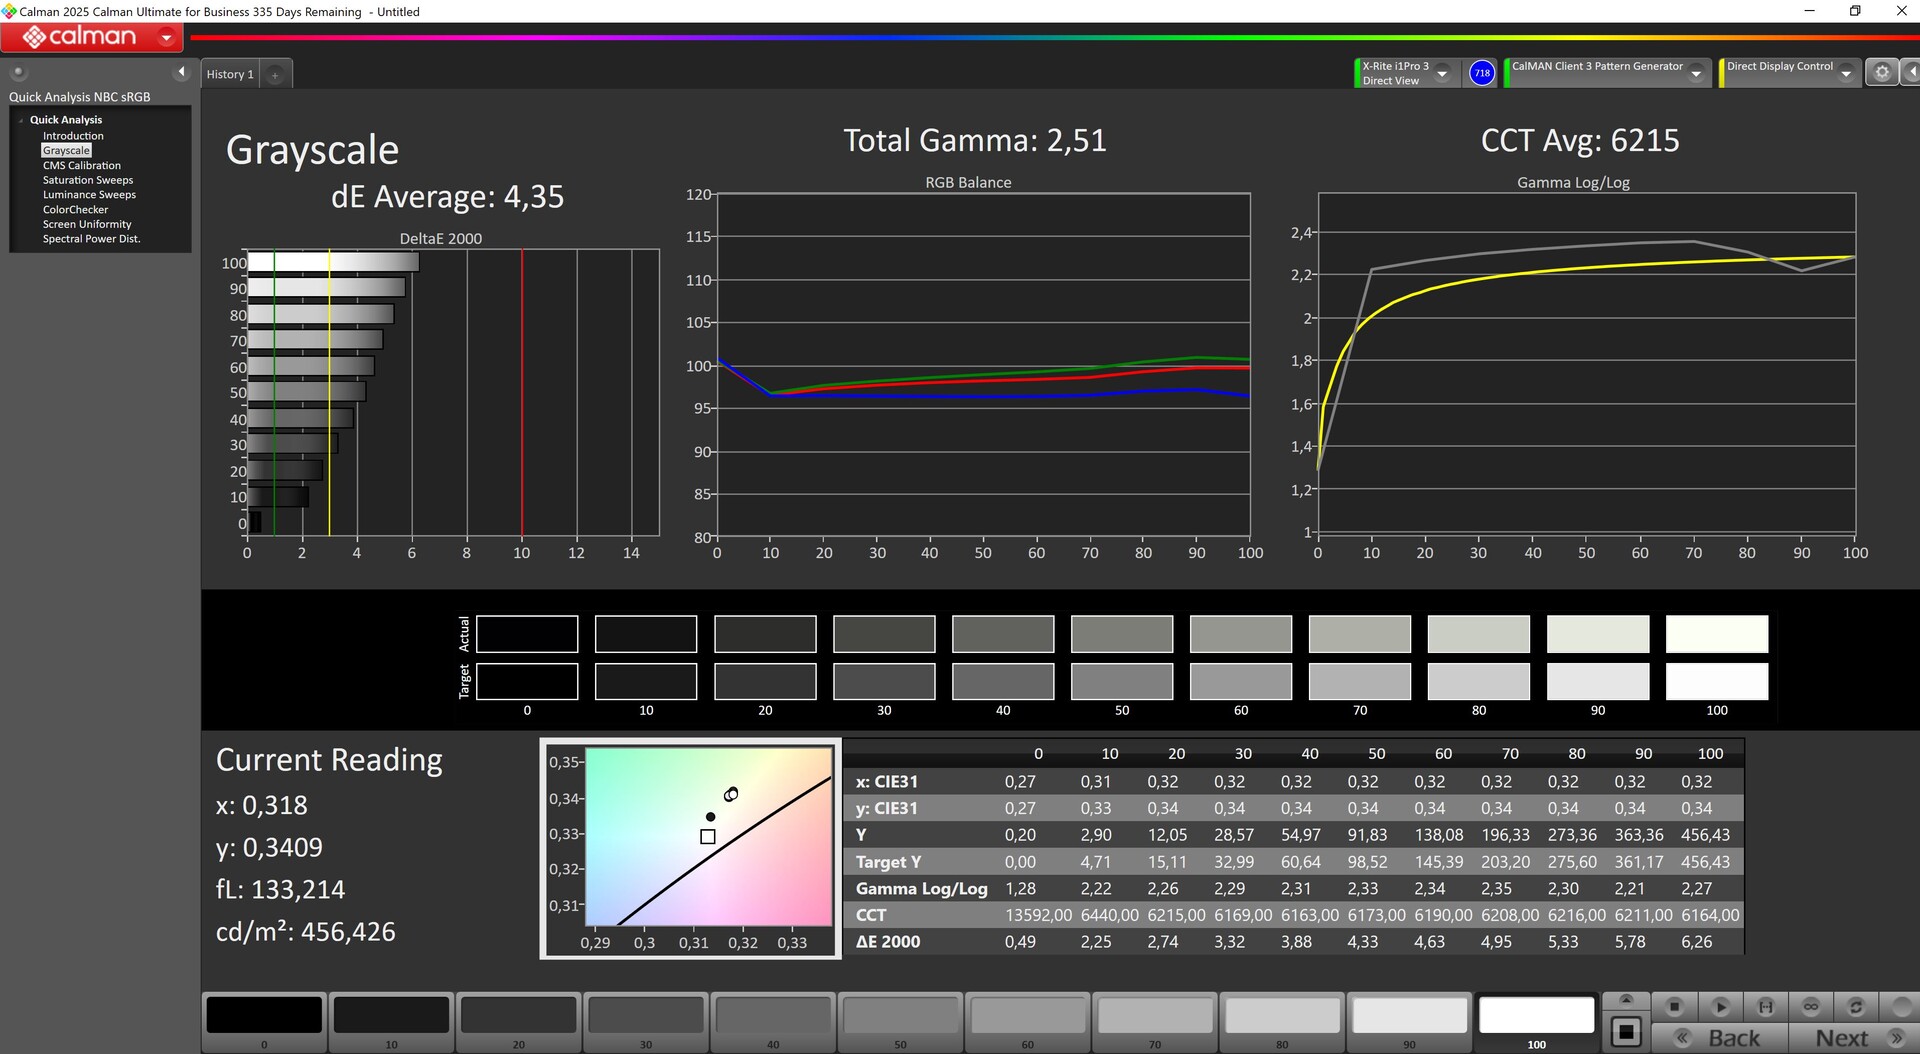
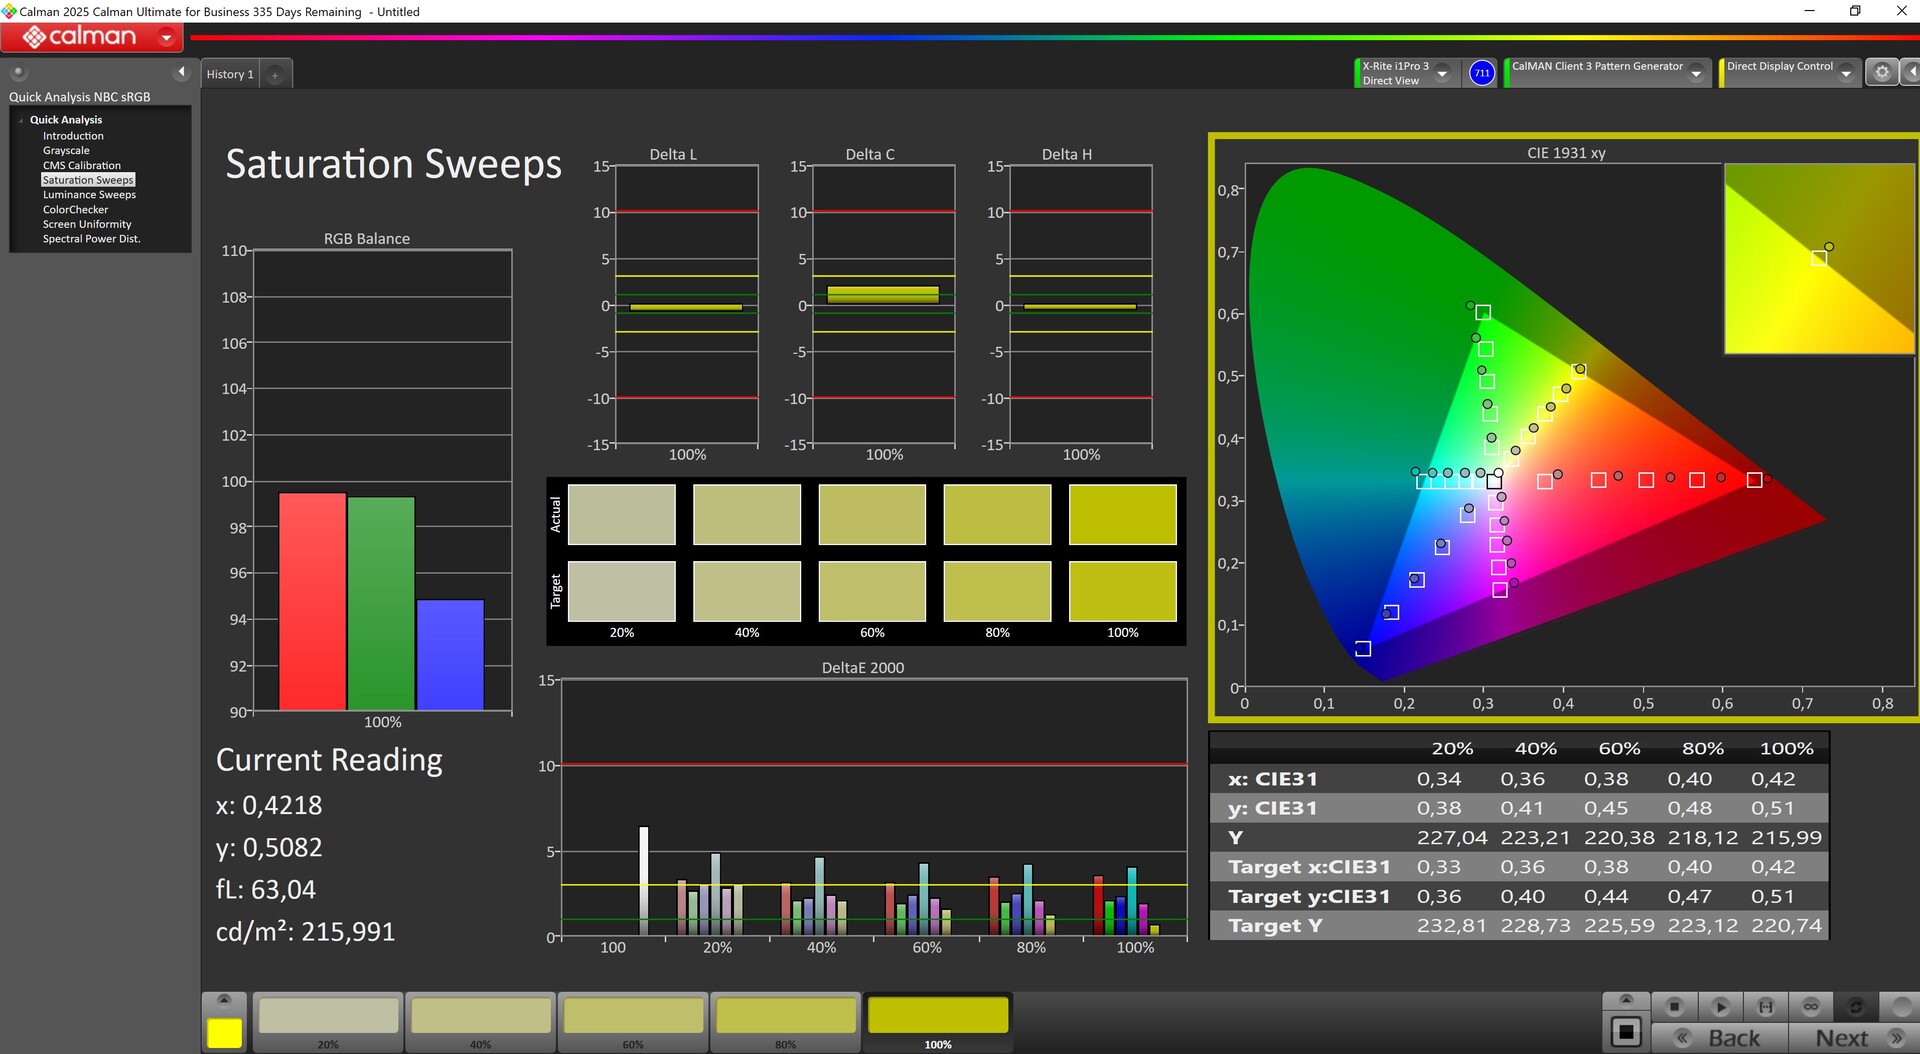
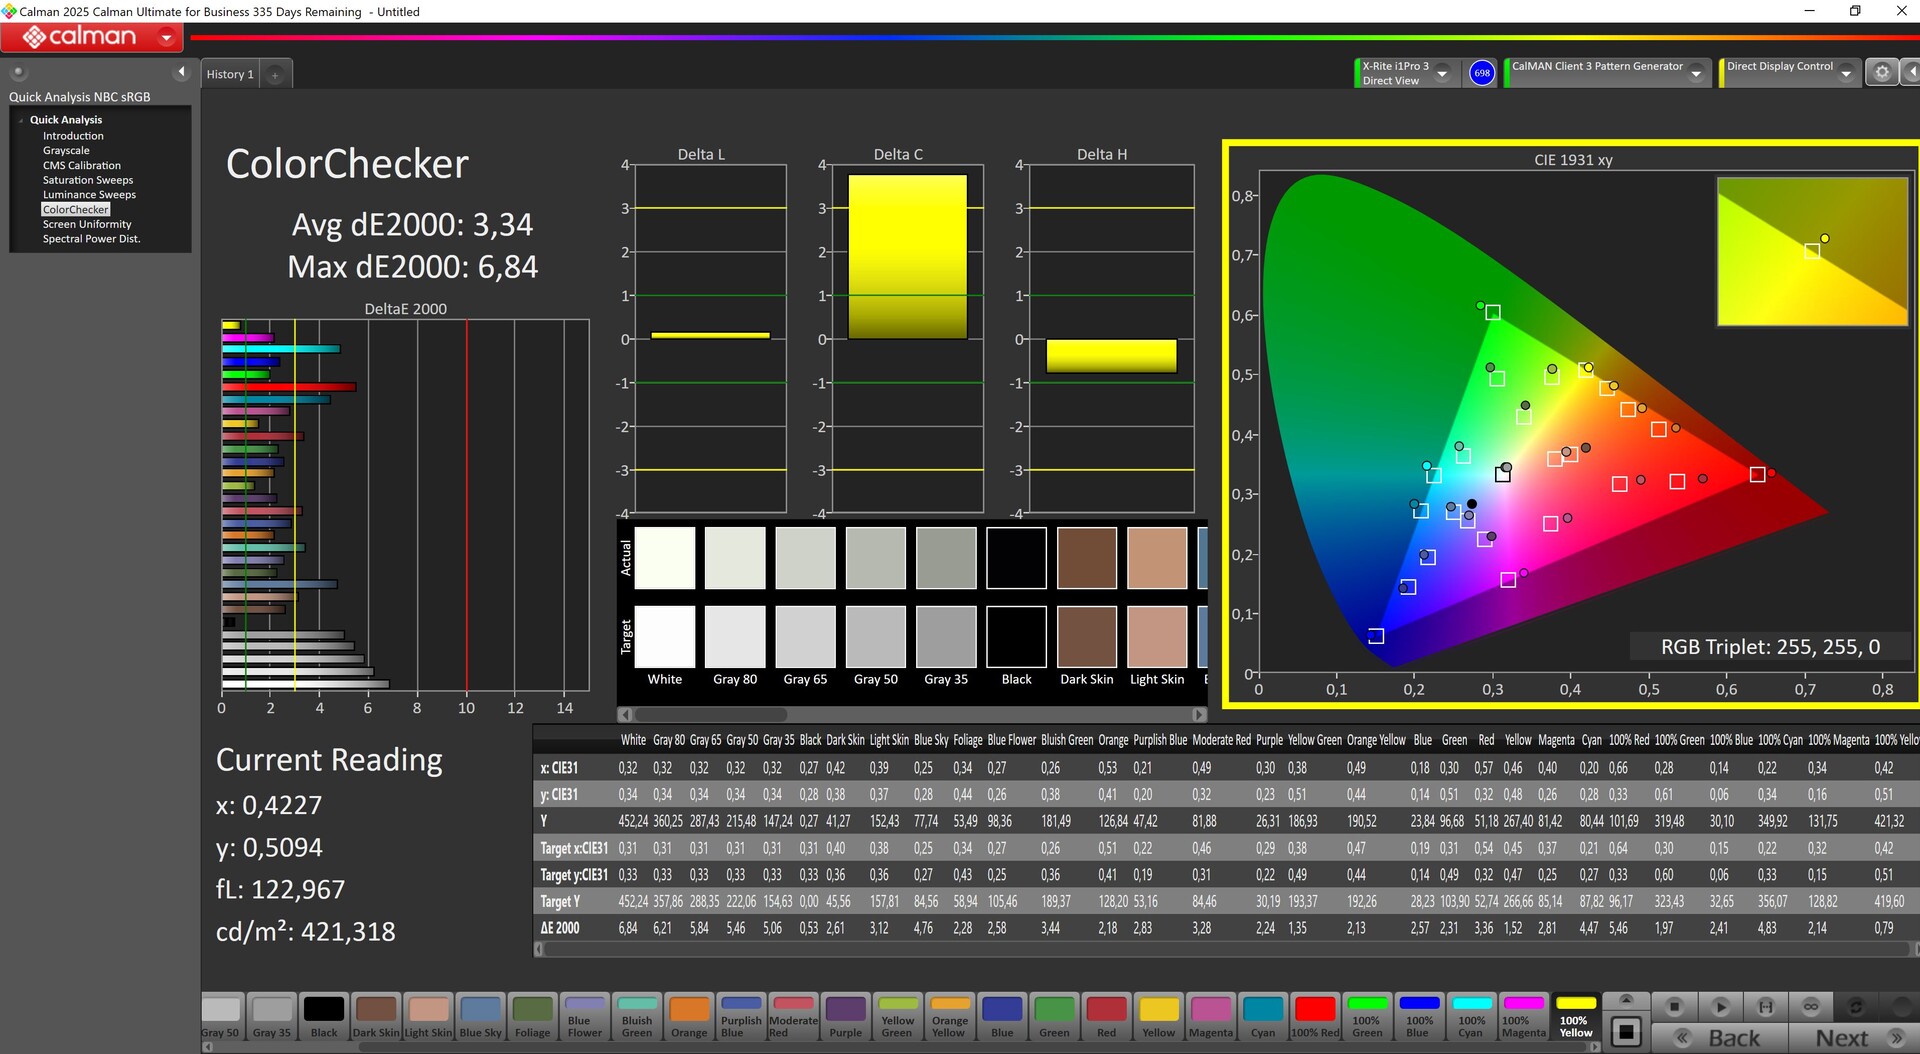
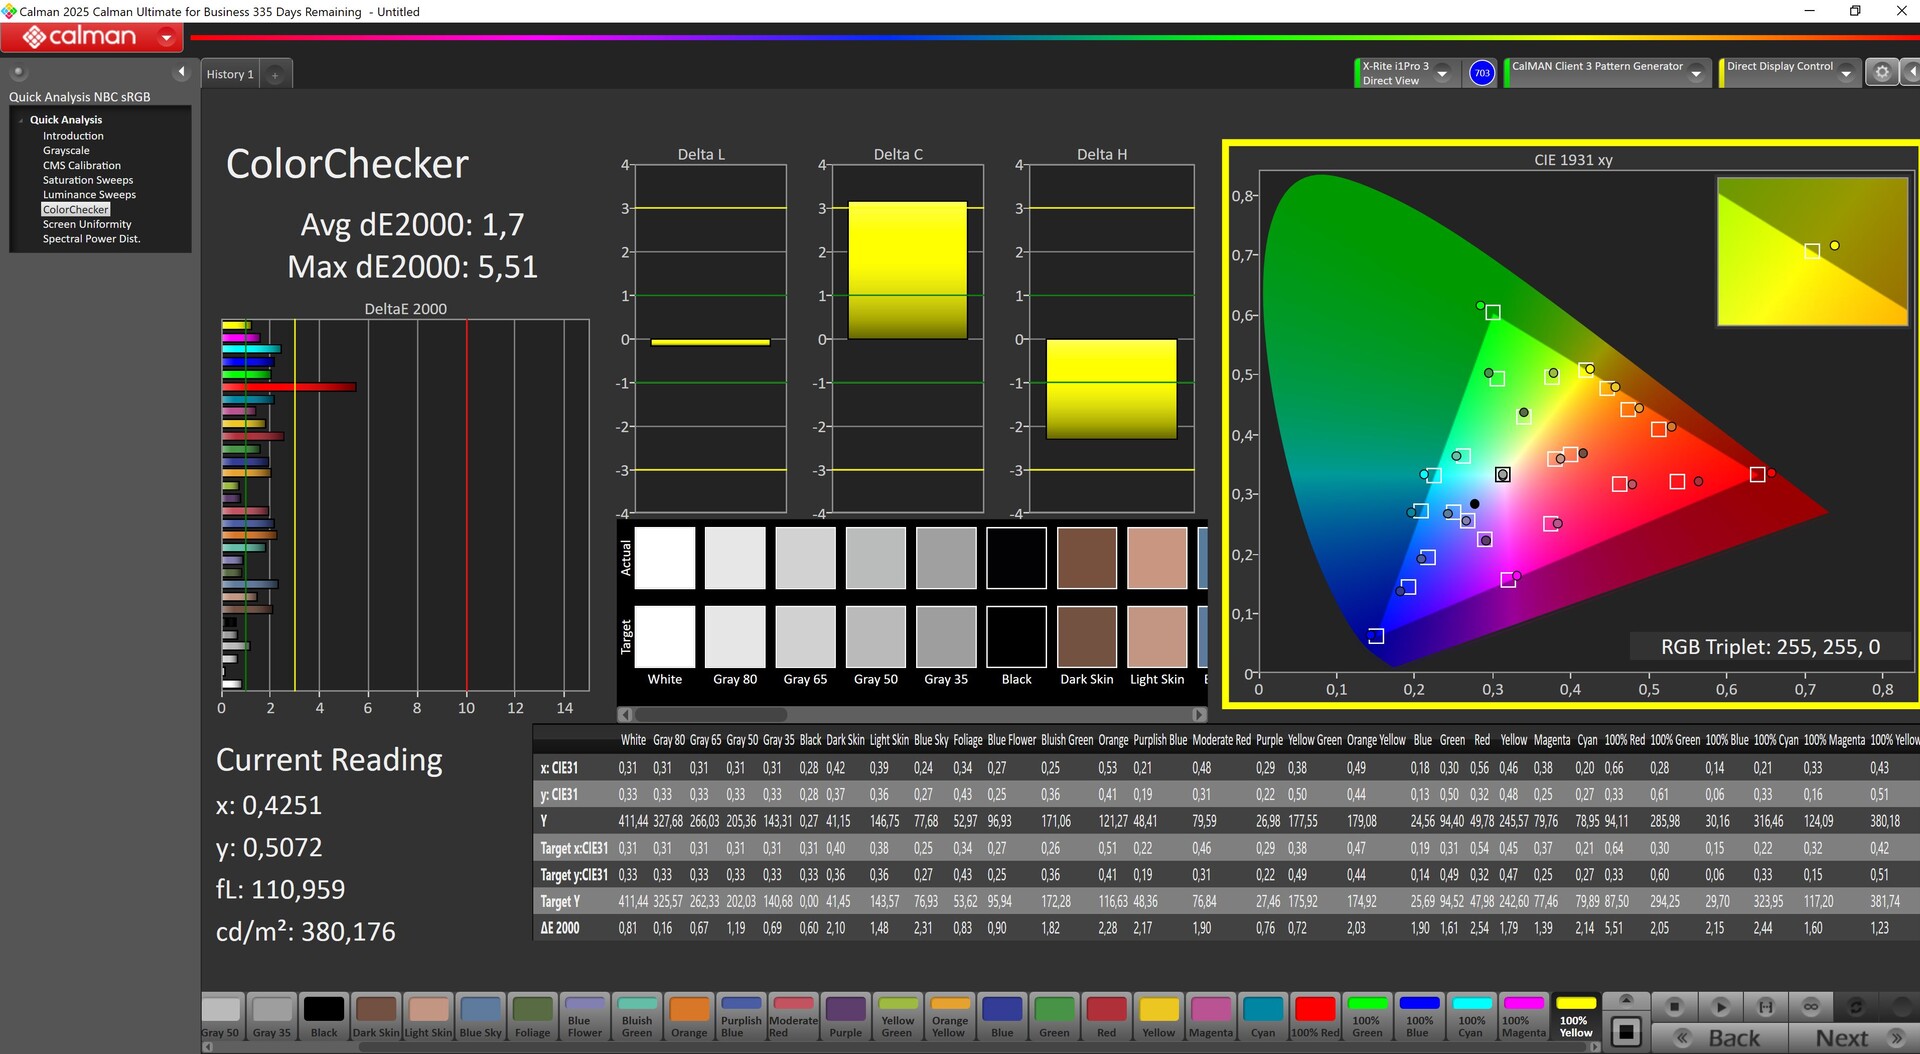
ΔE Color 3.3 | 0.5-29.43 Ø4.88, calibrated: 1.7
ΔE Greyscale 4.35 | 0.5-98 Ø5.1
75.9% AdobeRGB 1998 (Argyll 2.2.0 3D)
99.1% sRGB (Argyll 2.2.0 3D)
74.3% Display P3 (Argyll 2.2.0 3D)
Gamma: 2.51
| Dell Pro 13 Premium PA13250 B133UAN (AUOBEB0), IPS, 1920x1200, 13.3", 60 Hz | MSI Prestige 13 AI Plus Evo A2VMG ATNA33AA07-0, OLED, 2880x1800, 13.3", 60 Hz | Lenovo ThinkPad X13 2-in-1 Gen 5 Lenovo B133UAN01.2, IPS, 1920x1200, 13.3", 60 Hz | Framework Laptop 13.5 Core Ultra 7 155H BOE NE135A1M-NY1, IPS, 2880x1920, 13.5", 120 Hz | Dell XPS 13 9350 LG Philips 134WU2, IPS, 1920x1200, 13.4", 120 Hz | Microsoft Surface Pro Copilot+ LP129WT342166, IPS, 2880x1920, 13", 120 Hz | |
|---|---|---|---|---|---|---|
| Display | 20% | -4% | -2% | -6% | 6% | |
| Display P3 Coverage | 74.3 | 99.9 34% | 71.1 -4% | 72.8 -2% | 67.3 -9% | 83.4 12% |
| sRGB Coverage | 99.1 | 100 1% | 97.1 -2% | 98.6 -1% | 99 0% | 99.7 1% |
| AdobeRGB 1998 Coverage | 75.9 | 95.8 26% | 71.7 -6% | 72.9 -4% | 68.6 -10% | 79.4 5% |
| Response Times | 94% | -9% | 16% | 16% | 29% | |
| Response Time Grey 50% / Grey 80% * | 52.8 ? | 1.94 ? 96% | 50.2 ? 5% | 41.9 ? 21% | 37.3 ? 29% | 39.6 ? 25% |
| Response Time Black / White * | 26.4 ? | 2.02 ? 92% | 32.6 ? -23% | 23.7 ? 10% | 25.9 ? 2% | 18 ? 32% |
| PWM Frequency | 60 ? | |||||
| Screen | 17% | -9% | -11% | 31% | 4% | |
| Brightness middle | 456 | 382.4 -16% | 334 -27% | 498.5 9% | 462.8 1% | 585 28% |
| Brightness | 460 | 383 -17% | 308 -33% | 464 1% | 435 -5% | 574 25% |
| Brightness Distribution | 89 | 99 11% | 86 -3% | 86 -3% | 87 -2% | 89 0% |
| Black Level * | 0.23 | 0.37 -61% | 0.36 -57% | 0.19 17% | 0.56 -143% | |
| Contrast | 1983 | 903 -54% | 1385 -30% | 2436 23% | 1045 -47% | |
| Colorchecker dE 2000 * | 3.3 | 3.84 -16% | 2.36 28% | 4.27 -29% | 1.92 42% | 1.3 61% |
| Colorchecker dE 2000 max. * | 6.47 | 6.66 -3% | 4.93 24% | 7.08 -9% | 3.45 47% | 3 54% |
| Colorchecker dE 2000 calibrated * | 1.7 | 0.41 76% | 1.25 26% | 1.26 26% | 0.48 72% | |
| Greyscale dE 2000 * | 4.35 | 0.7 84% | 3.38 22% | 4.7 -8% | 0.6 86% | 2 54% |
| Gamma | 2.51 88% | 2.23 99% | 2.38 92% | 2.09 105% | 2.19 100% | 2.18 101% |
| CCT | 6215 105% | 6475 100% | 6352 102% | 7417 88% | 6539 99% | 6914 94% |
| Moyenne finale (programmes/paramètres) | 44% /
31% | -7% /
-8% | 1% /
-5% | 14% /
21% | 13% /
8% |
* ... Moindre est la valeur, meilleures sont les performances
L'écran n'est pas particulièrement bien calibré et, bien que notre calibrage manuel ait permis d'améliorer les valeurs DeltaE pour l'échelle de gris et le ColorChecker, il y avait toujours une valeur aberrante dans la zone rouge.
Temps de réponse de l'écran
| ↔ Temps de réponse noir à blanc | ||
|---|---|---|
| 26.4 ms ... hausse ↗ et chute ↘ combinées | ↗ 12.2 ms hausse | 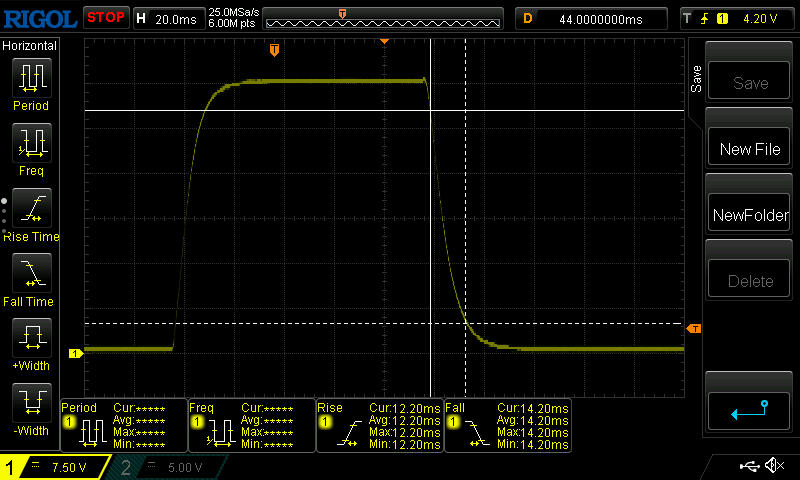 |
| ↘ 14.2 ms chute | ||
| L'écran souffre de latences relativement élevées, insuffisant pour le jeu. En comparaison, tous les appareils testés affichent entre 0.1 (minimum) et 240 (maximum) ms. » 63 % des appareils testés affichent de meilleures performances. Cela signifie que les latences relevées sont moins bonnes que la moyenne (20.8 ms) de tous les appareils testés. | ||
| ↔ Temps de réponse gris 50% à gris 80% | ||
| 52.8 ms ... hausse ↗ et chute ↘ combinées | ↗ 23.4 ms hausse | 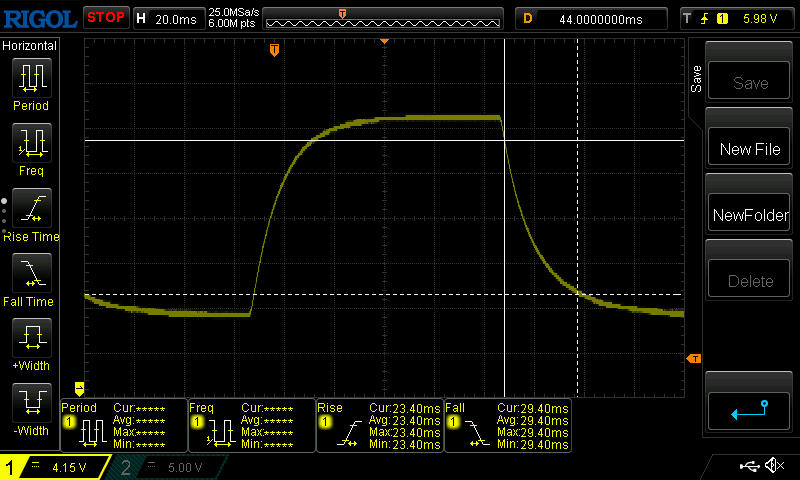 |
| ↘ 29.4 ms chute | ||
| L'écran souffre de latences très élevées, à éviter pour le jeu. En comparaison, tous les appareils testés affichent entre 0.165 (minimum) et 636 (maximum) ms. » 88 % des appareils testés affichent de meilleures performances. Cela signifie que les latences relevées sont moins bonnes que la moyenne (32.6 ms) de tous les appareils testés. | ||
Scintillement / MLI (Modulation de largeur d'impulsion)
| Scintillement / MLI (Modulation de largeur d'impulsion) non décelé |  | ||
En comparaison, 53 % des appareils testés n'emploient pas MDI pour assombrir leur écran. Nous avons relevé une moyenne à 8553 (minimum : 5 - maximum : 343500) Hz dans le cas où une MDI était active. | |||
En extérieur, la bonne luminosité et le bon contraste, la surface mate ainsi que la bonne stabilité de l'angle de vision contribuent à garantir un fonctionnement largement sans problème.

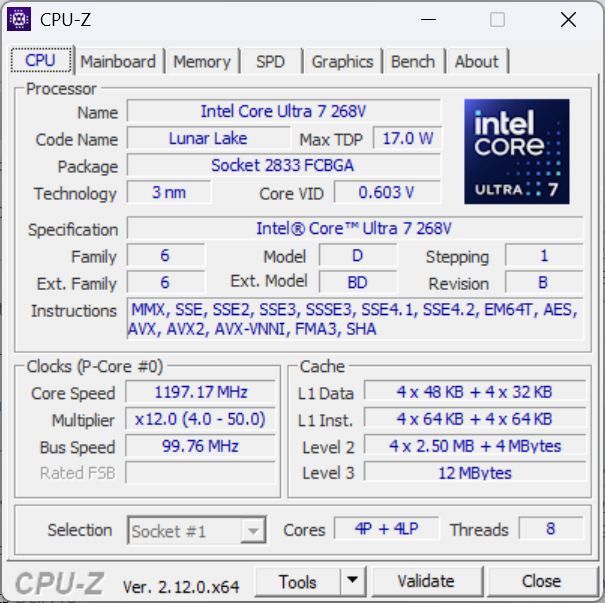
Performance - Un arc puissant 140V
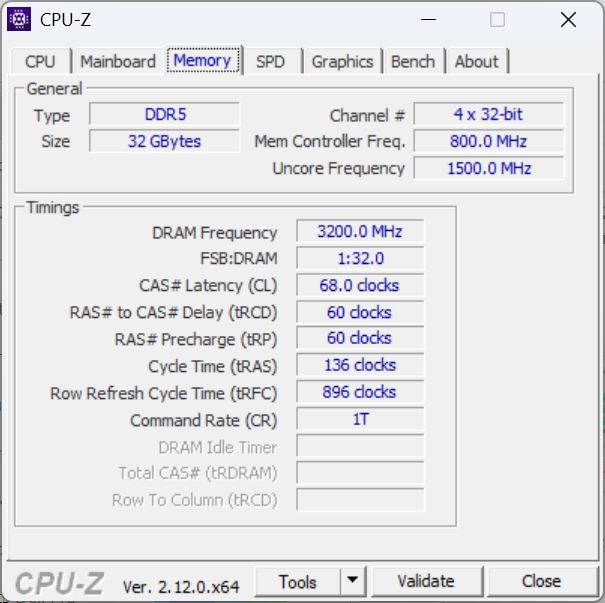
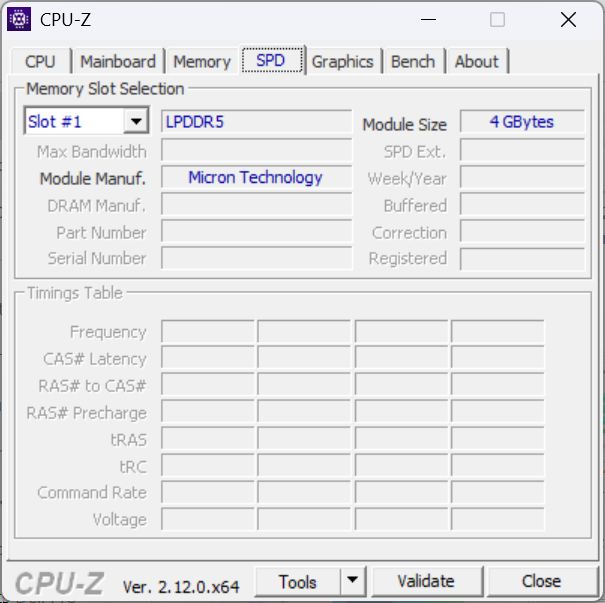
Le cœur battant est le nouveau Intel Core Ultra 7 268V avec 32 Go de mémoire vive intégrée. Il existe également une version dotée d'un processeur plus faible, le Core Ultra 5 236V plus faible et 16 Go de RAM. Le stockage est également disponible dans différentes configurations (256 Go, 512 Go, 1 To). Le Dell Pro 13 Premium est clairement destiné aux utilisateurs professionnels mobiles.
Conditions d'essai
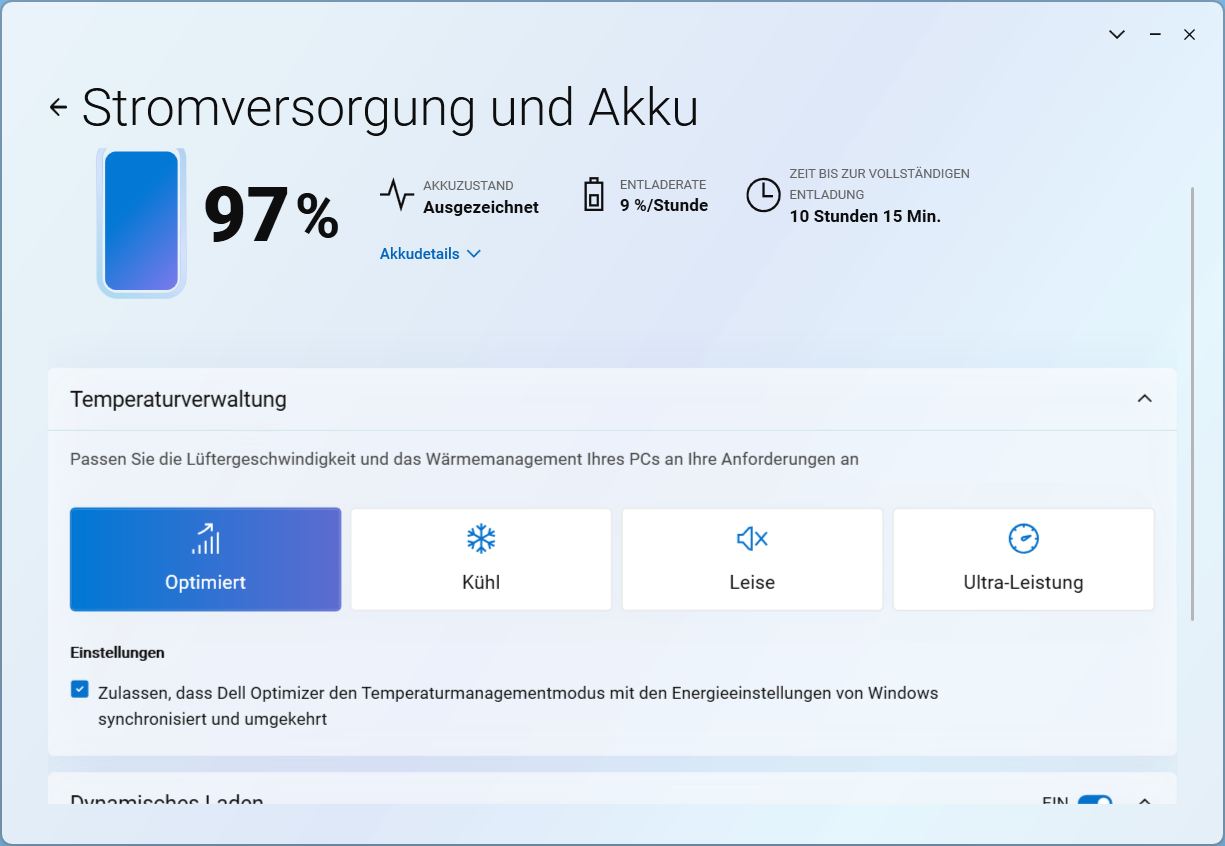
Dell Optimizer sert de centre de contrôle, offrant des réglages de ventilateur qui affectent les performances et quelques autres options. Pour nos benchmarks, nous l'avons laissé en mode "Optimisé" présélectionné.

Processeur

Le Intel Core Ultra 7 268V est l'un des modèles haut de gamme de la famille Lunar Lake à haute efficacité énergétique. Ses quatre cœurs E et quatre cœurs P sont cadencés entre 2,2 GHz et 5,0 GHz et disposent également d'un NPU 48 TOPS.
Ses performances à cœur unique ont été particulièrement impressionnantes dans tous les tests que nous avons effectués. Dans les tests multicœurs, le processeur du Dell Pro 13 est quelque peu décevant, souvent à la traîne par rapport à la concurrence, certains processeurs étant nominalement plus faibles. En mode batterie, environ 16 % des performances sont perdues.
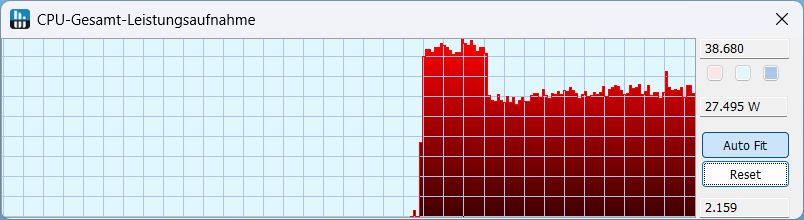
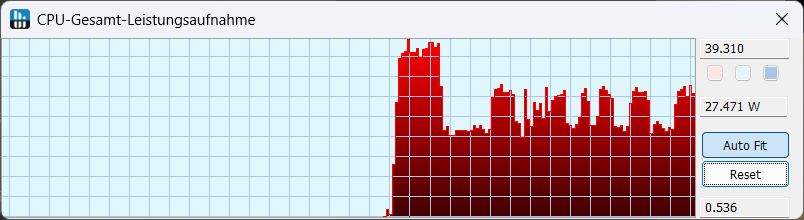
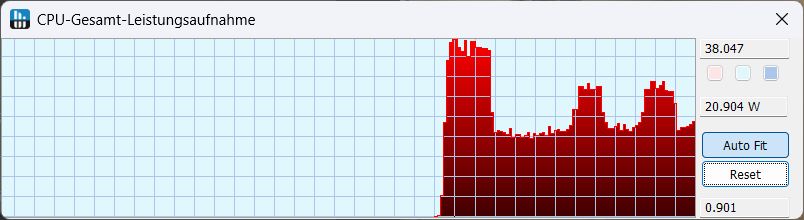
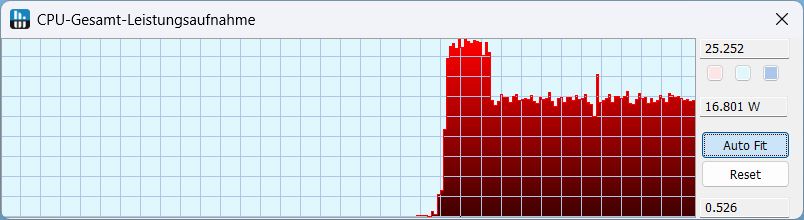
Dans la boucle Cinebench R15, les performances ont chuté d'environ 28 % ( !) au cours des trois premières exécutions et sont restées constantes par la suite. En mode optimisé standard, la consommation d'énergie a d'abord été d'environ 38 W, puis a chuté à 27 W. Les images de droite montrent le comportement de la consommation d'énergie dans Cinebench R23, en fonction du mode de ventilation.
Cinebench R15 Multi Continuous Test
Cinebench R23: Multi Core | Single Core
Cinebench R20: CPU (Multi Core) | CPU (Single Core)
Cinebench R15: CPU Multi 64Bit | CPU Single 64Bit
Blender: v2.79 BMW27 CPU
7-Zip 18.03: 7z b 4 | 7z b 4 -mmt1
Geekbench 6.4: Multi-Core | Single-Core
Geekbench 5.5: Multi-Core | Single-Core
HWBOT x265 Benchmark v2.2: 4k Preset
LibreOffice : 20 Documents To PDF
R Benchmark 2.5: Overall mean
| CPU Performance Rating | |
| Framework Laptop 13.5 Core Ultra 7 155H | |
| MSI Prestige 13 AI Plus Evo A2VMG | |
| Dell XPS 13 9350 | |
| Moyenne de la classe Subnotebook | |
| Dell Pro 13 Premium PA13250 | |
| Moyenne Intel Core Ultra 7 268V | |
| Lenovo ThinkPad X13 2-in-1 Gen 5 | |
| Microsoft Surface Pro Copilot+ -2! | |
| Cinebench R23 / Multi Core | |
| Framework Laptop 13.5 Core Ultra 7 155H | |
| Moyenne de la classe Subnotebook (1555 - 21812, n=73, 2 dernières années) | |
| MSI Prestige 13 AI Plus Evo A2VMG | |
| Dell XPS 13 9350 | |
| Dell Pro 13 Premium PA13250 | |
| Moyenne Intel Core Ultra 7 268V (n=1) | |
| Microsoft Surface Pro Copilot+ | |
| Lenovo ThinkPad X13 2-in-1 Gen 5 | |
| Cinebench R23 / Single Core | |
| Dell Pro 13 Premium PA13250 | |
| Moyenne Intel Core Ultra 7 268V (n=1) | |
| Dell XPS 13 9350 | |
| MSI Prestige 13 AI Plus Evo A2VMG | |
| Framework Laptop 13.5 Core Ultra 7 155H | |
| Moyenne de la classe Subnotebook (358 - 2165, n=73, 2 dernières années) | |
| Lenovo ThinkPad X13 2-in-1 Gen 5 | |
| Microsoft Surface Pro Copilot+ | |
| Cinebench R20 / CPU (Multi Core) | |
| Framework Laptop 13.5 Core Ultra 7 155H | |
| Moyenne de la classe Subnotebook (579 - 8541, n=68, 2 dernières années) | |
| MSI Prestige 13 AI Plus Evo A2VMG | |
| Dell XPS 13 9350 | |
| Dell Pro 13 Premium PA13250 | |
| Moyenne Intel Core Ultra 7 268V (n=1) | |
| Lenovo ThinkPad X13 2-in-1 Gen 5 | |
| Microsoft Surface Pro Copilot+ | |
| Cinebench R20 / CPU (Single Core) | |
| Dell Pro 13 Premium PA13250 | |
| Moyenne Intel Core Ultra 7 268V (n=1) | |
| Dell XPS 13 9350 | |
| MSI Prestige 13 AI Plus Evo A2VMG | |
| Framework Laptop 13.5 Core Ultra 7 155H | |
| Moyenne de la classe Subnotebook (128 - 790, n=68, 2 dernières années) | |
| Lenovo ThinkPad X13 2-in-1 Gen 5 | |
| Microsoft Surface Pro Copilot+ | |
| Cinebench R15 / CPU Multi 64Bit | |
| Framework Laptop 13.5 Core Ultra 7 155H | |
| Microsoft Surface Pro Copilot+ | |
| Moyenne de la classe Subnotebook (327 - 3345, n=74, 2 dernières années) | |
| MSI Prestige 13 AI Plus Evo A2VMG | |
| Dell Pro 13 Premium PA13250 | |
| Moyenne Intel Core Ultra 7 268V (n=1) | |
| Dell XPS 13 9350 | |
| Lenovo ThinkPad X13 2-in-1 Gen 5 | |
| Cinebench R15 / CPU Single 64Bit | |
| Dell Pro 13 Premium PA13250 | |
| Moyenne Intel Core Ultra 7 268V (n=1) | |
| Dell XPS 13 9350 | |
| MSI Prestige 13 AI Plus Evo A2VMG | |
| Framework Laptop 13.5 Core Ultra 7 155H | |
| Moyenne de la classe Subnotebook (72.4 - 307, n=69, 2 dernières années) | |
| Lenovo ThinkPad X13 2-in-1 Gen 5 | |
| Microsoft Surface Pro Copilot+ | |
| Blender / v2.79 BMW27 CPU | |
| Dell Pro 13 Premium PA13250 | |
| Moyenne Intel Core Ultra 7 268V (n=1) | |
| Microsoft Surface Pro Copilot+ | |
| Moyenne de la classe Subnotebook (159 - 2271, n=72, 2 dernières années) | |
| Lenovo ThinkPad X13 2-in-1 Gen 5 | |
| Dell XPS 13 9350 | |
| MSI Prestige 13 AI Plus Evo A2VMG | |
| Framework Laptop 13.5 Core Ultra 7 155H | |
| 7-Zip 18.03 / 7z b 4 | |
| Framework Laptop 13.5 Core Ultra 7 155H | |
| Moyenne de la classe Subnotebook (11668 - 77867, n=64, 2 dernières années) | |
| Microsoft Surface Pro Copilot+ | |
| Dell XPS 13 9350 | |
| MSI Prestige 13 AI Plus Evo A2VMG | |
| Dell Pro 13 Premium PA13250 | |
| Moyenne Intel Core Ultra 7 268V (n=1) | |
| Lenovo ThinkPad X13 2-in-1 Gen 5 | |
| 7-Zip 18.03 / 7z b 4 -mmt1 | |
| Dell Pro 13 Premium PA13250 | |
| Moyenne Intel Core Ultra 7 268V (n=1) | |
| Dell XPS 13 9350 | |
| MSI Prestige 13 AI Plus Evo A2VMG | |
| Moyenne de la classe Subnotebook (2643 - 6442, n=66, 2 dernières années) | |
| Framework Laptop 13.5 Core Ultra 7 155H | |
| Microsoft Surface Pro Copilot+ | |
| Lenovo ThinkPad X13 2-in-1 Gen 5 | |
| Geekbench 6.4 / Multi-Core | |
| Microsoft Surface Pro Copilot+ | |
| Framework Laptop 13.5 Core Ultra 7 155H | |
| Moyenne de la classe Subnotebook (2244 - 15220, n=69, 2 dernières années) | |
| MSI Prestige 13 AI Plus Evo A2VMG | |
| Dell XPS 13 9350 | |
| Moyenne Intel Core Ultra 7 268V (10589 - 10911, n=2) | |
| Dell Pro 13 Premium PA13250 | |
| Lenovo ThinkPad X13 2-in-1 Gen 5 | |
| Geekbench 6.4 / Single-Core | |
| Dell Pro 13 Premium PA13250 | |
| Dell XPS 13 9350 | |
| MSI Prestige 13 AI Plus Evo A2VMG | |
| Moyenne Intel Core Ultra 7 268V (2583 - 2809, n=2) | |
| Moyenne de la classe Subnotebook (960 - 3655, n=64, 2 dernières années) | |
| Microsoft Surface Pro Copilot+ | |
| Framework Laptop 13.5 Core Ultra 7 155H | |
| Lenovo ThinkPad X13 2-in-1 Gen 5 | |
| Lenovo ThinkPad X13 2-in-1 Gen 5 | |
| Geekbench 5.5 / Multi-Core | |
| Framework Laptop 13.5 Core Ultra 7 155H | |
| Moyenne de la classe Subnotebook (2557 - 14728, n=65, 2 dernières années) | |
| MSI Prestige 13 AI Plus Evo A2VMG | |
| Moyenne Intel Core Ultra 7 268V (9491 - 9766, n=2) | |
| Dell Pro 13 Premium PA13250 | |
| Dell XPS 13 9350 | |
| Lenovo ThinkPad X13 2-in-1 Gen 5 | |
| Geekbench 5.5 / Single-Core | |
| Dell XPS 13 9350 | |
| Dell Pro 13 Premium PA13250 | |
| Moyenne Intel Core Ultra 7 268V (2008 - 2008, n=2) | |
| MSI Prestige 13 AI Plus Evo A2VMG | |
| Moyenne de la classe Subnotebook (726 - 2350, n=65, 2 dernières années) | |
| Framework Laptop 13.5 Core Ultra 7 155H | |
| Lenovo ThinkPad X13 2-in-1 Gen 5 | |
| HWBOT x265 Benchmark v2.2 / 4k Preset | |
| MSI Prestige 13 AI Plus Evo A2VMG | |
| Framework Laptop 13.5 Core Ultra 7 155H | |
| Dell XPS 13 9350 | |
| Moyenne de la classe Subnotebook (0.97 - 25.1, n=67, 2 dernières années) | |
| Dell Pro 13 Premium PA13250 | |
| Moyenne Intel Core Ultra 7 268V (n=1) | |
| Lenovo ThinkPad X13 2-in-1 Gen 5 | |
| Microsoft Surface Pro Copilot+ | |
| LibreOffice / 20 Documents To PDF | |
| Dell Pro 13 Premium PA13250 | |
| Moyenne Intel Core Ultra 7 268V (n=1) | |
| Microsoft Surface Pro Copilot+ | |
| Lenovo ThinkPad X13 2-in-1 Gen 5 | |
| Moyenne de la classe Subnotebook (38.5 - 220, n=65, 2 dernières années) | |
| Dell XPS 13 9350 | |
| MSI Prestige 13 AI Plus Evo A2VMG | |
| Framework Laptop 13.5 Core Ultra 7 155H | |
| R Benchmark 2.5 / Overall mean | |
| Microsoft Surface Pro Copilot+ | |
| Lenovo ThinkPad X13 2-in-1 Gen 5 | |
| Moyenne de la classe Subnotebook (0.413 - 1.456, n=67, 2 dernières années) | |
| Framework Laptop 13.5 Core Ultra 7 155H | |
| MSI Prestige 13 AI Plus Evo A2VMG | |
| Dell XPS 13 9350 | |
| Dell Pro 13 Premium PA13250 | |
| Moyenne Intel Core Ultra 7 268V (n=1) | |
* ... Moindre est la valeur, meilleures sont les performances
AIDA64: FP32 Ray-Trace | FPU Julia | CPU SHA3 | CPU Queen | FPU SinJulia | FPU Mandel | CPU AES | CPU ZLib | FP64 Ray-Trace | CPU PhotoWorxx
| Performance Rating | |
| Framework Laptop 13.5 Core Ultra 7 155H | |
| Moyenne de la classe Subnotebook | |
| MSI Prestige 13 AI Plus Evo A2VMG | |
| Dell XPS 13 9350 | |
| Dell Pro 13 Premium PA13250 | |
| Moyenne Intel Core Ultra 7 268V | |
| Lenovo ThinkPad X13 2-in-1 Gen 5 | |
| Microsoft Surface Pro Copilot+ | |
| AIDA64 / FP32 Ray-Trace | |
| MSI Prestige 13 AI Plus Evo A2VMG | |
| Moyenne de la classe Subnotebook (1135 - 32888, n=67, 2 dernières années) | |
| Dell XPS 13 9350 | |
| Framework Laptop 13.5 Core Ultra 7 155H | |
| Dell Pro 13 Premium PA13250 | |
| Moyenne Intel Core Ultra 7 268V (n=1) | |
| Microsoft Surface Pro Copilot+ | |
| Lenovo ThinkPad X13 2-in-1 Gen 5 | |
| AIDA64 / FPU Julia | |
| MSI Prestige 13 AI Plus Evo A2VMG | |
| Dell XPS 13 9350 | |
| Framework Laptop 13.5 Core Ultra 7 155H | |
| Moyenne de la classe Subnotebook (5218 - 123315, n=67, 2 dernières années) | |
| Dell Pro 13 Premium PA13250 | |
| Moyenne Intel Core Ultra 7 268V (n=1) | |
| Lenovo ThinkPad X13 2-in-1 Gen 5 | |
| Microsoft Surface Pro Copilot+ | |
| AIDA64 / CPU SHA3 | |
| Moyenne de la classe Subnotebook (444 - 5287, n=67, 2 dernières années) | |
| MSI Prestige 13 AI Plus Evo A2VMG | |
| Framework Laptop 13.5 Core Ultra 7 155H | |
| Dell XPS 13 9350 | |
| Dell Pro 13 Premium PA13250 | |
| Moyenne Intel Core Ultra 7 268V (n=1) | |
| Lenovo ThinkPad X13 2-in-1 Gen 5 | |
| Microsoft Surface Pro Copilot+ | |
| AIDA64 / CPU Queen | |
| Framework Laptop 13.5 Core Ultra 7 155H | |
| Moyenne de la classe Subnotebook (10579 - 115682, n=67, 2 dernières années) | |
| Microsoft Surface Pro Copilot+ | |
| MSI Prestige 13 AI Plus Evo A2VMG | |
| Dell Pro 13 Premium PA13250 | |
| Moyenne Intel Core Ultra 7 268V (n=1) | |
| Dell XPS 13 9350 | |
| Lenovo ThinkPad X13 2-in-1 Gen 5 | |
| AIDA64 / FPU SinJulia | |
| Framework Laptop 13.5 Core Ultra 7 155H | |
| Moyenne de la classe Subnotebook (744 - 18418, n=67, 2 dernières années) | |
| Lenovo ThinkPad X13 2-in-1 Gen 5 | |
| Dell XPS 13 9350 | |
| MSI Prestige 13 AI Plus Evo A2VMG | |
| Dell Pro 13 Premium PA13250 | |
| Moyenne Intel Core Ultra 7 268V (n=1) | |
| Microsoft Surface Pro Copilot+ | |
| AIDA64 / FPU Mandel | |
| MSI Prestige 13 AI Plus Evo A2VMG | |
| Dell XPS 13 9350 | |
| Moyenne de la classe Subnotebook (3341 - 65433, n=67, 2 dernières années) | |
| Framework Laptop 13.5 Core Ultra 7 155H | |
| Dell Pro 13 Premium PA13250 | |
| Moyenne Intel Core Ultra 7 268V (n=1) | |
| Lenovo ThinkPad X13 2-in-1 Gen 5 | |
| Microsoft Surface Pro Copilot+ | |
| AIDA64 / CPU AES | |
| Framework Laptop 13.5 Core Ultra 7 155H | |
| Microsoft Surface Pro Copilot+ | |
| Moyenne de la classe Subnotebook (638 - 161430, n=67, 2 dernières années) | |
| Dell XPS 13 9350 | |
| MSI Prestige 13 AI Plus Evo A2VMG | |
| Lenovo ThinkPad X13 2-in-1 Gen 5 | |
| Dell Pro 13 Premium PA13250 | |
| Moyenne Intel Core Ultra 7 268V (n=1) | |
| AIDA64 / CPU ZLib | |
| Framework Laptop 13.5 Core Ultra 7 155H | |
| Moyenne de la classe Subnotebook (164.9 - 1379, n=67, 2 dernières années) | |
| Microsoft Surface Pro Copilot+ | |
| MSI Prestige 13 AI Plus Evo A2VMG | |
| Dell XPS 13 9350 | |
| Lenovo ThinkPad X13 2-in-1 Gen 5 | |
| Dell Pro 13 Premium PA13250 | |
| Moyenne Intel Core Ultra 7 268V (n=1) | |
| AIDA64 / FP64 Ray-Trace | |
| MSI Prestige 13 AI Plus Evo A2VMG | |
| Dell XPS 13 9350 | |
| Moyenne de la classe Subnotebook (610 - 17495, n=67, 2 dernières années) | |
| Framework Laptop 13.5 Core Ultra 7 155H | |
| Dell Pro 13 Premium PA13250 | |
| Moyenne Intel Core Ultra 7 268V (n=1) | |
| Lenovo ThinkPad X13 2-in-1 Gen 5 | |
| Microsoft Surface Pro Copilot+ | |
| AIDA64 / CPU PhotoWorxx | |
| MSI Prestige 13 AI Plus Evo A2VMG | |
| Dell XPS 13 9350 | |
| Dell Pro 13 Premium PA13250 | |
| Moyenne Intel Core Ultra 7 268V (n=1) | |
| Framework Laptop 13.5 Core Ultra 7 155H | |
| Lenovo ThinkPad X13 2-in-1 Gen 5 | |
| Moyenne de la classe Subnotebook (6569 - 54881, n=67, 2 dernières années) | |
| Microsoft Surface Pro Copilot+ | |
Performance du système
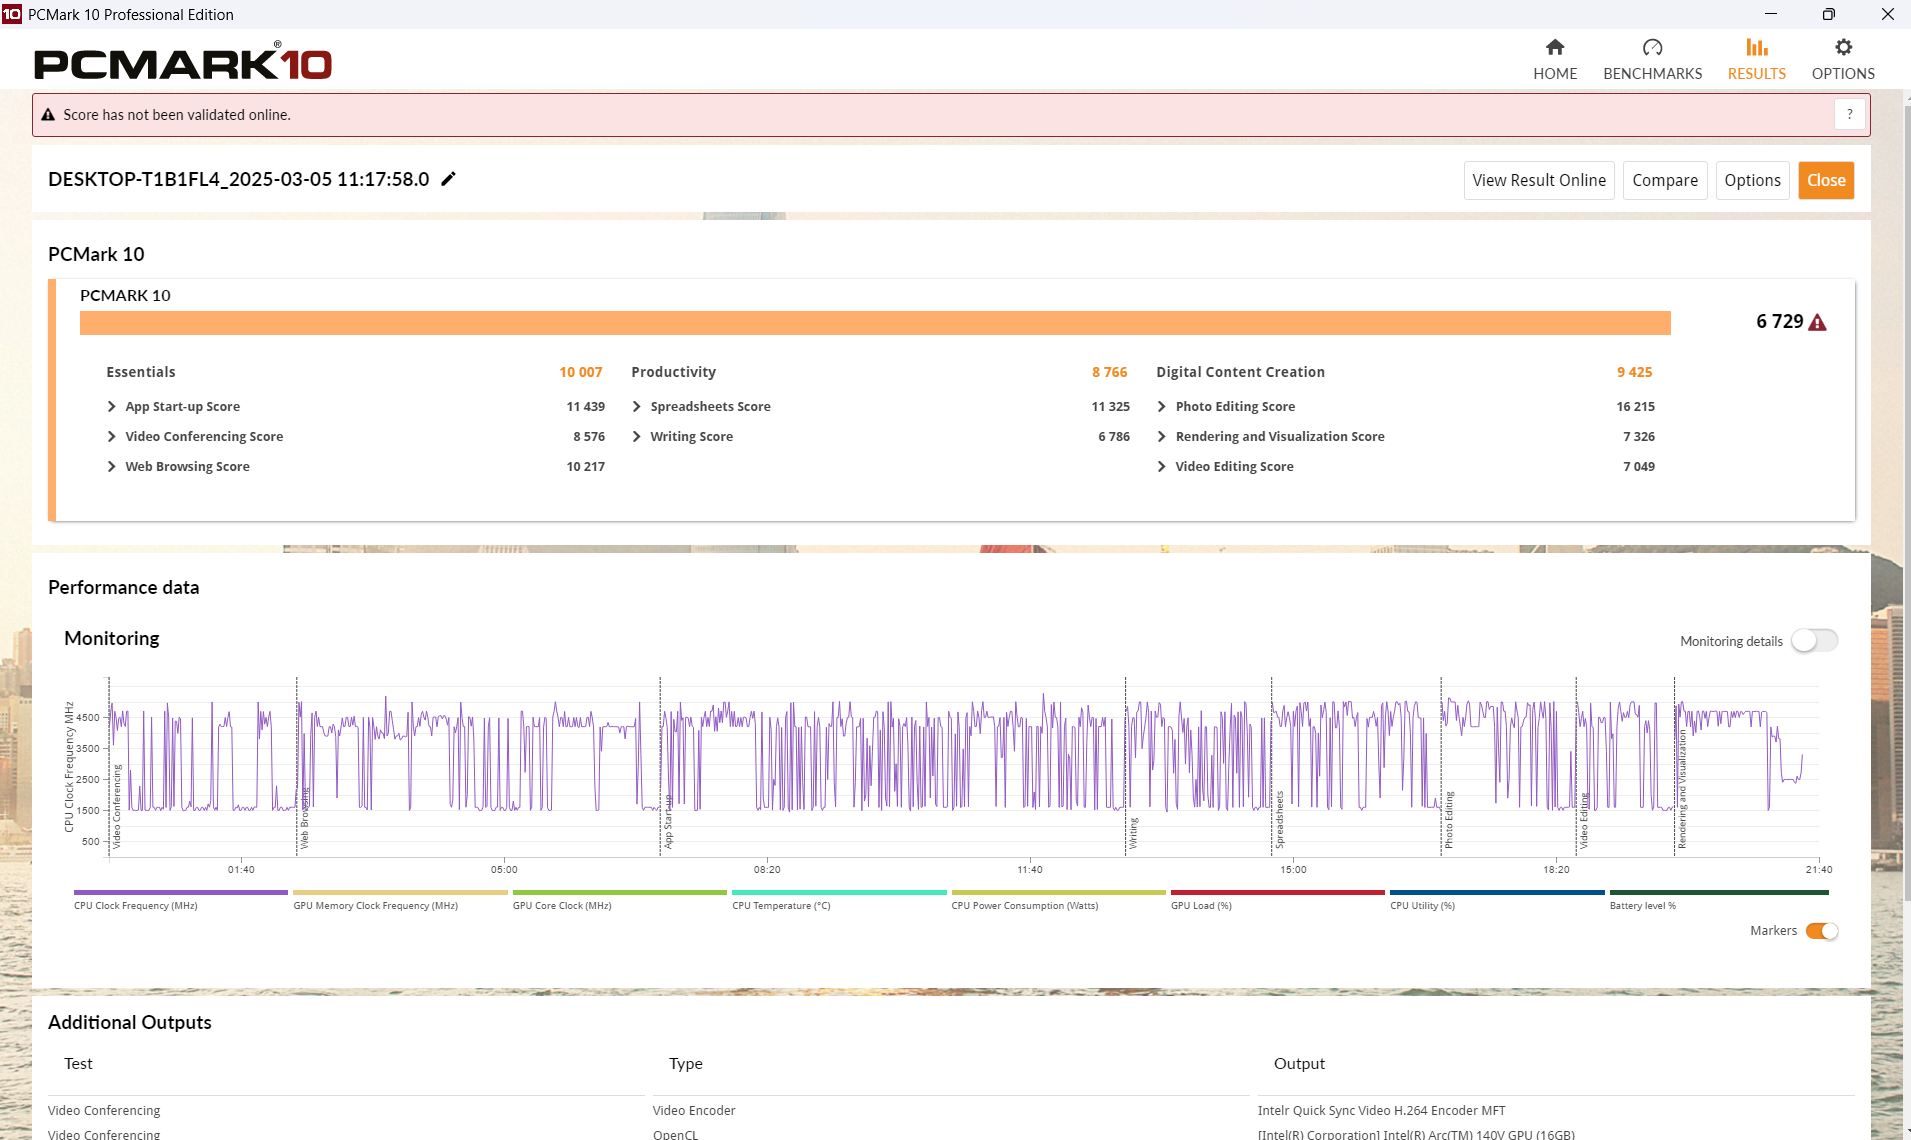
Dans PCMark 10 et CrossMark, les appareils de comparaison sont proches les uns des autres, mais dans ce domaine comme dans les tests Web, notre Dell Pro se situe plutôt dans la moyenne que dans la course à la première place.
CrossMark: Overall | Productivity | Creativity | Responsiveness
WebXPRT 3: Overall
WebXPRT 4: Overall
Mozilla Kraken 1.1: Total
| PCMark 10 / Score | |
| Dell XPS 13 9350 | |
| Framework Laptop 13.5 Core Ultra 7 155H | |
| MSI Prestige 13 AI Plus Evo A2VMG | |
| Dell Pro 13 Premium PA13250 | |
| Moyenne Intel Core Ultra 7 268V, Intel Arc Graphics 140V (n=1) | |
| Moyenne de la classe Subnotebook (4993 - 7788, n=56, 2 dernières années) | |
| Lenovo ThinkPad X13 2-in-1 Gen 5 | |
| PCMark 10 / Essentials | |
| Lenovo ThinkPad X13 2-in-1 Gen 5 | |
| Framework Laptop 13.5 Core Ultra 7 155H | |
| Moyenne de la classe Subnotebook (9363 - 11331, n=56, 2 dernières années) | |
| MSI Prestige 13 AI Plus Evo A2VMG | |
| Dell Pro 13 Premium PA13250 | |
| Moyenne Intel Core Ultra 7 268V, Intel Arc Graphics 140V (n=1) | |
| Dell XPS 13 9350 | |
| PCMark 10 / Productivity | |
| Dell XPS 13 9350 | |
| Dell Pro 13 Premium PA13250 | |
| Moyenne Intel Core Ultra 7 268V, Intel Arc Graphics 140V (n=1) | |
| Framework Laptop 13.5 Core Ultra 7 155H | |
| Moyenne de la classe Subnotebook (5435 - 10623, n=56, 2 dernières années) | |
| MSI Prestige 13 AI Plus Evo A2VMG | |
| Lenovo ThinkPad X13 2-in-1 Gen 5 | |
| PCMark 10 / Digital Content Creation | |
| MSI Prestige 13 AI Plus Evo A2VMG | |
| Dell XPS 13 9350 | |
| Framework Laptop 13.5 Core Ultra 7 155H | |
| Dell Pro 13 Premium PA13250 | |
| Moyenne Intel Core Ultra 7 268V, Intel Arc Graphics 140V (n=1) | |
| Moyenne de la classe Subnotebook (5305 - 10983, n=56, 2 dernières années) | |
| Lenovo ThinkPad X13 2-in-1 Gen 5 | |
| CrossMark / Overall | |
| Dell XPS 13 9350 | |
| MSI Prestige 13 AI Plus Evo A2VMG | |
| Framework Laptop 13.5 Core Ultra 7 155H | |
| Dell Pro 13 Premium PA13250 | |
| Moyenne Intel Core Ultra 7 268V, Intel Arc Graphics 140V (n=1) | |
| Moyenne de la classe Subnotebook (365 - 1978, n=65, 2 dernières années) | |
| Lenovo ThinkPad X13 2-in-1 Gen 5 | |
| Microsoft Surface Pro Copilot+ | |
| CrossMark / Productivity | |
| Dell XPS 13 9350 | |
| MSI Prestige 13 AI Plus Evo A2VMG | |
| Framework Laptop 13.5 Core Ultra 7 155H | |
| Dell Pro 13 Premium PA13250 | |
| Moyenne Intel Core Ultra 7 268V, Intel Arc Graphics 140V (n=1) | |
| Lenovo ThinkPad X13 2-in-1 Gen 5 | |
| Moyenne de la classe Subnotebook (364 - 1875, n=65, 2 dernières années) | |
| Microsoft Surface Pro Copilot+ | |
| CrossMark / Creativity | |
| MSI Prestige 13 AI Plus Evo A2VMG | |
| Dell XPS 13 9350 | |
| Framework Laptop 13.5 Core Ultra 7 155H | |
| Dell Pro 13 Premium PA13250 | |
| Moyenne Intel Core Ultra 7 268V, Intel Arc Graphics 140V (n=1) | |
| Moyenne de la classe Subnotebook (372 - 2298, n=65, 2 dernières années) | |
| Lenovo ThinkPad X13 2-in-1 Gen 5 | |
| Microsoft Surface Pro Copilot+ | |
| CrossMark / Responsiveness | |
| Lenovo ThinkPad X13 2-in-1 Gen 5 | |
| Framework Laptop 13.5 Core Ultra 7 155H | |
| Dell XPS 13 9350 | |
| Moyenne de la classe Subnotebook (312 - 1899, n=65, 2 dernières années) | |
| MSI Prestige 13 AI Plus Evo A2VMG | |
| Dell Pro 13 Premium PA13250 | |
| Moyenne Intel Core Ultra 7 268V, Intel Arc Graphics 140V (n=1) | |
| Microsoft Surface Pro Copilot+ | |
| WebXPRT 3 / Overall | |
| Microsoft Surface Pro Copilot+ | |
| Dell XPS 13 9350 | |
| Moyenne de la classe Subnotebook (156 - 479, n=65, 2 dernières années) | |
| MSI Prestige 13 AI Plus Evo A2VMG | |
| Framework Laptop 13.5 Core Ultra 7 155H | |
| Dell Pro 13 Premium PA13250 | |
| Moyenne Intel Core Ultra 7 268V, Intel Arc Graphics 140V (n=1) | |
| Lenovo ThinkPad X13 2-in-1 Gen 5 | |
| WebXPRT 4 / Overall | |
| MSI Prestige 13 AI Plus Evo A2VMG | |
| Dell XPS 13 9350 | |
| Moyenne de la classe Subnotebook (132 - 348, n=65, 2 dernières années) | |
| Microsoft Surface Pro Copilot+ | |
| Framework Laptop 13.5 Core Ultra 7 155H | |
| Dell Pro 13 Premium PA13250 | |
| Moyenne Intel Core Ultra 7 268V, Intel Arc Graphics 140V (n=1) | |
| Lenovo ThinkPad X13 2-in-1 Gen 5 | |
| Mozilla Kraken 1.1 / Total | |
| Lenovo ThinkPad X13 2-in-1 Gen 5 | |
| Framework Laptop 13.5 Core Ultra 7 155H | |
| Moyenne de la classe Subnotebook (278 - 1104, n=72, 2 dernières années) | |
| Dell Pro 13 Premium PA13250 | |
| Moyenne Intel Core Ultra 7 268V, Intel Arc Graphics 140V (n=1) | |
| MSI Prestige 13 AI Plus Evo A2VMG | |
| Dell XPS 13 9350 | |
| Microsoft Surface Pro Copilot+ | |
* ... Moindre est la valeur, meilleures sont les performances
| PCMark 10 Score | 6729 points | |
Aide | ||
| AIDA64 / Memory Copy | |
| MSI Prestige 13 AI Plus Evo A2VMG | |
| Dell XPS 13 9350 | |
| Dell Pro 13 Premium PA13250 | |
| Moyenne Intel Core Ultra 7 268V (n=1) | |
| Framework Laptop 13.5 Core Ultra 7 155H | |
| Moyenne de la classe Subnotebook (14554 - 109035, n=67, 2 dernières années) | |
| Lenovo ThinkPad X13 2-in-1 Gen 5 | |
| Microsoft Surface Pro Copilot+ | |
| AIDA64 / Memory Read | |
| Microsoft Surface Pro Copilot+ | |
| Dell XPS 13 9350 | |
| MSI Prestige 13 AI Plus Evo A2VMG | |
| Dell Pro 13 Premium PA13250 | |
| Moyenne Intel Core Ultra 7 268V (n=1) | |
| Framework Laptop 13.5 Core Ultra 7 155H | |
| Moyenne de la classe Subnotebook (15948 - 122210, n=67, 2 dernières années) | |
| Lenovo ThinkPad X13 2-in-1 Gen 5 | |
| AIDA64 / Memory Write | |
| MSI Prestige 13 AI Plus Evo A2VMG | |
| Dell Pro 13 Premium PA13250 | |
| Moyenne Intel Core Ultra 7 268V (n=1) | |
| Dell XPS 13 9350 | |
| Moyenne de la classe Subnotebook (15709 - 117898, n=67, 2 dernières années) | |
| Framework Laptop 13.5 Core Ultra 7 155H | |
| Lenovo ThinkPad X13 2-in-1 Gen 5 | |
| Microsoft Surface Pro Copilot+ | |
| AIDA64 / Memory Latency | |
| Lenovo ThinkPad X13 2-in-1 Gen 5 | |
| Framework Laptop 13.5 Core Ultra 7 155H | |
| Moyenne de la classe Subnotebook (7.2 - 187.8, n=66, 2 dernières années) | |
| Dell Pro 13 Premium PA13250 | |
| Moyenne Intel Core Ultra 7 268V (n=1) | |
| MSI Prestige 13 AI Plus Evo A2VMG | |
| Dell XPS 13 9350 | |
| Microsoft Surface Pro Copilot+ | |
* ... Moindre est la valeur, meilleures sont les performances
Latences DPC
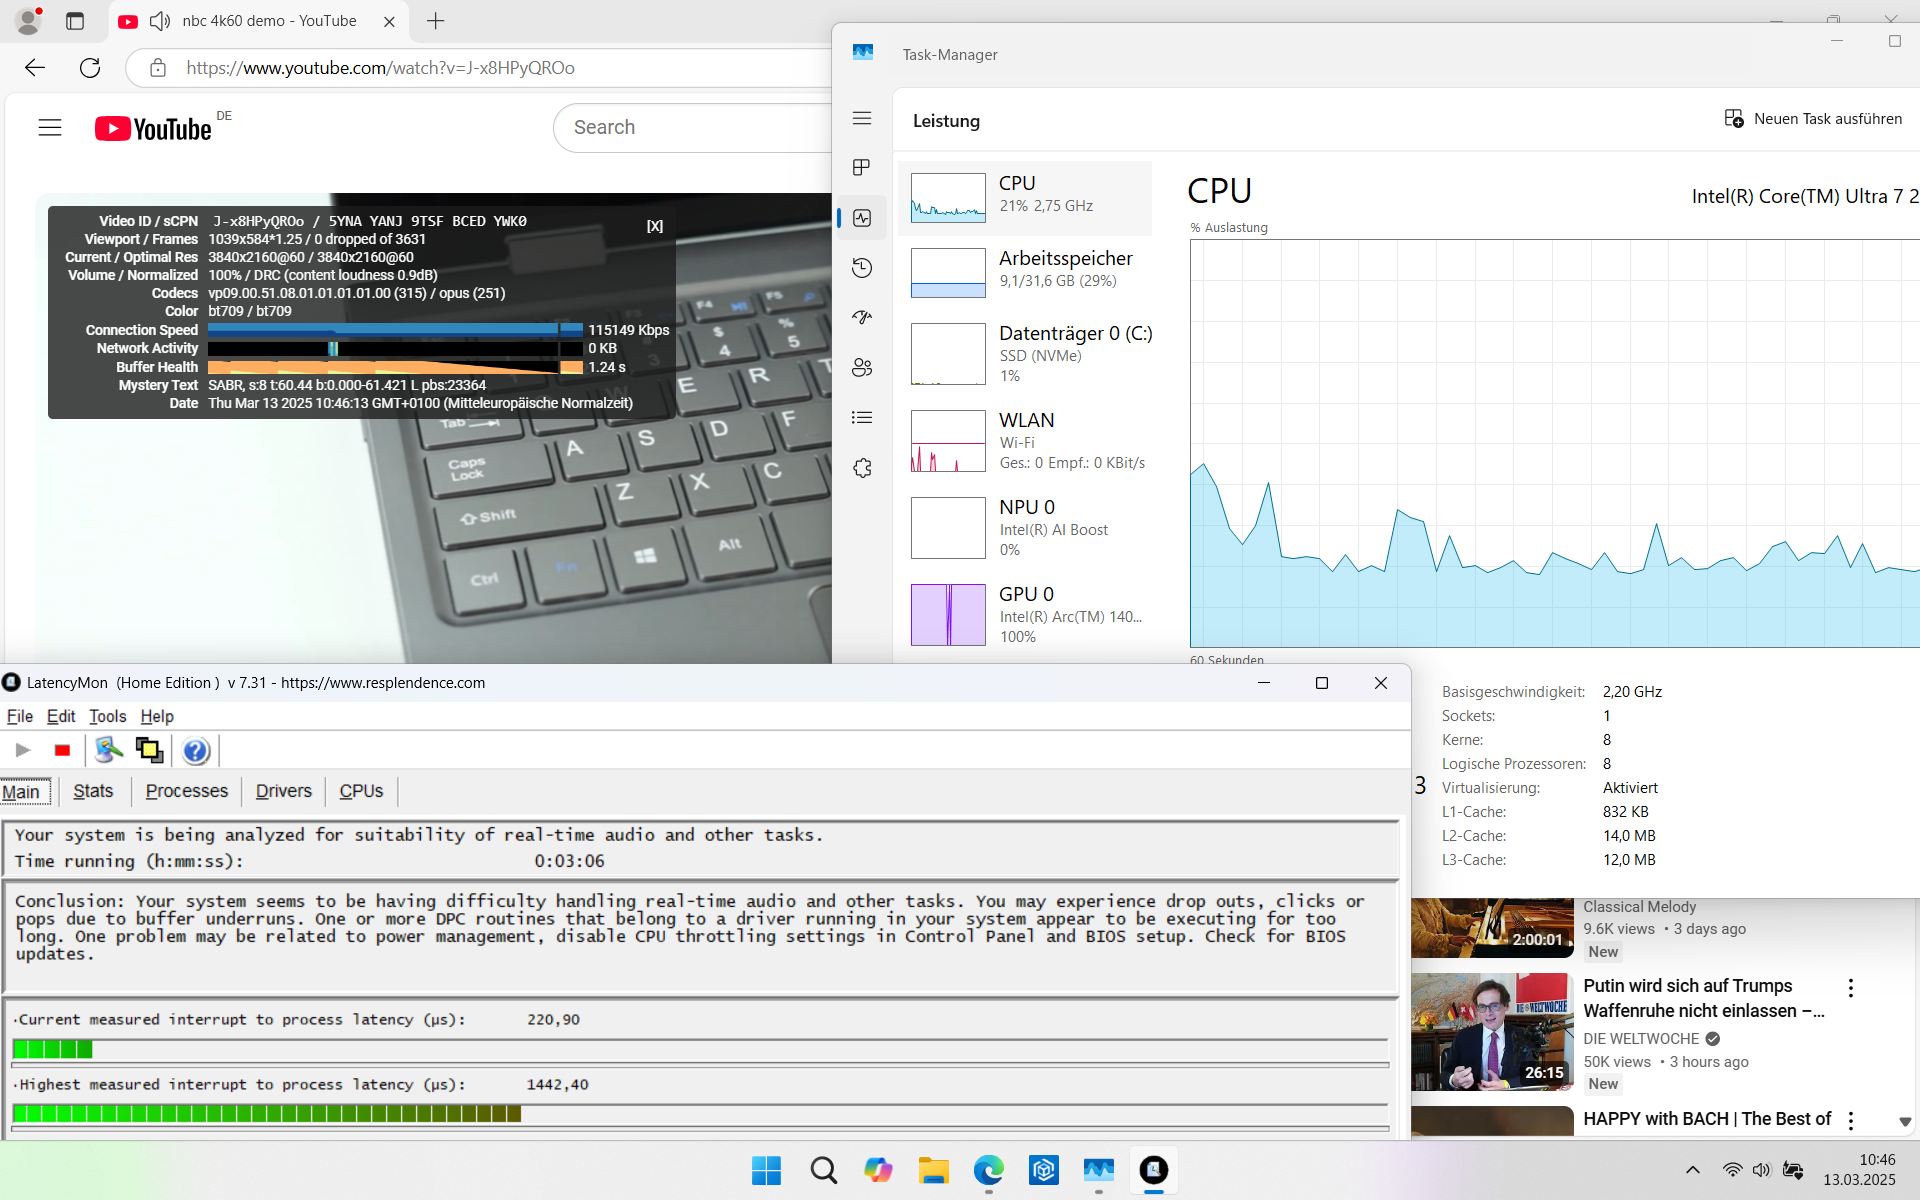
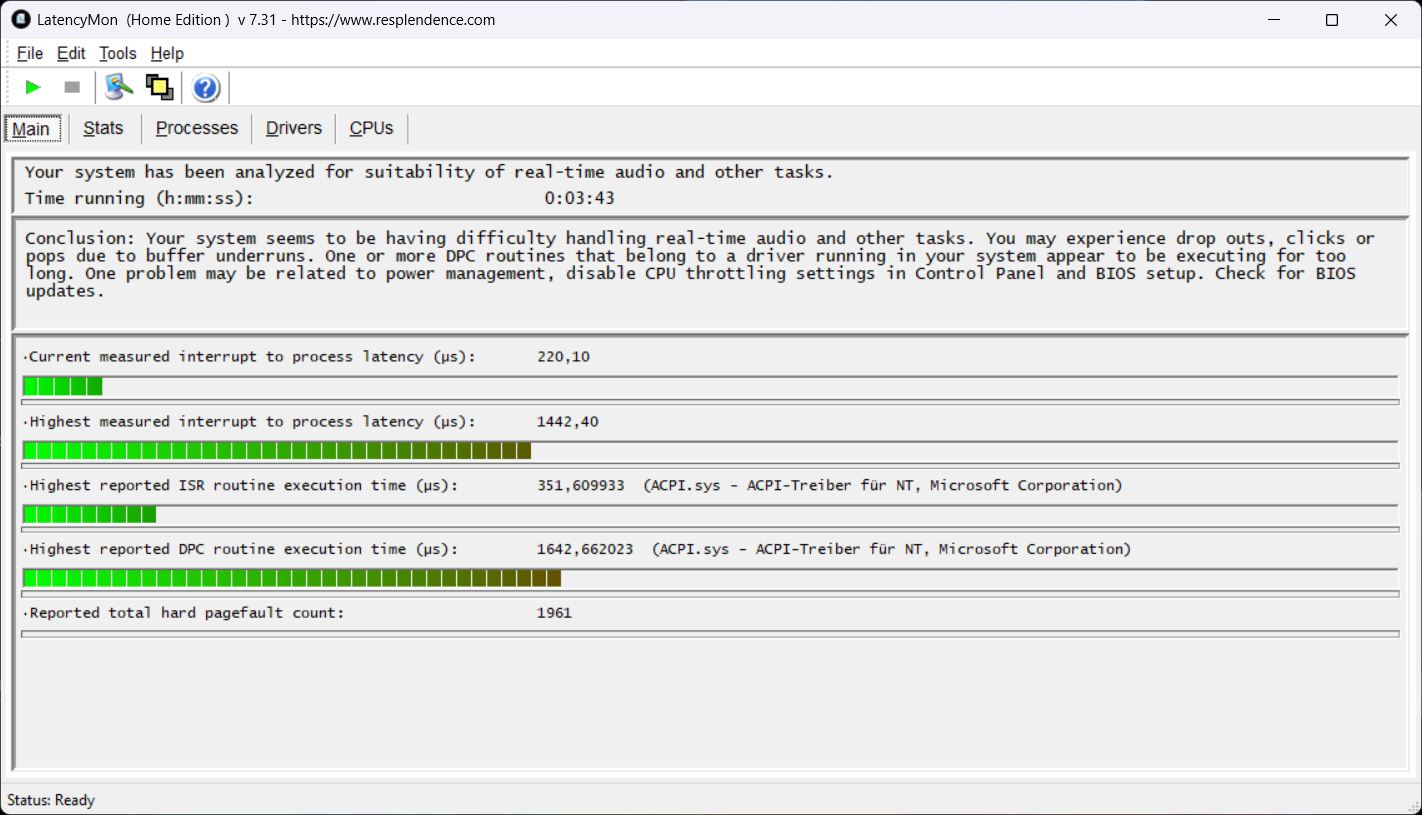
Les premiers problèmes sérieux de latence sont apparus lors de l'ouverture de plusieurs onglets de navigateur. La latence a augmenté lors de la lecture de notre vidéo YouTube 4K/60fps qui, heureusement, s'est déroulée sans perte d'images. La valeur finale est un peu trop élevée pour nous.
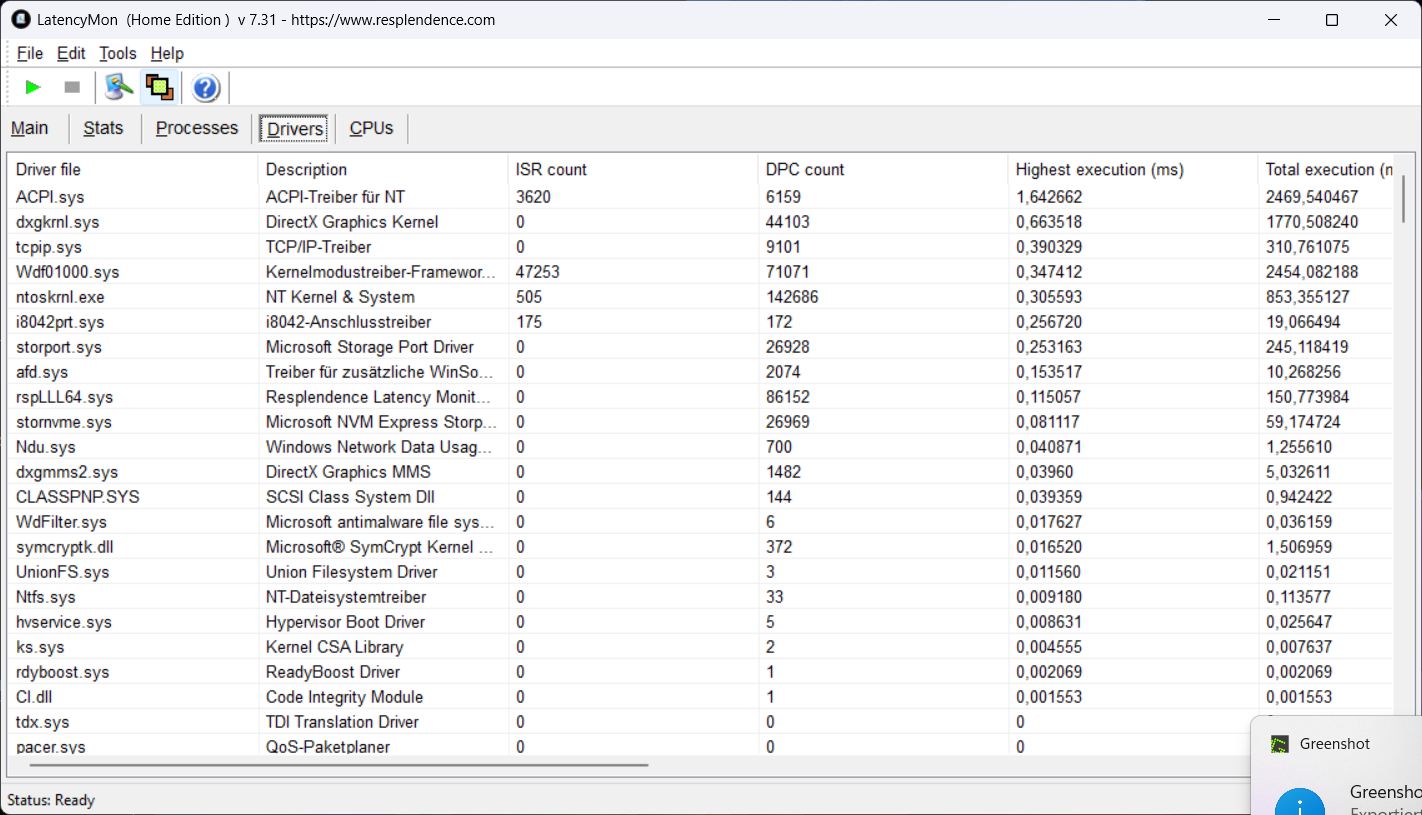
| DPC Latencies / LatencyMon - interrupt to process latency (max), Web, Youtube, Prime95 | |
| Dell Pro 13 Premium PA13250 | |
| Lenovo ThinkPad X13 2-in-1 Gen 5 | |
| MSI Prestige 13 AI Plus Evo A2VMG | |
| Framework Laptop 13.5 Core Ultra 7 155H | |
* ... Moindre est la valeur, meilleures sont les performances
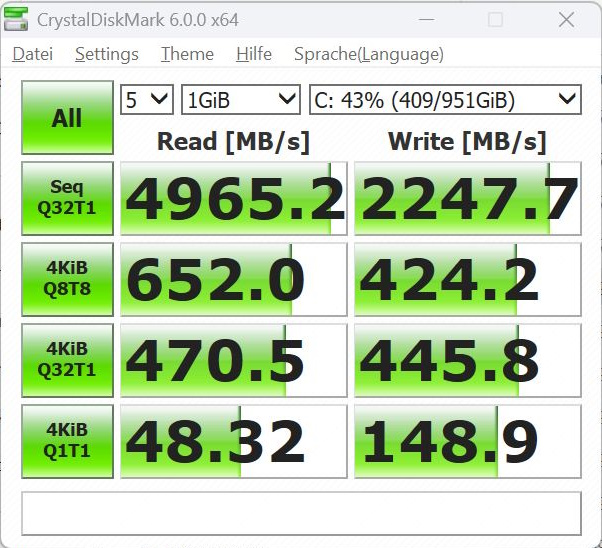
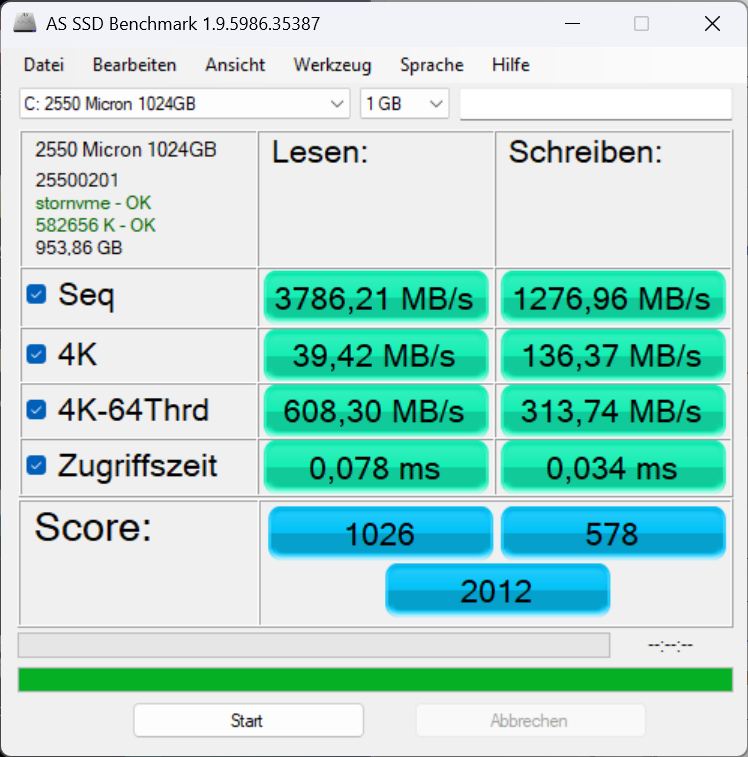
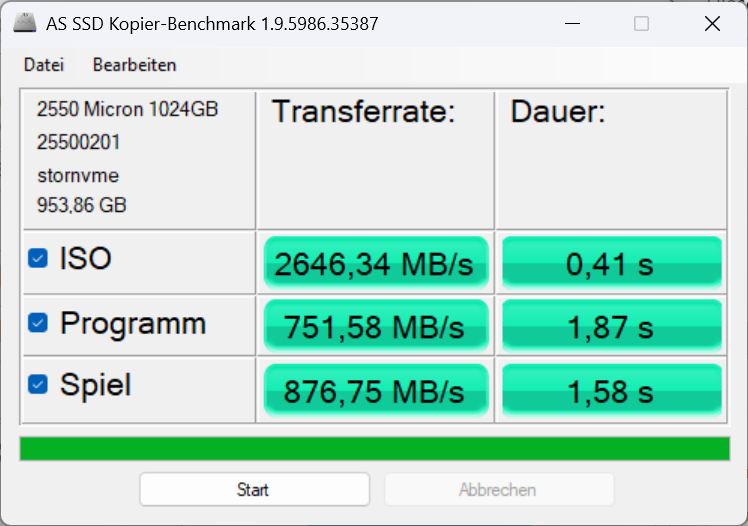
Mémoire de masse
Le stockage se présente sous la forme d'un Micron 2550 de 1 To, bien que, selon la configuration, des modèles de 512 Go soient également disponibles. Dans l'ensemble, le disque est décevant en termes de vitesse, mais les performances restent relativement constantes dans le temps.

* ... Moindre est la valeur, meilleures sont les performances
Continuous Performance Read: DiskSpd Read Loop, Queue Depth 8
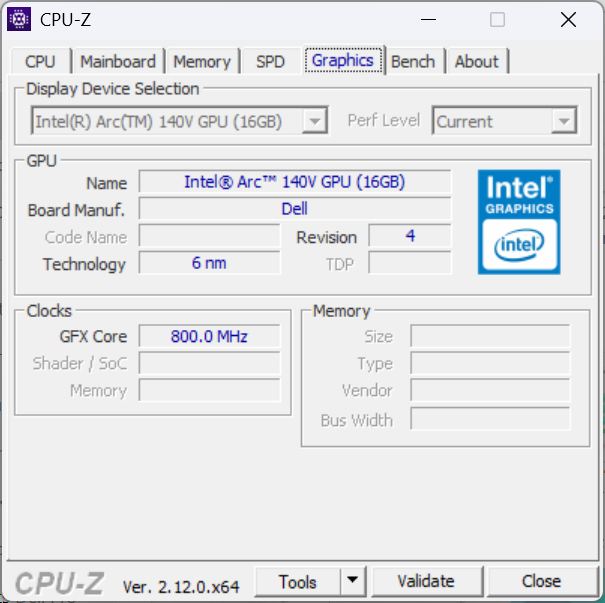
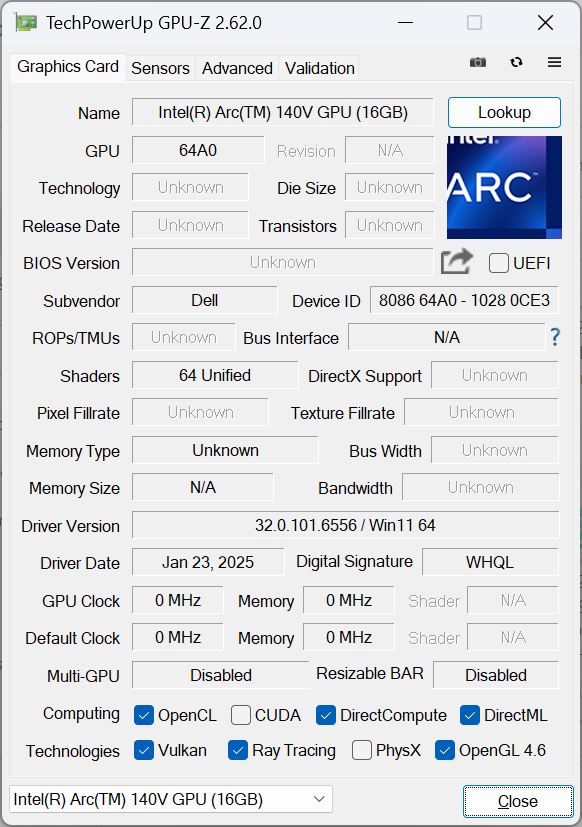
Carte graphique
Les cartes graphiques Intel Arc 140V Intel Arc Graphics 140V iGPU Il s'agit d'une carte graphique intégrée relativement rapide. Dans les benchmarks synthétiques 3DMark, ses performances sont égales ou légèrement supérieures à nos attentes. Nous n'avons remarqué aucune dégradation des performances sur le site Fire Strike fonctionnant sur batterie.
Ses performances sont également impressionnantes dans les jeux, presque tous les jeux fonctionnant en Full HD et avec des détails moyens supérieurs à 30 images par seconde, et dans certains cas, ils étaient même suffisants pour les détails élevés. La fréquence d'images sur 30 minutes dans Cyberpunk 2077 était très cohérente.
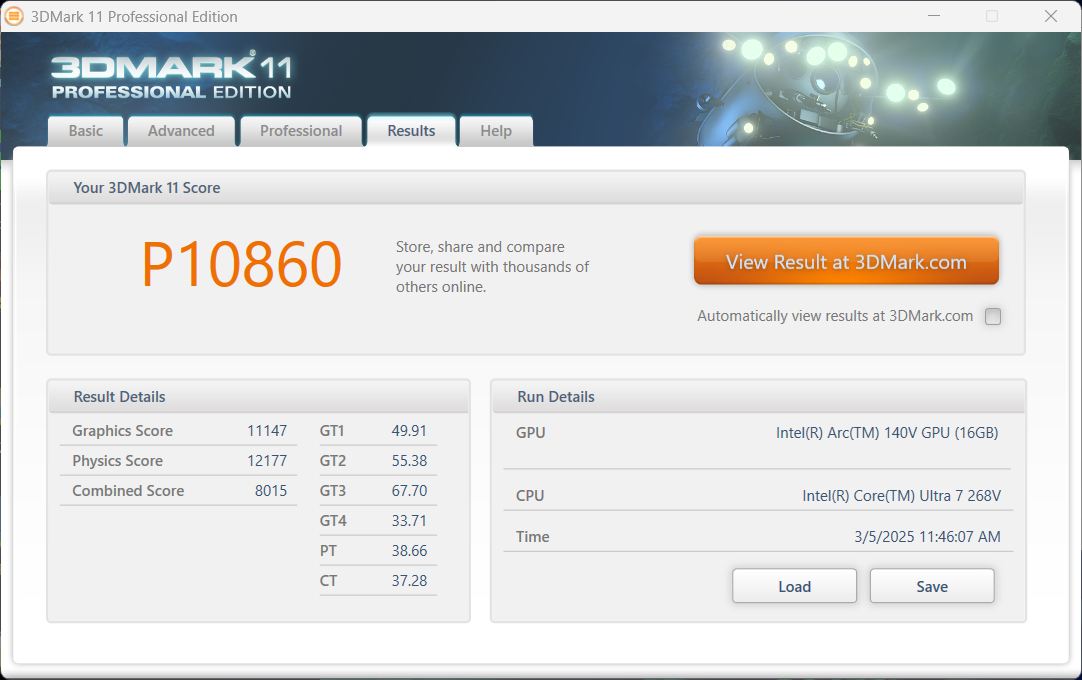
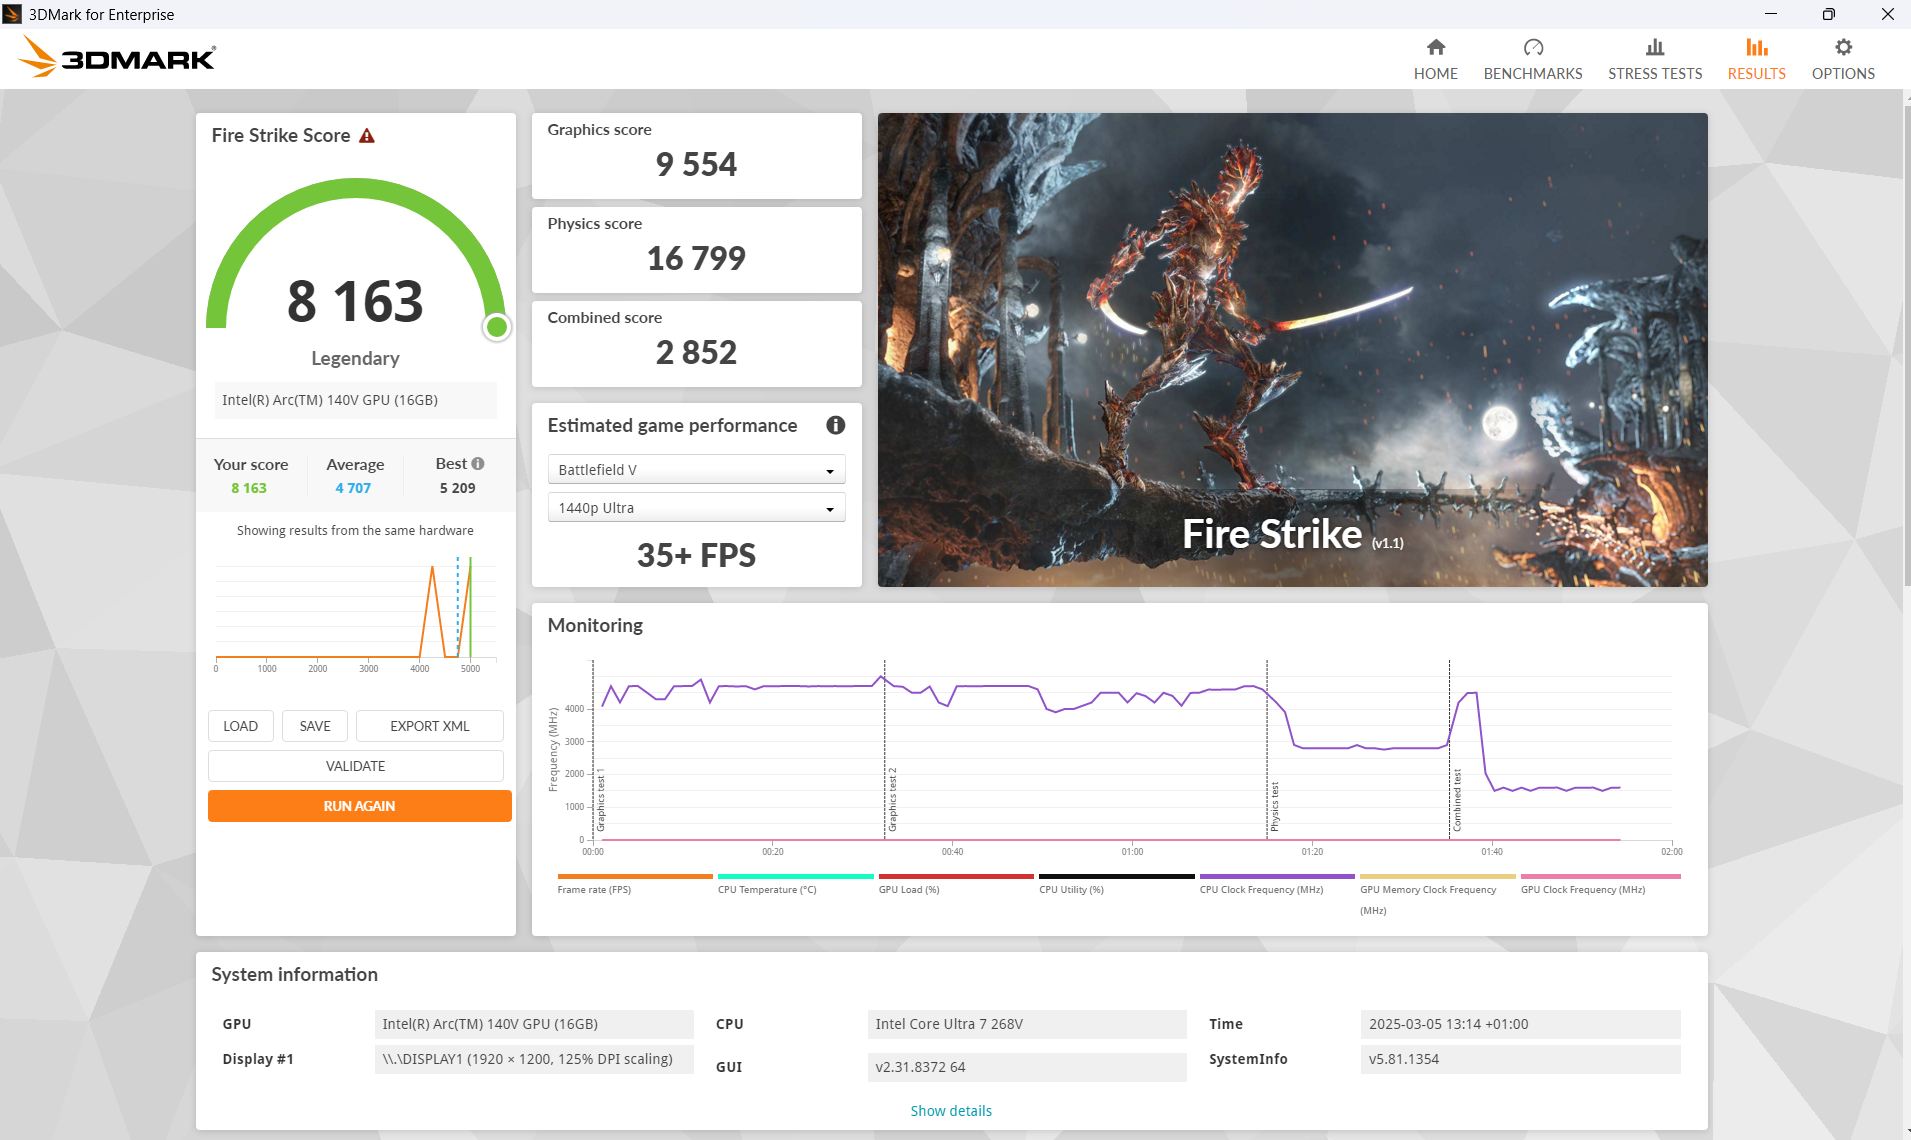
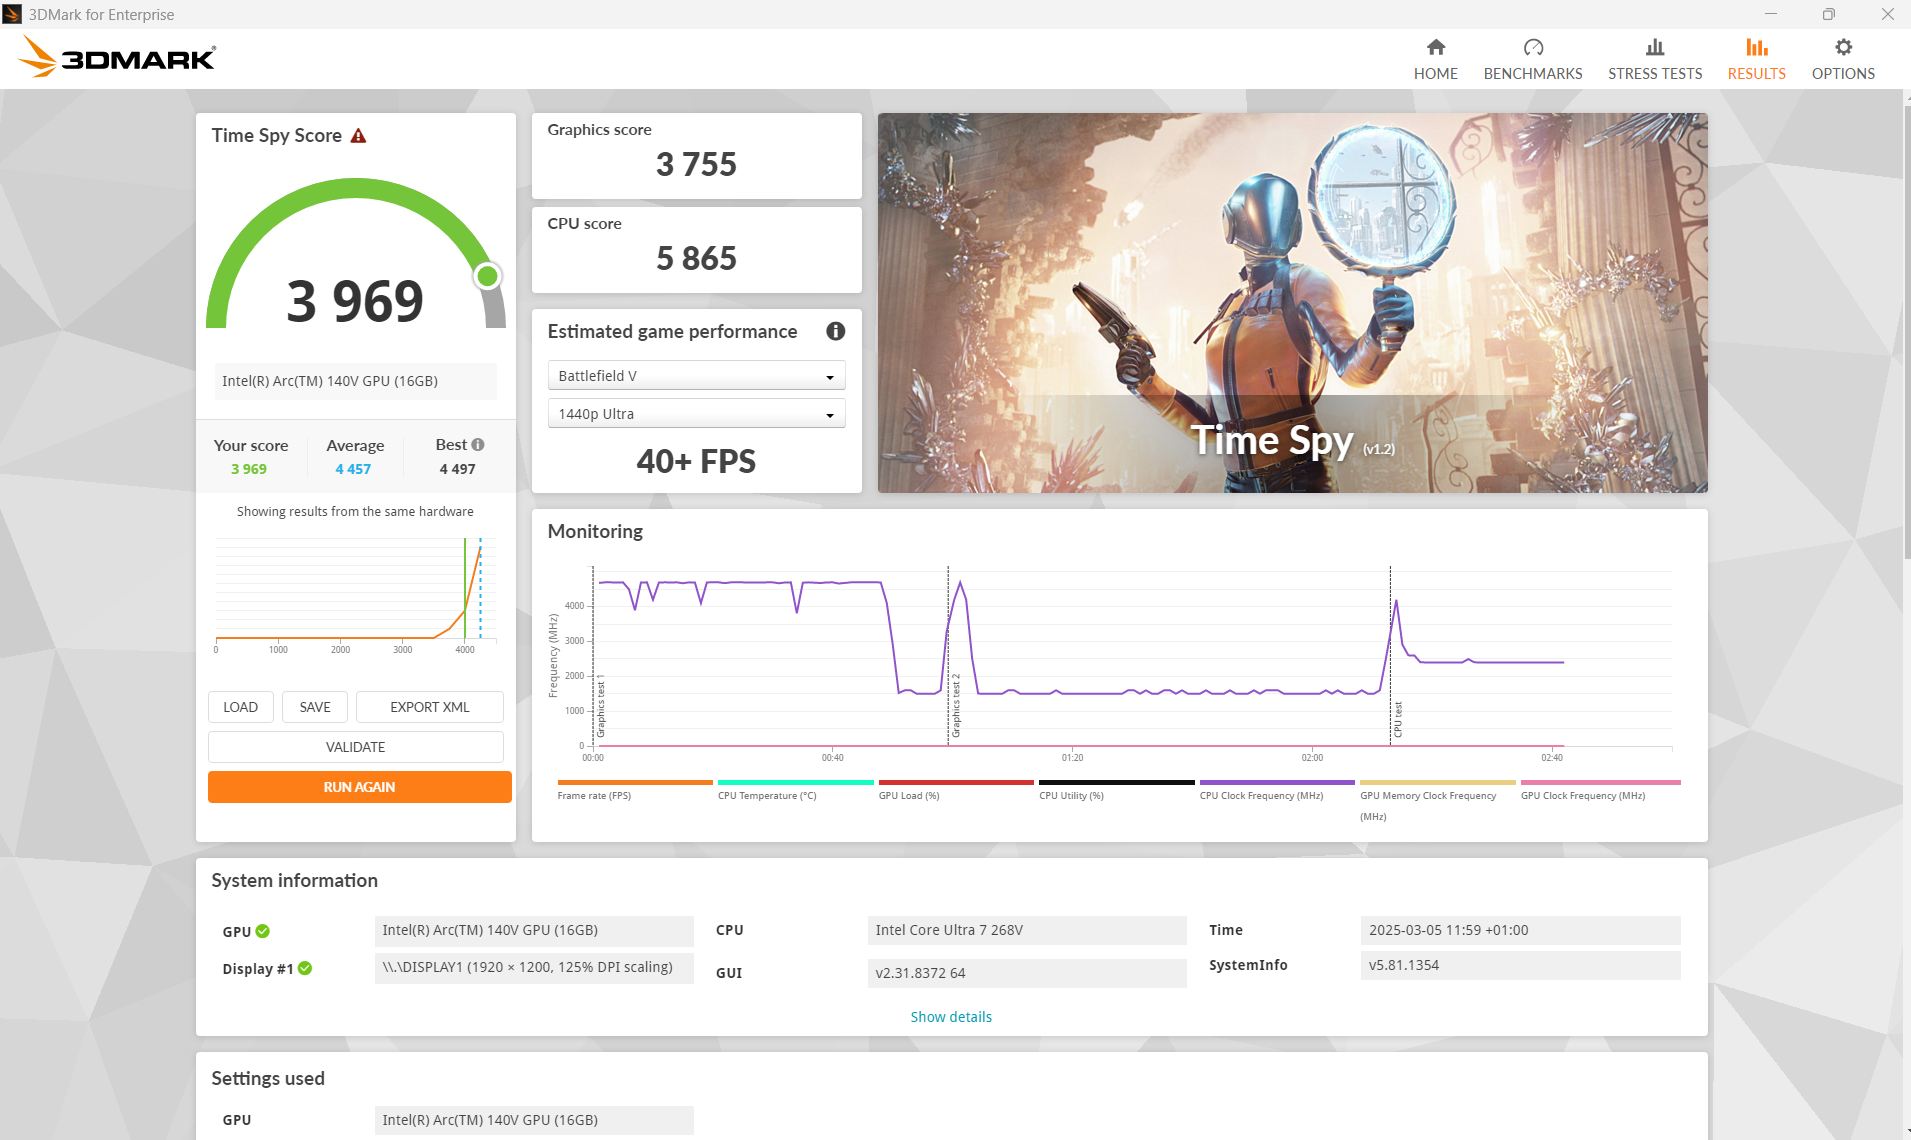
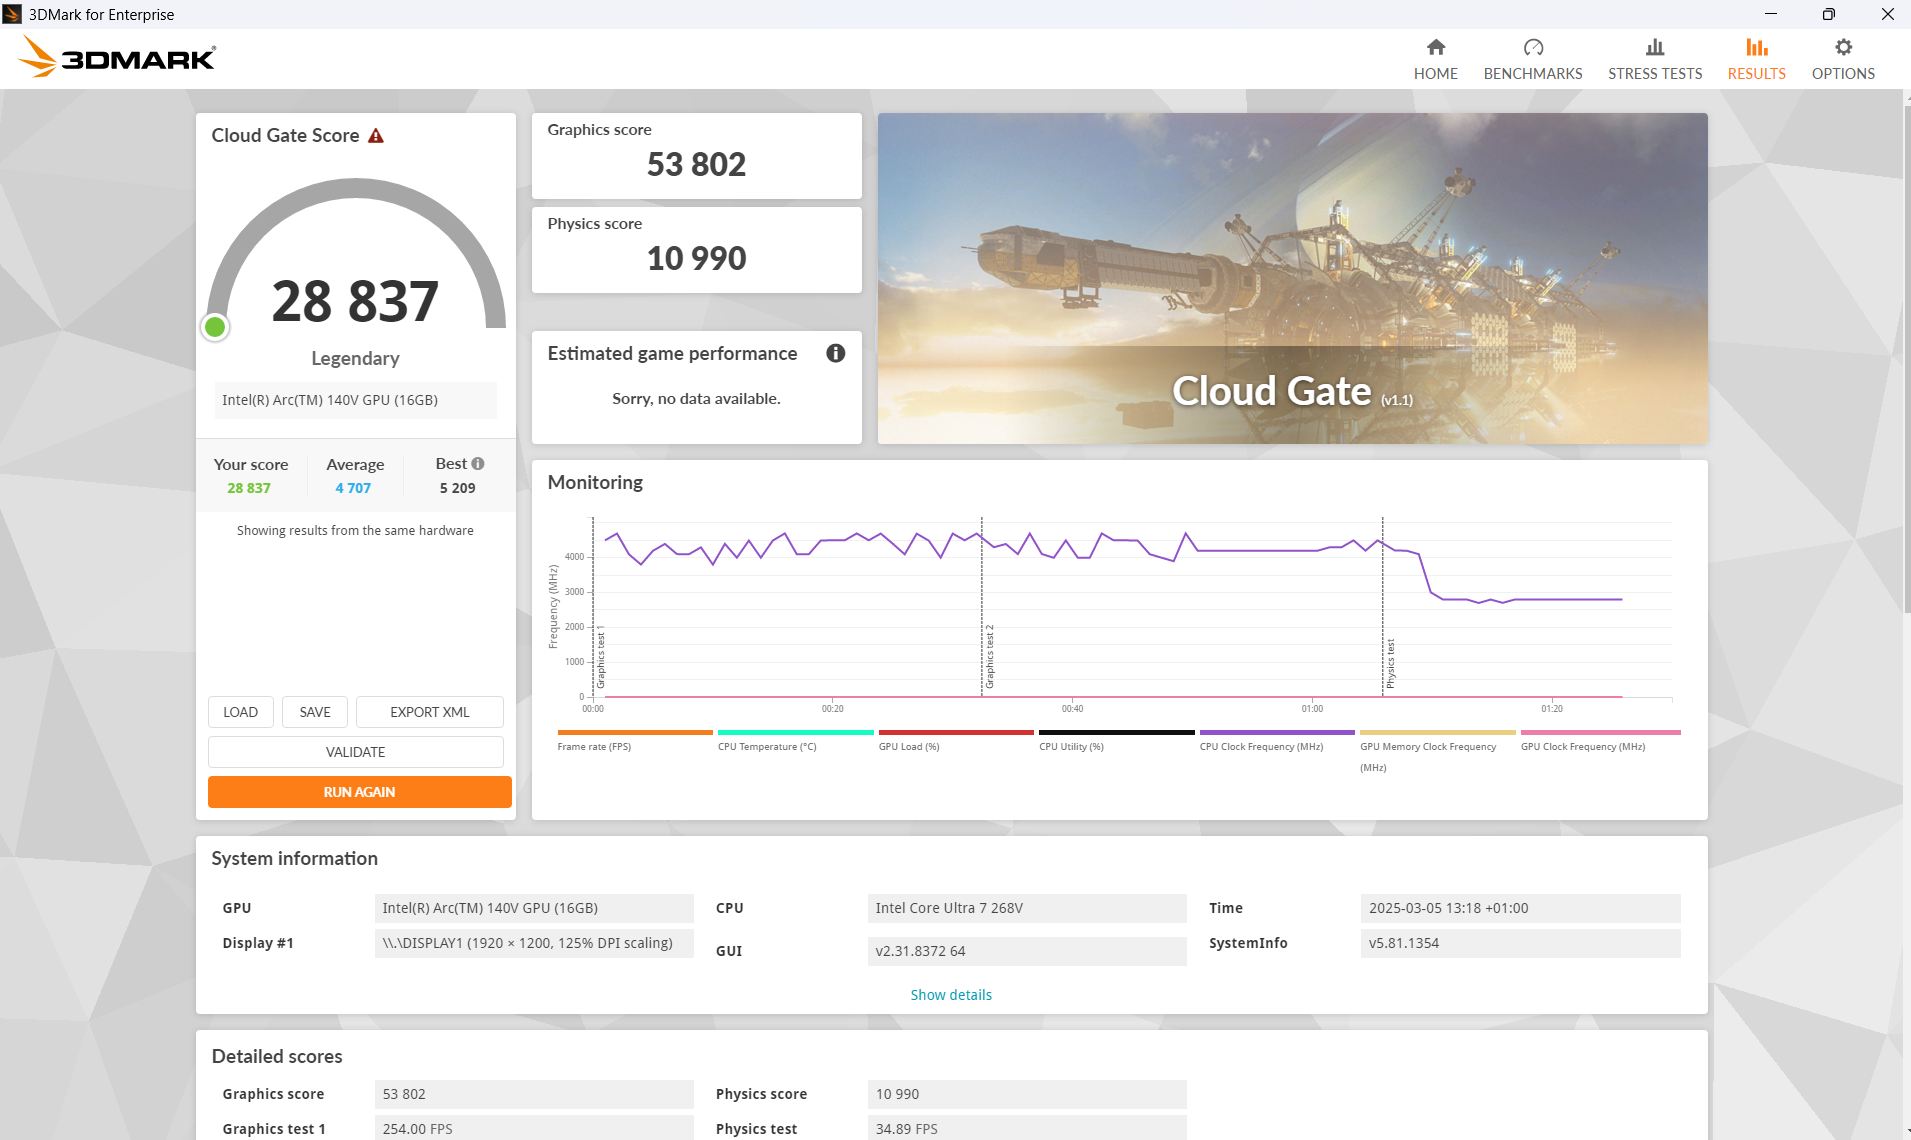
| 3DMark 11 Performance | 10860 points | |
| 3DMark Cloud Gate Standard Score | 28837 points | |
| 3DMark Fire Strike Score | 8163 points | |
| 3DMark Time Spy Score | 3969 points | |
Aide | ||
* ... Moindre est la valeur, meilleures sont les performances
| Cyberpunk 2077 2.2 Phantom Liberty - 1920x1080 Ultra Preset (FSR off) | |
| MSI Prestige 13 AI Plus Evo A2VMG | |
| Dell Pro 13 Premium PA13250 | |
| Framework Laptop 13.5 Core Ultra 7 155H | |
| Moyenne de la classe Subnotebook (8.48 - 31.4, n=44, 2 dernières années) | |
| Dell XPS 13 9350 | |
| Microsoft Surface Pro Copilot+ | |
| Lenovo ThinkPad X13 2-in-1 Gen 5 | |
| GTA V - 1920x1080 Highest Settings possible AA:4xMSAA + FX AF:16x | |
| MSI Prestige 13 AI Plus Evo A2VMG | |
| Dell Pro 13 Premium PA13250 | |
| Dell XPS 13 9350 | |
| Microsoft Surface Pro Copilot+ | |
| Moyenne de la classe Subnotebook (7.81 - 53, n=64, 2 dernières années) | |
| Framework Laptop 13.5 Core Ultra 7 155H | |
| Lenovo ThinkPad X13 2-in-1 Gen 5 | |
Cyberpunk 2077 ultra FPS diagram
| Bas | Moyen | Élevé | Ultra | |
|---|---|---|---|---|
| GTA V (2015) | 153.4 | 140 | 26.3 | |
| Dota 2 Reborn (2015) | 107.5 | 101.7 | 87.8 | 71.2 |
| Final Fantasy XV Benchmark (2018) | 74.9 | 42.3 | 29.1 | |
| X-Plane 11.11 (2018) | 48.1 | 36.7 | 32.7 | |
| Strange Brigade (2018) | 223 | 83.3 | 69.5 | 57.8 |
| Baldur's Gate 3 (2023) | 45.5 | 35.7 | 31.3 | 30.8 |
| Cyberpunk 2077 2.2 Phantom Liberty (2023) | 43.5 | 35.4 | 28.6 | 28.1 |
Émissions et énergie - Le Dell Pro est économique
Émissions sonores
Les ventilateurs sont généralement silencieux lorsqu'ils fonctionnent au ralenti. En jouant sous charge maximale, nous avons mesuré un maximum de 42 dB, mais en réalité, il était plus bas (même dans les tests de stress) et n'atteignait souvent que 36 ou 37 dB.
Degré de la nuisance sonore
| Au repos |
| 23 / 23 / 23 dB(A) |
| Fortement sollicité |
| 37 / 42.74 dB(A) |
 | ||
30 dB silencieux 40 dB(A) audible 50 dB(A) bruyant |
||
min: | ||
| Dell Pro 13 Premium PA13250 Arc 140V, Core Ultra 7 268V, Micron 2550 1TB | MSI Prestige 13 AI Plus Evo A2VMG Arc 140V, Core Ultra 7 258V | Lenovo ThinkPad X13 2-in-1 Gen 5 Graphics 4-Core, Ultra 7 165U, Lenovo UMIS RPETJ1T24MHP2QDQ | Framework Laptop 13.5 Core Ultra 7 155H Arc 8-Core, Ultra 7 155H | Dell XPS 13 9350 Arc 140V, Core Ultra 7 256V, Micron 2550 512GB | Microsoft Surface Pro Copilot+ Adreno X1-85 3.8 TFLOPS, SD X Plus X1P-64-100, Samsung PM9B1 256GB MZ9L4256HCJQ | |
|---|---|---|---|---|---|---|
| Noise | -8% | 4% | -7% | 3% | 2% | |
| arrêt / environnement * | 23 | 24.1 -5% | 23 -0% | 24 -4% | 24.1 -5% | 23.8 -3% |
| Idle Minimum * | 23 | 24.8 -8% | 23 -0% | 24.1 -5% | 24.4 -6% | 23.8 -3% |
| Idle Average * | 23 | 24.8 -8% | 23 -0% | 25.1 -9% | 24.4 -6% | 23.8 -3% |
| Idle Maximum * | 23 | 26.7 -16% | 23 -0% | 27 -17% | 24.4 -6% | 23.8 -3% |
| Load Average * | 37 | 36.8 1% | 34.44 7% | 38.4 -4% | 26.2 29% | 23.8 36% |
| Cyberpunk 2077 ultra * | 42.74 | 44.5 -4% | 38.28 10% | 43.7 -2% | 34.2 20% | 44.7 -5% |
| Load Maximum * | 42.74 | 50.8 -19% | 39.04 9% | 45.8 -7% | 45.2 -6% | 44.7 -5% |
* ... Moindre est la valeur, meilleures sont les performances
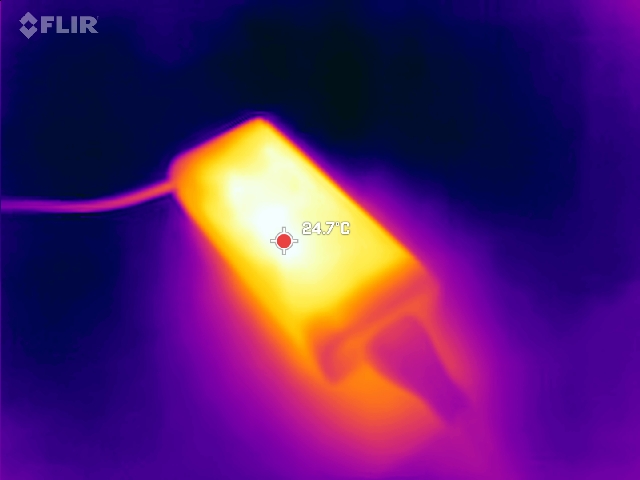
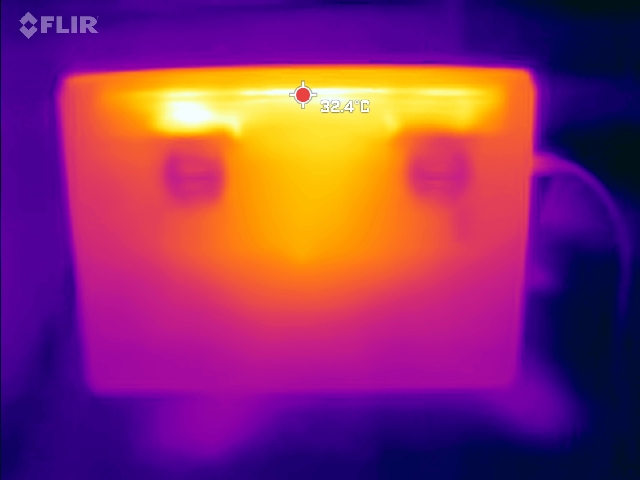
Température
Contrairement à de nombreux concurrents de cette taille, le Dell Pro 13 Premium utilise deux ventilateurs au lieu d'un seul, ce qui a un impact positif sur les températures de surface. Les jeux sont plus chauds que dans notre test de stress, mais même ici, nous avons mesuré des points chauds de seulement 37°C. Les deux côtés de l'ordinateur portable sont refroidis de manière égale, au lieu d'un seul côté comme c'est le cas chez certains concurrents.
(+) La température maximale du côté supérieur est de 31 °C / 88 F, par rapport à la moyenne de 35.9 °C / 97 F, allant de 21.4 à 59 °C pour la classe Subnotebook.
(+) Le fond chauffe jusqu'à un maximum de 31 °C / 88 F, contre une moyenne de 39.3 °C / 103 F
(+) En utilisation inactive, la température moyenne du côté supérieur est de 22.3 °C / 72 F, par rapport à la moyenne du dispositif de 30.8 °C / 87 F.
(+) 3: The average temperature for the upper side is 28.8 °C / 84 F, compared to the average of 30.8 °C / 87 F for the class Subnotebook.
(+) Les repose-poignets et le pavé tactile sont plus froids que la température de la peau avec un maximum de 26 °C / 78.8 F et sont donc froids au toucher.
(+) La température moyenne de la zone de l'appui-paume de dispositifs similaires était de 28.2 °C / 82.8 F (+2.2 °C / #4 F).

| Dell Pro 13 Premium PA13250 Intel Core Ultra 7 268V, Intel Arc Graphics 140V | MSI Prestige 13 AI Plus Evo A2VMG Intel Core Ultra 7 258V, Intel Arc Graphics 140V | Lenovo ThinkPad X13 2-in-1 Gen 5 Intel Core Ultra 7 165U, Intel Graphics 4-Core iGPU (Arc) | Framework Laptop 13.5 Core Ultra 7 155H Intel Core Ultra 7 155H, Intel Arc 8-Core iGPU | Dell XPS 13 9350 Intel Core Ultra 7 256V, Intel Arc Graphics 140V | Microsoft Surface Pro Copilot+ Qualcomm Snapdragon X Plus X1P-64-100, Qualcomm SD X Adreno X1-85 3.8 TFLOPS | |
|---|---|---|---|---|---|---|
| Heat | -23% | -52% | -29% | -12% | -25% | |
| Maximum Upper Side * | 31 | 43.4 -40% | 60 -94% | 42.8 -38% | 34.8 -12% | 43.9 -42% |
| Maximum Bottom * | 31 | 42.4 -37% | 57 -84% | 45.2 -46% | 37.4 -21% | 44.9 -45% |
| Idle Upper Side * | 24 | 25.4 -6% | 27 -13% | 27.2 -13% | 25.4 -6% | 26.2 -9% |
| Idle Bottom * | 24 | 25.6 -7% | 28 -17% | 28.6 -19% | 26.2 -9% | 24.6 -3% |
* ... Moindre est la valeur, meilleures sont les performances
Intervenants
Pour un ordinateur portable aussi petit, les haut-parleurs parviennent même à surpasser certains modèles beaucoup plus grands. Les médiums sont équilibrés, mais ils manquent encore de basses. Une entrée audio jack est disponible pour connecter des appareils externes.
Dell Pro 13 Premium PA13250 analyse audio
(+) | les haut-parleurs peuvent jouer relativement fort (87.49# dB)
Basses 100 - 315 Hz
(-) | presque aucune basse - en moyenne 15.9% plus bas que la médiane
(±) | la linéarité des basses est moyenne (8.3% delta à la fréquence précédente)
Médiums 400 - 2000 Hz
(+) | médiane équilibrée - seulement 2.9% de la médiane
(+) | les médiums sont linéaires (4.7% delta à la fréquence précédente)
Aiguës 2 - 16 kHz
(±) | sommets réduits - en moyenne 5.2% plus bas que la médiane
(±) | la linéarité des aigus est moyenne (7.1% delta à la fréquence précédente)
Globalement 100 - 16 000 Hz
(+) | le son global est linéaire (12.2% différence à la médiane)
Par rapport à la même classe
» 14% de tous les appareils testés de cette catégorie étaient meilleurs, 4% similaires, 82% pires
» Le meilleur avait un delta de 5%, la moyenne était de 19%, le pire était de 53%.
Par rapport à tous les appareils testés
» 8% de tous les appareils testés étaient meilleurs, 2% similaires, 89% pires
» Le meilleur avait un delta de 4%, la moyenne était de 24%, le pire était de 134%.
MSI Prestige 13 AI Plus Evo A2VMG analyse audio
(+) | les haut-parleurs peuvent jouer relativement fort (84.5# dB)
Basses 100 - 315 Hz
(-) | presque aucune basse - en moyenne 19.4% plus bas que la médiane
(±) | la linéarité des basses est moyenne (9.6% delta à la fréquence précédente)
Médiums 400 - 2000 Hz
(±) | médiane supérieure - en moyenne 6.4% supérieure à la médiane
(+) | les médiums sont linéaires (5.1% delta à la fréquence précédente)
Aiguës 2 - 16 kHz
(±) | sommets plus élevés - en moyenne 6.1% plus élevés que la médiane
(+) | les aigus sont linéaires (4.6% delta à la fréquence précédente)
Globalement 100 - 16 000 Hz
(±) | la linéarité du son global est moyenne (18.2% de différence avec la médiane)
Par rapport à la même classe
» 50% de tous les appareils testés de cette catégorie étaient meilleurs, 7% similaires, 43% pires
» Le meilleur avait un delta de 5%, la moyenne était de 19%, le pire était de 53%.
Par rapport à tous les appareils testés
» 36% de tous les appareils testés étaient meilleurs, 8% similaires, 56% pires
» Le meilleur avait un delta de 4%, la moyenne était de 24%, le pire était de 134%.
Consommation électrique
Grâce au SoC Lunar Lake, le Dell Pro 13 est très économique. Il ne consomme que 2 à 4,75 W au ralenti, et nous n'avons mesuré que 38 W en exécutant Cyberpunk 2077. Seul le Dell XPS 13 9350avec son CPU Lunar Lake légèrement plus faible, est plus économe, et tous les autres concurrents consomment plus d'énergie
| Éteint/en veille | |
| Au repos | |
| Fortement sollicité |
|
Légende:
min: | |
| Dell Pro 13 Premium PA13250 Core Ultra 7 268V, Arc 140V | MSI Prestige 13 AI Plus Evo A2VMG Core Ultra 7 258V, Arc 140V | Lenovo ThinkPad X13 2-in-1 Gen 5 Ultra 7 165U, Graphics 4-Core | Framework Laptop 13.5 Core Ultra 7 155H Ultra 7 155H, Arc 8-Core | Dell XPS 13 9350 Core Ultra 7 256V, Arc 140V | Microsoft Surface Pro Copilot+ SD X Plus X1P-64-100, Adreno X1-85 3.8 TFLOPS | Moyenne de la classe Subnotebook | |
|---|---|---|---|---|---|---|---|
| Power Consumption | -39% | -19% | -26% | 7% | -23% | -62% | |
| Idle Minimum * | 2 | 3.5 -75% | 3.2 -60% | 2.5 -25% | 1.3 35% | 1.9 5% | 4.29 ? -115% |
| Idle Average * | 4.3 | 5.9 -37% | 6.1 -42% | 5.2 -21% | 2.5 42% | 9.2 -114% | 7.35 ? -71% |
| Idle Maximum * | 4.75 | 10 -111% | 6.7 -41% | 5.8 -22% | 4.1 14% | 9.5 -100% | 9.14 ? -92% |
| Load Average * | 40 | 38.7 3% | 44.2 -11% | 47.5 -19% | 40.1 -0% | 29.6 26% | 44.8 ? -12% |
| Cyberpunk 2077 ultra * | 36.4 | 46.3 -27% | 25.2 31% | 54.5 -50% | 46.1 -27% | 39.5 -9% | |
| Cyberpunk 2077 ultra external monitor * | 38 | 45.6 -20% | 38.5 -1% | 52.4 -38% | 43.1 -13% | 37.4 2% | |
| Load Maximum * | 57 | 61.5 -8% | 62.5 -10% | 61.5 -8% | 57.3 -1% | 40.7 29% | 68.1 ? -19% |
* ... Moindre est la valeur, meilleures sont les performances
Power consumption Cyberpunk / stress test
Power consumption with an external monitor
Durée de vie de la batterie
Grâce à la faible consommation d'énergie, l'autonomie de la batterie est excellente. Nous avons enregistré près de 24 heures lors des tests Wi-Fi et vidéo, ce qui est un résultat fantastique ! La batterie de 60 W est plutôt moyenne en termes de capacité. Le XPS 13 ne perd que marginalement en raison de sa batterie légèrement plus petite (55 Wh).
| Dell Pro 13 Premium PA13250 Core Ultra 7 268V, Arc 140V, 60 Wh | MSI Prestige 13 AI Plus Evo A2VMG Core Ultra 7 258V, Arc 140V, 75 Wh | Lenovo ThinkPad X13 2-in-1 Gen 5 Ultra 7 165U, Graphics 4-Core, 54.7 Wh | Framework Laptop 13.5 Core Ultra 7 155H Ultra 7 155H, Arc 8-Core, 61 Wh | Dell XPS 13 9350 Core Ultra 7 256V, Arc 140V, 55 Wh | Microsoft Surface Pro Copilot+ SD X Plus X1P-64-100, Adreno X1-85 3.8 TFLOPS, 47 Wh | Moyenne de la classe Subnotebook | |
|---|---|---|---|---|---|---|---|
| Autonomie de la batterie | -44% | -50% | -52% | -15% | -48% | -36% | |
| H.264 | 1425 | 731 -49% | 841 -41% | 955 ? -33% | |||
| WiFi v1.3 | 1440 | 804 -44% | 739 -49% | 630 -56% | 1236 -14% | 662 -54% | 752 ? -48% |
| Load | 170 | 84 -51% | 90 -47% | 142 -16% | 89 -48% | 123.6 ? -27% | |
| Reader / Idle | 2296 | 3407 | 1882 ? |
Notebookcheck note globale
Le Dell Pro 13 Premium est presque tout ce que vous attendez d'un ordinateur portable professionnel mobile : Il est petit, léger, économique, dispose d'une grande autonomie et offre des performances de haut niveau. Hormis son prix élevé, il n'y a pratiquement aucune plainte à formuler.
Dell Pro 13 Premium PA13250
- 03/14/2025 v8
Christian Hintze
 Total Sustainability Score:
 Transparency
La sélection des appareils à examiner est effectuée par notre équipe éditoriale. L'échantillon de test a été prêté à l'auteur par le fabricant ou le détaillant pour les besoins de cet examen. Le prêteur n'a pas eu d'influence sur cette évaluation et le fabricant n'a pas reçu de copie de cette évaluation avant sa publication. Il n'y avait aucune obligation de publier cet article. Nous n'acceptons jamais de compensation ou de paiement en échange de nos commentaires. En tant que média indépendant, Notebookcheck n'est pas soumis à l'autorité des fabricants, des détaillants ou des éditeurs.
Voici comment Notebookcheck teste
Chaque année, Notebookcheck examine de manière indépendante des centaines d'ordinateurs portables et de smartphones en utilisant des procédures standardisées afin de garantir que tous les résultats sont comparables. Nous avons continuellement développé nos méthodes de test depuis environ 20 ans et avons établi des normes industrielles dans le processus. Dans nos laboratoires de test, des équipements de mesure de haute qualité sont utilisés par des techniciens et des rédacteurs expérimentés. Ces tests impliquent un processus de validation en plusieurs étapes. Notre système d'évaluation complexe repose sur des centaines de mesures et de points de référence bien fondés, ce qui garantit l'objectivité.
