Notebookcheck Logo

AMD Ryzen 9 9955HX face à Intel Core Ultra 9 275HX : bataille pour le CPU de jeu le plus puissant

Fire Range vs. Arrow Lake.

Avec les nouveaux GPU RTX 5000 pour ordinateur portable, les nouveaux CPU HX d'AMD et d'Intel sont également arrivés. Nous comparons l'AMD Ryzen 9 9955HX avec l'Intel Core Ultra 9 275HX et comparons non seulement la performance pure du CPU mais aussi la performance de jeu en conjonction avec le nouveau GPU RTX 5090 pour ordinateur portable.
L'AMD Ryzen 9 9955HX s'oppose à l'Intel Core Ultra 9 275HX

AMD et Nvidia ont tous deux présenté leurs nouveaux processeurs mobiles haut de gamme de classe HX, ainsi que les nouveaux GPU portables Nvidia RTX 5000 de Nvidia pour ordinateurs portables. Dans cet article d'analyse, nous comparons les AMD Ryzen 9 9955HX avec le Intel Core Ultra 9 275HX.

Outre les performances brutes du processeur, nous examinons également divers benchmarks système ainsi que des benchmarks de jeu en conjonction avec le nouveau GPU 175 W Nvidia GeForce RTX 5090 Laptop.

Vue d'ensemble : AMD Fire Range vs. Intel Arrow Lake

Les nouvelles UGS d'Intel et d'AMD ont été officiellement annoncées au CES 2025, et les deux fabricants prétendent offrir les meilleurs processeurs mobiles pour les applications créatives et les jeux.

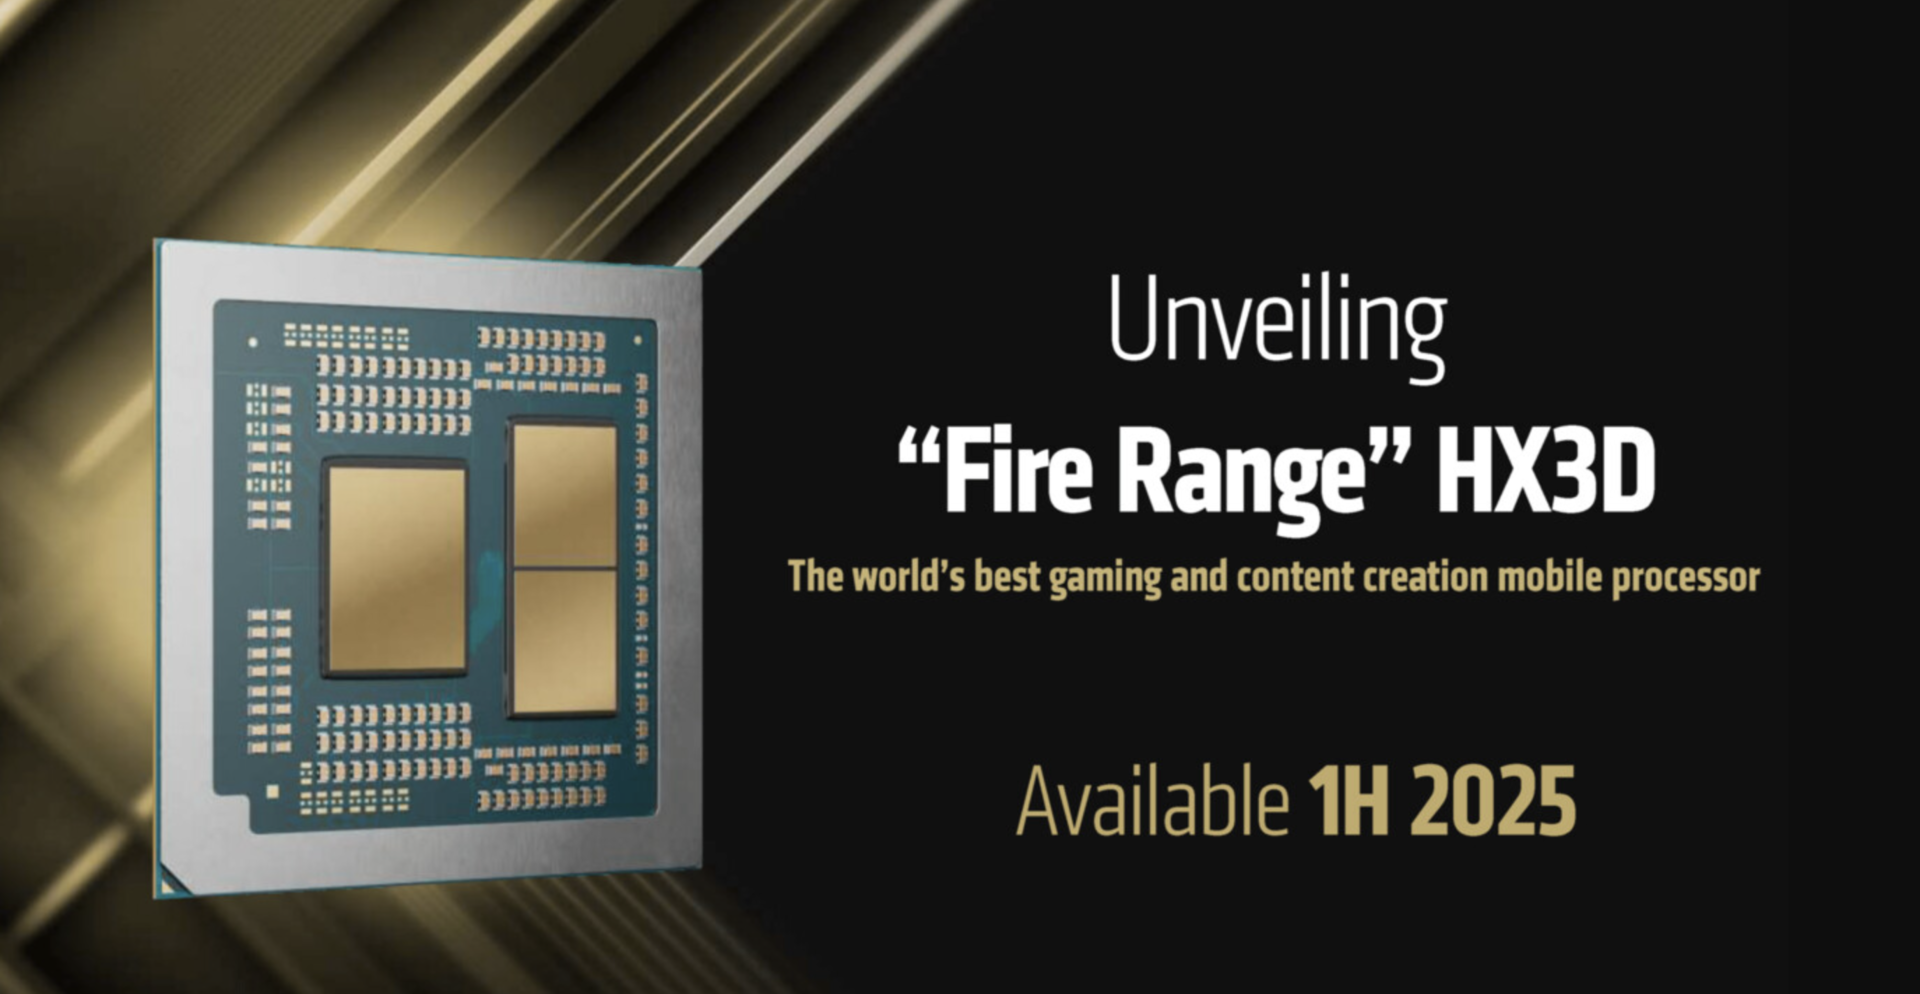
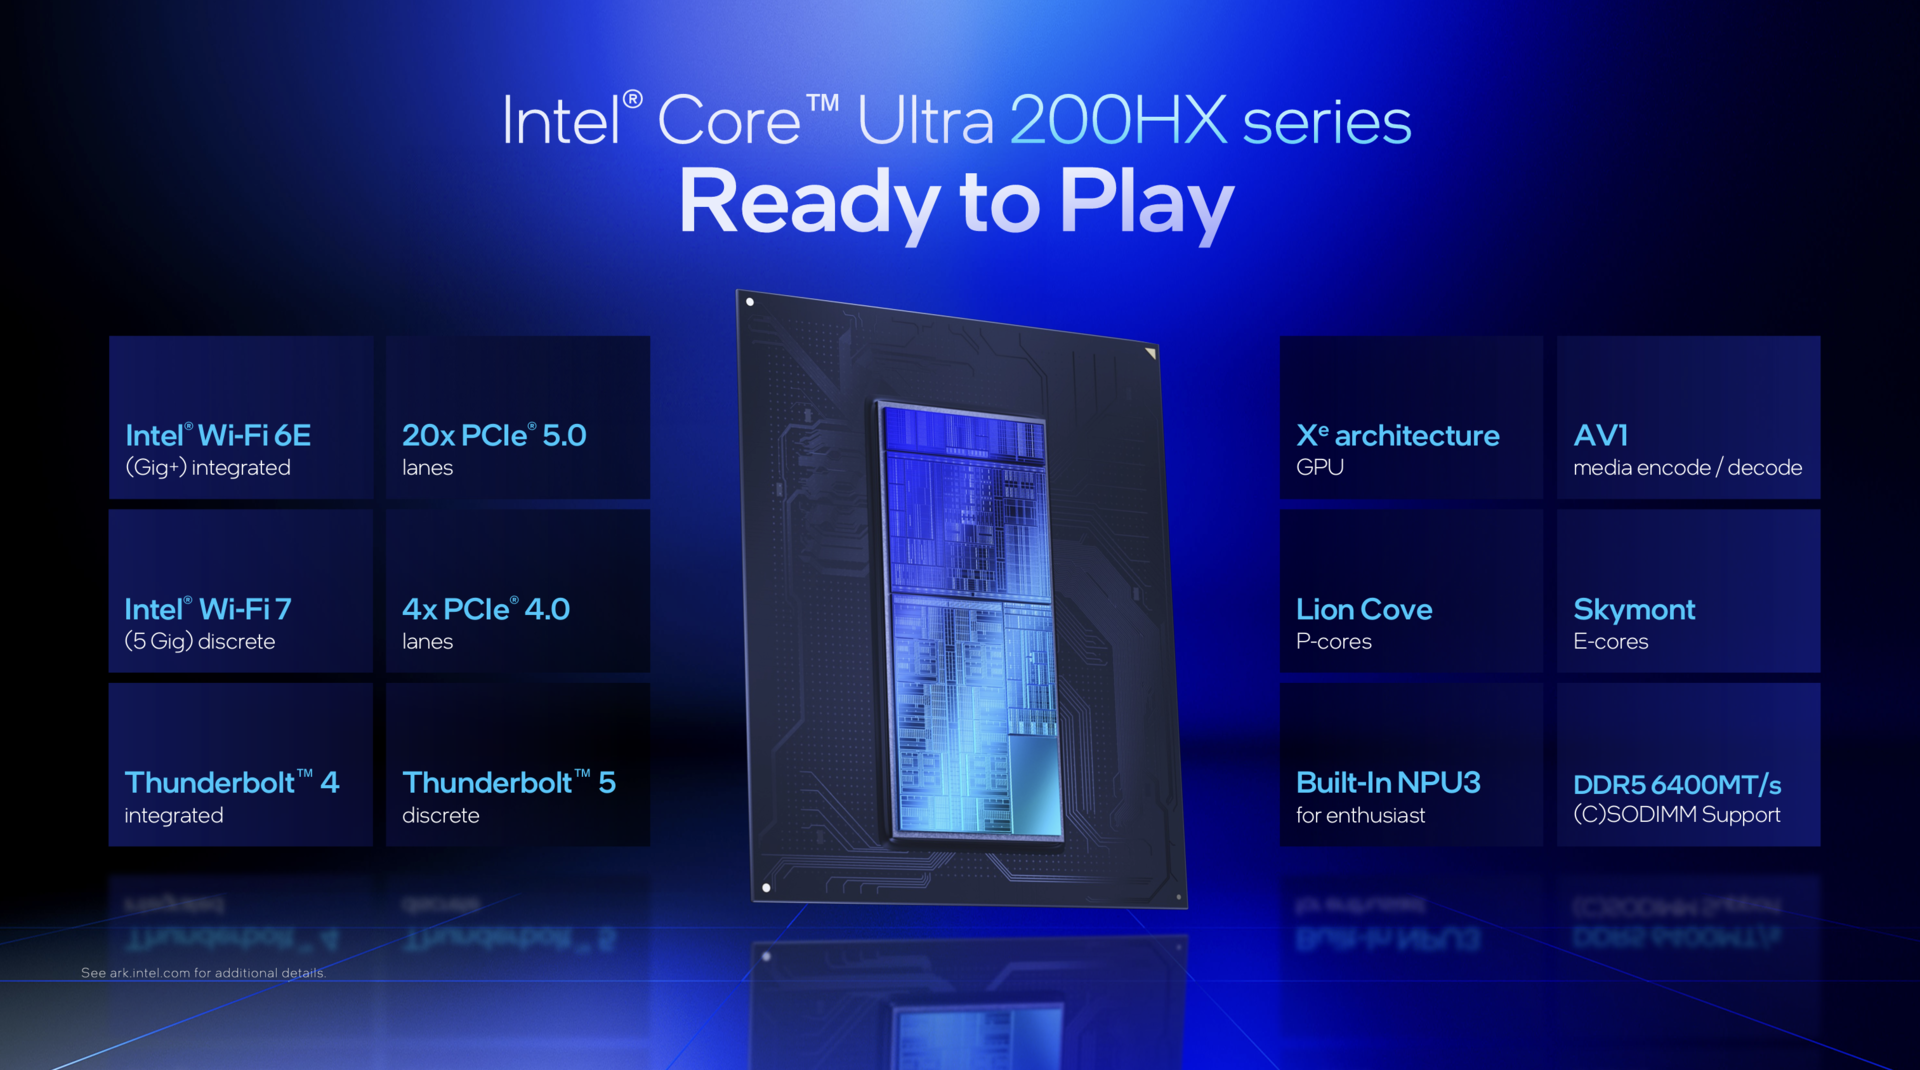
Les APU de la gamme Fire d'AMD sont basés sur les cœurs Zen 5 bien connus et une variante avec cache 3D-V est également disponible en option. Intel, quant à lui, s'appuie sur l'architecture Arrow Lake.

AMD Fire Range HX
AMD Fire Range HX
Intel Arrow Lake-HX
Intel Arrow Lake-HX

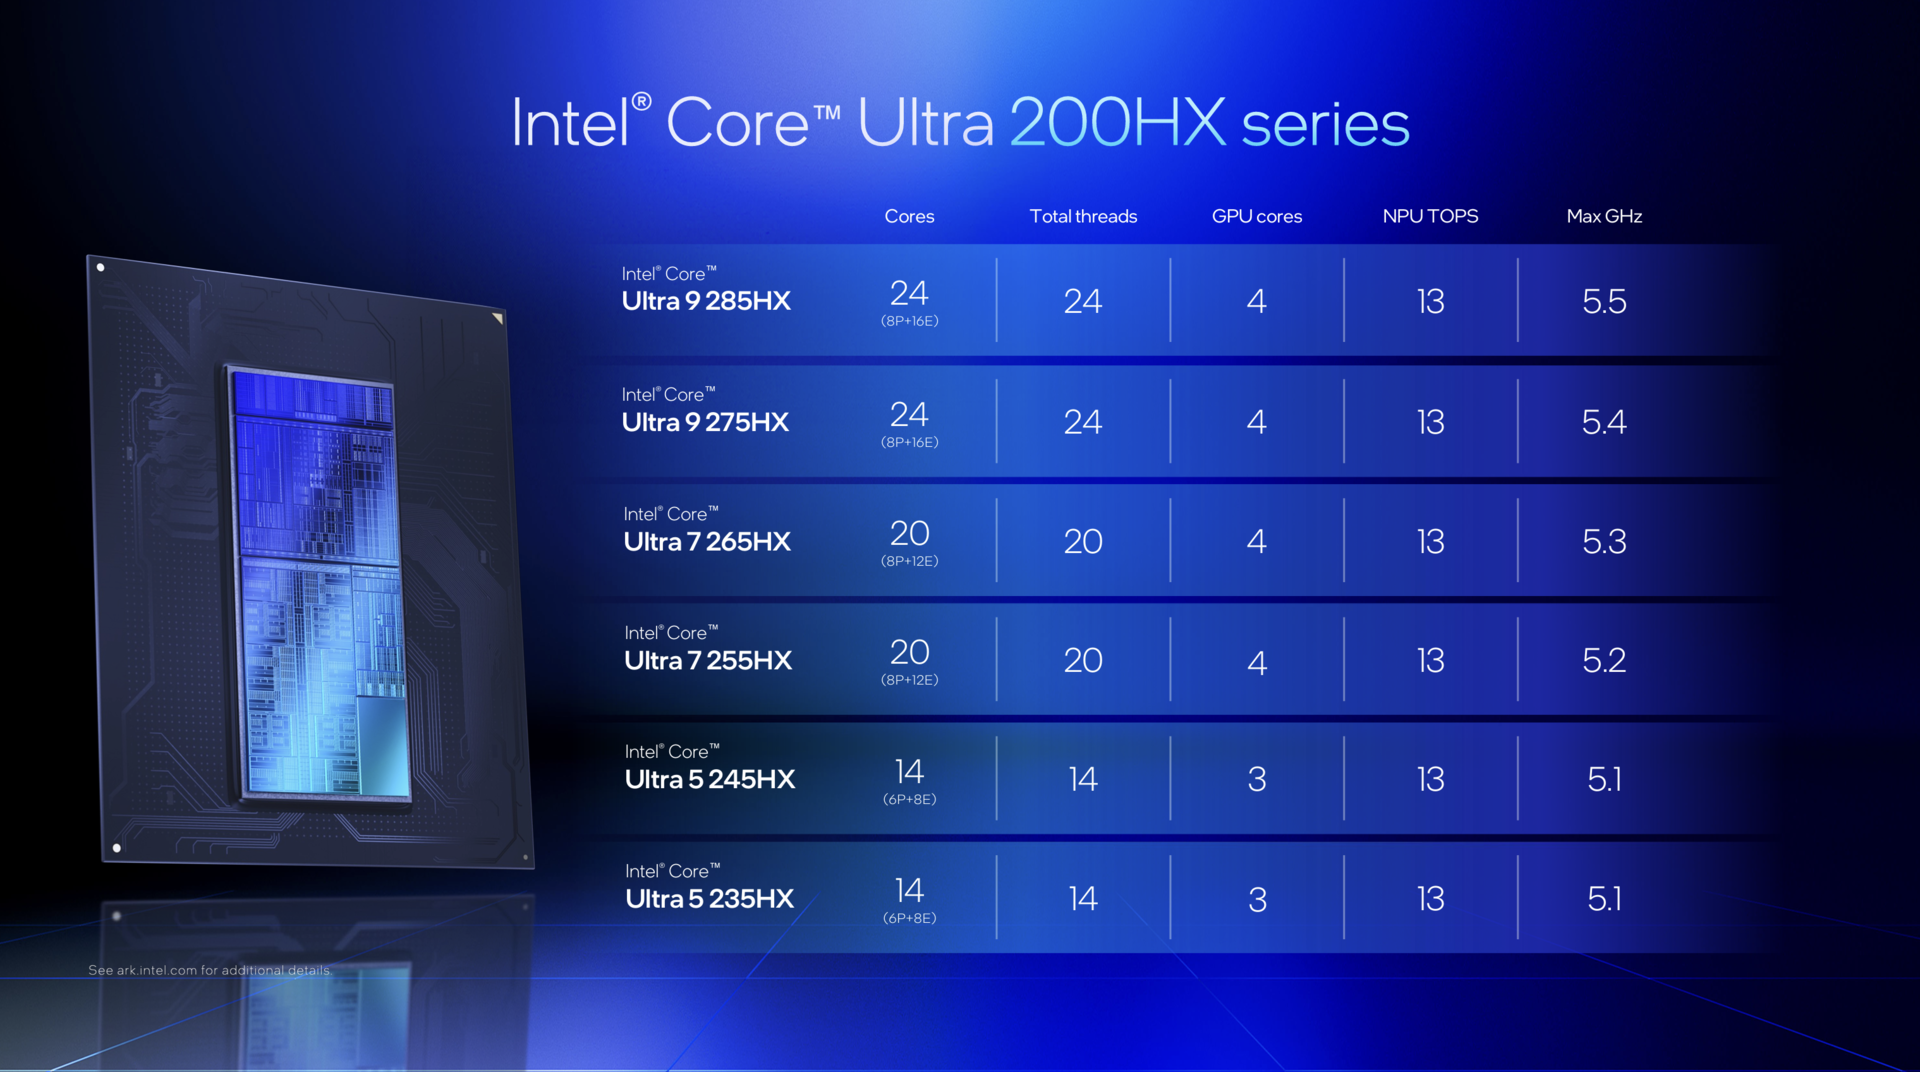
Nos deux processeurs de test sont les suivants AMD Ryzen 9 9955HX et le Intel Core Ultra 9 275HXqui ne sont pas exactement les plus rapides de leurs gammes respectives.

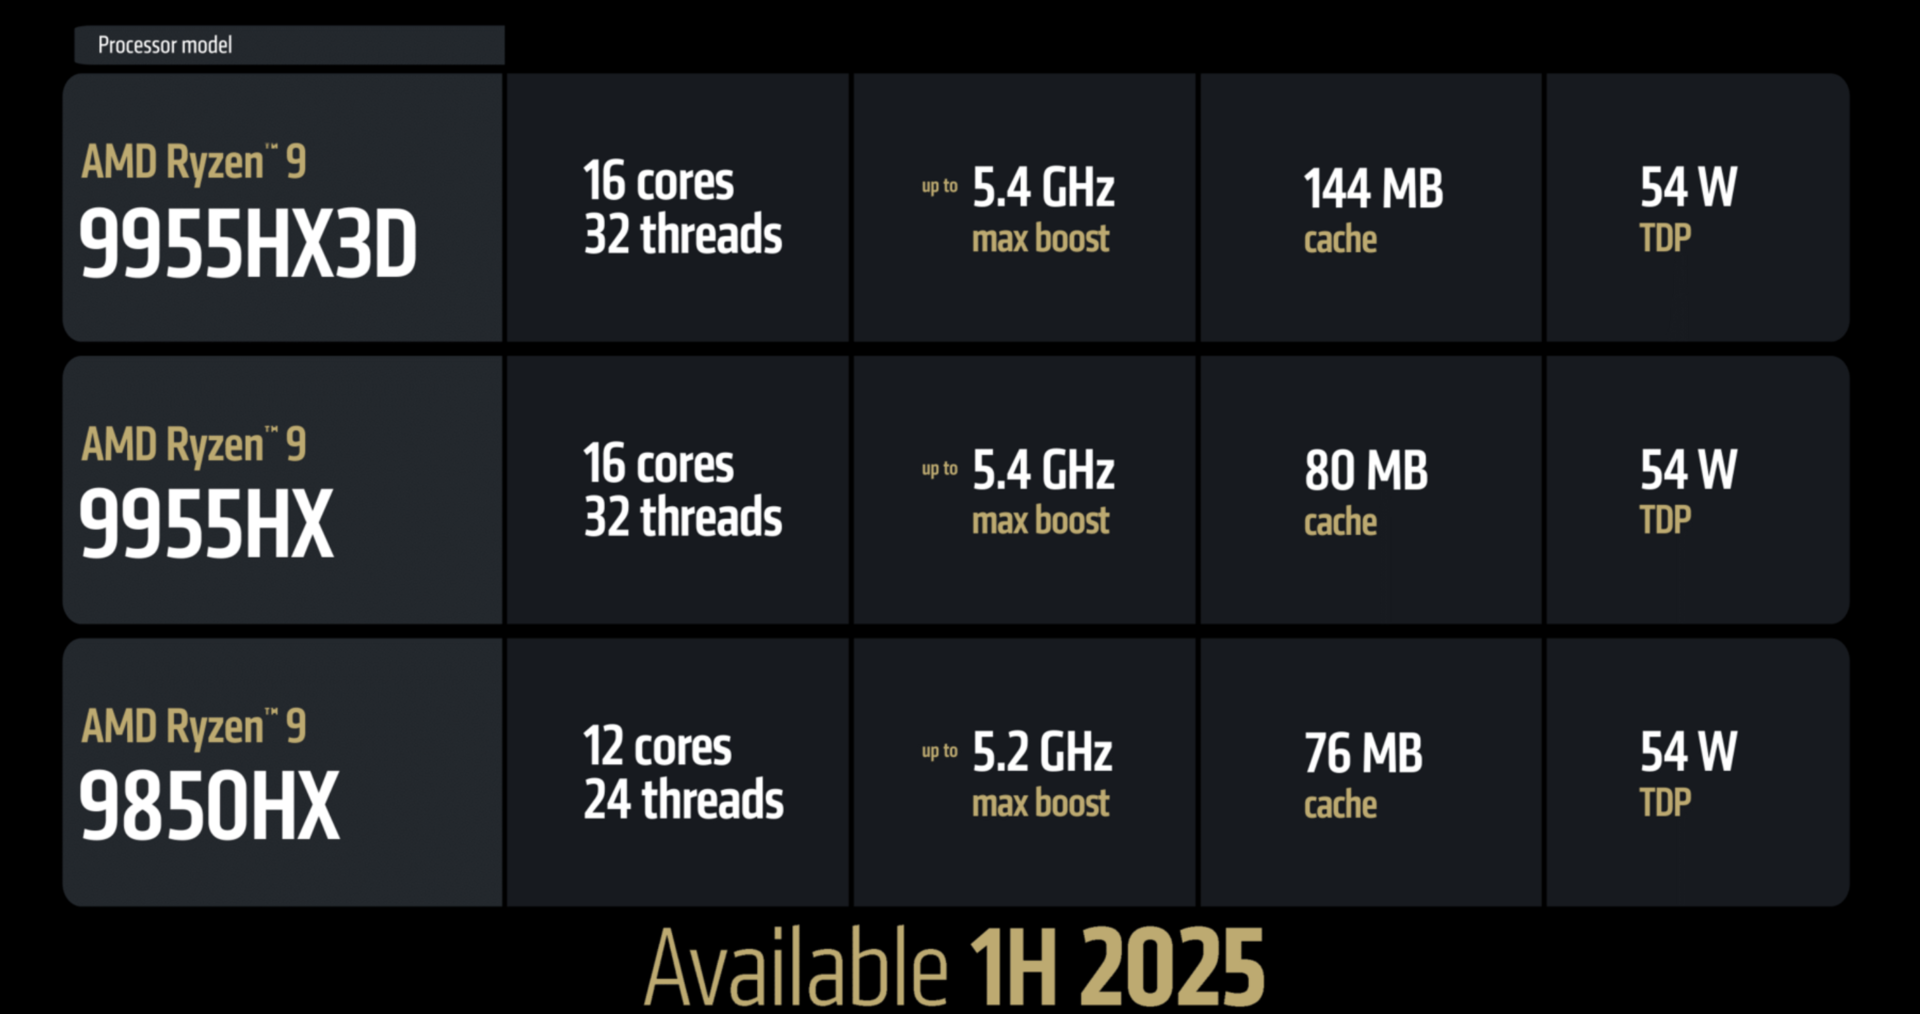
Néanmoins, ces deux processeurs sont susceptibles d'être utilisés le plus souvent dans des ordinateurs portables de jeu/création de haute performance. En théorie, le TDP des CPU est de 54 W pour AMD ou de 55 W pour Intel, mais à pleine charge, ils peuvent tous deux consommer brièvement plus de 150 W.

Le Ryzen 9 9955HX utilise 16 cœurs avec hyperthreading (32 threads), tandis que le Core Ultra 9 275HX utilise un total de 24 cœurs (8x Performance, 16x Efficiency) sans hyperthreading.

Gamme AMD Fire Range 9000HX
Gamme Intel Arrow Lake Core Ultra 200HX

Le Ryzen 9 9955HX3D, qui n'était malheureusement pas encore disponible pour les tests, est particulièrement intéressant. Grâce au 3D V-Cache, elle promet avant tout des performances de jeu accrues, ce que nous avons déjà pu constater avec son prédécesseur, le Ryzen 9 7945HX3D. Il ne reste plus qu'à espérer que la disponibilité sera meilleure cette fois-ci.

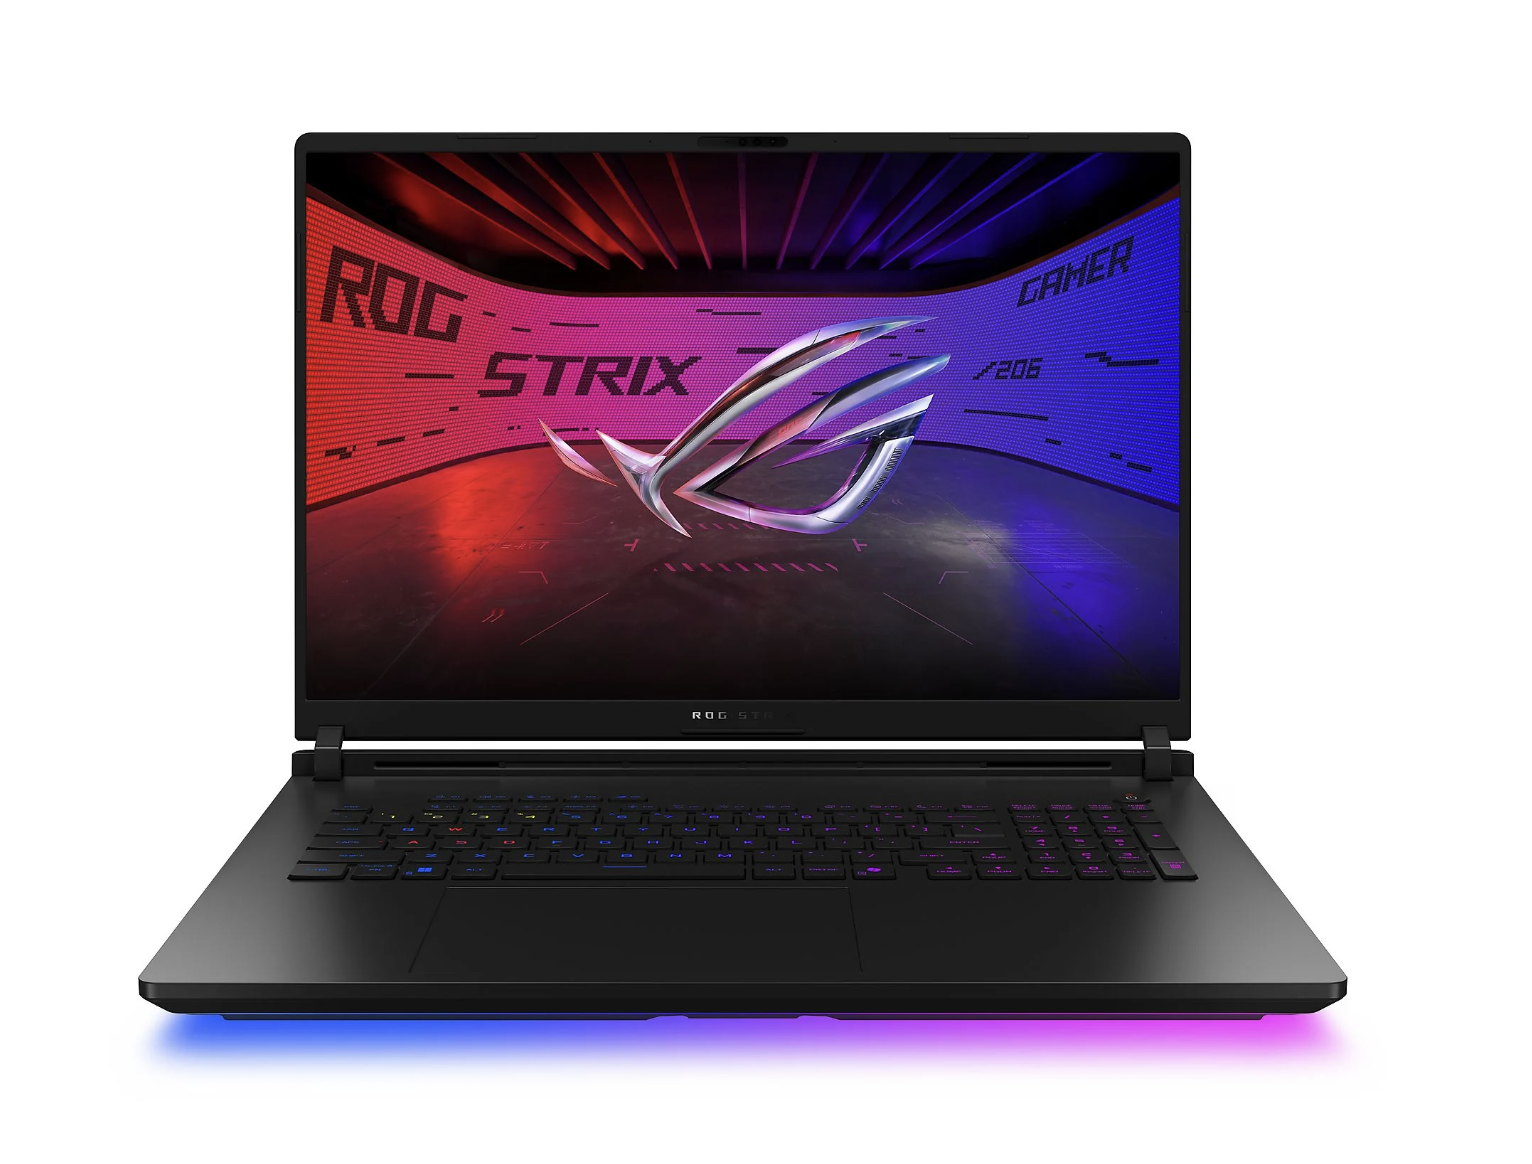
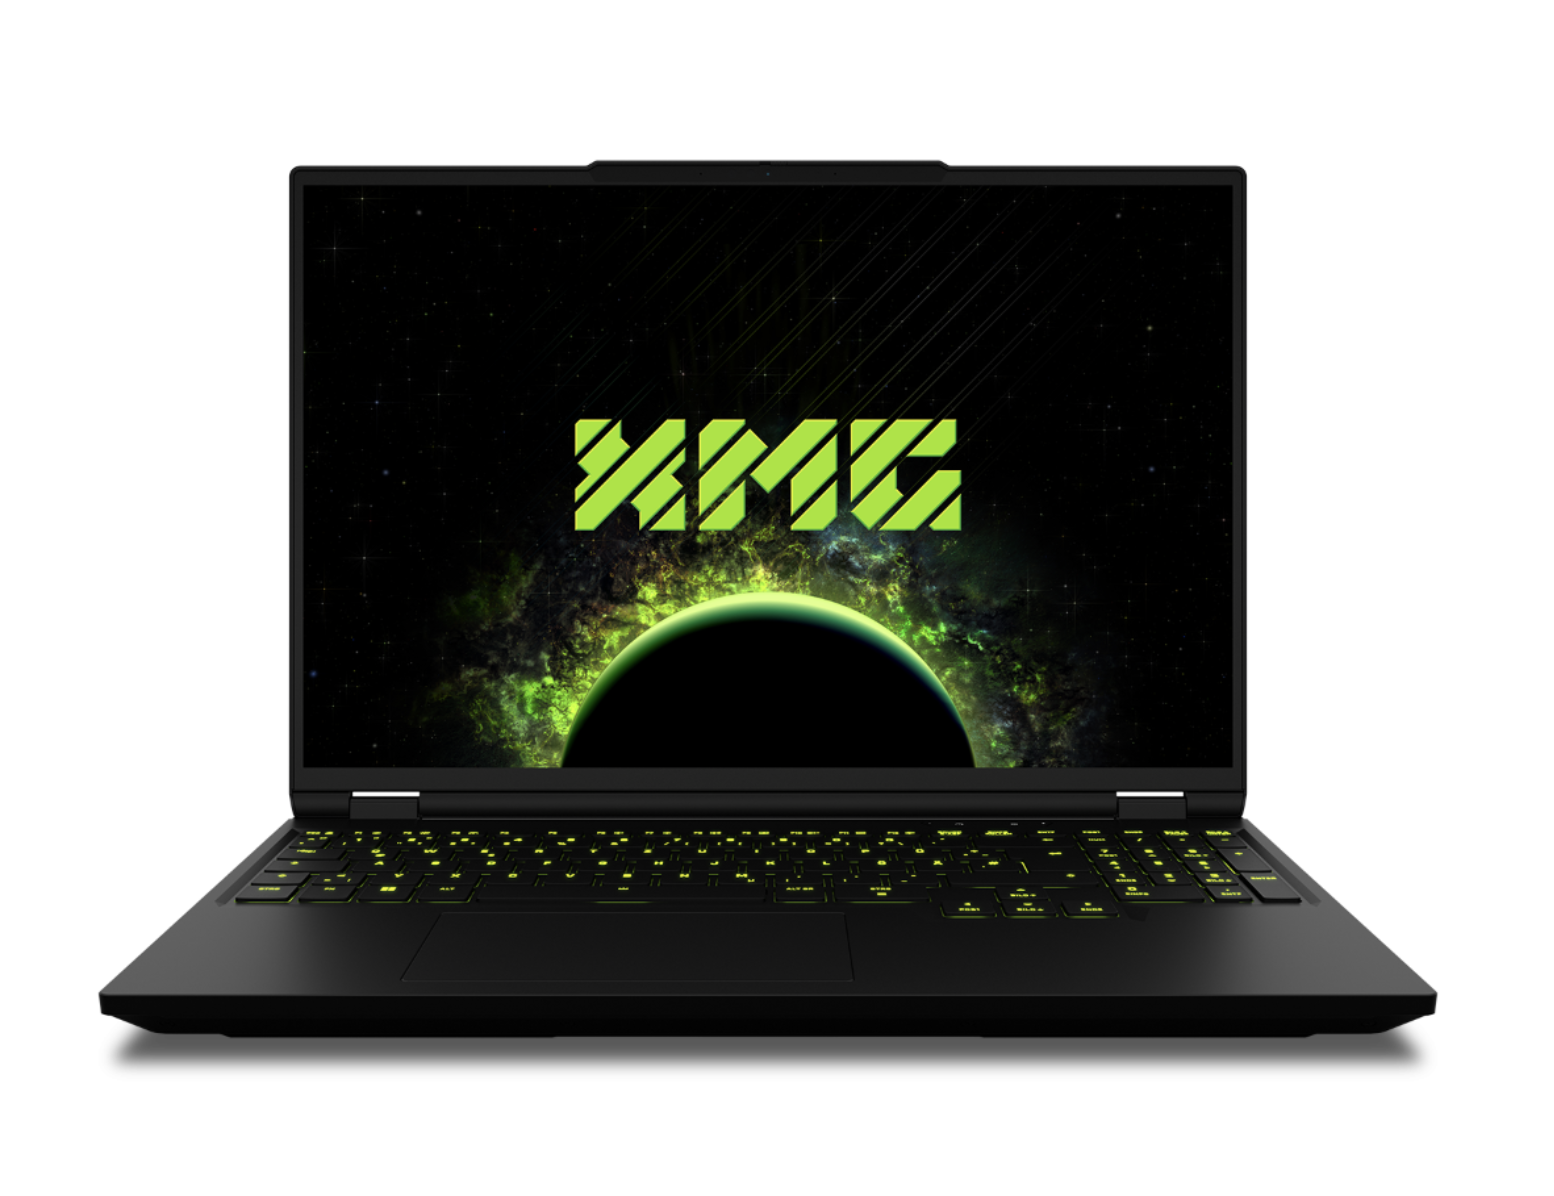
Systèmes de test : Asus Strix Scar 18 & XMG Neo 16 A25

Nous avions à notre disposition deux ordinateurs portables de jeu extrêmement puissants comme systèmes de test. L'un était le nouveau Asus ROG Strix SCAR 18 G835LX avec l'Intel Core Ultra 9 275HX et 64 Go de RAM, et l'autre était un échantillon technique du nouveau XMG Neo 16 A25 avec l'AMD Ryzen 9955HX en combinaison avec 32 Go de RAM.

Les deux appareils étaient équipés du nouveau GPU Nvidia GeForce RTX 5090 Laptop, qui peut consommer jusqu'à 175 W. Nous avons utilisé le pilote Nvidia Game Ready Driver 572.84 pour les deux appareils, ce qui le rend idéal pour les comparaisons de performances.

Asus Strix Scar 18 G835LX
XMG Neo 16 A25
XMG Neo 16 A25

A ce stade, cependant, nous nous abstiendrons de mesures de consommation étendues et de considérations d'efficacité, car le GPU Nvidia fonctionnait toujours sur le moniteur externe dans l'échantillon d'ingénierie du XMG Neo 16, ce qui aurait naturellement augmenté la consommation d'énergie et faussé les résultats d'efficacité. Nous vous communiquerons ces résultats dès que possible.

Performance d'un seul cœur

Nous avons utilisé Cinebench 2024 et Geekbench 6 pour les tests CPU, car ces deux tests fonctionnent nativement sur toutes les plateformes et permettent donc une très bonne comparaison des performances.

Dans les tests à cœur unique, le Core Ultra 9 275HX a pu augmenter ses performances d'environ 6 % par rapport au Core i9-14900HX. Le Ryzen 9 9955HX a quant à lui augmenté ses performances d'environ 11 % par rapport au Ryzen 9 7945HX et a ainsi rattrapé l'ancien Core i9-14900HX.

Les deux produits mobiles sont également légèrement à la traîne par rapport à leurs homologues de bureau respectifs et, comme prévu, Apple possède toujours un avantage massif avec la génération M4.

Dans le test Geekbench, cependant, le vent tourne et le Ryzen 9 9955HX devance légèrement le Core Ultra 9 275HX.

Performance Rating - Percent
Apple M4 Max (16 cores)
Apple MacBook Pro 16 M4 Max, M4 Max 40-Core GPU
100 pt
Apple M4 Pro (14 cores)
Apple MacBook Pro 16 2024 M4 Pro, M4 Pro 20-Core GPU
99.4 pt
AMD Ryzen 9 9950X3D
AMD Ryzen 9 9950X3D, NVIDIA GeForce RTX 4090
83.1 pt
Intel Core Ultra 9 285K
Intel Core Ultra 9 285K, NVIDIA GeForce RTX 4090
83.1 pt
Apple M3 Max 16-Core
Apple MacBook Pro 14 2023 M3 Max, M3 Max 40-Core GPU
80 pt
Intel Core Ultra 9 275HX
Asus Strix Scar 18 G835LX, GeForce RTX 5090 Laptop
79.5 pt
AMD Ryzen 9 9955HX
SCHENKER Neo 16 A25 5090 Engineering Sample, GeForce RTX 5090 Laptop
77.9 pt
Intel Core i9-14900HX
MSI Raider 18 HX A14V, NVIDIA GeForce RTX 4080 Laptop GPU
75.3 pt
Intel Core Ultra 9 285H
MSI Prestige 16 AI Evo B2HMG, Arc 140T
73.2 pt
Intel Core i9-13900HK
Beelink GTI13 Ultra, Iris Xe G7 96EUs
71.8 pt
AMD Ryzen AI Max+ 395
Asus ROG Flow Z13 GZ302EA-RU073W, Radeon RX 8060S
71.2 pt
Intel Core i7-14700HX
Lenovo ThinkPad P16 Gen 2, NVIDIA RTX 4000 Ada Generation Laptop GPU
71.2 pt
AMD Ryzen 9 7945HX3D
Asus ROG Strix Scar 17 G733PYV-LL053X, NVIDIA GeForce RTX 4090 Laptop GPU
69.9 pt
AMD Ryzen 9 7945HX
Minisforum BD795i SE, Radeon 610M
69.4 pt
Cinebench 2024 - CPU Single Core
Apple M4 Pro (14 cores)
Apple MacBook Pro 16 2024 M4 Pro, M4 Pro 20-Core GPU
178 Points +38%
Apple M4 Max (16 cores)
Apple MacBook Pro 16 M4 Max, M4 Max 40-Core GPU
178 Points +38%
Intel Core Ultra 9 285K
Intel Core Ultra 9 285K, NVIDIA GeForce RTX 4090
144 Points +12%
Apple M3 Max 16-Core
Apple MacBook Pro 14 2023 M3 Max, M3 Max 40-Core GPU
140 Points +9%
AMD Ryzen 9 9950X3D
AMD Ryzen 9 9950X3D, NVIDIA GeForce RTX 4090
138.4 Points +7%
Intel Core Ultra 9 275HX
Asus Strix Scar 18 G835LX, GeForce RTX 5090 Laptop
138 Points +7%
Intel Core i9-14900HX
MSI Raider 18 HX A14V, NVIDIA GeForce RTX 4080 Laptop GPU
129.9 Points +1%
AMD Ryzen 9 9955HX
SCHENKER Neo 16 A25 5090 Engineering Sample, GeForce RTX 5090 Laptop
129 Points
Intel Core Ultra 9 285H
MSI Prestige 16 AI Evo B2HMG, Arc 140T
127 Points -2%
Intel Core i9-13900HK
Beelink GTI13 Ultra, Iris Xe G7 96EUs
123.5 Points -4%
Intel Core i7-14700HX
Lenovo ThinkPad P16 Gen 2, NVIDIA RTX 4000 Ada Generation Laptop GPU
120.7 Points -6%
AMD Ryzen AI Max+ 395
Asus ROG Flow Z13 GZ302EA-RU073W, Radeon RX 8060S
116.8 Points -9%
AMD Ryzen 9 7945HX
Minisforum BD795i SE, Radeon 610M
116 Points -10%
AMD Ryzen 9 7945HX3D
Asus ROG Strix Scar 17 G733PYV-LL053X, NVIDIA GeForce RTX 4090 Laptop GPU
115 Points -11%
Geekbench 6.4 - Single-Core
Apple M4 Max (16 cores)
Apple MacBook Pro 16 M4 Max, M4 Max 40-Core GPU
3880 Points +20%
Apple M4 Pro (14 cores)
Apple MacBook Pro 16 2024 M4 Pro, M4 Pro 20-Core GPU
3836 Points +19%
AMD Ryzen 9 9950X3D
AMD Ryzen 9 9950X3D, NVIDIA GeForce RTX 4090
3434 Points +6%
Intel Core Ultra 9 285K
Intel Core Ultra 9 285K, NVIDIA GeForce RTX 4090
3306 Points +2%
AMD Ryzen 9 9955HX
SCHENKER Neo 16 A25 5090 Engineering Sample, GeForce RTX 5090 Laptop
3230 Points
Intel Core Ultra 9 275HX
Asus Strix Scar 18 G835LX, GeForce RTX 5090 Laptop
3158 Points -2%
Apple M3 Max 16-Core
Apple MacBook Pro 14 2023 M3 Max, M3 Max 40-Core GPU
3157 Points -2%
Intel Core i9-14900HX
MSI Raider 18 HX A14V, NVIDIA GeForce RTX 4080 Laptop GPU
3010 Points -7%
AMD Ryzen AI Max+ 395
Asus ROG Flow Z13 GZ302EA-RU073W, Radeon RX 8060S
2978 Points -8%
AMD Ryzen 9 7945HX3D
Asus ROG Strix Scar 17 G733PYV-LL053X, NVIDIA GeForce RTX 4090 Laptop GPU
2916 Points -10%
Intel Core Ultra 9 285H
MSI Prestige 16 AI Evo B2HMG, Arc 140T
2912 Points -10%
Intel Core i7-14700HX
Lenovo ThinkPad P16 Gen 2, NVIDIA RTX 4000 Ada Generation Laptop GPU
2892 Points -10%
Intel Core i9-13900HK
Beelink GTI13 Ultra, Iris Xe G7 96EUs
2883 Points -11%
AMD Ryzen 9 7945HX
Minisforum BD795i SE, Radeon 610M
2858 Points -12%

Performance multicœur

Dans le test multiple Cinebench 2024, le nouveau Core Ultra 9 275HX est très performant et peut surpasser l'ancien Core i9-14900HX de 30 %. L'Ultra 9 275HX bat également de justesse le Apple M4 Max Qui consomment pourtant beaucoup moins d'énergie.

Le Ryzen 9 9955HX devance ses prédécesseurs d'environ 15 % et le 275HX d'environ 7 %. Le multi-test Geekbench montre une image similaire, avec les deux SoC M4 Max en tête de ce test.

Performance Rating - Percent
Intel Core Ultra 9 285K
Intel Core Ultra 9 285K, NVIDIA GeForce RTX 4090
92.1 pt
AMD Ryzen 9 9950X3D
AMD Ryzen 9 9950X3D, NVIDIA GeForce RTX 4090
92 pt
Apple M4 Max (16 cores)
Apple MacBook Pro 16 M4 Max, M4 Max 40-Core GPU
91.9 pt
Intel Core Ultra 9 275HX
Asus Strix Scar 18 G835LX, GeForce RTX 5090 Laptop
87.7 pt
AMD Ryzen 9 9955HX
SCHENKER Neo 16 A25 5090 Engineering Sample, GeForce RTX 5090 Laptop
80.2 pt
Apple M4 Pro (14 cores)
Apple MacBook Pro 16 2024 M4 Pro, M4 Pro 20-Core GPU
79.2 pt
AMD Ryzen AI Max+ 395
Asus ROG Flow Z13 GZ302EA-RU073W, Radeon RX 8060S
75.1 pt
Apple M3 Max 16-Core
Apple MacBook Pro 14 2023 M3 Max, M3 Max 40-Core GPU
72.7 pt
AMD Ryzen 9 7945HX
Minisforum BD795i SE, Radeon 610M
69.8 pt
AMD Ryzen 9 7945HX3D
Asus ROG Strix Scar 17 G733PYV-LL053X, NVIDIA GeForce RTX 4090 Laptop GPU
69.3 pt
Intel Core i9-14900HX
MSI Raider 18 HX A14V, NVIDIA GeForce RTX 4080 Laptop GPU
68.2 pt
Intel Core i7-14700HX
Lenovo ThinkPad P16 Gen 2, NVIDIA RTX 4000 Ada Generation Laptop GPU
59.3 pt
Intel Core Ultra 9 285H
MSI Prestige 16 AI Evo B2HMG, Arc 140T
53.8 pt
Intel Core i9-13900HK
Beelink GTI13 Ultra, Iris Xe G7 96EUs
45.9 pt
Cinebench 2024 - CPU Multi Core
Intel Core Ultra 9 285K
Intel Core Ultra 9 285K, NVIDIA GeForce RTX 4090
2436 Points +18%
AMD Ryzen 9 9950X3D
AMD Ryzen 9 9950X3D, NVIDIA GeForce RTX 4090
2365 Points +15%
Intel Core Ultra 9 275HX
Asus Strix Scar 18 G835LX, GeForce RTX 5090 Laptop
2223 Points +8%
Apple M4 Max (16 cores)
Apple MacBook Pro 16 M4 Max, M4 Max 40-Core GPU
2069 Points +1%
Apple M4 Max (16 cores)
Apple MacBook Pro 16 M4 Max, M4 Max 40-Core GPU
2015 Points -2%
AMD Ryzen 9 9955HX
SCHENKER Neo 16 A25 5090 Engineering Sample, GeForce RTX 5090 Laptop
2058 Points
AMD Ryzen 9 7945HX
Minisforum BD795i SE, Radeon 610M
1799 Points -13%
AMD Ryzen 9 7945HX3D
Asus ROG Strix Scar 17 G733PYV-LL053X, NVIDIA GeForce RTX 4090 Laptop GPU
1772 Points -14%
Apple M4 Pro (14 cores)
Apple MacBook Pro 16 2024 M4 Pro, M4 Pro 20-Core GPU
1729 Points -16%
Intel Core i9-14900HX
MSI Raider 18 HX A14V, NVIDIA GeForce RTX 4080 Laptop GPU
1728 Points -16%
AMD Ryzen AI Max+ 395
Asus ROG Flow Z13 GZ302EA-RU073W, Radeon RX 8060S
1648 Points -20%
Apple M3 Max 16-Core
Apple MacBook Pro 14 2023 M3 Max, M3 Max 40-Core GPU
1532 Points -26%
Intel Core i7-14700HX
Lenovo ThinkPad P16 Gen 2, NVIDIA RTX 4000 Ada Generation Laptop GPU
1345 Points -35%
Intel Core Ultra 9 285H
MSI Prestige 16 AI Evo B2HMG, Arc 140T
991 Points -52%
Intel Core i9-13900HK
Beelink GTI13 Ultra, Iris Xe G7 96EUs
980 Points -52%
Geekbench 6.4 - Multi-Core
Apple M4 Max (16 cores)
Apple MacBook Pro 16 M4 Max, M4 Max 40-Core GPU
25760 Points +32%
Apple M4 Pro (14 cores)
Apple MacBook Pro 16 2024 M4 Pro, M4 Pro 20-Core GPU
22509 Points +15%
AMD Ryzen 9 9950X3D
AMD Ryzen 9 9950X3D, NVIDIA GeForce RTX 4090
22405 Points +15%
Intel Core Ultra 9 285K
Intel Core Ultra 9 285K, NVIDIA GeForce RTX 4090
21688 Points +11%
Intel Core Ultra 9 275HX
Asus Strix Scar 18 G835LX, GeForce RTX 5090 Laptop
21668 Points +11%
AMD Ryzen AI Max+ 395
Asus ROG Flow Z13 GZ302EA-RU073W, Radeon RX 8060S
21269 Points +9%
Apple M3 Max 16-Core
Apple MacBook Pro 14 2023 M3 Max, M3 Max 40-Core GPU
21264 Points +9%
AMD Ryzen 9 9955HX
SCHENKER Neo 16 A25 5090 Engineering Sample, GeForce RTX 5090 Laptop
19563 Points
Intel Core Ultra 9 285H
MSI Prestige 16 AI Evo B2HMG, Arc 140T
17262 Points -12%
AMD Ryzen 9 7945HX3D
Asus ROG Strix Scar 17 G733PYV-LL053X, NVIDIA GeForce RTX 4090 Laptop GPU
16957 Points -13%
AMD Ryzen 9 7945HX
Minisforum BD795i SE, Radeon 610M
16946 Points -13%
Intel Core i9-14900HX
MSI Raider 18 HX A14V, NVIDIA GeForce RTX 4080 Laptop GPU
16855 Points -14%
Intel Core i7-14700HX
Lenovo ThinkPad P16 Gen 2, NVIDIA RTX 4000 Ada Generation Laptop GPU
16326 Points -17%
Intel Core i9-13900HK
Beelink GTI13 Ultra, Iris Xe G7 96EUs
13309 Points -32%

Critères de référence du système

Dans les benchmarks système tels que PCMark 10, CrossMark ou les tests 3DMark Physics, le CPU AMD a presque toujours l'avantage sur le Core Ultra 9 275HX.

Cependant, les autres composants ont naturellement une influence sur les performances globales du système.

PCMark 10 / Score
AMD Ryzen 9 9950X3D
AMD Ryzen 9 9950X3D, NVIDIA GeForce RTX 4090
10843 Points +15%
Intel Core Ultra 9 285K
Intel Core Ultra 9 285K, NVIDIA GeForce RTX 4090
10514 Points +12%
AMD Ryzen 9 9955HX
SCHENKER Neo 16 A25 5090 Engineering Sample, GeForce RTX 5090 Laptop
9402 Points
Intel Core i9-14900HX
MSI Raider 18 HX A14V, NVIDIA GeForce RTX 4080 Laptop GPU
9223 Points -2%
AMD Ryzen AI Max+ 395
Asus ROG Flow Z13 GZ302EA-RU073W, Radeon RX 8060S
9125 Points -3%
AMD Ryzen 9 7945HX3D
Asus ROG Strix Scar 17 G733PYV-LL053X, NVIDIA GeForce RTX 4090 Laptop GPU
9117 Points -3%
Intel Core Ultra 9 275HX
Asus Strix Scar 18 G835LX, GeForce RTX 5090 Laptop
8623 Points -8%
Intel Core i7-14700HX
Lenovo ThinkPad P16 Gen 2, NVIDIA RTX 4000 Ada Generation Laptop GPU
8353 Points -11%
Intel Core Ultra 9 285H
MSI Prestige 16 AI Evo B2HMG, Arc 140T
7838 Points -17%
Intel Core i9-13900HK
Beelink GTI13 Ultra, Iris Xe G7 96EUs
6791 Points -28%
AMD Ryzen 9 7945HX
Minisforum BD795i SE, Radeon 610M
6558 Points -30%
PCMark 10 / Essentials
AMD Ryzen 9 9950X3D
AMD Ryzen 9 9950X3D, NVIDIA GeForce RTX 4090
12435 Points +10%
AMD Ryzen AI Max+ 395
Asus ROG Flow Z13 GZ302EA-RU073W, Radeon RX 8060S
12005 Points +7%
Intel Core i9-13900HK
Beelink GTI13 Ultra, Iris Xe G7 96EUs
11963 Points +6%
Intel Core i9-14900HX
MSI Raider 18 HX A14V, NVIDIA GeForce RTX 4080 Laptop GPU
11825 Points +5%
Intel Core Ultra 9 285K
Intel Core Ultra 9 285K, NVIDIA GeForce RTX 4090
11613 Points +3%
AMD Ryzen 9 7945HX
Minisforum BD795i SE, Radeon 610M
11584 Points +3%
AMD Ryzen 9 7945HX3D
Asus ROG Strix Scar 17 G733PYV-LL053X, NVIDIA GeForce RTX 4090 Laptop GPU
11561 Points +3%
AMD Ryzen 9 9955HX
SCHENKER Neo 16 A25 5090 Engineering Sample, GeForce RTX 5090 Laptop
11271 Points
Intel Core Ultra 9 285H
MSI Prestige 16 AI Evo B2HMG, Arc 140T
11171 Points -1%
Intel Core i7-14700HX
Lenovo ThinkPad P16 Gen 2, NVIDIA RTX 4000 Ada Generation Laptop GPU
11157 Points -1%
Intel Core Ultra 9 275HX
Asus Strix Scar 18 G835LX, GeForce RTX 5090 Laptop
10966 Points -3%
PCMark 10 / Productivity
AMD Ryzen 9 9950X3D
AMD Ryzen 9 9950X3D, NVIDIA GeForce RTX 4090
12578 Points +19%
Intel Core Ultra 9 285K
Intel Core Ultra 9 285K, NVIDIA GeForce RTX 4090
12340 Points +16%
Intel Core i9-14900HX
MSI Raider 18 HX A14V, NVIDIA GeForce RTX 4080 Laptop GPU
11082 Points +5%
AMD Ryzen 9 7945HX3D
Asus ROG Strix Scar 17 G733PYV-LL053X, NVIDIA GeForce RTX 4090 Laptop GPU
10881 Points +3%
AMD Ryzen 9 9955HX
SCHENKER Neo 16 A25 5090 Engineering Sample, GeForce RTX 5090 Laptop
10601 Points
AMD Ryzen AI Max+ 395
Asus ROG Flow Z13 GZ302EA-RU073W, Radeon RX 8060S
10377 Points -2%
AMD Ryzen 9 7945HX
Minisforum BD795i SE, Radeon 610M
9965 Points -6%
Intel Core i7-14700HX
Lenovo ThinkPad P16 Gen 2, NVIDIA RTX 4000 Ada Generation Laptop GPU
9712 Points -8%
Intel Core Ultra 9 285H
MSI Prestige 16 AI Evo B2HMG, Arc 140T
9594 Points -9%
Intel Core Ultra 9 275HX
Asus Strix Scar 18 G835LX, GeForce RTX 5090 Laptop
9444 Points -11%
Intel Core i9-13900HK
Beelink GTI13 Ultra, Iris Xe G7 96EUs
8203 Points -23%
PCMark 10 / Digital Content Creation
AMD Ryzen 9 9950X3D
AMD Ryzen 9 9950X3D, NVIDIA GeForce RTX 4090
22121 Points +17%
Intel Core Ultra 9 285K
Intel Core Ultra 9 285K, NVIDIA GeForce RTX 4090
22005 Points +17%
AMD Ryzen 9 9955HX
SCHENKER Neo 16 A25 5090 Engineering Sample, GeForce RTX 5090 Laptop
18874 Points
Intel Core Ultra 9 275HX
Asus Strix Scar 18 G835LX, GeForce RTX 5090 Laptop
16802 Points -11%
AMD Ryzen AI Max+ 395
Asus ROG Flow Z13 GZ302EA-RU073W, Radeon RX 8060S
16551 Points -12%
AMD Ryzen 9 7945HX3D
Asus ROG Strix Scar 17 G733PYV-LL053X, NVIDIA GeForce RTX 4090 Laptop GPU
16348 Points -13%
Intel Core i9-14900HX
MSI Raider 18 HX A14V, NVIDIA GeForce RTX 4080 Laptop GPU
16246 Points -14%
Intel Core i7-14700HX
Lenovo ThinkPad P16 Gen 2, NVIDIA RTX 4000 Ada Generation Laptop GPU
14598 Points -23%
Intel Core Ultra 9 285H
MSI Prestige 16 AI Evo B2HMG, Arc 140T
12193 Points -35%
Intel Core i9-13900HK
Beelink GTI13 Ultra, Iris Xe G7 96EUs
8661 Points -54%
AMD Ryzen 9 7945HX
Minisforum BD795i SE, Radeon 610M
6630 Points -65%
CrossMark / Overall
Intel Core Ultra 9 285K
Intel Core Ultra 9 285K, NVIDIA GeForce RTX 4090
2529 Points +12%
AMD Ryzen 9 9950X3D
AMD Ryzen 9 9950X3D, NVIDIA GeForce RTX 4090
2380 Points +5%
AMD Ryzen AI Max+ 395
Asus ROG Flow Z13 GZ302EA-RU073W, Radeon RX 8060S
2274 Points +1%
AMD Ryzen 9 9955HX
SCHENKER Neo 16 A25 5090 Engineering Sample, GeForce RTX 5090 Laptop
2259 Points
Apple M4 Max (16 cores)
Apple MacBook Pro 16 M4 Max, M4 Max 40-Core GPU
2255 Points 0%
Intel Core Ultra 9 275HX
Asus Strix Scar 18 G835LX, GeForce RTX 5090 Laptop
2221 Points -2%
Intel Core Ultra 9 285H
MSI Prestige 16 AI Evo B2HMG, Arc 140T
2173 Points -4%
Intel Core i9-14900HX
MSI Raider 18 HX A14V, NVIDIA GeForce RTX 4080 Laptop GPU
2151 Points -5%
Apple M4 Pro (14 cores)
Apple MacBook Pro 16 2024 M4 Pro, M4 Pro 20-Core GPU
2148 Points -5%
AMD Ryzen 9 7945HX
Minisforum BD795i SE, Radeon 610M
2110 Points -7%
Intel Core i9-13900HK
Beelink GTI13 Ultra, Iris Xe G7 96EUs
2099 Points -7%
AMD Ryzen 9 7945HX3D
Asus ROG Strix Scar 17 G733PYV-LL053X, NVIDIA GeForce RTX 4090 Laptop GPU
2086 Points -8%
Apple M3 Max 16-Core
Apple MacBook Pro 14 2023 M3 Max, M3 Max 40-Core GPU
2032 Points -10%
Intel Core i7-14700HX
Lenovo ThinkPad P16 Gen 2, NVIDIA RTX 4000 Ada Generation Laptop GPU
2011 Points -11%
CrossMark / Productivity
Intel Core Ultra 9 285K
Intel Core Ultra 9 285K, NVIDIA GeForce RTX 4090
2369 Points +18%
AMD Ryzen 9 9950X3D
AMD Ryzen 9 9950X3D, NVIDIA GeForce RTX 4090
2085 Points +4%
Intel Core Ultra 9 285H
MSI Prestige 16 AI Evo B2HMG, Arc 140T
2050 Points +2%
Apple M4 Max (16 cores)
Apple MacBook Pro 16 M4 Max, M4 Max 40-Core GPU
2042 Points +1%
Intel Core Ultra 9 275HX
Asus Strix Scar 18 G835LX, GeForce RTX 5090 Laptop
2025 Points +1%
Intel Core i9-14900HX
MSI Raider 18 HX A14V, NVIDIA GeForce RTX 4080 Laptop GPU
2014 Points 0%
AMD Ryzen 9 9955HX
SCHENKER Neo 16 A25 5090 Engineering Sample, GeForce RTX 5090 Laptop
2014 Points
Intel Core i9-13900HK
Beelink GTI13 Ultra, Iris Xe G7 96EUs
2012 Points 0%
Apple M4 Pro (14 cores)
Apple MacBook Pro 16 2024 M4 Pro, M4 Pro 20-Core GPU
1980 Points -2%
AMD Ryzen 9 7945HX3D
Asus ROG Strix Scar 17 G733PYV-LL053X, NVIDIA GeForce RTX 4090 Laptop GPU
1948 Points -3%
AMD Ryzen 9 7945HX
Minisforum BD795i SE, Radeon 610M
1946 Points -3%
AMD Ryzen AI Max+ 395
Asus ROG Flow Z13 GZ302EA-RU073W, Radeon RX 8060S
1925 Points -4%
Intel Core i7-14700HX
Lenovo ThinkPad P16 Gen 2, NVIDIA RTX 4000 Ada Generation Laptop GPU
1862 Points -8%
Apple M3 Max 16-Core
Apple MacBook Pro 14 2023 M3 Max, M3 Max 40-Core GPU
1832 Points -9%
CrossMark / Creativity
AMD Ryzen 9 9950X3D
AMD Ryzen 9 9950X3D, NVIDIA GeForce RTX 4090
2987 Points +12%
AMD Ryzen AI Max+ 395
Asus ROG Flow Z13 GZ302EA-RU073W, Radeon RX 8060S
2949 Points +11%
Apple M4 Max (16 cores)
Apple MacBook Pro 16 M4 Max, M4 Max 40-Core GPU
2795 Points +5%
Intel Core Ultra 9 285K
Intel Core Ultra 9 285K, NVIDIA GeForce RTX 4090
2766 Points +4%
AMD Ryzen 9 9955HX
SCHENKER Neo 16 A25 5090 Engineering Sample, GeForce RTX 5090 Laptop
2661 Points
Intel Core Ultra 9 275HX
Asus Strix Scar 18 G835LX, GeForce RTX 5090 Laptop
2606 Points -2%
Apple M4 Pro (14 cores)
Apple MacBook Pro 16 2024 M4 Pro, M4 Pro 20-Core GPU
2590 Points -3%
Apple M3 Max 16-Core
Apple MacBook Pro 14 2023 M3 Max, M3 Max 40-Core GPU
2509 Points -6%
AMD Ryzen 9 7945HX3D
Asus ROG Strix Scar 17 G733PYV-LL053X, NVIDIA GeForce RTX 4090 Laptop GPU
2415 Points -9%
Intel Core i9-14900HX
MSI Raider 18 HX A14V, NVIDIA GeForce RTX 4080 Laptop GPU
2388 Points -10%
Intel Core Ultra 9 285H
MSI Prestige 16 AI Evo B2HMG, Arc 140T
2377 Points -11%
AMD Ryzen 9 7945HX
Minisforum BD795i SE, Radeon 610M
2363 Points -11%
Intel Core i7-14700HX
Lenovo ThinkPad P16 Gen 2, NVIDIA RTX 4000 Ada Generation Laptop GPU
2311 Points -13%
Intel Core i9-13900HK
Beelink GTI13 Ultra, Iris Xe G7 96EUs
2192 Points -18%
CrossMark / Responsiveness
Intel Core Ultra 9 285K
Intel Core Ultra 9 285K, NVIDIA GeForce RTX 4090
2351 Points +21%
Intel Core i9-13900HK
Beelink GTI13 Ultra, Iris Xe G7 96EUs
2097 Points +7%
Intel Core Ultra 9 285H
MSI Prestige 16 AI Evo B2HMG, Arc 140T
1981 Points +2%
AMD Ryzen 9 9955HX
SCHENKER Neo 16 A25 5090 Engineering Sample, GeForce RTX 5090 Laptop
1951 Points
AMD Ryzen 9 7945HX
Minisforum BD795i SE, Radeon 610M
1916 Points -2%
Intel Core i9-14900HX
MSI Raider 18 HX A14V, NVIDIA GeForce RTX 4080 Laptop GPU
1913 Points -2%
Intel Core Ultra 9 275HX
Asus Strix Scar 18 G835LX, GeForce RTX 5090 Laptop
1813 Points -7%
AMD Ryzen 9 9950X3D
AMD Ryzen 9 9950X3D, NVIDIA GeForce RTX 4090
1792 Points -8%
AMD Ryzen AI Max+ 395
Asus ROG Flow Z13 GZ302EA-RU073W, Radeon RX 8060S
1719 Points -12%
Intel Core i7-14700HX
Lenovo ThinkPad P16 Gen 2, NVIDIA RTX 4000 Ada Generation Laptop GPU
1666 Points -15%
AMD Ryzen 9 7945HX3D
Asus ROG Strix Scar 17 G733PYV-LL053X, NVIDIA GeForce RTX 4090 Laptop GPU
1649 Points -15%
Apple M4 Max (16 cores)
Apple MacBook Pro 16 M4 Max, M4 Max 40-Core GPU
1595 Points -18%
Apple M4 Pro (14 cores)
Apple MacBook Pro 16 2024 M4 Pro, M4 Pro 20-Core GPU
1566 Points -20%
Apple M3 Max 16-Core
Apple MacBook Pro 14 2023 M3 Max, M3 Max 40-Core GPU
1474 Points -24%
3DMark / Time Spy CPU
Intel Core Ultra 9 285K
Intel Core Ultra 9 285K, NVIDIA GeForce RTX 4090
18322 Points +39%
Intel Core i9-14900HX
MSI Raider 18 HX A14V, NVIDIA GeForce RTX 4080 Laptop GPU
17547 Points +33%
Intel Core Ultra 9 275HX
Asus Strix Scar 18 G835LX, GeForce RTX 5090 Laptop
17285 Points +31%
AMD Ryzen 9 9950X3D
AMD Ryzen 9 9950X3D, NVIDIA GeForce RTX 4090
16950 Points +29%
Intel Core i7-14700HX
Lenovo ThinkPad P16 Gen 2, NVIDIA RTX 4000 Ada Generation Laptop GPU
14526 Points +10%
AMD Ryzen 9 7945HX3D
Asus ROG Strix Scar 17 G733PYV-LL053X, NVIDIA GeForce RTX 4090 Laptop GPU
14131 Points +7%
AMD Ryzen 9 9955HX
SCHENKER Neo 16 A25 5090 Engineering Sample, GeForce RTX 5090 Laptop
13188 Points
Intel Core Ultra 9 285H
MSI Prestige 16 AI Evo B2HMG, Arc 140T
11650 Points -12%
Intel Core i9-13900HK
Beelink GTI13 Ultra, Iris Xe G7 96EUs
11314 Points -14%
AMD Ryzen AI Max+ 395
Asus ROG Flow Z13 GZ302EA-RU073W, Radeon RX 8060S
11285 Points -14%
3DMark / Fire Strike Physics
Intel Core Ultra 9 285K
Intel Core Ultra 9 285K, NVIDIA GeForce RTX 4090
53541 Points +25%
AMD Ryzen 9 9950X3D
AMD Ryzen 9 9950X3D, NVIDIA GeForce RTX 4090
49235 Points +15%
Intel Core Ultra 9 275HX
Asus Strix Scar 18 G835LX, GeForce RTX 5090 Laptop
48219 Points +12%
AMD Ryzen 9 9955HX
SCHENKER Neo 16 A25 5090 Engineering Sample, GeForce RTX 5090 Laptop
42890 Points
Intel Core i9-14900HX
MSI Raider 18 HX A14V, NVIDIA GeForce RTX 4080 Laptop GPU
41396 Points -3%
AMD Ryzen 9 7945HX3D
Asus ROG Strix Scar 17 G733PYV-LL053X, NVIDIA GeForce RTX 4090 Laptop GPU
38826 Points -9%
AMD Ryzen 9 7945HX
Minisforum BD795i SE, Radeon 610M
38792 Points -10%
AMD Ryzen AI Max+ 395
Asus ROG Flow Z13 GZ302EA-RU073W, Radeon RX 8060S
38075 Points -11%
Intel Core Ultra 9 285H
MSI Prestige 16 AI Evo B2HMG, Arc 140T
35044 Points -18%
Intel Core i7-14700HX
Lenovo ThinkPad P16 Gen 2, NVIDIA RTX 4000 Ada Generation Laptop GPU
30534 Points -29%
Intel Core i9-13900HK
Beelink GTI13 Ultra, Iris Xe G7 96EUs
26486 Points -38%

Performances des jeux

Passons maintenant aux performances de jeu. Nous avons pris un certain nombre de titres actuels et les avons testés, bien que nous n'ayons pas utilisé les technologies d'upscaling dans chaque cas, car nous voulions voir l'influence de l'unité centrale.

Nous avons délibérément réduit le groupe de comparaison et n'avons comparé que les deux sujets de test actuels et le ROG Strix Scar 17qui, grâce à son processeur HX3D, faisait partie des ordinateurs portables de jeu les plus rapides de la dernière génération.

Dans tous les tests, l'AMD Ryzen 9 9955HX devance le Core Ultra 9 275HX et l'avantage moyen est de 5%. L'ancien Strix Scar avec le Ryzen 9 7945HX3D et le GPU pour portable RTX 4090 Laptop GPU peut se maintenir étonnamment bien et est même en avance dans certains titres.

1080p Performance Rating - Percent
AMD Ryzen 9 9955HX
SCHENKER Neo 16 A25 5090 Engineering Sample, Nvidia GeForce RTX 5090 Laptop
99.7 pt
Intel Core Ultra 9 275HX
Asus Strix Scar 18 G835LX, Nvidia GeForce RTX 5090 Laptop
95.4 pt
AMD Ryzen 9 7945HX3D
Asus ROG Strix Scar 17 G733PYV-LL053X, NVIDIA GeForce RTX 4090 Laptop GPU
92.7 pt
Cyberpunk 2077 2.2 Phantom Liberty - 1920x1080 Ultra Preset (FSR off)
AMD Ryzen 9 7945HX3D
Asus ROG Strix Scar 17 G733PYV-LL053X, NVIDIA GeForce RTX 4090 Laptop GPU
158 (123.9min - 206max) fps +1%
AMD Ryzen 9 9955HX
SCHENKER Neo 16 A25 5090 Engineering Sample, Nvidia GeForce RTX 5090 Laptop
157 (116.5min - 208max) fps
Intel Core Ultra 9 275HX
Asus Strix Scar 18 G835LX, Nvidia GeForce RTX 5090 Laptop
154.9 (126.3min - 196max) fps -1%
F1 24 - 1920x1080 Ultra High Preset AA:T AF:16x
AMD Ryzen 9 9955HX
SCHENKER Neo 16 A25 5090 Engineering Sample, Nvidia GeForce RTX 5090 Laptop
158.3 (73min, 93P1 - 189max) fps
Intel Core Ultra 9 275HX
Asus Strix Scar 18 G835LX, Nvidia GeForce RTX 5090 Laptop
148 fps -7%
AMD Ryzen 9 7945HX3D
Asus ROG Strix Scar 17 G733PYV-LL053X, NVIDIA GeForce RTX 4090 Laptop GPU
144.9 (85min, 92P1 - 172max) fps -8%
Assassin's Creed Shadows - 1920x1080 Ultra High
AMD Ryzen 9 9955HX
SCHENKER Neo 16 A25 5090 Engineering Sample, Nvidia GeForce RTX 5090 Laptop
74 fps
Intel Core Ultra 9 275HX
Asus Strix Scar 18 G835LX, Nvidia GeForce RTX 5090 Laptop
65 fps -12%
AMD Ryzen 9 7945HX3D
Asus ROG Strix Scar 17 G733PYV-LL053X, NVIDIA GeForce RTX 4090 Laptop GPU
55 fps -26%
Call of Duty Black Ops 6 - 1920x1080 Extreme Preset
AMD Ryzen 9 7945HX3D
Asus ROG Strix Scar 17 G733PYV-LL053X, NVIDIA GeForce RTX 4090 Laptop GPU
150 fps +2%
AMD Ryzen 9 9955HX
SCHENKER Neo 16 A25 5090 Engineering Sample, Nvidia GeForce RTX 5090 Laptop
147 fps
Intel Core Ultra 9 275HX
Asus Strix Scar 18 G835LX, Nvidia GeForce RTX 5090 Laptop
147 fps 0%
Monster Hunter Wilds - 1920x1080 ultra, RT: high, no upscaling
AMD Ryzen 9 9955HX
SCHENKER Neo 16 A25 5090 Engineering Sample, Nvidia GeForce RTX 5090 Laptop
89 fps
Intel Core Ultra 9 275HX
Asus Strix Scar 18 G835LX, Nvidia GeForce RTX 5090 Laptop
87.6 fps -2%
AMD Ryzen 9 7945HX3D
Asus ROG Strix Scar 17 G733PYV-LL053X, NVIDIA GeForce RTX 4090 Laptop GPU
85.6 fps -4%
Indiana Jones and the Great Circle - 1920x1080 Very Ultra Preset
AMD Ryzen 9 9955HX
SCHENKER Neo 16 A25 5090 Engineering Sample, Nvidia GeForce RTX 5090 Laptop
130.6 fps
AMD Ryzen 9 7945HX3D
Asus ROG Strix Scar 17 G733PYV-LL053X, NVIDIA GeForce RTX 4090 Laptop GPU
128.4 fps -2%
Intel Core Ultra 9 275HX
Asus Strix Scar 18 G835LX, Nvidia GeForce RTX 5090 Laptop
127.9 fps -2%
Baldur's Gate 3 - 1920x1080 Ultra Preset
AMD Ryzen 9 9955HX
SCHENKER Neo 16 A25 5090 Engineering Sample, Nvidia GeForce RTX 5090 Laptop
202 fps
Intel Core Ultra 9 275HX
Asus Strix Scar 18 G835LX, Nvidia GeForce RTX 5090 Laptop
193.7 fps -4%
AMD Ryzen 9 7945HX3D
Asus ROG Strix Scar 17 G733PYV-LL053X, NVIDIA GeForce RTX 4090 Laptop GPU
178.8 fps -11%
Alan Wake 2 - 1920x1080 High Preset
AMD Ryzen 9 9955HX
SCHENKER Neo 16 A25 5090 Engineering Sample, Nvidia GeForce RTX 5090 Laptop
124.7 fps
Intel Core Ultra 9 275HX
Asus Strix Scar 18 G835LX, Nvidia GeForce RTX 5090 Laptop
116.4 fps -7%
AMD Ryzen 9 7945HX3D
Asus ROG Strix Scar 17 G733PYV-LL053X, NVIDIA GeForce RTX 4090 Laptop GPU
116.1 fps -7%

En résolution QHD, la Ryzen 9 9955HX reste devant la Core Ultra 9 275HX dans tous les jeux, avec une différence d'environ 5%. L'ancien Strix Scar 17 continue de tenir son rang, mais doit céder un peu plus de terrain au nouveau Scar 18 2025.

QHD Performance Rating - Percent
AMD Ryzen 9 9955HX
SCHENKER Neo 16 A25 5090 Engineering Sample, Nvidia GeForce RTX 5090 Laptop
100 pt
Intel Core Ultra 9 275HX
Asus Strix Scar 18 G835LX, Nvidia GeForce RTX 5090 Laptop
94.5 pt
AMD Ryzen 9 7945HX3D
Asus ROG Strix Scar 17 G733PYV-LL053X, NVIDIA GeForce RTX 4090 Laptop GPU
91 pt
Cyberpunk 2077 2.2 Phantom Liberty - 2560x1440 Ultra Preset (FSR off)
AMD Ryzen 9 9955HX
SCHENKER Neo 16 A25 5090 Engineering Sample, Nvidia GeForce RTX 5090 Laptop
110.6 (91.2min - 141.1max) fps
Intel Core Ultra 9 275HX
Asus Strix Scar 18 G835LX, Nvidia GeForce RTX 5090 Laptop
106.8 (87.4min - 135.4max) fps -3%
AMD Ryzen 9 7945HX3D
Asus ROG Strix Scar 17 G733PYV-LL053X, NVIDIA GeForce RTX 4090 Laptop GPU
99.5 (80.5min - 128.2max) fps -10%
F1 24 - 2560x1440 Ultra High Preset AA:T AF:16x
AMD Ryzen 9 9955HX
SCHENKER Neo 16 A25 5090 Engineering Sample, Nvidia GeForce RTX 5090 Laptop
105.5 (73min, 83P1 - 126max) fps
Intel Core Ultra 9 275HX
Asus Strix Scar 18 G835LX, Nvidia GeForce RTX 5090 Laptop
100 fps -5%
AMD Ryzen 9 7945HX3D
Asus ROG Strix Scar 17 G733PYV-LL053X, NVIDIA GeForce RTX 4090 Laptop GPU
96.8 (79min, 78P1 - 118max) fps -8%
Assassin's Creed Shadows - 2560x1440 Ultra High
AMD Ryzen 9 9955HX
SCHENKER Neo 16 A25 5090 Engineering Sample, Nvidia GeForce RTX 5090 Laptop
59 fps
Intel Core Ultra 9 275HX
Asus Strix Scar 18 G835LX, Nvidia GeForce RTX 5090 Laptop
51 fps -14%
AMD Ryzen 9 7945HX3D
Asus ROG Strix Scar 17 G733PYV-LL053X, NVIDIA GeForce RTX 4090 Laptop GPU
47 fps -20%
Call of Duty Black Ops 6 - 2560x1440 Extreme Preset
AMD Ryzen 9 9955HX
SCHENKER Neo 16 A25 5090 Engineering Sample, Nvidia GeForce RTX 5090 Laptop
123 fps
AMD Ryzen 9 7945HX3D
Asus ROG Strix Scar 17 G733PYV-LL053X, NVIDIA GeForce RTX 4090 Laptop GPU
119 fps -3%
Intel Core Ultra 9 275HX
Asus Strix Scar 18 G835LX, Nvidia GeForce RTX 5090 Laptop
117 fps -5%
Monster Hunter Wilds - 2560x1440 ultra, RT: high, no upscaling
AMD Ryzen 9 9955HX
SCHENKER Neo 16 A25 5090 Engineering Sample, Nvidia GeForce RTX 5090 Laptop
75 fps
Intel Core Ultra 9 275HX
Asus Strix Scar 18 G835LX, Nvidia GeForce RTX 5090 Laptop
72 fps -4%
AMD Ryzen 9 7945HX3D
Asus ROG Strix Scar 17 G733PYV-LL053X, NVIDIA GeForce RTX 4090 Laptop GPU
69.4 fps -7%
Indiana Jones and the Great Circle - 2560x1440 Very Ultra Preset
AMD Ryzen 9 9955HX
SCHENKER Neo 16 A25 5090 Engineering Sample, Nvidia GeForce RTX 5090 Laptop
105 fps
Intel Core Ultra 9 275HX
Asus Strix Scar 18 G835LX, Nvidia GeForce RTX 5090 Laptop
102.2 fps -3%
AMD Ryzen 9 7945HX3D
Asus ROG Strix Scar 17 G733PYV-LL053X, NVIDIA GeForce RTX 4090 Laptop GPU
100.5 fps -4%
Baldur's Gate 3 - 2560x1440 Ultra Preset
AMD Ryzen 9 9955HX
SCHENKER Neo 16 A25 5090 Engineering Sample, Nvidia GeForce RTX 5090 Laptop
150.5 fps
Intel Core Ultra 9 275HX
Asus Strix Scar 18 G835LX, Nvidia GeForce RTX 5090 Laptop
145.6 fps -3%
AMD Ryzen 9 7945HX3D
Asus ROG Strix Scar 17 G733PYV-LL053X, NVIDIA GeForce RTX 4090 Laptop GPU
133.3 fps -11%
Alan Wake 2 - 2560x1440 High Preset
AMD Ryzen 9 9955HX
SCHENKER Neo 16 A25 5090 Engineering Sample, Nvidia GeForce RTX 5090 Laptop
88.3 fps
Intel Core Ultra 9 275HX
Asus Strix Scar 18 G835LX, Nvidia GeForce RTX 5090 Laptop
82.4 fps -7%
AMD Ryzen 9 7945HX3D
Asus ROG Strix Scar 17 G733PYV-LL053X, NVIDIA GeForce RTX 4090 Laptop GPU
82 fps -7%

En résolution 4K, l'influence du processeur diminue encore et la différence entre les puces AMD et Intel s'amenuise, même si AMD parvient à prendre une légère avance dans tous les jeux.

La Strix Scar 17 est plus nettement distancée, mais cela est dû à l'ancien GPU RTX 4090 Laptop.

4K Performance Rating - Percent
AMD Ryzen 9 9955HX
SCHENKER Neo 16 A25 5090 Engineering Sample, Nvidia GeForce RTX 5090 Laptop
100 pt
Intel Core Ultra 9 275HX
Asus Strix Scar 18 G835LX, Nvidia GeForce RTX 5090 Laptop
96.3 pt
AMD Ryzen 9 7945HX3D
Asus ROG Strix Scar 17 G733PYV-LL053X, NVIDIA GeForce RTX 4090 Laptop GPU
88.9 pt
F1 24 - 3840x2160 Ultra High Preset AA:T AF:16x
AMD Ryzen 9 9955HX
SCHENKER Neo 16 A25 5090 Engineering Sample, Nvidia GeForce RTX 5090 Laptop
54.2 (45min, 45P1 - 65max) fps
Intel Core Ultra 9 275HX
Asus Strix Scar 18 G835LX, Nvidia GeForce RTX 5090 Laptop
52 fps -4%
AMD Ryzen 9 7945HX3D
Asus ROG Strix Scar 17 G733PYV-LL053X, NVIDIA GeForce RTX 4090 Laptop GPU
48.4 (41min, 40P1 - 59max) fps -11%
Assassin's Creed Shadows - 3840x2160 Ultra High
AMD Ryzen 9 9955HX
SCHENKER Neo 16 A25 5090 Engineering Sample, Nvidia GeForce RTX 5090 Laptop
39 fps
Intel Core Ultra 9 275HX
Asus Strix Scar 18 G835LX, Nvidia GeForce RTX 5090 Laptop
36 fps -8%
AMD Ryzen 9 7945HX3D
Asus ROG Strix Scar 17 G733PYV-LL053X, NVIDIA GeForce RTX 4090 Laptop GPU
34 fps -13%
Call of Duty Black Ops 6 - 3840x2160 Extreme Preset
AMD Ryzen 9 9955HX
SCHENKER Neo 16 A25 5090 Engineering Sample, Nvidia GeForce RTX 5090 Laptop
82 fps
Intel Core Ultra 9 275HX
Asus Strix Scar 18 G835LX, Nvidia GeForce RTX 5090 Laptop
79 fps -4%
AMD Ryzen 9 7945HX3D
Asus ROG Strix Scar 17 G733PYV-LL053X, NVIDIA GeForce RTX 4090 Laptop GPU
76 fps -7%
Monster Hunter Wilds - 3840x2160 ultra, RT: high, no upscaling
AMD Ryzen 9 9955HX
SCHENKER Neo 16 A25 5090 Engineering Sample, Nvidia GeForce RTX 5090 Laptop
48.5 fps
Intel Core Ultra 9 275HX
Asus Strix Scar 18 G835LX, Nvidia GeForce RTX 5090 Laptop
46.3 fps -5%
AMD Ryzen 9 7945HX3D
Asus ROG Strix Scar 17 G733PYV-LL053X, NVIDIA GeForce RTX 4090 Laptop GPU
42.8 fps -12%
Indiana Jones and the Great Circle - 3840x2160 Very Ultra Preset
AMD Ryzen 9 9955HX
SCHENKER Neo 16 A25 5090 Engineering Sample, Nvidia GeForce RTX 5090 Laptop
66.6 fps
Intel Core Ultra 9 275HX
Asus Strix Scar 18 G835LX, Nvidia GeForce RTX 5090 Laptop
65 fps -2%
AMD Ryzen 9 7945HX3D
Asus ROG Strix Scar 17 G733PYV-LL053X, NVIDIA GeForce RTX 4090 Laptop GPU
60.6 fps -9%
Baldur's Gate 3 - 3840x2160 Ultra Preset
AMD Ryzen 9 9955HX
SCHENKER Neo 16 A25 5090 Engineering Sample, Nvidia GeForce RTX 5090 Laptop
84.3 fps
Intel Core Ultra 9 275HX
Asus Strix Scar 18 G835LX, Nvidia GeForce RTX 5090 Laptop
82.8 fps -2%
AMD Ryzen 9 7945HX3D
Asus ROG Strix Scar 17 G733PYV-LL053X, NVIDIA GeForce RTX 4090 Laptop GPU
74.6 fps -12%
Alan Wake 2 - 3840x2160 High Preset
AMD Ryzen 9 9955HX
SCHENKER Neo 16 A25 5090 Engineering Sample, Nvidia GeForce RTX 5090 Laptop
47.7 fps
Intel Core Ultra 9 275HX
Asus Strix Scar 18 G835LX, Nvidia GeForce RTX 5090 Laptop
46 fps -4%
AMD Ryzen 9 7945HX3D
Asus ROG Strix Scar 17 G733PYV-LL053X, NVIDIA GeForce RTX 4090 Laptop GPU
43.4 fps -9%
Cyberpunk 2077 2.2 Phantom Liberty - 3840x2160 Ultra Preset (FSR off)
AMD Ryzen 9 9955HX
SCHENKER Neo 16 A25 5090 Engineering Sample, Nvidia GeForce RTX 5090 Laptop
52.9 (42.8min - 66.9max) fps
Intel Core Ultra 9 275HX
Asus Strix Scar 18 G835LX, Nvidia GeForce RTX 5090 Laptop
52.1 (43.9min - 64.8max) fps -2%
AMD Ryzen 9 7945HX3D
Asus ROG Strix Scar 17 G733PYV-LL053X, NVIDIA GeForce RTX 4090 Laptop GPU
44.2 (37min - 55max) fps -16%

Performances avec différentes limites de puissance

Nous avons également testé les performances des deux nouveaux processeurs à des limites de puissance fixes. Ici, vous pouvez voir que le Core Ultra 9 275HX fournit une bonne performance même à des valeurs TDP inférieures et peut surpasser le Ryzen 9 9955HX, mais seulement dans Cinebench 2024.

Dans l'ancien Cinebench R23, AMD est en tête jusqu'à 100 W, mais se laisse ensuite distancer de manière significative.

Cinebench 2024 Multi
TDP AMD Ryzen 9 9955HX Core Ultra 9 275HX Core i9-14900HX
150 watts 2 061 points 2 158 points 1 834 points
130 watts 2 030 points 2 095 points 1 757 points
115 watts 2 008 points 2 015 points 1 525 points
100 Watt 1,948 points 1,963 points 1,424 points
80 Watt 1 809 points 1 875 points 1 373 points
55 Watt 1 489 points 1 633 points 1 105 points
Cinebench R23 Multi
TDP AMD Ryzen 9 9955HX Core Ultra 9 275HX Ryzen 9 7945HX3D Ryzen 9 7945HX Core i9-14900HX
150 watts 39,537 points 38,108 points 30,308 points
130 watts 38,502 points 36,165 points 34,202 points 28,933
115 watts 37,157 points 34,760 points 33,361 points 27,750
100 watts 35 500 points 33 670 points 32 977 points 32 947 points 26 232 points
80 watts 31 641 points 31 880 points 30 804 points 30 907 points 23 334 points
55 Watt 23,849 points 27,283 points 26,045 points 18,258 points

Conclusion : AMD propose le CPU gaming le plus rapide pour les ordinateurs portables en attendant l'arrivée du Ryzen 9 9955HX3D

Les deux nouveaux processeurs mobiles haut de gamme d'AMD et d'Intel n'offrent aucune surprise et sont plus rapides que leurs prédécesseurs respectifs, tant dans les tests à cœur unique que dans les tests multicœurs. Intel a également un léger avantage dans les tests synthétiques Cinebench, mais il ne peut pas le reproduire dans Geekbench ou dans les benchmarks système.

Dans les jeux, le gagnant est assez évident car avec le même GPU Nvidia GeForce RTX 5090 Laptop (analyse détaillée ici), le processeur AMD est légèrement plus rapide dans tous les jeux que nous avons testés.

Cela renforce la préférence pour le prochain Ryzen 9 9955HX3D, qui devrait une fois de plus offrir des performances de jeu nettement supérieures. Cependant, nous ne nous attendons pas à voir des appareils de test équipés de la puce HX3D avant quelques semaines, et nous ne pouvons qu'espérer que la disponibilité du processeur HX3D sera meilleure dans cette génération.

Please share our article, every link counts!
Mail Logo
> Revues et rapports de ordinateurs portatifs et smartphones, ordiphones > Critiques > AMD Ryzen 9 9955HX face à Intel Core Ultra 9 275HX : bataille pour le CPU de jeu le plus puissant
Andreas Osthoff, 2025-04- 7 (Update: 2025-04- 7)