 Deutsch
 English
 Español
 Français
 Italiano
 Nederlands
 Polski
 Português
 Русский
 Türkçe
 Svenska
 Chinese
 Magyar
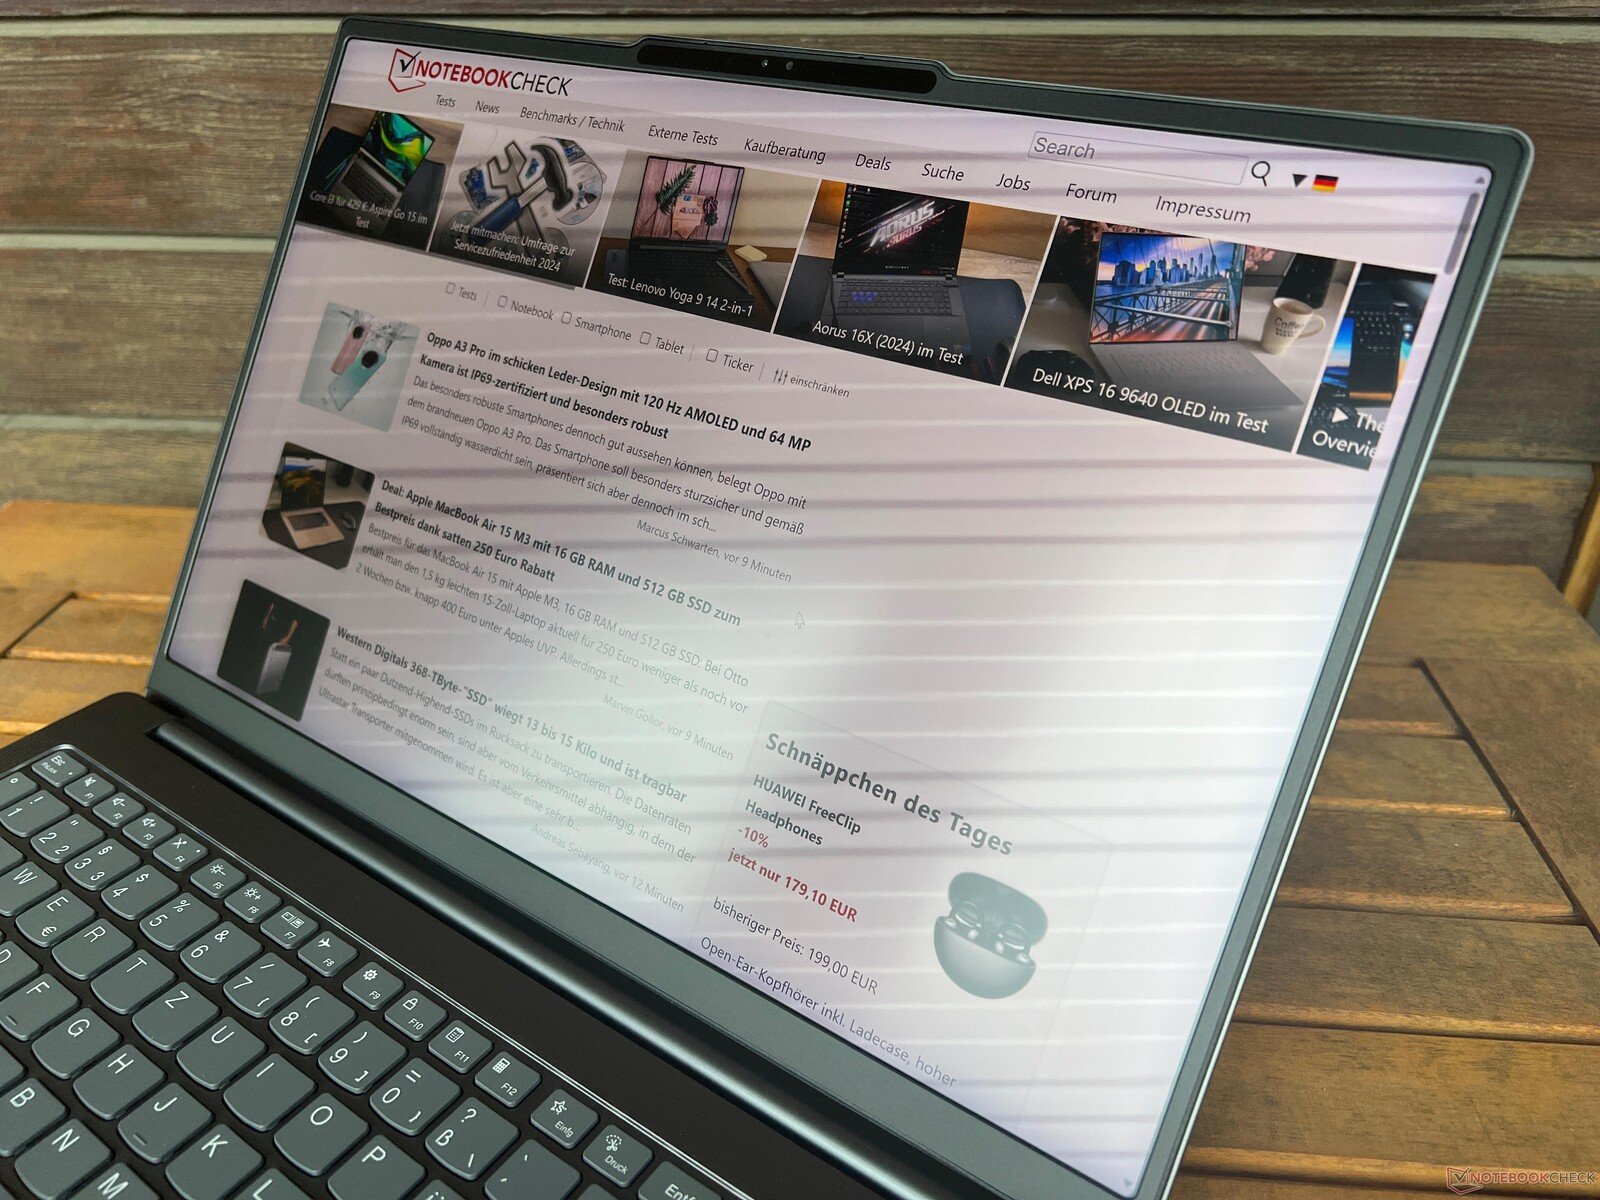
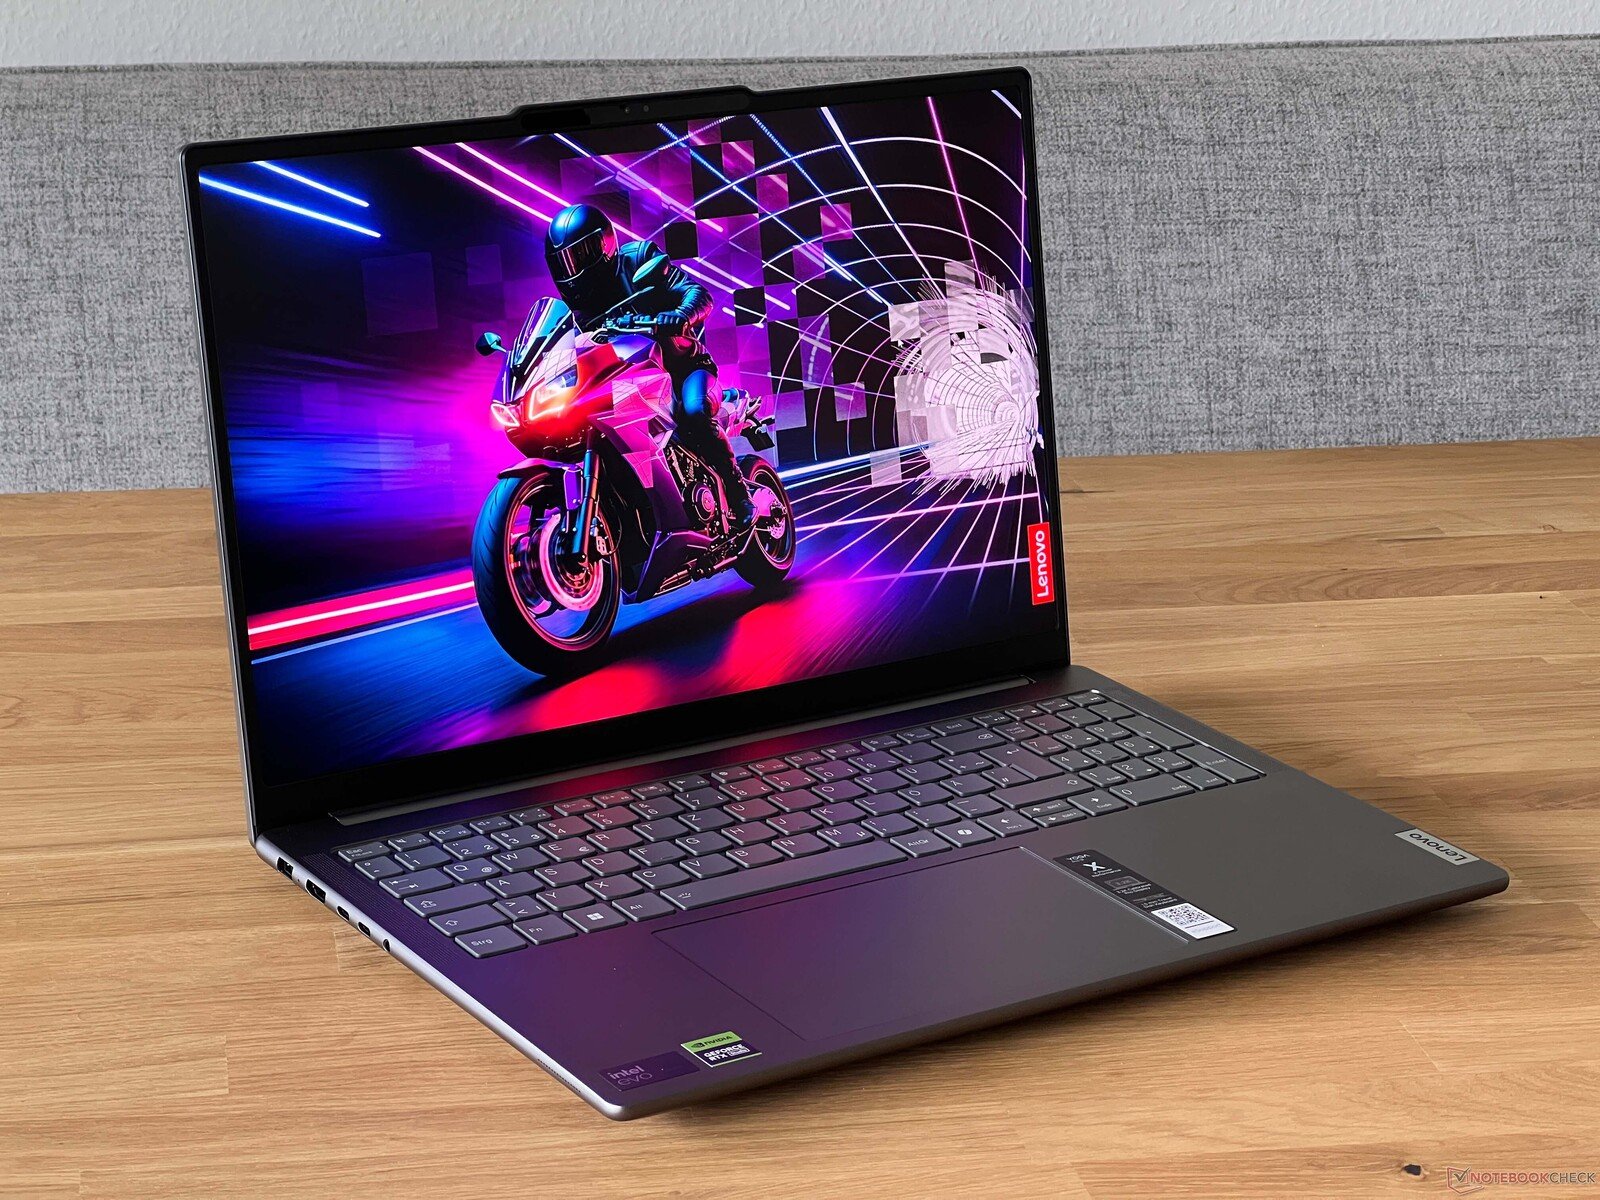
Test du Lenovo Yoga Pro 9i 16 G9 : mini-LEDà 1200 cd/m2 et Core Ultra 9
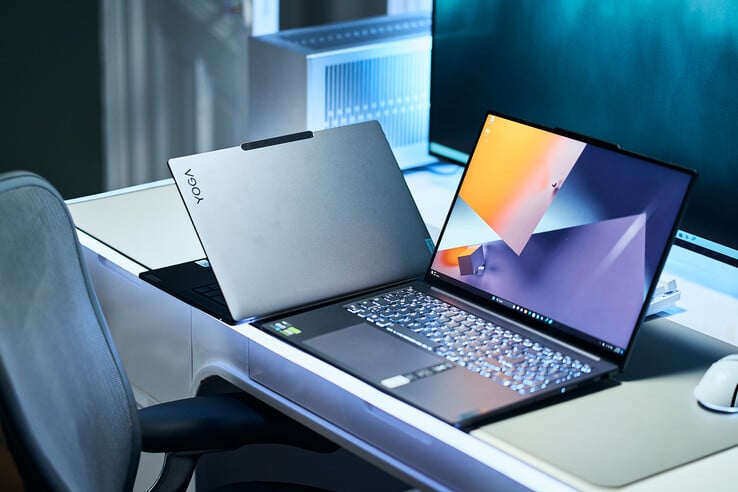
Le Yoga Pro 9i 16 est le meilleur ordinateur portable multimédia grand public de Lenovo. Avec son écran mini LED haute résolution et ses bonnes performances, il a été l'un des meilleurs appareils multimédias en 2023. Pour le nouveau modèle G9, quelques changements ont été apportés, notamment un processeur Meteor Lake actualisé d'Intel et le passage d'un panneau mini LED réfléchissant à un panneau mini LED mat, qui peut devenir extrêmement lumineux jusqu'à 1 200 nits. Les cartes graphiques sont les modèles RTX 4000 de GeForce jusqu'à la RTX 4070 Laptop avec un TGP de 100 watts.
Notre appareil de test (portant le numéro de modèle 83DN006HGE) est la variante haut de gamme au prix de 2700 EUR (environ 2875 $) et contient les éléments suivants Core Ultra 9 185H et GeForce RTX 4070 Laptop ainsi que 32 Go de RAM, un SSD de 1 To et un mini panneau LED lumineux. Le modèle le plus faible, avec le Core Ultra 7 155H et GeForce Ordinateur portable RTX 4060 est disponible pour 2300 EUR (2450 $), mais le reste du matériel est identique.
Comparaison avec les concurrents potentiels
Note | Date | Modèle | Poids | Épaisseur | Taille | Résolution | Meilleur prix |
|---|---|---|---|---|---|---|---|
| 88.7 % | 04/24 | Lenovo Yoga Pro 9 16IMH9 Ultra 9 185H, NVIDIA GeForce RTX 4070 Laptop GPU | 2.1 kg | 18.3 mm | 16.00" | 3200x2000 | |
| 88.6 % | 04/24 | Dell XPS 16 9640 Ultra 7 155H, NVIDIA GeForce RTX 4070 Laptop GPU | 2.3 kg | 18.7 mm | 16.30" | 3840x2400 | |
| 90 % | 03/24 | Honor MagicBook Pro 16 2024 Ultra 7 155H, NVIDIA GeForce RTX 4060 Laptop GPU | 1.9 kg | 17.9 mm | 16.00" | 3072x1920 | |
| 90.4 % | 03/24 | Samsung Galaxy Book4 Ultra Ultra 7 155H, NVIDIA GeForce RTX 4050 Laptop GPU | 1.8 kg | 17 mm | 16.00" | 2880x1800 | |
| 89.6 % | 01/24 | Framework Laptop 16 R9 7940HS, Radeon RX 7700S | 2.4 kg | 20.95 mm | 16.00" | 2560x1600 | |
| 88.6 % | 07/23 | SCHENKER VISION 16 Pro (M23) i7-13700H, NVIDIA GeForce RTX 4070 Laptop GPU | 1.6 kg | 17.1 mm | 16.00" | 2560x1600 |
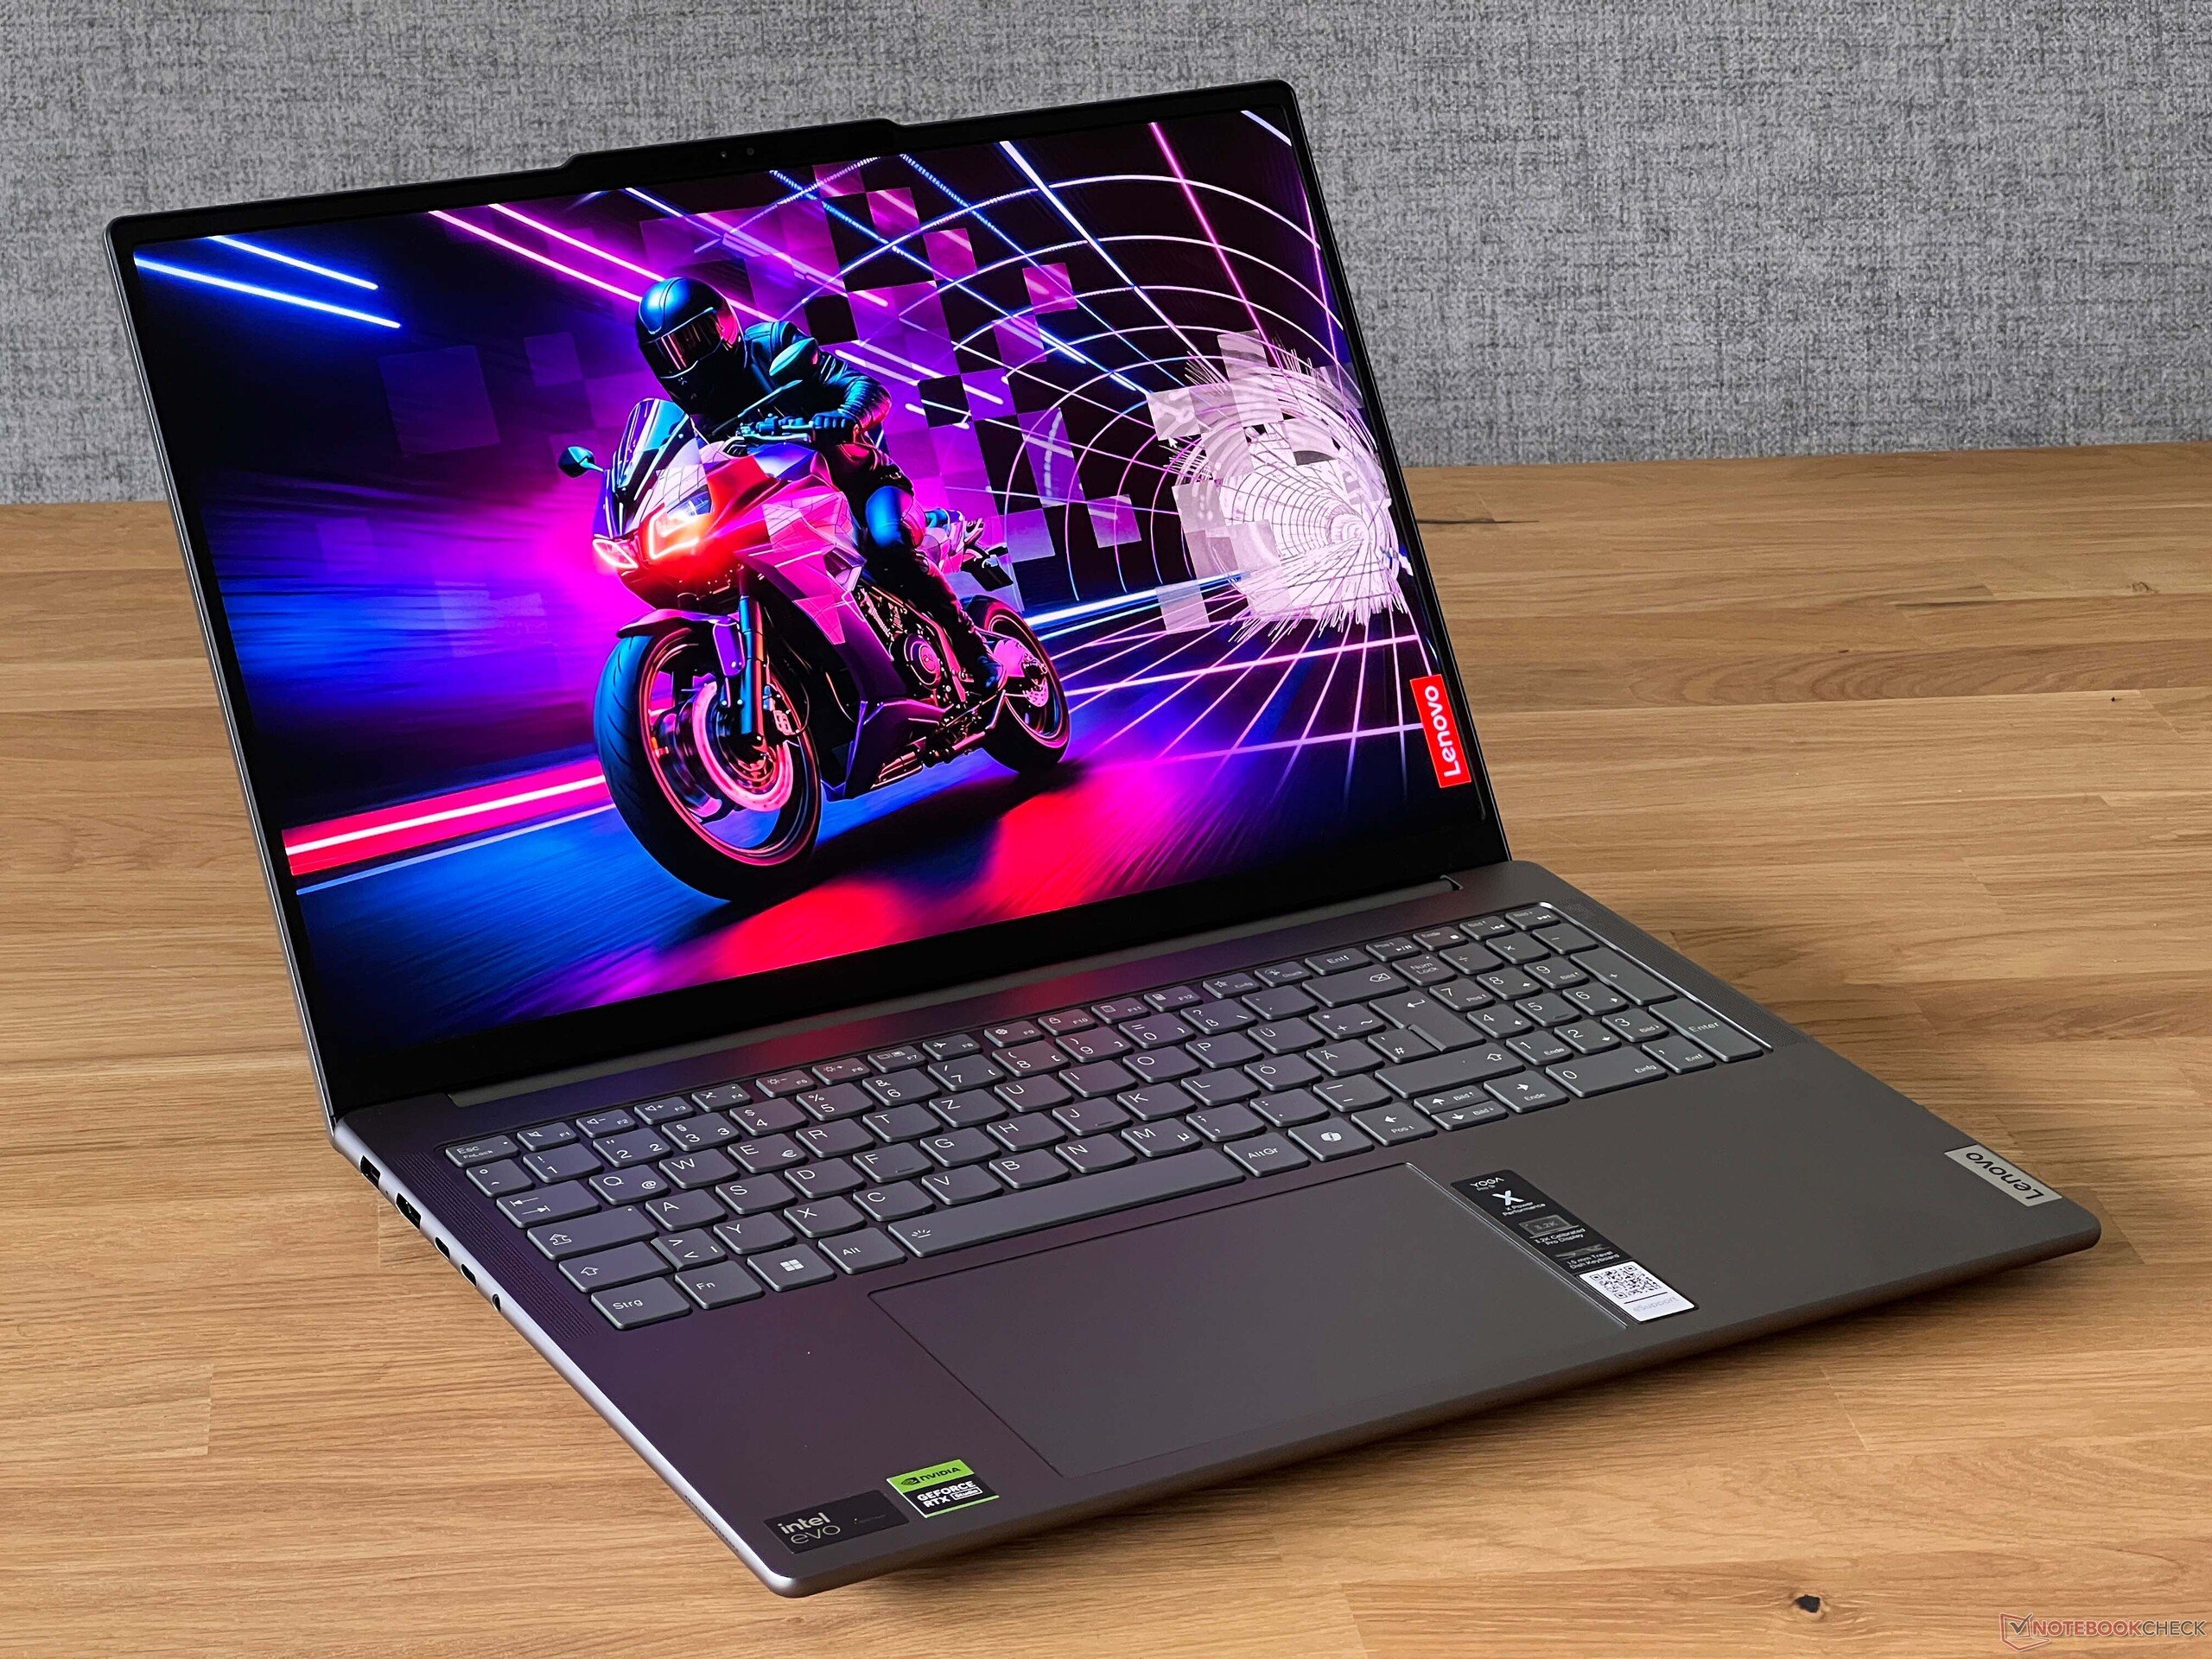
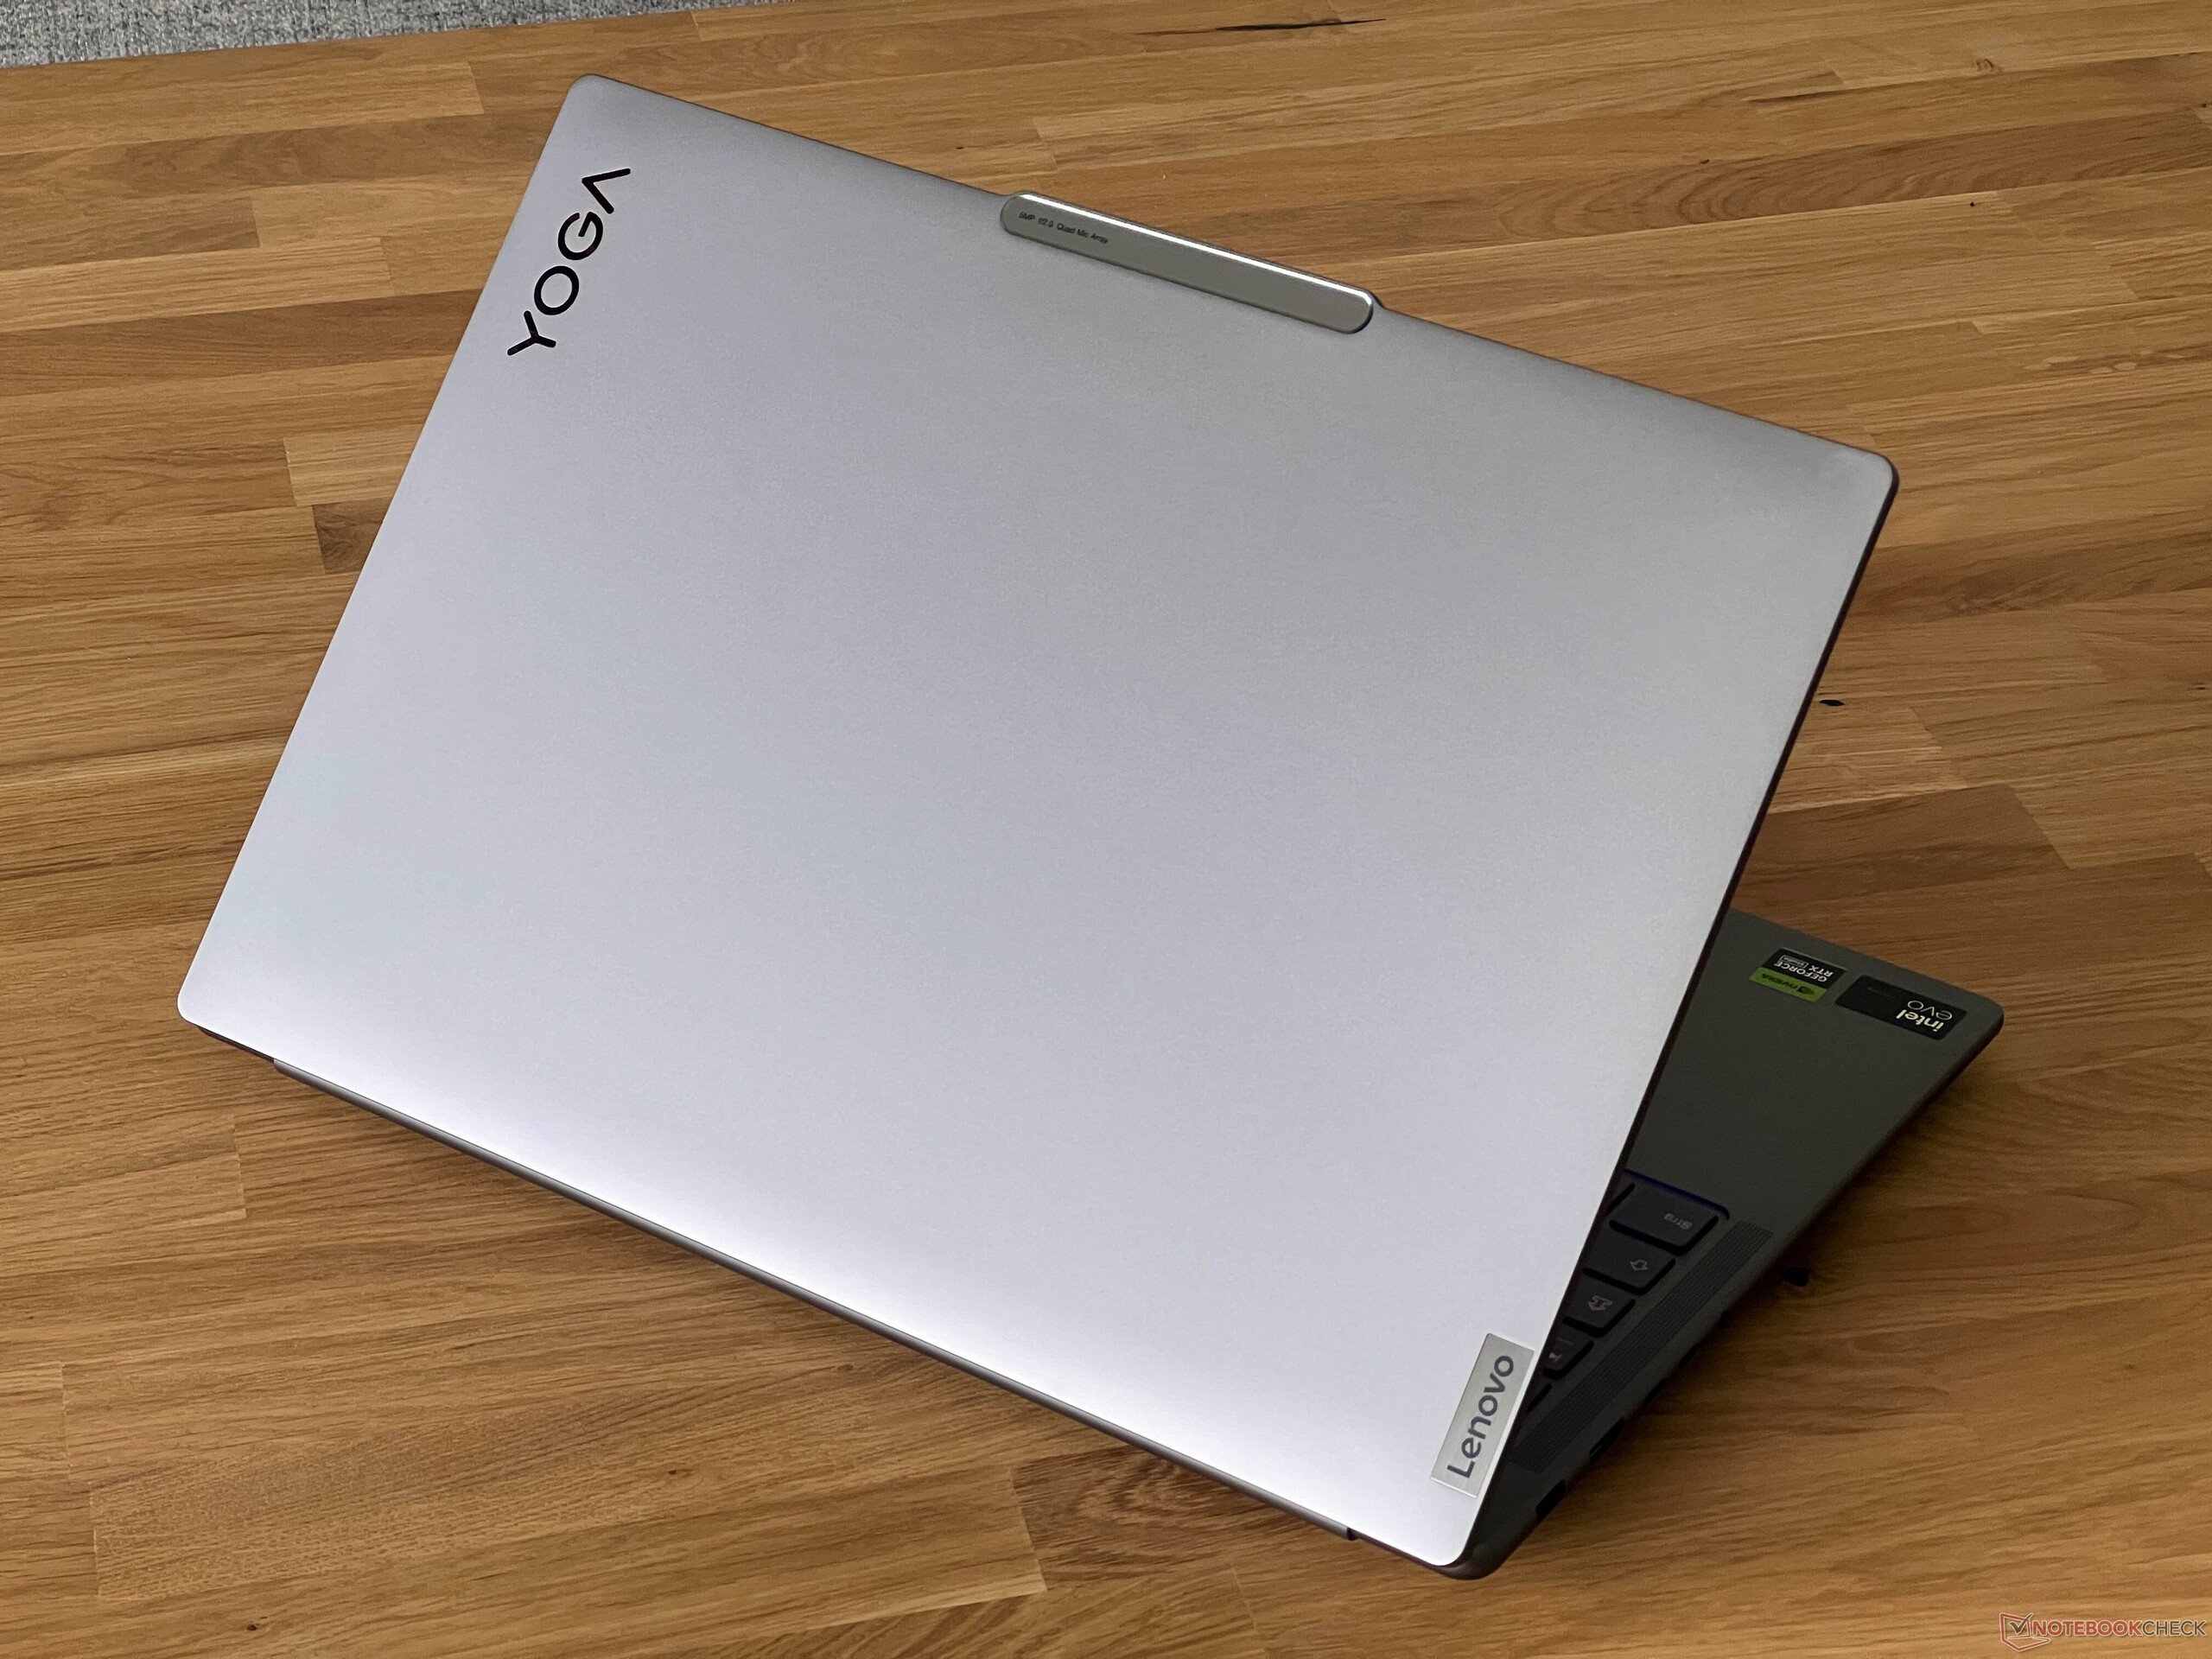
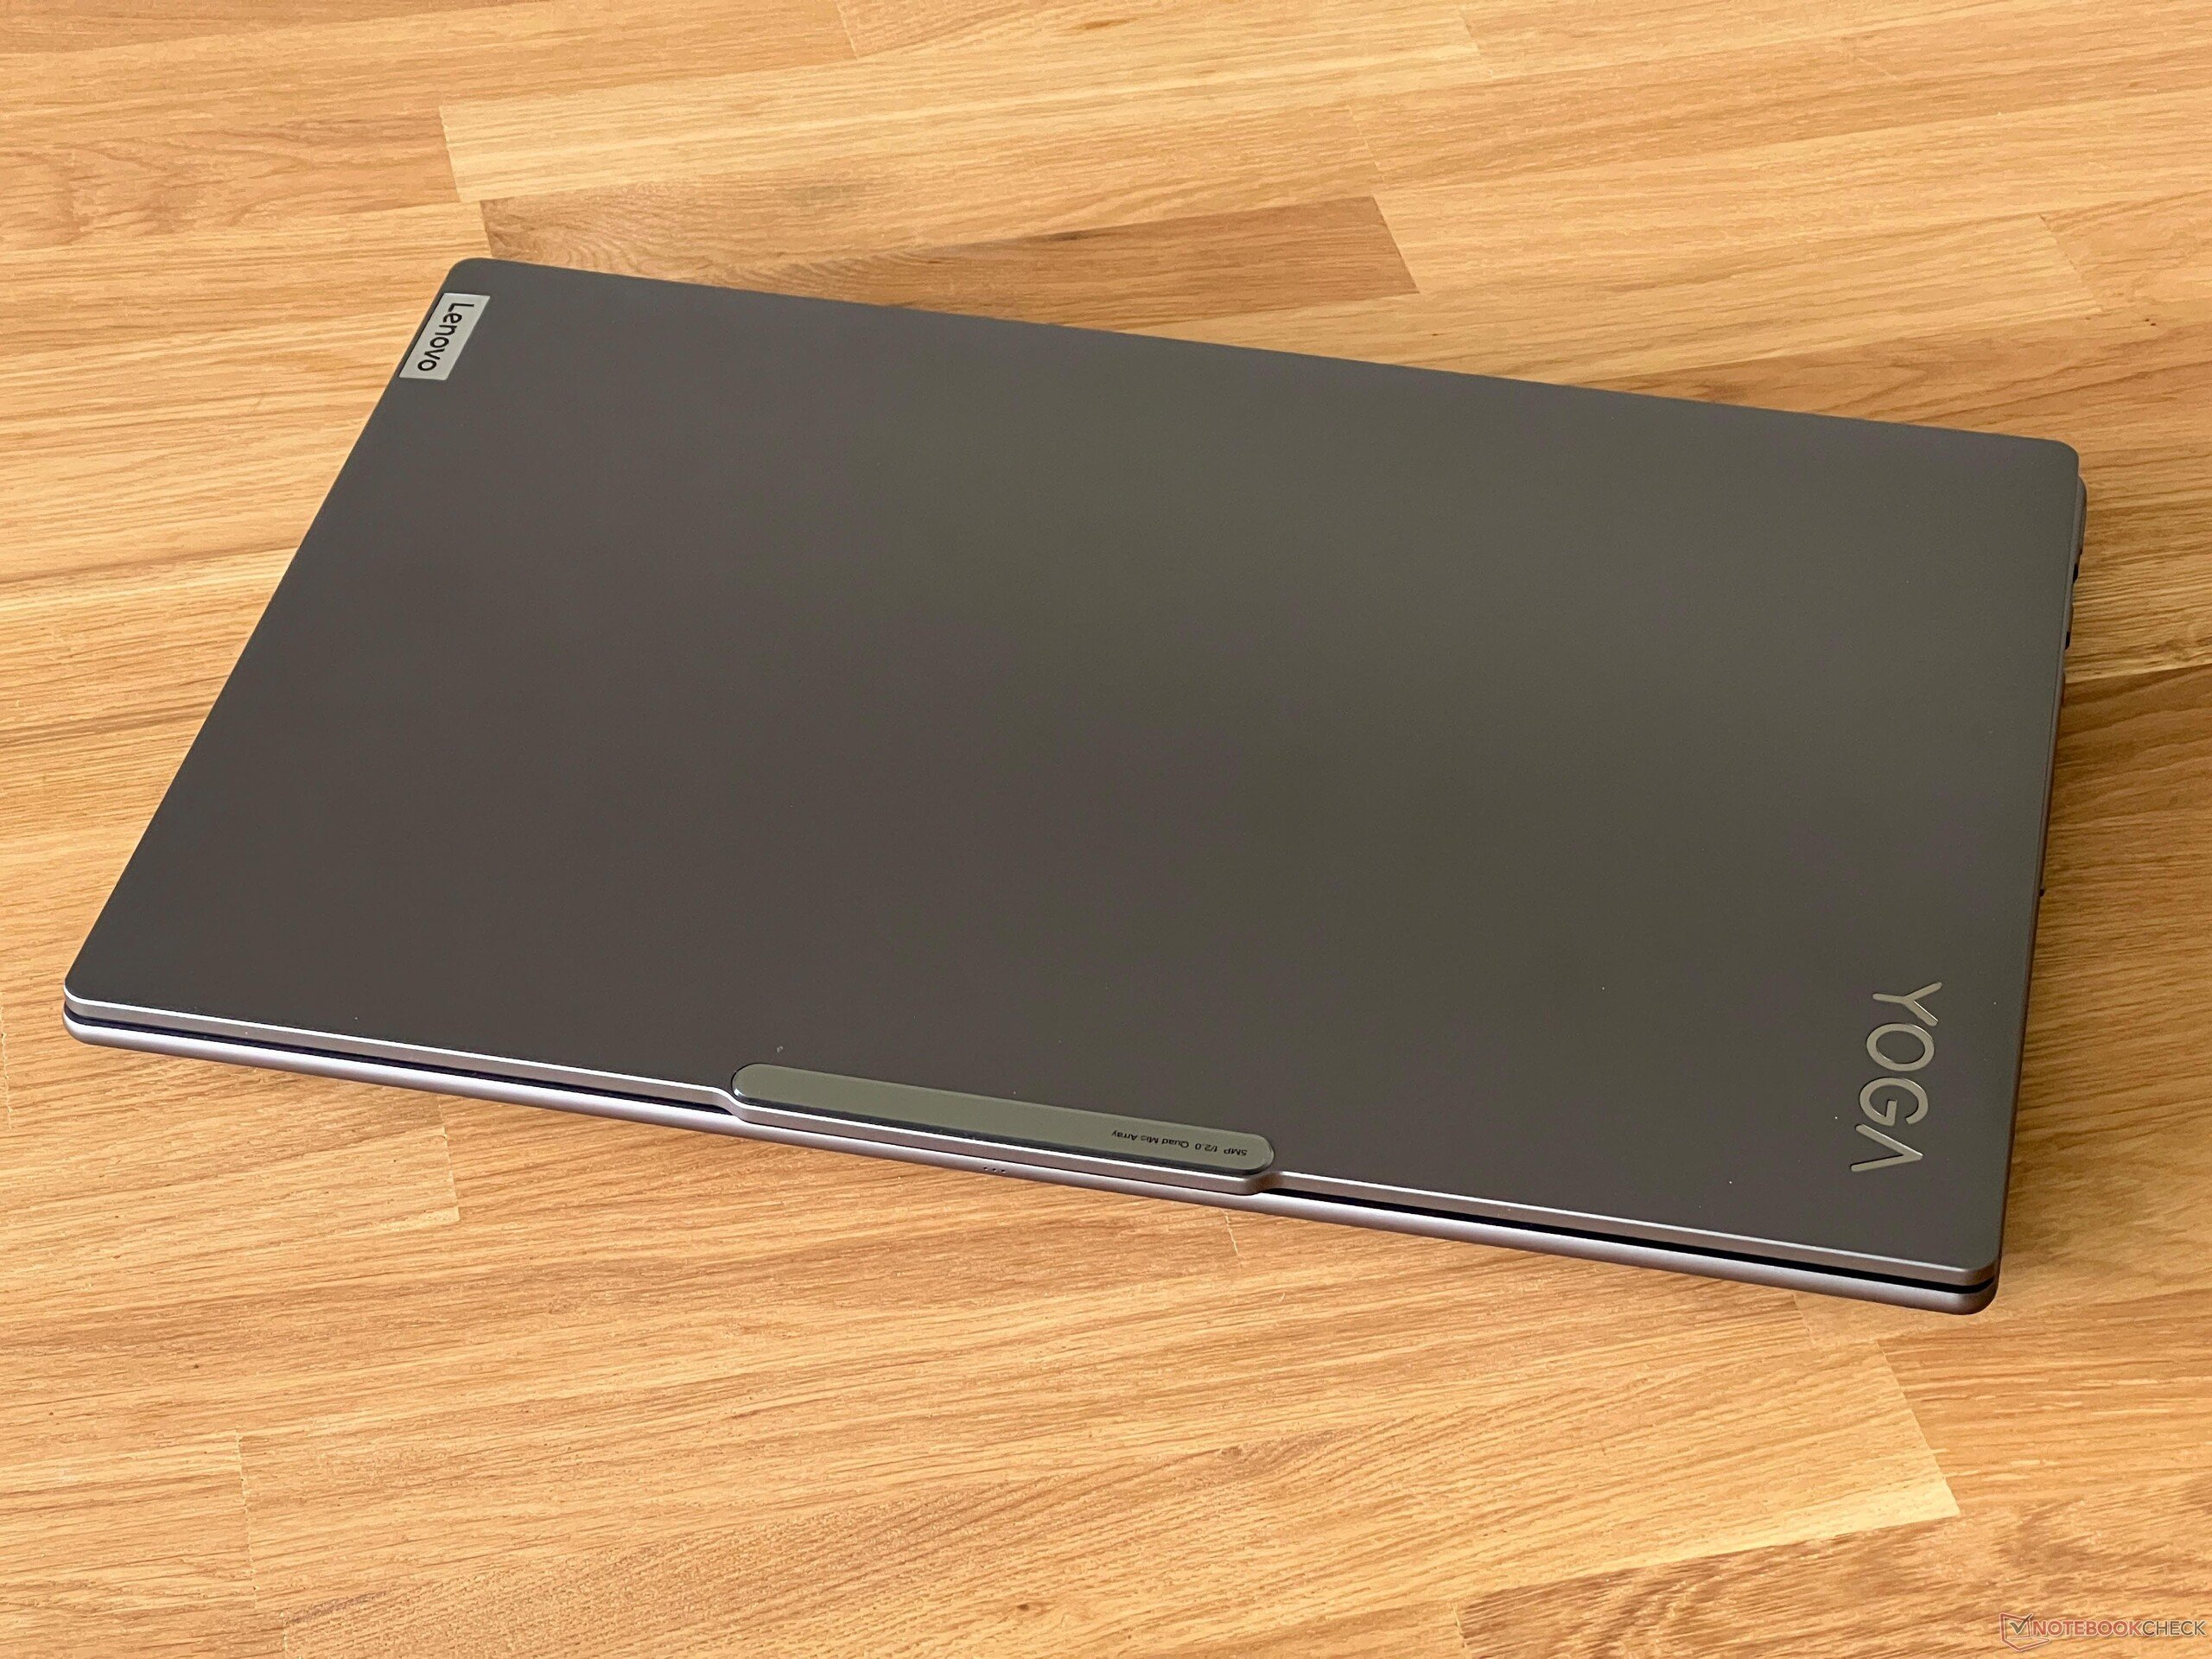
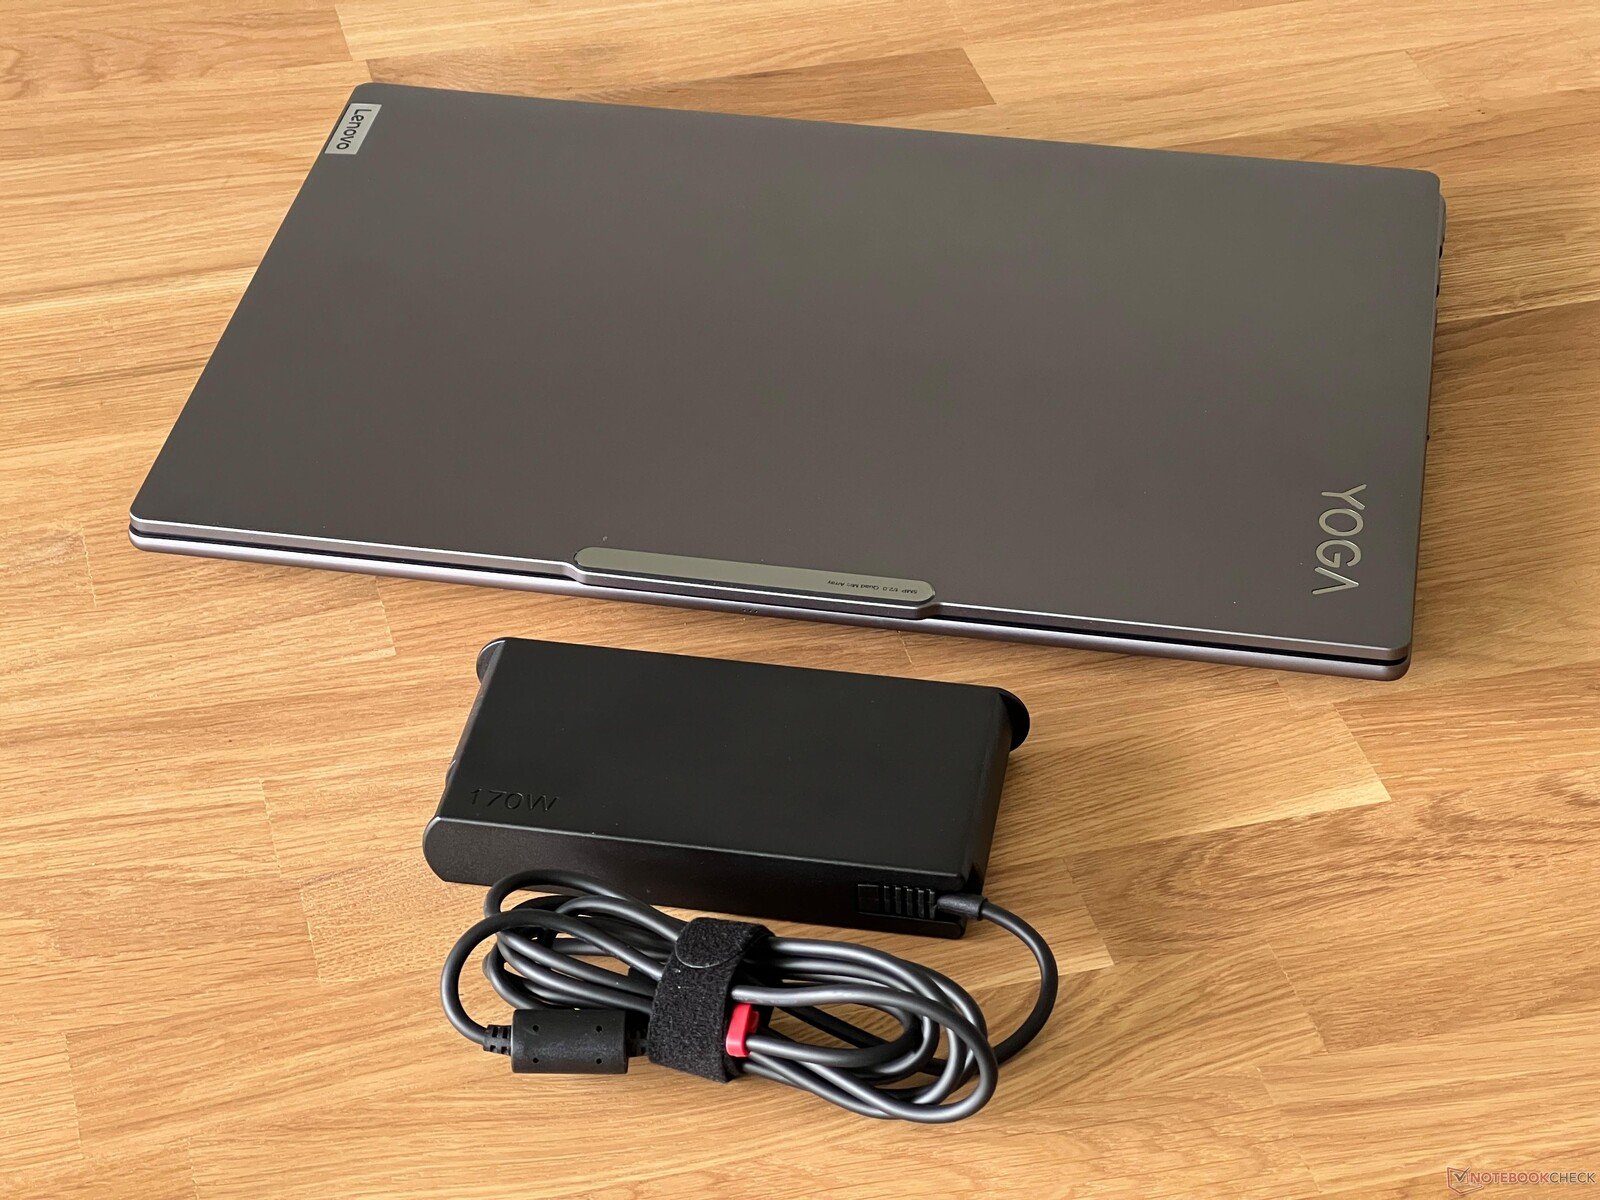
Boîtier - Aluminium et plaque de base fine
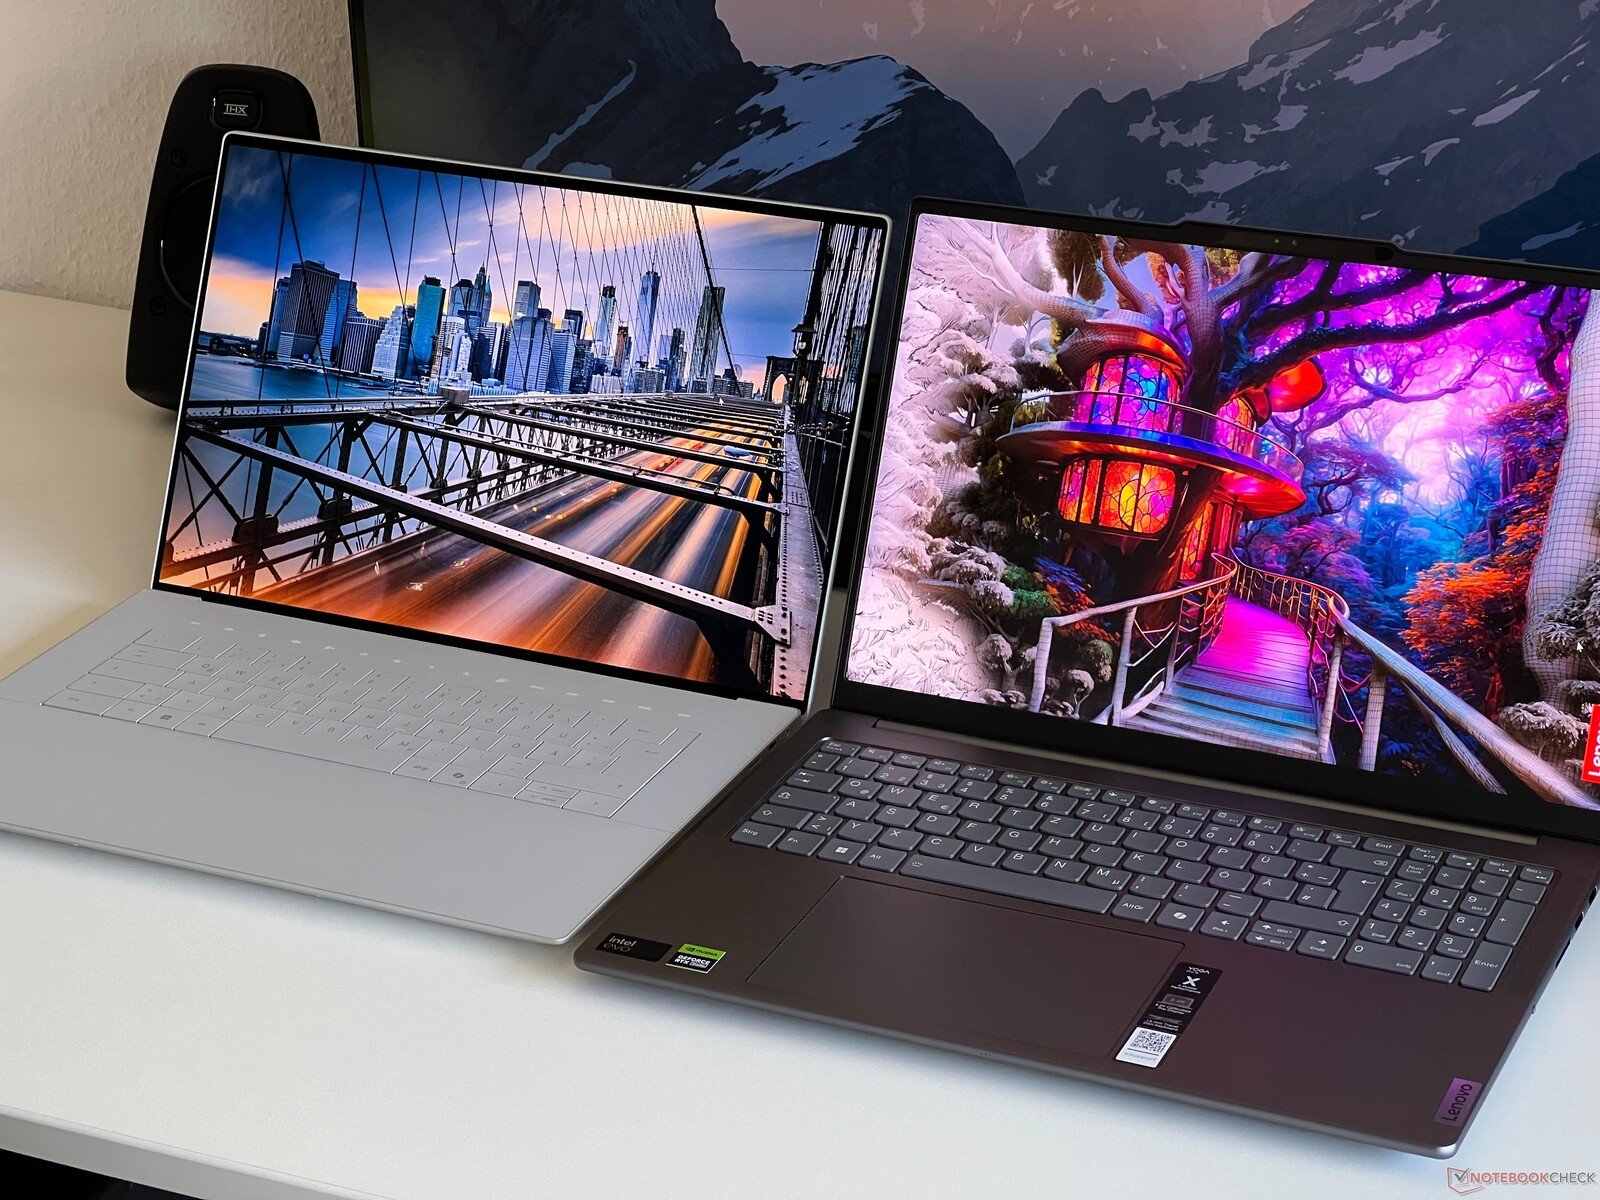
Le design du boîtier reste inchangé par rapport à l'ancien modèle ancien modèle et le boîtier en aluminium gris foncé (ou turquoise) est agréable à regarder, mais il n'y a pas de grande différence visuelle avec l'IdeaPad Pro 16 actuel. Le design est moderne ; seule la grande bosse de l'appareil photo perturbe quelque peu l'impression.
En termes de qualité, l'appareil testé donne une bonne impression dans l'ensemble. Seule la plaque de base, encore très fine, émet des grincements occasionnels. Cependant, l'unité de base elle-même est très stable et seule la zone centrale cède légèrement lorsqu'elle est soumise à une pression. Le couvercle de l'écran est un peu plus souple, mais nous n'avons pas pu constater de distorsion de l'image. Les charnières sont bien réglées et l'angle d'ouverture maximal est de 180 degrés.
Avec un poids d'un peu plus de 2 kg, le Yoga Pro se situe dans la moyenne, mais prend un peu plus de place que le nouveau Dell XPS 16par exemple. Le bloc d'alimentation de 170 watts pèse 566 grammes.
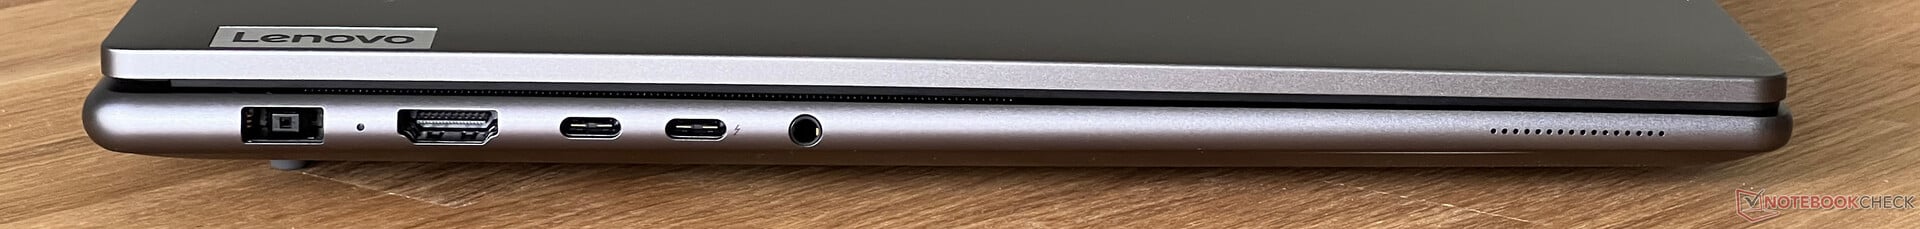
Équipement - Thunderbolt 4 et HDMI 2.1
Alors que le modèle de l'année dernière présentait encore des limitations au niveau du port HDMI, un port HDMI 2.1 moderne est désormais embarqué. Thunderbolt 4 et suffisamment de ports USB sont également disponibles. Toutes les sorties vidéo sont connectées via l'iGPU, de sorte que le GPU GeForce n'a pas besoin de fonctionner en permanence lors de l'utilisation d'un moniteur externe, ce qui réduit la consommation d'énergie.

Lecteur de carte SD
Le lecteur de cartes situé à droite offre un taux de transfert moyen de 80-90 MB/s avec notre carte de référence (Angelbird AV Pro V60). Les cartes insérées dépassent d'environ 1,5 cm du boîtier.
| SD Card Reader | |
| average JPG Copy Test (av. of 3 runs) | |
| Dell XPS 16 9640 (Angelbird AV Pro V60) | |
| Moyenne de la classe Multimedia (17.6 - 205, n=67, 2 dernières années) | |
| Samsung Galaxy Book4 Ultra (Angelbird AV Pro V60) | |
| Lenovo Yoga Pro 9 16IMH9 (Angelbird AV Pro V60) | |
| Lenovo Yoga Pro 9 16-IRP G8 (Angelibird AV Pro V60) | |
| SCHENKER VISION 16 Pro (M23) (Angelbird AV Pro V60) | |
| maximum AS SSD Seq Read Test (1GB) | |
| Dell XPS 16 9640 (Angelbird AV Pro V60) | |
| Moyenne de la classe Multimedia (16.8 - 266, n=63, 2 dernières années) | |
| Lenovo Yoga Pro 9 16IMH9 (Angelbird AV Pro V60) | |
| Samsung Galaxy Book4 Ultra (Angelbird AV Pro V60) | |
| Lenovo Yoga Pro 9 16-IRP G8 (Angelibird AV Pro V60) | |
| SCHENKER VISION 16 Pro (M23) (Angelbird AV Pro V60) | |
Communication
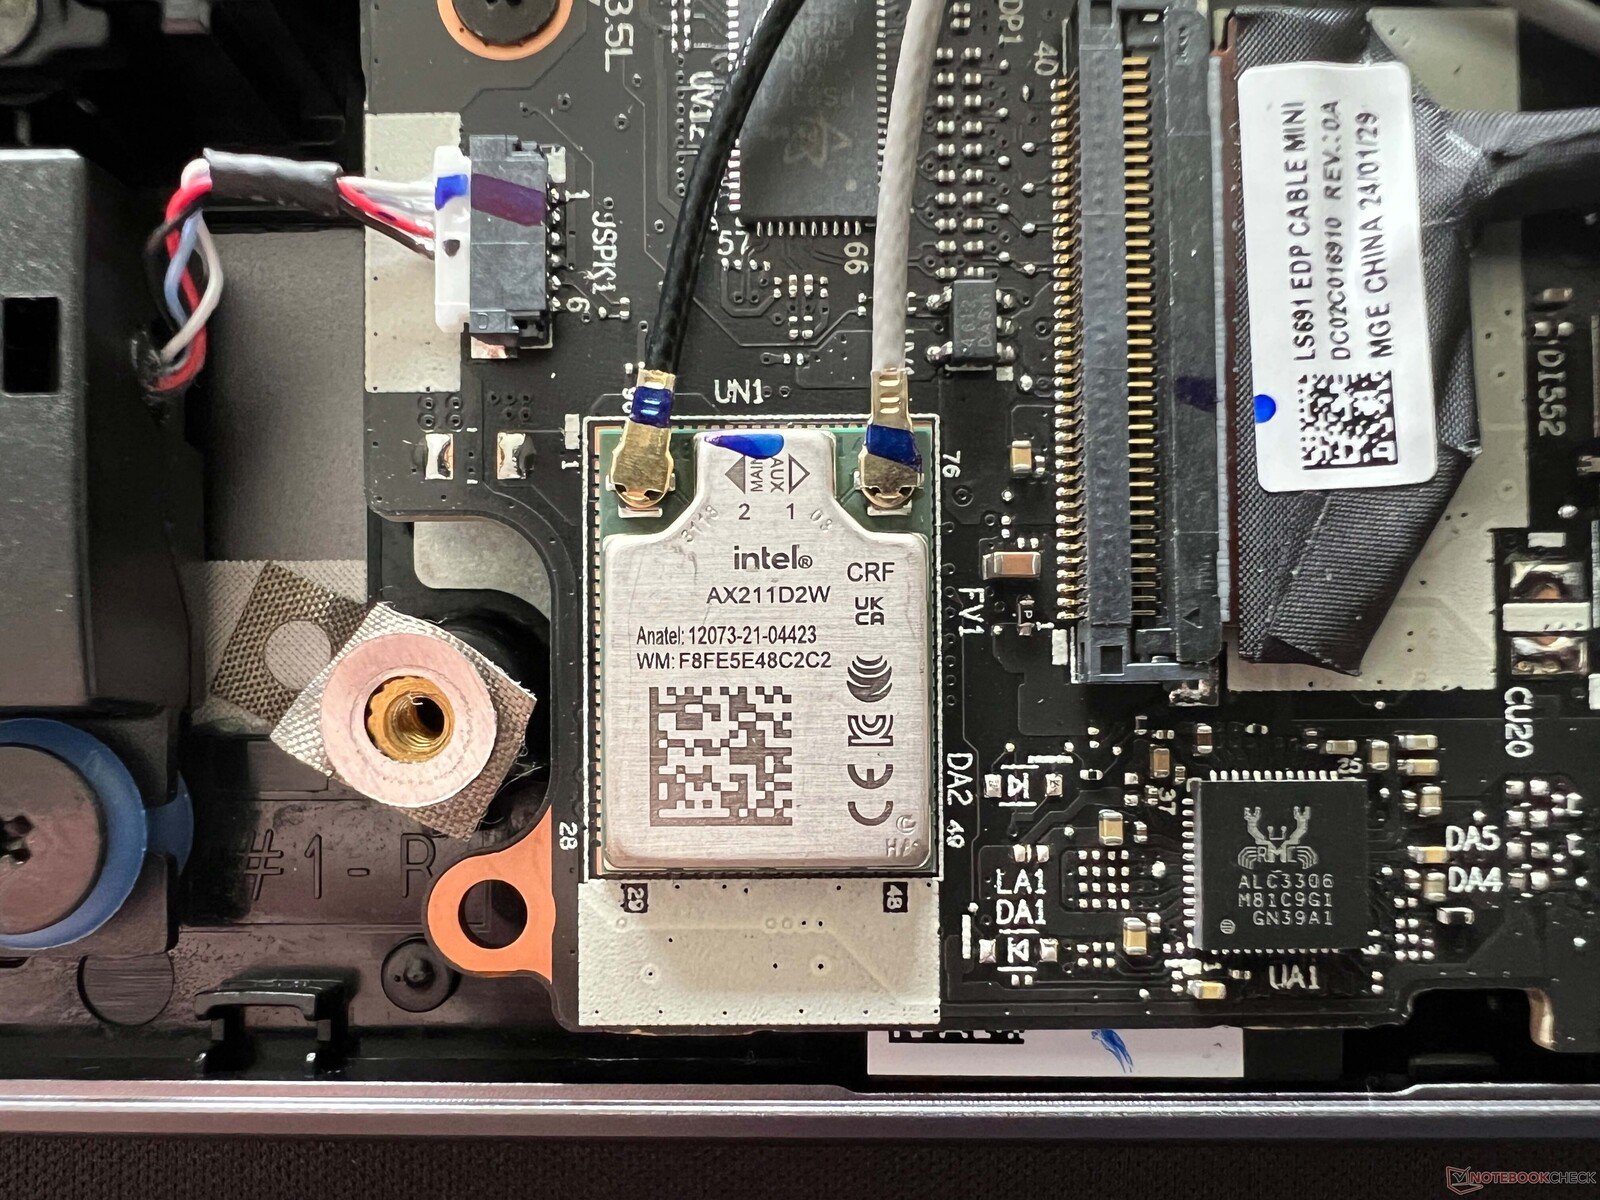
Le module WLAN AX211 d'Intel est soudé et prend en charge le WiFi 6E ainsi que le Bluetooth 5.3. Nous n'avons eu aucun problème de stabilité du WLAN lors de nos tests et les taux de transfert ont été très bons dans l'ensemble en conjonction avec notre routeur de référence d'Asus. Lenovo n'inclut pas de module WiFi 7.
| Networking | |
| Lenovo Yoga Pro 9 16IMH9 | |
| iperf3 transmit AXE11000 |
|
| iperf3 receive AXE11000 |
|
| Dell XPS 16 9640 | |
| iperf3 transmit AXE11000 |
|
| iperf3 receive AXE11000 |
|
| Honor MagicBook Pro 16 2024 | |
| iperf3 transmit AXE11000 |
|
| iperf3 receive AXE11000 |
|
| Samsung Galaxy Book4 Ultra | |
| iperf3 transmit AXE11000 |
|
| iperf3 receive AXE11000 |
|
| Framework Laptop 16 | |
| iperf3 transmit AXE11000 |
|
| iperf3 receive AXE11000 |
|
| iperf3 transmit AXE11000 6GHz |
|
| iperf3 receive AXE11000 6GHz |
|
| SCHENKER VISION 16 Pro (M23) | |
| iperf3 transmit AXE11000 |
|
| iperf3 receive AXE11000 |
|
| Lenovo Yoga Pro 9 16-IRP G8 | |
| iperf3 transmit AXE11000 |
|
| iperf3 receive AXE11000 |
|
Webcam
L'appareil photo de 5 MP offre une qualité d'image décente et il y a également un capteur IR pour la reconnaissance faciale via Windows Hello. En liaison avec le NPU du processeur, certains effets de studio (flou, suivi de la tête, etc.) sont disponibles directement dans Windows et indépendamment de l'application. La webcam dispose d'un obturateur électronique avec un bouton sur le côté droit du boîtier.


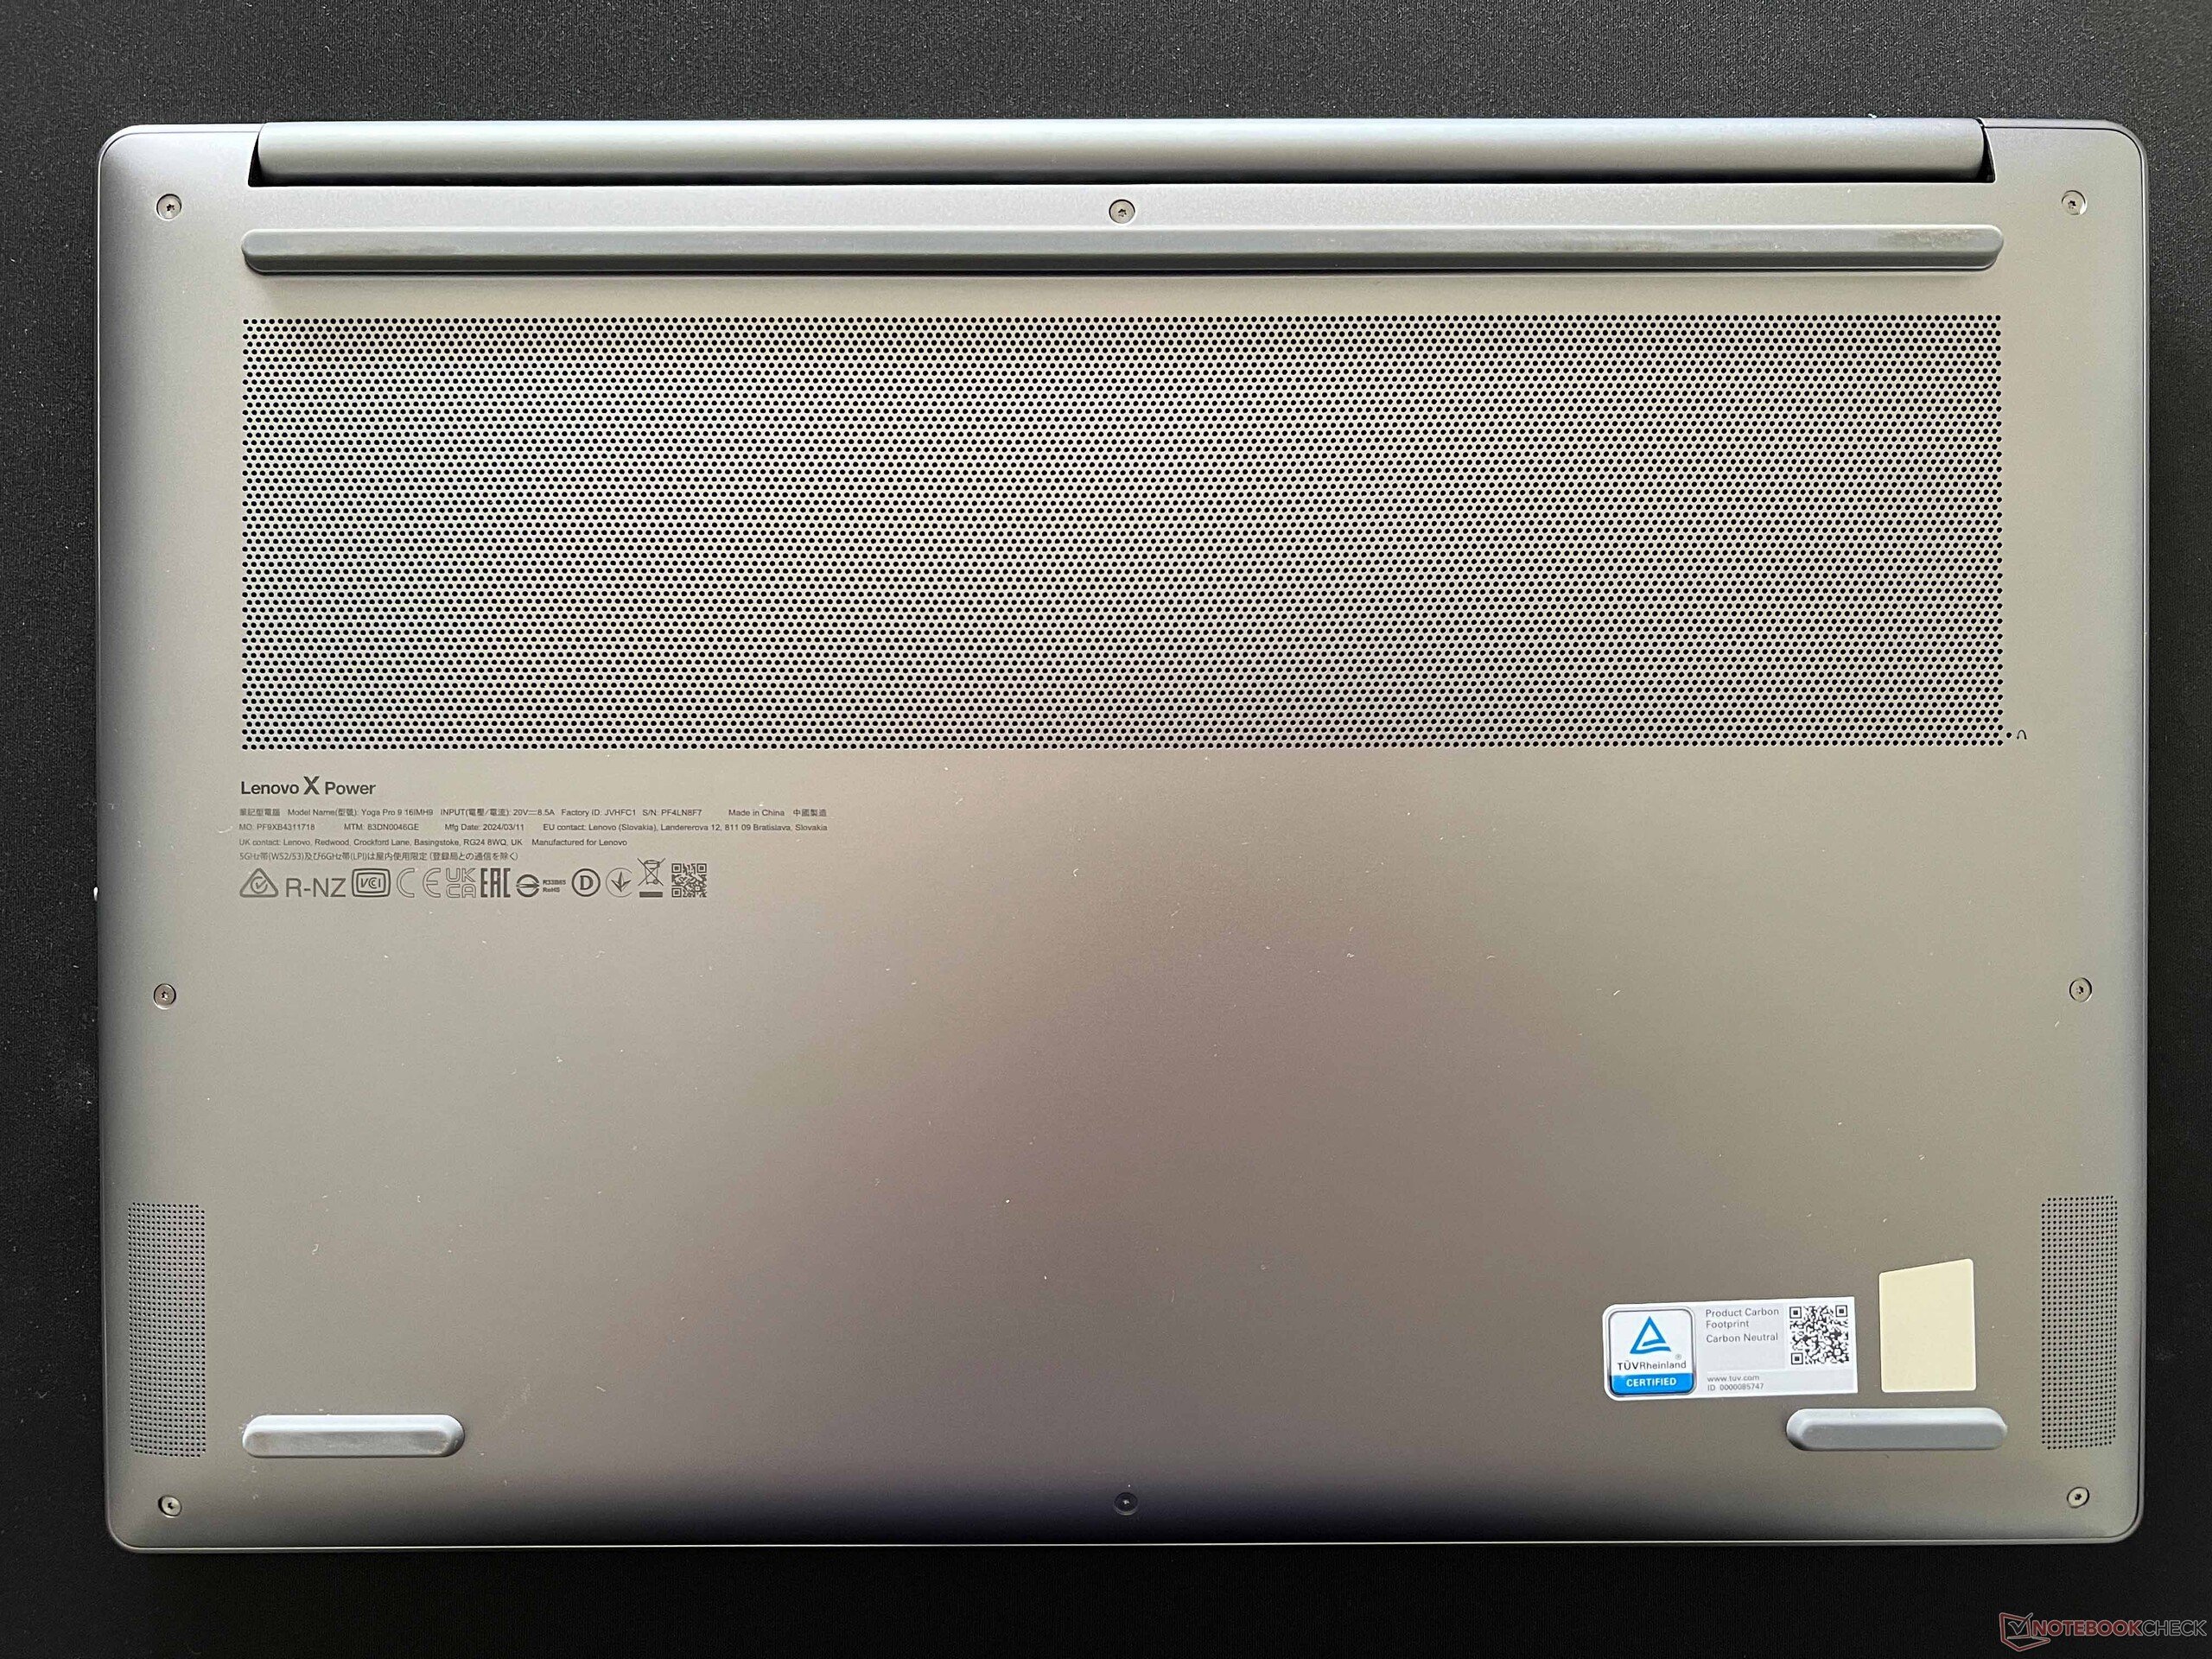
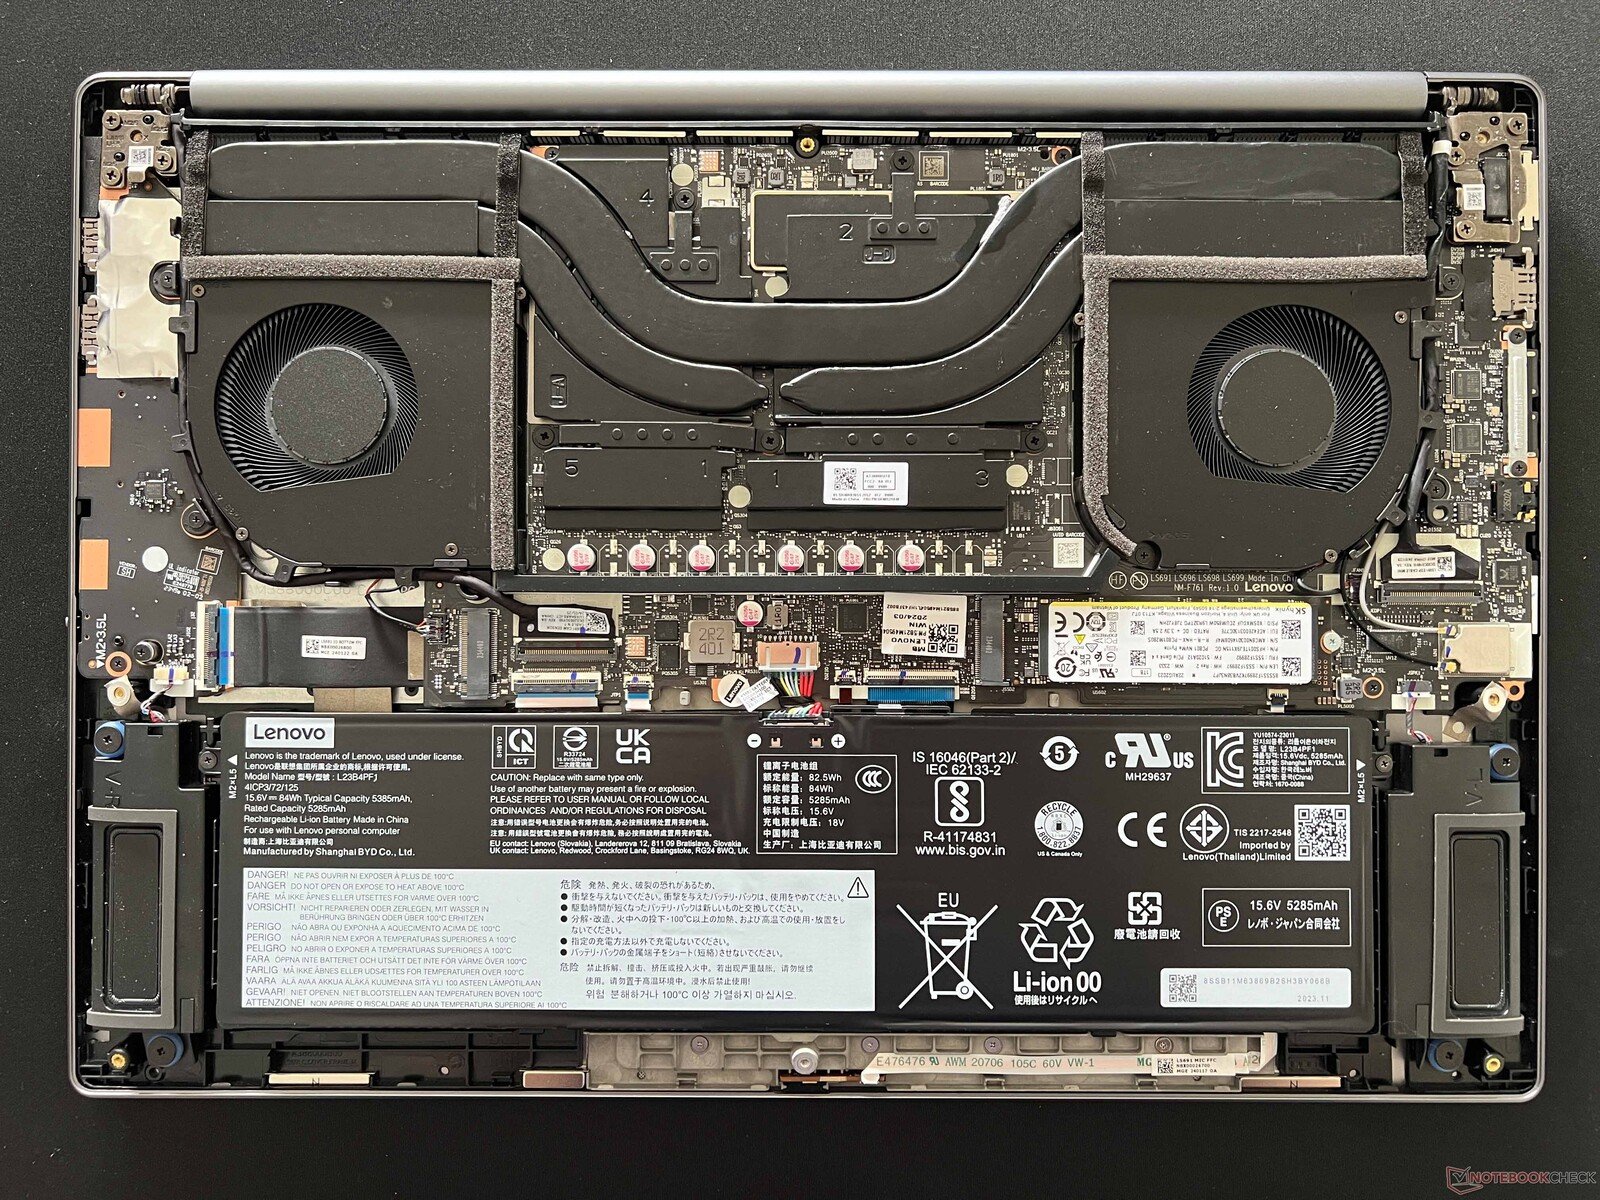
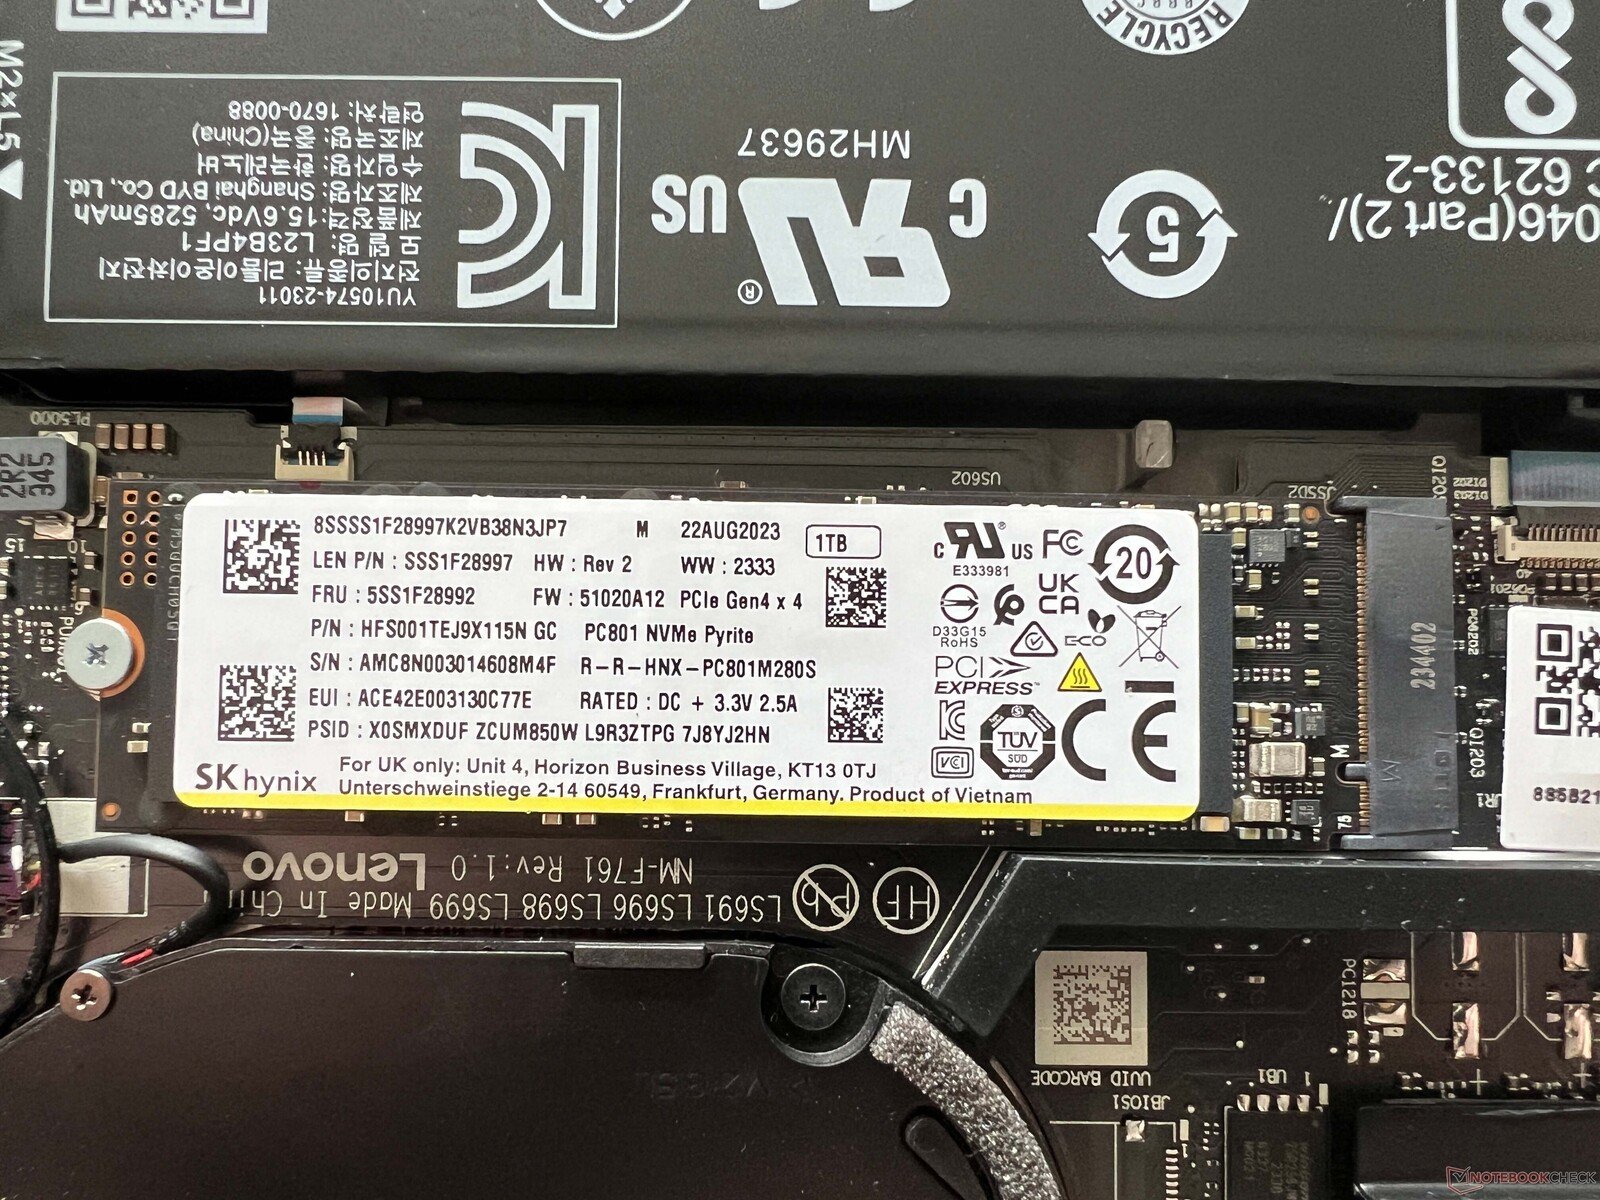
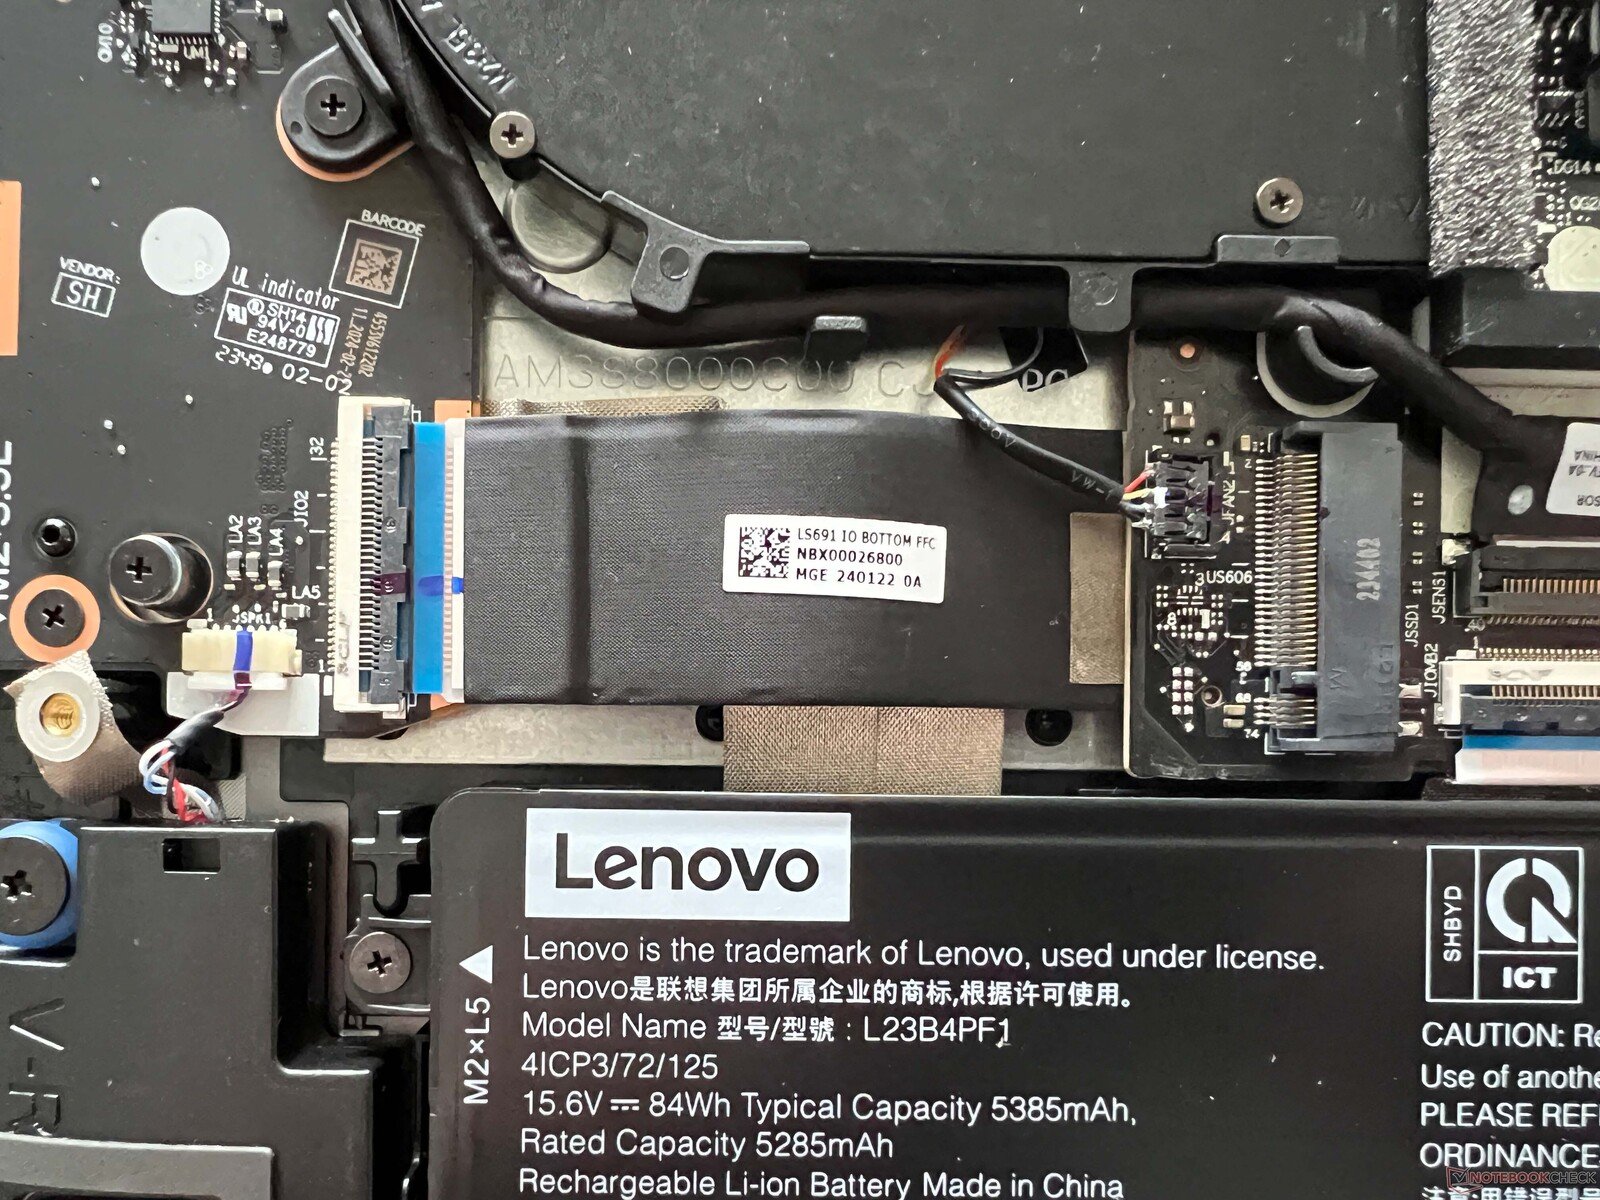
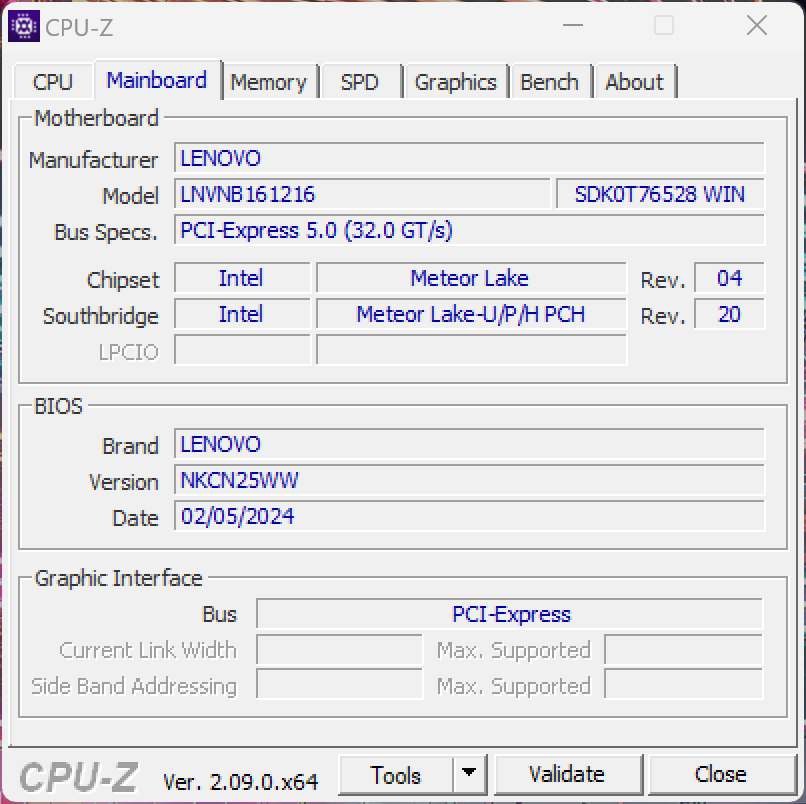
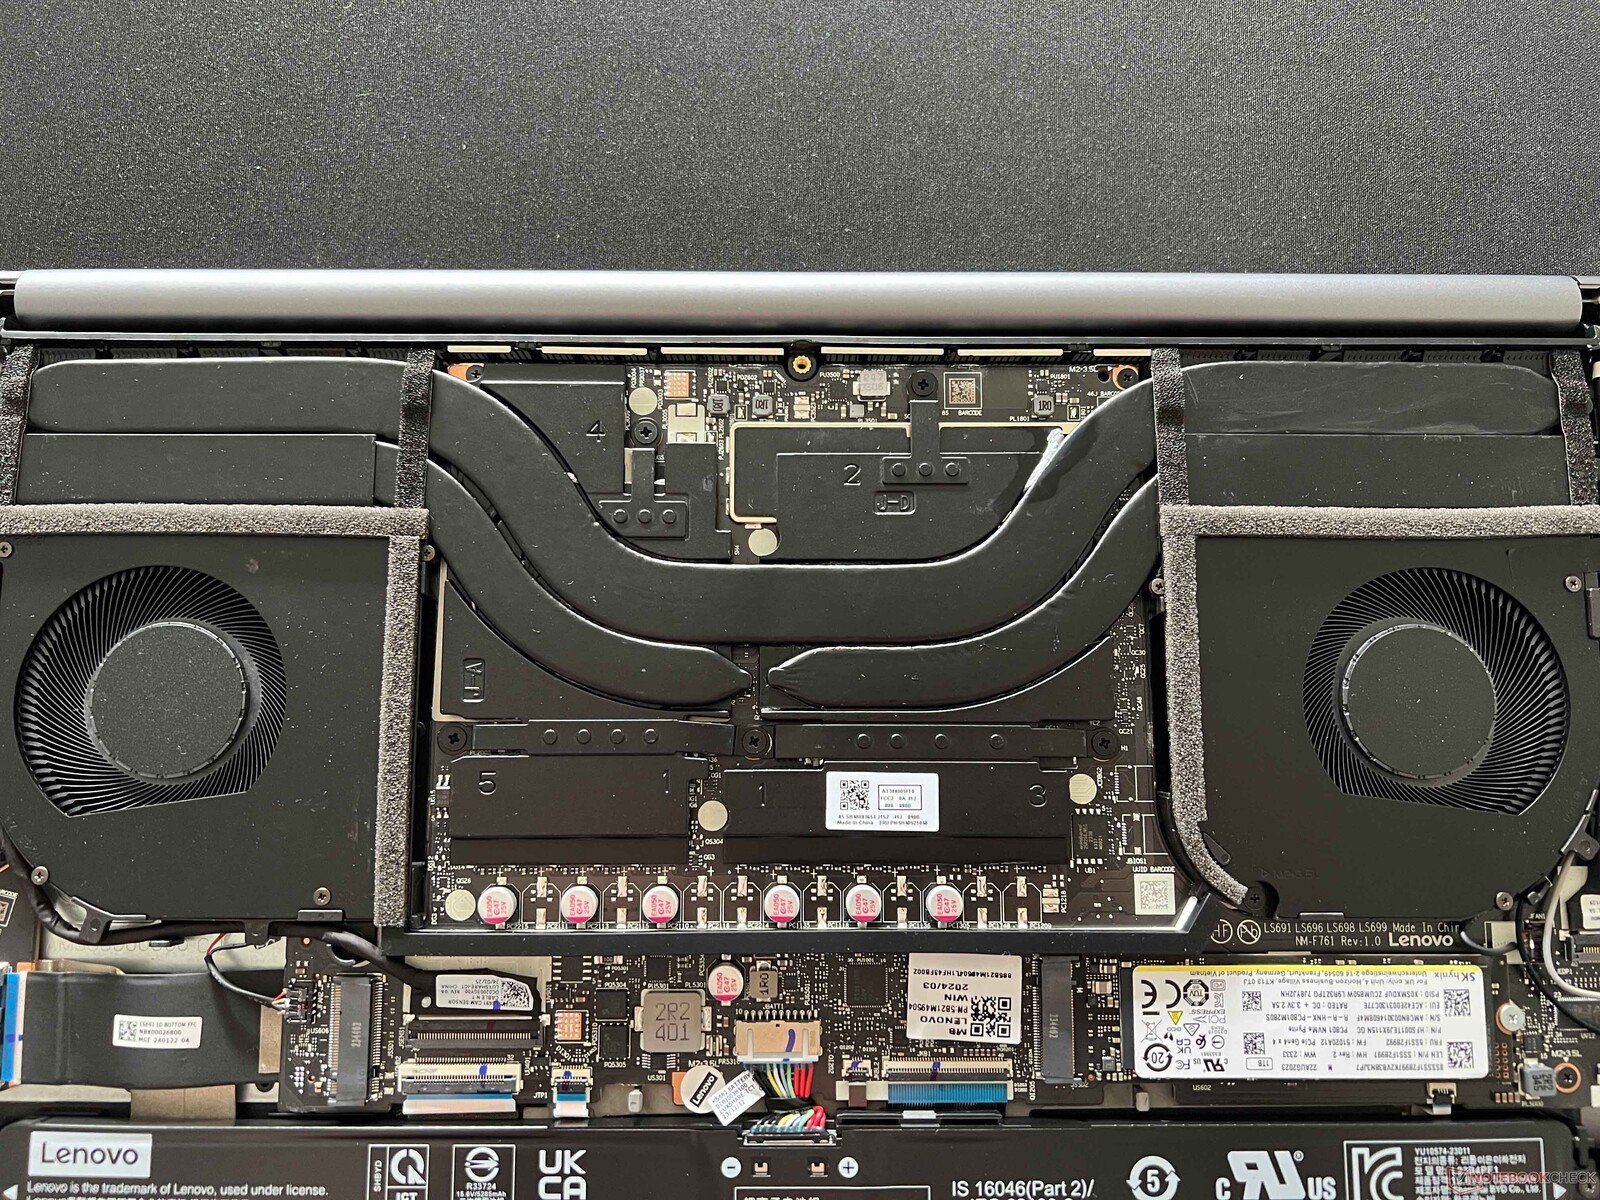
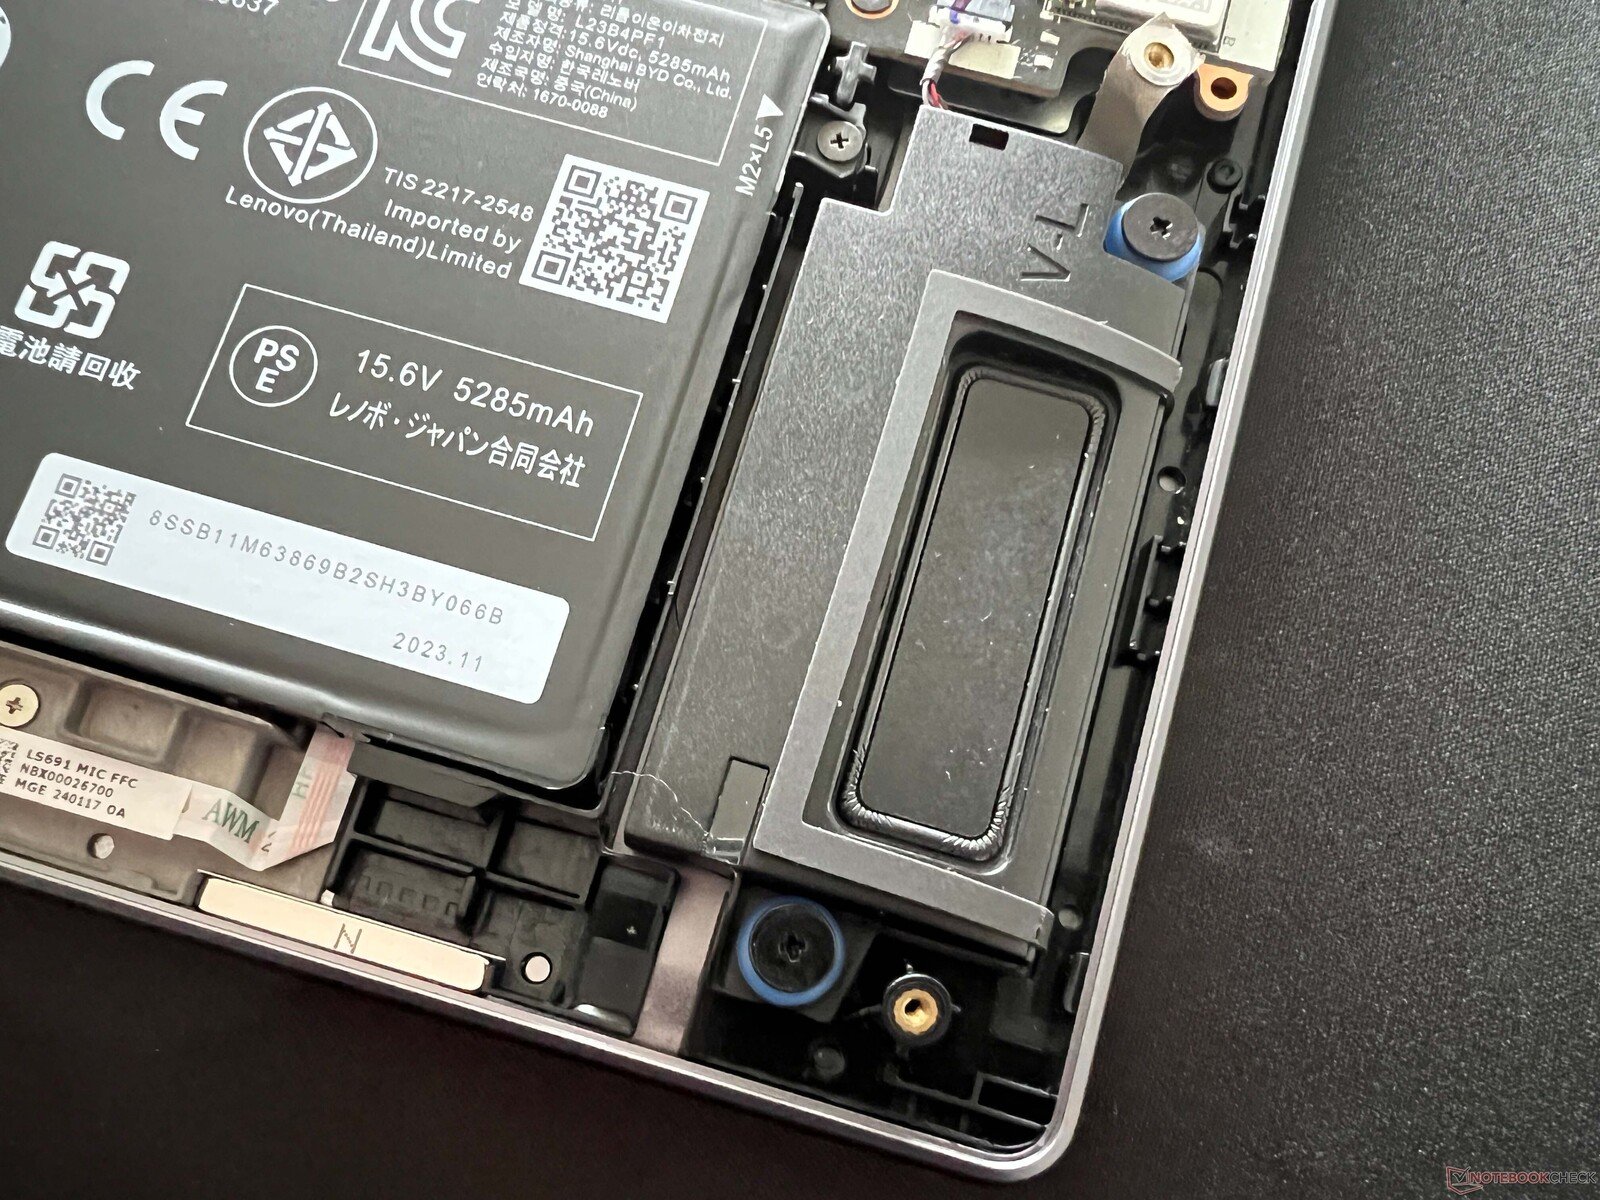
Maintenance
Le couvercle inférieur est fixé à l'aide de vis Torx (T5) et s'enlève facilement. À l'intérieur, la disposition a changé par rapport à l'ancien modèle, en partie pour faire de la place à une batterie plus grande. La mémoire vive et le module WLAN sont toujours soudés. Il y a toujours deux emplacements pour les SSD M.2 2280 et vous pouvez à la fois nettoyer les ventilateurs et remplacer la batterie (si nécessaire).
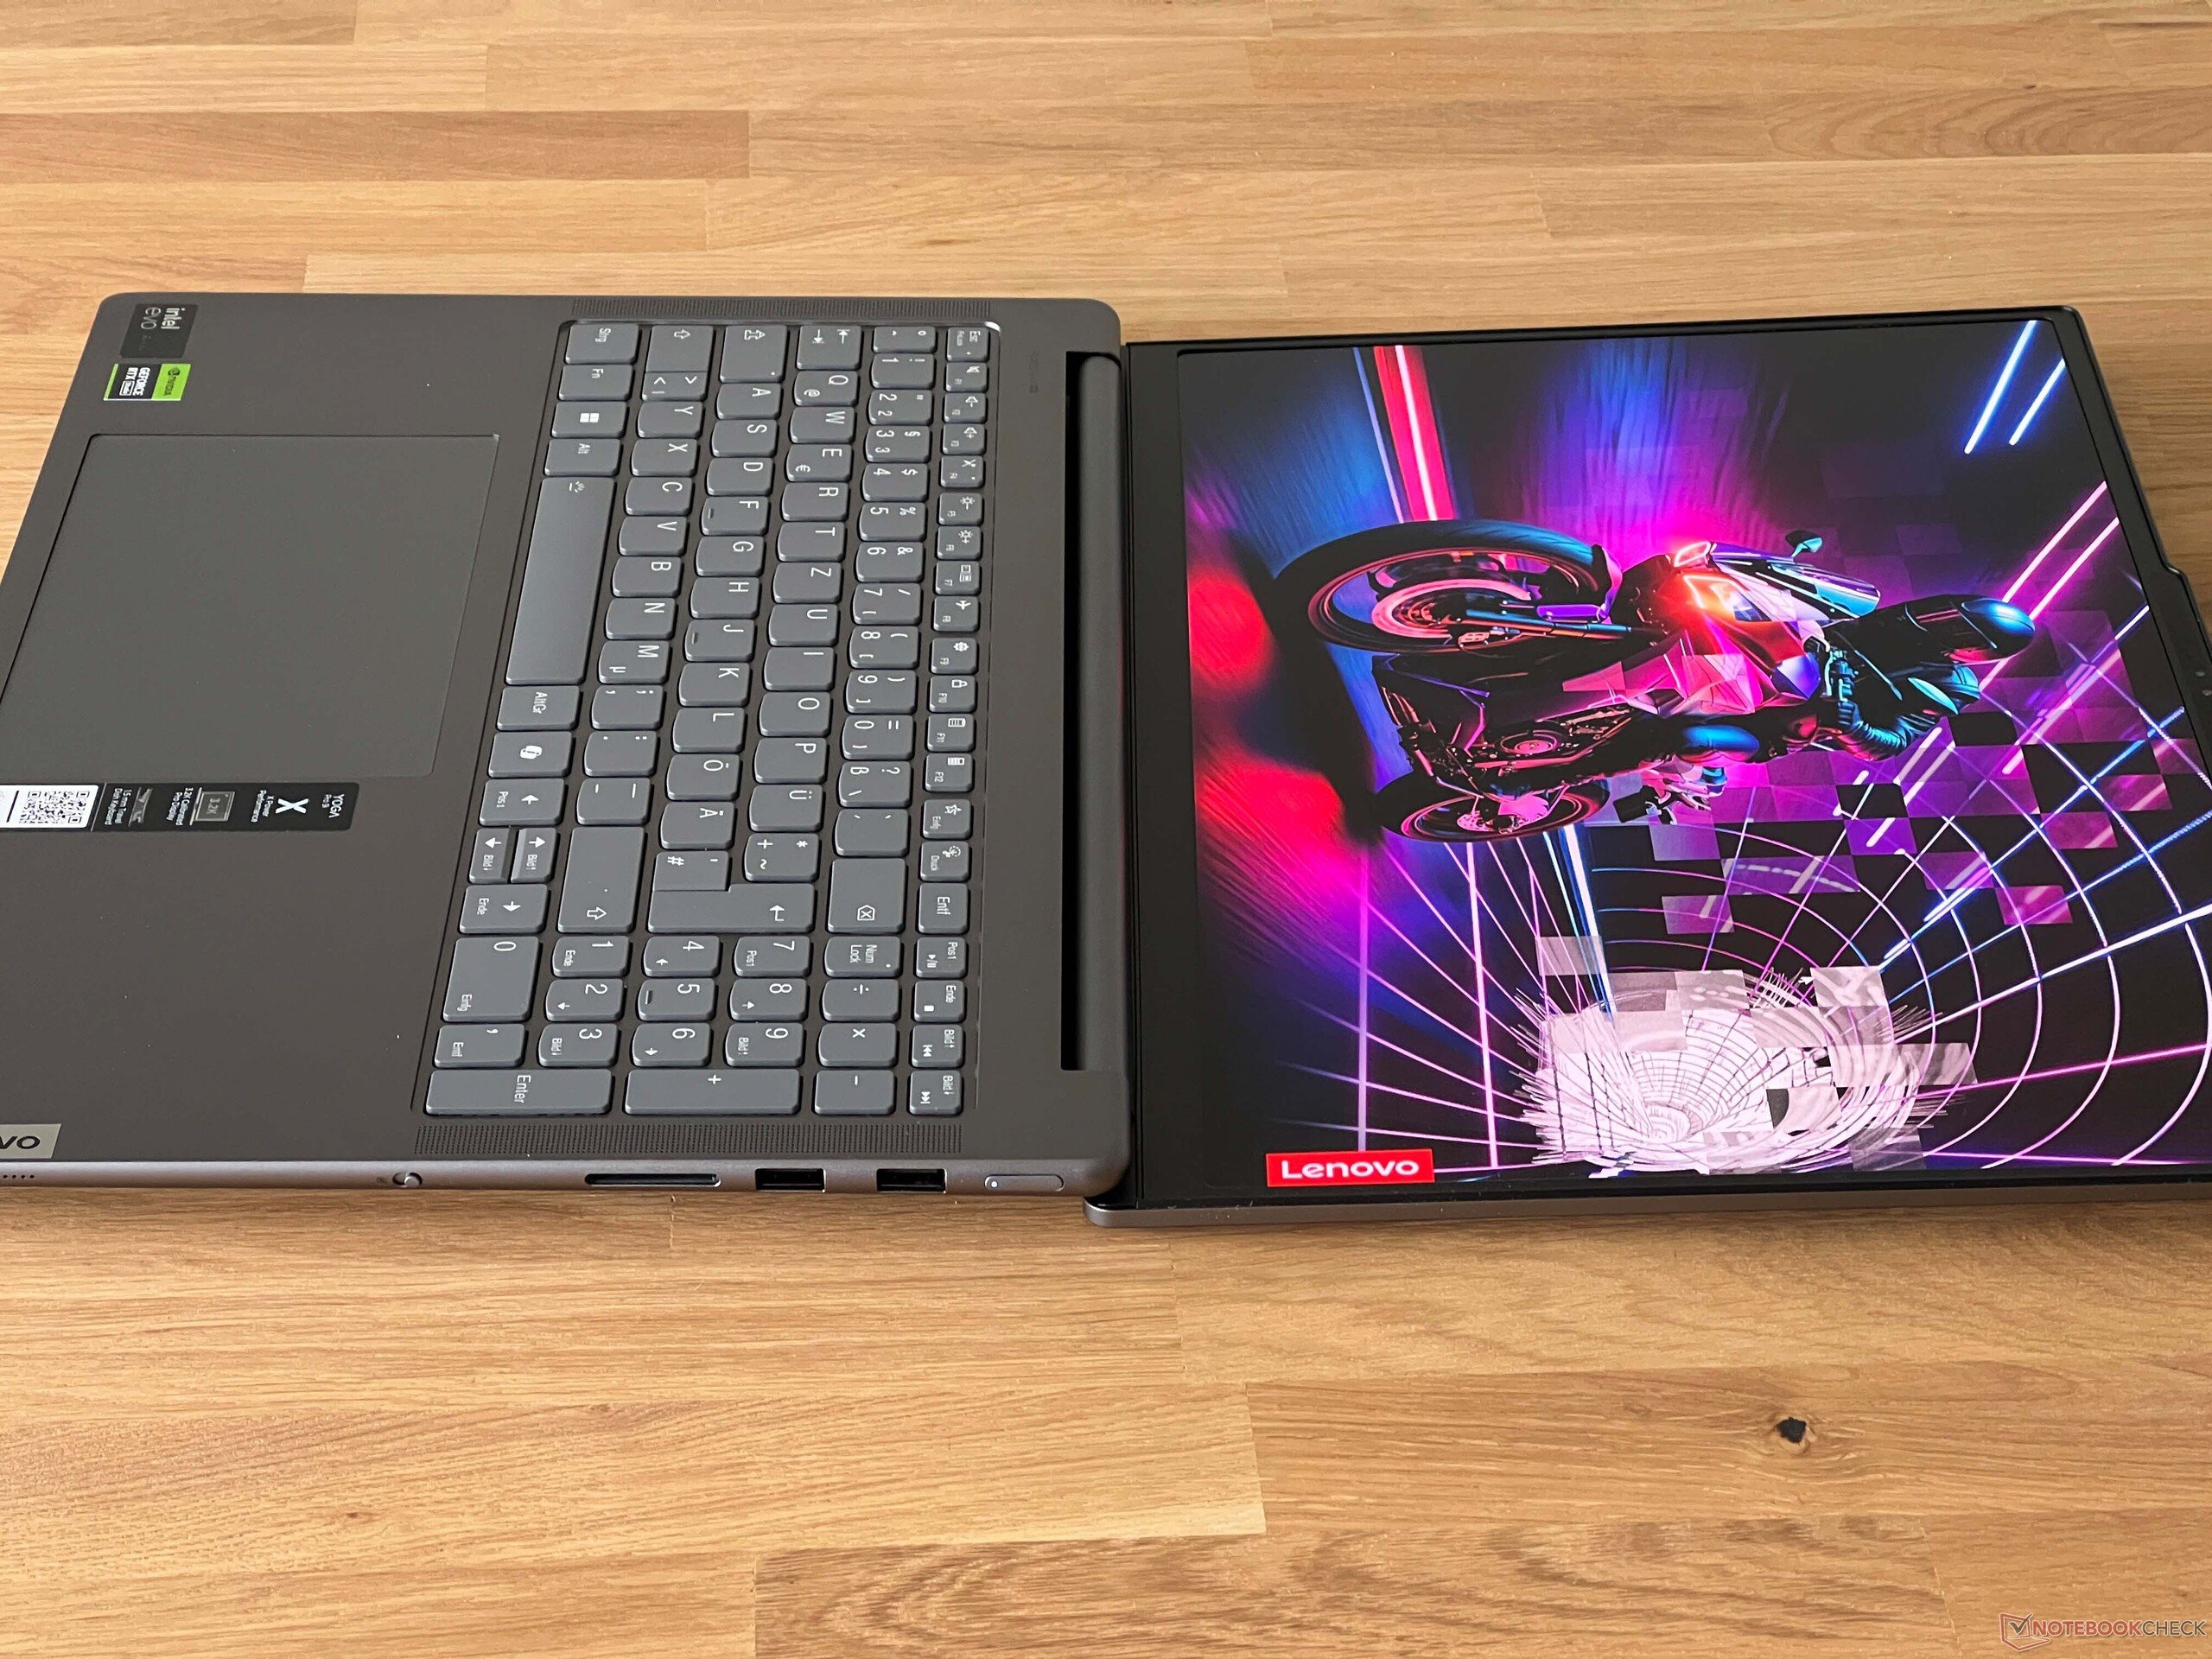
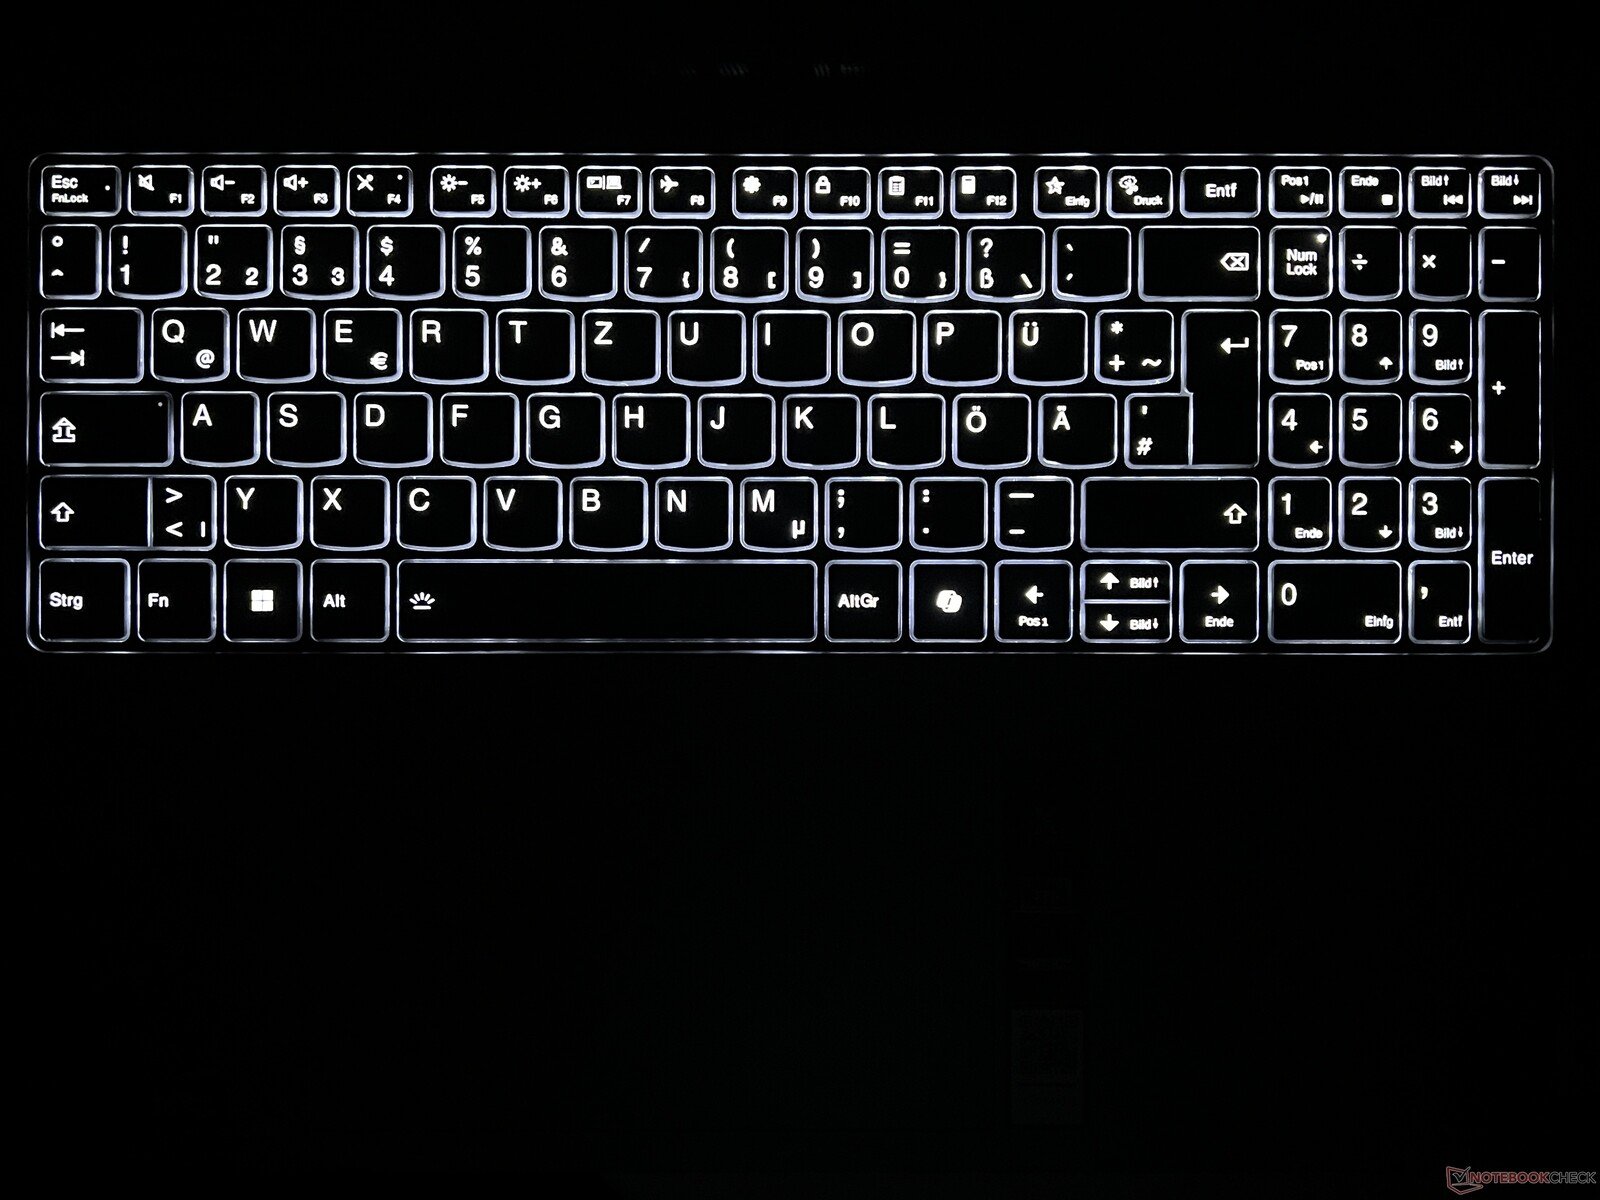
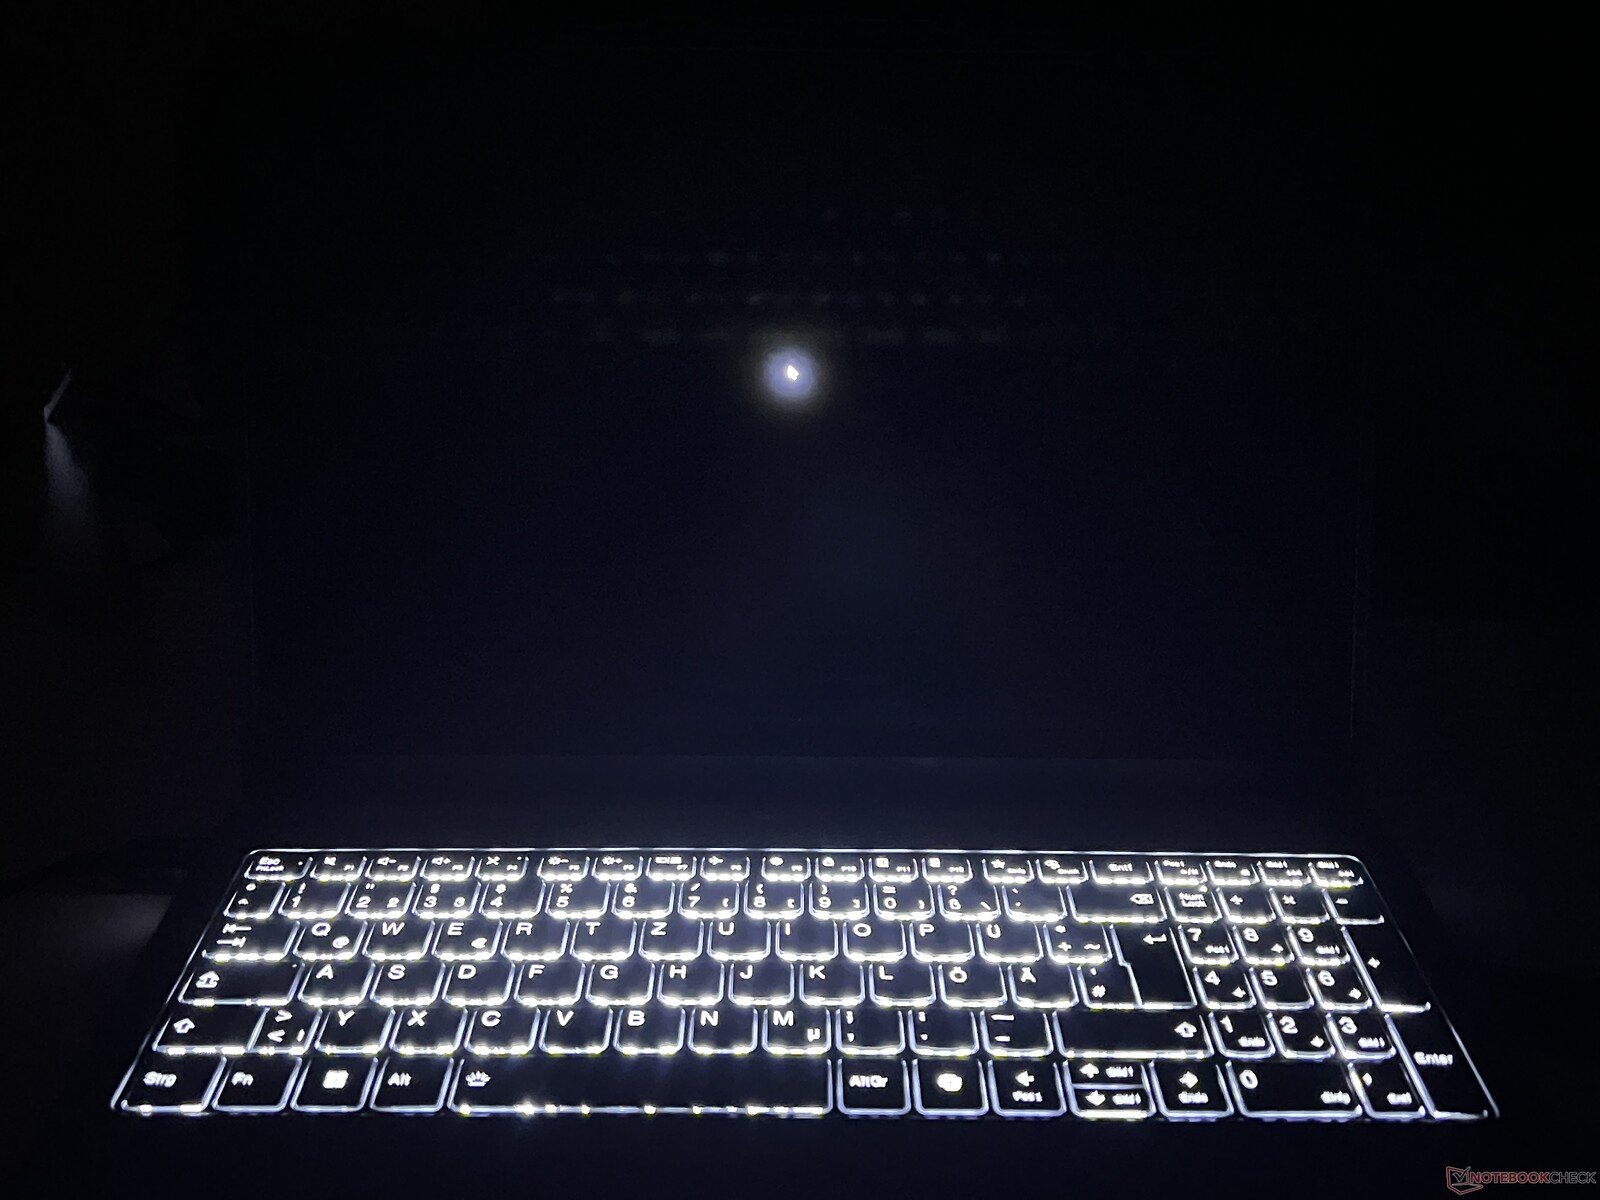
Dispositifs de saisie - course de 1,5 mm et pavé numérique
Les périphériques de saisie restent inchangés, à l'exception de la nouvelle touche Copilot (à la place de la touche Ctrl droite). Le clavier confortable offre une course suffisamment longue (1,5 mm) et permet de taper de longs textes sans problème. L'éclairage blanc à deux niveaux est activé automatiquement par un capteur.
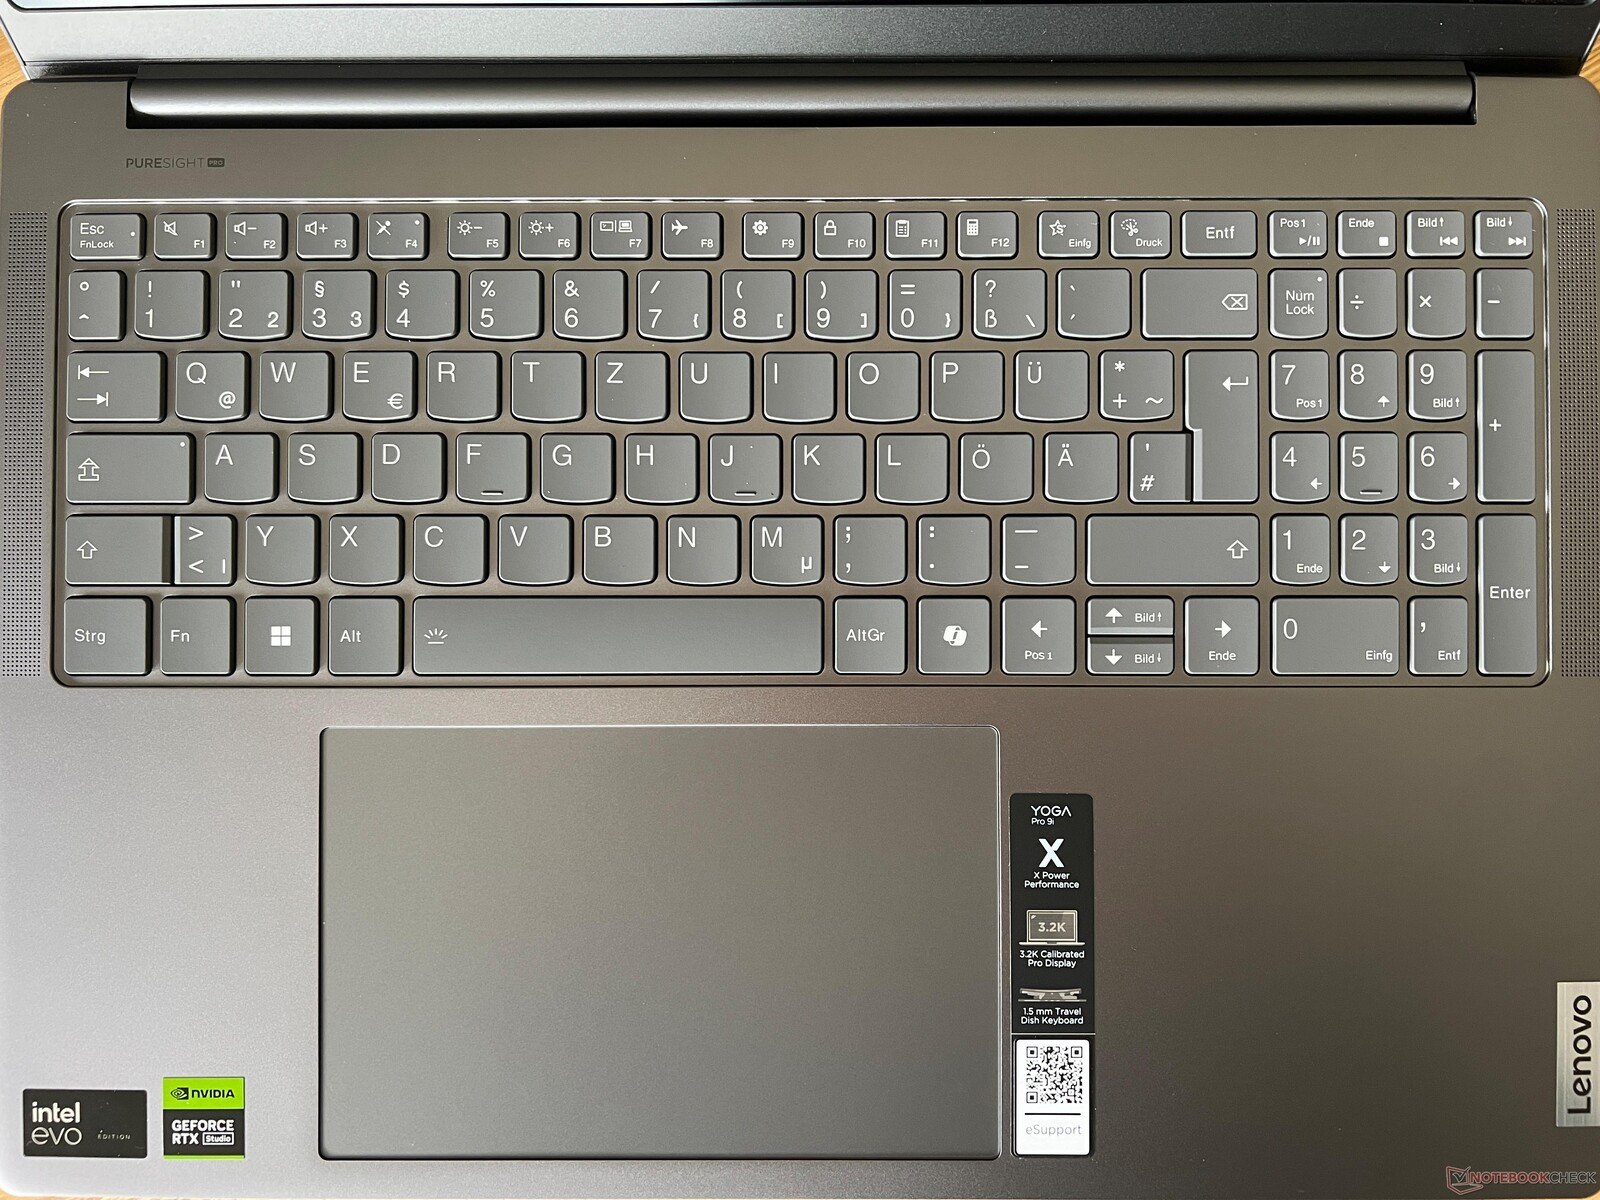
La taille du clavier reste inchangée (15 x 9,5 cm), mais Lenovo semble avoir pris en compte nos critiques et a revu la mécanique. Alors que les clics de l'ancien modèle semblaient bruyants et bon marché, ils sont désormais beaucoup plus feutrés et donnent une impression de très grande qualité. Comme toujours, les propriétés de glissement sont excellentes. Dans l'ensemble, la facilité d'utilisation du pavé tactile ne pose aucun problème.
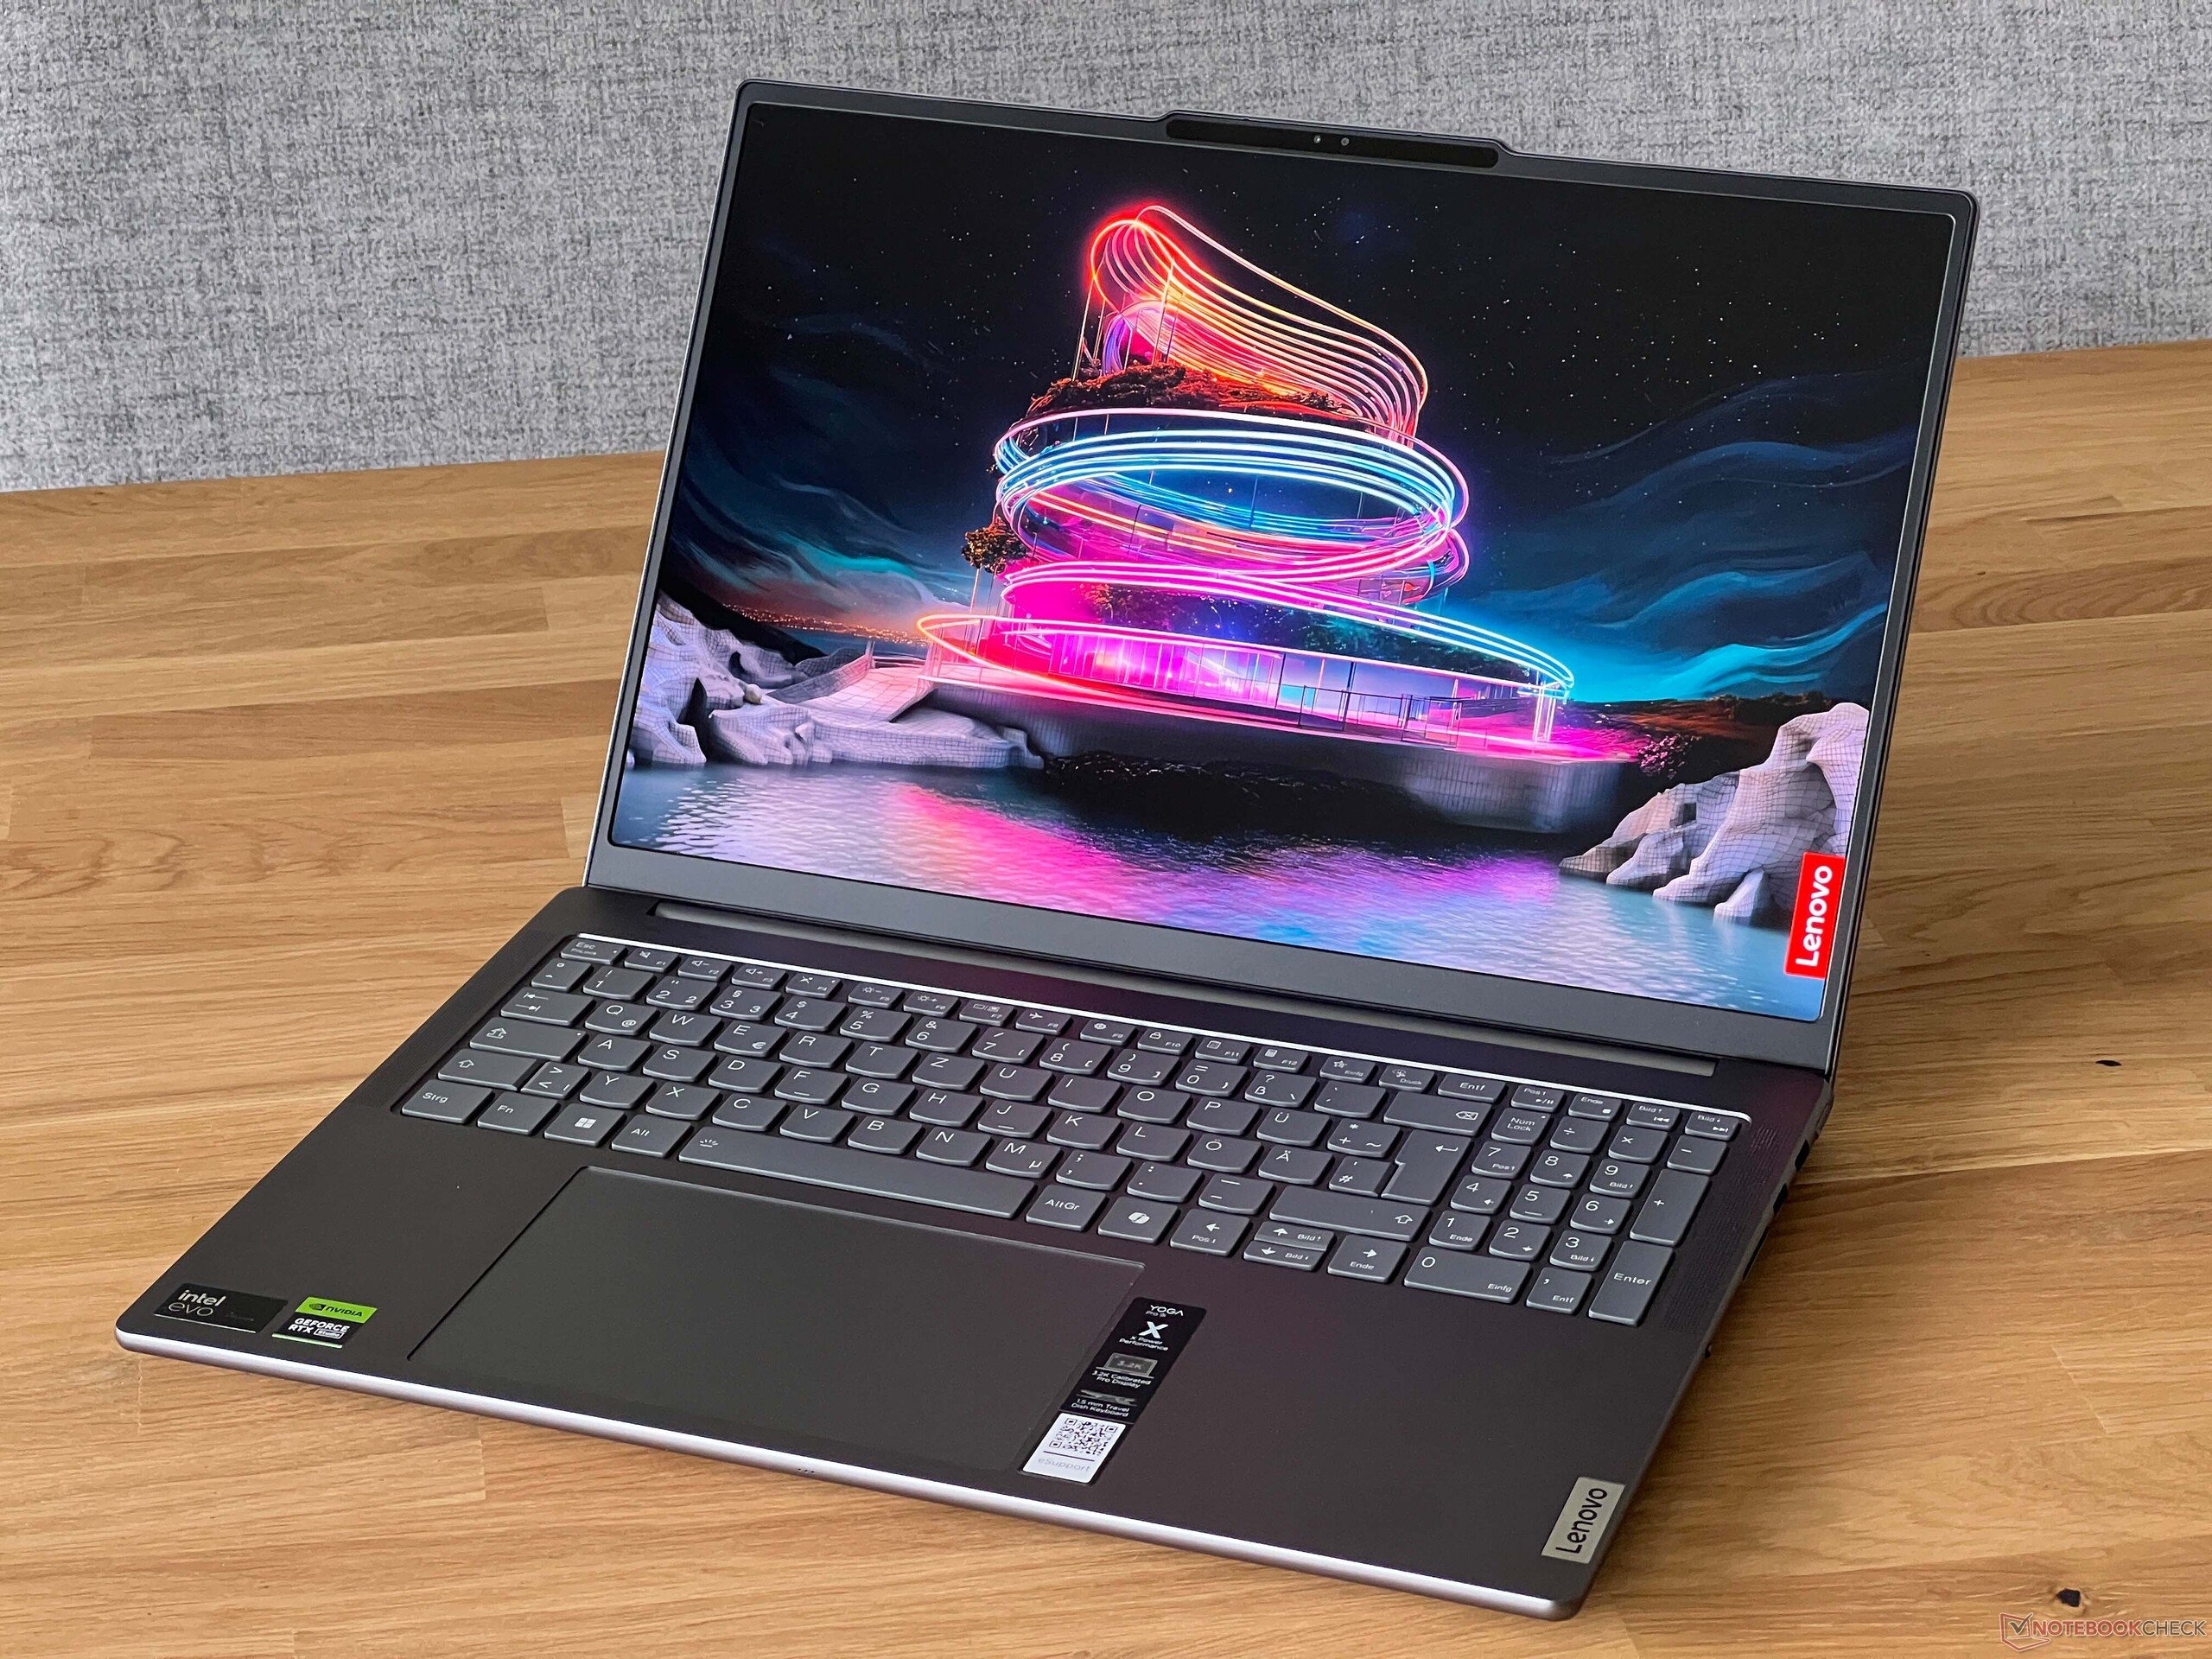
Affichage - Mini panneau LED mat
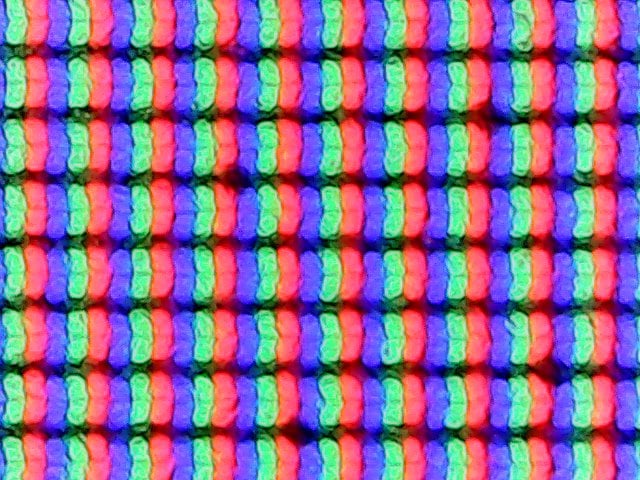
Lenovo propose différents écrans pour le Yoga Pro 9i 16 G9 et notre appareil de test est équipé d'un écran mini-LED mat d'une résolution de 3200 x 2000. La variante brillante et à écran tactile, que nous avons testée sur le prédécesseurest toujours disponible. Les mouvements sont très fluides grâce au taux de rafraîchissement élevé et les couleurs sont très vives. Même les surfaces brillantes n'apparaissent pas granuleuses malgré l'écran mat. Le mini panneau LED scintille à une fréquence constante de 4800 Hz, ce qui ne devrait pas poser de problème à la grande majorité des utilisateurs. Les temps de réponse sont légèrement inférieurs à ceux de l'ancien modèle, mais il n'y a pas eu d'images fantômes lors de l'utilisation quotidienne.
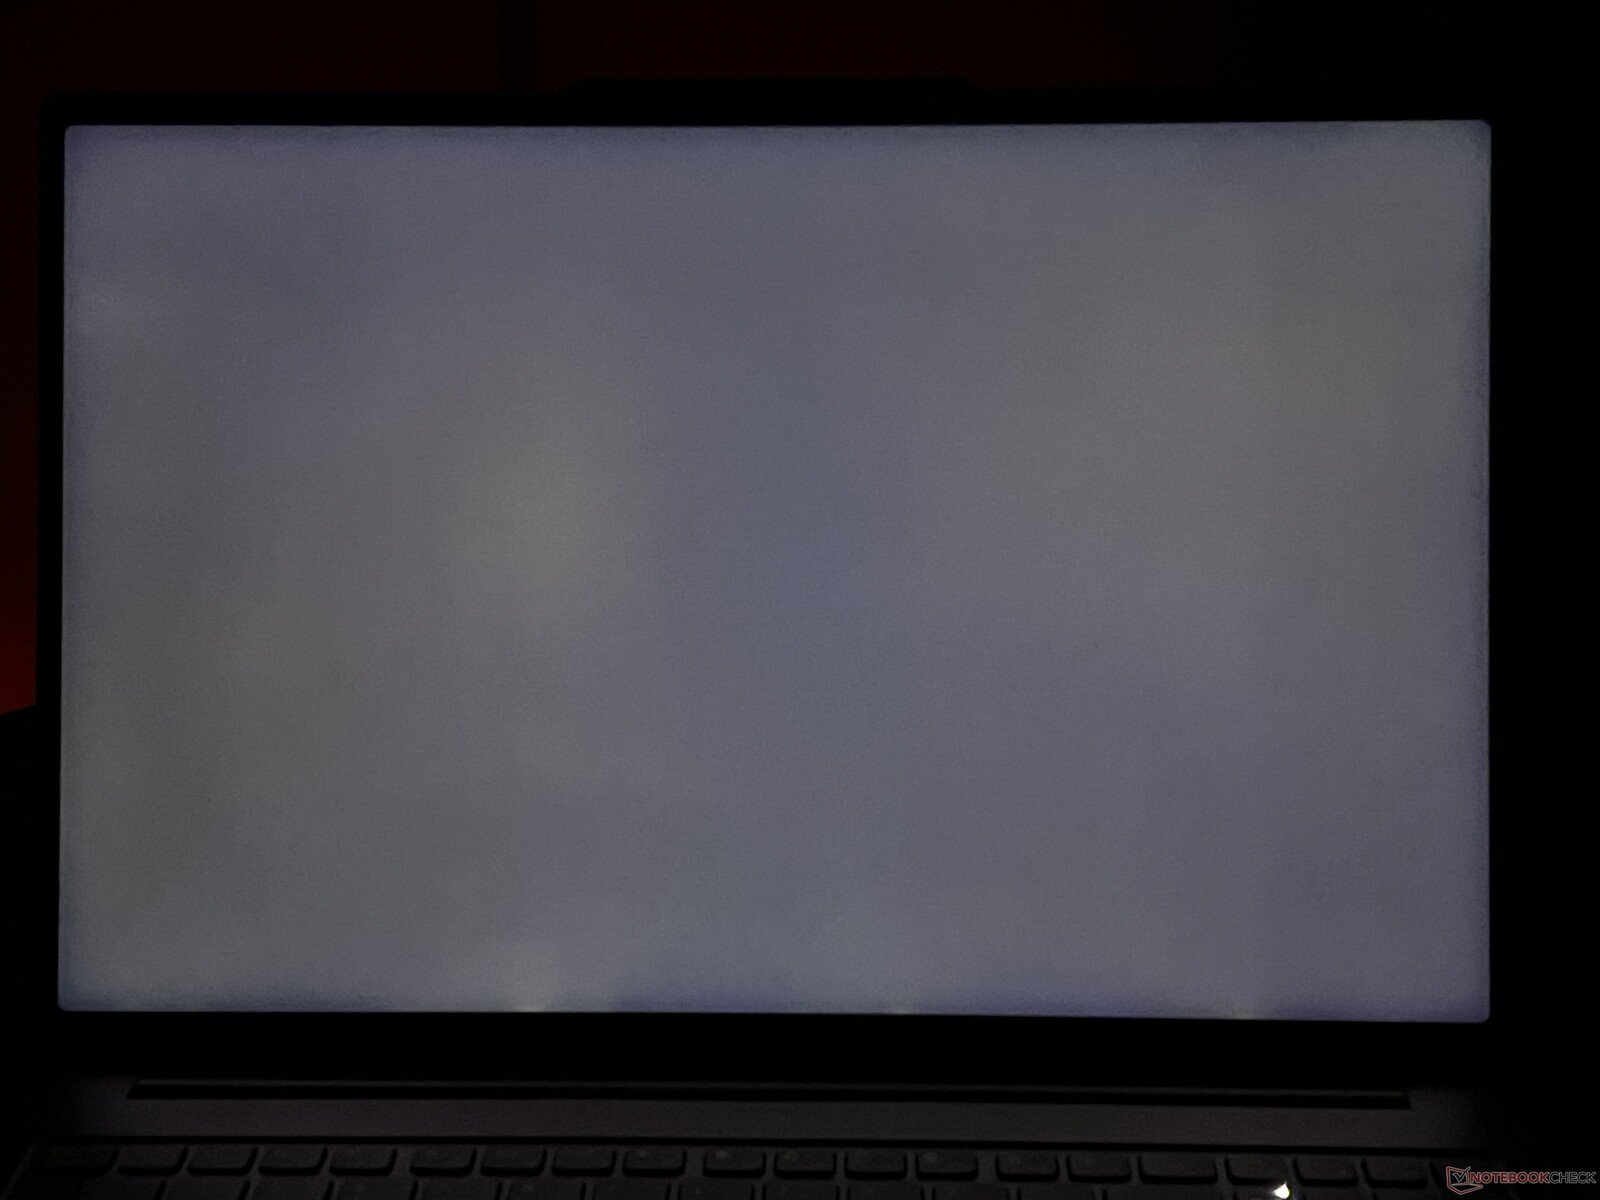
Le mini panneau LED se comporte différemment de ce à quoi vous pourriez vous attendre. En mode SDR, le panneau fonctionne comme un écran IPS normal et le noir n'est pas complètement noir ici. La luminosité moyenne est de 670 cd/m² et le niveau de noir est faible (0,22 cd/m²), ce qui donne un rapport de contraste maximal de près de 3000:1.
Ce n'est que lorsque le mode HDR est activé que l'écran passe à la gradation locale et que le noir devient vraiment noir, bien qu'il y ait également des effets de halo visibles avec des objets lumineux sur des arrière-plans sombres. La luminosité HDR maximale est de 1230 cd/m², à la fois sur de petites parties de l'image et sur une image presque entièrement blanche. C'est un exemple, mais la mise en œuvre du HDR par Windows reste problématique : le mode HDR doit être activé manuellement et n'est pas adapté à un fonctionnement continu, car le contenu SDR normal (comme le bureau Windows) apparaît alors nettement plus pâle qu'en mode SDR.
| |||||||||||||||||||||||||
Homogénéité de la luminosité: 93 %
Valeur mesurée au centre, sur batterie: 651 cd/m²
Contraste: 2959:1 (Valeurs des noirs: 0.22 cd/m²)
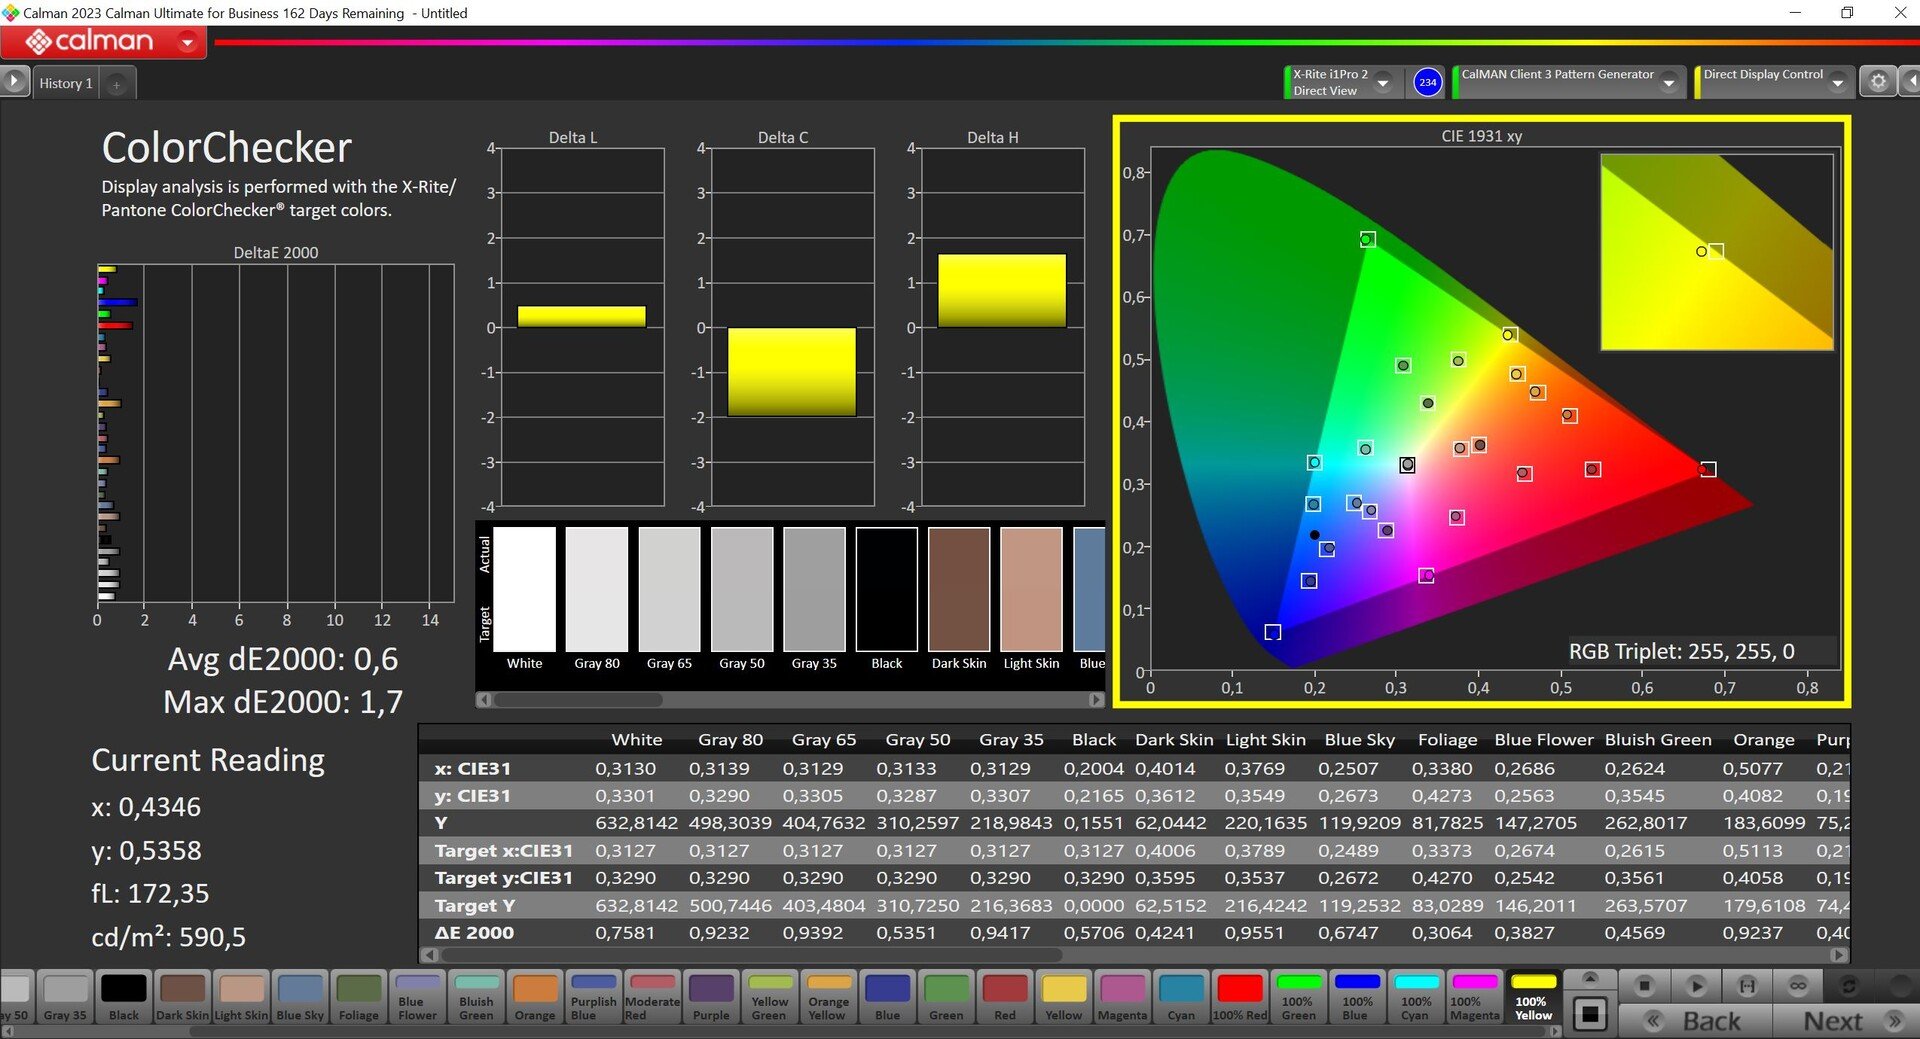
ΔE Color 1.9 | 0.5-29.43 Ø5, calibrated: 0.6
ΔE Greyscale 3 | 0.57-98 Ø5.3
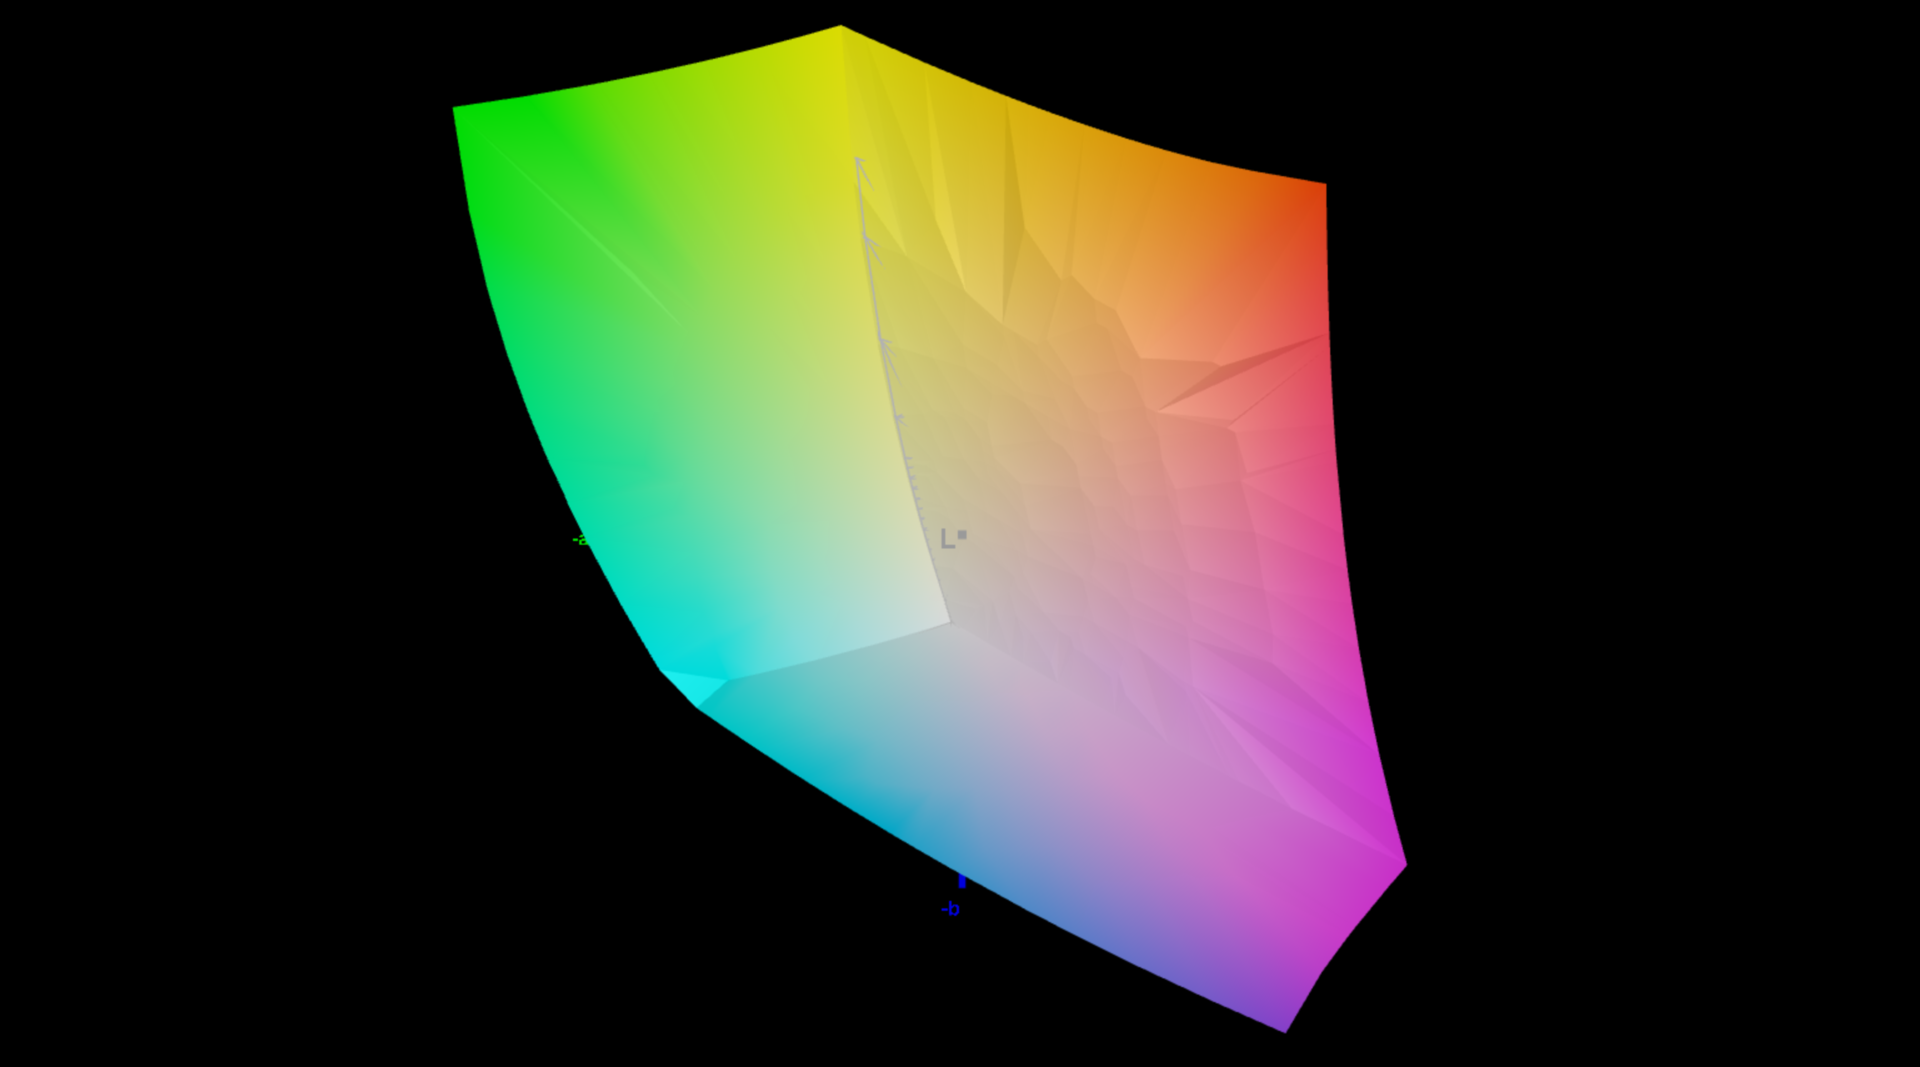
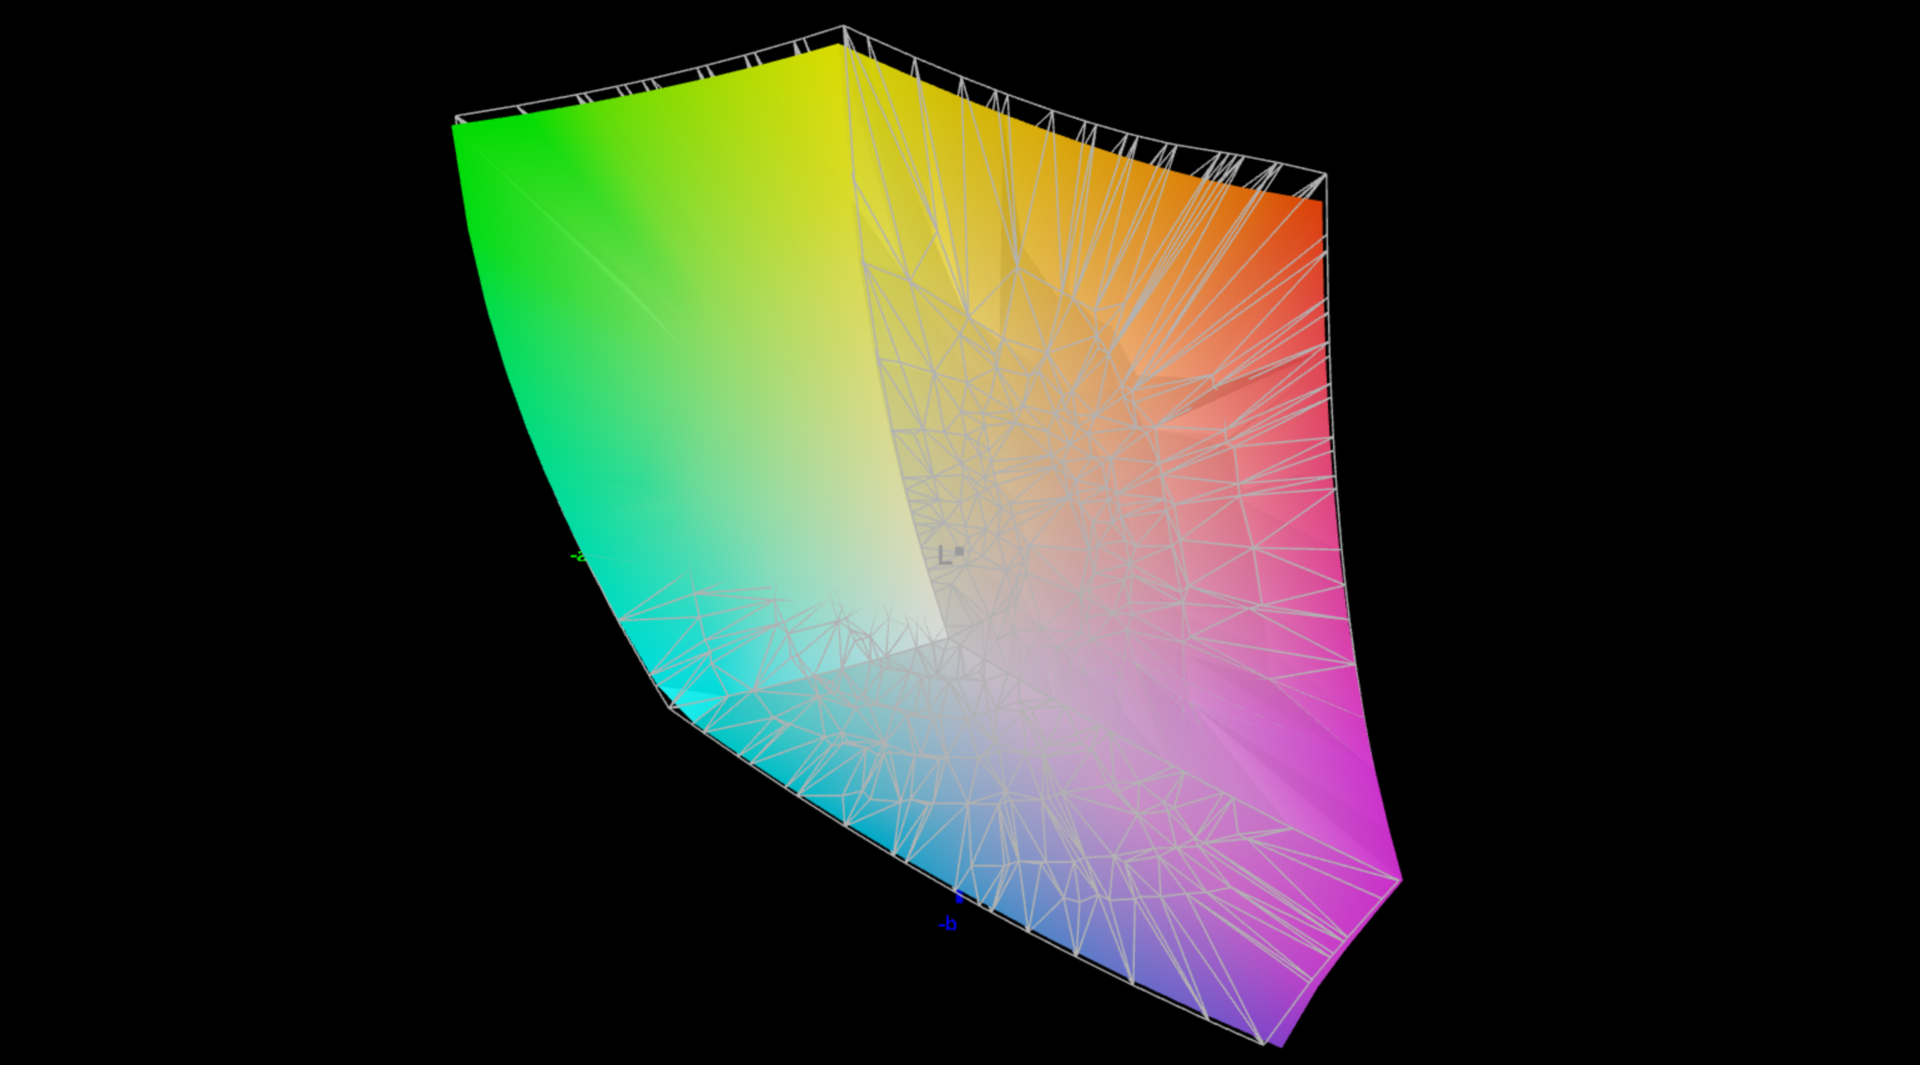
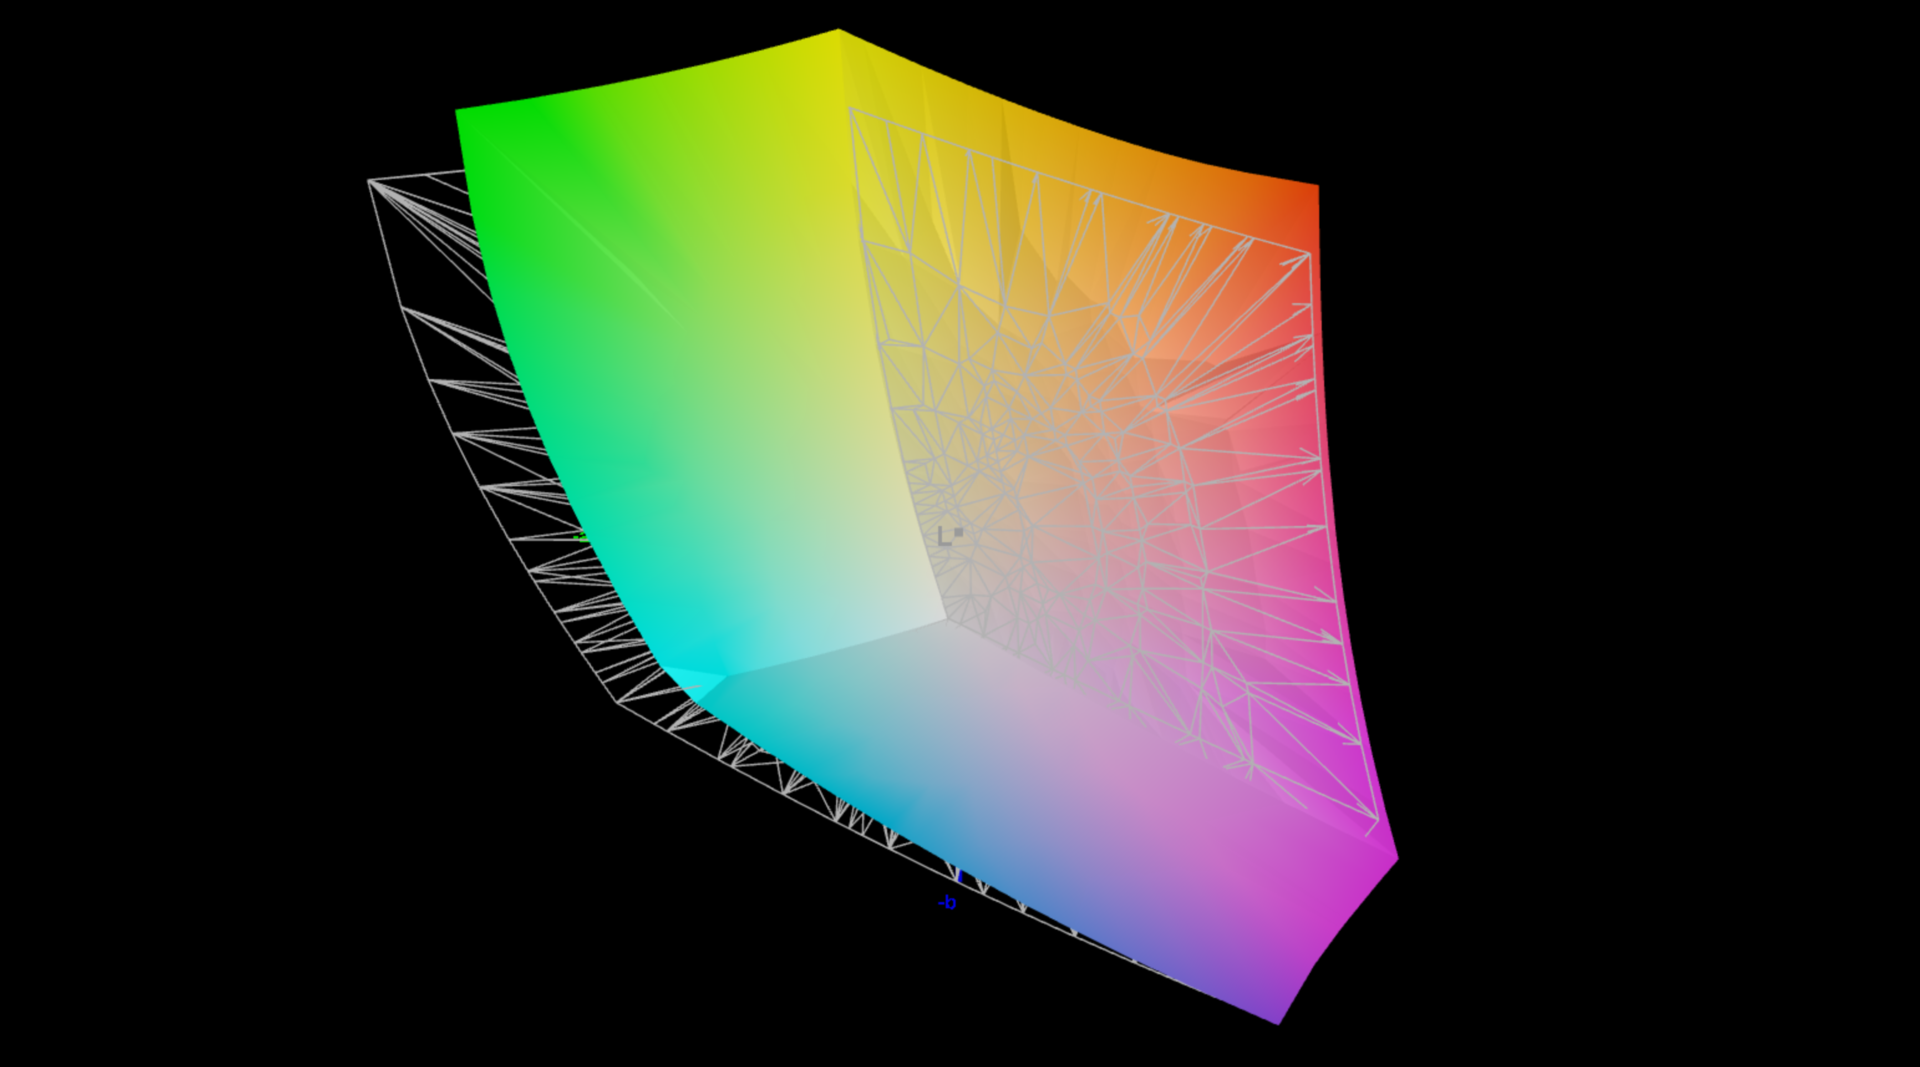
86.6% AdobeRGB 1998 (Argyll 2.2.0 3D)
99.9% sRGB (Argyll 2.2.0 3D)
97% Display P3 (Argyll 2.2.0 3D)
Gamma: 2.18
| Lenovo Yoga Pro 9 16IMH9 LEN160-3.2K, Mini-LED, 3200x2000, 16.00 | Dell XPS 16 9640 SDC4196, OLED, 3840x2400, 16.30 | Honor MagicBook Pro 16 2024 TL160MDMP01, IPS, 3072x1920, 16.00 | Samsung Galaxy Book4 Ultra ATNA60CL07-0, OLED, 2880x1800, 16.00 | Framework Laptop 16 2560x1600, 16.00 | SCHENKER VISION 16 Pro (M23) NE160QDM-NZ1, IPS, 2560x1600, 16.00 | Lenovo Yoga Pro 9 16-IRP G8 LEN160-3.2K, Mini-LED, 3200x2000, 16.00 | |
|---|---|---|---|---|---|---|---|
| Display | 1% | 2% | 1% | 0% | -16% | 3% | |
| Display P3 Coverage | 97 | 98.3 1% | 98.8 2% | 98.6 2% | 97.7 1% | 68.8 -29% | 97 0% |
| sRGB Coverage | 99.9 | 100 0% | 100 0% | 99.9 0% | 99.7 0% | 98.8 -1% | 99.8 0% |
| AdobeRGB 1998 Coverage | 86.6 | 87.8 1% | 89.1 3% | 88.5 2% | 87 0% | 70 -19% | 95.1 10% |
| Response Times | 33% | 70% | 33% | 34% | 45% | 34% | |
| Response Time Grey 50% / Grey 80% * | 22.2 ? | 0.82 ? 96% | 6.3 ? 72% | 0.54 ? 98% | 14.6 ? 34% | 13.7 ? 38% | 14 ? 37% |
| Response Time Black / White * | 17 ? | 0.85 ? 95% | 5.6 ? 67% | 0.69 ? 96% | 11.3 ? 34% | 8.1 ? 52% | 9.2 ? 46% |
| PWM Frequency | 4840 ? | 360 ? -93% | 240 ? -95% | 5800 ? 20% | |||
| Screen | -11% | -30% | 3% | -23% | -57% | 11% | |
| Brightness middle | 651 | 366 -44% | 551 -15% | 390 -40% | 504.8 -22% | 384 -41% | 539 -17% |
| Brightness | 673 | 367 -45% | 524 -22% | 393 -42% | 490 -27% | 371 -45% | 546 -19% |
| Brightness Distribution | 93 | 96 3% | 91 -2% | 98 5% | 84 -10% | 88 -5% | 96 3% |
| Black Level * | 0.22 | 0.52 -136% | 0.41 -86% | 0.3 -36% | 0.18 18% | ||
| Contrast | 2959 | 1060 -64% | 1231 -58% | 1280 -57% | 2994 1% | ||
| Colorchecker dE 2000 * | 1.9 | 1.3 32% | 1.7 11% | 1.4 26% | 1.23 35% | 3.4 -79% | 1.4 26% |
| Colorchecker dE 2000 max. * | 4.2 | 3.6 14% | 4.1 2% | 2.7 36% | 3.74 11% | 9.2 -119% | 2.1 50% |
| Colorchecker dE 2000 calibrated * | 0.6 | 1 -67% | 1 -67% | 1.1 -83% | 1.3 -117% | ||
| Greyscale dE 2000 * | 3 | 2.2 27% | 2.4 20% | 2.1 30% | 2 33% | 3.4 -13% | 2.2 27% |
| Gamma | 2.18 101% | 2.14 103% | 2.2 100% | 2.27 97% | 2.22 99% | 2.16 102% | 2.19 100% |
| CCT | 6738 96% | 6680 97% | 6842 95% | 6431 101% | 6670 97% | 7462 87% | 6479 100% |
| Moyenne finale (programmes/paramètres) | 8% /
2% | 14% /
-9% | 12% /
10% | 4% /
-10% | -9% /
-34% | 16% /
14% |
* ... Moindre est la valeur, meilleures sont les performances
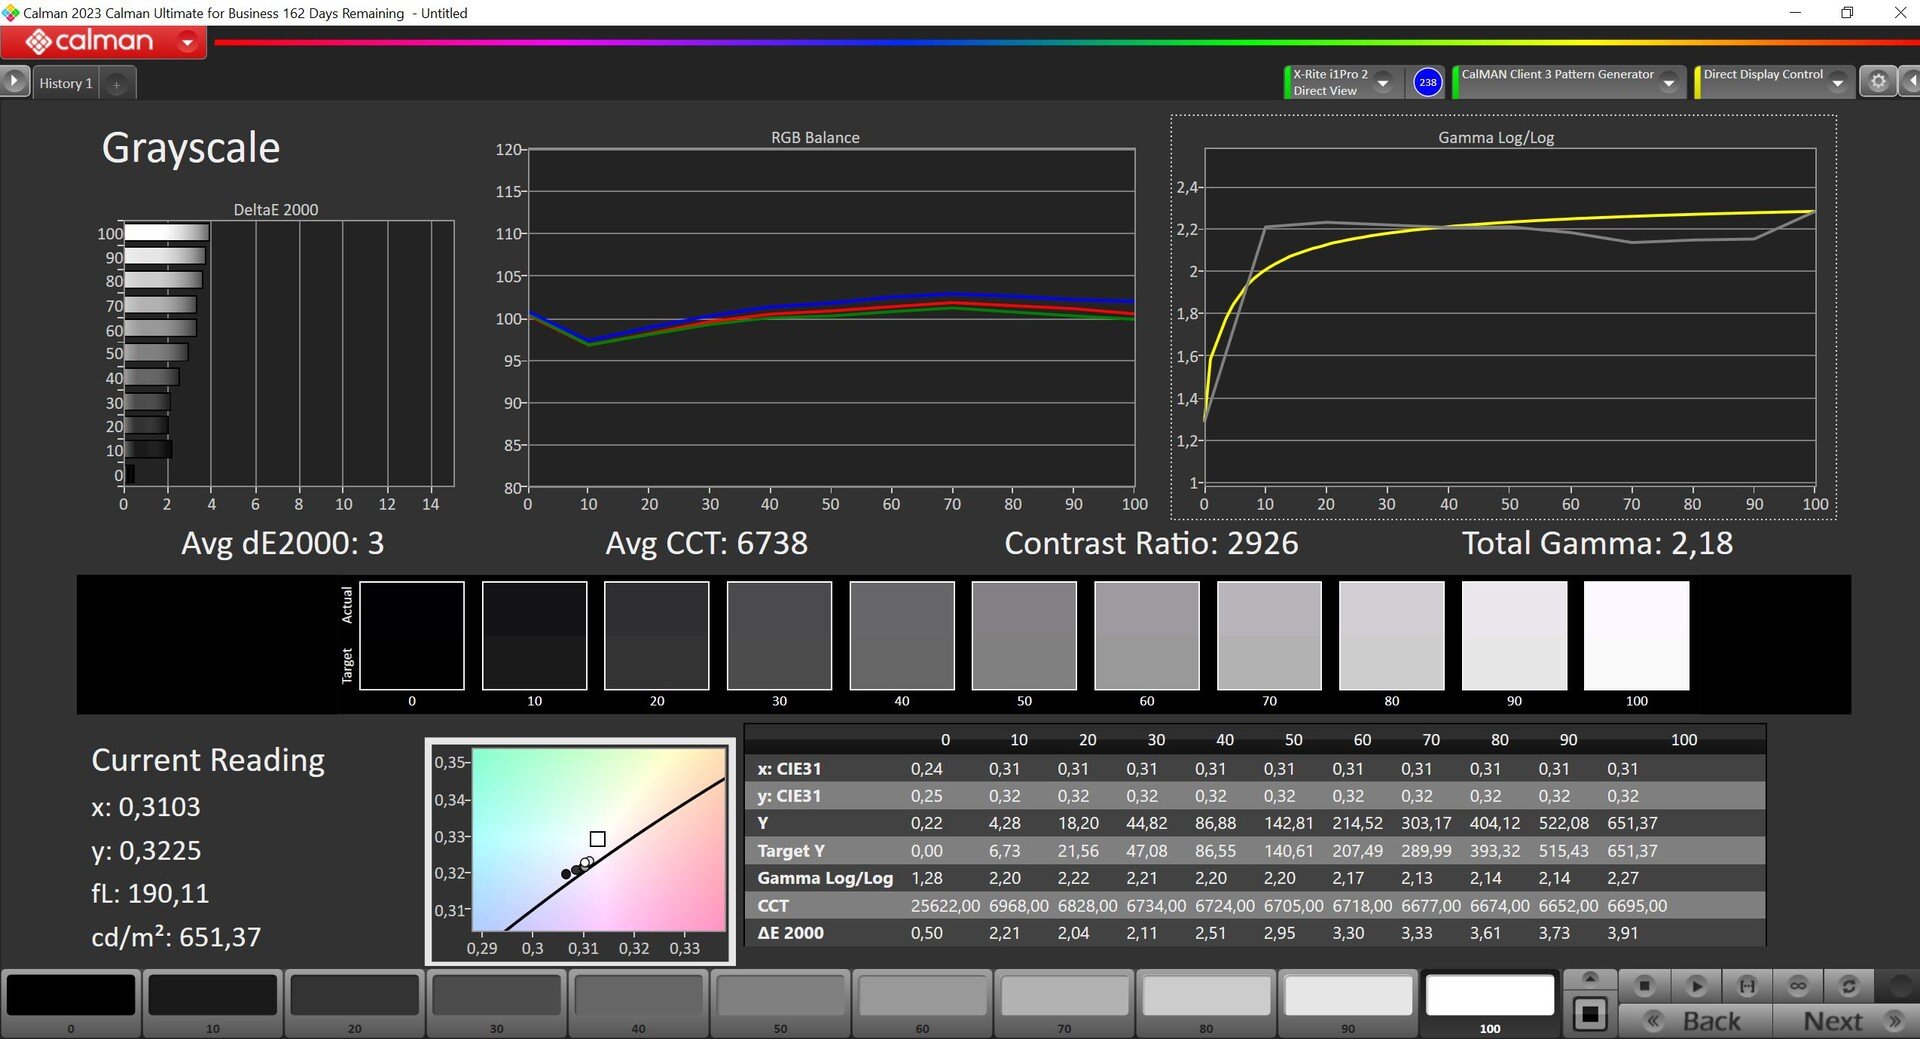
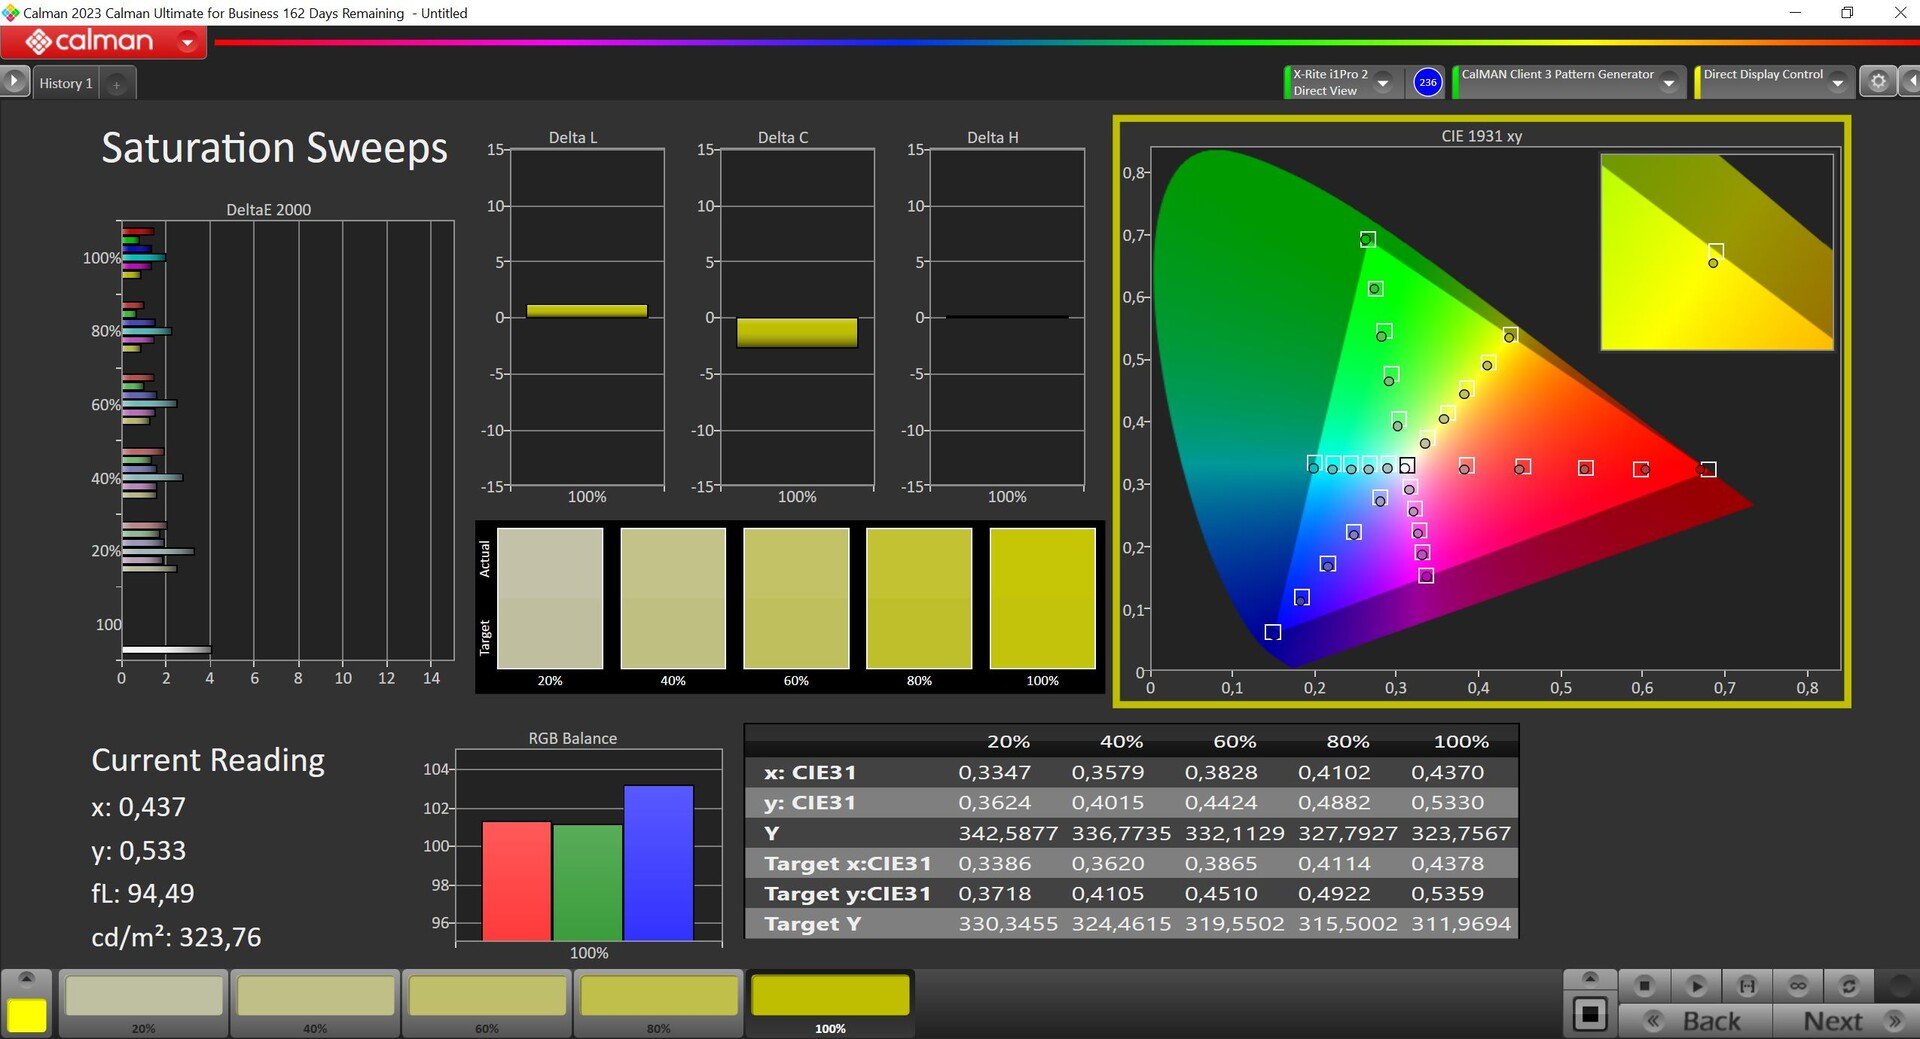
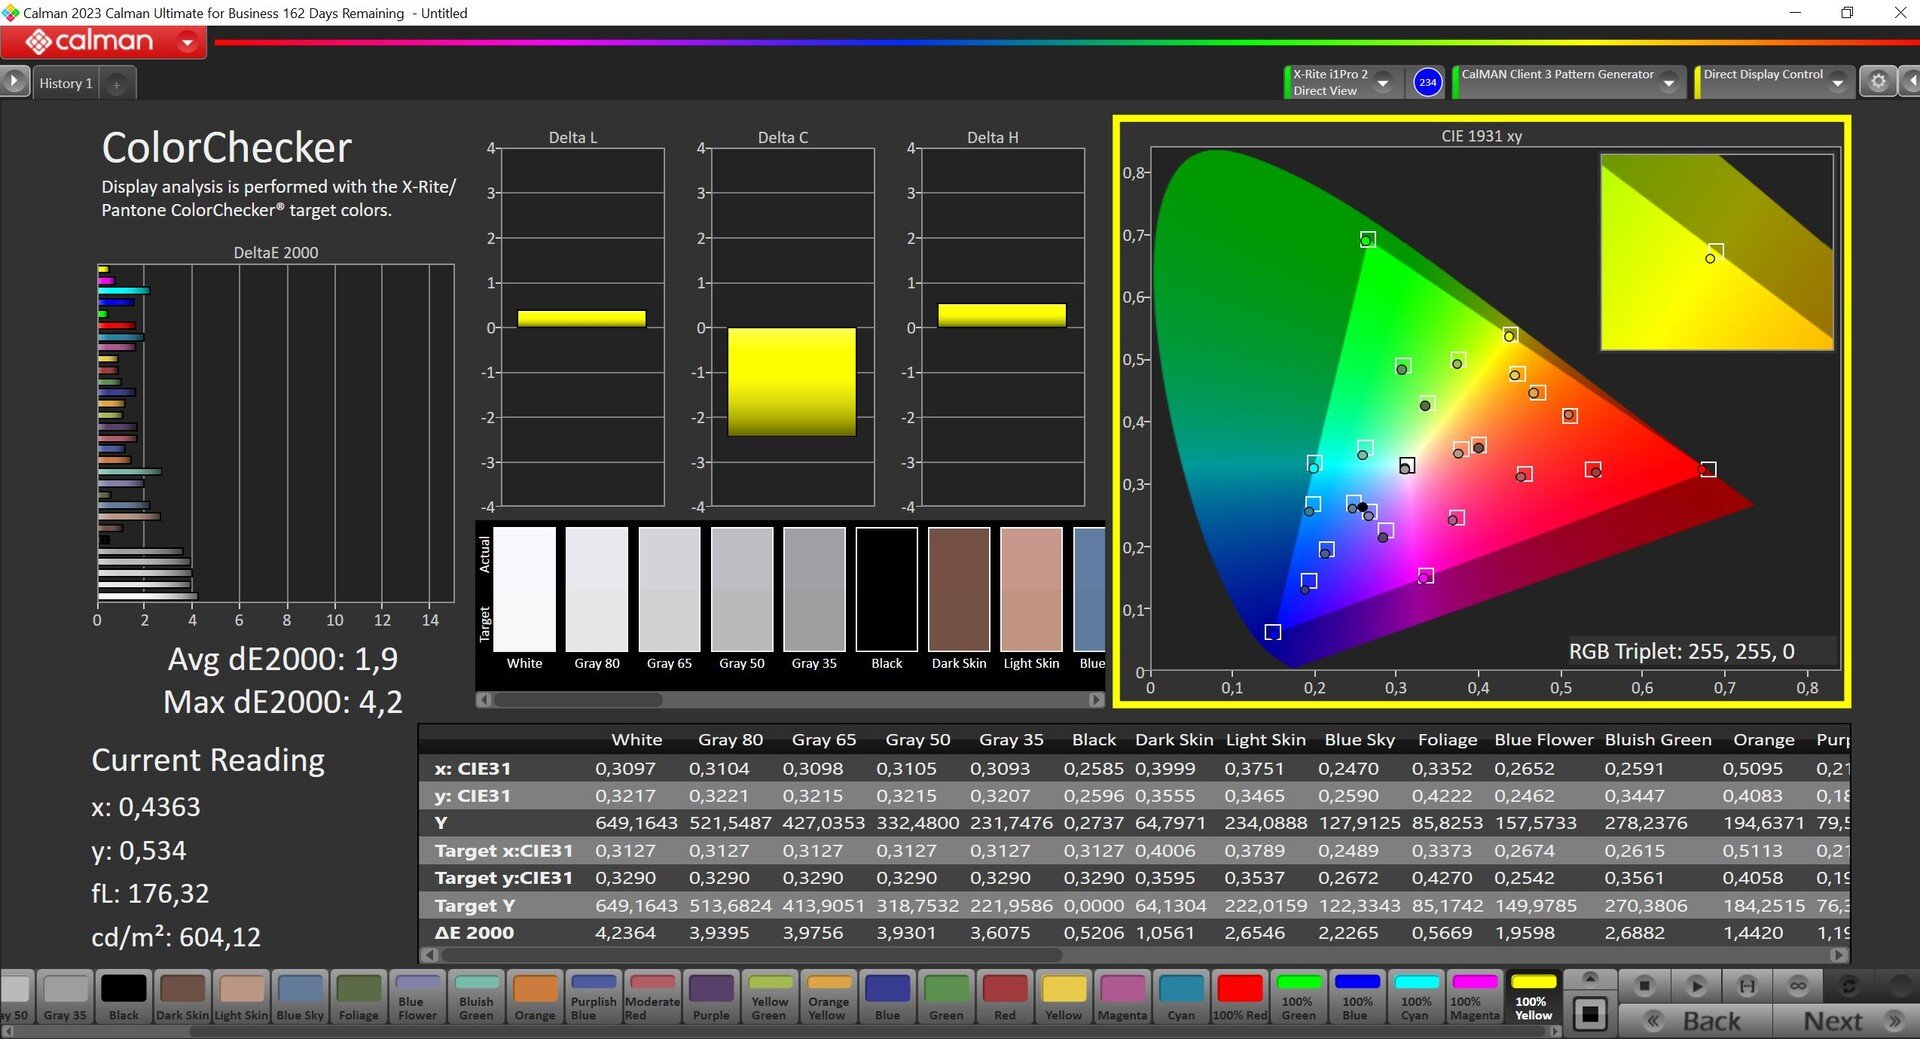
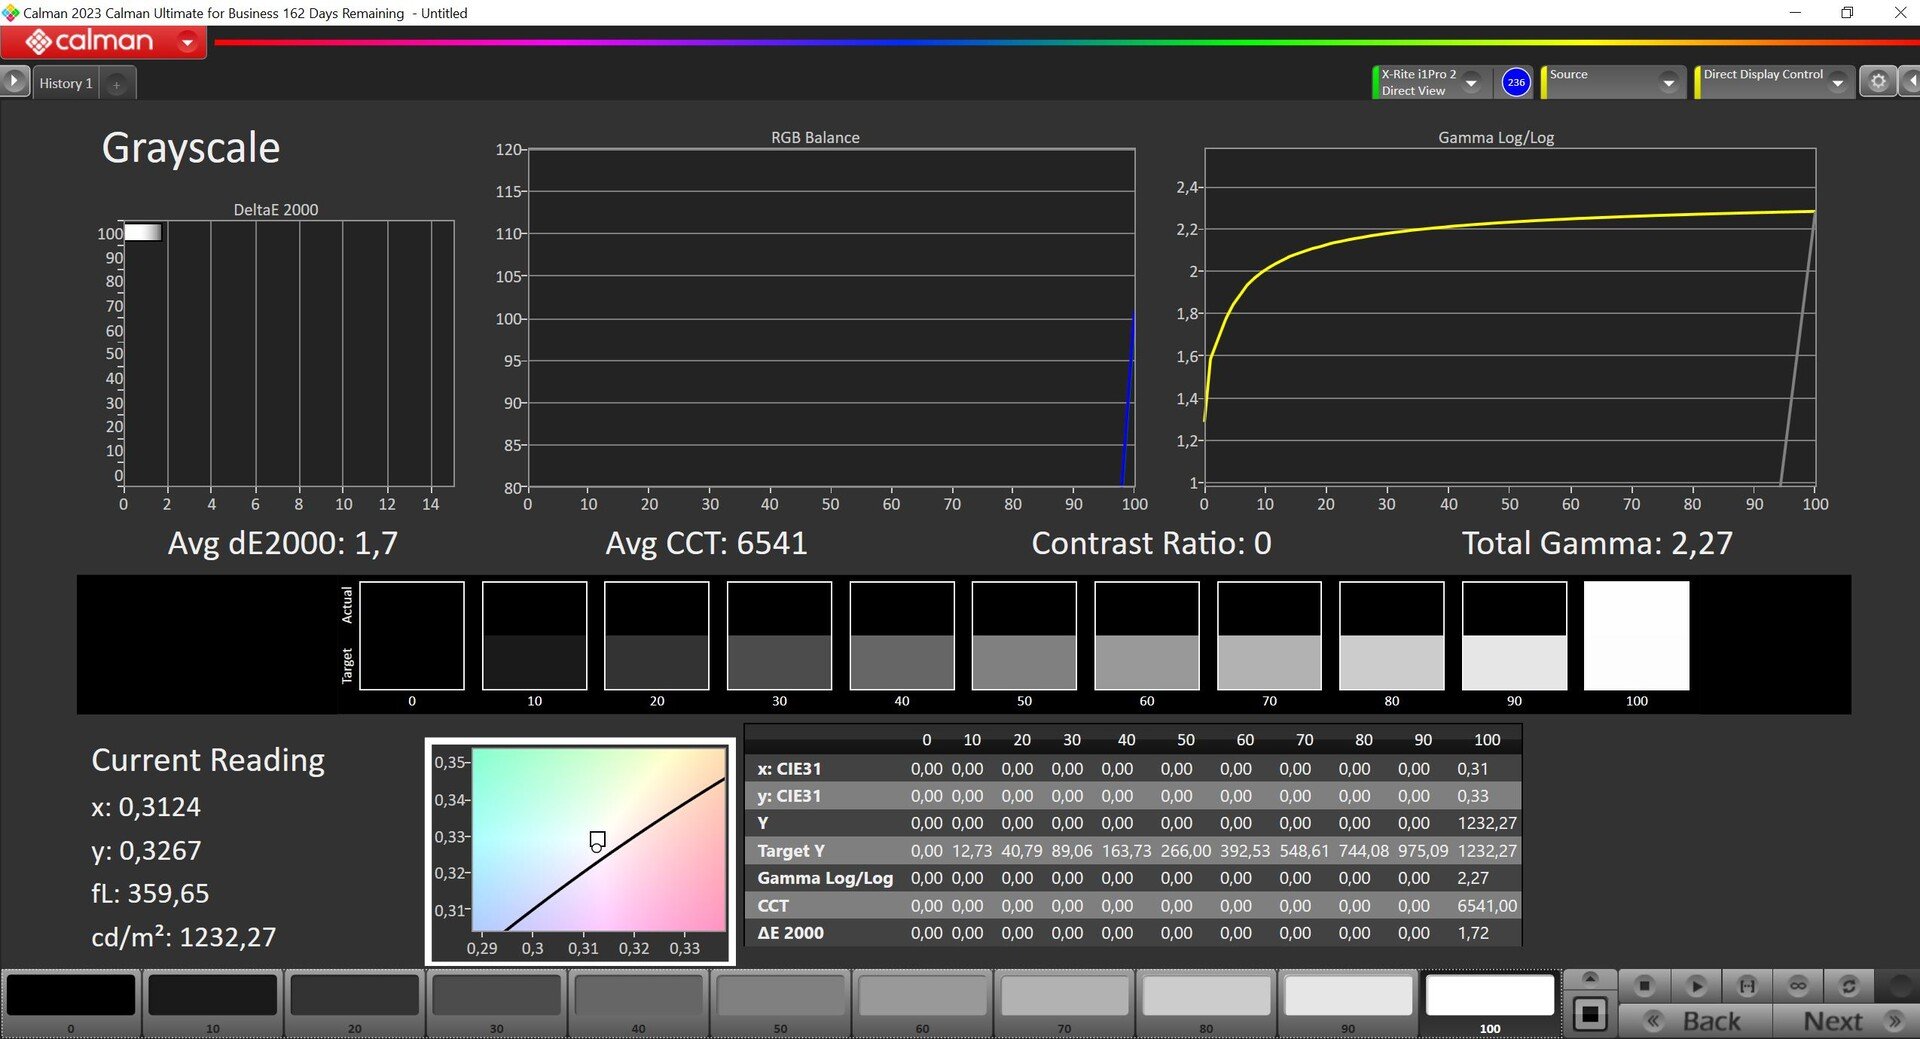
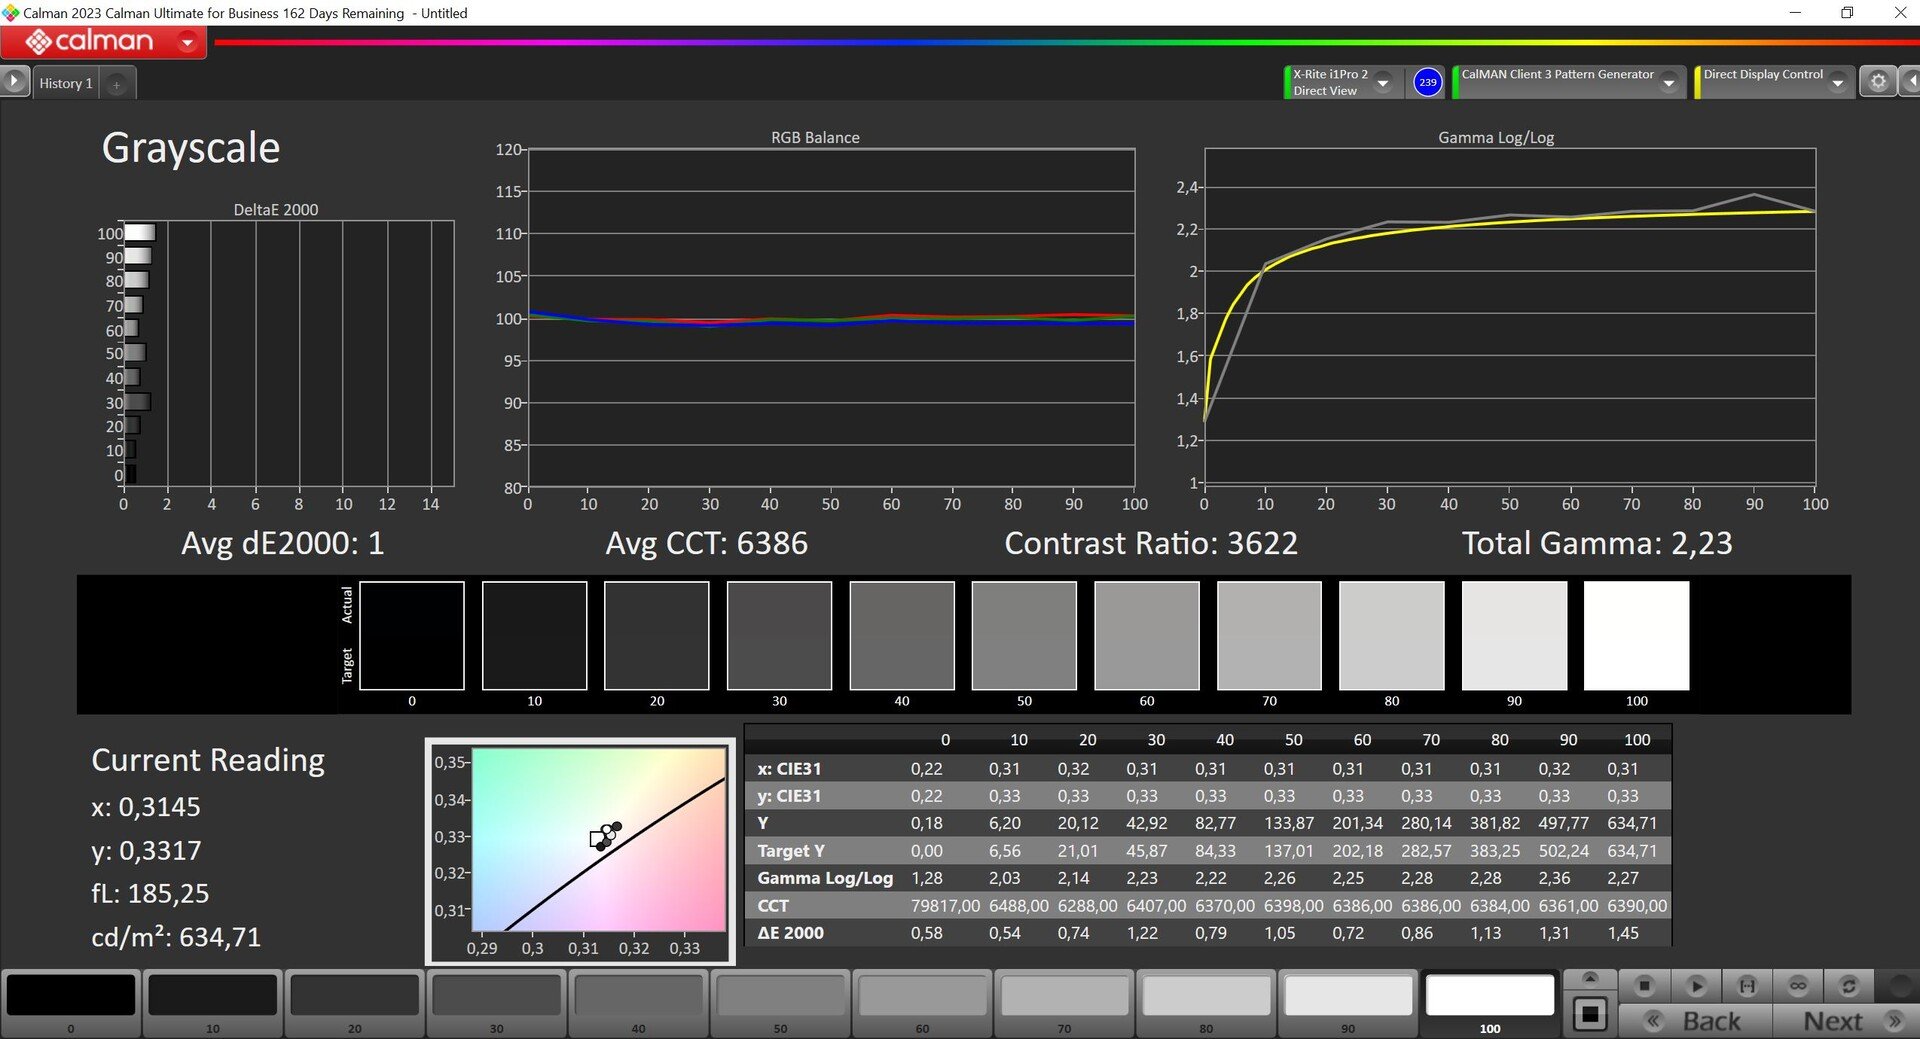
Nous avons analysé le panneau à l'aide du logiciel professionnel CalMAN (X-Rite i1 Pro 2) et nous avons été surpris de constater que le logiciel Lenovo Vantage ne fournit plus de profils de couleur pour les différents espaces colorimétriques. Lenovo annonce toujours AdobeRGB, mais le seul profil disponible est l'espace colorimétrique P3. La raison de cette restriction n'est pas claire, mais c'est vraiment ennuyeux. L'écran est déjà tout à fait décent, mais nous avons pu améliorer considérablement la qualité de l'image grâce à notre propre étalonnage (profil disponible en téléchargement gratuit ci-dessus).

Temps de réponse de l'écran
| ↔ Temps de réponse noir à blanc | ||
|---|---|---|
| 17 ms ... hausse ↗ et chute ↘ combinées | ↗ 8.2 ms hausse | 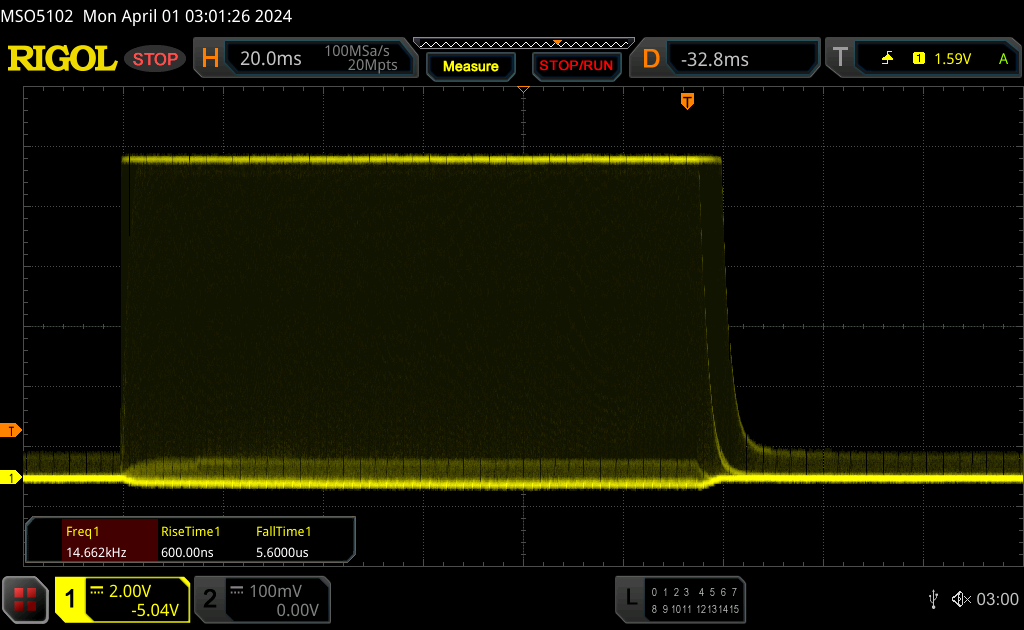 |
| ↘ 8.8 ms chute | ||
| L'écran montre de bons temps de réponse, mais insuffisant pour du jeu compétitif. En comparaison, tous les appareils testés affichent entre 0.1 (minimum) et 240 (maximum) ms. » 33 % des appareils testés affichent de meilleures performances. Cela signifie que les latences relevées sont meilleures que la moyenne (21.5 ms) de tous les appareils testés. | ||
| ↔ Temps de réponse gris 50% à gris 80% | ||
| 22.2 ms ... hausse ↗ et chute ↘ combinées | ↗ 9.6 ms hausse | 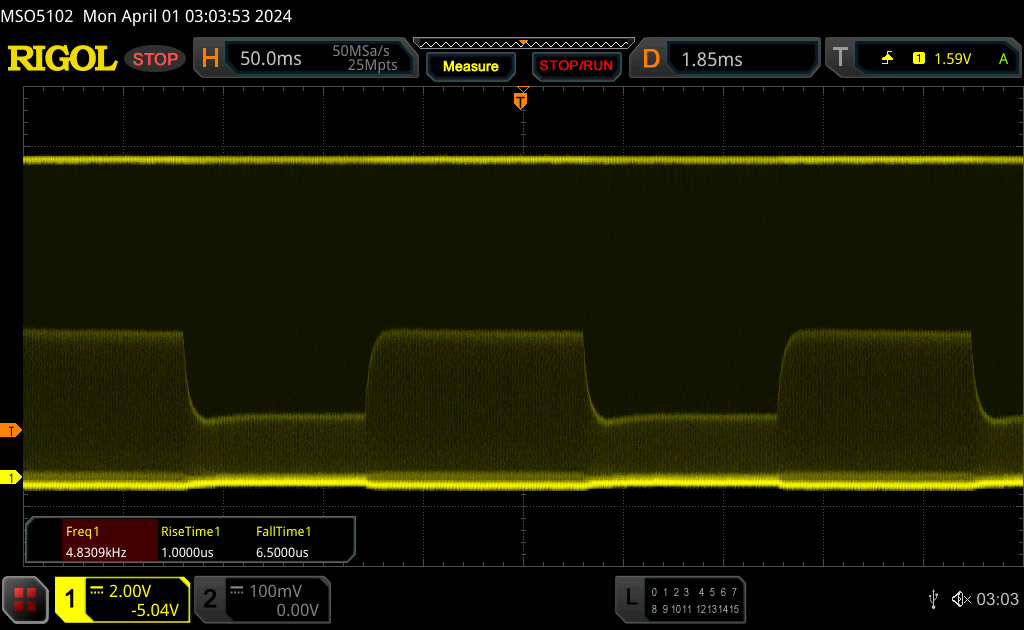 |
| ↘ 12.6 ms chute | ||
| L'écran montre de bons temps de réponse, mais insuffisant pour du jeu compétitif. En comparaison, tous les appareils testés affichent entre 0.2 (minimum) et 636 (maximum) ms. » 28 % des appareils testés affichent de meilleures performances. Cela signifie que les latences relevées sont meilleures que la moyenne (33.7 ms) de tous les appareils testés. | ||
Scintillement / MLI (Modulation de largeur d'impulsion)
| Scintillement / MLI (Modulation de largeur d'impulsion) décelé | 4840 Hz | ≤ 100 Niveau de luminosité | 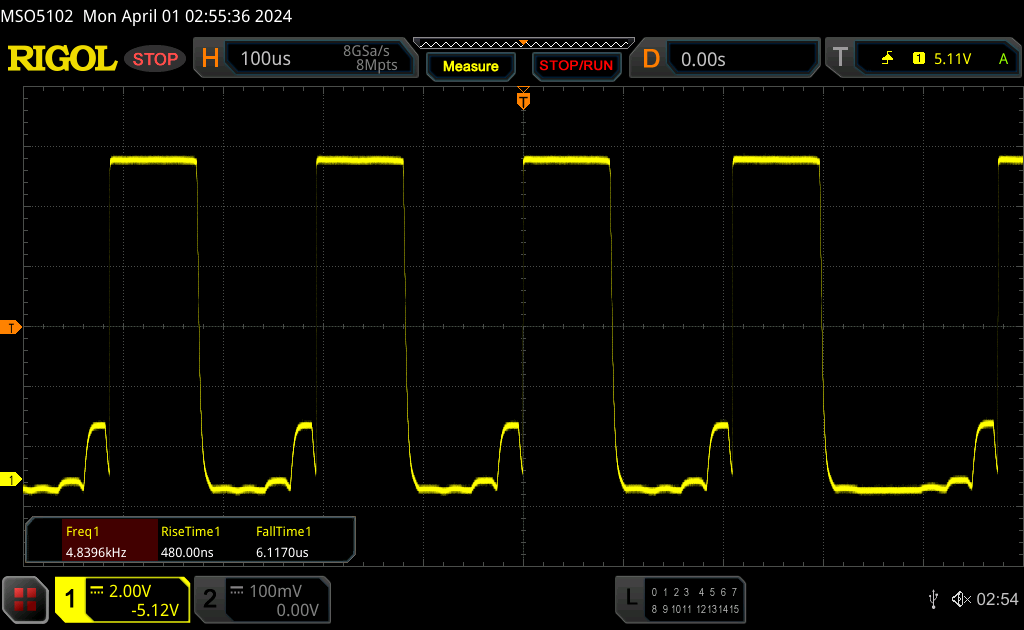 |
Le rétroéclairage de l'écran scintille à la fréquence de 4840 Hz (certainement du fait de l'utilisation d'une MDI - Modulation de largeur d'impulsion) à un niveau de luminosité inférieur ou égal à 100 % . Aucun scintillement ne devrait être perceptible au-dessus de cette valeur. La fréquence de rafraîchissement de 4840 Hz est élevée, la grande majorité des utilisateurs ne devrait pas percevoir de scintillements et être sujette à une fatigue oculaire accrue. En comparaison, 53 % des appareils testés n'emploient pas MDI pour assombrir leur écran. Nous avons relevé une moyenne à 17853 (minimum : 5 - maximum : 3846000) Hz dans le cas où une MDI était active. | |||
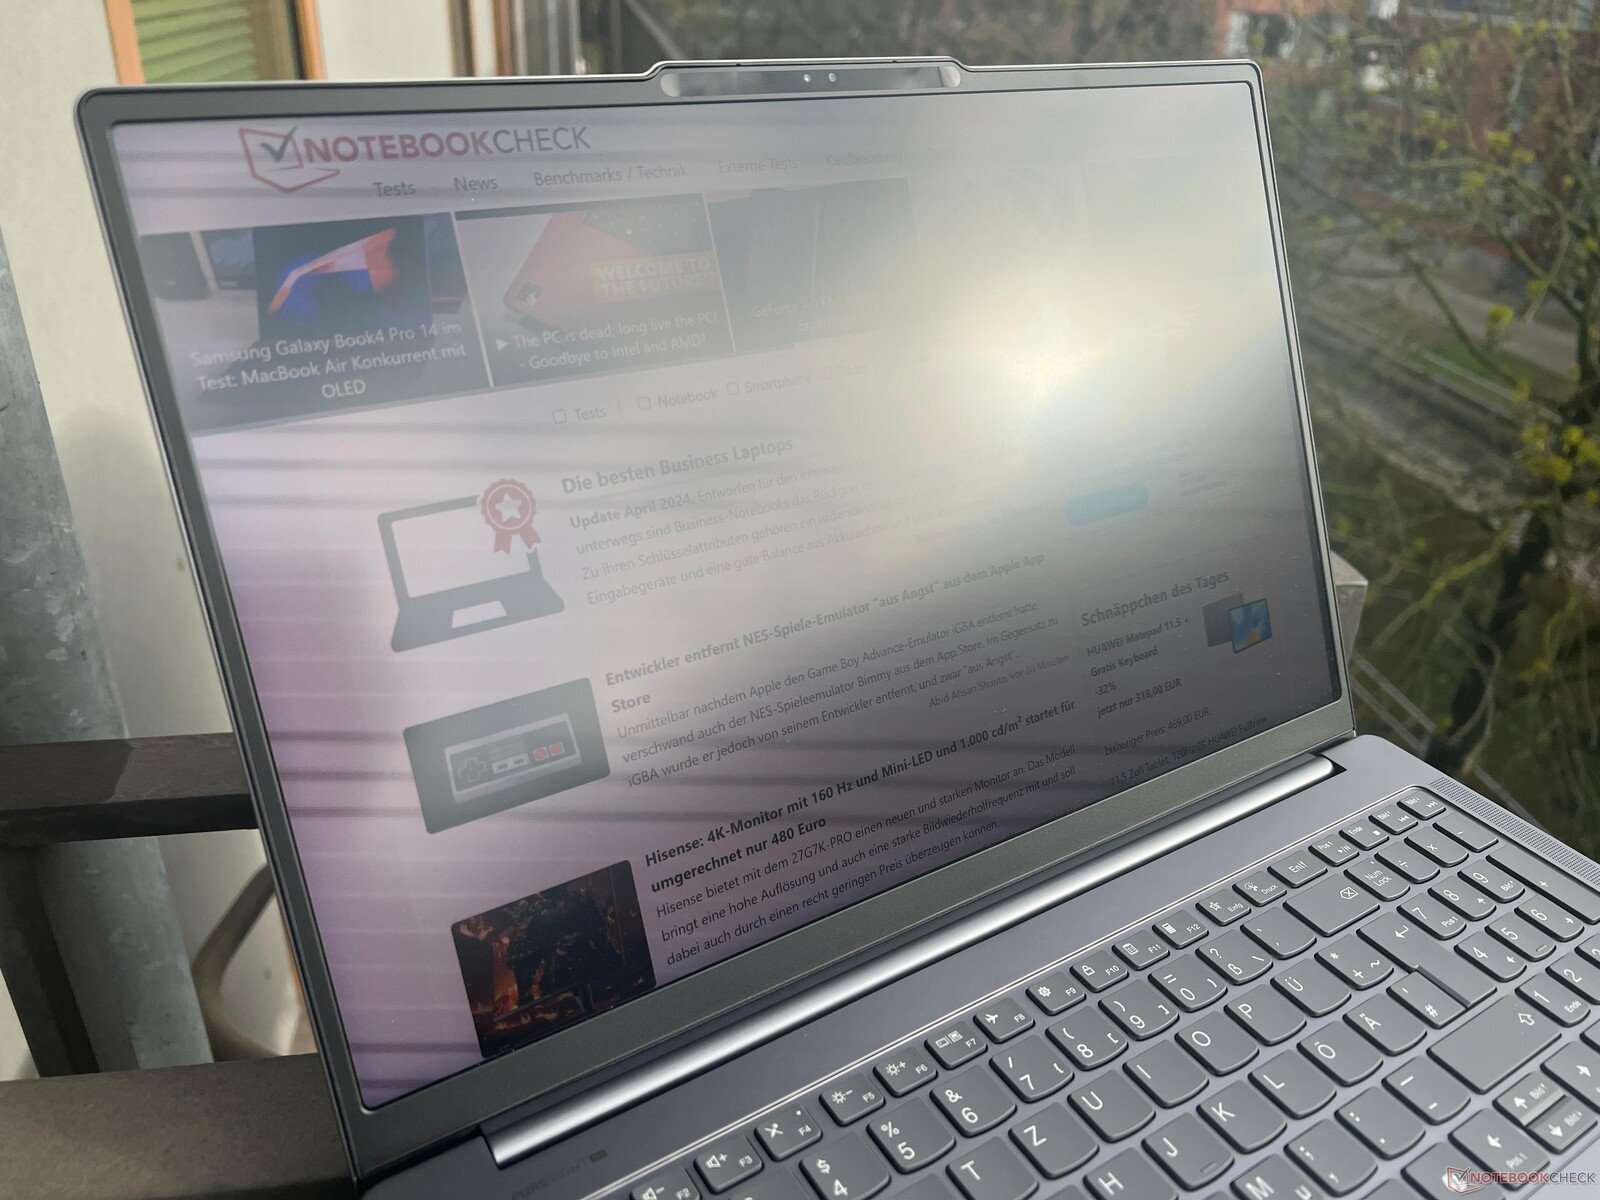
La version mate du mini panneau LED est naturellement plus performante à l'extérieur que l'écran tactile réfléchissant. Si vous évitez les reflets provenant de sources lumineuses directes, l'appareil peut également être utilisé sans problème dans des environnements très lumineux. La stabilité de l'angle de vision ne prête pas non plus le flanc à la critique.

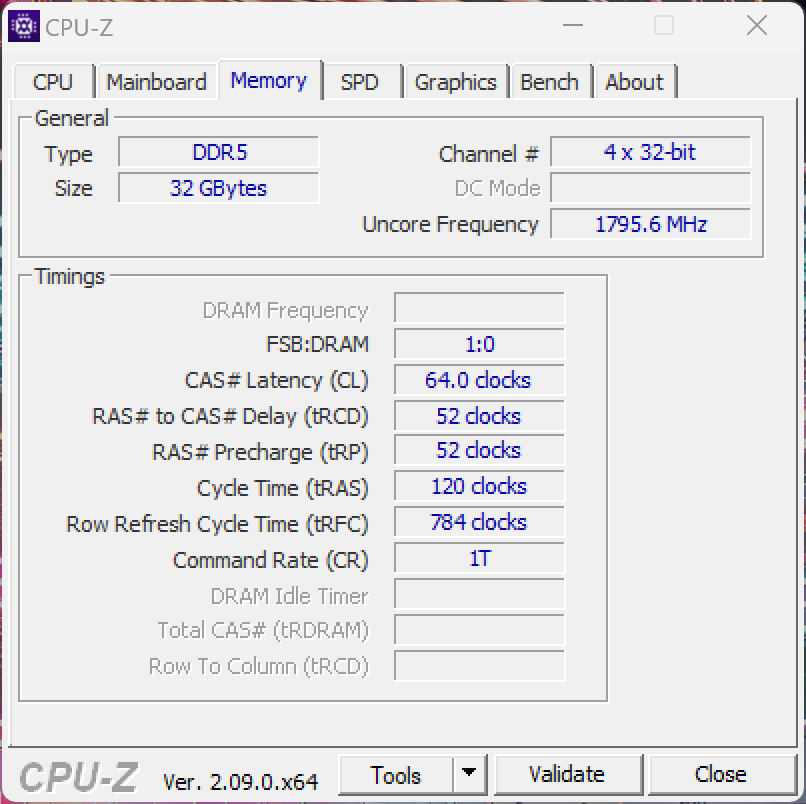
Performance - Ordinateur portable RTX 4070 avec Advanced Optimus
Lenovo propose le Yoga Pro 9i 16 G9 exclusivement avec les nouveaux processeurs Meteor Lake d'Intel (Core Ultra 7 ou 9) et les deux GeForce RTX 4060/4070 Laptop modèles. 32 Go de RAM (LPDDR5x-7467) sont fournis en standard, mais la quantité de RAM peut être doublée à 64 Go pour 130 EUR (environ 140 $) en choisissant le modèle Core Ultra 9 185H.
Conditions d'essai
Lenovo propose différents profils énergétiques et nous avons résumé les valeurs TDP/TGP correspondantes dans le tableau suivant. Nous avons effectué les benchmarks et les mesures en mode Performance .
| Profil énergétique | Charge CPU | CB R23 Multi | Charge GPU | Time Spy Graphique | Cyberpunk 2077 QHD Ultra |
volume max. du ventilateur |
|---|---|---|---|---|---|---|
| Batterie | 40 -> 30 watts | 12 824 points | 22 watts | 2 655 points | 10,3 FPS | 30,9 dB(A) |
| Auto | 78 -> 65 watts | 18 849 points | 65 watts | 10 032 points | 38,6 FPS | 44,9 dB(A) |
| Performance | 115 -> 80 watts | points | 100 watts | 12,181 points | 47.8 FPS | 53.9 dB(A) |
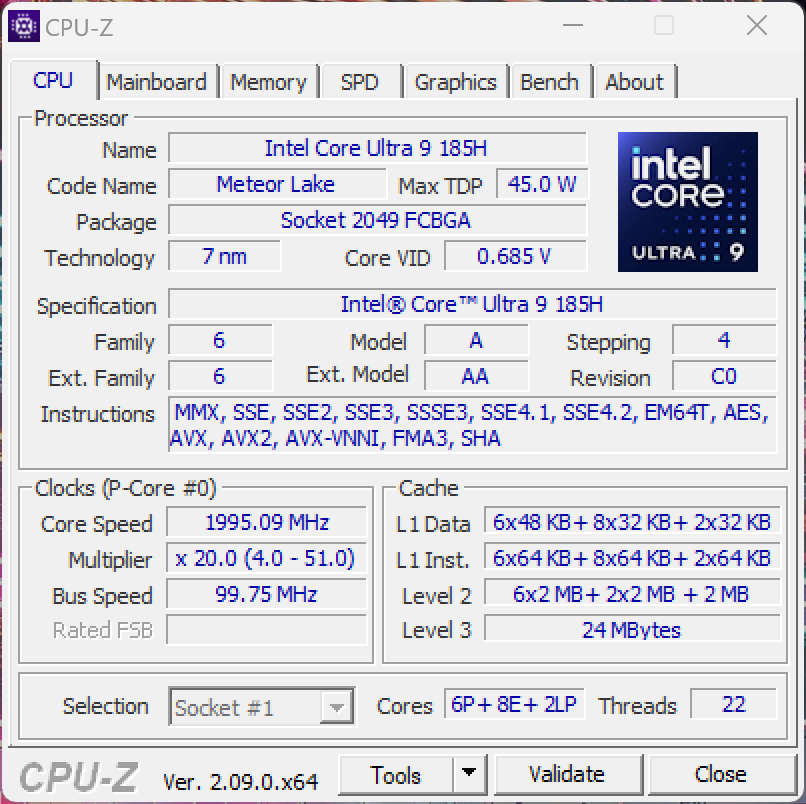
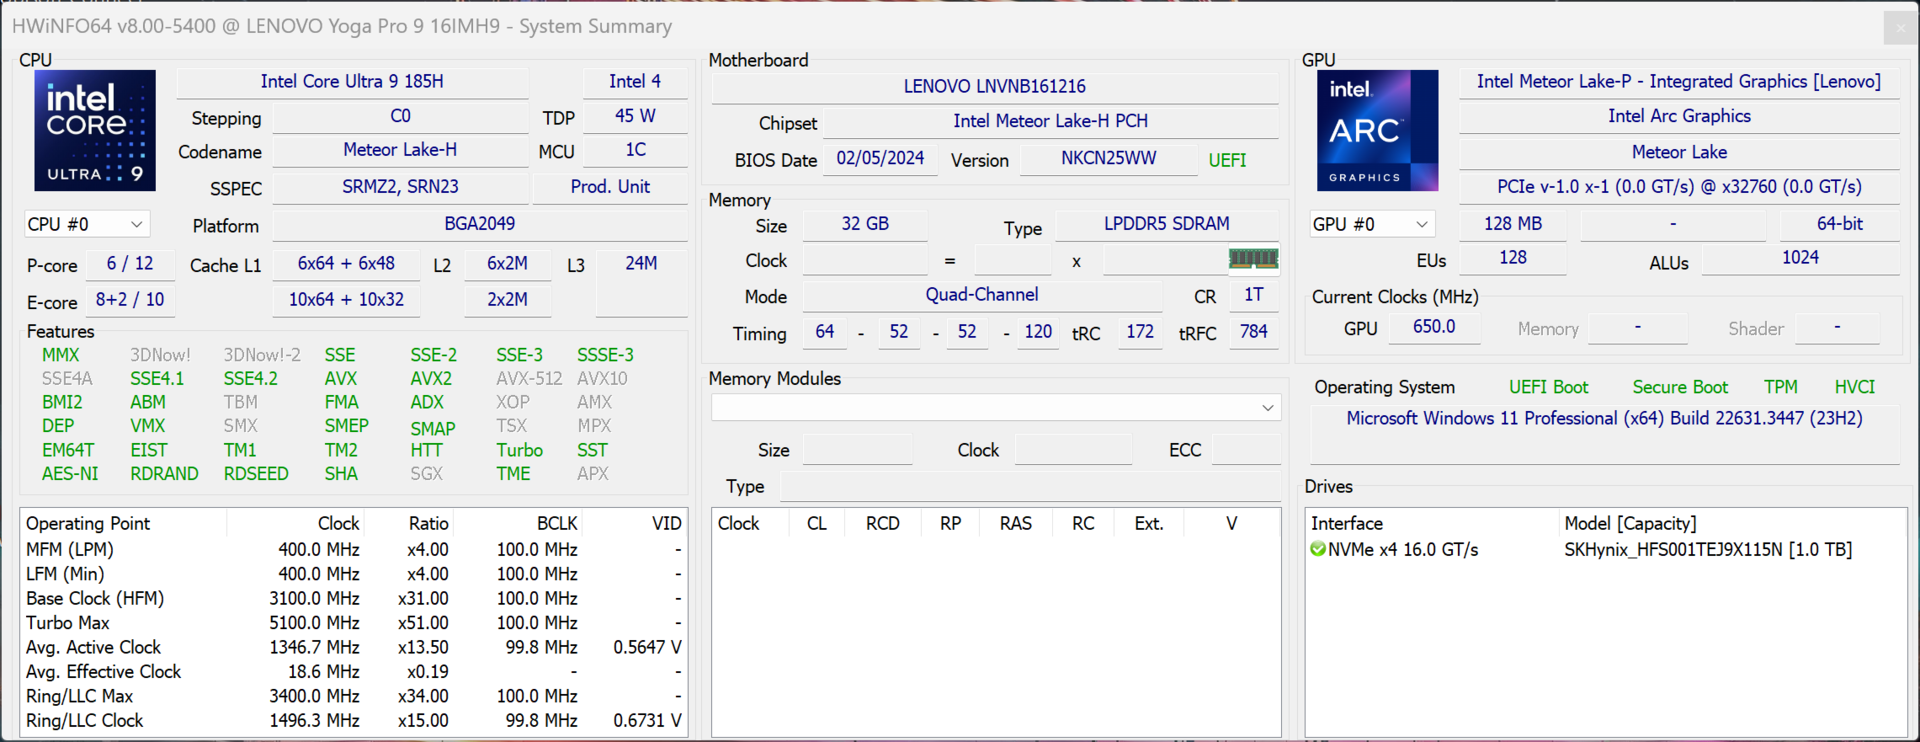
Processeur - Core Ultra 9 185H
Le Core Ultra 9 185H est le successeur du Core i9-13900H et offre 16 cœurs (22 threads). Par rapport au Core Ultra 7 155H, le 185H atteint une fréquence d'horloge maximale plus élevée, jusqu'à 5,1 GHz. Grâce aux limites de puissance élevées, les performances sont très bonnes, mais vous pouvez également constater que les performances multicœurs ne sont que marginalement meilleures que celles des anciennes puces Raptor Lake. En moyenne, le Core Ultra 9 n'a que 2 % d'avance sur le Core i7-13705H de son prédécesseur dans tous les benchmarks de CPU. Les performances restent également très stables en cas de charge soutenue.
En mode batterie, le processeur peut consommer un maximum de 80 watts, ce qui explique pourquoi les performances ne sont que légèrement inférieures à celles obtenues en fonctionnement normal. D'autres tests de performance du processeur sont disponibles dans notre section technique.
Cinebench R15 Multi Sustained Load
Cinebench R23: Multi Core | Single Core
Cinebench R20: CPU (Multi Core) | CPU (Single Core)
Cinebench R15: CPU Multi 64Bit | CPU Single 64Bit
Blender: v2.79 BMW27 CPU
7-Zip 18.03: 7z b 4 | 7z b 4 -mmt1
Geekbench 6.2: Multi-Core | Single-Core
Geekbench 5.5: Multi-Core | Single-Core
HWBOT x265 Benchmark v2.2: 4k Preset
LibreOffice : 20 Documents To PDF
R Benchmark 2.5: Overall mean
| CPU Performance Rating | |
| Lenovo Yoga Pro 9 16IMH9 | |
| Lenovo Yoga Pro 9 16-IRP G8 | |
| Framework Laptop 16 | |
| Honor MagicBook Pro 16 2024 | |
| Dell XPS 16 9640 | |
| Moyenne Intel Core Ultra 9 185H | |
| Samsung Galaxy Book4 Ultra | |
| SCHENKER VISION 16 Pro (M23) -2! | |
| Moyenne de la classe Multimedia | |
| Cinebench R23 / Multi Core | |
| Lenovo Yoga Pro 9 16IMH9 | |
| Lenovo Yoga Pro 9 16-IRP G8 | |
| Honor MagicBook Pro 16 2024 | |
| Dell XPS 16 9640 | |
| Moyenne Intel Core Ultra 9 185H (12688 - 19851, n=4) | |
| Framework Laptop 16 | |
| Samsung Galaxy Book4 Ultra | |
| SCHENKER VISION 16 Pro (M23) | |
| Moyenne de la classe Multimedia (4624 - 30789, n=102, 2 dernières années) | |
| Cinebench R23 / Single Core | |
| Lenovo Yoga Pro 9 16IMH9 | |
| SCHENKER VISION 16 Pro (M23) | |
| Lenovo Yoga Pro 9 16-IRP G8 | |
| Moyenne Intel Core Ultra 9 185H (1770 - 1906, n=4) | |
| Dell XPS 16 9640 | |
| Samsung Galaxy Book4 Ultra | |
| Honor MagicBook Pro 16 2024 | |
| Framework Laptop 16 | |
| Moyenne de la classe Multimedia (878 - 2110, n=100, 2 dernières années) | |
| Cinebench R20 / CPU (Multi Core) | |
| Lenovo Yoga Pro 9 16IMH9 | |
| Lenovo Yoga Pro 9 16-IRP G8 | |
| Honor MagicBook Pro 16 2024 | |
| Dell XPS 16 9640 | |
| Moyenne Intel Core Ultra 9 185H (4843 - 7651, n=4) | |
| Framework Laptop 16 | |
| Samsung Galaxy Book4 Ultra | |
| SCHENKER VISION 16 Pro (M23) | |
| Moyenne de la classe Multimedia (1783 - 11768, n=98, 2 dernières années) | |
| Cinebench R20 / CPU (Single Core) | |
| Lenovo Yoga Pro 9 16IMH9 | |
| Lenovo Yoga Pro 9 16-IRP G8 | |
| SCHENKER VISION 16 Pro (M23) | |
| Moyenne Intel Core Ultra 9 185H (680 - 735, n=4) | |
| Samsung Galaxy Book4 Ultra | |
| Honor MagicBook Pro 16 2024 | |
| Framework Laptop 16 | |
| Dell XPS 16 9640 | |
| Moyenne de la classe Multimedia (341 - 812, n=98, 2 dernières années) | |
| Cinebench R15 / CPU Multi 64Bit | |
| Lenovo Yoga Pro 9 16IMH9 | |
| Lenovo Yoga Pro 9 16-IRP G8 | |
| Honor MagicBook Pro 16 2024 | |
| Dell XPS 16 9640 | |
| Framework Laptop 16 | |
| Samsung Galaxy Book4 Ultra | |
| Moyenne Intel Core Ultra 9 185H (1582 - 3165, n=6) | |
| Moyenne de la classe Multimedia (785 - 4703, n=107, 2 dernières années) | |
| SCHENKER VISION 16 Pro (M23) | |
| Cinebench R15 / CPU Single 64Bit | |
| Lenovo Yoga Pro 9 16IMH9 | |
| Framework Laptop 16 | |
| SCHENKER VISION 16 Pro (M23) | |
| Lenovo Yoga Pro 9 16-IRP G8 | |
| Honor MagicBook Pro 16 2024 | |
| Moyenne Intel Core Ultra 9 185H (257 - 280, n=4) | |
| Dell XPS 16 9640 | |
| Samsung Galaxy Book4 Ultra | |
| Moyenne de la classe Multimedia (142.6 - 308, n=100, 2 dernières années) | |
| Blender / v2.79 BMW27 CPU | |
| Moyenne de la classe Multimedia (107 - 662, n=96, 2 dernières années) | |
| SCHENKER VISION 16 Pro (M23) | |
| Samsung Galaxy Book4 Ultra | |
| Moyenne Intel Core Ultra 9 185H (163 - 285, n=4) | |
| Framework Laptop 16 | |
| Honor MagicBook Pro 16 2024 | |
| Dell XPS 16 9640 | |
| Lenovo Yoga Pro 9 16-IRP G8 | |
| Lenovo Yoga Pro 9 16IMH9 | |
| 7-Zip 18.03 / 7z b 4 | |
| Lenovo Yoga Pro 9 16-IRP G8 | |
| Lenovo Yoga Pro 9 16IMH9 | |
| Framework Laptop 16 | |
| Dell XPS 16 9640 | |
| Honor MagicBook Pro 16 2024 | |
| Moyenne Intel Core Ultra 9 185H (52522 - 76331, n=4) | |
| Samsung Galaxy Book4 Ultra | |
| SCHENKER VISION 16 Pro (M23) | |
| Moyenne de la classe Multimedia (20166 - 119900, n=91, 2 dernières années) | |
| 7-Zip 18.03 / 7z b 4 -mmt1 | |
| Framework Laptop 16 | |
| SCHENKER VISION 16 Pro (M23) | |
| Lenovo Yoga Pro 9 16-IRP G8 | |
| Lenovo Yoga Pro 9 16IMH9 | |
| Moyenne de la classe Multimedia (3398 - 7163, n=91, 2 dernières années) | |
| Samsung Galaxy Book4 Ultra | |
| Honor MagicBook Pro 16 2024 | |
| Dell XPS 16 9640 | |
| Moyenne Intel Core Ultra 9 185H (4981 - 5781, n=4) | |
| Geekbench 6.2 / Multi-Core | |
| Lenovo Yoga Pro 9 16-IRP G8 | |
| Lenovo Yoga Pro 9 16IMH9 | |
| Moyenne Intel Core Ultra 9 185H (13351 - 14160, n=4) | |
| Dell XPS 16 9640 | |
| Moyenne de la classe Multimedia (8656 - 21264, n=31, 2 dernières années) | |
| Framework Laptop 16 | |
| Honor MagicBook Pro 16 2024 | |
| Samsung Galaxy Book4 Ultra | |
| Geekbench 6.2 / Single-Core | |
| Framework Laptop 16 | |
| Moyenne de la classe Multimedia (2320 - 3157, n=31, 2 dernières années) | |
| Lenovo Yoga Pro 9 16-IRP G8 | |
| Lenovo Yoga Pro 9 16IMH9 | |
| Moyenne Intel Core Ultra 9 185H (2384 - 2570, n=4) | |
| Honor MagicBook Pro 16 2024 | |
| Samsung Galaxy Book4 Ultra | |
| Dell XPS 16 9640 | |
| Geekbench 5.5 / Multi-Core | |
| Lenovo Yoga Pro 9 16-IRP G8 | |
| Lenovo Yoga Pro 9 16IMH9 | |
| Dell XPS 16 9640 | |
| Honor MagicBook Pro 16 2024 | |
| Moyenne Intel Core Ultra 9 185H (10441 - 14230, n=4) | |
| Samsung Galaxy Book4 Ultra | |
| Framework Laptop 16 | |
| SCHENKER VISION 16 Pro (M23) | |
| Moyenne de la classe Multimedia (3828 - 23059, n=101, 2 dernières années) | |
| Geekbench 5.5 / Single-Core | |
| Framework Laptop 16 | |
| Lenovo Yoga Pro 9 16IMH9 | |
| SCHENKER VISION 16 Pro (M23) | |
| Moyenne Intel Core Ultra 9 185H (1759 - 1902, n=4) | |
| Samsung Galaxy Book4 Ultra | |
| Honor MagicBook Pro 16 2024 | |
| Lenovo Yoga Pro 9 16-IRP G8 | |
| Dell XPS 16 9640 | |
| Moyenne de la classe Multimedia (926 - 2342, n=101, 2 dernières années) | |
| HWBOT x265 Benchmark v2.2 / 4k Preset | |
| Lenovo Yoga Pro 9 16IMH9 | |
| Lenovo Yoga Pro 9 16-IRP G8 | |
| Framework Laptop 16 | |
| Dell XPS 16 9640 | |
| Honor MagicBook Pro 16 2024 | |
| Moyenne Intel Core Ultra 9 185H (14.1 - 22.7, n=4) | |
| Samsung Galaxy Book4 Ultra | |
| SCHENKER VISION 16 Pro (M23) | |
| Moyenne de la classe Multimedia (4.99 - 30.5, n=89, 2 dernières années) | |
| LibreOffice / 20 Documents To PDF | |
| Moyenne de la classe Multimedia (6.7 - 84.9, n=93, 2 dernières années) | |
| Lenovo Yoga Pro 9 16-IRP G8 | |
| SCHENKER VISION 16 Pro (M23) | |
| Honor MagicBook Pro 16 2024 | |
| Samsung Galaxy Book4 Ultra | |
| Dell XPS 16 9640 | |
| Framework Laptop 16 | |
| Moyenne Intel Core Ultra 9 185H (39.7 - 44.6, n=4) | |
| Lenovo Yoga Pro 9 16IMH9 | |
| R Benchmark 2.5 / Overall mean | |
| Dell XPS 16 9640 | |
| Moyenne de la classe Multimedia (0.3826 - 0.723, n=91, 2 dernières années) | |
| Samsung Galaxy Book4 Ultra | |
| Honor MagicBook Pro 16 2024 | |
| Moyenne Intel Core Ultra 9 185H (0.4457 - 0.4757, n=4) | |
| Lenovo Yoga Pro 9 16-IRP G8 | |
| Framework Laptop 16 | |
| Lenovo Yoga Pro 9 16IMH9 | |
| SCHENKER VISION 16 Pro (M23) | |
* ... Moindre est la valeur, meilleures sont les performances
AIDA64: FP32 Ray-Trace | FPU Julia | CPU SHA3 | CPU Queen | FPU SinJulia | FPU Mandel | CPU AES | CPU ZLib | FP64 Ray-Trace | CPU PhotoWorxx
| Performance Rating | |
| Framework Laptop 16 | |
| Lenovo Yoga Pro 9 16IMH9 | |
| Honor MagicBook Pro 16 2024 | |
| Lenovo Yoga Pro 9 16-IRP G8 | |
| Dell XPS 16 9640 | |
| Moyenne Intel Core Ultra 9 185H | |
| Samsung Galaxy Book4 Ultra | |
| SCHENKER VISION 16 Pro (M23) | |
| Moyenne de la classe Multimedia | |
| AIDA64 / FP32 Ray-Trace | |
| Framework Laptop 16 | |
| Lenovo Yoga Pro 9 16IMH9 | |
| Lenovo Yoga Pro 9 16-IRP G8 | |
| Honor MagicBook Pro 16 2024 | |
| Dell XPS 16 9640 | |
| Moyenne Intel Core Ultra 9 185H (9220 - 18502, n=4) | |
| Samsung Galaxy Book4 Ultra | |
| SCHENKER VISION 16 Pro (M23) | |
| Moyenne de la classe Multimedia (3804 - 27411, n=89, 2 dernières années) | |
| AIDA64 / FPU Julia | |
| Framework Laptop 16 | |
| Lenovo Yoga Pro 9 16IMH9 | |
| Honor MagicBook Pro 16 2024 | |
| Lenovo Yoga Pro 9 16-IRP G8 | |
| Dell XPS 16 9640 | |
| Moyenne Intel Core Ultra 9 185H (48865 - 95213, n=4) | |
| Samsung Galaxy Book4 Ultra | |
| SCHENKER VISION 16 Pro (M23) | |
| Moyenne de la classe Multimedia (16379 - 136048, n=89, 2 dernières années) | |
| AIDA64 / CPU SHA3 | |
| Framework Laptop 16 | |
| Honor MagicBook Pro 16 2024 | |
| Lenovo Yoga Pro 9 16IMH9 | |
| Lenovo Yoga Pro 9 16-IRP G8 | |
| Dell XPS 16 9640 | |
| Moyenne Intel Core Ultra 9 185H (2394 - 4382, n=4) | |
| Samsung Galaxy Book4 Ultra | |
| SCHENKER VISION 16 Pro (M23) | |
| Moyenne de la classe Multimedia (1099 - 6681, n=89, 2 dernières années) | |
| AIDA64 / CPU Queen | |
| Framework Laptop 16 | |
| Lenovo Yoga Pro 9 16-IRP G8 | |
| SCHENKER VISION 16 Pro (M23) | |
| Lenovo Yoga Pro 9 16IMH9 | |
| Moyenne de la classe Multimedia (21547 - 134321, n=89, 2 dernières années) | |
| Dell XPS 16 9640 | |
| Moyenne Intel Core Ultra 9 185H (66785 - 94589, n=4) | |
| Samsung Galaxy Book4 Ultra | |
| Honor MagicBook Pro 16 2024 | |
| AIDA64 / FPU SinJulia | |
| Framework Laptop 16 | |
| Lenovo Yoga Pro 9 16IMH9 | |
| Lenovo Yoga Pro 9 16-IRP G8 | |
| Honor MagicBook Pro 16 2024 | |
| Dell XPS 16 9640 | |
| Moyenne Intel Core Ultra 9 185H (7255 - 11392, n=4) | |
| Samsung Galaxy Book4 Ultra | |
| Moyenne de la classe Multimedia (3099 - 15484, n=89, 2 dernières années) | |
| SCHENKER VISION 16 Pro (M23) | |
| AIDA64 / FPU Mandel | |
| Framework Laptop 16 | |
| Lenovo Yoga Pro 9 16IMH9 | |
| Dell XPS 16 9640 | |
| Honor MagicBook Pro 16 2024 | |
| Lenovo Yoga Pro 9 16-IRP G8 | |
| Moyenne Intel Core Ultra 9 185H (24004 - 47315, n=4) | |
| Samsung Galaxy Book4 Ultra | |
| Moyenne de la classe Multimedia (9602 - 68591, n=89, 2 dernières années) | |
| SCHENKER VISION 16 Pro (M23) | |
| AIDA64 / CPU AES | |
| Framework Laptop 16 | |
| Honor MagicBook Pro 16 2024 | |
| Lenovo Yoga Pro 9 16IMH9 | |
| Lenovo Yoga Pro 9 16-IRP G8 | |
| Dell XPS 16 9640 | |
| Moyenne Intel Core Ultra 9 185H (53116 - 94250, n=4) | |
| Moyenne de la classe Multimedia (23702 - 169946, n=89, 2 dernières années) | |
| Samsung Galaxy Book4 Ultra | |
| SCHENKER VISION 16 Pro (M23) | |
| AIDA64 / CPU ZLib | |
| Lenovo Yoga Pro 9 16IMH9 | |
| Honor MagicBook Pro 16 2024 | |
| Lenovo Yoga Pro 9 16-IRP G8 | |
| Dell XPS 16 9640 | |
| Moyenne Intel Core Ultra 9 185H (678 - 1341, n=4) | |
| Samsung Galaxy Book4 Ultra | |
| SCHENKER VISION 16 Pro (M23) | |
| Moyenne de la classe Multimedia (302 - 1901, n=89, 2 dernières années) | |
| Framework Laptop 16 | |
| AIDA64 / FP64 Ray-Trace | |
| Framework Laptop 16 | |
| Lenovo Yoga Pro 9 16IMH9 | |
| Lenovo Yoga Pro 9 16-IRP G8 | |
| Dell XPS 16 9640 | |
| Honor MagicBook Pro 16 2024 | |
| Moyenne Intel Core Ultra 9 185H (4428 - 9768, n=4) | |
| SCHENKER VISION 16 Pro (M23) | |
| Samsung Galaxy Book4 Ultra | |
| Moyenne de la classe Multimedia (1996 - 14590, n=89, 2 dernières années) | |
| AIDA64 / CPU PhotoWorxx | |
| Lenovo Yoga Pro 9 16IMH9 | |
| Lenovo Yoga Pro 9 16-IRP G8 | |
| Dell XPS 16 9640 | |
| Moyenne Intel Core Ultra 9 185H (50237 - 53918, n=4) | |
| Samsung Galaxy Book4 Ultra | |
| Honor MagicBook Pro 16 2024 | |
| SCHENKER VISION 16 Pro (M23) | |
| Framework Laptop 16 | |
| Moyenne de la classe Multimedia (7419 - 53918, n=89, 2 dernières années) | |
Performance du système
Les résultats dans les benchmarks synthétiques sont bons et le Yoga Pro 9i 16 est un appareil très rapide dans une utilisation quotidienne. Il n'y a qu'un court délai lors du passage à la carte graphique dédiée, mais c'est normal pour les appareils équipés d'Advanced Optimus. Aucun autre problème n'a été détecté lors des tests de performance du système.
CrossMark: Overall | Productivity | Creativity | Responsiveness
WebXPRT 3: Overall
WebXPRT 4: Overall
Mozilla Kraken 1.1: Total
| PCMark 10 / Score | |
| Framework Laptop 16 | |
| Lenovo Yoga Pro 9 16IMH9 | |
| Moyenne Intel Core Ultra 9 185H, NVIDIA GeForce RTX 4070 Laptop GPU () | |
| SCHENKER VISION 16 Pro (M23) | |
| Lenovo Yoga Pro 9 16-IRP G8 | |
| Dell XPS 16 9640 | |
| Samsung Galaxy Book4 Ultra | |
| Honor MagicBook Pro 16 2024 | |
| Moyenne de la classe Multimedia (4635 - 8670, n=86, 2 dernières années) | |
| PCMark 10 / Essentials | |
| Framework Laptop 16 | |
| Lenovo Yoga Pro 9 16IMH9 | |
| Moyenne Intel Core Ultra 9 185H, NVIDIA GeForce RTX 4070 Laptop GPU () | |
| Lenovo Yoga Pro 9 16-IRP G8 | |
| SCHENKER VISION 16 Pro (M23) | |
| Moyenne de la classe Multimedia (8480 - 12420, n=86, 2 dernières années) | |
| Samsung Galaxy Book4 Ultra | |
| Dell XPS 16 9640 | |
| Honor MagicBook Pro 16 2024 | |
| PCMark 10 / Productivity | |
| Framework Laptop 16 | |
| SCHENKER VISION 16 Pro (M23) | |
| Dell XPS 16 9640 | |
| Samsung Galaxy Book4 Ultra | |
| Lenovo Yoga Pro 9 16IMH9 | |
| Moyenne Intel Core Ultra 9 185H, NVIDIA GeForce RTX 4070 Laptop GPU () | |
| Lenovo Yoga Pro 9 16-IRP G8 | |
| Moyenne de la classe Multimedia (5845 - 11186, n=86, 2 dernières années) | |
| Honor MagicBook Pro 16 2024 | |
| PCMark 10 / Digital Content Creation | |
| Framework Laptop 16 | |
| Lenovo Yoga Pro 9 16IMH9 | |
| Moyenne Intel Core Ultra 9 185H, NVIDIA GeForce RTX 4070 Laptop GPU () | |
| Lenovo Yoga Pro 9 16-IRP G8 | |
| SCHENKER VISION 16 Pro (M23) | |
| Honor MagicBook Pro 16 2024 | |
| Dell XPS 16 9640 | |
| Samsung Galaxy Book4 Ultra | |
| Moyenne de la classe Multimedia (4688 - 13548, n=86, 2 dernières années) | |
| CrossMark / Overall | |
| SCHENKER VISION 16 Pro (M23) | |
| Dell XPS 16 9640 | |
| Lenovo Yoga Pro 9 16-IRP G8 | |
| Samsung Galaxy Book4 Ultra | |
| Honor MagicBook Pro 16 2024 | |
| Lenovo Yoga Pro 9 16IMH9 | |
| Moyenne Intel Core Ultra 9 185H, NVIDIA GeForce RTX 4070 Laptop GPU () | |
| Moyenne de la classe Multimedia (1009 - 2146, n=92, 2 dernières années) | |
| Framework Laptop 16 | |
| CrossMark / Productivity | |
| SCHENKER VISION 16 Pro (M23) | |
| Dell XPS 16 9640 | |
| Lenovo Yoga Pro 9 16-IRP G8 | |
| Honor MagicBook Pro 16 2024 | |
| Samsung Galaxy Book4 Ultra | |
| Moyenne de la classe Multimedia (971 - 2064, n=92, 2 dernières années) | |
| Lenovo Yoga Pro 9 16IMH9 | |
| Moyenne Intel Core Ultra 9 185H, NVIDIA GeForce RTX 4070 Laptop GPU () | |
| Framework Laptop 16 | |
| CrossMark / Creativity | |
| Lenovo Yoga Pro 9 16-IRP G8 | |
| Dell XPS 16 9640 | |
| SCHENKER VISION 16 Pro (M23) | |
| Lenovo Yoga Pro 9 16IMH9 | |
| Moyenne Intel Core Ultra 9 185H, NVIDIA GeForce RTX 4070 Laptop GPU () | |
| Samsung Galaxy Book4 Ultra | |
| Moyenne de la classe Multimedia (1054 - 2865, n=92, 2 dernières années) | |
| Framework Laptop 16 | |
| Honor MagicBook Pro 16 2024 | |
| CrossMark / Responsiveness | |
| SCHENKER VISION 16 Pro (M23) | |
| Dell XPS 16 9640 | |
| Honor MagicBook Pro 16 2024 | |
| Lenovo Yoga Pro 9 16-IRP G8 | |
| Samsung Galaxy Book4 Ultra | |
| Moyenne de la classe Multimedia (926 - 2171, n=92, 2 dernières années) | |
| Framework Laptop 16 | |
| Lenovo Yoga Pro 9 16IMH9 | |
| Moyenne Intel Core Ultra 9 185H, NVIDIA GeForce RTX 4070 Laptop GPU () | |
| WebXPRT 3 / Overall | |
| Framework Laptop 16 | |
| SCHENKER VISION 16 Pro (M23) | |
| Lenovo Yoga Pro 9 16-IRP G8 | |
| Lenovo Yoga Pro 9 16IMH9 | |
| Moyenne Intel Core Ultra 9 185H, NVIDIA GeForce RTX 4070 Laptop GPU () | |
| Moyenne de la classe Multimedia (171.4 - 432, n=94, 2 dernières années) | |
| Honor MagicBook Pro 16 2024 | |
| Dell XPS 16 9640 | |
| Samsung Galaxy Book4 Ultra | |
| WebXPRT 4 / Overall | |
| SCHENKER VISION 16 Pro (M23) | |
| Lenovo Yoga Pro 9 16IMH9 | |
| Moyenne Intel Core Ultra 9 185H, NVIDIA GeForce RTX 4070 Laptop GPU () | |
| Framework Laptop 16 | |
| Lenovo Yoga Pro 9 16-IRP G8 | |
| Honor MagicBook Pro 16 2024 | |
| Samsung Galaxy Book4 Ultra | |
| Dell XPS 16 9640 | |
| Moyenne de la classe Multimedia (133.2 - 348, n=71, 2 dernières années) | |
| Mozilla Kraken 1.1 / Total | |
| Moyenne de la classe Multimedia (363 - 1016, n=96, 2 dernières années) | |
| Honor MagicBook Pro 16 2024 | |
| Lenovo Yoga Pro 9 16-IRP G8 | |
| SCHENKER VISION 16 Pro (M23) | |
| Lenovo Yoga Pro 9 16IMH9 | |
| Moyenne Intel Core Ultra 9 185H, NVIDIA GeForce RTX 4070 Laptop GPU () | |
| Framework Laptop 16 | |
| Samsung Galaxy Book4 Ultra | |
* ... Moindre est la valeur, meilleures sont les performances
| PCMark 10 Score | 7547 points | |
Aide | ||
| AIDA64 / Memory Copy | |
| Lenovo Yoga Pro 9 16IMH9 | |
| Moyenne Intel Core Ultra 9 185H (91178 - 95718, n=4) | |
| Dell XPS 16 9640 | |
| Samsung Galaxy Book4 Ultra | |
| Honor MagicBook Pro 16 2024 | |
| Framework Laptop 16 | |
| Lenovo Yoga Pro 9 16-IRP G8 | |
| SCHENKER VISION 16 Pro (M23) | |
| Moyenne de la classe Multimedia (20513 - 94254, n=89, 2 dernières années) | |
| AIDA64 / Memory Read | |
| Samsung Galaxy Book4 Ultra | |
| Lenovo Yoga Pro 9 16IMH9 | |
| Moyenne Intel Core Ultra 9 185H (83175 - 87768, n=4) | |
| Dell XPS 16 9640 | |
| Lenovo Yoga Pro 9 16-IRP G8 | |
| Honor MagicBook Pro 16 2024 | |
| SCHENKER VISION 16 Pro (M23) | |
| Framework Laptop 16 | |
| Moyenne de la classe Multimedia (22917 - 90142, n=89, 2 dernières années) | |
| AIDA64 / Memory Write | |
| Lenovo Yoga Pro 9 16-IRP G8 | |
| Framework Laptop 16 | |
| Moyenne Intel Core Ultra 9 185H (73682 - 93871, n=4) | |
| Honor MagicBook Pro 16 2024 | |
| Samsung Galaxy Book4 Ultra | |
| Lenovo Yoga Pro 9 16IMH9 | |
| Dell XPS 16 9640 | |
| SCHENKER VISION 16 Pro (M23) | |
| Moyenne de la classe Multimedia (20226 - 95196, n=89, 2 dernières années) | |
| AIDA64 / Memory Latency | |
| Honor MagicBook Pro 16 2024 | |
| Samsung Galaxy Book4 Ultra | |
| Moyenne Intel Core Ultra 9 185H (129.6 - 144.5, n=4) | |
| Dell XPS 16 9640 | |
| Lenovo Yoga Pro 9 16IMH9 | |
| Lenovo Yoga Pro 9 16-IRP G8 | |
| Moyenne de la classe Multimedia (75 - 346, n=88, 2 dernières années) | |
| Framework Laptop 16 | |
| SCHENKER VISION 16 Pro (M23) | |
* ... Moindre est la valeur, meilleures sont les performances
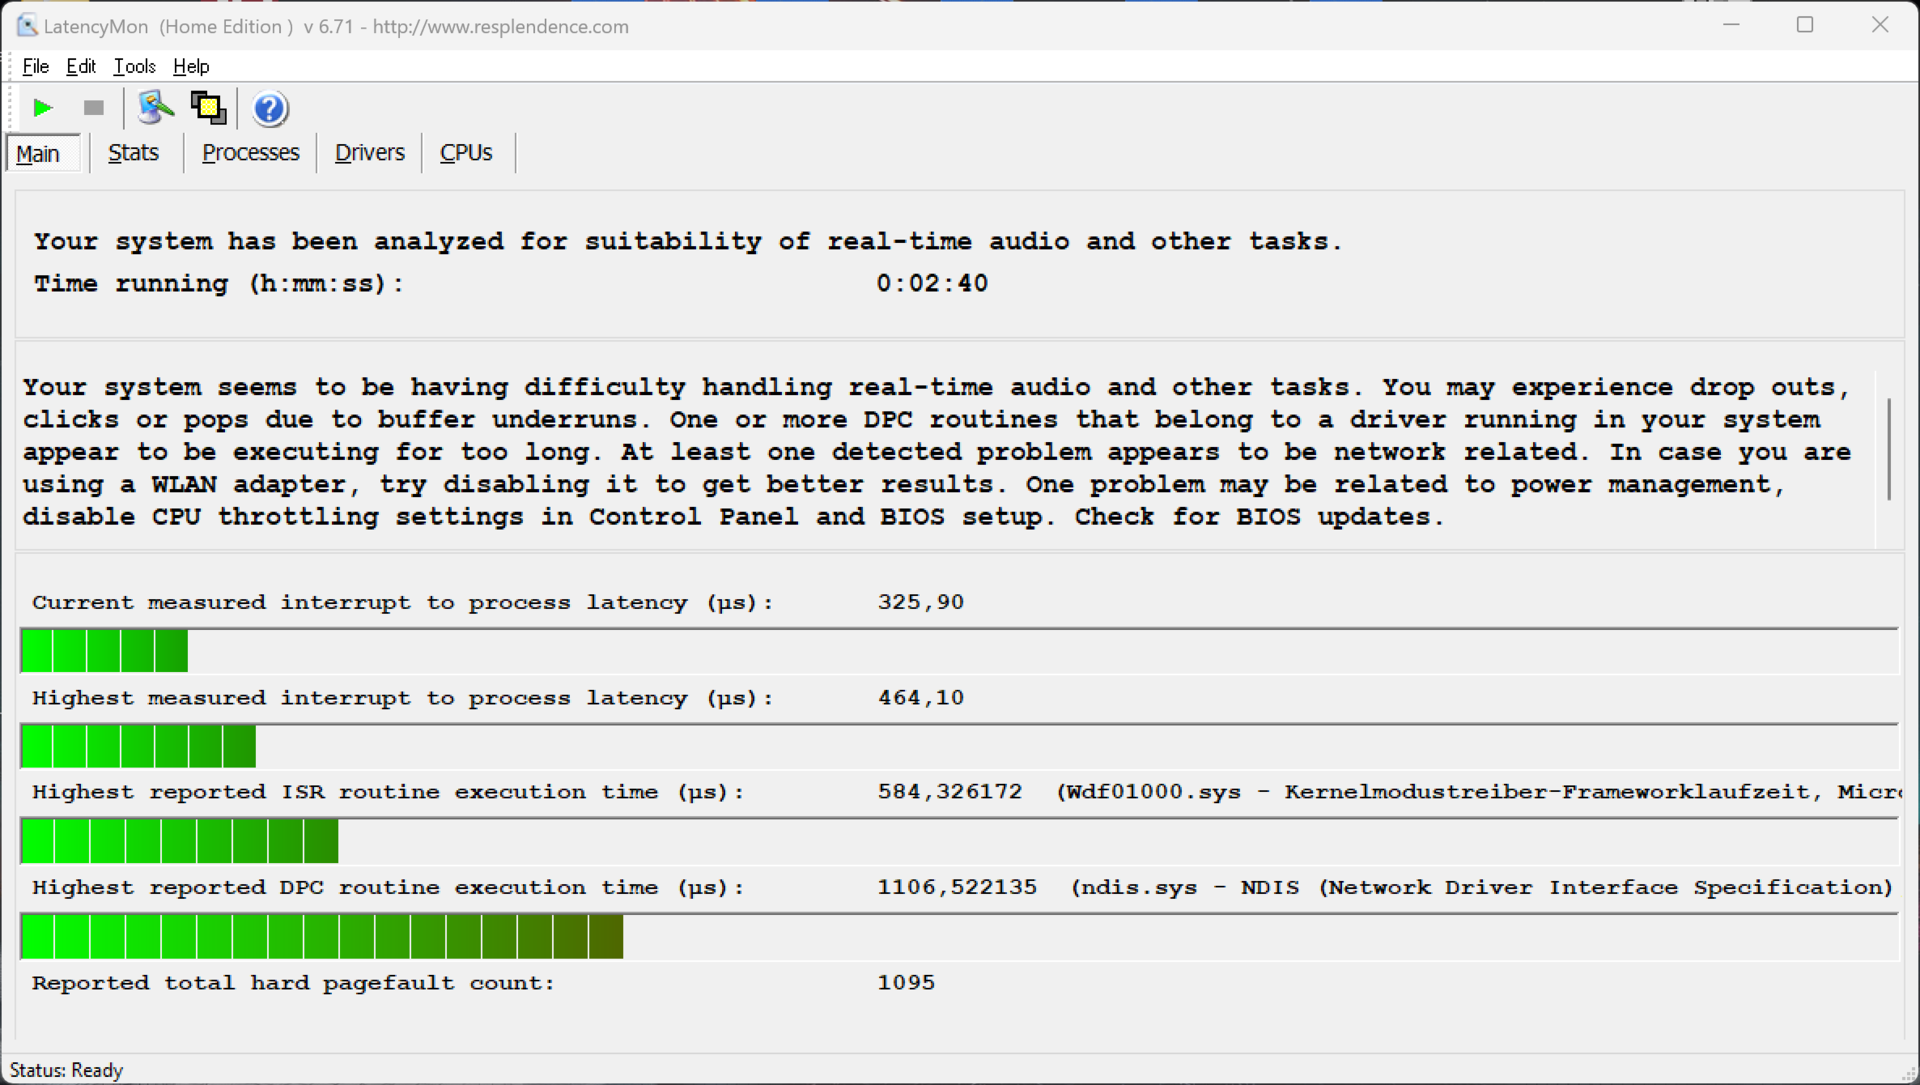
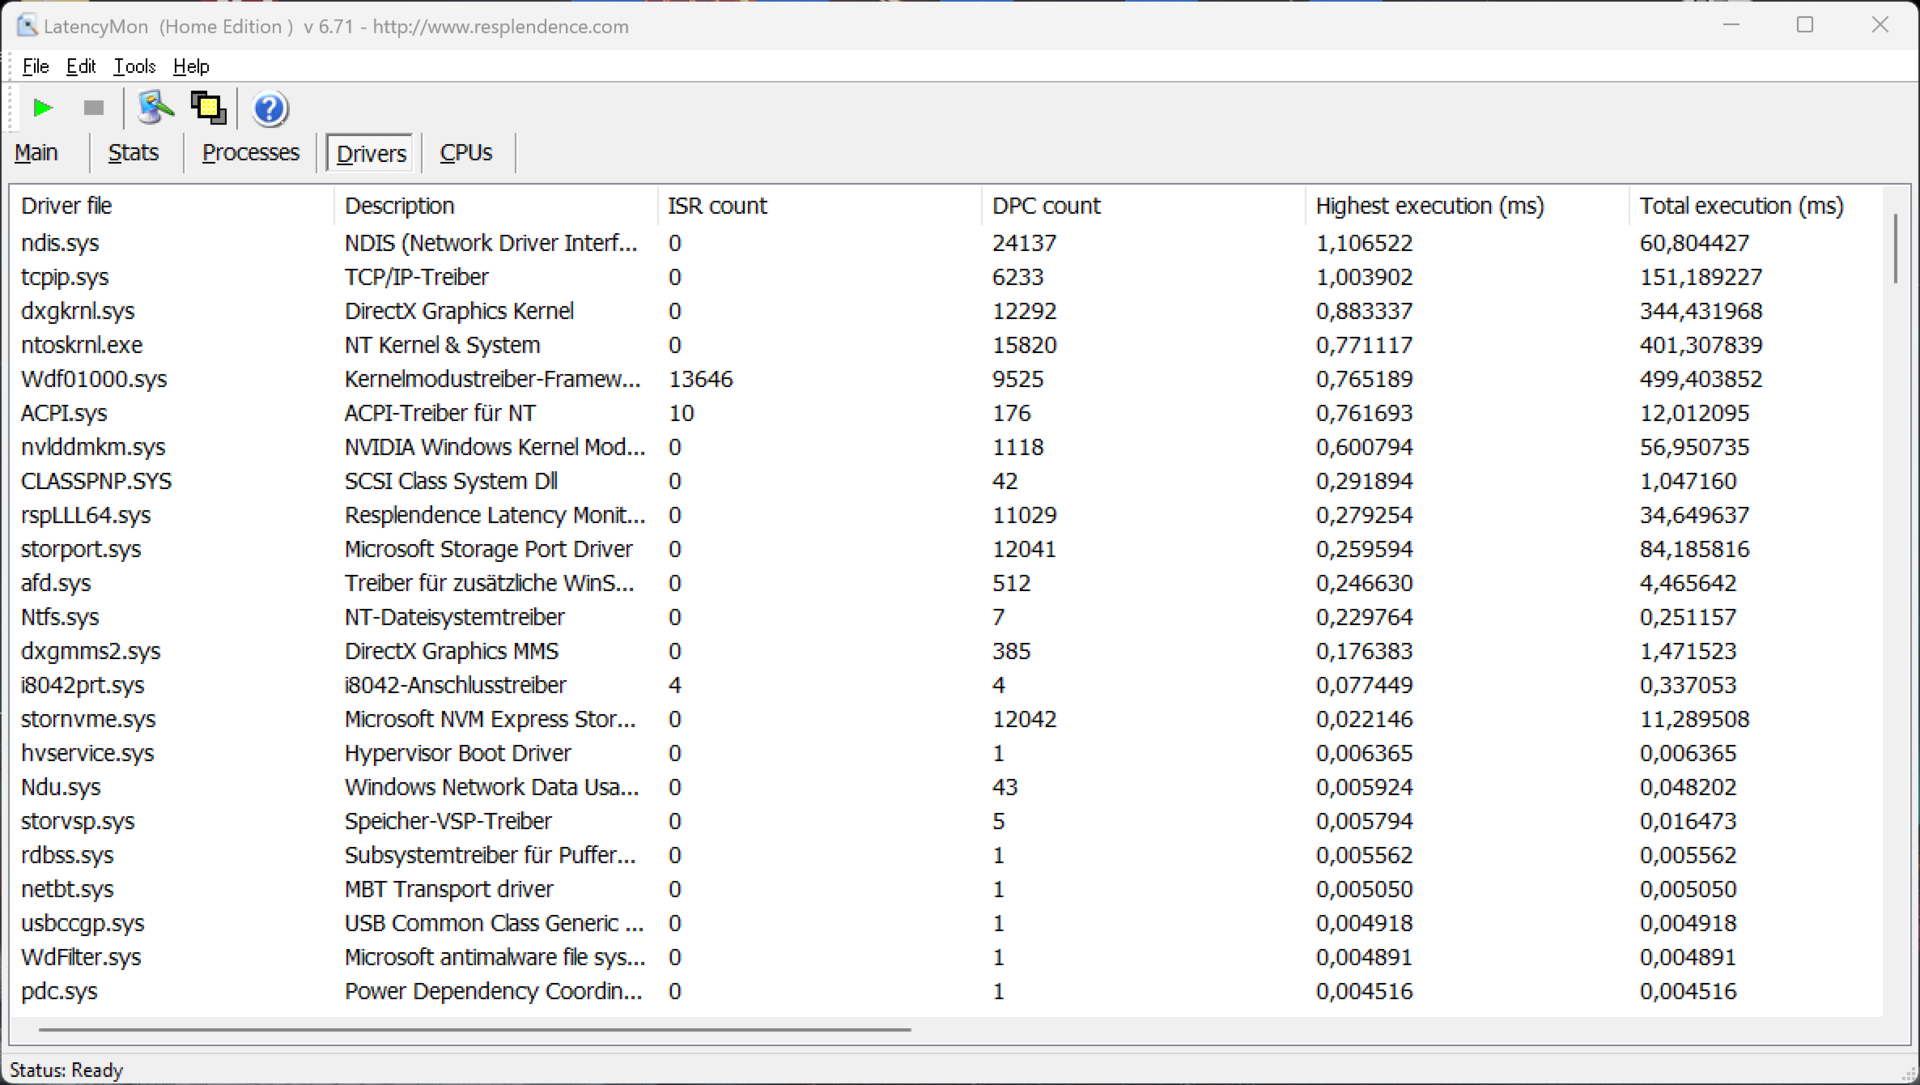
Latence DPC
Dans notre test de latence standardisé (navigation web, lecture YouTube 4K, charge CPU), notre appareil de test avec sa version BIOS actuelle n'a aucun problème à faire fonctionner des applications audio en temps réel. Bien qu'un pilote ait quelques difficultés, la valeur importante "interrupt-to-process-latency" est très faible.
| DPC Latencies / LatencyMon - interrupt to process latency (max), Web, Youtube, Prime95 | |
| Lenovo Yoga Pro 9 16-IRP G8 | |
| Honor MagicBook Pro 16 2024 | |
| Framework Laptop 16 | |
| Dell XPS 16 9640 | |
| SCHENKER VISION 16 Pro (M23) | |
| Samsung Galaxy Book4 Ultra | |
| Lenovo Yoga Pro 9 16IMH9 | |
* ... Moindre est la valeur, meilleures sont les performances
Dispositifs de stockage
Lenovo a installé un SSD PCIe 4.0 de 1 To de SK Hynix dans notre appareil de test, dont 877 Go sont disponibles au premier démarrage. Les résultats des tests de performance sont moyens, mais ce n'est pas un problème pour une utilisation quotidienne. Au moins, les performances restent stables en cas de charge soutenue. Le Yoga Pro offre également un second emplacement pour un disque SSD PCIe 4.0. Vous trouverez d'autres tests de performance pour les disques durs SSD ici.

* ... Moindre est la valeur, meilleures sont les performances
Sustained Read Performance: DiskSpd Read Loop, Queue Depth 8
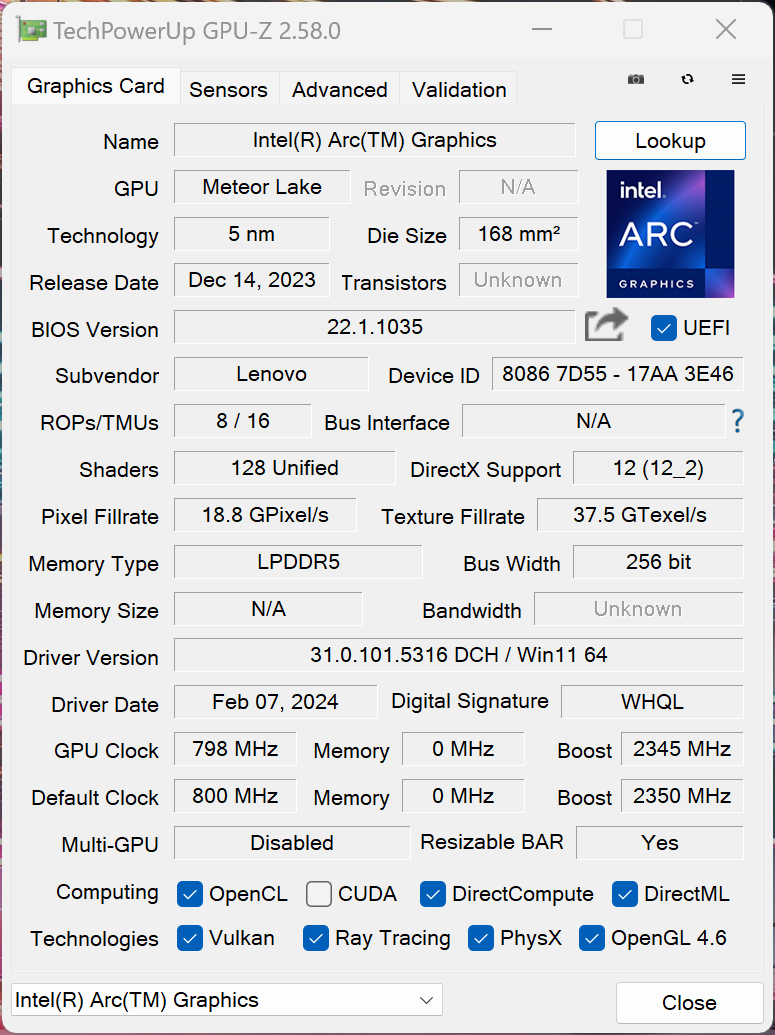
Carte graphique
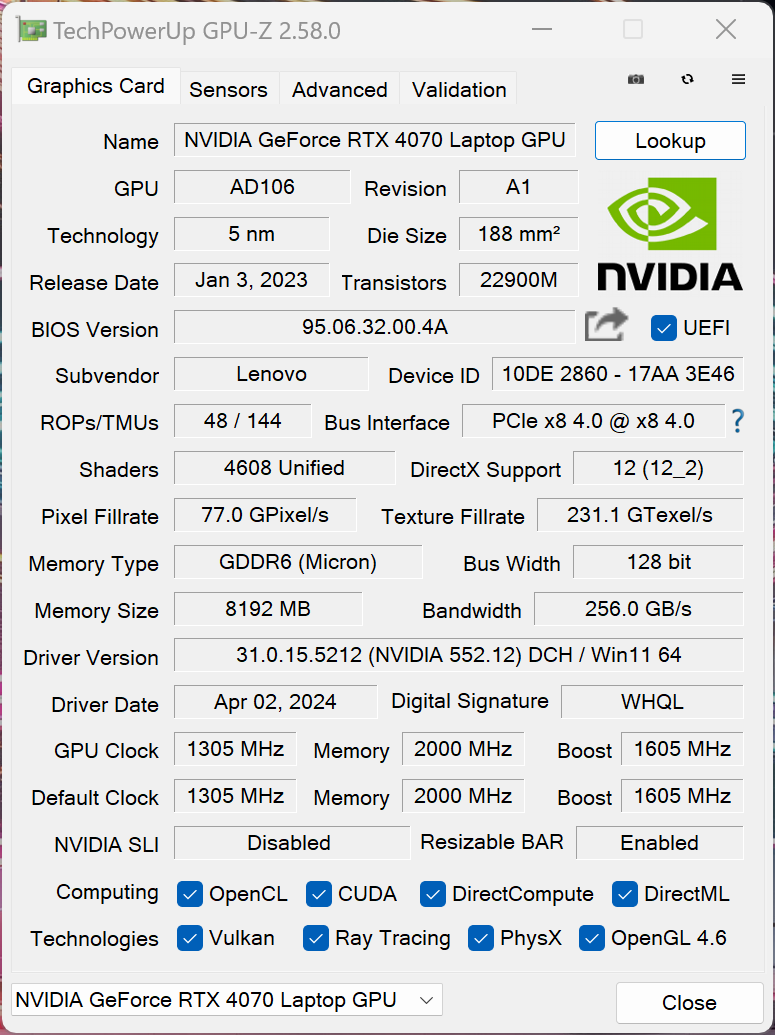
Rien n'a changé en ce qui concerne les cartes graphiques dédiées, puisque le Yoga Pro est toujours disponible avec la carte graphique Nvidia GeForce Ordinateur portable RTX 4060 ou RTX 4070 Laptop. Cependant, Advanced Optimus est désormais intégré pour la commutation graphique, ce qui n'était pas le cas dans l'ancien modèle. Le RTX 4070 Laptop plus rapide avec un TGP de 100 watts est installé dans notre appareil de test et les résultats du benchmark sont très bons dans l'ensemble. La carte graphique peut également être overclockée en option.
Le Yoga fait également bonne figure dans les benchmarks de jeu et même les titres modernes peuvent être joués avec le maximum de détails en résolution QHD sans problème, et la performance reste complètement stable pendant les longues sessions de jeu.
En mode batterie, la carte graphique dispose d'un maximum de 65 watts, ce qui explique que les performances soient inférieures d'environ 18 %. Vous trouverez d'autres tests de performance du GPU dans notre section technique.
| 3DMark 11 Performance | 34118 points | |
| 3DMark Fire Strike Score | 26981 points | |
| 3DMark Time Spy Score | 12105 points | |
Aide | ||
| Blender / v3.3 Classroom OPTIX/RTX | |
| Moyenne de la classe Multimedia (19 - 99, n=45, 2 dernières années) | |
| Samsung Galaxy Book4 Ultra | |
| Lenovo Yoga Pro 9 16-IRP G8 | |
| SCHENKER VISION 16 Pro (M23) | |
| Honor MagicBook Pro 16 2024 | |
| Moyenne NVIDIA GeForce RTX 4070 Laptop GPU (18 - 28, n=49) | |
| Dell XPS 16 9640 | |
| Lenovo Yoga Pro 9 16IMH9 | |
| Blender / v3.3 Classroom CUDA | |
| Moyenne de la classe Multimedia (32 - 152, n=47, 2 dernières années) | |
| Samsung Galaxy Book4 Ultra | |
| Lenovo Yoga Pro 9 16-IRP G8 | |
| Honor MagicBook Pro 16 2024 | |
| Moyenne NVIDIA GeForce RTX 4070 Laptop GPU (32 - 142, n=52) | |
| Dell XPS 16 9640 | |
| SCHENKER VISION 16 Pro (M23) | |
| Lenovo Yoga Pro 9 16IMH9 | |
| Blender / v3.3 Classroom CPU | |
| Moyenne de la classe Multimedia (190 - 1374, n=84, 2 dernières années) | |
| SCHENKER VISION 16 Pro (M23) | |
| Samsung Galaxy Book4 Ultra | |
| Honor MagicBook Pro 16 2024 | |
| Framework Laptop 16 | |
| Lenovo Yoga Pro 9 16-IRP G8 | |
| Dell XPS 16 9640 | |
| Moyenne NVIDIA GeForce RTX 4070 Laptop GPU (158 - 428, n=49) | |
| Lenovo Yoga Pro 9 16IMH9 | |
* ... Moindre est la valeur, meilleures sont les performances
| The Witcher 3 - 1920x1080 Ultra Graphics & Postprocessing (HBAO+) | |
| Lenovo Yoga Pro 9 16IMH9 | |
| SCHENKER VISION 16 Pro (M23) | |
| Lenovo Yoga Pro 9 16-IRP G8 | |
| Dell XPS 16 9640 | |
| Framework Laptop 16 | |
| Honor MagicBook Pro 16 2024 | |
| Samsung Galaxy Book4 Ultra | |
| Moyenne de la classe Multimedia (8 - 143.2, n=100, 2 dernières années) | |
| GTA V - 1920x1080 Highest Settings possible AA:4xMSAA + FX AF:16x | |
| Lenovo Yoga Pro 9 16IMH9 | |
| Lenovo Yoga Pro 9 16-IRP G8 | |
| Dell XPS 16 9640 | |
| Honor MagicBook Pro 16 2024 | |
| SCHENKER VISION 16 Pro (M23) | |
| Framework Laptop 16 | |
| Samsung Galaxy Book4 Ultra | |
| Moyenne de la classe Multimedia (4.24 - 123, n=89, 2 dernières années) | |
| Horizon Forbidden West | |
| 1920x1080 Very High Preset AA:T | |
| Moyenne NVIDIA GeForce RTX 4070 Laptop GPU (53.2 - 76.7, n=6) | |
| Lenovo Yoga Pro 9 16IMH9 | |
| Moyenne de la classe Multimedia (53.2 - 65.4, n=2, 2 dernières années) | |
| Dell XPS 16 9640 | |
| 2560x1440 Very High Preset AA:T | |
| Lenovo Yoga Pro 9 16IMH9 | |
| Moyenne NVIDIA GeForce RTX 4070 Laptop GPU (40.3 - 59.1, n=6) | |
| Moyenne de la classe Multimedia (40.3 - 56.1, n=2, 2 dernières années) | |
| Dell XPS 16 9640 | |
Witcher 3 FPS chart
| Bas | Moyen | Élevé | Ultra | QHD | |
| GTA V (2015) | 171.4 | 110.9 | 90.4 | ||
| The Witcher 3 (2015) | 242 | 107.8 | 89 | ||
| Dota 2 Reborn (2015) | 171.7 | 155.7 | 148.1 | 139 | |
| Final Fantasy XV Benchmark (2018) | 189.6 | 156.2 | 115.7 | 85.6 | |
| X-Plane 11.11 (2018) | 133.9 | 118.7 | 90.5 | ||
| Far Cry 5 (2018) | 156 | 133 | 130 | 116 | 109 |
| Strange Brigade (2018) | 418 | 300 | 244 | 213 | 139 |
| F1 23 (2023) | 229 | 239 | 209 | 68.9 | 44 |
| Baldur's Gate 3 (2023) | 166.3 | 136.6 | 119.9 | 117.7 | 79.8 |
| Cyberpunk 2077 2.0 Phantom Liberty (2023) | 129.6 | 106.8 | 90.5 | 76.9 | 47.8 |
| Horizon Forbidden West (2024) | 110.5 | 104.2 | 75.4 | 65.4 | 56.1 |
Émissions - Ventilateurs bruyants, haut-parleurs
Bruit
En mode ralenti et sous faible charge, les ventilateurs restent désactivés ou à peine audibles dans la plupart des cas. En revanche, sous charge, ils deviennent rapidement bruyants, tant en mode Auto qu'en mode Performance . Nous avons résumé les résultats pour les différents profils énergétiques dans le tableau suivant. En mode batterie, l'appareil reste très silencieux à tout moment, mais les performances sont considérablement réduites et ne sont plus suffisantes pour les jeux. Aucun bruit électronique tel que le ronflement de la bobine n'a été détecté sur notre appareil de test
| Profil énergétique | 3DMark 06 | Witcher 3 | Cyberpunk 2077 | Stress test |
|---|---|---|---|---|
| Batterie | 29,5 dB(A) | 29,5 dB(A) | 29,5 dB(A) | 30,9 dB(A) |
| Auto | 44,9 dB(A) | 44,9 dB(A) | 44,9 dB(A) | 44,9 dB(A) |
| Performance | 48.1 dB(A) | 49.7 dB(A) | 49.7 dB(A) | 53.9 dB(A) |
Degré de la nuisance sonore
| Au repos |
| 24.3 / 24.3 / 25.8 dB(A) |
| Fortement sollicité |
| 48.1 / 53.9 dB(A) |
 | ||
30 dB silencieux 40 dB(A) audible 50 dB(A) bruyant |
||
min: | ||
| Lenovo Yoga Pro 9 16IMH9 NVIDIA GeForce RTX 4070 Laptop GPU, Ultra 9 185H, SK Hynix HFS001TEJ9X115N | Dell XPS 16 9640 NVIDIA GeForce RTX 4070 Laptop GPU, Ultra 7 155H, Kioxia XG8 KXG80ZNV1T02 | Honor MagicBook Pro 16 2024 NVIDIA GeForce RTX 4060 Laptop GPU, Ultra 7 155H, WD PC SN740 SDDPNQD-1T00 | Samsung Galaxy Book4 Ultra NVIDIA GeForce RTX 4050 Laptop GPU, Ultra 7 155H, Samsung PM9A1 MZVL2512HCJQ | Framework Laptop 16 Radeon RX 7700S, R9 7940HS, WDC PC SN810 1TB | SCHENKER VISION 16 Pro (M23) NVIDIA GeForce RTX 4070 Laptop GPU, i7-13700H, Samsung 990 Pro 1 TB | Lenovo Yoga Pro 9 16-IRP G8 NVIDIA GeForce RTX 4060 Laptop GPU, i7-13705H, Samsung PM9A1 MZVL21T0HCLR | |
|---|---|---|---|---|---|---|---|
| Noise | 2% | 10% | 9% | 7% | -7% | -0% | |
| off / environment * | 24.3 | 24.5 -1% | 24 1% | 24.2 -0% | 23.8 2% | 25.9 -7% | 24.7 -2% |
| Idle Minimum * | 24.3 | 24.5 -1% | 24 1% | 24.2 -0% | 23.9 2% | 25.9 -7% | 24.7 -2% |
| Idle Average * | 24.3 | 24.5 -1% | 24 1% | 24.2 -0% | 23.9 2% | 25.9 -7% | 26.2 -8% |
| Idle Maximum * | 25.8 | 27.5 -7% | 27.2 -5% | 24.2 6% | 23.9 7% | 32 -24% | 26.2 -2% |
| Load Average * | 48.1 | 39.6 18% | 29 40% | 37.9 21% | 28.5 41% | 47.2 2% | 39.7 17% |
| Witcher 3 ultra * | 49.7 | 49.7 -0% | 42.1 15% | 41.7 16% | 51.9 -4% | 53.1 -7% | 53.2 -7% |
| Load Maximum * | 53.9 | 49.7 8% | 45 17% | 41.7 23% | 53.7 -0% | 53.1 1% | 53.2 1% |
* ... Moindre est la valeur, meilleures sont les performances
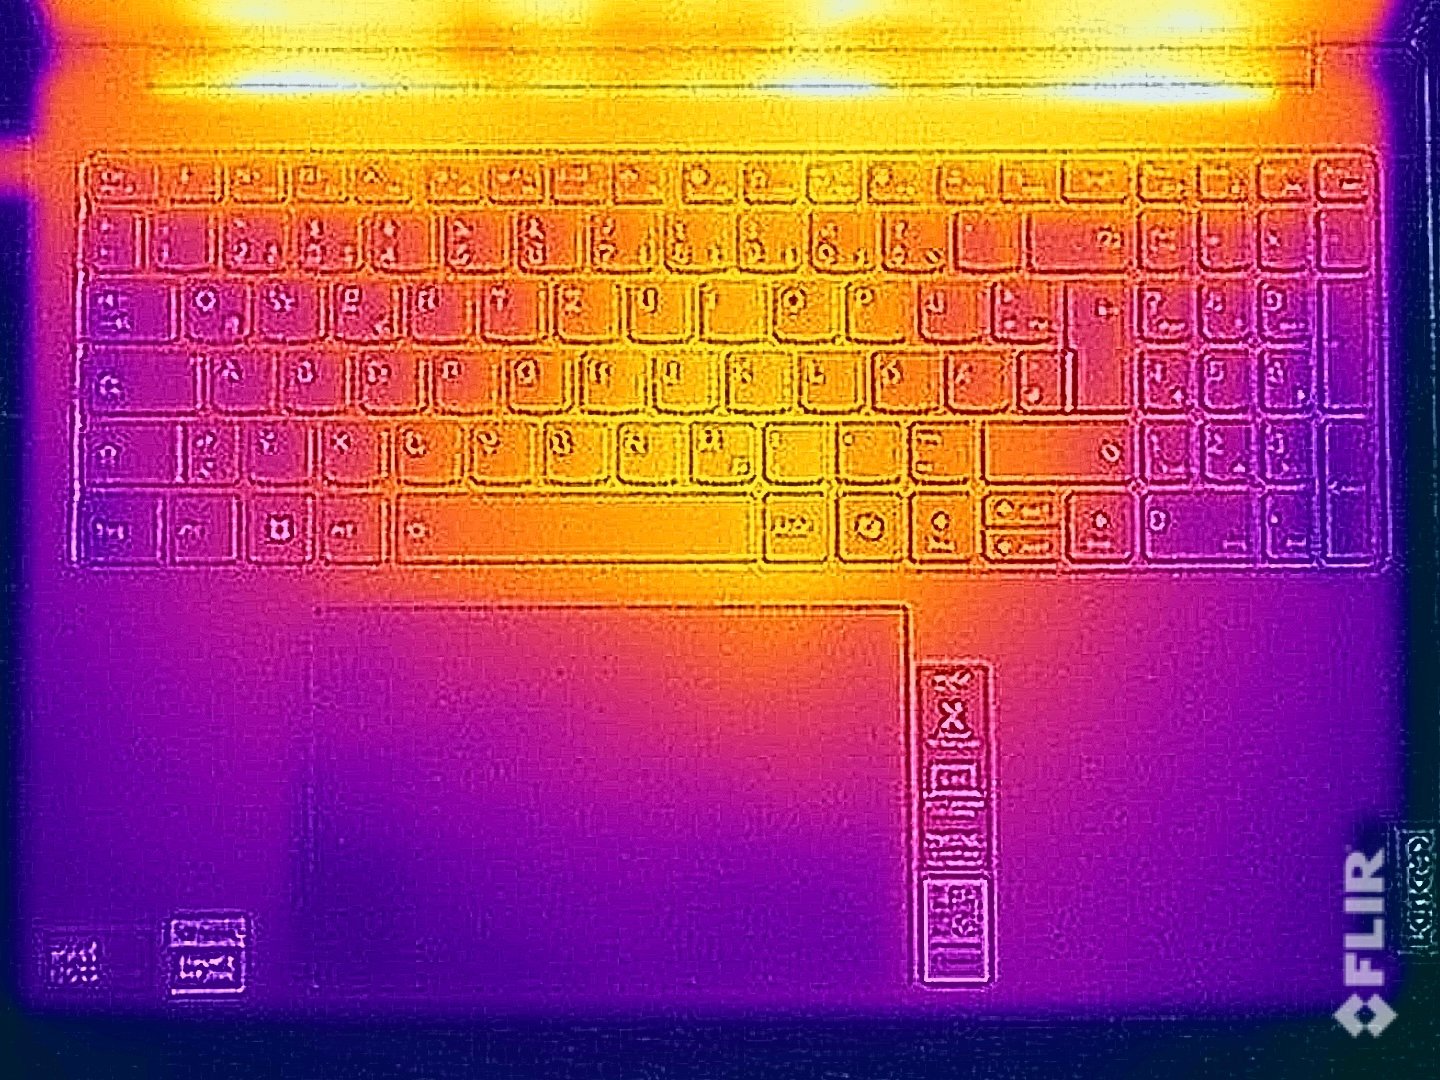
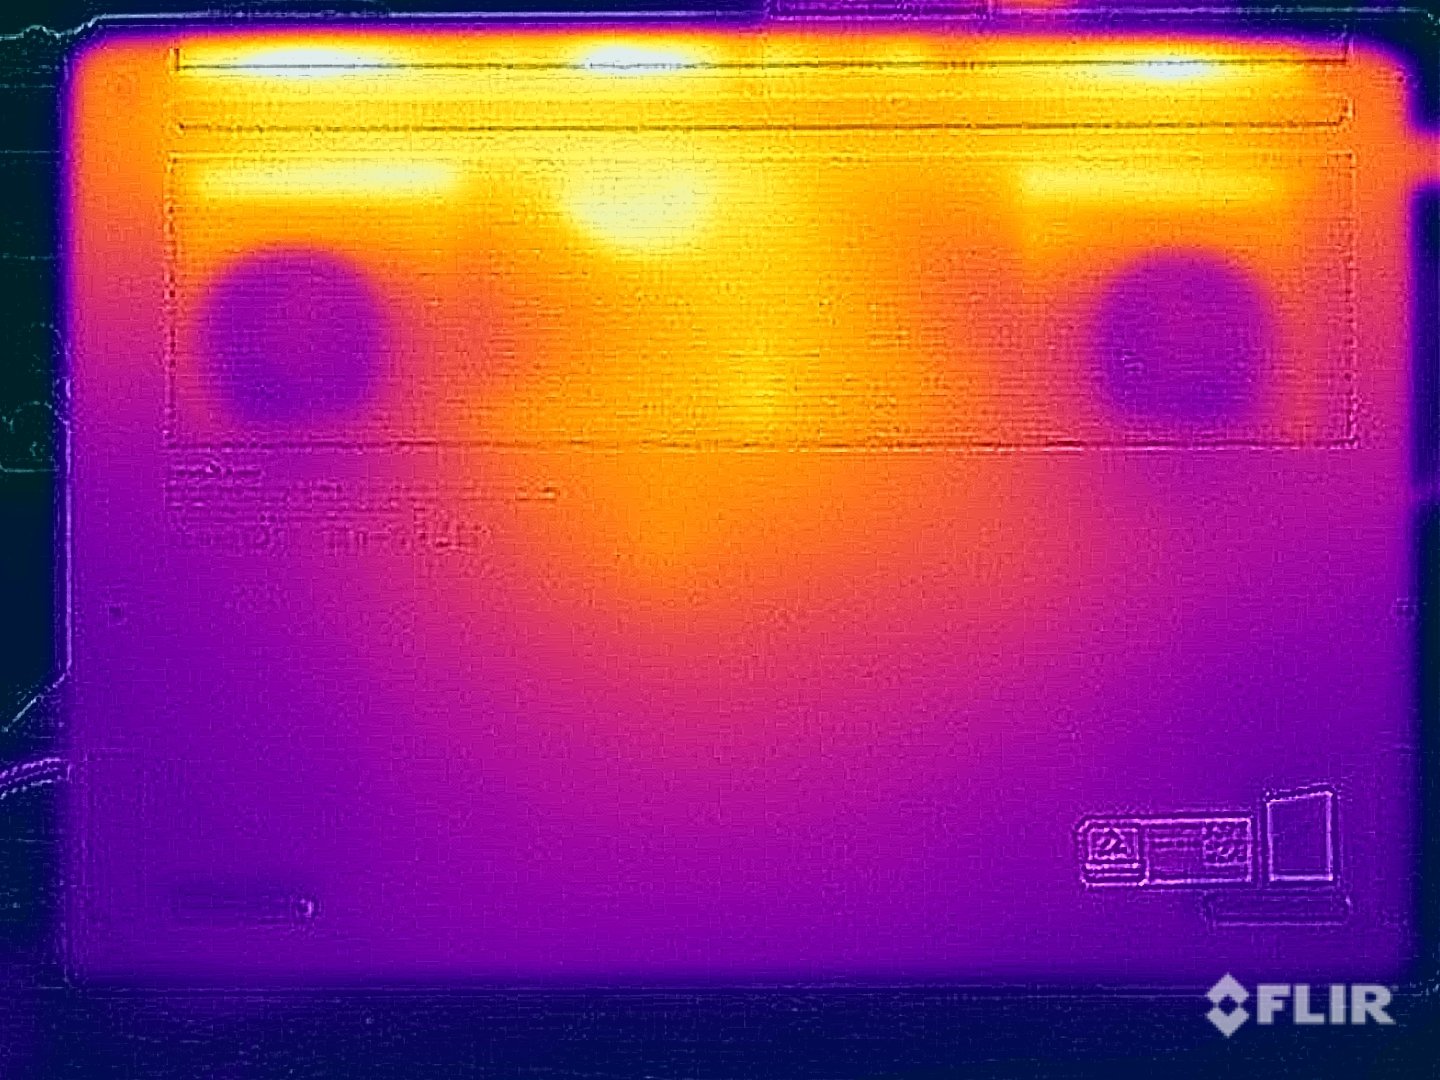
Température
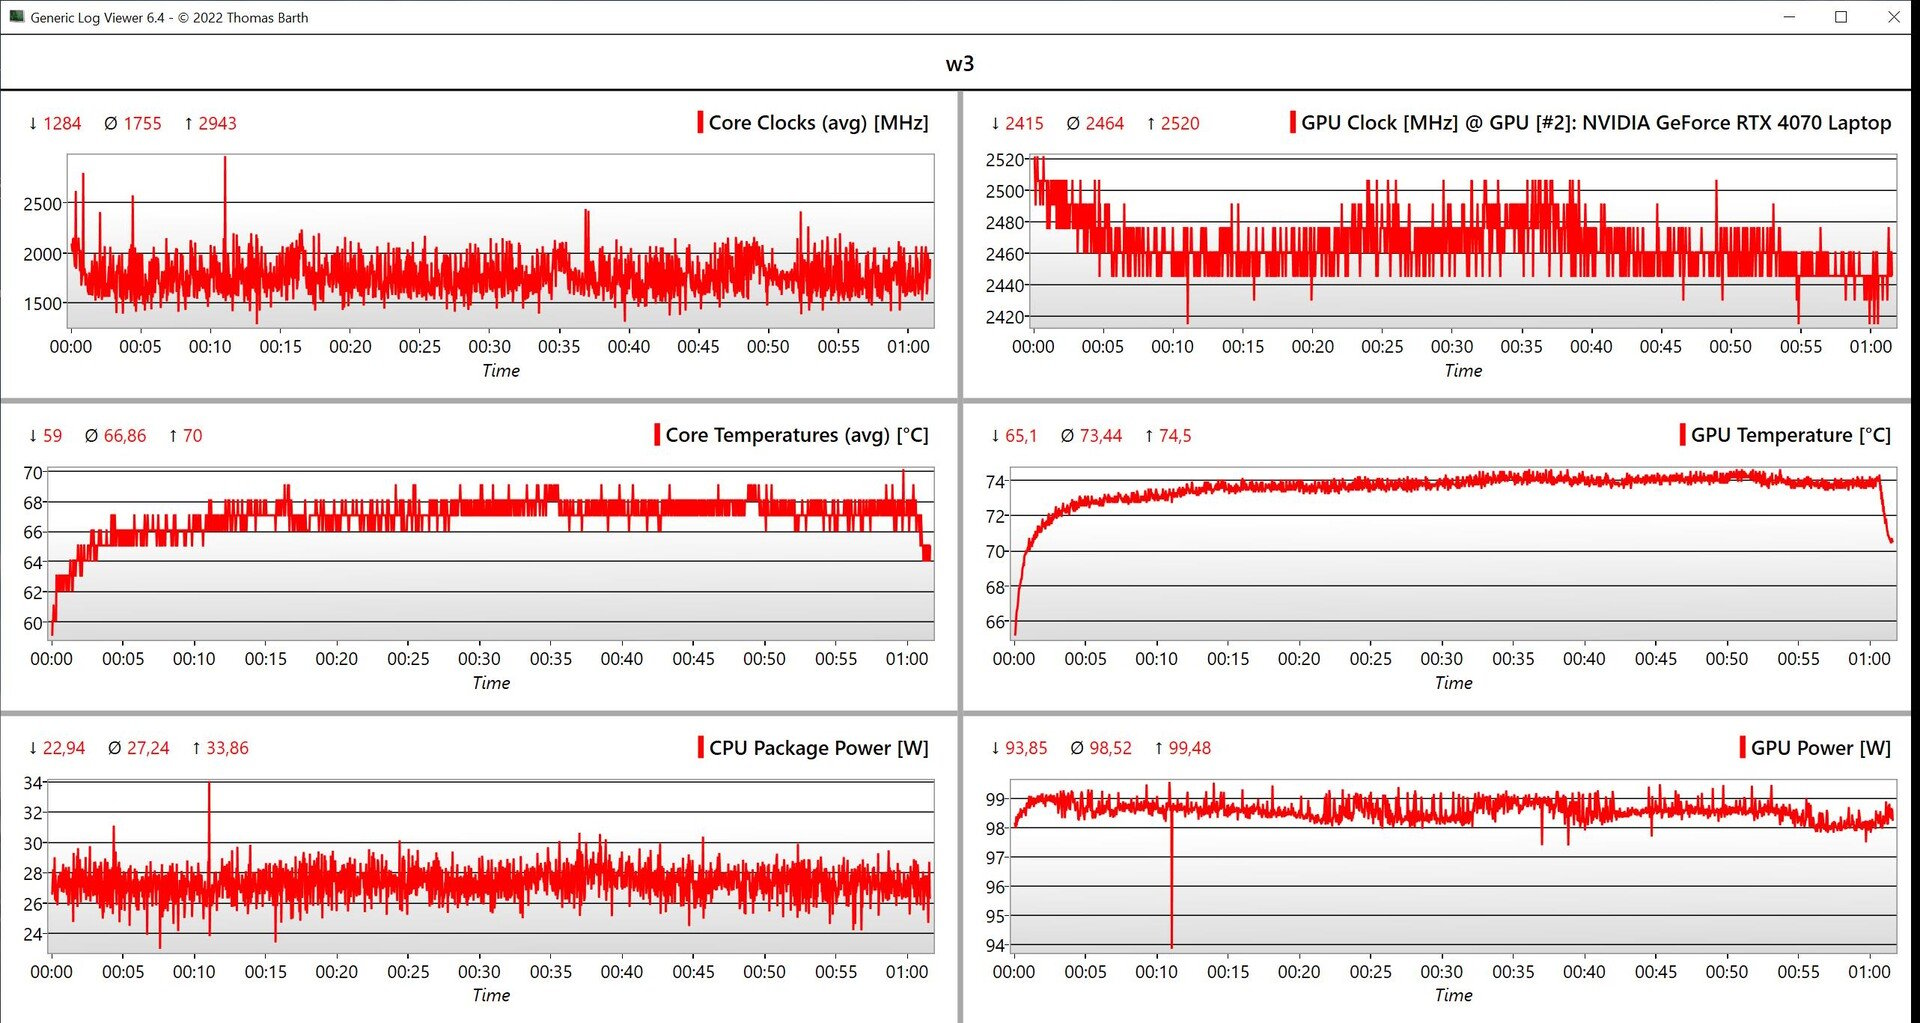
Le châssis reste agréablement frais pendant les tâches simples et la température maximale est également légèrement inférieure sous charge. Néanmoins, les utilisateurs remarqueront probablement le point chaud de plus de 45 °C sur la face inférieure, et il n'est donc pas recommandé de placer l'appareil sur les cuisses. Le clavier et l'unité de base restent nettement plus froids. Dans le test de stress avec une charge combinée CPU/GPU, la carte graphique fonctionne en permanence à environ 87 watts et le processeur à 42 watts. Il s'agit d'une performance solide dans l'ensemble.
(±) La température maximale du côté supérieur est de 41.7 °C / 107 F, par rapport à la moyenne de 36.9 °C / 98 F, allant de 21.1 à 71 °C pour la classe Multimedia.
(-) Le fond chauffe jusqu'à un maximum de 46.3 °C / 115 F, contre une moyenne de 39.1 °C / 102 F
(+) En utilisation inactive, la température moyenne du côté supérieur est de 25.5 °C / 78 F, par rapport à la moyenne du dispositif de 31.2 °C / 88 F.
(±) En jouant à The Witcher 3, la température moyenne du côté supérieur est de 35.4 °C / 96 F, alors que la moyenne de l'appareil est de 31.2 °C / 88 F.
(+) Les repose-poignets et le pavé tactile sont plus froids que la température de la peau avec un maximum de 31 °C / 87.8 F et sont donc froids au toucher.
(-) La température moyenne de la zone de l'appui-paume de dispositifs similaires était de 28.8 °C / 83.8 F (-2.2 °C / #-4 F).
| Lenovo Yoga Pro 9 16IMH9 Intel Core Ultra 9 185H, NVIDIA GeForce RTX 4070 Laptop GPU | Dell XPS 16 9640 Intel Core Ultra 7 155H, NVIDIA GeForce RTX 4070 Laptop GPU | Honor MagicBook Pro 16 2024 Intel Core Ultra 7 155H, NVIDIA GeForce RTX 4060 Laptop GPU | Samsung Galaxy Book4 Ultra Intel Core Ultra 7 155H, NVIDIA GeForce RTX 4050 Laptop GPU | Framework Laptop 16 AMD Ryzen 9 7940HS, AMD Radeon RX 7700S | SCHENKER VISION 16 Pro (M23) Intel Core i7-13700H, NVIDIA GeForce RTX 4070 Laptop GPU | Lenovo Yoga Pro 9 16-IRP G8 Intel Core i7-13705H, NVIDIA GeForce RTX 4060 Laptop GPU | |
|---|---|---|---|---|---|---|---|
| Heat | 4% | 9% | 10% | -3% | -7% | -3% | |
| Maximum Upper Side * | 41.7 | 39.4 6% | 39.7 5% | 38.5 8% | 42.4 -2% | 46.7 -12% | 41.6 -0% |
| Maximum Bottom * | 46.3 | 36.9 20% | 42.9 7% | 41.2 11% | 40.8 12% | 54.1 -17% | 50 -8% |
| Idle Upper Side * | 26.2 | 28.2 -8% | 23.7 10% | 23.5 10% | 31.4 -20% | 26.5 -1% | 26.8 -2% |
| Idle Bottom * | 27.2 | 27.4 -1% | 23.5 14% | 24.1 11% | 27.8 -2% | 26.8 1% | 27.9 -3% |
* ... Moindre est la valeur, meilleures sont les performances
Intervenants
Le système audio à 6 modules reste l'un des meilleurs modèles du segment multimédia et surpasse nombre de ses concurrents. Vous pouvez vous passer de haut-parleurs externes dans de nombreux cas, mais vous ne profiterez pas des haut-parleurs lorsque vous jouez en raison des ventilateurs bruyants. Un casque est recommandé dans ce cas.
Lenovo Yoga Pro 9 16IMH9 analyse audio
(+) | les haut-parleurs peuvent jouer relativement fort (84.5# dB)
Bass 100 - 315 Hz
(±) | basse réduite - en moyenne 7% inférieure à la médiane
(±) | la linéarité des basses est moyenne (7.2% delta à la fréquence précédente)
Mids 400 - 2000 Hz
(+) | médiane équilibrée - seulement 3.9% de la médiane
(+) | les médiums sont linéaires (4.5% delta à la fréquence précédente)
Aiguës 2 - 16 kHz
(+) | des sommets équilibrés - à seulement 2.8% de la médiane
(+) | les aigus sont linéaires (3.2% delta à la fréquence précédente)
Overall 100 - 16.000 Hz
(+) | le son global est linéaire (8.8% différence à la médiane)
Par rapport à la même classe
» 7% de tous les appareils testés de cette catégorie étaient meilleurs, 1% similaires, 92% pires
» Le meilleur avait un delta de 5%, la moyenne était de 18%, le pire était de 45%.
Par rapport à tous les appareils testés
» 2% de tous les appareils testés étaient meilleurs, 1% similaires, 98% pires
» Le meilleur avait un delta de 4%, la moyenne était de 25%, le pire était de 134%.
Dell XPS 16 9640 analyse audio
(+) | les haut-parleurs peuvent jouer relativement fort (83.4# dB)
Bass 100 - 315 Hz
(±) | basse réduite - en moyenne 11.2% inférieure à la médiane
(±) | la linéarité des basses est moyenne (8.9% delta à la fréquence précédente)
Mids 400 - 2000 Hz
(+) | médiane équilibrée - seulement 4.5% de la médiane
(+) | les médiums sont linéaires (3% delta à la fréquence précédente)
Aiguës 2 - 16 kHz
(+) | des sommets équilibrés - à seulement 1.4% de la médiane
(+) | les aigus sont linéaires (2% delta à la fréquence précédente)
Overall 100 - 16.000 Hz
(+) | le son global est linéaire (10% différence à la médiane)
Par rapport à la même classe
» 8% de tous les appareils testés de cette catégorie étaient meilleurs, 1% similaires, 91% pires
» Le meilleur avait un delta de 5%, la moyenne était de 18%, le pire était de 45%.
Par rapport à tous les appareils testés
» 3% de tous les appareils testés étaient meilleurs, 1% similaires, 96% pires
» Le meilleur avait un delta de 4%, la moyenne était de 25%, le pire était de 134%.
Honor MagicBook Pro 16 2024 analyse audio
(±) | le niveau sonore du haut-parleur est moyen mais bon (81.3# dB)
Bass 100 - 315 Hz
(±) | basse réduite - en moyenne 6.8% inférieure à la médiane
(±) | la linéarité des basses est moyenne (9% delta à la fréquence précédente)
Mids 400 - 2000 Hz
(+) | médiane équilibrée - seulement 2.1% de la médiane
(+) | les médiums sont linéaires (5.2% delta à la fréquence précédente)
Aiguës 2 - 16 kHz
(+) | des sommets équilibrés - à seulement 2.1% de la médiane
(+) | les aigus sont linéaires (6.5% delta à la fréquence précédente)
Overall 100 - 16.000 Hz
(+) | le son global est linéaire (8.7% différence à la médiane)
Par rapport à la même classe
» 7% de tous les appareils testés de cette catégorie étaient meilleurs, 1% similaires, 92% pires
» Le meilleur avait un delta de 5%, la moyenne était de 18%, le pire était de 45%.
Par rapport à tous les appareils testés
» 2% de tous les appareils testés étaient meilleurs, 0% similaires, 98% pires
» Le meilleur avait un delta de 4%, la moyenne était de 25%, le pire était de 134%.
Samsung Galaxy Book4 Ultra analyse audio
(+) | les haut-parleurs peuvent jouer relativement fort (85# dB)
Bass 100 - 315 Hz
(±) | basse réduite - en moyenne 14.4% inférieure à la médiane
(±) | la linéarité des basses est moyenne (11.3% delta à la fréquence précédente)
Mids 400 - 2000 Hz
(+) | médiane équilibrée - seulement 3.4% de la médiane
(+) | les médiums sont linéaires (3.4% delta à la fréquence précédente)
Aiguës 2 - 16 kHz
(+) | des sommets équilibrés - à seulement 3% de la médiane
(+) | les aigus sont linéaires (5.6% delta à la fréquence précédente)
Overall 100 - 16.000 Hz
(+) | le son global est linéaire (11.5% différence à la médiane)
Par rapport à la même classe
» 11% de tous les appareils testés de cette catégorie étaient meilleurs, 4% similaires, 85% pires
» Le meilleur avait un delta de 5%, la moyenne était de 18%, le pire était de 45%.
Par rapport à tous les appareils testés
» 6% de tous les appareils testés étaient meilleurs, 2% similaires, 93% pires
» Le meilleur avait un delta de 4%, la moyenne était de 25%, le pire était de 134%.
Gestion de l'énergie - Une batterie plus grande, des durées d'utilisation plus longues
Consommation électrique
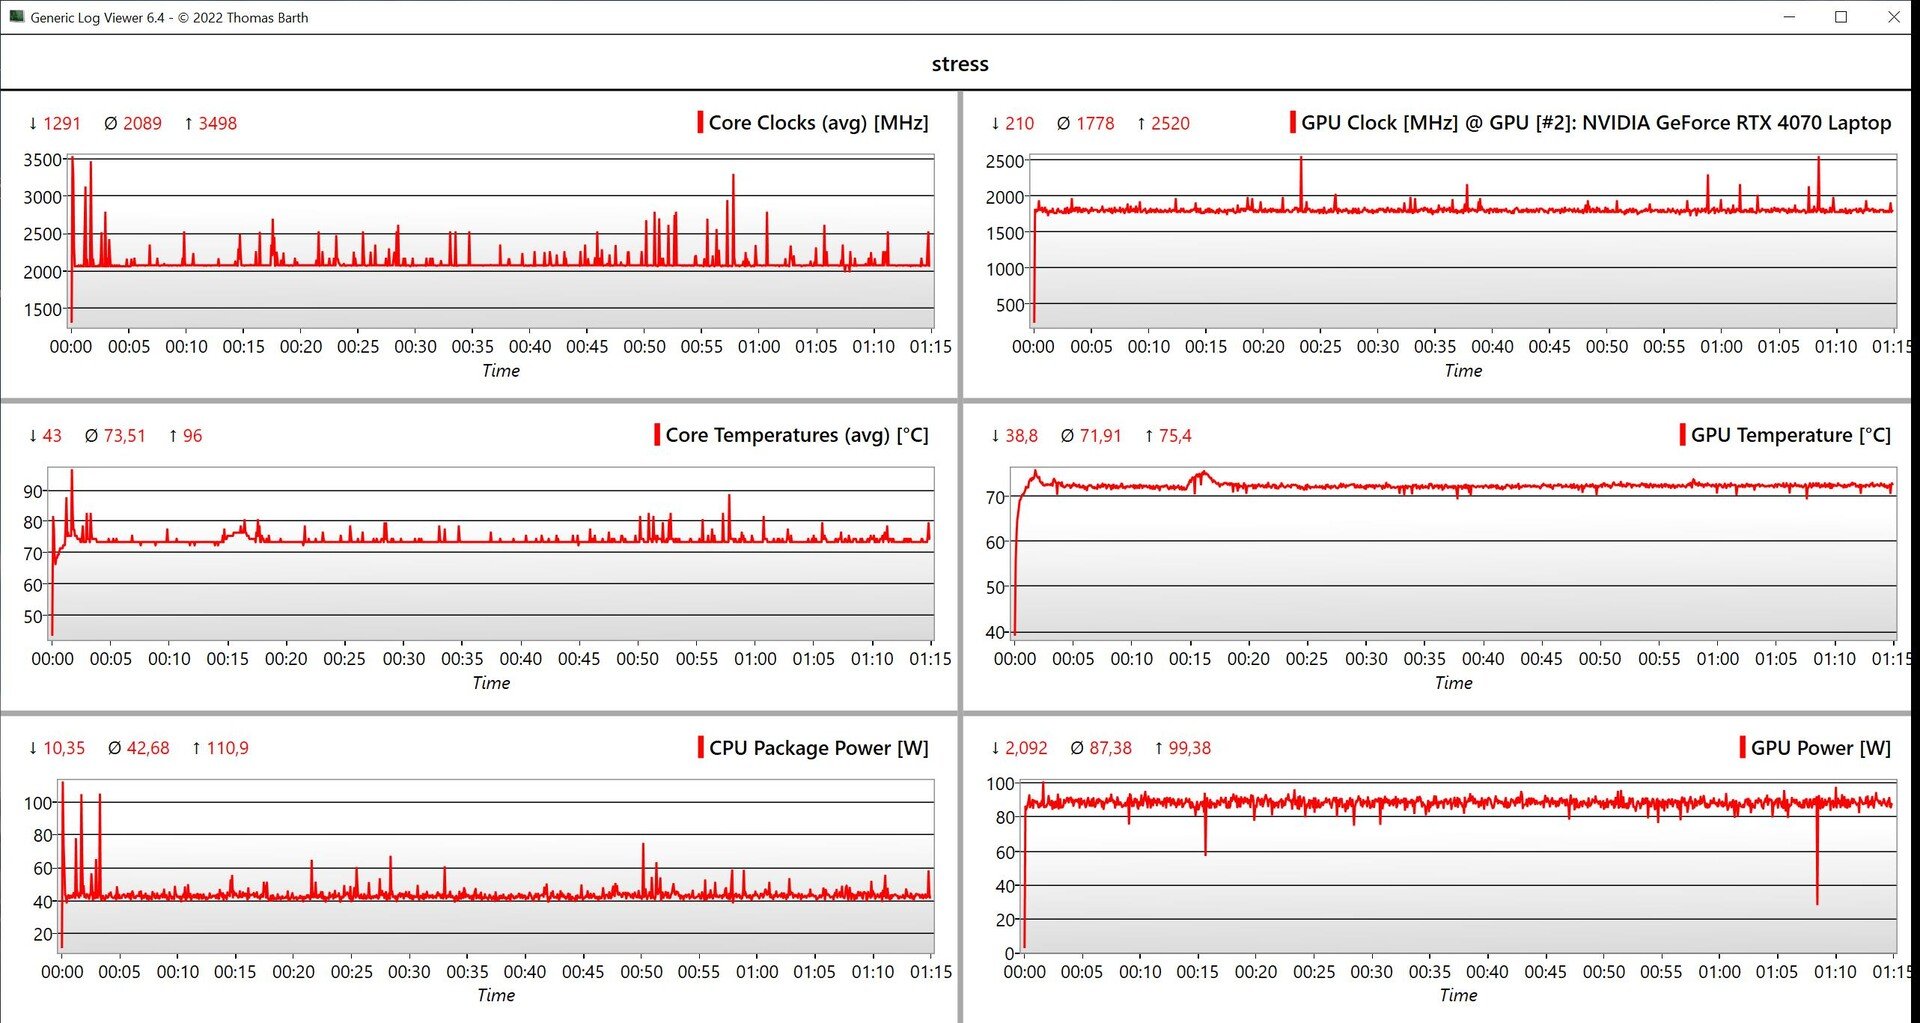
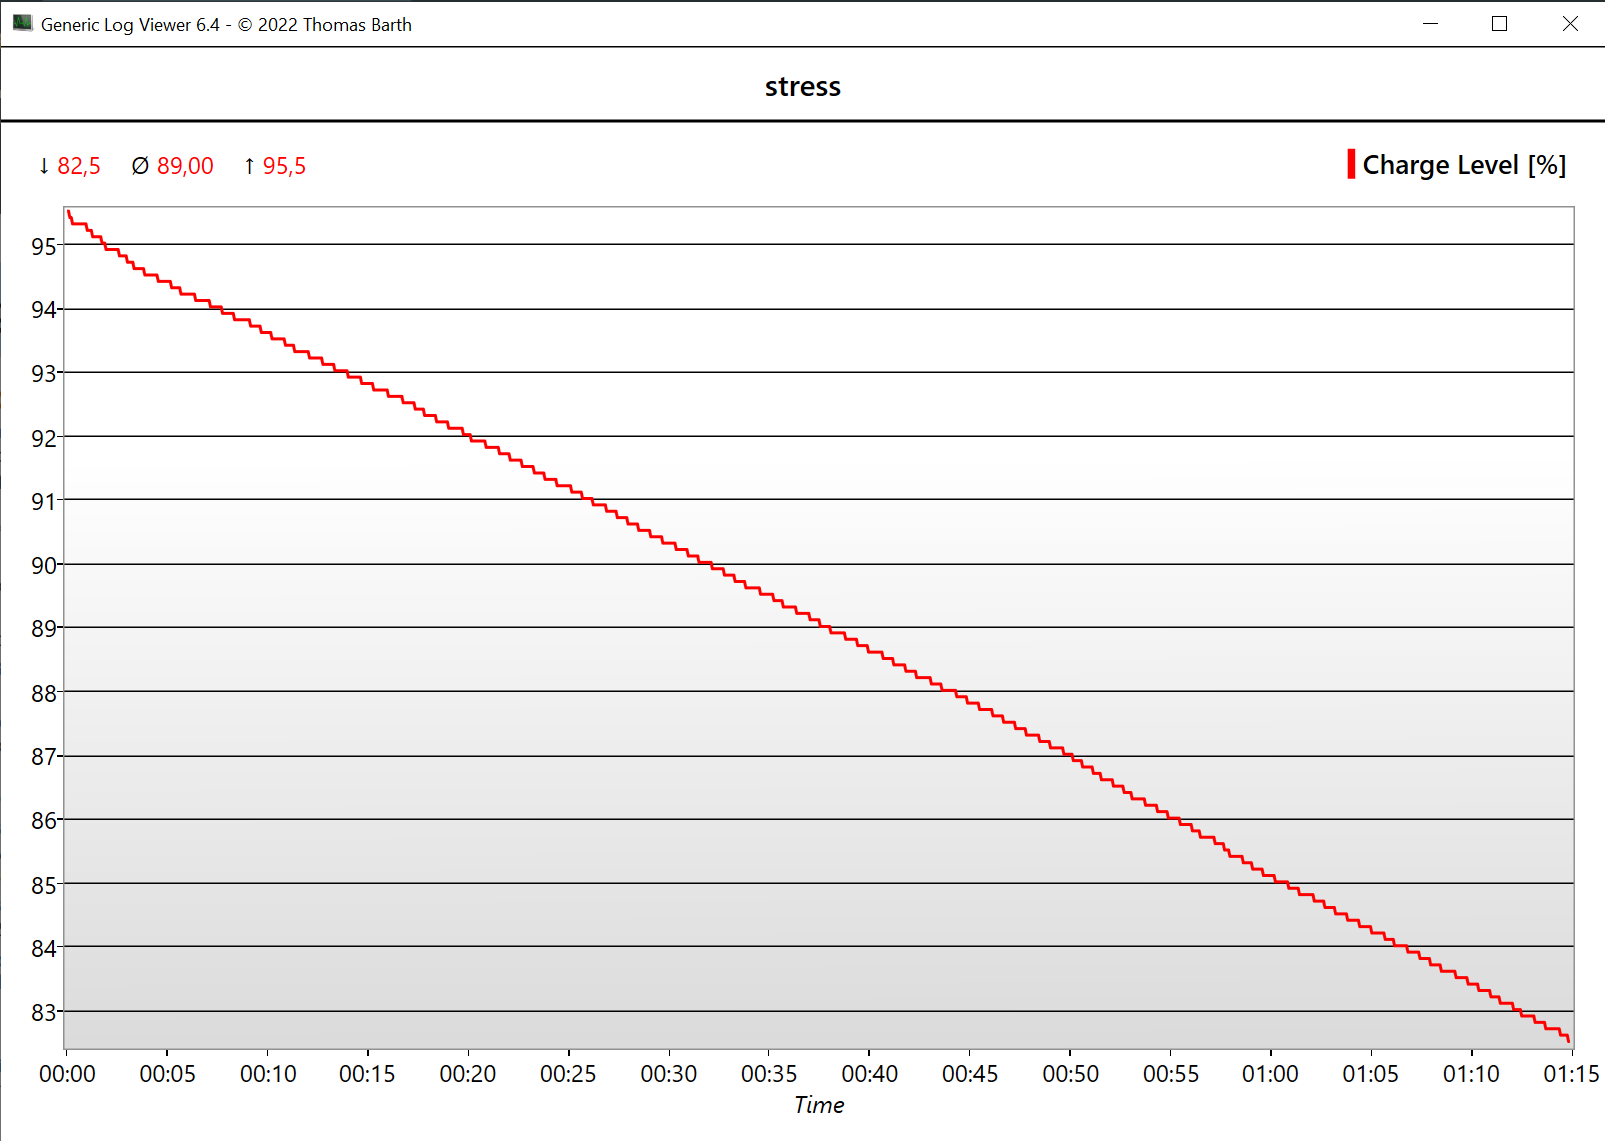
Il n'y a pas de changements significatifs dans les mesures de la consommation par rapport à l'année précédente prédécesseur. Mais il y a un autre problème : l'alimentation de 170 watts fournie ne couvre pas suffisamment la consommation maximale et l'appareil doit puiser dans la batterie. Et pas seulement brièvement, mais constamment, comme le montre clairement le graphique ci-dessous. Lors du test de stress, la capacité de la batterie diminue de 12 % en 75 minutes. Bien que notre test de stress soit le pire des scénarios et que tous les clients n'utiliseront pas le mode Performance , il s'agit clairement d'un problème et Lenovo ne fait pas les choses à moitié. Le Yoga Pro 9i 16 aurait dû être livré avec un bloc d'alimentation d'au moins 200 watts.
| Éteint/en veille | |
| Au repos | |
| Fortement sollicité |
|
| Lenovo Yoga Pro 9 16IMH9 Ultra 9 185H, NVIDIA GeForce RTX 4070 Laptop GPU, SK Hynix HFS001TEJ9X115N, Mini-LED, 3200x2000, 16.00 | Dell XPS 16 9640 Ultra 7 155H, NVIDIA GeForce RTX 4070 Laptop GPU, Kioxia XG8 KXG80ZNV1T02, OLED, 3840x2400, 16.30 | Honor MagicBook Pro 16 2024 Ultra 7 155H, NVIDIA GeForce RTX 4060 Laptop GPU, WD PC SN740 SDDPNQD-1T00, IPS, 3072x1920, 16.00 | Samsung Galaxy Book4 Ultra Ultra 7 155H, NVIDIA GeForce RTX 4050 Laptop GPU, Samsung PM9A1 MZVL2512HCJQ, OLED, 2880x1800, 16.00 | Framework Laptop 16 R9 7940HS, Radeon RX 7700S, WDC PC SN810 1TB, , 2560x1600, 16.00 | SCHENKER VISION 16 Pro (M23) i7-13700H, NVIDIA GeForce RTX 4070 Laptop GPU, Samsung 990 Pro 1 TB, IPS, 2560x1600, 16.00 | Lenovo Yoga Pro 9 16-IRP G8 i7-13705H, NVIDIA GeForce RTX 4060 Laptop GPU, Samsung PM9A1 MZVL21T0HCLR, Mini-LED, 3200x2000, 16.00 | Moyenne NVIDIA GeForce RTX 4070 Laptop GPU | Moyenne de la classe Multimedia | |
|---|---|---|---|---|---|---|---|---|---|
| Power Consumption | 32% | 21% | 47% | 8% | 22% | -1% | -6% | 32% | |
| Idle Minimum * | 10.3 | 7.7 25% | 5.2 50% | 4.8 53% | 9.5 8% | 8.6 17% | 10.9 -6% | 12.1 ? -17% | 7.25 ? 30% |
| Idle Average * | 21.9 | 10.3 53% | 14.4 34% | 7.5 66% | 17 22% | 12 45% | 22.6 -3% | 16.9 ? 23% | 11.8 ? 46% |
| Idle Maximum * | 22.4 | 10.6 53% | 15.4 31% | 7.9 65% | 17.2 23% | 12.4 45% | 23.5 -5% | 24.1 ? -8% | 14.5 ? 35% |
| Load Average * | 96.9 | 76.5 21% | 105.4 -9% | 79.3 18% | 96.2 1% | 80 17% | 84.6 13% | 99.5 ? -3% | 77.6 ? 20% |
| Witcher 3 ultra * | 159.6 | 126.4 21% | 107.6 33% | 79.2 50% | 171.9 -8% | 147.7 7% | 159.5 -0% | ||
| Load Maximum * | 173.8 | 138.5 20% | 195.2 -12% | 125 28% | 175.7 -1% | 173.1 -0% | 177.3 -2% | 220 ? -27% | 120.8 ? 30% |
* ... Moindre est la valeur, meilleures sont les performances
Power consumption Witcher 3 / Stress test
Power consumption with an external monitor
Durée de vie de la batterie
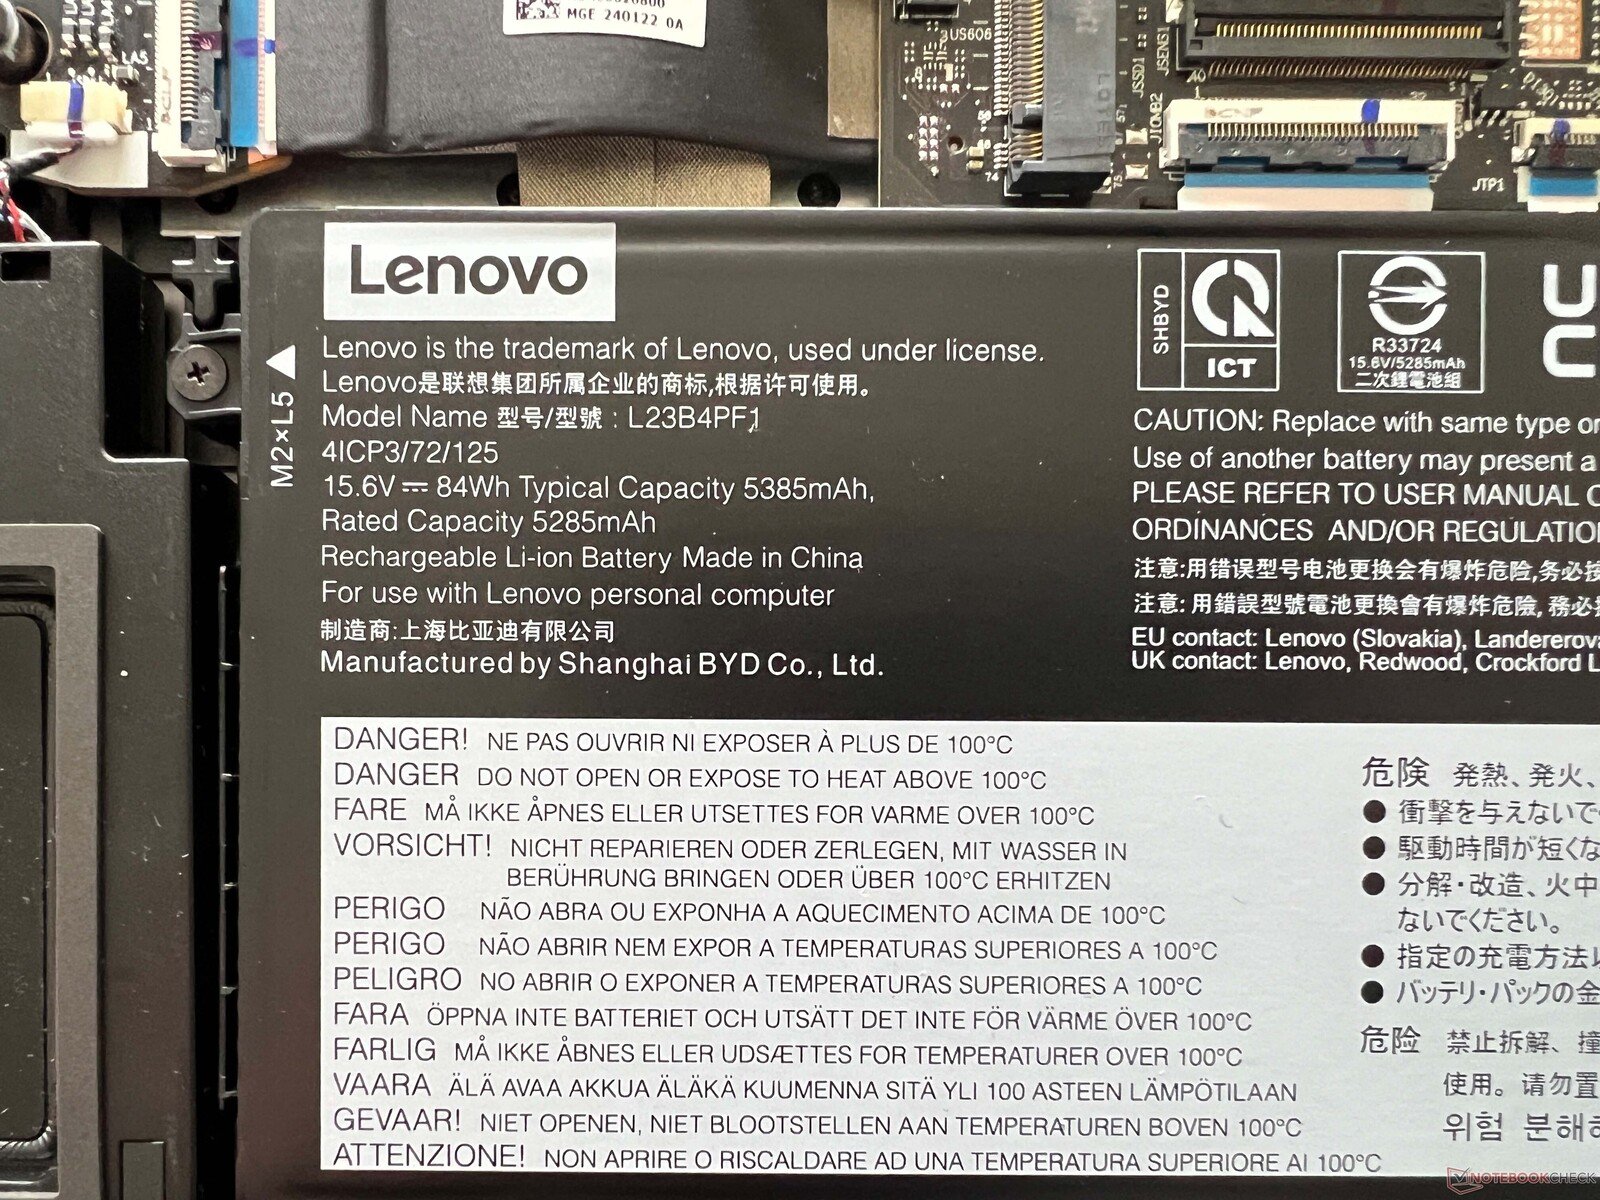
L'autonomie de la batterie n'était pas l'un des points forts de l'ancien modèle, ce qui était également dû à l'écran très lumineux. Lenovo a donc augmenté la capacité de la batterie de 75 à 84 watts pour son nouveau modèle G9, ce qui a amélioré l'autonomie. Avec une luminosité ajustée de 150 cd/m² en particulier, le nouveau Yoga est plus performant, même si les concurrents ont encore souvent un avantage. Dans le test WLAN, nous avons mesuré 8:46 heures à 60 Hz (~7,5 heures à 165 Hz), mais seulement 4,5 heures à pleine luminosité SDR et 60 Hz (4:10 heures à 165 Hz). Dans le test vidéo, l'autonomie est de 11,5 heures, mais une vidéo HDR à pleine luminosité ne dure que 2 h 40 et, à pleine charge, elle s'arrête au bout de 73 minutes. Une charge complète prend 96 minutes lorsque l'appareil est allumé.
| Lenovo Yoga Pro 9 16IMH9 Ultra 9 185H, NVIDIA GeForce RTX 4070 Laptop GPU, 84 Wh | Dell XPS 16 9640 Ultra 7 155H, NVIDIA GeForce RTX 4070 Laptop GPU, 99.5 Wh | Honor MagicBook Pro 16 2024 Ultra 7 155H, NVIDIA GeForce RTX 4060 Laptop GPU, 75 Wh | Samsung Galaxy Book4 Ultra Ultra 7 155H, NVIDIA GeForce RTX 4050 Laptop GPU, 76 Wh | Framework Laptop 16 R9 7940HS, Radeon RX 7700S, 85 Wh | SCHENKER VISION 16 Pro (M23) i7-13700H, NVIDIA GeForce RTX 4070 Laptop GPU, 80 Wh | Lenovo Yoga Pro 9 16-IRP G8 i7-13705H, NVIDIA GeForce RTX 4060 Laptop GPU, 75 Wh | Moyenne de la classe Multimedia | |
|---|---|---|---|---|---|---|---|---|
| Autonomie de la batterie | 27% | 11% | 29% | 15% | -13% | -34% | 15% | |
| H.264 | 692 | 988 43% | 784 13% | 1076 55% | 470 -32% | 449 -35% | 714 ? 3% | |
| WiFi v1.3 | 526 | 629 20% | 734 40% | 656 25% | 548 4% | 467 -11% | 385 -27% | 574 ? 9% |
| Load | 73 | 87 19% | 58 -21% | 78 7% | 92 26% | 77 5% | 44 -40% | 97.3 ? 33% |
Points positifs
Points négatifs
Verdict - Le Yoga Pro 9i 16 G9 ne se contente pas d'apporter des améliorations

Lenovo a amélioré son ordinateur portable multimédia Yoga Pro 9i 16 G9 dans un certain nombre de domaines. Un port HDMI moderne est installé, Advanced Optimus est embarqué et la mécanique du ClickPad a été améliorée. En outre, la batterie est désormais plus grande et les durées d'utilisation légèrement meilleures, mais si vous maximisez la luminosité du mini panneau LED, vous ne devez pas vous attendre à des miracles.
En termes de performances, le Yoga continue d'être très performant, mais le nouveau Core Ultra 9 185H n'offre pas de réel avantage en termes de performances par rapport aux anciennes puces Raptor Lake. Les performances de jeu sont solides et l'écran mini-LED mat est très beau, surtout avec du contenu HDR. Le problème, cependant, est que Lenovo ne propose plus de profils de couleurs pour sRGB et AdobeRGB, ce qui était le cas avec l'ancien modèle.
Lenovo propose une fois de plus un très bon ordinateur portable multimédia avec le Yoga Pro 9 16 G9, doté de composants rapides et d'un mini panneau LED extrêmement lumineux. Cependant, il y a aussi des inconvénients tels que les ventilateurs bruyants, le bloc d'alimentation plutôt faible et les courtes durées d'autonomie de la batterie lorsque la luminosité de l'écran est au maximum.
Le refroidissement devient encore très bruyant sous charge et l'alimentation électrique inadéquate est également problématique, car le Yoga doit constamment puiser dans la batterie en cas de charge prolongée. Dans l'ensemble, cependant, les aspects positifs l'emportent sur les aspects négatifs et le Yoga n'a guère de concurrents dans le segment Windows en ce qui concerne son panneau mini-LED. Les panneaux OLED sont loin d'être aussi lumineux, mais la mauvaise implémentation HDR de Windows reste un problème. Néanmoins, le Yoga Pro surpasse nettement d'autres concurrents multimédias tels que le nouveau Dell XPS 16 9640, surtout en termes de performances.
Prix et disponibilité
Le nouveau Yoga Pro 9 16 G9 peut être configuré et commandé directement auprès de Lenovo, le modèle de base étant proposé à partir d'un peu moins de 1500 dollars.
Lenovo Yoga Pro 9 16IMH9
-
04/20/2024 v7
Andreas Osthoff
Transparency
The present review sample was made available to the author as a loan by the manufacturer or a shop for the purposes of review. The lender had no influence on this review, nor did the manufacturer receive a copy of this review before publication. There was no obligation to publish this review.
Pricecompare

