Notebookcheck Logo

Test du MSI Raider 18 HX A14V : les performances d'un Titan, le prix en moins

Une meilleure affaire que le Titan 18 HX. Le nouveau Raider 18 abandonne de nombreuses caractéristiques "inutiles" du Titan 18 tout en conservant les mêmes options de CPU, GPU et d'affichage haut de gamme. Il offre donc la même expérience visuelle et de jeu, mais à un prix beaucoup plus bas, ce qui en fait un produit plus facile à recommander, même pour les passionnés.
MSI Raider 18 HX A14V (ou Raider GE68 HX A14V)

Les ordinateurs portables de jeu de 18 pouces font un retour en force et la gamme continue de s'élargir. MSI propose déjà l'expérience de jeu "ultime" en 18 pouces avec le Titan 18 HXmais ce dernier modèle Raider 18 HX est un cran en dessous en termes de fonctionnalités afin de réduire la barrière d'entrée.

Notre unité de test est une configuration intermédiaire avec le CPU Raptor Lake-R Core i9-14900HX, le GPU RTX 4080 de 175 W GeForce et l'écran Mini-LED 3840 x 2400 120 Hz pour un prix de détail d'environ 3200 $. D'autres SKUs incluent le Zen 4 Ryzen 9 7945HX, RTX 4070, RTX 4090, ou l'écran QHD+ 2560 x 1600 240 Hz IPS à la place.

Les concurrents du Raider 18 HX comprennent d'autres ordinateurs portables de jeu de 18 pouces comme le Razer Blade 18, Alienware m18 R2ou le Asus ROG Strix G18.

Plus d'avis sur MSI :

MSI Raider 18 HX A14V
Processeur
Intel Core i9-14900HX 24 x 1.6 - 5.8 GHz, 154 W PL2 / Short Burst, 145 W PL1 / Sustained, Raptor Lake-HX Refresh
Carte graphique
NVIDIA GeForce RTX 4080 Laptop GPU - 12 Go VRAM, Processeur: 1450 MHz, Mémoire: 2250 MHz, 175 W TDP, GDDR6, 560.81, MUX
Mémoire
64 Go 
, DDR5-5600, SK Hynix, 32-32-32-63, Dual-Channel
Écran
18.00 pouces 16:10, 3840 x 2400 pixel 252 PPP, AU Optronics B180ZAN1.0, Mini-LED, AUOC5AC, brillant: non, HDR, 120 Hz
Carte mère
Intel HM770 (Raptor Lake-S PCH)
Disque dur
Samsung PM9A1 MZVL22T0HBLB, 2048 Go 
Carte son
Intel Raptor Lake-S PCH - cAVS
Connexions
5 USB 3.1 Gen2, 2 Thunderbolt, USB-C Power Delivery (PD), 1 HDMI, 2 DisplayPort, 1 Encoche de Sécurité Kensington, Connectique audio: 3.5 mm headset, Lecteur de cartes mémoires: SD
Réseau
Killer E3000 2.5 Gigabit Ethernet Controller (10/100/1000/2500MBit/s), Intel Killer Wi-Fi 7 BE1750x BE200NGW (a/b/g/h/n = Wi-Fi 4/ac = Wi-Fi 5/ax = Wi-Fi 6/ Wi-Fi 6E 6 GHz be = Wi-Fi 7), Bluetooth 5.4
Taille
Hauteur x Largeur x Profondeur (en mm): 32 x 404 x 307.5
Batterie
99.9 Wh Lithium-Polymère
Système d'exploitation
Microsoft Windows 11 Pro
Appareil photo
Webcam: 1080p30
Appareil photo primaire: 2 MPix
Fonctionnalités additionnelles
Haut-parleurs: 4x 2 W tweeters, 2x 2 W woofer, Clavier: Chiclet, Rétroéclairage du clavier: oui, MSI Center, SteelSeries GG, 12 Mois Garantie
Poids
3.557 kg, Alimentation: 945 g
Prix
3400 USD
Remarque : le fabricant peut utiliser des composants provenant de différents fournisseurs, notamment des panneaux d'affichage, des lecteurs ou des clés USB ayant des spécifications similaires.


Comparaison avec les concurrents potentiels

Note
Version
Date
Modèle
Poids
Épaisseur
Taille
Résolution
Meilleur prix
84.7 %v8
09/24
MSI Raider 18 HX A14V
i9-14900HX, NVIDIA GeForce RTX 4080 Laptop GPU
3.6 kg32 mm18.00"3840x2400
90.5 %v7 (old)
05/24
Razer Blade 18 2024 RZ09-0509
i9-14900HX, NVIDIA GeForce RTX 4090 Laptop GPU
3.1 kg21.9 mm18.00"2560x1600
89.5 %v7 (old)
03/24
Alienware m18 R2
i9-14900HX, NVIDIA GeForce RTX 4090 Laptop GPU
4 kg26.7 mm18.00"2560x1600
88.8 %v7 (old)
01/24
MSI Titan 18 HX A14VIG
i9-14900HX, NVIDIA GeForce RTX 4090 Laptop GPU
3.6 kg32.1 mm18.00"3840x2400
87.4 %v7 (old)
03/23
Asus ROG Strix G18 G814JI
i7-13650HX, NVIDIA GeForce RTX 4070 Laptop GPU
3 kg31 mm18.00"2560x1600
87.1 %v7 (old)
03/24
Acer Predator Helios 18 PH18-72-98MW
i9-14900HX, NVIDIA GeForce RTX 4090 Laptop GPU
3.3 kg29.5 mm18.00"2560x1600

Cas - Du dragon bleu au dragon rouge

Le châssis est un dérivé du Titan 18 HX. Les accents rouges du Titan sont remplacés par du bleu sur le nouveau Raider et la plupart des surfaces sont noires au lieu d'être grises ou argentées pour un look plus sombre. MSI a également ajouté une barre LED le long du bord avant du système alors qu'elle était absente sur le Titan. Les changements sont principalement d'ordre esthétique et le Raider semble toujours aussi solide que son frère plus cher puisque les matériaux sous-jacents et le squelette sont les mêmes.

La différence visuelle la plus notable entre le Raider 18 HX et le Titan 18 HX est peut-être le clavier redessiné. Alors que le Titan 18 HX a un clavier plus plat avec un panneau de verre fantaisiste qui s'étend sur les repose-poignets et le pavé tactile, le Raider adopte une approche plus traditionnelle sans verre et avec juste un pavé tactile de base.

Les dimensions et le poids sont essentiellement identiques à ceux du Titan 18 HX, malgré toutes les différences extérieures entre eux. Le modèle se situe donc en milieu de peloton en ce qui concerne la portabilité, alors que des alternatives comme le Alienware m18 R2 sont plus lourds et plus grands, tandis que le ROG Strix G18 ou le Blade 18 sont beaucoup plus légers.

Les matériaux du châssis sont une combinaison d'alliage de magnésium et de plastique
Les surfaces lisses et foncées cachent relativement bien les empreintes digitales
Couvercle ouvert à l'angle maximum de ~145 degrés
Les charnières sont petites mais satisfaisantes, avec un léger flottement lors du réglage des angles
Plaque de fond stylisée avec de nombreuses grilles et marques esthétiques
Les grilles des haut-parleurs et le clavier sont très différents de ceux du Titan 18 HX

Comparaison des tailles

410.3 mm 319.9 mm 26.7 mm 4 kg404 mm 307.5 mm 32.1 mm 3.6 kg404 mm 307.5 mm 32 mm 3.6 kg405 mm 312 mm 29.5 mm 3.3 kg399 mm 294 mm 31 mm 3 kg399.9 mm 275.4 mm 21.9 mm 3.1 kg297 mm 210 mm 1 mm 5.7 g

Connectivité

Les ports et leur positionnement sont identiques à ceux du Titan 18 HX, ce qui donne une idée de ce qui vous attend sous le capot. Les options intégrées sont comparables à celles que vous trouverez sur le Blade 18 ou le ROG Strix G18, mais dans des dispositions très différentes.

Gardez à l'esprit que seul l'un des deux ports USB-C prend en charge Power Delivery. Les deux sont par ailleurs compatibles avec DisplayPort.

Avant : Pas de ports
À droite : casque 3,5 mm, USB-A 3.2 Gen. 2, 2x USB-C Thunderbolt 4 avec Power Delivery + DisplayPort
À l'arrière : Adaptateur secteur, HDMI 2.1 (8K@60), RJ-45 2,5 Gbps
À gauche : verrou Kensington, USB-A 3.2 Gen. 2, lecteur de carte SD

Lecteur de carte SD

Avec un débit d'environ 90 Mo/s, le lecteur de carte SD intégré est décent mais lent par rapport au prix élevé du Raider 18 HX. Les lecteurs de cartes SD du Razer Blade 18 ou du Alienware m18 R2par exemple, sont deux fois plus rapides.

Une carte SD complètement insérée dépasse encore de la moitié de sa longueur
SD Card Reader
average JPG Copy Test (av. of 3 runs)
Alienware m18 R2
Intel Core i9-14900HX (Toshiba Exceria Pro SDXC 64 GB UHS-II)
190.3 MB/s +120%
Razer Blade 18 2024 RZ09-0509
Intel Core i9-14900HX (Toshiba Exceria Pro SDXC 64 GB UHS-II)
188.25 MB/s +118%
Acer Predator Helios 18 PH18-72-98MW
Intel Core i9-14900HX (AV PRO microSD 128 GB V60)
87 MB/s +1%
MSI Raider 18 HX A14V
Intel Core i9-14900HX (Toshiba Exceria Pro SDXC 64 GB UHS-II)
86.4 MB/s
MSI Titan 18 HX A14VIG
Intel Core i9-14900HX (Toshiba Exceria Pro SDXC 64 GB UHS-II)
83.8 MB/s -3%
maximum AS SSD Seq Read Test (1GB)
Razer Blade 18 2024 RZ09-0509
Intel Core i9-14900HX (Toshiba Exceria Pro SDXC 64 GB UHS-II)
220.56 MB/s +142%
Alienware m18 R2
Intel Core i9-14900HX (Toshiba Exceria Pro SDXC 64 GB UHS-II)
219.7 MB/s +141%
MSI Titan 18 HX A14VIG
Intel Core i9-14900HX (Toshiba Exceria Pro SDXC 64 GB UHS-II)
91.5 MB/s +1%
MSI Raider 18 HX A14V
Intel Core i9-14900HX (Toshiba Exceria Pro SDXC 64 GB UHS-II)
91 MB/s
Acer Predator Helios 18 PH18-72-98MW
Intel Core i9-14900HX (AV PRO microSD 128 GB V60)
90 MB/s -1%

Communication

Le Killer BE1750x est équipé en standard d'une connectivité Wi-Fi 7 et Bluetooth 5.4. Les taux de transfert sont stables et fiables lorsqu'il est associé à notre routeur de test Wi-Fi 6E.

Module WLAN M.2 amovible
Networking
iperf3 transmit AXE11000
Asus ROG Strix G18 G814JI
Intel Wi-Fi 6E AX211
1586 (803min - 1641max) MBit/s +138%
Razer Blade 18 2024 RZ09-0509
Intel Wi-Fi 7 BE200 320MHz
1143 (813min - 1407max) MBit/s +72%
MSI Titan 18 HX A14VIG
Intel Killer Wi-Fi 7 BE1750x BE200NGW
1011 (514min - 1160max) MBit/s +52%
Acer Predator Helios 18 PH18-72-98MW
Intel Killer Wi-Fi 7 BE1750W 320 MHz (BE200NGW)
831 (611min - 909max) MBit/s +25%
Alienware m18 R2
Intel Killer Wi-Fi 7 BE1750x BE200NGW
791 (736min - 894max) MBit/s +19%
MSI Raider 18 HX A14V
Intel Killer Wi-Fi 7 BE1750x BE200NGW
665 (536min - 748max) MBit/s
iperf3 receive AXE11000
Asus ROG Strix G18 G814JI
Intel Wi-Fi 6E AX211
1611 (839min - 1699max) MBit/s +107%
Acer Predator Helios 18 PH18-72-98MW
Intel Killer Wi-Fi 7 BE1750W 320 MHz (BE200NGW)
1589 (1385min - 1671max) MBit/s +105%
Razer Blade 18 2024 RZ09-0509
Intel Wi-Fi 7 BE200 320MHz
1459 (1375min - 1525max) MBit/s +88%
Alienware m18 R2
Intel Killer Wi-Fi 7 BE1750x BE200NGW
1381 (1277min - 1427max) MBit/s +78%
MSI Titan 18 HX A14VIG
Intel Killer Wi-Fi 7 BE1750x BE200NGW
1116 (932min - 1352max) MBit/s +44%
MSI Raider 18 HX A14V
Intel Killer Wi-Fi 7 BE1750x BE200NGW
777 (388min - 821max) MBit/s
iperf3 transmit AXE11000 6GHz
Razer Blade 18 2024 RZ09-0509
Intel Wi-Fi 7 BE200 320MHz
1199 (1057min - 1319max) MBit/s +18%
MSI Titan 18 HX A14VIG
Intel Killer Wi-Fi 7 BE1750x BE200NGW
1096 (900min - 1242max) MBit/s +7%
MSI Raider 18 HX A14V
Intel Killer Wi-Fi 7 BE1750x BE200NGW
1020 (876min - 1213max) MBit/s
Alienware m18 R2
Intel Killer Wi-Fi 7 BE1750x BE200NGW
648 (595min - 759max) MBit/s -36%
iperf3 receive AXE11000 6GHz
MSI Titan 18 HX A14VIG
Intel Killer Wi-Fi 7 BE1750x BE200NGW
1379 (709min - 1426max) MBit/s +18%
Razer Blade 18 2024 RZ09-0509
Intel Wi-Fi 7 BE200 320MHz
1315 (1269min - 1369max) MBit/s +12%
Alienware m18 R2
Intel Killer Wi-Fi 7 BE1750x BE200NGW
1292 (1215min - 1327max) MBit/s +10%
MSI Raider 18 HX A14V
Intel Killer Wi-Fi 7 BE1750x BE200NGW
1171 (1063min - 1334max) MBit/s
0501001502002503003504004505005506006507007508008509009501000105011001150120012501300Tooltip
MSI Raider 18 HX A14V; iperf3 transmit AXE11000 6GHz; iperf 3.1.3: Ø1020 (876-1213)
MSI Raider 18 HX A14V; iperf3 receive AXE11000 6GHz; iperf 3.1.3: Ø1171 (1063-1334)

Webcam

Une webcam de 2 mégapixels avec infrarouge et obturateur physique est fournie en standard, comme sur le Titan 18 HX. Il est intéressant de noter que la caméra présente les mêmes problèmes de luminosité.

ColorChecker
8.6 ∆E
10.9 ∆E
5.9 ∆E
7.7 ∆E
12.2 ∆E
12.7 ∆E
13.4 ∆E
5.2 ∆E
5.4 ∆E
6.8 ∆E
10.6 ∆E
12.1 ∆E
8.6 ∆E
10.3 ∆E
3 ∆E
8.5 ∆E
9.7 ∆E
8.6 ∆E
12.6 ∆E
10.1 ∆E
6.8 ∆E
11 ∆E
8.5 ∆E
6.9 ∆E
ColorChecker MSI Raider 18 HX A14V: 9 ∆E min: 2.98 - max: 13.37 ∆E

Maintenance

Le panneau inférieur est fixé par 12 vis Phillips, ce qui permet de le retirer relativement facilement. Cependant, MSI reste l'un des rares fabricants à avoir un autocollant anti-tamper couvrant l'une des vis qui doit être cassée même pour des mises à jour simples comme la RAM ou le stockage.

Le Raider 18 HX partage la plupart des composants internes du Titan 18 HX. Les utilisateurs ont accès à deux emplacements M.2 2280 SSD et quatre emplacements DDR5 SODIMM. Notez que le troisième emplacement M.2 SSD a été retiré de ce modèle ; les utilisateurs doivent passer au Titan 18 HX pour bénéficier d'une telle fonctionnalité.

MSI Raider 18 HX A14V
Titan 18 HX A14VIG
Titan 18 HX A14VIG

Durabilité

L'emballage est entièrement recyclable et presque entièrement en carton, avec seulement un peu d'emballage en plastique pour le manuel de l'utilisateur. Cependant, il n'y a aucune information sur les matériaux recyclés utilisés lors de la fabrication du système.

Accessoires et garantie

La boîte ne contient rien d'autre que l'adaptateur secteur et la documentation. Les anciens modèles de Raider étaient livrés avec un chiffon de nettoyage en velours, mais il semble que ce ne soit plus le cas.

La garantie limitée habituelle d'un an du fabricant s'applique si vous l'achetez aux États-Unis.

Dispositifs d'entrée - Le familier plutôt que le fantaisiste

Clavier

Le clavier est visuellement identique à celui du Titan 18 HX mais avec une différence très importante : L'absence d'options mécaniques CherryMX. La frappe sur le Raider 18 HX est donc plus proche de la frappe sur des claviers d'ordinateurs portables plus traditionnels comme le MSI Stealth 16 ou les modèles Raider d'ancienne génération. Le retour d'information est loin d'être aussi précis ou ferme, mais le claquement plus doux peut être préférable pour des environnements tels que les salles de conférence, les salles de classe, les bibliothèques ou les dortoirs.

Nous apprécions particulièrement le pavé numérique et les touches fléchées de grande taille, car ils sont généralement plus étroits et plus petits que les touches QWERTY principales de la plupart des autres ordinateurs portables. Le travail sur tableur est donc plus confortable sur le Raider 18 HX que sur le Blade 18 ou le ROG Strix G18.

Pavé tactile

Contrairement au pavé tactile sans bords et éclairé par LED du Titan 18 HX, le Raider 18 HX utilise un pavé tactile traditionnel pour une sensation plus familière. La taille reste exactement la même (13 x 8,2 cm) et il est sans doute plus confortable à utiliser car il n'essaie pas d'être quelque chose de nouveau ou de résoudre un problème qui n'existait pas en premier lieu. La traction est ultra douce, avec juste un peu d'adhérence à des vitesses plus lentes pour la précision.

L'appui sur la souris pour obtenir un clic est malheureusement encore superficiel et mou, avec un retour d'information insatisfaisant. Un clic plus fort et plus ferme aurait été préférable, ou même le retour de touches dédiées à la souris, car le clavier est assez spacieux.

Même disposition que la Titan 18 HX, mais avec un retour d'information très différent
L'espace inutilisé autour du pavé tactile aurait pu être utilisé pour des boutons de souris dédiés
Les touches sont plus souples mais aussi beaucoup plus silencieuses que les touches mécaniques de la Titan 18 HX
Les touches fléchées et le pavé numérique de taille normale sont très spacieux et peu courants sur les ordinateurs portables

Affichage - L'expérience Titan 18 HX à moindre coût

Sous-pixels RVB mats

Le Raider 18 HX est livré avec le même panneau mini-LED 120 Hz AU Optronics B180ZAN01.0 que celui du Titan 18 HX, pour une expérience visuelle pratiquement identique. La luminosité maximale atteint presque 600 nits lorsque le HDR est désactivé ou 935 nits lorsque le HDR est activé. Comparé à l'IPS ou à l'OLED, le mini-LED offre une meilleure expérience de visualisation HDR car il est capable d'atteindre des niveaux de luminosité plus élevés que l'un ou l'autre, au prix d'une consommation d'énergie plus importante. Les ordinateurs portables IPS ou OLED prennent généralement en charge le HDR600 au mieux, tandis que les panneaux mini-LED promettent souvent le HDR1000.

Pas d'options bord à bord ou OLED
Encadrements latéraux étroits
574.2
cd/m²
590.8
cd/m²
578.8
cd/m²
568.3
cd/m²
575.7
cd/m²
580.7
cd/m²
553.7
cd/m²
575
cd/m²
565.2
cd/m²
Homogénéité de la luminosité
AU Optronics B180ZAN1.0 tested with X-Rite i1Pro 2
Maximum: 590.8 cd/m² (Nits) Moyenne: 573.6 cd/m² Minimum: 29.3 cd/m²
Homogénéité de la luminosité: 94 %
Valeur mesurée au centre, sur batterie: 392.2 cd/m²
Contraste: ∞:1 (Valeurs des noirs: 0 cd/m²)
ΔE Color 3.56 | 0.5-29.43 Ø4.95, calibrated: 2.69
ΔE Greyscale 5.6 | 0.5-98 Ø5.2
84.8% AdobeRGB 1998 (Argyll 2.2.0 3D)
99.9% sRGB (Argyll 2.2.0 3D)
96.6% Display P3 (Argyll 2.2.0 3D)
Gamma: 2.34
MSI Raider 18 HX A14V
AU Optronics B180ZAN1.0, Mini-LED, 3840x2400, 18", 120 Hz
Razer Blade 18 2024 RZ09-0509
BOE NE180QDM-NM1, Mini-LED, 2560x1600, 18", 300 Hz
Alienware m18 R2
BOE NE18NZ1, IPS, 2560x1600, 18", 165 Hz
MSI Titan 18 HX A14VIG
AU Optronics B180ZAN01.0, Mini-LED, 3840x2400, 18", 120 Hz
Asus ROG Strix G18 G814JI
NE180QDM-NZ2 (BOE0B35), IPS, 2560x1600, 18", 240 Hz
Acer Predator Helios 18 PH18-72-98MW
B180QAN01.2 (AUO45A8), Mini-LED, 2560x1600, 18", 250 Hz
Display
1%
2%
1%
1%
4%
Display P3 Coverage
96.6
99
2%
97.8
1%
98.1
2%
98.1
2%
99.7
3%
sRGB Coverage
99.9
100
0%
99.5
0%
99.8
0%
99.9
0%
100
0%
AdobeRGB 1998 Coverage
84.8
86.9
2%
88.9
5%
86.2
2%
85.6
1%
91.6
8%
Response Times
341%
68%
3%
67%
62%
Response Time Grey 50% / Grey 80% *
10.4 ?(4.8, 5.6)
7.6 ?(3.6, 4)
27%
5.3 ?(2.2, 3.1)
49%
8.6 ?(4.2, 4.4)
17%
5.6 ?(2.7, 2.9)
46%
8 ?(4.9, 3.1)
23%
Response Time Black / White *
75.8 ?(71, 4.8)
14 ?(6.6, 7.4)
82%
10.4 ?(4.8, 5.6)
86%
81.8 ?(76, 5.8)
-8%
9 ?(4, 5)
88%
17.6 ?(15.2, 2.4)
77%
PWM Frequency
2606.2 ?(100)
26444 ?(100)
915%
2592 ?(100)
-1%
4832 ?(100)
85%
Screen
29%
8%
2%
23%
24%
Brightness middle
575.7
605.4
5%
271.8
-53%
467.5
-19%
471
-18%
722
25%
Brightness
574
600
5%
275
-52%
459
-20%
422
-26%
724
26%
Brightness Distribution
94
97
3%
78
-17%
90
-4%
83
-12%
93
-1%
Black Level *
0.62
0.27
0.47
0.04
Colorchecker dE 2000 *
3.56
1.53
57%
2.48
30%
3.77
-6%
2.05
42%
3.4
4%
Colorchecker dE 2000 max. *
8.64
4.15
52%
5.59
35%
6.12
29%
4.15
52%
5.32
38%
Colorchecker dE 2000 calibrated *
2.69
0.56
79%
2.94
-9%
0.8
70%
1.6
41%
Greyscale dE 2000 *
5.6
2.6
54%
3.7
34%
3.2
43%
2.8
50%
3.8
32%
Gamma
2.34 94%
2.22 99%
2.2 100%
2.43 91%
2.204 100%
2.383 92%
CCT
7872 83%
6843 95%
6355 102%
6478 100%
7122 91%
7051 92%
Contrast
976
1007
1002
18050
Moyenne finale (programmes/paramètres)
124% / 100%
26% / 16%
2% / 2%
30% / 25%
30% / 28%

* ... Moindre est la valeur, meilleures sont les performances

vs. sRGB
vs. sRGB
vs. P3
vs. P3

La température des couleurs, lorsqu'elle est réglée sur Display P3 et HDR désactivé, est assez froide (7872). L'activation du HDR désactive automatiquement tous les paramètres TrueColor de MSI, mais la température des couleurs devient aussi automatiquement plus chaude à 6521 pour des couleurs plus précises. MSI n'annonce pas de calibration en usine pour ce modèle Raider.

Niveaux de gris avant étalonnage (vs. P3, HDR désactivé)
Balayages de saturation avant étalonnage (vs. P3, HDR désactivé)
ColorChecker avant étalonnage (vs. P3, HDR désactivé)
Niveaux de gris avant étalonnage (HDR activé)
Balayages de saturation avant étalonnage (HDR activé)
ColorChecker avant l'étalonnage (HDR activé)
Niveaux de gris après étalonnage
Balayages de saturation après étalonnage
ColorChecker après étalonnage

Temps de réponse de l'écran

Le temps de réponse d'un écran mesure la rapidité à laquelle l'écran est capable de changer une couleur pour une autre. Un temps de réponse élevé se traduit par une image floutée pour les objets en mouvement. Les joueurs bénéficieront de faibles latences d'affichage en jeu.
       Temps de réponse noir à blanc
75.8 ms ... hausse ↗ et chute ↘ combinées↗ 71 ms hausse
↘ 4.8 ms chute
L'écran souffre de latences très élevées, à éviter pour le jeu.
En comparaison, tous les appareils testés affichent entre 0.1 (minimum) et 240 (maximum) ms. » 100 % des appareils testés affichent de meilleures performances.
Cela signifie que les latences relevées sont moins bonnes que la moyenne (21.1 ms) de tous les appareils testés.
       Temps de réponse gris 50% à gris 80%
10.4 ms ... hausse ↗ et chute ↘ combinées↗ 4.8 ms hausse
↘ 5.6 ms chute
L'écran montre de bons temps de réponse, mais insuffisant pour du jeu compétitif.
En comparaison, tous les appareils testés affichent entre 0.165 (minimum) et 636 (maximum) ms. » 20 % des appareils testés affichent de meilleures performances.
Cela signifie que les latences relevées sont meilleures que la moyenne (33.1 ms) de tous les appareils testés.

Scintillement / MLI (Modulation de largeur d'impulsion)

Afin d'abaisser la luminosité de l'écran, certains ordinateurs portables font varier très rapidement le rétroéclairage entre éteint et allumé. La fréquence à laquelle le rétroéclairage s'éteint et se rallume est normalement fixée à une valeur qui permet de rendre la variation indétectable à l'œil nu? Si la fréquence est trop basse, certaines personnes peuvent être sujettes à une fatigue oculaire, des maux de tête ou même percevoir les variations.
Scintillement / MLI (Modulation de largeur d'impulsion) décelé 2606.2 Hz
Amplitude: 90 %
≤ 100 Niveau de luminosité

Le rétroéclairage de l'écran scintille à la fréquence de 2606.2 Hz (certainement du fait de l'utilisation d'une MDI - Modulation de largeur d'impulsion) à un niveau de luminosité inférieur ou égal à 100 % . Aucun scintillement ne devrait être perceptible au-dessus de cette valeur.

La fréquence de rafraîchissement de 2606.2 Hz est élevée, la grande majorité des utilisateurs ne devrait pas percevoir de scintillements et être sujette à une fatigue oculaire accrue.

En comparaison, 53 % des appareils testés n'emploient pas MDI pour assombrir leur écran. Nous avons relevé une moyenne à 17271 (minimum : 5 - maximum : 3846000) Hz dans le cas où une MDI était active.

0 % de luminosité
0 % de luminosité
25% de luminosité
25% de luminosité
50 % de luminosité
50 % de luminosité
75 % de luminosité
75 % de luminosité
100% de luminosité
100% de luminosité

La visibilité à l'extérieur est tout juste décente à l'ombre et moins bonne en plein soleil. L'utilisation de la batterie réduit la luminosité maximale à 392 nits et la fonction Windows HDR est automatiquement désactivée.

A l'extérieur, sous la lumière du soleil
A l'extérieur, à l'ombre
A l'extérieur, sous la lumière du soleil
Les angles de vision Mini-LED sont encore plus larges et plus stables que ceux de l'IPS ou de l'OLED

Performances - Nouveau nom de l'unité centrale, mêmes performances de l'unité centrale


Conditions d'essai

Nous avons réglé le GPU en mode graphique discret, Windows en mode Performance et MSI Center en mode Performance extrême avant d'effectuer les tests ci-dessous. Le mode Cooler Boost (c'est-à-dire le mode de ventilation maximale) est un autre paramètre du mode Extreme Performance, mais cette option n'est généralement pas nécessaire pour obtenir des performances maximales, comme le montrent nos résultats. Cela correspond à notre expérience sur d'autres ordinateurs portables MSI dotés de la même fonction Cooler Boost.

MUX est supporté pour basculer entre les modes dGPU, iGPU et MSHybrid mais Advanced Optimus n'est pas disponible comme sur la Titan 18 HX. En effet, l'un des principaux inconvénients de la dalle mini-LED 4K est l'absence de support G-Sync.

Fenêtre de profil d'alimentation du MSI Center
Surveillance du matériel en temps réel
Paramètres généraux du système
Outil pratique de mise à jour des logiciels et des pilotes dans le centre MSI

Processeur

Le Core i9-14900HX n'est qu'une version remaniée du Core i9-13900HX et n'offre donc au mieux que des avantages marginaux. Malgré cela, il reste l'un des CPU les plus rapides disponibles sur les ordinateurs portables lorsqu'il s'agit de mesures de performances traditionnelles comme CineBench ou le rendu Blender. Ce processeur complète le Meteor Lake Core Ultra 9 185H qui troque certaines performances brutes contre un NPU intégré pour accélérer les tâches d'intelligence artificielle.

La durabilité des performances est excellente et il n'y a pas de baisse importante de la fréquence d'horloge lorsque le processeur est sollicité, contrairement à ce que nous avons observé sur le Predator Helios 18 d'Acer Acer Predator Helios 18 équipé du même processeur Core i9-14900HX.

En passant au processeur Ryzen 9 7945HX devrait augmenter les performances multithread d'environ 10 à 15 % tout en réduisant les performances single-thread de 10 à 15 %.

Cinebench R15 Multi Loop

0245490735980122514701715196022052450269529403185343036753920416544104655Tooltip
MSI Raider 18 HX A14V Intel Core i9-14900HX: Ø4654 (4628.56-4676.17)
Razer Blade 18 2024 RZ09-0509 Intel Core i9-14900HX: Ø4163 (3956.09-4227.88)
Alienware m18 R2 Intel Core i9-14900HX: Ø4743 (4458.81-4807.11)
MSI Titan 18 HX A14VIG Intel Core i9-14900HX: Ø4753 (4700.35-4782.4)
Asus ROG Strix G18 G814JI Intel Core i7-13650HX: Ø3111 (3067.01-3136.03)
Acer Predator Helios 18 PH18-72-98MW Intel Core i9-14900HX: Ø4064 (3787.52-4673.44)
CPU Performance Rating: Percent
Cinebench R23: Multi Core | Single Core
Cinebench R20: CPU (Multi Core) | CPU (Single Core)
Cinebench R15: CPU Multi 64Bit | CPU Single 64Bit
Blender: v2.79 BMW27 CPU
7-Zip 18.03: 7z b 4 | 7z b 4 -mmt1
Geekbench 6.2: Multi-Core | Single-Core
Geekbench 5.5: Multi-Core | Single-Core
HWBOT x265 Benchmark v2.2: 4k Preset
LibreOffice : 20 Documents To PDF
R Benchmark 2.5: Overall mean
CPU Performance Rating
Alienware m18 R1 AMD
AMD Ryzen 9 7945HX
84.8 pt
Alienware m18 R2
Intel Core i9-14900HX
83.9 pt
MSI Raider 18 HX A14V
Intel Core i9-14900HX
82.4 pt
MSI Raider GE68HX 13VF
Intel Core i9-13950HX
82.1 pt
Alienware m18 R1 -2!
Intel Core i9-13980HX
81.3 pt
MSI Titan 18 HX A14VIG
Intel Core i9-14900HX
80.4 pt
Acer Predator Helios 18 N23Q2
Intel Core i9-13900HX
80 pt
Moyenne Intel Core i9-14900HX
 
79.3 pt
Alienware m16 R1 AMD
AMD Ryzen 9 7845HX
72.8 pt
Asus ROG Zephyrus G16 GA605WV
AMD Ryzen AI 9 HX 370
68.2 pt
Lenovo Legion Pro 5 16ARX8 -2!
AMD Ryzen 7 7745HX
61.4 pt
Asus TUF Gaming A15 FA507UV
AMD Ryzen 9 8945H
60.2 pt
Asus ROG Strix G18 G814JI -2!
Intel Core i7-13650HX
59.9 pt
Lenovo Legion Slim 7 16APH8
AMD Ryzen 7 7840HS
56.1 pt
Alienware x16 R2 P120F
Intel Core Ultra 9 185H
54.3 pt
Lenovo Legion S7 16ARHA7 -2!
AMD Ryzen 9 6900HX
49 pt
Cinebench R23 / Multi Core
Alienware m18 R1 AMD
AMD Ryzen 9 7945HX
34613 (33896.2min - 34613.2max) Points +16%
Alienware m18 R1
Intel Core i9-13980HX
32601 (28888.6min - 32601.4max) Points +9%
MSI Titan 18 HX A14VIG
Intel Core i9-14900HX
32428 (29693.8min - 32428.3max) Points +8%
Alienware m18 R2
Intel Core i9-14900HX
31391 (28656min - 31390.7max) Points +5%
MSI Raider GE68HX 13VF
Intel Core i9-13950HX
31127 (29141min - 31127.3max) Points +4%
Acer Predator Helios 18 N23Q2
Intel Core i9-13900HX
30631 Points +2%
MSI Raider 18 HX A14V
Intel Core i9-14900HX
29955 (28636.4min - 29954.9max) Points
Moyenne Intel Core i9-14900HX
  (17078 - 36249, n=31)
29063 Points -3%
Alienware m16 R1 AMD
AMD Ryzen 9 7845HX
26876 (25414.3min - 26876.4max) Points -10%
Asus ROG Zephyrus G16 GA605WV
AMD Ryzen AI 9 HX 370
22724 Points -24%
Asus ROG Strix G18 G814JI
Intel Core i7-13650HX
21006 Points -30%
Alienware x16 R2 P120F
Intel Core Ultra 9 185H
18338 (17139.2min - 18337.8max) Points -39%
Lenovo Legion Pro 5 16ARX8
AMD Ryzen 7 7745HX
18060 (17729.5min - 18059.9max) Points -40%
Asus TUF Gaming A15 FA507UV
AMD Ryzen 9 8945H
17423 Points -42%
Lenovo Legion Slim 7 16APH8
AMD Ryzen 7 7840HS
16364 Points -45%
Lenovo Legion S7 16ARHA7
AMD Ryzen 9 6900HX
14584 (14179.8min - 14584.2max) Points -51%
Cinebench R23 / Single Core
Alienware m18 R2
Intel Core i9-14900HX
2235 Points +2%
MSI Raider 18 HX A14V
Intel Core i9-14900HX
2181 Points
Moyenne Intel Core i9-14900HX
  (1720 - 2235, n=31)
2156 Points -1%
MSI Titan 18 HX A14VIG
Intel Core i9-14900HX
2143 Points -2%
Alienware m18 R1
Intel Core i9-13980HX
2106 Points -3%
MSI Raider GE68HX 13VF
Intel Core i9-13950HX
2096 Points -4%
Acer Predator Helios 18 N23Q2
Intel Core i9-13900HX
2093 Points -4%
Asus ROG Zephyrus G16 GA605WV
AMD Ryzen AI 9 HX 370
1973 Points -10%
Alienware m18 R1 AMD
AMD Ryzen 9 7945HX
1948 Points -11%
Asus ROG Strix G18 G814JI
Intel Core i7-13650HX
1903 Points -13%
Alienware m16 R1 AMD
AMD Ryzen 9 7845HX
1852 Points -15%
Lenovo Legion Pro 5 16ARX8
AMD Ryzen 7 7745HX
1846 Points -15%
Asus TUF Gaming A15 FA507UV
AMD Ryzen 9 8945H
1814 Points -17%
Lenovo Legion Slim 7 16APH8
AMD Ryzen 7 7840HS
1754 Points -20%
Alienware x16 R2 P120F
Intel Core Ultra 9 185H
1620 Points -26%
Lenovo Legion S7 16ARHA7
AMD Ryzen 9 6900HX
1614 Points -26%
Cinebench R20 / CPU (Multi Core)
Alienware m18 R1 AMD
AMD Ryzen 9 7945HX
13308 Points +17%
Alienware m18 R1
Intel Core i9-13980HX
12423 Points +9%
MSI Titan 18 HX A14VIG
Intel Core i9-14900HX
12103 Points +6%
MSI Raider GE68HX 13VF
Intel Core i9-13950HX
11909 Points +4%
Alienware m18 R2
Intel Core i9-14900HX
11816 Points +3%
Acer Predator Helios 18 N23Q2
Intel Core i9-13900HX
11726 Points +3%
MSI Raider 18 HX A14V
Intel Core i9-14900HX
11422 Points
Moyenne Intel Core i9-14900HX
  (6579 - 13832, n=31)
11064 Points -3%
Alienware m16 R1 AMD
AMD Ryzen 9 7845HX
10492 Points -8%
Asus ROG Zephyrus G16 GA605WV
AMD Ryzen AI 9 HX 370
8843 Points -23%
Asus ROG Strix G18 G814JI
Intel Core i7-13650HX
7999 Points -30%
Alienware x16 R2 P120F
Intel Core Ultra 9 185H
7081 Points -38%
Lenovo Legion Pro 5 16ARX8
AMD Ryzen 7 7745HX
7072 Points -38%
Asus TUF Gaming A15 FA507UV
AMD Ryzen 9 8945H
6859 Points -40%
Lenovo Legion Slim 7 16APH8
AMD Ryzen 7 7840HS
6379 Points -44%
Lenovo Legion S7 16ARHA7
AMD Ryzen 9 6900HX
5596 Points -51%
Cinebench R20 / CPU (Single Core)
MSI Raider 18 HX A14V
Intel Core i9-14900HX
854 Points
Alienware m18 R2
Intel Core i9-14900HX
853 Points 0%
Moyenne Intel Core i9-14900HX
  (657 - 859, n=31)
826 Points -3%
MSI Titan 18 HX A14VIG
Intel Core i9-14900HX
823 Points -4%
Alienware m18 R1
Intel Core i9-13980HX
807 Points -6%
Acer Predator Helios 18 N23Q2
Intel Core i9-13900HX
804 Points -6%
MSI Raider GE68HX 13VF
Intel Core i9-13950HX
801 Points -6%
Asus ROG Zephyrus G16 GA605WV
AMD Ryzen AI 9 HX 370
777 Points -9%
Alienware m18 R1 AMD
AMD Ryzen 9 7945HX
747 Points -13%
Asus ROG Strix G18 G814JI
Intel Core i7-13650HX
728 Points -15%
Alienware m16 R1 AMD
AMD Ryzen 9 7845HX
719 Points -16%
Lenovo Legion Pro 5 16ARX8
AMD Ryzen 7 7745HX
717 Points -16%
Lenovo Legion Slim 7 16APH8
AMD Ryzen 7 7840HS
672 Points -21%
Asus TUF Gaming A15 FA507UV
AMD Ryzen 9 8945H
670 Points -22%
Lenovo Legion S7 16ARHA7
AMD Ryzen 9 6900HX
630 Points -26%
Alienware x16 R2 P120F
Intel Core Ultra 9 185H
622 Points -27%
Cinebench R15 / CPU Multi 64Bit
Alienware m18 R1 AMD
AMD Ryzen 9 7945HX
5541 (5377.07min - 5540.93max) Points +18%
Alienware m18 R1
Intel Core i9-13980HX
4989 (4579.8min - 4989.4max) Points +7%
Alienware m18 R2
Intel Core i9-14900HX
4807 (4458.81min - 4807.11max) Points +3%
MSI Titan 18 HX A14VIG
Intel Core i9-14900HX
4782 (4700.35min - 4782.4max) Points +2%
MSI Raider 18 HX A14V
Intel Core i9-14900HX
4676 (4628.56min - 4676.17max) Points
MSI Raider GE68HX 13VF
Intel Core i9-13950HX
4632 (4343.11min - 4631.77max) Points -1%
Acer Predator Helios 18 N23Q2
Intel Core i9-13900HX
4585 (4495.39min - 4584.53max) Points -2%
Moyenne Intel Core i9-14900HX
  (3263 - 5589, n=32)
4444 Points -5%
Alienware m16 R1 AMD
AMD Ryzen 9 7845HX
4320 (4198.59min - 4320.12max) Points -8%
Asus ROG Zephyrus G16 GA605WV
AMD Ryzen AI 9 HX 370
3371 (3327.79min - 3370.98max) Points -28%
Asus ROG Strix G18 G814JI
Intel Core i7-13650HX
3136 (3067.01min - 3136.03max) Points -33%
Lenovo Legion Pro 5 16ARX8
AMD Ryzen 7 7745HX
2978 (2861.03min - 2977.96max) Points -36%
Alienware x16 R2 P120F
Intel Core Ultra 9 185H
2857 (2708.56min - 2857.35max) Points -39%
Asus TUF Gaming A15 FA507UV
AMD Ryzen 9 8945H
2777 Points -41%
Lenovo Legion Slim 7 16APH8
AMD Ryzen 7 7840HS
2564 (2422.77min - 2563.77max) Points -45%
Lenovo Legion S7 16ARHA7
AMD Ryzen 9 6900HX
2359 (2277.39min - 2359.33max) Points -50%
Cinebench R15 / CPU Single 64Bit
Alienware m18 R2
Intel Core i9-14900HX
318 Points +2%
MSI Raider 18 HX A14V
Intel Core i9-14900HX
313 Points
Alienware m18 R1 AMD
AMD Ryzen 9 7945HX
309 Points -1%
Moyenne Intel Core i9-14900HX
  (247 - 320, n=31)
306 Points -2%
Alienware m18 R1
Intel Core i9-13980HX
303 Points -3%
Asus ROG Zephyrus G16 GA605WV
AMD Ryzen AI 9 HX 370
303 Points -3%
MSI Titan 18 HX A14VIG
Intel Core i9-14900HX
300 Points -4%
MSI Raider GE68HX 13VF
Intel Core i9-13950HX
297 Points -5%
Alienware m16 R1 AMD
AMD Ryzen 9 7845HX
295 Points -6%
Acer Predator Helios 18 N23Q2
Intel Core i9-13900HX
295 Points -6%
Lenovo Legion Pro 5 16ARX8
AMD Ryzen 7 7745HX
294 Points -6%
Asus TUF Gaming A15 FA507UV
AMD Ryzen 9 8945H
284 Points -9%
Asus ROG Strix G18 G814JI
Intel Core i7-13650HX
275 Points -12%
Lenovo Legion Slim 7 16APH8
AMD Ryzen 7 7840HS
273 Points -13%
Lenovo Legion S7 16ARHA7
AMD Ryzen 9 6900HX
257 Points -18%
Alienware x16 R2 P120F
Intel Core Ultra 9 185H
238 Points -24%
Blender / v2.79 BMW27 CPU
Lenovo Legion S7 16ARHA7
AMD Ryzen 9 6900HX
214 Seconds * -102%
Lenovo Legion Slim 7 16APH8
AMD Ryzen 7 7840HS
195 Seconds * -84%
Asus TUF Gaming A15 FA507UV
AMD Ryzen 9 8945H
182 Seconds * -72%
Alienware x16 R2 P120F
Intel Core Ultra 9 185H
178 Seconds * -68%
Lenovo Legion Pro 5 16ARX8
AMD Ryzen 7 7745HX
174 Seconds * -64%
Asus ROG Strix G18 G814JI
Intel Core i7-13650HX
158 Seconds * -49%
Asus ROG Zephyrus G16 GA605WV
AMD Ryzen AI 9 HX 370
145 Seconds * -37%
Moyenne Intel Core i9-14900HX
  (91 - 206, n=31)
120.4 Seconds * -14%
Alienware m16 R1 AMD
AMD Ryzen 9 7845HX
117 Seconds * -10%
MSI Raider GE68HX 13VF
Intel Core i9-13950HX
107 Seconds * -1%
Acer Predator Helios 18 N23Q2
Intel Core i9-13900HX
106 Seconds * -0%
MSI Raider 18 HX A14V
Intel Core i9-14900HX
106 Seconds *
MSI Titan 18 HX A14VIG
Intel Core i9-14900HX
104 Seconds * +2%
Alienware m18 R2
Intel Core i9-14900HX
102 Seconds * +4%
Alienware m18 R1
Intel Core i9-13980HX
97 Seconds * +8%
Alienware m18 R1 AMD
AMD Ryzen 9 7945HX
87 Seconds * +18%
7-Zip 18.03 / 7z b 4
Alienware m18 R1 AMD
AMD Ryzen 9 7945HX
140493 MIPS +15%
Alienware m18 R1
Intel Core i9-13980HX
129804 MIPS +7%
Alienware m18 R2
Intel Core i9-14900HX
122772 MIPS +1%
MSI Raider 18 HX A14V
Intel Core i9-14900HX
121759 MIPS
MSI Titan 18 HX A14VIG
Intel Core i9-14900HX
121266 MIPS 0%
Acer Predator Helios 18 N23Q2
Intel Core i9-13900HX
119590 MIPS -2%
MSI Raider GE68HX 13VF
Intel Core i9-13950HX
119373 MIPS -2%
Moyenne Intel Core i9-14900HX
  (66769 - 136645, n=31)
111935 MIPS -8%
Alienware m16 R1 AMD
AMD Ryzen 9 7845HX
106033 MIPS -13%
Asus ROG Zephyrus G16 GA605WV
AMD Ryzen AI 9 HX 370
82463 MIPS -32%
Asus ROG Strix G18 G814JI
Intel Core i7-13650HX
80057 MIPS -34%
Lenovo Legion Pro 5 16ARX8
AMD Ryzen 7 7745HX
75557 MIPS -38%
Asus TUF Gaming A15 FA507UV
AMD Ryzen 9 8945H
73222 MIPS -40%
Lenovo Legion Slim 7 16APH8
AMD Ryzen 7 7840HS
70243 MIPS -42%
Alienware x16 R2 P120F
Intel Core Ultra 9 185H
67227 MIPS -45%
Lenovo Legion S7 16ARHA7
AMD Ryzen 9 6900HX
63347 MIPS -48%
7-Zip 18.03 / 7z b 4 -mmt1
Alienware m18 R1 AMD
AMD Ryzen 9 7945HX
7381 MIPS +12%
Lenovo Legion Pro 5 16ARX8
AMD Ryzen 7 7745HX
7244 MIPS +10%
Alienware m18 R2
Intel Core i9-14900HX
7103 MIPS +8%
Alienware m16 R1 AMD
AMD Ryzen 9 7845HX
7018 MIPS +7%
Moyenne Intel Core i9-14900HX
  (5452 - 7508, n=31)
7002 MIPS +6%
Acer Predator Helios 18 N23Q2
Intel Core i9-13900HX
6977 MIPS +6%
Alienware m18 R1
Intel Core i9-13980HX
6889 MIPS +5%
MSI Raider GE68HX 13VF
Intel Core i9-13950HX
6754 MIPS +3%
Asus TUF Gaming A15 FA507UV
AMD Ryzen 9 8945H
6615 MIPS 0%
Lenovo Legion Slim 7 16APH8
AMD Ryzen 7 7840HS
6604 MIPS 0%
MSI Raider 18 HX A14V
Intel Core i9-14900HX
6586 MIPS
MSI Titan 18 HX A14VIG
Intel Core i9-14900HX
6504 MIPS -1%
Asus ROG Zephyrus G16 GA605WV
AMD Ryzen AI 9 HX 370
6127 MIPS -7%
Asus ROG Strix G18 G814JI
Intel Core i7-13650HX
6125 MIPS -7%
Lenovo Legion S7 16ARHA7
AMD Ryzen 9 6900HX
6070 MIPS -8%
Alienware x16 R2 P120F
Intel Core Ultra 9 185H
4502 MIPS -32%
Geekbench 6.2 / Multi-Core
Alienware m18 R2
Intel Core i9-14900HX
18233 Points +8%
Acer Predator Helios 18 N23Q2
Intel Core i9-13900HX
18014 Points +7%
MSI Raider GE68HX 13VF
Intel Core i9-13950HX
17977 Points +7%
Moyenne Intel Core i9-14900HX
  (13158 - 19665, n=31)
17335 Points +3%
MSI Raider 18 HX A14V
Intel Core i9-14900HX
16855 Points
MSI Titan 18 HX A14VIG
Intel Core i9-14900HX
16652 Points -1%
Alienware m18 R1 AMD
AMD Ryzen 9 7945HX
16316 Points -3%
Asus ROG Zephyrus G16 GA605WV
AMD Ryzen AI 9 HX 370
15230 Points -10%
Lenovo Legion Slim 7 16APH8
AMD Ryzen 7 7840HS
12919 Points -23%
Alienware x16 R2 P120F
Intel Core Ultra 9 185H
12825 Points -24%
Asus TUF Gaming A15 FA507UV
AMD Ryzen 9 8945H
12662 Points -25%
Alienware m16 R1 AMD
AMD Ryzen 9 7845HX
12585 Points -25%
Geekbench 6.2 / Single-Core
Alienware m18 R2
Intel Core i9-14900HX
3057 Points +2%
MSI Raider 18 HX A14V
Intel Core i9-14900HX
3010 Points
Moyenne Intel Core i9-14900HX
  (2419 - 3129, n=31)
2977 Points -1%
Acer Predator Helios 18 N23Q2
Intel Core i9-13900HX
2892 Points -4%
MSI Raider GE68HX 13VF
Intel Core i9-13950HX
2890 Points -4%
Alienware m18 R1 AMD
AMD Ryzen 9 7945HX
2876 Points -4%
Asus ROG Zephyrus G16 GA605WV
AMD Ryzen AI 9 HX 370
2875 Points -4%
MSI Titan 18 HX A14VIG
Intel Core i9-14900HX
2843 Points -6%
Alienware m16 R1 AMD
AMD Ryzen 9 7845HX
2729 Points -9%
Asus TUF Gaming A15 FA507UV
AMD Ryzen 9 8945H
2711 Points -10%
Lenovo Legion Slim 7 16APH8
AMD Ryzen 7 7840HS
2625 Points -13%
Alienware x16 R2 P120F
Intel Core Ultra 9 185H
2199 Points -27%
Geekbench 5.5 / Multi-Core
Alienware m18 R1
Intel Core i9-13980HX
22200 Points +12%
MSI Raider GE68HX 13VF
Intel Core i9-13950HX
21568 Points +9%
Alienware m18 R2
Intel Core i9-14900HX
21284 Points +7%
Acer Predator Helios 18 N23Q2
Intel Core i9-13900HX
20566 Points +4%
MSI Raider 18 HX A14V
Intel Core i9-14900HX
19804 Points
Alienware m18 R1 AMD
AMD Ryzen 9 7945HX
19802 Points 0%
Moyenne Intel Core i9-14900HX
  (8618 - 23194, n=31)
19452 Points -2%
MSI Titan 18 HX A14VIG
Intel Core i9-14900HX
19137 Points -3%
Alienware m16 R1 AMD
AMD Ryzen 9 7845HX
15068 Points -24%
Asus ROG Zephyrus G16 GA605WV
AMD Ryzen AI 9 HX 370
14774 Points -25%
Asus ROG Strix G18 G814JI
Intel Core i7-13650HX
14367 Points -27%
Alienware x16 R2 P120F
Intel Core Ultra 9 185H
12759 Points -36%
Lenovo Legion Pro 5 16ARX8
AMD Ryzen 7 7745HX
12378 Points -37%
Asus TUF Gaming A15 FA507UV
AMD Ryzen 9 8945H
11949 Points -40%
Lenovo Legion Slim 7 16APH8
AMD Ryzen 7 7840HS
11872 Points -40%
Lenovo Legion S7 16ARHA7
AMD Ryzen 9 6900HX
10007 Points -49%
Geekbench 5.5 / Single-Core
Alienware m18 R2
Intel Core i9-14900HX
2193 Points +2%
MSI Raider 18 HX A14V
Intel Core i9-14900HX
2154 Points
Alienware m18 R1 AMD
AMD Ryzen 9 7945HX
2124 Points -1%
Asus ROG Zephyrus G16 GA605WV
AMD Ryzen AI 9 HX 370
2104 Points -2%
MSI Titan 18 HX A14VIG
Intel Core i9-14900HX
2098 Points -3%
Moyenne Intel Core i9-14900HX
  (1669 - 2210, n=31)
2093 Points -3%
Alienware m18 R1
Intel Core i9-13980HX
2062 Points -4%
MSI Raider GE68HX 13VF
Intel Core i9-13950HX
2055 Points -5%
Acer Predator Helios 18 N23Q2
Intel Core i9-13900HX
2054 Points -5%
Lenovo Legion Pro 5 16ARX8
AMD Ryzen 7 7745HX
2040 Points -5%
Alienware m16 R1 AMD
AMD Ryzen 9 7845HX
2008 Points -7%
Asus TUF Gaming A15 FA507UV
AMD Ryzen 9 8945H
1991 Points -8%
Lenovo Legion Slim 7 16APH8
AMD Ryzen 7 7840HS
1943 Points -10%
Asus ROG Strix G18 G814JI
Intel Core i7-13650HX
1838 Points -15%
Alienware x16 R2 P120F
Intel Core Ultra 9 185H
1700 Points -21%
Lenovo Legion S7 16ARHA7
AMD Ryzen 9 6900HX
1642 Points -24%
HWBOT x265 Benchmark v2.2 / 4k Preset
Alienware m18 R1 AMD
AMD Ryzen 9 7945HX
37.5 fps +15%
Alienware m18 R1
Intel Core i9-13980HX
33.1 fps +2%
MSI Raider 18 HX A14V
Intel Core i9-14900HX
32.6 fps
Alienware m18 R2
Intel Core i9-14900HX
32.1 fps -2%
MSI Raider GE68HX 13VF
Intel Core i9-13950HX
31.8 fps -2%
MSI Titan 18 HX A14VIG
Intel Core i9-14900HX
30.9 fps -5%
Acer Predator Helios 18 N23Q2
Intel Core i9-13900HX
30.7 fps -6%
Alienware m16 R1 AMD
AMD Ryzen 9 7845HX
29.7 fps -9%
Moyenne Intel Core i9-14900HX
  (16.8 - 38.9, n=31)
29.6 fps -9%
Asus ROG Zephyrus G16 GA605WV
AMD Ryzen AI 9 HX 370
26.5 fps -19%
Asus ROG Strix G18 G814JI
Intel Core i7-13650HX
23.6 fps -28%
Lenovo Legion Pro 5 16ARX8
AMD Ryzen 7 7745HX
23.2 fps -29%
Asus TUF Gaming A15 FA507UV
AMD Ryzen 9 8945H
21.9 fps -33%
Alienware x16 R2 P120F
Intel Core Ultra 9 185H
20.7 fps -37%
Lenovo Legion Slim 7 16APH8
AMD Ryzen 7 7840HS
20.1 fps -38%
Lenovo Legion S7 16ARHA7
AMD Ryzen 9 6900HX
18.3 fps -44%
LibreOffice / 20 Documents To PDF
Lenovo Legion Slim 7 16APH8
AMD Ryzen 7 7840HS
68.3 s * -99%
Asus ROG Strix G18 G814JI
Intel Core i7-13650HX
58.8 s * -71%
Asus ROG Zephyrus G16 GA605WV
AMD Ryzen AI 9 HX 370
53.8 s * -56%
Acer Predator Helios 18 N23Q2
Intel Core i9-13900HX
49.5 s * -44%
Lenovo Legion S7 16ARHA7
AMD Ryzen 9 6900HX
48.9 s * -42%
Asus TUF Gaming A15 FA507UV
AMD Ryzen 9 8945H
47.5 s * -38%
Alienware m18 R1
Intel Core i9-13980HX
46.7 s * -36%
MSI Titan 18 HX A14VIG
Intel Core i9-14900HX
46.2 s * -34%
Alienware x16 R2 P120F
Intel Core Ultra 9 185H
45.9 s * -33%
Alienware m18 R2
Intel Core i9-14900HX
44.8 s * -30%
Moyenne Intel Core i9-14900HX
  (31.4 - 85.1, n=31)
43.4 s * -26%
Alienware m18 R1 AMD
AMD Ryzen 9 7945HX
41.8 s * -22%
Alienware m16 R1 AMD
AMD Ryzen 9 7845HX
39.4 s * -15%
Lenovo Legion Pro 5 16ARX8
AMD Ryzen 7 7745HX
37.9 s * -10%
MSI Raider 18 HX A14V
Intel Core i9-14900HX
34.4 s *
MSI Raider GE68HX 13VF
Intel Core i9-13950HX
32.8 s * +5%
R Benchmark 2.5 / Overall mean
Alienware x16 R2 P120F
Intel Core Ultra 9 185H
0.503 sec * -33%
Lenovo Legion S7 16ARHA7
AMD Ryzen 9 6900HX
0.4636 sec * -23%
Lenovo Legion Slim 7 16APH8
AMD Ryzen 7 7840HS
0.4431 sec * -17%
Asus ROG Strix G18 G814JI
Intel Core i7-13650HX
0.4398 sec * -16%
Asus TUF Gaming A15 FA507UV
AMD Ryzen 9 8945H
0.4298 sec * -14%
Alienware m16 R1 AMD
AMD Ryzen 9 7845HX
0.4255 sec * -13%
Lenovo Legion Pro 5 16ARX8
AMD Ryzen 7 7745HX
0.421 sec * -11%
Alienware m18 R1 AMD
AMD Ryzen 9 7945HX
0.4145 sec * -10%
Asus ROG Zephyrus G16 GA605WV
AMD Ryzen AI 9 HX 370
0.4111 sec * -9%
Acer Predator Helios 18 N23Q2
Intel Core i9-13900HX
0.3997 sec * -6%
Alienware m18 R1
Intel Core i9-13980HX
0.3931 sec * -4%
MSI Titan 18 HX A14VIG
Intel Core i9-14900HX
0.3919 sec * -4%
MSI Raider GE68HX 13VF
Intel Core i9-13950HX
0.3913 sec * -3%
Moyenne Intel Core i9-14900HX
  (0.3609 - 0.4859, n=31)
0.3846 sec * -2%
MSI Raider 18 HX A14V
Intel Core i9-14900HX
0.3781 sec *
Alienware m18 R2
Intel Core i9-14900HX
0.3767 sec * -0%
CPU Performance Rating: Percent
Cinebench R23: Multi Core | Single Core
Cinebench R20: CPU (Multi Core) | CPU (Single Core)
Cinebench R15: CPU Multi 64Bit | CPU Single 64Bit
Blender: v2.79 BMW27 CPU
7-Zip 18.03: 7z b 4 | 7z b 4 -mmt1
Geekbench 6.2: Multi-Core | Single-Core
Geekbench 5.5: Multi-Core | Single-Core
HWBOT x265 Benchmark v2.2: 4k Preset
LibreOffice : 20 Documents To PDF
R Benchmark 2.5: Overall mean

* ... Moindre est la valeur, meilleures sont les performances

Cinebench R15 CPU Multi 64Bit
4676 Points
Cinebench R15 OpenGL 64Bit
308 fps
Cinebench R15 Ref. Match 64Bit
99.6 %
Cinebench R15 CPU Single 64Bit
313 Points
Aide
Performance Rating
Alienware m18 R2
Intel Core i9-14900HX, NVIDIA GeForce RTX 4090 Laptop GPU
96.9 pt
MSI Titan 18 HX A14VIG
Intel Core i9-14900HX, NVIDIA GeForce RTX 4090 Laptop GPU
96.8 pt
MSI Raider 18 HX A14V
Intel Core i9-14900HX, NVIDIA GeForce RTX 4080 Laptop GPU
92.1 pt
Moyenne Intel Core i9-14900HX
 
87.8 pt
Razer Blade 18 2024 RZ09-0509
Intel Core i9-14900HX, NVIDIA GeForce RTX 4090 Laptop GPU
86.9 pt
Acer Predator Helios 18 PH18-72-98MW
Intel Core i9-14900HX, NVIDIA GeForce RTX 4090 Laptop GPU
83.2 pt
Asus ROG Strix G18 G814JI
Intel Core i7-13650HX, NVIDIA GeForce RTX 4070 Laptop GPU
66.5 pt
AIDA64 / FP32 Ray-Trace
MSI Titan 18 HX A14VIG
Intel Core i9-14900HX, NVIDIA GeForce RTX 4090 Laptop GPU
29351 KRay/s +6%
Alienware m18 R2
Intel Core i9-14900HX, NVIDIA GeForce RTX 4090 Laptop GPU
29280 KRay/s +6%
MSI Raider 18 HX A14V
Intel Core i9-14900HX, NVIDIA GeForce RTX 4080 Laptop GPU
27572 KRay/s
Razer Blade 18 2024 RZ09-0509
Intel Core i9-14900HX, NVIDIA GeForce RTX 4090 Laptop GPU
25098 KRay/s -9%
Moyenne Intel Core i9-14900HX
  (13098 - 33474, n=30)
25023 KRay/s -9%
Acer Predator Helios 18 PH18-72-98MW
Intel Core i9-14900HX, NVIDIA GeForce RTX 4090 Laptop GPU
23862 KRay/s -13%
Asus ROG Strix G18 G814JI
Intel Core i7-13650HX, NVIDIA GeForce RTX 4070 Laptop GPU
20012 KRay/s -27%
AIDA64 / FPU Julia
MSI Titan 18 HX A14VIG
Intel Core i9-14900HX, NVIDIA GeForce RTX 4090 Laptop GPU
148888 Points +8%
Alienware m18 R2
Intel Core i9-14900HX, NVIDIA GeForce RTX 4090 Laptop GPU
142791 Points +4%
MSI Raider 18 HX A14V
Intel Core i9-14900HX, NVIDIA GeForce RTX 4080 Laptop GPU
137690 Points
Razer Blade 18 2024 RZ09-0509
Intel Core i9-14900HX, NVIDIA GeForce RTX 4090 Laptop GPU
128369 Points -7%
Moyenne Intel Core i9-14900HX
  (67573 - 166040, n=30)
125198 Points -9%
Acer Predator Helios 18 PH18-72-98MW
Intel Core i9-14900HX, NVIDIA GeForce RTX 4090 Laptop GPU
118469 Points -14%
Asus ROG Strix G18 G814JI
Intel Core i7-13650HX, NVIDIA GeForce RTX 4070 Laptop GPU
97317 Points -29%
AIDA64 / CPU SHA3
MSI Titan 18 HX A14VIG
Intel Core i9-14900HX, NVIDIA GeForce RTX 4090 Laptop GPU
7229 MB/s +8%
Alienware m18 R2
Intel Core i9-14900HX, NVIDIA GeForce RTX 4090 Laptop GPU
7095 MB/s +6%
MSI Raider 18 HX A14V
Intel Core i9-14900HX, NVIDIA GeForce RTX 4080 Laptop GPU
6715 MB/s
Moyenne Intel Core i9-14900HX
  (3589 - 7979, n=30)
6192 MB/s -8%
Razer Blade 18 2024 RZ09-0509
Intel Core i9-14900HX, NVIDIA GeForce RTX 4090 Laptop GPU
6159 MB/s -8%
Acer Predator Helios 18 PH18-72-98MW
Intel Core i9-14900HX, NVIDIA GeForce RTX 4090 Laptop GPU
5804 MB/s -14%
Asus ROG Strix G18 G814JI
Intel Core i7-13650HX, NVIDIA GeForce RTX 4070 Laptop GPU
4487 MB/s -33%
AIDA64 / CPU Queen
MSI Titan 18 HX A14VIG
Intel Core i9-14900HX, NVIDIA GeForce RTX 4090 Laptop GPU
148773 Points +4%
MSI Raider 18 HX A14V
Intel Core i9-14900HX, NVIDIA GeForce RTX 4080 Laptop GPU
142671 Points
Alienware m18 R2
Intel Core i9-14900HX, NVIDIA GeForce RTX 4090 Laptop GPU
139323 Points -2%
Acer Predator Helios 18 PH18-72-98MW
Intel Core i9-14900HX, NVIDIA GeForce RTX 4090 Laptop GPU
139146 Points -2%
Moyenne Intel Core i9-14900HX
  (118405 - 148966, n=30)
138474 Points -3%
Razer Blade 18 2024 RZ09-0509
Intel Core i9-14900HX, NVIDIA GeForce RTX 4090 Laptop GPU
136621 Points -4%
Asus ROG Strix G18 G814JI
Intel Core i7-13650HX, NVIDIA GeForce RTX 4070 Laptop GPU
110093 Points -23%
AIDA64 / FPU SinJulia
MSI Titan 18 HX A14VIG
Intel Core i9-14900HX, NVIDIA GeForce RTX 4090 Laptop GPU
18256 Points +7%
MSI Raider 18 HX A14V
Intel Core i9-14900HX, NVIDIA GeForce RTX 4080 Laptop GPU
17005 Points
Alienware m18 R2
Intel Core i9-14900HX, NVIDIA GeForce RTX 4090 Laptop GPU
16279 Points -4%
Razer Blade 18 2024 RZ09-0509
Intel Core i9-14900HX, NVIDIA GeForce RTX 4090 Laptop GPU
15500 Points -9%
Moyenne Intel Core i9-14900HX
  (10475 - 18517, n=30)
15345 Points -10%
Acer Predator Helios 18 PH18-72-98MW
Intel Core i9-14900HX, NVIDIA GeForce RTX 4090 Laptop GPU
15099 Points -11%
Asus ROG Strix G18 G814JI
Intel Core i7-13650HX, NVIDIA GeForce RTX 4070 Laptop GPU
10616 Points -38%
AIDA64 / FPU Mandel
Alienware m18 R2
Intel Core i9-14900HX, NVIDIA GeForce RTX 4090 Laptop GPU
72594 Points +5%
MSI Titan 18 HX A14VIG
Intel Core i9-14900HX, NVIDIA GeForce RTX 4090 Laptop GPU
72355 Points +5%
MSI Raider 18 HX A14V
Intel Core i9-14900HX, NVIDIA GeForce RTX 4080 Laptop GPU
69022 Points
Razer Blade 18 2024 RZ09-0509
Intel Core i9-14900HX, NVIDIA GeForce RTX 4090 Laptop GPU
62867 Points -9%
Moyenne Intel Core i9-14900HX
  (32543 - 83662, n=30)
61660 Points -11%
Acer Predator Helios 18 PH18-72-98MW
Intel Core i9-14900HX, NVIDIA GeForce RTX 4090 Laptop GPU
59005 Points -15%
Asus ROG Strix G18 G814JI
Intel Core i7-13650HX, NVIDIA GeForce RTX 4070 Laptop GPU
48323 Points -30%
AIDA64 / CPU AES
Moyenne Intel Core i9-14900HX
  (86964 - 241777, n=30)
138877 MB/s +7%
MSI Titan 18 HX A14VIG
Intel Core i9-14900HX, NVIDIA GeForce RTX 4090 Laptop GPU
138830 MB/s +7%
Alienware m18 R2
Intel Core i9-14900HX, NVIDIA GeForce RTX 4090 Laptop GPU
134675 MB/s +3%
MSI Raider 18 HX A14V
Intel Core i9-14900HX, NVIDIA GeForce RTX 4080 Laptop GPU
130254 MB/s
Razer Blade 18 2024 RZ09-0509
Intel Core i9-14900HX, NVIDIA GeForce RTX 4090 Laptop GPU
117887 MB/s -9%
Acer Predator Helios 18 PH18-72-98MW
Intel Core i9-14900HX, NVIDIA GeForce RTX 4090 Laptop GPU
112197 MB/s -14%
Asus ROG Strix G18 G814JI
Intel Core i7-13650HX, NVIDIA GeForce RTX 4070 Laptop GPU
85111 MB/s -35%
AIDA64 / CPU ZLib
MSI Titan 18 HX A14VIG
Intel Core i9-14900HX, NVIDIA GeForce RTX 4090 Laptop GPU
2149 MB/s +10%
Alienware m18 R2
Intel Core i9-14900HX, NVIDIA GeForce RTX 4090 Laptop GPU
2053 MB/s +5%
MSI Raider 18 HX A14V
Intel Core i9-14900HX, NVIDIA GeForce RTX 4080 Laptop GPU
1952 MB/s
Moyenne Intel Core i9-14900HX
  (1054 - 2292, n=30)
1808 MB/s -7%
Razer Blade 18 2024 RZ09-0509
Intel Core i9-14900HX, NVIDIA GeForce RTX 4090 Laptop GPU
1794 MB/s -8%
Acer Predator Helios 18 PH18-72-98MW
Intel Core i9-14900HX, NVIDIA GeForce RTX 4090 Laptop GPU
1696 MB/s -13%
Asus ROG Strix G18 G814JI
Intel Core i7-13650HX, NVIDIA GeForce RTX 4070 Laptop GPU
1251 MB/s -36%
AIDA64 / FP64 Ray-Trace
Alienware m18 R2
Intel Core i9-14900HX, NVIDIA GeForce RTX 4090 Laptop GPU
16128 KRay/s +8%
MSI Titan 18 HX A14VIG
Intel Core i9-14900HX, NVIDIA GeForce RTX 4090 Laptop GPU
16104 KRay/s +8%
MSI Raider 18 HX A14V
Intel Core i9-14900HX, NVIDIA GeForce RTX 4080 Laptop GPU
14941 KRay/s
Razer Blade 18 2024 RZ09-0509
Intel Core i9-14900HX, NVIDIA GeForce RTX 4090 Laptop GPU
13680 KRay/s -8%
Moyenne Intel Core i9-14900HX
  (6809 - 18349, n=30)
13478 KRay/s -10%
Acer Predator Helios 18 PH18-72-98MW
Intel Core i9-14900HX, NVIDIA GeForce RTX 4090 Laptop GPU
12565 KRay/s -16%
Asus ROG Strix G18 G814JI
Intel Core i7-13650HX, NVIDIA GeForce RTX 4070 Laptop GPU
10900 KRay/s -27%
AIDA64 / CPU PhotoWorxx
Alienware m18 R2
Intel Core i9-14900HX, NVIDIA GeForce RTX 4090 Laptop GPU
49716 MPixel/s +24%
Razer Blade 18 2024 RZ09-0509
Intel Core i9-14900HX, NVIDIA GeForce RTX 4090 Laptop GPU
47472 MPixel/s +19%
Acer Predator Helios 18 PH18-72-98MW
Intel Core i9-14900HX, NVIDIA GeForce RTX 4090 Laptop GPU
47343 MPixel/s +18%
Moyenne Intel Core i9-14900HX
  (23903 - 54702, n=30)
46341 MPixel/s +16%
Asus ROG Strix G18 G814JI
Intel Core i7-13650HX, NVIDIA GeForce RTX 4070 Laptop GPU
41319 MPixel/s +3%
MSI Raider 18 HX A14V
Intel Core i9-14900HX, NVIDIA GeForce RTX 4080 Laptop GPU
40052 MPixel/s
MSI Titan 18 HX A14VIG
Intel Core i9-14900HX, NVIDIA GeForce RTX 4090 Laptop GPU
33960 MPixel/s -15%

Test de stress

Le processeur atteignait 4 GHz, 86 C et 145 W lorsqu'il était soumis au stress Prime95, sans baisse majeure de la fréquence d'horloge ou des performances au fil du temps. Le grand châssis et la solution de refroidissement permettent d'extraire plus de performances du Core i9-14900HX par rapport à des systèmes plus petits équipés du même processeur, tels que le RedMagic Titan 16 Pro qui a un effet d'étranglement assez important.

L'utilisation du mode Extreme Performance avec Cooler Boost activé n'apporte aucun avantage tangible en termes de performances par rapport à Cooler Boost désactivé dans les jeux. Les fréquences d'horloge du GPU et de la mémoire, ainsi que la consommation d'énergie de la carte lors de l'exécution de Cyberpunk 2077 se stabilisent à 2550 MHz, 2250 MHz et 159 W, respectivement, entre les deux réglages. Les températures du cœur sont légèrement plus basses de quelques degrés C avec Cooler Boost activé car le bruit du ventilateur est plus fort, mais c'est le seul avantage notable.

Le passage en mode équilibré réduit les fréquences d'horloge du GPU et la consommation électrique de la carte à 2295 MHz et 150 W, respectivement, ce qui est à peine plus lent qu'en mode Performance extrême. Les écarts de performances entre les modes Balanced et Extreme Performance sont donc plus faibles que ce à quoi on pourrait s'attendre.

Les températures du GPU sont plus élevées que sur la Razer Blade 18 jusqu'à 9°C lors des jeux, même si notre MSI est le système le plus épais et le plus lourd.

Système en veille
Système en veille
Cyberpunk 2077 stress (Mode équilibré)
Prime95 stress
Prime95 stress
Cyberpunk 2077 stress (Performance extrême avec Cooler Boost désactivé)
Prime95+FurMark stress
Cyberpunk 2077 stress (Performance extrême avec Cooler Boost activé)
Horloge moyenne du CPU (GHz) Horloge du GPU (MHz) Température moyenne du CPU (°C) Température moyenne du GPU (°C)
Système en veille -- -- 54 43
Prime95 Stress 4.0 -- 84 50
Prime95 + FurMark Stress 2.5 2550 77 75
Cyberpunk 2077 Stress (mode équilibré) 1.5 2295 78 85
Cyberpunk 2077 Stress (Performance extrême avec Cooler Boost désactivé) 1.7 2550 81 83
Cyberpunk 2077 Stress (Performance extrême avec Cooler Boost activé) 1.6 2550 78 78

Performance du système

Les scores de PCMark 10 sont comparables à ceux de la Titan 18 HX de MSI, ce qui montre que les tâches quotidiennes ne sont pas vraiment plus lentes sur la Raider 18 HX, même s'il s'agit essentiellement d'une Titan atténuée.

Nous avons rencontré d'étranges problèmes de connexion avec notre unité de test lorsque nous passions du mode dGPU au mode iGPU, ce qui nous obligeait à réinitialiser le code PIN à chaque fois.

PCMark 10 Standard
PCMark 10 Standard
PCMark 10 / Score
Alienware m18 R2
NVIDIA GeForce RTX 4090 Laptop GPU, i9-14900HX, SK Hynix PC811 HFS002TEM9X152N
9234 Points 0%
MSI Raider 18 HX A14V
NVIDIA GeForce RTX 4080 Laptop GPU, i9-14900HX, Samsung PM9A1 MZVL22T0HBLB
9223 Points
MSI Titan 18 HX A14VIG
NVIDIA GeForce RTX 4090 Laptop GPU, i9-14900HX, 2x Samsung PM9A1a MZVL22T0HDLB (RAID 0)
8968 Points -3%
Razer Blade 18 2024 RZ09-0509
NVIDIA GeForce RTX 4090 Laptop GPU, i9-14900HX
8805 Points -5%
Moyenne Intel Core i9-14900HX, NVIDIA GeForce RTX 4080 Laptop GPU
  (7703 - 9223, n=5)
8686 Points -6%
Acer Predator Helios 18 PH18-72-98MW
NVIDIA GeForce RTX 4090 Laptop GPU, i9-14900HX, 2x SK Hynix HFS001TEJ9X115N (RAID 0)
8230 Points -11%
Asus ROG Strix G18 G814JI
NVIDIA GeForce RTX 4070 Laptop GPU, i7-13650HX, Micron 2400 MTFDKBA1T0QFM
6404 Points -31%
PCMark 10 / Essentials
MSI Raider 18 HX A14V
NVIDIA GeForce RTX 4080 Laptop GPU, i9-14900HX, Samsung PM9A1 MZVL22T0HBLB
11825 Points
MSI Titan 18 HX A14VIG
NVIDIA GeForce RTX 4090 Laptop GPU, i9-14900HX, 2x Samsung PM9A1a MZVL22T0HDLB (RAID 0)
11628 Points -2%
Moyenne Intel Core i9-14900HX, NVIDIA GeForce RTX 4080 Laptop GPU
  (11255 - 11825, n=5)
11558 Points -2%
Alienware m18 R2
NVIDIA GeForce RTX 4090 Laptop GPU, i9-14900HX, SK Hynix PC811 HFS002TEM9X152N
11415 Points -3%
Razer Blade 18 2024 RZ09-0509
NVIDIA GeForce RTX 4090 Laptop GPU, i9-14900HX
11378 Points -4%
Acer Predator Helios 18 PH18-72-98MW
NVIDIA GeForce RTX 4090 Laptop GPU, i9-14900HX, 2x SK Hynix HFS001TEJ9X115N (RAID 0)
11032 Points -7%
Asus ROG Strix G18 G814JI
NVIDIA GeForce RTX 4070 Laptop GPU, i7-13650HX, Micron 2400 MTFDKBA1T0QFM
9768 Points -17%
PCMark 10 / Productivity
Alienware m18 R2
NVIDIA GeForce RTX 4090 Laptop GPU, i9-14900HX, SK Hynix PC811 HFS002TEM9X152N
11415 Points +3%
MSI Raider 18 HX A14V
NVIDIA GeForce RTX 4080 Laptop GPU, i9-14900HX, Samsung PM9A1 MZVL22T0HBLB
11082 Points
MSI Titan 18 HX A14VIG
NVIDIA GeForce RTX 4090 Laptop GPU, i9-14900HX, 2x Samsung PM9A1a MZVL22T0HDLB (RAID 0)
10225 Points -8%
Razer Blade 18 2024 RZ09-0509
NVIDIA GeForce RTX 4090 Laptop GPU, i9-14900HX
10186 Points -8%
Moyenne Intel Core i9-14900HX, NVIDIA GeForce RTX 4080 Laptop GPU
  (6662 - 11410, n=5)
10080 Points -9%
Acer Predator Helios 18 PH18-72-98MW
NVIDIA GeForce RTX 4090 Laptop GPU, i9-14900HX, 2x SK Hynix HFS001TEJ9X115N (RAID 0)
9951 Points -10%
Asus ROG Strix G18 G814JI
NVIDIA GeForce RTX 4070 Laptop GPU, i7-13650HX, Micron 2400 MTFDKBA1T0QFM
8886 Points -20%
PCMark 10 / Digital Content Creation
MSI Titan 18 HX A14VIG
NVIDIA GeForce RTX 4090 Laptop GPU, i9-14900HX, 2x Samsung PM9A1a MZVL22T0HDLB (RAID 0)
16462 Points +1%
Alienware m18 R2
NVIDIA GeForce RTX 4090 Laptop GPU, i9-14900HX, SK Hynix PC811 HFS002TEM9X152N
16398 Points +1%
MSI Raider 18 HX A14V
NVIDIA GeForce RTX 4080 Laptop GPU, i9-14900HX, Samsung PM9A1 MZVL22T0HBLB
16246 Points
Razer Blade 18 2024 RZ09-0509
NVIDIA GeForce RTX 4090 Laptop GPU, i9-14900HX
15985 Points -2%
Moyenne Intel Core i9-14900HX, NVIDIA GeForce RTX 4080 Laptop GPU
  (14466 - 16246, n=5)
15488 Points -5%
Acer Predator Helios 18 PH18-72-98MW
NVIDIA GeForce RTX 4090 Laptop GPU, i9-14900HX, 2x SK Hynix HFS001TEJ9X115N (RAID 0)
13779 Points -15%
Asus ROG Strix G18 G814JI
NVIDIA GeForce RTX 4070 Laptop GPU, i7-13650HX, Micron 2400 MTFDKBA1T0QFM
8212 Points -49%
CrossMark / Overall
Moyenne Intel Core i9-14900HX, NVIDIA GeForce RTX 4080 Laptop GPU
  (2037 - 2334, n=5)
2190 Points +2%
MSI Raider 18 HX A14V
NVIDIA GeForce RTX 4080 Laptop GPU, i9-14900HX, Samsung PM9A1 MZVL22T0HBLB
2151 Points
Alienware m18 R2
NVIDIA GeForce RTX 4090 Laptop GPU, i9-14900HX, SK Hynix PC811 HFS002TEM9X152N
2073 Points -4%
Razer Blade 18 2024 RZ09-0509
NVIDIA GeForce RTX 4090 Laptop GPU, i9-14900HX
2048 Points -5%
MSI Titan 18 HX A14VIG
NVIDIA GeForce RTX 4090 Laptop GPU, i9-14900HX, 2x Samsung PM9A1a MZVL22T0HDLB (RAID 0)
1877 Points -13%
CrossMark / Productivity
Moyenne Intel Core i9-14900HX, NVIDIA GeForce RTX 4080 Laptop GPU
  (1874 - 2204, n=5)
2053 Points +2%
MSI Raider 18 HX A14V
NVIDIA GeForce RTX 4080 Laptop GPU, i9-14900HX, Samsung PM9A1 MZVL22T0HBLB
2014 Points
Razer Blade 18 2024 RZ09-0509
NVIDIA GeForce RTX 4090 Laptop GPU, i9-14900HX
1902 Points -6%
Alienware m18 R2
NVIDIA GeForce RTX 4090 Laptop GPU, i9-14900HX, SK Hynix PC811 HFS002TEM9X152N
1881 Points -7%
MSI Titan 18 HX A14VIG
NVIDIA GeForce RTX 4090 Laptop GPU, i9-14900HX, 2x Samsung PM9A1a MZVL22T0HDLB (RAID 0)
1738 Points -14%
CrossMark / Creativity
Moyenne Intel Core i9-14900HX, NVIDIA GeForce RTX 4080 Laptop GPU
  (2327 - 2500, n=5)
2401 Points +1%
Alienware m18 R2
NVIDIA GeForce RTX 4090 Laptop GPU, i9-14900HX, SK Hynix PC811 HFS002TEM9X152N
2393 Points 0%
MSI Raider 18 HX A14V
NVIDIA GeForce RTX 4080 Laptop GPU, i9-14900HX, Samsung PM9A1 MZVL22T0HBLB
2388 Points
Razer Blade 18 2024 RZ09-0509
NVIDIA GeForce RTX 4090 Laptop GPU, i9-14900HX
2316 Points -3%
MSI Titan 18 HX A14VIG
NVIDIA GeForce RTX 4090 Laptop GPU, i9-14900HX, 2x Samsung PM9A1a MZVL22T0HDLB (RAID 0)
2195 Points -8%
CrossMark / Responsiveness
Moyenne Intel Core i9-14900HX, NVIDIA GeForce RTX 4080 Laptop GPU
  (1756 - 2254, n=5)
2021 Points +6%
MSI Raider 18 HX A14V
NVIDIA GeForce RTX 4080 Laptop GPU, i9-14900HX, Samsung PM9A1 MZVL22T0HBLB
1913 Points
Alienware m18 R2
NVIDIA GeForce RTX 4090 Laptop GPU, i9-14900HX, SK Hynix PC811 HFS002TEM9X152N
1806 Points -6%
Razer Blade 18 2024 RZ09-0509
NVIDIA GeForce RTX 4090 Laptop GPU, i9-14900HX
1765 Points -8%
MSI Titan 18 HX A14VIG
NVIDIA GeForce RTX 4090 Laptop GPU, i9-14900HX, 2x Samsung PM9A1a MZVL22T0HDLB (RAID 0)
1478 Points -23%
WebXPRT 3 / Overall
Razer Blade 18 2024 RZ09-0509
NVIDIA GeForce RTX 4090 Laptop GPU, i9-14900HX
339 Points +1%
MSI Raider 18 HX A14V
NVIDIA GeForce RTX 4080 Laptop GPU, i9-14900HX, Samsung PM9A1 MZVL22T0HBLB
334 Points
MSI Titan 18 HX A14VIG
NVIDIA GeForce RTX 4090 Laptop GPU, i9-14900HX, 2x Samsung PM9A1a MZVL22T0HDLB (RAID 0)
327 Points -2%
Moyenne Intel Core i9-14900HX, NVIDIA GeForce RTX 4080 Laptop GPU
  (310 - 345, n=5)
327 Points -2%
Alienware m18 R2
NVIDIA GeForce RTX 4090 Laptop GPU, i9-14900HX, SK Hynix PC811 HFS002TEM9X152N
326 Points -2%
Asus ROG Strix G18 G814JI
NVIDIA GeForce RTX 4070 Laptop GPU, i7-13650HX, Micron 2400 MTFDKBA1T0QFM
312 Points -7%
Asus ROG Strix G18 G814JI
NVIDIA GeForce RTX 4070 Laptop GPU, i7-13650HX, Micron 2400 MTFDKBA1T0QFM
312 Points -7%
WebXPRT 4 / Overall
MSI Raider 18 HX A14V
NVIDIA GeForce RTX 4080 Laptop GPU, i9-14900HX, Samsung PM9A1 MZVL22T0HBLB
321 Points
Moyenne Intel Core i9-14900HX, NVIDIA GeForce RTX 4080 Laptop GPU
  (300 - 321, n=5)
311 Points -3%
Alienware m18 R2
NVIDIA GeForce RTX 4090 Laptop GPU, i9-14900HX, SK Hynix PC811 HFS002TEM9X152N
309 Points -4%
MSI Titan 18 HX A14VIG
NVIDIA GeForce RTX 4090 Laptop GPU, i9-14900HX, 2x Samsung PM9A1a MZVL22T0HDLB (RAID 0)
287 Points -11%
Asus ROG Strix G18 G814JI
NVIDIA GeForce RTX 4070 Laptop GPU, i7-13650HX, Micron 2400 MTFDKBA1T0QFM
277 Points -14%
Asus ROG Strix G18 G814JI
NVIDIA GeForce RTX 4070 Laptop GPU, i7-13650HX, Micron 2400 MTFDKBA1T0QFM
277 Points -14%
Mozilla Kraken 1.1 / Total
Asus ROG Strix G18 G814JI
NVIDIA GeForce RTX 4070 Laptop GPU, i7-13650HX, Micron 2400 MTFDKBA1T0QFM
502 ms * -13%
Asus ROG Strix G18 G814JI
NVIDIA GeForce RTX 4070 Laptop GPU, i7-13650HX, Micron 2400 MTFDKBA1T0QFM
502 ms * -13%
MSI Titan 18 HX A14VIG
NVIDIA GeForce RTX 4090 Laptop GPU, i9-14900HX, 2x Samsung PM9A1a MZVL22T0HDLB (RAID 0)
452 ms * -1%
Razer Blade 18 2024 RZ09-0509
NVIDIA GeForce RTX 4090 Laptop GPU, i9-14900HX
449 ms * -1%
MSI Raider 18 HX A14V
NVIDIA GeForce RTX 4080 Laptop GPU, i9-14900HX, Samsung PM9A1 MZVL22T0HBLB
446 ms *
Moyenne Intel Core i9-14900HX, NVIDIA GeForce RTX 4080 Laptop GPU
  (437 - 446, n=5)
442 ms * +1%
Acer Predator Helios 18 PH18-72-98MW
NVIDIA GeForce RTX 4090 Laptop GPU, i9-14900HX, 2x SK Hynix HFS001TEJ9X115N (RAID 0)
441 ms * +1%
Alienware m18 R2
NVIDIA GeForce RTX 4090 Laptop GPU, i9-14900HX, SK Hynix PC811 HFS002TEM9X152N
430 ms * +4%

* ... Moindre est la valeur, meilleures sont les performances

PCMark 10 Score
9223 points
Aide
AIDA64 / Memory Copy
Alienware m18 R2
Intel Core i9-14900HX, NVIDIA GeForce RTX 4090 Laptop GPU
79243 MB/s +23%
Acer Predator Helios 18 PH18-72-98MW
Intel Core i9-14900HX, NVIDIA GeForce RTX 4090 Laptop GPU
78016 MB/s +21%
Razer Blade 18 2024 RZ09-0509
Intel Core i9-14900HX, NVIDIA GeForce RTX 4090 Laptop GPU
76268 MB/s +18%
Moyenne Intel Core i9-14900HX
  (38028 - 83392, n=30)
74366 MB/s +15%
MSI Raider 18 HX A14V
Intel Core i9-14900HX, NVIDIA GeForce RTX 4080 Laptop GPU
64612 MB/s
Asus ROG Strix G18 G814JI
Intel Core i7-13650HX, NVIDIA GeForce RTX 4070 Laptop GPU
64308 MB/s 0%
MSI Titan 18 HX A14VIG
Intel Core i9-14900HX, NVIDIA GeForce RTX 4090 Laptop GPU
56992 MB/s -12%
AIDA64 / Memory Read
Alienware m18 R2
Intel Core i9-14900HX, NVIDIA GeForce RTX 4090 Laptop GPU
85791 MB/s +37%
Acer Predator Helios 18 PH18-72-98MW
Intel Core i9-14900HX, NVIDIA GeForce RTX 4090 Laptop GPU
85323 MB/s +36%
Razer Blade 18 2024 RZ09-0509
Intel Core i9-14900HX, NVIDIA GeForce RTX 4090 Laptop GPU
82992 MB/s +33%
Moyenne Intel Core i9-14900HX
  (43306 - 87507, n=30)
80356 MB/s +28%
Asus ROG Strix G18 G814JI
Intel Core i7-13650HX, NVIDIA GeForce RTX 4070 Laptop GPU
68497 MB/s +10%
MSI Raider 18 HX A14V
Intel Core i9-14900HX, NVIDIA GeForce RTX 4080 Laptop GPU
62535 MB/s
MSI Titan 18 HX A14VIG
Intel Core i9-14900HX, NVIDIA GeForce RTX 4090 Laptop GPU
54443 MB/s -13%
AIDA64 / Memory Write
Alienware m18 R2
Intel Core i9-14900HX, NVIDIA GeForce RTX 4090 Laptop GPU
77089 MB/s +27%
Moyenne Intel Core i9-14900HX
  (37146 - 80589, n=30)
71399 MB/s +18%
Acer Predator Helios 18 PH18-72-98MW
Intel Core i9-14900HX, NVIDIA GeForce RTX 4090 Laptop GPU
70089 MB/s +16%
Razer Blade 18 2024 RZ09-0509
Intel Core i9-14900HX, NVIDIA GeForce RTX 4090 Laptop GPU
67801 MB/s +12%
MSI Raider 18 HX A14V
Intel Core i9-14900HX, NVIDIA GeForce RTX 4080 Laptop GPU
60645 MB/s
Asus ROG Strix G18 G814JI
Intel Core i7-13650HX, NVIDIA GeForce RTX 4070 Laptop GPU
60111 MB/s -1%
MSI Titan 18 HX A14VIG
Intel Core i9-14900HX, NVIDIA GeForce RTX 4090 Laptop GPU
51387 MB/s -15%
AIDA64 / Memory Latency
MSI Titan 18 HX A14VIG
Intel Core i9-14900HX, NVIDIA GeForce RTX 4090 Laptop GPU
105 ns * -7%
MSI Raider 18 HX A14V
Intel Core i9-14900HX, NVIDIA GeForce RTX 4080 Laptop GPU
97.7 ns *
Razer Blade 18 2024 RZ09-0509
Intel Core i9-14900HX, NVIDIA GeForce RTX 4090 Laptop GPU
87.6 ns * +10%
Alienware m18 R2
Intel Core i9-14900HX, NVIDIA GeForce RTX 4090 Laptop GPU
86.4 ns * +12%
Moyenne Intel Core i9-14900HX
  (76.1 - 105, n=30)
85.1 ns * +13%
Asus ROG Strix G18 G814JI
Intel Core i7-13650HX, NVIDIA GeForce RTX 4070 Laptop GPU
83.7 ns * +14%
Acer Predator Helios 18 PH18-72-98MW
Intel Core i9-14900HX, NVIDIA GeForce RTX 4090 Laptop GPU
83 ns * +15%

* ... Moindre est la valeur, meilleures sont les performances

Latence DPC

LatencyMon révèle des problèmes de DPC lors de l'ouverture de plusieurs onglets de notre page d'accueil, même en mode iGPU. la lecture de vidéos 4K à 60 FPS est par ailleurs parfaite, sans aucune perte d'images.

LatencyMon
LatencyMon
Liste des conducteurs
DPC Latencies / LatencyMon - interrupt to process latency (max), Web, Youtube, Prime95
MSI Raider 18 HX A14V
NVIDIA GeForce RTX 4080 Laptop GPU, i9-14900HX, Samsung PM9A1 MZVL22T0HBLB
4561.7 μs *
Acer Predator Helios 18 PH18-72-98MW
NVIDIA GeForce RTX 4090 Laptop GPU, i9-14900HX, 2x SK Hynix HFS001TEJ9X115N (RAID 0)
3388 μs * +26%
Alienware m18 R2
NVIDIA GeForce RTX 4090 Laptop GPU, i9-14900HX, SK Hynix PC811 HFS002TEM9X152N
2815.1 μs * +38%
MSI Titan 18 HX A14VIG
NVIDIA GeForce RTX 4090 Laptop GPU, i9-14900HX, 2x Samsung PM9A1a MZVL22T0HDLB (RAID 0)
2384.5 μs * +48%
Razer Blade 18 2024 RZ09-0509
NVIDIA GeForce RTX 4090 Laptop GPU, i9-14900HX
1479.7 μs * +68%
Asus ROG Strix G18 G814JI
NVIDIA GeForce RTX 4070 Laptop GPU, i7-13650HX, Micron 2400 MTFDKBA1T0QFM
965.6 μs * +79%

* ... Moindre est la valeur, meilleures sont les performances

Dispositifs de stockage

Notre appareil est livré avec les éléments suivants Samsung PM9A1a MZVL22T0HDLB PCIe4 que l'on trouve couramment sur les ordinateurs portables haut de gamme. Les taux de transfert sont stables à ~7000 MB/s même lorsqu'ils sont sollicités et ils peuvent être encore plus rapides s'ils sont configurés avec un disque PCIe5. Cependant, l'absence d'un répartiteur de chaleur inclus peut signifier que les disques PCIe5 sont plus susceptibles de s'étrangler.

Emplacement principal PCIe5 x4 M.2 2280 SSD. Notez l'emplacement SSD inutilisé en dessous qui n'est disponible que sur la Titan 18 HX
Emplacement secondaire PCIe4 x4 M.2 2280 SSD pour extension
CDM 8
CDM 8
AS SSD
AS SSD
Samsung PM9A1 MZVL22T0HBLB
CDM 5/6 Read Seq Q32T1: 7067 MB/s
CDM 5/6 Write Seq Q32T1: 5217 MB/s
CDM 5/6 Read 4K Q32T1: 741.3 MB/s
CDM 5/6 Write 4K Q32T1: 560.5 MB/s
CDM 5 Read Seq: 4613 MB/s
CDM 5 Write Seq: 4565 MB/s
CDM 5/6 Read 4K: 92.28 MB/s
CDM 5/6 Write 4K: 268.9 MB/s
Drive Performance Rating - Percent
Alienware m18 R2
SK Hynix PC811 HFS002TEM9X152N
80.9 pt
MSI Raider 18 HX A14V
Samsung PM9A1 MZVL22T0HBLB
70.3 pt
Acer Predator Helios 18 PH18-72-98MW
2x SK Hynix HFS001TEJ9X115N (RAID 0)
66.1 pt
MSI Titan 18 HX A14VIG
2x Samsung PM9A1a MZVL22T0HDLB (RAID 0)
59.8 pt
Razer Blade 18 2024 RZ09-0509
 
48.4 pt
Asus ROG Strix G18 G814JI
Micron 2400 MTFDKBA1T0QFM
31 pt
DiskSpd
seq read
Acer Predator Helios 18 PH18-72-98MW
2x SK Hynix HFS001TEJ9X115N (RAID 0)
7045 (6975.86min - 7044.54max) MB/s +61%
Alienware m18 R2
SK Hynix PC811 HFS002TEM9X152N
5588 (5540.05min - 5587.65max) MB/s +27%
MSI Titan 18 HX A14VIG
2x Samsung PM9A1a MZVL22T0HDLB (RAID 0)
5424 (5395.57min - 5423.86max) MB/s +24%
MSI Raider 18 HX A14V
Samsung PM9A1 MZVL22T0HBLB
4386 (4353.9min - 4386.02max) MB/s
Razer Blade 18 2024 RZ09-0509
 
3560 (3002.28min - 3559.93max) MB/s -19%
Asus ROG Strix G18 G814JI
Micron 2400 MTFDKBA1T0QFM
1870 (1827.25min - 1869.82max) MB/s -57%
seq write
Acer Predator Helios 18 PH18-72-98MW
2x SK Hynix HFS001TEJ9X115N (RAID 0)
8992 (8801.75min - 8992.01max) MB/s +102%
MSI Titan 18 HX A14VIG
2x Samsung PM9A1a MZVL22T0HDLB (RAID 0)
7291 (7191.64min - 7291.38max) MB/s +64%
Alienware m18 R2
SK Hynix PC811 HFS002TEM9X152N
5153 (5139.7min - 5152.91max) MB/s +16%
MSI Raider 18 HX A14V
Samsung PM9A1 MZVL22T0HBLB
4451 (4428.51min - 4450.69max) MB/s
Razer Blade 18 2024 RZ09-0509
 
3367 (3255.82min - 3366.95max) MB/s -24%
Asus ROG Strix G18 G814JI
Micron 2400 MTFDKBA1T0QFM
2166 (2094.01min - 2166.15max) MB/s -51%
seq q8 t1 read
MSI Titan 18 HX A14VIG
2x Samsung PM9A1a MZVL22T0HDLB (RAID 0)
13588 (10727.3min - 13588.3max) MB/s +94%
Acer Predator Helios 18 PH18-72-98MW
2x SK Hynix HFS001TEJ9X115N (RAID 0)
11019 (9854.1min - 11018.8max) MB/s +57%
Alienware m18 R2
SK Hynix PC811 HFS002TEM9X152N
7110 (6256.85min - 7110.18max) MB/s +2%
MSI Raider 18 HX A14V
Samsung PM9A1 MZVL22T0HBLB
6998 (5678.67min - 6998.41max) MB/s
Razer Blade 18 2024 RZ09-0509
 
6797 (5573.18min - 6797.33max) MB/s -3%
Asus ROG Strix G18 G814JI
Micron 2400 MTFDKBA1T0QFM
4239 (3584.87min - 4239.18max) MB/s -39%
seq q8 t1 write
Acer Predator Helios 18 PH18-72-98MW
2x SK Hynix HFS001TEJ9X115N (RAID 0)
11472 (11391min - 11471.6max) MB/s +123%
MSI Titan 18 HX A14VIG
2x Samsung PM9A1a MZVL22T0HDLB (RAID 0)
10571 (10519.3min - 10571.3max) MB/s +105%
Alienware m18 R2
SK Hynix PC811 HFS002TEM9X152N
6779 (6710.47min - 6778.83max) MB/s +32%
MSI Raider 18 HX A14V
Samsung PM9A1 MZVL22T0HBLB
5151 (5107.26min - 5151.02max) MB/s
Razer Blade 18 2024 RZ09-0509
 
4902 (4309.42min - 4901.73max) MB/s -5%
Asus ROG Strix G18 G814JI
Micron 2400 MTFDKBA1T0QFM
2982 (2920.07min - 2981.52max) MB/s -42%
4k q1 t1 read
MSI Raider 18 HX A14V
Samsung PM9A1 MZVL22T0HBLB
86.1 (85.37min - 86.08max) MB/s
Acer Predator Helios 18 PH18-72-98MW
2x SK Hynix HFS001TEJ9X115N (RAID 0)
81.6 (81.02min - 81.62max) MB/s -5%
Alienware m18 R2
SK Hynix PC811 HFS002TEM9X152N
75.4 (73.49min - 75.43max) MB/s -12%
MSI Titan 18 HX A14VIG
2x Samsung PM9A1a MZVL22T0HDLB (RAID 0)
69.6 (68.6min - 69.57max) MB/s -19%
Razer Blade 18 2024 RZ09-0509
 
61.8 (61.2min - 61.81max) MB/s -28%
Asus ROG Strix G18 G814JI
Micron 2400 MTFDKBA1T0QFM
30.6 (30.29min - 30.64max) MB/s -64%
4k q1 t1 write
Alienware m18 R2
SK Hynix PC811 HFS002TEM9X152N
300 (297.27min - 299.6max) MB/s +17%
Acer Predator Helios 18 PH18-72-98MW
2x SK Hynix HFS001TEJ9X115N (RAID 0)
259 (250.68min - 258.82max) MB/s +1%
MSI Raider 18 HX A14V
Samsung PM9A1 MZVL22T0HBLB
256 (253.63min - 256.02max) MB/s
Razer Blade 18 2024 RZ09-0509
 
164 (110.95min - 164max) MB/s -36%
MSI Titan 18 HX A14VIG
2x Samsung PM9A1a MZVL22T0HDLB (RAID 0)
152.1 (149.74min - 152.09max) MB/s -41%
Asus ROG Strix G18 G814JI
Micron 2400 MTFDKBA1T0QFM
116.3 (111.83min - 116.33max) MB/s -55%
4k q32 t16 read
Alienware m18 R2
SK Hynix PC811 HFS002TEM9X152N
6067 (5596.15min - 6066.73max) MB/s +50%
MSI Raider 18 HX A14V
Samsung PM9A1 MZVL22T0HBLB
4033 (3849.17min - 4033.13max) MB/s
MSI Titan 18 HX A14VIG
2x Samsung PM9A1a MZVL22T0HDLB (RAID 0)
1623 (1464.8min - 1623.24max) MB/s -60%
Acer Predator Helios 18 PH18-72-98MW
2x SK Hynix HFS001TEJ9X115N (RAID 0)
1385 (1275.7min - 1385.11max) MB/s -66%
Razer Blade 18 2024 RZ09-0509
 
1005 (964.75min - 1004.59max) MB/s -75%
Asus ROG Strix G18 G814JI
Micron 2400 MTFDKBA1T0QFM
613 (588.72min - 613.33max) MB/s -85%
4k q32 t16 write
Alienware m18 R2
SK Hynix PC811 HFS002TEM9X152N
4176 (3805.57min - 4175.9max) MB/s +22%
MSI Raider 18 HX A14V
Samsung PM9A1 MZVL22T0HBLB
3411 (3258.46min - 3411.26max) MB/s
MSI Titan 18 HX A14VIG
2x Samsung PM9A1a MZVL22T0HDLB (RAID 0)
1377 (1306.51min - 1377.05max) MB/s -60%
Acer Predator Helios 18 PH18-72-98MW
2x SK Hynix HFS001TEJ9X115N (RAID 0)
1330 (1184.45min - 1330.4max) MB/s -61%
Razer Blade 18 2024 RZ09-0509
 
442 (336.87min - 441.83max) MB/s -87%
Asus ROG Strix G18 G814JI
Micron 2400 MTFDKBA1T0QFM
441 (428.19min - 440.55max) MB/s -87%
AS SSD
Score Total
Alienware m18 R2
SK Hynix PC811 HFS002TEM9X152N
10655 Points +23%
MSI Raider 18 HX A14V
Samsung PM9A1 MZVL22T0HBLB
8675 Points
MSI Titan 18 HX A14VIG
2x Samsung PM9A1a MZVL22T0HDLB (RAID 0)
5369 Points -38%
Acer Predator Helios 18 PH18-72-98MW
2x SK Hynix HFS001TEJ9X115N (RAID 0)
5102 Points -41%
Razer Blade 18 2024 RZ09-0509
 
4927 Points -43%
Asus ROG Strix G18 G814JI
Micron 2400 MTFDKBA1T0QFM
4272 Points -51%
Score Read
Alienware m18 R2
SK Hynix PC811 HFS002TEM9X152N
3753 Points +15%
MSI Raider 18 HX A14V
Samsung PM9A1 MZVL22T0HBLB
3266 Points
MSI Titan 18 HX A14VIG
2x Samsung PM9A1a MZVL22T0HDLB (RAID 0)
2194 Points -33%
Acer Predator Helios 18 PH18-72-98MW
2x SK Hynix HFS001TEJ9X115N (RAID 0)
2049 Points -37%
Razer Blade 18 2024 RZ09-0509
 
1667 Points -49%
Asus ROG Strix G18 G814JI
Micron 2400 MTFDKBA1T0QFM
1294 Points -60%
Score Write
Alienware m18 R2
SK Hynix PC811 HFS002TEM9X152N
4993 Points +32%
MSI Raider 18 HX A14V
Samsung PM9A1 MZVL22T0HBLB
3791 Points
Razer Blade 18 2024 RZ09-0509
 
2518 Points -34%
Asus ROG Strix G18 G814JI
Micron 2400 MTFDKBA1T0QFM
2387 Points -37%
MSI Titan 18 HX A14VIG
2x Samsung PM9A1a MZVL22T0HDLB (RAID 0)
2092 Points -45%
Acer Predator Helios 18 PH18-72-98MW
2x SK Hynix HFS001TEJ9X115N (RAID 0)
2038 Points -46%
Seq Read
MSI Titan 18 HX A14VIG
2x Samsung PM9A1a MZVL22T0HDLB (RAID 0)
9576.8 MB/s +70%
Acer Predator Helios 18 PH18-72-98MW
2x SK Hynix HFS001TEJ9X115N (RAID 0)
8496.25 MB/s +51%
Alienware m18 R2
SK Hynix PC811 HFS002TEM9X152N
5916.27 MB/s +5%
MSI Raider 18 HX A14V
Samsung PM9A1 MZVL22T0HBLB
5627.99 MB/s
Razer Blade 18 2024 RZ09-0509
 
5476.6 MB/s -3%
Asus ROG Strix G18 G814JI
Micron 2400 MTFDKBA1T0QFM
3810.59 MB/s -32%
Seq Write
MSI Titan 18 HX A14VIG
2x Samsung PM9A1a MZVL22T0HDLB (RAID 0)
8685.54 MB/s +90%
Acer Predator Helios 18 PH18-72-98MW
2x SK Hynix HFS001TEJ9X115N (RAID 0)
7597.23 MB/s +66%
Alienware m18 R2
SK Hynix PC811 HFS002TEM9X152N
5929.42 MB/s +30%
MSI Raider 18 HX A14V
Samsung PM9A1 MZVL22T0HBLB
4568.06 MB/s
Razer Blade 18 2024 RZ09-0509
 
2995.22 MB/s -34%
Asus ROG Strix G18 G814JI
Micron 2400 MTFDKBA1T0QFM
2319.92 MB/s -49%
4K Read
MSI Raider 18 HX A14V
Samsung PM9A1 MZVL22T0HBLB
78.43 MB/s
Acer Predator Helios 18 PH18-72-98MW
2x SK Hynix HFS001TEJ9X115N (RAID 0)
69.86 MB/s -11%
Razer Blade 18 2024 RZ09-0509
 
65.49 MB/s -16%
Alienware m18 R2
SK Hynix PC811 HFS002TEM9X152N
64.97 MB/s -17%
MSI Titan 18 HX A14VIG
2x Samsung PM9A1a MZVL22T0HDLB (RAID 0)
63.69 MB/s -19%
Asus ROG Strix G18 G814JI
Micron 2400 MTFDKBA1T0QFM
37.91 MB/s -52%
4K Write
Alienware m18 R2
SK Hynix PC811 HFS002TEM9X152N
238.28 MB/s +4%
MSI Raider 18 HX A14V
Samsung PM9A1 MZVL22T0HBLB
228.27 MB/s
Razer Blade 18 2024 RZ09-0509
 
219.58 MB/s -4%
Acer Predator Helios 18 PH18-72-98MW
2x SK Hynix HFS001TEJ9X115N (RAID 0)
200.92 MB/s -12%
Asus ROG Strix G18 G814JI
Micron 2400 MTFDKBA1T0QFM
152.19 MB/s -33%
MSI Titan 18 HX A14VIG
2x Samsung PM9A1a MZVL22T0HDLB (RAID 0)
134.66 MB/s -41%
4K-64 Read
Alienware m18 R2
SK Hynix PC811 HFS002TEM9X152N
3096 MB/s +18%
MSI Raider 18 HX A14V
Samsung PM9A1 MZVL22T0HBLB
2624.43 MB/s
MSI Titan 18 HX A14VIG
2x Samsung PM9A1a MZVL22T0HDLB (RAID 0)
1172.14 MB/s -55%
Acer Predator Helios 18 PH18-72-98MW
2x SK Hynix HFS001TEJ9X115N (RAID 0)
1129.76 MB/s -57%
Razer Blade 18 2024 RZ09-0509
 
1053.83 MB/s -60%
Asus ROG Strix G18 G814JI
Micron 2400 MTFDKBA1T0QFM
874.66 MB/s -67%
4K-64 Write
Alienware m18 R2
SK Hynix PC811 HFS002TEM9X152N
4161.9 MB/s +34%
MSI Raider 18 HX A14V
Samsung PM9A1 MZVL22T0HBLB
3105.6 MB/s
Asus ROG Strix G18 G814JI
Micron 2400 MTFDKBA1T0QFM
2002.63 MB/s -36%
Razer Blade 18 2024 RZ09-0509
 
1998.53 MB/s -36%
MSI Titan 18 HX A14VIG
2x Samsung PM9A1a MZVL22T0HDLB (RAID 0)
1088.59 MB/s -65%
Acer Predator Helios 18 PH18-72-98MW
2x SK Hynix HFS001TEJ9X115N (RAID 0)
1077.68 MB/s -65%
Access Time Read
Acer Predator Helios 18 PH18-72-98MW
2x SK Hynix HFS001TEJ9X115N (RAID 0)
0.044 ms * -38%
Asus ROG Strix G18 G814JI
Micron 2400 MTFDKBA1T0QFM
0.04 ms * -25%
MSI Titan 18 HX A14VIG
2x Samsung PM9A1a MZVL22T0HDLB (RAID 0)
0.036 ms * -13%
MSI Raider 18 HX A14V
Samsung PM9A1 MZVL22T0HBLB
0.032 ms *
Alienware m18 R2
SK Hynix PC811 HFS002TEM9X152N
0.029 ms * +9%
Razer Blade 18 2024 RZ09-0509
 
0.025 ms * +22%
Access Time Write
Asus ROG Strix G18 G814JI
Micron 2400 MTFDKBA1T0QFM
0.12 ms * -122%
MSI Titan 18 HX A14VIG
2x Samsung PM9A1a MZVL22T0HDLB (RAID 0)
0.091 ms * -69%
Razer Blade 18 2024 RZ09-0509
 
0.057 ms * -6%
Alienware m18 R2
SK Hynix PC811 HFS002TEM9X152N
0.055 ms * -2%
MSI Raider 18 HX A14V
Samsung PM9A1 MZVL22T0HBLB
0.054 ms *
Acer Predator Helios 18 PH18-72-98MW
2x SK Hynix HFS001TEJ9X115N (RAID 0)
0.019 ms * +65%

* ... Moindre est la valeur, meilleures sont les performances

Disk Throttling: DiskSpd Read Loop, Queue Depth 8

035571010651420177521302485284031953550390542604615497053255680603563906745Tooltip
MSI Raider 18 HX A14V Samsung PM9A1 MZVL22T0HBLB; diskspd 2.0.17 f: Ø6989 (6525.71-7010.57)
Razer Blade 18 2024 RZ09-0509  ; diskspd 2.0.17 f: Ø6880 (5682.4-6917.67)

Performance du GPU - 175 W TGP Graphics

Contrairement aux ordinateurs portables plus fins qui peuvent être livrés avec une carte graphique RTX 4080 de 80 W plus faible GeForce le Raider 18 HX, plus grand, est livré avec une version plus puissante de 175 W (150 W + 25 W de boost dynamique). Les performances sont environ 5 % plus rapides que celles de l'ordinateur portable moyen de notre base de données avec le même GPU même GPU tandis que la mise à niveau vers la RTX 4090 augmentera les performances de 10 % supplémentaires.

Gardez à l'esprit que les performances globales sont encore 30 à 35 % plus lentes que celles de la version de bureau du GPU RTX 4090 version de bureau de la GeForce RTX 4080 même si la version mobile porte le même nom. Les performances de notre RTX 4080 mobile sont donc plus proches de celles de la rTX 4070 de bureau.

Profil de puissanceScore graphiqueScore physiqueScore combiné
Performances extrêmes (Cooler Boost activé)422894139611806
Performances extrêmes (Cooler Boost désactivé)41778 (-1%)40723 (-2%)11968 (-1%)
Mode équilibré41673 (-2%)41013 (-1%)10404 (-12%)
Alimentation par batterie21731 (-49%)17988 (-57%)5809 (-51%)

Le passage du mode Extreme Performance au mode Balanced n'a qu'un faible impact sur les performances, ce qui correspond aux observations de notre test de stress ci-dessus. L'activation de Cooler Boost ne fait que peu de différence, si ce n'est qu'elle réduit la température des cœurs en augmentant le bruit des ventilateurs de manière significative.

3DMark 11
3DMark 11
Voie rapide
Voie rapide
Port Royal
Port Royal
Fire Strike (Performance extrême avec Cooler Boost activé)
Time Spy
Time Spy
Nomade d'acier
Nomade d'acier
3DMark Performance Rating - Percent
NVIDIA GeForce RTX 4080 Founders Edition -1!
NVIDIA GeForce RTX 4080, Intel Core i9-13900K
100 pt
Alienware m18 R2 -1!
NVIDIA GeForce RTX 4090 Laptop GPU, Intel Core i9-14900HX
78.8 pt
Razer Blade 18 2024 RZ09-0509 -1!
NVIDIA GeForce RTX 4090 Laptop GPU, Intel Core i9-14900HX
76.9 pt
MSI Raider 18 HX A14V
NVIDIA GeForce RTX 4080 Laptop GPU, Intel Core i9-14900HX
73 pt
Alienware m18 R1 AMD -2!
AMD Radeon RX 7900M, AMD Ryzen 9 7945HX
71 pt
Moyenne NVIDIA GeForce RTX 4080 Laptop GPU
 
69.6 pt
Zotac Gaming GeForce RTX 4070 AMP Airo -1!
NVIDIA GeForce RTX 4070, Intel Core i9-13900K
66.2 pt
Asus ROG Strix Scar 17 SE G733CX-LL014W -1!
NVIDIA GeForce RTX 3080 Ti Laptop GPU, Intel Core i9-12950HX
48.4 pt
Alienware x17 RTX 3080 P48E -2!
NVIDIA GeForce RTX 3080 Laptop GPU, Intel Core i7-11800H
45.6 pt
Asus ROG Strix G18 G814JI -2!
NVIDIA GeForce RTX 4070 Laptop GPU, Intel Core i7-13650HX
44.5 pt
SCHENKER XMG Ultra 17 Comet Lake -2!
NVIDIA GeForce RTX 2080 Super Mobile, Intel Core i9-10900K
40.4 pt
MSI Pulse GL76 12UGK -1!
NVIDIA GeForce RTX 3070 Laptop GPU, Intel Core i7-12700H
36.1 pt
3DMark
1920x1080 Fire Strike Graphics
NVIDIA GeForce RTX 4080 Founders Edition
NVIDIA GeForce RTX 4080, Intel Core i9-13900K
58893 Points +39%
Alienware m18 R1 AMD
AMD Radeon RX 7900M, AMD Ryzen 9 7945HX
50241 Points +19%
Razer Blade 18 2024 RZ09-0509
NVIDIA GeForce RTX 4090 Laptop GPU, Intel Core i9-14900HX
44702 Points +6%
Alienware m18 R2
NVIDIA GeForce RTX 4090 Laptop GPU, Intel Core i9-14900HX
44492 Points +5%
Zotac Gaming GeForce RTX 4070 AMP Airo
NVIDIA GeForce RTX 4070, Intel Core i9-13900K
43583 Points +3%
MSI Raider 18 HX A14V
NVIDIA GeForce RTX 4080 Laptop GPU, Intel Core i9-14900HX
42289 Points
Moyenne NVIDIA GeForce RTX 4080 Laptop GPU
  (33058 - 45220, n=21)
40807 Points -4%
Asus ROG Strix Scar 17 SE G733CX-LL014W
NVIDIA GeForce RTX 3080 Ti Laptop GPU, Intel Core i9-12950HX
32505 Points -23%
Alienware x17 RTX 3080 P48E
NVIDIA GeForce RTX 3080 Laptop GPU, Intel Core i7-11800H
28687 Points -32%
Asus ROG Strix G18 G814JI
NVIDIA GeForce RTX 4070 Laptop GPU, Intel Core i7-13650HX
28374 Points -33%
SCHENKER XMG Ultra 17 Comet Lake
NVIDIA GeForce RTX 2080 Super Mobile, Intel Core i9-10900K
25504 Points -40%
MSI Pulse GL76 12UGK
NVIDIA GeForce RTX 3070 Laptop GPU, Intel Core i7-12700H
25419 Points -40%
2560x1440 Time Spy Graphics
NVIDIA GeForce RTX 4080 Founders Edition
NVIDIA GeForce RTX 4080, Intel Core i9-13900K
28133 Points +50%
Alienware m18 R2
NVIDIA GeForce RTX 4090 Laptop GPU, Intel Core i9-14900HX
22290 Points +19%
Razer Blade 18 2024 RZ09-0509
NVIDIA GeForce RTX 4090 Laptop GPU, Intel Core i9-14900HX
21246 Points +13%
Alienware m18 R1 AMD
AMD Radeon RX 7900M, AMD Ryzen 9 7945HX
19434 Points +3%
MSI Raider 18 HX A14V
NVIDIA GeForce RTX 4080 Laptop GPU, Intel Core i9-14900HX
18809 Points
Zotac Gaming GeForce RTX 4070 AMP Airo
NVIDIA GeForce RTX 4070, Intel Core i9-13900K
17847 Points -5%
Moyenne NVIDIA GeForce RTX 4080 Laptop GPU
  (13282 - 19663, n=21)
17712 Points -6%
Asus ROG Strix Scar 17 SE G733CX-LL014W
NVIDIA GeForce RTX 3080 Ti Laptop GPU, Intel Core i9-12950HX
12791 Points -32%
Asus ROG Strix G18 G814JI
NVIDIA GeForce RTX 4070 Laptop GPU, Intel Core i7-13650HX
12111 Points -36%
Alienware x17 RTX 3080 P48E
NVIDIA GeForce RTX 3080 Laptop GPU, Intel Core i7-11800H
12055 Points -36%
SCHENKER XMG Ultra 17 Comet Lake
NVIDIA GeForce RTX 2080 Super Mobile, Intel Core i9-10900K
10938 Points -42%
MSI Pulse GL76 12UGK
NVIDIA GeForce RTX 3070 Laptop GPU, Intel Core i7-12700H
9548 Points -49%
2560x1440 Speed Way Score
NVIDIA GeForce RTX 4080 Founders Edition
NVIDIA GeForce RTX 4080, Intel Core i9-13900K
7169 Points +50%
Alienware m18 R2
NVIDIA GeForce RTX 4090 Laptop GPU, Intel Core i9-14900HX
5784 Points +21%
Razer Blade 18 2024 RZ09-0509
NVIDIA GeForce RTX 4090 Laptop GPU, Intel Core i9-14900HX
5736 Points +20%
MSI Raider 18 HX A14V
NVIDIA GeForce RTX 4080 Laptop GPU, Intel Core i9-14900HX
4778 Points
Moyenne NVIDIA GeForce RTX 4080 Laptop GPU
  (3702 - 4920, n=15)
4529 Points -5%
Zotac Gaming GeForce RTX 4070 AMP Airo
NVIDIA GeForce RTX 4070, Intel Core i9-13900K
4463 Points -7%
Asus ROG Strix Scar 17 SE G733CX-LL014W
NVIDIA GeForce RTX 3080 Ti Laptop GPU, Intel Core i9-12950HX
3234 Points -32%
MSI Pulse GL76 12UGK
NVIDIA GeForce RTX 3070 Laptop GPU, Intel Core i7-12700H
2398 Points -50%
2560x1440 Port Royal Graphics
NVIDIA GeForce RTX 4080 Founders Edition
NVIDIA GeForce RTX 4080, Intel Core i9-13900K
17861 Points +48%
Alienware m18 R2
NVIDIA GeForce RTX 4090 Laptop GPU, Intel Core i9-14900HX
14069 Points +17%
Razer Blade 18 2024 RZ09-0509
NVIDIA GeForce RTX 4090 Laptop GPU, Intel Core i9-14900HX
13936 Points +16%
MSI Raider 18 HX A14V
NVIDIA GeForce RTX 4080 Laptop GPU, Intel Core i9-14900HX
12048 Points
Moyenne NVIDIA GeForce RTX 4080 Laptop GPU
  (8973 - 12273, n=16)
11264 Points -7%
Zotac Gaming GeForce RTX 4070 AMP Airo
NVIDIA GeForce RTX 4070, Intel Core i9-13900K
11202 Points -7%
Alienware m18 R1 AMD
AMD Radeon RX 7900M, AMD Ryzen 9 7945HX
10814 Points -10%
Asus ROG Strix Scar 17 SE G733CX-LL014W
NVIDIA GeForce RTX 3080 Ti Laptop GPU, Intel Core i9-12950HX
8120 Points -33%
Alienware x17 RTX 3080 P48E
NVIDIA GeForce RTX 3080 Laptop GPU, Intel Core i7-11800H
7451 Points -38%
Asus ROG Strix G18 G814JI
NVIDIA GeForce RTX 4070 Laptop GPU, Intel Core i7-13650HX
7216 Points -40%
SCHENKER XMG Ultra 17 Comet Lake
NVIDIA GeForce RTX 2080 Super Mobile, Intel Core i9-10900K
6633 Points -45%
MSI Pulse GL76 12UGK
NVIDIA GeForce RTX 3070 Laptop GPU, Intel Core i7-12700H
5655 Points -53%
Steel Nomad Score
MSI Raider 18 HX A14V
NVIDIA GeForce RTX 4080 Laptop GPU, Intel Core i9-14900HX
4295 Points
Moyenne NVIDIA GeForce RTX 4080 Laptop GPU
  (3805 - 4295, n=3)
4040 Points -6%
3DMark 11 - 1280x720 Performance GPU
NVIDIA GeForce RTX 4080 Founders Edition
NVIDIA GeForce RTX 4080, Intel Core i9-13900K
86838 Points +53%
Alienware m18 R2
NVIDIA GeForce RTX 4090 Laptop GPU, Intel Core i9-14900HX
69254 Points +22%
Razer Blade 18 2024 RZ09-0509
NVIDIA GeForce RTX 4090 Laptop GPU, Intel Core i9-14900HX
64952 Points +14%
Alienware m18 R1 AMD
AMD Radeon RX 7900M, AMD Ryzen 9 7945HX
59943 Points +6%
Zotac Gaming GeForce RTX 4070 AMP Airo
NVIDIA GeForce RTX 4070, Intel Core i9-13900K
59510 Points +5%
MSI Raider 18 HX A14V
NVIDIA GeForce RTX 4080 Laptop GPU, Intel Core i9-14900HX
56772 Points
Moyenne NVIDIA GeForce RTX 4080 Laptop GPU
  (45199 - 63128, n=23)
56555 Points 0%
Asus ROG Strix Scar 17 SE G733CX-LL014W
NVIDIA GeForce RTX 3080 Ti Laptop GPU, Intel Core i9-12950HX
44134 Points -22%
Alienware x17 RTX 3080 P48E
NVIDIA GeForce RTX 3080 Laptop GPU, Intel Core i7-11800H
42555 Points -25%
Asus ROG Strix G18 G814JI
NVIDIA GeForce RTX 4070 Laptop GPU, Intel Core i7-13650HX
40413 Points -29%
SCHENKER XMG Ultra 17 Comet Lake
NVIDIA GeForce RTX 2080 Super Mobile, Intel Core i9-10900K
36838 Points -35%
MSI Pulse GL76 12UGK
NVIDIA GeForce RTX 3070 Laptop GPU, Intel Core i7-12700H
33048 Points -42%
3DMark 11 Performance
42822 points
3DMark Fire Strike Score
33524 points
3DMark Time Spy Score
18608 points
3DMark Steel Nomad Score
4295 points
Aide
Blender
v3.3 Classroom OPTIX/RTX
MSI Pulse GL76 12UGK
NVIDIA GeForce RTX 3070 Laptop GPU, Intel Core i7-12700H
26 Seconds * -86%
Asus ROG Strix G18 G814JI
NVIDIA GeForce RTX 4070 Laptop GPU, Intel Core i7-13650HX
24 Seconds * -71%
Asus ROG Strix Scar 17 SE G733CX-LL014W
NVIDIA GeForce RTX 3080 Ti Laptop GPU, Intel Core i9-12950HX
23 Seconds * -64%
Moyenne NVIDIA GeForce RTX 4080 Laptop GPU
  (13 - 20, n=20)
15.3 Seconds * -9%
Razer Blade 18 2024 RZ09-0509
NVIDIA GeForce RTX 4090 Laptop GPU, Intel Core i9-14900HX
14 Seconds * -0%
MSI Raider 18 HX A14V
NVIDIA GeForce RTX 4080 Laptop GPU, Intel Core i9-14900HX
14 Seconds *
Alienware m18 R2
NVIDIA GeForce RTX 4090 Laptop GPU, Intel Core i9-14900HX
12 Seconds * +14%
NVIDIA GeForce RTX 4080 Founders Edition
NVIDIA GeForce RTX 4080, Intel Core i9-13900K
10 Seconds * +29%
v3.3 Classroom CUDA
MSI Pulse GL76 12UGK
NVIDIA GeForce RTX 3070 Laptop GPU, Intel Core i7-12700H
45 Seconds * -105%
Asus ROG Strix G18 G814JI
NVIDIA GeForce RTX 4070 Laptop GPU, Intel Core i7-13650HX
37 Seconds * -68%
Asus ROG Strix Scar 17 SE G733CX-LL014W
NVIDIA GeForce RTX 3080 Ti Laptop GPU, Intel Core i9-12950HX
34 Seconds * -55%
Moyenne NVIDIA GeForce RTX 4080 Laptop GPU
  (21 - 28, n=21)
22.9 Seconds * -4%
MSI Raider 18 HX A14V
NVIDIA GeForce RTX 4080 Laptop GPU, Intel Core i9-14900HX
22 Seconds *
Razer Blade 18 2024 RZ09-0509
NVIDIA GeForce RTX 4090 Laptop GPU, Intel Core i9-14900HX
19 Seconds * +14%
Alienware m18 R2
NVIDIA GeForce RTX 4090 Laptop GPU, Intel Core i9-14900HX
18 Seconds * +18%
v3.3 Classroom CPU
MSI Pulse GL76 12UGK
NVIDIA GeForce RTX 3070 Laptop GPU, Intel Core i7-12700H
329 Seconds * -78%
Asus ROG Strix Scar 17 SE G733CX-LL014W
NVIDIA GeForce RTX 3080 Ti Laptop GPU, Intel Core i9-12950HX
301 Seconds * -63%
Asus ROG Strix G18 G814JI
NVIDIA GeForce RTX 4070 Laptop GPU, Intel Core i7-13650HX
273 Seconds * -48%
Moyenne NVIDIA GeForce RTX 4080 Laptop GPU
  (177 - 337, n=21)
232 Seconds * -25%
Razer Blade 18 2024 RZ09-0509
NVIDIA GeForce RTX 4090 Laptop GPU, Intel Core i9-14900HX
207 Seconds * -12%
MSI Raider 18 HX A14V
NVIDIA GeForce RTX 4080 Laptop GPU, Intel Core i9-14900HX
185 Seconds *
Alienware m18 R2
NVIDIA GeForce RTX 4090 Laptop GPU, Intel Core i9-14900HX
180 Seconds * +3%
Alienware m18 R1 AMD
AMD Radeon RX 7900M, AMD Ryzen 9 7945HX
138 Seconds * +25%
NVIDIA GeForce RTX 4080 Founders Edition
NVIDIA GeForce RTX 4080, Intel Core i9-13900K
136 Seconds * +26%

* ... Moindre est la valeur, meilleures sont les performances

Performances des jeux

Les titres modernes fonctionnent correctement à la résolution native 4K UHD+. Le DLSS est recommandé pour les titres plus exigeants comme Cyberpunk 2077 afin d'augmenter les taux de rafraîchissement et de les rapprocher des 60 FPS.

Curieusement, Baldur's Gate 3 n'a pas pu être lancé sur notre appareil, même après plusieurs réinitialisations du système en mode DX11 ou DX12.

Performance Rating - Percent
Alienware m18 R2
Intel Core i9-14900HX, NVIDIA GeForce RTX 4090 Laptop GPU
97.6 pt
MSI Titan 18 HX A14VIG
Intel Core i9-14900HX, NVIDIA GeForce RTX 4090 Laptop GPU
95.8 pt
MSI Raider 18 HX A14V
Intel Core i9-14900HX, NVIDIA GeForce RTX 4080 Laptop GPU
95.6 pt
Razer Blade 18 2024 RZ09-0509 -1!
Intel Core i9-14900HX, NVIDIA GeForce RTX 4090 Laptop GPU
87.4 pt
Acer Predator Helios 18 PH18-72-98MW
Intel Core i9-14900HX, NVIDIA GeForce RTX 4090 Laptop GPU
85.1 pt
Asus ROG Strix G18 G814JI
Intel Core i7-13650HX, NVIDIA GeForce RTX 4070 Laptop GPU
75.2 pt
GTA V - 1920x1080 Highest Settings possible AA:4xMSAA + FX AF:16x
MSI Raider 18 HX A14V
Intel Core i9-14900HX, NVIDIA GeForce RTX 4080 Laptop GPU
143.4 (4.06min, 90.9P1) fps
MSI Titan 18 HX A14VIG
Intel Core i9-14900HX, NVIDIA GeForce RTX 4090 Laptop GPU
139.2 (3.73min, 90.9P1) fps -3%
Alienware m18 R2
Intel Core i9-14900HX, NVIDIA GeForce RTX 4090 Laptop GPU
137 (7.81min, 83.3P1) fps -4%
Acer Predator Helios 18 PH18-72-98MW
Intel Core i9-14900HX, NVIDIA GeForce RTX 4090 Laptop GPU
134 (22.7min, 90.9P1) fps -7%
Razer Blade 18 2024 RZ09-0509
Intel Core i9-14900HX, NVIDIA GeForce RTX 4090 Laptop GPU
129.8 (16.1min, 90.9P1) fps -9%
Asus ROG Strix G18 G814JI
Intel Core i7-13650HX, NVIDIA GeForce RTX 4070 Laptop GPU
117.2 (6.43min, 76.9P1) fps -18%
Final Fantasy XV Benchmark - 1920x1080 High Quality
Alienware m18 R2
Intel Core i9-14900HX, NVIDIA GeForce RTX 4090 Laptop GPU
193.2 fps +9%
MSI Titan 18 HX A14VIG
Intel Core i9-14900HX, NVIDIA GeForce RTX 4090 Laptop GPU
184 fps +4%
MSI Raider 18 HX A14V
Intel Core i9-14900HX, NVIDIA GeForce RTX 4080 Laptop GPU
177 fps
Acer Predator Helios 18 PH18-72-98MW
Intel Core i9-14900HX, NVIDIA GeForce RTX 4090 Laptop GPU
157.1 fps -11%
Razer Blade 18 2024 RZ09-0509
Intel Core i9-14900HX, NVIDIA GeForce RTX 4090 Laptop GPU
156.9 fps -11%
Asus ROG Strix G18 G814JI
Intel Core i7-13650HX, NVIDIA GeForce RTX 4070 Laptop GPU
115.5 fps -35%
Strange Brigade - 1920x1080 ultra AA:ultra AF:16
MSI Titan 18 HX A14VIG
Intel Core i9-14900HX, NVIDIA GeForce RTX 4090 Laptop GPU
385 (27.2min, 274P1) fps +10%
Alienware m18 R2
Intel Core i9-14900HX, NVIDIA GeForce RTX 4090 Laptop GPU
369 (31.4min, 266P1) fps +6%
MSI Raider 18 HX A14V
Intel Core i9-14900HX, NVIDIA GeForce RTX 4080 Laptop GPU
349 (77.1min, 253P1) fps
Razer Blade 18 2024 RZ09-0509
Intel Core i9-14900HX, NVIDIA GeForce RTX 4090 Laptop GPU
325 (49.1min, 213P1) fps -7%
Acer Predator Helios 18 PH18-72-98MW
Intel Core i9-14900HX, NVIDIA GeForce RTX 4090 Laptop GPU
305 (14.5min, 223P1) fps -13%
Asus ROG Strix G18 G814JI
Intel Core i7-13650HX, NVIDIA GeForce RTX 4070 Laptop GPU
209 (45min, 152.5P1) fps -40%
Dota 2 Reborn - 1920x1080 ultra (3/3) best looking
Acer Predator Helios 18 PH18-72-98MW
Intel Core i9-14900HX, NVIDIA GeForce RTX 4090 Laptop GPU
178.3 (150.2min) fps +3%
MSI Titan 18 HX A14VIG
Intel Core i9-14900HX, NVIDIA GeForce RTX 4090 Laptop GPU
174.5 (151.1min) fps +1%
MSI Raider 18 HX A14V
Intel Core i9-14900HX, NVIDIA GeForce RTX 4080 Laptop GPU
172.5 (147.3min) fps
Alienware m18 R2
Intel Core i9-14900HX, NVIDIA GeForce RTX 4090 Laptop GPU
171.8 (143.6min) fps 0%
Razer Blade 18 2024 RZ09-0509
Intel Core i9-14900HX, NVIDIA GeForce RTX 4090 Laptop GPU
164 (140min) fps -5%
Asus ROG Strix G18 G814JI
Intel Core i7-13650HX, NVIDIA GeForce RTX 4070 Laptop GPU
154.7 (134.1min) fps -10%
X-Plane 11.11 - 1920x1080 high (fps_test=3)
MSI Raider 18 HX A14V
Intel Core i9-14900HX, NVIDIA GeForce RTX 4080 Laptop GPU
143.5 fps
Alienware m18 R2
Intel Core i9-14900HX, NVIDIA GeForce RTX 4090 Laptop GPU
140.6 fps -2%
Razer Blade 18 2024 RZ09-0509
Intel Core i9-14900HX, NVIDIA GeForce RTX 4090 Laptop GPU
127.2 fps -11%
MSI Titan 18 HX A14VIG
Intel Core i9-14900HX, NVIDIA GeForce RTX 4090 Laptop GPU
126.1 fps -12%
Acer Predator Helios 18 PH18-72-98MW
Intel Core i9-14900HX, NVIDIA GeForce RTX 4090 Laptop GPU
114.5 fps -20%
Asus ROG Strix G18 G814JI
Intel Core i7-13650HX, NVIDIA GeForce RTX 4070 Laptop GPU
112.6 fps -22%
Far Cry 5 - 1920x1080 Ultra Preset AA:T
Alienware m18 R2
Intel Core i9-14900HX, NVIDIA GeForce RTX 4090 Laptop GPU
160 (124min) fps +6%
MSI Titan 18 HX A14VIG
Intel Core i9-14900HX, NVIDIA GeForce RTX 4090 Laptop GPU
155 (116min) fps +3%
MSI Raider 18 HX A14V
Intel Core i9-14900HX, NVIDIA GeForce RTX 4080 Laptop GPU
151 (107min) fps
Asus ROG Strix G18 G814JI
Intel Core i7-13650HX, NVIDIA GeForce RTX 4070 Laptop GPU
144 (105min) fps -5%
Acer Predator Helios 18 PH18-72-98MW
Intel Core i9-14900HX, NVIDIA GeForce RTX 4090 Laptop GPU
123 (71min) fps -19%
Tiny Tina's Wonderlands
1920x1080 High Preset (DX12)
Alienware m18 R2
Intel Core i9-14900HX, NVIDIA GeForce RTX 4090 Laptop GPU
227.2 fps +12%
MSI Raider 18 HX A14V
Intel Core i9-14900HX, NVIDIA GeForce RTX 4080 Laptop GPU
203.3 fps
Moyenne NVIDIA GeForce RTX 4080 Laptop GPU
  (166.7 - 213, n=6)
190.7 fps -6%
1920x1080 Badass Preset (DX12)
Alienware m18 R2
Intel Core i9-14900HX, NVIDIA GeForce RTX 4090 Laptop GPU
187.5 fps +18%
MSI Raider 18 HX A14V
Intel Core i9-14900HX, NVIDIA GeForce RTX 4080 Laptop GPU
159.4 fps
Alienware m18 R1 AMD
AMD Ryzen 9 7945HX, AMD Radeon RX 7900M
150.2 fps -6%
Moyenne NVIDIA GeForce RTX 4080 Laptop GPU
  (112.9 - 167.1, n=9)
145.5 fps -9%
2560x1440 Badass Preset (DX12)
Alienware m18 R2
Intel Core i9-14900HX, NVIDIA GeForce RTX 4090 Laptop GPU
132.8 fps +19%
MSI Raider 18 HX A14V
Intel Core i9-14900HX, NVIDIA GeForce RTX 4080 Laptop GPU
111.2 fps
Alienware m18 R1 AMD
AMD Ryzen 9 7945HX, AMD Radeon RX 7900M
106.8 fps -4%
Moyenne NVIDIA GeForce RTX 4080 Laptop GPU
  (85 - 114.8, n=9)
103.5 fps -7%
3840x2160 Badass Preset (DX12)
Alienware m18 R2
Intel Core i9-14900HX, NVIDIA GeForce RTX 4090 Laptop GPU
71.2 fps +17%
MSI Raider 18 HX A14V
Intel Core i9-14900HX, NVIDIA GeForce RTX 4080 Laptop GPU
60.9 fps
Alienware m18 R1 AMD
AMD Ryzen 9 7945HX, AMD Radeon RX 7900M
56 fps -8%
Moyenne NVIDIA GeForce RTX 4080 Laptop GPU
  (46.4 - 60.9, n=9)
54.8 fps -10%
GTA V
1920x1080 Normal/Off AF:4x
Zotac Gaming GeForce RTX 4070 AMP Airo
Intel Core i9-13900K, NVIDIA GeForce RTX 4070
188.1 (3.54min, 200P1) fps +3%
NVIDIA GeForce RTX 4080 Founders Edition
Intel Core i9-13900K, NVIDIA GeForce RTX 4080
187.7 (5.03min, 200P1) fps +3%
Moyenne NVIDIA GeForce RTX 4080 Laptop GPU
  (169.3 - 187.7, n=18)
183.4 fps 0%
Asus ROG Strix G18 G814JI
Intel Core i7-13650HX, NVIDIA GeForce RTX 4070 Laptop GPU
182.7 (2.36min, 125P1) fps 0%
MSI Raider 18 HX A14V
Intel Core i9-14900HX, NVIDIA GeForce RTX 4080 Laptop GPU
182.7 (2.39min, 111.1P1) fps
Alienware m18 R2
Intel Core i9-14900HX, NVIDIA GeForce RTX 4090 Laptop GPU
180.9 (2.31min, 125P1) fps -1%
MSI Pulse GL76 12UGK
Intel Core i7-12700H, NVIDIA GeForce RTX 3070 Laptop GPU
180 (3.5min, 142.9P1) fps -1%
Alienware x17 RTX 3080 P48E
Intel Core i7-11800H, NVIDIA GeForce RTX 3080 Laptop GPU
173 (27.1min, 111P1) fps -5%
1920x1080 High/On (Advanced Graphics Off) AA:2xMSAA + FX AF:8x
NVIDIA GeForce RTX 4080 Founders Edition
Intel Core i9-13900K, NVIDIA GeForce RTX 4080
187.5 (3.4min, 200P1) fps +3%
Zotac Gaming GeForce RTX 4070 AMP Airo
Intel Core i9-13900K, NVIDIA GeForce RTX 4070
187.3 (2.7min, 200P1) fps +3%
MSI Raider 18 HX A14V
Intel Core i9-14900HX, NVIDIA GeForce RTX 4080 Laptop GPU
181.6 (3.05min, 125P1) fps
Asus ROG Strix Scar 17 SE G733CX-LL014W
Intel Core i9-12950HX, NVIDIA GeForce RTX 3080 Ti Laptop GPU
180.7 (3.28min, 111.1P1) fps 0%
Alienware m18 R2
Intel Core i9-14900HX, NVIDIA GeForce RTX 4090 Laptop GPU
179.6 (2.3min, 111.1P1) fps -1%
SCHENKER XMG Ultra 17 Comet Lake
Intel Core i9-10900K, NVIDIA GeForce RTX 2080 Super Mobile
179 (5.16min, 143P1) fps -1%
Moyenne NVIDIA GeForce RTX 4080 Laptop GPU
  (164.7 - 186.7, n=15)
178.8 fps -2%
Asus ROG Strix G18 G814JI
Intel Core i7-13650HX, NVIDIA GeForce RTX 4070 Laptop GPU
178.3 (2.45min, 111.1P1) fps -2%
MSI Pulse GL76 12UGK
Intel Core i7-12700H, NVIDIA GeForce RTX 3070 Laptop GPU
175.5 (3.74min, 125P1) fps -3%
Alienware m18 R1 AMD
AMD Ryzen 9 7945HX, AMD Radeon RX 7900M
172.9 (2.4min, 100P1) fps -5%
Alienware x17 RTX 3080 P48E
Intel Core i7-11800H, NVIDIA GeForce RTX 3080 Laptop GPU
163 (16.4min, 111P1) fps -10%
1920x1080 Highest Settings possible AA:4xMSAA + FX AF:16x
NVIDIA GeForce RTX 4080 Founders Edition
Intel Core i9-13900K, NVIDIA GeForce RTX 4080
172.4 (4.4min, 142.9P1) fps +20%
Zotac Gaming GeForce RTX 4070 AMP Airo
Intel Core i9-13900K, NVIDIA GeForce RTX 4070
161.7 (5.37min, 125P1) fps +13%
MSI Raider 18 HX A14V
Intel Core i9-14900HX, NVIDIA GeForce RTX 4080 Laptop GPU
143.4 (4.06min, 90.9P1) fps
Alienware m18 R2
Intel Core i9-14900HX, NVIDIA GeForce RTX 4090 Laptop GPU
137 (7.81min, 83.3P1) fps -4%
Moyenne NVIDIA GeForce RTX 4080 Laptop GPU
  (102.9 - 152.7, n=19)
131 fps -9%
Razer Blade 18 2024 RZ09-0509
Intel Core i9-14900HX, NVIDIA GeForce RTX 4090 Laptop GPU
129.8 (16.1min, 90.9P1) fps -9%
Asus ROG Strix Scar 17 SE G733CX-LL014W
Intel Core i9-12950HX, NVIDIA GeForce RTX 3080 Ti Laptop GPU
126.7 (9.75min, 76.9P1) fps -12%
Asus ROG Strix G18 G814JI
Intel Core i7-13650HX, NVIDIA GeForce RTX 4070 Laptop GPU
117.2 (6.43min, 76.9P1) fps -18%
MSI Pulse GL76 12UGK
Intel Core i7-12700H, NVIDIA GeForce RTX 3070 Laptop GPU
108.1 (4.6min, 76.9P1) fps -25%
Alienware m18 R1 AMD
AMD Ryzen 9 7945HX, AMD Radeon RX 7900M
105 (4.76min, 62.5P1) fps -27%
Alienware x17 RTX 3080 P48E
Intel Core i7-11800H, NVIDIA GeForce RTX 3080 Laptop GPU
98.1 (9.21min, 71.4P1) fps -32%
2560x1440 Highest Settings possible AA:4xMSAA + FX AF:16x
NVIDIA GeForce RTX 4080 Founders Edition
Intel Core i9-13900K, NVIDIA GeForce RTX 4080
167.9 (3.18min, 125P1) fps +25%
Zotac Gaming GeForce RTX 4070 AMP Airo
Intel Core i9-13900K, NVIDIA GeForce RTX 4070
138.4 (4.05min, 90.9P1) fps +3%
Alienware m18 R2
Intel Core i9-14900HX, NVIDIA GeForce RTX 4090 Laptop GPU
134.7 (5.05min, 83.3P1) fps 0%
MSI Raider 18 HX A14V
Intel Core i9-14900HX, NVIDIA GeForce RTX 4080 Laptop GPU
134.6 (4.06min, 90.9P1) fps
Razer Blade 18 2024 RZ09-0509
Intel Core i9-14900HX, NVIDIA GeForce RTX 4090 Laptop GPU
126.6 (5.15min, 83.3P1) fps -6%
Moyenne NVIDIA GeForce RTX 4080 Laptop GPU
  (100 - 140.7, n=18)
120.4 fps -11%
Asus ROG Strix Scar 17 SE G733CX-LL014W
Intel Core i9-12950HX, NVIDIA GeForce RTX 3080 Ti Laptop GPU
114.1 (7.48min, 76.9P1) fps -15%
Alienware m18 R1 AMD
AMD Ryzen 9 7945HX, AMD Radeon RX 7900M
105.6 (5.02min, 62.5P1) fps -22%
Alienware x17 RTX 3080 P48E
Intel Core i7-11800H, NVIDIA GeForce RTX 3080 Laptop GPU
89.2 (7.71min, 62.5P1) fps -34%
3840x2160 Highest Settings possible AA:4xMSAA + FX AF:16x
NVIDIA GeForce RTX 4080 Founders Edition
Intel Core i9-13900K, NVIDIA GeForce RTX 4080
95.1 (3.84min, 66.7P1) fps +40%
Alienware m18 R2
Intel Core i9-14900HX, NVIDIA GeForce RTX 4090 Laptop GPU
88.2 (3.48min, 58.8P1) fps +30%
MSI Raider 18 HX A14V
Intel Core i9-14900HX, NVIDIA GeForce RTX 4080 Laptop GPU
67.7 (4.12min, 45.5P1) fps
Alienware m18 R1 AMD
AMD Ryzen 9 7945HX, AMD Radeon RX 7900M
63.7 (8.69min, 45.5P1) fps -6%
Moyenne NVIDIA GeForce RTX 4080 Laptop GPU
  (51.6 - 67.7, n=9)
61.7 fps -9%
Zotac Gaming GeForce RTX 4070 AMP Airo
Intel Core i9-13900K, NVIDIA GeForce RTX 4070
59.6 (4.01min, 40P1) fps -12%
Alienware x17 RTX 3080 P48E
Intel Core i7-11800H, NVIDIA GeForce RTX 3080 Laptop GPU
57.8 (8.03min, 41.7P1) fps -15%
SCHENKER XMG Ultra 17 Comet Lake
Intel Core i9-10900K, NVIDIA GeForce RTX 2080 Super Mobile
49.3 (4.41min, 34.5P1) fps -27%
SCHENKER XMG Ultra 17 Comet Lake
Intel Core i9-10900K, NVIDIA GeForce RTX 2080 Super Mobile
49.3 (4.41min, 34.5P1) fps -27%
Dota 2 Reborn
1920x1080 high (2/3)
NVIDIA GeForce RTX 4080 Founders Edition
Intel Core i9-13900K, NVIDIA GeForce RTX 4080
251 (215.2min) fps +36%
Zotac Gaming GeForce RTX 4070 AMP Airo
Intel Core i9-13900K, NVIDIA GeForce RTX 4070
244.3 (210.5min) fps +32%
MSI Raider 18 HX A14V
Intel Core i9-14900HX, NVIDIA GeForce RTX 4080 Laptop GPU
184.6 (157.3min) fps
Alienware m18 R2
Intel Core i9-14900HX, NVIDIA GeForce RTX 4090 Laptop GPU
181.5 (155.8min) fps -2%
Asus ROG Strix Scar 17 SE G733CX-LL014W
Intel Core i9-12950HX, NVIDIA GeForce RTX 3080 Ti Laptop GPU
180.8 (156.9min) fps -2%
Razer Blade 18 2024 RZ09-0509
Intel Core i9-14900HX, NVIDIA GeForce RTX 4090 Laptop GPU
180.5 (150.3min) fps -2%
Moyenne NVIDIA GeForce RTX 4080 Laptop GPU
  (139.2 - 202, n=21)
174.5 fps -5%
SCHENKER XMG Ultra 17 Comet Lake
Intel Core i9-10900K, NVIDIA GeForce RTX 2080 Super Mobile
167 (144min) fps -10%
Asus ROG Strix G18 G814JI
Intel Core i7-13650HX, NVIDIA GeForce RTX 4070 Laptop GPU
164.4 (141.6min) fps -11%
Alienware m18 R1 AMD
AMD Ryzen 9 7945HX, AMD Radeon RX 7900M
162.8 (140.2min) fps -12%
Alienware x17 RTX 3080 P48E
Intel Core i7-11800H, NVIDIA GeForce RTX 3080 Laptop GPU
143 (121.6min) fps -23%
MSI Pulse GL76 12UGK
Intel Core i7-12700H, NVIDIA GeForce RTX 3070 Laptop GPU
141.2 (123.5min) fps -24%
1920x1080 ultra (3/3) best looking
NVIDIA GeForce RTX 4080 Founders Edition
Intel Core i9-13900K, NVIDIA GeForce RTX 4080
238.3 (202.7min) fps +38%
Zotac Gaming GeForce RTX 4070 AMP Airo
Intel Core i9-13900K, NVIDIA GeForce RTX 4070
229.9 (196.6min) fps +33%
MSI Raider 18 HX A14V
Intel Core i9-14900HX, NVIDIA GeForce RTX 4080 Laptop GPU
172.5 (147.3min) fps
Alienware m18 R2
Intel Core i9-14900HX, NVIDIA GeForce RTX 4090 Laptop GPU
171.8 (143.6min) fps 0%
Asus ROG Strix Scar 17 SE G733CX-LL014W
Intel Core i9-12950HX, NVIDIA GeForce RTX 3080 Ti Laptop GPU
169.8 (147.2min) fps -2%
Razer Blade 18 2024 RZ09-0509
Intel Core i9-14900HX, NVIDIA GeForce RTX 4090 Laptop GPU
164 (140min) fps -5%
Moyenne NVIDIA GeForce RTX 4080 Laptop GPU
  (133 - 194.7, n=21)
163.5 fps -5%
SCHENKER XMG Ultra 17 Comet Lake
Intel Core i9-10900K, NVIDIA GeForce RTX 2080 Super Mobile
156 (135.2min) fps -10%
Asus ROG Strix G18 G814JI
Intel Core i7-13650HX, NVIDIA GeForce RTX 4070 Laptop GPU
154.7 (134.1min) fps -10%
Alienware m18 R1 AMD
AMD Ryzen 9 7945HX, AMD Radeon RX 7900M
146.2 (121.3min) fps -15%
Alienware x17 RTX 3080 P48E
Intel Core i7-11800H, NVIDIA GeForce RTX 3080 Laptop GPU
135 (117.3min) fps -22%
MSI Pulse GL76 12UGK
Intel Core i7-12700H, NVIDIA GeForce RTX 3070 Laptop GPU
132.8 (116.8min) fps -23%
3840x2160 ultra (3/3) best looking
NVIDIA GeForce RTX 4080 Founders Edition
Intel Core i9-13900K, NVIDIA GeForce RTX 4080
232.6 (189.1min) fps +40%
Zotac Gaming GeForce RTX 4070 AMP Airo
Intel Core i9-13900K, NVIDIA GeForce RTX 4070
210.7 (177.6min) fps +27%
MSI Raider 18 HX A14V
Intel Core i9-14900HX, NVIDIA GeForce RTX 4080 Laptop GPU
166.4 (137.5min) fps
Alienware m18 R2
Intel Core i9-14900HX, NVIDIA GeForce RTX 4090 Laptop GPU
160.8 (134.2min) fps -3%
Moyenne NVIDIA GeForce RTX 4080 Laptop GPU
  (116.7 - 182.6, n=13)
148.6 fps -11%
Razer Blade 18 2024 RZ09-0509
Intel Core i9-14900HX, NVIDIA GeForce RTX 4090 Laptop GPU
147 (122.8min) fps -12%
SCHENKER XMG Ultra 17 Comet Lake
Intel Core i9-10900K, NVIDIA GeForce RTX 2080 Super Mobile
145 (120.7min) fps -13%
Alienware m18 R1 AMD
AMD Ryzen 9 7945HX, AMD Radeon RX 7900M
122.5 (105.6min) fps -26%
Alienware x17 RTX 3080 P48E
Intel Core i7-11800H, NVIDIA GeForce RTX 3080 Laptop GPU
111 (96.7min) fps -33%
Final Fantasy XV Benchmark
1920x1080 High Quality
NVIDIA GeForce RTX 4080 Founders Edition
Intel Core i9-13900K, NVIDIA GeForce RTX 4080
224 fps +27%
Alienware m18 R2
Intel Core i9-14900HX, NVIDIA GeForce RTX 4090 Laptop GPU
193.2 fps +9%
MSI Raider 18 HX A14V
Intel Core i9-14900HX, NVIDIA GeForce RTX 4080 Laptop GPU
177 fps
Zotac Gaming GeForce RTX 4070 AMP Airo
Intel Core i9-13900K, NVIDIA GeForce RTX 4070
175.8 fps -1%
Moyenne NVIDIA GeForce RTX 4080 Laptop GPU
  (129 - 182.1, n=21)
158.8 fps -10%
Razer Blade 18 2024 RZ09-0509
Intel Core i9-14900HX, NVIDIA GeForce RTX 4090 Laptop GPU
156.9 fps -11%
Alienware m18 R1 AMD
AMD Ryzen 9 7945HX, AMD Radeon RX 7900M
152.8 fps -14%
Asus ROG Strix Scar 17 SE G733CX-LL014W
Intel Core i9-12950HX, NVIDIA GeForce RTX 3080 Ti Laptop GPU
118.5 fps -33%
Asus ROG Strix G18 G814JI
Intel Core i7-13650HX, NVIDIA GeForce RTX 4070 Laptop GPU
115.5 fps -35%
Alienware x17 RTX 3080 P48E
Intel Core i7-11800H, NVIDIA GeForce RTX 3080 Laptop GPU
106 fps -40%
MSI Pulse GL76 12UGK
Intel Core i7-12700H, NVIDIA GeForce RTX 3070 Laptop GPU
89.7 fps -49%
2560x1440 High Quality
NVIDIA GeForce RTX 4080 Founders Edition
Intel Core i9-13900K, NVIDIA GeForce RTX 4080
198.4 fps +40%
Alienware m18 R2
Intel Core i9-14900HX, NVIDIA GeForce RTX 4090 Laptop GPU
160.1 fps +13%
MSI Raider 18 HX A14V
Intel Core i9-14900HX, NVIDIA GeForce RTX 4080 Laptop GPU
141.8 fps
Razer Blade 18 2024 RZ09-0509
Intel Core i9-14900HX, NVIDIA GeForce RTX 4090 Laptop GPU
139.1 fps -2%
Zotac Gaming GeForce RTX 4070 AMP Airo
Intel Core i9-13900K, NVIDIA GeForce RTX 4070
133.7 fps -6%
Moyenne NVIDIA GeForce RTX 4080 Laptop GPU
  (98 - 142, n=20)
124.7 fps -12%
Alienware m18 R1 AMD
AMD Ryzen 9 7945HX, AMD Radeon RX 7900M
114.6 fps -19%
Asus ROG Strix Scar 17 SE G733CX-LL014W
Intel Core i9-12950HX, NVIDIA GeForce RTX 3080 Ti Laptop GPU
92.8 fps -35%
Alienware x17 RTX 3080 P48E
Intel Core i7-11800H, NVIDIA GeForce RTX 3080 Laptop GPU
81.8 fps -42%
3840x2160 High Quality
NVIDIA GeForce RTX 4080 Founders Edition
Intel Core i9-13900K, NVIDIA GeForce RTX 4080
115.4 fps +47%
Alienware m18 R2
Intel Core i9-14900HX, NVIDIA GeForce RTX 4090 Laptop GPU
93.8 fps +19%
Razer Blade 18 2024 RZ09-0509
Intel Core i9-14900HX, NVIDIA GeForce RTX 4090 Laptop GPU
87.3 fps +11%
MSI Raider 18 HX A14V
Intel Core i9-14900HX, NVIDIA GeForce RTX 4080 Laptop GPU
78.6 fps
Zotac Gaming GeForce RTX 4070 AMP Airo
Intel Core i9-13900K, NVIDIA GeForce RTX 4070
74 fps -6%
Moyenne NVIDIA GeForce RTX 4080 Laptop GPU
  (60.8 - 79.5, n=12)
73.2 fps -7%
Alienware m18 R1 AMD
AMD Ryzen 9 7945HX, AMD Radeon RX 7900M
69.3 fps -12%
Alienware x17 RTX 3080 P48E
Intel Core i7-11800H, NVIDIA GeForce RTX 3080 Laptop GPU
50.8 fps -35%
X-Plane 11.11
1920x1080 med (fps_test=2)
NVIDIA GeForce RTX 4080 Founders Edition
Intel Core i9-13900K, NVIDIA GeForce RTX 4080
221 fps +24%
Zotac Gaming GeForce RTX 4070 AMP Airo
Intel Core i9-13900K, NVIDIA GeForce RTX 4070
214 fps +20%
Alienware m18 R2
Intel Core i9-14900HX, NVIDIA GeForce RTX 4090 Laptop GPU
180.1 fps +1%
MSI Raider 18 HX A14V
Intel Core i9-14900HX, NVIDIA GeForce RTX 4080 Laptop GPU
178.5 fps
Razer Blade 18 2024 RZ09-0509
Intel Core i9-14900HX, NVIDIA GeForce RTX 4090 Laptop GPU
158.2 fps -11%
Moyenne NVIDIA GeForce RTX 4080 Laptop GPU
  (117.4 - 184.3, n=21)
157.7 fps -12%
Asus ROG Strix G18 G814JI
Intel Core i7-13650HX, NVIDIA GeForce RTX 4070 Laptop GPU
145.8 fps -18%
Asus ROG Strix Scar 17 SE G733CX-LL014W
Intel Core i9-12950HX, NVIDIA GeForce RTX 3080 Ti Laptop GPU
143.5 fps -20%
SCHENKER XMG Ultra 17 Comet Lake
Intel Core i9-10900K, NVIDIA GeForce RTX 2080 Super Mobile
127 fps -29%
MSI Pulse GL76 12UGK
Intel Core i7-12700H, NVIDIA GeForce RTX 3070 Laptop GPU
122.9 fps -31%
Alienware x17 RTX 3080 P48E
Intel Core i7-11800H, NVIDIA GeForce RTX 3080 Laptop GPU
99.3 fps -44%
1920x1080 high (fps_test=3)
NVIDIA GeForce RTX 4080 Founders Edition
Intel Core i9-13900K, NVIDIA GeForce RTX 4080
166.3 fps +16%
Zotac Gaming GeForce RTX 4070 AMP Airo
Intel Core i9-13900K, NVIDIA GeForce RTX 4070
162.9 fps +14%
MSI Raider 18 HX A14V
Intel Core i9-14900HX, NVIDIA GeForce RTX 4080 Laptop GPU
143.5 fps
Alienware m18 R2
Intel Core i9-14900HX, NVIDIA GeForce RTX 4090 Laptop GPU
140.6 fps -2%
Razer Blade 18 2024 RZ09-0509
Intel Core i9-14900HX, NVIDIA GeForce RTX 4090 Laptop GPU
127.2 fps -11%
Moyenne NVIDIA GeForce RTX 4080 Laptop GPU
  (89.3 - 143.5, n=22)
122.9 fps -14%
Asus ROG Strix Scar 17 SE G733CX-LL014W
Intel Core i9-12950HX, NVIDIA GeForce RTX 3080 Ti Laptop GPU
116.2 fps -19%
Asus ROG Strix G18 G814JI
Intel Core i7-13650HX, NVIDIA GeForce RTX 4070 Laptop GPU
112.6 fps -22%
SCHENKER XMG Ultra 17 Comet Lake
Intel Core i9-10900K, NVIDIA GeForce RTX 2080 Super Mobile
103 fps -28%
MSI Pulse GL76 12UGK
Intel Core i7-12700H, NVIDIA GeForce RTX 3070 Laptop GPU
97.7 fps -32%
Alienware m18 R1 AMD
AMD Ryzen 9 7945HX, AMD Radeon RX 7900M
83.7 fps -42%
Alienware x17 RTX 3080 P48E
Intel Core i7-11800H, NVIDIA GeForce RTX 3080 Laptop GPU
79.7 fps -44%
3840x2160 high (fps_test=3)
NVIDIA GeForce RTX 4080 Founders Edition
Intel Core i9-13900K, NVIDIA GeForce RTX 4080
140.5 fps +18%
Zotac Gaming GeForce RTX 4070 AMP Airo
Intel Core i9-13900K, NVIDIA GeForce RTX 4070
136.5 fps +14%
Alienware m18 R2
Intel Core i9-14900HX, NVIDIA GeForce RTX 4090 Laptop GPU
120.4 fps +1%
MSI Raider 18 HX A14V
Intel Core i9-14900HX, NVIDIA GeForce RTX 4080 Laptop GPU
119.3 fps
Razer Blade 18 2024 RZ09-0509
Intel Core i9-14900HX, NVIDIA GeForce RTX 4090 Laptop GPU
107.2 fps -10%
Moyenne NVIDIA GeForce RTX 4080 Laptop GPU
  (78 - 143.7, n=12)
104.2 fps -13%
SCHENKER XMG Ultra 17 Comet Lake
Intel Core i9-10900K, NVIDIA GeForce RTX 2080 Super Mobile
88.2 fps -26%
Alienware m18 R1 AMD
AMD Ryzen 9 7945HX, AMD Radeon RX 7900M
64.3 fps -46%
Alienware x17 RTX 3080 P48E
Intel Core i7-11800H, NVIDIA GeForce RTX 3080 Laptop GPU
56.9 fps -52%
Far Cry 5
1920x1080 Ultra Preset AA:T
NVIDIA GeForce RTX 4080 Founders Edition
Intel Core i9-13900K, NVIDIA GeForce RTX 4080
219 (168min) fps +45%
Alienware m18 R2
Intel Core i9-14900HX, NVIDIA GeForce RTX 4090 Laptop GPU
160 (124min) fps +6%
MSI Raider 18 HX A14V
Intel Core i9-14900HX, NVIDIA GeForce RTX 4080 Laptop GPU
151 (107min) fps
Moyenne NVIDIA GeForce RTX 4080 Laptop GPU
  (114 - 161, n=10)
144.4 fps -4%
Asus ROG Strix G18 G814JI
Intel Core i7-13650HX, NVIDIA GeForce RTX 4070 Laptop GPU
144 (105min) fps -5%
Alienware m18 R1 AMD
AMD Ryzen 9 7945HX, AMD Radeon RX 7900M
128 (92min) fps -15%
Alienware x17 RTX 3080 P48E
Intel Core i7-11800H, NVIDIA GeForce RTX 3080 Laptop GPU
112 (86min) fps -26%
2560x1440 Ultra Preset AA:T
NVIDIA GeForce RTX 4080 Founders Edition
Intel Core i9-13900K, NVIDIA GeForce RTX 4080
217 (168min) fps +46%
Alienware m18 R2
Intel Core i9-14900HX, NVIDIA GeForce RTX 4090 Laptop GPU
154 (113min) fps +3%
MSI Raider 18 HX A14V
Intel Core i9-14900HX, NVIDIA GeForce RTX 4080 Laptop GPU
149 (110min) fps
Moyenne NVIDIA GeForce RTX 4080 Laptop GPU
  (114 - 157, n=9)
136.2 fps -9%
Alienware m18 R1 AMD
AMD Ryzen 9 7945HX, AMD Radeon RX 7900M
123 (89min) fps -17%
Alienware x17 RTX 3080 P48E
Intel Core i7-11800H, NVIDIA GeForce RTX 3080 Laptop GPU
98 (80min) fps -34%
3840x2160 Ultra Preset AA:T
NVIDIA GeForce RTX 4080 Founders Edition
Intel Core i9-13900K, NVIDIA GeForce RTX 4080
140 (126min) fps +46%
Alienware m18 R2
Intel Core i9-14900HX, NVIDIA GeForce RTX 4090 Laptop GPU
112 (100min) fps +17%
Alienware m18 R1 AMD
AMD Ryzen 9 7945HX, AMD Radeon RX 7900M
103 (91min) fps +7%
MSI Raider 18 HX A14V
Intel Core i9-14900HX, NVIDIA GeForce RTX 4080 Laptop GPU
96 (83min) fps
Moyenne NVIDIA GeForce RTX 4080 Laptop GPU
  (71 - 97, n=6)
86.8 fps -10%
Alienware x17 RTX 3080 P48E
Intel Core i7-11800H, NVIDIA GeForce RTX 3080 Laptop GPU
63 (55min) fps -34%
Strange Brigade
1920x1080 high AA:high AF:8
Alienware m18 R2
Intel Core i9-14900HX, NVIDIA GeForce RTX 4090 Laptop GPU
383 (130.9min, 284P1) fps +1%
MSI Raider 18 HX A14V
Intel Core i9-14900HX, NVIDIA GeForce RTX 4080 Laptop GPU
378 (149.2min, 282P1) fps
Zotac Gaming GeForce RTX 4070 AMP Airo
Intel Core i9-13900K, NVIDIA GeForce RTX 4070
375 (152min, 268P1) fps -1%
Moyenne NVIDIA GeForce RTX 4080 Laptop GPU
  (263 - 400, n=17)
341 fps -10%
Asus ROG Strix G18 G814JI
Intel Core i7-13650HX, NVIDIA GeForce RTX 4070 Laptop GPU
245 (28.8min, 174.5P1) fps -35%
Asus ROG Strix Scar 17 SE G733CX-LL014W
Intel Core i9-12950HX, NVIDIA GeForce RTX 3080 Ti Laptop GPU
236 (69.6min, 161.1P1) fps -38%
Alienware x17 RTX 3080 P48E
Intel Core i7-11800H, NVIDIA GeForce RTX 3080 Laptop GPU
225 (96.9min, 169P1) fps -40%
MSI Pulse GL76 12UGK
Intel Core i7-12700H, NVIDIA GeForce RTX 3070 Laptop GPU
186.6 (80min, 135.8P1) fps -51%
1920x1080 ultra AA:ultra AF:16
Alienware m18 R2
Intel Core i9-14900HX, NVIDIA GeForce RTX 4090 Laptop GPU
369 (31.4min, 266P1) fps +6%
MSI Raider 18 HX A14V
Intel Core i9-14900HX, NVIDIA GeForce RTX 4080 Laptop GPU
349 (77.1min, 253P1) fps
Alienware m18 R1 AMD
AMD Ryzen 9 7945HX, AMD Radeon RX 7900M
344 (145.8min, 227P1) fps -1%
Razer Blade 18 2024 RZ09-0509
Intel Core i9-14900HX, NVIDIA GeForce RTX 4090 Laptop GPU
325 (49.1min, 213P1) fps -7%
Zotac Gaming GeForce RTX 4070 AMP Airo
Intel Core i9-13900K, NVIDIA GeForce RTX 4070
321 (88min, 237P1) fps -8%
Moyenne NVIDIA GeForce RTX 4080 Laptop GPU
  (239 - 357, n=20)
312 fps -11%
Asus ROG Strix Scar 17 SE G733CX-LL014W
Intel Core i9-12950HX, NVIDIA GeForce RTX 3080 Ti Laptop GPU
211 (14.1min, 155.4P1) fps -40%
Asus ROG Strix G18 G814JI
Intel Core i7-13650HX, NVIDIA GeForce RTX 4070 Laptop GPU
209 (45min, 152.5P1) fps -40%
Alienware x17 RTX 3080 P48E
Intel Core i7-11800H, NVIDIA GeForce RTX 3080 Laptop GPU
199 (44.5min, 144P1) fps -43%
MSI Pulse GL76 12UGK
Intel Core i7-12700H, NVIDIA GeForce RTX 3070 Laptop GPU
164.5 (62.4min, 122.8P1) fps -53%
2560x1440 ultra AA:ultra AF:16
Alienware m18 R2
Intel Core i9-14900HX, NVIDIA GeForce RTX 4090 Laptop GPU
309 (45.6min, 236P1) fps +26%
Razer Blade 18 2024 RZ09-0509
Intel Core i9-14900HX, NVIDIA GeForce RTX 4090 Laptop GPU
268 (8min, 182P1) fps +9%
Alienware m18 R1 AMD
AMD Ryzen 9 7945HX, AMD Radeon RX 7900M
249 (137.9min, 183.7P1) fps +1%
MSI Raider 18 HX A14V
Intel Core i9-14900HX, NVIDIA GeForce RTX 4080 Laptop GPU
246 (50.1min, 193.9P1) fps
Moyenne NVIDIA GeForce RTX 4080 Laptop GPU
  (179.5 - 248, n=19)
229 fps -7%
Zotac Gaming GeForce RTX 4070 AMP Airo
Intel Core i9-13900K, NVIDIA GeForce RTX 4070
222 (62.9min, 177P1) fps -10%
Asus ROG Strix Scar 17 SE G733CX-LL014W
Intel Core i9-12950HX, NVIDIA GeForce RTX 3080 Ti Laptop GPU
157.7 (39.7min, 118.4P1) fps -36%
Alienware x17 RTX 3080 P48E
Intel Core i7-11800H, NVIDIA GeForce RTX 3080 Laptop GPU
152 (81.4min, 123P1) fps -38%
3840x2160 ultra AA:ultra AF:16
Alienware m18 R2
Intel Core i9-14900HX, NVIDIA GeForce RTX 4090 Laptop GPU
160.2 (49.6min, 139.3P1) fps +31%
Razer Blade 18 2024 RZ09-0509
Intel Core i9-14900HX, NVIDIA GeForce RTX 4090 Laptop GPU
149.2 (45.4min, 122P1) fps +22%
Alienware m18 R1 AMD
AMD Ryzen 9 7945HX, AMD Radeon RX 7900M
130.5 (79.1min, 110.9P1) fps +6%
MSI Raider 18 HX A14V
Intel Core i9-14900HX, NVIDIA GeForce RTX 4080 Laptop GPU
122.6 (10.4min, 102.7P1) fps
Zotac Gaming GeForce RTX 4070 AMP Airo
Intel Core i9-13900K, NVIDIA GeForce RTX 4070
121 (20.4min, 104.3P1) fps -1%
Moyenne NVIDIA GeForce RTX 4080 Laptop GPU
  (100.9 - 144.3, n=11)
119.2 fps -3%
Alienware x17 RTX 3080 P48E
Intel Core i7-11800H, NVIDIA GeForce RTX 3080 Laptop GPU
91.6 (64.5min, 78.7P1) fps -25%
F1 22
1920x1080 High Preset AA:T AF:16x
NVIDIA GeForce RTX 4080 Founders Edition
Intel Core i9-13900K, NVIDIA GeForce RTX 4080
370 (288min, 216P1) fps +37%
Zotac Gaming GeForce RTX 4070 AMP Airo
Intel Core i9-13900K, NVIDIA GeForce RTX 4070
296 (233min, 179P1) fps +9%
Alienware m18 R1 AMD
AMD Ryzen 9 7945HX, AMD Radeon RX 7900M
296 (178min, 58P1) fps +9%
Alienware m18 R2
Intel Core i9-14900HX, NVIDIA GeForce RTX 4090 Laptop GPU
276 (204min, 115P1) fps +2%
MSI Raider 18 HX A14V
Intel Core i9-14900HX, NVIDIA GeForce RTX 4080 Laptop GPU
271 (191min, 139P1) fps
Moyenne NVIDIA GeForce RTX 4080 Laptop GPU
  (185.7 - 297, n=14)
241 fps -11%
Asus ROG Strix Scar 17 SE G733CX-LL014W
Intel Core i9-12950HX, NVIDIA GeForce RTX 3080 Ti Laptop GPU
199.7 (171min, 123P1) fps -26%
1920x1080 Ultra High Preset AA:T AF:16x
NVIDIA GeForce RTX 4080 Founders Edition
Intel Core i9-13900K, NVIDIA GeForce RTX 4080
172.9 (150min, 123P1) fps +43%
Alienware m18 R2
Intel Core i9-14900HX, NVIDIA GeForce RTX 4090 Laptop GPU
135.1 (113min, 61P1) fps +11%
MSI Raider 18 HX A14V
Intel Core i9-14900HX, NVIDIA GeForce RTX 4080 Laptop GPU
121.2 (103min, 79P1) fps
Zotac Gaming GeForce RTX 4070 AMP Airo
Intel Core i9-13900K, NVIDIA GeForce RTX 4070
111.8 (89min, 91P1) fps -8%
Alienware m18 R1 AMD
AMD Ryzen 9 7945HX, AMD Radeon RX 7900M
102.8 (73min, 73P1) fps -15%
Moyenne NVIDIA GeForce RTX 4080 Laptop GPU
  (72.3 - 124.2, n=15)
102.5 fps -15%
Asus ROG Strix Scar 17 SE G733CX-LL014W
Intel Core i9-12950HX, NVIDIA GeForce RTX 3080 Ti Laptop GPU
78.9 (69min, 50P1) fps -35%
2560x1440 Ultra High Preset AA:T AF:16x
NVIDIA GeForce RTX 4080 Founders Edition
Intel Core i9-13900K, NVIDIA GeForce RTX 4080
114.4 (100min, 94P1) fps +47%
Alienware m18 R2
Intel Core i9-14900HX, NVIDIA GeForce RTX 4090 Laptop GPU
91.4 (78min, 71P1) fps +17%
MSI Raider 18 HX A14V
Intel Core i9-14900HX, NVIDIA GeForce RTX 4080 Laptop GPU
77.8 (68min, 61P1) fps
Zotac Gaming GeForce RTX 4070 AMP Airo
Intel Core i9-13900K, NVIDIA GeForce RTX 4070
71.9 (62min, 61P1) fps -8%
Moyenne NVIDIA GeForce RTX 4080 Laptop GPU
  (55.4 - 79, n=13)
71.3 fps -8%
Alienware m18 R1 AMD
AMD Ryzen 9 7945HX, AMD Radeon RX 7900M
69.3 (37min, 49P1) fps -11%
Asus ROG Strix Scar 17 SE G733CX-LL014W
Intel Core i9-12950HX, NVIDIA GeForce RTX 3080 Ti Laptop GPU
52.9 (46min, 41P1) fps -32%
3840x2160 Ultra High Preset AA:T AF:16x
NVIDIA GeForce RTX 4080 Founders Edition
Intel Core i9-13900K, NVIDIA GeForce RTX 4080
58.9 (50min, 49P1) fps +48%
Alienware m18 R2
Intel Core i9-14900HX, NVIDIA GeForce RTX 4090 Laptop GPU
45.4 (38min, 37P1) fps +14%
MSI Raider 18 HX A14V
Intel Core i9-14900HX, NVIDIA GeForce RTX 4080 Laptop GPU
39.8 (34min, 33P1) fps
Zotac Gaming GeForce RTX 4070 AMP Airo
Intel Core i9-13900K, NVIDIA GeForce RTX 4070
36.7 (31min, 28P1) fps -8%
Moyenne NVIDIA GeForce RTX 4080 Laptop GPU
  (25.8 - 39.8, n=10)
36.3 fps -9%
Alienware m18 R1 AMD
AMD Ryzen 9 7945HX, AMD Radeon RX 7900M
36.1 (24min, 25P1) fps -9%
Cyberpunk 2077 2.1 Phantom Liberty
1920x1080 Medium Preset (FSR off)
MSI Raider 18 HX A14V
Intel Core i9-14900HX, NVIDIA GeForce RTX 4080 Laptop GPU
150 (124.1min) fps
Alienware m18 R2
Intel Core i9-14900HX, NVIDIA GeForce RTX 4090 Laptop GPU
148.7 (43.5min) fps -1%
Moyenne NVIDIA GeForce RTX 4080 Laptop GPU
  (96.4 - 159.8, n=7)
132.6 fps -12%
1920x1080 High Preset (FSR off)
Alienware m18 R2
Intel Core i9-14900HX, NVIDIA GeForce RTX 4090 Laptop GPU
142.9 (38.4min) fps +2%
MSI Raider 18 HX A14V
Intel Core i9-14900HX, NVIDIA GeForce RTX 4080 Laptop GPU
140.7 (115.2min) fps
Alienware m18 R1 AMD
AMD Ryzen 9 7945HX, AMD Radeon RX 7900M
130.7 (21.1min) fps -7%
Moyenne NVIDIA GeForce RTX 4080 Laptop GPU
  (94.1 - 141.3, n=8)
120.5 fps -14%
1920x1080 Ultra Preset (FSR off)
Alienware m18 R2
Intel Core i9-14900HX, NVIDIA GeForce RTX 4090 Laptop GPU
133.9 (67.5min) fps +7%
Alienware m18 R1 AMD
AMD Ryzen 9 7945HX, AMD Radeon RX 7900M
129.6 (54.1min) fps +3%
MSI Raider 18 HX A14V
Intel Core i9-14900HX, NVIDIA GeForce RTX 4080 Laptop GPU
125.5 (97.4min) fps
Moyenne NVIDIA GeForce RTX 4080 Laptop GPU
  (83.9 - 127.1, n=11)
110.7 fps -12%
Razer Blade 18 2024 RZ09-0509
Intel Core i9-14900HX, NVIDIA GeForce RTX 4090 Laptop GPU
101.25 (77.2min) fps -19%
2560x1440 Ultra Preset (FSR off)
Alienware m18 R2
Intel Core i9-14900HX, NVIDIA GeForce RTX 4090 Laptop GPU
94.1 (57.3min) fps +14%
Alienware m18 R1 AMD
AMD Ryzen 9 7945HX, AMD Radeon RX 7900M
85.2 (59.4min) fps +3%
Razer Blade 18 2024 RZ09-0509
Intel Core i9-14900HX, NVIDIA GeForce RTX 4090 Laptop GPU
83.38 (67.53min) fps +1%
MSI Raider 18 HX A14V
Intel Core i9-14900HX, NVIDIA GeForce RTX 4080 Laptop GPU
82.5 (67.6min) fps
Moyenne NVIDIA GeForce RTX 4080 Laptop GPU
  (56.2 - 86.3, n=11)
74.2 fps -10%
3840x2160 Ultra Preset (FSR off)
Alienware m18 R2
Intel Core i9-14900HX, NVIDIA GeForce RTX 4090 Laptop GPU
43.4 (30.4min) fps +24%
Alienware m18 R1 AMD
AMD Ryzen 9 7945HX, AMD Radeon RX 7900M
37.7 (28.5min) fps +7%
Razer Blade 18 2024 RZ09-0509
Intel Core i9-14900HX, NVIDIA GeForce RTX 4090 Laptop GPU
37.38 (31.36min) fps +6%
MSI Raider 18 HX A14V
Intel Core i9-14900HX, NVIDIA GeForce RTX 4080 Laptop GPU
35.1 (29.5min) fps
Moyenne NVIDIA GeForce RTX 4080 Laptop GPU
  (25.8 - 39.8, n=6)
33.4 fps -5%
1920x1080 Ray Tracing Ultra Preset (DLSS off)
Alienware m18 R2
Intel Core i9-14900HX, NVIDIA GeForce RTX 4090 Laptop GPU
71.1 (19.3min) fps +6%
MSI Raider 18 HX A14V
Intel Core i9-14900HX, NVIDIA GeForce RTX 4080 Laptop GPU
67.2 (58.5min) fps
Moyenne NVIDIA GeForce RTX 4080 Laptop GPU
  (43.8 - 67.2, n=11)
56.8 fps -15%
Alienware m18 R1 AMD
AMD Ryzen 9 7945HX, AMD Radeon RX 7900M
42.5 (32.6min) fps -37%
3840x2160 Ray Tracing Ultra Preset (DLSS off, no Path Tracing)
Alienware m18 R2
Intel Core i9-14900HX, NVIDIA GeForce RTX 4090 Laptop GPU
22.3 (17.4min) fps +12%
MSI Raider 18 HX A14V
Intel Core i9-14900HX, NVIDIA GeForce RTX 4080 Laptop GPU
20 (17.7min) fps
Moyenne NVIDIA GeForce RTX 4080 Laptop GPU
  (16 - 20, n=3)
18.4 fps -8%

Cyberpunk 2077 ultra FPS Chart

0102030405060708090100110120Tooltip
MSI Raider 18 HX A14V i9-14900HX, NVIDIA GeForce RTX 4080 Laptop GPU: Ø121.7 (103.2-123.8)
Bas Moyen Élevé UltraQHD4K
GTA V (2015) 185.1 183.8 181.6 143.4 134.6 158.3
Dota 2 Reborn (2015) 218 193.1 184.6 172.5 166.4
Final Fantasy XV Benchmark (2018) 223 212 177 141.8 78.6
X-Plane 11.11 (2018) 199 178.5 143.5 119.3
Far Cry 5 (2018) 173 163 151 149 96
Strange Brigade (2018) 504 408 378 349 246 122.6
Tiny Tina's Wonderlands (2022) 352.5 292.6 203.3 159.4 111.2 60.9
F1 22 (2022) 305 299 271 121.2 77.8 39.8
Cyberpunk 2077 2.1 Phantom Liberty (2023) 150.6 150 140.7 125.5 82.5 35.1

Émissions - Silencieux au ralenti, bruyant en jeu

Bruit du système

Le bruit et le comportement du ventilateur sont similaires à ceux du Titan 18 HX malgré les différences de solutions de refroidissement. Les ventilateurs ont tendance à pulser même lorsque vous naviguez sur le web en mode équilibré ou en mode silencieux, comme sur la Titan, mais l'augmentation du bruit n'est heureusement pas assez forte pour être gênante.

Le MSI Center a un impact direct sur l'expérience de jeu car le bruit des ventilateurs est étroitement lié au profil d'alimentation que vous avez choisi. En exécutant Cyberpunk 2077 en mode équilibré, en mode Performance extrême avec Cooler Boost désactivé, et en mode Performance extrême avec Cooler Boost activé, le bruit du ventilateur est respectivement de 52,8 dB(A), 59,4 dB(A), et 62,7 dB(A). La différence de bruit entre les modes Balanced et Extreme Performance est significative même si le déficit de performance entre eux est faible, ce qui signifie que le mode Balanced est recommandé pour la plupart des scénarios de jeu. Cooler Boost est donc surtout utile pour l'overclocking manuel, car il n'apporte pas d'avantages majeurs pour le jeu avec les réglages d'origine.

La plage basse à moyenne de 50 dB(A) pour les jeux est très similaire à celle de la Blade 18 ou de l'Alienware m18 R2 Alienware m18 R2. Il est recommandé d'utiliser un casque, surtout si vous jouez en mode "Extreme Performance".

Les ventilateurs sont presque toujours actifs, même lorsqu'ils sont réglés sur le mode "silencieux"
Contrairement à la Titan 18 HX, la Raider 18 HX n'est pas équipée d'une chambre de refroidissement
La solution de refroidissement consiste en deux grands ventilateurs de ~70 mm et 6 caloducs en cuivre
Quatre emplacements SODIMM DDR5 accessibles
Profil de bruit du ventilateur (Blanc : Arrière-plan, Rouge : Système au ralenti, Bleu : 3DMark 06, Orange : Cyberpunk 2077, Vert : Prime95+FurMark avec Cooler Boost activé)

Degré de la nuisance sonore

Au repos
28.6 / 28.6 / 31.3 dB(A)
Fortement sollicité
44.1 / 62.7 dB(A)
  red to green bar
 
 
30 dB
silencieux
40 dB(A)
audible
50 dB(A)
bruyant
 
min: dark, med: mid, max: light   Earthworks M23R, Arta (à 15 cm de distance)   bruit ambiant: 23.3 dB(A)
dB(A) 0102030405060708090Deep BassMiddle BassHigh BassLower RangeMidsHigher MidsLower HighsMid HighsUpper HighsSuper Highs2040.43740.943.835.82528.826.226.327.827.53125.426.423.927.228.84026.826.522.321.930.45028.525.322.321.829.8632924.822.221.829.68034.427.424.823.93410029.826.925.622.632.612529.92518.418.831.216035.929.617.514.837.620035.126.816.815.737.425037.628.116.614.740.131539.730.224.513.44140041.830.126.912.143.250040.729.81911.144.163040.52917.39.942.680043.232.318.19.645.3100045.134.216.89.347.6125048.635.716.69.551.316004935.114.59.651.6200049.635.613.310.152.7250048.132.51210.451.6315050.531.512.111.353.2400049.129.311.911.353.8500046.227.51211.650.8630044.324.91312.548.280004420.413.912.646.81000042.317.713.812.345.91250040.114.812.912.243.51600035.813.313.412.140.3SPL59.444.128.623.362.7N134.410.515.8median 42.3median 29.3median 16.6median 12.1median 45.3Delta6.13.52.71.96.4hearing rangehide median Fan NoiseMSI Raider 18 HX A14V
MSI Raider 18 HX A14V
NVIDIA GeForce RTX 4080 Laptop GPU, i9-14900HX, Samsung PM9A1 MZVL22T0HBLB
Razer Blade 18 2024 RZ09-0509
NVIDIA GeForce RTX 4090 Laptop GPU, i9-14900HX
Alienware m18 R2
NVIDIA GeForce RTX 4090 Laptop GPU, i9-14900HX, SK Hynix PC811 HFS002TEM9X152N
MSI Titan 18 HX A14VIG
NVIDIA GeForce RTX 4090 Laptop GPU, i9-14900HX, 2x Samsung PM9A1a MZVL22T0HDLB (RAID 0)
Asus ROG Strix G18 G814JI
NVIDIA GeForce RTX 4070 Laptop GPU, i7-13650HX, Micron 2400 MTFDKBA1T0QFM
Acer Predator Helios 18 PH18-72-98MW
NVIDIA GeForce RTX 4090 Laptop GPU, i9-14900HX, 2x SK Hynix HFS001TEJ9X115N (RAID 0)
Noise
7%
11%
10%
8%
-12%
off / environment *
23.3
23.4
-0%
23.6
-1%
22.8
2%
25
-7%
25
-7%
Idle Minimum *
28.6
23.9
16%
23.8
17%
23.8
17%
26
9%
30
-5%
Idle Average *
28.6
28.2
1%
26.1
9%
23.8
17%
28
2%
36
-26%
Idle Maximum *
31.3
29
7%
31.5
-1%
28
11%
29
7%
44
-41%
Load Average *
44.1
36.8
17%
31.5
29%
38
14%
41
7%
48
-9%
Cyberpunk 2077 ultra *
59.4
Load Maximum *
62.7
61.1
3%
56.6
10%
62.8
-0%
46
27%
51
19%
Witcher 3 ultra *
54.1
52.1
57.3
44
49

* ... Moindre est la valeur, meilleures sont les performances

Température

Les points chauds peuvent atteindre un peu plus de 40°C en jouant, comme sur le Titan 18 HX. Les zones les plus chaudes se trouvent au centre du clavier et les touches WASD, le pavé numérique et les repose-paumes restent donc beaucoup plus froids et plus confortables pour la peau.

Quatre séries d'évents d'échappement
L'adaptateur CA atteint plus de 50°C lorsque les charges sont élevées
 37.2 °C40.4 °C38.6 °C 
 36.4 °C40.8 °C38.6 °C 
 28.4 °C27.6 °C26.6 °C 
Maximum: 40.8 °C
Moyenne: 35 °C
32 °C43.4 °C38 °C
33.6 °C38.6 °C33.8 °C
29.2 °C27.2 °C26.8 °C
Maximum: 43.4 °C
Moyenne: 33.6 °C
Alimentation (valeur maximale)  47.6 °C | Température ambiante de la pièce 20 °C | Fluke 62 Mini IR Thermometer
(±) La température moyenne de la face supérieure sous charge maximale est de 35 °C / 95 F, par rapport à la moyenne de 33.9 °C / 93 F pour les appareils de la classe Gaming.
(±) La température maximale du côté supérieur est de 40.8 °C / 105 F, par rapport à la moyenne de 40.5 °C / 105 F, allant de 21.2 à 68.8 °C pour la classe Gaming.
(±) Le fond chauffe jusqu'à un maximum de 43.4 °C / 110 F, contre une moyenne de 43.2 °C / 110 F
(±) En utilisation inactive, la température moyenne du côté supérieur est de 33.7 °C / 93 F, par rapport à la moyenne du dispositif de 33.9 °C / 93 F.
(±) 3: The average temperature for the upper side is 34.4 °C / 94 F, compared to the average of 33.9 °C / 93 F for the class Gaming.
(+) Les repose-poignets et le pavé tactile atteignent la température maximale de la peau (32.6 °C / 90.7 F) et ne sont donc pas chauds.
(-) La température moyenne de la zone de l'appui-paume de dispositifs similaires était de 28.9 °C / 84 F (-3.7 °C / #-6.7 F).
Système à l'arrêt (couvercle C)
Système à l'arrêt (couvercle D)
Cyberpunk 2077 stress (couverture C)
Cyberpunk 2077 stress (couverture D)
Prime95+FurMark stress (couverture C)
Prime95+FurMark stress (couverture D)
MSI Raider 18 HX A14V
Intel Core i9-14900HX, NVIDIA GeForce RTX 4080 Laptop GPU
Razer Blade 18 2024 RZ09-0509
Intel Core i9-14900HX, NVIDIA GeForce RTX 4090 Laptop GPU
Alienware m18 R2
Intel Core i9-14900HX, NVIDIA GeForce RTX 4090 Laptop GPU
MSI Titan 18 HX A14VIG
Intel Core i9-14900HX, NVIDIA GeForce RTX 4090 Laptop GPU
Asus ROG Strix G18 G814JI
Intel Core i7-13650HX, NVIDIA GeForce RTX 4070 Laptop GPU
Acer Predator Helios 18 PH18-72-98MW
Intel Core i9-14900HX, NVIDIA GeForce RTX 4090 Laptop GPU
Heat
-1%
-5%
6%
5%
-6%
Maximum Upper Side *
40.8
43.2
-6%
41.2
-1%
37.8
7%
45
-10%
43
-5%
Maximum Bottom *
43.4
42.6
2%
34.6
20%
37.6
13%
47
-8%
59
-36%
Idle Upper Side *
36.4
36
1%
42.8
-18%
34.8
4%
28
23%
32
12%
Idle Bottom *
36.4
36.4
-0%
43.6
-20%
36
1%
31
15%
34
7%

* ... Moindre est la valeur, meilleures sont les performances

Intervenants

Même configuration de six haut-parleurs que sur la Titan 18 HX (4x 2 W tweeters, 2x 2 W subwoofers)
Volume maximal élevé
dB(A) 0102030405060708090Deep BassMiddle BassHigh BassLower RangeMidsHigher MidsLower HighsMid HighsUpper HighsSuper Highs2036.53836.52526.226.126.23130.527.230.5403422.2345030.921.530.96334.42434.48039.521.539.510045.524.345.512551.622.351.616061.116.361.120061.818.161.825066.616.366.631568.117.168.140068.318.468.350071.919.571.963078.417.878.48007617.776100070.716.670.71250721772160072.51472.5200071.312.571.3250071.71271.7315074.31274.3400075.411.875.4500069.611.669.6630068.311.468.380006611.4661000061.711.561.71250056.611.256.61600061.910.961.9SPL84.626.884.6N64.90.864.9median 68.3median 16.3median 68.3Delta4.53.24.526.325.821.422.12624.925.127.622.532.523.448.72655.818.860.922.167.2267019.372.317.674.217.774.319.575.31571.711.871.311.27410.574.21072.710.17210.67210.97511.374.811.671.71269.71269.612.371.112.669.61270.111.269.824.784.70.666.6median 12median 71.73.42.2hearing rangehide median Pink NoiseMSI Raider 18 HX A14VApple MacBook Pro 16 2021 M1 Pro
Diagramme de fréquence (les cases peuvent être cochées et décochées pour comparer les appareils)
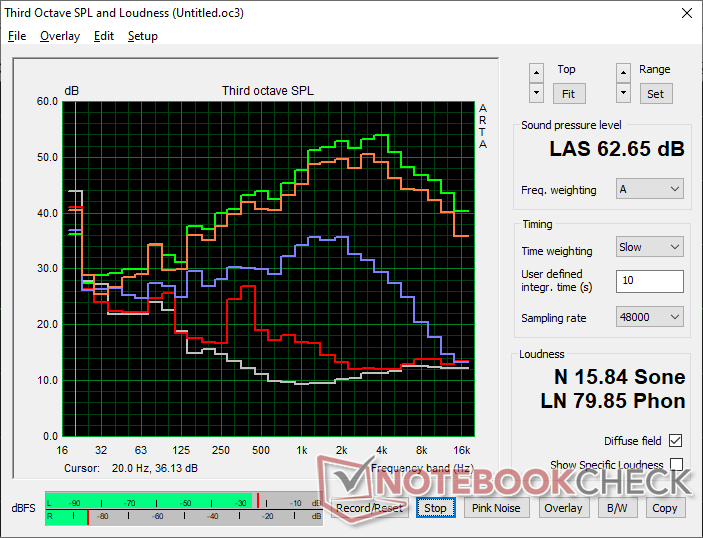
MSI Raider 18 HX A14V analyse audio

(+) | les haut-parleurs peuvent jouer relativement fort (84.6# dB)
Bass 100 - 315 Hz
(±) | basse réduite - en moyenne 9.2% inférieure à la médiane
(±) | la linéarité des basses est moyenne (9.2% delta à la fréquence précédente)
Mids 400 - 2000 Hz
(+) | médiane équilibrée - seulement 4.3% de la médiane
(+) | les médiums sont linéaires (5.1% delta à la fréquence précédente)
Aiguës 2 - 16 kHz
(+) | des sommets équilibrés - à seulement 3.8% de la médiane
(+) | les aigus sont linéaires (4.9% delta à la fréquence précédente)
Overall 100 - 16.000 Hz
(+) | le son global est linéaire (11.9% différence à la médiane)
Par rapport à la même classe
» 11% de tous les appareils testés de cette catégorie étaient meilleurs, 4% similaires, 85% pires
» Le meilleur avait un delta de 6%, la moyenne était de 18%, le pire était de 132%.
Par rapport à tous les appareils testés
» 7% de tous les appareils testés étaient meilleurs, 2% similaires, 91% pires
» Le meilleur avait un delta de 4%, la moyenne était de 25%, le pire était de 134%.

Apple MacBook Pro 16 2021 M1 Pro analyse audio

(+) | les haut-parleurs peuvent jouer relativement fort (84.7# dB)
Bass 100 - 315 Hz
(+) | bonne basse - seulement 3.8% loin de la médiane
(+) | les basses sont linéaires (5.2% delta à la fréquence précédente)
Mids 400 - 2000 Hz
(+) | médiane équilibrée - seulement 1.3% de la médiane
(+) | les médiums sont linéaires (2.1% delta à la fréquence précédente)
Aiguës 2 - 16 kHz
(+) | des sommets équilibrés - à seulement 1.9% de la médiane
(+) | les aigus sont linéaires (2.7% delta à la fréquence précédente)
Overall 100 - 16.000 Hz
(+) | le son global est linéaire (4.6% différence à la médiane)
Par rapport à la même classe
» 0% de tous les appareils testés de cette catégorie étaient meilleurs, 0% similaires, 100% pires
» Le meilleur avait un delta de 5%, la moyenne était de 18%, le pire était de 45%.
Par rapport à tous les appareils testés
» 0% de tous les appareils testés étaient meilleurs, 0% similaires, 100% pires
» Le meilleur avait un delta de 4%, la moyenne était de 25%, le pire était de 134%.

Gestion de l'énergie

Consommation électrique

La consommation globale est très élevée, comme on peut s'y attendre d'un DTR de 18 pouces équipé d'un écran mini-LED 4K exigeant. Le ralenti sur le bureau consomme entre 27 W et 48 W en fonction du réglage de la luminosité, du GPU et du profil d'alimentation. Les jeux nécessitent un peu plus de 300 W, contre seulement 220 W pour l'écran de bureau Acer Predator Helios 18.

Nous avons pu enregistrer une consommation allant jusqu'à 322 W à partir de l'adaptateur secteur de 330 W. Comparé à l'adaptateur 400 W de la Titan 18 HX, celui de 330 W est légèrement plus petit (~18.4 x 8.4 x 3.1 cm contre ~18.8 x 8.8 x 3.2 cm). La consommation lors de l'exécution de tâches intensives du CPU est généralement plus faible sur le Raider 18 HX bien qu'il soit livré avec le même CPU que le Titan 18 HX, ce qui correspond à la performance légèrement plus lente du CPU comme enregistré dans notre section CineBench ci-dessus.

consommation de 3DMark 06
Cyberpunk 2077 1080p Ultra consommation
La consommation atteindrait 222 W au début du stress Prime95, puis se stabiliserait rapidement à 211 W
Prime95+FurMark stress initié au bout de 10s
Consommation énergétique
Éteint/en veilledarklight 0.03 / 2.3 Watts
Au reposdarkmidlight 27.7 / 38.3 / 47.1 Watts
Fortement sollicité midlight 121.2 / 321.8 Watts
 color bar
Légende: min: dark, med: mid, max: light        Metrahit Energy
Currently we use the Metrahit Energy, a professional single phase power quality and energy measurement digital multimeter, for our measurements. Find out more about it here. All of our test methods can be found here.
MSI Raider 18 HX A14V
i9-14900HX, NVIDIA GeForce RTX 4080 Laptop GPU, Samsung PM9A1 MZVL22T0HBLB, Mini-LED, 3840x2400, 18"
Razer Blade 18 2024 RZ09-0509
i9-14900HX, NVIDIA GeForce RTX 4090 Laptop GPU, , Mini-LED, 2560x1600, 18"
Alienware m18 R2
i9-14900HX, NVIDIA GeForce RTX 4090 Laptop GPU, SK Hynix PC811 HFS002TEM9X152N, IPS, 2560x1600, 18"
MSI Titan 18 HX A14VIG
i9-14900HX, NVIDIA GeForce RTX 4090 Laptop GPU, 2x Samsung PM9A1a MZVL22T0HDLB (RAID 0), Mini-LED, 3840x2400, 18"
Asus ROG Strix G18 G814JI
i7-13650HX, NVIDIA GeForce RTX 4070 Laptop GPU, Micron 2400 MTFDKBA1T0QFM, IPS, 2560x1600, 18"
Acer Predator Helios 18 PH18-72-98MW
i9-14900HX, NVIDIA GeForce RTX 4090 Laptop GPU, 2x SK Hynix HFS001TEJ9X115N (RAID 0), Mini-LED, 2560x1600, 18"
Power Consumption
-2%
8%
5%
42%
-2%
Idle Minimum *
27.7
25.4
8%
10.6
62%
13.2
52%
8
71%
31
-12%
Idle Average *
38.3
37.7
2%
20.9
45%
25.4
34%
15
61%
35
9%
Idle Maximum *
47.1
57.9
-23%
40
15%
53.5
-14%
26
45%
43
9%
Load Average *
121.2
128.4
-6%
201.1
-66%
151.4
-25%
102
16%
144
-19%
Cyberpunk 2077 ultra *
313
Cyberpunk 2077 ultra external monitor *
306
Load Maximum *
321.8
297.9
7%
378.9
-18%
395.2
-23%
267
17%
318
1%
Witcher 3 ultra *
273.1
358
336
178.6
228

* ... Moindre est la valeur, meilleures sont les performances

Power Consumption Cyberpunk / Stress Test

020406080100120140160180200220240260280300320340360380Tooltip
MSI Raider 18 HX A14V i9-14900HX, NVIDIA GeForce RTX 4080 Laptop GPU; 1280x720 Prime95 28.10 and Furmark 1.25: Ø235 (210-305)
MSI Titan 18 HX A14VIG i9-14900HX, NVIDIA GeForce RTX 4090 Laptop GPU; 1280x720 Prime95 28.10 and Furmark 1.25: Ø340 (279-395)
MSI Raider 18 HX A14V i9-14900HX, NVIDIA GeForce RTX 4080 Laptop GPU; Idle 150cd/m2: Ø28.9 (25.3-41.2)
MSI Titan 18 HX A14VIG i9-14900HX, NVIDIA GeForce RTX 4090 Laptop GPU; Idle 150cd/m2: Ø21.7 (18.8-31.6)
MSI Raider 18 HX A14V i9-14900HX, NVIDIA GeForce RTX 4080 Laptop GPU; Cyberpunk 2077 FHD ultra no FSR 150cd: Ø313 (304-322)

Power Consumption external Monitor

020406080100120140160180200220240260280300Tooltip
MSI Raider 18 HX A14V i9-14900HX, NVIDIA GeForce RTX 4080 Laptop GPU; Prime95 V2810 Stress (external Monitor): Ø211 (203-222)
MSI Titan 18 HX A14VIG i9-14900HX, NVIDIA GeForce RTX 4090 Laptop GPU; Prime95 V2810 Stress (external Monitor): Ø283 (260-305)
MSI Raider 18 HX A14V i9-14900HX, NVIDIA GeForce RTX 4080 Laptop GPU; Cinebench R15 Multi (external Monitor): Ø187.1 (129.2-195.5)
MSI Titan 18 HX A14VIG i9-14900HX, NVIDIA GeForce RTX 4090 Laptop GPU; Cinebench R15 Multi (external Monitor): Ø258 (251-268)
MSI Raider 18 HX A14V i9-14900HX, NVIDIA GeForce RTX 4080 Laptop GPU; 1280x720 FurMark 1.19 GPU Stress Test (external Monitor): Ø250 (235-262)
MSI Titan 18 HX A14VIG i9-14900HX, NVIDIA GeForce RTX 4090 Laptop GPU; 1280x720 FurMark 1.19 GPU Stress Test (external Monitor): Ø256 (247-273)
MSI Raider 18 HX A14V i9-14900HX, NVIDIA GeForce RTX 4080 Laptop GPU; Idle 1min (external Monitor): Ø27.4 (22.8-34)
MSI Titan 18 HX A14VIG i9-14900HX, NVIDIA GeForce RTX 4090 Laptop GPU; Idle 1min (external Monitor): Ø20.8 (12.5-31.7)
MSI Raider 18 HX A14V i9-14900HX, NVIDIA GeForce RTX 4080 Laptop GPU; Cyberpunk 2077 FHD ultra no FSR - external Monitor: Ø306 (285-313)

Autonomie de la batterie

Le modèle est livré avec un adaptateur secteur de 330 W alors que le Titan 18 HX est livré avec une version de 400 W

Les durées d'utilisation sont courtes en raison de l'exigence du matériel. Nous avons pu enregistrer un peu plus de 3 heures d'utilisation réelle du WLAN, même en mode économie de batterie et en mode iGPU, alors que le ROG Strix G18 peut tenir plus de deux fois plus longtemps avec son écran IPS. La capacité de la batterie est déjà à son maximum légal de 99,9 Wh.

La charge de la batterie vide à la pleine capacité prend près de 2,5 heures, ce qui est un peu plus long que sur la plupart des autres ordinateurs portables. Le chargement avec des adaptateurs secteur USB-C tiers sera encore plus lent.

Autonomie
Au repos (module WiFi éteint, luminosité au minimum)
4h 24min
WiFi Websurfing
3h 18min
Fortement sollicité (luminosité au maximum)
1h 16min
MSI Raider 18 HX A14V
i9-14900HX, NVIDIA GeForce RTX 4080 Laptop GPU, 99.9 Wh
Razer Blade 18 2024 RZ09-0509
i9-14900HX, NVIDIA GeForce RTX 4090 Laptop GPU, 91.7 Wh
Alienware m18 R2
i9-14900HX, NVIDIA GeForce RTX 4090 Laptop GPU, 97 Wh
MSI Titan 18 HX A14VIG
i9-14900HX, NVIDIA GeForce RTX 4090 Laptop GPU, 99.9 Wh
Asus ROG Strix G18 G814JI
i7-13650HX, NVIDIA GeForce RTX 4070 Laptop GPU, 90 Wh
Acer Predator Helios 18 PH18-72-98MW
i9-14900HX, NVIDIA GeForce RTX 4090 Laptop GPU, 90 Wh
Autonomie de la batterie
20%
46%
19%
101%
-10%
Reader / Idle
264
395
50%
353
34%
702
166%
WiFi v1.3
198
263
33%
290
46%
252
27%
484
144%
192
-3%
Load
76
58
-24%
72
-5%
71
-7%
64
-16%

Points positifs

+ options mini-LED HDR1000 4K ou IPS QHD
+ clavier confortable avec pavé numérique de grande taille
+ supporte jusqu'à quatre modules SODIMM
+ Prise en charge des disques durs NVMe PCIe5
+ facile à entretenir

Points négatifs

- Les performances du Core i9-14900HX sont similaires à celles du Core i9-13900HX, moins cher
- pas d'options Advanced Optimus, G-Sync ou Meteor Lake
- grand et lourd, même pour un ordinateur portable de jeu de 18 pouces
- Le lecteur de carte SD pourrait être plus rapide
- faible autonomie de la batterie

Verdict - Un titan dans l'âme

En revue : MSI Raider 18 HX A14V

Lorsque nous avons examiné le Titan 18 HX en début d'année, nous avons loué ses performances, mais nous avons été choqués par son prix de vente de plus de 5 000 USD. Le fait que le CPU et le GPU n'aient rien de nouveau n'a fait que rendre le modèle encore moins attrayant. Le Raider 18 HX s'attaque au prix exorbitant du Titan 18 HX en le réduisant tout en conservant le même CPU, GPU et les mêmes options d'affichage. Les propriétaires du Raider perdent le clickpad rétro-éclairé, le refroidissement par chambre à vapeur, les touches mécaniques et le support SSD tertiaire M.2, mais ces caractéristiques de luxe sont faciles à abandonner quand l'expérience de jeu entre le Raider et le Titan est par ailleurs exactement la même. En fait, on peut dire que le Raider est plus confortable à utiliser car son clickpad traditionnel et son clavier à membrane sont plus familiers que l'approche atypique du Titan.

Le Raider 18 HX tire le maximum de performances de son processeur Core i9 et de son GPU 175 W, même s'il doit être plus grand, plus lourd et souvent plus bruyant que la plupart de ses concurrents.

Comparé à d'autres ordinateurs portables de jeu de 18 pouces, le Raider 18 HX offre une expérience de frappe plus spacieuse et quatre emplacements SODIMM, alors que des alternatives comme le Blade 18 ou le ROG Strix G18 n'ont pas de pavé numérique ou ne peuvent supporter que deux modules SODIMM. Cependant, le système MSI est toujours sensiblement plus grand et plus lourd que la plupart des concurrents et il ne fonctionne pas nécessairement plus silencieusement pour compenser. Les performances du CPU et du GPU sont légèrement plus rapides, mais de nombreux utilisateurs ne le remarqueront pas dans la pratique. Dans ce cas, vous devrez apprécier la facilité d'entretien et les options mini-LED 4K du Raider pour justifier son poids.

Prix et disponibilité

Le MSI Raider 18 HX tel que configuré dans notre revue est maintenant disponible sur Amazon pour 3190$. La version IPS est également disponible pour 3290$.

Note : Nous avons récemment mis à jour notre système d'évaluation et les résultats de la version 8 ne sont pas comparables à ceux de la version 7. De plus amples informations sont disponibles ici .

MSI Raider 18 HX A14V - 09/03/2024 v8
Allen Ngo

Châssis
85 / 98 → 87%
Clavier
87%
Dispositif de pointage
80%
Connectivité
74 / 80 → 93%
Poids
53 / 10-68 → 74%
Autonomie
53 / 95 → 55%
Écran
85%
Performances en jeu
92%
Performances dans les applications
92%
Chauffe
88 / 95 → 93%
Nuisance sonore
49 / 90 → 54%
Audio
84%
Appareil photo
33 / 75 → 44%
Moyenne
60%
85%
Gaming - Moyenne compensée
CO2 Emissions
No Data
Materials
0%
Packaging
75%
Power Use
73%
Repairability
40%
Software Updates
22.3%
Total Sustainability Score: 35.1%

Transparency

The present review sample was made available to the author as a loan by the manufacturer or a shop for the purposes of review. The lender had no influence on this review, nor did the manufacturer receive a copy of this review before publication. There was no obligation to publish this review.

Price comparison

Please share our article, every link counts!
> Revues et rapports de ordinateurs portatifs et smartphones, ordiphones > Critiques > Test du MSI Raider 18 HX A14V : les performances d'un Titan, le prix en moins
Allen Ngo, 2024-09- 4 (Update: 2024-09-16)