 Deutsch
 English
 Español
 Français
 Italiano
 Nederlands
 Polski
 Português
 Русский
 Türkçe
 Svenska
 Chinese
 Magyar
Test du Razer Blade 18 2024 : 1er PC portable du marché avec mini-LED et Thunderbolt 5
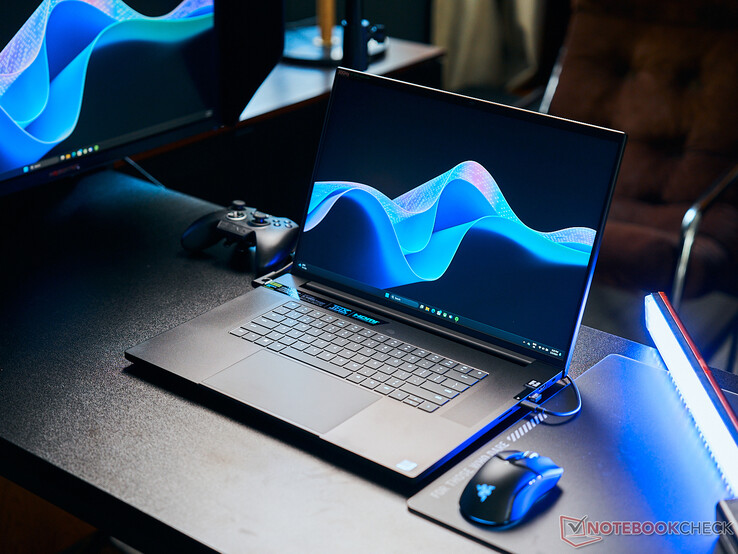
Le Razer Blade 18 a fait ses débuts en 2023 avec un design fortement inspiré du vieillissant Blade 17. Pour 2024, la dernière révision utilise le même design de châssis que l'année précédente, mais avec des fonctionnalités supplémentaires de haut niveau pour attirer les chasseurs de performances et les passionnés. Ces nouvelles options incluent un CPU Core i9-14900HX Raptor Lake, la connectivité Thunderbolt 5 et un écran IPS 4K 16:10 200 Hz en option. Ces deux derniers éléments en particulier font leurs débuts d'abord sur le système Razer avant d'apparaître éventuellement chez d'autres fabricants.
Notre configuration est livrée avec le GPU RTX 4090 de 175 W GeForce, un disque dur de 2 To et un écran Mini-LED de 2560 x 1600 300 Hz pour un prix d'environ 4500 USD. D'autres modèles sont livrés avec la RTX 4070/4080 GeForce ou l'écran IPS 4K 200 Hz mentionné plus haut, mais toutes les configurations sont actuellement équipées du même processeur Core i9-14900HX. La couleur blanche Mercury White n'est disponible que pour certaines configurations.
Il y a une petite poignée de concurrents au Blade 18, y compris le MSI Titan 18, Asus ROG Strix Scar 18, Acer Predator Helios 18ou l'énorme Alienware m18 R2.
Plus de commentaires sur Razer :
Comparaison avec les concurrents potentiels
Note | Date | Modèle | Poids | Épaisseur | Taille | Résolution | Meilleur prix |
|---|---|---|---|---|---|---|---|
| 90.5 % | 05/24 | Razer Blade 18 2024 RZ09-0509 i9-14900HX, NVIDIA GeForce RTX 4090 Laptop GPU | 3.1 kg | 21.9 mm | 18.00" | 2560x1600 | |
| 89.5 % | 03/24 | Alienware m18 R2 i9-14900HX, NVIDIA GeForce RTX 4090 Laptop GPU | 4 kg | 26.7 mm | 18.00" | 2560x1600 | |
| 87.2 % | 08/23 | Asus ROG Strix Scar 17 G733PYV-LL053X R9 7945HX3D, NVIDIA GeForce RTX 4090 Laptop GPU | 2.9 kg | 28.3 mm | 17.30" | 2560x1440 | |
| 88.8 % | 01/24 | MSI Titan 18 HX A14VIG i9-14900HX, NVIDIA GeForce RTX 4090 Laptop GPU | 3.6 kg | 32.1 mm | 18.00" | 3840x2400 | |
| 88.3 % | 02/24 | Asus ROG Strix Scar 18 G834JYR (2024) i9-14900HX, NVIDIA GeForce RTX 4090 Laptop GPU | 3.1 kg | 30.8 mm | 18.00" | 2560x1600 | |
| 91.1 % | 02/24 | Razer Blade 16 2024, RTX 4090 i9-14900HX, NVIDIA GeForce RTX 4090 Laptop GPU | 2.5 kg | 22 mm | 16.00" | 2560x1600 |
Case - Toujours aussi pointu
Nous vous recommandons de consulter notre avis sur le Blade 18 2023 pour en savoir plus sur les caractéristiques physiques du modèle, car tous nos commentaires s'appliquent également à la version 2024 pour en savoir plus sur les caractéristiques physiques du modèle, car tous nos commentaires s'appliquent à la version 2024. Bien qu'il n'y ait pas de changement au niveau du clavier ou du châssis pour différencier les deux années, il y a en fait un petit ajout pour aider à les distinguer visuellement ; le modèle 2024 inclut maintenant un curseur de webcam manuel alors que le modèle 2023 n'en avait pas.
Connectivité - L'avenir avec Thunderbolt 5


Le port Thunderbolt 4 a été mis à niveau vers Thunderbolt 5 pour le modèle 2024. Notez que cela ne s'applique qu'au port Type-C situé sur le bord droit et que le port Type-C situé sur le bord gauche est toujours limité à la connectivité USB 3.2 Gen. 2. Par rapport à Thunderbolt 4, Thunderbolt 5 prend en charge le double de la bande passante (80 Gbps contre 40 Gbps) avec des voies supplémentaires réservées aux périphériques externes plus exigeants comme les eGPU.
La spécification Thunderbolt 5 prend également en charge la charge en aval jusqu'à 240 W. Sur le Blade 18, cependant, la charge USB-C est toujours limitée à 100 W, soit moins d'un tiers de l'adaptateur secteur de 330 W du barillet principal. Pour être juste, aucun ordinateur portable ne prend en charge la charge USB-C complète de 240 W à ce jour, car des ajustements matériels supplémentaires sont nécessaires pour exploiter pleinement la nouvelle spécification.


Lecteur de carte SD
| SD Card Reader | |
| average JPG Copy Test (av. of 3 runs) | |
| Alienware m18 R2 (Toshiba Exceria Pro SDXC 64 GB UHS-II) | |
| Razer Blade 18 2024 RZ09-0509 (Toshiba Exceria Pro SDXC 64 GB UHS-II) | |
| Razer Blade 16 2024, RTX 4090 | |
| MSI Titan 18 HX A14VIG (Toshiba Exceria Pro SDXC 64 GB UHS-II) | |
| maximum AS SSD Seq Read Test (1GB) | |
| Razer Blade 18 2024 RZ09-0509 (Toshiba Exceria Pro SDXC 64 GB UHS-II) | |
| Alienware m18 R2 (Toshiba Exceria Pro SDXC 64 GB UHS-II) | |
| Razer Blade 16 2024, RTX 4090 | |
| MSI Titan 18 HX A14VIG (Toshiba Exceria Pro SDXC 64 GB UHS-II) | |
Communication
Le réseau local sans fil (WLAN) a été mis à niveau avec l'Intel BE200 pour la prise en charge du Bluetooth 5.4 et du Wi-Fi 7. Toutefois, la grande majorité des utilisateurs n'ont pas encore de routeurs Wi-Fi 7, et seuls quelques rares utilisateurs remarqueront une amélioration des performances pour l'instant.
| Networking | |
| iperf3 transmit AXE11000 | |
| Razer Blade 16 2024, RTX 4090 | |
| Razer Blade 18 2024 RZ09-0509 | |
| MSI Titan 18 HX A14VIG | |
| Asus ROG Strix Scar 18 G834JYR (2024) | |
| Alienware m18 R2 | |
| iperf3 receive AXE11000 | |
| Asus ROG Strix Scar 18 G834JYR (2024) | |
| Razer Blade 16 2024, RTX 4090 | |
| Razer Blade 18 2024 RZ09-0509 | |
| Alienware m18 R2 | |
| MSI Titan 18 HX A14VIG | |
| iperf3 transmit AXE11000 6GHz | |
| Razer Blade 16 2024, RTX 4090 | |
| Razer Blade 18 2024 RZ09-0509 | |
| MSI Titan 18 HX A14VIG | |
| Alienware m18 R2 | |
| iperf3 receive AXE11000 6GHz | |
| Razer Blade 16 2024, RTX 4090 | |
| MSI Titan 18 HX A14VIG | |
| Razer Blade 18 2024 RZ09-0509 | |
| Alienware m18 R2 | |
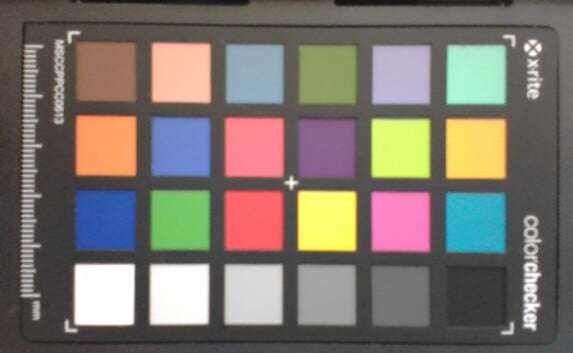
Webcam
La webcam de 5 MP + IR n'a pas changé, hormis le nouveau curseur d'obturation pour la confidentialité. Il est intéressant de noter qu'il s'agit du seul ordinateur portable de jeu de 18 pouces doté d'une webcam de 5 MP, à l'instar du Titan HX, Alienware m18 R2et le ROG Strix Scar 18 sont équipés de caméras de 1 à 2 MP.


Maintenance
Le modèle 2024 comporte des haut-parleurs légèrement plus grands près des coins avant. Pour le reste, il n'y a pas de différences notables par rapport à la version 2023.


Écran - QHD+ 300 Hz Mini-LED

La dalle QHD+ 240 Hz du Blade 18 2023 a été remplacée par deux nouvelles options cette année :
- QHD+ (2560 x 1600), 300 Hz, Mini-LED, HDR1000
- 4K UHD+ (3840 x 2400), 200 Hz, IPS, HDR400
Les deux écrans offrent G-Sync, un étalonnage d'usine, des couleurs DCI-P3 complètes et des temps de réponse rapides de <3 ms pour convenir à la fois au jeu intensif et à la plupart des tâches d'édition. Notre unité de test spécifique a été configurée avec l'option en gras. Notez que ce panneau BOE NE180QDM-NM1 se trouve également sur le ROG Strix Scar 18, ce qui signifie que les ordinateurs portables Razer et Asus peuvent offrir des expériences visuelles comparables.
Par rapport à l'IPS et à l'OLED, le mini-LED offre des niveaux de noir plus profonds que l'IPS et des blancs plus lumineux que l'OLED, afin de mieux répondre aux exigences du HDR. Par exemple, les ordinateurs portables équipés de panneaux IPS ou OLED haut de gamme couvrent généralement le HDR400 ou HDR500, tandis que les mini-LED satisfont souvent au HDR1000 pour une lecture multimédia plus vivante. La luminosité maximale de notre Blade 18 peut atteindre 1227 nits lorsque le HDR et la gradation locale sont activés, contre seulement 712 nits lorsque le HDR est activé mais que la gradation locale est désactivée. La luminosité est par ailleurs limitée à ~600 nits en mode SDR, ce qui reste beaucoup plus lumineux que la plupart des autres ordinateurs portables de jeu.
| Réglage de l'affichage | Mode SDR avec gradation locale désactivée | Mode SDR avec gradation locale activée | Mode HDR avec gradation locale désactivée | Mode HDR avec gradation locale activée |
| Luminosité maximale (nits) | 605 | 602 | 712 | 1227 |


Les niveaux de noir et donc le contraste sont également affectés par la gradation locale. Nous avons pu mesurer un niveau de noir de 0,62 nits avec la gradation locale désactivée contre 0,22 nits avec la gradation locale activée pour des niveaux de contraste beaucoup plus élevés, en particulier lorsque la fonction HDR est activée. La gradation locale n'est pas nécessaire ni même recommandée pour la navigation ou l'édition en raison de son effet "halo" inhérent, mais elle vaut la peine d'être activée pour les vidéos et les jeux HDR, où l'inconvénient est moins perceptible.
Gardez à l'esprit que le taux de rafraîchissement du panneau prend en charge jusqu'à 300 Hz en mode dGPU uniquement, car il est limité à 240 Hz en mode Optimus. Un taux de rafraîchissement dynamique jusqu'à 60 Hz n'est pris en charge qu'en mode Optimus.
| |||||||||||||||||||||||||
Homogénéité de la luminosité: 97 %
Valeur mesurée au centre, sur batterie: 605.4 cd/m²
Contraste: 976:1 (Valeurs des noirs: 0.62 cd/m²)
ΔE Color 1.53 | 0.5-29.43 Ø5
ΔE Greyscale 2.6 | 0.57-98 Ø5.3
86.9% AdobeRGB 1998 (Argyll 2.2.0 3D)
100% sRGB (Argyll 2.2.0 3D)
99% Display P3 (Argyll 2.2.0 3D)
Gamma: 2.22
| Razer Blade 18 2024 RZ09-0509 BOE NE180QDM-NM1, Mini-LED, 2560x1600, 18.00 | Razer Blade 18 RTX 4070 AU Optronics B180QAN01.0, IPS, 2560x1600, 18.00 | Alienware m18 R2 BOE NE18NZ1, IPS, 2560x1600, 18.00 | MSI Titan 18 HX A14VIG AU Optronics B180ZAN01.0, Mini-LED, 3840x2400, 18.00 | Asus ROG Strix Scar 18 G834JYR (2024) BOE NE180QDM-NM1, Mini LED, 2560x1600, 18.00 | |
|---|---|---|---|---|---|
| Display | -1% | 0% | -1% | 2% | |
| Display P3 Coverage | 99 | 96.9 -2% | 97.8 -1% | 98.1 -1% | 99.9 1% |
| sRGB Coverage | 100 | 99.8 0% | 99.5 0% | 99.8 0% | 100 0% |
| AdobeRGB 1998 Coverage | 86.9 | 85.3 -2% | 88.9 2% | 86.2 -1% | 90 4% |
| Response Times | 44% | 28% | -196% | -37% | |
| Response Time Grey 50% / Grey 80% * | 7.6 ? | 4.2 ? 45% | 5.3 ? 30% | 8.6 ? -13% | 12 ? -58% |
| Response Time Black / White * | 14 ? | 8 ? 43% | 10.4 ? 26% | 81.8 ? -484% | 10.7 ? 24% |
| PWM Frequency | 26444 ? | 2592 ? -90% | 5733 ? -78% | ||
| Screen | -20% | -26% | -45% | 202% | |
| Brightness middle | 605.4 | 549.6 -9% | 271.8 -55% | 467.5 -23% | 937 55% |
| Brightness | 600 | 524 -13% | 275 -54% | 459 -23% | 934 56% |
| Brightness Distribution | 97 | 89 -8% | 78 -20% | 90 -7% | 89 -8% |
| Black Level * | 0.62 | 0.53 15% | 0.27 56% | 0.066 89% | |
| Contrast | 976 | 1037 6% | 1007 3% | 14197 1355% | |
| Colorchecker dE 2000 * | 1.53 | 3.32 -117% | 2.48 -62% | 3.77 -146% | 1.52 1% |
| Colorchecker dE 2000 max. * | 4.15 | 6.63 -60% | 5.59 -35% | 6.12 -47% | 2.82 32% |
| Greyscale dE 2000 * | 2.6 | 2 23% | 3.7 -42% | 3.2 -23% | 1.7 35% |
| Gamma | 2.22 99% | 2.29 96% | 2.2 100% | 2.43 91% | 2.042 108% |
| CCT | 6843 95% | 6319 103% | 6355 102% | 6478 100% | 6578 99% |
| Colorchecker dE 2000 calibrated * | 2.7 | 0.56 | 2.94 | 1.21 | |
| Moyenne finale (programmes/paramètres) | 8% /
-6% | 1% /
-12% | -81% /
-72% | 56% /
108% |
* ... Moindre est la valeur, meilleures sont les performances


Le standard P3 est entièrement représenté comme annoncé. Les couleurs sRGB sont précises avec des valeurs moyennes DeltaE grayscale et ColorChecker de seulement 2,6 et 1,53, respectivement, mais les couleurs P3 sont plus imprécises même lorsqu'elles sont réglées sur le mode P3. La température des couleurs, par exemple, devient automatiquement plus chaude à 5600K lorsqu'elle est réglée sur P3. Il se peut qu'il y ait un bug dans la façon dont les couleurs P3 sont représentées lorsque vous passez d'un mode GPU à l'autre.


Temps de réponse de l'écran
| ↔ Temps de réponse noir à blanc | ||
|---|---|---|
| 14 ms ... hausse ↗ et chute ↘ combinées | ↗ 6.6 ms hausse |  |
| ↘ 7.4 ms chute | ||
| L'écran montre de bons temps de réponse, mais insuffisant pour du jeu compétitif. En comparaison, tous les appareils testés affichent entre 0.1 (minimum) et 240 (maximum) ms. » 29 % des appareils testés affichent de meilleures performances. Cela signifie que les latences relevées sont meilleures que la moyenne (21.4 ms) de tous les appareils testés. | ||
| ↔ Temps de réponse gris 50% à gris 80% | ||
| 7.6 ms ... hausse ↗ et chute ↘ combinées | ↗ 3.6 ms hausse |  |
| ↘ 4 ms chute | ||
| L'écran montre de très faibles temps de réponse, parfait pour le jeu. En comparaison, tous les appareils testés affichent entre 0.2 (minimum) et 636 (maximum) ms. » 15 % des appareils testés affichent de meilleures performances. Cela signifie que les latences relevées sont meilleures que la moyenne (33.7 ms) de tous les appareils testés. | ||
Scintillement / MLI (Modulation de largeur d'impulsion)
| Scintillement / MLI (Modulation de largeur d'impulsion) décelé | 26444 Hz | ≤ 100 Niveau de luminosité |  |
Le rétroéclairage de l'écran scintille à la fréquence de 26444 Hz (certainement du fait de l'utilisation d'une MDI - Modulation de largeur d'impulsion) à un niveau de luminosité inférieur ou égal à 100 % . Aucun scintillement ne devrait être perceptible au-dessus de cette valeur. La fréquence de rafraîchissement de 26444 Hz est élevée, la grande majorité des utilisateurs ne devrait pas percevoir de scintillements et être sujette à une fatigue oculaire accrue. En comparaison, 53 % des appareils testés n'emploient pas MDI pour assombrir leur écran. Nous avons relevé une moyenne à 17803 (minimum : 5 - maximum : 3846000) Hz dans le cas où une MDI était active. | |||
Le scintillement est présent comme sur d'autres ordinateurs portables dotés d'options mini-LED. Toutefois, sa fréquence est extrêmement élevée et il est donc moins susceptible de provoquer une fatigue oculaire chez les utilisateurs sensibles. L'intensité du scintillement semble également diminuer de manière significative lorsque les niveaux de luminosité sont réduits à moins de 50 %, de sorte que des niveaux de luminosité plus faibles ne sont pas forcément une mauvaise idée.


La visibilité à l'extérieur est correcte à l'ombre, d'autant plus que le revêtement mat minimise les reflets. Toutefois, il est préférable d'éviter la lumière directe du soleil pour une expérience visuelle optimale.


Performances - Les mêmes que celles d'antan


Conditions d'essai
Razer continue de mettre à jour Synapse avec des fonctionnalités supplémentaires et des cases à cocher pour une meilleure personnalisation. Les nouveautés de cette année sont le mode Turbo, le mode Max Fan, et des fonctions d'affichage intégrées comme les profils de couleur et les touches de raccourci pour ajuster le taux de rafraîchissement. Notez que le nouveau mode Turbo est essentiellement équivalent au mode Custom, comme le montrent nos tests ci-dessous. Razer affirme avoir ajouté le mode Turbo pour permettre aux utilisateurs de sélectionner plus facilement le "meilleur" mode pour le jeu, mais nous pensons que cela pourrait avoir l'effet inverse, car il y a maintenant trop de modes confus parmi lesquels choisir. Tous les tests ci-dessous ont été effectués en mode personnalisé, avec le CPU et le GPU réglés respectivement sur Boost et High, sauf indication contraire.
La fonctionnalité la plus importante à garder à l'esprit est sans doute le réglage local de la luminosité dans l'onglet Affichage. Il est intéressant de noter que Razer l'a désactivé par défaut alors que la gradation locale est l'un des principaux arguments de vente de la mini-LED. L'activation de cette fonction peut avoir un impact considérable sur les niveaux de luminosité en mode HDR, comme nous l'avons vu plus haut.


Processeur
Alors que le saut de la 12e génération de Core i9-12900HX à la 13e génération Core i9-13900HX entraînerait une augmentation des performances de 25 à 30 %, le passage du Core i9-13900HX de 13e génération au Core i9-14900HX de 14e génération entraînerait une augmentation des performances de 25 à 30 % Core i9-14900HX est essentiellement une ligne plate. Les résultats des benchmarks entre nos modèles Blade 18 2023 et 2024 se situeraient à moins de 5 points de pourcentage l'un de l'autre dans les charges de travail mono et multithread. Le i9-14900HX est décrit officieusement comme un rebrand du i9-13900HX et nos chiffres le reflètent.
| Profil de puissance | Score CineBench R23 xT (Points) | Puissance soutenue du processeur (W) | Cyberpunk 2077 QHD Ultra (FPS) |
| Équilibré | 14269 | 55 -> 45 | 65.13 |
| Turbo | 27029 | 135 -> 125 | 84.69 |
| Custom avec ventilateur max activé | 27167 | 135 -> 125 | 85.46 |
Il est intéressant de noter que les résultats du CPU de notre système Razer sont légèrement mais constamment plus lents que ceux de la plupart des autres ordinateurs portables de jeu équipés du même CPU, tels que le Alienware m18 R2 ou le MSI Titan 18 HX. Nous pensons que cela a été fait exprès pour permettre une plus grande marge d'overclocking via le logiciel Synapse. Les performances du CPU Turbo Boost et les niveaux de TDP sont liés aux différents profils d'alimentation, comme le montre le tableau ci-dessus.
Cinebench R15 Multi Loop
Cinebench R23: Multi Core | Single Core
Cinebench R20: CPU (Multi Core) | CPU (Single Core)
Cinebench R15: CPU Multi 64Bit | CPU Single 64Bit
Blender: v2.79 BMW27 CPU
7-Zip 18.03: 7z b 4 | 7z b 4 -mmt1
Geekbench 6.2: Multi-Core | Single-Core
Geekbench 5.5: Multi-Core | Single-Core
HWBOT x265 Benchmark v2.2: 4k Preset
LibreOffice : 20 Documents To PDF
R Benchmark 2.5: Overall mean
* ... Moindre est la valeur, meilleures sont les performances
AIDA64: FP32 Ray-Trace | FPU Julia | CPU SHA3 | CPU Queen | FPU SinJulia | FPU Mandel | CPU AES | CPU ZLib | FP64 Ray-Trace | CPU PhotoWorxx
| Performance Rating | |
| Asus ROG Strix Scar 17 G733PYV-LL053X | |
| Alienware m18 R2 | |
| MSI Titan 18 HX A14VIG | |
| Razer Blade 16 2024, RTX 4090 | |
| Asus ROG Strix Scar 18 G834JYR (2024) | |
| Moyenne Intel Core i9-14900HX | |
| Razer Blade 18 2024 RZ09-0509 | |
| Moyenne de la classe Gaming | |
| AIDA64 / FP32 Ray-Trace | |
| Asus ROG Strix Scar 17 G733PYV-LL053X | |
| MSI Titan 18 HX A14VIG | |
| Alienware m18 R2 | |
| Razer Blade 16 2024, RTX 4090 | |
| Asus ROG Strix Scar 18 G834JYR (2024) | |
| Moyenne Intel Core i9-14900HX (17244 - 29351, n=22) | |
| Razer Blade 18 2024 RZ09-0509 | |
| Moyenne de la classe Gaming (3069 - 60169, n=216, 2 dernières années) | |
| AIDA64 / FPU Julia | |
| Asus ROG Strix Scar 17 G733PYV-LL053X | |
| MSI Titan 18 HX A14VIG | |
| Alienware m18 R2 | |
| Asus ROG Strix Scar 18 G834JYR (2024) | |
| Razer Blade 18 2024 RZ09-0509 | |
| Razer Blade 16 2024, RTX 4090 | |
| Moyenne Intel Core i9-14900HX (88537 - 148888, n=22) | |
| Moyenne de la classe Gaming (18567 - 252486, n=216, 2 dernières années) | |
| AIDA64 / CPU SHA3 | |
| Asus ROG Strix Scar 17 G733PYV-LL053X | |
| MSI Titan 18 HX A14VIG | |
| Alienware m18 R2 | |
| Asus ROG Strix Scar 18 G834JYR (2024) | |
| Moyenne Intel Core i9-14900HX (4267 - 7229, n=22) | |
| Razer Blade 16 2024, RTX 4090 | |
| Razer Blade 18 2024 RZ09-0509 | |
| Moyenne de la classe Gaming (629 - 10389, n=216, 2 dernières années) | |
| AIDA64 / CPU Queen | |
| Asus ROG Strix Scar 17 G733PYV-LL053X | |
| MSI Titan 18 HX A14VIG | |
| Asus ROG Strix Scar 18 G834JYR (2024) | |
| Alienware m18 R2 | |
| Moyenne Intel Core i9-14900HX (118405 - 148773, n=22) | |
| Razer Blade 16 2024, RTX 4090 | |
| Razer Blade 18 2024 RZ09-0509 | |
| Moyenne de la classe Gaming (15371 - 200651, n=216, 2 dernières années) | |
| AIDA64 / FPU SinJulia | |
| Asus ROG Strix Scar 17 G733PYV-LL053X | |
| MSI Titan 18 HX A14VIG | |
| Alienware m18 R2 | |
| Asus ROG Strix Scar 18 G834JYR (2024) | |
| Razer Blade 16 2024, RTX 4090 | |
| Razer Blade 18 2024 RZ09-0509 | |
| Moyenne Intel Core i9-14900HX (12217 - 18256, n=22) | |
| Moyenne de la classe Gaming (2137 - 32988, n=216, 2 dernières années) | |
| AIDA64 / FPU Mandel | |
| Asus ROG Strix Scar 17 G733PYV-LL053X | |
| Alienware m18 R2 | |
| MSI Titan 18 HX A14VIG | |
| Razer Blade 16 2024, RTX 4090 | |
| Asus ROG Strix Scar 18 G834JYR (2024) | |
| Razer Blade 18 2024 RZ09-0509 | |
| Moyenne Intel Core i9-14900HX (43302 - 72594, n=22) | |
| Moyenne de la classe Gaming (10291 - 134044, n=216, 2 dernières années) | |
| AIDA64 / CPU AES | |
| Asus ROG Strix Scar 17 G733PYV-LL053X | |
| MSI Titan 18 HX A14VIG | |
| Moyenne Intel Core i9-14900HX (86964 - 241777, n=22) | |
| Alienware m18 R2 | |
| Razer Blade 16 2024, RTX 4090 | |
| Asus ROG Strix Scar 18 G834JYR (2024) | |
| Razer Blade 18 2024 RZ09-0509 | |
| Moyenne de la classe Gaming (19065 - 328679, n=216, 2 dernières années) | |
| AIDA64 / CPU ZLib | |
| MSI Titan 18 HX A14VIG | |
| Alienware m18 R2 | |
| Asus ROG Strix Scar 17 G733PYV-LL053X | |
| Razer Blade 16 2024, RTX 4090 | |
| Moyenne Intel Core i9-14900HX (1265 - 2149, n=22) | |
| Razer Blade 18 2024 RZ09-0509 | |
| Asus ROG Strix Scar 18 G834JYR (2024) | |
| Moyenne de la classe Gaming (150.9 - 2409, n=216, 2 dernières années) | |
| AIDA64 / FP64 Ray-Trace | |
| Asus ROG Strix Scar 17 G733PYV-LL053X | |
| Alienware m18 R2 | |
| MSI Titan 18 HX A14VIG | |
| Razer Blade 16 2024, RTX 4090 | |
| Razer Blade 18 2024 RZ09-0509 | |
| Asus ROG Strix Scar 18 G834JYR (2024) | |
| Moyenne Intel Core i9-14900HX (9170 - 16128, n=22) | |
| Moyenne de la classe Gaming (1518 - 31796, n=216, 2 dernières années) | |
| AIDA64 / CPU PhotoWorxx | |
| Alienware m18 R2 | |
| Asus ROG Strix Scar 18 G834JYR (2024) | |
| Razer Blade 16 2024, RTX 4090 | |
| Moyenne Intel Core i9-14900HX (33960 - 51118, n=22) | |
| Razer Blade 18 2024 RZ09-0509 | |
| Moyenne de la classe Gaming (10805 - 60161, n=217, 2 dernières années) | |
| Asus ROG Strix Scar 17 G733PYV-LL053X | |
| MSI Titan 18 HX A14VIG | |
Test de stress

La consommation du processeur lors de l'exécution de Prime95 se stabilise à environ 117 W, ce qui est très proche de ce que nous avons enregistré sur le Blade 18 de l'année dernière à 114 W. Associé à leurs performances presque identiques comme indiqué dans la section ci-dessus, cela renforce le fait que la nouvelle série Raptor Lake-HX refresh offre peu ou pas d'avantages par rapport à l'ancienne série Raptor Lake-HX Core i9-13950HX.
L'exécution de Witcher 3 pour représenter des charges de jeu typiques ne montre aucune différence de performance majeure entre Max Fan on et Max Fan off puisque la consommation d'énergie de la carte GPU reste pratiquement la même à 172 W. Le passage en mode Turbo réduit la consommation d'énergie du GPU de quelques watts seulement, ce qui est indiscernable dans la pratique. Les températures du CPU et du GPU se stabilisent respectivement à 80°C et 74°C, contre 87°C et 64°C sur l'Alienware m18 R2, beaucoup plus lourd et légèrement plus rapide.


| Horloge moyenne effective du CPU (GHz) | Horloge du GPU (MHz) | Température moyenne du CPU (°C) | Température moyenne du GPU (°C) | Puissance absorbée par la carte GPU | |
| Système en veille | -- | -- | 54 | 44 | -- |
| Prime95 Stress | 2.8 | -- | 78 | 54 | -- |
| Prime95 + FurMark Stress | 1.8 | 1515 - 2340 | 70 | 62 | 42 - 181 |
| Witcher 3 Stress(mode personnalisé avec ventilateur maximal activé) | ~0,6 | 2145 | 81 | 70 | 172 |
| Witcher 3 Stress (mode personnalisé avec ventilateurmaximal éteint) | ~0,5 | 2160 | 80 | 74 | 172 |
| Witcher 3 Stress (mode turbo) | ~0,5 | 2100 | 80 | 74 | 165 |
| Witcher 3 Stress (mode équilibré) | ~0,4 | 1740 | 79 | 71 | 127 |
Performance du système
Les scores PCMark sont comparables à ceux d'autres ordinateurs portables de jeu équipés de CPU Raptor Lake-HX similaires et de GPU GeForce RTX 4090, y compris les systèmes dotés de l'ancien Core i9-13900HX core i9-13900HX plus ancien. La vitesse de la RAM n'a pas changé par rapport au modèle 2023.
Nous avons rencontré quelques bugs lors de la mise en veille du système. Le système continuait à chauffer en mode Veille lorsqu'il était réglé sur le mode dGPU. En mode Optimus, le système semble entrer en mode Veille normalement. L'écran se figeait parfois pendant plusieurs secondes lorsque le système sortait du mode Veille.
Par ailleurs, les problèmes de G-Sync que nous avons rencontrés sur le modèle 2023 ne sont pas présents sur notre unité 2024.

CrossMark: Overall | Productivity | Creativity | Responsiveness
WebXPRT 3: Overall
WebXPRT 4: Overall
Mozilla Kraken 1.1: Total
| PCMark 10 / Score | |
| Alienware m18 R2 | |
| Asus ROG Strix Scar 17 G733PYV-LL053X | |
| MSI Titan 18 HX A14VIG | |
| Razer Blade 18 2024 RZ09-0509 | |
| Asus ROG Strix Scar 18 G834JYR (2024) | |
| Moyenne Intel Core i9-14900HX, NVIDIA GeForce RTX 4090 Laptop GPU (8230 - 9234, n=8) | |
| Razer Blade 16 2024, RTX 4090 | |
| PCMark 10 / Essentials | |
| MSI Titan 18 HX A14VIG | |
| Asus ROG Strix Scar 17 G733PYV-LL053X | |
| Alienware m18 R2 | |
| Asus ROG Strix Scar 18 G834JYR (2024) | |
| Razer Blade 18 2024 RZ09-0509 | |
| Moyenne Intel Core i9-14900HX, NVIDIA GeForce RTX 4090 Laptop GPU (10871 - 11628, n=8) | |
| Razer Blade 16 2024, RTX 4090 | |
| PCMark 10 / Productivity | |
| Alienware m18 R2 | |
| Razer Blade 16 2024, RTX 4090 | |
| Asus ROG Strix Scar 17 G733PYV-LL053X | |
| Moyenne Intel Core i9-14900HX, NVIDIA GeForce RTX 4090 Laptop GPU (9951 - 11759, n=8) | |
| Asus ROG Strix Scar 18 G834JYR (2024) | |
| MSI Titan 18 HX A14VIG | |
| Razer Blade 18 2024 RZ09-0509 | |
| PCMark 10 / Digital Content Creation | |
| MSI Titan 18 HX A14VIG | |
| Alienware m18 R2 | |
| Asus ROG Strix Scar 17 G733PYV-LL053X | |
| Razer Blade 18 2024 RZ09-0509 | |
| Asus ROG Strix Scar 18 G834JYR (2024) | |
| Moyenne Intel Core i9-14900HX, NVIDIA GeForce RTX 4090 Laptop GPU (13219 - 16462, n=8) | |
| Razer Blade 16 2024, RTX 4090 | |
| CrossMark / Overall | |
| Asus ROG Strix Scar 18 G834JYR (2024) | |
| Razer Blade 16 2024, RTX 4090 | |
| Moyenne Intel Core i9-14900HX, NVIDIA GeForce RTX 4090 Laptop GPU (1877 - 2238, n=8) | |
| Asus ROG Strix Scar 17 G733PYV-LL053X | |
| Alienware m18 R2 | |
| Razer Blade 18 2024 RZ09-0509 | |
| MSI Titan 18 HX A14VIG | |
| CrossMark / Productivity | |
| Asus ROG Strix Scar 18 G834JYR (2024) | |
| Razer Blade 16 2024, RTX 4090 | |
| Moyenne Intel Core i9-14900HX, NVIDIA GeForce RTX 4090 Laptop GPU (1738 - 2113, n=8) | |
| Asus ROG Strix Scar 17 G733PYV-LL053X | |
| Razer Blade 18 2024 RZ09-0509 | |
| Alienware m18 R2 | |
| MSI Titan 18 HX A14VIG | |
| CrossMark / Creativity | |
| Asus ROG Strix Scar 18 G834JYR (2024) | |
| Razer Blade 16 2024, RTX 4090 | |
| Asus ROG Strix Scar 17 G733PYV-LL053X | |
| Alienware m18 R2 | |
| Moyenne Intel Core i9-14900HX, NVIDIA GeForce RTX 4090 Laptop GPU (2195 - 2543, n=8) | |
| Razer Blade 18 2024 RZ09-0509 | |
| MSI Titan 18 HX A14VIG | |
| CrossMark / Responsiveness | |
| Asus ROG Strix Scar 18 G834JYR (2024) | |
| Razer Blade 16 2024, RTX 4090 | |
| Moyenne Intel Core i9-14900HX, NVIDIA GeForce RTX 4090 Laptop GPU (1478 - 2327, n=8) | |
| Alienware m18 R2 | |
| Razer Blade 18 2024 RZ09-0509 | |
| Asus ROG Strix Scar 17 G733PYV-LL053X | |
| MSI Titan 18 HX A14VIG | |
| WebXPRT 3 / Overall | |
| Asus ROG Strix Scar 17 G733PYV-LL053X | |
| Razer Blade 18 2024 RZ09-0509 | |
| Razer Blade 16 2024, RTX 4090 | |
| Moyenne Intel Core i9-14900HX, NVIDIA GeForce RTX 4090 Laptop GPU (322 - 339, n=7) | |
| MSI Titan 18 HX A14VIG | |
| Alienware m18 R2 | |
| Asus ROG Strix Scar 18 G834JYR (2024) | |
| WebXPRT 4 / Overall | |
| Asus ROG Strix Scar 17 G733PYV-LL053X | |
| Alienware m18 R2 | |
| Asus ROG Strix Scar 18 G834JYR (2024) | |
| Moyenne Intel Core i9-14900HX, NVIDIA GeForce RTX 4090 Laptop GPU (287 - 309, n=5) | |
| MSI Titan 18 HX A14VIG | |
| Mozilla Kraken 1.1 / Total | |
| MSI Titan 18 HX A14VIG | |
| Razer Blade 16 2024, RTX 4090 | |
| Asus ROG Strix Scar 18 G834JYR (2024) | |
| Razer Blade 18 2024 RZ09-0509 | |
| Moyenne Intel Core i9-14900HX, NVIDIA GeForce RTX 4090 Laptop GPU (430 - 467, n=8) | |
| Alienware m18 R2 | |
| Asus ROG Strix Scar 17 G733PYV-LL053X | |
* ... Moindre est la valeur, meilleures sont les performances
| PCMark 10 Score | 8805 points | |
Aide | ||
| AIDA64 / Memory Write | |
| Asus ROG Strix Scar 18 G834JYR (2024) | |
| Alienware m18 R2 | |
| Razer Blade 18 RTX 4070 | |
| Razer Blade 16 2024, RTX 4090 | |
| Moyenne Intel Core i9-14900HX (51387 - 78199, n=22) | |
| Razer Blade 18 2024 RZ09-0509 | |
| Asus ROG Strix Scar 17 G733PYV-LL053X | |
| MSI Titan 18 HX A14VIG | |
| AIDA64 / Memory Latency | |
| MSI Titan 18 HX A14VIG | |
| Asus ROG Strix Scar 17 G733PYV-LL053X | |
| Razer Blade 18 2024 RZ09-0509 | |
| Alienware m18 R2 | |
| Razer Blade 18 RTX 4070 | |
| Moyenne Intel Core i9-14900HX (79.7 - 105, n=22) | |
| Razer Blade 16 2024, RTX 4090 | |
| Asus ROG Strix Scar 18 G834JYR (2024) | |
* ... Moindre est la valeur, meilleures sont les performances
Latence DPC
LatencyMon ne révèle que des problèmes mineurs de DPC lors de l'ouverture de plusieurs onglets de notre page d'accueil. la lecture de vidéos 4K60 est également parfaite, sans aucune perte d'images, à l'exception d'une seule image lors de la capture d'écran.


| DPC Latencies / LatencyMon - interrupt to process latency (max), Web, Youtube, Prime95 | |
| Alienware m18 R2 | |
| MSI Titan 18 HX A14VIG | |
| Razer Blade 18 2024 RZ09-0509 | |
| Razer Blade 16 2024, RTX 4090 | |
| Asus ROG Strix Scar 18 G834JYR (2024) | |
| Asus ROG Strix Scar 17 G733PYV-LL053X | |
* ... Moindre est la valeur, meilleures sont les performances
Dispositifs de stockage
Nos unités Blade 18 2023 et 2024 sont toutes deux dotées des éléments suivants Micron CA6 NVMe de Micron, alors que la plupart des autres modèles Blade sont livrés avec des disques Samsung. Les taux de lecture et d'écriture des petits blocs de 4K peuvent être lents, mais il n'y a pas de problèmes d'étranglement des performances.
Les options SSD PCIe5 ne sont pas disponibles, probablement en raison des coûts et de l'offre limitée.


* ... Moindre est la valeur, meilleures sont les performances
Disk Throttling: DiskSpd Read Loop, Queue Depth 8
Performance de jeu - RTX 4090 pour la deuxième année consécutive
Les performances graphiques brutes de la mobile GeForce RTX 4090 est essentiellement identique à celle de la Blade 16 qui dispose également d'une carte graphique TGP de 175 W. Ainsi, le Blade 18 ne fera pas tourner les jeux sensiblement plus vite que son homologue plus petit. Si vous passez à la RTX 4080 ou 4070 devrait avoir un impact sur les performances d'environ 10 % et 35 à 40 %, respectivement. La MSI Titan 18 HX peut faire tourner le même GPU un peu plus rapidement que le Razer, mais il est également beaucoup plus grand et plus lourd.
Gardez à l'esprit que le mode Max Fan n'a que peu ou pas d'impact sur les performances du système, comme le montre notre tableau de résultats Fire Strike ci-dessous. Il n'est donc pas nécessaire d'activer le mode Max Fan pour tirer le meilleur parti du GPU. Même le mode Turbo ne semble pas avoir d'impact significatif sur les performances dans les jeux.
| Profil de puissance | Score graphique | Score physique | Score combiné |
| Profil personnalisé avec ventilateur maximal activé | 44702 | 38887 | 12094 |
| Profil personnalisé avec ventilateur maximal désactivé | 44397 (-1%) | 35809 (-8%) | 12595 (-0%) |
| Mode Turbo | 44111 (-1%) | 33180 (-15%) | 13065 (-0%) |
| Mode équilibré | 36832 (-18%) | 25159 (-35%) | 6109 (-49%) |
| Alimentation par batterie | 18581 (-58%) | 23066 (-41%) | 5093 (-58%) |
Le mode Optimus avancé permet de basculer entre les modes dGPU et Optimus. Cependant, il n'y a pas de mode iGPU uniquement pour des économies d'énergie supplémentaires, contrairement aux ordinateurs portables récents de la marque Alienware récents.


| 3DMark 11 Performance | 45938 points | |
| 3DMark Fire Strike Score | 34597 points | |
| 3DMark Time Spy Score | 20561 points | |
Aide | ||
* ... Moindre est la valeur, meilleures sont les performances
| The Witcher 3 - 1920x1080 Ultra Graphics & Postprocessing (HBAO+) | |
| MSI Titan 18 HX A14VIG | |
| Asus ROG Strix Scar 17 G733PYV-LL053X | |
| Alienware m18 R2 | |
| Razer Blade 16 2024, RTX 4090 | |
| Razer Blade 18 2024 RZ09-0509 | |
| Asus ROG Strix Scar 18 G834JYR (2024) | |
| Moyenne de la classe Gaming (8.61 - 216, n=216, 2 dernières années) | |
| GTA V - 1920x1080 Highest Settings possible AA:4xMSAA + FX AF:16x | |
| Asus ROG Strix Scar 17 G733PYV-LL053X | |
| MSI Titan 18 HX A14VIG | |
| Razer Blade 16 2024, RTX 4090 | |
| Alienware m18 R2 | |
| Asus ROG Strix Scar 18 G834JYR (2024) | |
| Razer Blade 18 2024 RZ09-0509 | |
| Moyenne de la classe Gaming (6.38 - 167.7, n=208, 2 dernières années) | |
Witcher 3 FPS Chart
| Bas | Moyen | Élevé | Ultra | QHD | 4K DLSS | 4K | |
| GTA V (2015) | 129.8 | 126.6 | 165.4 | ||||
| The Witcher 3 (2015) | 193 | 154.6 | 149.8 | ||||
| Dota 2 Reborn (2015) | 213 | 191.8 | 180.5 | 164 | 147 | ||
| Final Fantasy XV Benchmark (2018) | 156.9 | 139.1 | 87.3 | ||||
| X-Plane 11.11 (2018) | 183.8 | 158.2 | 127.2 | 107.2 | |||
| Strange Brigade (2018) | 325 | 268 | 149.2 | ||||
| F1 23 (2023) | 110.9 | 73.1 | 37.1 | ||||
| Baldur's Gate 3 (2023) | 160.5 | 119.2 | 94.4 | 70.5 | |||
| Cyberpunk 2077 2.0 Phantom Liberty (2023) | 101.25 | 83.38 | 54.59 | 37.38 | |||
| Assassin's Creed Mirage (2023) | 124 | 114 | 98 | 73 | |||
| Alan Wake 2 (2023) | 114.1 | 79.4 | 60.8 | 42.3 | |||
| Call of Duty Modern Warfare 3 2023 (2023) | 174 | 132 | 92 | 87 |
Émissions - Le son n'est fort que lorsque c'est nécessaire
Bruit du système
Le bruit des ventilateurs est généralement plus fort que celui que nous avons enregistré sur notre 2023 Blade 18, en grande partie à cause des différences de configuration de notre GPU. Les ventilateurs pulsent plus fréquemment entre 24 et 29 dB(A) même en mode Balanced et Optimus. C'est suffisamment fort pour être perceptible, mais jamais gênant.
Ce qui est peut-être le plus important pour les joueurs, c'est que le bruit des ventilateurs peut être très différent selon le réglage du profil d'alimentation. Lorsque vous utilisez Witcher 3 avec le mode Max Fan activé, par exemple, le bruit du ventilateur peut atteindre 61 dB(A) contre 54 dB(A) avec le mode Max Fan désactivé. Étant donné qu'il n'y a pas de différence de performances entre le mode Max Fan activé et désactivé dans les paramètres de base, nous vous recommandons de jouer avec le mode Max Fan désactivé pour réduire les niveaux de bruit. Le bruit du ventilateur en mode Turbo serait identique à celui du mode Max Fan désactivé, ce qui correspond à nos résultats de performance ci-dessus.
Par rapport à ses concurrents, le Blade 18 est comparable, voire légèrement plus bruyant que l'Alienware m18 R2 ou le ROG Strix Scar 18 fonctionnant avec le même GPU GeForce RTX 4090. Un casque est recommandé lorsque les niveaux de ventilation atteignent >50 dB(A), en particulier pour les jeux où les bruits de pas et autres petits indices audio sont vitaux pour le gameplay.
Degré de la nuisance sonore
| Au repos |
| 23.9 / 28.2 / 29 dB(A) |
| Fortement sollicité |
| 36.8 / 61.1 dB(A) |
 | ||
30 dB silencieux 40 dB(A) audible 50 dB(A) bruyant |
||
min: | ||
| Razer Blade 18 2024 RZ09-0509 NVIDIA GeForce RTX 4090 Laptop GPU, i9-14900HX | Razer Blade 18 RTX 4070 NVIDIA GeForce RTX 4070 Laptop GPU, i9-13950HX, SSSTC CA6-8D1024 | Alienware m18 R2 NVIDIA GeForce RTX 4090 Laptop GPU, i9-14900HX, SK Hynix PC811 HFS002TEM9X152N | MSI Titan 18 HX A14VIG NVIDIA GeForce RTX 4090 Laptop GPU, i9-14900HX, 2x Samsung PM9A1a MZVL22T0HDLB (RAID 0) | Asus ROG Strix Scar 18 G834JYR (2024) NVIDIA GeForce RTX 4090 Laptop GPU, i9-14900HX, Samsung PM9A1a MZVL22T0HDLB | Razer Blade 16 2024, RTX 4090 NVIDIA GeForce RTX 4090 Laptop GPU, i9-14900HX, Samsung PM9A1 MZVL22T0HBLB | |
|---|---|---|---|---|---|---|
| Noise | 7% | 3% | 1% | -5% | 6% | |
| off / environment * | 23.4 | 23.5 -0% | 23.6 -1% | 22.8 3% | 24 -3% | 23 2% |
| Idle Minimum * | 23.9 | 23.8 -0% | 23.8 -0% | 23.8 -0% | 27 -13% | 23 4% |
| Idle Average * | 28.2 | 23.8 16% | 26.1 7% | 23.8 16% | 28 1% | 23 18% |
| Idle Maximum * | 29 | 26.8 8% | 31.5 -9% | 28 3% | 32 -10% | 27.66 5% |
| Load Average * | 36.8 | 37.3 -1% | 31.5 14% | 38 -3% | 50 -36% | 43.76 -19% |
| Witcher 3 ultra * | 54.1 | 48 11% | 52.1 4% | 57.3 -6% | 50 8% | 46.81 13% |
| Load Maximum * | 61.1 | 53.5 12% | 56.6 7% | 62.8 -3% | 52 15% | 50.37 18% |
* ... Moindre est la valeur, meilleures sont les performances
Température
Les températures de surface en jeu sont sensiblement plus élevées que celles que nous avons enregistrées sur notre 2023, mais c'est encore une fois principalement dû aux différences de GPU dans nos configurations. Razer n'a pas modifié la solution de refroidissement sous-jacente.
Les briques d'alimentation de Razer continuent d'être parmi les plus petites et pourtant les plus chaudes du marché. Par exemple, notre adaptateur atteignait plus de 63°C en jouant contre 54°C pour l'adaptateur Alienware m18 R2. Les températures plus élevées sont le fruit de la conception des chargeurs GaN.


(±) La température maximale du côté supérieur est de 43.2 °C / 110 F, par rapport à la moyenne de 40.4 °C / 105 F, allant de 21.2 à 68.8 °C pour la classe Gaming.
(±) Le fond chauffe jusqu'à un maximum de 42.6 °C / 109 F, contre une moyenne de 43.2 °C / 110 F
(+) En utilisation inactive, la température moyenne du côté supérieur est de 31.3 °C / 88 F, par rapport à la moyenne du dispositif de 33.8 °C / 93 F.
(±) En jouant à The Witcher 3, la température moyenne du côté supérieur est de 34.9 °C / 95 F, alors que la moyenne de l'appareil est de 33.8 °C / 93 F.
(±) Les repose-poignets et le pavé tactile peuvent devenir très chauds au toucher, avec un maximum de 36.2 °C / 97.2# F.
(-) La température moyenne de la zone de l'appui-paume de dispositifs similaires était de 28.9 °C / 84 F (-7.3 °C / #-13.2 F).


| Razer Blade 18 2024 RZ09-0509 Intel Core i9-14900HX, NVIDIA GeForce RTX 4090 Laptop GPU | Razer Blade 18 RTX 4070 Intel Core i9-13950HX, NVIDIA GeForce RTX 4070 Laptop GPU | Alienware m18 R2 Intel Core i9-14900HX, NVIDIA GeForce RTX 4090 Laptop GPU | MSI Titan 18 HX A14VIG Intel Core i9-14900HX, NVIDIA GeForce RTX 4090 Laptop GPU | Asus ROG Strix Scar 18 G834JYR (2024) Intel Core i9-14900HX, NVIDIA GeForce RTX 4090 Laptop GPU | Razer Blade 16 2024, RTX 4090 Intel Core i9-14900HX, NVIDIA GeForce RTX 4090 Laptop GPU | |
|---|---|---|---|---|---|---|
| Heat | 12% | -4% | 7% | 3% | 7% | |
| Maximum Upper Side * | 43.2 | 39.2 9% | 41.2 5% | 37.8 12% | 49 -13% | 45 -4% |
| Maximum Bottom * | 42.6 | 35.6 16% | 34.6 19% | 37.6 12% | 47 -10% | 45 -6% |
| Idle Upper Side * | 36 | 31.8 12% | 42.8 -19% | 34.8 3% | 29 19% | 29 19% |
| Idle Bottom * | 36.4 | 33.2 9% | 43.6 -20% | 36 1% | 31 15% | 30 18% |
* ... Moindre est la valeur, meilleures sont les performances
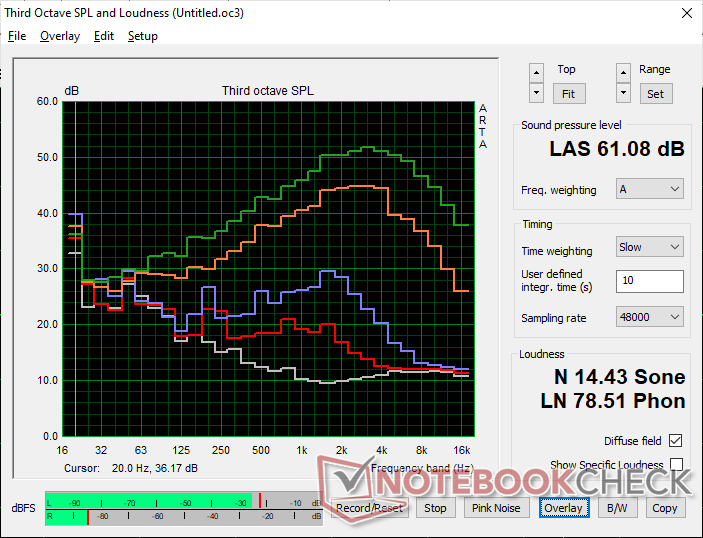
Intervenants
Razer Blade 18 2024 RZ09-0509 analyse audio
(+) | les haut-parleurs peuvent jouer relativement fort (85.2# dB)
Bass 100 - 315 Hz
(±) | basse réduite - en moyenne 5.3% inférieure à la médiane
(+) | les basses sont linéaires (6.5% delta à la fréquence précédente)
Mids 400 - 2000 Hz
(+) | médiane équilibrée - seulement 4.5% de la médiane
(±) | la linéarité des médiums est moyenne (7.1% delta à la fréquence précédente)
Aiguës 2 - 16 kHz
(+) | des sommets équilibrés - à seulement 2.9% de la médiane
(+) | les aigus sont linéaires (4% delta à la fréquence précédente)
Overall 100 - 16.000 Hz
(+) | le son global est linéaire (9.3% différence à la médiane)
Par rapport à la même classe
» 2% de tous les appareils testés de cette catégorie étaient meilleurs, 2% similaires, 96% pires
» Le meilleur avait un delta de 6%, la moyenne était de 18%, le pire était de 132%.
Par rapport à tous les appareils testés
» 2% de tous les appareils testés étaient meilleurs, 1% similaires, 97% pires
» Le meilleur avait un delta de 4%, la moyenne était de 25%, le pire était de 134%.
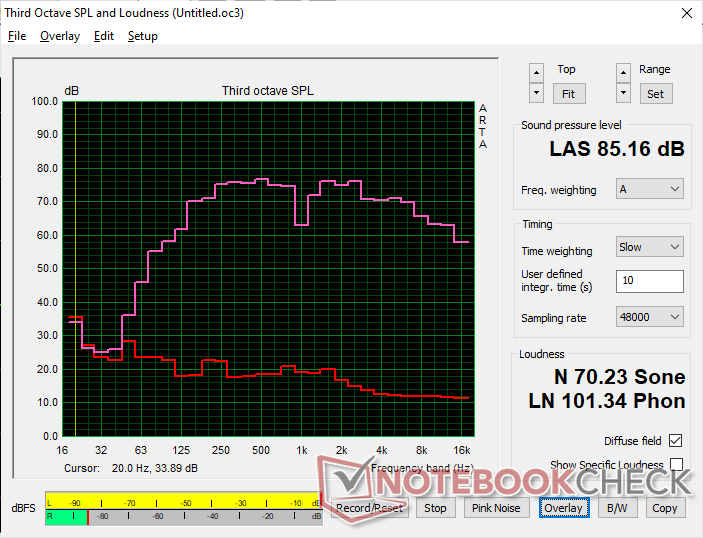
Apple MacBook Pro 16 2021 M1 Pro analyse audio
(+) | les haut-parleurs peuvent jouer relativement fort (84.7# dB)
Bass 100 - 315 Hz
(+) | bonne basse - seulement 3.8% loin de la médiane
(+) | les basses sont linéaires (5.2% delta à la fréquence précédente)
Mids 400 - 2000 Hz
(+) | médiane équilibrée - seulement 1.3% de la médiane
(+) | les médiums sont linéaires (2.1% delta à la fréquence précédente)
Aiguës 2 - 16 kHz
(+) | des sommets équilibrés - à seulement 1.9% de la médiane
(+) | les aigus sont linéaires (2.7% delta à la fréquence précédente)
Overall 100 - 16.000 Hz
(+) | le son global est linéaire (4.6% différence à la médiane)
Par rapport à la même classe
» 0% de tous les appareils testés de cette catégorie étaient meilleurs, 0% similaires, 100% pires
» Le meilleur avait un delta de 5%, la moyenne était de 18%, le pire était de 45%.
Par rapport à tous les appareils testés
» 0% de tous les appareils testés étaient meilleurs, 0% similaires, 100% pires
» Le meilleur avait un delta de 4%, la moyenne était de 25%, le pire était de 134%.
Gestion de l'énergie
Consommation électrique
La consommation est plus élevée dans tous les cas, comme on pouvait s'y attendre en raison des différences d'affichage et de GPU entre nos unités de test 2023 et 2024. La consommation en mode Optimus, luminosité minimale et taux de rafraîchissement de 60 Hz est d'environ 25 W alors qu'en mode dGPU, luminosité maximale et taux de rafraîchissement de 300 Hz, elle est deux fois plus élevée.
L'exécution de Witcher 3 demande environ 70 W de plus à notre unité de test alimentée par la RTX 4090 2024 qu'à notre unité 2023 alimentée par la RTX 4070 dans des conditions similaires. Par conséquent, les configurations RTX 4070 bas de gamme sont livrées avec un adaptateur GaN plus petit de 280 W, tandis que les configurations RTX 4080/4090 sont livrées avec un adaptateur GaN légèrement plus grand de 330 W (~18 x 7,5 x 2,5 cm contre ~16,3 x 7 x 2,5 cm)
| Éteint/en veille | |
| Au repos | |
| Fortement sollicité |
|
| Razer Blade 18 2024 RZ09-0509 i9-14900HX, NVIDIA GeForce RTX 4090 Laptop GPU, , Mini-LED, 2560x1600, 18.00 | Razer Blade 18 RTX 4070 i9-13950HX, NVIDIA GeForce RTX 4070 Laptop GPU, SSSTC CA6-8D1024, IPS, 2560x1600, 18.00 | Alienware m18 R2 i9-14900HX, NVIDIA GeForce RTX 4090 Laptop GPU, SK Hynix PC811 HFS002TEM9X152N, IPS, 2560x1600, 18.00 | MSI Titan 18 HX A14VIG i9-14900HX, NVIDIA GeForce RTX 4090 Laptop GPU, 2x Samsung PM9A1a MZVL22T0HDLB (RAID 0), Mini-LED, 3840x2400, 18.00 | Asus ROG Strix Scar 18 G834JYR (2024) i9-14900HX, NVIDIA GeForce RTX 4090 Laptop GPU, Samsung PM9A1a MZVL22T0HDLB, Mini LED, 2560x1600, 18.00 | |
|---|---|---|---|---|---|
| Power Consumption | 10% | 3% | 26% | ||
| Idle Minimum * | 25.4 | 24.5 4% | 13.2 48% | 14 45% | |
| Idle Average * | 37.7 | 34.1 10% | 25.4 33% | 17 55% | |
| Idle Maximum * | 57.9 | 47.7 18% | 53.5 8% | 24 59% | |
| Load Average * | 128.4 | 140 -9% | 151.4 -18% | 143 -11% | |
| Witcher 3 ultra * | 273.1 | 202 26% | 336 -23% | 251 8% | |
| Load Maximum * | 297.9 | 261 12% | 395.2 -33% | 302 -1% |
* ... Moindre est la valeur, meilleures sont les performances
Autonomie de la batterie
Les durées d'utilisation sont à peu près les mêmes qu'auparavant, si ce n'est un peu plus longues d'environ 20 minutes. Notez que notre test WLAN tient déjà compte du mode Optimus et du taux de rafraîchissement plus lent de 60 Hz, ce qui signifie que l'autonomie de la batterie serait encore plus courte en mode dGPU avec la gradation locale et les taux de rafraîchissement élevés activés.
Il n'est pas réaliste de s'attendre à de longues durées d'utilisation pour un écran de jeu de 18 pouces, mais des concurrents comme le ROG Strix Scar 18 ou l'Alienware m18 R2 ont encore une longueur d'avance sur le Razer à cet égard.
| Razer Blade 18 2024 RZ09-0509 i9-14900HX, NVIDIA GeForce RTX 4090 Laptop GPU, 91.7 Wh | Razer Blade 18 RTX 4070 i9-13950HX, NVIDIA GeForce RTX 4070 Laptop GPU, 91.7 Wh | Alienware m18 R2 i9-14900HX, NVIDIA GeForce RTX 4090 Laptop GPU, 97 Wh | MSI Titan 18 HX A14VIG i9-14900HX, NVIDIA GeForce RTX 4090 Laptop GPU, 99.9 Wh | Asus ROG Strix Scar 18 G834JYR (2024) i9-14900HX, NVIDIA GeForce RTX 4090 Laptop GPU, 90 Wh | Razer Blade 16 2024, RTX 4090 i9-14900HX, NVIDIA GeForce RTX 4090 Laptop GPU, 95.2 Wh | |
|---|---|---|---|---|---|---|
| Autonomie de la batterie | 12% | 10% | 3% | 54% | 31% | |
| Reader / Idle | 395 | 420 6% | 353 -11% | 612 55% | ||
| WiFi v1.3 | 263 | 240 -9% | 290 10% | 252 -4% | 461 75% | 329 25% |
| Load | 58 | 80 38% | 72 24% | 77 33% | 79 36% | |
| H.264 | 447 | 456 |
Points positifs
Points négatifs
Verdict - Tout savoir sur les nouvelles options d'affichage

En l'absence de nouveaux GPU Nvidia à intégrer cette année et de gains réels de la nouvelle série Raptor Lake-HX, Razer a dû chercher ailleurs pour rendre le 2024 Blade 18 plus attrayant que son prédécesseur 2023, visuellement identique. Dans ce cas, le dernier modèle inclut de nouvelles options d'affichage ainsi que la prise en charge de Thunderbolt 5 pour être l'un des premiers ordinateurs portables de jeu sur le marché avec à la fois mini-LED et Thunderbolt de nouvelle génération. D'autres mises à jour plus modestes comme le Wi-Fi 7 et l'obturateur de webcam sont les bienvenues, mais il ne s'agit néanmoins que de mises à jour mineures. Les joueurs qui ne sont pas séduits par ces caractéristiques spécifiques devraient plutôt considérer le 2023 Blade 18 qui offre les mêmes performances de jeu et la même expérience utilisateur pour plusieurs centaines d'euros de moins.
Thunderbolt 5, mini-LED et Wi-Fi 7 contribuent à distinguer le 2024 Blade 18 de son prédécesseur. Les chasseurs de performances ne trouveront cependant pas de différences majeures entre les modèles 2023 et 2024.
En ce qui concerne le mini-LED sur les ordinateurs portables, le panneau est le plus performant lorsque le HDR et la gradation locale sont actifs pour les jeux et les vidéos pris en charge. Sinon, vous devrez continuellement activer et désactiver la gradation locale en fonction de votre charge de travail pour éviter l'effet de halo. Si vous prévoyez d'utiliser le Blade 18 principalement pour les jeux et le multimédia, l'écran mini-LED 2K pourrait être l'option optimale. À l'inverse, les utilisateurs qui activent rarement le HDR et qui souhaitent utiliser le Blade 18 à des fins professionnelles, comme la création de contenu, l'édition ou la CAO, devraient envisager la configuration IPS 4K à plus haute résolution, qui s'associe bien à la grande taille de l'écran de 18 pouces. Razer a couvert les deux côtés de la médaille à cet égard.
Enfin, il convient de mentionner que le mini-LED 4K est disponible sur le MSI Titan 18 alors qu'elle est absente sur le Razer. En contrepartie, le système MSI ne prend pas en charge G-Sync et il n'y a donc pas de panneau mini-LED 18 pouces "ultime" pour le moment.
Prix et disponibilité
Amazon commercialise actuellement notre configuration mini-LED au prix de 4500 USD. Les utilisateurs peuvent également acheter directement auprès de Razer avec plus d'options de configuration entre les modèles 2023 et 2024.
Razer Blade 18 2024 RZ09-0509
-
05/05/2024 v7
Allen Ngo
Transparency
The present review sample was made available to the author as a loan by the manufacturer or a shop for the purposes of review. The lender had no influence on this review, nor did the manufacturer receive a copy of this review before publication. There was no obligation to publish this review.
Pricecompare

