

L'ordinateur portable RTX 5080 est optimal pour le jeu en WQHD - Asus ROG Strix G16 G615 Critique du produit
Qui a vraiment besoin d'un ordinateur portable RTX 5090 ?
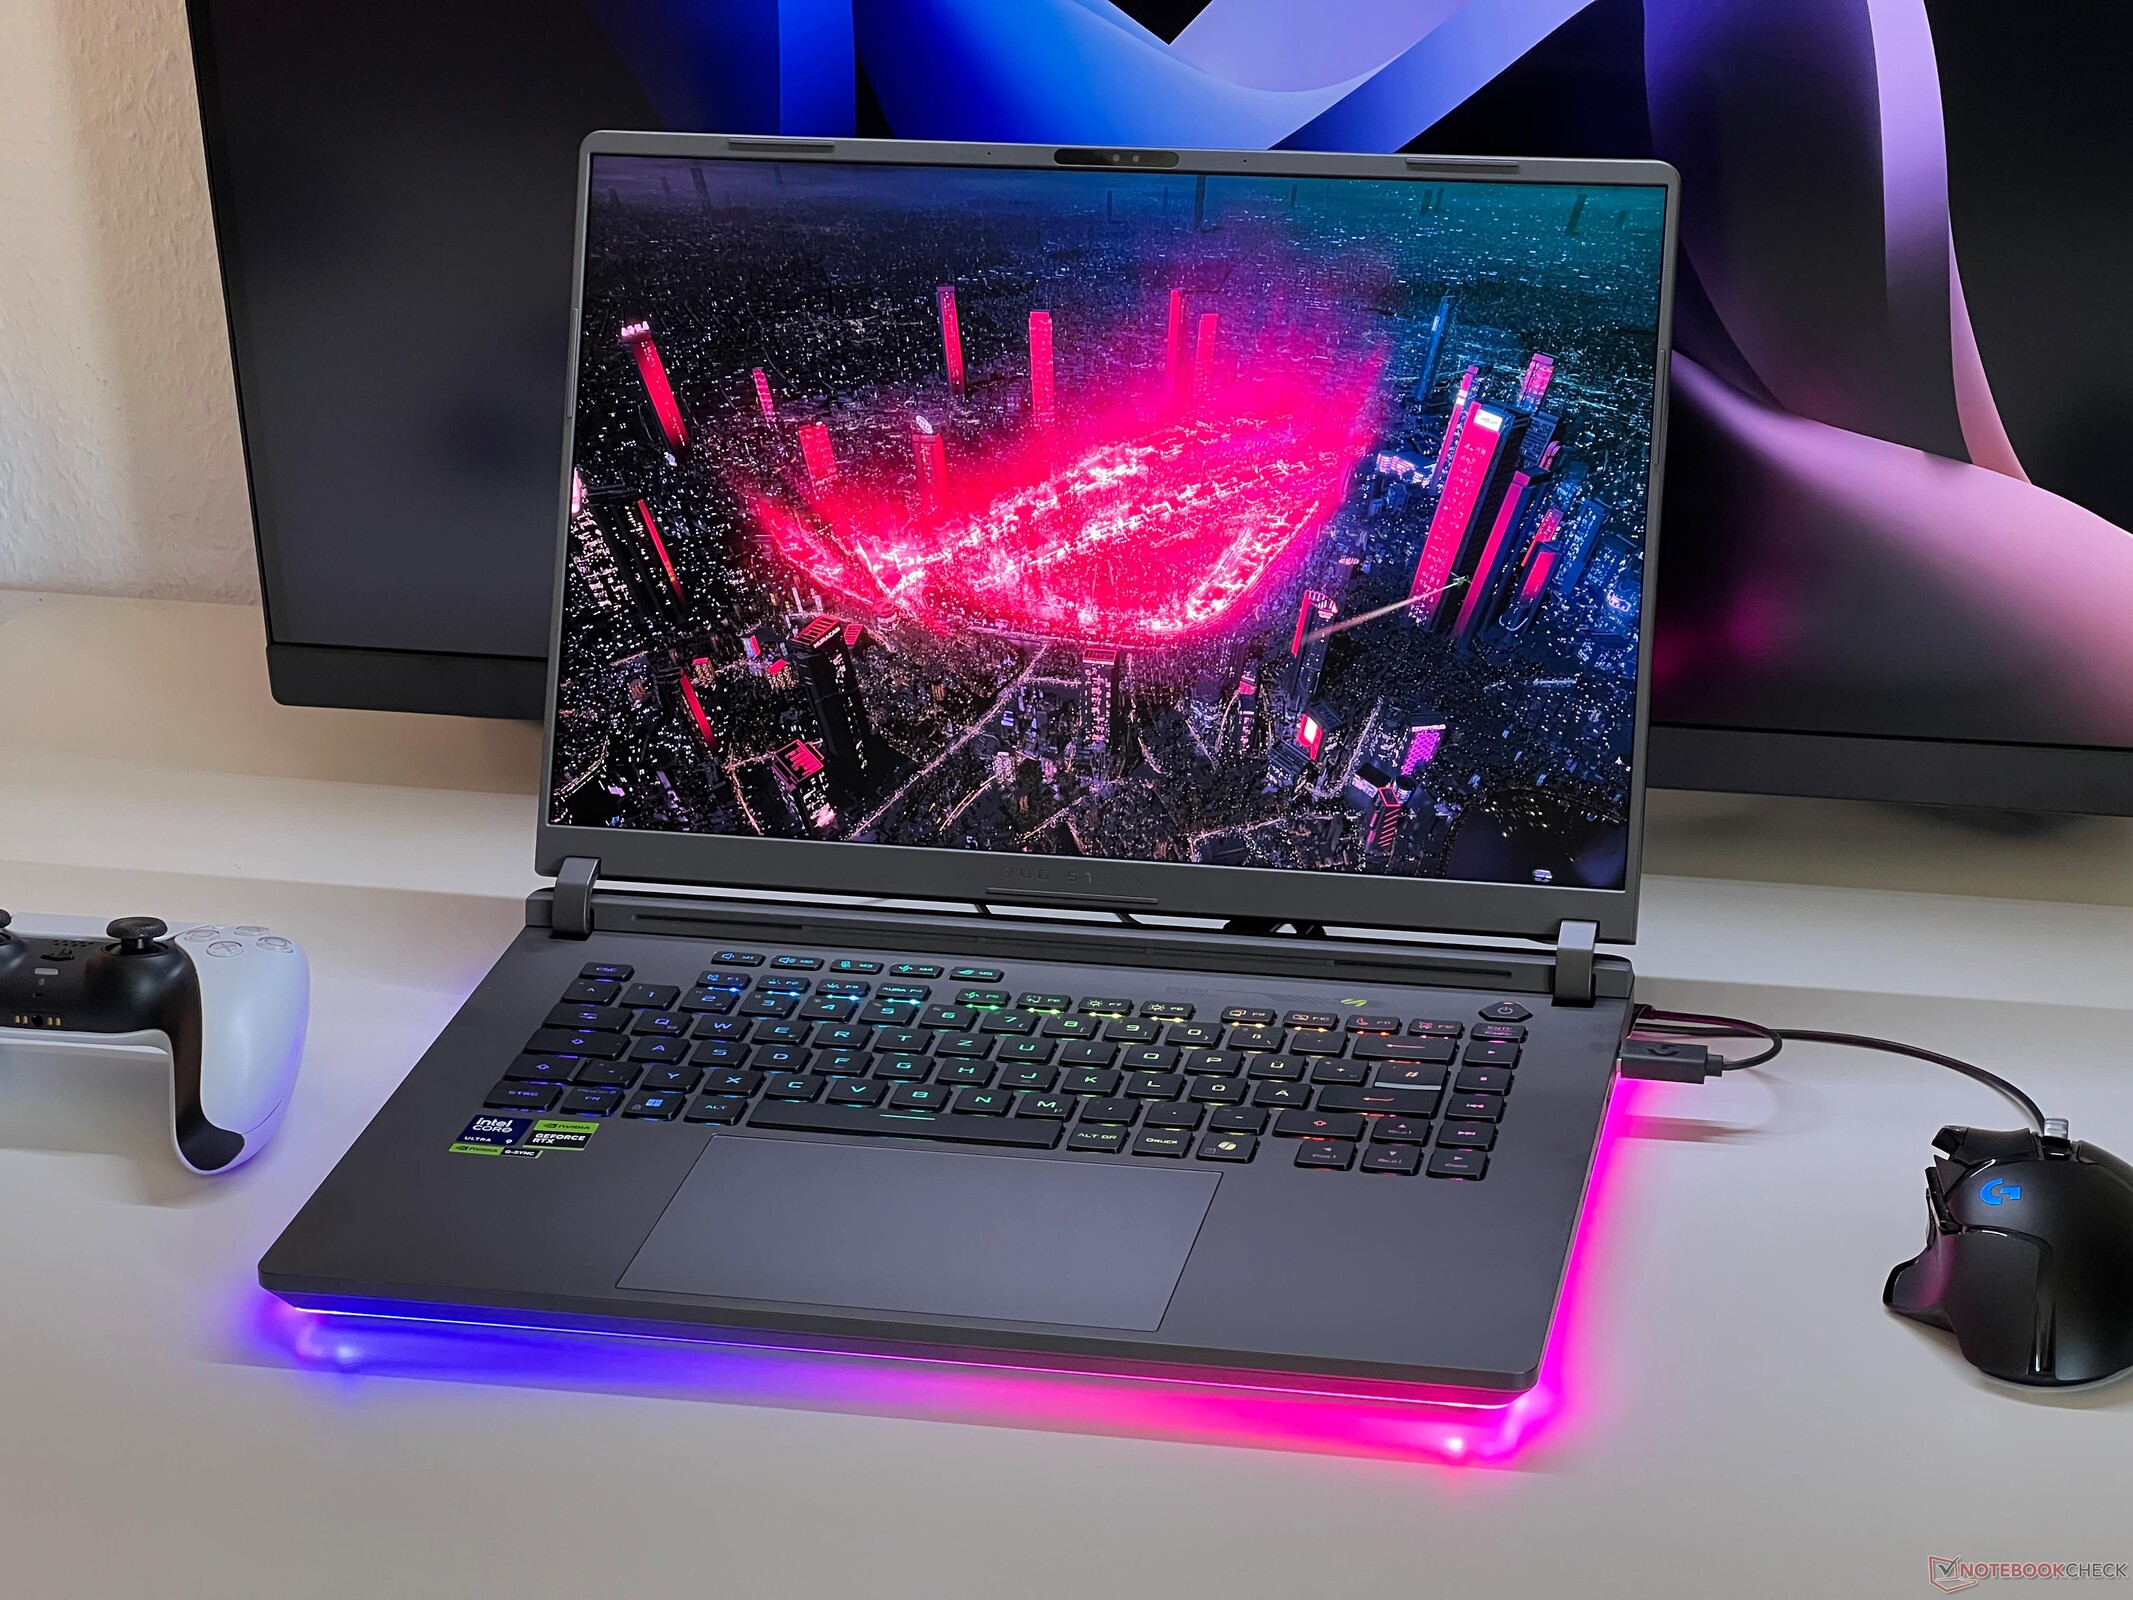
La nouvelle Asus ROG Strix G16 est disponible avec la RTX 5080 Laptop au maximum, mais ce n'est pas un problème pour jouer. Le Strix G16 représente un bon package de jeu avec un écran IPS mat, un Core Ultra 9 275 HX rapide, et de très bonnes options d'entretien.Andreas Osthoff, 👁 Andreas Osthoff (traduit par DeepL / Ninh Duy) Publié 🇺🇸 🇩🇪
Verdict - Le ROG Strix G16 est un bon ordinateur portable de jeu
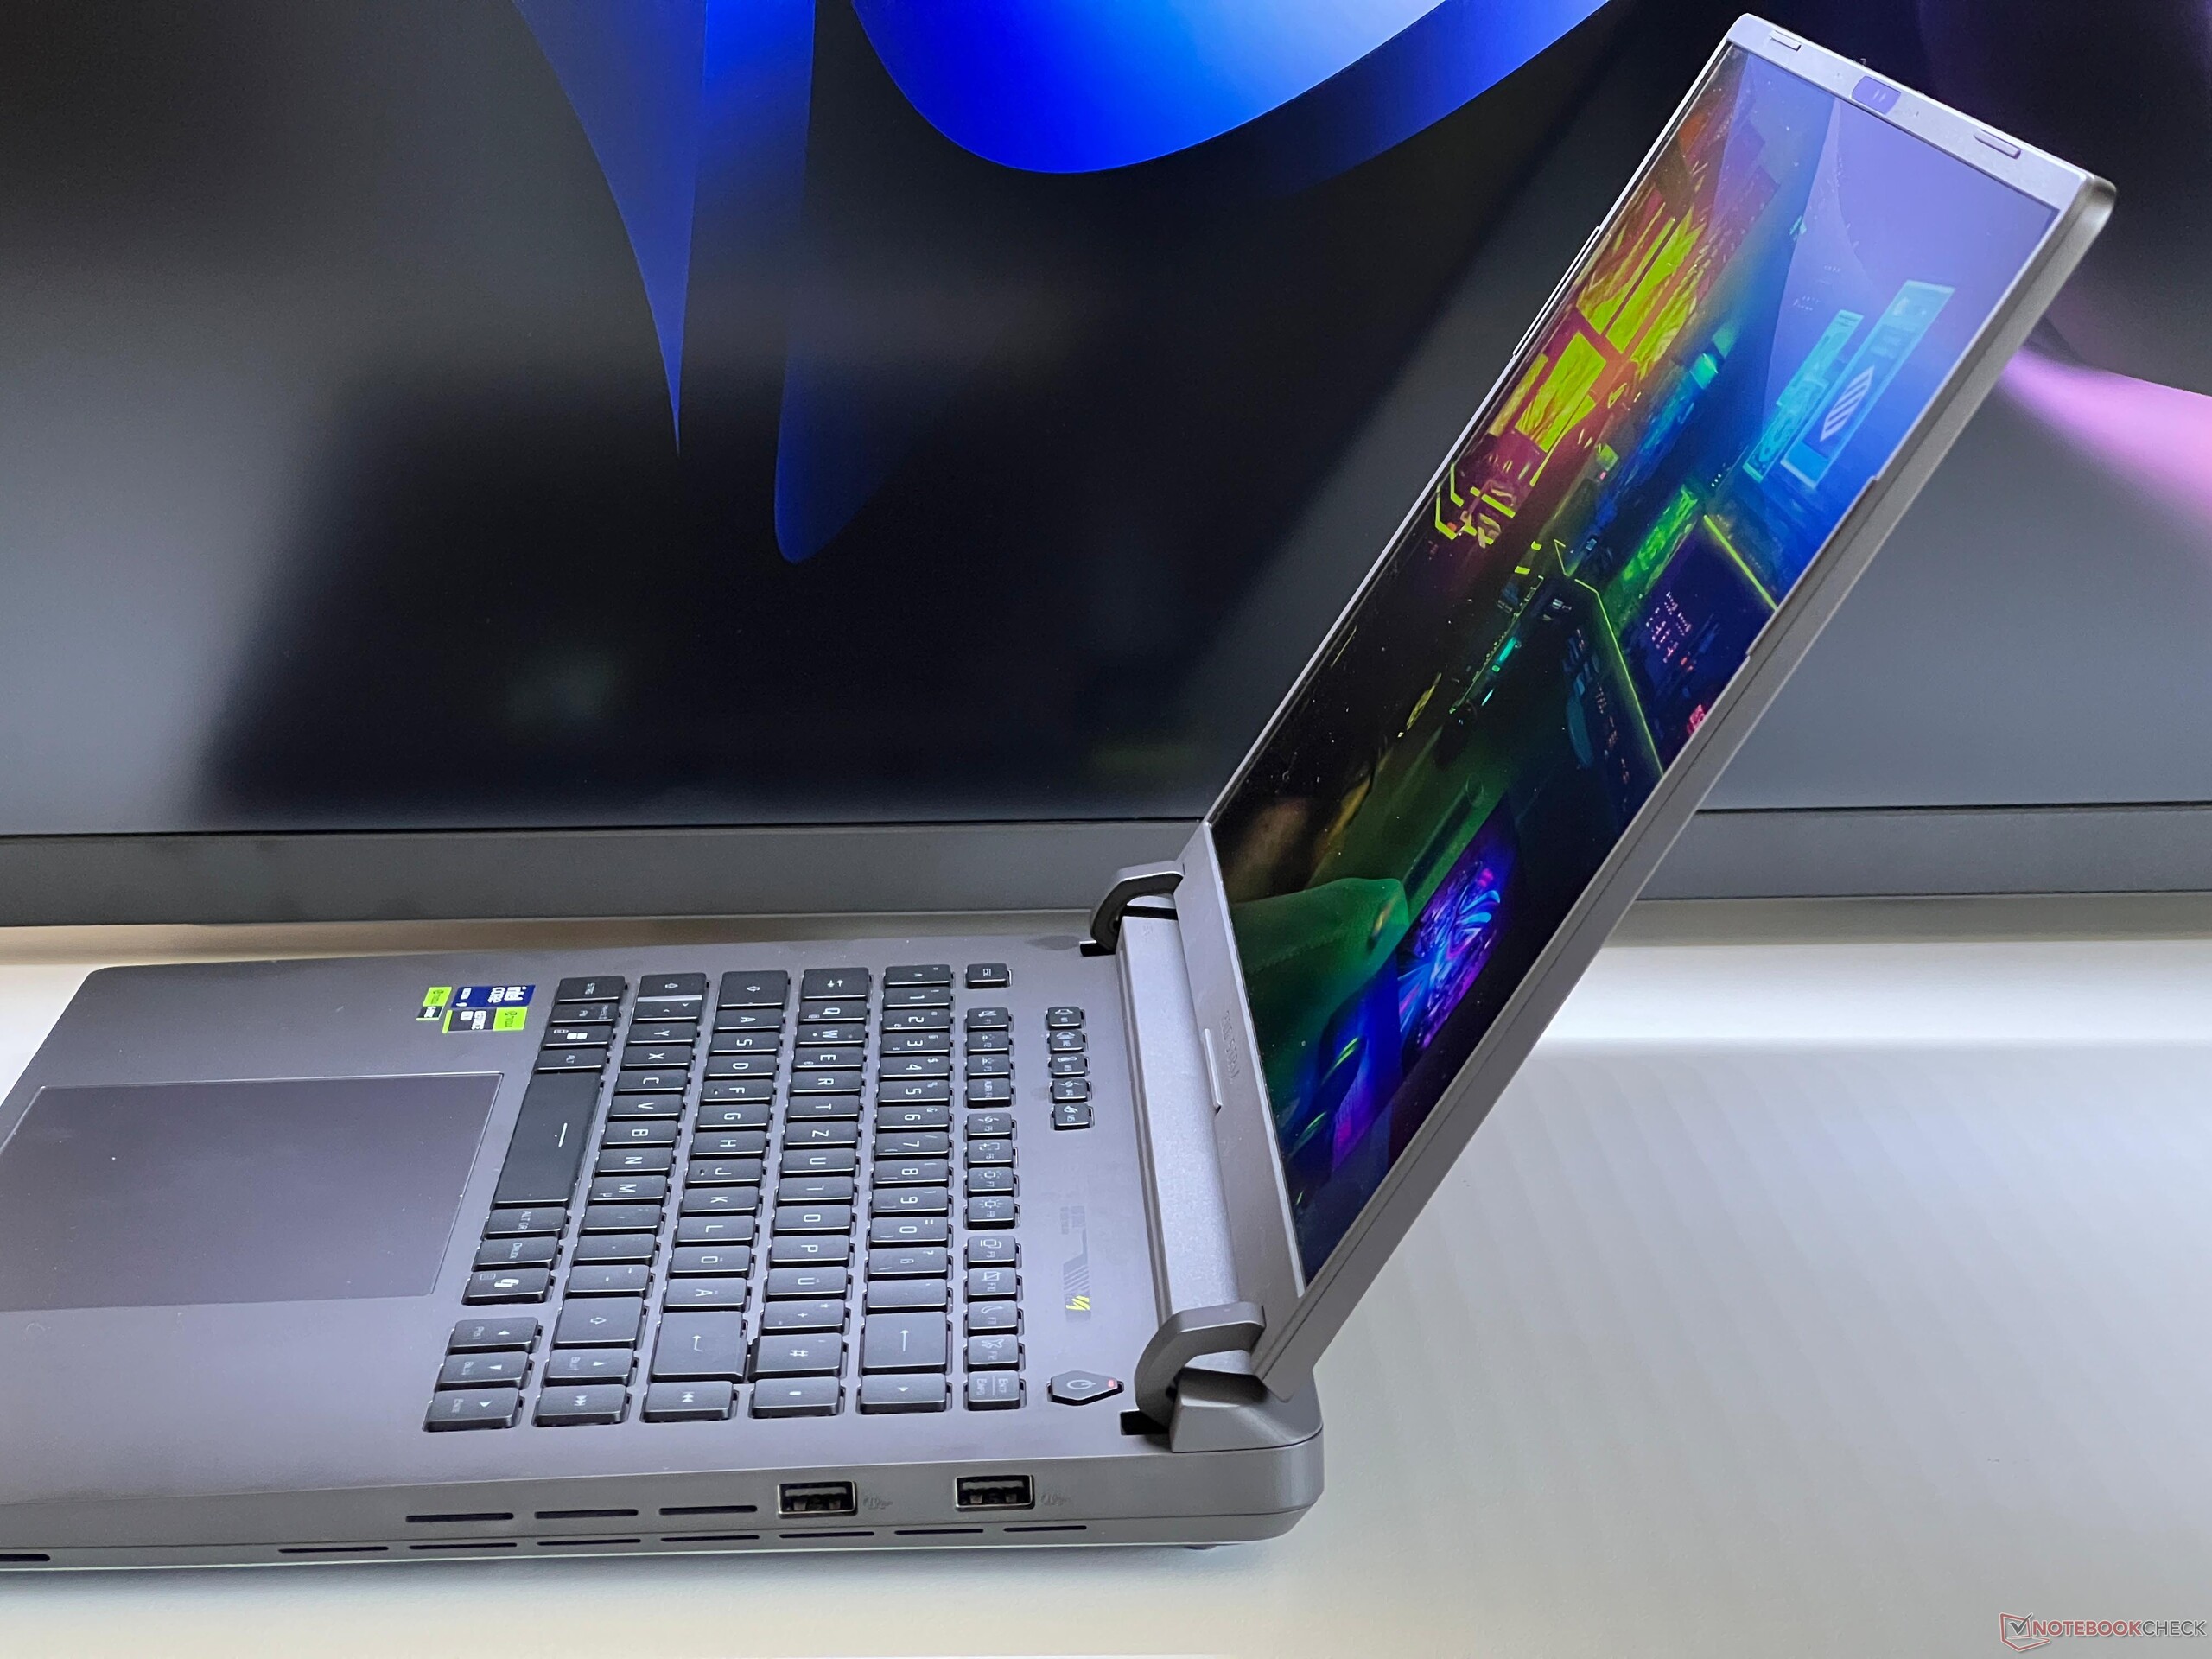
Le nouveau Asus ROG Strix G16 est un ordinateur portable de jeu puissant qui laisse une bonne impression générale dans notre test. Le fait que la dalle Mini-LED et la RTX 5090 Laptop soient réservées au Strix SCAR 16, plus cher, ne représente pas un grand problème. La dalle IPS mate avec 240 Hz reste un peu en retrait au niveau du contraste, mais d'un autre côté il n'y aura pas de scintillement PWM et la qualité de l'image est très bonne dans l'ensemble. Dans ce cas, vous devez seulement vous passer du HDR.
Le nouvel ordinateur portable GeForce RTX 5080 convient parfaitement à la résolution WQHD native et, avec le rapide Intel Core Ultra 9 275HX, vous obtiendrez de bonnes performances de jeu, même si l'ancien ordinateur portable RTX 4080 n'est pas en reste. Ainsi, une mise à niveau n'aura de sens que pour les utilisateurs d'anciens GPU RTX 3000. La RTX 5090 Laptop sera à nouveau légèrement plus rapide, mais ne pourra vraiment exploiter son avantage qu'en 4K. Ce qui est encore plus ennuyeux est le fait qu'Asus ne propose le processeur Ryzen 9 9955HX, potentiellement meilleur, qu'en combinaison avec le RTX 5070 Ti Laptop dans un boîtier plus ancien.
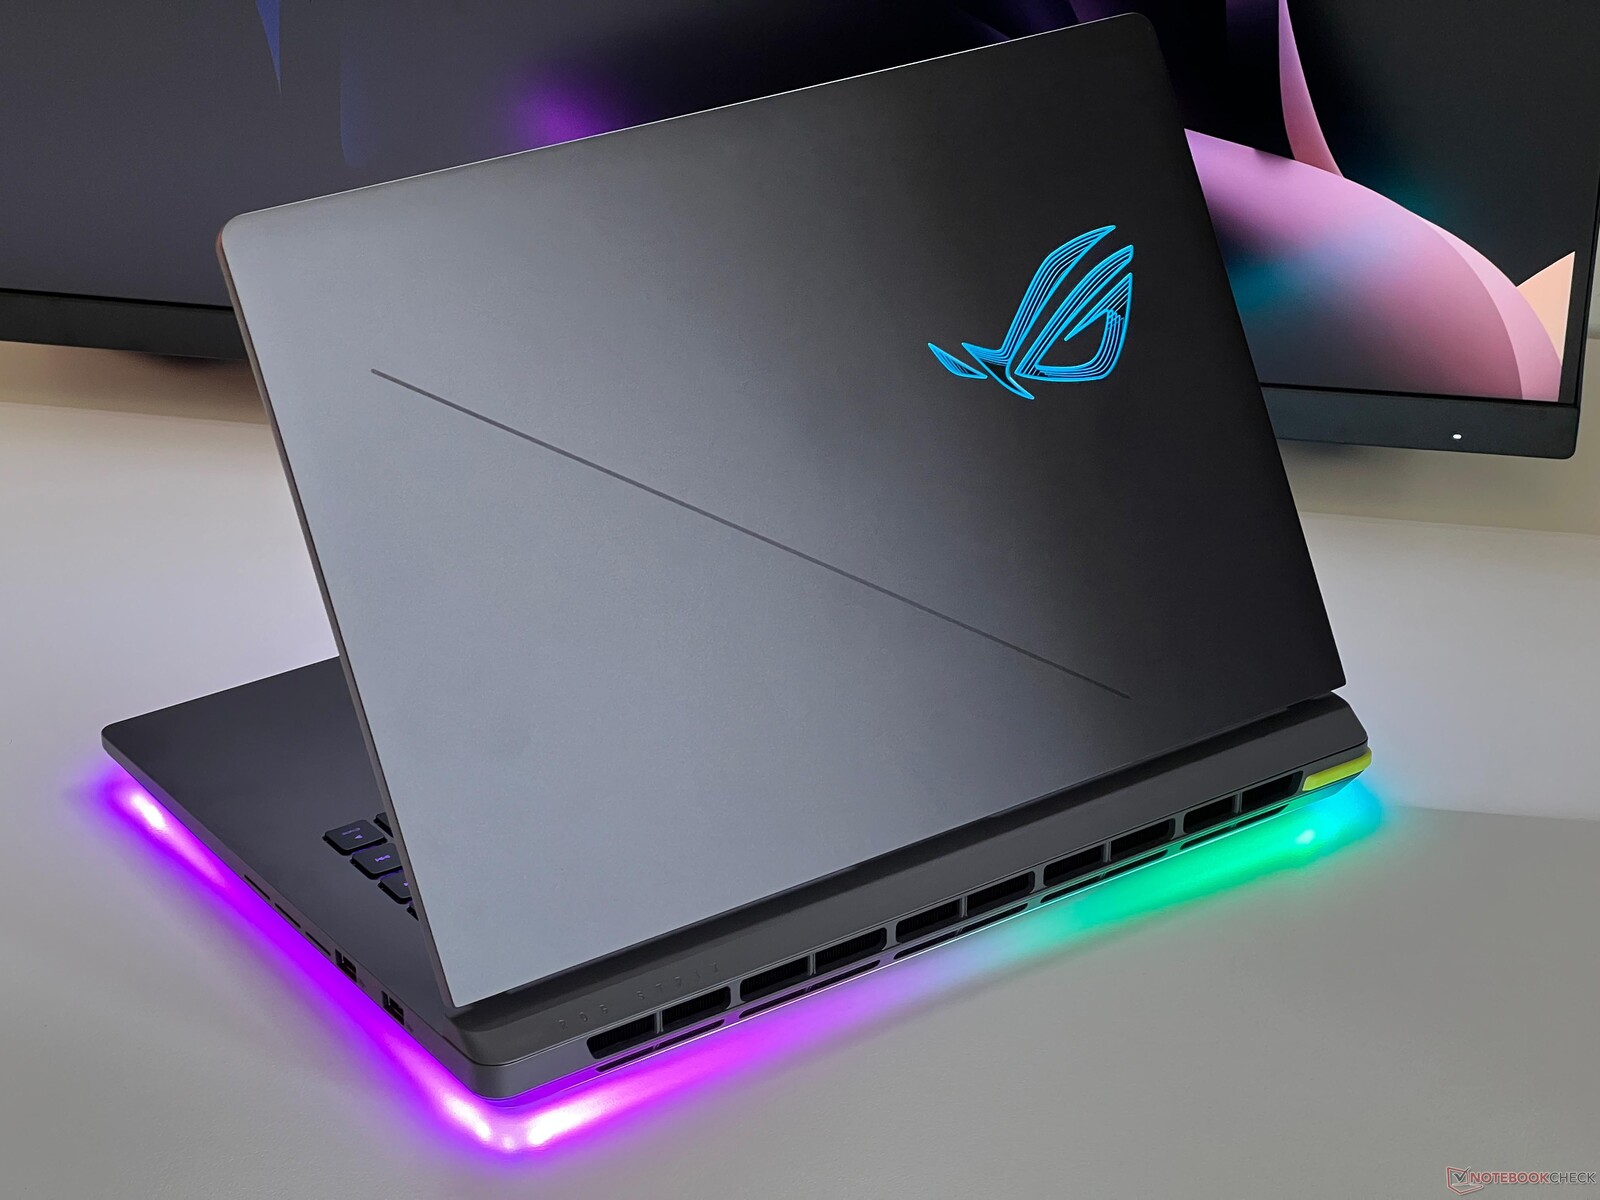
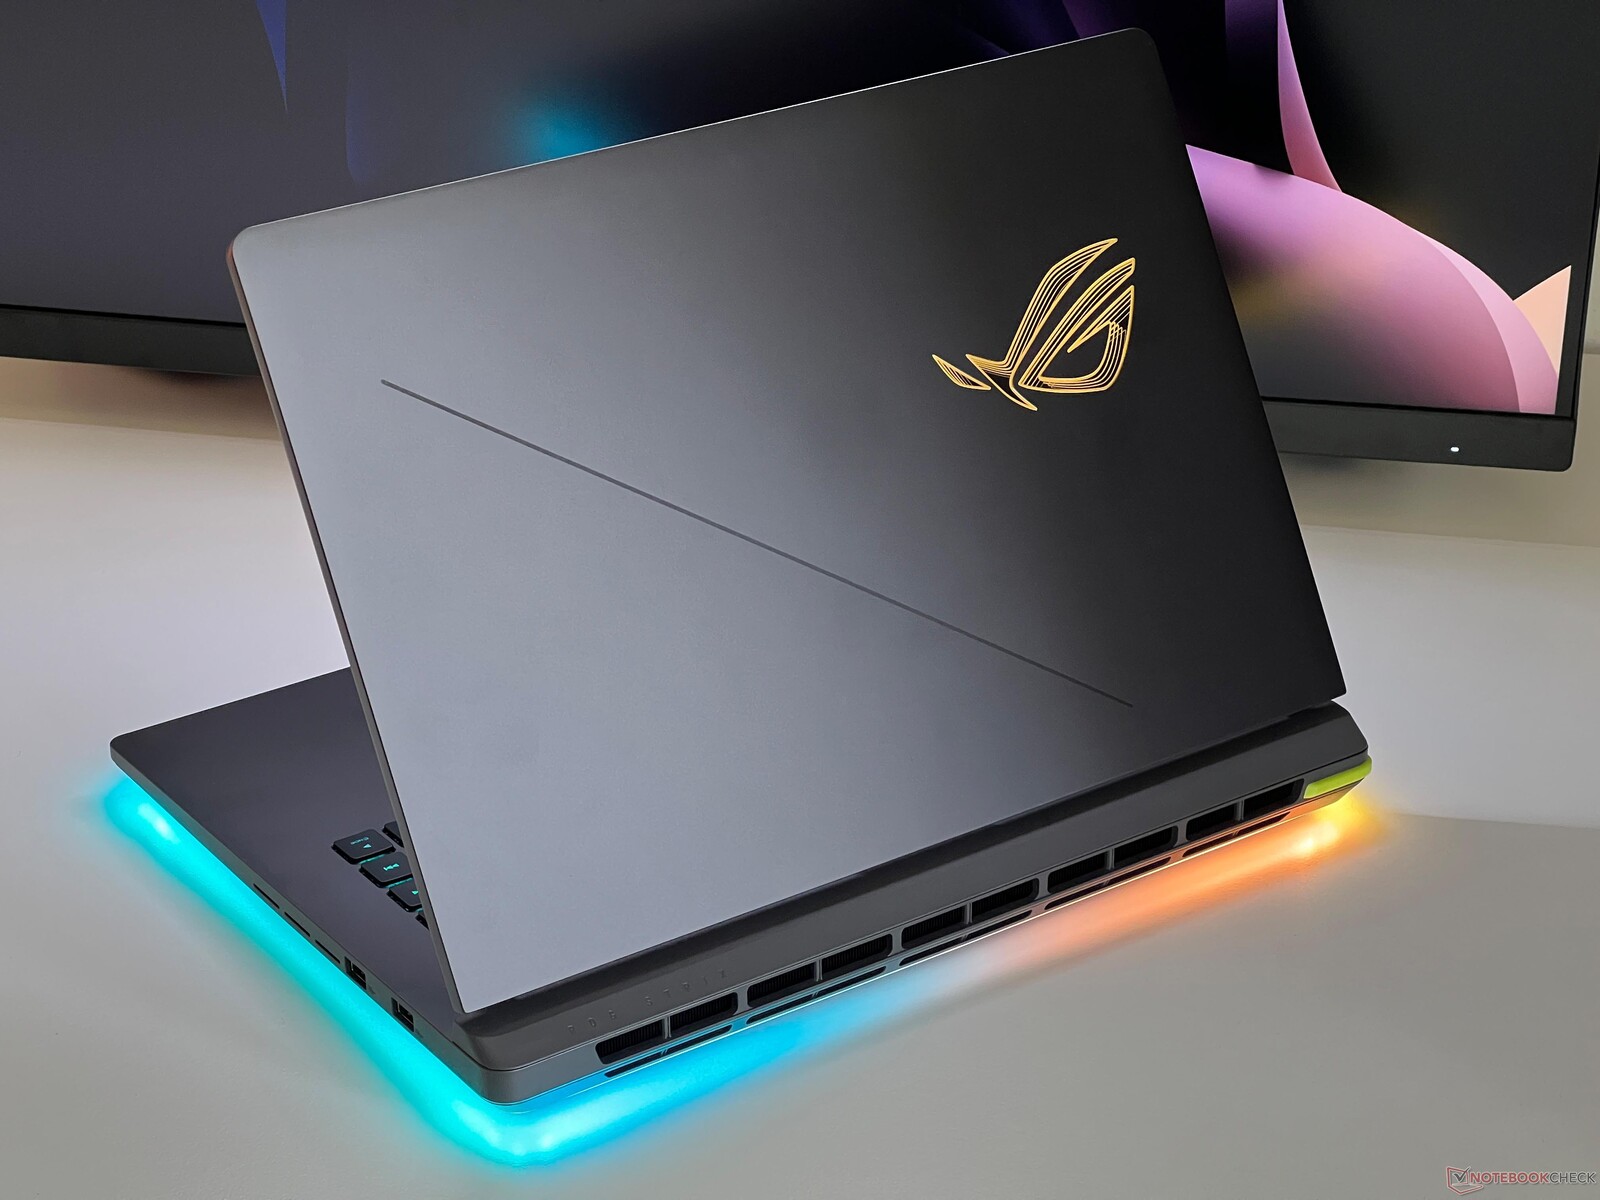
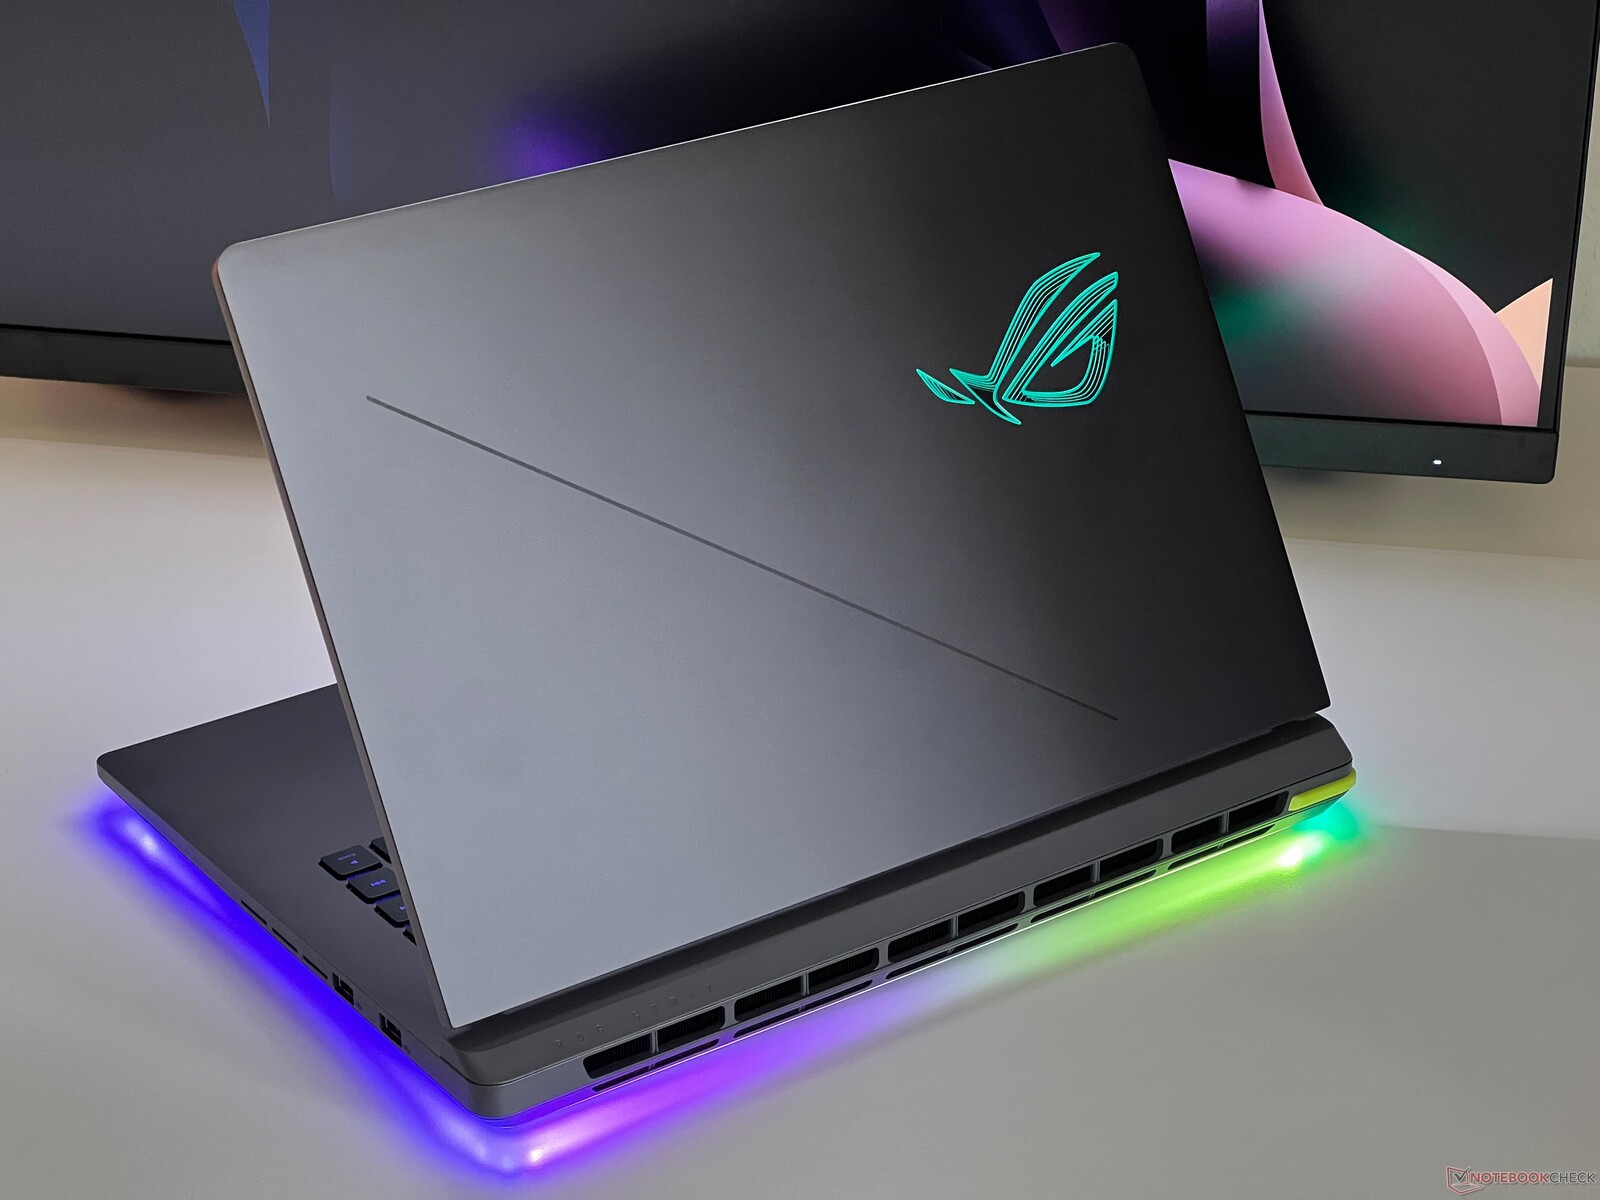
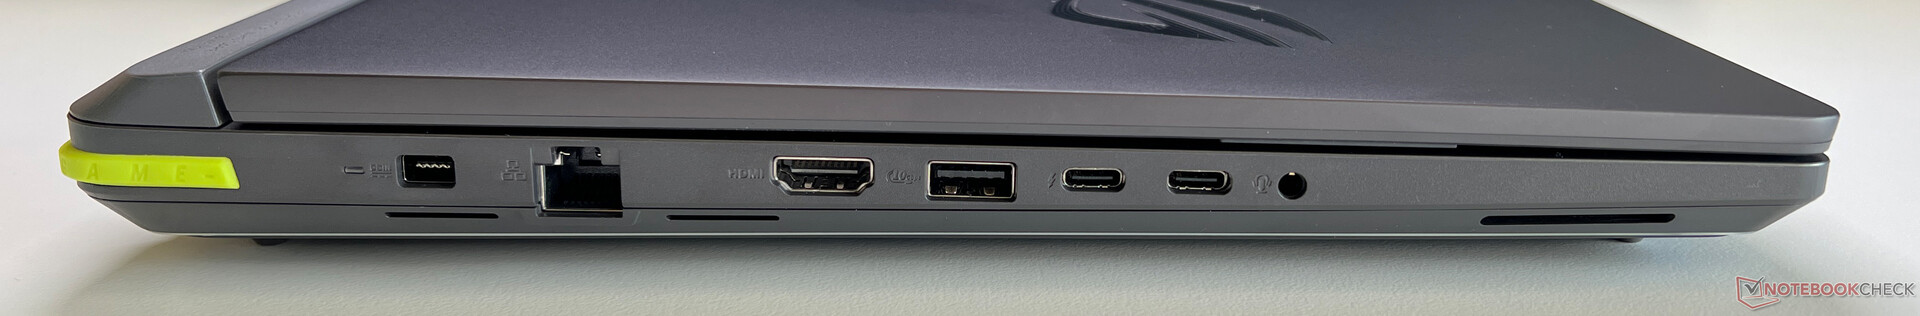
Le boîtier est fabriqué exclusivement en plastique, mais les surfaces grises ne sont pas aussi sujettes à la saleté que celles du ROG Strix SCAR noir. La qualité du boîtier est bonne dans l'ensemble, les points forts étant la barre LED illuminée autour du fond et le mécanisme de déverrouillage de l'emplacement de la base. En dehors de leur positionnement, nous n'avons rien à redire sur les connexions, puisque deux connexions Thunderbolt 5 rapides sont déjà incluses. Le clavier est très confortable, mais il manque un pavé numérique. L'autonomie de la batterie de la Strix G16 est également supérieure à celle de ses concurrents.
Le concurrent probablement le plus proche, le Lenovo Legion Pro 7i 16 G10le Lenovo Pro 7i 16 G10 offre des performances de jeu légèrement supérieures grâce à la RTX 5080 Laptop et propose un très bon écran OLED, bien qu'il soit réfléchissant et qu'il produise des scintillements PWM. En outre, la configuration comparable coûte 300 euros (~$341) de plus. Dans un futur proche, nous testerons également le XMG Neo 16 avec l'AMD Ryzen 9 9955HX et le RTX 5080 Laptop, dont l'échantillon d'ingénierie a déjà laissé une très bonne impression.
Points positifs
Points négatifs
Prix et disponibilité
Le ROG Strix G16 (2025) est disponible à partir de $1800 chez Asus aux États-Unis, le modèle RTX 5080 coûtant 2700 $.
Table des matières
- Verdict - Le ROG Strix G16 est un bon ordinateur portable de jeu
- Spécifications
- Cas - Gris foncé avec beaucoup d'éclairage
- Équipement - Strix G16 avec Thunderbolt 5
- Périphériques d'entrée - Un clavier confortable
- Écran - IPS avec 240 Hz et G-Sync
- Performance - Ordinateur portable Core Ultra 9 et RTX 5080
- Émissions - Basses températures
- Gestion de l'énergie - Ordinateur portable de jeu avec une longue durée de vie de la batterie
- Notebookcheck Note globale
- Possible Alternatives in Comparison
Les modèles ROG Strix sont les ordinateurs portables de jeu haut de gamme d'Asus, et il y a quelques différences entre les modèles Strix et Strix SCAR. Les modèles phares ROG SCAR sont disponibles avec le GPU le plus rapide (RTX 5090 Laptop) et offrent des panneaux Mini-LED ainsi que des options d'éclairage supplémentaires sous la forme d'écrans secondaires sur le couvercle de l'écran. En revanche, le ROG Strix normal (G16 ou G18) est disponible avec le RTX 5080 Laptop au maximum et comprend des écrans IPS. Les modèles AMD G16/G18 avec le Ryzen 9 9955HX sont même limités à la RTX 5070 Ti et utilisent également un boîtier complètement différent (sans la nouvelle trappe de maintenance).
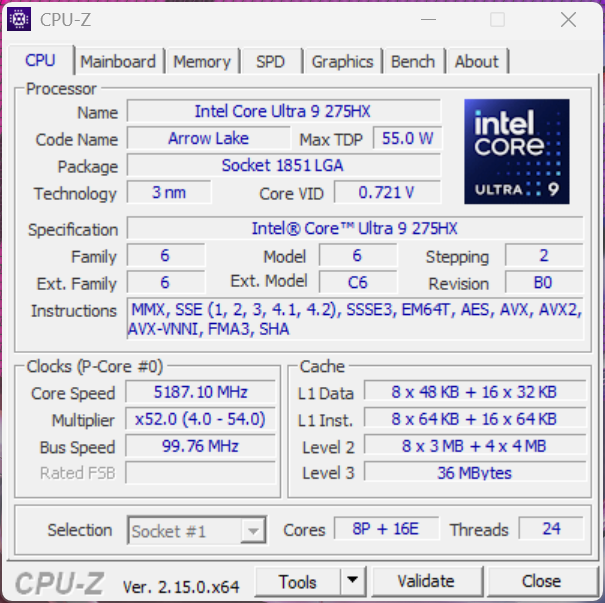
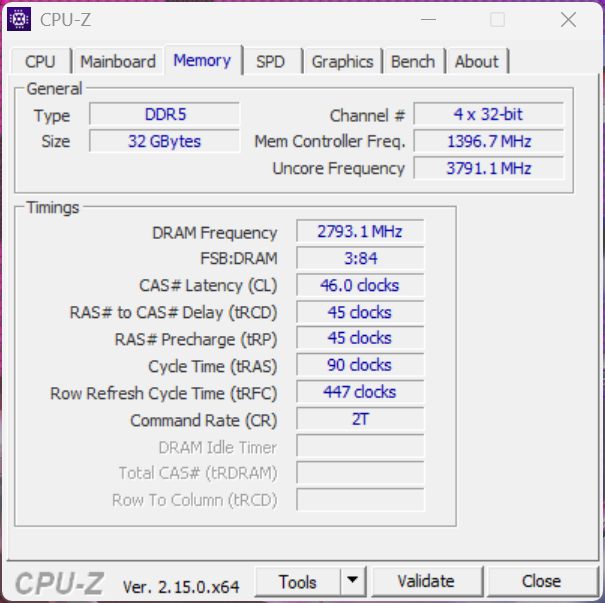
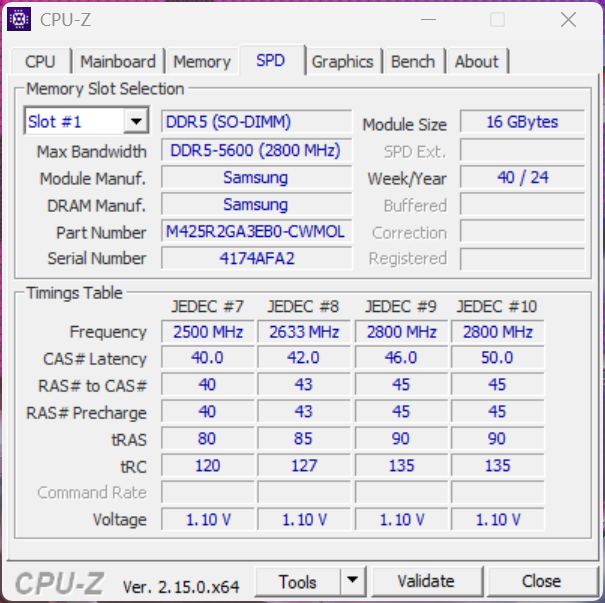
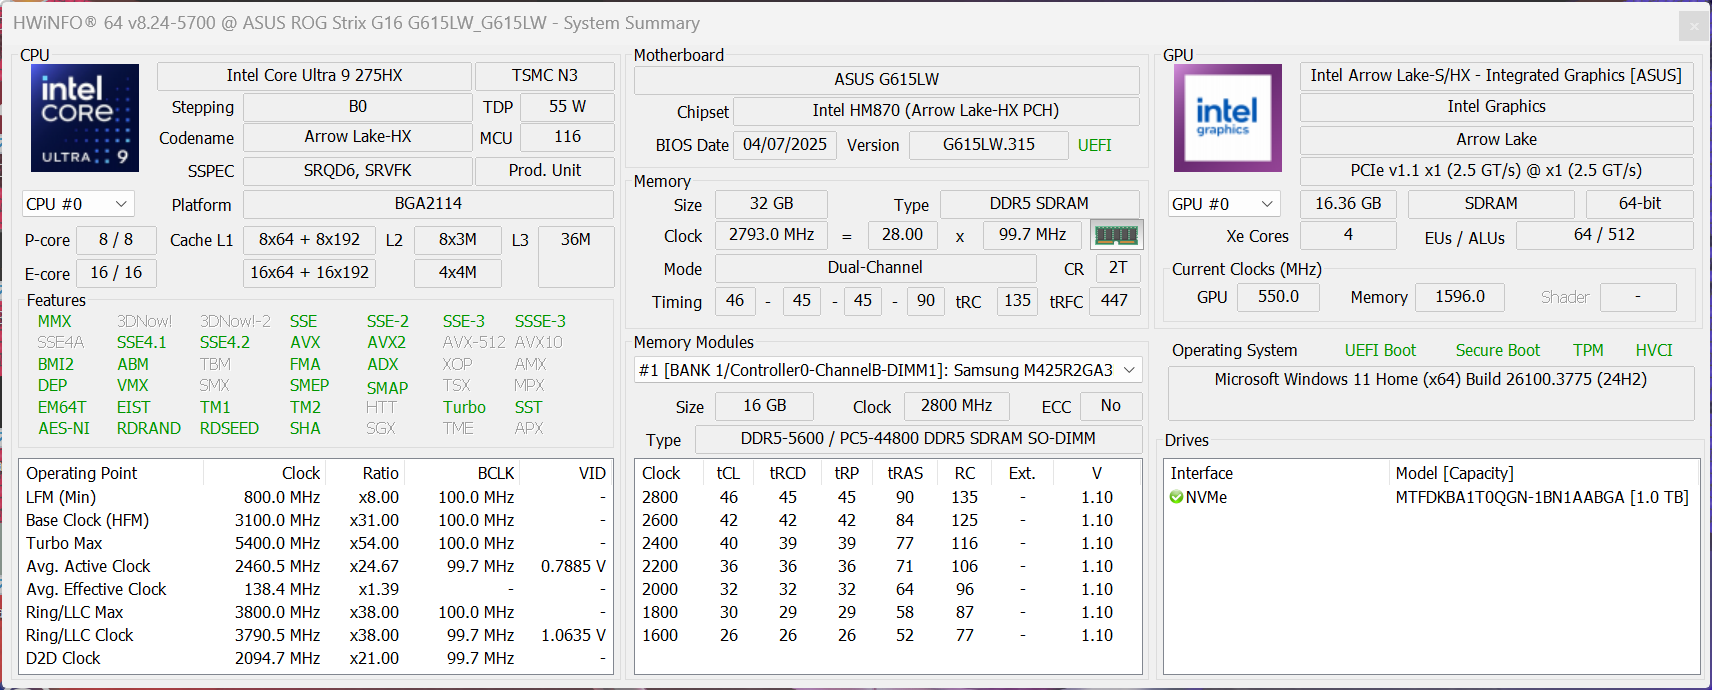
Aujourd'hui, nous testons le ROG Strix G16 G615 avec l'Intel Core Ultra 9 275HX, 32 Go de RAM, un SSD de 1 To, un écran WQHD-IPS à 240 Hz, et le GeForce RTX 5080 Laptop, disponible à un prix MSRP de 3,299 Euros (en Allemagne, ~$3,750).
Spécifications
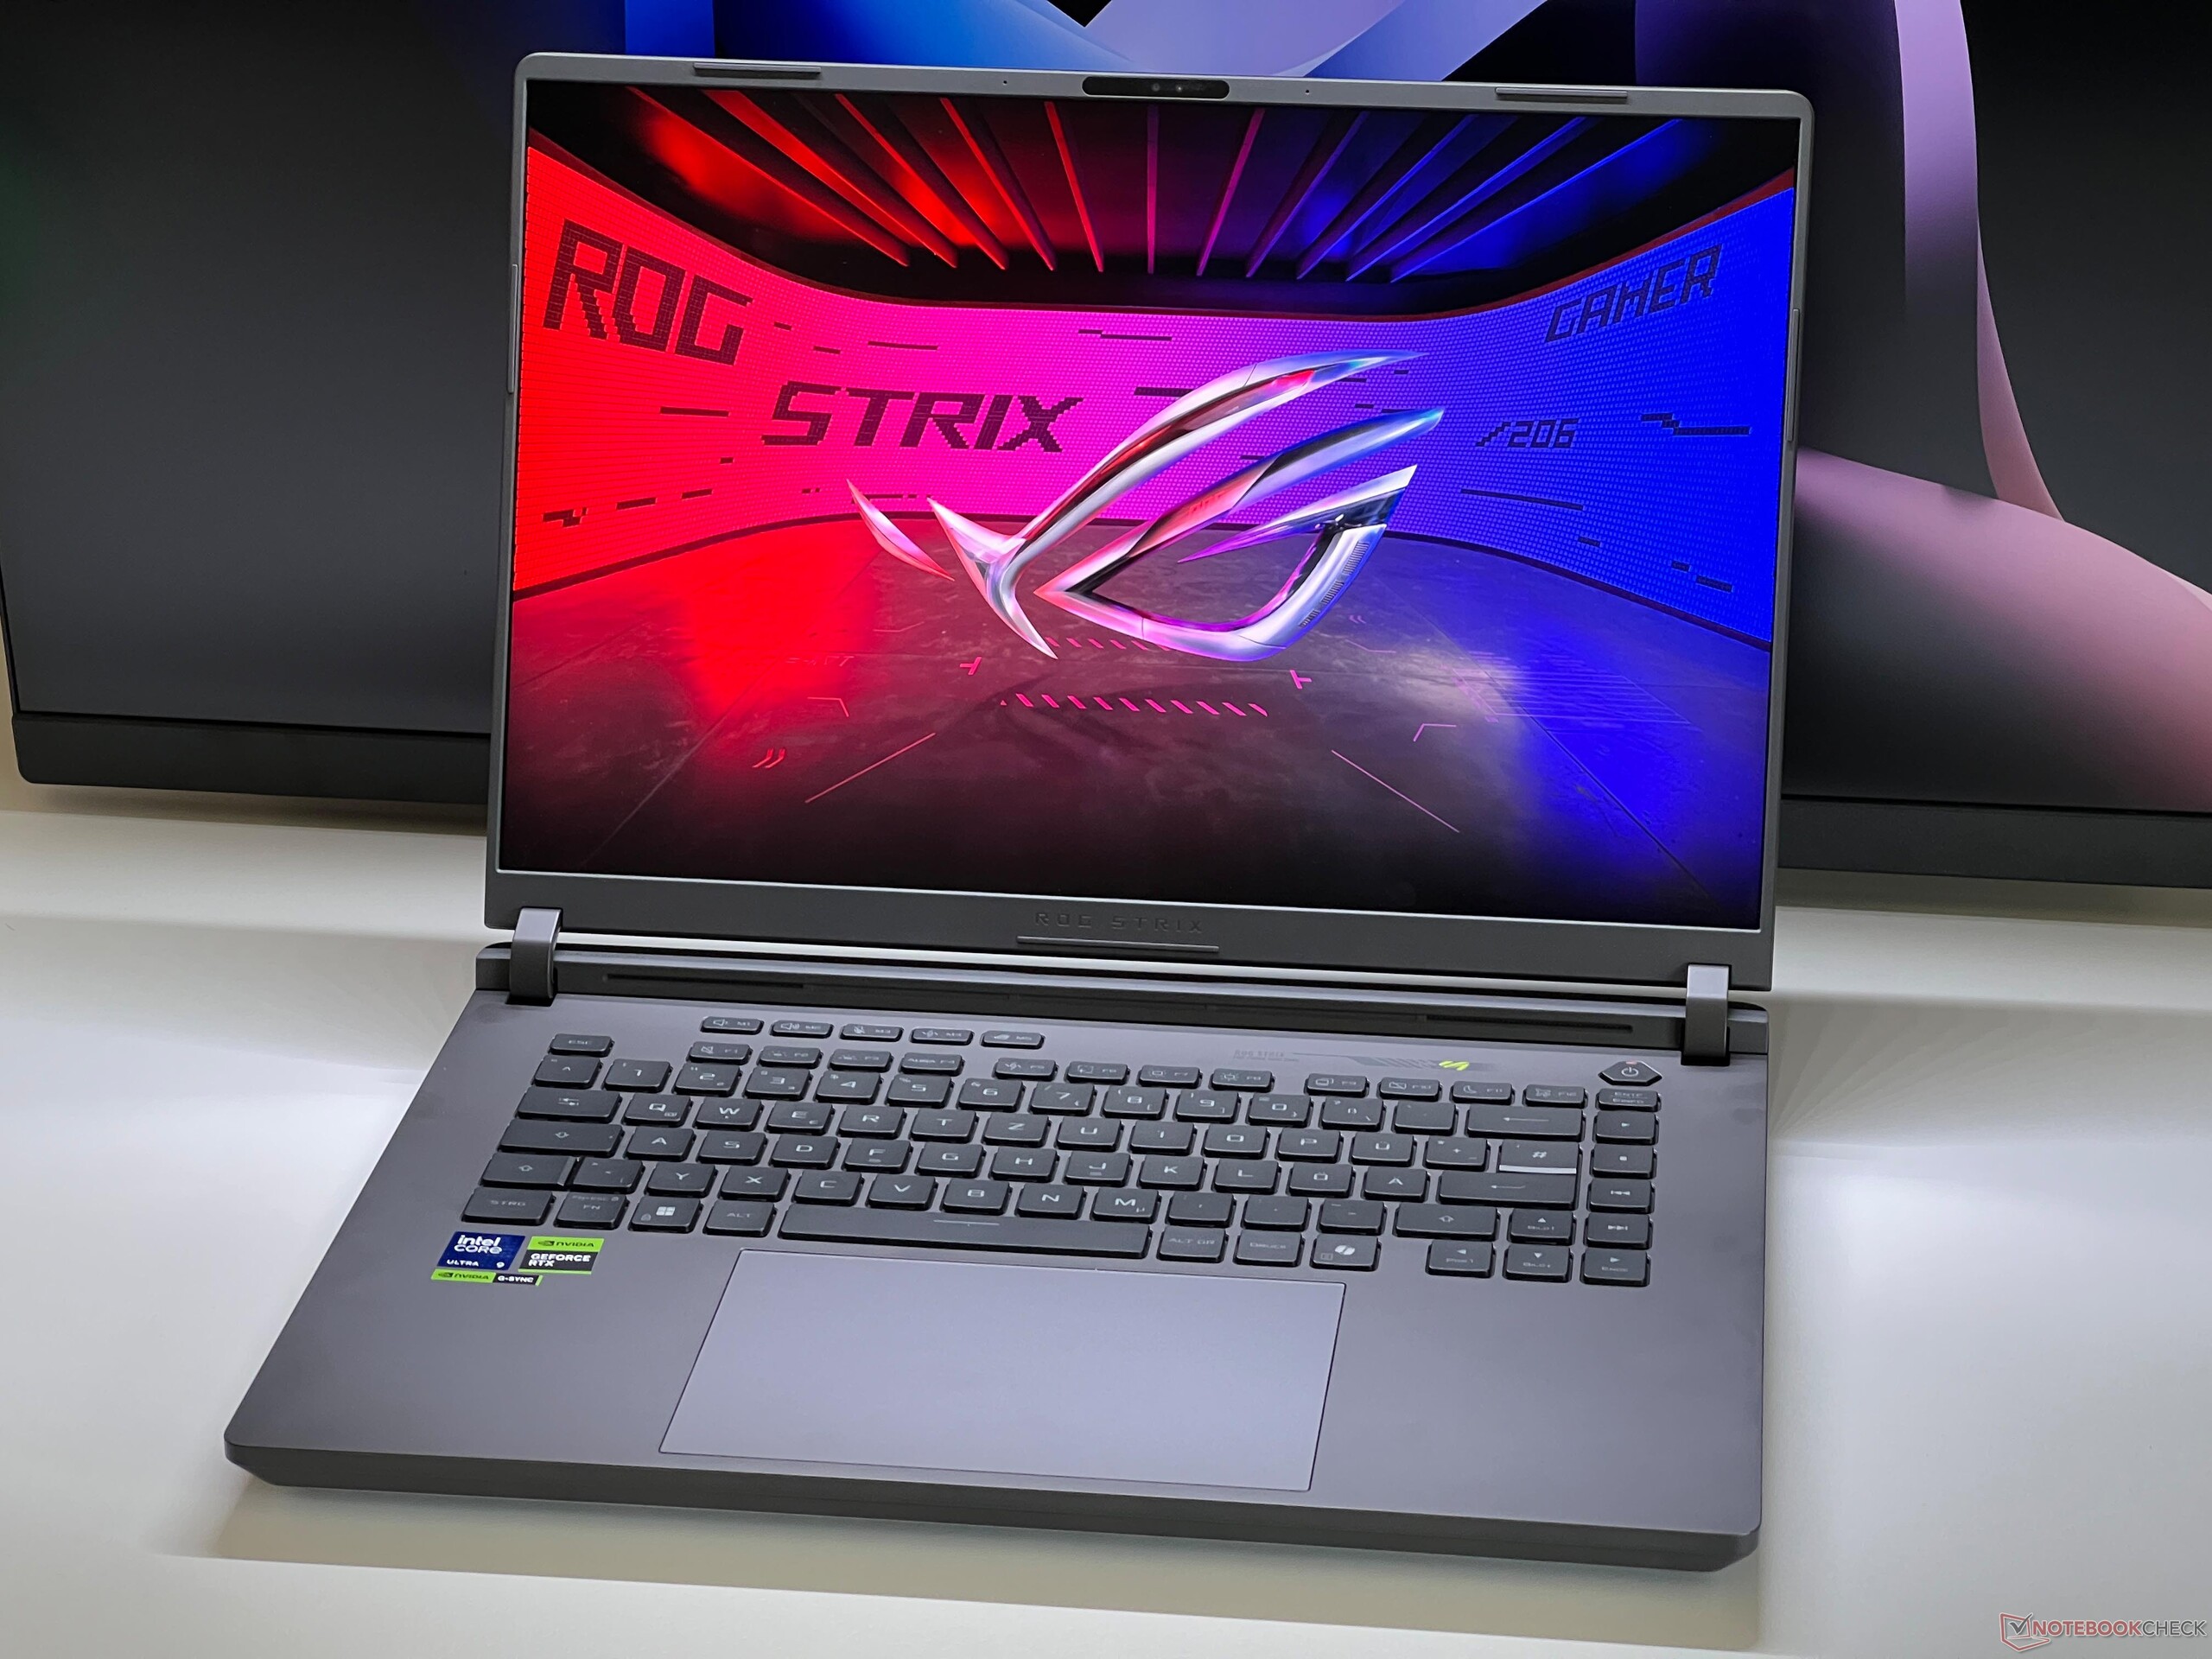
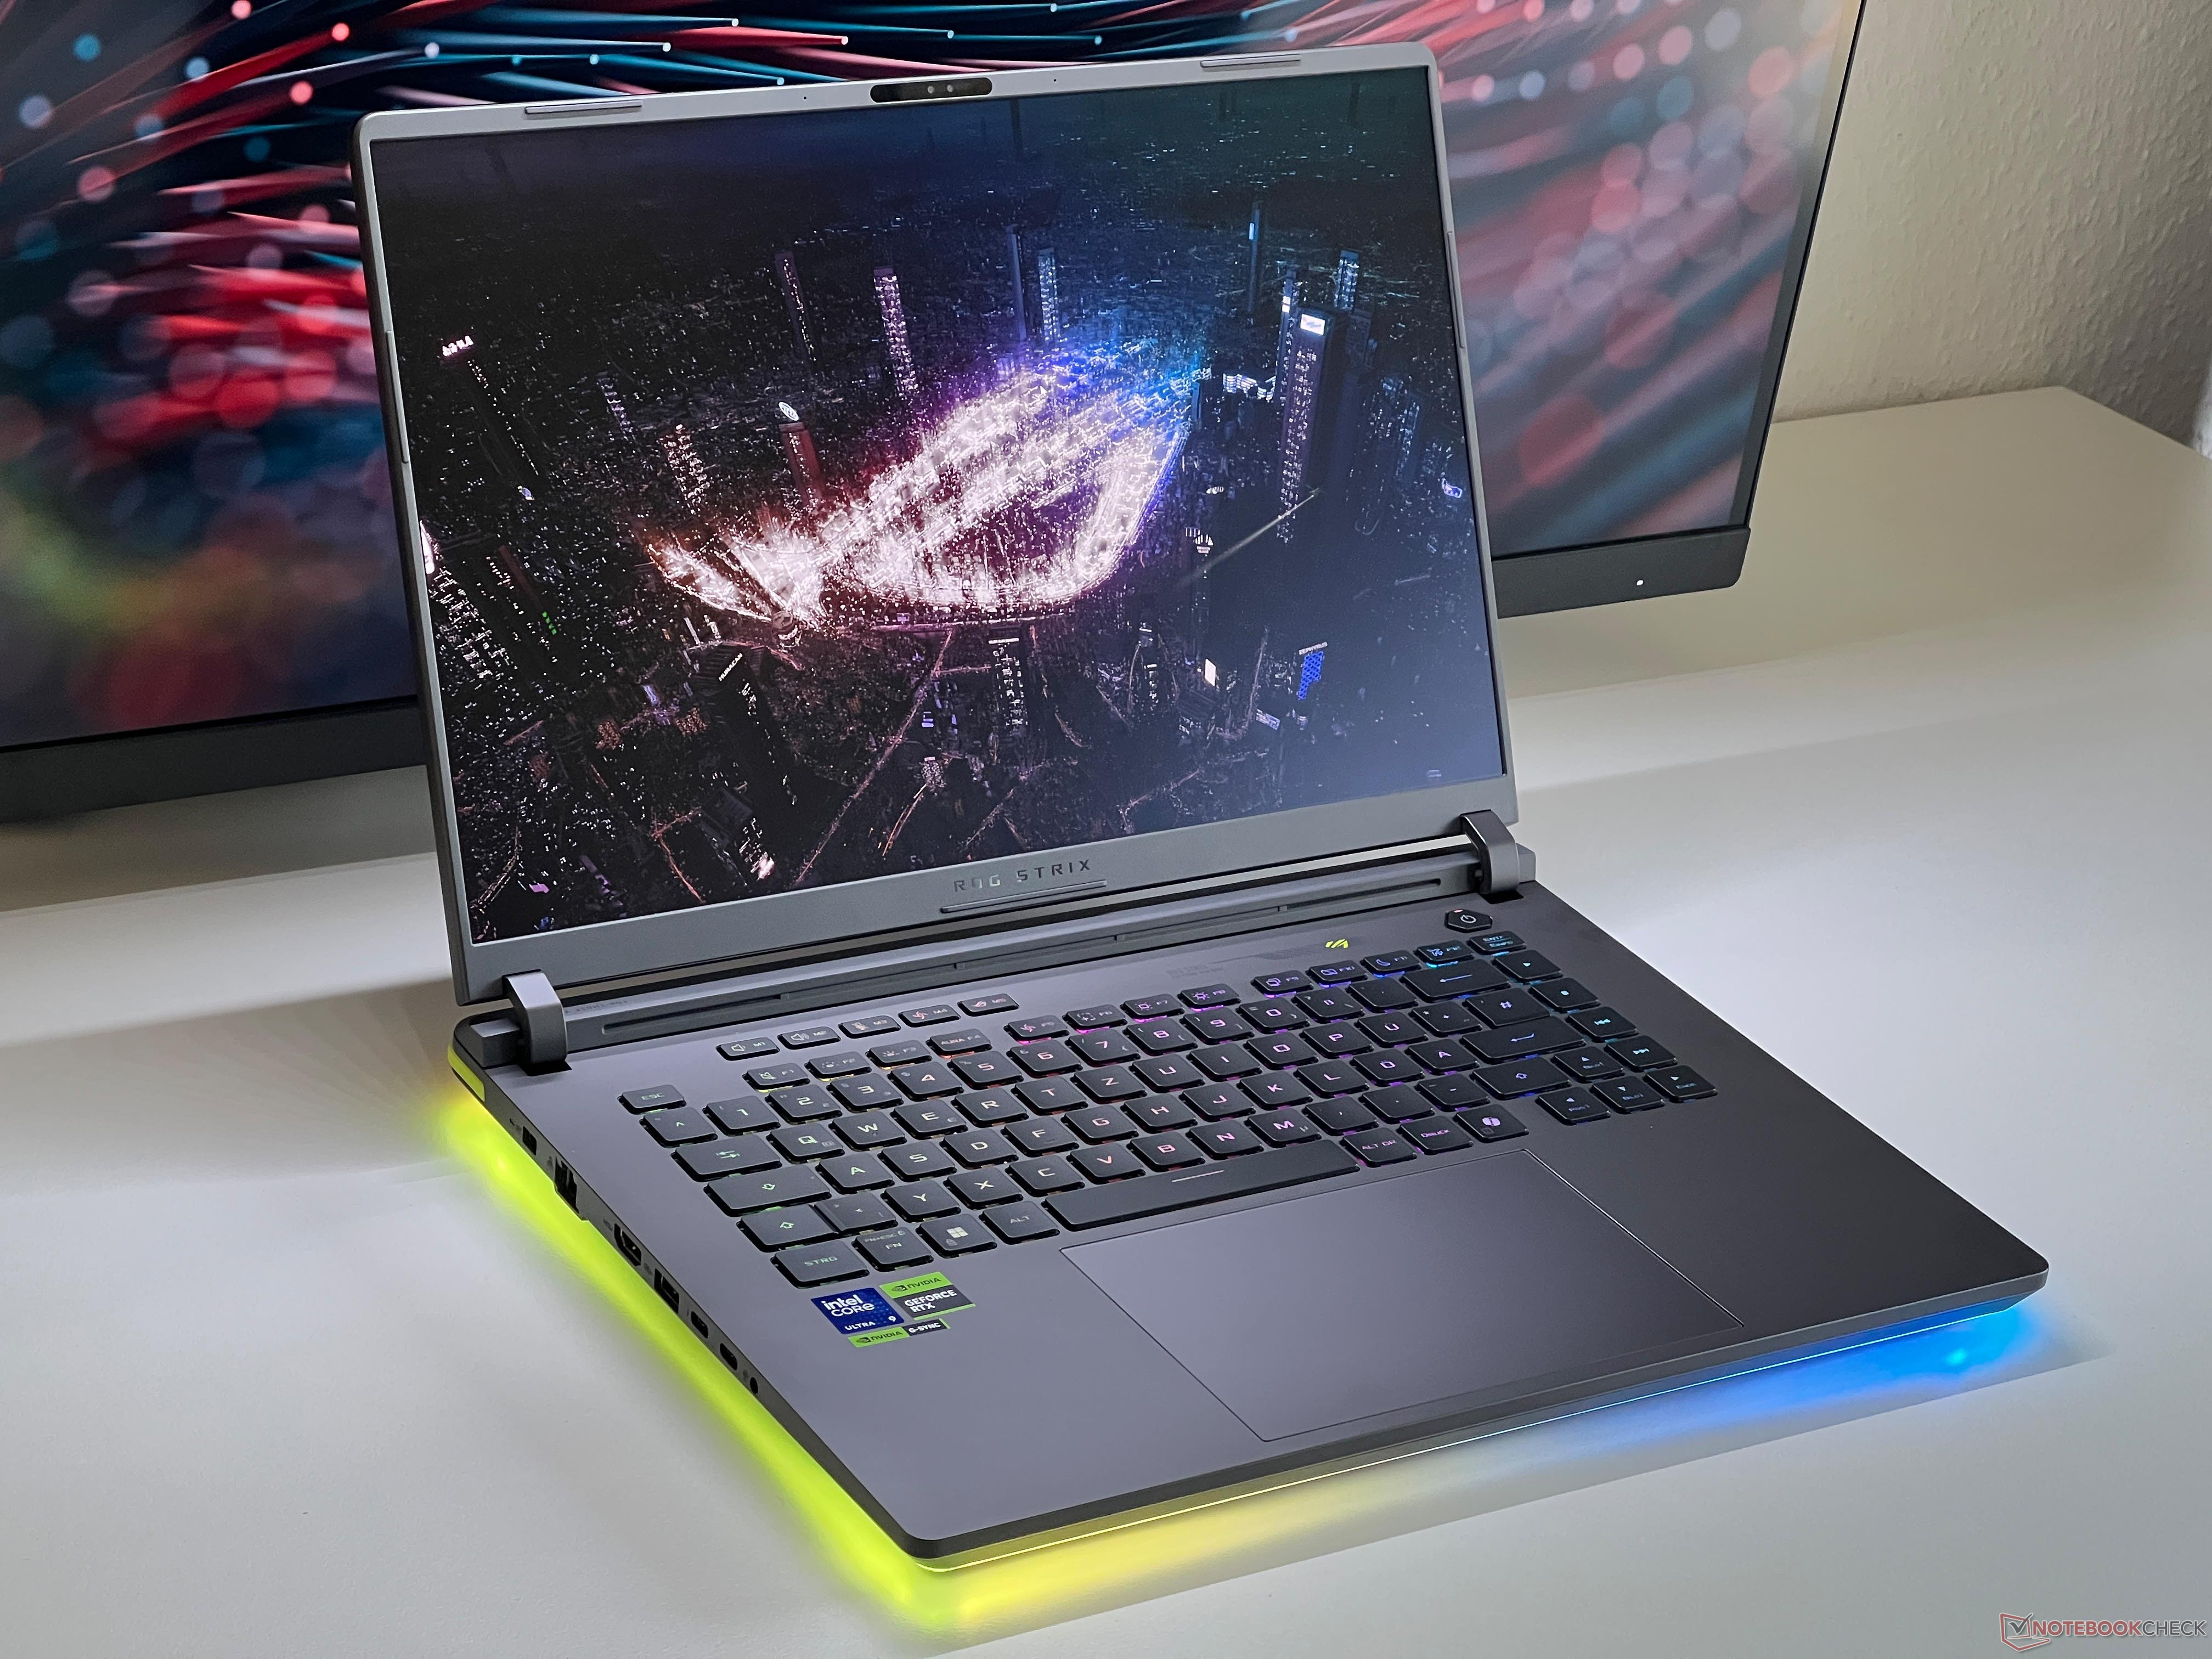
Cas - Gris foncé avec beaucoup d'éclairage
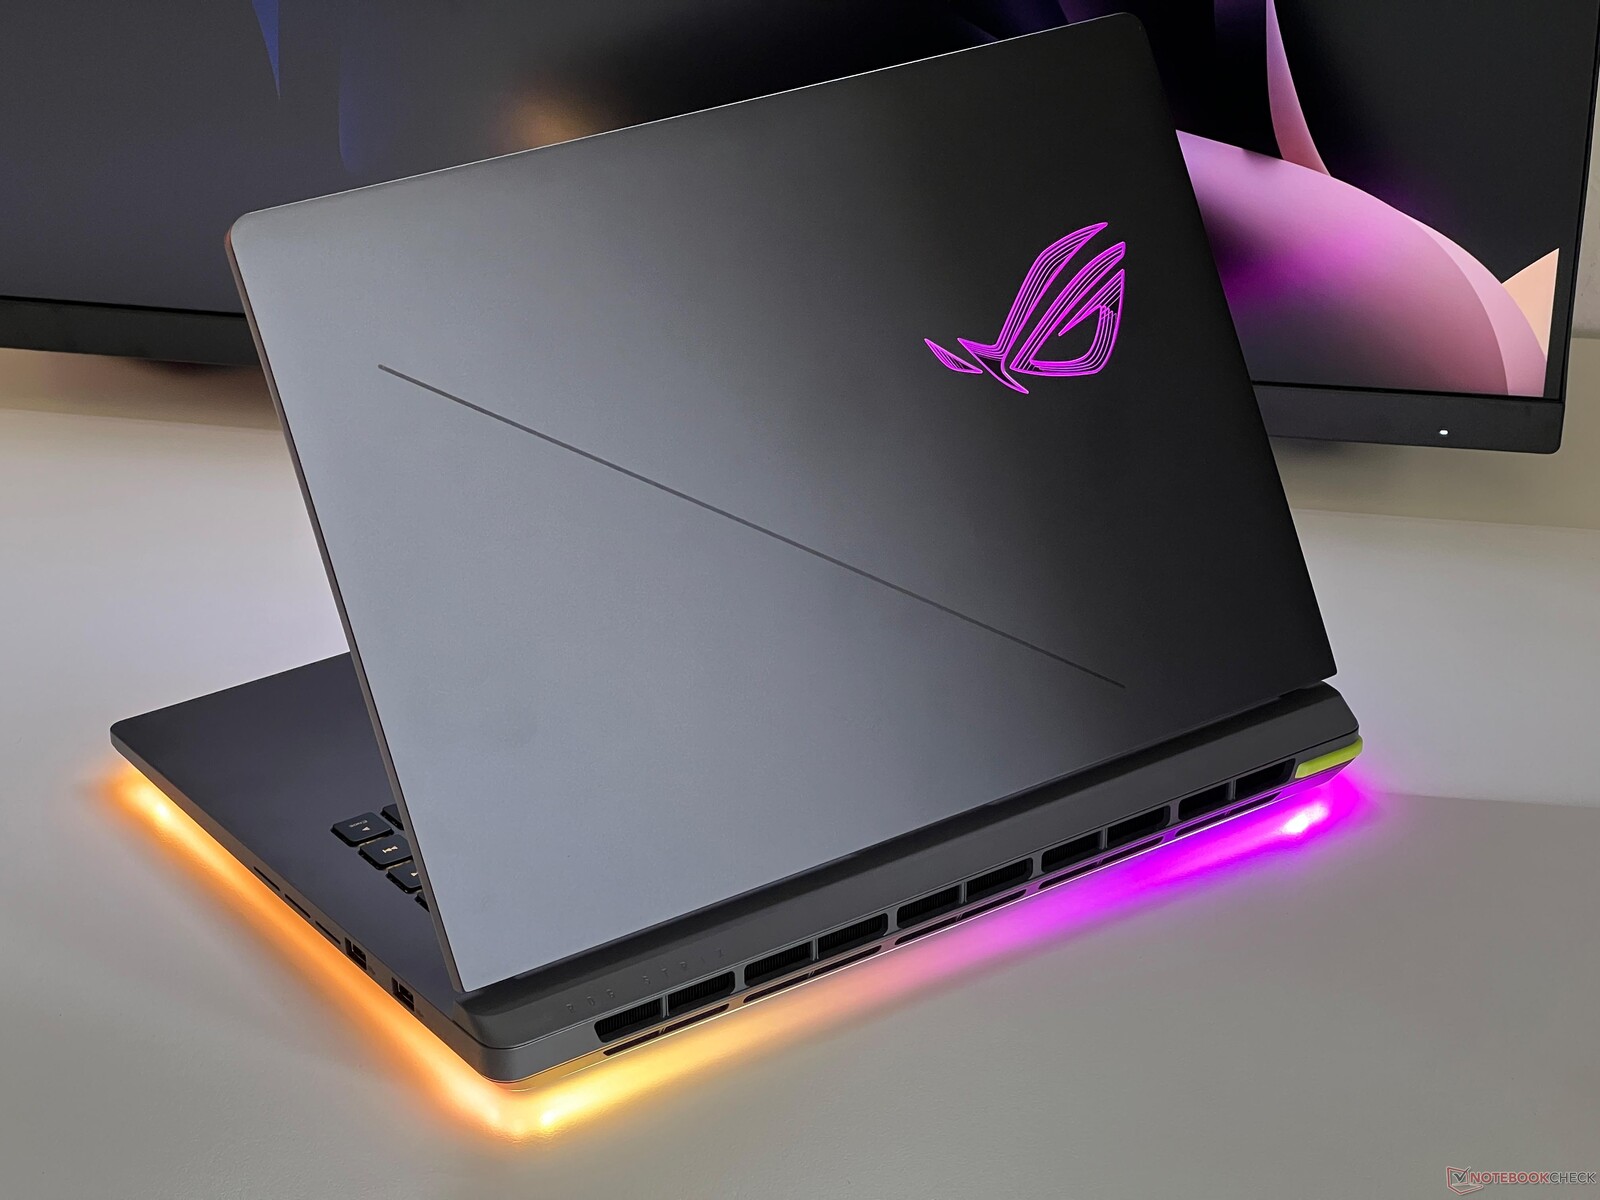
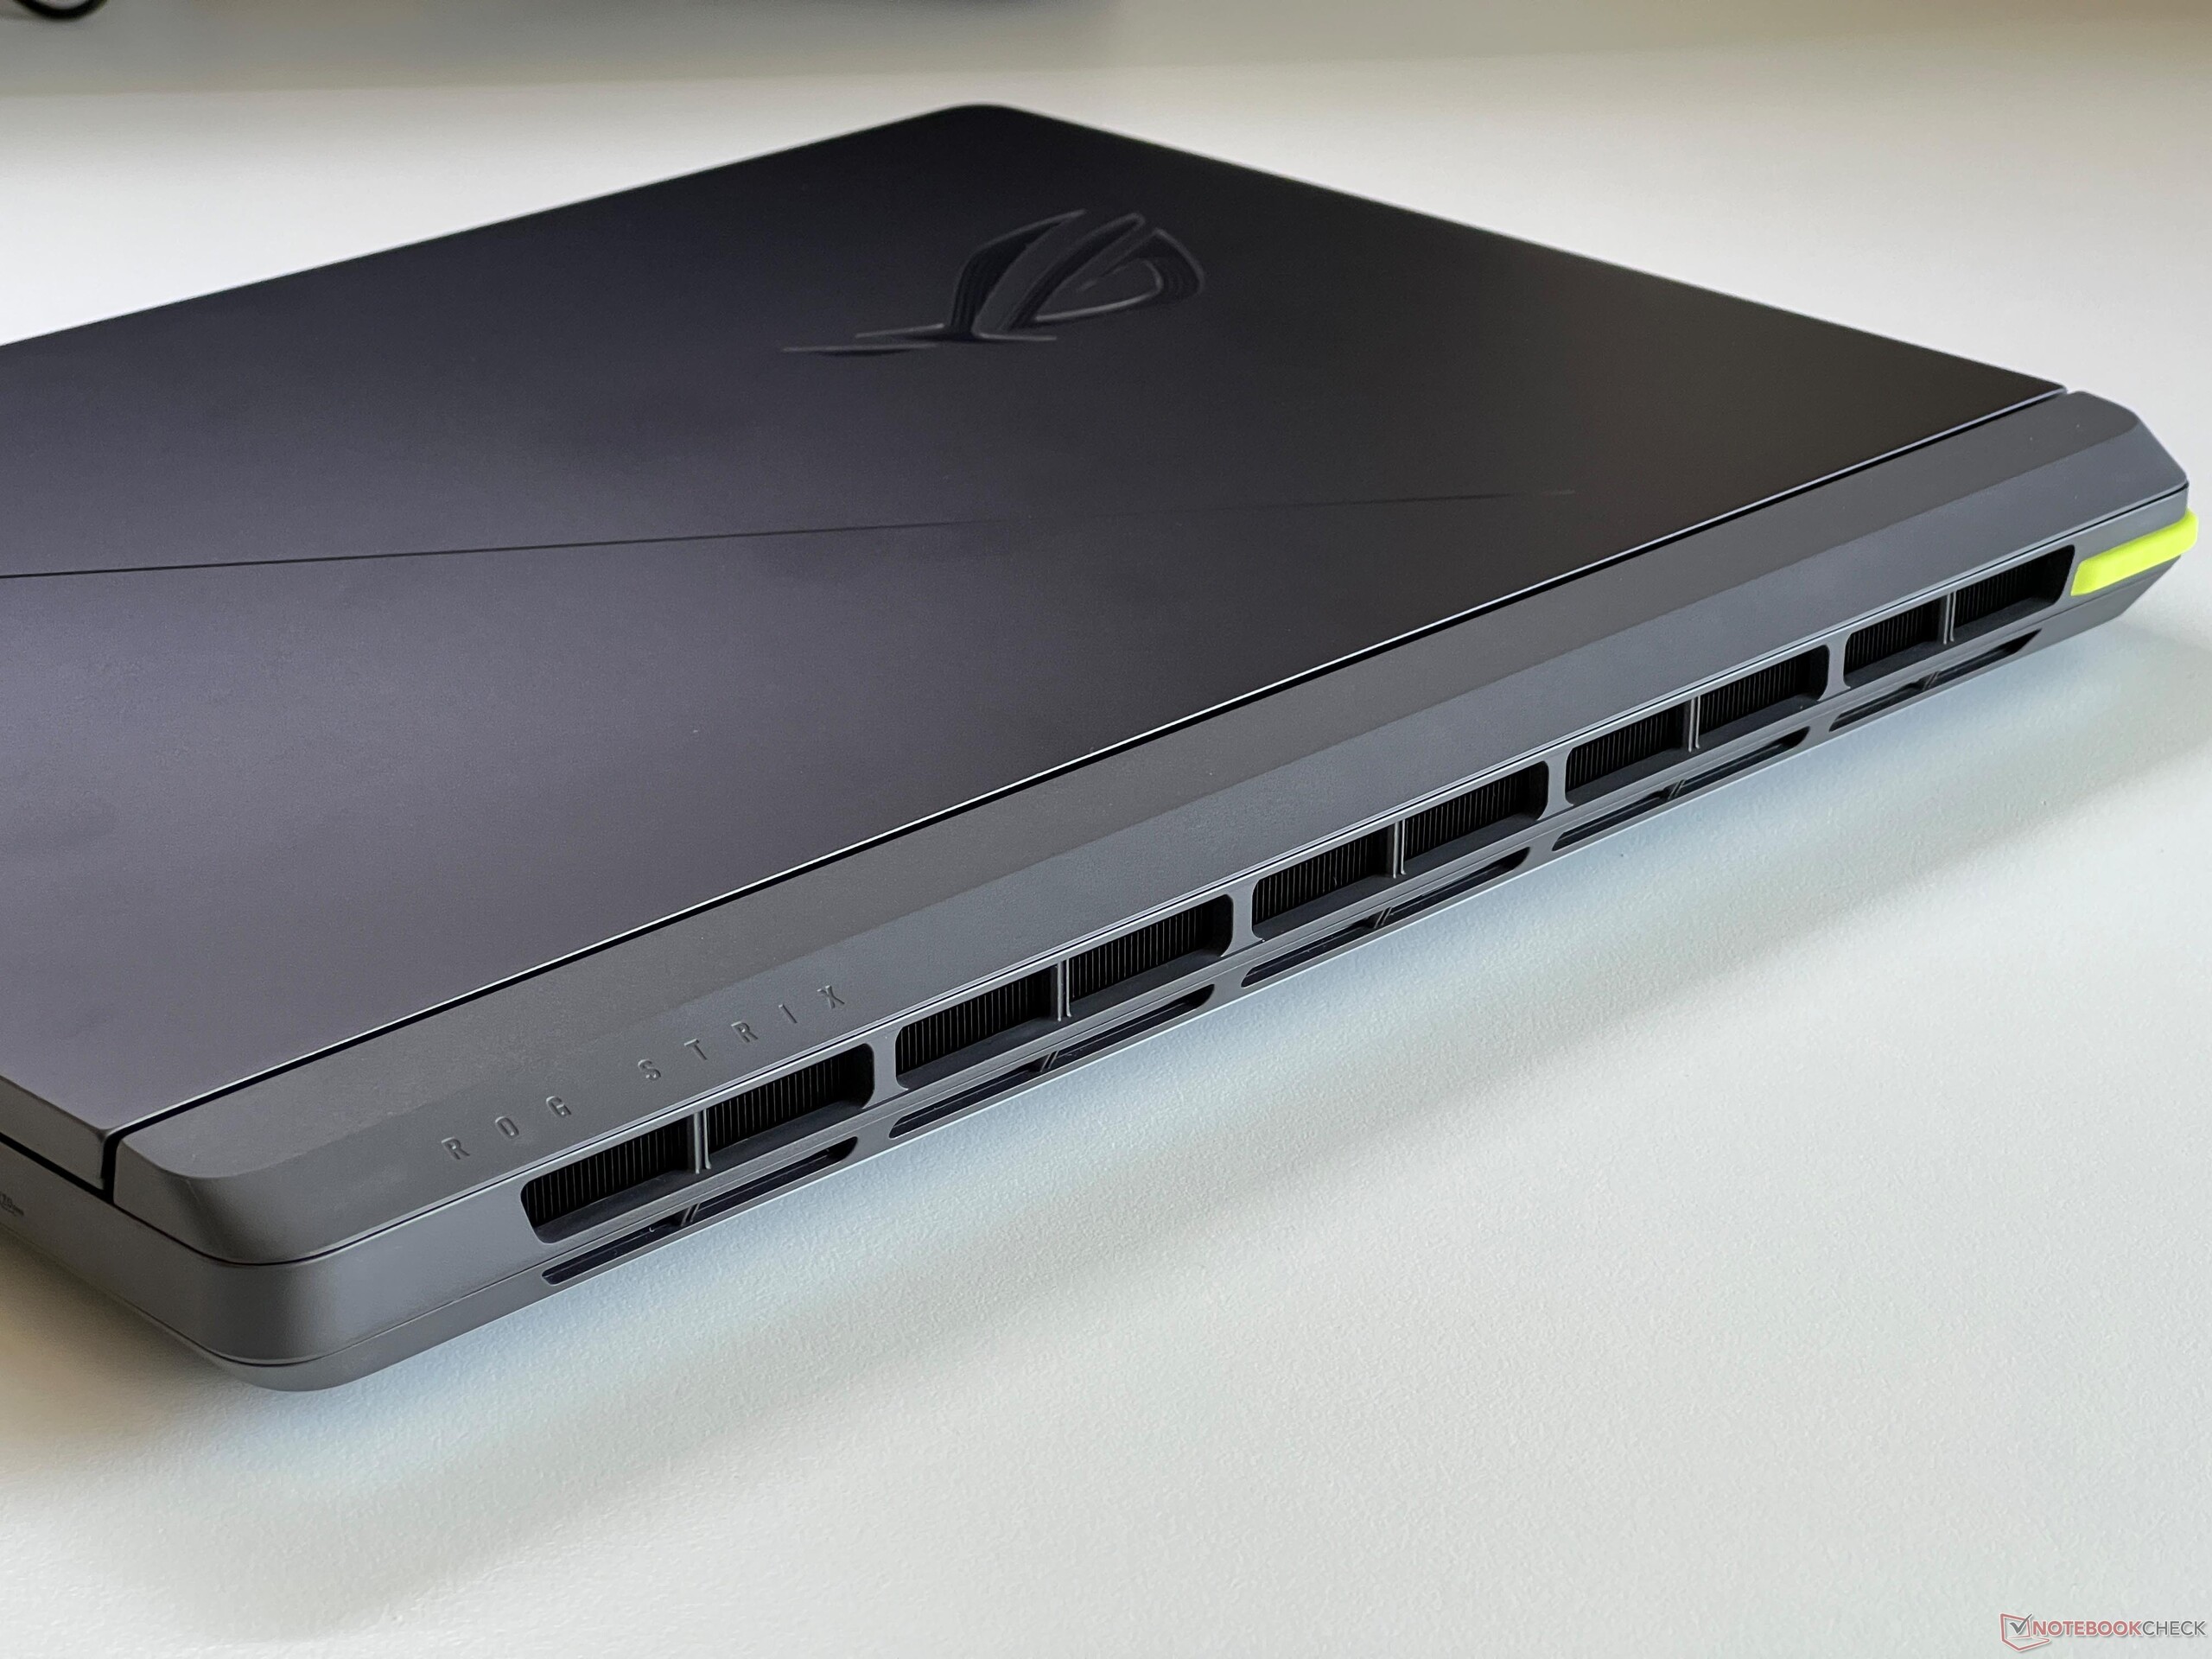
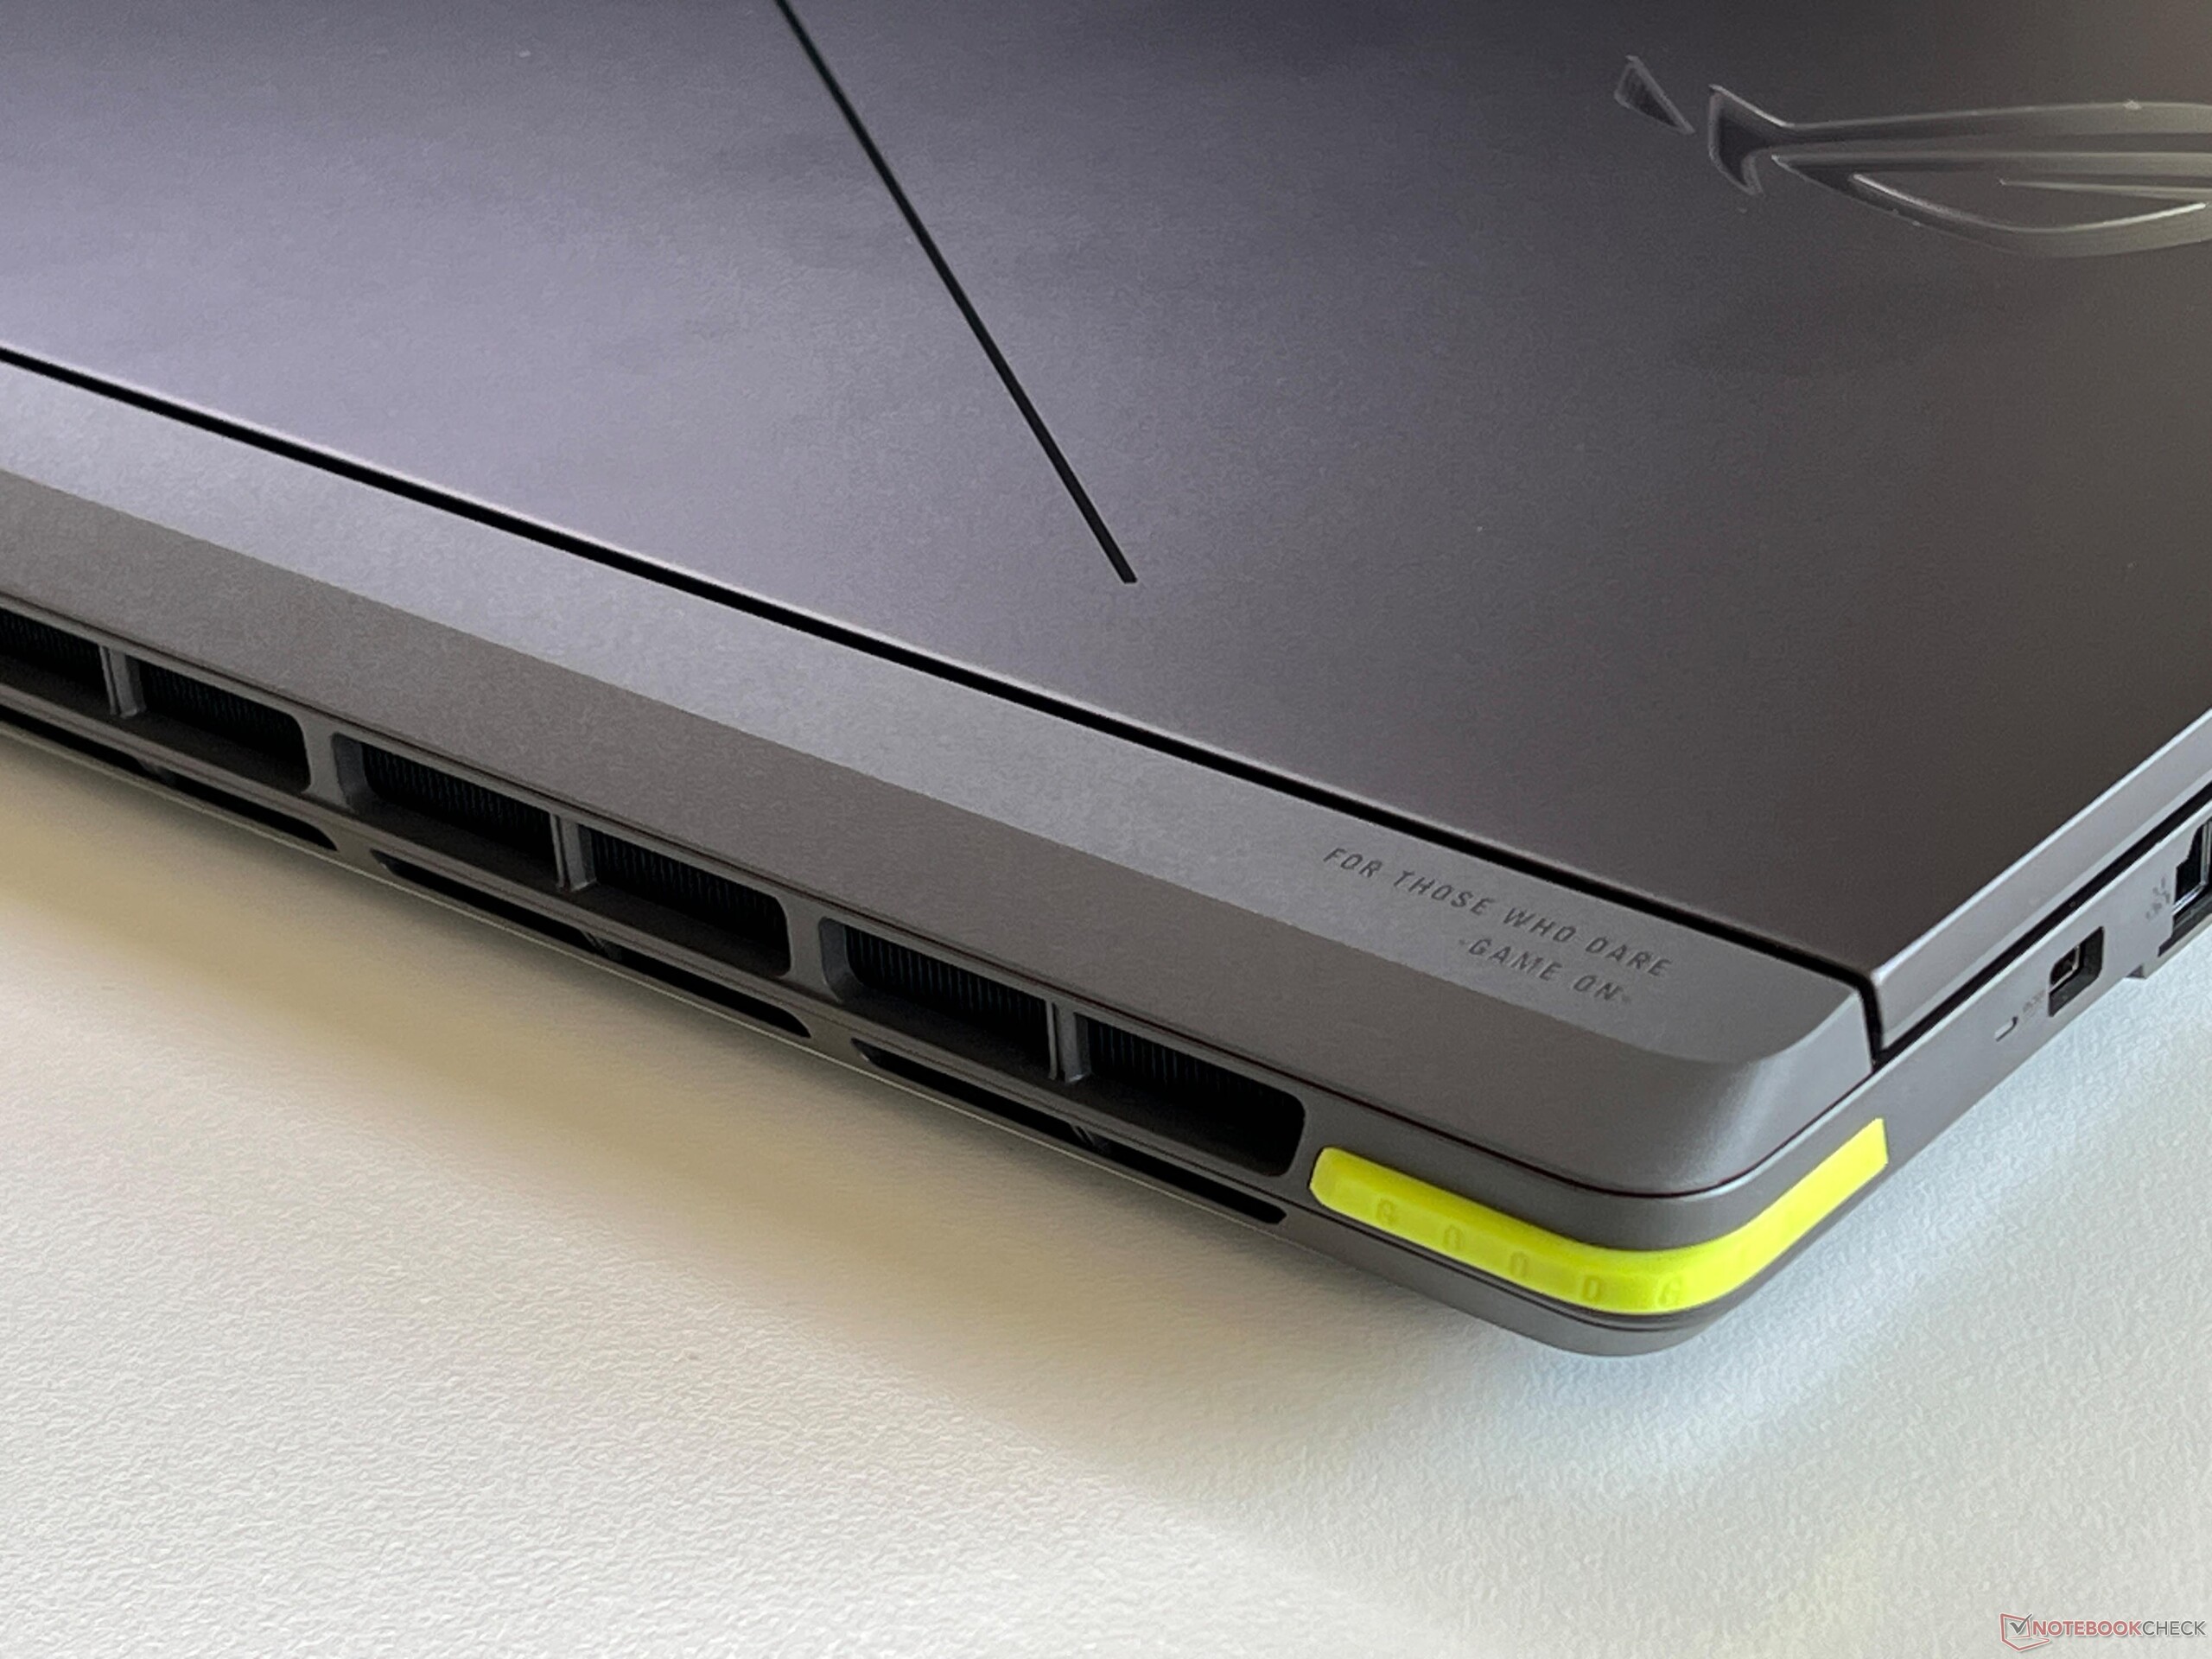
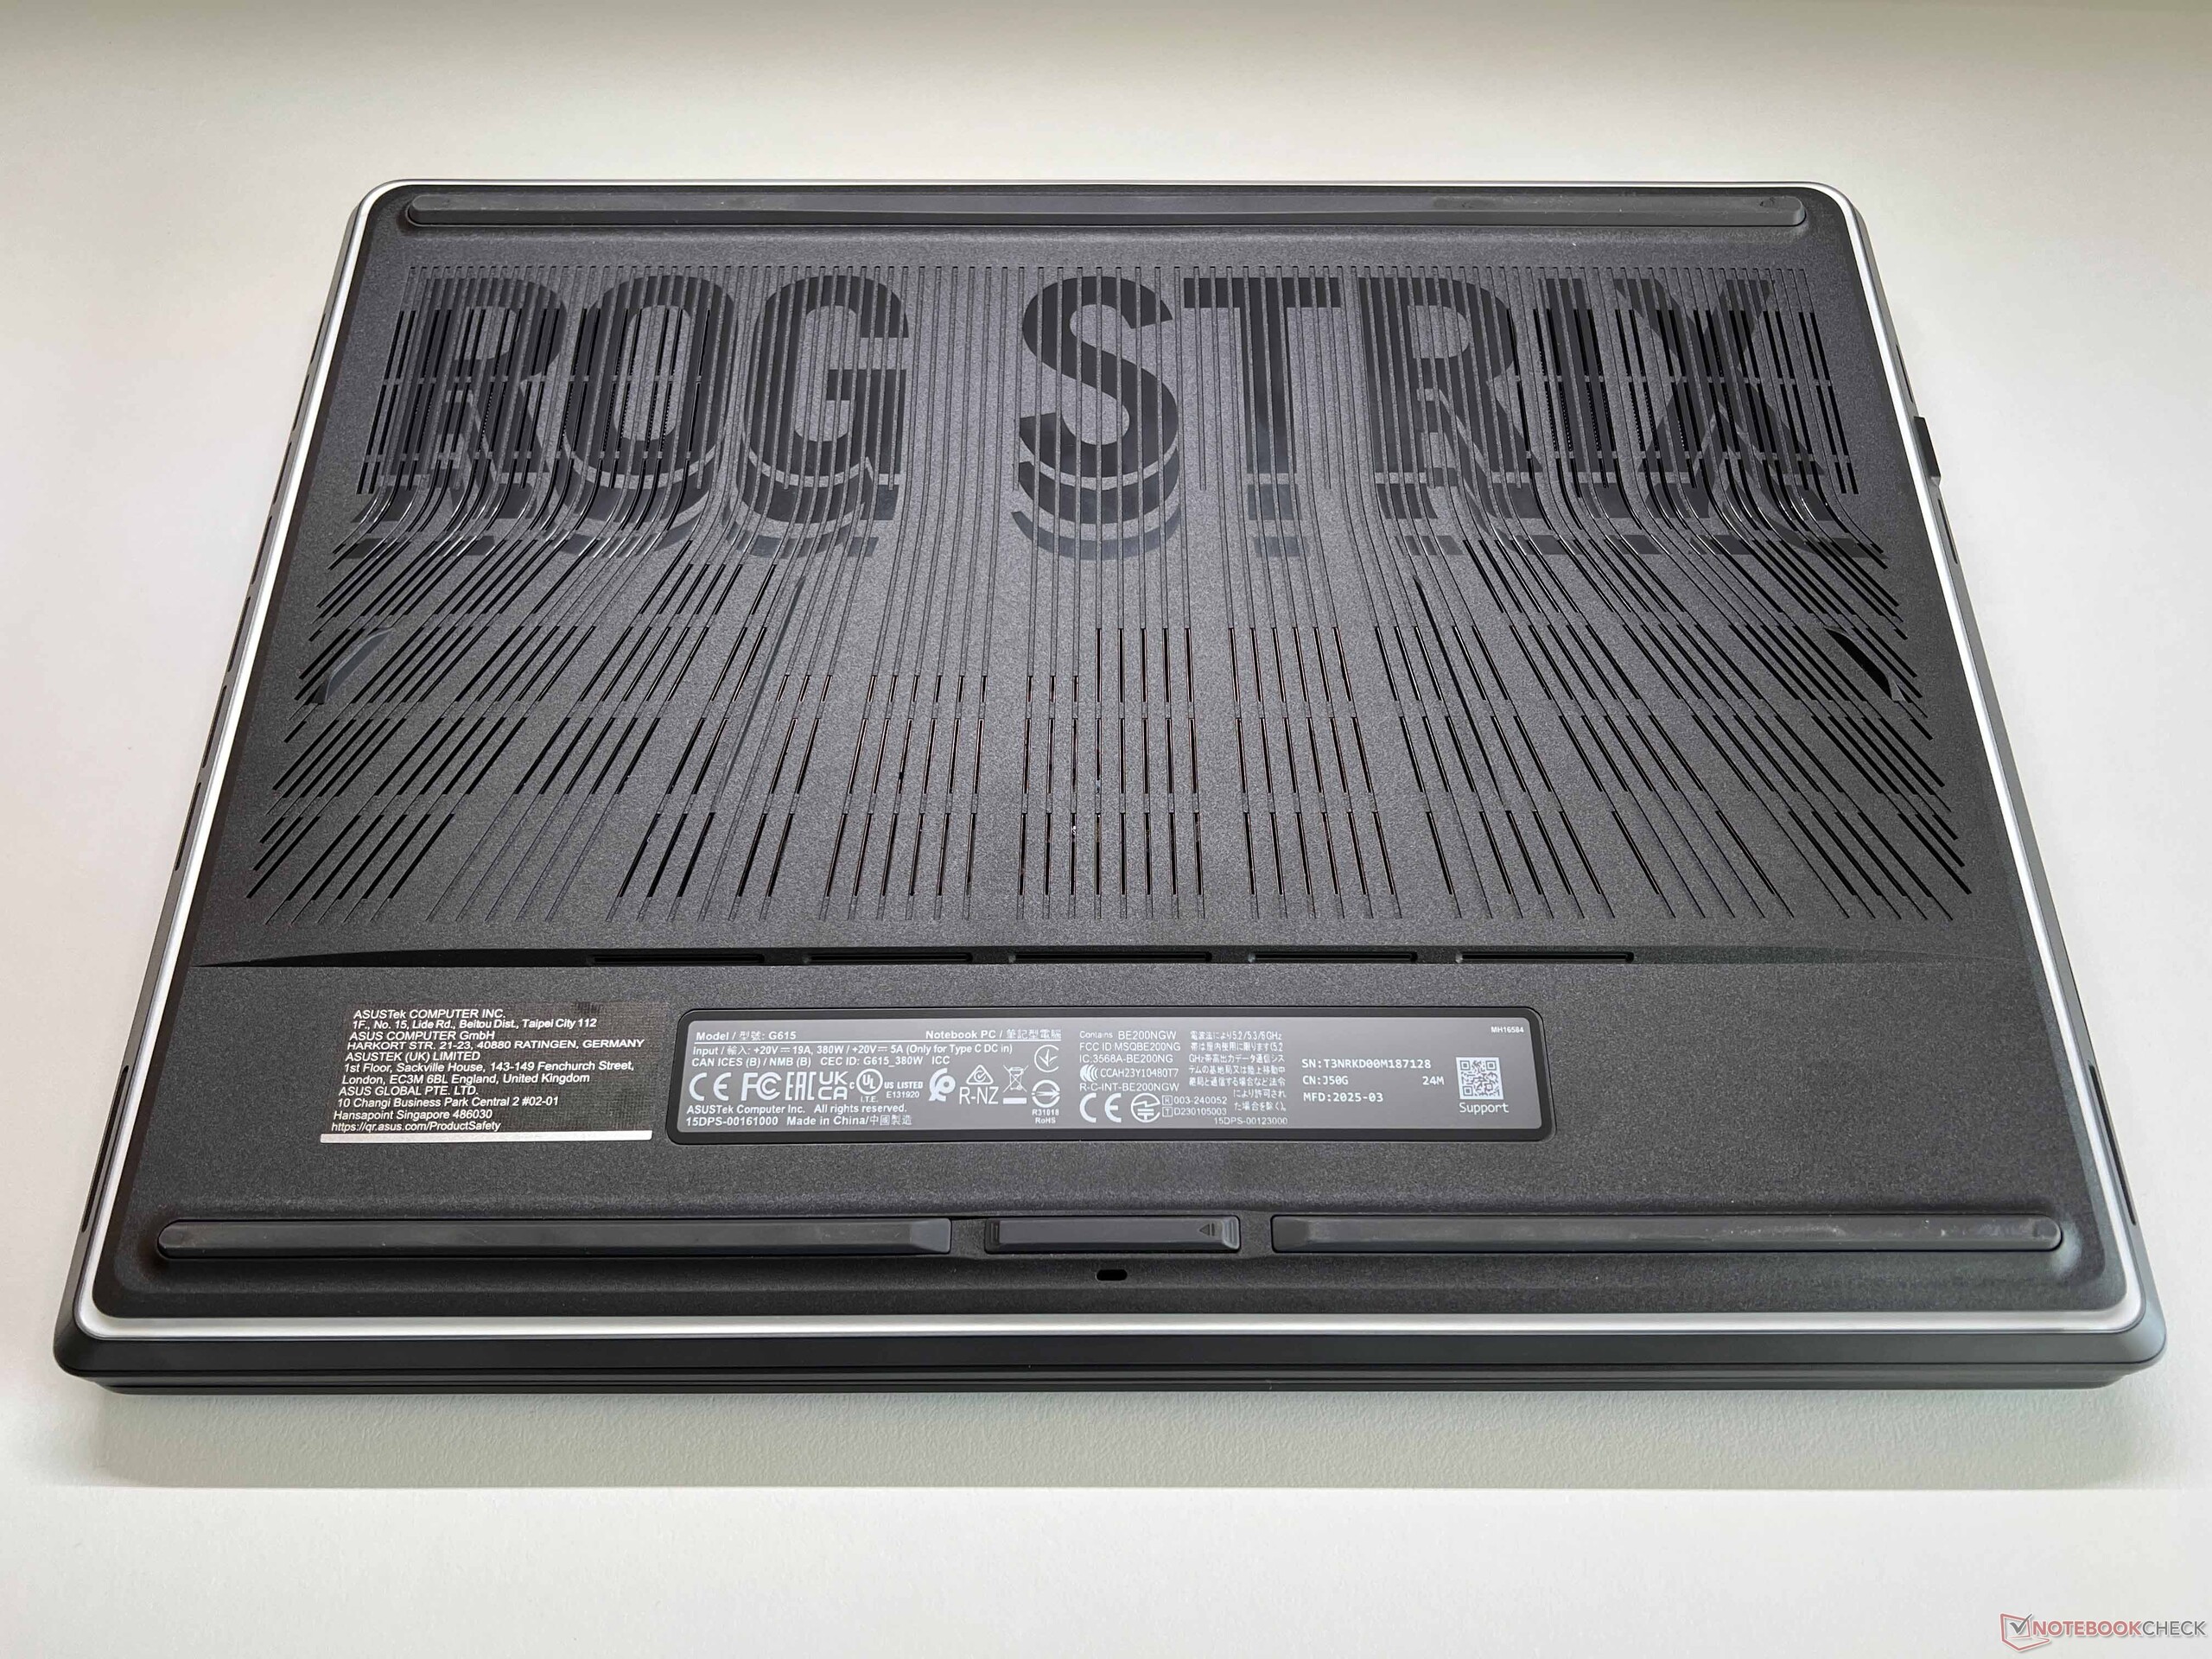
Comme nous l'avons déjà mentionné, la Strix G16 partage de nombreux éléments avec la série Strix SCAR, notamment le boîtier en plastique, la barre de LED illuminée autour de la base et le logo illuminé. Seul l'écran DotMatrix supplémentaire sur le couvercle n'est pas présent. De plus, il y a deux petits éléments de design en vert néon (le logo ROG au-dessus du clavier et une petite bande dans le coin arrière gauche). Vous pouvez faire des folies avec l'éclairage, mais vous pouvez aussi le désactiver complètement pour un look plus discret. Les surfaces en plastique gris foncé ne sont pas aussi sujettes aux traces de doigts et à la saleté que les surfaces noires du Strix SCAR 18 que nous avons testé récemment.
La qualité de l'étui est très bonne dans l'ensemble, même si vous devriez déjà pouvoir vous attendre à un étui en métal à ce niveau de prix. Nous n'avons trouvé aucun problème de stabilité ou de finition. Les charnières font également du bon travail, mais l'angle d'ouverture maximal n'est que d'environ 130 degrés.
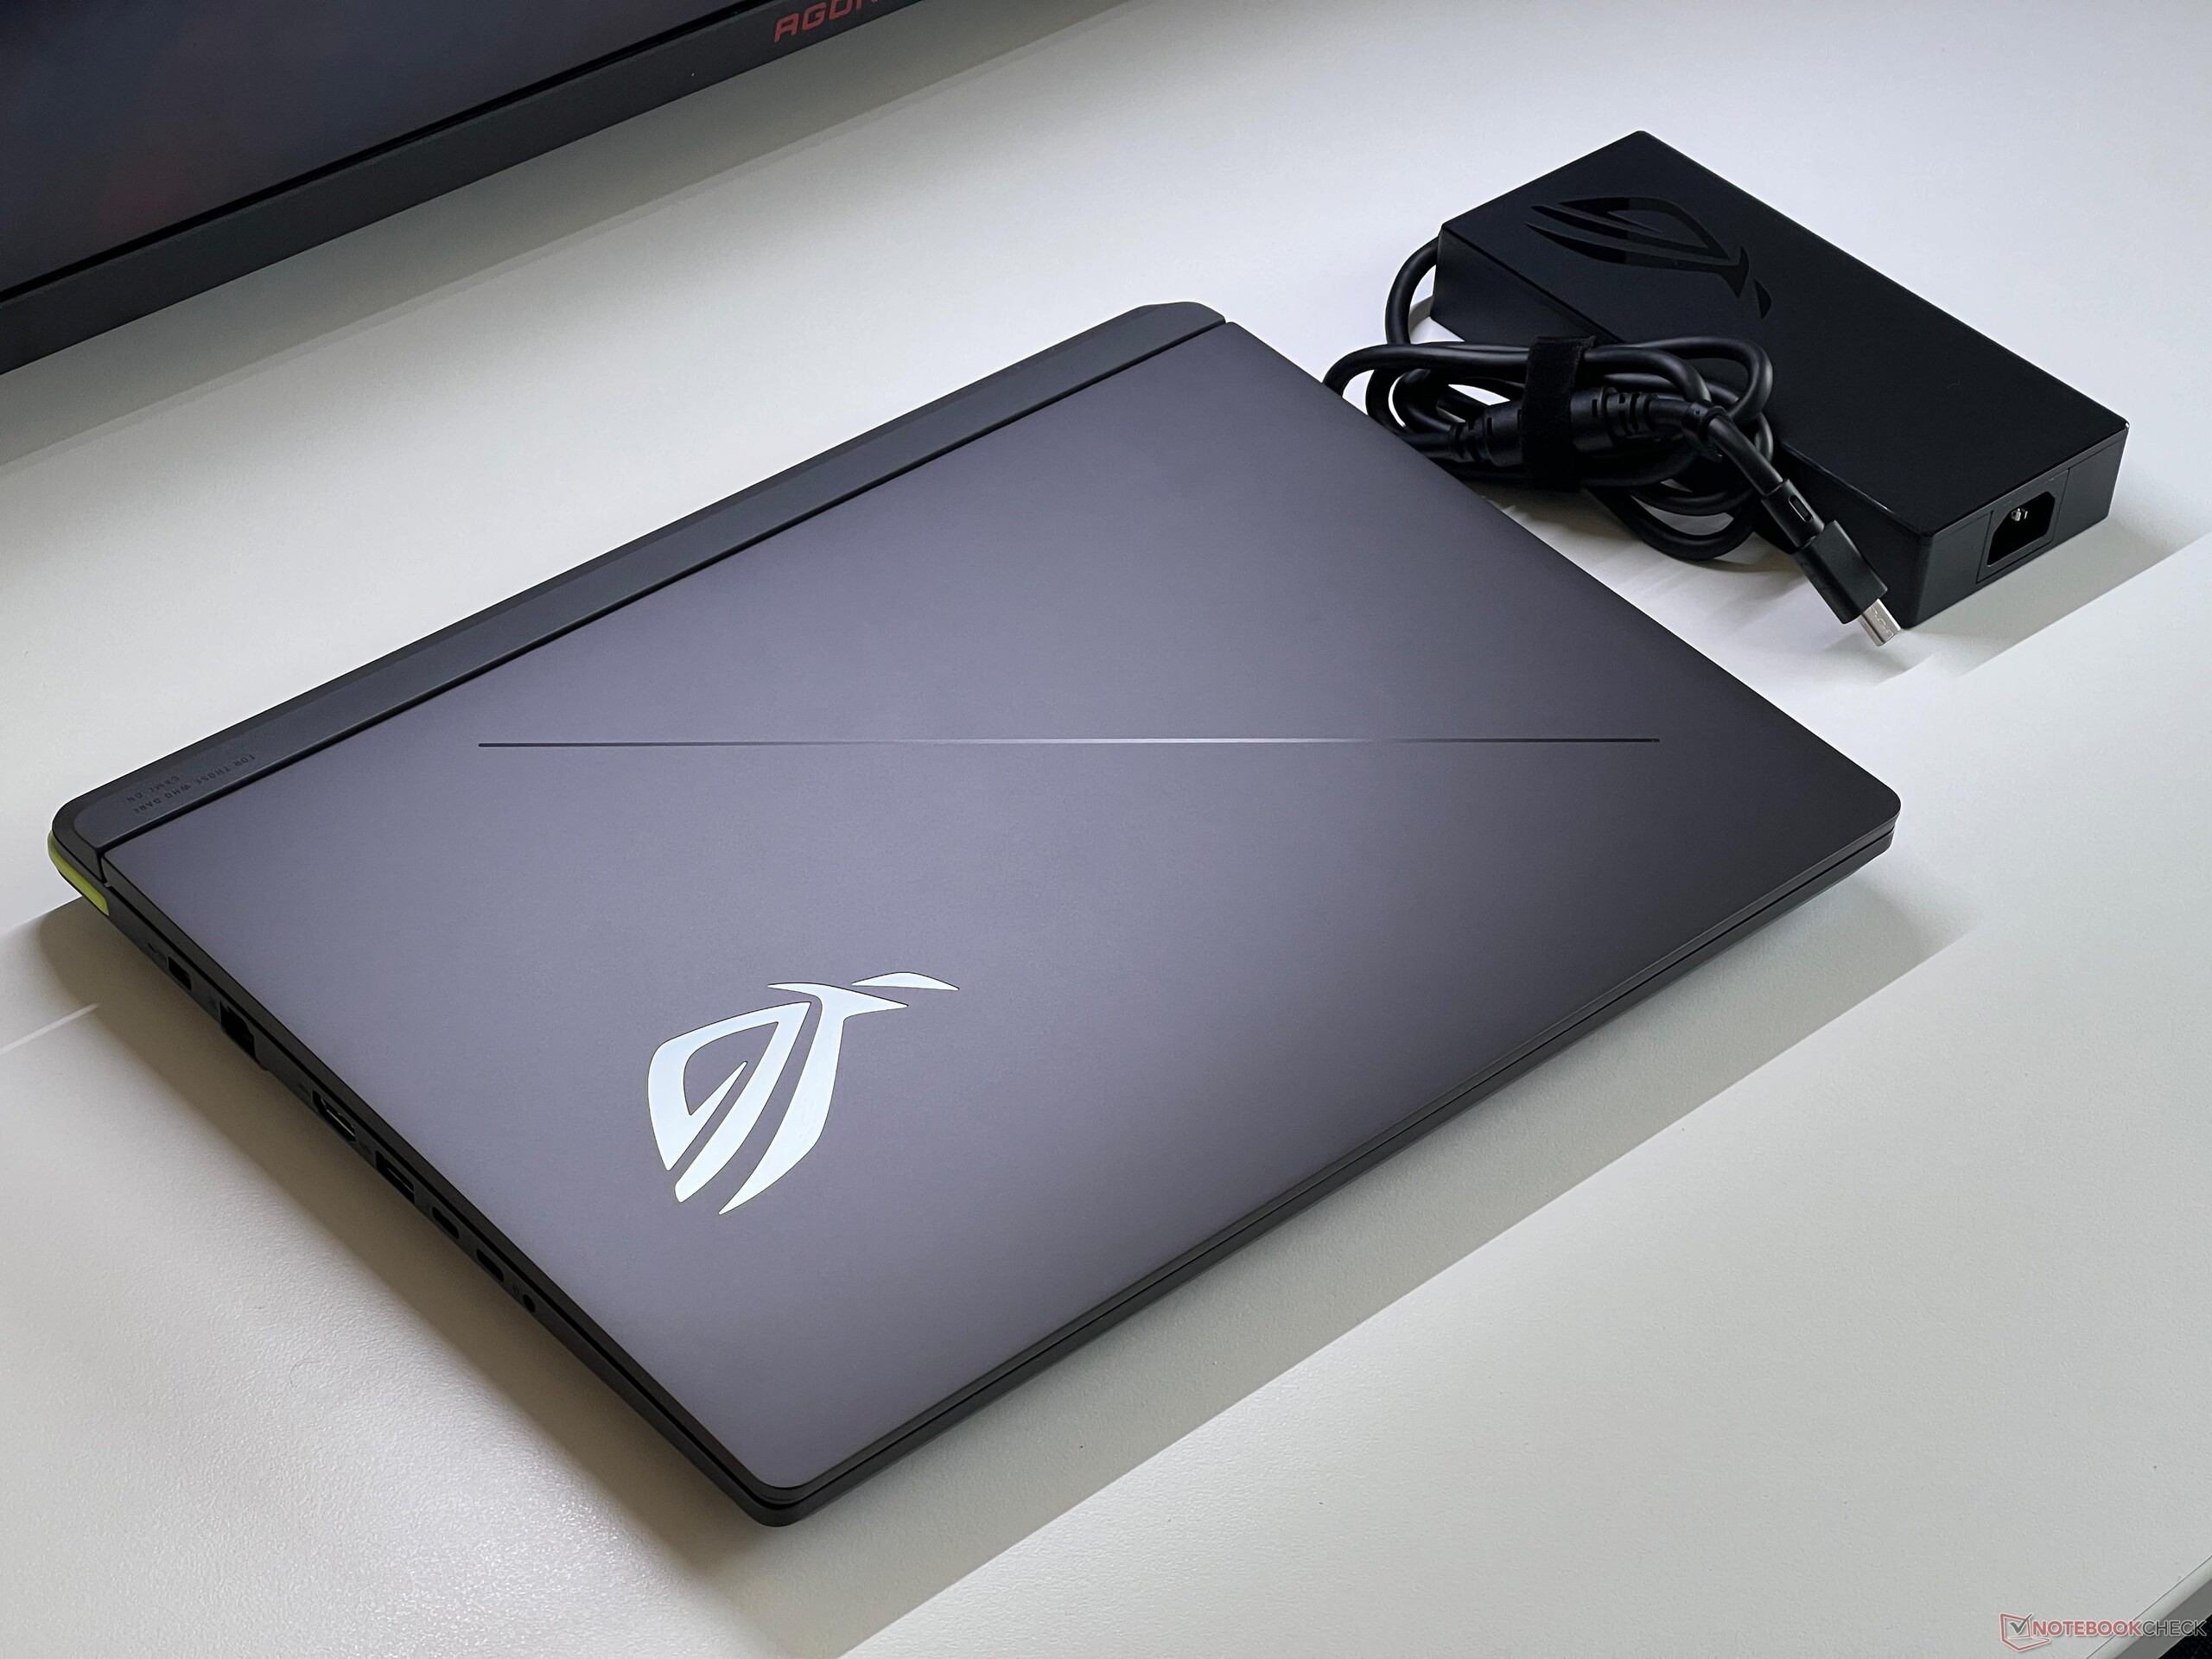

Les différences entre les appareils de notre comparaison en termes d'encombrement ne sont pas très importantes, car tous les ordinateurs portables sont relativement grands. Sur ce point, les appareils tels que le ROG Zephyrus G16 ont bien sûr un avantage. Le poids de notre appareil de test est de 2,6 kg, ce qui le situe également dans la moyenne. Le chargeur de 380 watts ajoute encore 1 kg au poids.
Équipement - Strix G16 avec Thunderbolt 5
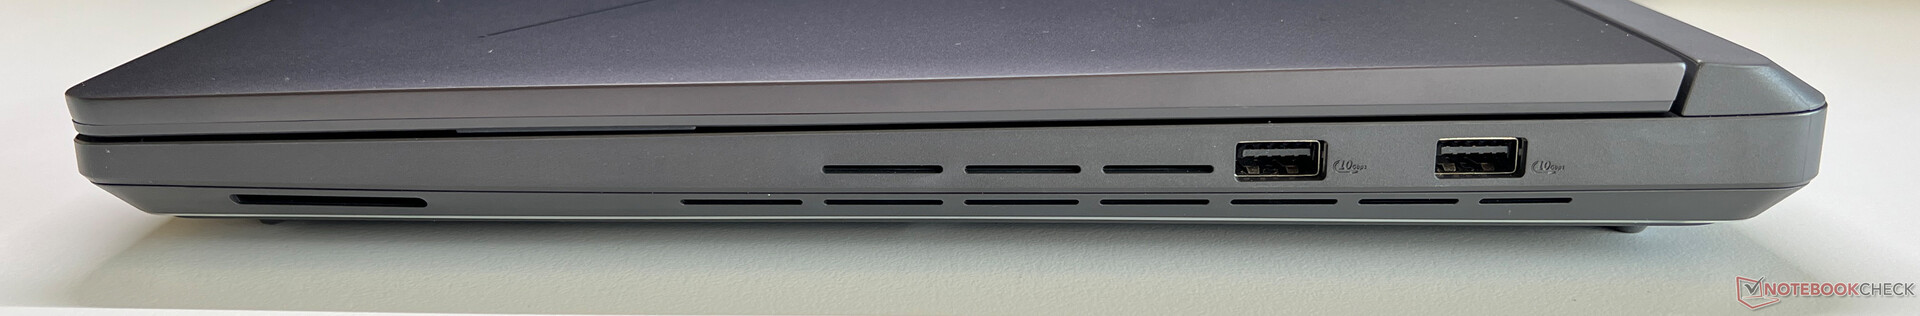
Comme tout l'arrière du boîtier est utilisé pour les ouvertures de refroidissement, toutes les connexions sont réparties sur les deux côtés. Cette solution n'est pas toujours idéale, notamment en ce qui concerne les connexions réseau, l'alimentation ou les sorties d'image. Le Strix G16 supporte déjà le Thunderbolt 5, et il y a suffisamment de connexions dans l'ensemble. Même s'il ne s'agit pas d'un ordinateur portable Copilot+, les fonctions telles que les effets de studio pour la webcam ou les sous-titres en direct sont toujours prises en charge.
Communication
Outre la connexion Ethernet (2,5 Gbit/s), un module Wi-Fi 7 moderne avec prise en charge Bluetooth 5.4 est également disponible. La vitesse de connexion est très bonne et stable lors de notre test standardisé avec le routeur de référence d'Asus.
| Networking | |
| Asus ROG Strix G16 G615 | |
| iperf3 transmit AXE11000 | |
| iperf3 receive AXE11000 | |
| Acer Predator Helios 16 PH16-72 | |
| iperf3 transmit AXE11000 | |
| iperf3 receive AXE11000 | |
| iperf3 transmit AXE11000 6GHz | |
| iperf3 receive AXE11000 6GHz | |
| SCHENKER XMG Neo 16 (Early 24) | |
| iperf3 transmit AXE11000 | |
| iperf3 receive AXE11000 | |
| Asus ROG Strix Scar 16 G634JZR | |
| iperf3 transmit AXE11000 | |
| iperf3 receive AXE11000 | |
| iperf3 transmit AXE11000 6GHz | |
| iperf3 receive AXE11000 6GHz | |
| HP Omen 16 (2024) | |
| iperf3 transmit AXE11000 | |
| iperf3 receive AXE11000 | |
| Lenovo Legion Pro 7 16IRX9H | |
| iperf3 transmit AXE11000 | |
| iperf3 receive AXE11000 | |
| Lenovo Legion Pro 7i 16 Gen 10 | |
| iperf3 transmit AXE11000 | |
| iperf3 receive AXE11000 | |
| iperf3 transmit AXE11000 6GHz | |
| iperf3 receive AXE11000 6GHz | |
Webcam
La webcam 1080p (sans obturateur manuel) fait son travail, mais les photos qu'elle prend n'ont rien de spécial. Le module IR intégré prend en charge la reconnaissance faciale via Windows Hello.


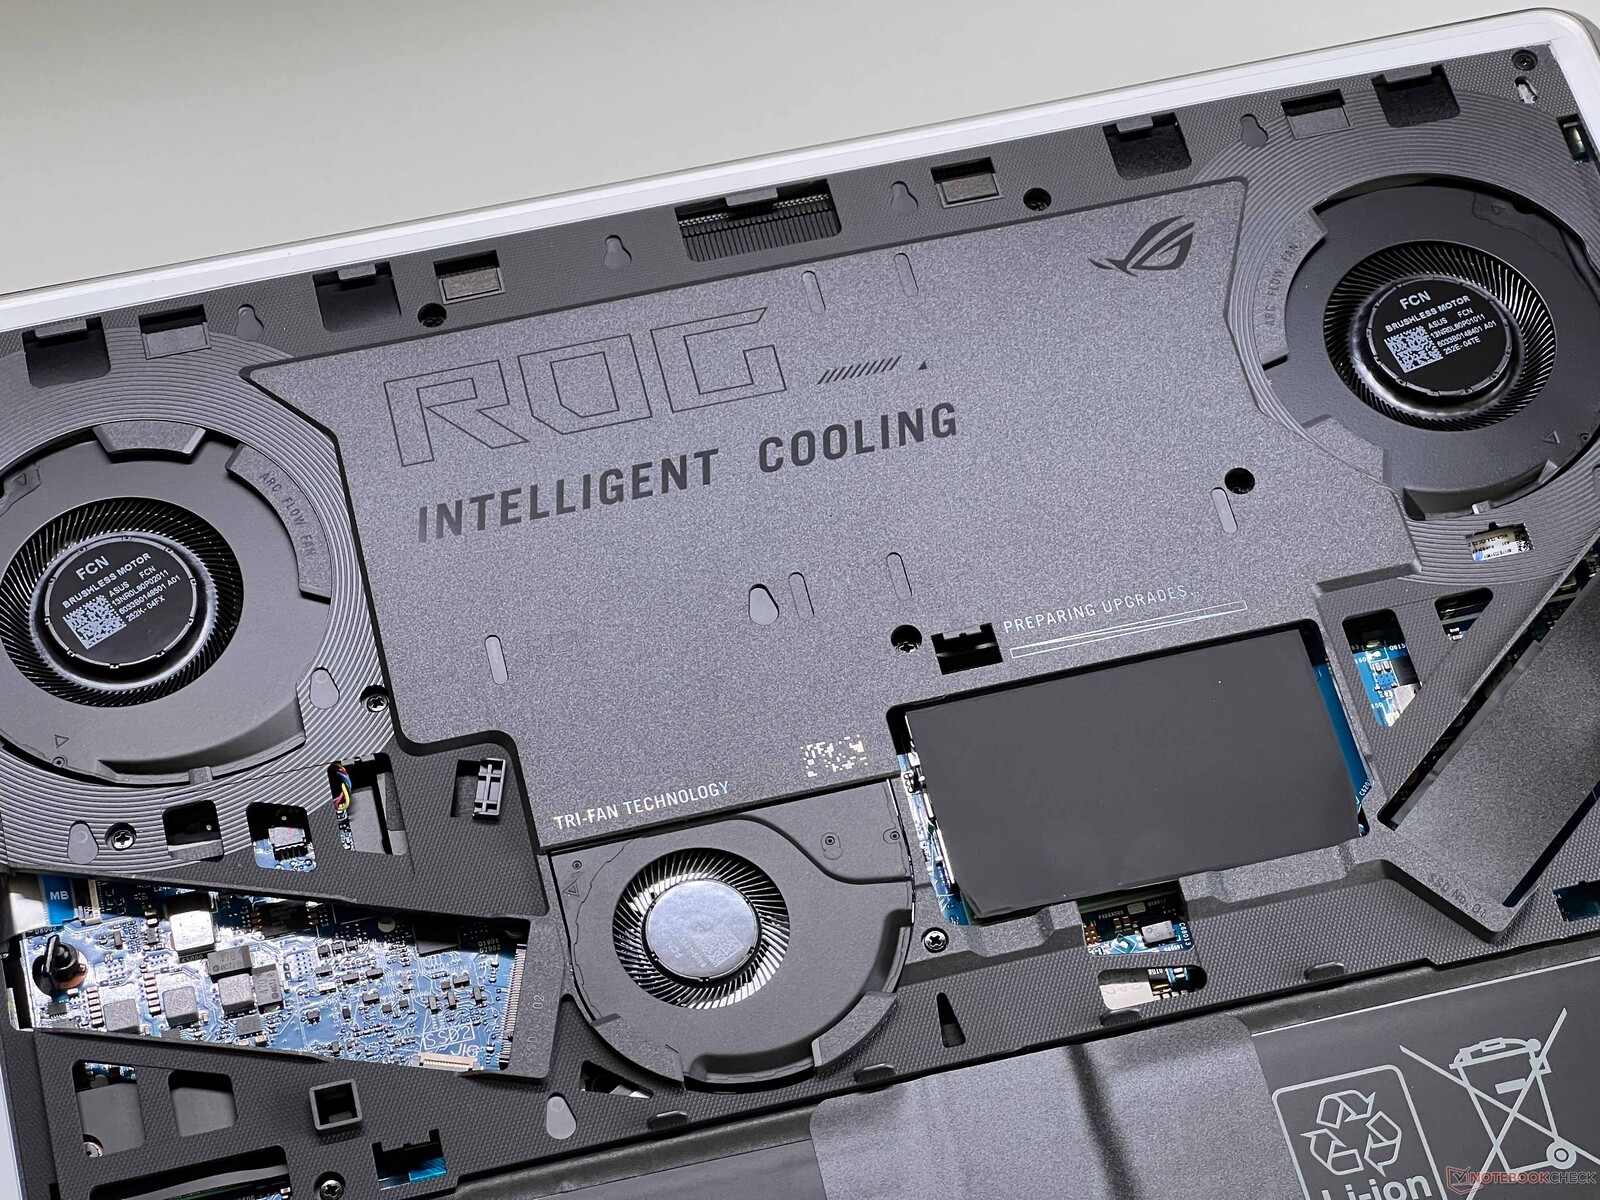
Maintenance

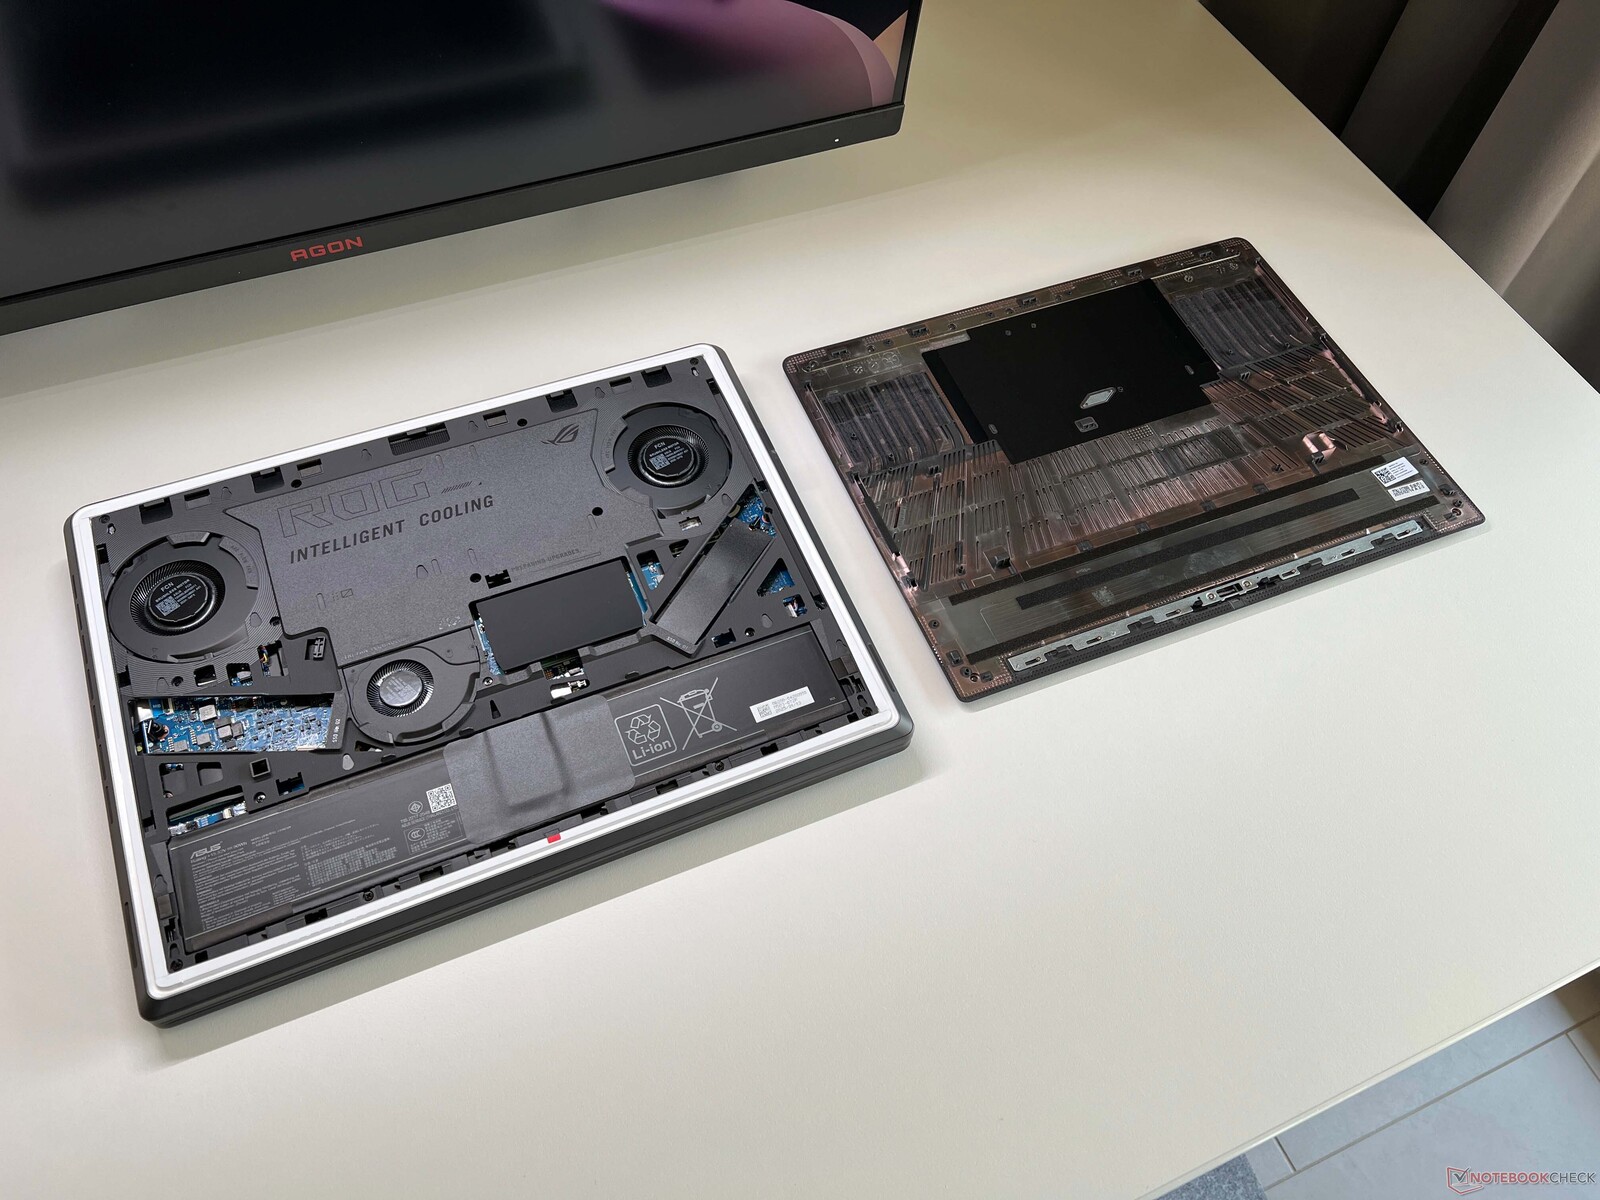
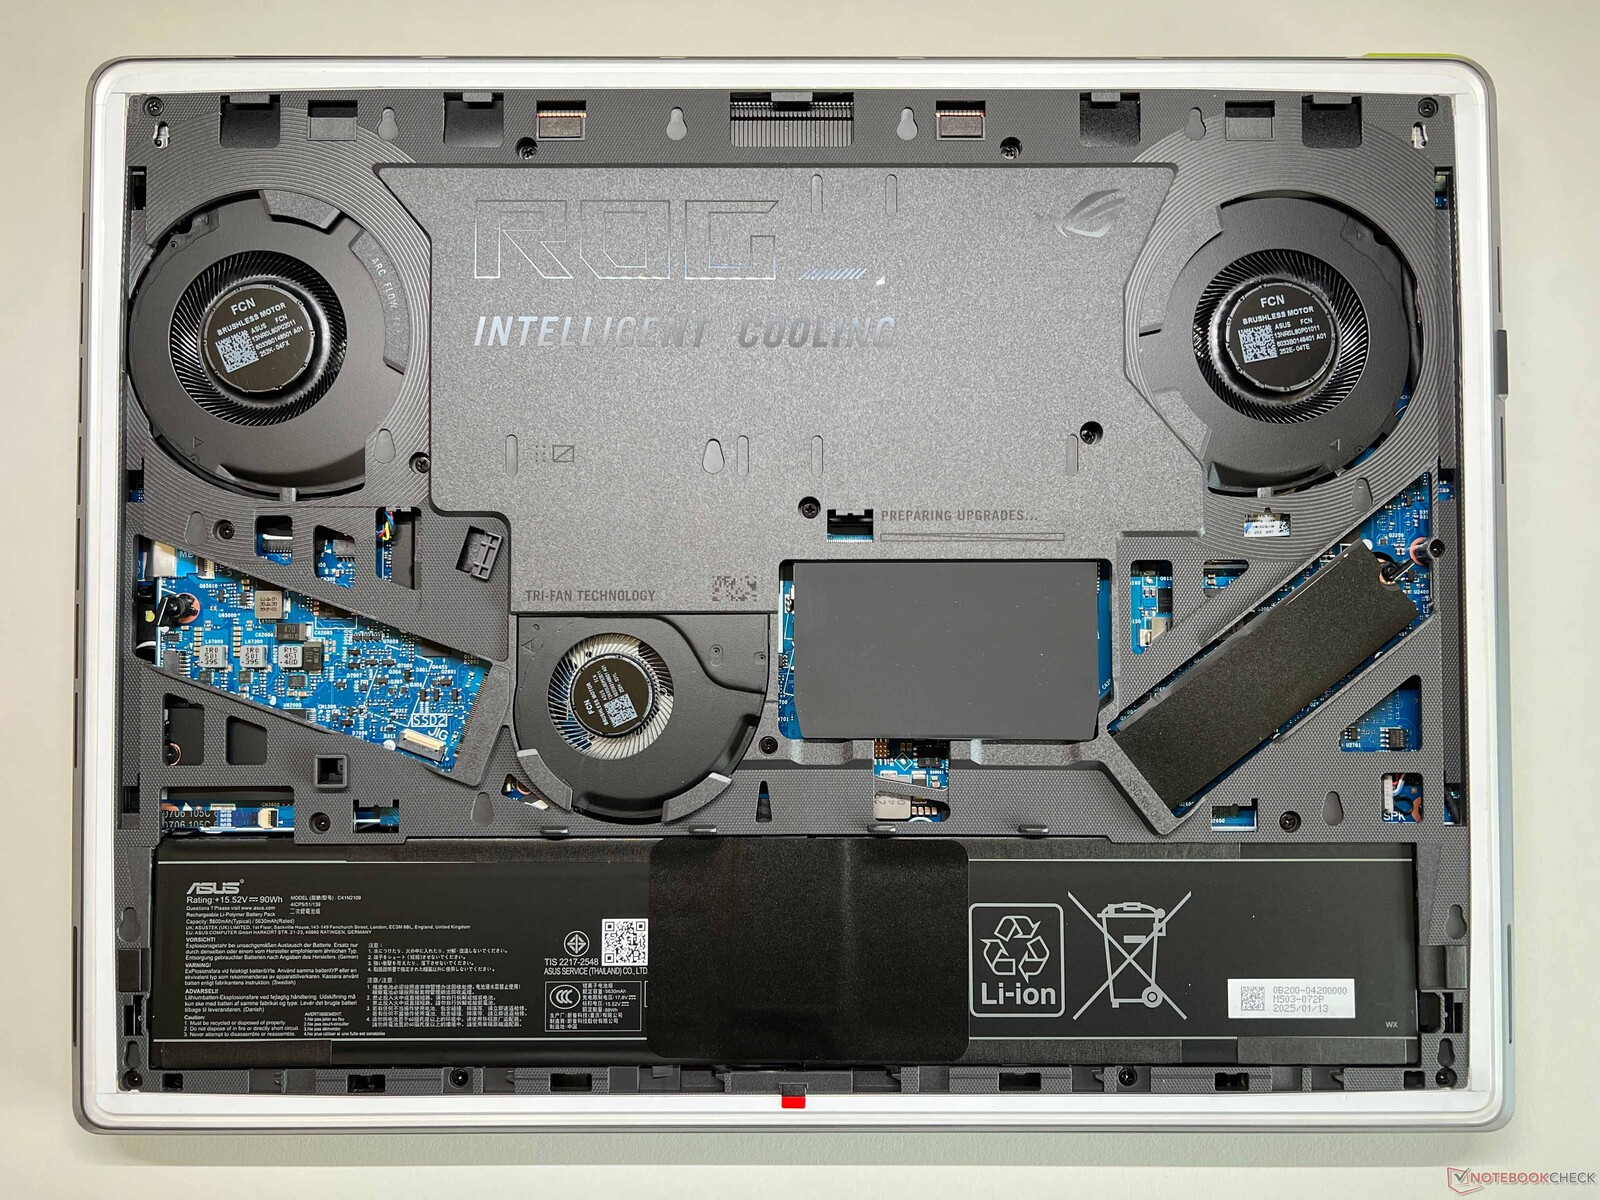
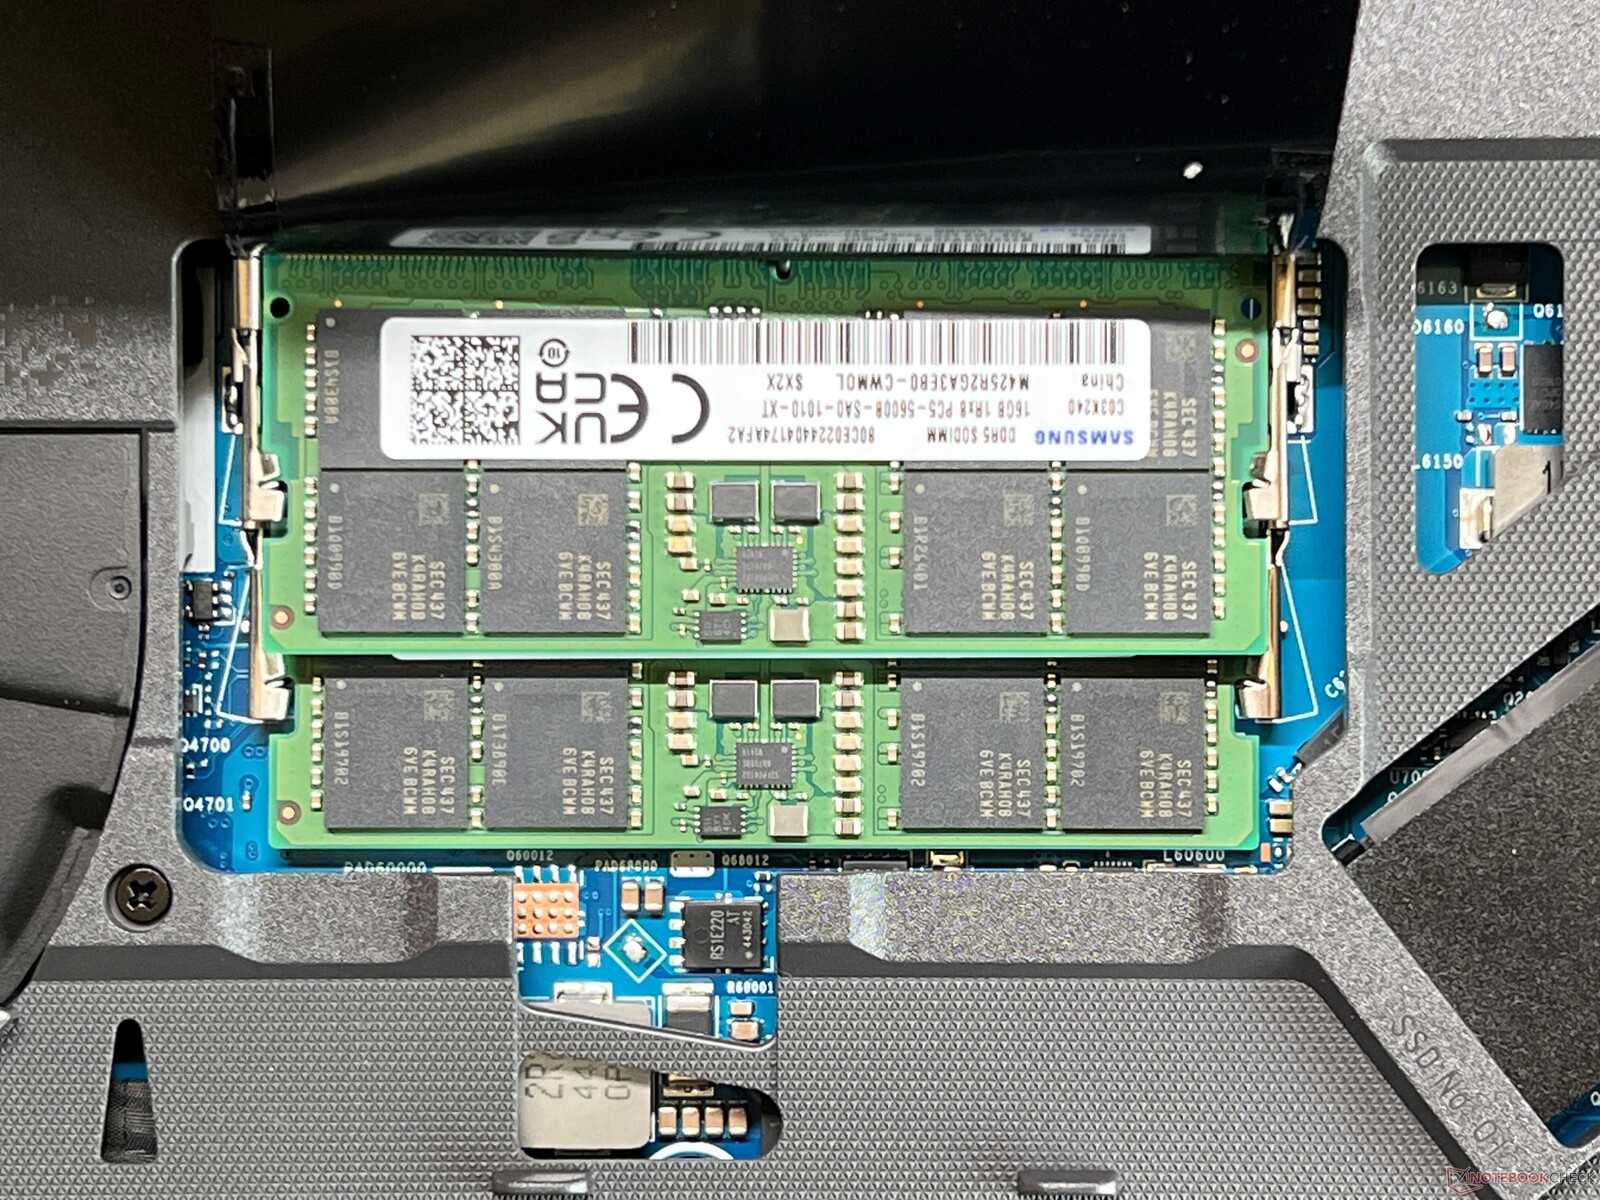
L'accès aux composants du Strix G16 est extrêmement facile, puisque vous pouvez facilement ouvrir un verrou de la plaque inférieure avec un petit curseur, ce qui vous permet de pousser la plaque inférieure vers l'avant pour la retirer. L'intérieur de l'ordinateur portable est dominé par le système de refroidissement avec sa chambre à vapeur et ses trois ventilateurs. L'utilisateur a également un accès rapide aux deux emplacements SSD et aux deux emplacements pour les modules RAM.
Durabilité
Asus ne fournit aucune information sur l'utilisation de matériaux recyclés ou sur l'empreinte CO2. L'emballage se compose essentiellement de carton et de papier.
Périphériques d'entrée - Un clavier confortable
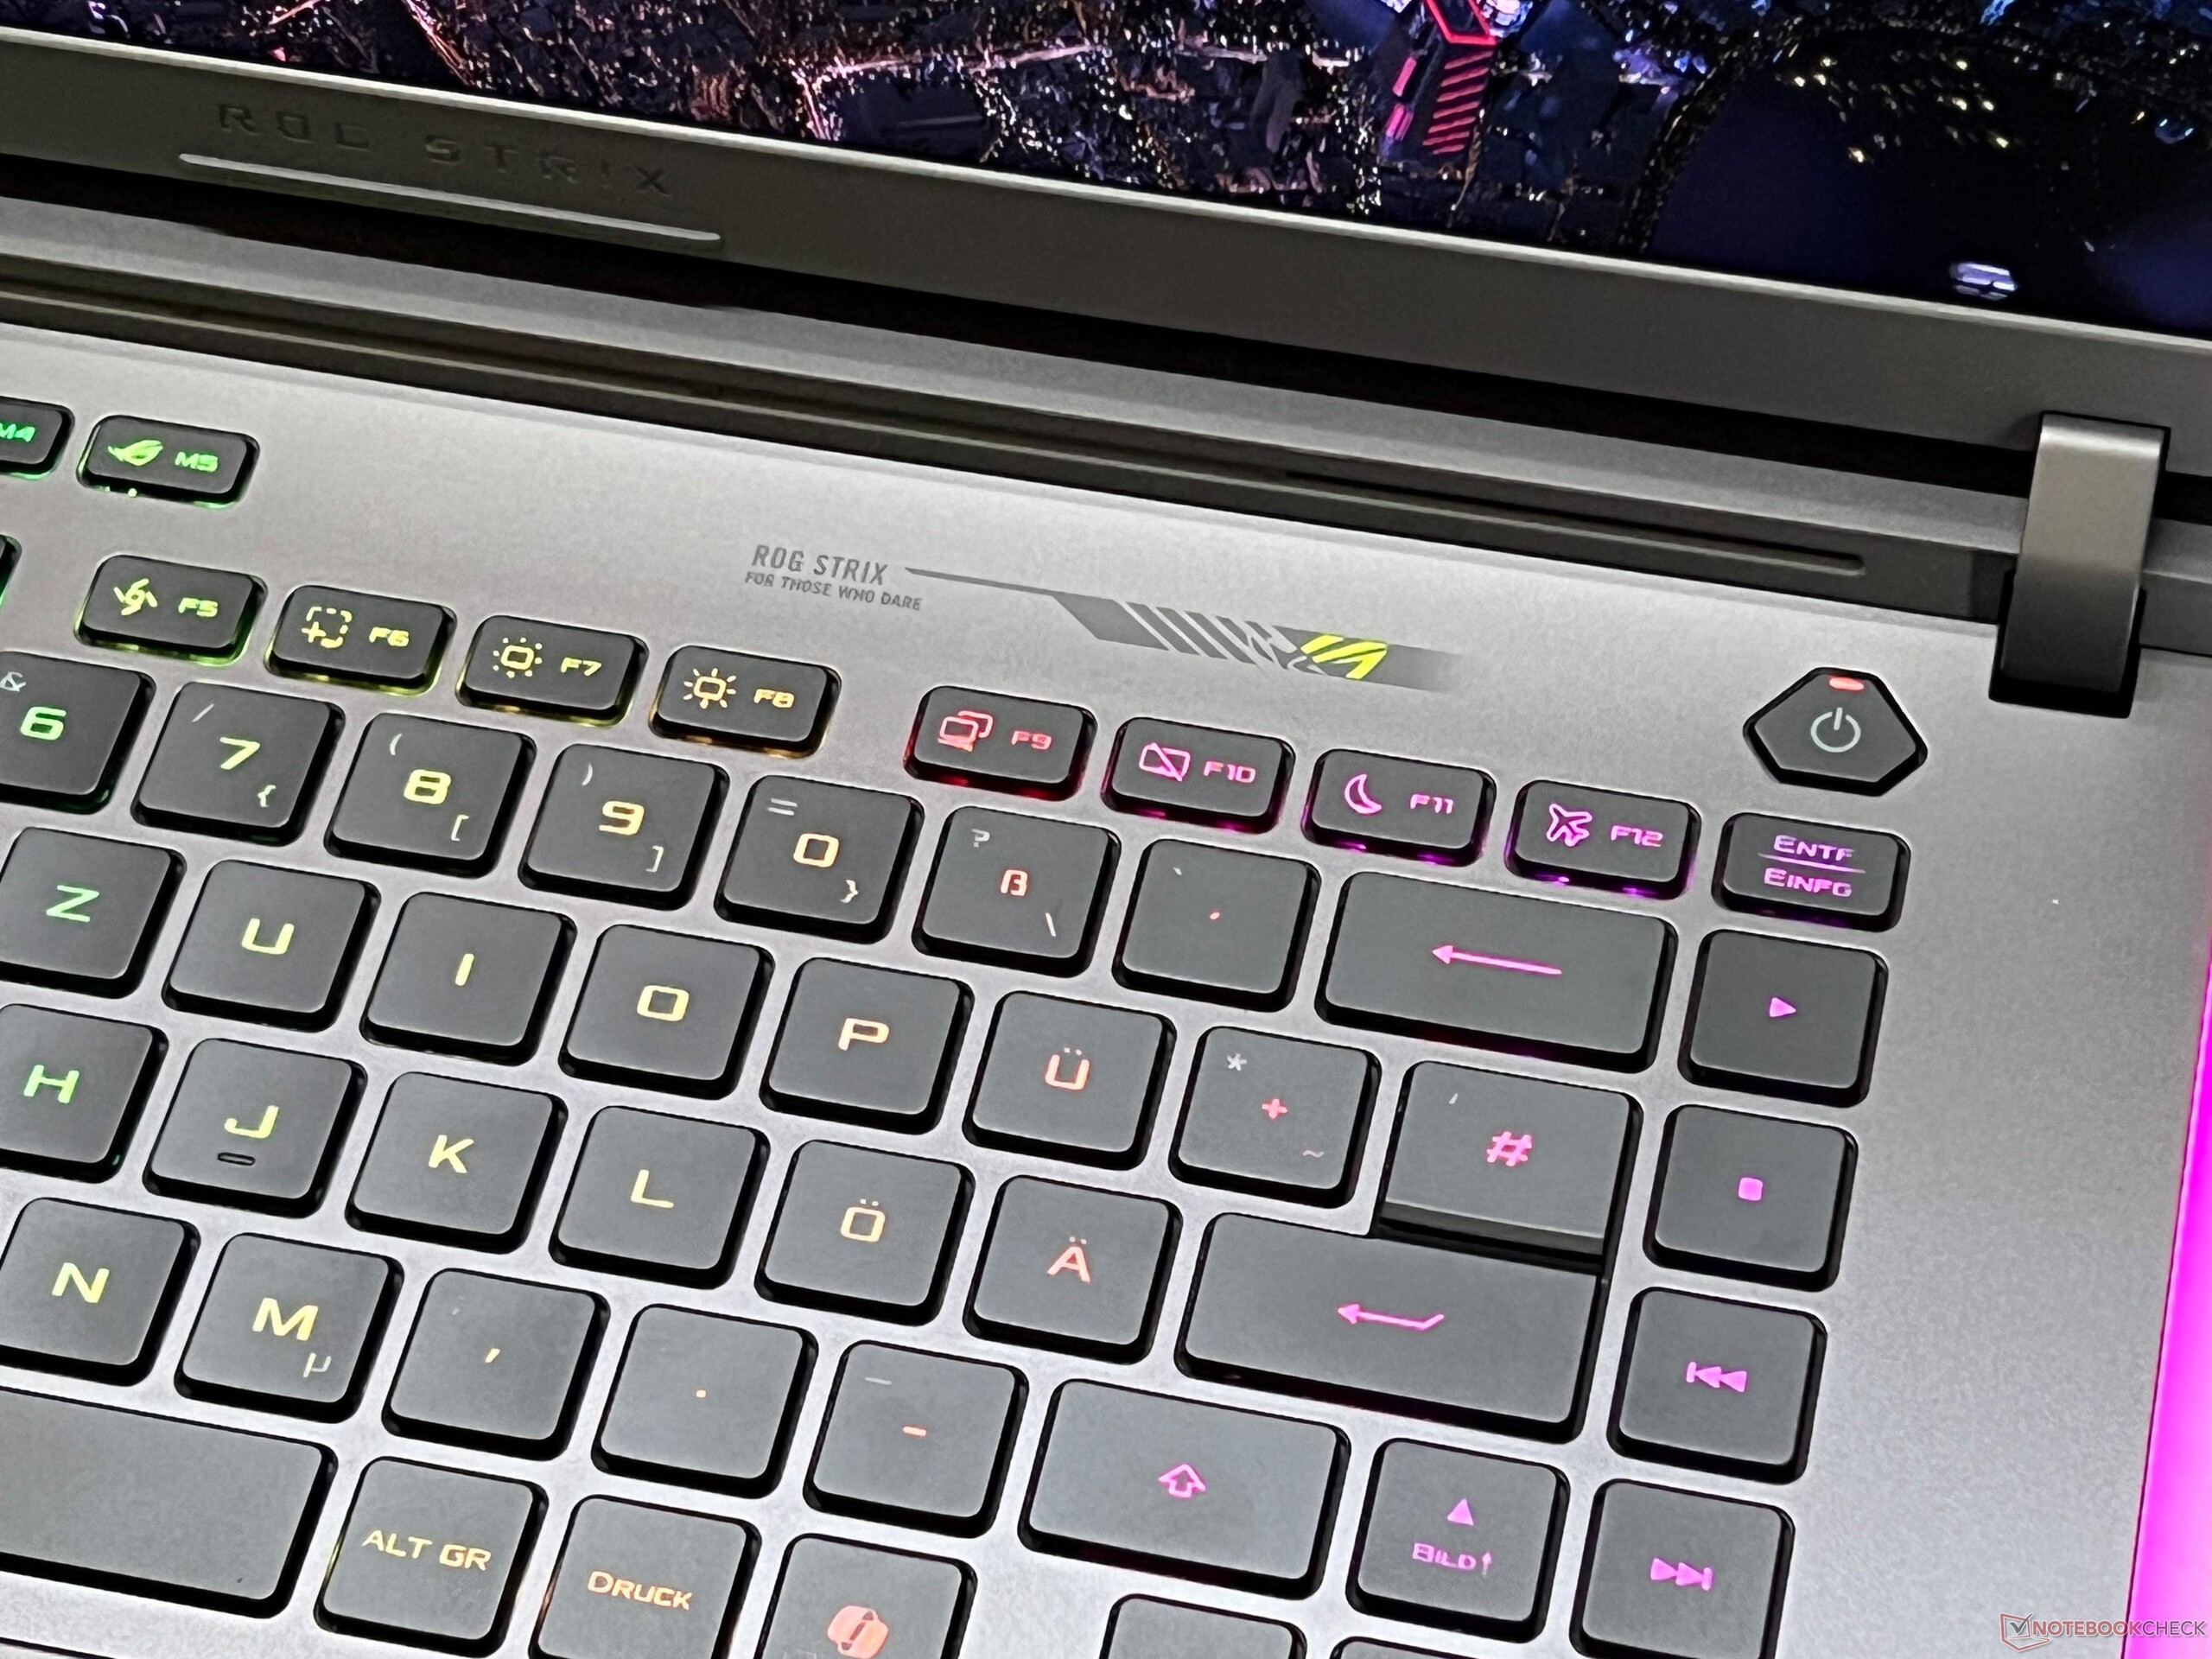
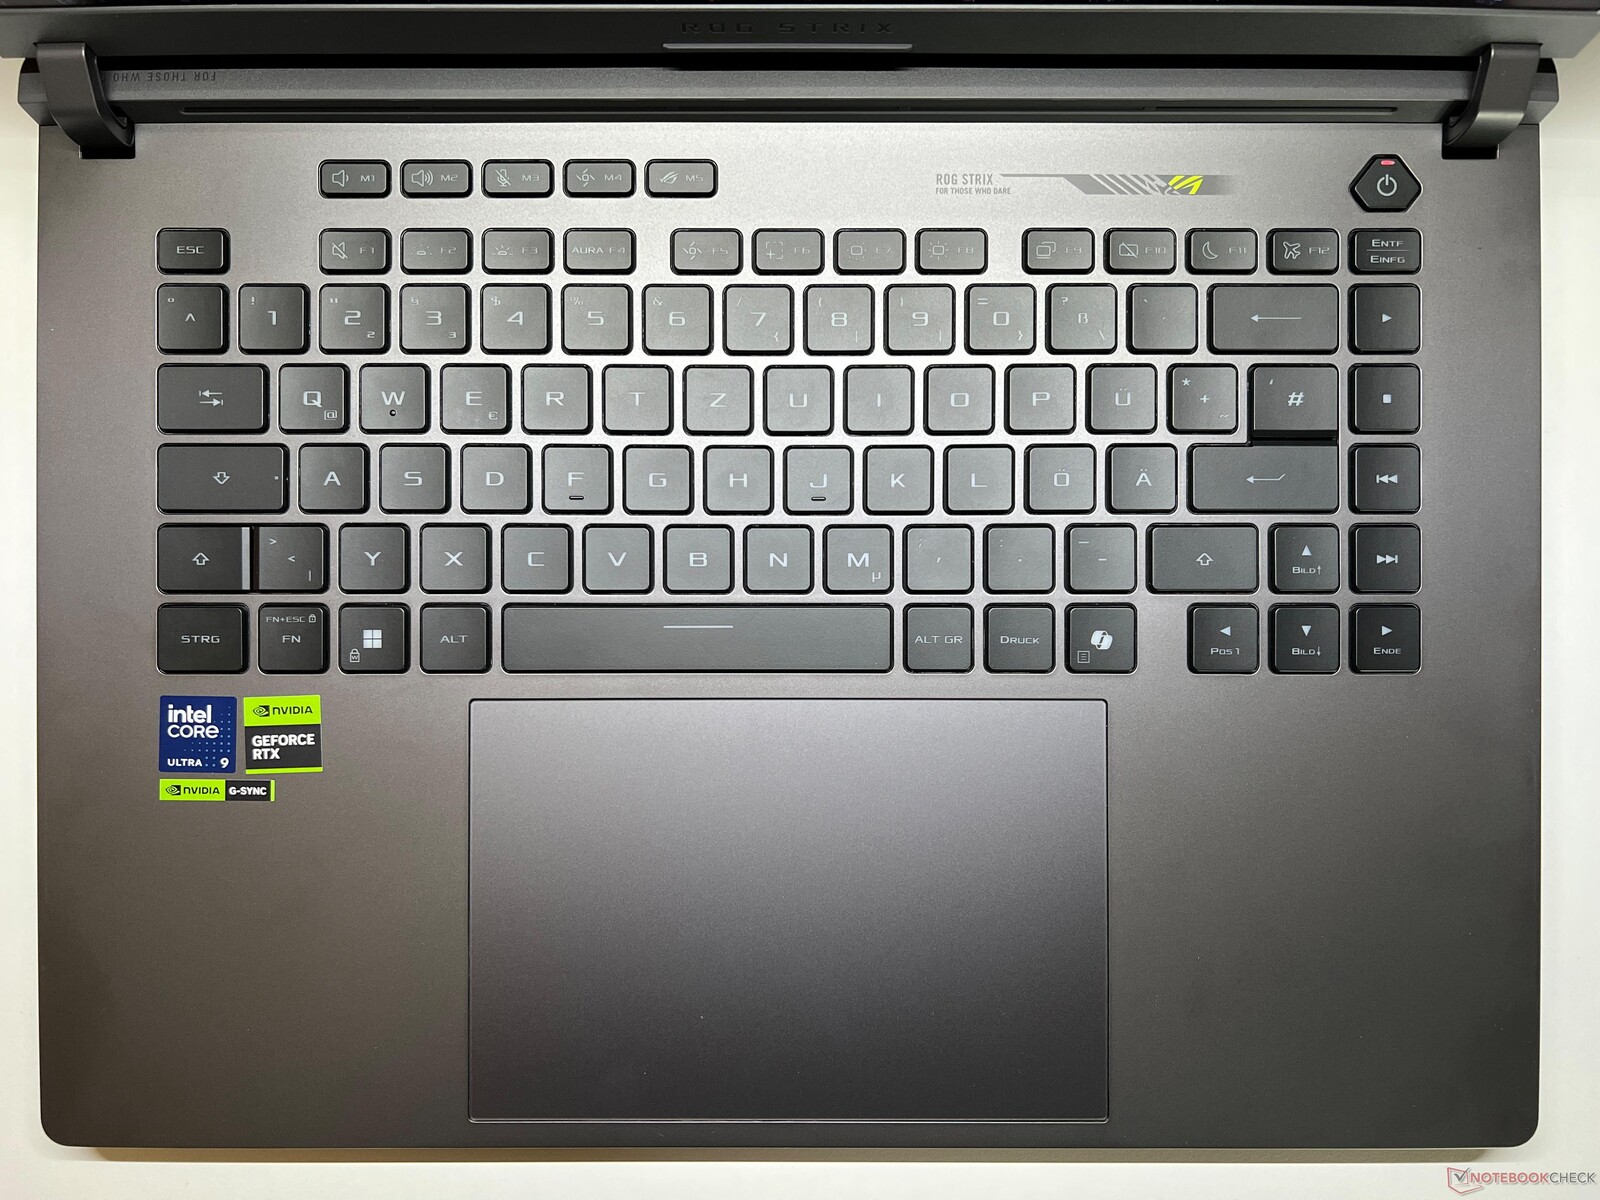
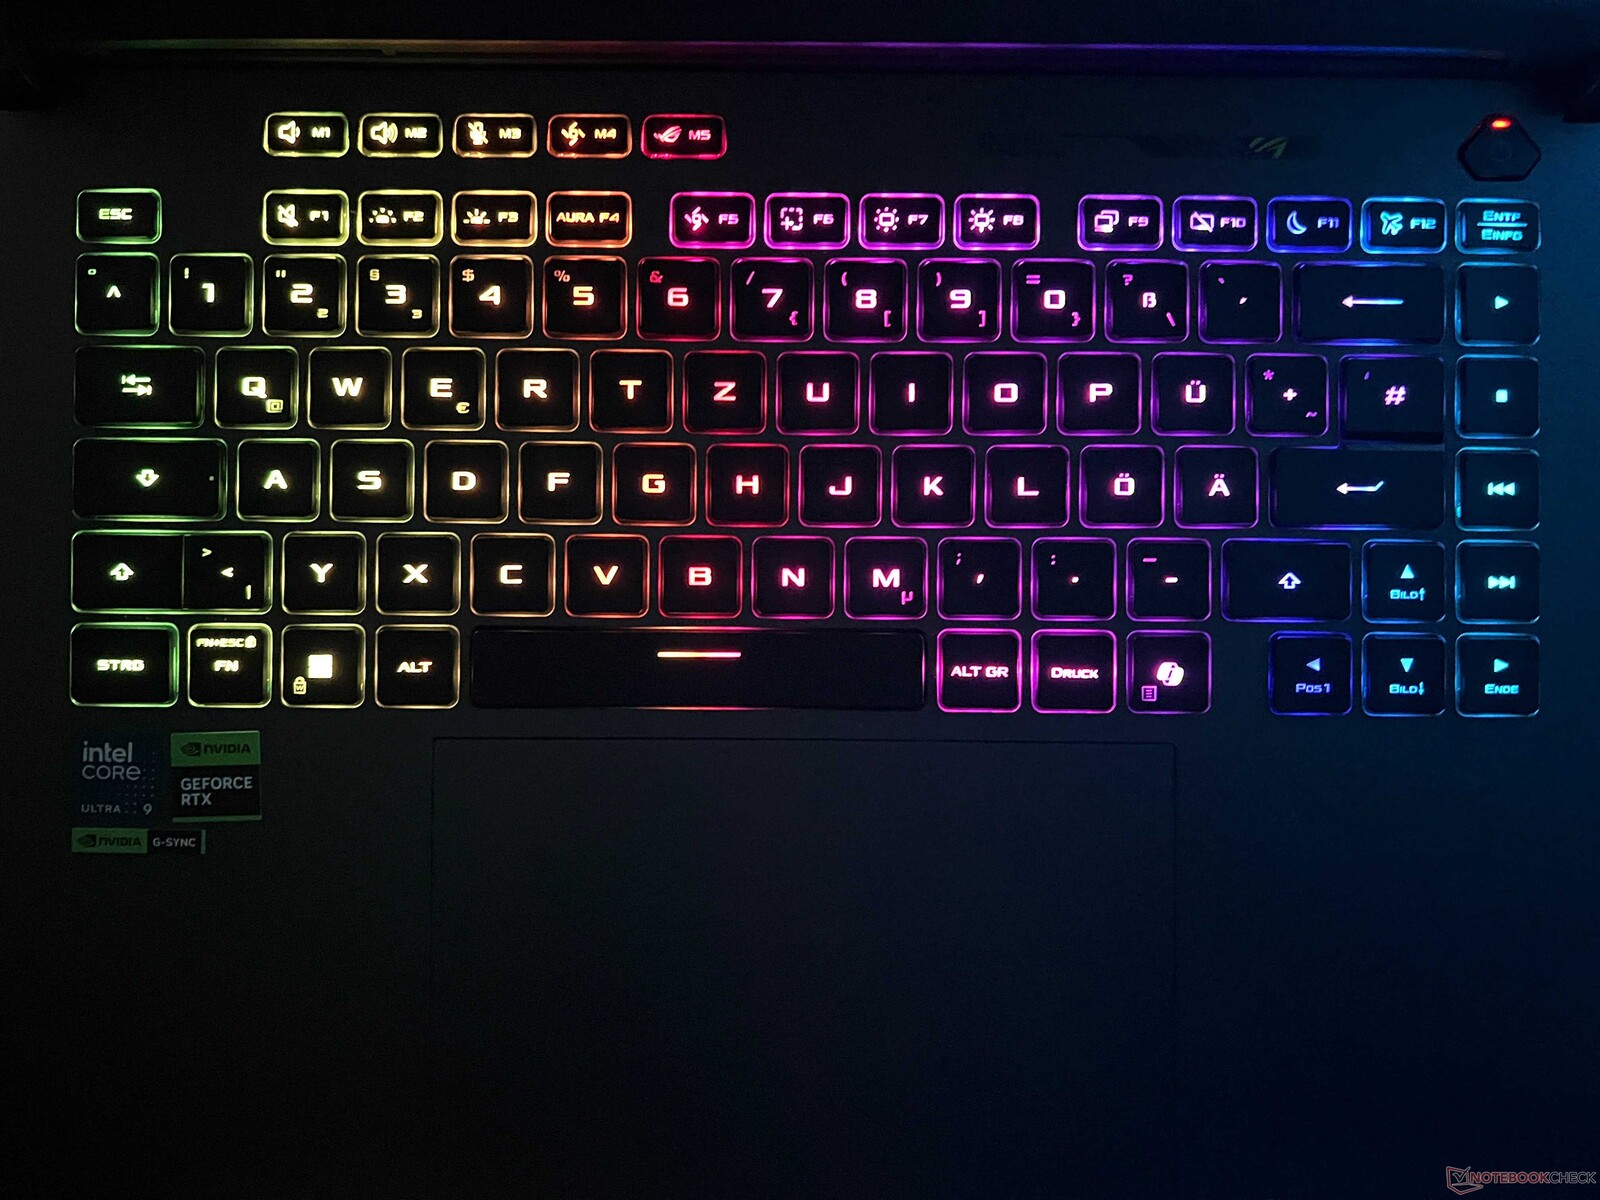
Le Strix G16 utilise un clavier à membrane avec une course suffisamment large, ce qui permet une expérience de frappe très confortable et silencieuse. Les touches peuvent être éclairées individuellement, ce qui peut bien sûr être synchronisé avec le reste de l'éclairage du boîtier. La disposition du clavier est très bonne dans l'ensemble, et la taille des touches fléchées n'est pas réduite. Cependant, il faut un peu de temps pour s'habituer à la colonne supplémentaire avec les touches de contrôle des médias sur le côté droit.
Comme Asus n'a pas inclus de bloc numérique ici, le très grand ClickPad (15 x 9,8 cm) est positionné au centre de l'unité de base. Grâce à ses bonnes caractéristiques de glissement, il fonctionne sans problème. Les clics mécaniques dans la zone inférieure donnent un bon retour d'information avec un son de clic étouffé et uniforme.
Écran - IPS avec 240 Hz et G-Sync

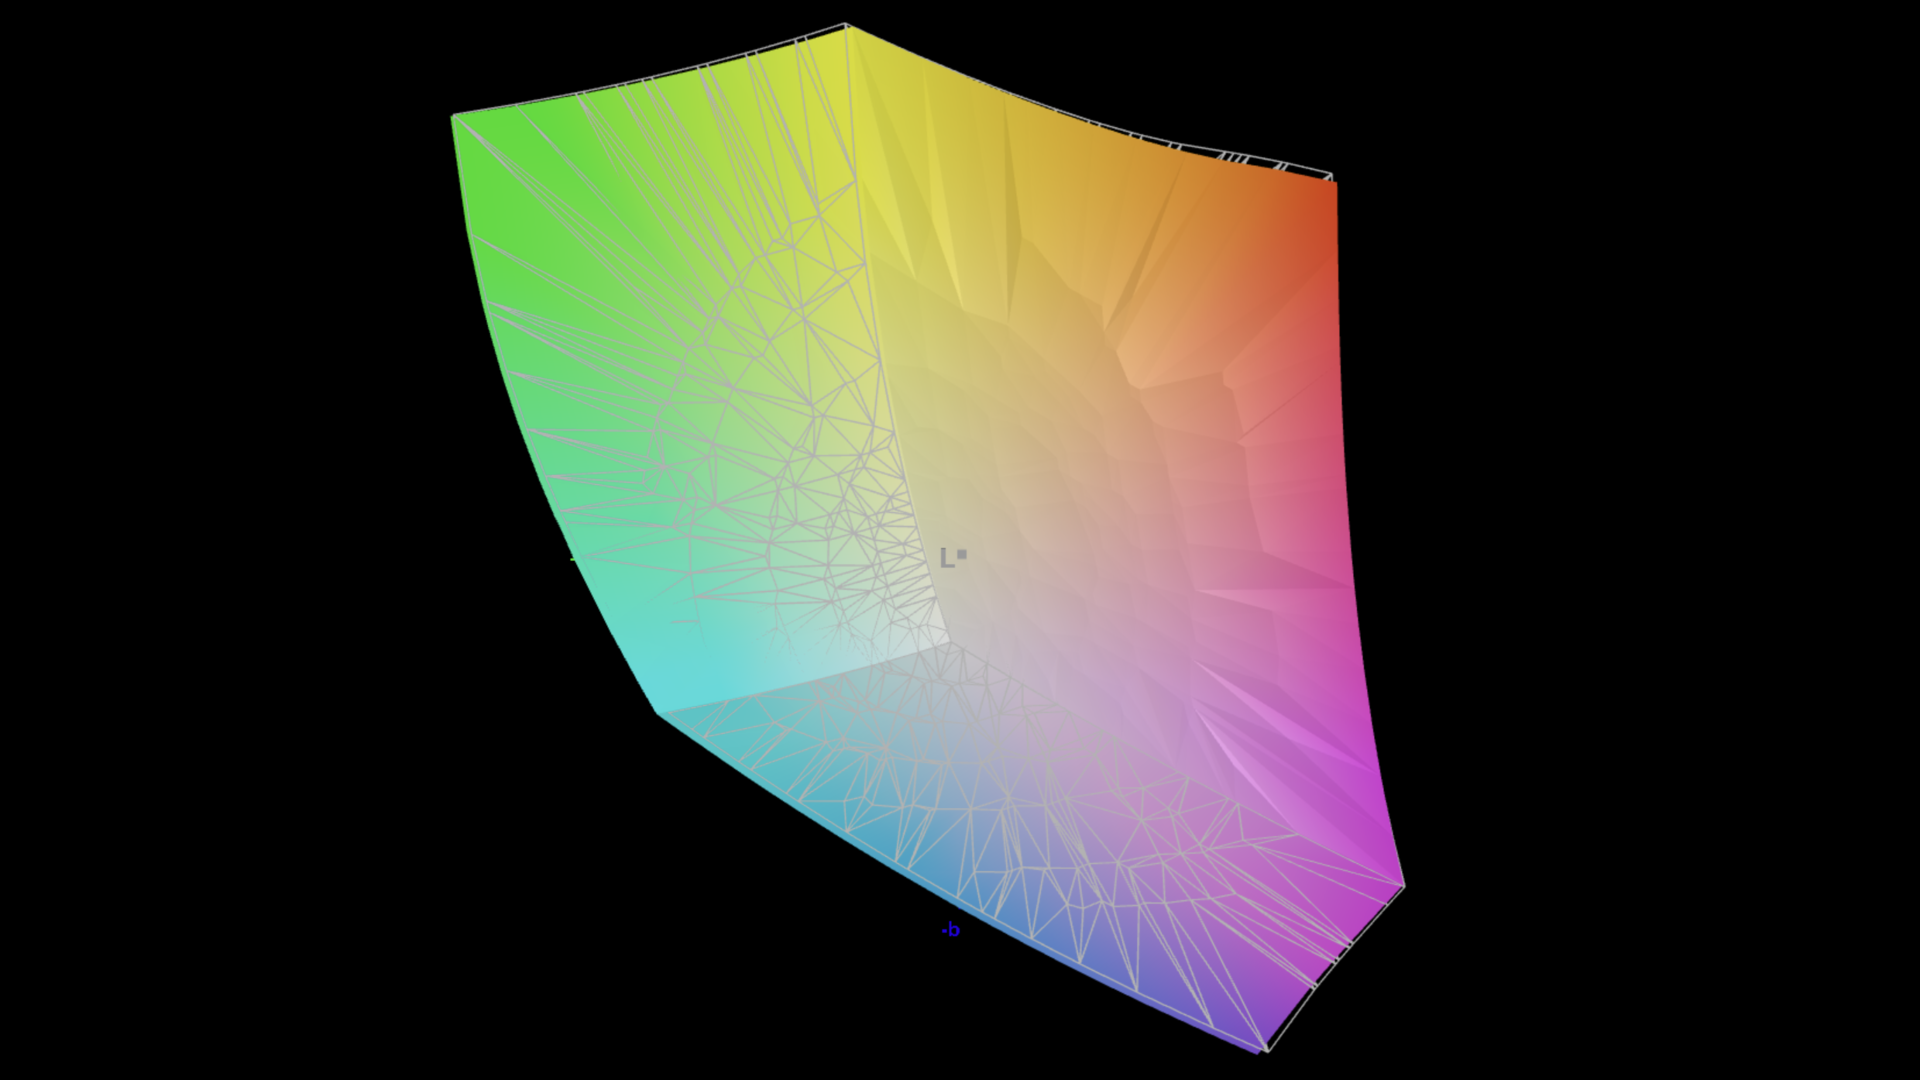
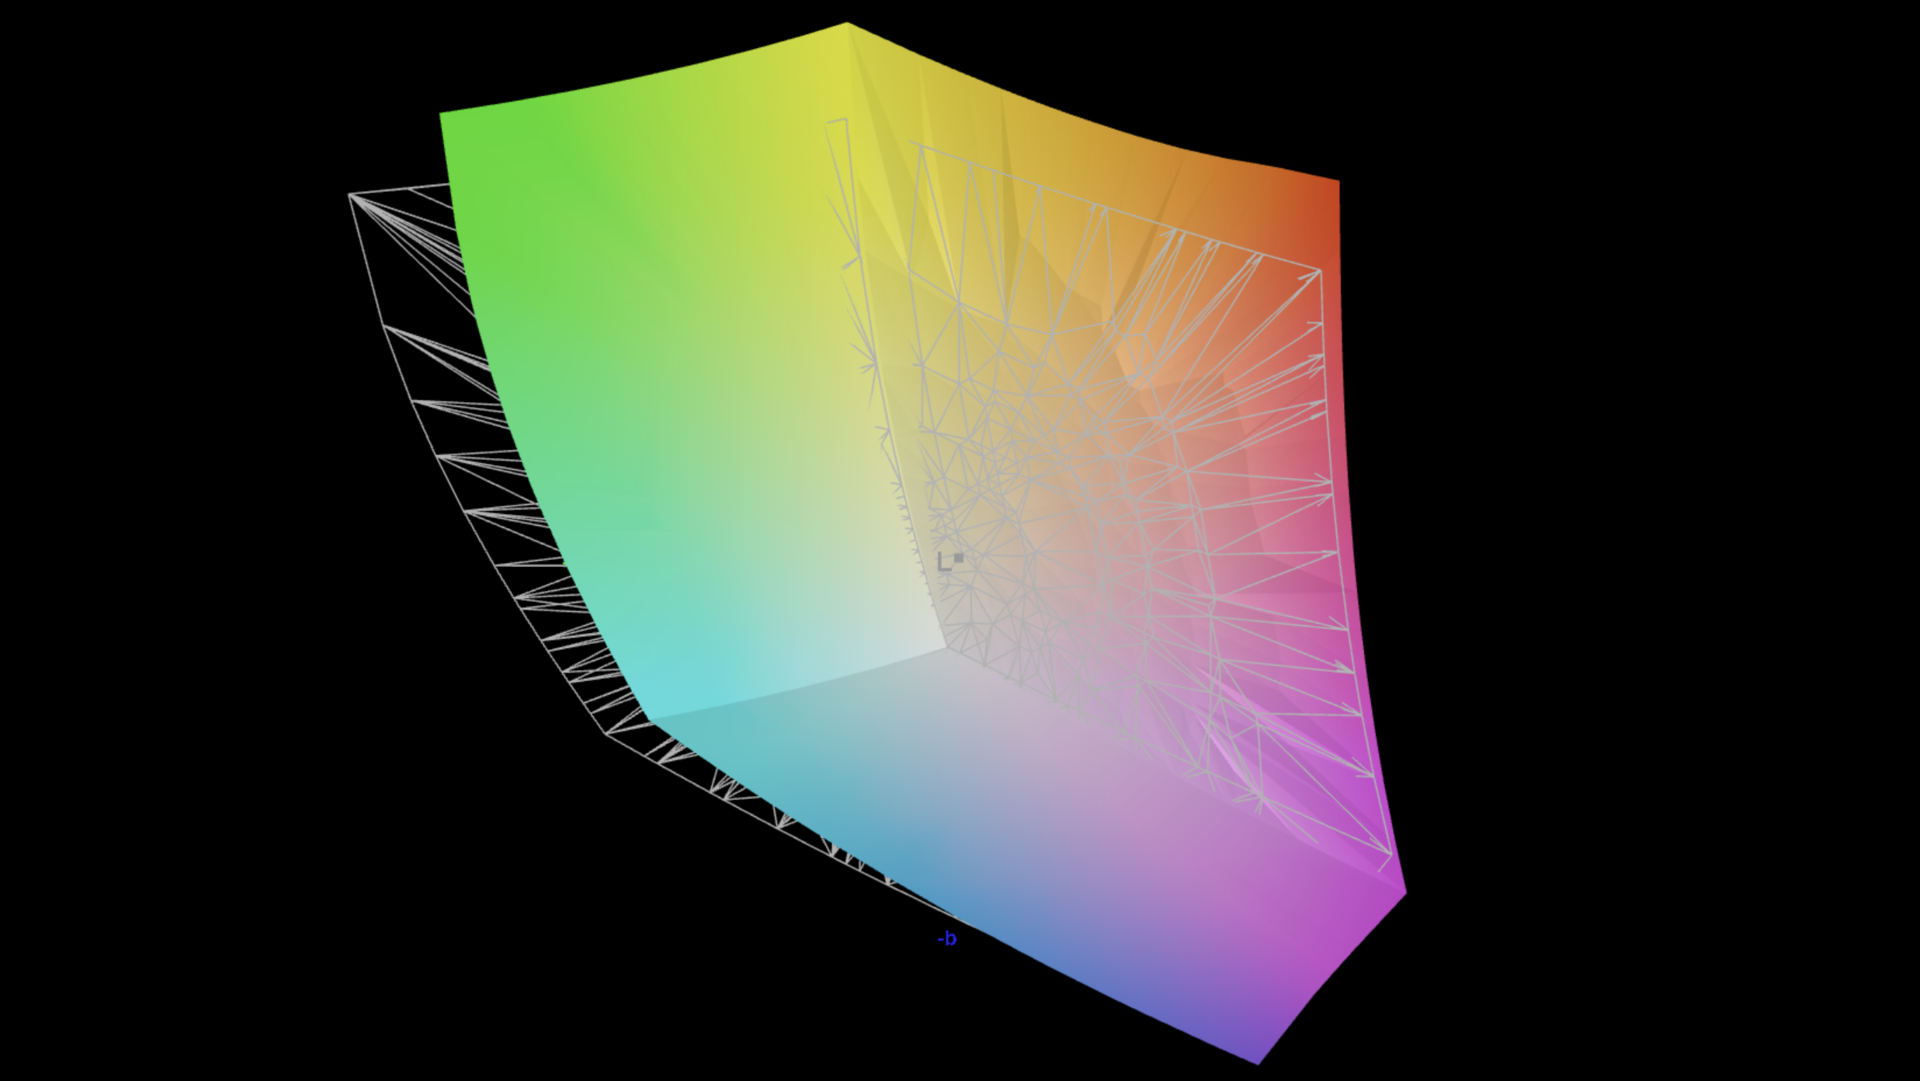
Le ROG Strix G16 est proposé exclusivement avec un grand écran IPS de 16 pouces avec une résolution de 2560x1600 pixels (16:10, G-Sync). La qualité d'image subjective de l'écran mat est très bonne. Même les zones lumineuses ne présentent pas de problèmes de granulation, mais le rapport de contraste est bien sûr inférieur à celui des écrans OLED ou Mini-LED. D'autre part, il n'y a pas de scintillement PWM, les temps de réponse sont très rapides et les mouvements semblent très fluides grâce au taux de rafraîchissement de 240 Hz. À pleine luminosité, vous pouvez voir de légers halos dans les images sombres. Le contenu HDR n'est pas pris en charge.
L'écran atteint une luminosité moyenne de ~535 cd/m². À 0,41 cd/m², la valeur du noir est légèrement plus élevée, ce qui entraîne un rapport de contraste maximal légèrement inférieur.
| |||||||||||||||||||||||||
Homogénéité de la luminosité: 89 %
Valeur mesurée au centre, sur batterie: 545 cd/m²
Contraste: 1329:1 (Valeurs des noirs: 0.41 cd/m²)
ΔE Color 1.6 | 0.5-29.43 Ø4.86, calibrated: 0.8
ΔE Greyscale 2.4 | 0.5-98 Ø5.1
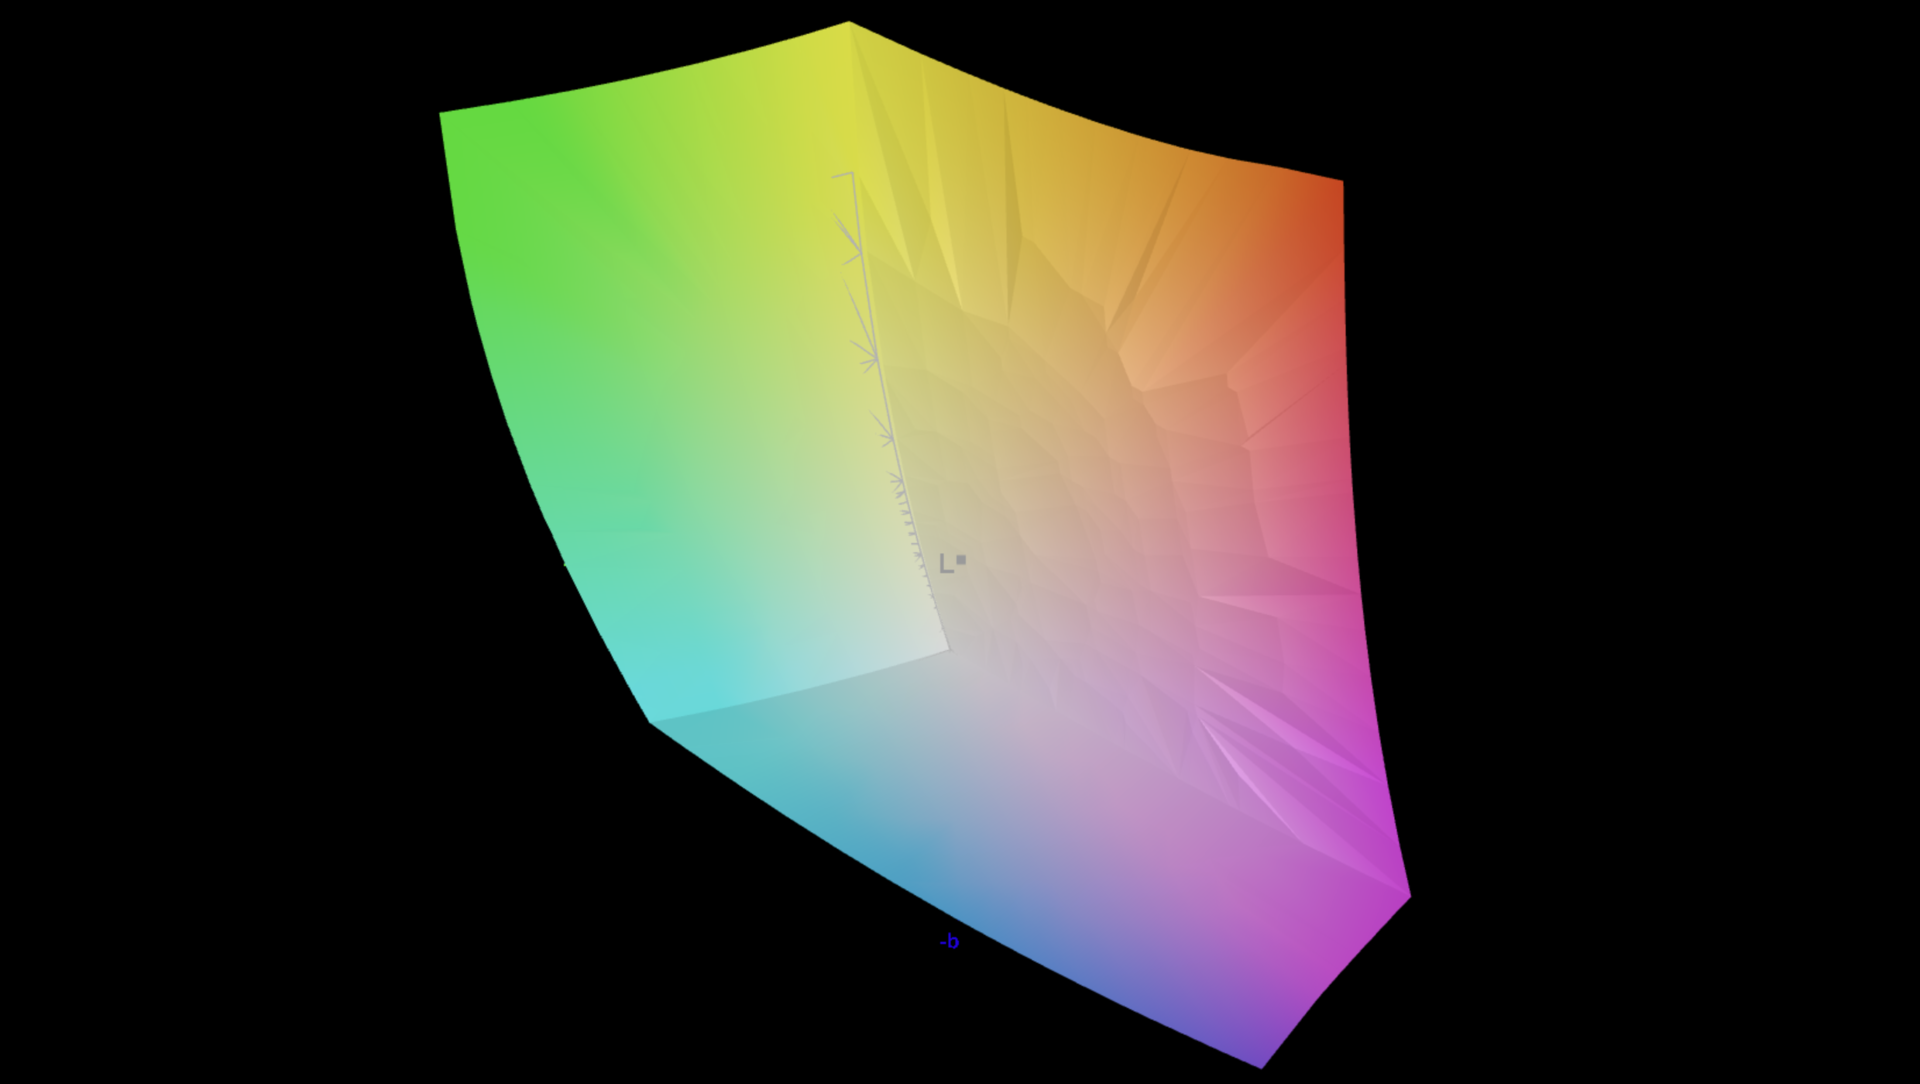
89.1% AdobeRGB 1998 (Argyll 2.2.0 3D)
99.9% sRGB (Argyll 2.2.0 3D)
99.1% Display P3 (Argyll 2.2.0 3D)
Gamma: 2.25
| Asus ROG Strix G16 G615 NE160QDM-NZC, IPS, 2560x1600, 16", 240 Hz | Acer Predator Helios 16 PH16-72 AUO43A8, IPS, 2560x1600, 16", 240 Hz | SCHENKER XMG Neo 16 (Early 24) BOE NE160QDM-NZA, IPS, 2560x1600, 16", 240 Hz | Asus ROG Strix Scar 16 G634JZR BOE NE160QDM-NM7, Mini LED, 2560x1600, 16", 240 Hz | HP Omen 16 (2024) BOE BOE0B7D, IPS, 2560x1440, 16.1", 240 Hz | Lenovo Legion Pro 7 16IRX9H BOE CQ NE16QDM-NZB, IPS, 2560x1600, 16", 240 Hz | Lenovo Legion Pro 7i 16 Gen 10 Samsung ATNA60HU01-0, OLED, 2560x1600, 16", 240 Hz | |
|---|---|---|---|---|---|---|---|
| Display | 2% | -17% | 1% | -18% | -1% | 2% | |
| Display P3 Coverage | 99.1 | 99.82 1% | 70.2 -29% | 99.8 1% | 68.6 -31% | 98.5 -1% | 99.5 0% |
| sRGB Coverage | 99.9 | 100 0% | 98 -2% | 100 0% | 98.6 -1% | 99.9 0% | 100 0% |
| AdobeRGB 1998 Coverage | 89.1 | 94.12 6% | 70.6 -21% | 90.8 2% | 70.6 -21% | 86.7 -3% | 94.4 6% |
| Response Times | -533% | -64% | -40% | -130% | -85% | 94% | |
| Response Time Grey 50% / Grey 80% * | 4.6 ? | 7.2 ? -57% | 11.2 ? -143% | 5 ? -9% | 14.1 ? -207% | 12.6 ? -174% | 0.28 ? 94% |
| Response Time Black / White * | 6.1 ? | 67.6 ? -1008% | 5.1 ? 16% | 10.4 ? -70% | 9.3 ? -52% | 5.8 ? 5% | 0.43 ? 93% |
| PWM Frequency | 2630 | 2040 ? | 1438 ? | ||||
| Screen | 58394% | -41% | 10% | -17% | 12% | -15% | |
| Brightness middle | 545 | 699 28% | 530 -3% | 490 -10% | 292 -46% | 487 -11% | 490.4 -10% |
| Brightness | 536 | 672 25% | 497 -7% | 487 -9% | 291 -46% | 460 -14% | 498 -7% |
| Brightness Distribution | 89 | 92 3% | 85 -4% | 94 6% | 85 -4% | 88 -1% | 97 9% |
| Black Level * | 0.41 | 0.0001 100% | 0.53 -29% | 0.4 2% | 0.24 41% | 0.42 -2% | |
| Contrast | 1329 | 6990000 525859% | 1000 -25% | 1225 -8% | 1217 -8% | 1160 -13% | |
| Colorchecker dE 2000 * | 1.6 | 3.89 -143% | 3.21 -101% | 1.08 32% | 2.36 -48% | 1.12 30% | 3.2 -100% |
| Colorchecker dE 2000 max. * | 4 | 5.51 -38% | 5.8 -45% | 2.38 40% | 4.08 -2% | 2.26 43% | 6.04 -51% |
| Colorchecker dE 2000 calibrated * | 0.8 | 2.17 -171% | 1.44 -80% | 0.9 -13% | 0.93 -16% | 0.54 32% | 0.84 -5% |
| Greyscale dE 2000 * | 2.4 | 5.14 -114% | 4.2 -75% | 1.1 54% | 3 -25% | 1.4 42% | 1 58% |
| Gamma | 2.25 98% | 2.018 109% | 2.226 99% | 2.13 103% | 2.101 105% | 2.242 98% | 2.24 98% |
| CCT | 6737 96% | 7113 91% | 6448 101% | 6724 97% | 5976 109% | 6809 95% | 6373 102% |
| Moyenne finale (programmes/paramètres) | 19288% /
37464% | -41% /
-39% | -10% /
1% | -55% /
-33% | -25% /
-5% | 27% /
7% |
* ... Moindre est la valeur, meilleures sont les performances
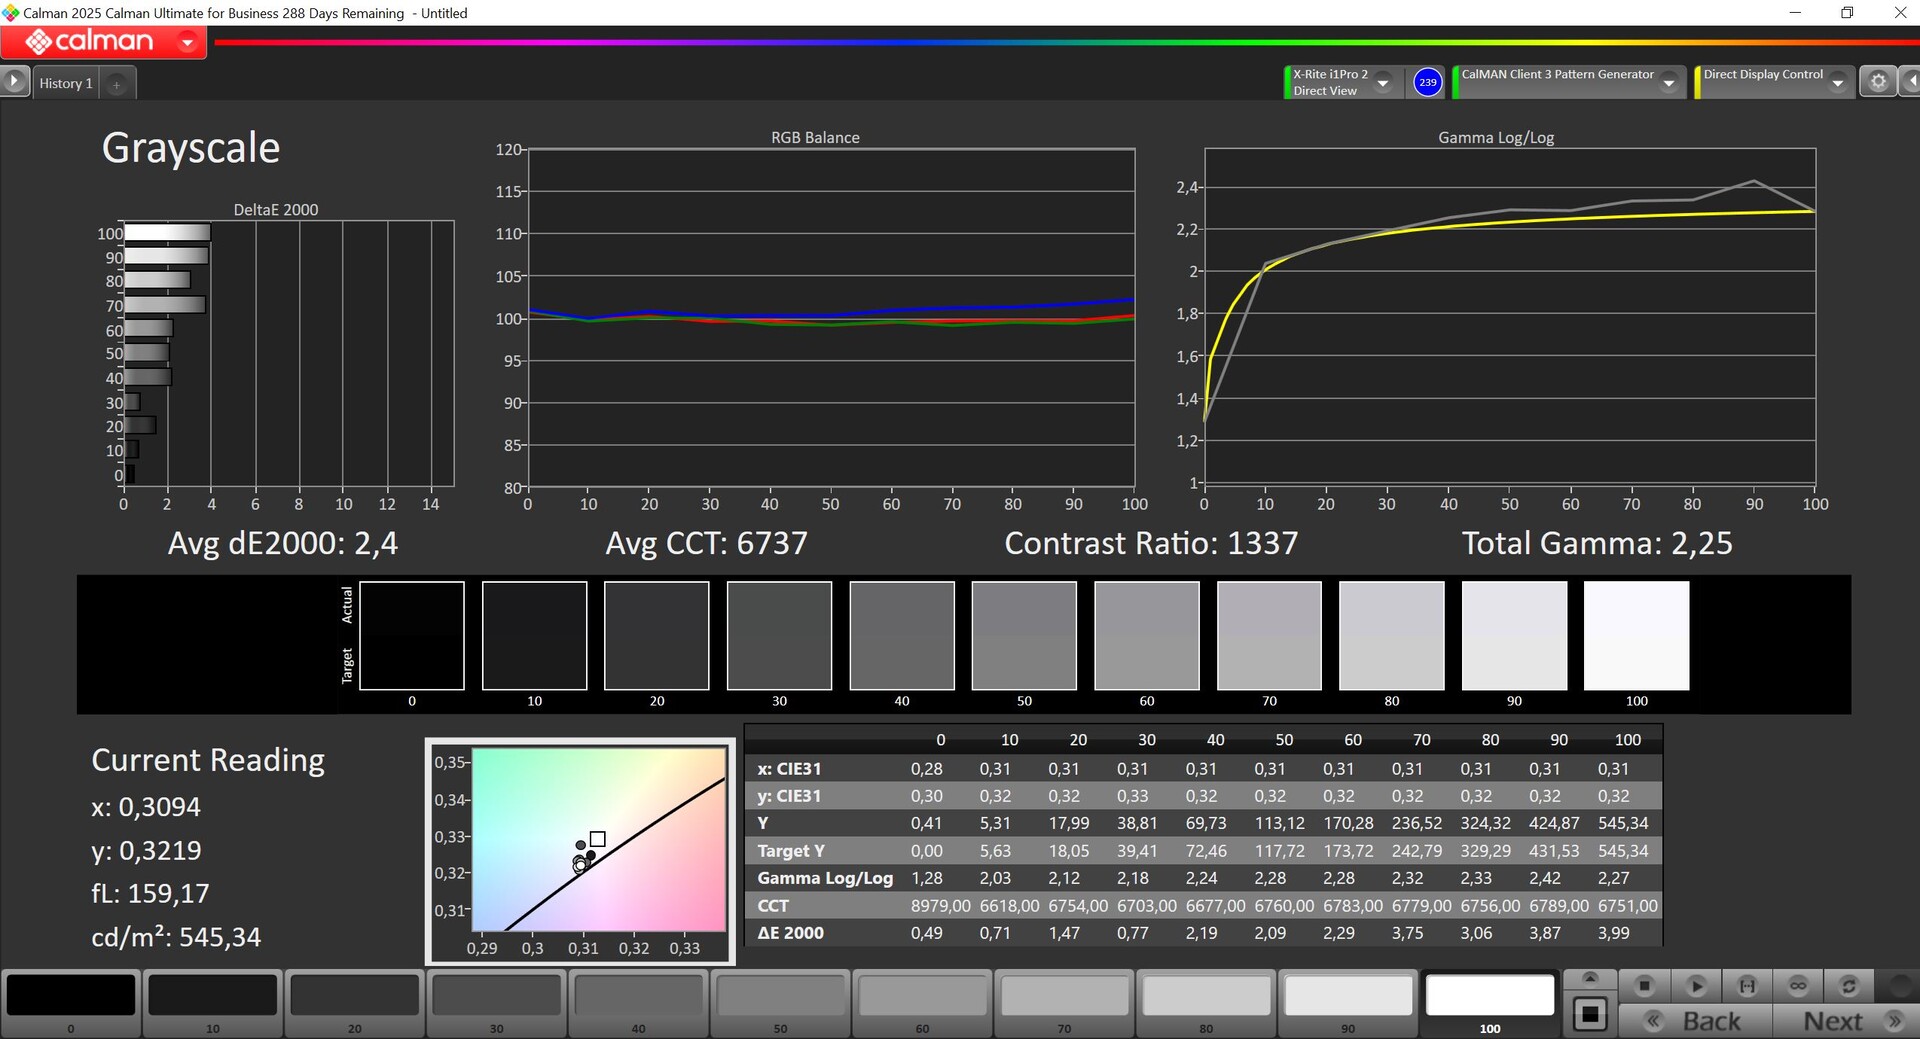
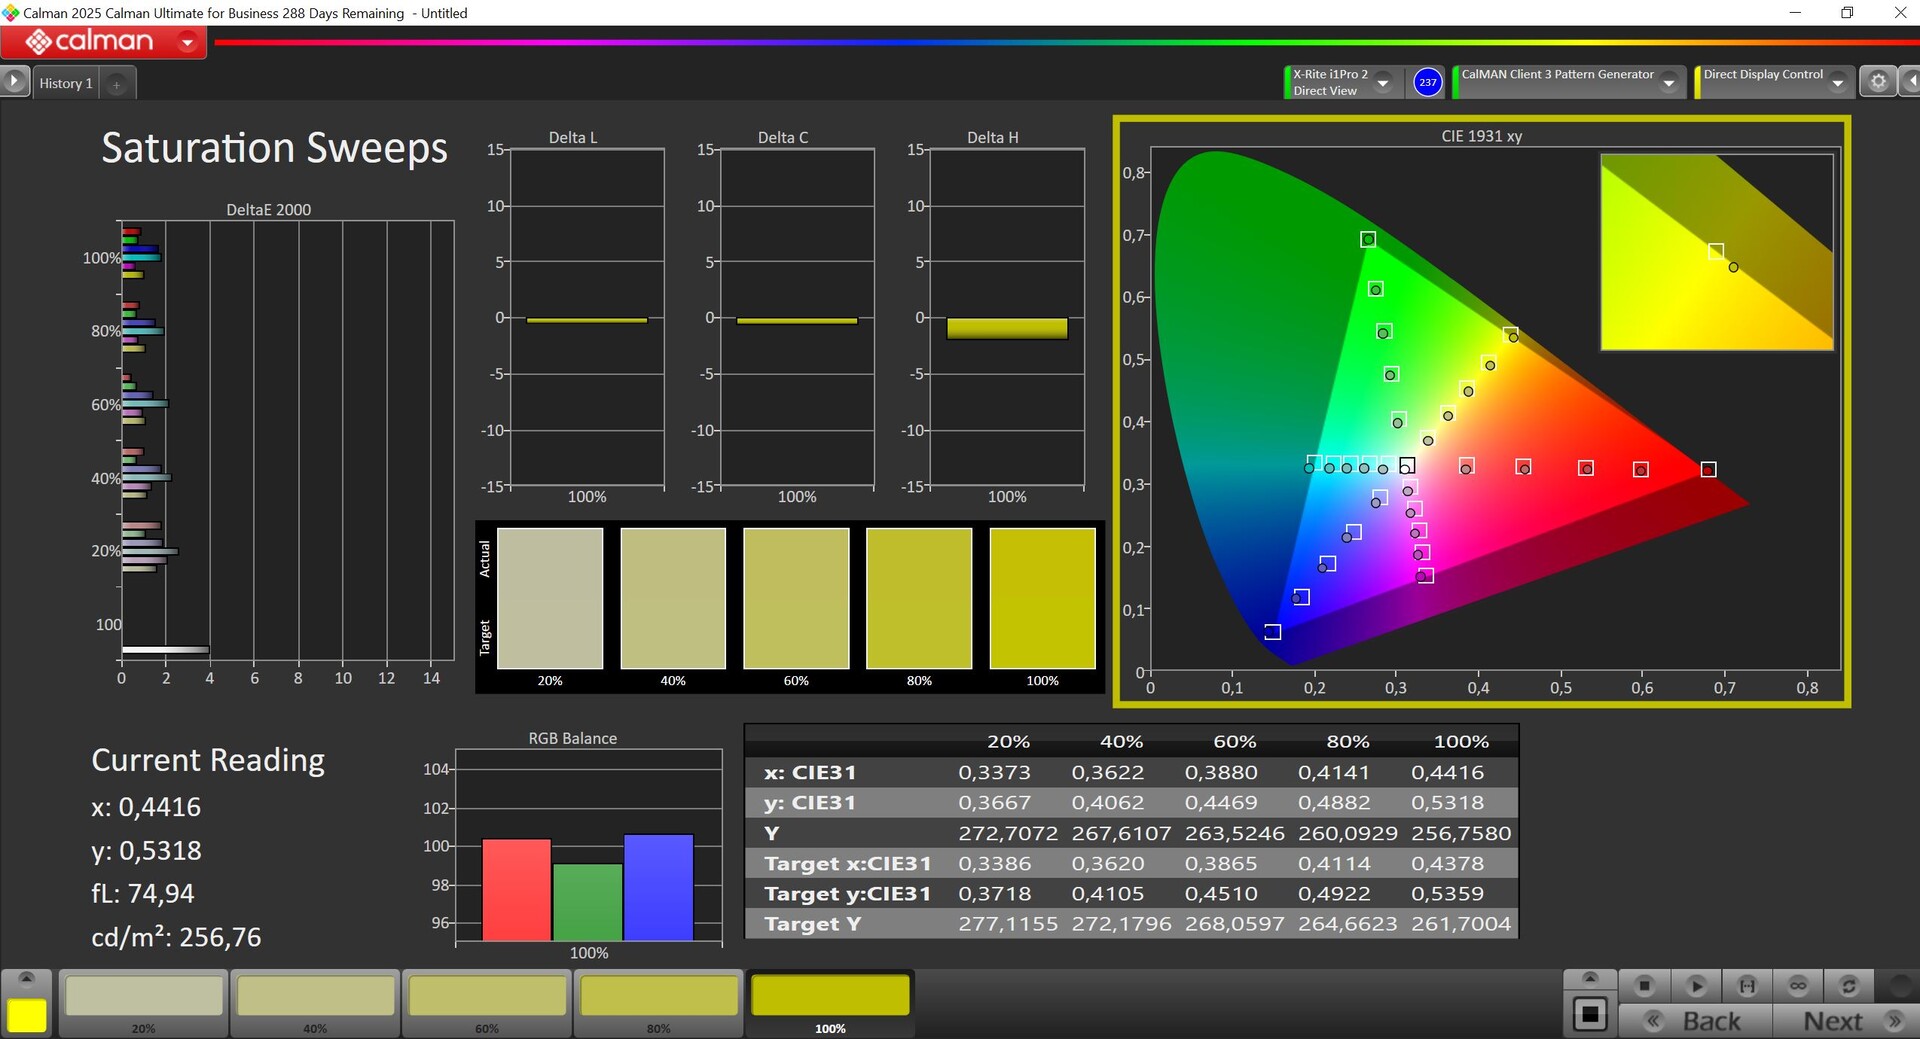


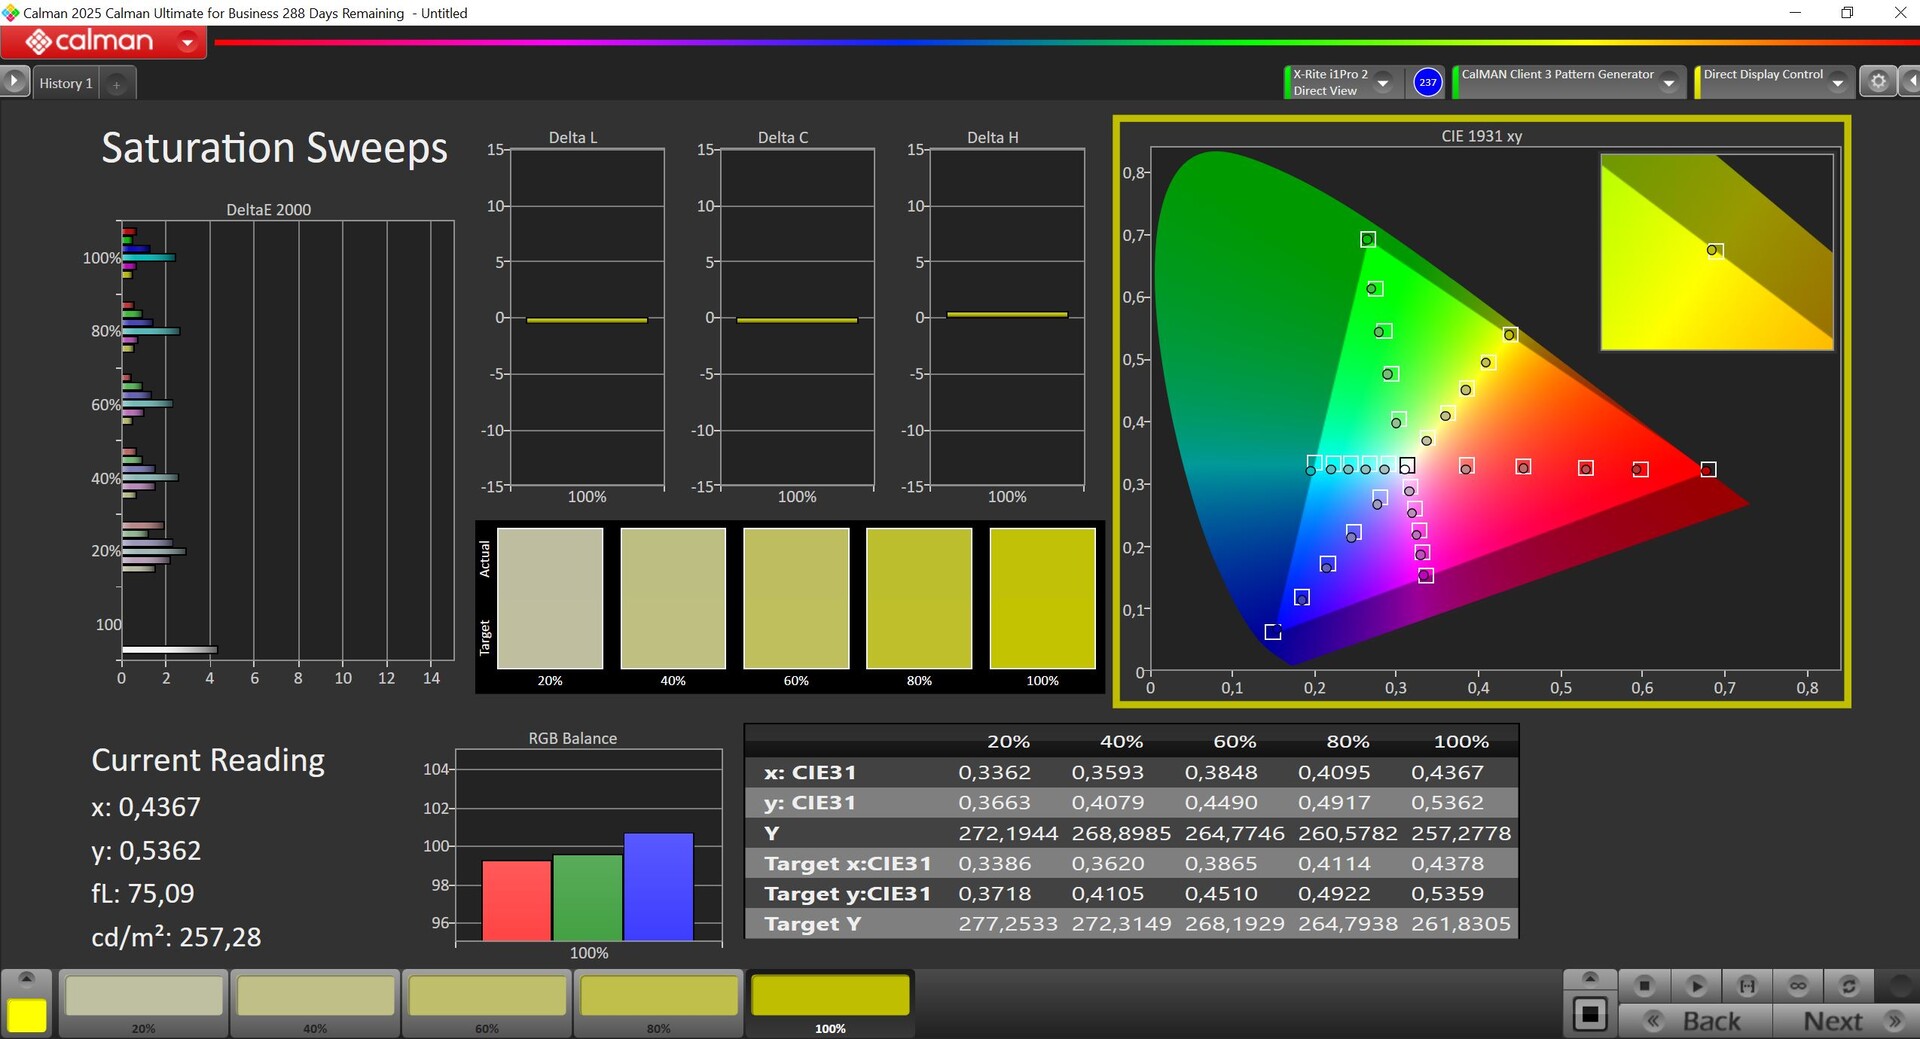


Asus propose différents profils de couleurs que nous mesurons avec le logiciel professionnel CalMAN. Tous les profils sont fondamentalement très similaires et offrent déjà une qualité d'image décente dans les espaces colorimétriques respectifs (P3 ou sRGB), mais nous ne pouvons exploiter tout le potentiel de l'écran que lorsque nous appliquons notre propre étalonnage (le profil correspondant est disponible en téléchargement gratuit à partir du lien ci-dessus). Grâce à la couverture complète de l'espace colorimétrique (P3 et sRGB), vous pouvez également utiliser l'écran pour le traitement d'images sans aucun problème.


Temps de réponse de l'écran
| ↔ Temps de réponse noir à blanc | ||
|---|---|---|
| 6.1 ms ... hausse ↗ et chute ↘ combinées | ↗ 1.6 ms hausse | 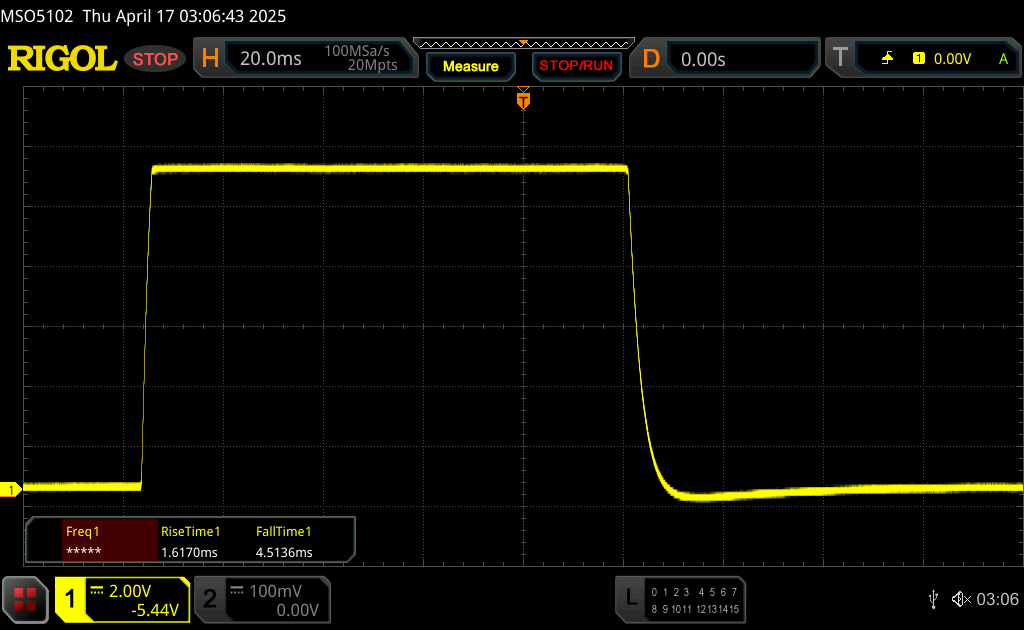 |
| ↘ 4.5 ms chute | ||
| L'écran montre de très faibles temps de réponse, parfait pour le jeu. En comparaison, tous les appareils testés affichent entre 0.1 (minimum) et 240 (maximum) ms. » 17 % des appareils testés affichent de meilleures performances. Cela signifie que les latences relevées sont meilleures que la moyenne (20.7 ms) de tous les appareils testés. | ||
| ↔ Temps de réponse gris 50% à gris 80% | ||
| 4.6 ms ... hausse ↗ et chute ↘ combinées | ↗ 2.1 ms hausse | 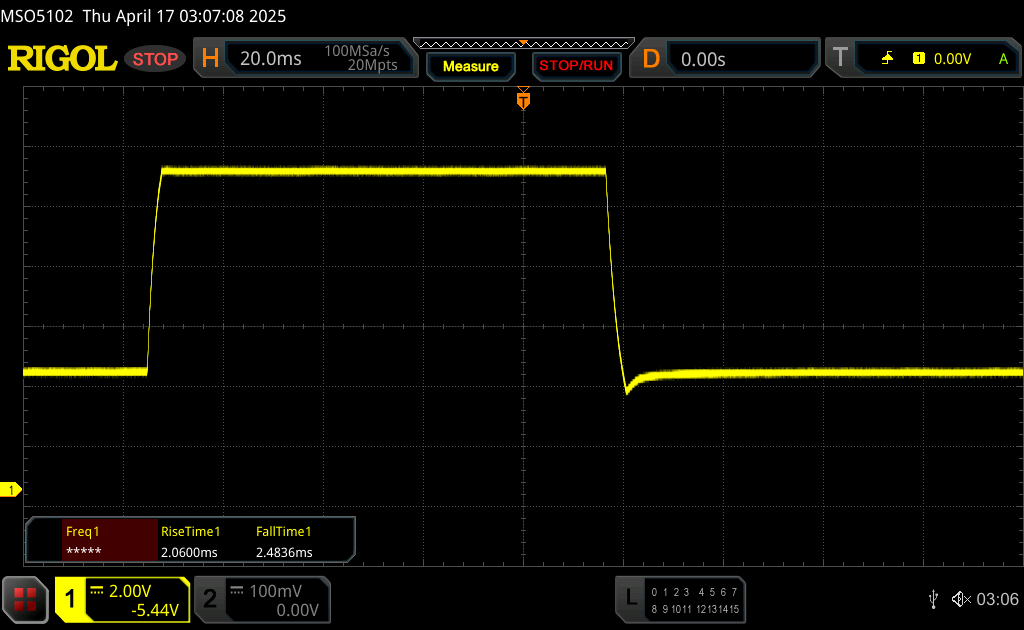 |
| ↘ 2.5 ms chute | ||
| L'écran montre de très faibles temps de réponse, parfait pour le jeu. En comparaison, tous les appareils testés affichent entre 0.165 (minimum) et 636 (maximum) ms. » 14 % des appareils testés affichent de meilleures performances. Cela signifie que les latences relevées sont meilleures que la moyenne (32.4 ms) de tous les appareils testés. | ||
Scintillement / MLI (Modulation de largeur d'impulsion)
| Scintillement / MLI (Modulation de largeur d'impulsion) non décelé |  | ||
En comparaison, 53 % des appareils testés n'emploient pas MDI pour assombrir leur écran. Nous avons relevé une moyenne à 8471 (minimum : 5 - maximum : 343500) Hz dans le cas où une MDI était active. | |||


Performance - Ordinateur portable Core Ultra 9 et RTX 5080
Conditions d'essai
Le ROG Strix G16 offre les profils de puissance habituels(Silent, Performance, Turbo) ainsi qu'un mode manuel et des modes supplémentaires pour la commutation du GPU. Le tableau suivant donne un aperçu des profils. Au quotidien, vous pouvez facilement passer d'un profil à l'autre en appuyant sur une touche. Nous effectuons nos tests et mesures en mode Turbo (mode GPU : Standard). En mode batterie, seuls les deux profils "Quiet " et " Performance" sont disponibles.
| Profil de puissance | CPU TDP | CB24 Multi | GPU TGP | Time Spy Graphics | Cyberpunk 2077 QHD Ultra | bruit max. du ventilateur |
|---|---|---|---|---|---|---|
| Silencieux | 160/45 Watt | 1,490 Points | 55 Watt | 11,041 Points | 43.1 FPS | 36.1 dB(A) |
| Performance | 160/105 Watt | 2,033 Points | 160 Watt | 20,138 Points | 91.6 FPS | 49.3 dB(A) |
| Turbo | 175/150 Watt | 2,207 Pointsse | 175 Watt | 21,571 Points | 99.5 FPS | 54.2 dB(A) |
| Batterie (performance) | 65/42 Watt | 1,627 Points | 55 Watt | 9,172 Points | 32 FPS | 34 dB(A) |
Processeur - Core Ultra 9 275HX
Asus utilise le nouveau Intel Core Ultra 9 275HX de la génération Arrow Lake, qui peut consommer un maximum de 175 watts avant de se stabiliser à 150 watts. Les performances du processeur sont excellentes, et le nouveau Stix G16 est capable de se placer en haut de notre champ de comparaison dans tous les benchmarks. Cependant, l'avantage par rapport aux implémentations rapides de l'ancien Core i9-14900HX n'est pas particulièrement important.
Cinebench R15 Multi Constant Load Test
Cinebench 2024: CPU Multi Core | CPU Single Core
Cinebench R23: Multi Core | Single Core
Cinebench R20: CPU (Multi Core) | CPU (Single Core)
Cinebench R15: CPU Multi 64Bit | CPU Single 64Bit
Blender: v2.79 BMW27 CPU
7-Zip 18.03: 7z b 4 | 7z b 4 -mmt1
Geekbench 6.4: Multi-Core | Single-Core
Geekbench 5.5: Multi-Core | Single-Core
HWBOT x265 Benchmark v2.2: 4k Preset
LibreOffice : 20 Documents To PDF
R Benchmark 2.5: Overall mean
| CPU Performance Rating | |
| Asus ROG Strix G16 G615 | |
| SCHENKER XMG Neo 16 (Early 24) | |
| Lenovo Legion Pro 7i 16 Gen 10 | |
| Moyenne Intel Core Ultra 9 275HX | |
| Lenovo Legion Pro 7 16IRX9H | |
| Asus ROG Strix Scar 16 G634JZR | |
| Acer Predator Helios 16 PH16-72 | |
| HP Omen 16 (2024) | |
| Moyenne de la classe Gaming | |
| Cinebench 2024 / CPU Multi Core | |
| Asus ROG Strix G16 G615 | |
| Moyenne Intel Core Ultra 9 275HX (1913 - 2223, n=4) | |
| Lenovo Legion Pro 7i 16 Gen 10 | |
| SCHENKER XMG Neo 16 (Early 24) | |
| Lenovo Legion Pro 7 16IRX9H | |
| Asus ROG Strix Scar 16 G634JZR | |
| Acer Predator Helios 16 PH16-72 | |
| Moyenne de la classe Gaming (331 - 2223, n=59, 2 dernières années) | |
| HP Omen 16 (2024) | |
| Cinebench 2024 / CPU Single Core | |
| Asus ROG Strix G16 G615 | |
| Moyenne Intel Core Ultra 9 275HX (130.7 - 138, n=4) | |
| Lenovo Legion Pro 7i 16 Gen 10 | |
| SCHENKER XMG Neo 16 (Early 24) | |
| Lenovo Legion Pro 7 16IRX9H | |
| HP Omen 16 (2024) | |
| Asus ROG Strix Scar 16 G634JZR | |
| Acer Predator Helios 16 PH16-72 | |
| Moyenne de la classe Gaming (68.2 - 138, n=60, 2 dernières années) | |
| Cinebench R23 / Multi Core | |
| Lenovo Legion Pro 7i 16 Gen 10 | |
| SCHENKER XMG Neo 16 (Early 24) | |
| Moyenne Intel Core Ultra 9 275HX (33449 - 39001, n=7) | |
| Asus ROG Strix G16 G615 | |
| Lenovo Legion Pro 7 16IRX9H | |
| Asus ROG Strix Scar 16 G634JZR | |
| Acer Predator Helios 16 PH16-72 | |
| HP Omen 16 (2024) | |
| Moyenne de la classe Gaming (5668 - 39652, n=148, 2 dernières années) | |
| Cinebench R23 / Single Core | |
| SCHENKER XMG Neo 16 (Early 24) | |
| Lenovo Legion Pro 7 16IRX9H | |
| HP Omen 16 (2024) | |
| Lenovo Legion Pro 7i 16 Gen 10 | |
| Asus ROG Strix Scar 16 G634JZR | |
| Asus ROG Strix G16 G615 | |
| Moyenne Intel Core Ultra 9 275HX (2126 - 2252, n=7) | |
| Acer Predator Helios 16 PH16-72 | |
| Moyenne de la classe Gaming (1136 - 2252, n=148, 2 dernières années) | |
| Cinebench R20 / CPU (Multi Core) | |
| Lenovo Legion Pro 7i 16 Gen 10 | |
| Moyenne Intel Core Ultra 9 275HX (13178 - 15517, n=7) | |
| Asus ROG Strix G16 G615 | |
| SCHENKER XMG Neo 16 (Early 24) | |
| Lenovo Legion Pro 7 16IRX9H | |
| Asus ROG Strix Scar 16 G634JZR | |
| Acer Predator Helios 16 PH16-72 | |
| HP Omen 16 (2024) | |
| Moyenne de la classe Gaming (2179 - 15517, n=148, 2 dernières années) | |
| Cinebench R20 / CPU (Single Core) | |
| Asus ROG Strix G16 G615 | |
| HP Omen 16 (2024) | |
| SCHENKER XMG Neo 16 (Early 24) | |
| Moyenne Intel Core Ultra 9 275HX (811 - 866, n=7) | |
| Asus ROG Strix Scar 16 G634JZR | |
| Lenovo Legion Pro 7 16IRX9H | |
| Lenovo Legion Pro 7i 16 Gen 10 | |
| Acer Predator Helios 16 PH16-72 | |
| Moyenne de la classe Gaming (439 - 866, n=148, 2 dernières années) | |
| Cinebench R15 / CPU Multi 64Bit | |
| Asus ROG Strix G16 G615 | |
| Lenovo Legion Pro 7i 16 Gen 10 | |
| Moyenne Intel Core Ultra 9 275HX (5044 - 6060, n=7) | |
| SCHENKER XMG Neo 16 (Early 24) | |
| Asus ROG Strix Scar 16 G634JZR | |
| Lenovo Legion Pro 7 16IRX9H | |
| Acer Predator Helios 16 PH16-72 | |
| HP Omen 16 (2024) | |
| Moyenne de la classe Gaming (1537 - 6074, n=151, 2 dernières années) | |
| Cinebench R15 / CPU Single 64Bit | |
| Asus ROG Strix G16 G615 | |
| Lenovo Legion Pro 7i 16 Gen 10 | |
| Moyenne Intel Core Ultra 9 275HX (317 - 343, n=7) | |
| Asus ROG Strix Scar 16 G634JZR | |
| Lenovo Legion Pro 7 16IRX9H | |
| HP Omen 16 (2024) | |
| SCHENKER XMG Neo 16 (Early 24) | |
| Acer Predator Helios 16 PH16-72 | |
| Moyenne de la classe Gaming (191.9 - 343, n=148, 2 dernières années) | |
| Blender / v2.79 BMW27 CPU | |
| Moyenne de la classe Gaming (81 - 517, n=142, 2 dernières années) | |
| HP Omen 16 (2024) | |
| Acer Predator Helios 16 PH16-72 | |
| Asus ROG Strix Scar 16 G634JZR | |
| Lenovo Legion Pro 7 16IRX9H | |
| SCHENKER XMG Neo 16 (Early 24) | |
| Moyenne Intel Core Ultra 9 275HX (86 - 102, n=7) | |
| Lenovo Legion Pro 7i 16 Gen 10 | |
| Asus ROG Strix G16 G615 | |
| 7-Zip 18.03 / 7z b 4 | |
| SCHENKER XMG Neo 16 (Early 24) | |
| Lenovo Legion Pro 7 16IRX9H | |
| Asus ROG Strix Scar 16 G634JZR | |
| Asus ROG Strix G16 G615 | |
| Lenovo Legion Pro 7i 16 Gen 10 | |
| Moyenne Intel Core Ultra 9 275HX (104686 - 122818, n=7) | |
| Acer Predator Helios 16 PH16-72 | |
| HP Omen 16 (2024) | |
| Moyenne de la classe Gaming (23795 - 144064, n=146, 2 dernières années) | |
| 7-Zip 18.03 / 7z b 4 -mmt1 | |
| Asus ROG Strix Scar 16 G634JZR | |
| SCHENKER XMG Neo 16 (Early 24) | |
| Lenovo Legion Pro 7 16IRX9H | |
| HP Omen 16 (2024) | |
| Asus ROG Strix G16 G615 | |
| Acer Predator Helios 16 PH16-72 | |
| Moyenne Intel Core Ultra 9 275HX (6186 - 7036, n=7) | |
| Lenovo Legion Pro 7i 16 Gen 10 | |
| Moyenne de la classe Gaming (4199 - 7573, n=146, 2 dernières années) | |
| Geekbench 6.4 / Multi-Core | |
| Asus ROG Strix G16 G615 | |
| SCHENKER XMG Neo 16 (Early 24) | |
| Moyenne Intel Core Ultra 9 275HX (16033 - 21668, n=8) | |
| Lenovo Legion Pro 7i 16 Gen 10 | |
| Asus ROG Strix Scar 16 G634JZR | |
| Lenovo Legion Pro 7 16IRX9H | |
| Acer Predator Helios 16 PH16-72 | |
| HP Omen 16 (2024) | |
| Moyenne de la classe Gaming (5340 - 21668, n=124, 2 dernières années) | |
| Geekbench 6.4 / Single-Core | |
| SCHENKER XMG Neo 16 (Early 24) | |
| HP Omen 16 (2024) | |
| Lenovo Legion Pro 7i 16 Gen 10 | |
| Moyenne Intel Core Ultra 9 275HX (2917 - 3158, n=8) | |
| Lenovo Legion Pro 7 16IRX9H | |
| Asus ROG Strix Scar 16 G634JZR | |
| Asus ROG Strix G16 G615 | |
| Acer Predator Helios 16 PH16-72 | |
| Moyenne de la classe Gaming (1490 - 3219, n=124, 2 dernières années) | |
| Geekbench 5.5 / Multi-Core | |
| Asus ROG Strix G16 G615 | |
| Moyenne Intel Core Ultra 9 275HX (21195 - 25855, n=7) | |
| SCHENKER XMG Neo 16 (Early 24) | |
| Lenovo Legion Pro 7i 16 Gen 10 | |
| Asus ROG Strix Scar 16 G634JZR | |
| Acer Predator Helios 16 PH16-72 | |
| Lenovo Legion Pro 7 16IRX9H | |
| HP Omen 16 (2024) | |
| Moyenne de la classe Gaming (4557 - 25855, n=145, 2 dernières années) | |
| Geekbench 5.5 / Single-Core | |
| Asus ROG Strix Scar 16 G634JZR | |
| Lenovo Legion Pro 7i 16 Gen 10 | |
| SCHENKER XMG Neo 16 (Early 24) | |
| Moyenne Intel Core Ultra 9 275HX (2034 - 2292, n=7) | |
| Asus ROG Strix G16 G615 | |
| HP Omen 16 (2024) | |
| Lenovo Legion Pro 7 16IRX9H | |
| Acer Predator Helios 16 PH16-72 | |
| Moyenne de la classe Gaming (986 - 2423, n=145, 2 dernières années) | |
| HWBOT x265 Benchmark v2.2 / 4k Preset | |
| Asus ROG Strix G16 G615 | |
| Lenovo Legion Pro 7i 16 Gen 10 | |
| Moyenne Intel Core Ultra 9 275HX (35 - 41.2, n=7) | |
| SCHENKER XMG Neo 16 (Early 24) | |
| Lenovo Legion Pro 7 16IRX9H | |
| Asus ROG Strix Scar 16 G634JZR | |
| Acer Predator Helios 16 PH16-72 | |
| Moyenne de la classe Gaming (7.7 - 42.9, n=146, 2 dernières années) | |
| HP Omen 16 (2024) | |
| LibreOffice / 20 Documents To PDF | |
| Moyenne Intel Core Ultra 9 275HX (36.9 - 88, n=7) | |
| Asus ROG Strix Scar 16 G634JZR | |
| Moyenne de la classe Gaming (19 - 96.6, n=144, 2 dernières années) | |
| HP Omen 16 (2024) | |
| Asus ROG Strix G16 G615 | |
| Lenovo Legion Pro 7i 16 Gen 10 | |
| Lenovo Legion Pro 7 16IRX9H | |
| SCHENKER XMG Neo 16 (Early 24) | |
| Acer Predator Helios 16 PH16-72 | |
| R Benchmark 2.5 / Overall mean | |
| Moyenne de la classe Gaming (0.3609 - 0.759, n=147, 2 dernières années) | |
| Moyenne Intel Core Ultra 9 275HX (0.3943 - 0.4568, n=7) | |
| Lenovo Legion Pro 7i 16 Gen 10 | |
| Asus ROG Strix G16 G615 | |
| Lenovo Legion Pro 7 16IRX9H | |
| Acer Predator Helios 16 PH16-72 | |
| HP Omen 16 (2024) | |
| Asus ROG Strix Scar 16 G634JZR | |
| SCHENKER XMG Neo 16 (Early 24) | |
* ... Moindre est la valeur, meilleures sont les performances
AIDA64: FP32 Ray-Trace | FPU Julia | CPU SHA3 | CPU Queen | FPU SinJulia | FPU Mandel | CPU AES | CPU ZLib | FP64 Ray-Trace | CPU PhotoWorxx
| Performance Rating | |
| Asus ROG Strix G16 G615 | |
| Lenovo Legion Pro 7i 16 Gen 10 | |
| Moyenne Intel Core Ultra 9 275HX | |
| SCHENKER XMG Neo 16 (Early 24) | |
| Asus ROG Strix Scar 16 G634JZR | |
| Lenovo Legion Pro 7 16IRX9H | |
| Acer Predator Helios 16 PH16-72 | |
| Moyenne de la classe Gaming | |
| HP Omen 16 (2024) | |
| AIDA64 / FP32 Ray-Trace | |
| Asus ROG Strix G16 G615 | |
| Moyenne Intel Core Ultra 9 275HX (32615 - 39551, n=7) | |
| Lenovo Legion Pro 7i 16 Gen 10 | |
| SCHENKER XMG Neo 16 (Early 24) | |
| Lenovo Legion Pro 7 16IRX9H | |
| Asus ROG Strix Scar 16 G634JZR | |
| Acer Predator Helios 16 PH16-72 | |
| Moyenne de la classe Gaming (7192 - 81639, n=146, 2 dernières années) | |
| HP Omen 16 (2024) | |
| AIDA64 / FPU Julia | |
| Asus ROG Strix G16 G615 | |
| Moyenne Intel Core Ultra 9 275HX (166245 - 194867, n=7) | |
| Lenovo Legion Pro 7i 16 Gen 10 | |
| SCHENKER XMG Neo 16 (Early 24) | |
| Lenovo Legion Pro 7 16IRX9H | |
| Asus ROG Strix Scar 16 G634JZR | |
| Acer Predator Helios 16 PH16-72 | |
| Moyenne de la classe Gaming (35040 - 252486, n=146, 2 dernières années) | |
| HP Omen 16 (2024) | |
| AIDA64 / CPU SHA3 | |
| Asus ROG Strix G16 G615 | |
| Moyenne Intel Core Ultra 9 275HX (7829 - 9482, n=7) | |
| Lenovo Legion Pro 7i 16 Gen 10 | |
| SCHENKER XMG Neo 16 (Early 24) | |
| Lenovo Legion Pro 7 16IRX9H | |
| Asus ROG Strix Scar 16 G634JZR | |
| Acer Predator Helios 16 PH16-72 | |
| Moyenne de la classe Gaming (1728 - 10389, n=146, 2 dernières années) | |
| HP Omen 16 (2024) | |
| AIDA64 / CPU Queen | |
| SCHENKER XMG Neo 16 (Early 24) | |
| Asus ROG Strix Scar 16 G634JZR | |
| Lenovo Legion Pro 7 16IRX9H | |
| Acer Predator Helios 16 PH16-72 | |
| Asus ROG Strix G16 G615 | |
| Lenovo Legion Pro 7i 16 Gen 10 | |
| Moyenne Intel Core Ultra 9 275HX (125013 - 139608, n=7) | |
| HP Omen 16 (2024) | |
| Moyenne de la classe Gaming (50699 - 200651, n=146, 2 dernières années) | |
| AIDA64 / FPU SinJulia | |
| SCHENKER XMG Neo 16 (Early 24) | |
| Lenovo Legion Pro 7 16IRX9H | |
| Asus ROG Strix Scar 16 G634JZR | |
| Acer Predator Helios 16 PH16-72 | |
| Lenovo Legion Pro 7i 16 Gen 10 | |
| Asus ROG Strix G16 G615 | |
| Moyenne Intel Core Ultra 9 275HX (12272 - 14112, n=7) | |
| Moyenne de la classe Gaming (5020 - 32988, n=146, 2 dernières années) | |
| HP Omen 16 (2024) | |
| AIDA64 / FPU Mandel | |
| Asus ROG Strix G16 G615 | |
| Moyenne Intel Core Ultra 9 275HX (87156 - 104057, n=7) | |
| Lenovo Legion Pro 7i 16 Gen 10 | |
| SCHENKER XMG Neo 16 (Early 24) | |
| Lenovo Legion Pro 7 16IRX9H | |
| Asus ROG Strix Scar 16 G634JZR | |
| Acer Predator Helios 16 PH16-72 | |
| Moyenne de la classe Gaming (17585 - 134044, n=146, 2 dernières années) | |
| HP Omen 16 (2024) | |
| AIDA64 / CPU AES | |
| Asus ROG Strix Scar 16 G634JZR | |
| SCHENKER XMG Neo 16 (Early 24) | |
| Lenovo Legion Pro 7 16IRX9H | |
| Asus ROG Strix G16 G615 | |
| Lenovo Legion Pro 7i 16 Gen 10 | |
| Moyenne Intel Core Ultra 9 275HX (118108 - 134920, n=7) | |
| Acer Predator Helios 16 PH16-72 | |
| Moyenne de la classe Gaming (19065 - 328679, n=146, 2 dernières années) | |
| HP Omen 16 (2024) | |
| AIDA64 / CPU ZLib | |
| SCHENKER XMG Neo 16 (Early 24) | |
| Asus ROG Strix G16 G615 | |
| Lenovo Legion Pro 7 16IRX9H | |
| Moyenne Intel Core Ultra 9 275HX (1896 - 2220, n=7) | |
| Lenovo Legion Pro 7i 16 Gen 10 | |
| Asus ROG Strix Scar 16 G634JZR | |
| Acer Predator Helios 16 PH16-72 | |
| Moyenne de la classe Gaming (373 - 2531, n=146, 2 dernières années) | |
| HP Omen 16 (2024) | |
| AIDA64 / FP64 Ray-Trace | |
| Asus ROG Strix G16 G615 | |
| Moyenne Intel Core Ultra 9 275HX (17631 - 21372, n=7) | |
| Lenovo Legion Pro 7i 16 Gen 10 | |
| SCHENKER XMG Neo 16 (Early 24) | |
| Lenovo Legion Pro 7 16IRX9H | |
| Asus ROG Strix Scar 16 G634JZR | |
| Acer Predator Helios 16 PH16-72 | |
| Moyenne de la classe Gaming (3856 - 43430, n=146, 2 dernières années) | |
| HP Omen 16 (2024) | |
| AIDA64 / CPU PhotoWorxx | |
| Lenovo Legion Pro 7i 16 Gen 10 | |
| Moyenne Intel Core Ultra 9 275HX (47726 - 56613, n=7) | |
| Asus ROG Strix Scar 16 G634JZR | |
| HP Omen 16 (2024) | |
| SCHENKER XMG Neo 16 (Early 24) | |
| Acer Predator Helios 16 PH16-72 | |
| Lenovo Legion Pro 7 16IRX9H | |
| Asus ROG Strix G16 G615 | |
| Moyenne de la classe Gaming (10805 - 60161, n=146, 2 dernières années) | |
Performance du système
Les performances du système sont excellentes, bien que les performances de tous les concurrents soient très similaires. La stabilité du système n'a posé aucun problème lors de notre test, et l'ordinateur portable est toujours très réactif. Lors de la commutation graphique, il y a une courte attente (par exemple au démarrage d'un jeu), mais c'est normal.
CrossMark: Overall | Productivity | Creativity | Responsiveness
WebXPRT 3: Overall
WebXPRT 4: Overall
Mozilla Kraken 1.1: Total
| PCMark 10 / Score | |
| Lenovo Legion Pro 7i 16 Gen 10 | |
| Acer Predator Helios 16 PH16-72 | |
| SCHENKER XMG Neo 16 (Early 24) | |
| Moyenne Intel Core Ultra 9 275HX, Nvidia GeForce RTX 5080 Laptop (8856 - 9153, n=2) | |
| Lenovo Legion Pro 7 16IRX9H | |
| HP Omen 16 (2024) | |
| Asus ROG Strix G16 G615 | |
| Moyenne de la classe Gaming (5776 - 9852, n=131, 2 dernières années) | |
| Asus ROG Strix Scar 16 G634JZR | |
| PCMark 10 / Essentials | |
| Acer Predator Helios 16 PH16-72 | |
| Lenovo Legion Pro 7 16IRX9H | |
| Asus ROG Strix Scar 16 G634JZR | |
| HP Omen 16 (2024) | |
| Lenovo Legion Pro 7i 16 Gen 10 | |
| Moyenne Intel Core Ultra 9 275HX, Nvidia GeForce RTX 5080 Laptop (11177 - 11215, n=2) | |
| Asus ROG Strix G16 G615 | |
| SCHENKER XMG Neo 16 (Early 24) | |
| Moyenne de la classe Gaming (9057 - 12600, n=131, 2 dernières années) | |
| PCMark 10 / Productivity | |
| SCHENKER XMG Neo 16 (Early 24) | |
| HP Omen 16 (2024) | |
| Lenovo Legion Pro 7 16IRX9H | |
| Acer Predator Helios 16 PH16-72 | |
| Moyenne de la classe Gaming (6662 - 14612, n=131, 2 dernières années) | |
| Lenovo Legion Pro 7i 16 Gen 10 | |
| Moyenne Intel Core Ultra 9 275HX, Nvidia GeForce RTX 5080 Laptop (9212 - 9590, n=2) | |
| Asus ROG Strix G16 G615 | |
| Asus ROG Strix Scar 16 G634JZR | |
| PCMark 10 / Digital Content Creation | |
| Lenovo Legion Pro 7i 16 Gen 10 | |
| Moyenne Intel Core Ultra 9 275HX, Nvidia GeForce RTX 5080 Laptop (18305 - 19351, n=2) | |
| Asus ROG Strix G16 G615 | |
| Asus ROG Strix Scar 16 G634JZR | |
| SCHENKER XMG Neo 16 (Early 24) | |
| HP Omen 16 (2024) | |
| Acer Predator Helios 16 PH16-72 | |
| Lenovo Legion Pro 7 16IRX9H | |
| Moyenne de la classe Gaming (6807 - 19351, n=131, 2 dernières années) | |
| CrossMark / Overall | |
| SCHENKER XMG Neo 16 (Early 24) | |
| Lenovo Legion Pro 7 16IRX9H | |
| HP Omen 16 (2024) | |
| Acer Predator Helios 16 PH16-72 | |
| Asus ROG Strix G16 G615 | |
| Moyenne Intel Core Ultra 9 275HX, Nvidia GeForce RTX 5080 Laptop (2017 - 2165, n=2) | |
| Asus ROG Strix Scar 16 G634JZR | |
| Lenovo Legion Pro 7i 16 Gen 10 | |
| Moyenne de la classe Gaming (1247 - 2344, n=111, 2 dernières années) | |
| CrossMark / Productivity | |
| Lenovo Legion Pro 7 16IRX9H | |
| SCHENKER XMG Neo 16 (Early 24) | |
| HP Omen 16 (2024) | |
| Acer Predator Helios 16 PH16-72 | |
| Asus ROG Strix G16 G615 | |
| Moyenne Intel Core Ultra 9 275HX, Nvidia GeForce RTX 5080 Laptop (1922 - 2014, n=2) | |
| Lenovo Legion Pro 7i 16 Gen 10 | |
| Asus ROG Strix Scar 16 G634JZR | |
| Moyenne de la classe Gaming (1299 - 2204, n=111, 2 dernières années) | |
| CrossMark / Creativity | |
| SCHENKER XMG Neo 16 (Early 24) | |
| Lenovo Legion Pro 7 16IRX9H | |
| Asus ROG Strix G16 G615 | |
| Acer Predator Helios 16 PH16-72 | |
| Moyenne Intel Core Ultra 9 275HX, Nvidia GeForce RTX 5080 Laptop (2288 - 2451, n=2) | |
| HP Omen 16 (2024) | |
| Asus ROG Strix Scar 16 G634JZR | |
| Lenovo Legion Pro 7i 16 Gen 10 | |
| Moyenne de la classe Gaming (1275 - 2660, n=111, 2 dernières années) | |
| CrossMark / Responsiveness | |
| Lenovo Legion Pro 7 16IRX9H | |
| HP Omen 16 (2024) | |
| SCHENKER XMG Neo 16 (Early 24) | |
| Acer Predator Helios 16 PH16-72 | |
| Asus ROG Strix G16 G615 | |
| Asus ROG Strix Scar 16 G634JZR | |
| Moyenne Intel Core Ultra 9 275HX, Nvidia GeForce RTX 5080 Laptop (1597 - 1853, n=2) | |
| Moyenne de la classe Gaming (1030 - 2330, n=111, 2 dernières années) | |
| Lenovo Legion Pro 7i 16 Gen 10 | |
| WebXPRT 3 / Overall | |
| Lenovo Legion Pro 7i 16 Gen 10 | |
| Moyenne Intel Core Ultra 9 275HX, Nvidia GeForce RTX 5080 Laptop (347 - 359, n=2) | |
| Asus ROG Strix G16 G615 | |
| Lenovo Legion Pro 7 16IRX9H | |
| SCHENKER XMG Neo 16 (Early 24) | |
| Acer Predator Helios 16 PH16-72 | |
| HP Omen 16 (2024) | |
| Asus ROG Strix Scar 16 G634JZR | |
| Moyenne de la classe Gaming (215 - 480, n=126, 2 dernières années) | |
| WebXPRT 4 / Overall | |
| Asus ROG Strix G16 G615 | |
| Moyenne Intel Core Ultra 9 275HX, Nvidia GeForce RTX 5080 Laptop (333 - 336, n=2) | |
| Lenovo Legion Pro 7i 16 Gen 10 | |
| Lenovo Legion Pro 7 16IRX9H | |
| HP Omen 16 (2024) | |
| Asus ROG Strix Scar 16 G634JZR | |
| SCHENKER XMG Neo 16 (Early 24) | |
| Acer Predator Helios 16 PH16-72 | |
| Moyenne de la classe Gaming (176.4 - 336, n=111, 2 dernières années) | |
| Mozilla Kraken 1.1 / Total | |
| Moyenne de la classe Gaming (405 - 674, n=139, 2 dernières années) | |
| Asus ROG Strix Scar 16 G634JZR | |
| Acer Predator Helios 16 PH16-72 | |
| Lenovo Legion Pro 7 16IRX9H | |
| HP Omen 16 (2024) | |
| SCHENKER XMG Neo 16 (Early 24) | |
| Lenovo Legion Pro 7i 16 Gen 10 | |
| Moyenne Intel Core Ultra 9 275HX, Nvidia GeForce RTX 5080 Laptop (405 - 408, n=2) | |
| Asus ROG Strix G16 G615 | |
* ... Moindre est la valeur, meilleures sont les performances
| PCMark 10 Score | 8856 points | |
Aide | ||
| AIDA64 / Memory Copy | |
| Asus ROG Strix G16 G615 | |
| Lenovo Legion Pro 7i 16 Gen 10 | |
| Moyenne Intel Core Ultra 9 275HX (74558 - 86549, n=7) | |
| HP Omen 16 (2024) | |
| Acer Predator Helios 16 PH16-72 | |
| SCHENKER XMG Neo 16 (Early 24) | |
| Asus ROG Strix Scar 16 G634JZR | |
| Lenovo Legion Pro 7 16IRX9H | |
| Moyenne de la classe Gaming (21750 - 97515, n=146, 2 dernières années) | |
| AIDA64 / Memory Read | |
| Lenovo Legion Pro 7i 16 Gen 10 | |
| Asus ROG Strix Scar 16 G634JZR | |
| SCHENKER XMG Neo 16 (Early 24) | |
| HP Omen 16 (2024) | |
| Lenovo Legion Pro 7 16IRX9H | |
| Acer Predator Helios 16 PH16-72 | |
| Moyenne Intel Core Ultra 9 275HX (74094 - 95542, n=7) | |
| Asus ROG Strix G16 G615 | |
| Moyenne de la classe Gaming (22956 - 102937, n=146, 2 dernières années) | |
| AIDA64 / Memory Write | |
| Lenovo Legion Pro 7i 16 Gen 10 | |
| Moyenne Intel Core Ultra 9 275HX (72929 - 84581, n=7) | |
| HP Omen 16 (2024) | |
| SCHENKER XMG Neo 16 (Early 24) | |
| Asus ROG Strix Scar 16 G634JZR | |
| Acer Predator Helios 16 PH16-72 | |
| Asus ROG Strix G16 G615 | |
| Lenovo Legion Pro 7 16IRX9H | |
| Moyenne de la classe Gaming (22297 - 108954, n=146, 2 dernières années) | |
| AIDA64 / Memory Latency | |
| Moyenne Intel Core Ultra 9 275HX (108.9 - 125.1, n=7) | |
| Asus ROG Strix G16 G615 | |
| Lenovo Legion Pro 7i 16 Gen 10 | |
| Moyenne de la classe Gaming (59.5 - 259, n=146, 2 dernières années) | |
| HP Omen 16 (2024) | |
| Acer Predator Helios 16 PH16-72 | |
| Asus ROG Strix Scar 16 G634JZR | |
| Lenovo Legion Pro 7 16IRX9H | |
| SCHENKER XMG Neo 16 (Early 24) | |
* ... Moindre est la valeur, meilleures sont les performances
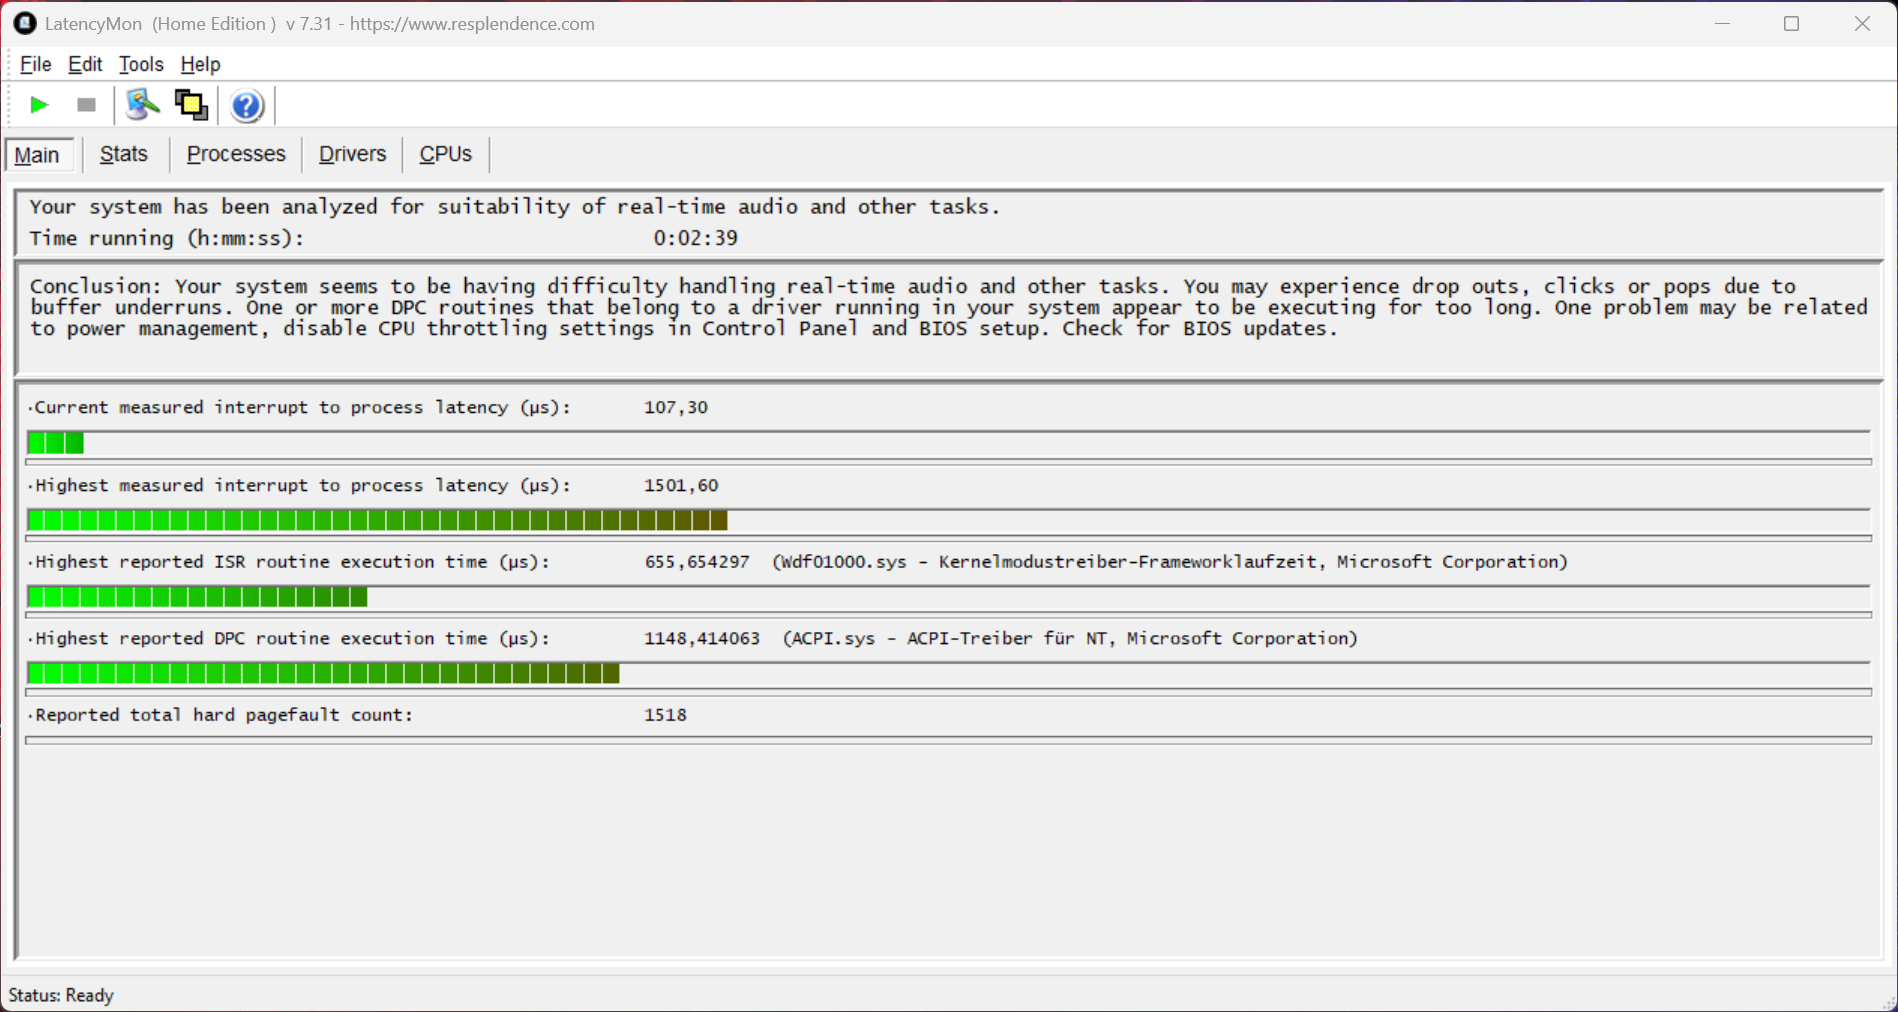
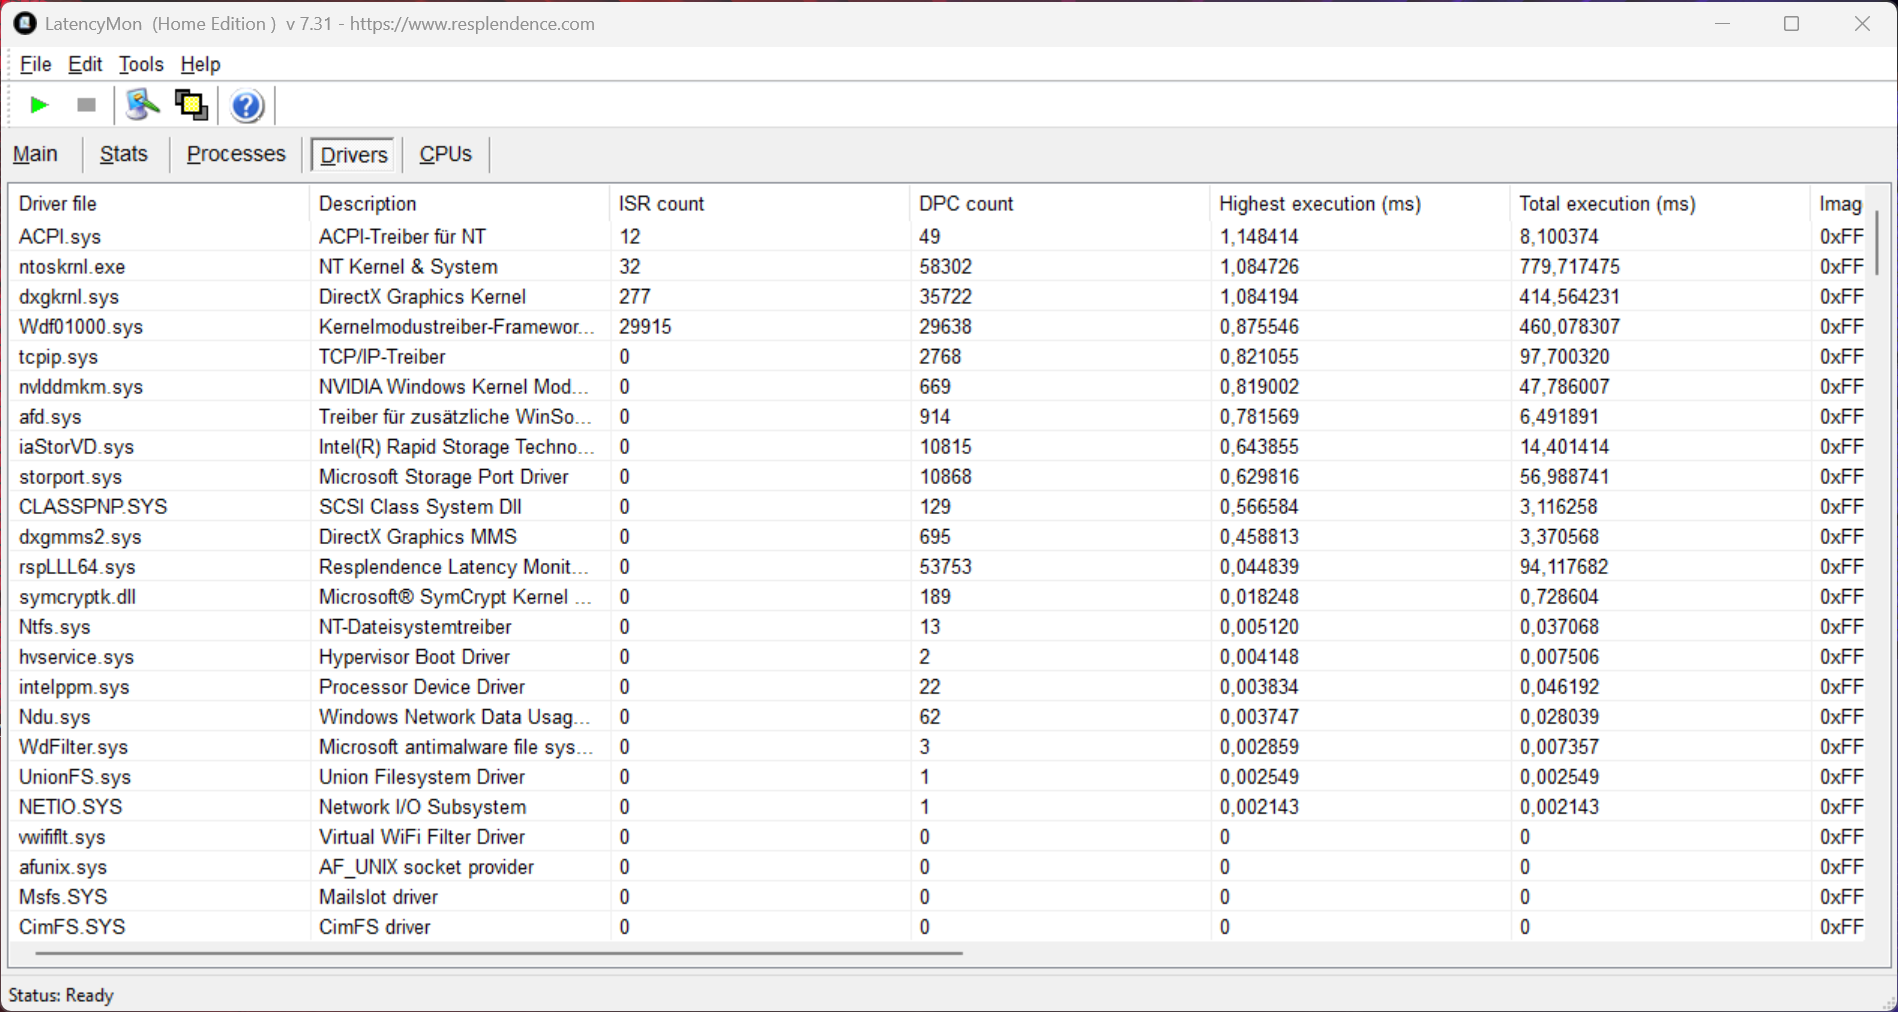
Latences DPC
Dans notre test de latence standardisé (surf sur Internet, lecture de vidéos YouTube 4K, charge du CPU), notre unité de test avec sa version actuelle du BIOS montre quelques légères limitations lors de l'utilisation d'applications audio en temps réel.
| DPC Latencies / LatencyMon - interrupt to process latency (max), Web, Youtube, Prime95 | |
| Asus ROG Strix Scar 16 G634JZR | |
| SCHENKER XMG Neo 16 (Early 24) | |
| Acer Predator Helios 16 PH16-72 | |
| Asus ROG Strix G16 G615 | |
| Lenovo Legion Pro 7 16IRX9H | |
| HP Omen 16 (2024) | |
| Lenovo Legion Pro 7i 16 Gen 10 | |
* ... Moindre est la valeur, meilleures sont les performances
Dispositifs de stockage
Notre unité de test utilise la version 1 To du Micron 2500, avec 840 Go encore disponibles pour l'utilisateur après la première opération. Les performances du SSD PCIe 4.0 sont très bonnes et stables. Avec le second slot M.2-2280, l'extension du stockage peut se faire sans problème et à bas prix. Le Strix G16 ne supporte pas le PCIe 5.0.

* ... Moindre est la valeur, meilleures sont les performances
Constant Read Performance: DiskSpd Read Loop, Queue Depth 8
Carte graphique
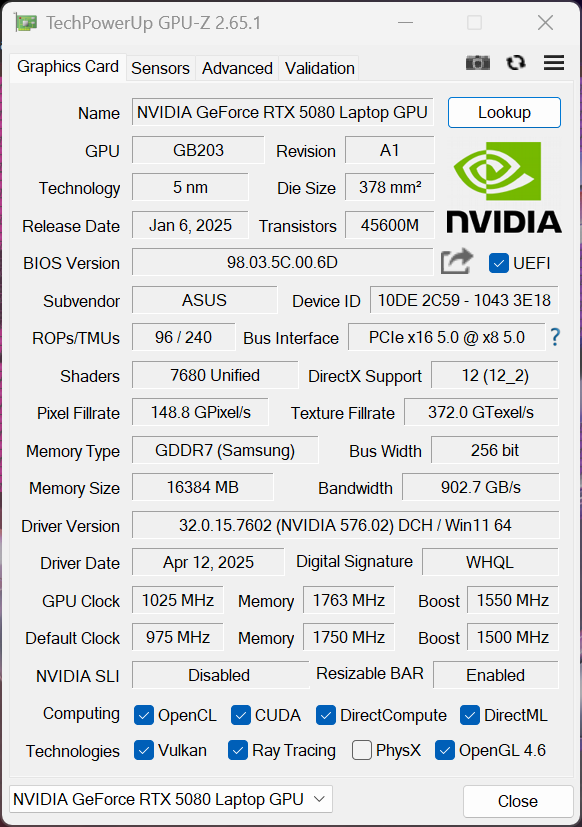
Notre unité de test de la Strix G16 est équipée de la nouvelle technologie GeForce RTX 5080 Laptop (16 Go VRAM), la version la plus rapide avec un TGP maximum de 175 watts étant utilisée ici (150 watts + 25 watts Dynamic Boost). Les résultats sont légèrement mitigés dans les benchmarks synthétiques, et nous avons déjà vu de meilleurs résultats pour le nouveau 5080 Laptop, bien que l'ancien RTX 4080 Laptop du ROG Strix SCAR 16 est toujours surpassé. Cependant, une mise à niveau à partir du nouvel ordinateur portable 4080 et encore moins à partir de l'ordinateur portable 4090 n'a pas vraiment de sens. D'un autre côté, l'avantage par rapport à l'ancien portable 3080 Ti Laptop est clairement perceptible. Sous une charge constante, les performances du GPU restent parfaitement stables.
| 3DMark 11 Performance | 45056 points | |
| 3DMark Fire Strike Score | 36371 points | |
| 3DMark Time Spy Score | 20753 points | |
| 3DMark Steel Nomad Score | 5156 points | |
| 3DMark Steel Nomad Light Score | 22259 points | |
| 3DMark Steel Nomad Light Unlimited Score | 21869 points | |
Aide | ||
| Blender / v3.3 Classroom OPTIX/RTX | |
| Moyenne de la classe Gaming (10 - 95, n=140, 2 dernières années) | |
| Acer Predator Helios 16 PH16-72 | |
| HP Omen 16 (2024) | |
| Lenovo Legion Pro 7 16IRX9H | |
| Asus ROG Strix Scar 16 G634JZR | |
| SCHENKER XMG Neo 16 (Early 24) | |
| Moyenne Nvidia GeForce RTX 5080 Laptop (11.6 - 12, n=2) | |
| Asus ROG Strix G16 G615 | |
| Blender / v3.3 Classroom CUDA | |
| Moyenne de la classe Gaming (15 - 156, n=142, 2 dernières années) | |
| HP Omen 16 (2024) | |
| Acer Predator Helios 16 PH16-72 | |
| Asus ROG Strix Scar 16 G634JZR | |
| Lenovo Legion Pro 7 16IRX9H | |
| Asus ROG Strix G16 G615 | |
| Moyenne Nvidia GeForce RTX 5080 Laptop (18 - 20, n=2) | |
| SCHENKER XMG Neo 16 (Early 24) | |
| Blender / v3.3 Classroom CPU | |
| Moyenne de la classe Gaming (123 - 962, n=147, 2 dernières années) | |
| HP Omen 16 (2024) | |
| Acer Predator Helios 16 PH16-72 | |
| Asus ROG Strix Scar 16 G634JZR | |
| Lenovo Legion Pro 7 16IRX9H | |
| SCHENKER XMG Neo 16 (Early 24) | |
| Moyenne Nvidia GeForce RTX 5080 Laptop (123 - 148, n=3) | |
| Asus ROG Strix G16 G615 | |
* ... Moindre est la valeur, meilleures sont les performances
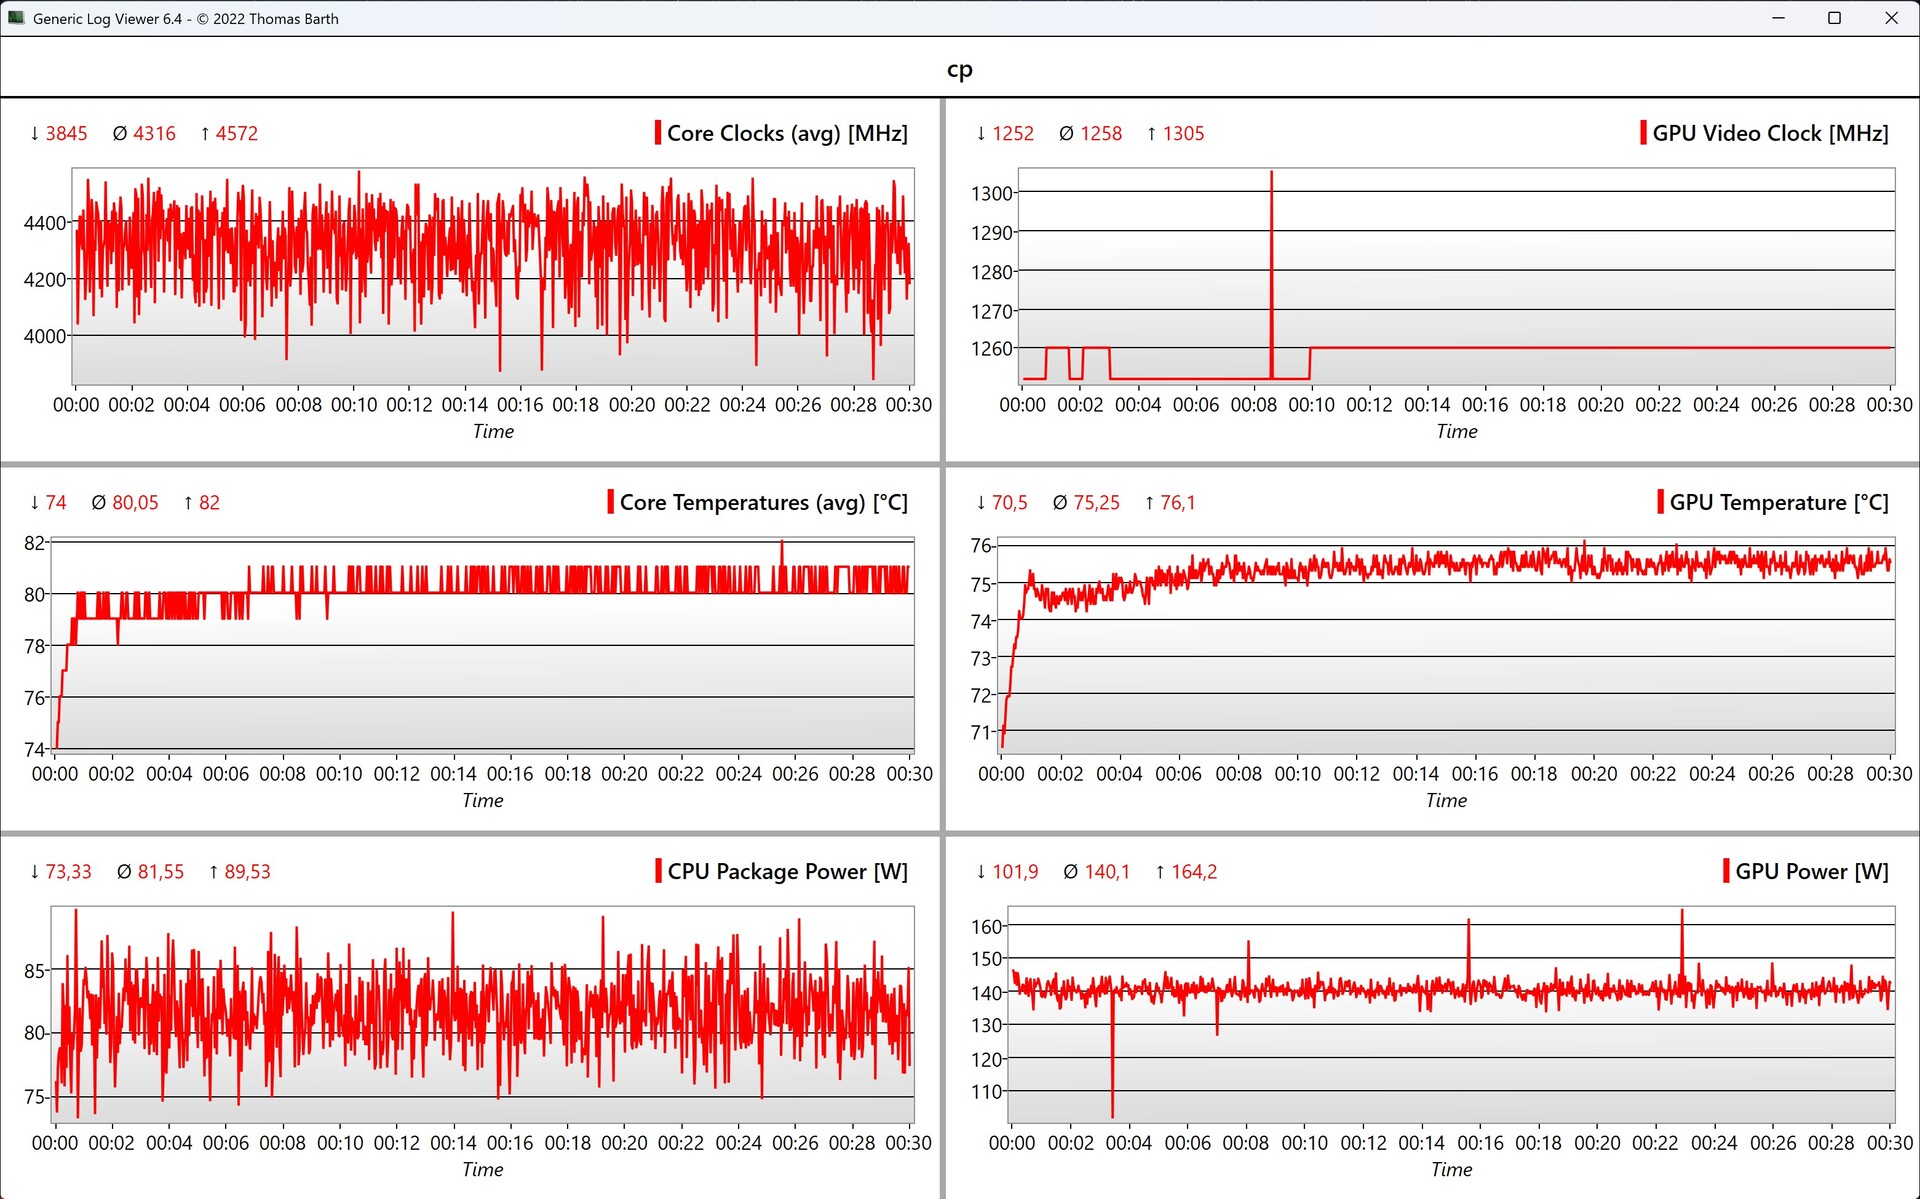
Performances des jeux
Les performances de jeu sont très bonnes dans l'ensemble, et la nouvelle RTX 5080 Laptop fait un très bon score, en particulier dans la résolution WQHD native. Nous avons déjà vu dans notre analyse des nouveaux GPU GeForce que le 5090 Laptop n'est vraiment capable de montrer sa pleine puissance que dans la résolution 4K. Avec les jeux actuels, les performances de jeu sont souvent au niveau de l'ancien RTX 4090 Laptop, et tous les jeux modernes peuvent être joués sans problème. Mais nous remarquons également que le Lenovo Legion Pro 7i G10 offre une performance de jeu légèrement supérieure avec des composants identiques.
| GTA V - 1920x1080 Highest Settings possible AA:4xMSAA + FX AF:16x | |
| SCHENKER XMG Neo 16 A25 5080 Engineering Sample | |
| Asus ROG Strix G16 G615 | |
| SCHENKER XMG Neo 16 (Early 24) | |
| Lenovo Legion Pro 7 16IRX9H | |
| Asus ROG Strix Scar 16 G634JZR | |
| Moyenne de la classe Gaming (12.1 - 168.2, n=125, 2 dernières années) | |
| Acer Predator Helios 16 PH16-72 | |
| HP Omen 16 (2024) | |
Cyberpunk 2077 Ultra FPS Chart
Cependant, si vous voulez utiliser le maximum de détails, y compris le raytracing ou le path tracing (qui est extrêmement bon), même la RTX 5080 Laptop atteint ses limites sans upscaling. Le tableau suivant le montre clairement en utilisant les deux jeux Cyberpunk 2077 et Alan Wake 2. La performance peut à nouveau être augmentée de manière significative en utilisant la génération de trames multiples (x4) dans les jeux qui le supportent.
| Setting | Cyberpunk 2077 Phantom Liberty RT Overdrive |
Alan Wake 2 Custom (Everything High/Ultra + PT) |
|---|---|---|
| Native | 21.9 FPS | 34.2 FPS |
| Qualité DLSS | 43.1 FPS | 56.9 FPS |
| DLSS Performance | 63.8 FPS | 75 FPS |
| DLSS Quality MFG x2 | 77.6 FPS | 98.9 FPS |
| DLSS Quality MFG x4 | 141.2 FPS | 173.9 FPS |
| Bas | Moyen | Élevé | Ultra | QHD DLSS | QHD | |
|---|---|---|---|---|---|---|
| GTA V (2015) | 164.1 | 156.2 | ||||
| Dota 2 Reborn (2015) | 228 | 201 | 191.6 | 175.5 | ||
| Final Fantasy XV Benchmark (2018) | 234 | 229 | 189.6 | 149.4 | ||
| X-Plane 11.11 (2018) | 135.7 | 136.3 | 110.6 | |||
| Strange Brigade (2018) | 553 | 406 | 386 | 367 | 283 | |
| Baldur's Gate 3 (2023) | 244.8 | 209.1 | 185.4 | 180.3 | 133.1 | |
| Cyberpunk 2077 2.2 Phantom Liberty (2023) | 187.9 | 180.5 | 160.9 | 144.3 | 110.6 | 99.5 |
| Alan Wake 2 (2023) | 112.6 | 76.5 | ||||
| F1 24 (2024) | 318 | 127.5 | 84.5 | |||
| Assassin's Creed Shadows (2025) | 58 | 60 | 50 |
Émissions - Basses températures
Émissions sonores
Comme d'habitude, le bruit du ventilateur dépend fortement des profils de puissance. En mode silencieux, la Strix G16 est un compagnon très silencieux au quotidien (avec le ventilateur souvent désactivé, 36,1 dB(A) max.), mais vous aurez certainement besoin d'un casque en mode Turbo lorsque vous jouez, car les ventilateurs tournent presque toujours à environ 30 dB(A) pendant le fonctionnement à vide. Notre appareil de test ne produit pas d'autres bruits électroniques.
Degré de la nuisance sonore
| Au repos |
| 24 / 30.1 / 30.1 dB(A) |
| Fortement sollicité |
| 41.1 / 54.2 dB(A) |
 | ||
30 dB silencieux 40 dB(A) audible 50 dB(A) bruyant |
||
min: | ||
| Asus ROG Strix G16 G615 GeForce RTX 5080 Laptop, Ultra 9 275HX, Micron 2500 1TB MTFDKBA1T0QGN | Acer Predator Helios 16 PH16-72 NVIDIA GeForce RTX 4080 Laptop GPU, i9-14900HX, Micron 3400 2TB MTFDKBA2T0TFH | SCHENKER XMG Neo 16 (Early 24) NVIDIA GeForce RTX 4090 Laptop GPU, i9-14900HX, Samsung 990 Pro 1 TB | Asus ROG Strix Scar 16 G634JZR NVIDIA GeForce RTX 4080 Laptop GPU, i9-14900HX, SK hynix PC801 HFS002TEJ9X101N | HP Omen 16 (2024) NVIDIA GeForce RTX 4080 Laptop GPU, i9-14900HX, SK hynix PC801 HFS001TEJ9X101N | Lenovo Legion Pro 7 16IRX9H NVIDIA GeForce RTX 4080 Laptop GPU, i9-14900HX, SK Hynix HFS001TEJ9X115N | Lenovo Legion Pro 7i 16 Gen 10 GeForce RTX 5080 Laptop, Ultra 9 275HX, SK Hynix HFS001TEJ9X115N | |
|---|---|---|---|---|---|---|---|
| Noise | 1% | -9% | -8% | -5% | -13% | 11% | |
| arrêt / environnement * | 24 | 26.1 -9% | 26 -8% | 21.07 12% | 25 -4% | 24 -0% | 22.9 5% |
| Idle Minimum * | 24 | 26.1 -9% | 28 -17% | 29.75 -24% | 29 -21% | 25 -4% | 22.9 5% |
| Idle Average * | 30.1 | 29.4 2% | 29 4% | 29.75 1% | 30 -0% | 30 -0% | 22.9 24% |
| Idle Maximum * | 30.1 | 31.9 -6% | 31 -3% | 29.75 1% | 31 -3% | 45 -50% | 26.3 13% |
| Load Average * | 41.1 | 51 -24% | 54.85 -33% | 46 -12% | 50 -22% | 27.8 32% | |
| Cyberpunk 2077 ultra * | 54.2 | 48.2 11% | 54.2 -0% | ||||
| Load Maximum * | 54.2 | 45.6 16% | 56 -3% | 58 -7% | 47 13% | 56 -3% | 53.9 1% |
| Witcher 3 ultra * | 54 | 57.8 | 47 | 54 |
* ... Moindre est la valeur, meilleures sont les performances
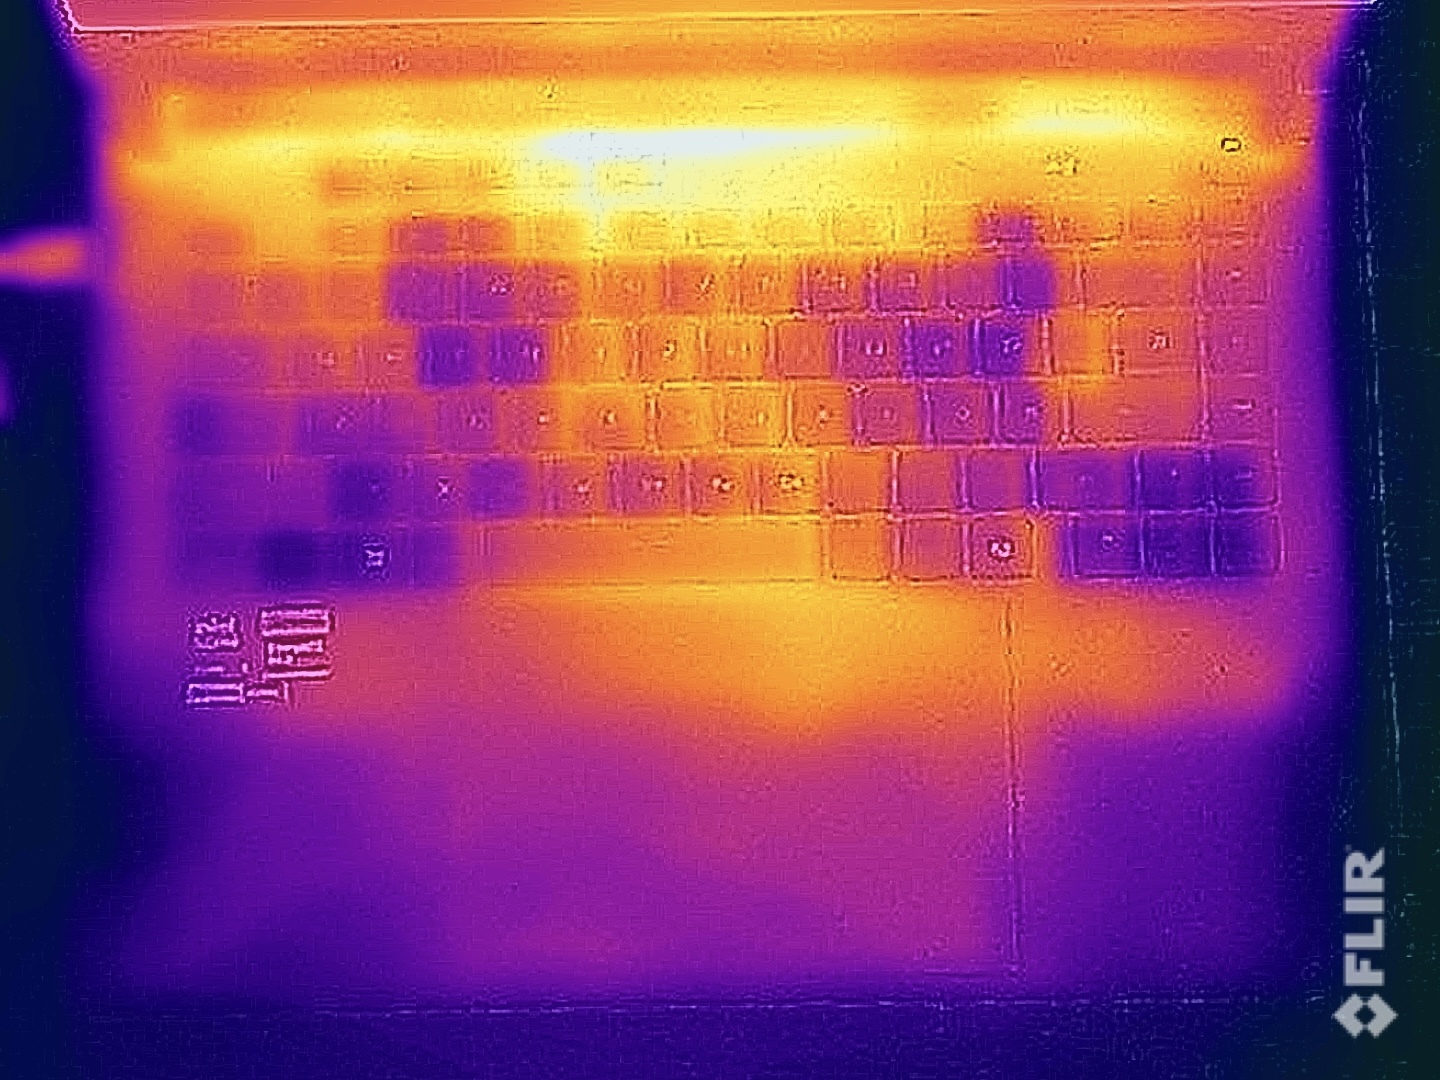
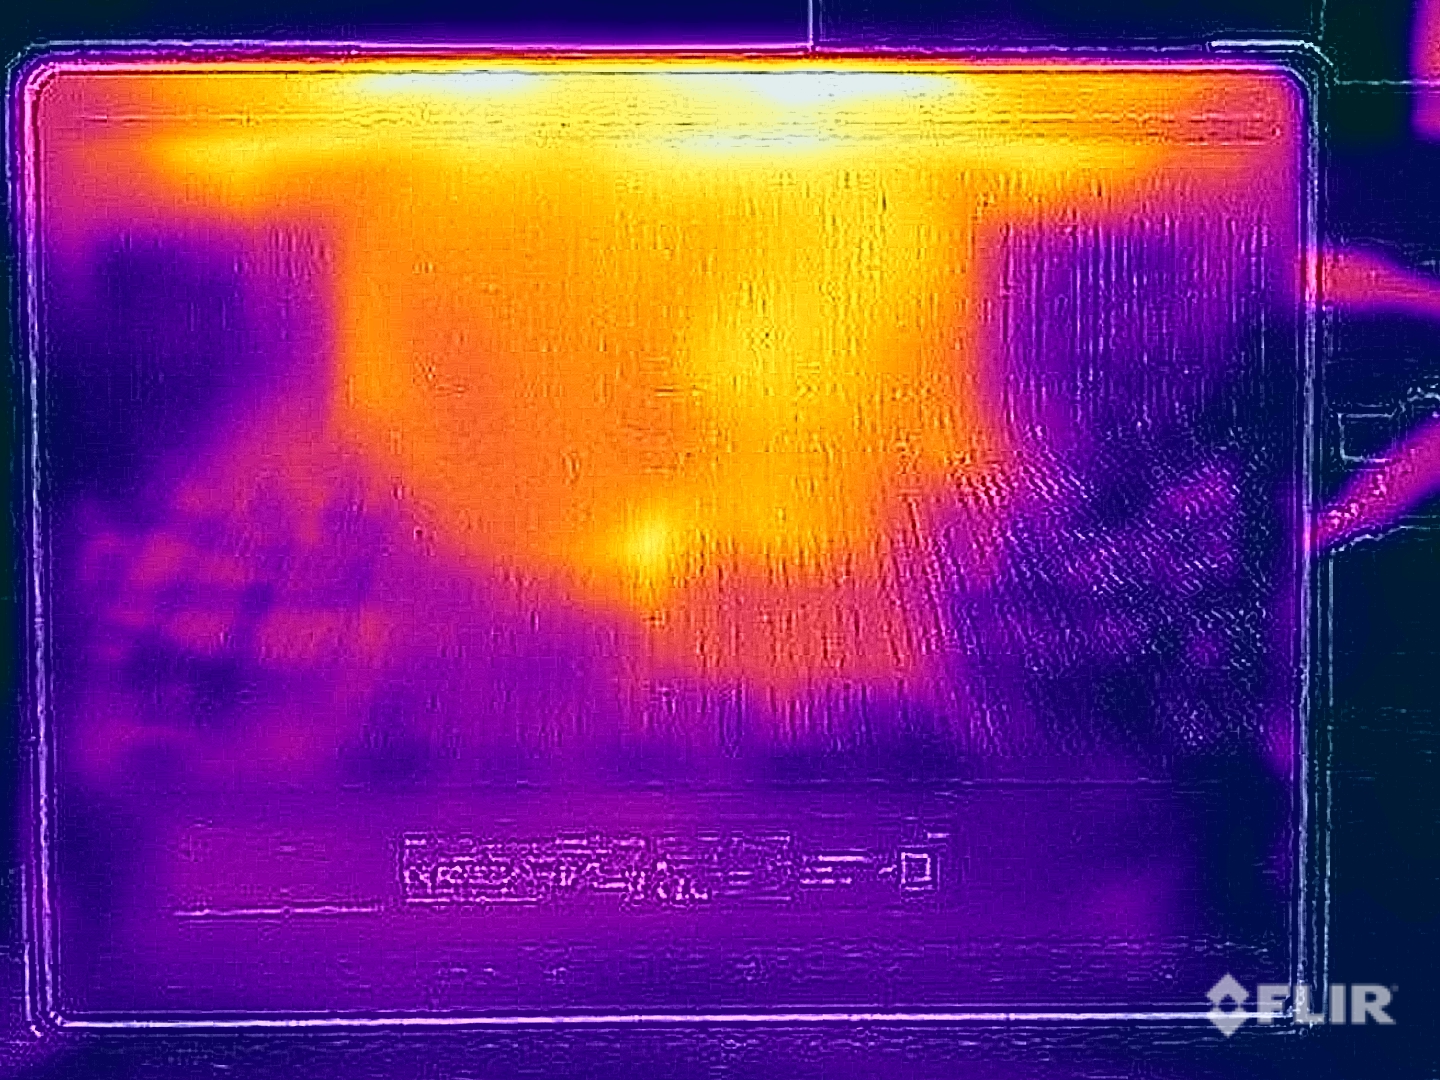
Températures
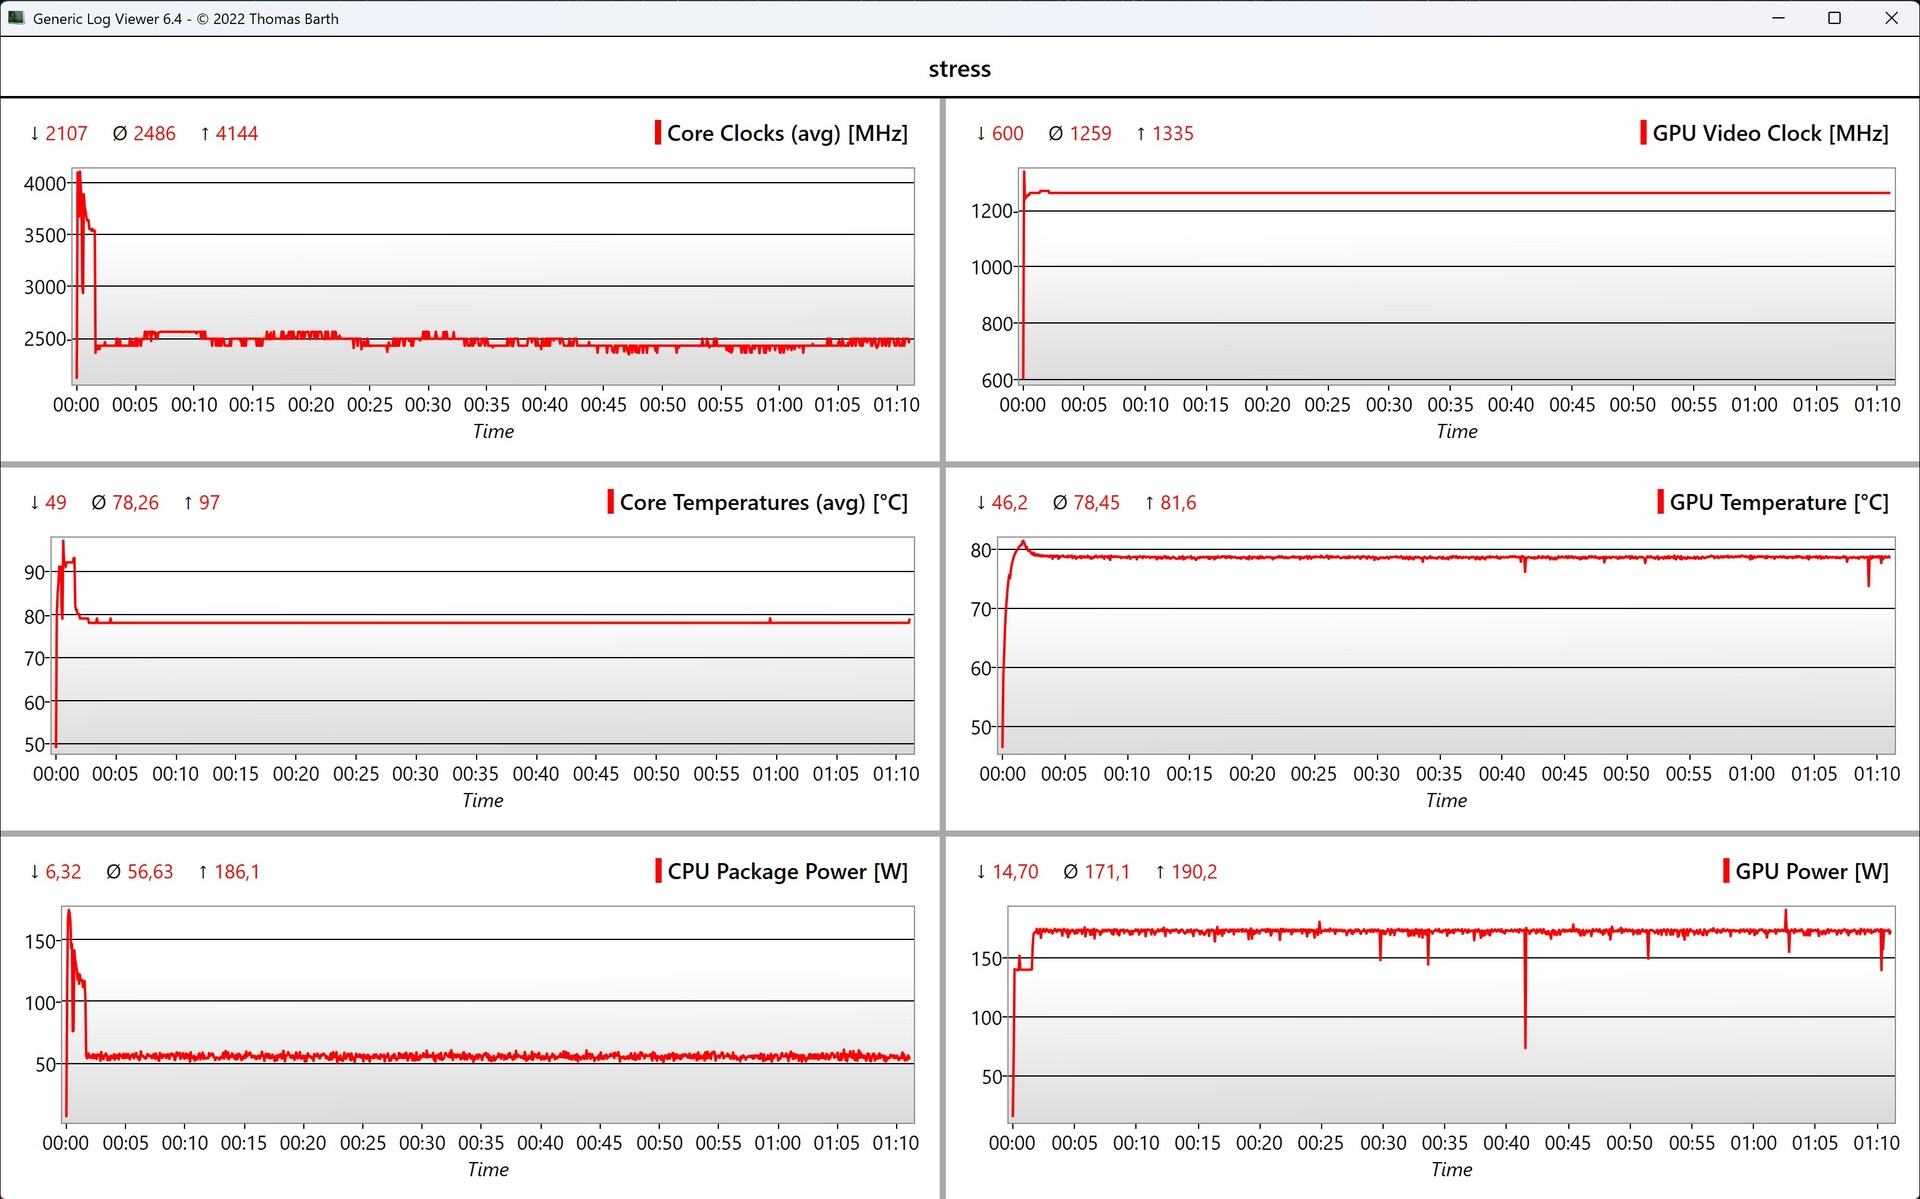
L'avantage des ventilateurs puissants réside dans les faibles températures de surface, et même en cas de charge extrême, l'appareil reste très frais, en particulier sur le dessus de l'unité de base. Cependant, la zone arrière en bas devient assez chaude (presque 50 °C, 122 °F), donc vous ne devriez pas placer le Strix G16 sur vos genoux. Pendant le test de stress, le CPU et le GPU atteignent respectivement 56 et 170 watts (32 et 44 watts en mode batterie).
(+) La température maximale du côté supérieur est de 39.6 °C / 103 F, par rapport à la moyenne de 40.4 °C / 105 F, allant de 21.2 à 68.8 °C pour la classe Gaming.
(-) Le fond chauffe jusqu'à un maximum de 49.7 °C / 121 F, contre une moyenne de 43.2 °C / 110 F
(+) En utilisation inactive, la température moyenne du côté supérieur est de 25.8 °C / 78 F, par rapport à la moyenne du dispositif de 33.9 °C / 93 F.
(±) 3: The average temperature for the upper side is 32.5 °C / 91 F, compared to the average of 33.9 °C / 93 F for the class Gaming.
(+) Les repose-poignets et le pavé tactile sont plus froids que la température de la peau avec un maximum de 31.3 °C / 88.3 F et sont donc froids au toucher.
(-) La température moyenne de la zone de l'appui-paume de dispositifs similaires était de 28.9 °C / 84 F (-2.4 °C / #-4.3 F).
| Asus ROG Strix G16 G615 Intel Core Ultra 9 275HX, Nvidia GeForce RTX 5080 Laptop | Acer Predator Helios 16 PH16-72 Intel Core i9-14900HX, NVIDIA GeForce RTX 4080 Laptop GPU | SCHENKER XMG Neo 16 (Early 24) Intel Core i9-14900HX, NVIDIA GeForce RTX 4090 Laptop GPU | Asus ROG Strix Scar 16 G634JZR Intel Core i9-14900HX, NVIDIA GeForce RTX 4080 Laptop GPU | HP Omen 16 (2024) Intel Core i9-14900HX, NVIDIA GeForce RTX 4080 Laptop GPU | Lenovo Legion Pro 7 16IRX9H Intel Core i9-14900HX, NVIDIA GeForce RTX 4080 Laptop GPU | Lenovo Legion Pro 7i 16 Gen 10 Intel Core Ultra 9 275HX, Nvidia GeForce RTX 5080 Laptop | |
|---|---|---|---|---|---|---|---|
| Heat | -14% | -9% | -18% | -6% | -24% | -9% | |
| Maximum Upper Side * | 39.6 | 37.5 5% | 47 -19% | 47.8 -21% | 47 -19% | 46 -16% | 42.6 -8% |
| Maximum Bottom * | 49.7 | 43.9 12% | 56 -13% | 52.2 -5% | 57 -15% | 49 1% | 41.2 17% |
| Idle Upper Side * | 26.3 | 31 -18% | 27 -3% | 32.4 -23% | 25 5% | 38 -44% | 32.6 -24% |
| Idle Bottom * | 27.3 | 42 -54% | 27 1% | 33 -21% | 26 5% | 37 -36% | 32.4 -19% |
* ... Moindre est la valeur, meilleures sont les performances
Intervenants
Les haut-parleurs stéréo font un très bon travail et font partie des meilleurs de notre comparatif. Cependant, ils ne parviennent pas à s'imposer face au bruit du ventilateur pendant les jeux.
Asus ROG Strix G16 G615 analyse audio
(+) | les haut-parleurs peuvent jouer relativement fort (82.2# dB)
Basses 100 - 315 Hz
(±) | basse réduite - en moyenne 7.5% inférieure à la médiane
(±) | la linéarité des basses est moyenne (7.4% delta à la fréquence précédente)
Médiums 400 - 2000 Hz
(+) | médiane équilibrée - seulement 2.9% de la médiane
(+) | les médiums sont linéaires (3.6% delta à la fréquence précédente)
Aiguës 2 - 16 kHz
(+) | des sommets équilibrés - à seulement 2.8% de la médiane
(±) | la linéarité des aigus est moyenne (8.3% delta à la fréquence précédente)
Globalement 100 - 16 000 Hz
(+) | le son global est linéaire (9.4% différence à la médiane)
Par rapport à la même classe
» 3% de tous les appareils testés de cette catégorie étaient meilleurs, 2% similaires, 95% pires
» Le meilleur avait un delta de 6%, la moyenne était de 18%, le pire était de 132%.
Par rapport à tous les appareils testés
» 3% de tous les appareils testés étaient meilleurs, 1% similaires, 96% pires
» Le meilleur avait un delta de 4%, la moyenne était de 24%, le pire était de 134%.
Acer Predator Helios 16 PH16-72 analyse audio
(±) | le niveau sonore du haut-parleur est moyen mais bon (81.9# dB)
Basses 100 - 315 Hz
(±) | basse réduite - en moyenne 14.2% inférieure à la médiane
(±) | la linéarité des basses est moyenne (11.7% delta à la fréquence précédente)
Médiums 400 - 2000 Hz
(±) | médiane supérieure - en moyenne 8.3% supérieure à la médiane
(±) | la linéarité des médiums est moyenne (8.8% delta à la fréquence précédente)
Aiguës 2 - 16 kHz
(+) | des sommets équilibrés - à seulement 4.2% de la médiane
(+) | les aigus sont linéaires (6% delta à la fréquence précédente)
Globalement 100 - 16 000 Hz
(±) | la linéarité du son global est moyenne (19% de différence avec la médiane)
Par rapport à la même classe
» 62% de tous les appareils testés de cette catégorie étaient meilleurs, 8% similaires, 30% pires
» Le meilleur avait un delta de 6%, la moyenne était de 18%, le pire était de 132%.
Par rapport à tous les appareils testés
» 42% de tous les appareils testés étaient meilleurs, 7% similaires, 50% pires
» Le meilleur avait un delta de 4%, la moyenne était de 24%, le pire était de 134%.
SCHENKER XMG Neo 16 (Early 24) analyse audio
(+) | les haut-parleurs peuvent jouer relativement fort (86# dB)
Basses 100 - 315 Hz
(-) | presque aucune basse - en moyenne 16.3% plus bas que la médiane
(±) | la linéarité des basses est moyenne (8.6% delta à la fréquence précédente)
Médiums 400 - 2000 Hz
(+) | médiane équilibrée - seulement 3% de la médiane
(+) | les médiums sont linéaires (3.6% delta à la fréquence précédente)
Aiguës 2 - 16 kHz
(+) | des sommets équilibrés - à seulement 2.5% de la médiane
(+) | les aigus sont linéaires (4.9% delta à la fréquence précédente)
Globalement 100 - 16 000 Hz
(+) | le son global est linéaire (12.4% différence à la médiane)
Par rapport à la même classe
» 14% de tous les appareils testés de cette catégorie étaient meilleurs, 3% similaires, 83% pires
» Le meilleur avait un delta de 6%, la moyenne était de 18%, le pire était de 132%.
Par rapport à tous les appareils testés
» 9% de tous les appareils testés étaient meilleurs, 2% similaires, 88% pires
» Le meilleur avait un delta de 4%, la moyenne était de 24%, le pire était de 134%.
Asus ROG Strix Scar 16 G634JZR analyse audio
(±) | le niveau sonore du haut-parleur est moyen mais bon (79# dB)
Basses 100 - 315 Hz
(±) | basse réduite - en moyenne 7.1% inférieure à la médiane
(±) | la linéarité des basses est moyenne (9% delta à la fréquence précédente)
Médiums 400 - 2000 Hz
(±) | médiane supérieure - en moyenne 5.5% supérieure à la médiane
(+) | les médiums sont linéaires (3.3% delta à la fréquence précédente)
Aiguës 2 - 16 kHz
(+) | des sommets équilibrés - à seulement 1.4% de la médiane
(+) | les aigus sont linéaires (2.6% delta à la fréquence précédente)
Globalement 100 - 16 000 Hz
(+) | le son global est linéaire (9.8% différence à la médiane)
Par rapport à la même classe
» 5% de tous les appareils testés de cette catégorie étaient meilleurs, 1% similaires, 94% pires
» Le meilleur avait un delta de 6%, la moyenne était de 18%, le pire était de 132%.
Par rapport à tous les appareils testés
» 4% de tous les appareils testés étaient meilleurs, 1% similaires, 96% pires
» Le meilleur avait un delta de 4%, la moyenne était de 24%, le pire était de 134%.
HP Omen 16 (2024) analyse audio
(±) | le niveau sonore du haut-parleur est moyen mais bon (78# dB)
Basses 100 - 315 Hz
(-) | presque aucune basse - en moyenne 15.2% plus bas que la médiane
(±) | la linéarité des basses est moyenne (14.3% delta à la fréquence précédente)
Médiums 400 - 2000 Hz
(+) | médiane équilibrée - seulement 4.8% de la médiane
(+) | les médiums sont linéaires (5% delta à la fréquence précédente)
Aiguës 2 - 16 kHz
(+) | des sommets équilibrés - à seulement 2% de la médiane
(+) | les aigus sont linéaires (4.1% delta à la fréquence précédente)
Globalement 100 - 16 000 Hz
(+) | le son global est linéaire (14.7% différence à la médiane)
Par rapport à la même classe
» 27% de tous les appareils testés de cette catégorie étaient meilleurs, 7% similaires, 66% pires
» Le meilleur avait un delta de 6%, la moyenne était de 18%, le pire était de 132%.
Par rapport à tous les appareils testés
» 17% de tous les appareils testés étaient meilleurs, 4% similaires, 79% pires
» Le meilleur avait un delta de 4%, la moyenne était de 24%, le pire était de 134%.
Lenovo Legion Pro 7 16IRX9H analyse audio
(+) | les haut-parleurs peuvent jouer relativement fort (84# dB)
Basses 100 - 315 Hz
(±) | basse réduite - en moyenne 9% inférieure à la médiane
(±) | la linéarité des basses est moyenne (7.4% delta à la fréquence précédente)
Médiums 400 - 2000 Hz
(+) | médiane équilibrée - seulement 2.8% de la médiane
(+) | les médiums sont linéaires (4% delta à la fréquence précédente)
Aiguës 2 - 16 kHz
(+) | des sommets équilibrés - à seulement 3% de la médiane
(+) | les aigus sont linéaires (5% delta à la fréquence précédente)
Globalement 100 - 16 000 Hz
(+) | le son global est linéaire (8.4% différence à la médiane)
Par rapport à la même classe
» 1% de tous les appareils testés de cette catégorie étaient meilleurs, 1% similaires, 97% pires
» Le meilleur avait un delta de 6%, la moyenne était de 18%, le pire était de 132%.
Par rapport à tous les appareils testés
» 2% de tous les appareils testés étaient meilleurs, 1% similaires, 98% pires
» Le meilleur avait un delta de 4%, la moyenne était de 24%, le pire était de 134%.
Gestion de l'énergie - Ordinateur portable de jeu avec une longue durée de vie de la batterie
Consommation électrique
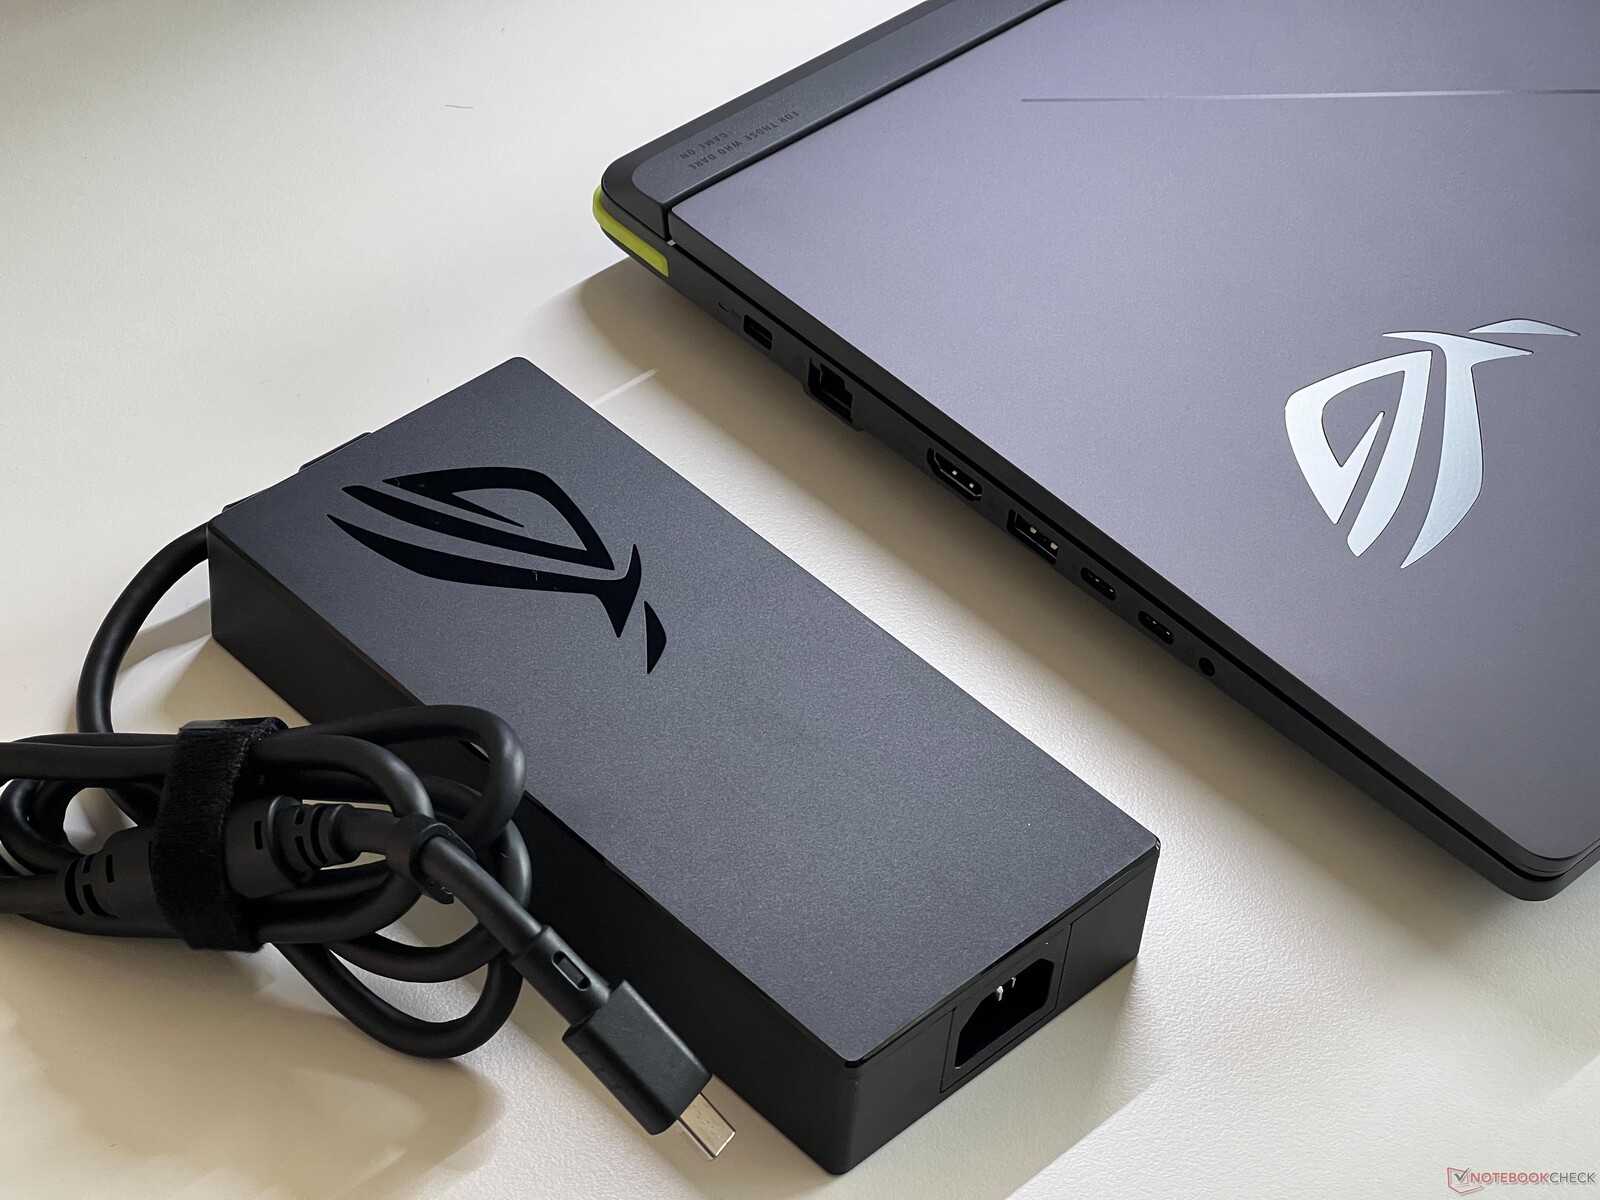
En mode veille, la Strix G16 est relativement efficace, avec une consommation maximale de 18 watts. Mais cela change en charge, ce qui n'est pas très surprenant compte tenu des limites de puissance élevées. Lors du test de stress, nous mesurons environ 360 watts pendant quelques secondes, avant que la consommation ne se stabilise autour de 300 watts. Vous pouvez vous attendre à une valeur similaire pendant les jeux, de sorte que le chargeur de 380 watts inclus est tout à fait suffisant. Avec 1,8 watts, la consommation en veille est trop élevée, même si tous les éclairages sont déjà désactivés (par défaut, la bande lumineuse produit un effet de pulsation en veille).
| Éteint/en veille | |
| Au repos | |
| Fortement sollicité |
|
Légende:
min: | |
| Asus ROG Strix G16 G615 Ultra 9 275HX, GeForce RTX 5080 Laptop, Micron 2500 1TB MTFDKBA1T0QGN, IPS, 2560x1600, 16" | Acer Predator Helios 16 PH16-72 i9-14900HX, NVIDIA GeForce RTX 4080 Laptop GPU, Micron 3400 2TB MTFDKBA2T0TFH, IPS, 2560x1600, 16" | SCHENKER XMG Neo 16 (Early 24) i9-14900HX, NVIDIA GeForce RTX 4090 Laptop GPU, Samsung 990 Pro 1 TB, IPS, 2560x1600, 16" | Asus ROG Strix Scar 16 G634JZR i9-14900HX, NVIDIA GeForce RTX 4080 Laptop GPU, SK hynix PC801 HFS002TEJ9X101N, Mini LED, 2560x1600, 16" | HP Omen 16 (2024) i9-14900HX, NVIDIA GeForce RTX 4080 Laptop GPU, SK hynix PC801 HFS001TEJ9X101N, IPS, 2560x1440, 16.1" | Lenovo Legion Pro 7 16IRX9H i9-14900HX, NVIDIA GeForce RTX 4080 Laptop GPU, SK Hynix HFS001TEJ9X115N, IPS, 2560x1600, 16" | Lenovo Legion Pro 7i 16 Gen 10 Ultra 9 275HX, GeForce RTX 5080 Laptop, SK Hynix HFS001TEJ9X115N, OLED, 2560x1600, 16" | Moyenne Nvidia GeForce RTX 5080 Laptop | Moyenne de la classe Gaming | |
|---|---|---|---|---|---|---|---|---|---|
| Power Consumption | -64% | 2% | -5% | -6% | -31% | -75% | -50% | -4% | |
| Idle Minimum * | 10.8 | 31.5 -192% | 6 44% | 10.71 1% | 9 17% | 16 -48% | 36.8 -241% | 23.8 ? -120% | 13.7 ? -27% |
| Idle Average * | 17.7 | 31.5 -78% | 16 10% | 14.75 17% | 16 10% | 21 -19% | 38.8 -119% | 28.3 ? -60% | 19.3 ? -9% |
| Idle Maximum * | 18.8 | 47.5 -153% | 28 -49% | 30 -60% | 35 -86% | 36 -91% | 45.6 -143% | 32.2 ? -71% | 26.9 ? -43% |
| Load Average * | 139.4 | 130 7% | 135 3% | 129 7% | 132 5% | 132.2 5% | 135.8 ? 3% | 102.8 ? 26% | |
| Cyberpunk 2077 ultra * | 295 | 231 22% | 318 -8% | ||||||
| Cyberpunk 2077 ultra external monitor * | 291 | 270 7% | 319 -10% | ||||||
| Load Maximum * | 359.3 | 313 13% | 361 -0% | 307 15% | 285 21% | 360 -0% | 384 -7% | 372 ? -4% | 247 ? 31% |
| Witcher 3 ultra * | 302 | 286 | 150.8 | 267 |
* ... Moindre est la valeur, meilleures sont les performances
Power Consumption Cyberpunk / Stress Test
Power Consumption with External Monitor
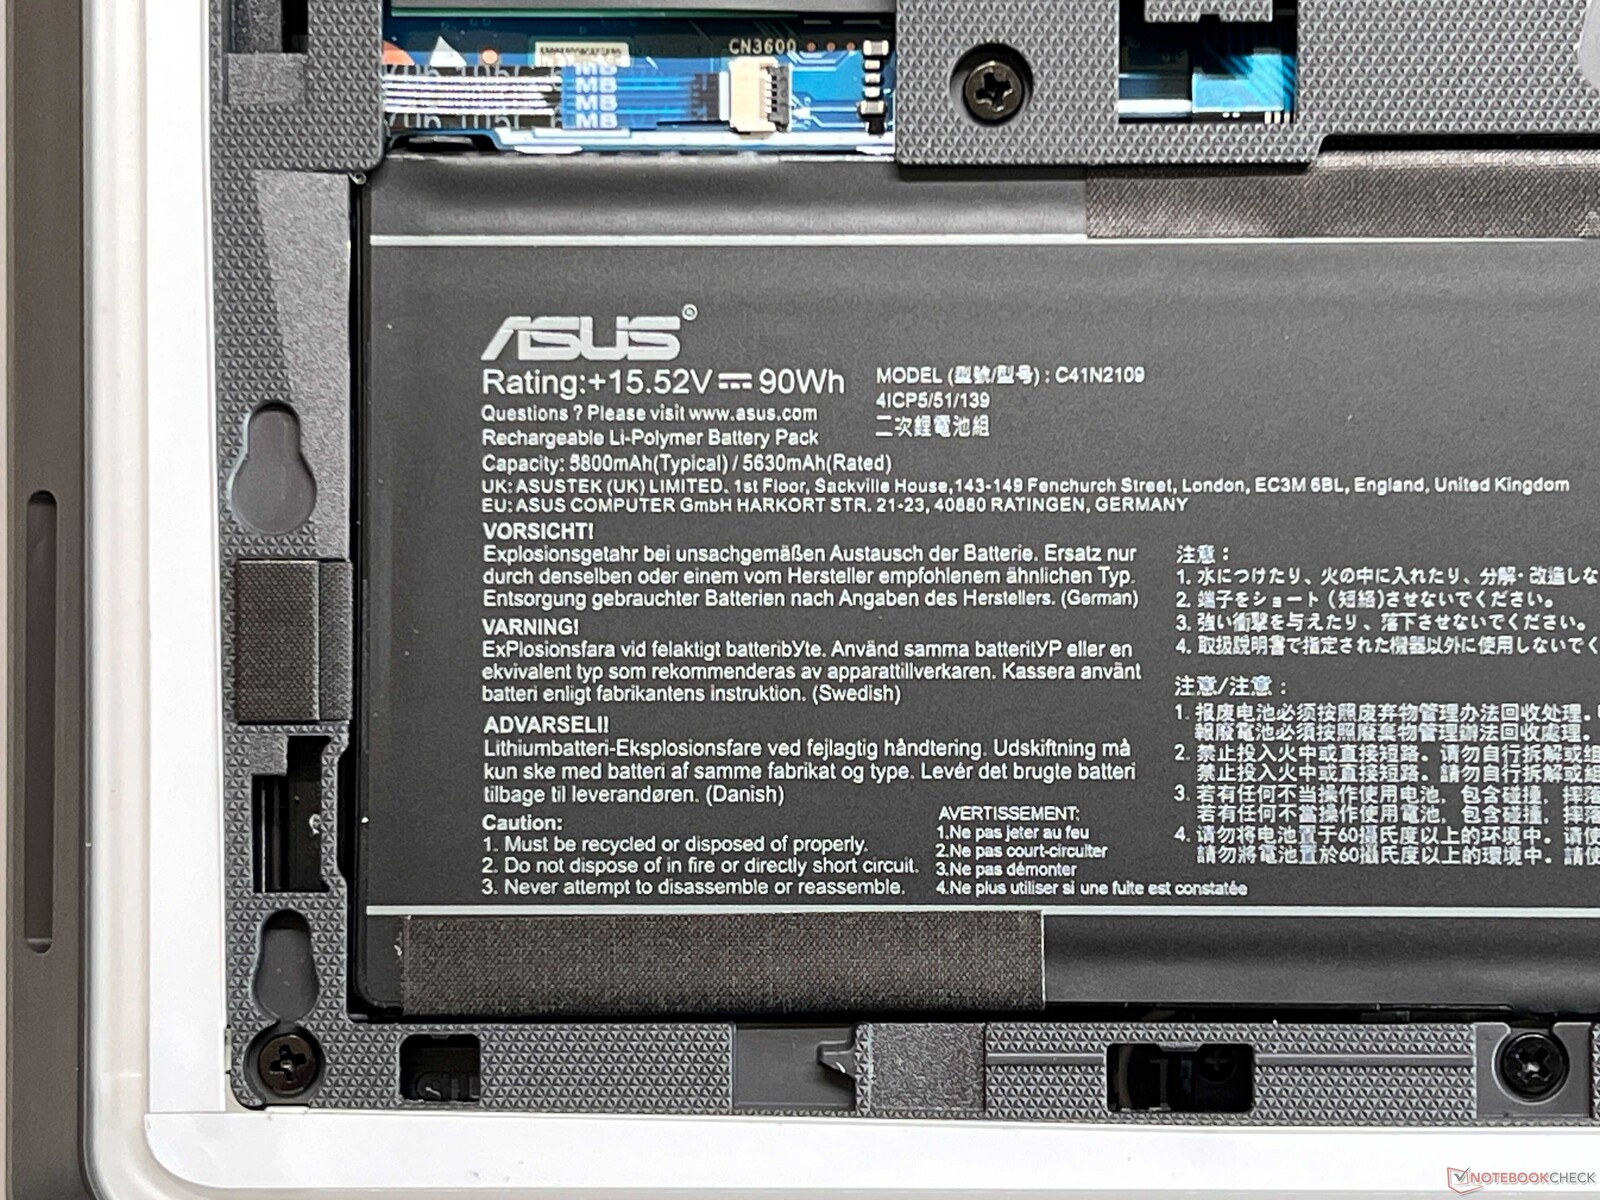
Autonomie de la batterie
Les ordinateurs portables de jeu ne sont pas réputés pour leur autonomie, mais le Strix G16 (batterie de 90 Wh) est une bonne surprise et peut même surpasser ses concurrents. Il tient près de 8 heures lors de notre test WLAN (6,5 heures à pleine luminosité) et près de 11 heures en jouant des vidéos. Dans les jeux, la batterie s'épuise après environ 48 minutes dans notre test.
| Asus ROG Strix G16 G615 Ultra 9 275HX, GeForce RTX 5080 Laptop, 90 Wh | Acer Predator Helios 16 PH16-72 i9-14900HX, NVIDIA GeForce RTX 4080 Laptop GPU, 90 Wh | SCHENKER XMG Neo 16 (Early 24) i9-14900HX, NVIDIA GeForce RTX 4090 Laptop GPU, 99.8 Wh | Asus ROG Strix Scar 16 G634JZR i9-14900HX, NVIDIA GeForce RTX 4080 Laptop GPU, 90 Wh | HP Omen 16 (2024) i9-14900HX, NVIDIA GeForce RTX 4080 Laptop GPU, 83 Wh | Lenovo Legion Pro 7 16IRX9H i9-14900HX, NVIDIA GeForce RTX 4080 Laptop GPU, 99.9 Wh | Lenovo Legion Pro 7i 16 Gen 10 Ultra 9 275HX, GeForce RTX 5080 Laptop, 99 Wh | Moyenne de la classe Gaming | |
|---|---|---|---|---|---|---|---|---|
| Autonomie de la batterie | -24% | -7% | -27% | -25% | -20% | -38% | -17% | |
| H.264 | 658 | 418 -36% | 451 -31% | 462 ? -30% | ||||
| WiFi v1.3 | 469 | 277 -41% | 350 -25% | 434 -7% | 352 -25% | 373 -20% | 323 -31% | 389 ? -17% |
| Cyberpunk 2077 ultra 150cd | 48 | 45 -6% | ||||||
| Load | 88 | 122 39% | 51 -42% | 48 -45% | 84.3 ? -4% | |||
| Witcher 3 ultra | 57 | 76.3 ? |
Notebookcheck Note globale
Asus ROG Strix G16 G615
- 04/25/2025 v8
Andreas Osthoff
 Total Sustainability Score:
 Possible Alternatives in Comparison
Image | Modèle | Prix | Poids | Épaisseur | Écran |
|---|---|---|---|---|---|
1. 87.3%  | Asus ROG Strix G16 G615 Intel Core Ultra 9 275HX ⎘ Nvidia GeForce RTX 5080 Laptop ⎘ 32 Go Mémoire, 1024 Go SSD | Amazon: 1. $1,199.99 ASUS ROG Strix G16 Gaming La... 2. $1,899.00 ASUS ROG Strix G16 (2024) Ga... 3. $1,499.99 ASUS ROG Strix G16 Gaming La... Prix de liste: 3299€ | 2.6 kg | 30.8 mm | 16.00" 2560x1600 189 PPI IPS |
2. 86%  | Acer Predator Helios 16 PH16-72 Intel Core i9-14900HX ⎘ NVIDIA GeForce RTX 4080 Laptop GPU ⎘ 32 Go Mémoire, 2048 Go SSD | Amazon: 1. $1,469.00 acer Predator Helios Neo 16 ... 2. $2,237.40 acer Predator Helios 16 PH16... 3. $2,577.04 acer Predator Helios 16 PH16... | 2.7 kg | 29.6 mm | 16.00" 2560x1600 189 PPI IPS |
3. 85.5%  | SCHENKER XMG Neo 16 (Early 24) Intel Core i9-14900HX ⎘ NVIDIA GeForce RTX 4090 Laptop GPU ⎘ 32 Go Mémoire, 1024 Go SSD | Amazon: 1. $143.00 16.0" for Schenker XMG Neo 1... 2. $150.00 16.0" Screen Replacement for... 3. $145.00 16.0" WQXGA 2560(RGB)×1600 ... Prix de liste: 3800 Euro | 2.5 kg | 26.6 mm | 16.00" 2560x1600 189 PPI IPS |
4. 87.6% v7 (old)  | Asus ROG Strix Scar 16 G634JZR Intel Core i9-14900HX ⎘ NVIDIA GeForce RTX 4080 Laptop GPU ⎘ 32 Go Mémoire, 2048 Go SSD | Amazon: $2,899.00 Prix de liste: 3199 EUR | 2.7 kg | 30.4 mm | 16.00" 2560x1600 189 PPI Mini LED |
5. 86.7% v7 (old) 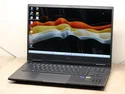 | HP Omen 16 (2024) Intel Core i9-14900HX ⎘ NVIDIA GeForce RTX 4080 Laptop GPU ⎘ 32 Go Mémoire, 1024 Go SSD | Amazon: 1. $1,169.09 HP OMEN 16 inch Laptop, FHD ... 2. $1,329.00 HP Omen 16 Gaming Laptop 16.... 3. $1,164.21 HP OMEN 16 inch Laptop, FHD ... Prix de liste: 3200 Euro | 2.4 kg | 23.5 mm | 16.10" 2560x1440 182 PPI IPS |
6. 89.5% v7 (old)  | Lenovo Legion Pro 7 16IRX9H Intel Core i9-14900HX ⎘ NVIDIA GeForce RTX 4080 Laptop GPU ⎘ 32 Go Mémoire, 1024 Go SSD | Amazon: Prix de liste: 2999 Euro | 2.7 kg | 21.95 mm | 16.00" 2560x1600 189 PPI IPS |
Transparency
La sélection des appareils à examiner est effectuée par notre équipe éditoriale. L'échantillon de test a été prêté à l'auteur par le fabricant ou le détaillant pour les besoins de cet examen. Le prêteur n'a pas eu d'influence sur cette évaluation et le fabricant n'a pas reçu de copie de cette évaluation avant sa publication. Il n'y avait aucune obligation de publier cet article. Nous n'acceptons jamais de compensation ou de paiement en échange de nos commentaires. En tant que média indépendant, Notebookcheck n'est pas soumis à l'autorité des fabricants, des détaillants ou des éditeurs.
Voici comment Notebookcheck teste
Chaque année, Notebookcheck examine de manière indépendante des centaines d'ordinateurs portables et de smartphones en utilisant des procédures standardisées afin de garantir que tous les résultats sont comparables. Nous avons continuellement développé nos méthodes de test depuis environ 20 ans et avons établi des normes industrielles dans le processus. Dans nos laboratoires de test, des équipements de mesure de haute qualité sont utilisés par des techniciens et des rédacteurs expérimentés. Ces tests impliquent un processus de validation en plusieurs étapes. Notre système d'évaluation complexe repose sur des centaines de mesures et de points de référence bien fondés, ce qui garantit l'objectivité.
