Notebookcheck Logo

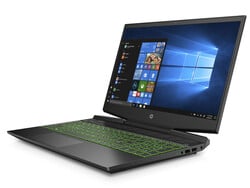
Courte critique du HP Gaming Pavilion 15 (i7-9750H, GTX 1660 Ti Max-Q, FHD, 144 Hz) : un portable de jeu puissant et discret

Efficace.

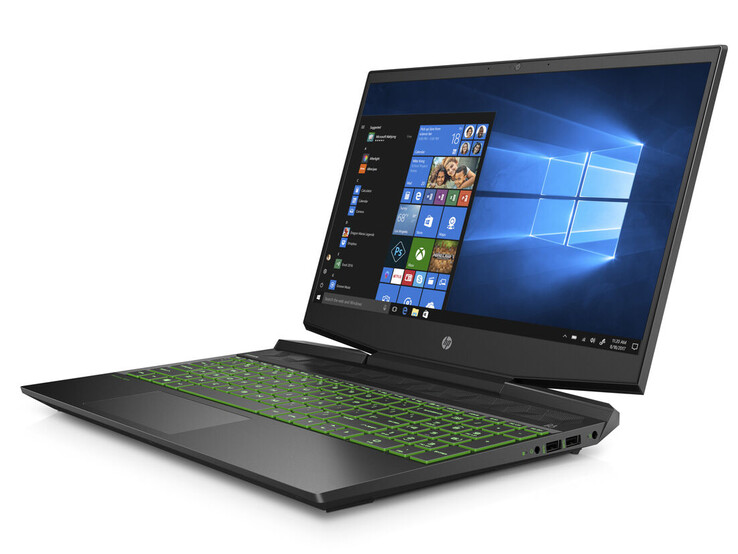
Le HP Gaming Pavilion 15 gère facilement tous les jeux modernes, sur son écran mat 1080p de 15,6 pouces, grâce à ses composants puissants. L’appareil peut même tirer profit de son taux de rafraîchissement de 144 Hz, tout en restant relativement silencieux. Les 16 Go de RAM DDR4 double canal soutiennent bien ces performances, tout comme le SSD de 256 Go.
HP Gaming Pavilion 15-dk0009ng (Pavilion 15-dk Gamme)
Processeur
Intel Core i7-9750H 6 x 2.6 - 4.5 GHz, Coffee Lake-H
Carte graphique
NVIDIA GeForce GTX 1660 Ti Max-Q - 6 Go VRAM, Processeur: 1335 MHz, RAM: 1500 MHz, GDDR6, 192 bits, Nvidia 431.36, Optimus
Mémoire
16 Go 
, DDR4-2666, double canal, deux emplacements SO-DIMM sur deux occupés
Écran
15.60 pouces 16:9, 1920 x 1080 pixel 141 PPP, LG Philips LGD05FE, IPS, 144 Hz, brillant: non
Carte mère
Intel Cannon Lake HM370
Disque dur
Samsung SSD PM981 MZVLB256HAHQ, 256 Go 
, + Seagate Barracuda Pro ST1000LM049 (1 To, 7 200 tr/min), 1131 Go libres
Carte son
Realtek ALC285 @ Intel Cannon Lake-H/S - cAVS
Connexions
3 USB 3.0 / 3.1 Gen1, 1 USB 3.1 Gen2, 1 HDMI, 1 DisplayPort, Connectique audio: jack 3,5 mm, Lecteur de cartes mémoires: SD, SDHC, SDXC, Capteurs: accéléromètre, TPM 2.0
Réseau
Realtek RTL8168/8111 Gigabit-LAN (10/100/1000MBit/s), Realtek RTL8822BE Wireless LAN 802.11ac PCIe Adapter (a/b/g/n = Wi-Fi 4/ac = Wi-Fi 5/), Bluetooth 4.2
Taille
Hauteur x Largeur x Profondeur (en mm): 23.4 x 360 x 256
Batterie
52.5 Wh, 4323 mAh Lithium-Ion, 11,55 V
Système d'exploitation
Microsoft Windows 10 Home 64 Bit
Appareil photo
Webcam: HD
Appareil photo primaire: 0.9 MPix
Fonctionnalités additionnelles
Haut-parleurs: stéréo, Clavier: chiclet, Rétroéclairage du clavier: oui, McAfee LiveSafe, 12 Mois Garantie
Poids
2.375 kg, Alimentation: 651 g
Prix
1399 Euro
Remarque : le fabricant peut utiliser des composants provenant de différents fournisseurs, notamment des panneaux d'affichage, des lecteurs ou des clés USB ayant des spécifications similaires.


Comparaison des tailles

385 mm 265 mm 33 mm 2.5 kg365 mm 260 mm 24 mm 2.3 kg364.3 mm 273.4 mm 23.7 mm 2.7 kg360 mm 256 mm 23.4 mm 2.4 kg359 mm 243 mm 22 mm 2.2 kg360 mm 252 mm 20.4 mm 2.1 kg297 mm 210 mm 1 mm 5.7 g
SD Card Reader
average JPG Copy Test (av. of 3 runs)
Moyenne de la classe Gaming
  (19 - 202, n=88, 2 dernières années)
95.9 MB/s +29%
CUK Model Z GK5CQ7Z
  (Toshiba Exceria Pro SDXC 64 GB UHS-II)
81.1 MB/s +9%
HP Gaming Pavilion 15-dk0009ng
  (Toshiba Exceria Pro SDXC 64 GB UHS-II)
74.1 MB/s
Dell G5 15 5590
  (Toshiba Exceria Pro SDXC 64 GB UHS-II)
19.1 MB/s -74%
Medion Erazer X6805-MD61085
  (Toshiba Exceria Pro SDXC 64 GB UHS-II)
19 MB/s -74%
maximum AS SSD Seq Read Test (1GB)
Moyenne de la classe Gaming
  (25.8 - 269, n=88, 2 dernières années)
120.1 MB/s +55%
CUK Model Z GK5CQ7Z
  (Toshiba Exceria Pro SDXC 64 GB UHS-II)
87.6 MB/s +13%
HP Gaming Pavilion 15-dk0009ng
  (Toshiba Exceria Pro SDXC 64 GB UHS-II)
77.6 MB/s
Medion Erazer X6805-MD61085
  (Toshiba Exceria Pro SDXC 64 GB UHS-II)
33 MB/s -57%
Dell G5 15 5590
  (Toshiba Exceria Pro SDXC 64 GB UHS-II)
32.2 MB/s -59%
Networking
iperf3 transmit AX12
Medion Erazer X6805-MD61085
Intel Wireless-AC 9560
642 MBit/s +1%
Dell G5 15 5590
Intel Wireless-AC 9560
642 (581min - 693max) MBit/s +1%
HP Gaming Pavilion 15-dk0009ng
Realtek RTL8822BE Wireless LAN 802.11ac PCIe Adapter
638 MBit/s
CUK Model Z GK5CQ7Z
Intel Wireless-AC 9560
611 MBit/s -4%
Asus ROG Zephyrus G15 GA502DU
Realtek 8821CE Wireless LAN 802.11ac PCI-E NIC
252 MBit/s -61%
Lenovo Legion Y530-15ICH
Intel Dual Band Wireless-AC 3165
144 (113min - 190max) MBit/s -77%
iperf3 receive AX12
Medion Erazer X6805-MD61085
Intel Wireless-AC 9560
674 MBit/s +10%
Dell G5 15 5590
Intel Wireless-AC 9560
657 (556min - 690max) MBit/s +7%
CUK Model Z GK5CQ7Z
Intel Wireless-AC 9560
638 MBit/s +4%
HP Gaming Pavilion 15-dk0009ng
Realtek RTL8822BE Wireless LAN 802.11ac PCIe Adapter
614 MBit/s
Asus ROG Zephyrus G15 GA502DU
Realtek 8821CE Wireless LAN 802.11ac PCI-E NIC
332 MBit/s -46%
Lenovo Legion Y530-15ICH
Intel Dual Band Wireless-AC 3165
293 (186min - 315max) MBit/s -52%
309
cd/m²
297
cd/m²
318
cd/m²
321
cd/m²
345
cd/m²
342
cd/m²
312
cd/m²
338
cd/m²
333
cd/m²
Homogénéité de la luminosité
LG Philips LGD05FE testé avec X-Rite i1Pro 2
Maximum: 345 cd/m² (Nits) Moyenne: 323.9 cd/m² Minimum: 19.3 cd/m²
Homogénéité de la luminosité: 86 %
Valeur mesurée au centre, sur batterie: 346 cd/m²
Contraste: 821:1 (Valeurs des noirs: 0.42 cd/m²)
ΔE Color 1.3 | 0.5-29.43 Ø4.9, calibrated: 1.1
ΔE Greyscale 1.2 | 0.5-98 Ø5.2
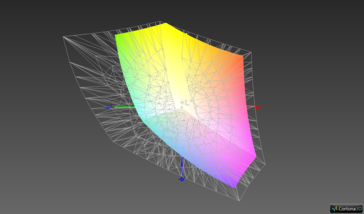
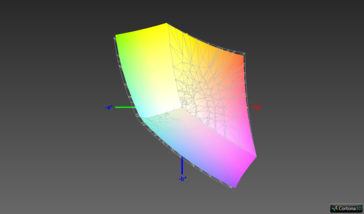
94.9% sRGB (Argyll 1.6.3 3D)
60.5% AdobeRGB 1998 (Argyll 1.6.3 3D)
65.8% AdobeRGB 1998 (Argyll 2.2.0 3D)
95.1% sRGB (Argyll 2.2.0 3D)
64.2% Display P3 (Argyll 2.2.0 3D)
Gamma: 2.31
HP Gaming Pavilion 15-dk0009ng
IPS, 1920x1080, 15.6"
CUK Model Z GK5CQ7Z
IPS, 1920x1080, 15.6"
Dell G5 15 5590
IPS, 1920x1080, 15.6"
Asus ROG Zephyrus G15 GA502DU
IPS, 1920x1080, 15.6"
Lenovo Legion Y530-15ICH
IPS, 1920x1080, 15.6"
Medion Erazer X6805-MD61085
IPS, 1920x1080, 15.6"
Display
-1%
-38%
-37%
-3%
-7%
Display P3 Coverage
64.2
64.5
0%
39.26
-39%
40.33
-37%
62.5
-3%
63.8
-1%
sRGB Coverage
95.1
93
-2%
59.1
-38%
60.6
-36%
93
-2%
82.4
-13%
AdobeRGB 1998 Coverage
65.8
65.7
0%
40.56
-38%
41.69
-37%
63.8
-3%
60.3
-8%
Response Times
1%
-181%
-138%
2%
-158%
Response Time Grey 50% / Grey 80% *
16.4 ?(8.4, 8)
13.6 ?(6.8, 6.8)
17%
45 ?(22, 23)
-174%
34 ?(17.2, 16.8)
-107%
15 ?(8, 7)
9%
38.4 ?(18.8, 19.6)
-134%
Response Time Black / White *
10.4 ?(5.2, 5.2)
12 ?(7.6, 4.4)
-15%
30 ?(17, 13)
-188%
28 ?(17.2, 10.8)
-169%
11 ?(7, 4)
-6%
29.2 ?(16.8, 12.4)
-181%
PWM Frequency
21280 ?(34)
20490 ?(99)
Screen
-44%
-181%
-117%
-70%
-91%
Brightness middle
345
306.8
-11%
234
-32%
240.1
-30%
305
-12%
270
-22%
Brightness
324
309
-5%
219
-32%
231
-29%
284
-12%
269
-17%
Brightness Distribution
86
87
1%
82
-5%
85
-1%
83
-3%
86
0%
Black Level *
0.42
0.38
10%
0.17
60%
0.34
19%
0.52
-24%
0.32
24%
Contrast
821
807
-2%
1376
68%
706
-14%
587
-29%
844
3%
Colorchecker dE 2000 *
1.3
3.16
-143%
8.6
-562%
4.2
-223%
3.63
-179%
5.1
-292%
Colorchecker dE 2000 max. *
2.8
6.05
-116%
17.49
-525%
17.8
-536%
8.18
-192%
9.25
-230%
Colorchecker dE 2000 calibrated *
1.1
2.4
-118%
4.06
-269%
4.09
-272%
1.31
-19%
3.25
-195%
Greyscale dE 2000 *
1.2
2.3
-92%
8.55
-613%
2.8
-133%
4.77
-298%
4.16
-247%
Gamma
2.31 95%
2.17 101%
3.02 73%
2.2 100%
2.54 87%
2.53 87%
CCT
6476 100%
6557 99%
7802 83%
6925 94%
7500 87%
6860 95%
Color Space (Percent of AdobeRGB 1998)
60.5
60
-1%
37
-39%
38.4
-37%
59
-2%
54
-11%
Color Space (Percent of sRGB)
94.9
92.6
-2%
59
-38%
60.4
-36%
93
-2%
82
-14%
Moyenne finale (programmes/paramètres)
-15% / -30%
-133% / -154%
-97% / -105%
-24% / -49%
-85% / -84%

* ... Moindre est la valeur, meilleures sont les performances

HP Pavilion Gaming 15 - 60,5% AdobeRVB.
HP Pavilion Gaming 15 - 94,9% sRVB.

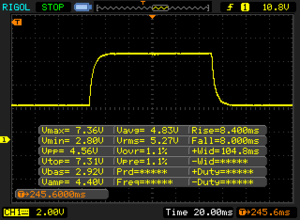
Temps de réponse de l'écran

Le temps de réponse d'un écran mesure la rapidité à laquelle l'écran est capable de changer une couleur pour une autre. Un temps de réponse élevé se traduit par une image floutée pour les objets en mouvement. Les joueurs bénéficieront de faibles latences d'affichage en jeu.
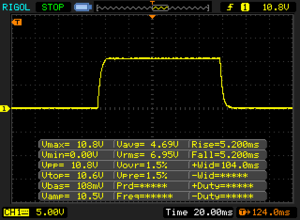
       Temps de réponse noir à blanc
10.4 ms ... hausse ↗ et chute ↘ combinées↗ 5.2 ms hausse
↘ 5.2 ms chute
L'écran montre de bons temps de réponse, mais insuffisant pour du jeu compétitif.
En comparaison, tous les appareils testés affichent entre 0.1 (minimum) et 240 (maximum) ms. » 25 % des appareils testés affichent de meilleures performances.
Cela signifie que les latences relevées sont meilleures que la moyenne (20.9 ms) de tous les appareils testés.
       Temps de réponse gris 50% à gris 80%
16.4 ms ... hausse ↗ et chute ↘ combinées↗ 8.4 ms hausse
↘ 8 ms chute
L'écran montre de bons temps de réponse, mais insuffisant pour du jeu compétitif.
En comparaison, tous les appareils testés affichent entre 0.165 (minimum) et 636 (maximum) ms. » 27 % des appareils testés affichent de meilleures performances.
Cela signifie que les latences relevées sont meilleures que la moyenne (32.8 ms) de tous les appareils testés.

Scintillement / MLI (Modulation de largeur d'impulsion)

Afin d'abaisser la luminosité de l'écran, certains ordinateurs portables font varier très rapidement le rétroéclairage entre éteint et allumé. La fréquence à laquelle le rétroéclairage s'éteint et se rallume est normalement fixée à une valeur qui permet de rendre la variation indétectable à l'œil nu? Si la fréquence est trop basse, certaines personnes peuvent être sujettes à une fatigue oculaire, des maux de tête ou même percevoir les variations.
Scintillement / MLI (Modulation de largeur d'impulsion) non décelé

En comparaison, 53 % des appareils testés n'emploient pas MDI pour assombrir leur écran. Nous avons relevé une moyenne à 8684 (minimum : 5 - maximum : 343500) Hz dans le cas où une MDI était active.

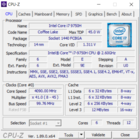
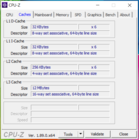
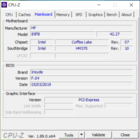
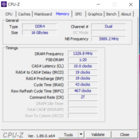
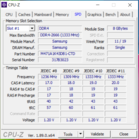
HP Pavilion Gaming 15 - CPU-Z.
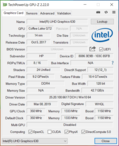
HP Pavilion Gaming 15 - GPU-Z.
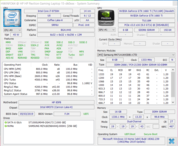
HP Pavilion Gaming 15 - HWInfo.
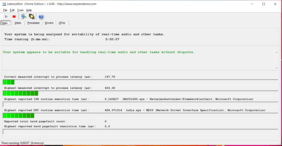
HP Pavilion Gaming 15 - LatencyMon.
 
0651301952603253904555205856507157808459109751040110511701235Tooltip
HP Gaming Pavilion 15-dk0009ng Intel Core i7-9750H, Intel Core i7-9750H: Ø1035 (1020.33-1139.99)
CUK Model Z GK5CQ7Z Intel Core i7-9750H, Intel Core i7-9750H: Ø1190 (1182.24-1239.66)
Dell G5 15 5590 Intel Core i7-8750H, Intel Core i7-8750H: Ø1144 (1121.11-1191.01)
Asus ROG Zephyrus G15 GA502DU AMD Ryzen 7 3750H, AMD Ryzen 7 3750H: Ø790 (787.28-796.5)
Lenovo Legion Y530-15ICH Intel Core i7-8750H, Intel Core i7-8750H: Ø1118 (1106.5-1218.62)
Medion Erazer X6805-MD61085 Intel Core i7-8750H, Intel Core i7-8750H: Ø1107 (1095.29-1196)
HP Pavilion Gaming 15 - Fréquence du processeur pendant une boucle CB R15 Multi 64Bit.
Cinebench R10 Rendering Single 32Bit
6983
Cinebench R10 Rendering Multiple CPUs 32Bit
34445
Cinebench R10 Shading 32Bit
8083
Cinebench R15 CPU Single 64Bit
186 Points
Cinebench R15 CPU Multi 64Bit
1140 Points
Cinebench R15 OpenGL 64Bit
116.4 fps
Cinebench R15 Ref. Match 64Bit
99.6 %
Cinebench R20 CPU (Multi Core)
2415 Points
Cinebench R20 CPU (Single Core)
447 Points
Aide
Cinebench R15
CPU Single 64Bit
Moyenne de la classe Gaming
  (191.9 - 318, n=189, 2 dernières années)
278 Points +49%
CUK Model Z GK5CQ7Z
Intel Core i7-9750H
187 Points +1%
HP Gaming Pavilion 15-dk0009ng
Intel Core i7-9750H
186 Points
Moyenne Intel Core i7-9750H
  (170 - 194, n=82)
183.7 Points -1%
Lenovo Legion Y530-15ICH
Intel Core i7-8750H
175 Points -6%
Medion Erazer X6805-MD61085
Intel Core i7-8750H
171 Points -8%
Dell G5 15 5590
Intel Core i7-8750H
165 Points -11%
Asus ROG Zephyrus G15 GA502DU
AMD Ryzen 7 3750H
144 Points -23%
CPU Multi 64Bit
Moyenne de la classe Gaming
  (905 - 5663, n=192, 2 dernières années)
3445 Points +202%
CUK Model Z GK5CQ7Z
Intel Core i7-9750H
1261 Points +11%
Lenovo Legion Y530-15ICH
Intel Core i7-8750H
1219 Points +7%
Medion Erazer X6805-MD61085
Intel Core i7-8750H
1196 Points +5%
Dell G5 15 5590
Intel Core i7-8750H
1191 Points +4%
Moyenne Intel Core i7-9750H
  (952 - 1306, n=85)
1182 Points +4%
HP Gaming Pavilion 15-dk0009ng
Intel Core i7-9750H
1140 Points
Asus ROG Zephyrus G15 GA502DU
AMD Ryzen 7 3750H
805 Points -29%
Cinebench R10
Rendering Single 32Bit
Moyenne de la classe Gaming
  (5719 - 15819, n=18, 2 dernières années)
9755 Points +40%
HP Gaming Pavilion 15-dk0009ng
Intel Core i7-9750H
6983 Points
Moyenne Intel Core i7-9750H
  (6659 - 7214, n=13)
6923 Points -1%
Dell G5 15 5590
Intel Core i7-8750H
6338 Points -9%
Asus ROG Zephyrus G15 GA502DU
AMD Ryzen 7 3750H
4770 Points -32%
Rendering Multiple CPUs 32Bit
Moyenne de la classe Gaming
  (32456 - 112749, n=18, 2 dernières années)
63783 Points +85%
Dell G5 15 5590
Intel Core i7-8750H
34465 Points 0%
HP Gaming Pavilion 15-dk0009ng
Intel Core i7-9750H
34445 Points
Moyenne Intel Core i7-9750H
  (28251 - 36304, n=13)
33539 Points -3%
Asus ROG Zephyrus G15 GA502DU
AMD Ryzen 7 3750H
20687 Points -40%
Cinebench R20
CPU (Single Core)
Moyenne de la classe Gaming
  (439 - 856, n=185, 2 dernières années)
727 Points +63%
HP Gaming Pavilion 15-dk0009ng
Intel Core i7-9750H
447 Points
Moyenne Intel Core i7-9750H
  (416 - 486, n=55)
443 Points -1%
Dell G5 15 5590
Intel Core i7-8750H
403 Points -10%
Asus ROG Zephyrus G15 GA502DU
AMD Ryzen 7 3750H
340 Points -24%
CPU (Multi Core)
Moyenne de la classe Gaming
  (2179 - 13832, n=185, 2 dernières années)
8379 Points +247%
Dell G5 15 5590
Intel Core i7-8750H
2707 Points +12%
Moyenne Intel Core i7-9750H
  (2017 - 3133, n=55)
2564 Points +6%
HP Gaming Pavilion 15-dk0009ng
Intel Core i7-9750H
2415 Points
Asus ROG Zephyrus G15 GA502DU
AMD Ryzen 7 3750H
1825 Points -24%
Geekbench 3
32 Bit Multi-Core Score
HP Gaming Pavilion 15-dk0009ng
Intel Core i7-9750H
22875 Points
Moyenne Intel Core i7-9750H
  (21185 - 23587, n=8)
22450 Points -2%
Dell G5 15 5590
Intel Core i7-8750H
21920 Points -4%
32 Bit Single-Core Score
HP Gaming Pavilion 15-dk0009ng
Intel Core i7-9750H
4263 Points
Moyenne Intel Core i7-9750H
  (4137 - 4428, n=8)
4243 Points 0%
Dell G5 15 5590
Intel Core i7-8750H
3868 Points -9%
Geekbench 4.4
64 Bit Multi-Core Score
Moyenne de la classe Gaming
  (31241 - 71700, n=15, 2 dernières années)
54312 Points +127%
HP Gaming Pavilion 15-dk0009ng
Intel Core i7-9750H
23928 Points
Moyenne Intel Core i7-9750H
  (17054 - 25043, n=27)
22076 Points -8%
Dell G5 15 5590
Intel Core i7-8750H
20450 Points -15%
Asus ROG Zephyrus G15 GA502DU
AMD Ryzen 7 3750H
11396 Points -52%
64 Bit Single-Core Score
Moyenne de la classe Gaming
  (6158 - 8945, n=15, 2 dernières années)
8126 Points +50%
HP Gaming Pavilion 15-dk0009ng
Intel Core i7-9750H
5423 Points
Moyenne Intel Core i7-9750H
  (4440 - 5511, n=27)
5238 Points -3%
Dell G5 15 5590
Intel Core i7-8750H
4723 Points -13%
Asus ROG Zephyrus G15 GA502DU
AMD Ryzen 7 3750H
3898 Points -28%
Mozilla Kraken 1.1 - Total
Dell G5 15 5590
Intel Core i7-8750H (Edge 44)
1137 ms * -7%
HP Gaming Pavilion 15-dk0009ng
Intel Core i7-9750H (Edge 44)
1066 ms *
Moyenne Intel Core i7-9750H
  (845 - 1713, n=54)
1048 ms * +2%
Lenovo Legion Y530-15ICH
Intel Core i7-8750H
799 ms * +25%
Moyenne de la classe Gaming
  (421 - 674, n=175, 2 dernières années)
502 ms * +53%
Octane V2 - Total Score
Moyenne de la classe Gaming
  (69893 - 115768, n=55, 2 dernières années)
95682 Points +155%
Lenovo Legion Y530-15ICH
Intel Core i7-8750H
37762 Points +1%
HP Gaming Pavilion 15-dk0009ng
Intel Core i7-9750H (Edge 44)
37557 Points
Moyenne Intel Core i7-9750H
  (22874 - 39708, n=47)
35814 Points -5%
Dell G5 15 5590
Intel Core i7-8750H (Edge 44)
33522 Points -11%
Asus ROG Zephyrus G15 GA502DU
AMD Ryzen 7 3750H (Edge 44.17763.1.0)
30577 Points -19%
JetStream 1.1 - Total Score
Moyenne de la classe Gaming
  (357 - 669, n=32, 2 dernières années)
528 Points +100%
HP Gaming Pavilion 15-dk0009ng
Intel Core i7-9750H (Edge 44)
264.4 Points
Moyenne Intel Core i7-9750H
  (212 - 280, n=47)
258 Points -2%
Dell G5 15 5590
Intel Core i7-8750H (Edge 44)
243.8 Points -8%
Asus ROG Zephyrus G15 GA502DU
AMD Ryzen 7 3750H (Edge 44.17763.1.0)
213.1 Points -19%
Lenovo Legion Y530-15ICH
Intel Core i7-8750H
205.1 Points -22%

* ... Moindre est la valeur, meilleures sont les performances

PCMark 7 Score
6847 points
PCMark 8 Home Score Accelerated v2
4362 points
PCMark 8 Creative Score Accelerated v2
4155 points
PCMark 8 Work Score Accelerated v2
5608 points
PCMark 10 Score
5583 points
Aide
PCMark 10
Score
Moyenne de la classe Gaming
  (5776 - 9852, n=163, 2 dernières années)
7825 Points +40%
CUK Model Z GK5CQ7Z
GeForce RTX 2070 Max-Q, i7-9750H, Intel SSD 660p 2TB SSDPEKNW020T8
5678 Points +2%
HP Gaming Pavilion 15-dk0009ng
GeForce GTX 1660 Ti Max-Q, i7-9750H, Samsung SSD PM981 MZVLB256HAHQ
5583 Points
Moyenne Intel Core i7-9750H, NVIDIA GeForce GTX 1660 Ti Max-Q
  (5429 - 5583, n=2)
5506 Points -1%
Medion Erazer X6805-MD61085
GeForce GTX 1060 Mobile, i7-8750H, Samsung PM961 MZVLW256HEHP
5234 Points -6%
Lenovo Legion Y530-15ICH
GeForce GTX 1060 Mobile, i7-8750H, Samsung SSD PM981 MZVLB256HAHQ
5125 Points -8%
Dell G5 15 5590
GeForce RTX 2060 Mobile, i7-8750H, KBG30ZMS128G
5069 Points -9%
Asus ROG Zephyrus G15 GA502DU
GeForce GTX 1660 Ti Max-Q, R7 3750H, Intel SSD 660p SSDPEKNW512G8
4322 Points -23%
Essentials
Moyenne de la classe Gaming
  (9057 - 12600, n=162, 2 dernières années)
10842 Points +15%
HP Gaming Pavilion 15-dk0009ng
GeForce GTX 1660 Ti Max-Q, i7-9750H, Samsung SSD PM981 MZVLB256HAHQ
9450 Points
Moyenne Intel Core i7-9750H, NVIDIA GeForce GTX 1660 Ti Max-Q
  (9320 - 9450, n=2)
9385 Points -1%
CUK Model Z GK5CQ7Z
GeForce RTX 2070 Max-Q, i7-9750H, Intel SSD 660p 2TB SSDPEKNW020T8
9158 Points -3%
Lenovo Legion Y530-15ICH
GeForce GTX 1060 Mobile, i7-8750H, Samsung SSD PM981 MZVLB256HAHQ
8702 Points -8%
Medion Erazer X6805-MD61085
GeForce GTX 1060 Mobile, i7-8750H, Samsung PM961 MZVLW256HEHP
8427 Points -11%
Dell G5 15 5590
GeForce RTX 2060 Mobile, i7-8750H, KBG30ZMS128G
8308 Points -12%
Asus ROG Zephyrus G15 GA502DU
GeForce GTX 1660 Ti Max-Q, R7 3750H, Intel SSD 660p SSDPEKNW512G8
7424 Points -21%
Productivity
Moyenne de la classe Gaming
  (6662 - 14612, n=162, 2 dernières années)
9918 Points +29%
HP Gaming Pavilion 15-dk0009ng
GeForce GTX 1660 Ti Max-Q, i7-9750H, Samsung SSD PM981 MZVLB256HAHQ
7687 Points
CUK Model Z GK5CQ7Z
GeForce RTX 2070 Max-Q, i7-9750H, Intel SSD 660p 2TB SSDPEKNW020T8
7546 Points -2%
Moyenne Intel Core i7-9750H, NVIDIA GeForce GTX 1660 Ti Max-Q
  (7165 - 7687, n=2)
7426 Points -3%
Medion Erazer X6805-MD61085
GeForce GTX 1060 Mobile, i7-8750H, Samsung PM961 MZVLW256HEHP
7102 Points -8%
Lenovo Legion Y530-15ICH
GeForce GTX 1060 Mobile, i7-8750H, Samsung SSD PM981 MZVLB256HAHQ
7019 Points -9%
Dell G5 15 5590
GeForce RTX 2060 Mobile, i7-8750H, KBG30ZMS128G
6808 Points -11%
Asus ROG Zephyrus G15 GA502DU
GeForce GTX 1660 Ti Max-Q, R7 3750H, Intel SSD 660p SSDPEKNW512G8
6305 Points -18%
Digital Content Creation
Moyenne de la classe Gaming
  (6807 - 18475, n=162, 2 dernières années)
12205 Points +88%
CUK Model Z GK5CQ7Z
GeForce RTX 2070 Max-Q, i7-9750H, Intel SSD 660p 2TB SSDPEKNW020T8
7190 Points +11%
HP Gaming Pavilion 15-dk0009ng
GeForce GTX 1660 Ti Max-Q, i7-9750H, Samsung SSD PM981 MZVLB256HAHQ
6502 Points
Moyenne Intel Core i7-9750H, NVIDIA GeForce GTX 1660 Ti Max-Q
  (6502 - 6502, n=2)
6502 Points 0%
Medion Erazer X6805-MD61085
GeForce GTX 1060 Mobile, i7-8750H, Samsung PM961 MZVLW256HEHP
6501 Points 0%
Dell G5 15 5590
GeForce RTX 2060 Mobile, i7-8750H, KBG30ZMS128G
6252 Points -4%
Lenovo Legion Y530-15ICH
GeForce GTX 1060 Mobile, i7-8750H, Samsung SSD PM981 MZVLB256HAHQ
5983 Points -8%
Asus ROG Zephyrus G15 GA502DU
GeForce GTX 1660 Ti Max-Q, R7 3750H, Intel SSD 660p SSDPEKNW512G8
4682 Points -28%
PCMark 8
Home Score Accelerated v2
Moyenne de la classe Gaming
  (4659 - 5937, n=18, 2 dernières années)
5259 Points +21%
CUK Model Z GK5CQ7Z
GeForce RTX 2070 Max-Q, i7-9750H, Intel SSD 660p 2TB SSDPEKNW020T8
4459 Points +2%
Lenovo Legion Y530-15ICH
GeForce GTX 1060 Mobile, i7-8750H, Samsung SSD PM981 MZVLB256HAHQ
4440 Points +2%
Medion Erazer X6805-MD61085
GeForce GTX 1060 Mobile, i7-8750H, Samsung PM961 MZVLW256HEHP
4404 Points +1%
HP Gaming Pavilion 15-dk0009ng
GeForce GTX 1660 Ti Max-Q, i7-9750H, Samsung SSD PM981 MZVLB256HAHQ
4362 Points
Moyenne Intel Core i7-9750H, NVIDIA GeForce GTX 1660 Ti Max-Q
  (4148 - 4362, n=2)
4255 Points -2%
Dell G5 15 5590
GeForce RTX 2060 Mobile, i7-8750H, KBG30ZMS128G
4165 Points -5%
Asus ROG Zephyrus G15 GA502DU
GeForce GTX 1660 Ti Max-Q, R7 3750H, Intel SSD 660p SSDPEKNW512G8
3642 Points -17%
Work Score Accelerated v2
Moyenne de la classe Gaming
  (5520 - 6712, n=16, 2 dernières années)
6051 Points +8%
CUK Model Z GK5CQ7Z
GeForce RTX 2070 Max-Q, i7-9750H, Intel SSD 660p 2TB SSDPEKNW020T8
5696 Points +2%
HP Gaming Pavilion 15-dk0009ng
GeForce GTX 1660 Ti Max-Q, i7-9750H, Samsung SSD PM981 MZVLB256HAHQ
5608 Points
Lenovo Legion Y530-15ICH
GeForce GTX 1060 Mobile, i7-8750H, Samsung SSD PM981 MZVLB256HAHQ
5543 Points -1%
Moyenne Intel Core i7-9750H, NVIDIA GeForce GTX 1660 Ti Max-Q
  (5222 - 5608, n=2)
5415 Points -3%
Medion Erazer X6805-MD61085
GeForce GTX 1060 Mobile, i7-8750H, Samsung PM961 MZVLW256HEHP
5379 Points -4%
Dell G5 15 5590
GeForce RTX 2060 Mobile, i7-8750H, KBG30ZMS128G
5291 Points -6%
Asus ROG Zephyrus G15 GA502DU
GeForce GTX 1660 Ti Max-Q, R7 3750H, Intel SSD 660p SSDPEKNW512G8
4956 Points -12%
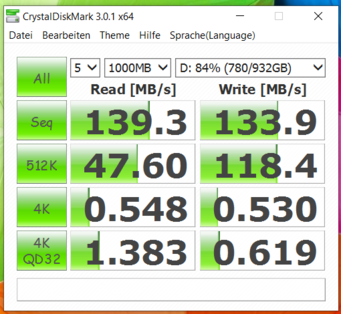
HP Pavilion Gaming 15 - CrystalDiskMark 3: Seagate Barracuda Pro HDD.
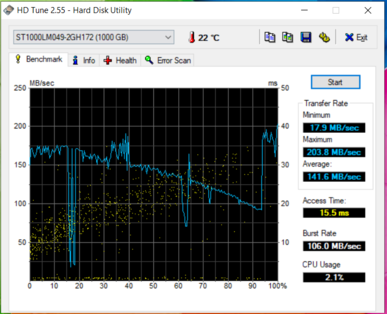
HP Pavilion Gaming 15 - HD Tune : Seagate Barracuda Pro HDD.
Samsung SSD PM981 MZVLB256HAHQ
Sequential Read: 1436 MB/s
Sequential Write: 1343 MB/s
512K Read: 362.5 MB/s
512K Write: 348.9 MB/s
4K Read: 27.2 MB/s
4K Write: 113.5 MB/s
4K QD32 Read: 524 MB/s
4K QD32 Write: 349.5 MB/s
HP Gaming Pavilion 15-dk0009ng
Samsung SSD PM981 MZVLB256HAHQ
CUK Model Z GK5CQ7Z
Intel SSD 660p 2TB SSDPEKNW020T8
Dell G5 15 5590
KBG30ZMS128G
Asus ROG Zephyrus G15 GA502DU
Intel SSD 660p SSDPEKNW512G8
Lenovo Legion Y530-15ICH
Samsung SSD PM981 MZVLB256HAHQ
Medion Erazer X6805-MD61085
Samsung PM961 MZVLW256HEHP
Moyenne Samsung SSD PM981 MZVLB256HAHQ
 
CrystalDiskMark 5.2 / 6
37%
-56%
-6%
2%
-9%
72%
Write 4K
100
134.4
34%
64.3
-36%
132.2
32%
108.9
9%
90.3
-10%
Read 4K
31.39
56.8
81%
29.3
-7%
55.5
77%
40.23
28%
38.98
24%
189.5 ?(31.4 - 3738, n=25)
504%
Write Seq
1308
1742
33%
131.1
-90%
986
-25%
1390
6%
1095
-16%
Read Seq
1083
1687
56%
776
-28%
1318
22%
964
-11%
777
-28%
Write 4K Q32T1
362.9
535
47%
96.8
-73%
220.3
-39%
314.2
-13%
302.7
-17%
Read 4K Q32T1
425.7
639
50%
198.6
-53%
315.5
-26%
369.2
-13%
352.2
-17%
Write Seq Q32T1
1411
1903
35%
127.8
-91%
987
-30%
1506
7%
1265
-10%
Read Seq Q32T1
3240
1849
-43%
1044
-68%
1416
-56%
3446
6%
3389
5%
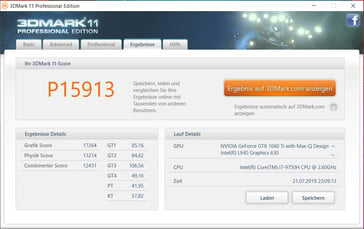
HP Pavilion Gaming 15 - 3DMark 11 : sur secteur.
HP Pavilion Gaming 15 - 3DMark 11 : sur batterie.
3DMark 06 Standard Score
38536 points
3DMark 11 Performance
15913 points
3DMark Ice Storm Standard Score
117976 points
3DMark Cloud Gate Standard Score
33027 points
3DMark Fire Strike Score
11615 points
3DMark Time Spy Score
5072 points
Aide
3DMark 11 - 1280x720 Performance GPU
Moyenne de la classe Gaming
  (1029 - 72178, n=181, 2 dernières années)
44043 Points +155%
CUK Model Z GK5CQ7Z
NVIDIA GeForce RTX 2070 Max-Q, Intel Core i7-9750H
21409 Points +24%
Dell G5 15 5590
NVIDIA GeForce RTX 2060 Mobile, Intel Core i7-8750H
20196 Points +17%
Moyenne NVIDIA GeForce GTX 1660 Ti Max-Q
  (17010 - 18653, n=8)
17711 Points +3%
HP Gaming Pavilion 15-dk0009ng
NVIDIA GeForce GTX 1660 Ti Max-Q, Intel Core i7-9750H
17264 Points
Asus ROG Zephyrus G15 GA502DU
NVIDIA GeForce GTX 1660 Ti Max-Q, AMD Ryzen 7 3750H
17170 Points -1%
Lenovo Legion Y530-15ICH
NVIDIA GeForce GTX 1060 Mobile, Intel Core i7-8750H
14569 Points -16%
Medion Erazer X6805-MD61085
NVIDIA GeForce GTX 1060 Mobile, Intel Core i7-8750H
14557 Points -16%
3DMark
1280x720 Cloud Gate Standard Graphics
Moyenne de la classe Gaming
  (15902 - 193851, n=101, 2 dernières années)
144496 Points +64%
CUK Model Z GK5CQ7Z
NVIDIA GeForce RTX 2070 Max-Q, Intel Core i7-9750H
110817 Points +26%
Dell G5 15 5590
NVIDIA GeForce RTX 2060 Mobile, Intel Core i7-8750H
95292 Points +8%
HP Gaming Pavilion 15-dk0009ng
NVIDIA GeForce GTX 1660 Ti Max-Q, Intel Core i7-9750H
88271 Points
Lenovo Legion Y530-15ICH
NVIDIA GeForce GTX 1060 Mobile, Intel Core i7-8750H
83591 Points -5%
Medion Erazer X6805-MD61085
NVIDIA GeForce GTX 1060 Mobile, Intel Core i7-8750H
82954 Points -6%
Moyenne NVIDIA GeForce GTX 1660 Ti Max-Q
  (38321 - 89505, n=7)
63736 Points -28%
Asus ROG Zephyrus G15 GA502DU
NVIDIA GeForce GTX 1660 Ti Max-Q, AMD Ryzen 7 3750H
44557 Points -50%
1920x1080 Fire Strike Graphics
Moyenne de la classe Gaming
  (781 - 53059, n=193, 2 dernières années)
31600 Points +145%
CUK Model Z GK5CQ7Z
NVIDIA GeForce RTX 2070 Max-Q, Intel Core i7-9750H
16460 Points +28%
Dell G5 15 5590
NVIDIA GeForce RTX 2060 Mobile, Intel Core i7-8750H
15415 Points +19%
Moyenne NVIDIA GeForce GTX 1660 Ti Max-Q
  (12903 - 13870, n=7)
13356 Points +4%
Asus ROG Zephyrus G15 GA502DU
NVIDIA GeForce GTX 1660 Ti Max-Q, AMD Ryzen 7 3750H
13355 Points +4%
HP Gaming Pavilion 15-dk0009ng
NVIDIA GeForce GTX 1660 Ti Max-Q, Intel Core i7-9750H
12903 Points
Medion Erazer X6805-MD61085
NVIDIA GeForce GTX 1060 Mobile, Intel Core i7-8750H
11662 Points -10%
Lenovo Legion Y530-15ICH
NVIDIA GeForce GTX 1060 Mobile, Intel Core i7-8750H
11640 Points -10%
2560x1440 Time Spy Graphics
Moyenne de la classe Gaming
  (224 - 22717, n=188, 2 dernières années)
13211 Points +168%
CUK Model Z GK5CQ7Z
NVIDIA GeForce RTX 2070 Max-Q, Intel Core i7-9750H
6503 Points +32%
Dell G5 15 5590
NVIDIA GeForce RTX 2060 Mobile, Intel Core i7-8750H
5977 Points +21%
Moyenne NVIDIA GeForce GTX 1660 Ti Max-Q
  (4867 - 5440, n=8)
5089 Points +3%
HP Gaming Pavilion 15-dk0009ng
NVIDIA GeForce GTX 1660 Ti Max-Q, Intel Core i7-9750H
4925 Points
Asus ROG Zephyrus G15 GA502DU
NVIDIA GeForce GTX 1660 Ti Max-Q, AMD Ryzen 7 3750H
4867 Points -1%
The Witcher 3 - 1920x1080 Ultra Graphics & Postprocessing (HBAO+)
Moyenne de la classe Gaming
  (18.4 - 216, n=160, 2 dernières années)
129.2 fps +143%
CUK Model Z GK5CQ7Z
Intel Core i7-9750H, NVIDIA GeForce RTX 2070 Max-Q
63 fps +19%
Dell G5 15 5590
Intel Core i7-8750H, NVIDIA GeForce RTX 2060 Mobile
60 fps +13%
HP Gaming Pavilion 15-dk0009ng
Intel Core i7-9750H, NVIDIA GeForce GTX 1660 Ti Max-Q
53.1 fps
Moyenne NVIDIA GeForce GTX 1660 Ti Max-Q
  (44.8 - 53.2, n=7)
50.3 fps -5%
Asus ROG Zephyrus G15 GA502DU
AMD Ryzen 7 3750H, NVIDIA GeForce GTX 1660 Ti Max-Q
48.8 fps -8%
Lenovo Legion Y530-15ICH
Intel Core i7-8750H, NVIDIA GeForce GTX 1060 Mobile
41.4 fps -22%
Medion Erazer X6805-MD61085
Intel Core i7-8750H, NVIDIA GeForce GTX 1060 Mobile
39.5 fps -26%
BioShock Infinite - 1920x1080 Ultra Preset, DX11 (DDOF)
CUK Model Z GK5CQ7Z
Intel Core i7-9750H, NVIDIA GeForce RTX 2070 Max-Q
150.2 fps +19%
Dell G5 15 5590
Intel Core i7-8750H, NVIDIA GeForce RTX 2060 Mobile
136.9 fps +8%
HP Gaming Pavilion 15-dk0009ng
Intel Core i7-9750H, NVIDIA GeForce GTX 1660 Ti Max-Q
126.3 fps
Moyenne NVIDIA GeForce GTX 1660 Ti Max-Q
  (102.3 - 130, n=5)
117 fps -7%
Lenovo Legion Y530-15ICH
Intel Core i7-8750H, NVIDIA GeForce GTX 1060 Mobile
114.2 fps -10%
Asus ROG Zephyrus G15 GA502DU
AMD Ryzen 7 3750H, NVIDIA GeForce GTX 1660 Ti Max-Q
102.3 fps -19%
Far Cry 5 - 1920x1080 Ultra Preset AA:T
Moyenne de la classe Gaming
  (34 - 218, n=100, 2 dernières années)
131.2 fps +77%
Dell G5 15 5590
Intel Core i7-8750H, NVIDIA GeForce RTX 2060 Mobile
79 fps +7%
HP Gaming Pavilion 15-dk0009ng
Intel Core i7-9750H, NVIDIA GeForce GTX 1660 Ti Max-Q
74 fps
Moyenne NVIDIA GeForce GTX 1660 Ti Max-Q
  (50 - 74, n=2)
62 fps -16%
05101520253035404550556065Tooltip
HP Gaming Pavilion 15-dk0009ng GeForce GTX 1660 Ti Max-Q, i7-9750H, Samsung SSD PM981 MZVLB256HAHQ: Ø49.5 (44-53)
CUK Model Z GK5CQ7Z GeForce RTX 2070 Max-Q, i7-9750H, Intel SSD 660p 2TB SSDPEKNW020T8: Ø59.7 (57-64)
Dell G5 15 5590 GeForce RTX 2060 Mobile, i7-8750H, KBG30ZMS128G: Ø60.1 (36-65)
Asus ROG Zephyrus G15 GA502DU GeForce GTX 1660 Ti Max-Q, R7 3750H, Intel SSD 660p SSDPEKNW512G8: Ø45 (37-48)
Lenovo Legion Y530-15ICH GeForce GTX 1060 Mobile, i7-8750H, Samsung SSD PM981 MZVLB256HAHQ: Ø39 (36-42)
Medion Erazer X6805-MD61085 GeForce GTX 1060 Mobile, i7-8750H, Samsung PM961 MZVLW256HEHP: Ø39.6 (36-44)
HP Pavilion Gaming 15 - Informations GPU durant le jeu The Witcher 3.
BasMoyenÉlevéUltra
BioShock Infinite (2013) 294 271.9 246.8 126.3
GTA V (2015) 161.3 151.5 114.6 59.6
The Witcher 3 (2015) 243 162.6 95.2 53.1
Rainbow Six Siege (2015) 232.8 200.1 163.6 148.8
Ghost Recon Wildlands (2017) 130.4 78.1 72.4 41.5
Final Fantasy XV Benchmark (2018) 106.4 70.3 50
Kingdom Come: Deliverance (2018) 125.6 91.7 77.3 53.7
X-Plane 11.11 (2018) 102.3 88.1 75.4
Far Cry 5 (2018) 103 84 79 74
Assassin´s Creed Odyssey (2018) 90 71 60 44
Battlefield V (2018) 117.4 74.6 65.9 61
Far Cry New Dawn (2019) 97 81 78 71
Dirt Rally 2.0 (2019) 194.2 139.9 103.2 59.2
The Division 2 (2019) 142 87 69 50
Anno 1800 (2019) 87.9 83.2 64.1 33.2
Rage 2 (2019) 154.7 70.9 58.7 58.2
Total War: Three Kingdoms (2019) 209.4 93.1 57.1 41.6
F1 2019 (2019) 183 140 117 71

Degré de la nuisance sonore

Au repos
29.3 / 29.3 / 29.3 dB(A)
Disque dur
29.7 dB(A)
Fortement sollicité
32.3 / 41.2 dB(A)
  red to green bar
 
 
30 dB
silencieux
40 dB(A)
audible
50 dB(A)
bruyant
 
min: dark, med: mid, max: light   Audix TM1, Arta (à 15 cm de distance)   bruit ambiant: 28.2 dB(A)
dB(A) 0102030405060708090Deep BassMiddle BassHigh BassLower RangeMidsHigher MidsLower HighsMid HighsUpper HighsSuper Highs2029.232.231.32925.527.728.92529.529.83130.327.726.7283126.82728.627.625.925254026.927.329.729.325.525.226.75025.125.425.726.123.723.124.46326.42225.623.921.523.3248024.822.62322.721.823.322.810022.822.721.922.120.621.522.112526.222.721.121.920.321.823.516024.120.321.821.320.920.921.820024.922.822.521.720.921.223.32502421.321.621.120.420.622.731524.621.421.320.519.920.523.340024.822.221.120.62020.522.950026.62221.319.419.31924.263026.822.721.62018.418.424.48002923.722.320.119.318.125.9100028.422.821.519.419.317.224.9125030.62422.418.318.516.42716003124.82317.917.115.527.5200030.424.821.217.217.514.928.6250033.322.620.216.516.414.827.1315031.621.719.416.516.314.726400027.418.817.816.215.914.522.9500025.617.416.615.815.814.321.6630022.615.915.214.514.414.320.2800019.31514.814.414.314.118.71000016.914.514.514.21413.916.9125001514.814.613.913.813.814.81600014.314.514.413.913.713.914.6SPL41.23432.329.729.328.237.3N3.41.91.61.31.21.12.5median 25.6median 22median 21.2median 18.3median 18.4median 16.4median 23.3Delta3.42.82.82.62.82.92.8hearing rangehide median Fan NoiseHP Gaming Pavilion 15-dk0009ng
HP Gaming Pavilion 15-dk0009ng
i7-9750H, GeForce GTX 1660 Ti Max-Q
CUK Model Z GK5CQ7Z
i7-9750H, GeForce RTX 2070 Max-Q
Dell G5 15 5590
i7-8750H, GeForce RTX 2060 Mobile
Asus ROG Zephyrus G15 GA502DU
R7 3750H, GeForce GTX 1660 Ti Max-Q
Lenovo Legion Y530-15ICH
i7-8750H, GeForce GTX 1060 Mobile
Medion Erazer X6805-MD61085
i7-8750H, GeForce GTX 1060 Mobile
Moyenne NVIDIA GeForce GTX 1660 Ti Max-Q
 
Moyenne de la classe Gaming
 
Noise
-23%
-13%
-20%
-9%
-20%
-5%
-5%
arrêt / environnement *
28.2
28.6
-1%
30.4
-8%
28
1%
30.2
-7%
29
-3%
Idle Minimum *
29.3
30.8
-5%
30.4
-4%
29.4
-0%
30.9
-5%
29
1%
Idle Average *
29.3
30.8
-5%
30.4
-4%
31.9
-9%
30.9
-5%
32
-9%
Idle Maximum *
29.3
35
-19%
33.4
-14%
33
-13%
31.6
-8%
35
-19%
30.4 ?(27 - 33, n=7)
-4%
Load Average *
32.3
45
-39%
42
-30%
41.2
-28%
42.3
-31%
45
-39%
37.3 ?(30.9 - 42.4, n=7)
-15%
Witcher 3 ultra *
34
51.6
-52%
53.8
-58%
47
-38%
Load Maximum *
41.2
57.8
-40%
48.7
-18%
55.7
-35%
40
3%
56
-36%
46.1 ?(34.3 - 55.7, n=7)
-12%

* ... Moindre est la valeur, meilleures sont les performances

 41.6 °C46.7 °C44 °C 
 36.8 °C43.9 °C42.5 °C 
 27.9 °C29.6 °C31.4 °C 
Maximum: 46.7 °C
Moyenne: 38.3 °C
49.7 °C53.7 °C43.3 °C
39.2 °C41.8 °C38.4 °C
27.1 °C26.4 °C25.9 °C
Maximum: 53.7 °C
Moyenne: 38.4 °C
Alimentation (valeur maximale)  47.9 °C | Température ambiante de la pièce 20.4 °C | Voltcraft IR-900
(-) La température moyenne de la face supérieure sous charge maximale est de 38.3 °C / 101 F, par rapport à la moyenne de 33.9 °C / 93 F pour les appareils de la classe Gaming.
(-) La température maximale du côté supérieur est de 46.7 °C / 116 F, par rapport à la moyenne de 40.5 °C / 105 F, allant de 21.2 à 68.8 °C pour la classe Gaming.
(-) Le fond chauffe jusqu'à un maximum de 53.7 °C / 129 F, contre une moyenne de 43.2 °C / 110 F
(+) En utilisation inactive, la température moyenne du côté supérieur est de 23.4 °C / 74 F, par rapport à la moyenne du dispositif de 33.9 °C / 93 F.
(-) En jouant à The Witcher 3, la température moyenne du côté supérieur est de 38.8 °C / 102 F, alors que la moyenne de l'appareil est de 33.9 °C / 93 F.
(+) Les repose-poignets et le pavé tactile atteignent la température maximale de la peau (33.3 °C / 91.9 F) et ne sont donc pas chauds.
(-) La température moyenne de la zone de l'appui-paume de dispositifs similaires était de 28.9 °C / 84 F (-4.4 °C / #-7.9 F).
HP Gaming Pavilion 15-dk0009ng
i7-9750H, GeForce GTX 1660 Ti Max-Q
CUK Model Z GK5CQ7Z
i7-9750H, GeForce RTX 2070 Max-Q
Dell G5 15 5590
i7-8750H, GeForce RTX 2060 Mobile
Asus ROG Zephyrus G15 GA502DU
R7 3750H, GeForce GTX 1660 Ti Max-Q
Lenovo Legion Y530-15ICH
i7-8750H, GeForce GTX 1060 Mobile
Medion Erazer X6805-MD61085
i7-8750H, GeForce GTX 1060 Mobile
Moyenne NVIDIA GeForce GTX 1660 Ti Max-Q
 
Moyenne de la classe Gaming
 
Heat
-38%
-8%
-27%
-5%
-10%
-12%
-15%
Maximum Upper Side *
46.7
47.2
-1%
51.5
-10%
55.8
-19%
48.4
-4%
43
8%
Maximum Bottom *
53.7
65.8
-23%
48.3
10%
58.2
-8%
48
11%
55
-2%
49.4 ?(39.5 - 65, n=7)
8%
Idle Upper Side *
23.8
35.2
-48%
27.2
-14%
33.4
-40%
26.7
-12%
28
-18%
30.1 ?(23.8 - 34.6, n=7)
-26%
Idle Bottom *
23.7
43
-81%
27.4
-16%
33.6
-42%
26.9
-14%
30
-27%

* ... Moindre est la valeur, meilleures sont les performances

dB(A) 0102030405060708090Deep BassMiddle BassHigh BassLower RangeMidsHigher MidsLower HighsMid HighsUpper HighsSuper Highs2027.730.12526.729.1312526.64025.227.45023.126.86323.326.28023.324.210021.523.212521.826.916020.935.820021.245.625020.651.431520.554.540020.555.15001960.163018.465.380018.167.2100017.262.7125016.462.6160015.561.8200014.963.7250014.864.7315014.762.6400014.564.9500014.364.9630014.363.8800014.165.51000013.962.61250013.858.21600013.952.9SPL28.275.8N1.137.9median 16.4median 62.6Delta2.97.8hearing rangehide median Pink NoiseHP Gaming Pavilion 15-dk0009ng
Diagramme de fréquence (les cases peuvent être cochées et décochées pour comparer les appareils)
HP Gaming Pavilion 15-dk0009ng analyse audio

(±) | le niveau sonore du haut-parleur est moyen mais bon (75.8# dB)
Basses 100 - 315 Hz
(-) | presque aucune basse - en moyenne 23.1% plus bas que la médiane
(±) | la linéarité des basses est moyenne (11.6% delta à la fréquence précédente)
Médiums 400 - 2000 Hz
(+) | médiane équilibrée - seulement 2.4% de la médiane
(+) | les médiums sont linéaires (5.4% delta à la fréquence précédente)
Aiguës 2 - 16 kHz
(+) | des sommets équilibrés - à seulement 1.5% de la médiane
(+) | les aigus sont linéaires (3.4% delta à la fréquence précédente)
Globalement 100 - 16 000 Hz
(±) | la linéarité du son global est moyenne (19% de différence avec la médiane)
Par rapport à la même classe
» 61% de tous les appareils testés de cette catégorie étaient meilleurs, 8% similaires, 31% pires
» Le meilleur avait un delta de 6%, la moyenne était de 18%, le pire était de 132%.
Par rapport à tous les appareils testés
» 41% de tous les appareils testés étaient meilleurs, 8% similaires, 51% pires
» Le meilleur avait un delta de 4%, la moyenne était de 25%, le pire était de 134%.

Consommation énergétique
Éteint/en veilledarklight 0.09 / 0.16 Watts
Au reposdarkmidlight 6.8 / 10.7 / 12.5 Watts
Fortement sollicité midlight 87.2 / 191.4 Watts
 color bar
Légende: min: dark, med: mid, max: light        Metrahit Energy
HP Gaming Pavilion 15-dk0009ng
i7-9750H, GeForce GTX 1660 Ti Max-Q
CUK Model Z GK5CQ7Z
i7-9750H, GeForce RTX 2070 Max-Q
Dell G5 15 5590
i7-8750H, GeForce RTX 2060 Mobile
Asus ROG Zephyrus G15 GA502DU
R7 3750H, GeForce GTX 1660 Ti Max-Q
Lenovo Legion Y530-15ICH
i7-8750H, GeForce GTX 1060 Mobile
Medion Erazer X6805-MD61085
i7-8750H, GeForce GTX 1060 Mobile
Moyenne NVIDIA GeForce GTX 1660 Ti Max-Q
 
Moyenne de la classe Gaming
 
Power Consumption
-101%
15%
-23%
-5%
-25%
12%
-69%
Idle Minimum *
6.8
23.5
-246%
3.5
49%
7.4
-9%
7.3
-7%
10
-47%
5.16 ?(3.4 - 7.4, n=7)
24%
Idle Average *
10.7
28
-162%
6.9
36%
8.6
20%
11.1
-4%
13
-21%
8.51 ?(7.4 - 10.7, n=7)
20%
Idle Maximum *
12.5
32
-156%
8.5
32%
39.1
-213%
12.6
-1%
21
-68%
14.6 ?(9 - 39.1, n=7)
-17%
Load Average *
87.2
102.4
-17%
127
-46%
65.9
24%
109
-25%
101
-16%
76.4 ?(55.1 - 90, n=7)
12%
Witcher 3 ultra *
121
142.8
-18%
106.9
12%
126
-4%
Load Maximum *
191.4
209
-9%
179
6%
141.3
26%
168
12%
176
8%
151.4 ?(108 - 191.4, n=7)
21%

* ... Moindre est la valeur, meilleures sont les performances

Autonomie
Au repos (module WiFi éteint, luminosité au minimum)
8h 42min
Witcher 3 ultra 150cd
1h 00min
WiFi Websurfing (Edge 44)
4h 50min
En lecture de Big Buck Bunny encodé en H.264 1080p
5h 17min
Fortement sollicité (luminosité au maximum)
1h 16min
HP Gaming Pavilion 15-dk0009ng
i7-9750H, GeForce GTX 1660 Ti Max-Q, 52.5 Wh
CUK Model Z GK5CQ7Z
i7-9750H, GeForce RTX 2070 Max-Q, 46.74 Wh
Dell G5 15 5590
i7-8750H, GeForce RTX 2060 Mobile, 60 Wh
Asus ROG Zephyrus G15 GA502DU
R7 3750H, GeForce GTX 1660 Ti Max-Q, 76 Wh
Lenovo Legion Y530-15ICH
i7-8750H, GeForce GTX 1060 Mobile, 52 Wh
Medion Erazer X6805-MD61085
i7-8750H, GeForce GTX 1060 Mobile, 46.7 Wh
Moyenne de la classe Gaming
 
Autonomie de la batterie
-39%
78%
68%
-31%
6%
23%
Reader / Idle
522
890
70%
916
75%
495
-5%
503
-4%
H.264
317
506
60%
WiFi v1.3
290
178
-39%
463
60%
482
66%
228
-21%
270
-7%
Witcher 3 ultra
60
Load
76
168
121%
123
62%
26
-66%
98
29%

Points positifs

+ écran mat
+ écran IPS
+ 144 Hz
+ fidélité des couleurs
+ SSD NVMe
+ disque dur de 1 To
+ niveau sonore
+ lecteur de carte
+ clavier rétroéclairé

Points négatifs

- contraste
- pas de Thunderbolt 3
- partie écran
- un an de garantie
En test : le HP Gaming Pavilion 15-dk0009ng. Modèle de test aimablement fourni par HP Allemagne.

Le HP Gaming Pavilion 15 fait ce pour quoi il est conçu, et affiche de façon fluide tous les jeux triple A modernes sur son écran 1080p de 15,6 pouces. Le Core i7-9750H et la GeForce GTX 1660 Ti Max-Q s’avèrent être une combinaison puissante, de celle qui permet d’exploiter les 144 Hz de la dalle aux graphismes maximaux dans certains jeux. Le Gaming Pavilion 15 tourne de façon plutôt silencieuse, le bruit de ses ventilateurs ne couvrant pas les haut-parleurs durant le jeu.

Le SSD NVMe rapide permet au système de rester fluide et réactif, tandis que l’espace pour les jeux ne devrait pas manquer, grâce à la présence d’un disque dur de 1 To. Mieux encore, les deux disques peuvent être remplacés – même s’il faudra retirer la coque inférieure pour pouvoir le faire.

Le HP Gaming Pavilion 15 est une machine polyvalente honnête, pour laquelle nous avons peu de critiques.

L’écran IPS marque des points, non seulement grâce à son taux de rafraîchissement de 144 Hz, mais également grâce à ses faibles temps de réponse, à ses bons angles de vision, à sa luminosité maximale élevée, et à des couleurs très fidèles. Tout n’est pas excellent, la valeur des noirs comparativement élevée débouchant sur un contraste vraiment faible. Nous en attendions plus d’un appareil de cette classe à ce prix.

Le Gaming Pavilion 15 ne séduira pas non plus par son autonomie, celle-ci n’étant que de 4h30 dans notre test Wifi réaliste - cela n’est pas une surprise vu sa capacité de seulement 52,6 Wh. Nos ultimes critiques se font à l’encontre d’absence de Thunderbolt 3, d’une partie écran peu stable, et de la garantie d’un an. En revanche le clavier rétroéclairé est agréable, et les nombreux ports pratiques. Dans l’ensemble, le Gaming Pavilion 15 possède un bon rapport qualité / prix, à environ 1 500 $, avec ses ventilateurs silencieux comme point fort.

L’intégralité de cette critique est disponible en anglais en suivant ce lien.

HP Gaming Pavilion 15-dk0009ng - 09/20/2019 v7 (old)
Sascha Mölck

Châssis
73 / 98 → 74%
Clavier
82%
Dispositif de pointage
88%
Connectivité
61 / 80 → 77%
Poids
61 / 10-66 → 90%
Autonomie
62 / 95 → 65%
Écran
90%
Performances en jeu
87%
Performances dans les applications
88%
Chauffe
85 / 95 → 90%
Nuisance sonore
93 / 90 → 100%
Audio
71%
Appareil photo
40 / 85 → 47%
Moyenne
76%
84%
Gaming - Moyenne compensée

Price comparison

Please share our article, every link counts!
Mail Logo
> Revues et rapports de ordinateurs portatifs et smartphones, ordiphones > Critiques > Courte critique du HP Gaming Pavilion 15 (i7-9750H, GTX 1660 Ti Max-Q, FHD, 144 Hz) : un portable de jeu puissant et discret
Sascha Mölck, 2019-08- 8 (Update: 2019-08- 8)