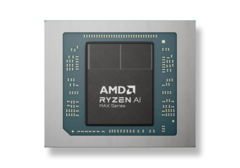
Le Core i9-14900HX est l'un des processeurs mobiles les plus rapides d'Intel, que l'on trouve couramment sur les grands ordinateurs portables de jeu comme l'Asus ROG Strix Scarpe de 18 pouces Asus ROG Strix Scar ou le MSI TItan. Néanmoins, son architecture Raptor Lake commence à montrer des signes de fatigue alors que les nouvelles options Zen 5 d'AMD commencent à offrir beaucoup plus sur presque tous les fronts avec le Ryzen AI Max+ 395 en est le dernier exemple.
Nos graphiques ci-dessous comparent le Ryzen AI Max+ 395 tel qu'on le trouve sur le petit 13 pouces Asus ROG Flow Z13 ou le HP ZBook Ultra G1a 14 de 14 pouces à des ordinateurs portables beaucoup plus grands équipés du Core i9-14900HX. Les performances multithread brutes se situent en moyenne à quelques points de pourcentage près entre les CPU AMD et Intel, malgré les différences considérables de taille d'écran. À ce jour, aucun ordinateur portable de 14 pouces n'est équipé d'un processeur Core i9-14900HX.
Le processeur AMD offre des fonctionnalités supplémentaires que l'on ne trouve pas sur le processeur Intel, en plus de son potentiel multithread brut, y compris un NPU 50 TOPS intégré et un processeur Radeon RX 8060S Radeon RX 8060S pour être à la fois prêt pour le CoPilot et prêt pour le jeu, respectivement. En revanche, les ordinateurs portables équipés du Core i9-14900HX sont presque toujours associés à un GPU Nvidia discret pour compenser la faiblesse de son GPU intégré et l'absence de NPU intégré.
Le Ryzen AI Max+ 395 peut encore être assez gourmand en énergie, avec un peu plus de 100 W lors de l'exécution de Prime95 sur notre ZBook Ultra G1a 14 soit presque deux fois plus que la plupart des ordinateurs portables de 14 pouces de la série U. Ses performances en single-thread sont également un peu moins bonnes que celles du Core i9-14900HX, de l'ordre de 15 %. Malgré cela, sa capacité à rivaliser avec les ordinateurs portables de jeu de 18 pouces de 2024 dans les charges de travail lourdes est remarquable pour les chasseurs de performances à la recherche d'options fines et légères.
Cinebench R15 Multi Loop
Top 10
» Le Top 10 des PC portables multimédia
» Le Top 10 des PC portables de jeu
» Le Top 10 des PC portables de jeu légers
» Le Top 10 des ordinateurs portables bureautiques
» Le Top 10 des PC portables bureautiques premium/professionnels
» Le Top 10 des Stations de travail mobiles
» Le Top 10 des Ultraportables
» Le Top 10 des Ultrabooks
» Le Top 10 des Convertibles
» Le Top 10 des Tablettes
» Le Top 10 des Tablettes Windows
» Le Top 10 des Smartphones
» Le Top 10 des PC Portables á moins de 300 euros
» Le Top 10 des PC Portables á moins de 500 euros
» Le Top 25 des meilleurs écrans d'ordinateurs
Cinebench 2024: CPU Multi Core | CPU Single Core
Cinebench R23: Multi Core | Single Core
Cinebench R20: CPU (Multi Core) | CPU (Single Core)
Cinebench R15: CPU Multi 64Bit | CPU Single 64Bit
Blender: v2.79 BMW27 CPU
7-Zip 18.03: 7z b 4 | 7z b 4 -mmt1
Geekbench 6.4: Multi-Core | Single-Core
Geekbench 5.5: Multi-Core | Single-Core
HWBOT x265 Benchmark v2.2: 4k Preset
LibreOffice : 20 Documents To PDF
R Benchmark 2.5: Overall mean
| CPU Performance Rating | |
| SCHENKER XMG Neo 16 (Early 24) | |
| MSI Raider 18 HX A14V | |
| Lenovo ThinkBook 16p G5 IRX 21N50011GE -2! | |
| Acer Predator Helios 16 PH16-72 | |
| HP ZBook Ultra G1a 14 | |
| Moyenne AMD Ryzen AI Max+ PRO 395 | |
| HP ZBook Fury 16 G11 | |
| SCHENKER XMG Pro 16 Studio (Mid 24) | |
| Nubia RedMagic Titan 16 Pro | |
| Cinebench 2024 / CPU Multi Core | |
| SCHENKER XMG Neo 16 (Early 24) | |
| MSI Raider 18 HX A14V | |
| HP ZBook Ultra G1a 14 | |
| Moyenne AMD Ryzen AI Max+ PRO 395 (n=1) | |
| Acer Predator Helios 16 PH16-72 | |
| SCHENKER XMG Pro 16 Studio (Mid 24) | |
| HP ZBook Fury 16 G11 | |
| Nubia RedMagic Titan 16 Pro | |
| Cinebench 2024 / CPU Single Core | |
| SCHENKER XMG Neo 16 (Early 24) | |
| MSI Raider 18 HX A14V | |
| Nubia RedMagic Titan 16 Pro | |
| HP ZBook Fury 16 G11 | |
| Acer Predator Helios 16 PH16-72 | |
| SCHENKER XMG Pro 16 Studio (Mid 24) | |
| HP ZBook Ultra G1a 14 | |
| Moyenne AMD Ryzen AI Max+ PRO 395 (n=1) | |
| Cinebench R23 / Multi Core | |
| SCHENKER XMG Neo 16 (Early 24) | |
| HP ZBook Ultra G1a 14 | |
| Moyenne AMD Ryzen AI Max+ PRO 395 (n=1) | |
| Lenovo ThinkBook 16p G5 IRX 21N50011GE | |
| Acer Predator Helios 16 PH16-72 | |
| MSI Raider 18 HX A14V | |
| SCHENKER XMG Pro 16 Studio (Mid 24) | |
| HP ZBook Fury 16 G11 | |
| Nubia RedMagic Titan 16 Pro | |
| Cinebench R23 / Single Core | |
| Lenovo ThinkBook 16p G5 IRX 21N50011GE | |
| SCHENKER XMG Neo 16 (Early 24) | |
| MSI Raider 18 HX A14V | |
| HP ZBook Fury 16 G11 | |
| Nubia RedMagic Titan 16 Pro | |
| Acer Predator Helios 16 PH16-72 | |
| SCHENKER XMG Pro 16 Studio (Mid 24) | |
| HP ZBook Ultra G1a 14 | |
| Moyenne AMD Ryzen AI Max+ PRO 395 (n=1) | |
| Cinebench R20 / CPU (Multi Core) | |
| SCHENKER XMG Neo 16 (Early 24) | |
| HP ZBook Ultra G1a 14 | |
| Moyenne AMD Ryzen AI Max+ PRO 395 (n=1) | |
| Lenovo ThinkBook 16p G5 IRX 21N50011GE | |
| MSI Raider 18 HX A14V | |
| Acer Predator Helios 16 PH16-72 | |
| SCHENKER XMG Pro 16 Studio (Mid 24) | |
| HP ZBook Fury 16 G11 | |
| Nubia RedMagic Titan 16 Pro | |
| Cinebench R20 / CPU (Single Core) | |
| MSI Raider 18 HX A14V | |
| Lenovo ThinkBook 16p G5 IRX 21N50011GE | |
| SCHENKER XMG Neo 16 (Early 24) | |
| HP ZBook Fury 16 G11 | |
| Nubia RedMagic Titan 16 Pro | |
| Acer Predator Helios 16 PH16-72 | |
| SCHENKER XMG Pro 16 Studio (Mid 24) | |
| HP ZBook Ultra G1a 14 | |
| Moyenne AMD Ryzen AI Max+ PRO 395 (n=1) | |
| Cinebench R15 / CPU Multi 64Bit | |
| SCHENKER XMG Neo 16 (Early 24) | |
| HP ZBook Ultra G1a 14 | |
| Moyenne AMD Ryzen AI Max+ PRO 395 (n=1) | |
| Lenovo ThinkBook 16p G5 IRX 21N50011GE | |
| MSI Raider 18 HX A14V | |
| Acer Predator Helios 16 PH16-72 | |
| SCHENKER XMG Pro 16 Studio (Mid 24) | |
| HP ZBook Fury 16 G11 | |
| Nubia RedMagic Titan 16 Pro | |
| Cinebench R15 / CPU Single 64Bit | |
| Lenovo ThinkBook 16p G5 IRX 21N50011GE | |
| Nubia RedMagic Titan 16 Pro | |
| MSI Raider 18 HX A14V | |
| SCHENKER XMG Neo 16 (Early 24) | |
| Acer Predator Helios 16 PH16-72 | |
| HP ZBook Ultra G1a 14 | |
| Moyenne AMD Ryzen AI Max+ PRO 395 (n=1) | |
| HP ZBook Fury 16 G11 | |
| SCHENKER XMG Pro 16 Studio (Mid 24) | |
| Blender / v2.79 BMW27 CPU | |
| Nubia RedMagic Titan 16 Pro | |
| HP ZBook Fury 16 G11 | |
| SCHENKER XMG Pro 16 Studio (Mid 24) | |
| Acer Predator Helios 16 PH16-72 | |
| Lenovo ThinkBook 16p G5 IRX 21N50011GE | |
| MSI Raider 18 HX A14V | |
| HP ZBook Ultra G1a 14 | |
| Moyenne AMD Ryzen AI Max+ PRO 395 (n=1) | |
| SCHENKER XMG Neo 16 (Early 24) | |
| 7-Zip 18.03 / 7z b 4 | |
| SCHENKER XMG Neo 16 (Early 24) | |
| MSI Raider 18 HX A14V | |
| Lenovo ThinkBook 16p G5 IRX 21N50011GE | |
| HP ZBook Ultra G1a 14 | |
| Moyenne AMD Ryzen AI Max+ PRO 395 (n=1) | |
| Acer Predator Helios 16 PH16-72 | |
| SCHENKER XMG Pro 16 Studio (Mid 24) | |
| HP ZBook Fury 16 G11 | |
| Nubia RedMagic Titan 16 Pro | |
| 7-Zip 18.03 / 7z b 4 -mmt1 | |
| Lenovo ThinkBook 16p G5 IRX 21N50011GE | |
| SCHENKER XMG Neo 16 (Early 24) | |
| Nubia RedMagic Titan 16 Pro | |
| Acer Predator Helios 16 PH16-72 | |
| HP ZBook Fury 16 G11 | |
| SCHENKER XMG Pro 16 Studio (Mid 24) | |
| MSI Raider 18 HX A14V | |
| HP ZBook Ultra G1a 14 | |
| Moyenne AMD Ryzen AI Max+ PRO 395 (n=1) | |
| Geekbench 6.4 / Multi-Core | |
| SCHENKER XMG Neo 16 (Early 24) | |
| Lenovo ThinkBook 16p G5 IRX 21N50011GE | |
| Acer Predator Helios 16 PH16-72 | |
| SCHENKER XMG Pro 16 Studio (Mid 24) | |
| MSI Raider 18 HX A14V | |
| HP ZBook Ultra G1a 14 | |
| Moyenne AMD Ryzen AI Max+ PRO 395 (n=1) | |
| HP ZBook Fury 16 G11 | |
| Nubia RedMagic Titan 16 Pro | |
| Geekbench 6.4 / Single-Core | |
| SCHENKER XMG Neo 16 (Early 24) | |
| Lenovo ThinkBook 16p G5 IRX 21N50011GE | |
| Nubia RedMagic Titan 16 Pro | |
| MSI Raider 18 HX A14V | |
| Acer Predator Helios 16 PH16-72 | |
| HP ZBook Fury 16 G11 | |
| SCHENKER XMG Pro 16 Studio (Mid 24) | |
| HP ZBook Ultra G1a 14 | |
| Moyenne AMD Ryzen AI Max+ PRO 395 (n=1) | |
| Geekbench 5.5 / Multi-Core | |
| SCHENKER XMG Neo 16 (Early 24) | |
| Acer Predator Helios 16 PH16-72 | |
| Lenovo ThinkBook 16p G5 IRX 21N50011GE | |
| MSI Raider 18 HX A14V | |
| SCHENKER XMG Pro 16 Studio (Mid 24) | |
| HP ZBook Fury 16 G11 | |
| HP ZBook Ultra G1a 14 | |
| Moyenne AMD Ryzen AI Max+ PRO 395 (n=1) | |
| Nubia RedMagic Titan 16 Pro | |
| Geekbench 5.5 / Single-Core | |
| Lenovo ThinkBook 16p G5 IRX 21N50011GE | |
| SCHENKER XMG Neo 16 (Early 24) | |
| Nubia RedMagic Titan 16 Pro | |
| MSI Raider 18 HX A14V | |
| Acer Predator Helios 16 PH16-72 | |
| HP ZBook Ultra G1a 14 | |
| Moyenne AMD Ryzen AI Max+ PRO 395 (n=1) | |
| HP ZBook Fury 16 G11 | |
| SCHENKER XMG Pro 16 Studio (Mid 24) | |
| HWBOT x265 Benchmark v2.2 / 4k Preset | |
| SCHENKER XMG Neo 16 (Early 24) | |
| HP ZBook Ultra G1a 14 | |
| Moyenne AMD Ryzen AI Max+ PRO 395 (n=1) | |
| MSI Raider 18 HX A14V | |
| Lenovo ThinkBook 16p G5 IRX 21N50011GE | |
| Acer Predator Helios 16 PH16-72 | |
| HP ZBook Fury 16 G11 | |
| SCHENKER XMG Pro 16 Studio (Mid 24) | |
| Nubia RedMagic Titan 16 Pro | |
| LibreOffice / 20 Documents To PDF | |
| HP ZBook Ultra G1a 14 | |
| Moyenne AMD Ryzen AI Max+ PRO 395 (n=1) | |
| HP ZBook Fury 16 G11 | |
| SCHENKER XMG Pro 16 Studio (Mid 24) | |
| Lenovo ThinkBook 16p G5 IRX 21N50011GE | |
| MSI Raider 18 HX A14V | |
| Nubia RedMagic Titan 16 Pro | |
| SCHENKER XMG Neo 16 (Early 24) | |
| Acer Predator Helios 16 PH16-72 | |
| R Benchmark 2.5 / Overall mean | |
| HP ZBook Ultra G1a 14 | |
| Moyenne AMD Ryzen AI Max+ PRO 395 (n=1) | |
| SCHENKER XMG Pro 16 Studio (Mid 24) | |
| HP ZBook Fury 16 G11 | |
| MSI Raider 18 HX A14V | |
| Acer Predator Helios 16 PH16-72 | |
| Nubia RedMagic Titan 16 Pro | |
| SCHENKER XMG Neo 16 (Early 24) | |
| Lenovo ThinkBook 16p G5 IRX 21N50011GE | |
* ... Moindre est la valeur, meilleures sont les performances


